Embed Size (px)
Citation preview
APPENDICIES
Appendix A - WNH Asset Condition Assessment (ACA) Report
Appendix B - 2021 Material Capital Investments
Appendix C - KWCG IRRP Report (2015)
Appendix D - KWCG RIP Report (2015)
Appendix E - KWCG Needs Assessment Report (2018)
Appendix F - KWCG IRRP Scoping Assessment Outcome Report (2019)
Appendix G - KWCG Regional Planning Status Letter
Appendix H - WNH Renewable Energy Generation (REG) Investment Plan
Appendix I - IESO REG Letter of Comment
Appendix J - WNH System Supply and Capacity Study
Appendix K - WNH Distribution System Reliability Report
Appendix L - WNH Customer Engagement Reports
Appendix M - WNH Fleet Management Plan
Appendix N - WNH Information Technology Management Plan
Appendix O - WNH Facilities Management Plan
Appendix P - WNH Operations Maintenance Report
Appendix Q - OEB Appendix 5-A Unit Cost Metrics
Appendix R - OEB Chapter 2 Appendix 2-AA

Appendix A:
WNH Asset Condition Assessment (ACA) Report

Appendix A:
WNH Asset Condition Assessment (ACA) Report
Waterloo North Hydro Inc.
DISTRIBUTION ASSETS
CONDITION ASSESSMENT
REPORT (ACA)
June 23, 2020
Version 1.0
June 23, 2020 2
TABLE OF CONTENTS
TABLE OF CONTENTS ........................................................................................................... 2
LIST OF TABLES .................................................................................................................... 5
LIST OF FIGURES .................................................................................................................. 7
GLOSSARY ............................................................................................................................. 8
1 INTRODUCTION .............................................................................................................11 1.1 Assets Under Study ..............................................................................................11 1.2 Asset Condition Assessment Methodology ...........................................................12
2 ASSET CONDITION ASSESSMENTS ............................................................................15 2.1 HIGH VOLTAGE STATION PRIMARY SWITCHES (230 kV and 115 kV) .............16
2.1.1 Asset Demographics ........................................................................................16
2.1.2 Condition Assessment Criteria .........................................................................16
2.1.3 Condition Assessment ......................................................................................17
2.1.4 Data Availability Indicator .................................................................................18
2.1.5 Analysis of Results ...........................................................................................18
2.2 STATION TRANSFORMERS (230 kV and 115 kV) ..............................................19 2.2.1 Asset Demographics ........................................................................................19
2.2.2 Condition Assessment Criteria .........................................................................20
2.2.3 Condition Assessment ......................................................................................21
2.2.4 Data Availability Indicator .................................................................................22
2.2.5 Analysis of Results ...........................................................................................22
2.3 STATION (TS) SWITCHGEAR .............................................................................23 2.3.1 Asset Demographics ........................................................................................23
2.3.2 Condition Assessment Criteria .........................................................................23
2.3.3 Condition Assessment ......................................................................................24
2.3.4 Data Availability Indicator .................................................................................25
2.3.5 Analysis of Results ...........................................................................................25
2.4 STATION (TS) CIRCUIT BREAKERS ...................................................................26 2.4.1 Asset Demographics ........................................................................................26
2.4.2 Condition Assessment Criteria .........................................................................28
2.4.3 Condition Assessment ......................................................................................29
2.4.4 Data Availability Indicator .................................................................................31
2.4.5 Analysis of Results ...........................................................................................31
2.5 STATION (TS) FEEDER CABLES ........................................................................33 2.5.1 Asset Demographics ........................................................................................33
2.5.2 Condition Assessment Criteria .........................................................................34
June 23, 2020 3
2.5.3 Condition Assessment ......................................................................................35
2.5.4 Data Availability Indicator .................................................................................37
2.5.5 Analysis of Results ...........................................................................................37
2.6 STATION (TS) PROTECTION RELAYS ...............................................................39 2.6.1 Asset Demographics ........................................................................................39
2.6.2 Condition Assessment Criteria .........................................................................40
2.6.3 Condition Assessment ......................................................................................41
2.6.4 Data Availability Indicator .................................................................................42
2.6.5 Analysis of Results ...........................................................................................42
2.7 DISTRIBUTION STATION (DS) TRANSFORMERS .............................................43 2.7.1 Asset Demographics ........................................................................................43
2.7.2 Condition Assessment Criteria .........................................................................43
2.7.3 Condition Assessment ......................................................................................45
2.7.4 Data Availability Indicator (DAI) ........................................................................45
2.7.5 Analysis of Results ...........................................................................................45
2.8 POLES .................................................................................................................47 2.8.1 Asset Demographics ........................................................................................47
2.8.2 Condition Assessment Criteria .........................................................................50
2.8.3 Condition Assessment ......................................................................................51
2.8.4 Data Availability Indicator (DAI) ........................................................................53
2.8.5 Analysis of Results ...........................................................................................53
2.9 PRIMARY UNDERGROUND DISTRIBUTION CABLES .......................................55 2.9.1 Asset Demographics ........................................................................................55
2.9.2 Condition Assessment Criteria .........................................................................59
2.9.3 Condition Assessment ......................................................................................60
2.9.4 Data Availability Indicator (DAI) ........................................................................61
2.9.5 Analysis of Results ...........................................................................................62
2.10 DISTRIBUTION TRANSFORMERS ......................................................................64 2.10.1 Asset Demographics ........................................................................................64
2.10.2 Condition Assessment Criteria .........................................................................64 2.10.2.1 PCB’s ...........................................................................................................68
2.10.3 Condition Assessment ......................................................................................69
2.10.4 Data Availability Indicator (DAI) ........................................................................70
2.10.5 Analysis of Results ...........................................................................................70
2.11 REVENUE METERS ............................................................................................71 2.11.1 Asset Demographics ........................................................................................71
2.11.2 Condition Assessment Criteria .........................................................................73
June 23, 2020 4
2.11.3 Condition Assessment ......................................................................................75
2.11.4 Data Availability Indicator .................................................................................76
2.11.5 Analysis of Results ...........................................................................................76
2.12 MANUAL LOADBREAK SWITCHES ....................................................................78 2.12.1 Asset Demographics ........................................................................................78
2.12.2 Condition Assessment Criteria .........................................................................78
2.12.3 Condition Assessment ......................................................................................79
2.12.4 Data Availability Indicator (DAI) ........................................................................80
2.12.5 Analysis of Results ...........................................................................................80
3 Asset Replacement Recommendations .......................................................................81
June 23, 2020 5
LIST OF TABLES
Table 2-1: TS HV Circuit Switches ................................................................................. 16
Table 2-2: TS HV Circuit Switches (TUL) ....................................................................... 16
Table 2-3: TS HV Circuit Switches Condition Assessment Criteria ................................ 17
Table 2-4: TS HV Circuit Switches Condition Assessments .......................................... 17
Table 2-5: TS Large Power Transformer Demographics ............................................... 19
Table 2-6: TS Step Up / Step Down Transformer Demographics .................................. 19
Table 2-7: TS Station Transformer (TUL) ...................................................................... 20
Table 2-8: TS Transformer Condition Assessment Criteria ........................................... 20
Table 2-9: Health Index Condition Categories ............................................................... 21
Table 2-10: TS Transformer Health Condition Assessments ........................................ 21
Table 2-11: TS Switchgear Demographics .................................................................... 23
Table 2-12: TS Switchgear (TUL) .................................................................................. 23
Table 2-13: TS Switchgear Condition Assessment Criteria ........................................... 24
Table 2-14: TS Switchgear Condition Assessments ..................................................... 24
Table 2-15: TS Main Bank and Tie Breaker Demographics .......................................... 26
Table 2-16: TS Feeder Breaker Demographics ............................................................. 27
Table 2-17: TS Main Bank and Tie Breaker (TUL) ........................................................ 28
Table 2-18: TS Breaker Condition Assessment Criteria ................................................ 28
Table 2-19: HMSTS”A” Breaker Condition Assessments .............................................. 29
Table 2-20: ERTS Breaker Condition Assessments ...................................................... 29
Table 2-21: HMSTS”B” Breaker Condition Assessments .............................................. 30
Table 2-22: HMSTS”B” Breaker Condition Assessments .............................................. 31
Table 2-23a: TS Feeder Cable Demographics .............................................................. 33
Table 2-23b: TS Feeder Cable Demographics .............................................................. 34
Table 2-24: TS Feeder Cables (TUL) ............................................................................ 34
Table 2-25: TS Feeder Cables Assessment Criteria ..................................................... 35
Table 2-26a: TS Feeder Cable Condition Assessments................................................ 35
Table 2-26b: TS Feeder Cable Condition Assessments................................................ 36
Table 2-26c: TS Feeder Cable Condition Assessments ................................................ 37
Table 2-27: TS Protection Systems Age and Condition ................................................. 39
June 23, 2020 6
Table 2-28: TS Protection Systems (TUL) ..................................................................... 40
Table 2-29: Protection Relay Condition Assessment Criteria .......................................... 41
Table 2-30: Protection Relay Condition Assessments ..................................................... 41
Table 2-31: WNH Municipal and Distribution Stations .................................................... 43
Table 2-32: DS Transformers (TUL) .............................................................................. 43
Table 2-33: DS Transformers Condition Assessment Criteria ....................................... 44
Table 2-34: DS Transformers Health Condition Assessments ...................................... 45
Table 2-35: Pole Population by Type ............................................................................ 47
Table 2-36: Pole Population Demographics by Municipality .......................................... 47
Table 2-37: Pole Population Urban / Rural .................................................................... 48
Table 2-38: Pole Utilization ........................................................................................... 48
Table 2-39: Pole Age..................................................................................................... 49
Table 2-40: Poles (TUL) ................................................................................................ 50
Table 2-41: Recommended Health Index Assessment Criteria ..................................... 51
Table 2-42: Recommended Health Index ...................................................................... 52
Table 2-43: Pole Health Index distribution by Number of Circuits ................................. 53
Table 2-44: Pole Replacement Recommendation ......................................................... 54
Table 2-45: Cable Population by Type .......................................................................... 55
Table 2-46: Cable Population by Installation Method .................................................... 56
Table 2-47: Cable Population by System Voltage ......................................................... 57
Table 2-48: Cable Population Demographics ................................................................ 57
Table 2-49: Cable TUL by Type .................................................................................... 59
Table 2-50: WNH Cable Assessment Criteria ................................................................ 60
Table 2-51: Condition Assessment Results ................................................................... 60
Table 2-52: Primary Cable Replacement Recommendation ......................................... 63
Table 2-53: WNH Distribution Transformer Population by Type .................................... 64
Table 2-54: WNH Distribution Transformer TUL’s ......................................................... 65
Table 2-55: Recommended Health Index Assessment Criteria ..................................... 66
Table 2-56: WNH Transformer Average Age ................................................................ 66
Table 2-57: WNH PCB Transformers ............................................................................ 68
Table 2-58: WNH Distribution Transformer HI ............................................................... 69
June 23, 2020 7
Table 2-59: Meters by Application ................................................................................. 71
Table 2-60: WNH Meters by Age ................................................................................... 72
Table 2-61: Metering Asset (TUL) ................................................................................. 73
Table 2-62: Meter Condition Assessment Criteria ......................................................... 73
Table 2-63: Meter Condition Assessments .................................................................... 75
Table 2-64: Load Break Switch (TUL) ........................................................................... 78
Table 2-65: Load Break Switch Assessment Criteria ..................................................... 79
Table 2-66: Manual Load Break Switch Age Profile ....................................................... 79
Table 2-67: Manual Load Break Switch Age Profile ....................................................... 80
Table 3-1: WNH Recommended Asset Replacement Plan ........................................... 81
LIST OF FIGURES
Figure 2-1: WNH Pole Population Age Profile ............................................................... 50
Figure 2-2: WNH Pole Population HI Distribution .......................................................... 52
Figure 2-3: XLPE Age Profile ........................................................................................ 58
Figure 2-4: TRXLPE Age Profile ................................................................................... 58
Figure 2-5: WNH Cable Population HI Profile ............................................................... 61
Figure 2-6: Transformer Age Profile .............................................................................. 67
Figure 2-7: WNH Distribution Transformer Utilization (%) ............................................. 67
Figure 2-8: WNH Distribution Transformer Population HI Profile .................................. 69
Figure 2-9: WNH Meter Installations by Age ................................................................. 72
Figure 2-10: Load Break Switch Population by % TUL.................................................. 78
June 23, 2020 8
GLOSSARY
1) ACA – Asset Condition Assessment
2) ACSR – Aluminum Conductor Steel-Reinforced
3) AM – Asset Management
4) AMI – Advanced Metering Infrastructure
5) AMP – Asset Management Process
6) BIL – Basic Impulse Level
7) CSA – Canadian Standards Association
8) DG – Distributed Generation
9) DGA – Dissolved Gas Analysis
10) DS – Distribution Station
11) DSC – Distribution System Code
12) DSP – Distribution System Plan
13) EOL – End of Life
14) ESA – Electrical Safety Authority
15) FLISR – Fault Location, Isolation and Service Restoration
16) GATR – Guelph Area Transmission Reinforcement
17) GIS – Geographic Information System
18) GS – General Service
19) HI - Health Indices
20) HONI – Hydro One Networks Inc.
21) IESO – Independent Electricity System Operator
22) IT – Information Technology
23) KPI – Key Performance Indicator
June 23, 2020 9
24) kW - kilowatt
25) KWCG – Kitchener – Waterloo – Cambridge – Guelph
26) KWHI – Kitchener-Wilmot Hydro Inc.
27) LDC – Local Distribution Company
28) LDG – Load Displacement Generation
29) LOS – Loss of Supply
30) LTLT – Long Term Load Transfer
31) LTR – Limited Time Rating
32) MC – Measurement Canada
33) NWA - Non-wires alternatives
34) O/H or OH - Overhead
35) O&M – Operation & Maintenance
36) O&M – Operation, Maintenance & Administration
37) ONAN - Oil Natural Air Natural
38) ONAF - Oil Natural Air Forced
39) ODS – Operational Data Store
40) OEB – Ontario Energy Board
41) OMS – Outage Management System
42) OPA – Ontario Power Authority
43) ORTAC – Ontario Resource and Transmission Assessment Criteria
44) OT – Operation Technology
45) REG – Renewable Energy Generation
46) RIP – Regional Infrastructure Planning
47) ROE – Return on Equity
June 23, 2020 10
48) RRFE – Renewed Regulatory Framework for Electricity Distributors
49) RTU – Remote Terminal Units
50) SCADA – Supervisory Control and Data Acquisition
51) SEI – Serious Electrical Incidents
52) the Board – Ontario Energy Board
53) the City – City of Waterloo
54) the Region – Region of Waterloo
55) TPSS – Traction Power Substations
56) TRXLPE – Tree-Retardant Cross-Linked Polyethylene
57) TUL – Typical Useful Life
58) TS – Transmission Station or Transformer Station
59) U/G or UG – Underground
60) ULTC – Under-Load Tap Changing
61) URD – Underground Residential Distribution
62) USF – Utilities Standards Forum
63) WNHI / WNH – Waterloo North Hydro Inc.
64) XFMR – Transformer
65) XLPE – Cross-Linked Polyethylene
June 23, 2020 11
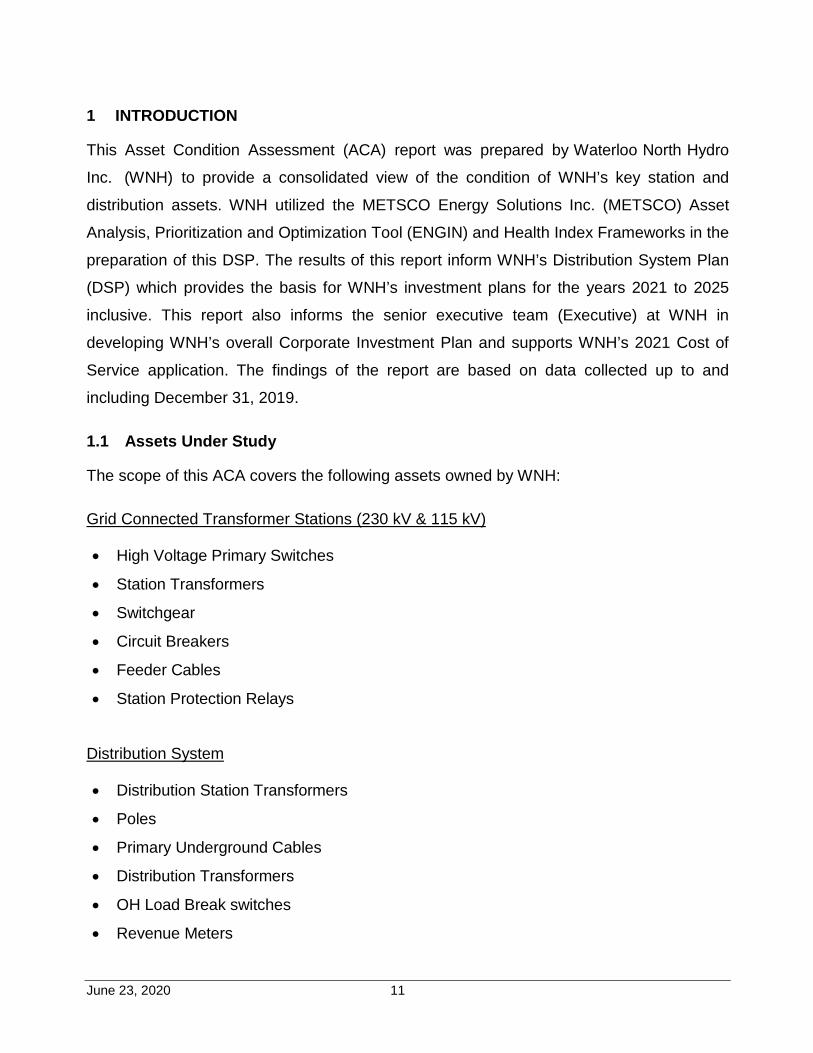
1 INTRODUCTION
This Asset Condition Assessment (ACA) report was prepared by Waterloo North Hydro
Inc. (WNH) to provide a consolidated view of the condition of WNH’s key station and
distribution assets. WNH utilized the METSCO Energy Solutions Inc. (METSCO) Asset
Analysis, Prioritization and Optimization Tool (ENGIN) and Health Index Frameworks in the
preparation of this DSP. The results of this report inform WNH’s Distribution System Plan
(DSP) which provides the basis for WNH’s investment plans for the years 2021 to 2025
inclusive. This report also informs the senior executive team (Executive) at WNH in
developing WNH’s overall Corporate Investment Plan and supports WNH’s 2021 Cost of
Service application. The findings of the report are based on data collected up to and
including December 31, 2019.
1.1 Assets Under Study
The scope of this ACA covers the following assets owned by WNH:
Grid Connected Transformer Stations (230 kV & 115 kV)
• High Voltage Primary Switches
• Station Transformers
• Switchgear
• Circuit Breakers
• Feeder Cables
• Station Protection Relays
Distribution System
• Distribution Station Transformers
• Poles
• Primary Underground Cables
• Distribution Transformers
• OH Load Break switches
• Revenue Meters
June 23, 2020 12
Fleet, Information Technology and Facilities assets are addressed in their own ACA Reports
and are not included within the scope of this report. They can be found in the following DSP
Appendices;
Appendix M - Fleet Management Plan
Appendix N – Information Technology Management Plan
Appendix O - Facilities Management Plan
1.2 Asset Condition Assessment Methodology
WNH’s Asset Condition Assessment methodology involves the continuous collection of
asset condition data, establishment of asset end-of-life (EOL) criteria, analysis of
performance and/or condition data against EOL criteria and the development of quantitative
asset Health Indices (HI) that help identify and rank assets at greatest risk; all to inform
WNH’s capital and maintenance investment plans.
Health Indices are quantified condition scores of the asset relative to its EOL criteria. The
major elements to health indexing include;
• Demographics – the foundation of WNH’s ACA process is based on its extensive Asset
Registry Database. Demographic information includes but is not limited to asset types,
features, ratings, age, and quantity for each of the asset classes under study.
• Degradation processes – identifying how each asset type deteriorates in condition,
performance and ultimately fails.
• End-Of-Life Criteria (Degradation Factors) – are developed by understanding the
degradation and failure processes for each asset and quantifying typical-useful-life
(TUL) and maximum-useful-life (MUL) parameters. WNH has relied on results of the
Kinectrics Inc. Report No: K-418033-RA-001-R000, April 28, 2010, Kinectrics Inc.
(Kinectrics Report) in this report.
• Health Index Framework – establishing a quantitative Health Index score by
establishing the relative weight (importance) each degradation factor has in
June 23, 2020 13
establishing the health of an asset and calculating the normalized sum of each
weighted degradation factor. Assets are classified in one of five asset conditions: Very
Good, Good, Fair, Poor, or Very Poor. The asset health conditions set the ground work
for developing a data driven asset replacement program.
• In order to create a Health Index Framework, a series of inputs are required including:
• Internal Knowledge: Understanding of key asset classes and sub-classes with
specialized characteristics that result in elevated failure probabilities that must be
captured as part of health index formulation;
• Maintenance Practices: In-field inspection data will be captured from current
maintenance practices to support health index quantification;
• Subject-Matter Experts: These experts represent a key component in the development
and validation of the HI formulation and include equipment manufacturers’
recommendations, WNH’s expertise, judgement and experience.
• Consultant Experience: Industry-defined degradation parameters can be produced
where current-state data remains limited. WNH has utilized both the Kinectrics report
and METSCO’s Health Index Frameworks as the basis of developing its own
framework as presented in this report.
• Condition/Performance Assessments - the collection of condition/performance data
through inspections, testing and maintenance, that relate to the degradation
processes guided by the Health Index Framework.
For poles and underground cable, WNH utilized ENGIN, a software application developed
by METSCO Energy Solutions Inc. (METSCO). ENGIN is an Asset Analysis, Prioritization
and Optimization Tool used in developing the asset assessment Health Indices for the
replacement analysis recommendations in this report. WNH is working with METSCO to
implement a fully risk-based asset management system for all of its key asset classes.
For the remainder of the assets under study, the asset condition assessments were
June 23, 2020 14
developed by WNH, aided by Health Index Frameworks developed by METSCO Energy
Solutions Inc. (METSCO). Where necessary, WNH tailored these frameworks to reflect
WNH’s specific asset types and their key degradation factors. These frameworks utilize the
asset degradation and weighting factors to develop the Health Indices for the assets studied
in this report.
Commonly the following guidelines are used to determine asset replacement.
• Assets in service and identified as in immediate danger of failure are assigned to
WNH’s Proactive Renewal Program. Depending on the condition, assets are planned
for replacement anywhere from next day to 12 months.
• Assets in service and in very poor or poor condition are assigned to WNH’s System
Renewal Plan. Depending on the condition and risk assessments, assets are normally
replaced anywhere from 1 to 2 years.
• Assets in Fair condition are monitored and may be revaluated in the upcoming 2 to 5
years to determine their rate of degradation. This may require additional inspection
and testing.
• All assets are revaluated as new inspection, testing, performance and financial data
become available. Replacement of assets evaluated in Good and Very Good condition
generally fall outside the current 5-year renewal plan.
In addition to the aforementioned health indices, additional asset demographic information
and metrics are provided including total population, age distribution, and average data
availability indicators (DAI). An analysis of results is provided with each asset group that
assists in the development of a renewal strategy for the asset class.
June 23, 2020 15
2 ASSET CONDITION ASSESSMENTS
WNH maintains an extensive asset register and has established comprehensive data
collection, asset inspection, testing and maintenance programs to provide condition
assessments for its major distribution system assets.
Factors such as condition assessment data, age, typical useful life (TUL), and asset
performance are evaluated with respect to condition and performance targets to develop a
condition rating.
Each asset condition assessment outlined in this report includes the following;
1. Asset Demographics – includes a description of the assets in each asset group,
quantities, age, ratings,
2. Condition Assessment Criteria – the degradation factors and measures by which asset
Health Indices are calculated.
3. Typical Useful Life – used to provide age demographics and inform the asset condition
assessments. Reference in this report is made frequently to Kinectrics Inc. Report No:
K-418033-RA-001-R000, April 28, 2010, Kinectrics Inc. (Kinectrics Report).
4. Health Index Scoring – the total of all evaluated degradation factors multiplied by their
individual weighting
5. Health Index Condition Categories – the categorization of Health Index scoring into five
categories from Very Good to Very Poor.
6. Data Availability Indicator - is a measure of the completeness of the data set required
to calculate the Health Indices and assess the overall condition of the asset group. The
DAI is a weighted average of the quantity of asset data used for the HI calculations and
the relative evaluation weighting of data, expressed as a percent of the maximum.
7. Analysis of Results – provides an overview of the asset condition assessments and
assets flagged for action.
June 23, 2020 16
2.1 HIGH VOLTAGE STATION PRIMARY SWITCHES (230 kV and 115 kV)
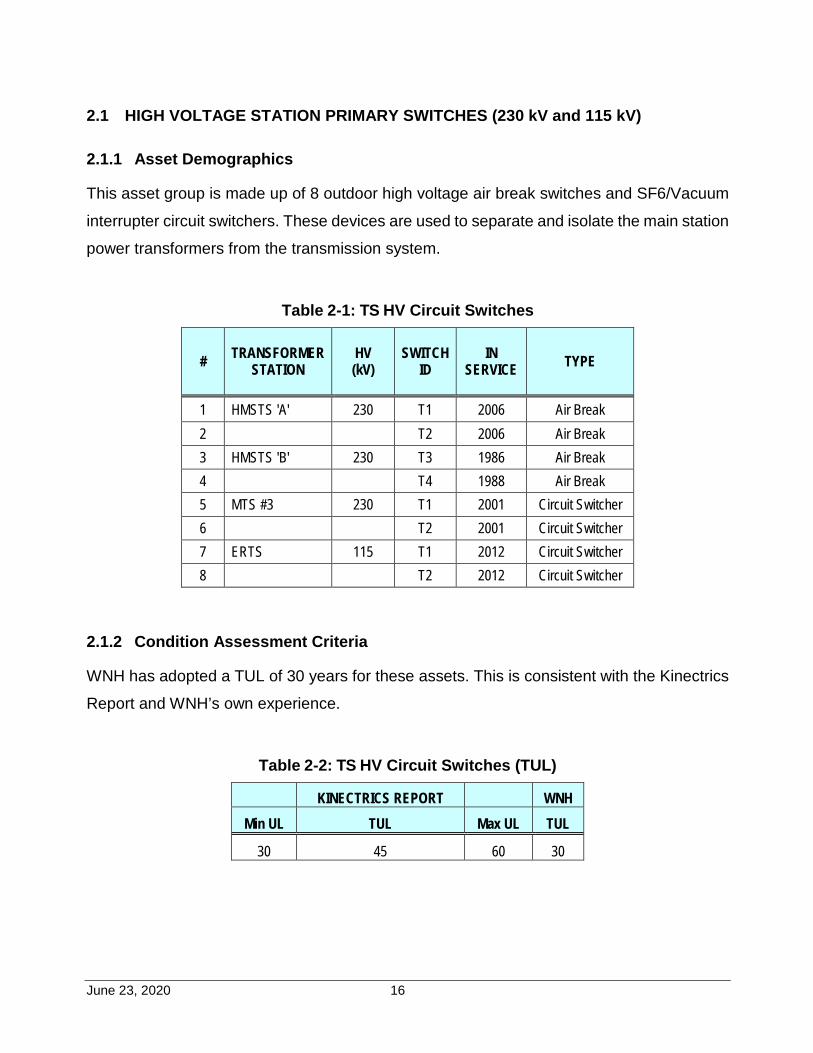
2.1.1 Asset Demographics
This asset group is made up of 8 outdoor high voltage air break switches and SF6/Vacuum
interrupter circuit switchers. These devices are used to separate and isolate the main station
power transformers from the transmission system.
Table 2-1: TS HV Circuit Switches
# TRANSFORMER STATION
HV (kV)
SWITCH ID
IN SERVICE TYPE
1 HMSTS 'A' 230 T1 2006 Air Break 2 T2 2006 Air Break 3 HMSTS 'B' 230 T3 1986 Air Break 4 T4 1988 Air Break 5 MTS #3 230 T1 2001 Circuit Switcher 6 T2 2001 Circuit Switcher 7 ERTS 115 T1 2012 Circuit Switcher 8 T2 2012 Circuit Switcher
2.1.2 Condition Assessment Criteria
WNH has adopted a TUL of 30 years for these assets. This is consistent with the Kinectrics
Report and WNH’s own experience.
Table 2-2: TS HV Circuit Switches (TUL)
KINECTRICS REPORT WNH Min UL TUL Max UL TUL
30 45 60 30
June 23, 2020 17
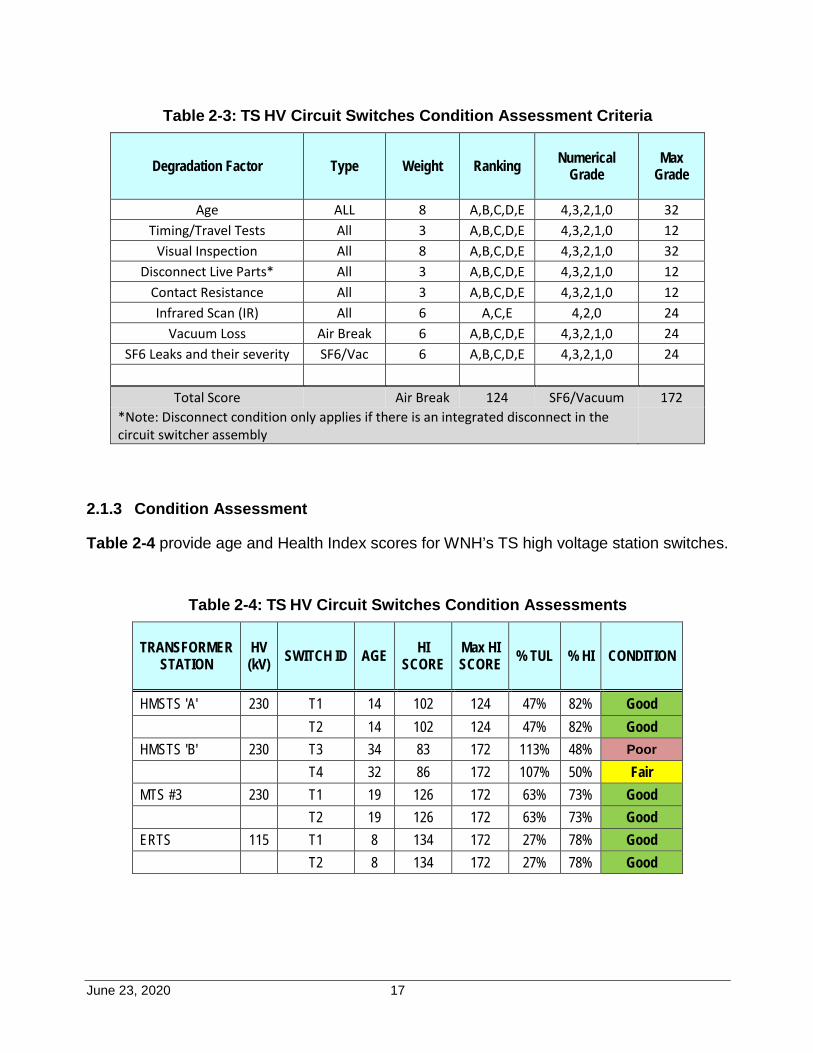
Table 2-3: TS HV Circuit Switches Condition Assessment Criteria
Degradation Factor Type Weight Ranking Numerical Grade
Max Grade
Age ALL 8 A,B,C,D,E 4,3,2,1,0 32 Timing/Travel Tests All 3 A,B,C,D,E 4,3,2,1,0 12
Visual Inspection All 8 A,B,C,D,E 4,3,2,1,0 32 Disconnect Live Parts* All 3 A,B,C,D,E 4,3,2,1,0 12
Contact Resistance All 3 A,B,C,D,E 4,3,2,1,0 12 Infrared Scan (IR) All 6 A,C,E 4,2,0 24
Vacuum Loss Air Break 6 A,B,C,D,E 4,3,2,1,0 24 SF6 Leaks and their severity SF6/Vac 6 A,B,C,D,E 4,3,2,1,0 24
Total Score Air Break 124 SF6/Vacuum 172
*Note: Disconnect condition only applies if there is an integrated disconnect in the circuit switcher assembly
2.1.3 Condition Assessment
Table 2-4 provide age and Health Index scores for WNH’s TS high voltage station switches.
Table 2-4: TS HV Circuit Switches Condition Assessments
TRANSFORMER STATION
HV (kV) SWITCH ID AGE HI
SCORE Max HI SCORE % TUL % HI CONDITION
HMSTS 'A' 230 T1 14 102 124 47% 82% Good T2 14 102 124 47% 82% Good HMSTS 'B' 230 T3 34 83 172 113% 48% Poor T4 32 86 172 107% 50% Fair MTS #3 230 T1 19 126 172 63% 73% Good T2 19 126 172 63% 73% Good ERTS 115 T1 8 134 172 27% 78% Good T2 8 134 172 27% 78% Good
June 23, 2020 18
2.1.4 Data Availability Indicator
WNH’s DAI for WNH’s TS high voltage station switches condition assessment data is 100%.
Travel timing tests have yet to be completed on the four air break switches. These tests will
be scheduled at the time of their next maintenance outage.
2.1.5 Analysis of Results
Although HMSTS “B” air break switches have exceeded their TUL, their operational
performance, inspection and maintenance results have been satisfactory. The T4 air break
switches are rated in fair condition and have their next scheduled maintenance in 2020. The
T3 switches are rated in poor condition mainly due to a poor contact resistance reading and
contact pitting on the red phase. This will be addressed during the 2020 scheduled
maintenance after which the condition rating is expected to increase to Fair.
Currently there are no indications the switches will not meet an extended service date of
2025 with regular maintenance. It is recommended that in 2024, WNH conduct another
thorough condition assessment to inform the next investment cycle with either a life
extension or replacement plan.
There are no replacements forecast for any of these assets prior to 2025.
June 23, 2020 19
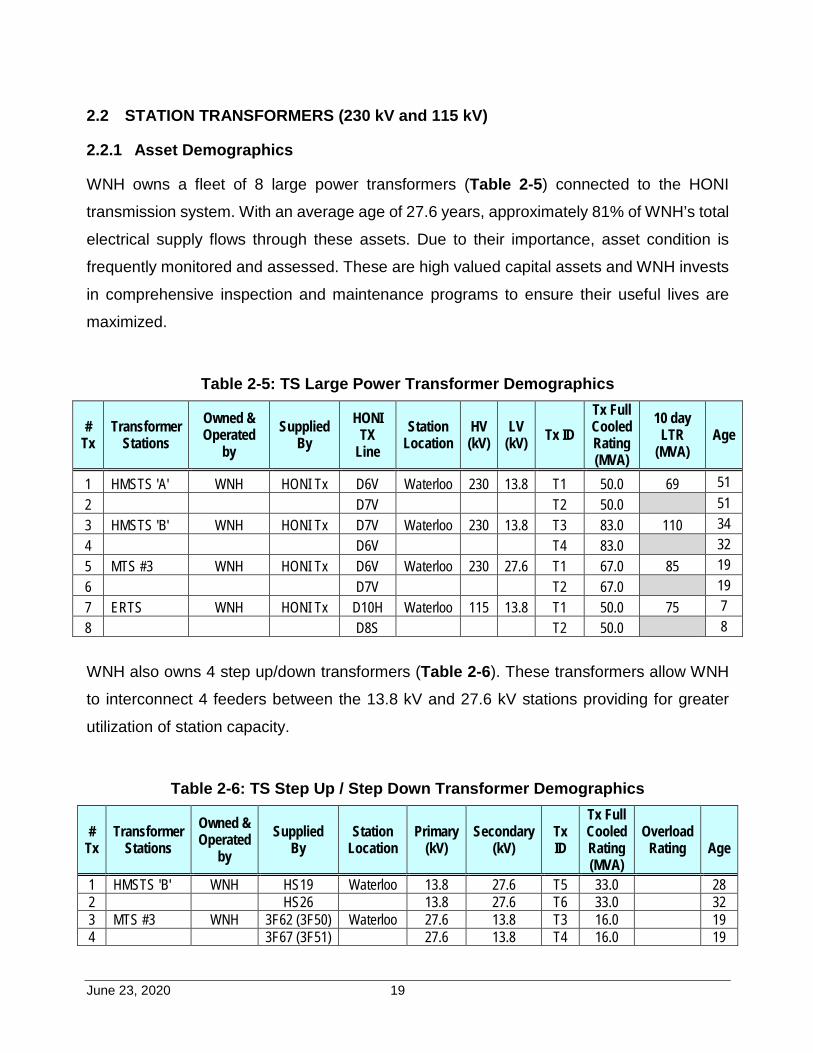
2.2 STATION TRANSFORMERS (230 kV and 115 kV)
2.2.1 Asset Demographics
WNH owns a fleet of 8 large power transformers (Table 2-5) connected to the HONI
transmission system. With an average age of 27.6 years, approximately 81% of WNH’s total
electrical supply flows through these assets. Due to their importance, asset condition is
frequently monitored and assessed. These are high valued capital assets and WNH invests
in comprehensive inspection and maintenance programs to ensure their useful lives are
maximized.
Table 2-5: TS Large Power Transformer Demographics
# Tx
Transformer Stations
Owned & Operated
by Supplied
By HONI
TX Line
Station Location
HV (kV)
LV (kV) Tx ID
Tx Full Cooled Rating (MVA)
10 day LTR
(MVA) Age
1 HMSTS 'A' WNH HONI Tx D6V Waterloo 230 13.8 T1 50.0 69 51 2 D7V T2 50.0 51 3 HMSTS 'B' WNH HONI Tx D7V Waterloo 230 13.8 T3 83.0 110 34 4 D6V T4 83.0 32 5 MTS #3 WNH HONI Tx D6V Waterloo 230 27.6 T1 67.0 85 19 6 D7V T2 67.0 19 7 ERTS WNH HONI Tx D10H Waterloo 115 13.8 T1 50.0 75 7 8 D8S T2 50.0 8
WNH also owns 4 step up/down transformers (Table 2-6). These transformers allow WNH
to interconnect 4 feeders between the 13.8 kV and 27.6 kV stations providing for greater
utilization of station capacity.
Table 2-6: TS Step Up / Step Down Transformer Demographics
# Tx
Transformer Stations
Owned & Operated
by Supplied
By Station
Location Primary
(kV) Secondary
(kV) Tx ID
Tx Full Cooled Rating (MVA)
Overload Rating
Age
1 HMSTS 'B' WNH HS19 Waterloo 13.8 27.6 T5 33.0 28 2 HS26 13.8 27.6 T6 33.0 32 3 MTS #3 WNH 3F62 (3F50) Waterloo 27.6 13.8 T3 16.0 19 4 3F67 (3F51) 27.6 13.8 T4 16.0 19
June 23, 2020 20
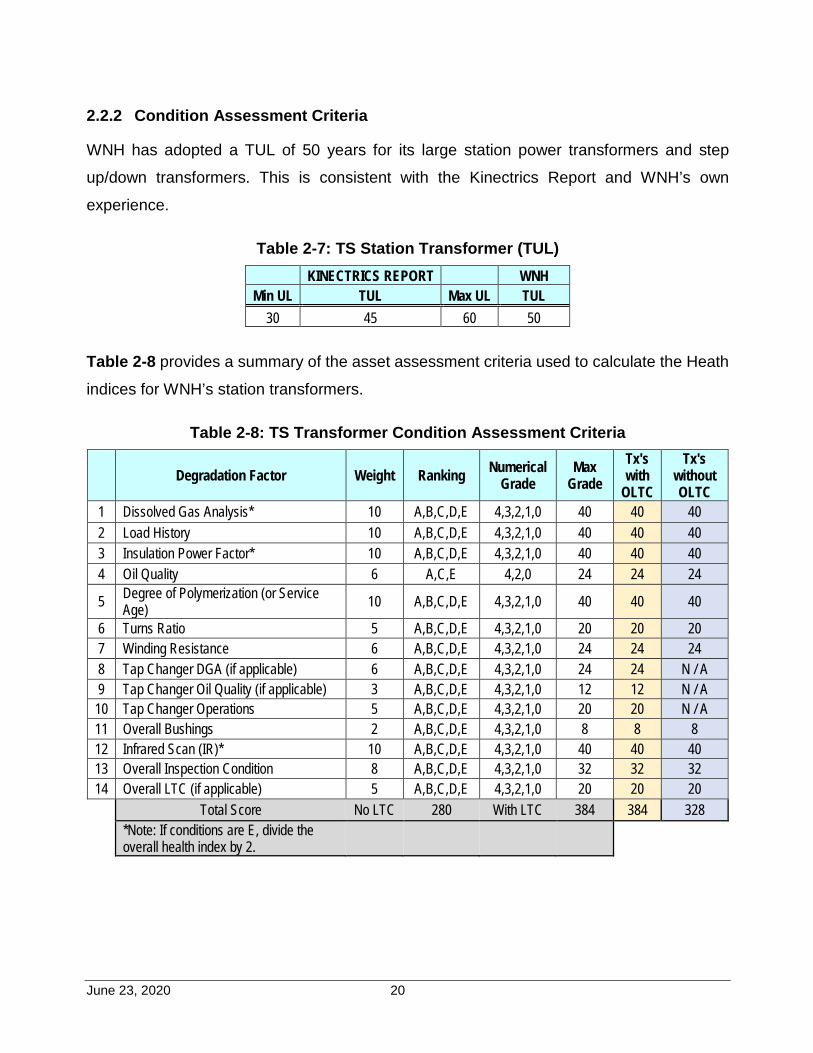
2.2.2 Condition Assessment Criteria
WNH has adopted a TUL of 50 years for its large station power transformers and step
up/down transformers. This is consistent with the Kinectrics Report and WNH’s own
experience.
Table 2-7: TS Station Transformer (TUL) KINECTRICS REPORT WNH
Min UL TUL Max UL TUL 30 45 60 50
Table 2-8 provides a summary of the asset assessment criteria used to calculate the Heath
indices for WNH’s station transformers.
Table 2-8: TS Transformer Condition Assessment Criteria
Degradation Factor Weight Ranking Numerical Grade
Max Grade
Tx's with
OLTC
Tx's without OLTC
1 Dissolved Gas Analysis* 10 A,B,C,D,E 4,3,2,1,0 40 40 40 2 Load History 10 A,B,C,D,E 4,3,2,1,0 40 40 40 3 Insulation Power Factor* 10 A,B,C,D,E 4,3,2,1,0 40 40 40 4 Oil Quality 6 A,C,E 4,2,0 24 24 24
5 Degree of Polymerization (or Service Age) 10 A,B,C,D,E 4,3,2,1,0 40 40 40
6 Turns Ratio 5 A,B,C,D,E 4,3,2,1,0 20 20 20 7 Winding Resistance 6 A,B,C,D,E 4,3,2,1,0 24 24 24 8 Tap Changer DGA (if applicable) 6 A,B,C,D,E 4,3,2,1,0 24 24 N / A 9 Tap Changer Oil Quality (if applicable) 3 A,B,C,D,E 4,3,2,1,0 12 12 N / A
10 Tap Changer Operations 5 A,B,C,D,E 4,3,2,1,0 20 20 N / A 11 Overall Bushings 2 A,B,C,D,E 4,3,2,1,0 8 8 8 12 Infrared Scan (IR)* 10 A,B,C,D,E 4,3,2,1,0 40 40 40 13 Overall Inspection Condition 8 A,B,C,D,E 4,3,2,1,0 32 32 32 14 Overall LTC (if applicable) 5 A,B,C,D,E 4,3,2,1,0 20 20 20
Total Score No LTC 280 With LTC 384 384 328 *Note: If conditions are E, divide the
overall health index by 2.
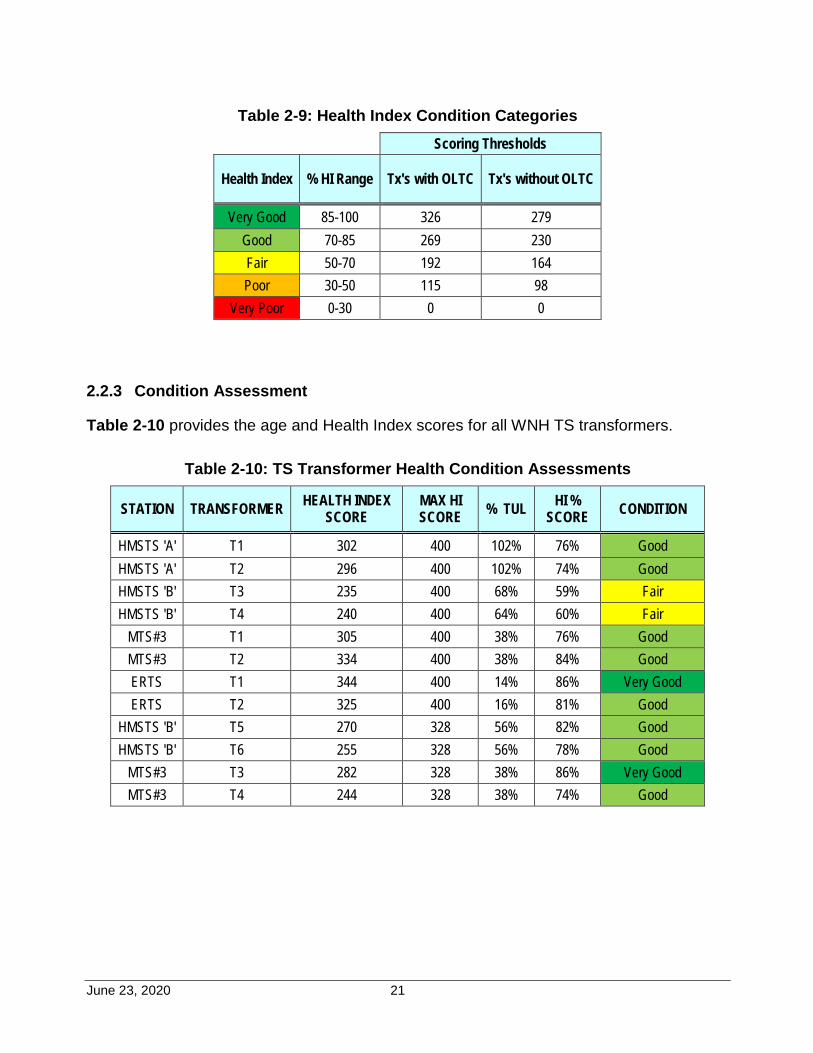
June 23, 2020 21
Table 2-9: Health Index Condition Categories Scoring Thresholds
Health Index % HI Range Tx's with OLTC Tx's without OLTC
Very Good 85-100 326 279 Good 70-85 269 230 Fair 50-70 192 164 Poor 30-50 115 98
Very Poor 0-30 0 0
2.2.3 Condition Assessment
Table 2-10 provides the age and Health Index scores for all WNH TS transformers.
Table 2-10: TS Transformer Health Condition Assessments
STATION TRANSFORMER HEALTH INDEX SCORE
MAX HI SCORE % TUL HI %
SCORE CONDITION
HMSTS 'A' T1 302 400 102% 76% Good HMSTS 'A' T2 296 400 102% 74% Good HMSTS 'B' T3 235 400 68% 59% Fair HMSTS 'B' T4 240 400 64% 60% Fair
MTS#3 T1 305 400 38% 76% Good MTS#3 T2 334 400 38% 84% Good ERTS T1 344 400 14% 86% Very Good ERTS T2 325 400 16% 81% Good
HMSTS 'B' T5 270 328 56% 82% Good HMSTS 'B' T6 255 328 56% 78% Good
MTS#3 T3 282 328 38% 86% Very Good MTS#3 T4 244 328 38% 74% Good
June 23, 2020 22
2.2.4 Data Availability Indicator
WNH’s DAI for Substation Transformer condition assessment data is 99%. High voltage
bushing power factor tests have yet to be completed on 4 of WNH’s youngest station
transformers. These tests will be scheduled at the time of their next maintenance outage.
2.2.5 Analysis of Results
HMSTS”A” T1 and T2 reached their TUL in 2019 however ongoing condition assessments
indicate that these assets will outperform this date. Recent tap changer maintenance, HV
bushing condition assessments and oil condition analysis are all positive. Due to their age;
however, it is prudent for WNH to monitor their condition closely. The planned addition of
on-line DGA monitoring is an important step towards that achievement. Replacement of
these transformers is forecast to be after 2025.
HMSTS”B” T3 and T4 have been evaluated to be in Fair condition at approximately two-
thirds, of their TUL. This is lower than expected and it is recommended that more analysis
be performed over the next 5 years to better quantify the rate of health decline in forecasting
EOL.
There are no replacements forecast for any of these assets prior to 2025.
June 23, 2020 23
2.3 STATION (TS) SWITCHGEAR
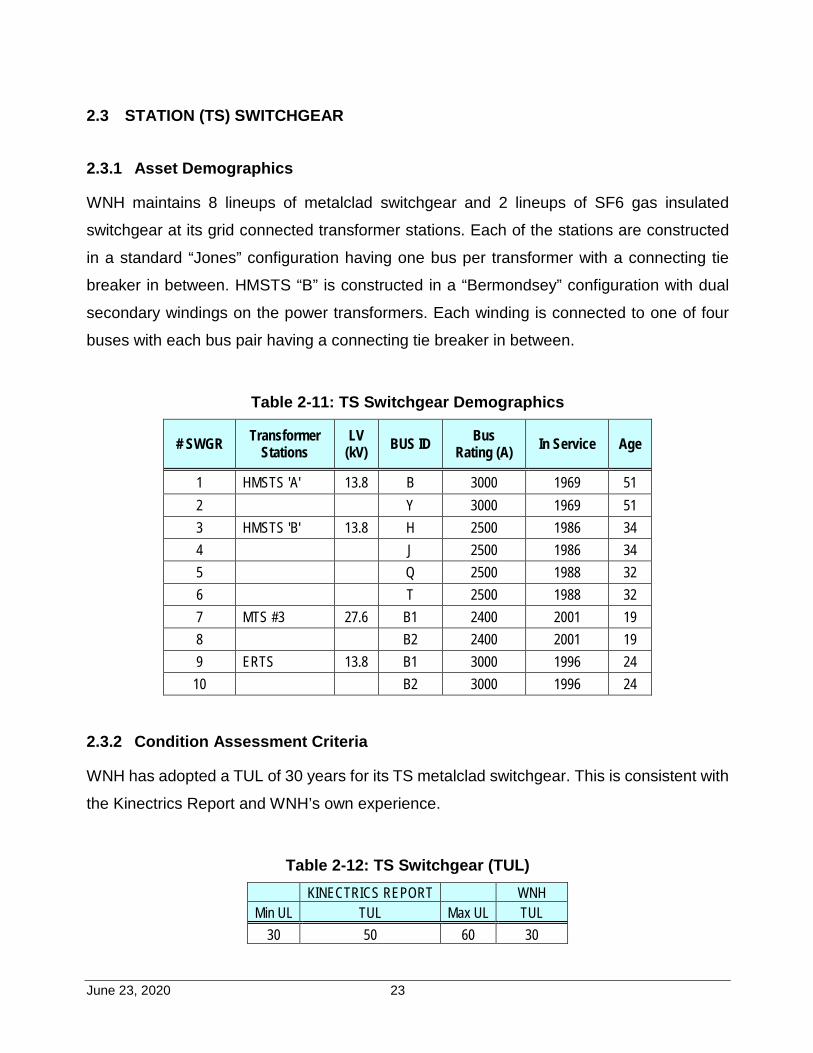
2.3.1 Asset Demographics
WNH maintains 8 lineups of metalclad switchgear and 2 lineups of SF6 gas insulated
switchgear at its grid connected transformer stations. Each of the stations are constructed
in a standard “Jones” configuration having one bus per transformer with a connecting tie
breaker in between. HMSTS “B” is constructed in a “Bermondsey” configuration with dual
secondary windings on the power transformers. Each winding is connected to one of four
buses with each bus pair having a connecting tie breaker in between.
Table 2-11: TS Switchgear Demographics
# SWGR Transformer Stations
LV (kV) BUS ID Bus
Rating (A) In Service Age
1 HMSTS 'A' 13.8 B 3000 1969 51 2 Y 3000 1969 51 3 HMSTS 'B' 13.8 H 2500 1986 34 4 J 2500 1986 34 5 Q 2500 1988 32 6 T 2500 1988 32 7 MTS #3 27.6 B1 2400 2001 19 8 B2 2400 2001 19 9 ERTS 13.8 B1 3000 1996 24
10 B2 3000 1996 24 2.3.2 Condition Assessment Criteria
WNH has adopted a TUL of 30 years for its TS metalclad switchgear. This is consistent with
the Kinectrics Report and WNH’s own experience.
Table 2-12: TS Switchgear (TUL)
KINECTRICS REPORT WNH Min UL TUL Max UL TUL
30 50 60 30
June 23, 2020 24
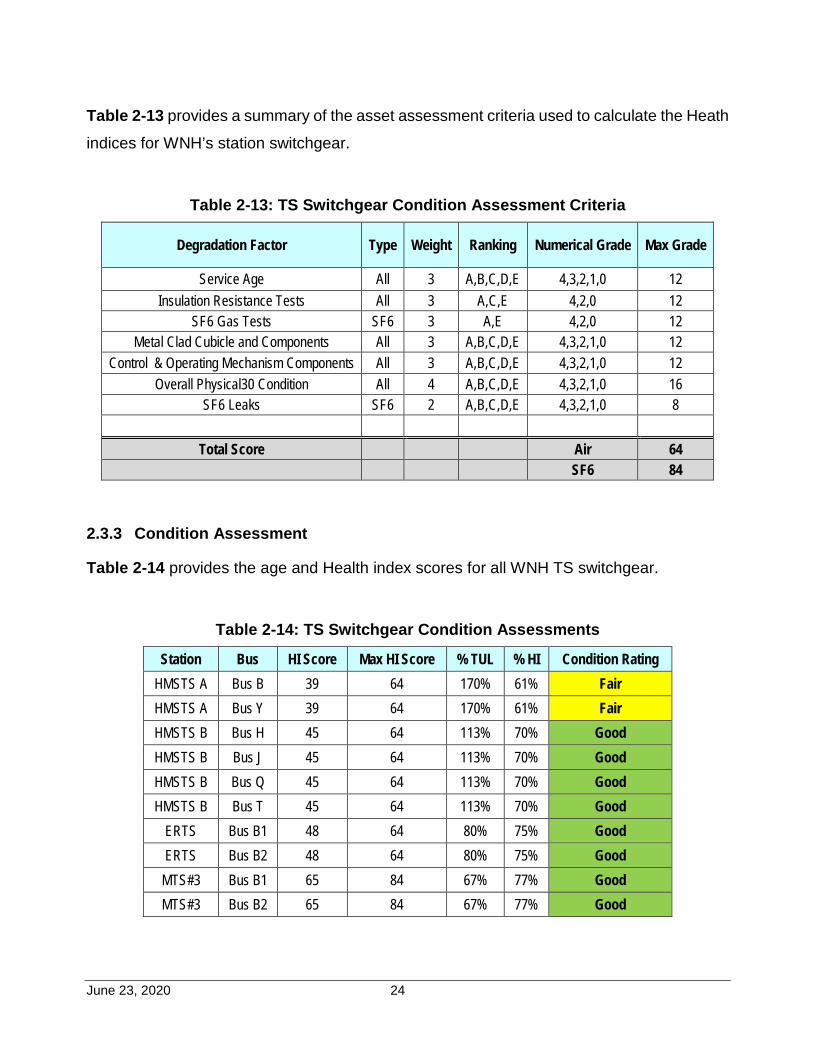
Table 2-13 provides a summary of the asset assessment criteria used to calculate the Heath
indices for WNH’s station switchgear.
Table 2-13: TS Switchgear Condition Assessment Criteria
Degradation Factor Type Weight Ranking Numerical Grade Max Grade
Service Age All 3 A,B,C,D,E 4,3,2,1,0 12 Insulation Resistance Tests All 3 A,C,E 4,2,0 12
SF6 Gas Tests SF6 3 A,E 4,2,0 12 Metal Clad Cubicle and Components All 3 A,B,C,D,E 4,3,2,1,0 12
Control & Operating Mechanism Components All 3 A,B,C,D,E 4,3,2,1,0 12 Overall Physical30 Condition All 4 A,B,C,D,E 4,3,2,1,0 16
SF6 Leaks SF6 2 A,B,C,D,E 4,3,2,1,0 8
Total Score Air 64 SF6 84
2.3.3 Condition Assessment
Table 2-14 provides the age and Health index scores for all WNH TS switchgear.
Table 2-14: TS Switchgear Condition Assessments
Station Bus HI Score Max HI Score % TUL % HI Condition Rating HMSTS A Bus B 39 64 170% 61% Fair HMSTS A Bus Y 39 64 170% 61% Fair HMSTS B Bus H 45 64 113% 70% Good HMSTS B Bus J 45 64 113% 70% Good HMSTS B Bus Q 45 64 113% 70% Good HMSTS B Bus T 45 64 113% 70% Good
ERTS Bus B1 48 64 80% 75% Good ERTS Bus B2 48 64 80% 75% Good
MTS#3 Bus B1 65 84 67% 77% Good MTS#3 Bus B2 65 84 67% 77% Good
June 23, 2020 25
2.3.4 Data Availability Indicator
WNH’s DAI for TS switchgear is data is 95%. There are no recent SF6 gas quality tests
available for MTS #3 switchgear. The switchgear bus is sealed, and gas pressures are
monitored with no indication of leaks. These tests will be scheduled at the time of the next
maintenance outage.
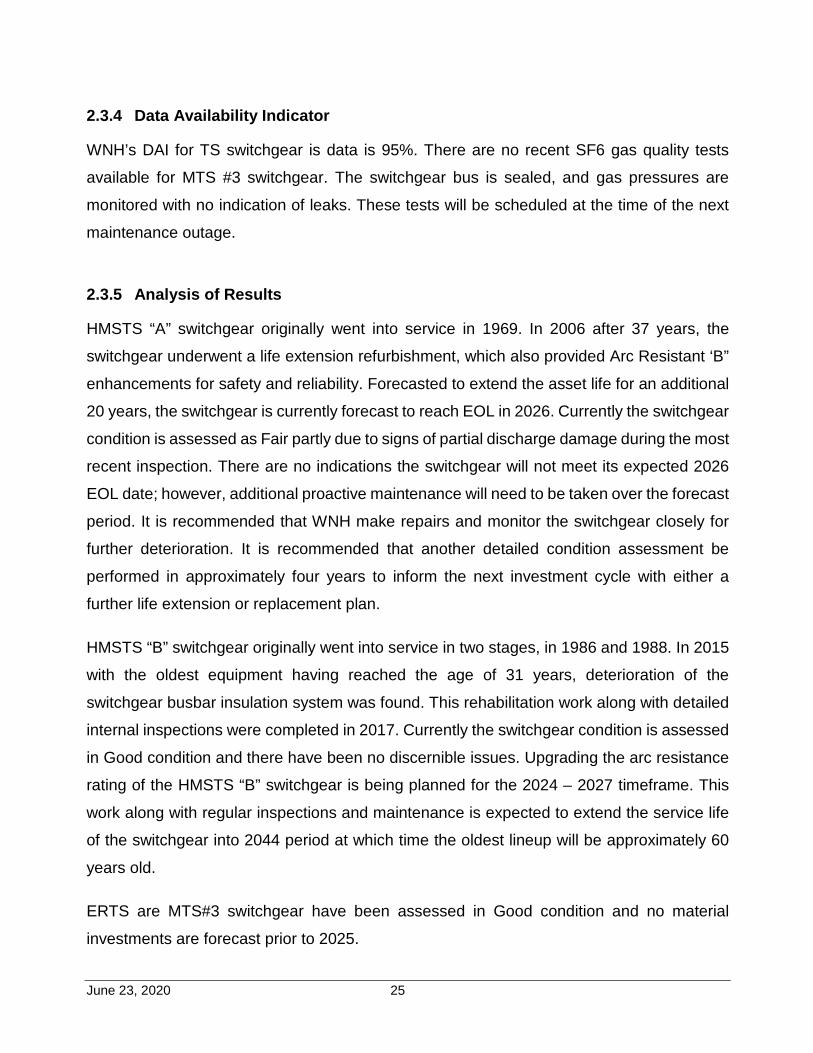
2.3.5 Analysis of Results
HMSTS “A” switchgear originally went into service in 1969. In 2006 after 37 years, the
switchgear underwent a life extension refurbishment, which also provided Arc Resistant ‘B”
enhancements for safety and reliability. Forecasted to extend the asset life for an additional
20 years, the switchgear is currently forecast to reach EOL in 2026. Currently the switchgear
condition is assessed as Fair partly due to signs of partial discharge damage during the most
recent inspection. There are no indications the switchgear will not meet its expected 2026
EOL date; however, additional proactive maintenance will need to be taken over the forecast
period. It is recommended that WNH make repairs and monitor the switchgear closely for
further deterioration. It is recommended that another detailed condition assessment be
performed in approximately four years to inform the next investment cycle with either a
further life extension or replacement plan.
HMSTS “B” switchgear originally went into service in two stages, in 1986 and 1988. In 2015
with the oldest equipment having reached the age of 31 years, deterioration of the
switchgear busbar insulation system was found. This rehabilitation work along with detailed
internal inspections were completed in 2017. Currently the switchgear condition is assessed
in Good condition and there have been no discernible issues. Upgrading the arc resistance
rating of the HMSTS “B” switchgear is being planned for the 2024 – 2027 timeframe. This
work along with regular inspections and maintenance is expected to extend the service life
of the switchgear into 2044 period at which time the oldest lineup will be approximately 60
years old.
ERTS are MTS#3 switchgear have been assessed in Good condition and no material
investments are forecast prior to 2025.
June 23, 2020 26
2.4 STATION (TS) CIRCUIT BREAKERS
2.4.1 Asset Demographics
There are 70 assets in this group including spare units and they are divided into two
categories; main bank / tie breakers and feeder breakers. The population also contains
several vintages of breakers including air insulated with vacuum interrupters, air insulated
with SF6 interrupters and SF6 insulated with vacuum interrupters.
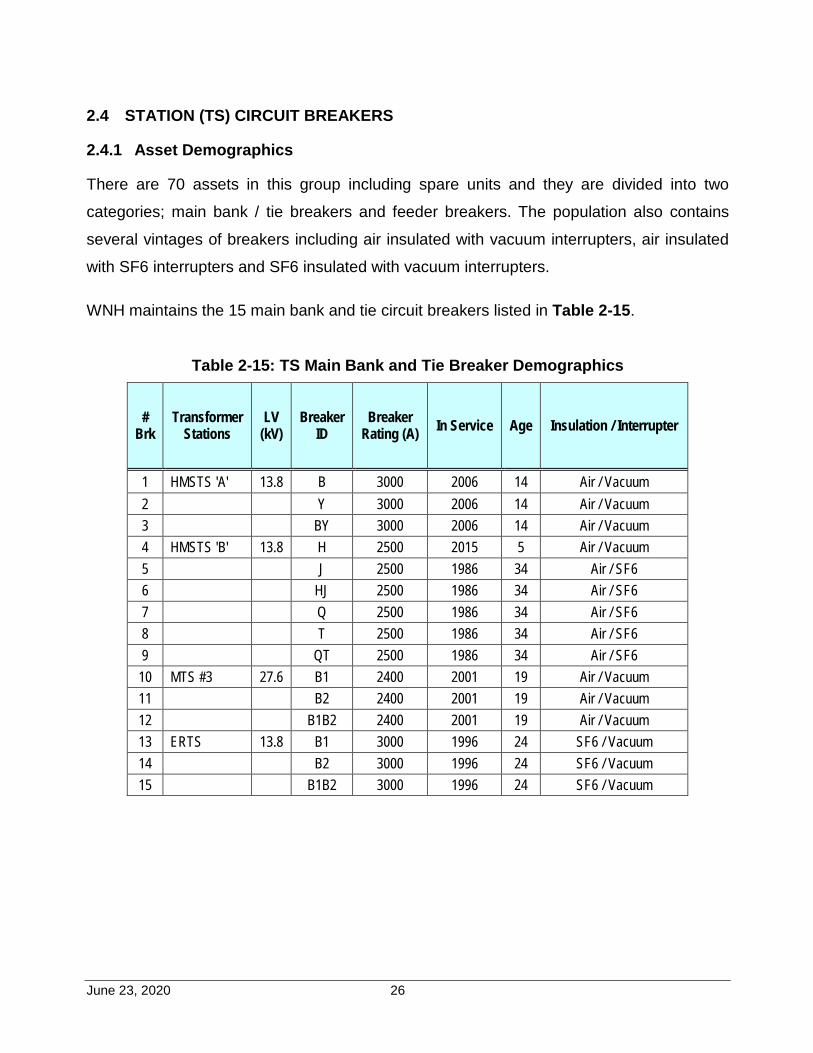
WNH maintains the 15 main bank and tie circuit breakers listed in Table 2-15.
Table 2-15: TS Main Bank and Tie Breaker Demographics
# Brk
Transformer Stations
LV (kV)
Breaker ID
Breaker Rating (A) In Service Age Insulation / Interrupter
1 HMSTS 'A' 13.8 B 3000 2006 14 Air / Vacuum 2 Y 3000 2006 14 Air / Vacuum 3 BY 3000 2006 14 Air / Vacuum 4 HMSTS 'B' 13.8 H 2500 2015 5 Air / Vacuum 5 J 2500 1986 34 Air / SF6 6 HJ 2500 1986 34 Air / SF6 7 Q 2500 1986 34 Air / SF6 8 T 2500 1986 34 Air / SF6 9 QT 2500 1986 34 Air / SF6
10 MTS #3 27.6 B1 2400 2001 19 Air / Vacuum 11 B2 2400 2001 19 Air / Vacuum 12 B1B2 2400 2001 19 Air / Vacuum 13 ERTS 13.8 B1 3000 1996 24 SF6 / Vacuum 14 B2 3000 1996 24 SF6 / Vacuum 15 B1B2 3000 1996 24 SF6 / Vacuum
June 23, 2020 27
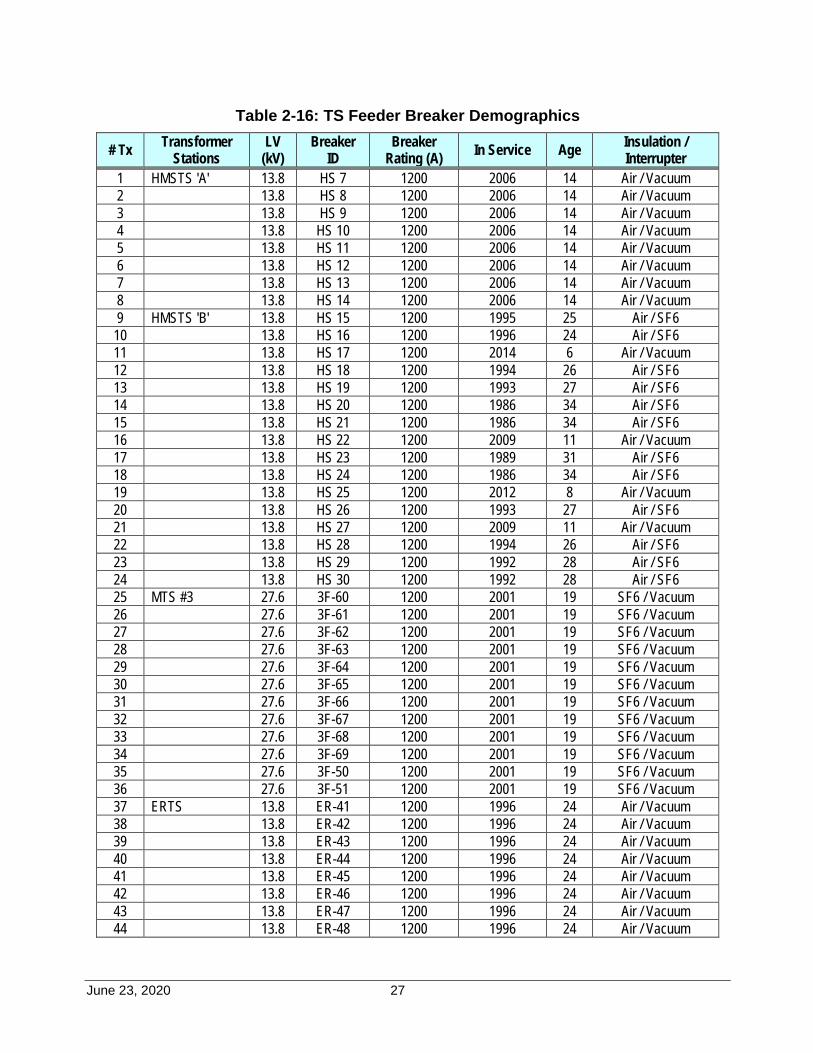
Table 2-16: TS Feeder Breaker Demographics
# Tx Transformer Stations
LV (kV)
Breaker ID
Breaker Rating (A) In Service Age Insulation /
Interrupter 1 HMSTS 'A' 13.8 HS 7 1200 2006 14 Air / Vacuum 2 13.8 HS 8 1200 2006 14 Air / Vacuum 3 13.8 HS 9 1200 2006 14 Air / Vacuum 4 13.8 HS 10 1200 2006 14 Air / Vacuum 5 13.8 HS 11 1200 2006 14 Air / Vacuum 6 13.8 HS 12 1200 2006 14 Air / Vacuum 7 13.8 HS 13 1200 2006 14 Air / Vacuum 8 13.8 HS 14 1200 2006 14 Air / Vacuum 9 HMSTS 'B' 13.8 HS 15 1200 1995 25 Air / SF6
10 13.8 HS 16 1200 1996 24 Air / SF6 11 13.8 HS 17 1200 2014 6 Air / Vacuum 12 13.8 HS 18 1200 1994 26 Air / SF6 13 13.8 HS 19 1200 1993 27 Air / SF6 14 13.8 HS 20 1200 1986 34 Air / SF6 15 13.8 HS 21 1200 1986 34 Air / SF6 16 13.8 HS 22 1200 2009 11 Air / Vacuum 17 13.8 HS 23 1200 1989 31 Air / SF6 18 13.8 HS 24 1200 1986 34 Air / SF6 19 13.8 HS 25 1200 2012 8 Air / Vacuum 20 13.8 HS 26 1200 1993 27 Air / SF6 21 13.8 HS 27 1200 2009 11 Air / Vacuum 22 13.8 HS 28 1200 1994 26 Air / SF6 23 13.8 HS 29 1200 1992 28 Air / SF6 24 13.8 HS 30 1200 1992 28 Air / SF6 25 MTS #3 27.6 3F-60 1200 2001 19 SF6 / Vacuum 26 27.6 3F-61 1200 2001 19 SF6 / Vacuum 27 27.6 3F-62 1200 2001 19 SF6 / Vacuum 28 27.6 3F-63 1200 2001 19 SF6 / Vacuum 29 27.6 3F-64 1200 2001 19 SF6 / Vacuum 30 27.6 3F-65 1200 2001 19 SF6 / Vacuum 31 27.6 3F-66 1200 2001 19 SF6 / Vacuum 32 27.6 3F-67 1200 2001 19 SF6 / Vacuum 33 27.6 3F-68 1200 2001 19 SF6 / Vacuum 34 27.6 3F-69 1200 2001 19 SF6 / Vacuum 35 27.6 3F-50 1200 2001 19 SF6 / Vacuum 36 27.6 3F-51 1200 2001 19 SF6 / Vacuum 37 ERTS 13.8 ER-41 1200 1996 24 Air / Vacuum 38 13.8 ER-42 1200 1996 24 Air / Vacuum 39 13.8 ER-43 1200 1996 24 Air / Vacuum 40 13.8 ER-44 1200 1996 24 Air / Vacuum 41 13.8 ER-45 1200 1996 24 Air / Vacuum 42 13.8 ER-46 1200 1996 24 Air / Vacuum 43 13.8 ER-47 1200 1996 24 Air / Vacuum 44 13.8 ER-48 1200 1996 24 Air / Vacuum
June 23, 2020 28
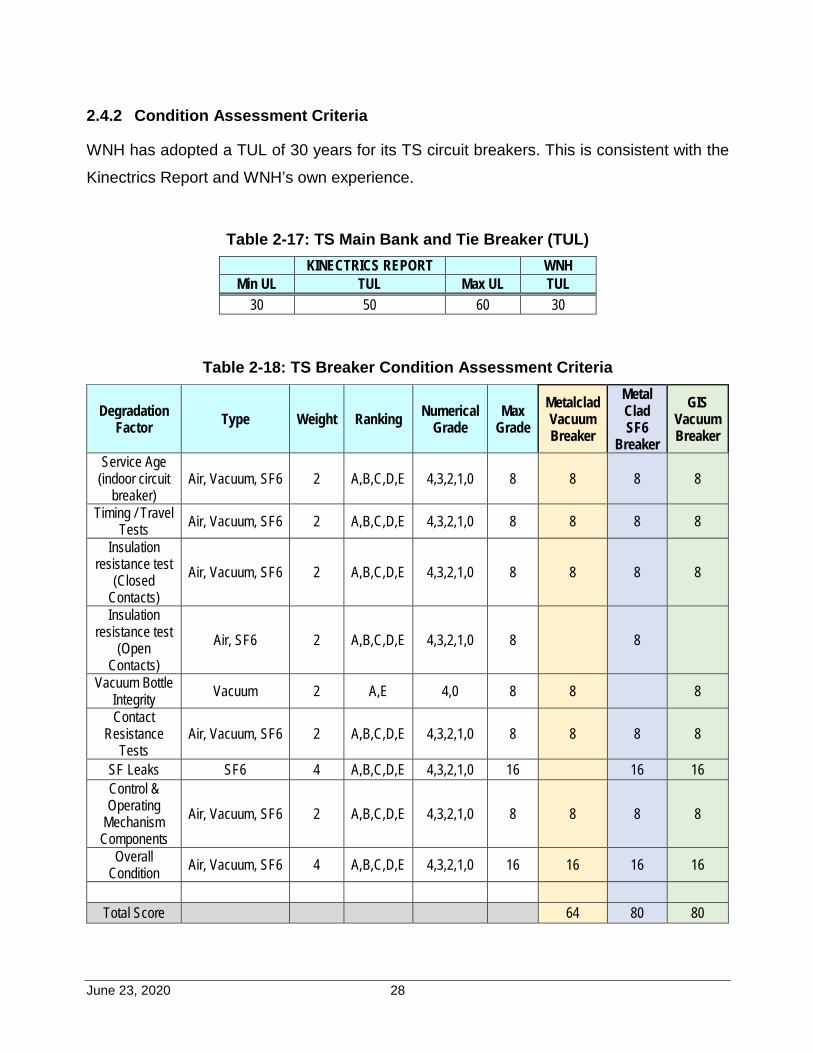
2.4.2 Condition Assessment Criteria
WNH has adopted a TUL of 30 years for its TS circuit breakers. This is consistent with the
Kinectrics Report and WNH’s own experience.
Table 2-17: TS Main Bank and Tie Breaker (TUL)
KINECTRICS REPORT WNH Min UL TUL Max UL TUL
30 50 60 30
Table 2-18: TS Breaker Condition Assessment Criteria
Degradation Factor Type Weight Ranking Numerical
Grade Max
Grade Metalclad Vacuum Breaker
Metal Clad SF6
Breaker
GIS Vacuum Breaker
Service Age (indoor circuit
breaker) Air, Vacuum, SF6 2 A,B,C,D,E 4,3,2,1,0 8 8 8 8
Timing / Travel Tests Air, Vacuum, SF6 2 A,B,C,D,E 4,3,2,1,0 8 8 8 8
Insulation resistance test
(Closed Contacts)
Air, Vacuum, SF6 2 A,B,C,D,E 4,3,2,1,0 8 8 8 8
Insulation resistance test
(Open Contacts)
Air, SF6 2 A,B,C,D,E 4,3,2,1,0 8 8
Vacuum Bottle Integrity Vacuum 2 A,E 4,0 8 8 8
Contact Resistance
Tests Air, Vacuum, SF6 2 A,B,C,D,E 4,3,2,1,0 8 8 8 8
SF Leaks SF6 4 A,B,C,D,E 4,3,2,1,0 16 16 16 Control & Operating
Mechanism Components
Air, Vacuum, SF6 2 A,B,C,D,E 4,3,2,1,0 8 8 8 8
Overall Condition Air, Vacuum, SF6 4 A,B,C,D,E 4,3,2,1,0 16 16 16 16
Total Score 64 80 80
June 23, 2020 29
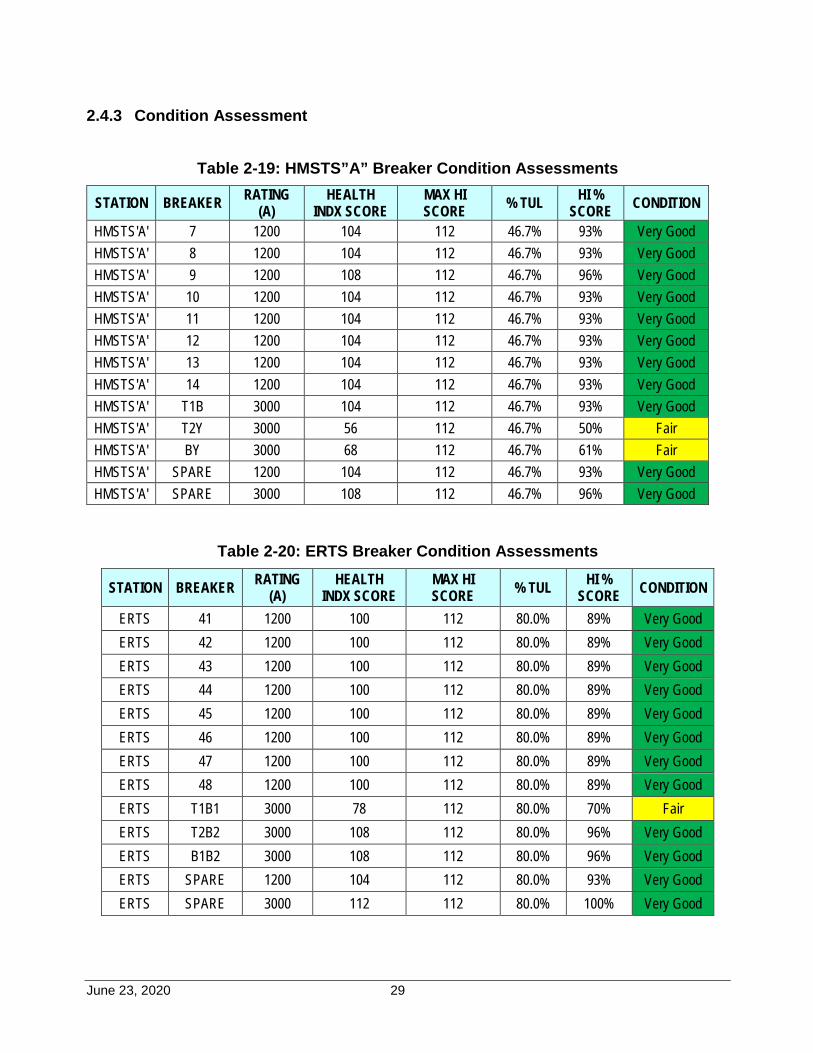
2.4.3 Condition Assessment
Table 2-19: HMSTS”A” Breaker Condition Assessments
STATION BREAKER RATING (A)
HEALTH INDX SCORE
MAX HI SCORE % TUL HI %
SCORE CONDITION
HMSTS'A' 7 1200 104 112 46.7% 93% Very Good HMSTS'A' 8 1200 104 112 46.7% 93% Very Good HMSTS'A' 9 1200 108 112 46.7% 96% Very Good HMSTS'A' 10 1200 104 112 46.7% 93% Very Good HMSTS'A' 11 1200 104 112 46.7% 93% Very Good HMSTS'A' 12 1200 104 112 46.7% 93% Very Good HMSTS'A' 13 1200 104 112 46.7% 93% Very Good HMSTS'A' 14 1200 104 112 46.7% 93% Very Good HMSTS'A' T1B 3000 104 112 46.7% 93% Very Good HMSTS'A' T2Y 3000 56 112 46.7% 50% Fair HMSTS'A' BY 3000 68 112 46.7% 61% Fair HMSTS'A' SPARE 1200 104 112 46.7% 93% Very Good HMSTS'A' SPARE 3000 108 112 46.7% 96% Very Good
Table 2-20: ERTS Breaker Condition Assessments
STATION BREAKER RATING (A)
HEALTH INDX SCORE
MAX HI SCORE % TUL HI %
SCORE CONDITION
ERTS 41 1200 100 112 80.0% 89% Very Good ERTS 42 1200 100 112 80.0% 89% Very Good ERTS 43 1200 100 112 80.0% 89% Very Good ERTS 44 1200 100 112 80.0% 89% Very Good ERTS 45 1200 100 112 80.0% 89% Very Good ERTS 46 1200 100 112 80.0% 89% Very Good ERTS 47 1200 100 112 80.0% 89% Very Good ERTS 48 1200 100 112 80.0% 89% Very Good ERTS T1B1 3000 78 112 80.0% 70% Fair ERTS T2B2 3000 108 112 80.0% 96% Very Good ERTS B1B2 3000 108 112 80.0% 96% Very Good ERTS SPARE 1200 104 112 80.0% 93% Very Good ERTS SPARE 3000 112 112 80.0% 100% Very Good
June 23, 2020 30
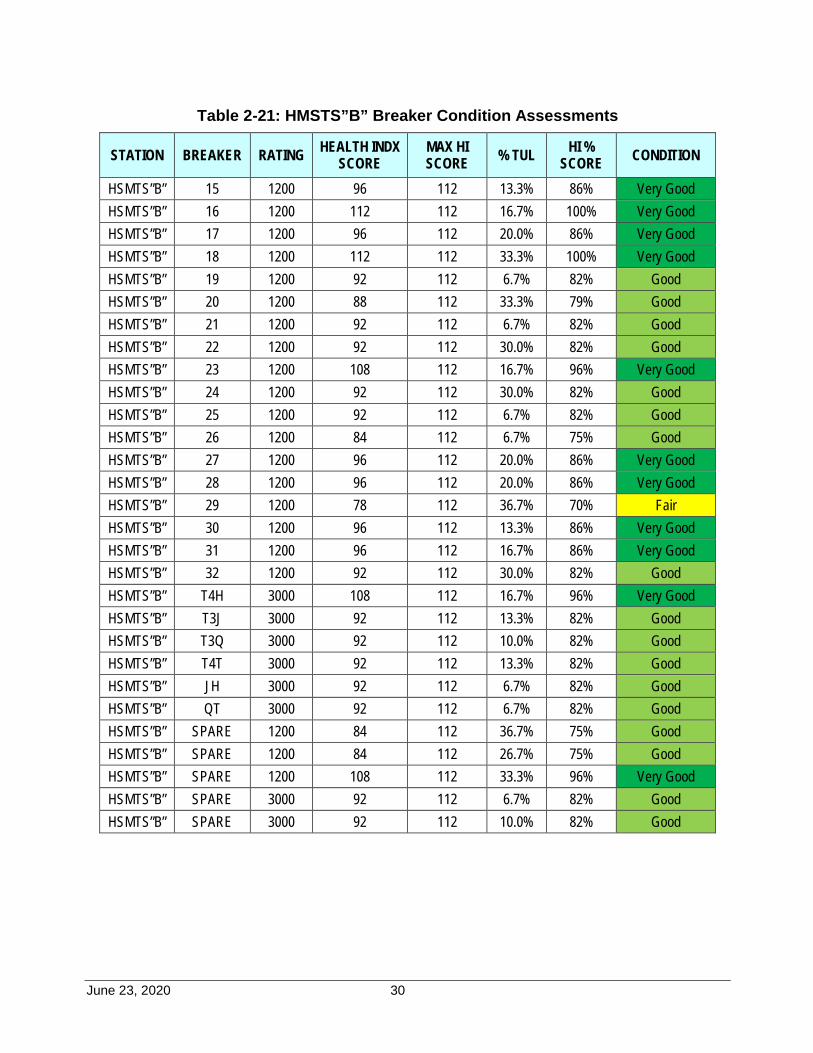
Table 2-21: HMSTS”B” Breaker Condition Assessments
STATION BREAKER RATING HEALTH INDX SCORE
MAX HI SCORE % TUL HI %
SCORE CONDITION
HSMTS”B” 15 1200 96 112 13.3% 86% Very Good HSMTS”B” 16 1200 112 112 16.7% 100% Very Good HSMTS”B” 17 1200 96 112 20.0% 86% Very Good HSMTS”B” 18 1200 112 112 33.3% 100% Very Good HSMTS”B” 19 1200 92 112 6.7% 82% Good HSMTS”B” 20 1200 88 112 33.3% 79% Good HSMTS”B” 21 1200 92 112 6.7% 82% Good HSMTS”B” 22 1200 92 112 30.0% 82% Good HSMTS”B” 23 1200 108 112 16.7% 96% Very Good HSMTS”B” 24 1200 92 112 30.0% 82% Good HSMTS”B” 25 1200 92 112 6.7% 82% Good HSMTS”B” 26 1200 84 112 6.7% 75% Good HSMTS”B” 27 1200 96 112 20.0% 86% Very Good HSMTS”B” 28 1200 96 112 20.0% 86% Very Good HSMTS”B” 29 1200 78 112 36.7% 70% Fair HSMTS”B” 30 1200 96 112 13.3% 86% Very Good HSMTS”B” 31 1200 96 112 16.7% 86% Very Good HSMTS”B” 32 1200 92 112 30.0% 82% Good HSMTS”B” T4H 3000 108 112 16.7% 96% Very Good HSMTS”B” T3J 3000 92 112 13.3% 82% Good HSMTS”B” T3Q 3000 92 112 10.0% 82% Good HSMTS”B” T4T 3000 92 112 13.3% 82% Good HSMTS”B” JH 3000 92 112 6.7% 82% Good HSMTS”B” QT 3000 92 112 6.7% 82% Good HSMTS”B” SPARE 1200 84 112 36.7% 75% Good HSMTS”B” SPARE 1200 84 112 26.7% 75% Good HSMTS”B” SPARE 1200 108 112 33.3% 96% Very Good HSMTS”B” SPARE 3000 92 112 6.7% 82% Good HSMTS”B” SPARE 3000 92 112 10.0% 82% Good
June 23, 2020 31
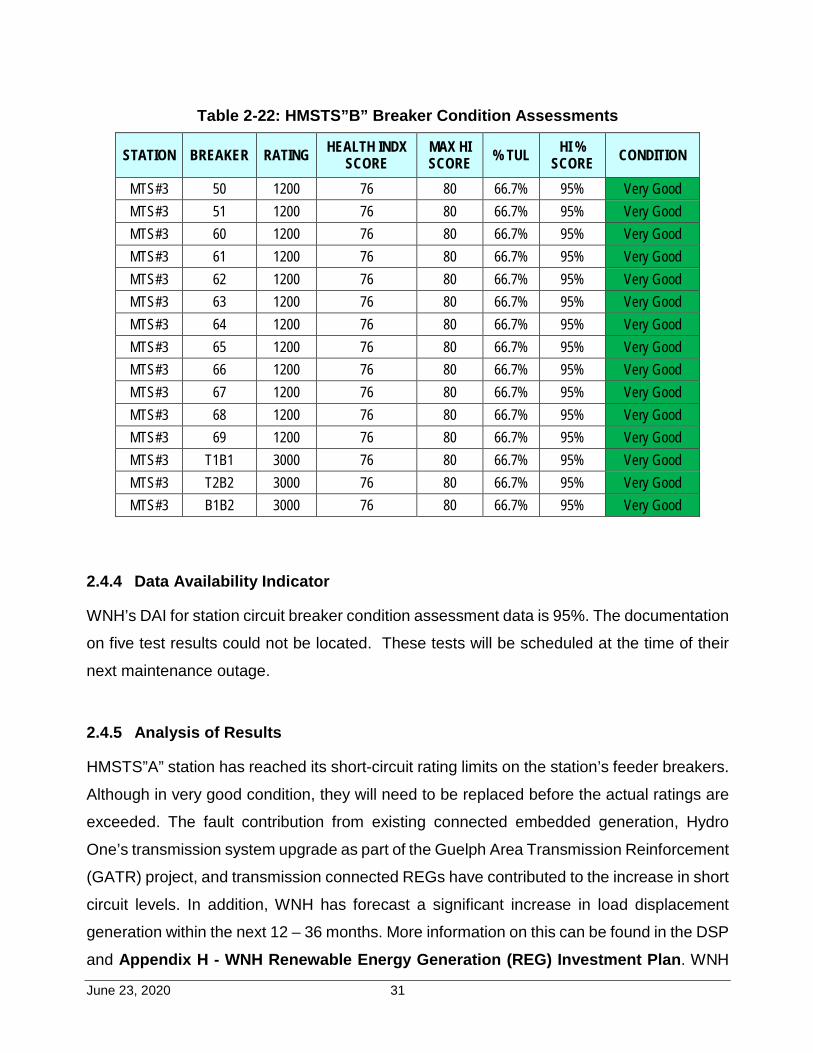
Table 2-22: HMSTS”B” Breaker Condition Assessments
STATION BREAKER RATING HEALTH INDX SCORE
MAX HI SCORE % TUL HI %
SCORE CONDITION
MTS#3 50 1200 76 80 66.7% 95% Very Good MTS#3 51 1200 76 80 66.7% 95% Very Good MTS#3 60 1200 76 80 66.7% 95% Very Good MTS#3 61 1200 76 80 66.7% 95% Very Good MTS#3 62 1200 76 80 66.7% 95% Very Good MTS#3 63 1200 76 80 66.7% 95% Very Good MTS#3 64 1200 76 80 66.7% 95% Very Good MTS#3 65 1200 76 80 66.7% 95% Very Good MTS#3 66 1200 76 80 66.7% 95% Very Good MTS#3 67 1200 76 80 66.7% 95% Very Good MTS#3 68 1200 76 80 66.7% 95% Very Good MTS#3 69 1200 76 80 66.7% 95% Very Good MTS#3 T1B1 3000 76 80 66.7% 95% Very Good MTS#3 T2B2 3000 76 80 66.7% 95% Very Good MTS#3 B1B2 3000 76 80 66.7% 95% Very Good
2.4.4 Data Availability Indicator
WNH’s DAI for station circuit breaker condition assessment data is 95%. The documentation
on five test results could not be located. These tests will be scheduled at the time of their
next maintenance outage.
2.4.5 Analysis of Results
HMSTS”A” station has reached its short-circuit rating limits on the station’s feeder breakers.
Although in very good condition, they will need to be replaced before the actual ratings are
exceeded. The fault contribution from existing connected embedded generation, Hydro
One’s transmission system upgrade as part of the Guelph Area Transmission Reinforcement
(GATR) project, and transmission connected REGs have contributed to the increase in short
circuit levels. In addition, WNH has forecast a significant increase in load displacement
generation within the next 12 – 36 months. More information on this can be found in the DSP
and Appendix H - WNH Renewable Energy Generation (REG) Investment Plan. WNH
June 23, 2020 32
has investigated the problem and has determined that the most cost effective solution will
be to replace the feeder breakers at the station. WNH is moving forward with the work to
reduce the risk of catastrophic failure of the circuit breakers during a fault clearing event.
The project will be executed over 2 years. WNH has included the cost to replace these circuit
breakers, $230,244 in 2020 and $209,762 in 2021, in their capital investment program. A
secondary benefit will be the increase of 6,630 kW of REG generation capacity at this station.
HMSTS”B” circuit breakers were originally installed in various stages starting in 1984.
Beginning in 2011, at 27 years of age WNH began to experience incidents of component
damage and elevated contact resistance on individual breakers. From 2014 to 2018 WNH
conducted a breaker life extension project with the original manufacturer. The circuit
breakers were rotated out of service and overhauled, retested and returned to service.
Forecasted to extend the asset life for an additional 20 years, the breakers are currently
forecast to reach EOL starting in 2034.
Currently in the asset group, all breakers are rated in Good to Very Good condition except
for 4 which are rated in Fair condition. Currently there are no indications the breakers rated
in Fair condition will require replacement before 2025 and it is recommended that in 2024,
WNH conduct another thorough condition assessment to inform the next investment cycle
with either a further life extension or replacement plan.
For the remainder of the asset group, here are no replacements forecast prior to 2025.
June 23, 2020 33
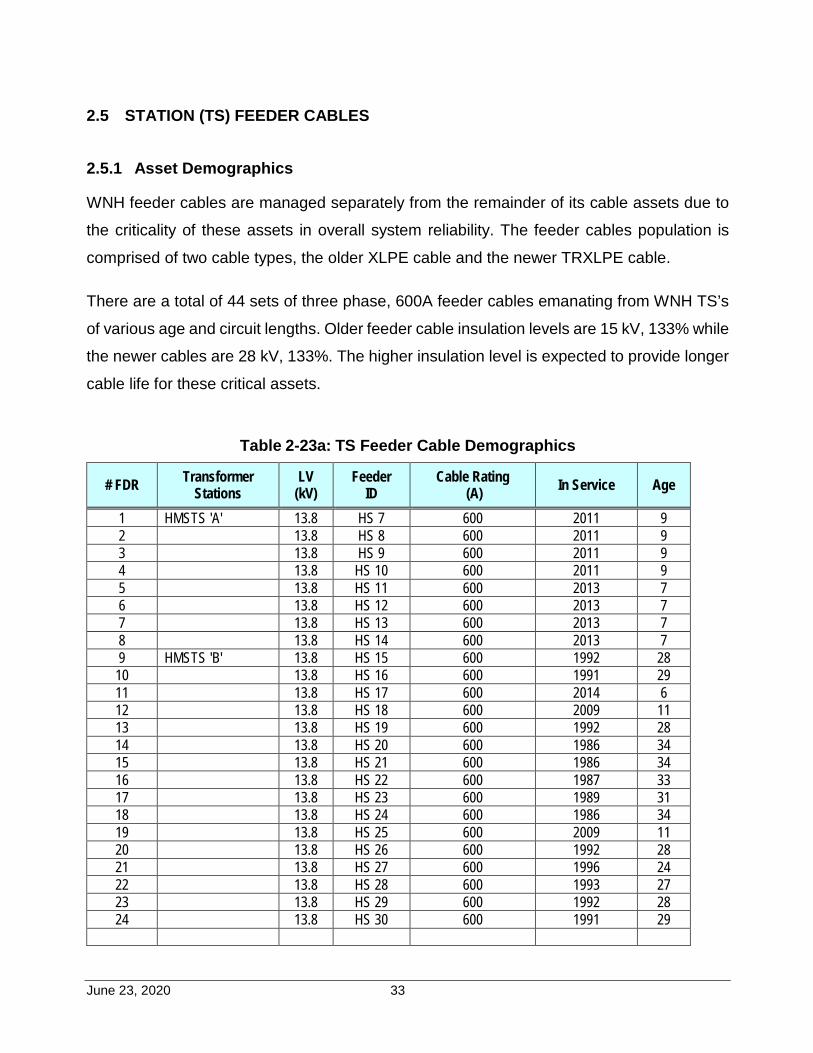
2.5 STATION (TS) FEEDER CABLES
2.5.1 Asset Demographics
WNH feeder cables are managed separately from the remainder of its cable assets due to
the criticality of these assets in overall system reliability. The feeder cables population is
comprised of two cable types, the older XLPE cable and the newer TRXLPE cable.
There are a total of 44 sets of three phase, 600A feeder cables emanating from WNH TS’s
of various age and circuit lengths. Older feeder cable insulation levels are 15 kV, 133% while
the newer cables are 28 kV, 133%. The higher insulation level is expected to provide longer
cable life for these critical assets.
Table 2-23a: TS Feeder Cable Demographics
# FDR Transformer Stations
LV (kV)
Feeder ID
Cable Rating (A) In Service Age
1 HMSTS 'A' 13.8 HS 7 600 2011 9 2 13.8 HS 8 600 2011 9 3 13.8 HS 9 600 2011 9 4 13.8 HS 10 600 2011 9 5 13.8 HS 11 600 2013 7 6 13.8 HS 12 600 2013 7 7 13.8 HS 13 600 2013 7 8 13.8 HS 14 600 2013 7 9 HMSTS 'B' 13.8 HS 15 600 1992 28
10 13.8 HS 16 600 1991 29 11 13.8 HS 17 600 2014 6 12 13.8 HS 18 600 2009 11 13 13.8 HS 19 600 1992 28 14 13.8 HS 20 600 1986 34 15 13.8 HS 21 600 1986 34 16 13.8 HS 22 600 1987 33 17 13.8 HS 23 600 1989 31 18 13.8 HS 24 600 1986 34 19 13.8 HS 25 600 2009 11 20 13.8 HS 26 600 1992 28 21 13.8 HS 27 600 1996 24 22 13.8 HS 28 600 1993 27 23 13.8 HS 29 600 1992 28 24 13.8 HS 30 600 1991 29
June 23, 2020 34
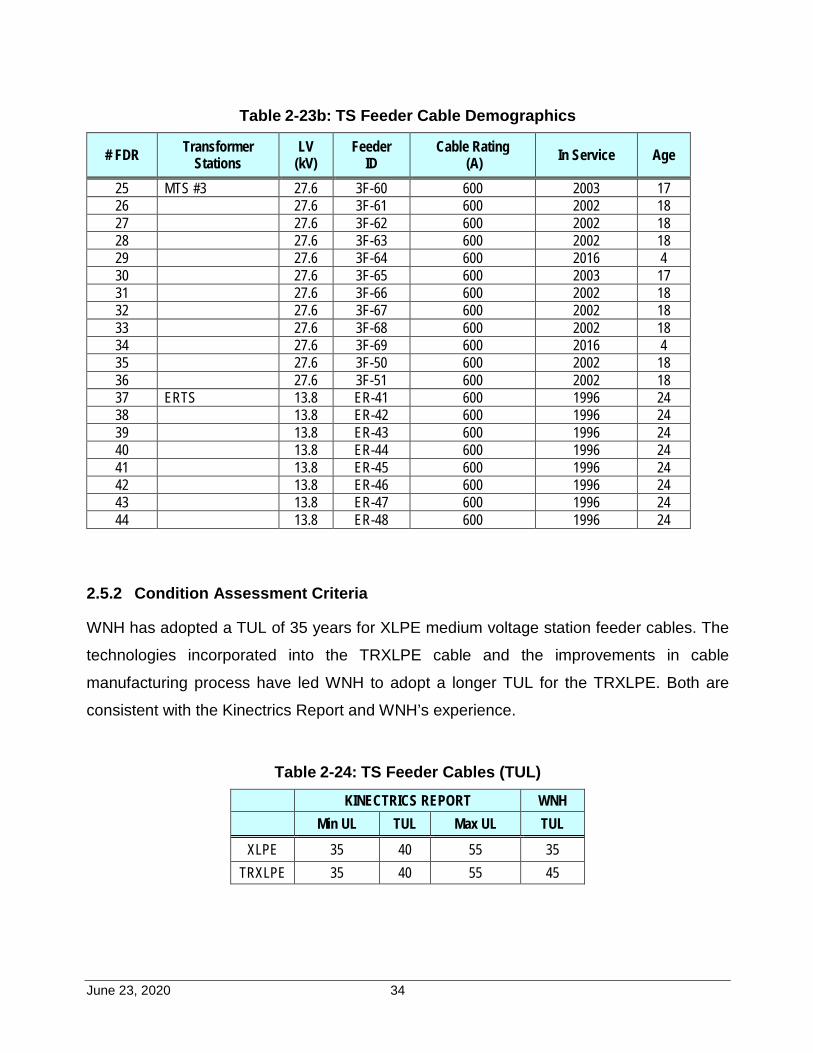
Table 2-23b: TS Feeder Cable Demographics
# FDR Transformer Stations
LV (kV)
Feeder ID
Cable Rating (A) In Service Age
25 MTS #3 27.6 3F-60 600 2003 17 26 27.6 3F-61 600 2002 18 27 27.6 3F-62 600 2002 18 28 27.6 3F-63 600 2002 18 29 27.6 3F-64 600 2016 4 30 27.6 3F-65 600 2003 17 31 27.6 3F-66 600 2002 18 32 27.6 3F-67 600 2002 18 33 27.6 3F-68 600 2002 18 34 27.6 3F-69 600 2016 4 35 27.6 3F-50 600 2002 18 36 27.6 3F-51 600 2002 18 37 ERTS 13.8 ER-41 600 1996 24 38 13.8 ER-42 600 1996 24 39 13.8 ER-43 600 1996 24 40 13.8 ER-44 600 1996 24 41 13.8 ER-45 600 1996 24 42 13.8 ER-46 600 1996 24 43 13.8 ER-47 600 1996 24 44 13.8 ER-48 600 1996 24
2.5.2 Condition Assessment Criteria
WNH has adopted a TUL of 35 years for XLPE medium voltage station feeder cables. The
technologies incorporated into the TRXLPE cable and the improvements in cable
manufacturing process have led WNH to adopt a longer TUL for the TRXLPE. Both are
consistent with the Kinectrics Report and WNH’s experience.
Table 2-24: TS Feeder Cables (TUL)
KINECTRICS REPORT WNH Min UL TUL Max UL TUL
XLPE 35 40 55 35 TRXLPE 35 40 55 45
June 23, 2020 35
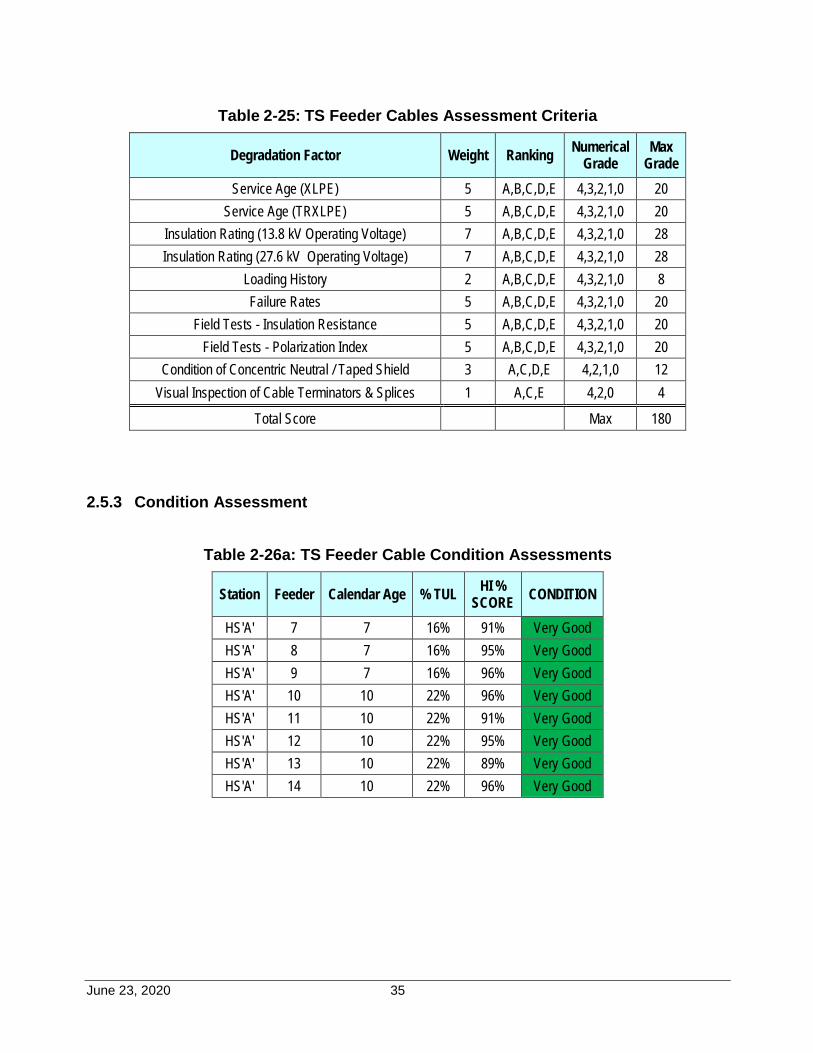
Table 2-25: TS Feeder Cables Assessment Criteria
Degradation Factor Weight Ranking Numerical Grade
Max Grade
Service Age (XLPE) 5 A,B,C,D,E 4,3,2,1,0 20 Service Age (TRXLPE) 5 A,B,C,D,E 4,3,2,1,0 20
Insulation Rating (13.8 kV Operating Voltage) 7 A,B,C,D,E 4,3,2,1,0 28 Insulation Rating (27.6 kV Operating Voltage) 7 A,B,C,D,E 4,3,2,1,0 28
Loading History 2 A,B,C,D,E 4,3,2,1,0 8 Failure Rates 5 A,B,C,D,E 4,3,2,1,0 20
Field Tests - Insulation Resistance 5 A,B,C,D,E 4,3,2,1,0 20 Field Tests - Polarization Index 5 A,B,C,D,E 4,3,2,1,0 20
Condition of Concentric Neutral / Taped Shield 3 A,C,D,E 4,2,1,0 12 Visual Inspection of Cable Terminators & Splices 1 A,C,E 4,2,0 4
Total Score Max 180
2.5.3 Condition Assessment
Table 2-26a: TS Feeder Cable Condition Assessments
Station Feeder Calendar Age % TUL HI % SCORE CONDITION
HS'A' 7 7 16% 91% Very Good HS'A' 8 7 16% 95% Very Good HS'A' 9 7 16% 96% Very Good HS'A' 10 10 22% 96% Very Good HS'A' 11 10 22% 91% Very Good HS'A' 12 10 22% 95% Very Good HS'A' 13 10 22% 89% Very Good HS'A' 14 10 22% 96% Very Good
June 23, 2020 36
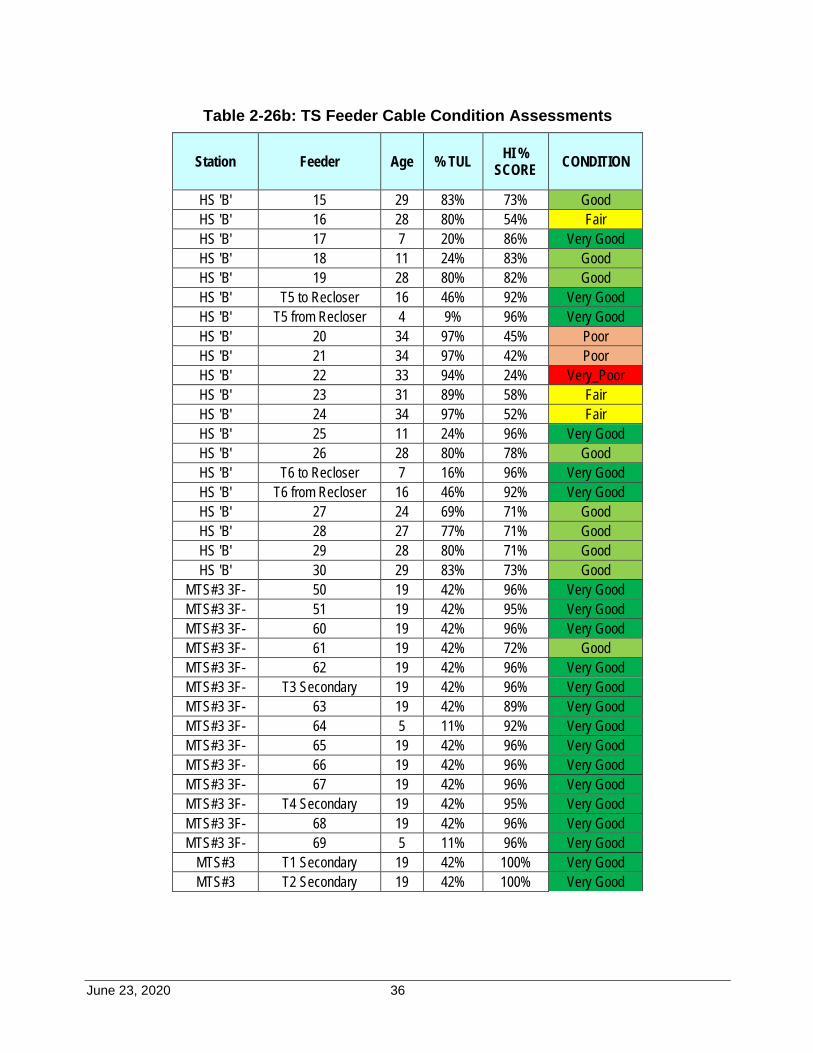
Table 2-26b: TS Feeder Cable Condition Assessments
Station Feeder Age % TUL HI % SCORE CONDITION
HS 'B' 15 29 83% 73% Good HS 'B' 16 28 80% 54% Fair HS 'B' 17 7 20% 86% Very Good HS 'B' 18 11 24% 83% Good HS 'B' 19 28 80% 82% Good HS 'B' T5 to Recloser 16 46% 92% Very Good HS 'B' T5 from Recloser 4 9% 96% Very Good HS 'B' 20 34 97% 45% Poor HS 'B' 21 34 97% 42% Poor HS 'B' 22 33 94% 24% Very_Poor HS 'B' 23 31 89% 58% Fair HS 'B' 24 34 97% 52% Fair HS 'B' 25 11 24% 96% Very Good HS 'B' 26 28 80% 78% Good HS 'B' T6 to Recloser 7 16% 96% Very Good HS 'B' T6 from Recloser 16 46% 92% Very Good HS 'B' 27 24 69% 71% Good HS 'B' 28 27 77% 71% Good HS 'B' 29 28 80% 71% Good HS 'B' 30 29 83% 73% Good
MTS#3 3F- 50 19 42% 96% Very Good MTS#3 3F- 51 19 42% 95% Very Good MTS#3 3F- 60 19 42% 96% Very Good MTS#3 3F- 61 19 42% 72% Good MTS#3 3F- 62 19 42% 96% Very Good MTS#3 3F- T3 Secondary 19 42% 96% Very Good MTS#3 3F- 63 19 42% 89% Very Good MTS#3 3F- 64 5 11% 92% Very Good MTS#3 3F- 65 19 42% 96% Very Good MTS#3 3F- 66 19 42% 96% Very Good MTS#3 3F- 67 19 42% 96% Very Good MTS#3 3F- T4 Secondary 19 42% 95% Very Good MTS#3 3F- 68 19 42% 96% Very Good MTS#3 3F- 69 5 11% 96% Very Good
MTS#3 T1 Secondary 19 42% 100% Very Good MTS#3 T2 Secondary 19 42% 100% Very Good
June 23, 2020 37
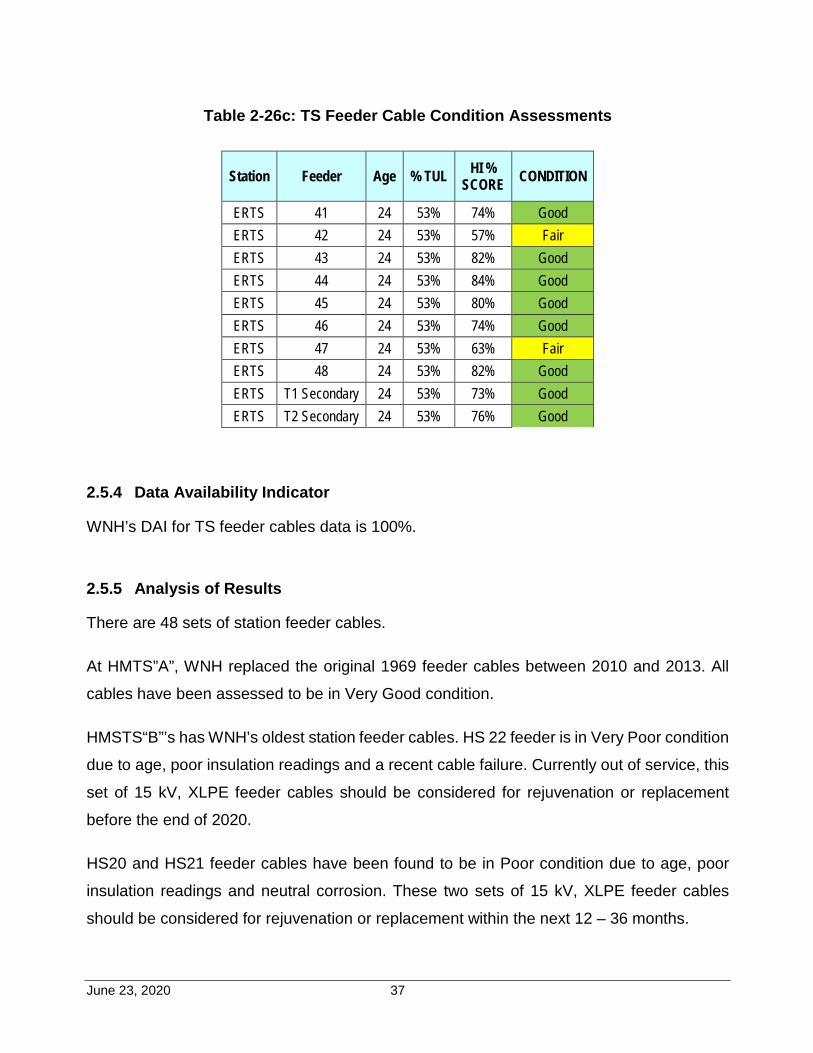
Table 2-26c: TS Feeder Cable Condition Assessments
Station Feeder Age % TUL HI % SCORE CONDITION
ERTS 41 24 53% 74% Good ERTS 42 24 53% 57% Fair ERTS 43 24 53% 82% Good ERTS 44 24 53% 84% Good ERTS 45 24 53% 80% Good ERTS 46 24 53% 74% Good ERTS 47 24 53% 63% Fair ERTS 48 24 53% 82% Good ERTS T1 Secondary 24 53% 73% Good ERTS T2 Secondary 24 53% 76% Good
2.5.4 Data Availability Indicator
WNH’s DAI for TS feeder cables data is 100%.
2.5.5 Analysis of Results
There are 48 sets of station feeder cables.
At HMTS”A”, WNH replaced the original 1969 feeder cables between 2010 and 2013. All
cables have been assessed to be in Very Good condition.
HMSTS“B”’s has WNH’s oldest station feeder cables. HS 22 feeder is in Very Poor condition
due to age, poor insulation readings and a recent cable failure. Currently out of service, this
set of 15 kV, XLPE feeder cables should be considered for rejuvenation or replacement
before the end of 2020.
HS20 and HS21 feeder cables have been found to be in Poor condition due to age, poor
insulation readings and neutral corrosion. These two sets of 15 kV, XLPE feeder cables
should be considered for rejuvenation or replacement within the next 12 – 36 months.
June 23, 2020 38
Three feeders, HS16, HS23, and HS24 have been assessed in Fair condition. These 15 kV,
XLPE feeder cables should be reassessed over the forecast period with possible
rejuvenation or replacement.
At ERTS, feeder cables for ER42 and ER47 have been assessed in Fair condition. These
15 kV, TRXLPE feeder cables should be reassessed over the forecast period.
The remaining station feeder cables are in Good or Very Good condition and no further
action is expected over the forecast period.
June 23, 2020 39
2.6 STATION (TS) PROTECTION RELAYS
2.6.1 Asset Demographics
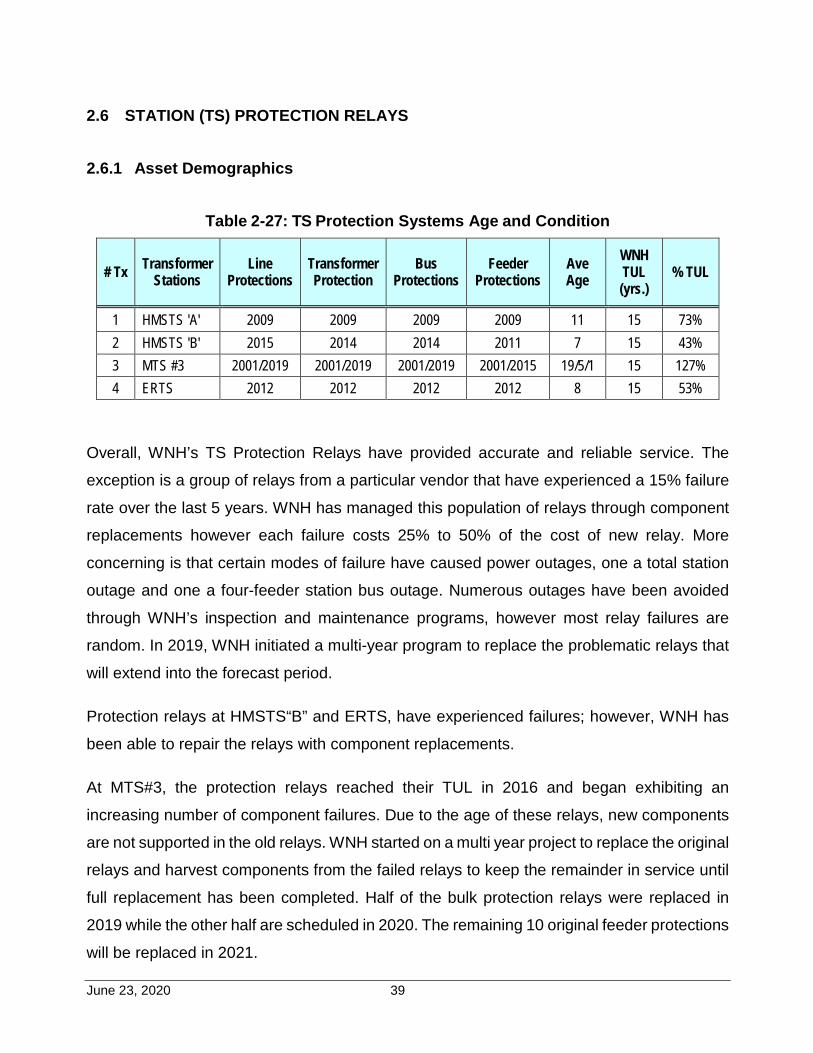
Table 2-27: TS Protection Systems Age and Condition
# Tx Transformer Stations
Line Protections
Transformer Protection
Bus Protections
Feeder Protections
Ave Age
WNH TUL (yrs.)
% TUL
1 HMSTS 'A' 2009 2009 2009 2009 11 15 73% 2 HMSTS 'B' 2015 2014 2014 2011 7 15 43% 3 MTS #3 2001/2019 2001/2019 2001/2019 2001/2015 19/5/1 15 127% 4 ERTS 2012 2012 2012 2012 8 15 53%
Overall, WNH’s TS Protection Relays have provided accurate and reliable service. The
exception is a group of relays from a particular vendor that have experienced a 15% failure
rate over the last 5 years. WNH has managed this population of relays through component
replacements however each failure costs 25% to 50% of the cost of new relay. More
concerning is that certain modes of failure have caused power outages, one a total station
outage and one a four-feeder station bus outage. Numerous outages have been avoided
through WNH’s inspection and maintenance programs, however most relay failures are
random. In 2019, WNH initiated a multi-year program to replace the problematic relays that
will extend into the forecast period.
Protection relays at HMSTS“B” and ERTS, have experienced failures; however, WNH has
been able to repair the relays with component replacements.
At MTS#3, the protection relays reached their TUL in 2016 and began exhibiting an
increasing number of component failures. Due to the age of these relays, new components
are not supported in the old relays. WNH started on a multi year project to replace the original
relays and harvest components from the failed relays to keep the remainder in service until
full replacement has been completed. Half of the bulk protection relays were replaced in
2019 while the other half are scheduled in 2020. The remaining 10 original feeder protections
will be replaced in 2021.
June 23, 2020 40
Similar to MTS#3, WNH’s protection relays at HMSTS“A” have experienced failures over the
last 5 years. These relays have been in service for 11 years and will reach their TUL in 2024.
WNH has been repairing these relays with replacement components to keep them in service;
however, will begin a 3-year program in 2022 to replace the problematic relays.
All TS protections systems are able to support WNH’s grid modernization program such as
Feeder Fault Detection, Isolation and Restoration (FLISR).
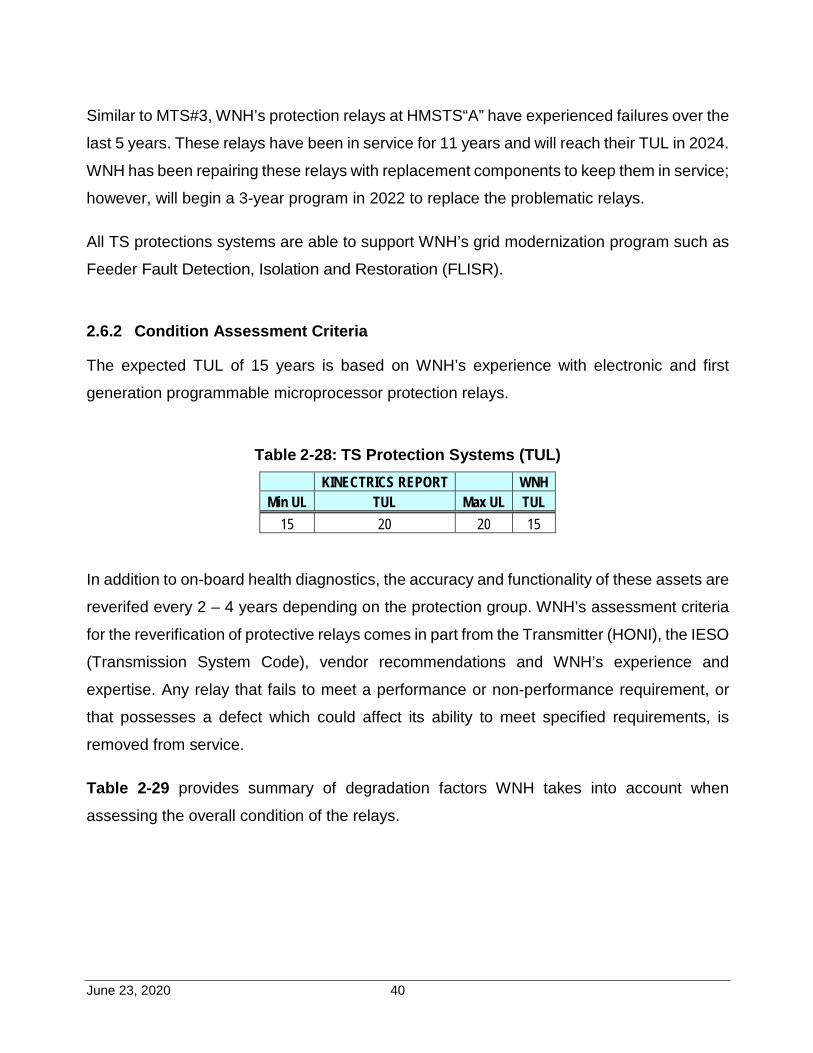
2.6.2 Condition Assessment Criteria
The expected TUL of 15 years is based on WNH’s experience with electronic and first
generation programmable microprocessor protection relays.
Table 2-28: TS Protection Systems (TUL)
KINECTRICS REPORT WNH Min UL TUL Max UL TUL
15 20 20 15 In addition to on-board health diagnostics, the accuracy and functionality of these assets are
reverifed every 2 – 4 years depending on the protection group. WNH’s assessment criteria
for the reverification of protective relays comes in part from the Transmitter (HONI), the IESO
(Transmission System Code), vendor recommendations and WNH’s experience and
expertise. Any relay that fails to meet a performance or non-performance requirement, or
that possesses a defect which could affect its ability to meet specified requirements, is
removed from service.
Table 2-29 provides summary of degradation factors WNH takes into account when
assessing the overall condition of the relays.
June 23, 2020 41
Table 2-29: Protection Relay Condition Assessment Criteria
Degradation Factor Weight Ranking Numerical Grade Max Grade
Service Age 4 A,B,C,D,E 4,3,2,1,0 16 Defect and Test Reports 2 A,B,C,D,E 4,3,2,1,0 8
Mean Time Between Failures 5 A,B,C,D,E 4,3,2,1,0 20 Visual Inspections 3 A,B,C,D,E 4,3,2,1,0 12
Non-Discretionary Obsolescence 5 A,E 4,0 20 Discretionary Obsolescence 1 A,B,C,D,E 4,3,2,1,0 4
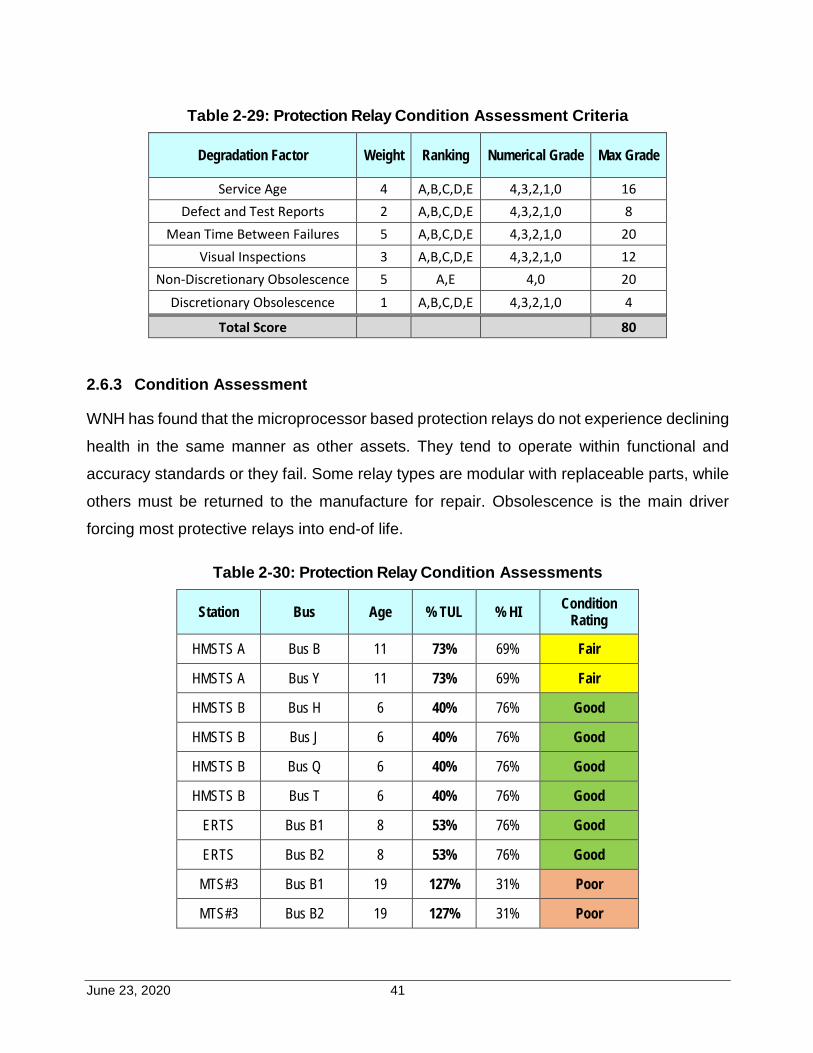
Total Score 80 2.6.3 Condition Assessment
WNH has found that the microprocessor based protection relays do not experience declining
health in the same manner as other assets. They tend to operate within functional and
accuracy standards or they fail. Some relay types are modular with replaceable parts, while
others must be returned to the manufacture for repair. Obsolescence is the main driver
forcing most protective relays into end-of life.
Table 2-30: Protection Relay Condition Assessments
Station Bus Age % TUL % HI Condition Rating
HMSTS A Bus B 11 73% 69% Fair
HMSTS A Bus Y 11 73% 69% Fair
HMSTS B Bus H 6 40% 76% Good
HMSTS B Bus J 6 40% 76% Good
HMSTS B Bus Q 6 40% 76% Good
HMSTS B Bus T 6 40% 76% Good
ERTS Bus B1 8 53% 76% Good
ERTS Bus B2 8 53% 76% Good
MTS#3 Bus B1 19 127% 31% Poor
MTS#3 Bus B2 19 127% 31% Poor
June 23, 2020 42
2.6.4 Data Availability Indicator
WNH’s DAI for TS protection relays condition evaluation data is 100%.
2.6.5 Analysis of Results
HMSTS”A” protection relays have experienced failures that have or potentially would have
caused power outages. The relays will also reach their TUL during the forecast period.
Based on current performance and age, these relays have been scheduled for replacement
during the forecast period.
The original MTS#3 protection relays were placed into service 19 years ago and reached
their TUL in 2016. With increasing component failures, lack of compatible components due
to their age, WNH entered into a replacement program to replace the bulk protection relays
between 2019 – 2020 and the remaining 10 feeder relays in 2021.The oldest relays will be
20 years old when replaced, reaching their maximum useful life as outlined in the Kinectrics
report.
Given the current performance and age of the relays at HMSTS” B” and ERTS, it is
recommended to manage these relays through close monitoring and repair of occasional
failures. Should the failure rate increase, a replacement strategy should be considered. WNH
does not expect to make any material investments in these protection systems over the
forecast period.
June 23, 2020 43
2.7 DISTRIBUTION STATION (DS) TRANSFORMERS
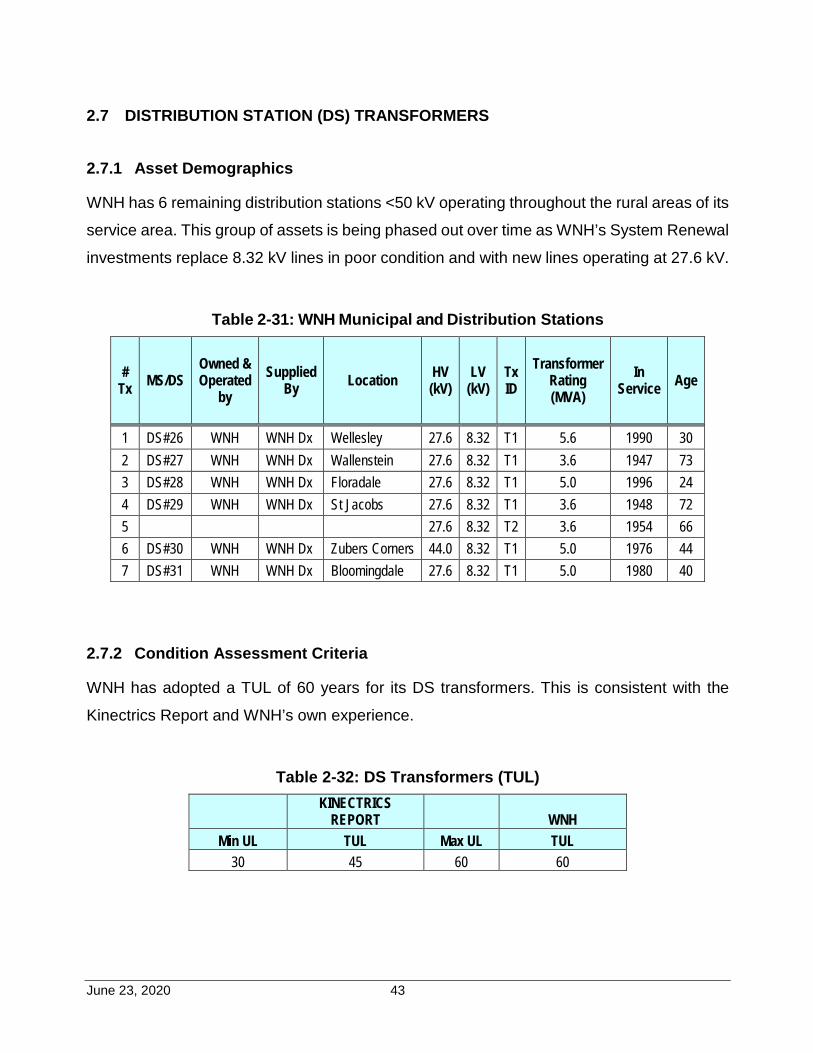
2.7.1 Asset Demographics
WNH has 6 remaining distribution stations <50 kV operating throughout the rural areas of its
service area. This group of assets is being phased out over time as WNH’s System Renewal
investments replace 8.32 kV lines in poor condition and with new lines operating at 27.6 kV.
Table 2-31: WNH Municipal and Distribution Stations
# Tx MS/DS
Owned & Operated
by Supplied
By Location HV (kV)
LV (kV)
Tx ID
Transformer Rating (MVA)
In Service Age
1 DS#26 WNH WNH Dx Wellesley 27.6 8.32 T1 5.6 1990 30 2 DS#27 WNH WNH Dx Wallenstein 27.6 8.32 T1 3.6 1947 73 3 DS#28 WNH WNH Dx Floradale 27.6 8.32 T1 5.0 1996 24 4 DS#29 WNH WNH Dx St Jacobs 27.6 8.32 T1 3.6 1948 72 5 27.6 8.32 T2 3.6 1954 66 6 DS#30 WNH WNH Dx Zubers Corners 44.0 8.32 T1 5.0 1976 44 7 DS#31 WNH WNH Dx Bloomingdale 27.6 8.32 T1 5.0 1980 40
2.7.2 Condition Assessment Criteria
WNH has adopted a TUL of 60 years for its DS transformers. This is consistent with the
Kinectrics Report and WNH’s own experience.
Table 2-32: DS Transformers (TUL)
KINECTRICS
REPORT WNH Min UL TUL Max UL TUL
30 45 60 60
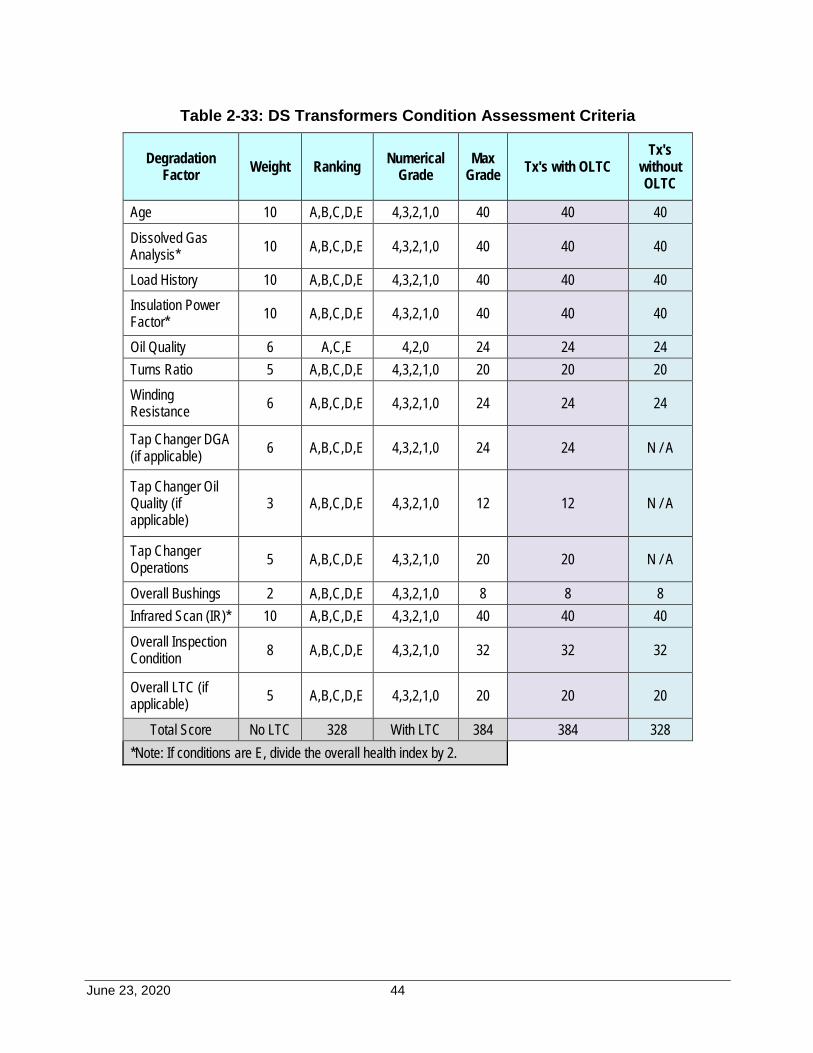
June 23, 2020 44
Table 2-33: DS Transformers Condition Assessment Criteria
Degradation Factor Weight Ranking Numerical
Grade Max
Grade Tx's with OLTC Tx's
without OLTC
Age 10 A,B,C,D,E 4,3,2,1,0 40 40 40
Dissolved Gas Analysis* 10 A,B,C,D,E 4,3,2,1,0 40 40 40
Load History 10 A,B,C,D,E 4,3,2,1,0 40 40 40 Insulation Power Factor* 10 A,B,C,D,E 4,3,2,1,0 40 40 40
Oil Quality 6 A,C,E 4,2,0 24 24 24 Turns Ratio 5 A,B,C,D,E 4,3,2,1,0 20 20 20 Winding Resistance 6 A,B,C,D,E 4,3,2,1,0 24 24 24
Tap Changer DGA (if applicable) 6 A,B,C,D,E 4,3,2,1,0 24 24 N / A
Tap Changer Oil Quality (if applicable)
3 A,B,C,D,E 4,3,2,1,0 12 12 N / A
Tap Changer Operations 5 A,B,C,D,E 4,3,2,1,0 20 20 N / A
Overall Bushings 2 A,B,C,D,E 4,3,2,1,0 8 8 8 Infrared Scan (IR)* 10 A,B,C,D,E 4,3,2,1,0 40 40 40
Overall Inspection Condition 8 A,B,C,D,E 4,3,2,1,0 32 32 32
Overall LTC (if applicable) 5 A,B,C,D,E 4,3,2,1,0 20 20 20
Total Score No LTC 328 With LTC 384 384 328 *Note: If conditions are E, divide the overall health index by 2.
June 23, 2020 45
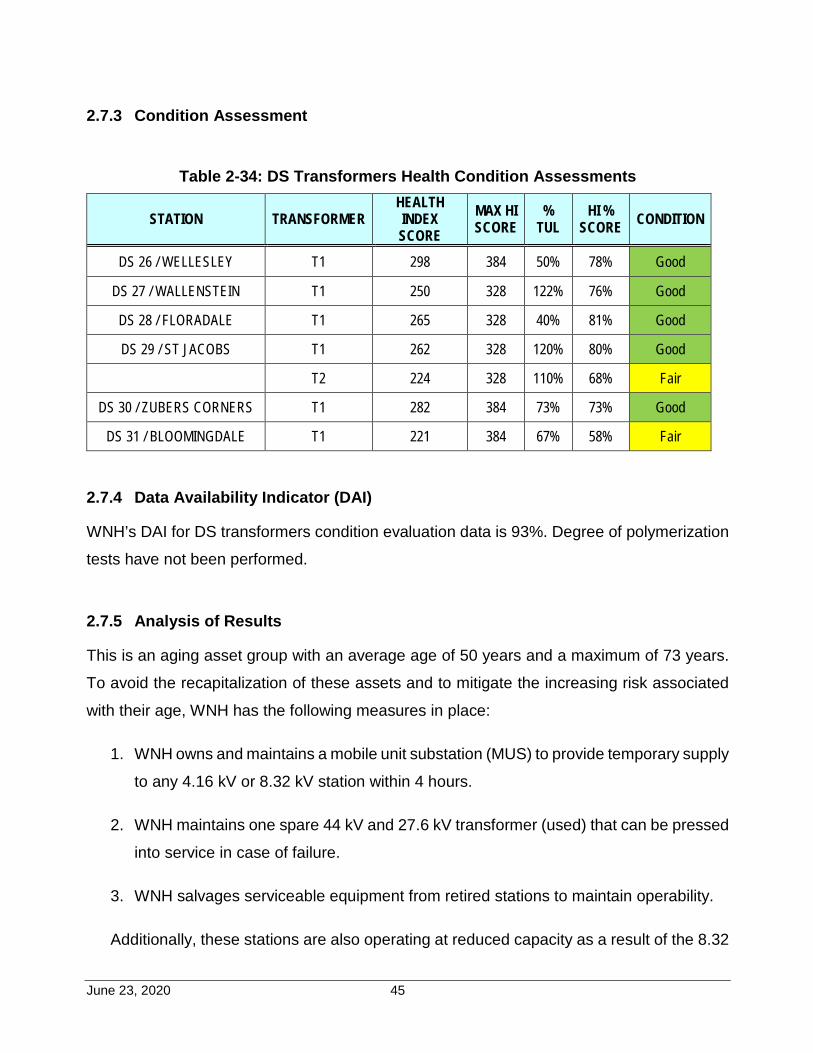
2.7.3 Condition Assessment
Table 2-34: DS Transformers Health Condition Assessments
STATION TRANSFORMER HEALTH INDEX SCORE
MAX HI SCORE
% TUL
HI % SCORE CONDITION
DS 26 / WELLESLEY T1 298 384 50% 78% Good
DS 27 / WALLENSTEIN T1 250 328 122% 76% Good
DS 28 / FLORADALE T1 265 328 40% 81% Good
DS 29 / ST JACOBS T1 262 328 120% 80% Good T2 224 328 110% 68% Fair
DS 30 / ZUBERS CORNERS T1 282 384 73% 73% Good
DS 31 / BLOOMINGDALE T1 221 384 67% 58% Fair 2.7.4 Data Availability Indicator (DAI)
WNH’s DAI for DS transformers condition evaluation data is 93%. Degree of polymerization
tests have not been performed.
2.7.5 Analysis of Results
This is an aging asset group with an average age of 50 years and a maximum of 73 years.
To avoid the recapitalization of these assets and to mitigate the increasing risk associated
with their age, WNH has the following measures in place:
1. WNH owns and maintains a mobile unit substation (MUS) to provide temporary supply
to any 4.16 kV or 8.32 kV station within 4 hours.
2. WNH maintains one spare 44 kV and 27.6 kV transformer (used) that can be pressed
into service in case of failure.
3. WNH salvages serviceable equipment from retired stations to maintain operability.
Additionally, these stations are also operating at reduced capacity as a result of the 8.32

June 23, 2020 46
kV load that has been transitioning over to 27.6 kV lines.
The condition assessments reveal the transformers are in relatively good condition in
spite of their age and other than DS26, which will be retired at the end of 2020, the
remaining stations are expected to remain in service to at least 2025.
June 23, 2020 47
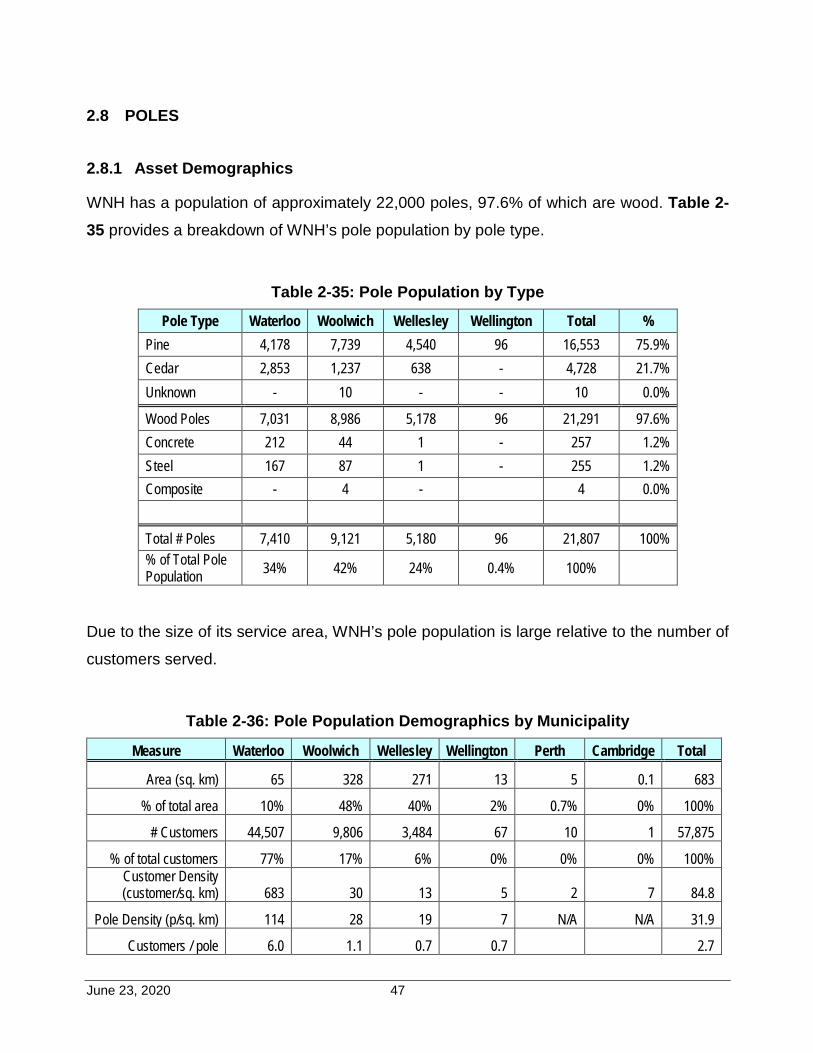
2.8 POLES
2.8.1 Asset Demographics
WNH has a population of approximately 22,000 poles, 97.6% of which are wood. Table 2-35 provides a breakdown of WNH’s pole population by pole type.
Table 2-35: Pole Population by Type
Pole Type Waterloo Woolwich Wellesley Wellington Total % Pine 4,178 7,739 4,540 96 16,553 75.9% Cedar 2,853 1,237 638 - 4,728 21.7% Unknown - 10 - - 10 0.0%
Wood Poles 7,031 8,986 5,178 96 21,291 97.6% Concrete 212 44 1 - 257 1.2% Steel 167 87 1 - 255 1.2% Composite - 4 - 4 0.0%
Total # Poles 7,410 9,121 5,180 96 21,807 100% % of Total Pole Population 34% 42% 24% 0.4% 100%
Due to the size of its service area, WNH’s pole population is large relative to the number of
customers served.
Table 2-36: Pole Population Demographics by Municipality
Measure Waterloo Woolwich Wellesley Wellington Perth Cambridge Total
Area (sq. km) 65 328 271 13 5 0.1 683
% of total area 10% 48% 40% 2% 0.7% 0% 100%
# Customers 44,507 9,806 3,484 67 10 1 57,875
% of total customers 77% 17% 6% 0% 0% 0% 100% Customer Density (customer/sq. km) 683 30 13 5 2 7 84.8
Pole Density (p/sq. km) 114 28 19 7 N/A N/A 31.9
Customers / pole 6.0 1.1 0.7 0.7 2.7
June 23, 2020 48
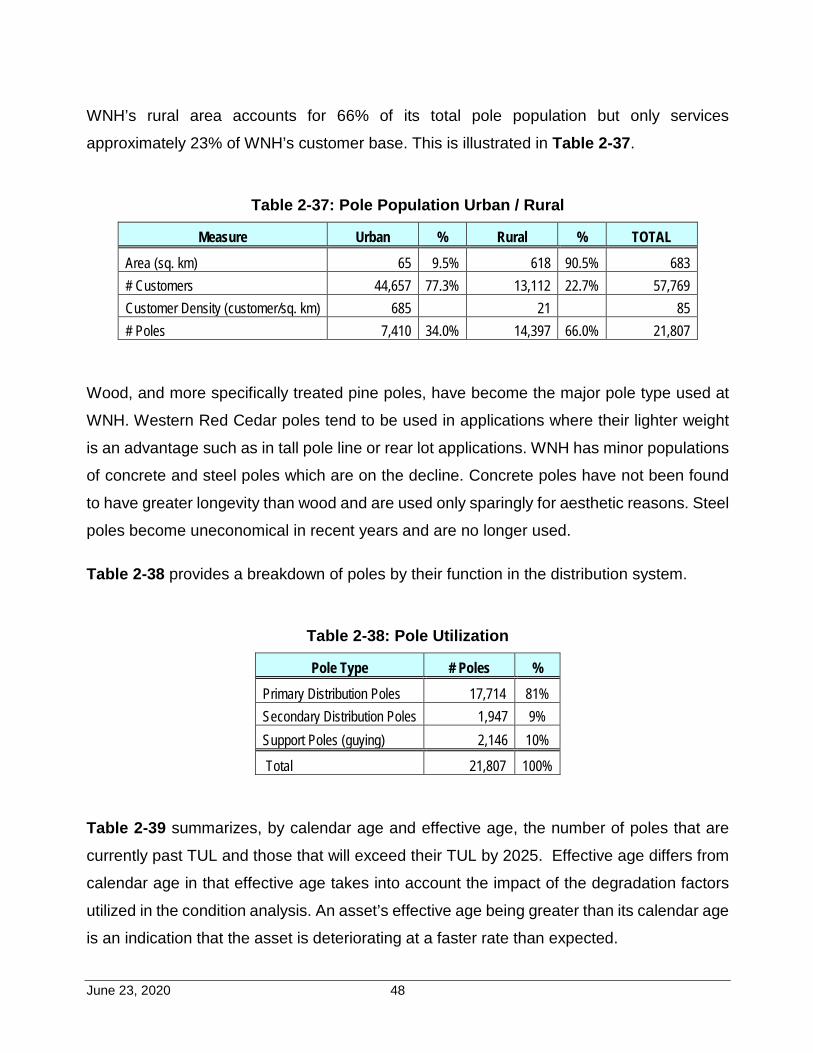
WNH’s rural area accounts for 66% of its total pole population but only services
approximately 23% of WNH’s customer base. This is illustrated in Table 2-37.
Table 2-37: Pole Population Urban / Rural
Measure Urban % Rural % TOTAL
Area (sq. km) 65 9.5% 618 90.5% 683 # Customers 44,657 77.3% 13,112 22.7% 57,769 Customer Density (customer/sq. km) 685 21 85 # Poles 7,410 34.0% 14,397 66.0% 21,807
Wood, and more specifically treated pine poles, have become the major pole type used at
WNH. Western Red Cedar poles tend to be used in applications where their lighter weight
is an advantage such as in tall pole line or rear lot applications. WNH has minor populations
of concrete and steel poles which are on the decline. Concrete poles have not been found
to have greater longevity than wood and are used only sparingly for aesthetic reasons. Steel
poles become uneconomical in recent years and are no longer used.
Table 2-38 provides a breakdown of poles by their function in the distribution system.
Table 2-38: Pole Utilization
Pole Type # Poles % Primary Distribution Poles 17,714 81% Secondary Distribution Poles 1,947 9% Support Poles (guying) 2,146 10%
Total 21,807 100%
Table 2-39 summarizes, by calendar age and effective age, the number of poles that are
currently past TUL and those that will exceed their TUL by 2025. Effective age differs from
calendar age in that effective age takes into account the impact of the degradation factors
utilized in the condition analysis. An asset’s effective age being greater than its calendar age
is an indication that the asset is deteriorating at a faster rate than expected.
June 23, 2020 49
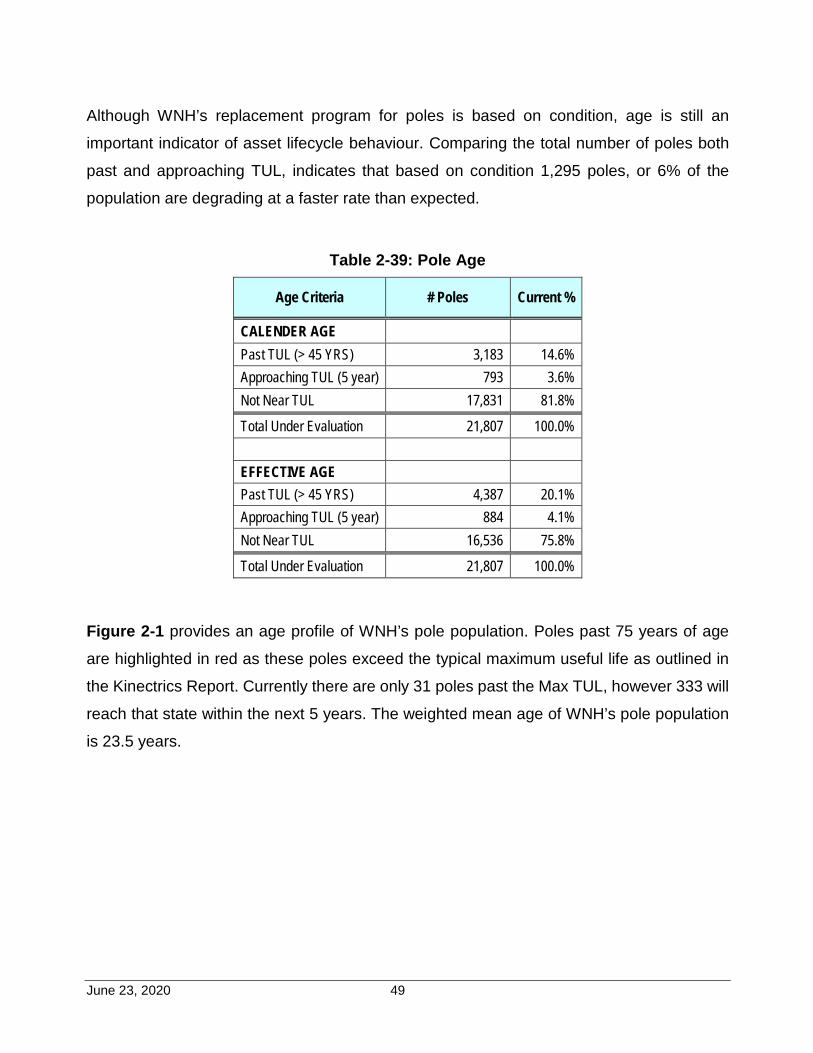
Although WNH’s replacement program for poles is based on condition, age is still an
important indicator of asset lifecycle behaviour. Comparing the total number of poles both
past and approaching TUL, indicates that based on condition 1,295 poles, or 6% of the
population are degrading at a faster rate than expected.
Table 2-39: Pole Age
Age Criteria # Poles Current %
CALENDER AGE Past TUL (> 45 YRS) 3,183 14.6% Approaching TUL (5 year) 793 3.6% Not Near TUL 17,831 81.8%
Total Under Evaluation 21,807 100.0% EFFECTIVE AGE Past TUL (> 45 YRS) 4,387 20.1% Approaching TUL (5 year) 884 4.1% Not Near TUL 16,536 75.8%
Total Under Evaluation 21,807 100.0%
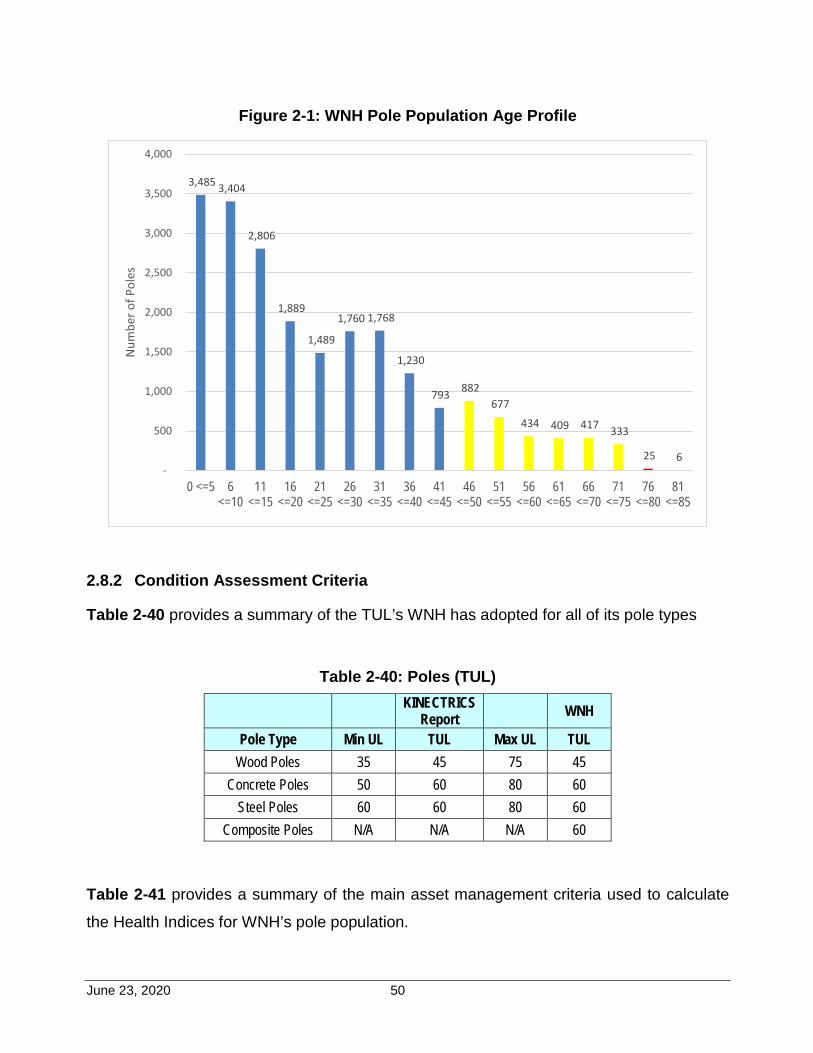
Figure 2-1 provides an age profile of WNH’s pole population. Poles past 75 years of age
are highlighted in red as these poles exceed the typical maximum useful life as outlined in
the Kinectrics Report. Currently there are only 31 poles past the Max TUL, however 333 will
reach that state within the next 5 years. The weighted mean age of WNH’s pole population
is 23.5 years.
June 23, 2020 50
Figure 2-1: WNH Pole Population Age Profile
2.8.2 Condition Assessment Criteria
Table 2-40 provides a summary of the TUL’s WNH has adopted for all of its pole types
Table 2-40: Poles (TUL)
KINECTRICS Report WNH
Pole Type Min UL TUL Max UL TUL Wood Poles 35 45 75 45
Concrete Poles 50 60 80 60 Steel Poles 60 60 80 60
Composite Poles N/A N/A N/A 60
Table 2-41 provides a summary of the main asset management criteria used to calculate
the Health Indices for WNH’s pole population.
3,485 3,404
2,806
1,889
1,489
1,760 1,768
1,230
793 882 677
434 409 417 333
25 6 -
500
1,000
1,500
2,000
2,500
3,000
3,500
4,000
0 <=5 6<=10
11<=15
16<=20
21<=25
26<=30
31<=35
36<=40
41<=45
46<=50
51<=55
56<=60
61<=65
66<=70
71<=75
76<=80
81<=85
Num
ber o
f Pol
es
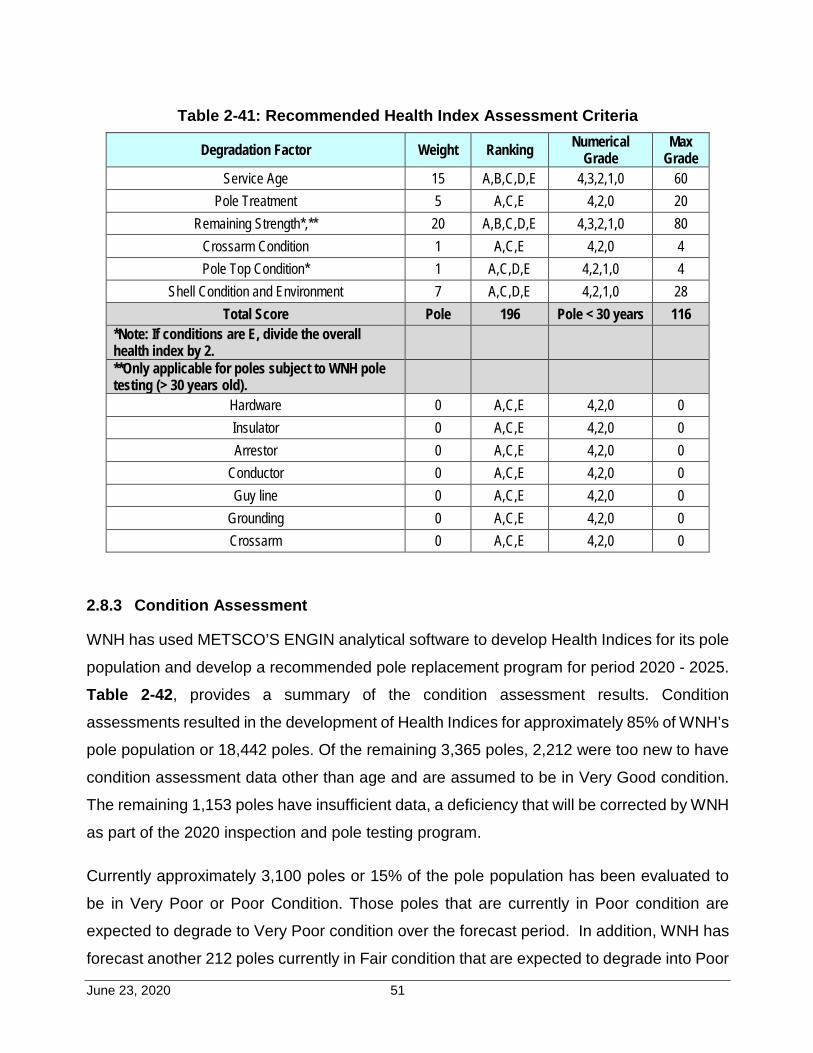
June 23, 2020 51
Table 2-41: Recommended Health Index Assessment Criteria
Degradation Factor Weight Ranking Numerical Grade
Max Grade
Service Age 15 A,B,C,D,E 4,3,2,1,0 60 Pole Treatment 5 A,C,E 4,2,0 20
Remaining Strength*,** 20 A,B,C,D,E 4,3,2,1,0 80 Crossarm Condition 1 A,C,E 4,2,0 4 Pole Top Condition* 1 A,C,D,E 4,2,1,0 4
Shell Condition and Environment 7 A,C,D,E 4,2,1,0 28 Total Score Pole 196 Pole < 30 years 116
*Note: If conditions are E, divide the overall health index by 2. **Only applicable for poles subject to WNH pole testing (> 30 years old).
Hardware 0 A,C,E 4,2,0 0 Insulator 0 A,C,E 4,2,0 0 Arrestor 0 A,C,E 4,2,0 0
Conductor 0 A,C,E 4,2,0 0 Guy line 0 A,C,E 4,2,0 0
Grounding 0 A,C,E 4,2,0 0 Crossarm 0 A,C,E 4,2,0 0
2.8.3 Condition Assessment
WNH has used METSCO’S ENGIN analytical software to develop Health Indices for its pole
population and develop a recommended pole replacement program for period 2020 - 2025.
Table 2-42, provides a summary of the condition assessment results. Condition
assessments resulted in the development of Health Indices for approximately 85% of WNH’s
pole population or 18,442 poles. Of the remaining 3,365 poles, 2,212 were too new to have
condition assessment data other than age and are assumed to be in Very Good condition.
The remaining 1,153 poles have insufficient data, a deficiency that will be corrected by WNH
as part of the 2020 inspection and pole testing program.
Currently approximately 3,100 poles or 15% of the pole population has been evaluated to
be in Very Poor or Poor Condition. Those poles that are currently in Poor condition are
expected to degrade to Very Poor condition over the forecast period. In addition, WNH has
forecast another 212 poles currently in Fair condition that are expected to degrade into Poor
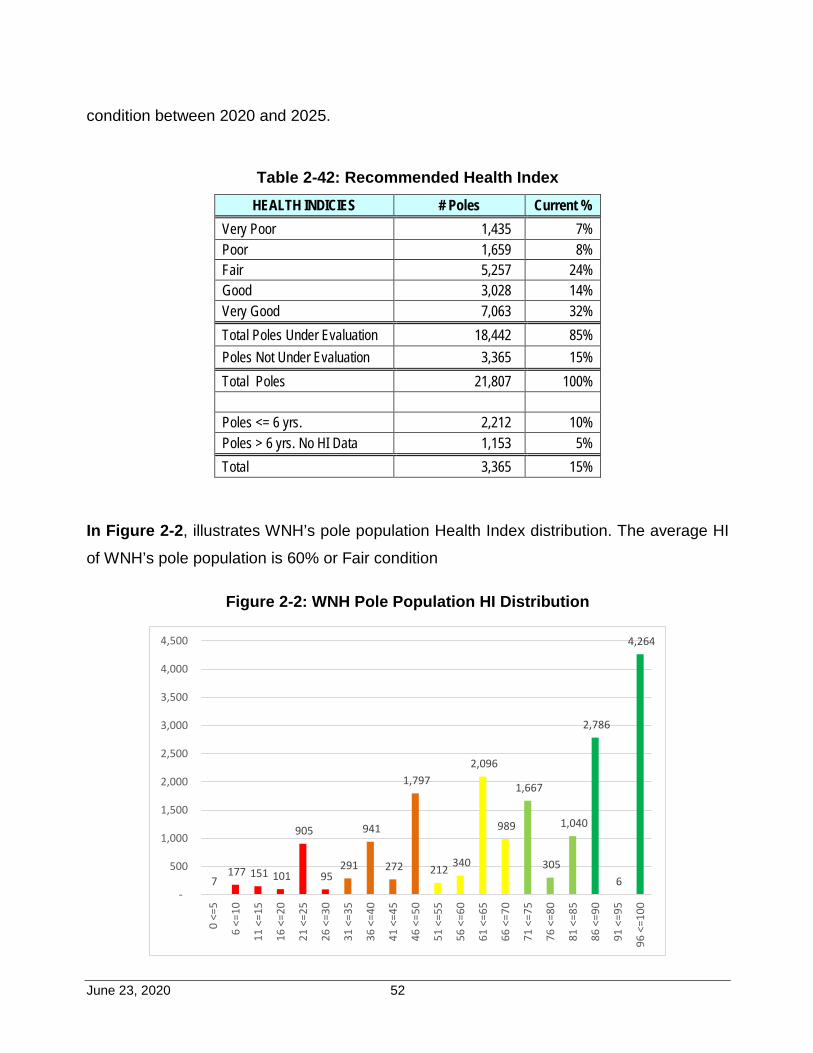
June 23, 2020 52
condition between 2020 and 2025.
Table 2-42: Recommended Health Index
HEALTH INDICIES # Poles Current % Very Poor 1,435 7% Poor 1,659 8% Fair 5,257 24% Good 3,028 14% Very Good 7,063 32% Total Poles Under Evaluation 18,442 85% Poles Not Under Evaluation 3,365 15% Total Poles 21,807 100% Poles <= 6 yrs. 2,212 10% Poles > 6 yrs. No HI Data 1,153 5% Total 3,365 15%
In Figure 2-2, illustrates WNH’s pole population Health Index distribution. The average HI
of WNH’s pole population is 60% or Fair condition
Figure 2-2: WNH Pole Population HI Distribution
7 177 151 101
905
95 291
941
272
1,797
212 340
2,096
989
1,667
305
1,040
2,786
6
4,264
-
500
1,000
1,500
2,000
2,500
3,000
3,500
4,000
4,500
0 <=
5
6 <=
10
11 <
=15
16 <
=20
21 <
=25
26 <
=30
31 <
=35
36 <
=40
41 <
=45
46 <
=50
51 <
=55
56 <
=60
61 <
=65
66 <
=70
71 <
=75
76 <
=80
81 <
=85
86 <
=90
91 <
=95
96 <
=100
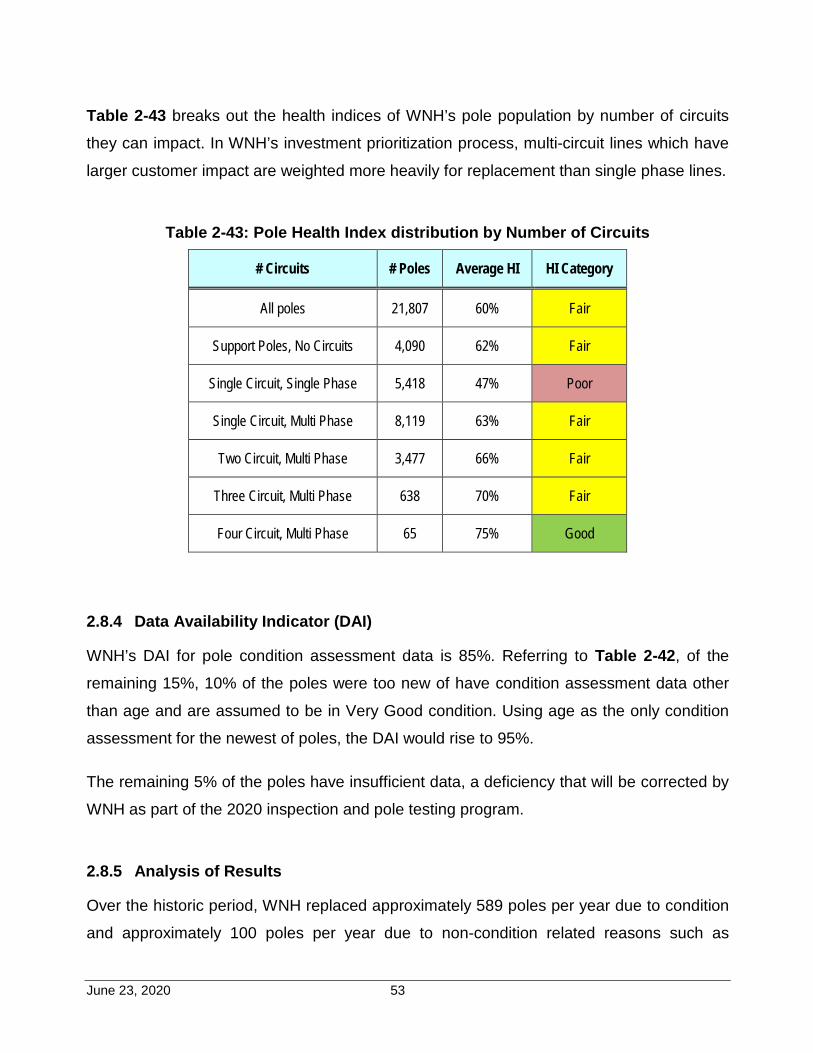
June 23, 2020 53
Table 2-43 breaks out the health indices of WNH’s pole population by number of circuits
they can impact. In WNH’s investment prioritization process, multi-circuit lines which have
larger customer impact are weighted more heavily for replacement than single phase lines.
Table 2-43: Pole Health Index distribution by Number of Circuits
# Circuits # Poles Average HI HI Category
All poles 21,807 60% Fair
Support Poles, No Circuits 4,090 62% Fair
Single Circuit, Single Phase 5,418 47% Poor
Single Circuit, Multi Phase 8,119 63% Fair
Two Circuit, Multi Phase 3,477 66% Fair
Three Circuit, Multi Phase 638 70% Fair
Four Circuit, Multi Phase 65 75% Good
2.8.4 Data Availability Indicator (DAI)
WNH’s DAI for pole condition assessment data is 85%. Referring to Table 2-42, of the
remaining 15%, 10% of the poles were too new of have condition assessment data other
than age and are assumed to be in Very Good condition. Using age as the only condition
assessment for the newest of poles, the DAI would rise to 95%.
The remaining 5% of the poles have insufficient data, a deficiency that will be corrected by
WNH as part of the 2020 inspection and pole testing program.
2.8.5 Analysis of Results
Over the historic period, WNH replaced approximately 589 poles per year due to condition
and approximately 100 poles per year due to non-condition related reasons such as
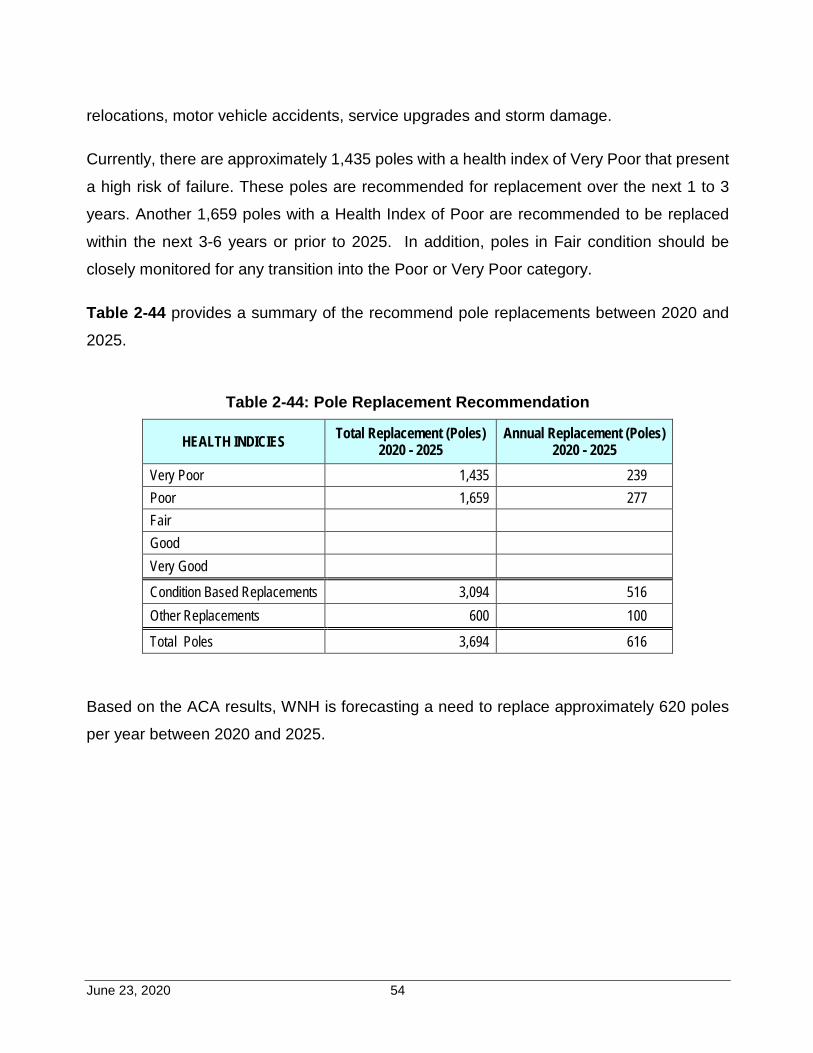
June 23, 2020 54
relocations, motor vehicle accidents, service upgrades and storm damage.
Currently, there are approximately 1,435 poles with a health index of Very Poor that present
a high risk of failure. These poles are recommended for replacement over the next 1 to 3
years. Another 1,659 poles with a Health Index of Poor are recommended to be replaced
within the next 3-6 years or prior to 2025. In addition, poles in Fair condition should be
closely monitored for any transition into the Poor or Very Poor category.
Table 2-44 provides a summary of the recommend pole replacements between 2020 and
2025.
Table 2-44: Pole Replacement Recommendation
HEALTH INDICIES Total Replacement (Poles) 2020 - 2025
Annual Replacement (Poles) 2020 - 2025
Very Poor 1,435 239 Poor 1,659 277 Fair Good Very Good
Condition Based Replacements 3,094 516 Other Replacements 600 100
Total Poles 3,694 616
Based on the ACA results, WNH is forecasting a need to replace approximately 620 poles
per year between 2020 and 2025.
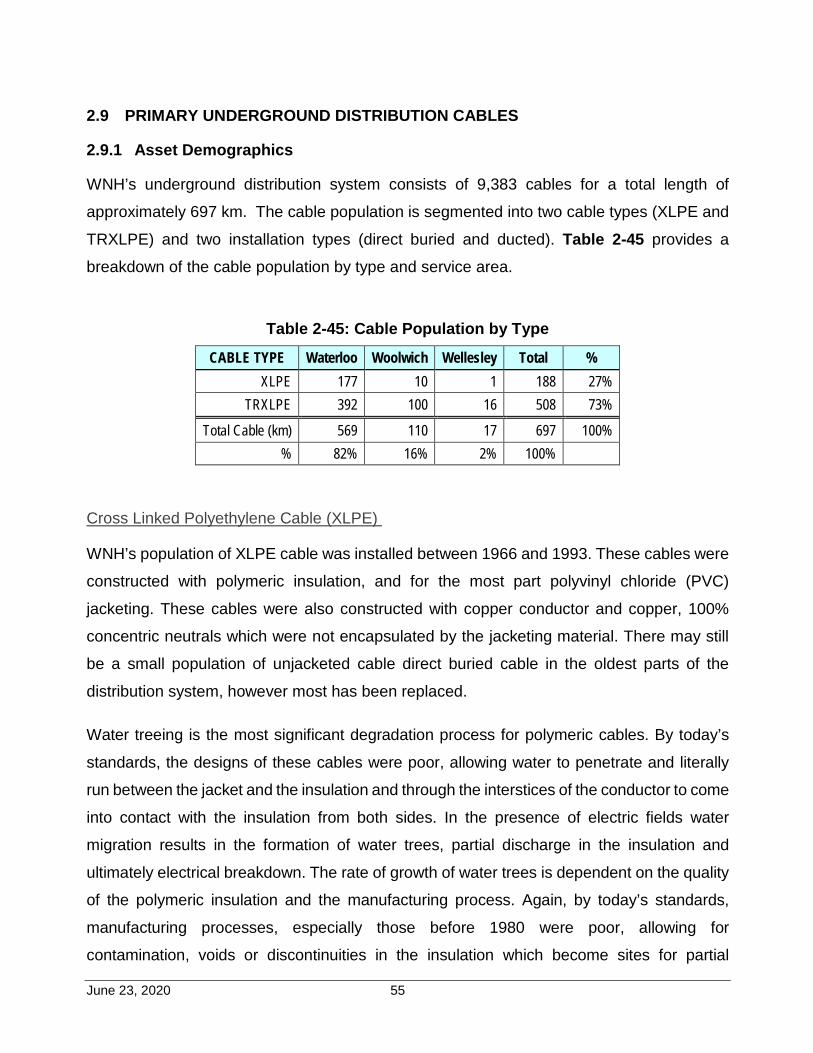
June 23, 2020 55
2.9 PRIMARY UNDERGROUND DISTRIBUTION CABLES
2.9.1 Asset Demographics
WNH’s underground distribution system consists of 9,383 cables for a total length of
approximately 697 km. The cable population is segmented into two cable types (XLPE and
TRXLPE) and two installation types (direct buried and ducted). Table 2-45 provides a
breakdown of the cable population by type and service area.
Table 2-45: Cable Population by Type
CABLE TYPE Waterloo Woolwich Wellesley Total % XLPE 177 10 1 188 27%
TRXLPE 392 100 16 508 73%
Total Cable (km) 569 110 17 697 100% % 82% 16% 2% 100%
Cross Linked Polyethylene Cable (XLPE)
WNH’s population of XLPE cable was installed between 1966 and 1993. These cables were
constructed with polymeric insulation, and for the most part polyvinyl chloride (PVC)
jacketing. These cables were also constructed with copper conductor and copper, 100%
concentric neutrals which were not encapsulated by the jacketing material. There may still
be a small population of unjacketed cable direct buried cable in the oldest parts of the
distribution system, however most has been replaced.
Water treeing is the most significant degradation process for polymeric cables. By today’s
standards, the designs of these cables were poor, allowing water to penetrate and literally
run between the jacket and the insulation and through the interstices of the conductor to come
into contact with the insulation from both sides. In the presence of electric fields water
migration results in the formation of water trees, partial discharge in the insulation and
ultimately electrical breakdown. The rate of growth of water trees is dependent on the quality
of the polymeric insulation and the manufacturing process. Again, by today’s standards,
manufacturing processes, especially those before 1980 were poor, allowing for
contamination, voids or discontinuities in the insulation which become sites for partial
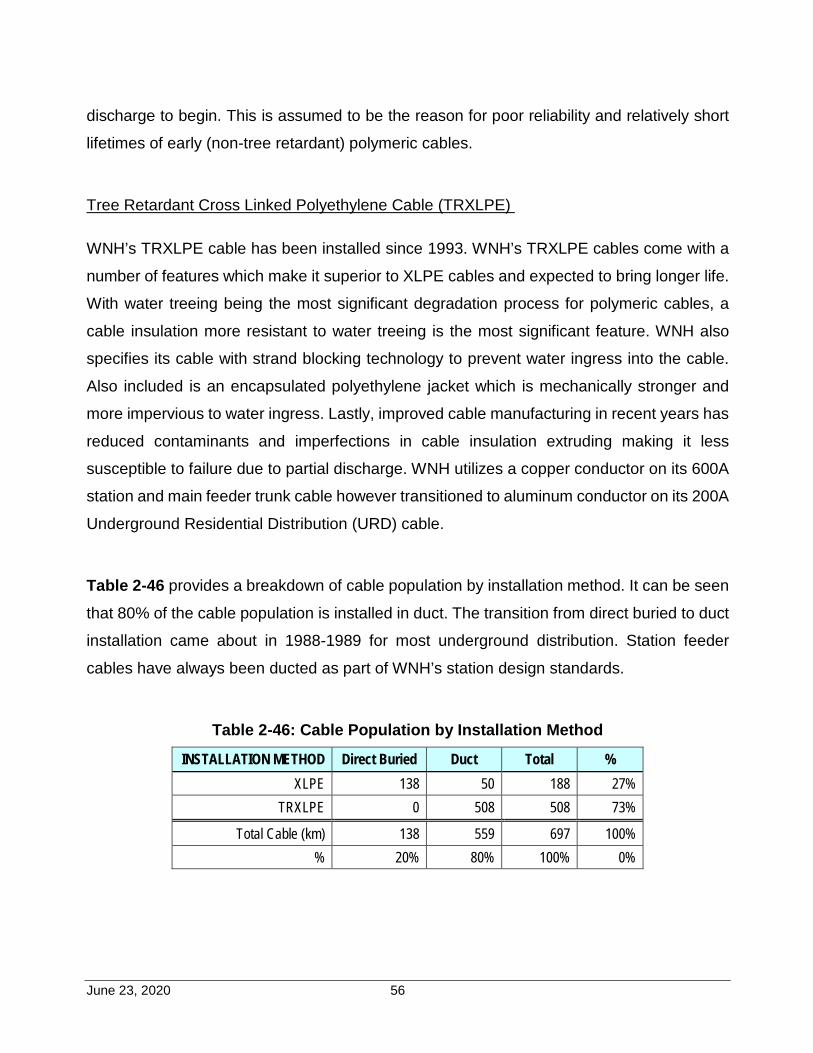
June 23, 2020 56
discharge to begin. This is assumed to be the reason for poor reliability and relatively short
lifetimes of early (non-tree retardant) polymeric cables.
Tree Retardant Cross Linked Polyethylene Cable (TRXLPE)
WNH’s TRXLPE cable has been installed since 1993. WNH’s TRXLPE cables come with a
number of features which make it superior to XLPE cables and expected to bring longer life.
With water treeing being the most significant degradation process for polymeric cables, a
cable insulation more resistant to water treeing is the most significant feature. WNH also
specifies its cable with strand blocking technology to prevent water ingress into the cable.
Also included is an encapsulated polyethylene jacket which is mechanically stronger and
more impervious to water ingress. Lastly, improved cable manufacturing in recent years has
reduced contaminants and imperfections in cable insulation extruding making it less
susceptible to failure due to partial discharge. WNH utilizes a copper conductor on its 600A
station and main feeder trunk cable however transitioned to aluminum conductor on its 200A
Underground Residential Distribution (URD) cable.
Table 2-46 provides a breakdown of cable population by installation method. It can be seen
that 80% of the cable population is installed in duct. The transition from direct buried to duct
installation came about in 1988-1989 for most underground distribution. Station feeder
cables have always been ducted as part of WNH’s station design standards.
Table 2-46: Cable Population by Installation Method
INSTALLATION METHOD Direct Buried Duct Total % XLPE 138 50 188 27%
TRXLPE 0 508 508 73%
Total Cable (km) 138 559 697 100% % 20% 80% 100% 0%
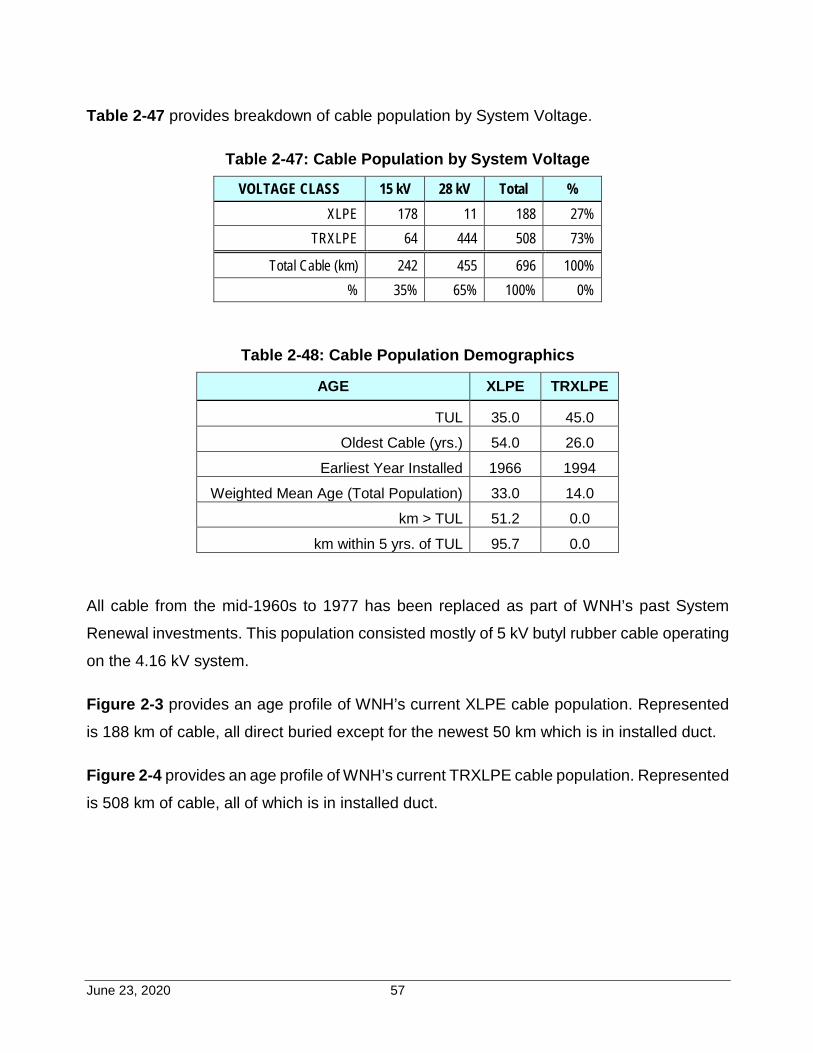
June 23, 2020 57
Table 2-47 provides breakdown of cable population by System Voltage.
Table 2-47: Cable Population by System Voltage
VOLTAGE CLASS 15 kV 28 kV Total % XLPE 178 11 188 27%
TRXLPE 64 444 508 73%
Total Cable (km) 242 455 696 100% % 35% 65% 100% 0%
Table 2-48: Cable Population Demographics
AGE XLPE TRXLPE
TUL 35.0 45.0
Oldest Cable (yrs.) 54.0 26.0
Earliest Year Installed 1966 1994
Weighted Mean Age (Total Population) 33.0 14.0
km > TUL 51.2 0.0
km within 5 yrs. of TUL 95.7 0.0
All cable from the mid-1960s to 1977 has been replaced as part of WNH’s past System
Renewal investments. This population consisted mostly of 5 kV butyl rubber cable operating
on the 4.16 kV system.
Figure 2-3 provides an age profile of WNH’s current XLPE cable population. Represented
is 188 km of cable, all direct buried except for the newest 50 km which is in installed duct.
Figure 2-4 provides an age profile of WNH’s current TRXLPE cable population. Represented
is 508 km of cable, all of which is in installed duct.
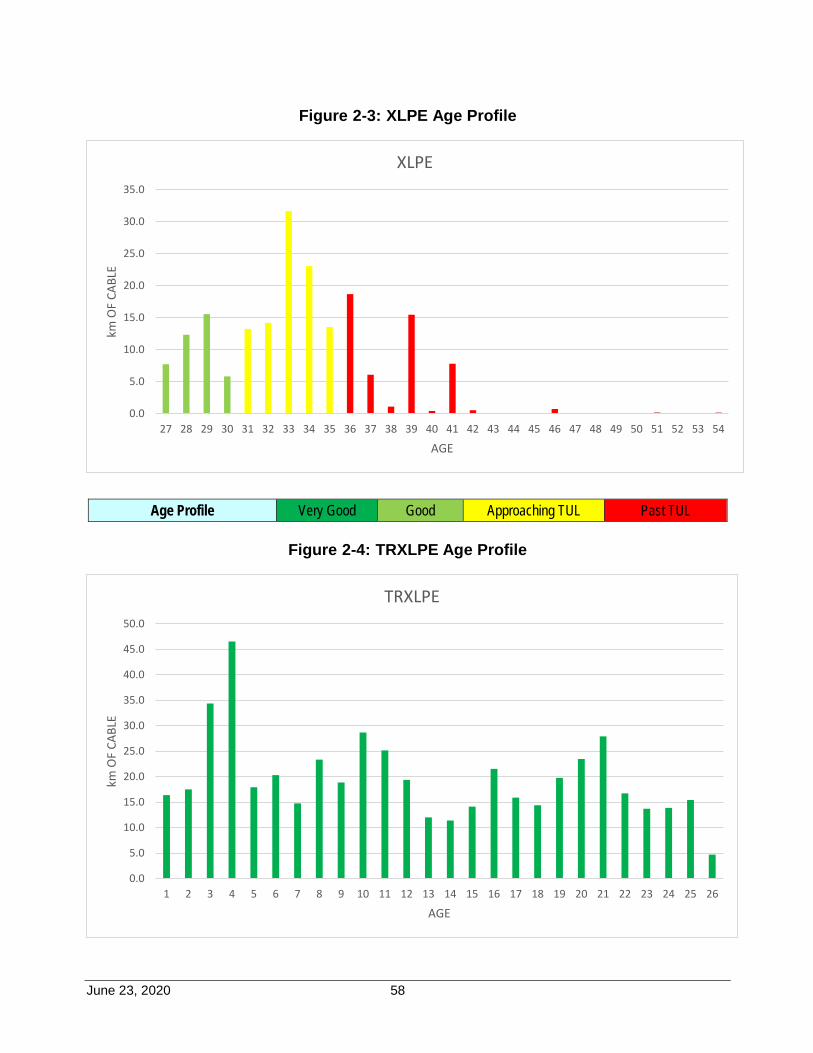
June 23, 2020 58
Figure 2-3: XLPE Age Profile
Age Profile Very Good Good Approaching TUL Past TUL
Figure 2-4: TRXLPE Age Profile
0.0
5.0
10.0
15.0
20.0
25.0
30.0
35.0
27 28 29 30 31 32 33 34 35 36 37 38 39 40 41 42 43 44 45 46 47 48 49 50 51 52 53 54
km O
F CA
BLE
AGE
XLPE
0.0
5.0
10.0
15.0
20.0
25.0
30.0
35.0
40.0
45.0
50.0
1 2 3 4 5 6 7 8 9 10 11 12 13 14 15 16 17 18 19 20 21 22 23 24 25 26
km O
F CA
BLE
AGE
TRXLPE
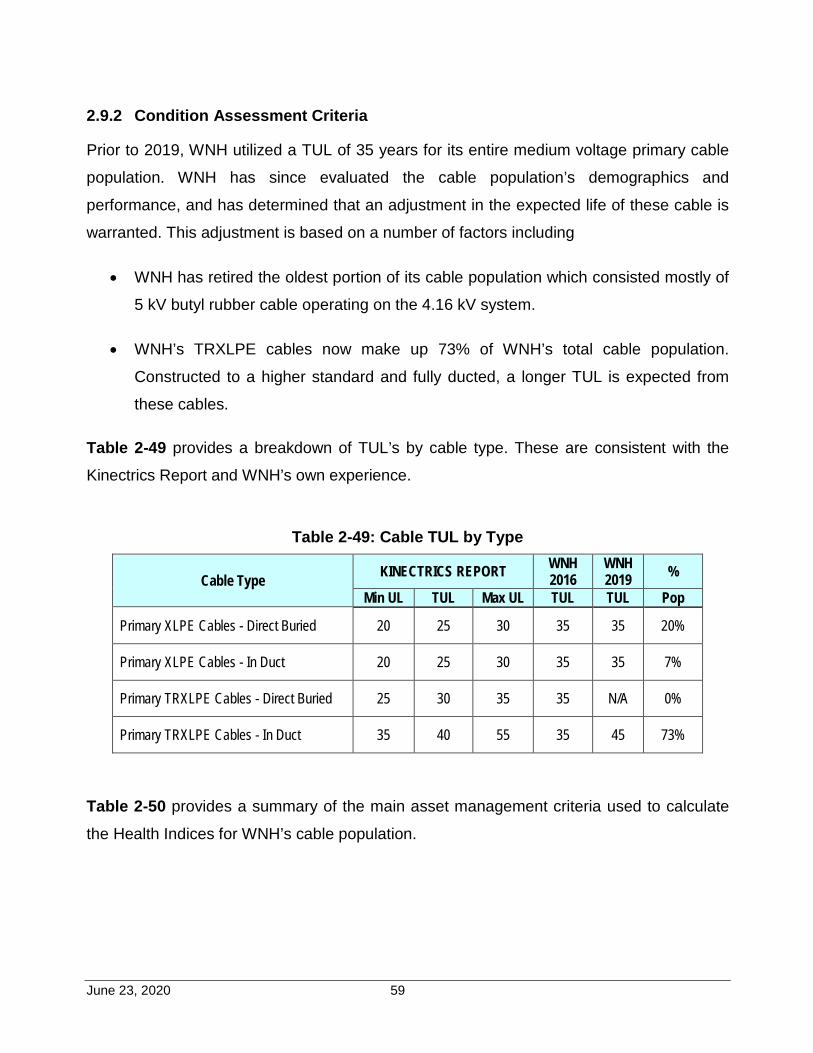
June 23, 2020 59
2.9.2 Condition Assessment Criteria
Prior to 2019, WNH utilized a TUL of 35 years for its entire medium voltage primary cable
population. WNH has since evaluated the cable population’s demographics and
performance, and has determined that an adjustment in the expected life of these cable is
warranted. This adjustment is based on a number of factors including
• WNH has retired the oldest portion of its cable population which consisted mostly of
5 kV butyl rubber cable operating on the 4.16 kV system.
• WNH’s TRXLPE cables now make up 73% of WNH’s total cable population.
Constructed to a higher standard and fully ducted, a longer TUL is expected from
these cables.
Table 2-49 provides a breakdown of TUL’s by cable type. These are consistent with the
Kinectrics Report and WNH’s own experience.
Table 2-49: Cable TUL by Type
Cable Type KINECTRICS REPORT WNH 2016
WNH 2019 %
Min UL TUL Max UL TUL TUL Pop
Primary XLPE Cables - Direct Buried 20 25 30 35 35 20%
Primary XLPE Cables - In Duct 20 25 30 35 35 7%
Primary TRXLPE Cables - Direct Buried 25 30 35 35 N/A 0%
Primary TRXLPE Cables - In Duct 35 40 55 35 45 73%
Table 2-50 provides a summary of the main asset management criteria used to calculate
the Health Indices for WNH’s cable population.
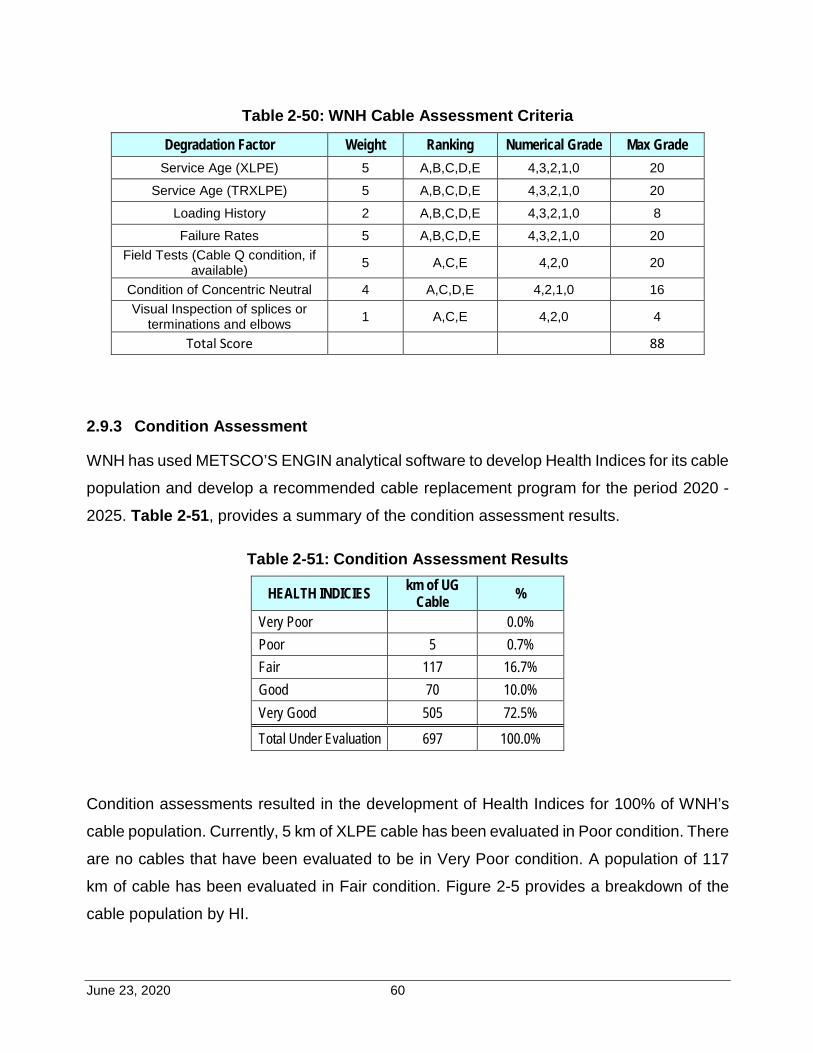
June 23, 2020 60
Table 2-50: WNH Cable Assessment Criteria
Degradation Factor Weight Ranking Numerical Grade Max Grade Service Age (XLPE) 5 A,B,C,D,E 4,3,2,1,0 20
Service Age (TRXLPE) 5 A,B,C,D,E 4,3,2,1,0 20
Loading History 2 A,B,C,D,E 4,3,2,1,0 8 Failure Rates 5 A,B,C,D,E 4,3,2,1,0 20
Field Tests (Cable Q condition, if available) 5 A,C,E 4,2,0 20
Condition of Concentric Neutral 4 A,C,D,E 4,2,1,0 16 Visual Inspection of splices or
terminations and elbows 1 A,C,E 4,2,0 4
Total Score 88
2.9.3 Condition Assessment
WNH has used METSCO’S ENGIN analytical software to develop Health Indices for its cable
population and develop a recommended cable replacement program for the period 2020 -
2025. Table 2-51, provides a summary of the condition assessment results.
Table 2-51: Condition Assessment Results
HEALTH INDICIES km of UG Cable %
Very Poor 0.0% Poor 5 0.7% Fair 117 16.7% Good 70 10.0% Very Good 505 72.5%
Total Under Evaluation 697 100.0%
Condition assessments resulted in the development of Health Indices for 100% of WNH’s
cable population. Currently, 5 km of XLPE cable has been evaluated in Poor condition. There
are no cables that have been evaluated to be in Very Poor condition. A population of 117
km of cable has been evaluated in Fair condition. Figure 2-5 provides a breakdown of the
cable population by HI.
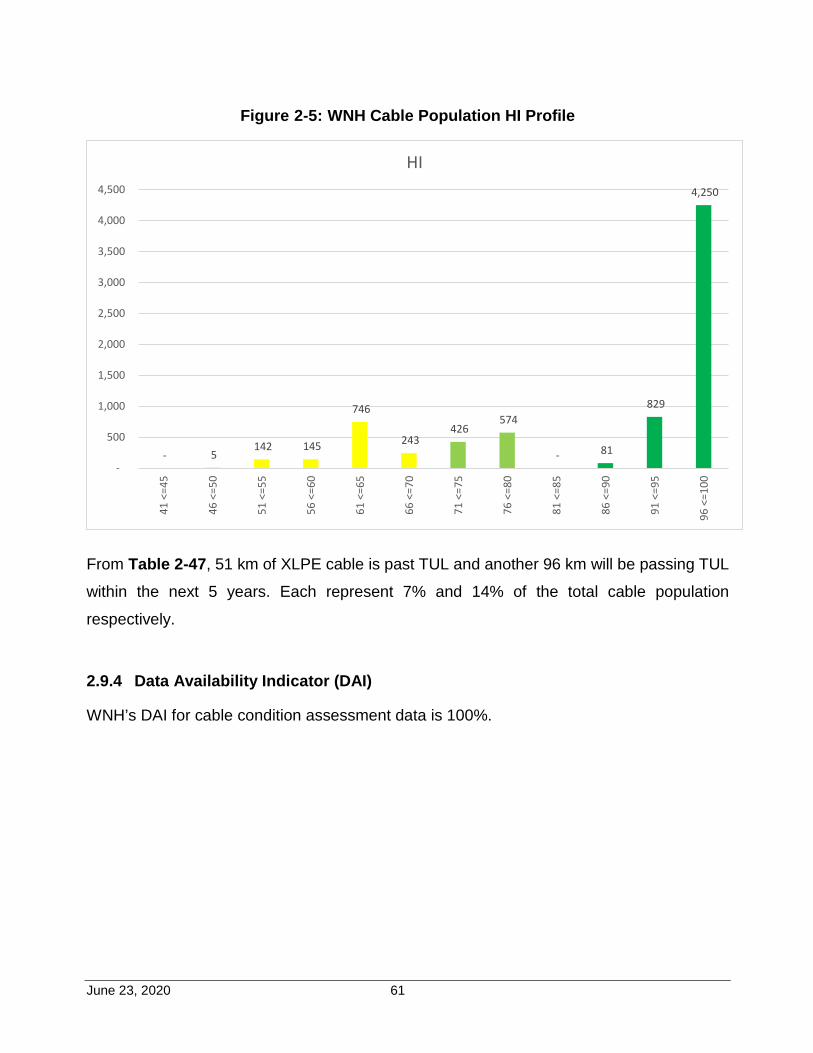
June 23, 2020 61
Figure 2-5: WNH Cable Population HI Profile
From Table 2-47, 51 km of XLPE cable is past TUL and another 96 km will be passing TUL
within the next 5 years. Each represent 7% and 14% of the total cable population
respectively.
2.9.4 Data Availability Indicator (DAI)
WNH’s DAI for cable condition assessment data is 100%.
- 5 142 145
746
243 426
574
- 81
829
4,250
-
500
1,000
1,500
2,000
2,500
3,000
3,500
4,000
4,500
41 <
=45
46 <
=50
51 <
=55
56 <
=60
61 <
=65
66 <
=70
71 <
=75
76 <
=80
81 <
=85
86 <
=90
91 <
=95
96 <
=100
HI
June 23, 2020 62
2.9.5 Analysis of Results
WNH has a population of 9,380 cables for a total length of 697 km, most problematic of which
are the 138 km of direct buried cable and associated underground transformers and vaults.
WNH’s direct buried cables are XLPE type with a TUL of 35 years. Currently 5 km (0.7%) of
direct buried cable is in Poor condition and 117 km (17%) are in Fair condition.
It is recommended to replace all direct buried underground cables (5 km) in Poor condition.
In addition, it is recommended to proactively replace approximately 37.5 km (20%) of direct
buried cable currently rated in Fair condition. WNH should be concerned with the large
number of XLPE cables past TUL (51 km) and the even larger quantity (96 km) approaching
TUL. The cables being targeted are those approaching the Poor condition and are expected
to reach this condition over the forecast period. These direct buried cables currently have an
average age of 34 years with the oldest being 46 years of age. Their replacement, along with
the associated submersible concrete vaults and transformers, is logistically difficult, disruptive
for customers in the area and time consuming.
Over the forecast period, WNH plans to replace approximately 7.1 km of direct buried cable
annually. This is consistent with WNH’s historical pace of cable replacement activity. For the
entire population of cable in Fair condition, this represents approximately 17 years of work at
this pace. The youngest cable currently in this group would be 44 years of age at the
competition of the program. As with all programs, WNH will evaluate annually and adjust the
pace accordingly.
Lastly, 80% of WNH’s cable population is now in duct. This allows WNH to replace cables on
an individual basis with much less cost and disruption. The vast amount of cable in duct is of
the TRXLPE type with a TUL of 45 years. There are no planed replacements of cable in duct
over the forecast period.
Table 2-52 provides a summary of the recommend cable replacements between 2020 and
2025.
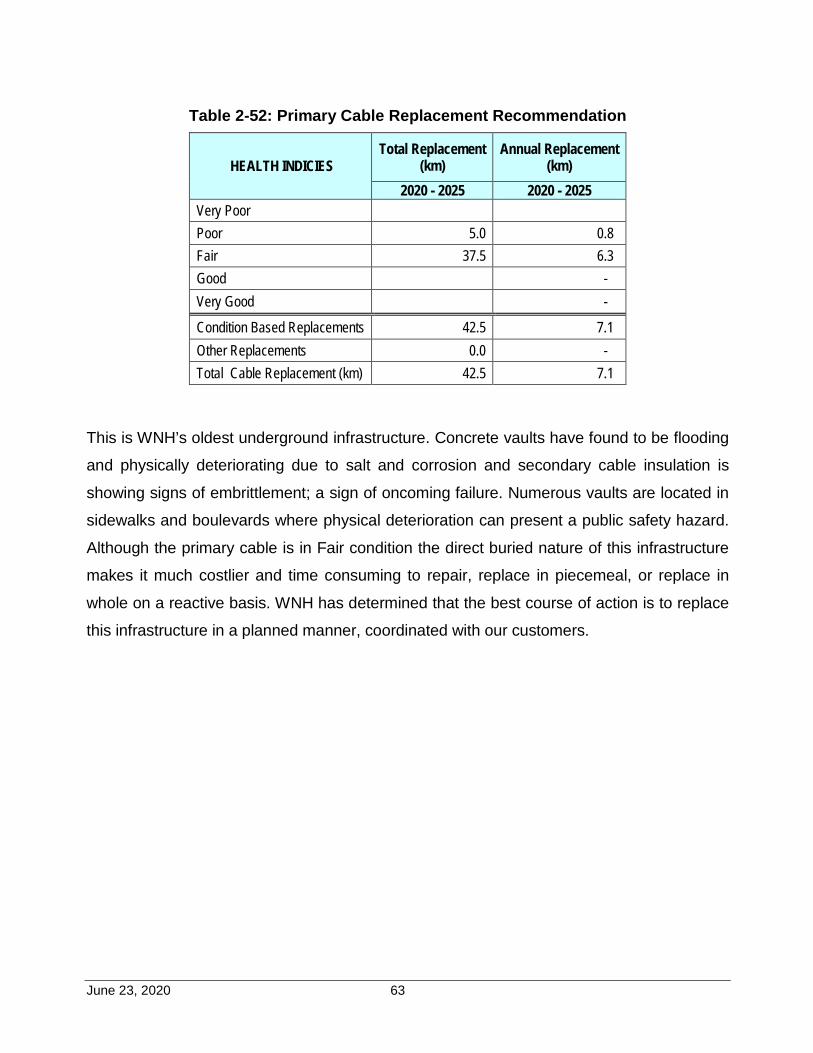
June 23, 2020 63
Table 2-52: Primary Cable Replacement Recommendation
HEALTH INDICIES Total Replacement
(km) Annual Replacement
(km) 2020 - 2025 2020 - 2025
Very Poor Poor 5.0 0.8 Fair 37.5 6.3 Good - Very Good -
Condition Based Replacements 42.5 7.1 Other Replacements 0.0 - Total Cable Replacement (km) 42.5 7.1
This is WNH’s oldest underground infrastructure. Concrete vaults have found to be flooding
and physically deteriorating due to salt and corrosion and secondary cable insulation is
showing signs of embrittlement; a sign of oncoming failure. Numerous vaults are located in
sidewalks and boulevards where physical deterioration can present a public safety hazard.
Although the primary cable is in Fair condition the direct buried nature of this infrastructure
makes it much costlier and time consuming to repair, replace in piecemeal, or replace in
whole on a reactive basis. WNH has determined that the best course of action is to replace
this infrastructure in a planned manner, coordinated with our customers.
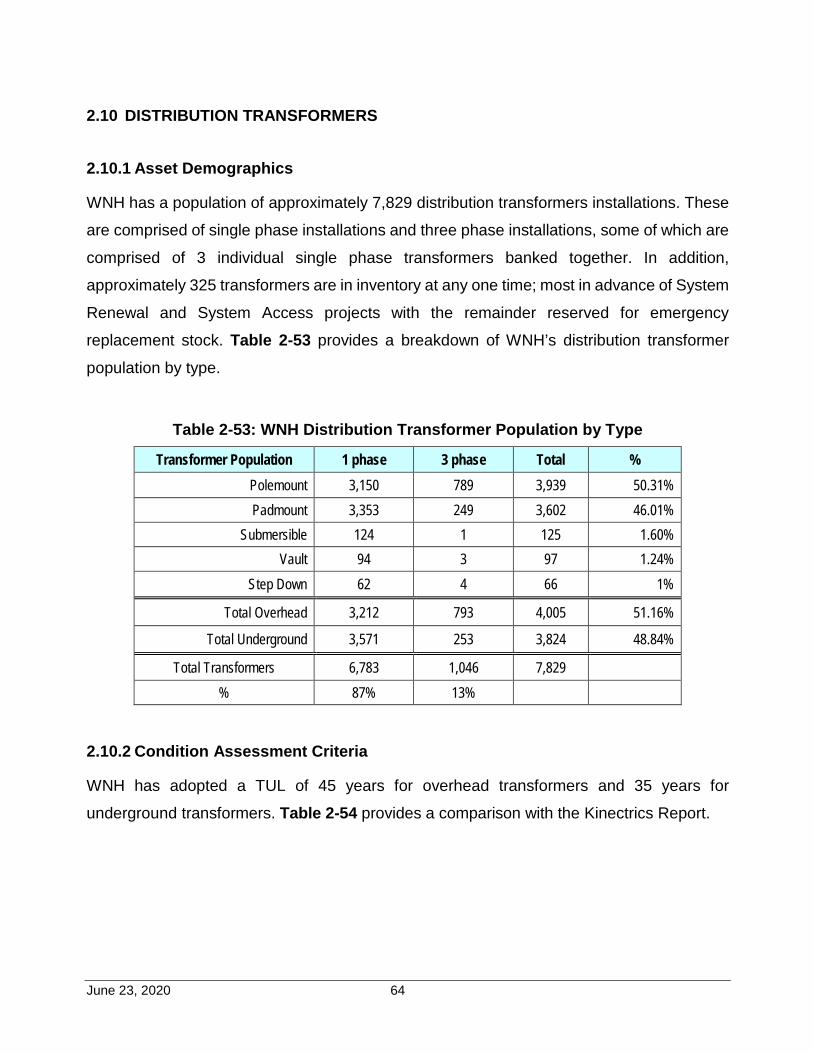
June 23, 2020 64
2.10 DISTRIBUTION TRANSFORMERS
2.10.1 Asset Demographics
WNH has a population of approximately 7,829 distribution transformers installations. These
are comprised of single phase installations and three phase installations, some of which are
comprised of 3 individual single phase transformers banked together. In addition,
approximately 325 transformers are in inventory at any one time; most in advance of System
Renewal and System Access projects with the remainder reserved for emergency
replacement stock. Table 2-53 provides a breakdown of WNH’s distribution transformer
population by type.
Table 2-53: WNH Distribution Transformer Population by Type
Transformer Population 1 phase 3 phase Total % Polemount 3,150 789 3,939 50.31% Padmount 3,353 249 3,602 46.01%
Submersible 124 1 125 1.60% Vault 94 3 97 1.24%
Step Down 62 4 66 1%
Total Overhead 3,212 793 4,005 51.16%
Total Underground 3,571 253 3,824 48.84%
Total Transformers 6,783 1,046 7,829 % 87% 13%
2.10.2 Condition Assessment Criteria
WNH has adopted a TUL of 45 years for overhead transformers and 35 years for
underground transformers. Table 2-54 provides a comparison with the Kinectrics Report.
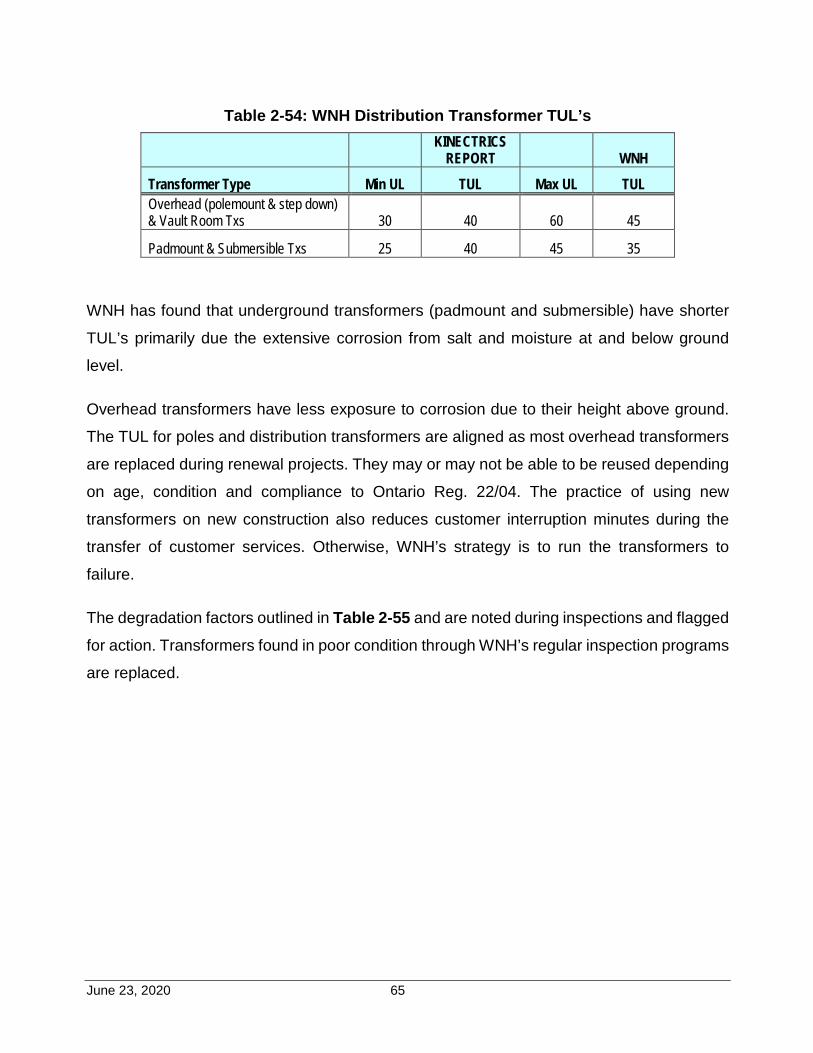
June 23, 2020 65
Table 2-54: WNH Distribution Transformer TUL’s
KINECTRICS
REPORT WNH Transformer Type Min UL TUL Max UL TUL Overhead (polemount & step down) & Vault Room Txs 30 40 60 45
Padmount & Submersible Txs 25 40 45 35
WNH has found that underground transformers (padmount and submersible) have shorter
TUL’s primarily due the extensive corrosion from salt and moisture at and below ground
level.
Overhead transformers have less exposure to corrosion due to their height above ground.
The TUL for poles and distribution transformers are aligned as most overhead transformers
are replaced during renewal projects. They may or may not be able to be reused depending
on age, condition and compliance to Ontario Reg. 22/04. The practice of using new
transformers on new construction also reduces customer interruption minutes during the
transfer of customer services. Otherwise, WNH’s strategy is to run the transformers to
failure.
The degradation factors outlined in Table 2-55 and are noted during inspections and flagged
for action. Transformers found in poor condition through WNH’s regular inspection programs
are replaced.
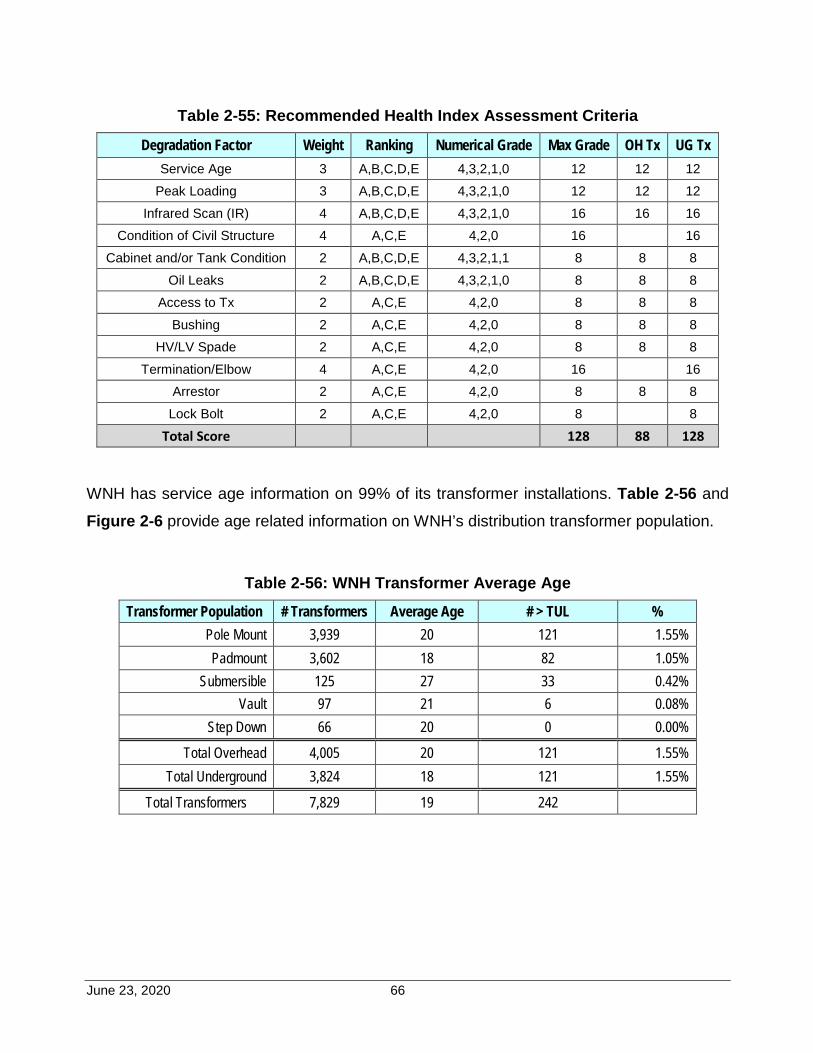
June 23, 2020 66
Table 2-55: Recommended Health Index Assessment Criteria
Degradation Factor Weight Ranking Numerical Grade Max Grade OH Tx UG Tx Service Age 3 A,B,C,D,E 4,3,2,1,0 12 12 12
Peak Loading 3 A,B,C,D,E 4,3,2,1,0 12 12 12 Infrared Scan (IR) 4 A,B,C,D,E 4,3,2,1,0 16 16 16
Condition of Civil Structure 4 A,C,E 4,2,0 16 16 Cabinet and/or Tank Condition 2 A,B,C,D,E 4,3,2,1,1 8 8 8
Oil Leaks 2 A,B,C,D,E 4,3,2,1,0 8 8 8 Access to Tx 2 A,C,E 4,2,0 8 8 8
Bushing 2 A,C,E 4,2,0 8 8 8 HV/LV Spade 2 A,C,E 4,2,0 8 8 8
Termination/Elbow 4 A,C,E 4,2,0 16 16 Arrestor 2 A,C,E 4,2,0 8 8 8
Lock Bolt 2 A,C,E 4,2,0 8 8 Total Score 128 88 128
WNH has service age information on 99% of its transformer installations. Table 2-56 and
Figure 2-6 provide age related information on WNH’s distribution transformer population.
Table 2-56: WNH Transformer Average Age
Transformer Population # Transformers Average Age # > TUL % Pole Mount 3,939 20 121 1.55% Padmount 3,602 18 82 1.05%
Submersible 125 27 33 0.42% Vault 97 21 6 0.08%
Step Down 66 20 0 0.00%
Total Overhead 4,005 20 121 1.55% Total Underground 3,824 18 121 1.55%
Total Transformers 7,829 19 242
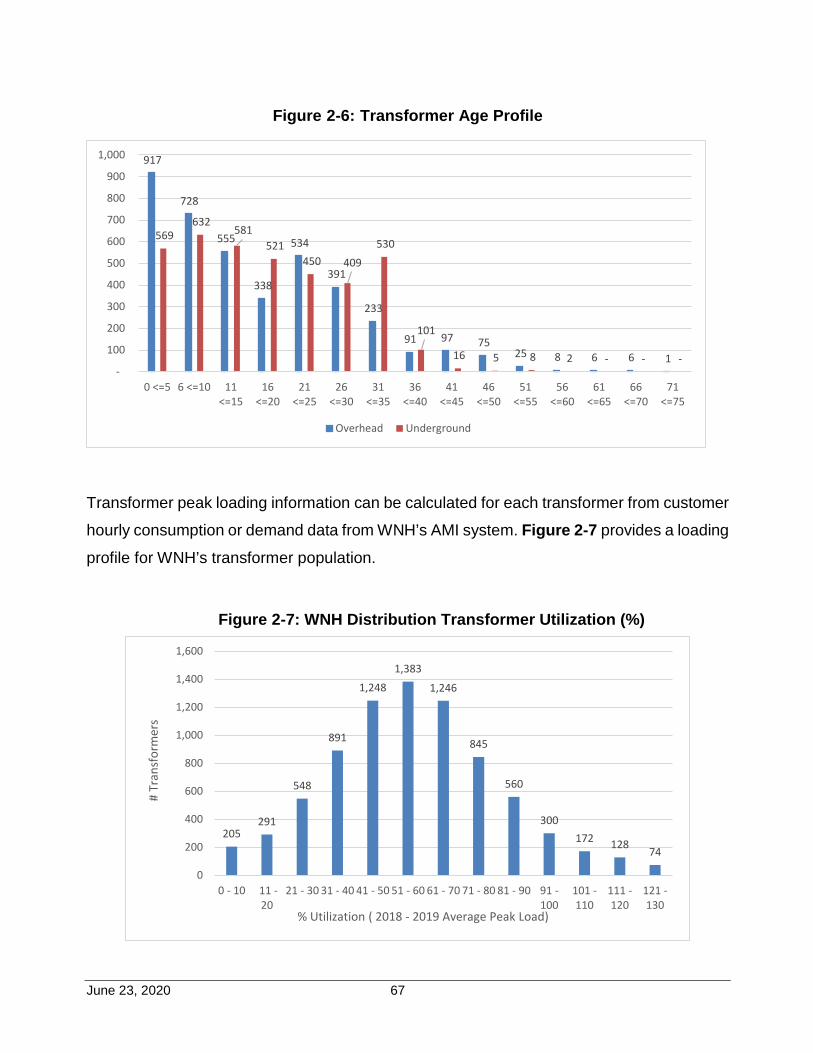
June 23, 2020 67
Figure 2-6: Transformer Age Profile
Transformer peak loading information can be calculated for each transformer from customer
hourly consumption or demand data from WNH’s AMI system. Figure 2-7 provides a loading
profile for WNH’s transformer population.
Figure 2-7: WNH Distribution Transformer Utilization (%)
917
728
555
338
534
391
233
91 97 75 25 8 6 6 1
569 632
581 521
450 409 530
101
16 5 8 2 - - - -
100
200
300
400
500
600
700
800
900
1,000
0 <=5 6 <=10 11<=15
16<=20
21<=25
26<=30
31<=35
36<=40
41<=45
46<=50
51<=55
56<=60
61<=65
66<=70
71<=75
Overhead Underground
205291
548
891
1,2481,383
1,246
845
560
300172 128 74
0
200
400
600
800
1,000
1,200
1,400
1,600
0 - 10 11 -20
21 - 30 31 - 40 41 - 50 51 - 60 61 - 70 71 - 80 81 - 90 91 -100
101 -110
111 -120
121 -130
# Tr
ansf
orm
ers
% Utilization ( 2018 - 2019 Average Peak Load)
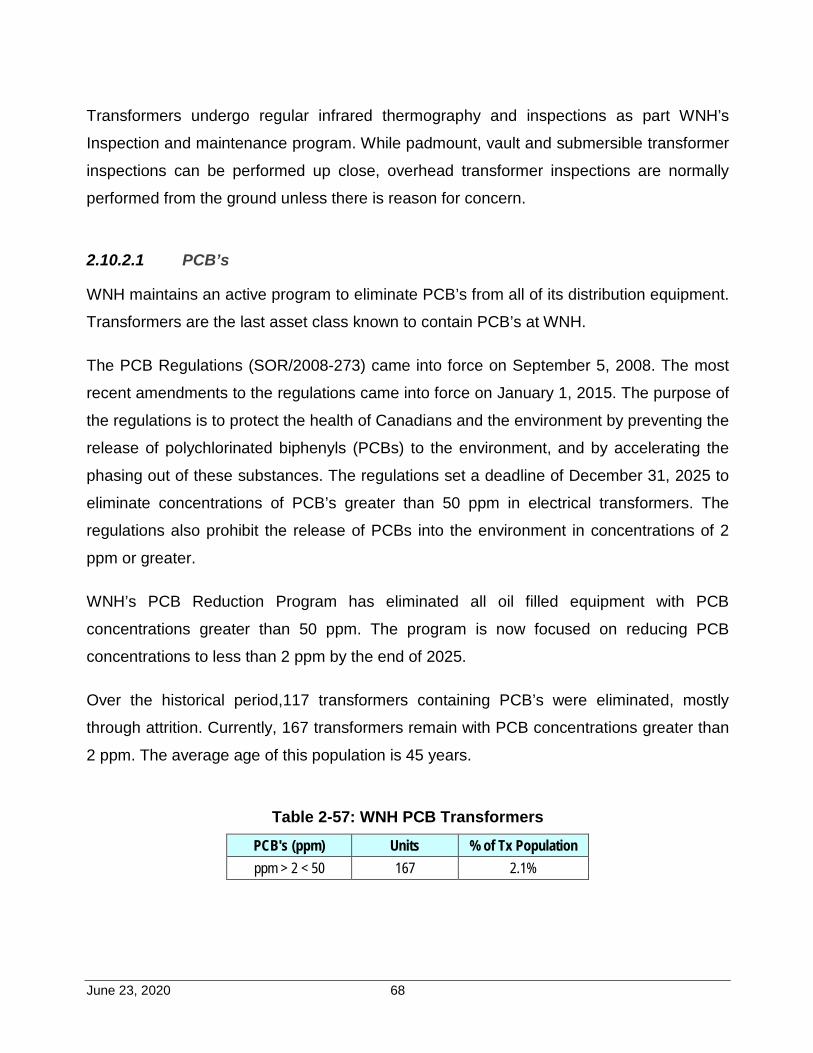
June 23, 2020 68
Transformers undergo regular infrared thermography and inspections as part WNH’s
Inspection and maintenance program. While padmount, vault and submersible transformer
inspections can be performed up close, overhead transformer inspections are normally
performed from the ground unless there is reason for concern.
2.10.2.1 PCB’s
WNH maintains an active program to eliminate PCB’s from all of its distribution equipment.
Transformers are the last asset class known to contain PCB’s at WNH.
The PCB Regulations (SOR/2008-273) came into force on September 5, 2008. The most
recent amendments to the regulations came into force on January 1, 2015. The purpose of
the regulations is to protect the health of Canadians and the environment by preventing the
release of polychlorinated biphenyls (PCBs) to the environment, and by accelerating the
phasing out of these substances. The regulations set a deadline of December 31, 2025 to
eliminate concentrations of PCB’s greater than 50 ppm in electrical transformers. The
regulations also prohibit the release of PCBs into the environment in concentrations of 2
ppm or greater.
WNH’s PCB Reduction Program has eliminated all oil filled equipment with PCB
concentrations greater than 50 ppm. The program is now focused on reducing PCB
concentrations to less than 2 ppm by the end of 2025.
Over the historical period,117 transformers containing PCB’s were eliminated, mostly
through attrition. Currently, 167 transformers remain with PCB concentrations greater than
2 ppm. The average age of this population is 45 years.
Table 2-57: WNH PCB Transformers
PCB's (ppm) Units % of Tx Population ppm > 2 < 50 167 2.1%
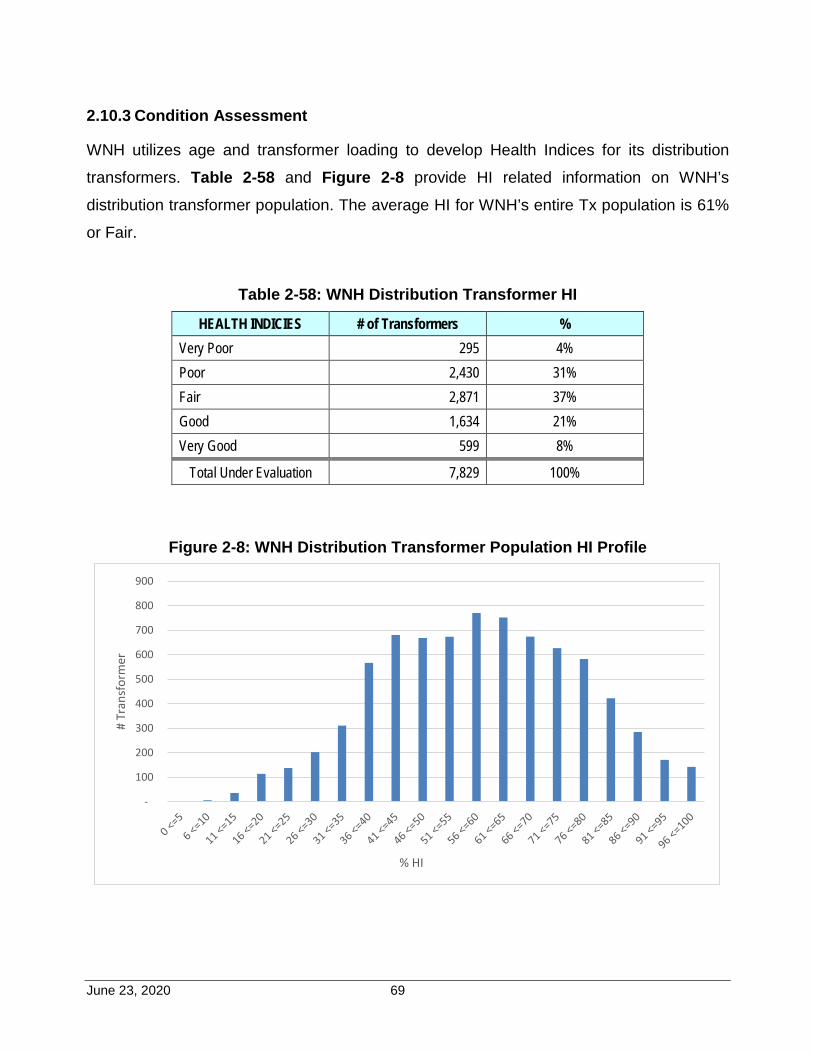
June 23, 2020 69
2.10.3 Condition Assessment
WNH utilizes age and transformer loading to develop Health Indices for its distribution
transformers. Table 2-58 and Figure 2-8 provide HI related information on WNH’s
distribution transformer population. The average HI for WNH’s entire Tx population is 61%
or Fair.
Table 2-58: WNH Distribution Transformer HI
HEALTH INDICIES # of Transformers % Very Poor 295 4% Poor 2,430 31% Fair 2,871 37% Good 1,634 21% Very Good 599 8%
Total Under Evaluation 7,829 100%
Figure 2-8: WNH Distribution Transformer Population HI Profile
-
100
200
300
400
500
600
700
800
900
# Tr
ansf
orm
er
% HI
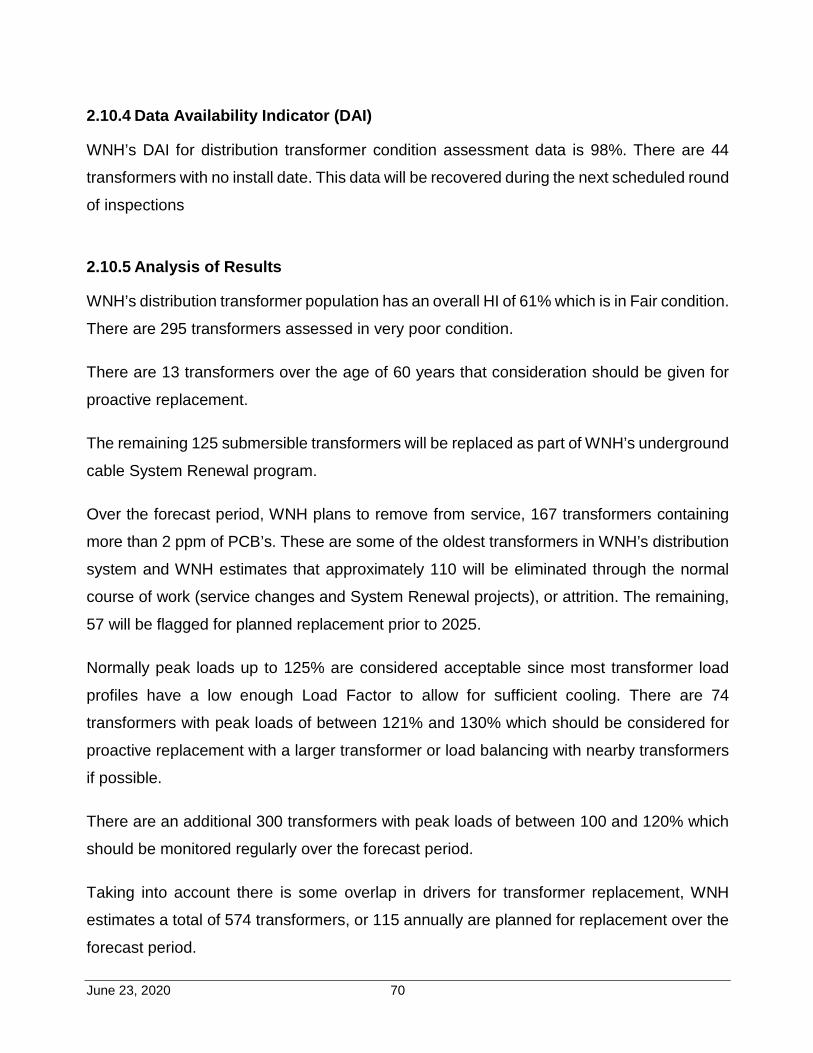
June 23, 2020 70
2.10.4 Data Availability Indicator (DAI)
WNH’s DAI for distribution transformer condition assessment data is 98%. There are 44
transformers with no install date. This data will be recovered during the next scheduled round
of inspections
2.10.5 Analysis of Results
WNH’s distribution transformer population has an overall HI of 61% which is in Fair condition.
There are 295 transformers assessed in very poor condition.
There are 13 transformers over the age of 60 years that consideration should be given for
proactive replacement.
The remaining 125 submersible transformers will be replaced as part of WNH’s underground
cable System Renewal program.
Over the forecast period, WNH plans to remove from service, 167 transformers containing
more than 2 ppm of PCB’s. These are some of the oldest transformers in WNH’s distribution
system and WNH estimates that approximately 110 will be eliminated through the normal
course of work (service changes and System Renewal projects), or attrition. The remaining,
57 will be flagged for planned replacement prior to 2025.
Normally peak loads up to 125% are considered acceptable since most transformer load
profiles have a low enough Load Factor to allow for sufficient cooling. There are 74
transformers with peak loads of between 121% and 130% which should be considered for
proactive replacement with a larger transformer or load balancing with nearby transformers
if possible.
There are an additional 300 transformers with peak loads of between 100 and 120% which
should be monitored regularly over the forecast period.
Taking into account there is some overlap in drivers for transformer replacement, WNH
estimates a total of 574 transformers, or 115 annually are planned for replacement over the
forecast period.
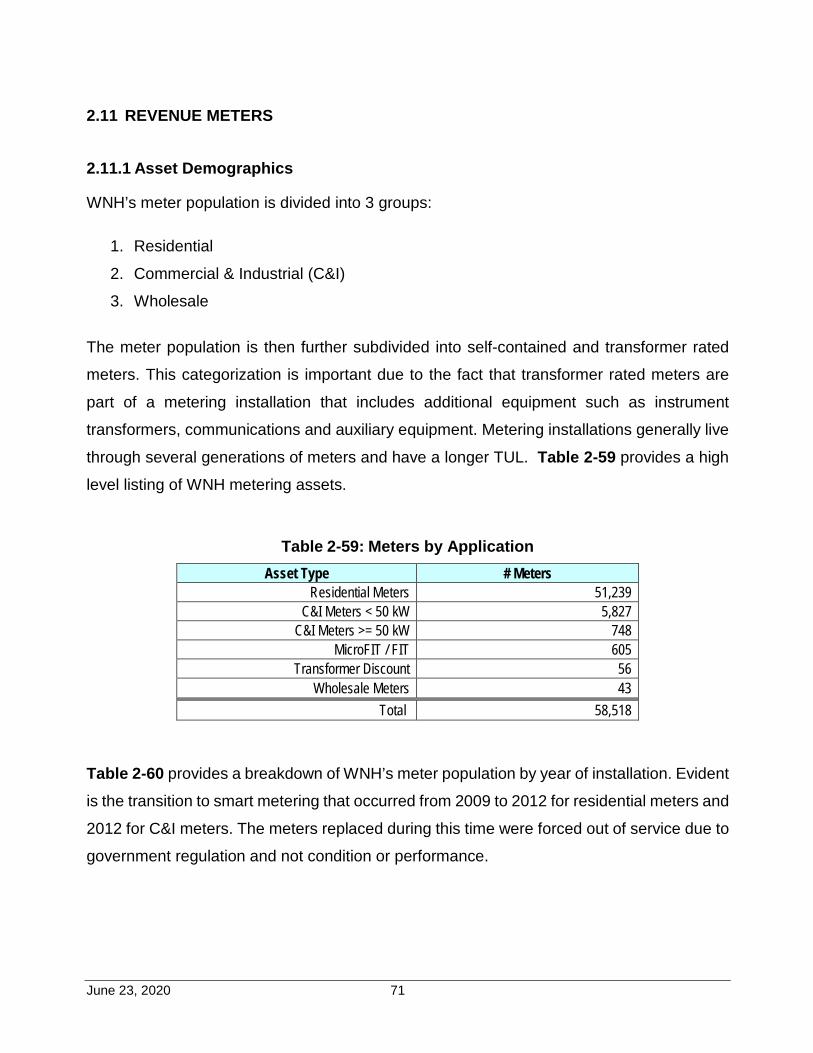
June 23, 2020 71
2.11 REVENUE METERS
2.11.1 Asset Demographics
WNH’s meter population is divided into 3 groups:
1. Residential
2. Commercial & Industrial (C&I)
3. Wholesale
The meter population is then further subdivided into self-contained and transformer rated
meters. This categorization is important due to the fact that transformer rated meters are
part of a metering installation that includes additional equipment such as instrument
transformers, communications and auxiliary equipment. Metering installations generally live
through several generations of meters and have a longer TUL. Table 2-59 provides a high
level listing of WNH metering assets.
Table 2-59: Meters by Application
Asset Type # Meters Residential Meters 51,239
C&I Meters < 50 kW 5,827 C&I Meters >= 50 kW 748
MicroFIT / FIT 605 Transformer Discount 56
Wholesale Meters 43 Total 58,518
Table 2-60 provides a breakdown of WNH’s meter population by year of installation. Evident
is the transition to smart metering that occurred from 2009 to 2012 for residential meters and
2012 for C&I meters. The meters replaced during this time were forced out of service due to
government regulation and not condition or performance.
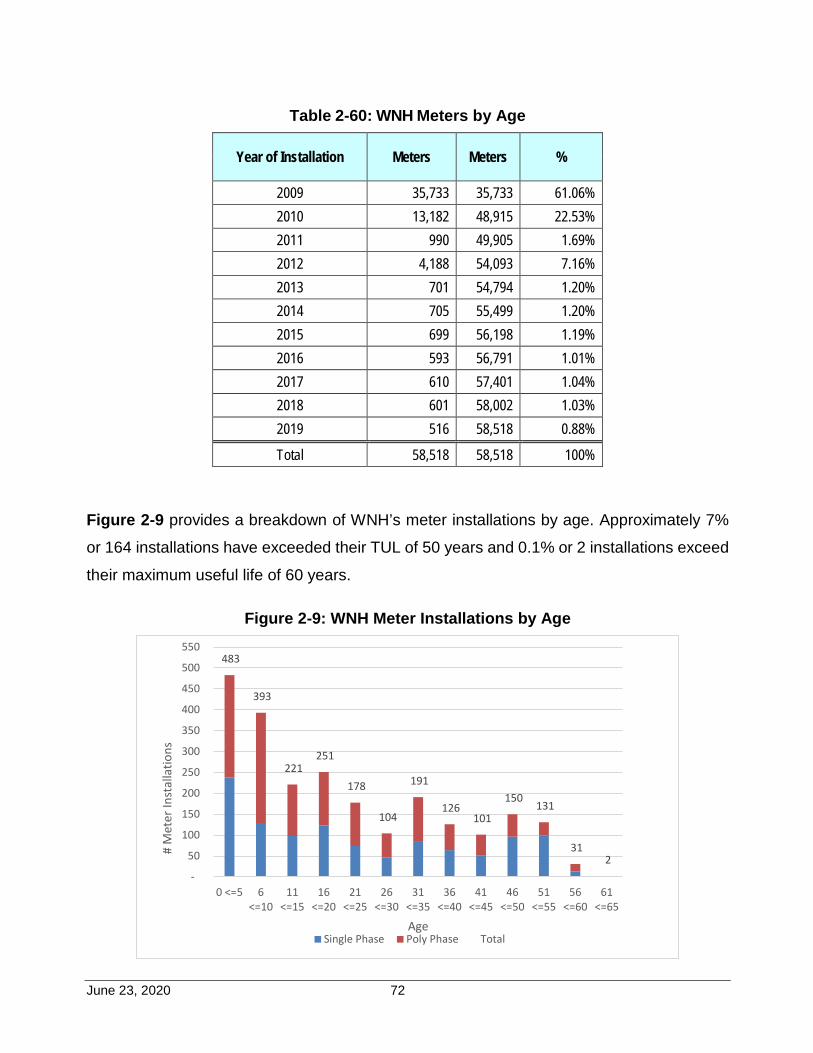
June 23, 2020 72
Table 2-60: WNH Meters by Age
Year of Installation Meters Meters %
2009 35,733 35,733 61.06% 2010 13,182 48,915 22.53% 2011 990 49,905 1.69% 2012 4,188 54,093 7.16% 2013 701 54,794 1.20% 2014 705 55,499 1.20% 2015 699 56,198 1.19% 2016 593 56,791 1.01% 2017 610 57,401 1.04% 2018 601 58,002 1.03% 2019 516 58,518 0.88%
Total 58,518 58,518 100%
Figure 2-9 provides a breakdown of WNH’s meter installations by age. Approximately 7%
or 164 installations have exceeded their TUL of 50 years and 0.1% or 2 installations exceed
their maximum useful life of 60 years.
Figure 2-9: WNH Meter Installations by Age
483
393
221 251
178
104
191
126 101
150 131
31 2
-
50
100
150
200
250
300
350
400
450
500
550
0 <=5 6<=10
11<=15
16<=20
21<=25
26<=30
31<=35
36<=40
41<=45
46<=50
51<=55
56<=60
61<=65
# M
eter
Inst
alla
tions
AgeSingle Phase Poly Phase Total
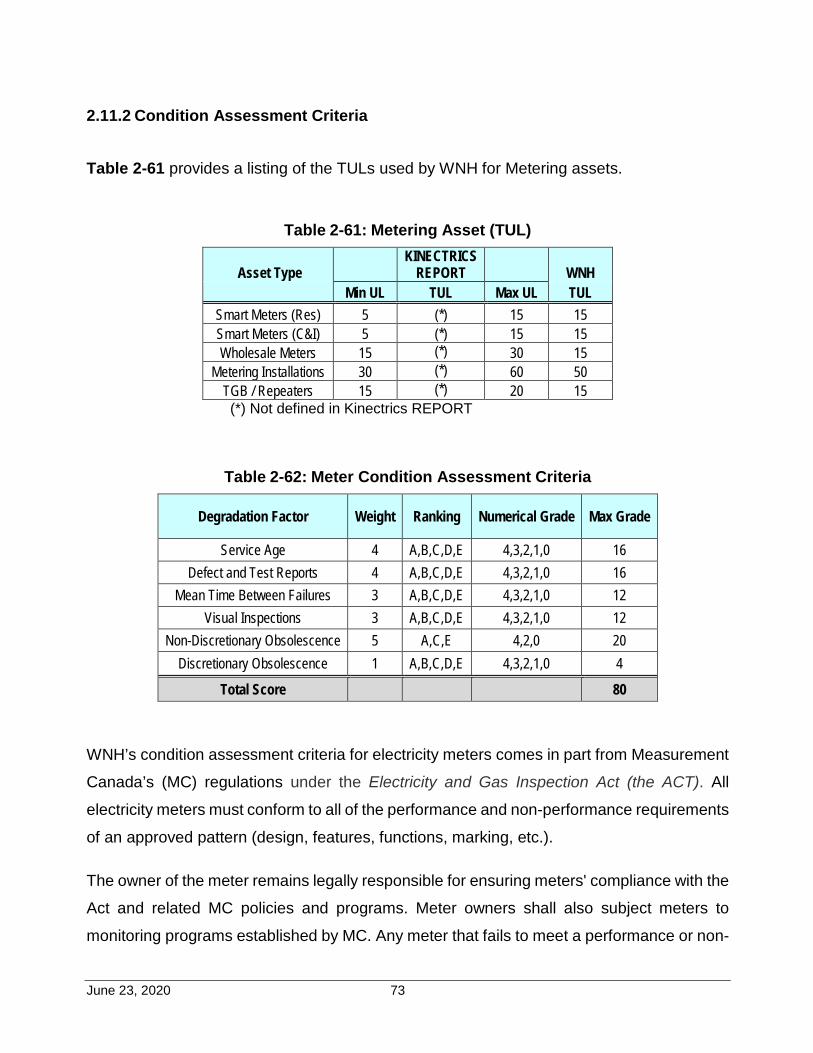
June 23, 2020 73
2.11.2 Condition Assessment Criteria
Table 2-61 provides a listing of the TULs used by WNH for Metering assets.
Table 2-61: Metering Asset (TUL)
Asset Type KINECTRICS
REPORT WNH Min UL TUL Max UL TUL
Smart Meters (Res) 5 (*) 15 15 Smart Meters (C&I) 5 (*) 15 15 Wholesale Meters 15 (*) 30 15
Metering Installations 30 (*) 60 50 TGB / Repeaters 15 (*) 20 15 (*) Not defined in Kinectrics REPORT
Table 2-62: Meter Condition Assessment Criteria
Degradation Factor Weight Ranking Numerical Grade Max Grade
Service Age 4 A,B,C,D,E 4,3,2,1,0 16 Defect and Test Reports 4 A,B,C,D,E 4,3,2,1,0 16
Mean Time Between Failures 3 A,B,C,D,E 4,3,2,1,0 12 Visual Inspections 3 A,B,C,D,E 4,3,2,1,0 12
Non-Discretionary Obsolescence 5 A,C,E 4,2,0 20 Discretionary Obsolescence 1 A,B,C,D,E 4,3,2,1,0 4
Total Score 80
WNH’s condition assessment criteria for electricity meters comes in part from Measurement
Canada’s (MC) regulations under the Electricity and Gas Inspection Act (the ACT). All
electricity meters must conform to all of the performance and non-performance requirements
of an approved pattern (design, features, functions, marking, etc.).
The owner of the meter remains legally responsible for ensuring meters' compliance with the
Act and related MC policies and programs. Meter owners shall also subject meters to
monitoring programs established by MC. Any meter that fails to meet a performance or non-
June 23, 2020 74
performance requirement, or that possesses a defect which could affect its ability to meet
specified requirements, shall be classified as nonconforming and is removed from service.
WNH ensures conformity to MC regulations by having the meters tested by a MC accredited
meter verifier.
Metering installations are predominately meter commercial / industrial customers. They are
inspected for condition and tested for accuracy (cross-phased) once every 8 - 10 years as
required by Measurement Canada. In the case of WNH’s larger customers, WNH attempts
to gain access to inspect and test metering installations at least once every 5 years. Any
degraded installation components are normally replaced at that time. Records of installation
inspection and testing are maintained and subject to Measurement Canada inspection.
For WNH’s in-service metering installations that have not been replaced during inspections,
the age of the instrument transformers is utilized as the primary degradation factor.
Installations greater than 50 years of age are scheduled for replacement over the next 5-
year period.
In addition, many of the failure modes of meter or meter installation components are
monitored and reported through WNH’s Advanced Metering Infrastructure (AMI). Reports
are monitored daily, and remediation is scheduled as soon as possible.
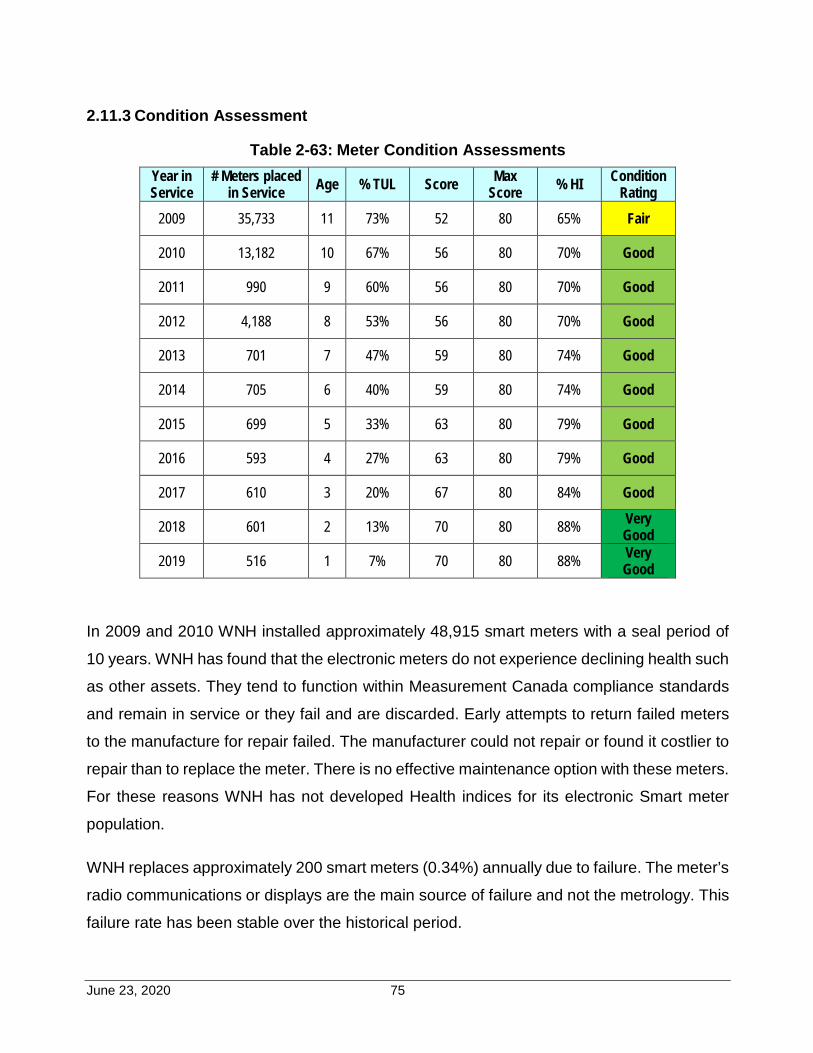
June 23, 2020 75
2.11.3 Condition Assessment
Table 2-63: Meter Condition Assessments Year in Service
# Meters placed in Service Age % TUL Score Max
Score % HI Condition Rating
2009 35,733 11 73% 52 80 65% Fair
2010 13,182 10 67% 56 80 70% Good
2011 990 9 60% 56 80 70% Good
2012 4,188 8 53% 56 80 70% Good
2013 701 7 47% 59 80 74% Good
2014 705 6 40% 59 80 74% Good
2015 699 5 33% 63 80 79% Good
2016 593 4 27% 63 80 79% Good
2017 610 3 20% 67 80 84% Good
2018 601 2 13% 70 80 88% Very Good
2019 516 1 7% 70 80 88% Very Good
In 2009 and 2010 WNH installed approximately 48,915 smart meters with a seal period of
10 years. WNH has found that the electronic meters do not experience declining health such
as other assets. They tend to function within Measurement Canada compliance standards
and remain in service or they fail and are discarded. Early attempts to return failed meters
to the manufacture for repair failed. The manufacturer could not repair or found it costlier to
repair than to replace the meter. There is no effective maintenance option with these meters.
For these reasons WNH has not developed Health indices for its electronic Smart meter
population.
WNH replaces approximately 200 smart meters (0.34%) annually due to failure. The meter’s
radio communications or displays are the main source of failure and not the metrology. This
failure rate has been stable over the historical period.
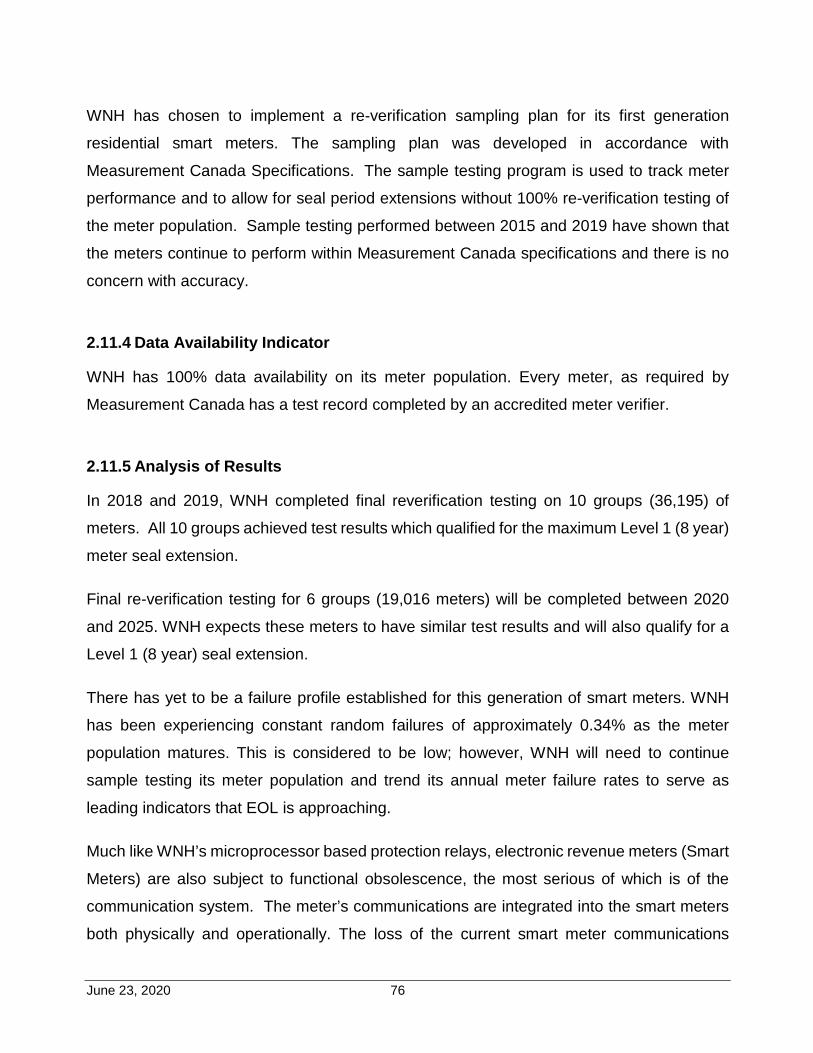
June 23, 2020 76
WNH has chosen to implement a re-verification sampling plan for its first generation
residential smart meters. The sampling plan was developed in accordance with
Measurement Canada Specifications. The sample testing program is used to track meter
performance and to allow for seal period extensions without 100% re-verification testing of
the meter population. Sample testing performed between 2015 and 2019 have shown that
the meters continue to perform within Measurement Canada specifications and there is no
concern with accuracy.
2.11.4 Data Availability Indicator
WNH has 100% data availability on its meter population. Every meter, as required by
Measurement Canada has a test record completed by an accredited meter verifier.
2.11.5 Analysis of Results
In 2018 and 2019, WNH completed final reverification testing on 10 groups (36,195) of
meters. All 10 groups achieved test results which qualified for the maximum Level 1 (8 year)
meter seal extension.
Final re-verification testing for 6 groups (19,016 meters) will be completed between 2020
and 2025. WNH expects these meters to have similar test results and will also qualify for a
Level 1 (8 year) seal extension.
There has yet to be a failure profile established for this generation of smart meters. WNH
has been experiencing constant random failures of approximately 0.34% as the meter
population matures. This is considered to be low; however, WNH will need to continue
sample testing its meter population and trend its annual meter failure rates to serve as
leading indicators that EOL is approaching.
Much like WNH’s microprocessor based protection relays, electronic revenue meters (Smart
Meters) are also subject to functional obsolescence, the most serious of which is of the
communication system. The meter’s communications are integrated into the smart meters
both physically and operationally. The loss of the current smart meter communications
June 23, 2020 77
platform could trigger a wholesale upgrade of all the meters, despite their good performance
in accuracy.
Given that these meters fully passed Measurement Canada reverification requirements, and
that there are no indications of an increasing failure rate, WNH expects them to remain in
Good condition past 2025 and into the next investment cycle.
There are 2 meter installations past their maximum useful life of 60 years and they are
scheduled for replacement in 2020. In addition, there are 162 meter installations currently
over the TUL of 50 years. These are recommended for replacement between 2020 and 2025.
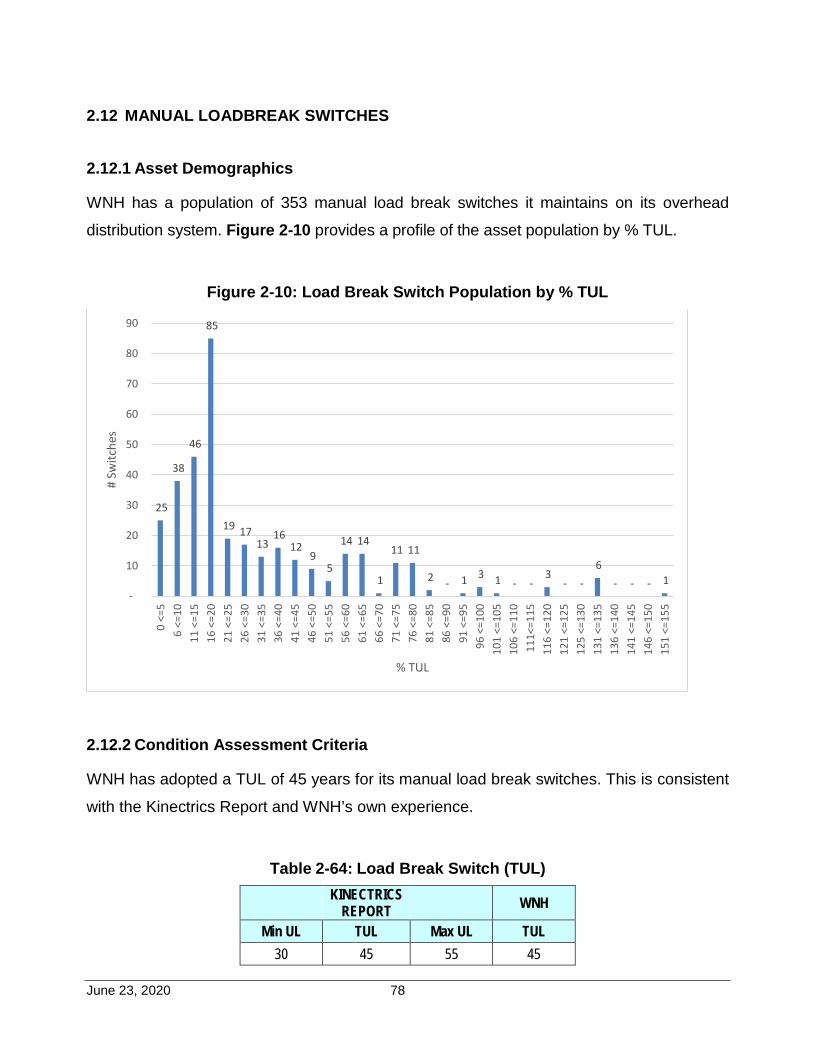
June 23, 2020 78
2.12 MANUAL LOADBREAK SWITCHES
2.12.1 Asset Demographics
WNH has a population of 353 manual load break switches it maintains on its overhead
distribution system. Figure 2-10 provides a profile of the asset population by % TUL.
Figure 2-10: Load Break Switch Population by % TUL
2.12.2 Condition Assessment Criteria
WNH has adopted a TUL of 45 years for its manual load break switches. This is consistent
with the Kinectrics Report and WNH’s own experience.
Table 2-64: Load Break Switch (TUL)
KINECTRICS REPORT WNH
Min UL TUL Max UL TUL 30 45 55 45
25
38
46
85
19 17 13
16 12
9 5
14 14
1
11 11
2 - 1 3 1 - -3
- -6
- - - 1 -
10
20
30
40
50
60
70
80
90
0 <=
56
<=10
11 <
=15
16 <
=20
21 <
=25
26 <
=30
31 <
=35
36 <
=40
41 <
=45
46 <
=50
51 <
=55
56 <
=60
61 <
=65
66 <
=70
71 <
=75
76 <
=80
81 <
=85
86 <
=90
91 <
=95
96 <
=100
101
<=10
510
6 <=
110
111<
=115
116
<=12
012
1 <=
125
125
<=13
013
1 <=
135
136
<=14
014
1 <=
145
146
<=15
015
1 <=
155
# Sw
itche
s
% TUL
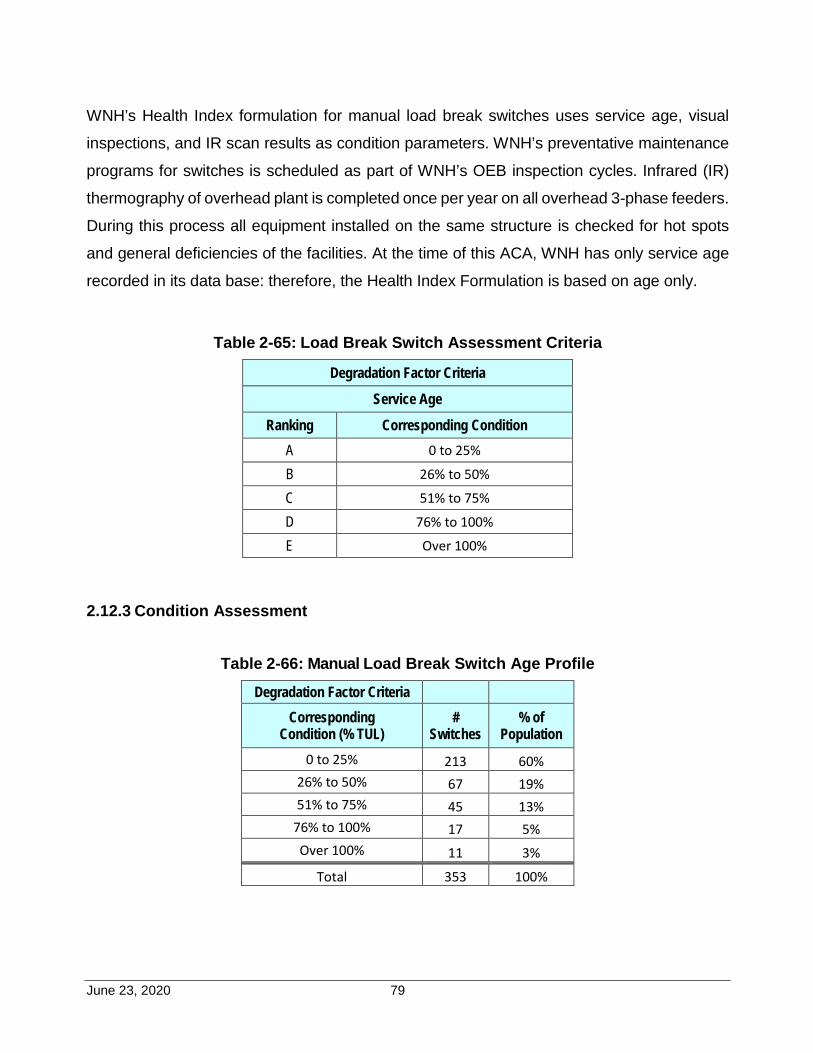
June 23, 2020 79
WNH’s Health Index formulation for manual load break switches uses service age, visual
inspections, and IR scan results as condition parameters. WNH’s preventative maintenance
programs for switches is scheduled as part of WNH’s OEB inspection cycles. Infrared (IR)
thermography of overhead plant is completed once per year on all overhead 3-phase feeders.
During this process all equipment installed on the same structure is checked for hot spots
and general deficiencies of the facilities. At the time of this ACA, WNH has only service age
recorded in its data base: therefore, the Health Index Formulation is based on age only.
Table 2-65: Load Break Switch Assessment Criteria
Degradation Factor Criteria
Service Age
Ranking Corresponding Condition A 0 to 25%
B 26% to 50%
C 51% to 75%
D 76% to 100%
E Over 100%
2.12.3 Condition Assessment
Table 2-66: Manual Load Break Switch Age Profile
Degradation Factor Criteria Corresponding
Condition (% TUL) #
Switches % of
Population 0 to 25% 213 60%
26% to 50% 67 19% 51% to 75% 45 13%
76% to 100% 17 5% Over 100% 11 3%
Total 353 100%
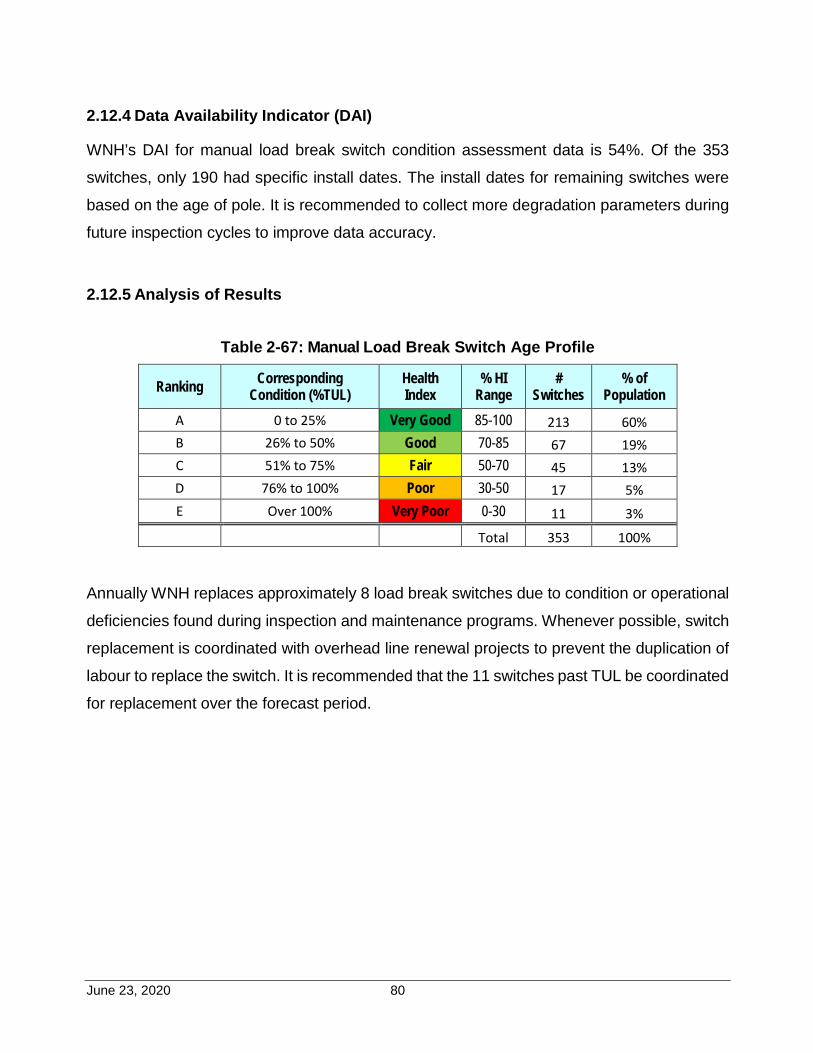
June 23, 2020 80
2.12.4 Data Availability Indicator (DAI)
WNH’s DAI for manual load break switch condition assessment data is 54%. Of the 353
switches, only 190 had specific install dates. The install dates for remaining switches were
based on the age of pole. It is recommended to collect more degradation parameters during
future inspection cycles to improve data accuracy.
2.12.5 Analysis of Results
Table 2-67: Manual Load Break Switch Age Profile
Ranking Corresponding Condition (%TUL)
Health Index
% HI Range
# Switches
% of Population
A 0 to 25% Very Good 85-100 213 60% B 26% to 50% Good 70-85 67 19% C 51% to 75% Fair 50-70 45 13% D 76% to 100% Poor 30-50 17 5% E Over 100% Very Poor 0-30 11 3%
Total 353 100% Annually WNH replaces approximately 8 load break switches due to condition or operational
deficiencies found during inspection and maintenance programs. Whenever possible, switch
replacement is coordinated with overhead line renewal projects to prevent the duplication of
labour to replace the switch. It is recommended that the 11 switches past TUL be coordinated
for replacement over the forecast period.
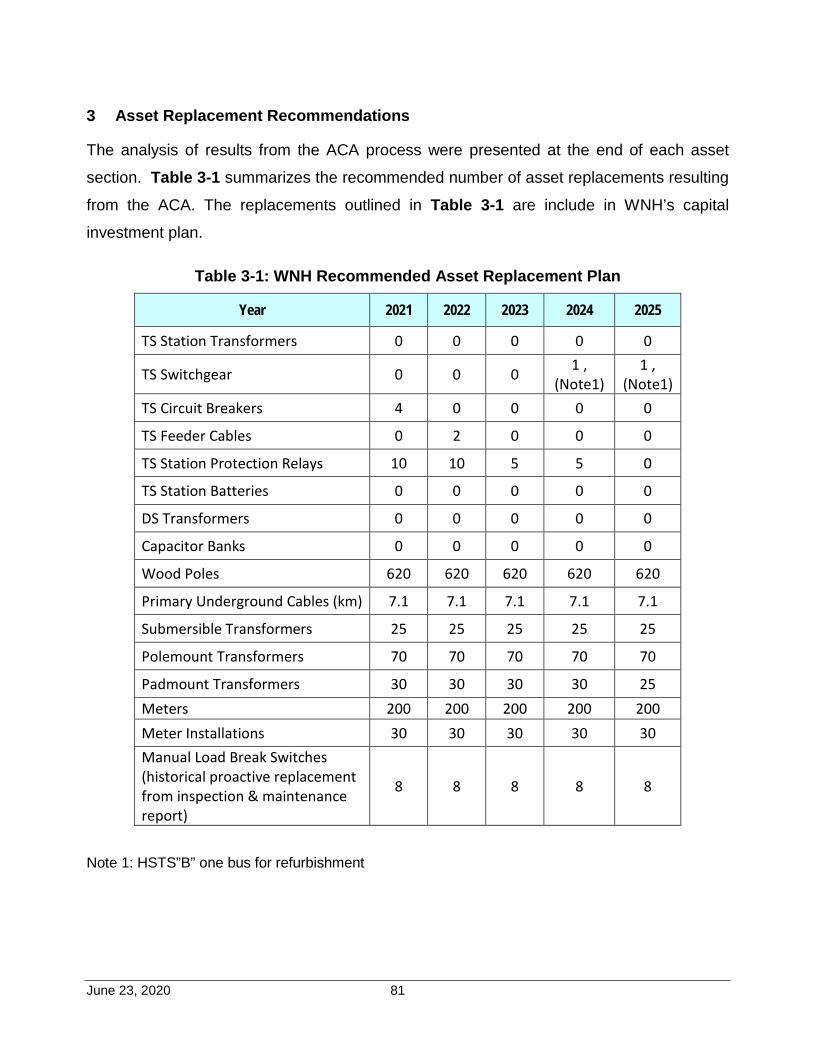
June 23, 2020 81
3 Asset Replacement Recommendations
The analysis of results from the ACA process were presented at the end of each asset
section. Table 3-1 summarizes the recommended number of asset replacements resulting
from the ACA. The replacements outlined in Table 3-1 are include in WNH’s capital
investment plan.
Table 3-1: WNH Recommended Asset Replacement Plan
Year 2021 2022 2023 2024 2025
TS Station Transformers 0 0 0 0 0
TS Switchgear 0 0 0 1 , (Note1)
1 , (Note1)
TS Circuit Breakers 4 0 0 0 0
TS Feeder Cables 0 2 0 0 0
TS Station Protection Relays 10 10 5 5 0
TS Station Batteries 0 0 0 0 0
DS Transformers 0 0 0 0 0
Capacitor Banks 0 0 0 0 0
Wood Poles 620 620 620 620 620
Primary Underground Cables (km) 7.1 7.1 7.1 7.1 7.1
Submersible Transformers 25 25 25 25 25
Polemount Transformers 70 70 70 70 70
Padmount Transformers 30 30 30 30 25 Meters 200 200 200 200 200 Meter Installations 30 30 30 30 30 Manual Load Break Switches (historical proactive replacement from inspection & maintenance report)
8 8 8 8 8
Note 1: HSTS”B” one bus for refurbishment

Appendix B:
2021 Material Capital Investments

Appendix B:
2021 Material Capital Investments
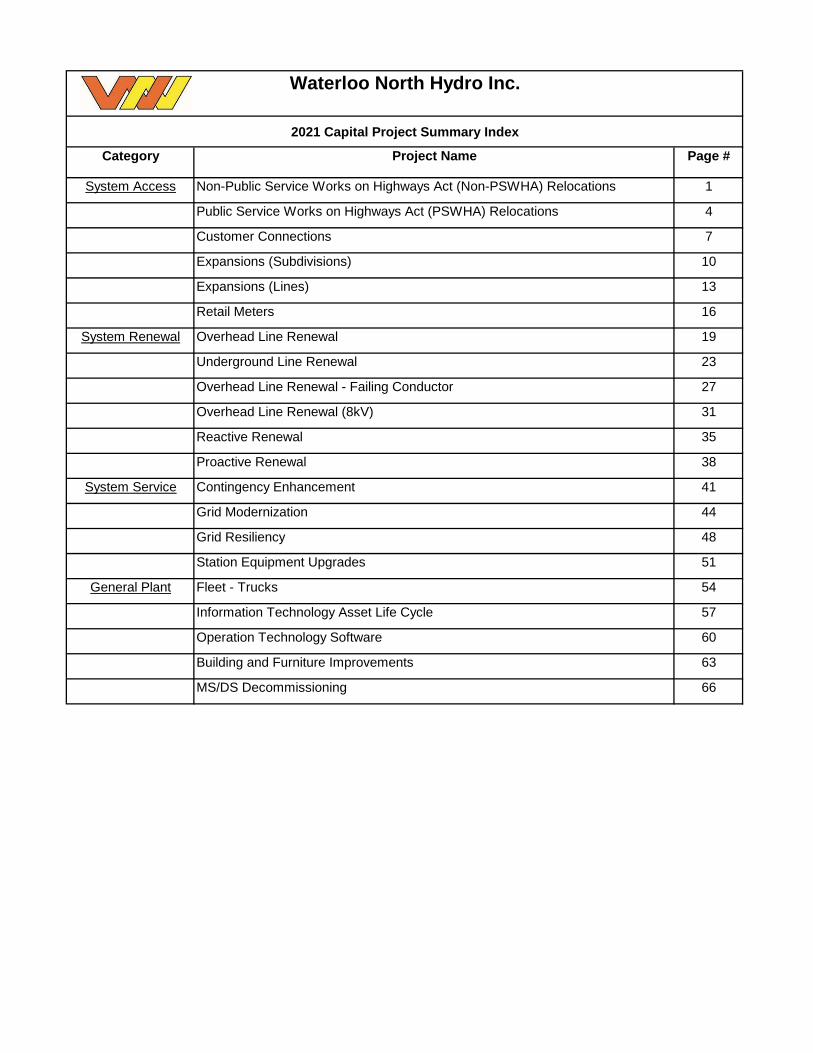
Waterloo North Hydro Inc.
2021 Capital Project Summary Index
Category Project Name Page #
System Access Non-Public Service Works on Highways Act (Non-PSWHA) Relocations 1
Public Service Works on Highways Act (PSWHA) Relocations 4
Customer Connections 7
Expansions (Subdivisions) 10
Expansions (Lines) 13
Retail Meters 16
System Renewal Overhead Line Renewal 19
Underground Line Renewal 23
Overhead Line Renewal - Failing Conductor 27
Overhead Line Renewal (8kV) 31
Reactive Renewal 35
Proactive Renewal 38
System Service Contingency Enhancement 41
Grid Modernization 44
Grid Resiliency 48
Station Equipment Upgrades 51
General Plant Fleet - Trucks 54
Information Technology Asset Life Cycle 57
Operation Technology Software 60
Building and Furniture Improvements 63
MS/DS Decommissioning 66
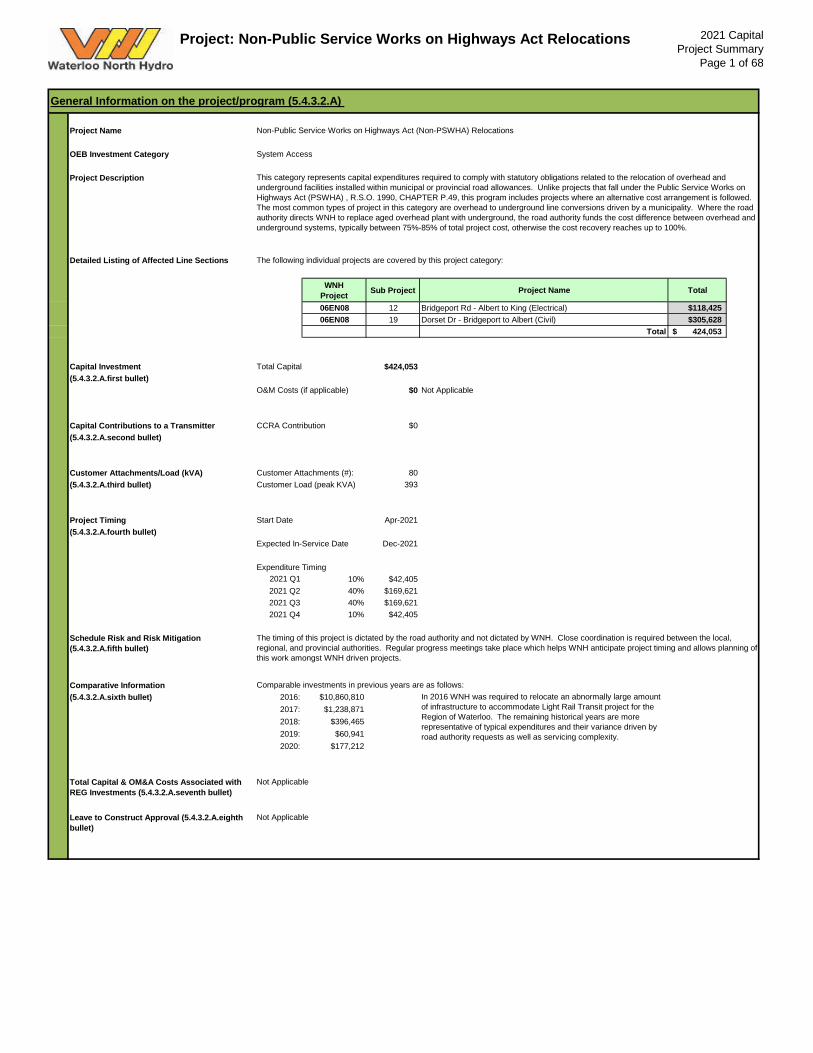
Project: Non-Public Service Works on Highways Act Relocations 2021 CapitalProject Summary
Page 1 of 68
Project Name OEB Investment Category System Access
Project Description
Detailed Listing of Affected Line Sections The following individual projects are covered by this project category:
WNH Project Sub Project Project Name Total
06EN08 12 Bridgeport Rd - Albert to King (Electrical) $118,42506EN08 19 Dorset Dr - Bridgeport to Albert (Civil) $305,628
Total 424,053$
Capital Investment Total Capital $424,053(5.4.3.2.A.first bullet)
O&M Costs (if applicable) $0
Capital Contributions to a Transmitter CCRA Contribution $0(5.4.3.2.A.second bullet)
Customer Attachments/Load (kVA) Customer Attachments (#): 80(5.4.3.2.A.third bullet) Customer Load (peak KVA) 393
Project Timing Start Date Apr-2021(5.4.3.2.A.fourth bullet)
Expected In-Service Date Dec-2021
Expenditure Timing 2021 Q1 10% $42,405 2021 Q2 40% $169,621 2021 Q3 40% $169,6212021 Q4 10% $42,405
Schedule Risk and Risk Mitigation (5.4.3.2.A.fifth bullet)
Comparative Information(5.4.3.2.A.sixth bullet) 2016: $10,860,810
2017: $1,238,8712018: $396,4652019: $60,9412020: $177,212
Total Capital & OM&A Costs Associated with REG Investments (5.4.3.2.A.seventh bullet)
Leave to Construct Approval (5.4.3.2.A.eighth bullet)
In 2016 WNH was required to relocate an abnormally large amount of infrastructure to accommodate Light Rail Transit project for the Region of Waterloo. The remaining historical years are more representative of typical expenditures and their variance driven by road authority requests as well as servicing complexity.
Not Applicable
Not Applicable
Not Applicable
The timing of this project is dictated by the road authority and not dictated by WNH. Close coordination is required between the local, regional, and provincial authorities. Regular progress meetings take place which helps WNH anticipate project timing and allows planning of this work amongst WNH driven projects.
Comparable investments in previous years are as follows:
General Information on the project/program (5.4.3.2.A)
Non-Public Service Works on Highways Act (Non-PSWHA) Relocations
This category represents capital expenditures required to comply with statutory obligations related to the relocation of overhead and underground facilities installed within municipal or provincial road allowances. Unlike projects that fall under the Public Service Works on Highways Act (PSWHA) , R.S.O. 1990, CHAPTER P.49, this program includes projects where an alternative cost arrangement is followed. The most common types of project in this category are overhead to underground line conversions driven by a municipality. Where the road authority directs WNH to replace aged overhead plant with underground, the road authority funds the cost difference between overhead and underground systems, typically between 75%-85% of total project cost, otherwise the cost recovery reaches up to 100%.
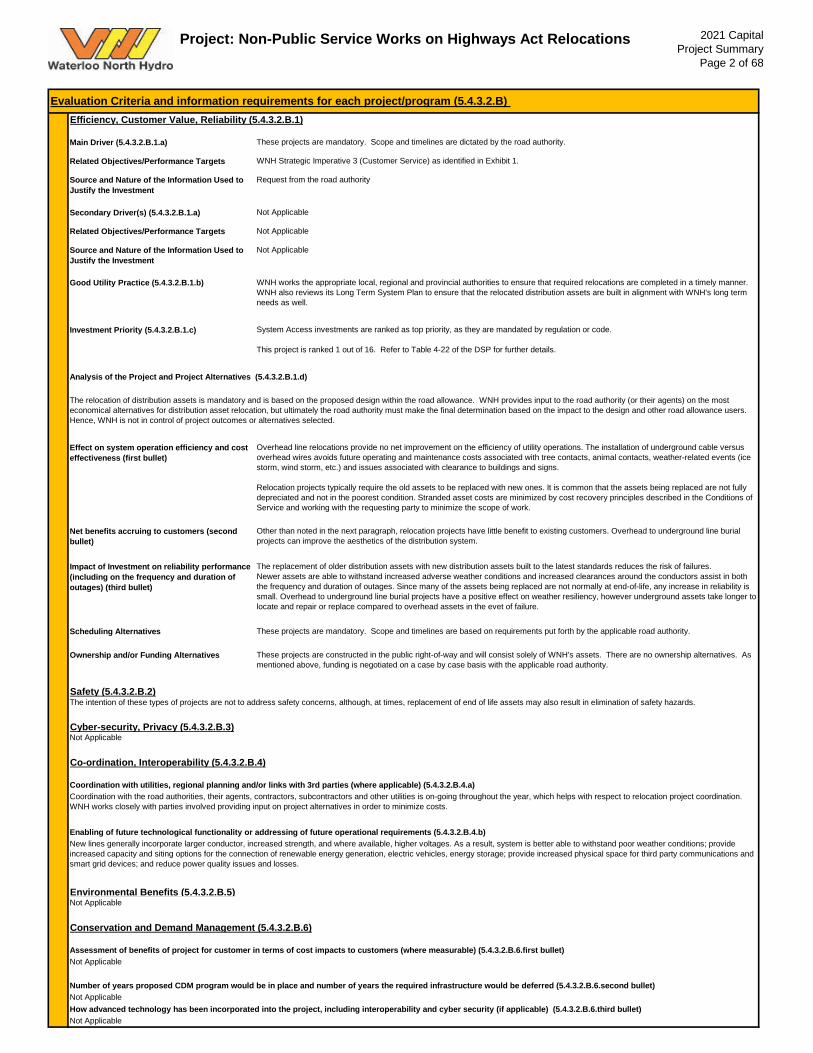
Project: Non-Public Service Works on Highways Act Relocations 2021 CapitalProject Summary
Page 2 of 68
Main Driver (5.4.3.2.B.1.a)
Related Objectives/Performance Targets
Source and Nature of the Information Used to Justify the Investment
Secondary Driver(s) (5.4.3.2.B.1.a)
Related Objectives/Performance Targets
Source and Nature of the Information Used to Justify the Investment
Good Utility Practice (5.4.3.2.B.1.b)
Investment Priority (5.4.3.2.B.1.c)
Effect on system operation efficiency and cost effectiveness (first bullet)
Net benefits accruing to customers (second bullet)
Impact of Investment on reliability performance (including on the frequency and duration of outages) (third bullet)
Scheduling Alternatives
Ownership and/or Funding Alternatives
Environmental Benefits (5.4.3.2.B.5)
Not ApplicableHow advanced technology has been incorporated into the project, including interoperability and cyber security (if applicable) (5.4.3.2.B.6.third bullet)Not Applicable
Number of years proposed CDM program would be in place and number of years the required infrastructure would be deferred (5.4.3.2.B.6.second bullet)
Cyber-security, Privacy (5.4.3.2.B.3)Not Applicable
Co-ordination, Interoperability (5.4.3.2.B.4)
Coordination with utilities, regional planning and/or links with 3rd parties (where applicable) (5.4.3.2.B.4.a)Coordination with the road authorities, their agents, contractors, subcontractors and other utilities is on-going throughout the year, which helps with respect to relocation project coordination. WNH works closely with parties involved providing input on project alternatives in order to minimize costs.
Enabling of future technological functionality or addressing of future operational requirements (5.4.3.2.B.4.b)New lines generally incorporate larger conductor, increased strength, and where available, higher voltages. As a result, system is better able to withstand poor weather conditions; provide increased capacity and siting options for the connection of renewable energy generation, electric vehicles, energy storage; provide increased physical space for third party communications and smart grid devices; and reduce power quality issues and losses.
Not Applicable
Conservation and Demand Management (5.4.3.2.B.6)
Assessment of benefits of project for customer in terms of cost impacts to customers (where measurable) (5.4.3.2.B.6.first bullet)Not Applicable
Not Applicable
Not Applicable
The intention of these types of projects are not to address safety concerns, although, at times, replacement of end of life assets may also result in elimination of safety hazards.
Not Applicable
WNH works the appropriate local, regional and provincial authorities to ensure that required relocations are completed in a timely manner. WNH also reviews its Long Term System Plan to ensure that the relocated distribution assets are built in alignment with WNH's long term needs as well.
System Access investments are ranked as top priority, as they are mandated by regulation or code.
This project is ranked 1 out of 16. Refer to Table 4-22 of the DSP for further details.
Analysis of the Project and Project Alternatives (5.4.3.2.B.1.d)
The relocation of distribution assets is mandatory and is based on the proposed design within the road allowance. WNH provides input to the road authority (or their agents) on the most economical alternatives for distribution asset relocation, but ultimately the road authority must make the final determination based on the impact to the design and other road allowance users. Hence, WNH is not in control of project outcomes or alternatives selected.
Overhead line relocations provide no net improvement on the efficiency of utility operations. The installation of underground cable versus overhead wires avoids future operating and maintenance costs associated with tree contacts, animal contacts, weather-related events (ice storm, wind storm, etc.) and issues associated with clearance to buildings and signs.
Relocation projects typically require the old assets to be replaced with new ones. It is common that the assets being replaced are not fully depreciated and not in the poorest condition. Stranded asset costs are minimized by cost recovery principles described in the Conditions of Service and working with the requesting party to minimize the scope of work.
Other than noted in the next paragraph, relocation projects have little benefit to existing customers. Overhead to underground line burial projects can improve the aesthetics of the distribution system.
The replacement of older distribution assets with new distribution assets built to the latest standards reduces the risk of failures. Newer assets are able to withstand increased adverse weather conditions and increased clearances around the conductors assist in both the frequency and duration of outages. Since many of the assets being replaced are not normally at end-of-life, any increase in reliability is small. Overhead to underground line burial projects have a positive effect on weather resiliency, however underground assets take longer to locate and repair or replace compared to overhead assets in the evet of failure.
These projects are mandatory. Scope and timelines are based on requirements put forth by the applicable road authority.
These projects are constructed in the public right-of-way and will consist solely of WNH's assets. There are no ownership alternatives. As mentioned above, funding is negotiated on a case by case basis with the applicable road authority.
Safety (5.4.3.2.B.2)
Evaluation Criteria and information requirements for each project/program (5.4.3.2.B) Efficiency, Customer Value, Reliability (5.4.3.2.B.1)
These projects are mandatory. Scope and timelines are dictated by the road authority.
WNH Strategic Imperative 3 (Customer Service) as identified in Exhibit 1.
Request from the road authority
Project: Non-Public Service Works on Highways Act Relocations 2021 CapitalProject Summary
Page 3 of 68
There are no expected long term impacts from projects in this category, however WNH's distribution system may be reconfigured during construction.
WNH negotiates cost recovery terms above and beyond the stipulated formula in the Public Service Works on Highways Act (PSWHA) , R.S.O. 1990, CHAPTER P.49 for projects in this category. Cost recovery varies with the nature of specific relocation work and can vary between 25% and 100%. In 2021, WNH is expected to recover approximately 98% of the over all costs for the entire project as compared to approximately 30% under PSWHA.
Feasible options are discussed with the road authority, their consultants and other stakeholders as the project develops. First and foremost, opportunities to avoid relocations are identified. Secondly, where relocations must occur due to conflicts, WNH works with stakeholders to minimize the extent and cost of relocations.
Summary of Analysis for "Least Cost" and "Cost Efficient" Options (5.4.3.2.C.a. seventh bullet)See Analysis of the Project and Project Alternatives (5.4.3.2.B.1.d) section above.
Results of the Final Economic Evaluation (5.4.3.2.C.a. eighth bullet)The Economic Evaluation is not applicable.
Nature and Magnitude of System Impacts, Costs and Cost Recovery (5.4.3.2.C.a. ninth bullet)
Other Project Design or Implementation Options Considered (5.4.3.2.C.a. sixth bullet)
Category-specific requirements for each project/program - System Renewal (5.4.3.2.C.b.)
Factors Affecting Project Timing/Priority (5.4.3.2.C.a. first bullet)The timing of individual projects is based on scheduling provided by the road authority or their agents. WNH works closely with all stakeholders via regular progress meetings to ensure sufficient notice is provided to WNH and work is completed in a timeframe required by the road authority. As explained in section 5.4.3.2.B.1.c, this work is top priority.
Factors Relating to Customer or 3rd Party Preference (5.4.3.2.C.a. second bullet)WNH works closely with the road authority and their agents to ensure the relocation of distribution assets is acceptable. All local utilities (communication companies, gas, water, sewer, etc.) work together to minimize costs and disruption, both in design and construction.
Factors Affecting Final Project Costs (5.4.3.2.C.a. third bullet)Factors affecting the cost of these relocation projects include number of circuits involved, the length of relocation required, number and type of customers connected to the line(s), depth of burial (for underground projects), unexpected subsurface conditions and level of traffic management needed during construction, many of these factors are not known until the road authority finalizes their design.
Controllable Cost Minimization (5.4.3.2.C.a. fourth bullet)Costs are minimized through effective coordination of design and construction scheduling of work. Cost sharing for these projects is negotiated on a per project basis and WNH recovers the cost according to the terms defined in our Conditions of Service.
Other Planning Objectives Met (5.4.3.2.C.a. fifth bullet)Where applicable, other planning objectives being considered include higher poles in some locations to address new framing standards or installation of additional ductwork in alignment with WNH long term system needs. WNH may also be able to change the schedule of a renewal project to align with the road authority’s work to maximize these benefits.
Project: Public Service Works on Highways Act Relocations 2021 CapitalProject Summary
Page 4 of 68
Project Name OEB Investment Category System Access
Project Description
Detailed Listing of Affected Line Sections The following individual projects are covered by this project category:
WNH Project Sub Project Project Name Total
06EN05 15 Weber St - Benjamin Rd to Lobsinger Ln $285,35506EN05 6 Northfield Dr - Bridge to University $240,08906EN05 21 Sawmill Rd (RR17) & Ebycrest - Round Abouts $148,72506EN05 23 Line 86 & Floradale Rd - Round Abouts $148,72506EN05 32 Lorindale St - Hillside to EOL $96,766
Total 919,660$
Capital Investment Total Capital $919,660(5.4.3.2.A.first bullet)
O&M Costs (if applicable) $0
Capital Contributions to a Transmitter CCRA Contribution $0(5.4.3.2.A.second bullet)
Customer Attachments/Load (kVA) Customer Attachments (#): 1,295(5.4.3.2.A.third bullet) Customer Load (peak KVA) 5,210
Project Timing Start Date Jan-2021(5.4.3.2.A.fourth bullet)
Expected In-Service Date Dec-2021
Expenditure Timing 2021 Q1 20% $183,932 2021 Q2 30% $275,898 2021 Q3 30% $275,8982021 Q4 20% $183,932
Schedule Risk and Risk Mitigation (5.4.3.2.A.fifth bullet)
Comparative Information(5.4.3.2.A.sixth bullet) 2016: $1,603,936
2017: $466,4052018: $1,958,8522019: $615,9542020: $1,411,093
Total Capital & OM&A Costs Associated with REG Investments (5.4.3.2.A.seventh bullet)
Leave to Construct Approval (5.4.3.2.A.eighth bullet)
The historical years are representative of typical expenditures and of their variance driven by road authority requests.
Not Applicable
Not Applicable
Not Applicable
The timing of this project is dictated by the road authority and not dictated by WNH. Close coordination is required between the local, regional, and provincial authorities. Regular progress meetings take place which helps WNH anticipate project timing and allows planning of this work amongst WNH driven projects.
Comparable investments in previous years are as follows:
General Information on the project/program (5.4.3.2.A)
Public Service Works on Highways Act (PSWHA) Relocations
This category represents capital expenditures required to comply with statutory obligations related to the relocation of overhead and underground facilities installed within municipal or provincial road allowances. Based on a legislated cost sharing formula under the Public Service Works on Highways Act (PSWHA) , R.S.O. 1990, CHAPTER P.49, road authority contributes 50% of labour and labour saving devices.
Project: Public Service Works on Highways Act Relocations 2021 CapitalProject Summary
Page 5 of 68
Main Driver (5.4.3.2.B.1.a)
Related Objectives/Performance Targets
Source and Nature of the Information Used to Justify the Investment
Secondary Driver(s) (5.4.3.2.B.1.a)
Related Objectives/Performance Targets
Source and Nature of the Information Used to Justify the Investment
Good Utility Practice (5.4.3.2.B.1.b)
Investment Priority (5.4.3.2.B.1.c)
Effect on system operation efficiency and cost effectiveness (first bullet)
Net benefits accruing to customers (second bullet)
Impact of Investment on reliability performance (including on the frequency and duration of outages) (third bullet)
Scheduling Alternatives
Ownership and/or Funding Alternatives
Environmental Benefits (5.4.3.2.B.5)
Not ApplicableHow advanced technology has been incorporated into the project, including interoperability and cyber security (if applicable) (5.4.3.2.B.6.third bullet)Not Applicable
Number of years proposed CDM program would be in place and number of years the required infrastructure would be deferred (5.4.3.2.B.6.second bullet)
Cyber-security, Privacy (5.4.3.2.B.3)Not Applicable
Co-ordination, Interoperability (5.4.3.2.B.4)
Coordination with utilities, regional planning and/or links with 3rd parties (where applicable) (5.4.3.2.B.4.a)Coordination with the road authorities, their agents, contractors, subcontractors and other utilities is on-going throughout the year, which helps with respect to road relocation project coordination. WNH works closely with parties involved providing input on project alternatives in order to minimize costs.
Enabling of future technological functionality or addressing of future operational requirements (5.4.3.2.B.4.b)New lines generally incorporate larger conductor, increased strength, and where available, higher voltages. As a result, system is better able to withstand poor weather conditions; provide increased capacity and siting options for the connection of renewable energy generation, electric vehicles, energy storage; provide increased physical space for third party communications and smart grid devices; and reduce power quality issues and losses.
Not Applicable
Conservation and Demand Management (5.4.3.2.B.6)
Assessment of benefits of project for customer in terms of cost impacts to customers (where measurable) (5.4.3.2.B.6.first bullet)Not Applicable
Not Applicable
Not Applicable
The intention of these types of projects are not to address safety concerns, although at times end of life assets are replaced which may involve elimination of safety hazards.
Not Applicable
WNH works the appropriate local, regional and provincial authorities to ensure that required relocations are completed in a timely manner. WNH also reviews its Long Term System Plan to ensure that the relocated distribution assets are built in alignment with WNH's long term needs as well.
System Access investments are ranked as top priority, as they are mandated by regulation or code.
This project is ranked 1 out of 16. Refer to Table 4-22 of the DSP for further details.
Analysis of the Project and Project Alternatives (5.4.3.2.B.1.d)
The relocation of distribution assets is mandatory and is based on the proposed road design. WNH provides input to the road authority (or their agents) on the most economical alternatives for distribution asset relocation, but ultimately the road authority must make the final determination based on the impact to the road design and other road allowance users. Hence, WNH is not in control of project outcomes or alternatives selected.
Overhead line relocations provide no net improvement the efficiency of utility operations.
Relocation projects typically require the old assets to be replaced with new ones. It is common that the assets being replaced are not fully depreciated and not in the poorest condition. As LDC’s can only recover 50% labour and labour saving devices, relocations are not an efficient means of renewing infrastructure. WNH works with the road authorities to minimize the scope of work and stranded asset costs.
Other than noted in the next paragraph, relocation projects have little benefit to existing customers.
The replacement of older distribution assets with new distribution assets built to the latest standards reduces the risk of failures. Newer assets are able to withstand increased adverse weather conditions and increased clearances around the conductors assist in both the frequency and duration of outages. Since many of the assets being replaced are not normally at end-of-life, any increase in reliability is small.
These projects are mandatory. Scope and timelines are based on requirements put forth by the applicable road authority.
These projects are constructed in the public right-of-way and will consist solely of WNH's assets. There are no ownership alternatives. As mentioned above, funding is non-negotiable as it must follow the prescribed formula in the Public Service Works on Highways Act, R.S.O. 1990, CHAPTER P.49.
Safety (5.4.3.2.B.2)
Evaluation Criteria and information requirements for each project/program (5.4.3.2.B) Efficiency, Customer Value, Reliability (5.4.3.2.B.1)
These projects are mandatory. Scope and timelines are dictated by the road authority.
WNH Strategic Imperative 3 (Customer Service) as identified in Exhibit 1.
Request from the road authority under the Public Service Works on Highways Act, R.S.O. 1990, CHAPTER P.49.
Project: Public Service Works on Highways Act Relocations 2021 CapitalProject Summary
Page 6 of 68
There are no expected long term impacts from projects in this category, however WNH's distribution system may be reconfigured during construction. Costs are recovered from road authorities according to the stipulated formula in the Public Service Works on Highways Act (PSWHA), R.S.O. 1990, CHAPTER P.49.
Feasible options are discussed with the road authority, their consultants and other stakeholders as the project develops. First and foremost, opportunities to avoid relocations are identified. Secondly, where relocations must occur due to conflicts, WNH works with stakeholders to minimize the extent and cost of relocations.
Summary of Analysis for "Least Cost" and "Cost Efficient" Options (5.4.3.2.C.a. seventh bullet)See Analysis of the Project and Project Alternatives (5.4.3.2.B.1.d) section above.
Results of the Final Economic Evaluation (5.4.3.2.C.a. eighth bullet)Not Applicable
Nature and Magnitude of System Impacts, Costs and Cost Recovery (5.4.3.2.C.a. ninth bullet)
Other Project Design or Implementation Options Considered (5.4.3.2.C.a. sixth bullet)
Category-specific requirements for each project/program - System Renewal (5.4.3.2.C.b.)
Factors Affecting Project Timing/Priority (5.4.3.2.C.a. first bullet)The timing of individual projects is based on scheduling provided by the road authority or their agents. WNH works closely with all stakeholders via regular progress meetings to ensure sufficient notice is provided to WNH and work is completed in a timeframe required by the road authority. As explained in section 5.4.3.2.B.1.c, this work is top priority.
Factors Relating to Customer or 3rd Party Preference (5.4.3.2.C.a. second bullet)WNH works closely with the road authority and their agents to ensure the relocation of distribution assets is acceptable. All local utilities (communication companies, gas, water, sewer, etc.) work together to minimize costs and disruption, both in design and construction.
Factors Affecting Final Project Costs (5.4.3.2.C.a. third bullet)Factors affecting the cost of these relocation projects include number of circuits involved, the length of relocation required, number and type of customers connected to the line(s), depth of burial (for underground projects), unexpected subsurface conditions and level of traffic management needed during construction, the latter ones are not known until the road authority finalizes their design. Cost sharing for these projects is as per the stipulated formula in the Public Service Works on Highways Act (PSWHA) , R.S.O. 1990, CHAPTER P.49.
Controllable Cost Minimization (5.4.3.2.C.a. fourth bullet)Costs are minimized through effective coordinated design and construction scheduling or work. Cost sharing for these projects is as per the stipulated formula in the Public Service Works on Highways Act (PSWHA) , R.S.O. 1990, CHAPTER P.49.
Other Planning Objectives Met (5.4.3.2.C.a. fifth bullet)Where applicable, other planning objectives being considered include higher poles in some locations to address new framing standards or installation of additional ductwork in alignment with WNH long term system needs. WNH may also be able to change the schedule of a renewal project to align with the road authority’s work to maximize these benefits.
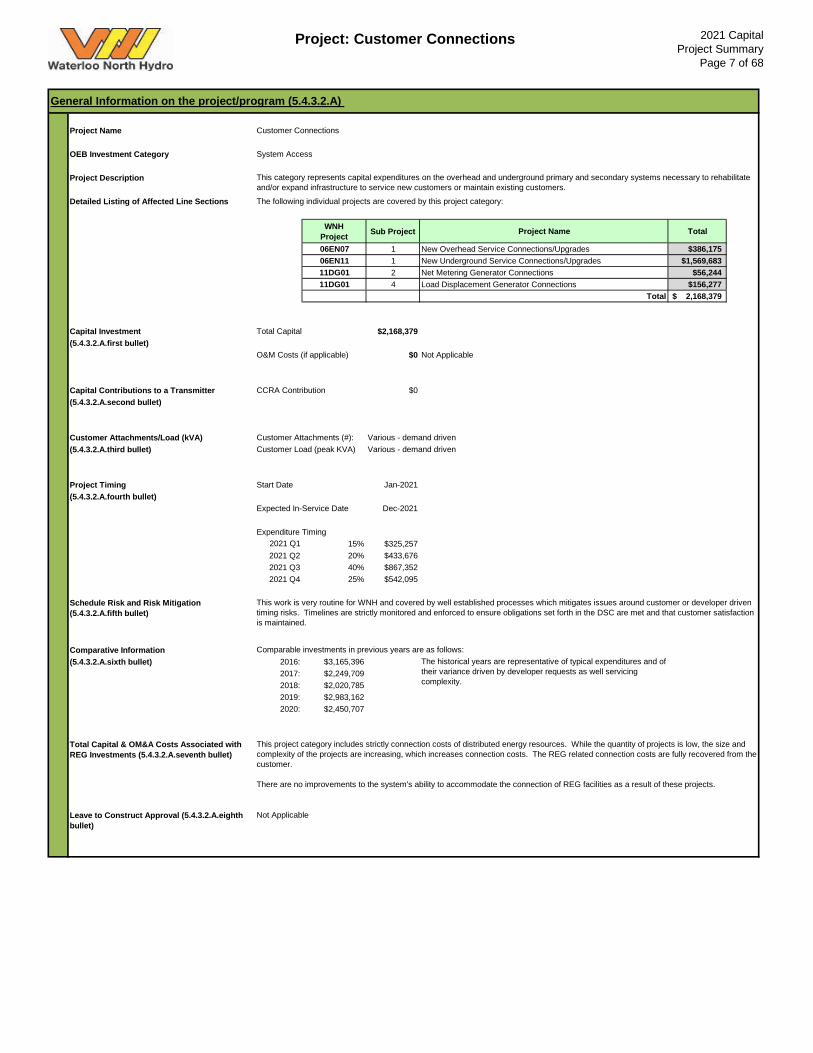
Project: Customer Connections 2021 CapitalProject Summary
Page 7 of 68
Project Name OEB Investment Category System Access
Project Description
Detailed Listing of Affected Line Sections The following individual projects are covered by this project category:
WNH Project Sub Project Project Name Total
06EN07 1 New Overhead Service Connections/Upgrades $386,17506EN11 1 New Underground Service Connections/Upgrades $1,569,68311DG01 2 Net Metering Generator Connections $56,24411DG01 4 Load Displacement Generator Connections $156,277
Total 2,168,379$
Capital Investment Total Capital $2,168,379(5.4.3.2.A.first bullet)
O&M Costs (if applicable) $0
Capital Contributions to a Transmitter CCRA Contribution $0(5.4.3.2.A.second bullet)
Customer Attachments/Load (kVA) Customer Attachments (#): Various - demand driven(5.4.3.2.A.third bullet) Customer Load (peak KVA) Various - demand driven
Project Timing Start Date Jan-2021(5.4.3.2.A.fourth bullet)
Expected In-Service Date Dec-2021
Expenditure Timing 2021 Q1 15% $325,257 2021 Q2 20% $433,676 2021 Q3 40% $867,3522021 Q4 25% $542,095
Schedule Risk and Risk Mitigation (5.4.3.2.A.fifth bullet)
Comparative Information(5.4.3.2.A.sixth bullet) 2016: $3,165,396
2017: $2,249,7092018: $2,020,7852019: $2,983,1622020: $2,450,707
Total Capital & OM&A Costs Associated with REG Investments (5.4.3.2.A.seventh bullet)
Leave to Construct Approval (5.4.3.2.A.eighth bullet)
The historical years are representative of typical expenditures and of their variance driven by developer requests as well servicing complexity.
This project category includes strictly connection costs of distributed energy resources. While the quantity of projects is low, the size and complexity of the projects are increasing, which increases connection costs. The REG related connection costs are fully recovered from the customer.
There are no improvements to the system's ability to accommodate the connection of REG facilities as a result of these projects.
Not Applicable
This work is very routine for WNH and covered by well established processes which mitigates issues around customer or developer driven timing risks. Timelines are strictly monitored and enforced to ensure obligations set forth in the DSC are met and that customer satisfaction is maintained.
Comparable investments in previous years are as follows:
General Information on the project/program (5.4.3.2.A)
Customer Connections
This category represents capital expenditures on the overhead and underground primary and secondary systems necessary to rehabilitate and/or expand infrastructure to service new customers or maintain existing customers.
Not Applicable
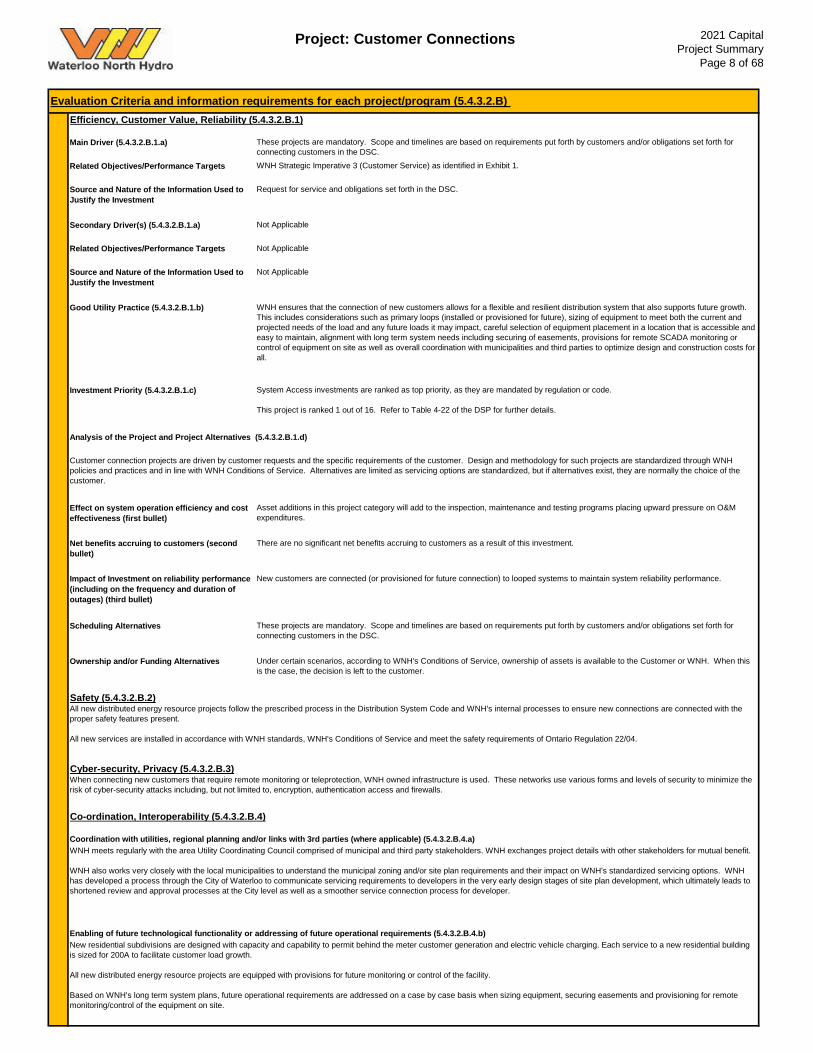
Project: Customer Connections 2021 CapitalProject Summary
Page 8 of 68
Main Driver (5.4.3.2.B.1.a)
Related Objectives/Performance Targets
Source and Nature of the Information Used to Justify the Investment
Secondary Driver(s) (5.4.3.2.B.1.a)
Related Objectives/Performance Targets
Source and Nature of the Information Used to Justify the Investment
Good Utility Practice (5.4.3.2.B.1.b)
Investment Priority (5.4.3.2.B.1.c)
Effect on system operation efficiency and cost effectiveness (first bullet)
Net benefits accruing to customers (second bullet)
Impact of Investment on reliability performance (including on the frequency and duration of outages) (third bullet)
Scheduling Alternatives
Ownership and/or Funding Alternatives
Cyber-security, Privacy (5.4.3.2.B.3)When connecting new customers that require remote monitoring or teleprotection, WNH owned infrastructure is used. These networks use various forms and levels of security to minimize the risk of cyber-security attacks including, but not limited to, encryption, authentication access and firewalls.
Co-ordination, Interoperability (5.4.3.2.B.4)
Coordination with utilities, regional planning and/or links with 3rd parties (where applicable) (5.4.3.2.B.4.a)WNH meets regularly with the area Utility Coordinating Council comprised of municipal and third party stakeholders. WNH exchanges project details with other stakeholders for mutual benefit.
WNH also works very closely with the local municipalities to understand the municipal zoning and/or site plan requirements and their impact on WNH's standardized servicing options. WNH has developed a process through the City of Waterloo to communicate servicing requirements to developers in the very early design stages of site plan development, which ultimately leads to shortened review and approval processes at the City level as well as a smoother service connection process for developer.
Enabling of future technological functionality or addressing of future operational requirements (5.4.3.2.B.4.b)New residential subdivisions are designed with capacity and capability to permit behind the meter customer generation and electric vehicle charging. Each service to a new residential building is sized for 200A to facilitate customer load growth.
All new distributed energy resource projects are equipped with provisions for future monitoring or control of the facility.
Based on WNH's long term system plans, future operational requirements are addressed on a case by case basis when sizing equipment, securing easements and provisioning for remote monitoring/control of the equipment on site.
All new distributed energy resource projects follow the prescribed process in the Distribution System Code and WNH's internal processes to ensure new connections are connected with the proper safety features present.
All new services are installed in accordance with WNH standards, WNH's Conditions of Service and meet the safety requirements of Ontario Regulation 22/04.
Not Applicable
WNH ensures that the connection of new customers allows for a flexible and resilient distribution system that also supports future growth. This includes considerations such as primary loops (installed or provisioned for future), sizing of equipment to meet both the current and projected needs of the load and any future loads it may impact, careful selection of equipment placement in a location that is accessible and easy to maintain, alignment with long term system needs including securing of easements, provisions for remote SCADA monitoring or control of equipment on site as well as overall coordination with municipalities and third parties to optimize design and construction costs for all.
System Access investments are ranked as top priority, as they are mandated by regulation or code.
This project is ranked 1 out of 16. Refer to Table 4-22 of the DSP for further details.
Analysis of the Project and Project Alternatives (5.4.3.2.B.1.d)
Asset additions in this project category will add to the inspection, maintenance and testing programs placing upward pressure on O&M expenditures.
There are no significant net benefits accruing to customers as a result of this investment.
These projects are mandatory. Scope and timelines are based on requirements put forth by customers and/or obligations set forth for connecting customers in the DSC.
Under certain scenarios, according to WNH's Conditions of Service, ownership of assets is available to the Customer or WNH. When this is the case, the decision is left to the customer.
Safety (5.4.3.2.B.2)
New customers are connected (or provisioned for future connection) to looped systems to maintain system reliability performance.
Customer connection projects are driven by customer requests and the specific requirements of the customer. Design and methodology for such projects are standardized through WNH policies and practices and in line with WNH Conditions of Service. Alternatives are limited as servicing options are standardized, but if alternatives exist, they are normally the choice of the customer.
Not Applicable
Not Applicable
Evaluation Criteria and information requirements for each project/program (5.4.3.2.B) Efficiency, Customer Value, Reliability (5.4.3.2.B.1)
These projects are mandatory. Scope and timelines are based on requirements put forth by customers and/or obligations set forth for connecting customers in the DSC.WNH Strategic Imperative 3 (Customer Service) as identified in Exhibit 1.
Request for service and obligations set forth in the DSC.
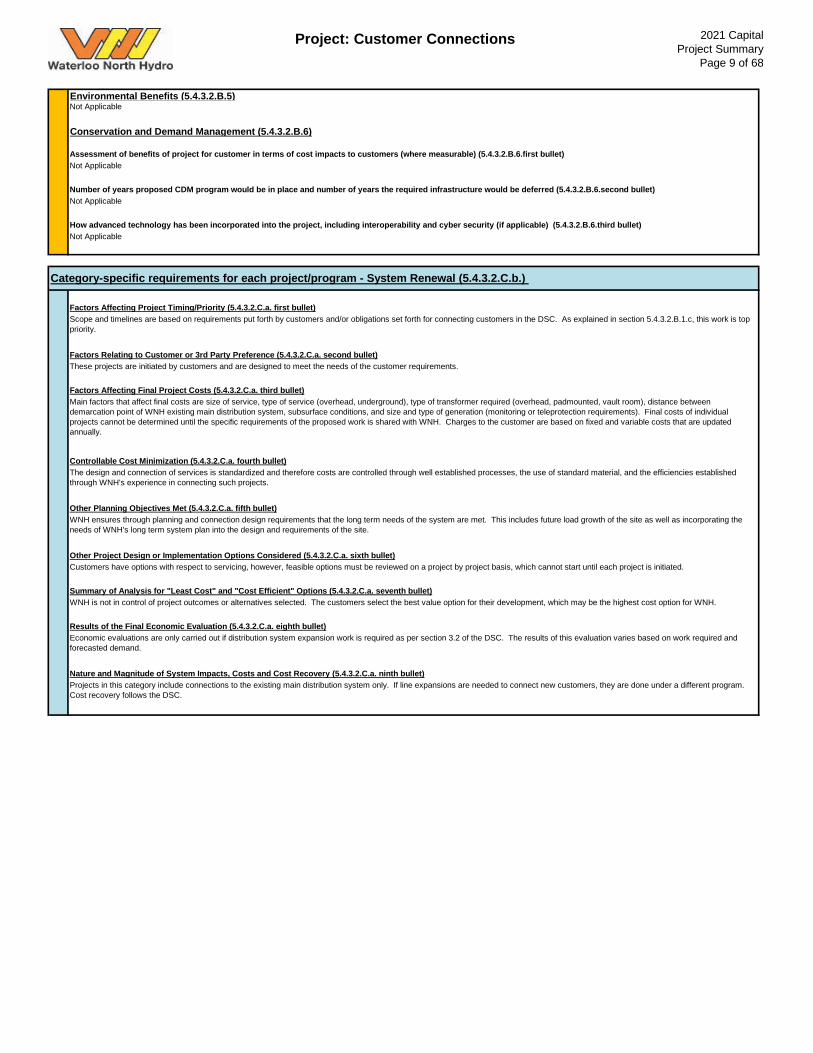
Project: Customer Connections 2021 CapitalProject Summary
Page 9 of 68
Environmental Benefits (5.4.3.2.B.5)
Projects in this category include connections to the existing main distribution system only. If line expansions are needed to connect new customers, they are done under a different program. Cost recovery follows the DSC.
Customers have options with respect to servicing, however, feasible options must be reviewed on a project by project basis, which cannot start until each project is initiated.
Summary of Analysis for "Least Cost" and "Cost Efficient" Options (5.4.3.2.C.a. seventh bullet)WNH is not in control of project outcomes or alternatives selected. The customers select the best value option for their development, which may be the highest cost option for WNH.
Results of the Final Economic Evaluation (5.4.3.2.C.a. eighth bullet)Economic evaluations are only carried out if distribution system expansion work is required as per section 3.2 of the DSC. The results of this evaluation varies based on work required and forecasted demand.
Nature and Magnitude of System Impacts, Costs and Cost Recovery (5.4.3.2.C.a. ninth bullet)
Other Project Design or Implementation Options Considered (5.4.3.2.C.a. sixth bullet)
Not Applicable
How advanced technology has been incorporated into the project, including interoperability and cyber security (if applicable) (5.4.3.2.B.6.third bullet)Not Applicable
Category-specific requirements for each project/program - System Renewal (5.4.3.2.C.b.)
Factors Affecting Project Timing/Priority (5.4.3.2.C.a. first bullet)Scope and timelines are based on requirements put forth by customers and/or obligations set forth for connecting customers in the DSC. As explained in section 5.4.3.2.B.1.c, this work is top priority.
Factors Relating to Customer or 3rd Party Preference (5.4.3.2.C.a. second bullet)These projects are initiated by customers and are designed to meet the needs of the customer requirements.
Factors Affecting Final Project Costs (5.4.3.2.C.a. third bullet)Main factors that affect final costs are size of service, type of service (overhead, underground), type of transformer required (overhead, padmounted, vault room), distance between demarcation point of WNH existing main distribution system, subsurface conditions, and size and type of generation (monitoring or teleprotection requirements). Final costs of individual projects cannot be determined until the specific requirements of the proposed work is shared with WNH. Charges to the customer are based on fixed and variable costs that are updated annually.
Controllable Cost Minimization (5.4.3.2.C.a. fourth bullet)The design and connection of services is standardized and therefore costs are controlled through well established processes, the use of standard material, and the efficiencies established through WNH's experience in connecting such projects.
Other Planning Objectives Met (5.4.3.2.C.a. fifth bullet)WNH ensures through planning and connection design requirements that the long term needs of the system are met. This includes future load growth of the site as well as incorporating the needs of WNH's long term system plan into the design and requirements of the site.
Number of years proposed CDM program would be in place and number of years the required infrastructure would be deferred (5.4.3.2.B.6.second bullet)
Not Applicable
Conservation and Demand Management (5.4.3.2.B.6)
Assessment of benefits of project for customer in terms of cost impacts to customers (where measurable) (5.4.3.2.B.6.first bullet)Not Applicable
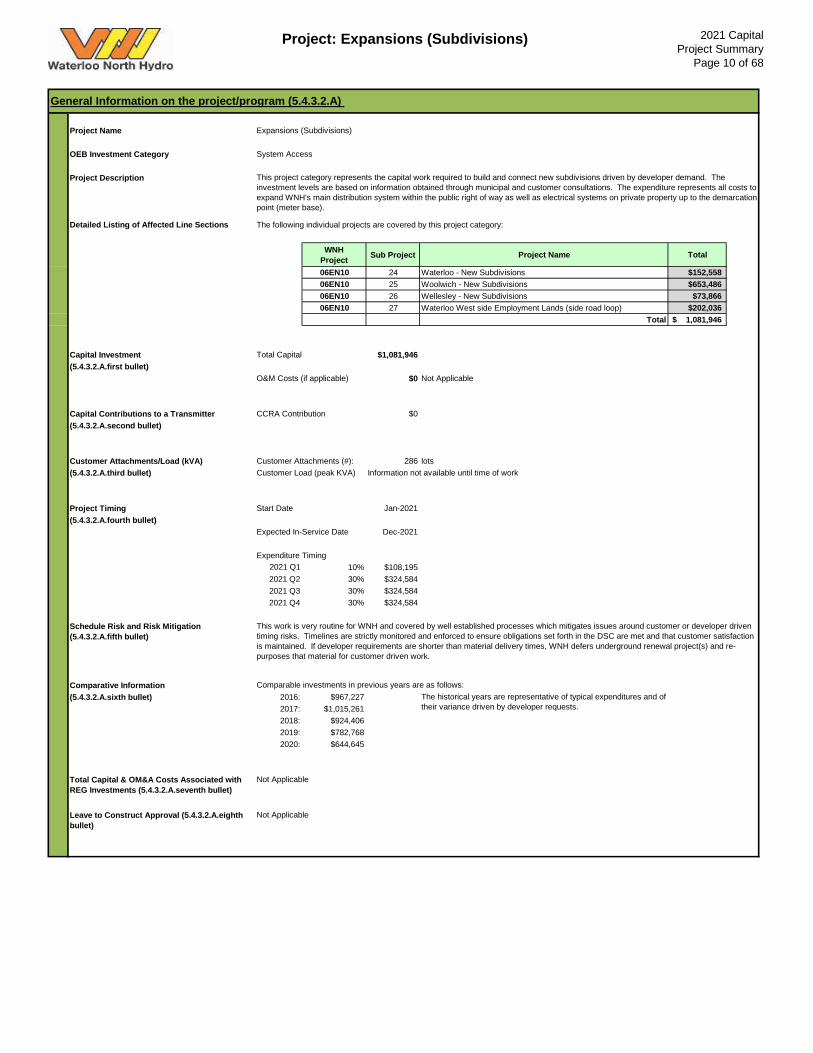
Project: Expansions (Subdivisions) 2021 CapitalProject Summary
Page 10 of 68
Project Name OEB Investment Category System Access
Project Description
Detailed Listing of Affected Line Sections The following individual projects are covered by this project category:
WNH Project Sub Project Project Name Total
06EN10 24 Waterloo - New Subdivisions $152,55806EN10 25 Woolwich - New Subdivisions $653,48606EN10 26 Wellesley - New Subdivisions $73,86606EN10 27 Waterloo West side Employment Lands (side road loop) $202,036
Total 1,081,946$
Capital Investment Total Capital $1,081,946(5.4.3.2.A.first bullet)
O&M Costs (if applicable) $0
Capital Contributions to a Transmitter CCRA Contribution $0(5.4.3.2.A.second bullet)
Customer Attachments/Load (kVA) Customer Attachments (#): 286 lots(5.4.3.2.A.third bullet) Customer Load (peak KVA) Information not available until time of work
Project Timing Start Date Jan-2021(5.4.3.2.A.fourth bullet)
Expected In-Service Date Dec-2021
Expenditure Timing 2021 Q1 10% $108,195 2021 Q2 30% $324,584 2021 Q3 30% $324,5842021 Q4 30% $324,584
Schedule Risk and Risk Mitigation (5.4.3.2.A.fifth bullet)
Comparative Information(5.4.3.2.A.sixth bullet) 2016: $967,227
2017: $1,015,2612018: $924,4062019: $782,7682020: $644,645
Total Capital & OM&A Costs Associated with REG Investments (5.4.3.2.A.seventh bullet)
Leave to Construct Approval (5.4.3.2.A.eighth bullet)
The historical years are representative of typical expenditures and of their variance driven by developer requests.
Not Applicable
Not Applicable
Not Applicable
This work is very routine for WNH and covered by well established processes which mitigates issues around customer or developer driven timing risks. Timelines are strictly monitored and enforced to ensure obligations set forth in the DSC are met and that customer satisfaction is maintained. If developer requirements are shorter than material delivery times, WNH defers underground renewal project(s) and re-purposes that material for customer driven work.
Comparable investments in previous years are as follows:
General Information on the project/program (5.4.3.2.A)
Expansions (Subdivisions)
This project category represents the capital work required to build and connect new subdivisions driven by developer demand. The investment levels are based on information obtained through municipal and customer consultations. The expenditure represents all costs to expand WNH's main distribution system within the public right of way as well as electrical systems on private property up to the demarcation point (meter base).
Project: Expansions (Subdivisions) 2021 CapitalProject Summary
Page 11 of 68
Main Driver (5.4.3.2.B.1.a)
Related Objectives/Performance Targets
Source and Nature of the Information Used to Justify the Investment
Secondary Driver(s) (5.4.3.2.B.1.a)
Related Objectives/Performance Targets
Source and Nature of the Information Used to Justify the Investment
Good Utility Practice (5.4.3.2.B.1.b)
Investment Priority (5.4.3.2.B.1.c)
Effect on system operation efficiency and cost effectiveness (first bullet)
Net benefits accruing to customers (second bullet)
Impact of Investment on reliability performance (including on the frequency and duration of outages) (third bullet)
Scheduling Alternatives
Ownership and/or Funding Alternatives
Environmental Benefits (5.4.3.2.B.5)
Cyber-security, Privacy (5.4.3.2.B.3)Not Applicable
Co-ordination, Interoperability (5.4.3.2.B.4)
Coordination with utilities, regional planning and/or links with 3rd parties (where applicable) (5.4.3.2.B.4.a)This work is very routine for WNH and covered by standardized and well established processes between the developer, municipality, WNH, and other utilities. Through this standardization, coordination and joint use trenching opportunities are maximized. Differences in project requirements requested by developers are addressed with municipalities and other utilities via meetings, drawing exchange, and the Utilities Coordinating Council. WNH meets regularly with the area Utility Coordinating Council comprised of municipal and third party stakeholders.
Enabling of future technological functionality or addressing of future operational requirements (5.4.3.2.B.4.b)New residential subdivisions are designed with capacity and capability to permit behind the meter customer generation and electric vehicle charging. Each service to a new residential building is sized for 200A to facilitate customer load growth.
Not Applicable
Conservation and Demand Management (5.4.3.2.B.6)
Assessment of benefits of project for customer in terms of cost impacts to customers (where measurable) (5.4.3.2.B.6.first bullet)Not Applicable
Not Applicable
Not Applicable
Safety is not a driver for this project. Safety is a key Strategic Imperative for WNH as identified in Exhibit 1.
Not Applicable
WNH ensures that the connection of new customers allows for a flexible and resilient distribution system that also supports future growth. This includes considerations such as primary loops (installed or provisioned for future), sizing of equipment to meet both the current and projected needs of the load and any future loads it may impact, careful selection of equipment placement in a location that is accessible and easy to maintain, alignment with long term system needs including securing of easements as well as overall coordination with municipalities and third parties to optimize design and construction costs for all.
System Access investments are ranked as top priority, as they are mandated by regulation or code.
This project is ranked 1 out of 16. Refer to Table 4-22 of the DSP for further details.
Analysis of the Project and Project Alternatives (5.4.3.2.B.1.d)
Subdivision projects are driven by developer requests. Design and methodology for such projects are standardized through WNH's policies and practices, although it differs from project to project based on developer specific requirements. Alternatives are considered based on individual project details as they are brought forth.
Asset additions in this project category will add to the inspection, maintenance and testing programs placing upward pressure on O&M expenditures.
There are no significant net benefits accruing to customers as a result of this investment.
New customers are connected (or provisioned for future connection) to looped systems to maintain system reliability performance.
These projects are mandatory. Scope and timelines are based on requirements put forth by customers and/or obligations set forth for connecting customers in the DSC.
WNH is responsible for all system design and ultimate ownership of the distribution plant it operates.
Developers are given the option of scheduling, funding and constructing the underground distribution system to WNH’s standards, subject to WNH inspection, provided it can be done without working on WNH's energized system. If this option is selected, the developer is required to transfer ownership of the plant to WNH prior to being connected to the energized system by WNH.
Safety (5.4.3.2.B.2)
Evaluation Criteria and information requirements for each project/program (5.4.3.2.B) Efficiency, Customer Value, Reliability (5.4.3.2.B.1)
These projects are mandatory. Scope and timelines are based on requirements put forth by customers and/or obligations set forth for connecting customers in the DSC.
WNH Strategic Imperative 3 (Customer Service) as identified in Exhibit 1.
Request for service and obligations set forth in the DSC.
Project: Expansions (Subdivisions) 2021 CapitalProject Summary
Page 12 of 68
As WNH's system is not constrained, and municipalities are striving to confine urban sprawl resulting in limited options for new subdivisions. These types of projects have very little impact on the system once they are complete. If development of a new subdivision is staged, the construction of the main distribution system may not be fully complete, resulting in system segregation and lesser ability to restore power quickly.
Costs for these projects are fairly predicable based on standardized processes and materials, and are partially recovered through economic evaluations as prescribed in the DSC.
Feasible options are discussed with municipalities, developers, their consultants and other utilities and stakeholders as the project develops.
Summary of Analysis for "Least Cost" and "Cost Efficient" Options (5.4.3.2.C.a. seventh bullet)Alternatives are considered, however, the analysis is completed on a project by project basis after the project is initiated.
Results of the Final Economic Evaluation (5.4.3.2.C.a. eighth bullet)Capital contributions toward these projects are collected and calculated based on the economic evaluation methodology in accordance with the DSC and WNH's Conditions of Service. Detailed results for each project can only be available after the project is initiated, however, due to the high level of standardization of these projects, capital contribution levels for budgetary purposes are estimated based on averages from actual results on previous projects.
Nature and Magnitude of System Impacts, Costs and Cost Recovery (5.4.3.2.C.a. ninth bullet)
Other Project Design or Implementation Options Considered (5.4.3.2.C.a. sixth bullet)
Not Applicable
How advanced technology has been incorporated into the project, including interoperability and cyber security (if applicable) (5.4.3.2.B.6.third bullet)Not Applicable
Category-specific requirements for each project/program - System Renewal (5.4.3.2.C.b.)
Factors Affecting Project Timing/Priority (5.4.3.2.C.a. first bullet)The timing of individual projects is based on scheduling provided by the developer or their agents. WNH works closely with all stakeholders via regular progress meetings to ensure sufficient notice is provided to WNH and work is completed in the required timeframe. As explained in section 5.4.3.2.B.1.c, this work is top priority.
Factors Relating to Customer or 3rd Party Preference (5.4.3.2.C.a. second bullet)These projects are initiated by developers and are designed to meet the needs of the proposed development in compliance with applicable standards and regulations.
Factors Affecting Final Project Costs (5.4.3.2.C.a. third bullet)Final costs of each subdivision cannot be determined until the project is brought forth to WNH. The conditions of the land being developed, the number of lots and type of residence being proposed are the largest factors that affect project costs. Cost recovery from the developer is governed by the economic evaluation process as prescribed in the DSC.
Controllable Cost Minimization (5.4.3.2.C.a. fourth bullet)The design of subdivision projects is standardized and therefore costs are controlled through well established processes, the use of standard material, and the efficiencies established through WNH's experience in connecting such projects. The developer also has the right to contest various parts of the required work as provided for in the DSC.
Other Planning Objectives Met (5.4.3.2.C.a. fifth bullet)As most new subdivisions are constructed in stages, WNH plans for and requires each developer to make provisions for servicing subsequent stages of development.
Number of years proposed CDM program would be in place and number of years the required infrastructure would be deferred (5.4.3.2.B.6.second bullet)
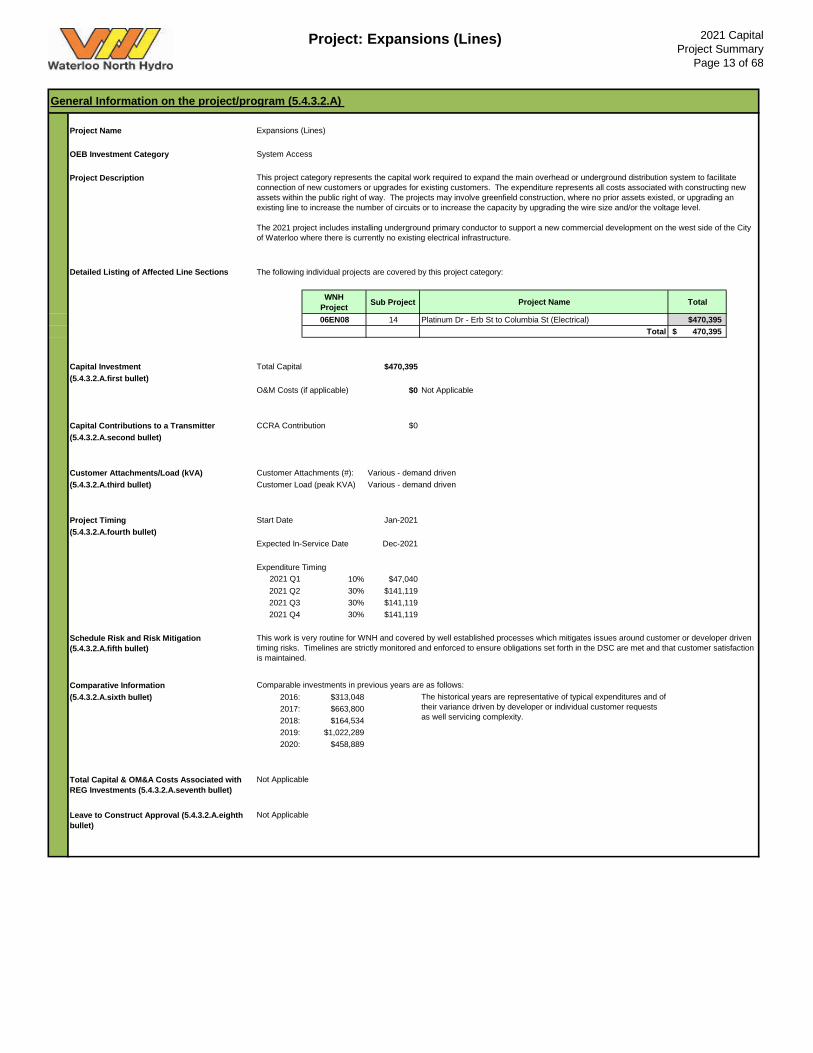
Project: Expansions (Lines) 2021 CapitalProject Summary
Page 13 of 68
Project Name OEB Investment Category System Access
Project Description
Detailed Listing of Affected Line Sections The following individual projects are covered by this project category:
WNH Project Sub Project Project Name Total
06EN08 14 Platinum Dr - Erb St to Columbia St (Electrical) $470,395Total 470,395$
Capital Investment Total Capital $470,395(5.4.3.2.A.first bullet)
O&M Costs (if applicable) $0
Capital Contributions to a Transmitter CCRA Contribution $0(5.4.3.2.A.second bullet)
Customer Attachments/Load (kVA) Customer Attachments (#): Various - demand driven(5.4.3.2.A.third bullet) Customer Load (peak KVA) Various - demand driven
Project Timing Start Date Jan-2021(5.4.3.2.A.fourth bullet)
Expected In-Service Date Dec-2021
Expenditure Timing 2021 Q1 10% $47,040 2021 Q2 30% $141,119 2021 Q3 30% $141,1192021 Q4 30% $141,119
Schedule Risk and Risk Mitigation (5.4.3.2.A.fifth bullet)
Comparative Information(5.4.3.2.A.sixth bullet) 2016: $313,048
2017: $663,8002018: $164,5342019: $1,022,2892020: $458,889
Total Capital & OM&A Costs Associated with REG Investments (5.4.3.2.A.seventh bullet)
Leave to Construct Approval (5.4.3.2.A.eighth bullet)
General Information on the project/program (5.4.3.2.A)
Expansions (Lines)
This project category represents the capital work required to expand the main overhead or underground distribution system to facilitate connection of new customers or upgrades for existing customers. The expenditure represents all costs associated with constructing new assets within the public right of way. The projects may involve greenfield construction, where no prior assets existed, or upgrading an existing line to increase the number of circuits or to increase the capacity by upgrading the wire size and/or the voltage level.
The 2021 project includes installing underground primary conductor to support a new commercial development on the west side of the City of Waterloo where there is currently no existing electrical infrastructure.
Not Applicable
Not Applicable
The historical years are representative of typical expenditures and of their variance driven by developer or individual customer requests as well servicing complexity.
Not Applicable
This work is very routine for WNH and covered by well established processes which mitigates issues around customer or developer driven timing risks. Timelines are strictly monitored and enforced to ensure obligations set forth in the DSC are met and that customer satisfaction is maintained.
Comparable investments in previous years are as follows:
Project: Expansions (Lines) 2021 CapitalProject Summary
Page 14 of 68
Main Driver (5.4.3.2.B.1.a)
Related Objectives/Performance Targets
Source and Nature of the Information Used to Justify the Investment
Secondary Driver(s) (5.4.3.2.B.1.a)
Related Objectives/Performance Targets
Source and Nature of the Information Used to Justify the Investment
Good Utility Practice (5.4.3.2.B.1.b)
Investment Priority (5.4.3.2.B.1.c)
Effect on system operation efficiency and cost effectiveness (first bullet)
Net benefits accruing to customers (second bullet)
Impact of Investment on reliability performance (including on the frequency and duration of outages) (third bullet)
Scheduling Alternatives
Ownership and/or Funding Alternatives
Evaluation Criteria and information requirements for each project/program (5.4.3.2.B)
Not Applicable
Safety is not a driver for this project. Safety is a key Strategic Imperative for WNH as identified in Exhibit 1.
Not Applicable
WNH ensures that the connection of new customers allows for a flexible and resilient distribution system that also supports future growth. This includes considerations such as primary loops (installed or provisioned for future), sizing of equipment to meet both the current and projected needs of the load and any future loads it may impact, careful selection of equipment placement in a location that is accessible and easy to maintain, alignment with long term system needs including securing of easements, provisions for remote SCADA monitoring or control of equipment on site as well as overall coordination with municipalities and third parties to optimize design and construction costs for all.
System Access investments are ranked as top priority, as they are mandated by regulation or code.
This project is ranked 1 out of 16. Refer to Table 4-22 of the DSP for further details.
Analysis of the Project and Project Alternatives (5.4.3.2.B.1.d)
These projects are driven by developer or individual customer requests and requirements. Design and methodology for such projects are standardized through WNH's policies, practices, and standards. Options that meet or exceed WNH's standards are provided to the customer based on their requirements and WNH's existing infrastructure. These may include overhead or underground circuits, grid modernization/microgrid integration, equipment capabilities or redundancy options. When the developer or individual customer chooses an option that exceeds the cost of a standard service, they must fund the difference.
For the specific project in 2021, WNH calculated the cost to build this expansion overhead, and when discussing project specifics, the developer chose to construct this area using underground circuits instead. As a result of this they are funding the difference between the overhead and underground costs.
The effects on system operation efficiency are highly dependent on the project details. If additional redundancy options are implemented as part of these projects, they may contribute toward greater reconfiguration options for the system as a whole, having a positive effect on reliability. Similar impact could be experienced by installation of additional circuits on existing lines or upgrading voltage of existing circuits. These projects may also have a positive effect on WNH's ability to rebalance the load between phases and improve power quality from a voltage performance point of view.
The installation of underground cable versus overhead wires avoids future operating and maintenance costs associated with tree contacts/tree trimming, animal contacts, weather-related events (ice storm, wind storm, etc.) and issues associated with clearance to buildings and signs.
Options selected by developers above WNH's standard level of service are funded by the developer or individual customer, but sometimes may benefit additional customers.
The benefits accruing to existing customers are highly dependent on the project details and as a result may have a positive effect on reliability, power quality, and aesthetics.
The impact on reliability performance is highly dependent on project details. If replacement of older distribution assets with new distribution assets built to the latest standards is part of the solution, then risk of future failures is reduced. Newer assets are able to withstand increased adverse weather conditions and incorporate increased clearances around the conductors, which assist in both the frequency and duration of outages.
Overhead to underground line burial projects have a positive effect on weather resiliency, however underground assets take longer to locate and repair or replace compared to overhead assets in the event of failure.
These projects are mandatory. Scope and timelines are based on requirements put forth by customers and/or obligations set forth for connecting customers in the DSC.
WNH is responsible for all system design and ultimate ownership of the distribution plant it operates.
Developers or individual customers are given the option of scheduling, funding and constructing the required expansion of the distribution system to WNH’s standards, subject to WNH's inspection, provided it can be done without working on WNH's energized system. If this option is selected, the developer or individual customer is required to transfer ownership of the plant to WNH prior to being connected to the energized system by WNH.
Safety (5.4.3.2.B.2)
Efficiency, Customer Value, Reliability (5.4.3.2.B.1)
These projects are mandatory. Scope and timelines are based on requirements put forth by customers and/or obligations set forth for connecting customers in the DSC.
WNH Strategic Imperative 3 (Customer Service) as identified in Exhibit 1.
Request for service and obligations set forth in the DSC.
Not Applicable
Cyber-security, Privacy (5.4.3.2.B.3)Not Applicable
Project: Expansions (Lines) 2021 CapitalProject Summary
Page 15 of 68
Environmental Benefits (5.4.3.2.B.5)
Number of years proposed CDM program would be in place and number of years the required infrastructure would be deferred (5.4.3.2.B.6.second bullet)
Co-ordination, Interoperability (5.4.3.2.B.4)
Coordination with utilities, regional planning and/or links with 3rd parties (where applicable) (5.4.3.2.B.4.a)This work is covered by standardized and well established processes between the developers or individual customers, municipality, WNH, and other utilities. Through this standardization, coordination and joint use trenching opportunities are maximized. Differences in project requirements requested by developers or individual customers are addressed with municipalities and other utilities via meetings, drawing exchange, and the Utilities Coordinating Council. WNH meets regularly with the area Utility Coordinating Council comprised of municipality and third party stakeholders.
Enabling of future technological functionality or addressing of future operational requirements (5.4.3.2.B.4.b)For all projects WNH ensures the Long Term System Plan objectives are incorporated and that provisions are made for grid modernization.
Other options for consideration of future technological functionality or operational requirements are highly dependent on the details of the project. If voltage or conductor upgrading form part of the project, this also has the added benefit of increasing capacity for future generation connections. This is not the case of for this project.
Not Applicable
Conservation and Demand Management (5.4.3.2.B.6)
Assessment of benefits of project for customer in terms of cost impacts to customers (where measurable) (5.4.3.2.B.6.first bullet)Not Applicable
Other Project Design or Implementation Options Considered (5.4.3.2.C.a. sixth bullet)
Not Applicable
How advanced technology has been incorporated into the project, including interoperability and cyber security (if applicable) (5.4.3.2.B.6.third bullet)Not Applicable
Category-specific requirements for each project/program - System Renewal (5.4.3.2.C.b.)
Factors Affecting Project Timing/Priority (5.4.3.2.C.a. first bullet)The timing of individual projects is based on scheduling provided by the developer, the individual customer, or their agents. WNH works closely with all stakeholders via regular progress meetings to ensure sufficient notice is provided to WNH and work is completed in the required timeframe. As explained in section 5.4.3.2.B.1.c, this work is top priority.
Factors Relating to Customer or 3rd Party Preference (5.4.3.2.C.a. second bullet)These projects are initiated by developers or individual customers and are designed to meet their needs in compliance with applicable standards and regulations.
Factors Affecting Final Project Costs (5.4.3.2.C.a. third bullet)Final costs of each project cannot be determined until the project is brought forth to WNH. The distance, complexity and infrastructure required for the expansion as well as the customers expected new load as result of the expansion all vary from project to project. Cost recovery is governed by the economic evaluation process as prescribed in the DSC.
Controllable Cost Minimization (5.4.3.2.C.a. fourth bullet)The design of these projects is standardized, regardless of if it is overhead or underground, and therefore costs are controlled through well established processes, the use of standard material, and the efficiencies established through WNH's experience in connecting such projects. The developer or individual customer also has the right to contest various parts of the required work as provided for in the DSC.
Other Planning Objectives Met (5.4.3.2.C.a. fifth bullet)For all projects WNH ensures the Long Term System Plan objectives are incorporated and that provisions are made for grid modernization.
Please see Section 5.4.3.2.B.1.d for general information on projects in this category.
For the 2021 project, since at this point WNH's system is not constrained, this project is not forecasted to have a large effect on WNH's distribution system.
Costs for these projects are fairly predictable based on standardized processes and materials, and are partially recovered through economic evaluations as prescribed in the DSC.
Feasible options are discussed with the developers or individual customers, their consultants and other stakeholders as the project develops.
Summary of Analysis for "Least Cost" and "Cost Efficient" Options (5.4.3.2.C.a. seventh bullet)WNH is not always in control of project outcomes or alternatives selected. The customers select the best value option for their development, which may be the highest cost option for WNH.
Results of the Final Economic Evaluation (5.4.3.2.C.a. eighth bullet)Capital contributions toward these projects are collected and calculated based on the economic evaluation methodology in accordance with the DSC and WNH's Conditions of Service. Detailed results for each project can only be available after the project is initiated, and are difficult to forecast on a program basis due to the large variance in these types of projects.
For the specific 2021 project, cost recovery approaches 100%.
Nature and Magnitude of System Impacts, Costs and Cost Recovery (5.4.3.2.C.a. ninth bullet)
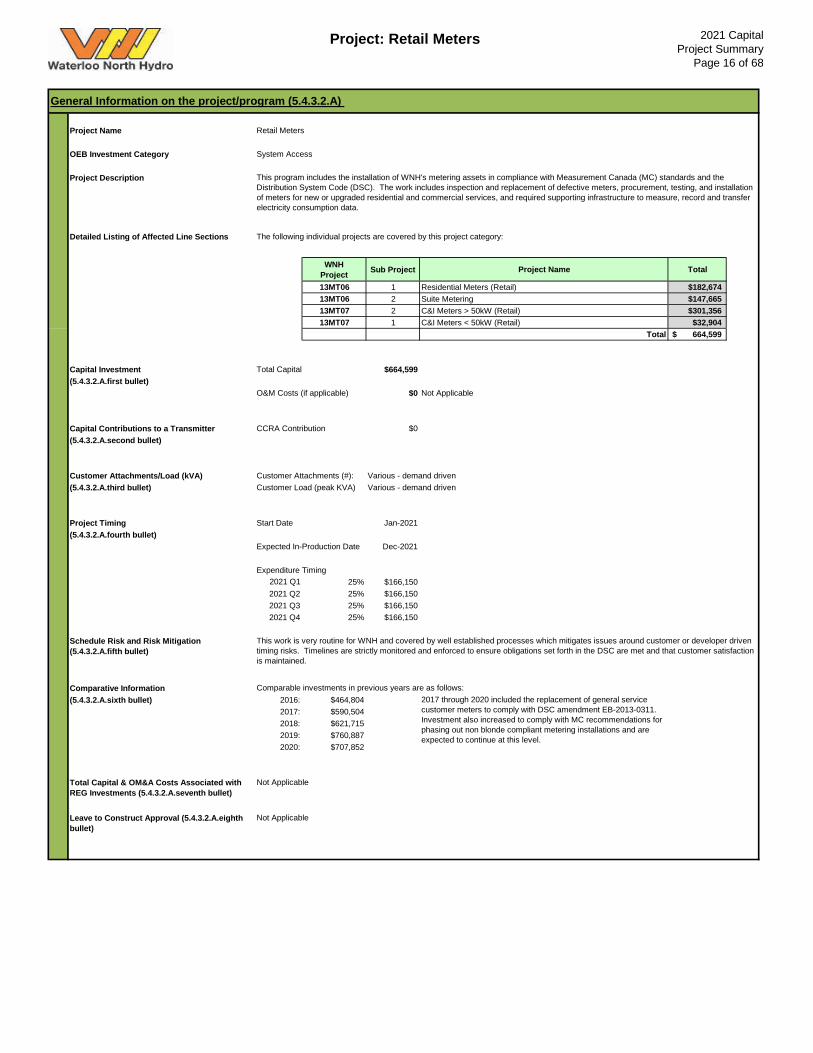
Project: Retail Meters 2021 CapitalProject Summary
Page 16 of 68
Project Name OEB Investment Category System Access
Project Description
Detailed Listing of Affected Line Sections The following individual projects are covered by this project category:
WNH Project Sub Project Project Name Total
13MT06 1 Residential Meters (Retail) $182,67413MT06 2 Suite Metering $147,66513MT07 2 C&I Meters > 50kW (Retail) $301,35613MT07 1 C&I Meters < 50kW (Retail) $32,904
Total 664,599$
Capital Investment Total Capital $664,599(5.4.3.2.A.first bullet)
O&M Costs (if applicable) $0
Capital Contributions to a Transmitter CCRA Contribution $0(5.4.3.2.A.second bullet)
Customer Attachments/Load (kVA) Customer Attachments (#): Various - demand driven(5.4.3.2.A.third bullet) Customer Load (peak KVA) Various - demand driven
Project Timing Start Date Jan-2021(5.4.3.2.A.fourth bullet)
Expected In-Production Date Dec-2021
Expenditure Timing 2021 Q1 25% $166,150 2021 Q2 25% $166,150 2021 Q3 25% $166,1502021 Q4 25% $166,150
Schedule Risk and Risk Mitigation (5.4.3.2.A.fifth bullet)
Comparative Information(5.4.3.2.A.sixth bullet) 2016: $464,804
2017: $590,5042018: $621,7152019: $760,8872020: $707,852
Total Capital & OM&A Costs Associated with REG Investments (5.4.3.2.A.seventh bullet)
Leave to Construct Approval (5.4.3.2.A.eighth bullet)
2017 through 2020 included the replacement of general service customer meters to comply with DSC amendment EB-2013-0311. Investment also increased to comply with MC recommendations for phasing out non blonde compliant metering installations and are expected to continue at this level.
Not Applicable
Not Applicable
Not Applicable
This work is very routine for WNH and covered by well established processes which mitigates issues around customer or developer driven timing risks. Timelines are strictly monitored and enforced to ensure obligations set forth in the DSC are met and that customer satisfaction is maintained.
Comparable investments in previous years are as follows:
General Information on the project/program (5.4.3.2.A)
Retail Meters
This program includes the installation of WNH's metering assets in compliance with Measurement Canada (MC) standards and the Distribution System Code (DSC). The work includes inspection and replacement of defective meters, procurement, testing, and installation of meters for new or upgraded residential and commercial services, and required supporting infrastructure to measure, record and transfer electricity consumption data.
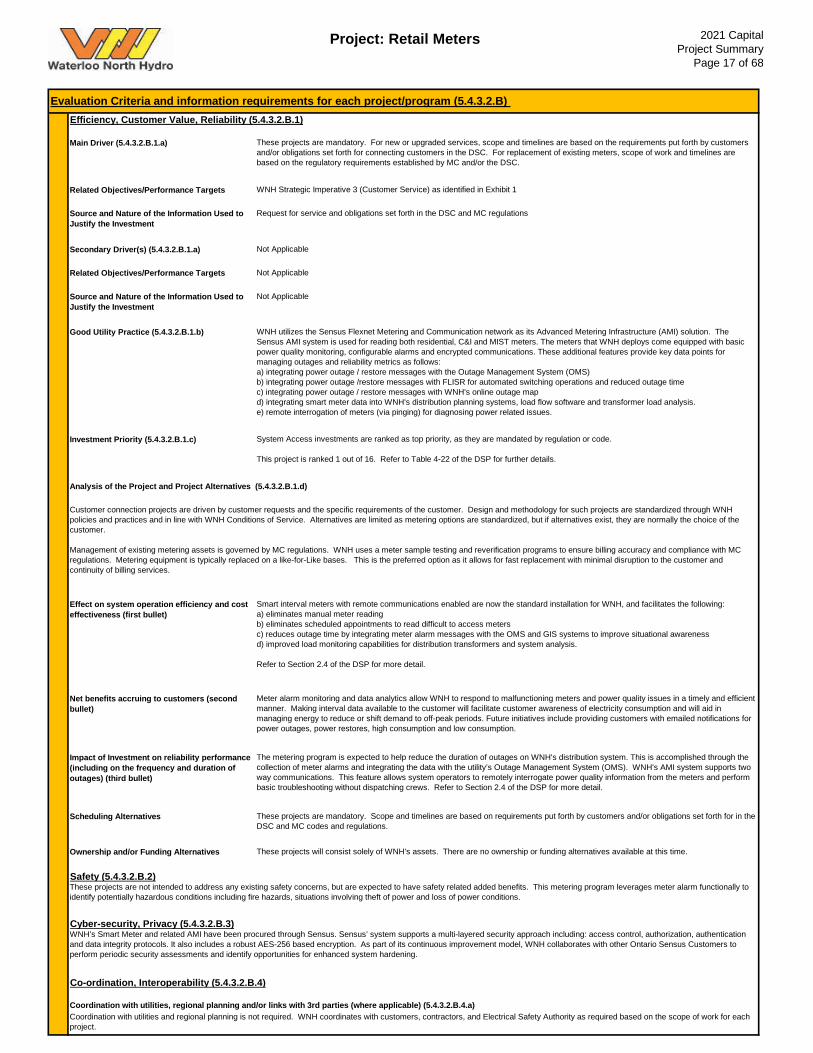
Project: Retail Meters 2021 CapitalProject Summary
Page 17 of 68
Main Driver (5.4.3.2.B.1.a)
Related Objectives/Performance Targets
Source and Nature of the Information Used to Justify the Investment
Secondary Driver(s) (5.4.3.2.B.1.a)
Related Objectives/Performance Targets
Source and Nature of the Information Used to Justify the Investment
Good Utility Practice (5.4.3.2.B.1.b)
Investment Priority (5.4.3.2.B.1.c)
Effect on system operation efficiency and cost effectiveness (first bullet)
Net benefits accruing to customers (second bullet)
Impact of Investment on reliability performance (including on the frequency and duration of outages) (third bullet)
Scheduling Alternatives
Ownership and/or Funding Alternatives
Cyber-security, Privacy (5.4.3.2.B.3)WNH’s Smart Meter and related AMI have been procured through Sensus. Sensus’ system supports a multi-layered security approach including: access control, authorization, authentication and data integrity protocols. It also includes a robust AES-256 based encryption. As part of its continuous improvement model, WNH collaborates with other Ontario Sensus Customers to perform periodic security assessments and identify opportunities for enhanced system hardening.
Co-ordination, Interoperability (5.4.3.2.B.4)
Coordination with utilities, regional planning and/or links with 3rd parties (where applicable) (5.4.3.2.B.4.a)Coordination with utilities and regional planning is not required. WNH coordinates with customers, contractors, and Electrical Safety Authority as required based on the scope of work for each project.
Not Applicable
Not Applicable
These projects are not intended to address any existing safety concerns, but are expected to have safety related added benefits. This metering program leverages meter alarm functionally to identify potentially hazardous conditions including fire hazards, situations involving theft of power and loss of power conditions.
Not Applicable
WNH utilizes the Sensus Flexnet Metering and Communication network as its Advanced Metering Infrastructure (AMI) solution. The Sensus AMI system is used for reading both residential, C&I and MIST meters. The meters that WNH deploys come equipped with basic power quality monitoring, configurable alarms and encrypted communications. These additional features provide key data points for managing outages and reliability metrics as follows:a) integrating power outage / restore messages with the Outage Management System (OMS)b) integrating power outage /restore messages with FLISR for automated switching operations and reduced outage timec) integrating power outage / restore messages with WNH's online outage mapd) integrating smart meter data into WNH's distribution planning systems, load flow software and transformer load analysis.e) remote interrogation of meters (via pinging) for diagnosing power related issues.
System Access investments are ranked as top priority, as they are mandated by regulation or code.
This project is ranked 1 out of 16. Refer to Table 4-22 of the DSP for further details.
Analysis of the Project and Project Alternatives (5.4.3.2.B.1.d)
Customer connection projects are driven by customer requests and the specific requirements of the customer. Design and methodology for such projects are standardized through WNH policies and practices and in line with WNH Conditions of Service. Alternatives are limited as metering options are standardized, but if alternatives exist, they are normally the choice of the customer.
Management of existing metering assets is governed by MC regulations. WNH uses a meter sample testing and reverification programs to ensure billing accuracy and compliance with MC regulations. Metering equipment is typically replaced on a like-for-Like bases. This is the preferred option as it allows for fast replacement with minimal disruption to the customer and continuity of billing services.
Smart interval meters with remote communications enabled are now the standard installation for WNH, and facilitates the following:a) eliminates manual meter reading b) eliminates scheduled appointments to read difficult to access meters c) reduces outage time by integrating meter alarm messages with the OMS and GIS systems to improve situational awarenessd) improved load monitoring capabilities for distribution transformers and system analysis.
Refer to Section 2.4 of the DSP for more detail.
Meter alarm monitoring and data analytics allow WNH to respond to malfunctioning meters and power quality issues in a timely and efficient manner. Making interval data available to the customer will facilitate customer awareness of electricity consumption and will aid in managing energy to reduce or shift demand to off-peak periods. Future initiatives include providing customers with emailed notifications for power outages, power restores, high consumption and low consumption.
The metering program is expected to help reduce the duration of outages on WNH's distribution system. This is accomplished through the collection of meter alarms and integrating the data with the utility’s Outage Management System (OMS). WNH's AMI system supports two way communications. This feature allows system operators to remotely interrogate power quality information from the meters and perform basic troubleshooting without dispatching crews. Refer to Section 2.4 of the DSP for more detail.
These projects are mandatory. Scope and timelines are based on requirements put forth by customers and/or obligations set forth for in the DSC and MC codes and regulations.
These projects will consist solely of WNH's assets. There are no ownership or funding alternatives available at this time.
Safety (5.4.3.2.B.2)
Evaluation Criteria and information requirements for each project/program (5.4.3.2.B) Efficiency, Customer Value, Reliability (5.4.3.2.B.1)
These projects are mandatory. For new or upgraded services, scope and timelines are based on the requirements put forth by customers and/or obligations set forth for connecting customers in the DSC. For replacement of existing meters, scope of work and timelines are based on the regulatory requirements established by MC and/or the DSC.
WNH Strategic Imperative 3 (Customer Service) as identified in Exhibit 1
Request for service and obligations set forth in the DSC and MC regulations
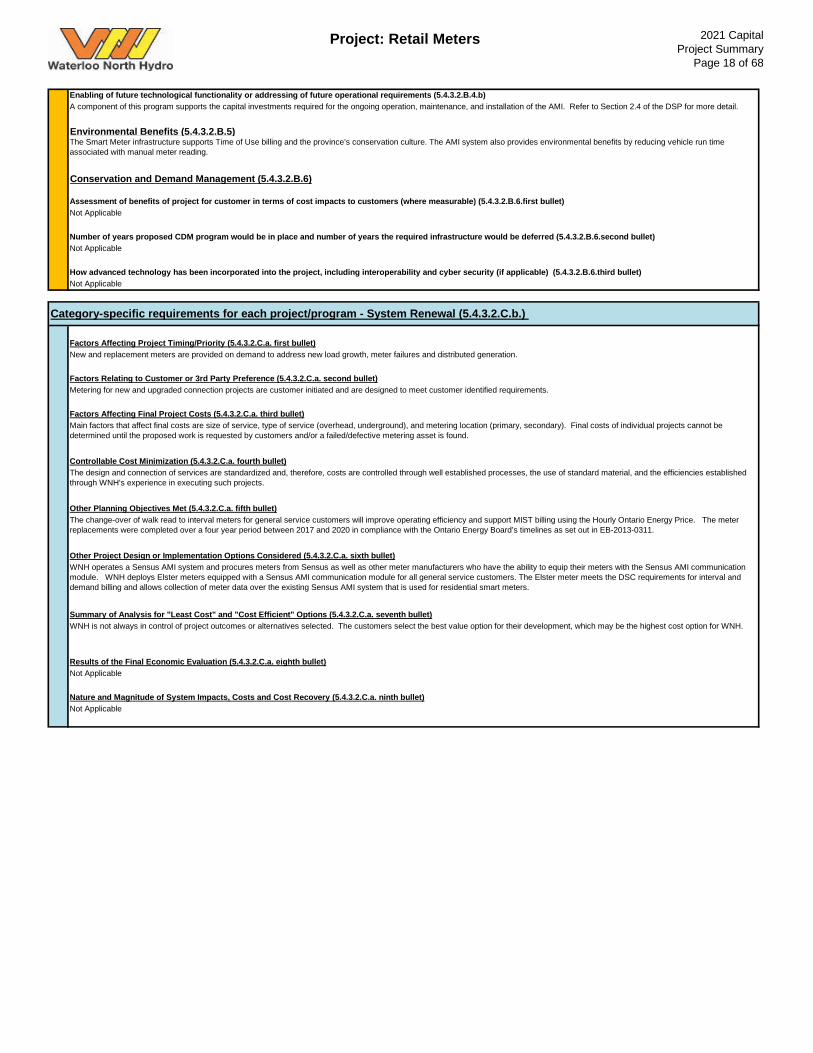
Project: Retail Meters 2021 CapitalProject Summary
Page 18 of 68
Environmental Benefits (5.4.3.2.B.5)
Not Applicable
WNH operates a Sensus AMI system and procures meters from Sensus as well as other meter manufacturers who have the ability to equip their meters with the Sensus AMI communication module. WNH deploys Elster meters equipped with a Sensus AMI communication module for all general service customers. The Elster meter meets the DSC requirements for interval and demand billing and allows collection of meter data over the existing Sensus AMI system that is used for residential smart meters.
Summary of Analysis for "Least Cost" and "Cost Efficient" Options (5.4.3.2.C.a. seventh bullet)WNH is not always in control of project outcomes or alternatives selected. The customers select the best value option for their development, which may be the highest cost option for WNH.
Results of the Final Economic Evaluation (5.4.3.2.C.a. eighth bullet)Not Applicable
Nature and Magnitude of System Impacts, Costs and Cost Recovery (5.4.3.2.C.a. ninth bullet)
Other Project Design or Implementation Options Considered (5.4.3.2.C.a. sixth bullet)
Not Applicable
How advanced technology has been incorporated into the project, including interoperability and cyber security (if applicable) (5.4.3.2.B.6.third bullet)Not Applicable
Category-specific requirements for each project/program - System Renewal (5.4.3.2.C.b.)
Factors Affecting Project Timing/Priority (5.4.3.2.C.a. first bullet)New and replacement meters are provided on demand to address new load growth, meter failures and distributed generation.
Factors Relating to Customer or 3rd Party Preference (5.4.3.2.C.a. second bullet)Metering for new and upgraded connection projects are customer initiated and are designed to meet customer identified requirements.
Factors Affecting Final Project Costs (5.4.3.2.C.a. third bullet)Main factors that affect final costs are size of service, type of service (overhead, underground), and metering location (primary, secondary). Final costs of individual projects cannot be determined until the proposed work is requested by customers and/or a failed/defective metering asset is found.
Controllable Cost Minimization (5.4.3.2.C.a. fourth bullet)The design and connection of services are standardized and, therefore, costs are controlled through well established processes, the use of standard material, and the efficiencies established through WNH's experience in executing such projects.
Other Planning Objectives Met (5.4.3.2.C.a. fifth bullet)The change-over of walk read to interval meters for general service customers will improve operating efficiency and support MIST billing using the Hourly Ontario Energy Price. The meter replacements were completed over a four year period between 2017 and 2020 in compliance with the Ontario Energy Board’s timelines as set out in EB-2013-0311.
Number of years proposed CDM program would be in place and number of years the required infrastructure would be deferred (5.4.3.2.B.6.second bullet)
Enabling of future technological functionality or addressing of future operational requirements (5.4.3.2.B.4.b)A component of this program supports the capital investments required for the ongoing operation, maintenance, and installation of the AMI. Refer to Section 2.4 of the DSP for more detail.
The Smart Meter infrastructure supports Time of Use billing and the province’s conservation culture. The AMI system also provides environmental benefits by reducing vehicle run time associated with manual meter reading.
Conservation and Demand Management (5.4.3.2.B.6)
Assessment of benefits of project for customer in terms of cost impacts to customers (where measurable) (5.4.3.2.B.6.first bullet)Not Applicable
Project: Overhead Line Renewal 2021 CapitalProject Summary
Page 19 of 68
Project Name OEB Investment Category System Renewal
Project Description
Detailed Listing of Affected Line Sections The following individual projects are covered by this project category:
WNH Project Sub Project Project Name Total
06EN04 16 Kumpf Dr - Randall to Northfield $349,87306EN04 18 Randall Dr/Conrad Pl $454,38506EN04 24 Bluevale Rd - Bridgeport to Mayfield Ave $199,37206EN04 32 Dutton Dr - Weber to OMSF $89,20806EN04 34 Bridge St W - University Ave to Lexington Rd $489,08006EN04 35 Boomer Ln - Kressler Rd to Herrgott Rd $542,02306EN04 41 Katherine St (RR23) - Lundy Rd to Crowsfoot Rd $639,81106EN04 73 Downtown Maryhill (St. Charles St & Maryhill Rd $417,594
Total 3,181,346$
Capital Investment Total Capital $3,181,346(5.4.3.2.A.first bullet)
O&M Costs (if applicable) $0
Capital Contributions to a Transmitter CCRA Contribution $0(5.4.3.2.A.second bullet)
Customer Attachments/Load (kVA) Customer Attachments (#): 3,587(5.4.3.2.A.third bullet) Customer Load (peak KVA) 21,198
Project Timing Start Date Sep-2020 Engineering(5.4.3.2.A.fourth bullet) Jan-2021 Construction
Expected In-Service Date Dec-2021
Expenditure Timing 2021 Q1 20% $636,269 2021 Q2 30% $954,404 2021 Q3 30% $954,4042021 Q4 20% $636,269
Schedule Risk and Risk Mitigation (5.4.3.2.A.fifth bullet)
General Information on the project/program (5.4.3.2.A)
Overhead Line Renewal
This program involves the planned rebuilding of overhead lines in poor condition. Typically these lines involve assets that are past their typical useful life (TUL), cannot be refurbished and if not replaced represent a risk to public safety and customer power reliability.
These lines were originally installed between the 1966 and 1980, are 40 to 54 yrs. of age, and have Health Index ratings in the Poor and Very Poor category. These ratings were developed through age, field inspection and pole testing criteria. In 2021, the program consists of 8 individual projects involving the replacement of 288 poles, 93 transformers and 11 km of overhead line. The lines being replaced have 470 customers directly connected to them and another 3117 customers connected down stream.
The project scope includes design, construction and installation of new taller poles designed to conform to O. Reg. 22/04 compliant standards as well as new wire, insulators, transformers and equipment. Newer construction standards and materials provide for more weather resilient assets to help maintain safety and reliability.
Projects within this program are prioritized based on condition of the assets from WNH's 2019 ACA results. Projects are scheduled and executed over the course of the year based on coordination with third parties and available resources. Overall this program is prioritized and paced in coordination with WNH's overall Capital Investment Plan.
Sub project numbers 16,18, and 32 are located in commercial/industrial areas. WNH's past experience with similar projects has found that scheduling outages with commercial customers is challenging due to the impact on their operations. WNH engages in extensive communication with each individual site owner to minimize impacts and delays.
Sub project numbers 24 and 34 are both located in established urban areas containing a substantial population of mature trees. WNH has past experience with similar projects and has found that greater public consultation is required to avoid the risk of project delays due to public objections. To help mitigate this risk, WNH reaches out to all customers well in advance of the project to inform them of upcoming work, provide options and to take customer input into consideration in the final design. Continuous communication prior to and throughout construction also takes place.
Sub project numbers 35 and 73 have no significant risk factors associated with their execution.
Part of sub project number 41 runs under a Hydro One Networks Inc. (HONI) transmission line. Rebuilding the line within HONI's right of way requires special conditions and authorization which can take time to work out. WNH is familiar with the requirements of this work and has experience obtaining the appropriate approvals prior to finalizing the of the design.
Not Applicable
Project: Overhead Line Renewal 2021 CapitalProject Summary
Page 20 of 68
Comparative Information(5.4.3.2.A.sixth bullet) 2016: 179,585$
2017: 608,222$ 2018: 514,169$ 2019: 1,117,214$ 2020: 235,928$
Total Capital & OM&A Costs Associated with REG Investments (5.4.3.2.A.seventh bullet)
Leave to Construct Approval (5.4.3.2.A.eighth bullet)
Main Driver (5.4.3.2.B.1.a)
Related Objectives/Performance Targets
Source and Nature of the Information Used to Justify the Investment
Secondary Driver(s) (5.4.3.2.B.1.a)
Related Objectives/Performance Targets
Source and Nature of the Information Used to Justify the Investment
Good Utility Practice (5.4.3.2.B.1.b)
Investment Priority (5.4.3.2.B.1.c)
Not Applicable
Not Applicable
Evaluation Criteria and information requirements for each project/program (5.4.3.2.B) Efficiency, Customer Value, Reliability (5.4.3.2.B.1)
The main driver for these project is the age and condition of the existing plant.
WNH Strategic Imperatives 1 (Supply & Reliability) & 2 (Health, Safety and Environment) as identified in Exhibit 1.
The source of the information used to justify this investment is the ACA, as further detailed in Appendix A of the DSP. These lines were originally installed between the 1966 and 1980, are 40 to 54 years of age, and 181 poles have Health Index ratings in the Poor and Very Poor category with another 62 in fair condition. These ratings were developed through WNH's 2019 ACA results.
WNH's ACA program uses asset degradation factors such as age, pole treatment, inspection and testing data to develop a Health Index (HI) for each of its pole assets. The HI is converted into a condition rating that can range from Very Good to Very Poor. Assets in Poor and Very Poor condition are identified and grouped into executable projects. Depending on their criticality to customer impact, assets in fair condition may also be grouped into executable projects and evaluated through the WNH asset management and prioritization process described in Section 3.1 and Section 4.2.2 of the DSP.
The projects selected for execution in 2021, in addition to having a substantial number of poles in very poor, poor, or approaching poor condition, also have higher customer impact of failure compared to other identified pole lines in poor condition. Subprojects 16, 18, and 32 are supplying power to commercial and industrial areas. All other subproject are along critical tie lines between feeders or stations. In addition, Subproject 24 is in a section of one of WNH's worst performing feeders.
Not Applicable
Not Applicable
Not Applicable
WNH utilizes Utility Standards Forum design standards. These standards are based on CSA C22.3 No 1-15 Overhead Systems Heavy Weather Loading design standards. Newer construction standards and materials provide for more weather resilient assets to help maintain safety and reliability. WNH overhead designs facilitates the future incorporation of grid modernization equipment and renewable energy generation. WNH conducts annual inspection and testing programs, evaluates the results and reprioritizes the replacement of assets if required.
Although pole condition is normally the main driver for overhead renewal projects, other assets such as transformers, insulators, wire, arrestors are also replaced as part of pole line rebuild. These assets are nearing end of life and would not normally survive a second life cycle. Replacing these assets all at the same time is more cost effective and less disruptive than waiting until individual assets fail or reach end of life.
System Access investments are ranked as top priority, as they are mandated by regulation or code.
System Renewal assets are prioritized by the health condition of the assets developed through its ACA program. Assets found at risk of imminent failure or high public safety risk are prioritized for immediate replacement.
WNH is utilizing METSCO's Asset Analysis, Prioritization, and Optimization Tool, ENGIN to aid in prioritizing asset replacement. Assets flagged for replacement are geospatially grouped to create constructible projects.
Projects are ranked by taking into account their overall health condition, customer impact, alignment with WNH Strategic Imperatives (refer to Table 4-4 of the DSP and Exhibit 1) such as reliability, safety, financial or environmental risk and additional drivers and benefits. In addition to the aforementioned this can include improvements in power quality, system loss reduction (voltage conversion), operational flexibility, accessibility to operate and maintain, ability to address future system growth or restoration needs, and regulatory compliance. The greater the customer impact or the more drivers or benefits that are attributed to a project the higher its priority.
Investments in System Service and General Plant categories are prioritized in a similar fashion. Analysis of impact on customers and consideration of impact of project deferral are also considered. The compiled list of projects is reviewed and prioritized by Senior WNH Engineering, Operations, IT and Finance staff.
Based on the outcome of this process, this project ranks 8 out of 16. Refer to Table 4-22 of the DSP for further details.
In 2016, WNH deferred some projects to free resources for a major System Access project. Planned renewal of pole lines in poor condition is divided between 4 categories: Overhead Line Renewal, Failing Conductor Renewal, Line Renewal (4kV), and Line Renewal (8kV). The 4kV line renewal program is now complete and the 8kV line renewal needs are now reduced. On a go forward basis, majority of pole line rebuild projects without failing conductor will be classified as Overhead Line Renewal, with the remaining being in the 8kV renewal category.
Comparable investments in previous years are as follows:
Project: Overhead Line Renewal 2021 CapitalProject Summary
Page 21 of 68
Effect on system operation efficiency and cost effectiveness (first bullet)
Net benefits accruing to customers (second bullet)
Impact of Investment on reliability performance (including on the frequency and duration of outages) (third bullet)
Scheduling Alternatives
Ownership and/or Funding Alternatives
Environmental Benefits (5.4.3.2.B.5)
Not Applicable
Not Applicable
Coordination with utilities, regional planning and/or links with 3rd parties (where applicable) (5.4.3.2.B.4.a)WNH will meet with the area Utility Coordinating Council and municipal staff (where applicable) as well as third party stakeholders to exchange project details to coordinate construction. Since these are 2021 projects, this coordination will most likely occur in Q3-Q4 2020.
Enabling of future technological functionality or addressing of future operational requirements (5.4.3.2.B.4.b)New lines generally incorporate larger conductor, increased strength, and where available, higher voltages. As a result, system is better able to withstand poor weather conditions; provide increased capacity and siting options for the connection of renewable energy generation, electric vehicles, energy storage; provide increased physical space for third party communications and smart grid devices; and reduce power quality issues and losses.
Not Applicable
Conservation and Demand Management (5.4.3.2.B.6)
Assessment of benefits of project for customer in terms of cost impacts to customers (where measurable) (5.4.3.2.B.6.first bullet)
Number of years proposed CDM program would be in place and number of years the required infrastructure would be deferred (5.4.3.2.B.6.second bullet)Not Applicable
How advanced technology has been incorporated into the project, including interoperability and cyber security (if applicable) (5.4.3.2.B.6.third bullet)
These projects ensure the elimination of safety hazards and that reliability is maintained. Additionally, the standards to which pole lines must be built today compared to the existing pole lines ensures they are able to withstand more adverse weather conditions and increases the clearances around the conductors to assist in both the frequency and duration of outages.
System Renewal investments are instrumental in reducing the risk of critical asset failures, maintaining reliability and safety performance measures and keeping expensive reactive maintenance activities to a minimum.
Scheduling changes within the calendar year due to weather, coordination with third parties and resource constraints can usually be accommodated for smaller projects. Rescheduling larger projects can increase costs due to the reassignment of labour and materials and the risk of asset failure. WNH evaluates the risk and cost of rescheduling any project to achieve the most cost effective outcome.
These projects are constructed in the public right-of-way and will consist solely of WNH's assets. There are no ownership or funding alternatives.
Safety (5.4.3.2.B.2)The new construction standards make work on pole lines much safer for all workers due to increased separation of high voltage conductors between themselves as well as from low voltage conductors. The replacement also minimizes the risk of unexpected pole failures in these areas, decreasing risk to the public.
Co-ordination, Interoperability (5.4.3.2.B.4)
Analysis of the Project and Project Alternatives (5.4.3.2.B.1.d)
All pole line sections under this project have been identified as being in poor condition and in need of replacement. In light of this fact, WNH considered the following alternatives:
a) Do Nothing - this option results in the perpetuation of operational issues, increased risk of safety incidents, and further deterioration resulting in a decrease in reliability, and is therefore not considered appropriate.
b) Refurbish the Lines - these line sections are not appropriate candidates for refurbishment as most poles are too short and structurally too weak to comply with today's safety standards as required by O. Reg. 22/04
c) Replace the Lines with Underground Lines - in most situations overhead line burial is technically feasible but often cost prohibitive. WNH's typical line burial costs range between 5x (for local single phase lines) to 10x (for three phase trunk circuits) the equivalent overhead rebuild costs. Due to cost impacts this option is not considered feasible.
d) Replace Like for Like to New Standards - this is the preferred option for those line sections already operating at their ultimate planned voltage (all subprojects except for 41 and 73). Today's safety standards require same class and height of poles for 8kV as for higher voltage systems and certain 8kV components are no longer available from manufacturers as they are considered obsolete technology. For all these reasons, the Replace Like for Like option is not considered appropriate nor technically feasible for lines presently operating at 8kV (subprojects 41 and 73).
e) Replace Like for Like with Provisions for Operation at Higher Voltages - this option allows for replacement of aged or unsafe equipment, allows for ultimate conversion to higher operating voltage with minimal equipment change when conversion takes place, ultimately eliminates the need for expensive station upgrades, provides operational flexibility by ultimately harmonizing the system voltage, improves power quality from a voltage performance point of view, and is therefore, the preferred option for subprojects 41 and 73.
The renewal of sub project numbers 41 and 73 will ultimately permit the operation of lines at 27.6kV, which will increase flexibility of the system as a whole in outage scenarios and day to day switching. It will also contribute to a small reduction of line loss on the system.
The renewal of this infrastructure will have the following benefits: the aversion of potentially adverse effects on reliability and safety, avoidance of an increase to maintenance costs, ultimately provide for increased flexibility of the system via harmonization of the distribution voltages, a small decrease in line losses, and a small increase in capacity for connection of DERs.
Cyber-security, Privacy (5.4.3.2.B.3)Not Applicable
Project: Overhead Line Renewal 2021 CapitalProject Summary
Page 22 of 68
Asset Condition Relative to Typical Life Cycle (5.4.3.2.C.b.first bullet.second dash)
Number of Customers in Each Class Potentially Affected (5.4.3.2.C.b.first bullet.third dash)
Quantitative Customer Impact and Risk (5.4.3.2.C.b.first bullet.fourth dash)
Qualitative Customer Impact and Risk (5.4.3.2.C.b.first bullet.fifth dash)
Value of Customer Impact (5.4.3.2.C.b.first bullet.sixth dash)
This project affects 3245 residential customers, 52 generation customers, 250 small commercial customers and 40 large commercial customers.
Quantitative customer impact and risk are not available. WNH is working with vendors of existing software platforms (OMS, AMI, and CIS) to develop data capture capabilities to be integrated with METSCO's Asset Analysis, Prioritization, and Optimization Tool, ENGIN. This process is expected to be substantially completed before WNH's next cost of service filing.
The renewal of these assets will ensure future level of reliability is maintained, eliminate safety issues and allow for increased flexibility of the operation of the grid. All of this will maintain or improve customer satisfaction.
Customer impact in terms of potential failure is medium. These projects supply a mix of residential, commercial, industrial and farm services. Although costs of repair of failed assets are high, the problem can be located quickly, and the risk of prolonged outages is low.
Category-specific requirements for each project/program - System Renewal (5.4.3.2.C.b.)
Relationship between the Characteristics of Targeted Assets and the Consequences of Asset Failure (5.4.3.2.C.b.first bullet)
Asset Performance Targets and Asset Lifecycle Optimization Policies and Practices (5.4.3.2.C.b.first bullet.first dash)The majority of the poles, conductors and equipment have been found to be in poor condition by WNH's ACA program and past their TUL.
The majority of the poles, conductors and equipment are past their TUL of 45 years and generally in poor condition. Intermixed, there may be poles that are newer but lack the required height and structural strength to meet today's safety standards required by O. Reg. 22/04. Pole lines are evaluated in their entirety when being considered for replacement.
Analysis of Project Benefits, Cost, Alternatives and Timing (5.4.3.2.C.b.fifth bullet)The projects identified are in poor condition, near or past their TUL. Further deferral carry an increased risk of negative impacts to safety and reliability. Alternatives selected where additional benefits cannot be readily quantified do not come at significant cost increases.
Like for Like Renewal Analysis (5.4.3.2.C.b.sixth bullet)Projects in this category fall as closely as possible to the Like for Like definition given the technical obsolescence of 8kV components. Alternatives selected where additional benefits cannot be readily quantified do not come at significant cost increases.
Other Factors Affecting Project Timing (5.4.3.2.C.b.second bullet)There are no factors that may affect the timing of the proposed projects that have not already been addressed above.
Consequences for System O&M costs (5.4.3.2.C.b.third bullet)There will be no immediate material impact to O&M costs for distribution lines. Without these projects, assets will transition from poor condition to failure, increasing future O&M costs.
Reliability and Safety Factors (5.4.3.2.C.b.fourth bullet)Please see answers provided to Section 5.4.3.2.B.1.d and Section 5.4.3.2.B.2 above.
Project: Underground Line Renewal 2021 CapitalProject Summary
Page 23 of 68
Project Name OEB Investment Category System Renewal
Project Description
Detailed Listing of Affected Line Sections The following individual projects are covered by this project category:
WNH Project Sub Project Project Name Total
06EN09 24 Northlake - Phase 3 (Area 4) $1,054,93206EN09 26 Golf Course Rd Voltage Conversion $380,515
Total 1,435,447$
Capital Investment Total Capital $1,435,447(5.4.3.2.A.first bullet)
O&M Costs (if applicable) $0
Capital Contributions to a Transmitter CCRA Contribution $0(5.4.3.2.A.second bullet)
Customer Attachments/Load (kVA) Customer Attachments (#): 406(5.4.3.2.A.third bullet) Customer Load (peak KVA) 1,189
Project Timing Start Date Apr-2021(5.4.3.2.A.fourth bullet)
Expected In-Service Date Dec-2021
Expenditure Timing 2021 Q1 10% $143,545 2021 Q2 30% $430,634 2021 Q3 30% $430,6342021 Q4 30% $430,634
Schedule Risk and Risk Mitigation (5.4.3.2.A.fifth bullet)
Comparative Information(5.4.3.2.A.sixth bullet) 2016: $1,536,029
2017: $1,602,5162018: $1,630,8172019: $1,953,6072020: $1,770,943
Total Capital & OM&A Costs Associated with REG Investments (5.4.3.2.A.seventh bullet)
Leave to Construct Approval (5.4.3.2.A.eighth bullet)
The historical years are representative of typical expenditures. 2021 projects, although budgeted lower, carry a risk of scope increase due to the condition of secondary conductor.
Not Applicable
Not Applicable
There will be no significant schedule risks anticipated since work in these neighbourhoods has already started with no issues. However, there is a risk of scope increase due to condition of secondary cable triggering spot replacement. Further field investigations are required, however, based on work done in this neighbourhood in 2019, it appears that some of the newer secondary cables may be in worse condition than older ones. Given that this is an anticipated risk, WNH is prepared to address this with additional contract resources.
Comparable investments in previous years are as follows:
General Information on the project/program (5.4.3.2.A)
Underground Line Renewal
This project category is comprised of direct buried underground lines, transformers and switches approaching or past their typical useful life (TUL).
These lines and associated equipment were originally installed between late 1970's and mid 1980's. At the time of initial installation, WNH followed a common practice of placing normal overhead transformers in below-grade vaults. Over the years this has proven to have several serious shortcomings, including safety risks for the crews due to the placement of exposed high voltage transformer connections, frequent failures of the transformers due to water and moisture issues causing premature corrosion as well as associated environmental concerns with oil leaks due to rusted transformers. Many are located in sidewalks and boulevards where physical deterioration can present a public safety hazard. The replacement of these assets is being planned as they are costly and time consuming to repair on a reactive basis.
The project scope includes design, construction and installation of new primary cables in conduits as well as replacement of existing below-grade transformers with padmounted style ones, resulting in improved reliability as well as safety. Section 2.1.1.1 of the DSP describes the plan to pace WNH’s direct buried underground cable replacements. This approach was developed to lower the risk to WNH as the timing of asset failure is never a certainty and with a large approaching population of assets near end-of-life, even a small sudden change in failure rates could be overwhelming.
The new underground primary system will be converted from existing voltages to 27.6 kV as part of the overall system planning strategy. Rebuilds in the Northlake area have already been started and support the system need to offload Scheifele B Transformer Station as described in the WNH System Supply Capacity Study (Appendix J of the DSP). As construction and conversion from 13.8kV to 27.6kV proceeds, the looped supplies on the 13.8kV side are severed and the project must continue until new looped supplies are re-established at the 27.6kV system level. Rebuilds in the Golf Course area support rebuild and voltage conversion of an 8.32kV pole line to 27.6kV, which in turn enhances contingency options for supplying one of WNH's distribution stations.
Not Applicable
Project: Underground Line Renewal 2021 CapitalProject Summary
Page 24 of 68
Main Driver (5.4.3.2.B.1.a)
Related Objectives/Performance Targets
Source and Nature of the Information Used to Justify the Investment
Secondary Driver(s) (5.4.3.2.B.1.a)
Related Objectives/Performance Targets
Source and Nature of the Information Used to Justify the Investment
Good Utility Practice (5.4.3.2.B.1.b)
Investment Priority (5.4.3.2.B.1.c)
The new underground primary system will be converted from existing voltages to 27.6 kV as part of the overall system planning strategy. WNH incorporates voltage conversion as part of the renewal program where appropriate. Distribution systems at higher voltages increase load transfer capability to improve reliability of supply and allow a higher penetration of distributed energy resources.
Rebuilds in the Northlake area have already been started and support the system need to offload Scheifele B Transformer Station as described in the WNH System Supply Capacity Study (Appendix J of the DSP). As construction and conversion from 13.8kV to 27.6kV proceeds, the looped supplies on the 13.8kV side are severed and the project must continue until new looped supplies are re-established at the 27.6kV system level.
Rebuilds in the Golf Course Rd area support rebuild and voltage conversion of an 8.32kV pole line to 27.6kV, which in turn enhances contingency options for supplying one of WNH's distribution stations.
Please refer to Section 3.1 of the DSP for further details on WNH's asset management process.
Replacing deteriorated assets with those that meet today's standards improves safety, maintains reliability, increases resilience, and facilitates connection of new innovative technologies to the grid.
WNH ensures that renewal of underground residential subdivisions allows for a flexible and resilient distribution system that also supports future growth. This includes considerations such as primary loops (installed or provisioned for future), sizing of equipment to meet current and any future loads, careful selection of equipment placement in a location that is accessible and easy to maintain, and alignment with long term system needs including securing of easements.
System Access investments are ranked as top priority, as they are mandated by regulation or code.
System Renewal assets are prioritized by the health condition of the assets developed through its ACA program. Assets found at risk of imminent failure or high public safety risk are prioritized for immediate replacement.
WNH is utilizing METSCO's Asset Analysis, Prioritization, and Optimization Tool, ENGIN to aid in prioritizing asset replacement. Assets flagged for replacement are geospatially grouped to create constructible projects.
Projects are ranked by taking into account their overall health condition, customer impact, alignment with WNH Strategic Imperatives (refer to Table 4-4 of the DSP and Exhibit 1) such as reliability, safety, financial or environmental risk and additional drivers and benefits. In addition to the aforementioned this can include improvements in power quality, system loss reduction (voltage conversion), operational flexibility, accessibility to operate and maintain, ability to address future system growth or restoration needs, and regulatory compliance. The greater the customer impact or the more drivers or benefits that are attributed to a project the higher its priority.
Investments in System Service and General Plant categories are prioritized in a similar fashion. Analysis of impact on customers and consideration of impact of project deferral are also considered. The compiled list of projects is reviewed and prioritized by Senior WNH Engineering, Operations, IT and Finance staff.
Based on the outcome of this process, this project ranks 7 out of 16. Refer to Table 4-22 of the DSP for further details.
Evaluation Criteria and information requirements for each project/program (5.4.3.2.B) Efficiency, Customer Value, Reliability (5.4.3.2.B.1)
The assets targeted by this program are direct buried cables near end of typical useful life. In Northlake additional drivers include age and condition of existing below grade transformers and termination connection accessories.
WNH Strategic Imperatives 1 (Supply & Reliability) & 2 (Health, Safety and Environment) as identified in Exhibit 1.
The majority of the proposed work involves the replacement of approximately 7.1 km of direct buried XLPE primary cables approaching poor condition along with associated transformers and devices. The submersible transformers, vaults and devices have also been found to be physically deteriorating due to salt and corrosion. Many are located in sidewalks and boulevards where physical deterioration can present a public safety hazard. The replacement of these assets is being planned as they are costly and time consuming to repair on a reactive basis.
WNH has total 138 km directly buried primary cable with 35.5 km of directly buried cable approaching poor condition. WNH looks beyond the 5-year forecast period to determine the rate of approaching asset replacements and develops a pace of replacement that attempts to levelize capital expenditures and resources. At the proposed pace, it will take 17 years in order for completely replace the total population of the directly buried cables. This approach lowers the risk to WNH as the timing of asset failure is never a certainty and with a large population of assets approaching end-of-life, even a small sudden change in failure rates could be overwhelming.
Please refer to Section 2.1.1.1 of the DSP for additional details as well as Section 3.1 of the DSP for WNH's asset management process.
The secondary drivers for this program are operational efficiency and restoration of reliability standards.
WNH Strategic Imperatives 6 (Organizational Effectiveness) & 1 (Supply & Reliability) as identified in Exhibit 1.
Project: Underground Line Renewal 2021 CapitalProject Summary
Page 25 of 68
Effect on system operation efficiency and cost effectiveness (first bullet)
Net benefits accruing to customers (second bullet)
Impact of Investment on reliability performance (including on the frequency and duration of outages) (third bullet)
Scheduling Alternatives
Ownership and/or Funding Alternatives
Environmental Benefits (5.4.3.2.B.5)
All pad mounted transformers built to CSA Standards have no exposed live components. Replacing below-grade overhead type transformers with pad mounted transformers mitigates electrical contact risk and increases operational safety to utility workers.
Analysis of the Project and Project Alternatives (5.4.3.2.B.1.d)
a) Do Nothing - this option results in the perpetuation of operational issues, increased risk of safety incidents, environmental concerns due to oil leaks, and further deterioration resulting in decrease in reliability. It also would not contribute to addressing grater system needs such as load rebalancing and contingency enhancements, and is therefore not considered appropriate.
b) Replace with Overhead Lines - this option was investigated and considered not viable as it violates conditions applied to subdivision approvals requiring the burial of hydro services, as secured through a legally binding agreement pursuant to the Planning Act that remains binding after the completion of the subdivision. It also is in direct contradiction to the preferences communicated by customers regarding tree trimming. Adding new overhead lines in previously underground areas with many mature trees increases substantially tree trimming. Approximately 90% of WNH customers would like to see same or less tree trimming as detailed in the Customer Engagement Survey Report in Appendix L of the DSP. c) Refurbish the Lines - WNH considered the option of cable rejuvenation and found that it was not a good fit for this neighbourhood because of the advanced deterioration of the cable as well as a large number of splice locations, some under driveways, considerably driving up rejuvenation and restoration costs. Through the analysis of this option, WNH also learned that the initial cable installation consisted of unjacketed cable, which over time resulted in deterioration of the neutral conductors. In addition, this option would perpetuate operational, safety, environmental, efficiency, and reliability risks associated with below-grade transformers. It also would not contribute to addressing greater system needs such as load rebalancing and contingency enhancements, and for these reasons, was not considered appropriate.
d) Replace Like for Like to New Standards - Today's standard for WNH underground construction call for use of padmounted transformers. This option adequately addresses the operational, safety, environmental, and reliability risks, but it does not contribute to better utilization of existing 27.6kV capacity and does not align with long term system plans. It is important to note that for WNH, the costs for renewal of underground infrastructure in residential subdivisions is approximately the same for 27.6kV as for 13.8kV. A number of years ago, WNH surveyed the marketplace and concluded that it was cheaper to standardize on 27.6kV cable and use it in 13.8kV applications than to buy separate quantities of each. Hence, WNH only stocks 28kV class underground cable and associated terminations. This is not the preferred option as it fails to reap the benefits of operation at 27.6kV voltage at no additional cost and it does not align with long term system plans.
e) Replace Like for Like at Higher Operating Voltages - this option adequately addresses the operational, safety, environmental, reliability, efficiency, and system needs and is the preferred solution.
The renewal of this infrastructure will have the following benefits: reduction of the number and duration of outages, improvements in operational efficiency due to removal of extra steps required to deal with safety risks of below-grade transformers, avoidance of an increase to maintenance costs, better utilization of existing infrastructure, a decrease in line losses, and reduced environmental risks due to oil spills from leaky rusty below grade transformers.
Many existing aging below-grade transformers have experienced failing primary and secondary connection accessories due to exposure to water and moisture. Accessing those connection points for repair is normally time consuming as described above. The renewal of this infrastructure is expected to have a positive effect on reliability to the customers in these subdivisions.
System Renewal investments are instrumental in reducing the risk of critical asset failures, maintaining reliability and safety performance measures and keeping expensive reactive maintenance activities to a minimum.
Scheduling changes within the calendar year due to weather, coordination with third parties and resource constraints can usually be accommodated for smaller projects. Rescheduling larger projects can increase costs due to the reassignment of labour and materials and the risk of asset failure as well as defers immediate benefits to the system and to customers. WNH evaluates the risk and cost of rescheduling any project to achieve the most cost effective outcome.
These projects are constructed in the public right-of-way and will consist solely of WNH's assets. There are no ownership or funding alternatives.
Safety (5.4.3.2.B.2)
The replacement of below-grade transformers is expected to have a positive effect on the efficiency of operations in this neighbourhood for day to day switching as well as during unplanned outage scenarios. This is because WNH must follow extra steps to address safety concerns with exposed high voltage connections in below-grade transformers that are not required for switching padmounted transformers. As the below-grade transformers are often submersed in water, extra time in needed to deal with this concern when connection changes at a transformer are needed, especially in colder months when the water freezes.
Renewal of the subdivisions at 27.6kV will make more efficient use of capacity available at this voltage, reduce losses, address greater system needs such as load rebalancing and contingency enhancements.
Number of years proposed CDM program would be in place and number of years the required infrastructure would be deferred (5.4.3.2.B.6.second bullet)
Cyber-security, Privacy (5.4.3.2.B.3)Not Applicable
Co-ordination, Interoperability (5.4.3.2.B.4)
Coordination with utilities, regional planning and/or links with 3rd parties (where applicable) (5.4.3.2.B.4.a)WNH meets with the area Utility Coordinating Council and municipal staff (where applicable) as well as third party stakeholders to exchange project details to coordinate construction. As portions this projects have already started prior to 2021, this coordination is on-going.
Enabling of future technological functionality or addressing of future operational requirements (5.4.3.2.B.4.b)This project is in direct support of the WNH short term and long term system needs. If full replacement of secondary service conductors becomes a part of this project, new residential services are designed with capacity and capability to permit behind the meter customer generation and electric vehicle charging. Each new service to a residential building is sized 200A to facilitate customer load growth.
Reduced risk of oil spills due to leaking transformers.
Conservation and Demand Management (5.4.3.2.B.6)
Assessment of benefits of project for customer in terms of cost impacts to customers (where measurable) (5.4.3.2.B.6.first bullet)Not Applicable
Not Applicable
How advanced technology has been incorporated into the project, including interoperability and cyber security (if applicable) (5.4.3.2.B.6.third bullet)Not Applicable
Project: Underground Line Renewal 2021 CapitalProject Summary
Page 26 of 68
Asset Condition Relative to Typical Life Cycle (5.4.3.2.C.b.first bullet.second dash)
Number of Customers in Each Class Potentially Affected (5.4.3.2.C.b.first bullet.third dash)
Quantitative Customer Impact and Risk (5.4.3.2.C.b.first bullet.fourth dash)
Qualitative Customer Impact and Risk (5.4.3.2.C.b.first bullet.fifth dash)
Value of Customer Impact (5.4.3.2.C.b.first bullet.sixth dash)
Consequences for System O&M costs (5.4.3.2.C.b.third bullet)
Category-specific requirements for each project/program - System Renewal (5.4.3.2.C.b.)
Relationship between the Characteristics of Targeted Assets and the Consequences of Asset Failure (5.4.3.2.C.b.first bullet)
Asset Performance Targets and Asset Lifecycle Optimization Policies and Practices (5.4.3.2.C.b.first bullet.first dash)Section 2.1.1.1 of the DSP describes the plan to pace WNH’s direct buried underground cable replacements. This approach was developed to lower the risk to WNH as the timing of asset failure is never a certainty and with a large population of assets approaching end-of-life, even a small sudden change in failure rates could be overwhelming. Thoughtfully paced asset replacement strategy is the only viable alternative.
Some assets planned for replacement in this program are deteriorated beyond repair and in some cases contain critical design flaws. These factors pose failure and safety risks to the system, customers, and field crews. This will continue to drive O&M costs if not addressed.
This project affects 401 residential customers, 5 small commercial customers.
Quantitative customer impact and risk are not available. WNH is working with vendors of existing software platforms (OMS, AMI, and CIS) to develop data capture capabilities to be integrated with METSCO's Asset Analysis, Prioritization, and Optimization Tool, ENGIN. This process is expected to be substantially completed before WNH's next cost of service filing.
The renewal of this section of line will ensure that the number and duration of outages are reduced, future level of reliability is maintained, eliminate safety issues, make efficient use of existing infrastructure, and support future system needs. All of this will maintain or improve customer satisfaction.
Customer impact in terms of potential failure is medium. Even though this area is predominately residential and loss of economic productivity is not a significant factor, asset failures are often hard to find, cannot be repaired quickly (require excavation, emergency locates, etc.) and therefore, lead to prolonged outages.
Other Factors Affecting Project Timing (5.4.3.2.C.b.second bullet)Subproject 24 is part of a multi-year program to rebuild and convert the Lakeshore North subdivision to 27.6kV. Delays in the 2020 portion of the work may be added to the scope of the 2021 work. Subproject 26 must be done in tandem with the rebuild of Sawmill Rd described in Overhead Renewal (8kV) program.
Please see answers provided to Section 5.4.3.2.B.1.d above.
There will be no immediate material impact to O&M costs for distribution lines. Without these projects taking place, O&M costs are expected to rise over time at an increasing rate due to increase of below-grade transformer failures, oil spills, and associated environmental cleanup costs.
Reliability and Safety Factors (5.4.3.2.C.b.fourth bullet)Without these projects, assets will transition from poor condition to failure increasing system interruptions and customer outage minutes. Please see answers provided to Section 5.4.3.2.B.1.d and Section 5.4.3.2.B.2 above.
Analysis of Project Benefits, Cost, Alternatives and Timing (5.4.3.2.C.b.fifth bullet)Please see answers provided to Section 5.4.3.2.B.1.d above. Alternatives selected where additional benefits cannot be readily quantified do not come at significant cost increases.
Like for Like Renewal Analysis (5.4.3.2.C.b.sixth bullet)
Project: Overhead Line Renewal - Failing Conductor 2021 CapitalProject Summary
Page 27 of 68
Project Name OEB Investment Category System Renewal
Project Description
Detailed Listing of Affected Line Sections The following individual projects are covered by this project category:
WNH Project Sub Project Project Name Total
06EN04 29 Floradale Rd - Arthur St to Cedar Spring $406,81306EN04 30 Lerch Rd - Downstream of Tx 7693 $128,41706EN04 31 Maryhill Rd - Crowsfoot Rd to FC-8-826 $318,757
Total 853,987$
Capital Investment Total Capital $853,987(5.4.3.2.A.first bullet)
O&M Costs (if applicable) $0
Capital Contributions to a Transmitter CCRA Contribution $0(5.4.3.2.A.second bullet)
Customer Attachments/Load (kVA) Customer Attachments (#): 35(5.4.3.2.A.third bullet) Customer Load (peak KVA) 128
Project Timing Start Date May-2021(5.4.3.2.A.fourth bullet)
Expected In-Service Date Nov-2021
Expenditure Timing 2021 Q1 20% $170,797 2021 Q2 30% $256,196 2021 Q3 30% $256,1962021 Q4 20% $170,797
Schedule Risk and Risk Mitigation (5.4.3.2.A.fifth bullet)
Comparative Information(5.4.3.2.A.sixth bullet) 2016: $30,618
2017: $405,6732018: $312,8012019: $647,7912020: $1,245,812
Total Capital & OM&A Costs Associated with REG Investments (5.4.3.2.A.seventh bullet)
Leave to Construct Approval (5.4.3.2.A.eighth bullet)
2016 expenditures were unusually low. Please see Section 4.3.4 of the DSP for an explanation. In 2018, through asset inspection programs, additional segments of rural lines with failing conductor were identified and program expenditures increased to $900,000 per year. One of the planned 2019 projects started very late in the year and is being completed in 2020.
Not Applicable
Not Applicable
Not Applicable
These projects have no significant risk factors associated with their execution. As some of these projects are located within narrow right of ways, negotiations for anchoring easements on private properties may be required. This is a factor that is identified early in the design process to ensure sufficient time is available for coordination with land owners.
Comparable investments in previous years are as follows:
General Information on the project/program (5.4.3.2.A)
This project category is comprised of overhead lines that pose a safety risk and are in poor condition. These lines have small conductors which have a tendency to become brittle as they age and fail prematurely, especially during storms. Such failures result in significant safety risk to workers and general public such as energization of the earth near the fallen conductor (which could lead to electrocution of any person or livestock nearby), fire on the ground as well as at the pole, and falling debris due to fire.
These lines are also in need of complete replacement due to their age (early 1960's to late 1980's), condition, or inadequacy to meet today's standards. In 2021, the program consists of 3 individual projects involving the replacement of 89 poles, 30 transformers and 5.8 km of overhead line. The lines being replaced have 35 customers directly connected to them.
The project scope includes design, construction and installation of new taller poles framed to conform to O. Reg. 22/04 compliant standards as well as new wire, insulators, transformers and equipment. Newer construction standards and materials provide for more weather resilient assets to help maintain safety and reliability.
Projects within this program are prioritized based on condition of the assets from WNH's 2019 ACA results. Projects are scheduled and executed over the course of the year based on coordination with third parties and available resources. Overall this program is prioritized and paced in coordination with WNH's overall Capital Investment Plan.
Overhead Line Renewal - Failing Conductor
Project: Overhead Line Renewal - Failing Conductor 2021 CapitalProject Summary
Page 28 of 68
Main Driver (5.4.3.2.B.1.a)
Related Objectives/Performance Targets
Source and Nature of the Information Used to Justify the Investment
Secondary Driver(s) (5.4.3.2.B.1.a)
Related Objectives/Performance Targets
Source and Nature of the Information Used to Justify the Investment
Good Utility Practice (5.4.3.2.B.1.b)
Investment Priority (5.4.3.2.B.1.c)
Effect on system operation efficiency and cost effectiveness (first bullet)
The source of the information used to justify this investment is the ACA, as further detailed in Appendix A of the DSP. WNH's ACA program uses asset degradation factors such as age, pole treatment, inspection and testing data to develop a Health Index (HI) for each of its pole assets. The HI is converted into a condition rating that can range from Very Good to Very Poor. Assets in Poor and Very Poor condition are identified and grouped into executable projects.
Most of the infrastructure being replaced was originally put in service from early 1960's, with some poles replaced in the early 80's. The older poles have been identified through regular inspection as being in poor condition. The newer poles lack the required height and structural strength for accommodating a larger wire and meeting today's standards, and must also be replaced. The combination of the primary and secondary drivers adds a level of urgency to this specific category of projects.
WNH utilizes Utility Standards Forum design standards. These standards are based on CSA C22.3 No 1-15 Overhead Systems Heavy Weather Loading design standards. Newer construction standards and materials provide for more weather resilient assets to help maintain safety and reliability. WNH overhead designs facilitates the future incorporation of grid modernization equipment and renewable energy generation. WNH conducts annual inspection and testing programs, evaluates the results and reprioritizes the replacement of assets if required.
For these projects, conductor condition is the main driver, however, other assets such as poles, transformers, insulators, arrestors are also replaced. These assets are nearing end of life and would not normally survive a second life cycle. Replacing these assets all at the same time is more cost effective and less disruptive than waiting until individual assets fail or reach end of life.
System Access investments are ranked as top priority, as they are mandated by regulation or code.
System Renewal assets are prioritized by the health condition of the assets developed through its ACA program. Assets found at risk of imminent failure or high public safety risk are prioritized for immediate replacement.
WNH is utilizing METSCO's Asset Analysis, Prioritization, and Optimization Tool, ENGIN to aid in prioritizing asset replacement. Assets flagged for replacement are geospatially grouped to create constructible projects.
Projects are ranked by taking into account their overall health condition, customer impact, alignment with WNH Strategic Imperatives (refer to Table 4-4 of the DSP and Exhibit 1) such as reliability, safety, financial or environmental risk and additional drivers and benefits. In addition to the aforementioned this can include improvements in power quality, system loss reduction (voltage conversion), operational flexibility, accessibility to operate and maintain, ability to address future system growth or restoration needs, and regulatory compliance. The greater the customer impact or the more drivers or benefits that are attributed to a project the higher its priority.
Investments in System Service and General Plant categories are prioritized in a similar fashion. Analysis of impact on customers and consideration of impact of project deferral are also considered. The compiled list of projects is reviewed and prioritized by Senior WNH Engineering, Operations, IT and Finance staff.
Based on the outcome of this process, this project ranks 3 out of 16. Refer to Table 4-22 of the DSP for further details.
Analysis of the Project and Project Alternatives (5.4.3.2.B.1.d)
All pole line sections under this project have been identified as posing a safety risk to workers and general public, being at the end of their useful life, and in need of replacement. In light of this fact, WNH considered the following alternatives:
a) Do Nothing - this option results in an increased risk of serious safety incidents and further deterioration in reliability. Given the severity of the safety risks to general public, the Do Nothing option could be considered negligent, and for all these reasons, is not considered appropriate. b) Refurbish the Lines - these line sections are not appropriate candidates for refurbishment as most poles are too short and structurally too weak to comply with today's safety standards as required by O. Reg. 22/04.
c) Replace the Lines with Underground Lines - in most situations overhead line burial is technically feasible but often cost prohibitive. WNH's typical line burial costs range between 5x (for local single phase lines) to 10x (for three phase trunk circuits) the equivalent overhead rebuild costs. Due to cost impacts this option is not considered feasible.
d) Replace Like for Like to New Standards - this option would perpetuate the premature conductor failure issues in the future. Today's safety standards require same class and height of poles for 8kV as for higher voltage systems and certain 8kV components are no longer available from manufacturers as they are considered obsolete technology. Overall material costs of 8kV systems are in line with 27.6kV systems. For these reasons, the Replace Like for Like option is not considered appropriate nor technically feasible for lines presently operating at 8kV.
e) Replace Like for Like with Provisions for Operation at Higher Voltages - this option allows for replacement of aged or unsafe equipment, allows for ultimate conversion to higher operating voltage with minimal equipment change when conversion takes place, ultimately eliminates the need for expensive station upgrades, provides operational flexibility by ultimately harmonizing the system voltage, improves power quality from a voltage performance point of view, and is therefore, the preferred option for subprojects 29 and 31.
f) Replace Like for Like at Higher Operating Voltages - this option allows for replacement of aged or unsafe equipment, allows for conversion to higher operating voltage, ultimately eliminates the need for expensive station upgrades, provides operational flexibility by harmonizing the system voltage, improves power quality from a voltage performance point of view, and is therefore, the preferred option for subproject 30.
The installation of larger conductors allows WNH better control of the voltage regulation on these lines, and hence, improves the power quality to all customers supplied by these lines through better voltage performance at each customer connection point. In addition, where higher operating voltages are available, the line renewal is planned to be done at the higher operating voltage (27.6kV as appropriate), which increases flexibility of the system as a whole in outage scenarios and day to day switching and contributes to a small reduction of line loss on the system.
The main driver for these project is the increased safety risk due to premature conductor failure.
WNH Strategic Imperative 2 (Health, Safety, & Environment) as identified in Exhibit 1.
Field inspections, asset condition data, and WNH prior experience with conductors falling to the ground (consistent with experience of other LDCs in Ontario).
The secondary driver for these projects is the age and condition of the existing plant.
WNH Strategic Imperatives 1 (Supply & Reliability) & 2 (Health, Safety and Environment) as identified in Exhibit 1.
Evaluation Criteria and information requirements for each project/program (5.4.3.2.B) Efficiency, Customer Value, Reliability (5.4.3.2.B.1)
Project: Overhead Line Renewal - Failing Conductor 2021 CapitalProject Summary
Page 29 of 68
Net benefits accruing to customers (second bullet)
Impact of Investment on reliability performance (including on the frequency and duration of outages) (third bullet)
Scheduling Alternatives
Ownership and/or Funding Alternatives
Environmental Benefits (5.4.3.2.B.5)
Not Applicable
How advanced technology has been incorporated into the project, including interoperability and cyber security (if applicable) (5.4.3.2.B.6.third bullet)Not Applicable
Number of years proposed CDM program would be in place and number of years the required infrastructure would be deferred (5.4.3.2.B.6.second bullet)
Cyber-security, Privacy (5.4.3.2.B.3)Not Applicable
Co-ordination, Interoperability (5.4.3.2.B.4)
Coordination with utilities, regional planning and/or links with 3rd parties (where applicable) (5.4.3.2.B.4.a)WNH will meet with the area Utility Coordinating Council and municipal staff (where applicable) as well as third party stakeholders to exchange project details to coordinate construction. Since these are 2021 projects, this coordination will most likely occur in Q3-Q4 2020.
Enabling of future technological functionality or addressing of future operational requirements (5.4.3.2.B.4.b)New lines generally incorporate larger conductor, increased strength, and where available, higher voltages. As a result, system is better able to withstand poor weather conditions; provide increased capacity and siting options for the connection of renewable energy generation, electric vehicles, energy storage; provide increased physical space for third party communications and smart grid devices; and reduce power quality issues and losses.
Not Applicable
Conservation and Demand Management (5.4.3.2.B.6)
Assessment of benefits of project for customer in terms of cost impacts to customers (where measurable) (5.4.3.2.B.6.first bullet)Not Applicable
The new construction standards make work on pole lines much safer for all workers due to increased separation of high voltage conductors between themselves as well as from low voltage conductors. The replacement also minimizes the risk of unexpected pole failures in these areas, decreasing risk to the public.
The renewal of this infrastructure will have the following benefits: the aversion of potentially adverse effects on reliability and safety, avoidance of an increase to maintenance costs, ultimately provide for increased flexibility of the system via harmonization of the distribution voltages, a small decrease in line losses, and a small increase in capacity for connection of DERs.
These projects ensure the elimination of safety hazards and that reliability is maintained. Additionally, the standards to which pole lines must be built today compared to the existing pole lines ensures they are able to withstand more adverse weather conditions and increases the clearances around the conductors to assist in both the frequency and duration of outages.
System Renewal investments are instrumental in reducing the risk of critical asset failures, maintaining reliability and safety performance measures and keeping expensive reactive maintenance activities to a minimum.
Scheduling changes within the calendar year due to weather, coordination with third parties and resource constraints can usually be accommodated for smaller projects. Rescheduling larger projects can increase costs due to the reassignment of labour and materials and the risk of asset failure as well as defers immediate improvement to public safety. WNH evaluates the risk and cost of rescheduling any project to achieve the most cost effective outcome.
These projects are constructed in the public right-of-way and will consist solely of WNH's assets. There are no ownership or funding alternatives.
Safety (5.4.3.2.B.2)
Project: Overhead Line Renewal - Failing Conductor 2021 CapitalProject Summary
Page 30 of 68
Asset Condition Relative to Typical Life Cycle (5.4.3.2.C.b.first bullet.second dash)
Number of Customers in Each Class Potentially Affected (5.4.3.2.C.b.first bullet.third dash)
Quantitative Customer Impact and Risk (5.4.3.2.C.b.first bullet.fourth dash)
Qualitative Customer Impact and Risk (5.4.3.2.C.b.first bullet.fifth dash)
Value of Customer Impact (5.4.3.2.C.b.first bullet.sixth dash)
Projects in this category cannot fall as closely as possible to the Like for Like replacement as this would perpetuate the premature conductor failure issues in the future. These projects fall as closely as possible to the Like for Like replacement to new standards given the technical obsolescence of 8kV components. Alternatives selected where additional benefits cannot be readily quantified do not come at significant cost increases.
There will be no immediate material impact to O&M costs for distribution lines. Without these projects, assets will transition from poor condition to failure, increasing future O&M costs.
Reliability and Safety Factors (5.4.3.2.C.b.fourth bullet)Please see answers provided to Section 5.4.3.2.B.1.d and Section 5.4.3.2.B.2 above.
Analysis of Project Benefits, Cost, Alternatives and Timing (5.4.3.2.C.b.fifth bullet)The projects identified are in poor condition, near or past their TUL. There are no risks to execution that have not already been addressed. Further deferral carry an increased risk of negative impacts to safety and reliability. Alternatives selected where additional benefits cannot be readily quantified do not come at significant cost increases.
Like for Like Renewal Analysis (5.4.3.2.C.b.sixth bullet)
Consequences for System O&M costs (5.4.3.2.C.b.third bullet)
Category-specific requirements for each project/program - System Renewal (5.4.3.2.C.b.)
Relationship between the Characteristics of Targeted Assets and the Consequences of Asset Failure (5.4.3.2.C.b.first bullet)
Asset Performance Targets and Asset Lifecycle Optimization Policies and Practices (5.4.3.2.C.b.first bullet.first dash)A significant number of the poles, conductors and equipment have been found through inspection to be in poor condition and pose a safety hazard, and therefore, are considered no longer fit for the purpose they were intended to do. The conductor used on these line sections is small, which makes it more susceptible for corrosion and brittleness to cause failure compared to larger size conductors of the same vintage.
A significant number of the poles, conductors and equipment are over 40 years of age and generally in poor condition. The poles that are newer lack the required height and structural strength to meet today's safety standards required by O. Reg. 22/04. Hence, these pole lines must be considered in their entirety and are considered past their useful life.
These project affects 35 customers in total, which consists of 22 residential customers, 9 commercial customers, and 4 generation customers.
Quantitative customer impact and risk are not available. WNH is working with vendors of existing software platforms (OMS, AMI, and CIS) to develop data capture capabilities to be integrated with METSCO's Asset Analysis, Prioritization, and Optimization Tool, ENGIN. This process is expected to be substantially completed before WNH's next cost of service filing.
The renewal of this section of line will ensure future level of reliability is maintained, eliminate safety issues and allow for increased flexibility of the operation of the grid. All of this will maintain or improve customer satisfaction.
Customer impact in terms of potential failure is high, mostly due to the severity of safety risks associated with conductor failure. Given the history of failures for lines in this project category, the probability of failure is high compared to other line sections. Although costs of repair of failed assets are high, the problem can be located quickly, and the risk of prolonged outages is lower.
Other Factors Affecting Project Timing (5.4.3.2.C.b.second bullet)There are no factors that may affect the timing of the proposed projects that have not already been addressed above.
Project: Overhead Line Renewal (8kV) 2021 CapitalProject Summary
Page 31 of 68
Project Name OEB Investment Category System Renewal
Project Description
Detailed Listing of Affected Line Sections The following individual projects are covered by this project category:
WNH Project Sub Project Project Name Total
06EN04 10 Hutchinson Rd - William Hastings to EOL $125,54306EN04 57 Sawmill Rd - Golf Course Rd to Katherine St $577,533
Total 703,076$
Capital Investment Total Capital $703,076(5.4.3.2.A.first bullet)
O&M Costs (if applicable) $0 Not Applicable
Capital Contributions to a Transmitter CCRA Contribution $0(5.4.3.2.A.second bullet)
Customer Attachments/Load (kVA) Customer Attachments (#): 230(5.4.3.2.A.third bullet) Customer Load (peak KVA) 919
Project Timing Start Date Jan-2021(5.4.3.2.A.fourth bullet)
Expected In-Service Date Dec-2021
Expenditure Timing 2021 Q1 40% $281,230 2021 Q2 25% $175,769 2021 Q3 25% $175,7692021 Q4 10% $70,308
Schedule Risk and Risk Mitigation (5.4.3.2.A.fifth bullet)
Comparative Information(5.4.3.2.A.sixth bullet) 2016: $1,514,370
2017: $1,527,5372018: $2,148,8772019: $1,970,7582020: $3,252,494
Total Capital & OM&A Costs Associated with REG Investments (5.4.3.2.A.seventh bullet)
Leave to Construct Approval (5.4.3.2.A.eighth bullet)
Not Applicable
These projects have no significant risk factors associated with their execution. As some of these projects are located within narrow right of ways, negotiations for anchoring easements on private properties may be required. This is a factor that is identified early in the design process to ensure sufficient time is available for coordination with land owners.
Comparable investments in previous years are as follows:
General Information on the project/program (5.4.3.2.A)
Overhead Line Renewal (8kV)
This project category is comprised of overhead lines in poor condition and past their typical useful life (TUL). These lines were originally installed in 1960's and have Health Index ratings in the Poor and Very Poor category. These ratings were developed through age, field inspection and pole testing criteria.
Presently these lines are operating at 8.32kV, some with small conductors that have shown a tendency to become brittle and fail. Field inspections have determined that complete replacement of the assets is required. As part of the renewal project, WNH will take the opportunity to gain efficiencies uprate the operating voltage to 27.6kV.
In 2021, the program consists of 2 individual projects involving the replacement of 111 poles, 26 transformers and 6.1 km of overhead line. The lines being replaced have 230 customers connected to them.
The project scope includes design, construction and installation of new taller poles designed to conform to O. Reg. 22/04 compliant standards as well as new wire, insulators, transformers and equipment. Newer construction standards and materials provide for more weather resilient assets to help maintain safety and reliability.
The effort of 8kV overhead line renewal and upgrade to 27.6kV was consistent is the past. The increase in the capital expense in 2020 is because of the decommissioning of one 8 kV rural station in WNH service territory, which results of accelerate 8kV line upgrade to 27.6kV.
Not Applicable
Project: Overhead Line Renewal (8kV) 2021 CapitalProject Summary
Page 32 of 68
Main Driver (5.4.3.2.B.1.a)
Related Objectives/Performance Targets
Source and Nature of the Information Used to Justify the Investment
Secondary Driver(s) (5.4.3.2.B.1.a)
Related Objectives/Performance Targets
Source and Nature of the Information Used to Justify the Investment
Good Utility Practice (5.4.3.2.B.1.b)
Investment Priority (5.4.3.2.B.1.c)
Upgrading lines to higher more efficient voltages provides for increased flexibility of the system via harmonization of distribution voltages, a small decrease inline losses, a small increase in capacity for connection of DERs, and improved power quality from a voltage performance point of view. Over time, each project under this category contributes to the ultimate retirement of distribution transformer stations that may otherwise be in need of expensive upgrades.
Please refer to Section 3.1 of the DSP for further details on WNH's asset management process.
WNH utilizes Utility Standards Forum design standards. These standards are based on CSA C22.3 No 1-15 Overhead Systems Heavy Weather Loading design standards. Newer construction standards and materials provide for more weather resilient assets to help maintain safety and reliability. WNH overhead designs facilitates the future incorporation of grid modernization equipment and renewable energy generation. WNH conducts annual inspection and testing programs, evaluates the results and reprioritizes the replacement of assets if required.
Although pole condition is normally the main driver for overhead renewal projects, other assets such as transformers, insulators, wire, arrestors are also replaced as part of pole line rebuild. These assets are nearing end of life and would not normally survive a second life cycle. Replacing these assets all at the same time is more cost effective and less disruptive than waiting until individual assets fail or reach end of life.
Projects in this category are also benefiting the operation of the system by eliminating older, inefficient operating voltages, providing better power quality to customers, contributing toward ultimate removal of older and inefficient distribution stations, and aligning with WNH's Long Term System Plans.
System Access investments are ranked as top priority, as they are mandated by regulation or code.
System Renewal assets are prioritized by the health condition of the assets developed through its ACA program. Assets found at risk of imminent failure or high public safety risk are prioritized for immediate replacement.
WNH is utilizing METSCO's Asset Analysis, Prioritization, and Optimization Tool, ENGIN to aid in prioritizing asset replacement. Assets flagged for replacement are geospatially grouped to create constructible projects.
Projects are ranked by taking into account their overall health condition, customer impact, alignment with WNH Strategic Imperatives (refer to Table 4-4 of the DSP and Exhibit 1) such as reliability, safety, financial or environmental risk and additional drivers and benefits. In addition to the aforementioned this can include improvements in power quality, system loss reduction (voltage conversion), operational flexibility, accessibility to operate and maintain, ability to address future system growth or restoration needs, and regulatory compliance. The greater the customer impact or the more drivers or benefits that are attributed to a project the higher its priority.
Investments in System Service and General Plant categories are prioritized in a similar fashion. Analysis of impact on customers and consideration of impact of project deferral are also considered. The compiled list of projects is reviewed and prioritized by Senior WNH Engineering, Operations, IT and Finance staff.
Based on the outcome of this process, this project ranks 6 out of 16. Refer to Table 4-22 of the DSP for further details.
Analysis of the Project and Project Alternatives (5.4.3.2.B.1.d)
All pole line sections under this project have been identified as being in poor condition and in need of replacement. In light of this fact, WNH considered the following alternatives:
a) Do Nothing - this option results in the perpetuation of operational issues, increased risk of safety incidents, further deterioration resulting in a decrease in reliability, and failure to take the opportunity to address future system needs. Therefore, this option considered not appropriate.
b) Refurbish the Lines - these line sections are not appropriate candidates for refurbishment as most poles are too short and structurally too weak to comply with today's safety standards as required by O. Reg. 22/04.
c) Replace the Lines with Underground Lines - in most situations overhead line burial is technically feasible but often cost prohibitive. WNH's typical line burial costs range between 5x (for local single phase lines) to 10x (for three phase trunk circuits) the equivalent overhead rebuild costs. Due to cost impacts this option is not considered feasible.
d) Replace Like for Like to New Standards - Today's safety standards require same class and height of poles for 8kV as for higher voltage systems and certain 8kV components are no longer available from manufacturers as they are considered obsolete technology. Overall material costs of 8kV systems are in line with 27.6kV systems. For these reasons, the Replace Like for Like option is not considered appropriate nor technically feasible for lines presently operating at 8kV.
e) Replace Like for Like at Higher Operating Voltages - this option allows for replacement of aged or unsafe equipment, allows for conversion to higher operating voltage, ultimately eliminates the need for expensive station upgrades, provides operational flexibility by harmonizing the system voltage, improves power quality from a voltage performance point of view, and is therefore, the preferred option.
The main driver for these projects are the age and condition of the existing plant.
WNH Strategic Imperatives 1 (Supply & Reliability) & 2 (Health, Safety and Environment) as identified in Exhibit 1.
The source of the information used to justify this investment is the ACA, as further detailed in Appendix A of the DSP. These lines were originally installed between 1950's and 1960's and vast majority have Health Index ratings in the Poor and Very Poor category. These ratings were developed through WNH's 2019 ACA results..
WNH's ACA program uses asset degradation factors such as age, pole treatment, inspection and testing data to develop a Health Index (HI) for each of its pole assets. The HI is converted into a condition rating that can range from Very Good to Very Poor. Assets in Poor and Very Poor condition are identified and grouped into executable projects. Projects are evaluated through the WNH asset management and prioritization process described in Section 3.1 and Section 4.2.2 of the DSP.
The secondary driver is uprating these lines to higher and more efficient operating voltages.
WNH Strategic Imperatives 5 (Productivity and Cost Reduction) & 6 (Organizational Effectiveness) as identified in Exhibit 1.
Evaluation Criteria and information requirements for each project/program (5.4.3.2.B) Efficiency, Customer Value, Reliability (5.4.3.2.B.1)
Project: Overhead Line Renewal (8kV) 2021 CapitalProject Summary
Page 33 of 68
Effect on system operation efficiency and cost effectiveness (first bullet)
Net benefits accruing to customers (second bullet)
Impact of Investment on reliability performance (including on the frequency and duration of outages) (third bullet)
Scheduling Alternatives
Ownership and/or Funding Alternatives
Environmental Benefits (5.4.3.2.B.5)
Not Applicable
How advanced technology has been incorporated into the project, including interoperability and cyber security (if applicable) (5.4.3.2.B.6.third bullet)Not Applicable
Number of years proposed CDM program would be in place and number of years the required infrastructure would be deferred (5.4.3.2.B.6.second bullet)
Cyber-security, Privacy (5.4.3.2.B.3)Not Applicable
Co-ordination, Interoperability (5.4.3.2.B.4)
Coordination with utilities, regional planning and/or links with 3rd parties (where applicable) (5.4.3.2.B.4.a)WNH will meet with the area Utility Coordinating Council and municipal staff (where applicable) and third party stakeholders to exchange project details to coordinate construction. Since this is a 2021 project this coordination will most likely occur in Q3-Q4 2020.
Enabling of future technological functionality or addressing of future operational requirements (5.4.3.2.B.4.b)New lines generally incorporate larger conductor, increased strength, and higher voltages. As a result, system is better able to withstand poor weather conditions; provide increased capacity and siting options for the connection of renewable energy generation, electric vehicles, energy storage; provide increased physical space for third party communications and smart grid devices; and reduce power quality issues and losses.
Albeit small, these projects may have a positive environmental benefit due to reduction in power generation requirements, and hence greenhouse gases, as follows:a) reduction in losses due to voltage upgradeb) increased capacity for green generation due to voltage upgradec) provision for sharing transformer station capacity with neighbouring utilities.
Conservation and Demand Management (5.4.3.2.B.6)
Assessment of benefits of project for customer in terms of cost impacts to customers (where measurable) (5.4.3.2.B.6.first bullet)Not Applicable
These projects also involve replacement of small conductors which are prone to failure due to brittleness, and presents a hazard to the public and all workers. The failure can result in hazards such as energization of the earth near the fallen conductor potentially electrocuting any person nearby, fire on the ground as well as at the pole, and falling debris due to fire.
Presently hazards associated with undersized conductors for WNH workers are managed by appropriate safety policies and procedures. The new construction standards make work on pole lines much safer for all workers due to increased separation of high voltage conductors between themselves as well as from low voltage conductors.
The renewal on this project will permit the operation of lines at 27.6kV, which increases flexibility of the system as a whole in outage scenarios and day to day switching, contributes to a small reduction of line loss on the system, and provides for future system needs. Over time, it supports distribution station retirement to help avoid expensive station upgrades.
The renewal of this infrastructure will have the following benefits: the aversion of potentially adverse effects on reliability and safety, avoidance of an increase to maintenance costs, provide for increased flexibility of the system via harmonization of the distribution voltages, improvement in power quality from a voltage performance point of view, a small decrease in line losses, and a small increase in capacity for connection of DERs.
The completion of this project is expected to have a positive effect on reliability over time for the following reasons:a) voltage harmonization allowing greater flexibility in responding to distribution system eventsb) reduced risk of prolonged outages associated with aged station equipment needing replacementc) pole lines built to today's standards are able to withstand more adverse weather conditions and have increased clearances around the conductors to assist in reducing the frequency and duration of outages.
System Renewal investments are instrumental in reducing the risk of critical asset failures, maintaining reliability and safety performance measures and keeping expensive reactive maintenance activities to a minimum.
Scheduling changes within the calendar year due to weather, coordination with third parties and resource constraints can usually be accommodated for smaller projects. Rescheduling larger projects can increase costs due to the reassignment of labour and materials and the risk of asset failure as well as defers immediate benefits to the system and to customers. WNH evaluates the risk and cost of rescheduling any project to achieve the most cost effective outcome.
These projects are constructed in the public right-of-way and will consist solely of WNH's assets. There are no ownership or funding alternatives.
Safety (5.4.3.2.B.2)
Project: Overhead Line Renewal (8kV) 2021 CapitalProject Summary
Page 34 of 68
Asset Condition Relative to Typical Life Cycle (5.4.3.2.C.b.first bullet.second dash)
Number of Customers in Each Class Potentially Affected (5.4.3.2.C.b.first bullet.third dash)
Quantitative Customer Impact and Risk (5.4.3.2.C.b.first bullet.fourth dash)
Qualitative Customer Impact and Risk (5.4.3.2.C.b.first bullet.fifth dash)
Value of Customer Impact (5.4.3.2.C.b.first bullet.sixth dash)
Like for Like Renewal was determined not to be appropriate. See Section 5.4.5.2.B.1.c above for further details.
There will be no immediate material impact to O&M costs for distribution lines.
The renewal of the 8kV system as a whole will help reduce equipment failure, eliminate safety hazards, and correct substandard conditions prevalent with this vintage of assets, all of which will help reduce future O&M costs. The elimination of the 8kV system also as a whole will result in increased operational flexibility, increased reliability through greater redundancy and options for the resupply of customers formerly in the 8kV area from 27.6kV sources, reduced line losses, reduced inventory levels and carrying costs, all of which will help reduce O&M costs. Eventually, System O&M resources that were dedicated to the 8kV issues on these lines will be available for other O&M tasks at WNH.
Reliability and Safety Factors (5.4.3.2.C.b.fourth bullet)There will be no immediate material impact on reliability, however, the 8kV renewal as a whole will help reduce interruptions related to failed equipment. The elimination of safety hazards were considered to be important factors of the project.
Analysis of Project Benefits, Cost, Alternatives and Timing (5.4.3.2.C.b.fifth bullet)The projects identified are in poor condition, near or past their TUL. There are no risks to execution that have not already been addressed. Further deferral carry an increased risk of negative impacts to safety and reliability. Alternatives selected where additional benefits cannot be readily quantified do not come at significant cost increases.
Like for Like Renewal Analysis (5.4.3.2.C.b.sixth bullet)
Consequences for System O&M costs (5.4.3.2.C.b.third bullet)
Category-specific requirements for each project/program - System Renewal (5.4.3.2.C.b.)
Relationship between the Characteristics of Targeted Assets and the Consequences of Asset Failure (5.4.3.2.C.b.first bullet)
Asset Performance Targets and Asset Lifecycle Optimization Policies and Practices (5.4.3.2.C.b.first bullet.first dash)The majority of the poles, conductors and equipment have been found to be in poor condition by WNH's ACA program and past their TUL.
The majority of the poles, conductors and equipment are past their TUL of 45 years and generally in poor condition. Intermixed, there may be poles that are newer but lack the required height and structural strength to meet today's safety standards required by O. Reg. 22/04. Pole lines are evaluated in their entirety when being considered for replacement.
This project affects total 230 customers, 7 small commercial customers, 1 large commercial customer, 2 generation customers and 219 residential customers.
Quantitative customer impact and risk are not available. WNH is working with vendors of existing software platforms (OMS, AMI, and CIS) to develop data capture capabilities to be integrated with METSCO's Asset Analysis, Prioritization, and Optimization Tool, ENGIN. This process is expected to be substantially completed before WNH's next cost of service filing.
The renewal of this section of line will ensure future level of reliability is maintained, eliminate safety issues and allow for increased flexibility of the operation of the grid as well as improvements in power quality from a voltage regulation point of view. All of this will maintain or improve customer satisfaction.
Customer impact in terms of potential failure is low. These line sections supply a mix of residential and farm services. Although costs of repair of failed assets are high, the problem can be located quickly, and the risk of prolonged outages is low.
Other Factors Affecting Project Timing (5.4.3.2.C.b.second bullet)Subproject 57 must be done in tandem with the rebuild of Golf Course Rd described in Underground Renewal program.
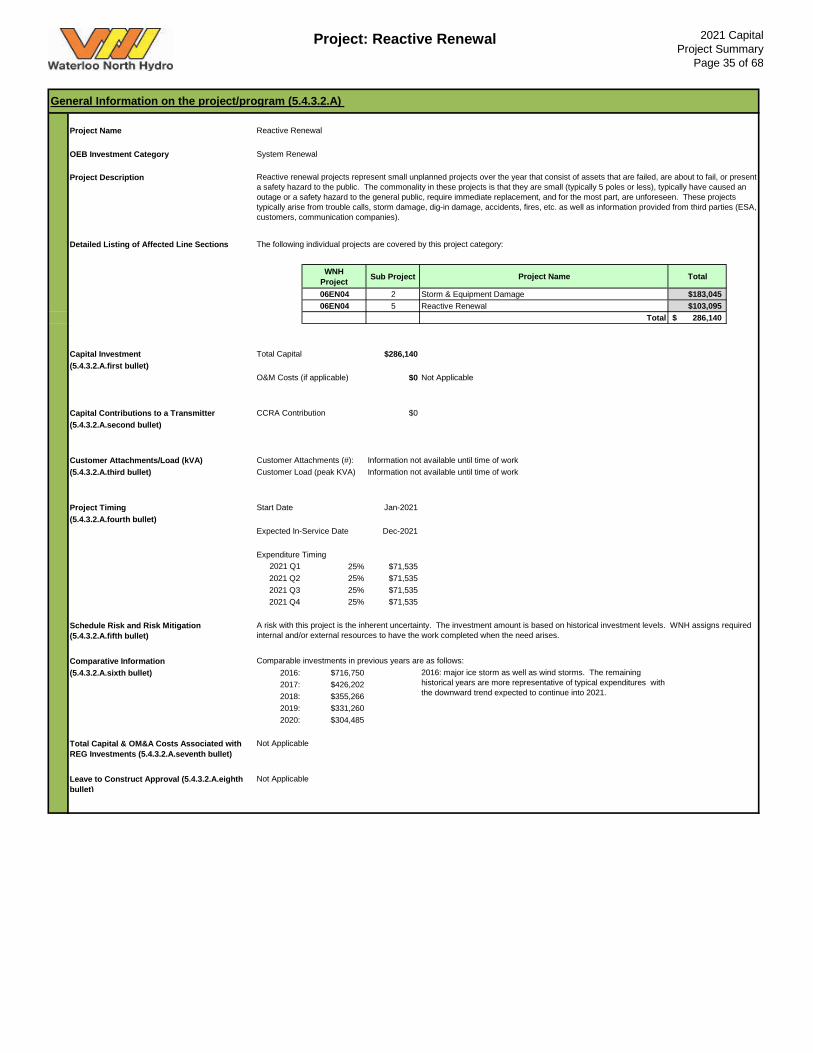
Project: Reactive Renewal 2021 CapitalProject Summary
Page 35 of 68
Project Name OEB Investment Category System Renewal
Project Description
Detailed Listing of Affected Line Sections The following individual projects are covered by this project category:
WNH Project Sub Project Project Name Total
06EN04 2 Storm & Equipment Damage $183,04506EN04 5 Reactive Renewal $103,095
Total 286,140$
Capital Investment Total Capital $286,140(5.4.3.2.A.first bullet)
O&M Costs (if applicable) $0
Capital Contributions to a Transmitter CCRA Contribution $0(5.4.3.2.A.second bullet)
Customer Attachments/Load (kVA) Customer Attachments (#): Information not available until time of work(5.4.3.2.A.third bullet) Customer Load (peak KVA) Information not available until time of work
Project Timing Start Date Jan-2021(5.4.3.2.A.fourth bullet)
Expected In-Service Date Dec-2021
Expenditure Timing 2021 Q1 25% $71,535 2021 Q2 25% $71,535 2021 Q3 25% $71,5352021 Q4 25% $71,535
Schedule Risk and Risk Mitigation (5.4.3.2.A.fifth bullet)
Comparative Information(5.4.3.2.A.sixth bullet) 2016: $716,750
2017: $426,2022018: $355,2662019: $331,2602020: $304,485
Total Capital & OM&A Costs Associated with REG Investments (5.4.3.2.A.seventh bullet)
Leave to Construct Approval (5.4.3.2.A.eighth bullet)
2016: major ice storm as well as wind storms. The remaining historical years are more representative of typical expenditures with the downward trend expected to continue into 2021.
Not Applicable
Not Applicable
Not Applicable
A risk with this project is the inherent uncertainty. The investment amount is based on historical investment levels. WNH assigns required internal and/or external resources to have the work completed when the need arises.
Comparable investments in previous years are as follows:
General Information on the project/program (5.4.3.2.A)
Reactive Renewal
Reactive renewal projects represent small unplanned projects over the year that consist of assets that are failed, are about to fail, or present a safety hazard to the public. The commonality in these projects is that they are small (typically 5 poles or less), typically have caused an outage or a safety hazard to the general public, require immediate replacement, and for the most part, are unforeseen. These projects typically arise from trouble calls, storm damage, dig-in damage, accidents, fires, etc. as well as information provided from third parties (ESA, customers, communication companies).
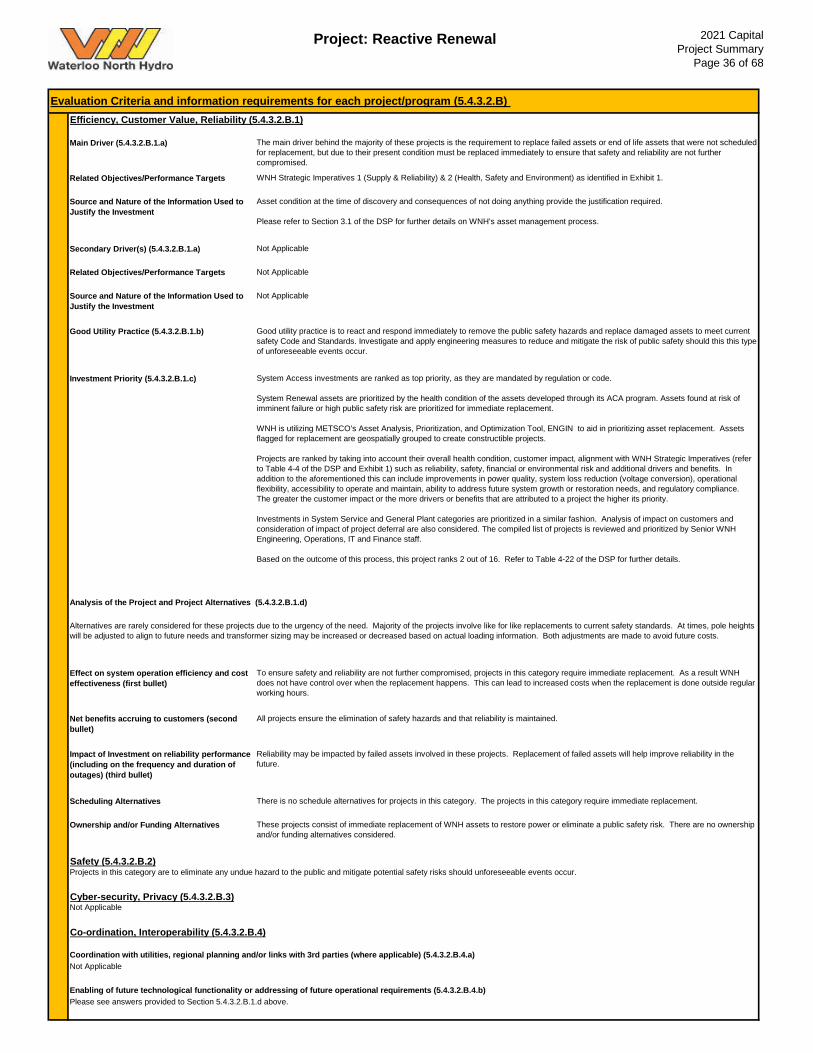
Project: Reactive Renewal 2021 CapitalProject Summary
Page 36 of 68
Main Driver (5.4.3.2.B.1.a)
Related Objectives/Performance Targets
Source and Nature of the Information Used to Justify the Investment
Secondary Driver(s) (5.4.3.2.B.1.a)
Related Objectives/Performance Targets
Source and Nature of the Information Used to Justify the Investment
Good Utility Practice (5.4.3.2.B.1.b)
Investment Priority (5.4.3.2.B.1.c)
Effect on system operation efficiency and cost effectiveness (first bullet)
Net benefits accruing to customers (second bullet)
Impact of Investment on reliability performance (including on the frequency and duration of outages) (third bullet)
Scheduling Alternatives
Ownership and/or Funding Alternatives
Cyber-security, Privacy (5.4.3.2.B.3)Not Applicable
Co-ordination, Interoperability (5.4.3.2.B.4)
Coordination with utilities, regional planning and/or links with 3rd parties (where applicable) (5.4.3.2.B.4.a)Not Applicable
Enabling of future technological functionality or addressing of future operational requirements (5.4.3.2.B.4.b)Please see answers provided to Section 5.4.3.2.B.1.d above.
Not Applicable
Not Applicable
Projects in this category are to eliminate any undue hazard to the public and mitigate potential safety risks should unforeseeable events occur.
Not Applicable
Good utility practice is to react and respond immediately to remove the public safety hazards and replace damaged assets to meet current safety Code and Standards. Investigate and apply engineering measures to reduce and mitigate the risk of public safety should this this type of unforeseeable events occur.
System Access investments are ranked as top priority, as they are mandated by regulation or code.
System Renewal assets are prioritized by the health condition of the assets developed through its ACA program. Assets found at risk of imminent failure or high public safety risk are prioritized for immediate replacement.
WNH is utilizing METSCO's Asset Analysis, Prioritization, and Optimization Tool, ENGIN to aid in prioritizing asset replacement. Assets flagged for replacement are geospatially grouped to create constructible projects.
Projects are ranked by taking into account their overall health condition, customer impact, alignment with WNH Strategic Imperatives (refer to Table 4-4 of the DSP and Exhibit 1) such as reliability, safety, financial or environmental risk and additional drivers and benefits. In addition to the aforementioned this can include improvements in power quality, system loss reduction (voltage conversion), operational flexibility, accessibility to operate and maintain, ability to address future system growth or restoration needs, and regulatory compliance. The greater the customer impact or the more drivers or benefits that are attributed to a project the higher its priority.
Investments in System Service and General Plant categories are prioritized in a similar fashion. Analysis of impact on customers and consideration of impact of project deferral are also considered. The compiled list of projects is reviewed and prioritized by Senior WNH Engineering, Operations, IT and Finance staff.
Based on the outcome of this process, this project ranks 2 out of 16. Refer to Table 4-22 of the DSP for further details.
Analysis of the Project and Project Alternatives (5.4.3.2.B.1.d)
Alternatives are rarely considered for these projects due to the urgency of the need. Majority of the projects involve like for like replacements to current safety standards. At times, pole heights will be adjusted to align to future needs and transformer sizing may be increased or decreased based on actual loading information. Both adjustments are made to avoid future costs.
To ensure safety and reliability are not further compromised, projects in this category require immediate replacement. As a result WNH does not have control over when the replacement happens. This can lead to increased costs when the replacement is done outside regular working hours.
All projects ensure the elimination of safety hazards and that reliability is maintained.
Reliability may be impacted by failed assets involved in these projects. Replacement of failed assets will help improve reliability in the future.
There is no schedule alternatives for projects in this category. The projects in this category require immediate replacement.
These projects consist of immediate replacement of WNH assets to restore power or eliminate a public safety risk. There are no ownership and/or funding alternatives considered.
Safety (5.4.3.2.B.2)
Evaluation Criteria and information requirements for each project/program (5.4.3.2.B) Efficiency, Customer Value, Reliability (5.4.3.2.B.1)
The main driver behind the majority of these projects is the requirement to replace failed assets or end of life assets that were not scheduled for replacement, but due to their present condition must be replaced immediately to ensure that safety and reliability are not further compromised.
WNH Strategic Imperatives 1 (Supply & Reliability) & 2 (Health, Safety and Environment) as identified in Exhibit 1.
Asset condition at the time of discovery and consequences of not doing anything provide the justification required.
Please refer to Section 3.1 of the DSP for further details on WNH's asset management process.
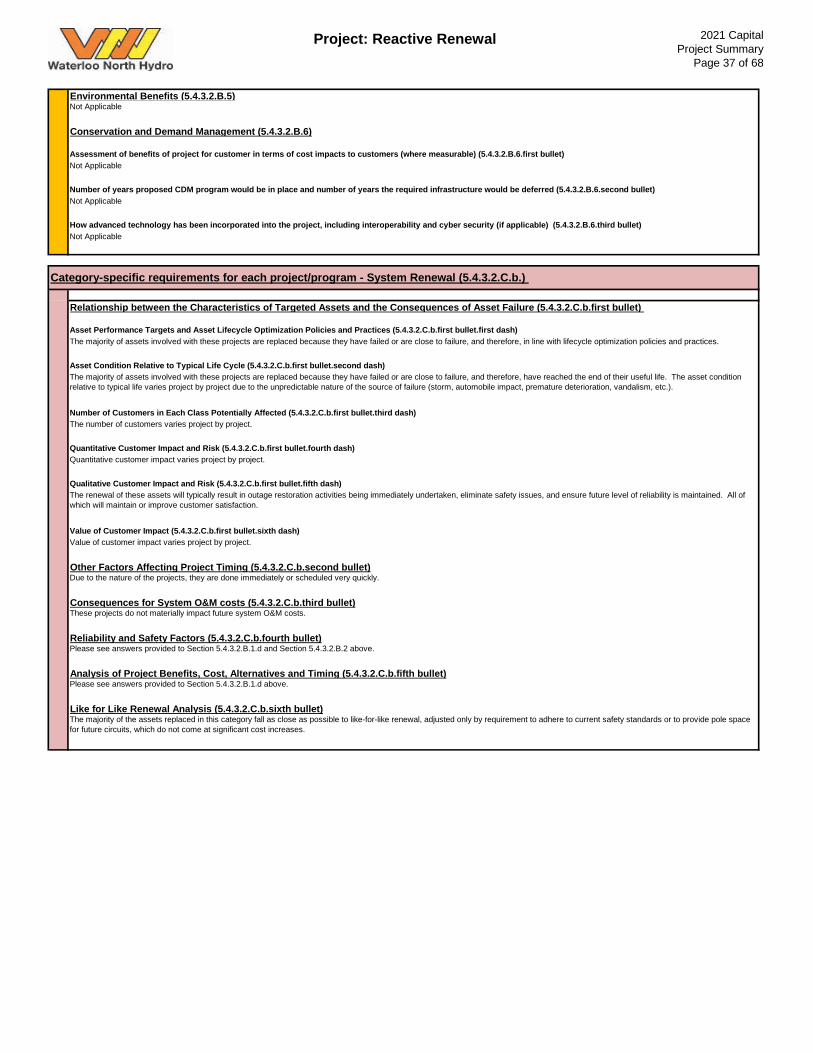
Project: Reactive Renewal 2021 CapitalProject Summary
Page 37 of 68
Environmental Benefits (5.4.3.2.B.5)
Asset Condition Relative to Typical Life Cycle (5.4.3.2.C.b.first bullet.second dash)
Number of Customers in Each Class Potentially Affected (5.4.3.2.C.b.first bullet.third dash)
Quantitative Customer Impact and Risk (5.4.3.2.C.b.first bullet.fourth dash)
Qualitative Customer Impact and Risk (5.4.3.2.C.b.first bullet.fifth dash)
Value of Customer Impact (5.4.3.2.C.b.first bullet.sixth dash)
The majority of the assets replaced in this category fall as close as possible to like-for-like renewal, adjusted only by requirement to adhere to current safety standards or to provide pole space for future circuits, which do not come at significant cost increases.
These projects do not materially impact future system O&M costs.
Reliability and Safety Factors (5.4.3.2.C.b.fourth bullet)Please see answers provided to Section 5.4.3.2.B.1.d and Section 5.4.3.2.B.2 above.
Analysis of Project Benefits, Cost, Alternatives and Timing (5.4.3.2.C.b.fifth bullet)Please see answers provided to Section 5.4.3.2.B.1.d above.
Like for Like Renewal Analysis (5.4.3.2.C.b.sixth bullet)
Consequences for System O&M costs (5.4.3.2.C.b.third bullet)
Not Applicable
How advanced technology has been incorporated into the project, including interoperability and cyber security (if applicable) (5.4.3.2.B.6.third bullet)Not Applicable
Category-specific requirements for each project/program - System Renewal (5.4.3.2.C.b.)
Relationship between the Characteristics of Targeted Assets and the Consequences of Asset Failure (5.4.3.2.C.b.first bullet)
Asset Performance Targets and Asset Lifecycle Optimization Policies and Practices (5.4.3.2.C.b.first bullet.first dash)The majority of assets involved with these projects are replaced because they have failed or are close to failure, and therefore, in line with lifecycle optimization policies and practices.
The majority of assets involved with these projects are replaced because they have failed or are close to failure, and therefore, have reached the end of their useful life. The asset condition relative to typical life varies project by project due to the unpredictable nature of the source of failure (storm, automobile impact, premature deterioration, vandalism, etc.).
The number of customers varies project by project.
Quantitative customer impact varies project by project.
The renewal of these assets will typically result in outage restoration activities being immediately undertaken, eliminate safety issues, and ensure future level of reliability is maintained. All of which will maintain or improve customer satisfaction.
Value of customer impact varies project by project.
Other Factors Affecting Project Timing (5.4.3.2.C.b.second bullet)Due to the nature of the projects, they are done immediately or scheduled very quickly.
Number of years proposed CDM program would be in place and number of years the required infrastructure would be deferred (5.4.3.2.B.6.second bullet)
Not Applicable
Conservation and Demand Management (5.4.3.2.B.6)
Assessment of benefits of project for customer in terms of cost impacts to customers (where measurable) (5.4.3.2.B.6.first bullet)Not Applicable
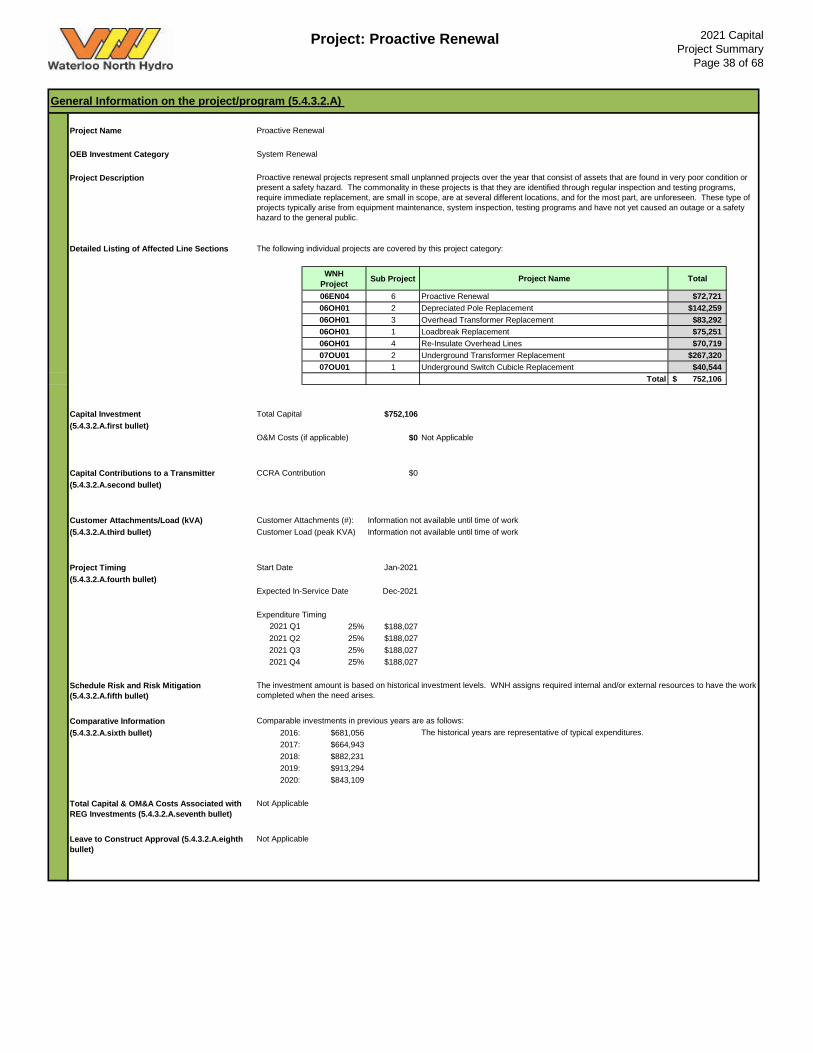
Project: Proactive Renewal 2021 CapitalProject Summary
Page 38 of 68
Project Name OEB Investment Category System Renewal
Project Description
Detailed Listing of Affected Line Sections The following individual projects are covered by this project category:
WNH Project Sub Project Project Name Total
06EN04 6 Proactive Renewal $72,72106OH01 2 Depreciated Pole Replacement $142,25906OH01 3 Overhead Transformer Replacement $83,29206OH01 1 Loadbreak Replacement $75,25106OH01 4 Re-Insulate Overhead Lines $70,71907OU01 2 Underground Transformer Replacement $267,32007OU01 1 Underground Switch Cubicle Replacement $40,544
Total 752,106$
Capital Investment Total Capital $752,106(5.4.3.2.A.first bullet)
O&M Costs (if applicable) $0
Capital Contributions to a Transmitter CCRA Contribution $0(5.4.3.2.A.second bullet)
Customer Attachments/Load (kVA) Customer Attachments (#): Information not available until time of work(5.4.3.2.A.third bullet) Customer Load (peak KVA) Information not available until time of work
Project Timing Start Date Jan-2021(5.4.3.2.A.fourth bullet)
Expected In-Service Date Dec-2021
Expenditure Timing 2021 Q1 25% $188,027 2021 Q2 25% $188,027 2021 Q3 25% $188,0272021 Q4 25% $188,027
Schedule Risk and Risk Mitigation (5.4.3.2.A.fifth bullet)
Comparative Information(5.4.3.2.A.sixth bullet) 2016: $681,056
2017: $664,9432018: $882,2312019: $913,2942020: $843,109
Total Capital & OM&A Costs Associated with REG Investments (5.4.3.2.A.seventh bullet)
Leave to Construct Approval (5.4.3.2.A.eighth bullet)
The historical years are representative of typical expenditures.
Not Applicable
Not Applicable
Not Applicable
The investment amount is based on historical investment levels. WNH assigns required internal and/or external resources to have the work completed when the need arises.
Comparable investments in previous years are as follows:
General Information on the project/program (5.4.3.2.A)
Proactive Renewal
Proactive renewal projects represent small unplanned projects over the year that consist of assets that are found in very poor condition or present a safety hazard. The commonality in these projects is that they are identified through regular inspection and testing programs, require immediate replacement, are small in scope, are at several different locations, and for the most part, are unforeseen. These type of projects typically arise from equipment maintenance, system inspection, testing programs and have not yet caused an outage or a safety hazard to the general public.
Project: Proactive Renewal 2021 CapitalProject Summary
Page 39 of 68
Main Driver (5.4.3.2.B.1.a)
Related Objectives/Performance Targets
Source and Nature of the Information Used to Justify the Investment
Secondary Driver(s) (5.4.3.2.B.1.a)
Related Objectives/Performance Targets
Source and Nature of the Information Used to Justify the Investment
Good Utility Practice (5.4.3.2.B.1.b)
Investment Priority (5.4.3.2.B.1.c)
Effect on system operation efficiency and cost effectiveness (first bullet)
Net benefits accruing to customers (second bullet)
Impact of Investment on reliability performance (including on the frequency and duration of outages) (third bullet)
Scheduling Alternatives
Ownership and/or Funding Alternatives
Cyber-security, Privacy (5.4.3.2.B.3)Not Applicable
Co-ordination, Interoperability (5.4.3.2.B.4)
Coordination with utilities, regional planning and/or links with 3rd parties (where applicable) (5.4.3.2.B.4.a)Not Applicable
Enabling of future technological functionality or addressing of future operational requirements (5.4.3.2.B.4.b)In certain circumstances, manual load break switches flagged for action during inspection may be replaced with automated switches instead if such would be in line with the grid modernization strategy.
Not Applicable
Not Applicable
The majority of these projects involve assets that are about to fail, and therefore, the work almost always involves eliminating a soon to be safety hazard.
Not Applicable
WNH conducts annual inspection and testing programs, evaluates the results and prioritizes the replacement of assets. Replacing deteriorated assets with those that meet today's standards improves safety, maintains reliability, increases resilience, and facilitates connection of new innovative technologies to the grid.
System Access investments are ranked as top priority, as they are mandated by regulation or code.
System Renewal assets are prioritized by the health condition of the assets developed through its ACA program. Assets found at risk of imminent failure or high public safety risk are prioritized for immediate replacement.
WNH is utilizing METSCO's Asset Analysis, Prioritization, and Optimization Tool, ENGIN to aid in prioritizing asset replacement. Assets flagged for replacement are geospatially grouped to create constructible projects.
Projects are ranked by taking into account their overall health condition, customer impact, alignment with WNH Strategic Imperatives (refer to Table 4-4 of the DSP and Exhibit 1) such as reliability, safety, financial or environmental risk and additional drivers and benefits. In addition to the aforementioned this can include improvements in power quality, system loss reduction (voltage conversion), operational flexibility, accessibility to operate and maintain, ability to address future system growth or restoration needs, and regulatory compliance. The greater the customer impact or the more drivers or benefits that are attributed to a project the higher its priority.
Investments in System Service and General Plant categories are prioritized in a similar fashion. Analysis of impact on customers and consideration of impact of project deferral are also considered. The compiled list of projects is reviewed and prioritized by Senior WNH Engineering, Operations, IT and Finance staff.
Based on the outcome of this process, this project ranks 4 out of 16. Refer to Table 4-22 of the DSP for further details.
Analysis of the Project and Project Alternatives (5.4.3.2.B.1.d)
Alternatives are often not considered for these projects due to the urgency of the need. Majority of the projects involve like for like replacements to current safety standards. At times, pole heights will be adjusted to align to future needs and transformer sizing may be increased or decreased based on actual loading information. Some load break switches may be replaced with automated switches and in other cases consideration may be given to relocating the equipment at the time of replacement if accessibility is an issue. All adjustments are made to avoid future costs.
By proactively planning the replacement of poles rather than forced replacement at the time of failure, the cost per pole is managed as the replacement can be scheduled during regular working hours.
All projects ensure the elimination of safety hazards and that reliability is maintained.
These projects involve replacement of assets at very high risk of failure. Replacing these assets will not improve reliability, however, without these projects reliability will be compromised.
There is no schedule alternatives for projects in this category. The projects in this category require urgent execution.
These projects consist of urgent replacement of WNH assets to restore power or eliminate a public safety risk. There are no ownership and/or funding alternatives considered.
Safety (5.4.3.2.B.2)
Evaluation Criteria and information requirements for each project/program (5.4.3.2.B) Efficiency, Customer Value, Reliability (5.4.3.2.B.1)
The main driver behind the majority of these projects is the requirement to replace end of life assets that were not scheduled for replacement, but due to their present condition must be replaced immediately to ensure that safety and reliability are not compromised.
WNH Strategic Imperatives 1 (Supply & Reliability) & 2 (Health, Safety and Environment) as identified in Exhibit 1.
Asset condition at the time of discovery and consequences of not doing anything provide the justification required.
Please refer to Section 3.1 of the DSP for further details on WNH's asset management process.
Project: Proactive Renewal 2021 CapitalProject Summary
Page 40 of 68
Environmental Benefits (5.4.3.2.B.5)
Asset Condition Relative to Typical Life Cycle (5.4.3.2.C.b.first bullet.second dash)
Number of Customers in Each Class Potentially Affected (5.4.3.2.C.b.first bullet.third dash)
Quantitative Customer Impact and Risk (5.4.3.2.C.b.first bullet.fourth dash)
Qualitative Customer Impact and Risk (5.4.3.2.C.b.first bullet.fifth dash)
Value of Customer Impact (5.4.3.2.C.b.first bullet.sixth dash)
The majority of the assets replaced in this category fall as close as possible to like-for-like renewal, adjusted only by requirement to adhere to current safety standards or to provide pole space for future circuits, which do not come at significant cost increases.
There will be no immediate material impact to O&M costs for distribution lines. Without these projects, assets will transition from poor condition to failure, increasing future O&M costs.
Reliability and Safety Factors (5.4.3.2.C.b.fourth bullet)Please see answers provided to Section 5.4.3.2.B.1.d and Section 5.4.3.2.B.2 above.
Analysis of Project Benefits, Cost, Alternatives and Timing (5.4.3.2.C.b.fifth bullet)Please see answers provided to Section 5.4.3.2.B.1.d above.
Like for Like Renewal Analysis (5.4.3.2.C.b.sixth bullet)
Consequences for System O&M costs (5.4.3.2.C.b.third bullet)
Not Applicable
How advanced technology has been incorporated into the project, including interoperability and cyber security (if applicable) (5.4.3.2.B.6.third bullet)Not Applicable
Category-specific requirements for each project/program - System Renewal (5.4.3.2.C.b.)
Relationship between the Characteristics of Targeted Assets and the Consequences of Asset Failure (5.4.3.2.C.b.first bullet)
Asset Performance Targets and Asset Lifecycle Optimization Policies and Practices (5.4.3.2.C.b.first bullet.first dash)The majority of assets involved with these projects are replaced because they are close to failure, and therefore, in line with lifecycle optimization policies and practices.
For assets requiring attention, WNH considers all three options: replacement, refurbishment, and maintenance and chooses the most cost effective option from those technically available for each asset category. This investment category is for assets where replacement is the only or best viable option.
The majority of assets involved with these projects are replaced because they are close to failure, and therefore, have reached the end of their useful life. Replacement of assets sooner than their Typical Life Cycle is not uncommon.
The number of customers varies project by project.
Quantitative customer impact varies project by project.
The renewal of these assets will ensure future level of reliability is maintained, eliminate safety issues and allow for increased flexibility of the operation of the grid. All of this will maintain or improve customer satisfaction.
Value of customer impact varies project by project.
Other Factors Affecting Project Timing (5.4.3.2.C.b.second bullet)There are no factors that may affect the timing of the proposed projects that have not already been addressed above.
Number of years proposed CDM program would be in place and number of years the required infrastructure would be deferred (5.4.3.2.B.6.second bullet)
Not Applicable
Conservation and Demand Management (5.4.3.2.B.6)
Assessment of benefits of project for customer in terms of cost impacts to customers (where measurable) (5.4.3.2.B.6.first bullet)Not Applicable
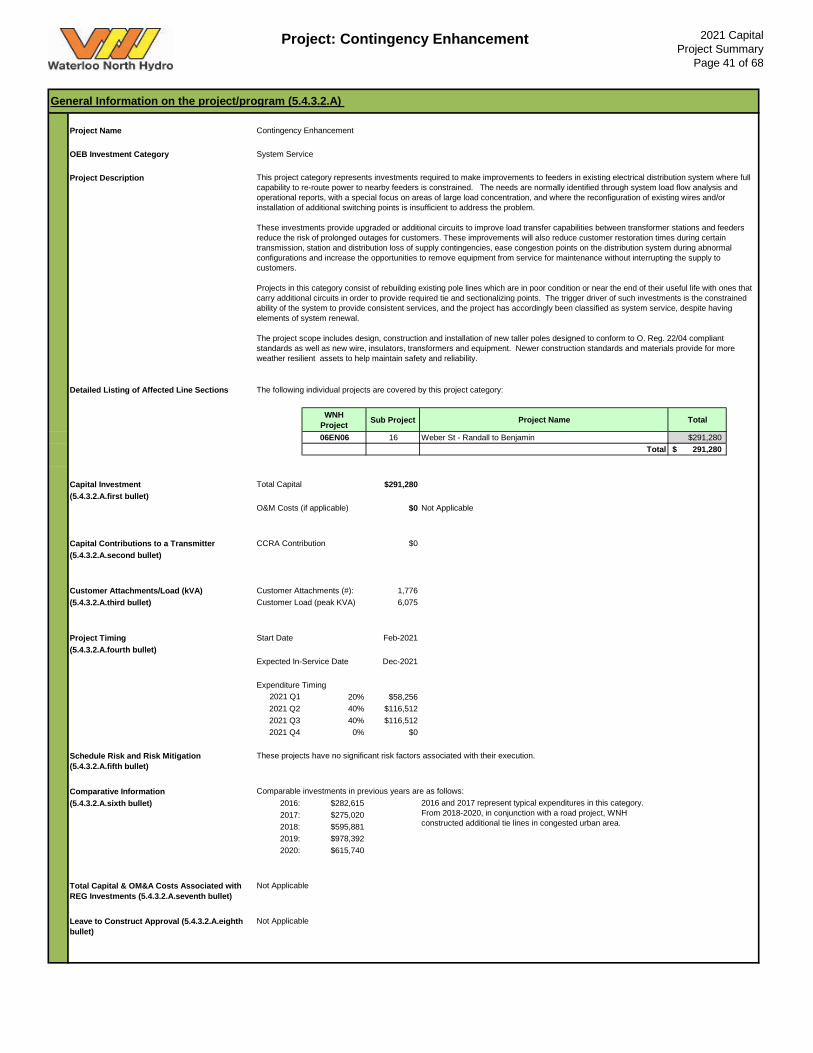
Project: Contingency Enhancement 2021 CapitalProject Summary
Page 41 of 68
Project Name OEB Investment Category System Service
Project Description
Detailed Listing of Affected Line Sections The following individual projects are covered by this project category:
WNH Project Sub Project Project Name Total
06EN06 16 Weber St - Randall to Benjamin $291,280Total 291,280$
Capital Investment Total Capital $291,280(5.4.3.2.A.first bullet)
O&M Costs (if applicable) $0
Capital Contributions to a Transmitter CCRA Contribution $0(5.4.3.2.A.second bullet)
Customer Attachments/Load (kVA) Customer Attachments (#): 1,776(5.4.3.2.A.third bullet) Customer Load (peak KVA) 6,075
Project Timing Start Date Feb-2021(5.4.3.2.A.fourth bullet)
Expected In-Service Date Dec-2021
Expenditure Timing 2021 Q1 20% $58,256 2021 Q2 40% $116,512 2021 Q3 40% $116,5122021 Q4 0% $0
Schedule Risk and Risk Mitigation (5.4.3.2.A.fifth bullet)
Comparative Information(5.4.3.2.A.sixth bullet) 2016: $282,615
2017: $275,0202018: $595,8812019: $978,3922020: $615,740
Total Capital & OM&A Costs Associated with REG Investments (5.4.3.2.A.seventh bullet)
Leave to Construct Approval (5.4.3.2.A.eighth bullet)
Not Applicable
Not Applicable
2016 and 2017 represent typical expenditures in this category. From 2018-2020, in conjunction with a road project, WNH constructed additional tie lines in congested urban area.
Not Applicable
These projects have no significant risk factors associated with their execution.
Comparable investments in previous years are as follows:
General Information on the project/program (5.4.3.2.A)
Contingency Enhancement
This project category represents investments required to make improvements to feeders in existing electrical distribution system where full capability to re-route power to nearby feeders is constrained. The needs are normally identified through system load flow analysis and operational reports, with a special focus on areas of large load concentration, and where the reconfiguration of existing wires and/or installation of additional switching points is insufficient to address the problem.
These investments provide upgraded or additional circuits to improve load transfer capabilities between transformer stations and feeders reduce the risk of prolonged outages for customers. These improvements will also reduce customer restoration times during certain transmission, station and distribution loss of supply contingencies, ease congestion points on the distribution system during abnormal configurations and increase the opportunities to remove equipment from service for maintenance without interrupting the supply to customers.
Projects in this category consist of rebuilding existing pole lines which are in poor condition or near the end of their useful life with ones that carry additional circuits in order to provide required tie and sectionalizing points. The trigger driver of such investments is the constrained ability of the system to provide consistent services, and the project has accordingly been classified as system service, despite having elements of system renewal.
The project scope includes design, construction and installation of new taller poles designed to conform to O. Reg. 22/04 compliant standards as well as new wire, insulators, transformers and equipment. Newer construction standards and materials provide for more weather resilient assets to help maintain safety and reliability.
Project: Contingency Enhancement 2021 CapitalProject Summary
Page 42 of 68
Main Driver (5.4.3.2.B.1.a)
Related Objectives/Performance Targets
Source and Nature of the Information Used to Justify the Investment
Secondary Driver(s) (5.4.3.2.B.1.a)
Related Objectives/Performance Targets
Source and Nature of the Information Used to Justify the Investment
Good Utility Practice (5.4.3.2.B.1.b)
Investment Priority (5.4.3.2.B.1.c)
Effect on system operation efficiency and cost effectiveness (first bullet)
The secondary driver for these projects are the age and condition of the existing plant. A significant portion of the infrastructure being replaced was originally put in service since mid 1970's and has been identified through regular inspection as being in poor condition.
WNH Strategic Imperatives 1 (Supply & Reliability) & 2 (Health, Safety and Environment) as identified in Exhibit 1.
The source of the information used to justify this investment is the ACA, as further detailed in Appendix A of the DSP. WNH's ACA program uses asset degradation factors such as age, pole treatment, inspection and testing data to develop a Health Index (HI) for each of its pole assets. The HI is converted into a condition rating that can range from Very Good to Very Poor. Assets in Poor and Very Poor condition are identified and grouped into executable projects.
WNH makes investments to attain reliable, resilient, and flexible grid that also supports future needs by: a) reducing the number of distribution systems by voltage conversions to harmonize and optimize the capacity of supplyb) investing to provide upgraded or additional circuits to improve load transfer capabilities and build adequate system tiesc) installing or making provisions for innovative technologies that establish flexible switching capabilities under normal and abnormal conditionsd) ensuring project alignment with WNH long term system planse) utilizing newer construction standards and materials that provide for more weather resilient assets to help maintain safety and reliability.
System Access investments are ranked as top priority, as they are mandated by regulation or code.
Under the System Service category, WNH identifies project opportunities to address service level issues based on a detailed review of the WNH Distribution System Reliability Report, expected or known system constraints, post-mortem analysis of large outages, introducing functionality to address operational objectives or system performance issues and then develops a list of solutions. The solutions that can be implemented quickly and/or inexpensively are prioritized for faster execution. To prioritize the remaining projects in this category, WNH takes into account alignment with WNH Strategic Imperatives (refer to Table 4-4 of the DSP and Exhibit 1), customer impact, and additional drivers or benefits from each project. These include criticality of assets, safety issues, health index of asset(s), improved condition assessments, system loss reduction (voltage conversion), alignment with WNH's long term distribution system plan, relocation requirements (WNH or municipally driven), or replacement for regulatory compliance. The greater the alignment with WNH Strategic Imperatives, the greater the customer impact or the more drivers or benefits are attributed to a solution, the higher the priority.
Investments in System Renewal and General Plant categories are prioritized in a similar fashion. Analysis of impact on customers and consideration of impact of project deferral are also considered. The compiled list of projects is reviewed and prioritized by Senior WNH Engineering, Operations, IT and Finance staff.
Based on the outcome of this process, this project ranks 11 out of 16. Refer to Table 4-22 of the DSP for further details.
Analysis of the Project and Project Alternatives (5.4.3.2.B.1.d)
a) Do Nothing - this option will perpetuate issues over time leading to notable deterioration of reliability, therefore, it is not an acceptable option.
b) Add new circuits to pole lines build with provisions for additional circuits - in some cases WNH renews existing lines with provisions for future circuits in accordance with our long term system plans. If such pole lines exist between desired interconnection points, this option is executed as soon as possible as it requires very little design time and relatively short construction times.
c) Uprate Existing Lines - this option consists of identifying line sections between desired interconnection points that presently operate at lower voltages and/or utilize undersized conductors. Reinsulation or reconductoring projects are very quick to design and relatively quick to construct. These options are only executed if they sufficiently address the need and if the remaining life of the poles is sufficient to justify off-cycle replacement of insulators or conductors.
d) Renew and Expand Existing Lines - this option consists of renewing line sections between desired interconnection points and installing additional wires. This option is primarily considered for line sections that are approaching or at the end of their useful life and the additional circuitry is required as per the long term system plan. If absolutely no other technical solutions exist to address the contingency enhancement requirements, this option may be executed if long term system plans can be adjusted to take advantage of the new circuits.
e) System Expansion - this option consists of building new pole lines where none exist today. This option is only executed if it is required by the long term system plan. If no other technical solution exists to address the contingency issue at hand, this option may be executed if long term system plans can be adjusted to take advantage of the new circuits.
f) Combination of Alternatives b) thru e) - Most often, the adequate technical solution requires the use of a combination of the above identified alternatives. It involves identifying various line sections where multiple trigger drivers or benefits can be realized and forming a solution comprised of various steps. This may result in providing a technical solution that is not along the shortest path of desired interconnection points, but is always the one that minimizes overall and future costs, avoids the possibility of renewing pole lines that are not approaching end of life, and minimizes the risk of stranded assets on a long term basis.
In 2021, option d) above best addresses required needs.
The line section selected for renewal and contingency enhancement under this project category will provide a tie between two transformer stations to increase operational flexibility for day to day switching, expand window of time when outages for maintenance purposes are possible increasing flexibility in scheduling maintenance work.
Evaluation Criteria and information requirements for each project/program (5.4.3.2.B) Efficiency, Customer Value, Reliability (5.4.3.2.B.1)
The main driver for these projects are to improve system performance under contingency situations for areas of large load concentration, such as a distribution station or a large subdivision.WNH Strategic Imperative 1 (Supply & Reliability) as identified in Exhibit 1.
The system capacity constraints are normally identified through system load flow analysis. The Lakeshore north subdivision is being rebuild due to asset condition and also upgraded from 13.8kV to 27.6kV to help with load balancing needs of the system. Refer WNH System Supply and Capacity Study in Appendix J of the DSP for further detail.
As a result of system conversion from 13.8kV to 27.6kV, the Lakeshore subdivision no longer has adequate levels of redundancy. New 27.6kV tie line need to be constructed to restore the lever of service that was present prior to system upgrades as well as to comply with standard level of redundancy provided to all underground subdivision customers.
Project: Contingency Enhancement 2021 CapitalProject Summary
Page 43 of 68
Net benefits accruing to customers (second bullet)
Impact of Investment on reliability performance (including on the frequency and duration of outages) (third bullet)
Scheduling Alternatives
Ownership and/or Funding Alternatives
Environmental Benefits (5.4.3.2.B.5)
Please see answers provided to Section 5.4.3.2.B.1.d above.
Integration of Advanced Technology is always considered when looking for solutions to system service issues. For projects that consist primarily of renewing existing lines, this level of analysis will be performed at the individual project level during detailed design.
System Benefits to Reliability, Efficiency, Safety and Coordination (5.4.3.2.C.c.fourth bullet)Please see answers provided to Section 5.4.3.2.B.1.d above regarding Reliability and Efficiency, Section 5.4.3.2.B.2 above regarding Safety and Section 5.4.3.2.B.4 above regarding Coordination
Factors Affecting Implementation Timing/Priority (5.4.3.2.C.c.fifth bullet)
Summary of Options Analysis (5.4.3.2.C.c.sixth bullet)
Not Applicable
How advanced technology has been incorporated into the project, including interoperability and cyber security (if applicable) (5.4.3.2.B.6.third bullet)Not Applicable
Category-specific requirements for each project/program - System Renewal (5.4.3.2.C.b.)
Assessment of the Benefits of the Project for Customers and Customer Costs (5.4.3.2.C.c.first bullet) Please see answers provided to Section 5.4.3.2.B.1.d and Section 5.4.3.2.A.first bullet above.
Information on Regional Planning (5.4.3.2.C.c.second bullet)Although not directly related to the Regional Planning process, the individual projects identified above support the concept of addressing system service issues with distribution level solutions.
How advanced technology has been incorporated into the project, including interoperability and cyber security (if applicable) (5.4.3.2.C.c.third bullet)
Please see answers provided in Section 5.4.3.2.B.1.c above regarding Priority as well as Section 5.4.3.2.A.fifth bullet and Section 5.4.3.2.B.1.d regarding Implementation Timing.
The completion of this project is expected to have a significant positive effect on reliability for the localized areas these projects are meant to address as a result of significantly reducing the risk of prolonged outages for these areas. On a system level, these projects will have some positive effect over time due to:a) providing additional system ties in urban area between two transformer stationsb) improved interconnection capabilities for day to day usec) reduction of failure risk associated with aging assets.
This project is also part of the ongoing voltage conversion plan in Lakeshore North urban area. If projects with a higher priority arise during the year, there is some potential to defer, however, delaying this project will sacrifice supply redundancy for the entire Lakeshore North subdivision.
These projects are constructed in the public right-of-way and will consist solely of WNH's assets. There are no ownership or funding alternatives.
Safety (5.4.3.2.B.2)
Number of years proposed CDM program would be in place and number of years the required infrastructure would be deferred (5.4.3.2.B.6.second bullet)
Cyber-security, Privacy (5.4.3.2.B.3)Not Applicable
Co-ordination, Interoperability (5.4.3.2.B.4)
Coordination with utilities, regional planning and/or links with 3rd parties (where applicable) (5.4.3.2.B.4.a)WNH will meet with the area Utility Coordinating Council and municipal staff (where applicable) as well as third party stakeholders to exchange project details to coordinate construction. Since these are 2021 projects, this coordination will most likely occur in Q3-Q4 2020.
Enabling of future technological functionality or addressing of future operational requirements (5.4.3.2.B.4.b)New lines generally incorporate larger conductor, increased strength, and where available, higher voltages. As a result, system is better able to withstand poor weather conditions; provide increased capacity and siting options for the connection of renewable energy generation, electric vehicles, energy storage; provide increased physical space for third party communications and smart grid devices; and reduce power quality issues and losses.
Not Applicable
Conservation and Demand Management (5.4.3.2.B.6)
Assessment of benefits of project for customer in terms of cost impacts to customers (where measurable) (5.4.3.2.B.6.first bullet)Not Applicable
The intention of these types of projects are not to address safety concerns, although at times end of life assets are replaced which may involve elimination of safety hazards.
Upon completion of this project, standard levels of redundancy of supply for underground residential subdivisions will be restored for the customers affected the by Northlake underground renewal program.
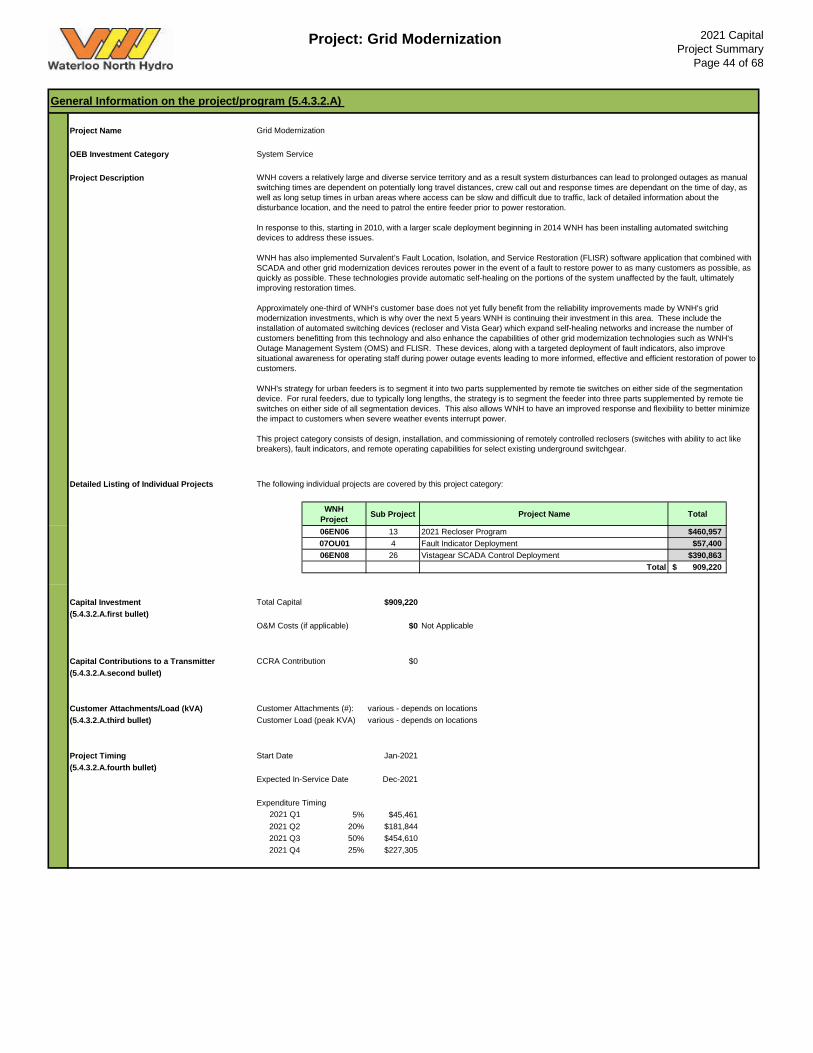
Project: Grid Modernization 2021 CapitalProject Summary
Page 44 of 68
Project Name OEB Investment Category System Service
Project Description
Detailed Listing of Individual Projects The following individual projects are covered by this project category:
WNH Project Sub Project Project Name Total
06EN06 13 2021 Recloser Program $460,95707OU01 4 Fault Indicator Deployment $57,40006EN08 26 Vistagear SCADA Control Deployment $390,863
Total 909,220$
Capital Investment Total Capital $909,220(5.4.3.2.A.first bullet)
O&M Costs (if applicable) $0
Capital Contributions to a Transmitter CCRA Contribution $0(5.4.3.2.A.second bullet)
Customer Attachments/Load (kVA) Customer Attachments (#): various - depends on locations(5.4.3.2.A.third bullet) Customer Load (peak KVA) various - depends on locations
Project Timing Start Date Jan-2021(5.4.3.2.A.fourth bullet)
Expected In-Service Date Dec-2021
Expenditure Timing 2021 Q1 5% $45,461 2021 Q2 20% $181,844 2021 Q3 50% $454,6102021 Q4 25% $227,305
Not Applicable
General Information on the project/program (5.4.3.2.A)
Grid Modernization
WNH covers a relatively large and diverse service territory and as a result system disturbances can lead to prolonged outages as manual switching times are dependent on potentially long travel distances, crew call out and response times are dependant on the time of day, as well as long setup times in urban areas where access can be slow and difficult due to traffic, lack of detailed information about the disturbance location, and the need to patrol the entire feeder prior to power restoration.
In response to this, starting in 2010, with a larger scale deployment beginning in 2014 WNH has been installing automated switching devices to address these issues.
WNH has also implemented Survalent’s Fault Location, Isolation, and Service Restoration (FLISR) software application that combined with SCADA and other grid modernization devices reroutes power in the event of a fault to restore power to as many customers as possible, as quickly as possible. These technologies provide automatic self-healing on the portions of the system unaffected by the fault, ultimately improving restoration times.
Approximately one-third of WNH's customer base does not yet fully benefit from the reliability improvements made by WNH's grid modernization investments, which is why over the next 5 years WNH is continuing their investment in this area. These include the installation of automated switching devices (recloser and Vista Gear) which expand self-healing networks and increase the number of customers benefitting from this technology and also enhance the capabilities of other grid modernization technologies such as WNH's Outage Management System (OMS) and FLISR. These devices, along with a targeted deployment of fault indicators, also improve situational awareness for operating staff during power outage events leading to more informed, effective and efficient restoration of power to customers.
WNH's strategy for urban feeders is to segment it into two parts supplemented by remote tie switches on either side of the segmentation device. For rural feeders, due to typically long lengths, the strategy is to segment the feeder into three parts supplemented by remote tie switches on either side of all segmentation devices. This also allows WNH to have an improved response and flexibility to better minimize the impact to customers when severe weather events interrupt power.
This project category consists of design, installation, and commissioning of remotely controlled reclosers (switches with ability to act like breakers), fault indicators, and remote operating capabilities for select existing underground switchgear.
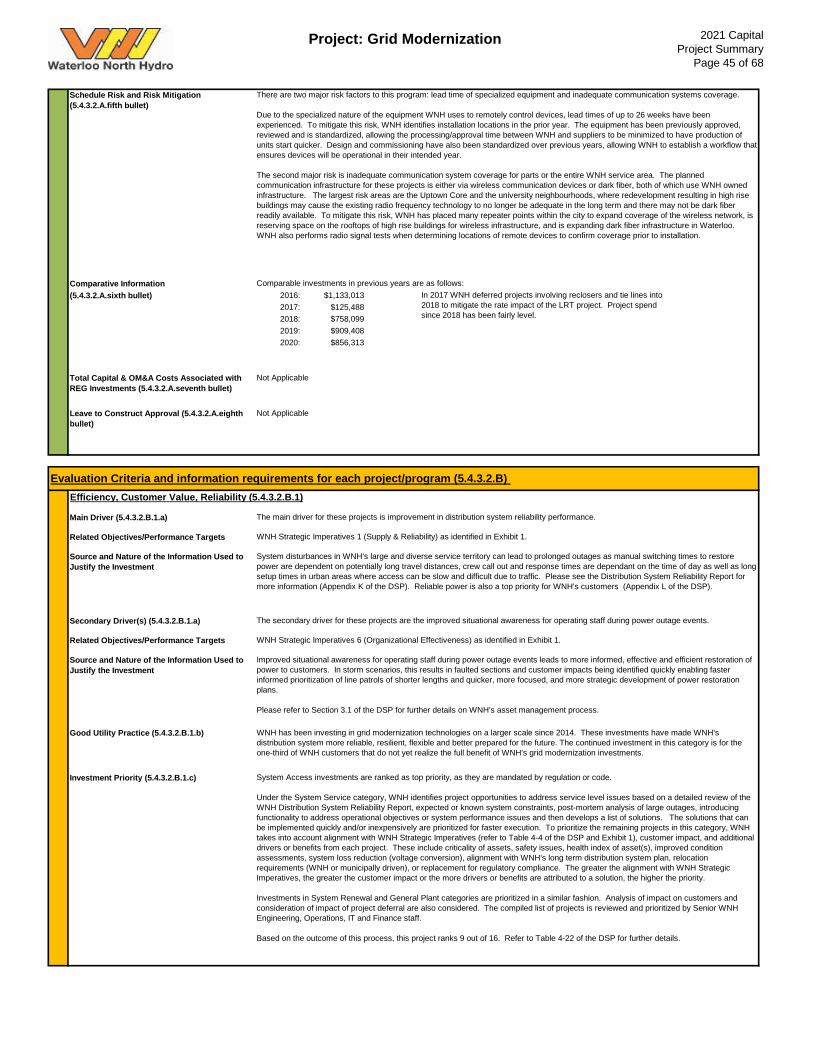
Project: Grid Modernization 2021 CapitalProject Summary
Page 45 of 68
Schedule Risk and Risk Mitigation (5.4.3.2.A.fifth bullet)
Comparative Information(5.4.3.2.A.sixth bullet) 2016: $1,133,013
2017: $125,4882018: $758,0992019: $909,4082020: $856,313
Total Capital & OM&A Costs Associated with REG Investments (5.4.3.2.A.seventh bullet)
Leave to Construct Approval (5.4.3.2.A.eighth bullet)
Main Driver (5.4.3.2.B.1.a)
Related Objectives/Performance Targets
Source and Nature of the Information Used to Justify the Investment
Secondary Driver(s) (5.4.3.2.B.1.a)
Related Objectives/Performance Targets
Source and Nature of the Information Used to Justify the Investment
Good Utility Practice (5.4.3.2.B.1.b)
Investment Priority (5.4.3.2.B.1.c)
Evaluation Criteria and information requirements for each project/program (5.4.3.2.B) Efficiency, Customer Value, Reliability (5.4.3.2.B.1)
The main driver for these projects is improvement in distribution system reliability performance.
WNH Strategic Imperatives 1 (Supply & Reliability) as identified in Exhibit 1.
System disturbances in WNH's large and diverse service territory can lead to prolonged outages as manual switching times to restore power are dependent on potentially long travel distances, crew call out and response times are dependant on the time of day as well as long setup times in urban areas where access can be slow and difficult due to traffic. Please see the Distribution System Reliability Report for more information (Appendix K of the DSP). Reliable power is also a top priority for WNH's customers (Appendix L of the DSP).
The secondary driver for these projects are the improved situational awareness for operating staff during power outage events.
WNH Strategic Imperatives 6 (Organizational Effectiveness) as identified in Exhibit 1.
Improved situational awareness for operating staff during power outage events leads to more informed, effective and efficient restoration of power to customers. In storm scenarios, this results in faulted sections and customer impacts being identified quickly enabling faster informed prioritization of line patrols of shorter lengths and quicker, more focused, and more strategic development of power restoration plans.
Please refer to Section 3.1 of the DSP for further details on WNH's asset management process.
WNH has been investing in grid modernization technologies on a larger scale since 2014. These investments have made WNH's distribution system more reliable, resilient, flexible and better prepared for the future. The continued investment in this category is for the one-third of WNH customers that do not yet realize the full benefit of WNH's grid modernization investments.
System Access investments are ranked as top priority, as they are mandated by regulation or code.
Under the System Service category, WNH identifies project opportunities to address service level issues based on a detailed review of the WNH Distribution System Reliability Report, expected or known system constraints, post-mortem analysis of large outages, introducing functionality to address operational objectives or system performance issues and then develops a list of solutions. The solutions that can be implemented quickly and/or inexpensively are prioritized for faster execution. To prioritize the remaining projects in this category, WNH takes into account alignment with WNH Strategic Imperatives (refer to Table 4-4 of the DSP and Exhibit 1), customer impact, and additional drivers or benefits from each project. These include criticality of assets, safety issues, health index of asset(s), improved condition assessments, system loss reduction (voltage conversion), alignment with WNH's long term distribution system plan, relocation requirements (WNH or municipally driven), or replacement for regulatory compliance. The greater the alignment with WNH Strategic Imperatives, the greater the customer impact or the more drivers or benefits are attributed to a solution, the higher the priority.
Investments in System Renewal and General Plant categories are prioritized in a similar fashion. Analysis of impact on customers and consideration of impact of project deferral are also considered. The compiled list of projects is reviewed and prioritized by Senior WNH Engineering, Operations, IT and Finance staff.
Based on the outcome of this process, this project ranks 9 out of 16. Refer to Table 4-22 of the DSP for further details.
Not Applicable
There are two major risk factors to this program: lead time of specialized equipment and inadequate communication systems coverage.
Due to the specialized nature of the equipment WNH uses to remotely control devices, lead times of up to 26 weeks have been experienced. To mitigate this risk, WNH identifies installation locations in the prior year. The equipment has been previously approved, reviewed and is standardized, allowing the processing/approval time between WNH and suppliers to be minimized to have production of units start quicker. Design and commissioning have also been standardized over previous years, allowing WNH to establish a workflow that ensures devices will be operational in their intended year.
The second major risk is inadequate communication system coverage for parts or the entire WNH service area. The planned communication infrastructure for these projects is either via wireless communication devices or dark fiber, both of which use WNH owned infrastructure. The largest risk areas are the Uptown Core and the university neighbourhoods, where redevelopment resulting in high rise buildings may cause the existing radio frequency technology to no longer be adequate in the long term and there may not be dark fiber readily available. To mitigate this risk, WNH has placed many repeater points within the city to expand coverage of the wireless network, is reserving space on the rooftops of high rise buildings for wireless infrastructure, and is expanding dark fiber infrastructure in Waterloo. WNH also performs radio signal tests when determining locations of remote devices to confirm coverage prior to installation.
Comparable investments in previous years are as follows:In 2017 WNH deferred projects involving reclosers and tie lines into 2018 to mitigate the rate impact of the LRT project. Project spend since 2018 has been fairly level.
Not Applicable
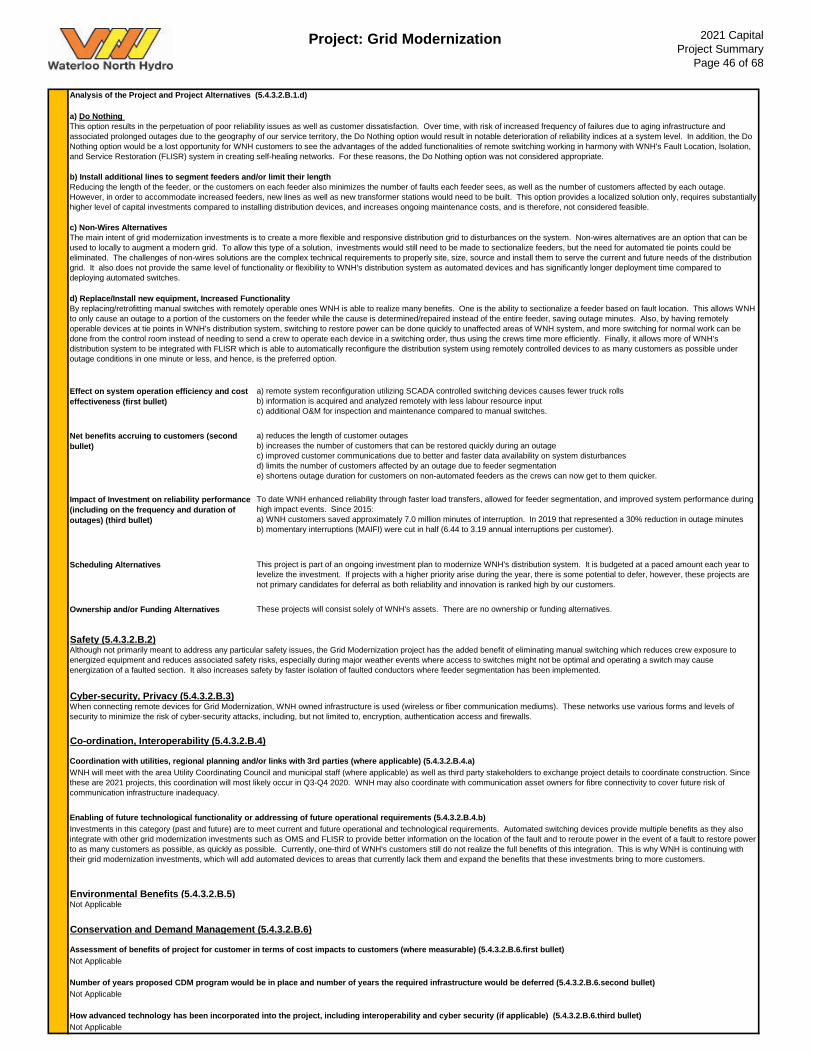
Project: Grid Modernization 2021 CapitalProject Summary
Page 46 of 68
Effect on system operation efficiency and cost effectiveness (first bullet)
Net benefits accruing to customers (second bullet)
Impact of Investment on reliability performance (including on the frequency and duration of outages) (third bullet)
Scheduling Alternatives
Ownership and/or Funding Alternatives
Environmental Benefits (5.4.3.2.B.5)
Not Applicable
How advanced technology has been incorporated into the project, including interoperability and cyber security (if applicable) (5.4.3.2.B.6.third bullet)Not Applicable
Number of years proposed CDM program would be in place and number of years the required infrastructure would be deferred (5.4.3.2.B.6.second bullet)
Cyber-security, Privacy (5.4.3.2.B.3)When connecting remote devices for Grid Modernization, WNH owned infrastructure is used (wireless or fiber communication mediums). These networks use various forms and levels of security to minimize the risk of cyber-security attacks, including, but not limited to, encryption, authentication access and firewalls.
Co-ordination, Interoperability (5.4.3.2.B.4)
Coordination with utilities, regional planning and/or links with 3rd parties (where applicable) (5.4.3.2.B.4.a)WNH will meet with the area Utility Coordinating Council and municipal staff (where applicable) as well as third party stakeholders to exchange project details to coordinate construction. Since these are 2021 projects, this coordination will most likely occur in Q3-Q4 2020. WNH may also coordinate with communication asset owners for fibre connectivity to cover future risk of communication infrastructure inadequacy.
Enabling of future technological functionality or addressing of future operational requirements (5.4.3.2.B.4.b)Investments in this category (past and future) are to meet current and future operational and technological requirements. Automated switching devices provide multiple benefits as they also integrate with other grid modernization investments such as OMS and FLISR to provide better information on the location of the fault and to reroute power in the event of a fault to restore power to as many customers as possible, as quickly as possible. Currently, one-third of WNH's customers still do not realize the full benefits of this integration. This is why WNH is continuing with their grid modernization investments, which will add automated devices to areas that currently lack them and expand the benefits that these investments bring to more customers.
Not Applicable
Conservation and Demand Management (5.4.3.2.B.6)
Assessment of benefits of project for customer in terms of cost impacts to customers (where measurable) (5.4.3.2.B.6.first bullet)Not Applicable
Although not primarily meant to address any particular safety issues, the Grid Modernization project has the added benefit of eliminating manual switching which reduces crew exposure to energized equipment and reduces associated safety risks, especially during major weather events where access to switches might not be optimal and operating a switch may cause energization of a faulted section. It also increases safety by faster isolation of faulted conductors where feeder segmentation has been implemented.
Analysis of the Project and Project Alternatives (5.4.3.2.B.1.d)
a) Do Nothing This option results in the perpetuation of poor reliability issues as well as customer dissatisfaction. Over time, with risk of increased frequency of failures due to aging infrastructure and associated prolonged outages due to the geography of our service territory, the Do Nothing option would result in notable deterioration of reliability indices at a system level. In addition, the Do Nothing option would be a lost opportunity for WNH customers to see the advantages of the added functionalities of remote switching working in harmony with WNH's Fault Location, Isolation, and Service Restoration (FLISR) system in creating self-healing networks. For these reasons, the Do Nothing option was not considered appropriate.
b) Install additional lines to segment feeders and/or limit their lengthReducing the length of the feeder, or the customers on each feeder also minimizes the number of faults each feeder sees, as well as the number of customers affected by each outage. However, in order to accommodate increased feeders, new lines as well as new transformer stations would need to be built. This option provides a localized solution only, requires substantially higher level of capital investments compared to installing distribution devices, and increases ongoing maintenance costs, and is therefore, not considered feasible.
c) Non-Wires AlternativesThe main intent of grid modernization investments is to create a more flexible and responsive distribution grid to disturbances on the system. Non-wires alternatives are an option that can be used to locally to augment a modern grid. To allow this type of a solution, investments would still need to be made to sectionalize feeders, but the need for automated tie points could be eliminated. The challenges of non-wires solutions are the complex technical requirements to properly site, size, source and install them to serve the current and future needs of the distribution grid. It also does not provide the same level of functionality or flexibility to WNH's distribution system as automated devices and has significantly longer deployment time compared to deploying automated switches.
d) Replace/Install new equipment, Increased FunctionalityBy replacing/retrofitting manual switches with remotely operable ones WNH is able to realize many benefits. One is the ability to sectionalize a feeder based on fault location. This allows WNH to only cause an outage to a portion of the customers on the feeder while the cause is determined/repaired instead of the entire feeder, saving outage minutes. Also, by having remotely operable devices at tie points in WNH's distribution system, switching to restore power can be done quickly to unaffected areas of WNH system, and more switching for normal work can be done from the control room instead of needing to send a crew to operate each device in a switching order, thus using the crews time more efficiently. Finally, it allows more of WNH's distribution system to be integrated with FLISR which is able to automatically reconfigure the distribution system using remotely controlled devices to as many customers as possible under outage conditions in one minute or less, and hence, is the preferred option.
a) remote system reconfiguration utilizing SCADA controlled switching devices causes fewer truck rollsb) information is acquired and analyzed remotely with less labour resource inputc) additional O&M for inspection and maintenance compared to manual switches.
a) reduces the length of customer outagesb) increases the number of customers that can be restored quickly during an outagec) improved customer communications due to better and faster data availability on system disturbancesd) limits the number of customers affected by an outage due to feeder segmentatione) shortens outage duration for customers on non-automated feeders as the crews can now get to them quicker.
To date WNH enhanced reliability through faster load transfers, allowed for feeder segmentation, and improved system performance during high impact events. Since 2015:a) WNH customers saved approximately 7.0 million minutes of interruption. In 2019 that represented a 30% reduction in outage minutesb) momentary interruptions (MAIFI) were cut in half (6.44 to 3.19 annual interruptions per customer).
This project is part of an ongoing investment plan to modernize WNH's distribution system. It is budgeted at a paced amount each year to levelize the investment. If projects with a higher priority arise during the year, there is some potential to defer, however, these projects are not primary candidates for deferral as both reliability and innovation is ranked high by our customers.
These projects will consist solely of WNH's assets. There are no ownership or funding alternatives.
Safety (5.4.3.2.B.2)
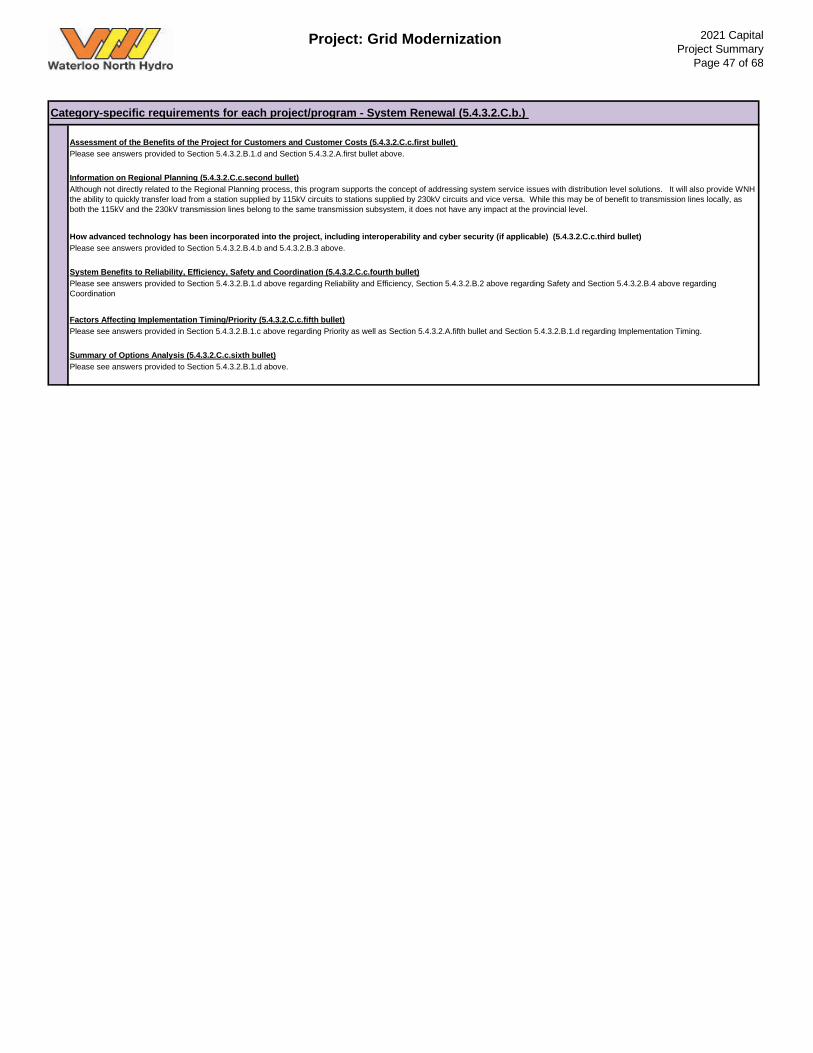
Project: Grid Modernization 2021 CapitalProject Summary
Page 47 of 68
Please see answers provided to Section 5.4.3.2.B.1.d above.
Please see answers provided to Section 5.4.3.2.B.4.b and 5.4.3.2.B.3 above.
System Benefits to Reliability, Efficiency, Safety and Coordination (5.4.3.2.C.c.fourth bullet)Please see answers provided to Section 5.4.3.2.B.1.d above regarding Reliability and Efficiency, Section 5.4.3.2.B.2 above regarding Safety and Section 5.4.3.2.B.4 above regarding Coordination
Factors Affecting Implementation Timing/Priority (5.4.3.2.C.c.fifth bullet)
Summary of Options Analysis (5.4.3.2.C.c.sixth bullet)
Category-specific requirements for each project/program - System Renewal (5.4.3.2.C.b.)
Assessment of the Benefits of the Project for Customers and Customer Costs (5.4.3.2.C.c.first bullet) Please see answers provided to Section 5.4.3.2.B.1.d and Section 5.4.3.2.A.first bullet above.
Information on Regional Planning (5.4.3.2.C.c.second bullet)Although not directly related to the Regional Planning process, this program supports the concept of addressing system service issues with distribution level solutions. It will also provide WNH the ability to quickly transfer load from a station supplied by 115kV circuits to stations supplied by 230kV circuits and vice versa. While this may be of benefit to transmission lines locally, as both the 115kV and the 230kV transmission lines belong to the same transmission subsystem, it does not have any impact at the provincial level.
How advanced technology has been incorporated into the project, including interoperability and cyber security (if applicable) (5.4.3.2.C.c.third bullet)
Please see answers provided in Section 5.4.3.2.B.1.c above regarding Priority as well as Section 5.4.3.2.A.fifth bullet and Section 5.4.3.2.B.1.d regarding Implementation Timing.
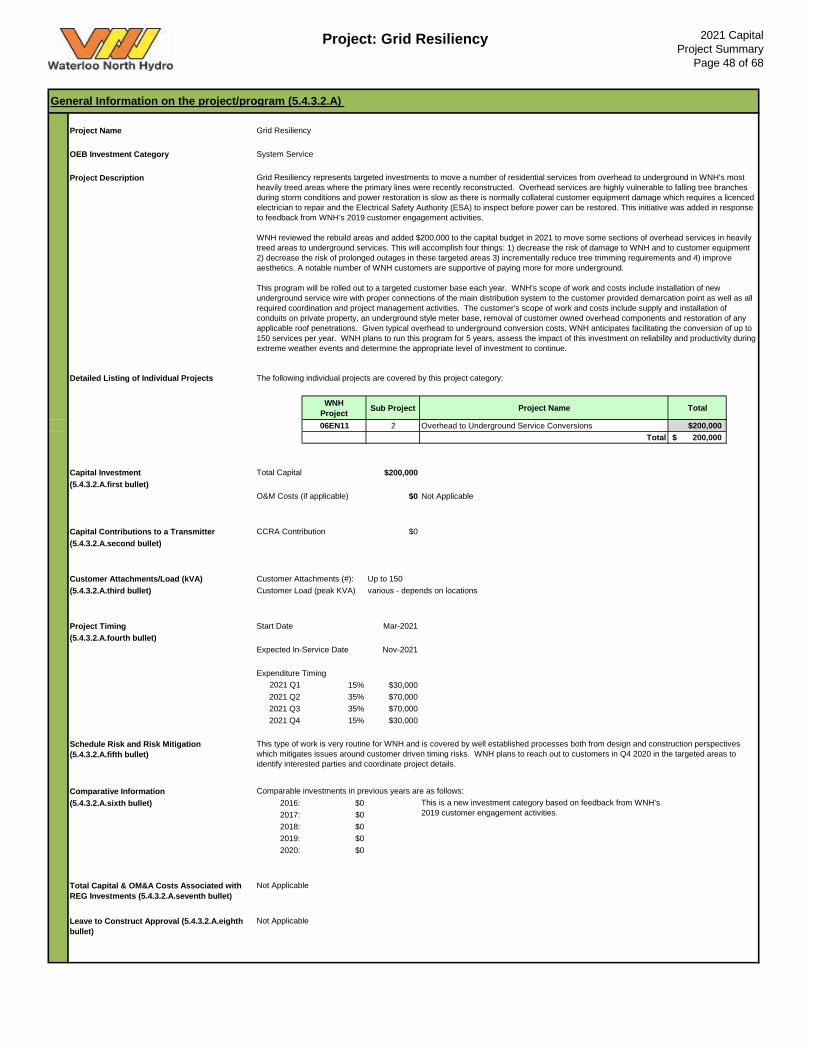
Project: Grid Resiliency 2021 CapitalProject Summary
Page 48 of 68
Project Name OEB Investment Category System Service
Project Description
Detailed Listing of Individual Projects The following individual projects are covered by this project category:
WNH Project Sub Project Project Name Total
06EN11 2 Overhead to Underground Service Conversions $200,000Total 200,000$
Capital Investment Total Capital $200,000(5.4.3.2.A.first bullet)
O&M Costs (if applicable) $0
Capital Contributions to a Transmitter CCRA Contribution $0(5.4.3.2.A.second bullet)
Customer Attachments/Load (kVA) Customer Attachments (#): Up to 150(5.4.3.2.A.third bullet) Customer Load (peak KVA) various - depends on locations
Project Timing Start Date Mar-2021(5.4.3.2.A.fourth bullet)
Expected In-Service Date Nov-2021
Expenditure Timing 2021 Q1 15% $30,000 2021 Q2 35% $70,000 2021 Q3 35% $70,0002021 Q4 15% $30,000
Schedule Risk and Risk Mitigation (5.4.3.2.A.fifth bullet)
Comparative Information(5.4.3.2.A.sixth bullet) 2016: $0
2017: $02018: $02019: $02020: $0
Total Capital & OM&A Costs Associated with REG Investments (5.4.3.2.A.seventh bullet)
Leave to Construct Approval (5.4.3.2.A.eighth bullet)
Not Applicable
Not Applicable
This type of work is very routine for WNH and is covered by well established processes both from design and construction perspectives which mitigates issues around customer driven timing risks. WNH plans to reach out to customers in Q4 2020 in the targeted areas to identify interested parties and coordinate project details.
Comparable investments in previous years are as follows:
General Information on the project/program (5.4.3.2.A)
Grid Resiliency
Grid Resiliency represents targeted investments to move a number of residential services from overhead to underground in WNH's most heavily treed areas where the primary lines were recently reconstructed. Overhead services are highly vulnerable to falling tree branches during storm conditions and power restoration is slow as there is normally collateral customer equipment damage which requires a licenced electrician to repair and the Electrical Safety Authority (ESA) to inspect before power can be restored. This initiative was added in response to feedback from WNH’s 2019 customer engagement activities.
WNH reviewed the rebuild areas and added $200,000 to the capital budget in 2021 to move some sections of overhead services in heavily treed areas to underground services. This will accomplish four things: 1) decrease the risk of damage to WNH and to customer equipment 2) decrease the risk of prolonged outages in these targeted areas 3) incrementally reduce tree trimming requirements and 4) improve aesthetics. A notable number of WNH customers are supportive of paying more for more underground.
This program will be rolled out to a targeted customer base each year. WNH's scope of work and costs include installation of new underground service wire with proper connections of the main distribution system to the customer provided demarcation point as well as all required coordination and project management activities. The customer's scope of work and costs include supply and installation of conduits on private property, an underground style meter base, removal of customer owned overhead components and restoration of any applicable roof penetrations. Given typical overhead to underground conversion costs, WNH anticipates facilitating the conversion of up to 150 services per year. WNH plans to run this program for 5 years, assess the impact of this investment on reliability and productivity during extreme weather events and determine the appropriate level of investment to continue.
This is a new investment category based on feedback from WNH’s 2019 customer engagement activities.
Not Applicable
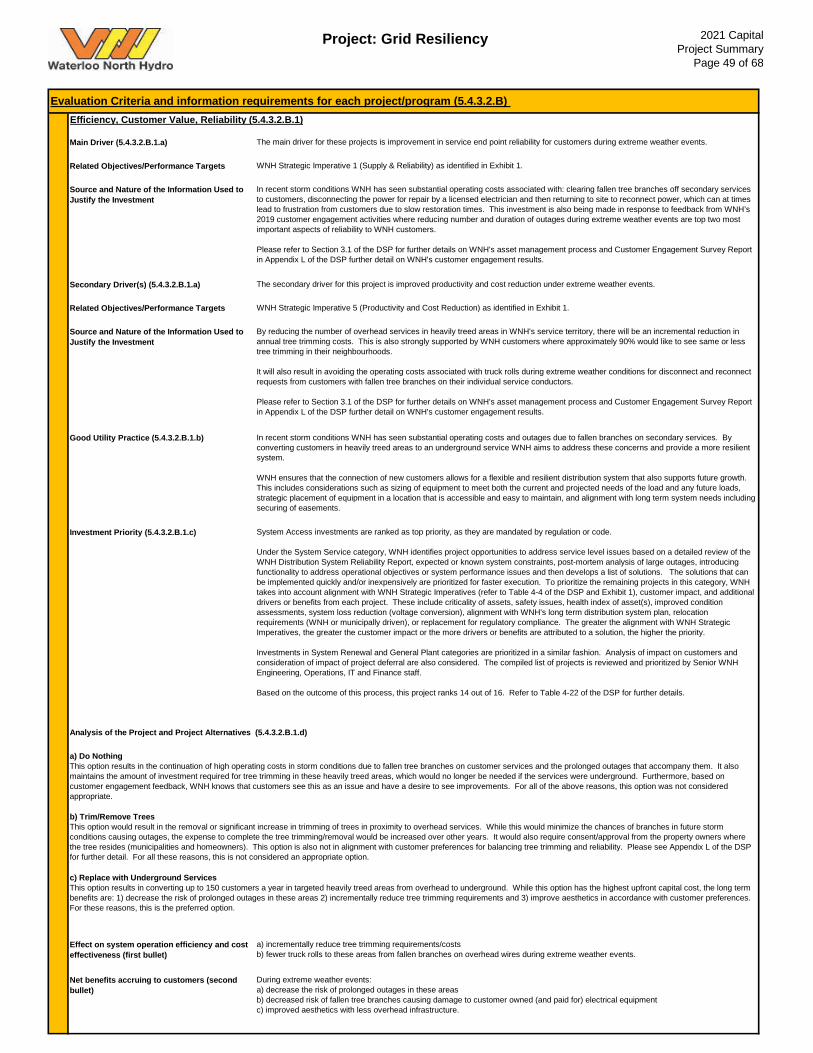
Project: Grid Resiliency 2021 CapitalProject Summary
Page 49 of 68
Main Driver (5.4.3.2.B.1.a)
Related Objectives/Performance Targets
Source and Nature of the Information Used to Justify the Investment
Secondary Driver(s) (5.4.3.2.B.1.a)
Related Objectives/Performance Targets
Source and Nature of the Information Used to Justify the Investment
Good Utility Practice (5.4.3.2.B.1.b)
Investment Priority (5.4.3.2.B.1.c)
Effect on system operation efficiency and cost effectiveness (first bullet)
Net benefits accruing to customers (second bullet)
Evaluation Criteria and information requirements for each project/program (5.4.3.2.B) Efficiency, Customer Value, Reliability (5.4.3.2.B.1)
The main driver for these projects is improvement in service end point reliability for customers during extreme weather events.
WNH Strategic Imperative 1 (Supply & Reliability) as identified in Exhibit 1.
In recent storm conditions WNH has seen substantial operating costs associated with: clearing fallen tree branches off secondary services to customers, disconnecting the power for repair by a licensed electrician and then returning to site to reconnect power, which can at times lead to frustration from customers due to slow restoration times. This investment is also being made in response to feedback from WNH’s 2019 customer engagement activities where reducing number and duration of outages during extreme weather events are top two most important aspects of reliability to WNH customers.
Please refer to Section 3.1 of the DSP for further details on WNH's asset management process and Customer Engagement Survey Report in Appendix L of the DSP further detail on WNH's customer engagement results.
The secondary driver for this project is improved productivity and cost reduction under extreme weather events.
WNH Strategic Imperative 5 (Productivity and Cost Reduction) as identified in Exhibit 1.
By reducing the number of overhead services in heavily treed areas in WNH's service territory, there will be an incremental reduction in annual tree trimming costs. This is also strongly supported by WNH customers where approximately 90% would like to see same or less tree trimming in their neighbourhoods.
It will also result in avoiding the operating costs associated with truck rolls during extreme weather conditions for disconnect and reconnect requests from customers with fallen tree branches on their individual service conductors.
Please refer to Section 3.1 of the DSP for further details on WNH's asset management process and Customer Engagement Survey Report in Appendix L of the DSP further detail on WNH's customer engagement results.
In recent storm conditions WNH has seen substantial operating costs and outages due to fallen branches on secondary services. By converting customers in heavily treed areas to an underground service WNH aims to address these concerns and provide a more resilient system.
WNH ensures that the connection of new customers allows for a flexible and resilient distribution system that also supports future growth. This includes considerations such as sizing of equipment to meet both the current and projected needs of the load and any future loads, strategic placement of equipment in a location that is accessible and easy to maintain, and alignment with long term system needs including securing of easements.
System Access investments are ranked as top priority, as they are mandated by regulation or code.
Under the System Service category, WNH identifies project opportunities to address service level issues based on a detailed review of the WNH Distribution System Reliability Report, expected or known system constraints, post-mortem analysis of large outages, introducing functionality to address operational objectives or system performance issues and then develops a list of solutions. The solutions that can be implemented quickly and/or inexpensively are prioritized for faster execution. To prioritize the remaining projects in this category, WNH takes into account alignment with WNH Strategic Imperatives (refer to Table 4-4 of the DSP and Exhibit 1), customer impact, and additional drivers or benefits from each project. These include criticality of assets, safety issues, health index of asset(s), improved condition assessments, system loss reduction (voltage conversion), alignment with WNH's long term distribution system plan, relocation requirements (WNH or municipally driven), or replacement for regulatory compliance. The greater the alignment with WNH Strategic Imperatives, the greater the customer impact or the more drivers or benefits are attributed to a solution, the higher the priority.
Investments in System Renewal and General Plant categories are prioritized in a similar fashion. Analysis of impact on customers and consideration of impact of project deferral are also considered. The compiled list of projects is reviewed and prioritized by Senior WNH Engineering, Operations, IT and Finance staff.
Based on the outcome of this process, this project ranks 14 out of 16. Refer to Table 4-22 of the DSP for further details.
Analysis of the Project and Project Alternatives (5.4.3.2.B.1.d)
a) Do Nothing This option results in the continuation of high operating costs in storm conditions due to fallen tree branches on customer services and the prolonged outages that accompany them. It also maintains the amount of investment required for tree trimming in these heavily treed areas, which would no longer be needed if the services were underground. Furthermore, based on customer engagement feedback, WNH knows that customers see this as an issue and have a desire to see improvements. For all of the above reasons, this option was not considered appropriate. b) Trim/Remove TreesThis option would result in the removal or significant increase in trimming of trees in proximity to overhead services. While this would minimize the chances of branches in future storm conditions causing outages, the expense to complete the tree trimming/removal would be increased over other years. It would also require consent/approval from the property owners where the tree resides (municipalities and homeowners). This option is also not in alignment with customer preferences for balancing tree trimming and reliability. Please see Appendix L of the DSP for further detail. For all these reasons, this is not considered an appropriate option.
c) Replace with Underground ServicesThis option results in converting up to 150 customers a year in targeted heavily treed areas from overhead to underground. While this option has the highest upfront capital cost, the long term benefits are: 1) decrease the risk of prolonged outages in these areas 2) incrementally reduce tree trimming requirements and 3) improve aesthetics in accordance with customer preferences. For these reasons, this is the preferred option.
a) incrementally reduce tree trimming requirements/costs b) fewer truck rolls to these areas from fallen branches on overhead wires during extreme weather events.
During extreme weather events:a) decrease the risk of prolonged outages in these areas b) decreased risk of fallen tree branches causing damage to customer owned (and paid for) electrical equipmentc) improved aesthetics with less overhead infrastructure.
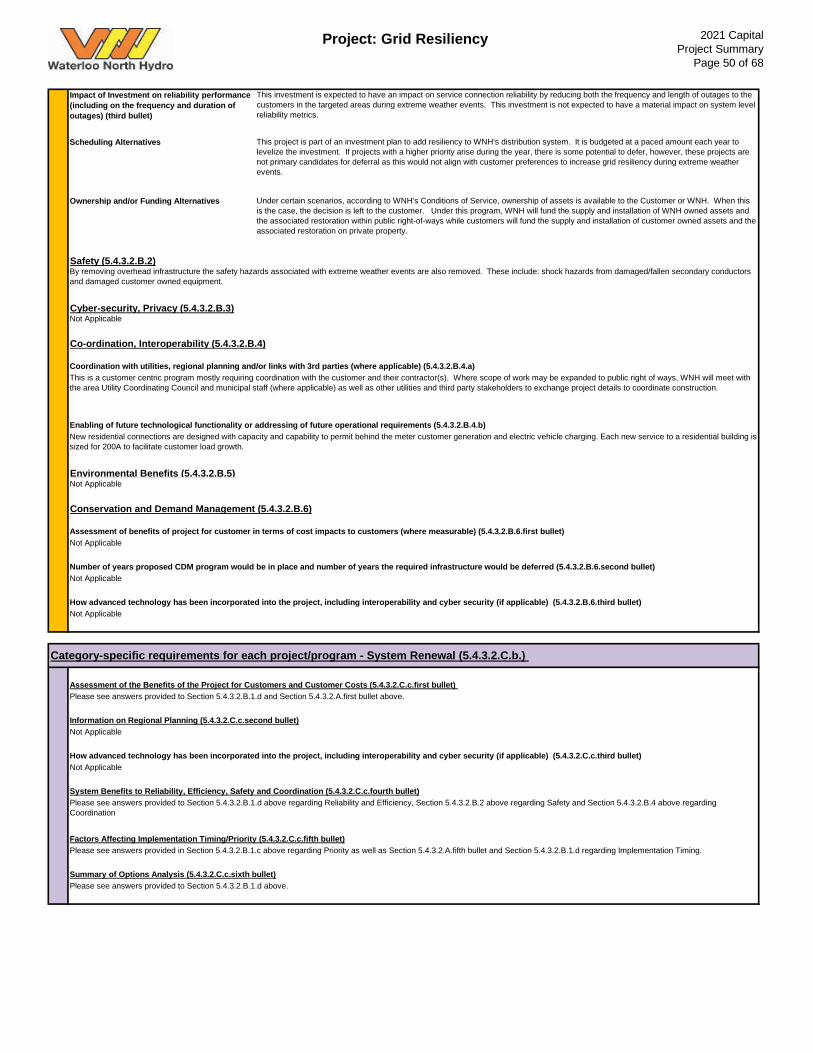
Project: Grid Resiliency 2021 CapitalProject Summary
Page 50 of 68
Impact of Investment on reliability performance (including on the frequency and duration of outages) (third bullet)
Scheduling Alternatives
Ownership and/or Funding Alternatives
Environmental Benefits (5.4.3.2.B.5)
Please see answers provided to Section 5.4.3.2.B.1.d above.
Not Applicable
System Benefits to Reliability, Efficiency, Safety and Coordination (5.4.3.2.C.c.fourth bullet)Please see answers provided to Section 5.4.3.2.B.1.d above regarding Reliability and Efficiency, Section 5.4.3.2.B.2 above regarding Safety and Section 5.4.3.2.B.4 above regarding Coordination
Factors Affecting Implementation Timing/Priority (5.4.3.2.C.c.fifth bullet)
Summary of Options Analysis (5.4.3.2.C.c.sixth bullet)
Not Applicable
How advanced technology has been incorporated into the project, including interoperability and cyber security (if applicable) (5.4.3.2.B.6.third bullet)Not Applicable
Category-specific requirements for each project/program - System Renewal (5.4.3.2.C.b.)
Assessment of the Benefits of the Project for Customers and Customer Costs (5.4.3.2.C.c.first bullet) Please see answers provided to Section 5.4.3.2.B.1.d and Section 5.4.3.2.A.first bullet above.
Information on Regional Planning (5.4.3.2.C.c.second bullet)Not Applicable
How advanced technology has been incorporated into the project, including interoperability and cyber security (if applicable) (5.4.3.2.C.c.third bullet)
Please see answers provided in Section 5.4.3.2.B.1.c above regarding Priority as well as Section 5.4.3.2.A.fifth bullet and Section 5.4.3.2.B.1.d regarding Implementation Timing.
Number of years proposed CDM program would be in place and number of years the required infrastructure would be deferred (5.4.3.2.B.6.second bullet)
Cyber-security, Privacy (5.4.3.2.B.3)Not Applicable
Co-ordination, Interoperability (5.4.3.2.B.4)
Coordination with utilities, regional planning and/or links with 3rd parties (where applicable) (5.4.3.2.B.4.a)This is a customer centric program mostly requiring coordination with the customer and their contractor(s). Where scope of work may be expanded to public right of ways, WNH will meet with the area Utility Coordinating Council and municipal staff (where applicable) as well as other utilities and third party stakeholders to exchange project details to coordinate construction.
Enabling of future technological functionality or addressing of future operational requirements (5.4.3.2.B.4.b)New residential connections are designed with capacity and capability to permit behind the meter customer generation and electric vehicle charging. Each new service to a residential building is sized for 200A to facilitate customer load growth.
Not Applicable
Conservation and Demand Management (5.4.3.2.B.6)
Assessment of benefits of project for customer in terms of cost impacts to customers (where measurable) (5.4.3.2.B.6.first bullet)Not Applicable
By removing overhead infrastructure the safety hazards associated with extreme weather events are also removed. These include: shock hazards from damaged/fallen secondary conductors and damaged customer owned equipment.
This investment is expected to have an impact on service connection reliability by reducing both the frequency and length of outages to the customers in the targeted areas during extreme weather events. This investment is not expected to have a material impact on system level reliability metrics.
This project is part of an investment plan to add resiliency to WNH's distribution system. It is budgeted at a paced amount each year to levelize the investment. If projects with a higher priority arise during the year, there is some potential to defer, however, these projects are not primary candidates for deferral as this would not align with customer preferences to increase grid resiliency during extreme weather events.
Under certain scenarios, according to WNH's Conditions of Service, ownership of assets is available to the Customer or WNH. When this is the case, the decision is left to the customer. Under this program, WNH will fund the supply and installation of WNH owned assets and the associated restoration within public right-of-ways while customers will fund the supply and installation of customer owned assets and the associated restoration on private property.
Safety (5.4.3.2.B.2)
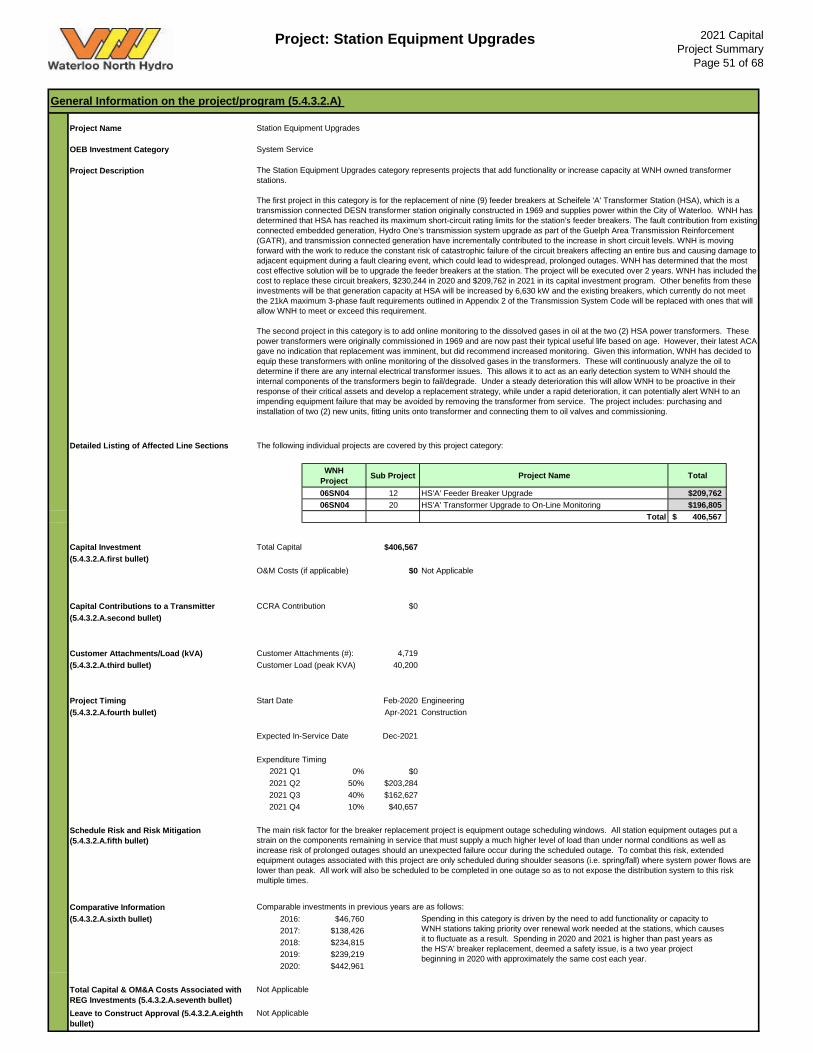
Project: Station Equipment Upgrades 2021 CapitalProject Summary
Page 51 of 68
Project Name OEB Investment Category System Service
Project Description
Detailed Listing of Affected Line Sections The following individual projects are covered by this project category:
WNH Project Sub Project Project Name Total
06SN04 12 HS'A' Feeder Breaker Upgrade $209,76206SN04 20 HS'A' Transformer Upgrade to On-Line Monitoring $196,805
Total 406,567$
Capital Investment Total Capital $406,567(5.4.3.2.A.first bullet)
O&M Costs (if applicable) $0
Capital Contributions to a Transmitter CCRA Contribution $0(5.4.3.2.A.second bullet)
Customer Attachments/Load (kVA) Customer Attachments (#): 4,719(5.4.3.2.A.third bullet) Customer Load (peak KVA) 40,200
Project Timing Start Date Feb-2020 Engineering(5.4.3.2.A.fourth bullet) Apr-2021 Construction
Expected In-Service Date Dec-2021
Expenditure Timing 2021 Q1 0% $0 2021 Q2 50% $203,284 2021 Q3 40% $162,6272021 Q4 10% $40,657
Schedule Risk and Risk Mitigation (5.4.3.2.A.fifth bullet)
Comparative Information(5.4.3.2.A.sixth bullet) 2016: $46,760
2017: $138,4262018: $234,8152019: $239,2192020: $442,961
Total Capital & OM&A Costs Associated with REG Investments (5.4.3.2.A.seventh bullet)Leave to Construct Approval (5.4.3.2.A.eighth bullet)
Spending in this category is driven by the need to add functionality or capacity to WNH stations taking priority over renewal work needed at the stations, which causes it to fluctuate as a result. Spending in 2020 and 2021 is higher than past years as the HS'A' breaker replacement, deemed a safety issue, is a two year project beginning in 2020 with approximately the same cost each year.
General Information on the project/program (5.4.3.2.A)
Station Equipment Upgrades
The Station Equipment Upgrades category represents projects that add functionality or increase capacity at WNH owned transformer stations.
The first project in this category is for the replacement of nine (9) feeder breakers at Scheifele 'A' Transformer Station (HSA), which is a transmission connected DESN transformer station originally constructed in 1969 and supplies power within the City of Waterloo. WNH has determined that HSA has reached its maximum short-circuit rating limits for the station’s feeder breakers. The fault contribution from existing connected embedded generation, Hydro One’s transmission system upgrade as part of the Guelph Area Transmission Reinforcement (GATR), and transmission connected generation have incrementally contributed to the increase in short circuit levels. WNH is moving forward with the work to reduce the constant risk of catastrophic failure of the circuit breakers affecting an entire bus and causing damage to adjacent equipment during a fault clearing event, which could lead to widespread, prolonged outages. WNH has determined that the most cost effective solution will be to upgrade the feeder breakers at the station. The project will be executed over 2 years. WNH has included the cost to replace these circuit breakers, $230,244 in 2020 and $209,762 in 2021 in its capital investment program. Other benefits from these investments will be that generation capacity at HSA will be increased by 6,630 kW and the existing breakers, which currently do not meet the 21kA maximum 3-phase fault requirements outlined in Appendix 2 of the Transmission System Code will be replaced with ones that will allow WNH to meet or exceed this requirement.
The second project in this category is to add online monitoring to the dissolved gases in oil at the two (2) HSA power transformers. These power transformers were originally commissioned in 1969 and are now past their typical useful life based on age. However, their latest ACA gave no indication that replacement was imminent, but did recommend increased monitoring. Given this information, WNH has decided to equip these transformers with online monitoring of the dissolved gases in the transformers. These will continuously analyze the oil to determine if there are any internal electrical transformer issues. This allows it to act as an early detection system to WNH should the internal components of the transformers begin to fail/degrade. Under a steady deterioration this will allow WNH to be proactive in their response of their critical assets and develop a replacement strategy, while under a rapid deterioration, it can potentially alert WNH to an impending equipment failure that may be avoided by removing the transformer from service. The project includes: purchasing and installation of two (2) new units, fitting units onto transformer and connecting them to oil valves and commissioning.
The main risk factor for the breaker replacement project is equipment outage scheduling windows. All station equipment outages put a strain on the components remaining in service that must supply a much higher level of load than under normal conditions as well as increase risk of prolonged outages should an unexpected failure occur during the scheduled outage. To combat this risk, extended equipment outages associated with this project are only scheduled during shoulder seasons (i.e. spring/fall) where system power flows are lower than peak. All work will also be scheduled to be completed in one outage so as to not expose the distribution system to this risk multiple times.
Comparable investments in previous years are as follows:
Not Applicable
Not Applicable
Not Applicable
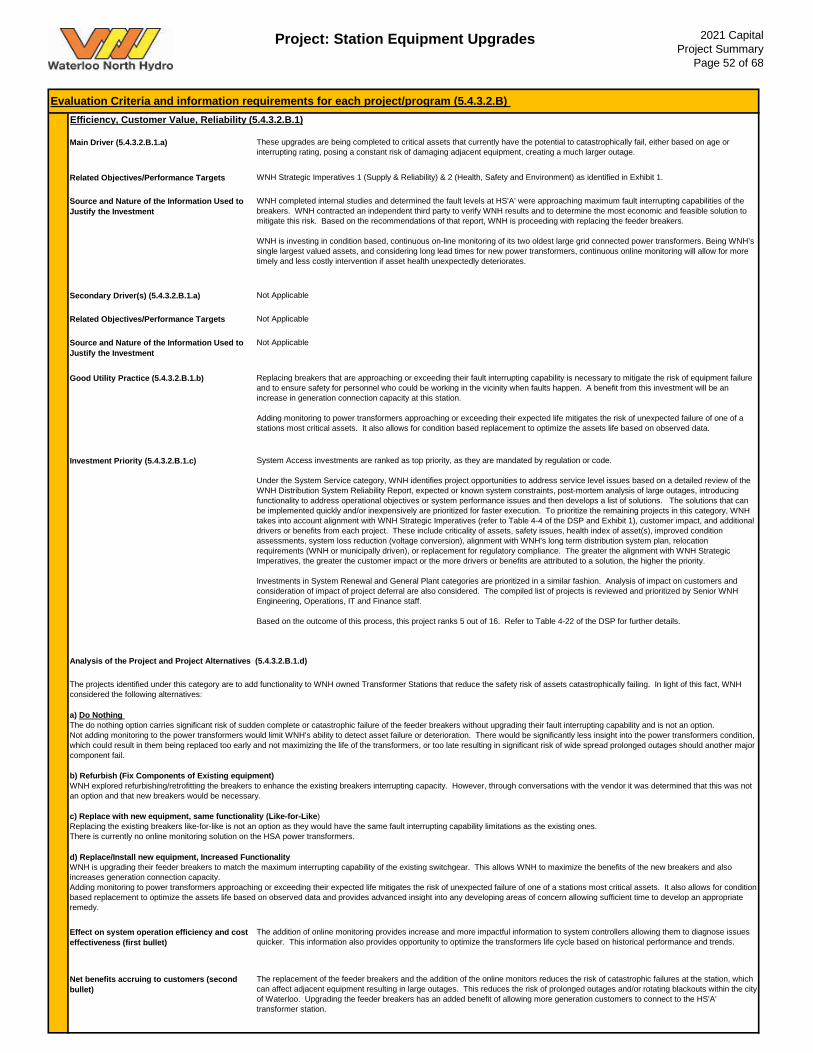
Project: Station Equipment Upgrades 2021 CapitalProject Summary
Page 52 of 68
Main Driver (5.4.3.2.B.1.a)
Related Objectives/Performance Targets
Source and Nature of the Information Used to Justify the Investment
Secondary Driver(s) (5.4.3.2.B.1.a)
Related Objectives/Performance Targets
Source and Nature of the Information Used to Justify the Investment
Good Utility Practice (5.4.3.2.B.1.b)
Investment Priority (5.4.3.2.B.1.c)
Effect on system operation efficiency and cost effectiveness (first bullet)
Net benefits accruing to customers (second bullet)
Not Applicable
Replacing breakers that are approaching or exceeding their fault interrupting capability is necessary to mitigate the risk of equipment failure and to ensure safety for personnel who could be working in the vicinity when faults happen. A benefit from this investment will be an increase in generation connection capacity at this station.
Adding monitoring to power transformers approaching or exceeding their expected life mitigates the risk of unexpected failure of one of a stations most critical assets. It also allows for condition based replacement to optimize the assets life based on observed data.
System Access investments are ranked as top priority, as they are mandated by regulation or code.
Under the System Service category, WNH identifies project opportunities to address service level issues based on a detailed review of the WNH Distribution System Reliability Report, expected or known system constraints, post-mortem analysis of large outages, introducing functionality to address operational objectives or system performance issues and then develops a list of solutions. The solutions that can be implemented quickly and/or inexpensively are prioritized for faster execution. To prioritize the remaining projects in this category, WNH takes into account alignment with WNH Strategic Imperatives (refer to Table 4-4 of the DSP and Exhibit 1), customer impact, and additional drivers or benefits from each project. These include criticality of assets, safety issues, health index of asset(s), improved condition assessments, system loss reduction (voltage conversion), alignment with WNH's long term distribution system plan, relocation requirements (WNH or municipally driven), or replacement for regulatory compliance. The greater the alignment with WNH Strategic Imperatives, the greater the customer impact or the more drivers or benefits are attributed to a solution, the higher the priority.
Investments in System Renewal and General Plant categories are prioritized in a similar fashion. Analysis of impact on customers and consideration of impact of project deferral are also considered. The compiled list of projects is reviewed and prioritized by Senior WNH Engineering, Operations, IT and Finance staff.
Based on the outcome of this process, this project ranks 5 out of 16. Refer to Table 4-22 of the DSP for further details.
Analysis of the Project and Project Alternatives (5.4.3.2.B.1.d)
The replacement of the feeder breakers and the addition of the online monitors reduces the risk of catastrophic failures at the station, which can affect adjacent equipment resulting in large outages. This reduces the risk of prolonged outages and/or rotating blackouts within the city of Waterloo. Upgrading the feeder breakers has an added benefit of allowing more generation customers to connect to the HS'A' transformer station.
The projects identified under this category are to add functionality to WNH owned Transformer Stations that reduce the safety risk of assets catastrophically failing. In light of this fact, WNH considered the following alternatives:
a) Do Nothing The do nothing option carries significant risk of sudden complete or catastrophic failure of the feeder breakers without upgrading their fault interrupting capability and is not an option.Not adding monitoring to the power transformers would limit WNH's ability to detect asset failure or deterioration. There would be significantly less insight into the power transformers condition, which could result in them being replaced too early and not maximizing the life of the transformers, or too late resulting in significant risk of wide spread prolonged outages should another major component fail. b) Refurbish (Fix Components of Existing equipment)WNH explored refurbishing/retrofitting the breakers to enhance the existing breakers interrupting capacity. However, through conversations with the vendor it was determined that this was not an option and that new breakers would be necessary.
c) Replace with new equipment, same functionality (Like-for-Like)Replacing the existing breakers like-for-like is not an option as they would have the same fault interrupting capability limitations as the existing ones. There is currently no online monitoring solution on the HSA power transformers.
d) Replace/Install new equipment, Increased FunctionalityWNH is upgrading their feeder breakers to match the maximum interrupting capability of the existing switchgear. This allows WNH to maximize the benefits of the new breakers and also increases generation connection capacity. Adding monitoring to power transformers approaching or exceeding their expected life mitigates the risk of unexpected failure of one of a stations most critical assets. It also allows for condition based replacement to optimize the assets life based on observed data and provides advanced insight into any developing areas of concern allowing sufficient time to develop an appropriate remedy.
The addition of online monitoring provides increase and more impactful information to system controllers allowing them to diagnose issues quicker. This information also provides opportunity to optimize the transformers life cycle based on historical performance and trends.
Evaluation Criteria and information requirements for each project/program (5.4.3.2.B) Efficiency, Customer Value, Reliability (5.4.3.2.B.1)
These upgrades are being completed to critical assets that currently have the potential to catastrophically fail, either based on age or interrupting rating, posing a constant risk of damaging adjacent equipment, creating a much larger outage.
WNH Strategic Imperatives 1 (Supply & Reliability) & 2 (Health, Safety and Environment) as identified in Exhibit 1.
WNH completed internal studies and determined the fault levels at HS'A' were approaching maximum fault interrupting capabilities of the breakers. WNH contracted an independent third party to verify WNH results and to determine the most economic and feasible solution to mitigate this risk. Based on the recommendations of that report, WNH is proceeding with replacing the feeder breakers.
WNH is investing in condition based, continuous on-line monitoring of its two oldest large grid connected power transformers. Being WNH’s single largest valued assets, and considering long lead times for new power transformers, continuous online monitoring will allow for more timely and less costly intervention if asset health unexpectedly deteriorates.
Not Applicable
Not Applicable
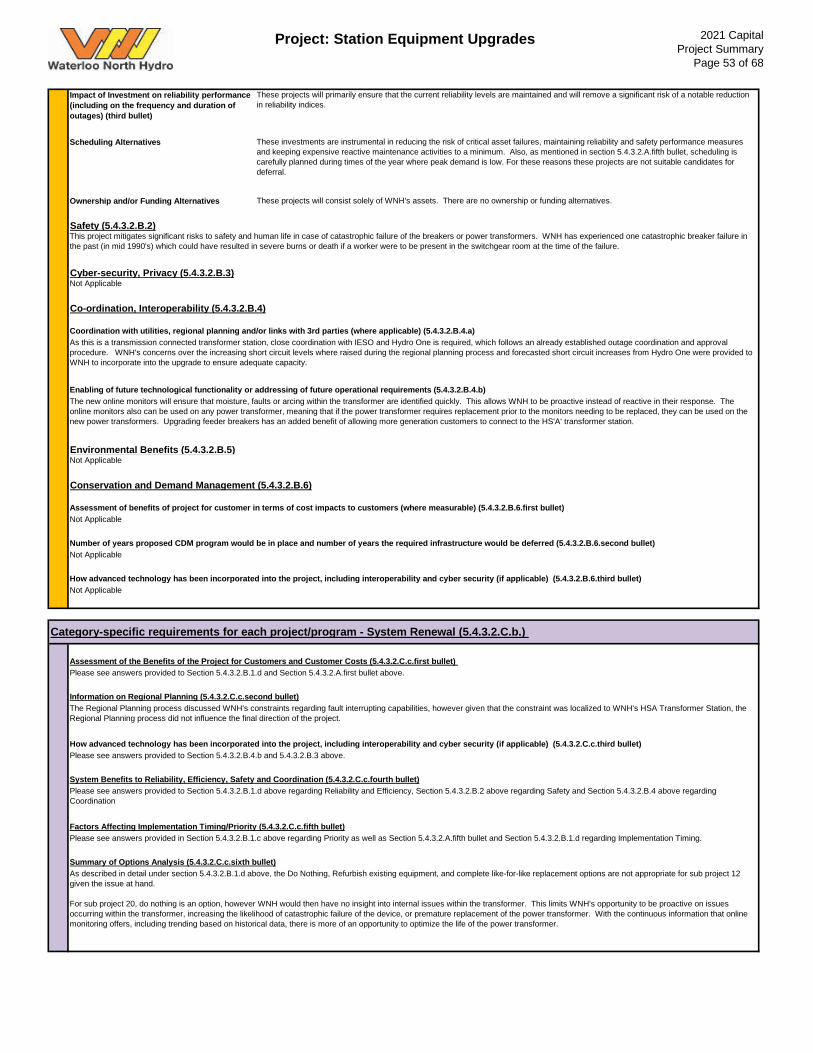
Project: Station Equipment Upgrades 2021 CapitalProject Summary
Page 53 of 68
Impact of Investment on reliability performance (including on the frequency and duration of outages) (third bullet)
Scheduling Alternatives
Ownership and/or Funding Alternatives
Environmental Benefits (5.4.3.2.B.5)
Assessment of benefits of project for customer in terms of cost impacts to customers (where measurable) (5.4.3.2.B.6.first bullet)
Conservation and Demand Management (5.4.3.2.B.6)
Summary of Options Analysis (5.4.3.2.C.c.sixth bullet)
These projects will primarily ensure that the current reliability levels are maintained and will remove a significant risk of a notable reduction in reliability indices.
These investments are instrumental in reducing the risk of critical asset failures, maintaining reliability and safety performance measures and keeping expensive reactive maintenance activities to a minimum. Also, as mentioned in section 5.4.3.2.A.fifth bullet, scheduling is carefully planned during times of the year where peak demand is low. For these reasons these projects are not suitable candidates for deferral.
These projects will consist solely of WNH's assets. There are no ownership or funding alternatives.
Safety (5.4.3.2.B.2)
Number of years proposed CDM program would be in place and number of years the required infrastructure would be deferred (5.4.3.2.B.6.second bullet)
Cyber-security, Privacy (5.4.3.2.B.3)Not Applicable
Co-ordination, Interoperability (5.4.3.2.B.4)
Coordination with utilities, regional planning and/or links with 3rd parties (where applicable) (5.4.3.2.B.4.a)As this is a transmission connected transformer station, close coordination with IESO and Hydro One is required, which follows an already established outage coordination and approval procedure. WNH's concerns over the increasing short circuit levels where raised during the regional planning process and forecasted short circuit increases from Hydro One were provided to WNH to incorporate into the upgrade to ensure adequate capacity.
Enabling of future technological functionality or addressing of future operational requirements (5.4.3.2.B.4.b)
Please see answers provided to Section 5.4.3.2.B.4.b and 5.4.3.2.B.3 above.
System Benefits to Reliability, Efficiency, Safety and Coordination (5.4.3.2.C.c.fourth bullet)Please see answers provided to Section 5.4.3.2.B.1.d above regarding Reliability and Efficiency, Section 5.4.3.2.B.2 above regarding Safety and Section 5.4.3.2.B.4 above regarding Coordination
Not Applicable
As described in detail under section 5.4.3.2.B.1.d above, the Do Nothing, Refurbish existing equipment, and complete like-for-like replacement options are not appropriate for sub project 12 given the issue at hand.
For sub project 20, do nothing is an option, however WNH would then have no insight into internal issues within the transformer. This limits WNH's opportunity to be proactive on issues occurring within the transformer, increasing the likelihood of catastrophic failure of the device, or premature replacement of the power transformer. With the continuous information that online monitoring offers, including trending based on historical data, there is more of an opportunity to optimize the life of the power transformer.
Factors Affecting Implementation Timing/Priority (5.4.3.2.C.c.fifth bullet)Please see answers provided in Section 5.4.3.2.B.1.c above regarding Priority as well as Section 5.4.3.2.A.fifth bullet and Section 5.4.3.2.B.1.d regarding Implementation Timing.
This project mitigates significant risks to safety and human life in case of catastrophic failure of the breakers or power transformers. WNH has experienced one catastrophic breaker failure in the past (in mid 1990's) which could have resulted in severe burns or death if a worker were to be present in the switchgear room at the time of the failure.
Not Applicable
The new online monitors will ensure that moisture, faults or arcing within the transformer are identified quickly. This allows WNH to be proactive instead of reactive in their response. The online monitors also can be used on any power transformer, meaning that if the power transformer requires replacement prior to the monitors needing to be replaced, they can be used on the new power transformers. Upgrading feeder breakers has an added benefit of allowing more generation customers to connect to the HS'A' transformer station.
Not Applicable
Information on Regional Planning (5.4.3.2.C.c.second bullet)The Regional Planning process discussed WNH's constraints regarding fault interrupting capabilities, however given that the constraint was localized to WNH's HSA Transformer Station, the Regional Planning process did not influence the final direction of the project.
How advanced technology has been incorporated into the project, including interoperability and cyber security (if applicable) (5.4.3.2.C.c.third bullet)
How advanced technology has been incorporated into the project, including interoperability and cyber security (if applicable) (5.4.3.2.B.6.third bullet)Not Applicable
Category-specific requirements for each project/program - System Renewal (5.4.3.2.C.b.)
Assessment of the Benefits of the Project for Customers and Customer Costs (5.4.3.2.C.c.first bullet) Please see answers provided to Section 5.4.3.2.B.1.d and Section 5.4.3.2.A.first bullet above.
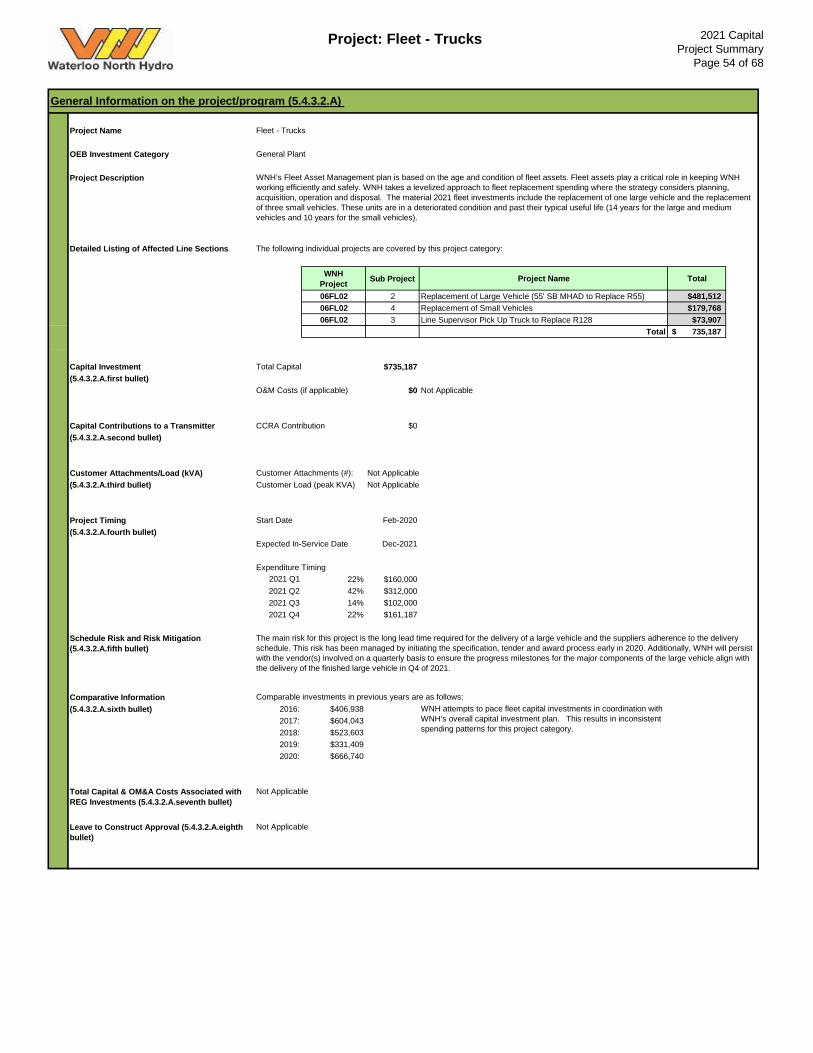
Project: Fleet - Trucks 2021 CapitalProject Summary
Page 54 of 68
Project Name OEB Investment Category General Plant
Project Description
Detailed Listing of Affected Line Sections The following individual projects are covered by this project category:
WNH Project Sub Project Project Name Total
06FL02 2 Replacement of Large Vehicle (55' SB MHAD to Replace R55) $481,51206FL02 4 Replacement of Small Vehicles $179,76806FL02 3 Line Supervisor Pick Up Truck to Replace R128 $73,907
Total 735,187$
Capital Investment Total Capital $735,187(5.4.3.2.A.first bullet)
O&M Costs (if applicable) $0
Capital Contributions to a Transmitter CCRA Contribution $0(5.4.3.2.A.second bullet)
Customer Attachments/Load (kVA) Customer Attachments (#): Not Applicable(5.4.3.2.A.third bullet) Customer Load (peak KVA) Not Applicable
Project Timing Start Date Feb-2020(5.4.3.2.A.fourth bullet)
Expected In-Service Date Dec-2021
Expenditure Timing 2021 Q1 22% $160,000 2021 Q2 42% $312,000 2021 Q3 14% $102,0002021 Q4 22% $161,187
Schedule Risk and Risk Mitigation (5.4.3.2.A.fifth bullet)
Comparative Information(5.4.3.2.A.sixth bullet) 2016: $406,938
2017: $604,0432018: $523,6032019: $331,4092020: $666,740
Total Capital & OM&A Costs Associated with REG Investments (5.4.3.2.A.seventh bullet)
Leave to Construct Approval (5.4.3.2.A.eighth bullet)
General Information on the project/program (5.4.3.2.A)
Fleet - Trucks
WNH’s Fleet Asset Management plan is based on the age and condition of fleet assets. Fleet assets play a critical role in keeping WNH working efficiently and safely. WNH takes a levelized approach to fleet replacement spending where the strategy considers planning, acquisition, operation and disposal. The material 2021 fleet investments include the replacement of one large vehicle and the replacement of three small vehicles. These units are in a deteriorated condition and past their typical useful life (14 years for the large and medium vehicles and 10 years for the small vehicles).
Not Applicable
The main risk for this project is the long lead time required for the delivery of a large vehicle and the suppliers adherence to the delivery schedule. This risk has been managed by initiating the specification, tender and award process early in 2020. Additionally, WNH will persist with the vendor(s) involved on a quarterly basis to ensure the progress milestones for the major components of the large vehicle align with the delivery of the finished large vehicle in Q4 of 2021.
Comparable investments in previous years are as follows:
Not Applicable
WNH attempts to pace fleet capital investments in coordination with WNH’s overall capital investment plan. This results in inconsistent spending patterns for this project category.
Not Applicable
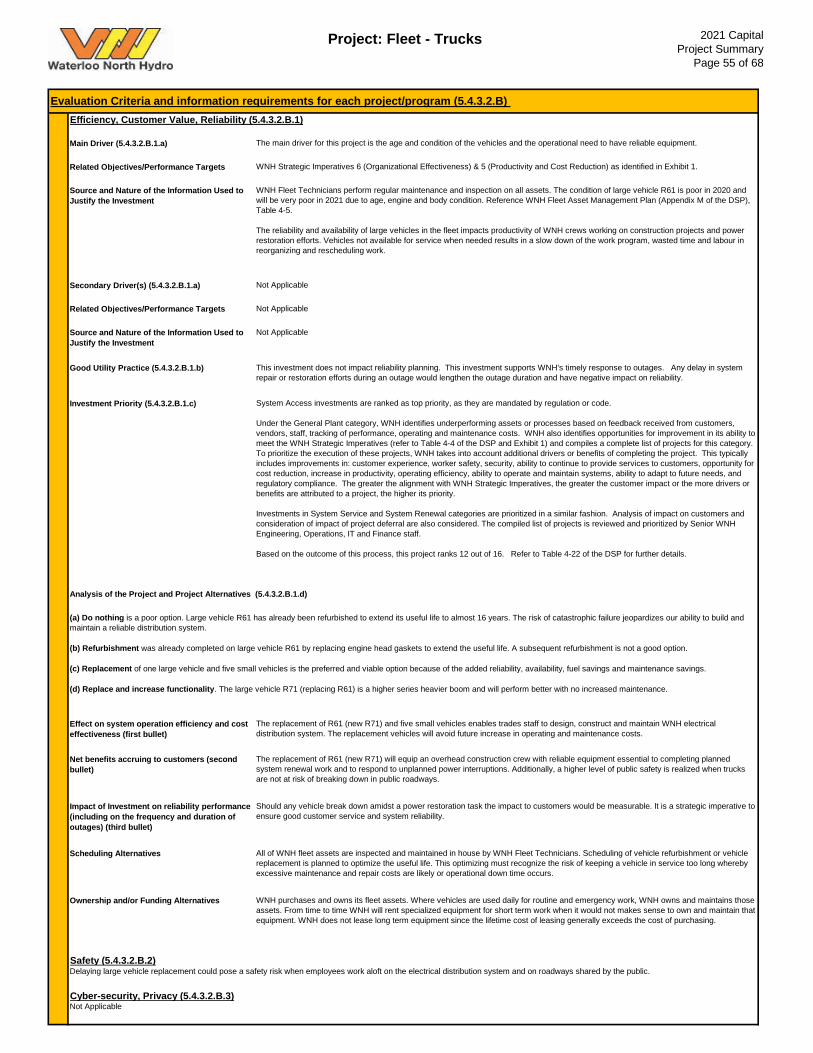
Project: Fleet - Trucks 2021 CapitalProject Summary
Page 55 of 68
Main Driver (5.4.3.2.B.1.a)
Related Objectives/Performance Targets
Source and Nature of the Information Used to Justify the Investment
Secondary Driver(s) (5.4.3.2.B.1.a)
Related Objectives/Performance Targets
Source and Nature of the Information Used to Justify the Investment
Good Utility Practice (5.4.3.2.B.1.b)
Investment Priority (5.4.3.2.B.1.c)
Effect on system operation efficiency and cost effectiveness (first bullet)
Net benefits accruing to customers (second bullet)
Impact of Investment on reliability performance (including on the frequency and duration of outages) (third bullet)
Scheduling Alternatives
Ownership and/or Funding Alternatives
The replacement of R61 (new R71) will equip an overhead construction crew with reliable equipment essential to completing planned system renewal work and to respond to unplanned power interruptions. Additionally, a higher level of public safety is realized when trucks are not at risk of breaking down in public roadways.
Evaluation Criteria and information requirements for each project/program (5.4.3.2.B) Efficiency, Customer Value, Reliability (5.4.3.2.B.1)
The main driver for this project is the age and condition of the vehicles and the operational need to have reliable equipment.
WNH Strategic Imperatives 6 (Organizational Effectiveness) & 5 (Productivity and Cost Reduction) as identified in Exhibit 1.
WNH Fleet Technicians perform regular maintenance and inspection on all assets. The condition of large vehicle R61 is poor in 2020 and will be very poor in 2021 due to age, engine and body condition. Reference WNH Fleet Asset Management Plan (Appendix M of the DSP), Table 4-5.
The reliability and availability of large vehicles in the fleet impacts productivity of WNH crews working on construction projects and power restoration efforts. Vehicles not available for service when needed results in a slow down of the work program, wasted time and labour in reorganizing and rescheduling work.
Not Applicable
Not Applicable
Delaying large vehicle replacement could pose a safety risk when employees work aloft on the electrical distribution system and on roadways shared by the public.
Not Applicable
This investment does not impact reliability planning. This investment supports WNH's timely response to outages. Any delay in system repair or restoration efforts during an outage would lengthen the outage duration and have negative impact on reliability.
System Access investments are ranked as top priority, as they are mandated by regulation or code.
Under the General Plant category, WNH identifies underperforming assets or processes based on feedback received from customers, vendors, staff, tracking of performance, operating and maintenance costs. WNH also identifies opportunities for improvement in its ability to meet the WNH Strategic Imperatives (refer to Table 4-4 of the DSP and Exhibit 1) and compiles a complete list of projects for this category. To prioritize the execution of these projects, WNH takes into account additional drivers or benefits of completing the project. This typically includes improvements in: customer experience, worker safety, security, ability to continue to provide services to customers, opportunity for cost reduction, increase in productivity, operating efficiency, ability to operate and maintain systems, ability to adapt to future needs, and regulatory compliance. The greater the alignment with WNH Strategic Imperatives, the greater the customer impact or the more drivers or benefits are attributed to a project, the higher its priority.
Investments in System Service and System Renewal categories are prioritized in a similar fashion. Analysis of impact on customers and consideration of impact of project deferral are also considered. The compiled list of projects is reviewed and prioritized by Senior WNH Engineering, Operations, IT and Finance staff.
Based on the outcome of this process, this project ranks 12 out of 16. Refer to Table 4-22 of the DSP for further details.
Analysis of the Project and Project Alternatives (5.4.3.2.B.1.d)
(a) Do nothing is a poor option. Large vehicle R61 has already been refurbished to extend its useful life to almost 16 years. The risk of catastrophic failure jeopardizes our ability to build and maintain a reliable distribution system.
(b) Refurbishment was already completed on large vehicle R61 by replacing engine head gaskets to extend the useful life. A subsequent refurbishment is not a good option.
(c) Replacement of one large vehicle and five small vehicles is the preferred and viable option because of the added reliability, availability, fuel savings and maintenance savings.
(d) Replace and increase functionality. The large vehicle R71 (replacing R61) is a higher series heavier boom and will perform better with no increased maintenance.
The replacement of R61 (new R71) and five small vehicles enables trades staff to design, construct and maintain WNH electrical distribution system. The replacement vehicles will avoid future increase in operating and maintenance costs.
Should any vehicle break down amidst a power restoration task the impact to customers would be measurable. It is a strategic imperative to ensure good customer service and system reliability.
All of WNH fleet assets are inspected and maintained in house by WNH Fleet Technicians. Scheduling of vehicle refurbishment or vehicle replacement is planned to optimize the useful life. This optimizing must recognize the risk of keeping a vehicle in service too long whereby excessive maintenance and repair costs are likely or operational down time occurs.
WNH purchases and owns its fleet assets. Where vehicles are used daily for routine and emergency work, WNH owns and maintains those assets. From time to time WNH will rent specialized equipment for short term work when it would not makes sense to own and maintain that equipment. WNH does not lease long term equipment since the lifetime cost of leasing generally exceeds the cost of purchasing.
Safety (5.4.3.2.B.2)
Cyber-security, Privacy (5.4.3.2.B.3)Not Applicable
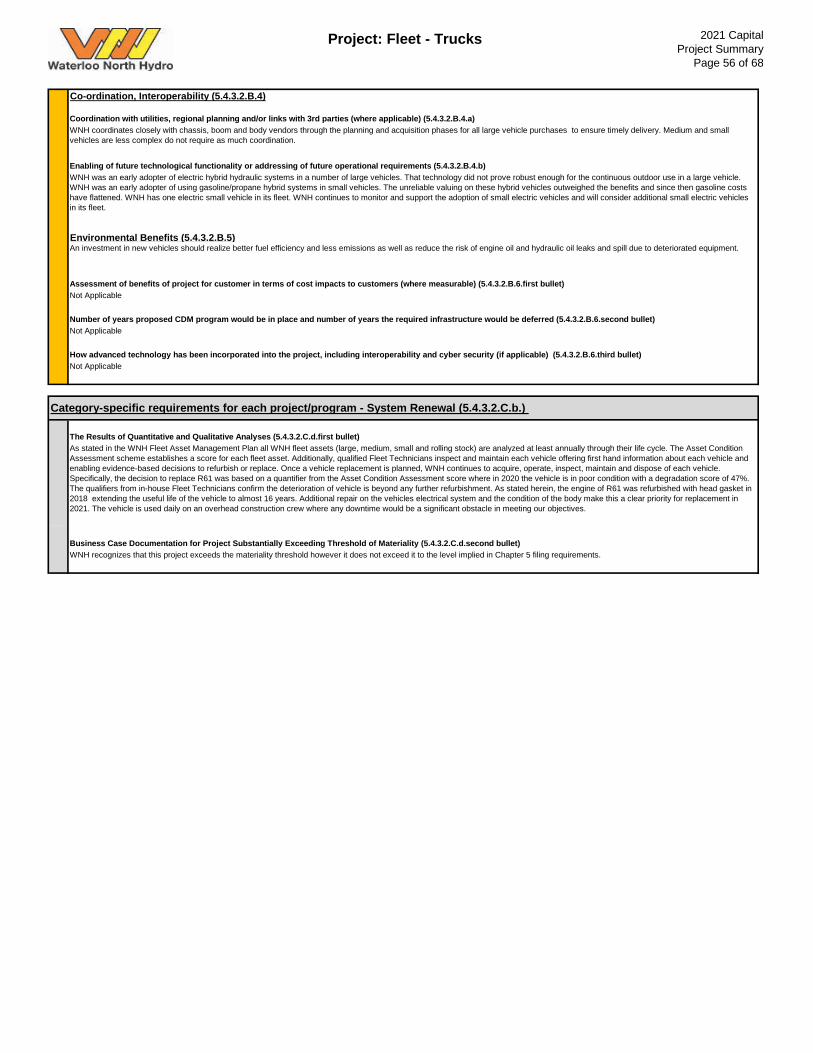
Project: Fleet - Trucks 2021 CapitalProject Summary
Page 56 of 68
Environmental Benefits (5.4.3.2.B.5)
Assessment of benefits of project for customer in terms of cost impacts to customers (where measurable) (5.4.3.2.B.6.first bullet)Not Applicable
As stated in the WNH Fleet Asset Management Plan all WNH fleet assets (large, medium, small and rolling stock) are analyzed at least annually through their life cycle. The Asset Condition Assessment scheme establishes a score for each fleet asset. Additionally, qualified Fleet Technicians inspect and maintain each vehicle offering first hand information about each vehicle and enabling evidence-based decisions to refurbish or replace. Once a vehicle replacement is planned, WNH continues to acquire, operate, inspect, maintain and dispose of each vehicle. Specifically, the decision to replace R61 was based on a quantifier from the Asset Condition Assessment score where in 2020 the vehicle is in poor condition with a degradation score of 47%. The qualifiers from in-house Fleet Technicians confirm the deterioration of vehicle is beyond any further refurbishment. As stated herein, the engine of R61 was refurbished with head gasket in 2018 extending the useful life of the vehicle to almost 16 years. Additional repair on the vehicles electrical system and the condition of the body make this a clear priority for replacement in 2021. The vehicle is used daily on an overhead construction crew where any downtime would be a significant obstacle in meeting our objectives.
Business Case Documentation for Project Substantially Exceeding Threshold of Materiality (5.4.3.2.C.d.second bullet)WNH recognizes that this project exceeds the materiality threshold however it does not exceed it to the level implied in Chapter 5 filing requirements.
Number of years proposed CDM program would be in place and number of years the required infrastructure would be deferred (5.4.3.2.B.6.second bullet)
Co-ordination, Interoperability (5.4.3.2.B.4)
Coordination with utilities, regional planning and/or links with 3rd parties (where applicable) (5.4.3.2.B.4.a)WNH coordinates closely with chassis, boom and body vendors through the planning and acquisition phases for all large vehicle purchases to ensure timely delivery. Medium and small vehicles are less complex do not require as much coordination.
Enabling of future technological functionality or addressing of future operational requirements (5.4.3.2.B.4.b)WNH was an early adopter of electric hybrid hydraulic systems in a number of large vehicles. That technology did not prove robust enough for the continuous outdoor use in a large vehicle. WNH was an early adopter of using gasoline/propane hybrid systems in small vehicles. The unreliable valuing on these hybrid vehicles outweighed the benefits and since then gasoline costs have flattened. WNH has one electric small vehicle in its fleet. WNH continues to monitor and support the adoption of small electric vehicles and will consider additional small electric vehicles in its fleet.
An investment in new vehicles should realize better fuel efficiency and less emissions as well as reduce the risk of engine oil and hydraulic oil leaks and spill due to deteriorated equipment.
Not Applicable
How advanced technology has been incorporated into the project, including interoperability and cyber security (if applicable) (5.4.3.2.B.6.third bullet)Not Applicable
Category-specific requirements for each project/program - System Renewal (5.4.3.2.C.b.)
The Results of Quantitative and Qualitative Analyses (5.4.3.2.C.d.first bullet)
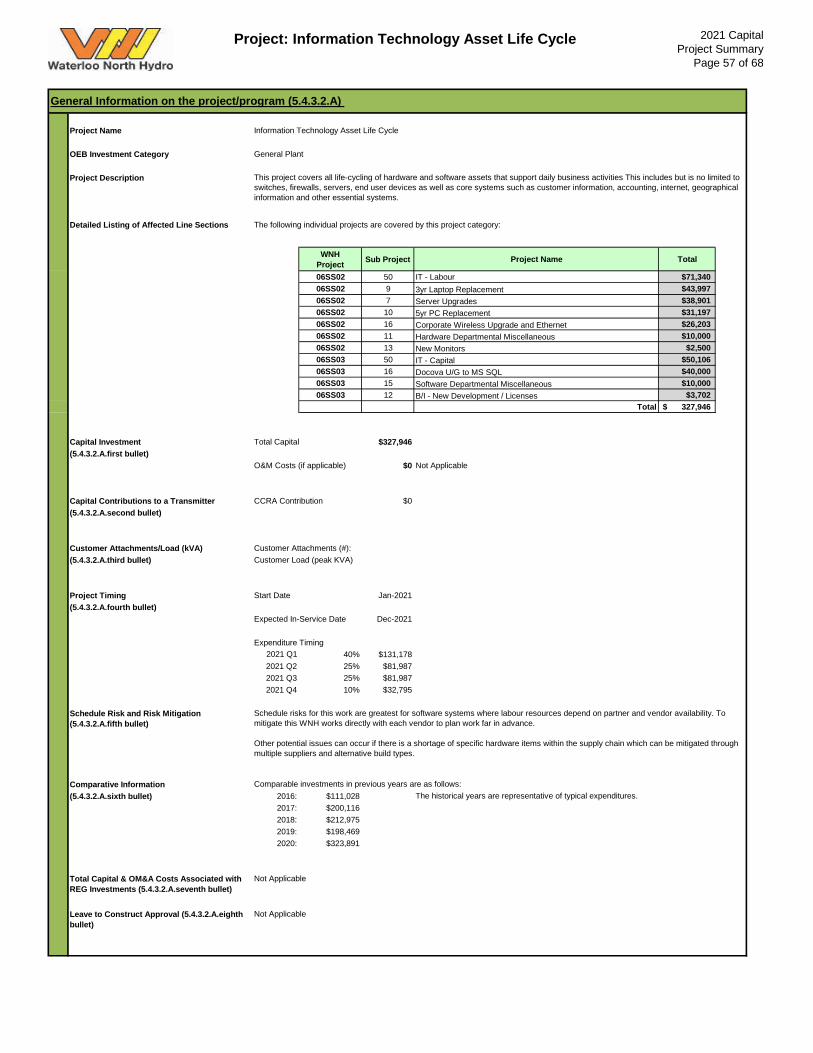
Project: Information Technology Asset Life Cycle 2021 CapitalProject Summary
Page 57 of 68
Project Name OEB Investment Category General Plant
Project Description
Detailed Listing of Affected Line Sections The following individual projects are covered by this project category:
WNH Project Sub Project Project Name Total
06SS02 50 IT - Labour $71,34006SS02 9 3yr Laptop Replacement $43,99706SS02 7 Server Upgrades $38,90106SS02 10 5yr PC Replacement $31,19706SS02 16 Corporate Wireless Upgrade and Ethernet $26,20306SS02 11 Hardware Departmental Miscellaneous $10,00006SS02 13 New Monitors $2,50006SS03 50 IT - Capital $50,10606SS03 16 Docova U/G to MS SQL $40,00006SS03 15 Software Departmental Miscellaneous $10,00006SS03 12 B/I - New Development / Licenses $3,702
Total 327,946$
Capital Investment Total Capital $327,946(5.4.3.2.A.first bullet)
O&M Costs (if applicable) $0
Capital Contributions to a Transmitter CCRA Contribution $0(5.4.3.2.A.second bullet)
Customer Attachments/Load (kVA) Customer Attachments (#): (5.4.3.2.A.third bullet) Customer Load (peak KVA)
Project Timing Start Date Jan-2021(5.4.3.2.A.fourth bullet)
Expected In-Service Date Dec-2021
Expenditure Timing 2021 Q1 40% $131,178 2021 Q2 25% $81,987 2021 Q3 25% $81,9872021 Q4 10% $32,795
Schedule Risk and Risk Mitigation (5.4.3.2.A.fifth bullet)
Comparative Information(5.4.3.2.A.sixth bullet) 2016: $111,028
2017: $200,1162018: $212,9752019: $198,4692020: $323,891
Total Capital & OM&A Costs Associated with REG Investments (5.4.3.2.A.seventh bullet)
Leave to Construct Approval (5.4.3.2.A.eighth bullet)
General Information on the project/program (5.4.3.2.A)
Information Technology Asset Life Cycle
This project covers all life-cycling of hardware and software assets that support daily business activities This includes but is no limited to switches, firewalls, servers, end user devices as well as core systems such as customer information, accounting, internet, geographical information and other essential systems.
Not Applicable
Schedule risks for this work are greatest for software systems where labour resources depend on partner and vendor availability. To mitigate this WNH works directly with each vendor to plan work far in advance.
Other potential issues can occur if there is a shortage of specific hardware items within the supply chain which can be mitigated through multiple suppliers and alternative build types.
Comparable investments in previous years are as follows:
Not Applicable
The historical years are representative of typical expenditures.
Not Applicable
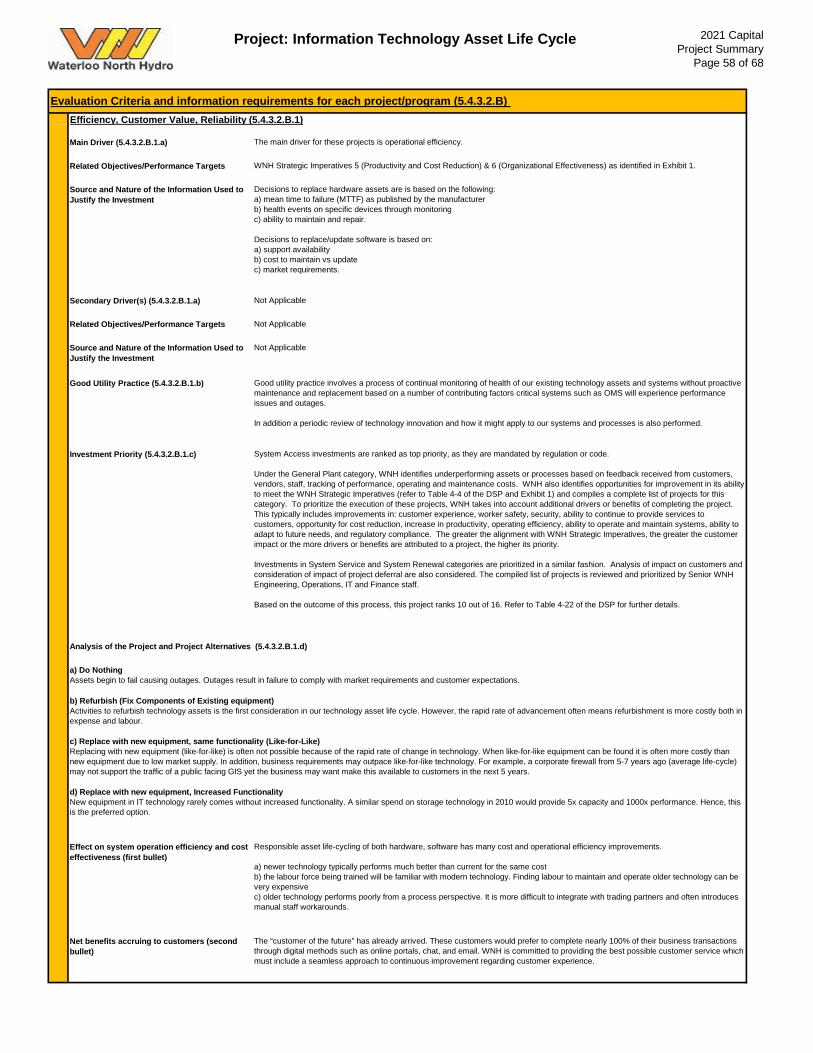
Project: Information Technology Asset Life Cycle 2021 CapitalProject Summary
Page 58 of 68
Main Driver (5.4.3.2.B.1.a)
Related Objectives/Performance Targets
Source and Nature of the Information Used to Justify the Investment
Secondary Driver(s) (5.4.3.2.B.1.a)
Related Objectives/Performance Targets
Source and Nature of the Information Used to Justify the Investment
Good Utility Practice (5.4.3.2.B.1.b)
Investment Priority (5.4.3.2.B.1.c)
Effect on system operation efficiency and cost effectiveness (first bullet)
Net benefits accruing to customers (second bullet)
Responsible asset life-cycling of both hardware, software has many cost and operational efficiency improvements.
a) newer technology typically performs much better than current for the same costb) the labour force being trained will be familiar with modern technology. Finding labour to maintain and operate older technology can be very expensivec) older technology performs poorly from a process perspective. It is more difficult to integrate with trading partners and often introduces manual staff workarounds.
The “customer of the future” has already arrived. These customers would prefer to complete nearly 100% of their business transactions through digital methods such as online portals, chat, and email. WNH is committed to providing the best possible customer service which must include a seamless approach to continuous improvement regarding customer experience.
Evaluation Criteria and information requirements for each project/program (5.4.3.2.B) Efficiency, Customer Value, Reliability (5.4.3.2.B.1)
The main driver for these projects is operational efficiency.
WNH Strategic Imperatives 5 (Productivity and Cost Reduction) & 6 (Organizational Effectiveness) as identified in Exhibit 1.
Decisions to replace hardware assets are is based on the following:a) mean time to failure (MTTF) as published by the manufacturerb) health events on specific devices through monitoringc) ability to maintain and repair.
Decisions to replace/update software is based on:a) support availabilityb) cost to maintain vs updatec) market requirements.
Not Applicable
Not Applicable
Not Applicable
Good utility practice involves a process of continual monitoring of health of our existing technology assets and systems without proactive maintenance and replacement based on a number of contributing factors critical systems such as OMS will experience performance issues and outages.
In addition a periodic review of technology innovation and how it might apply to our systems and processes is also performed.
System Access investments are ranked as top priority, as they are mandated by regulation or code.
Under the General Plant category, WNH identifies underperforming assets or processes based on feedback received from customers, vendors, staff, tracking of performance, operating and maintenance costs. WNH also identifies opportunities for improvement in its ability to meet the WNH Strategic Imperatives (refer to Table 4-4 of the DSP and Exhibit 1) and compiles a complete list of projects for this category. To prioritize the execution of these projects, WNH takes into account additional drivers or benefits of completing the project. This typically includes improvements in: customer experience, worker safety, security, ability to continue to provide services to customers, opportunity for cost reduction, increase in productivity, operating efficiency, ability to operate and maintain systems, ability to adapt to future needs, and regulatory compliance. The greater the alignment with WNH Strategic Imperatives, the greater the customer impact or the more drivers or benefits are attributed to a project, the higher its priority.
Investments in System Service and System Renewal categories are prioritized in a similar fashion. Analysis of impact on customers and consideration of impact of project deferral are also considered. The compiled list of projects is reviewed and prioritized by Senior WNH Engineering, Operations, IT and Finance staff.
Based on the outcome of this process, this project ranks 10 out of 16. Refer to Table 4-22 of the DSP for further details.
Analysis of the Project and Project Alternatives (5.4.3.2.B.1.d)
a) Do NothingAssets begin to fail causing outages. Outages result in failure to comply with market requirements and customer expectations. b) Refurbish (Fix Components of Existing equipment)Activities to refurbish technology assets is the first consideration in our technology asset life cycle. However, the rapid rate of advancement often means refurbishment is more costly both in expense and labour.
c) Replace with new equipment, same functionality (Like-for-Like)Replacing with new equipment (like-for-like) is often not possible because of the rapid rate of change in technology. When like-for-like equipment can be found it is often more costly than new equipment due to low market supply. In addition, business requirements may outpace like-for-like technology. For example, a corporate firewall from 5-7 years ago (average life-cycle) may not support the traffic of a public facing GIS yet the business may want make this available to customers in the next 5 years.
d) Replace with new equipment, Increased FunctionalityNew equipment in IT technology rarely comes without increased functionality. A similar spend on storage technology in 2010 would provide 5x capacity and 1000x performance. Hence, this is the preferred option.
Project: Information Technology Asset Life Cycle 2021 CapitalProject Summary
Page 59 of 68
Impact of Investment on reliability performance (including on the frequency and duration of outages) (third bullet)
Scheduling Alternatives
Ownership and/or Funding Alternatives
Environmental Benefits (5.4.3.2.B.5)
Conservation and Demand Management (5.4.3.2.B.6)
Assessment of benefits of project for customer in terms of cost impacts to customers (where measurable) (5.4.3.2.B.6.first bullet)Not Applicable
Both planned and emergency work are conducted using data and communication tools that rely heavily on information technology assets. The integrity and availability of this information can affect the quality and safety of work in addition to being a platform for training and awareness.
Quantitative analysis is not available. Qualitative analysis is described in relevant sections of 5.4.3.2.B above.
Business Case Documentation for Project Substantially Exceeding Threshold of Materiality (5.4.3.2.C.d.second bullet)WNH recognizes that this project exceeds the materiality threshold however it does not exceed it to the level implied in Chapter 5 filing requirements.
Information Technology (IT) and Operational Technology (OT) are both systems which rely on each other. Through improvements in OT WNH has been able to noticeably lower outage minutes experienced by customers. Failure to invest in IT would result in reduced outage savings going forward.
WNH's workforce has evolved as manual tasks have been automated by technology. Not too long ago every electric meter would be read manually in the field which is something that is no longer. The workforce, equipment and ability to do this work is also no longer available. Additionally the regulated environment now demands digital reads to be conducted on an hourly basis. The systems supporting this process are WNH business machines, Customer Information system and Regional network interface. If any of these systems have an outage, perform poorly or become unavailable we will fail to meet our objectives.
WNH's existing practice is a staggered replacement of technology assets. Delayed implementation would disrupt workflow, customer experience and introduce inconsistent spending patterns.
While WNH is required to have some assets owned and operated on site. It is possible to shift some of capital cost towards operating through the modern “As a Service” model. This is typically not cheaper but it is being evaluated.
Safety (5.4.3.2.B.2)
Number of years proposed CDM program would be in place and number of years the required infrastructure would be deferred (5.4.3.2.B.6.second bullet)
Cyber-security, Privacy (5.4.3.2.B.3)Every hour of every day a new vulnerability (CVE) is published. These are only the discovered ones. Improvement in the technology used will enable better cyber security processes and reduce the risk of:a) service unavailability due to a cyber attackb) lost or stolen customer informationc) damage to the integrity of our systems in a lasting way due to a cyber attack.
In addition the cyber-security of every project that involves technology depends on the foundation of our technology assets.
Co-ordination, Interoperability (5.4.3.2.B.4)
Coordination with utilities, regional planning and/or links with 3rd parties (where applicable) (5.4.3.2.B.4.a)Collaboration for research, testing and procurement of technology assets exists. This takes place through regional communication, working groups and joint projects efforts where applicable.
Enabling of future technological functionality or addressing of future operational requirements (5.4.3.2.B.4.b)WNH is on a path in regards to technology towards a high level of agility which will enable WNH to adapt to future requirements at an extremely fast rate. To accomplish a high level of technological agility WNH will heavily favour the following for all future technology purchases:a) standard, open and whenever possible non-proprietary technologyb) use of APIs for scalable integrationc) software defined storage, networks and communicationsd) distributed system architecture that scales with ease and reduces single points of failuree) innovation within the culture of staff that will implement WNH's life-cycle.
Not Applicable
Not Applicable
How advanced technology has been incorporated into the project, including interoperability and cyber security (if applicable) (5.4.3.2.B.6.third bullet)Not Applicable
Category-specific requirements for each project/program - System Renewal (5.4.3.2.C.b.)
The Results of Quantitative and Qualitative Analyses (5.4.3.2.C.d.first bullet)
Project: Operation Technology Software 2021 CapitalProject Summary
Page 60 of 68
Project Name OEB Investment Category General Plant
Project Description
Detailed Listing of Affected Line Sections The following individual projects are covered by this project category:
WNH Project Sub Project Project Name Total
06EN13 21 GIS Migration - Geometric Network-to-Utility Network Phase II $209,98706EN13 19 Mobile Apps & Enterprise Web Service $71,535
Total 281,522$
Capital Investment Total Capital $281,522(5.4.3.2.A.first bullet)
O&M Costs (if applicable) $0
Capital Contributions to a Transmitter CCRA Contribution $0(5.4.3.2.A.second bullet)
Customer Attachments/Load (kVA) Customer Attachments (#): Not Applicable(5.4.3.2.A.third bullet) Customer Load (peak KVA) Not Applicable
Project Timing Start Date Jan-2021(5.4.3.2.A.fourth bullet)
Expected In-Service Date Dec-2021
Expenditure Timing 2021 Q1 10% $28,152 2021 Q2 20% $56,304 2021 Q3 40% $112,6092021 Q4 30% $84,457
Schedule Risk and Risk Mitigation (5.4.3.2.A.fifth bullet)
Not Applicable
With deployment of relatively new software to the industry, there are two main schedule risks that required WNH to develop risk mitigation methods: lack of employee skill set and shortage of industry skill set with respect to the new software.
The employee skill set risks are controllable by WNH. To mitigate this risk WNH plans to start required training in 2020 through structured courses and a learning sandbox environment provided by the vendor. This approach will also help in becoming educated in selecting the right partners for the implementation stage of this project.
The second risk of shortage of skilled industry resources is addressed by starting this project ahead of other users to minimize competition for the same resources. Starting Phase II of the project in 2021 will provide WNH enough lead time to complete the GIS system migration prior to the end of support for the existing geometric network GIS by January 2024.
General Information on the project/program (5.4.3.2.A)
Operation Technology Software
WNH’s Graphical Information System (GIS) is the cornerstone software of this project category. The current geometric network based GIS technology was developed in the 80's. WNH's GIS provider, Environmental Systems Research Institute (ESRI), announced that due to the limitations of this 30+ year old technology, this system will have reached the end of its useful life and is ending support for this technology by January 2024. At that time support, maintenance and security updates to their existing offering, as well as their accompanying applications will no longer be available to users.
ESRI is providing a migration path to utility network based GIS, ESRI's current technology. The utility network provides numerous enhancements to overcome the limitations of the geometric network and address the industry specific needs of Local Distribution Companies that were not envisioned when the geometric network was developed. These include: integration with more systems and devices, eliminating the need for client side software, simplified data sharing, data accessibility and editing using web connectivity, support of 3D visualization, more detailed and accurate data collection as it relates to field assets. ESRI also created templates for current users to migrate data from their Geometric Network over to the Utility Network to minimize the need to recreate or replicate data.
WNH began preparing for this change in 2019 with Phase I of WNH's migration to the utility network, which concludes in 2020 and includes: staff training, data mapping design, and piloting WNH data in ESRI's utility network environment.
Full deployment of the new framework is a multi-year project. It starts with Phase II in 2021 which will include: system migration, web app and service development, testing and by the end of the year, running the utility network in WNH's production GIS environment, while still maintaining the necessary links to the legacy geometric network. Subsequent phases in 2022 and through to the end of 3rd quarter in 2023 WNH plans to migrate all applications, integrations, interfaces and business process to the utility network, allowing for decommissioning of the geometric network.
Each year WNH looks to enhance existing or develop new GIS applications used by WNH staff. In 2021, these plans include the development of an OEB repair app. This app will be integrated with WNH’s existing OEB inspection app using ESRI’s Workforce for ArcGIS. It will use outputs from the OEB inspection app to identify all needed repairs, track the repair status, timestamp when repairs are completed and also fulfill all regulatory requirements around safety. In subsequent years new apps will also be added. These include: a streetlight repair app where the public can report streetlight outages/issues, an interactive dashboard with a live link to WNH's outage logging software showing outage location, cause, and date, as well as data sharing with municipalities and other utilities. New apps are also contemplated as opportunities arise.
Project: Operation Technology Software 2021 CapitalProject Summary
Page 61 of 68
Comparative Information(5.4.3.2.A.sixth bullet) 2016: $76,913
2017: $176,0282018: $282,8342019: $278,7832020: $251,346
Total Capital & OM&A Costs Associated with REG Investments (5.4.3.2.A.seventh bullet)
Leave to Construct Approval (5.4.3.2.A.eighth bullet)
Main Driver (5.4.3.2.B.1.a)
Related Objectives/Performance Targets
Source and Nature of the Information Used to Justify the Investment
Secondary Driver(s) (5.4.3.2.B.1.a)
Related Objectives/Performance Targets
Source and Nature of the Information Used to Justify the Investment
Good Utility Practice (5.4.3.2.B.1.b)
Investment Priority (5.4.3.2.B.1.c)
Efficiency, Customer Value, Reliability (5.4.3.2.B.1)
The main driver of the project is functional obsolescence as announced by the GIS vendor. The current geometric network based GIS will no longer be supported as of January 2024.
WNH Strategic Imperative 3 (Customer Service) as identified in Exhibit 1.
ESRI announcement of milestone dates when existing support to the geometric network based GIS will no longer be available.
The secondary driver for these projects is the operational efficiency.
WNH Strategic Imperative 6 (Organizational Effectiveness) as identified in Exhibit 1.
Comparable investments in previous years are as follows:
Evaluation Criteria and information requirements for each project/program (5.4.3.2.B)
Once fully deployed, Utility Network provides WNH with a GIS onto which new applications can be developed that support more functionality to engage internal and external stakeholders as GIS users, while obtaining better, faster up to date spatial asset information, allowing for more analysis and better business decisions. The Utility Network based GIS also provides a better environment to support web services and user applications, which in turn can improve the efficiency of daily business activities.
At WNH, the GIS system is a crucial component of a highly integrated ecosystem supporting day to day operation of the Control Centre and the distribution grid. It needs to be accurate and reliable in providing data to staff and to other integrated systems to support operational decisions. To ensure that standard is maintained through the migration process of the GIS, WNH plans to conduct a full needs analysis and gap analysis prior to the data migration. All systems that GIS supports and integrates with will be maintained and migrated to the new Utility Network GIS by maintaining a link to the Geometric Network GIS during the transition period. This is essential to maintain day to day operations reliably while implementing, configuring, and testing the new system and all other systems it must integrate to.
System Access investments are ranked as top priority, as they are mandated by regulation or code.
Under the General Plant category, WNH identifies underperforming assets or processes based on feedback received from customers, vendors, staff, tracking of performance, operating and maintenance costs. WNH also identifies opportunities for improvement in its ability to meet the WNH Strategic Imperatives (refer to Table 4-4 of the DSP and Exhibit 1) and compiles a complete list of projects for this category. To prioritize the execution of these projects, WNH takes into account additional drivers or benefits of completing the project. This typically includes improvements in: customer experience, worker safety, security, ability to continue to provide services to customers, opportunity for cost reduction, increase in productivity, operating efficiency, ability to operate and maintain systems, ability to adapt to future needs, and regulatory compliance. The greater the alignment with WNH Strategic Imperatives, the greater the customer impact or the more drivers or benefits are attributed to a project, the higher its priority.
Investments in System Service and System Renewal categories are prioritized in a similar fashion. Analysis of impact on customers and consideration of impact of project deferral are also considered. The compiled list of projects is reviewed and prioritized by Senior WNH Engineering, Operations, IT and Finance staff.
Based on the outcome of this process, this project ranks 13 out of 16. Refer to Table 4-22 of the DSP for further details.
Analysis of the Project and Project Alternatives (5.4.3.2.B.1.d)
a) Do Nothing Do nothing or deferring the projects to the following year will eventually result in the current GIS system becoming unsupported from a functionality and a cyber security point of view. Given the criticality of the GIS system to the day-to-day operation of the distribution system, this risk, and hence, this option is unacceptable. b) Continue to Run the Existing System and Perform Software Update PatchesThis option only allows for continued maintenance of the existing system until January 2024 after which there will be no new release, security patches or application development available any more. This option is not an alternative to system upgrade.
c) Replace with new system, same functionality (Like-for-Like)Like-for-Like replacement option is common in solving hardware problems but not a proper option for solving a functionally obsolete software. Once a software is obsoleted by the vendor, it is no longer available for purchase to any user, therefore, this option is not available.
d) Replace with system from new vendorReplacing the existing Geometric Network GIS with a different vendors GIS offering is another option. However, this option would require data migration/data mapping to a completely different, vendor specific platform, re-training of all staff on a new platform, rebuilding of all GIS applications that field staff currently use, and re-integration of all other ESRI GIS interfaces (e.g. OMS, CIS, Synergi). For these reasons this option was not deemed appropriate.
e) Replace with new system, Increased FunctionalityMigrating from the existing Geometric Network GIS to the Utility Network GIS will not only address the concerns with obsolescence and lack of support, but also expand GIS functionality as not only the system of record but also as the system of engagement and system of insight. Utility Network GIS holds a web based environment that supports services and apps for users to increase productivity and operational effectiveness and therefore this option is the only viable option.
Not Applicable
The historical years are representative of typical expenditures.
Not Applicable
Project: Operation Technology Software 2021 CapitalProject Summary
Page 62 of 68
Effect on system operation efficiency and cost effectiveness (first bullet)
Net benefits accruing to customers (second bullet)
Impact of Investment on reliability performance (including on the frequency and duration of outages) (third bullet)
Scheduling Alternatives
Ownership and/or Funding Alternatives
Environmental Benefits (5.4.3.2.B.5)
Please see answers provided to Section 5.4.3.2.B.1.d and Section 5.4.3.2.B.4.b above.
Business Case Documentation for Project Substantially Exceeding Threshold of Materiality (5.4.3.2.C.d.second bullet)WNH recognizes that this project exceeds the materiality threshold however it does not exceed it to the level implied in Chapter 5 filing requirements.
Not Applicable
How advanced technology has been incorporated into the project, including interoperability and cyber security (if applicable) (5.4.3.2.B.6.third bullet)Not Applicable
Category-specific requirements for each project/program - System Renewal (5.4.3.2.C.b.)
The Results of Quantitative and Qualitative Analyses (5.4.3.2.C.d.first bullet)
These projects are part of a multi-year plan. It is budgeted at a paced amount each year to levelize the investment and resource availability. There could be a potential to defer, if other higher priority projects arise or an unforeseeable event happens during the year. However, since the obsolescence date is fixed, deferring this project would increase the scope of work in subsequent years, triggering resource shortages that would need to be solved by procuring additional contract resources at potentially higher overall costs.
Unlike hardware options, where leasing is an alternative, software licences must be owned and funded by the end user.
Safety (5.4.3.2.B.2)
Number of years proposed CDM program would be in place and number of years the required infrastructure would be deferred (5.4.3.2.B.6.second bullet)
Cyber-security, Privacy (5.4.3.2.B.3)WNH will work with our IT department to ensure cyber security and privacy requirements are in place prior to and throughout the project. Contractors from third parties who will be working on WNH data will be required to sign a confidentiality agreement. The access to WNH systems whether on site or via a remote secured connection will be set up and monitored by our IT department and WNH GIS Staff.
Co-ordination, Interoperability (5.4.3.2.B.4)
Coordination with utilities, regional planning and/or links with 3rd parties (where applicable) (5.4.3.2.B.4.a)Not Applicable
Enabling of future technological functionality or addressing of future operational requirements (5.4.3.2.B.4.b)The ArcGIS Utility Network uses connectivity, containment and structural attachment, three associated concepts to accurately model the wires, electrical assets and civil assets all together with inherent rules to enforce the data integrity while forming a traceable network from tier to tier. The service based web environment enables user access anytime, anywhere and makes real-time GIS field changes and map service updates possible. Users within the organization can share data, publish maps or conduct their own spatial analysis to engage people and make better business decisions more effectively. Using the web GIS portal organizations can share information through data collaboration, e.g. the municipalities can share their water, sewer and storm infrastructure as map services with hydro utilities and vice versa to allow businesses to operate more efficiently and effectively. Mobile applications also make engineering design, field inspection, asset management, outage management, emergency response and workforce management more productive and efficient.
Not Applicable
Conservation and Demand Management (5.4.3.2.B.6)
Assessment of benefits of project for customer in terms of cost impacts to customers (where measurable) (5.4.3.2.B.6.first bullet)Not Applicable
Safety is not a driver for this project. Safety is a key Strategic Imperative for WNH as identified in Exhibit 1.
Once the new web services based Utility Network GIS is fully in service it can provide better support for interactive map services to the public and allow customers to report outages or spot equipment failure. With the new GIS, utilities can accurately model their infrastructure in 3D which can help customers with accuracy of locates.
There will be no immediate impact to reliability as a result of initiating this project. Over time, the new Utility Network technology and newly developed applications will facilitate better system modelling rules and data governance improving the quality of data to WNH's asset management system for performing failure and risk analysis. Ultimately, a more targeted guidance to proactive capital investments in the distribution system should lead to improvements in system reliability performance.
It is not uncommon to expect increased O&M costs in the first year of implementing a relatively new system to the industry due to the learning curve of the administrators and users as well as discovery of software bugs that need to be resolved by the vendor. However, once fully implemented, the Utility Network web based GIS, makes the spatial asset information available to authorized users anywhere, anytime for their day to day work. Live data collection from the field can be validated, processed and updated to the system in real time. Users can create and share their maps with others in the organization. Organizations can share information by providing and subscribing to services through collaboration. These projects will ultimately improve efficiency of asset data collection and accuracy, support situational awareness platforms, increase efficiency and effectiveness of engineering and field staff.
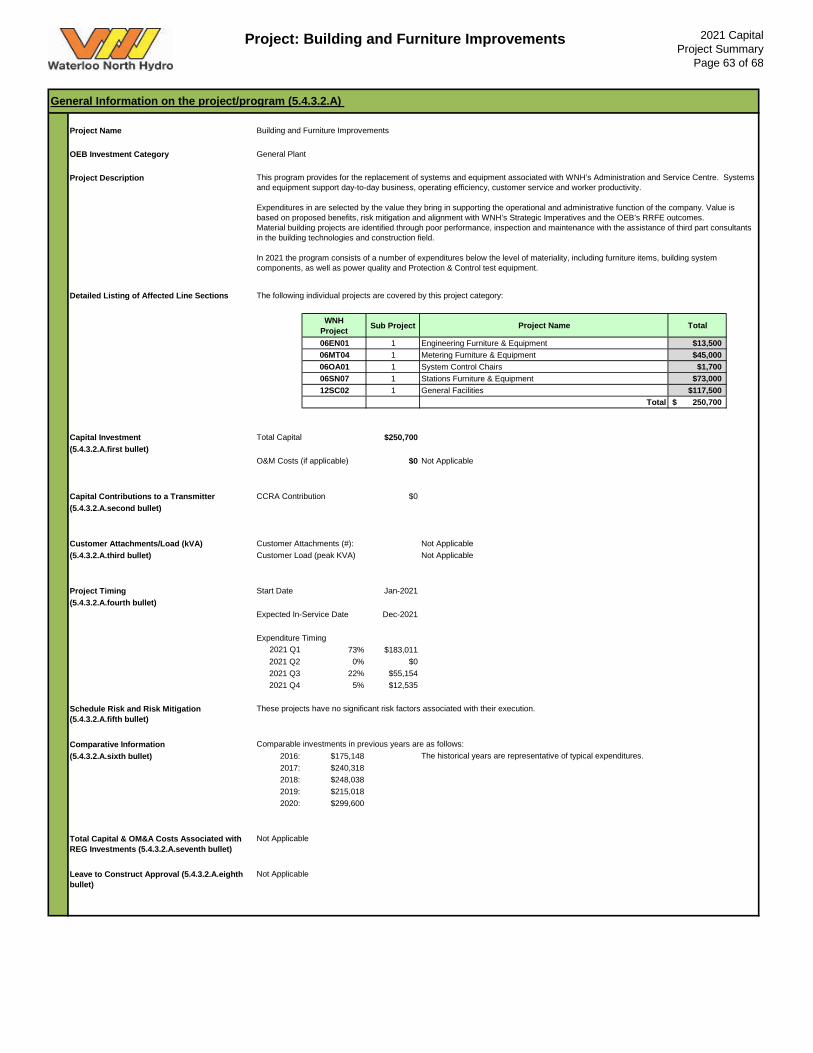
Project: Building and Furniture Improvements 2021 CapitalProject Summary
Page 63 of 68
Project Name OEB Investment Category General Plant
Project Description
Detailed Listing of Affected Line Sections The following individual projects are covered by this project category:
WNH Project Sub Project Project Name Total
06EN01 1 Engineering Furniture & Equipment $13,50006MT04 1 Metering Furniture & Equipment $45,00006OA01 1 System Control Chairs $1,70006SN07 1 Stations Furniture & Equipment $73,00012SC02 1 General Facilities $117,500
Total 250,700$
Capital Investment Total Capital $250,700(5.4.3.2.A.first bullet)
O&M Costs (if applicable) $0
Capital Contributions to a Transmitter CCRA Contribution $0(5.4.3.2.A.second bullet)
Customer Attachments/Load (kVA) Customer Attachments (#): Not Applicable(5.4.3.2.A.third bullet) Customer Load (peak KVA) Not Applicable
Project Timing Start Date Jan-2021(5.4.3.2.A.fourth bullet)
Expected In-Service Date Dec-2021
Expenditure Timing 2021 Q1 73% $183,011 2021 Q2 0% $0 2021 Q3 22% $55,1542021 Q4 5% $12,535
Schedule Risk and Risk Mitigation (5.4.3.2.A.fifth bullet)
Comparative Information(5.4.3.2.A.sixth bullet) 2016: $175,148
2017: $240,3182018: $248,0382019: $215,0182020: $299,600
Total Capital & OM&A Costs Associated with REG Investments (5.4.3.2.A.seventh bullet)
Leave to Construct Approval (5.4.3.2.A.eighth bullet)
Comparable investments in previous years are as follows:
Not Applicable
Not Applicable
These projects have no significant risk factors associated with their execution.
General Information on the project/program (5.4.3.2.A)
Building and Furniture Improvements
This program provides for the replacement of systems and equipment associated with WNH’s Administration and Service Centre. Systems and equipment support day-to-day business, operating efficiency, customer service and worker productivity.
Expenditures in are selected by the value they bring in supporting the operational and administrative function of the company. Value is based on proposed benefits, risk mitigation and alignment with WNH’s Strategic Imperatives and the OEB’s RRFE outcomes. Material building projects are identified through poor performance, inspection and maintenance with the assistance of third part consultants in the building technologies and construction field.
In 2021 the program consists of a number of expenditures below the level of materiality, including furniture items, building system components, as well as power quality and Protection & Control test equipment.
The historical years are representative of typical expenditures.
Not Applicable
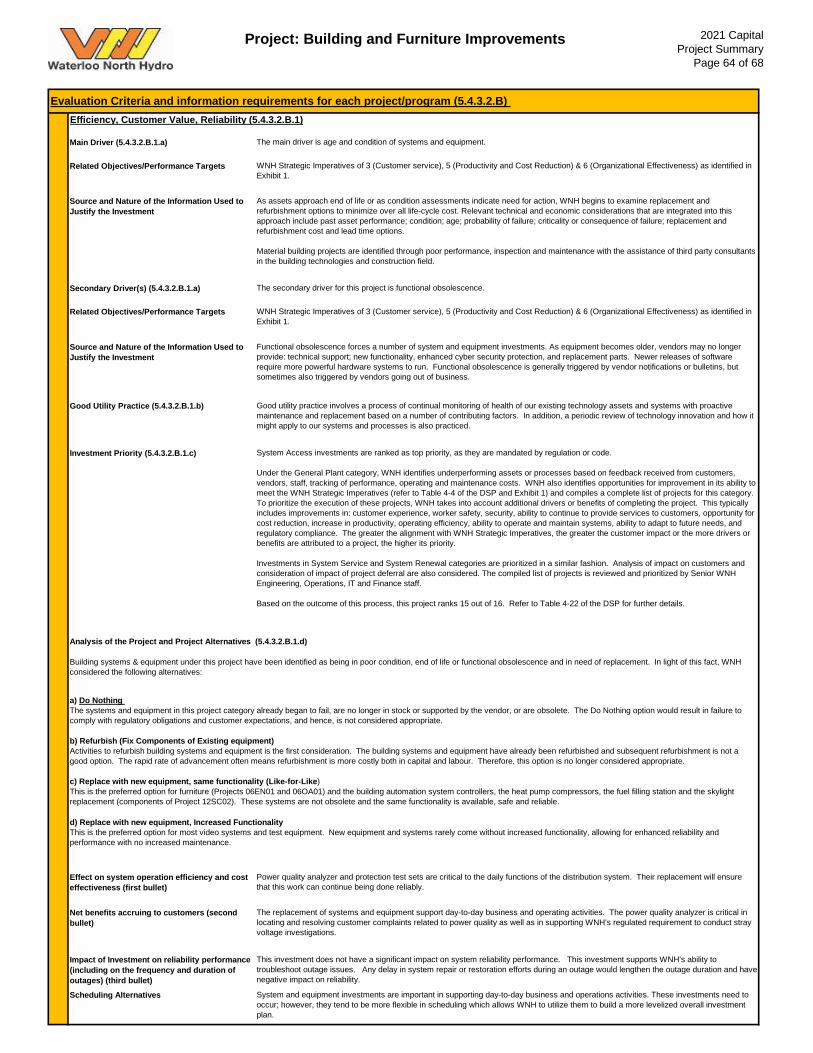
Project: Building and Furniture Improvements 2021 CapitalProject Summary
Page 64 of 68
Main Driver (5.4.3.2.B.1.a)
Related Objectives/Performance Targets
Source and Nature of the Information Used to Justify the Investment
Secondary Driver(s) (5.4.3.2.B.1.a)
Related Objectives/Performance Targets
Source and Nature of the Information Used to Justify the Investment
Good Utility Practice (5.4.3.2.B.1.b)
Investment Priority (5.4.3.2.B.1.c)
Effect on system operation efficiency and cost effectiveness (first bullet)
Net benefits accruing to customers (second bullet)
Impact of Investment on reliability performance (including on the frequency and duration of outages) (third bullet)Scheduling Alternatives
Efficiency, Customer Value, Reliability (5.4.3.2.B.1)
The main driver is age and condition of systems and equipment.
WNH Strategic Imperatives of 3 (Customer service), 5 (Productivity and Cost Reduction) & 6 (Organizational Effectiveness) as identified in Exhibit 1.
As assets approach end of life or as condition assessments indicate need for action, WNH begins to examine replacement and refurbishment options to minimize over all life-cycle cost. Relevant technical and economic considerations that are integrated into this approach include past asset performance; condition; age; probability of failure; criticality or consequence of failure; replacement and refurbishment cost and lead time options.
Material building projects are identified through poor performance, inspection and maintenance with the assistance of third party consultants in the building technologies and construction field.
The secondary driver for this project is functional obsolescence.
WNH Strategic Imperatives of 3 (Customer service), 5 (Productivity and Cost Reduction) & 6 (Organizational Effectiveness) as identified in Exhibit 1.
System and equipment investments are important in supporting day-to-day business and operations activities. These investments need to occur; however, they tend to be more flexible in scheduling which allows WNH to utilize them to build a more levelized overall investment plan.
The replacement of systems and equipment support day-to-day business and operating activities. The power quality analyzer is critical in locating and resolving customer complaints related to power quality as well as in supporting WNH's regulated requirement to conduct stray voltage investigations.
This investment does not have a significant impact on system reliability performance. This investment supports WNH's ability to troubleshoot outage issues. Any delay in system repair or restoration efforts during an outage would lengthen the outage duration and have negative impact on reliability.
Evaluation Criteria and information requirements for each project/program (5.4.3.2.B)
Functional obsolescence forces a number of system and equipment investments. As equipment becomes older, vendors may no longer provide: technical support; new functionality, enhanced cyber security protection, and replacement parts. Newer releases of software require more powerful hardware systems to run. Functional obsolescence is generally triggered by vendor notifications or bulletins, but sometimes also triggered by vendors going out of business.
Good utility practice involves a process of continual monitoring of health of our existing technology assets and systems with proactive maintenance and replacement based on a number of contributing factors. In addition, a periodic review of technology innovation and how it might apply to our systems and processes is also practiced.
System Access investments are ranked as top priority, as they are mandated by regulation or code.
Under the General Plant category, WNH identifies underperforming assets or processes based on feedback received from customers, vendors, staff, tracking of performance, operating and maintenance costs. WNH also identifies opportunities for improvement in its ability to meet the WNH Strategic Imperatives (refer to Table 4-4 of the DSP and Exhibit 1) and compiles a complete list of projects for this category. To prioritize the execution of these projects, WNH takes into account additional drivers or benefits of completing the project. This typically includes improvements in: customer experience, worker safety, security, ability to continue to provide services to customers, opportunity for cost reduction, increase in productivity, operating efficiency, ability to operate and maintain systems, ability to adapt to future needs, and regulatory compliance. The greater the alignment with WNH Strategic Imperatives, the greater the customer impact or the more drivers or benefits are attributed to a project, the higher its priority.
Investments in System Service and System Renewal categories are prioritized in a similar fashion. Analysis of impact on customers and consideration of impact of project deferral are also considered. The compiled list of projects is reviewed and prioritized by Senior WNH Engineering, Operations, IT and Finance staff.
Based on the outcome of this process, this project ranks 15 out of 16. Refer to Table 4-22 of the DSP for further details.
Analysis of the Project and Project Alternatives (5.4.3.2.B.1.d)
Building systems & equipment under this project have been identified as being in poor condition, end of life or functional obsolescence and in need of replacement. In light of this fact, WNH considered the following alternatives:
a) Do Nothing The systems and equipment in this project category already began to fail, are no longer in stock or supported by the vendor, or are obsolete. The Do Nothing option would result in failure to comply with regulatory obligations and customer expectations, and hence, is not considered appropriate. b) Refurbish (Fix Components of Existing equipment)Activities to refurbish building systems and equipment is the first consideration. The building systems and equipment have already been refurbished and subsequent refurbishment is not a good option. The rapid rate of advancement often means refurbishment is more costly both in capital and labour. Therefore, this option is no longer considered appropriate.
c) Replace with new equipment, same functionality (Like-for-Like)This is the preferred option for furniture (Projects 06EN01 and 06OA01) and the building automation system controllers, the heat pump compressors, the fuel filling station and the skylight replacement (components of Project 12SC02). These systems are not obsolete and the same functionality is available, safe and reliable.
d) Replace with new equipment, Increased FunctionalityThis is the preferred option for most video systems and test equipment. New equipment and systems rarely come without increased functionality, allowing for enhanced reliability and performance with no increased maintenance.
Power quality analyzer and protection test sets are critical to the daily functions of the distribution system. Their replacement will ensure that this work can continue being done reliably.
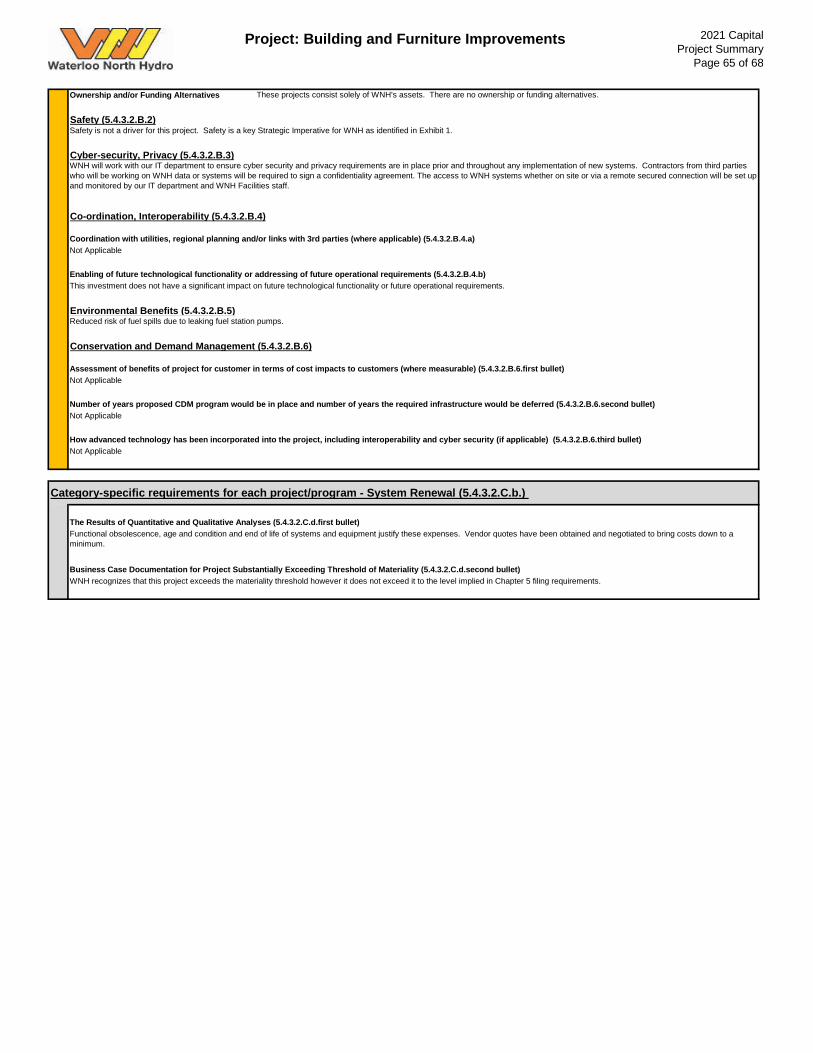
Project: Building and Furniture Improvements 2021 CapitalProject Summary
Page 65 of 68
Ownership and/or Funding Alternatives
Environmental Benefits (5.4.3.2.B.5)
Functional obsolescence, age and condition and end of life of systems and equipment justify these expenses. Vendor quotes have been obtained and negotiated to bring costs down to a minimum.
Business Case Documentation for Project Substantially Exceeding Threshold of Materiality (5.4.3.2.C.d.second bullet)WNH recognizes that this project exceeds the materiality threshold however it does not exceed it to the level implied in Chapter 5 filing requirements.
Not Applicable
How advanced technology has been incorporated into the project, including interoperability and cyber security (if applicable) (5.4.3.2.B.6.third bullet)Not Applicable
Category-specific requirements for each project/program - System Renewal (5.4.3.2.C.b.)
The Results of Quantitative and Qualitative Analyses (5.4.3.2.C.d.first bullet)
These projects consist solely of WNH's assets. There are no ownership or funding alternatives.
Safety (5.4.3.2.B.2)
Number of years proposed CDM program would be in place and number of years the required infrastructure would be deferred (5.4.3.2.B.6.second bullet)
Cyber-security, Privacy (5.4.3.2.B.3)WNH will work with our IT department to ensure cyber security and privacy requirements are in place prior and throughout any implementation of new systems. Contractors from third parties who will be working on WNH data or systems will be required to sign a confidentiality agreement. The access to WNH systems whether on site or via a remote secured connection will be set up and monitored by our IT department and WNH Facilities staff.
Co-ordination, Interoperability (5.4.3.2.B.4)
Coordination with utilities, regional planning and/or links with 3rd parties (where applicable) (5.4.3.2.B.4.a)Not Applicable
Enabling of future technological functionality or addressing of future operational requirements (5.4.3.2.B.4.b)This investment does not have a significant impact on future technological functionality or future operational requirements.
Reduced risk of fuel spills due to leaking fuel station pumps.
Conservation and Demand Management (5.4.3.2.B.6)
Assessment of benefits of project for customer in terms of cost impacts to customers (where measurable) (5.4.3.2.B.6.first bullet)Not Applicable
Safety is not a driver for this project. Safety is a key Strategic Imperative for WNH as identified in Exhibit 1.
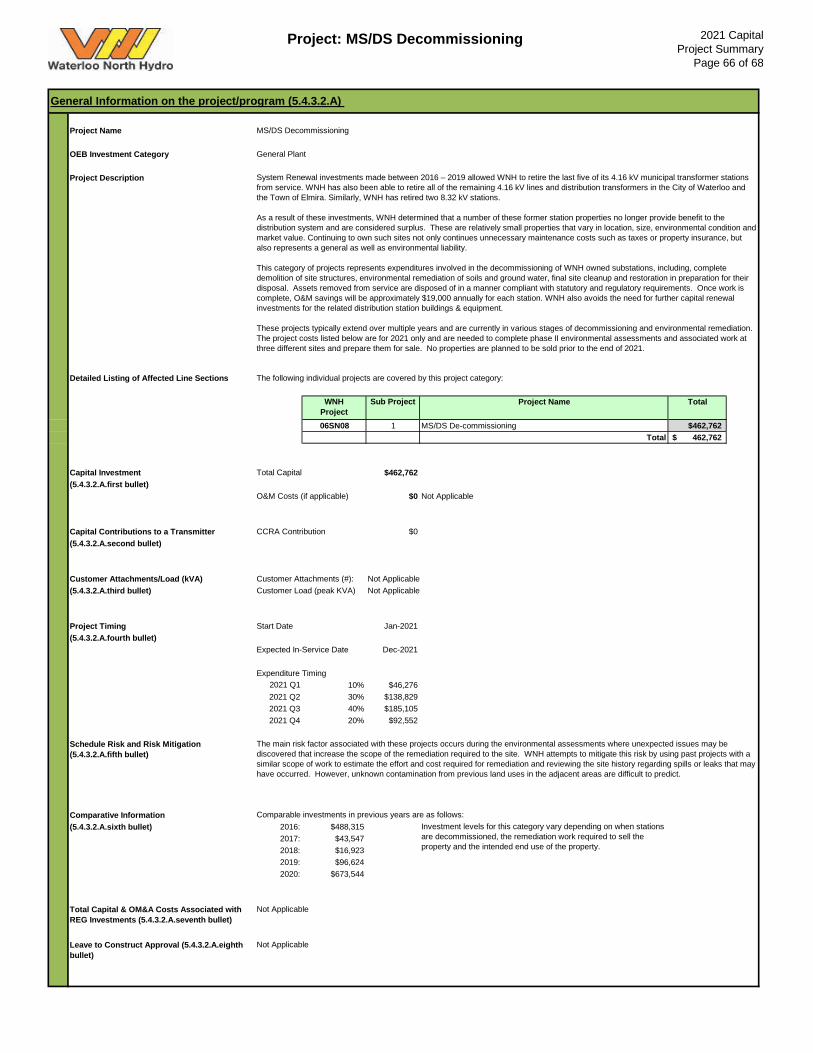
Project: MS/DS Decommissioning 2021 CapitalProject Summary
Page 66 of 68
Project Name OEB Investment Category General Plant
Project Description
Detailed Listing of Affected Line Sections The following individual projects are covered by this project category:
WNH Project
Sub Project Project Name Total
06SN08 1 MS/DS De-commissioning $462,762Total 462,762$
Capital Investment Total Capital $462,762(5.4.3.2.A.first bullet)
O&M Costs (if applicable) $0
Capital Contributions to a Transmitter CCRA Contribution $0(5.4.3.2.A.second bullet)
Customer Attachments/Load (kVA) Customer Attachments (#): Not Applicable(5.4.3.2.A.third bullet) Customer Load (peak KVA) Not Applicable
Project Timing Start Date Jan-2021(5.4.3.2.A.fourth bullet)
Expected In-Service Date Dec-2021
Expenditure Timing 2021 Q1 10% $46,276 2021 Q2 30% $138,829 2021 Q3 40% $185,1052021 Q4 20% $92,552
Schedule Risk and Risk Mitigation (5.4.3.2.A.fifth bullet)
Comparative Information(5.4.3.2.A.sixth bullet) 2016: $488,315
2017: $43,5472018: $16,9232019: $96,6242020: $673,544
Total Capital & OM&A Costs Associated with REG Investments (5.4.3.2.A.seventh bullet)
Leave to Construct Approval (5.4.3.2.A.eighth bullet)
Investment levels for this category vary depending on when stations are decommissioned, the remediation work required to sell the property and the intended end use of the property.
Not Applicable
Not Applicable
Not Applicable
The main risk factor associated with these projects occurs during the environmental assessments where unexpected issues may be discovered that increase the scope of the remediation required to the site. WNH attempts to mitigate this risk by using past projects with a similar scope of work to estimate the effort and cost required for remediation and reviewing the site history regarding spills or leaks that may have occurred. However, unknown contamination from previous land uses in the adjacent areas are difficult to predict.
Comparable investments in previous years are as follows:
General Information on the project/program (5.4.3.2.A)
MS/DS Decommissioning
System Renewal investments made between 2016 – 2019 allowed WNH to retire the last five of its 4.16 kV municipal transformer stations from service. WNH has also been able to retire all of the remaining 4.16 kV lines and distribution transformers in the City of Waterloo and the Town of Elmira. Similarly, WNH has retired two 8.32 kV stations.
As a result of these investments, WNH determined that a number of these former station properties no longer provide benefit to the distribution system and are considered surplus. These are relatively small properties that vary in location, size, environmental condition and market value. Continuing to own such sites not only continues unnecessary maintenance costs such as taxes or property insurance, but also represents a general as well as environmental liability.
This category of projects represents expenditures involved in the decommissioning of WNH owned substations, including, complete demolition of site structures, environmental remediation of soils and ground water, final site cleanup and restoration in preparation for their disposal. Assets removed from service are disposed of in a manner compliant with statutory and regulatory requirements. Once work is complete, O&M savings will be approximately $19,000 annually for each station. WNH also avoids the need for further capital renewal investments for the related distribution station buildings & equipment.
These projects typically extend over multiple years and are currently in various stages of decommissioning and environmental remediation. The project costs listed below are for 2021 only and are needed to complete phase II environmental assessments and associated work at three different sites and prepare them for sale. No properties are planned to be sold prior to the end of 2021.
Project: MS/DS Decommissioning 2021 CapitalProject Summary
Page 67 of 68
Main Driver (5.4.3.2.B.1.a)
Related Objectives/Performance Targets
Source and Nature of the Information Used to Justify the Investment
Secondary Driver(s) (5.4.3.2.B.1.a)
Related Objectives/Performance Targets
Source and Nature of the Information Used to Justify the Investment
Good Utility Practice (5.4.3.2.B.1.b)
Investment Priority (5.4.3.2.B.1.c)
Effect on system operation efficiency and cost effectiveness (first bullet)
Net benefits accruing to customers (second bullet)
Impact of Investment on reliability performance (including on the frequency and duration of outages) (third bullet)
Scheduling Alternatives
Ownership and/or Funding Alternatives
Cyber-security, Privacy (5.4.3.2.B.3)Not Applicable
Not Applicable
Not Applicable
By removing all above grade structures and contaminated soil from the properties the risk to the public is minimized.
Not Applicable
The investments in this category have no impact on reliability performance concerns, nor are they intended to be capable of addressing future challenges.
System Access investments are ranked as top priority, as they are mandated by regulation or code.
Under the General Plant category, WNH identifies underperforming assets or processes based on feedback received from customers, vendors, staff, tracking of performance, operating and maintenance costs. WNH also identifies opportunities for improvement in its ability to meet the WNH Strategic Imperatives (refer to Table 4-4 of the DSP and Exhibit 1) and compiles a complete list of projects for this category. To prioritize the execution of these projects, WNH takes into account additional drivers or benefits of completing the project. This typically includes improvements in: customer experience, worker safety, security, ability to continue to provide services to customers, opportunity for cost reduction, increase in productivity, operating efficiency, ability to operate and maintain systems, ability to adapt to future needs, and regulatory compliance. The greater the alignment with WNH Strategic Imperatives, the greater the customer impact or the more drivers or benefits are attributed to a project, the higher its priority.
Investments in System Service and System Renewal categories are prioritized in a similar fashion. Analysis of impact on customers and consideration of impact of project deferral are also considered. The compiled list of projects is reviewed and prioritized by Senior WNH Engineering, Operations, IT and Finance staff.
Based on the outcome of this process, this project ranks 16 out of 16. Refer to Table 4-22 of the DSP for further details.
Analysis of the Project and Project Alternatives (5.4.3.2.B.1.d)
a) Do Nothing This option is the least expensive, however carries the most risk. These sites generally have older equipment that leak oil and contaminate the soil or structures that cost more to fix or remove in the future due to rising environmental cleanup standards. This would also perpetuate ongoing maintenance costs (approximately $19,000 per station annually). b) Equipment Removal OnlyThis option minimizes site risk as the potential for oil leaks or damage from degrading structures/buildings is removed, however still carries the risk of environmental cross contamination of adjacent properties. This is the preferable option if WNH plans to re-purpose the site for their own use. Given that the properties in this project category bring no benefit to the distribution system and have been deemed surplus, continuing to own such sites not only continues unnecessary maintenance costs such as lawn care or taxes, but they also represent a general, as well as environmental liability. Delaying cleanup and disposal also carries the risk that the rising environmental cleanup standards could significantly increase future cleanup costs.
c) Remove Equipment, Remediate and Sell PropertyThis is the desired option when WNH does not plan to re-purpose the land for their own use. This option allows WNH to ensure that all equipment has been disposed of and the site has been cleaned up properly. It also removes any ongoing costs and risks associated with the property.
Decommissioning stations reduces future capital and O&M costs associated with those particular stations (approximately $19,000 per year per station). When stations are decommissioned the areas they served are converted to a higher, more efficient voltage level.
By decommissioning the stations and disposing of the properties, WNH customers no longer have to pay for the costs associated with owning those properties or carry the risk of substantial future disposal cost increases.
The investments in this category do not have an impact on reliability.
If other projects of a higher priority appear in the year, this project can be deferred if need be. However, this comes at the risk of significant increases to future disposal costs due to rising environmental cleanup standards as well as additional unplanned operating costs for property maintenance and continued general and environmental liability.
There are no ownership or funding alternatives as this is WNH owned equipment and land.
Safety (5.4.3.2.B.2)
Evaluation Criteria and information requirements for each project/program (5.4.3.2.B) Efficiency, Customer Value, Reliability (5.4.3.2.B.1)
The main driver for these projects is disposal of end of life surplus assets.
WNH Strategic Imperatives 5 (Productivity and Cost Reduction) as identified in Exhibit 1.
O&M savings will be approximately $19,000 annually for each station. WNH also avoids the need for further capital renewal investments for the related distribution station buildings & equipment. General, as well as environmental risks and liability are also reduced.
Please refer to Section 3.1 of the DSP for further details on WNH's asset management process.
Project: MS/DS Decommissioning 2021 CapitalProject Summary
Page 68 of 68
Environmental Benefits (5.4.3.2.B.5)
Please see detailed information in the Project Description above. WNH has not quantified the reduction in general liability and environmental risk.
Business Case Documentation for Project Substantially Exceeding Threshold of Materiality (5.4.3.2.C.d.second bullet)WNH recognizes that this project exceeds the materiality threshold however it does not exceed it to the level implied in Chapter 5 filing requirements.
Not Applicable
How advanced technology has been incorporated into the project, including interoperability and cyber security (if applicable) (5.4.3.2.B.6.third bullet)Not Applicable
Category-specific requirements for each project/program - System Renewal (5.4.3.2.C.b.)
The Results of Quantitative and Qualitative Analyses (5.4.3.2.C.d.first bullet)
Number of years proposed CDM program would be in place and number of years the required infrastructure would be deferred (5.4.3.2.B.6.second bullet)
Co-ordination, Interoperability (5.4.3.2.B.4)
Coordination with utilities, regional planning and/or links with 3rd parties (where applicable) (5.4.3.2.B.4.a)WNH is obligated to give the first right of refusal to the municipal shareholder in whose service territory the surplus land is located. WNH works closely with the appropriate municipality to determine their interest in purchasing the property.
Enabling of future technological functionality or addressing of future operational requirements (5.4.3.2.B.4.b)This investment does not have a significant impact on future technological functionality or future operational requirements.
By removing all above ground structures and contaminated soil and completing environmental assessments WNH removes any hazardous material from the site and disposes of it properly.
Conservation and Demand Management (5.4.3.2.B.6)
Assessment of benefits of project for customer in terms of cost impacts to customers (where measurable) (5.4.3.2.B.6.first bullet)Not Applicable

Appendix C:
KWCG IRRP Report (2015)
KITCHENER-WATERLOO-CAMBRIDGE-GUELPH REGION INTEGRATED REGIONAL RESOURCE PLANApril 28, 2015
Page i
Integrated Regional Resource Plan
Kitchener-Waterloo-Cambridge-Guelph
This Integrated Regional Resource Plan (“IRRP”) was prepared by the IESO pursuant to the
terms of its Ontario Energy Board licence, EI-2013-0066.
This IRRP was prepared on behalf of the KWCG Region Working Group, which included the following members:
• Independent Electricity System Operator • Kitchener-Wilmot Hydro Inc. • Waterloo North Hydro Inc. • Cambridge & North Dumfries Hydro Inc. • Guelph Hydro Electric Systems Inc. • Hydro One Networks Inc. (Distribution) and • Hydro One Networks Inc. (Transmission)
The KWCG Region Working Group assessed the adequacy of electricity supply to customers in the KWCG Region over a 20-year period; developed a flexible, comprehensive, integrated plan
that considers opportunities for coordination in anticipation of potential demand growth scenarios and varying supply conditions in the KWCG Region; and developed an
implementation plan for the recommended options, while maintaining flexibility in order to
accommodate changes in key assumptions over time.
KWCG Region Working Group members agree with the IRRP’s recommendations and support
implementation of the plan through the recommended actions. KWCG Region Working Group members do not commit to any capital expenditures and must still obtain all necessary
regulatory and other approvals to implement recommended actions.
Copyright © 2015 Independent Electricity System Operator. All rights reserved.
Page ii
Table of Contents
1. Introduction ................................................................................................................................... 1
2. The Integrated Regional Resource Plan ................................................................................... 3
2.1 Near- and Medium-Term Plan (2014-2023) .................................................................. 3
2.2 Long-Term Plan (2024-2033) ........................................................................................... 5
3. Development of the IRRP ........................................................................................................... 7
3.1 The Regional Planning Process ...................................................................................... 7
3.2 The IESO’s Approach to Regional Planning ............................................................... 10
3.3 KWCG Working Group and IRRP Development ...................................................... 11
4. Background and Scope of the KWCG IRRP .......................................................................... 13
4.1 Scope of the KWCG IRRP .............................................................................................. 13
4.2 Existing Electricity System in the KWCG Region ...................................................... 15
5. Demand Forecast ........................................................................................................................ 17
5.1 Historical Electricity Demand ....................................................................................... 17
5.2 Demand Forecast Methodology ................................................................................... 18
5.3 Near- and Medium-Term Planning Forecast.............................................................. 20
5.3.1 Gross Demand Forecast .......................................................................................... 20
5.3.2 Estimated Peak Demand Savings from Provincial Energy Conservation Targets ....................................................................................................................... 21
5.3.3 Expected Peak Demand Contribution of Contracted Distributed Generation23
5.3.4 Planning Forecast ..................................................................................................... 23
5.4 Long-Term Planning Forecast ...................................................................................... 24
5.4.1 High-Growth Scenario ............................................................................................ 25
5.4.2 Low-Growth Scenario ............................................................................................. 26
5.5 Summary of Demand Forecast ..................................................................................... 27
6. Near- and Medium-Term Plan ................................................................................................. 28
6.1 Needs Assessment Methodology ................................................................................. 28
6.2 Summary of Near- and Medium-Term Needs ........................................................... 29
6.2.1 Supply Capacity Needs on the South-Central Guelph and Kitchener-Guelph 115 kV Systems ......................................................................................................... 31
Page iii
6.2.2 Load Restoration Needs on the Waterloo-Guelph, and Cambridge-Kitchener
230 kV Sub-system ................................................................................................... 31
6.3 Options to Address the Near- and Medium-Term Needs ........................................ 32
6.3.1 Guelph Area Transmission Refurbishment (GATR) Project .............................. 33
6.3.2 Options to Improve Load Restoration on the Cambridge-Kitchener 230 kV
Sub-system ................................................................................................................ 35
6.4 Recommendations for the Near and Medium Term ................................................. 38
7. Long-Term Plan (2024-2033) ..................................................................................................... 40
7.1 Summary of Long-Term Needs .................................................................................... 40
7.1.1 High-Growth Scenario – Long-Term Needs ........................................................ 40
7.1.2 Low-Growth Scenario – Long-Term Needs ......................................................... 41
7.2 Approaches to Address Long-Term Needs ................................................................ 42
7.2.1 Community Self-Sufficiency ................................................................................... 42
7.2.2 Delivering Provincial Resources (“Wires” Planning) ......................................... 46
7.2.3 Large, Localized Generation Resources ................................................................ 47
7.3 Recommendations for the Long Term ......................................................................... 49
8. Community, Aboriginal and Stakeholder Engagement...................................................... 51
9. Conclusion ................................................................................................................................... 55
Page iv
List of Figures
Figure 3-1: Levels of Electricity System Planning ................................................................................ 9
Figure 3-2: Steps in the IRRP Process ................................................................................................... 11
Figure 4-1: Kitchener, Waterloo, Cambridge and Guelph Area ....................................................... 14
Figure 4-2: KWCG Electricity System .................................................................................................. 15
Figure 4-3: LDC Service Area ................................................................................................................ 16
Figure 5-1: Historical Summer Peak Demand in the KWCG Region .............................................. 18
Figure 5-2: Development of a 20-Year Planning Forecast ................................................................. 19
Figure 5-3: Gross Demand Forecast by LDCs ..................................................................................... 21
Figure 5-4: KWCG Near-and Medium-Term Planning Forecast 2014-2023 ................................... 24
Figure 5-5: Long-Term Planning Forecast Scenarios 2024-2033 ....................................................... 25
Figure 5-6: High-Growth Scenario – Incremental Peak Demand Growth 2024-2033 by
Municipality...................................................................................................................................... 26
Figure 5-7: Historical Peak Demand, Planning Forecast and Long-Term Scenarios ..................... 27
Figure 6-1: Regional Sub-systems in the KWCG Region ................................................................... 30
Figure 6-2: Guelph Area Transmission Refurbishment (GATR) Project ......................................... 34
Figure 6-3: Two Circuit Switchers at Galt Junction ............................................................................ 36
Figure 7-1: Remaining Transmission Supply Capacity 2024-2033 ................................................... 41
Figure 7-2: Potential Transmission Supply into the KWCG Region ................................................ 47
Figure 7-3: Large, Transmission-Connected Generation Option ..................................................... 48
Figure 8-1: Summary of the KWCG IRRP Community Engagement Process ................................ 52
Page v
List of Tables
Table 6-1: Near- and Medium-Term Needs in the KWCG Region .................................................. 30
Table 6-2: Summary of Needs Addressed by the GATR Project ...................................................... 35
Table 6-3: Implementation of the Near-Term Plan for the KWCG Region ..................................... 39
Table 7-1: Implementation of Near-Term Actions in Support of the Long-Term Plan for KWCG
Region ................................................................................................................................................ 50
List of Appendices
Appendix A: Demand Forecasting – Methodology and Assumptions
Appendix B: Needs Assessment
Appendix C: Transmission Options to Improve Load Restoration on Cambridge-Kitchener 230 kV Sub-system
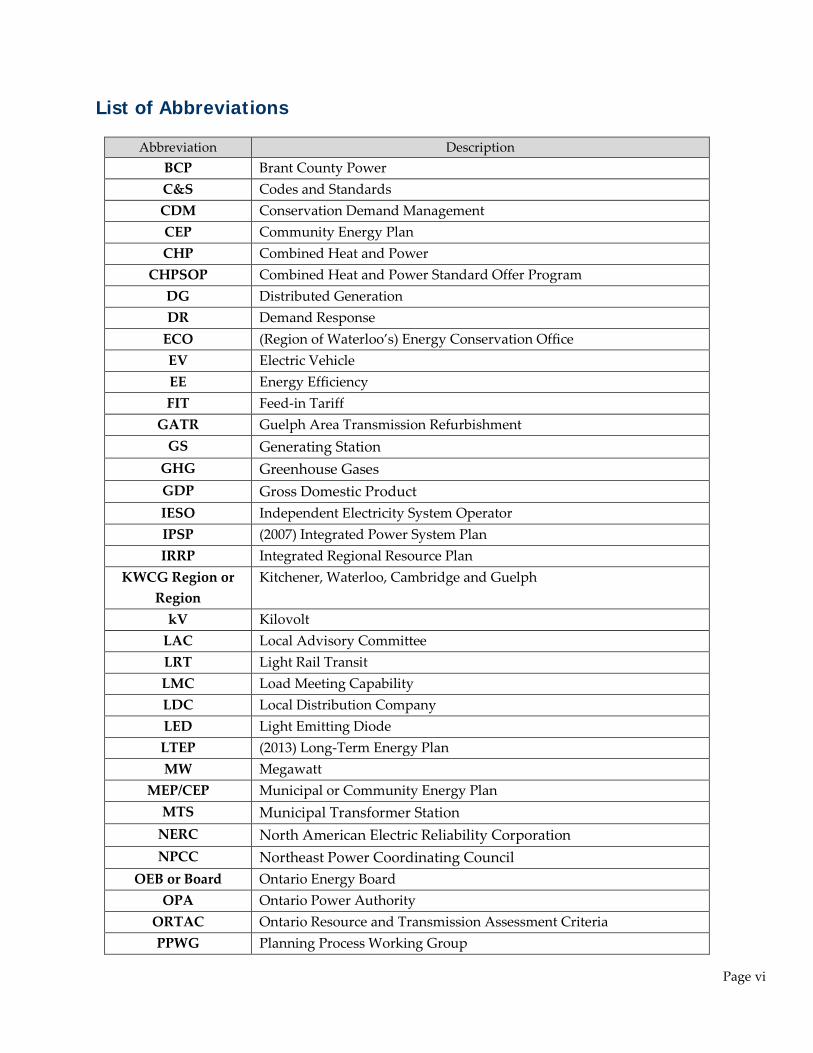
Page vi
List of Abbreviations
Abbreviation Description BCP Brant County Power C&S Codes and Standards CDM Conservation Demand Management CEP Community Energy Plan CHP Combined Heat and Power
CHPSOP Combined Heat and Power Standard Offer Program DG Distributed Generation DR Demand Response
ECO (Region of Waterloo’s) Energy Conservation Office EV Electric Vehicle EE Energy Efficiency FIT Feed-in Tariff
GATR Guelph Area Transmission Refurbishment GS Generating Station
GHG Greenhouse Gases GDP Gross Domestic Product IESO Independent Electricity System Operator IPSP (2007) Integrated Power System Plan IRRP Integrated Regional Resource Plan
KWCG Region or Region
Kitchener, Waterloo, Cambridge and Guelph
kV Kilovolt LAC Local Advisory Committee LRT Light Rail Transit LMC Load Meeting Capability LDC Local Distribution Company LED Light Emitting Diode LTEP (2013) Long-Term Energy Plan MW Megawatt
MEP/CEP Municipal or Community Energy Plan MTS Municipal Transformer Station
NERC North American Electric Reliability Corporation NPCC Northeast Power Coordinating Council
OEB or Board Ontario Energy Board OPA Ontario Power Authority
ORTAC Ontario Resource and Transmission Assessment Criteria PPWG Planning Process Working Group
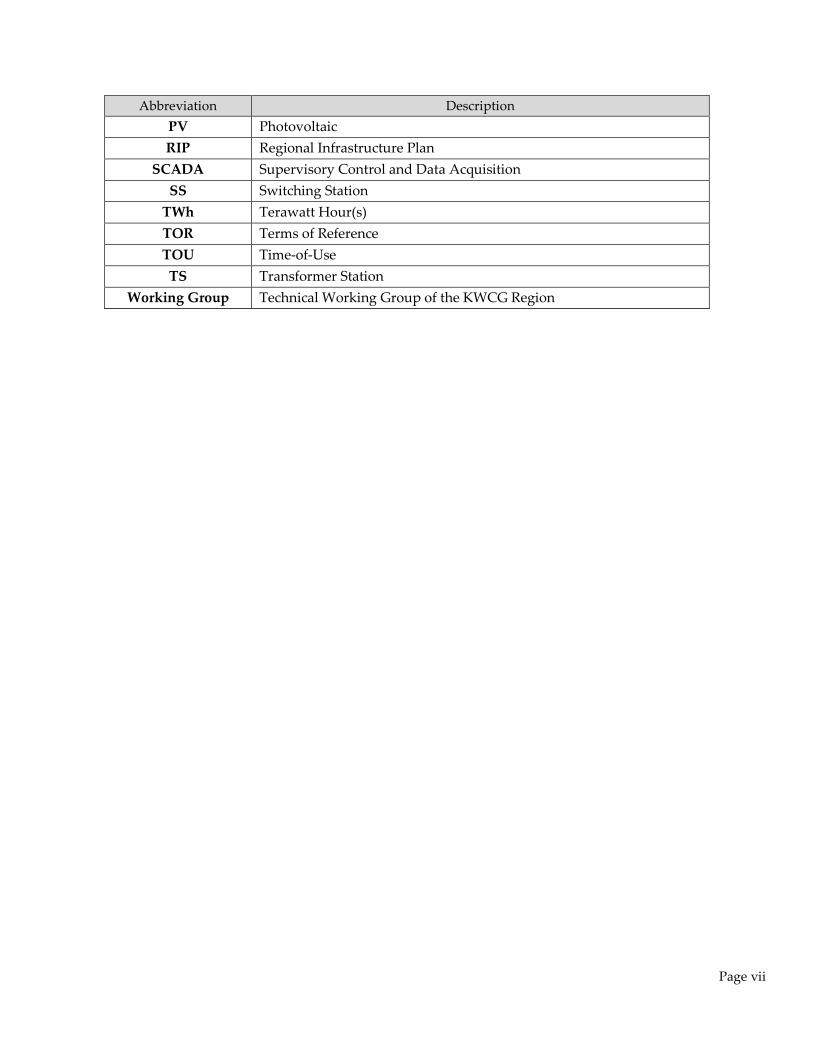
Page vii
Abbreviation Description PV Photovoltaic RIP Regional Infrastructure Plan
SCADA Supervisory Control and Data Acquisition SS Switching Station
TWh Terawatt Hour(s) TOR Terms of Reference TOU Time-of-Use TS Transformer Station
Working Group Technical Working Group of the KWCG Region
Page 1 of 55
1. Introduction
This report outlines the Integrated Regional Resource Plan (“IRRP”) for the Kitchener,
Waterloo, Cambridge and Guelph (“KWCG”) Region (together “KWCG Region” or “Region”)
over the next 20 years. This report was prepared by the IESO on behalf of a technical Working Group composed of Kitchener-Wilmot Hydro, Waterloo North Hydro, Guelph Hydro Electric
Systems Inc., Hydro One Distribution, Cambridge and North Dumfries Hydro, and Hydro One Transmission (the “Working Group”).
The KWCG Region is located in southwestern Ontario and includes the Region of Waterloo, the City of Guelph, Wellington County and a portion of Oxford County. The population of the
region is forecast to significantly grow during the 20-year period (2011-2031) – by roughly 40% –
according to the province’s “Places to Grow” initiative.1 This growth will be accompanied by population intensification, the development of regional transit infrastructure, redevelopment of
the downtown areas, and the development of commercial and industrial parks. A reliable supply of electricity is essential to supporting community growth. There is therefore a strong
need for integrated regional electricity planning to ensure that the electricity system can
support the pace of development over the long term.
In Ontario, planning to meet the electrical supply and reliability needs of a large area or region
is done through regional electricity planning, a process that was formalized by the Ontario Energy Board (“OEB” or “Board”) in 2013. In accordance with the OEB regional planning
process, transmitters, distributers and the IESO are required to carry out regional planning
activities for the 21 electricity planning regions at least once every five years.
The KWCG Region is one of the 21 electricity planning regions in Ontario as identified through
the regional planning process. This IRRP fulfills the requirements for the Region as required by the IESO’s OEB licence.
This IRRP for KWCG identifies electricity supply and reliability needs in the near term (0-5 years), medium term (5-10 years) and long term (10-20 years), and sets out specific
priorities and investments to meet near- and medium-term needs, respecting the lead time for
development. This IRRP also identifies actions to develop long-term options and to facilitate discussions about how the communities may plan their future electricity supply. Since
1 http://www.placestogrow.ca/

Page 2 of 55
economic, demographic, and technological conditions will inevitably change, IRRPs will be
reviewed on a five-year cycle so that plans can be updated to reflect the changing electricity outlook. The KWCG IRRP will be revisited in 2020 or sooner, if significant changes occur
relative to the current forecast.
This report is organized as follows:
• A summary of the recommended plan for the Region is provided in Section 2; • The process and methodology used to develop the plan are discussed in Section 3; • The context for electricity planning in the Region and the study scope are discussed in
Section 4; • Demand forecast scenarios, and conservation and DG assumptions, are described in
Section 5; • The near- and medium-term plan is presented in Section 6; • The long-term plan is presented in Section 7; • A summary of community, aboriginal and stakeholder engagement to date and moving
forward in developing this IRRP is provided in Section 8; • A conclusion is provided in Section 9.
Page 3 of 55
2. The Integrated Regional Resource Plan
The KWCG IRRP addresses the Region’s electricity needs over the next 20 years, based on application of the IESO’s Ontario Resource and Transmission Assessment Criteria (“ORTAC”). This IRRP identifies the needs that are forecast to arise in the near- and medium-term (0-10 years) and in the long-term (10-20 years). These two planning horizons are distinguished in the IRRP to reflect the level of commitment required to address needs over these time periods. The plans for both timeframes are coordinated to ensure consistency. The IRRP was developed based on consideration of planning criteria, including reliability, cost and feasibility; and, in the near term, it seeks to maximize the use of the existing electricity system, where it is economic to do so.
For the near- and medium-term, the IRRP identifies specific actions and investments for immediate implementation. This ensures that necessary resources are in service in time to
address the KWCG Region’s more urgent needs.
For the long term, the IRRP identifies potential approaches to meet needs that may arise in
10-20 years. It is not necessary to recommend specific projects at this time (nor would it be
prudent given forecast uncertainty and the potential for technological change). Instead, the long-term plan focuses on developing and maintaining the viability of long-term options,
engaging with the communities, and gathering information to lay the groundwork for making decisions on future options. These actions are intended to be completed before the next IRRP
cycle in 2020 so that their results can inform a decision, should one be needed at that time.
The needs and recommended actions are summarized below.
2.1 Near- and Medium-Term Plan (2014-2023)
Today, the electricity system supplying the KWCG Region is approaching its maximum
capacity and has limited ability to minimize potential supply interruptions to customers. The plan to meet the needs of electricity customers in the KWCG Region over the near and medium
term was developed based on consideration of planning criteria, including reliability, cost,
feasibility, and maximizing the use of the existing electricity system, where it is economic to do so. The near- and medium-term plan was also developed to be consistent with the long-term
development of the Region’s electricity system.
Page 4 of 55
Recommendations
1. Implement conservation and distributed generation (LDCs/IESO)
The implementation of provincial energy conservation targets established in the 2013 Long-Term Energy Plan (“LTEP”) is a key component of the near- and medium-term plan for the
KWCG Region. As part of the near- and medium-term plan, peak demand savings from provincial energy conservation targets are estimated to account for 40% of the forecast peak
demand growth in the KWCG Region between 2014-2023.
To ensure that these savings materialize, it is recommended that the LDCs’ conservation efforts be focused not only on achieving their energy savings targets, but also maximizing peak
demand reductions. Monitoring conservation achievements, and measuring peak demand savings, will be important elements of the near- and medium-term plan, and will also lay the
foundation for the long-term plan by reviewing performance of specific conservation measures
in the KWCG Region, and assessing potential in the KWCG Region for further conservation efforts.
Provincial programs that encourage the development of DG, such as the Feed-in Tariff (“FIT”), and Combined Heat and Power Standard Offer (“CHPSOP”) programs, and local interests and
opportunities for distributed generation (“DG”) development can also contribute to reducing peak demand in the KWCG Region. The LDCs and the IESO will continue their activities to
support these initiatives and monitor their impacts.
2. Implement the Guelph Area Transmission Refurbishment (GATR) project (Hydro One)
In 2012, the Working Group recommended proceeding with the implementation of the Guelph
Area Transmission Refurbishment (“GATR”) project to address imminent supply needs in South-Central Guelph and the Kitchener area and to minimize the impact of potential supply
interruptions to customers in Waterloo, Guelph and surrounding areas. This project includes
the installation of two 115 kV/230 kV auto-transformers, switching facilities, and the upgrade of an existing transmission line in Guelph. The GATR project was approved by the OEB on
September 26, 2013 and is expected to be in service by spring 2016. The project will substantially contribute to meeting near- and medium-term needs in the KWCG Region.
Page 5 of 55
3. Install two circuit switchers at Galt Junction and explore opportunities to further improve restoration capability in the Cambridge area (Hydro One)
To substantially improve load restoration in the Cambridge and Kitchener area following a
major transmission outage, the Working Group recommends proceeding with the installation of two 230 kilovolt (“kV”) circuit switchers at Galt Junction, near Highway 5. Hydro One has
begun early development work on these switching facilities, which are expected to be in-service
by spring 2017. Hydro One will continue to examine other potential measures to further improve the restoration capability in the Cambridge area. Please refer to Appendix C for
further information regarding load restoration improvements for the Cambridge-Kitchener 230 kV sub-system.
2.2 Long-Term Plan (2024-2033)
There are no major regional supply and reliability needs identified in the KWCG Region
beyond 2023, therefore early development work for major infrastructure projects in the KWCG Region is not required at this time. Localized needs, such as transformer station (“TS”) capacity
needs in the KWCG Region, may arise over the long term under certain growth scenarios, but these potential needs do not require any immediate action. There may be opportunity for
communities and local utilities to manage their future electricity demand through the
development of community-based solutions. Communities and local utilities in the KWCG Region have become increasingly involved in the development of DG and conservation
initiatives. The results of early community-based pilot projects, energy conservation initiatives, and achievable potential studies of the IESO will provide useful information to consider the
potential for conservation to address identified needs in the KWCG Region in the next iteration of the plan and the ongoing regional planning process.2
Recommendations
1. Undertake community engagement (IESO/LDCs)
In between the 5-year regional planning cycle, the IESO and LDCs will continue to engage with First Nations communities and other stakeholders through community planning,
environmental and sustainability initiatives, and broader community outreach such as, informational public open houses.
2 The IESO’s is currently developing an achievable potential study scheduled to be completed by June 1, 2016. This study will provide an updated forecast for conservation potential in Ontario.
Page 6 of 55
2. Monitor demand growth, conservation and demand management (CDM) achievement and distributed generation (IESO)
On an annual basis, the IESO will coordinate a review of conservation and demand
management (“CDM” or “conservation”) achievement, provincial DG projects, and demand growth in the KWCG Region. This information will be used to track the expected timing of
long-term needs to determine when a decision on the long-term plan is required. Information
on CDM and DG performance will also provide useful input into the ongoing development of these options as potential long-term solutions.
3. Explore opportunities to coordinate use and development of transformation station facilities in the KWCG Region (LDCs)
Depending on the location, timing and magnitude of electricity demand growth, TS capacity needs may arise in the KWCG Region beyond 2023. LDCs will monitor the load closely to
determine the timing of potential transformation needs. Where possible, these LDCs will
coordinate use and development of transformation station facilities in the KWCG Region. The need, timing and location of transformer(s) will be confirmed in the next planning cycle.
Page 7 of 55
3. Development of the IRRP
3.1 The Regional Planning Process
In Ontario, planning to meet the electricity needs of customers at a regional level is done
through regional planning. Regional planning assesses the interrelated needs of a region -
defined by common electricity supply infrastructure over the near, medium and long term, and develops a plan to ensure cost-effective, reliable, electricity supply. Regional plans consider the
existing electricity infrastructure in an area, forecast growth and customer reliability, evaluate options for addressing needs, and recommend actions.
Regional planning has been conducted on an as needed basis in Ontario for many years. Most
recently, the Ontario Power Authority (“OPA”) carried out regional planning activities to address regional electricity supply needs. The OPA conducted joint regional planning studies
with distributors, transmitters, the IESO and other stakeholders in regions where a need for coordinated regional planning had been identified.
In 2012, the Ontario Energy Board convened the Planning Process Working Group (“PPWG”) to
develop a more structured, transparent, and systematic regional planning process. This group was composed of industry stakeholders including electricity agencies, utilities, and
stakeholders. In May 2013, the PPWG released its Working Group Report to the Board, setting out the new regional planning process. Twenty-one electricity planning regions in the province
were identified in the Working Group Report and a phased schedule for completion was outlined. The Board endorsed the Working Group Report and formalized the process timelines
through changes to the Transmission System Code and Distribution System Code in
August 2013, as well as through changes to the OPA’s licence in October 2013. The OPA licence changes required it to lead a number of aspects of regional planning, including the completion
of comprehensive IRRPs. Following the merger of the IESO and the OPA on January 1, 2015, the regional planning responsibilities identified in the OPA’s licence were transferred to the
IESO.
The regional planning process begins with a Needs Screening process performed by the transmitter, which determines whether there are needs requiring regional coordination. If
regional planning is required, the IESO then conducts a Scoping Assessment to determine whether a comprehensive IRRP is required, which considers conservation, generation,
transmission, and distribution solutions, or whether a straightforward “wires” solution is the
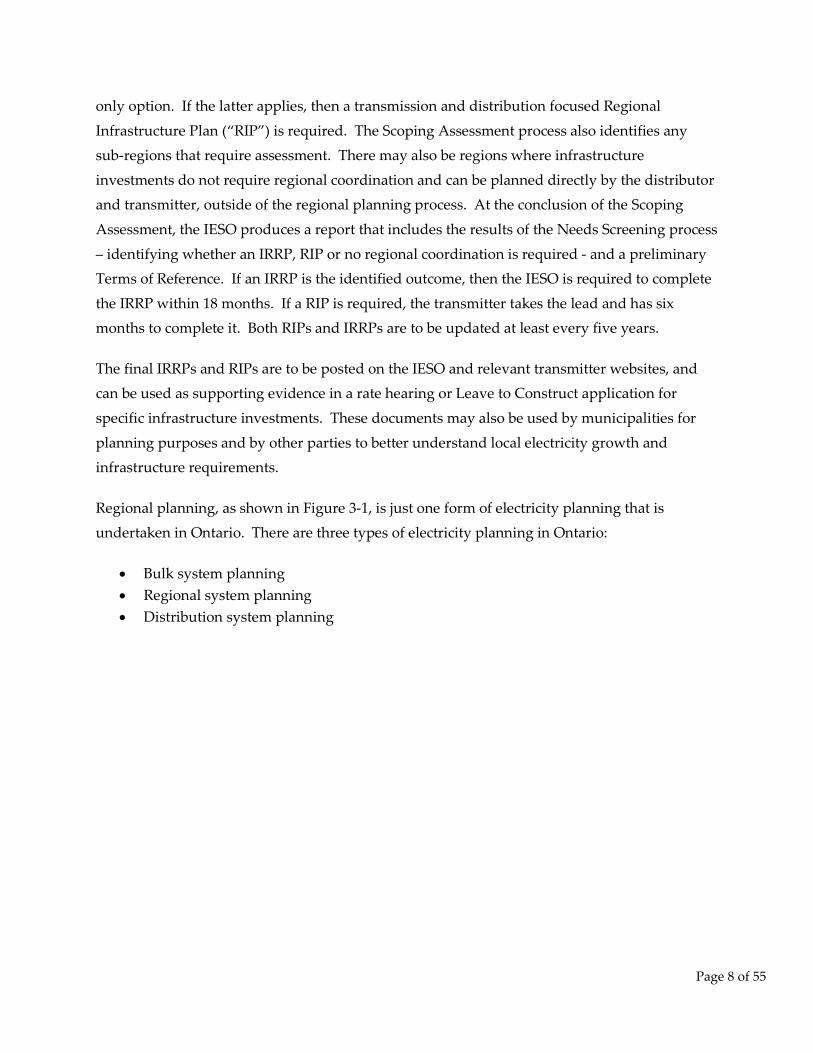
Page 8 of 55
only option. If the latter applies, then a transmission and distribution focused Regional
Infrastructure Plan (“RIP”) is required. The Scoping Assessment process also identifies any sub-regions that require assessment. There may also be regions where infrastructure
investments do not require regional coordination and can be planned directly by the distributor and transmitter, outside of the regional planning process. At the conclusion of the Scoping
Assessment, the IESO produces a report that includes the results of the Needs Screening process
– identifying whether an IRRP, RIP or no regional coordination is required - and a preliminary Terms of Reference. If an IRRP is the identified outcome, then the IESO is required to complete
the IRRP within 18 months. If a RIP is required, the transmitter takes the lead and has six months to complete it. Both RIPs and IRRPs are to be updated at least every five years.
The final IRRPs and RIPs are to be posted on the IESO and relevant transmitter websites, and can be used as supporting evidence in a rate hearing or Leave to Construct application for
specific infrastructure investments. These documents may also be used by municipalities for
planning purposes and by other parties to better understand local electricity growth and infrastructure requirements.
Regional planning, as shown in Figure 3-1, is just one form of electricity planning that is undertaken in Ontario. There are three types of electricity planning in Ontario:
• Bulk system planning • Regional system planning • Distribution system planning
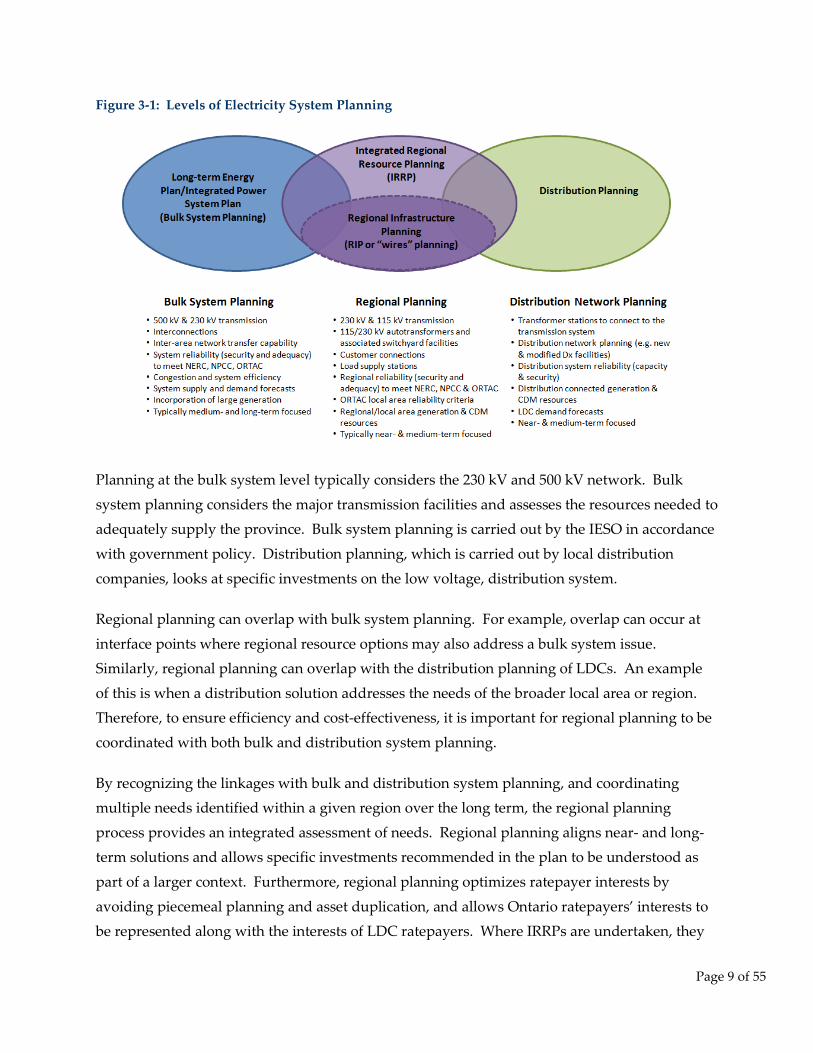
Page 9 of 55
Figure 3-1: Levels of Electricity System Planning
Planning at the bulk system level typically considers the 230 kV and 500 kV network. Bulk
system planning considers the major transmission facilities and assesses the resources needed to adequately supply the province. Bulk system planning is carried out by the IESO in accordance
with government policy. Distribution planning, which is carried out by local distribution
companies, looks at specific investments on the low voltage, distribution system.
Regional planning can overlap with bulk system planning. For example, overlap can occur at
interface points where regional resource options may also address a bulk system issue. Similarly, regional planning can overlap with the distribution planning of LDCs. An example
of this is when a distribution solution addresses the needs of the broader local area or region. Therefore, to ensure efficiency and cost-effectiveness, it is important for regional planning to be
coordinated with both bulk and distribution system planning.
By recognizing the linkages with bulk and distribution system planning, and coordinating multiple needs identified within a given region over the long term, the regional planning
process provides an integrated assessment of needs. Regional planning aligns near- and long-term solutions and allows specific investments recommended in the plan to be understood as
part of a larger context. Furthermore, regional planning optimizes ratepayer interests by
avoiding piecemeal planning and asset duplication, and allows Ontario ratepayers’ interests to be represented along with the interests of LDC ratepayers. Where IRRPs are undertaken, they
Page 10 of 55
allow an evaluation of the multiple options available to meet needs, including conservation,
generation, and “wires” solutions. Regional plans also provide greater transparency through engagement in the planning process, and by making plans available to the public.
3.2 The IESO’s Approach to Regional Planning
IRRPs assess electricity system needs for a region over a 20-year period. The 20-year outlook anticipates long-term trends so that near-term actions are developed within the context of a
longer-term view. This enables coordination and consistency with the long-term plan, rather
than simply reacting to immediate needs.
In developing an IRRP, a different approach is taken to developing the plan for the first 10 years
of the plan—the near- and medium-term—than for the longer-term period of 10-20 years. The plan for the first 10 years is developed based on best available information on demand,
conservation, and other local developments. Given the long lead time to develop electricity
infrastructure, near-term electricity needs require prompt action to enable the specified solutions in a timely manner. By contrast, the long-term plan is characterized by greater
forecast uncertainty and longer development lead time; as such solutions do not need to be committed to immediately. Given the potential for changing conditions and technological
development, the IRRP for the long term is more directional, focusing on developing and
maintaining the viability of options for the future, and continuing to monitor demand forecast scenarios.
In developing an IRRP, the IESO and regional working groups (see Figure 3-2 below) carry out a number of steps. These steps include electricity demand forecasts; technical studies to
determine electricity needs and the timing of these needs; the development of potential options; and, a recommended plan including actions for the near and long-term. Throughout this
process, engagement is carried out with communities, including local First Nations and Métis
communities and stakeholders who may have an interest in the planning area. The steps of an IRRP are illustrated in Figure 3-2 below.
The IRRP report documents the inputs, findings and recommendations developed through the process described above, and provides recommended actions for the various entities
responsible for plan implementation. Where “wires”” solutions are included in the plan
recommendations, the completion of the IRRP report is the trigger for the transmitter to initiate an RIP process to develop those options. Other actions may involve development of
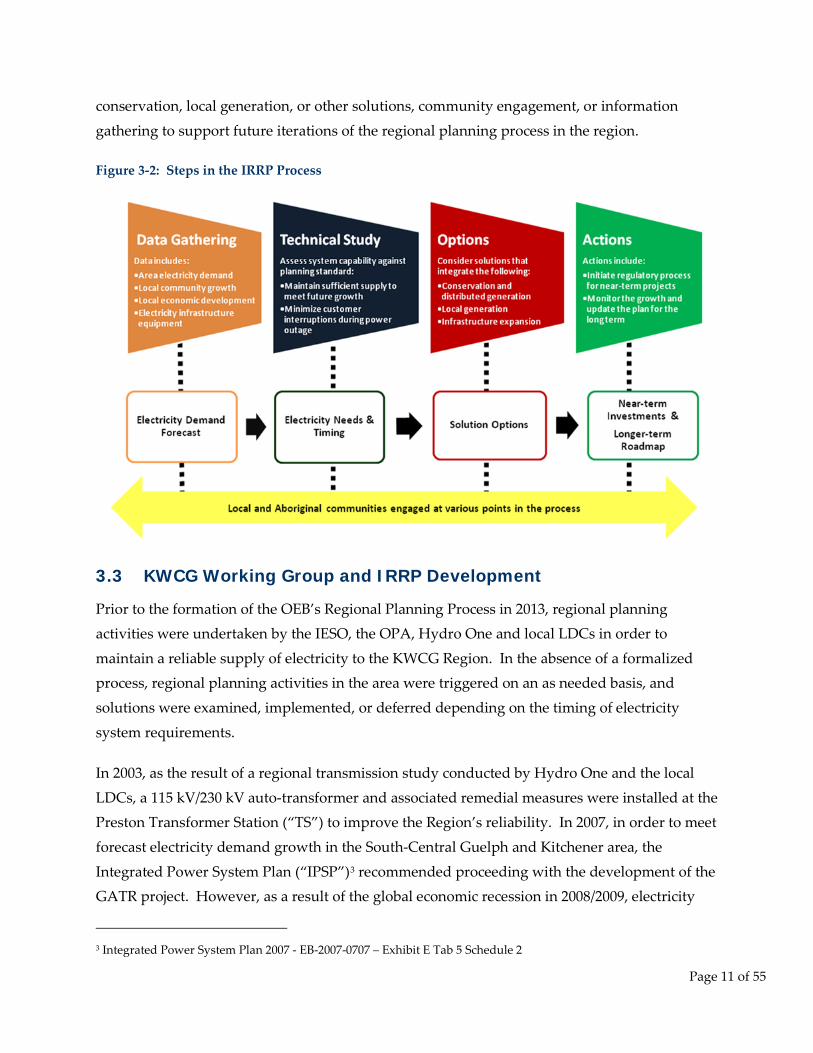
Page 11 of 55
conservation, local generation, or other solutions, community engagement, or information
gathering to support future iterations of the regional planning process in the region.
Figure 3-2: Steps in the IRRP Process
3.3 KWCG Working Group and IRRP Development
Prior to the formation of the OEB’s Regional Planning Process in 2013, regional planning activities were undertaken by the IESO, the OPA, Hydro One and local LDCs in order to
maintain a reliable supply of electricity to the KWCG Region. In the absence of a formalized process, regional planning activities in the area were triggered on an as needed basis, and
solutions were examined, implemented, or deferred depending on the timing of electricity
system requirements.
In 2003, as the result of a regional transmission study conducted by Hydro One and the local
LDCs, a 115 kV/230 kV auto-transformer and associated remedial measures were installed at the Preston Transformer Station (“TS”) to improve the Region’s reliability. In 2007, in order to meet
forecast electricity demand growth in the South-Central Guelph and Kitchener area, the
Integrated Power System Plan (“IPSP”)3 recommended proceeding with the development of the GATR project. However, as a result of the global economic recession in 2008/2009, electricity
3 Integrated Power System Plan 2007 - EB-2007-0707 – Exhibit E Tab 5 Schedule 2
Page 12 of 55
consumption declined across the KWCG Region and the development work for the GATR
project was put on hold.
In 2010, the KWCG planning electricity supply study was initiated to re-assess electricity supply
and reliability over the next 20 years. The OPA agreed that a coordinated, integrated approach was appropriate and formed the Working Group. The Working Group developed the Terms of
Reference for the study4 and gathered data, identified near and long-term needs in the Region,
and assessed a range of integrated options. In 2012/2013, the Working Group recommended proceeding with the implementation of GATR and initiating early development work on the
second 115 kV/230 kV auto-transformer at Preston TS to address imminent supply and reliability needs in the KWCG Region.5 In March 2013, Hydro One submitted the Leave to
Construct application for the GATR project and in September 2013, the application was approved by the OEB.6
In October 2013, the KWCG planning electricity supply study was transitioned to align with the
OEB’s new regional planning process. The Working Group revised the Terms of Reference to reflect the new process, and updated the study information, including demand forecasts and
conservation and DG data.7 With this updated information, the Working Group re-confirmed the reliability and supply needs in the KWCG Region, re-examined the need for the second
115 kV/230 kV auto-transformer at Preston in the near term, and continued to revise the near-
term plan and to develop recommendations for the long-term plan. This IRRP reflects this revised and updated information.
4 Original Terms of Reference: http://www.ieso.ca/Documents/Regional-Planning/KWCG/KWCG-Terms-of-References.pdf 5 OPA Letter to Hydro One - March 8, 2012: http://www.ieso.ca/Documents/Regional-Planning/KWCG/Exhibit%20B-1-4,%20Attachments%201%20and%202.pdf OPA Letter to Hydro One - May 29, 2013: http://www.ieso.ca/Documents/Regional-Planning/KWCG/OPA-Letter-Hydro-One-KWCG.pdf 6 (EB-2013-0056) Ontario Energy Board Decision and Order dated September 26, 2013 7 Revised July 2014 Terms of Reference (Addendum): http://www.ieso.ca/Documents/Regional-Planning/KWCG/Addendum-TOR-KWCG.pdf
Page 13 of 55
4. Background and Scope of the KWCG IRRP
The KWCG IRRP assesses the regional electricity supply and reliability needs for the KWCG
Region, and identifies integrated solutions for the 20-year period from 2014 to 2033.
Specifically, this IRRP includes the following components:
• Examination of electricity demand requirements in the near- and medium-term (2014-2023) and under alternate long-term demand growth scenarios (2024-2033);
• Reliability and adequacy assessment of the electricity system in the KWCG Region; • Development and evaluation of integrated alternatives including a mix of CDM,
generation, transmission and distribution facilities, and other electricity system initiatives to address near- and medium-term electricity supply needs in this region (2014-2023);
• Assessment of alternate demand scenarios and development of potential approaches for the local community to address future long-term electricity supply needs (2024-2033); and
• Development of an implementation plan to address near- and medium-term electricity requirements and to ensure that options remain available to address long-term needs.
To set the context for this IRRP, the scope of this IRRP and a description of the Region are set out in Section 4.1. Section 4.2 details the existing transmission system in the KWCG Region.
4.1 Scope of the KWCG IRRP
The KWCG Region is located in southwestern Ontario and includes the Region of Waterloo, the City of Guelph, Wellington County and the Township of Blandford-Blenheim (Oxford County),
as shown in Figure 4-1.
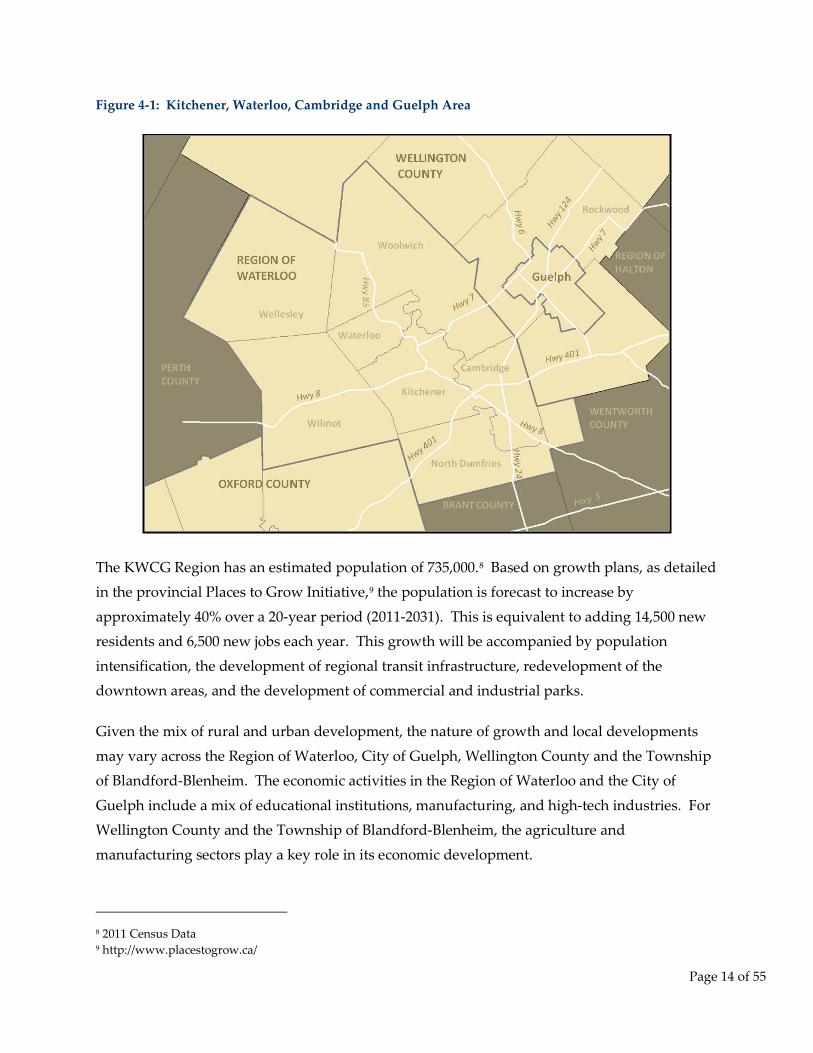
Page 14 of 55
Figure 4-1: Kitchener, Waterloo, Cambridge and Guelph Area
The KWCG Region has an estimated population of 735,000.8 Based on growth plans, as detailed in the provincial Places to Grow Initiative,9 the population is forecast to increase by
approximately 40% over a 20-year period (2011-2031). This is equivalent to adding 14,500 new residents and 6,500 new jobs each year. This growth will be accompanied by population
intensification, the development of regional transit infrastructure, redevelopment of the downtown areas, and the development of commercial and industrial parks.
Given the mix of rural and urban development, the nature of growth and local developments
may vary across the Region of Waterloo, City of Guelph, Wellington County and the Township of Blandford-Blenheim. The economic activities in the Region of Waterloo and the City of
Guelph include a mix of educational institutions, manufacturing, and high-tech industries. For Wellington County and the Township of Blandford-Blenheim, the agriculture and
manufacturing sectors play a key role in its economic development.
8 2011 Census Data 9 http://www.placestogrow.ca/
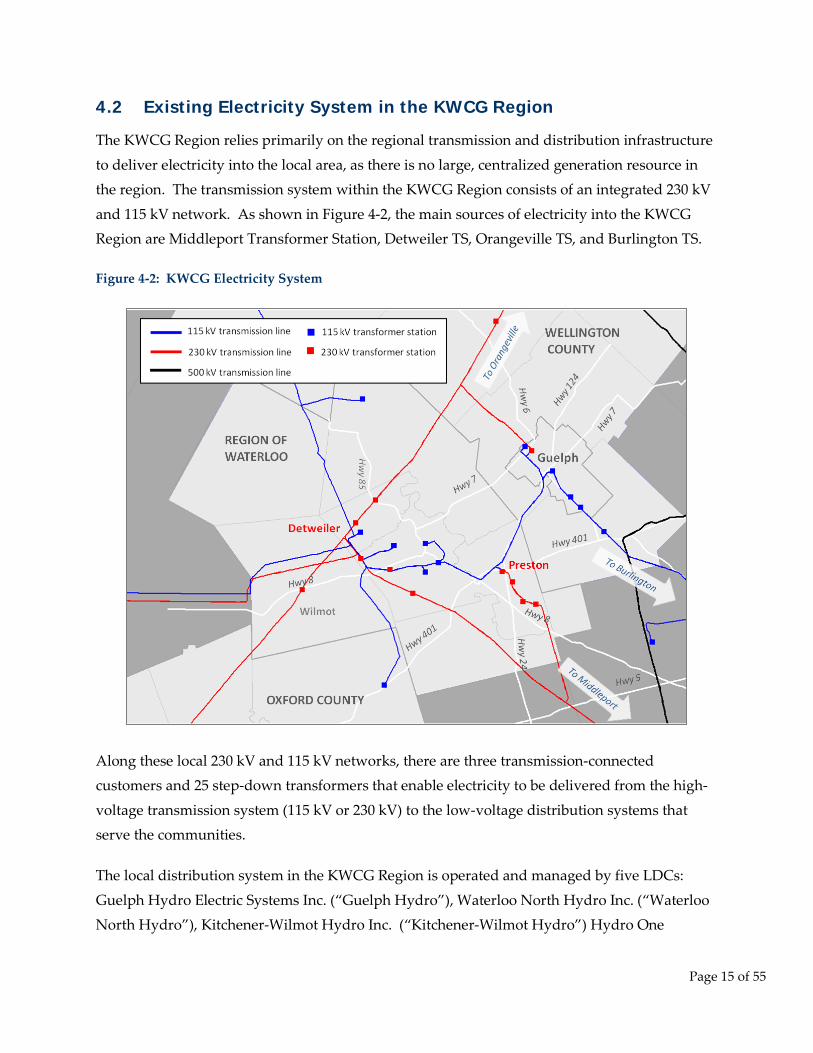
Page 15 of 55
4.2 Existing Electricity System in the KWCG Region
The KWCG Region relies primarily on the regional transmission and distribution infrastructure
to deliver electricity into the local area, as there is no large, centralized generation resource in the region. The transmission system within the KWCG Region consists of an integrated 230 kV
and 115 kV network. As shown in Figure 4-2, the main sources of electricity into the KWCG Region are Middleport Transformer Station, Detweiler TS, Orangeville TS, and Burlington TS.
Figure 4-2: KWCG Electricity System
Along these local 230 kV and 115 kV networks, there are three transmission-connected customers and 25 step-down transformers that enable electricity to be delivered from the high-
voltage transmission system (115 kV or 230 kV) to the low-voltage distribution systems that serve the communities.
The local distribution system in the KWCG Region is operated and managed by five LDCs:
Guelph Hydro Electric Systems Inc. (“Guelph Hydro”), Waterloo North Hydro Inc. (“Waterloo North Hydro”), Kitchener-Wilmot Hydro Inc. (“Kitchener-Wilmot Hydro”) Hydro One
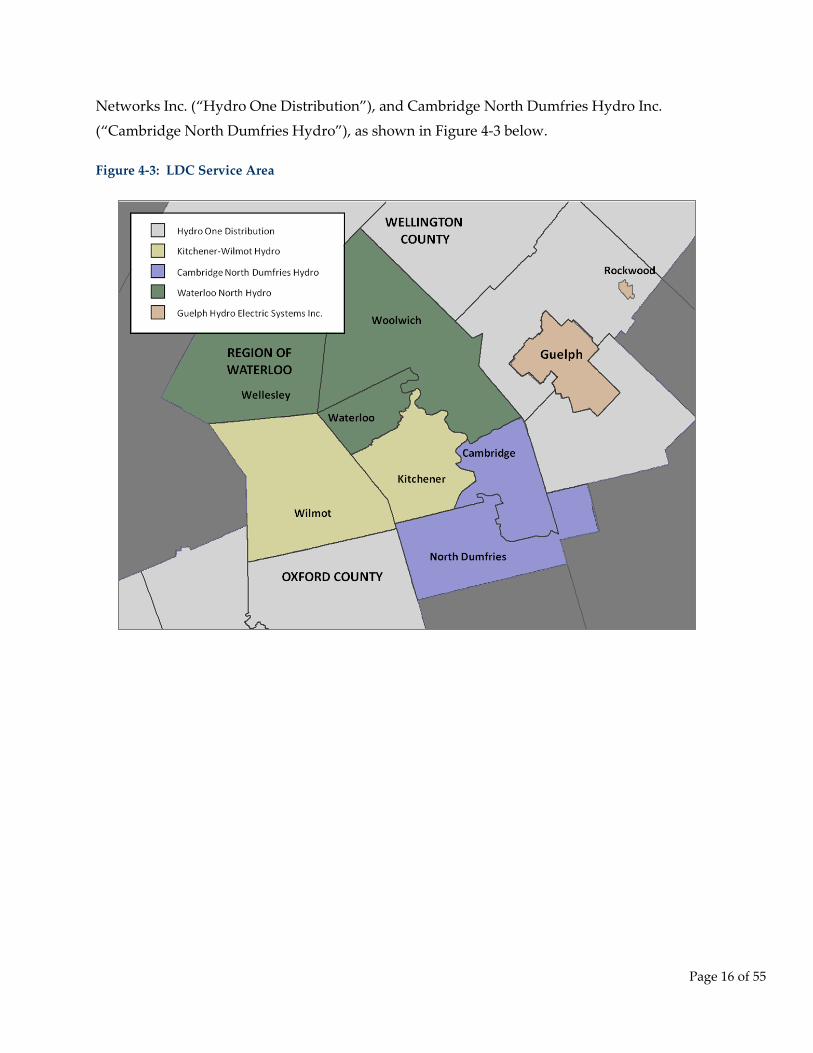
Page 16 of 55
Networks Inc. (“Hydro One Distribution”), and Cambridge North Dumfries Hydro Inc.
(“Cambridge North Dumfries Hydro”), as shown in Figure 4-3 below.
Figure 4-3: LDC Service Area
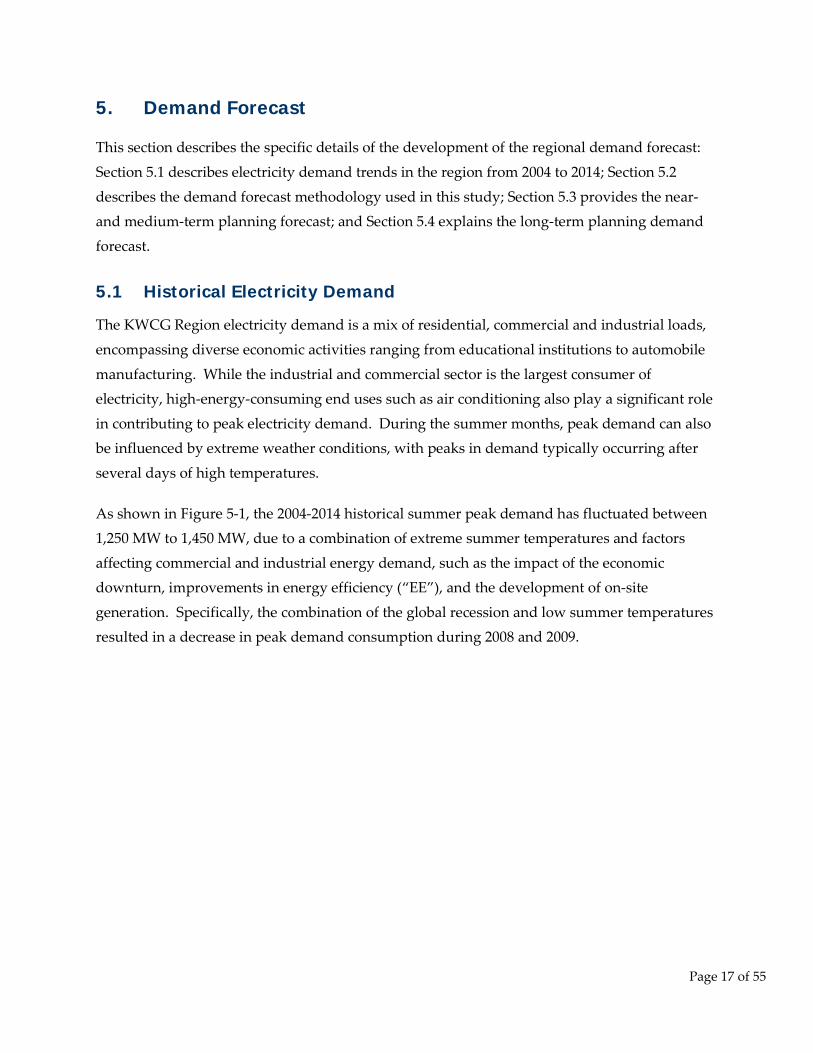
Page 17 of 55
5. Demand Forecast
This section describes the specific details of the development of the regional demand forecast:
Section 5.1 describes electricity demand trends in the region from 2004 to 2014; Section 5.2
describes the demand forecast methodology used in this study; Section 5.3 provides the near- and medium-term planning forecast; and Section 5.4 explains the long-term planning demand
forecast.
5.1 Historical Electricity Demand
The KWCG Region electricity demand is a mix of residential, commercial and industrial loads,
encompassing diverse economic activities ranging from educational institutions to automobile
manufacturing. While the industrial and commercial sector is the largest consumer of electricity, high-energy-consuming end uses such as air conditioning also play a significant role
in contributing to peak electricity demand. During the summer months, peak demand can also be influenced by extreme weather conditions, with peaks in demand typically occurring after
several days of high temperatures.
As shown in Figure 5-1, the 2004-2014 historical summer peak demand has fluctuated between 1,250 MW to 1,450 MW, due to a combination of extreme summer temperatures and factors
affecting commercial and industrial energy demand, such as the impact of the economic downturn, improvements in energy efficiency (“EE”), and the development of on-site
generation. Specifically, the combination of the global recession and low summer temperatures resulted in a decrease in peak demand consumption during 2008 and 2009.
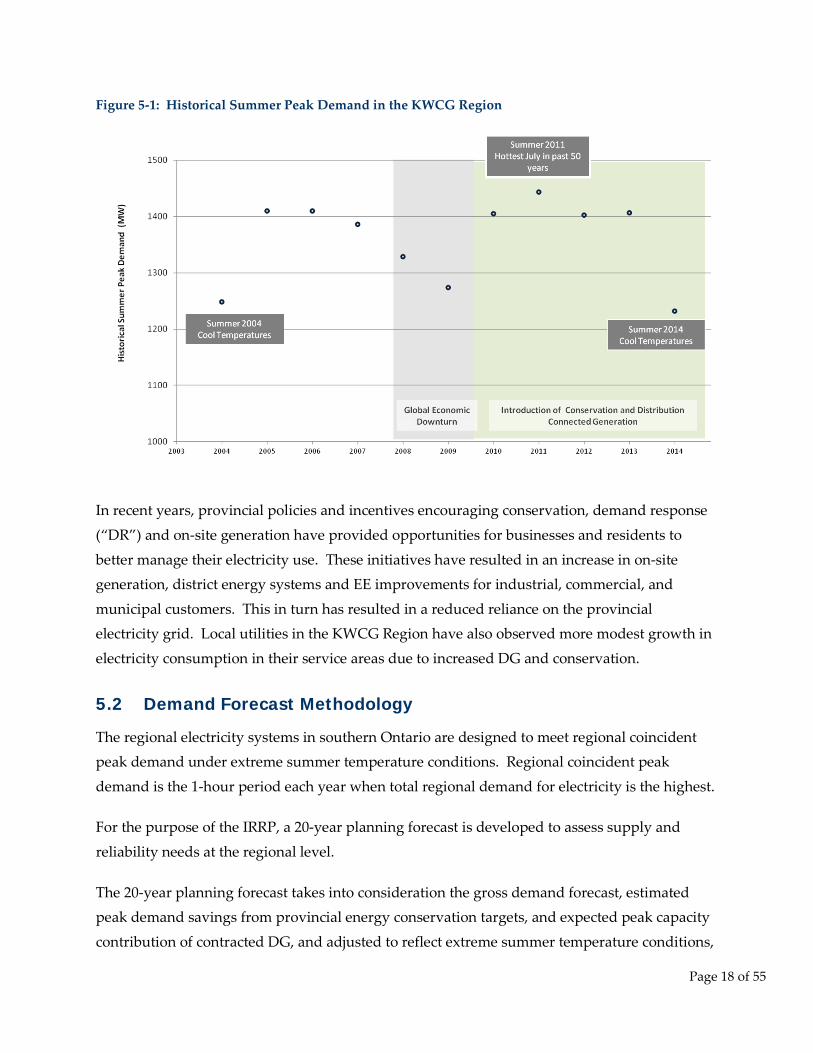
Page 18 of 55
Figure 5-1: Historical Summer Peak Demand in the KWCG Region
In recent years, provincial policies and incentives encouraging conservation, demand response
(“DR”) and on-site generation have provided opportunities for businesses and residents to
better manage their electricity use. These initiatives have resulted in an increase in on-site generation, district energy systems and EE improvements for industrial, commercial, and
municipal customers. This in turn has resulted in a reduced reliance on the provincial electricity grid. Local utilities in the KWCG Region have also observed more modest growth in
electricity consumption in their service areas due to increased DG and conservation.
5.2 Demand Forecast Methodology
The regional electricity systems in southern Ontario are designed to meet regional coincident peak demand under extreme summer temperature conditions. Regional coincident peak
demand is the 1-hour period each year when total regional demand for electricity is the highest.
For the purpose of the IRRP, a 20-year planning forecast is developed to assess supply and
reliability needs at the regional level.
The 20-year planning forecast takes into consideration the gross demand forecast, estimated peak demand savings from provincial energy conservation targets, and expected peak capacity
contribution of contracted DG, and adjusted to reflect extreme summer temperature conditions,
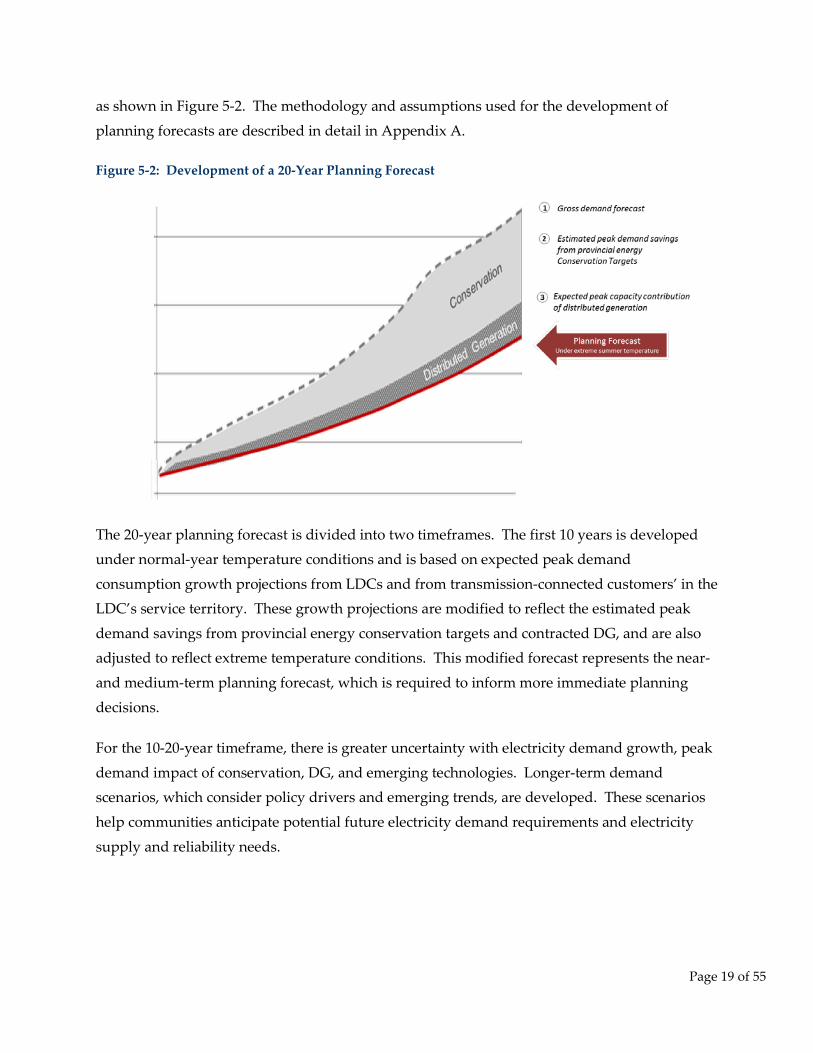
Page 19 of 55
as shown in Figure 5-2. The methodology and assumptions used for the development of
planning forecasts are described in detail in Appendix A.
Figure 5-2: Development of a 20-Year Planning Forecast
The 20-year planning forecast is divided into two timeframes. The first 10 years is developed under normal-year temperature conditions and is based on expected peak demand
consumption growth projections from LDCs and from transmission-connected customers’ in the LDC’s service territory. These growth projections are modified to reflect the estimated peak
demand savings from provincial energy conservation targets and contracted DG, and are also adjusted to reflect extreme temperature conditions. This modified forecast represents the near-
and medium-term planning forecast, which is required to inform more immediate planning
decisions.
For the 10-20-year timeframe, there is greater uncertainty with electricity demand growth, peak
demand impact of conservation, DG, and emerging technologies. Longer-term demand scenarios, which consider policy drivers and emerging trends, are developed. These scenarios
help communities anticipate potential future electricity demand requirements and electricity
supply and reliability needs.
Page 20 of 55
5.3 Near- and Medium-Term Planning Forecast
As described above, the near- and medium-term planning forecast (2014-2023) begins with the
LDCs’ gross demand forecast. Peak demand savings from provincial energy conservation targets and contracted DG are then deducted, and the forecast adjusted for extreme weather to
produce the planning forecast. The details of this near- and medium-term forecast are described in the following sections.
5.3.1 Gross Demand Forecast
The gross demand forecast was initially developed in 2010 by the LDCs based on customer
connection requests, local economic development and growth assumptions outlined in Ontario’s Places to Grow Act, 2005, which are reflected in municipal and regional plans. LDCs
periodically reviewed and updated the gross demand forecast for their service area to reflect the latest information and electricity demand trends.
Based on the most up-to-date information, LDCs indicate that the gross demand in the KWCG
Region is expected to grow at an annual rate of 2.5% in the near and medium term. Consistent with the 2010 projection, Kitchener-Wilmot Hydro, Waterloo North Hydro, and Hydro One
Distribution’s service areas are forecast to grow at annual rates of 1.7%, 3.2%, and 1.1% respectively. Although Guelph Hydro has made a downward adjustment to the 2014 electricity
peak demand level to align with current electricity consumption patterns, it expects electricity
peak demand in its service area to grow at an annual rate of 3.4% over the next 10 years. In contrast, Cambridge and North Dumfries Hydro anticipate slower growth in the near term than
initially forecast in 2010. A slower than expected economic recovery and a decline in energy usage from industrial customers are the primary reasons for the reduced peak demand growth
in the near and medium term. Figure 5-3 shows the gross demand forecast for the LDCs in the KWCG Region.
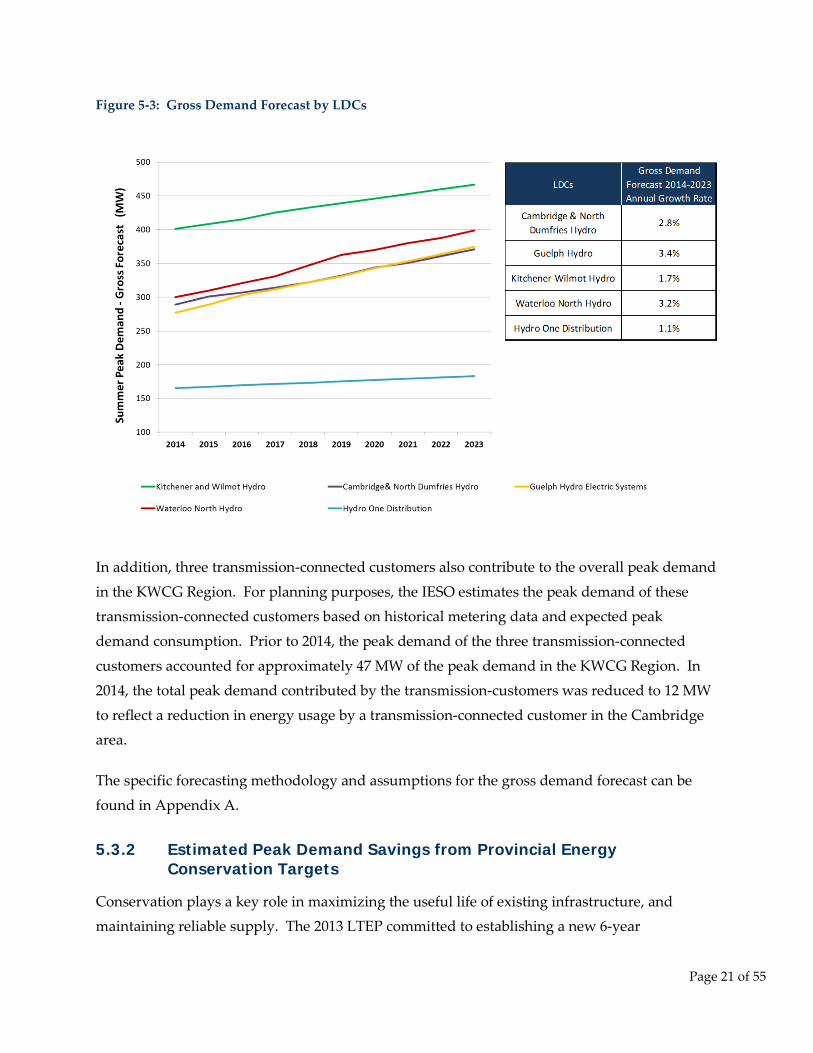
Page 21 of 55
Figure 5-3: Gross Demand Forecast by LDCs
In addition, three transmission-connected customers also contribute to the overall peak demand
in the KWCG Region. For planning purposes, the IESO estimates the peak demand of these transmission-connected customers based on historical metering data and expected peak
demand consumption. Prior to 2014, the peak demand of the three transmission-connected
customers accounted for approximately 47 MW of the peak demand in the KWCG Region. In 2014, the total peak demand contributed by the transmission-customers was reduced to 12 MW
to reflect a reduction in energy usage by a transmission-connected customer in the Cambridge area.
The specific forecasting methodology and assumptions for the gross demand forecast can be
found in Appendix A.
5.3.2 Estimated Peak Demand Savings from Provincial Energy Conservation Targets
Conservation plays a key role in maximizing the useful life of existing infrastructure, and maintaining reliable supply. The 2013 LTEP committed to establishing a new 6-year
Page 22 of 55
Conservation First Framework beginning in January 2015 to enable the achievement of all cost-
effective conservation. In the near term, Ontario’s LDCs have an aggregate energy reduction target of 7 TWh, as well as individual LDC specific targets. These targets are to be achieved
between 2015 and the end of 2020 through LDC conservation programs enabled by the Conservation First Framework. Each LDC is required to prepare a CDM Plan describing how
their target will be achieved and submit their CDM Plan by May 1, 2015.10 The LDC CDM Plans
will link closely with regional plans, providing more detail about how a portion of the conservation targets that have been incorporated into regional planning will be realized.
As part of the Conservation First policy, the provincial government has adopted a broad definition of conservation that includes various types of customer action and behind-the-meter
generation. This means that conservation includes any efforts to reduce the amount of energy consumed from the provincial electricity grid. Conservation initiatives, including behind the
meter generation projects and on-site generation,11 are expected to reduce customers’ reliance
on the provincial electricity grid and contribute to peak demand savings in the KWCG Region over the next 10 years. For the purpose of this IRRP, the allocation of the provincial energy
savings target for the KWCG Region is estimated to offset approximately 144 MW or 40% of the forecast peak demand growth in the KWCG Region between 2014-2023. It is assumed that
existing DR already in the base year will continue but savings from potential future DR
resources are not included in the forecast. Instead, future savings are considered as possible solution to identified future needs.
Using a planning forecast that is net of provincial energy conservation targets provides consistency with the province’s Conservation First policy by reducing demand requirements
before assessing any growth-related needs. The planning forecast assumes that the targets will
be met, and will produce the expected local peak demand impacts. Therefore, an important aspect of plan implementation will be monitoring the actual peak demand impacts of
conservation programs delivered by the local LDCs.
The estimated annual peak demand savings from the provincial energy conservation targets in
the KWCG Region are summarized in Appendix A.
10 At the time of this report, the CDM plans have not been submitted by the LDCs. The CDM plans will be available on the IESO and LDCs’ websites once they have been submitted and reviewed. 11 The government has directed the former OPA to “consider CDM to be inclusive of activities aimed at reducing electricity consumption and reducing the draw from the electricity grid, such as geothermal heating and cooling, solar heating and small scale (i.e., < 10 MW) behind-the-meter customer generation.”
Page 23 of 55
5.3.3 Expected Peak Demand Contribution of Contracted Distributed Generation
In recent years, a number of DG projects including, wind, solar, hydro and combined heat and power (“CHP”) projects, have been developed in the KWCG Region as a result of provincial
procurement programs such as FIT and CHPSOP. Since 2010, an additional 98 MW of DG was
contracted in the KWCG Region. These contracted DG resources are expected to reduce the regional peak demand by 35 MW or about 10% of forecast demand growth in the Region during
the 2014-2023 timeframe. Future DG uptake was, as noted, not included in the planning forecast and is instead considered as an option for meeting identified needs.
The expected annual peak demand contribution of contracted DG in the KWCG Region can be found in Appendix A.
5.3.4 Planning Forecast
Figure 5-4 shows the near- and medium-term planning forecast for the KWCG Region (2014-
2023), which takes into consideration the gross demand forecast, estimated peak demand savings from provincial energy conservation targets, and contracted DG adjusted to reflect
extreme summer temperature conditions.
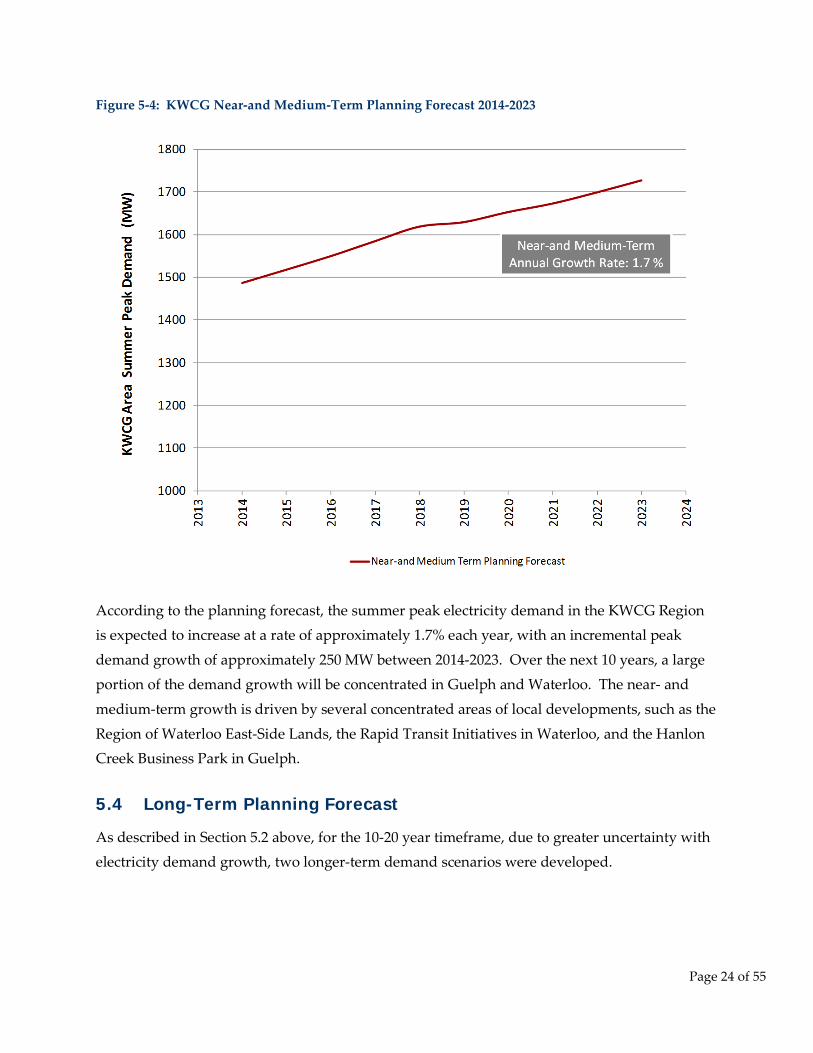
Page 24 of 55
Figure 5-4: KWCG Near-and Medium-Term Planning Forecast 2014-2023
According to the planning forecast, the summer peak electricity demand in the KWCG Region is expected to increase at a rate of approximately 1.7% each year, with an incremental peak
demand growth of approximately 250 MW between 2014-2023. Over the next 10 years, a large portion of the demand growth will be concentrated in Guelph and Waterloo. The near- and
medium-term growth is driven by several concentrated areas of local developments, such as the
Region of Waterloo East-Side Lands, the Rapid Transit Initiatives in Waterloo, and the Hanlon Creek Business Park in Guelph.
5.4 Long-Term Planning Forecast
As described in Section 5.2 above, for the 10-20 year timeframe, due to greater uncertainty with electricity demand growth, two longer-term demand scenarios were developed.
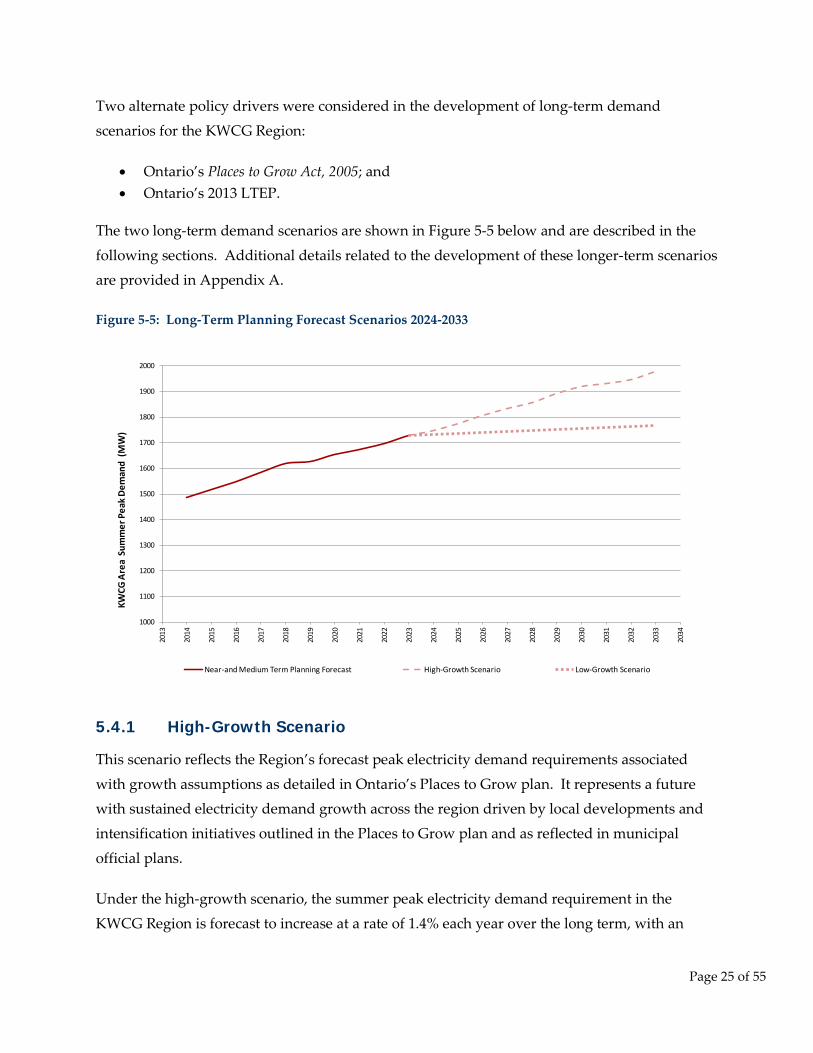
Page 25 of 55
Two alternate policy drivers were considered in the development of long-term demand
scenarios for the KWCG Region:
• Ontario’s Places to Grow Act, 2005; and • Ontario’s 2013 LTEP.
The two long-term demand scenarios are shown in Figure 5-5 below and are described in the
following sections. Additional details related to the development of these longer-term scenarios are provided in Appendix A.
Figure 5-5: Long-Term Planning Forecast Scenarios 2024-2033
5.4.1 High-Growth Scenario
This scenario reflects the Region’s forecast peak electricity demand requirements associated
with growth assumptions as detailed in Ontario’s Places to Grow plan. It represents a future with sustained electricity demand growth across the region driven by local developments and
intensification initiatives outlined in the Places to Grow plan and as reflected in municipal
official plans.
Under the high-growth scenario, the summer peak electricity demand requirement in the
KWCG Region is forecast to increase at a rate of 1.4% each year over the long term, with an
1000
1100
1200
1300
1400
1500
1600
1700
1800
1900
2000
2013
2014
2015
2016
2017
2018
2019
2020
2021
2022
2023
2024
2025
2026
2027
2028
2029
2030
2031
2032
2033
2034
KWCG
Are
a Su
mm
er P
eak D
eman
d (M
W)
Near-and Medium Term Planning Forecast High-Growth Scenario Low-Growth Scenario
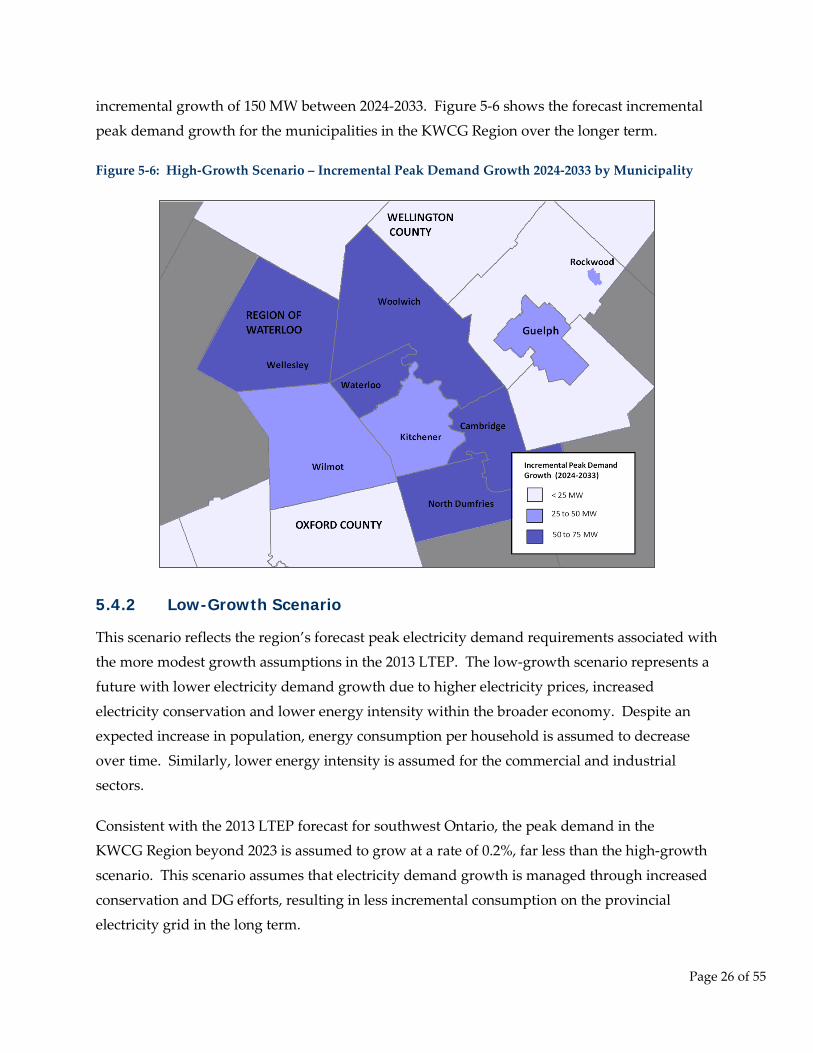
Page 26 of 55
incremental growth of 150 MW between 2024-2033. Figure 5-6 shows the forecast incremental
peak demand growth for the municipalities in the KWCG Region over the longer term.
Figure 5-6: High-Growth Scenario – Incremental Peak Demand Growth 2024-2033 by Municipality
5.4.2 Low-Growth Scenario
This scenario reflects the region’s forecast peak electricity demand requirements associated with the more modest growth assumptions in the 2013 LTEP. The low-growth scenario represents a
future with lower electricity demand growth due to higher electricity prices, increased
electricity conservation and lower energy intensity within the broader economy. Despite an expected increase in population, energy consumption per household is assumed to decrease
over time. Similarly, lower energy intensity is assumed for the commercial and industrial sectors.
Consistent with the 2013 LTEP forecast for southwest Ontario, the peak demand in the KWCG Region beyond 2023 is assumed to grow at a rate of 0.2%, far less than the high-growth
scenario. This scenario assumes that electricity demand growth is managed through increased
conservation and DG efforts, resulting in less incremental consumption on the provincial electricity grid in the long term.
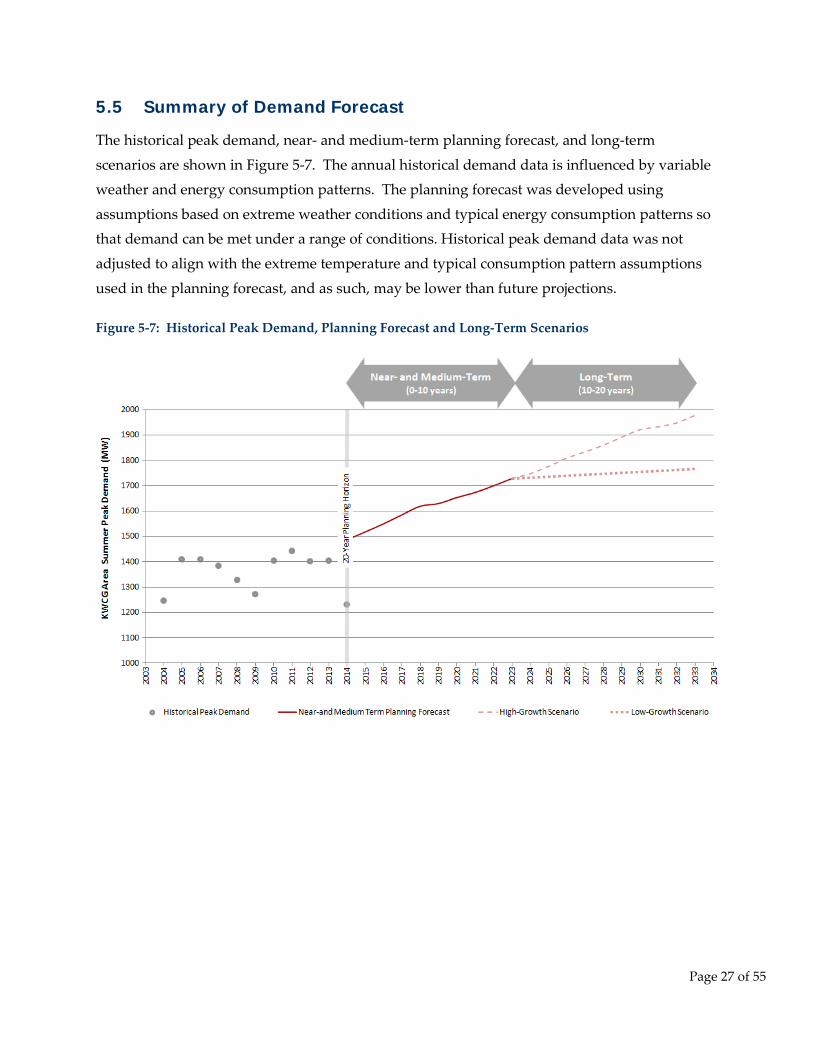
Page 27 of 55
5.5 Summary of Demand Forecast
The historical peak demand, near- and medium-term planning forecast, and long-term
scenarios are shown in Figure 5-7. The annual historical demand data is influenced by variable weather and energy consumption patterns. The planning forecast was developed using
assumptions based on extreme weather conditions and typical energy consumption patterns so that demand can be met under a range of conditions. Historical peak demand data was not
adjusted to align with the extreme temperature and typical consumption pattern assumptions
used in the planning forecast, and as such, may be lower than future projections.
Figure 5-7: Historical Peak Demand, Planning Forecast and Long-Term Scenarios
Page 28 of 55
6. Near- and Medium-Term Plan
The regional planning process considers when system needs may arise by comparing the
capability of the existing system with the forecast electricity demand. This section identifies the
needs in the near and medium term, considers available options, and recommends actions in the near and medium term.
6.1 Needs Assessment Methodology
The IESO’s Ontario Resource and Transmission Assessment Criteria (“ORTAC”),12 the provincial standard for assessing the reliability of the transmission system, was applied to
assess supply capacity and reliability needs. ORTAC includes criteria related to the assessment
of the bulk transmission system, as well as the assessment of local or regional reliability requirements (see Appendix B for more details).
Through the application of these criteria, three broad categories of needs can be identified:
• Transformer Station Capacity describes the electricity system’s ability to deliver power to the local distribution network through the regional transformer stations. This is limited by the 10-day Limited Time Rating (“LTR”) of the step-down transformer stations in the local area. Transformer station capacity need is identified when the peak demand at step-down transformer stations in the local area exceeds the combined LTR ratings.
• Supply Capacity describes the electricity system’s ability to provide continuous supply to a local area. This is limited by the load meeting capability (“LMC”) of the transmission line or sub-system which is the maximum demand that can be supplied on a transmission line or sub-system under applicable transmission and generation outage scenarios as prescribed by ORTAC, and is determined through power system simulations analysis (See Appendix B for more details). Supply capacity needs are identified when peak demand on a transmission line or sub-system exceeds its LMC.
• Load Security and Restoration describes the electricity system’s ability to minimize the impacts of potential supply interruptions to customers in the event of a major transmission outage, such as an outage on a double-circuit tower line resulting in the loss of both circuits. Load security describes the amount of load susceptible to supply interruptions in the event of a major transmission outage. Load restoration describes the
12 http://www.ieso.ca/imoweb/pubs/marketadmin/imo_req_0041_transmissionassessmentcriteria.pdf
Page 29 of 55
electricity system’s ability to restore power to those affected by a major transmission outage within reasonable timeframes. The specific load security and restoration requirements prescribed by ORTAC are described in Appendix B.
In addition, the needs assessment may also identify needs related to transmission reliability
performance, equipment end-of-life and planned sustainment activities. Reliability performance describes the frequency and probability of major outages on an electricity system,
which can be affected by various factors such as exposure to elements, age and maintenance of equipment, and length and configuration of the transmission or distribution network.
Equipment reaching the end of its life and planned sustainment activities may have an impact
on the needs assessment and option development.
6.2 Summary of Near- and Medium-Term Needs
As noted earlier, the transmission system within the KWCG Region consists of an integrated
230 kV and 115 kV network. Figure 6-1, The KWCG transmission system can be further subdivided into four regional sub-systems.
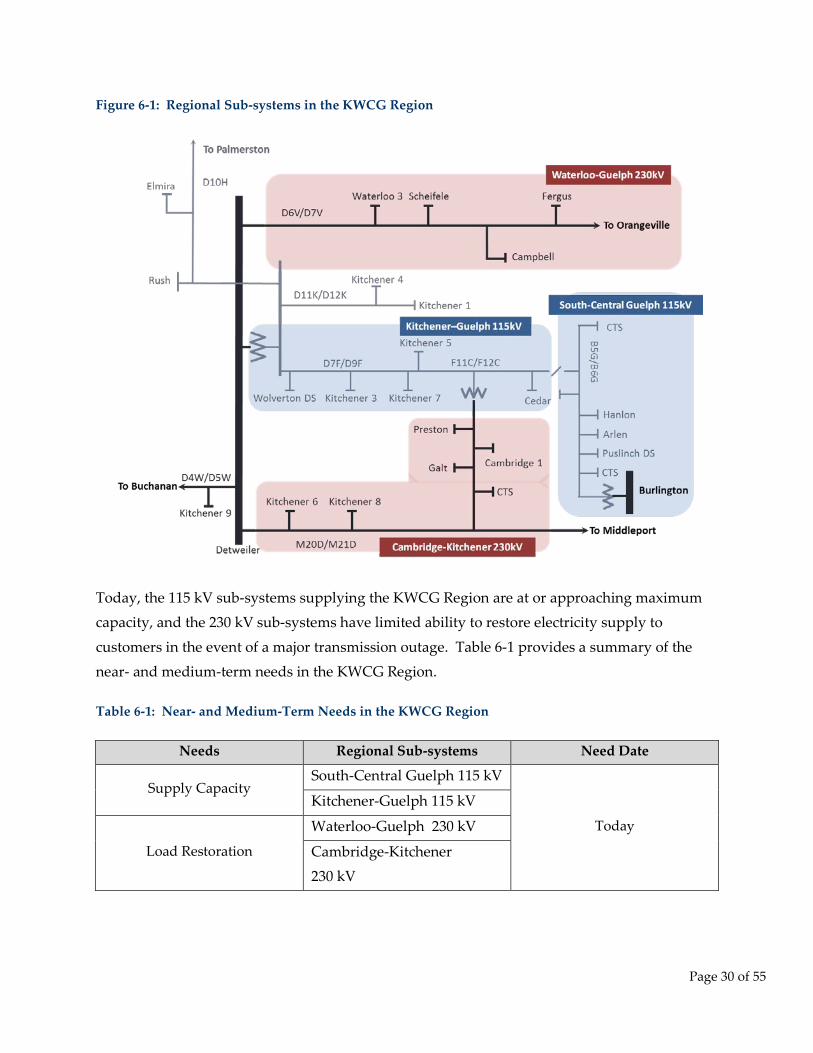
Page 30 of 55
Figure 6-1: Regional Sub-systems in the KWCG Region
Today, the 115 kV sub-systems supplying the KWCG Region are at or approaching maximum capacity, and the 230 kV sub-systems have limited ability to restore electricity supply to
customers in the event of a major transmission outage. Table 6-1 provides a summary of the near- and medium-term needs in the KWCG Region.
Table 6-1: Near- and Medium-Term Needs in the KWCG Region
Needs Regional Sub-systems Need Date
Supply Capacity South-Central Guelph 115 kV
Today
Kitchener-Guelph 115 kV
Load Restoration
Waterloo-Guelph 230 kV
Cambridge-Kitchener 230 kV
Page 31 of 55
6.2.1 Supply Capacity Needs on the South-Central Guelph and Kitchener-Guelph 115 kV Systems
South-Central Guelph 115 kV Sub-system
The South-Central Guelph 115 kV sub-system can provide up to 100 MW of continuous supply to the Kitchener and Guelph area under specific transmission and outage scenarios as defined
by ORTAC (South-Central Guelph 115 kV System LMC = 100 MW). Based on the historical
peak demand, the summer peak demand in the South-Central Guelph area has already exceeded the 100 MW LMC limit of the South-Central Guelph 115 kV sub-system over the last
two years. The existing South-Central Guelph 115 kV sub-system therefore does not meet the ORTAC supply capacity criteria.
Kitchener-Guelph 115 kV sub-system
The Kitchener-Guelph 115 kV sub-system can provide up to 260 MW of continuous supply to
the Kitchener and Guelph area under specific transmission and outage scenarios as defined by ORTAC (Kitchener-Guelph 115 kV sub-system LMC = 260 MW). Based on the planning
forecast, the peak demand in the Kitchener and Guelph area exceeded the 260 MW LMC limit of Kitchener-Guelph 115 kV system in the summer of 2014. Given the forecast near- and medium-
term summer peak demand growth, the existing Kitchener-Guelph 115 kV sub-system does not
meet the ORTAC supply capacity criteria.
6.2.2 Load Restoration Needs on the Waterloo-Guelph, and Cambridge-Kitchener 230 kV Sub-system
Waterloo-Guelph 230 kV Sub-system
The Waterloo-Guelph 230 kV sub-system is a 77 km double-circuit 230 kV transmission line (D6V/D7V) between Detweiler TS and Orangeville TS. This system currently supplies about
465 MW of peak demand load in the Waterloo and Guelph area. Based on the planning
forecast, the summer peak demand on this system is expected to increase to about 550 MW by 2023. As prescribed by ORTAC, no more than 250 MW of load can be without electricity supply
within 30 minutes of a major outage involving the loss of two transmission elements.
In the event of a major outage involving the loss of both transmission circuits on the Waterloo-
Guelph 230 kV system (D6/7V), all load supplied by this transmission line would be
interrupted. The existing system cannot restore any load within 30 minutes, and can only
Page 32 of 55
restore electricity supply in 3-4 hours using manual restoration procedures. As a result, the
Waterloo-Guelph 230 kV system does not meet the ORTAC 30 minute restoration criteria.
A major outage of this type occurred on February 29, 2012, when a forced outage on one of the
D6V/D7V circuits, coupled with scheduled maintenance on the companion circuit, resulted in the interruption of electricity supply for three hours to approximately 350 MW of load in
Waterloo, Guelph and the surrounding area.
Cambridge-Kitchener 230 kV Sub-system
The Cambridge-Kitchener 230 kV sub-system consists of an 82 km double-circuit 230 kV transmission line (M20D/M21D) between Detweiler TS and Middleport TS. This system
currently supplies about 420 MW of peak electricity demand in the Cambridge and Kitchener area. Based on the planning forecast, the summer peak demand on this system is expected to
increase to about 480 MW by 2023. As prescribed by ORTAC, no more than 250 MW of load
can be without electricity supply within 30 minutes of a major transmission outage.
Should a major outage involving the loss of both transmission circuits on the Cambridge-
Kitchener 230 kV system (M20/21D) occur, all load supplied by M20D/M21D would be interrupted. The existing system has the ability to restore up to 65 MW of electricity supply in
Cambridge within 30 minutes via the existing 115 kV/230 kV auto-transformer and the circuit switchers at Preston TS. This existing system does not meet the ORTAC criteria because more
than 250 MW of load on the Cambridge-Kitchener 230 kV system would still be without service
within 30 minutes of a major outage. In fact, a large portion of the customers on the Cambridge-Kitchener 230 kV sub-system would be without power for at least 3-4 hours.
Prior to the installation of the existing 115 kV/230 kV auto-transformer and disconnect switches at Preston TS, power could not be restored to any customers in the area in a timely manner.
Such was the case in 2003, when supply to parts of the City of Cambridge, the Township of
North Dumfries and the City of Kitchener, totaling over 250 MW, was interrupted for nearly four hours.
6.3 Options to Address the Near- and Medium-Term Needs
In developing the near- and medium-term plan, the Working Group considered a range of integrated alternatives for addressing the needs, including a mix of conservation, generation,
transmission and distribution facilities, and other electricity system initiatives. Technical
Page 33 of 55
feasibility, cost, and consistency with long-term needs and options were considered when
evaluating alternatives. Solutions that maximized the use of existing infrastructure were given priority.
For needs arising in the near term, specific projects are recommended. Given the lead time required to develop electricity infrastructure and CDM programs, these projects must be
commenced as soon as possible to ensure customer reliability. Typically, conservation solutions can be implemented within six months, or up to two years for larger projects, whereas
transmission and distribution facilities can take 5-7 years. The lead time for generation development is typically 2-3 years, but it could be longer depending on the size and technology
type. Recommended actions are therefore identified to initiate investments.
6.3.1 Guelph Area Transmission Refurbishment (GATR) Project
As discussed in Section 3.3, the Working Group recommended proceeding with the implementation of the GATR project, in combination with increased conservation and DG, to
address imminent supply capacity and restoration needs in the KWCG Region. This project includes the installation of two 115 kV/230 kV auto-transformers, two 230 kV circuit switchers
at Guelph North Junction, two 115 kV breakers at Cedar TS, and the upgrade of an existing
transmission line in Guelph (as shown in Figure 6-2). The cost of the GATR project is approximately $95 million. The project was approved by the OEB and is expected to be in-
service by spring 2016.13
13 EB-2013-0056 Ontario Energy Board Decision and Order dated September 26, 2013
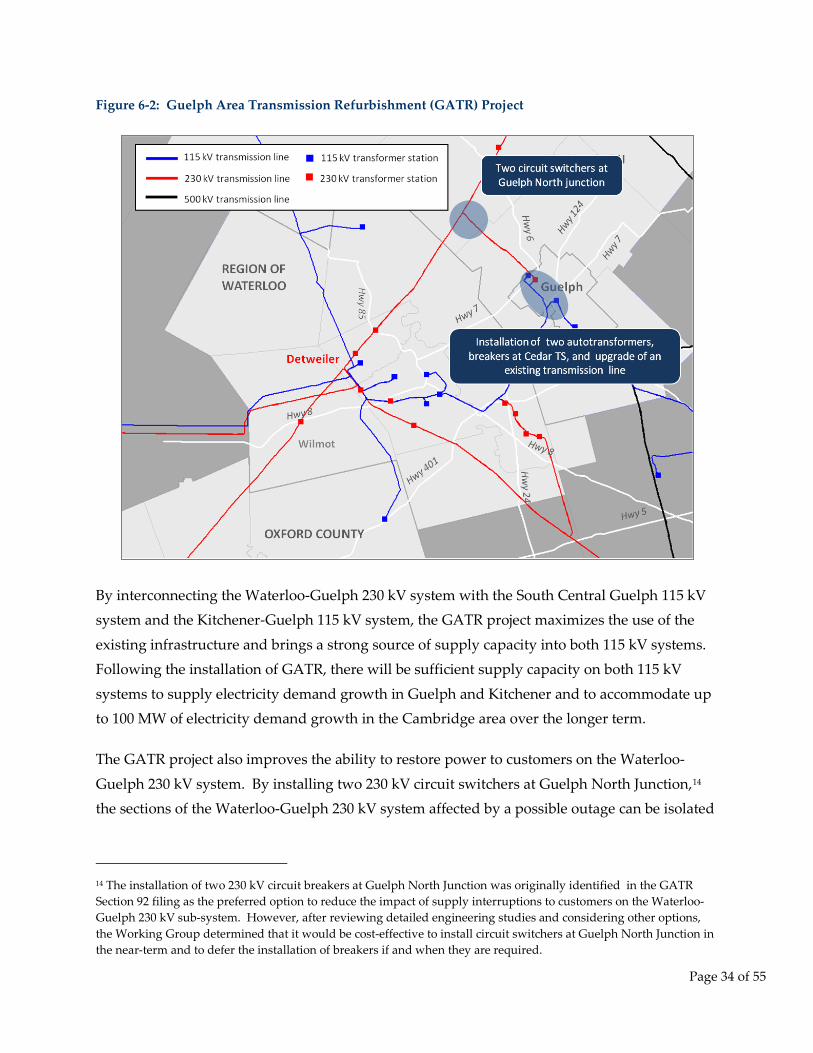
Page 34 of 55
Figure 6-2: Guelph Area Transmission Refurbishment (GATR) Project
By interconnecting the Waterloo-Guelph 230 kV system with the South Central Guelph 115 kV system and the Kitchener-Guelph 115 kV system, the GATR project maximizes the use of the
existing infrastructure and brings a strong source of supply capacity into both 115 kV systems. Following the installation of GATR, there will be sufficient supply capacity on both 115 kV
systems to supply electricity demand growth in Guelph and Kitchener and to accommodate up to 100 MW of electricity demand growth in the Cambridge area over the longer term.
The GATR project also improves the ability to restore power to customers on the Waterloo-
Guelph 230 kV system. By installing two 230 kV circuit switchers at Guelph North Junction,14 the sections of the Waterloo-Guelph 230 kV system affected by a possible outage can be isolated
14 The installation of two 230 kV circuit breakers at Guelph North Junction was originally identified in the GATR Section 92 filing as the preferred option to reduce the impact of supply interruptions to customers on the Waterloo-Guelph 230 kV sub-system. However, after reviewing detailed engineering studies and considering other options, the Working Group determined that it would be cost-effective to install circuit switchers at Guelph North Junction in the near-term and to defer the installation of breakers if and when they are required.
Page 35 of 55
quickly. As a result, about 50% of the electricity supply to customers on the Waterloo-Guelph
230 kV system could be restored within 30 minutes.
The detailed discussion on rationale for GATR and alternatives considered can be found in the
Hydro One Inc. Leave to Construct filing for GATR.15
6.3.2 Options to Improve Load Restoration on the Cambridge-Kitchener 230 kV Sub-system
As shown in Table 6-2, the GATR project provides sufficient supply capacity on the 115 kV
regional sub-systems to meet the electricity demand growth in Guelph, Kitchener and Cambridge over the near and medium term, and improve the ability to restore supply to
customers in Waterloo and Guelph. However, the restoration needs on the Cambridge-Kitchener 230 kV sub-system remain.
Table 6-2: Summary of Needs Addressed by the GATR Project
To substantially improve load restoration in Cambridge and Kitchener in the event of major transmission outages, the Working Group recommended proceeding with the installation of
two 230 kV circuit switchers at Galt Junction, near Highway 5, as shown in Figure 6-3. The following section describes the alternatives considered and the rationale for the
recommendation.
15 EB-2013-0056 http://www.rds.ontarioenergyboard.ca/webdrawer/webdrawer.dll/webdrawer/search/rec&sm_udf10=eb-2013-0053&sortd1=rs_dateregistered&rows=200
Needs Regional Sub-systems Needs addressed by the GATR project
Supply Capacity South Central Guelph 115 kV
Kitchener-Guelph 115 kV
Load Restoration Waterloo-Guelph 230 kV
Cambridge-Kitchener 230 kV
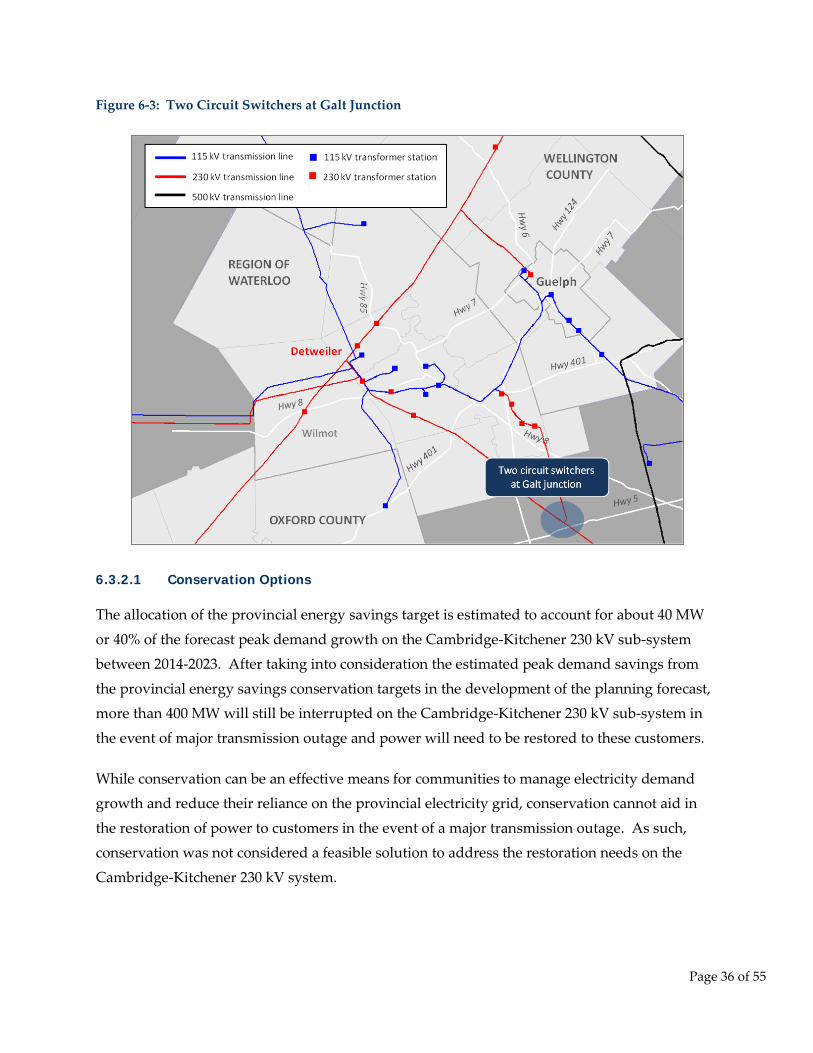
Page 36 of 55
Figure 6-3: Two Circuit Switchers at Galt Junction
6.3.2.1 Conservation Options
The allocation of the provincial energy savings target is estimated to account for about 40 MW
or 40% of the forecast peak demand growth on the Cambridge-Kitchener 230 kV sub-system between 2014-2023. After taking into consideration the estimated peak demand savings from
the provincial energy savings conservation targets in the development of the planning forecast, more than 400 MW will still be interrupted on the Cambridge-Kitchener 230 kV sub-system in
the event of major transmission outage and power will need to be restored to these customers.
While conservation can be an effective means for communities to manage electricity demand growth and reduce their reliance on the provincial electricity grid, conservation cannot aid in
the restoration of power to customers in the event of a major transmission outage. As such, conservation was not considered a feasible solution to address the restoration needs on the
Cambridge-Kitchener 230 kV system.
Page 37 of 55
6.3.2.2 Local Generation Options
The extent to which DG can restore electricity supply following a major transmission outage
depends on a number of factors, such as the size of the facility, the facility’s start-up time, the ramp rate, the availability of black-start capability, storage options, safety protocols and other
operating procedures. Given the uncertainties and variability associated with DG, the Working Group agreed that it cannot rely on DG to address restoration needs on the Cambridge-
Kitchener 230 kV sub-system.
A large, centralized, transmission-connected generation source (100-200 MW) could improve the restoration on the 230 kV system if properly sited and integrated (e.g., Preston TS and
associated switching devices). However, given the high cost associated with large, centralized generation, this option is only cost-effective when it can contribute to both regional and
provincial capacity and energy needs. It is not cost-effective to implement a large, centralized
generation only for improving load restoration in a local area. This option was therefore ruled out by the Working Group.
6.3.2.3 Distribution Options
One method to restore electricity supply to customers following a major outage on the transmission system is to execute temporary load transfers through the distribution network to
unaffected neighboring transformer stations. The amount of load that can be transferred
temporarily through the distribution network, as well as the time required to transfer, are highly variable and can depend on various factors such as load level at neighboring stations,
distance between stations, voltage of the neighboring distribution system, time of day and operating procedures in place on the distribution system. As such, the Working Group
determined that it is difficult to rely on distribution load transfer to restore large amounts of load on the Cambridge-Kitchener 230 kV sub-system in the event of a major transmission
outage.
6.3.2.4 Transmission Options
As discussed in Section 3.3, in 2013, the installation of a second 115 kV/230 kV auto-transformer at Preston TS and associated switching and reactive facilities was previously identified by the
Working Group as a potential option to address the restoration needs on the Cambridge-Kitchener 230 kV sub-system. In response to the hand-off letter to undertake a detailed study
Page 38 of 55
on the development of the second 115 kV/230 kV auto-transformer at Preston TS option,16
Hydro One also identified and examined a number of alternatives to reduce the impact of supply interruptions to customers in Cambridge and Kitchener in the event of a major
transmission outage on the 230 kV system. Based on Hydro One’s analysis,17 the installation of two 230 kV circuit switchers at Galt junction meets the ORTAC 30-minute restoration criteria on
the Cambridge-Kitchener 230 kV sub-system, provides regional benefits, and strikes a
reasonable balance between cost, reliability improvement, and feasibility. As such, the Working Group recommended proceeding with the installation of two 230 kV circuit switchers at Galt
junction. Hydro One has begun early development work on these switching facilities, which are expected to be in service by spring 2017. Hydro One will continue to examine other
potential measures to further improve the restoration capability in the Cambridge area. Please refer to Appendix C for further information regarding load restoration improvements for the
Cambridge-Kitchener 230 kV sub-system.
6.4 Recommendations for the Near and Medium Term
Based on the evaluation of alternatives discussed above, the Working Group recommends the actions described below to meet the near-term electricity needs of the KWCG Region.
Successful implementation of this plan will substantially address the regional electricity supply
needs in the KWCG Region over the next 20 years.
To ensure that the near-term electricity needs of the KWCG Region are addressed, it is
important that the near-term plan recommendations are implemented in a timely manner. The specific actions and deliverables associated with the near-term plan are outlined in Table 6-3,
along with the proposed timing and the parties that will lead the implementation.
The KWCG Working Group will continue to meet at regular intervals during the
implementation phase of this IRRP to monitor developments in the KWCG Region and to track
progress toward these deliverables.
16 OPA Letter to Hydro One - May 29, 2013 for the 2nd Preston Autotransformer: http://www.ieso.ca/Documents/Regional-Planning/KWCG/OPA-Letter-Hydro-One-KWCG.pdf 17 Hydro One’s Kitchener-Waterloo-Cambridge-Guelph area Adequacy of Transmission Facilities Report 2013/2014 report
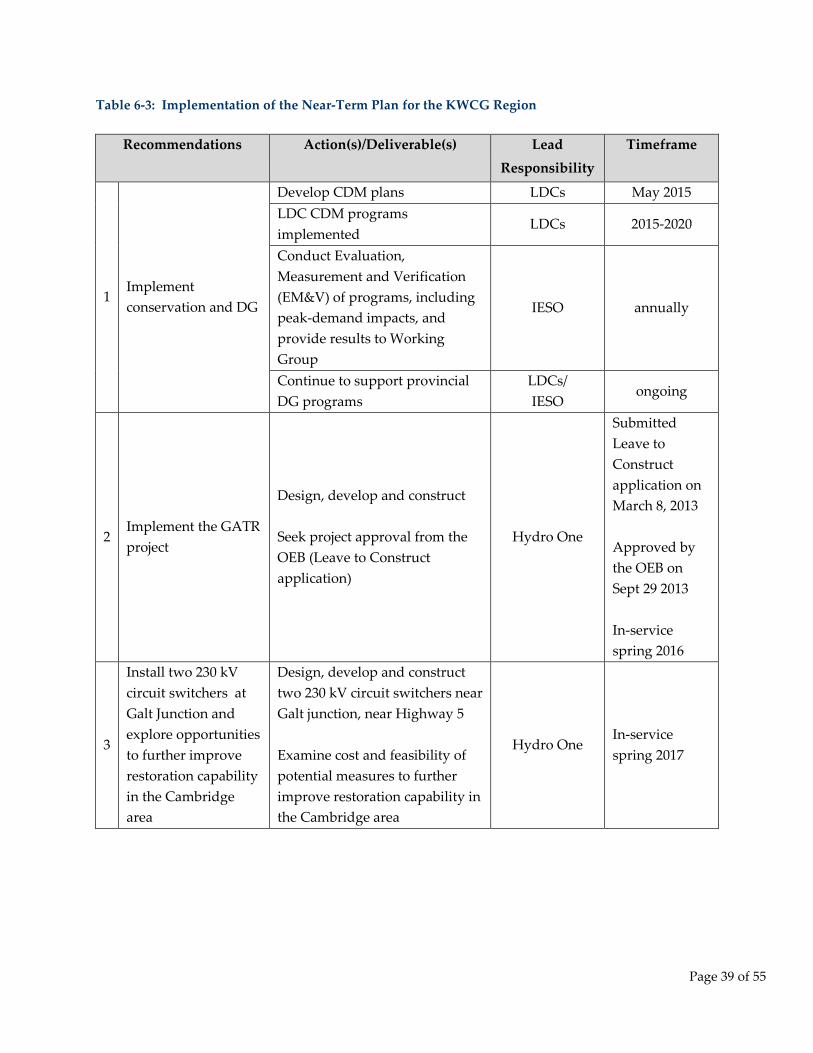
Page 39 of 55
Table 6-3: Implementation of the Near-Term Plan for the KWCG Region
Recommendations Action(s)/Deliverable(s) Lead Responsibility
Timeframe
1 Implement conservation and DG
Develop CDM plans LDCs May 2015 LDC CDM programs implemented
LDCs 2015-2020
Conduct Evaluation, Measurement and Verification (EM&V) of programs, including peak-demand impacts, and provide results to Working Group
IESO annually
Continue to support provincial DG programs
LDCs/ IESO
ongoing
2 Implement the GATR project
Design, develop and construct Seek project approval from the OEB (Leave to Construct application)
Hydro One
Submitted Leave to Construct application on March 8, 2013 Approved by the OEB on Sept 29 2013 In-service spring 2016
3
Install two 230 kV circuit switchers at Galt Junction and explore opportunities to further improve restoration capability in the Cambridge area
Design, develop and construct two 230 kV circuit switchers near Galt junction, near Highway 5 Examine cost and feasibility of potential measures to further improve restoration capability in the Cambridge area
Hydro One In-service spring 2017
Page 40 of 55
7. Long-Term Plan (2024-2033)
Given the uncertainty in forecasting demand beyond 2023, the purpose of the long-term plan is to consider alternate potential demand scenarios in order to facilitate discussions about how the
KWCG Region may plan its future electricity supply, and to lay the groundwork for the next regional planning cycle. This section describes potential long-term needs, approaches to
addressing these needs, and recommended actions.
7.1 Summary of Long-Term Needs
Using the needs assessment methodology outlined in Section 6.1, the KWCG Region was assessed under both of the long-term scenarios: the high-growth scenario and the low-growth
scenario.
7.1.1 High-Growth Scenario – Long-Term Needs
Following the implementation of the near-term plan (Section 6.4), there will be sufficient supply capacity on the 115 kV and 230 kV systems over the long term to support the electricity demand
growth projected under the high-growth scenario.
Although the 230 kV transmission system supplying customers in the Cambridge area is
expected to approach its maximum capacity in the long term, as shown in Figure 7-1, future electricity demand growth in the Cambridge area can utilize the Kitchener-Guelph 115 kV sub-
system as an alternative source of supply.
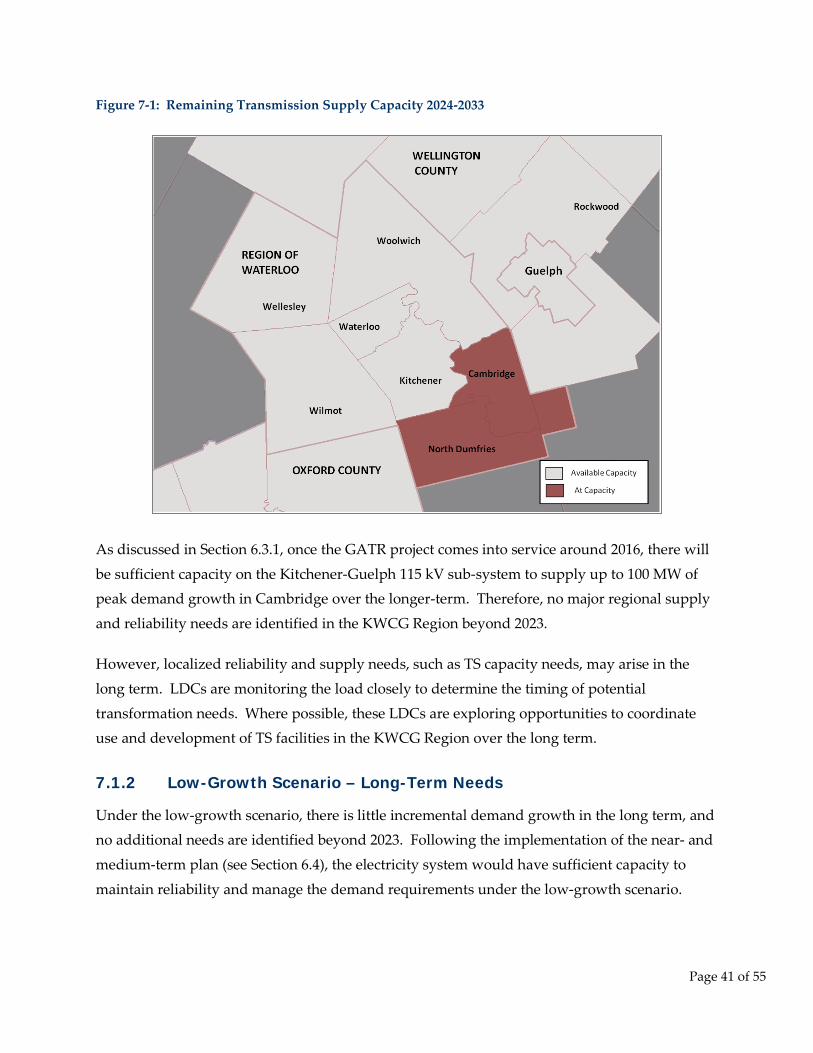
Page 41 of 55
Figure 7-1: Remaining Transmission Supply Capacity 2024-2033
As discussed in Section 6.3.1, once the GATR project comes into service around 2016, there will
be sufficient capacity on the Kitchener-Guelph 115 kV sub-system to supply up to 100 MW of peak demand growth in Cambridge over the longer-term. Therefore, no major regional supply
and reliability needs are identified in the KWCG Region beyond 2023.
However, localized reliability and supply needs, such as TS capacity needs, may arise in the
long term. LDCs are monitoring the load closely to determine the timing of potential
transformation needs. Where possible, these LDCs are exploring opportunities to coordinate use and development of TS facilities in the KWCG Region over the long term.
7.1.2 Low-Growth Scenario – Long-Term Needs
Under the low-growth scenario, there is little incremental demand growth in the long term, and no additional needs are identified beyond 2023. Following the implementation of the near- and
medium-term plan (see Section 6.4), the electricity system would have sufficient capacity to
maintain reliability and manage the demand requirements under the low-growth scenario.
Page 42 of 55
7.2 Approaches to Address Long-Term Needs
For localized needs developing over the long term, there is an opportunity to develop and
explore a broader set of options, as specific projects do not need to be committed to immediately. Instead, the focus is on identifying possible approaches to meeting long-term
needs, including alternatives that are not currently in widespread use but which show promise for the future. To facilitate these long-term options, preliminary actions should be taken to
develop the identified alternatives, monitor growth, and engage with stakeholders and
communities in the KWCG Region.
This approach is designed to maintain flexibility, avoid committing ratepayers to investments
before they are needed, provide adequate time to gauge the success and future potential of conservation measures, test out emerging technologies, engage with communities and
stakeholders, coordinate with any municipal or community energy planning (“MEP/CEP”)
activities, and to lay the foundation for informed decisions in the future. While it is not necessary to commit to specific projects given forecast uncertainty and technological change, the
long-term plan identifies near-term actions to develop alternatives, engage with the communities, gather information and lay the groundwork for future options.
To facilitate discussions about how the KWCG Region may plan its future electricity supply and
lay the groundwork for the next planning cycle, the Working Group examined three conceptual approaches to address potential long-term electricity needs in the KWCG Region: community
self-sufficiency; delivering provincial resources (“wires” planning); and, large localized generation. In practice, certain elements of electricity plans will be common to all three
approaches, and some overlap between them may be necessary. It is likely that all plans will contain some combination of conservation, local generation, transmission and distribution
elements. The following section describes the attributes, benefits, risks and implementation
requirements associated with each of the three long-term approaches.
7.2.1 Community Self-Sufficiency
The purpose of the community self-sufficiency approach is to reduce a community’s reliance on
the provincial electricity system by meeting their electricity needs with local, distributed resources and community-based solutions. This approach can include: aggressive DR and
conservation programs, DG and advanced storage technologies, micro-grid and smart-grid
technologies, and more efficient and integrated process systems combining heat and power and electric vehicles (“EV”).
Page 43 of 55
Community self-sufficiency can supplement and/or defer transmission or generation
infrastructure development and improve energy security for communities by reducing their reliance on the provincial electricity system through conservation efforts and DG. This
approach can be an effective means for addressing localized supply and reliability needs and managing a community’s electricity demand growth over the long term.
This approach acknowledges community interest and the desire for grassroots involvement in
local electricity planning and infrastructure siting. In recent years, a number of municipalities across the province began undertaking Municipal Energy Plans18 to better understand their
local energy needs, identify opportunities for EE and renewable energy, and to begin aligning their land use planning with energy infrastructure planning. With the self-sufficiency
approach, commercial and industrial businesses, educational institutions, municipalities and community energy cooperatives have the ability to take greater ownership of their electricity
needs and related infrastructure requirements.
Addressing the long-term needs of the KWCG Region through community self-sufficiency requires leadership from the community to identify local opportunities, to align community
energy planning initiatives with the regional electricity planning process, and to develop appropriate local and provincial policy and incentives to guide the development of community-
based energy solutions. This can be achieved through the development of municipal and
community energy plans and increased coordination between the provincial, regional and municipal governments and local utilities.
As this approach relies on emerging technologies, recently, some communities and/or local utilities are taking action to examine the feasibility, scalability and cost-effectiveness of such
technologies through the implementation of pilot projects. Going forward, regulatory guidance
would be required to clarify cost recovery mechanisms for emerging technologies and to address the potential risk of stranding assets.
Communities and local utilities in the KWCG Region have become increasingly involved in the development of DG and conservation initiatives as a result of provincial procurement programs
and conservation policy. The following sections provide an overview of the ongoing
18 A Municipal Energy Plan is a comprehensive long-term plan to improve energy efficiency, reduce energy consumption and greenhouse gas (GHG) emissions.
Page 44 of 55
community energy initiatives, policies and solutions being developed in the City of Guelph,
Region of Waterloo, Wellington County and Oxford County.
City of Guelph
The City of Guelph places an emphasis on community-based energy management and
solutions. According to the Guelph Community Energy Initiative, the City of Guelph has established ambitious goals to reduce energy use per capita, to encourage and facilitate
community-based renewable energy systems and to reduce greenhouse gases (“GHG”) over the
next 20 years.
To facilitate the implementation of these goals under the Guelph Community Energy Initiative,
the City of Guelph formed Envida Community Energy Inc. to develop and implement community-based electricity generation, thermal energy and energy management solutions. In
recent years, Envida has successfully developed and implemented various district energy,
combined heat and power, solar energy and bio-energy projects. Such projects include the Hanlon Creek Business Park District Energy System and Combined Heat and Power Project, the
Eastview Landfill Gas Facility, and the Galt District Energy System in downtown Guelph. To facilitate the integration and optimization of these distributed resources, Guelph Hydro has
been upgrading its smart grid.
In addition, Guelph Hydro and Envida have taken steps to better understand the potential and
feasibility of community-based solutions and emerging technologies. Guelph Hydro conducted
an Electric Vehicle Market Research Study in 2011 and was involved with an EV charging station pilot. As part of Guelph’s District Energy Strategic Plan, Envida identified 10 potential
areas for district energy development and set out a 20-year roadmap for district energy development in Guelph.
To facilitate EE improvements, the City of Guelph has established building codes and efficiency
requirements on building renovations and implemented voluntary energy performance labeling in buildings.
Region of Waterloo
The Region of Waterloo released a Corporate Energy Plan for 2014-2024 to effectively manage the region’s corporate energy use. Over the next 10 years, the region plans to pursue EE
retrofits for buildings and renewable energy generation. The region’s Energy Conservation
Office (“ECO”), established in 2007, will play a leading role in implementing the goals as
Page 45 of 55
detailed in the Corporate Energy Plan. To date, the ECO has implemented more than 130
conservation and DG projects across the region, including demand shifting, energy audits, building retrofits, and geothermal, biogas, landfill gas, solar heating and solar photovoltaic
(“PV”) installations. The ECO will provide information on new and emerging generation technologies to the region, by initiating new partnerships with cities and local organizations,
attending relevant conferences, and reviewing research publications.
A Climate Action Plan was also developed for the region, as a collective direction for municipal and community leaders to investigate several strategies to reduce energy needs and increase
local renewable energy generation. According to the plan, local building codes and standards are to be updated and improved in terms of energy efficiency, targeting building retrofits and
new development. In order to help cover capital costs of building retrofits and renewable generation for homeowners, the region will consider using Local Improvement Charges as a
funding mechanism. A district energy feasibility study will be conducted for the Region of
Waterloo, to identify opportunities within the region for both homes and businesses. By installing public EV charging stations and raising awareness among the local residents, the
region intends to have 1,000 EVs in the community. The application of geothermal energy, solar hot water systems and PV net metering solutions will be explored and developed through
increased collaboration with LDCs.
The Community Environmental Fund in the Region of Waterloo has supported community-based environmental initiatives, such as supporting a solar thermal project and associated
education workshops, and funding a green housing demonstration project combining passive and active solar design as well as integrated energy production.
To facilitate the integration and optimization of distributed resources, LDCs in the Region of
Waterloo have invested in advanced smart grid technologies, such as automated switching, Supervisory Control and Data Acquisition (“SCADA”), and outage management systems.
Wellington and Oxford Counties
Both Wellington and Oxford Counties have recently published their Energy Management Plans that outline their goals and initiatives to monitor energy usage, reduce energy consumption and
minimize carbon emission and environmental footprints in their communities. These initiatives
include installing light emitting diode (“LED”) streetlights, conducting energy audits in municipal-owned and high-energy consumption buildings and exploring opportunities for the
development of DG in their communities. Today, Wellington County has 15 solar PV units
Page 46 of 55
operating with revenues directed to the Green Energy Reserve, a fund for future green
initiatives.
7.2.2 Delivering Provincial Resources (“Wires” Planning)
Delivering provincial resources, or “wires” planning, reflects the traditional regional electricity
planning approach associated with the development of centralized electric power systems. This approach involves using transmission and distribution infrastructure to supply a region’s
electricity needs, taking power from the provincial electricity system. This model takes
advantage of generation that is planned at the provincial level, with generation sources typically located remotely from the region. Utilities, both transmitters and distributors, play a
lead role in the development of this approach.
Transmission and distribution enhancements, such as the installation of a TS, reactive support
and switching facilities, can be an effective means for addressing localized supply and
reliability needs in the KWCG Region in the long term.
Although it is not required at this time, a transmission line bringing supply from the west,
south or east into the KWCG regional electricity system can be a potential option to address major regional supply needs (as shown in Figure 7-2), if such needs are identified in future
planning cycles.
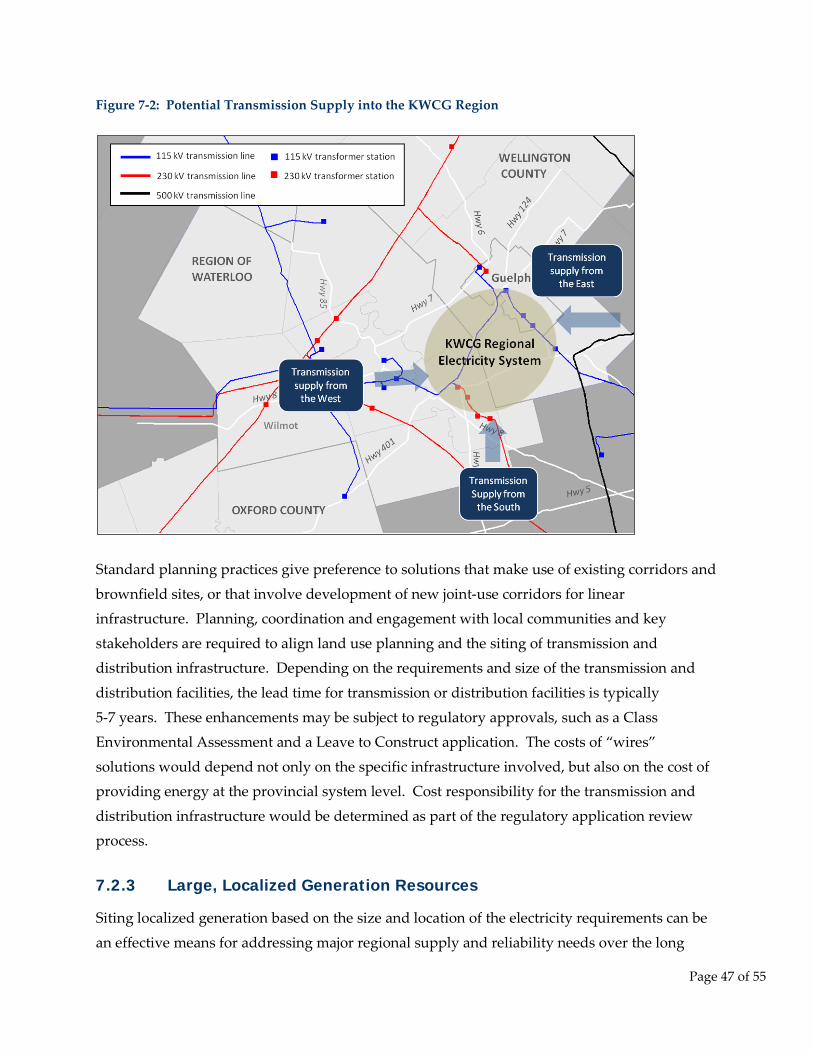
Page 47 of 55
Figure 7-2: Potential Transmission Supply into the KWCG Region
Standard planning practices give preference to solutions that make use of existing corridors and
brownfield sites, or that involve development of new joint-use corridors for linear infrastructure. Planning, coordination and engagement with local communities and key
stakeholders are required to align land use planning and the siting of transmission and distribution infrastructure. Depending on the requirements and size of the transmission and
distribution facilities, the lead time for transmission or distribution facilities is typically
5-7 years. These enhancements may be subject to regulatory approvals, such as a Class Environmental Assessment and a Leave to Construct application. The costs of “wires”
solutions would depend not only on the specific infrastructure involved, but also on the cost of providing energy at the provincial system level. Cost responsibility for the transmission and
distribution infrastructure would be determined as part of the regulatory application review process.
7.2.3 Large, Localized Generation Resources
Siting localized generation based on the size and location of the electricity requirements can be
an effective means for addressing major regional supply and reliability needs over the long
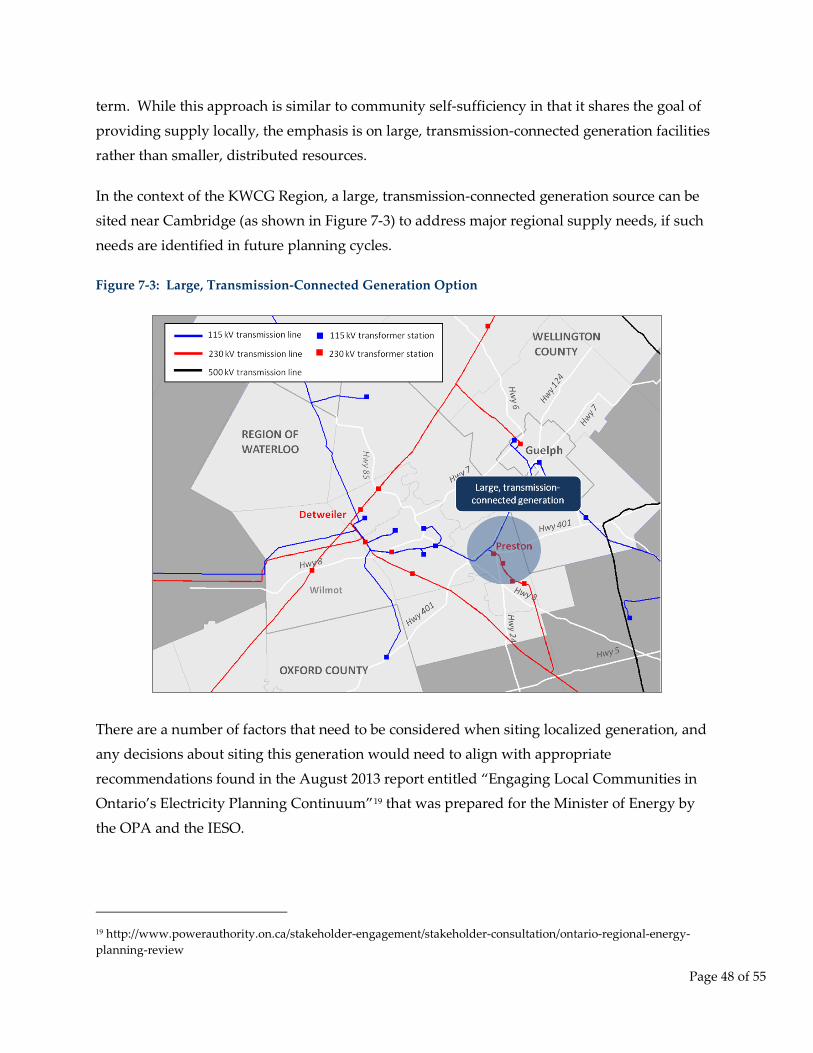
Page 48 of 55
term. While this approach is similar to community self-sufficiency in that it shares the goal of
providing supply locally, the emphasis is on large, transmission-connected generation facilities rather than smaller, distributed resources.
In the context of the KWCG Region, a large, transmission-connected generation source can be sited near Cambridge (as shown in Figure 7-3) to address major regional supply needs, if such
needs are identified in future planning cycles.
Figure 7-3: Large, Transmission-Connected Generation Option
There are a number of factors that need to be considered when siting localized generation, and any decisions about siting this generation would need to align with appropriate
recommendations found in the August 2013 report entitled “Engaging Local Communities in Ontario’s Electricity Planning Continuum”19 that was prepared for the Minister of Energy by
the OPA and the IESO.
19 http://www.powerauthority.on.ca/stakeholder-engagement/stakeholder-consultation/ontario-regional-energy-planning-review
Page 49 of 55
As the requirements in the KWCG Region are for additional capacity during times of peak
demand, a large, transmission-connected generation solution would need to be capable of being dispatched when needed, and to operate at an appropriate capacity factor. In some cases,
additional transmission reinforcements may be required to accompany the generation. In addition, siting may be a challenge if the generation is to be sited in densely populated and/or
urban areas.
The cost of the centralized generation option depends on the size and technology of the units chosen, as well as the degree to which they can contribute to the local and provincial capacity or
energy need. The lead time for generation development is typically 2-3 years, but it could be longer depending on the size and technology type.
7.3 Recommendations for the Long Term
While specific solutions do not need to be committed to today, it is appropriate to begin work
now to gather information, monitor developments, engage the community and develop alternatives to support decision-making for the next iteration of the IRRP. The long-term plan
sets out the near-term actions required to ensure that options remain available to address future needs, if and when they arise.
Localized reliability and supply needs may still arise in the long term under certain growth
scenarios, but these potential needs do not require any immediate action. There may be opportunity for communities and local utilities to manage their future electricity demand
through the development of community-based solutions. Communities and local utilities in the KWCG Region have become increasing involved in the development of DG and conservation
initiatives. The results of early community-based pilot projects, energy conservation initiatives, and achievable potential studies will be an important input to the long-term plan for the KWCG
Region and will be considered in the next iteration of the KWCG IRRP.
The recommended actions and deliverables for the long-term plan are outlined in Table 7-1, along with the proposed timing, and the parties assigned with lead responsibility for
implementation. The KWCG Working Group will continue to meet regularly during the implementation phase of this IRRP to monitor developments in the KWCG Region and to track
progress of these deliverables.
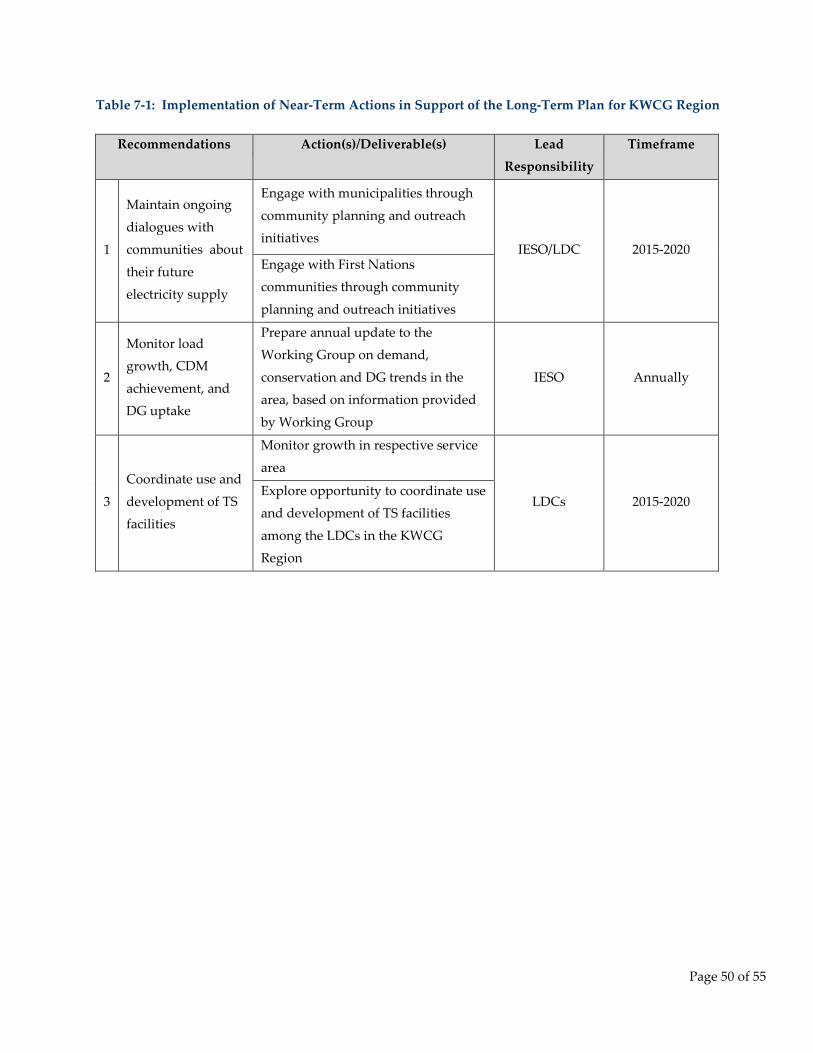
Page 50 of 55
Table 7-1: Implementation of Near-Term Actions in Support of the Long-Term Plan for KWCG Region
Recommendations Action(s)/Deliverable(s) Lead
Responsibility
Timeframe
1
Maintain ongoing
dialogues with
communities about
their future
electricity supply
Engage with municipalities through
community planning and outreach
initiatives IESO/LDC 2015-2020
Engage with First Nations
communities through community
planning and outreach initiatives
2
Monitor load
growth, CDM
achievement, and
DG uptake
Prepare annual update to the
Working Group on demand,
conservation and DG trends in the
area, based on information provided
by Working Group
IESO Annually
3
Coordinate use and
development of TS
facilities
Monitor growth in respective service
area
LDCs 2015-2020 Explore opportunity to coordinate use
and development of TS facilities
among the LDCs in the KWCG
Region
Page 51 of 55
8. Community, Aboriginal and Stakeholder Engagement
Community engagement is an important aspect of the regional planning process. Providing
opportunities for input in the regional planning process enables the views and preferences of
the community to be considered in the development of the plan, and helps lay the foundation for successful implementation. This section outlines the engagement principles as well as the
activities undertaken to date for the KWCG Region IRRP and those that will take place to discuss the long-term needs identified in the plan and obtain input in the development of
options.
A phased community engagement approach has been developed for the KWCG IRRP based on
the core principles of creating transparency, engaging early and often, and bringing
communities to the table. These principles were established as a result of the IESO’s outreach with Ontarians to determine how to improve the regional planning process, and they are now
guiding the IRRP outreach with communities and will ensure this dialogue continues and expands as the plan moves forward.
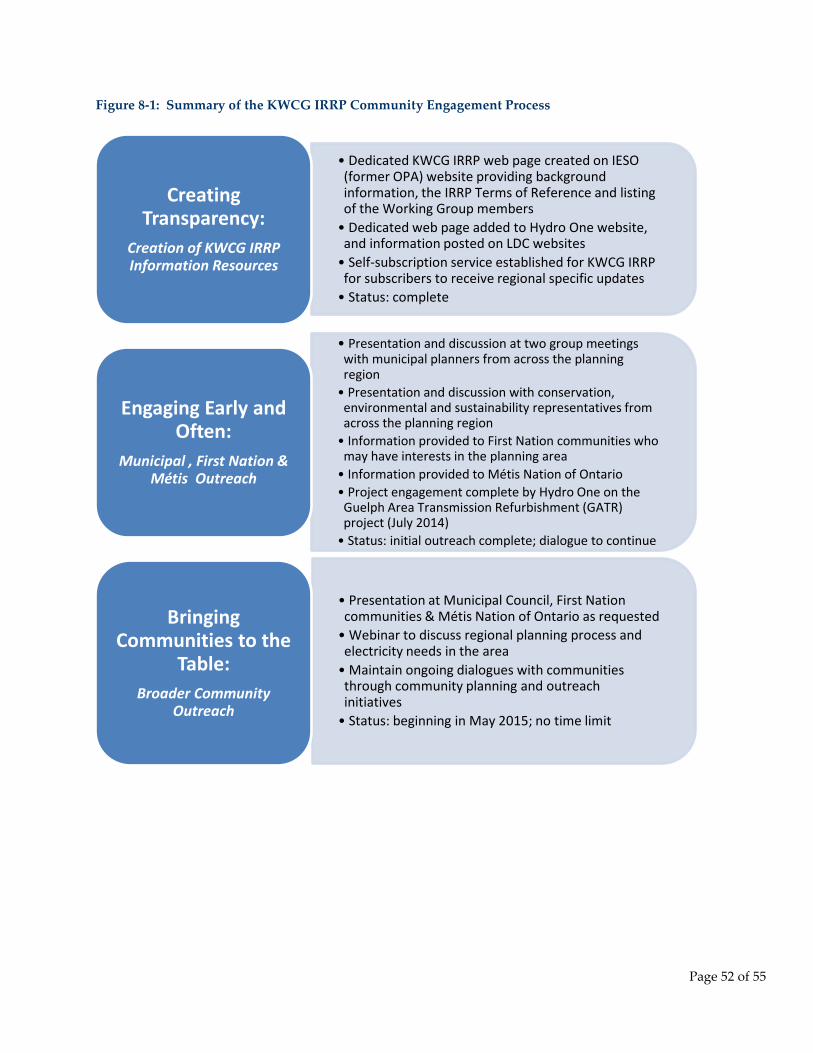
Page 52 of 55
Figure 8-1: Summary of the KWCG IRRP Community Engagement Process
• Dedicated KWCG IRRP web page created on IESO (former OPA) website providing background information, the IRRP Terms of Reference and listing of the Working Group members
• Dedicated web page added to Hydro One website, and information posted on LDC websites
• Self-subscription service established for KWCG IRRP for subscribers to receive regional specific updates
• Status: complete
Creating Transparency:
Creation of KWCG IRRP Information Resources
• Presentation and discussion at two group meetings with municipal planners from across the planning region
• Presentation and discussion with conservation, environmental and sustainability representatives from across the planning region
• Information provided to First Nation communities who may have interests in the planning area
• Information provided to Métis Nation of Ontario • Project engagement complete by Hydro One on the Guelph Area Transmission Refurbishment (GATR) project (July 2014)
• Status: initial outreach complete; dialogue to continue
Engaging Early and Often:
Municipal , First Nation & Métis Outreach
• Presentation at Municipal Council, First Nation communities & Métis Nation of Ontario as requested
• Webinar to discuss regional planning process and electricity needs in the area
• Maintain ongoing dialogues with communities through community planning and outreach initiatives
• Status: beginning in May 2015; no time limit
Bringing Communities to the
Table: Broader Community
Outreach
Page 53 of 55
Creating Transparency
To start the dialogue on the KWCG IRRP and build transparency in the planning process, a
number of information resources were created for the plan. A dedicated web page was created on the IESO (former OPA) website to provide a map of the regional planning area, information
on why the plan was being developed, the Terms of Reference for the IRRP and a listing of the organizations involved was posted on the websites of the Working Group members. A
dedicated email subscription service was also established for the KWCG IRRP where
communities and stakeholders could subscribe to receive email updates about the IRRP.
Engaging Early and Often
The first step in the engagement of the KWCG IRRP was meeting with representatives from the
municipalities and the First Nations communities in the Region. For the municipal meetings, presentations were made to the KWCG Region municipal planners at two group meetings held
in Kitchener and Guelph. The IESO held a separate meeting with representatives of the Six
Nations Elected Council. During these meetings, key topics of discussion included Hydro One’s Guelph Area Transmission Refurbishment Project (GATR), confirmation of the growth
projections, discussion of the near- and long-term needs identified in the KWCG Region, a review of the identified near-term projects including those that have already begun due to
timing requirements, and a discussion of the possible approaches to address long-term needs.
The discussion also focused on ways to achieve greater community self-sufficiency in the long term, a topic which was also discussed at a separate meeting with conservation, environmental
and sustainability representatives from across the planning Region. Invitations to meet to discuss the KWCG IRRP were also extended to the Mississaugas of the New Credit First Nation
and to the Haudenosaunee Confederacy Chiefs Council, and the IESO remains committed to responding to any questions or concerns from these communities.
Over the last couple of years, Hydro One has undertaken engagement activities for the GATR
project. Going forward, additional engagement activities may be undertaken for other near-term projects. Information on these project-level engagements will be provided on Hydro One’s
website and will also be listed on the IESO’s KWCG IRRP main webpage.
Bringing Communities to the Table
This engagement will begin with a webinar hosted by the Working Group to discuss the plan
and potential approaches of possible long-term options. Presentations on the KWCG IRRP will
also be made to Municipal Councils on request. To maintain ongoing dialogues with
Page 54 of 55
communities, the IESO and LDCs will continue to engage with First Nations, the Métis Nation
of Ontario and municipalities through community planning, environmental and sustainability initiatives and broader community outreach such as, informational public open houses, in
between the 5-year regional planning cycle.
Strengthening processes for early and sustained engagement with communities and the public
were introduced following an engagement held in 2013 with 1,250 Ontarians on how to enhance
regional electricity planning in 2013. This feedback resulted in the development of a series of recommendations that were presented to, and subsequently adopted by the Minister of Energy.
Further information can be found in the report entitled “Engaging Local Communities in Ontario’s Electricity Planning Continuum”20 available on the IESO website.
Information on outreach activities for the KWCG Region IRRP can be found on the IESO website and updates will be sent to all subscribers who have requested updates on the KWCG
IRRP.
20 http://www.powerauthority.on.ca/stakeholder-engagement/stakeholder-consultation/ontario-regional-energy-planning-review
Page 55 of 55
9. Conclusion
This report documents the IRRP that has been carried out for the KWCG Region and fulfills the
OEB’s regional planning requirement for the KWCG Region. The IRRP identifies electricity
needs in the KWCG Region over the 20-year period from 2014 to 2033, and recommends a plan to address near-term needs and actions to facilitate discussions about how the KWCG Region
may plan its future electricity supply over the longer-term.
Implementation of the near-term plan is already underway. Consistent with the Conservation
First policy, LDCs are currently preparing CDM plans, which will be submitted to the IESO by May 2015. Concurrently, the GATR project has been approved and is expected to come into
service in 2016. The early development work for the two circuit switchers on the Cambridge-
Kitchener 230 kV sub-system is underway. The implementation of these near-term actions would substantially address electricity supply and reliability needs in the KWCG Region and
there are no major regional needs identified beyond 2023. Early development work for major electricity infrastructure projects in the KWCG Region is not required at this time. Localized
reliability and supply needs may still arise in the long term under certain growth scenarios, but
these potential needs do not require any immediate action. There may be opportunity for communities and local utilities to manage their future electricity demand through the
development of community-based solutions.
The KWCG Working Group will continue to meet regularly throughout the implementation of
the plan to monitor progress and developments in the area, and will produce annual update
reports that will be posted on the IESO website. To support development of the long-term plan, a number of actions have been identified to develop alternatives, engage with the community,
and monitor growth in the area, and responsibility has been assigned to appropriate members of the Working Group for these actions. Information gathered and lessons learned from these
activities will inform development of the next iteration of the IRRP for the KWCG Region. The plan will be revisited according to the OEB-mandated 5-year schedule.

<Blank Page>

Appendix D:
KWCG RIP Report (2015)
Kitchener-Waterloo-Cambridge-Guelph REGIONAL INFRASTRUCTURE PLAN
December 15, 2015

KWCG – Regional Infrastructure Plan December 15, 2015
2
[This page is intentionally left blank]

KWCG – Regional Infrastructure Plan December 15, 2015
3
Prepared and supported by:
Company
Hydro One Networks Inc. (Lead Transmitter)
Cambridge and North Dumfries Hydro Inc.
Centre Wellington Hydro
Guelph Hydro Electric System Inc.
Halton Hills Hydro
Hydro One Distribution
Independent Electricity System Operator
Kitchener Wilmot Hydro Inc.
Milton Hydro
Waterloo North Hydro Inc.
Wellington North Power Inc.

KWCG – Regional Infrastructure Plan December 15, 2015
4
[This page is intentionally left blank]

KWCG – Regional Infrastructure Plan December 15, 2015
5
DISCLAIMER This Regional Infrastructure Plan (“RIP”) report was prepared for the purpose of developing an electricity infrastructure plan to address needs identified in previous planning phases and also any additional needs identified based on new and/or updated information provided by the RIP Working Group. The preferred solution(s) that have been identified in this report may be reevaluated based on the findings of further analysis. The load forecast and results reported in this RIP report are based on the information provided and assumptions made by the participants of the RIP Working Group. Working Group participants, their respective affiliated organizations, and Hydro One Networks Inc. (collectively, “the Authors”) make no representations or warranties (express, implied, statutory or otherwise) as to the RIP report or its contents, including, without limitation, the accuracy or completeness of the information therein and shall not, under any circumstances whatsoever, be liable to each other, or to any third party for whom the RIP report was prepared (“the Intended Third Parties”), or to any other third party reading or receiving the RIP report (“the Other Third Parties”), for any direct, indirect or consequential loss or damages or for any punitive, incidental or special damages or any loss of profit, loss of contract, loss of opportunity or loss of goodwill resulting from or in any way related to the reliance on, acceptance or use of the RIP report or its contents by any person or entity, including, but not limited to, the aforementioned persons and entities.

KWCG – Regional Infrastructure Plan December 15, 2015
6
[This page is intentionally left blank]
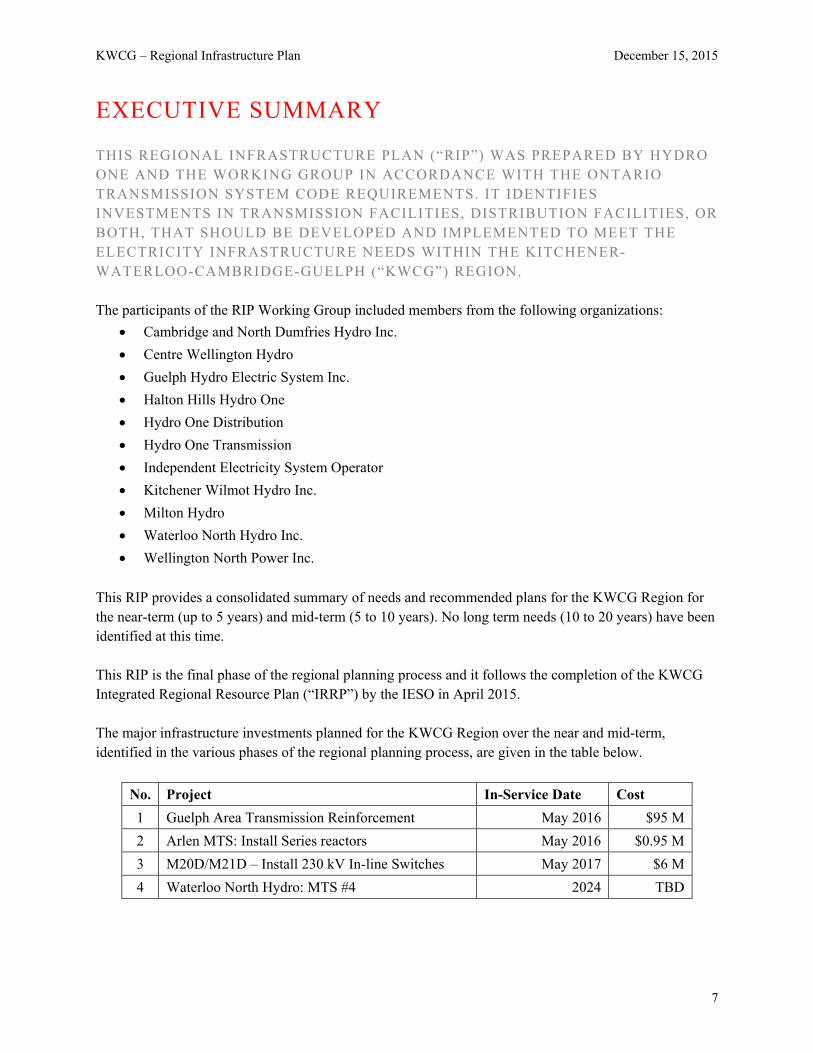
KWCG – Regional Infrastructure Plan December 15, 2015
7
EXECUTIVE SUMMARY THIS REGIONAL INFRASTRUCTURE PLAN (“RIP”) WAS PREPARED BY HYDRO ONE AND THE WORKING GROUP IN ACCORDANCE WITH THE ONTARIO TRANSMISSION SYSTEM CODE REQUIREMENTS. IT IDENTIFIES INVESTMENTS IN TRANSMISSION FACILITIES, DISTRIBUTION FACILITIES, OR BOTH, THAT SHOULD BE DEVELOPED AND IMPLEMENTED TO MEET THE ELECTRICITY INFRASTRUCTURE NEEDS WITHIN THE KITCHENER-WATERLOO-CAMBRIDGE-GUELPH (“KWCG”) REGION. The participants of the RIP Working Group included members from the following organizations:
Cambridge and North Dumfries Hydro Inc.
Centre Wellington Hydro
Guelph Hydro Electric System Inc.
Halton Hills Hydro One
Hydro One Distribution
Hydro One Transmission
Independent Electricity System Operator
Kitchener Wilmot Hydro Inc.
Milton Hydro
Waterloo North Hydro Inc.
Wellington North Power Inc. This RIP provides a consolidated summary of needs and recommended plans for the KWCG Region for the near-term (up to 5 years) and mid-term (5 to 10 years). No long term needs (10 to 20 years) have been identified at this time. This RIP is the final phase of the regional planning process and it follows the completion of the KWCG Integrated Regional Resource Plan (“IRRP”) by the IESO in April 2015. The major infrastructure investments planned for the KWCG Region over the near and mid-term, identified in the various phases of the regional planning process, are given in the table below.
No. Project In-Service Date Cost
1 Guelph Area Transmission Reinforcement May 2016 $95 M
2 Arlen MTS: Install Series reactors May 2016 $0.95 M
3 M20D/M21D – Install 230 kV In-line Switches May 2017 $6 M
4 Waterloo North Hydro: MTS #4 2024 TBD

KWCG – Regional Infrastructure Plan December 15, 2015
8
In accordance with the Regional Planning process, the Regional Plan should be reviewed and/or updated at least every five years. The Region will continue to be monitored and should there be a need that emerges due to a change in load forecast or any other reason, the next regional planning cycle may be started earlier to address the need.
KWCG – Regional Infrastructure Plan December 15, 2015
9
TABLE OF CONTENTS
Disclaimer ..................................................................................................................................................... 5 Executive Summary ...................................................................................................................................... 7 Table of Contents .......................................................................................................................................... 9 List of Figures ............................................................................................................................................. 11 List of Tables .............................................................................................................................................. 11 1. Introduction .......................................................................................................................................... 13
1.1 Scope and Objectives .................................................................................................................. 14 1.2 Structure...................................................................................................................................... 14
2. Regional Planning Process ................................................................................................................... 15 2.1 Overview .................................................................................................................................... 15 2.3 RIP Methodology ....................................................................................................................... 18
3. Regional Characteristics ....................................................................................................................... 19 5. Forecast And Other Study Assumptions .............................................................................................. 24 6. Adequacy of Facilities and Regional Needs over the 2015-2025 Period ............................................. 26
6.1 230 kV Transmission Facilities .................................................................................................. 28 6.2 500/230 kV and 230/115 kV Transformation Facilities ............................................................. 28 6.3 Supply Capacity of the 115 kV Network .................................................................................... 28 6.4 Step-down Transformer Stations ................................................................................................ 29 6.5 Other Items Identified During Regional Planning ...................................................................... 29
6.5.1 Customer Impact Assessment for the GATR project ........................................................ 29 6.5.2 System Impact Assessment for the GATR Project ........................................................... 29 6.5.3 Load Restoration to the Cambridge area .......................................................................... 30
6.6 Long-Term Regional Needs ....................................................................................................... 30 7. Regional Plans ...................................................................................................................................... 31
7.1 Transmission Circuit Capacity and Load Restoration ................................................................ 31 7.1.1 South-Central Guelph 115 kV Sub-system ....................................................................... 31 7.1.2 Kitchener-Guelph 115 kV Sub-system ............................................................................. 31 7.1.3 Waterloo-Guelph 230 kV Sub-system .............................................................................. 31 7.1.4 Recommended Plan and Current Status ............................................................................ 31
7.2 Load Restoration ......................................................................................................................... 32 7.2.1 Cambridge-Kitchener 230 kV Sub-system ....................................................................... 32 7.2.2 Recommended Plan and Current Status ............................................................................ 32
7.3 Step-down Transformation Capacity .......................................................................................... 33 7.3.1 Waterloo North Hydro ...................................................................................................... 33 7.3.2 Recommended Plan and Current Status ............................................................................ 33
7.4 Station Short Circuit Capability .................................................................................................. 33 7.4.1 Arlen MTS ........................................................................................................................ 33 7.4.2 Recommended Plan and Current Status ............................................................................ 33
8. Conclusions .......................................................................................................................................... 34 9. References ............................................................................................................................................ 35 Appendix A. Step-Down Transformer Stations in the KWCG Region .................................................. 36 Appendix B. Transmission Lines in the KWCG Region ....................................................................... 37

KWCG – Regional Infrastructure Plan December 15, 2015
10
Appendix C. Distributors in the KWCG Region .................................................................................... 38 Appendix D. KWCG Regional Load Forecast (2015-2025) .................................................................. 39 Appendix E. List of Acronyms .............................................................................................................. 41 Appendix F. KWCG Adequacy of Transmission Facilities and Transmission Plan 2016-2025 ........... 42

KWCG – Regional Infrastructure Plan December 15, 2015
11
LIST OF FIGURES
Figure 1-1 KWCG Region .......................................................................................................................... 13 Figure 2-1 Regional Planning Process Flowchart ....................................................................................... 17 Figure 2-2 RIP Methodology ...................................................................................................................... 18 Figure 3-1 Geographical Area of the KWCG Region with Electrical Layout ............................................ 20 Figure 3-2 KWCG Single Line Diagram .................................................................................................... 21 Figure 5-1 KWCG Region’s Planning Forecast ......................................................................................... 24
LIST OF TABLES
Table 6-1 Near and Medium Term Regional Needs ................................................................................... 27 Table 8-1 Regional Plans – Next Steps, Lead Responsibility and Plan In-Service Dates .......................... 34

KWCG – Regional Infrastructure Plan December 15, 2015
12
[This page is intentionally left blank]
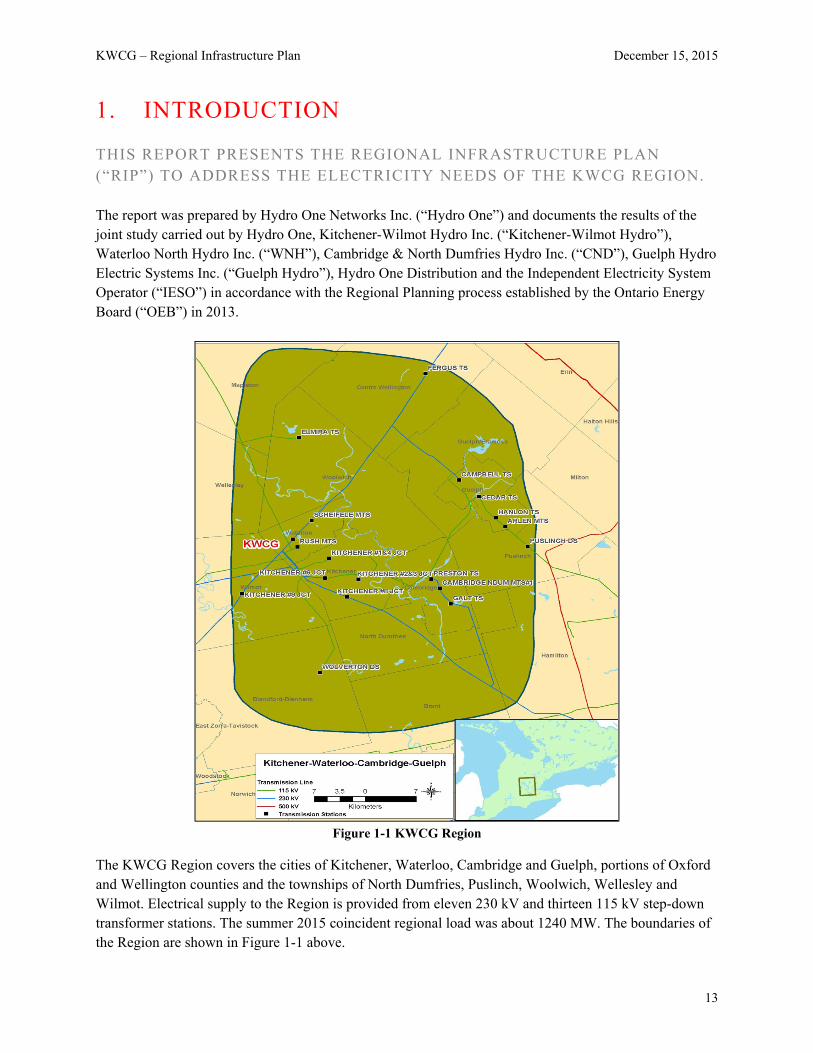
KWCG – Regional Infrastructure Plan December 15, 2015
13
1. INTRODUCTION
THIS REPORT PRESENTS THE REGIONAL INFRASTRUCTURE PLAN (“RIP”) TO ADDRESS THE ELECTRICITY NEEDS OF THE KWCG REGION. The report was prepared by Hydro One Networks Inc. (“Hydro One”) and documents the results of the joint study carried out by Hydro One, Kitchener-Wilmot Hydro Inc. (“Kitchener-Wilmot Hydro”), Waterloo North Hydro Inc. (“WNH”), Cambridge & North Dumfries Hydro Inc. (“CND”), Guelph Hydro Electric Systems Inc. (“Guelph Hydro”), Hydro One Distribution and the Independent Electricity System Operator (“IESO”) in accordance with the Regional Planning process established by the Ontario Energy Board (“OEB”) in 2013.
Figure 1-1 KWCG Region
The KWCG Region covers the cities of Kitchener, Waterloo, Cambridge and Guelph, portions of Oxford and Wellington counties and the townships of North Dumfries, Puslinch, Woolwich, Wellesley and Wilmot. Electrical supply to the Region is provided from eleven 230 kV and thirteen 115 kV step-down transformer stations. The summer 2015 coincident regional load was about 1240 MW. The boundaries of the Region are shown in Figure 1-1 above.
KWCG – Regional Infrastructure Plan December 15, 2015
14
1.1 Scope and Objectives This RIP report examines the needs in the KWCG Region. Its objectives are:
To identify new supply needs that may have emerged since previous planning phases (e.g. Needs Assessment, Scoping Assessment, Local Plan, and/or Integrated Regional Resource Plan)
To assess and develop a wires plan to address these needs
To provide the status of wires planning currently underway or completed for specific needs
To identify investments in transmission and distribution facilities or both that should be developed and implemented on a coordinated basis to meet the electricity infrastructure needs within the region.
The RIP reviews factors such as load forecast, transmission and distribution system capabilities along with any updates with respect to local plans, conservation and demand management (“CDM”), renewable and non-renewable generation development, and other electricity system and local drivers that may impact the need and alternatives under consideration. The scope of this RIP is as follows:
A consolidated report of all the needs and relevant plans to address near and mid-term needs (2015-2025) identified in previous planning phases (Needs Assessment, Scoping Assessment, Local Plan or Integrated Regional Resource Plan)
Identification of any new needs over the 2015-2025 period and a wires plan to address these needs based on new and/or updated RIP phase information
Develop a plan to address any longer term needs identified by the Working Group The IRRP or RIP Working Group did not identify any long term needs at this time. If required, further assessment will be undertaken in the next planning cycle because adequate time is available to plan for required facilities.
1.2 Structure The rest of the report is organized as the follows:
Section 2 provides an overview of the regional planning process
Section 3 describes the region
Section 4 describes the transmission work completed over the last ten years
Section 5 describes the load forecast and study assumptions used in this assessment
Section 6 describes the results of the adequacy assessment of the transmission facilities and identifies the needs
Section 7 summarizes the Regional Plan to address the needs
Section 8 provides the conclusions and next steps
KWCG – Regional Infrastructure Plan December 15, 2015
15
2. REGIONAL PLANNING PROCESS
2.1 Overview Planning for the electricity system in Ontario is done at essentially three levels: bulk system planning, regional system planning, and distribution system planning. These levels differ in the facilities that are considered and the scope of impact on the electricity system. Planning at the bulk system level typically looks at issues that impact the system on a provincial level, while planning at the regional and distribution levels looks at issues on a more regional or localized level. Regional planning looks at supply and reliability issues at a regional or local area level. Therefore, it largely considers the 115 kV and 230 kV portions of the power system that supply various parts of the province.
2.2 Regional Planning Process A structured regional planning process was established by the Ontario Energy Board in 2013, through amendments to the Transmission System Code (“TSC”) and the Distribution System Code (“DSC”). The process consists of four phases: the Needs Assessment1 (“NA”), the Scoping Assessment (‘SA”), the Integrated Regional Resource Plan (“IRRP”), and the Regional Infrastructure Plan (“RIP”). The regional planning process begins with the NA phase which is led by the transmitter to determine if there are regional needs. The NA phase identifies the needs and the Working Group determines whether further regional coordination is necessary to address them. If no further regional coordination is required, further planning is undertaken by the transmitter and the impacted local distribution company (“LDC”) or customer and develops a Local Plan (“LP”) to address them. These needs are local in nature and can be best addressed by a straight forward wires solution. In situations where identified needs require coordination at the regional or sub-regional levels, the IESO initiates the SA phase. During this phase, the IESO, in collaboration with the transmitter and impacted LDCs, reviews the information collected as part of the NA phase, along with additional information on potential non-wires alternatives, and makes a decision on the most appropriate regional planning approach. The approach is either a RIP, which is led by the transmitter, or an IRRP, which is led by the IESO. If more than one sub-region was identified in the NA phase, it is possible that a different approach could be taken for different sub-regions. The IRRP phase will generally assess infrastructure (wires) versus resource (CDM and Distributed Generation (“DG”)) options at a higher or more macro level but sufficient to permit a comparison of options. If the IRRP process identifies that infrastructure options may be most appropriate to meet a need, the RIP phase will conduct detailed planning to identify and assess the specific wires alternatives and recommend the preferred wires solution. Similarly, resource options which the IRRP identifies as best 1 Also referred to a Needs Screening
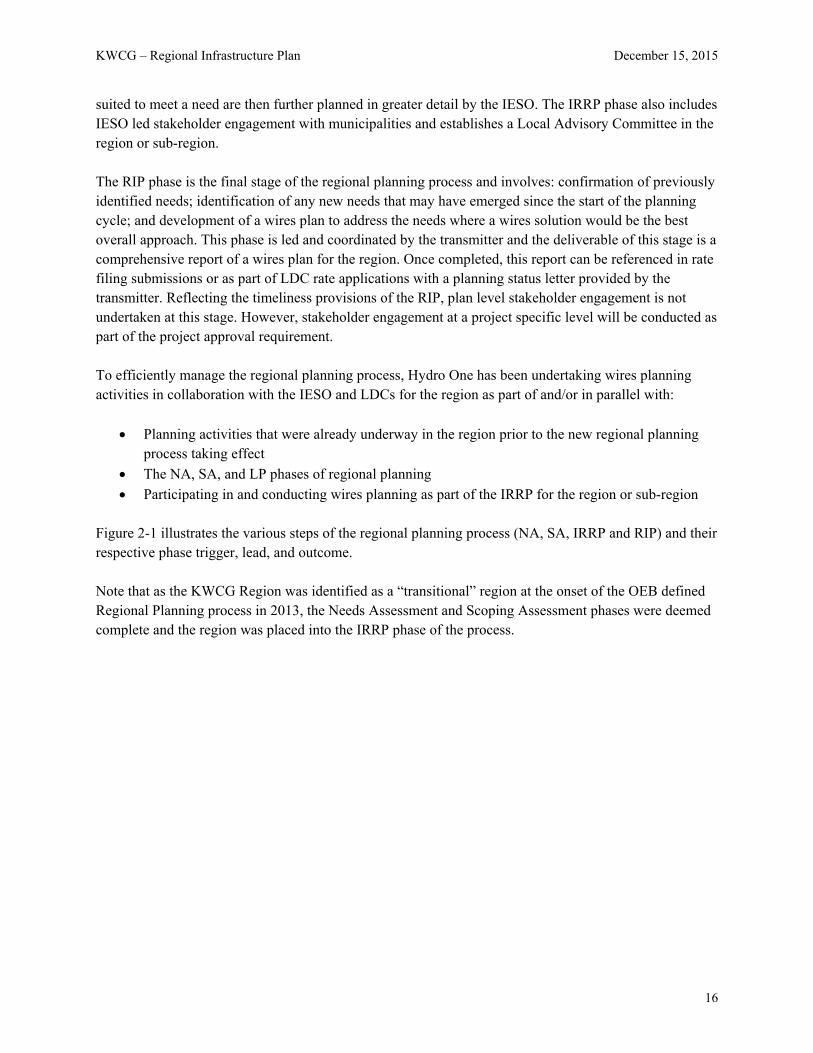
KWCG – Regional Infrastructure Plan December 15, 2015
16
suited to meet a need are then further planned in greater detail by the IESO. The IRRP phase also includes IESO led stakeholder engagement with municipalities and establishes a Local Advisory Committee in the region or sub-region. The RIP phase is the final stage of the regional planning process and involves: confirmation of previously identified needs; identification of any new needs that may have emerged since the start of the planning cycle; and development of a wires plan to address the needs where a wires solution would be the best overall approach. This phase is led and coordinated by the transmitter and the deliverable of this stage is a comprehensive report of a wires plan for the region. Once completed, this report can be referenced in rate filing submissions or as part of LDC rate applications with a planning status letter provided by the transmitter. Reflecting the timeliness provisions of the RIP, plan level stakeholder engagement is not undertaken at this stage. However, stakeholder engagement at a project specific level will be conducted as part of the project approval requirement. To efficiently manage the regional planning process, Hydro One has been undertaking wires planning activities in collaboration with the IESO and LDCs for the region as part of and/or in parallel with:
Planning activities that were already underway in the region prior to the new regional planning process taking effect
The NA, SA, and LP phases of regional planning
Participating in and conducting wires planning as part of the IRRP for the region or sub-region Figure 2-1 illustrates the various steps of the regional planning process (NA, SA, IRRP and RIP) and their respective phase trigger, lead, and outcome. Note that as the KWCG Region was identified as a “transitional” region at the onset of the OEB defined Regional Planning process in 2013, the Needs Assessment and Scoping Assessment phases were deemed complete and the region was placed into the IRRP phase of the process.
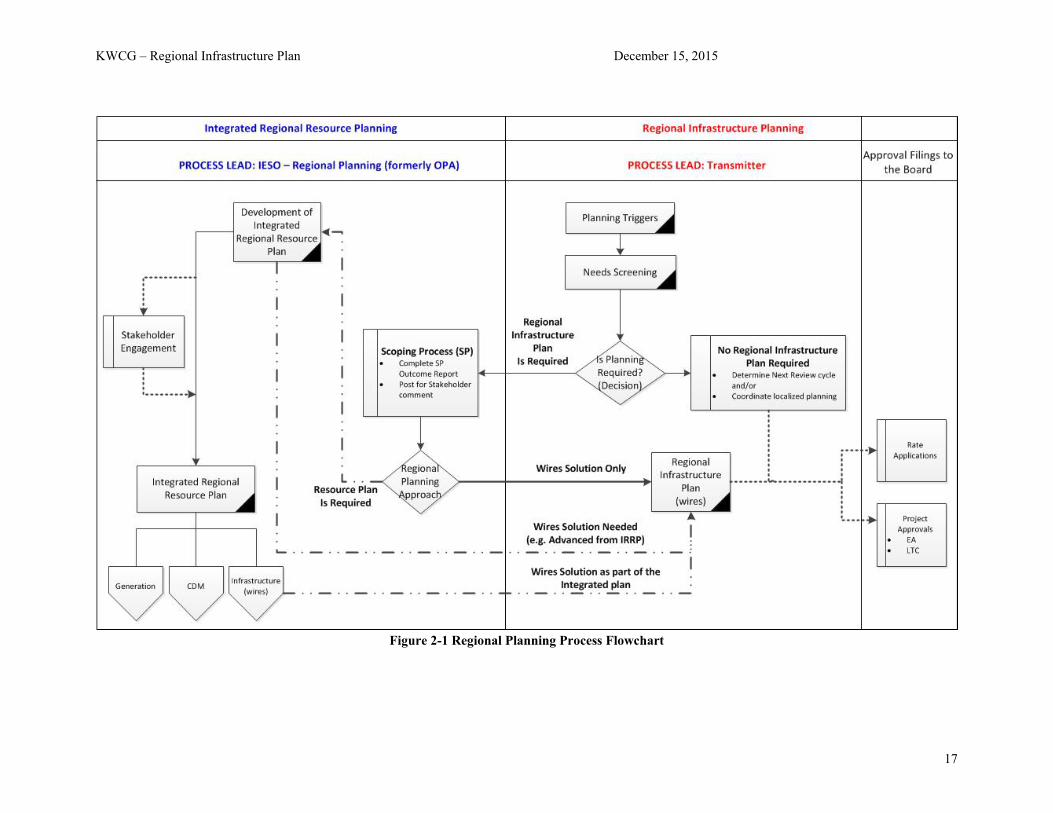
KWCG – Regional Infrastructure Plan December 15, 2015
17
Figure 2-1 Regional Planning Process Flowchart
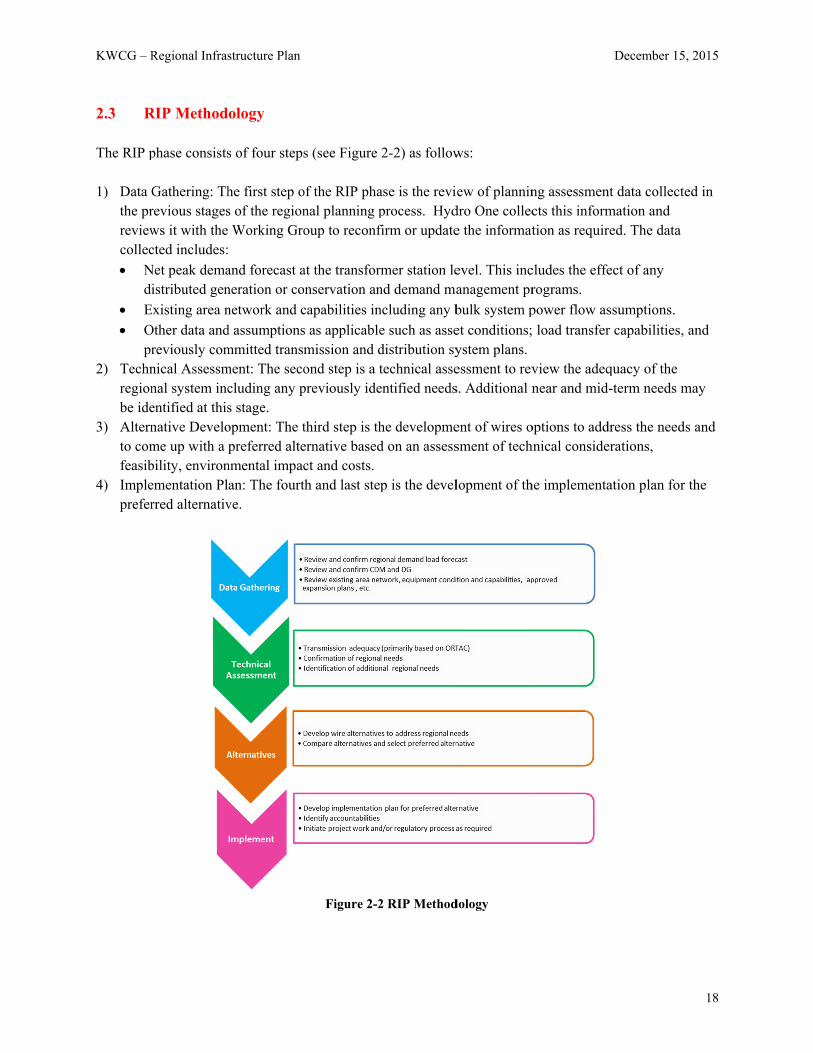
KWCG – R
2.3 R The RIP p 1) Data G
the prreviewcollec
Ndi
E
Opr
2) Technregionbe ide
3) Alternto comfeasib
4) Impleprefer
Regional Infras
RIP Method
phase consists
Gathering: Threvious stagesws it with thected includes:
Net peak demaistributed gen
Existing area n
Other data andreviously comnical Assessmnal system incentified at thisnative Develome up with a bility, environementation Plrred alternativ
structure Plan
ology
s of four steps
he first step os of the regionWorking Gro
and forecast aneration or co
network and c
d assumptionsmmitted transmment: The secocluding any ps stage. opment: The tpreferred alte
nmental impacan: The fourtve.
s (see Figure
of the RIP phanal planning poup to reconf
at the transfornservation an
capabilities in
s as applicablemission and dond step is a tpreviously ide
third step is thernative basedct and costs.th and last step
Figure 2-2
2-2) as follow
ase is the reviprocess. Hydfirm or update
rmer station lend demand ma
ncluding any b
e such as assedistribution sytechnical asseentified needs
he developmed on an assess
p is the devel
2 RIP Method
ws:
ew of plannindro One collece the informat
evel. This incanagement pr
bulk system p
et conditions;ystem plans.essment to revs. Additional n
ent of wires osment of tech
lopment of th
dology
ng assessmencts this informtion as requir
cludes the efferograms.
power flow as
load transfer
view the adeqnear and mid
options to addhnical conside
he implementa
December 15
nt data collectmation and red. The data
ect of any
ssumptions.
r capabilities,
quacy of the -term needs m
dress the neederations,
ation plan for
5, 2015
18
ed in
and
may
ds and
r the
KWCG – Regional Infrastructure Plan December 15, 2015
19
3. REGIONAL CHARACTERISTICS
THE KWCG REGION COMPRISES OF THE CITIES OF KITCHENER, WATERLOO, CAMBRIDGE AND GUELPH, PORTIONS OF OXFORD AND WELLINGTON COUNTIES AND THE TOWNSHIPS OF NORTH DUMFRIES, PUSLINCH, WOOLWICH, WELLESLEY AND WILMOT AS SHOWN IN FIGURE 3-1. The main sources of electricity into the KWCG Region are from four Hydro One stations: Middleport TS, Detweiler TS, Orangeville TS and Burlington TS. At these stations electricity is transformed from 500 kV and 230 kV to 230 kV and 115 kV, respectively. Electricity is then delivered to the end users of LDCs and directly-connected industrial customers by 24 step-down transformer stations. Figure 3-2 illustrates these stations as well as the four major regional sub-systems: Waterloo-Guelph 230 kV sub-system, Cambridge-Kitchener 230 kV sub-system, Kitchener-Guelph 115 kV sub-system and South-Central Guelph 115 kV sub-system. Appendix A lists all step-down transformer stations in the KWCG Region, Appendix B lists all transmission circuits in the KWCG Region and Appendix C lists LDCs in the KWCG Region.
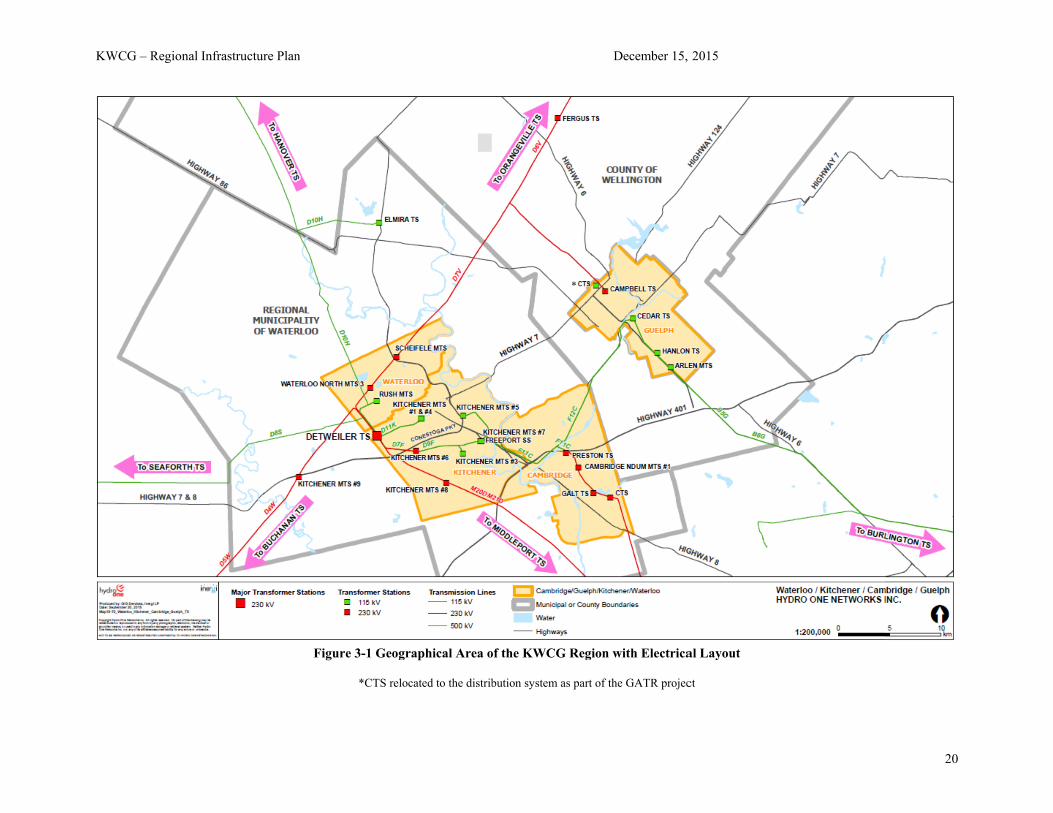
K
KWCG – Regionall Infrastructure Plann
Figure 3-1 Geo
*CTS r
ographical Area o
elocated to the distrib
of the KWCG Reg
bution system as part
*
December 15,
gion with Electrica
t of the GATR projec
2015
al Layout
ct
20
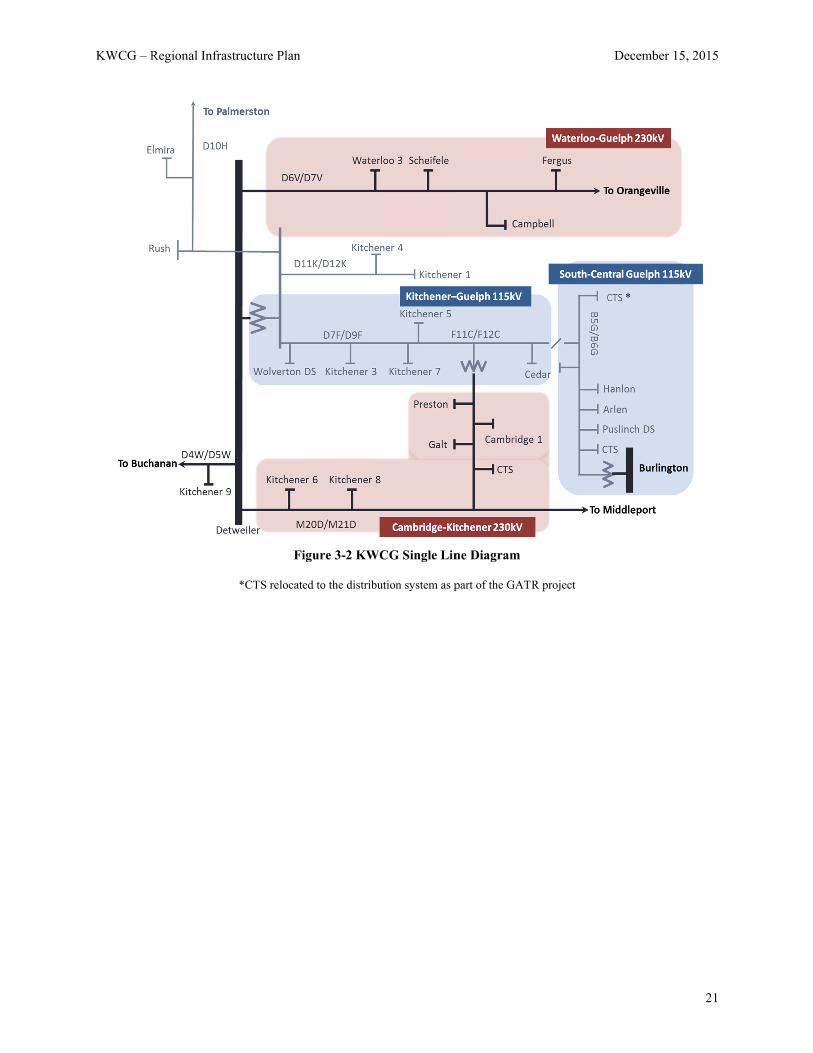
KWCG – R
Regional Infrasstructure Plan
Fi
*CTS relocate
igure 3-2 KWC
ed to the distribu
CG Single Lin
ution system as p
ne Diagram
part of the GATRR project
December 15
*
5, 2015
21
KWCG – Regional Infrastructure Plan December 15, 2015
22
4. TRANSMISSION FACILITIES COMPLETED OVER LAST TEN YEARS OR CURRENTLY UNDERWAY
OVER THE LAST 10 YEARS A NUMBER OF TRANSMISSION PROJECTS HAVE BEEN COMPLETED BY HYDRO ONE, OR ARE UNDERWAY, AIMED AT IMPROVING THE SUPPLY TO THE KWCG REGION.
These projects were identified as a result of joint planning studies undertaken by Hydro One, IESO and the LDCs; or initiated to meet the needs of the LDCs; and/or to meet Provincial Government policies. A brief listing of the completed projects is given below. For transmission voltage level transformation capacity needs:
250 MVA 230/115 kV autotransformer T4 at Burlington TS replaced in 2006
250 MVA 230/115 kV autotransformer T6 at Burlington TS replaced in 2009
For distribution voltage level transformation capacity needs:
Kitchener MTS#9 connected to replace the Detweiler TS DESN in 2010
Arlen MTS connected in 2011
For reactive and voltage support needs:
a 13.8 kV shunt capacitor bank installed at Cedar TS in 2006
a 230 kV shunt capacitor bank installed at Detweiler TS in 2007
a 230 kV shunt capacitor bank installed at Orangeville TS in 2008
a 230 kV shunt capacitor bank installed at Burlington TS in 2010
a 115 kV shunt capacitor bank installed at Detweiler TS in 2012
For transmission circuit capacity needs:
M20D/M21D circuit sections capacity increased by sag limit mitigation in 2014
For transmission load security needs:
Freeport SS installed to sectionalize circuits D7G/D9G (Detweiler TS by Cedar TS) in 2008
For transmission load restoration needs:
250 MVA 230/115 kV autotransformer T2 installed at Preston TS in 2007
The following projects are underway:
Guelph Area Transmission Reinforcement (GATR) project that entails the extension the 230kV circuits D6V/D7V to Cedar TS; the installation of two new 250MVA, 230/115kV
KWCG – Regional Infrastructure Plan December 15, 2015
23
autotransformers at Cedar TS; and the installation of two 230 kV in-line switches onto circuits D6V/D7V at Guelph North Junction. This project reinforces the Kitchener-Guelph and South-Central Guelph 115kV sub-systems as well as improves restoration capability to the Waterloo-Guelph 230 kV sub-system. This project is identified in the IESO KWCG IRRP, reference [1].
The installation of a 13.8 kV series reactor to mitigate short circuit levels at Arlen MTS. This project was identified in the RIP phase.
The installation two new 230kV in-line switches onto circuits M20D/M21D near Galt Junction to improve restoration capability in the Cambridge-Kitchener 230 kV sub-system. This project is identified in Hydro One’s KWCG Adequacy of Transmission Facilities & Transmission Plan 2016-2025 report, reference [2]/Appendix F as well as reference [1].
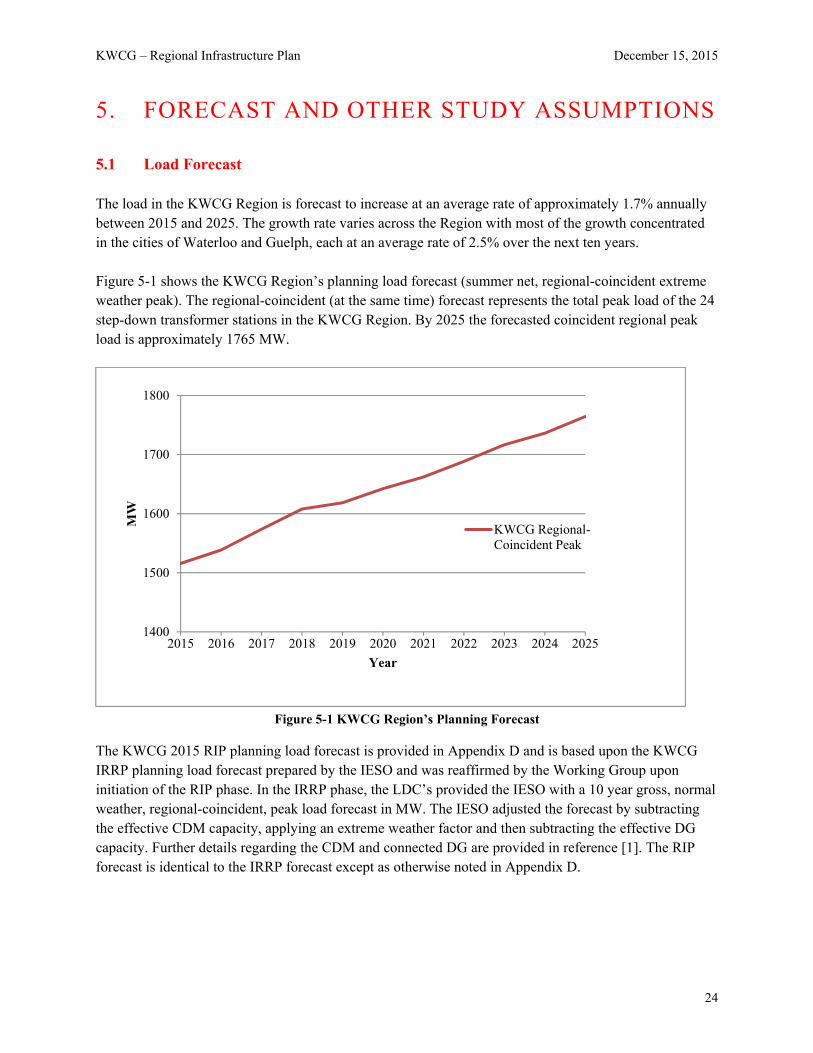
KWCG – Regional Infrastructure Plan December 15, 2015
24
5. FORECAST AND OTHER STUDY ASSUMPTIONS
5.1 Load Forecast The load in the KWCG Region is forecast to increase at an average rate of approximately 1.7% annually between 2015 and 2025. The growth rate varies across the Region with most of the growth concentrated in the cities of Waterloo and Guelph, each at an average rate of 2.5% over the next ten years. Figure 5-1 shows the KWCG Region’s planning load forecast (summer net, regional-coincident extreme weather peak). The regional-coincident (at the same time) forecast represents the total peak load of the 24 step-down transformer stations in the KWCG Region. By 2025 the forecasted coincident regional peak load is approximately 1765 MW.
Figure 5-1 KWCG Region’s Planning Forecast
The KWCG 2015 RIP planning load forecast is provided in Appendix D and is based upon the KWCG IRRP planning load forecast prepared by the IESO and was reaffirmed by the Working Group upon initiation of the RIP phase. In the IRRP phase, the LDC’s provided the IESO with a 10 year gross, normal weather, regional-coincident, peak load forecast in MW. The IESO adjusted the forecast by subtracting the effective CDM capacity, applying an extreme weather factor and then subtracting the effective DG capacity. Further details regarding the CDM and connected DG are provided in reference [1]. The RIP forecast is identical to the IRRP forecast except as otherwise noted in Appendix D.
1400
1500
1600
1700
1800
2015 2016 2017 2018 2019 2020 2021 2022 2023 2024 2025
MW
Year
KWCG Regional-Coincident Peak
KWCG – Regional Infrastructure Plan December 15, 2015
25
5.2 Other Study Assumptions The following other assumptions are made in this report.
1) The Study period for the RIP assessment is 2015-2025.
2) All planned facilities for which work has been initiated and are listed in Section 4 are assumed to be in-service.
3) Summer is the critical period with respect to line and transformer loadings. The assessment is based therefore based on summer peak loads.
4) Station capacity adequacy is assessed by comparing the non-coincident peak load with the station’s normal planning supply capacity, assuming a 90% lagging power factor for stations having no low-voltage capacitor banks and 95% lagging power factor for stations having low-voltage capacitor banks.
5) Normal planning supply capacity for Hydro One transformer stations in this Region is determined by the summer 10-Day Limited Time Rating (LTR), while some LDCs use different methodologies for determining transformer station LTR.
6) Adequacy assessment is done as per the Ontario Resource and Transmission Adequacy Criteria (“ORTAC”).
KWCG – Regional Infrastructure Plan December 15, 2015
26
6. ADEQUACY OF FACILITIES AND REGIONAL NEEDS OVER THE 2015-2025 PERIOD
THIS SECTION REVIEWS THE ADEQUACY OF THE EXISTING TRANSMISSION SYSTEM AND DELIVERY STATION FACILITIES SUPPLYING THE KWCG REGION AND LISTS THE FACILITIES REQUIRING REINFORCEMENT OVER THE NEAR AND MID-TERM. Within the current regional planning cycle two regional assessments have been conducted for the KWCG Region. The findings of these studies are input to the RIP. The studies are:
1) IESO’s KWCG Integrated Regional Resource Plan – dated April 28, 2015[1]
2) Hydro One’s Adequacy of Transmission Facilities and Transmission Plan 2016-2025 – dated April 1, 2015 with revision 1 – dated October 30, 2015[2] (please see Appendix F)
The IRRP identified a number of regional needs to meet the forecast load demand over the near to mid-term. Due to the immediate nature of the needs the Guelph Area Transmission Reinforcement (GATR) project was initiated to provide adequate load supply capability to the KWCG area while the IRRP study was still underway. A detailed description and status of the GATR project and other work initiated or planned to meet these needs is given in Section 7. This RIP reviewed the loading on transmission lines and stations in the KWCG Region assuming the GATR project is in-service. Sections 6.1-6.4 present the results of this review and Table 6-1 lists the Region’s needs identified in both the IRRP and RIP phases.
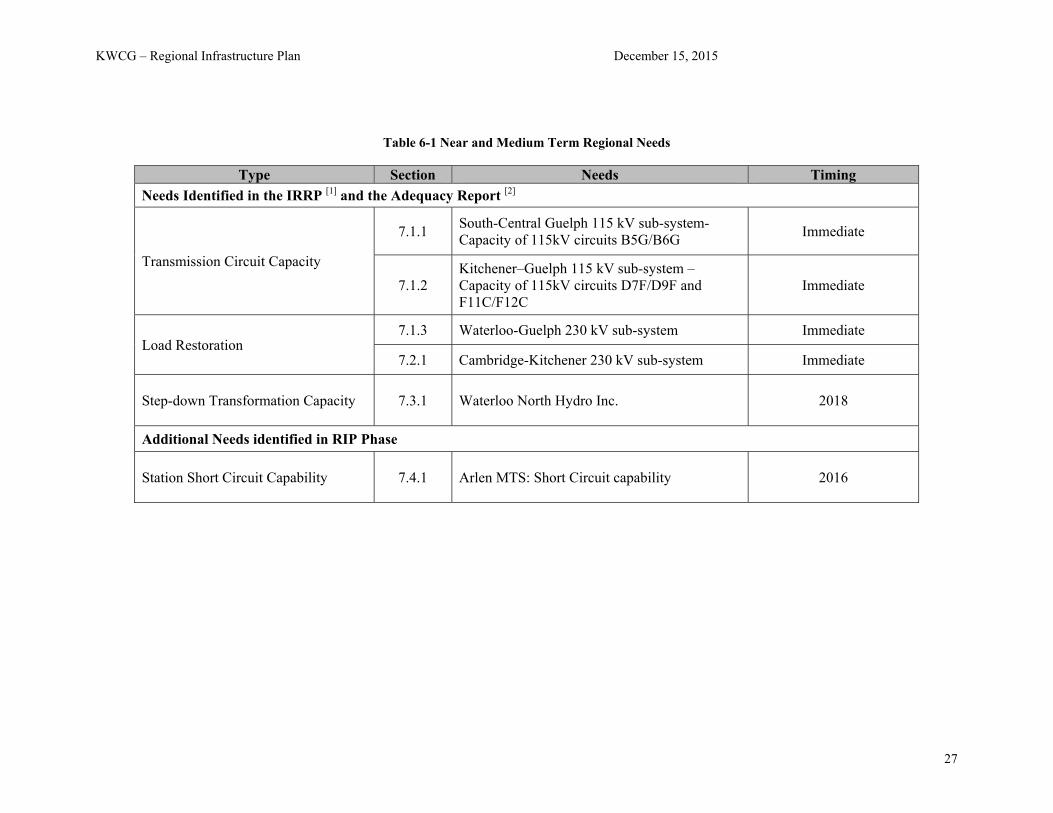
KWCG – Regional Infrastructure Plan December 15, 2015
27
Table 6-1 Near and Medium Term Regional Needs
Type Section Needs Timing
Needs Identified in the IRRP [1] and the Adequacy Report [2]
Transmission Circuit Capacity
7.1.1 South-Central Guelph 115 kV sub-system-Capacity of 115kV circuits B5G/B6G
Immediate
7.1.2 Kitchener–Guelph 115 kV sub-system – Capacity of 115kV circuits D7F/D9F and F11C/F12C
Immediate
Load Restoration 7.1.3 Waterloo-Guelph 230 kV sub-system Immediate
7.2.1 Cambridge-Kitchener 230 kV sub-system Immediate
Step-down Transformation Capacity
7.3.1 Waterloo North Hydro Inc. 2018
Additional Needs identified in RIP Phase
Station Short Circuit Capability
7.4.1 Arlen MTS: Short Circuit capability 2016
KWCG – Regional Infrastructure Plan December 15, 2015
28
6.1 230 kV Transmission Facilities All 230 kV transmission circuits in the KWCG Region are classified as part of the Bulk Electricity System (“BES”). They connect the Region to the rest of the Ontario’s transmission system and are also part of the transmission path from generation in Southwestern Ontario to the load centers in the Hamilton, Niagara and GTA areas. These circuits also serve local area stations within the Region and the power flow on them depends on the bulk system transfer as well as local area loads. These circuits are as follows (refer to Figure 3-2):
1) Detweiler TS to Orangeville TS 230 kV transmission circuits D6V/D7V – supplies Fergus TS, Campbell TS, Waterloo North MTS#3 and Scheifele MTS
2) Detweiler TS to Middleport TS 230 kV transmission circuits M20D/M21D – supplies Kitchener MTS #6, Kitchener MTS # 8, Cambridge MTS #1, Galt TS, Preston TS and Customer #1 CTS
3) Detweiler TS to Buchanan TS 230 kV transmission circuits D4W/D5W – supplies Kitchener MTS#9.
The RIP review shows that based on current forecast station loadings and bulk transfers, all 230 kV circuits are expected to be adequate over the study period. Refer to section 3.4.2 of Appendix F for the detailed analysis.
6.2 500/230 kV and 230/115 kV Transformation Facilities Bulk power supply to the KWCG Region is provided by Hydro One’s 500 kV to 230 kV and 230 kV to 115 kV autotransformers. The number and location of these autotransformers are as follows:
1) Two 500/230 kV autotransformers at Middleport TS
2) Four 230/115 kV autotransformers at Burlington TS
3) Three 230/115 kV autotransformers at Detweiler TS
4) Two 230/115 kV autotransformers at Cedar TS
5) One 230/115 kV autotransformer at Preston TS
The RIP review shows that based on current forecast station loadings and bulk transfers, the auto-transformation supply capacity is adequate over the study period. Refer to section 3.4.1 of Appendix F for the detailed analysis.
6.3 Supply Capacity of the 115 kV Network The KWCG Region contains five pairs of double circuit 115 kV lines. This 115 kV network serves local area load. These circuits are as follows (see Figure 3-2):
KWCG – Regional Infrastructure Plan December 15, 2015
29
1) Detweiler TS to Freeport SS 115 kV transmission circuits D7F/D9F – supplies Wolverton DS, Kitchener MTS #3, Kitchener MTS#7
2) Freeport SS to Cedar TS 115 kV transmission circuits F11C/F12C – supplies Kitchener MTS#5 and Cedar T1/T2 transformers
3) Burlington TS to Cedar TS 115 kV transmission circuits B5G/B6G – supplies Puslinch DS, Arlen MTS, Hanlon TS, Customer #2 CTS and Cedar T7/T8 transformers
4) Detweiler TS 115 kV radial transmission circuit D11K/D12K – supplies Kitchener MTS#1 and Kitchener MTS#4
5) Detweiler TS to Seaforth TS/Hanover TS 115 kV transmission circuit D8S/D10H with Normally Open (N/O) points – supplies Rush MTS and Elmira TS
The RIP review shows that based on current forecast station loadings and bulk transfers, the supply capacity of the 115 kV network is adequate over the study period. Refer to section 3.4.3 of Appendix F for the detailed analysis.
6.4 Step-down Transformer Stations There are 24 step-down transformer stations within the KWCG Region. Twenty-two supply electricity to LDCs and two are transmission-connected industrial customer stations. These stations are listed within the load forecast in Appendix D. Of those 24 stations, 15 of them are owned and operated by the LDCs. As part of the IRRP, step-down transformation station capacity was reviewed and resulted in the IRRP forecast which was reaffirmed by the Working Group for use in the RIP phase. According to the load forecast, Waterloo North Hydro anticipates requiring additional step-down transformation capacity in 2018.
6.5 Other Items Identified During Regional Planning
6.5.1 Customer Impact Assessment for the GATR project Based on the Customer Impact Assessment [3] for the GATR project, Guelph Hydro identified the need to mitigate short circuit levels at Arlen MTS in order to ensure the short circuit levels remain within the TSC limits and equipment ratings. The project need date is May 2016 so as to correlate with the completion of the GATR project.
6.5.2 System Impact Assessment for the GATR Project A System Impact Assessment (“SIA”) [4] was performed for Hydro One’s application to the IESO for the Guelph Area Transmission Reinforcement (GATR) project. Several findings emanated from the SIA report due to conservative assumptions made for the Bulk Power System. The Working Group has reviewed these findings and recommends that the assumptions be
KWCG – Regional Infrastructure Plan December 15, 2015
30
looked at in greater detail within a Bulk Power System study. If the Bulk Power System study results in regional needs then an early trigger of the next Regional Planning cycle may occur.
6.5.3 Load Restoration to the Cambridge area The IRRP recommended Hydro One to continue to explore options with Cambridge and North Dumfries Hydro (“CND”) to further improve the load restoration capability to the Cambridge area. During the RIP phase Hydro One presented to CND a detailed explanation of its capability to restore power to transformer stations that service the Cambridge area. Based on this discussion, CND and Hydro One have agreed that, at this time, no additional infrastructure is required and the restoration capability afforded by the GATR project and the 230 kV in-line switches at Galt Junction is acceptable for the study period.
6.6 Long-Term Regional Needs The IRRP examined high-growth and low-growth scenarios to identify long-term needs. Under the high-growth scenario, there is sufficient transmission capacity afforded by the GATR project to meet demand in the long-term; however the need for additional step-down transformation capacity may arise. LDC’s to closely monitor their load to determine the timing of potential step-down transformation needs. Under the low-growth scenario, no needs were identified in the long-term. Consistent with the IRRP, the Working Group did not identify any additional long-term needs during the RIP phase. If new long-term needs were to arise, there is sufficient time to assess them in the next planning cycle which can also be started earlier to make timely investment decisions..
KWCG – Regional Infrastructure Plan December 15, 2015
31
7. REGIONAL PLANS
THIS SECTION DISCUSSES THE ELECTRICAL SUPPLY NEEDS FOR THE KWCG REGION AND SUMMARIZES THE REGIONAL PLANS FOR ADDRESSING THE NEEDS. THESE NEEDS ARE LISTED IN TABLE 6-1 AND INCLUDE NEEDS PREVIOUSLY IDENTIFIED IN THE IRRP AS WELL AS THE NEEDS IDENTIFIED DURING THE RIP PHASE.
7.1 Transmission Circuit Capacity and Load Restoration
7.1.1 South-Central Guelph 115 kV Sub-system The South-Central Guelph area is supplied by the 115 kV double circuit line B5G/B6G. As per section 6.2.1 of the IRRP, historical peak demand on the B5G/B6G line has already exceeded the 100 MW line Load Meeting Capability (“LMC”).
7.1.2 Kitchener-Guelph 115 kV Sub-system The Kitchener-Guelph area is supplied by two 115 kV double-circuit lines D7F/D9F and F11C/F12C supported by 230/115 kV autotransformers at Detweiler TS and Preston TS. As per section 6.2.1 of the IRRP, the planning forecast peak demand in the Kitchener-Guelph 115 kV sub-system will exceeded the 260 MW line LMC by summer 2014.
7.1.3 Waterloo-Guelph 230 kV Sub-system As per section 6.2.2 of the IRRP, the transmission infrastructure supplying load in the Waterloo-Guelph 230 kV sub-system does not meet reliability requirements to quickly restore supply in the event of a major outage involving the loss of both transmission circuits, D6V and D7V.
7.1.4 Recommended Plan and Current Status To address the transmission circuit capacity needs for the South-Central Guelph 115 kV sub-system and the Kitchener-Guelph 115 kV sub-system, the IRRP Working Group recommended reinforcement of the 115 kV transmission system by introducing a new 230 kV – 115 kV injection point. The new injection point is to be located at Cedar TS using two new 230 kV/115 kV autotransformers in conjunction with a 5 km extension of the existing 230 kV double-circuit transmission line, D6V/D7V from Campbell TS to Cedar TS. This reinforcement is covered under the GATR project. To address the load restoration need of the Waterloo-Guelph 230 kV sub-system, the IRRP Working Group’s preferred alternative is to install two new 230 kV in-line switches near Guelph North Junction. The switches will enable Hydro One to quickly isolate a problem and allow the resupply of load to occur expeditiously. This work is also covered under the GATR project.
KWCG – Regional Infrastructure Plan December 15, 2015
32
Current Status of the GATR Project Hydro One initiated construction on the GATR project in fall 2013 following the OEB approval in September 2013. The project has three components:
Campbell TS x Cedar TS: Extend the 230 kV D6V/D7V tap from Campbell TS to Cedar TS. This requires replacing approximately a 5 km section of the existing 115 kV double circuit transmission section between CGE Junction and Campbell TS with a new 230 kV double circuit transmission line,
Cedar TS: Install two new 230/115 kV autotransformers and associated 115 kV switching facilities at Cedar TS. Connect 115 kV switching facilities to the existing B5G/B6G line and the F11C/F12C at Cedar TS.
Guelph North Junction: Install two in-line 230 kV switches at Guelph North Jct. This investment will provide for sufficient 230/115 kV autotransformation capacity beyond the study period. The current in-service date of the project is May 2016. The cost of this project is approximately $95 million. The project is a transmission pool investment as the autotransformers provide supply to all customers in the Region.
7.2 Load Restoration
7.2.1 Cambridge-Kitchener 230 kV Sub-system As per section 6.2.2 of the IRRP and the section 3.4.8 of the Adequacy of Transmission Facilities report, transmission infrastructure supplying load in the Cambridge-Kitchener 230 kV sub-system does not meet reliability requirements to quickly restore supply in the event of a major outage involving the loss of both transmission circuits, M20D and M21D.
7.2.2 Recommended Plan and Current Status To address the load restoration need of the Cambridge-Kitchener 230 kV sub-system, the IRRP Working Group’s preferred alternative is to install two new 230 kV in-line switches on the M20D/M21D line near Galt Junction. The switches will enable Hydro One to quickly isolate a problem and allow the resupply of load to occur expeditiously. This work is covered under the M20D/M21D Install 230 kV In-line Switches project.
Current Status of the 230 kV In-Line Switches near Galt Junction Hydro One has established a project to install the two 230 kV in-line switches onto the M20D/M21D double circuit line. One set of switches to be installed onto each circuit. One set of switches to be installed north of the Junction while the other to be installed south of Galt Junction. The switches will enable
KWCG – Regional Infrastructure Plan December 15, 2015
33
Hydro One to quickly isolate a problem on either side of the junction and initiate the restoration of load to the Cambridge-Kitchener 230 kV sub-system. The project is currently in the detailed design and estimation phase which also includes real estate negotiations. The cost of this project is approximately $6 million and it will be a transmission pool investment. The planned in-service date is May 2017.
7.3 Step-down Transformation Capacity
7.3.1 Waterloo North Hydro The RIP/IRRP planning load forecast indicates that additional step-down transformation capacity is required by 2018, specifically Waterloo North Hydro’s MTS #4.
7.3.2 Recommended Plan and Current Status To address step-down transformation capacity needs of Waterloo North Hydro, Waterloo North Hydro will, wherever possible, manage load growth by maximizing the utilization of existing stations by increasing distribution load transfer capability between those stations and will continue to explore opportunities for CDM and DG. In addition Waterloo North Hydro will also explore, with other LDCs, opportunities to coordinate possible joint use and development of step-down transformer stations in the Region over the long term. With this in mind, additional step-down transformation capacity is not anticipated prior to 2024. This need will be reviewed in the next cycle of regional planning.
7.4 Station Short Circuit Capability
7.4.1 Arlen MTS Arlen MTS is a 115/13.8 kV step-down transformer station owned by Guelph Hydro. As a result of the new 230/115 kV injection point afforded by the GATR project, the short circuit levels at Arlen MTS’s 13.8 kV bus will exceed the TSC limit and equipment capability.
7.4.2 Recommended Plan and Current Status To address the station short circuit capability need at Arlen MTS, Guelph Hydro will install series reactors to bring station short circuit levels within TSC limits and within equipment ratings.
Current Status of Short Circuit Mitigation Guelph Hydro has initiated a project to install series reactors to bring station short circuit levels within TSC limits and equipment ratings. The cost of this project is $0.95 million and the expected completion date is May 2016 so as to correlate with the completion of the GATR project.
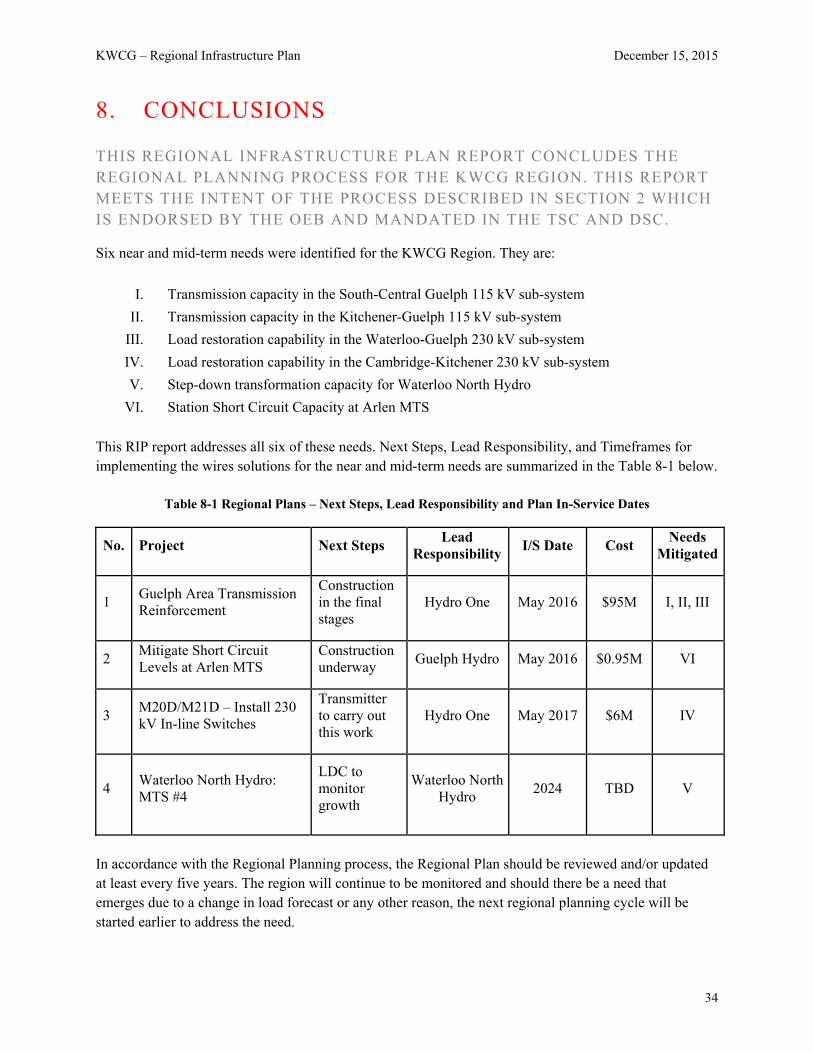
KWCG – Regional Infrastructure Plan December 15, 2015
34
8. CONCLUSIONS
THIS REGIONAL INFRASTRUCTURE PLAN REPORT CONCLUDES THE REGIONAL PLANNING PROCESS FOR THE KWCG REGION. THIS REPORT MEETS THE INTENT OF THE PROCESS DESCRIBED IN SECTION 2 WHICH IS ENDORSED BY THE OEB AND MANDATED IN THE TSC AND DSC.
Six near and mid-term needs were identified for the KWCG Region. They are:
I. Transmission capacity in the South-Central Guelph 115 kV sub-system
II. Transmission capacity in the Kitchener-Guelph 115 kV sub-system
III. Load restoration capability in the Waterloo-Guelph 230 kV sub-system
IV. Load restoration capability in the Cambridge-Kitchener 230 kV sub-system
V. Step-down transformation capacity for Waterloo North Hydro
VI. Station Short Circuit Capacity at Arlen MTS This RIP report addresses all six of these needs. Next Steps, Lead Responsibility, and Timeframes for implementing the wires solutions for the near and mid-term needs are summarized in the Table 8-1 below.
Table 8-1 Regional Plans – Next Steps, Lead Responsibility and Plan In-Service Dates
No. Project Next Steps Lead
ResponsibilityI/S Date Cost
Needs Mitigated
1 Guelph Area Transmission Reinforcement
Construction in the final stages
Hydro One May 2016 $95M I, II, III
2 Mitigate Short Circuit Levels at Arlen MTS
Construction underway
Guelph Hydro May 2016 $0.95M VI
3 M20D/M21D – Install 230 kV In-line Switches
Transmitter to carry out this work
Hydro One May 2017 $6M IV
4 Waterloo North Hydro: MTS #4
LDC to monitor growth
Waterloo North Hydro
2024 TBD V
In accordance with the Regional Planning process, the Regional Plan should be reviewed and/or updated at least every five years. The region will continue to be monitored and should there be a need that emerges due to a change in load forecast or any other reason, the next regional planning cycle will be started earlier to address the need.
KWCG – Regional Infrastructure Plan December 15, 2015
35
9. REFERENCES [1] Independent Electricity System Operator, Kitchener-Waterloo-Cambridge-Guelph Region
Integrated Region Resource Plan, 28 April 2015. http://www.ieso.ca/Documents/Regional-Planning/KWCG/2015-KWCG-IRRP-Report.pdf
[2] Hydro One Networks Inc., Kitchener-Waterloo-Cambridge-Guelph Area – Adequacy of
Transmission Facilities and Transmission Plan 2016-2025, 1 April 2015, revised 30 October 2015.
[3] Hydro One Networks Inc., Customer Impact Assessment Guelph Area Transmission Refurbishment Project, 28 May 2013,
[4] Independent Electricity System Operator, System Impact Assessment, CAA ID: 2012-478,
Project: Guelph Area Transmission Refurbishment, 17 May 2013. http://www.ieso.ca/Documents/caa/CAA_2012-478_GATR_Final_Report.pdf
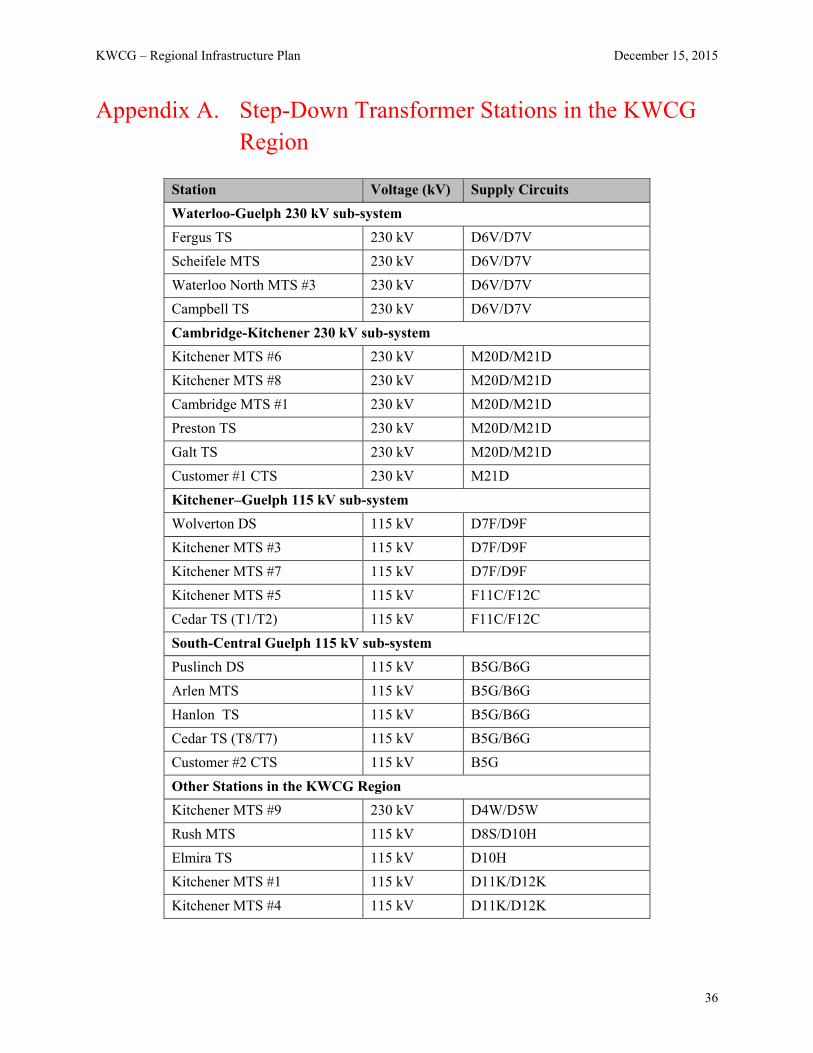
KWCG – Regional Infrastructure Plan December 15, 2015
36
Appendix A. Step-Down Transformer Stations in the KWCG Region
Station Voltage (kV) Supply Circuits
Waterloo-Guelph 230 kV sub-system
Fergus TS 230 kV D6V/D7V
Scheifele MTS 230 kV D6V/D7V
Waterloo North MTS #3 230 kV D6V/D7V
Campbell TS 230 kV D6V/D7V
Cambridge-Kitchener 230 kV sub-system
Kitchener MTS #6 230 kV M20D/M21D
Kitchener MTS #8 230 kV M20D/M21D
Cambridge MTS #1 230 kV M20D/M21D
Preston TS 230 kV M20D/M21D
Galt TS 230 kV M20D/M21D
Customer #1 CTS 230 kV M21D
Kitchener–Guelph 115 kV sub-system
Wolverton DS 115 kV D7F/D9F
Kitchener MTS #3 115 kV D7F/D9F
Kitchener MTS #7 115 kV D7F/D9F
Kitchener MTS #5 115 kV F11C/F12C
Cedar TS (T1/T2) 115 kV F11C/F12C
South-Central Guelph 115 kV sub-system
Puslinch DS 115 kV B5G/B6G
Arlen MTS 115 kV B5G/B6G
Hanlon TS 115 kV B5G/B6G
Cedar TS (T8/T7) 115 kV B5G/B6G
Customer #2 CTS 115 kV B5G
Other Stations in the KWCG Region
Kitchener MTS #9 230 kV D4W/D5W
Rush MTS 115 kV D8S/D10H
Elmira TS 115 kV D10H
Kitchener MTS #1 115 kV D11K/D12K
Kitchener MTS #4 115 kV D11K/D12K
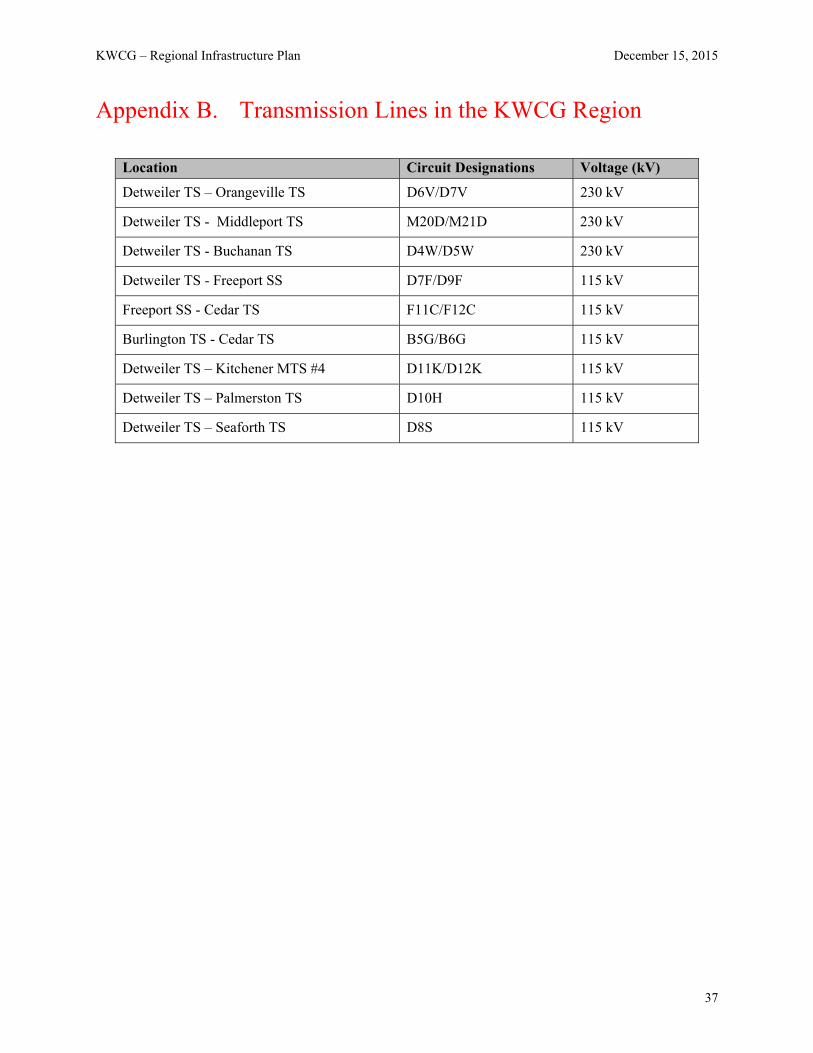
KWCG – Regional Infrastructure Plan December 15, 2015
37
Appendix B. Transmission Lines in the KWCG Region
Location Circuit Designations Voltage (kV)
Detweiler TS – Orangeville TS D6V/D7V 230 kV
Detweiler TS - Middleport TS M20D/M21D 230 kV
Detweiler TS - Buchanan TS D4W/D5W 230 kV
Detweiler TS - Freeport SS D7F/D9F 115 kV
Freeport SS - Cedar TS F11C/F12C 115 kV
Burlington TS - Cedar TS B5G/B6G 115 kV
Detweiler TS – Kitchener MTS #4 D11K/D12K 115 kV
Detweiler TS – Palmerston TS D10H 115 kV
Detweiler TS – Seaforth TS D8S 115 kV
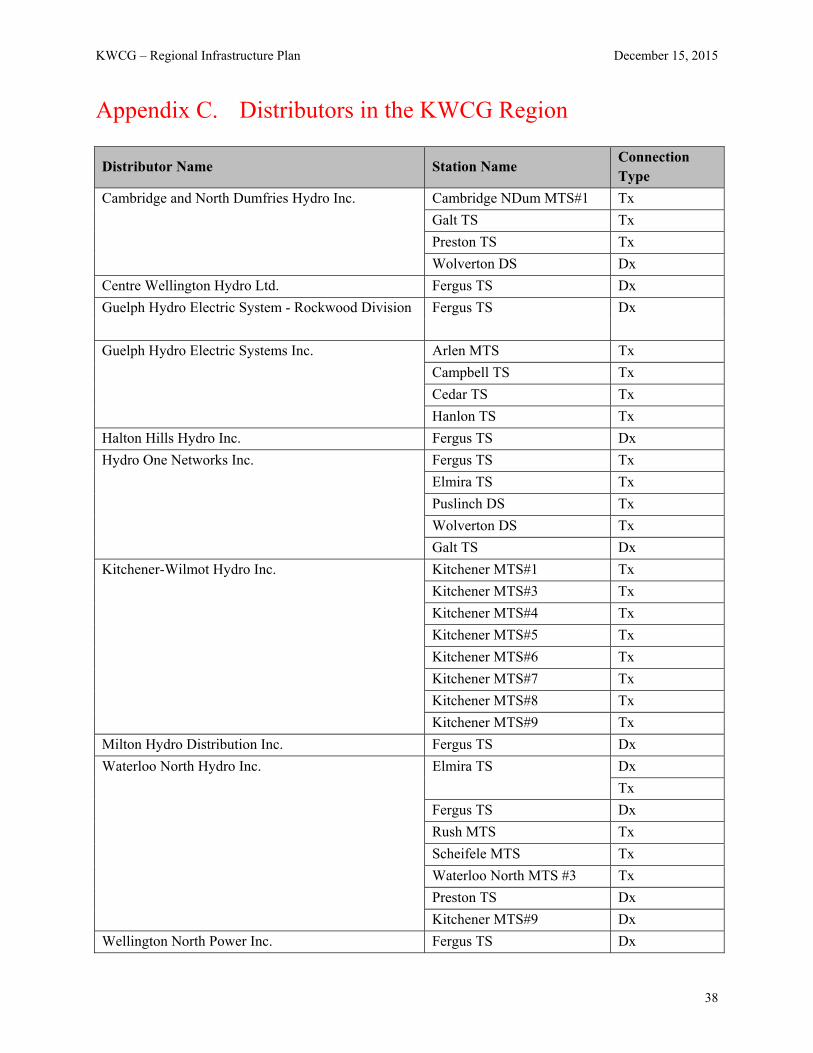
KWCG – Regional Infrastructure Plan December 15, 2015
38
Appendix C. Distributors in the KWCG Region
Distributor Name Station Name Connection Type
Cambridge and North Dumfries Hydro Inc. Cambridge NDum MTS#1 Tx
Galt TS Tx
Preston TS Tx
Wolverton DS Dx
Centre Wellington Hydro Ltd. Fergus TS Dx
Guelph Hydro Electric System - Rockwood Division Fergus TS Dx
Guelph Hydro Electric Systems Inc. Arlen MTS Tx
Campbell TS Tx
Cedar TS Tx
Hanlon TS Tx
Halton Hills Hydro Inc. Fergus TS Dx
Hydro One Networks Inc. Fergus TS Tx
Elmira TS Tx
Puslinch DS Tx
Wolverton DS Tx
Galt TS Dx
Kitchener-Wilmot Hydro Inc. Kitchener MTS#1 Tx
Kitchener MTS#3 Tx
Kitchener MTS#4 Tx
Kitchener MTS#5 Tx
Kitchener MTS#6 Tx
Kitchener MTS#7 Tx
Kitchener MTS#8 Tx
Kitchener MTS#9 Tx
Milton Hydro Distribution Inc. Fergus TS Dx
Waterloo North Hydro Inc. Elmira TS Dx
Tx
Fergus TS Dx
Rush MTS Tx
Scheifele MTS Tx
Waterloo North MTS #3 Tx
Preston TS Dx
Kitchener MTS#9 Dx
Wellington North Power Inc. Fergus TS Dx
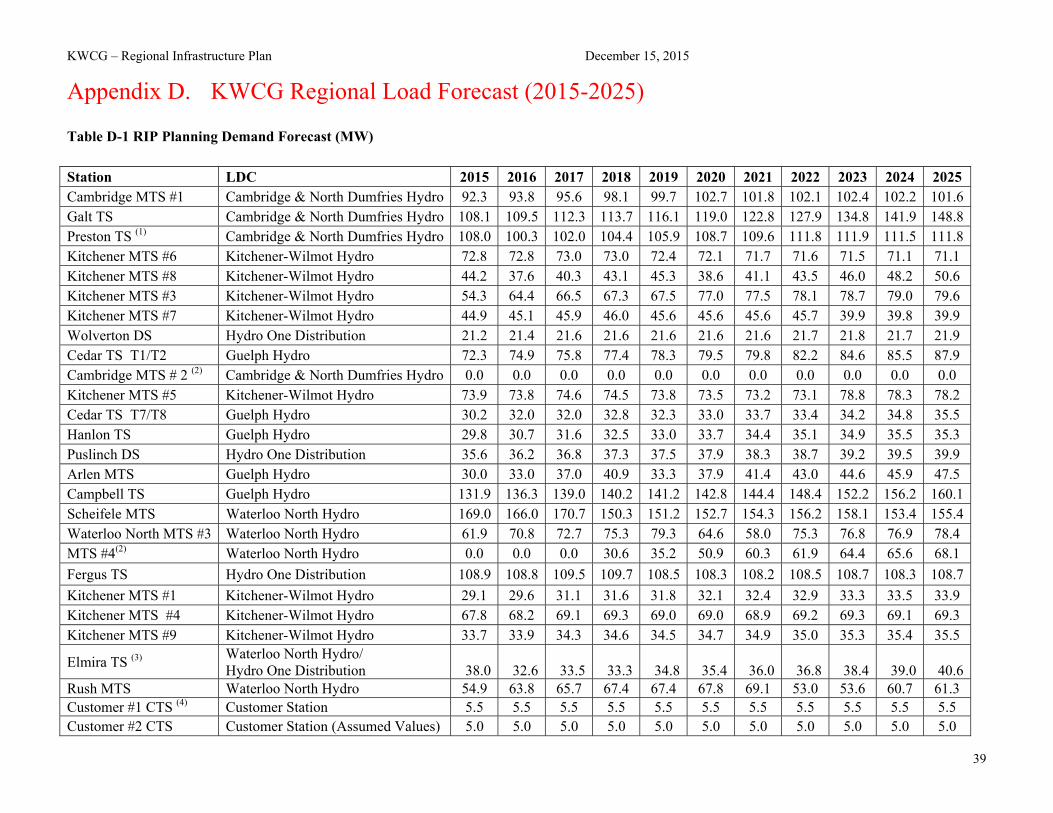
KWCG – Regional Infrastructure Plan December 15, 2015
39
Appendix D. KWCG Regional Load Forecast (2015-2025) Table D-1 RIP Planning Demand Forecast (MW)
Station LDC 2015 2016 2017 2018 2019 2020 2021 2022 2023 2024 2025 Cambridge MTS #1 Cambridge & North Dumfries Hydro 92.3 93.8 95.6 98.1 99.7 102.7 101.8 102.1 102.4 102.2 101.6Galt TS Cambridge & North Dumfries Hydro 108.1 109.5 112.3 113.7 116.1 119.0 122.8 127.9 134.8 141.9 148.8Preston TS (1) Cambridge & North Dumfries Hydro 108.0 100.3 102.0 104.4 105.9 108.7 109.6 111.8 111.9 111.5 111.8Kitchener MTS #6 Kitchener-Wilmot Hydro 72.8 72.8 73.0 73.0 72.4 72.1 71.7 71.6 71.5 71.1 71.1 Kitchener MTS #8 Kitchener-Wilmot Hydro 44.2 37.6 40.3 43.1 45.3 38.6 41.1 43.5 46.0 48.2 50.6 Kitchener MTS #3 Kitchener-Wilmot Hydro 54.3 64.4 66.5 67.3 67.5 77.0 77.5 78.1 78.7 79.0 79.6 Kitchener MTS #7 Kitchener-Wilmot Hydro 44.9 45.1 45.9 46.0 45.6 45.6 45.6 45.7 39.9 39.8 39.9 Wolverton DS Hydro One Distribution 21.2 21.4 21.6 21.6 21.6 21.6 21.6 21.7 21.8 21.7 21.9 Cedar TS T1/T2 Guelph Hydro 72.3 74.9 75.8 77.4 78.3 79.5 79.8 82.2 84.6 85.5 87.9 Cambridge MTS # 2 (2) Cambridge & North Dumfries Hydro 0.0 0.0 0.0 0.0 0.0 0.0 0.0 0.0 0.0 0.0 0.0 Kitchener MTS #5 Kitchener-Wilmot Hydro 73.9 73.8 74.6 74.5 73.8 73.5 73.2 73.1 78.8 78.3 78.2 Cedar TS T7/T8 Guelph Hydro 30.2 32.0 32.0 32.8 32.3 33.0 33.7 33.4 34.2 34.8 35.5 Hanlon TS Guelph Hydro 29.8 30.7 31.6 32.5 33.0 33.7 34.4 35.1 34.9 35.5 35.3 Puslinch DS Hydro One Distribution 35.6 36.2 36.8 37.3 37.5 37.9 38.3 38.7 39.2 39.5 39.9 Arlen MTS Guelph Hydro 30.0 33.0 37.0 40.9 33.3 37.9 41.4 43.0 44.6 45.9 47.5 Campbell TS Guelph Hydro 131.9 136.3 139.0 140.2 141.2 142.8 144.4 148.4 152.2 156.2 160.1Scheifele MTS Waterloo North Hydro 169.0 166.0 170.7 150.3 151.2 152.7 154.3 156.2 158.1 153.4 155.4Waterloo North MTS #3 Waterloo North Hydro 61.9 70.8 72.7 75.3 79.3 64.6 58.0 75.3 76.8 76.9 78.4 MTS #4(2) Waterloo North Hydro 0.0 0.0 0.0 30.6 35.2 50.9 60.3 61.9 64.4 65.6 68.1
Fergus TS Hydro One Distribution 108.9 108.8 109.5 109.7 108.5 108.3 108.2 108.5 108.7 108.3 108.7
Kitchener MTS #1 Kitchener-Wilmot Hydro 29.1 29.6 31.1 31.6 31.8 32.1 32.4 32.9 33.3 33.5 33.9 Kitchener MTS #4 Kitchener-Wilmot Hydro 67.8 68.2 69.1 69.3 69.0 69.0 68.9 69.2 69.3 69.1 69.3 Kitchener MTS #9 Kitchener-Wilmot Hydro 33.7 33.9 34.3 34.6 34.5 34.7 34.9 35.0 35.3 35.4 35.5
Elmira TS (3) Waterloo North Hydro/ Hydro One Distribution 38.0 32.6 33.5 33.3 34.8 35.4 36.0 36.8 38.4 39.0 40.6
Rush MTS Waterloo North Hydro 54.9 63.8 65.7 67.4 67.4 67.8 69.1 53.0 53.6 60.7 61.3 Customer #1 CTS (4) Customer Station 5.5 5.5 5.5 5.5 5.5 5.5 5.5 5.5 5.5 5.5 5.5 Customer #2 CTS Customer Station (Assumed Values) 5.0 5.0 5.0 5.0 5.0 5.0 5.0 5.0 5.0 5.0 5.0

KWCG – Regional Infrastructure Plan December 15, 2015
40
Table D1 -is based upon KWCG 2015 IRRP Planning Load Forecast except as noted.
(1) Cambridge and North Dumfries Hydro (“CND”) has confirmed 9.2 MW of cogeneration at a large customer to be accounted for in the Preston TS forecast starting year 2016. The generation plant is expected to run most of the time and would offset the customer's load. This cogeneration was not factored into the KWCG 2015 IRRP Planning Load Forecast.
(2) Both CND and Waterloo North Hydro (“WNH”) are monitoring the load closely to determine the timing of potential transformation needs. For planning purposes, WNH has moved back the in service date of MTS #4 from 2018 to 2024. WNH is closely monitoring the need for additional transformation capacity to determine if the load growth indicated at MTS #4 in the forecast can be managed through a combination of improving transformer station interties, CDM and DG in the Waterloo Region. Where possible, these LDCs are exploring opportunities to coordinate possible joint use and development of step-down transformer station facilities in the KWCG Region over the long term.
(3) Updated to include Hydro One Distribution load
(4) Based on information provided by the transmission-connected customer
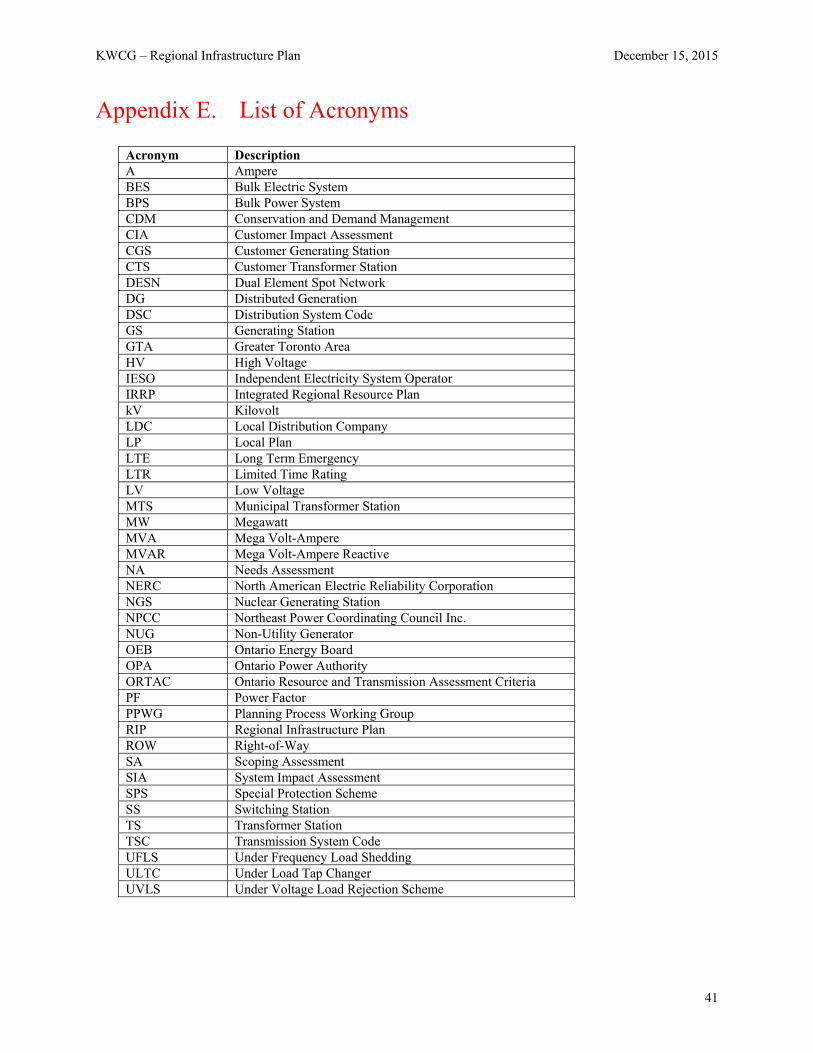
KWCG – Regional Infrastructure Plan December 15, 2015
41
Appendix E. List of Acronyms
Acronym Description A Ampere BES Bulk Electric System BPS Bulk Power System CDM Conservation and Demand Management CIA Customer Impact Assessment CGS Customer Generating Station CTS Customer Transformer Station DESN Dual Element Spot Network DG Distributed Generation DSC Distribution System Code GS Generating Station GTA Greater Toronto Area HV High Voltage IESO Independent Electricity System Operator IRRP Integrated Regional Resource Plan kV Kilovolt LDC Local Distribution Company LP Local Plan LTE Long Term Emergency LTR Limited Time Rating LV Low Voltage MTS Municipal Transformer Station MW Megawatt MVA Mega Volt-Ampere MVAR Mega Volt-Ampere Reactive NA Needs Assessment NERC North American Electric Reliability Corporation NGS Nuclear Generating Station NPCC Northeast Power Coordinating Council Inc. NUG Non-Utility Generator OEB Ontario Energy Board OPA Ontario Power Authority ORTAC Ontario Resource and Transmission Assessment Criteria PF Power Factor PPWG Planning Process Working Group RIP Regional Infrastructure Plan ROW Right-of-Way SA Scoping Assessment SIA System Impact Assessment SPS Special Protection Scheme SS Switching Station TS Transformer Station TSC Transmission System Code UFLS Under Frequency Load Shedding ULTC Under Load Tap Changer UVLS Under Voltage Load Rejection Scheme

KWCG – Regional Infrastructure Plan December 15, 2015
42
Appendix F. KWCG Adequacy of Transmission Facilities and Transmission Plan 2016-2025
10-Year Transmission Plan for the KWCG area October 30, 2015
1
Revision 1
KITCHENER/WATERLOO/CAMBRIDGE/GUELPH AREA
ADEQUACY OF TRANSMISSION FACILITIES
AND
TRANSMISSION PLAN 2016 – 2025
October 30, 2015
Prepared by Hydro One Networks Inc. in Consultation with the KWCG Working Group
10-Year Transmission Plan for the KWCG area October 30, 2015
2
Foreword
This report is the result of a joint study by KWCG Working Group. It has been prepared by Hydro One Networks in consultation with the Working Group.
The working group members were:
Entity Member
Kitchener-Wilmot Hydro Shaun Wang L. Frank G. Cameron
Waterloo North Hydro Inc. Herbert Haller David Wilkinson Dorothy Moryc
Cambridge & North Dumfries Hydro Ron Sinclair Shawn Jackson
Guelph Hydro Electric System Inc. Michael Wittemund K. Marouf Eric Veneman
Hydro One Distribution Charlie Lee
Ontario Power Authority Bob Chow Bernice Chan
Independent Electricity Operator Peter Drury
Hydro One Networks Inc.
Alessia Dawes Farooq Qureshy Emeka Okongwu Qasim Raza
The preferred plan has been selected based on technical and economic considerations. The issue of cost allocation between utilities was not addressed.
Prepared by: Qasim Raza – Transmission Planning Officer
Reviewed by: Alessia Dawes – Senior Transmission Planning Engineer
Approved by: Farooq Qureshy – Manager, Transmission System Development, Central & East
October 30, 2015
Revision History
Revision Date Author Description of change 1 October 30, 2015 Qasim Raza Refreshed based on 2015 IRRP/RIP load
forecast (April/August2015) 0 April 1, 2015 Alessia Dawes Original- based on May 2013 forecast
10-Year Transmission Plan for the KWCG area October 30, 2015
3
TABLE OF CONTENTS
ExecutiveSummary.............................................................................................................................................................5
1.0 Introduction..............................................................................................................................................................6
2.0 ExistingTransmissionInfrastructure........................................................................................................7
2.1 TransmissioninKWCG...................................................................................................................................7
2.2 Transmission‐ConnectedGeneration....................................................................................................8
3.0 AdequacyofExistingTransmissionInfrastructureinKWCGarea.............................................8
3.1 StudyAssumptions...........................................................................................................................................8
3.2 StudyCriteria.......................................................................................................................................................8
3.3 LoadForecast.......................................................................................................................................................9
3.4 SupplyCapacityNeeds....................................................................................................................................9
3.4.1 Auto-transformation Supply Capacity.............................................................................................9
3.4.2 Supply Capacity of the 230 kV Network........................................................................................10
3.4.3 Supply Capacity of the 115 kV Network........................................................................................10
3.4.4 Voltage Performance..............................................................................................................................10
3.4.5 Load Security Analysis..........................................................................................................................10
3.4.6 Load Restoration Capability Analysis............................................................................................11
3.4.7 Impact of Contingencies on the BPS to the KWCG Area.......................................................11
3.4.8 Summary of Needs...................................................................................................................................12
4.0 OptionstoAddresstheNeed..........................................................................................................................12
5.0 DiscussionofPreferredOptions..................................................................................................................14
5.1 PreferredOptiontoImproveRestorationtoM20/21DLoad.................................................14
6.0 DevelopmentPlan................................................................................................................................................14
7.0 Conclusions..............................................................................................................................................................14
8.0 Recommendations...............................................................................................................................................15
AppendixA:KWCGMaps................................................................................................................................................16
AppendixB:Transmission‐ConnectedGenerationintheKWCGarea..................................................18
AppendixC:KWCGCustomer&LDCLoadForecasts......................................................................................19
AppendixD:TechnicalResults–LocalAreaAnalysis....................................................................................20
AppendixE:TechnicalResults–BulkPowerSystemConsiderations...................................................21
AppendixF:LoadSecurityAnalysis..........................................................................................................................23
AppendixG:LoadRestorationAnalysis.................................................................................................................25

10-Year Transmission Plan for the KWCG area October 30, 2015
4
AppendixH:SupplyToElmiraTSandRushMTS..............................................................................................29
10-Year Transmission Plan for the KWCG area October 30, 2015
5
EXECUTIVE SUMMARY
In 2010 an integrated regional planning study was initiated to assess the electricity supply and reliability over a twenty year period for the Kitchener-Waterloo-Cambridge-Guelph (KWCG) areas and continues to be conducted by a Working Group led by the Ontario Power Authority (OPA) and includes staff from the Independent Electricity System Operator (IESO), Hydro One Networks Inc., Kitchener-Wilmot Hydro, Waterloo North Hydro, Cambridge & North Dumfries Hydro, Guelph Hydro Electric Systems Inc. and Hydro One Distribution.
The early results of the integrated regional planning study identified the need to reinforce supply capacity for the South-Central Guelph and the City of Cambridge over the near and medium term. It also identified the need to minimize the impact of double circuit interruptions in the area1. As a result, the Working Group recommended two transmission projects in conjunction with conservation and distributed generation:
1. The Guelph Area Transmission Reinforcement (GATR) project – comprising a new 230/115kV autotransformer station at Guelph Cedar TS, upgrading the circuit section between Campbell TS and CGE Junction to 230 kV and in-line switching on the Orangeville TS x Detweiler TS 230kV circuits D6V/D7V – to reinforce supply to South Central Guelph,
2. The Preston TS Autotransformer Project – comprising the installation of a second 230/115kV autotransformer at Preston TS - to reinforce supply to the City of Cambridge.
Work on the GATR project was started in 2014 following approval from the Ontario Energy Board and the Ministry of Environment. The project’s planned in-service date is June 2016.
For the Preston project, the OPA issued Hydro One a hand off letter to develop a “Wires” solution to improve the supply to the Cambridge area and to facilitate the connection of a future Cambridge and North Dumfries Hydro transformer station by 2018.
This report presents the results of Hydro One led “Wires” study of the adequacy of supply to the City of Cambridge and the wider KWCG area based on the planned in-service of the GATR project in summer 2016. The main conclusions of the report are as follows:
The supply capability to the KWCG 115kV area has been significantly increased to meet all 2025 forecast loads by the addition of the GATR project. The need for the Preston autotransformer can be deferred to beyond 2025.
There is inadequate load restoration capability for load connected to Middleport TS x Detweiler TS 230kV double circuit line M20D and M21D
This report recommends that the most cost effective plan to improve load restoration capability for load connected to circuits M20/21D is to install 230 kV in-line switches onto circuits M20/21D.
1OPASubmissiontotheOEBfortheGATRProject–DocumentEB‐2013‐0053datedMarch8,2013entitled,“Kitchener‐Waterloo‐Cambridge‐GuelphArea
10-Year Transmission Plan for the KWCG area October 30, 2015
6
1.0 INTRODUCTION
This transmission adequacy assessment focused on the electrical supply to the municipalities of Kitchener, Waterloo, Cambridge and Guelph and their surrounding areas of Ontario, collectively referred to as the KWCG area in this report. Its primary focus was to confirm the near and mid-term transmission needs for the area and to provide a 10-year transmission plan in order satisfy those Needs.
Geographically, the KWCG area consists of 4 municipalities – Kitchener, Waterloo, Cambridge, Guelph and portions of two counties - Perth and Wellington. Hydro One Networks Inc. is the sole high voltage transmitter in the KWCG area; however the low voltage distribution of electricity in the KWCG area is carried out by Cambridge and North Dumfries Hydro Inc., Guelph Hydro Electric System Inc., Hydro One Distribution, Kitchener-Wilmot Hydro Inc., and Waterloo North Hydro. A geographic map of the area is shown in Appendix A, Map 1 while an electrical map of the area is shown in Appendix A, Map 2.
The KWCG area is a major regional load centre in Ontario. The area has a well-established history in manufacturing and technology. The area peak load is approximately 1400 MW.
This report presents the results of the Hydro One led “Wires” study of the adequacy of supply to the City of Cambridge and the wider KWCG area based on the planned in-service of the GATR project in summer 2016.
10-Year Transmission Plan for the KWCG area October 30, 2015
7
2.0 EXISTING TRANSMISSION INFRASTRUCTURE
2.1 TRANSMISSION IN KWCG
Electrical Supply in this area is provided through 230 kV and 115 kV transmission lines and step down transformation facilities (transmission stations, TS) as show in Appendix A, Map 2.
The main sources of electricity into the KWCG Region are Middleport TS, Detweiler TS, Orangeville TS, Cedar TS and Burlington TS. At these stations electricity is transformed from 500 kV and 230 kV to 230 kV and 115 kV, respectively. The KWCG Region transmission system is connected as follows:
Two 230 kV circuits (D6V/D7V) that run North-East from Detweiler TS to Orangeville TS that supply five load serving stations;
Two 230 kV circuits (M20/21D) that run South-East from Detweiler TS to Middleport TS that supply five load serving stations and one transmission-connected customer;
Two 230 kV circuits (D4W/D5W) that run South-West from Detweiler TS to Buchanan TS (in the “London area”) that supply one load serving station;
Four 115 kV circuits (D7F/D9F, F11C/F12C) that run East-West: D7/9F from Detweiler TS to Freeport SS that supply three load serving stations and F11/12C from Freeport SS to Cedar TS that supply one load serving station;
Two 115 kV circuits (B5G/B6G) that run North-West from Burlington TS to Cedar TS that supply three load serving stations and one transmission-connect customer;
Two 115 kV radial circuits (D11K/D12K) emanating East from Detweiler TS that supply two load serving stations; and,
Two 115 kV circuit (D8S and D10H) emanating North from Detweiler TS that supply two load serving stations in the KWCG area.
Voltage support is provided in the area by:
Four high voltage shunt capacitor banks and one SVC at Detweiler TS Four high voltage shunt capacitor banks at Middleport TS Three high voltage shunt capacitor banks at Burlington TS One high voltage shunt capacitor bank at Orangeville TS 43.2 MVar low voltage station shunt capacitor at Galt TS 21.6 MVar low voltage station shunt capacitors at Campbell TS 59.81 MVar low voltage station shunt capacitors at Cedar TS 9.92 MVar low voltage station shunt capacitors at Elmira TS Low voltage feeder shunt capacitors were lumped at: C&ND MTS#1, Waterloo North Hydro
MTS #3, Scheifele MTS
All stations in the KWCG Region were considered in the analysis to determine the adequacy of the existing transmission system. Transformation capacity at individual load serving stations was previously analyzed by the OPA as part of the Integrated Regional Resource Plan (IRRP). The result of that analysis was a load forecast that included proposed new stations, as shown in Appendix C. Therefore, transformation capacity at individual load serving stations was not considered in this study.
10-Year Transmission Plan for the KWCG area October 30, 2015
8
2.2 TRANSMISSION-CONNECTED GENERATION
There are no existing large-scale transmission-connected generation plants in the KWCG area; however two contracted renewable transmission-connected wind farms were included in the study area and are listed in Appendix B.
3.0 ADEQUACY OF EXISTING TRANSMISSION INFRASTRUCTURE IN KWCG AREA
3.1 STUDY ASSUMPTIONS
Assumptions were made in order to assess the effects of contingencies to verify the adequacy of the transmission system. The assumptions used in the study were:
1. A 10 year load forecast: years 2016 to 2025; shown in Appendix C 2. Forecasted loads were provided by the LDC’s in MW. The MVAR portion of the load was set to
40% of the MW load which is a reasonable assumption to achieve a power factor of 0.9 at the defined meter point of load serving transformer stations (TS, CTS, MTS)
3. A summer assessment was performed as the KWCG area is summer load peaking while the equipment is at its lowest rating during summer ambient conditions. This was deemed to be the most conservative approach;
4. Equipment continuous and Limited Time Ratings (LTR) were based on an ambient temperature of 35C for summer and a wind speed of 4 km/hour;
5. The Guelph Area Transmission Reinforcement (GATR) project would be in-service in June 2016; 6. Circuits M20D and M21D are assigned their updated long-term emergency rating (LTE) based on
a maximum temperature of 127C; 7. Simulation of year 2025 load forecast was performed as it was the maximum loading of the area
for the duration of the study period; year 2016 was simulated as necessary; 8. Waterloo North Hydro’s Snider MTS #4 (MTS #4) will connect to 230 kV circuit D6/7V between
Scheifele MTS and Guelph North Jct., projected in-service date 2024 (refer to Note 2 in Appendix C, Table C1)
9. The flows on Ontario’s major internal transmission interfaces were assumed as follows: FETT ~ 4500 MW FS ~1250 MW FABCW ~ 5800MW NBLIP ~ 1650 MW (the slightly high NBLIP was offset by the lower FABCW) QFW ~ 1550 MW
3.2 STUDY CRITERIA
The adequacy of the transmission system is assessed as per the IESO Ontario Resource and Transmission Assessment Criteria, Issue 5.0.
10-Year Transmission Plan for the KWCG area October 30, 2015
9
3.3 LOAD FORECAST
The load forecast used in this assessment is the KWCG 2015 RIP forecast as shown in Appendix C. This summer forecast is an extreme weather, area coincident, net, peak load forecast.
The KWCG 2015 RIP forecast is based upon the KWCG 2015 IRRP forecast. The LDC’s provided the IESO with a 20 year gross, normal weather, area coincident, peak load forecast in MW. The IESO adjusted the forecast by subtracting the effective conservation and demand management (CDM) capacity, applying an extreme weather factor and then subtracting the effective Distribution Generation (DG) capacity.
3.4 SUPPLY CAPACITY NEEDS
Single element contingencies were considered in assessing the adequacy and reliability of the local transmission system that serves the KWCG area. Figure 1 summarizes the local KWCG area Needs for the 10-year period under study. Appendices D, F and G detail the technical study and results.
At stations, within the KWCG area, classified as NPCC Bulk Power System (BPS) additional contingencies were considered to establish their impact to the local KWCG area. Appendix E details the technical study and results.
3.4.1 AUTO-TRANSFORMATION SUPPLY CAPACITY
There is no major generation station in the KWCG area. Hence, the majority of supply to the load is provided by Hydro One’s 500 kV to 230 kV and 230 kV to 115 kV auto-transformers. The number and location of these auto-transformers are as follows:
Two 500/230 kV autotransformers at Middleport TS Four 230/115 kV autotransformers at Burlington TS2 Three 230/115 kV autotransformers at Detweiler TS Two 230/115 kV autotransformers at Cedar TS One 230/115 kV autotransformer at Preston TS
Single autotransformer contingencies were performed to assess the adequacy of the transmission system to supply bulk power into the KWCG area via the autotransformers for year 2025 loading.
The results indicate that there are no thermal overloads and no voltage violations for the loss of a single autotransformer.
2 The loading of the autotransformers at Burlington TS is mainly driven by the load connected in the Burlington to Nanticoke area. Only a small percentage of the autotransformer load is due to local Guelph load and as such, analysis of the Burlington TS autotransformers was undertaken in the ‘Burlington to Nanticoke’ Regional Infrastructure Plan.
10-Year Transmission Plan for the KWCG area October 30, 2015
10
3.4.2 SUPPLY CAPACITY OF THE 230 KV NETWORK
The KWCG area contains three pairs of double circuit 230 kV lines: M20D/M21D, D6V/D7V and D4W/D5W.
Single circuit contingencies were performed to assess the adequacy of the local 230 kV transmission system for year 2025 loading3.
As indicated in Appendix D there are no thermal overloads and no voltage violations for the loss of a single 230 kV circuit.
3.4.3 SUPPLY CAPACITY OF THE 115 KV NETWORK
The KWCG area contains five pairs of double circuit 115 kV lines: D7F/D9F, F11C/F12C, B5G/B6G, D11K/D12K and D8S/D10H.
Single circuit contingencies were performed to assess the adequacy of the local 115 kV transmission system for year 2025 loading.
As indicated in Appendix D there are no thermal overloads and no voltage violations for the loss of a single 115 kV circuit. Appendix H details supply capacity on circuit D8S and D10H as request by the LDC.
3.4.4 VOLTAGE PERFORMANCE
Single circuit contingencies as well as single element HV shunt capacitor bank contingencies were performed to determine the overall voltage performance of the KWCG area for year 2025 loading.
As indicated in Appendix D there are no thermal overloads and no voltage violations for these contingencies. Appendix H details voltage performance at Elmira TS and Rush MTS as request by the LDC.
3.4.5 LOAD SECURITY ANALYSIS
The most stringent load security criterion that applies to the KWCG area states that with any two elements out of service:
Voltage must be within applicable emergency ratings and equipment loading must be within applicable short-term emergency ratings;
Load transfers to meet the applicable long-term emergency ratings must be able to be made in the time afforded by short-time ratings;
Planned load curtailment or load rejection in excess of 150 MW is not permissible (except for local generation outages) and;
3 Note, if another element such as an autotransformer, circuit or capacitor bank shared the same “switching position” and/or zone of protection with the circuit under contingency, both were removed from service.
10-Year Transmission Plan for the KWCG area October 30, 2015
11
Not more than 600 MW of load may be interrupted by configuration and by planned load curtailment or load rejection excluding voluntary demand management with any two transmission elements out of service.
There are three pairs of 230 kV double circuit lines and five pairs of 115 kV double circuit lines in the KWCG area. While one circuit of a double circuit line is out of service, the loss of the companion circuit in the pair would result in the loss of all load stations connected to the pair by configuration. Tables F1 and F2 in Appendix F illustrate the load lost due to configuration in both years 2016 and 2025.
There are five stations in the KWCG area that have autotransformers. Overlapping autotransformer contingencies were taken and Table F3 in Appendix F illustrates any load transfer requirements due to two overlapping autotransformer outages.
As seen in Appendix F, the load forecasted on all circuit pairs is less than 600 MW within the 10-year study period and the loss of two autotransformers within this local area does not result in equipment loading beyond their applicable emergency ratings; therefore there is no concern with Load Security in the KWCG area for the study period.
3.4.6 LOAD RESTORATION CAPABILITY ANALYSIS
The load restoration criteria requires that the transmission system be planned such that following local area design criteria contingencies, the affected loads can be restored within the restoration times indicated below4:
All load lost must be restored within 8 hours; Load lost in excess of 250 MW must be restored within 30 min; and Load lost between the amount of 150 MW and 250 MW must be restored within 4 hours.
Each pair of double circuit 230 kV and 115 kV lines were assessed to verify their load restoration capability. This assessment is detailed in Appendix G.
The results indicated the existing transmission system can adequately restore load to each circuit pair with the exception of M20/21D. Therefore, improvement to the restoration capability of load connected to circuits M20D and M21D is required.
3.4.7 IMPACT OF CONTINGENCIES ON THE BPS TO THE KWCG AREA
Northeast Power Coordinating Council (NPCC) Bulk Power System stations in the KWCG area are:
Middleport TS 500 kV bus Middleport TS 230 kV bus Detweiler TS 230 kV bus
4 As per ORTAC: “These approximate restoration times are intended for locations that are near staffed centres. In more remote locations, restoration times should be commensurate with travel times and accessibility.”
10-Year Transmission Plan for the KWCG area October 30, 2015
12
All elements connected to BPS buses are considered BPS facilities. Elements refer to circuit breakers, transmission lines, generators, transformers and reactive devices (e.g. SVC or capacitor bank).
Appendix E: Technical Results-Bulk Power System Considerations provides a list of BPS contingencies and the results. A limited number of BPS contingencies were performed in order to establish the impact of contingencies on the BPS to the local KWCG area.
Three NPCC Directory 1 contingency events were utilized in this study:
1. Simultaneous loss of two adjacent transmission circuits on a multiple circuit tower 2. Loss of any element with delayed fault clearing (a.k.a. Breaker Failure) 3. Loss of a critical element, followed by system adjustment, then loss of a critical element.
These BPS contingency events were applied to BPS buses only. The results can be summarized as follows:
As per Table E3 and E5 when two of the three auto-transformers at Detweiler TS are not available the remaining auto-transformer may become overloaded. Since the loading of the remaining auto-transformer is within its 15-minute Short-Term Emergency Rating (STE) operational control actions can be taken to reduce the loading to within acceptable limits. Control actions could entail isolation of the faulted element e.g. circuit breaker, bus or transformer, and placing back in-service a healthy auto-transformer (at Detweiler TS and/or Preston TS). Another control action could entail opening of 115kV breakers at Freeport SS to redirect flows through the Cedar TS autotransformers.
3.4.8 SUMMARY OF NEEDS
Figure 1 illustrates the Needs timeline for the KWCG region.
Figure 1: Transmission Needs in the KWCG Area
4.0 OPTIONS TO ADDRESS THE NEED
Options were considered to address the insufficient load restoration capability for loads connected to circuits M20D and M21D. These options are shown in Table 1. Although there are several metrics that can be utilized to measure and compare options, the simple metric “initial capital cost/MW of load restored” was selected because it compares the unit costs of remedial measures. This was deemed sufficient in order to select the preferred option
10-Year Transmission Plan for the KWCG area October 30, 2015
13
Table 1: Options to Improve M20/21D Load Restoration
Option Options to Improve Restoration Fault on the Main Line –Restorable Load (Note 1)
Fault on the Tap – Restorable Load (Note 1)
Initial Capital
Cost (Note 3)
Initial Capital Cost/ MW Load
Restored
-- Existing (Benchmark) 100 MW (Preston TS only)
100 MW (Preston TS only) 0 $0/MW
1 230 kV in-line switches on M20/21D at Preston Junction
100 MW (C&ND load only-Note 2)
100 MW (C&ND load only-Note 2) $6M $60k/MW
2 230 kV in-line switches on M20/21D at Galt Junction (main line) 368 MW - 484 MW
234 MW (100 MW via existing Preston
Auto) $6M $12k/MW to
$26k/MW
3 One 230 kV cap bank at Preston TS plus 230 kV in-line switches on MxD at Preston Junction
140 MW (Note 4) (C&ND load only-Note 2)
140 MW (Note 4) (C&ND load only-Note 2) $11M $79k/MW
4 2nd autotransformer at Preston TS plus 230 kV in-line switches on MxD at Preston Junction
200 MW (Note 4) (C&ND load only-Note 2)
200 MW (Note 4) (C&ND load only-Note 2) $21M $105k/MW
5
2nd autotransformer at Preston TS plus 230 kV in-line switches on MxD at Preston Junction plus two 230 kV cap banks at Preston TS
280 MW (Note 4) (C&ND load only-Note 2)
280 MW (Note 4) (C&ND load only-Note 2) $31M $111k/MW
NOTE 1 Restorable load values are approximate values only as the actual amount of restorable load will depend on the prevailing system conditions and Operating/Control Centre protocols and priorities
NOTE 2 “C&ND load only” means that only those customers connected to Galt TS, C&ND MTS#1 and Preston TS will benefit. Cambridge and North Dumfries Hydro customers are the sole customers of these three stations.
NOTE 3 All prices are based on historical data: taxes extra, overhead extra, no escalation considered, no assumptions are made to feasibility or constructability, no assumptions made as to space requirements, real estate and environmental cost extra
NOTE 4 Restoration of 230 kV load (Cambridge and North Dumfries load ) via the Preston TS auto-transformer may require operational measures on the 115 kV system to secure the transmission system to handle a subsequent contingency e.g. open the low voltage bus-tie breakers/switches at 115kV connected stations
10-Year Transmission Plan for the KWCG area October 30, 2015
14
5.0 DISCUSSION OF PREFERRED OPTIONS
5.1 PREFERRED OPTION TO IMPROVE RESTORATION TO M20/21D LOAD
Currently, loads connected to circuits M20/21D do not meet the restoration criteria.
Of the five options, option #2: 230 kV in-line switches on M20/21D at/near Galt Junction is the preferred option to satisfy the Need as it will provide the capability to restore the most load supplied from M20/21D.
Not only does Option #2 allow for more load to be restored, it provides for better operational flexibility; and is the most economical solution. As option 2 substantially meets the need by significantly improving the existing restoration capability, it is therefore the preferred option.
6.0 DEVELOPMENT PLAN
The transmission infrastructure development plan for the KWCG area is as followings:
1) Immediate Action: Install 230 kV In-Line Switches
Install 230 kV Load Interrupter type in-line switches on circuits M20D and M21D on the main line near Galt Junction. Note that load interrupter type switches cannot be used to interrupt fault current.
7.0 CONCLUSIONS
The following conclusions can be reached from the analysis performed by this study.
Local Area Performance
1. Improvement to the load restoration capability of transmission-connected customers on circuits M20D and M21D is required. The preferred option can be implemented by summer 2017.
BPS Performance
2. Autotransformer T2 at Detweiler TS is expected to be at 104.4% of LTE loading for year 2016 for the following contingency:
i. Detweiler T4 outage plus Detweiler T3 with M20D (includes Preston T2 via Preston SPS). Since the post-contingency flow is below the auto-transformer STE, operational control actions can be taken to reduce loading to within the LTE rating.

10-Year Transmission Plan for the KWCG area October 30, 2015
15
8.0 RECOMMENDATIONS
The following recommendations are to address the transmission infrastructure deficiencies within the study period for the KWCG area. These recommendations are:
1. Hydro One Networks to install a set of 230 kV in-line switches onto the main line of circuits M20D and M21D near Galt Junction as soon as possible.
2. Hydro One Networks, the LDCs and the IESO to review the KWCG local area in 2019 with updated KWCG load forecasts to decide on appropriate actions to meet longer-term needs as they emerge.
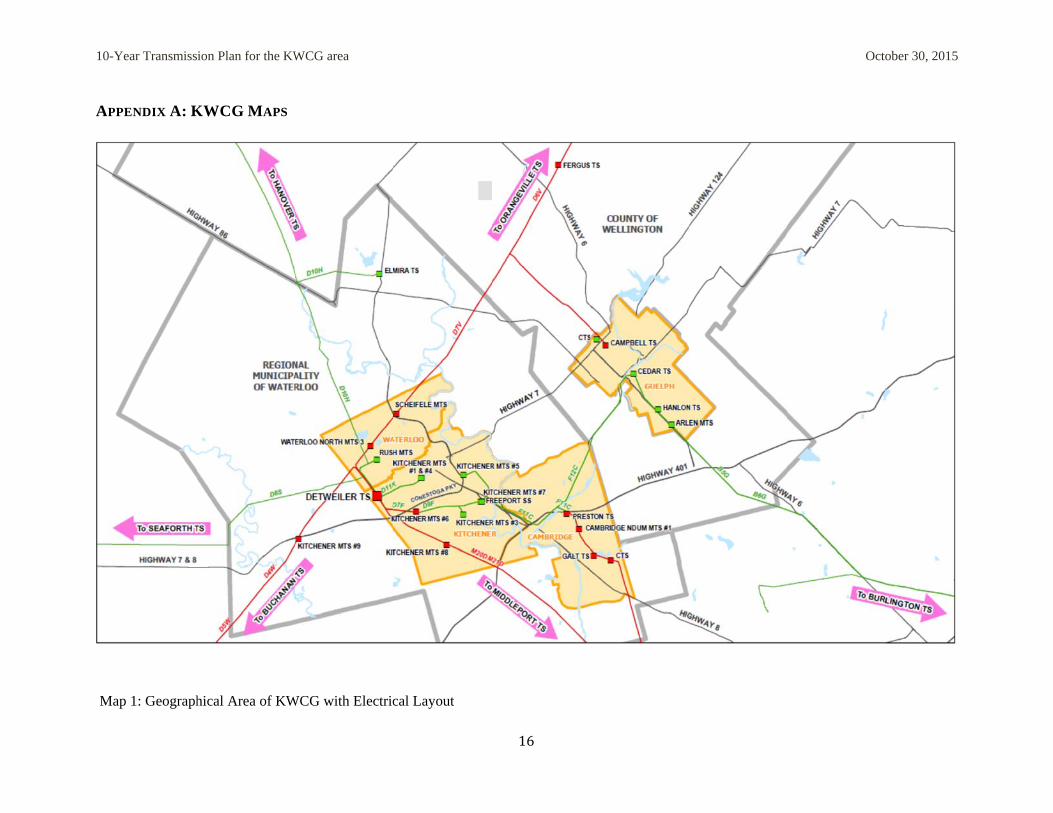
1
A
10-Year Transmiss
APPENDIX A: K
Map 1: Geograph
sion Plan for the KW
KWCG MAPS
hical Area of KW
WCG area
WCG with Electriccal Layout
16
Octoober 30, 2015
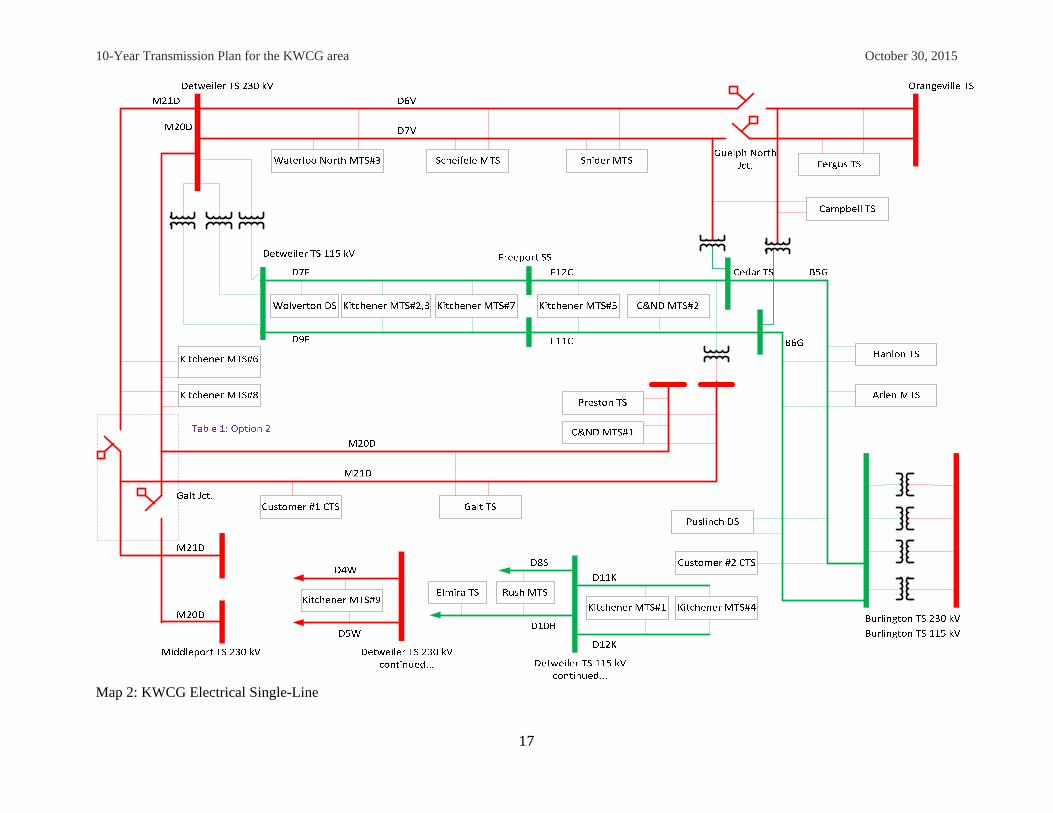
10-Year Transmission Plan for the KWCG area October 30, 2015
17
Map 2: KWCG Electrical Single-Line
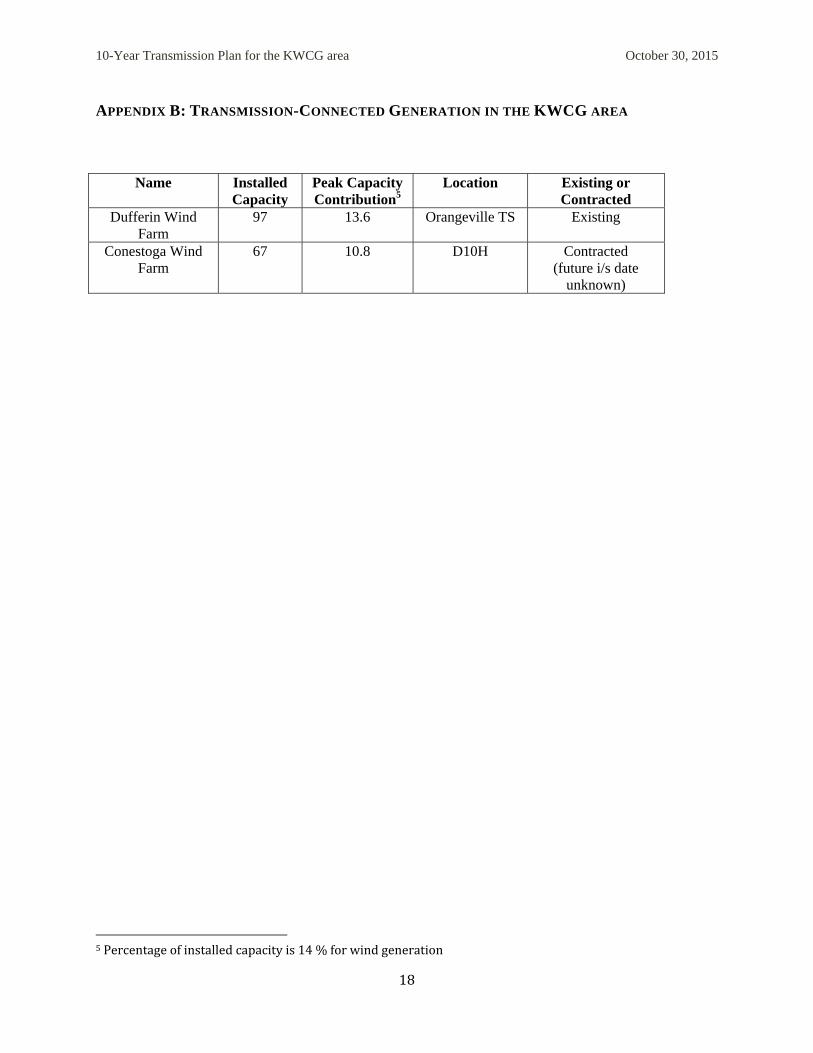
10-Year Transmission Plan for the KWCG area October 30, 2015
18
APPENDIX B: TRANSMISSION-CONNECTED GENERATION IN THE KWCG AREA
Name Installed Capacity
Peak Capacity Contribution5
Location Existing or Contracted
Dufferin Wind Farm
97 13.6 Orangeville TS Existing
Conestoga Wind Farm
67 10.8 D10H Contracted (future i/s date
unknown)
5Percentageofinstalledcapacityis14%forwindgeneration
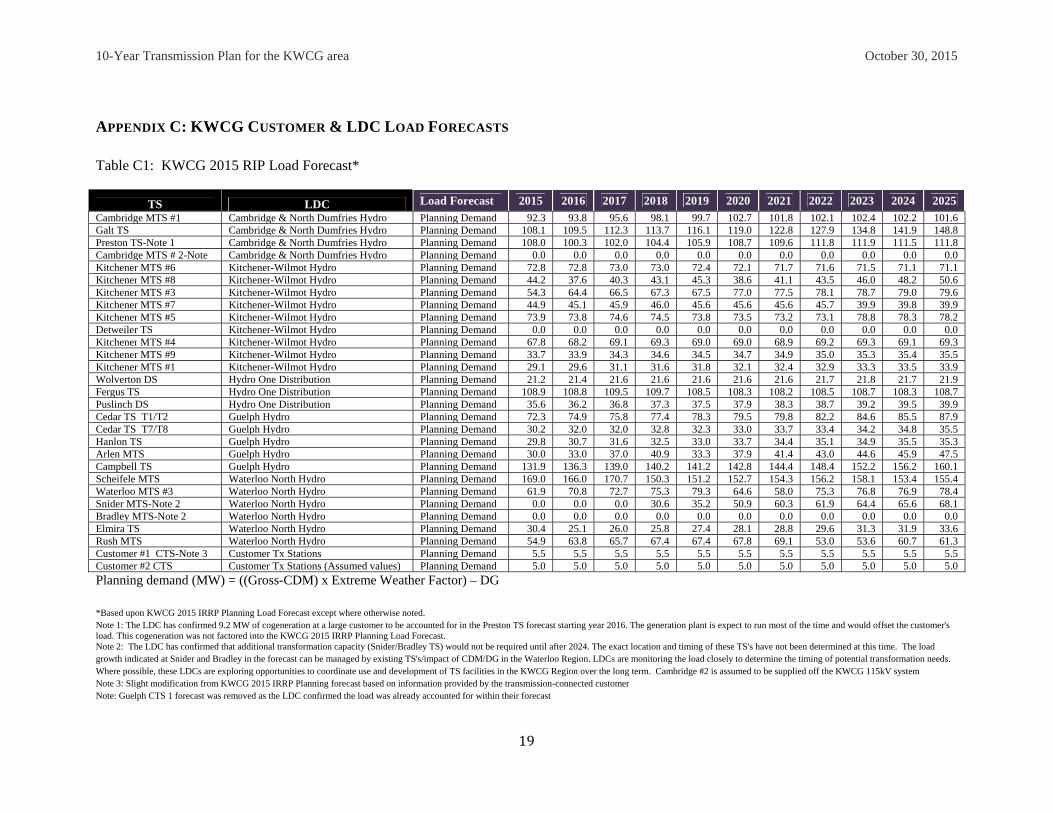
10-Year Transmission Plan for the KWCG area October 30, 2015
19
APPENDIX C: KWCG CUSTOMER & LDC LOAD FORECASTS
Table C1: KWCG 2015 RIP Load Forecast*
TS LDC Load Forecast 2015 2016 2017 2018 2019 2020 2021 2022 2023 2024 2025
Cambridge MTS #1 Cambridge & North Dumfries Hydro Planning Demand 92.3 93.8 95.6 98.1 99.7 102.7 101.8 102.1 102.4 102.2 101.6Galt TS Cambridge & North Dumfries Hydro Planning Demand 108.1 109.5 112.3 113.7 116.1 119.0 122.8 127.9 134.8 141.9 148.8Preston TS-Note 1 Cambridge & North Dumfries Hydro Planning Demand 108.0 100.3 102.0 104.4 105.9 108.7 109.6 111.8 111.9 111.5 111.8Cambridge MTS # 2-Note Cambridge & North Dumfries Hydro Planning Demand 0.0 0.0 0.0 0.0 0.0 0.0 0.0 0.0 0.0 0.0 0.0Kitchener MTS #6 Kitchener-Wilmot Hydro Planning Demand 72.8 72.8 73.0 73.0 72.4 72.1 71.7 71.6 71.5 71.1 71.1Kitchener MTS #8 Kitchener-Wilmot Hydro Planning Demand 44.2 37.6 40.3 43.1 45.3 38.6 41.1 43.5 46.0 48.2 50.6Kitchener MTS #3 Kitchener-Wilmot Hydro Planning Demand 54.3 64.4 66.5 67.3 67.5 77.0 77.5 78.1 78.7 79.0 79.6Kitchener MTS #7 Kitchener-Wilmot Hydro Planning Demand 44.9 45.1 45.9 46.0 45.6 45.6 45.6 45.7 39.9 39.8 39.9Kitchener MTS #5 Kitchener-Wilmot Hydro Planning Demand 73.9 73.8 74.6 74.5 73.8 73.5 73.2 73.1 78.8 78.3 78.2Detweiler TS Kitchener-Wilmot Hydro Planning Demand 0.0 0.0 0.0 0.0 0.0 0.0 0.0 0.0 0.0 0.0 0.0Kitchener MTS #4 Kitchener-Wilmot Hydro Planning Demand 67.8 68.2 69.1 69.3 69.0 69.0 68.9 69.2 69.3 69.1 69.3Kitchener MTS #9 Kitchener-Wilmot Hydro Planning Demand 33.7 33.9 34.3 34.6 34.5 34.7 34.9 35.0 35.3 35.4 35.5Kitchener MTS #1 Kitchener-Wilmot Hydro Planning Demand 29.1 29.6 31.1 31.6 31.8 32.1 32.4 32.9 33.3 33.5 33.9Wolverton DS Hydro One Distribution Planning Demand 21.2 21.4 21.6 21.6 21.6 21.6 21.6 21.7 21.8 21.7 21.9Fergus TS Hydro One Distribution Planning Demand 108.9 108.8 109.5 109.7 108.5 108.3 108.2 108.5 108.7 108.3 108.7Puslinch DS Hydro One Distribution Planning Demand 35.6 36.2 36.8 37.3 37.5 37.9 38.3 38.7 39.2 39.5 39.9Cedar TS T1/T2 Guelph Hydro Planning Demand 72.3 74.9 75.8 77.4 78.3 79.5 79.8 82.2 84.6 85.5 87.9Cedar TS T7/T8 Guelph Hydro Planning Demand 30.2 32.0 32.0 32.8 32.3 33.0 33.7 33.4 34.2 34.8 35.5Hanlon TS Guelph Hydro Planning Demand 29.8 30.7 31.6 32.5 33.0 33.7 34.4 35.1 34.9 35.5 35.3Arlen MTS Guelph Hydro Planning Demand 30.0 33.0 37.0 40.9 33.3 37.9 41.4 43.0 44.6 45.9 47.5Campbell TS Guelph Hydro Planning Demand 131.9 136.3 139.0 140.2 141.2 142.8 144.4 148.4 152.2 156.2 160.1Scheifele MTS Waterloo North Hydro Planning Demand 169.0 166.0 170.7 150.3 151.2 152.7 154.3 156.2 158.1 153.4 155.4Waterloo MTS #3 Waterloo North Hydro Planning Demand 61.9 70.8 72.7 75.3 79.3 64.6 58.0 75.3 76.8 76.9 78.4Snider MTS-Note 2 Waterloo North Hydro Planning Demand 0.0 0.0 0.0 30.6 35.2 50.9 60.3 61.9 64.4 65.6 68.1Bradley MTS-Note 2 Waterloo North Hydro Planning Demand 0.0 0.0 0.0 0.0 0.0 0.0 0.0 0.0 0.0 0.0 0.0Elmira TS Waterloo North Hydro Planning Demand 30.4 25.1 26.0 25.8 27.4 28.1 28.8 29.6 31.3 31.9 33.6Rush MTS Waterloo North Hydro Planning Demand 54.9 63.8 65.7 67.4 67.4 67.8 69.1 53.0 53.6 60.7 61.3Customer #1 CTS-Note 3 Customer Tx Stations Planning Demand 5.5 5.5 5.5 5.5 5.5 5.5 5.5 5.5 5.5 5.5 5.5Customer #2 CTS Customer Tx Stations (Assumed values) Planning Demand 5.0 5.0 5.0 5.0 5.0 5.0 5.0 5.0 5.0 5.0 5.0Planning demand (MW) = ((Gross-CDM) x Extreme Weather Factor) – DG *Based upon KWCG 2015 IRRP Planning Load Forecast except where otherwise noted. Note 1: The LDC has confirmed 9.2 MW of cogeneration at a large customer to be accounted for in the Preston TS forecast starting year 2016. The generation plant is expect to run most of the time and would offset the customer's load. This cogeneration was not factored into the KWCG 2015 IRRP Planning Load Forecast. Note 2: The LDC has confirmed that additional transformation capacity (Snider/Bradley TS) would not be required until after 2024. The exact location and timing of these TS's have not been determined at this time. The load growth indicated at Snider and Bradley in the forecast can be managed by existing TS's/impact of CDM/DG in the Waterloo Region. LDCs are monitoring the load closely to determine the timing of potential transformation needs. Where possible, these LDCs are exploring opportunities to coordinate use and development of TS facilities in the KWCG Region over the long term. Cambridge #2 is assumed to be supplied off the KWCG 115kV system Note 3: Slight modification from KWCG 2015 IRRP Planning forecast based on information provided by the transmission-connected customer Note: Guelph CTS 1 forecast was removed as the LDC confirmed the load was already accounted for within their forecast
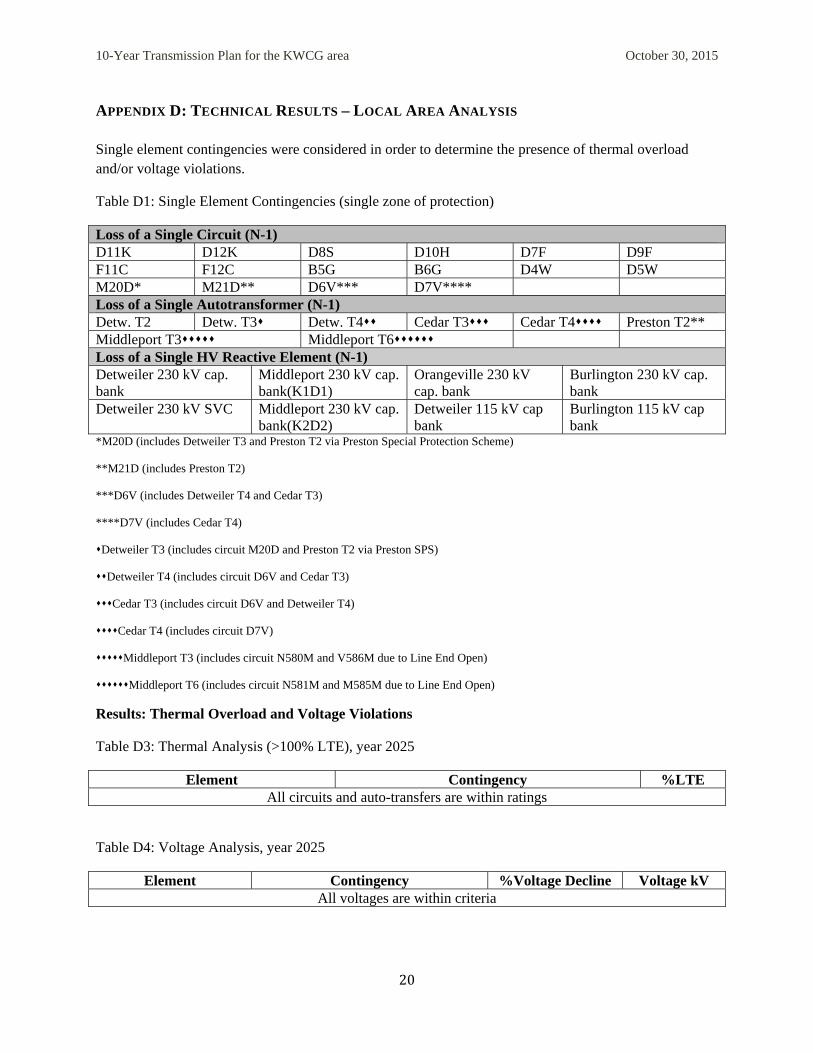
10-Year Transmission Plan for the KWCG area October 30, 2015
20
APPENDIX D: TECHNICAL RESULTS – LOCAL AREA ANALYSIS
Single element contingencies were considered in order to determine the presence of thermal overload and/or voltage violations.
Table D1: Single Element Contingencies (single zone of protection)
Loss of a Single Circuit (N-1) D11K D12K D8S D10H D7F D9F F11C F12C B5G B6G D4W D5W M20D* M21D** D6V*** D7V**** Loss of a Single Autotransformer (N-1) Detw. T2 Detw. T3 Detw. T4 Cedar T3 Cedar T4 Preston T2** Middleport T3 Middleport T6 Loss of a Single HV Reactive Element (N-1) Detweiler 230 kV cap. bank
Middleport 230 kV cap. bank(K1D1)
Orangeville 230 kV cap. bank
Burlington 230 kV cap. bank
Detweiler 230 kV SVC Middleport 230 kV cap. bank(K2D2)
Detweiler 115 kV cap bank
Burlington 115 kV cap bank
*M20D (includes Detweiler T3 and Preston T2 via Preston Special Protection Scheme)
**M21D (includes Preston T2)
***D6V (includes Detweiler T4 and Cedar T3)
****D7V (includes Cedar T4)
Detweiler T3 (includes circuit M20D and Preston T2 via Preston SPS)
Detweiler T4 (includes circuit D6V and Cedar T3)
Cedar T3 (includes circuit D6V and Detweiler T4)
Cedar T4 (includes circuit D7V)
Middleport T3 (includes circuit N580M and V586M due to Line End Open)
Middleport T6 (includes circuit N581M and M585M due to Line End Open)
Results: Thermal Overload and Voltage Violations
Table D3: Thermal Analysis (>100% LTE), year 2025
Element Contingency %LTE All circuits and auto-transfers are within ratings
Table D4: Voltage Analysis, year 2025
Element Contingency %Voltage Decline Voltage kV All voltages are within criteria
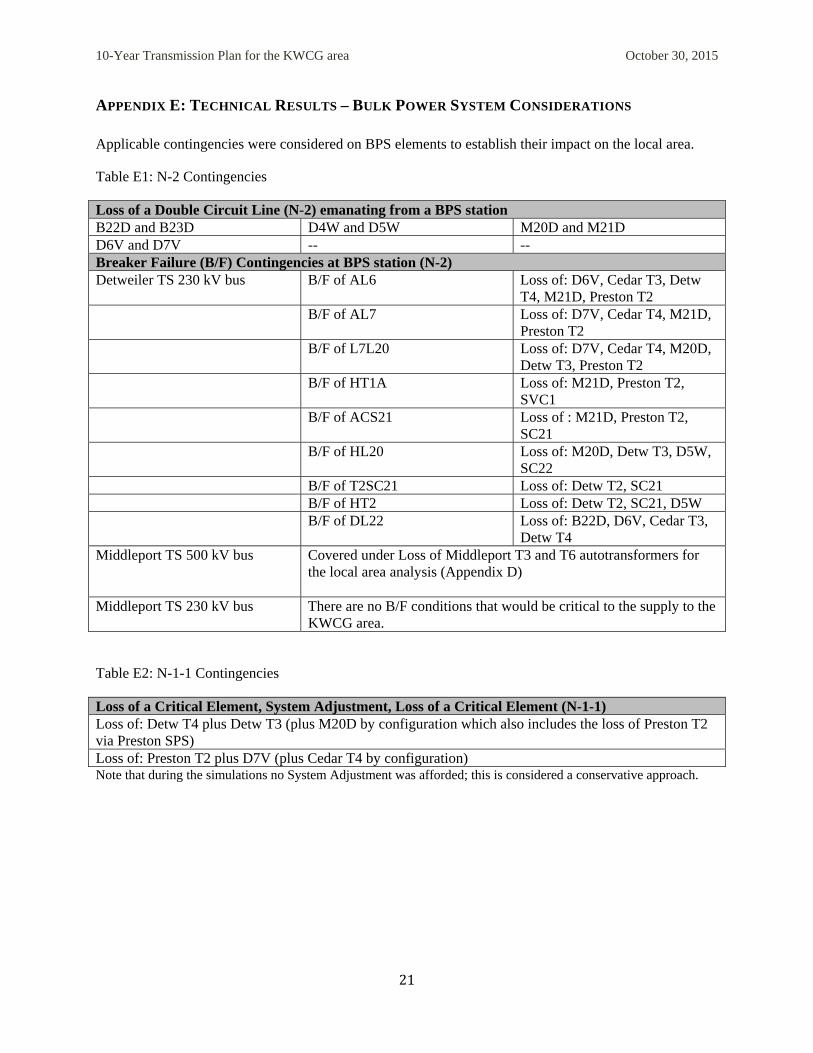
10-Year Transmission Plan for the KWCG area October 30, 2015
21
APPENDIX E: TECHNICAL RESULTS – BULK POWER SYSTEM CONSIDERATIONS
Applicable contingencies were considered on BPS elements to establish their impact on the local area.
Table E1: N-2 Contingencies
Loss of a Double Circuit Line (N-2) emanating from a BPS station B22D and B23D D4W and D5W M20D and M21D D6V and D7V -- -- Breaker Failure (B/F) Contingencies at BPS station (N-2) Detweiler TS 230 kV bus B/F of AL6 Loss of: D6V, Cedar T3, Detw
T4, M21D, Preston T2 B/F of AL7 Loss of: D7V, Cedar T4, M21D,
Preston T2 B/F of L7L20 Loss of: D7V, Cedar T4, M20D,
Detw T3, Preston T2 B/F of HT1A Loss of: M21D, Preston T2,
SVC1 B/F of ACS21 Loss of : M21D, Preston T2,
SC21 B/F of HL20 Loss of: M20D, Detw T3, D5W,
SC22 B/F of T2SC21 Loss of: Detw T2, SC21 B/F of HT2 Loss of: Detw T2, SC21, D5W B/F of DL22 Loss of: B22D, D6V, Cedar T3,
Detw T4 Middleport TS 500 kV bus Covered under Loss of Middleport T3 and T6 autotransformers for
the local area analysis (Appendix D)
Middleport TS 230 kV bus There are no B/F conditions that would be critical to the supply to the KWCG area.
Table E2: N-1-1 Contingencies
Loss of a Critical Element, System Adjustment, Loss of a Critical Element (N-1-1) Loss of: Detw T4 plus Detw T3 (plus M20D by configuration which also includes the loss of Preston T2 via Preston SPS) Loss of: Preston T2 plus D7V (plus Cedar T4 by configuration) Note that during the simulations no System Adjustment was afforded; this is considered a conservative approach.
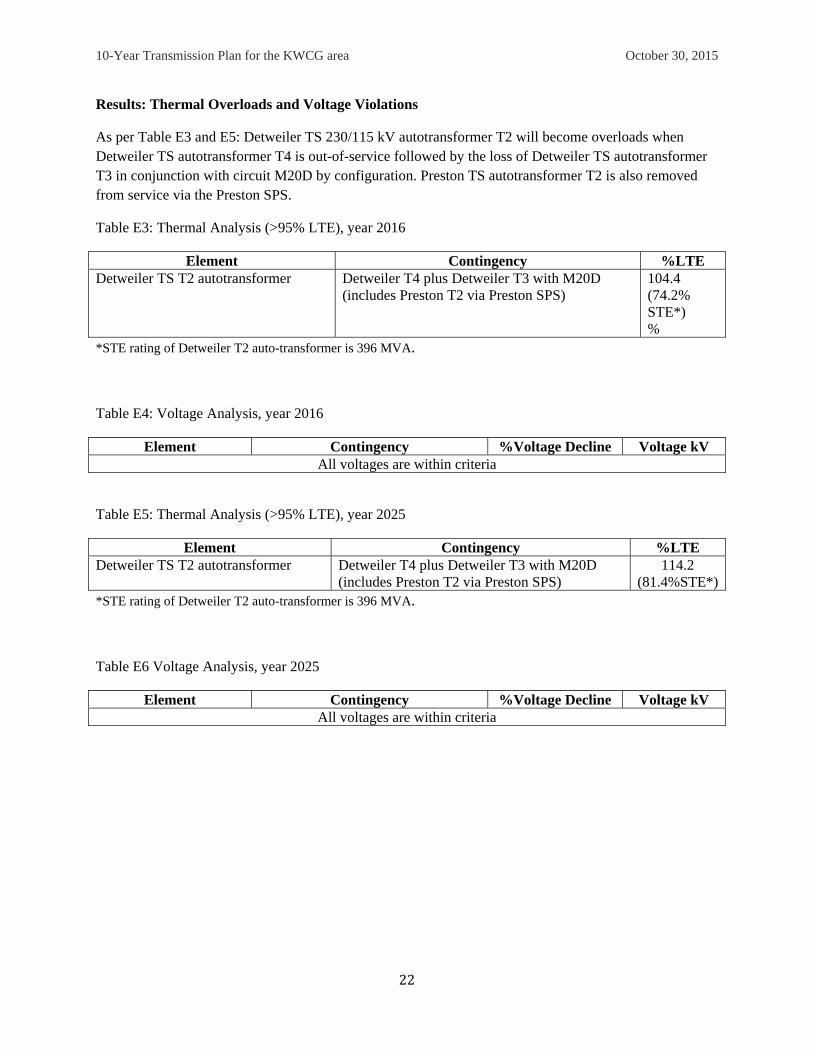
10-Year Transmission Plan for the KWCG area October 30, 2015
22
Results: Thermal Overloads and Voltage Violations
As per Table E3 and E5: Detweiler TS 230/115 kV autotransformer T2 will become overloads when Detweiler TS autotransformer T4 is out-of-service followed by the loss of Detweiler TS autotransformer T3 in conjunction with circuit M20D by configuration. Preston TS autotransformer T2 is also removed from service via the Preston SPS.
Table E3: Thermal Analysis (>95% LTE), year 2016
Element Contingency %LTE Detweiler TS T2 autotransformer Detweiler T4 plus Detweiler T3 with M20D
(includes Preston T2 via Preston SPS) 104.4 (74.2% STE*) %
*STE rating of Detweiler T2 auto-transformer is 396 MVA.
Table E4: Voltage Analysis, year 2016
Element Contingency %Voltage Decline Voltage kV All voltages are within criteria
Table E5: Thermal Analysis (>95% LTE), year 2025
Element Contingency %LTE Detweiler TS T2 autotransformer Detweiler T4 plus Detweiler T3 with M20D
(includes Preston T2 via Preston SPS) 114.2
(81.4%STE*)*STE rating of Detweiler T2 auto-transformer is 396 MVA.
Table E6 Voltage Analysis, year 2025
Element Contingency %Voltage Decline Voltage kV All voltages are within criteria
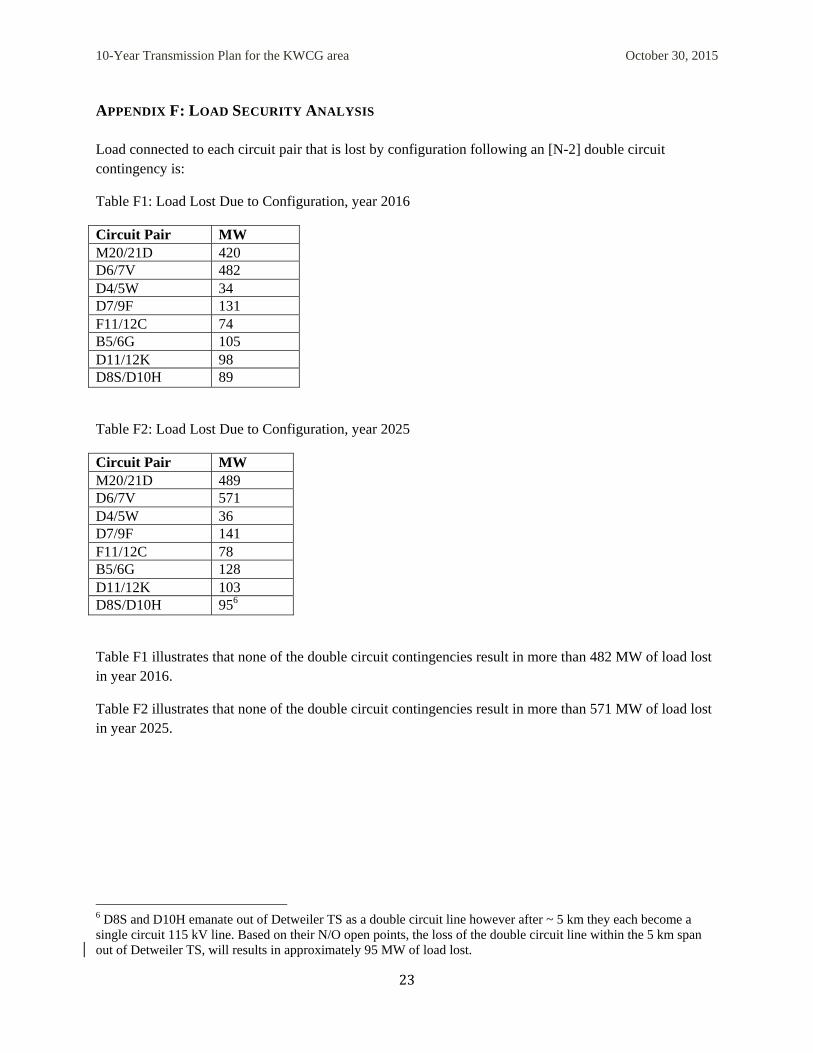
10-Year Transmission Plan for the KWCG area October 30, 2015
23
APPENDIX F: LOAD SECURITY ANALYSIS
Load connected to each circuit pair that is lost by configuration following an [N-2] double circuit contingency is:
Table F1: Load Lost Due to Configuration, year 2016
Circuit Pair MW M20/21D 420 D6/7V 482 D4/5W 34 D7/9F 131 F11/12C 74 B5/6G 105 D11/12K 98 D8S/D10H 89
Table F2: Load Lost Due to Configuration, year 2025
Circuit Pair MW M20/21D 489 D6/7V 571 D4/5W 36 D7/9F 141 F11/12C 78 B5/6G 128 D11/12K 103 D8S/D10H 956
Table F1 illustrates that none of the double circuit contingencies result in more than 482 MW of load lost in year 2016.
Table F2 illustrates that none of the double circuit contingencies result in more than 571 MW of load lost in year 2025.
6 D8S and D10H emanate out of Detweiler TS as a double circuit line however after ~ 5 km they each become a single circuit 115 kV line. Based on their N/O open points, the loss of the double circuit line within the 5 km span out of Detweiler TS, will results in approximately 95 MW of load lost.
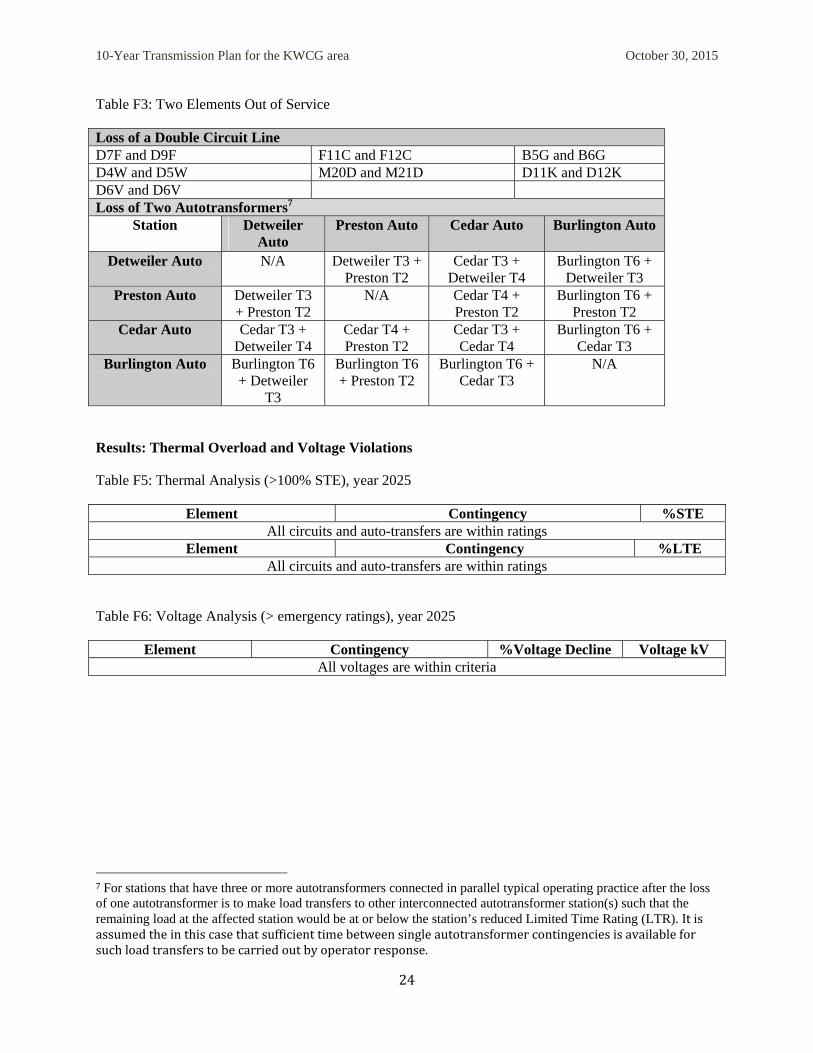
10-Year Transmission Plan for the KWCG area October 30, 2015
24
Table F3: Two Elements Out of Service
Loss of a Double Circuit Line D7F and D9F F11C and F12C B5G and B6G D4W and D5W M20D and M21D D11K and D12K D6V and D6V Loss of Two Autotransformers7
Station Detweiler Auto
Preston Auto Cedar Auto Burlington Auto
Detweiler Auto N/A Detweiler T3 + Preston T2
Cedar T3 + Detweiler T4
Burlington T6 + Detweiler T3
Preston Auto Detweiler T3 + Preston T2
N/A Cedar T4 + Preston T2
Burlington T6 + Preston T2
Cedar Auto Cedar T3 + Detweiler T4
Cedar T4 + Preston T2
Cedar T3 + Cedar T4
Burlington T6 + Cedar T3
Burlington Auto Burlington T6 + Detweiler
T3
Burlington T6 + Preston T2
Burlington T6 + Cedar T3
N/A
Results: Thermal Overload and Voltage Violations
Table F5: Thermal Analysis (>100% STE), year 2025
Element Contingency %STE All circuits and auto-transfers are within ratings
Element Contingency %LTE All circuits and auto-transfers are within ratings
Table F6: Voltage Analysis (> emergency ratings), year 2025
Element Contingency %Voltage Decline Voltage kV All voltages are within criteria
7For stations that have three or more autotransformers connected in parallel typical operating practice after the loss of one autotransformer is to make load transfers to other interconnected autotransformer station(s) such that the remaining load at the affected station would be at or below the station’s reduced Limited Time Rating (LTR). Itisassumedtheinthiscasethatsufficienttimebetweensingleautotransformercontingenciesisavailableforsuchloadtransferstobecarriedoutbyoperatorresponse.
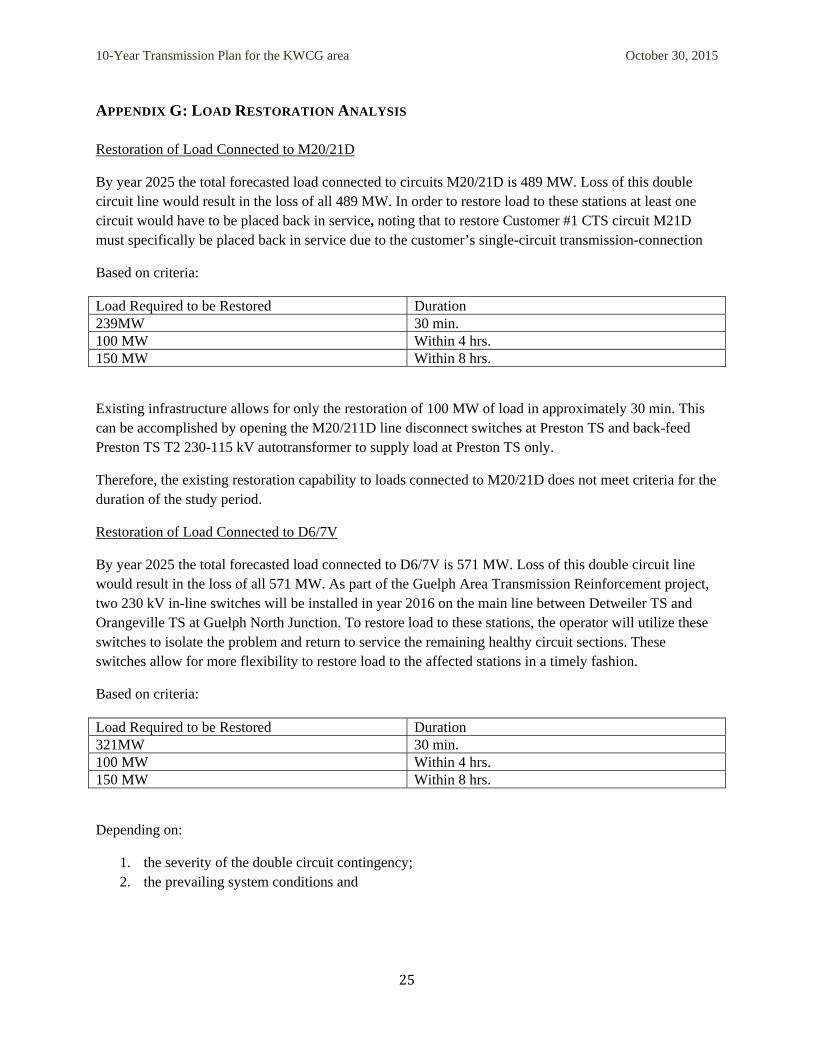
10-Year Transmission Plan for the KWCG area October 30, 2015
25
APPENDIX G: LOAD RESTORATION ANALYSIS
Restoration of Load Connected to M20/21D
By year 2025 the total forecasted load connected to circuits M20/21D is 489 MW. Loss of this double circuit line would result in the loss of all 489 MW. In order to restore load to these stations at least one circuit would have to be placed back in service, noting that to restore Customer #1 CTS circuit M21D must specifically be placed back in service due to the customer’s single-circuit transmission-connection
Based on criteria:
Load Required to be Restored Duration 239MW 30 min. 100 MW Within 4 hrs. 150 MW Within 8 hrs.
Existing infrastructure allows for only the restoration of 100 MW of load in approximately 30 min. This can be accomplished by opening the M20/211D line disconnect switches at Preston TS and back-feed Preston TS T2 230-115 kV autotransformer to supply load at Preston TS only.
Therefore, the existing restoration capability to loads connected to M20/21D does not meet criteria for the duration of the study period.
Restoration of Load Connected to D6/7V
By year 2025 the total forecasted load connected to D6/7V is 571 MW. Loss of this double circuit line would result in the loss of all 571 MW. As part of the Guelph Area Transmission Reinforcement project, two 230 kV in-line switches will be installed in year 2016 on the main line between Detweiler TS and Orangeville TS at Guelph North Junction. To restore load to these stations, the operator will utilize these switches to isolate the problem and return to service the remaining healthy circuit sections. These switches allow for more flexibility to restore load to the affected stations in a timely fashion.
Based on criteria:
Load Required to be Restored Duration 321MW 30 min. 100 MW Within 4 hrs. 150 MW Within 8 hrs.
Depending on:
1. the severity of the double circuit contingency; 2. the prevailing system conditions and
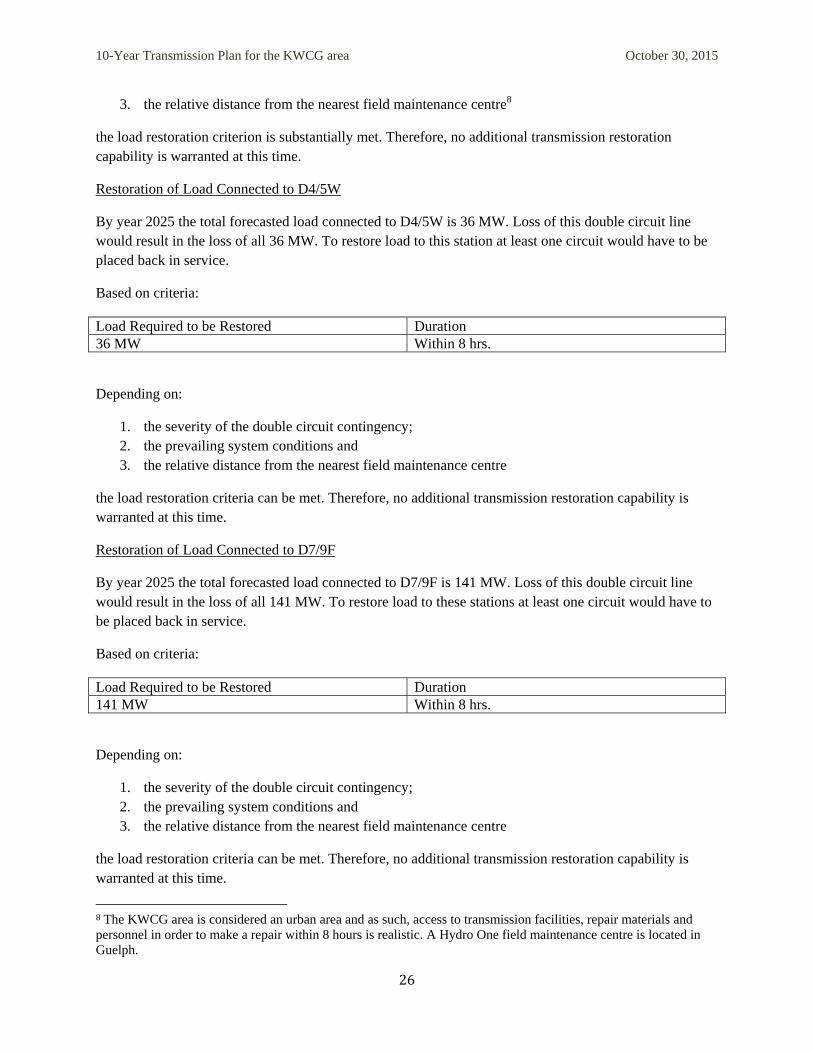
10-Year Transmission Plan for the KWCG area October 30, 2015
26
3. the relative distance from the nearest field maintenance centre8
the load restoration criterion is substantially met. Therefore, no additional transmission restoration capability is warranted at this time.
Restoration of Load Connected to D4/5W
By year 2025 the total forecasted load connected to D4/5W is 36 MW. Loss of this double circuit line would result in the loss of all 36 MW. To restore load to this station at least one circuit would have to be placed back in service.
Based on criteria:
Load Required to be Restored Duration 36 MW Within 8 hrs.
Depending on:
1. the severity of the double circuit contingency; 2. the prevailing system conditions and 3. the relative distance from the nearest field maintenance centre
the load restoration criteria can be met. Therefore, no additional transmission restoration capability is warranted at this time.
Restoration of Load Connected to D7/9F
By year 2025 the total forecasted load connected to D7/9F is 141 MW. Loss of this double circuit line would result in the loss of all 141 MW. To restore load to these stations at least one circuit would have to be placed back in service.
Based on criteria:
Load Required to be Restored Duration 141 MW Within 8 hrs.
Depending on:
1. the severity of the double circuit contingency; 2. the prevailing system conditions and 3. the relative distance from the nearest field maintenance centre
the load restoration criteria can be met. Therefore, no additional transmission restoration capability is warranted at this time.
8The KWCG area is considered an urban area and as such, access to transmission facilities, repair materials and personnel in order to make a repair within 8 hours is realistic. A Hydro One field maintenance centre is located in Guelph.

10-Year Transmission Plan for the KWCG area October 30, 2015
27
Restoration of Load Connected to F11/12C
By year 2025 the total forecasted load connected to F11/12C is 78 MW. Loss of this double circuit line would result in the loss of all 78 MW. To restore load to these stations at least one circuit would have to be placed back in service.
Based on criteria:
Load Required to be Restored Duration 78 MW Within 8 hrs.
Depending on:
1. the severity of the double circuit contingency; 2. the prevailing system conditions and 3. the relative distance from the nearest field maintenance centre
the load restoration criteria can be met. Therefore, no additional transmission restoration capability is warranted at this time.
Restoration of Load Connected to B5/6G
By year 2025 the total forecasted load connected to B5/6G is 128 MW. Loss of this double circuit line would result in the loss of all 128 MW. To restore load to Enbridge Westover CTS’s circuit B5G must be placed back in service due to the CTS’s single-circuit transmission connection. To restore load at the other stations at least one circuit would to be placed back in service.
Based on criteria:
Load Required to be Restored Duration 128 MW Within 8 hrs.
Depending on:
1. the severity of the double circuit contingency; 2. the prevailing system conditions and 3. the relative distance from the nearest field maintenance centre
the load restoration criteria can be met. Therefore, no additional transmission restoration capability is warranted at this time.
Restoration of Load Connected to D11/12K
The total forecasted load serviced by radial circuits D11/12K will not exceed 103 MW by 2025. Loss of this double circuit line would result in the loss of all 103 MW. To restore load to these stations at least one circuit would have to be placed back in service.
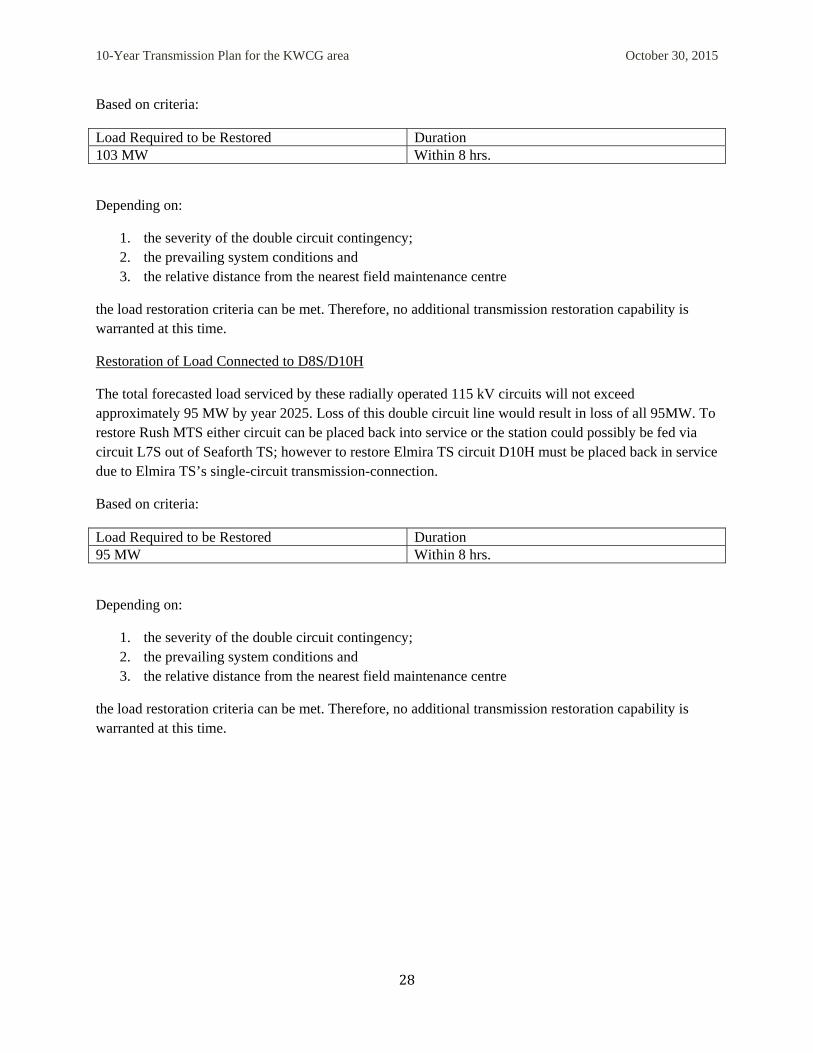
10-Year Transmission Plan for the KWCG area October 30, 2015
28
Based on criteria:
Load Required to be Restored Duration 103 MW Within 8 hrs.
Depending on:
1. the severity of the double circuit contingency; 2. the prevailing system conditions and 3. the relative distance from the nearest field maintenance centre
the load restoration criteria can be met. Therefore, no additional transmission restoration capability is warranted at this time.
Restoration of Load Connected to D8S/D10H
The total forecasted load serviced by these radially operated 115 kV circuits will not exceed approximately 95 MW by year 2025. Loss of this double circuit line would result in loss of all 95MW. To restore Rush MTS either circuit can be placed back into service or the station could possibly be fed via circuit L7S out of Seaforth TS; however to restore Elmira TS circuit D10H must be placed back in service due to Elmira TS’s single-circuit transmission-connection.
Based on criteria:
Load Required to be Restored Duration 95 MW Within 8 hrs.
Depending on:
1. the severity of the double circuit contingency; 2. the prevailing system conditions and 3. the relative distance from the nearest field maintenance centre
the load restoration criteria can be met. Therefore, no additional transmission restoration capability is warranted at this time.
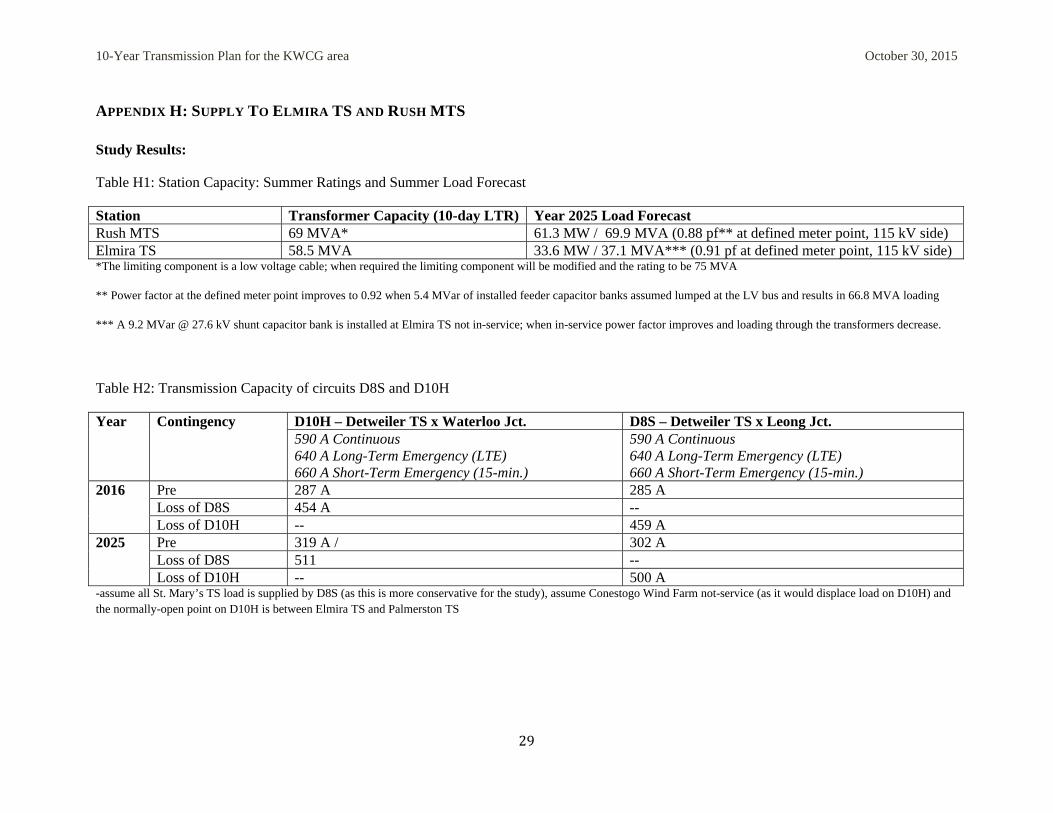
10-Year Transmission Plan for the KWCG area October 30, 2015
29
APPENDIX H: SUPPLY TO ELMIRA TS AND RUSH MTS
Study Results:
Table H1: Station Capacity: Summer Ratings and Summer Load Forecast
Station Transformer Capacity (10-day LTR) Year 2025 Load Forecast Rush MTS 69 MVA* 61.3 MW / 69.9 MVA (0.88 pf** at defined meter point, 115 kV side) Elmira TS 58.5 MVA 33.6 MW / 37.1 MVA*** (0.91 pf at defined meter point, 115 kV side) *The limiting component is a low voltage cable; when required the limiting component will be modified and the rating to be 75 MVA
** Power factor at the defined meter point improves to 0.92 when 5.4 MVar of installed feeder capacitor banks assumed lumped at the LV bus and results in 66.8 MVA loading
*** A 9.2 MVar @ 27.6 kV shunt capacitor bank is installed at Elmira TS not in-service; when in-service power factor improves and loading through the transformers decrease.
Table H2: Transmission Capacity of circuits D8S and D10H
Year Contingency D10H – Detweiler TS x Waterloo Jct. D8S – Detweiler TS x Leong Jct. 590 A Continuous 640 A Long-Term Emergency (LTE) 660 A Short-Term Emergency (15-min.)
590 A Continuous 640 A Long-Term Emergency (LTE) 660 A Short-Term Emergency (15-min.)
2016 Pre 287 A 285 A Loss of D8S 454 A -- Loss of D10H -- 459 A
2025 Pre 319 A / 302 A Loss of D8S 511 -- Loss of D10H -- 500 A
-assume all St. Mary’s TS load is supplied by D8S (as this is more conservative for the study), assume Conestogo Wind Farm not-service (as it would displace load on D10H) and the normally-open point on D10H is between Elmira TS and Palmerston TS
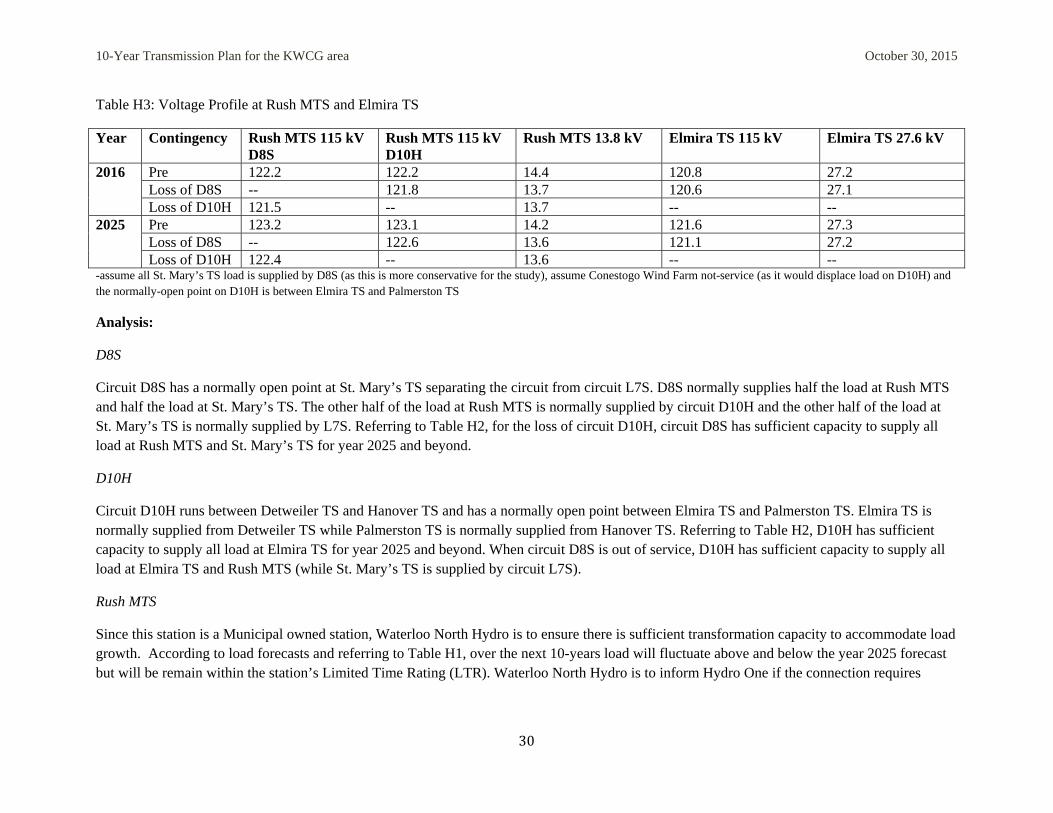
10-Year Transmission Plan for the KWCG area October 30, 2015
30
Table H3: Voltage Profile at Rush MTS and Elmira TS
Year Contingency Rush MTS 115 kV D8S
Rush MTS 115 kV D10H
Rush MTS 13.8 kV Elmira TS 115 kV Elmira TS 27.6 kV
2016 Pre 122.2 122.2 14.4 120.8 27.2 Loss of D8S -- 121.8 13.7 120.6 27.1 Loss of D10H 121.5 -- 13.7 -- --
2025 Pre 123.2 123.1 14.2 121.6 27.3 Loss of D8S -- 122.6 13.6 121.1 27.2 Loss of D10H 122.4 -- 13.6 -- --
-assume all St. Mary’s TS load is supplied by D8S (as this is more conservative for the study), assume Conestogo Wind Farm not-service (as it would displace load on D10H) and the normally-open point on D10H is between Elmira TS and Palmerston TS
Analysis:
D8S
Circuit D8S has a normally open point at St. Mary’s TS separating the circuit from circuit L7S. D8S normally supplies half the load at Rush MTS and half the load at St. Mary’s TS. The other half of the load at Rush MTS is normally supplied by circuit D10H and the other half of the load at St. Mary’s TS is normally supplied by L7S. Referring to Table H2, for the loss of circuit D10H, circuit D8S has sufficient capacity to supply all load at Rush MTS and St. Mary’s TS for year 2025 and beyond.
D10H
Circuit D10H runs between Detweiler TS and Hanover TS and has a normally open point between Elmira TS and Palmerston TS. Elmira TS is normally supplied from Detweiler TS while Palmerston TS is normally supplied from Hanover TS. Referring to Table H2, D10H has sufficient capacity to supply all load at Elmira TS for year 2025 and beyond. When circuit D8S is out of service, D10H has sufficient capacity to supply all load at Elmira TS and Rush MTS (while St. Mary’s TS is supplied by circuit L7S).
Rush MTS
Since this station is a Municipal owned station, Waterloo North Hydro is to ensure there is sufficient transformation capacity to accommodate load growth. According to load forecasts and referring to Table H1, over the next 10-years load will fluctuate above and below the year 2025 forecast but will be remain within the station’s Limited Time Rating (LTR). Waterloo North Hydro is to inform Hydro One if the connection requires
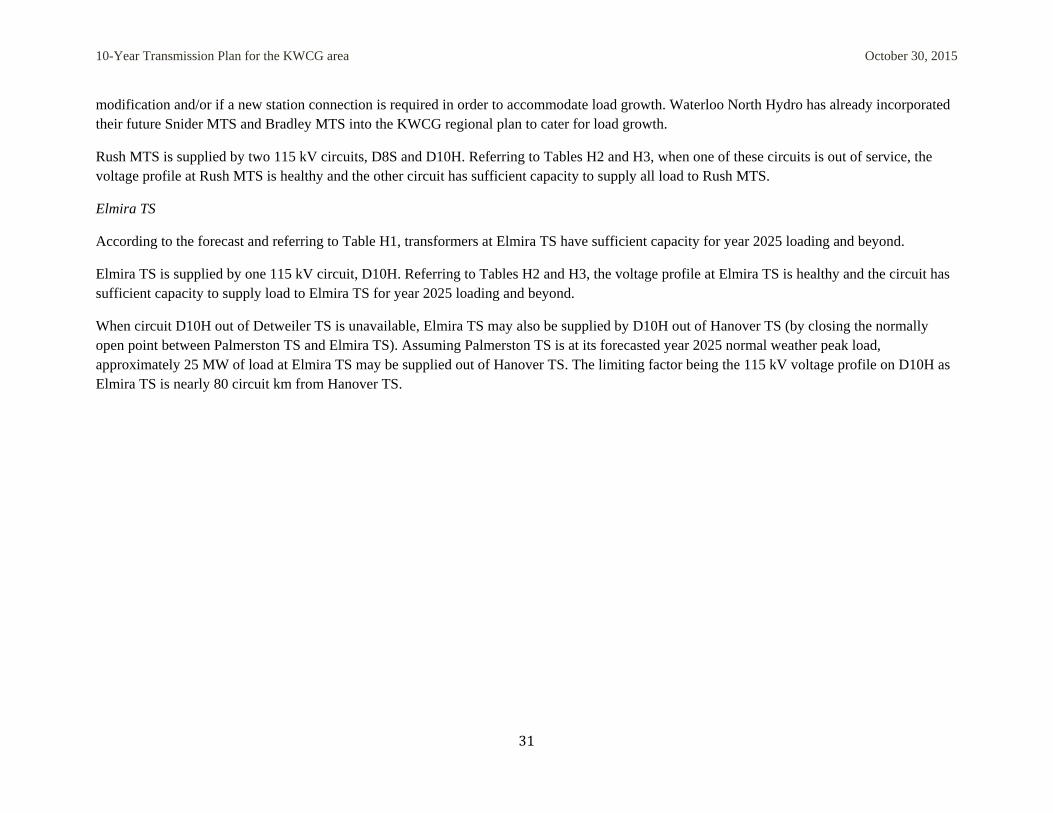
10-Year Transmission Plan for the KWCG area October 30, 2015
31
modification and/or if a new station connection is required in order to accommodate load growth. Waterloo North Hydro has already incorporated their future Snider MTS and Bradley MTS into the KWCG regional plan to cater for load growth.
Rush MTS is supplied by two 115 kV circuits, D8S and D10H. Referring to Tables H2 and H3, when one of these circuits is out of service, the voltage profile at Rush MTS is healthy and the other circuit has sufficient capacity to supply all load to Rush MTS.
Elmira TS
According to the forecast and referring to Table H1, transformers at Elmira TS have sufficient capacity for year 2025 loading and beyond.
Elmira TS is supplied by one 115 kV circuit, D10H. Referring to Tables H2 and H3, the voltage profile at Elmira TS is healthy and the circuit has sufficient capacity to supply load to Elmira TS for year 2025 loading and beyond.
When circuit D10H out of Detweiler TS is unavailable, Elmira TS may also be supplied by D10H out of Hanover TS (by closing the normally open point between Palmerston TS and Elmira TS). Assuming Palmerston TS is at its forecasted year 2025 normal weather peak load, approximately 25 MW of load at Elmira TS may be supplied out of Hanover TS. The limiting factor being the 115 kV voltage profile on D10H as Elmira TS is nearly 80 circuit km from Hanover TS.

<Blank Page>

Appendix E:
KWCG Needs Assessment Report (2018)
Page 1
Hydro One Networks Inc.483 Bay StreetToronto, OntarioM5G 2P5
Prepared by: KWCG Region Study Team
NEEDS ASSESSMENT REPORT
Kitchener - Waterloo - Cambridge - Guelph (KWCG) Region
Date: December 19, 2018
KWCG Region – Needs Assessment December 19, 2018
Page 2
Disclaimer
This Needs Assessment Report was prepared for the purpose of identifying potential needs in the KWCG Region and to recommend which need may require further assessment and/or regional coordination to develop a preferred plan. The results reported in this Needs Assessment are based on the input and information provided by the Study Team.
The Study Team participants, their respective affiliated organizations, and Hydro One Networks Inc. (collectively, “the Authors”) shall not, under any circumstances whatsoever, be liable to each other, to any third party for whom the Needs Assessment Report was prepared (“the Intended Third Parties”) or to any other third party reading or receiving the Needs Assessment Report (“the Other Third Parties”). The Authors, Intended Third Parties and Other Third Parties acknowledge and agree that: (a) the Authors make no representations or warranties (express, implied, statutory or otherwise) as to this document or its contents, including, without limitation, the accuracy or completeness of the information therein; (b) the Authors, Intended Third Parties and Other Third Parties and their respective employees, directors and agents (the “Representatives”) shall be responsible for their respective use of the document and any conclusions derived from its contents; (c) and the Authors will not be liable for any damages resulting from or in any way related to the reliance on, acceptance or use of the document or its contents by the Authors, Intended Third Parties or Other Third Parties or their respective Representatives.
KWCG Region – Needs Assessment December 19, 2018
Page 3
Executive Summary
REGION Kitchener - Waterloo - Cambridge - Guelph (KWCG) Region
LEAD Hydro One Networks Inc. (“HONI”)
START DATE September 17, 2018 END DATE December 19, 2018
1. INTRODUCTION
The first cycle of the Regional Planning process for the KWCG Region an Integrated Regional Resource Plan (“IRRP”) was published in April 2015 which identified a number of near- and mid-term needs in the KWCG region. The planning process was completed in December 2015 with the publication of the Regional Infrastructure Plan (“RIP”) which provided a description of needs and recommendations of preferred wires plans to address near-term needs. The RIP also identified some near- and mid-term needs that will be reviewed during this Regional Planning cycle.The purpose of this Needs Assessment (“NA”) is to identify any new needs and to reaffirm needs identified in the previous KWCG Regional Planning cycle.
2. REGIONAL ISSUE/TRIGGER
In accordance with the Regional Planning process, the regional planning cycle should be triggered at least every five years. In light of the timing of the needs identified in the previous Integrated Regional Resource Plan (“IRRP”) and RIP reports as well as new replacement/ refurbishment needs in the KWCG Region, the 2nd Regional Planning cycle was triggered for this Region.
3. SCOPE OF NEEDS ASSESSMENT
The scope of this NA includes:
Review and reaffirm needs/plans identified in the previous RIP; and
Identification and assessment of system capacity, reliability, operation, and aging infrastructure needs.
The Study Team may also identify additional needs during the next phases of the planning process, namely Scoping Assessment (“SA”), IRRP and RIP, based on updated information available at that time.
4. INPUTS/DATA
The Study Team representatives from Local Distribution Companies (“LDC”), the Independent Electricity System Operator (“IESO”), and Hydro One provided input and relevant information for the KWCG Region regarding capacity needs, reliability needs, operational issues, and major assets/facilities approaching end-of-life (“EOL”). In addition, community energy plans in the region have also been scanned and reviewed.
5. ASSESSMENT METHODOLOGY
The assessment’s primary objective is to identify the electrical infrastructure needs, recommend further mitigation or action plan(s) to address these needs, and determine whether further regional coordination or broader study would be beneficial. The assessment reviewed available information including load forecasts, conservation and demand management (“CDM”) and distributed generation (“DG”) forecasts, reliability needs, operational issues, and major high
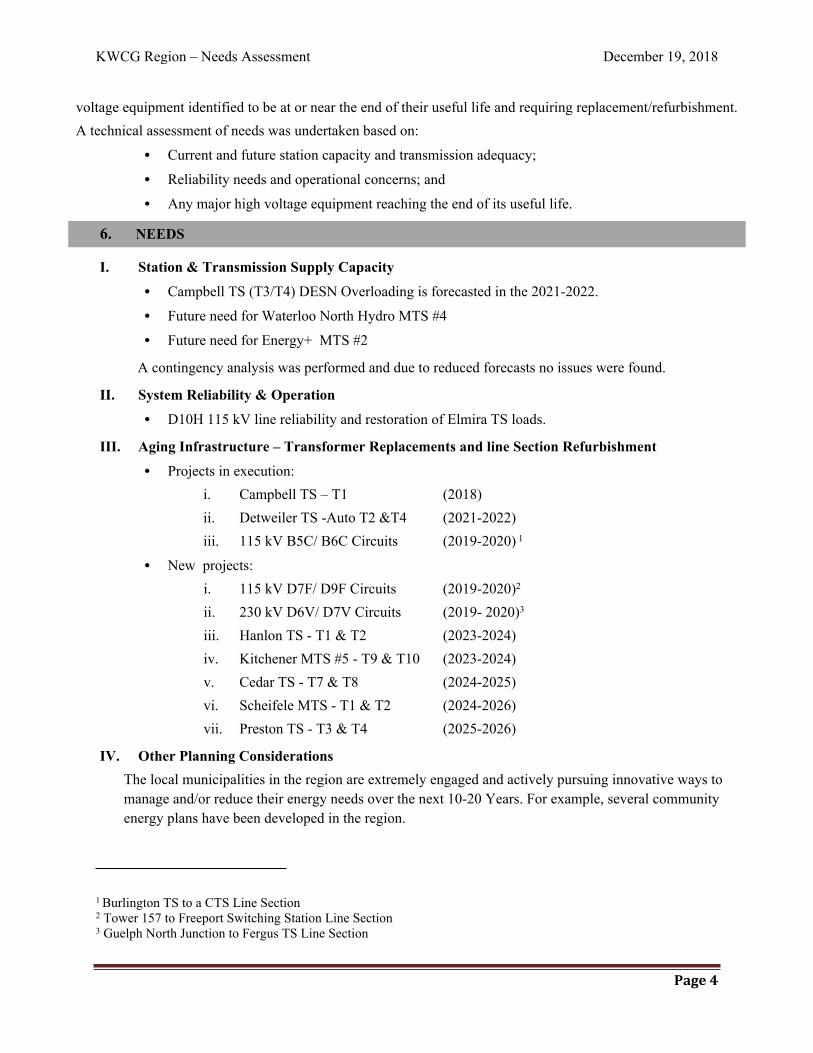
KWCG Region – Needs Assessment December 19, 2018
Page 4
voltage equipment identified to be at or near the end of their useful life and requiring replacement/refurbishment.A technical assessment of needs was undertaken based on:
Current and future station capacity and transmission adequacy;
Reliability needs and operational concerns; and
Any major high voltage equipment reaching the end of its useful life.
6. NEEDS
I. Station & Transmission Supply Capacity
Campbell TS (T3/T4) DESN Overloading is forecasted in the 2021-2022.
Future need for Waterloo North Hydro MTS #4
Future need for Energy+ MTS #2
A contingency analysis was performed and due to reduced forecasts no issues were found.
II. System Reliability & Operation
D10H 115 kV line reliability and restoration of Elmira TS loads.
III. Aging Infrastructure – Transformer Replacements and line Section Refurbishment
Projects in execution:i. Campbell TS – T1 (2018)ii. Detweiler TS -Auto T2 &T4 (2021-2022)iii. 115 kV B5C/ B6C Circuits (2019-2020) 1
New projects: i. 115 kV D7F/ D9F Circuits (2019-2020)2
ii. 230 kV D6V/ D7V Circuits (2019- 2020)3
iii. Hanlon TS - T1 & T2 (2023-2024)iv. Kitchener MTS #5 - T9 & T10 (2023-2024) v. Cedar TS - T7 & T8 (2024-2025)vi. Scheifele MTS - T1 & T2 (2024-2026)vii. Preston TS - T3 & T4 (2025-2026)
IV. Other Planning ConsiderationsThe local municipalities in the region are extremely engaged and actively pursuing innovative ways to manage and/or reduce their energy needs over the next 10-20 Years. For example, several community energy plans have been developed in the region.
1 Burlington TS to a CTS Line Section2 Tower 157 to Freeport Switching Station Line Section3 Guelph North Junction to Fergus TS Line Section
KWCG Region – Needs Assessment December 19, 2018
Page 5
7. RECOMMENDATIONS
The Study Team’s recommendations for the above identified needs are as follows:
a) The replacement of EOL station supply transformers at Campbell TS, Hanlon TS, Cedar TS, Kitchener MTS #5 and Preston TS along with the EOL auto transformers at Detweiler to proceed. Hydro One and the concerned LDCs will coordinate replacement of above equipment and develop replacement plans.
b) The refurbishment of EOL line sections 115 kV B5C/ B6C, D7F/ D9F and 230 kV D6V/ D7V to proceed. Hydro One will coordinate refurbishment of these line sections with affected LDCs/ Customer.
c) Hydro One will continue to work with Waterloo North Hydro Inc. to address the supply reliability issue at Elmira TS.
d) The Study Team has recommended that Hydro One Transmission and the Guelph Hydro Electric System Inc. to closely monitor the loading at the T3/T4 Campbell TS DESN and to balance the loads between these DESNs when required.
e) The Study Team recommends that the supply capacity needs with regards to Energy + MTS #2 and WNH MTS #4 be further assessed for optimization in the SA phase of regional planning. Once the optimization options are complete, Waterloo North Hydro and Energy+ shall conduct a technical and economic assessment in consultation with Hydro One.
f) The Study Team has recommended that community energy plans will be further considered in the SA phase of the regional planning process.
KWCG Region – Needs Assessment December 19, 2018
Page 6
TABLE OF CONTENTS1 Introduction ...........................................................................................................................................72 Regional Issue/Trigger ..........................................................................................................................83 Scope of Needs Assessment..................................................................................................................84 Regional Description and Connection Configuration ...........................................................................85 Inputs and Data ...................................................................................................................................116 Assessment Methodology ...................................................................................................................117 Needs...................................................................................................................................................128 Conclusion and Recommendations .....................................................................................................249 References ...........................................................................................................................................25Appendix A: KWCG Region Non-Coincident Summer Load Forecast......................................................26Appendix B: Lists of Step-Down Transformer Stations..............................................................................28Appendix C: Lists of Transmission Circuits................................................................................................29Appendix D: Lists of LDCs in the KWCG Region .....................................................................................30Appendix E: Acronyms................................................................................................................................31
List of Tables and Figures
Table 1: KWCG Region Study Team Participants ........................................................................................7Table 2: Needs Identified in the Previous Regional Planning Cycle...........................................................12Table 3: End-of-Life Equipment – KWCG Region.....................................................................................13
Figure 1: Geographical Area of the KWCG Region with Electrical Layout.................................................9Figure 2: KWCG Region (Single Line Diagram) ........................................................................................10Figure 3: Burlington TS to Harper’s Jct. to CTS B5C/ B6C Line Sections ................................................16Figure 5: Tower #157 Jct. to Freeport SS F11C/ F12C Line Section..........................................................17Figure 4: Guelph North Jct. to Fergus TS D6V/ D7V Line Section............................................................18Figure 6: D10H 115 kV Line (Burlington TS to Elmira TS).......................................................................22
KWCG Region – Needs Assessment December 19, 2018
Page 7
1 INTRODUCTION
The first cycle of the Regional Planning process for the KWCG Region was completed in December 2015 with the publication of the Regional Infrastructure Plan (“RIP”). The RIP provided a description of needs and recommendations of preferred wires plans to address near- and medium-term needs. Waterloo North Hydro MTS #4 was the only need to be reviewed in this planning cycle.
The purpose of this Needs Assessment (“NA”) is to identify new needs and to reconfirm needs identified in the previous KWCG regional planning cycle. Since the previous regional planning cycle, some new needs in the region have been identified.
This report was prepared by the KWCG Region Study Team (“Study Team”), led by Hydro One Networks Inc. Participants of the Study Team are listed below in Table 1. The report presents the results of the assessment based on information provided by the Hydro One, the Local Distribution Companies (“LDC”) and the Independent Electricity System Operator (“IESO”).
Table 1: KWCG Region Study Team Participants
Company
Centre Wellington Hydro
Energy+
Guelph Hydro Electric System Inc.
Halton Hills Hydro
Hydro One Networks Inc. (Lead Transmitter)
Hydro One Networks Inc. (Distribution)
Independent Electricity System Operator (“IESO”)
Kitchener Wilmot Hydro Inc.
Milton Hydro
Waterloo North Hydro Inc.
Wellington North Power Inc.
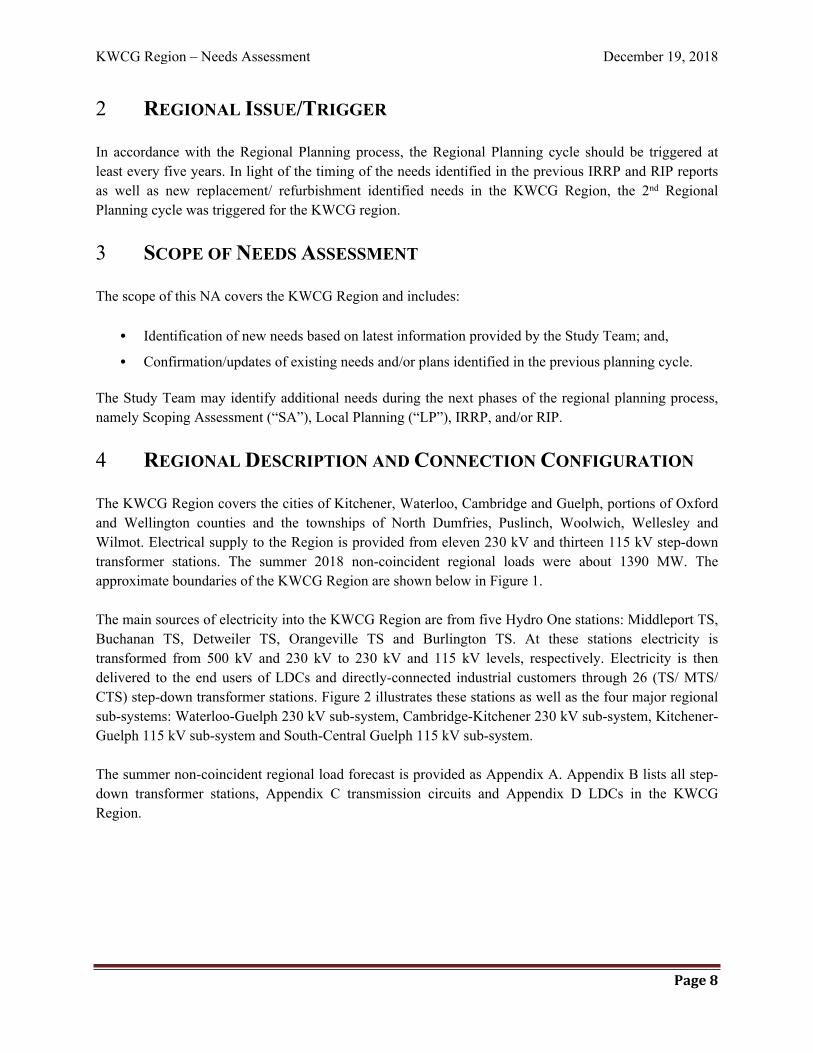
KWCG Region – Needs Assessment December 19, 2018
Page 8
2 REGIONAL ISSUE/TRIGGER
In accordance with the Regional Planning process, the Regional Planning cycle should be triggered at least every five years. In light of the timing of the needs identified in the previous IRRP and RIP reports as well as new replacement/ refurbishment identified needs in the KWCG Region, the 2nd Regional Planning cycle was triggered for the KWCG region.
3 SCOPE OF NEEDS ASSESSMENT
The scope of this NA covers the KWCG Region and includes:
Identification of new needs based on latest information provided by the Study Team; and,
Confirmation/updates of existing needs and/or plans identified in the previous planning cycle.
The Study Team may identify additional needs during the next phases of the regional planning process, namely Scoping Assessment (“SA”), Local Planning (“LP”), IRRP, and/or RIP.
4 REGIONAL DESCRIPTION AND CONNECTION CONFIGURATION
The KWCG Region covers the cities of Kitchener, Waterloo, Cambridge and Guelph, portions of Oxford and Wellington counties and the townships of North Dumfries, Puslinch, Woolwich, Wellesley and Wilmot. Electrical supply to the Region is provided from eleven 230 kV and thirteen 115 kV step-down transformer stations. The summer 2018 non-coincident regional loads were about 1390 MW. The approximate boundaries of the KWCG Region are shown below in Figure 1.
The main sources of electricity into the KWCG Region are from five Hydro One stations: Middleport TS, Buchanan TS, Detweiler TS, Orangeville TS and Burlington TS. At these stations electricity is transformed from 500 kV and 230 kV to 230 kV and 115 kV levels, respectively. Electricity is then delivered to the end users of LDCs and directly-connected industrial customers through 26 (TS/ MTS/ CTS) step-down transformer stations. Figure 2 illustrates these stations as well as the four major regional sub-systems: Waterloo-Guelph 230 kV sub-system, Cambridge-Kitchener 230 kV sub-system, Kitchener-Guelph 115 kV sub-system and South-Central Guelph 115 kV sub-system.
The summer non-coincident regional load forecast is provided as Appendix A. Appendix B lists all step-down transformer stations, Appendix C transmission circuits and Appendix D LDCs in the KWCG Region.
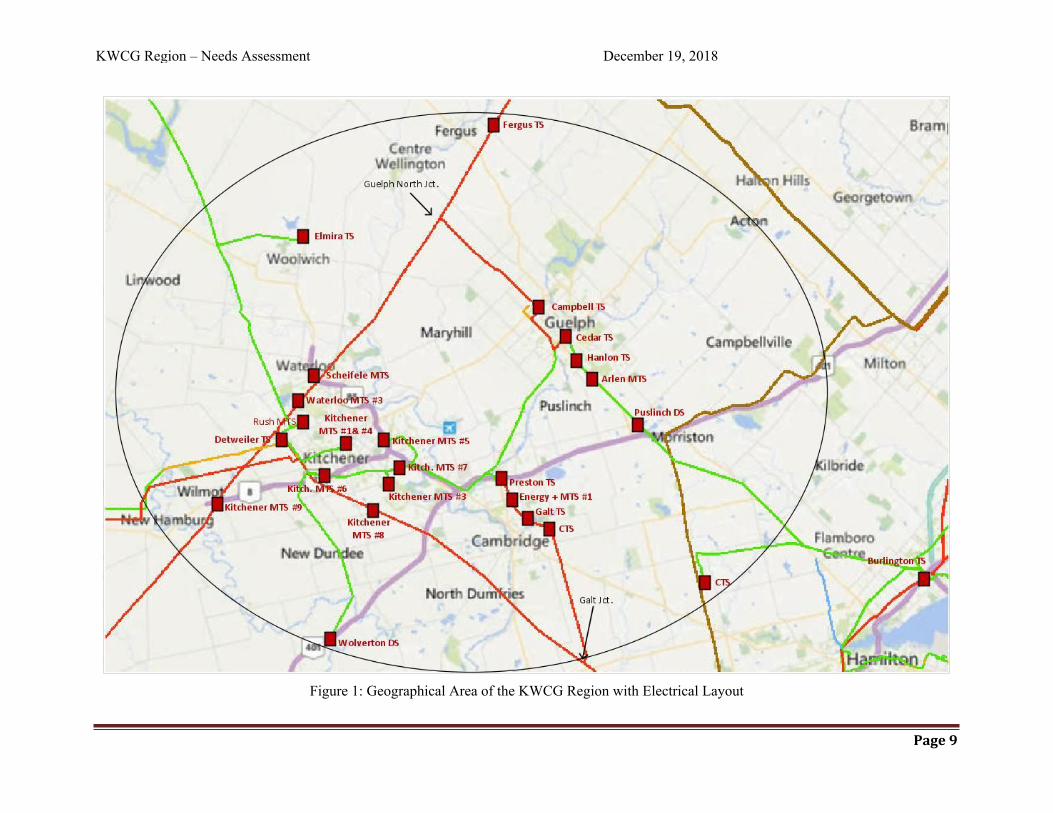
KWCG Region – Needs Assessment December 19, 2018
Page 9
Figure 1: Geographical Area of the KWCG Region with Electrical Layout
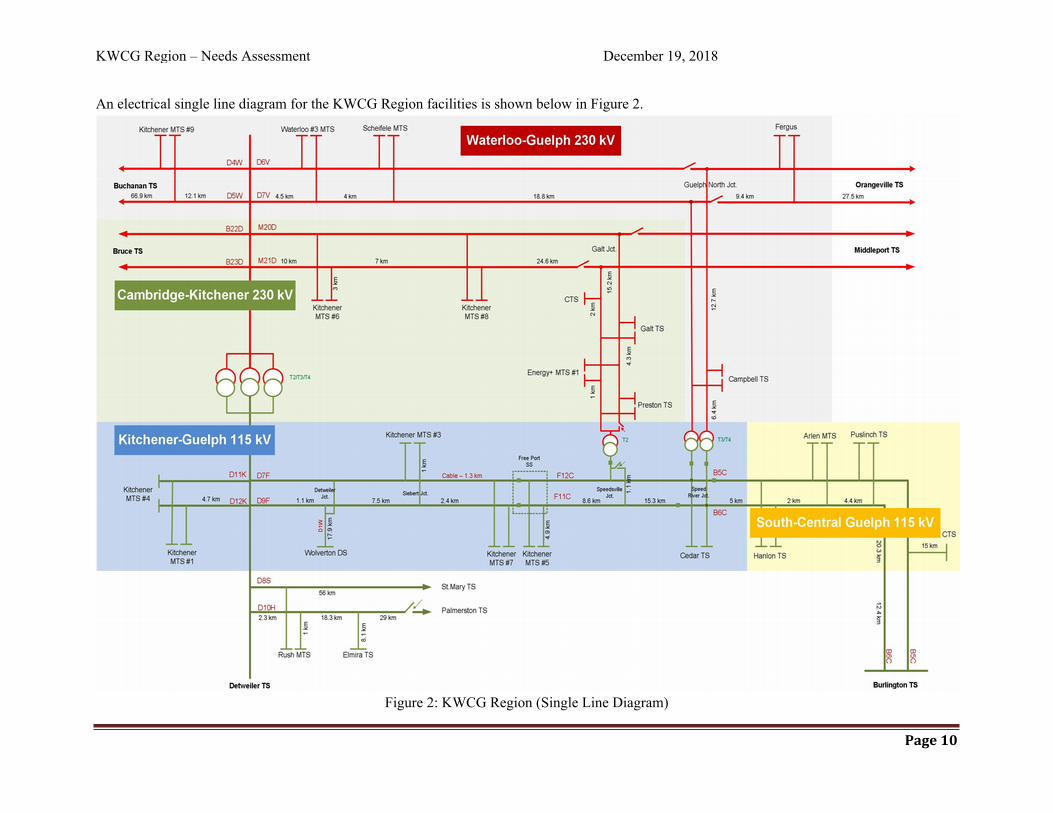
KWCG Region – Needs Assessment December 19, 2018
Page 10
An electrical single line diagram for the KWCG Region facilities is shown below in Figure 2.
Figure 2: KWCG Region (Single Line Diagram)
KWCG Region – Needs Assessment December 19, 2018
Page 11
5 INPUTS AND DATA
Study Team participants, including representatives from LDCs, IESO, and Hydro One provided information and input for the KWCG Region NA. The information provided includes the following:
KWCG Load Forecast for all supply stations;
Known capacity and reliability needs, operating issues, and/or major assets approaching the end of their useful life (“EOL”); and
Planned/foreseen transmission and distribution investments that are relevant to regional planning for the KWCG Region.
6 ASSESSMENT METHODOLOGY
The following methodology and assumptions are made in this Needs Assessment:
Information gathering included:
i. Load forecast: The relevant LDCs provided load forecasts for all the stations supplying their loads in the KWCG region for the 10 year study period. The IESO provided a Conservation and Demand Management (“CDM”) and Distributed Generation (“DG”) forecast for the KWCG region. The region’s extreme summer non-coincident peak gross load forecast for each station were prepared by applying the LDC load forecast load growth rates to the actual 2018 summer peak extreme weather corrected loads. The extreme summer weather correction factors were provided by Hydro One. The net extreme weather summer load forecasts were produced by reducing the gross load forecasts for each station by the % age CDM and then by the amount of effective DG capacity provided by the IESO for that station. These extreme weather summer load forecast for the individual stations in the KWCG region is given in Appendix A;
ii. Relevant information regarding system reliability and operational issues in the region; and
iii. List of major HV transmission equipment planned and/or identified to be refurbished and/or replaced due to the end of their useful life which is relevant for regional planning purposes. This includes HV transformers, autotransformers, HV Breakers, HV underground cables and overhead lines.
A technical assessment of needs was undertaken based on:
Current and future station capacity and transmission adequacy;
System reliability and operational concerns; and
Any major high voltage equipment reaching the end of its useful life.
In addition, Hydro One has reviewed the Community Energy Plans in the region. It is worth noting that there are several community energy plans in the region and some of them are meant to sustain at the
KWCG Region – Needs Assessment December 19, 2018
Page 12
current level or reduce the community’s reliance on the provincial electric system by meeting future electricity needs with local, distributed resources and/or community-based solutions. These plans may have potential to supplement and/or defer future transmission infrastructure development needs.
7 NEEDS
This section describes emerging needs identified in the KWCG Region, and also reaffirms the near, mid, and long-term needs already identified in the previous regional planning cycle.
The recent load forecast prepared for this report is lower than that of the previous cycle of regional planning. A contingency analysis was performed for the region and due to reduced load forecasts, as expected; no new system needs were identified.
The newly identified/emerging needs pertaining to this NA will be discussed further in the following sub-sections, while the status of the previously identified needs is summarized in Table 2 below.
Table 2: Needs Identified in the Previous Regional Planning Cycle
Type of Needs identified in the previous RP cycle Needs Details Current Status
115kV System Supply Capacity
GATR ProjectTwo new additional 230/115kV autotransformers at Cedar TS to reinforce supply to both 115kV sub-systems in the region.
Completed
GATR ProjectTwo new additional 230 kV in-line switches on D6V/D7V circuits to improve restoration capability of Waterloo-Guelph 230 kV sub-system.
Completed
230kV Load Restoration Needs Galt Junction
Two new additional 230kV in-line switches on M20D/M21D circuits to improve restoration capability of the Cambridge-Kitchener 230 kV sub-system.
Completed
Station Short Circuit Capacity
Arlen MTSInstall 13.8 kV series reactors to mitigate LV bus short circuit levels.
Completed
Station Transformation Capacity
New Waterloo North Hydro: MTS #4 (2024). Need is now expected beyond 2029.
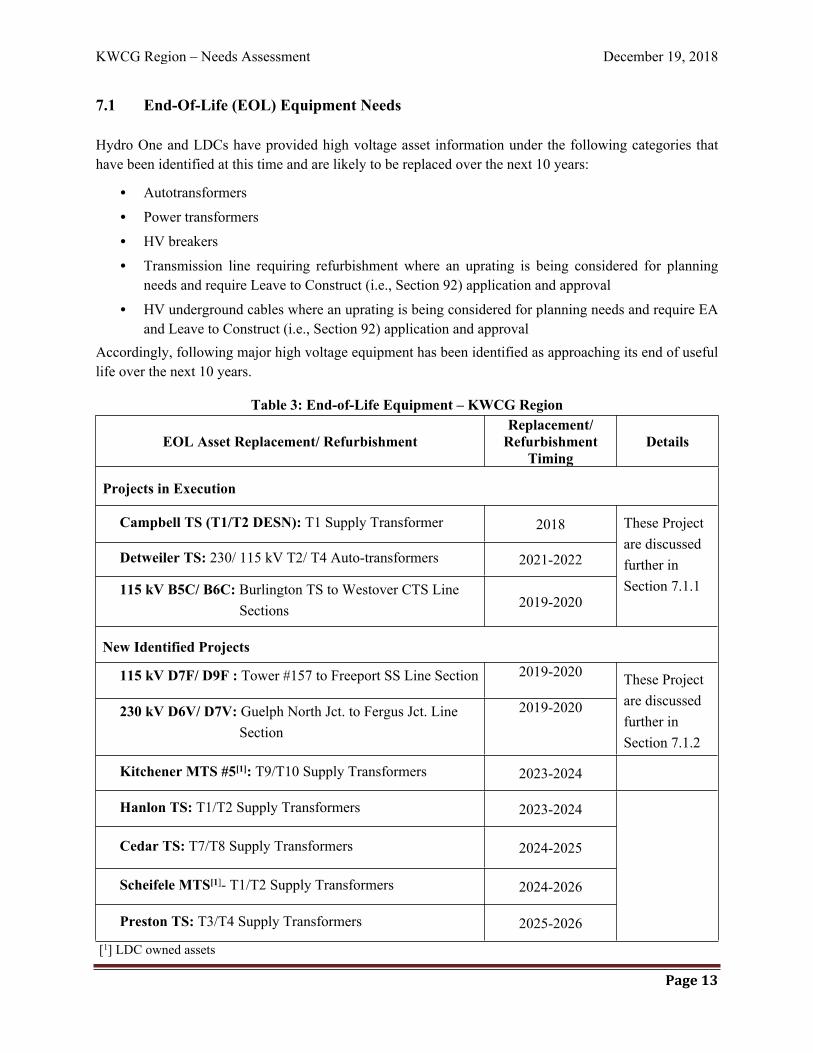
KWCG Region – Needs Assessment December 19, 2018
Page 13
7.1 End-Of-Life (EOL) Equipment Needs
Hydro One and LDCs have provided high voltage asset information under the following categories that have been identified at this time and are likely to be replaced over the next 10 years:
Autotransformers
Power transformers
HV breakers
Transmission line requiring refurbishment where an uprating is being considered for planning needs and require Leave to Construct (i.e., Section 92) application and approval
HV underground cables where an uprating is being considered for planning needs and require EA and Leave to Construct (i.e., Section 92) application and approval
Accordingly, following major high voltage equipment has been identified as approaching its end of useful life over the next 10 years.
Table 3: End-of-Life Equipment – KWCG Region
EOL Asset Replacement/ RefurbishmentReplacement/
Refurbishment Timing
Details
Projects in Execution
Campbell TS (T1/T2 DESN): T1 Supply Transformer 2018
Detweiler TS: 230/ 115 kV T2/ T4 Auto-transformers 2021-2022
115 kV B5C/ B6C: Burlington TS to Westover CTS Line Sections 2019-2020
These Project are discussed further in Section 7.1.1
New Identified Projects
115 kV D7F/ D9F : Tower #157 to Freeport SS Line Section 2019-2020
230 kV D6V/ D7V: Guelph North Jct. to Fergus Jct. Line Section
2019-2020
These Project are discussed further in Section 7.1.2
Kitchener MTS #5[1]: T9/T10 Supply Transformers 2023-2024
Hanlon TS: T1/T2 Supply Transformers 2023-2024
Cedar TS: T7/T8 Supply Transformers 2024-2025
Scheifele MTS[1]- T1/T2 Supply Transformers 2024-2026
Preston TS: T3/T4 Supply Transformers 2025-2026
[1] LDC owned assets
KWCG Region – Needs Assessment December 19, 2018
Page 14
The end-of-life assessment for the above high voltage equipment typically included consideration of the following options:
1. Maintaining the status quo;
2. Replacing equipment with similar equipment of lower ratings and built to current standards;
3. Replacing equipment with lower ratings and built to current standards by transferring some load to other existing facilities;
4. Eliminating equipment by transferring all of the load to other existing facilities;
5. Replacing equipment with similar equipment and built to current standards (i.e., “like-for-like” replacement);
6. Replacing equipment with higher ratings and built to current standards; and
7. Station reconfiguration
Maintaining status quo is not an option for any of the above EOL autotransformer, station transformer or line sections due to risk of equipment failure, would result in increased maintenance cost and customer outages. Replacing “Like-for-Like” with nonstandard transformers would result in complexity with failures and difficulty in getting similar spare equipment along with their installation. Nonstandard equipment also poses serious safety risk for employees under normal and emergency situations.
No other lines or HV station equipment in the KWCG region have been identified for major replacement/ refurbishment at this time. If and when new and/or additional information is available, it will be provided during the next planning phase underway at the time.
7.1.1 Projects in Execution
The following end-of-life refurbishment needs are under execution. This region was deemed to be in transition and NA for this region was deemed complete. Hence, following projects were not listed or discussed in the first cycle of regional planning and are currently in execution:
Campbell TS – T1 Transformer
Campbell TS is located in the city of Guelph supplying Guelph Hydro Electric System Inc. loads. Campbell TS has two 230/ 13.8 kV DESNs T1/T2 and T3/T4 of 75 MVA transformers with an LTR of 105 MVA (94 MW @ 0.9 PF) and 63 MVA (56 MW @ 0.9 PF) respectively. The loads on these two DESNs are currently forecasted to be about 87 MW and 66 MW respectively by the end of study period.
The 75 MVA T1/T2 DESN transformer T2 failed in 2017 and was replaced with a new standard 100 MVA unit and transformer T1 is also being replaced with a similar unit. In 2021-2022, Hydro One in addition plans to replace the secondary equipment limiting the station LTR. This will result in sufficient LTR of about 130 MVA for T1/T2 DESN, over the study period.
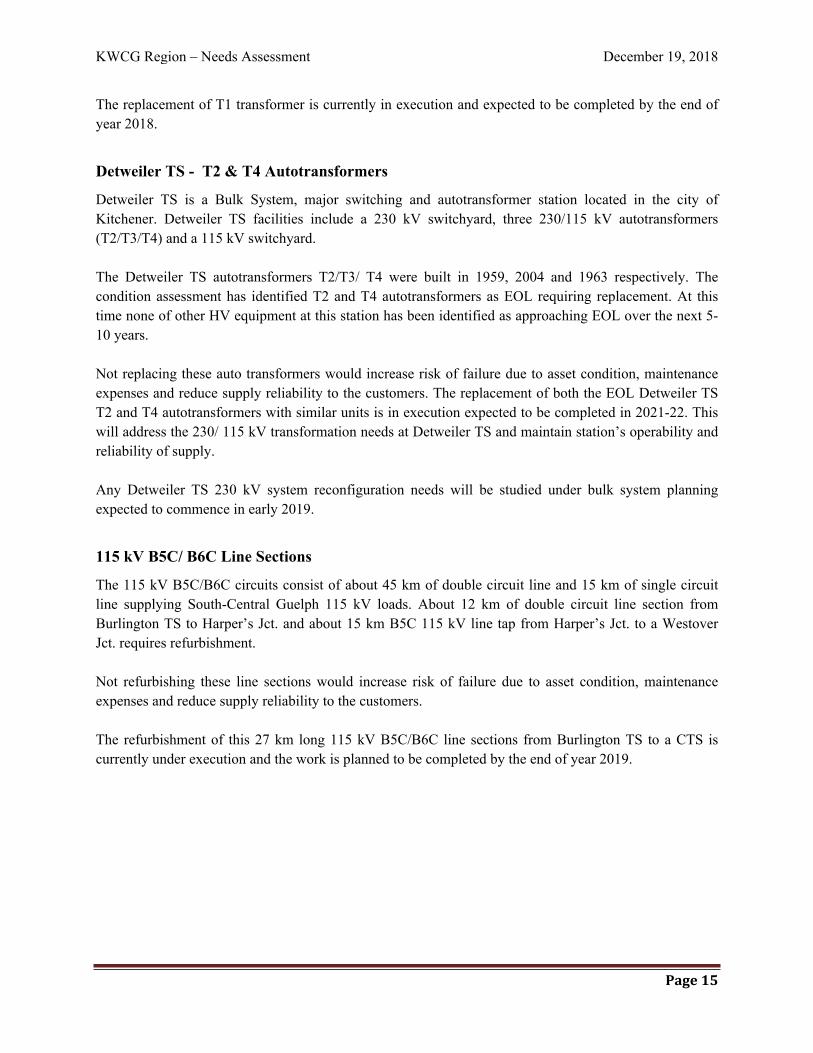
KWCG Region – Needs Assessment December 19, 2018
Page 15
The replacement of T1 transformer is currently in execution and expected to be completed by the end of year 2018.
Detweiler TS - T2 & T4 Autotransformers
Detweiler TS is a Bulk System, major switching and autotransformer station located in the city of Kitchener. Detweiler TS facilities include a 230 kV switchyard, three 230/115 kV autotransformers (T2/T3/T4) and a 115 kV switchyard.
The Detweiler TS autotransformers T2/T3/ T4 were built in 1959, 2004 and 1963 respectively. The condition assessment has identified T2 and T4 autotransformers as EOL requiring replacement. At this time none of other HV equipment at this station has been identified as approaching EOL over the next 5-10 years.
Not replacing these auto transformers would increase risk of failure due to asset condition, maintenance expenses and reduce supply reliability to the customers. The replacement of both the EOL Detweiler TS T2 and T4 autotransformers with similar units is in execution expected to be completed in 2021-22. This will address the 230/ 115 kV transformation needs at Detweiler TS and maintain station’s operability and reliability of supply.
Any Detweiler TS 230 kV system reconfiguration needs will be studied under bulk system planning expected to commence in early 2019.
115 kV B5C/ B6C Line Sections
The 115 kV B5C/B6C circuits consist of about 45 km of double circuit line and 15 km of single circuit line supplying South-Central Guelph 115 kV loads. About 12 km of double circuit line section from Burlington TS to Harper’s Jct. and about 15 km B5C 115 kV line tap from Harper’s Jct. to a Westover Jct. requires refurbishment.
Not refurbishing these line sections would increase risk of failure due to asset condition, maintenance expenses and reduce supply reliability to the customers.
The refurbishment of this 27 km long 115 kV B5C/B6C line sections from Burlington TS to a CTS is currently under execution and the work is planned to be completed by the end of year 2019.
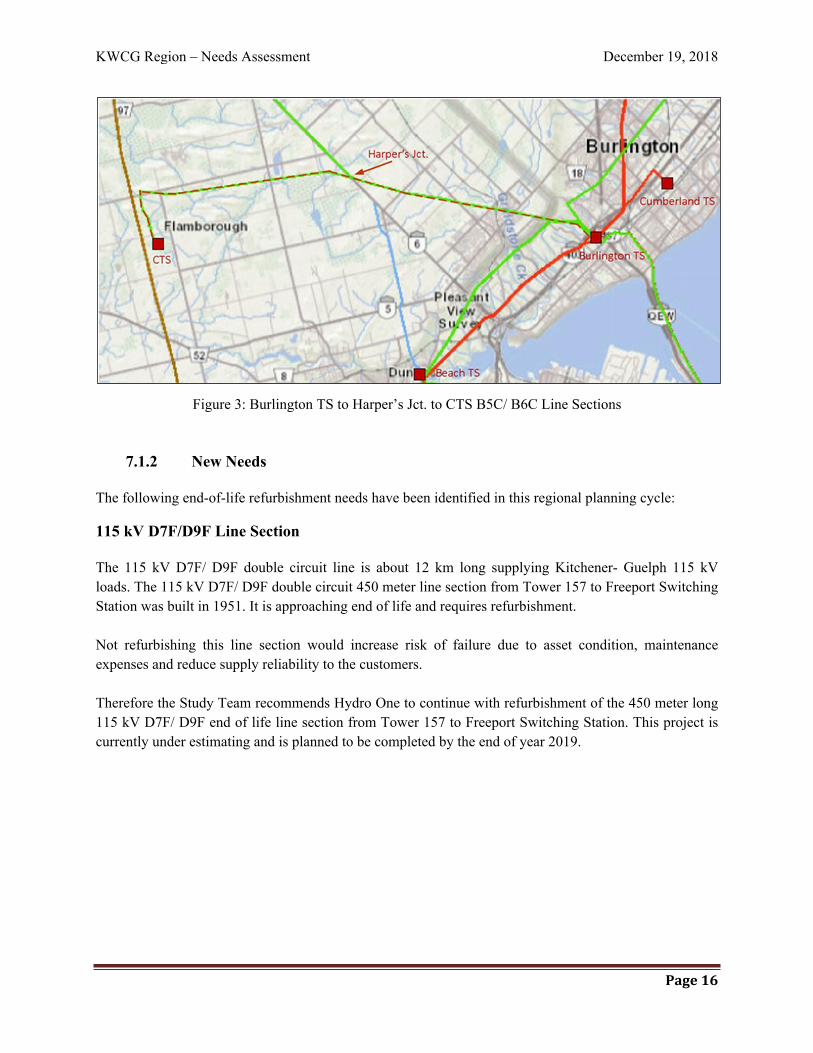
KWCG Region – Needs Assessment December 19, 2018
Page 16
Figure 3: Burlington TS to Harper’s Jct. to CTS B5C/ B6C Line Sections
7.1.2 New Needs
The following end-of-life refurbishment needs have been identified in this regional planning cycle:
115 kV D7F/D9F Line Section
The 115 kV D7F/ D9F double circuit line is about 12 km long supplying Kitchener- Guelph 115 kV loads. The 115 kV D7F/ D9F double circuit 450 meter line section from Tower 157 to Freeport Switching Station was built in 1951. It is approaching end of life and requires refurbishment.
Not refurbishing this line section would increase risk of failure due to asset condition, maintenance expenses and reduce supply reliability to the customers.
Therefore the Study Team recommends Hydro One to continue with refurbishment of the 450 meter long 115 kV D7F/ D9F end of life line section from Tower 157 to Freeport Switching Station. This project is currently under estimating and is planned to be completed by the end of year 2019.
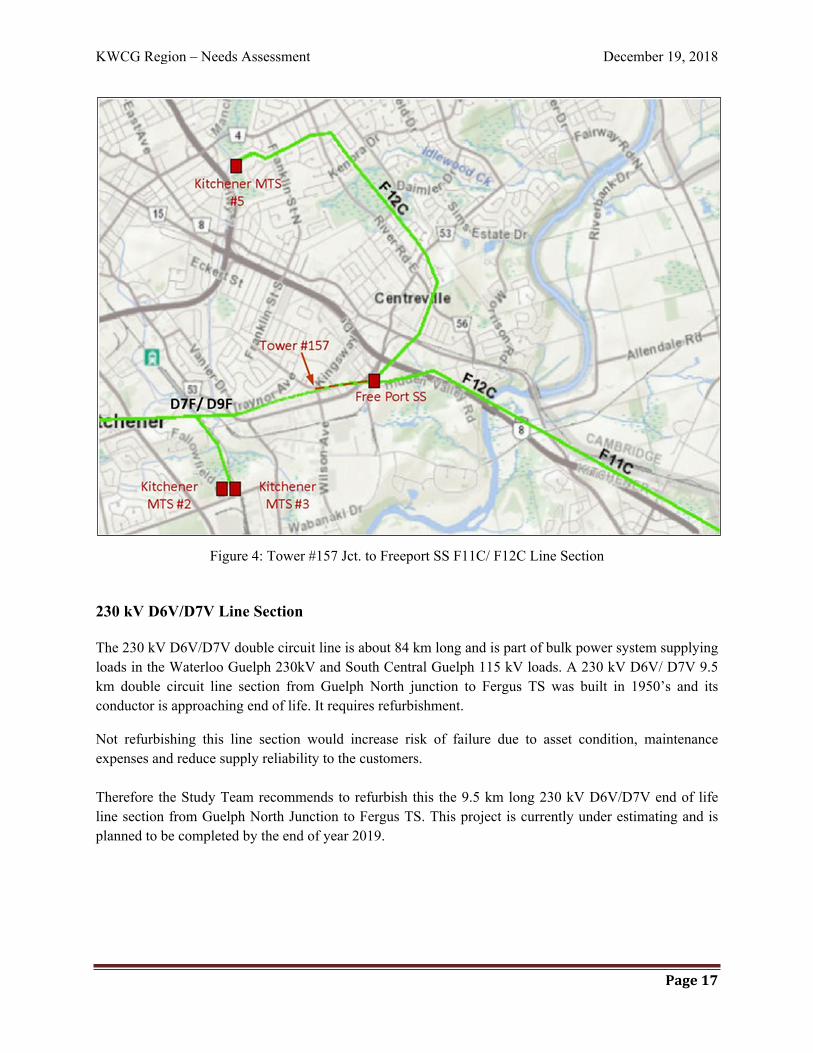
KWCG Region – Needs Assessment December 19, 2018
Page 17
Figure 4: Tower #157 Jct. to Freeport SS F11C/ F12C Line Section
230 kV D6V/D7V Line Section
The 230 kV D6V/D7V double circuit line is about 84 km long and is part of bulk power system supplying loads in the Waterloo Guelph 230kV and South Central Guelph 115 kV loads. A 230 kV D6V/ D7V 9.5 km double circuit line section from Guelph North junction to Fergus TS was built in 1950’s and its conductor is approaching end of life. It requires refurbishment.
Not refurbishing this line section would increase risk of failure due to asset condition, maintenance expenses and reduce supply reliability to the customers.
Therefore the Study Team recommends to refurbish this the 9.5 km long 230 kV D6V/D7V end of life line section from Guelph North Junction to Fergus TS. This project is currently under estimating and is planned to be completed by the end of year 2019.
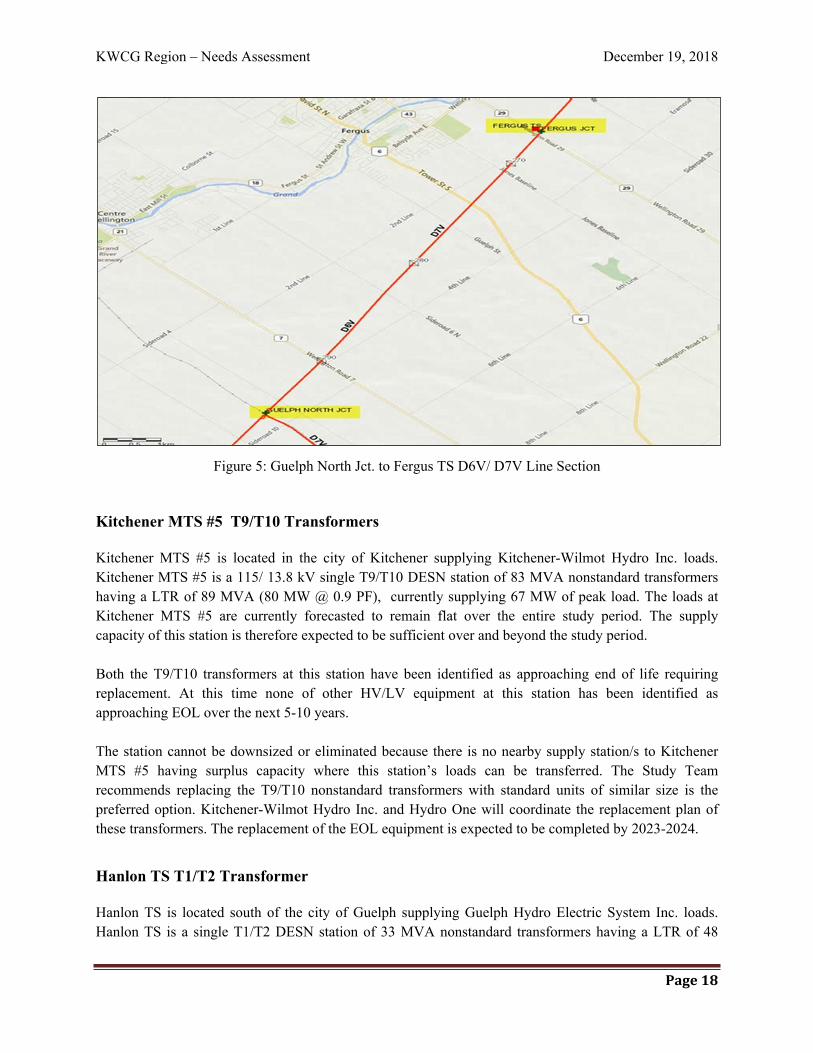
KWCG Region – Needs Assessment December 19, 2018
Page 18
Figure 5: Guelph North Jct. to Fergus TS D6V/ D7V Line Section
Kitchener MTS #5 T9/T10 Transformers
Kitchener MTS #5 is located in the city of Kitchener supplying Kitchener-Wilmot Hydro Inc. loads. Kitchener MTS #5 is a 115/ 13.8 kV single T9/T10 DESN station of 83 MVA nonstandard transformers having a LTR of 89 MVA (80 MW @ 0.9 PF), currently supplying 67 MW of peak load. The loads at Kitchener MTS #5 are currently forecasted to remain flat over the entire study period. The supply capacity of this station is therefore expected to be sufficient over and beyond the study period.
Both the T9/T10 transformers at this station have been identified as approaching end of life requiring replacement. At this time none of other HV/LV equipment at this station has been identified as approaching EOL over the next 5-10 years.
The station cannot be downsized or eliminated because there is no nearby supply station/s to Kitchener MTS #5 having surplus capacity where this station’s loads can be transferred. The Study Team recommends replacing the T9/T10 nonstandard transformers with standard units of similar size is the preferred option. Kitchener-Wilmot Hydro Inc. and Hydro One will coordinate the replacement plan of these transformers. The replacement of the EOL equipment is expected to be completed by 2023-2024.
Hanlon TS T1/T2 Transformer
Hanlon TS is located south of the city of Guelph supplying Guelph Hydro Electric System Inc. loads. Hanlon TS is a single T1/T2 DESN station of 33 MVA nonstandard transformers having a LTR of 48
KWCG Region – Needs Assessment December 19, 2018
Page 19
MVA (43 MW @ 0.9 PF). This station is currently supplying about 27 MW of peak load. The loads at Hanlon TS are currently forecasted to remain flat over the entire study period. The supply capacity of this station is therefore expected to be sufficient over and beyond the study period.
The T1/T2 transformers are of 1955/ 56 built and have been identified as EOL requiring replacement. At this time none of other HV/LV equipment at this station has been identified as approaching EOL over the next 5-10 years.
There is no nearby supply station/s to Hanlon TS having surplus capacity where this station’s loads can be transferred therefore Hydro One plans to replace these EOL transformers with standard size units of 42 MVA in 2023-2024.
Cedar TS – T7/ T8 Transformers
Cedar TS is located in the city of Guelph supplying Guelph Hydro Electric System Inc. loads. Cedar TS has two 115/ 13.8 kV DESN units T1/T2 and T7/T8 of 75 MVA with a LTR of 115 MVA (103 MW @ 0.9 PF) and 37 MVA with a LTR of 44 MVA (40 MW @ 0.9 PF), currently supplying 67 MW and 36 MW of peak loads respectively. The loads at both Cedar TS DESNs are currently forecasted to remain almost flat over the entire study period. The supply capacity of this station is therefore expected to be sufficient over and beyond the study period.
The T7/T8 DESN 38 MVA nonstandard transformers are of 1958 built have been identified for replacement. The T1/T2 transformers are relatively newer and were built in early 1990s. At this time none of other HV/LV equipment at this station has been identified as approaching EOL over the next 5-10 years.
The station cannot be downsized or eliminated because there is no nearby supply station/s to Cedar TS having surplus capacity where this station’s loads can be transferred therefore Hydro One plans to replace these EOL transformers with standard size units of 42 MVA in 2024-2025 timeframe.
Cedar TS and Hanlon TS Optimization with Neighbouring StationsAfter performing an analysis of the current distribution situation, it was determined that there are not enough spare feeder positions at HONI and GHESI stations to reallocate DESN loads in the sub-system without significant distribution system and neighboring station upgrades.
Over loading of Campbell DESN T3/T4 will be effectively managed by load transfer to DESN T1/T2 after 2021/22. Following that there will be no additional capacity at these two DESNs.
Secondly, Hanlon TS DESN has eight (8) feeders with three (3) being dedicated underground infrastructure to existing customers, two (2) feeders supplying the industrial load in the Hanlon Industrial Park, two (2) feeder circuits supplying residential load north of Hanlon TS and one (1) feeder to be utilized for planned future load growth at Gordon/ Clair. In addition, due to technical limitations at 13.8 kV distribution voltage and density of load on certain feeders sections, it is not possible to supply existing
KWCG Region – Needs Assessment December 19, 2018
Page 20
loads from any other station without significant transmission and distribution investments. Therefore there are little or no significant optimization opportunity is present at this point in time. Option considered for load transfer will require significant new investment; for example:
The two residential distribution feeders supplying loads north of Hanlon TS could be transferred to existing feeders out of Cedar TS. These load transfers will result in increased line losses and reduced capacity (due to voltage drop)
Another option could be transferring remaining Hanlon TS load to Arlen MTS. This load transfer will require an additional DESN and underground infrastructure at Arlen MTS.
Hence, the Study Team recommends that Hydro One undertakes replacement of Cedar TS T7/T8 and Hanlon TS T1/T2 transformers with 42 MVA standard size units, being technically and economical most suitable solution. The replacement of EOL equipment is expected to be completed by 2023-2025 timeframe for both stations.
Scheifele MTS – T1/ T2 Transformers
Scheifele MTS is located in the city of Waterloo supplying Waterloo North Hydro Inc. loads. Scheifele MTS has four 230/ 13.8 kV transformers T1 and T2 of 67 MVA, and T3 and T4 of 83 MVA currently supplying 145 MW of peak loads. The load at this station is forecasted to remain almost flat over the entire study period. The total supply capacity of Scheifele MTS is 161 MW expected to be sufficient over the study period.
The T1/T2 transformers based on their age have been identified by Waterloo North Hydro Inc. as approaching end of life potentially requiring replacement in the 2024- 2026 timeframe. Waterloo North Hydro will be monitoring the condition of these transformers to assess their replacement need. At this time none of other HV/LV equipment at this station has been identified as approaching EOL over the next 5-10 years.
The station cannot be downsized or eliminated because there is no nearby supply station/s to Scheifele MTS having surplus capacity where this station’s loads can be transferred. The Study Team recommends that Waterloo North Hydro continue monitoring the condition of these T1/T2 transformers at Scheifele MTS and this need to be reassessed in the next regional planning cycle.
Preston TS T3/T4 Transformers
Preston TS (DESN) is located in the city of Cambridge supplying Energy+ loads. Preston TS is a single T3/T4 DESN station of 125 MVA transformers with no additional LTR capability available i.e. 125 MVA (113 MW @ 0.9 PF). This station is currently supplying about 92 MW of peak load. The loads at Preston TS are currently forecasted to peak at about 102 MW during the study period.
KWCG Region – Needs Assessment December 19, 2018
Page 21
The T3/T4 transformers are almost 50 years old, having been built in 1968. Condition assessment has identified that both T3/T4 transformers at their EOL requiring replacement. At this time none of other HV/LV equipment at this station has been identified as EOL over the next 5-10 years.
The station cannot be downsized or eliminated because there is no nearby supply station/s to Preston TS having spare supply capacity where this station’s loads can be transferred. The Study Team recommends replacing the existing 125 MVA 230/ 27.6 kV T3/T4 transformers at Preston TS with 125 MVA standard units. This will also result in an increased supplying capacity at Preston TS required to meet the future Energy+ needs in the Cambridge distribution area. The replacement plan for the equipment will be developed by Hydro One and coordinated with the affected LDC and/or customers and it is expected to be completed by 2025-2026.
7.2 Supply Reliability Needs
Supply reliability of Elmira TS –D10H 115 kV Line
The 115 kV D10H circuit between Detweiler TS and Hanover TS supplies loads at Rush MTS, Elmira TS and Palmerston TS. The D10H circuit has a normally open point just south of Palmerston TS through a motorized disconnect switch. The northern section of D10H is supplied from Hanover TS radially supplying Palmerston TS loads. The southern section of D10H supplied from Detweiler TS radially supplies Waterloo North Hydro’s 34 MW Elmira TS peak loads. D10H also supplies Rush MTS which is also supplied by 115 kV D8S circuit from Detweiler TS.
The normally open motorized switch near Palmerston TS helps restore the loads at Elmira TS from Hanover TS in-case supply from Detweiler TS is interrupted and similarly helps restoring Palmerston TS loads from Detweiler if supply from Hanover is interrupted.
In last three years, supply to Elmira TS from Detweiler TS resulted in 3 outages due to faults on the D10H line section between Elmira TS tap and Detweiler TS. The Elmira TS load restoration from Hanover TS is slower due to manually operated disconnect switches at Elmira TS tap location.
Hydro One is currently assessing the condition of line and will continue to work with Waterloo North Hydro to address the supply reliability at Elmira TS. The developed mitigation plan to improve supply reliability of Elmira TS loads will be included in the final RIP report.

KWCG Region – Needs Assessment December 19, 2018
Page 22
Figure 6: D10H 115 kV Line (Burlington TS to Elmira TS)
7.3 Station and Transmission Capacity Needs in the KWCG Region
The following Station and Transmission supply capacities needs have been identified in the KWCG region during the study period of 2019 to 2028.
7.3.1 Campbell TS (T3/T4) DESN Overloading
There are two DESN stations inside Campbell TS boundary. Both the T1/T2 and T3/T4 DESNs are 230 kV/ 13.8 kV having supply capacities of 94 MW and 56 MW, currently supplying 84 MW and 52 MW of loads respectively. The 75 MVA transformer T2 recently failed and was replaced with a Hydro One standard 100 MVA unit. The transformer T1 is also being replaced with a similar 100 MVA unit by the end of 2018. The load at T3/T4 DESN is forecasted to exceed its supply capacity of 56 MW in the 2021-2022 timeframe.
At Campbell TS, after replacement of T1 transformer and secondary equipment there will be sufficient spare supply capacity on T1/T2 DESN where excess T3/T4 DESN loads can be transferred. Hydro One Transmission and the Guelph Hydro Electric System Inc. will monitor the loading at the T3/T4 Campbell TS DESN and will balance the loads between the two DESNs, when required. The Study Team therefore recommends that no further action is required at this time.
KWCG Region – Needs Assessment December 19, 2018
Page 23
7.3.2 Waterloo North Hydro MTS #4
During the last regional planning cycle a need for a new MTS #4 DESN was identified in the 2024 timeframe. The current load forecast defers this need beyond the needs assessment study period.
7.3.3 Energy+ MTS #2
Energy+ has initially identified a future need for a new DESN station (MTS #2) in the city of Cambridge near Preston TS. This station need is due to a potential new load center growth in their service territory. The additional supply capacity due to EOL transformer replacement and available new feeder positions at Preston TS, will defer this new MTS need beyond the study period of current regional planning cycle.
WNH MTS #4 and Energy+ MTS #2 OptimizationThe Preston TS like-for-like transformer replacement is critical for local supply needs and will proceed according to the current plan. However, study team recommends that the supply capacity needs with regards to Energy + MTS #2 and WNH MTS #4 be further assessed for optimization in the next phases of regional planning. Once the optimization options are complete, Waterloo North Hydro and Energy+ shall conduct a technical and economic assessment in consultation with Hydro One.
7.4 Other Planning Considerations in the KWCG Region
Municipalities in KWCG region have developed their community energy plans with a primary focus to reduce their energy consumption by local initiatives over next 25 to 30 years. With respect to electricity, these communities are planning for an increased reliance on community energy sources such as distributed generation, generation behind the meters like rooftop solar systems and local battery storage systems to reduce cost and for improved reliability of electricity supply.
There are situations where behind the meter battery storage cannot be connected due to technical constraints. The LDCs in this region and Hydro One, outside the regional planning forum, can undertake the task of exploring the issue to assess technical constraints and /or other solutions that can facilitate connection of additional battery storage.
Communities are also working towards self-sufficiency by improving efficiencies of existing local energy systems i.e. reducing energy consumption and losses by means of utilizing smarter buildings, houses, efficient heating, cooling, appliances, equipment, and processes for all community needs. Ultimately, the objective of these energy plans in the region is to be a net zero carbon community.
Community energy plans may have potential to supplement and/or defer future transmission infrastructure development needs. The Study Team therefore recommends reviewing the community energy plans in the SA phase.
KWCG Region – Needs Assessment December 19, 2018
Page 24
8 CONCLUSION AND RECOMMENDATIONS
Hydro One and Waterloo North Hydro Inc. will develop a supply reliability improvement plan for Elmira TS loads. The developed local plan to improve supply reliability of Elmira TS loads will be included in the final RIP report.
At Campbell TS, after replacement of T1 transformer and addressing the secondary equipment limitations there will be sufficient spare supply capacity on T1/T2 DESN to accommodate T3/T4 DESN overloading. Hydro One and the LDC will work together to balance loads between the two Campbell TS DESNs, when required.
The distribution system in the Cedar TS, Hanlon TS and Arlen MTS supply area is already optimized and there are not enough spare feeder positions at any of the stations to reallocate DESN loads without significant distribution system investments and upgrades at neighboring stations.
The Study Team’s recommendations for the above identified needs are as follows:
a) The replacement of EOL station supply transformers at Campbell TS, Hanlon TS, Cedar TS, Kitchener MTS #5 and Preston TS along with the EOL auto transformers at Detweiler to proceed. Hydro One and the concerned LDCs will coordinate replacement of above equipment and develop replacement plans.
b) The refurbishment of EOL line sections 115 kV B5C/ B6C, D7F/ D9F and 230 kV D6V/ D7V to proceed. Hydro One will coordinate refurbishment of these line sections with affected LDCs/ Customer.
c) Hydro One will continue to work with Waterloo North Hydro Inc. to address the supply reliability issue at Elmira TS.
d) The Study Team has recommended that Hydro One Transmission and the Guelph Hydro Electric System Inc. to closely monitor the loading at the T3/T4 Campbell TS DESN and to balance the loads between these DESNs when required.
e) The Study Team recommends that the supply capacity needs with regards to Energy + MTS #2 and WNH MTS #4 be further assessed for optimization in the SA phase of regional planning. Once the optimization options are complete, Waterloo North Hydro and Energy+ shall conduct a technical and economic assessment in consultation with Hydro One.
f) The Study Team has recommended that community energy plans will be further considered in the SA phase of the regional planning process.

KWCG Region – Needs Assessment December 19, 2018
Page 25
9 REFERENCES
[1] KWCG Regional Infrastructure Plan - December 2015
[2] Planning Process Working Group Report to the Ontario Energy Board - May 2013
[3] Ontario Resource and Transmission Assessment Criteria (ORTAC) – Issue 5.0 -August 2007
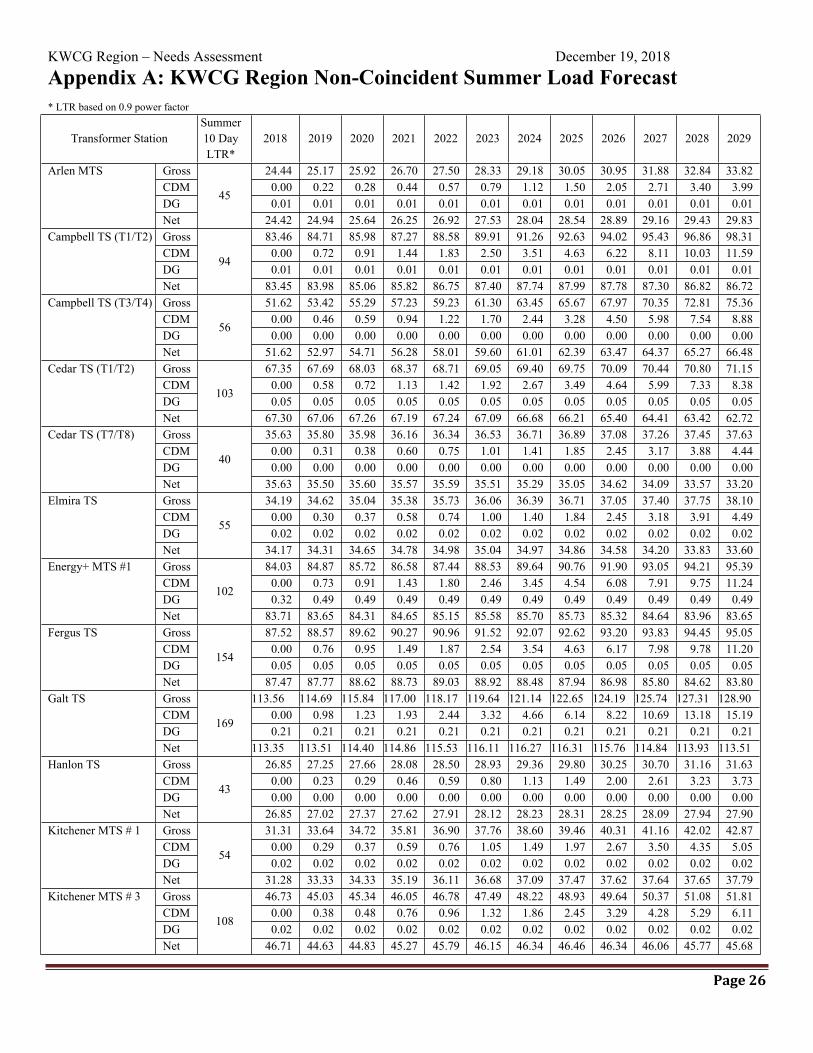
KWCG Region – Needs Assessment December 19, 2018
Page 26
Appendix A: KWCG Region Non-Coincident Summer Load Forecast* LTR based on 0.9 power factor
Transformer StationSummer10 DayLTR*
2018 2019 2020 2021 2022 2023 2024 2025 2026 2027 2028 2029
Gross 24.44 25.17 25.92 26.70 27.50 28.33 29.18 30.05 30.95 31.88 32.84 33.82CDM 0.00 0.22 0.28 0.44 0.57 0.79 1.12 1.50 2.05 2.71 3.40 3.99DG 0.01 0.01 0.01 0.01 0.01 0.01 0.01 0.01 0.01 0.01 0.01 0.01
Arlen MTS
Net
45
24.42 24.94 25.64 26.25 26.92 27.53 28.04 28.54 28.89 29.16 29.43 29.83Gross 83.46 84.71 85.98 87.27 88.58 89.91 91.26 92.63 94.02 95.43 96.86 98.31CDM 0.00 0.72 0.91 1.44 1.83 2.50 3.51 4.63 6.22 8.11 10.03 11.59DG 0.01 0.01 0.01 0.01 0.01 0.01 0.01 0.01 0.01 0.01 0.01 0.01
Campbell TS (T1/T2)
Net
94
83.45 83.98 85.06 85.82 86.75 87.40 87.74 87.99 87.78 87.30 86.82 86.72Gross 51.62 53.42 55.29 57.23 59.23 61.30 63.45 65.67 67.97 70.35 72.81 75.36CDM 0.00 0.46 0.59 0.94 1.22 1.70 2.44 3.28 4.50 5.98 7.54 8.88DG 0.00 0.00 0.00 0.00 0.00 0.00 0.00 0.00 0.00 0.00 0.00 0.00
Campbell TS (T3/T4)
Net
56
51.62 52.97 54.71 56.28 58.01 59.60 61.01 62.39 63.47 64.37 65.27 66.48Gross 67.35 67.69 68.03 68.37 68.71 69.05 69.40 69.75 70.09 70.44 70.80 71.15CDM 0.00 0.58 0.72 1.13 1.42 1.92 2.67 3.49 4.64 5.99 7.33 8.38DG 0.05 0.05 0.05 0.05 0.05 0.05 0.05 0.05 0.05 0.05 0.05 0.05
Cedar TS (T1/T2)
Net
103
67.30 67.06 67.26 67.19 67.24 67.09 66.68 66.21 65.40 64.41 63.42 62.72Gross 35.63 35.80 35.98 36.16 36.34 36.53 36.71 36.89 37.08 37.26 37.45 37.63CDM 0.00 0.31 0.38 0.60 0.75 1.01 1.41 1.85 2.45 3.17 3.88 4.44DG 0.00 0.00 0.00 0.00 0.00 0.00 0.00 0.00 0.00 0.00 0.00 0.00
Cedar TS (T7/T8)
Net
40
35.63 35.50 35.60 35.57 35.59 35.51 35.29 35.05 34.62 34.09 33.57 33.20Gross 34.19 34.62 35.04 35.38 35.73 36.06 36.39 36.71 37.05 37.40 37.75 38.10CDM 0.00 0.30 0.37 0.58 0.74 1.00 1.40 1.84 2.45 3.18 3.91 4.49DG 0.02 0.02 0.02 0.02 0.02 0.02 0.02 0.02 0.02 0.02 0.02 0.02
Elmira TS
Net
55
34.17 34.31 34.65 34.78 34.98 35.04 34.97 34.86 34.58 34.20 33.83 33.60Gross 84.03 84.87 85.72 86.58 87.44 88.53 89.64 90.76 91.90 93.05 94.21 95.39CDM 0.00 0.73 0.91 1.43 1.80 2.46 3.45 4.54 6.08 7.91 9.75 11.24DG 0.32 0.49 0.49 0.49 0.49 0.49 0.49 0.49 0.49 0.49 0.49 0.49
Energy+ MTS #1
Net
102
83.71 83.65 84.31 84.65 85.15 85.58 85.70 85.73 85.32 84.64 83.96 83.65Gross 87.52 88.57 89.62 90.27 90.96 91.52 92.07 92.62 93.20 93.83 94.45 95.05CDM 0.00 0.76 0.95 1.49 1.87 2.54 3.54 4.63 6.17 7.98 9.78 11.20DG 0.05 0.05 0.05 0.05 0.05 0.05 0.05 0.05 0.05 0.05 0.05 0.05
Fergus TS
Net
154
87.47 87.77 88.62 88.73 89.03 88.92 88.48 87.94 86.98 85.80 84.62 83.80Gross 113.56 114.69 115.84 117.00 118.17 119.64 121.14 122.65 124.19 125.74 127.31 128.90CDM 0.00 0.98 1.23 1.93 2.44 3.32 4.66 6.14 8.22 10.69 13.18 15.19DG 0.21 0.21 0.21 0.21 0.21 0.21 0.21 0.21 0.21 0.21 0.21 0.21
Galt TS
Net
169
113.35 113.51 114.40 114.86 115.53 116.11 116.27 116.31 115.76 114.84 113.93 113.51Gross 26.85 27.25 27.66 28.08 28.50 28.93 29.36 29.80 30.25 30.70 31.16 31.63CDM 0.00 0.23 0.29 0.46 0.59 0.80 1.13 1.49 2.00 2.61 3.23 3.73DG 0.00 0.00 0.00 0.00 0.00 0.00 0.00 0.00 0.00 0.00 0.00 0.00
Hanlon TS
Net
43
26.85 27.02 27.37 27.62 27.91 28.12 28.23 28.31 28.25 28.09 27.94 27.90Gross 31.31 33.64 34.72 35.81 36.90 37.76 38.60 39.46 40.31 41.16 42.02 42.87CDM 0.00 0.29 0.37 0.59 0.76 1.05 1.49 1.97 2.67 3.50 4.35 5.05DG 0.02 0.02 0.02 0.02 0.02 0.02 0.02 0.02 0.02 0.02 0.02 0.02
Kitchener MTS # 1
Net
54
31.28 33.33 34.33 35.19 36.11 36.68 37.09 37.47 37.62 37.64 37.65 37.79Gross 46.73 45.03 45.34 46.05 46.78 47.49 48.22 48.93 49.64 50.37 51.08 51.81CDM 0.00 0.38 0.48 0.76 0.96 1.32 1.86 2.45 3.29 4.28 5.29 6.11DG 0.02 0.02 0.02 0.02 0.02 0.02 0.02 0.02 0.02 0.02 0.02 0.02
Kitchener MTS # 3
Net
108
46.71 44.63 44.83 45.27 45.79 46.15 46.34 46.46 46.34 46.06 45.77 45.68
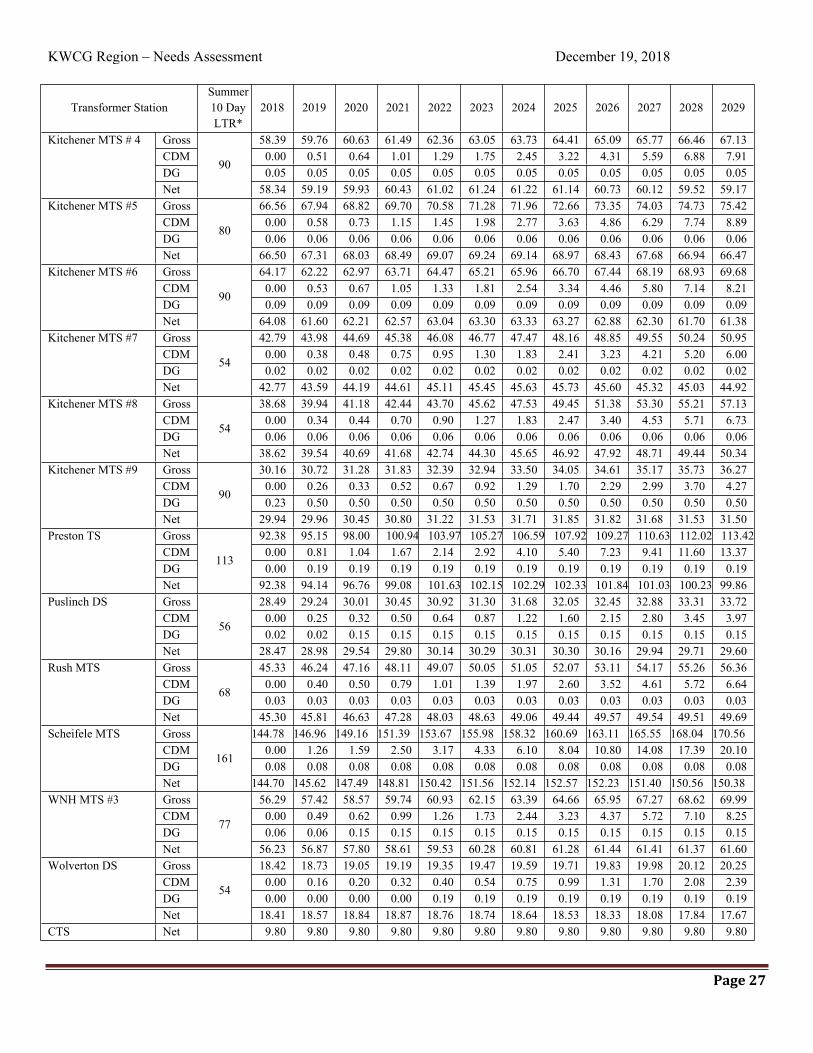
KWCG Region – Needs Assessment December 19, 2018
Page 27
Transformer StationSummer 10 Day LTR*
2018 2019 2020 2021 2022 2023 2024 2025 2026 2027 2028 2029
Gross 58.39 59.76 60.63 61.49 62.36 63.05 63.73 64.41 65.09 65.77 66.46 67.13CDM 0.00 0.51 0.64 1.01 1.29 1.75 2.45 3.22 4.31 5.59 6.88 7.91DG 0.05 0.05 0.05 0.05 0.05 0.05 0.05 0.05 0.05 0.05 0.05 0.05
Kitchener MTS # 4
Net
90
58.34 59.19 59.93 60.43 61.02 61.24 61.22 61.14 60.73 60.12 59.52 59.17Gross 66.56 67.94 68.82 69.70 70.58 71.28 71.96 72.66 73.35 74.03 74.73 75.42CDM 0.00 0.58 0.73 1.15 1.45 1.98 2.77 3.63 4.86 6.29 7.74 8.89DG 0.06 0.06 0.06 0.06 0.06 0.06 0.06 0.06 0.06 0.06 0.06 0.06
Kitchener MTS #5
Net
80
66.50 67.31 68.03 68.49 69.07 69.24 69.14 68.97 68.43 67.68 66.94 66.47Gross 64.17 62.22 62.97 63.71 64.47 65.21 65.96 66.70 67.44 68.19 68.93 69.68CDM 0.00 0.53 0.67 1.05 1.33 1.81 2.54 3.34 4.46 5.80 7.14 8.21DG 0.09 0.09 0.09 0.09 0.09 0.09 0.09 0.09 0.09 0.09 0.09 0.09
Kitchener MTS #6
Net
90
64.08 61.60 62.21 62.57 63.04 63.30 63.33 63.27 62.88 62.30 61.70 61.38Gross 42.79 43.98 44.69 45.38 46.08 46.77 47.47 48.16 48.85 49.55 50.24 50.95CDM 0.00 0.38 0.48 0.75 0.95 1.30 1.83 2.41 3.23 4.21 5.20 6.00DG 0.02 0.02 0.02 0.02 0.02 0.02 0.02 0.02 0.02 0.02 0.02 0.02
Kitchener MTS #7
Net
54
42.77 43.59 44.19 44.61 45.11 45.45 45.63 45.73 45.60 45.32 45.03 44.92Gross 38.68 39.94 41.18 42.44 43.70 45.62 47.53 49.45 51.38 53.30 55.21 57.13CDM 0.00 0.34 0.44 0.70 0.90 1.27 1.83 2.47 3.40 4.53 5.71 6.73DG 0.06 0.06 0.06 0.06 0.06 0.06 0.06 0.06 0.06 0.06 0.06 0.06
Kitchener MTS #8
Net
54
38.62 39.54 40.69 41.68 42.74 44.30 45.65 46.92 47.92 48.71 49.44 50.34Gross 30.16 30.72 31.28 31.83 32.39 32.94 33.50 34.05 34.61 35.17 35.73 36.27CDM 0.00 0.26 0.33 0.52 0.67 0.92 1.29 1.70 2.29 2.99 3.70 4.27DG 0.23 0.50 0.50 0.50 0.50 0.50 0.50 0.50 0.50 0.50 0.50 0.50
Kitchener MTS #9
Net
90
29.94 29.96 30.45 30.80 31.22 31.53 31.71 31.85 31.82 31.68 31.53 31.50Gross 92.38 95.15 98.00 100.94 103.97 105.27 106.59 107.92 109.27 110.63 112.02 113.42CDM 0.00 0.81 1.04 1.67 2.14 2.92 4.10 5.40 7.23 9.41 11.60 13.37DG 0.00 0.19 0.19 0.19 0.19 0.19 0.19 0.19 0.19 0.19 0.19 0.19
Preston TS
Net
113
92.38 94.14 96.76 99.08 101.63 102.15 102.29 102.33 101.84 101.03 100.23 99.86Gross 28.49 29.24 30.01 30.45 30.92 31.30 31.68 32.05 32.45 32.88 33.31 33.72CDM 0.00 0.25 0.32 0.50 0.64 0.87 1.22 1.60 2.15 2.80 3.45 3.97DG 0.02 0.02 0.15 0.15 0.15 0.15 0.15 0.15 0.15 0.15 0.15 0.15
Puslinch DS
Net
56
28.47 28.98 29.54 29.80 30.14 30.29 30.31 30.30 30.16 29.94 29.71 29.60Gross 45.33 46.24 47.16 48.11 49.07 50.05 51.05 52.07 53.11 54.17 55.26 56.36CDM 0.00 0.40 0.50 0.79 1.01 1.39 1.97 2.60 3.52 4.61 5.72 6.64DG 0.03 0.03 0.03 0.03 0.03 0.03 0.03 0.03 0.03 0.03 0.03 0.03
Rush MTS
Net
68
45.30 45.81 46.63 47.28 48.03 48.63 49.06 49.44 49.57 49.54 49.51 49.69Gross 144.78 146.96 149.16 151.39 153.67 155.98 158.32 160.69 163.11 165.55 168.04 170.56CDM 0.00 1.26 1.59 2.50 3.17 4.33 6.10 8.04 10.80 14.08 17.39 20.10DG 0.08 0.08 0.08 0.08 0.08 0.08 0.08 0.08 0.08 0.08 0.08 0.08
Scheifele MTS
Net
161
144.70 145.62 147.49 148.81 150.42 151.56 152.14 152.57 152.23 151.40 150.56 150.38Gross 56.29 57.42 58.57 59.74 60.93 62.15 63.39 64.66 65.95 67.27 68.62 69.99CDM 0.00 0.49 0.62 0.99 1.26 1.73 2.44 3.23 4.37 5.72 7.10 8.25DG 0.06 0.06 0.15 0.15 0.15 0.15 0.15 0.15 0.15 0.15 0.15 0.15
WNH MTS #3
Net
77
56.23 56.87 57.80 58.61 59.53 60.28 60.81 61.28 61.44 61.41 61.37 61.60Gross 18.42 18.73 19.05 19.19 19.35 19.47 19.59 19.71 19.83 19.98 20.12 20.25CDM 0.00 0.16 0.20 0.32 0.40 0.54 0.75 0.99 1.31 1.70 2.08 2.39DG 0.00 0.00 0.00 0.00 0.19 0.19 0.19 0.19 0.19 0.19 0.19 0.19
Wolverton DS
Net
54
18.41 18.57 18.84 18.87 18.76 18.74 18.64 18.53 18.33 18.08 17.84 17.67CTS Net 9.80 9.80 9.80 9.80 9.80 9.80 9.80 9.80 9.80 9.80 9.80 9.80
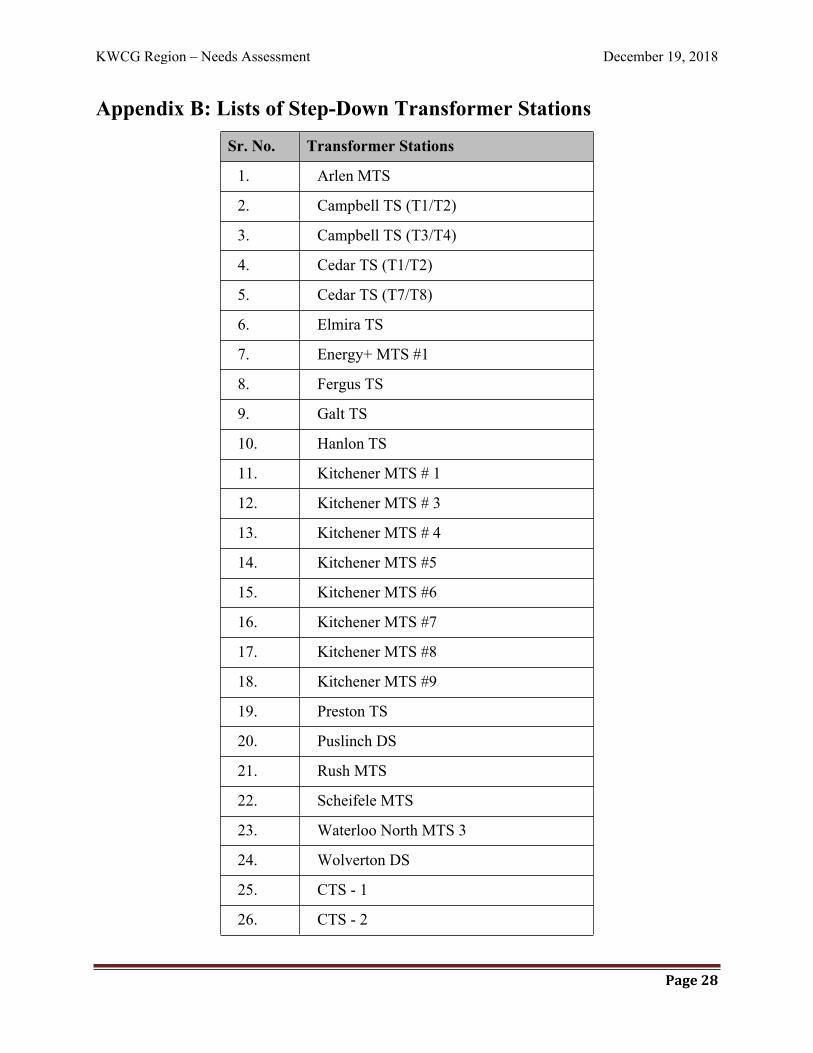
KWCG Region – Needs Assessment December 19, 2018
Page 28
Appendix B: Lists of Step-Down Transformer Stations
Sr. No. Transformer Stations
1. Arlen MTS
2. Campbell TS (T1/T2)
3. Campbell TS (T3/T4)
4. Cedar TS (T1/T2)
5. Cedar TS (T7/T8)
6. Elmira TS
7. Energy+ MTS #1
8. Fergus TS
9. Galt TS
10. Hanlon TS
11. Kitchener MTS # 1
12. Kitchener MTS # 3
13. Kitchener MTS # 4
14. Kitchener MTS #5
15. Kitchener MTS #6
16. Kitchener MTS #7
17. Kitchener MTS #8
18. Kitchener MTS #9
19. Preston TS
20. Puslinch DS
21. Rush MTS
22. Scheifele MTS
23. Waterloo North MTS 3
24. Wolverton DS
25. CTS - 1
26. CTS - 2
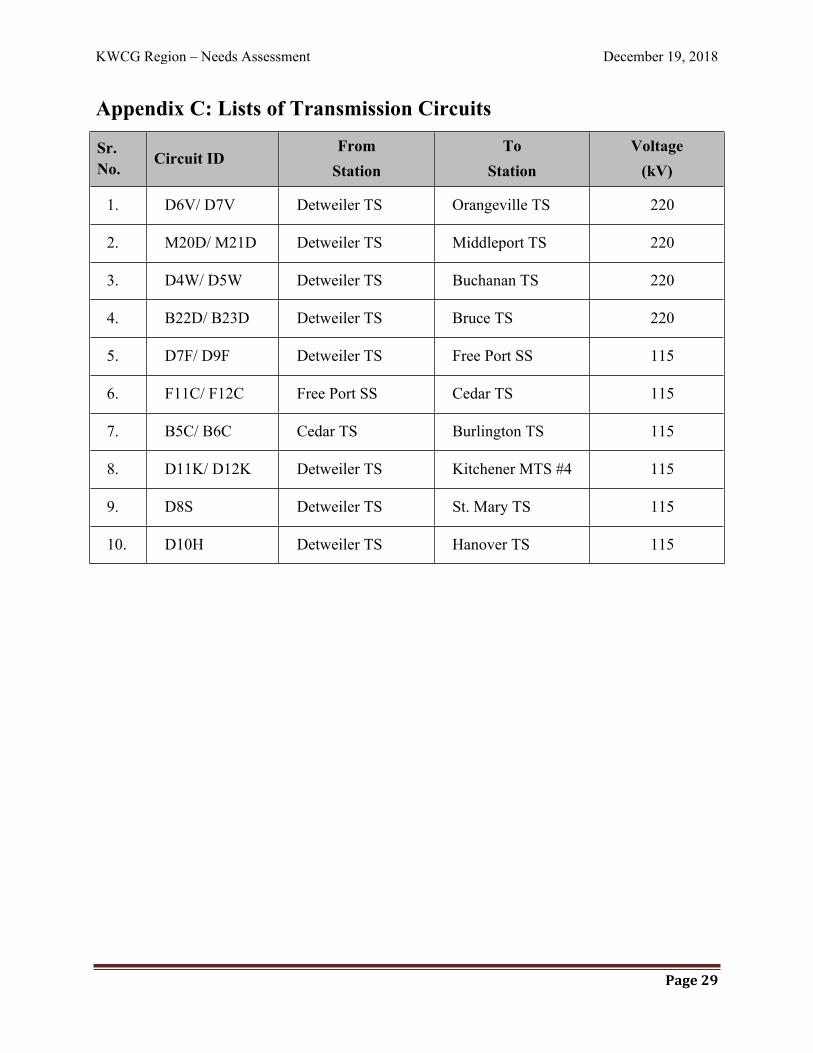
KWCG Region – Needs Assessment December 19, 2018
Page 29
Appendix C: Lists of Transmission Circuits
Sr. No.
Circuit IDFrom
StationTo
StationVoltage
(kV)
1. D6V/ D7V Detweiler TS Orangeville TS 220
2. M20D/ M21D Detweiler TS Middleport TS 220
3. D4W/ D5W Detweiler TS Buchanan TS 220
4. B22D/ B23D Detweiler TS Bruce TS 220
5. D7F/ D9F Detweiler TS Free Port SS 115
6. F11C/ F12C Free Port SS Cedar TS 115
7. B5C/ B6C Cedar TS Burlington TS 115
8. D11K/ D12K Detweiler TS Kitchener MTS #4 115
9. D8S Detweiler TS St. Mary TS 115
10. D10H Detweiler TS Hanover TS 115
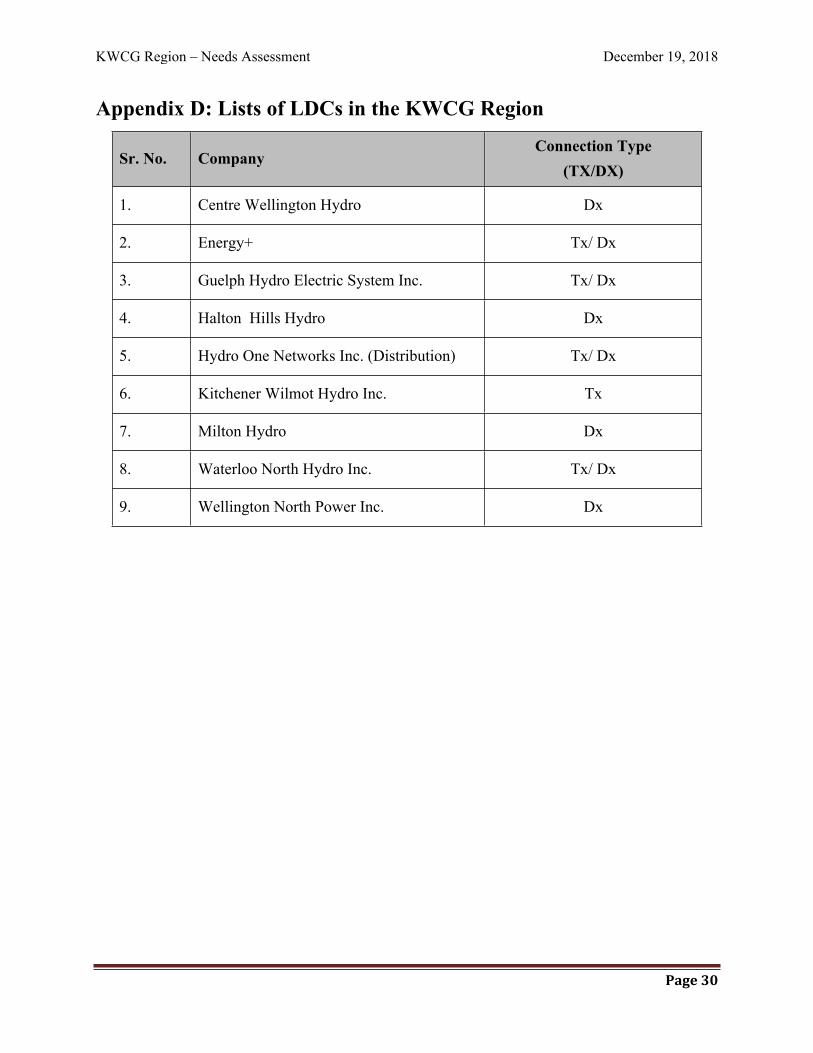
KWCG Region – Needs Assessment December 19, 2018
Page 30
Appendix D: Lists of LDCs in the KWCG Region
Sr. No. CompanyConnection Type
(TX/DX)
1. Centre Wellington Hydro Dx
2. Energy+ Tx/ Dx
3. Guelph Hydro Electric System Inc. Tx/ Dx
4. Halton Hills Hydro Dx
5. Hydro One Networks Inc. (Distribution) Tx/ Dx
6. Kitchener Wilmot Hydro Inc. Tx
7. Milton Hydro Dx
8. Waterloo North Hydro Inc. Tx/ Dx
9. Wellington North Power Inc. Dx
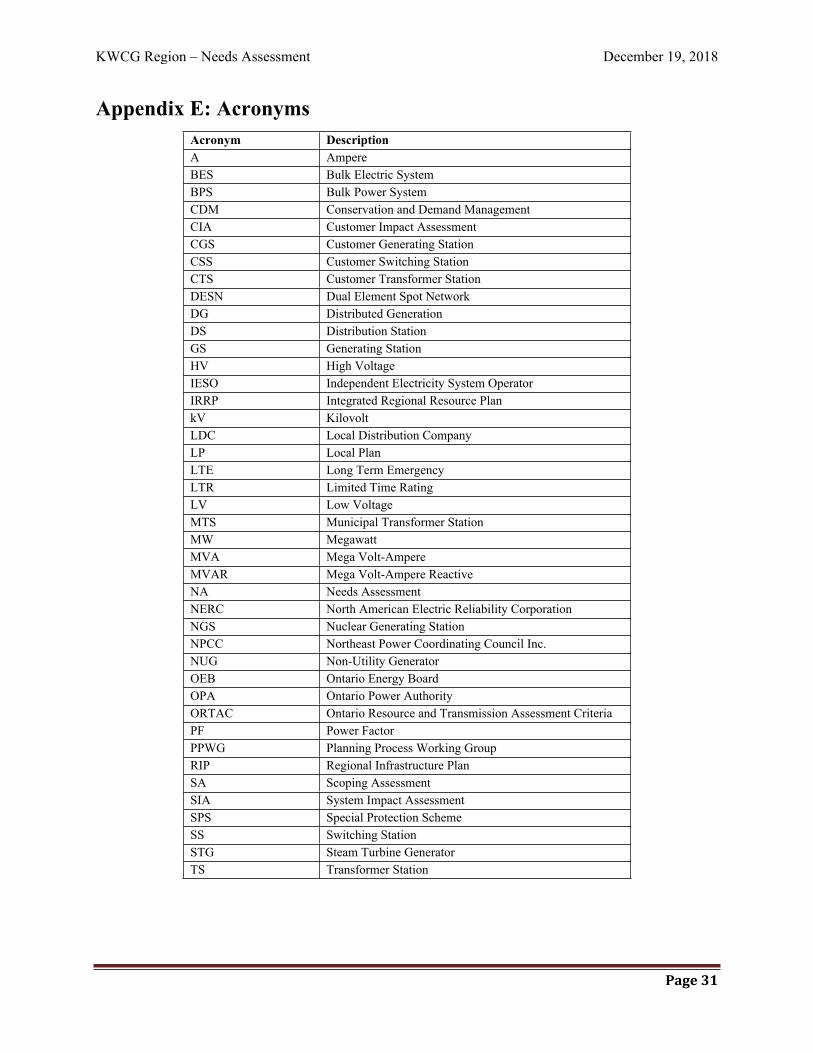
KWCG Region – Needs Assessment December 19, 2018
Page 31
Appendix E: AcronymsAcronym DescriptionA AmpereBES Bulk Electric SystemBPS Bulk Power SystemCDM Conservation and Demand ManagementCIA Customer Impact AssessmentCGS Customer Generating StationCSS Customer Switching StationCTS Customer Transformer StationDESN Dual Element Spot NetworkDG Distributed GenerationDS Distribution StationGS Generating StationHV High Voltage IESO Independent Electricity System OperatorIRRP Integrated Regional Resource PlankV KilovoltLDC Local Distribution CompanyLP Local PlanLTE Long Term EmergencyLTR Limited Time RatingLV Low VoltageMTS Municipal Transformer StationMW MegawattMVA Mega Volt-AmpereMVAR Mega Volt-Ampere ReactiveNA Needs AssessmentNERC North American Electric Reliability CorporationNGS Nuclear Generating StationNPCC Northeast Power Coordinating Council Inc.NUG Non-Utility GeneratorOEB Ontario Energy BoardOPA Ontario Power AuthorityORTAC Ontario Resource and Transmission Assessment CriteriaPF Power FactorPPWG Planning Process Working GroupRIP Regional Infrastructure PlanSA Scoping AssessmentSIA System Impact AssessmentSPS Special Protection SchemeSS Switching StationSTG Steam Turbine GeneratorTS Transformer Station

Appendix F:
KWCG IRRP Scoping Assessment Outcome
Report (2019)
1
KITCHENER-WATERLOO-CAMBRIDGE-GUELPH REGION SCOPING ASSESSMENT OUTCOME REPORT MAY 9, 2019
2
Table of Contents
KWCG Scoping Study Team .................................................................................................................... 3
1. Introduction ........................................................................................................................................ 4
2. Team ...................................................................................................................................................... 5
3. Categories of Needs, Analysis and Results ..................................................................................... 5
4. Conclusion ......................................................................................................................................... 12
List of Acronyms ...................................................................................................................................... 14
Appendix A: The Kitchener-Waterloo-Cambridge-Guelph IRRP Terms of Reference ................. 15
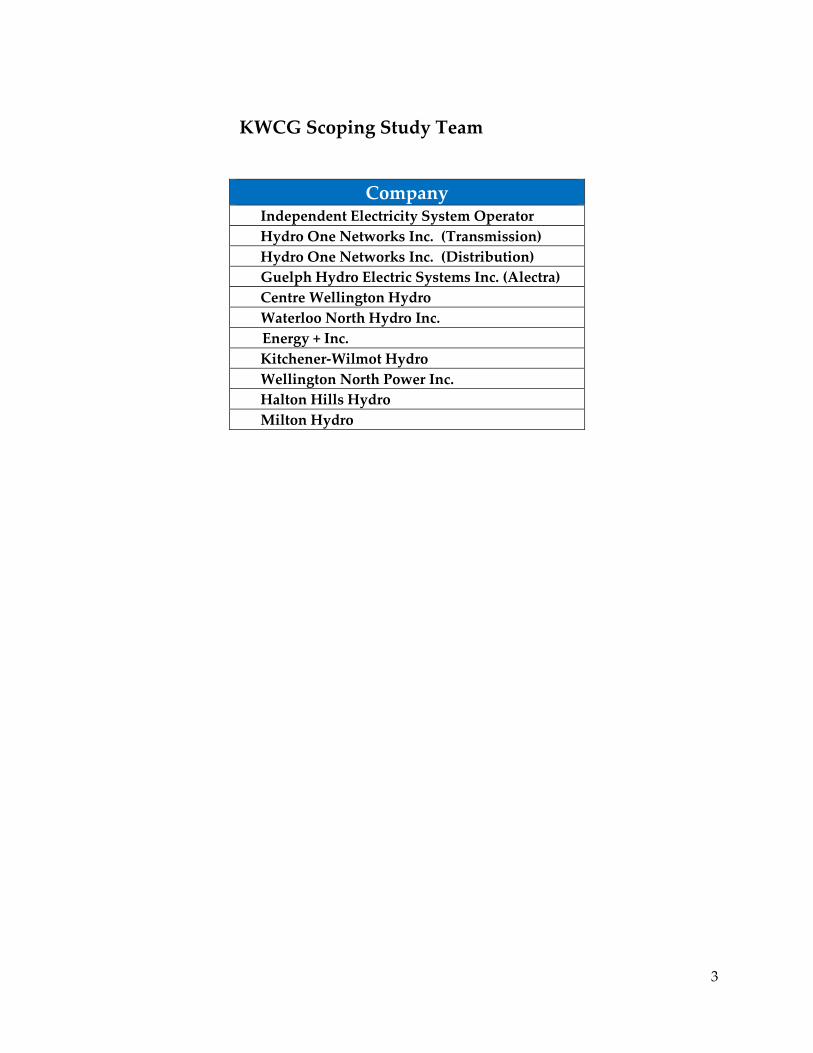
3
KWCG Scoping Study Team
Company Independent Electricity System Operator
Hydro One Networks Inc. (Transmission)
Hydro One Networks Inc. (Distribution)
Guelph Hydro Electric Systems Inc. (Alectra)
Centre Wellington Hydro
Waterloo North Hydro Inc.
Energy + Inc.
Kitchener-Wilmot Hydro
Wellington North Power Inc.
Halton Hills Hydro
Milton Hydro
4
Scoping Assessment Outcome Report Summary Region:
KWCG
Start Date
February 8, 2019 End Date May 8, 2019
1. Introduction
This Scoping Assessment Outcome Report is part of the Ontario Energy Board (OEB)’s regional
planning process. The Board endorsed the Planning Process Working Group’s Report to the
Board in May 2013 and formalized the process and timelines through changes to the
Transmission System Code and Distribution System Code in August 2013.
The first cycle of the regional planning process for the KWCG region was completed in April
2015. Needs were identified in the near- to medium-term timeframes, and solutions were
recommended to address them, including the Guelph Area Transmission Reinforcement Project
that is now in service.
The second cycle of the regional planning process for the KWCG region was initiated in
September 2018 with the Needs Assessment (NA) – the first step in the regional planning
process – carried out by the study team led by Hydro One Networks Inc. (Hydro One). This
report was issued on December 19, 2018 and concluded that a number of needs did not require
regional coordination, while others required regional coordination. The need information from
the Needs Assessment has been input into the scoping process to determine the nature of the
planning process to address the identified needs.
During the scoping assessment, participants reviewed the nature and timing of all known needs
in the region to determine both the most appropriate planning approach and the best
geographic grouping of needs to facilitate an efficient study. Planning approaches discussed
include an Integrated Regional Resource Plan (IRRP), where non-wires options have potential
to address needs; a Regional Infrastructure Plan (“RIP”), which considers wires-only options; or
a local plan undertaken by the transmitter and affected Local distribution company (LDC)
where no further regional coordination is needed.
Additional information on selecting a planning approach can be found in Appendix B.
This Scoping Assessment Report:
Lists the needs requiring more comprehensive planning, as identified in the Needs
Assessment Report;
Reassesses the areas that need to be studied and the geographic grouping of the needs;
5
Determines the appropriate regional planning approach and scope for each sub-region
where a need for regional coordination or more comprehensive planning is identified;
Establishes terms of reference for an IRRP if one is required;
Establishes the composition of the Working Group for the IRRP.
2. Team
The scoping assessment was carried out with members of the study team:
Independent Electricity System Operator (IESO)
Hydro One Networks Inc. (“Hydro One Transmission”)
Hydro One Networks Inc. (“Hydro One Distribution”)
Guelph Hydro Electric Systems Inc. (Alectra)
Centre Wellington Hydro
Waterloo North Hydro Inc.
Energy + Inc.
Kitchener- Wilmot Hydro Inc.
Wellington North Power
Halton Hills Hydro
Milton Hydro
3. Categories of Needs, Analysis and Results
I. Overview of the region
The Kitchener-Waterloo-Cambridge-Guelph (KWCG) region in southwestern Ontario includes
the Region of Waterloo,1 the City of Guelph, Wellington County and the Township of
Blandford-Blenheim (Oxford County).
Located in this region are the Grand River Métis Council, and two First Nation communities:
Six Nations of the Grand River and Mississaugas of the New Credit.
A summer-peaking region, KWCG is supplied by a network of 230 kV and 115 kV regional
transmission and distribution infrastructure. Electricity to the region is primarily supplied by
five major bulk transmission stations: Middleport TS, Buchanan TS, Detweiler TS, Orangeville
TS and Burlington TS. Customers in the area are supplied via a number of LDCs: Guelph
Hydro Electric Systems Inc., Hydro One Distribution, Centre Wellington Hydro, Waterloo
North Hydro Inc., Energy + Inc., Kitchener Wilmot Hydro Inc., Halton Hills Hydro and Milton
1 The Region of Waterloo includes the cities of Kitchener, Cambridge, Waterloo and the townships of
North Dumfries, Wellesley, Wilmot and Woolwich.
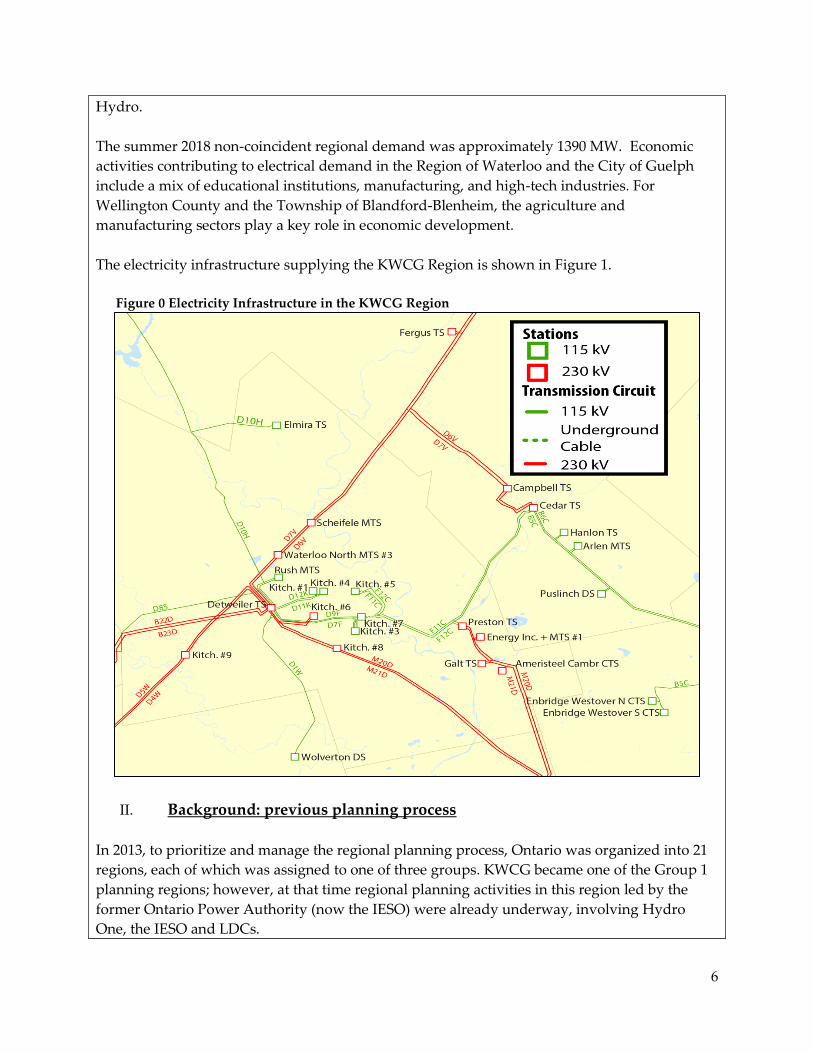
6
Hydro.
The summer 2018 non-coincident regional demand was approximately 1390 MW. Economic
activities contributing to electrical demand in the Region of Waterloo and the City of Guelph
include a mix of educational institutions, manufacturing, and high-tech industries. For
Wellington County and the Township of Blandford-Blenheim, the agriculture and
manufacturing sectors play a key role in economic development.
The electricity infrastructure supplying the KWCG Region is shown in Figure 1.
Figure 0 Electricity Infrastructure in the KWCG Region
II. Background: previous planning process
In 2013, to prioritize and manage the regional planning process, Ontario was organized into 21
regions, each of which was assigned to one of three groups. KWCG became one of the Group 1
planning regions; however, at that time regional planning activities in this region led by the
former Ontario Power Authority (now the IESO) were already underway, involving Hydro
One, the IESO and LDCs.
7
In October 2013, the KWCG planning electricity supply study was transitioned to align with the
OEB’s new regional planning process. The Working Group revised the terms of reference to
reflect the new process, and updated the study information, including demand forecasts and
conservation and distributed generation (DG) data, to confirm the region’s reliability and
supply needs.
To meet these needs, the Working Group recommended implementation of:
The Guelph Area Transmission Reinforcement (GATR) project
Installation of two new 230/115kV autotransformers at Cedar TS to reinforce
supply to the 115 kV sub-systems in the region; and upgrading of the 5km idle
115 kV line B5G/B6G between Campbell TS and Cedar TS to 230 kV
Installation of two new 230 kV in-line switches on D6V/D7V circuits to improve
restoration capability of the Waterloo-Guelph 230 kV sub-system
In-line switches at Galt Junction
Installation of two new 230kV in-line switches on M20D/M21D circuits to
improve restoration capability of the Cambridge-Kitchener 230 kV sub-system
These projects are complete and in service.
Following the IRRP, a regional infrastructure plan (RIP) was published in December 2015 to
address transmission needs identified in the needs assessment and the IRRP. Plans to address
some of these needs were further developed in the RIP, with some in the medium- to longer-
term timeframe to be confirmed in the next regional planning cycle.
This second regional planning cycle started with the Needs Assessment Report published by
Hydro One in December 2018. The needs identified in this report form the basis of the analysis
for this scoping assessment and are discussed in further detail in section III.
III. Identified needs
Hydro One’s NA identified a number of needs in the KWCG region based on the most up-to-
date sustainment plans and a 10-year demand forecast. These needs are outlined in Table 1-1,
which summarizes both the projects underway to address near-term needs, and the needs to be
addressed in this regional planning cycle.
Projects and Plans Underway
The NA completed recently by Hydro One listed projects currently underway to meet near-
term needs. Table 1-1 below lists these needs and the plans to address them.
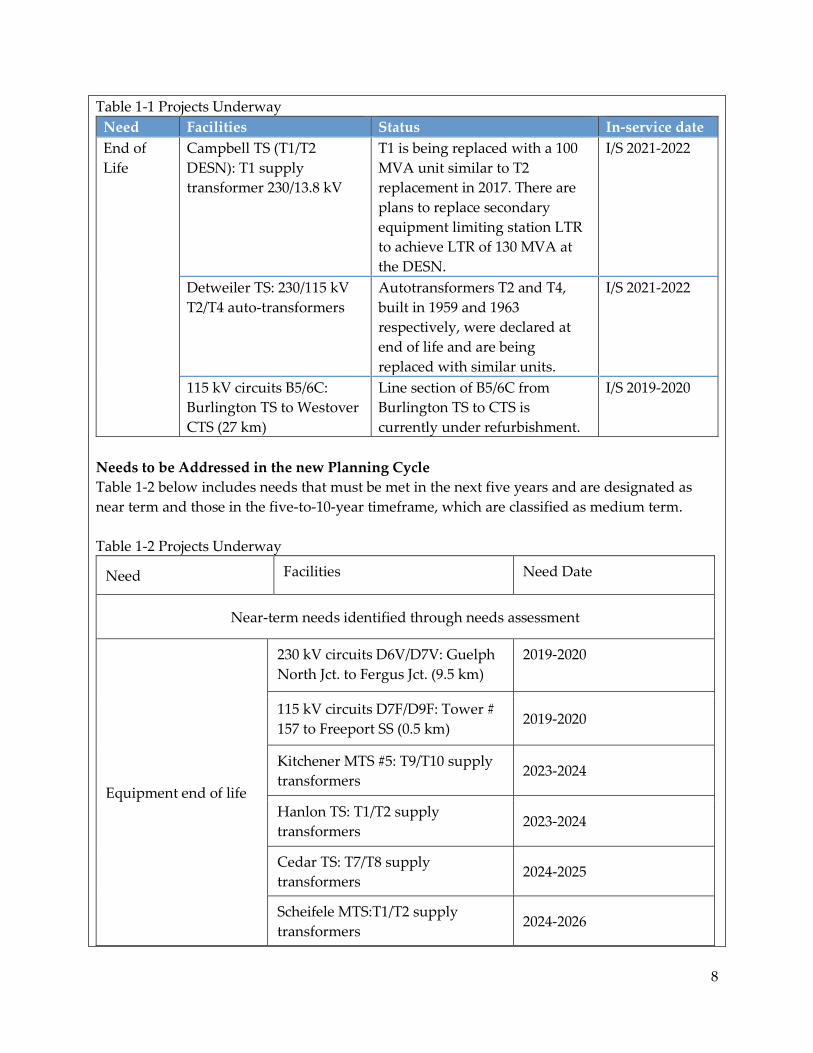
8
Table 1-1 Projects Underway
Need Facilities Status In-service date
End of
Life
Campbell TS (T1/T2
DESN): T1 supply
transformer 230/13.8 kV
T1 is being replaced with a 100
MVA unit similar to T2
replacement in 2017. There are
plans to replace secondary
equipment limiting station LTR
to achieve LTR of 130 MVA at
the DESN.
I/S 2021-2022
Detweiler TS: 230/115 kV
T2/T4 auto-transformers
Autotransformers T2 and T4,
built in 1959 and 1963
respectively, were declared at
end of life and are being
replaced with similar units.
I/S 2021-2022
115 kV circuits B5/6C:
Burlington TS to Westover
CTS (27 km)
Line section of B5/6C from
Burlington TS to CTS is
currently under refurbishment.
I/S 2019-2020
Needs to be Addressed in the new Planning Cycle
Table 1-2 below includes needs that must be met in the next five years and are designated as
near term and those in the five-to-10-year timeframe, which are classified as medium term.
Table 1-2 Projects Underway
Need Facilities Need Date
Near-term needs identified through needs assessment
Equipment end of life
230 kV circuits D6V/D7V: Guelph
North Jct. to Fergus Jct. (9.5 km) 2019-2020
115 kV circuits D7F/D9F: Tower #
157 to Freeport SS (0.5 km) 2019-2020
Kitchener MTS #5: T9/T10 supply
transformers 2023-2024
Hanlon TS: T1/T2 supply
transformers 2023-2024
Cedar TS: T7/T8 supply
transformers 2024-2025
Scheifele MTS:T1/T2 supply
transformers 2024-2026
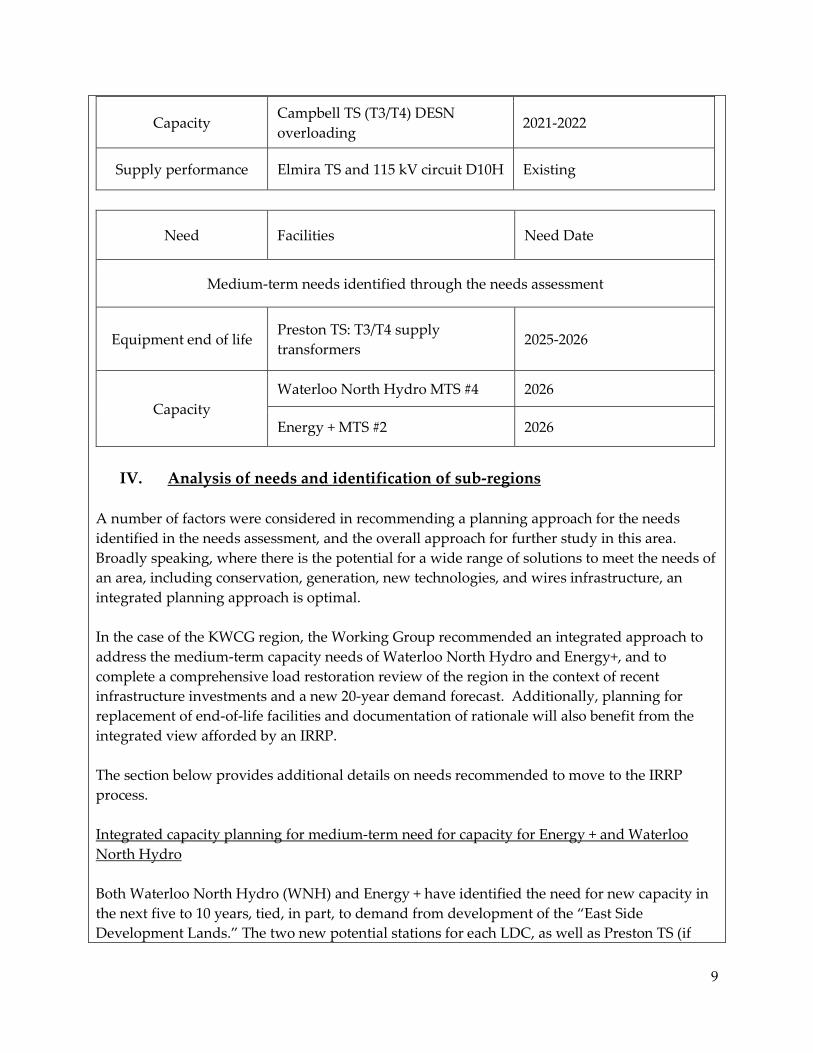
9
Capacity Campbell TS (T3/T4) DESN
overloading 2021-2022
Supply performance Elmira TS and 115 kV circuit D10H Existing
Need Facilities Need Date
Medium-term needs identified through the needs assessment
Equipment end of life Preston TS: T3/T4 supply
transformers 2025-2026
Capacity Waterloo North Hydro MTS #4 2026
Energy + MTS #2 2026
IV. Analysis of needs and identification of sub-regions
A number of factors were considered in recommending a planning approach for the needs
identified in the needs assessment, and the overall approach for further study in this area.
Broadly speaking, where there is the potential for a wide range of solutions to meet the needs of
an area, including conservation, generation, new technologies, and wires infrastructure, an
integrated planning approach is optimal.
In the case of the KWCG region, the Working Group recommended an integrated approach to
address the medium-term capacity needs of Waterloo North Hydro and Energy+, and to
complete a comprehensive load restoration review of the region in the context of recent
infrastructure investments and a new 20-year demand forecast. Additionally, planning for
replacement of end-of-life facilities and documentation of rationale will also benefit from the
integrated view afforded by an IRRP.
The section below provides additional details on needs recommended to move to the IRRP
process.
Integrated capacity planning for medium-term need for capacity for Energy + and Waterloo
North Hydro
Both Waterloo North Hydro (WNH) and Energy + have identified the need for new capacity in
the next five to 10 years, tied, in part, to demand from development of the “East Side
Development Lands.” The two new potential stations for each LDC, as well as Preston TS (if
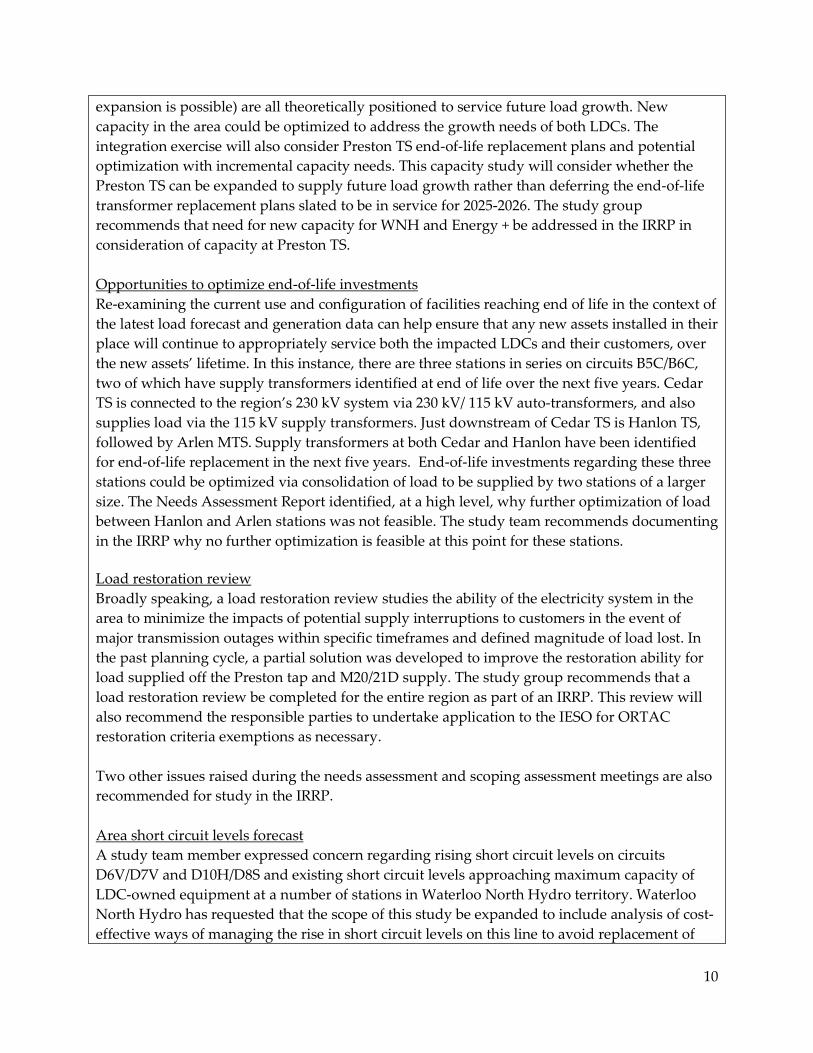
10
expansion is possible) are all theoretically positioned to service future load growth. New
capacity in the area could be optimized to address the growth needs of both LDCs. The
integration exercise will also consider Preston TS end-of-life replacement plans and potential
optimization with incremental capacity needs. This capacity study will consider whether the
Preston TS can be expanded to supply future load growth rather than deferring the end-of-life
transformer replacement plans slated to be in service for 2025-2026. The study group
recommends that need for new capacity for WNH and Energy + be addressed in the IRRP in
consideration of capacity at Preston TS.
Opportunities to optimize end-of-life investments
Re-examining the current use and configuration of facilities reaching end of life in the context of
the latest load forecast and generation data can help ensure that any new assets installed in their
place will continue to appropriately service both the impacted LDCs and their customers, over
the new assets’ lifetime. In this instance, there are three stations in series on circuits B5C/B6C,
two of which have supply transformers identified at end of life over the next five years. Cedar
TS is connected to the region’s 230 kV system via 230 kV/ 115 kV auto-transformers, and also
supplies load via the 115 kV supply transformers. Just downstream of Cedar TS is Hanlon TS,
followed by Arlen MTS. Supply transformers at both Cedar and Hanlon have been identified
for end-of-life replacement in the next five years. End-of-life investments regarding these three
stations could be optimized via consolidation of load to be supplied by two stations of a larger
size. The Needs Assessment Report identified, at a high level, why further optimization of load
between Hanlon and Arlen stations was not feasible. The study team recommends documenting
in the IRRP why no further optimization is feasible at this point for these stations.
Load restoration review
Broadly speaking, a load restoration review studies the ability of the electricity system in the
area to minimize the impacts of potential supply interruptions to customers in the event of
major transmission outages within specific timeframes and defined magnitude of load lost. In
the past planning cycle, a partial solution was developed to improve the restoration ability for
load supplied off the Preston tap and M20/21D supply. The study group recommends that a
load restoration review be completed for the entire region as part of an IRRP. This review will
also recommend the responsible parties to undertake application to the IESO for ORTAC
restoration criteria exemptions as necessary.
Two other issues raised during the needs assessment and scoping assessment meetings are also
recommended for study in the IRRP.
Area short circuit levels forecast
A study team member expressed concern regarding rising short circuit levels on circuits
D6V/D7V and D10H/D8S and existing short circuit levels approaching maximum capacity of
LDC-owned equipment at a number of stations in Waterloo North Hydro territory. Waterloo
North Hydro has requested that the scope of this study be expanded to include analysis of cost-
effective ways of managing the rise in short circuit levels on this line to avoid replacement of
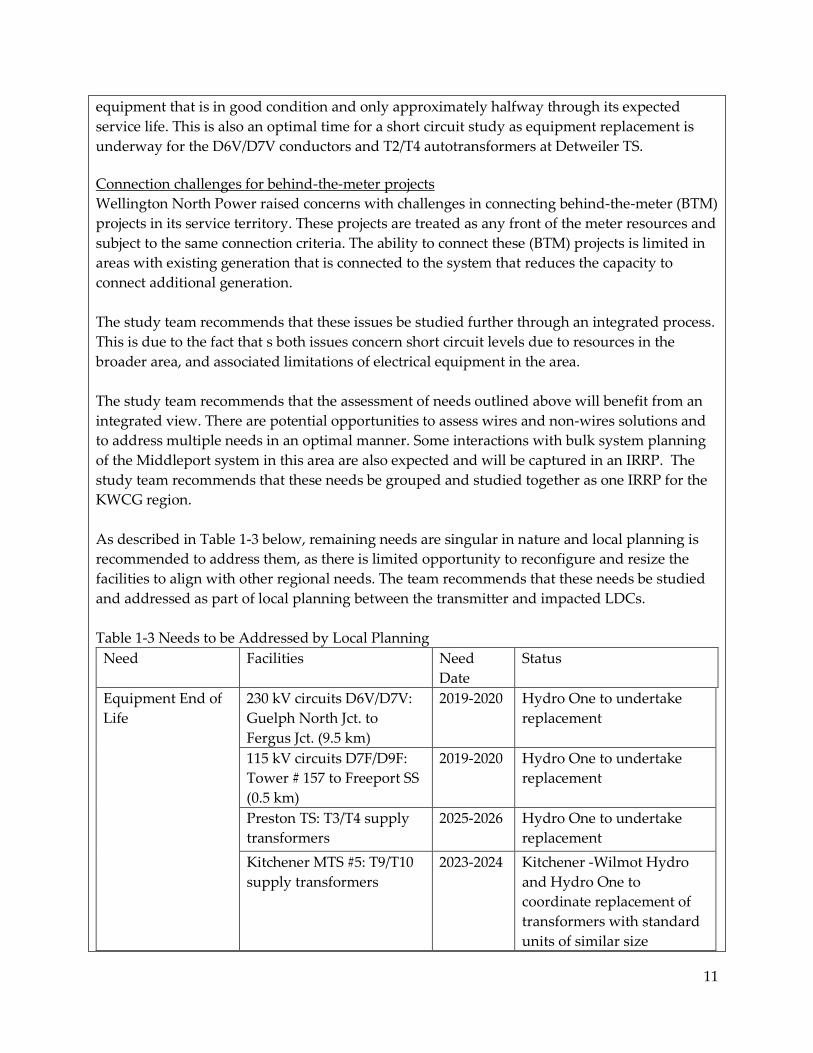
11
equipment that is in good condition and only approximately halfway through its expected
service life. This is also an optimal time for a short circuit study as equipment replacement is
underway for the D6V/D7V conductors and T2/T4 autotransformers at Detweiler TS.
Connection challenges for behind-the-meter projects
Wellington North Power raised concerns with challenges in connecting behind-the-meter (BTM)
projects in its service territory. These projects are treated as any front of the meter resources and
subject to the same connection criteria. The ability to connect these (BTM) projects is limited in
areas with existing generation that is connected to the system that reduces the capacity to
connect additional generation.
The study team recommends that these issues be studied further through an integrated process.
This is due to the fact that s both issues concern short circuit levels due to resources in the
broader area, and associated limitations of electrical equipment in the area.
The study team recommends that the assessment of needs outlined above will benefit from an
integrated view. There are potential opportunities to assess wires and non-wires solutions and
to address multiple needs in an optimal manner. Some interactions with bulk system planning
of the Middleport system in this area are also expected and will be captured in an IRRP. The
study team recommends that these needs be grouped and studied together as one IRRP for the
KWCG region.
As described in Table 1-3 below, remaining needs are singular in nature and local planning is
recommended to address them, as there is limited opportunity to reconfigure and resize the
facilities to align with other regional needs. The team recommends that these needs be studied
and addressed as part of local planning between the transmitter and impacted LDCs.
Table 1-3 Needs to be Addressed by Local Planning
Need Facilities Need
Date
Status
Equipment End of
Life 230 kV circuits D6V/D7V:
Guelph North Jct. to
Fergus Jct. (9.5 km)
2019-2020 Hydro One to undertake
replacement
115 kV circuits D7F/D9F:
Tower # 157 to Freeport SS
(0.5 km)
2019-2020 Hydro One to undertake
replacement
Preston TS: T3/T4 supply
transformers 2025-2026 Hydro One to undertake
replacement
Kitchener MTS #5: T9/T10
supply transformers 2023-2024 Kitchener -Wilmot Hydro
and Hydro One to
coordinate replacement of
transformers with standard
units of similar size
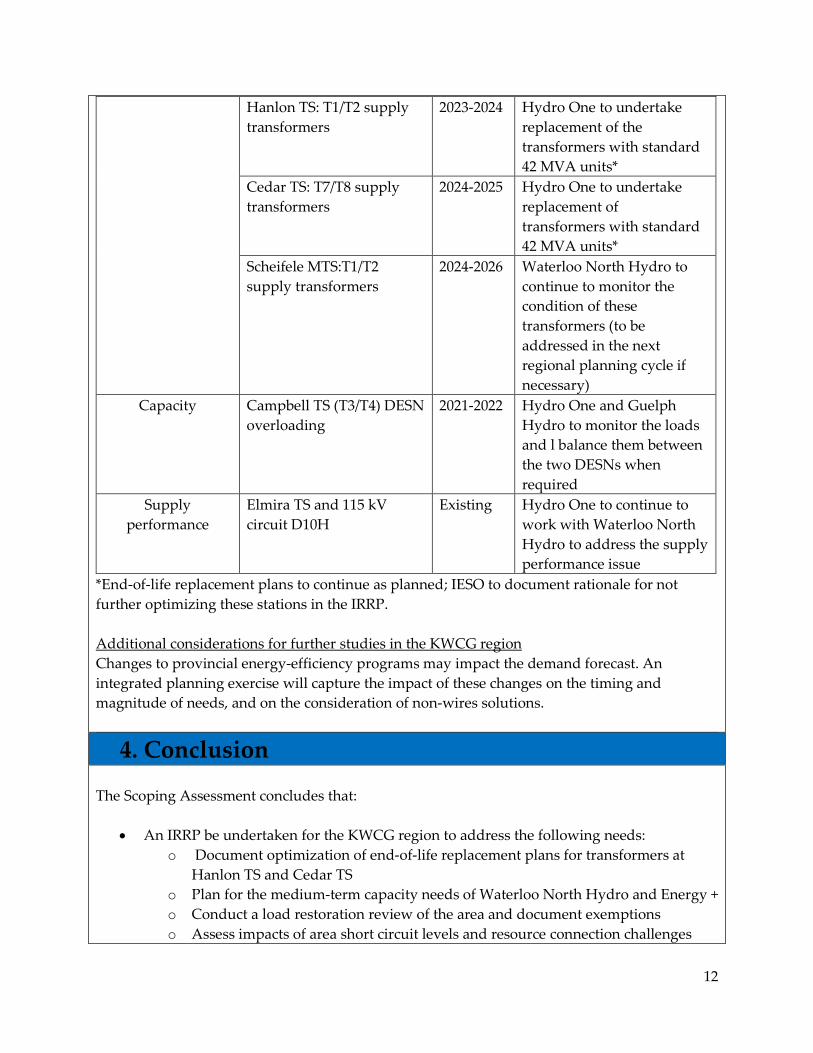
12
Hanlon TS: T1/T2 supply
transformers 2023-2024 Hydro One to undertake
replacement of the
transformers with standard
42 MVA units*
Cedar TS: T7/T8 supply
transformers 2024-2025 Hydro One to undertake
replacement of
transformers with standard
42 MVA units*
Scheifele MTS:T1/T2
supply transformers 2024-2026 Waterloo North Hydro to
continue to monitor the
condition of these
transformers (to be
addressed in the next
regional planning cycle if
necessary)
Capacity Campbell TS (T3/T4) DESN
overloading 2021-2022 Hydro One and Guelph
Hydro to monitor the loads
and l balance them between
the two DESNs when
required
Supply
performance Elmira TS and 115 kV
circuit D10H Existing Hydro One to continue to
work with Waterloo North
Hydro to address the supply
performance issue
*End-of-life replacement plans to continue as planned; IESO to document rationale for not
further optimizing these stations in the IRRP.
Additional considerations for further studies in the KWCG region
Changes to provincial energy-efficiency programs may impact the demand forecast. An
integrated planning exercise will capture the impact of these changes on the timing and
magnitude of needs, and on the consideration of non-wires solutions.
4. Conclusion
The Scoping Assessment concludes that:
An IRRP be undertaken for the KWCG region to address the following needs:
o Document optimization of end-of-life replacement plans for transformers at
Hanlon TS and Cedar TS
o Plan for the medium-term capacity needs of Waterloo North Hydro and Energy +
o Conduct a load restoration review of the area and document exemptions
o Assess impacts of area short circuit levels and resource connection challenges
13
Additional needs identified in the needs assessment (outlined below) will be addressed
through local planning between the transmitter and relevant LDC:
o End-of-life replacements
Section of 230 kV circuits D6V/D7V
Section of 115 kV circuits D7F/D9F
T9/T10 transformers at Kitchener MTS #9
T1/T2 transformers at Scheifele MTS
T3/T4 transformers at Preston TS
T7/T8 transformers at Cedar TS
T1/T2 transformers at Hanlon TS
o Supply performance issue at Elmira TS and supply from D10H
o Campbell TS DESN overloading
The draft terms of reference for the KWCG IRRP is attached in Appendix A.
14
List of Acronyms
CDM Conservation and Demand Management
DG Distributed Generation
IESO Independent Electricity System Operator
IRRP Integrated Regional Resource Plan
kV Kilovolt
LDC Local Distribution Company
MW Megawatt
NA Needs Assessment
OEB Ontario Energy Board
ORTAC Ontario Resource and Transmission Assessment Criteria
RIP Regional Infrastructure Plan
TS Transformer Station
15
Appendix A: The Kitchener-Waterloo-Cambridge-
Guelph IRRP Terms of Reference
1. Introduction and Background
These Terms of Reference establish the objectives, scope, key assumptions, roles and
responsibilities, activities, deliverables and timelines for an Integrated Regional Resource Plan
(IRRP) for the Kitchener-Waterloo-Cambridge-Guelph (KWCG) region.
Based on the needs identified within the region, including opportunities for coordinating
demand and supply options with capacity needs in the Waterloo North Hydro and Energy +
territories, load restoration capability review, short circuit capability needs, and challenges in
connecting behind-the-meter energy storage, an integrated regional resource planning approach
for the KWCG region is recommended.
The KWCG Region
The KWCG region in southwestern Ontario includes the Region of Waterloo,2 the City of
Guelph, Wellington County and the Township of Blandford-Blenheim (Oxford County). Under
the “Places to Grow" policy, the KWCG area is expected to meet the mandated population
growth target set by the province in the coming decades.
The approximate geographical boundaries of the region are shown in Figure A-1.
2 The Region of Waterloo includes the cities of Kitchener, Cambridge, Waterloo and the townships of
North Dumfries, Wellesley, Wilmot and Woolwich.
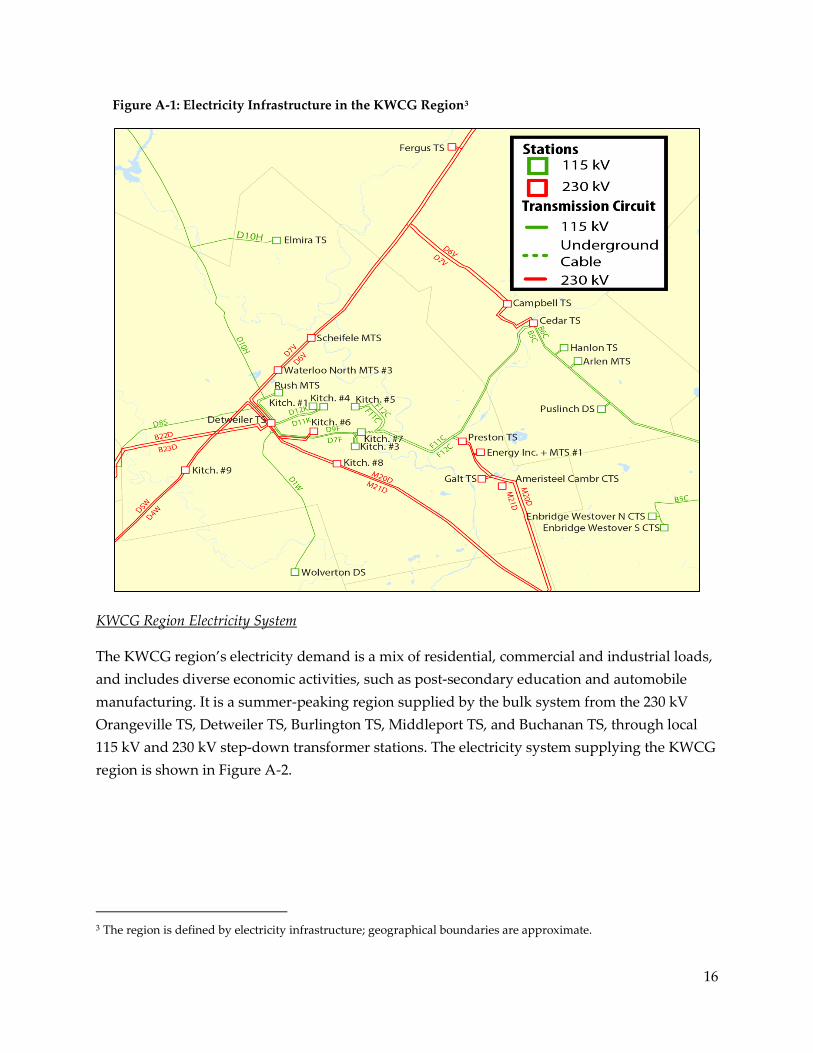
16
Figure A-1: Electricity Infrastructure in the KWCG Region3
KWCG Region Electricity System
The KWCG region’s electricity demand is a mix of residential, commercial and industrial loads,
and includes diverse economic activities, such as post-secondary education and automobile
manufacturing. It is a summer-peaking region supplied by the bulk system from the 230 kV
Orangeville TS, Detweiler TS, Burlington TS, Middleport TS, and Buchanan TS, through local
115 kV and 230 kV step-down transformer stations. The electricity system supplying the KWCG
region is shown in Figure A-2.
3 The region is defined by electricity infrastructure; geographical boundaries are approximate.
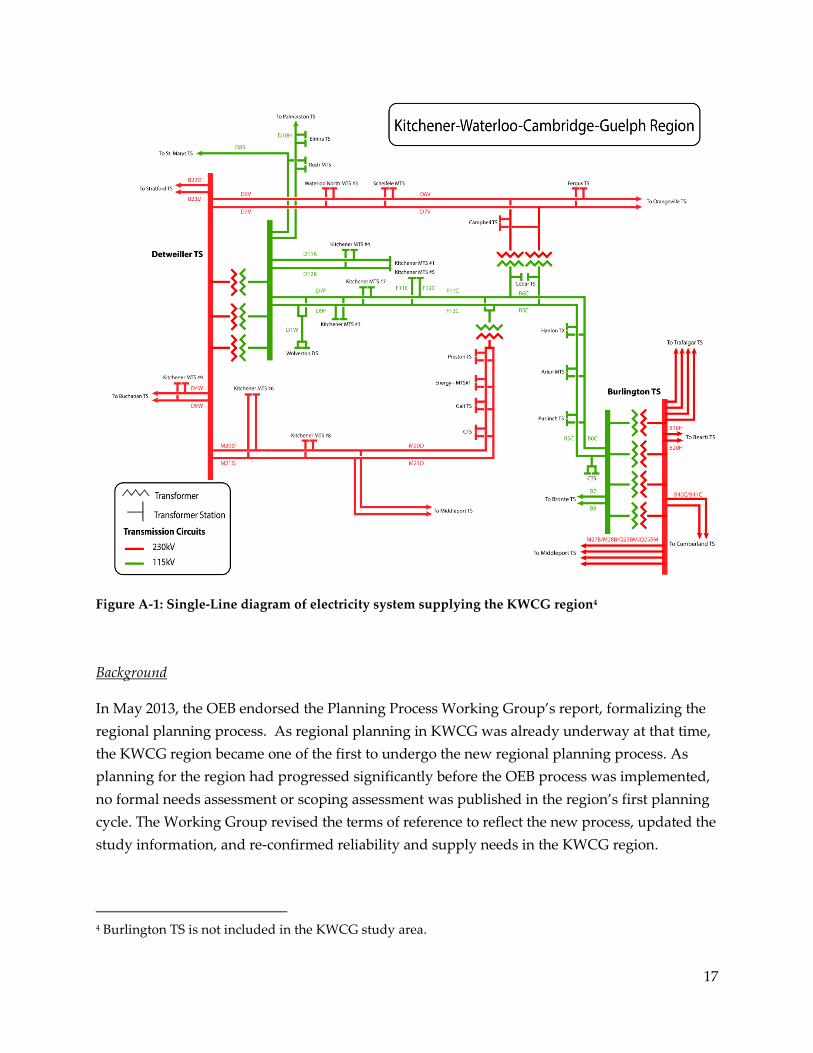
17
Figure A-1: Single-Line diagram of electricity system supplying the KWCG region4
Background
In May 2013, the OEB endorsed the Planning Process Working Group’s report, formalizing the
regional planning process. As regional planning in KWCG was already underway at that time,
the KWCG region became one of the first to undergo the new regional planning process. As
planning for the region had progressed significantly before the OEB process was implemented,
no formal needs assessment or scoping assessment was published in the region’s first planning
cycle. The Working Group revised the terms of reference to reflect the new process, updated the
study information, and re-confirmed reliability and supply needs in the KWCG region.
4 Burlington TS is not included in the KWCG study area.
18
In April 2015, the IESO published an IRRP for the KWCG region recommending conservation
and distributed generation to help meet peak demand growth. The plan also recommended the
implementation of Guelph Area Transmission Refurbishment (GATR) that focused on
addressing supply needs in the south-central Guelph and Kitchener area, and minimizing the
impact of potential supply interruptions to customers in Waterloo, Guelph and surrounding
areas. The plan also called for the installation of two circuit switches at Galt Junction to further
improve restoration capability in the Cambridge and Kitchener area. Both the GATR project
and Galt Junction in-line switches have been completed and are in service.
Subsequently, and in accordance with the OEB’s process, in December 2015 Hydro One
Transmission published a regional infrastructure plan (RIP) to address transmission needs
identified in the IRRP.
The second cycle of KWCG regional planning launched in late 2018, and Hydro One published
the Needs Assessment Report in December of the same year. Because a number of needs
identified in the report require integrated regional consideration, the scoping assessment led by
the IESO with Hydro One and LDCs recommended an integrated regional resource plan (IRRP)
be undertaken to address these needs.
2. Objectives
The KWCG IRRP will assess the adequacy of electricity supply to customers in the region and
will develop a set of recommended actions to maintain reliability of supply to the region over
the next 20 years.
Assess the adequacy of electricity supply to customers in the KWCG area over the next
20 years
Determine whether there is a need to initiate development work or to fully commit
infrastructure investments in this planning cycle
Identify and coordinate major asset renewal needs with customer needs, and develop a
flexible, comprehensive, integrated electricity plan for KWCG
Develop an implementation plan, while maintaining the flexibility to accommodate
changes in key assumptions over time
3. Scope
This IRRP will develop and recommend an integrated plan to meet the needs of the KWCG
region. The plan was developed by members of the KWCG IRRP Working Group comprising
Centre Wellington Hydro, Energy + Inc., Guelph Hydro Electric Systems Inc. (Alectra), Hydro
19
One Distribution, Kitchener-Wilmot Hydro, Waterloo North Hydro Inc., Wellington North
Power Inc., Hydro One Transmission, and the IESO.
The plan will focus on these items in order of priority:
Documentation of end-of-life needs optimization at Hanlon/Cedar/Campbell stations
Medium-term integrated planning for capacity needs of Waterloo North Hydro and
Energy+
Review of restoration capability in the area, including undertaking restoration criteria
exemptions as necessary
Long-term planning for the 115 kV system in this region
Review of short circuit capability needs associated with rising short circuit levels,
including recommendation of integrated solutions
Review of connection challenges of behind-the-meter energy storage projects, including
recommendation of solutions as relevant or recommendation to address in other forums
In its identification or confirmation of any capacity or restoration needs, and analysis of options
for addressing end-of-life needs, this plan – like all IRRPs – will integrate forecast electricity
demand growth, conservation and demand management (CDM) with transmission and
distribution system capability, relevant community plans, other bulk system developments, and
the uptake of distributed energy resources (DER).
The IESO will assess the adequacy of the bulk system supplying the area in the Middleport bulk
system planning study through a separate process. Results of that study will be shared with the
Working Group and incorporated into applicable regional studies as they become available.
Based on the identified needs, the KWCG IRRP process will involve the:
1) Development of an updated 20-year demand forecast for the region.
2) Confirmation of the adequacy of transformer station ratings and the area’s load-meeting
capability and reliability.
a. Identify or confirm the transformer station capacity needs and sufficiency of the
area’s load-meeting capability for the study period using the updated load
forecast.
b. Confirm identified restoration needs using the updated load forecast.
c. Collect information on known reliability issues and load transfer capabilities
from the LDCs.
3) Assessment of options for confirmed needs, using decision-making criteria that includes,
but is not limited to, technical feasibility, economics, reliability performance, and
environmental and social factors.
20
The options analysis has been divided into groupings based on the priority/timing of the
needs, known lead time information, and the depth of analysis required.
a. Phase 1:
i. Confirm and document the reasons and conclusion(s) of the optimization
of end-of-life Hanlon/Cedar/Campbell stations.
ii. Identify options for meeting medium-term capacity needs in Waterloo
North Hydro and Energy+ territories, with consideration of supply from
Preston TS per recommendations from the Working Group.
b. Phase 2:
i. Review restoration capabilities in the area, and recommend responsible
parties to undertake restoration criteria exemption application as
necessary.
ii. Long-term planning for the 115 kV system between Detweiler TS and
Cedar TS.
iii. Review options for managing rising short circuit capability need.
iv. Review options to address challenges of connecting behind-the-meter
energy storage projects, and recommend solutions.
v. Engage with representatives from the Region of Waterloo, municipalities
and Indigenous communities, to review and consider municipal energy
plans.
4) Development of the long-term recommendations and the implementation plan.
5) Completion of the IRRP report documenting near-, mid-, and long-term needs and
recommendations.
In order to carry out this scope of work, the Working Group will consider the data and
assumptions outlined in section 4 below.
4. Data and Assumptions
The plan will consider the following data and assumptions:
Demand data
o Historical coincident and non-coincident peak demand information Historical
weather correction, for median and extreme conditions
o Gross peak demand forecast scenarios by region, TS
o Coincident peak demand data, including transmission-connected customers
o Identified potential future load customers
Conservation and demand management (CDM)
21
o LDC CDM plans
o Verified results and CDM programs/opportunities in the area
o Long-term conservation forecast for LDC customers based on planned provincial
CDM activities
o Conservation potential studies, if available
o Potential for CDM at transmission-connected customer facilities
o Load segmentation data for each TS based on customer type (e.g., residential,
commercial, industrial, agricultural) and proportion of LDC service territory
within the study area
Local resources
o Existing local generation, including distributed generation (DG), district energy,
customer-based generation, non-utility generators and hydroelectric facilities as
applicable
o Existing or committed renewable generation from feed-in-tariff (FIT” and non-
FIT procurements
o Future resource proposals as relevant
Relevant local plans, as applicable
o LDC distribution system plans
o Community energy plans and municipal energy plans (e.g., Community Energy
Investment Strategy for Waterloo Region)
o Municipal growth plans
o Any transit plans impacting electricity use or tied to community developments
Criteria, codes and other requirements
o Ontario Resource and Transmission Assessment Criteria (ORTAC)
Supply capability
Load security
Load restoration requirements
o NERC and NPCC reliability criteria, as applicable
o OEB Transmission System Code
o OEB Distribution System Code
o Reliability considerations, e.g., frequency and duration of interruptions to
customers
o Other applicable requirements
Existing system capability
o Transmission line ratings as per transmitter records
o System capability as per current IESO PSS/E base cases
o Transformer station ratings (10-day LTR) as per asset owner
o Load transfer capability
o Technical and operating characteristics of local generation
22
End-of-life asset considerations and sustainment plans
o Transmission assets
o Distribution assets
o Impact of ongoing plans and projects on applicable facility ratings
Other considerations, as applicable
5. Working Group
The core Working Group will consist of planning representatives from the following
organizations, including embedded LDCs that have identified needs in this region:
Independent Electricity System Operator (Team Lead for IRRP)
Hydro One Transmission
Guelph Hydro Electric Systems Inc. (Alectra)
Centre Wellington Hydro
Waterloo North Hydro Inc.
Energy + Inc.
Kitchener-Wilmot Hydro
Wellington North Power Inc.
Hydro One Distribution
Other LDCs in the region are welcome to participate as observers and the study outcome will be
shared with all participants.
Authority and Funding
Each entity involved in the study will be responsible for complying with regulatory
requirements as applicable to the actions/tasks assigned under the implementation plan
resulting from this IRRP. For the duration of the study process, each participant is responsible
for their own funding.
5. Engagement
Integrating early and sustained engagement with communities and stakeholders was
recommended by the IESO, and adopted by the provincial government to enhance the regional
planning and siting processes in 2013. The Working Group is committed to conducting plan-
level engagement throughout the development of the KWCG IRRP.
The first step in engagement will consist of meetings with representatives from the region,
including municipalities and Indigenous communities within the planning area, Indigenous
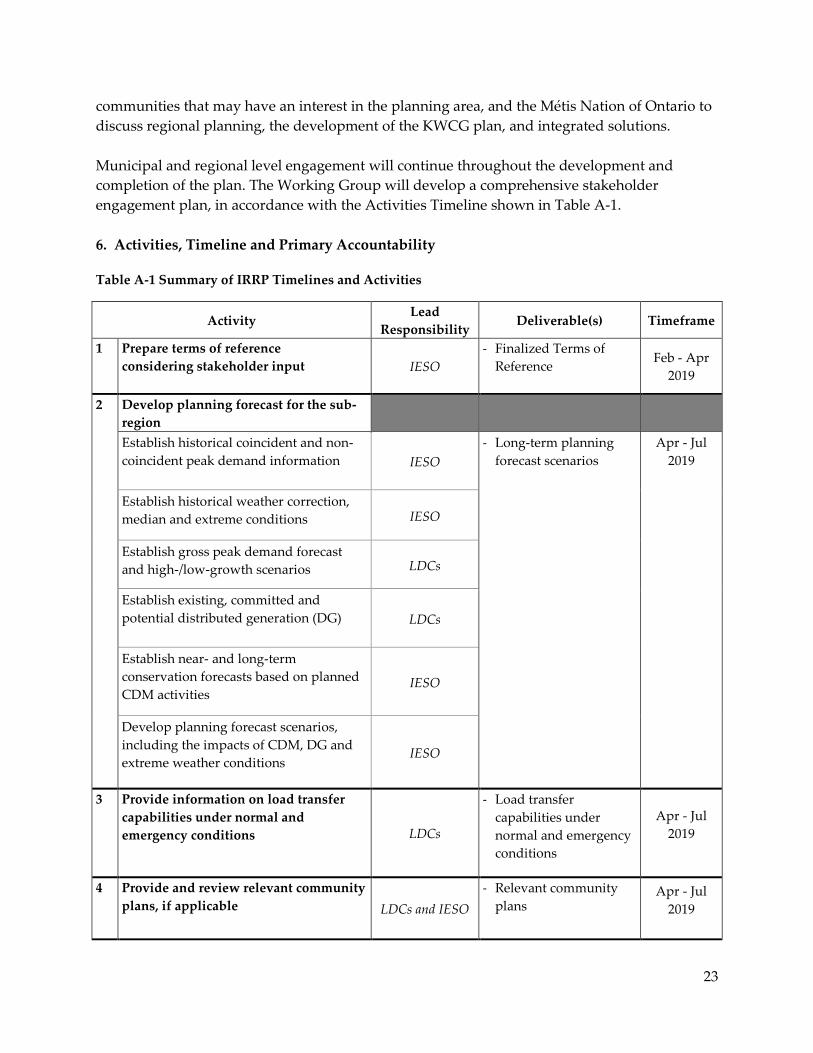
23
communities that may have an interest in the planning area, and the Métis Nation of Ontario to
discuss regional planning, the development of the KWCG plan, and integrated solutions.
Municipal and regional level engagement will continue throughout the development and
completion of the plan. The Working Group will develop a comprehensive stakeholder
engagement plan, in accordance with the Activities Timeline shown in Table A-1.
6. Activities, Timeline and Primary Accountability
Table A-1 Summary of IRRP Timelines and Activities
Activity Lead
Responsibility Deliverable(s) Timeframe
1 Prepare terms of reference
considering stakeholder input IESO
- Finalized Terms of
Reference Feb - Apr
2019
2 Develop planning forecast for the sub-
region
Establish historical coincident and non-
coincident peak demand information IESO
- Long-term planning
forecast scenarios
Apr - Jul
2019
Establish historical weather correction,
median and extreme conditions IESO
Establish gross peak demand forecast
and high-/low-growth scenarios LDCs
Establish existing, committed and
potential distributed generation (DG) LDCs
Establish near- and long-term
conservation forecasts based on planned
CDM activities IESO
Develop planning forecast scenarios,
including the impacts of CDM, DG and
extreme weather conditions IESO
3 Provide information on load transfer
capabilities under normal and
emergency conditions LDCs
- Load transfer
capabilities under
normal and emergency
conditions
Apr - Jul
2019
4 Provide and review relevant community
plans, if applicable LDCs and IESO
- Relevant community
plans Apr - Jul
2019
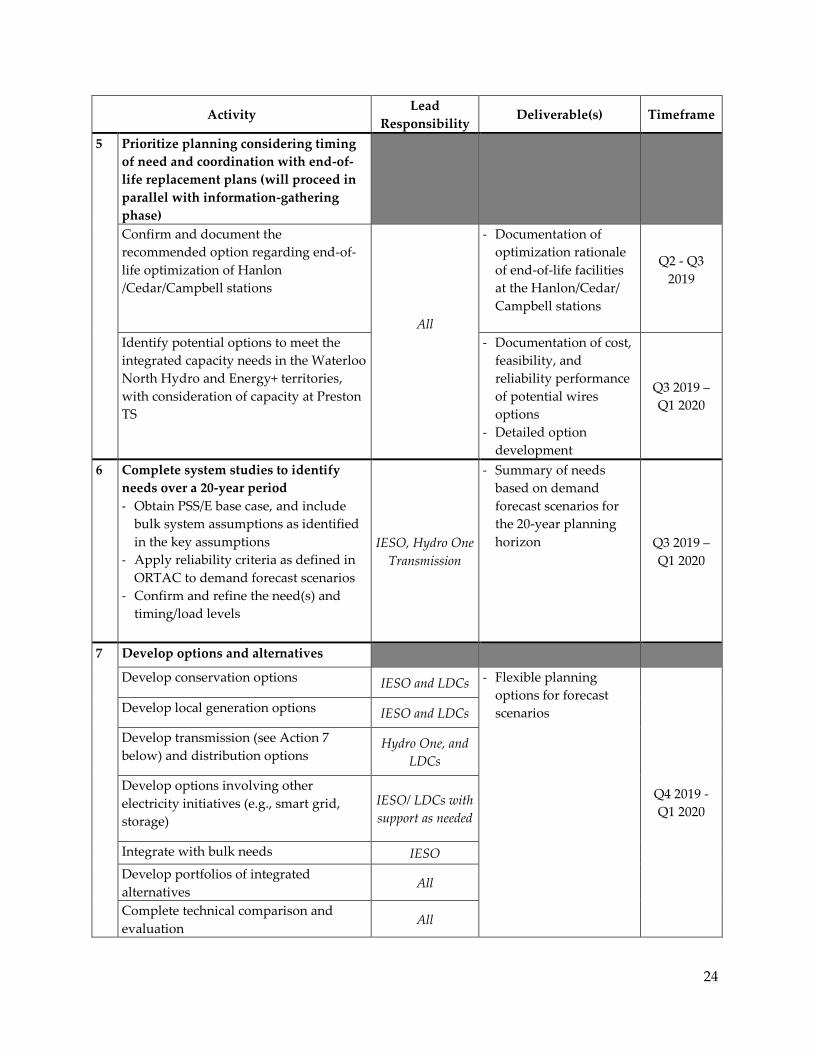
24
Activity Lead
Responsibility Deliverable(s) Timeframe
5 Prioritize planning considering timing
of need and coordination with end-of-
life replacement plans (will proceed in
parallel with information-gathering
phase)
Confirm and document the
recommended option regarding end-of-
life optimization of Hanlon
/Cedar/Campbell stations
All
- Documentation of
optimization rationale
of end-of-life facilities
at the Hanlon/Cedar/
Campbell stations
Q2 - Q3
2019
Identify potential options to meet the
integrated capacity needs in the Waterloo
North Hydro and Energy+ territories,
with consideration of capacity at Preston
TS
- Documentation of cost,
feasibility, and
reliability performance
of potential wires
options
- Detailed option
development
Q3 2019 –
Q1 2020
6 Complete system studies to identify
needs over a 20-year period
- Obtain PSS/E base case, and include
bulk system assumptions as identified
in the key assumptions
- Apply reliability criteria as defined in
ORTAC to demand forecast scenarios
- Confirm and refine the need(s) and
timing/load levels
IESO, Hydro One
Transmission
- Summary of needs
based on demand
forecast scenarios for
the 20-year planning
horizon Q3 2019 –
Q1 2020
7 Develop options and alternatives
Develop conservation options IESO and LDCs - Flexible planning
options for forecast
scenarios
Q4 2019 -
Q1 2020
Develop local generation options IESO and LDCs
Develop transmission (see Action 7
below) and distribution options Hydro One, and
LDCs
Develop options involving other
electricity initiatives (e.g., smart grid,
storage)
IESO/ LDCs with
support as needed
Integrate with bulk needs IESO
Develop portfolios of integrated
alternatives All
Complete technical comparison and
evaluation All
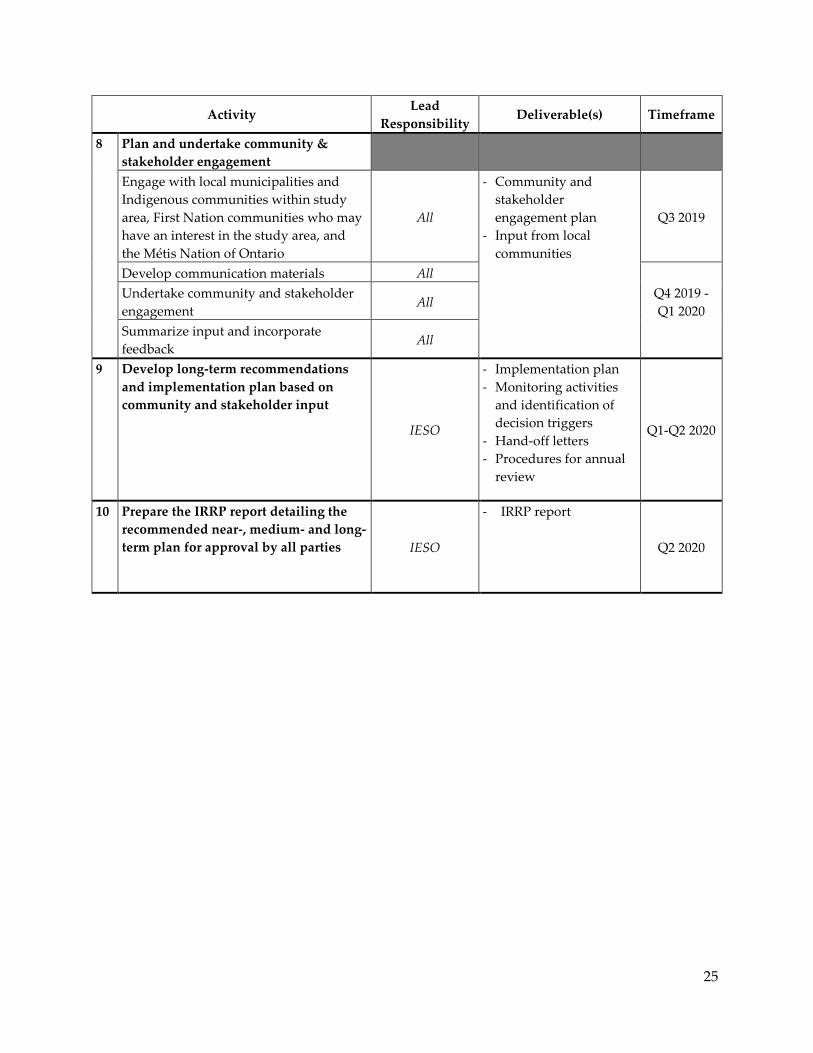
25
Activity Lead
Responsibility Deliverable(s) Timeframe
8 Plan and undertake community &
stakeholder engagement
Engage with local municipalities and
Indigenous communities within study
area, First Nation communities who may
have an interest in the study area, and
the Métis Nation of Ontario
All
- Community and
stakeholder
engagement plan
- Input from local
communities
Q3 2019
Develop communication materials All
Q4 2019 -
Q1 2020
Undertake community and stakeholder
engagement All
Summarize input and incorporate
feedback All
9 Develop long-term recommendations
and implementation plan based on
community and stakeholder input
IESO
- Implementation plan
- Monitoring activities
and identification of
decision triggers
- Hand-off letters
- Procedures for annual
review
Q1-Q2 2020
10 Prepare the IRRP report detailing the
recommended near-, medium- and long-
term plan for approval by all parties IESO
- IRRP report
Q2 2020

Appendix G:
KWCG Regional Planning Status Letter
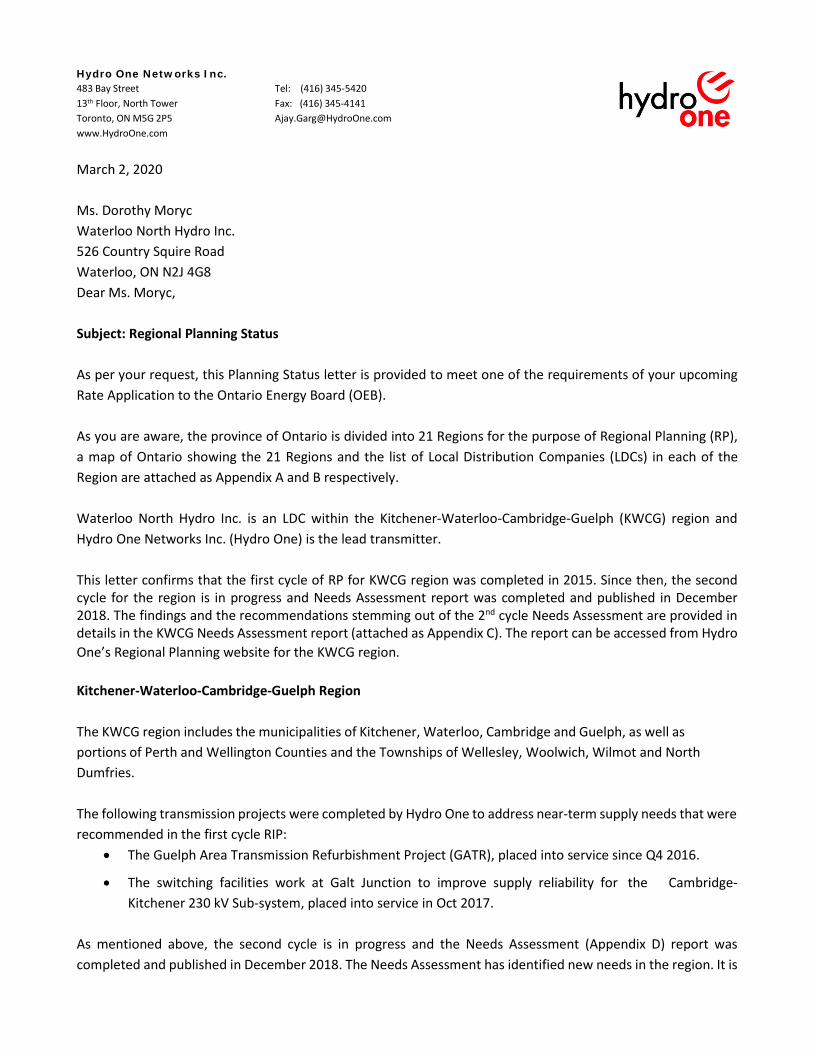
Hydro One Networks Inc. 483 Bay Street Tel: (416) 345-5420 13th Floor, North Tower Fax: (416) 345-4141 Toronto, ON M5G 2P5 [email protected] www.HydroOne.com
March 2, 2020
Ms. Dorothy Moryc Waterloo North Hydro Inc. 526 Country Squire Road Waterloo, ON N2J 4G8 Dear Ms. Moryc,
Subject: Regional Planning Status
As per your request, this Planning Status letter is provided to meet one of the requirements of your upcoming Rate Application to the Ontario Energy Board (OEB).
As you are aware, the province of Ontario is divided into 21 Regions for the purpose of Regional Planning (RP), a map of Ontario showing the 21 Regions and the list of Local Distribution Companies (LDCs) in each of the Region are attached as Appendix A and B respectively.
Waterloo North Hydro Inc. is an LDC within the Kitchener-Waterloo-Cambridge-Guelph (KWCG) region and Hydro One Networks Inc. (Hydro One) is the lead transmitter.
This letter confirms that the first cycle of RP for KWCG region was completed in 2015. Since then, the second cycle for the region is in progress and Needs Assessment report was completed and published in December 2018. The findings and the recommendations stemming out of the 2nd cycle Needs Assessment are provided in details in the KWCG Needs Assessment report (attached as Appendix C). The report can be accessed from Hydro One’s Regional Planning website for the KWCG region.
Kitchener-Waterloo-Cambridge-Guelph Region
The KWCG region includes the municipalities of Kitchener, Waterloo, Cambridge and Guelph, as well as portions of Perth and Wellington Counties and the Townships of Wellesley, Woolwich, Wilmot and North Dumfries.
The following transmission projects were completed by Hydro One to address near-term supply needs that were recommended in the first cycle RIP:
• The Guelph Area Transmission Refurbishment Project (GATR), placed into service since Q4 2016.
• The switching facilities work at Galt Junction to improve supply reliability for the Cambridge-Kitchener 230 kV Sub-system, placed into service in Oct 2017.
As mentioned above, the second cycle is in progress and the Needs Assessment (Appendix D) report was completed and published in December 2018. The Needs Assessment has identified new needs in the region. It is
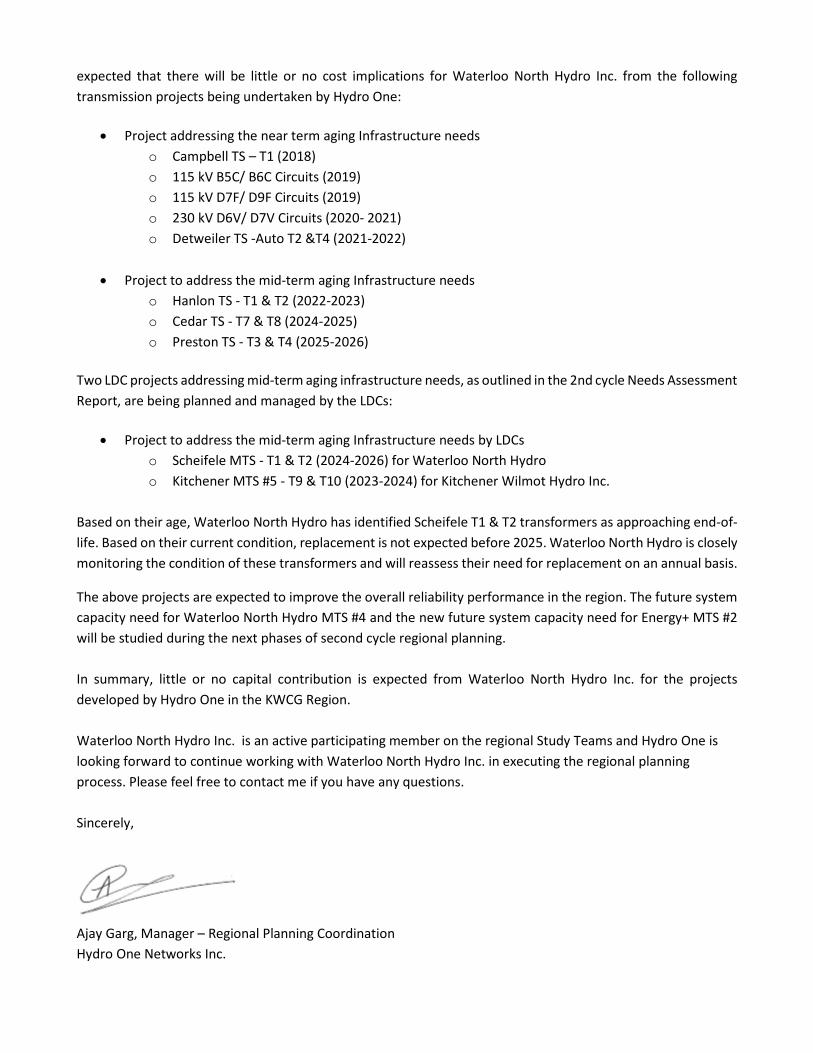
expected that there will be little or no cost implications for Waterloo North Hydro Inc. from the following transmission projects being undertaken by Hydro One:
• Project addressing the near term aging Infrastructure needs o Campbell TS – T1 (2018) o 115 kV B5C/ B6C Circuits (2019) o 115 kV D7F/ D9F Circuits (2019) o 230 kV D6V/ D7V Circuits (2020- 2021) o Detweiler TS -Auto T2 &T4 (2021-2022)
• Project to address the mid-term aging Infrastructure needs
o Hanlon TS - T1 & T2 (2022-2023) o Cedar TS - T7 & T8 (2024-2025) o Preston TS - T3 & T4 (2025-2026)
Two LDC projects addressing mid-term aging infrastructure needs, as outlined in the 2nd cycle Needs Assessment Report, are being planned and managed by the LDCs:
• Project to address the mid-term aging Infrastructure needs by LDCs o Scheifele MTS - T1 & T2 (2024-2026) for Waterloo North Hydro o Kitchener MTS #5 - T9 & T10 (2023-2024) for Kitchener Wilmot Hydro Inc.
Based on their age, Waterloo North Hydro has identified Scheifele T1 & T2 transformers as approaching end-of- life. Based on their current condition, replacement is not expected before 2025. Waterloo North Hydro is closely monitoring the condition of these transformers and will reassess their need for replacement on an annual basis.
The above projects are expected to improve the overall reliability performance in the region. The future system capacity need for Waterloo North Hydro MTS #4 and the new future system capacity need for Energy+ MTS #2 will be studied during the next phases of second cycle regional planning. In summary, little or no capital contribution is expected from Waterloo North Hydro Inc. for the projects developed by Hydro One in the KWCG Region. Waterloo North Hydro Inc. is an active participating member on the regional Study Teams and Hydro One is looking forward to continue working with Waterloo North Hydro Inc. in executing the regional planning process. Please feel free to contact me if you have any questions. Sincerely,
Ajay Garg, Manager – Regional Planning Coordination Hydro One Networks Inc.
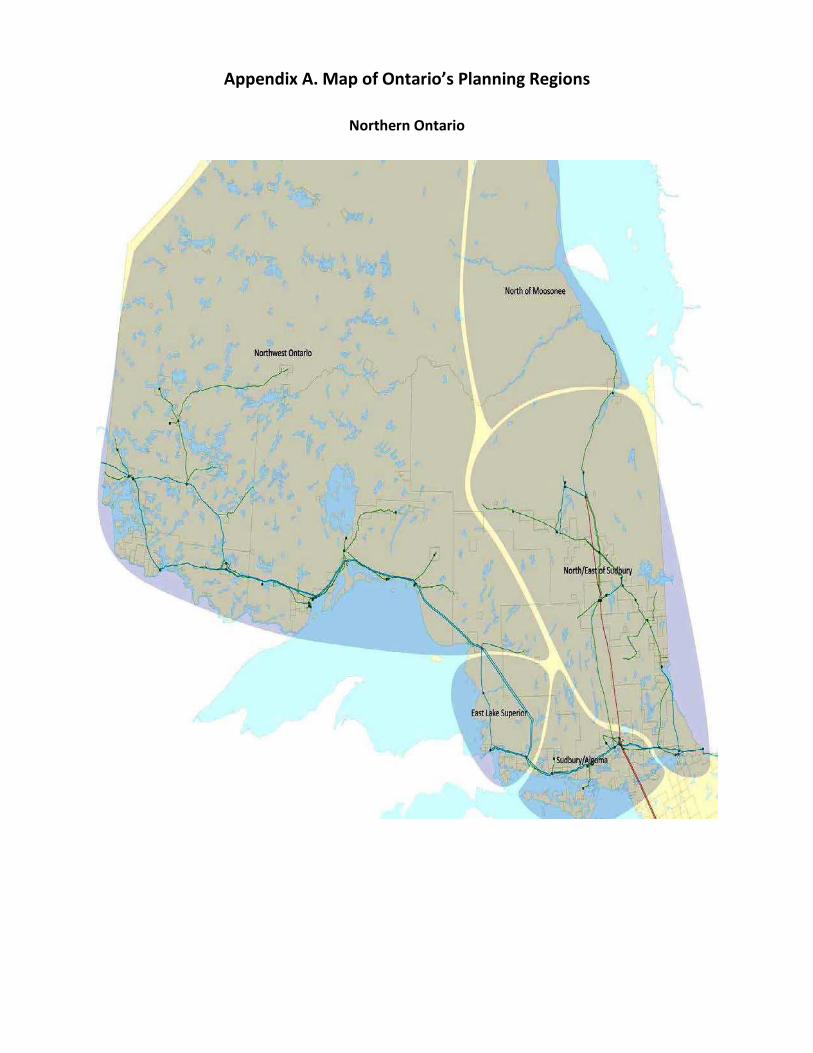
Appendix A. Map of Ontario’s Planning Regions
Northern Ontario
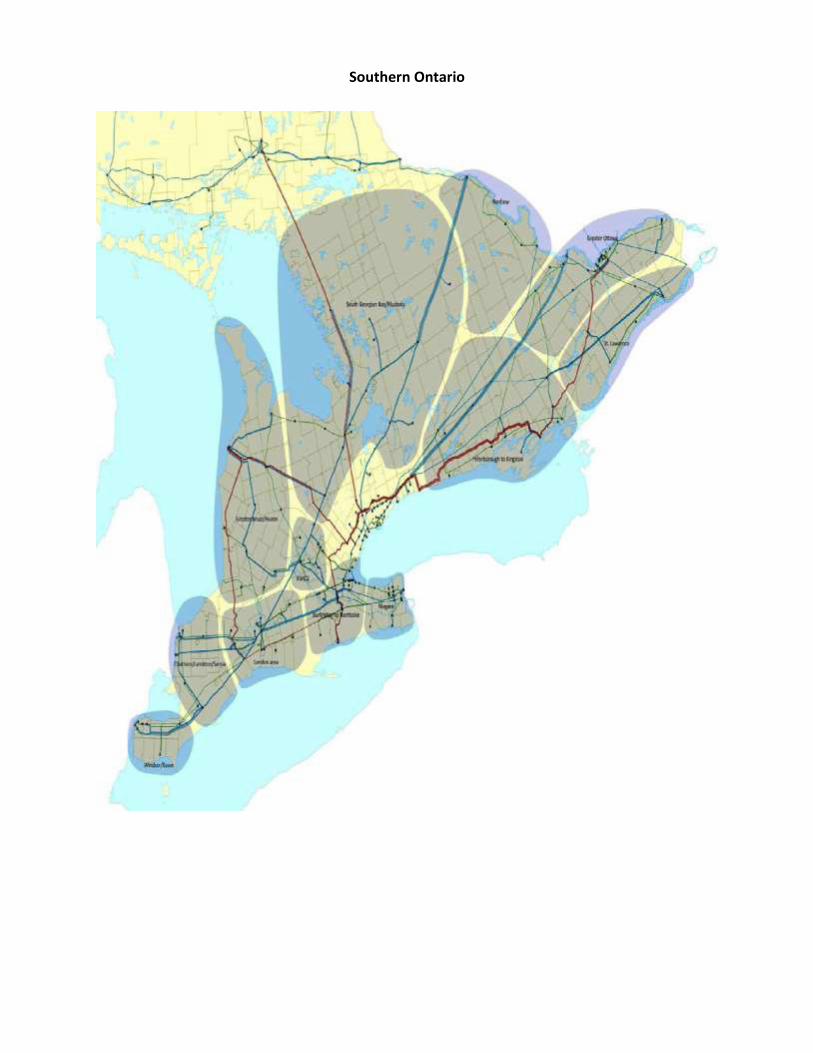
Southern Ontario
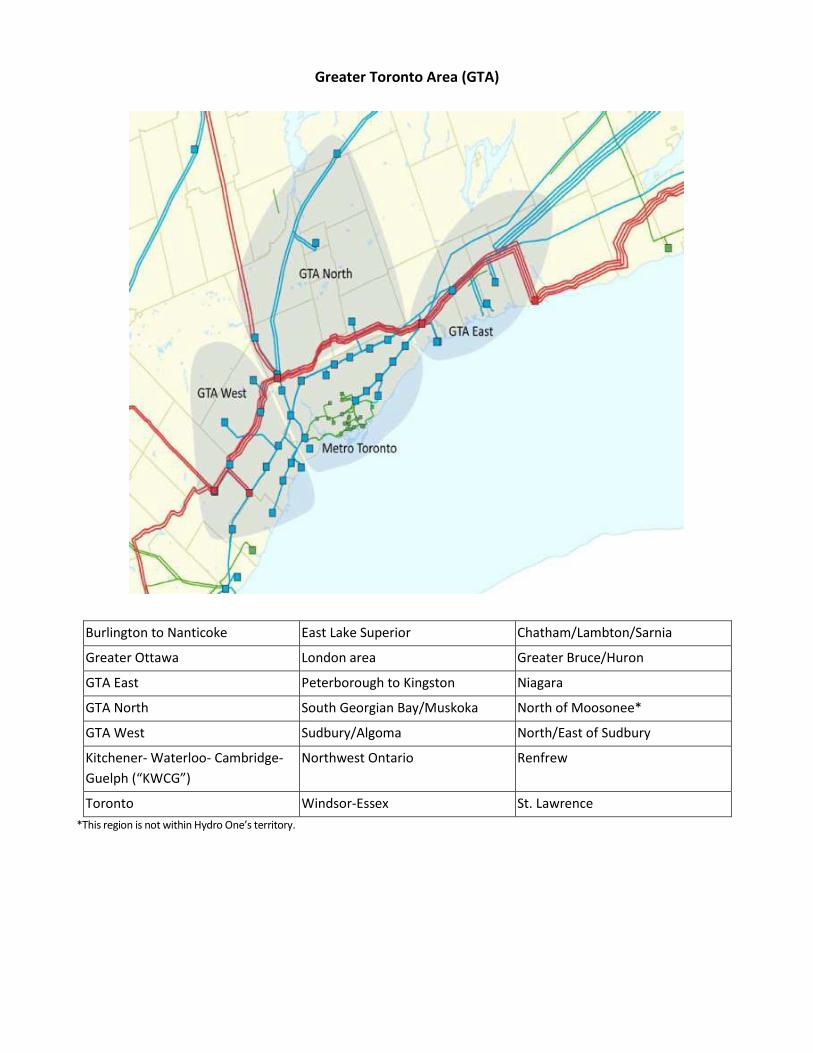
Greater Toronto Area (GTA)
Burlington to Nanticoke East Lake Superior Chatham/Lambton/Sarnia
Greater Ottawa London area Greater Bruce/Huron
GTA East Peterborough to Kingston Niagara
GTA North South Georgian Bay/Muskoka North of Moosonee*
GTA West Sudbury/Algoma North/East of Sudbury
Kitchener- Waterloo- Cambridge-Guelph (“KWCG”)
Northwest Ontario Renfrew
Toronto Windsor-Essex St. Lawrence *This region is not within Hydro One’s territory.
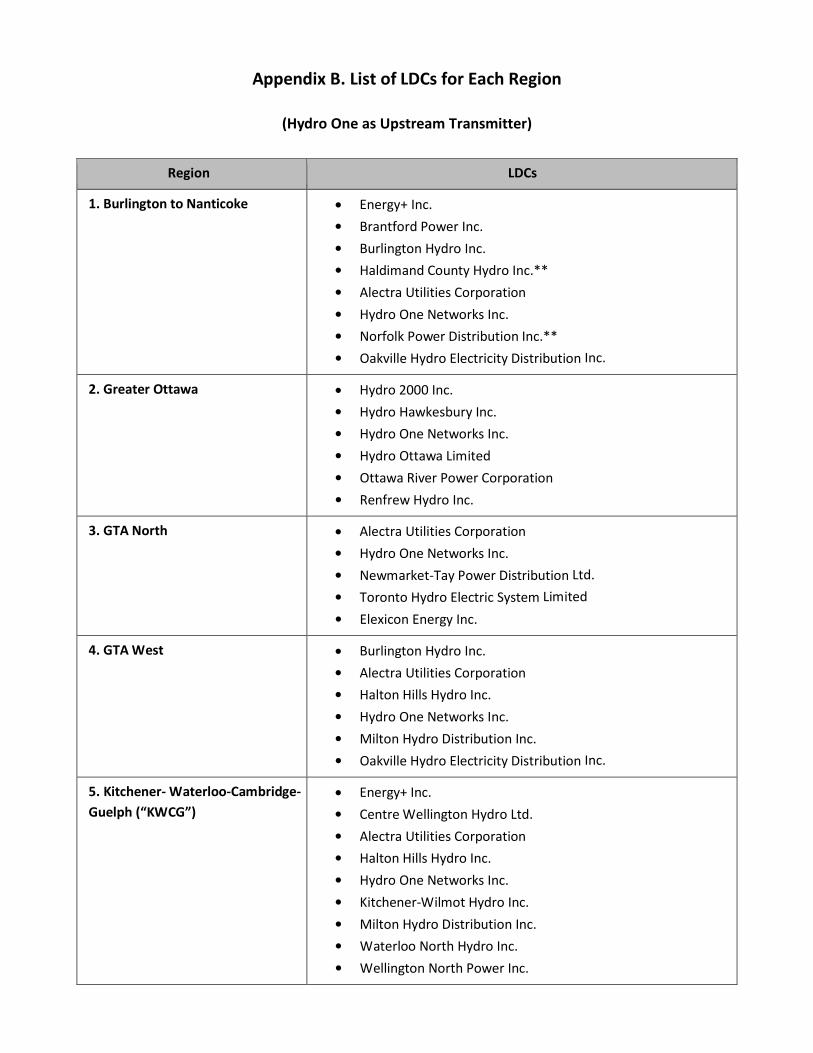
Appendix B. List of LDCs for Each Region
(Hydro One as Upstream Transmitter)
Region LDCs
1. Burlington to Nanticoke • Energy+ Inc. • Brantford Power Inc. • Burlington Hydro Inc. • Haldimand County Hydro Inc.** • Alectra Utilities Corporation • Hydro One Networks Inc. • Norfolk Power Distribution Inc.** • Oakville Hydro Electricity Distribution Inc.
2. Greater Ottawa • Hydro 2000 Inc. • Hydro Hawkesbury Inc. • Hydro One Networks Inc. • Hydro Ottawa Limited • Ottawa River Power Corporation • Renfrew Hydro Inc.
3. GTA North • Alectra Utilities Corporation • Hydro One Networks Inc. • Newmarket-Tay Power Distribution Ltd. • Toronto Hydro Electric System Limited • Elexicon Energy Inc.
4. GTA West • Burlington Hydro Inc. • Alectra Utilities Corporation • Halton Hills Hydro Inc. • Hydro One Networks Inc. • Milton Hydro Distribution Inc. • Oakville Hydro Electricity Distribution Inc.
5. Kitchener- Waterloo-Cambridge-Guelph (“KWCG”)
• Energy+ Inc. • Centre Wellington Hydro Ltd. • Alectra Utilities Corporation • Halton Hills Hydro Inc. • Hydro One Networks Inc. • Kitchener-Wilmot Hydro Inc. • Milton Hydro Distribution Inc. • Waterloo North Hydro Inc. • Wellington North Power Inc.
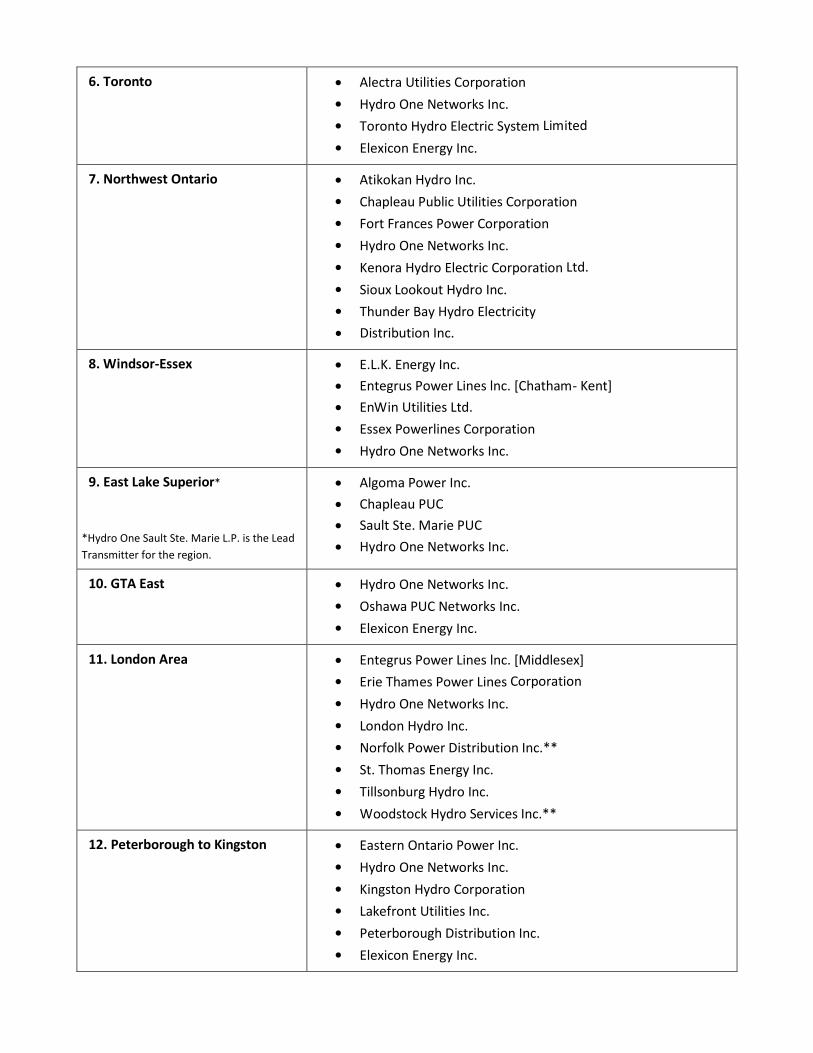
6. Toronto • Alectra Utilities Corporation • Hydro One Networks Inc. • Toronto Hydro Electric System Limited • Elexicon Energy Inc.
7. Northwest Ontario • Atikokan Hydro Inc. • Chapleau Public Utilities Corporation • Fort Frances Power Corporation • Hydro One Networks Inc. • Kenora Hydro Electric Corporation Ltd. • Sioux Lookout Hydro Inc. • Thunder Bay Hydro Electricity • Distribution Inc.
8. Windsor-Essex • E.L.K. Energy Inc. • Entegrus Power Lines lnc. [Chatham- Kent] • EnWin Utilities Ltd. • Essex Powerlines Corporation • Hydro One Networks Inc.
9. East Lake Superior*
*Hydro One Sault Ste. Marie L.P. is the Lead Transmitter for the region.
• Algoma Power Inc. • Chapleau PUC • Sault Ste. Marie PUC • Hydro One Networks Inc.
10. GTA East • Hydro One Networks Inc. • Oshawa PUC Networks Inc. • Elexicon Energy Inc.
11. London Area • Entegrus Power Lines lnc. [Middlesex] • Erie Thames Power Lines Corporation • Hydro One Networks Inc. • London Hydro Inc. • Norfolk Power Distribution Inc.** • St. Thomas Energy Inc. • Tillsonburg Hydro Inc. • Woodstock Hydro Services Inc.**
12. Peterborough to Kingston • Eastern Ontario Power Inc. • Hydro One Networks Inc. • Kingston Hydro Corporation • Lakefront Utilities Inc. • Peterborough Distribution Inc. • Elexicon Energy Inc.
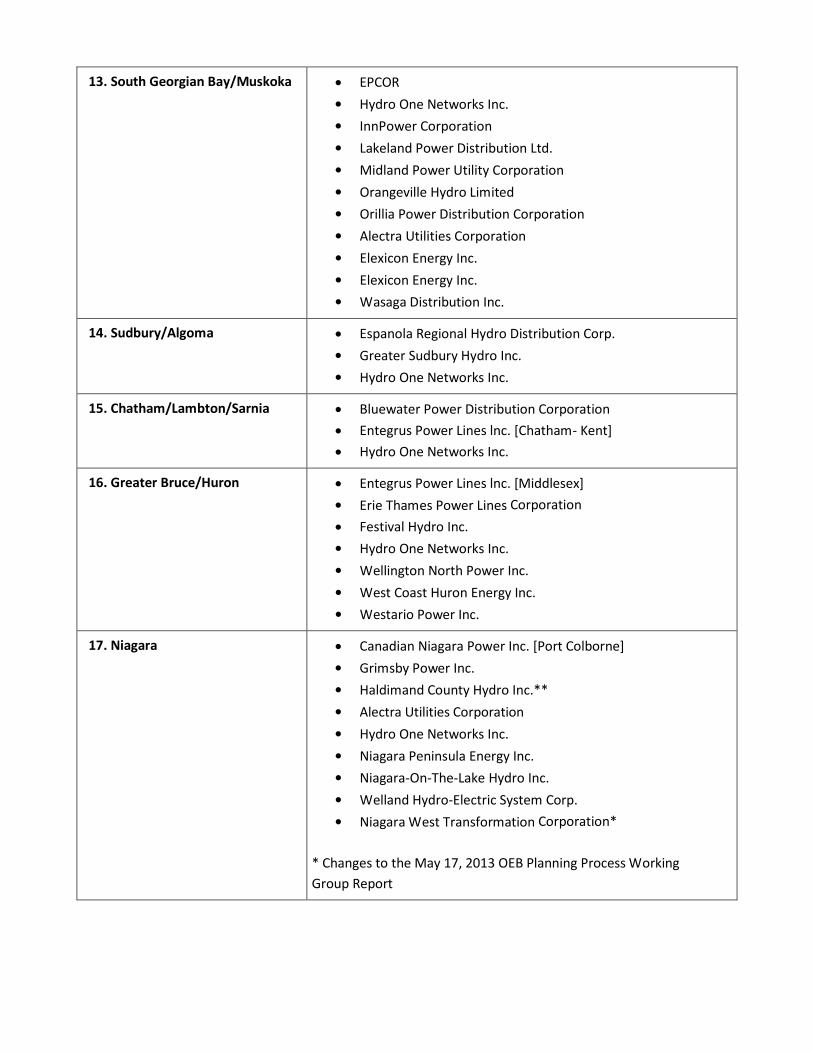
13. South Georgian Bay/Muskoka • EPCOR • Hydro One Networks Inc. • InnPower Corporation • Lakeland Power Distribution Ltd. • Midland Power Utility Corporation • Orangeville Hydro Limited • Orillia Power Distribution Corporation • Alectra Utilities Corporation • Elexicon Energy Inc. • Elexicon Energy Inc. • Wasaga Distribution Inc.
14. Sudbury/Algoma • Espanola Regional Hydro Distribution Corp. • Greater Sudbury Hydro Inc. • Hydro One Networks Inc.
15. Chatham/Lambton/Sarnia • Bluewater Power Distribution Corporation • Entegrus Power Lines lnc. [Chatham- Kent] • Hydro One Networks Inc.
16. Greater Bruce/Huron • Entegrus Power Lines lnc. [Middlesex] • Erie Thames Power Lines Corporation • Festival Hydro Inc. • Hydro One Networks Inc. • Wellington North Power Inc. • West Coast Huron Energy Inc. • Westario Power Inc.
17. Niagara • Canadian Niagara Power Inc. [Port Colborne] • Grimsby Power Inc. • Haldimand County Hydro Inc.** • Alectra Utilities Corporation • Hydro One Networks Inc. • Niagara Peninsula Energy Inc. • Niagara-On-The-Lake Hydro Inc. • Welland Hydro-Electric System Corp. • Niagara West Transformation Corporation*
* Changes to the May 17, 2013 OEB Planning Process Working Group Report
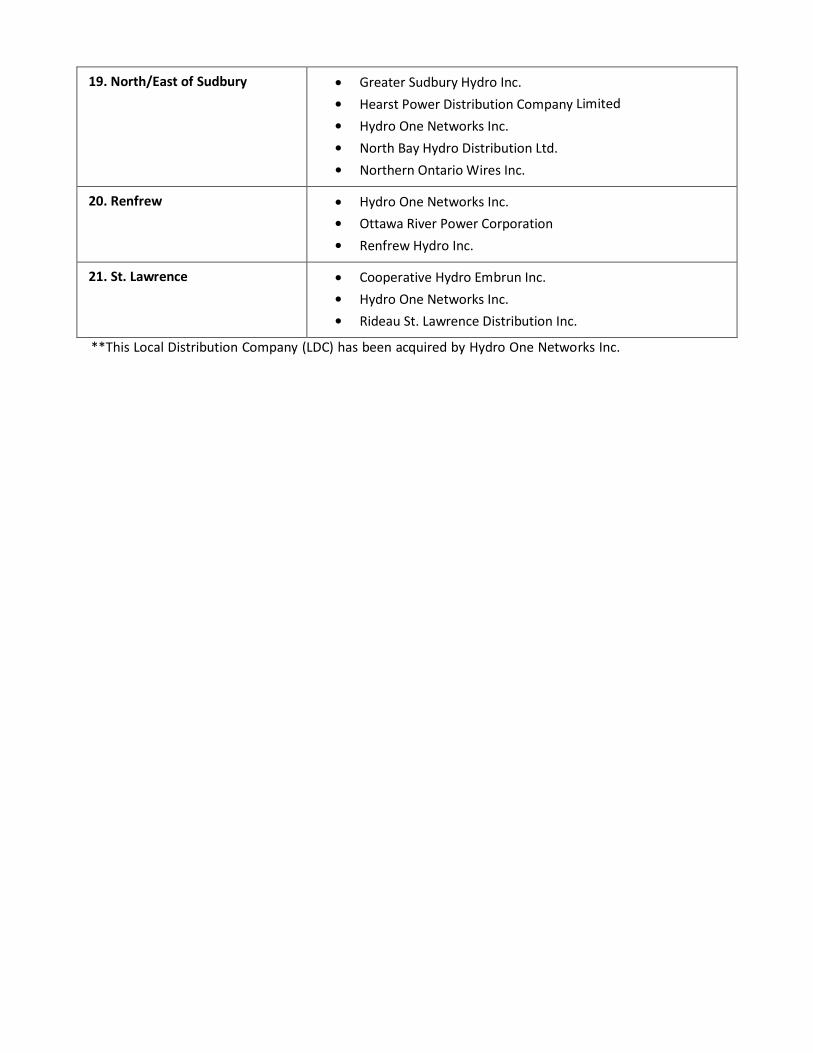
19. North/East of Sudbury • Greater Sudbury Hydro Inc. • Hearst Power Distribution Company Limited • Hydro One Networks Inc. • North Bay Hydro Distribution Ltd. • Northern Ontario Wires Inc.
20. Renfrew • Hydro One Networks Inc. • Ottawa River Power Corporation • Renfrew Hydro Inc.
21. St. Lawrence • Cooperative Hydro Embrun Inc. • Hydro One Networks Inc. • Rideau St. Lawrence Distribution Inc.
**This Local Distribution Company (LDC) has been acquired by Hydro One Networks Inc.
Appendix C 2nd cycle Needs Assessment (NA) Report – December 2018
Prepared
d by: KWCG
Kitchen
G Region Stud
NEED
ner - Wat
dy Team
DS ASSESS
erloo - CaRe
Date: Dece
SMENT R
ambridge -egion
mber 19, 201
H4TM
REPORT
- Guelph (
18
Hydro One N483 Bay StreeToronto, OntaM5G 2P5
(KWCG)
P
Networks Incet ario
Page1
c.
KWCG Region – Needs Assessment December 19, 2018
Page2
Disclaimer This Needs Assessment Report was prepared for the purpose of identifying potential needs in the KWCG Region and to recommend which need may require further assessment and/or regional coordination to develop a preferred plan. The results reported in this Needs Assessment are based on the input and information provided by the Study Team. The Study Team participants, their respective affiliated organizations, and Hydro One Networks Inc. (collectively, “the Authors”) shall not, under any circumstances whatsoever, be liable to each other, to any third party for whom the Needs Assessment Report was prepared (“the Intended Third Parties”) or to any other third party reading or receiving the Needs Assessment Report (“the Other Third Parties”). The Authors, Intended Third Parties and Other Third Parties acknowledge and agree that: (a) the Authors make no representations or warranties (express, implied, statutory or otherwise) as to this document or its contents, including, without limitation, the accuracy or completeness of the information therein; (b) the Authors, Intended Third Parties and Other Third Parties and their respective employees, directors and agents (the “Representatives”) shall be responsible for their respective use of the document and any conclusions derived from its contents; (c) and the Authors will not be liable for any damages resulting from or in any way related to the reliance on, acceptance or use of the document or its contents by the Authors, Intended Third Parties or Other Third Parties or their respective Representatives.
KWCG Region – Needs Assessment December 19, 2018
Page3
Executive Summary
REGION Kitchener - Waterloo - Cambridge - Guelph (KWCG) Region
LEAD Hydro One Networks Inc. (“HONI”)
START DATE September 17, 2018 END DATE December 19, 2018
1. INTRODUCTION
The first cycle of the Regional Planning process for the KWCG Region an Integrated Regional Resource Plan (“IRRP”) was published in April 2015 which identified a number of near- and mid-term needs in the KWCG region. The planning process was completed in December 2015 with the publication of the Regional Infrastructure Plan (“RIP”) which provided a description of needs and recommendations of preferred wires plans to address near-term needs. The RIP also identified some near- and mid-term needs that will be reviewed during this Regional Planning cycle. The purpose of this Needs Assessment (“NA”) is to identify any new needs and to reaffirm needs identified in the previous KWCG Regional Planning cycle.
2. REGIONAL ISSUE/TRIGGER
In accordance with the Regional Planning process, the regional planning cycle should be triggered at least every five years. In light of the timing of the needs identified in the previous Integrated Regional Resource Plan (“IRRP”) and RIP reports as well as new replacement/ refurbishment needs in the KWCG Region, the 2nd Regional Planning cycle was triggered for this Region.
3. SCOPE OF NEEDS ASSESSMENT
The scope of this NA includes:
Review and reaffirm needs/plans identified in the previous RIP; and
Identification and assessment of system capacity, reliability, operation, and aging infrastructure needs.
The Study Team may also identify additional needs during the next phases of the planning process, namely Scoping Assessment (“SA”), IRRP and RIP, based on updated information available at that time.
4. INPUTS/DATA
The Study Team representatives from Local Distribution Companies (“LDC”), the Independent Electricity System Operator (“IESO”), and Hydro One provided input and relevant information for the KWCG Region regarding capacity needs, reliability needs, operational issues, and major assets/facilities approaching end-of-life (“EOL”). In addition, community energy plans in the region have also been scanned and reviewed.
5. ASSESSMENT METHODOLOGY
The assessment’s primary objective is to identify the electrical infrastructure needs, recommend further mitigation or action plan(s) to address these needs, and determine whether further regional coordination or broader study would be beneficial. The assessment reviewed available information including load forecasts, conservation and demand management (“CDM”) and distributed generation (“DG”) forecasts, reliability needs, operational issues, and major high
KWCG Region – Needs Assessment December 19, 2018
Page4
voltage equipment identified to be at or near the end of their useful life and requiring replacement/refurbishment. A technical assessment of needs was undertaken based on:
Current and future station capacity and transmission adequacy;
Reliability needs and operational concerns; and
Any major high voltage equipment reaching the end of its useful life.
6. NEEDS
I. Station & Transmission Supply Capacity
Campbell TS (T3/T4) DESN Overloading is forecasted in the 2021-2022.
Future need for Waterloo North Hydro MTS #4
Future need for Energy+ MTS #2
A contingency analysis was performed and due to reduced forecasts no issues were found.
II. System Reliability & Operation
D10H 115 kV line reliability and restoration of Elmira TS loads.
III. Aging Infrastructure – Transformer Replacements and line Section Refurbishment
Projects in execution: i. Campbell TS – T1 (2018) ii. Detweiler TS -Auto T2 &T4 (2021-2022) iii. 115 kV B5C/ B6C Circuits (2019-2020) 1
New projects: i. 115 kV D7F/ D9F Circuits (2019-2020)2 ii. 230 kV D6V/ D7V Circuits (2019- 2020)3 iii. Hanlon TS - T1 & T2 (2023-2024) iv. Kitchener MTS #5 - T9 & T10 (2023-2024) v. Cedar TS - T7 & T8 (2024-2025) vi. Scheifele MTS - T1 & T2 (2024-2026) vii. Preston TS - T3 & T4 (2025-2026)
IV. Other Planning Considerations
The local municipalities in the region are extremely engaged and actively pursuing innovative ways to manage and/or reduce their energy needs over the next 10-20 Years. For example, several community energy plans have been developed in the region.
1 Burlington TS to a CTS Line Section
2 Tower 157 to Freeport Switching Station Line Section 3 Guelph North Junction to Fergus TS Line Section
KWCG Region – Needs Assessment December 19, 2018
Page5
7. RECOMMENDATIONS
The Study Team’s recommendations for the above identified needs are as follows:
a) The replacement of EOL station supply transformers at Campbell TS, Hanlon TS, Cedar TS, Kitchener MTS #5 and Preston TS along with the EOL auto transformers at Detweiler to proceed. Hydro One and the concerned LDCs will coordinate replacement of above equipment and develop replacement plans.
b) The refurbishment of EOL line sections 115 kV B5C/ B6C, D7F/ D9F and 230 kV D6V/ D7V to proceed. Hydro One will coordinate refurbishment of these line sections with affected LDCs/ Customer.
c) Hydro One will continue to work with Waterloo North Hydro Inc. to address the supply reliability issue at Elmira TS.
d) The Study Team has recommended that Hydro One Transmission and the Guelph Hydro Electric System Inc. to closely monitor the loading at the T3/T4 Campbell TS DESN and to balance the loads between these DESNs when required.
e) The Study Team recommends that the supply capacity needs with regards to Energy + MTS #2 and WNH MTS #4 be further assessed for optimization in the SA phase of regional planning. Once the optimization options are complete, Waterloo North Hydro and Energy+ shall conduct a technical and economic assessment in consultation with Hydro One.
f) The Study Team has recommended that community energy plans will be further considered in the SA phase of the regional planning process.
KWCG Region – Needs Assessment December 19, 2018
Page6
TABLE OF CONTENTS
1 Introduction .......................................................................................................................................... 7 2 Regional Issue/Trigger ......................................................................................................................... 8 3 Scope of Needs Assessment ................................................................................................................. 8 4 Regional Description and Connection Configuration .......................................................................... 8 5 Inputs and Data .................................................................................................................................. 11 6 Assessment Methodology .................................................................................................................. 11 7 Needs .................................................................................................................................................. 12 8 Conclusion and Recommendations .................................................................................................... 24 9 References .......................................................................................................................................... 25 Appendix A: KWCG Region Non-Coincident Summer Load Forecast ..................................................... 26 Appendix B: Lists of Step-Down Transformer Stations ............................................................................. 28 Appendix C: Lists of Transmission Circuits ............................................................................................... 29 Appendix D: Lists of LDCs in the KWCG Region .................................................................................... 30 Appendix E: Acronyms ............................................................................................................................... 31
List of Tables and Figures
Table 1: KWCG Region Study Team Participants ....................................................................................... 7 Table 2: Needs Identified in the Previous Regional Planning Cycle .......................................................... 12 Table 3: End-of-Life Equipment – KWCG Region .................................................................................... 13 Figure 1: Geographical Area of the KWCG Region with Electrical Layout ................................................ 9 Figure 2: KWCG Region (Single Line Diagram) ....................................................................................... 10 Figure 3: Burlington TS to Harper’s Jct. to CTS B5C/ B6C Line Sections ................................................ 16 Figure 5: Tower #157 Jct. to Freeport SS F11C/ F12C Line Section ......................................................... 17 Figure 4: Guelph North Jct. to Fergus TS D6V/ D7V Line Section ........................................................... 18 Figure 6: D10H 115 kV Line (Burlington TS to Elmira TS) ...................................................................... 22
KWCG Region – Needs Assessment December 19, 2018
Page7
1 INTRODUCTION The first cycle of the Regional Planning process for the KWCG Region was completed in December 2015 with the publication of the Regional Infrastructure Plan (“RIP”). The RIP provided a description of needs and recommendations of preferred wires plans to address near- and medium-term needs. Waterloo North Hydro MTS #4 was the only need to be reviewed in this planning cycle. The purpose of this Needs Assessment (“NA”) is to identify new needs and to reconfirm needs identified in the previous KWCG regional planning cycle. Since the previous regional planning cycle, some new needs in the region have been identified. This report was prepared by the KWCG Region Study Team (“Study Team”), led by Hydro One Networks Inc. Participants of the Study Team are listed below in Table 1. The report presents the results of the assessment based on information provided by the Hydro One, the Local Distribution Companies (“LDC”) and the Independent Electricity System Operator (“IESO”).
Table 1: KWCG Region Study Team Participants
Company
Centre Wellington Hydro
Energy+
Guelph Hydro Electric System Inc.
Halton Hills Hydro
Hydro One Networks Inc. (Lead Transmitter)
Hydro One Networks Inc. (Distribution)
Independent Electricity System Operator (“IESO”)
Kitchener Wilmot Hydro Inc.
Milton Hydro
Waterloo North Hydro Inc.
Wellington North Power Inc.
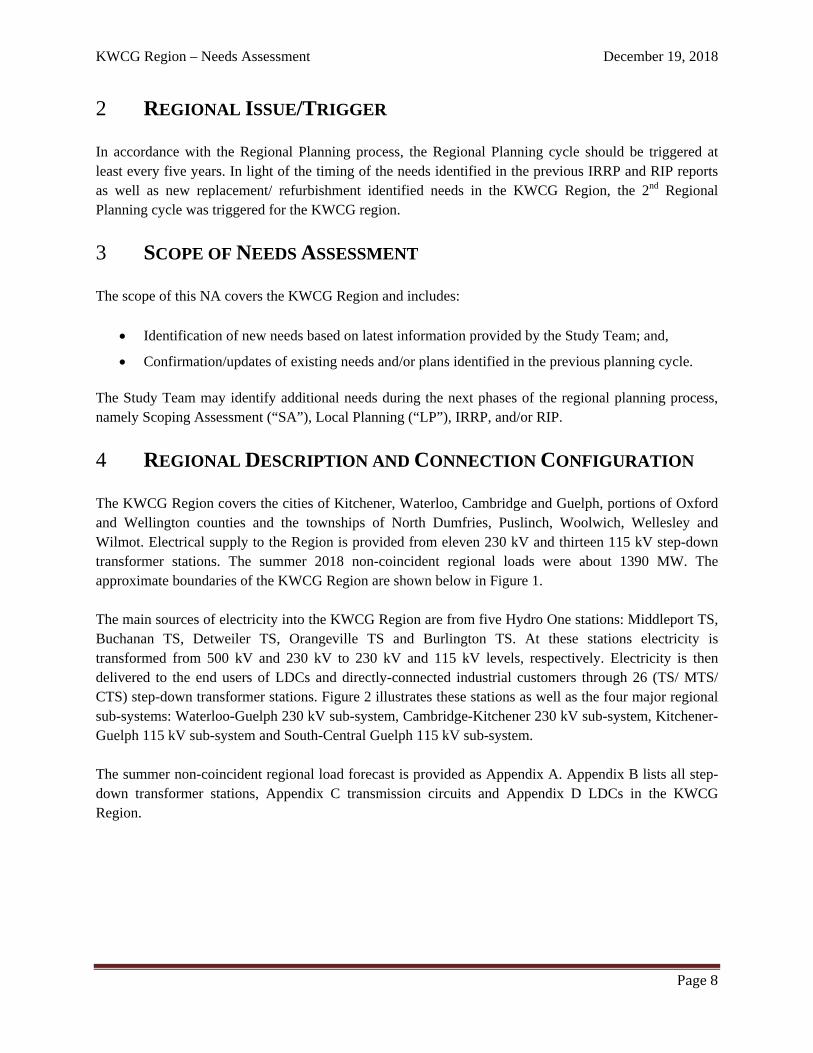
KWCG Region – Needs Assessment December 19, 2018
Page8
2 REGIONAL ISSUE/TRIGGER In accordance with the Regional Planning process, the Regional Planning cycle should be triggered at least every five years. In light of the timing of the needs identified in the previous IRRP and RIP reports as well as new replacement/ refurbishment identified needs in the KWCG Region, the 2nd Regional Planning cycle was triggered for the KWCG region.
3 SCOPE OF NEEDS ASSESSMENT The scope of this NA covers the KWCG Region and includes:
Identification of new needs based on latest information provided by the Study Team; and,
Confirmation/updates of existing needs and/or plans identified in the previous planning cycle. The Study Team may identify additional needs during the next phases of the regional planning process, namely Scoping Assessment (“SA”), Local Planning (“LP”), IRRP, and/or RIP.
4 REGIONAL DESCRIPTION AND CONNECTION CONFIGURATION The KWCG Region covers the cities of Kitchener, Waterloo, Cambridge and Guelph, portions of Oxford and Wellington counties and the townships of North Dumfries, Puslinch, Woolwich, Wellesley and Wilmot. Electrical supply to the Region is provided from eleven 230 kV and thirteen 115 kV step-down transformer stations. The summer 2018 non-coincident regional loads were about 1390 MW. The approximate boundaries of the KWCG Region are shown below in Figure 1. The main sources of electricity into the KWCG Region are from five Hydro One stations: Middleport TS, Buchanan TS, Detweiler TS, Orangeville TS and Burlington TS. At these stations electricity is transformed from 500 kV and 230 kV to 230 kV and 115 kV levels, respectively. Electricity is then delivered to the end users of LDCs and directly-connected industrial customers through 26 (TS/ MTS/ CTS) step-down transformer stations. Figure 2 illustrates these stations as well as the four major regional sub-systems: Waterloo-Guelph 230 kV sub-system, Cambridge-Kitchener 230 kV sub-system, Kitchener-Guelph 115 kV sub-system and South-Central Guelph 115 kV sub-system. The summer non-coincident regional load forecast is provided as Appendix A. Appendix B lists all step-down transformer stations, Appendix C transmission circuits and Appendix D LDCs in the KWCG Region.
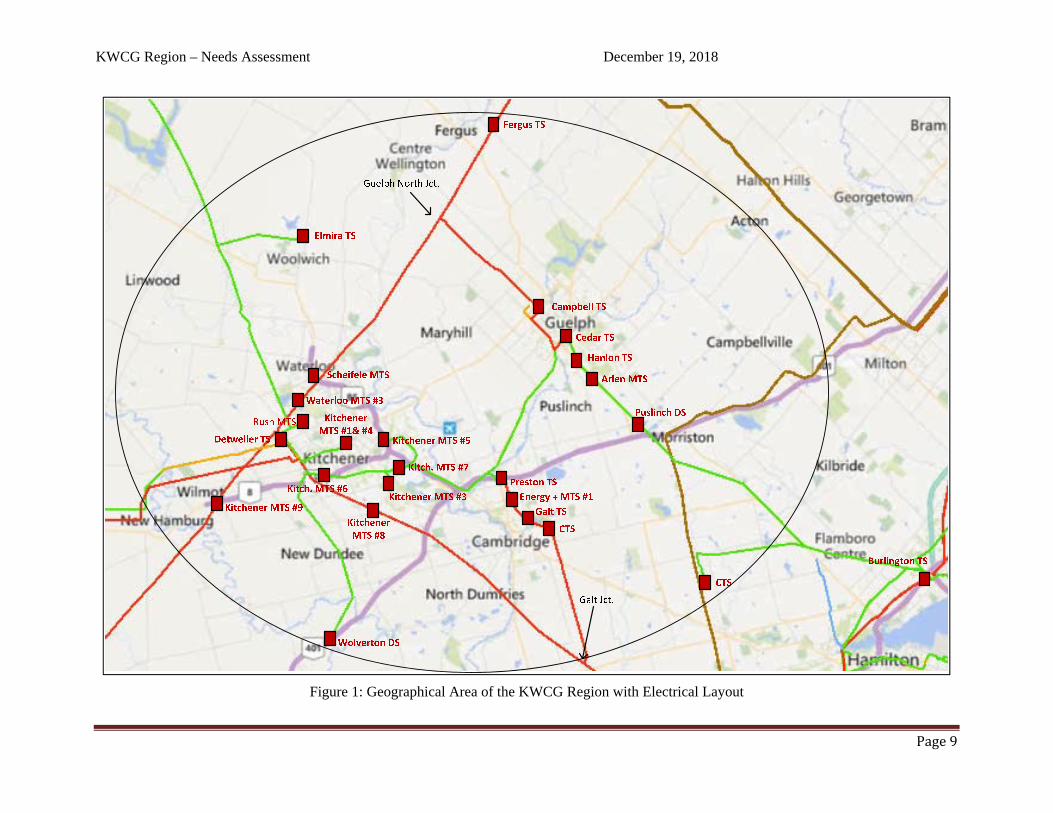
KWCG Region – Needs Assessment December 19, 2018
Page9
Figure 1: Geographical Area of the KWCG Region with Electrical Layout
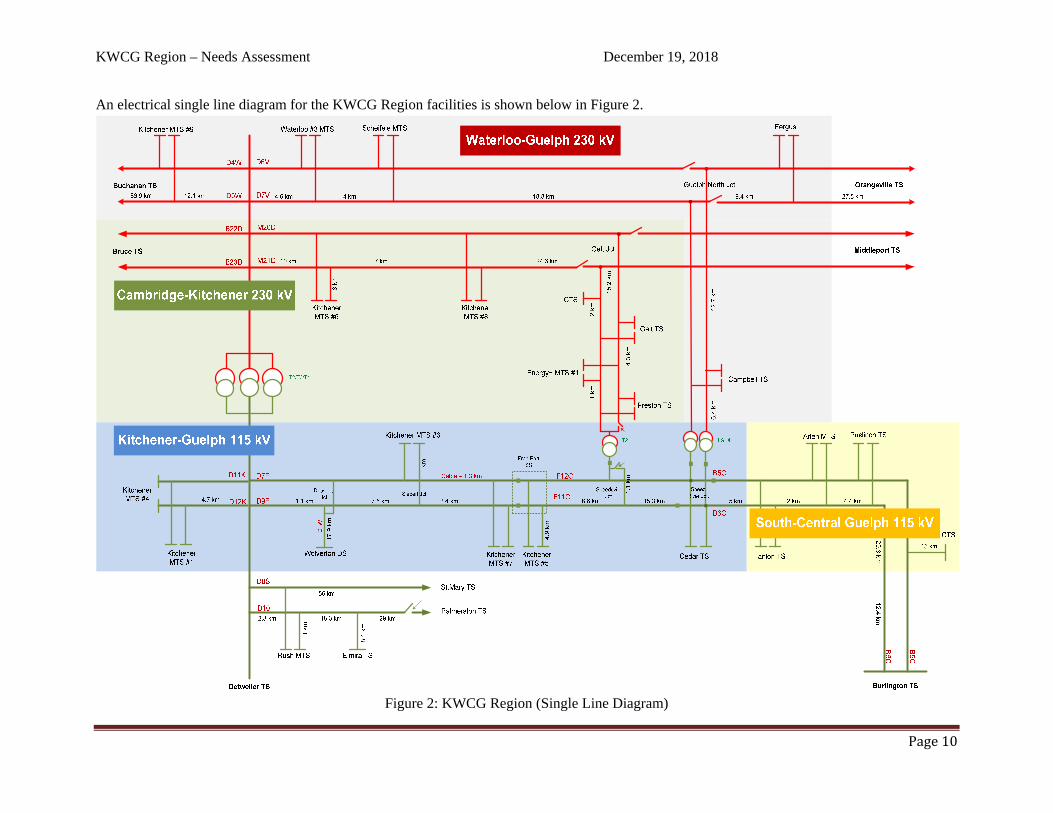
KWCG Region – Needs Assessment December 19, 2018
Page10
An electrical single line diagram for the KWCG Region facilities is shown below in Figure 2.
Figure 2: KWCG Region (Single Line Diagram)
KWCG Region – Needs Assessment December 19, 2018
Page11
5 INPUTS AND DATA Study Team participants, including representatives from LDCs, IESO, and Hydro One provided information and input for the KWCG Region NA. The information provided includes the following:
KWCG Load Forecast for all supply stations;
Known capacity and reliability needs, operating issues, and/or major assets approaching the end of their useful life (“EOL”); and
Planned/foreseen transmission and distribution investments that are relevant to regional planning for the KWCG Region.
6 ASSESSMENT METHODOLOGY The following methodology and assumptions are made in this Needs Assessment: Information gathering included:
i. Load forecast: The relevant LDCs provided load forecasts for all the stations supplying their loads in the KWCG region for the 10 year study period. The IESO provided a Conservation and Demand Management (“CDM”) and Distributed Generation (“DG”) forecast for the KWCG region. The region’s extreme summer non-coincident peak gross load forecast for each station were prepared by applying the LDC load forecast load growth rates to the actual 2018 summer peak extreme weather corrected loads. The extreme summer weather correction factors were provided by Hydro One. The net extreme weather summer load forecasts were produced by reducing the gross load forecasts for each station by the % age CDM and then by the amount of effective DG capacity provided by the IESO for that station. These extreme weather summer load forecast for the individual stations in the KWCG region is given in Appendix A;
ii. Relevant information regarding system reliability and operational issues in the region; and
iii. List of major HV transmission equipment planned and/or identified to be refurbished and/or replaced due to the end of their useful life which is relevant for regional planning purposes. This includes HV transformers, autotransformers, HV Breakers, HV underground cables and overhead lines.
A technical assessment of needs was undertaken based on:
Current and future station capacity and transmission adequacy;
System reliability and operational concerns; and
Any major high voltage equipment reaching the end of its useful life.
In addition, Hydro One has reviewed the Community Energy Plans in the region. It is worth noting that there are several community energy plans in the region and some of them are meant to sustain at the
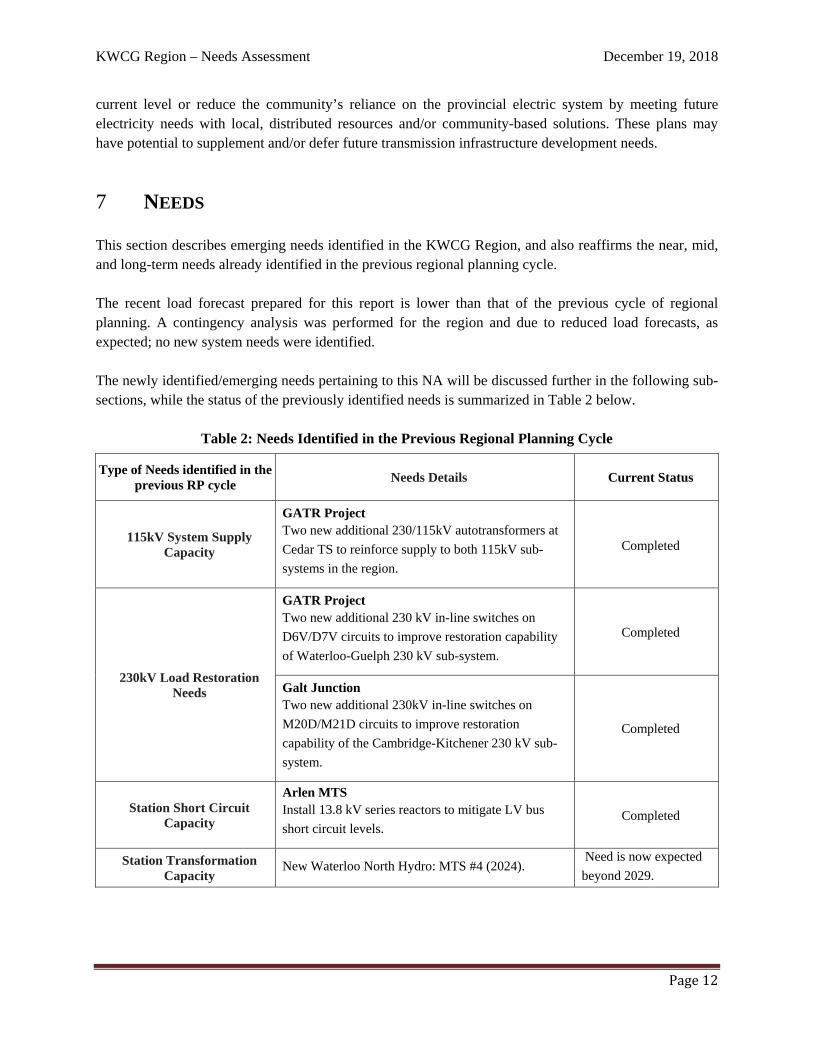
KWCG Region – Needs Assessment December 19, 2018
Page12
current level or reduce the community’s reliance on the provincial electric system by meeting future electricity needs with local, distributed resources and/or community-based solutions. These plans may have potential to supplement and/or defer future transmission infrastructure development needs.
7 NEEDS This section describes emerging needs identified in the KWCG Region, and also reaffirms the near, mid, and long-term needs already identified in the previous regional planning cycle. The recent load forecast prepared for this report is lower than that of the previous cycle of regional planning. A contingency analysis was performed for the region and due to reduced load forecasts, as expected; no new system needs were identified. The newly identified/emerging needs pertaining to this NA will be discussed further in the following sub-sections, while the status of the previously identified needs is summarized in Table 2 below.
Table 2: Needs Identified in the Previous Regional Planning Cycle
Type of Needs identified in the previous RP cycle
Needs Details Current Status
115kV System Supply Capacity
GATR Project Two new additional 230/115kV autotransformers at Cedar TS to reinforce supply to both 115kV sub-systems in the region.
Completed
230kV Load Restoration Needs
GATR Project Two new additional 230 kV in-line switches on D6V/D7V circuits to improve restoration capability of Waterloo-Guelph 230 kV sub-system.
Completed
Galt Junction Two new additional 230kV in-line switches on M20D/M21D circuits to improve restoration capability of the Cambridge-Kitchener 230 kV sub-system.
Completed
Station Short Circuit Capacity
Arlen MTS Install 13.8 kV series reactors to mitigate LV bus short circuit levels.
Completed
Station Transformation Capacity
New Waterloo North Hydro: MTS #4 (2024). Need is now expected beyond 2029.
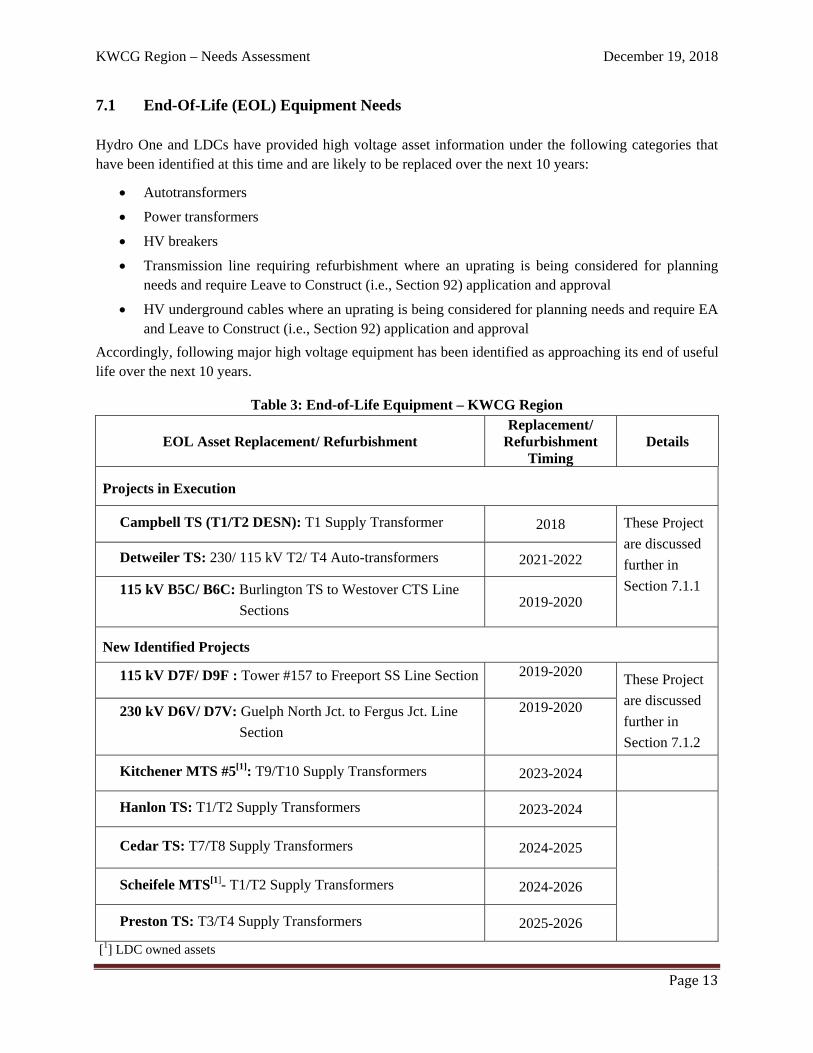
KWCG Region – Needs Assessment December 19, 2018
Page13
7.1 End-Of-Life (EOL) Equipment Needs Hydro One and LDCs have provided high voltage asset information under the following categories that have been identified at this time and are likely to be replaced over the next 10 years:
Autotransformers
Power transformers
HV breakers
Transmission line requiring refurbishment where an uprating is being considered for planning needs and require Leave to Construct (i.e., Section 92) application and approval
HV underground cables where an uprating is being considered for planning needs and require EA and Leave to Construct (i.e., Section 92) application and approval
Accordingly, following major high voltage equipment has been identified as approaching its end of useful life over the next 10 years.
Table 3: End-of-Life Equipment – KWCG Region
EOL Asset Replacement/ Refurbishment Replacement/
Refurbishment Timing
Details
Projects in Execution
Campbell TS (T1/T2 DESN): T1 Supply Transformer 2018 These Project are discussed further in Section 7.1.1
Detweiler TS: 230/ 115 kV T2/ T4 Auto-transformers 2021-2022
115 kV B5C/ B6C: Burlington TS to Westover CTS Line Sections
2019-2020
New Identified Projects
115 kV D7F/ D9F : Tower #157 to Freeport SS Line Section 2019-2020 These Project are discussed further in Section 7.1.2
230 kV D6V/ D7V: Guelph North Jct. to Fergus Jct. Line Section
2019-2020
Kitchener MTS #5[1]: T9/T10 Supply Transformers 2023-2024
Hanlon TS: T1/T2 Supply Transformers 2023-2024
Cedar TS: T7/T8 Supply Transformers 2024-2025
Scheifele MTS[1]- T1/T2 Supply Transformers 2024-2026
Preston TS: T3/T4 Supply Transformers 2025-2026
[1] LDC owned assets
KWCG R
The end-ofollowing
1. M
2. R
3. Rto
4. E
5. Rre
6. R
7. St Maintainiline sectiooutages. failures aequipmen No other refurbishmduring the
7.1.1
The follotransition discussed
Campbe
CampbellCampbell105 MVADESNs ar The 75 MMVA uniaddition pLTR of ab
Region – Need
of-life assessmg options:
Maintaining th
Replacing equ
Replacing equo other existin
Eliminating eq
Replacing equeplacement);
Replacing equ
tation reconfi
ing status quoons due to risReplacing “L
and difficultynt also poses s
lines or HV sment at this tie next plannin
Proje1
wing end-of-and NA for in the first cy
ell TS – T1 T
l TS is locatl TS has two A (94 MW @re currently fo
MVA T1/T2 Dit and transfoplans to replabout 130 MV
ds Assessmen
ment for the
he status quo;
ipment with s
uipment with ng facilities;
quipment by t
uipment with
ipment with h
iguration
o is not an opsk of equipmLike-for-Likey in getting serious safety
station equipmime. If and wng phase unde
ects in Execu
-life refurbishthis region
ycle of region
Transforme
ted in the cit230/ 13.8 kV
@ 0.9 PF) andorecasted to b
DESN transfoormer T1 is aace the secondA for T1/T2 D
nt
above high v
similar equipm
lower ratings
transferring a
similar equip
higher ratings
ption for any oment failure, we” with nonssimilar spare risk for empl
ment in the Kwhen new anderway at the t
ution
hment needs was deemed
nal planning a
er
ty of GuelphV DESNs T1/d 63 MVA (5be about 87 M
former T2 faialso being repdary equipmeDESN, over t
voltage equipm
ment of lower
s and built to
all of the load
pment and bu
s and built to
of the above would result istandard transe equipment loyees under
KWCG region d/or additionaltime.
are under excomplete. H
and are curren
h supplying /T2 and T3/T56 MW @ 0.
MW and 66 M
iled in 2017 placed with aent limiting ththe study peri
ment typicall
r ratings and
current stand
d to other exis
uilt to curren
current stand
EOL autotranin increased msformers woalong with normal and e
n have been idl information
xecution. ThiHence, followntly in execut
Guelph HydT4 of 75 MVA.9 PF) respec
MW respective
and was repla similar unithe station LTiod.
D
ly included co
built to curre
dards by tran
sting facilities
nt standards (
dards; and
nsformer, statmaintenance
ould result intheir installa
emergency sit
dentified for mn is available,
is region waswing projects tion:
dro Electric SA transformectively. The lely by the end
laced with a t. In 2021-20
TR. This will
December 19,
Pa
onsideration
nt standards;
sferring some
s;
i.e., “like-for
tion transformcost and cus
n complexityation. Nonstatuations.
major replaceit will be pro
s deemed to were not list
System Inc. ers with an LTloads on thesd of study per
new standard022, Hydro Oresult in suff
, 2018
age14
of the
e load
r-like”
mer or tomer
y with andard
ement/ ovided
be in ted or
loads. TR of se two riod.
d 100 One in ficient
KWCG Region – Needs Assessment December 19, 2018
Page15
The replacement of T1 transformer is currently in execution and expected to be completed by the end of year 2018.
Detweiler TS - T2 & T4 Autotransformers
Detweiler TS is a Bulk System, major switching and autotransformer station located in the city of Kitchener. Detweiler TS facilities include a 230 kV switchyard, three 230/115 kV autotransformers (T2/T3/T4) and a 115 kV switchyard. The Detweiler TS autotransformers T2/T3/ T4 were built in 1959, 2004 and 1963 respectively. The condition assessment has identified T2 and T4 autotransformers as EOL requiring replacement. At this time none of other HV equipment at this station has been identified as approaching EOL over the next 5-10 years. Not replacing these auto transformers would increase risk of failure due to asset condition, maintenance expenses and reduce supply reliability to the customers. The replacement of both the EOL Detweiler TS T2 and T4 autotransformers with similar units is in execution expected to be completed in 2021-22. This will address the 230/ 115 kV transformation needs at Detweiler TS and maintain station’s operability and reliability of supply. Any Detweiler TS 230 kV system reconfiguration needs will be studied under bulk system planning expected to commence in early 2019.
115 kV B5C/ B6C Line Sections
The 115 kV B5C/B6C circuits consist of about 45 km of double circuit line and 15 km of single circuit line supplying South-Central Guelph 115 kV loads. About 12 km of double circuit line section from Burlington TS to Harper’s Jct. and about 15 km B5C 115 kV line tap from Harper’s Jct. to a Westover Jct. requires refurbishment. Not refurbishing these line sections would increase risk of failure due to asset condition, maintenance expenses and reduce supply reliability to the customers. The refurbishment of this 27 km long 115 kV B5C/B6C line sections from Burlington TS to a CTS is currently under execution and the work is planned to be completed by the end of year 2019.
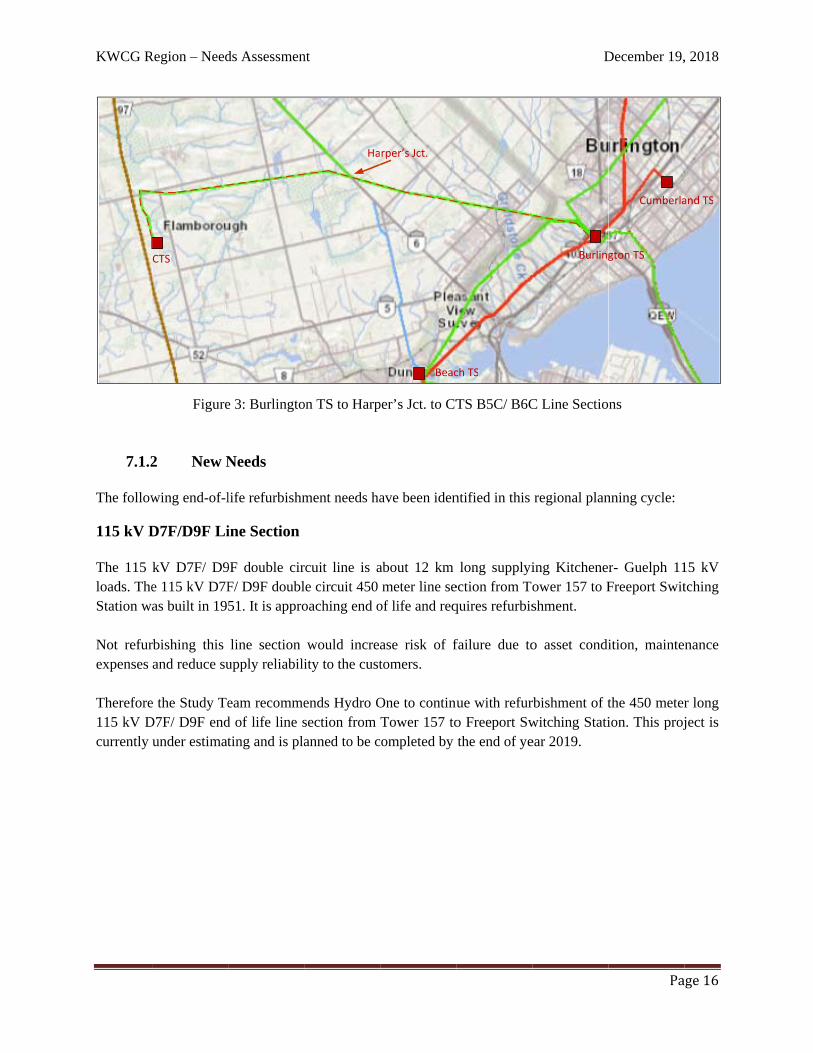
KWCG R
7.1.2
The follow
115 kV D
The 115 loads. TheStation w Not refurexpenses Therefore115 kV Dcurrently
Region – Need
Figure
New N2
wing end-of-l
D7F/D9F Li
kV D7F/ D9e 115 kV D7Fas built in 19
rbishing this and reduce su
e the Study TeD7F/ D9F end
under estimat
CTS
ds Assessmen
e 3: Burlingto
Needs
life refurbishm
ine Section
9F double cirF/ D9F doubl51. It is appro
line section upply reliabili
eam recommed of life line sting and is pla
nt
on TS to Harp
ment needs ha
rcuit line is ale circuit 450 oaching end o
would increaity to the cust
ends Hydro Osection from anned to be c
Ha
per’s Jct. to CT
ave been iden
about 12 km meter line se
of life and req
ase risk of ftomers.
One to continuTower 157 to
completed by
Beac
rper’s Jct.
TS B5C/ B6C
ntified in this
long supplyiection from Toquires refurbis
failure due to
ue with refuro Freeport Swthe end of ye
ch TS
D
C Line Sectio
regional plan
ing Kitcheneower 157 to Fshment.
o asset condi
rbishment of twitching Statiear 2019.
Burling
December 19,
Pa
ns
nning cycle:
r- Guelph 11Freeport Swit
ition, mainte
the 450 meterion. This proj
Cumberla
gton TS
, 2018
age16
15 kV tching
nance
r long ject is
and TS
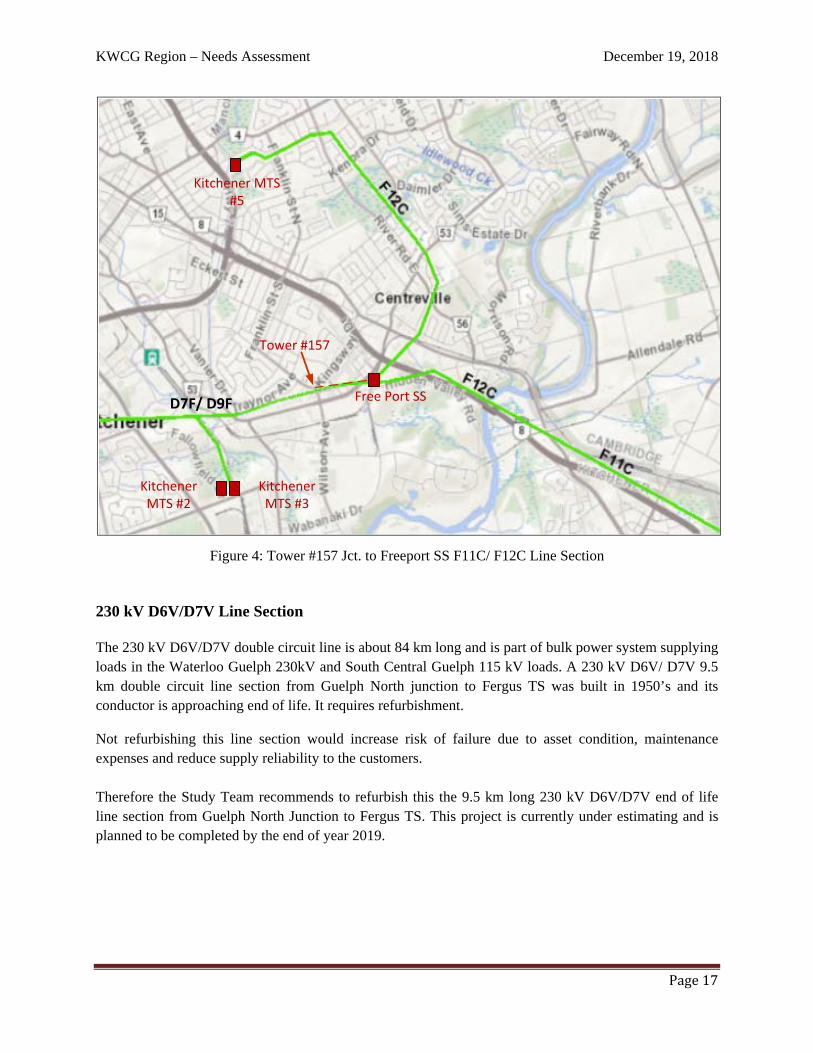
KWCG Region – Needs Assessment December 19, 2018
Page17
Figure 4: Tower #157 Jct. to Freeport SS F11C/ F12C Line Section
230 kV D6V/D7V Line Section
The 230 kV D6V/D7V double circuit line is about 84 km long and is part of bulk power system supplying loads in the Waterloo Guelph 230kV and South Central Guelph 115 kV loads. A 230 kV D6V/ D7V 9.5 km double circuit line section from Guelph North junction to Fergus TS was built in 1950’s and its conductor is approaching end of life. It requires refurbishment.
Not refurbishing this line section would increase risk of failure due to asset condition, maintenance expenses and reduce supply reliability to the customers. Therefore the Study Team recommends to refurbish this the 9.5 km long 230 kV D6V/D7V end of life line section from Guelph North Junction to Fergus TS. This project is currently under estimating and is planned to be completed by the end of year 2019.
Kitchener MTS #5
Tower #157
Free Port SS
Kitchener MTS #2
Kitchener MTS #3
D7F/ D9F
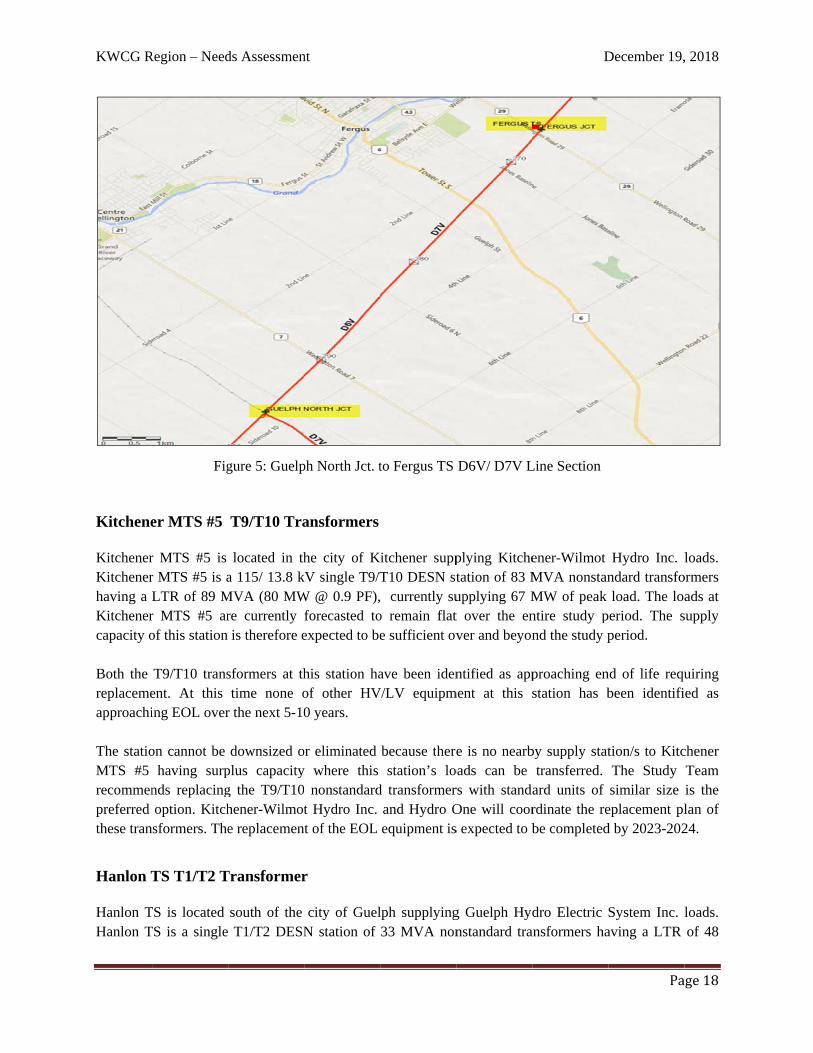
KWCG R
Kitchene
KitchenerKitchenerhaving a LKitchenercapacity o Both the replacemeapproachi The statioMTS #5 recommenpreferred these tran
Hanlon T
Hanlon THanlon T
Region – Need
Fig
er MTS #5
r MTS #5 is r MTS #5 is aLTR of 89 Mr MTS #5 arof this station
T9/T10 transent. At this ing EOL over
on cannot be having surp
nds replacingoption. Kitchsformers. The
TS T1/T2 T
TS is located TS is a single
ds Assessmen
gure 5: Guelp
T9/T10 Tra
located in tha 115/ 13.8 k
MVA (80 MWre currently is therefore e
sformers at thtime none o
r the next 5-10
downsized oplus capacityg the T9/T10hener-Wilmote replacemen
Transformer
south of the T1/T2 DESN
nt
ph North Jct. t
ansformers
he city of KkV single T9/TW @ 0.9 PF),
forecasted toexpected to be
his station haof other HV0 years.
or eliminated y where this
nonstandardt Hydro Inc. t of the EOL
r
city of GuelN station of
to Fergus TS
Kitchener suppT10 DESN st currently su
o remain flate sufficient ov
ave been idenV/LV equipm
because therestation’s lo
d transformerand Hydro Oequipment is
lph supplying33 MVA non
D6V/ D7V L
plying Kitchetation of 83 Mupplying 67 Mt over the enver and beyon
ntified as appment at this s
e is no nearboads can be rs with standaOne will coors expected to b
g Guelph Hydnstandard tra
D
Line Section
ener-Wilmot MVA nonstanMW of peak ntire study pnd the study p
proaching enstation has b
by supply stattransferred.
ard units of rdinate the rebe completed
dro Electric ansformers ha
December 19,
Pa
Hydro Inc. ndard transfoload. The lo
period. The speriod.
nd of life requbeen identifi
tion/s to KitcThe Study similar size
eplacement pld by 2023-202
System Inc. aving a LTR
, 2018
age18
loads. ormers ads at
supply
uiring ed as
chener Team is the lan of 24.
loads. of 48
KWCG Region – Needs Assessment December 19, 2018
Page19
MVA (43 MW @ 0.9 PF). This station is currently supplying about 27 MW of peak load. The loads at Hanlon TS are currently forecasted to remain flat over the entire study period. The supply capacity of this station is therefore expected to be sufficient over and beyond the study period. The T1/T2 transformers are of 1955/ 56 built and have been identified as EOL requiring replacement. At this time none of other HV/LV equipment at this station has been identified as approaching EOL over the next 5-10 years. There is no nearby supply station/s to Hanlon TS having surplus capacity where this station’s loads can be transferred therefore Hydro One plans to replace these EOL transformers with standard size units of 42 MVA in 2023-2024.
Cedar TS – T7/ T8 Transformers
Cedar TS is located in the city of Guelph supplying Guelph Hydro Electric System Inc. loads. Cedar TS has two 115/ 13.8 kV DESN units T1/T2 and T7/T8 of 75 MVA with a LTR of 115 MVA (103 MW @ 0.9 PF) and 37 MVA with a LTR of 44 MVA (40 MW @ 0.9 PF), currently supplying 67 MW and 36 MW of peak loads respectively. The loads at both Cedar TS DESNs are currently forecasted to remain almost flat over the entire study period. The supply capacity of this station is therefore expected to be sufficient over and beyond the study period. The T7/T8 DESN 38 MVA nonstandard transformers are of 1958 built have been identified for replacement. The T1/T2 transformers are relatively newer and were built in early 1990s. At this time none of other HV/LV equipment at this station has been identified as approaching EOL over the next 5-10 years. The station cannot be downsized or eliminated because there is no nearby supply station/s to Cedar TS having surplus capacity where this station’s loads can be transferred therefore Hydro One plans to replace these EOL transformers with standard size units of 42 MVA in 2024-2025 timeframe.
Cedar TS and Hanlon TS Optimization with Neighbouring Stations After performing an analysis of the current distribution situation, it was determined that there are not enough spare feeder positions at HONI and GHESI stations to reallocate DESN loads in the sub-system without significant distribution system and neighboring station upgrades. Over loading of Campbell DESN T3/T4 will be effectively managed by load transfer to DESN T1/T2 after 2021/22. Following that there will be no additional capacity at these two DESNs. Secondly, Hanlon TS DESN has eight (8) feeders with three (3) being dedicated underground infrastructure to existing customers, two (2) feeders supplying the industrial load in the Hanlon Industrial Park, two (2) feeder circuits supplying residential load north of Hanlon TS and one (1) feeder to be utilized for planned future load growth at Gordon/ Clair. In addition, due to technical limitations at 13.8 kV distribution voltage and density of load on certain feeders sections, it is not possible to supply existing
KWCG Region – Needs Assessment December 19, 2018
Page20
loads from any other station without significant transmission and distribution investments. Therefore there are little or no significant optimization opportunity is present at this point in time. Option considered for load transfer will require significant new investment; for example:
The two residential distribution feeders supplying loads north of Hanlon TS could be transferred to existing feeders out of Cedar TS. These load transfers will result in increased line losses and reduced capacity (due to voltage drop)
Another option could be transferring remaining Hanlon TS load to Arlen MTS. This load transfer will require an additional DESN and underground infrastructure at Arlen MTS.
Hence, the Study Team recommends that Hydro One undertakes replacement of Cedar TS T7/T8 and Hanlon TS T1/T2 transformers with 42 MVA standard size units, being technically and economical most suitable solution. The replacement of EOL equipment is expected to be completed by 2023-2025 timeframe for both stations.
Scheifele MTS – T1/ T2 Transformers
Scheifele MTS is located in the city of Waterloo supplying Waterloo North Hydro Inc. loads. Scheifele MTS has four 230/ 13.8 kV transformers T1 and T2 of 67 MVA, and T3 and T4 of 83 MVA currently supplying 145 MW of peak loads. The load at this station is forecasted to remain almost flat over the entire study period. The total supply capacity of Scheifele MTS is 161 MW expected to be sufficient over the study period. The T1/T2 transformers based on their age have been identified by Waterloo North Hydro Inc. as approaching end of life potentially requiring replacement in the 2024- 2026 timeframe. Waterloo North Hydro will be monitoring the condition of these transformers to assess their replacement need. At this time none of other HV/LV equipment at this station has been identified as approaching EOL over the next 5-10 years. The station cannot be downsized or eliminated because there is no nearby supply station/s to Scheifele MTS having surplus capacity where this station’s loads can be transferred. The Study Team recommends that Waterloo North Hydro continue monitoring the condition of these T1/T2 transformers at Scheifele MTS and this need to be reassessed in the next regional planning cycle.
Preston TS T3/T4 Transformers
Preston TS (DESN) is located in the city of Cambridge supplying Energy+ loads. Preston TS is a single T3/T4 DESN station of 125 MVA transformers with no additional LTR capability available i.e. 125 MVA (113 MW @ 0.9 PF). This station is currently supplying about 92 MW of peak load. The loads at Preston TS are currently forecasted to peak at about 102 MW during the study period.
KWCG Region – Needs Assessment December 19, 2018
Page21
The T3/T4 transformers are almost 50 years old, having been built in 1968. Condition assessment has identified that both T3/T4 transformers at their EOL requiring replacement. At this time none of other HV/LV equipment at this station has been identified as EOL over the next 5-10 years. The station cannot be downsized or eliminated because there is no nearby supply station/s to Preston TS having spare supply capacity where this station’s loads can be transferred. The Study Team recommends replacing the existing 125 MVA 230/ 27.6 kV T3/T4 transformers at Preston TS with 125 MVA standard units. This will also result in an increased supplying capacity at Preston TS required to meet the future Energy+ needs in the Cambridge distribution area. The replacement plan for the equipment will be developed by Hydro One and coordinated with the affected LDC and/or customers and it is expected to be completed by 2025-2026. 7.2 Supply Reliability Needs
Supply reliability of Elmira TS –D10H 115 kV Line
The 115 kV D10H circuit between Detweiler TS and Hanover TS supplies loads at Rush MTS, Elmira TS and Palmerston TS. The D10H circuit has a normally open point just south of Palmerston TS through a motorized disconnect switch. The northern section of D10H is supplied from Hanover TS radially supplying Palmerston TS loads. The southern section of D10H supplied from Detweiler TS radially supplies Waterloo North Hydro’s 34 MW Elmira TS peak loads. D10H also supplies Rush MTS which is also supplied by 115 kV D8S circuit from Detweiler TS. The normally open motorized switch near Palmerston TS helps restore the loads at Elmira TS from Hanover TS in-case supply from Detweiler TS is interrupted and similarly helps restoring Palmerston TS loads from Detweiler if supply from Hanover is interrupted. In last three years, supply to Elmira TS from Detweiler TS resulted in 3 outages due to faults on the D10H line section between Elmira TS tap and Detweiler TS. The Elmira TS load restoration from Hanover TS is slower due to manually operated disconnect switches at Elmira TS tap location. Hydro One is currently assessing the condition of line and will continue to work with Waterloo North Hydro to address the supply reliability at Elmira TS. The developed mitigation plan to improve supply reliability of Elmira TS loads will be included in the final RIP report.
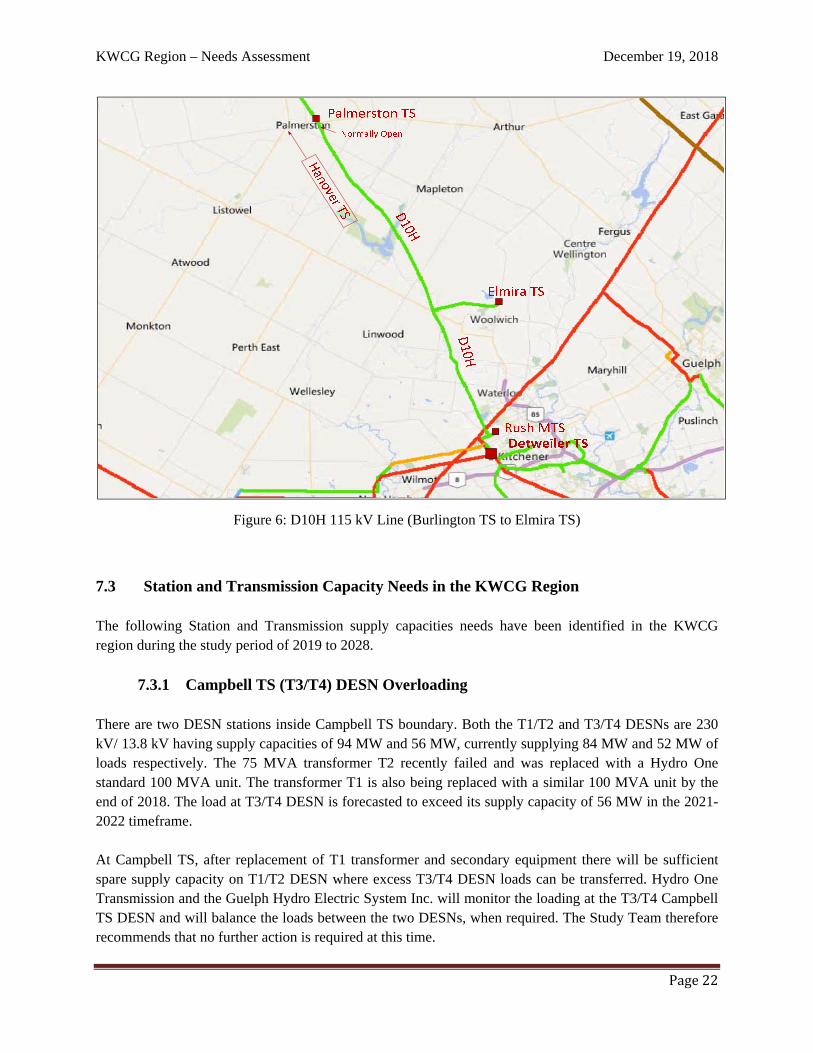
KWCG Region – Needs Assessment December 19, 2018
Page22
Figure 6: D10H 115 kV Line (Burlington TS to Elmira TS)
7.3 Station and Transmission Capacity Needs in the KWCG Region The following Station and Transmission supply capacities needs have been identified in the KWCG region during the study period of 2019 to 2028.
7.3.1 Campbell TS (T3/T4) DESN Overloading
There are two DESN stations inside Campbell TS boundary. Both the T1/T2 and T3/T4 DESNs are 230 kV/ 13.8 kV having supply capacities of 94 MW and 56 MW, currently supplying 84 MW and 52 MW of loads respectively. The 75 MVA transformer T2 recently failed and was replaced with a Hydro One standard 100 MVA unit. The transformer T1 is also being replaced with a similar 100 MVA unit by the end of 2018. The load at T3/T4 DESN is forecasted to exceed its supply capacity of 56 MW in the 2021-2022 timeframe. At Campbell TS, after replacement of T1 transformer and secondary equipment there will be sufficient spare supply capacity on T1/T2 DESN where excess T3/T4 DESN loads can be transferred. Hydro One Transmission and the Guelph Hydro Electric System Inc. will monitor the loading at the T3/T4 Campbell TS DESN and will balance the loads between the two DESNs, when required. The Study Team therefore recommends that no further action is required at this time.
KWCG Region – Needs Assessment December 19, 2018
Page23
7.3.2 Waterloo North Hydro MTS #4 During the last regional planning cycle a need for a new MTS #4 DESN was identified in the 2024 timeframe. The current load forecast defers this need beyond the needs assessment study period.
7.3.3 Energy+ MTS #2 Energy+ has initially identified a future need for a new DESN station (MTS #2) in the city of Cambridge near Preston TS. This station need is due to a potential new load center growth in their service territory. The additional supply capacity due to EOL transformer replacement and available new feeder positions at Preston TS, will defer this new MTS need beyond the study period of current regional planning cycle.
WNH MTS #4 and Energy+ MTS #2 Optimization The Preston TS like-for-like transformer replacement is critical for local supply needs and will proceed according to the current plan. However, study team recommends that the supply capacity needs with regards to Energy + MTS #2 and WNH MTS #4 be further assessed for optimization in the next phases of regional planning. Once the optimization options are complete, Waterloo North Hydro and Energy+ shall conduct a technical and economic assessment in consultation with Hydro One. 7.4 Other Planning Considerations in the KWCG Region Municipalities in KWCG region have developed their community energy plans with a primary focus to reduce their energy consumption by local initiatives over next 25 to 30 years. With respect to electricity, these communities are planning for an increased reliance on community energy sources such as distributed generation, generation behind the meters like rooftop solar systems and local battery storage systems to reduce cost and for improved reliability of electricity supply. There are situations where behind the meter battery storage cannot be connected due to technical constraints. The LDCs in this region and Hydro One, outside the regional planning forum, can undertake the task of exploring the issue to assess technical constraints and /or other solutions that can facilitate connection of additional battery storage. Communities are also working towards self-sufficiency by improving efficiencies of existing local energy systems i.e. reducing energy consumption and losses by means of utilizing smarter buildings, houses, efficient heating, cooling, appliances, equipment, and processes for all community needs. Ultimately, the objective of these energy plans in the region is to be a net zero carbon community.
Community energy plans may have potential to supplement and/or defer future transmission infrastructure development needs. The Study Team therefore recommends reviewing the community energy plans in the SA phase.
KWCG Region – Needs Assessment December 19, 2018
Page24
8 CONCLUSION AND RECOMMENDATIONS Hydro One and Waterloo North Hydro Inc. will develop a supply reliability improvement plan for Elmira TS loads. The developed local plan to improve supply reliability of Elmira TS loads will be included in the final RIP report. At Campbell TS, after replacement of T1 transformer and addressing the secondary equipment limitations there will be sufficient spare supply capacity on T1/T2 DESN to accommodate T3/T4 DESN overloading. Hydro One and the LDC will work together to balance loads between the two Campbell TS DESNs, when required. The distribution system in the Cedar TS, Hanlon TS and Arlen MTS supply area is already optimized and there are not enough spare feeder positions at any of the stations to reallocate DESN loads without significant distribution system investments and upgrades at neighboring stations.
The Study Team’s recommendations for the above identified needs are as follows:
a) The replacement of EOL station supply transformers at Campbell TS, Hanlon TS, Cedar TS, Kitchener MTS #5 and Preston TS along with the EOL auto transformers at Detweiler to proceed. Hydro One and the concerned LDCs will coordinate replacement of above equipment and develop replacement plans.
b) The refurbishment of EOL line sections 115 kV B5C/ B6C, D7F/ D9F and 230 kV D6V/ D7V to proceed. Hydro One will coordinate refurbishment of these line sections with affected LDCs/ Customer.
c) Hydro One will continue to work with Waterloo North Hydro Inc. to address the supply reliability issue at Elmira TS.
d) The Study Team has recommended that Hydro One Transmission and the Guelph Hydro Electric System Inc. to closely monitor the loading at the T3/T4 Campbell TS DESN and to balance the loads between these DESNs when required.
e) The Study Team recommends that the supply capacity needs with regards to Energy + MTS #2 and WNH MTS #4 be further assessed for optimization in the SA phase of regional planning. Once the optimization options are complete, Waterloo North Hydro and Energy+ shall conduct a technical and economic assessment in consultation with Hydro One.
f) The Study Team has recommended that community energy plans will be further considered in the SA phase of the regional planning process.

KWCG Region – Needs Assessment December 19, 2018
Page25
9 REFERENCES
[1] KWCG Regional Infrastructure Plan - December 2015
[2] Planning Process Working Group Report to the Ontario Energy Board - May 2013
[3] Ontario Resource and Transmission Assessment Criteria (ORTAC) – Issue 5.0 -August 2007
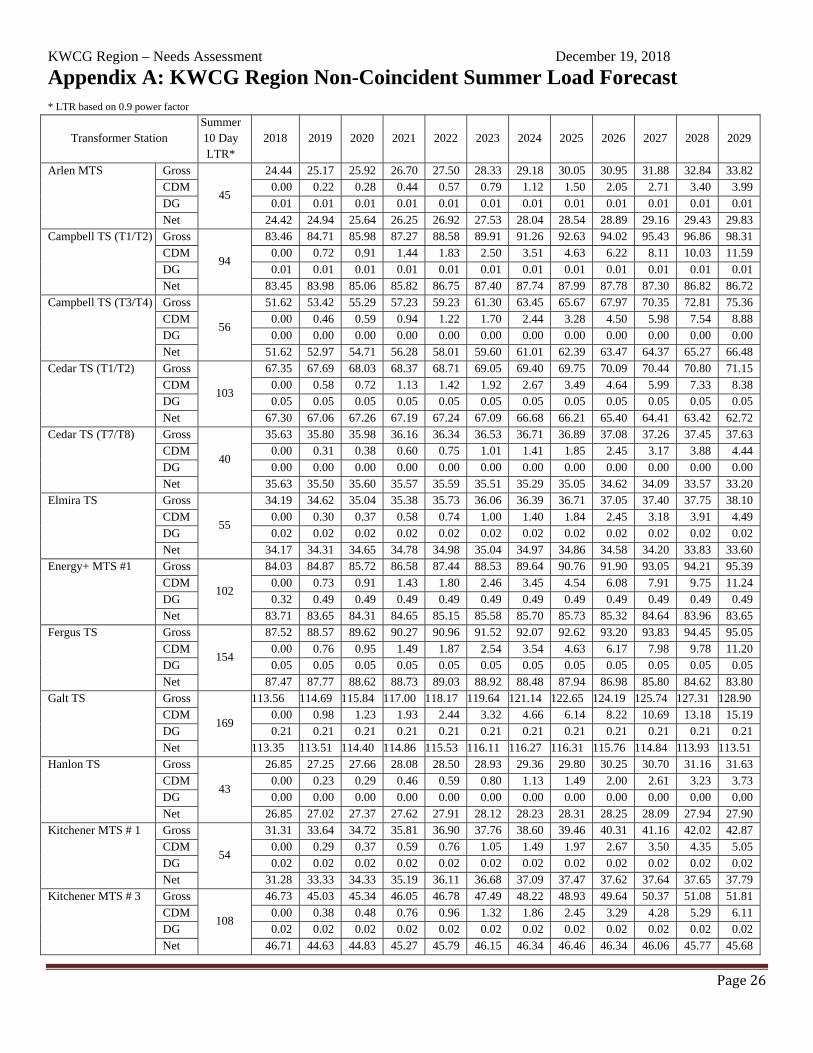
KWCG Region – Needs Assessment December 19, 2018
Page26
Appendix A: KWCG Region Non-Coincident Summer Load Forecast * LTR based on 0.9 power factor
Transformer Station Summer 10 Day LTR*
2018 2019 2020 2021 2022 2023 2024 2025 2026 2027 2028 2029
Arlen MTS Gross
45
24.44 25.17 25.92 26.70 27.50 28.33 29.18 30.05 30.95 31.88 32.84 33.82 CDM 0.00 0.22 0.28 0.44 0.57 0.79 1.12 1.50 2.05 2.71 3.40 3.99 DG 0.01 0.01 0.01 0.01 0.01 0.01 0.01 0.01 0.01 0.01 0.01 0.01 Net 24.42 24.94 25.64 26.25 26.92 27.53 28.04 28.54 28.89 29.16 29.43 29.83
Campbell TS (T1/T2) Gross
94
83.46 84.71 85.98 87.27 88.58 89.91 91.26 92.63 94.02 95.43 96.86 98.31 CDM 0.00 0.72 0.91 1.44 1.83 2.50 3.51 4.63 6.22 8.11 10.03 11.59 DG 0.01 0.01 0.01 0.01 0.01 0.01 0.01 0.01 0.01 0.01 0.01 0.01 Net 83.45 83.98 85.06 85.82 86.75 87.40 87.74 87.99 87.78 87.30 86.82 86.72
Campbell TS (T3/T4) Gross
56
51.62 53.42 55.29 57.23 59.23 61.30 63.45 65.67 67.97 70.35 72.81 75.36 CDM 0.00 0.46 0.59 0.94 1.22 1.70 2.44 3.28 4.50 5.98 7.54 8.88 DG 0.00 0.00 0.00 0.00 0.00 0.00 0.00 0.00 0.00 0.00 0.00 0.00 Net 51.62 52.97 54.71 56.28 58.01 59.60 61.01 62.39 63.47 64.37 65.27 66.48
Cedar TS (T1/T2) Gross
103
67.35 67.69 68.03 68.37 68.71 69.05 69.40 69.75 70.09 70.44 70.80 71.15 CDM 0.00 0.58 0.72 1.13 1.42 1.92 2.67 3.49 4.64 5.99 7.33 8.38 DG 0.05 0.05 0.05 0.05 0.05 0.05 0.05 0.05 0.05 0.05 0.05 0.05 Net 67.30 67.06 67.26 67.19 67.24 67.09 66.68 66.21 65.40 64.41 63.42 62.72
Cedar TS (T7/T8) Gross
40
35.63 35.80 35.98 36.16 36.34 36.53 36.71 36.89 37.08 37.26 37.45 37.63 CDM 0.00 0.31 0.38 0.60 0.75 1.01 1.41 1.85 2.45 3.17 3.88 4.44 DG 0.00 0.00 0.00 0.00 0.00 0.00 0.00 0.00 0.00 0.00 0.00 0.00 Net 35.63 35.50 35.60 35.57 35.59 35.51 35.29 35.05 34.62 34.09 33.57 33.20
Elmira TS Gross
55
34.19 34.62 35.04 35.38 35.73 36.06 36.39 36.71 37.05 37.40 37.75 38.10 CDM 0.00 0.30 0.37 0.58 0.74 1.00 1.40 1.84 2.45 3.18 3.91 4.49 DG 0.02 0.02 0.02 0.02 0.02 0.02 0.02 0.02 0.02 0.02 0.02 0.02 Net 34.17 34.31 34.65 34.78 34.98 35.04 34.97 34.86 34.58 34.20 33.83 33.60
Energy+ MTS #1 Gross
102
84.03 84.87 85.72 86.58 87.44 88.53 89.64 90.76 91.90 93.05 94.21 95.39 CDM 0.00 0.73 0.91 1.43 1.80 2.46 3.45 4.54 6.08 7.91 9.75 11.24 DG 0.32 0.49 0.49 0.49 0.49 0.49 0.49 0.49 0.49 0.49 0.49 0.49 Net 83.71 83.65 84.31 84.65 85.15 85.58 85.70 85.73 85.32 84.64 83.96 83.65
Fergus TS Gross
154
87.52 88.57 89.62 90.27 90.96 91.52 92.07 92.62 93.20 93.83 94.45 95.05 CDM 0.00 0.76 0.95 1.49 1.87 2.54 3.54 4.63 6.17 7.98 9.78 11.20 DG 0.05 0.05 0.05 0.05 0.05 0.05 0.05 0.05 0.05 0.05 0.05 0.05 Net 87.47 87.77 88.62 88.73 89.03 88.92 88.48 87.94 86.98 85.80 84.62 83.80
Galt TS Gross
169
113.56 114.69 115.84 117.00 118.17 119.64 121.14 122.65 124.19 125.74 127.31 128.90 CDM 0.00 0.98 1.23 1.93 2.44 3.32 4.66 6.14 8.22 10.69 13.18 15.19 DG 0.21 0.21 0.21 0.21 0.21 0.21 0.21 0.21 0.21 0.21 0.21 0.21 Net 113.35 113.51 114.40 114.86 115.53 116.11 116.27 116.31 115.76 114.84 113.93 113.51
Hanlon TS Gross
43
26.85 27.25 27.66 28.08 28.50 28.93 29.36 29.80 30.25 30.70 31.16 31.63 CDM 0.00 0.23 0.29 0.46 0.59 0.80 1.13 1.49 2.00 2.61 3.23 3.73 DG 0.00 0.00 0.00 0.00 0.00 0.00 0.00 0.00 0.00 0.00 0.00 0.00 Net 26.85 27.02 27.37 27.62 27.91 28.12 28.23 28.31 28.25 28.09 27.94 27.90
Kitchener MTS # 1 Gross
54
31.31 33.64 34.72 35.81 36.90 37.76 38.60 39.46 40.31 41.16 42.02 42.87 CDM 0.00 0.29 0.37 0.59 0.76 1.05 1.49 1.97 2.67 3.50 4.35 5.05 DG 0.02 0.02 0.02 0.02 0.02 0.02 0.02 0.02 0.02 0.02 0.02 0.02 Net 31.28 33.33 34.33 35.19 36.11 36.68 37.09 37.47 37.62 37.64 37.65 37.79
Kitchener MTS # 3 Gross
108
46.73 45.03 45.34 46.05 46.78 47.49 48.22 48.93 49.64 50.37 51.08 51.81 CDM 0.00 0.38 0.48 0.76 0.96 1.32 1.86 2.45 3.29 4.28 5.29 6.11 DG 0.02 0.02 0.02 0.02 0.02 0.02 0.02 0.02 0.02 0.02 0.02 0.02 Net 46.71 44.63 44.83 45.27 45.79 46.15 46.34 46.46 46.34 46.06 45.77 45.68
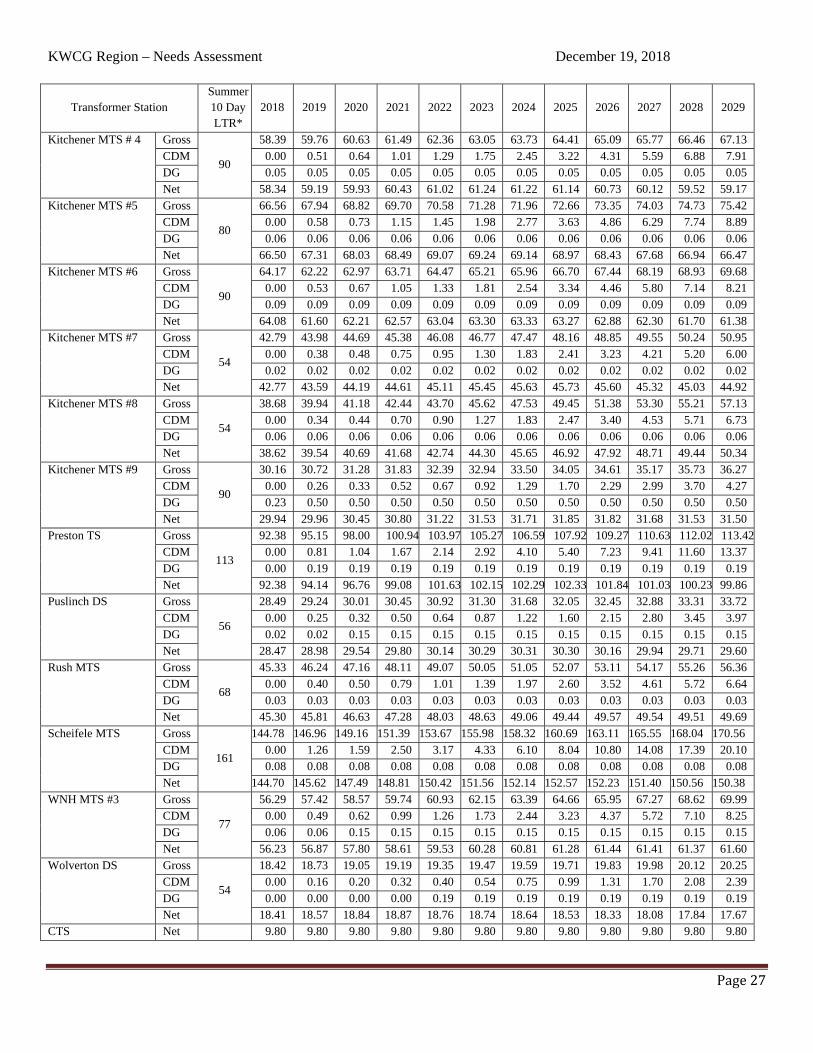
KWCG Region – Needs Assessment December 19, 2018
Page27
Transformer Station Summer 10 Day LTR*
2018 2019 2020 2021 2022 2023 2024 2025 2026 2027 2028 2029
Kitchener MTS # 4 Gross
90
58.39 59.76 60.63 61.49 62.36 63.05 63.73 64.41 65.09 65.77 66.46 67.13 CDM 0.00 0.51 0.64 1.01 1.29 1.75 2.45 3.22 4.31 5.59 6.88 7.91 DG 0.05 0.05 0.05 0.05 0.05 0.05 0.05 0.05 0.05 0.05 0.05 0.05 Net 58.34 59.19 59.93 60.43 61.02 61.24 61.22 61.14 60.73 60.12 59.52 59.17
Kitchener MTS #5 Gross
80
66.56 67.94 68.82 69.70 70.58 71.28 71.96 72.66 73.35 74.03 74.73 75.42 CDM 0.00 0.58 0.73 1.15 1.45 1.98 2.77 3.63 4.86 6.29 7.74 8.89 DG 0.06 0.06 0.06 0.06 0.06 0.06 0.06 0.06 0.06 0.06 0.06 0.06 Net 66.50 67.31 68.03 68.49 69.07 69.24 69.14 68.97 68.43 67.68 66.94 66.47
Kitchener MTS #6 Gross
90
64.17 62.22 62.97 63.71 64.47 65.21 65.96 66.70 67.44 68.19 68.93 69.68 CDM 0.00 0.53 0.67 1.05 1.33 1.81 2.54 3.34 4.46 5.80 7.14 8.21 DG 0.09 0.09 0.09 0.09 0.09 0.09 0.09 0.09 0.09 0.09 0.09 0.09 Net 64.08 61.60 62.21 62.57 63.04 63.30 63.33 63.27 62.88 62.30 61.70 61.38
Kitchener MTS #7 Gross
54
42.79 43.98 44.69 45.38 46.08 46.77 47.47 48.16 48.85 49.55 50.24 50.95 CDM 0.00 0.38 0.48 0.75 0.95 1.30 1.83 2.41 3.23 4.21 5.20 6.00 DG 0.02 0.02 0.02 0.02 0.02 0.02 0.02 0.02 0.02 0.02 0.02 0.02 Net 42.77 43.59 44.19 44.61 45.11 45.45 45.63 45.73 45.60 45.32 45.03 44.92
Kitchener MTS #8 Gross
54
38.68 39.94 41.18 42.44 43.70 45.62 47.53 49.45 51.38 53.30 55.21 57.13 CDM 0.00 0.34 0.44 0.70 0.90 1.27 1.83 2.47 3.40 4.53 5.71 6.73 DG 0.06 0.06 0.06 0.06 0.06 0.06 0.06 0.06 0.06 0.06 0.06 0.06 Net 38.62 39.54 40.69 41.68 42.74 44.30 45.65 46.92 47.92 48.71 49.44 50.34
Kitchener MTS #9 Gross
90
30.16 30.72 31.28 31.83 32.39 32.94 33.50 34.05 34.61 35.17 35.73 36.27 CDM 0.00 0.26 0.33 0.52 0.67 0.92 1.29 1.70 2.29 2.99 3.70 4.27 DG 0.23 0.50 0.50 0.50 0.50 0.50 0.50 0.50 0.50 0.50 0.50 0.50 Net 29.94 29.96 30.45 30.80 31.22 31.53 31.71 31.85 31.82 31.68 31.53 31.50
Preston TS Gross
113
92.38 95.15 98.00 100.94 103.97 105.27 106.59 107.92 109.27 110.63 112.02 113.42CDM 0.00 0.81 1.04 1.67 2.14 2.92 4.10 5.40 7.23 9.41 11.60 13.37 DG 0.00 0.19 0.19 0.19 0.19 0.19 0.19 0.19 0.19 0.19 0.19 0.19 Net 92.38 94.14 96.76 99.08 101.63 102.15 102.29 102.33 101.84 101.03 100.23 99.86
Puslinch DS Gross
56
28.49 29.24 30.01 30.45 30.92 31.30 31.68 32.05 32.45 32.88 33.31 33.72 CDM 0.00 0.25 0.32 0.50 0.64 0.87 1.22 1.60 2.15 2.80 3.45 3.97 DG 0.02 0.02 0.15 0.15 0.15 0.15 0.15 0.15 0.15 0.15 0.15 0.15 Net 28.47 28.98 29.54 29.80 30.14 30.29 30.31 30.30 30.16 29.94 29.71 29.60
Rush MTS Gross
68
45.33 46.24 47.16 48.11 49.07 50.05 51.05 52.07 53.11 54.17 55.26 56.36 CDM 0.00 0.40 0.50 0.79 1.01 1.39 1.97 2.60 3.52 4.61 5.72 6.64 DG 0.03 0.03 0.03 0.03 0.03 0.03 0.03 0.03 0.03 0.03 0.03 0.03 Net 45.30 45.81 46.63 47.28 48.03 48.63 49.06 49.44 49.57 49.54 49.51 49.69
Scheifele MTS Gross
161
144.78 146.96 149.16 151.39 153.67 155.98 158.32 160.69 163.11 165.55 168.04 170.56 CDM 0.00 1.26 1.59 2.50 3.17 4.33 6.10 8.04 10.80 14.08 17.39 20.10 DG 0.08 0.08 0.08 0.08 0.08 0.08 0.08 0.08 0.08 0.08 0.08 0.08 Net 144.70 145.62 147.49 148.81 150.42 151.56 152.14 152.57 152.23 151.40 150.56 150.38
WNH MTS #3 Gross
77
56.29 57.42 58.57 59.74 60.93 62.15 63.39 64.66 65.95 67.27 68.62 69.99 CDM 0.00 0.49 0.62 0.99 1.26 1.73 2.44 3.23 4.37 5.72 7.10 8.25 DG 0.06 0.06 0.15 0.15 0.15 0.15 0.15 0.15 0.15 0.15 0.15 0.15 Net 56.23 56.87 57.80 58.61 59.53 60.28 60.81 61.28 61.44 61.41 61.37 61.60
Wolverton DS Gross
54
18.42 18.73 19.05 19.19 19.35 19.47 19.59 19.71 19.83 19.98 20.12 20.25 CDM 0.00 0.16 0.20 0.32 0.40 0.54 0.75 0.99 1.31 1.70 2.08 2.39 DG 0.00 0.00 0.00 0.00 0.19 0.19 0.19 0.19 0.19 0.19 0.19 0.19 Net 18.41 18.57 18.84 18.87 18.76 18.74 18.64 18.53 18.33 18.08 17.84 17.67
CTS Net 9.80 9.80 9.80 9.80 9.80 9.80 9.80 9.80 9.80 9.80 9.80 9.80
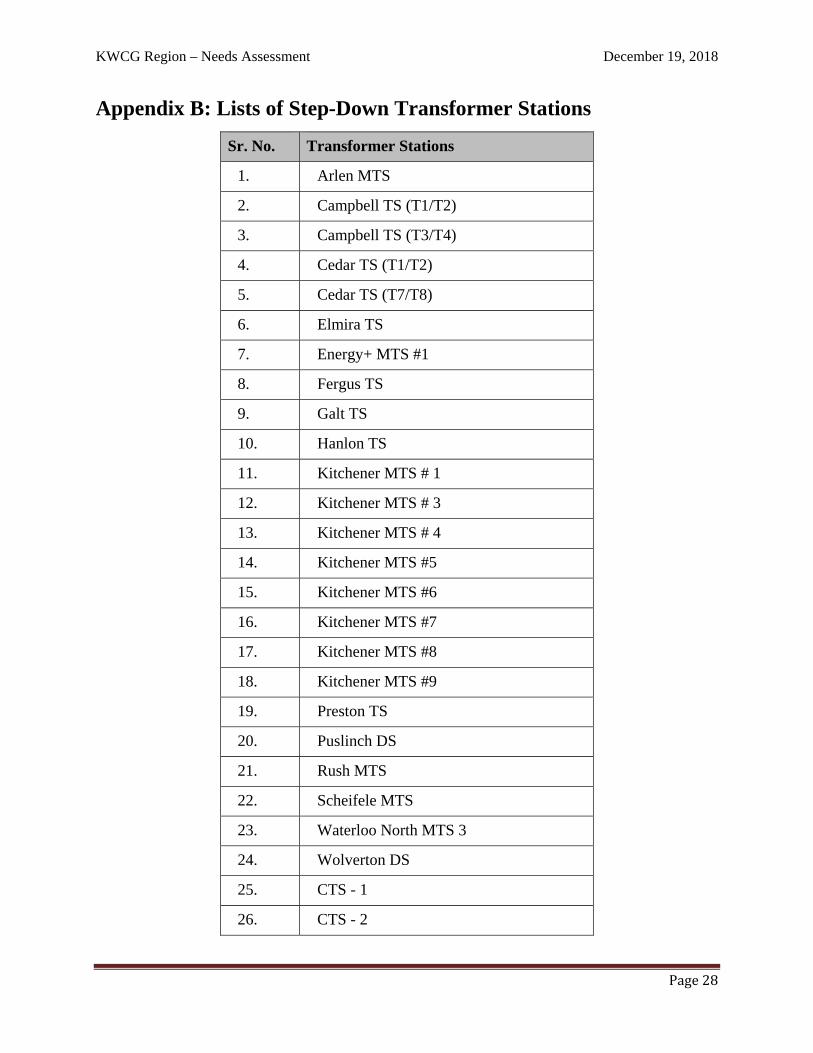
KWCG Region – Needs Assessment December 19, 2018
Page28
Appendix B: Lists of Step-Down Transformer Stations
Sr. No. Transformer Stations
1. Arlen MTS
2. Campbell TS (T1/T2)
3. Campbell TS (T3/T4)
4. Cedar TS (T1/T2)
5. Cedar TS (T7/T8)
6. Elmira TS
7. Energy+ MTS #1
8. Fergus TS
9. Galt TS
10. Hanlon TS
11. Kitchener MTS # 1
12. Kitchener MTS # 3
13. Kitchener MTS # 4
14. Kitchener MTS #5
15. Kitchener MTS #6
16. Kitchener MTS #7
17. Kitchener MTS #8
18. Kitchener MTS #9
19. Preston TS
20. Puslinch DS
21. Rush MTS
22. Scheifele MTS
23. Waterloo North MTS 3
24. Wolverton DS
25. CTS - 1
26. CTS - 2
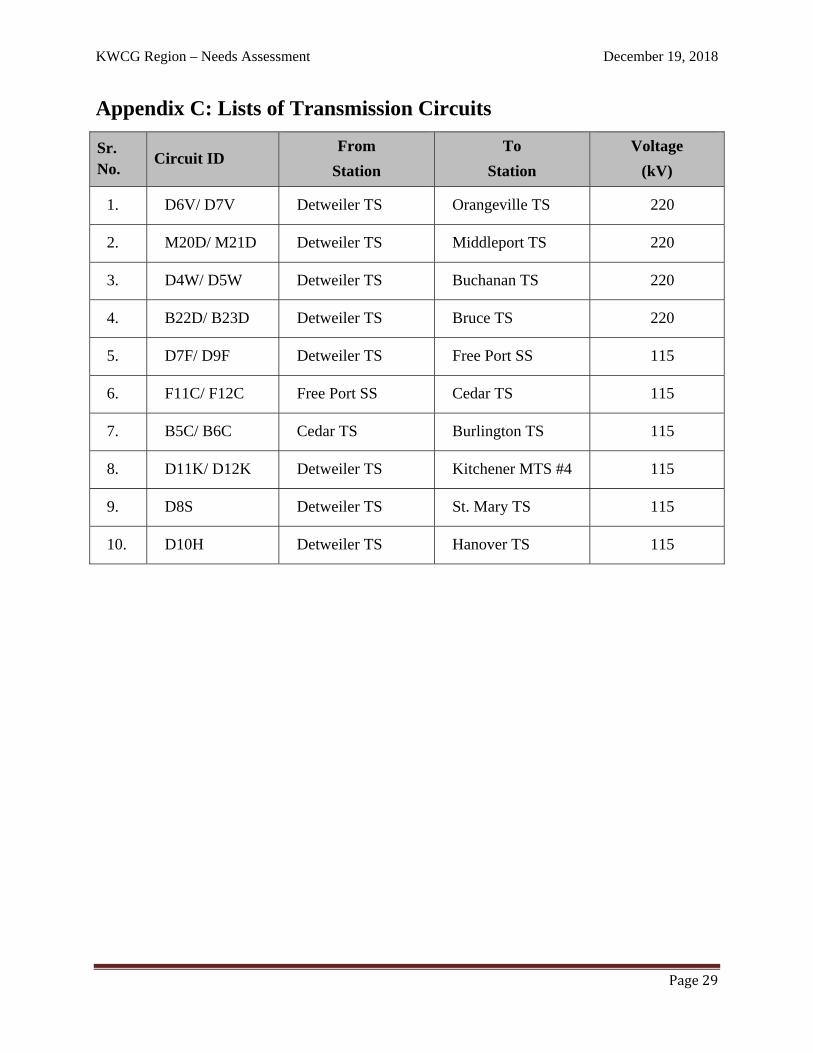
KWCG Region – Needs Assessment December 19, 2018
Page29
Appendix C: Lists of Transmission Circuits
Sr. No.
Circuit ID From
Station
To
Station
Voltage
(kV)
1. D6V/ D7V Detweiler TS Orangeville TS 220
2. M20D/ M21D Detweiler TS Middleport TS 220
3. D4W/ D5W Detweiler TS Buchanan TS 220
4. B22D/ B23D Detweiler TS Bruce TS 220
5. D7F/ D9F Detweiler TS Free Port SS 115
6. F11C/ F12C Free Port SS Cedar TS 115
7. B5C/ B6C Cedar TS Burlington TS 115
8. D11K/ D12K Detweiler TS Kitchener MTS #4 115
9. D8S Detweiler TS St. Mary TS 115
10. D10H Detweiler TS Hanover TS 115
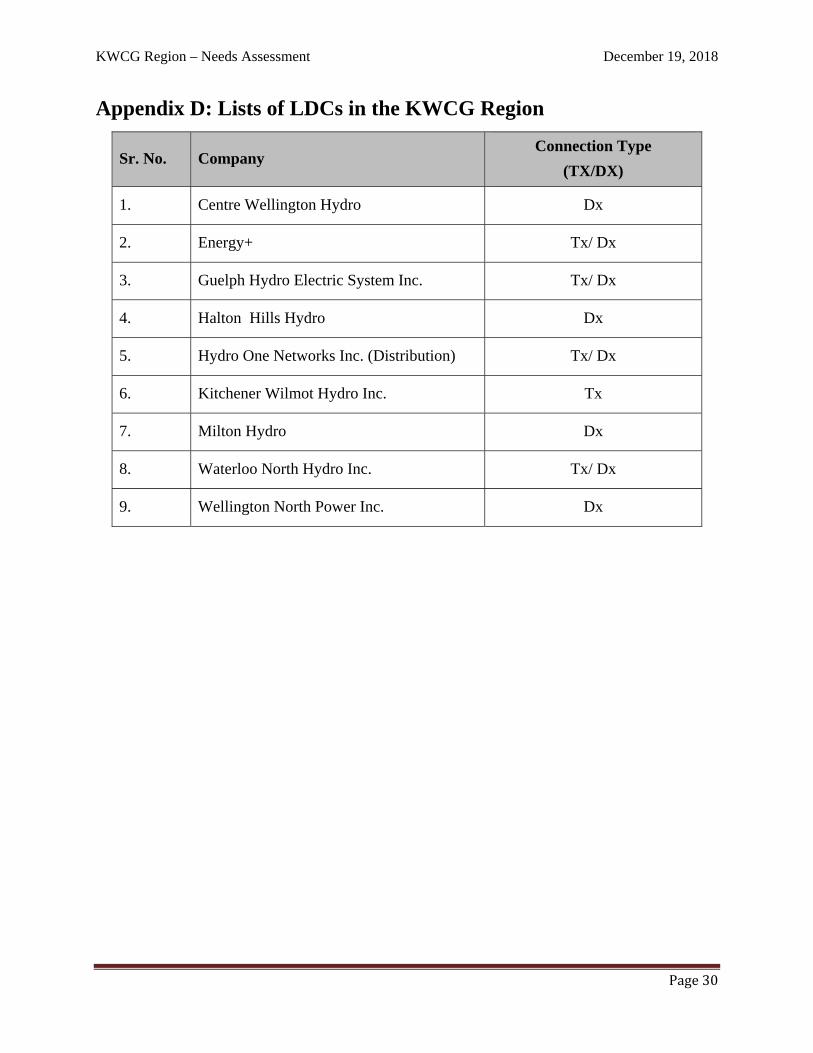
KWCG Region – Needs Assessment December 19, 2018
Page30
Appendix D: Lists of LDCs in the KWCG Region
Sr. No. Company Connection Type
(TX/DX)
1. Centre Wellington Hydro Dx
2. Energy+ Tx/ Dx
3. Guelph Hydro Electric System Inc. Tx/ Dx
4. Halton Hills Hydro Dx
5. Hydro One Networks Inc. (Distribution) Tx/ Dx
6. Kitchener Wilmot Hydro Inc. Tx
7. Milton Hydro Dx
8. Waterloo North Hydro Inc. Tx/ Dx
9. Wellington North Power Inc. Dx
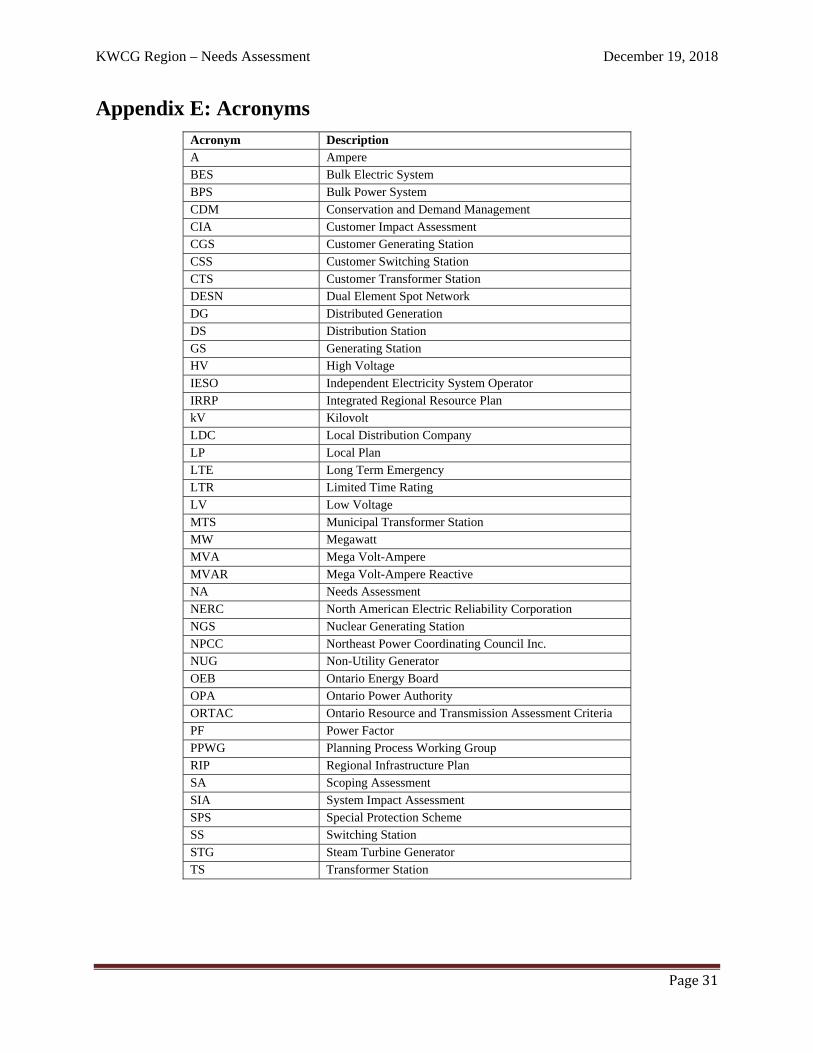
KWCG Region – Needs Assessment December 19, 2018
Page31
Appendix E: Acronyms Acronym Description A Ampere BES Bulk Electric System BPS Bulk Power System CDM Conservation and Demand Management CIA Customer Impact Assessment CGS Customer Generating Station CSS Customer Switching Station CTS Customer Transformer Station DESN Dual Element Spot Network DG Distributed Generation DS Distribution Station GS Generating Station HV High Voltage IESO Independent Electricity System Operator IRRP Integrated Regional Resource Plan kV Kilovolt LDC Local Distribution Company LP Local Plan LTE Long Term Emergency LTR Limited Time Rating LV Low Voltage MTS Municipal Transformer Station MW Megawatt MVA Mega Volt-Ampere MVAR Mega Volt-Ampere Reactive NA Needs Assessment NERC North American Electric Reliability Corporation NGS Nuclear Generating Station NPCC Northeast Power Coordinating Council Inc. NUG Non-Utility Generator OEB Ontario Energy Board OPA Ontario Power Authority ORTAC Ontario Resource and Transmission Assessment Criteria PF Power Factor PPWG Planning Process Working Group RIP Regional Infrastructure Plan SA Scoping Assessment SIA System Impact Assessment SPS Special Protection Scheme SS Switching Station STG Steam Turbine Generator TS Transformer Station

Appendix H:
WNH Renewable Energy Generation (REG)
Investment Plan
Waterloo North Hydro Inc.
Renewable Energy Generation Investments Plan
2019
June 21, 2020
Filed with
Waterloo North Hydro’s
2021 COS Application
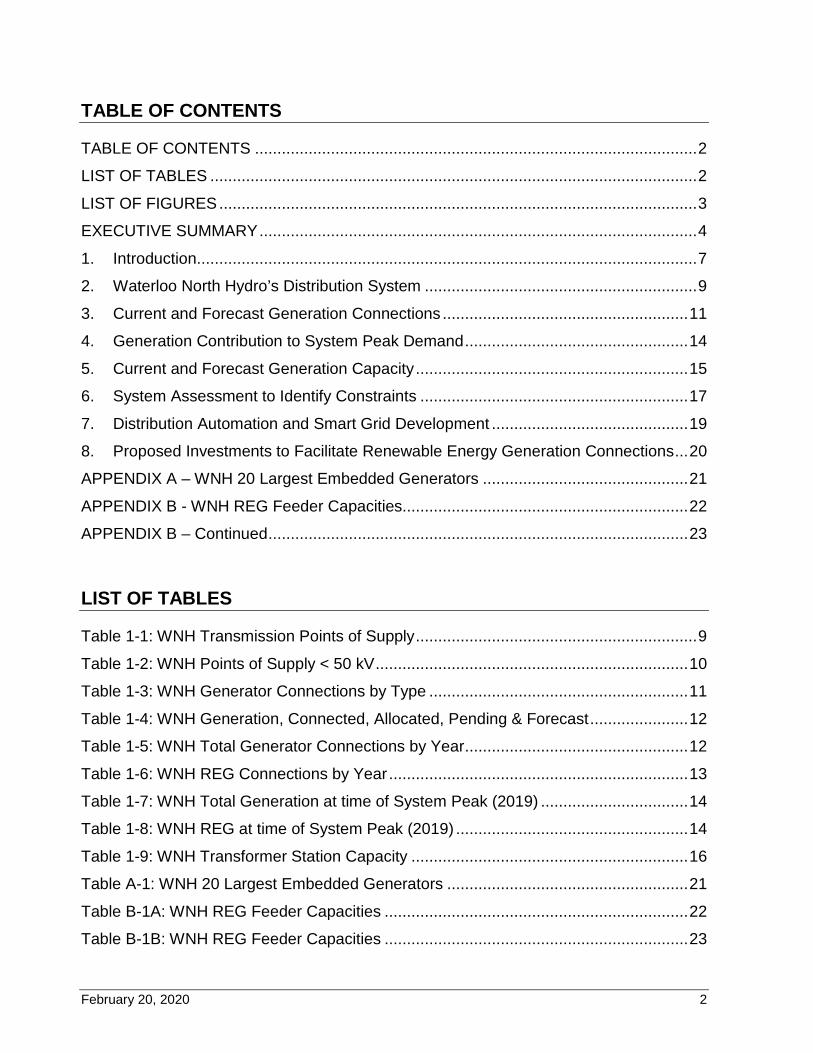
February 20, 2020 2
TABLE OF CONTENTS
TABLE OF CONTENTS ................................................................................................... 2
LIST OF TABLES ............................................................................................................. 2
LIST OF FIGURES ........................................................................................................... 3
EXECUTIVE SUMMARY .................................................................................................. 4
1. Introduction ................................................................................................................ 7
2. Waterloo North Hydro’s Distribution System ............................................................. 9
3. Current and Forecast Generation Connections ....................................................... 11
4. Generation Contribution to System Peak Demand .................................................. 14
5. Current and Forecast Generation Capacity ............................................................. 15
6. System Assessment to Identify Constraints ............................................................ 17
7. Distribution Automation and Smart Grid Development ............................................ 19
8. Proposed Investments to Facilitate Renewable Energy Generation Connections ... 20
APPENDIX A – WNH 20 Largest Embedded Generators .............................................. 21
APPENDIX B - WNH REG Feeder Capacities................................................................ 22
APPENDIX B – Continued .............................................................................................. 23
LIST OF TABLES
Table 1-1: WNH Transmission Points of Supply ............................................................... 9
Table 1-2: WNH Points of Supply < 50 kV ...................................................................... 10
Table 1-3: WNH Generator Connections by Type .......................................................... 11
Table 1-4: WNH Generation, Connected, Allocated, Pending & Forecast ...................... 12
Table 1-5: WNH Total Generator Connections by Year .................................................. 12
Table 1-6: WNH REG Connections by Year ................................................................... 13
Table 1-7: WNH Total Generation at time of System Peak (2019) ................................. 14
Table 1-8: WNH REG at time of System Peak (2019) .................................................... 14
Table 1-9: WNH Transformer Station Capacity .............................................................. 16
Table A-1: WNH 20 Largest Embedded Generators ...................................................... 21
Table B-1A: WNH REG Feeder Capacities .................................................................... 22
Table B-1B: WNH REG Feeder Capacities .................................................................... 23

February 20, 2020 3
LIST OF FIGURES
Figure 1-1: WNH Service Area ......................................................................................... 8
Figure 1-2: Historical and Forecast Growth in Connected Generation ........................... 13
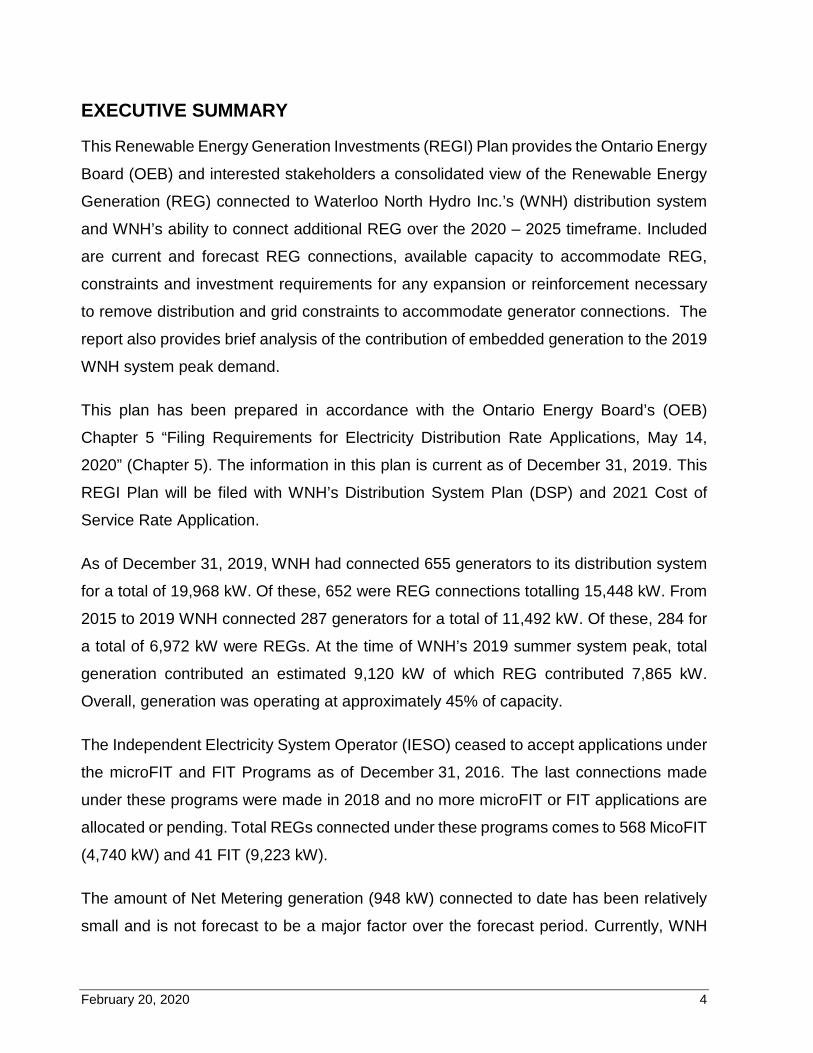
February 20, 2020 4
EXECUTIVE SUMMARY
This Renewable Energy Generation Investments (REGI) Plan provides the Ontario Energy
Board (OEB) and interested stakeholders a consolidated view of the Renewable Energy
Generation (REG) connected to Waterloo North Hydro Inc.’s (WNH) distribution system
and WNH’s ability to connect additional REG over the 2020 – 2025 timeframe. Included
are current and forecast REG connections, available capacity to accommodate REG,
constraints and investment requirements for any expansion or reinforcement necessary
to remove distribution and grid constraints to accommodate generator connections. The
report also provides brief analysis of the contribution of embedded generation to the 2019
WNH system peak demand.
This plan has been prepared in accordance with the Ontario Energy Board’s (OEB)
Chapter 5 “Filing Requirements for Electricity Distribution Rate Applications, May 14,
2020” (Chapter 5). The information in this plan is current as of December 31, 2019. This
REGI Plan will be filed with WNH’s Distribution System Plan (DSP) and 2021 Cost of
Service Rate Application.
As of December 31, 2019, WNH had connected 655 generators to its distribution system
for a total of 19,968 kW. Of these, 652 were REG connections totalling 15,448 kW. From
2015 to 2019 WNH connected 287 generators for a total of 11,492 kW. Of these, 284 for
a total of 6,972 kW were REGs. At the time of WNH’s 2019 summer system peak, total
generation contributed an estimated 9,120 kW of which REG contributed 7,865 kW.
Overall, generation was operating at approximately 45% of capacity.
The Independent Electricity System Operator (IESO) ceased to accept applications under
the microFIT and FIT Programs as of December 31, 2016. The last connections made
under these programs were made in 2018 and no more microFIT or FIT applications are
allocated or pending. Total REGs connected under these programs comes to 568 MicoFIT
(4,740 kW) and 41 FIT (9,223 kW).
The amount of Net Metering generation (948 kW) connected to date has been relatively
small and is not forecast to be a major factor over the forecast period. Currently, WNH
February 20, 2020 5
has only 2 projects allocated for a total of 230 kW.
For the past two years, Load Displacement Generation (LDG), incented by higher Global
Adjustment charges and electricity commodity pricing, has been the fastest growing
segment of connected generation. Currently WNH has 7 LDG projects allocated for a total
of 10,348 kW and one LDG project pending for a total of 1,890 kW, the majority being
non-renewable gas fired generation.
Solar represents the largest segment of REG at 12,330 kW or 80% of REG. Biomass is
the second largest segment at 18% for REG but also has the single largest generator
(2,850 kW) in WNH’s service area.
There is significant remaining generation capacity at WNH’s transformer stations and
feeders, however currently there are constraints related to the connection of generation
at two WNH stations.
1) Scheifele ‘A’ station has reached its short-circuit rating limits at the station’s feeder
breakers. The fault contribution from existing connected embedded generation and
Hydro One’s transmission system upgrade as part of the Guelph Area
Transmission Reinforcement (GATR) have contributed to the increase in short
circuit levels. Taking into consideration the amount of generation that is allocated
and pending, these short circuit rating limits will be exceeded within the next 12 –
36 months.
WNH has investigated the problem and has determined that the most cost effective
solution will be to upgrade the feeder breakers at the station. WNH is moving
forward with the work to reduce the risk of catastrophic failure of the circuit breakers
during a fault clearing event. The project will be executed over 2 years. WNH has
included the cost to replace these circuit breakers, $230,244 in 2020 and $209,762
in 2021, in their capital investment program. A secondary benefit will be the
increase of 6,630 kW of generation capacity at this station.
2) Scheifele ‘B’ station has dual secondary winding transformers used in a
Bermondsey configuration. Generation capacity is limited to the minimum load on
February 20, 2020 6
a single transformer due to concerns with reverse power through this type of
transformer configuration. There is considerable generation capacity at this station
with the limitation in effect, therefore there is no action required at this time. WNH
will revaluate this situation in the future if additional generation capacity is required.
WNH is not proposing any other capital investments to accommodate the connection of
generation for the period 2021 to 2025.
WNH does not believe that the aforementioned constraints will have any material impact
on the connection of REGs from 2020 to 2025.
No constraints have been identified on WNH feeders and there are no expansion or
reinforcement investments necessary to remove grid constraints to accommodate the
connections of REG relating to WNH.
February 20, 2020 7
1. Introduction
Waterloo North Hydro Inc. (WNH) is an Electricity Distribution Company (LDC) licensed
by the OEB in accordance with its Distribution License ED-2002-0575. With a service area
of approximately 683 sq. km., WNH provides all regulated electricity distribution services
to approximately 58,000 customers mostly within the City of Waterloo, the Township of
Woolwich and the Township of Wellesley. Due to service area boundary amendments,
since 2017, WNH also provides distribution services to approximately 127 customers in
the Township of Perth East, Township of Mapleton, Township of Centre Wellington,
Township of Guelph/Eramosa, and the City of Cambridge. Figure 1-1 illustrates a map of
WNH’s service area.
WNH is incorporated under the Ontario Business Corporations Act and is a subsidiary of
Waterloo North Hydro Holding Company (WNHHC) whose shareholders are the City of
Waterloo (73.2%), the Township of Woolwich (20.2%) and the Township of Wellesley
(6.6%).
WNH is preparing a Cost of Service Rate Application as set out in the report of the Board:
Renewed Regulatory Framework for Electricity (RRFE), for rates to be in effect January
01, 2021. WNH has prepared this Renewable Energy Generation Investments (REGI)
Plan in accordance with the Ontario Energy Board’s (OEB) Chapter 5 “Filing
Requirements for Electricity Distribution Rate Applications, July 12, 2018” (Chapter 5).
This REGI Plan provides information to the OEB and interested stakeholders, regarding
the readiness of WNH’s distribution system to connect Renewable Energy Generation
(REG), including details on existing generation connections, available capacity and a
forecast of proposed connections. The Plan also identifies if any investments are required
to accommodate REG connections including any expansion or reinforcement necessary
to remove grid constraints to accommodate these connections for the period 2021 to 2025.
WNH’s previous REGI Plan was prepared in 2015. The information contained in this report
is current as of December 31, 2019.
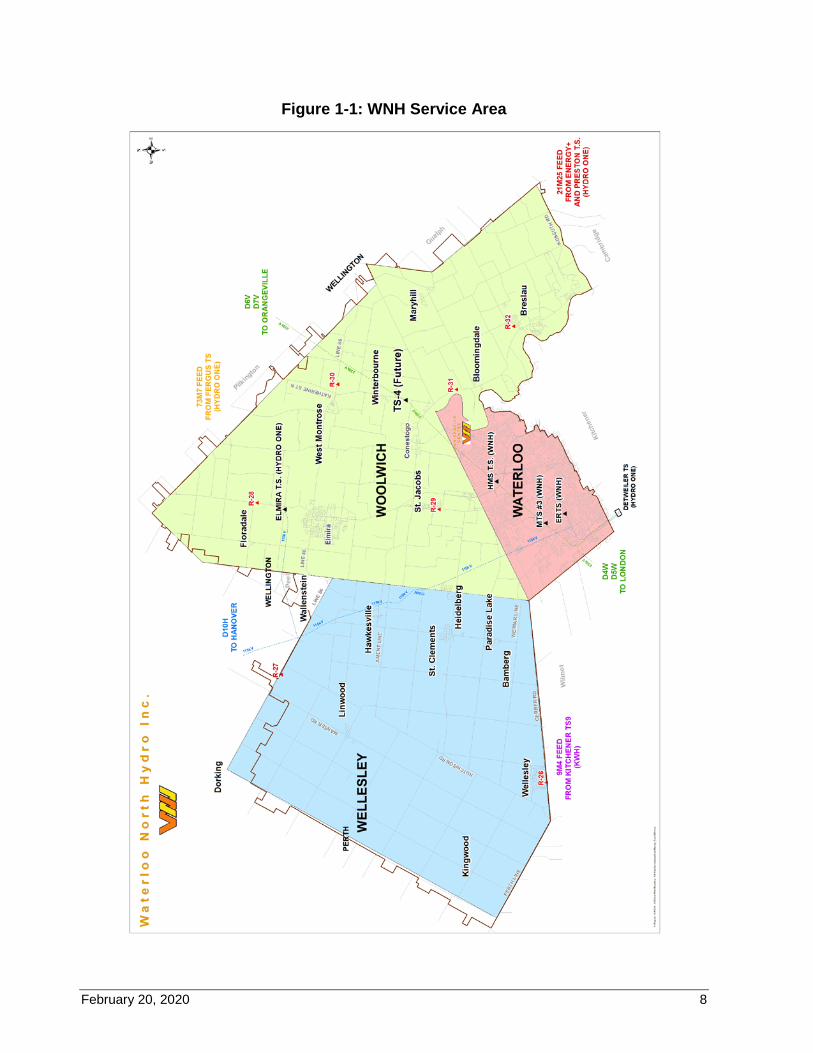
February 20, 2020 8
Figure 1-1: WNH Service Area
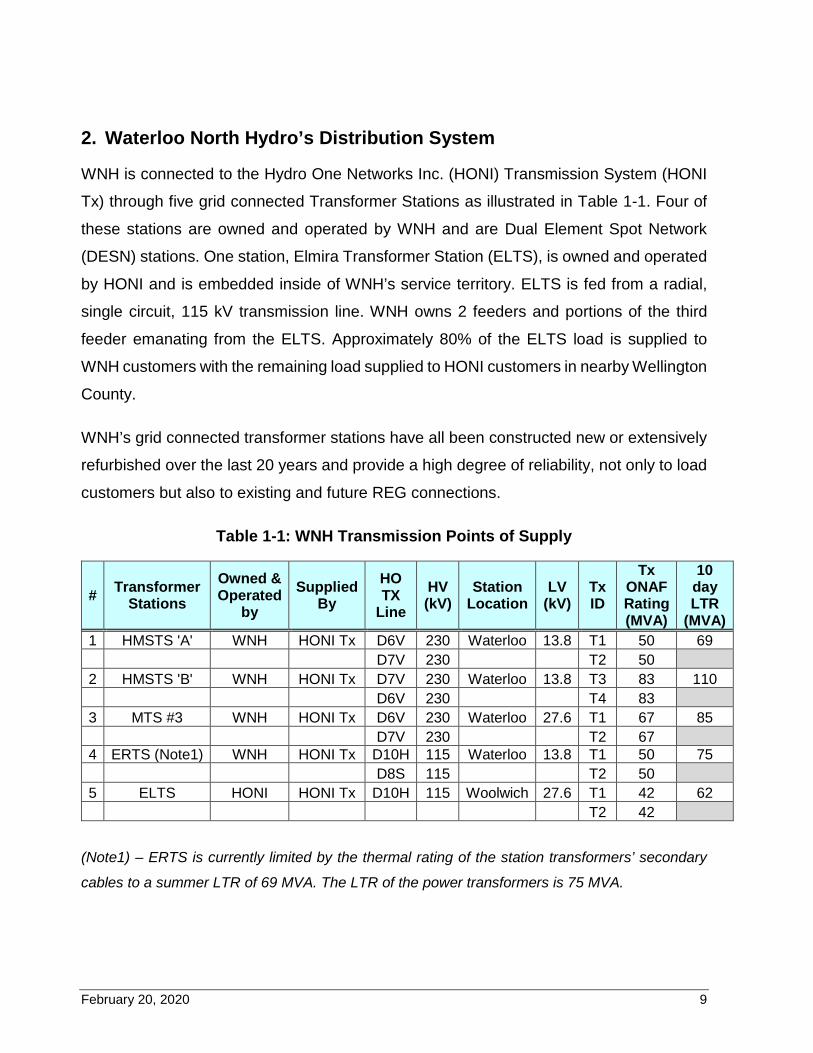
February 20, 2020 9
2. Waterloo North Hydro’s Distribution System
WNH is connected to the Hydro One Networks Inc. (HONI) Transmission System (HONI
Tx) through five grid connected Transformer Stations as illustrated in Table 1-1. Four of
these stations are owned and operated by WNH and are Dual Element Spot Network
(DESN) stations. One station, Elmira Transformer Station (ELTS), is owned and operated
by HONI and is embedded inside of WNH’s service territory. ELTS is fed from a radial,
single circuit, 115 kV transmission line. WNH owns 2 feeders and portions of the third
feeder emanating from the ELTS. Approximately 80% of the ELTS load is supplied to
WNH customers with the remaining load supplied to HONI customers in nearby Wellington
County.
WNH’s grid connected transformer stations have all been constructed new or extensively
refurbished over the last 20 years and provide a high degree of reliability, not only to load
customers but also to existing and future REG connections.
Table 1-1: WNH Transmission Points of Supply
# Transformer Stations
Owned & Operated
by Supplied
By HO TX
Line HV (kV)
Station Location
LV (kV)
Tx ID
Tx ONAF Rating (MVA)
10 day LTR
(MVA) 1 HMSTS 'A' WNH HONI Tx D6V 230 Waterloo 13.8 T1 50 69 D7V 230 T2 50 2 HMSTS 'B' WNH HONI Tx D7V 230 Waterloo 13.8 T3 83 110 D6V 230 T4 83 3 MTS #3 WNH HONI Tx D6V 230 Waterloo 27.6 T1 67 85 D7V 230 T2 67 4 ERTS (Note1) WNH HONI Tx D10H 115 Waterloo 13.8 T1 50 75 D8S 115 T2 50 5 ELTS HONI HONI Tx D10H 115 Woolwich 27.6 T1 42 62 T2 42
(Note1) – ERTS is currently limited by the thermal rating of the station transformers’ secondary
cables to a summer LTR of 69 MVA. The LTR of the power transformers is 75 MVA.
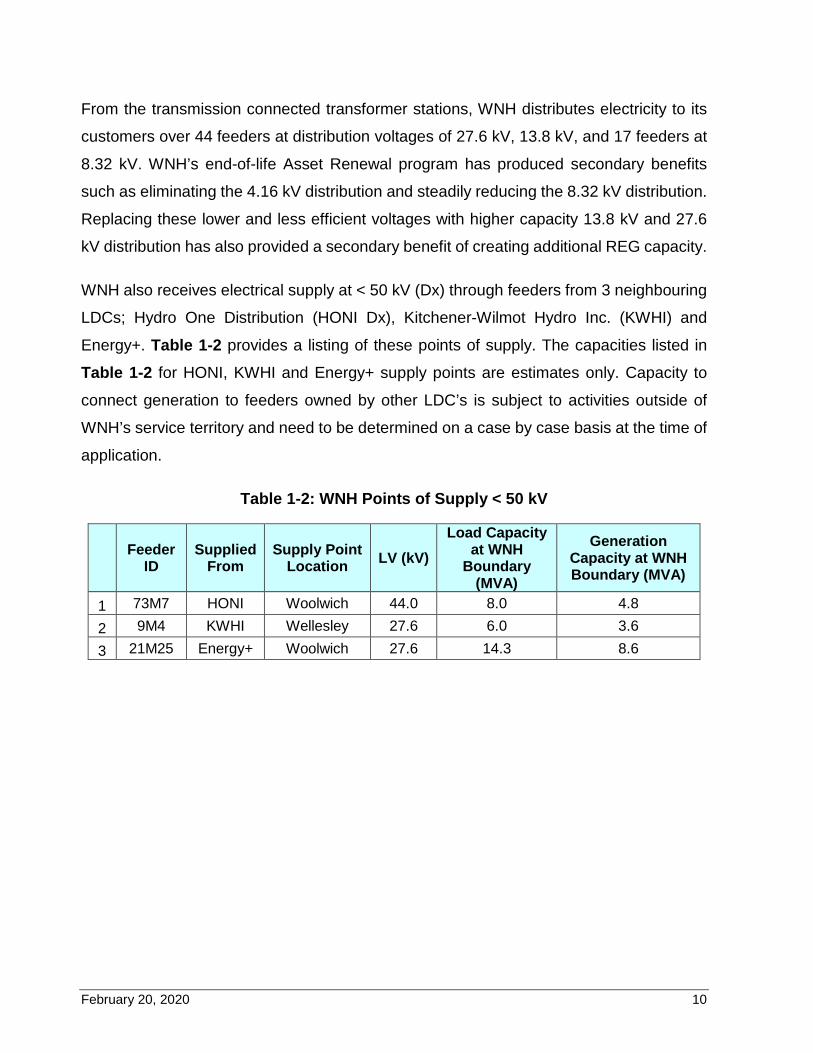
February 20, 2020 10
From the transmission connected transformer stations, WNH distributes electricity to its
customers over 44 feeders at distribution voltages of 27.6 kV, 13.8 kV, and 17 feeders at
8.32 kV. WNH’s end-of-life Asset Renewal program has produced secondary benefits
such as eliminating the 4.16 kV distribution and steadily reducing the 8.32 kV distribution.
Replacing these lower and less efficient voltages with higher capacity 13.8 kV and 27.6
kV distribution has also provided a secondary benefit of creating additional REG capacity.
WNH also receives electrical supply at < 50 kV (Dx) through feeders from 3 neighbouring
LDCs; Hydro One Distribution (HONI Dx), Kitchener-Wilmot Hydro Inc. (KWHI) and
Energy+. Table 1-2 provides a listing of these points of supply. The capacities listed in
Table 1-2 for HONI, KWHI and Energy+ supply points are estimates only. Capacity to
connect generation to feeders owned by other LDC’s is subject to activities outside of
WNH’s service territory and need to be determined on a case by case basis at the time of
application.
Table 1-2: WNH Points of Supply < 50 kV
Feeder ID
Supplied From
Supply Point Location LV (kV)
Load Capacity at WNH
Boundary (MVA)
Generation Capacity at WNH Boundary (MVA)
1 73M7 HONI Woolwich 44.0 8.0 4.8
2 9M4 KWHI Wellesley 27.6 6.0 3.6
3 21M25 Energy+ Woolwich 27.6 14.3 8.6
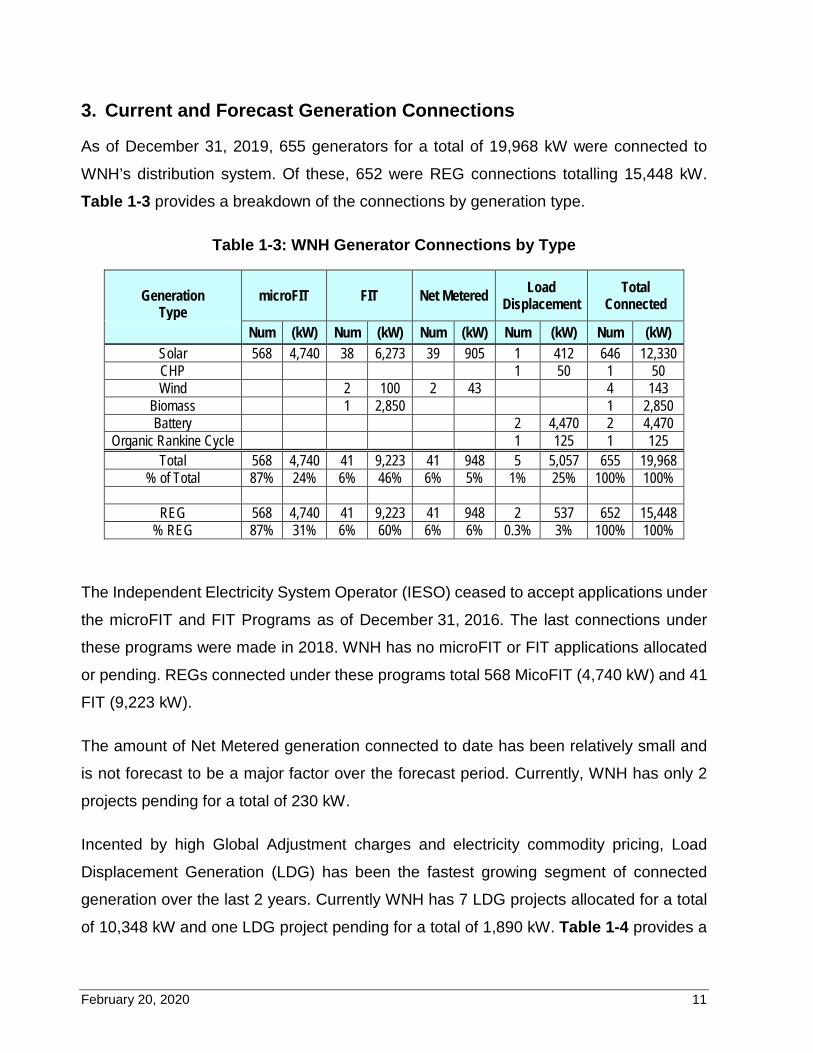
February 20, 2020 11
3. Current and Forecast Generation Connections
As of December 31, 2019, 655 generators for a total of 19,968 kW were connected to
WNH’s distribution system. Of these, 652 were REG connections totalling 15,448 kW.
Table 1-3 provides a breakdown of the connections by generation type.
Table 1-3: WNH Generator Connections by Type
Generation
Type microFIT FIT Net Metered Load
Displacement Total
Connected Num (kW) Num (kW) Num (kW) Num (kW) Num (kW)
Solar 568 4,740 38 6,273 39 905 1 412 646 12,330 CHP 1 50 1 50 Wind 2 100 2 43 4 143
Biomass 1 2,850 1 2,850 Battery 2 4,470 2 4,470
Organic Rankine Cycle 1 125 1 125 Total 568 4,740 41 9,223 41 948 5 5,057 655 19,968
% of Total 87% 24% 6% 46% 6% 5% 1% 25% 100% 100%
REG 568 4,740 41 9,223 41 948 2 537 652 15,448 % REG 87% 31% 6% 60% 6% 6% 0.3% 3% 100% 100%
The Independent Electricity System Operator (IESO) ceased to accept applications under
the microFIT and FIT Programs as of December 31, 2016. The last connections under
these programs were made in 2018. WNH has no microFIT or FIT applications allocated
or pending. REGs connected under these programs total 568 MicoFIT (4,740 kW) and 41
FIT (9,223 kW).
The amount of Net Metered generation connected to date has been relatively small and
is not forecast to be a major factor over the forecast period. Currently, WNH has only 2
projects pending for a total of 230 kW.
Incented by high Global Adjustment charges and electricity commodity pricing, Load
Displacement Generation (LDG) has been the fastest growing segment of connected
generation over the last 2 years. Currently WNH has 7 LDG projects allocated for a total
of 10,348 kW and one LDG project pending for a total of 1,890 kW. Table 1-4 provides a
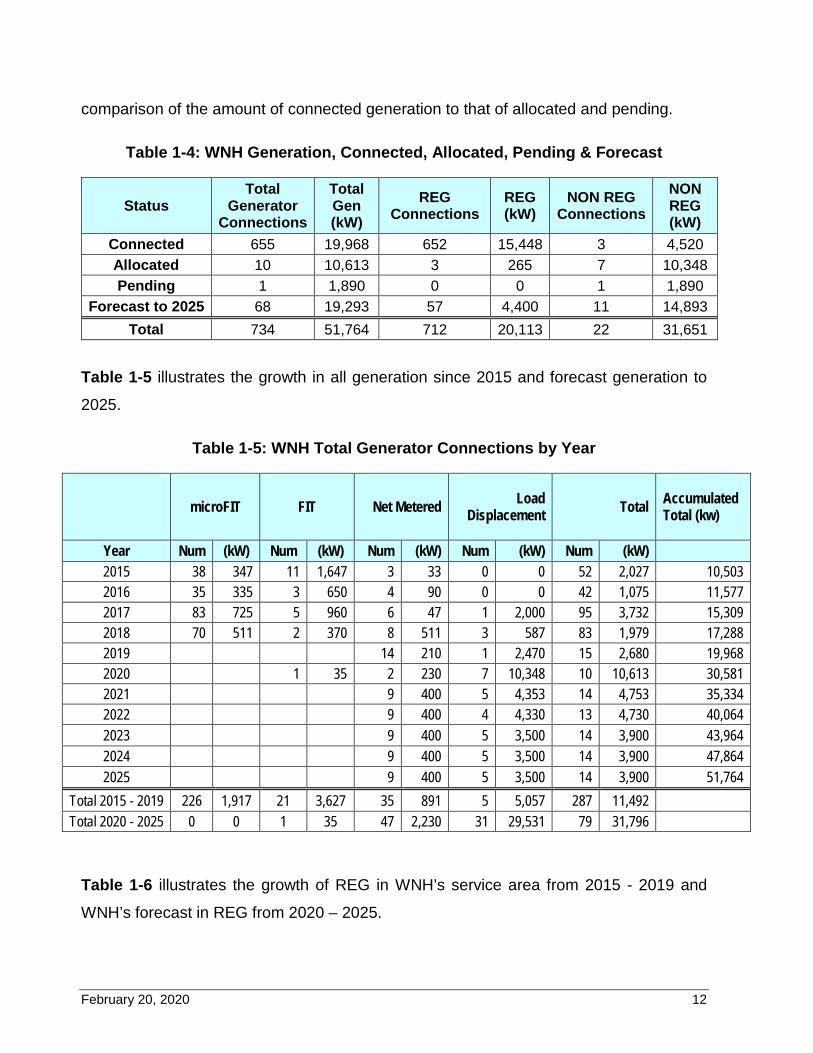
February 20, 2020 12
comparison of the amount of connected generation to that of allocated and pending.
Table 1-4: WNH Generation, Connected, Allocated, Pending & Forecast
Status Total
Generator Connections
Total Gen (kW)
REG Connections
REG (kW)
NON REG Connections
NON REG (kW)
Connected 655 19,968 652 15,448 3 4,520 Allocated 10 10,613 3 265 7 10,348 Pending 1 1,890 0 0 1 1,890
Forecast to 2025 68 19,293 57 4,400 11 14,893 Total 734 51,764 712 20,113 22 31,651
Table 1-5 illustrates the growth in all generation since 2015 and forecast generation to
2025.
Table 1-5: WNH Total Generator Connections by Year
microFIT FIT Net Metered Load
Displacement Total Accumulated Total (kw)
Year Num (kW) Num (kW) Num (kW) Num (kW) Num (kW) 8476 2015 38 347 11 1,647 3 33 0 0 52 2,027 10,503 2016 35 335 3 650 4 90 0 0 42 1,075 11,577 2017 83 725 5 960 6 47 1 2,000 95 3,732 15,309 2018 70 511 2 370 8 511 3 587 83 1,979 17,288 2019 14 210 1 2,470 15 2,680 19,968 2020 1 35 2 230 7 10,348 10 10,613 30,581 2021 9 400 5 4,353 14 4,753 35,334 2022 9 400 4 4,330 13 4,730 40,064 2023 9 400 5 3,500 14 3,900 43,964 2024 9 400 5 3,500 14 3,900 47,864 2025 9 400 5 3,500 14 3,900 51,764
Total 2015 - 2019 226 1,917 21 3,627 35 891 5 5,057 287 11,492 Total 2020 - 2025 0 0 1 35 47 2,230 31 29,531 79 31,796
Table 1-6 illustrates the growth of REG in WNH’s service area from 2015 - 2019 and
WNH’s forecast in REG from 2020 – 2025.
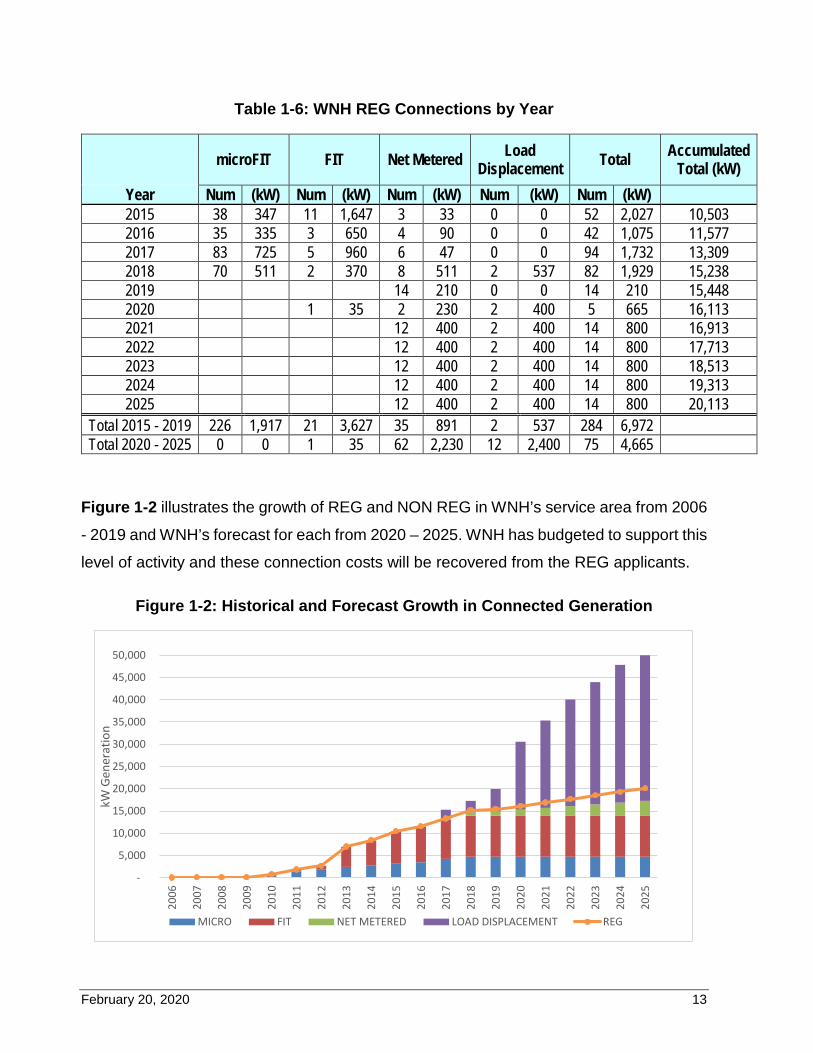
February 20, 2020 13
Table 1-6: WNH REG Connections by Year
microFIT FIT Net Metered Load Displacement Total Accumulated
Total (kW) Year Num (kW) Num (kW) Num (kW) Num (kW) Num (kW) 8476 2015 38 347 11 1,647 3 33 0 0 52 2,027 10,503 2016 35 335 3 650 4 90 0 0 42 1,075 11,577 2017 83 725 5 960 6 47 0 0 94 1,732 13,309 2018 70 511 2 370 8 511 2 537 82 1,929 15,238 2019 14 210 0 0 14 210 15,448 2020 1 35 2 230 2 400 5 665 16,113 2021 12 400 2 400 14 800 16,913 2022 12 400 2 400 14 800 17,713 2023 12 400 2 400 14 800 18,513 2024 12 400 2 400 14 800 19,313 2025 12 400 2 400 14 800 20,113
Total 2015 - 2019 226 1,917 21 3,627 35 891 2 537 284 6,972 Total 2020 - 2025 0 0 1 35 62 2,230 12 2,400 75 4,665
Figure 1-2 illustrates the growth of REG and NON REG in WNH’s service area from 2006
- 2019 and WNH’s forecast for each from 2020 – 2025. WNH has budgeted to support this
level of activity and these connection costs will be recovered from the REG applicants.
Figure 1-2: Historical and Forecast Growth in Connected Generation
-
5,000
10,000
15,000
20,000
25,000
30,000
35,000
40,000
45,000
50,000
2006
2007
2008
2009
2010
2011
2012
2013
2014
2015
2016
2017
2018
2019
2020
2021
2022
2023
2024
2025
kW G
ener
atio
n
MICRO FIT NET METERED LOAD DISPLACEMENT REG
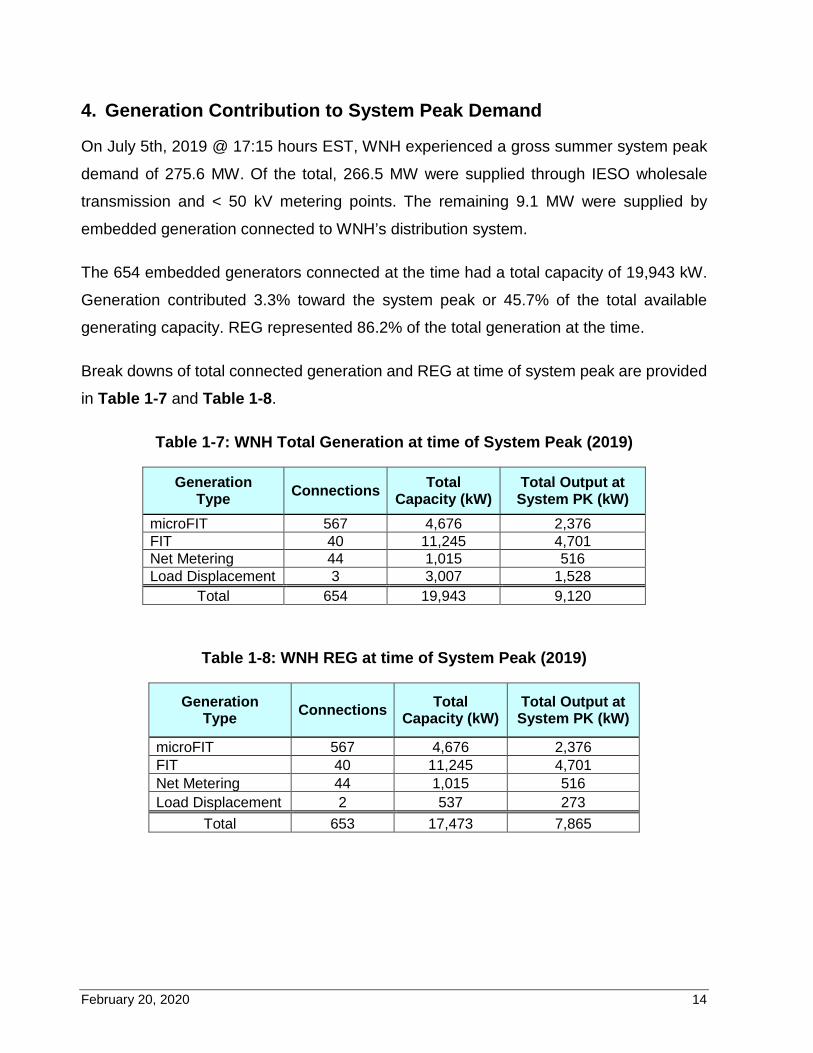
February 20, 2020 14
4. Generation Contribution to System Peak Demand
On July 5th, 2019 @ 17:15 hours EST, WNH experienced a gross summer system peak
demand of 275.6 MW. Of the total, 266.5 MW were supplied through IESO wholesale
transmission and < 50 kV metering points. The remaining 9.1 MW were supplied by
embedded generation connected to WNH’s distribution system.
The 654 embedded generators connected at the time had a total capacity of 19,943 kW.
Generation contributed 3.3% toward the system peak or 45.7% of the total available
generating capacity. REG represented 86.2% of the total generation at the time.
Break downs of total connected generation and REG at time of system peak are provided
in Table 1-7 and Table 1-8.
Table 1-7: WNH Total Generation at time of System Peak (2019)
Generation Type Connections Total
Capacity (kW) Total Output at System PK (kW)
microFIT 567 4,676 2,376 FIT 40 11,245 4,701 Net Metering 44 1,015 516 Load Displacement 3 3,007 1,528
Total 654 19,943 9,120
Table 1-8: WNH REG at time of System Peak (2019)
Generation Type Connections Total
Capacity (kW) Total Output at System PK (kW)
microFIT 567 4,676 2,376 FIT 40 11,245 4,701 Net Metering 44 1,015 516 Load Displacement 2 537 273
Total 653 17,473 7,865
February 20, 2020 15
5. Current and Forecast Generation Capacity
Table 1-9 illustrates the estimated generation capacity that is available at WNH points of
supply. Overall there is a significant amount of generation capacity available, however
currently there are two constraints related to the connection of generation at the WNH
stations.
While most of WNH’s transformer stations have sufficient short-circuit capacity and
thermal rating to accommodate the existing and forecast generation connections, there
are two exceptions:
1) Scheifele ‘A’ station has reached its short-circuit rating limits at the station’s feeder
breakers. The fault contribution from existing connected embedded generation and
Hydro One’s transmission system upgrade as part of the Guelph Area
Transmission Reinforcement (GATR) project have contributed to the increase in
short circuit levels. Taking into consideration the amount of generation that is
allocated and pending, these short circuit rating limits will be exceeded within the
next 12 – 36 months.
2) Scheifele ‘B’ station has dual secondary winding transformers used in a
Bermondsey configuration. Generation capacity is limited to the minimum load on
a single transformer due to concerns with reverse power through this type of
transformer configuration. There is considerable generation capacity at this station
with the limitation in effect, therefore there is no action required at this time. WNH
will revaluate this situation in the future if additional generation capacity is required.
No constraints pertaining to WNH’s 13.8 kV and 27.6 kV station feeders have been
identified. The capacities listed in Table 1-9 for HONI and Energy+ supply points are
estimates only. Capacity to connect generation to feeders owned by other LDCs is subject
to activities outside of WNH’s service territory and need to be determined on a case by
case basis at the time of application.
WNH’s 8.32 kV distribution lines have limited capacity and can only accept small to mid-
sized generation (< 500 kW). There is capacity to connect larger scale generation at the
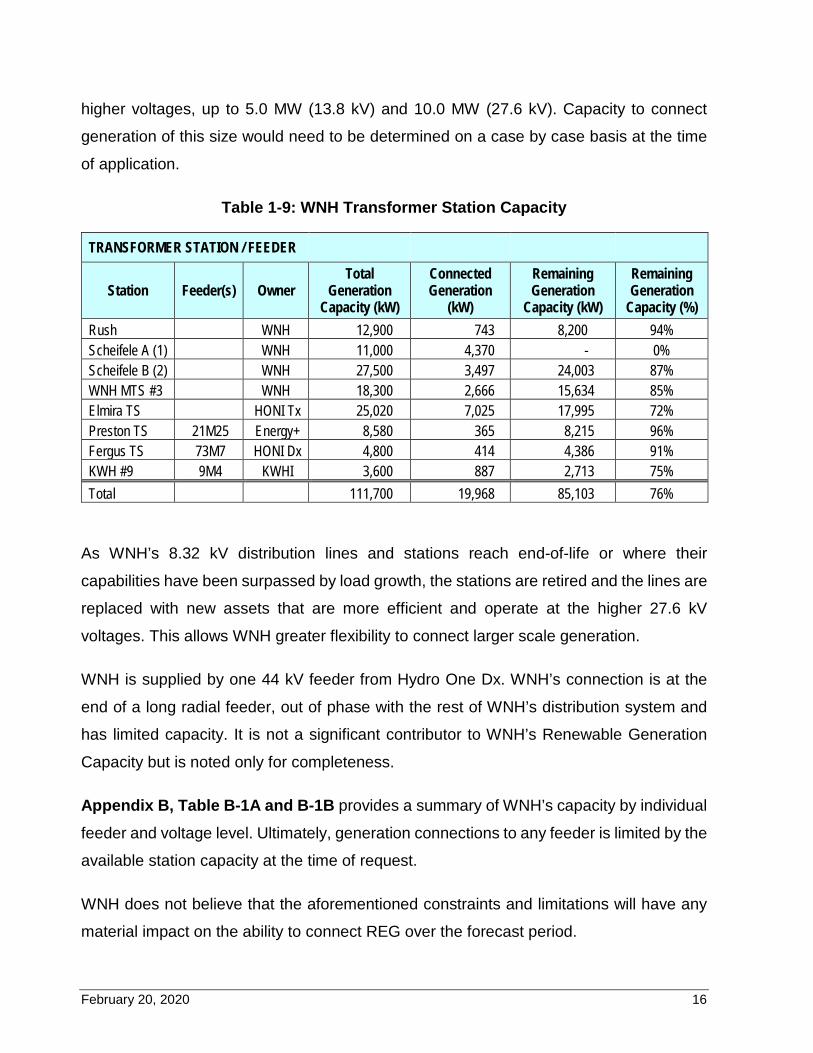
February 20, 2020 16
higher voltages, up to 5.0 MW (13.8 kV) and 10.0 MW (27.6 kV). Capacity to connect
generation of this size would need to be determined on a case by case basis at the time
of application.
Table 1-9: WNH Transformer Station Capacity
TRANSFORMER STATION / FEEDER
Station Feeder(s) Owner Total
Generation Capacity (kW)
Connected Generation
(kW)
Remaining Generation
Capacity (kW)
Remaining Generation
Capacity (%) Rush WNH 12,900 743 8,200 94% Scheifele A (1) WNH 11,000 4,370 - 0% Scheifele B (2) WNH 27,500 3,497 24,003 87% WNH MTS #3 WNH 18,300 2,666 15,634 85% Elmira TS HONI Tx 25,020 7,025 17,995 72% Preston TS 21M25 Energy+ 8,580 365 8,215 96% Fergus TS 73M7 HONI Dx 4,800 414 4,386 91% KWH #9 9M4 KWHI 3,600 887 2,713 75% Total 111,700 19,968 85,103 76%
As WNH’s 8.32 kV distribution lines and stations reach end-of-life or where their
capabilities have been surpassed by load growth, the stations are retired and the lines are
replaced with new assets that are more efficient and operate at the higher 27.6 kV
voltages. This allows WNH greater flexibility to connect larger scale generation.
WNH is supplied by one 44 kV feeder from Hydro One Dx. WNH’s connection is at the
end of a long radial feeder, out of phase with the rest of WNH’s distribution system and
has limited capacity. It is not a significant contributor to WNH’s Renewable Generation
Capacity but is noted only for completeness.
Appendix B, Table B-1A and B-1B provides a summary of WNH’s capacity by individual
feeder and voltage level. Ultimately, generation connections to any feeder is limited by the
available station capacity at the time of request.
WNH does not believe that the aforementioned constraints and limitations will have any
material impact on the ability to connect REG over the forecast period.
February 20, 2020 17
6. System Assessment to Identify Constraints
On an annual basis, WNH internally reviews its station capacities and constraints. Two
constraints have been identified at WNH Transformer Stations and are described in
Section 4.
WNH also assesses its distribution network for capacity constraints. WNH’s three phase
13.8 kV and 27.6 kV feeders have sufficient capacity to permit the forecast amount of
REG connections. WNH’s 8.32 kV distribution has limited capacity and can only accept
small to mid-sized generation (<500 kW).
WNH also works with the organizations listed below to develop the Kitchener-Waterloo-
Cambridge-Guelph (KWCG) Regional Infrastructure Plans (RIP) and the Integrated
Regional Resources Plans (IRRP).
i. Kitchener-Wilmot Hydro Inc. (KWHI),
ii. Cambridge and North Dumfries Hydro (CNDH now Energy+),
iii. Guelph Hydro Electric System Inc. (GHESI now Alectra),
iv. Hydro One Distribution (HONI Dx),
v. Hydro One Transmission, (HONI Tx)
vi. Independent Electricity System Operator (IESO)
vii. Ontario Power Authority (now IESO)
The RIP and IRRP review factors such as load forecast, transmission and distribution
system capabilities along with any updates with respect to local plans, conservation and
demand management (“CDM”), renewable and non-renewable generation development.
The first cycle of regional planning for the region began in 2010 and was completed in
April 2015 with the release of an Integrated Regional Resource Plan (IRRP). Currently a
new regional planning cycle is underway for the Kitchener-Waterloo-Cambridge-Guelph
(KWCG) Region. The next IRRP for the region is anticipated to be completed in Q2 2020.
February 20, 2020 18
WNH has participated in the planning meetings and consulted with all of the
aforementioned stakeholders and determined that there are no expansion or
reinforcement investments necessary to remove grid constraints to accommodate the
connections of REG relating to WNH.
WNH notes an increasing trend in the connection of Load Displacement Generation
(behind the meter natural gas generation) since 2018. Allocated and pending projects
signal a significant increase in LDG between 2020 and 2025. Problematic for REG in the
future is the fact that natural gas generation can reduce available generation capacity at
a much faster rate than renewable inverter-based generation.
However, based on WNH’s evaluation of current connections and forecast applications,
WNH believes that there is adequate capacity to connect the anticipated generation over
the forecast period.
February 20, 2020 19
7. Distribution Automation and Smart Grid Development
All WNH grid connected Transformer Stations, Municipal Stations, and Distribution
Stations have SCADA monitoring and control, programmable electronic protection
systems and communication systems. The same is true of all < 50 kV points of supply
from HONI Dx, KWHI and Energy+. All are interfaced with WNH’s Survalent Outage
Management System.
WNH also has 84 electronic reclosers with SCADA monitoring and control, programmable
electronic protection and communications installed at various locations on its distribution
system.
Although REG has not been the primary driver for these Renewal and System Service
investments, they have had the added benefit of facilitating these connections.
February 20, 2020 20
8. Proposed Investments to Facilitate Renewable Energy Generation Connections
As mentioned in Section 4, there is one constraint at Scheifele ‘A’ station caused by the
maximum available short circuit level being reached at the station.
1) Scheifele ‘A’ station has reached its short-circuit rating limits at the station’s feeder
breakers. The fault contribution from existing connected embedded generation and
Hydro One’s transmission system upgrade as part of the Guelph Area
Transmission Reinforcement (GATR) have contributed to the increase in short
circuit levels. Taking into consideration the amount of generation that is allocated
and pending, these short circuit rating limits will be exceeded within the next 12 –
36 months.
WNH has investigated the problem and has determined that the most cost effective
solution will be to upgrade the feeder breakers at the station. WNH is moving
forward with the work to reduce the risk of catastrophic failure of the circuit breakers
during a fault clearing event. The project will be executed over 2 years. WNH has
included the cost to replace these circuit breakers, $230,244 in 2020 and $209,762
in 2021, in their capital investment program. A secondary benefit will be the
increase of 6,630 kW of generation capacity at this station.
WNH is not proposing and other capital investments to accommodate the connection of
generation for the period 2021 to 2025.
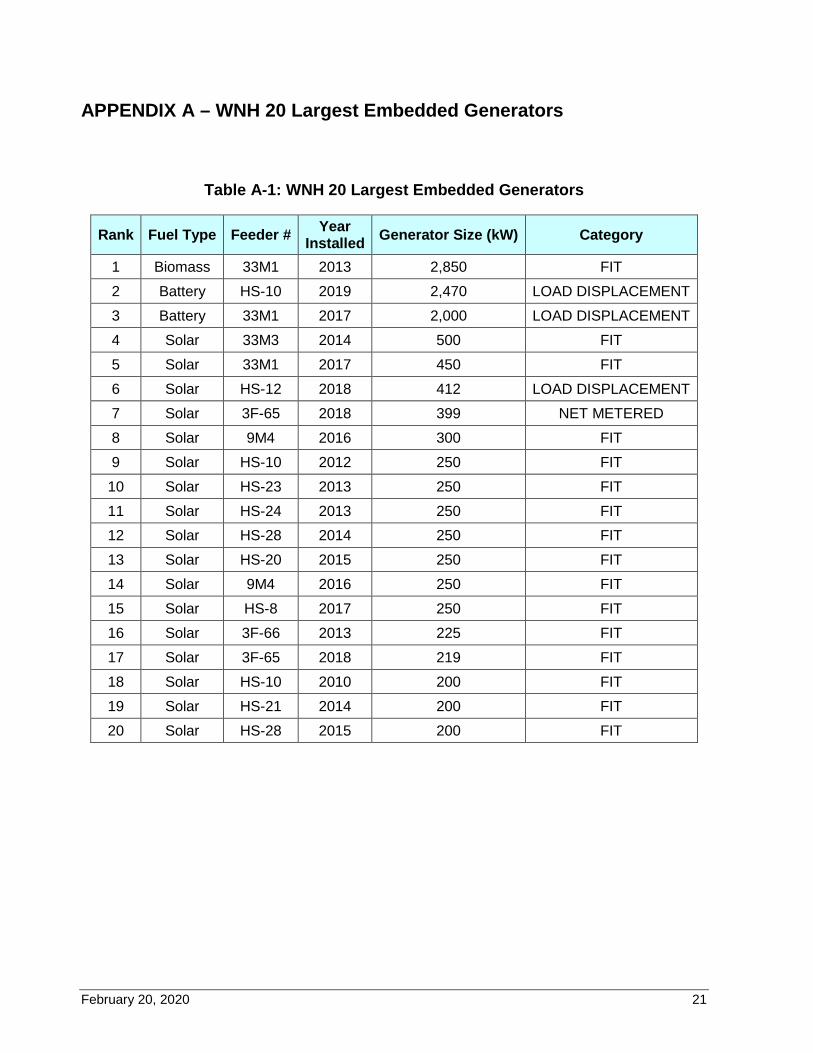
February 20, 2020 21
APPENDIX A – WNH 20 Largest Embedded Generators
Table A-1: WNH 20 Largest Embedded Generators
Rank Fuel Type Feeder # Year Installed Generator Size (kW) Category
1 Biomass 33M1 2013 2,850 FIT 2 Battery HS-10 2019 2,470 LOAD DISPLACEMENT 3 Battery 33M1 2017 2,000 LOAD DISPLACEMENT 4 Solar 33M3 2014 500 FIT 5 Solar 33M1 2017 450 FIT 6 Solar HS-12 2018 412 LOAD DISPLACEMENT 7 Solar 3F-65 2018 399 NET METERED 8 Solar 9M4 2016 300 FIT 9 Solar HS-10 2012 250 FIT 10 Solar HS-23 2013 250 FIT 11 Solar HS-24 2013 250 FIT 12 Solar HS-28 2014 250 FIT 13 Solar HS-20 2015 250 FIT 14 Solar 9M4 2016 250 FIT 15 Solar HS-8 2017 250 FIT 16 Solar 3F-66 2013 225 FIT 17 Solar 3F-65 2018 219 FIT 18 Solar HS-10 2010 200 FIT 19 Solar HS-21 2014 200 FIT 20 Solar HS-28 2015 200 FIT
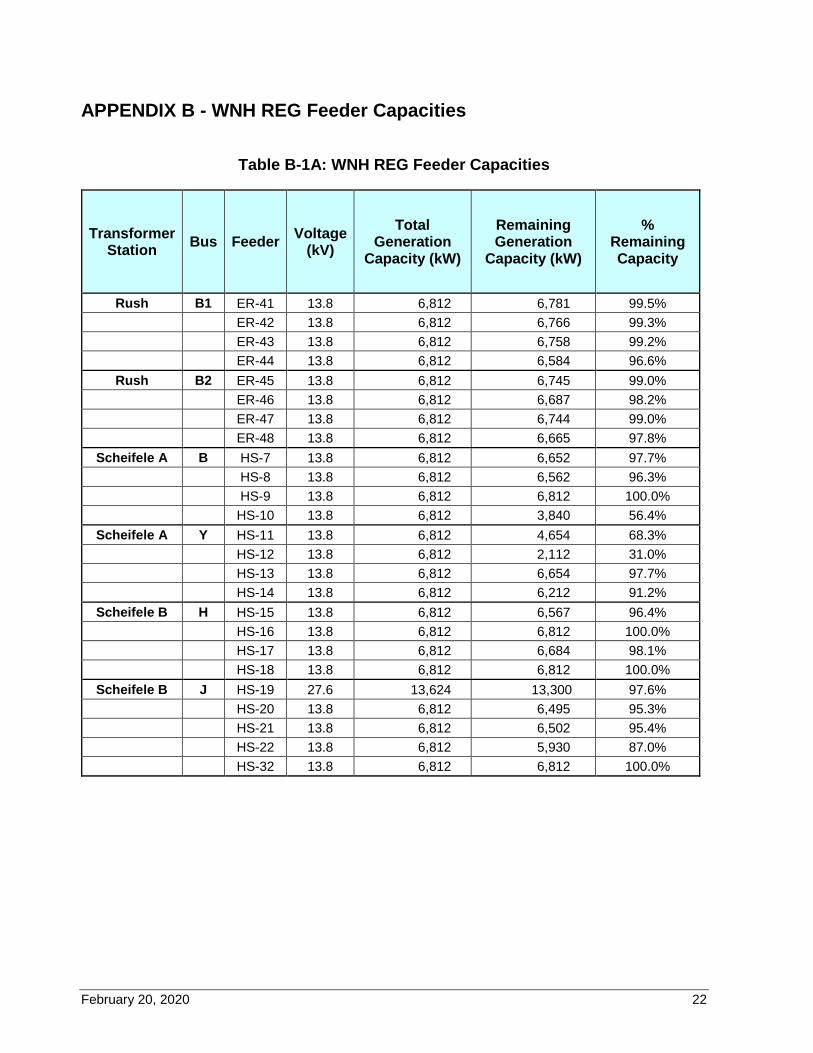
February 20, 2020 22
APPENDIX B - WNH REG Feeder Capacities
Table B-1A: WNH REG Feeder Capacities
Transformer Station Bus Feeder Voltage
(kV) Total
Generation Capacity (kW)
Remaining Generation
Capacity (kW)
% Remaining Capacity
Rush B1 ER-41 13.8 6,812 6,781 99.5% ER-42 13.8 6,812 6,766 99.3% ER-43 13.8 6,812 6,758 99.2% ER-44 13.8 6,812 6,584 96.6%
Rush B2 ER-45 13.8 6,812 6,745 99.0% ER-46 13.8 6,812 6,687 98.2% ER-47 13.8 6,812 6,744 99.0% ER-48 13.8 6,812 6,665 97.8%
Scheifele A B HS-7 13.8 6,812 6,652 97.7% HS-8 13.8 6,812 6,562 96.3% HS-9 13.8 6,812 6,812 100.0% HS-10 13.8 6,812 3,840 56.4%
Scheifele A Y HS-11 13.8 6,812 4,654 68.3% HS-12 13.8 6,812 2,112 31.0% HS-13 13.8 6,812 6,654 97.7% HS-14 13.8 6,812 6,212 91.2%
Scheifele B H HS-15 13.8 6,812 6,567 96.4% HS-16 13.8 6,812 6,812 100.0% HS-17 13.8 6,812 6,684 98.1% HS-18 13.8 6,812 6,812 100.0%
Scheifele B J HS-19 27.6 13,624 13,300 97.6% HS-20 13.8 6,812 6,495 95.3% HS-21 13.8 6,812 6,502 95.4% HS-22 13.8 6,812 5,930 87.0% HS-32 13.8 6,812 6,812 100.0%
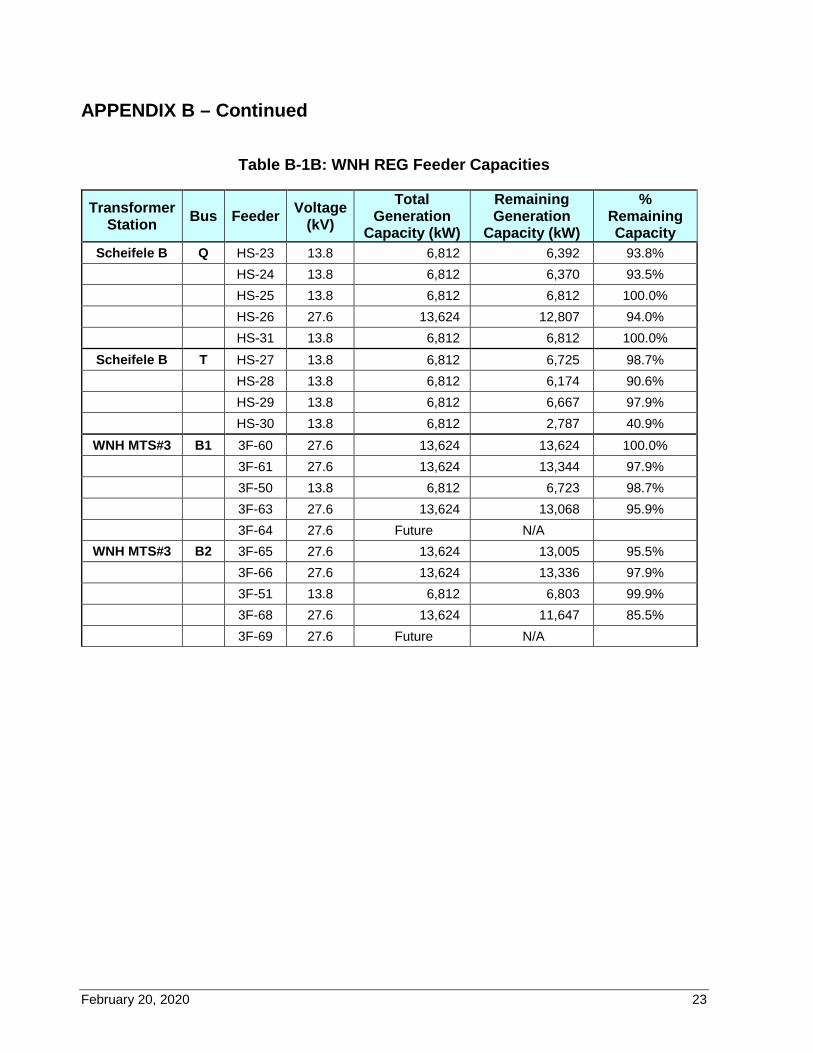
February 20, 2020 23
APPENDIX B – Continued
Table B-1B: WNH REG Feeder Capacities
Transformer Station Bus Feeder Voltage
(kV) Total
Generation Capacity (kW)
Remaining Generation
Capacity (kW)
% Remaining Capacity
Scheifele B Q HS-23 13.8 6,812 6,392 93.8% HS-24 13.8 6,812 6,370 93.5% HS-25 13.8 6,812 6,812 100.0% HS-26 27.6 13,624 12,807 94.0% HS-31 13.8 6,812 6,812 100.0%
Scheifele B T HS-27 13.8 6,812 6,725 98.7% HS-28 13.8 6,812 6,174 90.6% HS-29 13.8 6,812 6,667 97.9% HS-30 13.8 6,812 2,787 40.9%
WNH MTS#3 B1 3F-60 27.6 13,624 13,624 100.0% 3F-61 27.6 13,624 13,344 97.9% 3F-50 13.8 6,812 6,723 98.7% 3F-63 27.6 13,624 13,068 95.9% 3F-64 27.6 Future N/A
WNH MTS#3 B2 3F-65 27.6 13,624 13,005 95.5% 3F-66 27.6 13,624 13,336 97.9% 3F-51 13.8 6,812 6,803 99.9% 3F-68 27.6 13,624 11,647 85.5% 3F-69 27.6 Future N/A

Appendix I:
IESO REG Letter of Comment
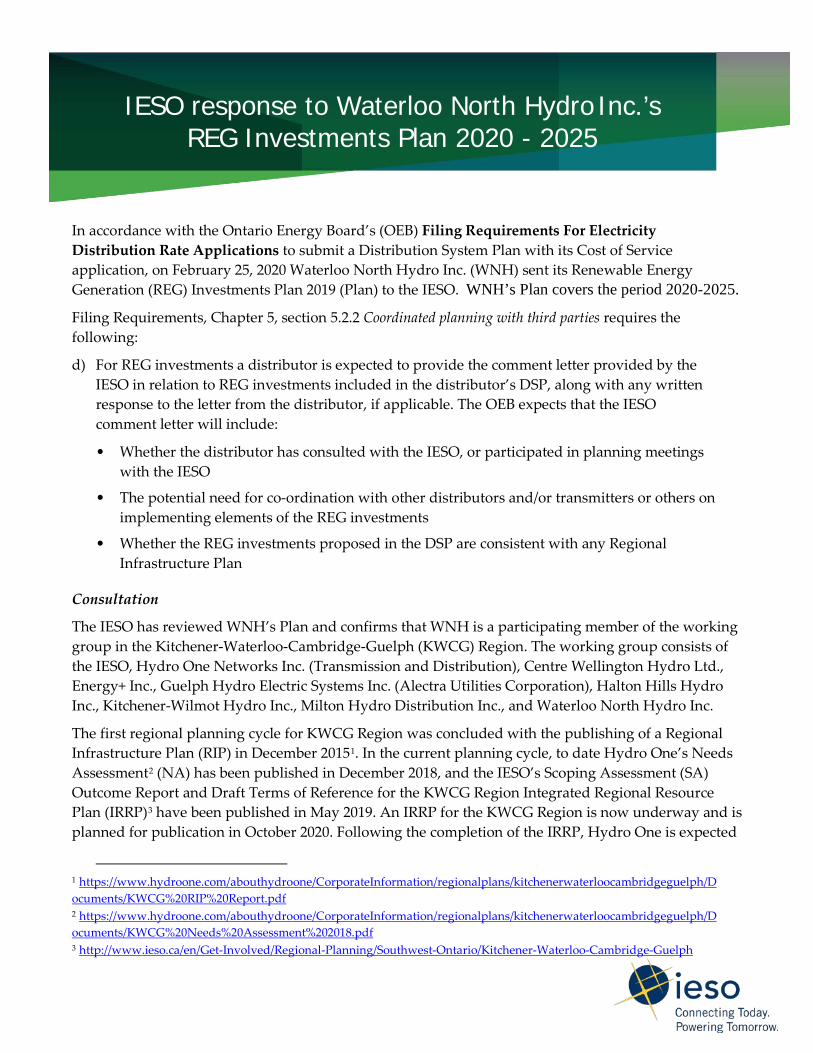
In accordance with the Ontario Energy Board’s (OEB) Filing Requirements For Electricity Distribution Rate Applications to submit a Distribution System Plan with its Cost of Service application, on February 25, 2020 Waterloo North Hydro Inc. (WNH) sent its Renewable Energy Generation (REG) Investments Plan 2019 (Plan) to the IESO. WNH’s Plan covers the period 2020-2025.
Filing Requirements, Chapter 5, section 5.2.2 Coordinated planning with third parties requires the following:
d) For REG investments a distributor is expected to provide the comment letter provided by the IESO in relation to REG investments included in the distributor’s DSP, along with any written response to the letter from the distributor, if applicable. The OEB expects that the IESO comment letter will include:
• Whether the distributor has consulted with the IESO, or participated in planning meetings with the IESO
• The potential need for co-ordination with other distributors and/or transmitters or others on implementing elements of the REG investments
• Whether the REG investments proposed in the DSP are consistent with any Regional Infrastructure Plan
Consultation
The IESO has reviewed WNH’s Plan and confirms that WNH is a participating member of the working group in the Kitchener-Waterloo-Cambridge-Guelph (KWCG) Region. The working group consists of the IESO, Hydro One Networks Inc. (Transmission and Distribution), Centre Wellington Hydro Ltd., Energy+ Inc., Guelph Hydro Electric Systems Inc. (Alectra Utilities Corporation), Halton Hills Hydro Inc., Kitchener-Wilmot Hydro Inc., Milton Hydro Distribution Inc., and Waterloo North Hydro Inc.
The first regional planning cycle for KWCG Region was concluded with the publishing of a Regional Infrastructure Plan (RIP) in December 20151. In the current planning cycle, to date Hydro One’s Needs Assessment2 (NA) has been published in December 2018, and the IESO’s Scoping Assessment (SA) Outcome Report and Draft Terms of Reference for the KWCG Region Integrated Regional Resource Plan (IRRP)3 have been published in May 2019. An IRRP for the KWCG Region is now underway and is planned for publication in October 2020. Following the completion of the IRRP, Hydro One is expected
1 https://www.hydroone.com/abouthydroone/CorporateInformation/regionalplans/kitchenerwaterloocambridgeguelph/Documents/KWCG%20RIP%20Report.pdf 2 https://www.hydroone.com/abouthydroone/CorporateInformation/regionalplans/kitchenerwaterloocambridgeguelph/Documents/KWCG%20Needs%20Assessment%202018.pdf 3 http://www.ieso.ca/en/Get-Involved/Regional-Planning/Southwest-Ontario/Kitchener-Waterloo-Cambridge-Guelph
IESO response to Waterloo North Hydro Inc.’s REG Investments Plan 2020 - 2025
March 31, 2020 2 of 2
to conduct a RIP to complete this cycle of the regional planning process. As part of a planning process requirement WNH provided the IESO with load forecasts and other supporting information in its service territory.
Coordination
Based on a review of the investments proposed in WNH’s Plan, the IESO only sees potential need for co-ordination with the transmitter Hydro One on implementing elements of the REG investments.
Consistency
Regarding REG investments, WNH Plan indicates that while most of its transformer stations are capable of accommodating existing and forecast generation connections, Scheifele “A” station has reached its short-circuit rating limits at the station’s feeder breakers. Considering its allocated and pending generation, WNH estimates that these short circuit rating limits will be exceeded within the next 12 – 36 months. WNH’s Plan includes capital investments for 2020 and 2021 to replace Scheifele “A” feeder breakers which WNH indicates will also allow for an increase in generation connection capacity of 6,630 kW.
The IESO notes that WNH has no other capital investments to accommodate the connection of generation for the Plan period.
Although the specific investments described in WNH’s Plan are not included within the most recent RIP, addressing barriers to connect additional distributed generation (DG) including REG within WNH’s service area is consistent with regional planning principles. Removing technical barriers to new DG connections can provide lasting benefits to the upstream transmission system by reducing the need, over time, for additional load meeting demands on the high voltage transmission serving the area.
The IESO looks forward to working with WNH on regional planning through the current cycle and appreciates this opportunity to comment on the REG investment information provided as part of its Distribution System Plan.

Appendix J:
WNH System Supply and Capacity Study
Waterloo North Hydro Inc.
System Supply and
Capacity Study
June 21, 2020
Filed with
Waterloo North Hydro’s
2021 COS Application
June 22, 2020 1
TABLE OF CONTENTS
TABLE OF CONTENTS ...................................................................................................... 1
LIST OF TABLES ................................................................................................................ 2
LIST OF FIGURES ............................................................................................................. 2
GLOSSARY ........................................................................................................................ 3
EXECUTIVE SUMMARY .................................................................................................... 5
1. OVERVIEW OF WNH’s DISTRIBUTION SYSTEM ..................................................... 8
2. WNH SYSTEM DEMAND .......................................................................................... 10
2.1. Overview .............................................................................................................. 10
2.2. Impact of Embedded Generation ......................................................................... 10
3. WNH ELECTRICAL SUPPLY .................................................................................... 13
4. WNH CAPACITY UTILIZATION ................................................................................ 15
4.1. HONI Transmission Lines (230 kV & 115 kV) ...................................................... 15
4.2. WNH Transmission Connected Stations (230 kV & 115 kV) ................................ 16
4.3. Transformer Station Feeders (27.6 kV and 13.8 kV) ............................................ 19
4.4. Municipal and Distribution Station (DS) Capacity Utilization ................................ 23
4.5. Distribution Feeder (8 kV) Capacity Utilization ..................................................... 24
4.6. Distribution Transformers ..................................................................................... 25
June 22, 2020 2
LIST OF TABLES
Table 1-1: WNH Customer & Service Area Demographics ................................................. 8
Table 3-1: WNH Gross Summer Peak Load MW (2019) ................................................... 13
Table 3-2: WNH Peak Load by Delivery Point (2019) ....................................................... 13
Table 3-3: WNH Average Peak Load by Delivery Point (2016 - 2019) .............................. 14
Table 3-4: WNH Embedded Generation (2019) ................................................................ 14
Table 4-1: WNH Transmission Supply .............................................................................. 15
Table 4-2: WNH Transmission Connected Stations .......................................................... 16
Table 4-3: Capacity Utilization - Station Transformers ...................................................... 17
Table 4-4: Station Feeder Utilization HMSTS”A” (2016 – 2019) ....................................... 20
Table 4-5: Station Feeder Utilization HMSTS”B” (2016 – 2019) ....................................... 20
Table 4-6: Station Feeder Utilization MTS#3 (2016 – 2019) ............................................. 20
Table 4-7: Station Feeder Utilization ERTS (2016 – 2019) ............................................... 21
Table 4-8: Station Feeder Utilization ELTS (2016 – 2019) ................................................ 22
Table 4-9: Delivery Point Feeder Utilization (< 50 kV) (2016 – 2019) ............................... 22
Table 4-10: WNH DS Station Capacity Utilization ............................................................. 23
Table 4-11: WNH DS Station Feeder Capacity Utilization ................................................. 24
LIST OF FIGURES
Figure 1-1: WNH Service Area ............................................................................................ 9
Figure 2-1: WNH Historical and Forecast Peak Demand .................................................. 11
Figure 2-2: Historical and Forecast Growth in Generation ................................................ 12
Figure 4-1: WNH Distribution Transformer Utilization (%) ................................................. 25
June 22, 2020 3
GLOSSARY
1) AM – Asset Management
2) AMP – Asset Management Plan
3) CEA – Canadian Electrical Association
4) CSA – Canadian Standard Association
5) DS – Distribution Station
6) DSC – Distribution System Code
7) DSP – Distribution System Plan
8) EOL – End-of-Life
9) GM – Grid Modernization
10) HONI – Hydro One Networks Inc.
11) IESO – Independent Electricity System Operator
12) KWCG – Kitchener – Waterloo – Cambridge – Guelph
13) KWHI – Kitchener-Wilmot Hydro Inc.
14) LDC – Local Distribution Company
15) LOS – Loss of Supply
16) MS – Municipal Station
17) MVA - Motor Vehicle Accident
18) O/H or OH - Overhead
19) O&M – Operation & Maintenance
20) OEB – Ontario Energy Board
21) REG – Renewable Energy Generation
22) SCADA – Supervisory Control and Data Acquisition
23) TUL – Typical Useful Life

June 22, 2020 4
24) TS – Transmission Station or Transformer Station
25) U/G or UG – Underground
26) WNHI / WNH – Waterloo North Hydro Inc.
27) XFMR / Tx – Transformer
June 22, 2020 5
EXECUTIVE SUMMARY
WNH’s System Supply and Capacity Study (SSCS) provides a consolidated view of WNH’s
distribution system’s ability to supply current and forecasted load customers. The SSCS
informs WNH’s senior executive team (Executive) and aides in the development of WNH’s
business plans and budgets. The SSCS also provides key information to allow WNH to
develop, manage and maintain its major distribution system assets and provide a safe,
secure, reliable, efficient and cost-effective service to its customers.
This SSCS supports WNH’s Distribution System Plan (DSP) and compliments information
found in the Renewable Energy Generation Investments (REGI) Plan. The information
contained in this report is current as of December 31, 2019.
The report examines WNH’s historical and forecast growth in electrical demand. In addition,
the report also examines the capacity and load supplied by WNH’s key infrastructure
components including:
1) delivery points, both at the transmission and distribution level;
2) grid-connected power transformers and feeders;
3) DS station transformers and feeders;
4) distribution transformers.
Overall, WNH supply and capacity levels are adequate to sustain the forecasted load growth
to the end of 2025. Components that are nearing capacity limits are noted and mitigation
measures are being taken in the DSP. These measures are mostly about rebalancing of
loads to improve utilization of existing assets.
For the period 2020 – 2025, WNH is forecasting an annualized growth rate of 1.0% in
summer demand and 0.2% in winter demand. There are no capacity or supply constraints
forecast at WNH’s major transmission delivery points.
At WNH’s transformer stations and feeders, one capacity issue has been identified. The
utilization of HMSTS “B” capacity is significantly higher and growing at a higher rate than
that of other WNH stations. This is mainly due to the impact of urban intensification in the
June 22, 2020 6
central areas of Waterloo. Load rebalancing between stations having the same operating
voltage is a normal part of system operations; however, feeder length, voltage drop and
reliability have started to limit opportunities. WNH is taking advantage of voltage conversion
measures, during System Renewal projects in the Lakeshore area of Waterloo, to move
load away from HMSTS “B”. Other feeder load rebalancing efforts that are likely to occur
are expected to be minor and will be addressed on a case by case basis. No capacity
expansion at the transformer station level is forecast before 2025.
The replacement of HMSTS “A” T1 and T2 transformers, due to condition, is also expected
to be sometime after 2025. It is recommended that options of increasing the rating of the
replacement transformers and the ability to integrate that additional capacity into the
distribution system, be studied.
Two of WNH’s three < 50 kV delivery points are near capacity. Although not a major point
of supply, the 09M4 27.6 kV feeder from KWHI is strategically important to WNH due to its
geographic location and needs to be maintained. WNH is taking advantage of voltage
conversion measures during System Renewal projects in the Wellesley West area to move
load to its own 27.6 kV system and prevent overloading of the delivery point. The 21M25
27.6 kV feeder from Energy+ is also strategically important to WNH due to its geographic
location. WNH is working with the IESO and Energy+ in the latest round of the KWCG IRRP
to find a regional solution to supply issues in this area of Woolwich Township and the City
of Cambridge. Further information can be found in Appendix F - KWCG IRRP Scoping Assessment Outcome Report (2019).
WNH’s third < 50 kV delivery point is the 73M7 feeder from HONI Dx. This is WNH’s only
44 kV delivery point, at the end of a long radial feeder and has had relatively poor historical
reliability. Load being supplied by the 73M7 is gradually being migrated over to WNH’s 27.6
kV system as a result of voltage conversion measures during System Renewal projects in
the Woolwich East area.
WNH’s 8 kV distribution system is undergoing a gradual but planned transformation, as
System Renewal investments replace assets that are inefficient and in poor condition with
new assets operating at 27.6 kV. As the 8 kV system downsizes, interconnectivity options
June 22, 2020 7
are reduced making WNH more reliant on the use of its Mobile Unit Substation (MUS) in
the case of a distribution station transformer failure. WNH does not forecast any significant
constraints or lack of capacity on the 8 kV system over the 2021 – 2025 forecast period.
WNH forecasts sufficient capacity in its population of distribution transformers over the 2021
- 2025 forecast period to serve the growing load, including the connection of electric
vehicles. Some localized constraints may occur over time and will be addressed on a case
by case basis.
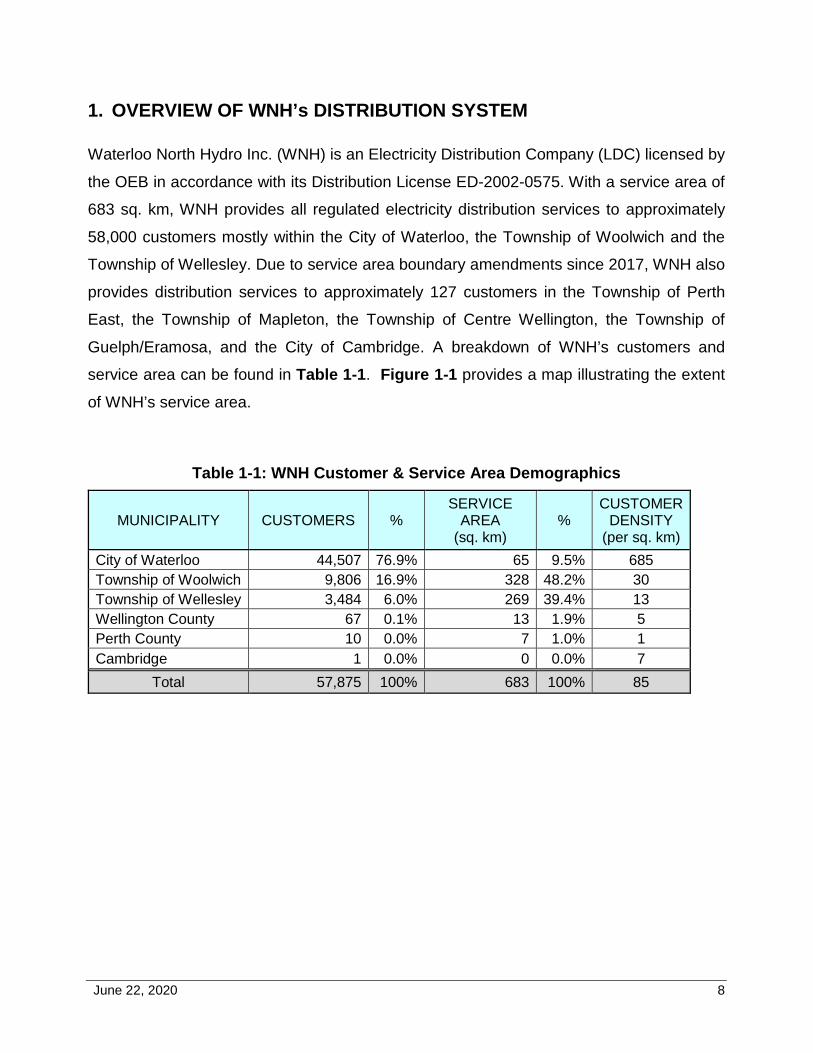
June 22, 2020 8
1. OVERVIEW OF WNH’s DISTRIBUTION SYSTEM
Waterloo North Hydro Inc. (WNH) is an Electricity Distribution Company (LDC) licensed by
the OEB in accordance with its Distribution License ED-2002-0575. With a service area of
683 sq. km, WNH provides all regulated electricity distribution services to approximately
58,000 customers mostly within the City of Waterloo, the Township of Woolwich and the
Township of Wellesley. Due to service area boundary amendments since 2017, WNH also
provides distribution services to approximately 127 customers in the Township of Perth
East, the Township of Mapleton, the Township of Centre Wellington, the Township of
Guelph/Eramosa, and the City of Cambridge. A breakdown of WNH’s customers and
service area can be found in Table 1-1. Figure 1-1 provides a map illustrating the extent
of WNH’s service area.
Table 1-1: WNH Customer & Service Area Demographics
MUNICIPALITY CUSTOMERS % SERVICE
AREA (sq. km)
% CUSTOMER
DENSITY (per sq. km)
City of Waterloo 44,507 76.9% 65 9.5% 685 Township of Woolwich 9,806 16.9% 328 48.2% 30 Township of Wellesley 3,484 6.0% 269 39.4% 13 Wellington County 67 0.1% 13 1.9% 5 Perth County 10 0.0% 7 1.0% 1 Cambridge 1 0.0% 0 0.0% 7
Total 57,875 100% 683 100% 85
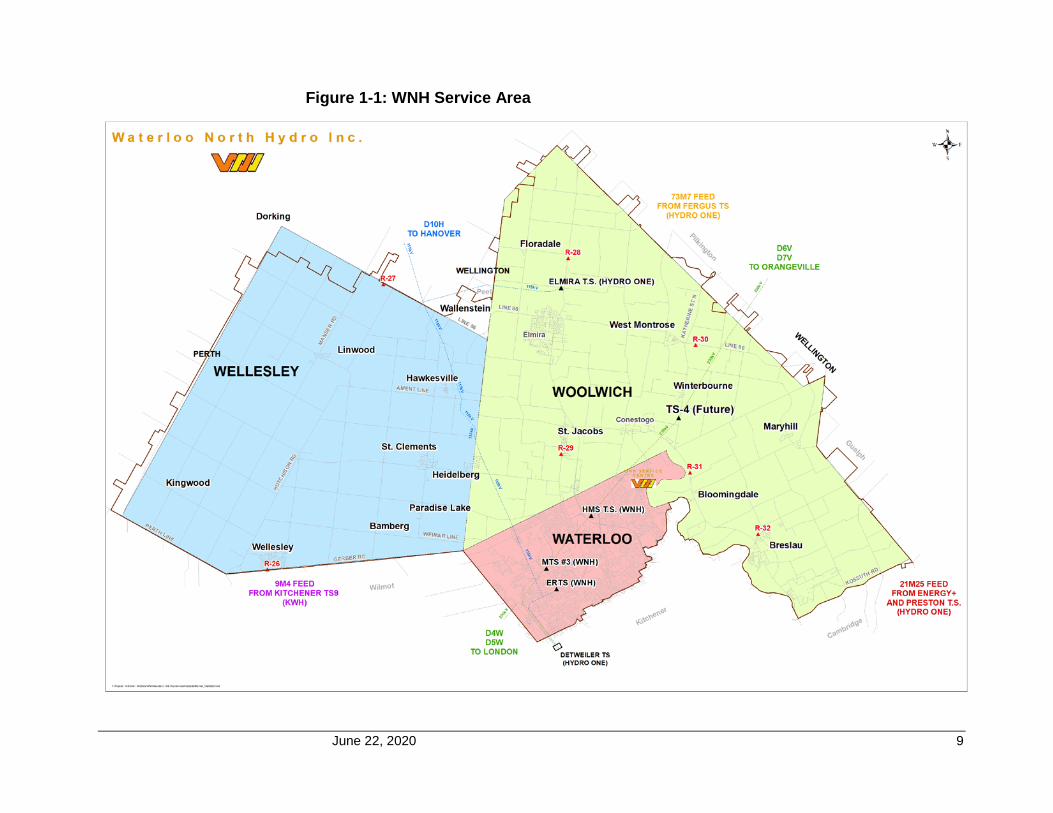
June 22, 2020 9
Figure 1-1: WNH Service Area
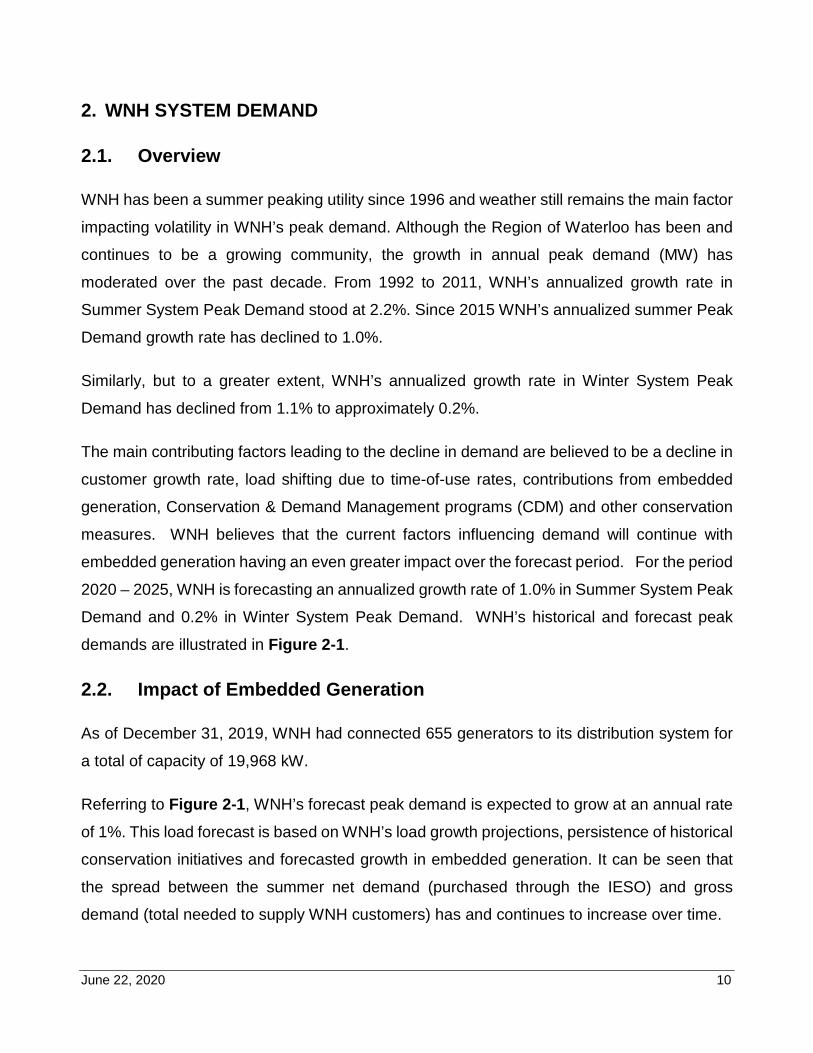
June 22, 2020 10
2. WNH SYSTEM DEMAND
2.1. Overview
WNH has been a summer peaking utility since 1996 and weather still remains the main factor
impacting volatility in WNH’s peak demand. Although the Region of Waterloo has been and
continues to be a growing community, the growth in annual peak demand (MW) has
moderated over the past decade. From 1992 to 2011, WNH’s annualized growth rate in
Summer System Peak Demand stood at 2.2%. Since 2015 WNH’s annualized summer Peak
Demand growth rate has declined to 1.0%.
Similarly, but to a greater extent, WNH’s annualized growth rate in Winter System Peak
Demand has declined from 1.1% to approximately 0.2%.
The main contributing factors leading to the decline in demand are believed to be a decline in
customer growth rate, load shifting due to time-of-use rates, contributions from embedded
generation, Conservation & Demand Management programs (CDM) and other conservation
measures. WNH believes that the current factors influencing demand will continue with
embedded generation having an even greater impact over the forecast period. For the period
2020 – 2025, WNH is forecasting an annualized growth rate of 1.0% in Summer System Peak
Demand and 0.2% in Winter System Peak Demand. WNH’s historical and forecast peak
demands are illustrated in Figure 2-1.
2.2. Impact of Embedded Generation
As of December 31, 2019, WNH had connected 655 generators to its distribution system for
a total of capacity of 19,968 kW.
Referring to Figure 2-1, WNH’s forecast peak demand is expected to grow at an annual rate
of 1%. This load forecast is based on WNH’s load growth projections, persistence of historical
conservation initiatives and forecasted growth in embedded generation. It can be seen that
the spread between the summer net demand (purchased through the IESO) and gross
demand (total needed to supply WNH customers) has and continues to increase over time.
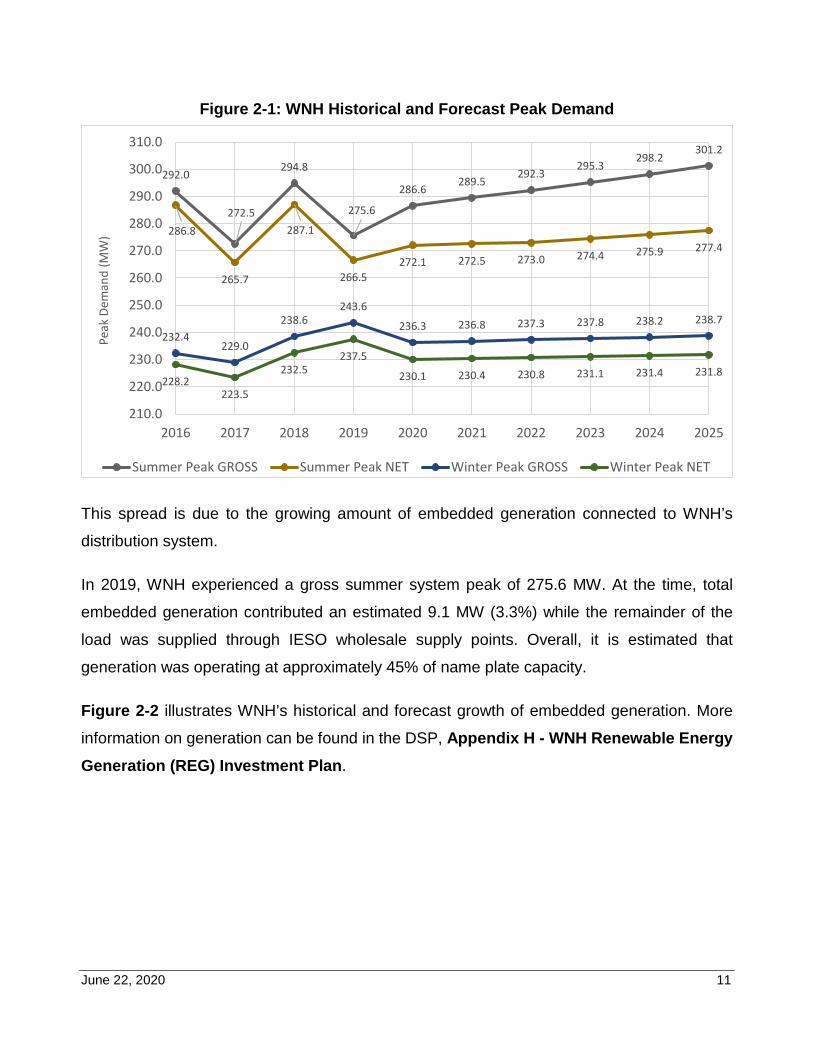
June 22, 2020 11
Figure 2-1: WNH Historical and Forecast Peak Demand
This spread is due to the growing amount of embedded generation connected to WNH’s
distribution system.
In 2019, WNH experienced a gross summer system peak of 275.6 MW. At the time, total
embedded generation contributed an estimated 9.1 MW (3.3%) while the remainder of the
load was supplied through IESO wholesale supply points. Overall, it is estimated that
generation was operating at approximately 45% of name plate capacity.
Figure 2-2 illustrates WNH’s historical and forecast growth of embedded generation. More
information on generation can be found in the DSP, Appendix H - WNH Renewable Energy Generation (REG) Investment Plan.
292.0
272.5
294.8
275.6
286.6289.5
292.3295.3
298.2301.2
286.8
265.7
287.1
266.5272.1 272.5 273.0 274.4 275.9 277.4
232.4229.0
238.6243.6
236.3 236.8 237.3 237.8 238.2 238.7
228.2223.5
232.5237.5
230.1 230.4 230.8 231.1 231.4 231.8
210.0
220.0
230.0
240.0
250.0
260.0
270.0
280.0
290.0
300.0
310.0
2016 2017 2018 2019 2020 2021 2022 2023 2024 2025
Peak
Dem
and
(MW
)
Summer Peak GROSS Summer Peak NET Winter Peak GROSS Winter Peak NET
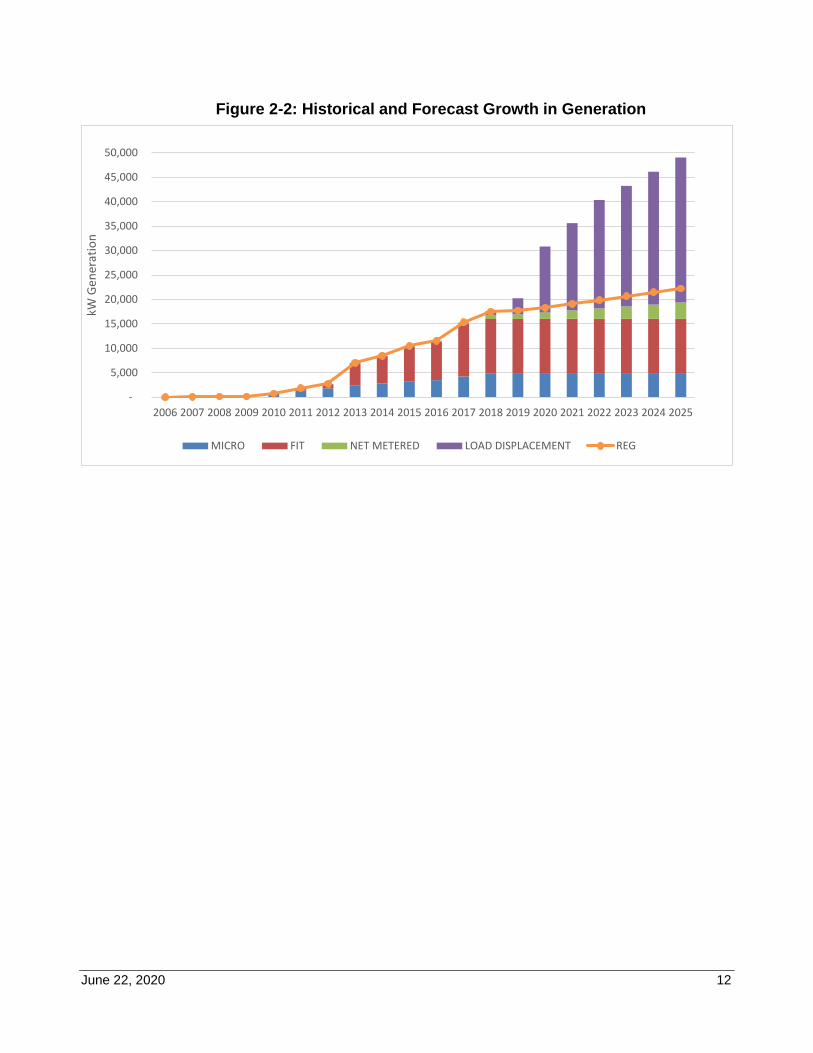
June 22, 2020 12
Figure 2-2: Historical and Forecast Growth in Generation
-
5,000
10,000
15,000
20,000
25,000
30,000
35,000
40,000
45,000
50,000
2006 2007 2008 2009 2010 2011 2012 2013 2014 2015 2016 2017 2018 2019 2020 2021 2022 2023 2024 2025
kW G
ener
atio
n
MICRO FIT NET METERED LOAD DISPLACEMENT REG
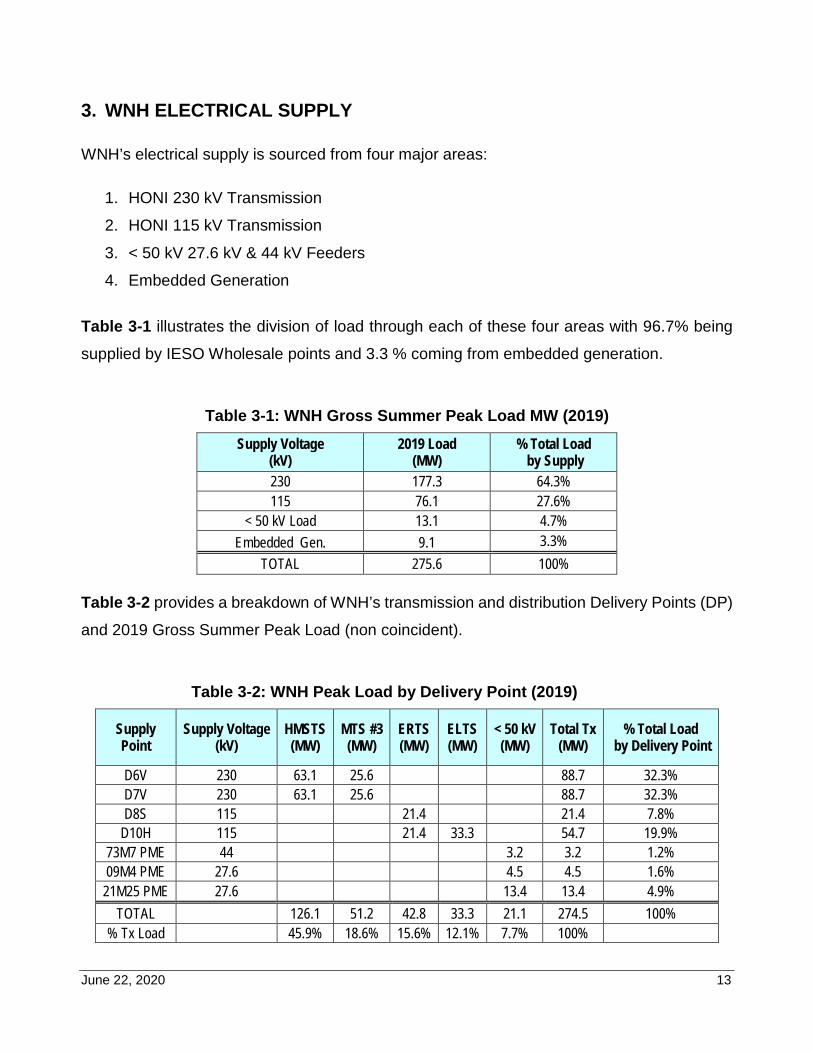
June 22, 2020 13
3. WNH ELECTRICAL SUPPLY
WNH’s electrical supply is sourced from four major areas:
1. HONI 230 kV Transmission
2. HONI 115 kV Transmission
3. < 50 kV 27.6 kV & 44 kV Feeders
4. Embedded Generation
Table 3-1 illustrates the division of load through each of these four areas with 96.7% being
supplied by IESO Wholesale points and 3.3 % coming from embedded generation.
Table 3-1: WNH Gross Summer Peak Load MW (2019)
Supply Voltage (kV)
2019 Load (MW)
% Total Load by Supply
230 177.3 64.3% 115 76.1 27.6%
< 50 kV Load 13.1 4.7% Embedded Gen. 9.1 3.3%
TOTAL 275.6 100% Table 3-2 provides a breakdown of WNH’s transmission and distribution Delivery Points (DP)
and 2019 Gross Summer Peak Load (non coincident).
Table 3-2: WNH Peak Load by Delivery Point (2019)
Supply Point
Supply Voltage (kV)
HMSTS (MW)
MTS #3 (MW)
ERTS (MW)
ELTS (MW)
< 50 kV (MW)
Total Tx (MW)
% Total Load by Delivery Point
D6V 230 63.1 25.6 88.7 32.3% D7V 230 63.1 25.6 88.7 32.3% D8S 115 21.4 21.4 7.8%
D10H 115 21.4 33.3 54.7 19.9% 73M7 PME 44 3.2 3.2 1.2% 09M4 PME 27.6 4.5 4.5 1.6%
21M25 PME 27.6 13.4 13.4 4.9% TOTAL 126.1 51.2 42.8 33.3 21.1 274.5 100%
% Tx Load 45.9% 18.6% 15.6% 12.1% 7.7% 100%
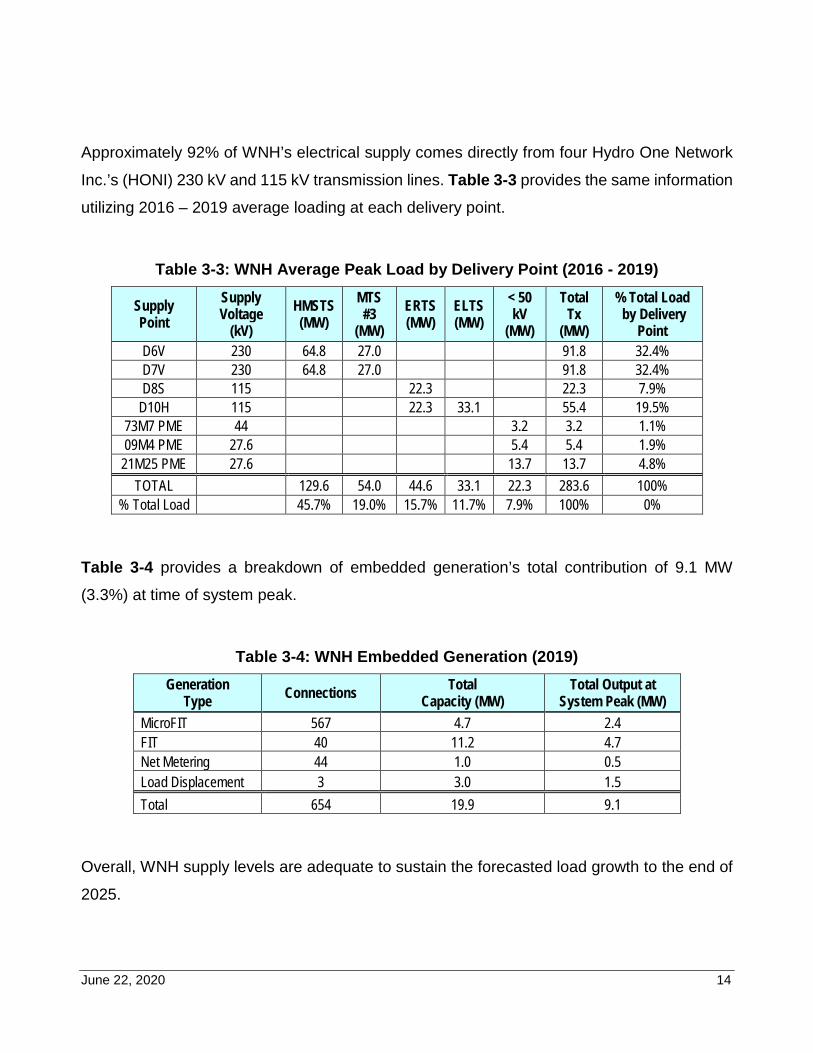
June 22, 2020 14
Approximately 92% of WNH’s electrical supply comes directly from four Hydro One Network
Inc.’s (HONI) 230 kV and 115 kV transmission lines. Table 3-3 provides the same information
utilizing 2016 – 2019 average loading at each delivery point.
Table 3-3: WNH Average Peak Load by Delivery Point (2016 - 2019)
Supply Point
Supply Voltage
(kV) HMSTS (MW)
MTS #3
(MW) ERTS (MW)
ELTS (MW)
< 50 kV
(MW)
Total Tx
(MW)
% Total Load by Delivery
Point D6V 230 64.8 27.0 91.8 32.4% D7V 230 64.8 27.0 91.8 32.4% D8S 115 22.3 22.3 7.9%
D10H 115 22.3 33.1 55.4 19.5% 73M7 PME 44 3.2 3.2 1.1% 09M4 PME 27.6 5.4 5.4 1.9%
21M25 PME 27.6 13.7 13.7 4.8% TOTAL 129.6 54.0 44.6 33.1 22.3 283.6 100%
% Total Load 45.7% 19.0% 15.7% 11.7% 7.9% 100% 0%
Table 3-4 provides a breakdown of embedded generation’s total contribution of 9.1 MW
(3.3%) at time of system peak.
Table 3-4: WNH Embedded Generation (2019)
Generation Type Connections Total
Capacity (MW) Total Output at
System Peak (MW) MicroFIT 567 4.7 2.4 FIT 40 11.2 4.7 Net Metering 44 1.0 0.5 Load Displacement 3 3.0 1.5 Total 654 19.9 9.1
Overall, WNH supply levels are adequate to sustain the forecasted load growth to the end of
2025.
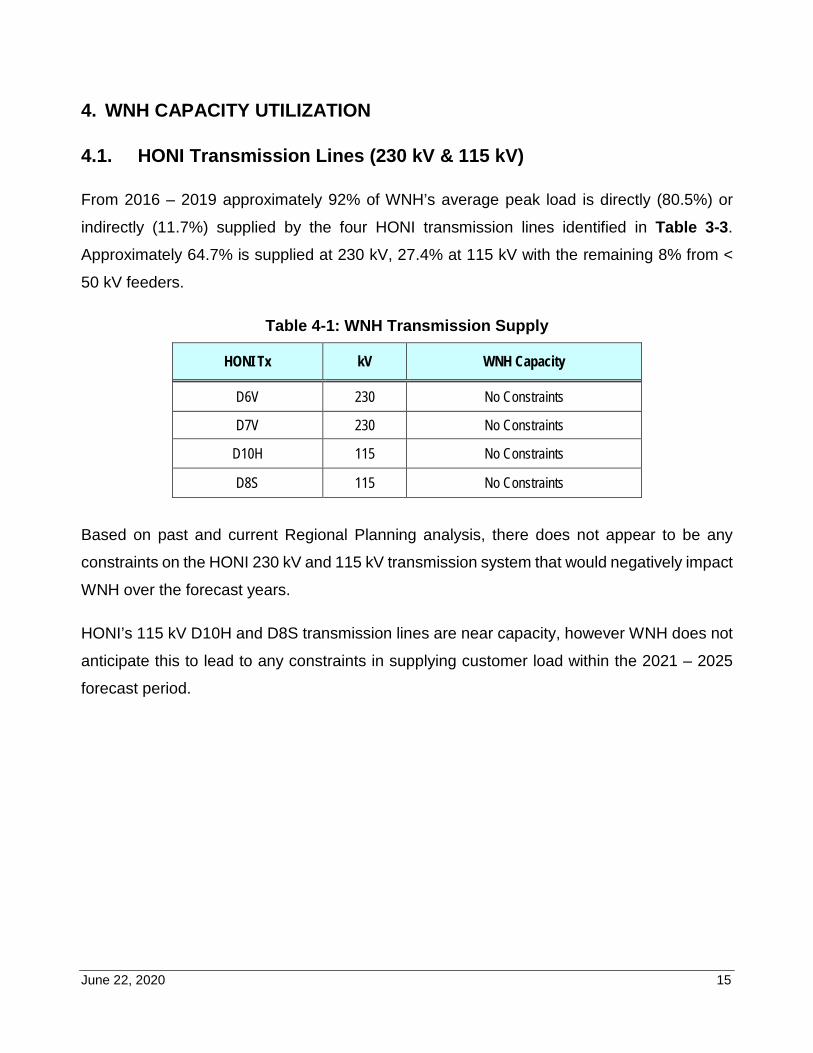
June 22, 2020 15
4. WNH CAPACITY UTILIZATION
4.1. HONI Transmission Lines (230 kV & 115 kV)
From 2016 – 2019 approximately 92% of WNH’s average peak load is directly (80.5%) or
indirectly (11.7%) supplied by the four HONI transmission lines identified in Table 3-3.
Approximately 64.7% is supplied at 230 kV, 27.4% at 115 kV with the remaining 8% from <
50 kV feeders.
Table 4-1: WNH Transmission Supply
HONI Tx kV WNH Capacity
D6V 230 No Constraints
D7V 230 No Constraints
D10H 115 No Constraints
D8S 115 No Constraints
Based on past and current Regional Planning analysis, there does not appear to be any
constraints on the HONI 230 kV and 115 kV transmission system that would negatively impact
WNH over the forecast years.
HONI’s 115 kV D10H and D8S transmission lines are near capacity, however WNH does not
anticipate this to lead to any constraints in supplying customer load within the 2021 – 2025
forecast period.
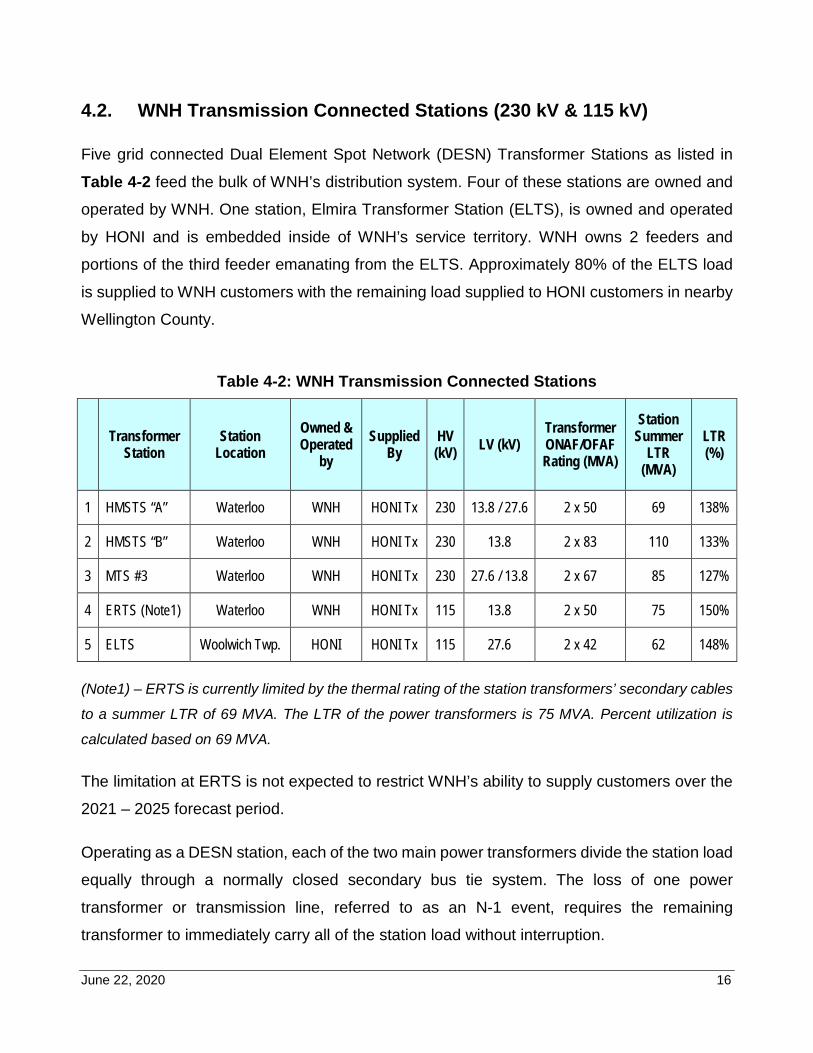
June 22, 2020 16
4.2. WNH Transmission Connected Stations (230 kV & 115 kV)
Five grid connected Dual Element Spot Network (DESN) Transformer Stations as listed in
Table 4-2 feed the bulk of WNH’s distribution system. Four of these stations are owned and
operated by WNH. One station, Elmira Transformer Station (ELTS), is owned and operated
by HONI and is embedded inside of WNH’s service territory. WNH owns 2 feeders and
portions of the third feeder emanating from the ELTS. Approximately 80% of the ELTS load
is supplied to WNH customers with the remaining load supplied to HONI customers in nearby
Wellington County.
Table 4-2: WNH Transmission Connected Stations
Transformer Station
Station Location
Owned & Operated
by Supplied
By HV (kV) LV (kV)
Transformer ONAF/OFAF Rating (MVA)
Station Summer
LTR (MVA)
LTR (%)
1 HMSTS “A” Waterloo WNH HONI Tx 230 13.8 / 27.6 2 x 50 69 138%
2 HMSTS “B” Waterloo WNH HONI Tx 230 13.8 2 x 83 110 133%
3 MTS #3 Waterloo WNH HONI Tx 230 27.6 / 13.8 2 x 67 85 127%
4 ERTS (Note1) Waterloo WNH HONI Tx 115 13.8 2 x 50 75 150%
5 ELTS Woolwich Twp. HONI HONI Tx 115 27.6 2 x 42 62 148%
(Note1) – ERTS is currently limited by the thermal rating of the station transformers’ secondary cables
to a summer LTR of 69 MVA. The LTR of the power transformers is 75 MVA. Percent utilization is
calculated based on 69 MVA.
The limitation at ERTS is not expected to restrict WNH’s ability to supply customers over the
2021 – 2025 forecast period.
Operating as a DESN station, each of the two main power transformers divide the station load
equally through a normally closed secondary bus tie system. The loss of one power
transformer or transmission line, referred to as an N-1 event, requires the remaining
transformer to immediately carry all of the station load without interruption.
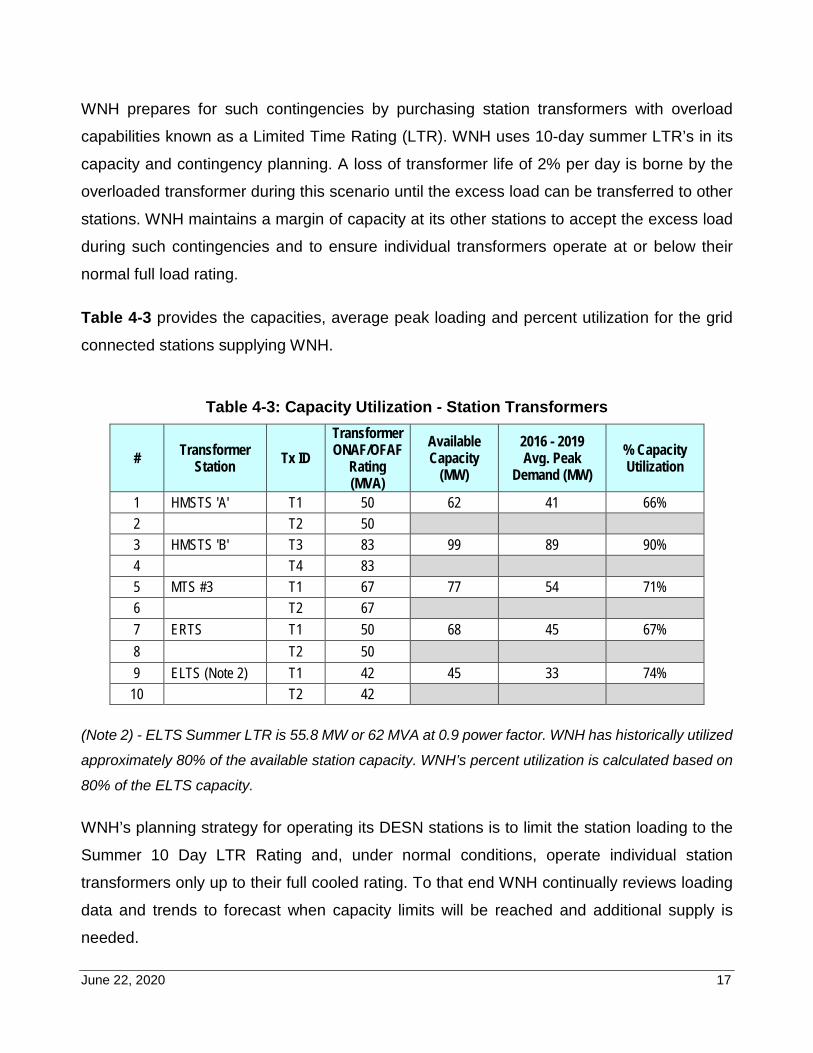
June 22, 2020 17
WNH prepares for such contingencies by purchasing station transformers with overload
capabilities known as a Limited Time Rating (LTR). WNH uses 10-day summer LTR’s in its
capacity and contingency planning. A loss of transformer life of 2% per day is borne by the
overloaded transformer during this scenario until the excess load can be transferred to other
stations. WNH maintains a margin of capacity at its other stations to accept the excess load
during such contingencies and to ensure individual transformers operate at or below their
normal full load rating.
Table 4-3 provides the capacities, average peak loading and percent utilization for the grid
connected stations supplying WNH.
Table 4-3: Capacity Utilization - Station Transformers
# Transformer Station Tx ID
Transformer ONAF/OFAF
Rating (MVA)
Available Capacity
(MW)
2016 - 2019 Avg. Peak
Demand (MW) % Capacity Utilization
1 HMSTS 'A' T1 50 62 41 66% 2 T2 50 3 HMSTS 'B' T3 83 99 89 90% 4 T4 83 5 MTS #3 T1 67 77 54 71% 6 T2 67 7 ERTS T1 50 68 45 67% 8 T2 50 9 ELTS (Note 2) T1 42 45 33 74%
10 T2 42 (Note 2) - ELTS Summer LTR is 55.8 MW or 62 MVA at 0.9 power factor. WNH has historically utilized
approximately 80% of the available station capacity. WNH’s percent utilization is calculated based on
80% of the ELTS capacity.
WNH’s planning strategy for operating its DESN stations is to limit the station loading to the
Summer 10 Day LTR Rating and, under normal conditions, operate individual station
transformers only up to their full cooled rating. To that end WNH continually reviews loading
data and trends to forecast when capacity limits will be reached and additional supply is
needed.
June 22, 2020 18
WNH believes there is sufficient existing supply and capacity to serve load and generation
customers over the 2021 - 2025 forecast period. Some localized constraints within the
distribution system may occur over time and will be addressed on a case by case basis.
WNH is looking beyond 2025 to determine when additional supply may be required. This
possibility has been identified in the IESO’s Scoping Assessment Outcome Report (2019) as
part of the second cycle of regional planning which is underway for the Kitchener-Waterloo-
Cambridge-Guelph (KWCG) Region. More information on this can be found in Appendix F - KWCG IRRP Scoping Assessment Outcome Report (2019).
The replacement of HMSTS “A” T1 and T2 transformers, due to condition, is also expected to
be sometime after 2025. It is recommended that options in increasing the rating of the
transformers and the ability to integrate that additional capacity into the distribution system,
be studied.
June 22, 2020 19
4.3. Transformer Station Feeders (27.6 kV and 13.8 kV)
From the transmission connected transformer stations, WNH distributes electricity to its
customers through its 47 feeders at distribution voltages of 13.8 kV and 27.6 kV. WNH’s 13.8
kV and 27.6 kV feeder capacities are rated at 600A, the limiting factor being the rating of the
station feeder cables and overhead line conductors. All of WNH’s station feeder breakers are
rated for 1,200 amperes and do not present a limiting factor in supplying load.
WNH uses a planning criterion of 400A (66.7%) for average feeder loading. This allows for
the load of a feeder that is planned or forced out of service to be moved to a minimum of 2
adjacent feeders and remain within loading limits. The installation of automated switching as
part of WNH’s grid modernization investments are assisting in WNH meeting this goal.
WNH also receives approximately 7.9% of its electrical supply at < 50 kV (Dx) through feeders
from 3 neighbouring LDCs; Hydro One Distribution (HONI Dx), Kitchener-Wilmot Hydro Inc.
(KWHI) and Energy Plus (Energy+).
From 2016 – 2019, WNH experienced an overall station feeder utilization of approximately
40% and a maximum peak utilization of approximately 75%. Although not in an overload state,
summer loads do push feeder peak utilization above WNH’s 66.7% planning criteria target.
Excess feeder capacity is not available in every combination of feeder contingencies. Care
must be taken by WNH in terms of system configuration and planned equipment outages
during these times. WNH regularly reviews feeder loading and rebalances the system when
needed. When rebalancing is not possible within the existing configuration parameters,
Contingency Enhancement solutions are proposed and evaluated. WNH grid modernization
investments over the historic period have allowed for better utilization of feeder capacity. WNH
believes there is sufficient station feeder capacity during the 2021 – 2025 forecast period.
The following tables in this section provide capacity utilizations for WNH’s 47 TS feeders by
delivery point.
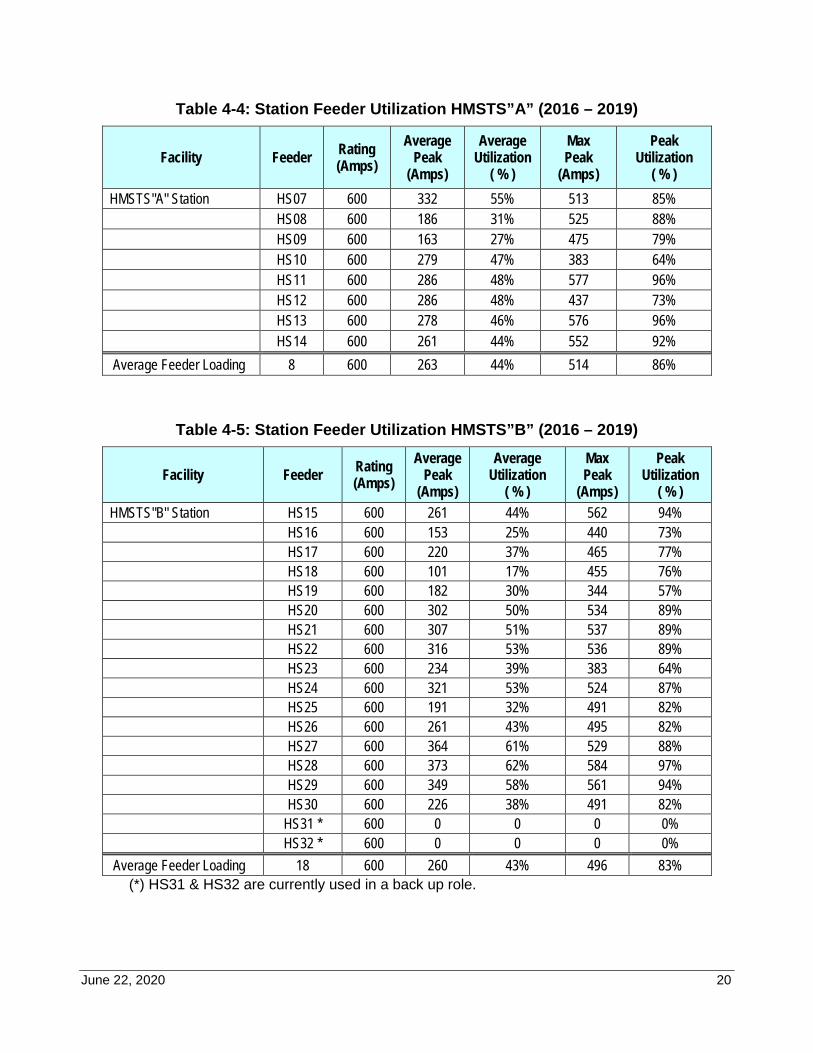
June 22, 2020 20
Table 4-4: Station Feeder Utilization HMSTS”A” (2016 – 2019)
Facility Feeder Rating (Amps)
Average Peak
(Amps)
Average Utilization
( % )
Max Peak
(Amps)
Peak Utilization
( % ) HMSTS"A" Station HS07 600 332 55% 513 85% HS08 600 186 31% 525 88% HS09 600 163 27% 475 79% HS10 600 279 47% 383 64% HS11 600 286 48% 577 96% HS12 600 286 48% 437 73% HS13 600 278 46% 576 96% HS14 600 261 44% 552 92% Average Feeder Loading 8 600 263 44% 514 86%
Table 4-5: Station Feeder Utilization HMSTS”B” (2016 – 2019)
Facility Feeder Rating (Amps)
Average Peak
(Amps)
Average Utilization
( % )
Max Peak
(Amps)
Peak Utilization
( % ) HMSTS"B" Station HS15 600 261 44% 562 94% HS16 600 153 25% 440 73% HS17 600 220 37% 465 77% HS18 600 101 17% 455 76% HS19 600 182 30% 344 57% HS20 600 302 50% 534 89% HS21 600 307 51% 537 89% HS22 600 316 53% 536 89% HS23 600 234 39% 383 64% HS24 600 321 53% 524 87% HS25 600 191 32% 491 82% HS26 600 261 43% 495 82% HS27 600 364 61% 529 88% HS28 600 373 62% 584 97% HS29 600 349 58% 561 94% HS30 600 226 38% 491 82% HS31 * 600 0 0 0 0% HS32 * 600 0 0 0 0% Average Feeder Loading 18 600 260 43% 496 83%
(*) HS31 & HS32 are currently used in a back up role.
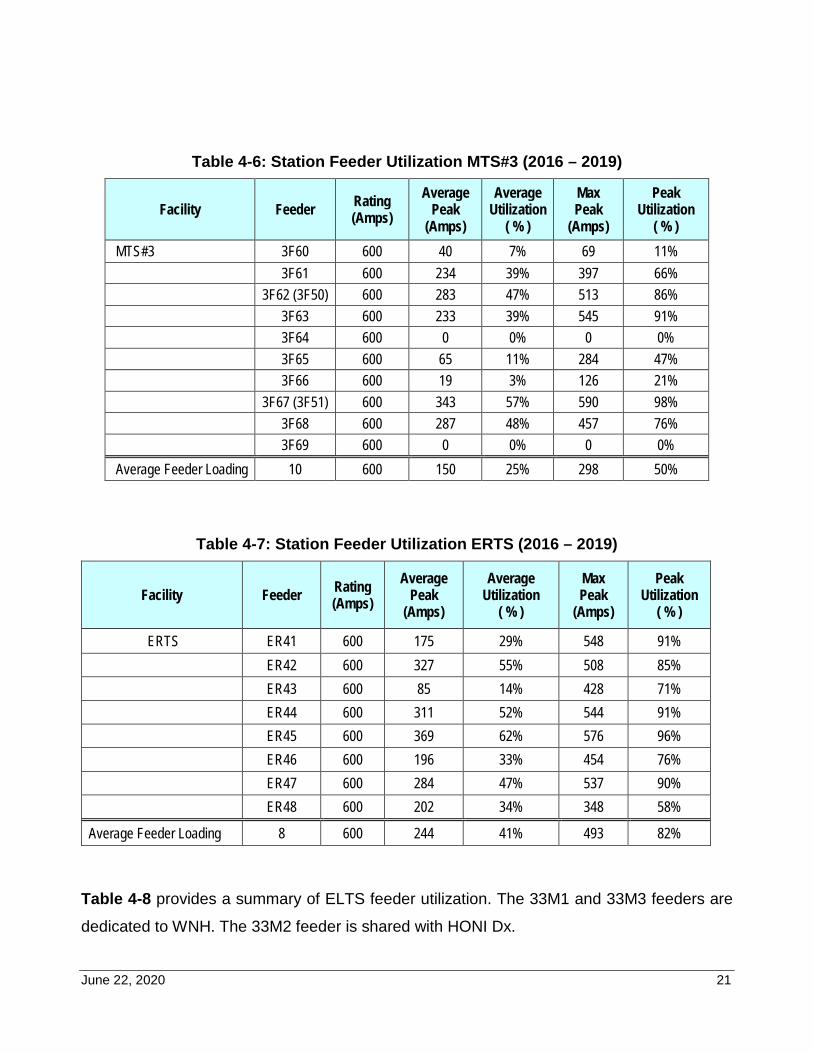
June 22, 2020 21
Table 4-6: Station Feeder Utilization MTS#3 (2016 – 2019)
Facility Feeder Rating (Amps)
Average Peak
(Amps)
Average Utilization
( % )
Max Peak
(Amps)
Peak Utilization
( % ) MTS#3 3F60 600 40 7% 69 11% 3F61 600 234 39% 397 66% 3F62 (3F50) 600 283 47% 513 86% 3F63 600 233 39% 545 91% 3F64 600 0 0% 0 0% 3F65 600 65 11% 284 47% 3F66 600 19 3% 126 21% 3F67 (3F51) 600 343 57% 590 98%
3F68 600 287 48% 457 76% 3F69 600 0 0% 0 0%
Average Feeder Loading 10 600 150 25% 298 50%
Table 4-7: Station Feeder Utilization ERTS (2016 – 2019)
Facility Feeder Rating (Amps)
Average Peak
(Amps)
Average Utilization
( % )
Max Peak
(Amps)
Peak Utilization
( % )
ERTS ER41 600 175 29% 548 91% ER42 600 327 55% 508 85% ER43 600 85 14% 428 71% ER44 600 311 52% 544 91% ER45 600 369 62% 576 96% ER46 600 196 33% 454 76% ER47 600 284 47% 537 90% ER48 600 202 34% 348 58%
Average Feeder Loading 8 600 244 41% 493 82%
Table 4-8 provides a summary of ELTS feeder utilization. The 33M1 and 33M3 feeders are
dedicated to WNH. The 33M2 feeder is shared with HONI Dx.
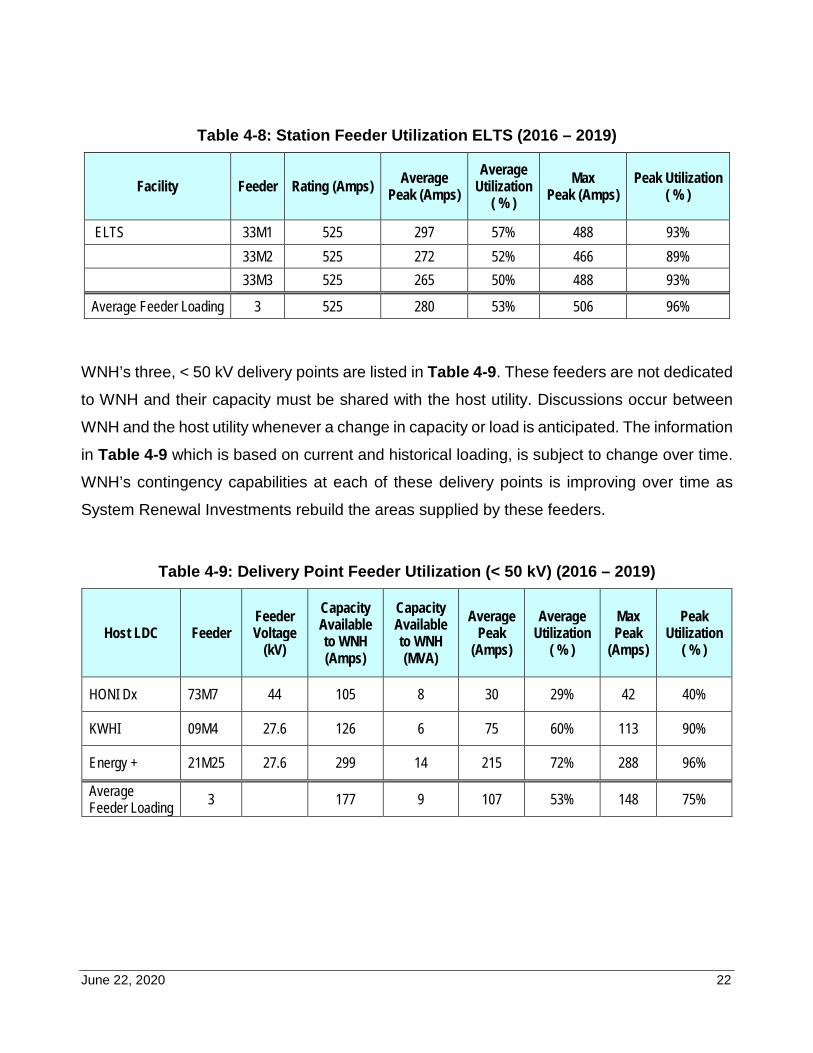
June 22, 2020 22
Table 4-8: Station Feeder Utilization ELTS (2016 – 2019)
Facility Feeder Rating (Amps) Average Peak (Amps)
Average Utilization
( % ) Max
Peak (Amps) Peak Utilization
( % )
ELTS 33M1 525 297 57% 488 93% 33M2 525 272 52% 466 89% 33M3 525 265 50% 488 93%
Average Feeder Loading 3 525 280 53% 506 96%
WNH’s three, < 50 kV delivery points are listed in Table 4-9. These feeders are not dedicated
to WNH and their capacity must be shared with the host utility. Discussions occur between
WNH and the host utility whenever a change in capacity or load is anticipated. The information
in Table 4-9 which is based on current and historical loading, is subject to change over time.
WNH’s contingency capabilities at each of these delivery points is improving over time as
System Renewal Investments rebuild the areas supplied by these feeders.
Table 4-9: Delivery Point Feeder Utilization (< 50 kV) (2016 – 2019)
Host LDC Feeder Feeder Voltage
(kV)
Capacity Available to WNH (Amps)
Capacity Available to WNH (MVA)
Average Peak
(Amps)
Average Utilization
( % )
Max Peak
(Amps)
Peak Utilization
( % )
HONI Dx 73M7 44 105 8 30 29% 42 40%
KWHI 09M4 27.6 126 6 75 60% 113 90%
Energy + 21M25 27.6 299 14 215 72% 288 96%
Average Feeder Loading 3 177 9 107 53% 148 75%
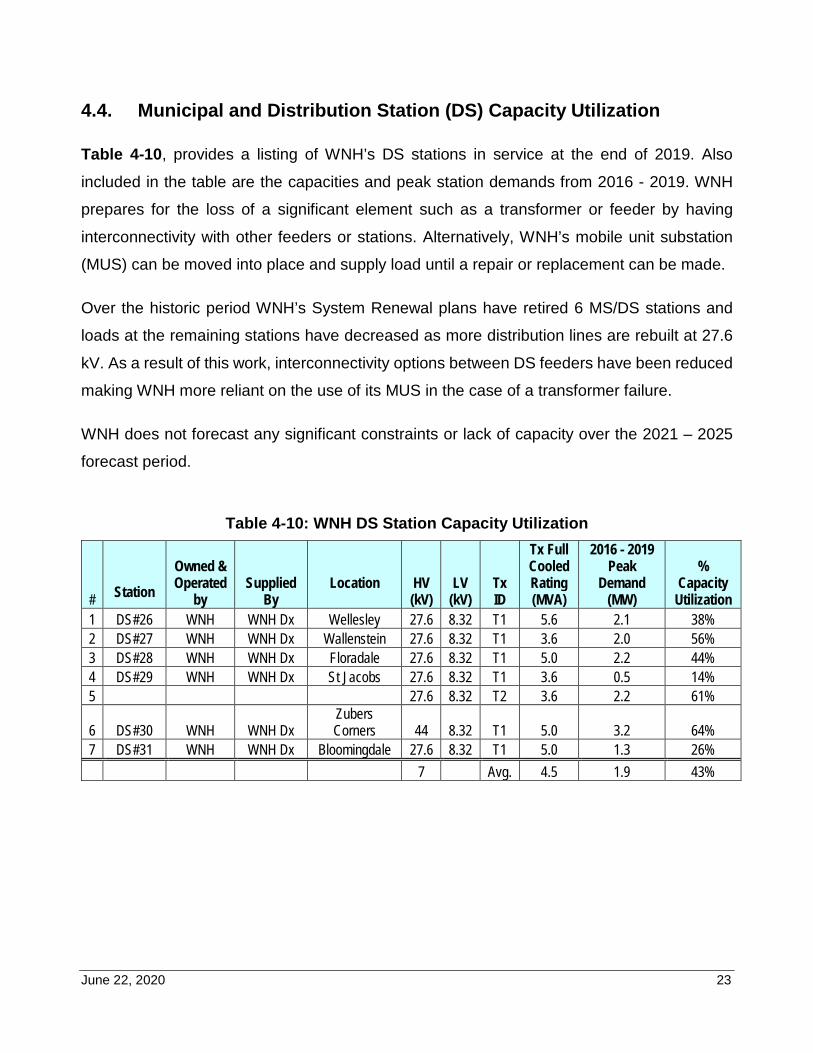
June 22, 2020 23
4.4. Municipal and Distribution Station (DS) Capacity Utilization
Table 4-10, provides a listing of WNH’s DS stations in service at the end of 2019. Also
included in the table are the capacities and peak station demands from 2016 - 2019. WNH
prepares for the loss of a significant element such as a transformer or feeder by having
interconnectivity with other feeders or stations. Alternatively, WNH’s mobile unit substation
(MUS) can be moved into place and supply load until a repair or replacement can be made.
Over the historic period WNH’s System Renewal plans have retired 6 MS/DS stations and
loads at the remaining stations have decreased as more distribution lines are rebuilt at 27.6
kV. As a result of this work, interconnectivity options between DS feeders have been reduced
making WNH more reliant on the use of its MUS in the case of a transformer failure.
WNH does not forecast any significant constraints or lack of capacity over the 2021 – 2025
forecast period.
Table 4-10: WNH DS Station Capacity Utilization
# Station
Owned & Operated
by Supplied
By Location
HV (kV)
LV (kV)
Tx ID
Tx Full Cooled Rating (MVA)
2016 - 2019 Peak
Demand (MW)
% Capacity
Utilization 1 DS#26 WNH WNH Dx Wellesley 27.6 8.32 T1 5.6 2.1 38% 2 DS#27 WNH WNH Dx Wallenstein 27.6 8.32 T1 3.6 2.0 56% 3 DS#28 WNH WNH Dx Floradale 27.6 8.32 T1 5.0 2.2 44% 4 DS#29 WNH WNH Dx St Jacobs 27.6 8.32 T1 3.6 0.5 14% 5 27.6 8.32 T2 3.6 2.2 61%
6 DS#30 WNH WNH Dx Zubers Corners 44 8.32 T1 5.0 3.2 64%
7 DS#31 WNH WNH Dx Bloomingdale 27.6 8.32 T1 5.0 1.3 26% 7 Avg. 4.5 1.9 43%
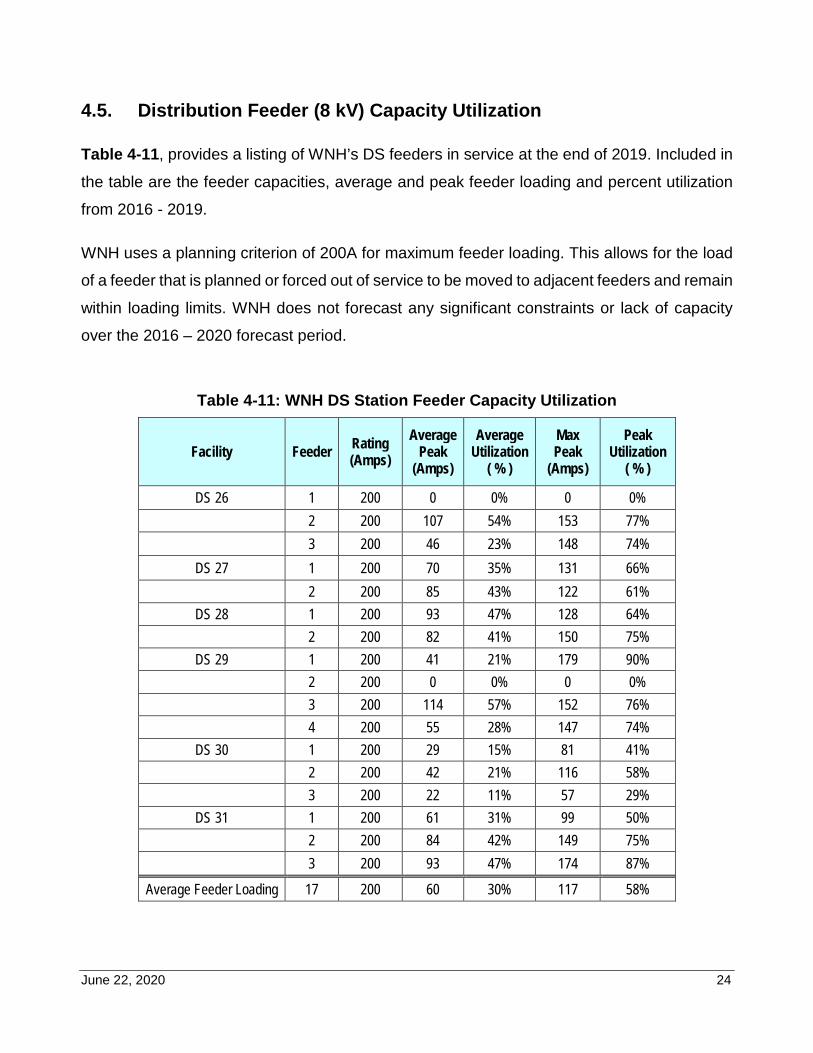
June 22, 2020 24
4.5. Distribution Feeder (8 kV) Capacity Utilization
Table 4-11, provides a listing of WNH’s DS feeders in service at the end of 2019. Included in
the table are the feeder capacities, average and peak feeder loading and percent utilization
from 2016 - 2019.
WNH uses a planning criterion of 200A for maximum feeder loading. This allows for the load
of a feeder that is planned or forced out of service to be moved to adjacent feeders and remain
within loading limits. WNH does not forecast any significant constraints or lack of capacity
over the 2016 – 2020 forecast period.
Table 4-11: WNH DS Station Feeder Capacity Utilization
Facility Feeder Rating (Amps)
Average Peak
(Amps)
Average Utilization
( % )
Max Peak
(Amps)
Peak Utilization
( % )
DS 26 1 200 0 0% 0 0% 2 200 107 54% 153 77%
3 200 46 23% 148 74% DS 27 1 200 70 35% 131 66%
2 200 85 43% 122 61% DS 28 1 200 93 47% 128 64%
2 200 82 41% 150 75% DS 29 1 200 41 21% 179 90%
2 200 0 0% 0 0% 3 200 114 57% 152 76% 4 200 55 28% 147 74%
DS 30 1 200 29 15% 81 41% 2 200 42 21% 116 58% 3 200 22 11% 57 29%
DS 31 1 200 61 31% 99 50% 2 200 84 42% 149 75% 3 200 93 47% 174 87%
Average Feeder Loading 17 200 60 30% 117 58%
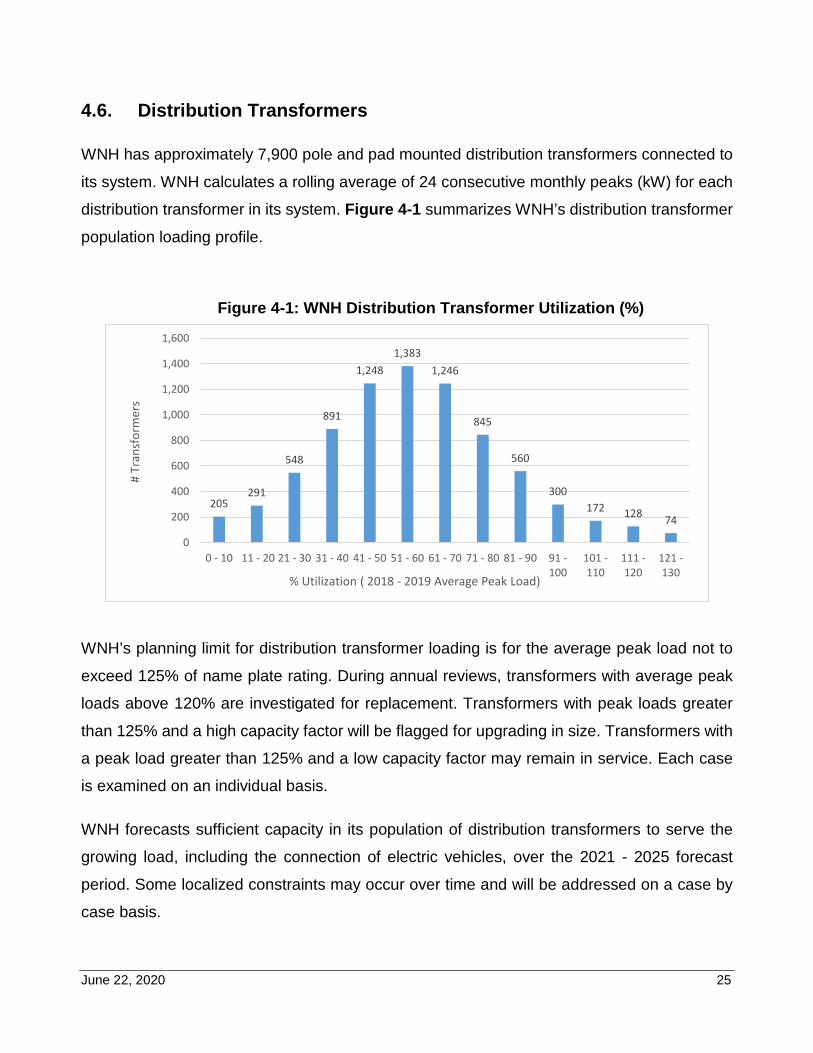
June 22, 2020 25
4.6. Distribution Transformers
WNH has approximately 7,900 pole and pad mounted distribution transformers connected to
its system. WNH calculates a rolling average of 24 consecutive monthly peaks (kW) for each
distribution transformer in its system. Figure 4-1 summarizes WNH’s distribution transformer
population loading profile.
Figure 4-1: WNH Distribution Transformer Utilization (%)
WNH’s planning limit for distribution transformer loading is for the average peak load not to
exceed 125% of name plate rating. During annual reviews, transformers with average peak
loads above 120% are investigated for replacement. Transformers with peak loads greater
than 125% and a high capacity factor will be flagged for upgrading in size. Transformers with
a peak load greater than 125% and a low capacity factor may remain in service. Each case
is examined on an individual basis.
WNH forecasts sufficient capacity in its population of distribution transformers to serve the
growing load, including the connection of electric vehicles, over the 2021 - 2025 forecast
period. Some localized constraints may occur over time and will be addressed on a case by
case basis.
205291
548
891
1,2481,383
1,246
845
560
300172 128 74
0
200
400
600
800
1,000
1,200
1,400
1,600
0 - 10 11 - 20 21 - 30 31 - 40 41 - 50 51 - 60 61 - 70 71 - 80 81 - 90 91 -100
101 -110
111 -120
121 -130
# Tr
ansf
orm
ers
% Utilization ( 2018 - 2019 Average Peak Load)
Appendix K:
WNH Distribution System Reliability Report
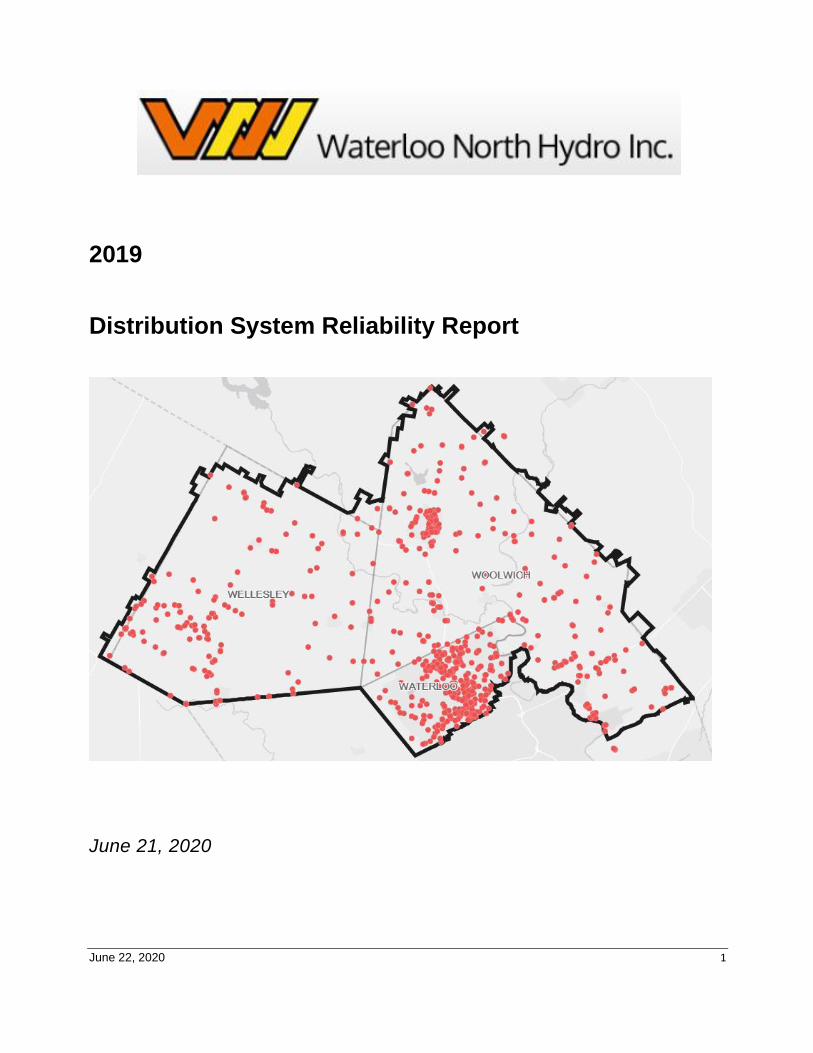
June 22, 2020 1
2019
Distribution System Reliability Report
June 21, 2020

June 22, 2020 2
(Page Intentionally left blank)
June 22, 2020 3
CONTENTS
CONTENTS ................................................................................................................................. 3
LIST OF TABLES ........................................................................................................................ 5
LIST OF FIGURES ...................................................................................................................... 7
GLOSSARY ................................................................................................................................. 8
1. EXECUTIVE SUMMARY .................................................................................................... 10
1.1. Purpose of this Report ............................................................................................. 10
1.2. Overview ................................................................................................................. 10
1.3. Description of the Utility Company ........................................................................... 12
1.4. Conclusions and Recommendations ....................................................................... 12
2. Sustained Interruptions ...................................................................................................... 15
2.1. Customer Minutes of Interruption (CMI) (Overview) ................................................. 15
2.2. Customer Minutes of Interruption Saved (CMIS) ..................................................... 19
2.3. Major Event Days (MED) ......................................................................................... 19
2.4. Top Contributing Interruption Events ....................................................................... 21
3. Sustained Interruption Cause Codes .................................................................................. 25
3.1. Overview ................................................................................................................. 25
3.2. Cause Code 0: Unknown / Other ............................................................................. 27
3.3. Cause Code 1: Scheduled Interruptions .................................................................. 29
3.4. Cause Code 2: Loss of Supply ................................................................................ 31
3.4.1. Overview ............................................................................................................ 31
3.4.2. HONI Transmission Circuit D10H Reliability ....................................................... 33
3.5. Code 3 – Tree Contacts .......................................................................................... 35
3.6. Code 4 – Lightning Contacts ................................................................................... 37
3.7. Code 5 – Defective Equipment ................................................................................ 39
3.8. Code 6 – Adverse Weather ..................................................................................... 41
3.9. Code 7 – Adverse Environment ............................................................................... 43
3.10. Code 8 – Human Element ....................................................................................... 44
3.11. Code 9 – Foreign Interference ................................................................................. 46
4. Operational Effectiveness – System Reliability ................................................................... 49
4.1. Reliability Targets .................................................................................................... 49
4.2. Reliability Performance Overview (2016 – 2019) ..................................................... 49
4.3. System Average Interruption Duration Index (SAIDI) ............................................... 50
4.4. System Average Interruption Frequency Index (SAIFI) ............................................ 51
4.5. Momentary Interruptions (MAIFI) ............................................................................. 52
5. Impact of Grid Modernization on Reliability ........................................................................ 54

June 22, 2020 4
6. Electrical Safety Authority Serious Electrical Incidents ....................................................... 56
7. 2019 Worst Performing Feeders ........................................................................................ 58
June 22, 2020 5
LIST OF TABLES
Table 1-1: WNH Reliability Performance (2016 - 2019) ................................................................. 11
Table 2-1: Sustained Interruptions (2016 - 2019) ........................................................................... 15
Table 2-2: Customer & Event Data (2016 - 2019) .......................................................................... 16
Table 2-3: Historical Sustained Interruptions (2016 - 2019) ........................................................... 17
Table 2-4: Customer Minutes of Interruption Savings .................................................................... 19
Table 2-5: MED 2016 - 2019 .......................................................................................................... 20
Table 2-6: Top Contributing Sustained Events 2019 ...................................................................... 21
Table 2-7: Top Contributing Sustained Events 2018 ...................................................................... 22
Table 2-8: Top Contributing Sustained Events 2017 ...................................................................... 23
Table 2-9: Top Contributing Sustained Events 2016 ...................................................................... 24
Table 3-1: Interruption Events Trending ......................................................................................... 25
Table 3-2: CMI Trending (2016 – 2019) ......................................................................................... 26
Table 3-3: Reliability Event Causes by Rank (2016 - 2019) ........................................................... 26
Table 3-4: Unknown Cause (2016 - 2019) ..................................................................................... 28
Table 3-5: Scheduled Interruptions (2016 - 2019) .......................................................................... 30
Table 3-6: WNH Loss of Supply ..................................................................................................... 31
Table 3-7: WNH Loss of Supply/ MED ........................................................................................... 32
Table 3-8: WNH Loss of Supply by Delivery Point ......................................................................... 32
Table 3-9: WNH Tree Contacts (2016-2019) ................................................................................. 35
Table 3-10: WNH Tree Contacts and MEDs (2016-2019) .............................................................. 36
Table 3-11: Lightning Events (2016-2019) ..................................................................................... 38
Table 3-12: WNH Lightning Events and MEDs (2016-2019) .......................................................... 38
Table 3-13: Defective Equipment (2016-2019)............................................................................... 40
Table 3-14: Defective Equipment and MEDs (2016-2019) ............................................................. 40
Table 3-15: Adverse Weather (2016-2019) .................................................................................... 42
Table 3-16: Adverse Weather and MEDs (2016-2019) .................................................................. 42
Table 3-17: Adverse Environment (2016-2019) ............................................................................. 43
Table 3-18: Human Element (2016-2019) ...................................................................................... 45
Table 3-19: Foreign Interference (2016-2019) ............................................................................... 47
Table 3-20: Foreign Interference and MEDs (2016-2019) .............................................................. 47
Table 3-21: Foreign Interference by Subcause (2016-2019) ........................................................ 48
June 22, 2020 6
Table 4-1: WNH Reliability Performance 2011-2015 ...................................................................... 49
Table 4-2: WNH Historical CMI, SAIDI, SAIFI, MAIFI (All Inclusive) ............................................... 49
Table 4-3: WNH Historical CMI, SAIDI, SAIFI, MAIFI (Excluding LOS & MED) ............................. 50
Table 4-4: Momentary Interruption Events (2016 – 2019) .............................................................. 52
Table 6-1: Serious Incidents 2015 – 2019 ...................................................................................... 56
Table 7-1: Worst Performing Feeders (2019) ................................................................................. 58
Table 7-2: Worst Performing Feeder Action Plans (2019) .............................................................. 59
Table 7-3a: WNH Feeder Performance Excluding Planned & Major Event Days ........................... 60
Table 7-3b: WNH Feeder Performance Excluding Planned & Major Event Days ........................... 61
June 22, 2020 7
LIST OF FIGURES
Figure 1-1: WNH Service Territory ................................................................................................. 14
Figure 2-1: CMI Trending (2016 – 2019) ........................................................................................ 15
Figure 2-2: CMI / Customer Trending (2016 – 2019)...................................................................... 16
Figure 2-3: Interruption Events Trending (2016 – 2019) ................................................................. 17
Figure 3-1: Unknown / Other Cause Trending ............................................................................... 27
Figure 3-2: Scheduled Interruptions Cause Trending ..................................................................... 29
Figure 3-3: Scheduled Interruptions (2019) .................................................................................... 30
Figure 3-4: WNH Loss of Supply/ MED .......................................................................................... 32
Figure 3-5: Tree Contact Trending ................................................................................................. 35
Figure 3-6: Lightning Events Cause Trending ................................................................................ 37
Figure 3-7: Defective Equipment (2016 – 2019) ............................................................................. 39
Figure 3-8: Adverse Weather (2016 – 2019) .................................................................................. 41
Figure 3-9: Adverse Environment (2016-2019) .............................................................................. 43
Figure 3-10: Human Element (2016 – 2019) .................................................................................. 44
Figure 3-11: Foreign Interference (2016 – 2019) ........................................................................... 46
Figure 3-12: Foreign Interference Causes (2016 – 2019) .............................................................. 48
Figure 4-1: SAIDI (2016 – 2019) .................................................................................................... 51
Figure 4-2: SAIFI (2016 – 2019) .................................................................................................... 52
Figure 4-3: MAIFI (2016-2019) ...................................................................................................... 53
Figure 6-1: Serious Incidents ......................................................................................................... 56
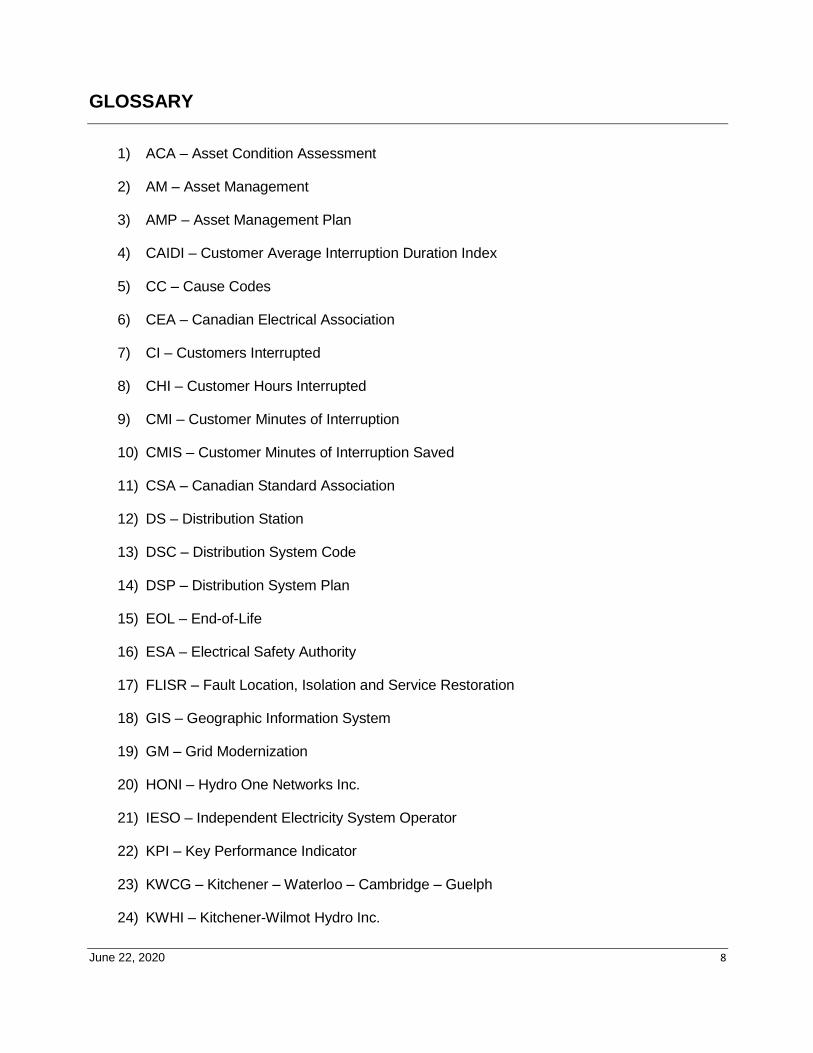
June 22, 2020 8
GLOSSARY
1) ACA – Asset Condition Assessment
2) AM – Asset Management
3) AMP – Asset Management Plan
4) CAIDI – Customer Average Interruption Duration Index
5) CC – Cause Codes
6) CEA – Canadian Electrical Association
7) CI – Customers Interrupted
8) CHI – Customer Hours Interrupted
9) CMI – Customer Minutes of Interruption
10) CMIS – Customer Minutes of Interruption Saved
11) CSA – Canadian Standard Association
12) DS – Distribution Station
13) DSC – Distribution System Code
14) DSP – Distribution System Plan
15) EOL – End-of-Life
16) ESA – Electrical Safety Authority
17) FLISR – Fault Location, Isolation and Service Restoration
18) GIS – Geographic Information System
19) GM – Grid Modernization
20) HONI – Hydro One Networks Inc.
21) IESO – Independent Electricity System Operator
22) KPI – Key Performance Indicator
23) KWCG – Kitchener – Waterloo – Cambridge – Guelph
24) KWHI – Kitchener-Wilmot Hydro Inc.
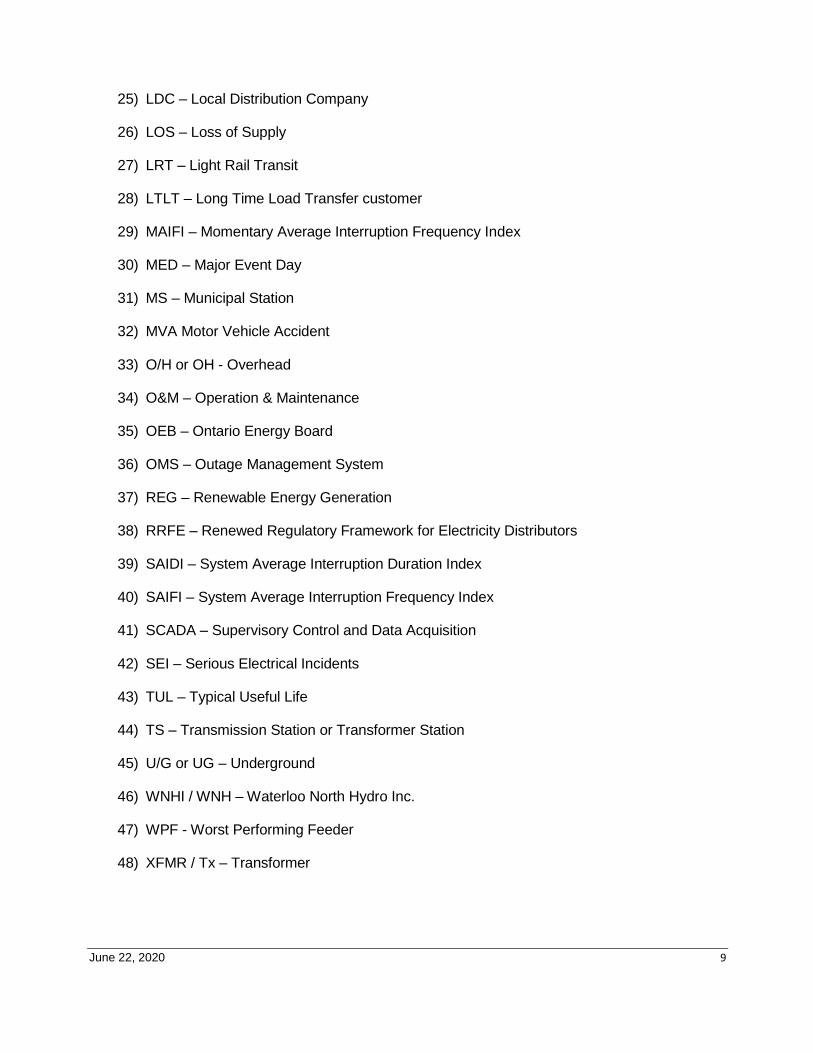
June 22, 2020 9
25) LDC – Local Distribution Company
26) LOS – Loss of Supply
27) LRT – Light Rail Transit
28) LTLT – Long Time Load Transfer customer
29) MAIFI – Momentary Average Interruption Frequency Index
30) MED – Major Event Day
31) MS – Municipal Station
32) MVA Motor Vehicle Accident
33) O/H or OH - Overhead
34) O&M – Operation & Maintenance
35) OEB – Ontario Energy Board
36) OMS – Outage Management System
37) REG – Renewable Energy Generation
38) RRFE – Renewed Regulatory Framework for Electricity Distributors
39) SAIDI – System Average Interruption Duration Index
40) SAIFI – System Average Interruption Frequency Index
41) SCADA – Supervisory Control and Data Acquisition
42) SEI – Serious Electrical Incidents
43) TUL – Typical Useful Life
44) TS – Transmission Station or Transformer Station
45) U/G or UG – Underground
46) WNHI / WNH – Waterloo North Hydro Inc.
47) WPF - Worst Performing Feeder
48) XFMR / Tx – Transformer
June 22, 2020 10
1. EXECUTIVE SUMMARY
1.1. Purpose of this Report
Good reliability performance is consistently at or near the top of WNH’s customers’ stated
preferences. It is one of WNH’s top two Strategic Imperatives and Asset Management Objectives.
Good reliability also helps support the achievement of the OEB’s key performance outcome of
Operational Effectiveness as established in the Renewed Regulatory Framework for Electricity
(RRFE).
Waterloo North Hydro’s “Distribution System Reliability Report” provides a consolidated view of
WNH’s reliability performance over the period covering 2016 – 2019 inclusive. This report provides
historical data and trends in reliability performance. The performance of all WNH feeders are
reviewed annually and the worst performing feeders, based on three year rolling CMI averages, are
identified and flagged for action. Reliability issues, including leading causes, are identified and
recommendations for action are provided.
The information in this report informs WNH’s senior executive team (Executive) and aides in the
development of WNH’s business plans, budgets and Distribution System Plan (DSP). This report
also informs the system reliability portion of the OEB’s RRR filing and has been prepared to support
WNH’s 2021 Cost of Service Application (Application).
All information contained in this report is current as of December 31, 2019.
1.2. Overview
Table 1-1 provides a summary of WNH’s reliability performance from 2016 and 2019 inclusive.
WNH’s most recent OEB reliability targets of SAIDI (0.62) and SAIFI (1.16) were set in 2016 and
based on WNH’s 2011- 2015 reliability performance. WNH’s 2019 reliability performance for SAIDI
(0.85) and for SAIFI (1.29) were an improvement over 2018; however, WNH did not meet the OEB’s
reliability targets.
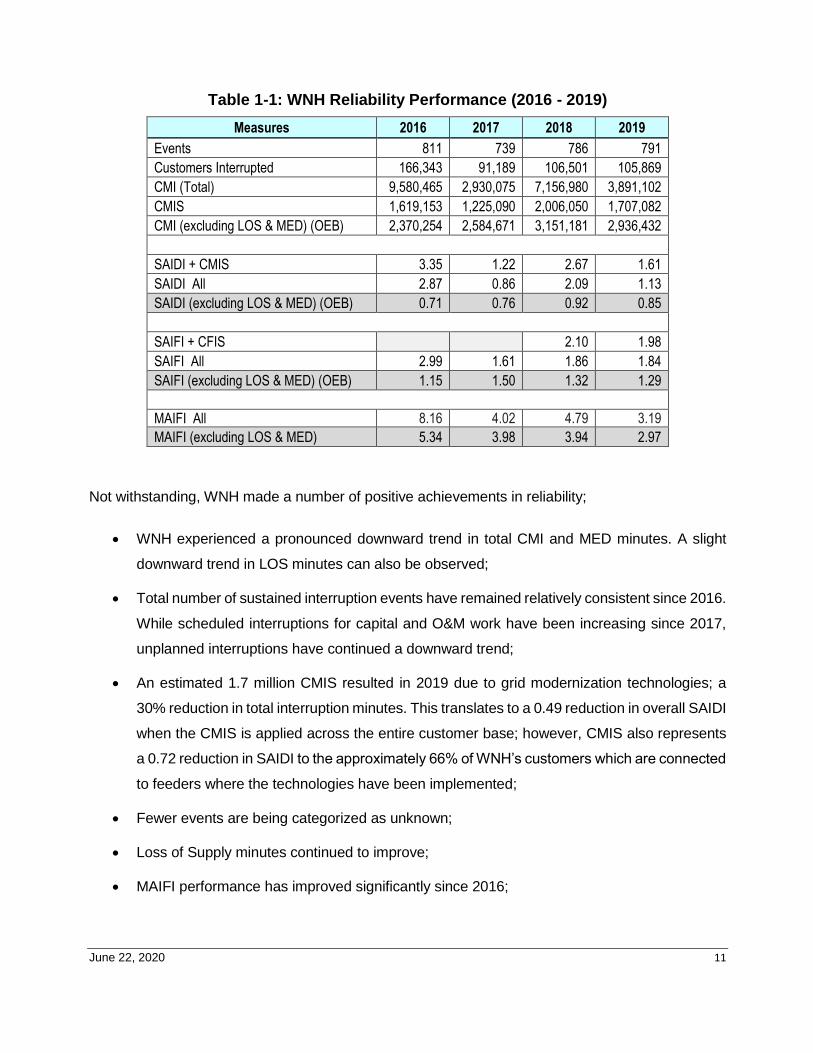
June 22, 2020 11
Table 1-1: WNH Reliability Performance (2016 - 2019)
Measures 2016 2017 2018 2019
Events 811 739 786 791
Customers Interrupted 166,343 91,189 106,501 105,869
CMI (Total) 9,580,465 2,930,075 7,156,980 3,891,102
CMIS 1,619,153 1,225,090 2,006,050 1,707,082
CMI (excluding LOS & MED) (OEB) 2,370,254 2,584,671 3,151,181 2,936,432
SAIDI + CMIS 3.35 1.22 2.67 1.61
SAIDI All 2.87 0.86 2.09 1.13
SAIDI (excluding LOS & MED) (OEB) 0.71 0.76 0.92 0.85
SAIFI + CFIS 2.10 1.98
SAIFI All 2.99 1.61 1.86 1.84
SAIFI (excluding LOS & MED) (OEB) 1.15 1.50 1.32 1.29
MAIFI All 8.16 4.02 4.79 3.19
MAIFI (excluding LOS & MED) 5.34 3.98 3.94 2.97
Not withstanding, WNH made a number of positive achievements in reliability;
WNH experienced a pronounced downward trend in total CMI and MED minutes. A slight
downward trend in LOS minutes can also be observed;
Total number of sustained interruption events have remained relatively consistent since 2016.
While scheduled interruptions for capital and O&M work have been increasing since 2017,
unplanned interruptions have continued a downward trend;
An estimated 1.7 million CMIS resulted in 2019 due to grid modernization technologies; a
30% reduction in total interruption minutes. This translates to a 0.49 reduction in overall SAIDI
when the CMIS is applied across the entire customer base; however, CMIS also represents
a 0.72 reduction in SAIDI to the approximately 66% of WNH’s customers which are connected
to feeders where the technologies have been implemented;
Fewer events are being categorized as unknown;
Loss of Supply minutes continued to improve;
MAIFI performance has improved significantly since 2016;
June 22, 2020 12
Points of note include;
Although down slightly in 2019, CMI excluding LOS and MED has been on an upward trend
since 2016.
The most significant interruption event in 2019 was a 2-day event that began on July 20th
when extreme wind (>90km/h) and heavy rain caused tree limbs to fall throughout WNH’s
territory. CMI totaled 798,799 and accounted for 20.5% of the 2019 total CMI. Both days
were classified as Major Event Days (MED) by OEB definition. More detail is available within
this report.
Of the 791 sustained interruption events in 2019, 452 (57%) were due to scheduled
interruptions representing 15.6% of total CMI. This has been relatively consistent since 2016.
In 2019, Adverse Weather ranked 1st, (25.6%) in sustained interruption causes and since
2016 has contributed 7,287,685 or 30% of WNH’s total CMI, ranking it 1st overall.
1.3. Description of the Utility Company
A current map of WNH’s Service Area is provided in Figure 1-1. Please refer to WNH’s Distribution
System Plan, Section 1.38 for a complete description of the utility.
1.4. Conclusions and Recommendations
In spite on not meeting OEB reliability targets as previously mentioned, analysis of the 2016 – 2019
reliability data indicates that the incremental grid modernization investments WNH has made are
positively impacting customer reliability. Given that WNH’s customers have placed a high value on
the reliability of their electrical supply, it would be prudent for WNH to continue to explore cost
effective investments in this area.
Approximately one-third of WNH’s customer base does not yet fully benefit from the reliability
improvements made by WNH’s grid modernization investments. Opportunities for improvement exist
with further rollout of these technologies.

June 22, 2020 13
WNH’s distribution system will evolve over time with development, changing load and generation.
Even where grid modernization technologies have been implemented, regular re-examination of
feeder performance will identify further opportunities for improvement.
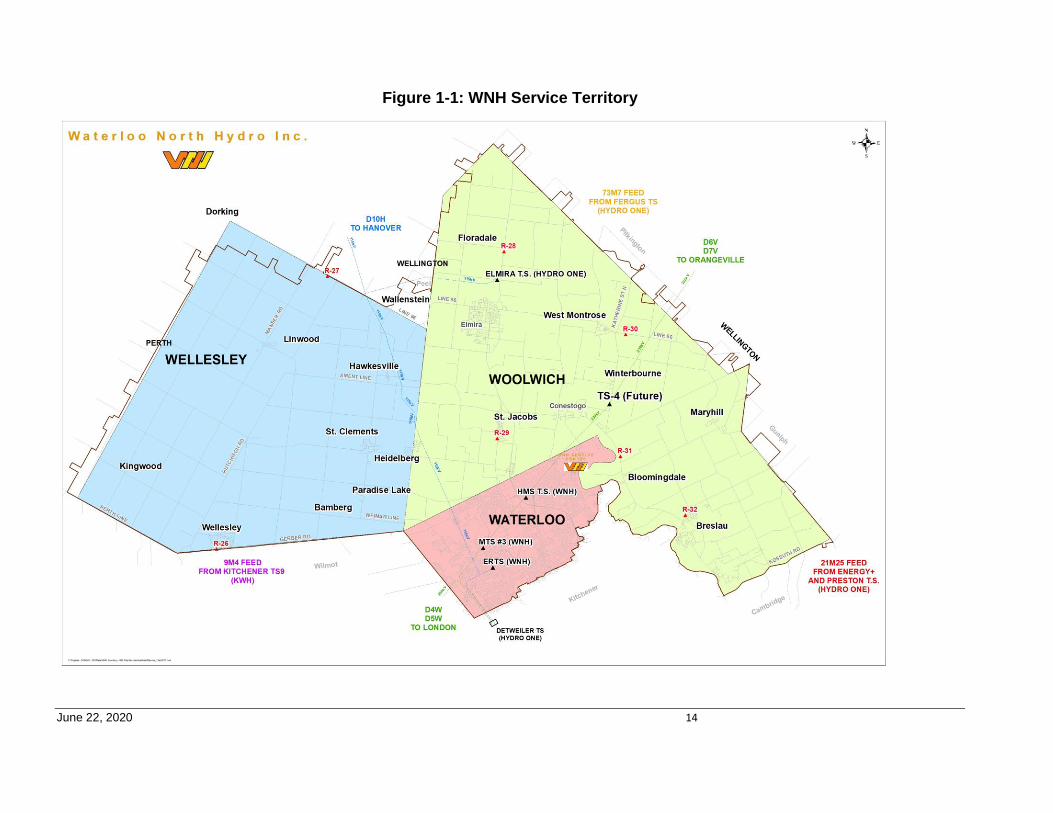
June 22, 2020 14
Figure 1-1: WNH Service Territory
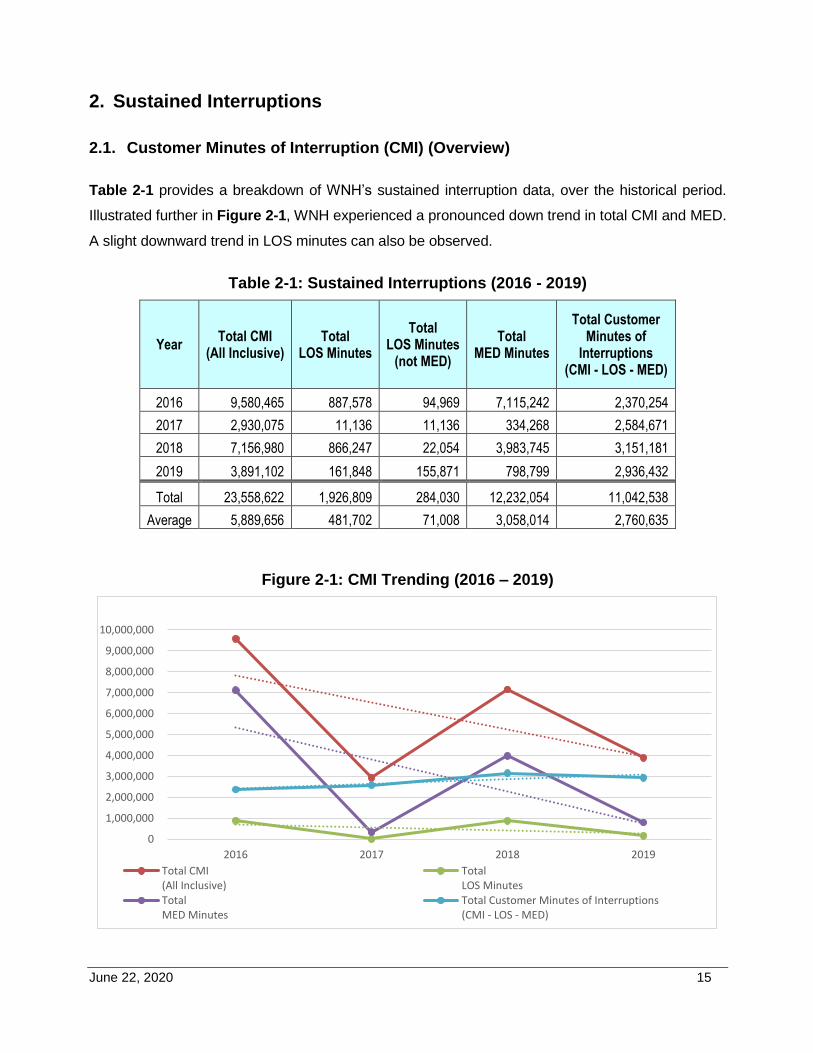
June 22, 2020 15
2. Sustained Interruptions
2.1. Customer Minutes of Interruption (CMI) (Overview)
Table 2-1 provides a breakdown of WNH’s sustained interruption data, over the historical period.
Illustrated further in Figure 2-1, WNH experienced a pronounced down trend in total CMI and MED.
A slight downward trend in LOS minutes can also be observed.
Table 2-1: Sustained Interruptions (2016 - 2019)
Year Total CMI
(All Inclusive) Total
LOS Minutes
Total LOS Minutes
(not MED)
Total MED Minutes
Total Customer Minutes of
Interruptions (CMI - LOS - MED)
2016 9,580,465 887,578 94,969 7,115,242 2,370,254
2017 2,930,075 11,136 11,136 334,268 2,584,671
2018 7,156,980 866,247 22,054 3,983,745 3,151,181
2019 3,891,102 161,848 155,871 798,799 2,936,432
Total 23,558,622 1,926,809 284,030 12,232,054 11,042,538
Average 5,889,656 481,702 71,008 3,058,014 2,760,635
Figure 2-1: CMI Trending (2016 – 2019)
0
1,000,000
2,000,000
3,000,000
4,000,000
5,000,000
6,000,000
7,000,000
8,000,000
9,000,000
10,000,000
2016 2017 2018 2019
Total CMI(All Inclusive)
TotalLOS Minutes
TotalMED Minutes
Total Customer Minutes of Interruptions(CMI - LOS - MED)
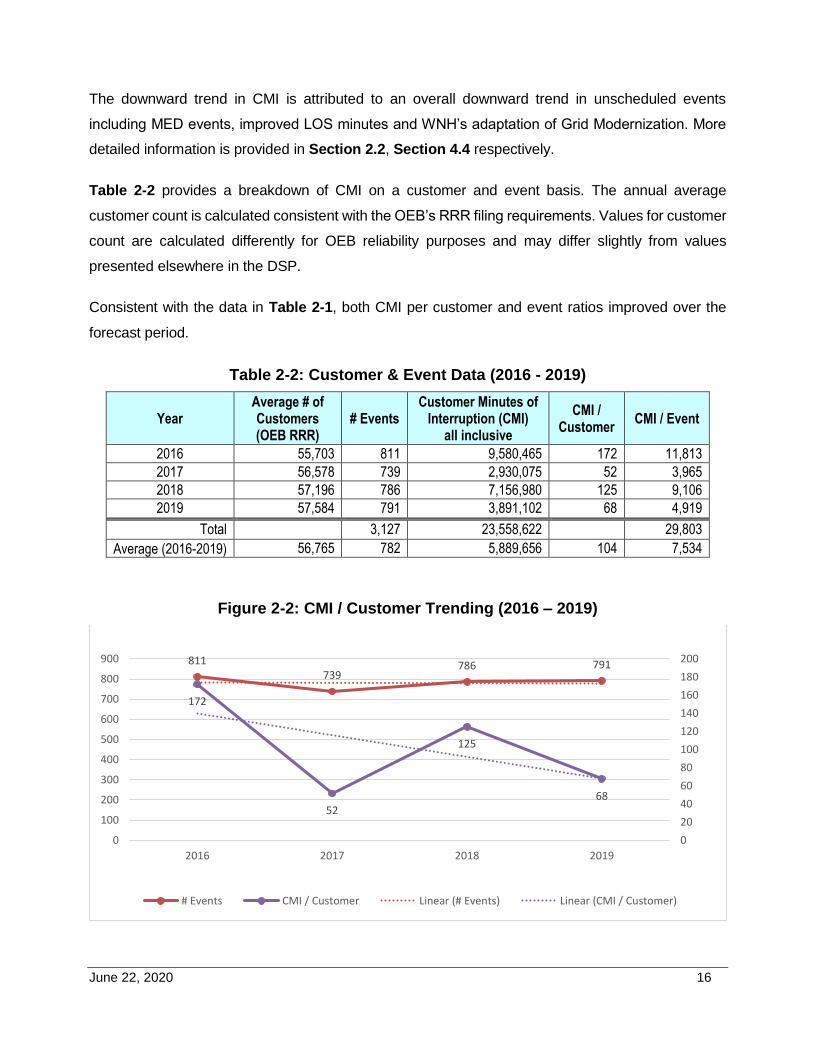
June 22, 2020 16
The downward trend in CMI is attributed to an overall downward trend in unscheduled events
including MED events, improved LOS minutes and WNH’s adaptation of Grid Modernization. More
detailed information is provided in Section 2.2, Section 4.4 respectively.
Table 2-2 provides a breakdown of CMI on a customer and event basis. The annual average
customer count is calculated consistent with the OEB’s RRR filing requirements. Values for customer
count are calculated differently for OEB reliability purposes and may differ slightly from values
presented elsewhere in the DSP.
Consistent with the data in Table 2-1, both CMI per customer and event ratios improved over the
forecast period.
Table 2-2: Customer & Event Data (2016 - 2019)
Year Average # of Customers (OEB RRR)
# Events Customer Minutes of
Interruption (CMI) all inclusive
CMI / Customer
CMI / Event
2016 55,703 811 9,580,465 172 11,813
2017 56,578 739 2,930,075 52 3,965
2018 57,196 786 7,156,980 125 9,106
2019 57,584 791 3,891,102 68 4,919
Total 3,127 23,558,622 29,803
Average (2016-2019) 56,765 782 5,889,656 104 7,534
Figure 2-2: CMI / Customer Trending (2016 – 2019)
811739
786 791
172
52
125
68
0
20
40
60
80
100
120
140
160
180
200
0
100
200
300
400
500
600
700
800
900
2016 2017 2018 2019
# Events CMI / Customer Linear (# Events) Linear (CMI / Customer)
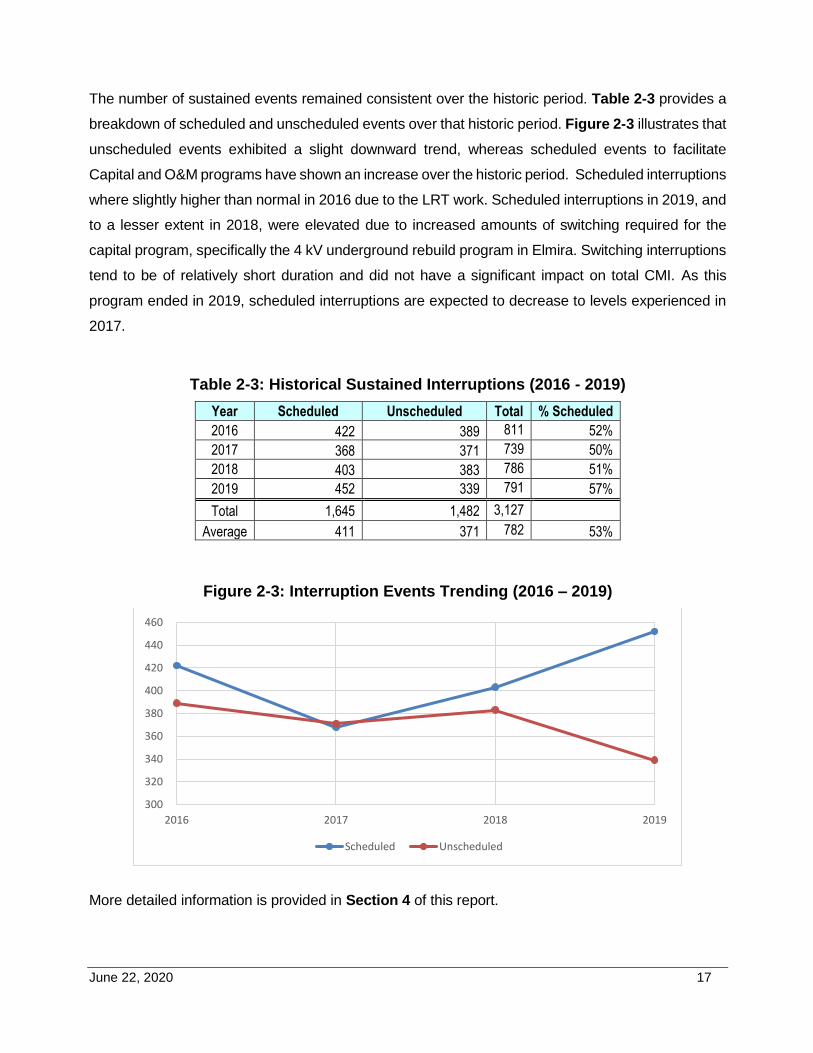
June 22, 2020 17
The number of sustained events remained consistent over the historic period. Table 2-3 provides a
breakdown of scheduled and unscheduled events over that historic period. Figure 2-3 illustrates that
unscheduled events exhibited a slight downward trend, whereas scheduled events to facilitate
Capital and O&M programs have shown an increase over the historic period. Scheduled interruptions
where slightly higher than normal in 2016 due to the LRT work. Scheduled interruptions in 2019, and
to a lesser extent in 2018, were elevated due to increased amounts of switching required for the
capital program, specifically the 4 kV underground rebuild program in Elmira. Switching interruptions
tend to be of relatively short duration and did not have a significant impact on total CMI. As this
program ended in 2019, scheduled interruptions are expected to decrease to levels experienced in
2017.
Table 2-3: Historical Sustained Interruptions (2016 - 2019)
Year Scheduled Unscheduled Total % Scheduled
2016 422 389 811 52%
2017 368 371 739 50%
2018 403 383 786 51%
2019 452 339 791 57%
Total 1,645 1,482 3,127
Average 411 371 782 53%
Figure 2-3: Interruption Events Trending (2016 – 2019)
More detailed information is provided in Section 4 of this report.
300
320
340
360
380
400
420
440
460
2016 2017 2018 2019
Scheduled Unscheduled
June 22, 2020 18
Although it can be seen from Figure 2-1 that the historic period experienced a downward trend in
loss of supply and MED minutes, the adjusted CMI, excluding LOS and MED experienced an
increasing trend. WNH expects that both trends are due to the effects of grid modernization
investments that are helping reduce customer interruption minutes.
Analysis of the results suggests the following;
a) WNH implemented a number of grid modernization technologies over the historical period.
Survalent’s Fault Location, Isolation, and Service Restoration (FLISR) software application
that combines with SCADA, OMS, and automated switching devices that reroute power in the
event of a fault to restore power to as many customers as possible, as quickly as possible.
These technologies provide automatic self-healing on the portions of the system unaffected
by the fault, ultimately improving restoration times. Since 2016, in areas where these
technologies have been implemented, WNH customers have saved approximately 6.6 million
customer minutes of interruption, averaging 1.64 million customer minutes saved annually. In
2019 WNH estimates 1.7 million customer minutes were saved; a 30% reduction in
interruption minutes. More detailed information is provided in Section 2.2.
b) WNH’s outage management system (OMS) went into service in 2015. This technology has
improved the accuracy of recording both CI and CMI over the historical period. WNH suspects
that this has also worsened its baseline reliability performance measures by capturing more
data.
c) The implementation of grid modernization technology by WNH has saved approximately 1.64
million customer interruption minutes annually. This has also had the effect in some
interruption events to reduce the CMI below the major event day (MED) threshold. Where in
the past, the entire CMI for such an event would have fallen under a MED event and not
contributed to the overall performance record, dropping below the MED threshold results in a
step increase in customer interruption minutes that are added to the performance record.
WNH suspects that this has also worsened its baseline reliability performance measures.
d) WNH has made a conscious decision to increase the number of line safety patrols prior to
restoring power during an unplanned interruption. This was as a result of safety concerns
where incidents of foreign interference or damaged equipment created situations where the
public could have come in contact with energized conductors. The patrols increase public
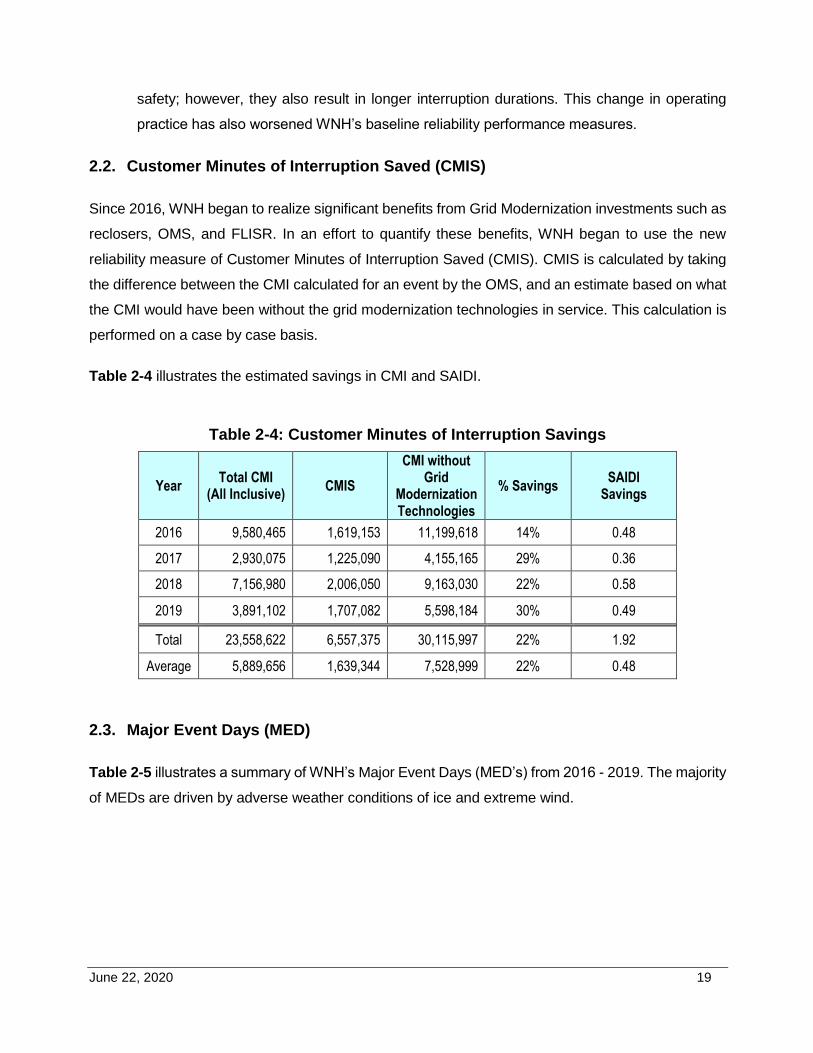
June 22, 2020 19
safety; however, they also result in longer interruption durations. This change in operating
practice has also worsened WNH’s baseline reliability performance measures.
2.2. Customer Minutes of Interruption Saved (CMIS)
Since 2016, WNH began to realize significant benefits from Grid Modernization investments such as
reclosers, OMS, and FLISR. In an effort to quantify these benefits, WNH began to use the new
reliability measure of Customer Minutes of Interruption Saved (CMIS). CMIS is calculated by taking
the difference between the CMI calculated for an event by the OMS, and an estimate based on what
the CMI would have been without the grid modernization technologies in service. This calculation is
performed on a case by case basis.
Table 2-4 illustrates the estimated savings in CMI and SAIDI.
Table 2-4: Customer Minutes of Interruption Savings
Year Total CMI
(All Inclusive) CMIS
CMI without Grid
Modernization Technologies
% Savings SAIDI
Savings
2016 9,580,465 1,619,153 11,199,618 14% 0.48
2017 2,930,075 1,225,090 4,155,165 29% 0.36
2018 7,156,980 2,006,050 9,163,030 22% 0.58
2019 3,891,102 1,707,082 5,598,184 30% 0.49
Total 23,558,622 6,557,375 30,115,997 22% 1.92
Average 5,889,656 1,639,344 7,528,999 22% 0.48
2.3. Major Event Days (MED)
Table 2-5 illustrates a summary of WNH’s Major Event Days (MED’s) from 2016 - 2019. The majority
of MEDs are driven by adverse weather conditions of ice and extreme wind.
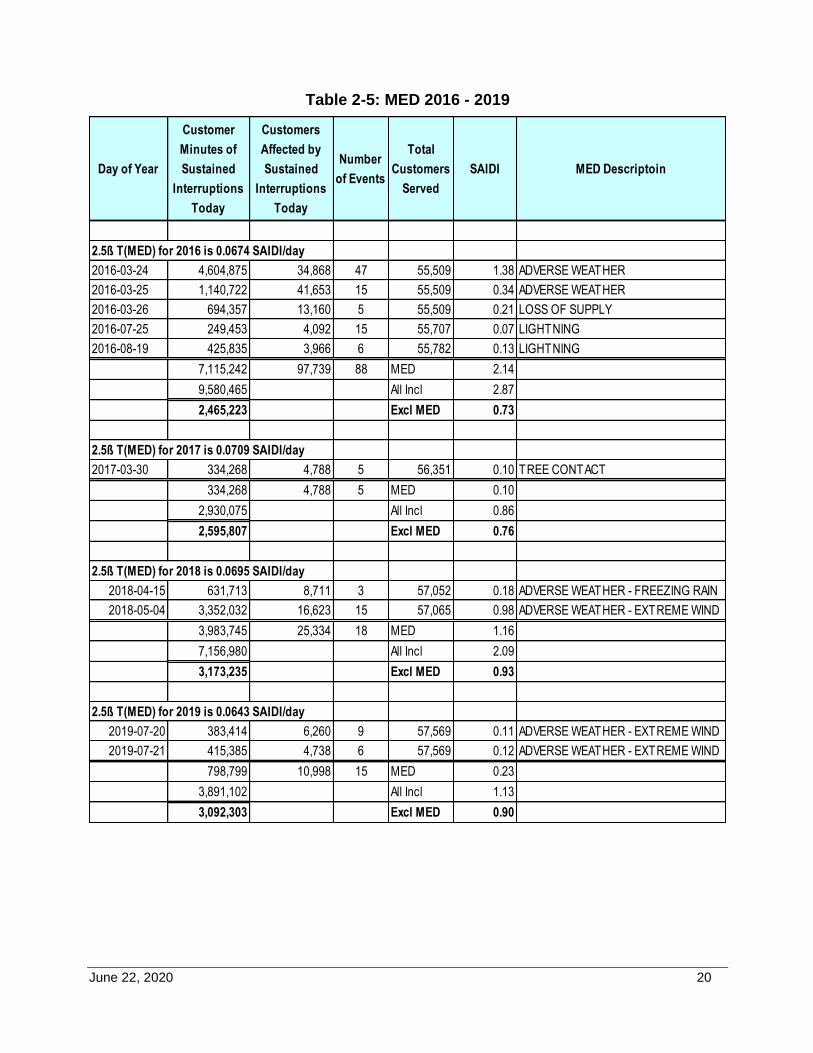
June 22, 2020 20
Table 2-5: MED 2016 - 2019
Day of Year
Customer
Minutes of
Sustained
Interruptions
Today
Customers
Affected by
Sustained
Interruptions
Today
Number
of Events
Total
Customers
Served
SAIDI MED Descriptoin
2.5ß T(MED) for 2016 is 0.0674 SAIDI/day
2016-03-24 4,604,875 34,868 47 55,509 1.38 ADVERSE WEATHER
2016-03-25 1,140,722 41,653 15 55,509 0.34 ADVERSE WEATHER
2016-03-26 694,357 13,160 5 55,509 0.21 LOSS OF SUPPLY
2016-07-25 249,453 4,092 15 55,707 0.07 LIGHTNING
2016-08-19 425,835 3,966 6 55,782 0.13 LIGHTNING
7,115,242 97,739 88 MED 2.14
9,580,465 All Incl 2.87
2,465,223 Excl MED 0.73
2.5ß T(MED) for 2017 is 0.0709 SAIDI/day
2017-03-30 334,268 4,788 5 56,351 0.10 TREE CONTACT
334,268 4,788 5 MED 0.10
2,930,075 All Incl 0.86
2,595,807 Excl MED 0.76
2.5ß T(MED) for 2018 is 0.0695 SAIDI/day
2018-04-15 631,713 8,711 3 57,052 0.18 ADVERSE WEATHER - FREEZING RAIN
2018-05-04 3,352,032 16,623 15 57,065 0.98 ADVERSE WEATHER - EXTREME WIND
3,983,745 25,334 18 MED 1.16
7,156,980 All Incl 2.09
3,173,235 Excl MED 0.93
2.5ß T(MED) for 2019 is 0.0643 SAIDI/day
2019-07-20 383,414 6,260 9 57,569 0.11 ADVERSE WEATHER - EXTREME WIND
2019-07-21 415,385 4,738 6 57,569 0.12 ADVERSE WEATHER - EXTREME WIND
798,799 10,998 15 MED 0.23
3,891,102 All Incl 1.13
3,092,303 Excl MED 0.90
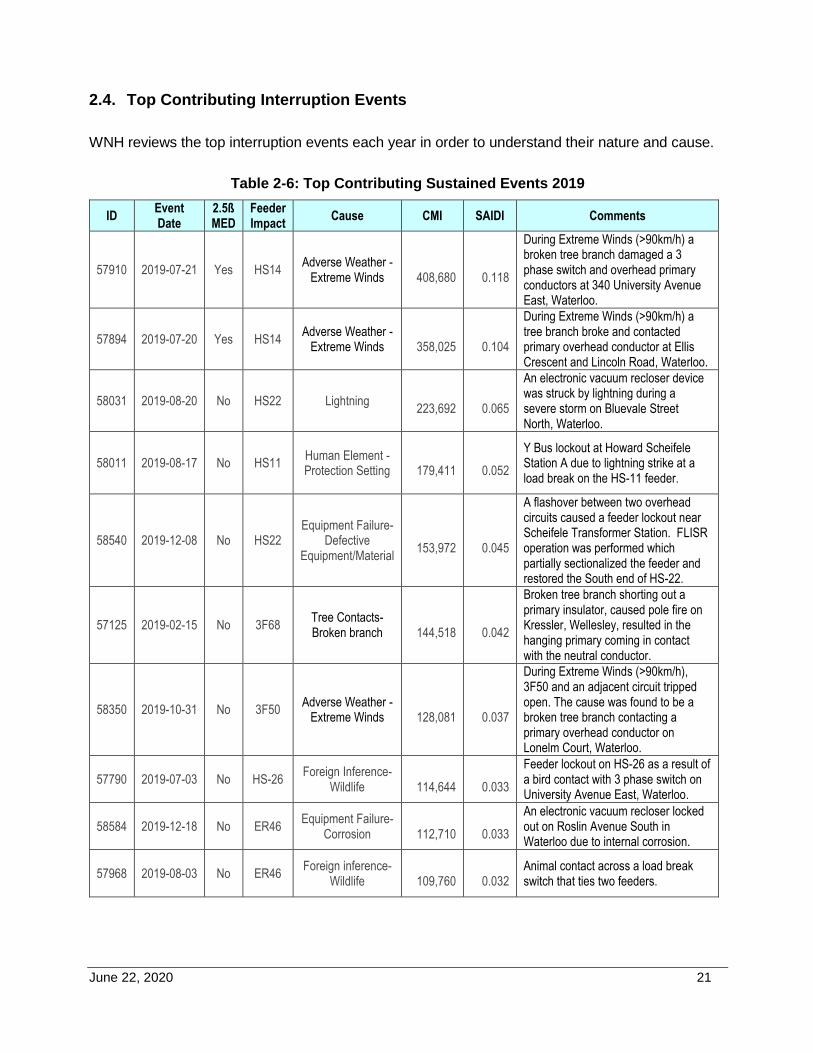
June 22, 2020 21
2.4. Top Contributing Interruption Events
WNH reviews the top interruption events each year in order to understand their nature and cause.
Table 2-6: Top Contributing Sustained Events 2019
ID Event Date
2.5ß MED
Feeder Impact
Cause CMI SAIDI Comments
57910 2019-07-21 Yes HS14 Adverse Weather -
Extreme Winds
408,680
0.118
During Extreme Winds (>90km/h) a broken tree branch damaged a 3 phase switch and overhead primary conductors at 340 University Avenue East, Waterloo.
57894 2019-07-20 Yes HS14 Adverse Weather -
Extreme Winds
358,025
0.104
During Extreme Winds (>90km/h) a tree branch broke and contacted primary overhead conductor at Ellis Crescent and Lincoln Road, Waterloo.
58031 2019-08-20 No HS22 Lightning
223,692
0.065
An electronic vacuum recloser device was struck by lightning during a severe storm on Bluevale Street North, Waterloo.
58011 2019-08-17 No HS11 Human Element - Protection Setting
179,411
0.052
Y Bus lockout at Howard Scheifele Station A due to lightning strike at a load break on the HS-11 feeder.
58540 2019-12-08 No HS22 Equipment Failure-
Defective Equipment/Material
153,972
0.045
A flashover between two overhead circuits caused a feeder lockout near Scheifele Transformer Station. FLISR operation was performed which partially sectionalized the feeder and restored the South end of HS-22.
57125 2019-02-15 No 3F68 Tree Contacts- Broken branch
144,518
0.042
Broken tree branch shorting out a primary insulator, caused pole fire on Kressler, Wellesley, resulted in the hanging primary coming in contact with the neutral conductor.
58350 2019-10-31 No 3F50 Adverse Weather -
Extreme Winds
128,081
0.037
During Extreme Winds (>90km/h), 3F50 and an adjacent circuit tripped open. The cause was found to be a broken tree branch contacting a primary overhead conductor on Lonelm Court, Waterloo.
57790 2019-07-03 No HS-26 Foreign Inference-
Wildlife
114,644
0.033
Feeder lockout on HS-26 as a result of a bird contact with 3 phase switch on University Avenue East, Waterloo.
58584 2019-12-18 No ER46 Equipment Failure-
Corrosion
112,710
0.033
An electronic vacuum recloser locked out on Roslin Avenue South in Waterloo due to internal corrosion.
57968 2019-08-03 No ER46 Foreign inference-
Wildlife
109,760
0.032 Animal contact across a load break switch that ties two feeders.
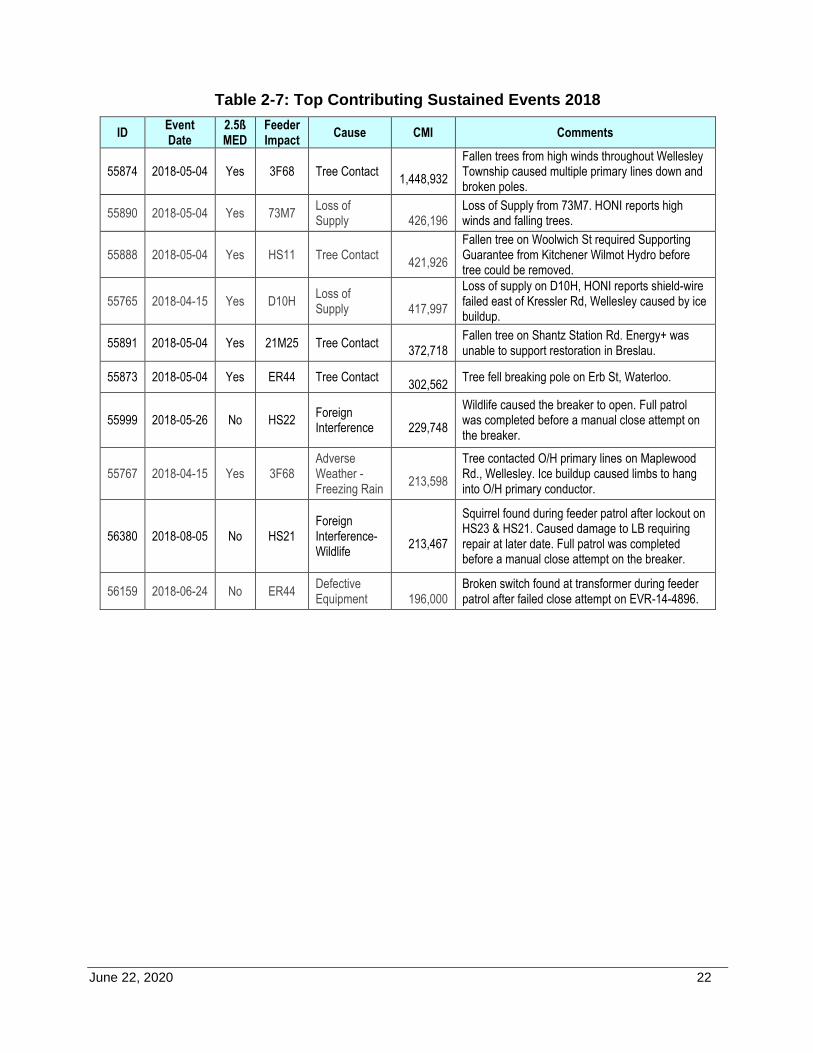
June 22, 2020 22
Table 2-7: Top Contributing Sustained Events 2018
ID Event Date
2.5ß MED
Feeder Impact
Cause CMI Comments
55874 2018-05-04 Yes 3F68 Tree Contact
1,448,932
Fallen trees from high winds throughout Wellesley Township caused multiple primary lines down and broken poles.
55890 2018-05-04 Yes 73M7 Loss of Supply
426,196
Loss of Supply from 73M7. HONI reports high winds and falling trees.
55888 2018-05-04 Yes HS11 Tree Contact
421,926
Fallen tree on Woolwich St required Supporting Guarantee from Kitchener Wilmot Hydro before tree could be removed.
55765 2018-04-15 Yes D10H Loss of Supply
417,997
Loss of supply on D10H, HONI reports shield-wire failed east of Kressler Rd, Wellesley caused by ice buildup.
55891 2018-05-04 Yes 21M25 Tree Contact
372,718 Fallen tree on Shantz Station Rd. Energy+ was unable to support restoration in Breslau.
55873 2018-05-04 Yes ER44 Tree Contact
302,562 Tree fell breaking pole on Erb St, Waterloo.
55999 2018-05-26 No HS22 Foreign Interference
229,748
Wildlife caused the breaker to open. Full patrol was completed before a manual close attempt on the breaker.
55767 2018-04-15 Yes 3F68 Adverse Weather - Freezing Rain
213,598
Tree contacted O/H primary lines on Maplewood Rd., Wellesley. Ice buildup caused limbs to hang into O/H primary conductor.
56380 2018-08-05 No HS21 Foreign Interference- Wildlife
213,467
Squirrel found during feeder patrol after lockout on HS23 & HS21. Caused damage to LB requiring repair at later date. Full patrol was completed before a manual close attempt on the breaker.
56159 2018-06-24 No ER44 Defective Equipment
196,000
Broken switch found at transformer during feeder patrol after failed close attempt on EVR-14-4896.
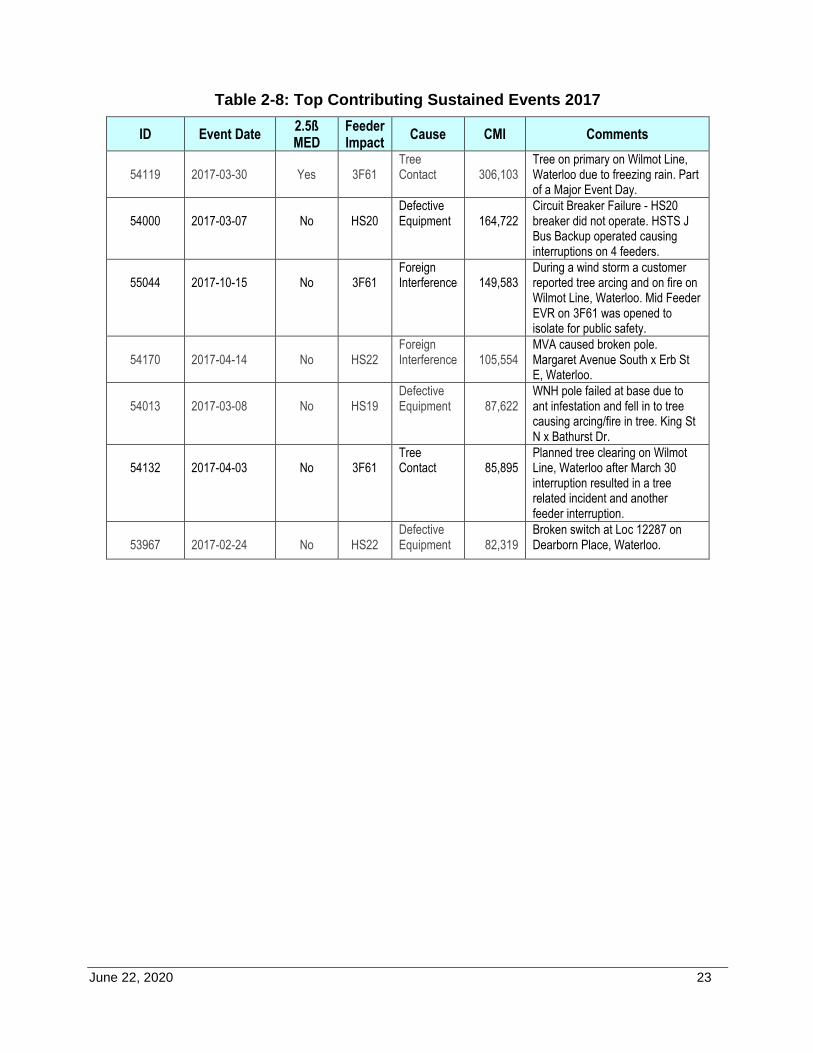
June 22, 2020 23
Table 2-8: Top Contributing Sustained Events 2017
ID Event Date 2.5ß MED
Feeder Impact
Cause CMI Comments
54119
2017-03-30
Yes
3F61
Tree Contact
306,103
Tree on primary on Wilmot Line, Waterloo due to freezing rain. Part of a Major Event Day.
54000
2017-03-07
No
HS20
Defective Equipment
164,722
Circuit Breaker Failure - HS20 breaker did not operate. HSTS J Bus Backup operated causing interruptions on 4 feeders.
55044
2017-10-15
No
3F61
Foreign Interference
149,583
During a wind storm a customer reported tree arcing and on fire on Wilmot Line, Waterloo. Mid Feeder EVR on 3F61 was opened to isolate for public safety.
54170
2017-04-14
No
HS22
Foreign Interference
105,554
MVA caused broken pole. Margaret Avenue South x Erb St E, Waterloo.
54013
2017-03-08
No
HS19
Defective Equipment
87,622
WNH pole failed at base due to ant infestation and fell in to tree causing arcing/fire in tree. King St N x Bathurst Dr.
54132
2017-04-03
No
3F61
Tree Contact
85,895
Planned tree clearing on Wilmot Line, Waterloo after March 30 interruption resulted in a tree related incident and another feeder interruption.
53967
2017-02-24
No
HS22
Defective Equipment
82,319
Broken switch at Loc 12287 on Dearborn Place, Waterloo.
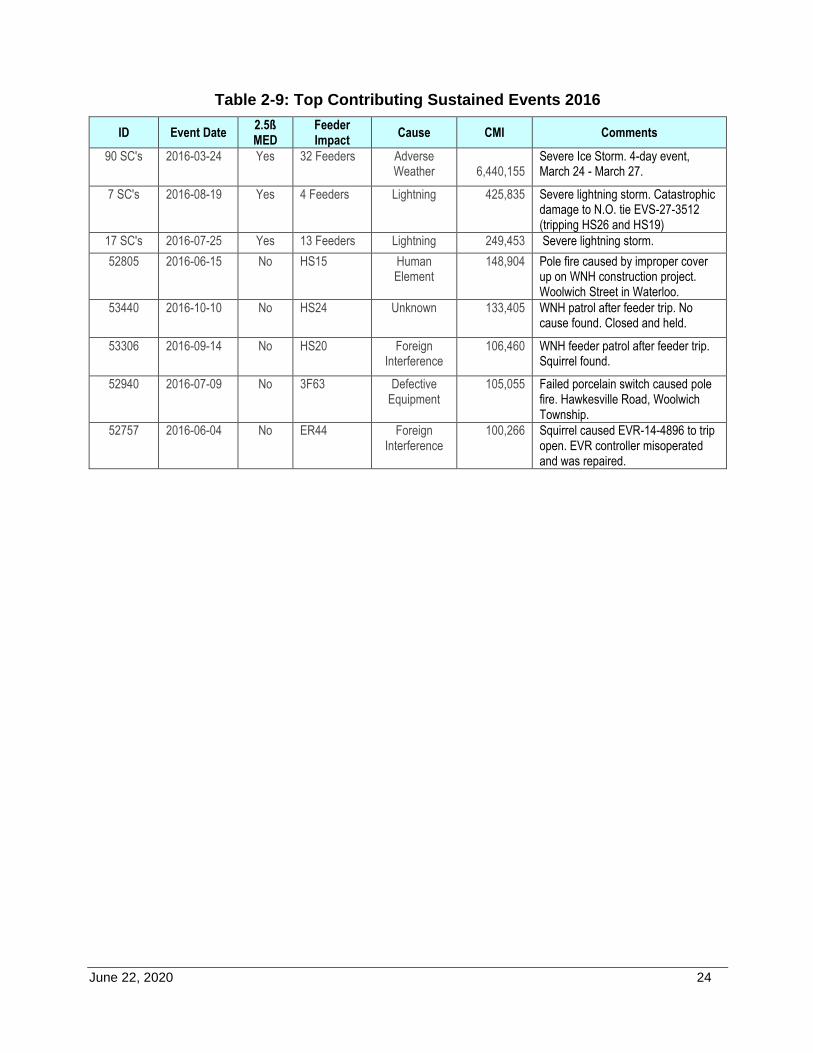
June 22, 2020 24
Table 2-9: Top Contributing Sustained Events 2016
ID Event Date 2.5ß MED
Feeder Impact
Cause CMI Comments
90 SC's 2016-03-24 Yes 32 Feeders Adverse Weather
6,440,155
Severe Ice Storm. 4-day event, March 24 - March 27.
7 SC's 2016-08-19 Yes 4 Feeders Lightning 425,835 Severe lightning storm. Catastrophic damage to N.O. tie EVS-27-3512 (tripping HS26 and HS19)
17 SC's 2016-07-25 Yes 13 Feeders Lightning 249,453 Severe lightning storm.
52805 2016-06-15 No HS15 Human Element
148,904 Pole fire caused by improper cover up on WNH construction project. Woolwich Street in Waterloo.
53440 2016-10-10 No HS24 Unknown 133,405 WNH patrol after feeder trip. No cause found. Closed and held.
53306 2016-09-14 No HS20 Foreign Interference
106,460 WNH feeder patrol after feeder trip. Squirrel found.
52940 2016-07-09 No 3F63 Defective Equipment
105,055 Failed porcelain switch caused pole fire. Hawkesville Road, Woolwich Township.
52757 2016-06-04 No ER44 Foreign Interference
100,266 Squirrel caused EVR-14-4896 to trip open. EVR controller misoperated and was repaired.
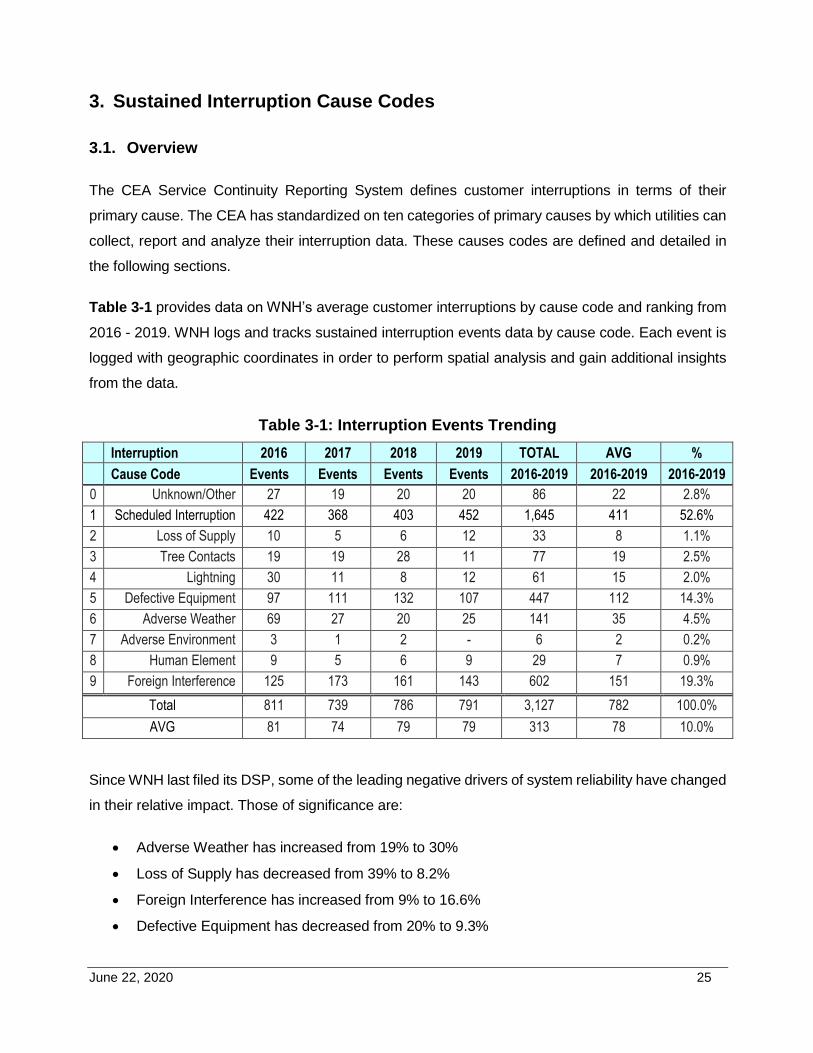
June 22, 2020 25
3. Sustained Interruption Cause Codes
3.1. Overview
The CEA Service Continuity Reporting System defines customer interruptions in terms of their
primary cause. The CEA has standardized on ten categories of primary causes by which utilities can
collect, report and analyze their interruption data. These causes codes are defined and detailed in
the following sections.
Table 3-1 provides data on WNH’s average customer interruptions by cause code and ranking from
2016 - 2019. WNH logs and tracks sustained interruption events data by cause code. Each event is
logged with geographic coordinates in order to perform spatial analysis and gain additional insights
from the data.
Table 3-1: Interruption Events Trending
Interruption 2016 2017 2018 2019 TOTAL AVG %
Cause Code Events Events Events Events 2016-2019 2016-2019 2016-2019
0 Unknown/Other 27 19 20 20 86 22 2.8%
1 Scheduled Interruption 422 368 403 452 1,645 411 52.6%
2 Loss of Supply 10 5 6 12 33 8 1.1%
3 Tree Contacts 19 19 28 11 77 19 2.5%
4 Lightning 30 11 8 12 61 15 2.0%
5 Defective Equipment 97 111 132 107 447 112 14.3%
6 Adverse Weather 69 27 20 25 141 35 4.5%
7 Adverse Environment 3 1 2 - 6 2 0.2%
8 Human Element 9 5 6 9 29 7 0.9%
9 Foreign Interference 125 173 161 143 602 151 19.3%
Total 811 739 786 791 3,127 782 100.0%
AVG 81 74 79 79 313 78 10.0%
Since WNH last filed its DSP, some of the leading negative drivers of system reliability have changed
in their relative impact. Those of significance are:
Adverse Weather has increased from 19% to 30%
Loss of Supply has decreased from 39% to 8.2%
Foreign Interference has increased from 9% to 16.6%
Defective Equipment has decreased from 20% to 9.3%
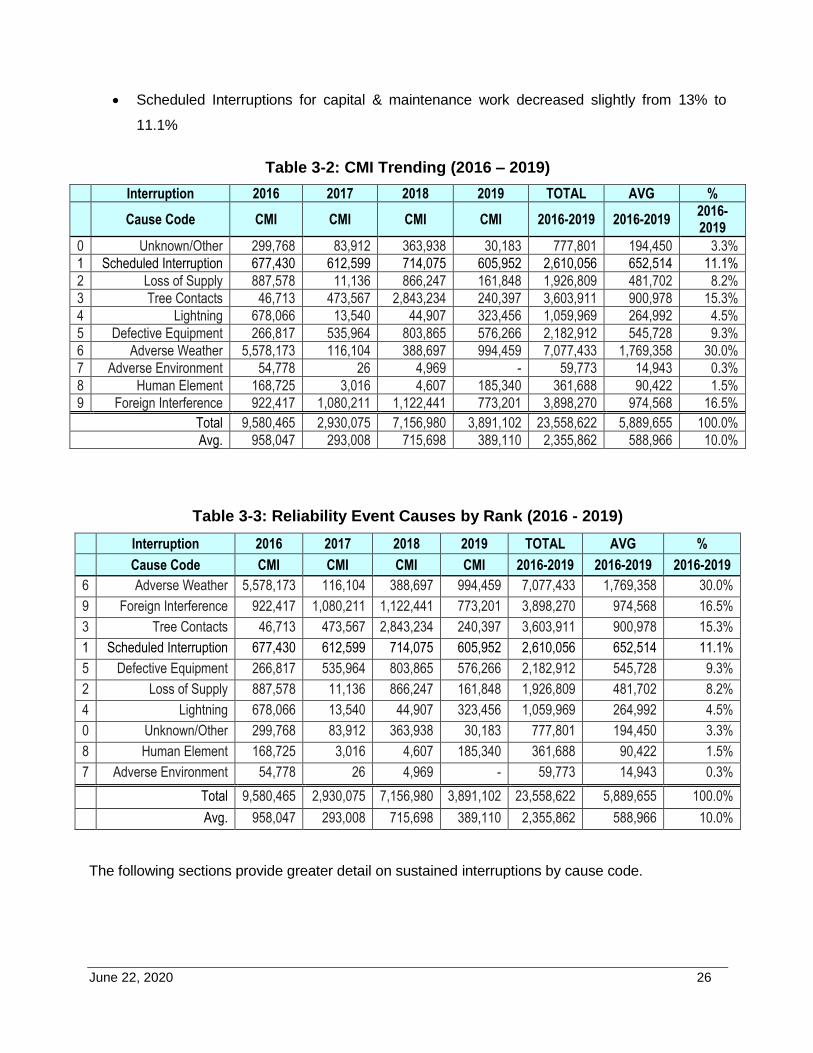
June 22, 2020 26
Scheduled Interruptions for capital & maintenance work decreased slightly from 13% to
11.1%
Table 3-2: CMI Trending (2016 – 2019)
Interruption 2016 2017 2018 2019 TOTAL AVG %
Cause Code CMI CMI CMI CMI 2016-2019 2016-2019 2016-2019
0 Unknown/Other 299,768 83,912 363,938 30,183 777,801 194,450 3.3%
1 Scheduled Interruption 677,430 612,599 714,075 605,952 2,610,056 652,514 11.1%
2 Loss of Supply 887,578 11,136 866,247 161,848 1,926,809 481,702 8.2%
3 Tree Contacts 46,713 473,567 2,843,234 240,397 3,603,911 900,978 15.3%
4 Lightning 678,066 13,540 44,907 323,456 1,059,969 264,992 4.5%
5 Defective Equipment 266,817 535,964 803,865 576,266 2,182,912 545,728 9.3%
6 Adverse Weather 5,578,173 116,104 388,697 994,459 7,077,433 1,769,358 30.0%
7 Adverse Environment 54,778 26 4,969 - 59,773 14,943 0.3%
8 Human Element 168,725 3,016 4,607 185,340 361,688 90,422 1.5%
9 Foreign Interference 922,417 1,080,211 1,122,441 773,201 3,898,270 974,568 16.5%
Total 9,580,465 2,930,075 7,156,980 3,891,102 23,558,622 5,889,655 100.0%
Avg. 958,047 293,008 715,698 389,110 2,355,862 588,966 10.0%
Table 3-3: Reliability Event Causes by Rank (2016 - 2019)
Interruption 2016 2017 2018 2019 TOTAL AVG %
Cause Code CMI CMI CMI CMI 2016-2019 2016-2019 2016-2019
6 Adverse Weather 5,578,173 116,104 388,697 994,459 7,077,433 1,769,358 30.0%
9 Foreign Interference 922,417 1,080,211 1,122,441 773,201 3,898,270 974,568 16.5%
3 Tree Contacts 46,713 473,567 2,843,234 240,397 3,603,911 900,978 15.3%
1 Scheduled Interruption 677,430 612,599 714,075 605,952 2,610,056 652,514 11.1%
5 Defective Equipment 266,817 535,964 803,865 576,266 2,182,912 545,728 9.3%
2 Loss of Supply 887,578 11,136 866,247 161,848 1,926,809 481,702 8.2%
4 Lightning 678,066 13,540 44,907 323,456 1,059,969 264,992 4.5%
0 Unknown/Other 299,768 83,912 363,938 30,183 777,801 194,450 3.3%
8 Human Element 168,725 3,016 4,607 185,340 361,688 90,422 1.5%
7 Adverse Environment 54,778 26 4,969 - 59,773 14,943 0.3%
Total 9,580,465 2,930,075 7,156,980 3,891,102 23,558,622 5,889,655 100.0%
Avg. 958,047 293,008 715,698 389,110 2,355,862 588,966 10.0%
The following sections provide greater detail on sustained interruptions by cause code.
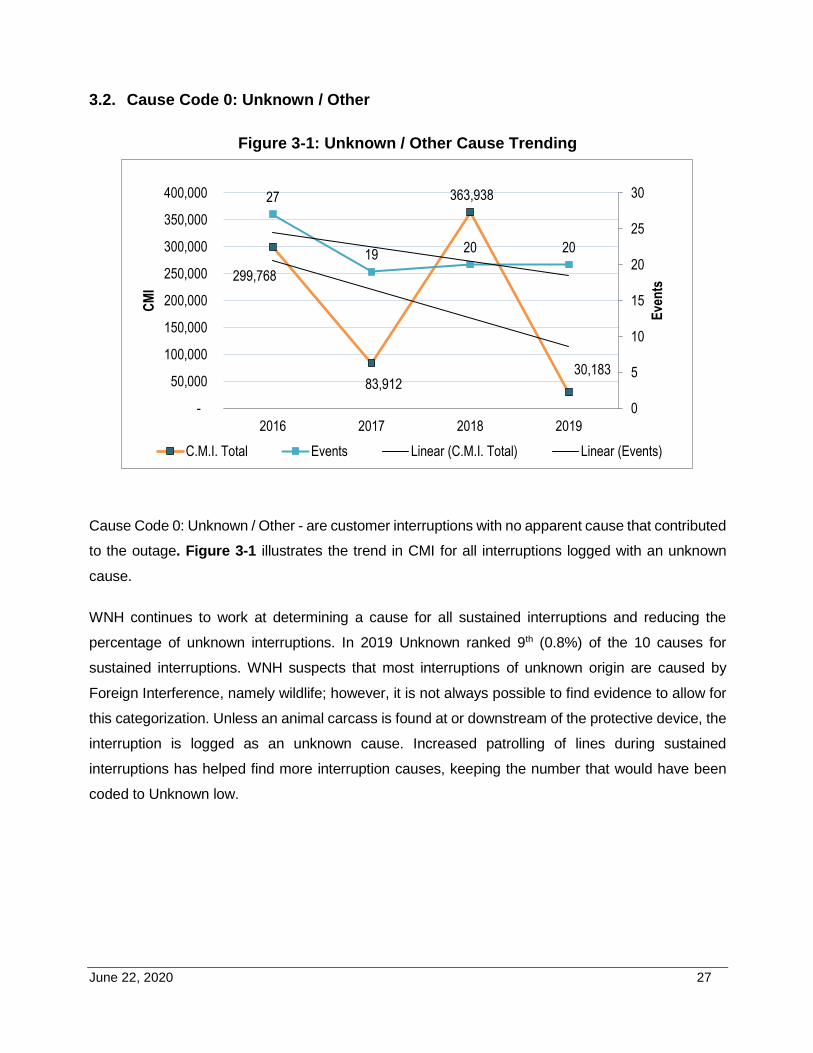
June 22, 2020 27
3.2. Cause Code 0: Unknown / Other
Figure 3-1: Unknown / Other Cause Trending
Cause Code 0: Unknown / Other - are customer interruptions with no apparent cause that contributed
to the outage. Figure 3-1 illustrates the trend in CMI for all interruptions logged with an unknown
cause.
WNH continues to work at determining a cause for all sustained interruptions and reducing the
percentage of unknown interruptions. In 2019 Unknown ranked 9th (0.8%) of the 10 causes for
sustained interruptions. WNH suspects that most interruptions of unknown origin are caused by
Foreign Interference, namely wildlife; however, it is not always possible to find evidence to allow for
this categorization. Unless an animal carcass is found at or downstream of the protective device, the
interruption is logged as an unknown cause. Increased patrolling of lines during sustained
interruptions has helped find more interruption causes, keeping the number that would have been
coded to Unknown low.
299,768
83,912
363,938
30,183
27
1920 20
0
5
10
15
20
25
30
-
50,000
100,000
150,000
200,000
250,000
300,000
350,000
400,000
2016 2017 2018 2019
Eve
nts
CM
I
C.M.I. Total Events Linear (C.M.I. Total) Linear (Events)
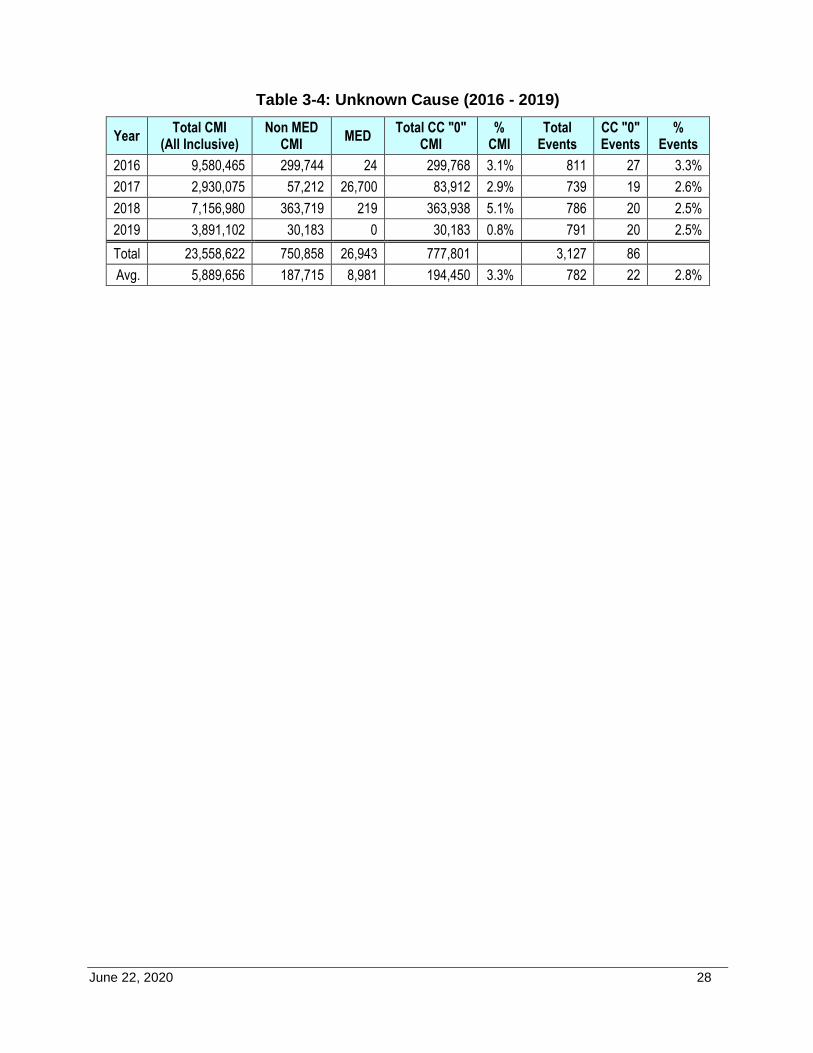
June 22, 2020 28
Table 3-4: Unknown Cause (2016 - 2019)
Year Total CMI
(All Inclusive) Non MED
CMI MED
Total CC "0" CMI
% CMI
Total Events
CC "0" Events
% Events
2016 9,580,465 299,744 24 299,768 3.1% 811 27 3.3%
2017 2,930,075 57,212 26,700 83,912 2.9% 739 19 2.6%
2018 7,156,980 363,719 219 363,938 5.1% 786 20 2.5%
2019 3,891,102 30,183 0 30,183 0.8% 791 20 2.5%
Total 23,558,622 750,858 26,943 777,801 3,127 86
Avg. 5,889,656 187,715 8,981 194,450 3.3% 782 22 2.8%
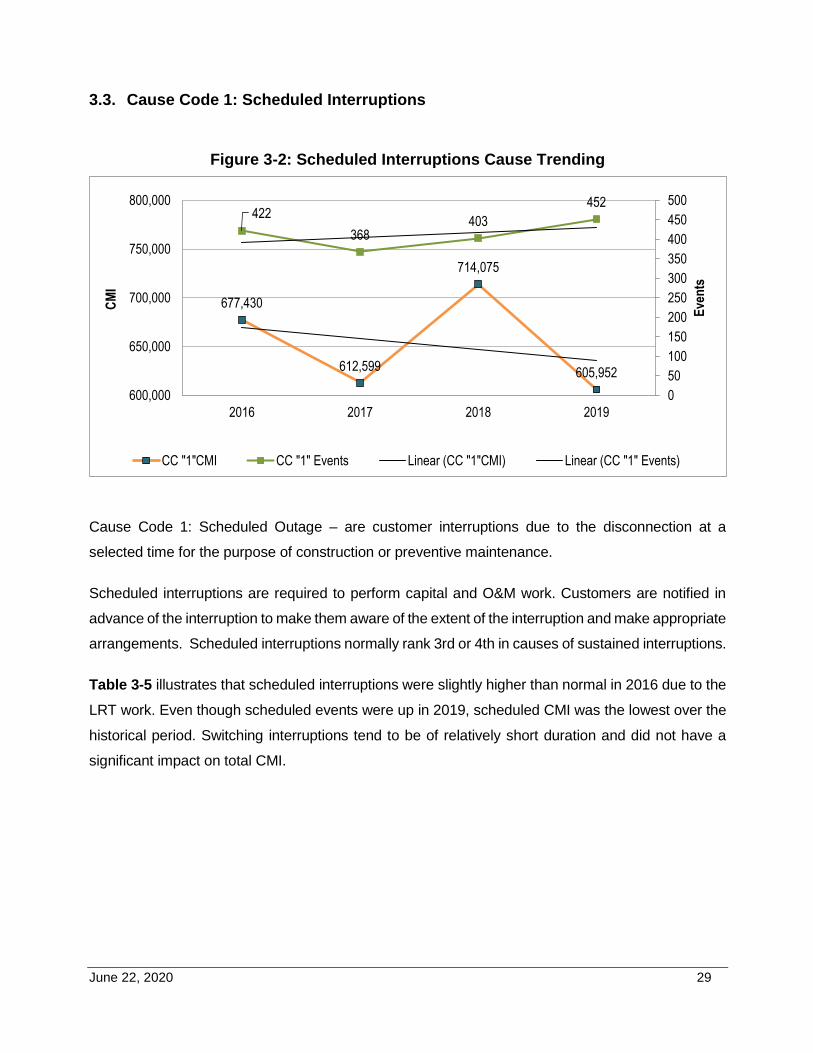
June 22, 2020 29
3.3. Cause Code 1: Scheduled Interruptions
Figure 3-2: Scheduled Interruptions Cause Trending
Cause Code 1: Scheduled Outage – are customer interruptions due to the disconnection at a
selected time for the purpose of construction or preventive maintenance.
Scheduled interruptions are required to perform capital and O&M work. Customers are notified in
advance of the interruption to make them aware of the extent of the interruption and make appropriate
arrangements. Scheduled interruptions normally rank 3rd or 4th in causes of sustained interruptions.
Table 3-5 illustrates that scheduled interruptions were slightly higher than normal in 2016 due to the
LRT work. Even though scheduled events were up in 2019, scheduled CMI was the lowest over the
historical period. Switching interruptions tend to be of relatively short duration and did not have a
significant impact on total CMI.
677,430
612,599
714,075
605,952
422
368403
452
0
50
100
150
200
250
300
350
400
450
500
600,000
650,000
700,000
750,000
800,000
2016 2017 2018 2019
Eve
nts
CM
I
CC "1"CMI CC "1" Events Linear (CC "1"CMI) Linear (CC "1" Events)
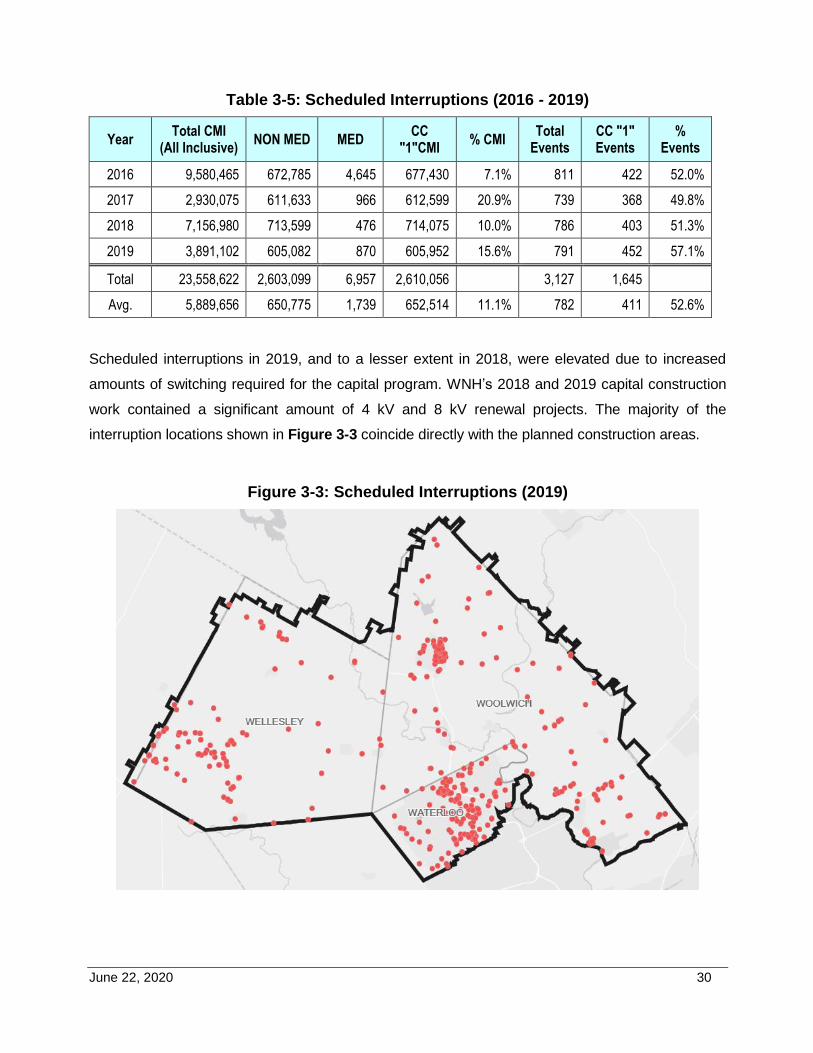
June 22, 2020 30
Table 3-5: Scheduled Interruptions (2016 - 2019)
Year Total CMI
(All Inclusive) NON MED MED
CC "1"CMI
% CMI Total
Events CC "1" Events
% Events
2016 9,580,465 672,785 4,645 677,430 7.1% 811 422 52.0%
2017 2,930,075 611,633 966 612,599 20.9% 739 368 49.8%
2018 7,156,980 713,599 476 714,075 10.0% 786 403 51.3%
2019 3,891,102 605,082 870 605,952 15.6% 791 452 57.1%
Total 23,558,622 2,603,099 6,957 2,610,056 3,127 1,645
Avg. 5,889,656 650,775 1,739 652,514 11.1% 782 411 52.6%
Scheduled interruptions in 2019, and to a lesser extent in 2018, were elevated due to increased
amounts of switching required for the capital program. WNH’s 2018 and 2019 capital construction
work contained a significant amount of 4 kV and 8 kV renewal projects. The majority of the
interruption locations shown in Figure 3-3 coincide directly with the planned construction areas.
Figure 3-3: Scheduled Interruptions (2019)
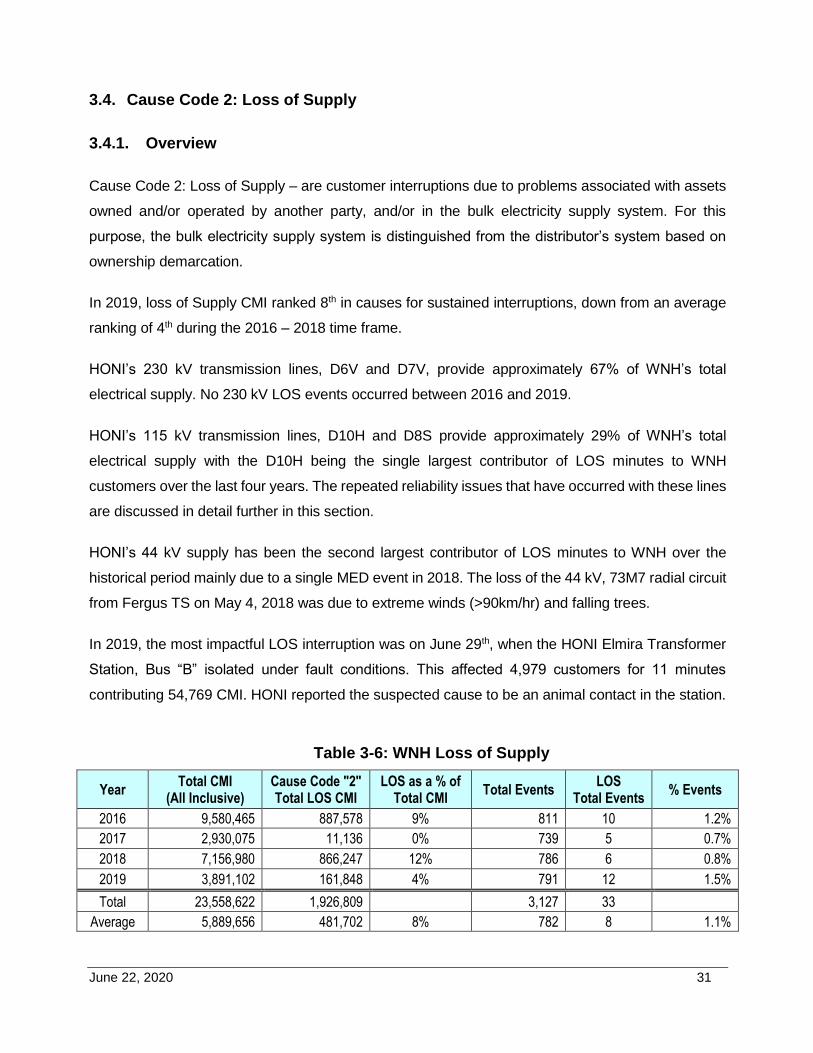
June 22, 2020 31
3.4. Cause Code 2: Loss of Supply
3.4.1. Overview
Cause Code 2: Loss of Supply – are customer interruptions due to problems associated with assets
owned and/or operated by another party, and/or in the bulk electricity supply system. For this
purpose, the bulk electricity supply system is distinguished from the distributor’s system based on
ownership demarcation.
In 2019, loss of Supply CMI ranked 8th in causes for sustained interruptions, down from an average
ranking of 4th during the 2016 – 2018 time frame.
HONI’s 230 kV transmission lines, D6V and D7V, provide approximately 67% of WNH’s total
electrical supply. No 230 kV LOS events occurred between 2016 and 2019.
HONI’s 115 kV transmission lines, D10H and D8S provide approximately 29% of WNH’s total
electrical supply with the D10H being the single largest contributor of LOS minutes to WNH
customers over the last four years. The repeated reliability issues that have occurred with these lines
are discussed in detail further in this section.
HONI’s 44 kV supply has been the second largest contributor of LOS minutes to WNH over the
historical period mainly due to a single MED event in 2018. The loss of the 44 kV, 73M7 radial circuit
from Fergus TS on May 4, 2018 was due to extreme winds (>90km/hr) and falling trees.
In 2019, the most impactful LOS interruption was on June 29th, when the HONI Elmira Transformer
Station, Bus “B” isolated under fault conditions. This affected 4,979 customers for 11 minutes
contributing 54,769 CMI. HONI reported the suspected cause to be an animal contact in the station.
Table 3-6: WNH Loss of Supply
Year Total CMI
(All Inclusive) Cause Code "2" Total LOS CMI
LOS as a % of Total CMI
Total Events LOS
Total Events % Events
2016 9,580,465 887,578 9% 811 10 1.2%
2017 2,930,075 11,136 0% 739 5 0.7%
2018 7,156,980 866,247 12% 786 6 0.8%
2019 3,891,102 161,848 4% 791 12 1.5%
Total 23,558,622 1,926,809 3,127 33
Average 5,889,656 481,702 8% 782 8 1.1%
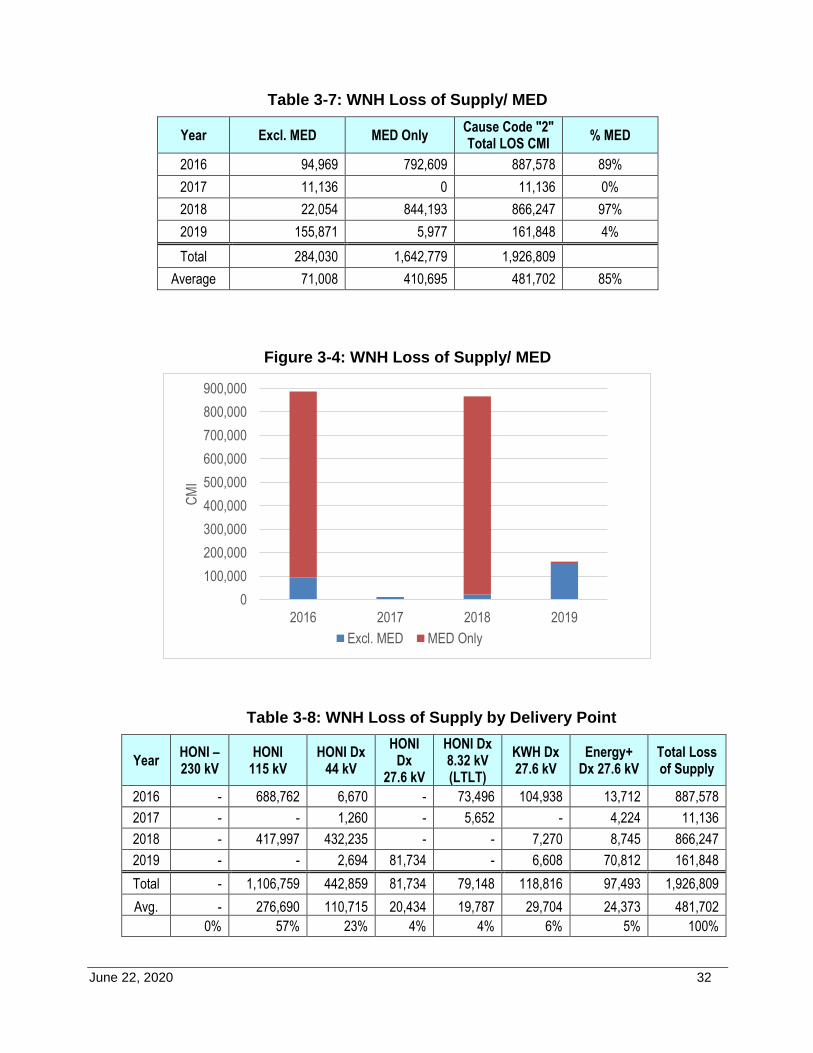
June 22, 2020 32
Table 3-7: WNH Loss of Supply/ MED
Year Excl. MED MED Only Cause Code "2" Total LOS CMI
% MED
2016 94,969 792,609 887,578 89%
2017 11,136 0 11,136 0%
2018 22,054 844,193 866,247 97%
2019 155,871 5,977 161,848 4%
Total 284,030 1,642,779 1,926,809
Average 71,008 410,695 481,702 85%
Figure 3-4: WNH Loss of Supply/ MED
Table 3-8: WNH Loss of Supply by Delivery Point
Year HONI – 230 kV
HONI 115 kV
HONI Dx 44 kV
HONI Dx
27.6 kV
HONI Dx 8.32 kV (LTLT)
KWH Dx 27.6 kV
Energy+ Dx 27.6 kV
Total Loss of Supply
2016 - 688,762 6,670 - 73,496 104,938 13,712 887,578
2017 - - 1,260 - 5,652 - 4,224 11,136
2018 - 417,997 432,235 - - 7,270 8,745 866,247
2019 - - 2,694 81,734 - 6,608 70,812 161,848
Total - 1,106,759 442,859 81,734 79,148 118,816 97,493 1,926,809
Avg. - 276,690 110,715 20,434 19,787 29,704 24,373 481,702
0% 57% 23% 4% 4% 6% 5% 100%
0
100,000
200,000
300,000
400,000
500,000
600,000
700,000
800,000
900,000
2016 2017 2018 2019
CM
I
Excl. MED MED Only
June 22, 2020 33
3.4.2. HONI Transmission Circuit D10H Reliability
The D10H circuit feeding the Elmira Transformer Station (ELTS) is a 115 kV transmission circuit that
connects Detweiler TS and Hanover TS. All of these assets are owned and operated by Hydro One
Networks Inc. (HONI). Approximately 80% of the ELTS load supplies WNH customers.
Since 2013, there have been five unplanned interruptions on the D10H circuit impacting the ELTS
and WNH customers. Three of these interruptions were caused by shield-wire failures between the
Waterloo and Wallenstein Junction. The remaining two interruptions were attributed to a loose cross
brace and a tree contact, respectively. After each of these interruptions, repairs were completed at
the affected line section and the D10H circuit was returned to service.
2016 HONI D10H
In 2016 a loss of supply event occurred on March 26th when a shield-wire failed under heavy ice load
during a severe ice storm. The problem was detected via helicopter patrol and located near the
Wallenstein Junction. WNH implemented a contingency plan to pick up load from alternate 27.6 kV
sources with all 8,147 customers restored within 14 to 148 minutes equaling 684,365 CMI vs
1,393,137 if WNH had waited for HONI to restore the D10H.
2018 HONI D10H
In 2018 the loss of supply event occurred on April 15th when a shield-wire failed under heavy ice load
during a storm. WNH implemented a contingency plan to pick up load from alternate 27.6 kV sources
with all 5,936 customers restored within 5 to 191 minutes equaling 417,997 CMI vs 1,573,480 if WNH
had waited for HONI to restore the D10H.
Follow-up
After each LOS event HONI provides WNH with information on the event and the remediation taken.
Periodically, at WNH’s request, meetings are held with HONI to discuss the reliability issues in greater
detail and actions that can be taken to prevent further occurrences.
The April 15, 2018 shield-wire failure was a culminating event and WNH insisted that more needed
to be done to prevent what had now been the third shield-wire LOS event in five years. HONI
launched an internal investigation to improve D10H’s reliability which was completed in the fourth
quarter (Q4) of 2018.
June 22, 2020 34
The investigation consisted of multiple activities that included: a detailed helicopter inspection, foot
patrol on the sub-sections where helicopter inspection could not be carried out due to flying
restrictions, and an engineering design review of the shield-wire. The shield-wire on D10H line
section was installed in 1994, and it was determined that it is designed to sustain the mechanical and
electrical loadings as per HONI standards.
However, during the inspections which covered approximately 50 km’s of the D10H’s length, the
following deficiencies were observed:
Broken or damaged bond wires and/or down grounds leading to the shield-wire;
Broken /damaged /missing shield-wire dampers;
A non-concerning loose shield-wire clamp;
Two non-concerning loose cross braces.
2019 Q4 Update
Hydro One has completed the corrective work to address these deficiencies. The work was attempted
to be completed earlier however there were potential D10H loading and thermal issues in the spring
and summer months of 2019. Hydro One and WNH will monitor the performance of D10H and ensure
that the remedial actions taken by HONI prove effective.
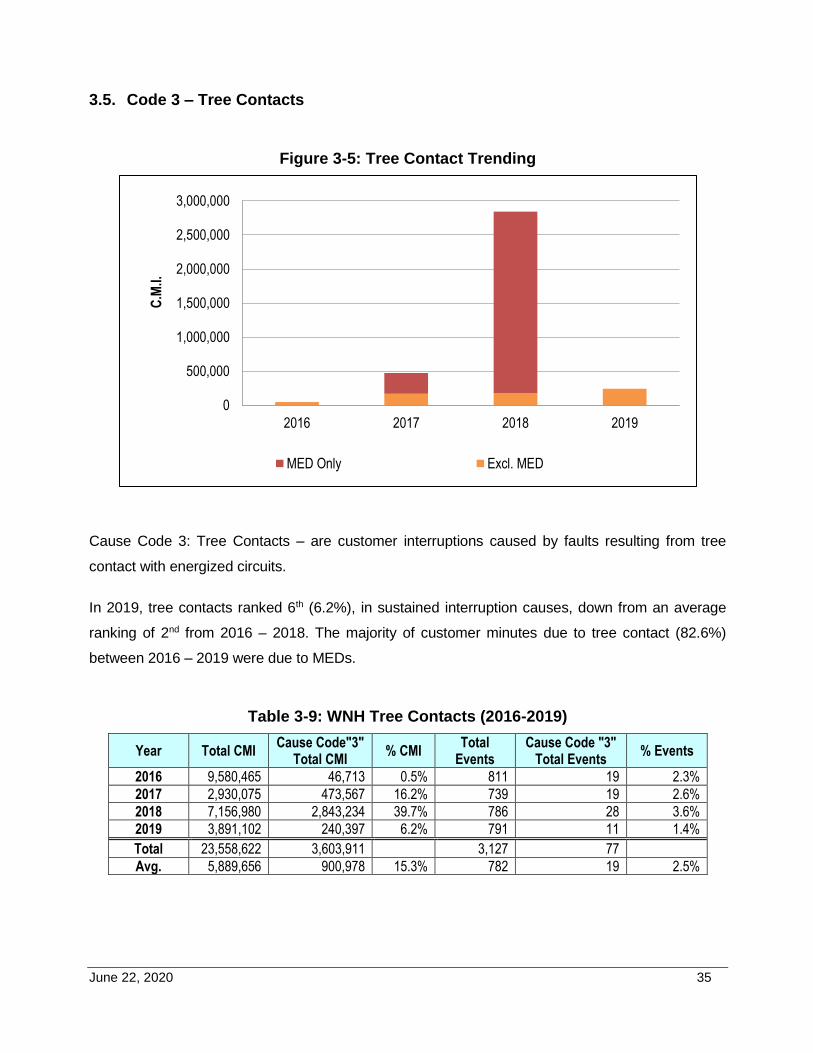
June 22, 2020 35
3.5. Code 3 – Tree Contacts
Figure 3-5: Tree Contact Trending
Cause Code 3: Tree Contacts – are customer interruptions caused by faults resulting from tree
contact with energized circuits.
In 2019, tree contacts ranked 6th (6.2%), in sustained interruption causes, down from an average
ranking of 2nd from 2016 – 2018. The majority of customer minutes due to tree contact (82.6%)
between 2016 – 2019 were due to MEDs.
Table 3-9: WNH Tree Contacts (2016-2019)
Year Total CMI Cause Code"3"
Total CMI % CMI
Total Events
Cause Code "3" Total Events
% Events
2016 9,580,465 46,713 0.5% 811 19 2.3%
2017 2,930,075 473,567 16.2% 739 19 2.6%
2018 7,156,980 2,843,234 39.7% 786 28 3.6%
2019 3,891,102 240,397 6.2% 791 11 1.4%
Total 23,558,622 3,603,911 3,127 77
Avg. 5,889,656 900,978 15.3% 782 19 2.5%
0
500,000
1,000,000
1,500,000
2,000,000
2,500,000
3,000,000
2016 2017 2018 2019
C.M
.I.
MED Only Excl. MED
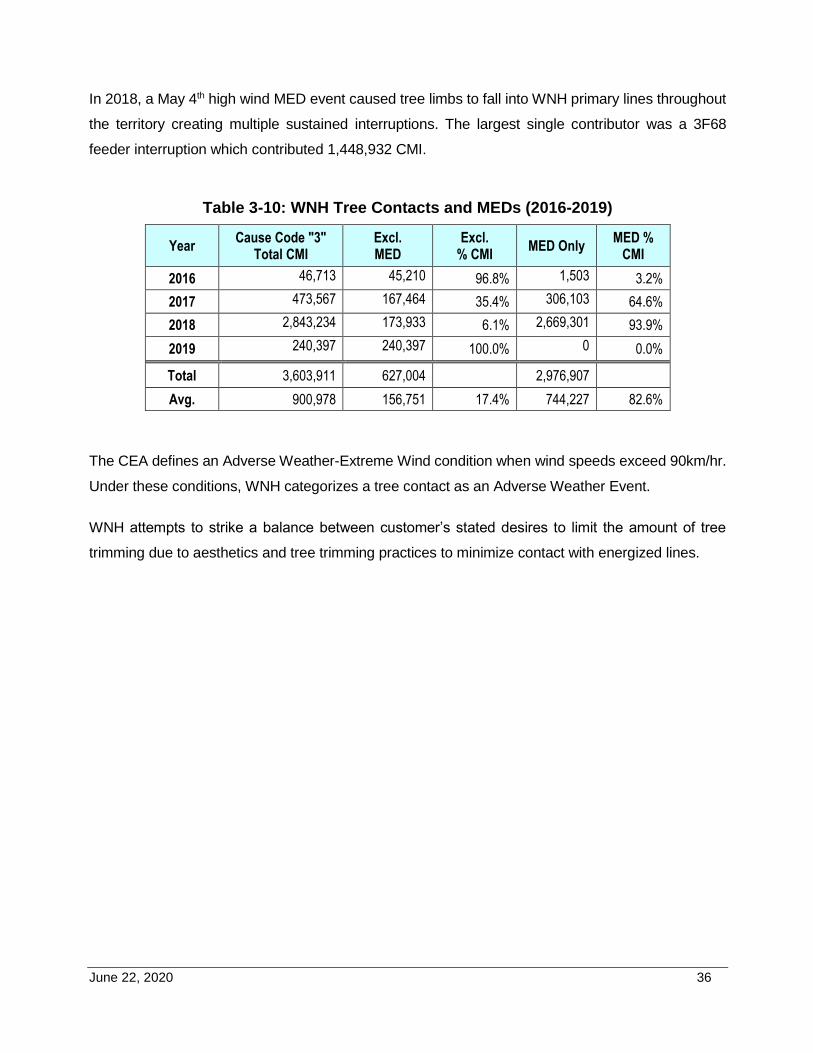
June 22, 2020 36
In 2018, a May 4th high wind MED event caused tree limbs to fall into WNH primary lines throughout
the territory creating multiple sustained interruptions. The largest single contributor was a 3F68
feeder interruption which contributed 1,448,932 CMI.
Table 3-10: WNH Tree Contacts and MEDs (2016-2019)
Year Cause Code "3"
Total CMI Excl. MED
Excl. % CMI
MED Only MED %
CMI
2016 46,713 45,210 96.8% 1,503 3.2%
2017 473,567 167,464 35.4% 306,103 64.6%
2018 2,843,234 173,933 6.1% 2,669,301 93.9%
2019 240,397 240,397 100.0% 0 0.0%
Total 3,603,911 627,004 2,976,907
Avg. 900,978 156,751 17.4% 744,227 82.6%
The CEA defines an Adverse Weather-Extreme Wind condition when wind speeds exceed 90km/hr.
Under these conditions, WNH categorizes a tree contact as an Adverse Weather Event.
WNH attempts to strike a balance between customer’s stated desires to limit the amount of tree
trimming due to aesthetics and tree trimming practices to minimize contact with energized lines.
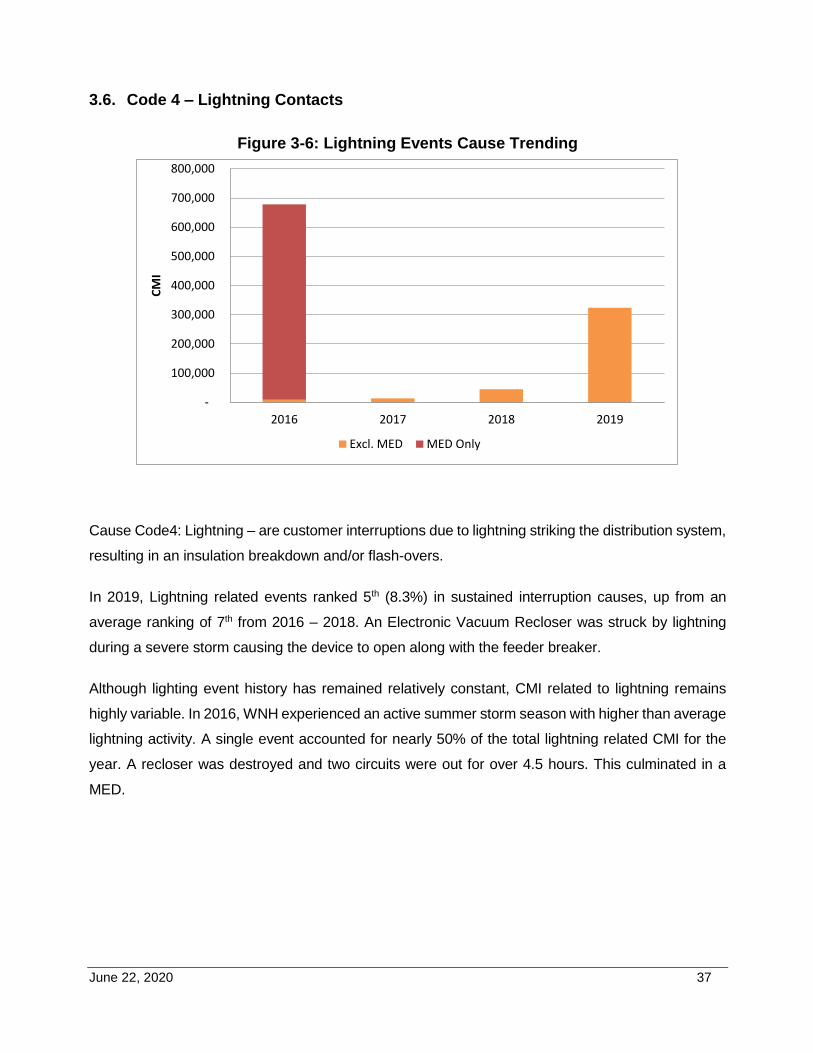
June 22, 2020 37
3.6. Code 4 – Lightning Contacts
Figure 3-6: Lightning Events Cause Trending
Cause Code4: Lightning – are customer interruptions due to lightning striking the distribution system,
resulting in an insulation breakdown and/or flash-overs.
In 2019, Lightning related events ranked 5th (8.3%) in sustained interruption causes, up from an
average ranking of 7th from 2016 – 2018. An Electronic Vacuum Recloser was struck by lightning
during a severe storm causing the device to open along with the feeder breaker.
Although lighting event history has remained relatively constant, CMI related to lightning remains
highly variable. In 2016, WNH experienced an active summer storm season with higher than average
lightning activity. A single event accounted for nearly 50% of the total lightning related CMI for the
year. A recloser was destroyed and two circuits were out for over 4.5 hours. This culminated in a
MED.
-
100,000
200,000
300,000
400,000
500,000
600,000
700,000
800,000
2016 2017 2018 2019
CMI
Excl. MED MED Only
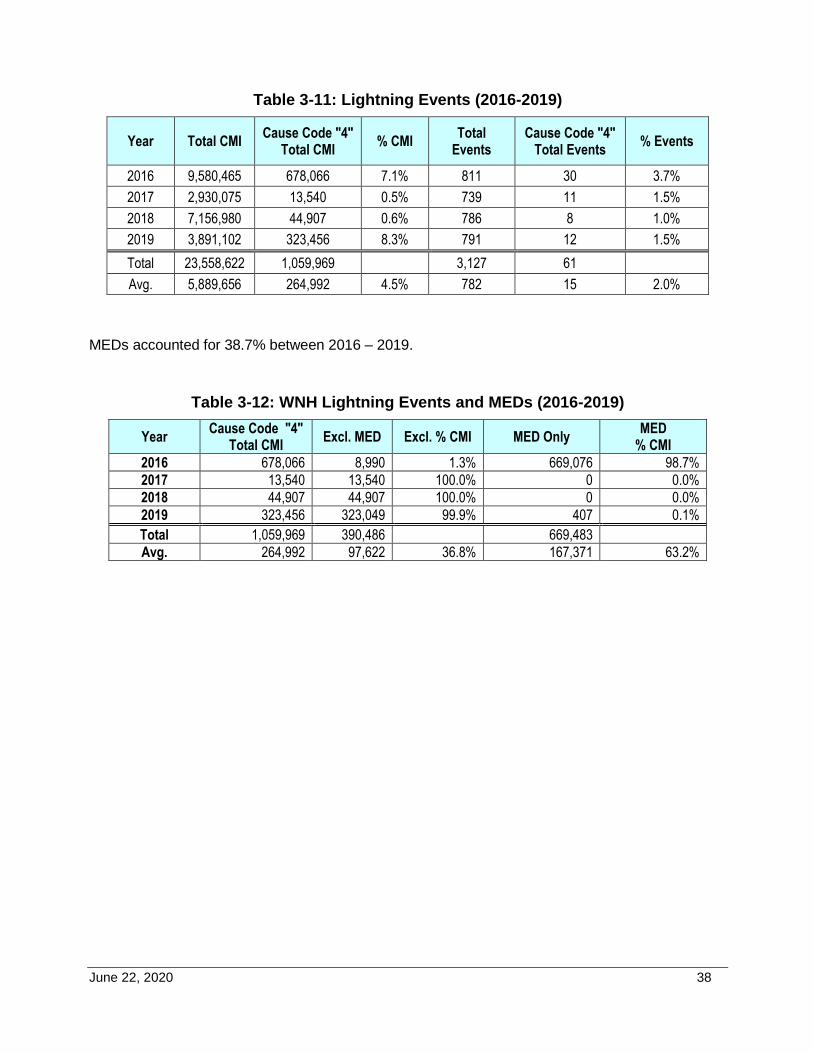
June 22, 2020 38
Table 3-11: Lightning Events (2016-2019)
Year Total CMI Cause Code "4"
Total CMI % CMI
Total Events
Cause Code "4" Total Events
% Events
2016 9,580,465 678,066 7.1% 811 30 3.7%
2017 2,930,075 13,540 0.5% 739 11 1.5%
2018 7,156,980 44,907 0.6% 786 8 1.0%
2019 3,891,102 323,456 8.3% 791 12 1.5%
Total 23,558,622 1,059,969 3,127 61
Avg. 5,889,656 264,992 4.5% 782 15 2.0%
MEDs accounted for 38.7% between 2016 – 2019.
Table 3-12: WNH Lightning Events and MEDs (2016-2019)
Year Cause Code "4"
Total CMI Excl. MED Excl. % CMI MED Only
MED % CMI
2016 678,066 8,990 1.3% 669,076 98.7%
2017 13,540 13,540 100.0% 0 0.0%
2018 44,907 44,907 100.0% 0 0.0%
2019 323,456 323,049 99.9% 407 0.1%
Total 1,059,969 390,486 669,483
Avg. 264,992 97,622 36.8% 167,371 63.2%
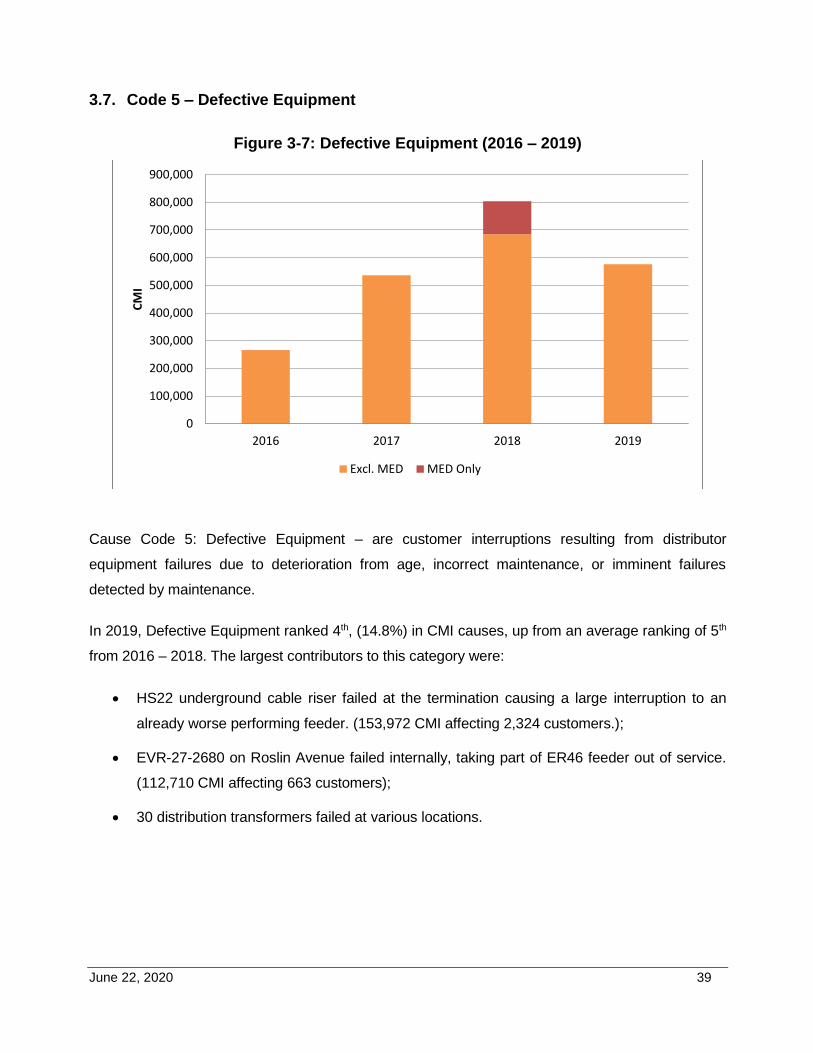
June 22, 2020 39
3.7. Code 5 – Defective Equipment
Figure 3-7: Defective Equipment (2016 – 2019)
Cause Code 5: Defective Equipment – are customer interruptions resulting from distributor
equipment failures due to deterioration from age, incorrect maintenance, or imminent failures
detected by maintenance.
In 2019, Defective Equipment ranked 4th, (14.8%) in CMI causes, up from an average ranking of 5th
from 2016 – 2018. The largest contributors to this category were:
HS22 underground cable riser failed at the termination causing a large interruption to an
already worse performing feeder. (153,972 CMI affecting 2,324 customers.);
EVR-27-2680 on Roslin Avenue failed internally, taking part of ER46 feeder out of service.
(112,710 CMI affecting 663 customers);
30 distribution transformers failed at various locations.
0
100,000
200,000
300,000
400,000
500,000
600,000
700,000
800,000
900,000
2016 2017 2018 2019
CMI
Excl. MED MED Only
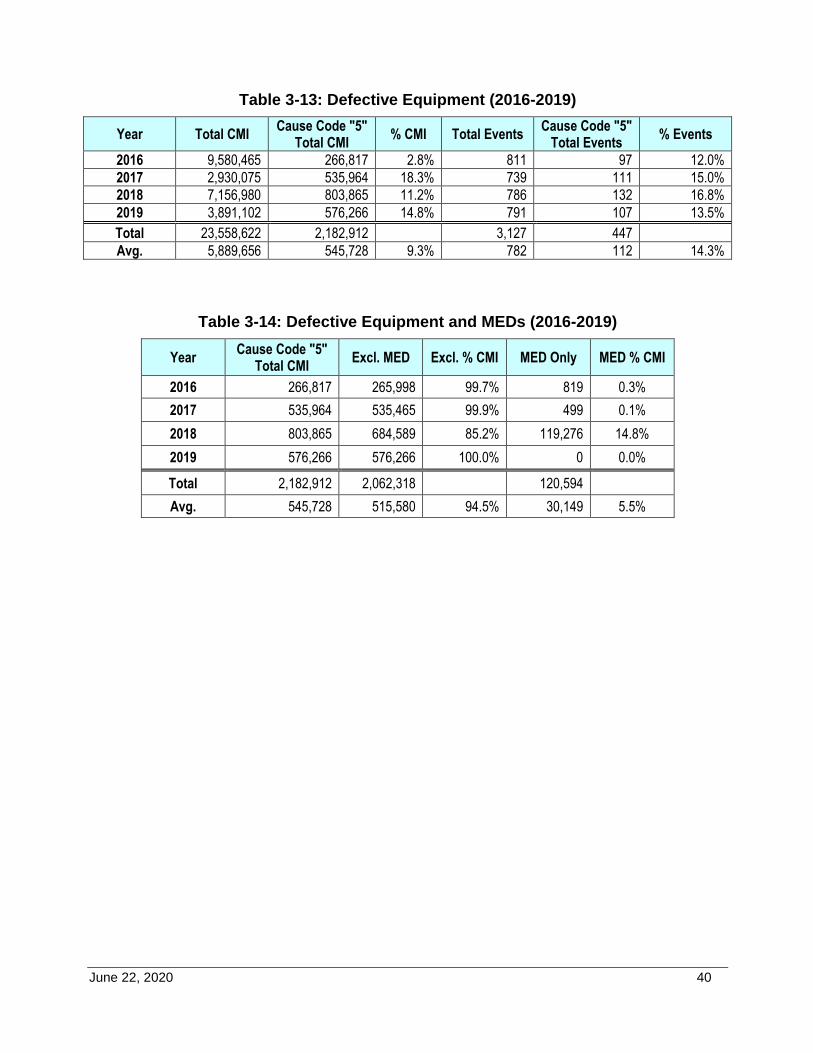
June 22, 2020 40
Table 3-13: Defective Equipment (2016-2019)
Year Total CMI Cause Code "5"
Total CMI % CMI Total Events
Cause Code "5" Total Events
% Events
2016 9,580,465 266,817 2.8% 811 97 12.0%
2017 2,930,075 535,964 18.3% 739 111 15.0%
2018 7,156,980 803,865 11.2% 786 132 16.8%
2019 3,891,102 576,266 14.8% 791 107 13.5%
Total 23,558,622 2,182,912 3,127 447
Avg. 5,889,656 545,728 9.3% 782 112 14.3%
Table 3-14: Defective Equipment and MEDs (2016-2019)
Year Cause Code "5"
Total CMI Excl. MED Excl. % CMI MED Only MED % CMI
2016 266,817 265,998 99.7% 819 0.3%
2017 535,964 535,465 99.9% 499 0.1%
2018 803,865 684,589 85.2% 119,276 14.8%
2019 576,266 576,266 100.0% 0 0.0%
Total 2,182,912 2,062,318 120,594
Avg. 545,728 515,580 94.5% 30,149 5.5%
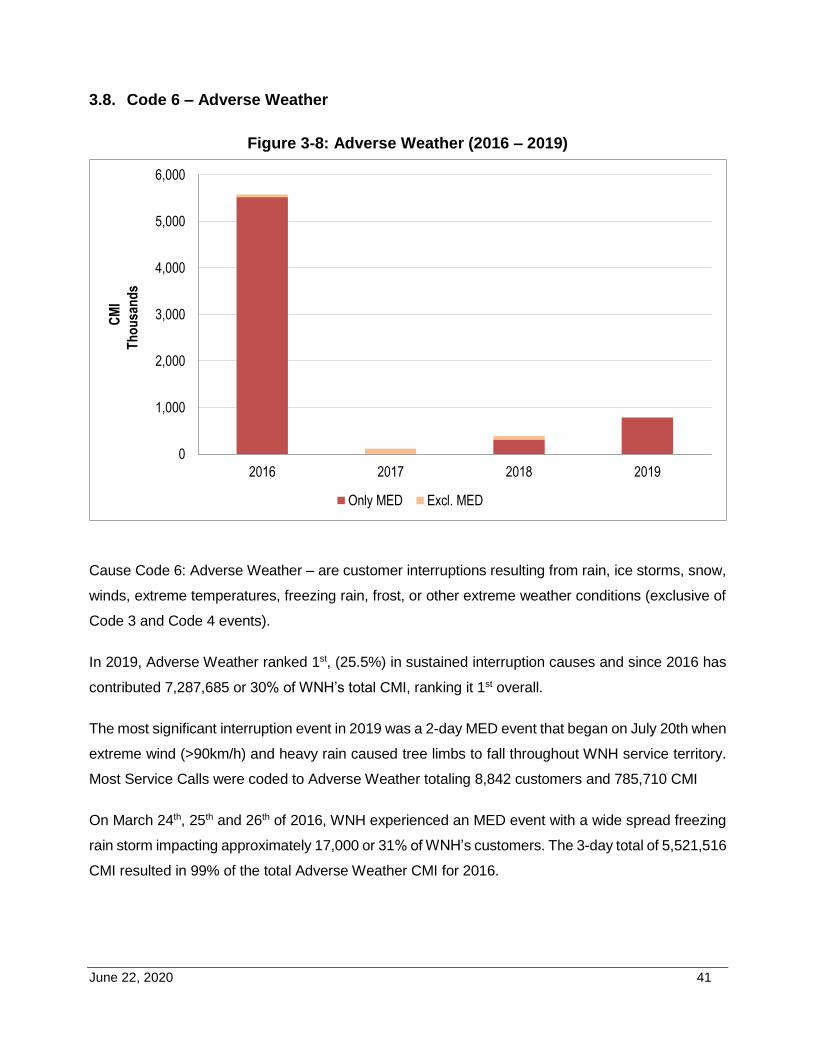
June 22, 2020 41
3.8. Code 6 – Adverse Weather
Figure 3-8: Adverse Weather (2016 – 2019)
Cause Code 6: Adverse Weather – are customer interruptions resulting from rain, ice storms, snow,
winds, extreme temperatures, freezing rain, frost, or other extreme weather conditions (exclusive of
Code 3 and Code 4 events).
In 2019, Adverse Weather ranked 1st, (25.5%) in sustained interruption causes and since 2016 has
contributed 7,287,685 or 30% of WNH’s total CMI, ranking it 1st overall.
The most significant interruption event in 2019 was a 2-day MED event that began on July 20th when
extreme wind (>90km/h) and heavy rain caused tree limbs to fall throughout WNH service territory.
Most Service Calls were coded to Adverse Weather totaling 8,842 customers and 785,710 CMI
On March 24th, 25th and 26th of 2016, WNH experienced an MED event with a wide spread freezing
rain storm impacting approximately 17,000 or 31% of WNH’s customers. The 3-day total of 5,521,516
CMI resulted in 99% of the total Adverse Weather CMI for 2016.
0
1,000
2,000
3,000
4,000
5,000
6,000
2016 2017 2018 2019
CM
I
Th
ou
san
ds
Only MED Excl. MED
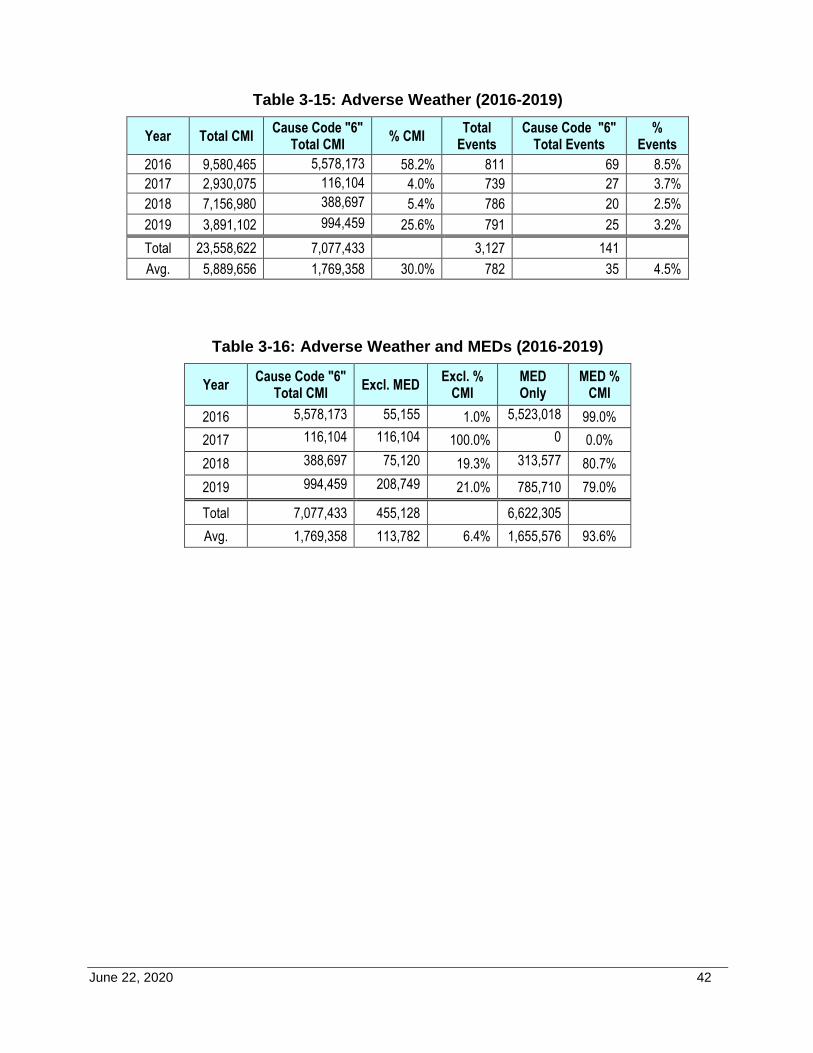
June 22, 2020 42
Table 3-15: Adverse Weather (2016-2019)
Year Total CMI Cause Code "6"
Total CMI % CMI
Total Events
Cause Code "6" Total Events
% Events
2016 9,580,465 5,578,173 58.2% 811 69 8.5%
2017 2,930,075 116,104 4.0% 739 27 3.7%
2018 7,156,980 388,697 5.4% 786 20 2.5%
2019 3,891,102 994,459 25.6% 791 25 3.2%
Total 23,558,622 7,077,433 3,127 141
Avg. 5,889,656 1,769,358 30.0% 782 35 4.5%
Table 3-16: Adverse Weather and MEDs (2016-2019)
Year Cause Code "6"
Total CMI Excl. MED
Excl. % CMI
MED Only
MED % CMI
2016 5,578,173 55,155 1.0% 5,523,018 99.0%
2017 116,104 116,104 100.0% 0 0.0%
2018 388,697 75,120 19.3% 313,577 80.7%
2019 994,459 208,749 21.0% 785,710 79.0%
Total 7,077,433 455,128 6,622,305
Avg. 1,769,358 113,782 6.4% 1,655,576 93.6%
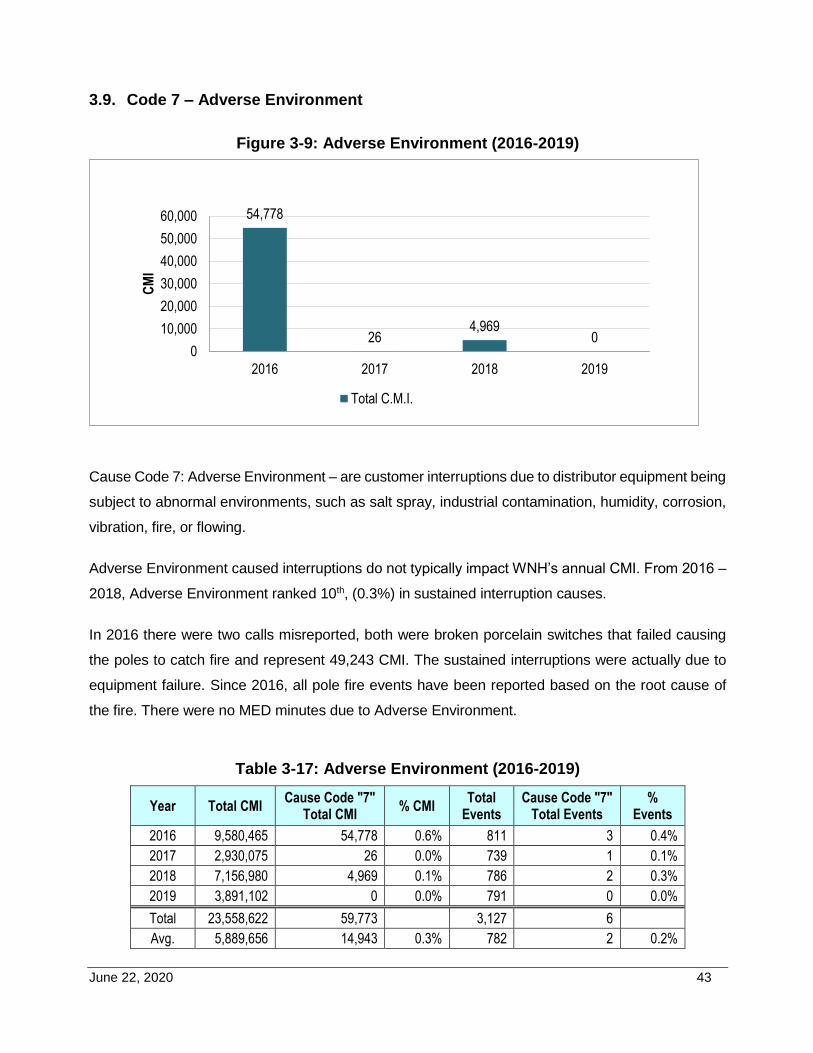
June 22, 2020 43
3.9. Code 7 – Adverse Environment
Figure 3-9: Adverse Environment (2016-2019)
Cause Code 7: Adverse Environment – are customer interruptions due to distributor equipment being
subject to abnormal environments, such as salt spray, industrial contamination, humidity, corrosion,
vibration, fire, or flowing.
Adverse Environment caused interruptions do not typically impact WNH’s annual CMI. From 2016 –
2018, Adverse Environment ranked 10th, (0.3%) in sustained interruption causes.
In 2016 there were two calls misreported, both were broken porcelain switches that failed causing
the poles to catch fire and represent 49,243 CMI. The sustained interruptions were actually due to
equipment failure. Since 2016, all pole fire events have been reported based on the root cause of
the fire. There were no MED minutes due to Adverse Environment.
Table 3-17: Adverse Environment (2016-2019)
Year Total CMI Cause Code "7"
Total CMI % CMI
Total Events
Cause Code "7" Total Events
% Events
2016 9,580,465 54,778 0.6% 811 3 0.4%
2017 2,930,075 26 0.0% 739 1 0.1%
2018 7,156,980 4,969 0.1% 786 2 0.3%
2019 3,891,102 0 0.0% 791 0 0.0%
Total 23,558,622 59,773 3,127 6
Avg. 5,889,656 14,943 0.3% 782 2 0.2%
54,778
264,969
00
10,000
20,000
30,000
40,000
50,000
60,000
2016 2017 2018 2019
CM
I
Total C.M.I.
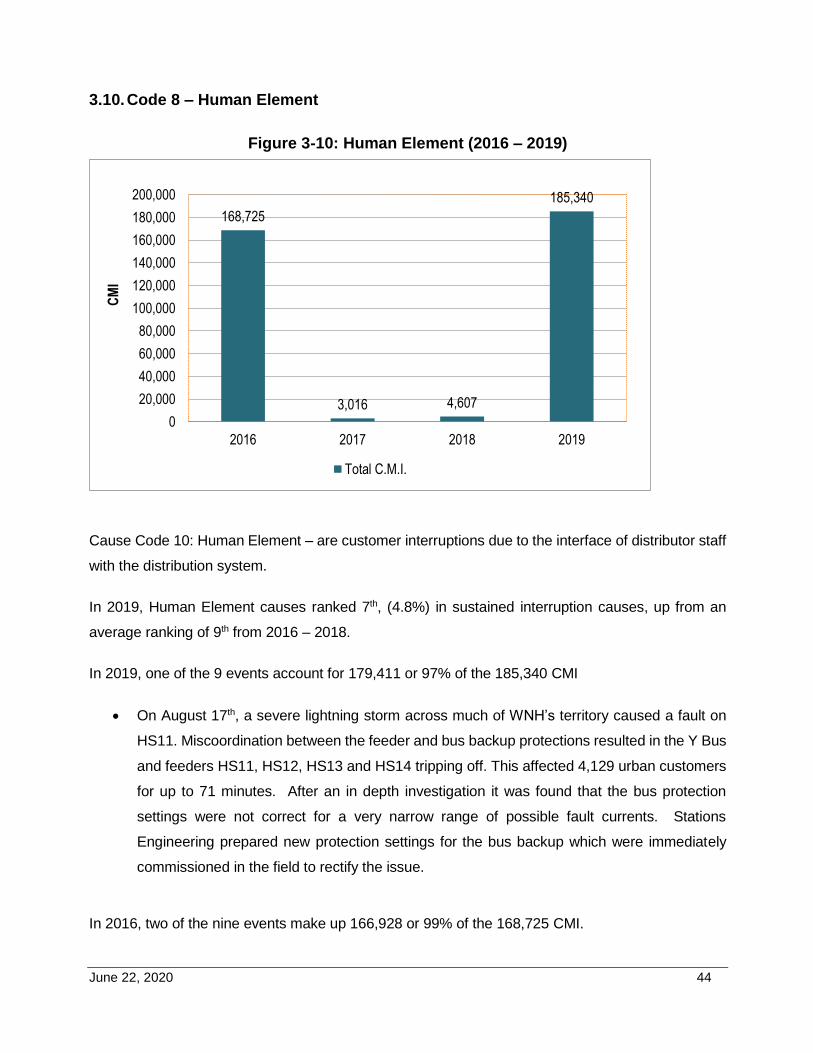
June 22, 2020 44
3.10. Code 8 – Human Element
Figure 3-10: Human Element (2016 – 2019)
Cause Code 10: Human Element – are customer interruptions due to the interface of distributor staff
with the distribution system.
In 2019, Human Element causes ranked 7th, (4.8%) in sustained interruption causes, up from an
average ranking of 9th from 2016 – 2018.
In 2019, one of the 9 events account for 179,411 or 97% of the 185,340 CMI
On August 17th, a severe lightning storm across much of WNH’s territory caused a fault on
HS11. Miscoordination between the feeder and bus backup protections resulted in the Y Bus
and feeders HS11, HS12, HS13 and HS14 tripping off. This affected 4,129 urban customers
for up to 71 minutes. After an in depth investigation it was found that the bus protection
settings were not correct for a very narrow range of possible fault currents. Stations
Engineering prepared new protection settings for the bus backup which were immediately
commissioned in the field to rectify the issue.
In 2016, two of the nine events make up 166,928 or 99% of the 168,725 CMI.
168,725
3,016 4,607
185,340
0
20,000
40,000
60,000
80,000
100,000
120,000
140,000
160,000
180,000
200,000
2016 2017 2018 2019
CM
I
Total C.M.I.
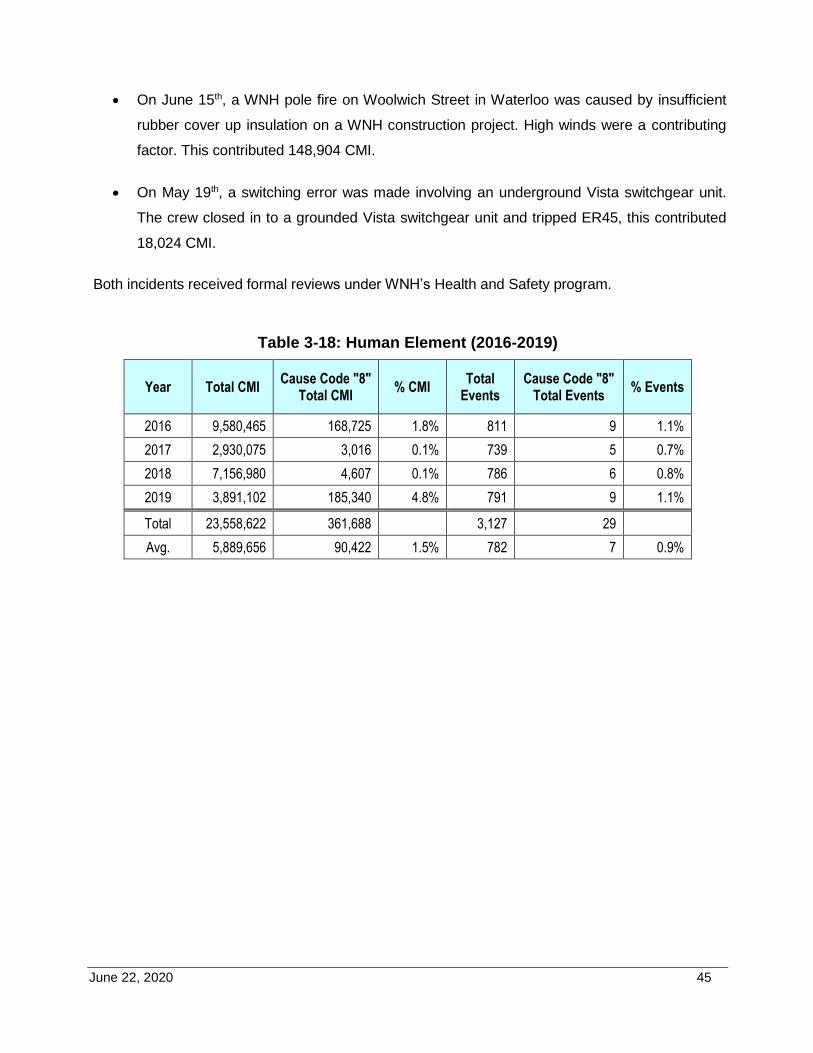
June 22, 2020 45
On June 15th, a WNH pole fire on Woolwich Street in Waterloo was caused by insufficient
rubber cover up insulation on a WNH construction project. High winds were a contributing
factor. This contributed 148,904 CMI.
On May 19th, a switching error was made involving an underground Vista switchgear unit.
The crew closed in to a grounded Vista switchgear unit and tripped ER45, this contributed
18,024 CMI.
Both incidents received formal reviews under WNH’s Health and Safety program.
Table 3-18: Human Element (2016-2019)
Year Total CMI Cause Code "8"
Total CMI % CMI
Total Events
Cause Code "8" Total Events
% Events
2016 9,580,465 168,725 1.8% 811 9 1.1%
2017 2,930,075 3,016 0.1% 739 5 0.7%
2018 7,156,980 4,607 0.1% 786 6 0.8%
2019 3,891,102 185,340 4.8% 791 9 1.1%
Total 23,558,622 361,688 3,127 29
Avg. 5,889,656 90,422 1.5% 782 7 0.9%
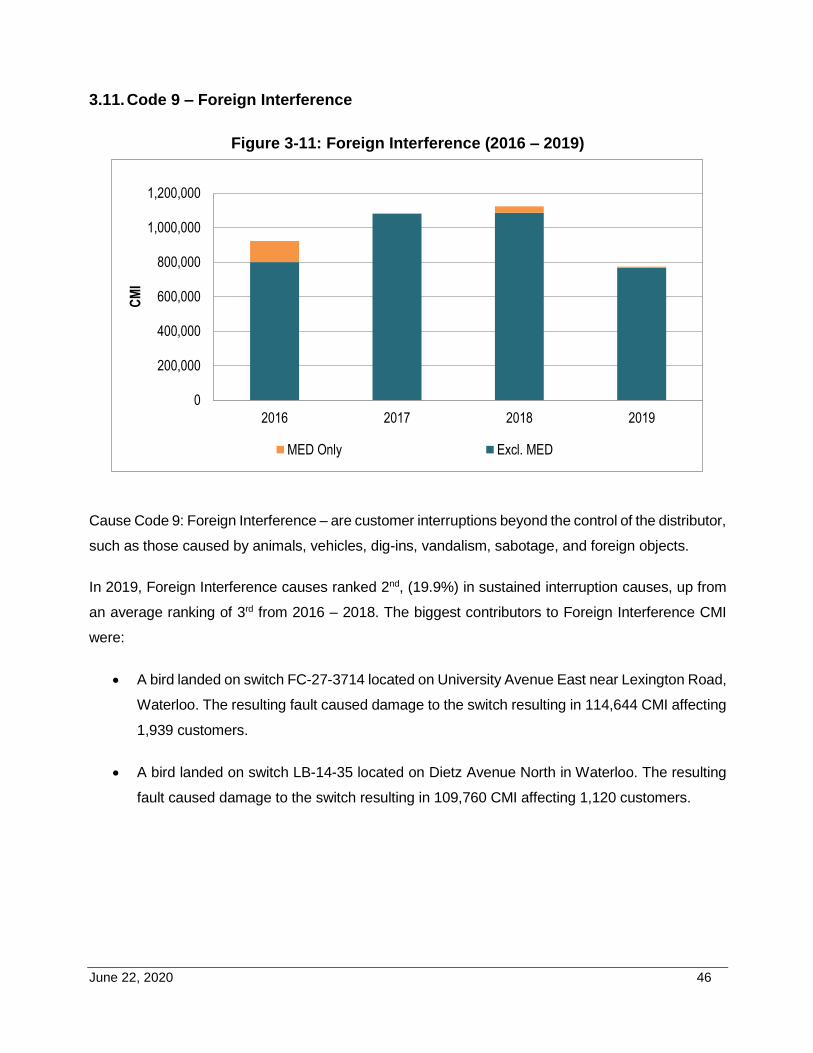
June 22, 2020 46
3.11. Code 9 – Foreign Interference
Figure 3-11: Foreign Interference (2016 – 2019)
Cause Code 9: Foreign Interference – are customer interruptions beyond the control of the distributor,
such as those caused by animals, vehicles, dig-ins, vandalism, sabotage, and foreign objects.
In 2019, Foreign Interference causes ranked 2nd, (19.9%) in sustained interruption causes, up from
an average ranking of 3rd from 2016 – 2018. The biggest contributors to Foreign Interference CMI
were:
A bird landed on switch FC-27-3714 located on University Avenue East near Lexington Road,
Waterloo. The resulting fault caused damage to the switch resulting in 114,644 CMI affecting
1,939 customers.
A bird landed on switch LB-14-35 located on Dietz Avenue North in Waterloo. The resulting
fault caused damage to the switch resulting in 109,760 CMI affecting 1,120 customers.
0
200,000
400,000
600,000
800,000
1,000,000
1,200,000
2016 2017 2018 2019
CM
I
MED Only Excl. MED
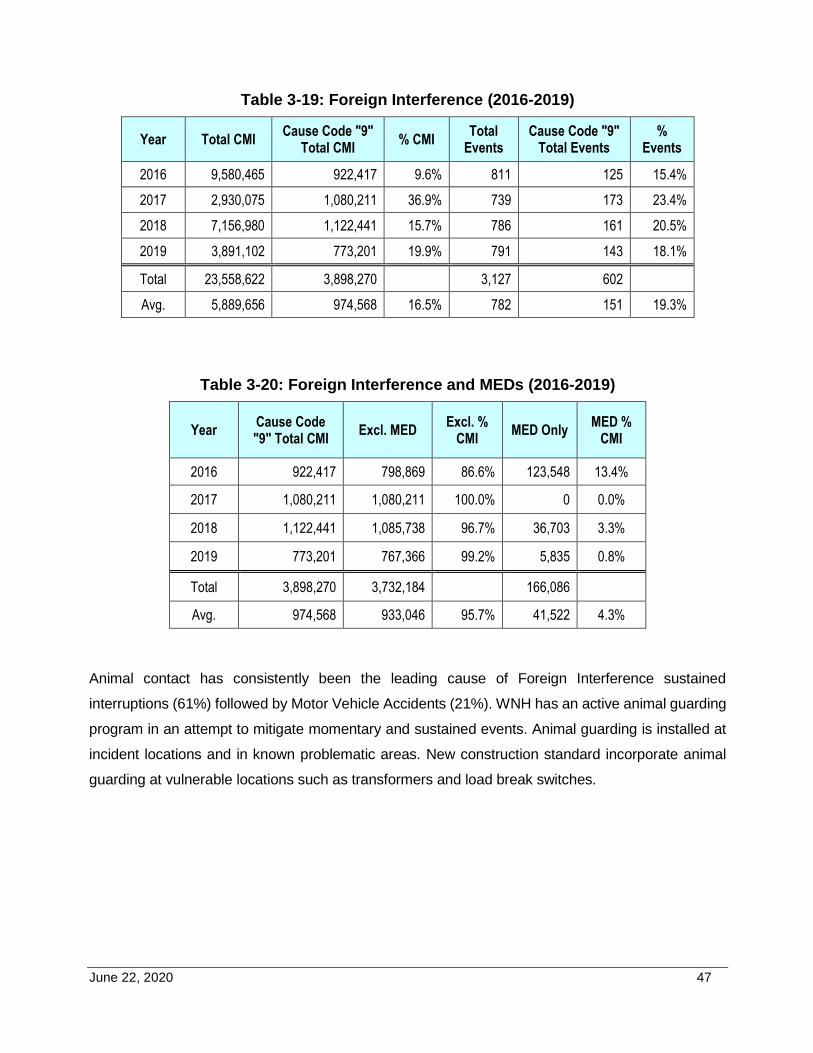
June 22, 2020 47
Table 3-19: Foreign Interference (2016-2019)
Year Total CMI Cause Code "9"
Total CMI % CMI
Total Events
Cause Code "9" Total Events
% Events
2016 9,580,465 922,417 9.6% 811 125 15.4%
2017 2,930,075 1,080,211 36.9% 739 173 23.4%
2018 7,156,980 1,122,441 15.7% 786 161 20.5%
2019 3,891,102 773,201 19.9% 791 143 18.1%
Total 23,558,622 3,898,270 3,127 602
Avg. 5,889,656 974,568 16.5% 782 151 19.3%
Table 3-20: Foreign Interference and MEDs (2016-2019)
Year Cause Code "9" Total CMI
Excl. MED Excl. %
CMI MED Only
MED % CMI
2016 922,417 798,869 86.6% 123,548 13.4%
2017 1,080,211 1,080,211 100.0% 0 0.0%
2018 1,122,441 1,085,738 96.7% 36,703 3.3%
2019 773,201 767,366 99.2% 5,835 0.8%
Total 3,898,270 3,732,184 166,086
Avg. 974,568 933,046 95.7% 41,522 4.3%
Animal contact has consistently been the leading cause of Foreign Interference sustained
interruptions (61%) followed by Motor Vehicle Accidents (21%). WNH has an active animal guarding
program in an attempt to mitigate momentary and sustained events. Animal guarding is installed at
incident locations and in known problematic areas. New construction standard incorporate animal
guarding at vulnerable locations such as transformers and load break switches.
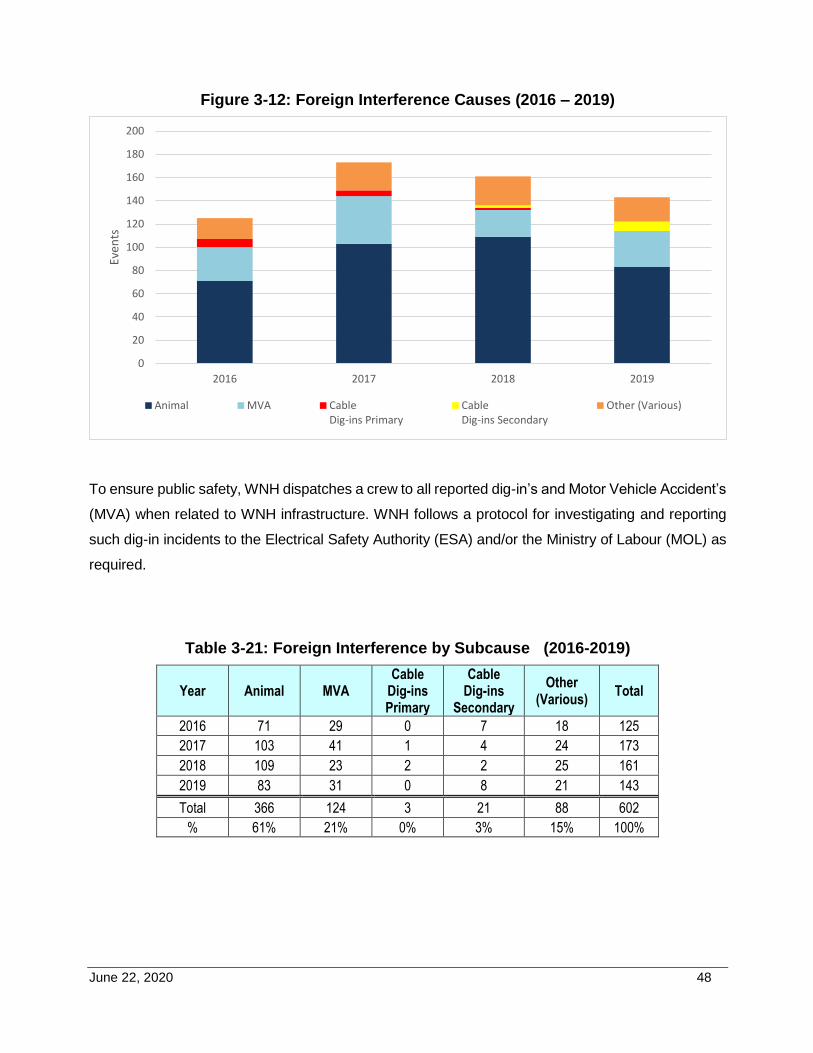
June 22, 2020 48
Figure 3-12: Foreign Interference Causes (2016 – 2019)
To ensure public safety, WNH dispatches a crew to all reported dig-in’s and Motor Vehicle Accident’s
(MVA) when related to WNH infrastructure. WNH follows a protocol for investigating and reporting
such dig-in incidents to the Electrical Safety Authority (ESA) and/or the Ministry of Labour (MOL) as
required.
Table 3-21: Foreign Interference by Subcause (2016-2019)
Year Animal MVA Cable
Dig-ins Primary
Cable Dig-ins
Secondary
Other (Various)
Total
2016 71 29 0 7 18 125
2017 103 41 1 4 24 173
2018 109 23 2 2 25 161
2019 83 31 0 8 21 143
Total 366 124 3 21 88 602
% 61% 21% 0% 3% 15% 100%
0
20
40
60
80
100
120
140
160
180
200
2016 2017 2018 2019
Even
ts
Animal MVA CableDig-ins Primary
CableDig-ins Secondary
Other (Various)
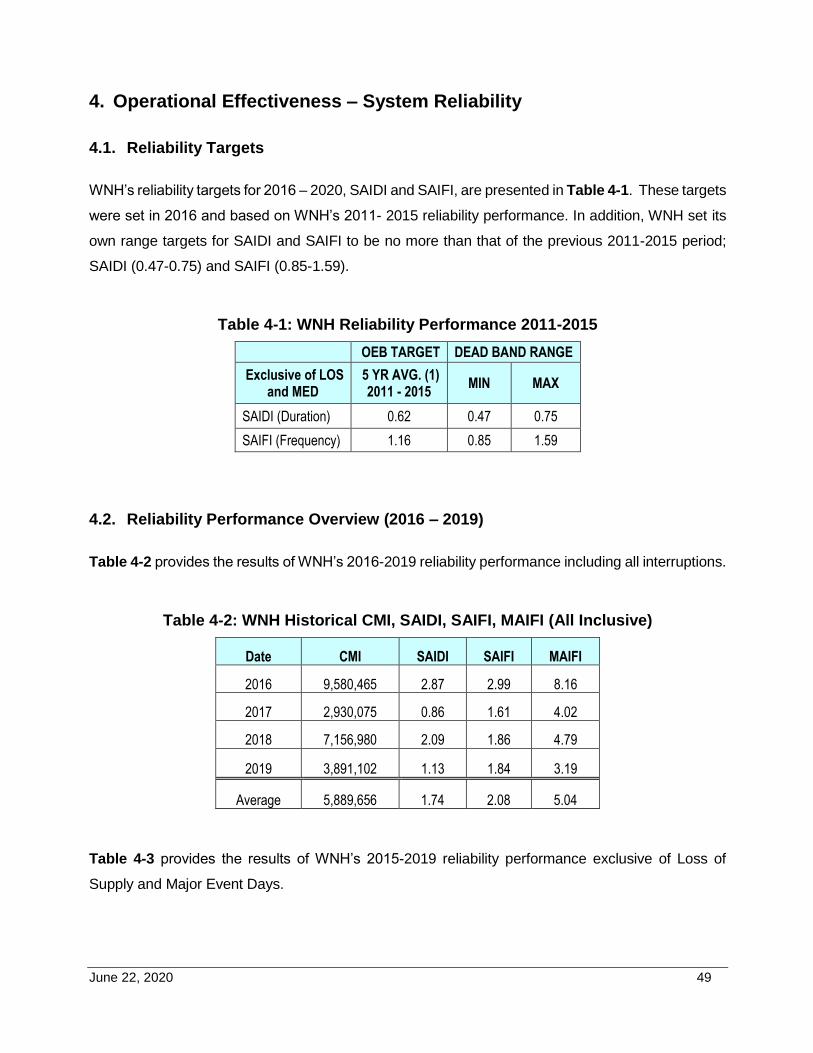
June 22, 2020 49
4. Operational Effectiveness – System Reliability
4.1. Reliability Targets
WNH’s reliability targets for 2016 – 2020, SAIDI and SAIFI, are presented in Table 4-1. These targets
were set in 2016 and based on WNH’s 2011- 2015 reliability performance. In addition, WNH set its
own range targets for SAIDI and SAIFI to be no more than that of the previous 2011-2015 period;
SAIDI (0.47-0.75) and SAIFI (0.85-1.59).
Table 4-1: WNH Reliability Performance 2011-2015
OEB TARGET DEAD BAND RANGE
Exclusive of LOS and MED
5 YR AVG. (1) 2011 - 2015
MIN MAX
SAIDI (Duration) 0.62 0.47 0.75
SAIFI (Frequency) 1.16 0.85 1.59
4.2. Reliability Performance Overview (2016 – 2019)
Table 4-2 provides the results of WNH’s 2016-2019 reliability performance including all interruptions.
Table 4-2: WNH Historical CMI, SAIDI, SAIFI, MAIFI (All Inclusive)
Date CMI SAIDI SAIFI MAIFI
2016 9,580,465 2.87 2.99 8.16
2017 2,930,075 0.86 1.61 4.02
2018 7,156,980 2.09 1.86 4.79
2019 3,891,102 1.13 1.84 3.19
Average 5,889,656 1.74 2.08 5.04
Table 4-3 provides the results of WNH’s 2015-2019 reliability performance exclusive of Loss of
Supply and Major Event Days.
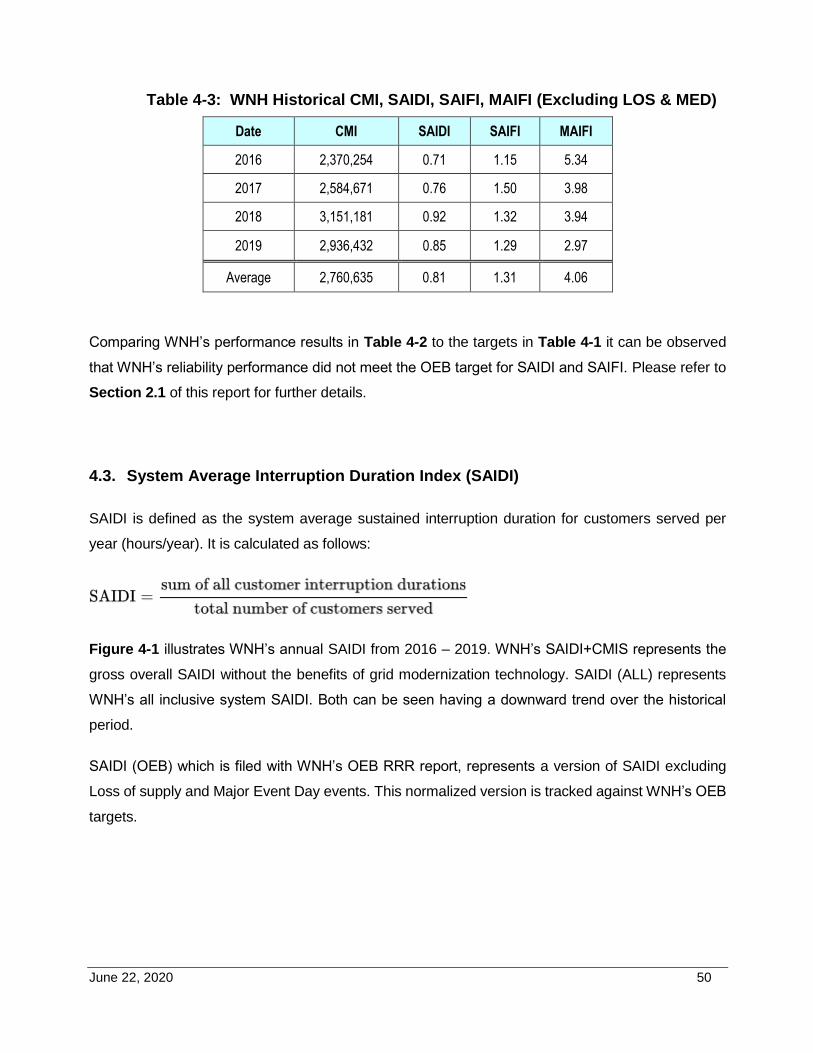
June 22, 2020 50
Table 4-3: WNH Historical CMI, SAIDI, SAIFI, MAIFI (Excluding LOS & MED)
Date CMI SAIDI SAIFI MAIFI
2016 2,370,254 0.71 1.15 5.34
2017 2,584,671 0.76 1.50 3.98
2018 3,151,181 0.92 1.32 3.94
2019 2,936,432 0.85 1.29 2.97
Average 2,760,635 0.81 1.31 4.06
Comparing WNH’s performance results in Table 4-2 to the targets in Table 4-1 it can be observed
that WNH’s reliability performance did not meet the OEB target for SAIDI and SAIFI. Please refer to
Section 2.1 of this report for further details.
4.3. System Average Interruption Duration Index (SAIDI)
SAIDI is defined as the system average sustained interruption duration for customers served per
year (hours/year). It is calculated as follows:
Figure 4-1 illustrates WNH’s annual SAIDI from 2016 – 2019. WNH’s SAIDI+CMIS represents the
gross overall SAIDI without the benefits of grid modernization technology. SAIDI (ALL) represents
WNH’s all inclusive system SAIDI. Both can be seen having a downward trend over the historical
period.
SAIDI (OEB) which is filed with WNH’s OEB RRR report, represents a version of SAIDI excluding
Loss of supply and Major Event Day events. This normalized version is tracked against WNH’s OEB
targets.
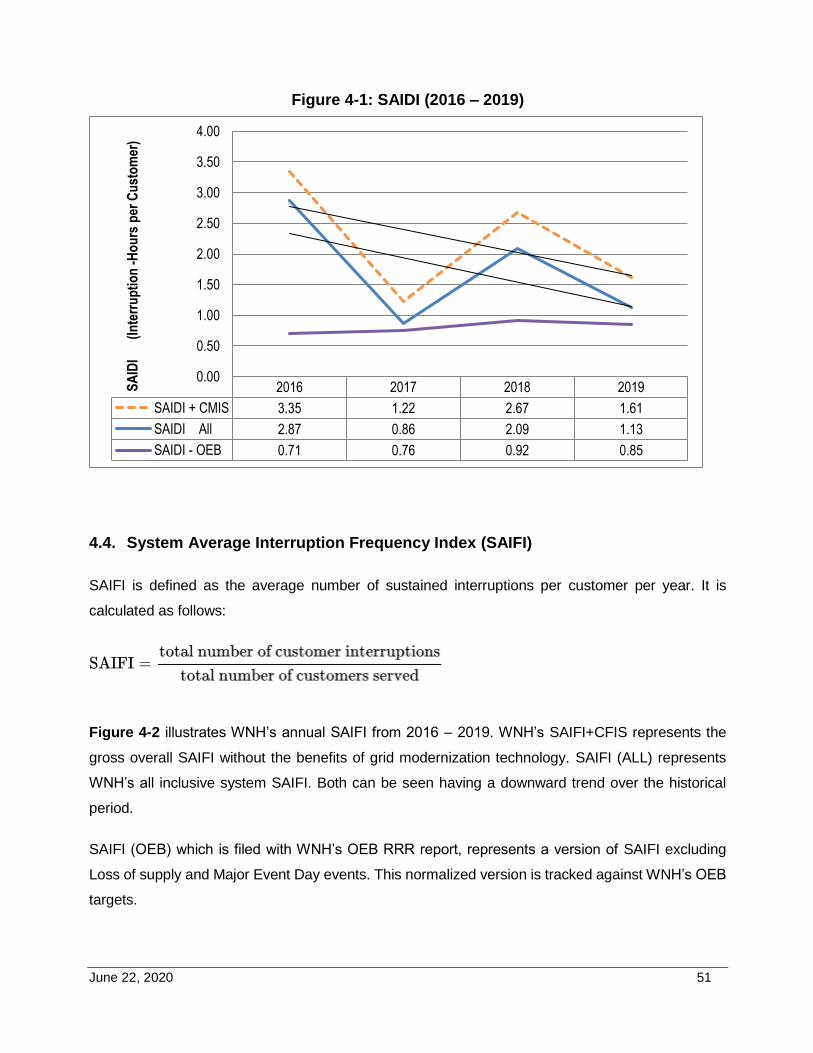
June 22, 2020 51
Figure 4-1: SAIDI (2016 – 2019)
4.4. System Average Interruption Frequency Index (SAIFI)
SAIFI is defined as the average number of sustained interruptions per customer per year. It is
calculated as follows:
Figure 4-2 illustrates WNH’s annual SAIFI from 2016 – 2019. WNH’s SAIFI+CFIS represents the
gross overall SAIFI without the benefits of grid modernization technology. SAIFI (ALL) represents
WNH’s all inclusive system SAIFI. Both can be seen having a downward trend over the historical
period.
SAIFI (OEB) which is filed with WNH’s OEB RRR report, represents a version of SAIFI excluding
Loss of supply and Major Event Day events. This normalized version is tracked against WNH’s OEB
targets.
2016 2017 2018 2019
SAIDI + CMIS 3.35 1.22 2.67 1.61
SAIDI All 2.87 0.86 2.09 1.13
SAIDI - OEB 0.71 0.76 0.92 0.85
0.00
0.50
1.00
1.50
2.00
2.50
3.00
3.50
4.00S
AID
I
(In
terr
up
tio
n -
Ho
urs
per
Cu
sto
mer
)
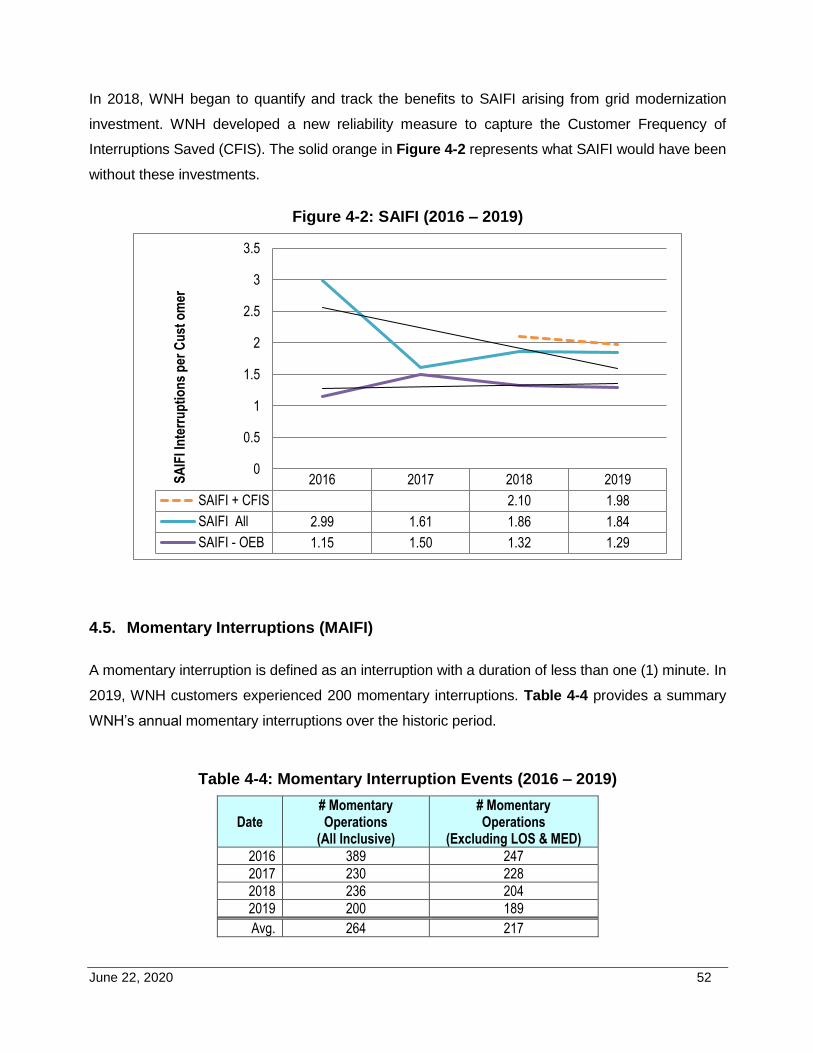
June 22, 2020 52
In 2018, WNH began to quantify and track the benefits to SAIFI arising from grid modernization
investment. WNH developed a new reliability measure to capture the Customer Frequency of
Interruptions Saved (CFIS). The solid orange in Figure 4-2 represents what SAIFI would have been
without these investments.
Figure 4-2: SAIFI (2016 – 2019)
4.5. Momentary Interruptions (MAIFI)
A momentary interruption is defined as an interruption with a duration of less than one (1) minute. In
2019, WNH customers experienced 200 momentary interruptions. Table 4-4 provides a summary
WNH’s annual momentary interruptions over the historic period.
Table 4-4: Momentary Interruption Events (2016 – 2019)
Date # Momentary Operations
(All Inclusive)
# Momentary Operations
(Excluding LOS & MED)
2016 389 247
2017 230 228
2018 236 204
2019 200 189
Avg. 264 217
2016 2017 2018 2019
SAIFI + CFIS 2.10 1.98
SAIFI All 2.99 1.61 1.86 1.84
SAIFI - OEB 1.15 1.50 1.32 1.29
0
0.5
1
1.5
2
2.5
3
3.5
SA
IFI I
nte
rru
pti
on
s p
er C
ust
om
er
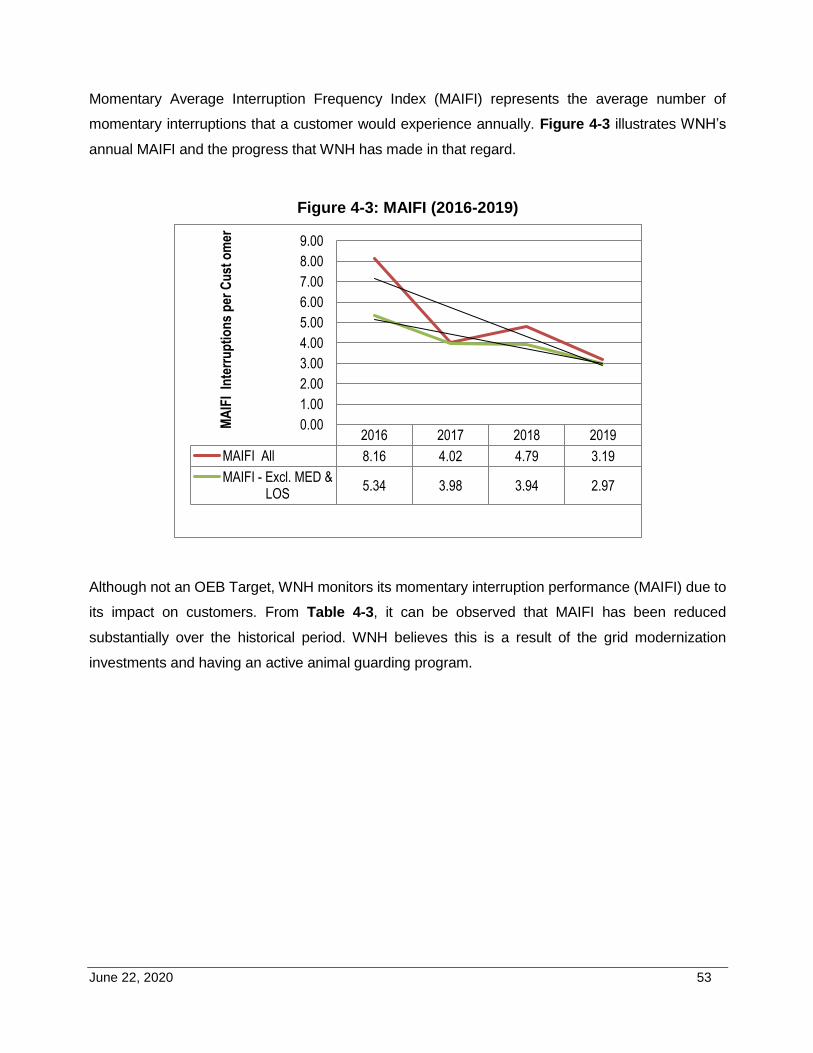
June 22, 2020 53
Momentary Average Interruption Frequency Index (MAIFI) represents the average number of
momentary interruptions that a customer would experience annually. Figure 4-3 illustrates WNH’s
annual MAIFI and the progress that WNH has made in that regard.
Figure 4-3: MAIFI (2016-2019)
Although not an OEB Target, WNH monitors its momentary interruption performance (MAIFI) due to
its impact on customers. From Table 4-3, it can be observed that MAIFI has been reduced
substantially over the historical period. WNH believes this is a result of the grid modernization
investments and having an active animal guarding program.
2016 2017 2018 2019
MAIFI All 8.16 4.02 4.79 3.19
MAIFI - Excl. MED &LOS
5.34 3.98 3.94 2.97
0.00
1.00
2.00
3.00
4.00
5.00
6.00
7.00
8.00
9.00M
AIF
I In
terr
up
tio
ns
per
Cu
st o
mer
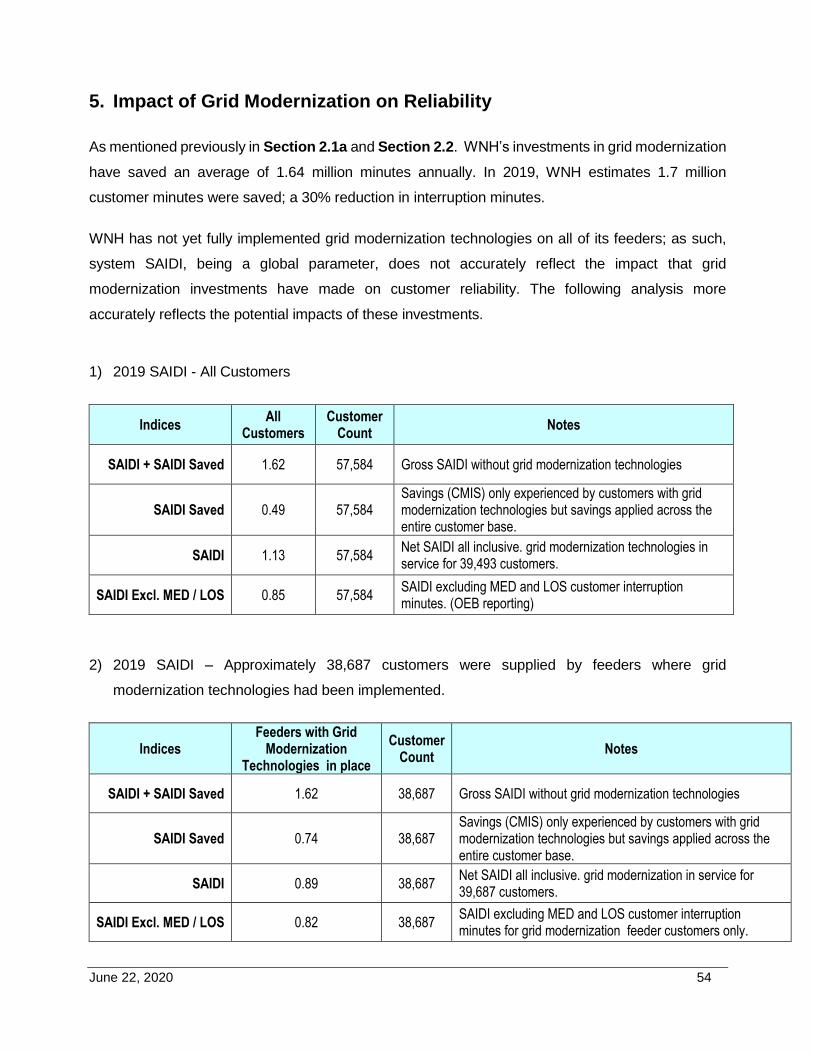
June 22, 2020 54
5. Impact of Grid Modernization on Reliability
As mentioned previously in Section 2.1a and Section 2.2. WNH’s investments in grid modernization
have saved an average of 1.64 million minutes annually. In 2019, WNH estimates 1.7 million
customer minutes were saved; a 30% reduction in interruption minutes.
WNH has not yet fully implemented grid modernization technologies on all of its feeders; as such,
system SAIDI, being a global parameter, does not accurately reflect the impact that grid
modernization investments have made on customer reliability. The following analysis more
accurately reflects the potential impacts of these investments.
1) 2019 SAIDI - All Customers
Indices All
Customers Customer
Count Notes
SAIDI + SAIDI Saved 1.62 57,584 Gross SAIDI without grid modernization technologies
SAIDI Saved 0.49 57,584 Savings (CMIS) only experienced by customers with grid modernization technologies but savings applied across the entire customer base.
SAIDI 1.13 57,584 Net SAIDI all inclusive. grid modernization technologies in service for 39,493 customers.
SAIDI Excl. MED / LOS 0.85 57,584 SAIDI excluding MED and LOS customer interruption minutes. (OEB reporting)
2) 2019 SAIDI – Approximately 38,687 customers were supplied by feeders where grid
modernization technologies had been implemented.
Indices Feeders with Grid
Modernization Technologies in place
Customer Count
Notes
SAIDI + SAIDI Saved 1.62 38,687 Gross SAIDI without grid modernization technologies
SAIDI Saved 0.74 38,687 Savings (CMIS) only experienced by customers with grid modernization technologies but savings applied across the entire customer base.
SAIDI 0.89 38,687 Net SAIDI all inclusive. grid modernization in service for 39,687 customers.
SAIDI Excl. MED / LOS 0.82 38,687 SAIDI excluding MED and LOS customer interruption minutes for grid modernization feeder customers only.
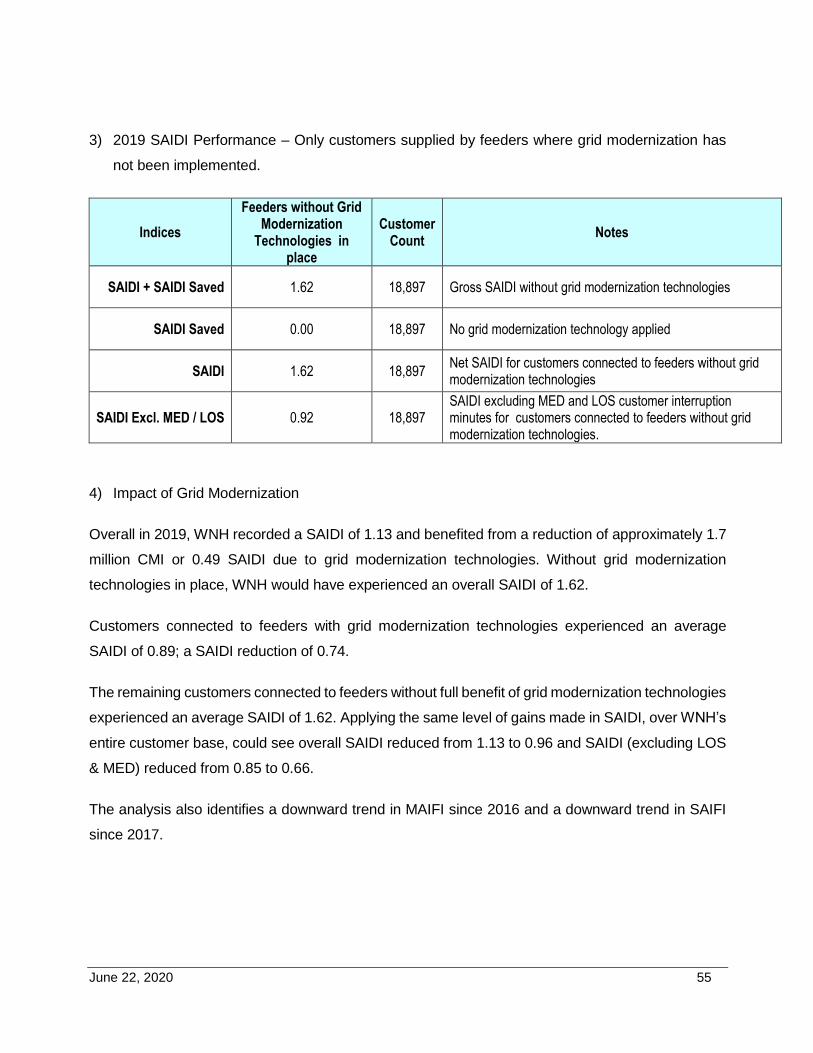
June 22, 2020 55
3) 2019 SAIDI Performance – Only customers supplied by feeders where grid modernization has
not been implemented.
Indices
Feeders without Grid Modernization
Technologies in place
Customer Count
Notes
SAIDI + SAIDI Saved 1.62 18,897 Gross SAIDI without grid modernization technologies
SAIDI Saved 0.00 18,897 No grid modernization technology applied
SAIDI 1.62 18,897 Net SAIDI for customers connected to feeders without grid modernization technologies
SAIDI Excl. MED / LOS 0.92 18,897 SAIDI excluding MED and LOS customer interruption minutes for customers connected to feeders without grid modernization technologies.
4) Impact of Grid Modernization
Overall in 2019, WNH recorded a SAIDI of 1.13 and benefited from a reduction of approximately 1.7
million CMI or 0.49 SAIDI due to grid modernization technologies. Without grid modernization
technologies in place, WNH would have experienced an overall SAIDI of 1.62.
Customers connected to feeders with grid modernization technologies experienced an average
SAIDI of 0.89; a SAIDI reduction of 0.74.
The remaining customers connected to feeders without full benefit of grid modernization technologies
experienced an average SAIDI of 1.62. Applying the same level of gains made in SAIDI, over WNH’s
entire customer base, could see overall SAIDI reduced from 1.13 to 0.96 and SAIDI (excluding LOS
& MED) reduced from 0.85 to 0.66.
The analysis also identifies a downward trend in MAIFI since 2016 and a downward trend in SAIFI
since 2017.
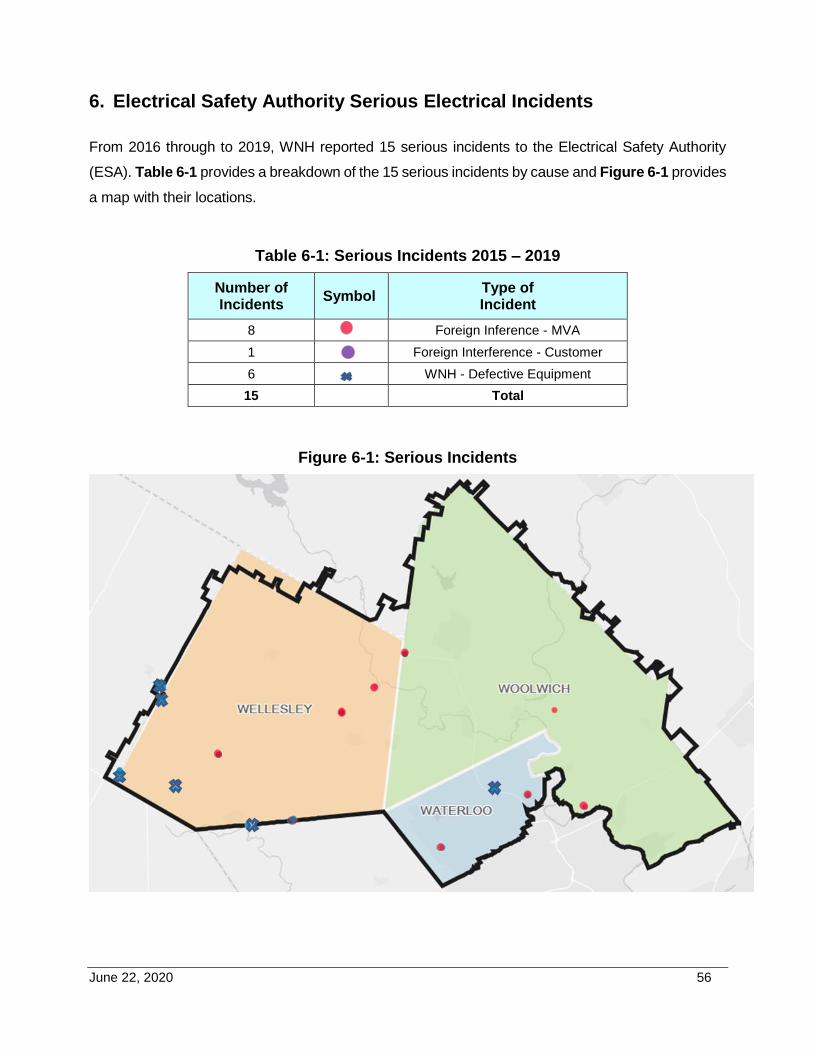
June 22, 2020 56
6. Electrical Safety Authority Serious Electrical Incidents
From 2016 through to 2019, WNH reported 15 serious incidents to the Electrical Safety Authority
(ESA). Table 6-1 provides a breakdown of the 15 serious incidents by cause and Figure 6-1 provides
a map with their locations.
Table 6-1: Serious Incidents 2015 – 2019
Number of Incidents
Symbol Type of Incident
8
Foreign Inference - MVA
1
Foreign Interference - Customer
6
WNH - Defective Equipment
15 Total
Figure 6-1: Serious Incidents
June 22, 2020 57
Foreign Interference accounted for 9 (60%) out of the total 15 reported incidents meaning they were
not within WNH’s direct control.
Of the remaining 6 incidents, all were caused by WNH Defective Equipment in the form of a fallen
primary or primary neutral conductor. None of the incidents involving Defective Equipment involved
an electrical contact or personal injury.
WNH’s distribution system in Wellesley Township contributed to 5 Defective Equipment events. As
of Q4 2019, the lines involved in these incidents have been inspected and where needed, sections
of the lines were rebuilt.
WNH has gone on to perform more detailed inspections of small sized overhead conductor in the
rural area and found that more conductor in poor condition exists. The rebuilding of overhead lines
with failing conductor has been identified and incorporated into WNH’s System Renewal program.
More detail can be found in WNH’s DSP, Section 4.4.2 Material Investments.
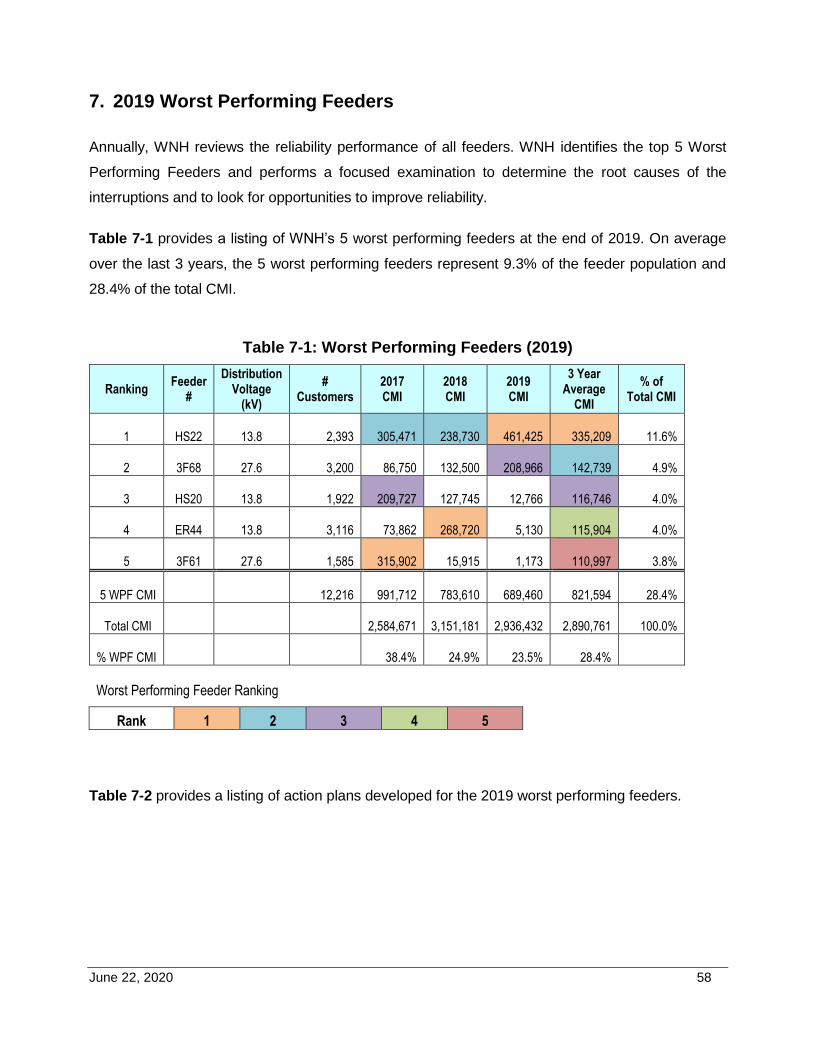
June 22, 2020 58
7. 2019 Worst Performing Feeders
Annually, WNH reviews the reliability performance of all feeders. WNH identifies the top 5 Worst
Performing Feeders and performs a focused examination to determine the root causes of the
interruptions and to look for opportunities to improve reliability.
Table 7-1 provides a listing of WNH’s 5 worst performing feeders at the end of 2019. On average
over the last 3 years, the 5 worst performing feeders represent 9.3% of the feeder population and
28.4% of the total CMI.
Table 7-1: Worst Performing Feeders (2019)
Ranking Feeder
#
Distribution Voltage
(kV)
# Customers
2017 CMI
2018 CMI
2019 CMI
3 Year Average
CMI
% of Total CMI
1 HS22 13.8
2,393
305,471
238,730
461,425
335,209 11.6%
2 3F68 27.6
3,200
86,750
132,500
208,966
142,739 4.9%
3 HS20 13.8
1,922
209,727
127,745
12,766
116,746 4.0%
4 ER44 13.8
3,116
73,862
268,720
5,130
115,904 4.0%
5 3F61 27.6
1,585
315,902
15,915
1,173
110,997 3.8%
5 WPF CMI
12,216
991,712
783,610
689,460
821,594 28.4%
Total CMI
2,584,671
3,151,181
2,936,432
2,890,761 100.0%
% WPF CMI 38.4% 24.9% 23.5% 28.4%
Worst Performing Feeder Ranking
Rank 1 2 3 4 5
Table 7-2 provides a listing of action plans developed for the 2019 worst performing feeders.
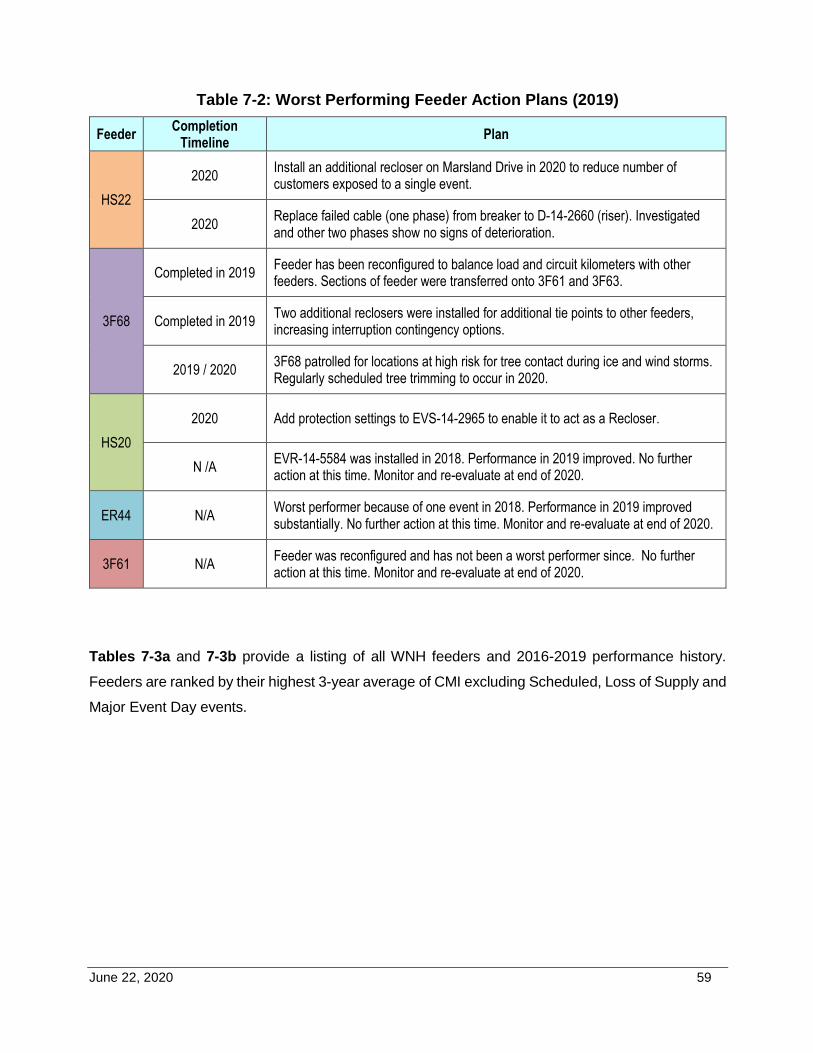
June 22, 2020 59
Table 7-2: Worst Performing Feeder Action Plans (2019)
Feeder Completion
Timeline Plan
HS22
2020 Install an additional recloser on Marsland Drive in 2020 to reduce number of customers exposed to a single event.
2020 Replace failed cable (one phase) from breaker to D-14-2660 (riser). Investigated and other two phases show no signs of deterioration.
3F68
Completed in 2019 Feeder has been reconfigured to balance load and circuit kilometers with other feeders. Sections of feeder were transferred onto 3F61 and 3F63.
Completed in 2019 Two additional reclosers were installed for additional tie points to other feeders, increasing interruption contingency options.
2019 / 2020 3F68 patrolled for locations at high risk for tree contact during ice and wind storms. Regularly scheduled tree trimming to occur in 2020.
HS20
2020 Add protection settings to EVS-14-2965 to enable it to act as a Recloser.
N /A EVR-14-5584 was installed in 2018. Performance in 2019 improved. No further action at this time. Monitor and re-evaluate at end of 2020.
ER44 N/A Worst performer because of one event in 2018. Performance in 2019 improved substantially. No further action at this time. Monitor and re-evaluate at end of 2020.
3F61 N/A Feeder was reconfigured and has not been a worst performer since. No further action at this time. Monitor and re-evaluate at end of 2020.
Tables 7-3a and 7-3b provide a listing of all WNH feeders and 2016-2019 performance history.
Feeders are ranked by their highest 3-year average of CMI excluding Scheduled, Loss of Supply and
Major Event Day events.
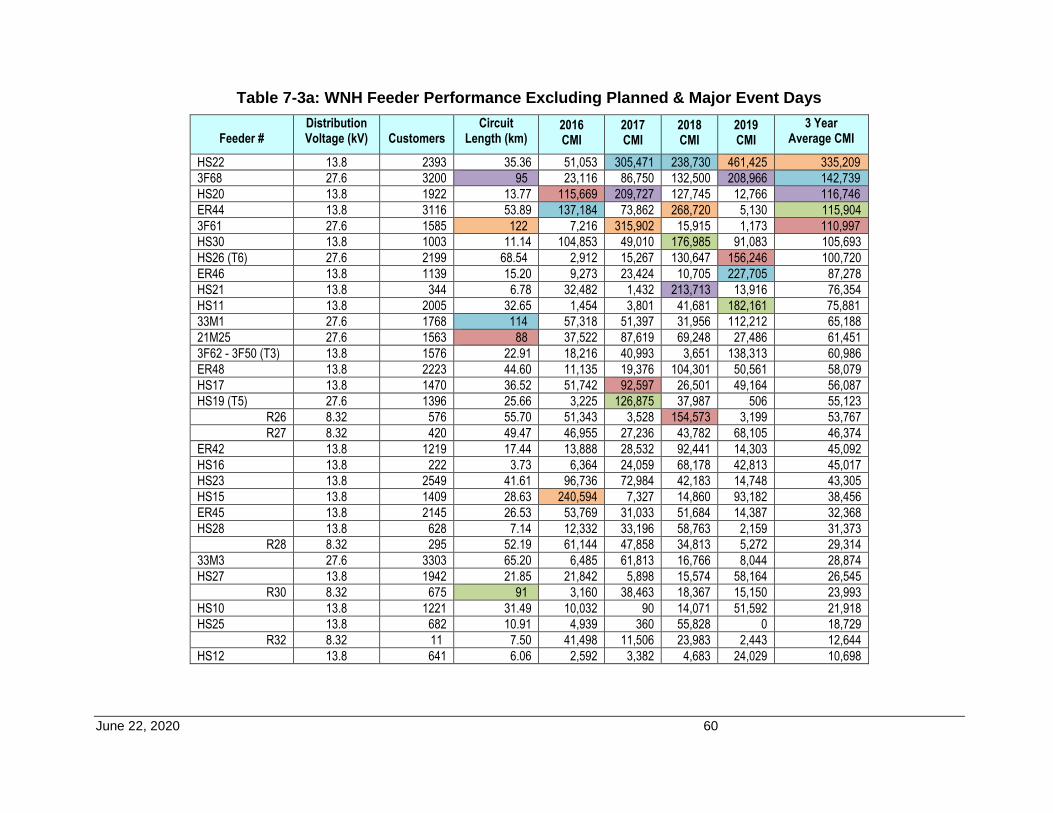
June 22, 2020 60
Table 7-3a: WNH Feeder Performance Excluding Planned & Major Event Days
Feeder # Distribution Voltage (kV) Customers
Circuit Length (km)
2016 CMI
2017 CMI
2018 CMI
2019 CMI
3 Year Average CMI
HS22 13.8 2393 35.36 51,053 305,471 238,730 461,425 335,209
3F68 27.6 3200 95 23,116 86,750 132,500 208,966 142,739
HS20 13.8 1922 13.77 115,669 209,727 127,745 12,766 116,746
ER44 13.8 3116 53.89 137,184 73,862 268,720 5,130 115,904
3F61 27.6 1585 122 7,216 315,902 15,915 1,173 110,997
HS30 13.8 1003 11.14 104,853 49,010 176,985 91,083 105,693
HS26 (T6) 27.6 2199 68.54 2,912 15,267 130,647 156,246 100,720
ER46 13.8 1139 15.20 9,273 23,424 10,705 227,705 87,278
HS21 13.8 344 6.78 32,482 1,432 213,713 13,916 76,354
HS11 13.8 2005 32.65 1,454 3,801 41,681 182,161 75,881
33M1 27.6 1768 114 57,318 51,397 31,956 112,212 65,188
21M25 27.6 1563 88 37,522 87,619 69,248 27,486 61,451
3F62 - 3F50 (T3) 13.8 1576 22.91 18,216 40,993 3,651 138,313 60,986
ER48 13.8 2223 44.60 11,135 19,376 104,301 50,561 58,079
HS17 13.8 1470 36.52 51,742 92,597 26,501 49,164 56,087
HS19 (T5) 27.6 1396 25.66 3,225 126,875 37,987 506 55,123
R26 8.32 576 55.70 51,343 3,528 154,573 3,199 53,767
R27 8.32 420 49.47 46,955 27,236 43,782 68,105 46,374
ER42 13.8 1219 17.44 13,888 28,532 92,441 14,303 45,092
HS16 13.8 222 3.73 6,364 24,059 68,178 42,813 45,017
HS23 13.8 2549 41.61 96,736 72,984 42,183 14,748 43,305
HS15 13.8 1409 28.63 240,594 7,327 14,860 93,182 38,456
ER45 13.8 2145 26.53 53,769 31,033 51,684 14,387 32,368
HS28 13.8 628 7.14 12,332 33,196 58,763 2,159 31,373
R28 8.32 295 52.19 61,144 47,858 34,813 5,272 29,314
33M3 27.6 3303 65.20 6,485 61,813 16,766 8,044 28,874
HS27 13.8 1942 21.85 21,842 5,898 15,574 58,164 26,545
R30 8.32 675 91 3,160 38,463 18,367 15,150 23,993
HS10 13.8 1221 31.49 10,032 90 14,071 51,592 21,918
HS25 13.8 682 10.91 4,939 360 55,828 0 18,729
R32 8.32 11 7.50 41,498 11,506 23,983 2,443 12,644
HS12 13.8 641 6.06 2,592 3,382 4,683 24,029 10,698
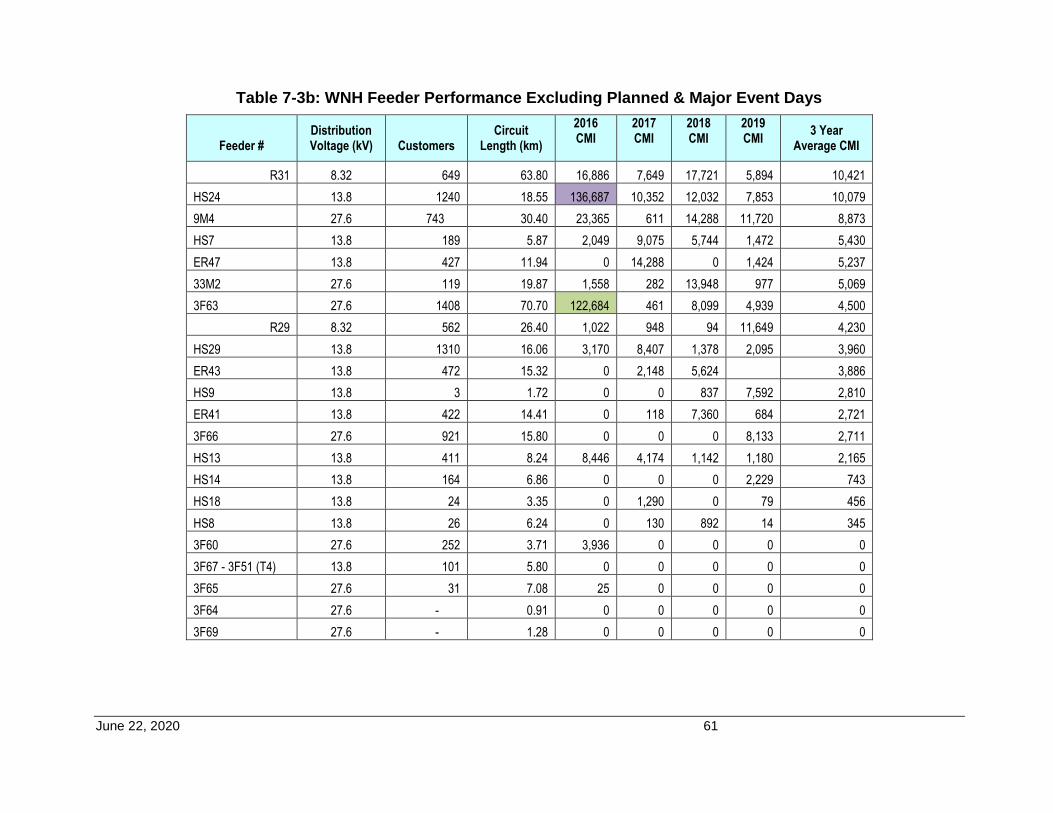
June 22, 2020 61
Table 7-3b: WNH Feeder Performance Excluding Planned & Major Event Days
Feeder # Distribution Voltage (kV) Customers
Circuit Length (km)
2016 CMI
2017 CMI
2018 CMI
2019 CMI
3 Year Average CMI
R31 8.32 649 63.80 16,886 7,649 17,721 5,894 10,421
HS24 13.8 1240 18.55 136,687 10,352 12,032 7,853 10,079
9M4 27.6 743 30.40 23,365 611 14,288 11,720 8,873
HS7 13.8 189 5.87 2,049 9,075 5,744 1,472 5,430
ER47 13.8 427 11.94 0 14,288 0 1,424 5,237
33M2 27.6 119 19.87 1,558 282 13,948 977 5,069
3F63 27.6 1408 70.70 122,684 461 8,099 4,939 4,500
R29 8.32 562 26.40 1,022 948 94 11,649 4,230
HS29 13.8 1310 16.06 3,170 8,407 1,378 2,095 3,960
ER43 13.8 472 15.32 0 2,148 5,624 3,886
HS9 13.8 3 1.72 0 0 837 7,592 2,810
ER41 13.8 422 14.41 0 118 7,360 684 2,721
3F66 27.6 921 15.80 0 0 0 8,133 2,711
HS13 13.8 411 8.24 8,446 4,174 1,142 1,180 2,165
HS14 13.8 164 6.86 0 0 0 2,229 743
HS18 13.8 24 3.35 0 1,290 0 79 456
HS8 13.8 26 6.24 0 130 892 14 345
3F60 27.6 252 3.71 3,936 0 0 0 0
3F67 - 3F51 (T4) 13.8 101 5.80 0 0 0 0 0
3F65 27.6 31 7.08 25 0 0 0 0
3F64 27.6 - 0.91 0 0 0 0 0
3F69 27.6 - 1.28 0 0 0 0 0

Appendix L:
WNH Customer Engagement Reports

November 2016
Waterloo North Hydro Inc.
2018
Electric Utility
Customer
Satisfaction
Survey
2 November 2018
The purpose of this report is to profile the connection between Waterloo North Hydro Inc. (Waterloo North Hydro) and its customers. The primary objective of the Electric Utility Customer Satisfaction Survey is to provide information to support discussions about improving customer care at every level in your utility. The UtilityPULSE Report Card® and survey analysis contained in this report is intended to capture the state of mind or perceptions about your customers’ need and wants – the information contained in this report will help guide your discussions for making meaningful improvements. This survey report is privileged and confidential material, and no part may be used outside of Waterloo North Hydro Inc. without written permission from UtilityPULSE, the electric utility survey division of Simul Corporation.
All comments and questions should be addressed to:
Sid Ridgley, UtilityPULSE division, Simul Corporation Toll free: 1-888-291-7892 or Local: 905-895-7900 Email: [email protected] or [email protected]
3 November 2018
Feedback, Information & Insights Eighteen months ago, customers were very angry about the quickly increasing costs of electricity over the
previous 5 or more years. In fact, some years were double-digit increases while wages and inflation hovered
around the 2% mark. We know this because the number of survey respondents in the Ontario benchmark
survey who said they ‘sometimes worry about paying their bill’ grew from 21% to 31% and the number of At
Risk customers grew from 11% to 17%.
Data from the Waterloo North Hydro and Ontario benchmark surveys show the level of “anger” has dramatically
reduced. Whether changes in perception were created by the Liberal Government’s Spring 2016 reduction by
25% in electricity prices, or the change to a Conservative government June 2018, or the promise of further
reductions in electricity prices, or improvements in the economy, or improvements that LDCs have made in
managing outages while improving customers service, or all of the above - a major shift towards a more
positive view has taken place. Customers who have a positive view of their LDC and the industry exhibit less
resistance to change.
For Waterloo North Hydro in the Fall 2018 survey 14% of respondents and 21% of the Ontario benchmark
respondents said they ‘sometimes worry about paying their bill.’ Also, the At Risk customer respondent levels
were 4% for Waterloo North Hydro and 13% for the Ontario benchmark. To be clear, customers are still
concerned about the costs of electricity as shown by very low scores in the attribute “The cost of electricity is
reasonable when compared to other utilities such as gas, cable or telephone.”
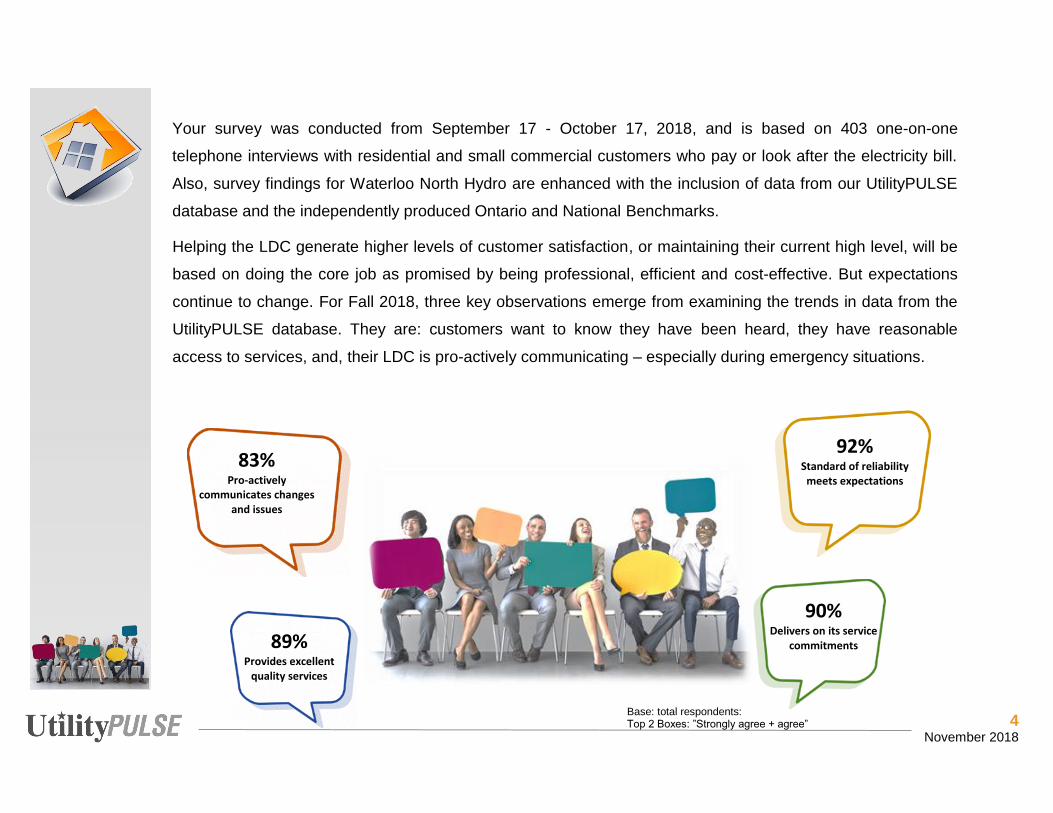
4 November 2018
Your survey was conducted from September 17 - October 17, 2018, and is based on 403 one-on-one
telephone interviews with residential and small commercial customers who pay or look after the electricity bill.
Also, survey findings for Waterloo North Hydro are enhanced with the inclusion of data from our UtilityPULSE
database and the independently produced Ontario and National Benchmarks.
Helping the LDC generate higher levels of customer satisfaction, or maintaining their current high level, will be
based on doing the core job as promised by being professional, efficient and cost-effective. But expectations
continue to change. For Fall 2018, three key observations emerge from examining the trends in data from the
UtilityPULSE database. They are: customers want to know they have been heard, they have reasonable
access to services, and, their LDC is pro-actively communicating – especially during emergency situations.
92% Standard of reliability
meets expectations
Base: total respondents: Top 2 Boxes: ”Strongly agree + agree”
90% Delivers on its service
commitments 89% Provides excellent
quality services
83% Pro-actively
communicates changes and issues

5 November 2018
The Core Responsibilities
Waterloo North Hydro survey respondents agree strongly + agree somewhat (Top 2 boxes), their LDC:
Provides consistent, reliable electricity 94%, Quickly handles outages and restores power 94%, Accurate billing
92% and Makes electricity safety a top priority for employees, contractors, and the public 87%.
Issues: Billing and Blackouts, the “Killer B’s”
In a world, which is becoming more complex, and where people are time-pressed, outage and billing issues are
likely to motivate customers to contact their LDC.
Problems: Blackouts
Percentage of Respondents indicating that they had a Blackout or Outage problem in the last 12 months
Waterloo North Hydro National Ontario
2018 37% 39% 44% Base: total respondents Problems: Billing issues
Percentage of Respondents indicating that they had a Billing problem in the last 12 months
Waterloo North Hydro National Ontario
2018 5% 9% 9% Base: total respondents
While it is true, Waterloo North Hydro receives very good operational scores, it also has a responsibility to
professionally and quickly deal with issues customers contact them about. In a complex electricity industry
world, this puts additional strain on the skills and competencies of everyone who interacts with customers.

6 November 2018
Customer Service
Satisfaction with Customer Service
Top 2 Boxes: ‘very + fairly satisfied’ Waterloo North Hydro National Ontario
The time it took to contact someone 86% 66% 64%
The time it took someone to deal with your problem 88% 72% 65%
The helpfulness of the staff who dealt with you 91% 70% 64%
The knowledge of the staff who dealt with you 89% 70% 64%
The level of courtesy of the staff who dealt with you 95% 78% 70%
The quality of information provided by the staff who dealt with you 88% 73% 61% Base: total respondents who contacted the utility Traditionally LDCs handle inbound, or customer initiated communications when there are issues. However,
more and more customers have an expectation their LDC will also be proficient with outbound communications
regarding the important issues.
Communication channels preferred by customers Most, if not all, of our LDC clients, expect that customers will utilize the electronic channels for getting
information or dealing with issues. By doing so, costs for the LDC should decrease. However, in a world where
customers expect some outbound contact, they expect their LDC to use those channels to communicate
directly with them. Therefore, when problems do occur, and the LDC must initiate contact with their customer, it
would be beneficial to the process if customers were contacted via channels they most prefer.
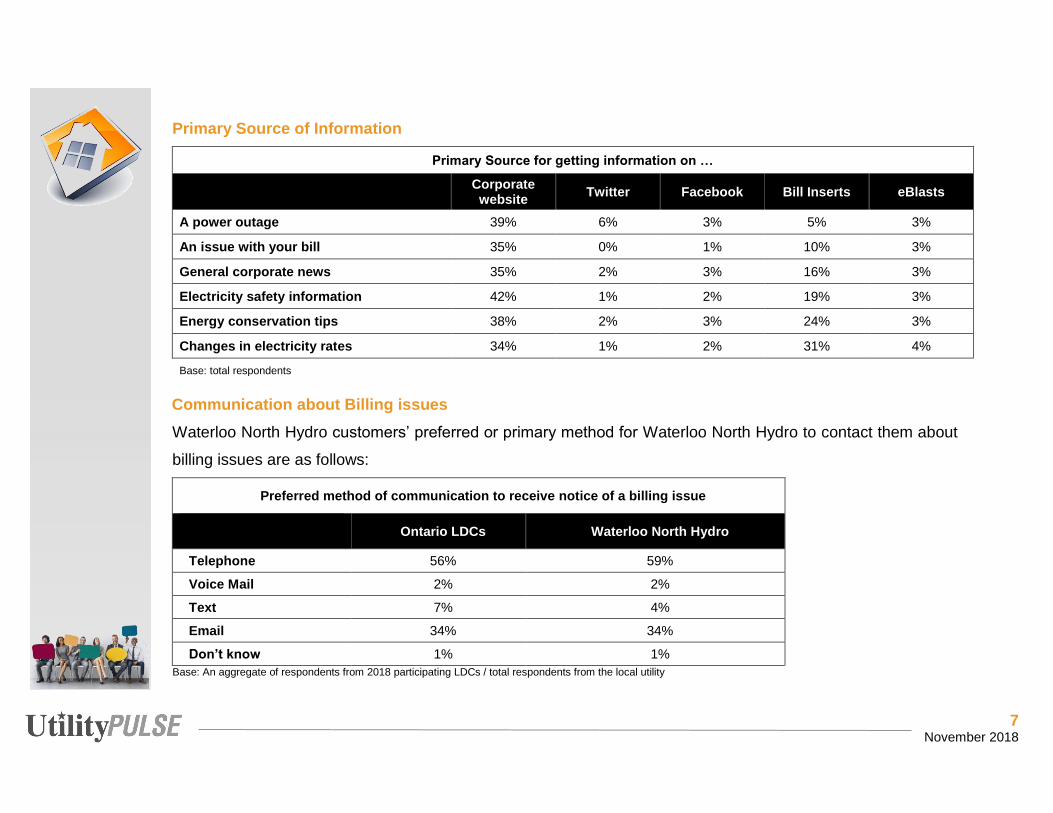
7 November 2018
Primary Source of Information
Primary Source for getting information on … Corporate
website Twitter Facebook Bill Inserts eBlasts
A power outage 39% 6% 3% 5% 3%
An issue with your bill 35% 0% 1% 10% 3%
General corporate news 35% 2% 3% 16% 3%
Electricity safety information 42% 1% 2% 19% 3%
Energy conservation tips 38% 2% 3% 24% 3%
Changes in electricity rates 34% 1% 2% 31% 4%
Base: total respondents
Communication about Billing issues Waterloo North Hydro customers’ preferred or primary method for Waterloo North Hydro to contact them about
billing issues are as follows:
Preferred method of communication to receive notice of a billing issue
Ontario LDCs Waterloo North Hydro
Telephone 56% 59%
Voice Mail 2% 2%
Text 7% 4%
Email 34% 34%
Don’t know 1% 1% Base: An aggregate of respondents from 2018 participating LDCs / total respondents from the local utility
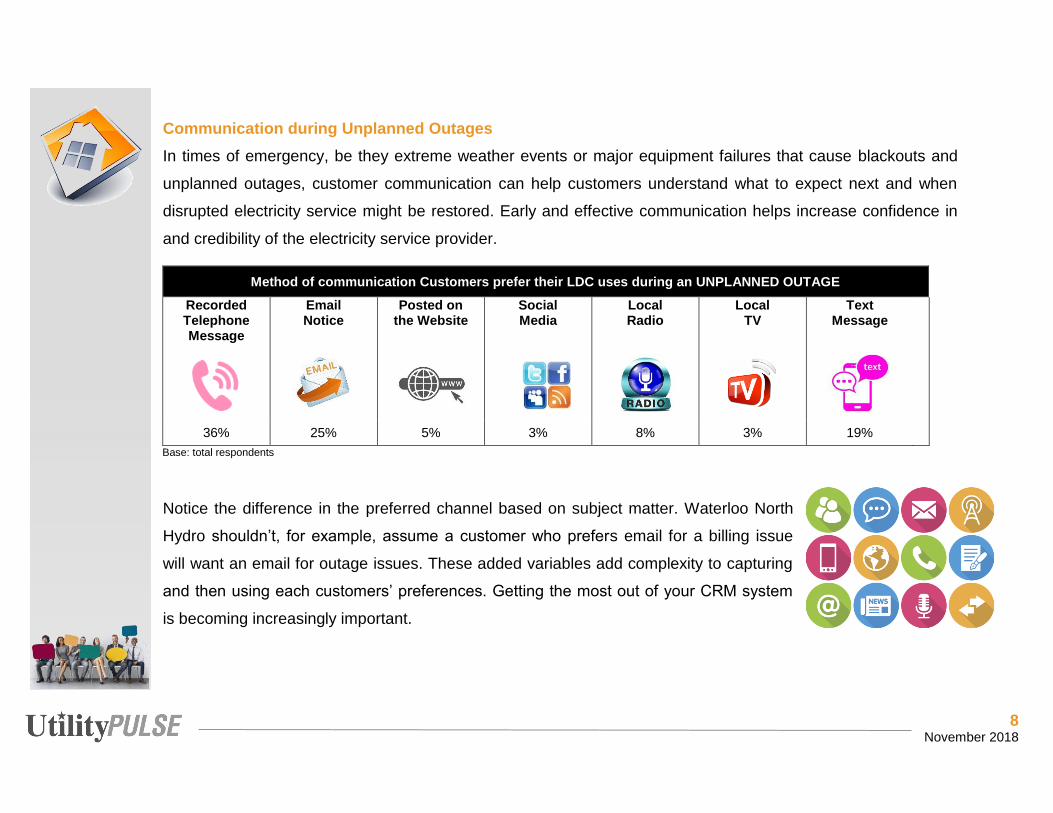
8 November 2018
Communication during Unplanned Outages In times of emergency, be they extreme weather events or major equipment failures that cause blackouts and
unplanned outages, customer communication can help customers understand what to expect next and when
disrupted electricity service might be restored. Early and effective communication helps increase confidence in
and credibility of the electricity service provider.
Method of communication Customers prefer their LDC uses during an UNPLANNED OUTAGE
Recorded Telephone Message
Email Notice
Posted on the Website
Social Media
Local Radio
Local TV
Text Message
36% 25% 5% 3% 8% 3% 19% Base: total respondents
Notice the difference in the preferred channel based on subject matter. Waterloo North
Hydro shouldn’t, for example, assume a customer who prefers email for a billing issue
will want an email for outage issues. These added variables add complexity to capturing
and then using each customers’ preferences. Getting the most out of your CRM system
is becoming increasingly important.

9 November 2018
Preferred Communication Platforms
Which communication platform or platforms would you prefer Waterloo North Hydro use …
Social media 16%
Newspaper 14%
Radio 16%
Bill inserts 27%
Website 27%
Email / eBlasts 48%
Other 8% Base: total respondents
Which of the following methods would you most like to see Waterloo North Hydro contact you by…
Live chat 2%
Phone call 45%
Email 41%
Text/SMS Message 9%
In-person visit 2%
Base: total respondents
Providing communication platforms that are
effective and meet customers’ needs is key to
improving the customer experience. To do this,
Waterloo North Hydro must understand how
customers communicate with you, and how they
would like Waterloo North Hydro to communicate
with them in future. Knowing this will allow
Waterloo North Hydro to: allocate resources
where they are most needed; tailor services to
meet customers’ needs; and, identify where
improvements can be made.
However, while most customers appear to have
capacity and willingness to use digital channels,
there are also customers who do not for a variety
of reasons, such as a lack of ability or resources,
or due to a preference for other channels.
Waterloo North Hydro will need to consider how
these customers can be supported and
encouraged to use digital services in the future.

10 November 2018
Customers were asked about their level of satisfaction with the information provided by Waterloo North Hydro
on the following:
Satisfaction with information provided Top 2 Boxes: ‘very + fairly satisfied’ Ontario LDCs Waterloo North Hydro
The amount of information available to you about energy conservation 82% 82%
The quality of information available when outages occur 73% 78%
The electricity safety education provided to the public 74% 75%
The timeliness and relevance of information for things such as planned outages, construction activity, tree trimming. 78% 77%
Base: An aggregate of respondents from 2018 participating LDCs / total respondents from the local utility
While providing information is important, one must ensure that it is neither overwhelming the audience to the
point of turning them off, or not providing enough information causing recipients to feel you have not
adequately looked after them.
Amount of Information received is …
LESS than you would like
About the RIGHT amount
MORE than you need
Safety 7% 81% 5%
Energy Efficiency 12% 77% 7%
Billing and Account Questions 4% 86% 4%
Outages 13% 75% 4%
Construction projects and planning 15% 69% 7% Base: total respondents
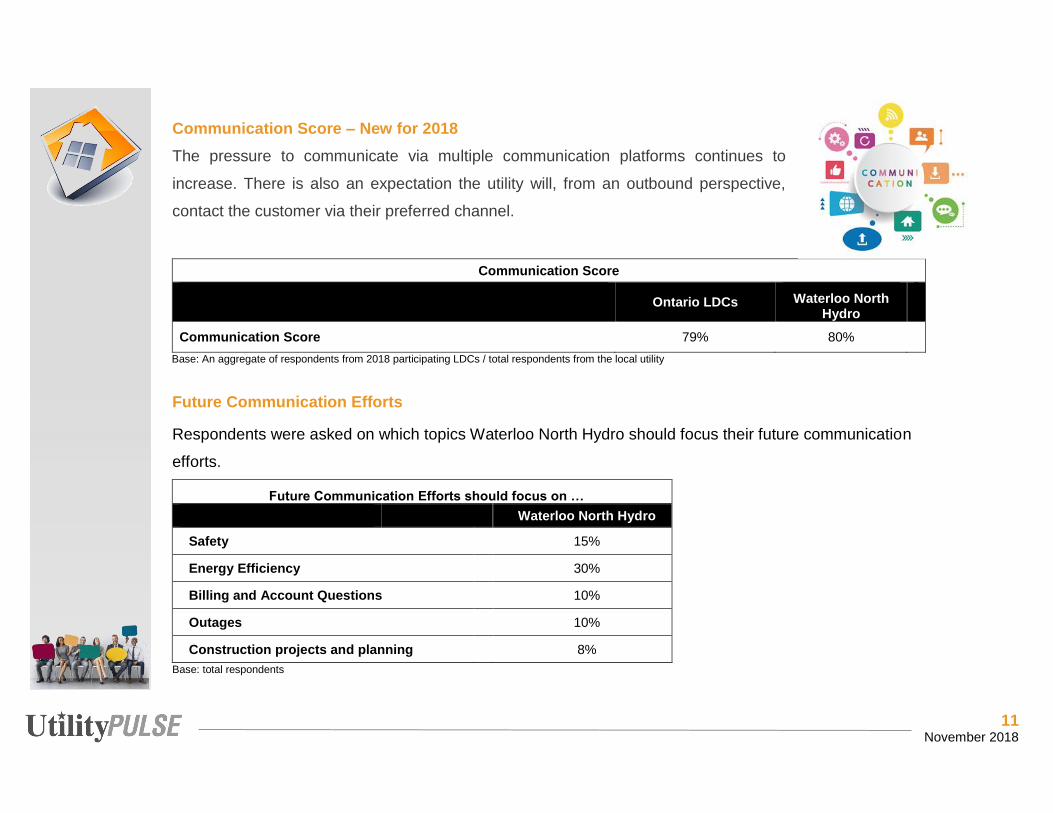
11 November 2018
Communication Score – New for 2018 The pressure to communicate via multiple communication platforms continues to
increase. There is also an expectation the utility will, from an outbound perspective,
contact the customer via their preferred channel.
Communication Score
Ontario LDCs Waterloo North Hydro
Communication Score 79% 80% Base: An aggregate of respondents from 2018 participating LDCs / total respondents from the local utility
Future Communication Efforts
Respondents were asked on which topics Waterloo North Hydro should focus their future communication
efforts.
Future Communication Efforts should focus on … Waterloo North Hydro
Safety 15%
Energy Efficiency 30%
Billing and Account Questions 10%
Outages 10%
Construction projects and planning 8%
Base: total respondents

12 November 2018
Respondents were asked: “Is there a topic other than the ones we’ve talked about that you would like
Waterloo North Hydro to provide more information about?” Base: total respondents
14% wanted additional information.
85% Required no further information.
ADDITIONAL TOPICS mentioned: • Prices/costs/fees • Communication with customers • Rebates • Payment options • My usage/my neighbour’s consumption • Potential mergers • SMART meters • Outage map

13 November 2018
The Convenience of Services Score – New for 2018
Rising customer expectations and demands means customers expect to be able to contact
you 24 hours a day, seven days a week using various communication avenues, i.e.
Telephone, your website and/or even social media. Customers expect flexible and more
personalized services. Providing customers with clear, easy to access services and information which is easy
to understand has a significant impact on the customer experience.
Providing customers with clear, easy to access services and information which is easy to understand has a
significant impact on the customer experience.
Access to services
Top 2 Boxes: ‘very + somewhat satisfied’ Ontario LDCs Waterloo North Hydro
The availability of call-centre staff Monday to Friday from 8:30 am to 4:30 pm 76% 75%
The 24/7 availability of system operators to respond to outages 77% 80%
The online self-serve options for managing your account 63% 67%
The online self-serve options for request services 56% 61%
The 24/7 availability of outage map on the website n/a 66%
Base: An aggregate of respondents from 2018 participating LDCs / total respondents from the local utility
Based on customer responses, Waterloo North Hydro has rated 81%
for Convenience of Services while Ontario LDCs rated 79%.
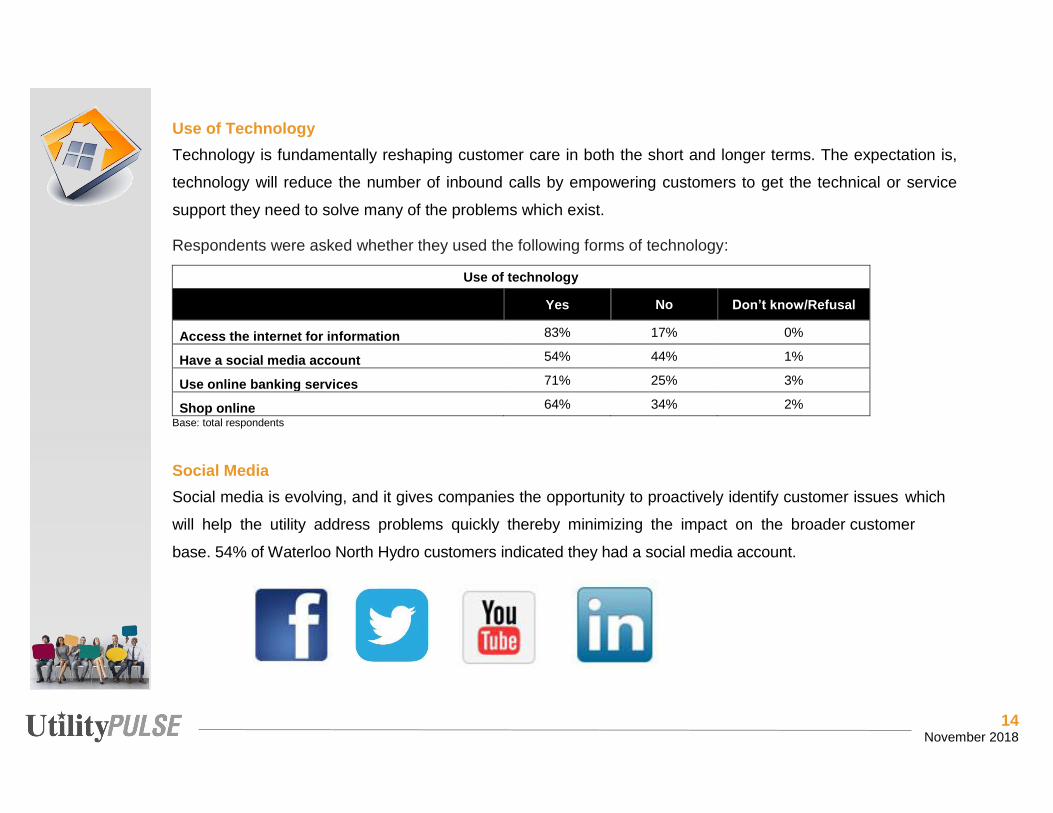
14 November 2018
Use of Technology Technology is fundamentally reshaping customer care in both the short and longer terms. The expectation is,
technology will reduce the number of inbound calls by empowering customers to get the technical or service
support they need to solve many of the problems which exist.
Respondents were asked whether they used the following forms of technology:
Use of technology
Yes No Don’t know/Refusal
Access the internet for information 83% 17% 0%
Have a social media account 54% 44% 1%
Use online banking services 71% 25% 3%
Shop online 64% 34% 2% Base: total respondents Social Media Social media is evolving, and it gives companies the opportunity to proactively identify customer issues which
will help the utility address problems quickly thereby minimizing the impact on the broader customer
base. 54% of Waterloo North Hydro customers indicated they had a social media account.

15 November 2018
Which social media accounts do you have …
Facebook 58%
Twitter 24%
YouTube 34%
LinkedIn 38% Base: total respondents who claimed to have social media accounts
Do you follow Waterloo North Hydro in … Yes No Don’t know
Facebook 5% 95% 0%
Twitter 29% 70% 1%
YouTube 3% 97% 0%
LinkedIn 4% 95% 1% Base: total respondents who claimed to have social media accounts Credibility & Trust Index
As society becomes more complicated and complex, the opportunities for failure increase. A key to healthy
relationships with customers is to be trusted, trustworthy and credible.
Waterloo North Hydro Credibility & Trust score is 87% while the Ontario benchmark is 81% and the National
benchmark is 82%.
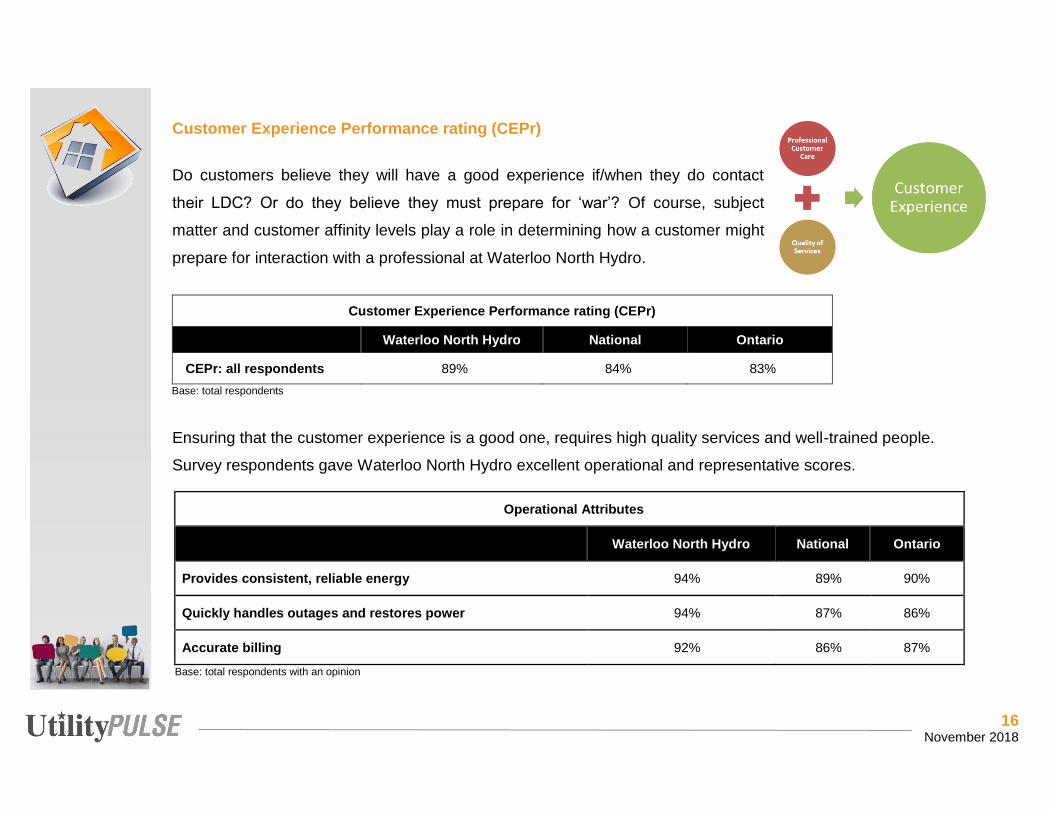
16 November 2018
Customer Experience Performance rating (CEPr)
Do customers believe they will have a good experience if/when they do contact
their LDC? Or do they believe they must prepare for ‘war’? Of course, subject
matter and customer affinity levels play a role in determining how a customer might
prepare for interaction with a professional at Waterloo North Hydro.
Customer Experience Performance rating (CEPr)
Waterloo North Hydro National Ontario
CEPr: all respondents 89% 84% 83% Base: total respondents
Ensuring that the customer experience is a good one, requires high quality services and well-trained people.
Survey respondents gave Waterloo North Hydro excellent operational and representative scores.
Operational Attributes
Waterloo North Hydro National Ontario
Provides consistent, reliable energy 94% 89% 90%
Quickly handles outages and restores power 94% 87% 86%
Accurate billing 92% 86% 87%
Base: total respondents with an opinion

17 November 2018
Representative Attributes
Waterloo North Hydro National Ontario
Deals professionally with customers’ problems 89% 83% 82%
Is ‘easy to do business with’ 90% 82% 82%
Customer-focused and treats customers as if they’re valued 83% 80% 79%
Base: total respondents with an opinion
Customer Centric Engagement Index The term “customer engagement” is used by many but understood by few. The purpose of customer
engagement is to have two-way interactions which build understanding between the stakeholders and stronger
professional business-like relationships. Customers who are highly engaged are more inclined to look past
costs and money issues and be more supportive of what the LDC wants to do or accomplish.
As we have stated in previous reports: Customer Engagement is about how customers think, feel and act
towards the organization. Ensuring customers respond positively requires they be rationally satisfied with the
services provided AND emotionally connected to the LDC and its brand.
Utility Customer Centric Engagement Index (CCEI)
Waterloo North Hydro National Ontario
CCEI 86% 81% 80%
Base: total respondents
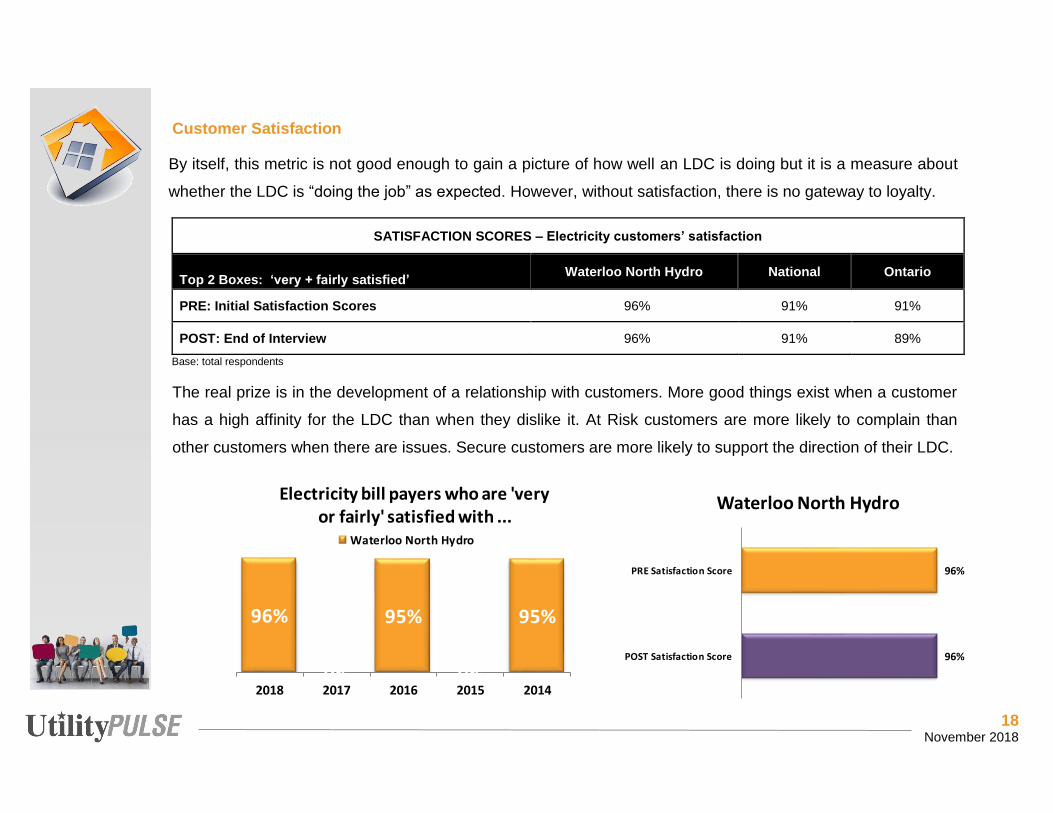
18 November 2018
Customer Satisfaction
By itself, this metric is not good enough to gain a picture of how well an LDC is doing but it is a measure about
whether the LDC is “doing the job” as expected. However, without satisfaction, there is no gateway to loyalty.
SATISFACTION SCORES – Electricity customers’ satisfaction
Top 2 Boxes: ‘very + fairly satisfied’ Waterloo North Hydro National Ontario
PRE: Initial Satisfaction Scores 96% 91% 91%
POST: End of Interview 96% 91% 89% Base: total respondents
The real prize is in the development of a relationship with customers. More good things exist when a customer
has a high affinity for the LDC than when they dislike it. At Risk customers are more likely to complain than
other customers when there are issues. Secure customers are more likely to support the direction of their LDC.
96%
96%
PRE Satisfaction Score
POST Satisfaction Score
Waterloo North Hydro
96%
0%
95%
0%
95%
2018 2017 2016 2015 2014
Electricity bill payers who are 'very or fairly' satisfied with ...
Waterloo North Hydro

19 November 2018
Loyalty Groups
Customer Loyalty Groups
Waterloo North Hydro Secure Favorable Indifferent At Risk
2018 34% 19% 43% 4%
Base: total respondents
In the monopoly world of the LDC, loyalty is an attitudinal metric. In private industry, it is a behavioural metric.
Customer Commitment
Electricity customers’ loyalty – … Is a company that you would like to continue to do business with
Waterloo North Hydro National Ontario
Top 2 Boxes: ‘Definitely + Probably’ would continue 90% 80% 78% Base: total respondents
Customer Advocacy
Electricity customers’ loyalty – … is a company that you would recommend to a friend or colleague
Waterloo North Hydro National Ontario
Top 2 boxes: ‘Definitely + Probably’ would recommend 87% 76% 70% Base: total respondents

20 November 2018
UtilityPULSE Report Card®
The purpose of the UtilityPULSE Report Card is to provide electric utilities with a snapshot of performance – on
the things customers deem to be important.
Waterloo North Hydro's UtilityPULSE Report Card®
Performance
CATEGORY Waterloo North Hydro National Ontario
1 Customer Care A B+ B+
Price and Value B+ B B
Customer Service A A B+
2 Company Image A B+ B+
Company Leadership A B+ B+
Corporate Stewardship A A B+
3 Management Operations A+ A A
Operational Effectiveness A+ A A
Power Quality and Reliability A+ A A
OVERALL A A B+ Base: total respondents

21 November 2018
Looking to the future, where to from here? Technological advances, social disruptions, and other issues will continue for everyone in the LDC industry.
Fixing the ills of yesterday are not possible, but instilling confidence that the LDC can handle future customer
needs & wants strengthens the customer-supplier relationship. By engaging stakeholders and obtaining their
input in undertaking a priority planning process helps to build "prepared minds"—that is, to make sure that the
LDC decision makers have a solid understanding of customer priorities, and what the business might need to
change or make investments in.
High priority items based on information taken from our UtilityPULSE database include: ‘Pro-actively
maintaining and upgrading equipment,’ ‘Reducing response times to outages,’ and ‘Investing more in the
electricity grid to reduce outages and to increase reliability and safety.’
The high scoring attributes demonstrate Waterloo North Hydro's operational effectiveness, while the low
scoring attributes point to a need for more marketing communications and/or PR types of activities.
Highest scoring attributes
High scoring attributes
Top 2 Boxes: ‘Strongly + Somewhat agree’ Waterloo North Hydro National Ontario
Provides consistent, reliable electricity 94% 89% 90%
Makes electricity safety a top priority for employees and contractors
87% 87% 86%
Quickly handles outages and restores power 94% 87% 86%
Has a standard of reliability that meets expectations 92% 88% 88%
Base: total respondents with an opinion

22 November 2018
Lowest scoring attributes
Low scoring attributes
Top 2 Boxes: ‘Strongly + Somewhat agree’ Waterloo North Hydro National Ontario
Spends money prudently 84% 73% 66%
Operates a cost-effective electricity system 78% 70% 71%
Provides good value for your money 79% 72% 71%
Cost of electricity is reasonable when compared to other utilities
70% 66% 61%
Base: total respondents with an opinion
Paying for electricity
Fall 2018 data shows dramatic changes in customers’ ability to pay. Whether the change is due to price
reductions, or anticipated price reductions, or a better economy, is unclear. Ability to pay is highly correlated to
satisfaction. The number one billing problem, for 20 years, is “the amount is too high.”
Is paying for electricity a worry or a major problem?
Not a worry Sometimes Often Depends
Waterloo North Hydro 78% 14% 5% 1%
National 71% 18% 7% 0%
Ontario 68% 21% 8% 1% Base: total respondents
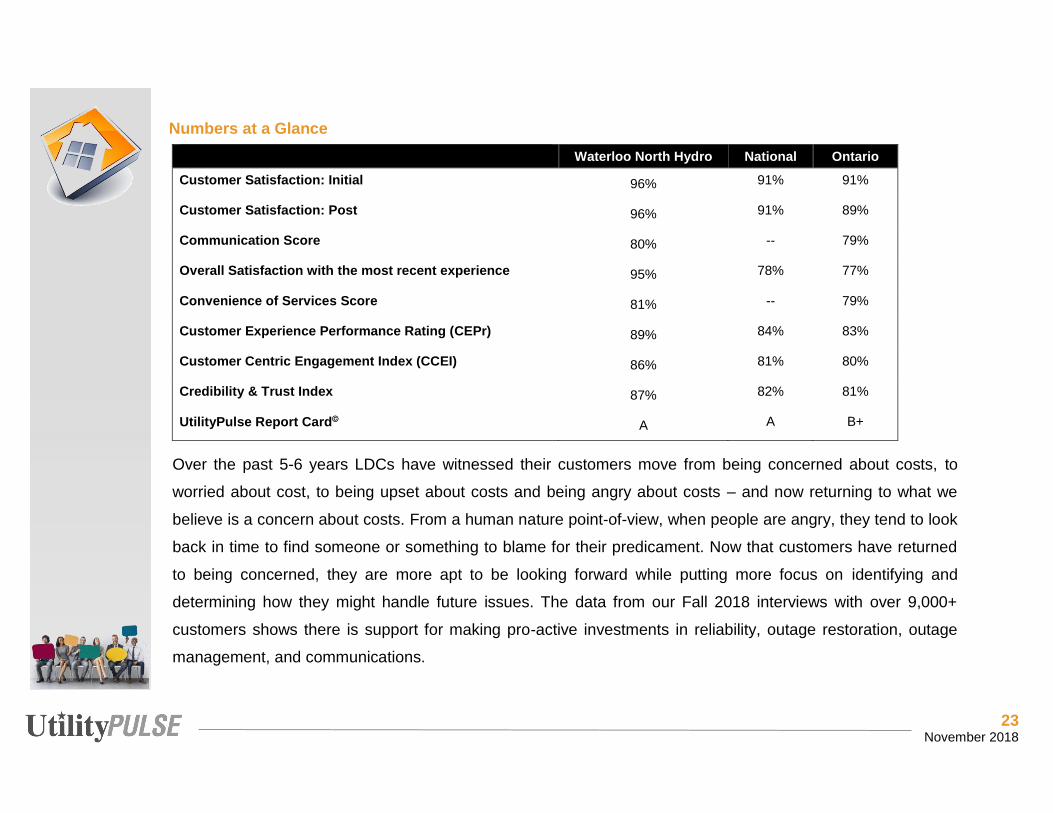
23 November 2018
Numbers at a Glance
Waterloo North Hydro National Ontario Customer Satisfaction: Initial 96% 91% 91%
Customer Satisfaction: Post 96% 91% 89%
Communication Score 80% -- 79%
Overall Satisfaction with the most recent experience 95% 78% 77%
Convenience of Services Score 81% -- 79%
Customer Experience Performance Rating (CEPr) 89% 84% 83%
Customer Centric Engagement Index (CCEI) 86% 81% 80%
Credibility & Trust Index 87% 82% 81%
UtilityPulse Report Card A A B+
Over the past 5-6 years LDCs have witnessed their customers move from being concerned about costs, to
worried about cost, to being upset about costs and being angry about costs – and now returning to what we
believe is a concern about costs. From a human nature point-of-view, when people are angry, they tend to look
back in time to find someone or something to blame for their predicament. Now that customers have returned
to being concerned, they are more apt to be looking forward while putting more focus on identifying and
determining how they might handle future issues. The data from our Fall 2018 interviews with over 9,000+
customers shows there is support for making pro-active investments in reliability, outage restoration, outage
management, and communications.
24 November 2018
Sid Ridgley
Simul/UtilityPULSE Email: [email protected] or [email protected] November 2018
We believe, for many in society, from 2008 to mid-2017 survival was the key goal, less so in 2018. The outlook
for the economy is better; wages are improving and, job openings are more plentiful – therefore putting more
focus on the future.
The good news is Waterloo North Hydro remains what we call an influential brand company. The safe, reliable
distribution of electricity to homes and businesses is a job which makes life better, more interesting and
meaningful for consumers and customers. As a company which affects the daily life of people and businesses
– an influential brand – it must consistently demonstrate that it is credible, trusted, future-oriented, cares about
customers, cares about safety, cares about the environment, is professional, has high standards and is a
valued corporate citizen.
The industry is far more complex today than it was 20 years ago when we conducted the 1st
Annual Customer Satisfaction survey for electric utilities. Data shows that being customer-
centric is important for ensuring future success of the LDC. Customers want respect.
We recommend leveraging the results from your 2018 customer satisfaction survey by having meaningful
conversations with everyone about your customers’ – satisfaction, concerns, wants, etc. LDCs with a
constructive employee culture with high levels of employee engagement and empowerment will have an easier
time defining a future path forward.
25 November 2018
Table of contents Page Page
Executive summary 3 Communication Channels 44
- Primary source of information 44
Satisfaction (pre & post) 27 - Communication re: billing issue 45
- Communication re: unplanned outage 46
Customer Service 32 - Preferred communication platforms 47
- Overall satisfaction with most recent experience 34
Information and Communication 48
Bill payers’ Problems and Problem Resolution 36 - Satisfaction with information provided 49
- Outages & Standard of Reliability 37 - Amount of information received 49
- Billing problems 38 - Communication Score 50
- Types of Billing Problems 39 - Future communication efforts 51
- Problem solved rating 40
Convenience of Services Score 52
Use of Technology 41 - Access to services 52
- Convenience of Services Score 53
Social Media 42
26 November 2018
Page Page
Customer Experience Performance rating (CEPr) 54 What do customers think about electricity costs 84
Customer Centric Engagement Index (CCEI) 56 What do small commercial customers think? 87
UtilityPULSE Report Card® 59 Method 95
- Waterloo North Hydro's Report Card® Scores 64
About Simul 98
The Loyalty Factor 67
- Customer commitment 73
- Word of mouth 76
Corporate Image 79
Corporate Credibility & Trust 80
How can service to customers be improved? 82
27 November 2018
Satisfaction (pre & post) As stated multiple times over many years, measuring satisfaction is an important starting point, for the creation
of loyal customers. However, it is a misnomer to conclude that highly satisfied customers are also customers
with a high affinity or loyalty quotient. One can be satisfied but not necessarily loyal. But it is true to conclude
that the LDC (its people) must do the job as expected and required before there can be a positive emotional
connection.
We’ve stated in the past, a focus on satisfaction prompts an organization to continue to evolve in ways which
make sense to those who pay the bills. A focus on satisfaction is a focus on effectiveness in the delivery of
service to the customer. Satisfied customers who trust their LDC may be more likely to seek advice, i.e. energy
efficiency methods and may be more receptive to important messages, i.e. safety, new capital projects, etc.
About ratings/measures:
- Satisfaction is not a program; it is an outcome.
- Efficiency is about achieving objectives with the minimum amount of people, time,
money and other resources.
- Effectiveness ratings are measures keeping the organization and its people more future
focused than efficiency ratings
Finding the right balance between efficiency and effectiveness measures is difficult.
Efficiency Effectiveness
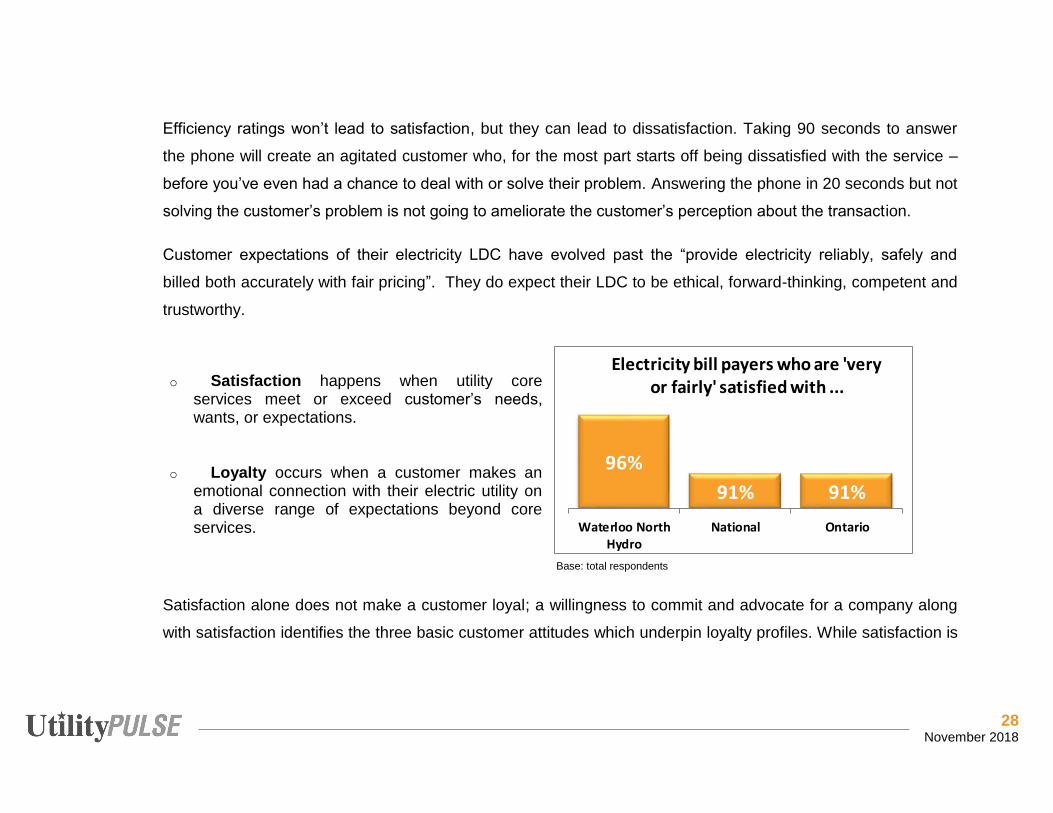
28 November 2018
Efficiency ratings won’t lead to satisfaction, but they can lead to dissatisfaction. Taking 90 seconds to answer
the phone will create an agitated customer who, for the most part starts off being dissatisfied with the service –
before you’ve even had a chance to deal with or solve their problem. Answering the phone in 20 seconds but not
solving the customer’s problem is not going to ameliorate the customer’s perception about the transaction.
Customer expectations of their electricity LDC have evolved past the “provide electricity reliably, safely and
billed both accurately with fair pricing”. They do expect their LDC to be ethical, forward-thinking, competent and
trustworthy.
o Satisfaction happens when utility core services meet or exceed customer’s needs, wants, or expectations.
o Loyalty occurs when a customer makes an emotional connection with their electric utility on a diverse range of expectations beyond core services.
Satisfaction alone does not make a customer loyal; a willingness to commit and advocate for a company along
with satisfaction identifies the three basic customer attitudes which underpin loyalty profiles. While satisfaction is
Base: total respondents
96%
91% 91%
Waterloo NorthHydro
National Ontario
Electricity bill payers who are 'very or fairly' satisfied with ...
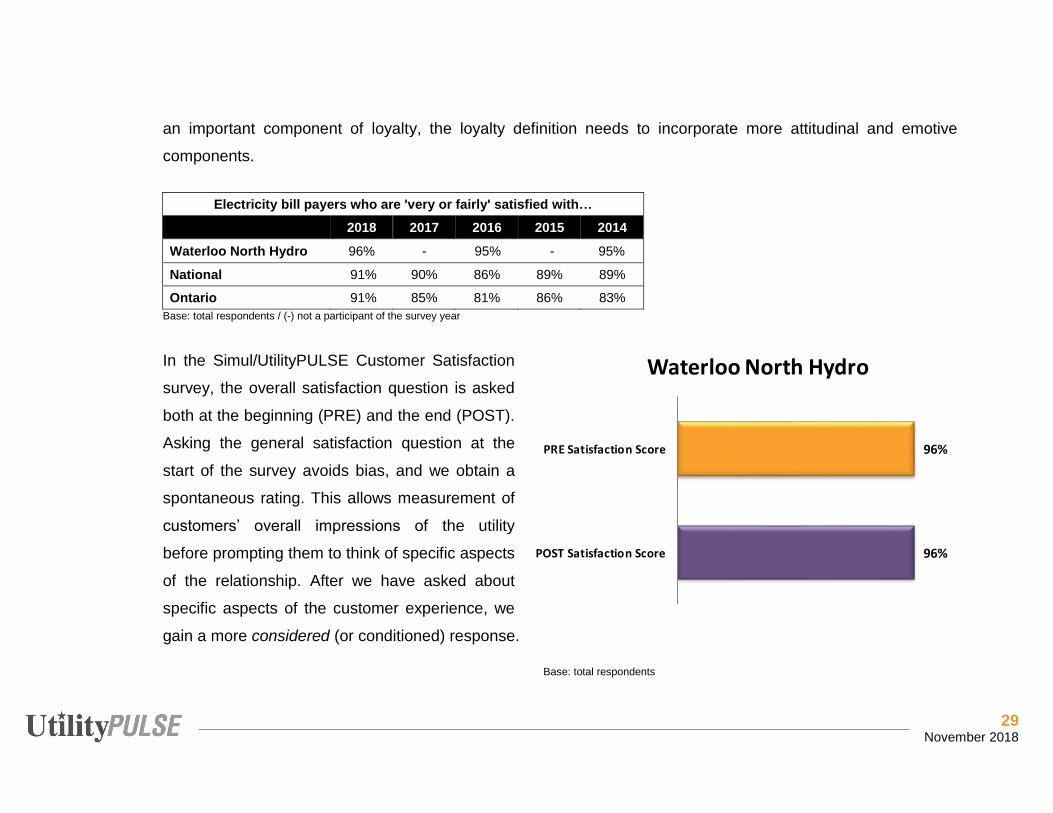
29 November 2018
an important component of loyalty, the loyalty definition needs to incorporate more attitudinal and emotive
components.
Electricity bill payers who are 'very or fairly' satisfied with… 2018 2017 2016 2015 2014
Waterloo North Hydro 96% - 95% - 95%
National 91% 90% 86% 89% 89%
Ontario 91% 85% 81% 86% 83% Base: total respondents / (-) not a participant of the survey year
In the Simul/UtilityPULSE Customer Satisfaction
survey, the overall satisfaction question is asked
both at the beginning (PRE) and the end (POST).
Asking the general satisfaction question at the
start of the survey avoids bias, and we obtain a
spontaneous rating. This allows measurement of
customers’ overall impressions of the utility
before prompting them to think of specific aspects
of the relationship. After we have asked about
specific aspects of the customer experience, we
gain a more considered (or conditioned) response.
Base: total respondents
96%
96%
PRE Satisfaction Score
POST Satisfaction Score
Waterloo North Hydro
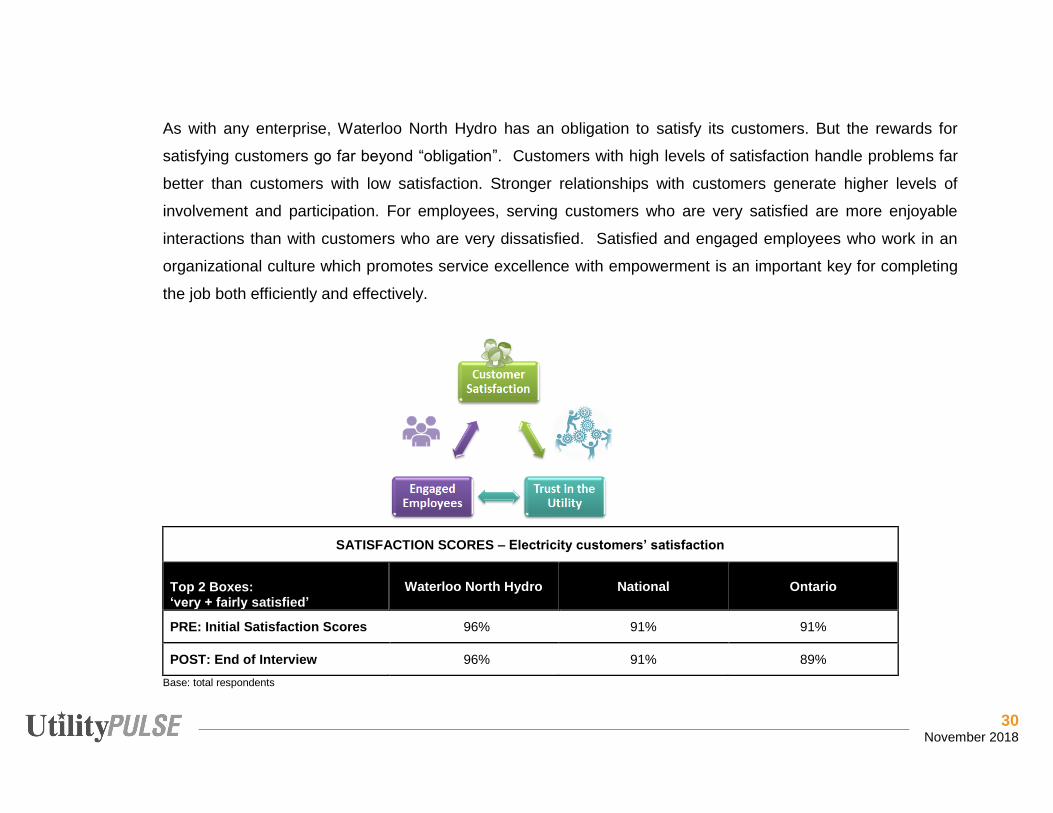
30 November 2018
As with any enterprise, Waterloo North Hydro has an obligation to satisfy its customers. But the rewards for
satisfying customers go far beyond “obligation”. Customers with high levels of satisfaction handle problems far
better than customers with low satisfaction. Stronger relationships with customers generate higher levels of
involvement and participation. For employees, serving customers who are very satisfied are more enjoyable
interactions than with customers who are very dissatisfied. Satisfied and engaged employees who work in an
organizational culture which promotes service excellence with empowerment is an important key for completing
the job both efficiently and effectively.
SATISFACTION SCORES – Electricity customers’ satisfaction
Top 2 Boxes: ‘very + fairly satisfied’
Waterloo North Hydro National Ontario
PRE: Initial Satisfaction Scores 96% 91% 91%
POST: End of Interview 96% 91% 89% Base: total respondents
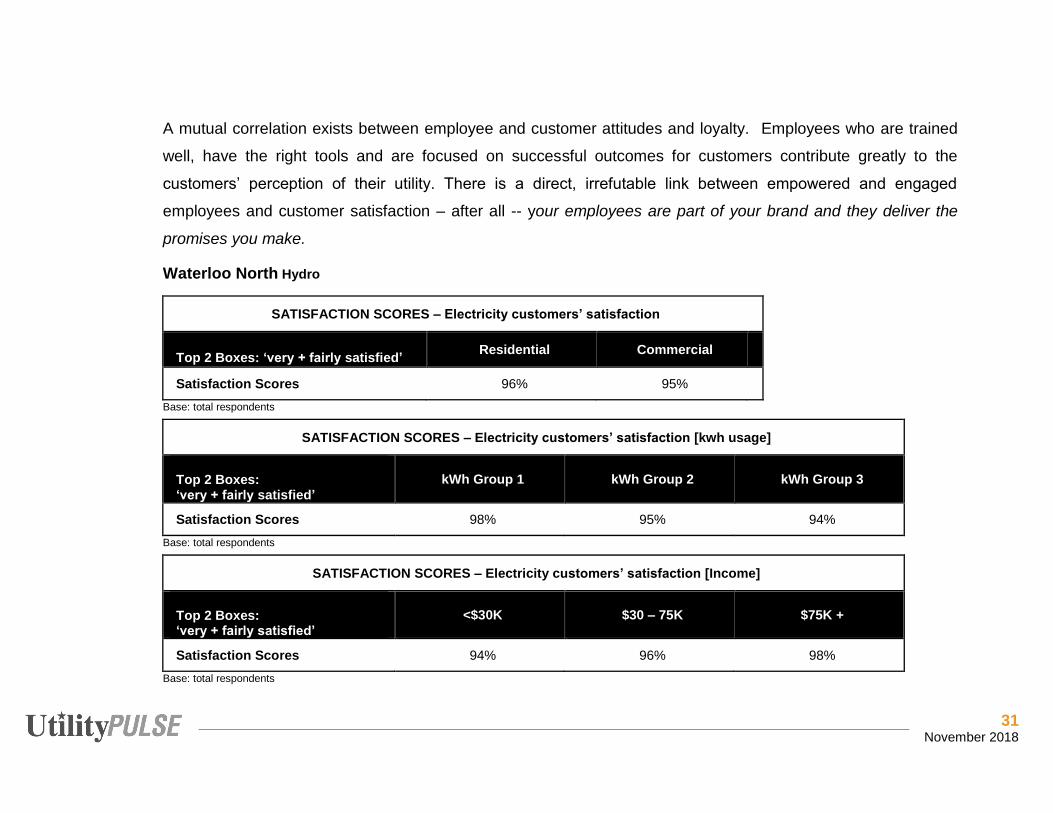
31 November 2018
A mutual correlation exists between employee and customer attitudes and loyalty. Employees who are trained
well, have the right tools and are focused on successful outcomes for customers contribute greatly to the
customers’ perception of their utility. There is a direct, irrefutable link between empowered and engaged
employees and customer satisfaction – after all -- your employees are part of your brand and they deliver the
promises you make.
Waterloo North Hydro
SATISFACTION SCORES – Electricity customers’ satisfaction
Top 2 Boxes: ‘very + fairly satisfied’ Residential Commercial
Satisfaction Scores 96% 95% Base: total respondents
SATISFACTION SCORES – Electricity customers’ satisfaction [kwh usage]
Top 2 Boxes: ‘very + fairly satisfied’
kWh Group 1 kWh Group 2 kWh Group 3
Satisfaction Scores 98% 95% 94% Base: total respondents
SATISFACTION SCORES – Electricity customers’ satisfaction [Income]
Top 2 Boxes: ‘very + fairly satisfied’
<$30K $30 – 75K $75K +
Satisfaction Scores 94% 96% 98% Base: total respondents
32 November 2018
Customer Service As written in previous years, given the rapidly expanding availability and use of technology finding an
appropriate balance between automated self-service and human-interactive service is a huge challenge for all
involved in providing service to customers. Customer Service is about the experience your customers have with
your utility, your products, and your service – regardless of the channel for used for delivering customer service.
The goal is to ensure each of your customers receives high-quality customer service and an experience which
meets or exceeds their expectations - on each and every interaction with the LDC.
Given the increased complexity for delivery customer service, we have seen a shift towards a stronger focus on
the touch points which create the customer experience.
Most of us want the same things when we are customers: We want to be treated with respect. We want to be
listened to. We don't want to be bounced around or ignored or treated as inferior. The customer experience is
largely defined by the outcomes generated when customers have a need, want to solve a problem, or simply
want answers to issues/concerns they face.
With more technology there will be more shifting of calls away from the call
centre. However, the volume of calls which remain are and will be more
complex and challenging. We’re already witnessing the fact that calls are
taking longer to deal with customer issues.
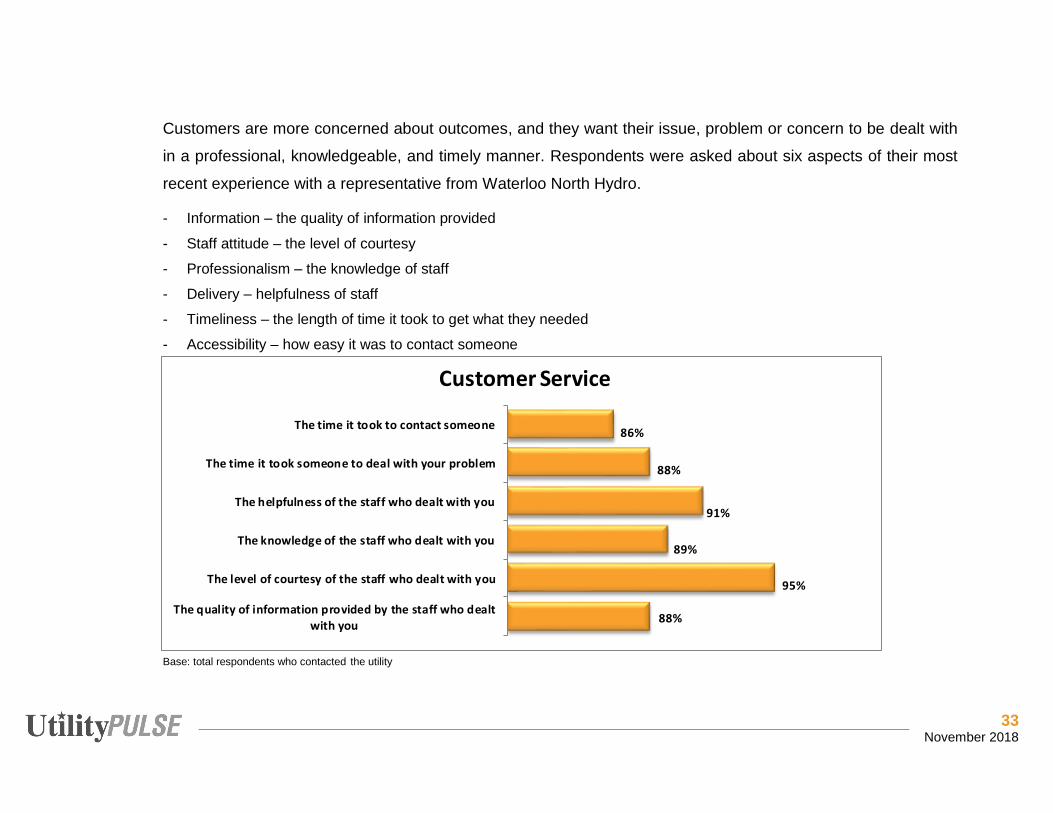
33 November 2018
Customers are more concerned about outcomes, and they want their issue, problem or concern to be dealt with
in a professional, knowledgeable, and timely manner. Respondents were asked about six aspects of their most
recent experience with a representative from Waterloo North Hydro.
- Information – the quality of information provided
- Staff attitude – the level of courtesy
- Professionalism – the knowledge of staff
- Delivery – helpfulness of staff
- Timeliness – the length of time it took to get what they needed
- Accessibility – how easy it was to contact someone
Base: total respondents who contacted the utility
86%
88%
91%
89%
95%
88%
The time it took to contact someone
The time it took someone to deal with your problem
The helpfulness of the staff who dealt with you
The knowledge of the staff who dealt with you
The level of courtesy of the staff who dealt with you
The quality of information provided by the staff who dealt
with you
Customer Service
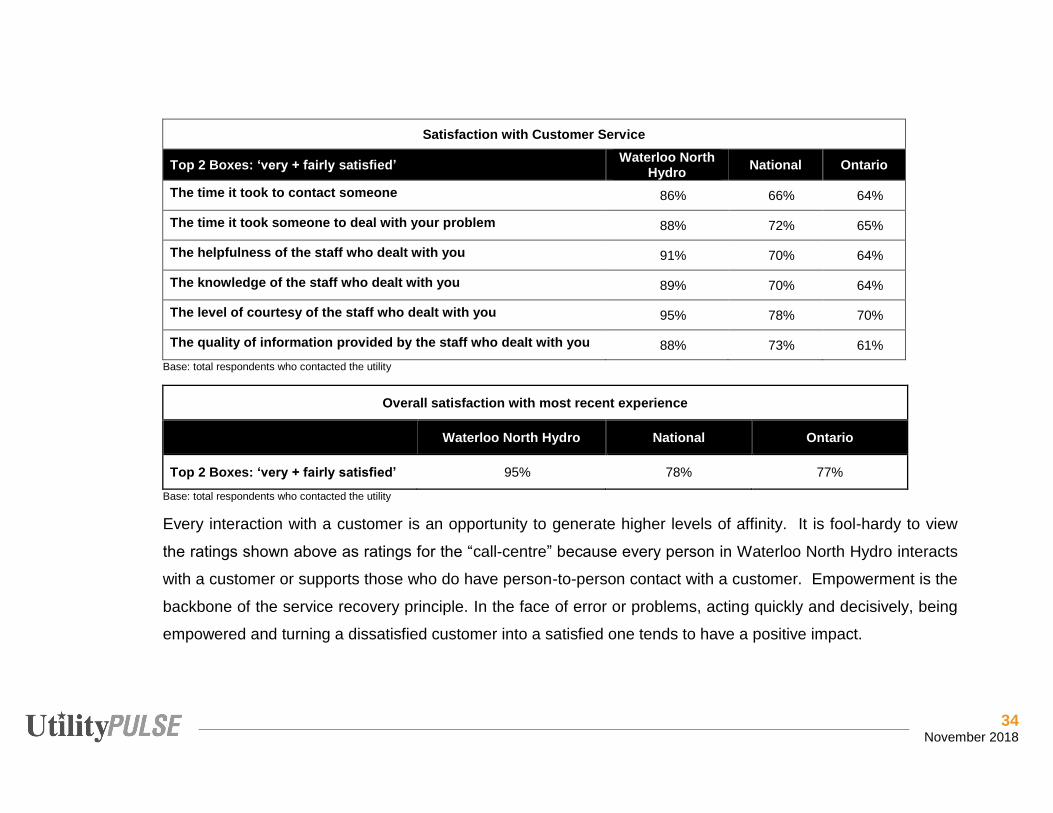
34 November 2018
Satisfaction with Customer Service
Top 2 Boxes: ‘very + fairly satisfied’ Waterloo North Hydro National Ontario
The time it took to contact someone 86% 66% 64%
The time it took someone to deal with your problem 88% 72% 65%
The helpfulness of the staff who dealt with you 91% 70% 64%
The knowledge of the staff who dealt with you 89% 70% 64%
The level of courtesy of the staff who dealt with you 95% 78% 70%
The quality of information provided by the staff who dealt with you 88% 73% 61% Base: total respondents who contacted the utility
Overall satisfaction with most recent experience
Waterloo North Hydro National Ontario
Top 2 Boxes: ‘very + fairly satisfied’ 95% 78% 77%
Base: total respondents who contacted the utility Every interaction with a customer is an opportunity to generate higher levels of affinity. It is fool-hardy to view
the ratings shown above as ratings for the “call-centre” because every person in Waterloo North Hydro interacts
with a customer or supports those who do have person-to-person contact with a customer. Empowerment is the
backbone of the service recovery principle. In the face of error or problems, acting quickly and decisively, being
empowered and turning a dissatisfied customer into a satisfied one tends to have a positive impact.
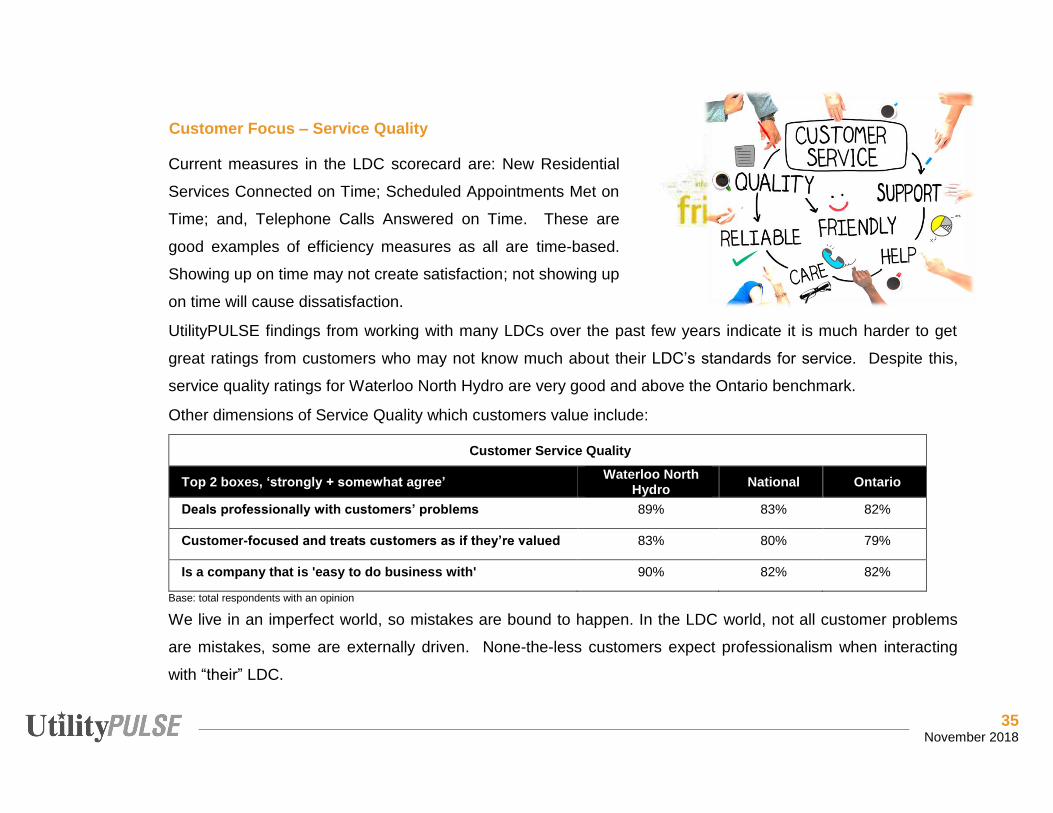
35 November 2018
Customer Focus – Service Quality
Current measures in the LDC scorecard are: New Residential
Services Connected on Time; Scheduled Appointments Met on
Time; and, Telephone Calls Answered on Time. These are
good examples of efficiency measures as all are time-based.
Showing up on time may not create satisfaction; not showing up
on time will cause dissatisfaction.
UtilityPULSE findings from working with many LDCs over the past few years indicate it is much harder to get
great ratings from customers who may not know much about their LDC’s standards for service. Despite this,
service quality ratings for Waterloo North Hydro are very good and above the Ontario benchmark.
Other dimensions of Service Quality which customers value include:
Customer Service Quality
Top 2 boxes, ‘strongly + somewhat agree’ Waterloo North Hydro National Ontario
Deals professionally with customers’ problems 89% 83% 82%
Customer-focused and treats customers as if they’re valued 83% 80% 79%
Is a company that is 'easy to do business with' 90% 82% 82%
Base: total respondents with an opinion
We live in an imperfect world, so mistakes are bound to happen. In the LDC world, not all customer problems
are mistakes, some are externally driven. None-the-less customers expect professionalism when interacting
with “their” LDC.
36 November 2018
Bill Payers’ Problems and Problem Resolution As previously written over multiple years, we call blackouts (outages) and billing problems, the “Killer B’s”, the
two issues which are most likely to cause grief to utility customers.
At one time, if the power went off for a few minutes, it was considered annoying and inconvenient. However, with
the onset of computers and smart appliances in homes and businesses, a power outage is now unbearable.
Customers have little tolerance for an interruption in their flow of electricity.
LDCs have certainly been putting more energy into
disseminating information to customers about
outages. Many have installed an “outage map” on
their website. However, our UP database shows
only 13% of customers who accessed their LDC’s
website did so to get information about an outage or
look at the outage map!
37% of Waterloo North Hydro respondents claimed they experienced an outage problem in the past 12 months.
Like it or not, there will be times when the power goes off – and for reasons beyond the control of the LDC.
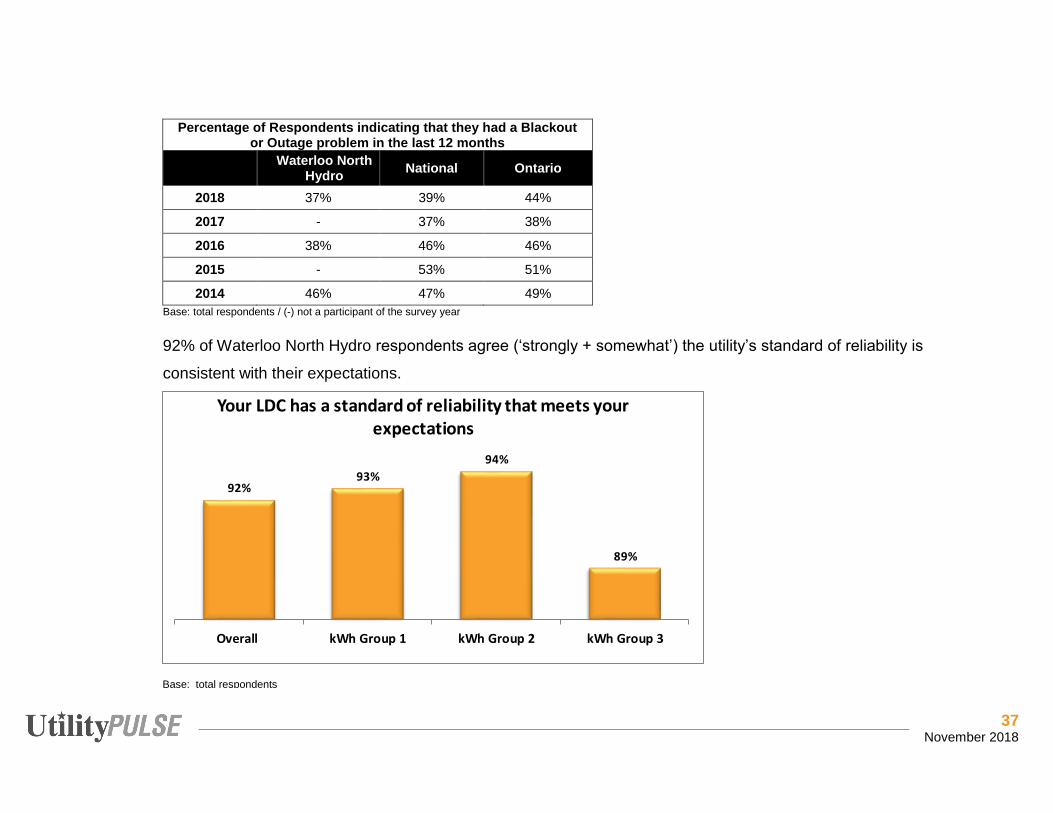
37 November 2018
Base: total respondents
Percentage of Respondents indicating that they had a Blackout or Outage problem in the last 12 months
Waterloo North Hydro National Ontario
2018 37% 39% 44%
2017 - 37% 38%
2016 38% 46% 46%
2015 - 53% 51%
2014 46% 47% 49% Base: total respondents / (-) not a participant of the survey year
92% of Waterloo North Hydro respondents agree (‘strongly + somewhat’) the utility’s standard of reliability is
consistent with their expectations.
92%93%
94%
89%
Overall kWh Group 1 kWh Group 2 kWh Group 3
Your LDC has a standard of reliability that meets your expectations
38 November 2018
For nearly every business, the simple act of collecting payments from customers is quite complex.
Organizations want to make it easy and convenient for customers to pay, so they offer multiple choices of
payment types and channels. However, making it easy for the customer often makes it more complex—
and costly—for the business and is certainly not without its problems or flaws.
Percentage of Respondents indicating that they had a Billing problem in the last 12 months
Waterloo North Hydro National Ontario
2018 5% 9% 9% 2017 - 12% 15% 2016 20% 15% 25% 2015 - 9% 15% 2014 9% 16% 25%
Base: total respondents / (-) not a participant of the survey year
The impact of poor billing on a utility’s business is considerable, in terms of costs incurred handling customer
queries and complaints. The quality of billing remains a driving force behind managing customer satisfaction and
can help utilities reduce costs associated with customer service. Through reducing the total number of calls to a
utility by providing accurate bills which are easily understood, a utility stems the flow of billing-related complaints
into its call-centre. However, customers have a different definition than their utility as to what constitutes a billing
problem.
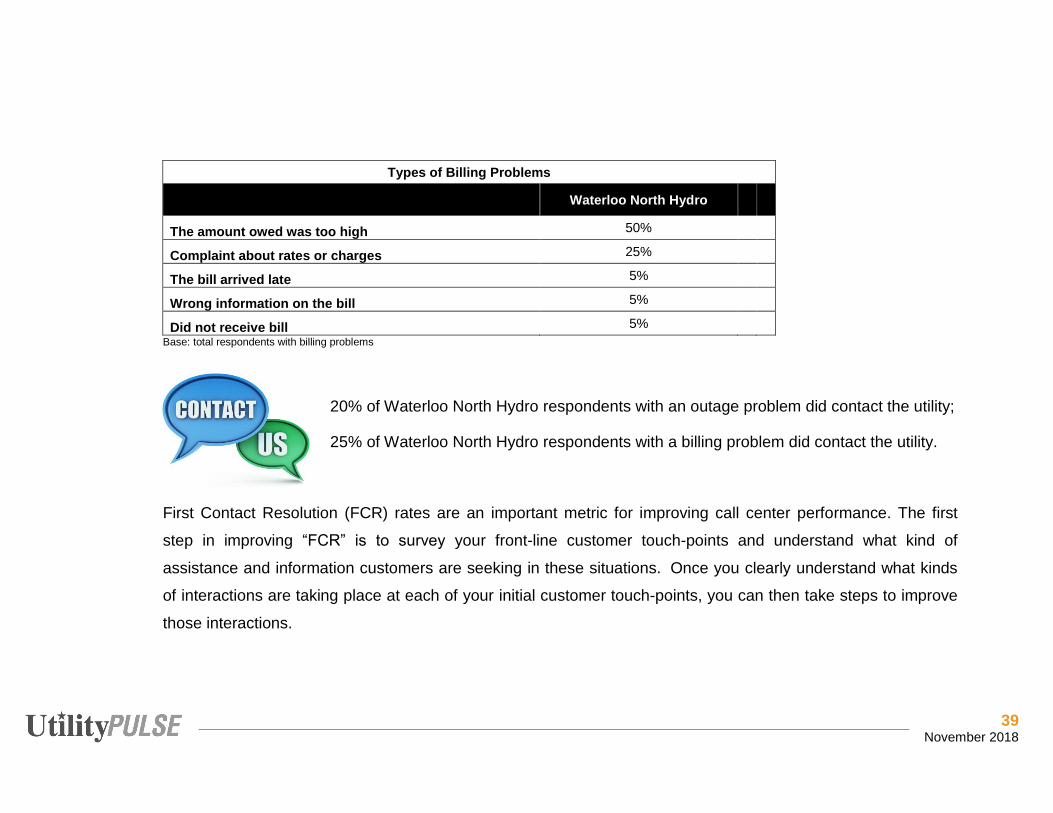
39 November 2018
Types of Billing Problems
Waterloo North Hydro
The amount owed was too high 50%
Complaint about rates or charges 25%
The bill arrived late 5%
Wrong information on the bill 5%
Did not receive bill 5% Base: total respondents with billing problems
20% of Waterloo North Hydro respondents with an outage problem did contact the utility;
25% of Waterloo North Hydro respondents with a billing problem did contact the utility.
First Contact Resolution (FCR) rates are an important metric for improving call center performance. The first
step in improving “FCR” is to survey your front-line customer touch-points and understand what kind of
assistance and information customers are seeking in these situations. Once you clearly understand what kinds
of interactions are taking place at each of your initial customer touch-points, you can then take steps to improve
those interactions.
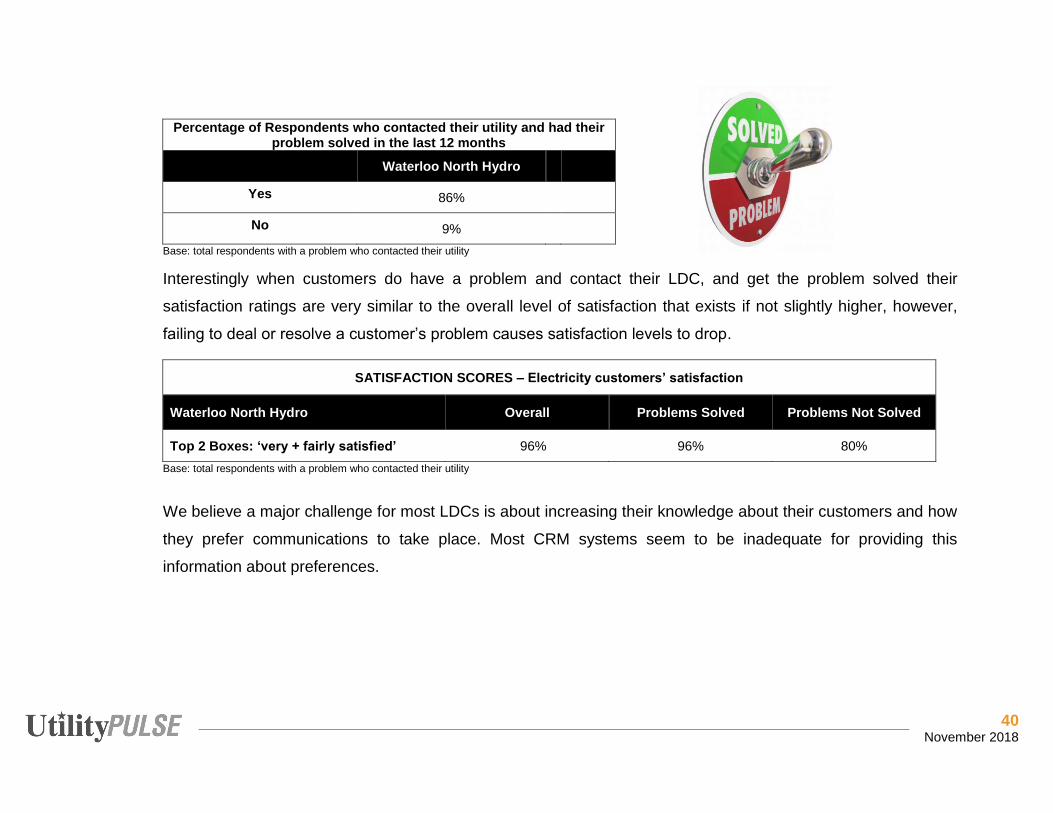
40 November 2018
Percentage of Respondents who contacted their utility and had their problem solved in the last 12 months
Waterloo North Hydro
Yes 86%
No 9% Base: total respondents with a problem who contacted their utility
Interestingly when customers do have a problem and contact their LDC, and get the problem solved their
satisfaction ratings are very similar to the overall level of satisfaction that exists if not slightly higher, however,
failing to deal or resolve a customer’s problem causes satisfaction levels to drop.
SATISFACTION SCORES – Electricity customers’ satisfaction
Waterloo North Hydro Overall Problems Solved Problems Not Solved
Top 2 Boxes: ‘very + fairly satisfied’ 96% 96% 80% Base: total respondents with a problem who contacted their utility
We believe a major challenge for most LDCs is about increasing their knowledge about their customers and how
they prefer communications to take place. Most CRM systems seem to be inadequate for providing this
information about preferences.
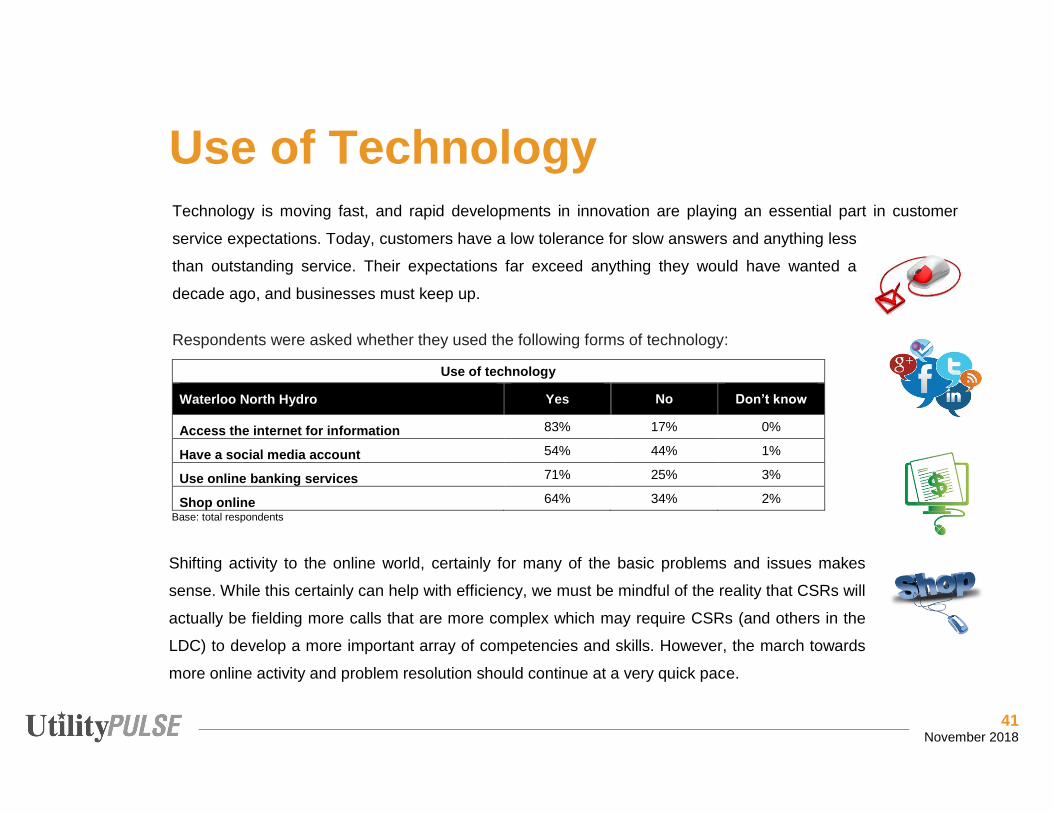
41 November 2018
Use of Technology
Technology is moving fast, and rapid developments in innovation are playing an essential part in customer
service expectations. Today, customers have a low tolerance for slow answers and anything less
than outstanding service. Their expectations far exceed anything they would have wanted a
decade ago, and businesses must keep up.
Respondents were asked whether they used the following forms of technology:
Use of technology
Waterloo North Hydro Yes No Don’t know
Access the internet for information 83% 17% 0%
Have a social media account 54% 44% 1%
Use online banking services 71% 25% 3%
Shop online 64% 34% 2% Base: total respondents
Shifting activity to the online world, certainly for many of the basic problems and issues makes
sense. While this certainly can help with efficiency, we must be mindful of the reality that CSRs will
actually be fielding more calls that are more complex which may require CSRs (and others in the
LDC) to develop a more important array of competencies and skills. However, the march towards
more online activity and problem resolution should continue at a very quick pace.

42 November 2018
Social Media
Internet forums, user communities, and social-networking sites are the new
ways people are talking to each other and getting some of the answers they
need. Twitter is fast becoming the go-to medium for customer support. Have a
question – tweet it – and wait sometimes less than an hour for a quick fix,
recommended remedy, or information on where to go next. Twitter and
Facebook are increasingly being used as tools to not only disseminate
information, organizations of all types can use the channels to push out news
and pull prospects into their websites.
Social media is evolving, and it gives companies the opportunity to proactively identify customer issues which
will help the utility address problems quickly thereby minimizing the impact on the broader customer
base.
Which social media accounts do you have … Waterloo North Hydro
Facebook 58%
Twitter 24%
YouTube 34%
LinkedIn 38% Base: total respondents who claimed to have social media accounts
54% of Waterloo North Hydro customers
indicated they had a social media account.
Base: total respondents
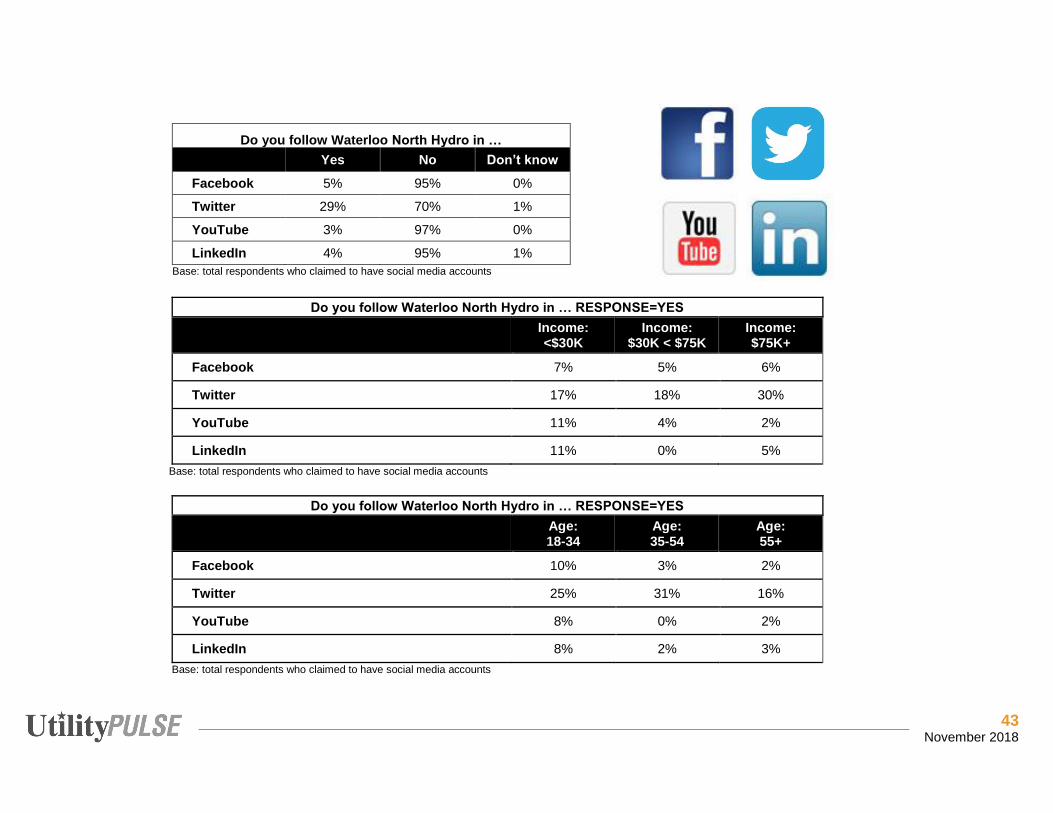
43 November 2018
Do you follow Waterloo North Hydro in … Yes No Don’t know
Facebook 5% 95% 0%
Twitter 29% 70% 1%
YouTube 3% 97% 0%
LinkedIn 4% 95% 1% Base: total respondents who claimed to have social media accounts
Do you follow Waterloo North Hydro in … RESPONSE=YES
Income: <$30K
Income: $30K < $75K
Income: $75K+
Facebook 7% 5% 6%
Twitter 17% 18% 30%
YouTube 11% 4% 2%
LinkedIn 11% 0% 5% Base: total respondents who claimed to have social media accounts
Do you follow Waterloo North Hydro in … RESPONSE=YES
Age: 18-34
Age: 35-54
Age: 55+
Facebook 10% 3% 2%
Twitter 25% 31% 16%
YouTube 8% 0% 2%
LinkedIn 8% 2% 3% Base: total respondents who claimed to have social media accounts

44 November 2018
Communication Channels
Utilities need to know the response they are seeking from customers when planning their communications and
outreach. Sending inserts with monthly bills which provide information to a customer is passive and not very
effective. Although your customer audience is captive, a poorly targeted message is often ignored. Posting
information on a website—unless a customer is actively searching for it—will likely not be found. Email blasts,
and social media campaigns will reach customers, but may not lead to action. Such messages are typically read
when in transit or multitasking, making them an afterthought. So, it often takes several pushes for these
messages to resonate before action is taken. Successful marketing and messaging is simple, consistent, and
continually reinforced.
Primary Source of Information
Primary Source for getting information on …
Waterloo North Hydro Corporate website Twitter Facebook Bill Inserts eBlasts
A power outage 39% 6% 3% 5% 3%
An issue with your bill 35% 0% 1% 10% 3%
General corporate news 35% 2% 3% 16% 3%
Electricity safety information 42% 1% 2% 19% 3%
Energy conservation tips 38% 2% 3% 24% 3%
Changes in electricity rates 34% 1% 2% 31% 4%
Base: total respondents
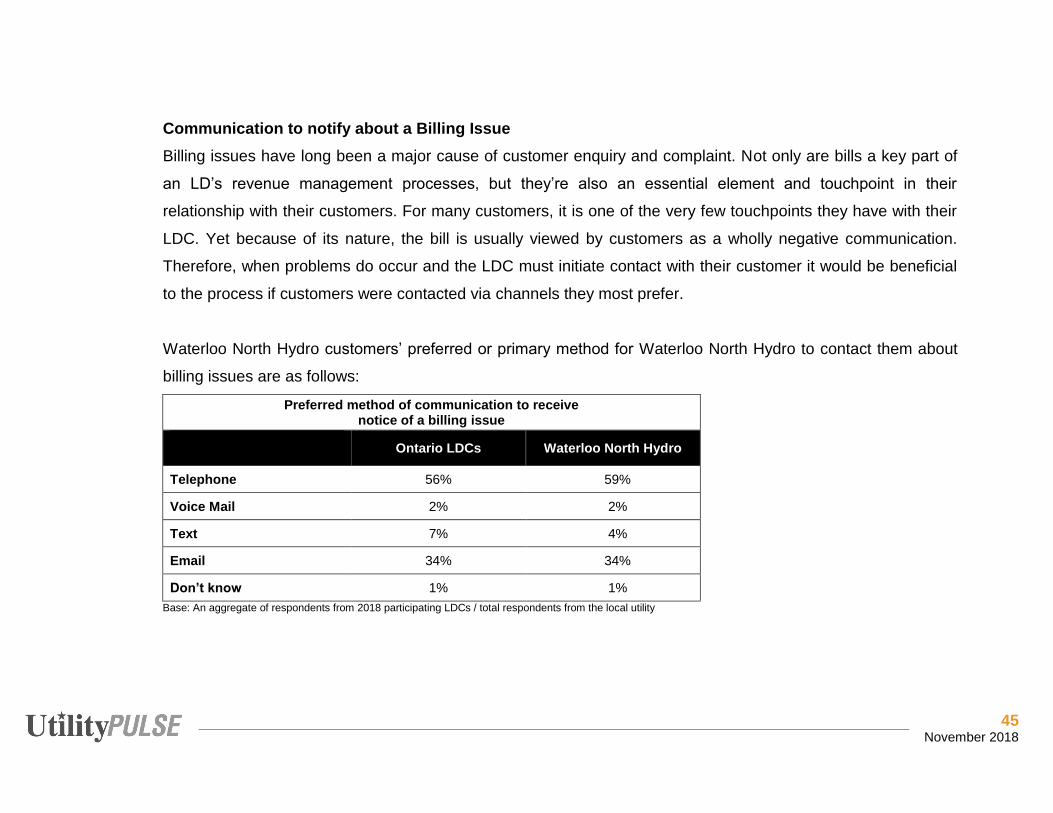
45 November 2018
Communication to notify about a Billing Issue Billing issues have long been a major cause of customer enquiry and complaint. Not only are bills a key part of
an LD’s revenue management processes, but they’re also an essential element and touchpoint in their
relationship with their customers. For many customers, it is one of the very few touchpoints they have with their
LDC. Yet because of its nature, the bill is usually viewed by customers as a wholly negative communication.
Therefore, when problems do occur and the LDC must initiate contact with their customer it would be beneficial
to the process if customers were contacted via channels they most prefer.
Waterloo North Hydro customers’ preferred or primary method for Waterloo North Hydro to contact them about
billing issues are as follows:
Preferred method of communication to receive notice of a billing issue
Ontario LDCs Waterloo North Hydro
Telephone 56% 59%
Voice Mail 2% 2%
Text 7% 4%
Email 34% 34%
Don’t know 1% 1%
Base: An aggregate of respondents from 2018 participating LDCs / total respondents from the local utility
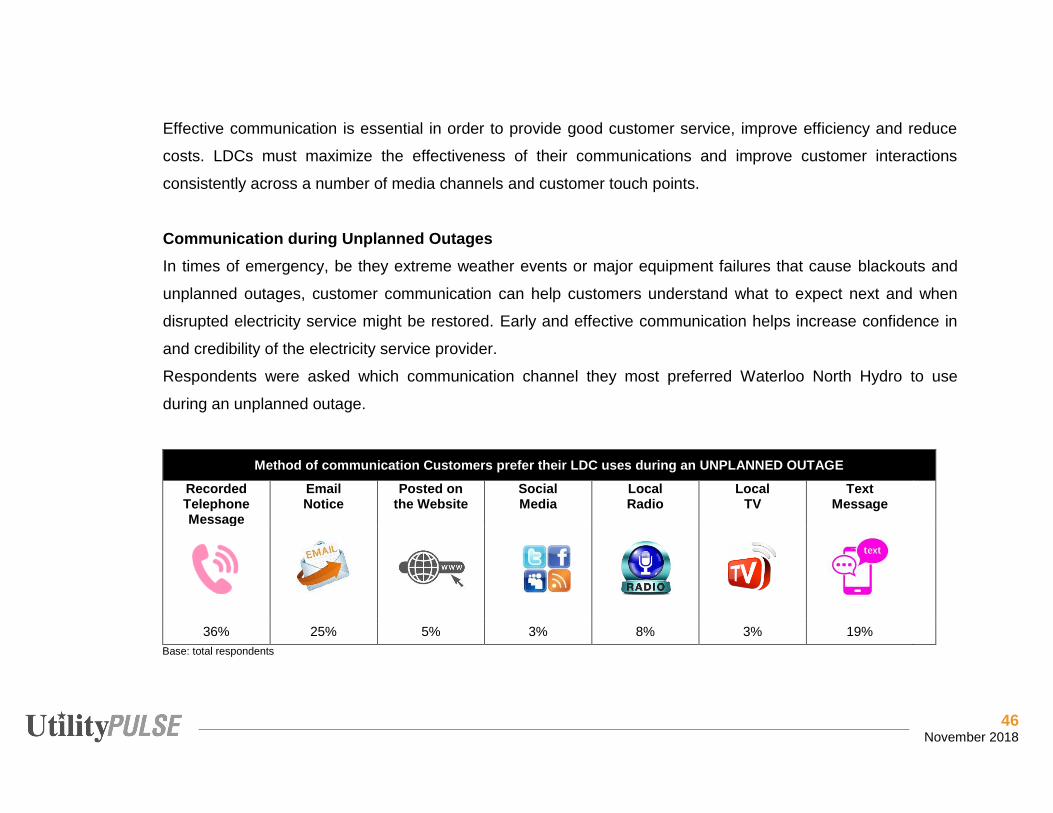
46 November 2018
Effective communication is essential in order to provide good customer service, improve efficiency and reduce
costs. LDCs must maximize the effectiveness of their communications and improve customer interactions
consistently across a number of media channels and customer touch points.
Communication during Unplanned Outages In times of emergency, be they extreme weather events or major equipment failures that cause blackouts and
unplanned outages, customer communication can help customers understand what to expect next and when
disrupted electricity service might be restored. Early and effective communication helps increase confidence in
and credibility of the electricity service provider.
Respondents were asked which communication channel they most preferred Waterloo North Hydro to use
during an unplanned outage.
Method of communication Customers prefer their LDC uses during an UNPLANNED OUTAGE
Recorded Telephone Message
Email Notice
Posted on the Website
Social Media
Local Radio
Local TV
Text Message
36% 25% 5% 3% 8% 3% 19% Base: total respondents
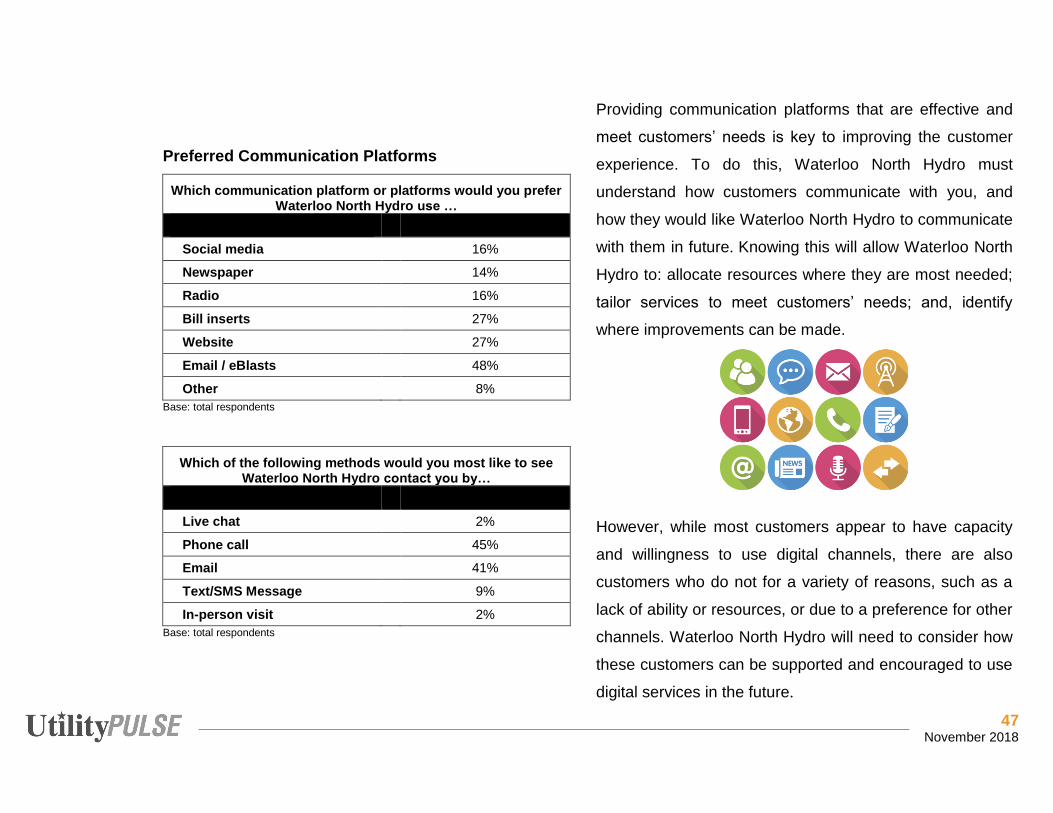
47 November 2018
Preferred Communication Platforms
Which communication platform or platforms would you prefer Waterloo North Hydro use …
Social media 16%
Newspaper 14%
Radio 16%
Bill inserts 27%
Website 27%
Email / eBlasts 48%
Other 8% Base: total respondents
Which of the following methods would you most like to see Waterloo North Hydro contact you by…
Live chat 2%
Phone call 45%
Email 41%
Text/SMS Message 9%
In-person visit 2%
Base: total respondents
Providing communication platforms that are effective and
meet customers’ needs is key to improving the customer
experience. To do this, Waterloo North Hydro must
understand how customers communicate with you, and
how they would like Waterloo North Hydro to communicate
with them in future. Knowing this will allow Waterloo North
Hydro to: allocate resources where they are most needed;
tailor services to meet customers’ needs; and, identify
where improvements can be made.
However, while most customers appear to have capacity
and willingness to use digital channels, there are also
customers who do not for a variety of reasons, such as a
lack of ability or resources, or due to a preference for other
channels. Waterloo North Hydro will need to consider how
these customers can be supported and encouraged to use
digital services in the future.
48 November 2018
Information and Communication
LDCs across the province are increasingly seeing the need to invest in aging infrastructure, new technologies,
regulatory requirements, and a skilled workforce. They are addressing these needs to uphold their public service
duty, all the while keeping in mind the need to communicate with their customers. Part of communication is the
requirement of providing information and/or education to the public in order to raise the level of understanding
surrounding an issue or topic that may be of practical concern to residents.
Consumer information is meant to
attune consumers to certain
problems [i.e. outage problems,
etc.], create awareness and
educate [i.e. electricity safety, etc.]
or even guide (influence) their
behaviour [i.e. energy conservation, etc.]. Individuals and stakeholders are then able to properly assess and
evaluate the impacts of various policies and initiatives proposed by the LDC.
Customers were asked about their level of satisfaction with the information provided by Waterloo North Hydro on
the following:
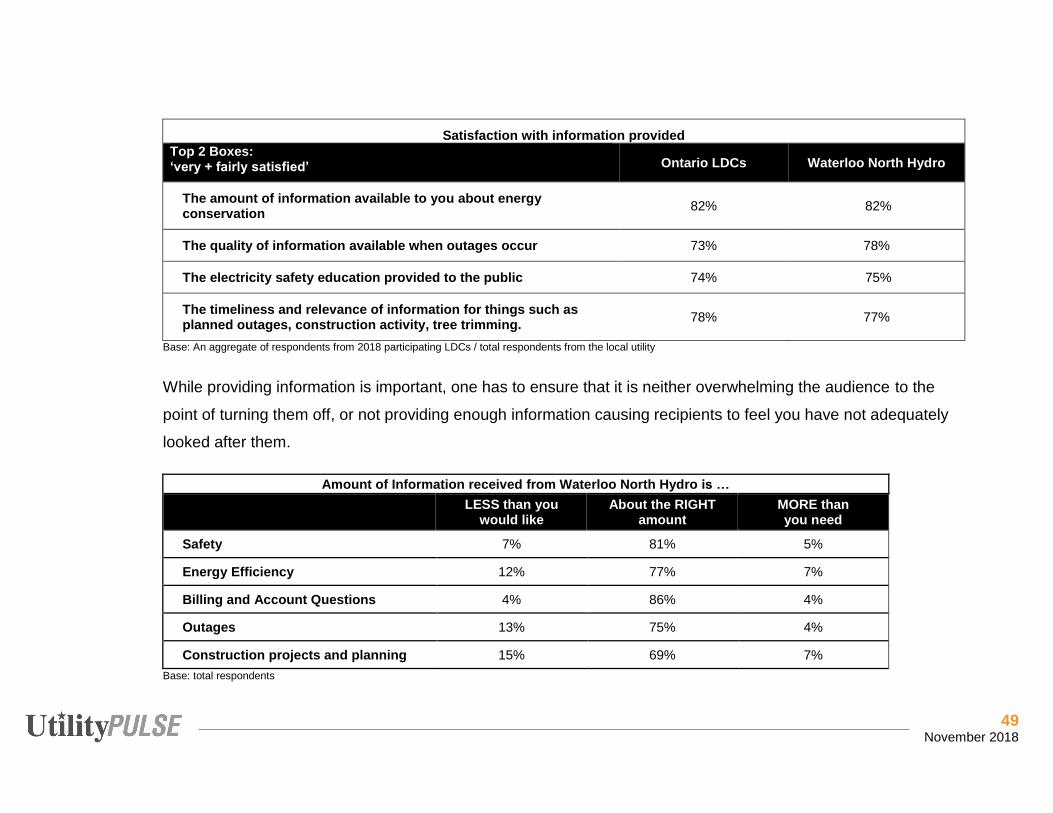
49 November 2018
Satisfaction with information provided Top 2 Boxes: ‘very + fairly satisfied’ Ontario LDCs Waterloo North Hydro
The amount of information available to you about energy conservation 82% 82%
The quality of information available when outages occur 73% 78%
The electricity safety education provided to the public 74% 75%
The timeliness and relevance of information for things such as planned outages, construction activity, tree trimming. 78% 77%
Base: An aggregate of respondents from 2018 participating LDCs / total respondents from the local utility While providing information is important, one has to ensure that it is neither overwhelming the audience to the
point of turning them off, or not providing enough information causing recipients to feel you have not adequately
looked after them.
Amount of Information received from Waterloo North Hydro is …
LESS than you would like
About the RIGHT amount
MORE than you need
Safety 7% 81% 5%
Energy Efficiency 12% 77% 7%
Billing and Account Questions 4% 86% 4%
Outages 13% 75% 4%
Construction projects and planning 15% 69% 7% Base: total respondents
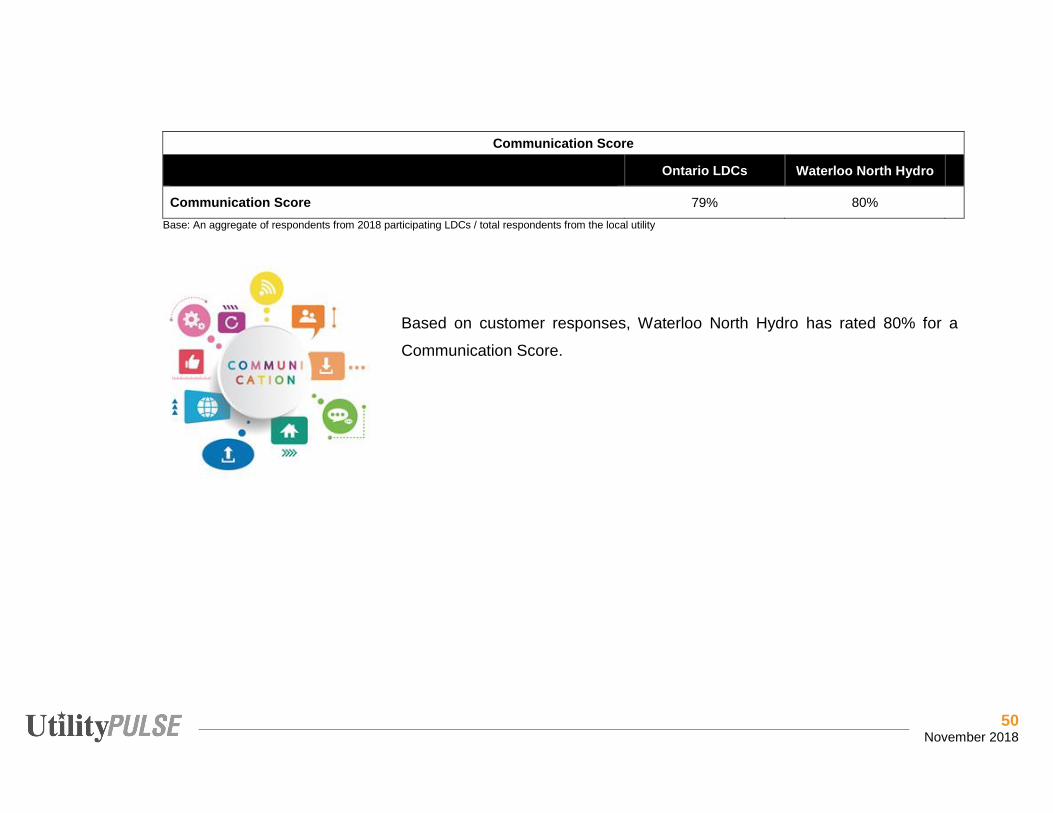
50 November 2018
Communication Score
Ontario LDCs Waterloo North Hydro
Communication Score 79% 80% Base: An aggregate of respondents from 2018 participating LDCs / total respondents from the local utility
Based on customer responses, Waterloo North Hydro has rated 80% for a
Communication Score.
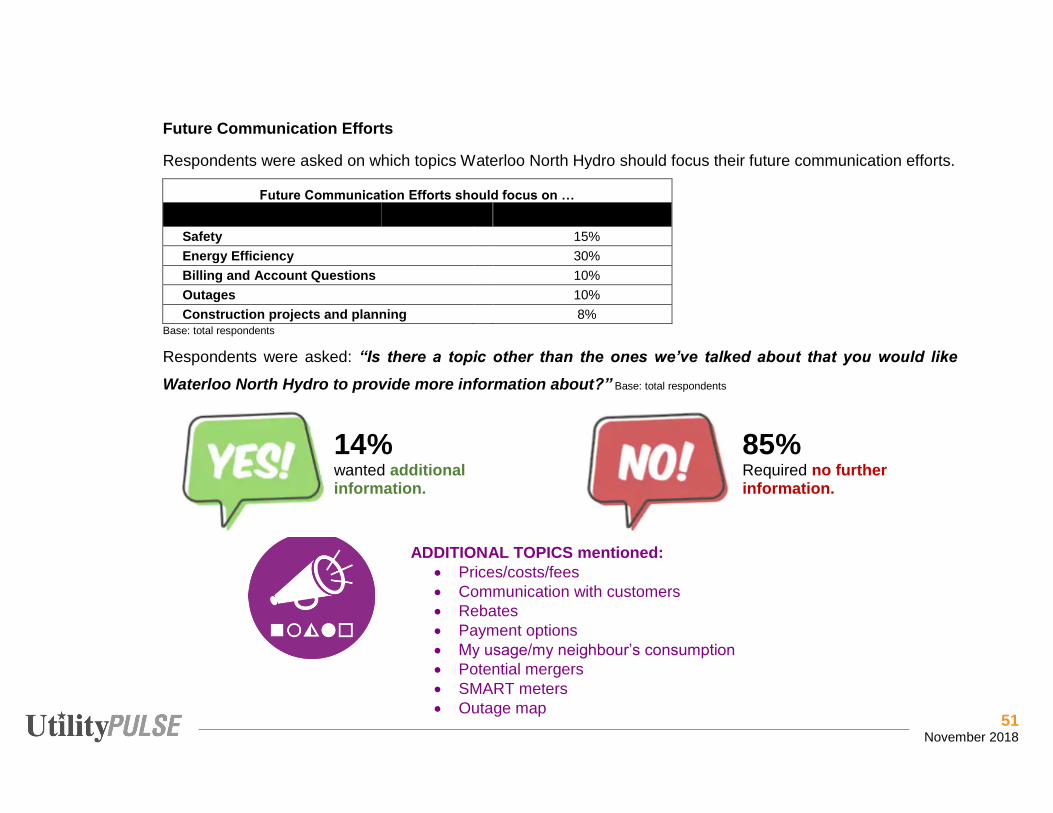
51 November 2018
Future Communication Efforts
Respondents were asked on which topics Waterloo North Hydro should focus their future communication efforts.
Future Communication Efforts should focus on …
Safety 15% Energy Efficiency 30% Billing and Account Questions 10%
Outages 10%
Construction projects and planning 8%
Base: total respondents
Respondents were asked: “Is there a topic other than the ones we’ve talked about that you would like
Waterloo North Hydro to provide more information about?” Base: total respondents
14% wanted additional information.
85% Required no further information.
ADDITIONAL TOPICS mentioned: • Prices/costs/fees • Communication with customers • Rebates • Payment options • My usage/my neighbour’s consumption • Potential mergers • SMART meters • Outage map
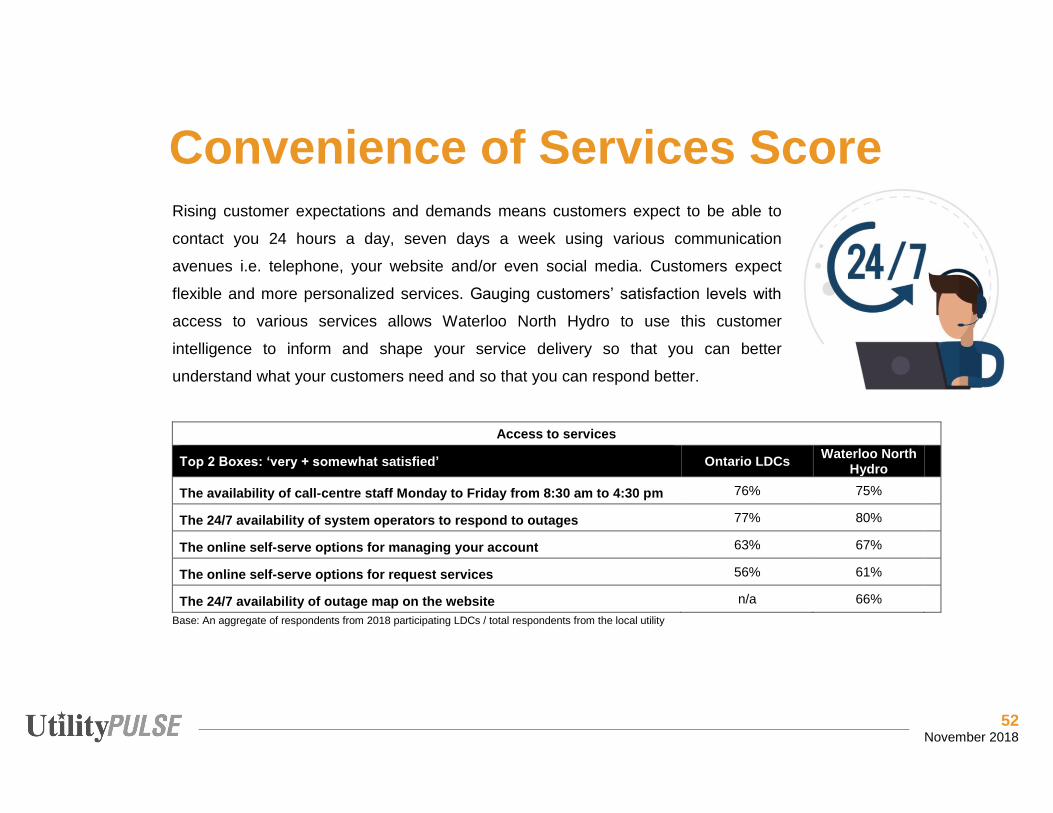
52 November 2018
Convenience of Services Score
Rising customer expectations and demands means customers expect to be able to
contact you 24 hours a day, seven days a week using various communication
avenues i.e. telephone, your website and/or even social media. Customers expect
flexible and more personalized services. Gauging customers’ satisfaction levels with
access to various services allows Waterloo North Hydro to use this customer
intelligence to inform and shape your service delivery so that you can better
understand what your customers need and so that you can respond better.
Access to services
Top 2 Boxes: ‘very + somewhat satisfied’ Ontario LDCs Waterloo North Hydro
The availability of call-centre staff Monday to Friday from 8:30 am to 4:30 pm 76% 75%
The 24/7 availability of system operators to respond to outages 77% 80%
The online self-serve options for managing your account 63% 67%
The online self-serve options for request services 56% 61%
The 24/7 availability of outage map on the website n/a 66%
Base: An aggregate of respondents from 2018 participating LDCs / total respondents from the local utility
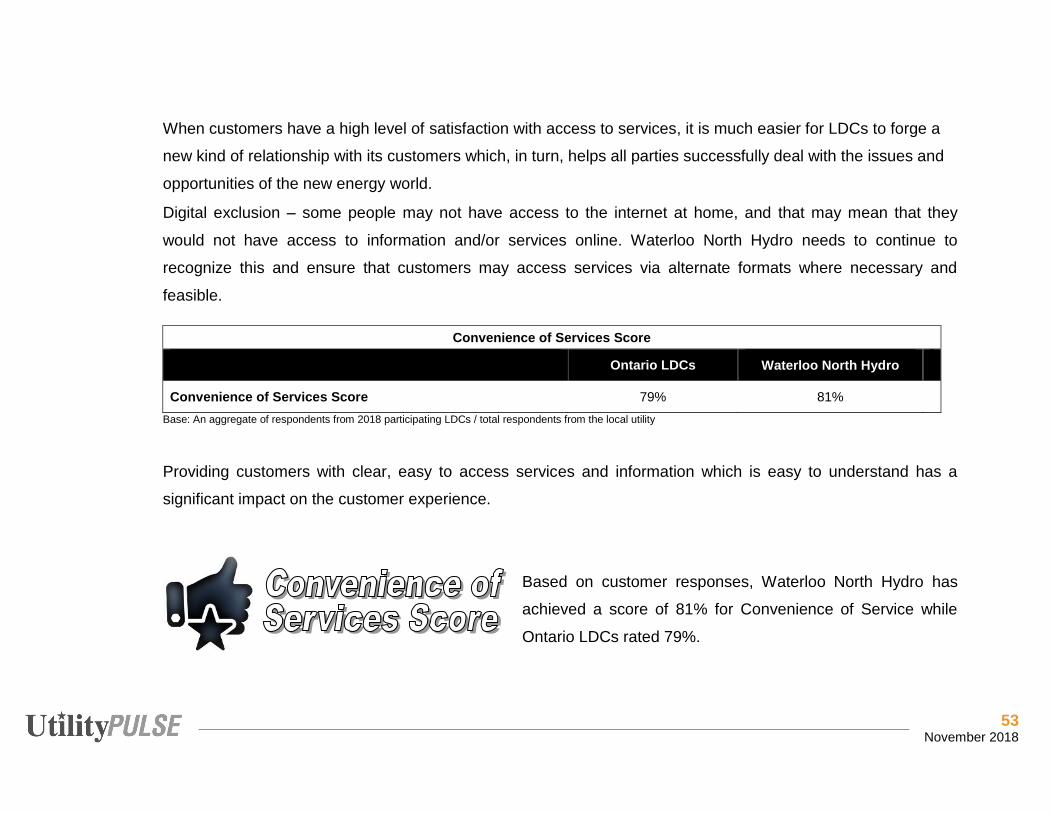
53 November 2018
When customers have a high level of satisfaction with access to services, it is much easier for LDCs to forge a
new kind of relationship with its customers which, in turn, helps all parties successfully deal with the issues and
opportunities of the new energy world.
Digital exclusion – some people may not have access to the internet at home, and that may mean that they
would not have access to information and/or services online. Waterloo North Hydro needs to continue to
recognize this and ensure that customers may access services via alternate formats where necessary and
feasible.
Convenience of Services Score
Ontario LDCs Waterloo North Hydro
Convenience of Services Score 79% 81% Base: An aggregate of respondents from 2018 participating LDCs / total respondents from the local utility
Providing customers with clear, easy to access services and information which is easy to understand has a
significant impact on the customer experience.
Based on customer responses, Waterloo North Hydro has
achieved a score of 81% for Convenience of Service while
Ontario LDCs rated 79%.
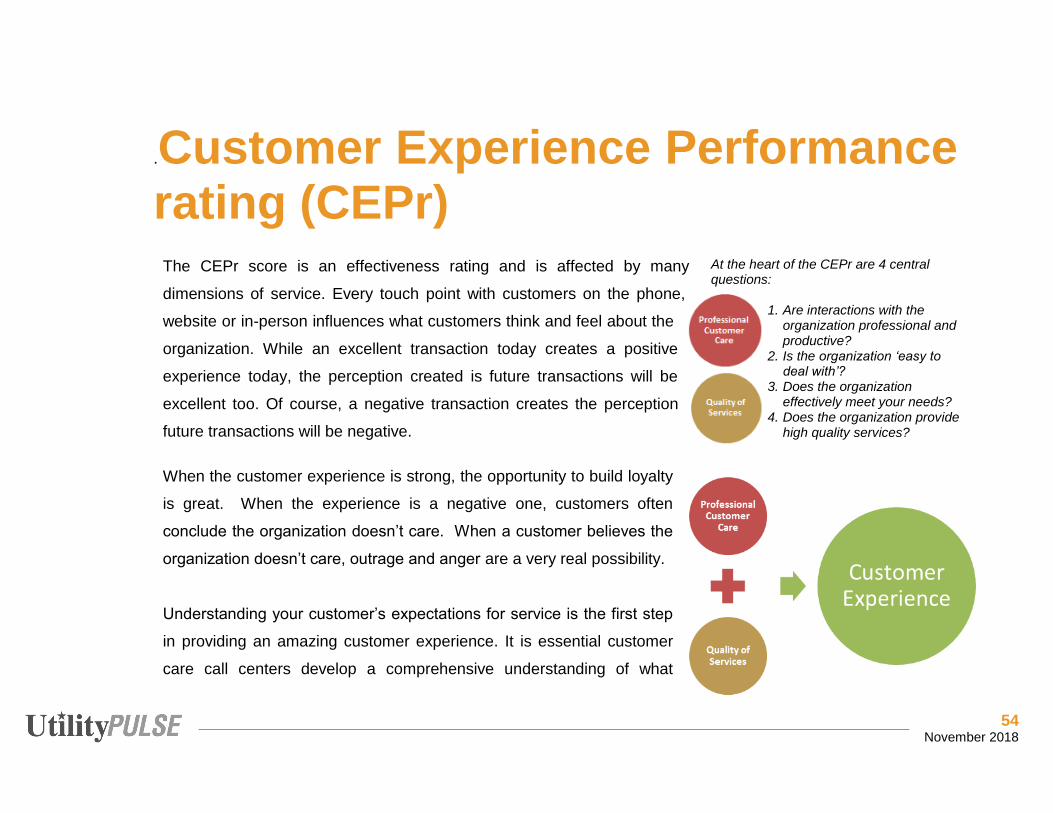
54 November 2018
.Customer Experience Performance rating (CEPr)
The CEPr score is an effectiveness rating and is affected by many
dimensions of service. Every touch point with customers on the phone,
website or in-person influences what customers think and feel about the
organization. While an excellent transaction today creates a positive
experience today, the perception created is future transactions will be
excellent too. Of course, a negative transaction creates the perception
future transactions will be negative.
When the customer experience is strong, the opportunity to build loyalty
is great. When the experience is a negative one, customers often
conclude the organization doesn’t care. When a customer believes the
organization doesn’t care, outrage and anger are a very real possibility.
Understanding your customer’s expectations for service is the first step
in providing an amazing customer experience. It is essential customer
care call centers develop a comprehensive understanding of what
At the heart of the CEPr are 4 central questions:
1. Are interactions with the organization professional and productive?
2. Is the organization ‘easy to deal with’?
3. Does the organization effectively meet your needs?
4. Does the organization provide high quality services?
55 November 2018
customers expect from them, whether or not their needs are being met and how they can improve their service
to meet their expectations.
Some of the factors which contribute to the overall customer experience:
- Delivering accessible and consistent customer service (multi-channel)
- Understanding customer expectations
- Maintaining timely resolution timelines
- Providing effective communication(s) according to customer needs
- Demonstrating responsiveness
- Speeding up problem resolution
- Conducting problem analysis to prevent recurring issues
- Easy to do business with
- Seeking customer feedback and following through on recommendations
Customer Experience Performance rating (CEPr)
Waterloo North Hydro National Ontario
CEPr: all respondents 89% 84% 83% Base: total respondents The CEPr for Waterloo North Hydro is 89%. This rating would suggest that a very large majority of customers
have a belief they will have a good to excellent experience dealing with Waterloo North Hydro professionals.
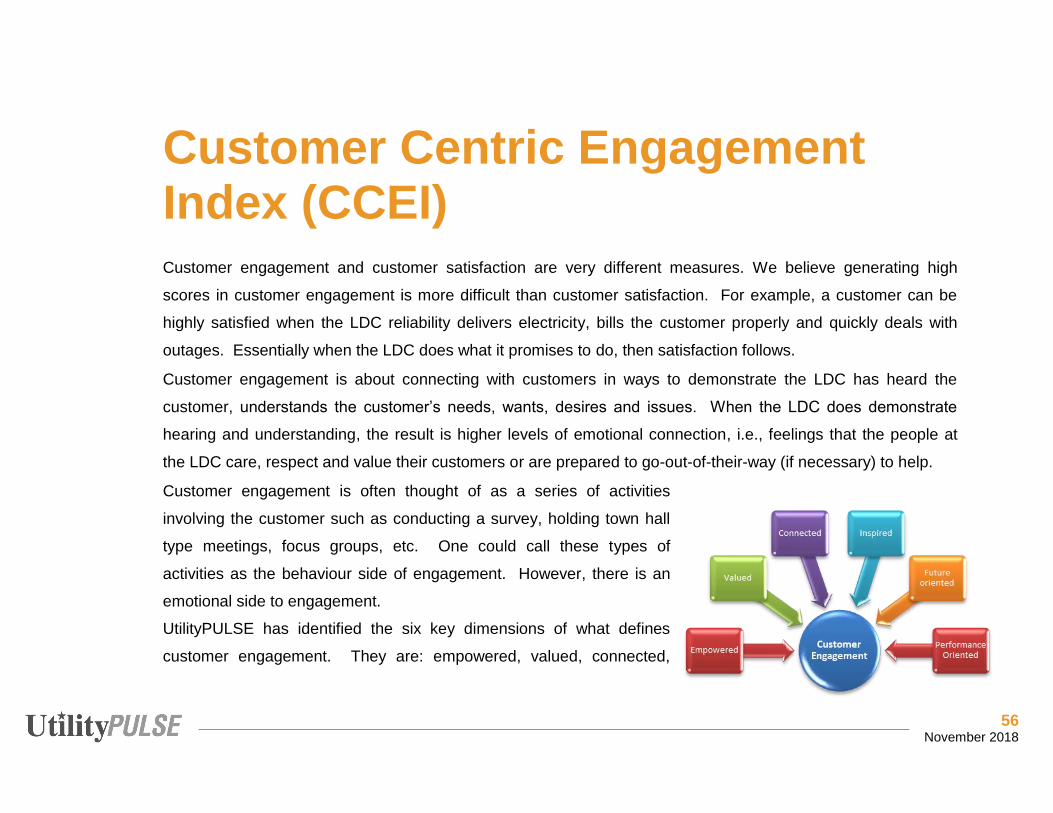
56 November 2018
Customer Centric Engagement Index (CCEI)
Customer engagement and customer satisfaction are very different measures. We believe generating high
scores in customer engagement is more difficult than customer satisfaction. For example, a customer can be
highly satisfied when the LDC reliability delivers electricity, bills the customer properly and quickly deals with
outages. Essentially when the LDC does what it promises to do, then satisfaction follows.
Customer engagement is about connecting with customers in ways to demonstrate the LDC has heard the
customer, understands the customer’s needs, wants, desires and issues. When the LDC does demonstrate
hearing and understanding, the result is higher levels of emotional connection, i.e., feelings that the people at
the LDC care, respect and value their customers or are prepared to go-out-of-their-way (if necessary) to help.
Customer engagement is often thought of as a series of activities
involving the customer such as conducting a survey, holding town hall
type meetings, focus groups, etc. One could call these types of
activities as the behaviour side of engagement. However, there is an
emotional side to engagement.
UtilityPULSE has identified the six key dimensions of what defines
customer engagement. They are: empowered, valued, connected,
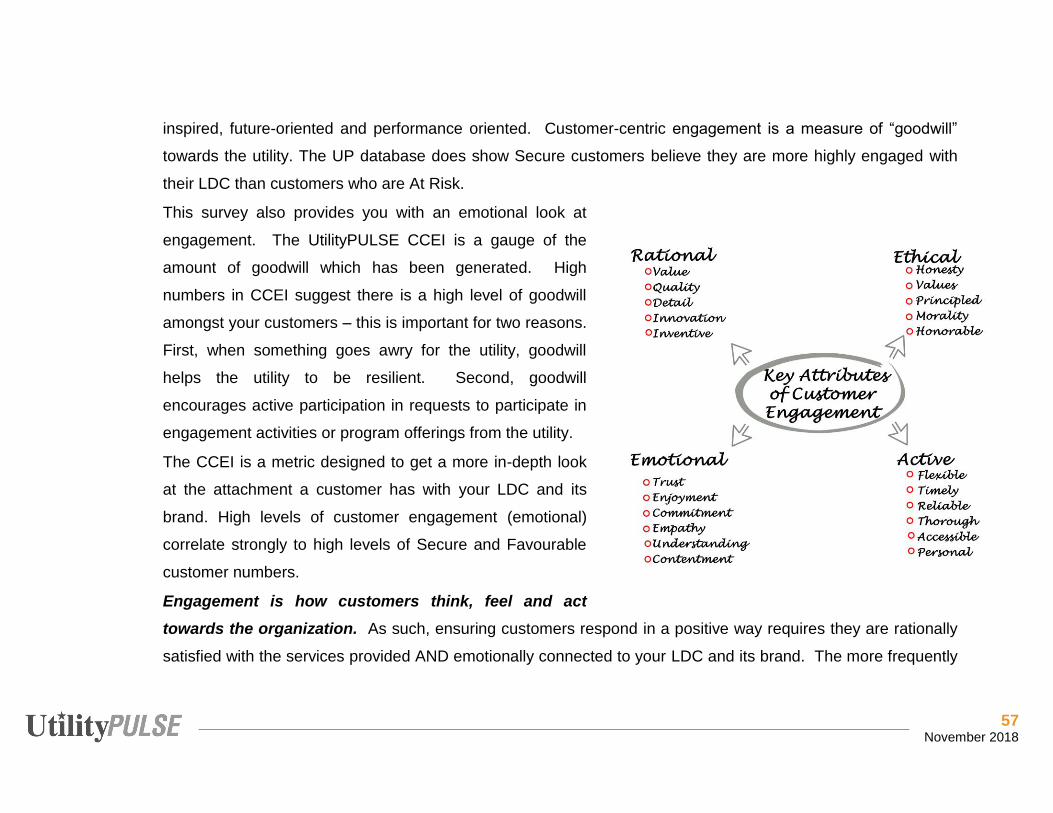
57 November 2018
inspired, future-oriented and performance oriented. Customer-centric engagement is a measure of “goodwill”
towards the utility. The UP database does show Secure customers believe they are more highly engaged with
their LDC than customers who are At Risk.
This survey also provides you with an emotional look at
engagement. The UtilityPULSE CCEI is a gauge of the
amount of goodwill which has been generated. High
numbers in CCEI suggest there is a high level of goodwill
amongst your customers – this is important for two reasons.
First, when something goes awry for the utility, goodwill
helps the utility to be resilient. Second, goodwill
encourages active participation in requests to participate in
engagement activities or program offerings from the utility.
The CCEI is a metric designed to get a more in-depth look
at the attachment a customer has with your LDC and its
brand. High levels of customer engagement (emotional)
correlate strongly to high levels of Secure and Favourable
customer numbers.
Engagement is how customers think, feel and act
towards the organization. As such, ensuring customers respond in a positive way requires they are rationally
satisfied with the services provided AND emotionally connected to your LDC and its brand. The more frequently
58 November 2018
and consistently an organization’s products and services can connect with a customer, especially on an
emotional level, the stronger and deeper the customer becomes engaged with the organization.
Utility Customer Centric Engagement Index (CCEI)
Waterloo North Hydro National Ontario
CCEI 86% 81% 80%
Base: total respondents Customers who are less engaged, as measured by the CCEI are more likely to let costs and/or price impact their
perceptions of their LDC. Customers who are highly engaged are more inclined to look past costs and money
issues and use a rational approach to make values-based decisions. Highly engaged customers have a stronger
emotional connection to your utility. It’s this emotional connection which will drive commitment, loyalty, and
advocacy.
Using the measures of Satisfaction and Engagement the LDCs relationship with its customers would fall into one
of four quadrants: Q1- low satisfaction/low engagement; Q2- high satisfaction/low engagement; Q3- low
satisfaction/high engagement and Q4- high satisfaction/high engagement. Most LDCs would agree to have
customers fall into the Q1 quadrant isn’t good and having customers fall into Q4 is ideal.
When LDCs have candid conversations with customers and employees about their joint and different needs &
perspectives the better, the LDC can be for creating an excellent place to do business with and to work.
59 November 2018
UtilityPULSE Report Card®
Simul’s UtilityPULSE Report Card® is based on tens of thousands of customer interviews gathered over eighteen
years. The purpose of the UtilityPULSE Report Card® is to provide electric utilities with a snapshot of
performance – on the things customers deem to be important. Research has identified over 20 attributes, sorted
into six topic categories (we call these drivers), which customers have used to describe their utility when they
have been satisfied or very satisfied with their utility. These attributes form the nucleus, or base, from which
“scores” are assigned. Customer satisfaction and loyalty also play a major role in the calculations.
There are two main dimensions of the UtilityPULSE Report Card® the first is customer psyche and the other is
customer perceptions about how the utility executes its business.
The Psyche of Customers
Every utility has virtually the same responsibility – provide safe and reliable electricity – yet not all customers are
the same. The following chart shows the weight or significance of each category to the customer when forming
their overall impression of the utility. Three major themes, each with two major categories make up the
UtilityPULSE Report Card®. In effect, the Report Card provides feedback about your customers’ perception of
the importance of each category and driver – as it relates to the benchmark.
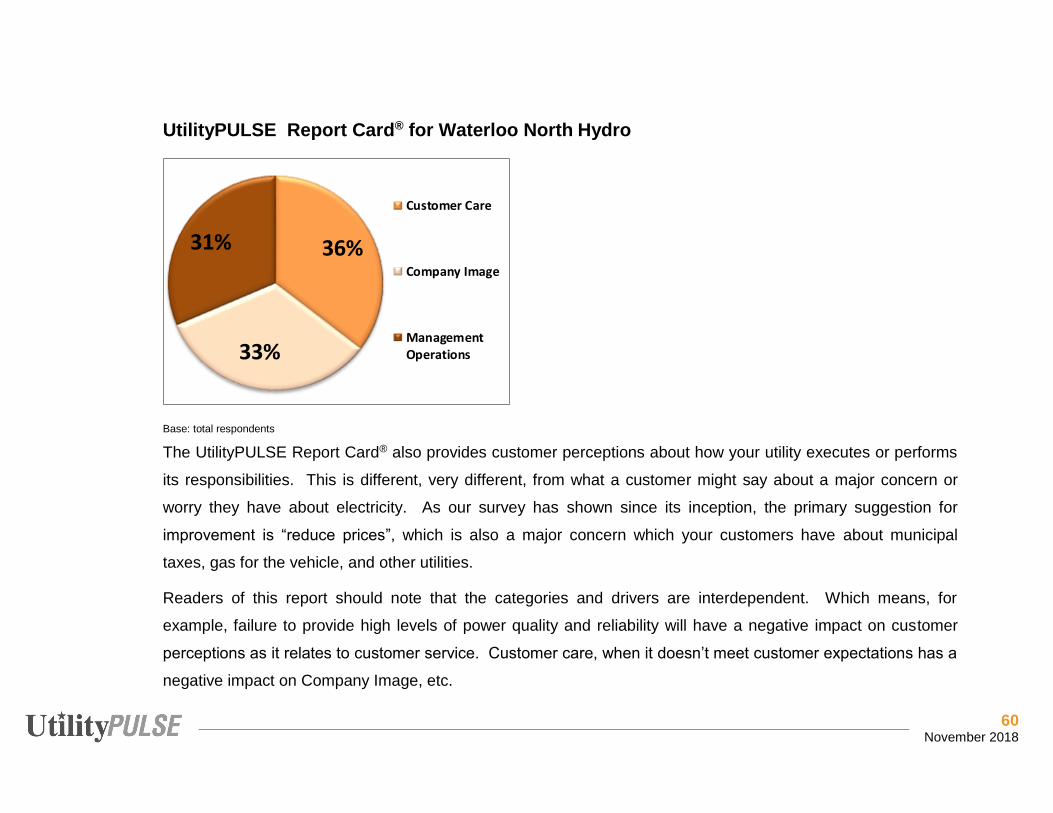
60 November 2018
UtilityPULSE Report Card® for Waterloo North Hydro
Base: total respondents
The UtilityPULSE Report Card® also provides customer perceptions about how your utility executes or performs
its responsibilities. This is different, very different, from what a customer might say about a major concern or
worry they have about electricity. As our survey has shown since its inception, the primary suggestion for
improvement is “reduce prices”, which is also a major concern which your customers have about municipal
taxes, gas for the vehicle, and other utilities.
Readers of this report should note that the categories and drivers are interdependent. Which means, for
example, failure to provide high levels of power quality and reliability will have a negative impact on customer
perceptions as it relates to customer service. Customer care, when it doesn’t meet customer expectations has a
negative impact on Company Image, etc.
36%
33%
31%
Customer Care
Company Image
ManagementOperations
61 November 2018
Defining the categories and major drivers:
Category: Customer Care Drivers: Price and Value; Customer Service Just because everyone likes good customer care, that in and by itself, is not a reason to provide it – though it
may be important to do so. In highly competitive industries good customer service may be a differentiating
factor. The case for electric utilities is simple, high levels of customer care result in less work (hence cost) of
responding to customer inquiries and higher levels of acceptance of the utility’s actions.
Price and Value:
Customers have to purchase electricity because life and lifestyle depend on it. This driver measures customer
perceptions as to whether the total costs of electricity represent good value and whether the utility is seen as
working in the best interests of its customers as it relates to keeping costs affordable.
Customer Service:
Customers do have needs, and every now and again have to interface with their utility. How the utility handles
various customers’ requests, and concerns are what this driver is all about. Promptly answering inquiries,
providing sound information, keeping customers informed and doing so in a professional manner are the major
components of this driver.

62 November 2018
Category: Company Image Drivers: Company Leadership; Corporate Stewardship Utilities have an image even if they do not undertake any activities to try to build it. A company’s image is both a
simple and complex concept. It is simple because companies do create images which are easily described and
recognized by their target customers. It is complex because it takes many discrete elements to create an image
which includes, but is not limited to: advertising, marketing communications, publicity, service offering, and
pricing.
An electric utility trying to manage its image has one more challenge to deal with, and that is the electric industry
itself. There are so many players, residential customers (in particular) don’t know who does what or who is
responsible for what. So, when there are political or regulatory announcements, the local utility is often swept up
into the collective reaction of the population.
Company Leadership
This driver is comprised of customer perceptions as it relates to industry leadership, keeping promises and being
a respected company in the community.
Corporate Stewardship
Customers rely on electricity and want to know their utility is both a trusted and credible organization which is
well managed, accountable, socially responsible and has its financial house in order.
63 November 2018
Category: Management Operations Drivers: Operational Effectiveness; Power Quality and Reliability Electrical power is the primary product which utilities provide their customers and, they have very high
expectations the power will be there when they need it. Customers have little tolerance for outages. The reality
is, every utility must get this part right…no excuses. It is the utility’s core business. This category and its drivers
are clearly the most important for fulfilling the rational needs of a utility’s customers.
Operational Effectiveness
This driver measures customers’ perceptions as they relate to ensuring their utility runs smoothly. Attributes
such as accurate billing and meter reading, completing service work in a professional and timely manner and
maintaining equipment in good repair are deemed as important to customers.
Power Quality and Reliability
Power outages are a fact of life – and, customers know it. They expect their utility to provide consistent, reliable
electricity, handle outages and restore power quickly and make using electricity safely an important priority.
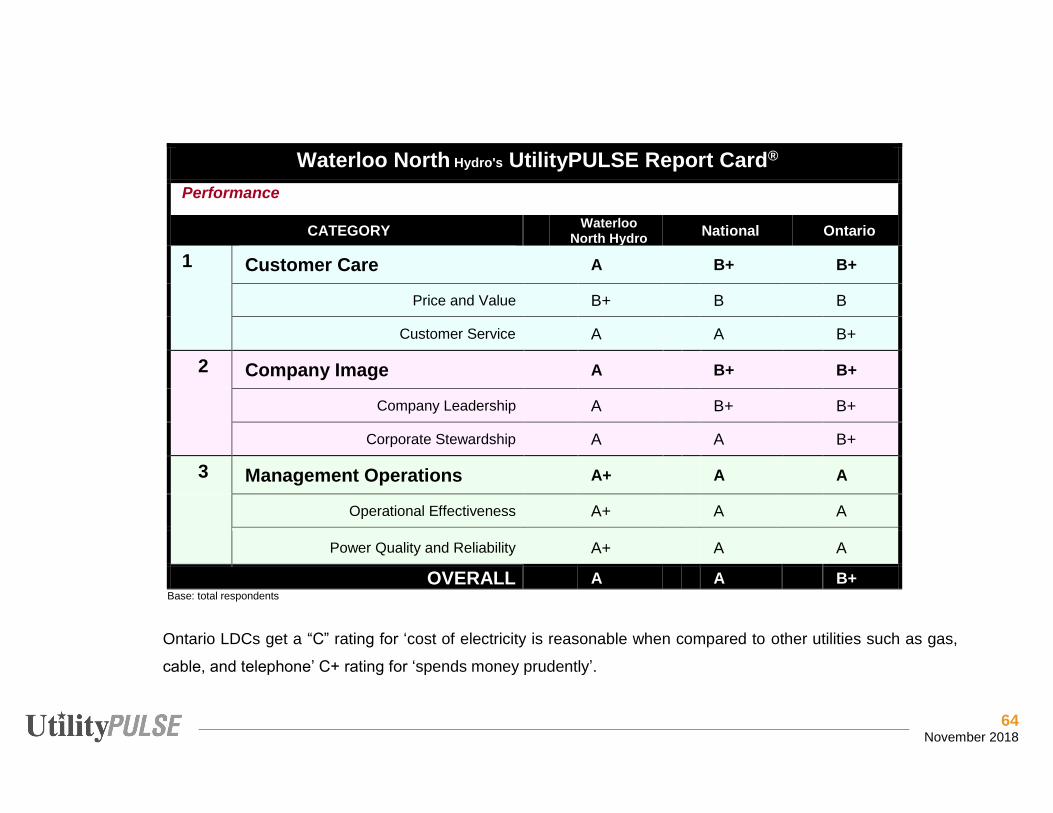
64 November 2018
Waterloo North Hydro's UtilityPULSE Report Card®
Performance
CATEGORY Waterloo North Hydro National Ontario
1 Customer Care A B+ B+
Price and Value B+ B B
Customer Service A A B+
2 Company Image A B+ B+
Company Leadership A B+ B+
Corporate Stewardship A A B+
3 Management Operations A+ A A
Operational Effectiveness A+ A A
Power Quality and Reliability A+ A A
OVERALL A A B+ Base: total respondents
Ontario LDCs get a “C” rating for ‘cost of electricity is reasonable when compared to other utilities such as gas,
cable, and telephone’ C+ rating for ‘spends money prudently’.
65 November 2018
As the UtilityPULSE Report Card® shows, the total customer experience with an electric utility is defined as more
than “keeping the lights on”. Customers deal with your utility every day for a variety of reasons, most likely
because they need someone to help them solve a problem, answer a question or take their order for service. All
your employees, from customer service representatives to linemen, leave a lasting impression on the customers
they interact with. In effect, there are many moments of truth. Moments of truth are every customer touch point
a utility has with their customers. Therefore, managing these moments of truth creates higher levels of Secure
customers while reducing the number of At Risk customers which exist.
It's the small things done consistently that matter: Things like greeting every customer, whether on the phone or
in person, in a friendly and helpful manner. Things like listening to the customer's needs, providing solutions to
their problems and showing appreciation to the customer for their business.
Utilities now recognize customer communications as a valuable aspect of their business. The better a utility
communicates with customers in a manner which speaks to them; the more satisfied they are with their overall
service. “Sending out information” is not the same as having a “conversation” with a customer. We believe it is
increasingly important to channel your communications to the various customer segments which exist.
Obviously, employees – in every area – play a critical role in customer service success. Consequently, how
they feel about their job responsibilities and role in the company will be communicated indirectly through the
level of service which they provide customers with whom they interact. The reality is engaged employees are
the key to excellent customer care.
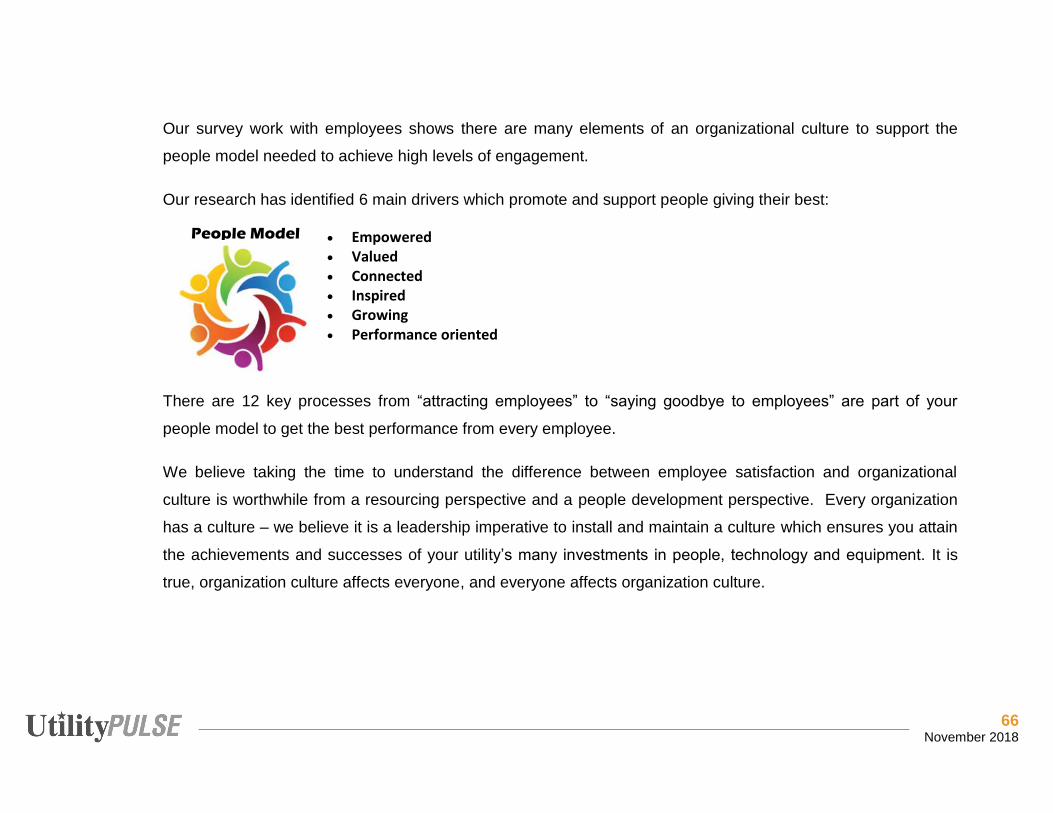
66 November 2018
Our survey work with employees shows there are many elements of an organizational culture to support the
people model needed to achieve high levels of engagement.
Our research has identified 6 main drivers which promote and support people giving their best:
There are 12 key processes from “attracting employees” to “saying goodbye to employees” are part of your
people model to get the best performance from every employee.
We believe taking the time to understand the difference between employee satisfaction and organizational
culture is worthwhile from a resourcing perspective and a people development perspective. Every organization
has a culture – we believe it is a leadership imperative to install and maintain a culture which ensures you attain
the achievements and successes of your utility’s many investments in people, technology and equipment. It is
true, organization culture affects everyone, and everyone affects organization culture.
• Empowered • Valued • Connected • Inspired • Growing • Performance oriented
People Model

67 November 2018
The Loyalty Factor If a customer is satisfied, it doesn’t necessarily mean he or
she is loyal. Satisfaction is about fulfilling
promises/expectations; loyalty goes way beyond that by
creating exceptional experiences and long-lasting
relationships. There is a reason why marketing campaigns
strive to build brand loyalty, not brand satisfaction.
Measuring customer loyalty in an industry where many
customers don’t have a choice of providers doesn’t make
sense. Or does it?
The answer depends on how you define “customer loyalty.”
Private industry often equates customer loyalty with basic customer retention. If a customer continues to do
business with a company, the customer is, by definition, considered to be loyal. If this definition were applied to
many companies in the utility industry, all customers would automatically be considered loyal. As such,
measuring customer loyalty would appear to be unnecessary.
Natural monopolies (like LDCs) are not really different in what they should measure except that trying to
determine which customers are “loyal” or “at risk” is not about their future behaviour but more about their
“attitudinal” loyalty (are they advocates?).
Hierarchy of Loyalty
© UtilityPULSE
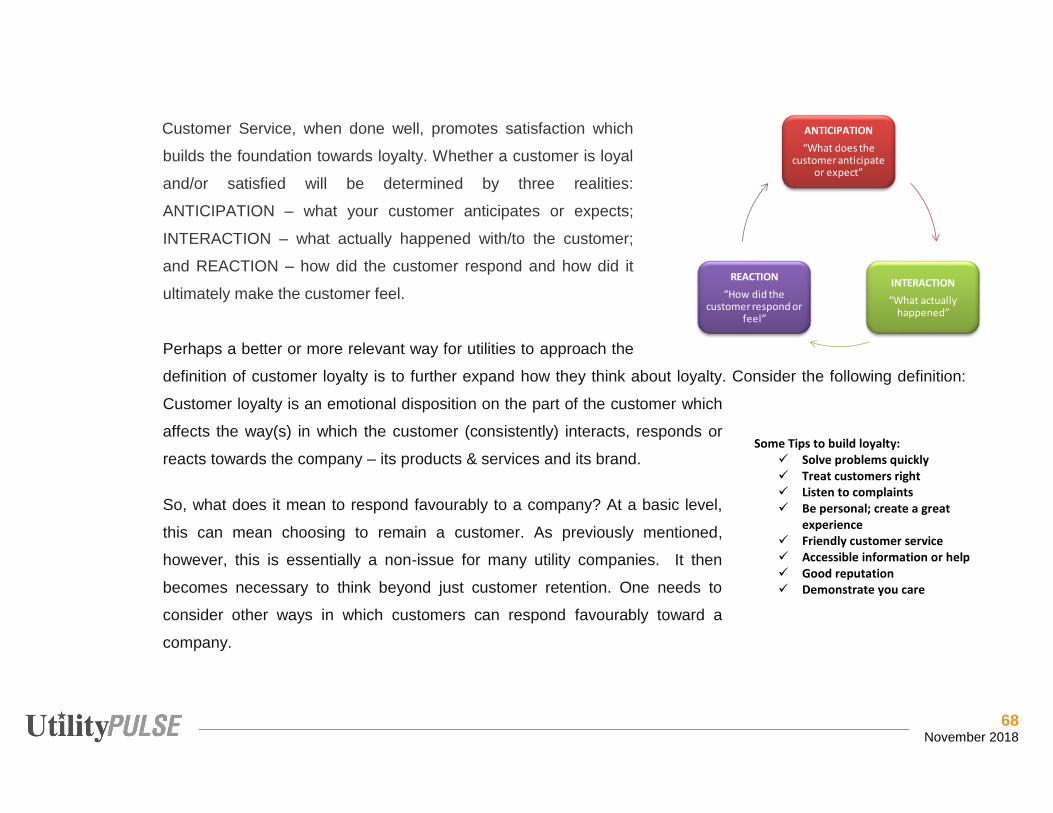
68 November 2018
Customer Service, when done well, promotes satisfaction which
builds the foundation towards loyalty. Whether a customer is loyal
and/or satisfied will be determined by three realities:
ANTICIPATION – what your customer anticipates or expects;
INTERACTION – what actually happened with/to the customer;
and REACTION – how did the customer respond and how did it
ultimately make the customer feel.
Perhaps a better or more relevant way for utilities to approach the
definition of customer loyalty is to further expand how they think about loyalty. Consider the following definition:
Customer loyalty is an emotional disposition on the part of the customer which
affects the way(s) in which the customer (consistently) interacts, responds or
reacts towards the company – its products & services and its brand.
So, what does it mean to respond favourably to a company? At a basic level,
this can mean choosing to remain a customer. As previously mentioned,
however, this is essentially a non-issue for many utility companies. It then
becomes necessary to think beyond just customer retention. One needs to
consider other ways in which customers can respond favourably toward a
company.
Some Tips to build loyalty: ✓ Solve problems quickly ✓ Treat customers right ✓ Listen to complaints ✓ Be personal; create a great
experience ✓ Friendly customer service ✓ Accessible information or help ✓ Good reputation ✓ Demonstrate you care
ANTICIPATION
“What does the customer anticipate
or expect”
INTERACTION
“What actually happened”
REACTION
“How did the customer respond or
feel”
69 November 2018
Other favourable responses or behaviours can be classified into one of three categories that reflect the concept
of customer loyalty: • Participation • Compliance or Influence • Advocacy
Specific examples of potential participatory behaviour in the electric utility industry include: • Signing up for programs which help the customer reduce or manage their energy consumption • Using the utility as a consultant when selecting energy products and services from a third party • Participating in pilot programs or research studies.
Specific examples of potential compliance or influence behaviours utility customers might exhibit include: • Seeking the utility’s advice or expertise on an energy-related issue • Voluntarily cutting back on electricity usage if the utility advised the customer to do so • Accepting the utility’s energy advice or referrals to energy contractors or equipment • Being influenced by the utility’s opinion regarding energy- management advice, equipment, or technologies • Providing personal information which enables the utility to better serve the customer • Paying bills online.
Creating customer advocates can be especially important for a company in a regulated industry. In the absence
of customer advocates, or worse, in a situation where customers speak unfavourably about a company or
actively work to support issues that are counter to those the company supports, companies can suffer a variety
of negative consequences like increased business costs, lawsuits, fines, and construction delays. For an electric
utility, specific examples of potential advocacy behaviour include:
• Supporting the utility’s positions or actions on energy-related public issues, including the environment • Supporting the utility’s position on the location and construction of facilities • Providing testimonials about positive experiences with the utility.
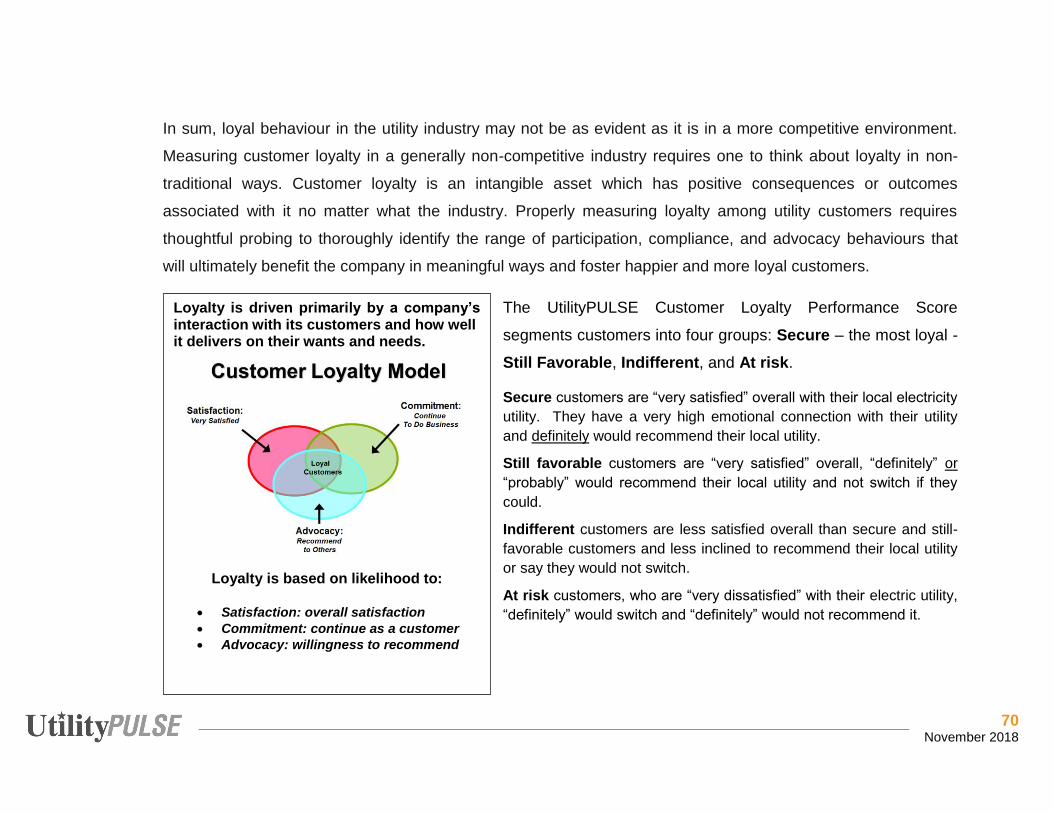
70 November 2018
In sum, loyal behaviour in the utility industry may not be as evident as it is in a more competitive environment.
Measuring customer loyalty in a generally non-competitive industry requires one to think about loyalty in non-
traditional ways. Customer loyalty is an intangible asset which has positive consequences or outcomes
associated with it no matter what the industry. Properly measuring loyalty among utility customers requires
thoughtful probing to thoroughly identify the range of participation, compliance, and advocacy behaviours that
will ultimately benefit the company in meaningful ways and foster happier and more loyal customers.
The UtilityPULSE Customer Loyalty Performance Score
segments customers into four groups: Secure – the most loyal -
Still Favorable, Indifferent, and At risk.
Secure customers are “very satisfied” overall with their local electricity
utility. They have a very high emotional connection with their utility and definitely would recommend their local utility.
Still favorable customers are “very satisfied” overall, “definitely” or “probably” would recommend their local utility and not switch if they
could.
Indifferent customers are less satisfied overall than secure and still-favorable customers and less inclined to recommend their local utility or say they would not switch.
At risk customers, who are “very dissatisfied” with their electric utility, “definitely” would switch and “definitely” would not recommend it.
Loyalty is driven primarily by a company’s interaction with its customers and how well it delivers on their wants and needs.
Loyalty is based on likelihood to:
• Satisfaction: overall satisfaction
• Commitment: continue as a customer
• Advocacy: willingness to recommend
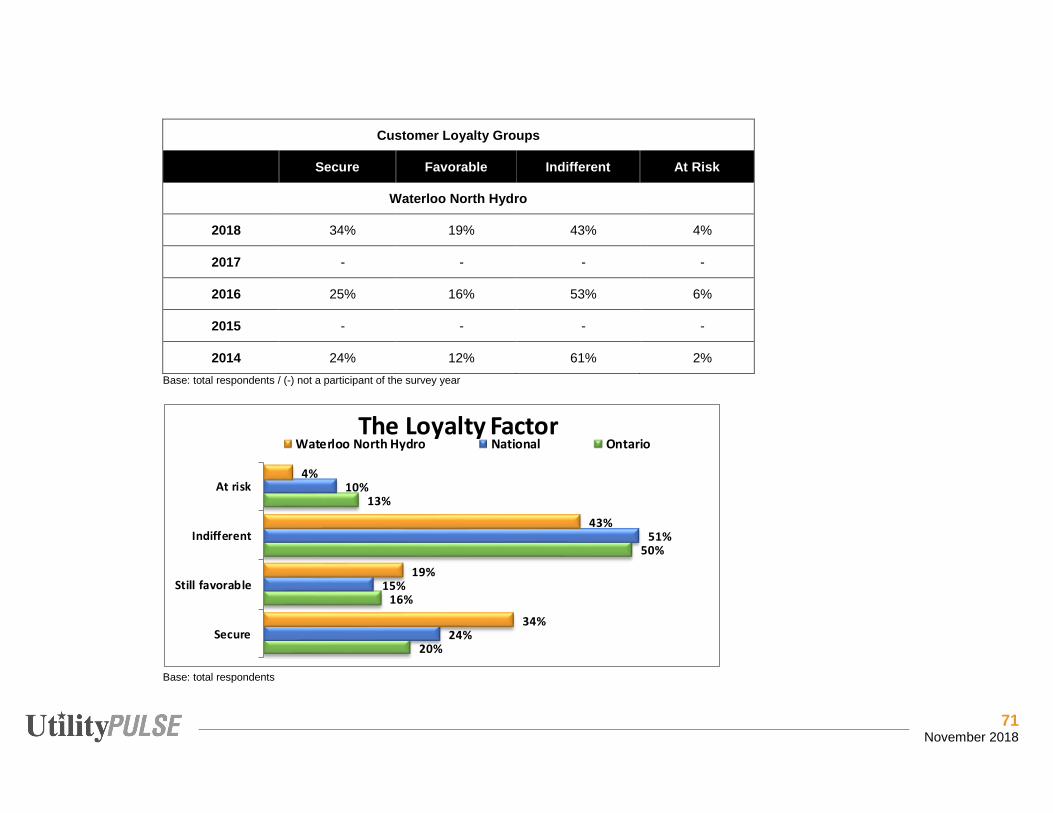
71 November 2018
Customer Loyalty Groups
Secure Favorable Indifferent At Risk
Waterloo North Hydro
2018 34% 19% 43% 4%
2017 - - - -
2016 25% 16% 53% 6%
2015 - - - -
2014 24% 12% 61% 2%
Base: total respondents / (-) not a participant of the survey year Base: total respondents
20%
16%
50%
13%
24%
15%
51%
10%
34%
19%
43%
4%
Secure
Still favorable
Indifferent
At risk
The Loyalty FactorWaterloo North Hydro National Ontario
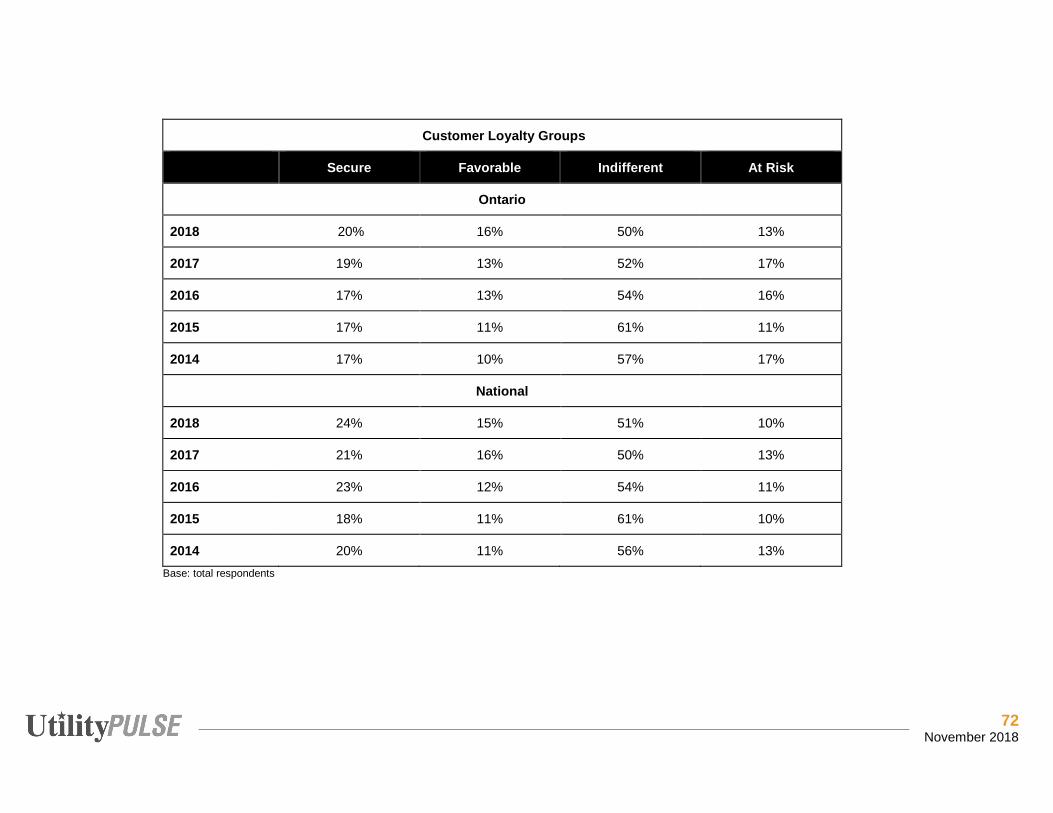
72 November 2018
Customer Loyalty Groups
Secure Favorable Indifferent At Risk
Ontario
2018 20% 16% 50% 13%
2017 19% 13% 52% 17%
2016 17% 13% 54% 16%
2015 17% 11% 61% 11%
2014 17% 10% 57% 17%
National
2018 24% 15% 51% 10%
2017 21% 16% 50% 13%
2016 23% 12% 54% 11%
2015 18% 11% 61% 10%
2014 20% 11% 56% 13% Base: total respondents
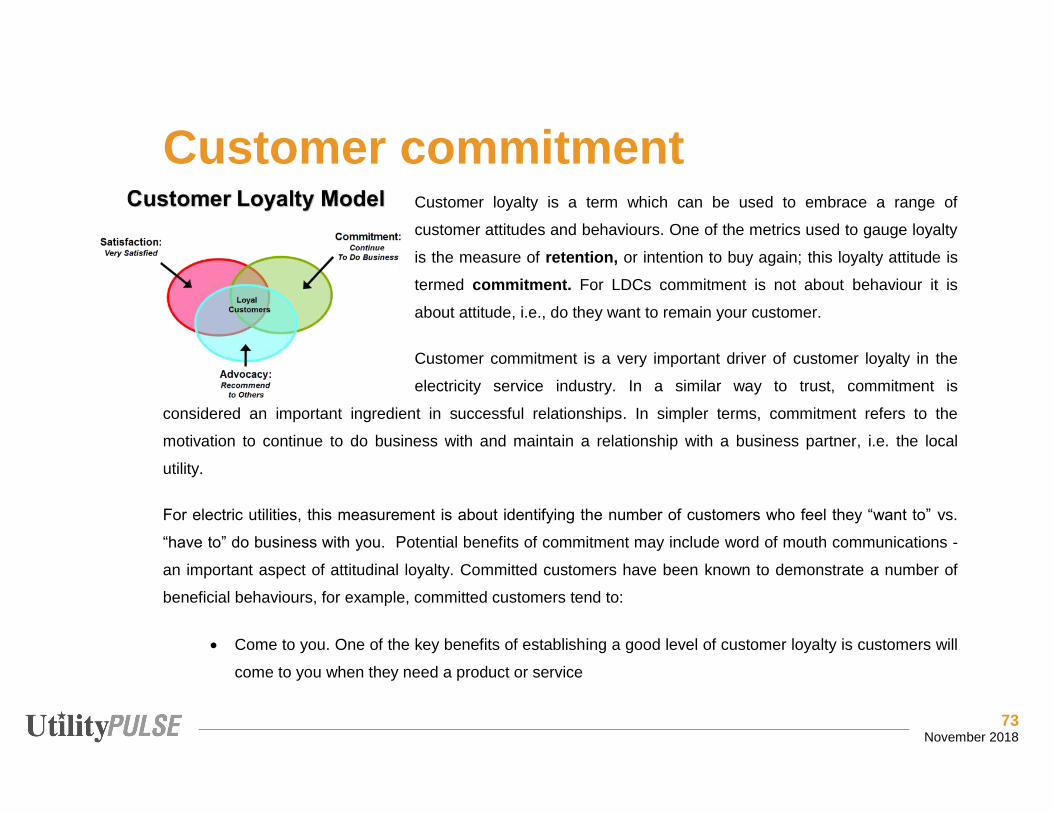
73 November 2018
Customer commitment Customer loyalty is a term which can be used to embrace a range of
customer attitudes and behaviours. One of the metrics used to gauge loyalty
is the measure of retention, or intention to buy again; this loyalty attitude is
termed commitment. For LDCs commitment is not about behaviour it is
about attitude, i.e., do they want to remain your customer.
Customer commitment is a very important driver of customer loyalty in the
electricity service industry. In a similar way to trust, commitment is
considered an important ingredient in successful relationships. In simpler terms, commitment refers to the
motivation to continue to do business with and maintain a relationship with a business partner, i.e. the local
utility.
For electric utilities, this measurement is about identifying the number of customers who feel they “want to” vs.
“have to” do business with you. Potential benefits of commitment may include word of mouth communications -
an important aspect of attitudinal loyalty. Committed customers have been known to demonstrate a number of
beneficial behaviours, for example, committed customers tend to:
• Come to you. One of the key benefits of establishing a good level of customer loyalty is customers will
come to you when they need a product or service
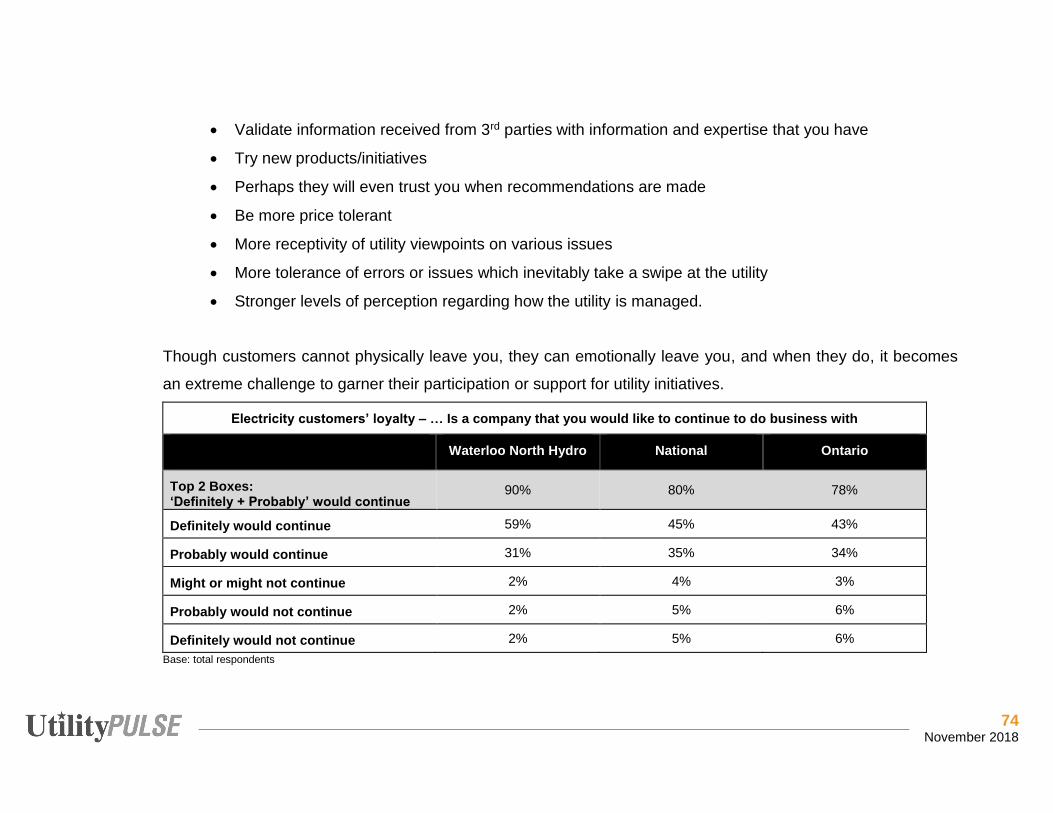
74 November 2018
• Validate information received from 3rd parties with information and expertise that you have
• Try new products/initiatives
• Perhaps they will even trust you when recommendations are made
• Be more price tolerant
• More receptivity of utility viewpoints on various issues
• More tolerance of errors or issues which inevitably take a swipe at the utility
• Stronger levels of perception regarding how the utility is managed.
Though customers cannot physically leave you, they can emotionally leave you, and when they do, it becomes
an extreme challenge to garner their participation or support for utility initiatives.
Electricity customers’ loyalty – … Is a company that you would like to continue to do business with
Waterloo North Hydro National Ontario
Top 2 Boxes: ‘Definitely + Probably’ would continue
90% 80% 78%
Definitely would continue 59% 45% 43%
Probably would continue 31% 35% 34%
Might or might not continue 2% 4% 3%
Probably would not continue 2% 5% 6%
Definitely would not continue 2% 5% 6% Base: total respondents
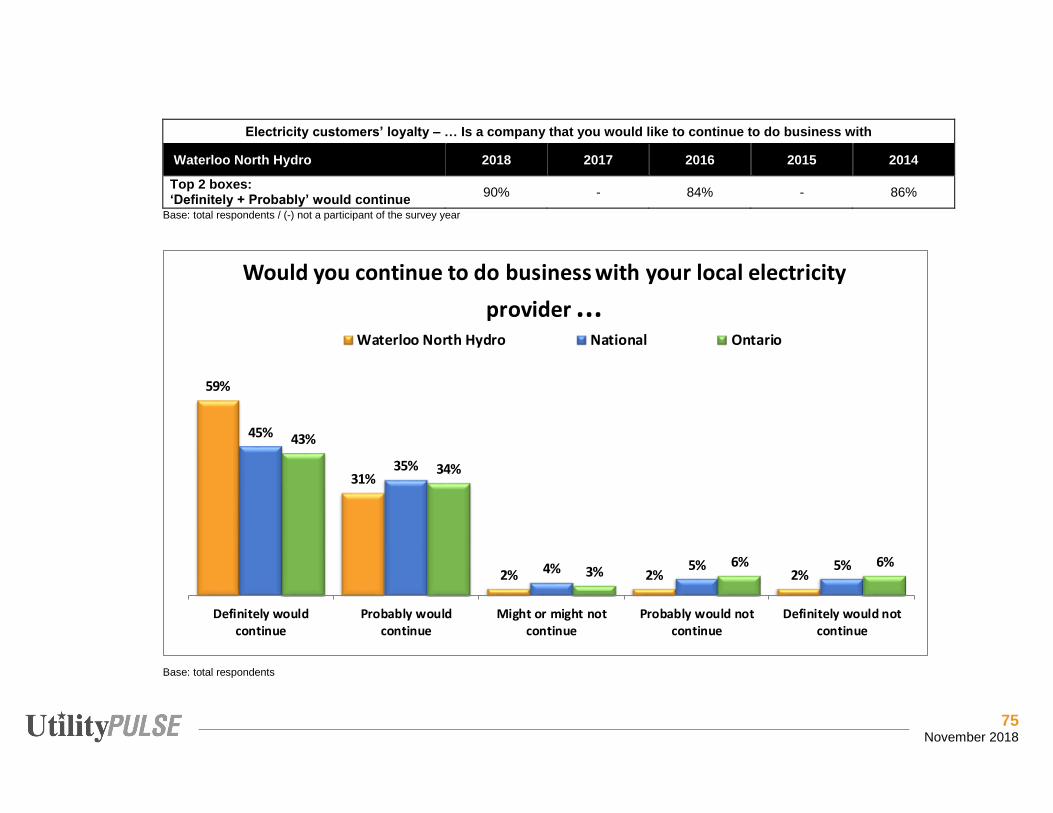
75 November 2018
Electricity customers’ loyalty – … Is a company that you would like to continue to do business with
Waterloo North Hydro 2018 2017 2016 2015 2014
Top 2 boxes: ‘Definitely + Probably’ would continue 90% - 84% - 86%
Base: total respondents / (-) not a participant of the survey year
Base: total respondents
59%
31%
2% 2% 2%
45%
35%
4% 5% 5%
43%
34%
3%6% 6%
Definitely wouldcontinue
Probably wouldcontinue
Might or might notcontinue
Probably would notcontinue
Definitely would notcontinue
Would you continue to do business with your local electricity
provider ...Waterloo North Hydro National Ontario
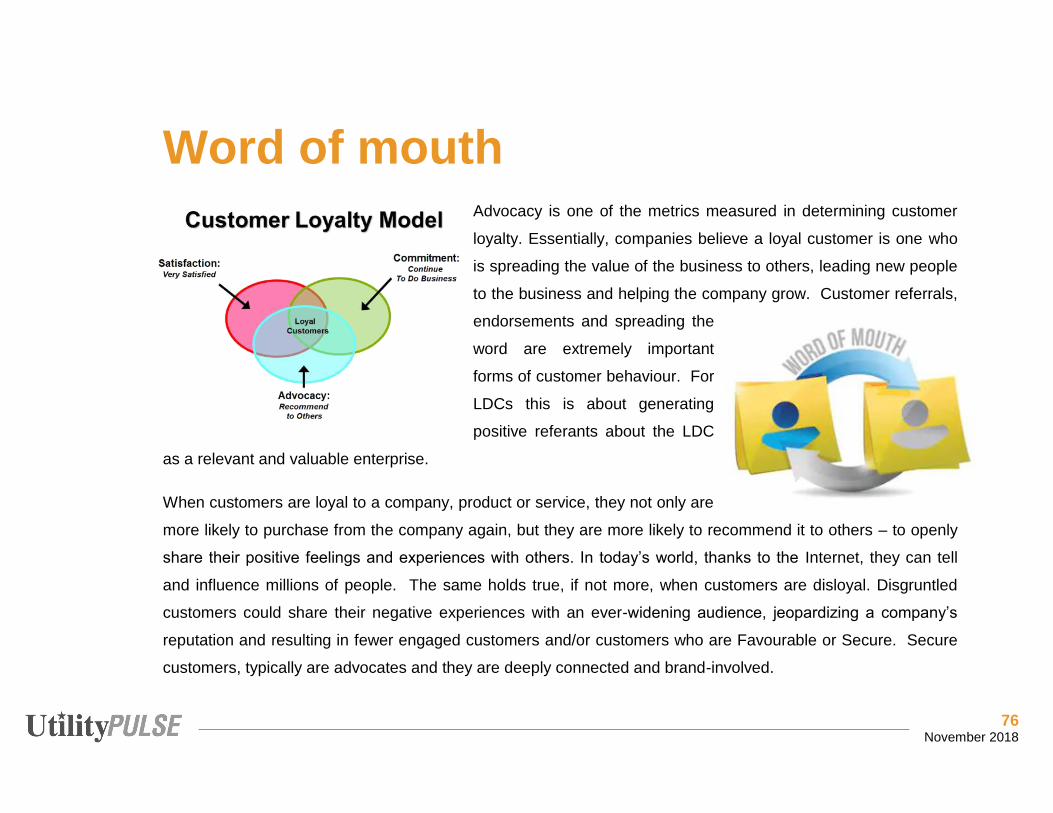
76 November 2018
Word of mouth Advocacy is one of the metrics measured in determining customer
loyalty. Essentially, companies believe a loyal customer is one who
is spreading the value of the business to others, leading new people
to the business and helping the company grow. Customer referrals,
endorsements and spreading the
word are extremely important
forms of customer behaviour. For
LDCs this is about generating
positive referants about the LDC
as a relevant and valuable enterprise.
When customers are loyal to a company, product or service, they not only are
more likely to purchase from the company again, but they are more likely to recommend it to others – to openly
share their positive feelings and experiences with others. In today’s world, thanks to the Internet, they can tell
and influence millions of people. The same holds true, if not more, when customers are disloyal. Disgruntled
customers could share their negative experiences with an ever-widening audience, jeopardizing a company’s
reputation and resulting in fewer engaged customers and/or customers who are Favourable or Secure. Secure
customers, typically are advocates and they are deeply connected and brand-involved.
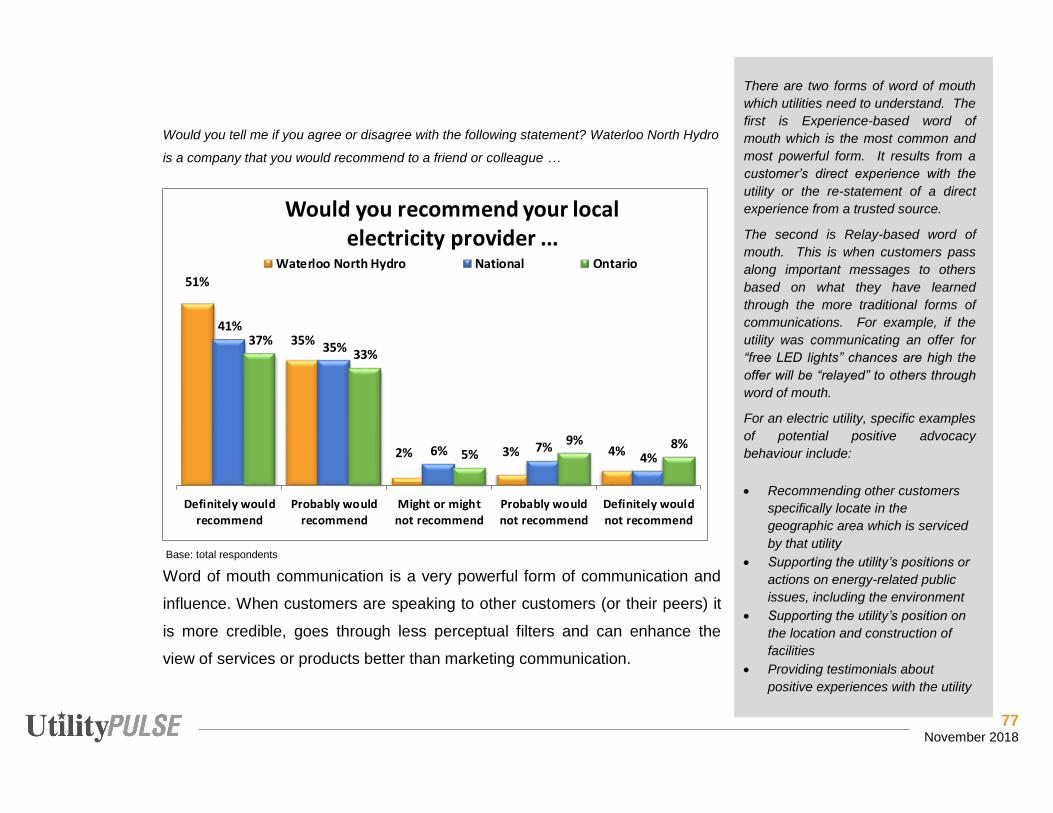
77 November 2018
There are two forms of word of mouth
which utilities need to understand. The
first is Experience-based word of
mouth which is the most common and
most powerful form. It results from a
customer’s direct experience with the
utility or the re-statement of a direct
experience from a trusted source.
The second is Relay-based word of
mouth. This is when customers pass
along important messages to others
based on what they have learned
through the more traditional forms of
communications. For example, if the
utility was communicating an offer for
“free LED lights” chances are high the
offer will be “relayed” to others through
word of mouth.
For an electric utility, specific examples
of potential positive advocacy
behaviour include:
• Recommending other customers
specifically locate in the
geographic area which is serviced
by that utility
• Supporting the utility’s positions or
actions on energy-related public
issues, including the environment
• Supporting the utility’s position on
the location and construction of
facilities
• Providing testimonials about
positive experiences with the utility
Would you tell me if you agree or disagree with the following statement? Waterloo North Hydro
is a company that you would recommend to a friend or colleague …
Base: total respondents Word of mouth communication is a very powerful form of communication and
influence. When customers are speaking to other customers (or their peers) it
is more credible, goes through less perceptual filters and can enhance the
view of services or products better than marketing communication.
51%
35%
2% 3% 4%
41%
35%
6% 7%4%
37%33%
5%9% 8%
Definitely would
recommend
Probably would
recommend
Might or might
not recommend
Probably would
not recommend
Definitely would
not recommend
Would you recommend your local electricity provider ...
Waterloo North Hydro National Ontario
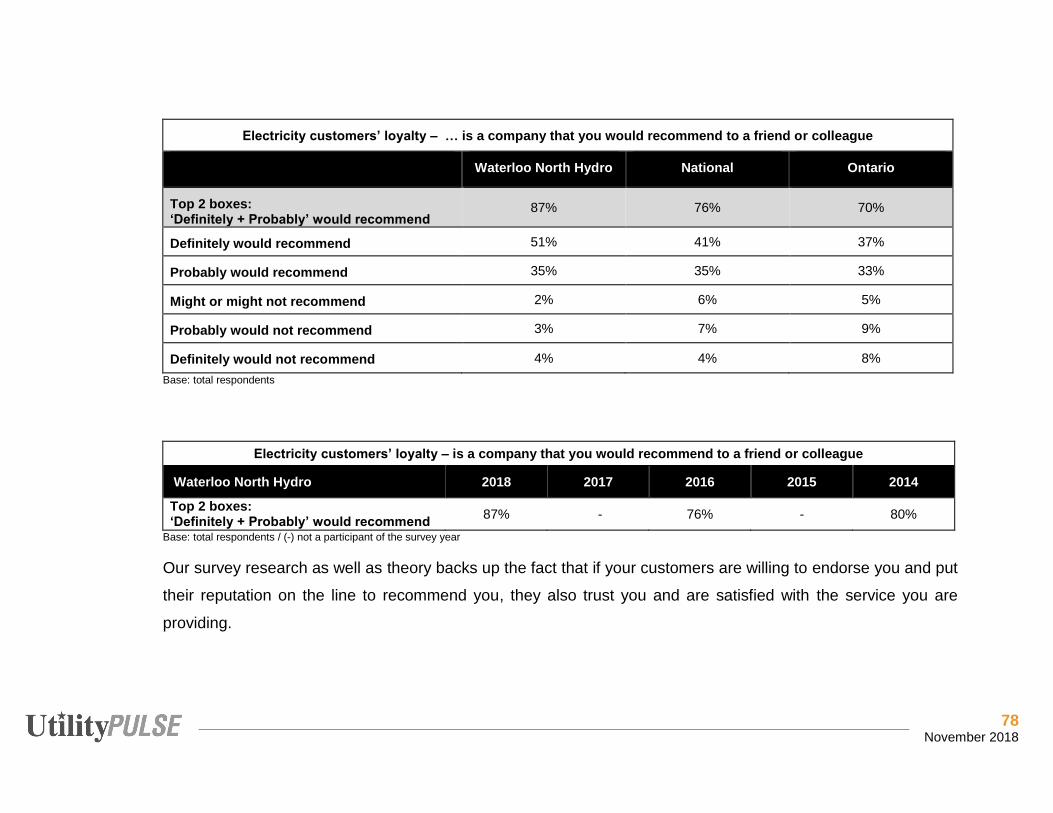
78 November 2018
Electricity customers’ loyalty – … is a company that you would recommend to a friend or colleague
Waterloo North Hydro National Ontario
Top 2 boxes: ‘Definitely + Probably’ would recommend
87% 76% 70%
Definitely would recommend 51% 41% 37%
Probably would recommend 35% 35% 33%
Might or might not recommend 2% 6% 5%
Probably would not recommend 3% 7% 9%
Definitely would not recommend 4% 4% 8% Base: total respondents
Electricity customers’ loyalty – is a company that you would recommend to a friend or colleague
Waterloo North Hydro 2018 2017 2016 2015 2014
Top 2 boxes: ‘Definitely + Probably’ would recommend 87% - 76% - 80%
Base: total respondents / (-) not a participant of the survey year Our survey research as well as theory backs up the fact that if your customers are willing to endorse you and put
their reputation on the line to recommend you, they also trust you and are satisfied with the service you are
providing.

79 November 2018
Corporate image Although reputation is an intangible concept, a strong corporate image makes it easier to capture the attention of
more customers – more often. Also, to be seen as an independent organization thereby making it easier to
introduce new ideas. Employees appreciate a strong corporate image.
Attributes measured in the annual UtilityPULSE survey which are strongly linked to a utility’s image include:
Marketing – Communications
Waterloo North Hydro National Ontario
Topics which require more pro-active communication
Cost of electricity is reasonable when compared to other utilities 70% 66% 61%
Provides good value for money 79% 72% 71%
Operates a cost-effective electricity distribution system 78% 70% 71%
Provides information to help customers reduce their costs 80% 78% 78%
Adapts well to changes in customer expectations 79% 73% 72%
Topics that your utility scores very well on
Delivers on its service commitments 90% 86% 86%
Electricity safety is a top priority 87% 87% 86%
Quickly handles outages and restores power 94% 87% 86%
Standard of reliability delivering electricity that meets expectations 92% 88% 88%
Provides consistent, reliable energy 94% 89% 90% Base: total respondents with an opinion

80 November 2018
Corporate Credibility & Trust
Credibility is a judgment, customers and others make about whether a person or an organization has the
competencies and experience to do what they promise to do. Trust, is a feeling or belief, that a person or an
organization they are dealing with is doing so in an honest, open manner with no hidden agendas. How
customers and other stakeholders respond to your communications is affected by the person’s perception.
Without credibility and trust, everything you say to customers, employees, and others can be questioned.
Of paramount importance to maintaining credibility & trust is effectively managing expectations—customers,
employees and other stakeholders that matter to the business of the LDC. A key to this is open and honest
communications. An important benefit of having a high degree of credibility & trust is, authentic collaboration
can become a reality. Credibility & trust is a powerful currency for building relationships. Credibility & trust are
outcomes based on what the LDC actually does, not what it might be doing.
Attributes strongly linked to Credibility & Trust
Waterloo North Hydro National Ontario
Overall the utility provides excellent quality services 89% 85% 86%
Keeps its promises to customers and the community 85% 79% 80%
Customer-focused and treats customers as if they’re valued 83% 80% 79%
Is a trusted and trustworthy company 89% 83% 82%
Base: total respondents with an opinion
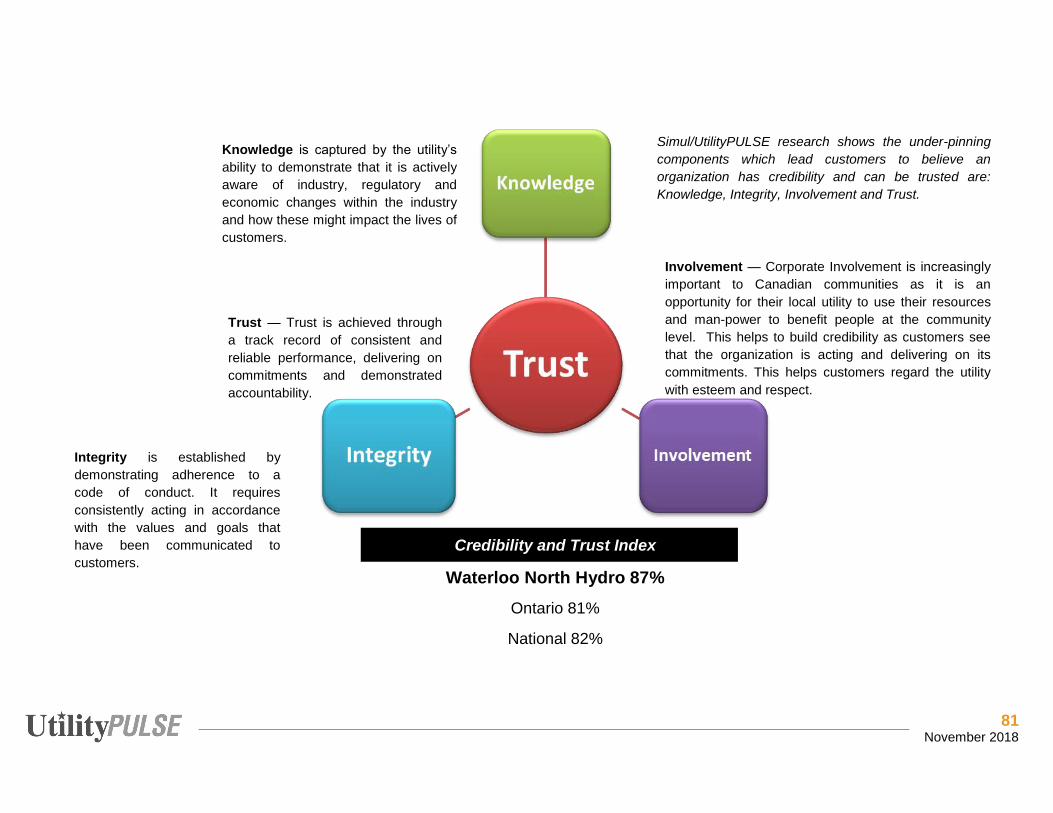
81 November 2018
Credibility and Trust Index
Waterloo North Hydro 87%
Ontario 81%
National 82%
Knowledge is captured by the utility’s
ability to demonstrate that it is actively aware of industry, regulatory and economic changes within the industry and how these might impact the lives of customers.
Simul/UtilityPULSE research shows the under-pinning
components which lead customers to believe an
organization has credibility and can be trusted are:
Knowledge, Integrity, Involvement and Trust.
Integrity is established by demonstrating adherence to a code of conduct. It requires consistently acting in accordance with the values and goals that have been communicated to customers.
Involvement — Corporate Involvement is increasingly important to Canadian communities as it is an opportunity for their local utility to use their resources and man-power to benefit people at the community level. This helps to build credibility as customers see that the organization is acting and delivering on its commitments. This helps customers regard the utility with esteem and respect.
Trust — Trust is achieved through a track record of consistent and reliable performance, delivering on commitments and demonstrated accountability.
82 November 2018
How can service to customers be improved? The electric utility industry is in a state of continuous transformation. External factors - including shifts in governmental policies, a global thrust to conserve energy, advances in new technologies and power generation are driving massive changes throughout the industry. LDCs of today and the future can also expect a much more intense level of customer involvement. UtilityPULSE research shows customers want to be heard. Despite all the talk today centered on quality, new processes and systems, continuous improvement, and costs, unless all of this is aimed at obtaining customer satisfaction it will not be worth much over the longer term.
Qualitative questions typically do not provide the statistical richness which is associated with a quantitative
question. However, they do provide words, phrases, insights into the thinking patterns and/or feelings of
customers. This means qualitative questions have an interpretive richness that assists in deriving meaning from
the survey. The broader range of suggestions we are getting when conducting the survey is a sign the customer
base is becoming more and more segmented. Not all customers are the same.
The struggle for electric utilities is finding the right balance between cost-effective, technology-enabled
approaches to customer services and person-to-person contact.
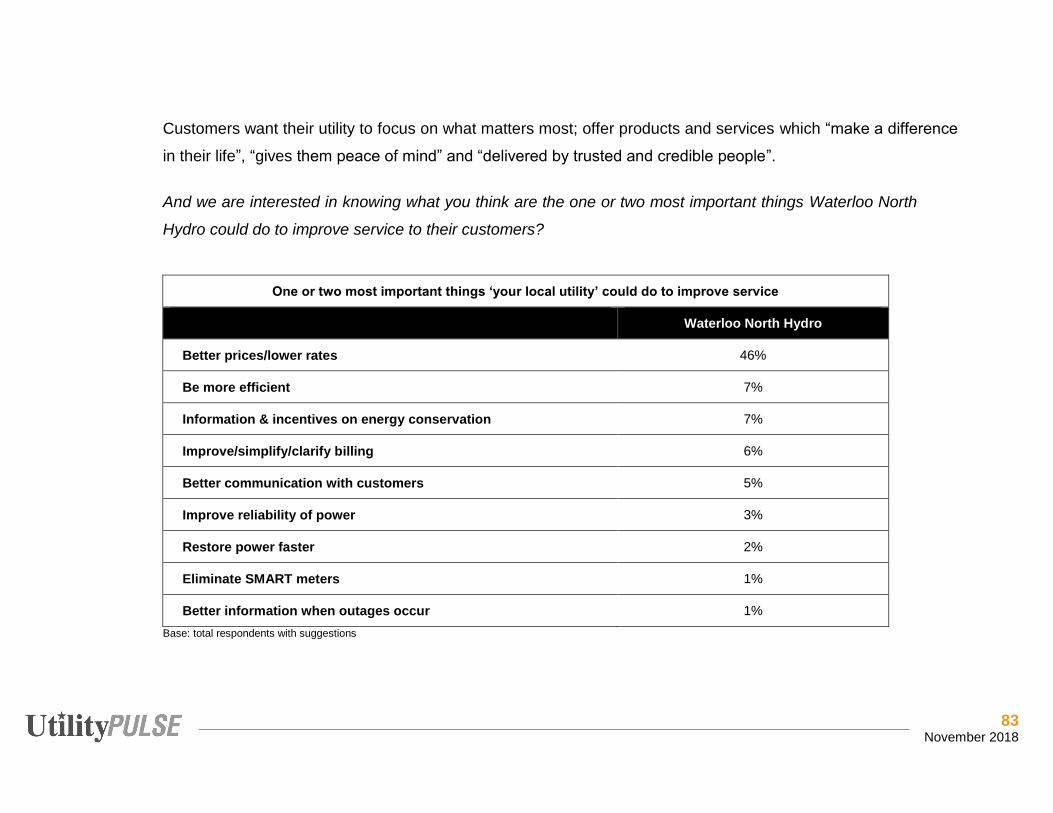
83 November 2018
Customers want their utility to focus on what matters most; offer products and services which “make a difference
in their life”, “gives them peace of mind” and “delivered by trusted and credible people”.
And we are interested in knowing what you think are the one or two most important things Waterloo North
Hydro could do to improve service to their customers?
One or two most important things ‘your local utility’ could do to improve service
Waterloo North Hydro
Better prices/lower rates 46%
Be more efficient 7%
Information & incentives on energy conservation 7%
Improve/simplify/clarify billing 6%
Better communication with customers 5%
Improve reliability of power 3%
Restore power faster 2%
Eliminate SMART meters 1%
Better information when outages occur 1% Base: total respondents with suggestions

84 November 2018
What do customers think about electricity costs? At the height of the ‘anger’ stage for many customers, the UtilityPULSE database showed 31% of survey
respondents said they sometimes worried about paying their bill. Customers felt they were paying more but not
getting more, especially disconcerting when wages and inflation were hovering around the 2% mark. Five years
earlier that number was 21%. The 2017 25% reduction in costs, coupled with a promise to further reduce the
cost and a better economy has helped to move the number back to 21% in Ontario. This is a huge change.
Next, I am going to read a number of statements people might use about paying for their electricity. Which one
comes closest to your own feelings, even if none is exactly right? Paying for electricity is not really a worry,
Sometimes I worry about finding the money to pay for electricity, or Paying for electricity is often a major
problem?
Is paying for electricity a worry or a major problem?
Not a worry Sometimes Often Depends
Waterloo North Hydro 78% 14% 5% 1%
National 71% 18% 7% 0%
Ontario 68% 21% 8% 1% Base: total respondents
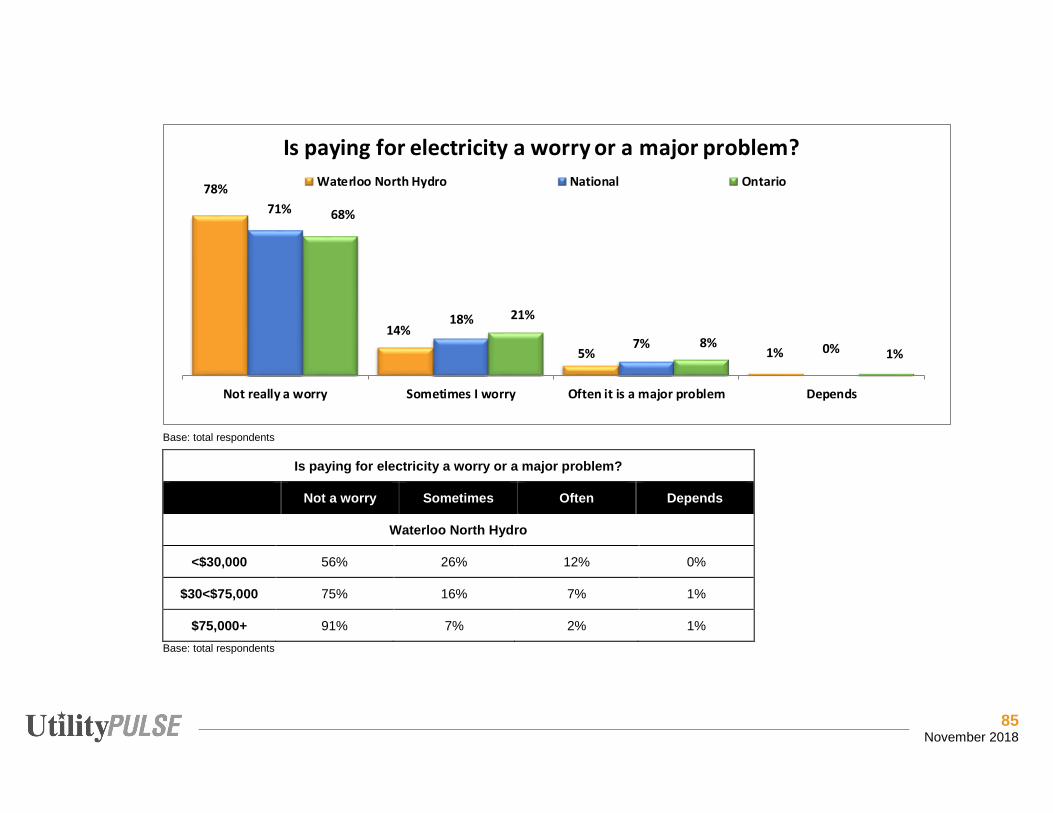
85 November 2018
Base: total respondents
Is paying for electricity a worry or a major problem?
Not a worry Sometimes Often Depends
Waterloo North Hydro
<$30,000 56% 26% 12% 0%
$30<$75,000 75% 16% 7% 1%
$75,000+ 91% 7% 2% 1% Base: total respondents
78%
14%
5% 1%
71%
18%
7% 0%
68%
21%
8%1%
Not really a worry Sometimes I worry Often it is a major problem Depends
Is paying for electricity a worry or a major problem?
Waterloo North Hydro National Ontario
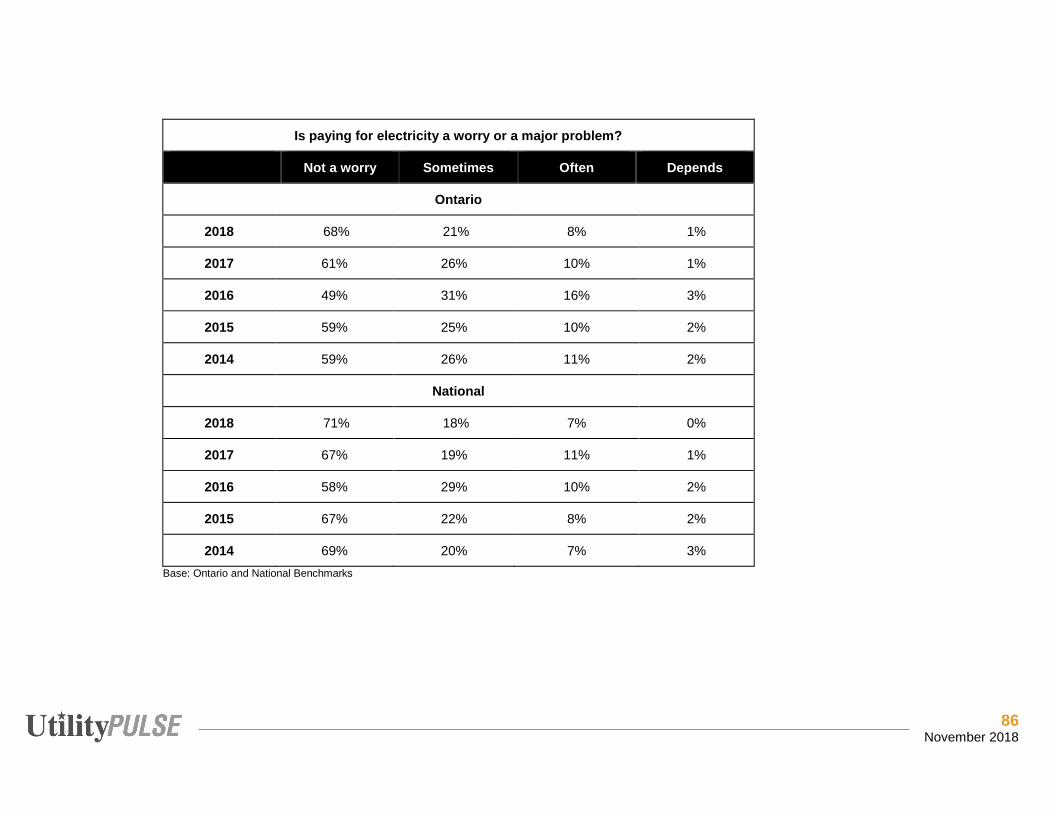
86 November 2018
Is paying for electricity a worry or a major problem?
Not a worry Sometimes Often Depends
Ontario
2018 68% 21% 8% 1%
2017 61% 26% 10% 1%
2016 49% 31% 16% 3%
2015 59% 25% 10% 2%
2014 59% 26% 11% 2%
National
2018 71% 18% 7% 0%
2017 67% 19% 11% 1%
2016 58% 29% 10% 2%
2015 67% 22% 8% 2%
2014 69% 20% 7% 3% Base: Ontario and National Benchmarks

87 November 2018
What do small commercial customers think? Based on data in the UtilityPULSE database, small commercial customers have
relatively similar views about their utility. The tables associated with this report
will contain your specific information as it relates to residential and commercial
customers. A word of caution, smaller data samples create greater swings or
spreads in the data, hence mitigating the effect of a small data sample by using
the UP database.
An area of concern is about the LDC’s ability to “target” its communications to the type of business. Beyond
having a contact telephone number, company name and address there isn’t much “knowledge” about the small
commercial customer. In a time when “targeted” communication is important, knowing the type of category of
Small Commercial Customer (General Service < 50kW Demand) A small commercial customer is defined by the OEB as a non-residential customer in a less than 50 kW demand rate class. These customers are similar to the residential customer in that their bill does not have a demand component to it and their charges are based upon KWH of consumption. Most of these customers would occupy small storefront locations or offices
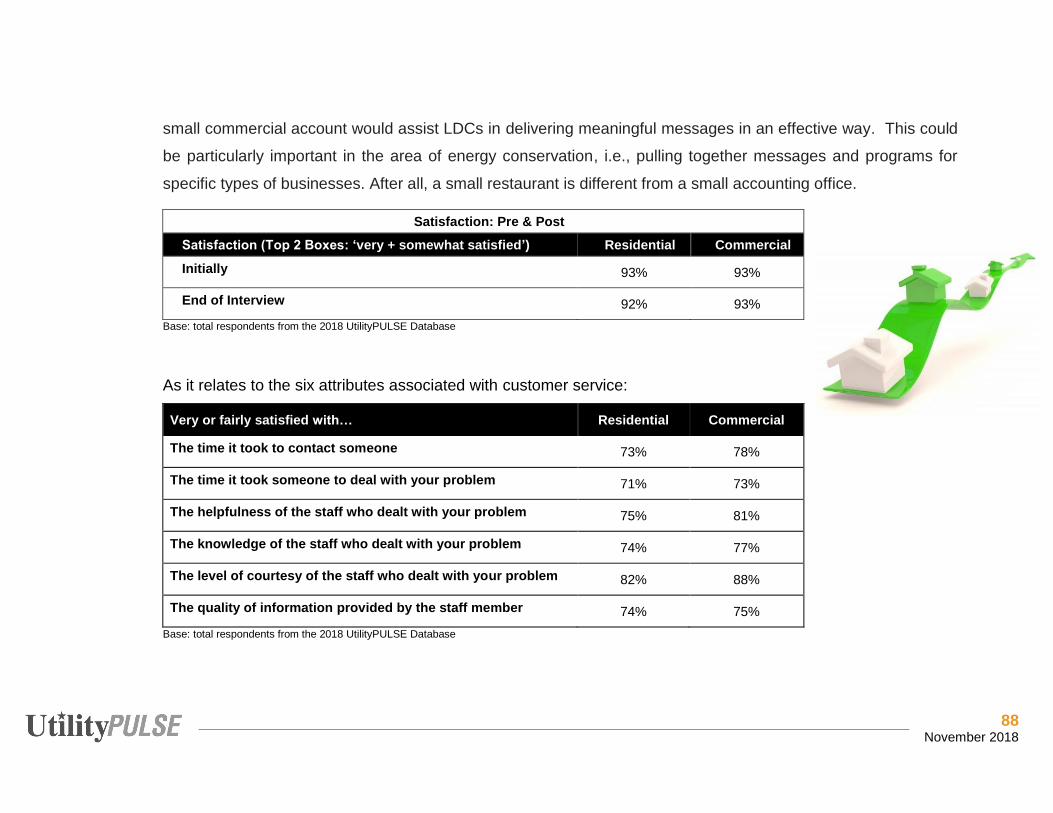
88 November 2018
small commercial account would assist LDCs in delivering meaningful messages in an effective way. This could
be particularly important in the area of energy conservation, i.e., pulling together messages and programs for
specific types of businesses. After all, a small restaurant is different from a small accounting office.
Satisfaction: Pre & Post Satisfaction (Top 2 Boxes: ‘very + somewhat satisfied’) Residential Commercial Initially 93% 93%
End of Interview 92% 93% Base: total respondents from the 2018 UtilityPULSE Database
As it relates to the six attributes associated with customer service:
Very or fairly satisfied with… Residential Commercial
The time it took to contact someone 73% 78%
The time it took someone to deal with your problem 71% 73%
The helpfulness of the staff who dealt with your problem 75% 81%
The knowledge of the staff who dealt with your problem 74% 77%
The level of courtesy of the staff who dealt with your problem 82% 88%
The quality of information provided by the staff member 74% 75% Base: total respondents from the 2018 UtilityPULSE Database
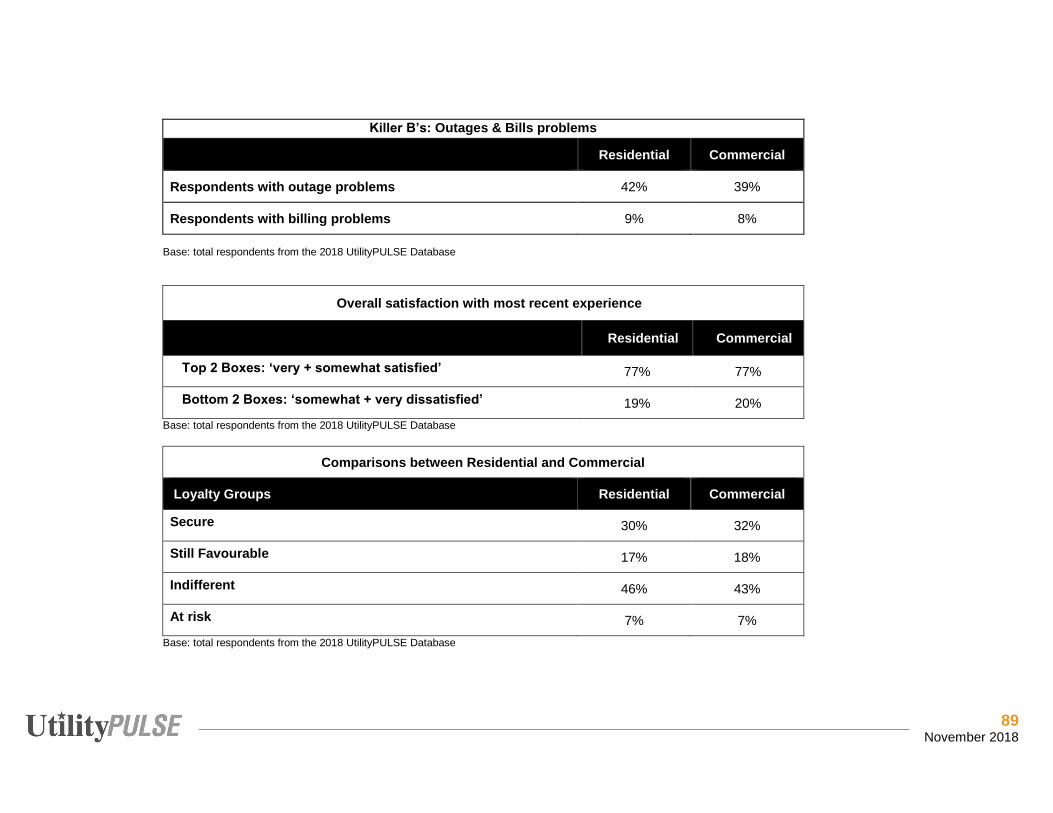
89 November 2018
Killer B’s: Outages & Bills problems
Residential Commercial
Respondents with outage problems 42% 39%
Respondents with billing problems 9% 8% Base: total respondents from the 2018 UtilityPULSE Database
Overall satisfaction with most recent experience
Residential Commercial
Top 2 Boxes: ‘very + somewhat satisfied’ 77% 77%
Bottom 2 Boxes: ‘somewhat + very dissatisfied’ 19% 20% Base: total respondents from the 2018 UtilityPULSE Database
Comparisons between Residential and Commercial
Loyalty Groups Residential Commercial
Secure 30% 32%
Still Favourable 17% 18%
Indifferent 46% 43%
At risk 7% 7% Base: total respondents from the 2018 UtilityPULSE Database
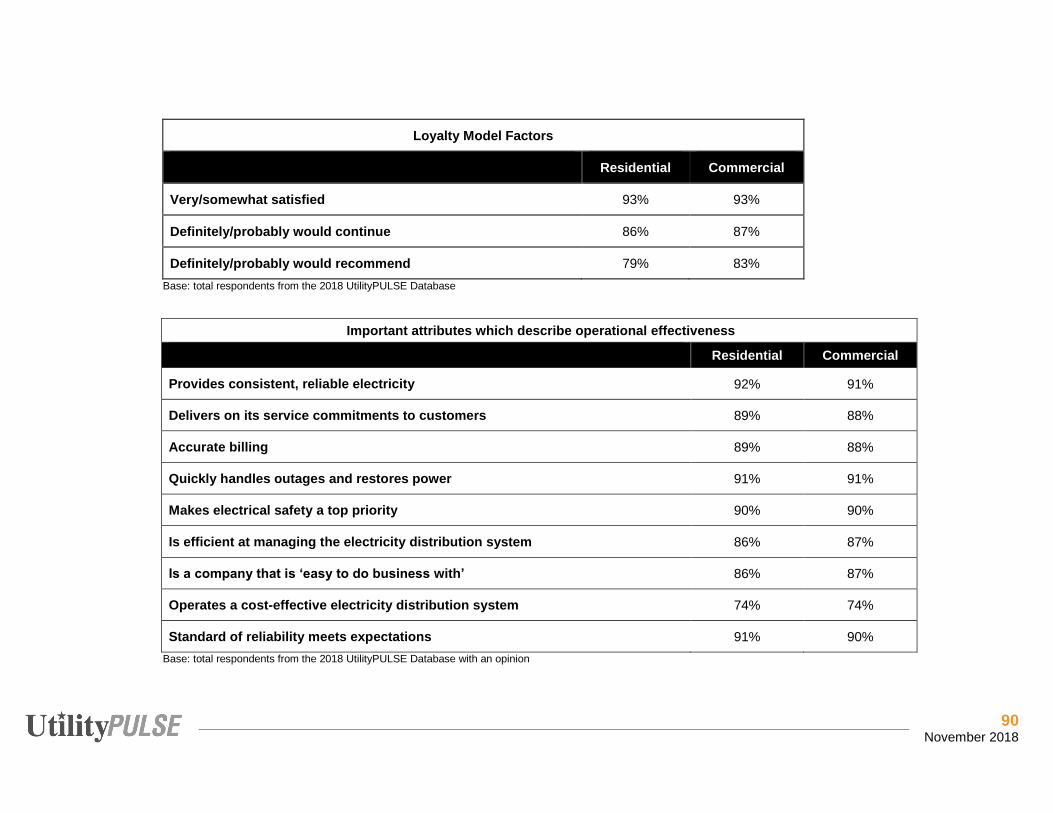
90 November 2018
Loyalty Model Factors
Residential Commercial
Very/somewhat satisfied 93% 93%
Definitely/probably would continue 86% 87%
Definitely/probably would recommend 79% 83% Base: total respondents from the 2018 UtilityPULSE Database
Important attributes which describe operational effectiveness
Residential Commercial
Provides consistent, reliable electricity 92% 91%
Delivers on its service commitments to customers 89% 88%
Accurate billing 89% 88%
Quickly handles outages and restores power 91% 91%
Makes electrical safety a top priority 90% 90%
Is efficient at managing the electricity distribution system 86% 87%
Is a company that is ‘easy to do business with’ 86% 87%
Operates a cost-effective electricity distribution system 74% 74%
Standard of reliability meets expectations 91% 90% Base: total respondents from the 2018 UtilityPULSE Database with an opinion
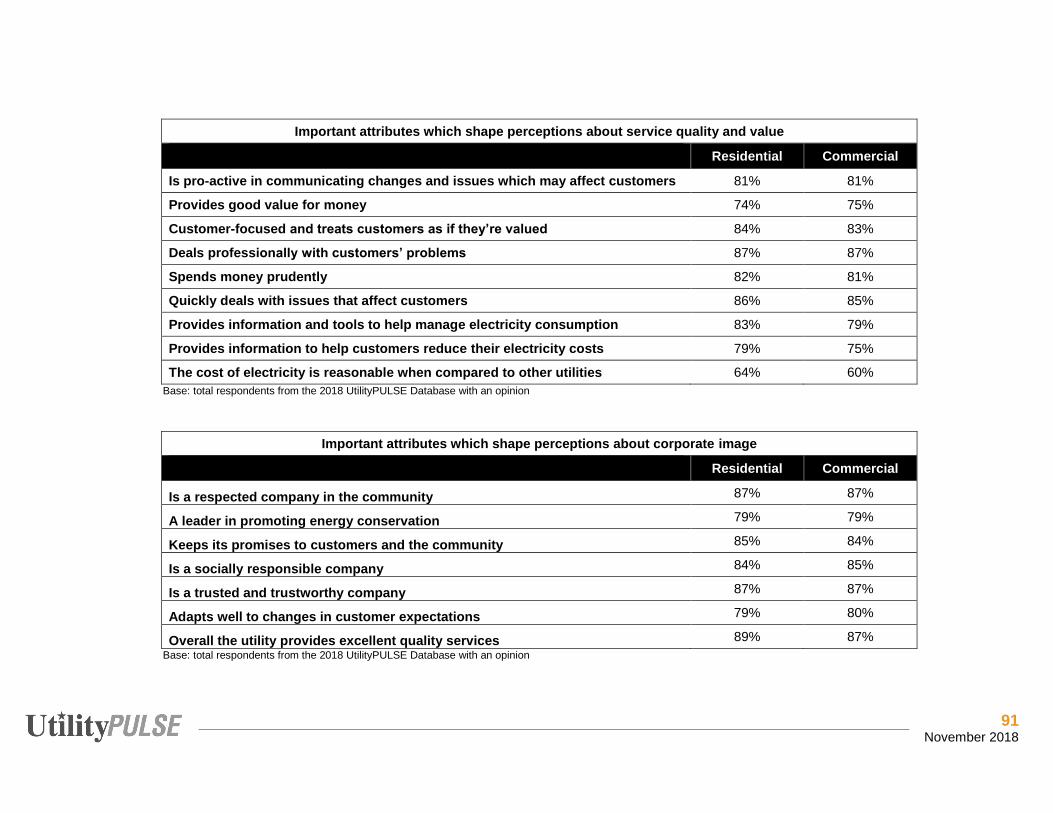
91 November 2018
Important attributes which shape perceptions about service quality and value
Residential Commercial
Is pro-active in communicating changes and issues which may affect customers 81% 81%
Provides good value for money 74% 75%
Customer-focused and treats customers as if they’re valued 84% 83%
Deals professionally with customers’ problems 87% 87%
Spends money prudently 82% 81%
Quickly deals with issues that affect customers 86% 85%
Provides information and tools to help manage electricity consumption 83% 79%
Provides information to help customers reduce their electricity costs 79% 75%
The cost of electricity is reasonable when compared to other utilities 64% 60% Base: total respondents from the 2018 UtilityPULSE Database with an opinion
Important attributes which shape perceptions about corporate image
Residential Commercial
Is a respected company in the community 87% 87%
A leader in promoting energy conservation 79% 79%
Keeps its promises to customers and the community 85% 84%
Is a socially responsible company 84% 85%
Is a trusted and trustworthy company 87% 87%
Adapts well to changes in customer expectations 79% 80%
Overall the utility provides excellent quality services 89% 87% Base: total respondents from the 2018 UtilityPULSE Database with an opinion
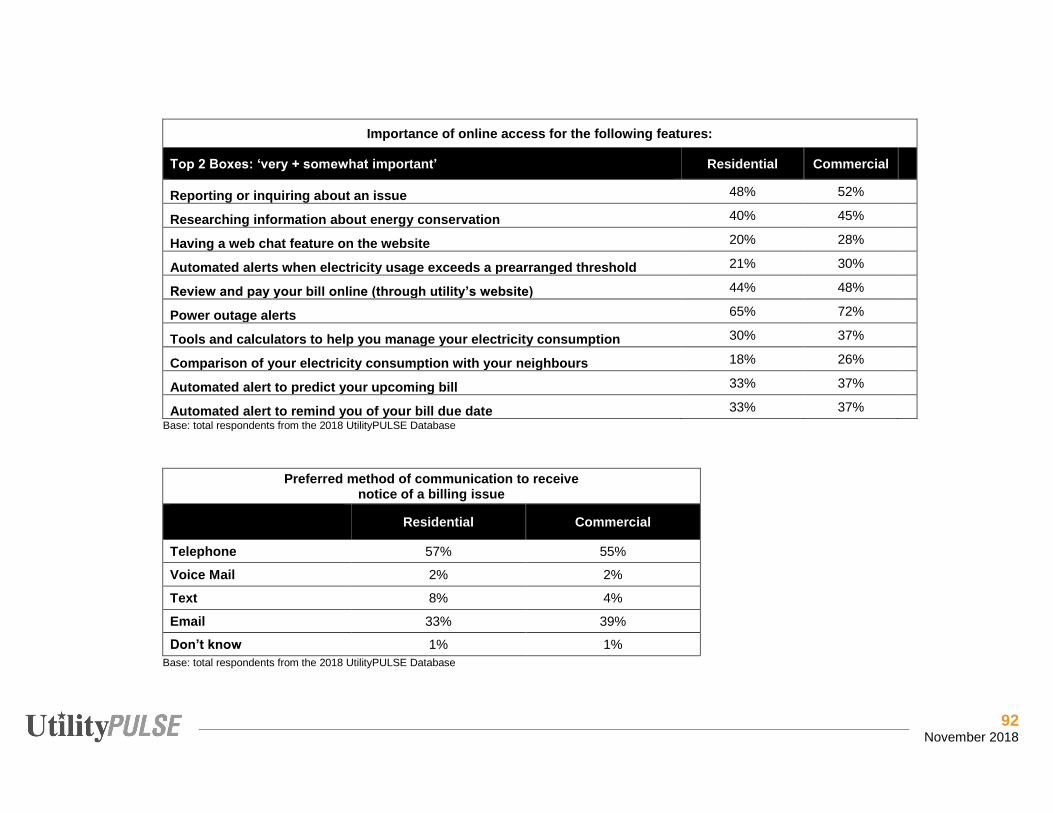
92 November 2018
Importance of online access for the following features:
Top 2 Boxes: ‘very + somewhat important’ Residential Commercial
Reporting or inquiring about an issue 48% 52%
Researching information about energy conservation 40% 45%
Having a web chat feature on the website 20% 28%
Automated alerts when electricity usage exceeds a prearranged threshold 21% 30%
Review and pay your bill online (through utility’s website) 44% 48%
Power outage alerts 65% 72%
Tools and calculators to help you manage your electricity consumption 30% 37%
Comparison of your electricity consumption with your neighbours 18% 26%
Automated alert to predict your upcoming bill 33% 37%
Automated alert to remind you of your bill due date 33% 37% Base: total respondents from the 2018 UtilityPULSE Database
Preferred method of communication to receive notice of a billing issue
Residential Commercial
Telephone 57% 55%
Voice Mail 2% 2%
Text 8% 4%
Email 33% 39%
Don’t know 1% 1% Base: total respondents from the 2018 UtilityPULSE Database
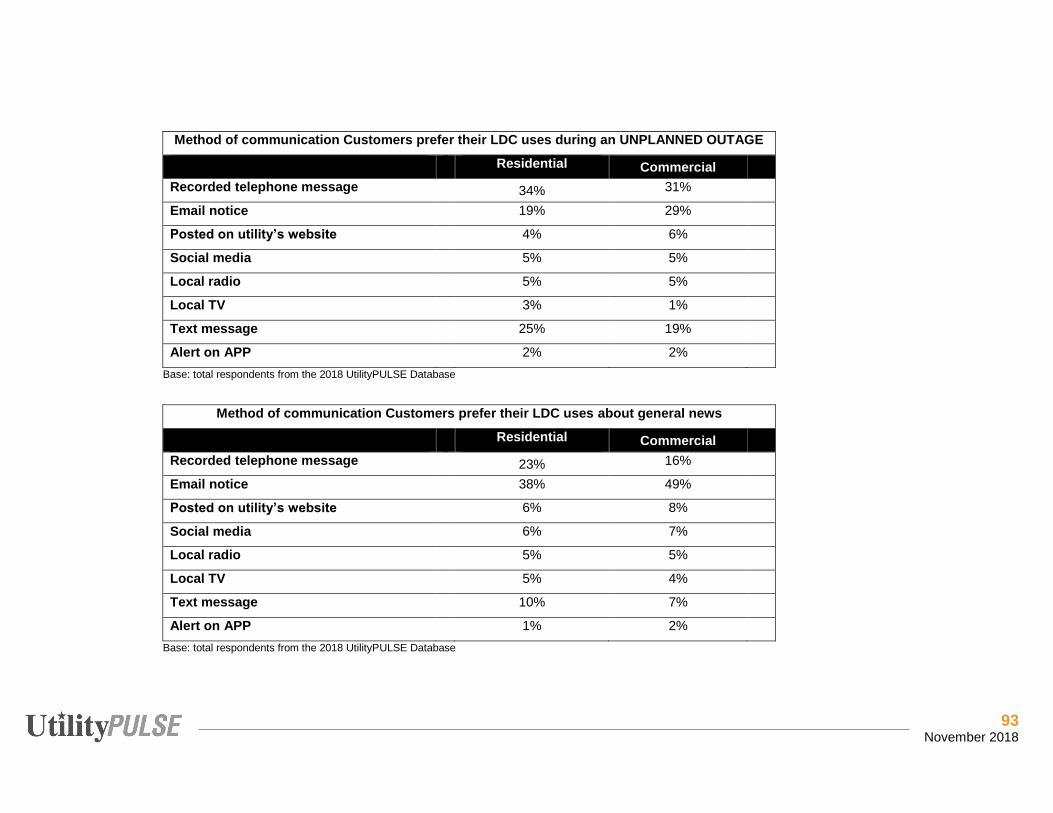
93 November 2018
Method of communication Customers prefer their LDC uses during an UNPLANNED OUTAGE Residential Commercial Recorded telephone message 34% 31% Email notice 19% 29% Posted on utility’s website 4% 6% Social media 5% 5% Local radio 5% 5% Local TV 3% 1% Text message 25% 19% Alert on APP 2% 2%
Base: total respondents from the 2018 UtilityPULSE Database
Method of communication Customers prefer their LDC uses about general news Residential Commercial Recorded telephone message 23% 16% Email notice 38% 49% Posted on utility’s website 6% 8% Social media 6% 7% Local radio 5% 5% Local TV 5% 4% Text message 10% 7% Alert on APP 1% 2%
Base: total respondents from the 2018 UtilityPULSE Database
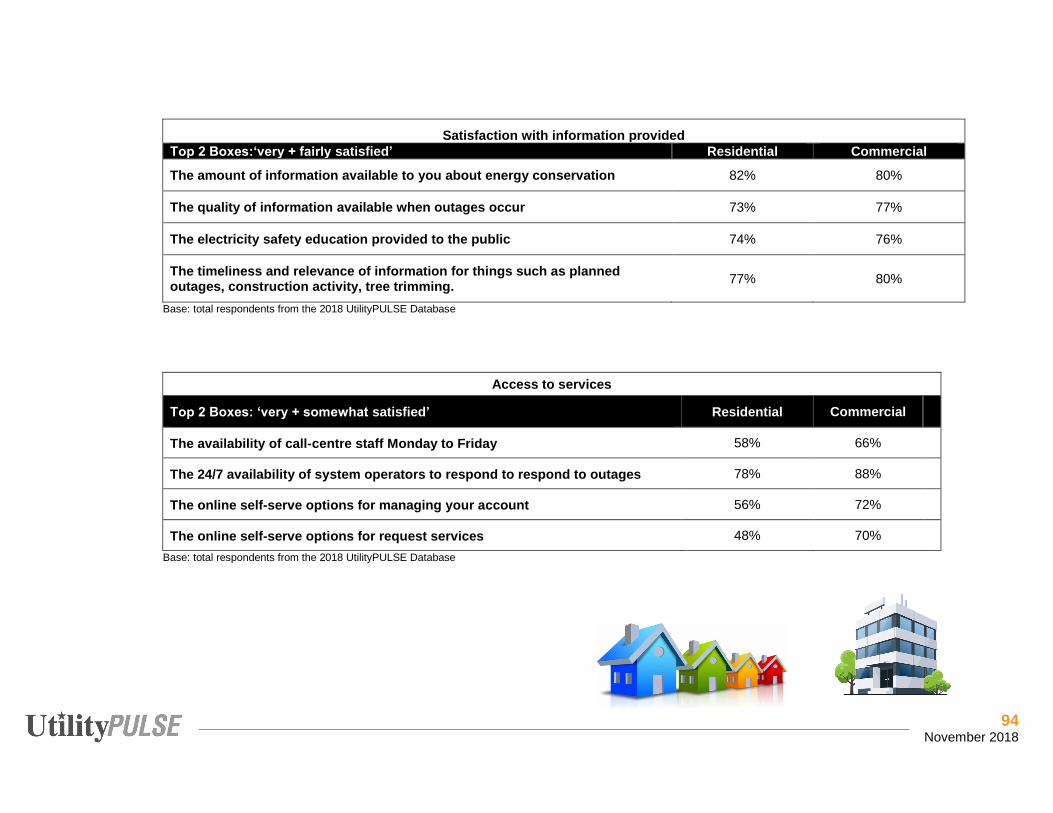
94 November 2018
Satisfaction with information provided Top 2 Boxes:‘very + fairly satisfied’ Residential Commercial
The amount of information available to you about energy conservation 82% 80%
The quality of information available when outages occur 73% 77%
The electricity safety education provided to the public 74% 76%
The timeliness and relevance of information for things such as planned outages, construction activity, tree trimming. 77% 80%
Base: total respondents from the 2018 UtilityPULSE Database
Access to services
Top 2 Boxes: ‘very + somewhat satisfied’ Residential Commercial
The availability of call-centre staff Monday to Friday 58% 66%
The 24/7 availability of system operators to respond to respond to outages 78% 88%
The online self-serve options for managing your account 56% 72%
The online self-serve options for request services 48% 70% Base: total respondents from the 2018 UtilityPULSE Database
95 November 2018
Method The findings in this report are based on telephone interviews
conducted for Simul Corp. / UtilityPULSE by Logit Group
between September 17 - October 17, 2018, with 403
respondents who pay or look after the electricity bills from a
list of residential and small and medium-sized business
customers supplied by Waterloo North Hydro.
The sample of phone numbers chosen was drawn randomly
to ensure each business or residential phone number on the
list had an equal chance of being included in the poll.
The sample was stratified so that 85% of the interviews were
conducted with residential customers and 15% with
commercial customers.
In sampling theory, in 19 cases out of 20 (95% of polls in
other words), the results based on a random sample of 403
residential and commercial customers will differ by no more
than ±4.90 percentage points where opinion is evenly split.
This means you can be 95% certain that the survey results
do not vary by more than 4.90 percentage points in either
direction from results that would have been obtained by
interviewing all Waterloo North Hydro residential and small
and medium-sized commercial customers if the ratio of
residential to commercial customers is 85%:15%.
The margin of error for the sub-samples is larger. To see the
error margin for subgroups, use the calculator at
http://www.surveysystem.com/sscalc.htm.
Interviewers reached 2,662 households and businesses
from the customer list supplied by Waterloo North Hydro.
The 403 who completed the interview represent a 15%
response rate.
The findings for the Simul/UtilityPULSE National Benchmark
of Electric Utility Customers are based on telephone
interviews conducted with adults throughout the country who
are responsible for paying electric utility bills. The ratio of
85% residential customers and 15% small and medium-
sized business customers in the National study reflects the
ratios used in the local community surveys. The margin of
error in the National poll is ±2.95 percentage points at the
95% confidence level.
For the National study, the sample of phone numbers
chosen was drawn by recognized probability sampling
methods to ensure each region of the country was
96 November 2018
represented in proportion to its population and by a method
that gave all residential telephone numbers, both listed and
unlisted, an equal chance of being included in the poll.
The data were weighted in each region of the country to
match the regional shares of the population.
The margin of error refers only to sampling error; other non-
random forms of error may be present. Even in true random
samples, precision can be compromised by other factors,
such as the wording of questions or the order in which
questions were asked.
Random samples of any size have some degree of
precision. A larger sample is not always better than a
smaller sample. The important rule in sampling is not how
many respondents are selected but how they are selected. A
reliable sample selects poll respondents randomly or in a
manner which ensures that everyone in the population being
surveyed has an equal chance of being selected.
How can a sample of only several hundred truly reflect the
opinions of thousands or millions of electricity customers
within a few percentage points?
Measures of sample reliability are derived from the science
of statistics. At the root of statistical reliability is probability,
the odds of obtaining a particular outcome by chance alone.
For example, the chances of having a coin come up heads
in a single toss are 50%. A head is one of only two possible
outcomes.
The chance of getting two heads in two coin tosses is less
because two heads are only one of four possible outcomes:
a head/head, head/tail, tail/head and tail/tail.
But as the number of coin tosses increases, it becomes
increasingly more likely to get outcomes that are either close
to or exactly half heads and half tails because there are
more ways to get such outcomes. Sample survey reliability
works the same way but on a much larger scale.
As in coin tosses, the most likely sample outcome is the true
percentage of whatever we are measuring across the total
customer base or population surveyed. Next most likely are
outcomes very close to this true percentage. A statement of
the potential margin of error or sample precision reflects this.
Some pages in the computer tables also show the standard
deviation (S.D.) and the standard error of the estimate (S.E.)
for the findings. The standard deviation embraces the range
where 68% (or approximately two-thirds) of the respondents
would fall if the distribution of answers were a normal bell-
shaped curve. The spread of responses is a way of showing
how much the result deviates from the "standard mean" or
97 November 2018
average. In the Waterloo North Hydro data on corporate
image, Simul converted the answers to a point scale with 4
meaning agree strongly, 3 meaning agree somewhat and so
on (see in the computer tables).
For example, the mean score is 3.74 for providing
consistent, reliable electricity. The average is 3.20 for
providing information to help customers reduce their energy
costs.
For reliable electricity, the standard deviation is 0.49. For
providing information to help customers reduce their energy
costs, the S.D. is 0.86. These findings mean there is a wider
range of opinion – meaning less consensus – about whether
help to reduce energy costs than about whether Waterloo
North Hydro energy supplies are reliable.
Beneath the S.D. in the tables is the standard error of the
estimate. The S.E. is a measure of confidence or reliability,
roughly equivalent to the error margin cited for sample sizes.
The S.E. measures how far off the sample’s results are from
the standard deviation. The smaller the S.E., the greater the
reliability of the data.
In other words, a low S.E. indicates the answers given by
respondents in a certain group (such as residential bill
payers or women) do not differ much from the probable
spread of the answers "predicted" in sampling and
probability theory.
In certain instances, all of the sub-datasets from the entire
UtilityPULSE database for 2018 were concatenated in order
to use the average of all the control samples for comparison.
The cumulated population base for these questions was in
excess of 9,000.
Copyright 2018 Simul/UtilityPULSE. All rights reserved.
Brand, logos and product names referred to in this document
are the trademarks or registered trademarks of their
respective companies.

98 November 2018
Good things happen when workplaces work. You’ll receive both strategic and pragmatic guidance about how to improve Customer satisfaction & Employee engagement with leaders who lead and a front-line which is inspired. We provide training, consulting, surveys, diagnostic tools, and keynotes. The electric utility industry is a market segment we specialize in. Both large and small utilities have received actionable insights. For 20 years we have been talking to 1000’s of utility customers in Ontario and across Canada and we have expertise which is beneficial to every utility.
Culture, Leadership & Performance – Organizational Development
Focus Groups, Surveys, Polls, Diagnostics
Customer Service Excellence
Leadership development Diagnostics ie. Change Readiness, Leadership
Effectiveness, Managerial Competencies Service Excellence Leadership
Strategic Planning Surveys & Polls Telephone Skills
Teambuilding Customer Satisfaction and Loyalty
Benchmarking Surveys Customer Care
Organizational Culture Transformation Organization Culture Surveys Dealing with Difficult Customers
Benefit from our expertise in Customer Satisfaction, Leadership development, Strategy development or review, and Front-line & Top-line driven-change. We’re experts in helping you assess and then transform your organization’s culture to one where achieving goals while creating higher levels of customer satisfaction is important. Anyone can present data, or design programs – we believe having an understanding of the industry before doing so is crucial. Call us when creating an organization where more employees satisfy more customers more often, is important.
Your personal contact is: Sid Ridgley, CSP
Phone: (905) 895-7900 x 29 E-mail: [email protected]

November 2016
Waterloo North Hydro Inc.
2018
Electric Utility Customer
Sat
isfaction
Survey
Summary

2 November 2018
The purpose of this report is to profile the connection between Waterloo North Hydro Inc. (Waterloo North Hydro) and its customers. The primary objective of the Electric Utility Customer Satisfaction Survey is to provide information to support discussions about improving customer care at every level in your utility. The UtilityPULSE Report Card® and survey analysis contained in this report is intended to capture the state of mind or perceptions about your customers’ need and wants – the information contained in this report will help guide your discussions for making meaningful improvements. This survey report is privileged and confidential material, and no part may be used outside of Waterloo North Hydro Inc. without written permission from UtilityPULSE, the electric utility survey division of Simul Corporation.
All comments and questions should be addressed to:
Sid Ridgley, UtilityPULSE division, Simul Corporation Toll free: 1-888-291-7892 or Local: 905-895-7900 Email: [email protected] or [email protected]

3 November 2018
Feedback, Information & Insights Eighteen months ago, customers were very angry about the quickly increasing costs of electricity over the
previous 5 or more years. In fact, some years were double-digit increases while wages and inflation hovered
around the 2% mark. We know this because the number of survey respondents in the Ontario benchmark
survey who said they ‘sometimes worry about paying their bill’ grew from 21% to 31% and the number of At
Risk customers grew from 11% to 17%.
Data from the Waterloo North Hydro and Ontario benchmark surveys show the level of “anger” has dramatically
reduced. Whether changes in perception were created by the Liberal Government’s Spring 2016 reduction by
25% in electricity prices, or the change to a Conservative government June 2018, or the promise of further
reductions in electricity prices, or improvements in the economy, or improvements that LDCs have made in
managing outages while improving customers service, or all of the above - a major shift towards a more
positive view has taken place. Customers who have a positive view of their LDC and the industry exhibit less
resistance to change.
For Waterloo North Hydro in the Fall 2018 survey 14% of respondents and 21% of the Ontario benchmark
respondents said they ‘sometimes worry about paying their bill.’ Also, the At Risk customer respondent levels
were 4% for Waterloo North Hydro and 13% for the Ontario benchmark. To be clear, customers are still
concerned about the costs of electricity as shown by very low scores in the attribute “The cost of electricity is
reasonable when compared to other utilities such as gas, cable or telephone.”

4 November 2018
Your survey was conducted from September 17 - October 17, 2018, and is based on 403 one-on-one
telephone interviews with residential and small commercial customers who pay or look after the electricity bill.
Also, survey findings for Waterloo North Hydro are enhanced with the inclusion of data from our UtilityPULSE
database and the independently produced Ontario and National Benchmarks.
Helping the LDC generate higher levels of customer satisfaction, or maintaining their current high level, will be
based on doing the core job as promised by being professional, efficient and cost-effective. But expectations
continue to change. For Fall 2018, three key observations emerge from examining the trends in data from the
UtilityPULSE database. They are: customers want to know they have been heard, they have reasonable
access to services, and, their LDC is pro-actively communicating – especially during emergency situations.
92% Standard of reliability
meets expectations
Base: total respondents: Top 2 Boxes: ”Strongly agree + agree”
90% Delivers on its service
commitments 89% Provides excellent
quality services
83% Pro-actively
communicates changes and issues
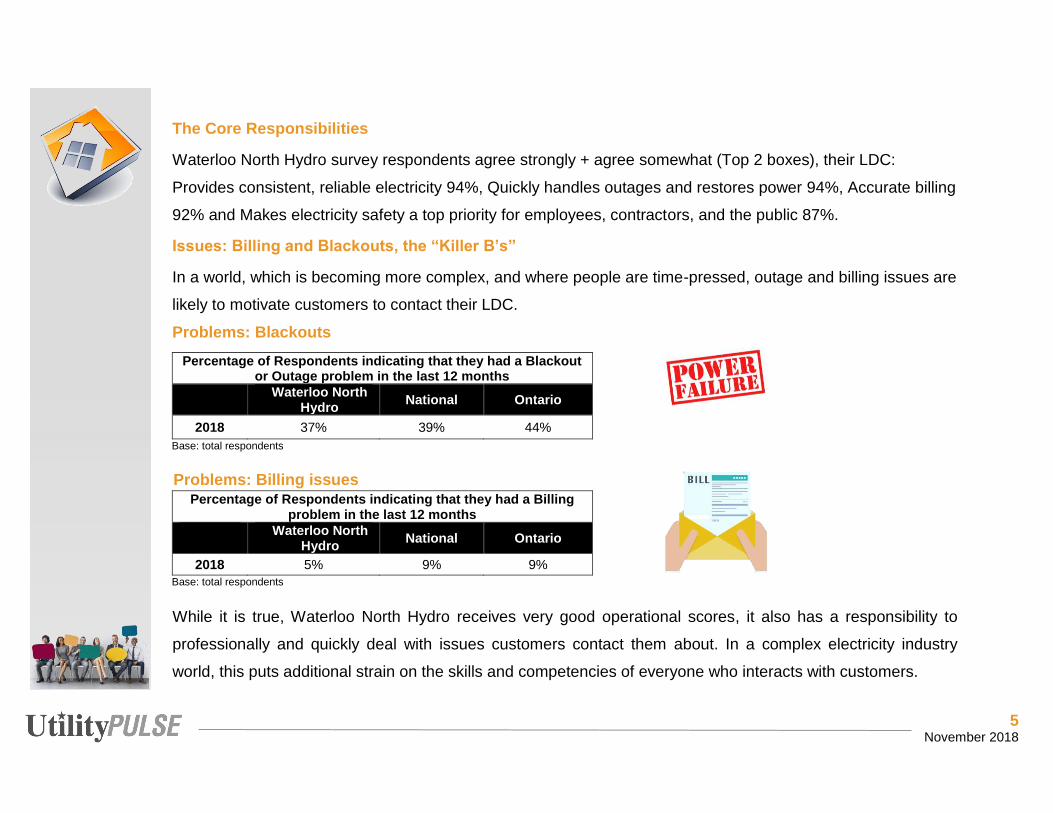
5 November 2018
The Core Responsibilities
Waterloo North Hydro survey respondents agree strongly + agree somewhat (Top 2 boxes), their LDC:
Provides consistent, reliable electricity 94%, Quickly handles outages and restores power 94%, Accurate billing
92% and Makes electricity safety a top priority for employees, contractors, and the public 87%.
Issues: Billing and Blackouts, the “Killer B’s”
In a world, which is becoming more complex, and where people are time-pressed, outage and billing issues are
likely to motivate customers to contact their LDC.
Problems: Blackouts
Percentage of Respondents indicating that they had a Blackout or Outage problem in the last 12 months
Waterloo North Hydro National Ontario
2018 37% 39% 44% Base: total respondents Problems: Billing issues
Percentage of Respondents indicating that they had a Billing problem in the last 12 months
Waterloo North Hydro National Ontario
2018 5% 9% 9% Base: total respondents
While it is true, Waterloo North Hydro receives very good operational scores, it also has a responsibility to
professionally and quickly deal with issues customers contact them about. In a complex electricity industry
world, this puts additional strain on the skills and competencies of everyone who interacts with customers.
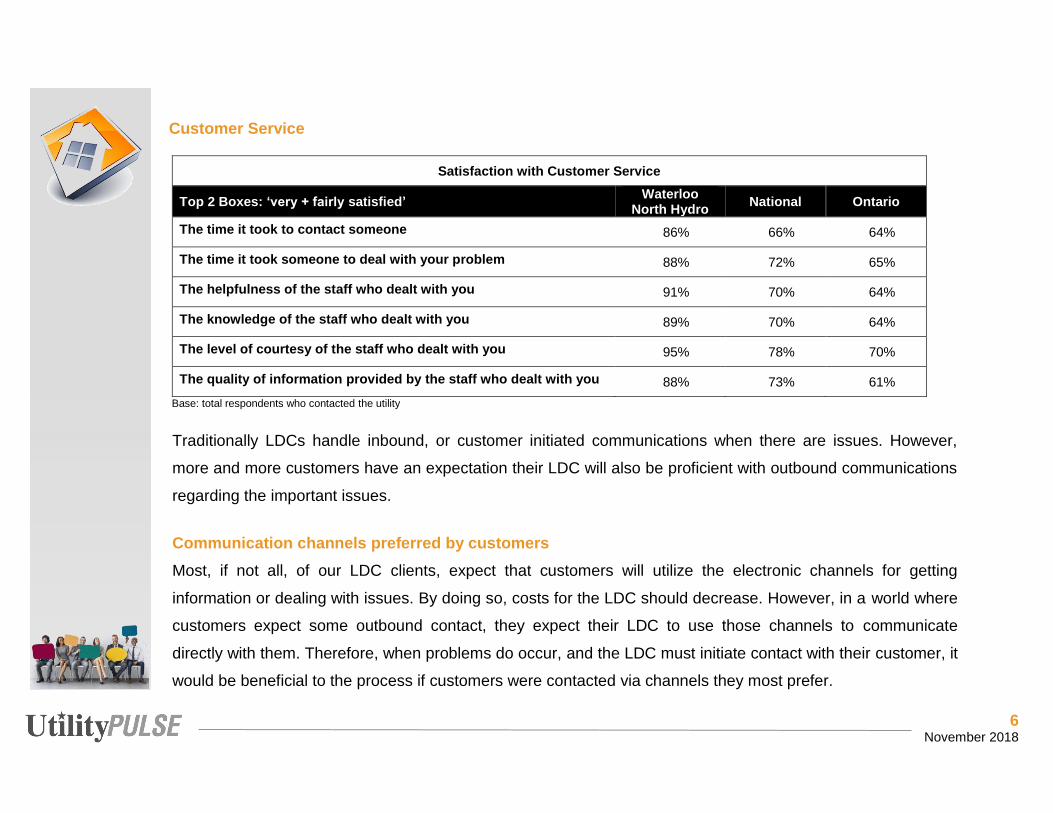
6 November 2018
Customer Service
Satisfaction with Customer Service
Top 2 Boxes: ‘very + fairly satisfied’ Waterloo North Hydro National Ontario
The time it took to contact someone 86% 66% 64%
The time it took someone to deal with your problem 88% 72% 65%
The helpfulness of the staff who dealt with you 91% 70% 64%
The knowledge of the staff who dealt with you 89% 70% 64%
The level of courtesy of the staff who dealt with you 95% 78% 70%
The quality of information provided by the staff who dealt with you 88% 73% 61% Base: total respondents who contacted the utility Traditionally LDCs handle inbound, or customer initiated communications when there are issues. However,
more and more customers have an expectation their LDC will also be proficient with outbound communications
regarding the important issues.
Communication channels preferred by customers Most, if not all, of our LDC clients, expect that customers will utilize the electronic channels for getting
information or dealing with issues. By doing so, costs for the LDC should decrease. However, in a world where
customers expect some outbound contact, they expect their LDC to use those channels to communicate
directly with them. Therefore, when problems do occur, and the LDC must initiate contact with their customer, it
would be beneficial to the process if customers were contacted via channels they most prefer.

7 November 2018
Primary Source of Information
Primary Source for getting information on … Corporate
website Twitter Facebook Bill Inserts eBlasts
A power outage 39% 6% 3% 5% 3%
An issue with your bill 35% 0% 1% 10% 3%
General corporate news 35% 2% 3% 16% 3%
Electricity safety information 42% 1% 2% 19% 3%
Energy conservation tips 38% 2% 3% 24% 3%
Changes in electricity rates 34% 1% 2% 31% 4%
Base: total respondents
Communication about Billing issues Waterloo North Hydro customers’ preferred or primary method for Waterloo North Hydro to contact them about
billing issues are as follows:
Preferred method of communication to receive notice of a billing issue
Ontario LDCs Waterloo North Hydro
Telephone 56% 59%
Voice Mail 2% 2%
Text 7% 4%
Email 34% 34%
Don’t know 1% 1% Base: An aggregate of respondents from 2018 participating LDCs / total respondents from the local utility

8 November 2018
Communication during Unplanned Outages In times of emergency, be they extreme weather events or major equipment failures that cause blackouts and
unplanned outages, customer communication can help customers understand what to expect next and when
disrupted electricity service might be restored. Early and effective communication helps increase confidence in
and credibility of the electricity service provider.
Method of communication Customers prefer their LDC uses during an UNPLANNED OUTAGE
Recorded Telephone Message
Email Notice
Posted on the Website
Social Media
Local Radio
Local TV
Text Message
36% 25% 5% 3% 8% 3% 19% Base: total respondents
Notice the difference in the preferred channel based on subject matter. Waterloo North
Hydro shouldn’t, for example, assume a customer who prefers email for a billing issue
will want an email for outage issues. These added variables add complexity to capturing
and then using each customers’ preferences. Getting the most out of your CRM system
is becoming increasingly important.
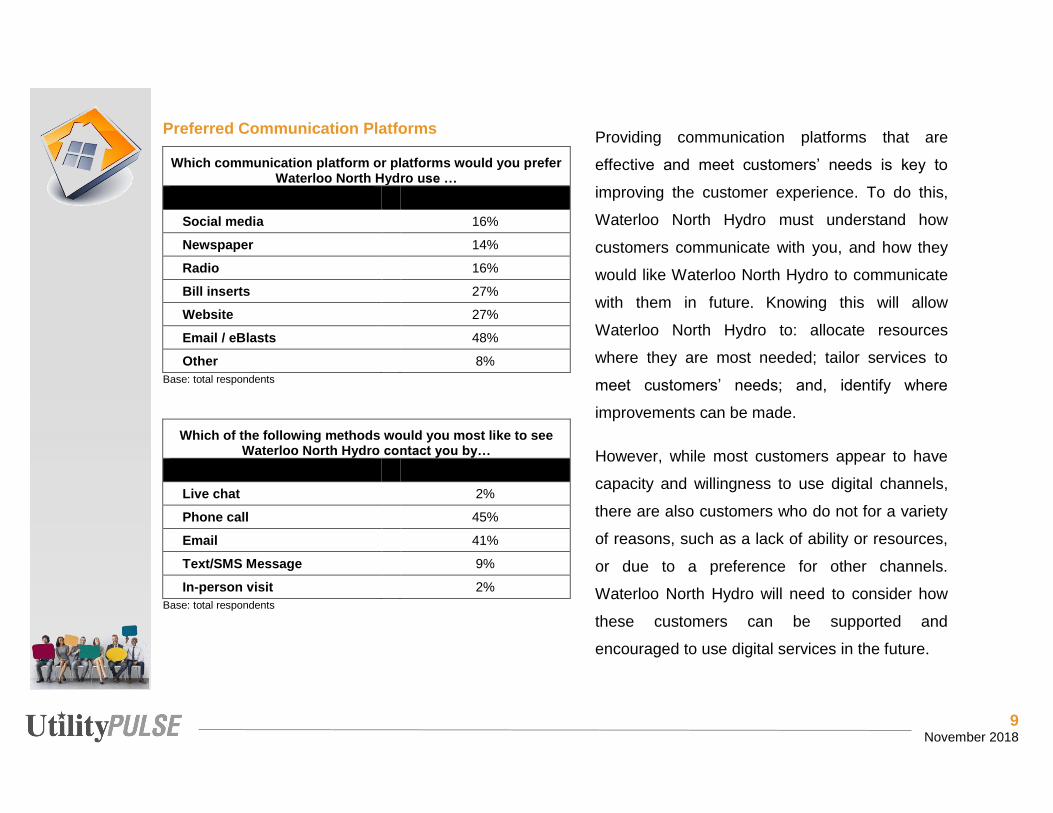
9 November 2018
Preferred Communication Platforms
Which communication platform or platforms would you prefer Waterloo North Hydro use …
Social media 16%
Newspaper 14%
Radio 16%
Bill inserts 27%
Website 27%
Email / eBlasts 48%
Other 8% Base: total respondents
Which of the following methods would you most like to see Waterloo North Hydro contact you by…
Live chat 2%
Phone call 45%
Email 41%
Text/SMS Message 9%
In-person visit 2%
Base: total respondents
Providing communication platforms that are
effective and meet customers’ needs is key to
improving the customer experience. To do this,
Waterloo North Hydro must understand how
customers communicate with you, and how they
would like Waterloo North Hydro to communicate
with them in future. Knowing this will allow
Waterloo North Hydro to: allocate resources
where they are most needed; tailor services to
meet customers’ needs; and, identify where
improvements can be made.
However, while most customers appear to have
capacity and willingness to use digital channels,
there are also customers who do not for a variety
of reasons, such as a lack of ability or resources,
or due to a preference for other channels.
Waterloo North Hydro will need to consider how
these customers can be supported and
encouraged to use digital services in the future.
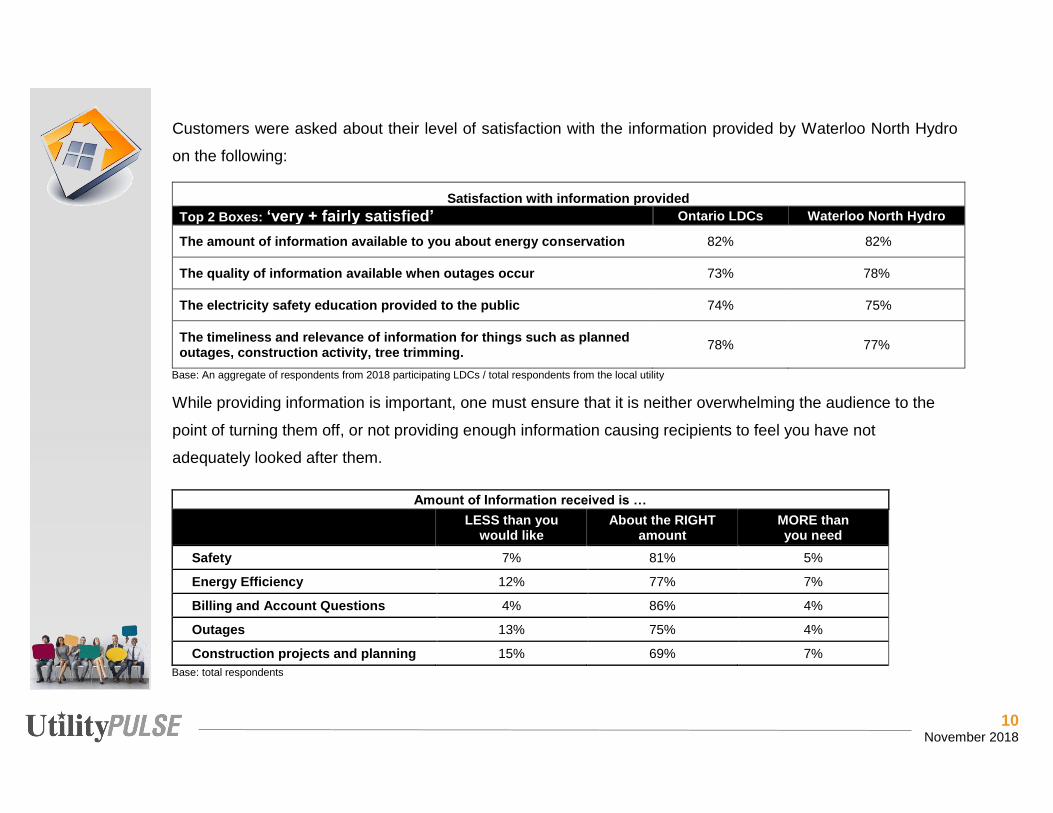
10 November 2018
Customers were asked about their level of satisfaction with the information provided by Waterloo North Hydro
on the following:
Satisfaction with information provided Top 2 Boxes: ‘very + fairly satisfied’ Ontario LDCs Waterloo North Hydro
The amount of information available to you about energy conservation 82% 82%
The quality of information available when outages occur 73% 78%
The electricity safety education provided to the public 74% 75%
The timeliness and relevance of information for things such as planned outages, construction activity, tree trimming. 78% 77%
Base: An aggregate of respondents from 2018 participating LDCs / total respondents from the local utility
While providing information is important, one must ensure that it is neither overwhelming the audience to the
point of turning them off, or not providing enough information causing recipients to feel you have not
adequately looked after them.
Amount of Information received is …
LESS than you would like
About the RIGHT amount
MORE than you need
Safety 7% 81% 5%
Energy Efficiency 12% 77% 7%
Billing and Account Questions 4% 86% 4%
Outages 13% 75% 4%
Construction projects and planning 15% 69% 7% Base: total respondents

11 November 2018
Communication Score – New for 2018 The pressure to communicate via multiple communication platforms continues to
increase. There is also an expectation the utility will, from an outbound perspective,
contact the customer via their preferred channel.
Communication Score
Ontario LDCs Waterloo North Hydro
Communication Score 79% 80% Base: An aggregate of respondents from 2018 participating LDCs / total respondents from the local utility
Future Communication Efforts
Respondents were asked on which topics Waterloo North Hydro should focus their future communication
efforts.
Future Communication Efforts should focus on … Waterloo North Hydro
Safety 15%
Energy Efficiency 30%
Billing and Account Questions 10%
Outages 10%
Construction projects and planning 8%
Base: total respondents
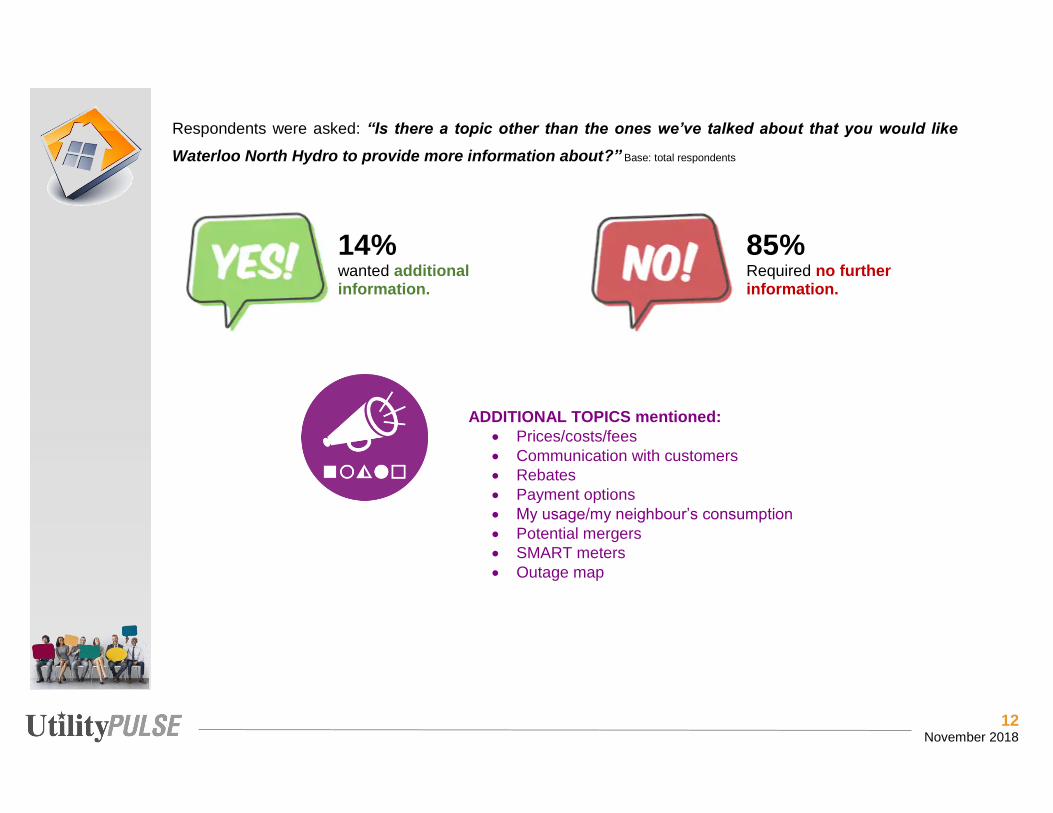
12 November 2018
Respondents were asked: “Is there a topic other than the ones we’ve talked about that you would like
Waterloo North Hydro to provide more information about?” Base: total respondents
14% wanted additional information.
85% Required no further information.
ADDITIONAL TOPICS mentioned: • Prices/costs/fees • Communication with customers • Rebates • Payment options • My usage/my neighbour’s consumption • Potential mergers • SMART meters • Outage map
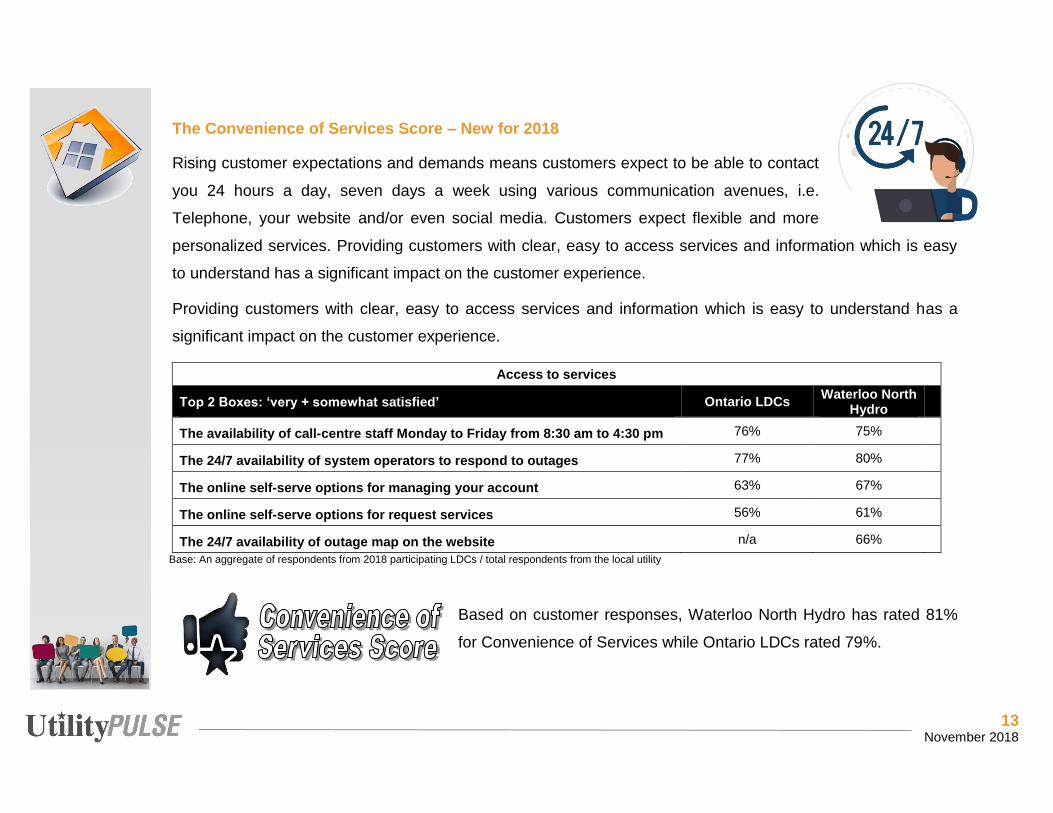
13 November 2018
The Convenience of Services Score – New for 2018
Rising customer expectations and demands means customers expect to be able to contact
you 24 hours a day, seven days a week using various communication avenues, i.e.
Telephone, your website and/or even social media. Customers expect flexible and more
personalized services. Providing customers with clear, easy to access services and information which is easy
to understand has a significant impact on the customer experience.
Providing customers with clear, easy to access services and information which is easy to understand has a
significant impact on the customer experience.
Access to services
Top 2 Boxes: ‘very + somewhat satisfied’ Ontario LDCs Waterloo North Hydro
The availability of call-centre staff Monday to Friday from 8:30 am to 4:30 pm 76% 75%
The 24/7 availability of system operators to respond to outages 77% 80%
The online self-serve options for managing your account 63% 67%
The online self-serve options for request services 56% 61%
The 24/7 availability of outage map on the website n/a 66%
Base: An aggregate of respondents from 2018 participating LDCs / total respondents from the local utility
Based on customer responses, Waterloo North Hydro has rated 81%
for Convenience of Services while Ontario LDCs rated 79%.

14 November 2018
Use of Technology Technology is fundamentally reshaping customer care in both the short and longer terms. The expectation is,
technology will reduce the number of inbound calls by empowering customers to get the technical or service
support they need to solve many of the problems which exist.
Respondents were asked whether they used the following forms of technology:
Use of technology
Yes No Don’t know/Refusal
Access the internet for information 83% 17% 0%
Have a social media account 54% 44% 1%
Use online banking services 71% 25% 3%
Shop online 64% 34% 2% Base: total respondents Social Media Social media is evolving, and it gives companies the opportunity to proactively identify customer issues which
will help the utility address problems quickly thereby minimizing the impact on the broader customer
base. 54% of Waterloo North Hydro customers indicated they had a social media account.
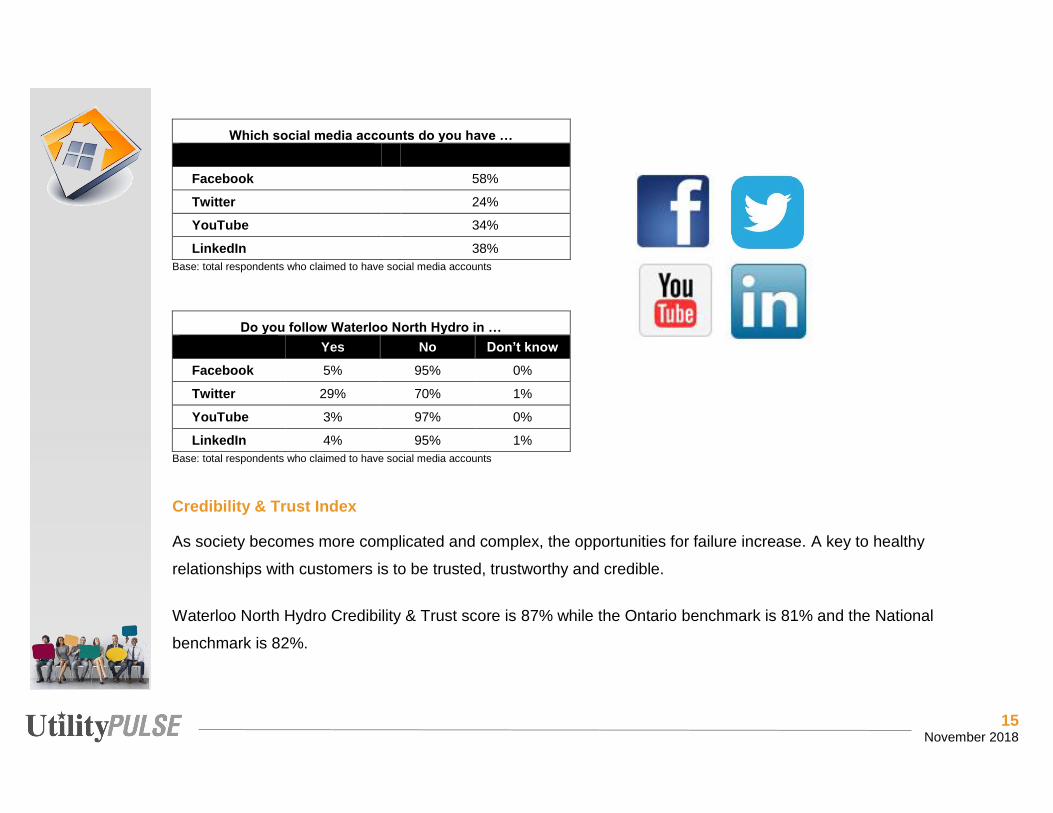
15 November 2018
Which social media accounts do you have …
Facebook 58%
Twitter 24%
YouTube 34%
LinkedIn 38% Base: total respondents who claimed to have social media accounts
Do you follow Waterloo North Hydro in … Yes No Don’t know
Facebook 5% 95% 0%
Twitter 29% 70% 1%
YouTube 3% 97% 0%
LinkedIn 4% 95% 1% Base: total respondents who claimed to have social media accounts Credibility & Trust Index
As society becomes more complicated and complex, the opportunities for failure increase. A key to healthy
relationships with customers is to be trusted, trustworthy and credible.
Waterloo North Hydro Credibility & Trust score is 87% while the Ontario benchmark is 81% and the National
benchmark is 82%.

16 November 2018
Customer Experience Performance rating (CEPr)
Do customers believe they will have a good experience if/when they do contact
their LDC? Or do they believe they must prepare for ‘war’? Of course, subject
matter and customer affinity levels play a role in determining how a customer might
prepare for interaction with a professional at Waterloo North Hydro.
Customer Experience Performance rating (CEPr)
Waterloo North Hydro National Ontario
CEPr: all respondents 89% 84% 83% Base: total respondents
Ensuring that the customer experience is a good one, requires high quality services and well-trained people.
Survey respondents gave Waterloo North Hydro excellent operational and representative scores.
Operational Attributes
Waterloo North Hydro National Ontario
Provides consistent, reliable energy 94% 89% 90%
Quickly handles outages and restores power 94% 87% 86%
Accurate billing 92% 86% 87%
Base: total respondents with an opinion
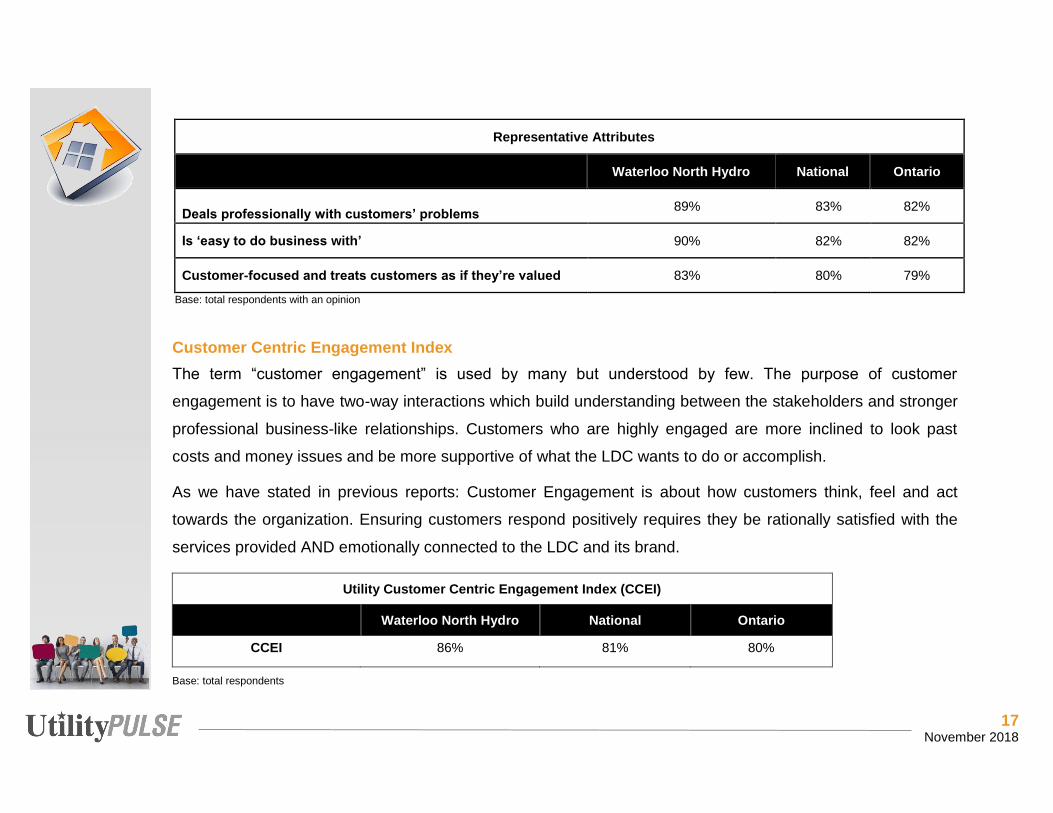
17 November 2018
Representative Attributes
Waterloo North Hydro National Ontario
Deals professionally with customers’ problems 89% 83% 82%
Is ‘easy to do business with’ 90% 82% 82%
Customer-focused and treats customers as if they’re valued 83% 80% 79%
Base: total respondents with an opinion
Customer Centric Engagement Index The term “customer engagement” is used by many but understood by few. The purpose of customer
engagement is to have two-way interactions which build understanding between the stakeholders and stronger
professional business-like relationships. Customers who are highly engaged are more inclined to look past
costs and money issues and be more supportive of what the LDC wants to do or accomplish.
As we have stated in previous reports: Customer Engagement is about how customers think, feel and act
towards the organization. Ensuring customers respond positively requires they be rationally satisfied with the
services provided AND emotionally connected to the LDC and its brand.
Utility Customer Centric Engagement Index (CCEI)
Waterloo North Hydro National Ontario
CCEI 86% 81% 80%
Base: total respondents

18 November 2018
Customer Satisfaction
By itself, this metric is not good enough to gain a picture of how well an LDC is doing but it is a measure about
whether the LDC is “doing the job” as expected. However, without satisfaction, there is no gateway to loyalty.
SATISFACTION SCORES – Electricity customers’ satisfaction
Top 2 Boxes: ‘very + fairly satisfied’ Waterloo North Hydro National Ontario
PRE: Initial Satisfaction Scores 96% 91% 91%
POST: End of Interview 96% 91% 89% Base: total respondents
The real prize is in the development of a relationship with customers. More good things exist when a customer
has a high affinity for the LDC than when they dislike it. At Risk customers are more likely to complain than
other customers when there are issues. Secure customers are more likely to support the direction of their LDC.
96%
96%
PRE Satisfaction Score
POST Satisfaction Score
Waterloo North Hydro
96%
0%
95%
0%
95%
2018 2017 2016 2015 2014
Electricity bill payers who are 'very or fairly' satisfied with ...
Waterloo North Hydro
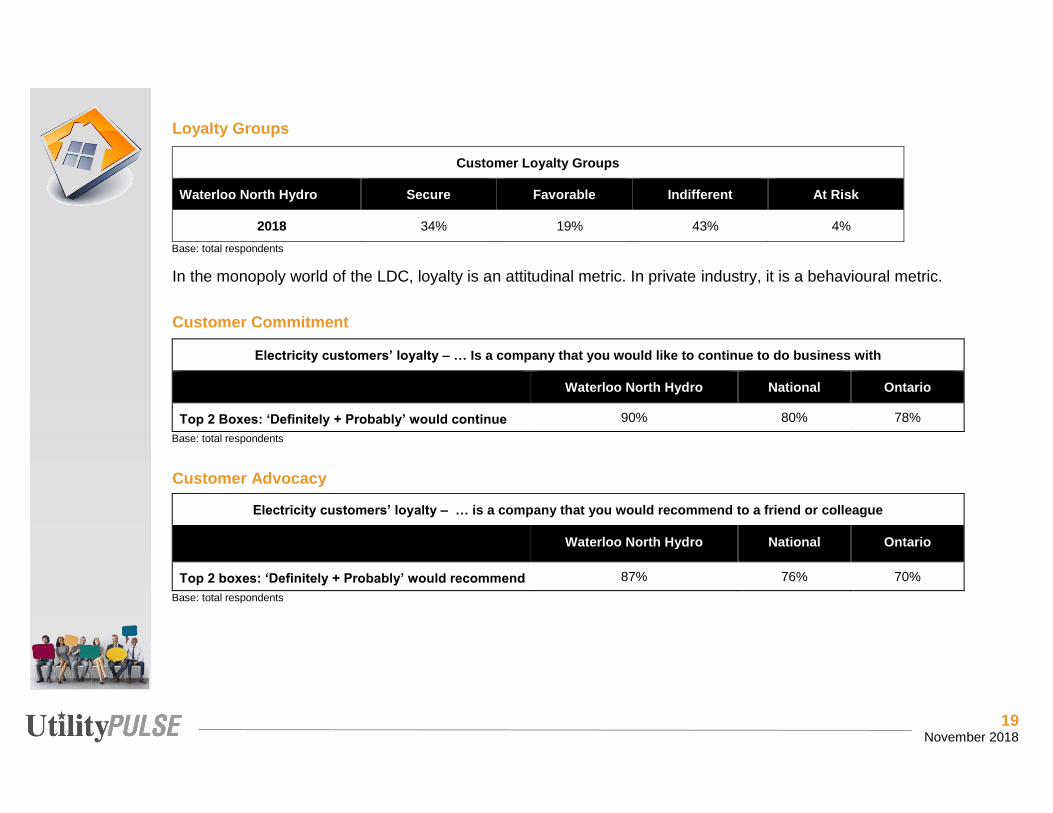
19 November 2018
Loyalty Groups
Customer Loyalty Groups
Waterloo North Hydro Secure Favorable Indifferent At Risk
2018 34% 19% 43% 4%
Base: total respondents
In the monopoly world of the LDC, loyalty is an attitudinal metric. In private industry, it is a behavioural metric.
Customer Commitment
Electricity customers’ loyalty – … Is a company that you would like to continue to do business with
Waterloo North Hydro National Ontario
Top 2 Boxes: ‘Definitely + Probably’ would continue 90% 80% 78% Base: total respondents
Customer Advocacy
Electricity customers’ loyalty – … is a company that you would recommend to a friend or colleague
Waterloo North Hydro National Ontario
Top 2 boxes: ‘Definitely + Probably’ would recommend 87% 76% 70% Base: total respondents
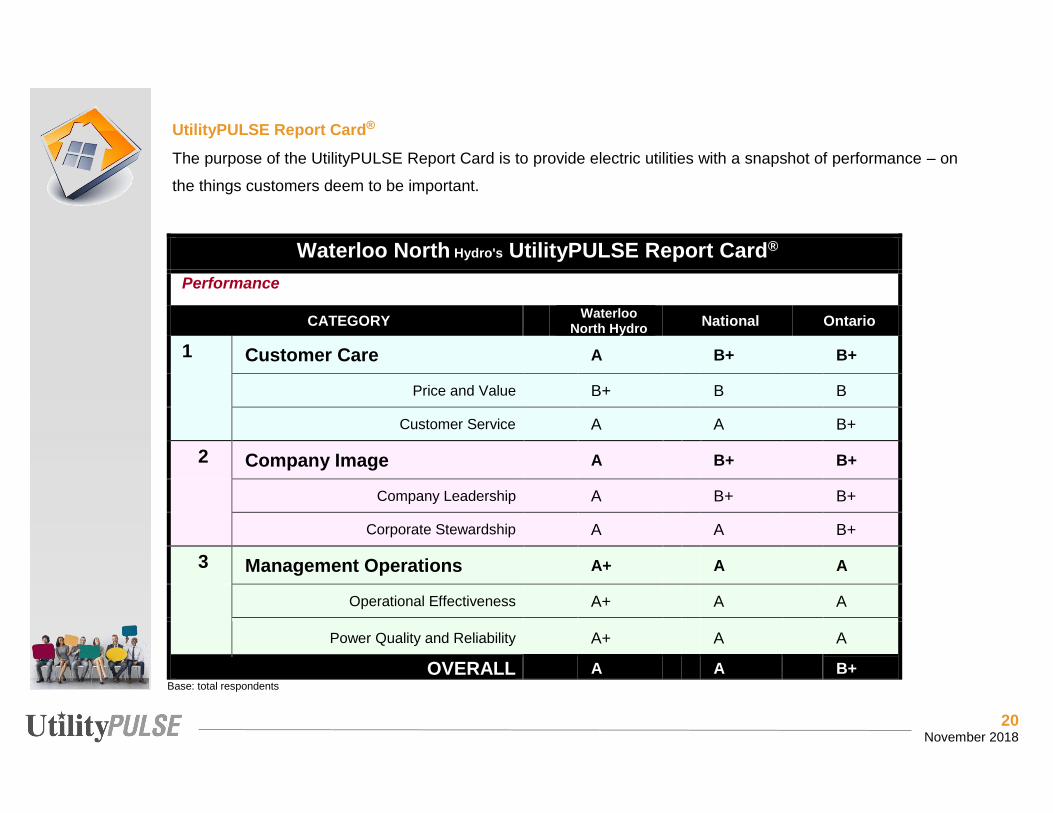
20 November 2018
UtilityPULSE Report Card®
The purpose of the UtilityPULSE Report Card is to provide electric utilities with a snapshot of performance – on
the things customers deem to be important.
Waterloo North Hydro's UtilityPULSE Report Card®
Performance
CATEGORY Waterloo North Hydro National Ontario
1 Customer Care A B+ B+
Price and Value B+ B B
Customer Service A A B+
2 Company Image A B+ B+
Company Leadership A B+ B+
Corporate Stewardship A A B+
3 Management Operations A+ A A
Operational Effectiveness A+ A A
Power Quality and Reliability A+ A A
OVERALL A A B+ Base: total respondents
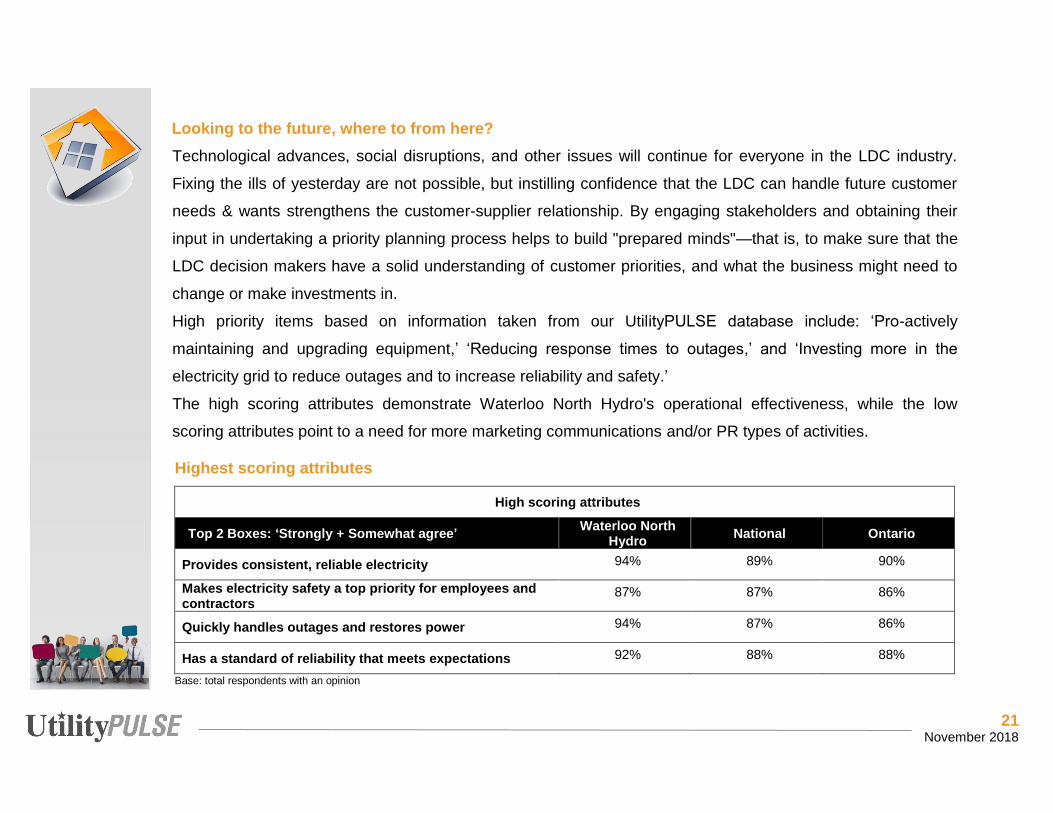
21 November 2018
Looking to the future, where to from here? Technological advances, social disruptions, and other issues will continue for everyone in the LDC industry.
Fixing the ills of yesterday are not possible, but instilling confidence that the LDC can handle future customer
needs & wants strengthens the customer-supplier relationship. By engaging stakeholders and obtaining their
input in undertaking a priority planning process helps to build "prepared minds"—that is, to make sure that the
LDC decision makers have a solid understanding of customer priorities, and what the business might need to
change or make investments in.
High priority items based on information taken from our UtilityPULSE database include: ‘Pro-actively
maintaining and upgrading equipment,’ ‘Reducing response times to outages,’ and ‘Investing more in the
electricity grid to reduce outages and to increase reliability and safety.’
The high scoring attributes demonstrate Waterloo North Hydro's operational effectiveness, while the low
scoring attributes point to a need for more marketing communications and/or PR types of activities.
Highest scoring attributes
High scoring attributes
Top 2 Boxes: ‘Strongly + Somewhat agree’ Waterloo North Hydro National Ontario
Provides consistent, reliable electricity 94% 89% 90%
Makes electricity safety a top priority for employees and contractors
87% 87% 86%
Quickly handles outages and restores power 94% 87% 86%
Has a standard of reliability that meets expectations 92% 88% 88%
Base: total respondents with an opinion
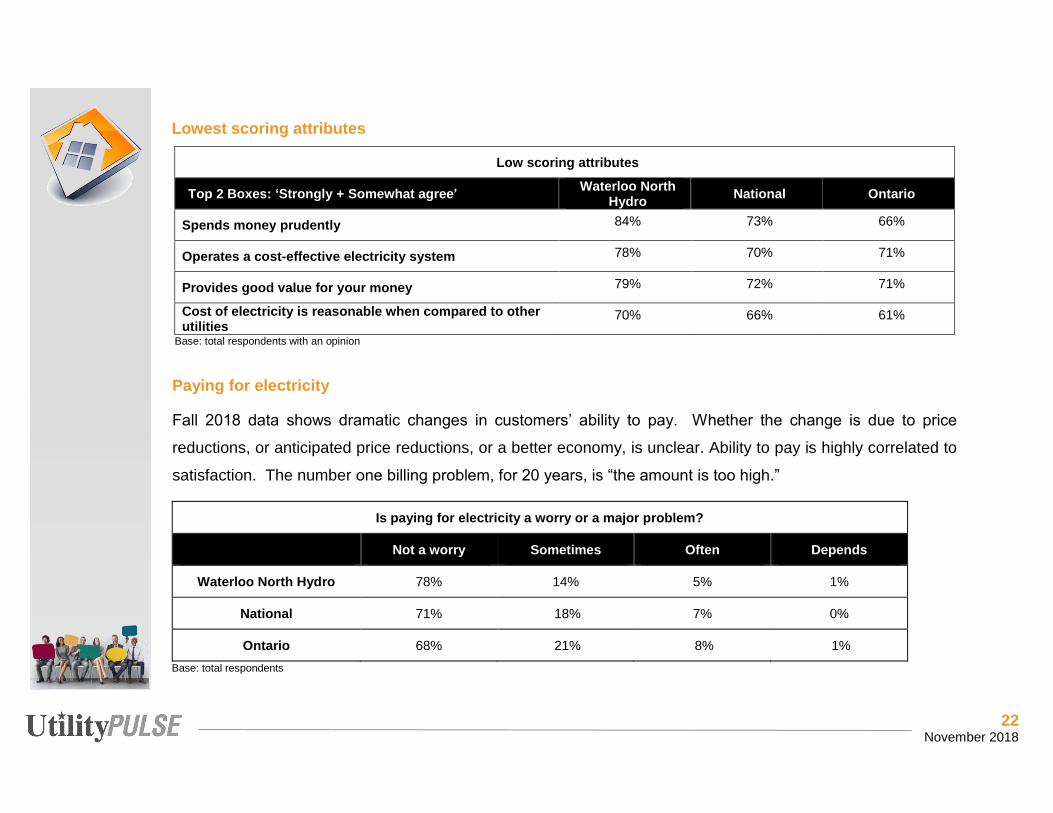
22 November 2018
Lowest scoring attributes
Low scoring attributes
Top 2 Boxes: ‘Strongly + Somewhat agree’ Waterloo North Hydro National Ontario
Spends money prudently 84% 73% 66%
Operates a cost-effective electricity system 78% 70% 71%
Provides good value for your money 79% 72% 71%
Cost of electricity is reasonable when compared to other utilities
70% 66% 61%
Base: total respondents with an opinion
Paying for electricity
Fall 2018 data shows dramatic changes in customers’ ability to pay. Whether the change is due to price
reductions, or anticipated price reductions, or a better economy, is unclear. Ability to pay is highly correlated to
satisfaction. The number one billing problem, for 20 years, is “the amount is too high.”
Is paying for electricity a worry or a major problem?
Not a worry Sometimes Often Depends
Waterloo North Hydro 78% 14% 5% 1%
National 71% 18% 7% 0%
Ontario 68% 21% 8% 1% Base: total respondents

23 November 2018
Numbers at a Glance
Waterloo North Hydro National Ontario Customer Satisfaction: Initial 96% 91% 91%
Customer Satisfaction: Post 96% 91% 89%
Communication Score 80% -- 79%
Overall Satisfaction with the most recent experience 95% 78% 77%
Convenience of Services Score 81% -- 79%
Customer Experience Performance Rating (CEPr) 89% 84% 83%
Customer Centric Engagement Index (CCEI) 86% 81% 80%
Credibility & Trust Index 87% 82% 81%
UtilityPulse Report Card A A B+
Over the past 5-6 years LDCs have witnessed their customers move from being concerned about costs, to
worried about cost, to being upset about costs and being angry about costs – and now returning to what we
believe is a concern about costs. From a human nature point-of-view, when people are angry, they tend to look
back in time to find someone or something to blame for their predicament. Now that customers have returned
to being concerned, they are more apt to be looking forward while putting more focus on identifying and
determining how they might handle future issues. The data from our Fall 2018 interviews with over 9,000+
customers shows there is support for making pro-active investments in reliability, outage restoration, outage
management, and communications.

24 November 2018
Sid Ridgley
Simul/UtilityPULSE Email: [email protected] or [email protected] November 2018
We believe, for many in society, from 2008 to mid-2017 survival was the key goal, less so in 2018. The outlook
for the economy is better; wages are improving and, job openings are more plentiful – therefore putting more
focus on the future.
The good news is Waterloo North Hydro remains what we call an influential brand company. The safe, reliable
distribution of electricity to homes and businesses is a job which makes life better, more interesting and
meaningful for consumers and customers. As a company which affects the daily life of people and businesses
– an influential brand – it must consistently demonstrate that it is credible, trusted, future-oriented, cares about
customers, cares about safety, cares about the environment, is professional, has high standards and is a
valued corporate citizen.
The industry is far more complex today than it was 20 years ago when we conducted the 1st
Annual Customer Satisfaction survey for electric utilities. Data shows that being customer-
centric is important for ensuring future success of the LDC. Customers want respect.
We recommend leveraging the results from your 2018 customer satisfaction survey by having meaningful
conversations with everyone about your customers’ – satisfaction, concerns, wants, etc. LDCs with a
constructive employee culture with high levels of employee engagement and empowerment will have an easier
time defining a future path forward.

98 November 2018
Good things happen when workplaces work. You’ll receive both strategic and pragmatic guidance about how to improve Customer satisfaction & Employee engagement with leaders who lead and a front-line which is inspired. We provide training, consulting, surveys, diagnostic tools, and keynotes. The electric utility industry is a market segment we specialize in. Both large and small utilities have received actionable insights. For 20 years we have been talking to 1000’s of utility customers in Ontario and across Canada and we have expertise which is beneficial to every utility.
Culture, Leadership & Performance – Organizational Development
Focus Groups, Surveys, Polls, Diagnostics
Customer Service Excellence
Leadership development Diagnostics ie. Change Readiness, Leadership
Effectiveness, Managerial Competencies Service Excellence Leadership
Strategic Planning Surveys & Polls Telephone Skills
Teambuilding Customer Satisfaction and Loyalty
Benchmarking Surveys Customer Care
Organizational Culture Transformation Organization Culture Surveys Dealing with Difficult Customers
Benefit from our expertise in Customer Satisfaction, Leadership development, Strategy development or review, and Front-line & Top-line driven-change. We’re experts in helping you assess and then transform your organization’s culture to one where achieving goals while creating higher levels of customer satisfaction is important. Anyone can present data, or design programs – we believe having an understanding of the industry before doing so is crucial. Call us when creating an organization where more employees satisfy more customers more often, is important.
Your personal contact is: Sid Ridgley, CSP
Phone: (905) 895-7900 x 29 E-mail: [email protected]
Customer Satisfaction Survey Report
March 2019
1
Brickworks Communications Inc. 1377 Cormorant Road, Unit 207 Ancaster Ontario L9G 4V5
Phone: (905) 632-8772 Fax: (905) 632-4502
Table of Contents
Methodology & Logistics 2
Respondent Profile 3
Keeping the Lights On 4
Customer Preferences 5 Electric Vehicles 6 Rooftop Solar 7 Community Solar 8
Onsite Power Storage 9
Electricity Usage Tracking & Alerts 10
Smart Home 11
2
Brickworks Communications Inc. 1377 Cormorant Road, Unit 207 Ancaster Ontario L9G 4V5
Phone: (905) 632-8772 Fax: (905) 632-4502
Methodology & Logistics
Background & Overview: Brickworks Communications was commissioned by Waterloo North Hydro to conduct a satisfaction survey of its customers. This report contains an executive summary of the results, while separate Excel reports include the results by individual question.
Survey Method: All surveys were completed online using Computer Assisted Web Interviewing (CAWI). This was a self-selection survey where respondents connected with the link to the survey site to complete their interview. Waterloo North Hydro promoted the survey and issues with an e-blast to its customer base advising them of the project. As an incentive, participants completing the survey and filling out personal information were eligible for a prize draw.
Study Sample: In total, N=4355 customers fully completed online questionnaires. In addition, there were N=471 partially completed surveys where respondents filled out at least one question.
Logistics: Surveys were completed online from the days of February 5th through February 22nd, 2019.
Confidence: It is not customary to assign online samples a margin of error to self-selection samples. However, a probability sample of N=4355 has a margin of error or is considered accurate ± 1.5%, 19 times out of 20.
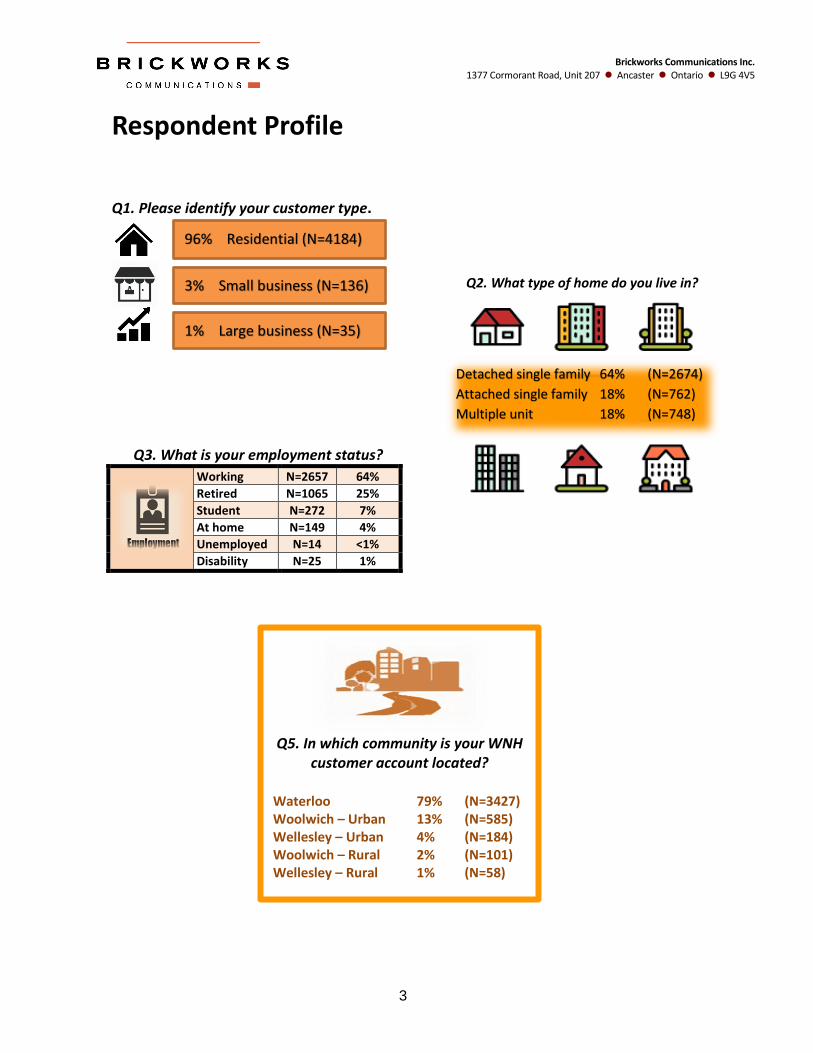
3
Brickworks Communications Inc. 1377 Cormorant Road, Unit 207 Ancaster Ontario L9G 4V5
Phone: (905) 632-8772 Fax: (905) 632-4502
Respondent Profile
Q1. Please identify your customer type.
Q3. What is your employment status?
Working N=2657 64%
Retired N=1065 25%
Student N=272 7%
At home N=149 4%
Unemployed N=14 <1%
Disability N=25 1%
96% Residential (N=4184)
3% Small business (N=136)
1% Large business (N=35)
Q2. What type of home do you live in?
Detached single family 64% (N=2674)
Attached single family 18% (N=762)
Multiple unit 18% (N=748)
Q5. In which community is your WNH
customer account located?
Waterloo 79% (N=3427) Woolwich – Urban 13% (N=585) Wellesley – Urban 4% (N=184) Woolwich – Rural 2% (N=101) Wellesley – Rural 1% (N=58)
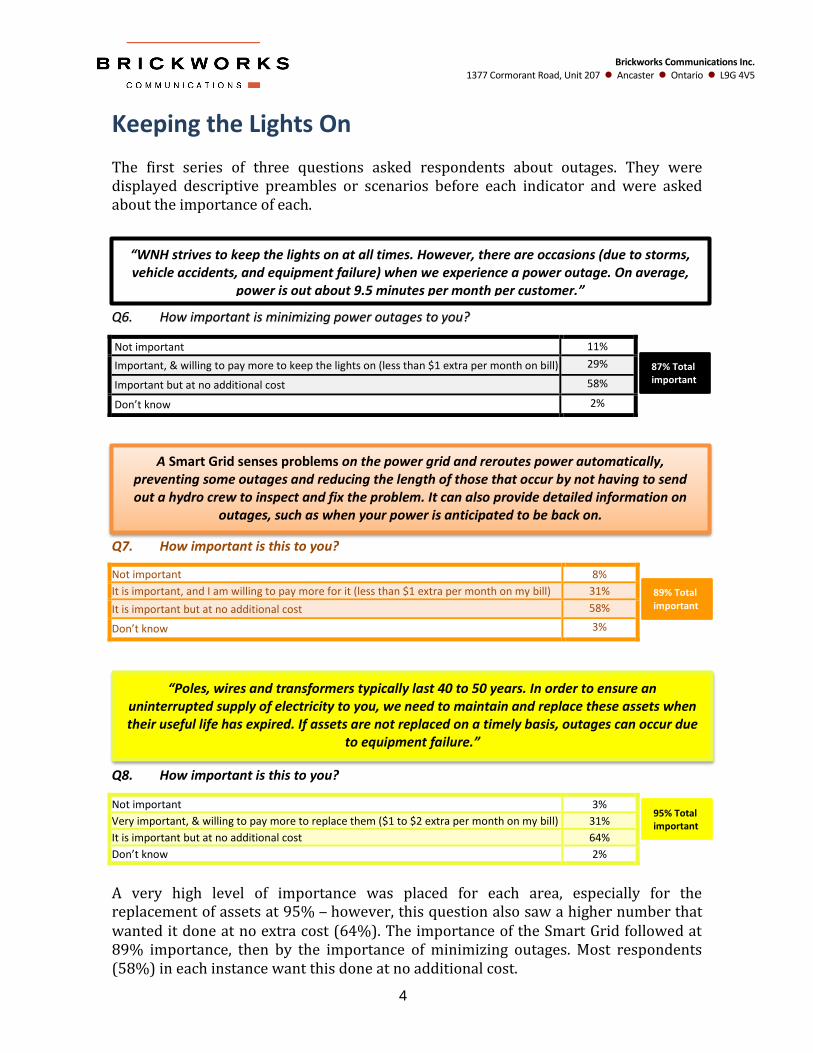
4
Brickworks Communications Inc. 1377 Cormorant Road, Unit 207 Ancaster Ontario L9G 4V5
Phone: (905) 632-8772 Fax: (905) 632-4502
Keeping the Lights On
The first series of three questions asked respondents about outages. They were displayed descriptive preambles or scenarios before each indicator and were asked about the importance of each. Q6. How important is minimizing power outages to you?
Not important 11%
Important, & willing to pay more to keep the lights on (less than $1 extra per month on bill) 29%
Important but at no additional cost 58%
Don’t know 2%
Q7. How important is this to you?
Not important 8%
It is important, and I am willing to pay more for it (less than $1 extra per month on my bill) 31%
It is important but at no additional cost 58%
Don’t know 3%
Q8. How important is this to you?
Not important 3%
Very important, & willing to pay more to replace them ($1 to $2 extra per month on my bill) 31%
It is important but at no additional cost 64%
Don’t know 2%
A very high level of importance was placed for each area, especially for the replacement of assets at 95% – however, this question also saw a higher number that wanted it done at no extra cost (64%). The importance of the Smart Grid followed at 89% importance, then by the importance of minimizing outages. Most respondents (58%) in each instance want this done at no additional cost.
“WNH strives to keep the lights on at all times. However, there are occasions (due to storms, vehicle accidents, and equipment failure) when we experience a power outage. On average,
power is out about 9.5 minutes per month per customer.”
87% Total important
A Smart Grid senses problems on the power grid and reroutes power automatically, preventing some outages and reducing the length of those that occur by not having to send out a hydro crew to inspect and fix the problem. It can also provide detailed information on
outages, such as when your power is anticipated to be back on.
89% Total important
“Poles, wires and transformers typically last 40 to 50 years. In order to ensure an uninterrupted supply of electricity to you, we need to maintain and replace these assets when their useful life has expired. If assets are not replaced on a timely basis, outages can occur due
to equipment failure.”
95% Total important

5
Brickworks Communications Inc. 1377 Cormorant Road, Unit 207 Ancaster Ontario L9G 4V5
Phone: (905) 632-8772 Fax: (905) 632-4502
Customer Preferences
2.2 WNH provides electricity that is “Reliable” (fewer outages)
2.4 WNH provides electricity that is “Safe”
3.2 WNH provides electricity at low cost (at the expense of reliability and customer
service)
3.4 WNH invests in innovative solutions such as smart grid, battery storage, solar,
and smart home technologies
3.7 WNH provides excellent customer service
The highest importance with a mean score of 2.2 was for providing reliable electricity, closely followed by safe electricity at 2.4. A mid-point ranking of 3.2 was accorded to providing electricity at a low cost – this at the expense of customer service. Lower scored by customers was for investing in innovating solutions (3.4), while the lowest ranked was for the area of providing excellent customer service (3.7).
Respondents were asked to rank in order five preference areas in terms of importance to them as customers. The ranking of one (1) was highest and five (5) the lowest, with the mean scores ranked from highest to lowest below.
Mean
Sco
re
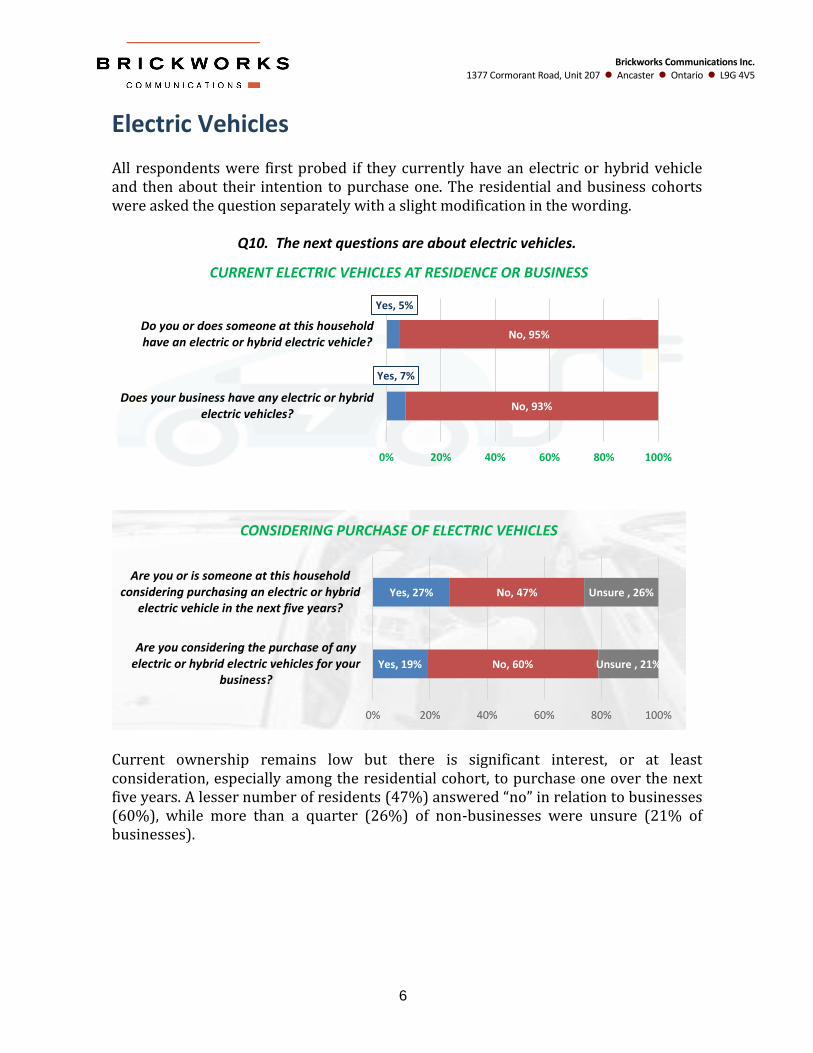
6
Brickworks Communications Inc. 1377 Cormorant Road, Unit 207 Ancaster Ontario L9G 4V5
Phone: (905) 632-8772 Fax: (905) 632-4502
Electric Vehicles All respondents were first probed if they currently have an electric or hybrid vehicle and then about their intention to purchase one. The residential and business cohorts were asked the question separately with a slight modification in the wording.
Q10. The next questions are about electric vehicles.
Current ownership remains low but there is significant interest, or at least consideration, especially among the residential cohort, to purchase one over the next five years. A lesser number of residents (47%) answered “no” in relation to businesses (60%), while more than a quarter (26%) of non-businesses were unsure (21% of businesses).
Yes, 7%
Yes, 5%
No, 93%
No, 95%
0% 20% 40% 60% 80% 100%
Does your business have any electric or hybridelectric vehicles?
Do you or does someone at this householdhave an electric or hybrid electric vehicle?
CURRENT ELECTRIC VEHICLES AT RESIDENCE OR BUSINESS
Yes, 19%
Yes, 27%
No, 60%
No, 47%
Unsure , 21%
Unsure , 26%
0% 20% 40% 60% 80% 100%
Are you considering the purchase of anyelectric or hybrid electric vehicles for your
business?
Are you or is someone at this householdconsidering purchasing an electric or hybrid
electric vehicle in the next five years?
CONSIDERING PURCHASE OF ELECTRIC VEHICLES
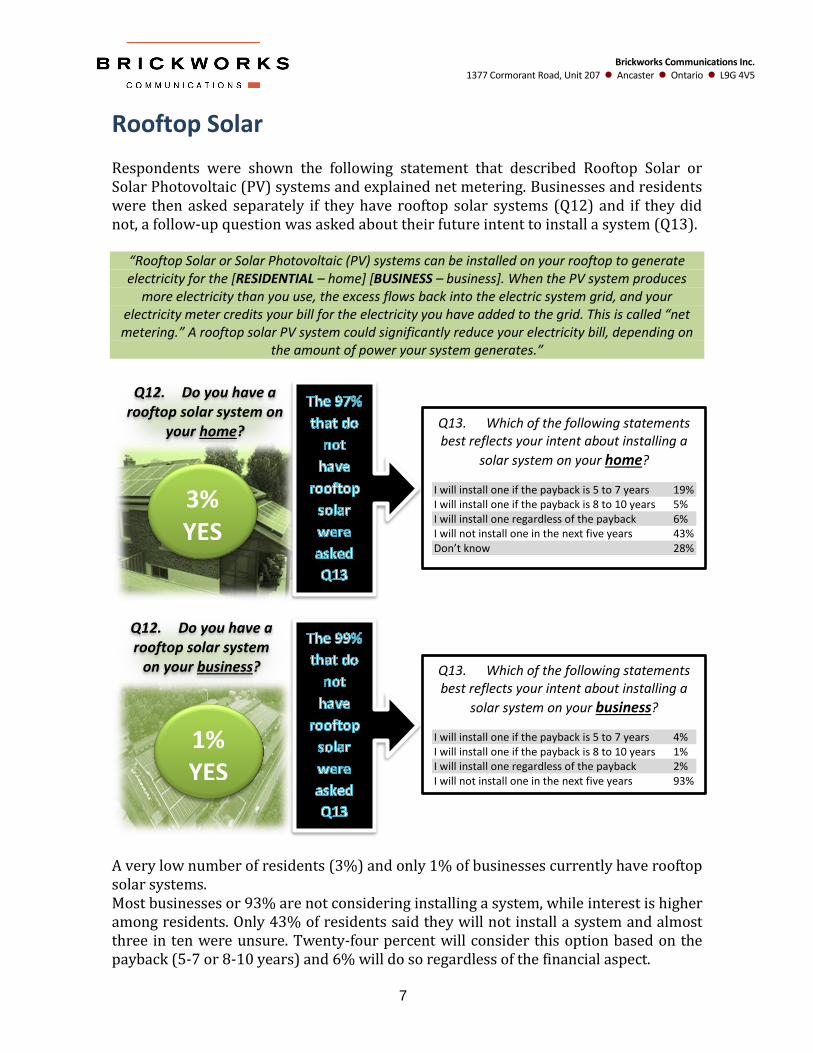
7
Brickworks Communications Inc. 1377 Cormorant Road, Unit 207 Ancaster Ontario L9G 4V5
Phone: (905) 632-8772 Fax: (905) 632-4502
Rooftop Solar Respondents were shown the following statement that described Rooftop Solar or Solar Photovoltaic (PV) systems and explained net metering. Businesses and residents were then asked separately if they have rooftop solar systems (Q12) and if they did not, a follow-up question was asked about their future intent to install a system (Q13).
“Rooftop Solar or Solar Photovoltaic (PV) systems can be installed on your rooftop to generate electricity for the [RESIDENTIAL – home] [BUSINESS – business]. When the PV system produces
more electricity than you use, the excess flows back into the electric system grid, and your electricity meter credits your bill for the electricity you have added to the grid. This is called “net metering.” A rooftop solar PV system could significantly reduce your electricity bill, depending on
the amount of power your system generates.”
A very low number of residents (3%) and only 1% of businesses currently have rooftop solar systems. Most businesses or 93% are not considering installing a system, while interest is higher among residents. Only 43% of residents said they will not install a system and almost three in ten were unsure. Twenty-four percent will consider this option based on the payback (5-7 or 8-10 years) and 6% will do so regardless of the financial aspect.
3% YES
1% YES
Q12. Do you have a rooftop solar system on
your home?
Q12. Do you have a rooftop solar system
on your business?
Q13. Which of the following statements best reflects your intent about installing a
solar system on your home?
I will install one if the payback is 5 to 7 years 19% I will install one if the payback is 8 to 10 years 5% I will install one regardless of the payback 6% I will not install one in the next five years 43% Don’t know 28%
Q13. Which of the following statements best reflects your intent about installing a
solar system on your business?
I will install one if the payback is 5 to 7 years 4% I will install one if the payback is 8 to 10 years 1% I will install one regardless of the payback 2% I will not install one in the next five years 93%
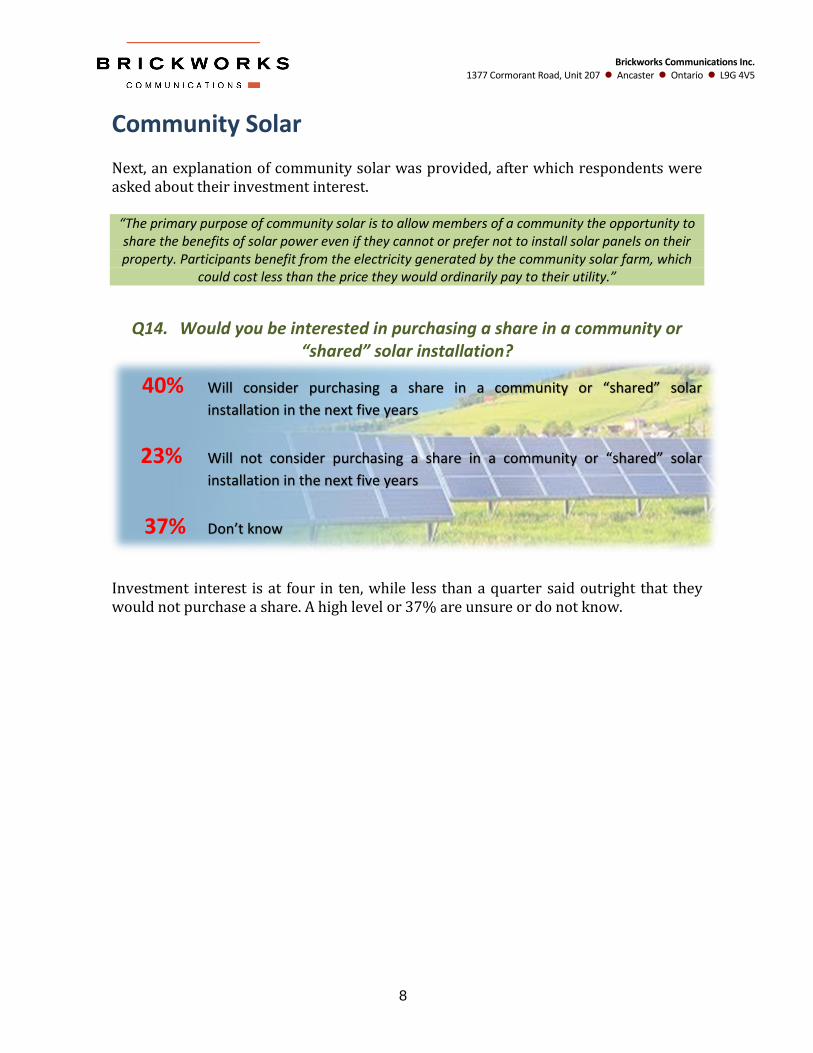
8
Brickworks Communications Inc. 1377 Cormorant Road, Unit 207 Ancaster Ontario L9G 4V5
Phone: (905) 632-8772 Fax: (905) 632-4502
Community Solar Next, an explanation of community solar was provided, after which respondents were asked about their investment interest.
“The primary purpose of community solar is to allow members of a community the opportunity to share the benefits of solar power even if they cannot or prefer not to install solar panels on their property. Participants benefit from the electricity generated by the community solar farm, which
could cost less than the price they would ordinarily pay to their utility.”
Q14. Would you be interested in purchasing a share in a community or “shared” solar installation?
40% Will consider purchasing a share in a community or “shared” solar
installation in the next five years
23% Will not consider purchasing a share in a community or “shared” solar
installation in the next five years
37% Don’t know
Investment interest is at four in ten, while less than a quarter said outright that they would not purchase a share. A high level or 37% are unsure or do not know.

9
Brickworks Communications Inc. 1377 Cormorant Road, Unit 207 Ancaster Ontario L9G 4V5
Phone: (905) 632-8772 Fax: (905) 632-4502
On-Site Power Storage The following description of on-site power storage was provided and then both the residential and business cohorts were asked about demand. “On-site power storage enables you to store electricity at your [RES – home / BUS – business] using
batteries. The battery can be a wall unit, or you could use the battery in an electric vehicle. This technology can provide backup power in the case of a power outage.”
Q15. Would you consider installing battery storage in the next five years?
RESIDENTIAL
Will consider installing one in the next five years 36%
Will not consider installing one in the next five years 28%
Don’t know 36%
BUSINESS
Will consider installing one in the next five years 40%
Will not consider installing one in the next five years 19%
Don’t know 41%
The appeal for on-site storage was slightly higher among businesses, while more residential customers were indifferent to the energy solution saying they will not consider it over the next five years.
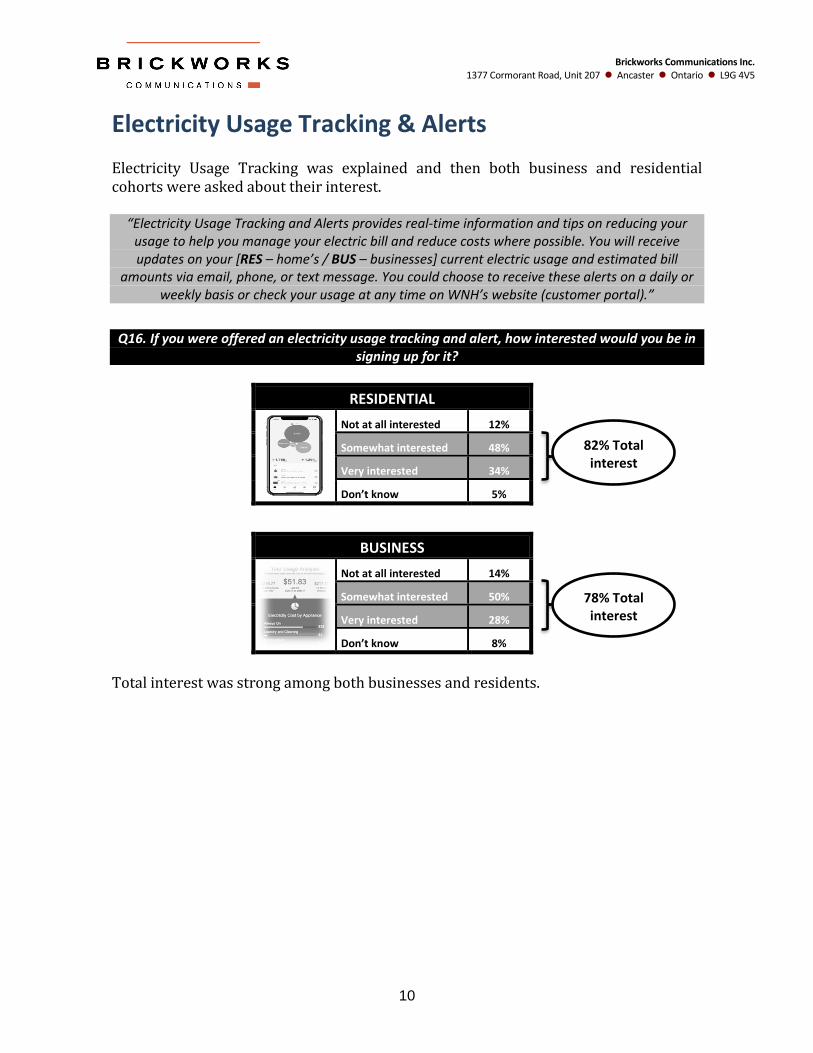
10
Brickworks Communications Inc. 1377 Cormorant Road, Unit 207 Ancaster Ontario L9G 4V5
Phone: (905) 632-8772 Fax: (905) 632-4502
Electricity Usage Tracking & Alerts Electricity Usage Tracking was explained and then both business and residential cohorts were asked about their interest.
“Electricity Usage Tracking and Alerts provides real-time information and tips on reducing your usage to help you manage your electric bill and reduce costs where possible. You will receive updates on your [RES – home’s / BUS – businesses] current electric usage and estimated bill
amounts via email, phone, or text message. You could choose to receive these alerts on a daily or weekly basis or check your usage at any time on WNH’s website (customer portal).”
Q16. If you were offered an electricity usage tracking and alert, how interested would you be in
signing up for it?
RESIDENTIAL
Not at all interested 12%
Somewhat interested 48%
Very interested 34%
Don’t know 5%
BUSINESS
Not at all interested 14%
Somewhat interested 50%
Very interested 28%
Don’t know 8%
Total interest was strong among both businesses and residents.
82% Total interest
78% Total interest
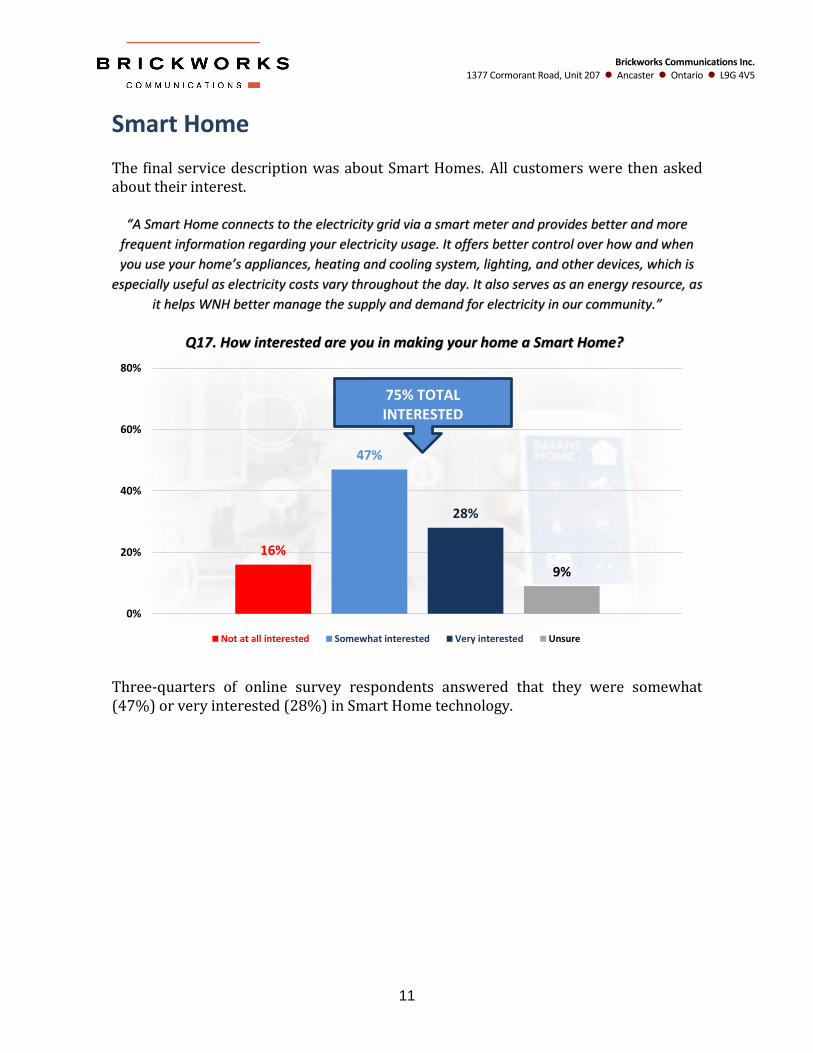
11
Brickworks Communications Inc. 1377 Cormorant Road, Unit 207 Ancaster Ontario L9G 4V5
Phone: (905) 632-8772 Fax: (905) 632-4502
Smart Home The final service description was about Smart Homes. All customers were then asked about their interest.
“A Smart Home connects to the electricity grid via a smart meter and provides better and more
frequent information regarding your electricity usage. It offers better control over how and when
you use your home’s appliances, heating and cooling system, lighting, and other devices, which is
especially useful as electricity costs vary throughout the day. It also serves as an energy resource, as
it helps WNH better manage the supply and demand for electricity in our community.”
Three-quarters of online survey respondents answered that they were somewhat (47%) or very interested (28%) in Smart Home technology.
16%
47%
28%
9%
0%
20%
40%
60%
80%
Q17. How interested are you in making your home a Smart Home?
Not at all interested Somewhat interested Very interested Unsure
75% TOTAL INTERESTED
Customer Engagement Survey Report
Dec 2019 / Jan 2020

1
Table of Contents
Background & Overview 2
Methodology & Logistics – Online Survey 3
Methodology & Logistics – Telephone Survey 4
Telephone Survey Results 5 Online Survey Results 18 Summary & Highlights 35
2
Background & Overview
Waterloo North Hydro commissioned Brickworks Communications to conduct an engagement survey of its customers. The purpose of this survey process was to obtain customer input regarding Waterloo North Hydro’s business plans for the period 2021 to 2025, and to gather information from them about service and cost. Feedback from this survey process will be used to help shape capital and operating plans, which will be presented to the Ontario Energy Board (OEB) when Waterloo North Hydro (WNH) files its rate application for 2021. There were two main approaches used in this process including an open online survey forum that resulted in N=2393 completes and a random telephone survey of N=600 customers. Customers were assured that all responses to this survey would be confidential, and as such only overall or aggregate results are reported. No financial incentives were provided for the telephone poll, while customers who completed the online survey were offered the option of being entered into a draw to win six VISA gift cards worth $250 each.
In addition, there was an open house held by WNH on November 28, 2019, where small business customers were allowed to complete surveys using a written paper survey form. In total N=32 completed surveys using a questionnaire that was modified from the online version and included different indicators.
Reporting Notes
This report contains an executive summary of the results from both the telephone and online components, while a separate Excel report includes the results by individual question for each. Results are presented in the order that they were asked in each survey. In addition, the descriptive preambles along with graphic displays are also shown in relation to each question. Methodologically, the background information contained is considered to be associated with the questions that follow and is are presented as such.
Results from the M=32 small business surveys are included in an Excel report and findings are referenced in the Summary & Highlights section of this report. Given the small sample size, we represent findings by count or N rather than in percentages.
3
Methodology & Logistics – Online Survey
Survey Method All surveys were completed online using Computer Assisted Web Interviewing (CAWI). This was a self-selection survey where respondents connected with the link to the survey site to complete their interview. Waterloo North Hydro promoted the survey with e-blasts to its customer base advising them of the project.
Study Sample In total, N=2393 customers fully completed online questionnaires.
Logistics Surveys were completed online from the days of November 14th and November 29th, 2019.
Confidence It is not customary to assign online self-selection samples a margin of error. However, a probability sample of N=2393 has a margin of error or is considered accurate ± 2.0%, 19 times out of 20.
4
Methodology & Logistics – Telephone Survey
Study Sample Waterloo North Hydro provided Brickworks with a database of their residential and business customers to be surveyed. A total of N=550 residential customers and N=50 business customers were randomly selected from the database and surveyed by telephone using person to person live telephone interviewing. Respondents were screened to ensure that they were 18 years of age or older, a WNH customer and were one of the persons either at the business or residence that was a decision maker as it relates to reviewing utility bills and making payments.
Survey Method The survey was conducted using computer-assisted techniques of telephone interviewing (CATI) and random number selection. A total of 20% of all interviews were monitored and the Brickworks management supervised 100%.
Logistics Interviews were completed between the days of November 14th to November 24th, 2019. Initial calls for the residential component were made between the hours of 5 p.m. and 9 p.m. Subsequent call backs of no-answers and busy numbers were made on a (staggered) daily rotating basis up to 5 times (from 10 a.m. to 9 p.m.) until contact was made. In addition, telephone interview appointments were attempted with those respondents unable to complete the survey at the time of contact. At least one attempt was made to contact respondents on a weekend. Calls to business customers were first made from 8:30 a.m. to 5:30 p.m. during weekdays. There was at least one follow up call after 5:30 p.m. and one on a weekend. In addition, telephone appointments were accepted and made as per the respondent’s time preference.
Confidence The margin of error for the N=600-respondent survey is 4.0%, 19/20 times.
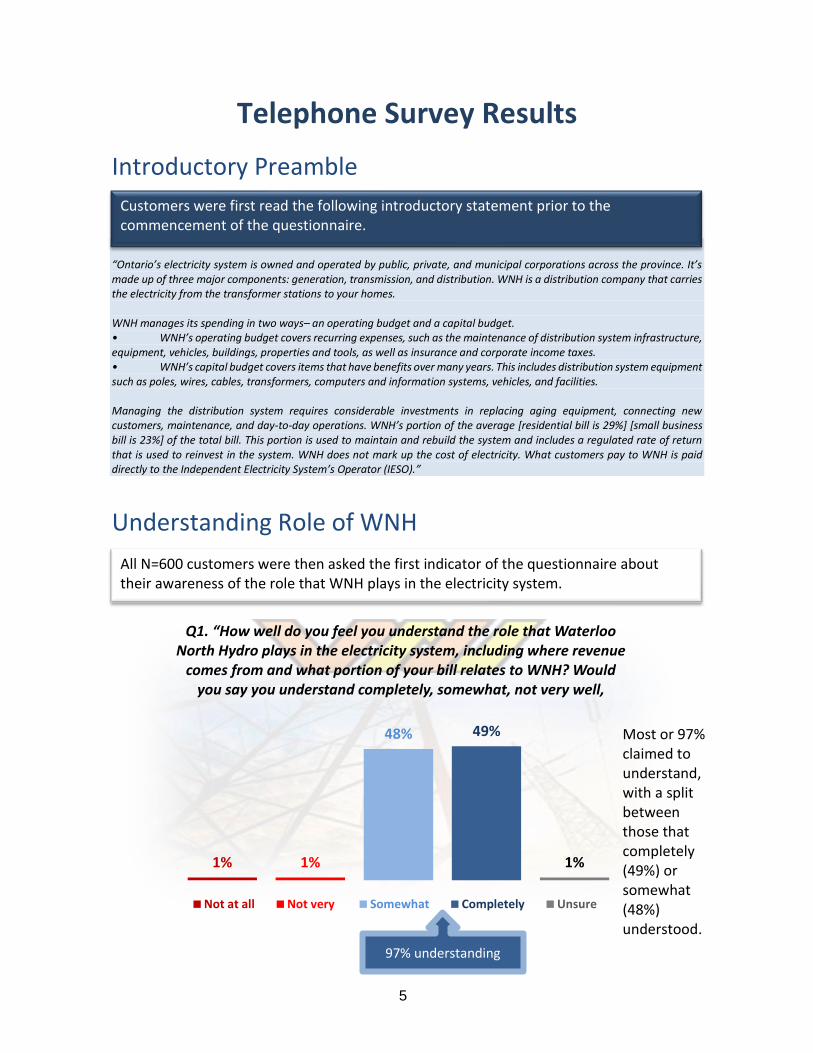
5
Telephone Survey Results
Introductory Preamble “Ontario’s electricity system is owned and operated by public, private, and municipal corporations across the province. It’s made up of three major components: generation, transmission, and distribution. WNH is a distribution company that carries the electricity from the transformer stations to your homes. WNH manages its spending in two ways– an operating budget and a capital budget. • WNH’s operating budget covers recurring expenses, such as the maintenance of distribution system infrastructure, equipment, vehicles, buildings, properties and tools, as well as insurance and corporate income taxes. • WNH’s capital budget covers items that have benefits over many years. This includes distribution system equipment such as poles, wires, cables, transformers, computers and information systems, vehicles, and facilities. Managing the distribution system requires considerable investments in replacing aging equipment, connecting new customers, maintenance, and day-to-day operations. WNH’s portion of the average [residential bill is 29%] [small business bill is 23%] of the total bill. This portion is used to maintain and rebuild the system and includes a regulated rate of return that is used to reinvest in the system. WNH does not mark up the cost of electricity. What customers pay to WNH is paid directly to the Independent Electricity System’s Operator (IESO).”
Understanding Role of WNH
1% 1%
48% 49%
1%
Q1. “How well do you feel you understand the role that Waterloo North Hydro plays in the electricity system, including where revenue
comes from and what portion of your bill relates to WNH? Would you say you understand completely, somewhat, not very well,
Not at all Not very Somewhat Completely Unsure
Customers were first read the following introductory statement prior to the commencement of the questionnaire.
All N=600 customers were then asked the first indicator of the questionnaire about their awareness of the role that WNH plays in the electricity system. N=72) & both Thorold and
surrounding areas (61%, N=243)
97% understanding
Most or 97% claimed to understand, with a split between those that completely (49%) or somewhat (48%) understood.
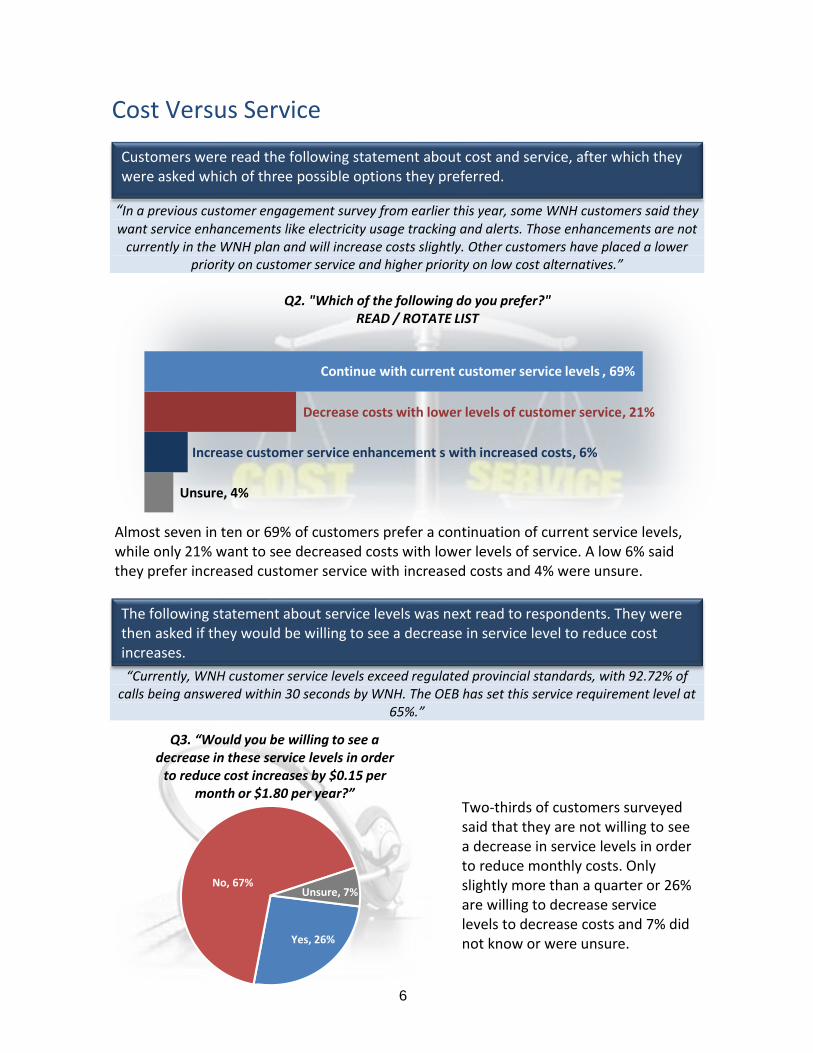
6
Cost Versus Service “In a previous customer engagement survey from earlier this year, some WNH customers said they want service enhancements like electricity usage tracking and alerts. Those enhancements are not
currently in the WNH plan and will increase costs slightly. Other customers have placed a lower priority on customer service and higher priority on low cost alternatives.”
“Currently, WNH customer service levels exceed regulated provincial standards, with 92.72% of calls being answered within 30 seconds by WNH. The OEB has set this service requirement level at
65%.”
Unsure, 4%
Increase customer service enhancement s with increased costs, 6%
Decrease costs with lower levels of customer service, 21%
Continue with current customer service levels , 69%
Q2. "Which of the following do you prefer?" READ / ROTATE LIST
Yes, 26%
No, 67%Unsure, 7%
Q3. “Would you be willing to see a decrease in these service levels in order
to reduce cost increases by $0.15 per month or $1.80 per year?”
Customers were read the following statement about cost and service, after which they were asked which of three possible options they preferred.
The following statement about service levels was next read to respondents. They were then asked if they would be willing to see a decrease in service level to reduce cost increases.
Almost seven in ten or 69% of customers prefer a continuation of current service levels, while only 21% want to see decreased costs with lower levels of service. A low 6% said they prefer increased customer service with increased costs and 4% were unsure.
Two-thirds of customers surveyed said that they are not willing to see a decrease in service levels in order to reduce monthly costs. Only slightly more than a quarter or 26% are willing to decrease service levels to decrease costs and 7% did not know or were unsure.
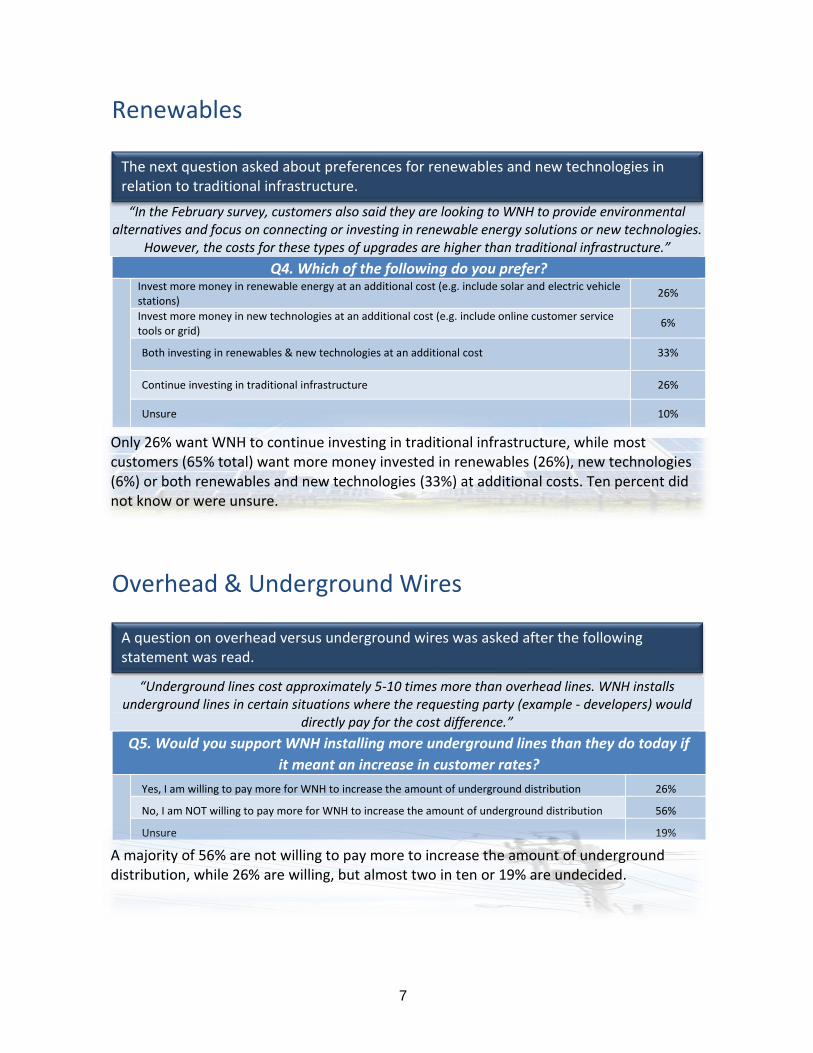
7
Renewables
“In the February survey, customers also said they are looking to WNH to provide environmental alternatives and focus on connecting or investing in renewable energy solutions or new technologies.
However, the costs for these types of upgrades are higher than traditional infrastructure.”
Q4. Which of the following do you prefer?
Invest more money in renewable energy at an additional cost (e.g. include solar and electric vehicle stations)
26%
Invest more money in new technologies at an additional cost (e.g. include online customer service tools or grid)
6%
Both investing in renewables & new technologies at an additional cost 33%
Continue investing in traditional infrastructure 26%
Unsure 10%
Overhead & Underground Wires
“Underground lines cost approximately 5-10 times more than overhead lines. WNH installs underground lines in certain situations where the requesting party (example - developers) would
directly pay for the cost difference.”
Q5. Would you support WNH installing more underground lines than they do today if
it meant an increase in customer rates? Yes, I am willing to pay more for WNH to increase the amount of underground distribution 26%
No, I am NOT willing to pay more for WNH to increase the amount of underground distribution 56%
Unsure 19%
The next question asked about preferences for renewables and new technologies in relation to traditional infrastructure.
Only 26% want WNH to continue investing in traditional infrastructure, while most customers (65% total) want more money invested in renewables (26%), new technologies (6%) or both renewables and new technologies (33%) at additional costs. Ten percent did not know or were unsure.
A majority of 56% are not willing to pay more to increase the amount of underground distribution, while 26% are willing, but almost two in ten or 19% are undecided.
A question on overhead versus underground wires was asked after the following statement was read.
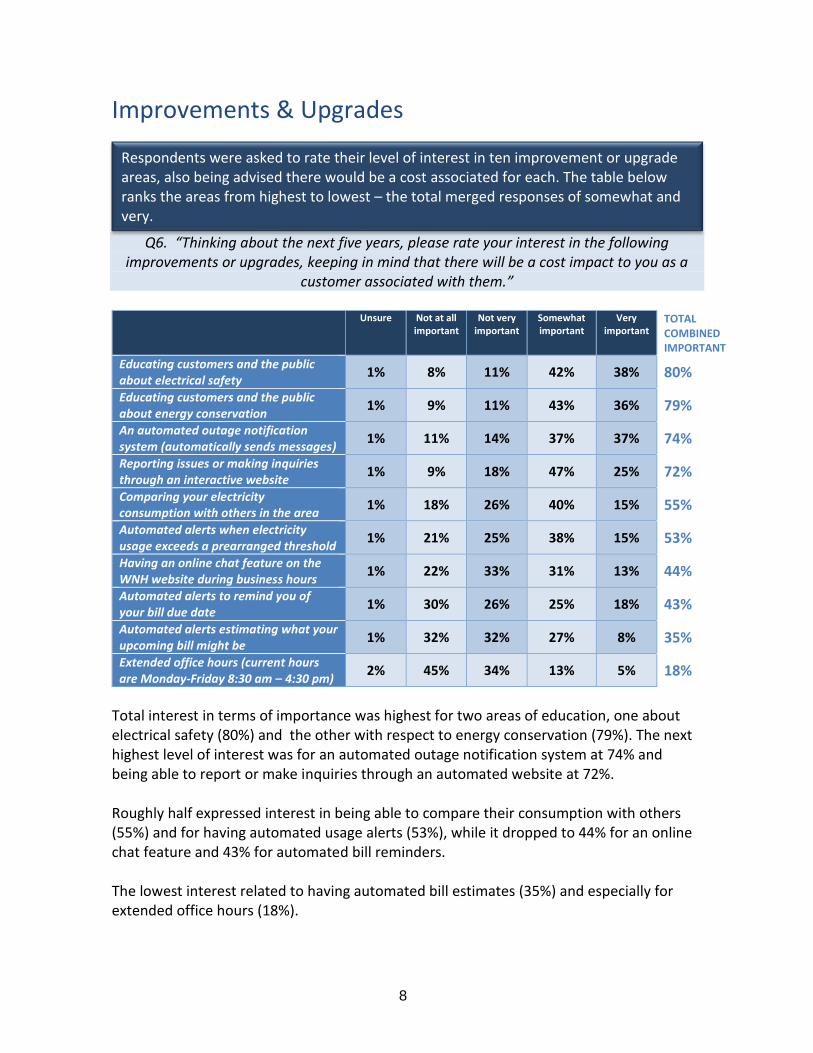
8
Improvements & Upgrades
Q6. “Thinking about the next five years, please rate your interest in the following improvements or upgrades, keeping in mind that there will be a cost impact to you as a
customer associated with them.”
Unsure Not at all important
Not very important
Somewhat important
Very important
TOTAL COMBINED IMPORTANT
Educating customers and the public about electrical safety
1% 8% 11% 42% 38% 80%
Educating customers and the public about energy conservation
1% 9% 11% 43% 36% 79%
An automated outage notification system (automatically sends messages)
1% 11% 14% 37% 37% 74%
Reporting issues or making inquiries through an interactive website
1% 9% 18% 47% 25% 72%
Comparing your electricity consumption with others in the area
1% 18% 26% 40% 15% 55%
Automated alerts when electricity usage exceeds a prearranged threshold
1% 21% 25% 38% 15% 53%
Having an online chat feature on the WNH website during business hours
1% 22% 33% 31% 13% 44%
Automated alerts to remind you of your bill due date
1% 30% 26% 25% 18% 43%
Automated alerts estimating what your upcoming bill might be
1% 32% 32% 27% 8% 35%
Extended office hours (current hours are Monday-Friday 8:30 am – 4:30 pm)
2% 45% 34% 13% 5% 18%
Total interest in terms of importance was highest for two areas of education, one about electrical safety (80%) and the other with respect to energy conservation (79%). The next highest level of interest was for an automated outage notification system at 74% and being able to report or make inquiries through an automated website at 72%. Roughly half expressed interest in being able to compare their consumption with others (55%) and for having automated usage alerts (53%), while it dropped to 44% for an online chat feature and 43% for automated bill reminders. The lowest interest related to having automated bill estimates (35%) and especially for extended office hours (18%).
Respondents were asked to rate their level of interest in ten improvement or upgrade areas, also being advised there would be a cost associated for each. The table below ranks the areas from highest to lowest – the total merged responses of somewhat and very.

9
Electronic & Paper Bills
The main mentions for preventing customers from receiving an E-bill related to not being aware of the cost savings (31%), closely followed by the perceived convenience of receiving a bill by mail (29%) and that a hard copy by mail serves as a reminder to pay.
Yes, 38%
No, 62%
Q7. “Do you currently receive an E-bill from WNH?”
I was not aware that the cost savings of e-billing help offset future cost increases 31% It is more convenient to receive the bill by mail 29% Receiving the bill by mail is a reminder to pay 20% I am not comfortable with technology 7% I am concerned about online security from receiving electronic bill 5% Prefer paper copy 3% Have not gotten to it yet 2% Not aware option existed 2% I do not have regular access to the internet 1%
All N=600 customers were asked if they currently receive an E-bill from Waterloo North Hydro of which 38% said they do. The 62% (N=374) that do not were then asked a follow-up question about what is preventing them from signing up for an E-bill.72) & both Thorold and
surrounding areas (61%, N=243)
Q8. “The cost of receiving a paper bill is $1.05 per month per customer or $12.60 per year. What is preventing you from registering to receive an E-bill?”
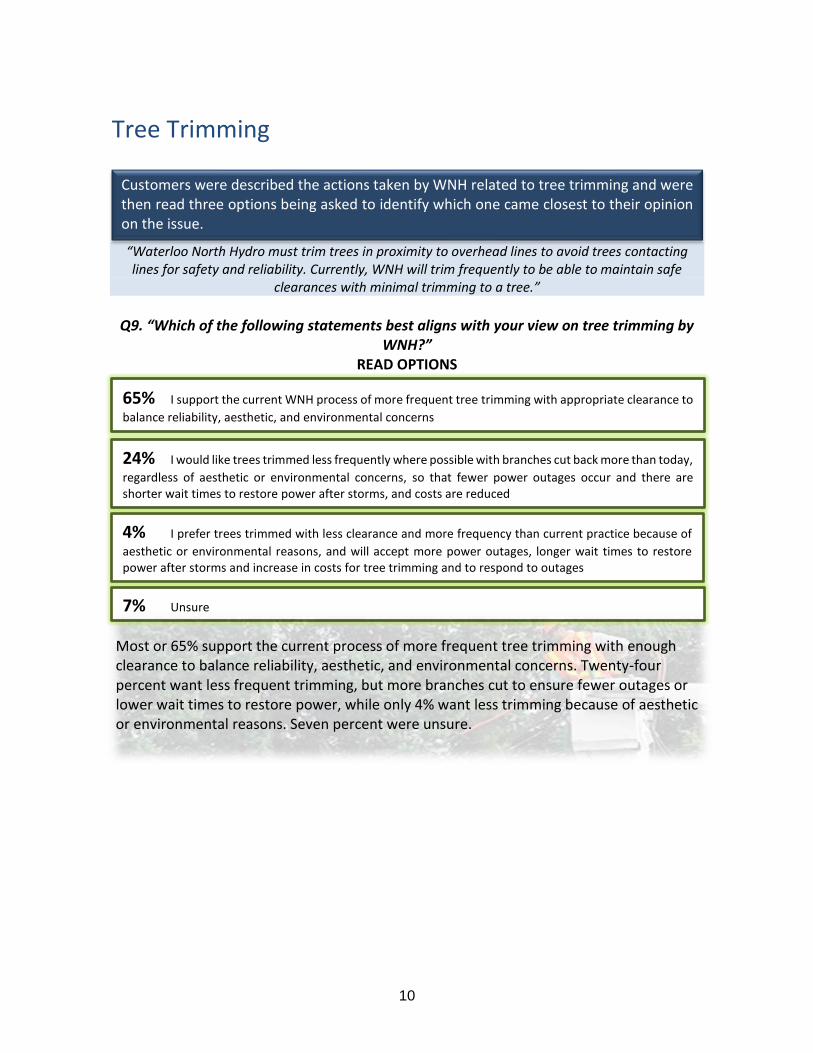
10
Tree Trimming
“Waterloo North Hydro must trim trees in proximity to overhead lines to avoid trees contacting lines for safety and reliability. Currently, WNH will trim frequently to be able to maintain safe
clearances with minimal trimming to a tree.”
Q9. “Which of the following statements best aligns with your view on tree trimming by
WNH?” READ OPTIONS
Customers were described the actions taken by WNH related to tree trimming and were then read three options being asked to identify which one came closest to their opinion on the issue.
65% I support the current WNH process of more frequent tree trimming with appropriate clearance to
balance reliability, aesthetic, and environmental concerns
4% I prefer trees trimmed with less clearance and more frequency than current practice because of
aesthetic or environmental reasons, and will accept more power outages, longer wait times to restore power after storms and increase in costs for tree trimming and to respond to outages
24% I would like trees trimmed less frequently where possible with branches cut back more than today,
regardless of aesthetic or environmental concerns, so that fewer power outages occur and there are shorter wait times to restore power after storms, and costs are reduced
7% Unsure
Most or 65% support the current process of more frequent tree trimming with enough clearance to balance reliability, aesthetic, and environmental concerns. Twenty-four percent want less frequent trimming, but more branches cut to ensure fewer outages or lower wait times to restore power, while only 4% want less trimming because of aesthetic or environmental reasons. Seven percent were unsure.
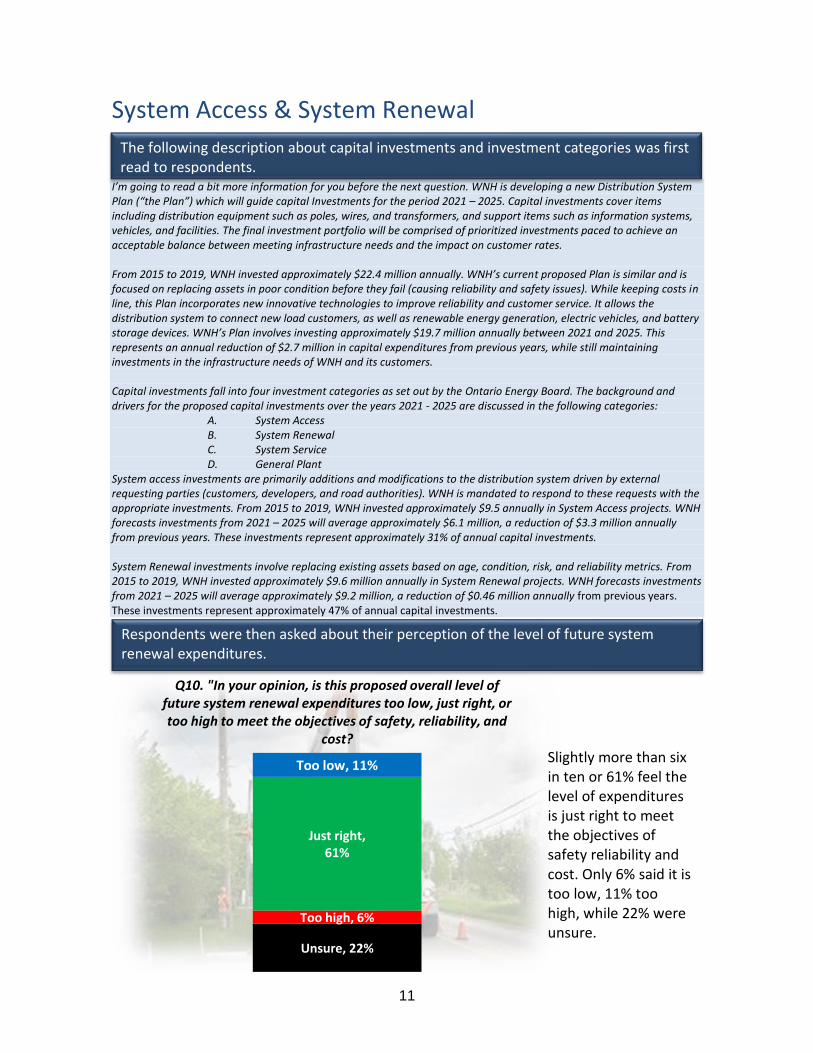
11
System Access & System Renewal I’m going to read a bit more information for you before the next question. WNH is developing a new Distribution System Plan (“the Plan”) which will guide capital Investments for the period 2021 – 2025. Capital investments cover items including distribution equipment such as poles, wires, and transformers, and support items such as information systems, vehicles, and facilities. The final investment portfolio will be comprised of prioritized investments paced to achieve an acceptable balance between meeting infrastructure needs and the impact on customer rates. From 2015 to 2019, WNH invested approximately $22.4 million annually. WNH’s current proposed Plan is similar and is focused on replacing assets in poor condition before they fail (causing reliability and safety issues). While keeping costs in line, this Plan incorporates new innovative technologies to improve reliability and customer service. It allows the distribution system to connect new load customers, as well as renewable energy generation, electric vehicles, and battery storage devices. WNH’s Plan involves investing approximately $19.7 million annually between 2021 and 2025. This represents an annual reduction of $2.7 million in capital expenditures from previous years, while still maintaining investments in the infrastructure needs of WNH and its customers. Capital investments fall into four investment categories as set out by the Ontario Energy Board. The background and drivers for the proposed capital investments over the years 2021 - 2025 are discussed in the following categories: A. System Access
B. System Renewal C. System Service D. General Plant System access investments are primarily additions and modifications to the distribution system driven by external requesting parties (customers, developers, and road authorities). WNH is mandated to respond to these requests with the appropriate investments. From 2015 to 2019, WNH invested approximately $9.5 annually in System Access projects. WNH forecasts investments from 2021 – 2025 will average approximately $6.1 million, a reduction of $3.3 million annually from previous years. These investments represent approximately 31% of annual capital investments. System Renewal investments involve replacing existing assets based on age, condition, risk, and reliability metrics. From 2015 to 2019, WNH invested approximately $9.6 million annually in System Renewal projects. WNH forecasts investments from 2021 – 2025 will average approximately $9.2 million, a reduction of $0.46 million annually from previous years. These investments represent approximately 47% of annual capital investments.
Unsure, 22%
Too high, 6%
Just right, 61%
Too low, 11%
Q10. "In your opinion, is this proposed overall level of future system renewal expenditures too low, just right, or too high to meet the objectives of safety, reliability, and
cost?
The following description about capital investments and investment categories was first read to respondents.
Slightly more than six in ten or 61% feel the level of expenditures is just right to meet the objectives of safety reliability and cost. Only 6% said it is too low, 11% too high, while 22% were unsure.
Respondents were then asked about their perception of the level of future system renewal expenditures.
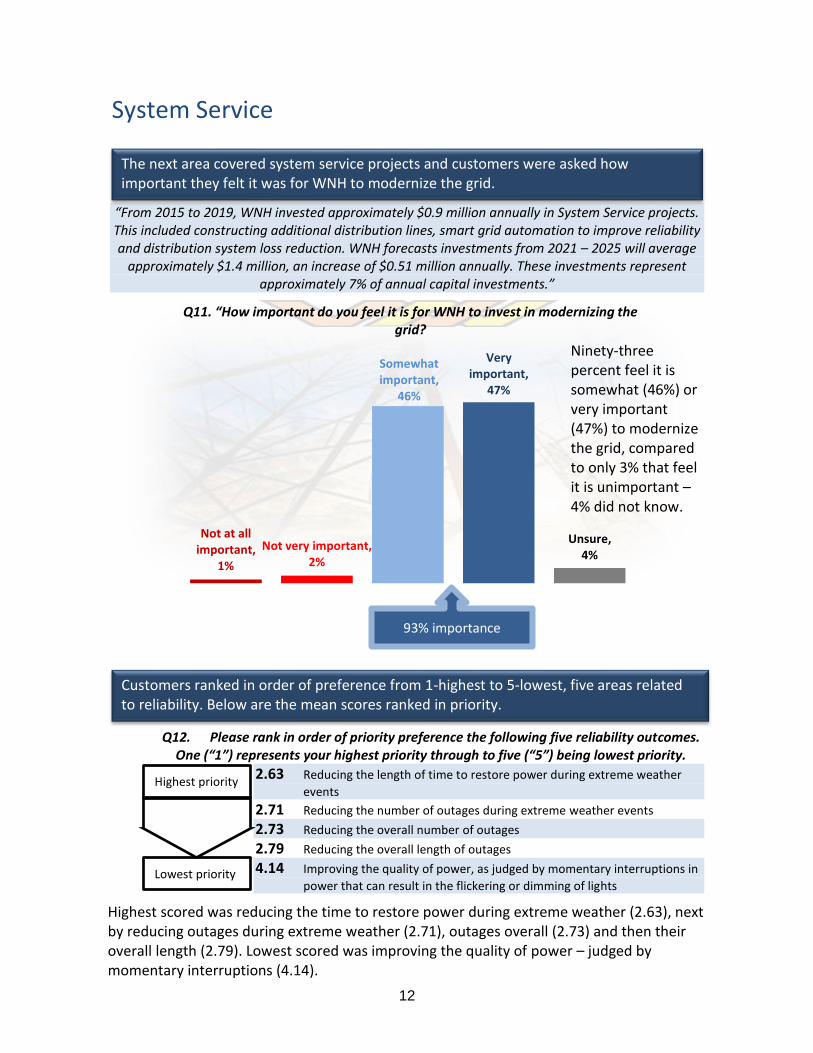
12
System Service “From 2015 to 2019, WNH invested approximately $0.9 million annually in System Service projects. This included constructing additional distribution lines, smart grid automation to improve reliability and distribution system loss reduction. WNH forecasts investments from 2021 – 2025 will average
approximately $1.4 million, an increase of $0.51 million annually. These investments represent approximately 7% of annual capital investments.”
Q12. Please rank in order of priority preference the following five reliability outcomes. One (“1”) represents your highest priority through to five (“5”) being lowest priority.
2.63 Reducing the length of time to restore power during extreme weather
events
2.71 Reducing the number of outages during extreme weather events
2.73 Reducing the overall number of outages
2.79 Reducing the overall length of outages
4.14 Improving the quality of power, as judged by momentary interruptions in
power that can result in the flickering or dimming of lights
Not at all important,
1%
Not very important, 2%
Somewhat important,
46%
Very important,
47%
Unsure, 4%
Q11. “How important do you feel it is for WNH to invest in modernizing the grid?
The next area covered system service projects and customers were asked how important they felt it was for WNH to modernize the grid.
93% importance
Ninety-three percent feel it is somewhat (46%) or very important (47%) to modernize the grid, compared to only 3% that feel it is unimportant – 4% did not know.
Highest priority
Highest scored was reducing the time to restore power during extreme weather (2.63), next by reducing outages during extreme weather (2.71), outages overall (2.73) and then their overall length (2.79). Lowest scored was improving the quality of power – judged by momentary interruptions (4.14).
Customers ranked in order of preference from 1-highest to 5-lowest, five areas related to reliability. Below are the mean scores ranked in priority.
Lowest priority
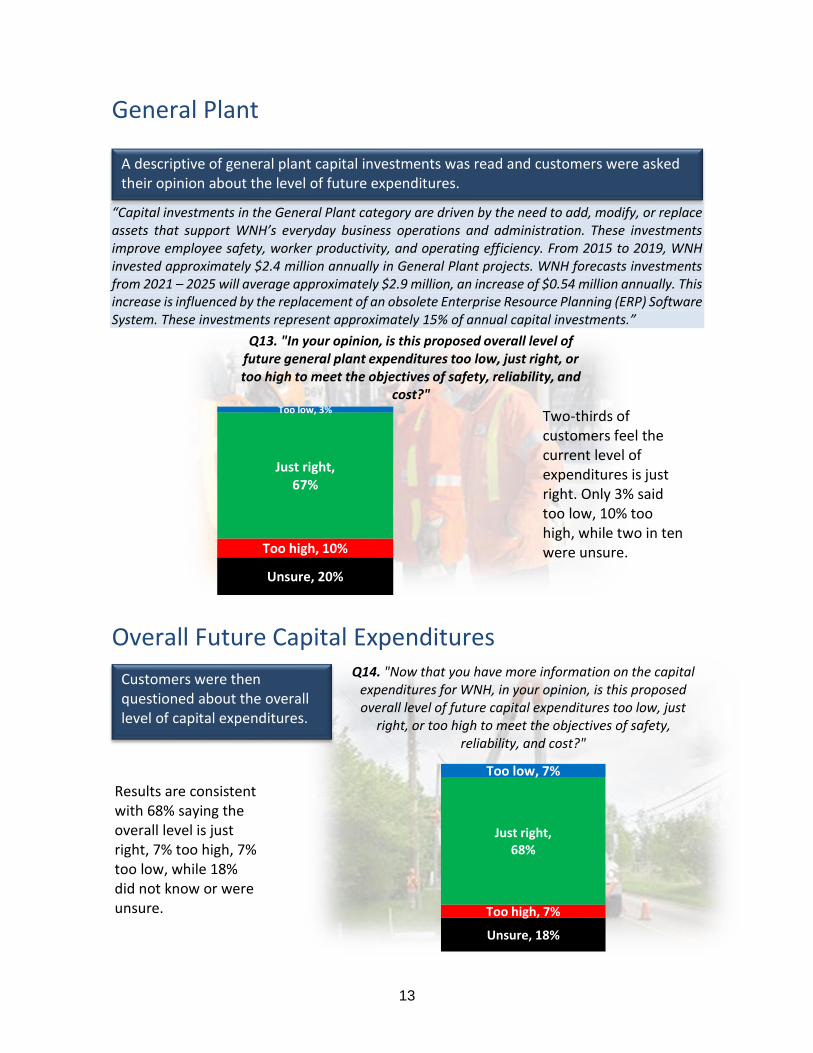
13
General Plant
“Capital investments in the General Plant category are driven by the need to add, modify, or replace assets that support WNH’s everyday business operations and administration. These investments improve employee safety, worker productivity, and operating efficiency. From 2015 to 2019, WNH invested approximately $2.4 million annually in General Plant projects. WNH forecasts investments from 2021 – 2025 will average approximately $2.9 million, an increase of $0.54 million annually. This increase is influenced by the replacement of an obsolete Enterprise Resource Planning (ERP) Software System. These investments represent approximately 15% of annual capital investments.”
Overall Future Capital Expenditures
Unsure, 20%
Too high, 10%
Just right, 67%
Too low, 3%
Q13. "In your opinion, is this proposed overall level of future general plant expenditures too low, just right, or too high to meet the objectives of safety, reliability, and
cost?"
Unsure, 18%
Too high, 7%
Just right, 68%
Too low, 7%
Q14. "Now that you have more information on the capital expenditures for WNH, in your opinion, is this proposed overall level of future capital expenditures too low, just
right, or too high to meet the objectives of safety, reliability, and cost?"
A descriptive of general plant capital investments was read and customers were asked their opinion about the level of future expenditures.
Two-thirds of customers feel the current level of expenditures is just right. Only 3% said too low, 10% too high, while two in ten were unsure.
Customers were then questioned about the overall level of capital expenditures.
Results are consistent with 68% saying the overall level is just right, 7% too high, 7% too low, while 18% did not know or were unsure.
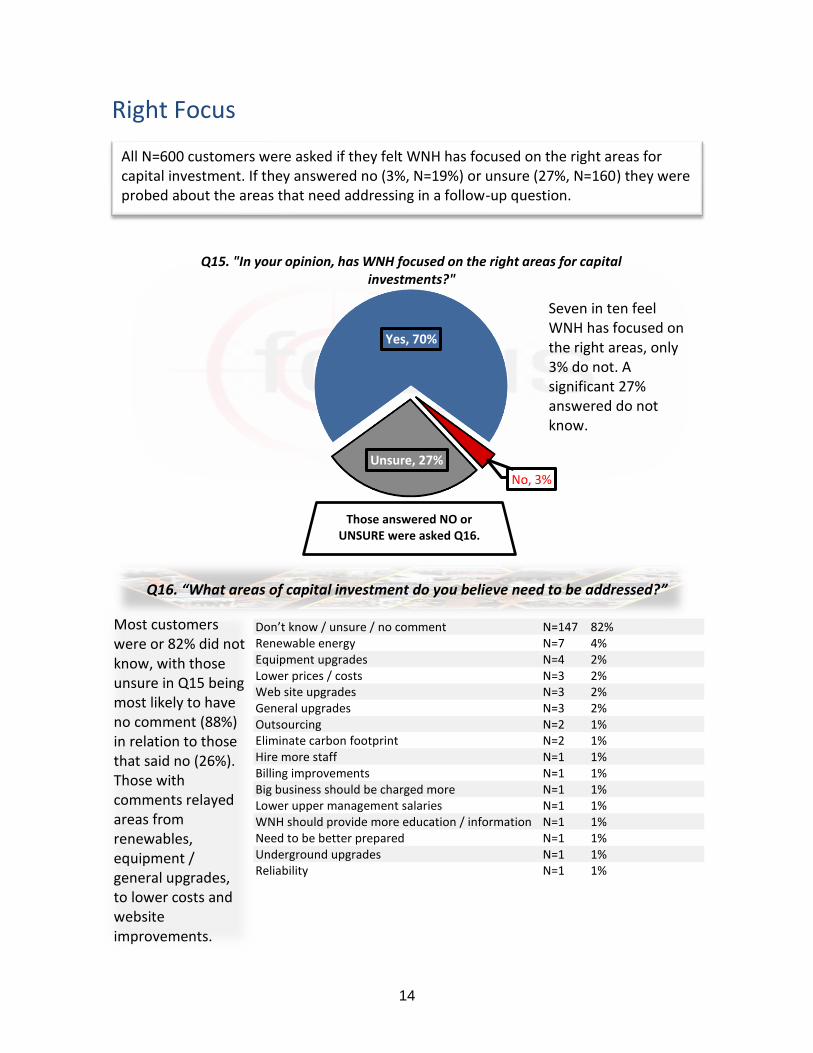
14
Right Focus
Q16. “What areas of capital investment do you believe need to be addressed?”
Don’t know / unsure / no comment N=147 82% Renewable energy N=7 4% Equipment upgrades N=4 2% Lower prices / costs N=3 2% Web site upgrades N=3 2% General upgrades N=3 2% Outsourcing N=2 1% Eliminate carbon footprint N=2 1% Hire more staff N=1 1% Billing improvements N=1 1% Big business should be charged more N=1 1% Lower upper management salaries N=1 1% WNH should provide more education / information N=1 1% Need to be better prepared N=1 1% Underground upgrades N=1 1% Reliability N=1 1%
Yes, 70%
No, 3%
Unsure, 27%
Q15. "In your opinion, has WNH focused on the right areas for capital investments?"
All N=600 customers were asked if they felt WNH has focused on the right areas for capital investment. If they answered no (3%, N=19%) or unsure (27%, N=160) they were probed about the areas that need addressing in a follow-up question.) & both Thorold and
surrounding areas (61%, N=243)
Those answered NO or UNSURE were asked Q16.
Seven in ten feel WNH has focused on the right areas, only 3% do not. A significant 27% answered do not know.
Most customers were or 82% did not know, with those unsure in Q15 being most likely to have no comment (88%) in relation to those that said no (26%). Those with comments relayed areas from renewables, equipment / general upgrades, to lower costs and website improvements.
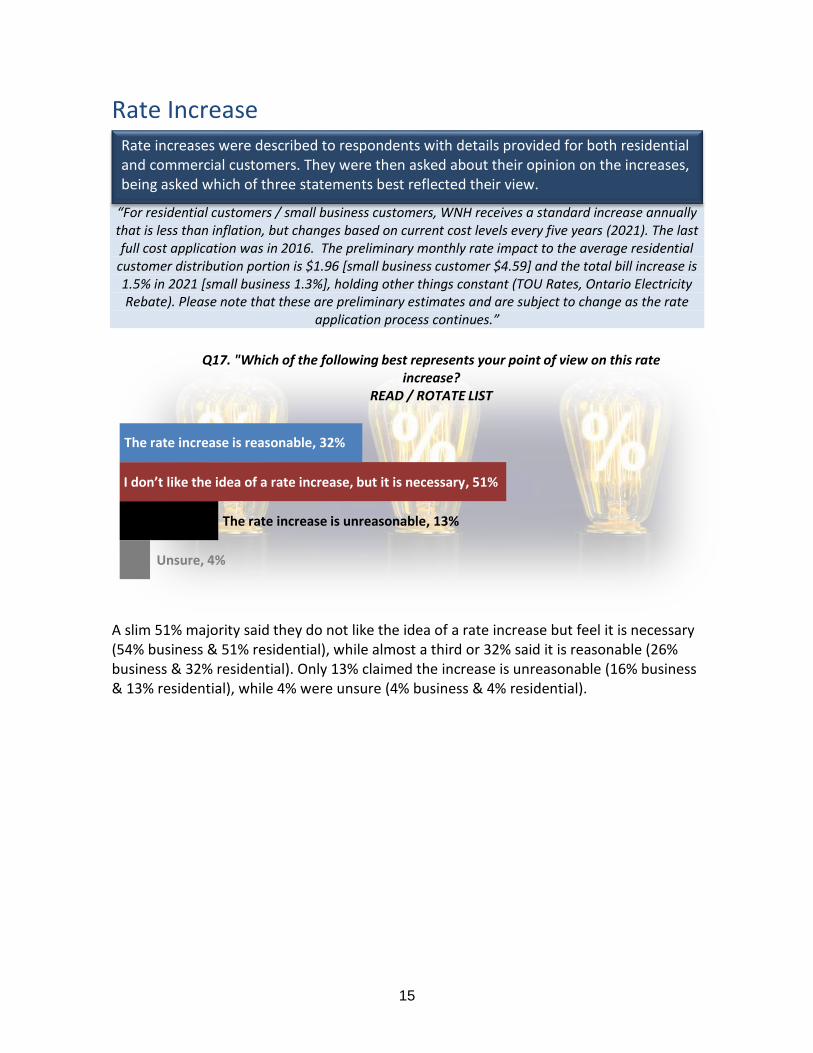
15
Rate Increase “For residential customers / small business customers, WNH receives a standard increase annually that is less than inflation, but changes based on current cost levels every five years (2021). The last full cost application was in 2016. The preliminary monthly rate impact to the average residential
customer distribution portion is $1.96 [small business customer $4.59] and the total bill increase is 1.5% in 2021 [small business 1.3%], holding other things constant (TOU Rates, Ontario Electricity Rebate). Please note that these are preliminary estimates and are subject to change as the rate
application process continues.”
A slim 51% majority said they do not like the idea of a rate increase but feel it is necessary (54% business & 51% residential), while almost a third or 32% said it is reasonable (26% business & 32% residential). Only 13% claimed the increase is unreasonable (16% business & 13% residential), while 4% were unsure (4% business & 4% residential).
Unsure, 4%
The rate increase is unreasonable, 13%
I don’t like the idea of a rate increase, but it is necessary, 51%
The rate increase is reasonable, 32%
Q17. "Which of the following best represents your point of view on this rate increase?
READ / ROTATE LIST
Rate increases were described to respondents with details provided for both residential and commercial customers. They were then asked about their opinion on the increases, being asked which of three statements best reflected their view.
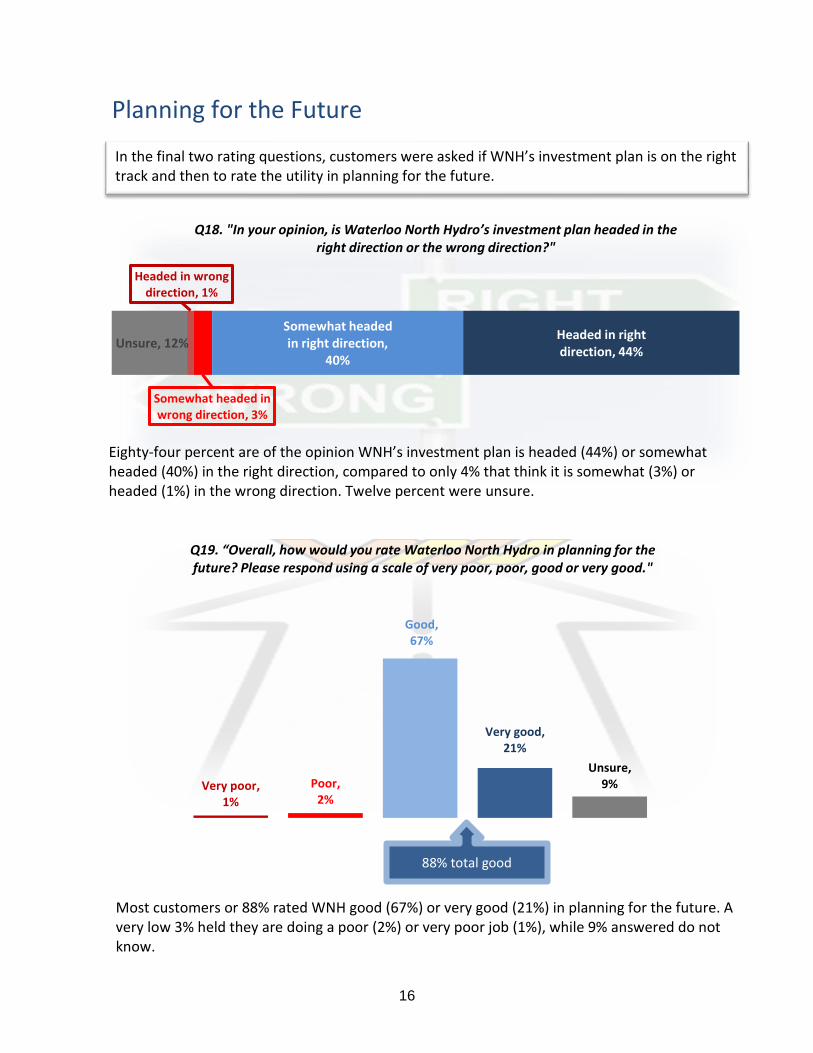
16
Planning for the Future
Unsure, 12%
Headed in wrong direction, 1%
Somewhat headed in wrong direction, 3%
Somewhat headed in right direction,
40%
Headed in right direction, 44%
Q18. "In your opinion, is Waterloo North Hydro’s investment plan headed in the right direction or the wrong direction?"
Very poor, 1%
Poor, 2%
Good, 67%
Very good, 21%
Unsure, 9%
Q19. “Overall, how would you rate Waterloo North Hydro in planning for the future? Please respond using a scale of very poor, poor, good or very good."
88% total good
In the final two rating questions, customers were asked if WNH’s investment plan is on the right track and then to rate the utility in planning for the future. Thorold and surrounding areas (61%, N=243)
Eighty-four percent are of the opinion WNH’s investment plan is headed (44%) or somewhat headed (40%) in the right direction, compared to only 4% that think it is somewhat (3%) or headed (1%) in the wrong direction. Twelve percent were unsure.
Most customers or 88% rated WNH good (67%) or very good (21%) in planning for the future. A very low 3% held they are doing a poor (2%) or very poor job (1%), while 9% answered do not know.
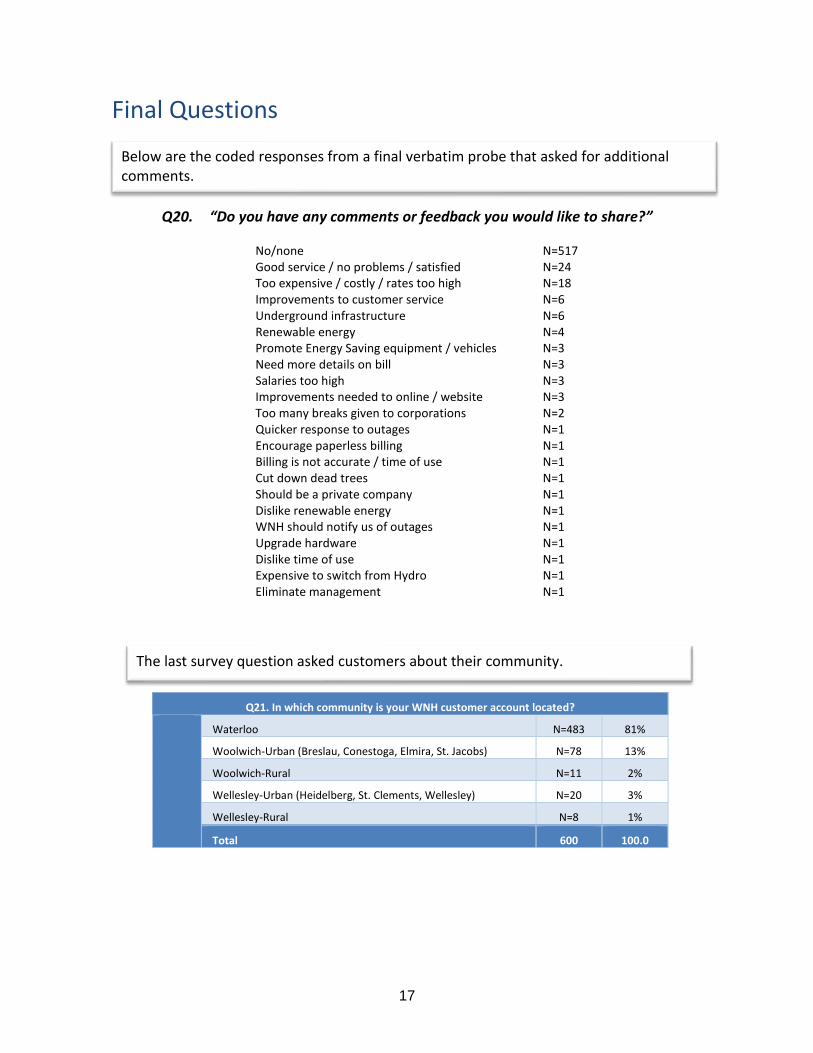
17
Final Questions
Q20. “Do you have any comments or feedback you would like to share?”
No/none N=517 Good service / no problems / satisfied N=24 Too expensive / costly / rates too high N=18 Improvements to customer service N=6 Underground infrastructure N=6 Renewable energy N=4 Promote Energy Saving equipment / vehicles N=3 Need more details on bill N=3 Salaries too high N=3 Improvements needed to online / website N=3 Too many breaks given to corporations N=2 Quicker response to outages N=1 Encourage paperless billing N=1 Billing is not accurate / time of use N=1 Cut down dead trees N=1 Should be a private company N=1 Dislike renewable energy N=1 WNH should notify us of outages N=1 Upgrade hardware N=1 Dislike time of use N=1 Expensive to switch from Hydro N=1 Eliminate management N=1
Q21. In which community is your WNH customer account located?
Waterloo N=483 81%
Woolwich-Urban (Breslau, Conestoga, Elmira, St. Jacobs) N=78 13%
Woolwich-Rural N=11 2%
Wellesley-Urban (Heidelberg, St. Clements, Wellesley) N=20 3%
Wellesley-Rural N=8 1%
Total 600 100.0
Below are the coded responses from a final verbatim probe that asked for additional comments. and surrounding areas (61%, N=243)
The last survey question asked customers about their community. areas (61%, N=243)
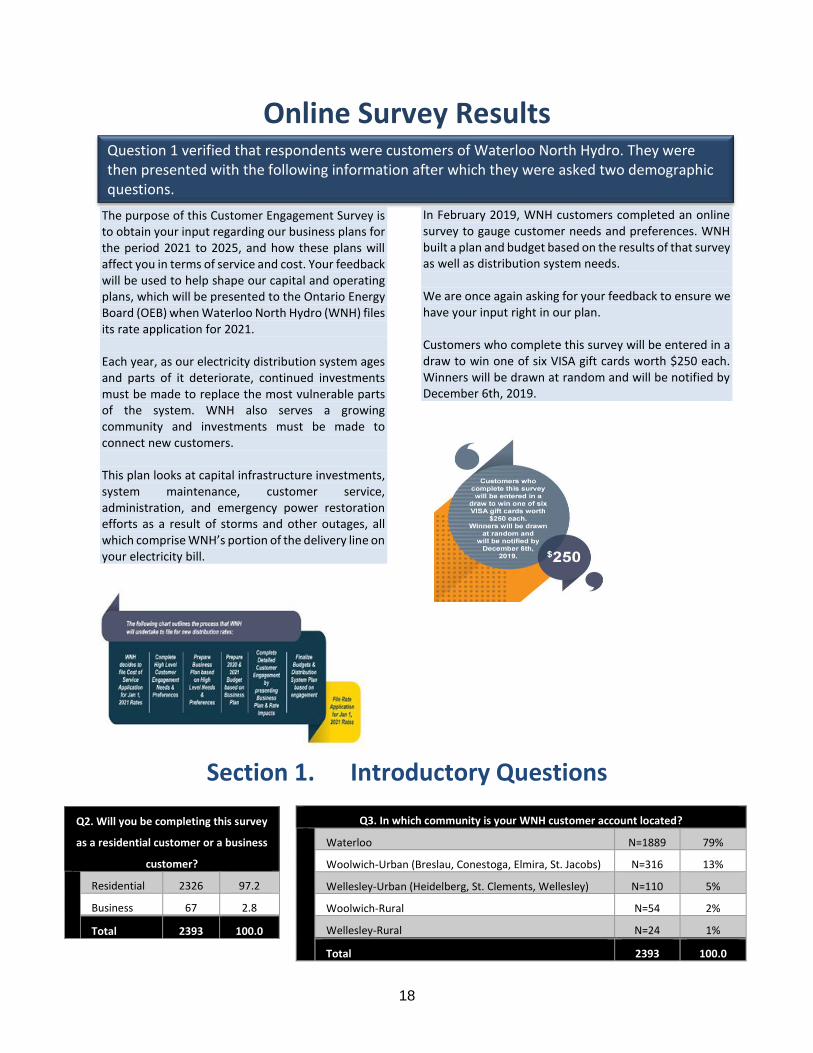
18
Online Survey Results
Section 1. Introductory Questions
Q3. In which community is your WNH customer account located?
Waterloo N=1889 79%
Woolwich-Urban (Breslau, Conestoga, Elmira, St. Jacobs) N=316 13%
Wellesley-Urban (Heidelberg, St. Clements, Wellesley) N=110 5%
Woolwich-Rural N=54 2%
Wellesley-Rural N=24 1%
Total 2393 100.0
Question 1 verified that respondents were customers of Waterloo North Hydro. They were then presented with the following information after which they were asked two demographic questions.
The purpose of this Customer Engagement Survey is to obtain your input regarding our business plans for the period 2021 to 2025, and how these plans will affect you in terms of service and cost. Your feedback will be used to help shape our capital and operating plans, which will be presented to the Ontario Energy Board (OEB) when Waterloo North Hydro (WNH) files its rate application for 2021. Each year, as our electricity distribution system ages and parts of it deteriorate, continued investments must be made to replace the most vulnerable parts of the system. WNH also serves a growing community and investments must be made to connect new customers. This plan looks at capital infrastructure investments, system maintenance, customer service, administration, and emergency power restoration efforts as a result of storms and other outages, all which comprise WNH’s portion of the delivery line on your electricity bill. Our continued priority is to reliably and efficiently deliver the electricity that you depend on.
Q2. Will you be completing this survey
as a residential customer or a business
customer?
Residential 2326 97.2
Business 67 2.8
Total 2393 100.0
In February 2019, WNH customers completed an online survey to gauge customer needs and preferences. WNH built a plan and budget based on the results of that survey as well as distribution system needs. We are once again asking for your feedback to ensure we have your input right in our plan. Customers who complete this survey will be entered in a draw to win one of six VISA gift cards worth $250 each. Winners will be drawn at random and will be notified by December 6th, 2019.
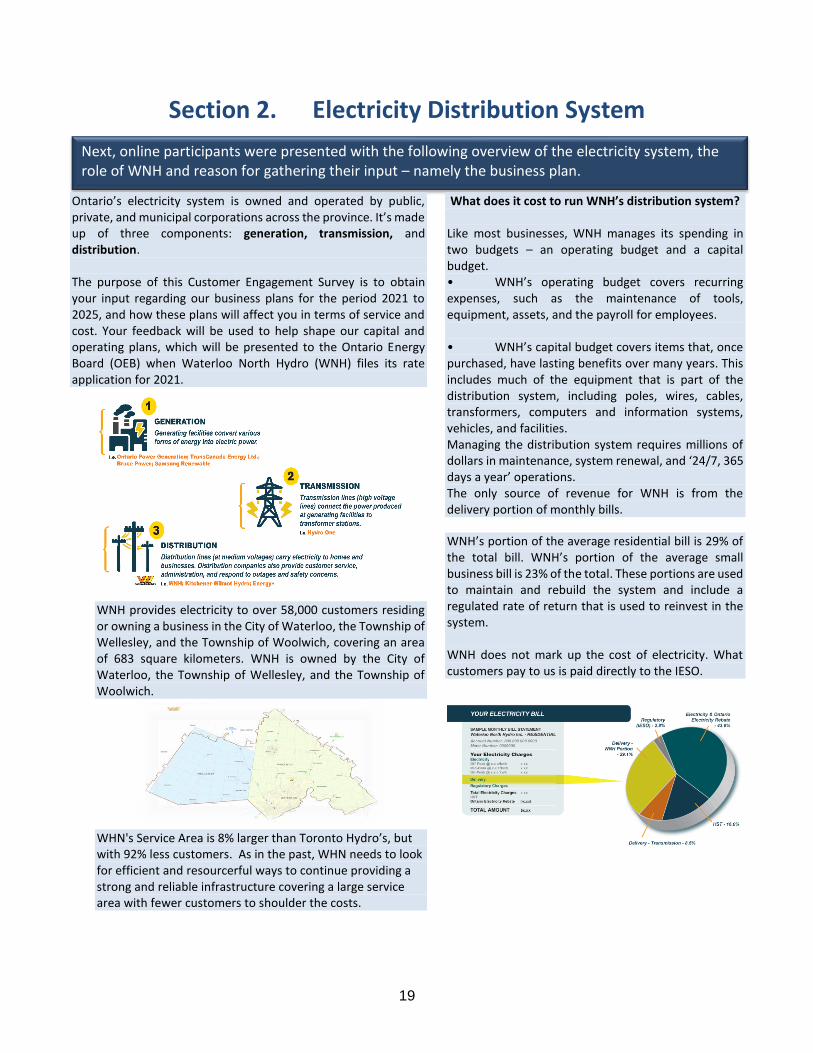
19
Section 2. Electricity Distribution System
Next, online participants were presented with the following overview of the electricity system, the role of WNH and reason for gathering their input – namely the business plan.
Ontario’s electricity system is owned and operated by public, private, and municipal corporations across the province. It’s made up of three components: generation, transmission, and distribution. The purpose of this Customer Engagement Survey is to obtain your input regarding our business plans for the period 2021 to 2025, and how these plans will affect you in terms of service and cost. Your feedback will be used to help shape our capital and operating plans, which will be presented to the Ontario Energy Board (OEB) when Waterloo North Hydro (WNH) files its rate application for 2021.
WNH provides electricity to over 58,000 customers residing or owning a business in the City of Waterloo, the Township of Wellesley, and the Township of Woolwich, covering an area of 683 square kilometers. WNH is owned by the City of Waterloo, the Township of Wellesley, and the Township of Woolwich.
WHN's Service Area is 8% larger than Toronto Hydro’s, but with 92% less customers. As in the past, WHN needs to look for efficient and resourcerful ways to continue providing a strong and reliable infrastructure covering a large service area with fewer customers to shoulder the costs.
What does it cost to run WNH’s distribution system?
Like most businesses, WNH manages its spending in two budgets – an operating budget and a capital budget. • WNH’s operating budget covers recurring expenses, such as the maintenance of tools, equipment, assets, and the payroll for employees. • WNH’s capital budget covers items that, once purchased, have lasting benefits over many years. This includes much of the equipment that is part of the distribution system, including poles, wires, cables, transformers, computers and information systems, vehicles, and facilities. Managing the distribution system requires millions of dollars in maintenance, system renewal, and ‘24/7, 365 days a year’ operations. The only source of revenue for WNH is from the delivery portion of monthly bills.
WNH’s portion of the average residential bill is 29% of the total bill. WNH’s portion of the average small business bill is 23% of the total. These portions are used to maintain and rebuild the system and include a regulated rate of return that is used to reinvest in the system. WNH does not mark up the cost of electricity. What customers pay to us is paid directly to the IESO.
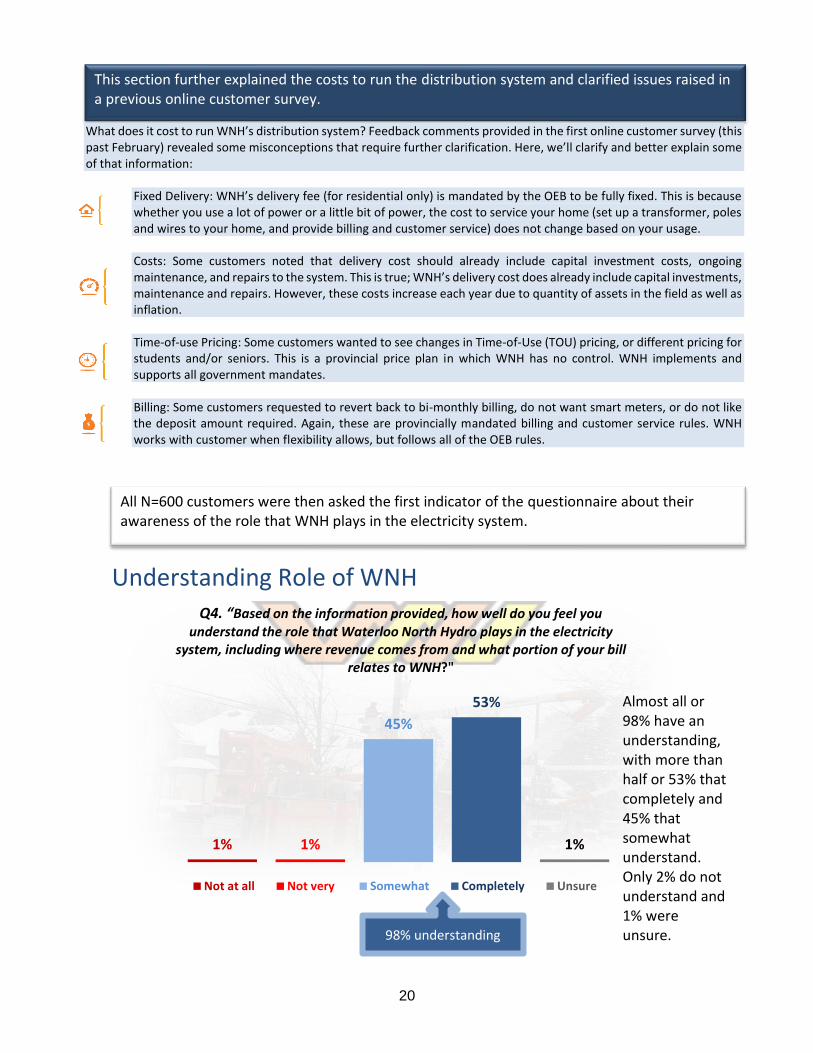
20
Understanding Role of WNH
1% 1%
45%
53%
1%
Q4. “Based on the information provided, how well do you feel you understand the role that Waterloo North Hydro plays in the electricity
system, including where revenue comes from and what portion of your bill relates to WNH?"
Not at all Not very Somewhat Completely Unsure
This section further explained the costs to run the distribution system and clarified issues raised in a previous online customer survey.
What does it cost to run WNH’s distribution system? Feedback comments provided in the first online customer survey (this past February) revealed some misconceptions that require further clarification. Here, we’ll clarify and better explain some of that information:
Fixed Delivery: WNH’s delivery fee (for residential only) is mandated by the OEB to be fully fixed. This is because whether you use a lot of power or a little bit of power, the cost to service your home (set up a transformer, poles and wires to your home, and provide billing and customer service) does not change based on your usage. Costs: Some customers noted that delivery cost should already include capital investment costs, ongoing maintenance, and repairs to the system. This is true; WNH’s delivery cost does already include capital investments, maintenance and repairs. However, these costs increase each year due to quantity of assets in the field as well as inflation. Time-of-use Pricing: Some customers wanted to see changes in Time-of-Use (TOU) pricing, or different pricing for students and/or seniors. This is a provincial price plan in which WNH has no control. WNH implements and supports all government mandates. Billing: Some customers requested to revert back to bi-monthly billing, do not want smart meters, or do not like the deposit amount required. Again, these are provincially mandated billing and customer service rules. WNH works with customer when flexibility allows, but follows all of the OEB rules.
All N=600 customers were then asked the first indicator of the questionnaire about their awareness of the role that WNH plays in the electricity system. N=72) & both Thorold and surrounding
areas (61%, N=243)
98% understanding
Almost all or 98% have an understanding, with more than half or 53% that completely and 45% that somewhat understand. Only 2% do not understand and 1% were unsure.
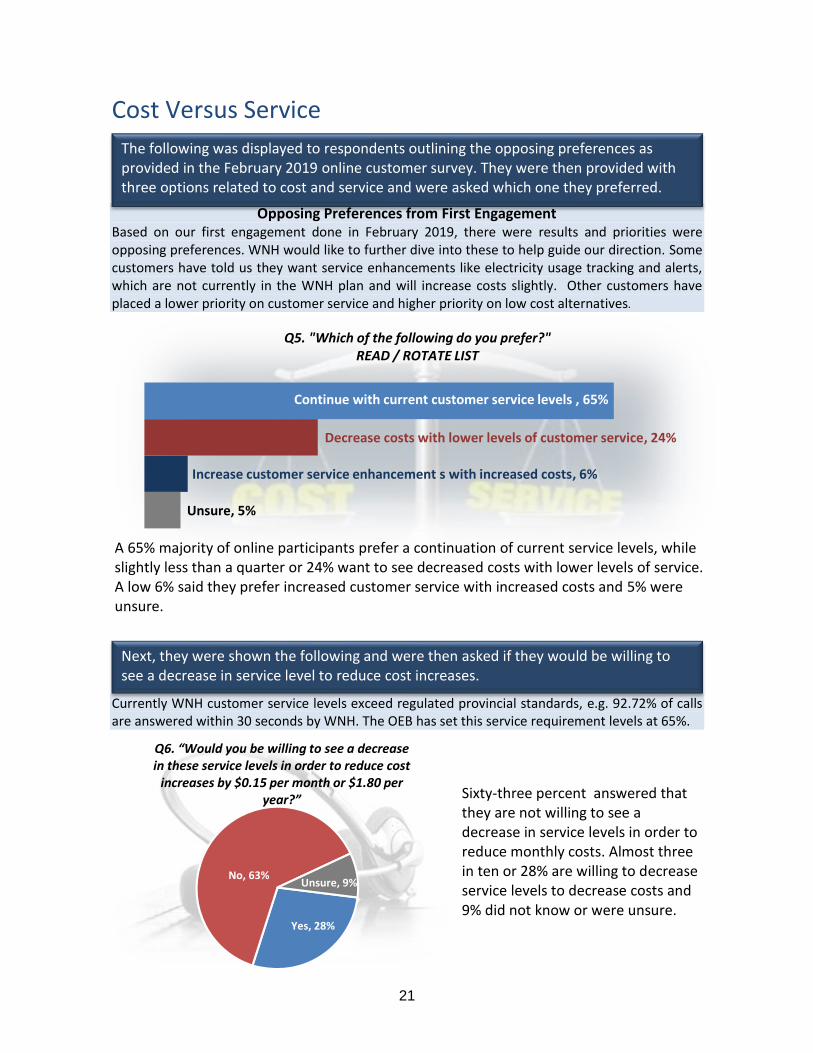
21
Cost Versus Service
Opposing Preferences from First Engagement Based on our first engagement done in February 2019, there were results and priorities were opposing preferences. WNH would like to further dive into these to help guide our direction. Some customers have told us they want service enhancements like electricity usage tracking and alerts, which are not currently in the WNH plan and will increase costs slightly. Other customers have placed a lower priority on customer service and higher priority on low cost alternatives.
Currently WNH customer service levels exceed regulated provincial standards, e.g. 92.72% of calls are answered within 30 seconds by WNH. The OEB has set this service requirement levels at 65%.
Unsure, 5%
Increase customer service enhancement s with increased costs, 6%
Decrease costs with lower levels of customer service, 24%
Continue with current customer service levels , 65%
Q5. "Which of the following do you prefer?" READ / ROTATE LIST
Yes, 28%
No, 63%Unsure, 9%
Q6. “Would you be willing to see a decrease in these service levels in order to reduce cost
increases by $0.15 per month or $1.80 per year?”
The following was displayed to respondents outlining the opposing preferences as provided in the February 2019 online customer survey. They were then provided with three options related to cost and service and were asked which one they preferred.
A 65% majority of online participants prefer a continuation of current service levels, while slightly less than a quarter or 24% want to see decreased costs with lower levels of service. A low 6% said they prefer increased customer service with increased costs and 5% were unsure.
Next, they were shown the following and were then asked if they would be willing to see a decrease in service level to reduce cost increases.
Sixty-three percent answered that they are not willing to see a decrease in service levels in order to reduce monthly costs. Almost three in ten or 28% are willing to decrease service levels to decrease costs and 9% did not know or were unsure.
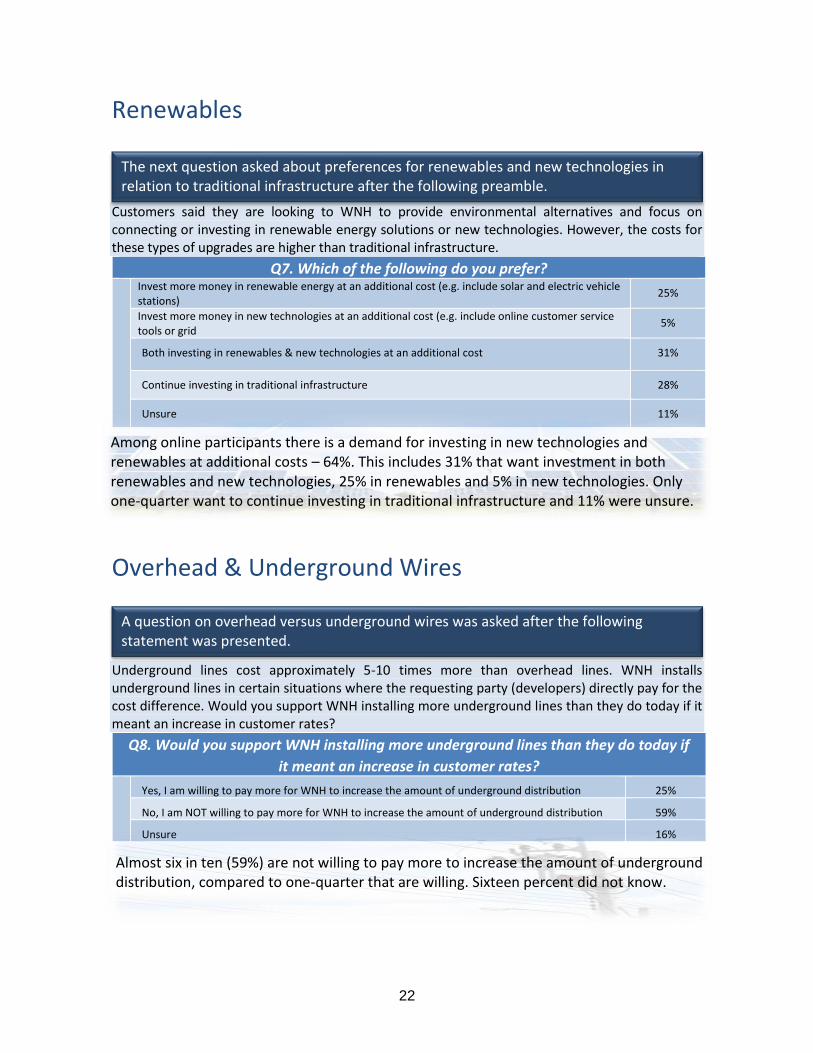
22
Renewables Customers said they are looking to WNH to provide environmental alternatives and focus on connecting or investing in renewable energy solutions or new technologies. However, the costs for these types of upgrades are higher than traditional infrastructure.
Q7. Which of the following do you prefer?
Invest more money in renewable energy at an additional cost (e.g. include solar and electric vehicle stations)
25%
Invest more money in new technologies at an additional cost (e.g. include online customer service tools or grid
5%
Both investing in renewables & new technologies at an additional cost 31%
Continue investing in traditional infrastructure 28%
Unsure 11%
Overhead & Underground Wires Underground lines cost approximately 5-10 times more than overhead lines. WNH installs underground lines in certain situations where the requesting party (developers) directly pay for the cost difference. Would you support WNH installing more underground lines than they do today if it meant an increase in customer rates?
Q8. Would you support WNH installing more underground lines than they do today if
it meant an increase in customer rates? Yes, I am willing to pay more for WNH to increase the amount of underground distribution 25%
No, I am NOT willing to pay more for WNH to increase the amount of underground distribution 59%
Unsure 16%
The next question asked about preferences for renewables and new technologies in relation to traditional infrastructure after the following preamble.
Among online participants there is a demand for investing in new technologies and renewables at additional costs – 64%. This includes 31% that want investment in both renewables and new technologies, 25% in renewables and 5% in new technologies. Only one-quarter want to continue investing in traditional infrastructure and 11% were unsure.
Almost six in ten (59%) are not willing to pay more to increase the amount of underground distribution, compared to one-quarter that are willing. Sixteen percent did not know.
A question on overhead versus underground wires was asked after the following statement was presented.
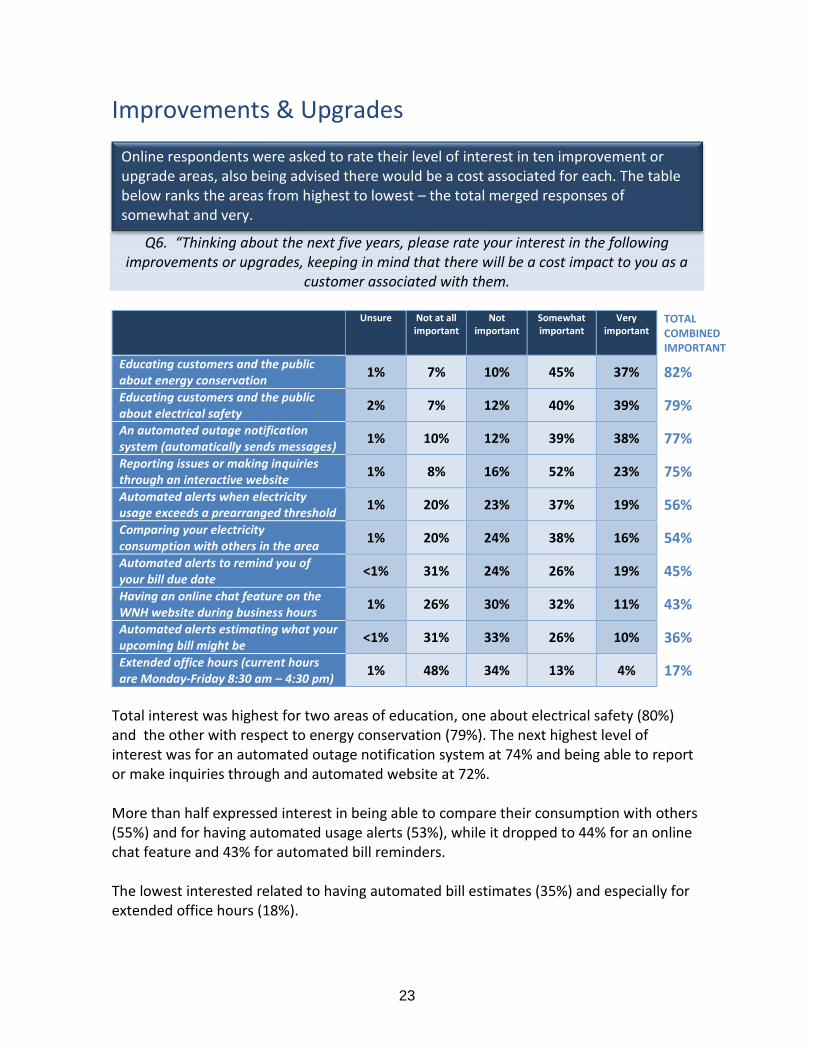
23
Improvements & Upgrades
Q6. “Thinking about the next five years, please rate your interest in the following improvements or upgrades, keeping in mind that there will be a cost impact to you as a
customer associated with them.
Unsure Not at all important
Not important
Somewhat important
Very important
TOTAL COMBINED IMPORTANT
Educating customers and the public about energy conservation
1% 7% 10% 45% 37% 82%
Educating customers and the public about electrical safety
2% 7% 12% 40% 39% 79%
An automated outage notification system (automatically sends messages)
1% 10% 12% 39% 38% 77%
Reporting issues or making inquiries through an interactive website
1% 8% 16% 52% 23% 75%
Automated alerts when electricity usage exceeds a prearranged threshold
1% 20% 23% 37% 19% 56%
Comparing your electricity consumption with others in the area
1% 20% 24% 38% 16% 54%
Automated alerts to remind you of your bill due date
<1% 31% 24% 26% 19% 45%
Having an online chat feature on the WNH website during business hours
1% 26% 30% 32% 11% 43%
Automated alerts estimating what your upcoming bill might be
<1% 31% 33% 26% 10% 36%
Extended office hours (current hours are Monday-Friday 8:30 am – 4:30 pm)
1% 48% 34% 13% 4% 17%
Total interest was highest for two areas of education, one about electrical safety (80%) and the other with respect to energy conservation (79%). The next highest level of interest was for an automated outage notification system at 74% and being able to report or make inquiries through and automated website at 72%. More than half expressed interest in being able to compare their consumption with others (55%) and for having automated usage alerts (53%), while it dropped to 44% for an online chat feature and 43% for automated bill reminders. The lowest interested related to having automated bill estimates (35%) and especially for extended office hours (18%).
Online respondents were asked to rate their level of interest in ten improvement or upgrade areas, also being advised there would be a cost associated for each. The table below ranks the areas from highest to lowest – the total merged responses of somewhat and very.
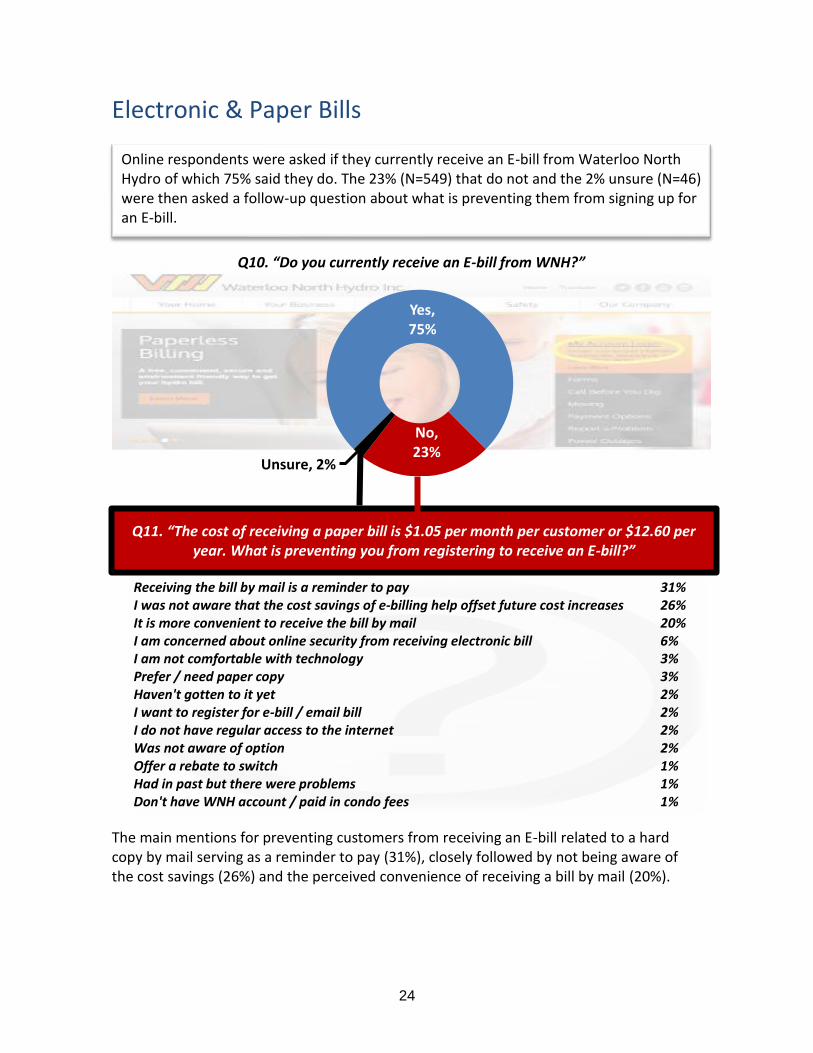
24
Electronic & Paper Bills
The main mentions for preventing customers from receiving an E-bill related to a hard copy by mail serving as a reminder to pay (31%), closely followed by not being aware of the cost savings (26%) and the perceived convenience of receiving a bill by mail (20%).
Yes, 75%
No, 23%
Unsure, 2%
Q10. “Do you currently receive an E-bill from WNH?”
Online respondents were asked if they currently receive an E-bill from Waterloo North Hydro of which 75% said they do. The 23% (N=549) that do not and the 2% unsure (N=46) were then asked a follow-up question about what is preventing them from signing up for an E-bill.72) & both Thorold and surrounding areas (61%, N=243)
Q11. “The cost of receiving a paper bill is $1.05 per month per customer or $12.60 per year. What is preventing you from registering to receive an E-bill?”
Receiving the bill by mail is a reminder to pay 31% I was not aware that the cost savings of e-billing help offset future cost increases 26% It is more convenient to receive the bill by mail 20% I am concerned about online security from receiving electronic bill 6% I am not comfortable with technology 3% Prefer / need paper copy 3% Haven't gotten to it yet 2% I want to register for e-bill / email bill 2% I do not have regular access to the internet 2% Was not aware of option 2% Offer a rebate to switch 1% Had in past but there were problems 1% Don't have WNH account / paid in condo fees 1%
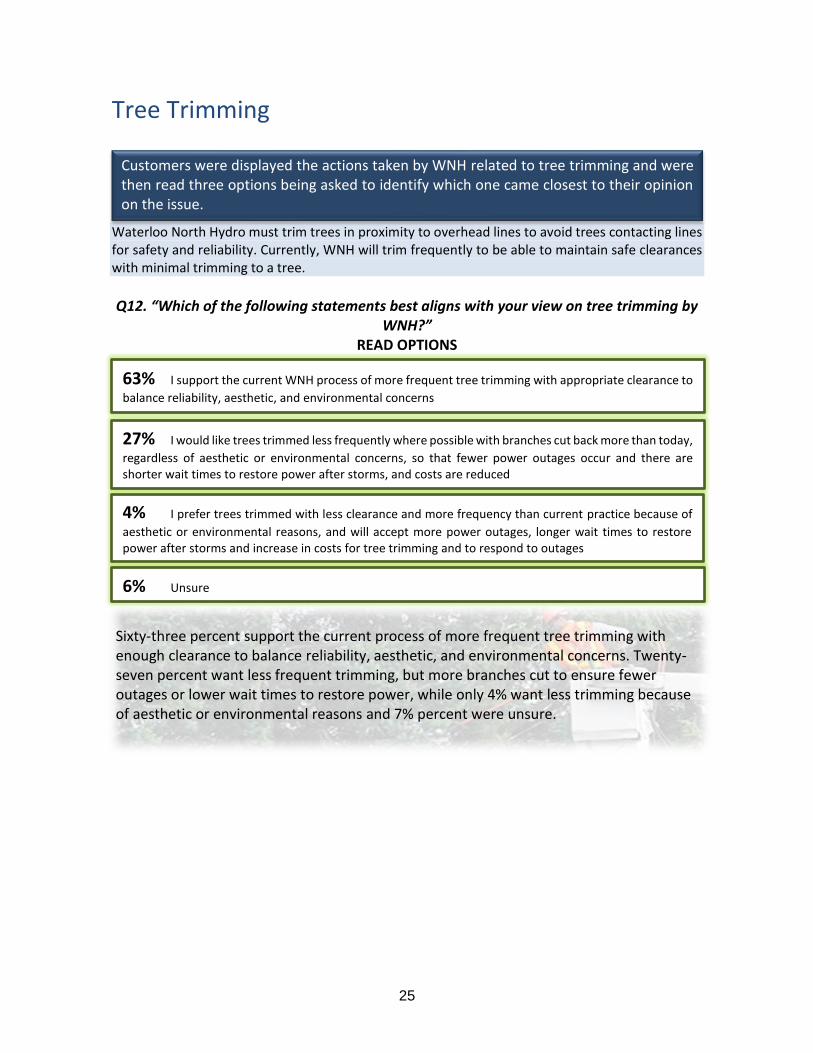
25
Tree Trimming Waterloo North Hydro must trim trees in proximity to overhead lines to avoid trees contacting lines for safety and reliability. Currently, WNH will trim frequently to be able to maintain safe clearances with minimal trimming to a tree.
Q12. “Which of the following statements best aligns with your view on tree trimming by
WNH?” READ OPTIONS
Customers were displayed the actions taken by WNH related to tree trimming and were then read three options being asked to identify which one came closest to their opinion on the issue.
63% I support the current WNH process of more frequent tree trimming with appropriate clearance to
balance reliability, aesthetic, and environmental concerns
4% I prefer trees trimmed with less clearance and more frequency than current practice because of
aesthetic or environmental reasons, and will accept more power outages, longer wait times to restore power after storms and increase in costs for tree trimming and to respond to outages
27% I would like trees trimmed less frequently where possible with branches cut back more than today,
regardless of aesthetic or environmental concerns, so that fewer power outages occur and there are shorter wait times to restore power after storms, and costs are reduced
6% Unsure
Sixty-three percent support the current process of more frequent tree trimming with enough clearance to balance reliability, aesthetic, and environmental concerns. Twenty-seven percent want less frequent trimming, but more branches cut to ensure fewer outages or lower wait times to restore power, while only 4% want less trimming because of aesthetic or environmental reasons and 7% percent were unsure.
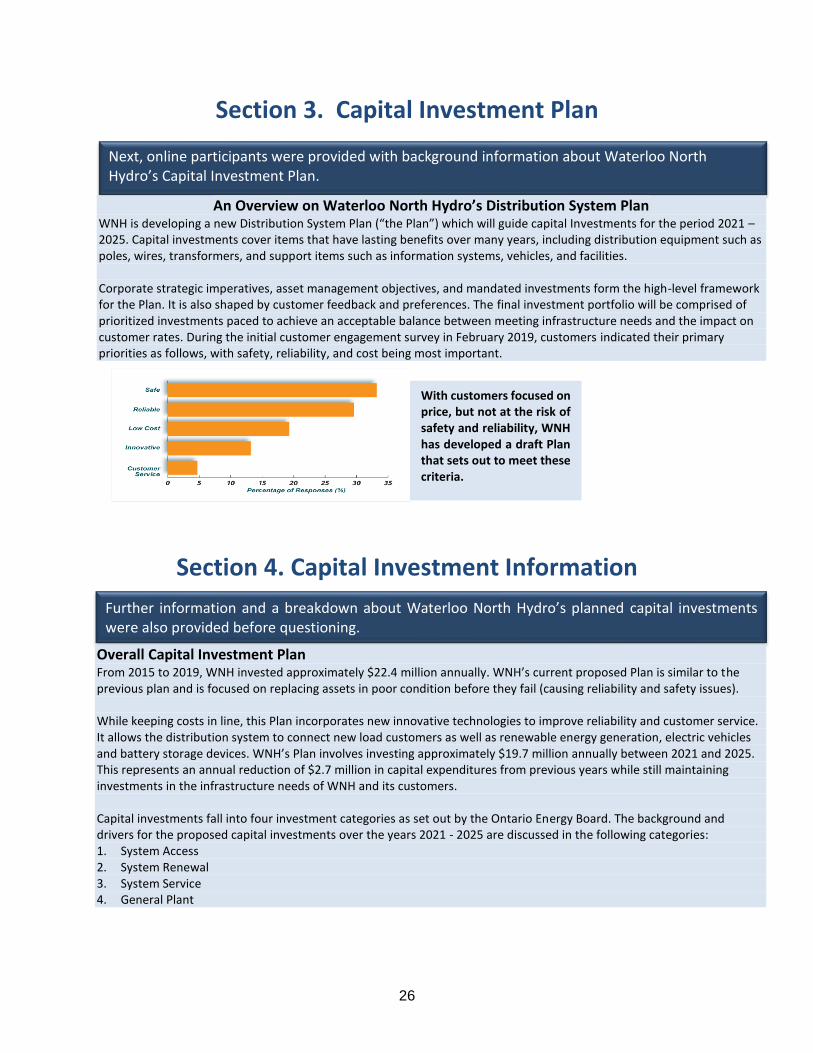
26
Section 3. Capital Investment Plan
Section 4. Capital Investment Information
.
Next, online participants were provided with background information about Waterloo North Hydro’s Capital Investment Plan.
With customers focused on price, but not at the risk of safety and reliability, WNH has developed a draft Plan that sets out to meet these criteria.
Further information and a breakdown about Waterloo North Hydro’s planned capital investments were also provided before questioning.
An Overview on Waterloo North Hydro’s Distribution System Plan
WNH is developing a new Distribution System Plan (“the Plan”) which will guide capital Investments for the period 2021 – 2025. Capital investments cover items that have lasting benefits over many years, including distribution equipment such as poles, wires, transformers, and support items such as information systems, vehicles, and facilities. Corporate strategic imperatives, asset management objectives, and mandated investments form the high-level framework for the Plan. It is also shaped by customer feedback and preferences. The final investment portfolio will be comprised of prioritized investments paced to achieve an acceptable balance between meeting infrastructure needs and the impact on customer rates. During the initial customer engagement survey in February 2019, customers indicated their primary priorities as follows, with safety, reliability, and cost being most important.
Overall Capital Investment Plan From 2015 to 2019, WNH invested approximately $22.4 million annually. WNH’s current proposed Plan is similar to the previous plan and is focused on replacing assets in poor condition before they fail (causing reliability and safety issues). While keeping costs in line, this Plan incorporates new innovative technologies to improve reliability and customer service. It allows the distribution system to connect new load customers as well as renewable energy generation, electric vehicles and battery storage devices. WNH’s Plan involves investing approximately $19.7 million annually between 2021 and 2025. This represents an annual reduction of $2.7 million in capital expenditures from previous years while still maintaining investments in the infrastructure needs of WNH and its customers. Capital investments fall into four investment categories as set out by the Ontario Energy Board. The background and drivers for the proposed capital investments over the years 2021 - 2025 are discussed in the following categories: 1. System Access 2. System Renewal 3. System Service 4. General Plant .
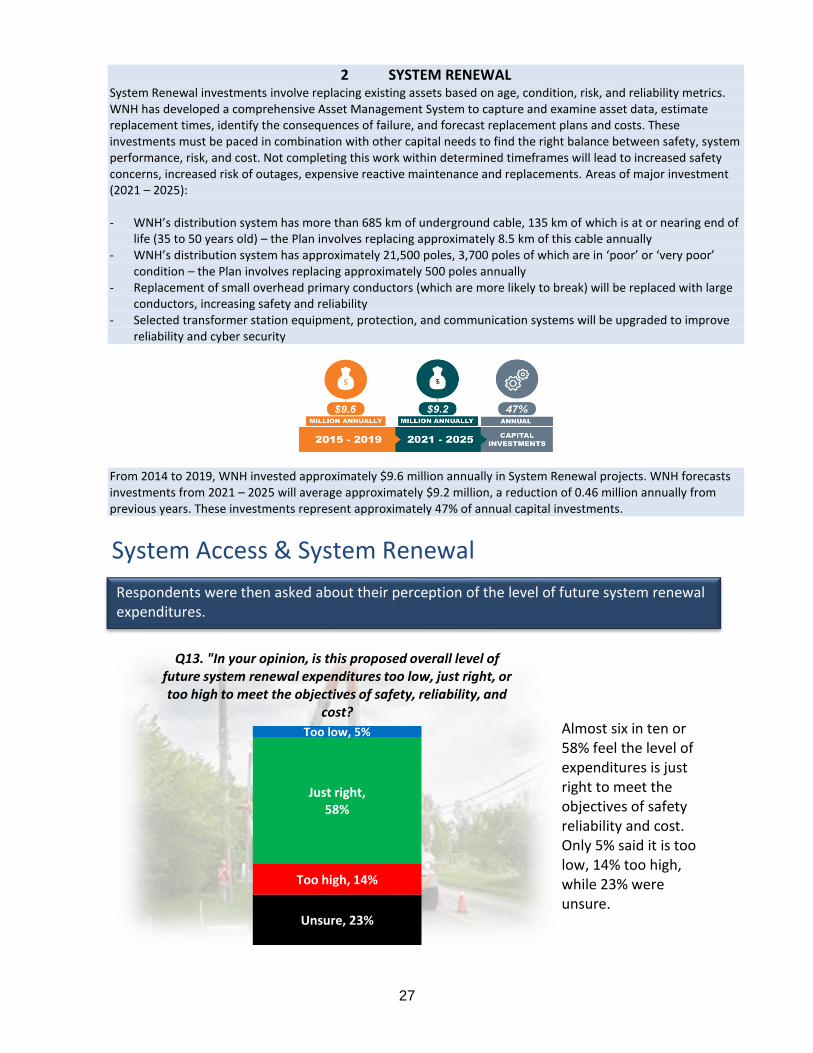
27
System Access & System Renewal
Unsure, 23%
Too high, 14%
Just right, 58%
Too low, 5%
Q13. "In your opinion, is this proposed overall level of future system renewal expenditures too low, just right, or too high to meet the objectives of safety, reliability, and
cost?
2 SYSTEM RENEWAL System Renewal investments involve replacing existing assets based on age, condition, risk, and reliability metrics. WNH has developed a comprehensive Asset Management System to capture and examine asset data, estimate replacement times, identify the consequences of failure, and forecast replacement plans and costs. These investments must be paced in combination with other capital needs to find the right balance between safety, system performance, risk, and cost. Not completing this work within determined timeframes will lead to increased safety concerns, increased risk of outages, expensive reactive maintenance and replacements. Areas of major investment (2021 – 2025): - WNH’s distribution system has more than 685 km of underground cable, 135 km of which is at or nearing end of
life (35 to 50 years old) – the Plan involves replacing approximately 8.5 km of this cable annually - WNH’s distribution system has approximately 21,500 poles, 3,700 poles of which are in ‘poor’ or ‘very poor’
condition – the Plan involves replacing approximately 500 poles annually - Replacement of small overhead primary conductors (which are more likely to break) will be replaced with large
conductors, increasing safety and reliability - Selected transformer station equipment, protection, and communication systems will be upgraded to improve
reliability and cyber security
From 2014 to 2019, WNH invested approximately $9.6 million annually in System Renewal projects. WNH forecasts investments from 2021 – 2025 will average approximately $9.2 million, a reduction of 0.46 million annually from previous years. These investments represent approximately 47% of annual capital investments. .
Almost six in ten or 58% feel the level of expenditures is just right to meet the objectives of safety reliability and cost. Only 5% said it is too low, 14% too high, while 23% were unsure.
Respondents were then asked about their perception of the level of future system renewal expenditures.
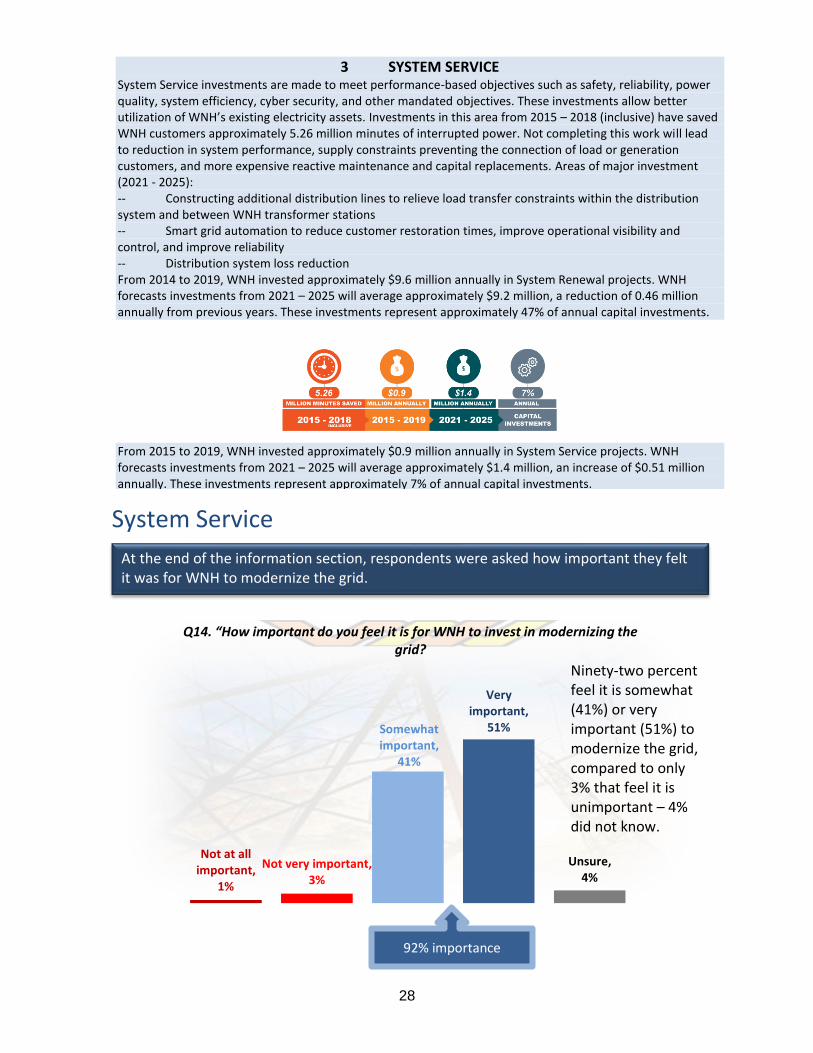
28
System Service
Not at all important,
1%
Not very important, 3%
Somewhat important,
41%
Very important,
51%
Unsure, 4%
Q14. “How important do you feel it is for WNH to invest in modernizing the grid?
3 SYSTEM SERVICE System Service investments are made to meet performance-based objectives such as safety, reliability, power quality, system efficiency, cyber security, and other mandated objectives. These investments allow better utilization of WNH’s existing electricity assets. Investments in this area from 2015 – 2018 (inclusive) have saved WNH customers approximately 5.26 million minutes of interrupted power. Not completing this work will lead to reduction in system performance, supply constraints preventing the connection of load or generation customers, and more expensive reactive maintenance and capital replacements. Areas of major investment (2021 - 2025): -- Constructing additional distribution lines to relieve load transfer constraints within the distribution system and between WNH transformer stations -- Smart grid automation to reduce customer restoration times, improve operational visibility and control, and improve reliability -- Distribution system loss reduction From 2014 to 2019, WNH invested approximately $9.6 million annually in System Renewal projects. WNH forecasts investments from 2021 – 2025 will average approximately $9.2 million, a reduction of 0.46 million annually from previous years. These investments represent approximately 47% of annual capital investments.
From 2015 to 2019, WNH invested approximately $0.9 million annually in System Service projects. WNH forecasts investments from 2021 – 2025 will average approximately $1.4 million, an increase of $0.51 million annually. These investments represent approximately 7% of annual capital investments. .
92% importance
Ninety-two percent feel it is somewhat (41%) or very important (51%) to modernize the grid, compared to only 3% that feel it is unimportant – 4% did not know.
At the end of the information section, respondents were asked how important they felt it was for WNH to modernize the grid.
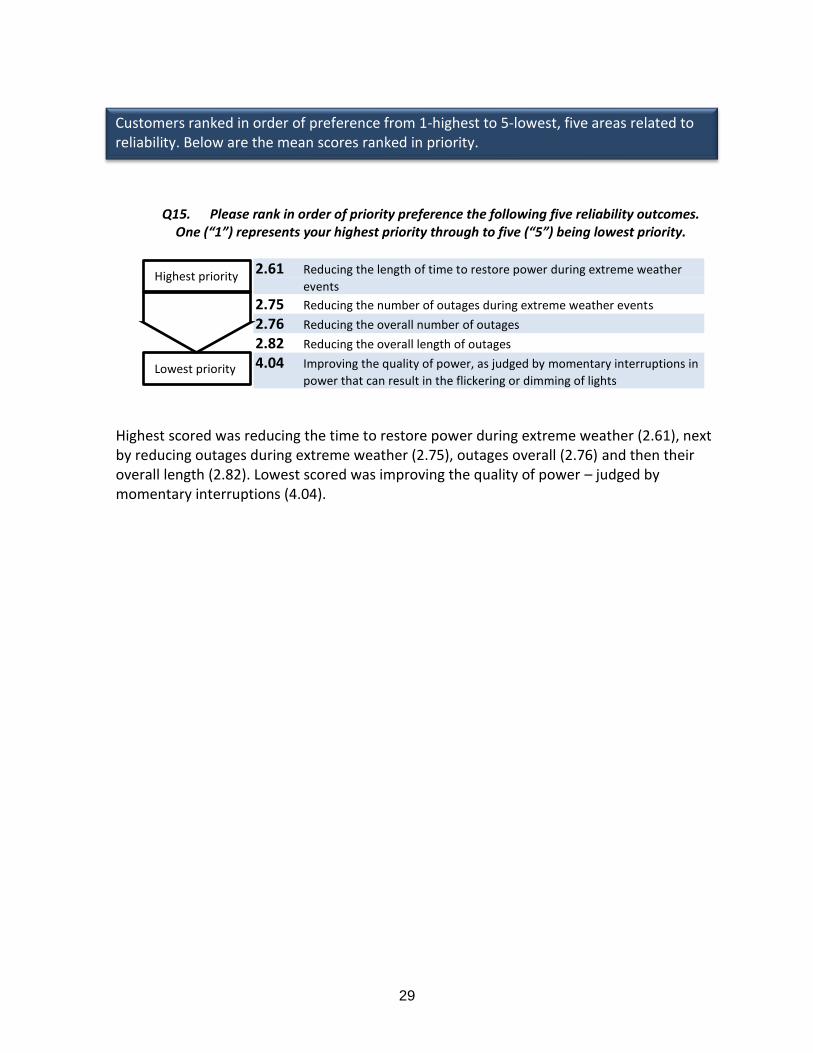
29
Q15. Please rank in order of priority preference the following five reliability outcomes. One (“1”) represents your highest priority through to five (“5”) being lowest priority.
2.61 Reducing the length of time to restore power during extreme weather
events
2.75 Reducing the number of outages during extreme weather events
2.76 Reducing the overall number of outages
2.82 Reducing the overall length of outages
4.04 Improving the quality of power, as judged by momentary interruptions in
power that can result in the flickering or dimming of lights
Highest priority
Highest scored was reducing the time to restore power during extreme weather (2.61), next by reducing outages during extreme weather (2.75), outages overall (2.76) and then their overall length (2.82). Lowest scored was improving the quality of power – judged by momentary interruptions (4.04).
Customers ranked in order of preference from 1-highest to 5-lowest, five areas related to reliability. Below are the mean scores ranked in priority.
Lowest priority
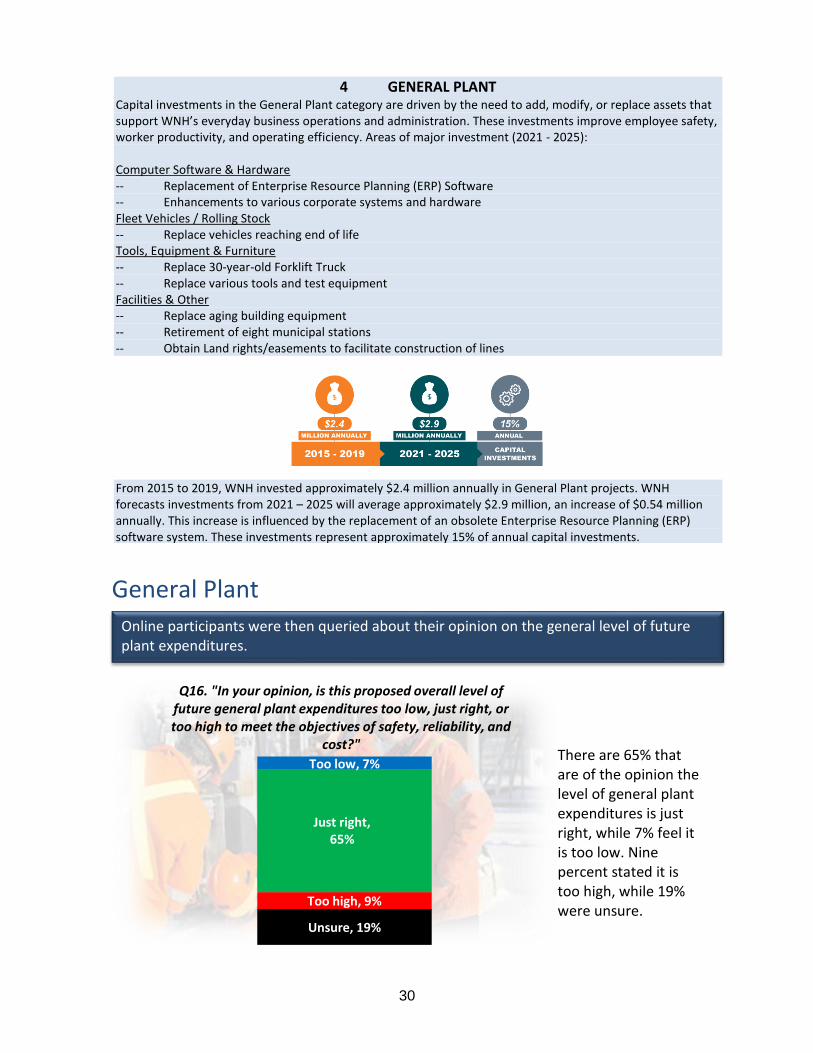
30
General Plant
Unsure, 19%
Too high, 9%
Just right, 65%
Too low, 7%
Q16. "In your opinion, is this proposed overall level of future general plant expenditures too low, just right, or too high to meet the objectives of safety, reliability, and
cost?"
4 GENERAL PLANT Capital investments in the General Plant category are driven by the need to add, modify, or replace assets that support WNH’s everyday business operations and administration. These investments improve employee safety, worker productivity, and operating efficiency. Areas of major investment (2021 - 2025): Computer Software & Hardware -- Replacement of Enterprise Resource Planning (ERP) Software -- Enhancements to various corporate systems and hardware Fleet Vehicles / Rolling Stock -- Replace vehicles reaching end of life Tools, Equipment & Furniture -- Replace 30-year-old Forklift Truck -- Replace various tools and test equipment Facilities & Other -- Replace aging building equipment -- Retirement of eight municipal stations -- Obtain Land rights/easements to facilitate construction of lines
From 2015 to 2019, WNH invested approximately $2.4 million annually in General Plant projects. WNH forecasts investments from 2021 – 2025 will average approximately $2.9 million, an increase of $0.54 million annually. This increase is influenced by the replacement of an obsolete Enterprise Resource Planning (ERP) software system. These investments represent approximately 15% of annual capital investments. .
There are 65% that are of the opinion the level of general plant expenditures is just right, while 7% feel it is too low. Nine percent stated it is too high, while 19% were unsure.
Online participants were then queried about their opinion on the general level of future plant expenditures.
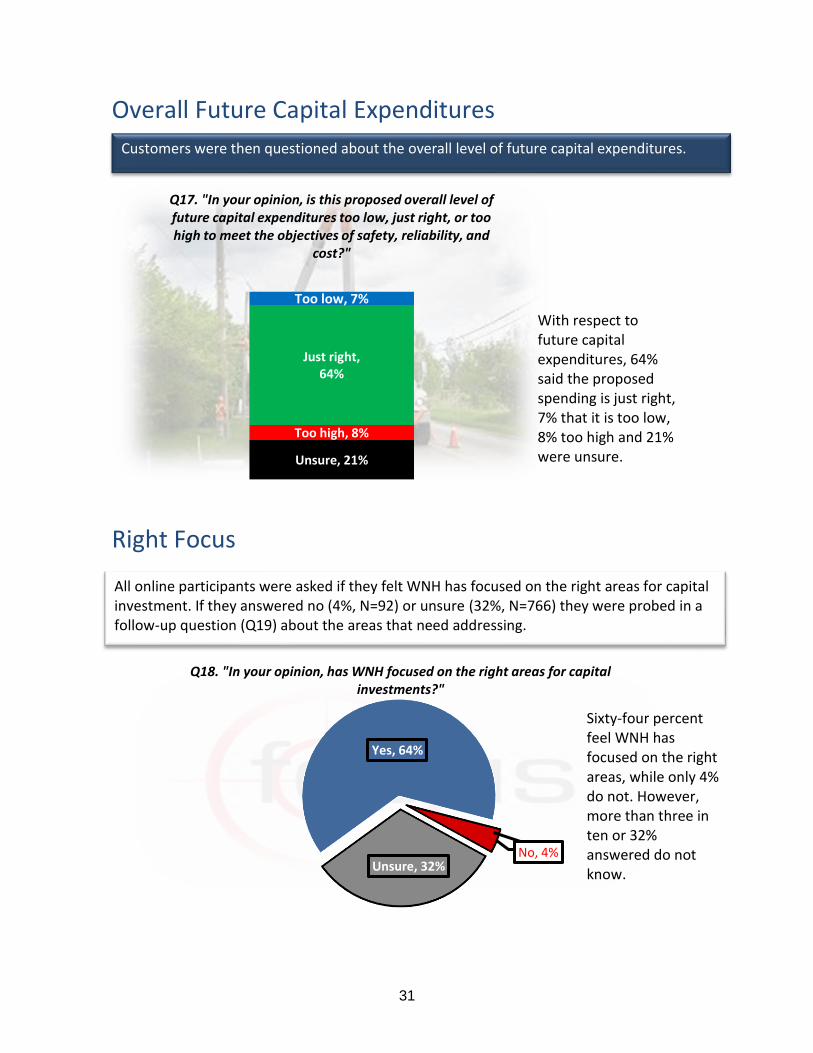
31
Overall Future Capital Expenditures
Right Focus
Unsure, 21%
Too high, 8%
Just right, 64%
Too low, 7%
Q17. "In your opinion, is this proposed overall level of future capital expenditures too low, just right, or too high to meet the objectives of safety, reliability, and
cost?"
Yes, 64%
No, 4%Unsure, 32%
Q18. "In your opinion, has WNH focused on the right areas for capital investments?"
Customers were then questioned about the overall level of future capital expenditures.
With respect to future capital expenditures, 64% said the proposed spending is just right, 7% that it is too low, 8% too high and 21% were unsure.
All online participants were asked if they felt WNH has focused on the right areas for capital investment. If they answered no (4%, N=92) or unsure (32%, N=766) they were probed in a follow-up question (Q19) about the areas that need addressing.) & both Thorold and surrounding
areas (61%, N=243)
Sixty-four percent feel WNH has focused on the right areas, while only 4% do not. However, more than three in ten or 32% answered do not know.
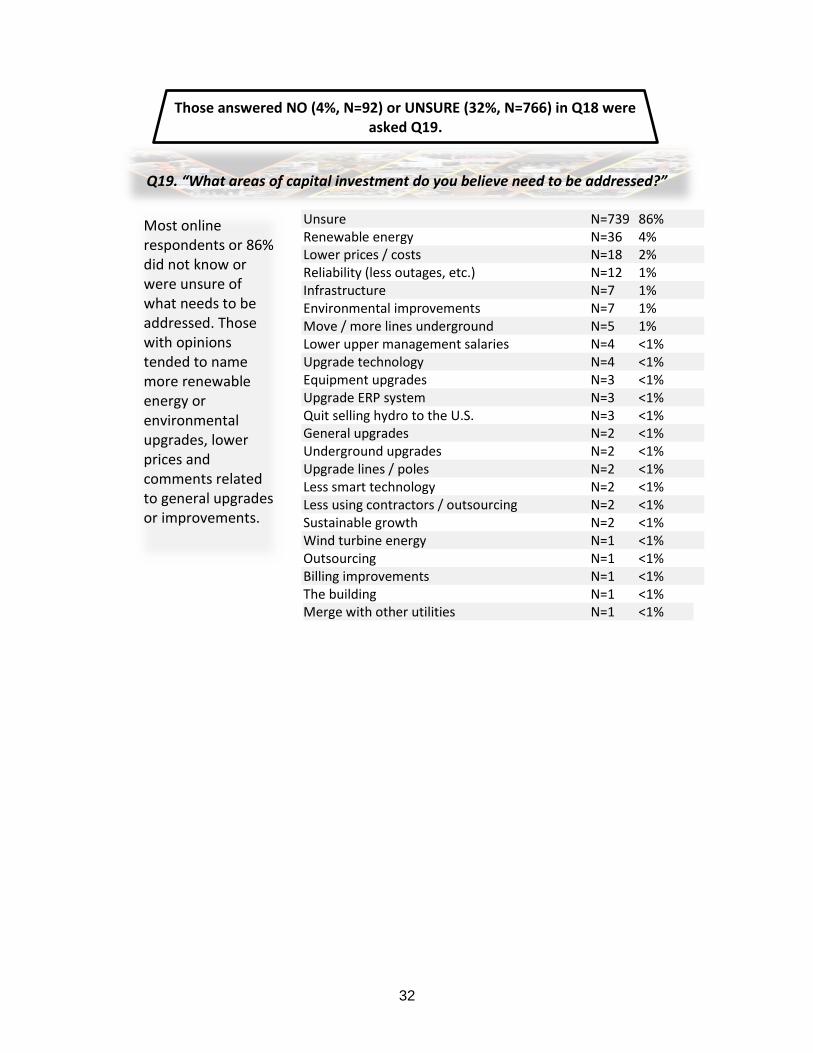
32
Q19. “What areas of capital investment do you believe need to be addressed?”
Unsure N=739 86% Renewable energy N=36 4% Lower prices / costs N=18 2% Reliability (less outages, etc.) N=12 1% Infrastructure N=7 1% Environmental improvements N=7 1% Move / more lines underground N=5 1% Lower upper management salaries N=4 <1% Upgrade technology N=4 <1% Equipment upgrades N=3 <1% Upgrade ERP system N=3 <1% Quit selling hydro to the U.S. N=3 <1% General upgrades N=2 <1% Underground upgrades N=2 <1% Upgrade lines / poles N=2 <1% Less smart technology N=2 <1% Less using contractors / outsourcing N=2 <1% Sustainable growth N=2 <1% Wind turbine energy N=1 <1% Outsourcing N=1 <1% Billing improvements N=1 <1% The building N=1 <1% Merge with other utilities N=1 <1%
Those answered NO (4%, N=92) or UNSURE (32%, N=766) in Q18 were asked Q19.
Most online respondents or 86% did not know or were unsure of what needs to be addressed. Those with opinions tended to name more renewable energy or environmental upgrades, lower prices and comments related to general upgrades or improvements.
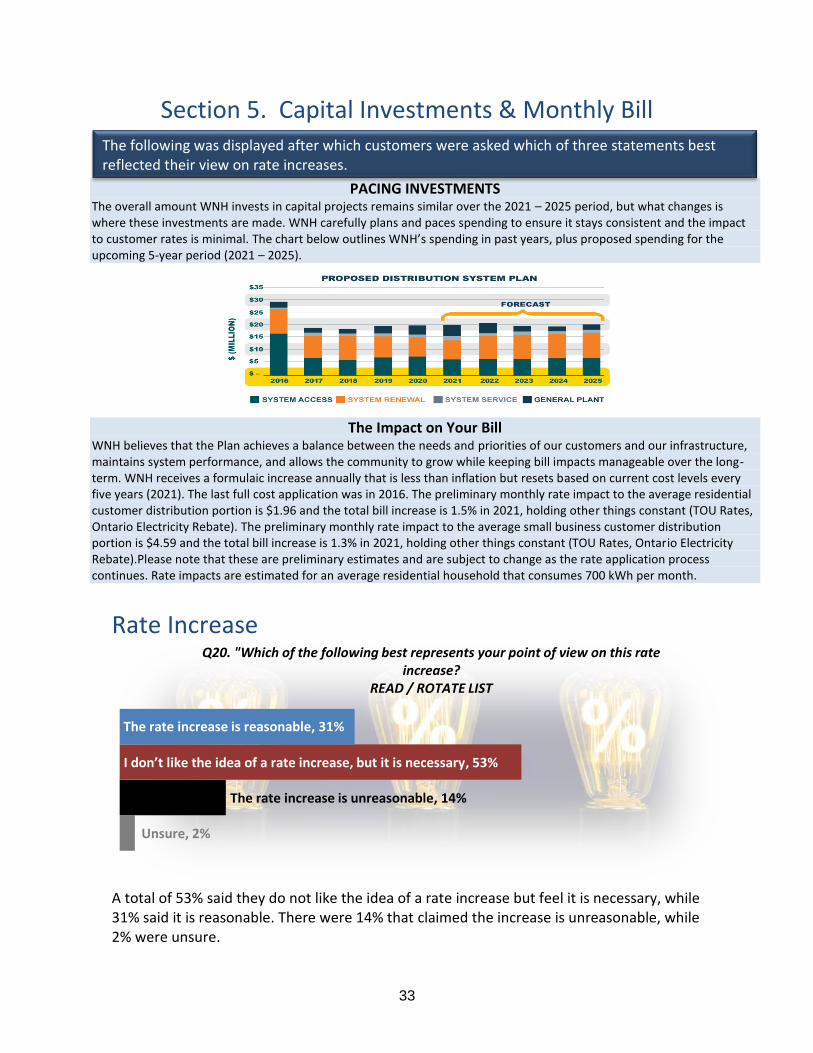
33
Section 5. Capital Investments & Monthly Bill
Rate Increase
A total of 53% said they do not like the idea of a rate increase but feel it is necessary, while 31% said it is reasonable. There were 14% that claimed the increase is unreasonable, while 2% were unsure.
Unsure, 2%
The rate increase is unreasonable, 14%
I don’t like the idea of a rate increase, but it is necessary, 53%
The rate increase is reasonable, 31%
Q20. "Which of the following best represents your point of view on this rate increase?
READ / ROTATE LIST
PACING INVESTMENTS The overall amount WNH invests in capital projects remains similar over the 2021 – 2025 period, but what changes is where these investments are made. WNH carefully plans and paces spending to ensure it stays consistent and the impact to customer rates is minimal. The chart below outlines WNH’s spending in past years, plus proposed spending for the upcoming 5-year period (2021 – 2025).
The Impact on Your Bill
WNH believes that the Plan achieves a balance between the needs and priorities of our customers and our infrastructure, maintains system performance, and allows the community to grow while keeping bill impacts manageable over the long-term. WNH receives a formulaic increase annually that is less than inflation but resets based on current cost levels every five years (2021). The last full cost application was in 2016. The preliminary monthly rate impact to the average residential customer distribution portion is $1.96 and the total bill increase is 1.5% in 2021, holding other things constant (TOU Rates, Ontario Electricity Rebate). The preliminary monthly rate impact to the average small business customer distribution portion is $4.59 and the total bill increase is 1.3% in 2021, holding other things constant (TOU Rates, Ontario Electricity Rebate).Please note that these are preliminary estimates and are subject to change as the rate application process continues. Rate impacts are estimated for an average residential household that consumes 700 kWh per month. .
The following was displayed after which customers were asked which of three statements best reflected their view on rate increases.
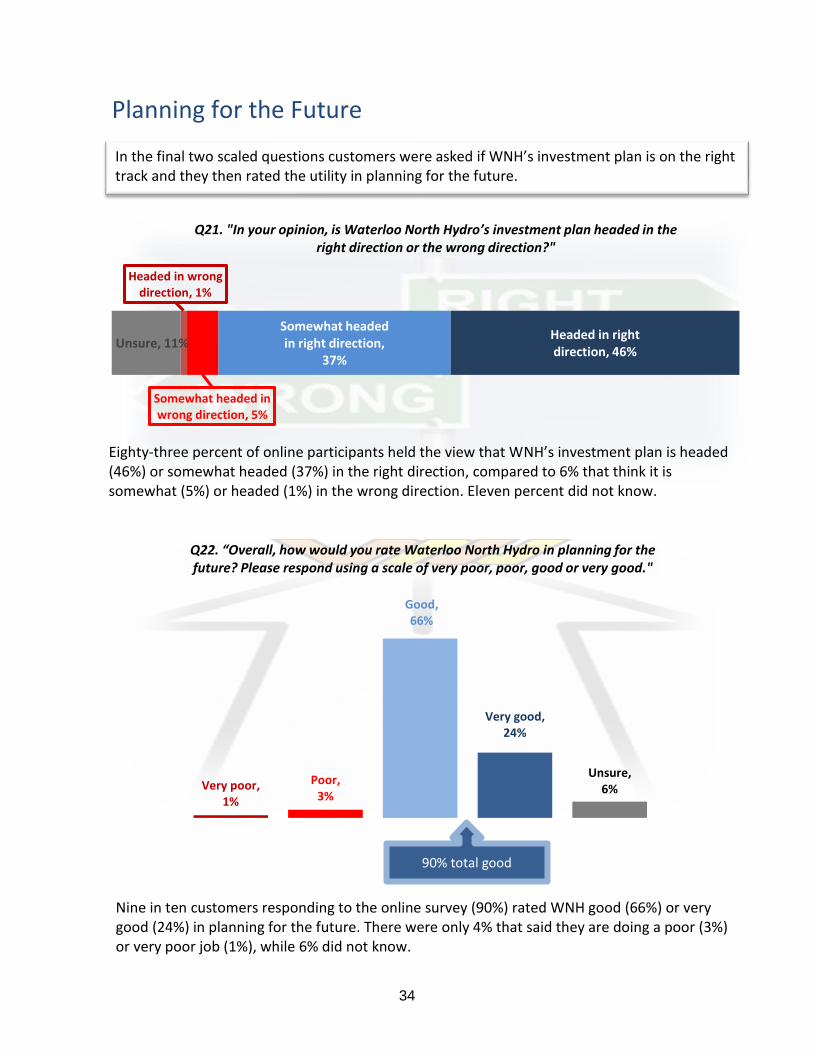
34
Planning for the Future
Unsure, 11%
Headed in wrong direction, 1%
Somewhat headed in wrong direction, 5%
Somewhat headed in right direction,
37%
Headed in right direction, 46%
Q21. "In your opinion, is Waterloo North Hydro’s investment plan headed in the right direction or the wrong direction?"
Very poor, 1%
Poor, 3%
Good, 66%
Very good, 24%
Unsure, 6%
Q22. “Overall, how would you rate Waterloo North Hydro in planning for the future? Please respond using a scale of very poor, poor, good or very good."
90% total good
In the final two scaled questions customers were asked if WNH’s investment plan is on the right track and they then rated the utility in planning for the future. Thorold and surrounding areas (61%, N=243)
Eighty-three percent of online participants held the view that WNH’s investment plan is headed (46%) or somewhat headed (37%) in the right direction, compared to 6% that think it is somewhat (5%) or headed (1%) in the wrong direction. Eleven percent did not know.
Nine in ten customers responding to the online survey (90%) rated WNH good (66%) or very good (24%) in planning for the future. There were only 4% that said they are doing a poor (3%) or very poor job (1%), while 6% did not know.
35
Summary & Highlights
Results from both the online and telephone survey components reveal similar opinions with respect to most indicators. This despite the extensive background information contained in the online survey in relation to the abridged text read in the telephone survey. For instance, findings from both surveys reveal a high level of understanding (somewhat & completely) of the role that Waterloo North Hydro plays in the electricity system, including where revenue comes from and what portion of their bill relates to WNH – including 98% of online and 97% of telephone respondents. However, more online participants said they were completely aware (53%) than telephone respondents (49%), while more phone customers said somewhat aware (48%) in relation to those online (45%). Among the N=32 small businesses that completed paper questionnaires, N=18 said they were completely aware and N=14 somewhat aware. In a question only asked to the N=32 small businesses, N=18 answered they somewhat and N=14 very well understand the cost drivers that Waterloo North Hydro is responding to. Customers were presented with choosing among three options, including (a) service enhancements that they were told would increase costs, (b) having a lower priority on service while favoring lower cost alternatives and (c) continuing with current levels of customer service. Overall, the WNH client base prefers a continuation of current customer service levels, including 69% of telephone and a slightly lower 65% of online respondents. Next most named by 21% of telephone and 24% of online participants was decreasing costs with lower levels of customer service, while only 6% from both surveys want increased service (4% of phone & 6% of online participants were unsure). As WNH currently exceeds regulated provincial standards as in area of answering calls within 30 seconds, most customers do not want to see service levels decreased in order to save 15¢ per month or $1.80 per year. This includes two-thirds of telephone and 63% of online survey respondents. Only slightly more than a quarter or 26% of phone and 28% of online survey participants are willing to decrease service levels to lower costs – 7% and 9% respectively did not know or were unsure. There is demand among customers for WNH to provide environmental alternatives and to focus on connecting or investing in renewable energy solutions or new technologies (at additional costs). Only 26% of telephone survey respondents want WNH to continue investing in traditional infrastructure, while a 65% majority from the phone poll want more money invested in renewables (26%), new technologies (6%) or both renewables and new technologies (33%) at additional costs. Ten percent did not know or were unsure. Among online participants there is a similar demand for investing in new technologies and renewables at additional costs – 64%. This includes 31% that want investment in both renewables and new technologies, 25% in renewables and 5% in new technologies. Only one-quarter want to continue investing in traditional infrastructure and 11% were unsure.
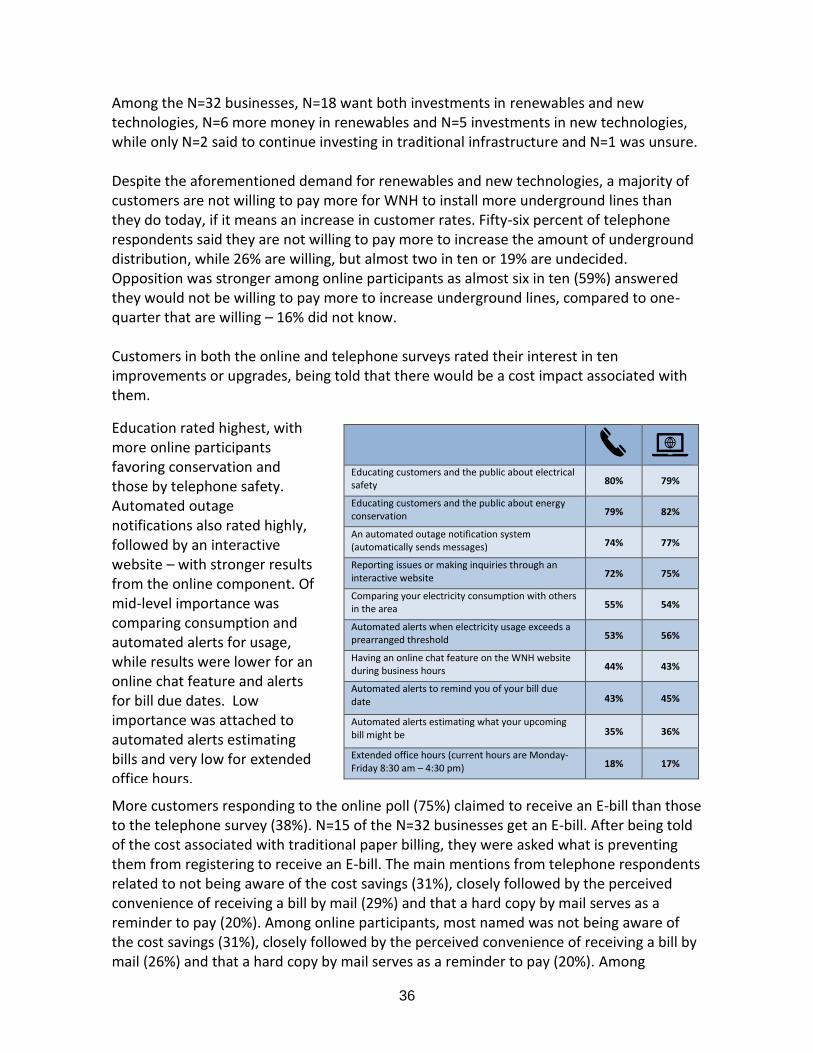
36
Among the N=32 businesses, N=18 want both investments in renewables and new technologies, N=6 more money in renewables and N=5 investments in new technologies, while only N=2 said to continue investing in traditional infrastructure and N=1 was unsure. Despite the aforementioned demand for renewables and new technologies, a majority of customers are not willing to pay more for WNH to install more underground lines than they do today, if it means an increase in customer rates. Fifty-six percent of telephone respondents said they are not willing to pay more to increase the amount of underground distribution, while 26% are willing, but almost two in ten or 19% are undecided. Opposition was stronger among online participants as almost six in ten (59%) answered they would not be willing to pay more to increase underground lines, compared to one-quarter that are willing – 16% did not know. Customers in both the online and telephone surveys rated their interest in ten improvements or upgrades, being told that there would be a cost impact associated with them.
Educating customers and the public about electrical safety 80% 79%
Educating customers and the public about energy conservation 79% 82%
An automated outage notification system (automatically sends messages) 74% 77%
Reporting issues or making inquiries through an interactive website 72% 75%
Comparing your electricity consumption with others in the area 55% 54%
Automated alerts when electricity usage exceeds a prearranged threshold 53% 56%
Having an online chat feature on the WNH website during business hours 44% 43%
Automated alerts to remind you of your bill due date 43% 45%
Automated alerts estimating what your upcoming bill might be 35% 36%
Extended office hours (current hours are Monday-Friday 8:30 am – 4:30 pm) 18% 17%
More customers responding to the online poll (75%) claimed to receive an E-bill than those to the telephone survey (38%). N=15 of the N=32 businesses get an E-bill. After being told of the cost associated with traditional paper billing, they were asked what is preventing them from registering to receive an E-bill. The main mentions from telephone respondents related to not being aware of the cost savings (31%), closely followed by the perceived convenience of receiving a bill by mail (29%) and that a hard copy by mail serves as a reminder to pay (20%). Among online participants, most named was not being aware of the cost savings (31%), closely followed by the perceived convenience of receiving a bill by mail (26%) and that a hard copy by mail serves as a reminder to pay (20%). Among
Education rated highest, with more online participants favoring conservation and those by telephone safety. Automated outage notifications also rated highly, followed by an interactive website – with stronger results from the online component. Of mid-level importance was comparing consumption and automated alerts for usage, while results were lower for an online chat feature and alerts for bill due dates. Low importance was attached to automated alerts estimating bills and very low for extended office hours.
37
businesses, most named by N=5 was not being aware of the cost savings, followed by N=3 that responded convenience and N=3 that it is a reminder to pay.
On the issue of tree trimming, customers support the status quo. Most (65% telephone & 63% online) back the current process of more frequent tree trimming with enough clearance to balance reliability, aesthetic, and environmental concerns. Twenty-four percent of telephone and 27% of online respondents want less frequent trimming, but more branches cut to ensure fewer outages or lower wait times to restore power, while only 4% (both surveys) want less trimming because of aesthetic or environmental reasons.
System Renewal Slightly more than six in ten or 61% of telephone survey respondents feel the level of system renewal expenditures is just right to meet the objectives of safety reliability and cost. Only 6% said it is too low, 11% too high, while 22% were unsure. Among online participants, almost six in ten or 58% feel the level of expenditures is just right to meet the objectives of safety, reliability and cost. Only 5% said it is too low, 14% too high, while 23% were unsure. N=27 of the small businesses said the level is appropriate, N=3 too low and N=2 were unsure.
System Service Among telephone respondents, 93% feel it is somewhat (46%) or very important (47%) to modernize the grid, compared to only 3% that feel it is unimportant – 4% did not know.
While a similar 92% of online participants said it is important to modernize, more answered very important (51%) compared to the telephone survey, while 41% answered somewhat important and 4% were unsure.
With respect to small businesses, N=23 answered very important and N=9 somewhat important.
When asked to rank in order of priority preference five reliability outcomes, the highest scored (mean) was reducing the time to restore power during extreme weather (2.63 – telephone & 2.61 online), next by reducing outages during extreme weather (2.71 – telephone & 2.75 – online), outages overall (2.73 – telephone & 2.76 online) and then their overall length (2.79 – telephone & 2.82 online). Lowest scored was improving the quality of power, judged by momentary interruptions (4.14 – telephone & 4.04 – online). Among the N=32 small businesses, reducing the overall number of outages ranked first (2.55), followed by the length of outages (2.69), the length of time to restore power during extreme weather (3.03), and the number of outages during extreme weather (3.28). Also scored lowest was improving the quality of power, judged by momentary interruptions (3.34).
38
General Plant Two-thirds of customers responding to the phone survey feel the current level of expenditures is just right. Only 3% said too low, 10% too high, while two in ten were unsure. Sixty-five percent of online participants are of the opinion the level of general plant expenditures is just right, while 7% feel it is too low. Nine percent stated it is too high, while 19% were unsure. N=26 businesses claimed it was appropriate, N=3 too low and N=3 did not know. With respect to future capital expenditures, results show that 68% of telephone and 64% of online participants feel the overall level is just right, 7% phone (8% online) said it is too high, 7% too low (same for both), while 18% of phone and 21% of online respondents were unsure.
Capital Investments
Seven in ten telephone respondents feel WNH has focused on the right areas for capital investments, only 3% do not. A significant 27% answered do not know. The number dips among online respondent’s as 64% feel WNH has focused on the right areas, while only 3% do not. However, more than three in ten or 32% answered do not know. N=28 of the N=32 businesses stated WNH is focused on the right areas, while N=4 were unsure. When those that do not feel WNH is focused on the right areas or did not know were asked in a follow-up about what they think needs to be addressed, most were unsure (82% - phone & 86% online). Among those providing answers, most mentions related to renewables or environmental upgrades, equipment / general upgrades and lower prices.
After being read or presented with a background to rate increases, customers were then asked which of three statements best reflected their view on the topic. There is a sense that while rate increases are disliked they are necessary – 51% from the telephone and 53% from the online survey hold this view. A core segment feel they are reasonable (32% telephone & 31% online), while few consider them unreasonable (13% telephone & 14% online) and the undecideds are low (4% telephone & 2% online). The same pattern held for businesses as N=20 answered that while they don’t like the idea, they are necessary, N=10 think them reasonable, only N=1 said it is unreasonable and N=1 was unsure.
Overall, there appears buy-in with the direction being taken by WNH as a strong majority including 84% of telephone and 83% of online participants, feel WNH’s investment plan is headed in the right direction. Results are even stronger on the perception among customers of how WNH is preparing for the future. Most of those responding by telephone or 88% said the utility is doing a good job in planning for the future as did 90% of online participants and all N=32 businesses.
June 29, 2020 1
FLEET MANAGEMENT PLAN
OVERVIEW & FORECAST 2021 - 2025 June 22, 2020
Waterloo North Hydro Inc.
June 29, 2020 2
CONTENTS
CONTENTS ................................................................................................................................. 2
LIST OF TABLES ........................................................................................................................ 3
LIST OF FIGURES ...................................................................................................................... 4
GLOSSARY ................................................................................................................................. 5
1. INTRODUCTION .................................................................................................................. 6 1.1. Purpose of this Report ............................................................................................... 6 1.2. Overview ................................................................................................................... 6
2. FLEET ASSET MANAGEMENT PLAN (AMP) ...................................................................... 8 2.1. Strategy ..................................................................................................................... 8 2.2. Objectives ............................................................................................................... 10
3. ASSETS UNDER MANAGEMENT ..................................................................................... 12 3.1. Large Vehicles ........................................................................................................ 12 3.2. Medium Sized Vehicles ........................................................................................... 13 3.3. Small Sized Vehicles ............................................................................................... 13 3.4. Rolling Stock ........................................................................................................... 15
4. FLEET ASSET CONDITION ASSESSMENTS ................................................................... 16 4.1. Asset Condition Assessment – Large Vehicles ........................................................ 18 4.2. Asset Condition Assessment – Medium Vehicles .................................................... 21 4.3. Asset Condition Assessment – Small Vehicles ........................................................ 24 4.4. Asset Condition Assessment – Rolling Stock .......................................................... 28
5. CAPITAL INVESTMENT PLAN 2021 to 2025 .................................................................... 30
June 29, 2020 3
LIST OF TABLES
Table 2-1: Inspections ..................................................................................................................... 9
Table 2-2: Maintenance ................................................................................................................... 9
Table 2-3 WNH Strategic Imperatives ............................................................................................ 11
Table 3-1: Fleet Inventory – Large Vehicles ................................................................................... 12
Table 3-2: Fleet Inventory – Medium Vehicles ............................................................................... 13
Table 3-3: Fleet Inventory – Small Vehicles ................................................................................... 14
Table 3-4: Fleet Inventory - Rolling Stock ..................................................................................... 15
Table 4-1: Health Index & Replacement Guidelines ....................................................................... 17
Table 4-2: Fleet Assets TUL & Order Lead-times .......................................................................... 17
Table 4-3: Evaluation Framework – Large Vehicles ....................................................................... 18
Table 4-4: Asset Condition Evaluation Criteria – Large Vehicles.................................................... 19
Table 4-5: Health Condition Index Results – Large Vehicles .......................................................... 20
Table 4-6: Evaluation Framework – Medium Vehicles ................................................................... 21
Table 4-7: Asset Condition Evaluation Criteria – Medium Vehicles ................................................ 22
Table 4-8: Health Condition Index Results – Medium Vehicles ...................................................... 23
Table 4-9: Evaluation Framework – Small Vehicles ....................................................................... 24
Table 4-10: Asset Condition Evaluation Criteria – Small Vehicles .................................................. 25
Table 4-11a: Health Condition Index Results – Small Vehicles ...................................................... 26
Table 4-11b: Health Condition Index Results – Small Vehicles (continued) ................................... 27
Table 4-12: Evaluation Framework – Rolling Stock ........................................................................ 28
Table 4-13: Asset Condition Evaluation Criteria – Rolling Stock .................................................... 28
Table 4-14: Health Condition Index Results – Rolling Stock .......................................................... 29
Table 5-1: Historical & Forecast Fleet Capital Expenditures .......................................................... 30
Table 5-2: Forecast Fleet Replacements ....................................................................................... 31
Table 5-3: Fleet Asset Reduction ................................................................................................... 32

June 29, 2020 4
LIST OF FIGURES
Figure 2-1: WNH’s Life Cycle approach to Fleet Management ......................................................... 8
June 29, 2020 5
GLOSSARY
1) ACA – Asset Condition Assessment
2) AM – Asset Management
3) AMP – Asset Management Plan
4) CEA – Canadian Electrical Association
5) CSA – Canadian Standards Association
6) DSC – Distribution System Code
7) DSP – Distribution System Plan
8) EOL – End-of-Life
9) GIS – Geographic Information System
10) GUP – Good Utility Practices
11) KPI – Key Performance Indicator
12) LDC – Local Distribution Company
13) MTO - Ministry of Transportation of Ontario
14) O/H or OH - Overhead
15) O&M – Operation & Maintenance
16) OEB – Ontario Energy Board
17) TUL – Typical Useful Life
18) TS – Transmission Station or Transformer Station
19) U/G or UG – Underground
20) WNHI / WNH – Waterloo North Hydro Inc.
21) XFMR / Tx – Transformer
June 29, 2020 6
1. INTRODUCTION
1.1. Purpose of this Report
Waterloo North Hydro’s (WNH) fleet services are provided by the Fleet Services section of the
Operations Division under the direction of the Vice President of Operations. Services provided
include purchasing, rental, inspection, maintenance, repair, and replacement of vehicles and rolling
stock equipment.
The purpose of this report is to provide a consolidated view of WNH’s fleet management strategy,
objectives, assets under management, asset condition assessments and investment plan for the
years 2021 to 2025 inclusive. The report includes a summary of asset data, condition evaluation
criteria and condition assessments that form the basis on which fleet capital investment plans have
been formulated.
The information in this report also informs WNH’s senior executive team (Executive) and aides in the
development of WNH’s Distribution System Plan (DSP) and supports WNH’s 2021 Cost of Service
Application (Application).
All information contained in this report is current as of December 31, 2019.
1.2. Overview
Fleet assets play a critical role in keeping the WNH staff working efficiently and safely. These assets
are required to be reliable and maintained in a safe and efficient manner. Vehicles not available for
service when needed results in a slow down of the work program, wasted time and labour in
reorganizing and rescheduling work.
WNH’s fleet assets consist of 53 vehicles, 16 trailers and 4 specialty-power operated equipment.
Fleet assets have been divided into 4 asset groups, each with their own common set of asset
condition parameters. A current listing of all WNH fleet assets can be found in Section 3 of this
report.
June 29, 2020 7
WNH performs regular inspection and maintenance on all fleet assets. The level of detail and
frequency is determined by asset type, regulatory requirements and condition.
Condition data collected feeds into the Fleet Asset Condition Assessments which utilize condition
parameters, asset condition scoring and relative weighting for each condition parameter to develop
a Health Index (HI) for each vehicle.
The HI scores are ranked and grouped into 5 categories from Very Good to Very Poor. The condition
assessments and ranking helps management staff to identify and prioritize worst performing assets,
and help develop an action plan for fleet investments. Actions taken may range from increased
inspection and maintenance to capital refurbishment or replacement. The current health score for all
fleet assets is summarized in Section 4 of this report.
WNH attempts to pace fleet capital investments in coordination with WNH’s overall capital investment
plan. This means that fleet investments at times will be lumpy in order to smooth out WNH’s overall
capital expenditures. A summary of WNH’s fleet capital investments proposed for 2021 to 2025 can
be found in Section 5 of this report.
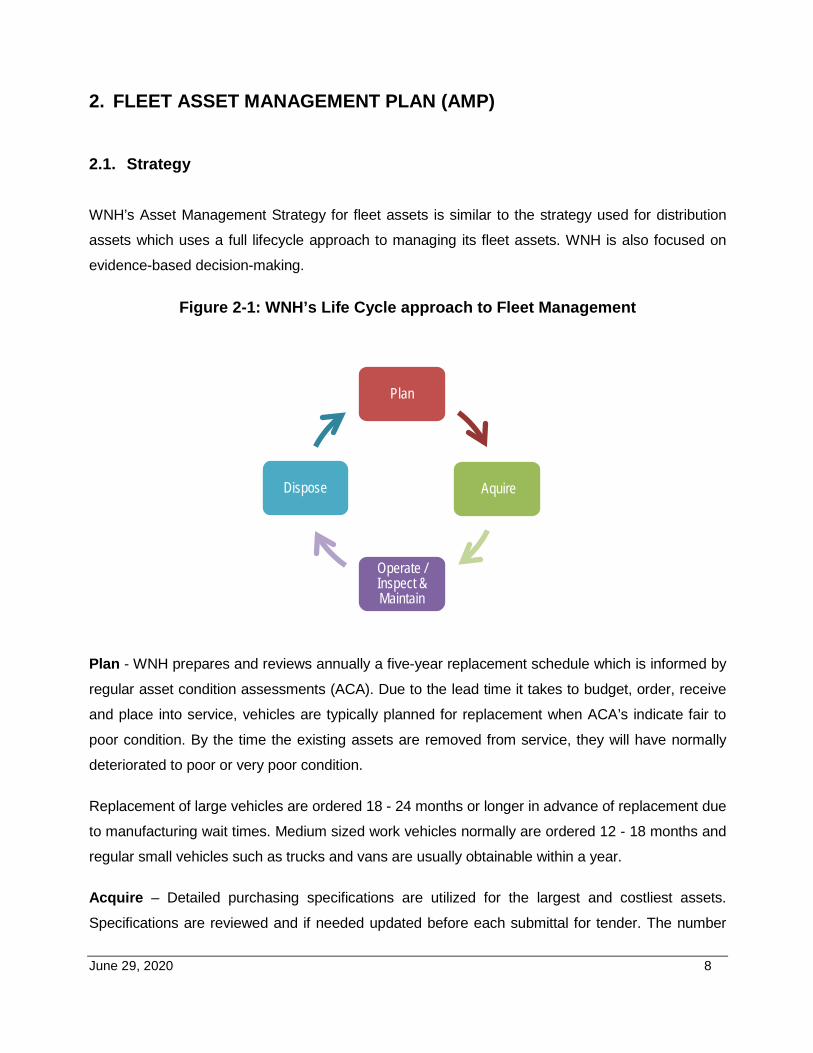
June 29, 2020 8
2. FLEET ASSET MANAGEMENT PLAN (AMP)
2.1. Strategy
WNH’s Asset Management Strategy for fleet assets is similar to the strategy used for distribution
assets which uses a full lifecycle approach to managing its fleet assets. WNH is also focused on
evidence-based decision-making.
Figure 2-1: WNH’s Life Cycle approach to Fleet Management
Plan - WNH prepares and reviews annually a five-year replacement schedule which is informed by
regular asset condition assessments (ACA). Due to the lead time it takes to budget, order, receive
and place into service, vehicles are typically planned for replacement when ACA’s indicate fair to
poor condition. By the time the existing assets are removed from service, they will have normally
deteriorated to poor or very poor condition.
Replacement of large vehicles are ordered 18 - 24 months or longer in advance of replacement due
to manufacturing wait times. Medium sized work vehicles normally are ordered 12 - 18 months and
regular small vehicles such as trucks and vans are usually obtainable within a year.
Acquire – Detailed purchasing specifications are utilized for the largest and costliest assets.
Specifications are reviewed and if needed updated before each submittal for tender. The number
Plan
Aquire
Operate / Inspect & Maintain
Dispose
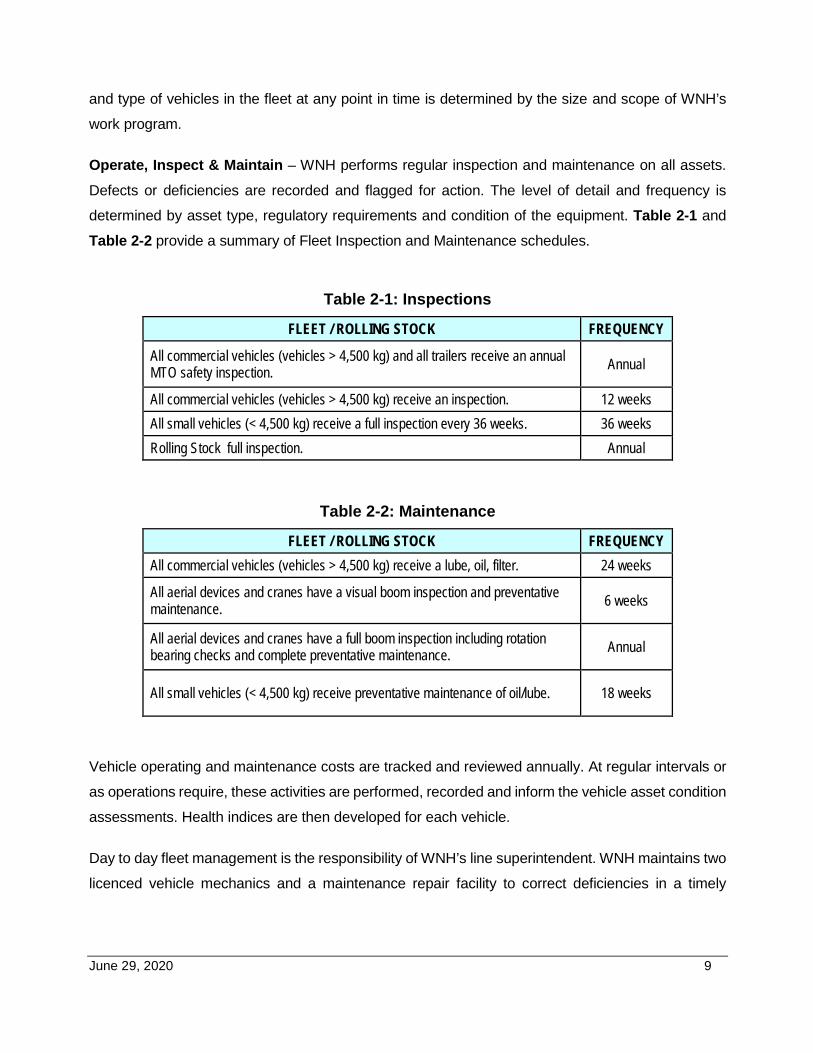
June 29, 2020 9
and type of vehicles in the fleet at any point in time is determined by the size and scope of WNH’s
work program.
Operate, Inspect & Maintain – WNH performs regular inspection and maintenance on all assets.
Defects or deficiencies are recorded and flagged for action. The level of detail and frequency is
determined by asset type, regulatory requirements and condition of the equipment. Table 2-1 and
Table 2-2 provide a summary of Fleet Inspection and Maintenance schedules.
Table 2-1: Inspections
FLEET / ROLLING STOCK FREQUENCY
All commercial vehicles (vehicles > 4,500 kg) and all trailers receive an annual MTO safety inspection. Annual
All commercial vehicles (vehicles > 4,500 kg) receive an inspection. 12 weeks All small vehicles (< 4,500 kg) receive a full inspection every 36 weeks. 36 weeks Rolling Stock full inspection. Annual
Table 2-2: Maintenance
FLEET / ROLLING STOCK FREQUENCY All commercial vehicles (vehicles > 4,500 kg) receive a lube, oil, filter. 24 weeks
All aerial devices and cranes have a visual boom inspection and preventative maintenance. 6 weeks
All aerial devices and cranes have a full boom inspection including rotation bearing checks and complete preventative maintenance. Annual
All small vehicles (< 4,500 kg) receive preventative maintenance of oil/lube. 18 weeks
Vehicle operating and maintenance costs are tracked and reviewed annually. At regular intervals or
as operations require, these activities are performed, recorded and inform the vehicle asset condition
assessments. Health indices are then developed for each vehicle.
Day to day fleet management is the responsibility of WNH’s line superintendent. WNH maintains two
licenced vehicle mechanics and a maintenance repair facility to correct deficiencies in a timely
June 29, 2020 10
manner. WNH also utilizes external contractors for specialized work or where it has been found to
be cost effective.
Disposal – WNH disposes of its fleet assets when they are normally in poor or very poor condition.
They are no longer economical, safe or reliable enough to withstand the daily rigors of utility
operations or construction on high voltage lines. Vehicles for disposal are normally sold at auction or
donated to college programs.
2.2. Objectives
Fleet operations and investments are key elements in facilitating the overall mission of WNH. WNH’s
Fleet Asset Management Strategy is aligned with and supports four of WNH’s corporate strategic
imperatives as illustrated in Table 2-3.
Cost, risk and performance are balanced through a whole life cycle management strategy that takes
the assets from procurement to disposal.
To support the Fleet Asset Management Strategy, the following objectives were developed:
• maximize the operational effectiveness of the workforce by maximizing operational
functionality and availability of the vehicles;
• maximize asset longevity through effective purchasing specifications, operational inspections
and maintenance;
• minimize total lifecycle costs by tracking operational and maintenance costs as well as
downtime costs;
• maximize safety of the fleet by minimizing accidents and incidents. WNH manages its fleet to ensure these objectives can be achieved consistently and are sustainable
over time.
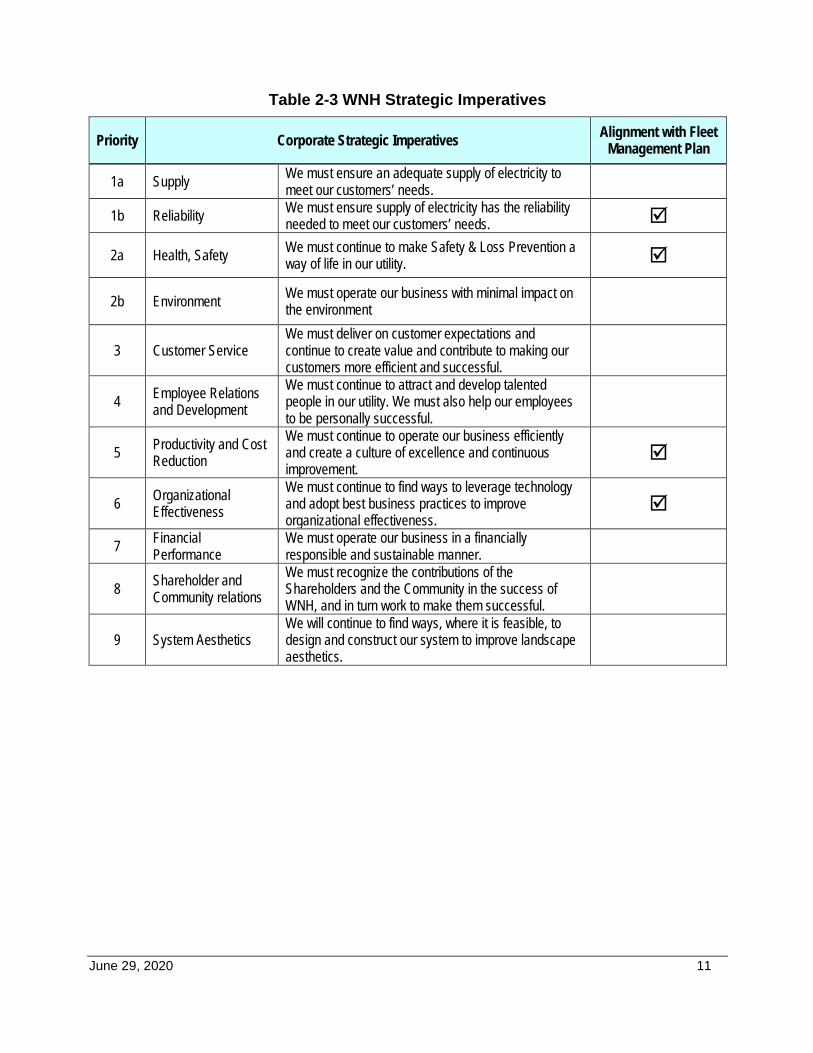
June 29, 2020 11
Table 2-3 WNH Strategic Imperatives
Priority Corporate Strategic Imperatives Alignment with Fleet Management Plan
1a Supply We must ensure an adequate supply of electricity to meet our customers’ needs.
1b Reliability We must ensure supply of electricity has the reliability needed to meet our customers’ needs.
2a Health, Safety We must continue to make Safety & Loss Prevention a way of life in our utility.
2b Environment We must operate our business with minimal impact on the environment
3 Customer Service We must deliver on customer expectations and continue to create value and contribute to making our customers more efficient and successful.
4 Employee Relations and Development
We must continue to attract and develop talented people in our utility. We must also help our employees to be personally successful.
5 Productivity and Cost Reduction
We must continue to operate our business efficiently and create a culture of excellence and continuous improvement.
6 Organizational Effectiveness
We must continue to find ways to leverage technology and adopt best business practices to improve organizational effectiveness.
7 Financial Performance
We must operate our business in a financially responsible and sustainable manner.
8 Shareholder and Community relations
We must recognize the contributions of the Shareholders and the Community in the success of WNH, and in turn work to make them successful.
9 System Aesthetics We will continue to find ways, where it is feasible, to design and construct our system to improve landscape aesthetics.
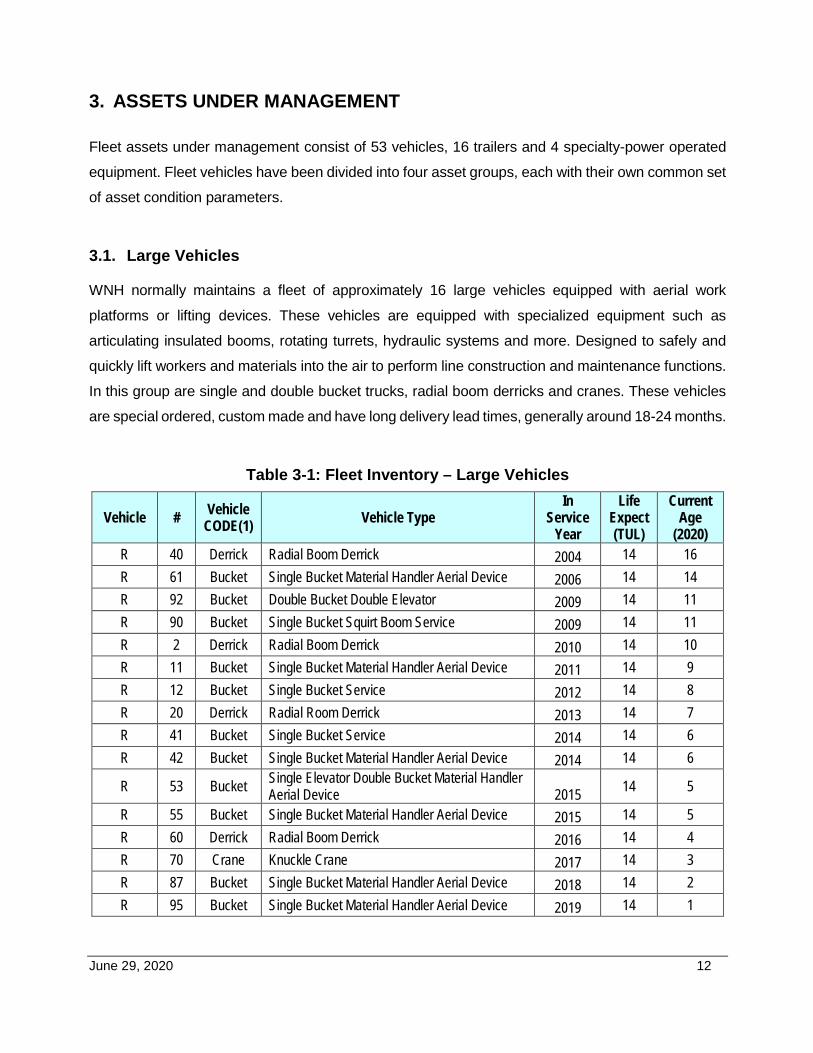
June 29, 2020 12
3. ASSETS UNDER MANAGEMENT
Fleet assets under management consist of 53 vehicles, 16 trailers and 4 specialty-power operated
equipment. Fleet vehicles have been divided into four asset groups, each with their own common set
of asset condition parameters.
3.1. Large Vehicles
WNH normally maintains a fleet of approximately 16 large vehicles equipped with aerial work
platforms or lifting devices. These vehicles are equipped with specialized equipment such as
articulating insulated booms, rotating turrets, hydraulic systems and more. Designed to safely and
quickly lift workers and materials into the air to perform line construction and maintenance functions.
In this group are single and double bucket trucks, radial boom derricks and cranes. These vehicles
are special ordered, custom made and have long delivery lead times, generally around 18-24 months.
Table 3-1: Fleet Inventory – Large Vehicles
Vehicle # Vehicle CODE(1) Vehicle Type
In Service
Year
Life Expect (TUL)
Current Age
(2020) R 40 Derrick Radial Boom Derrick 2004 14 16 R 61 Bucket Single Bucket Material Handler Aerial Device 2006 14 14 R 92 Bucket Double Bucket Double Elevator 2009 14 11 R 90 Bucket Single Bucket Squirt Boom Service 2009 14 11 R 2 Derrick Radial Boom Derrick 2010 14 10 R 11 Bucket Single Bucket Material Handler Aerial Device 2011 14 9 R 12 Bucket Single Bucket Service 2012 14 8 R 20 Derrick Radial Room Derrick 2013 14 7 R 41 Bucket Single Bucket Service 2014 14 6 R 42 Bucket Single Bucket Material Handler Aerial Device 2014 14 6
R 53 Bucket Single Elevator Double Bucket Material Handler Aerial Device 2015 14 5
R 55 Bucket Single Bucket Material Handler Aerial Device 2015 14 5 R 60 Derrick Radial Boom Derrick 2016 14 4 R 70 Crane Knuckle Crane 2017 14 3 R 87 Bucket Single Bucket Material Handler Aerial Device 2018 14 2 R 95 Bucket Single Bucket Material Handler Aerial Device 2019 14 1
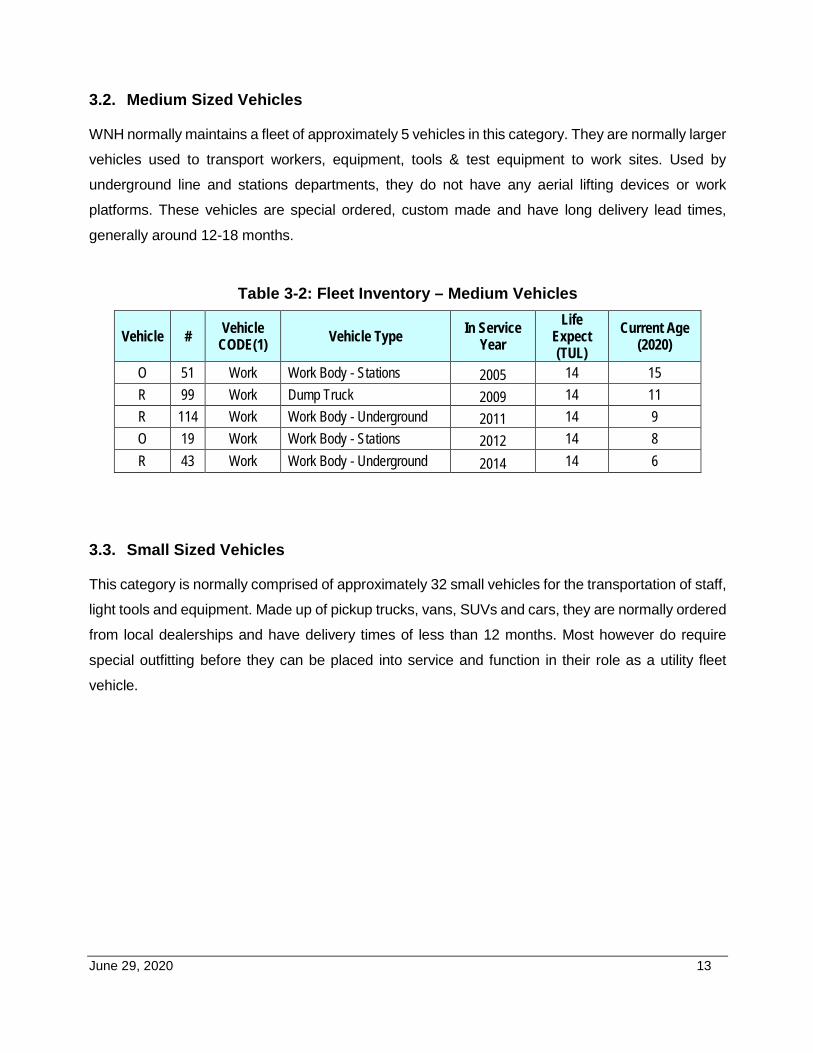
June 29, 2020 13
3.2. Medium Sized Vehicles
WNH normally maintains a fleet of approximately 5 vehicles in this category. They are normally larger
vehicles used to transport workers, equipment, tools & test equipment to work sites. Used by
underground line and stations departments, they do not have any aerial lifting devices or work
platforms. These vehicles are special ordered, custom made and have long delivery lead times,
generally around 12-18 months.
Table 3-2: Fleet Inventory – Medium Vehicles
Vehicle # Vehicle CODE(1) Vehicle Type In Service
Year Life
Expect (TUL)
Current Age (2020)
O 51 Work Work Body - Stations 2005 14 15 R 99 Work Dump Truck 2009 14 11 R 114 Work Work Body - Underground 2011 14 9 O 19 Work Work Body - Stations 2012 14 8 R 43 Work Work Body - Underground 2014 14 6
3.3. Small Sized Vehicles
This category is normally comprised of approximately 32 small vehicles for the transportation of staff,
light tools and equipment. Made up of pickup trucks, vans, SUVs and cars, they are normally ordered
from local dealerships and have delivery times of less than 12 months. Most however do require
special outfitting before they can be placed into service and function in their role as a utility fleet
vehicle.
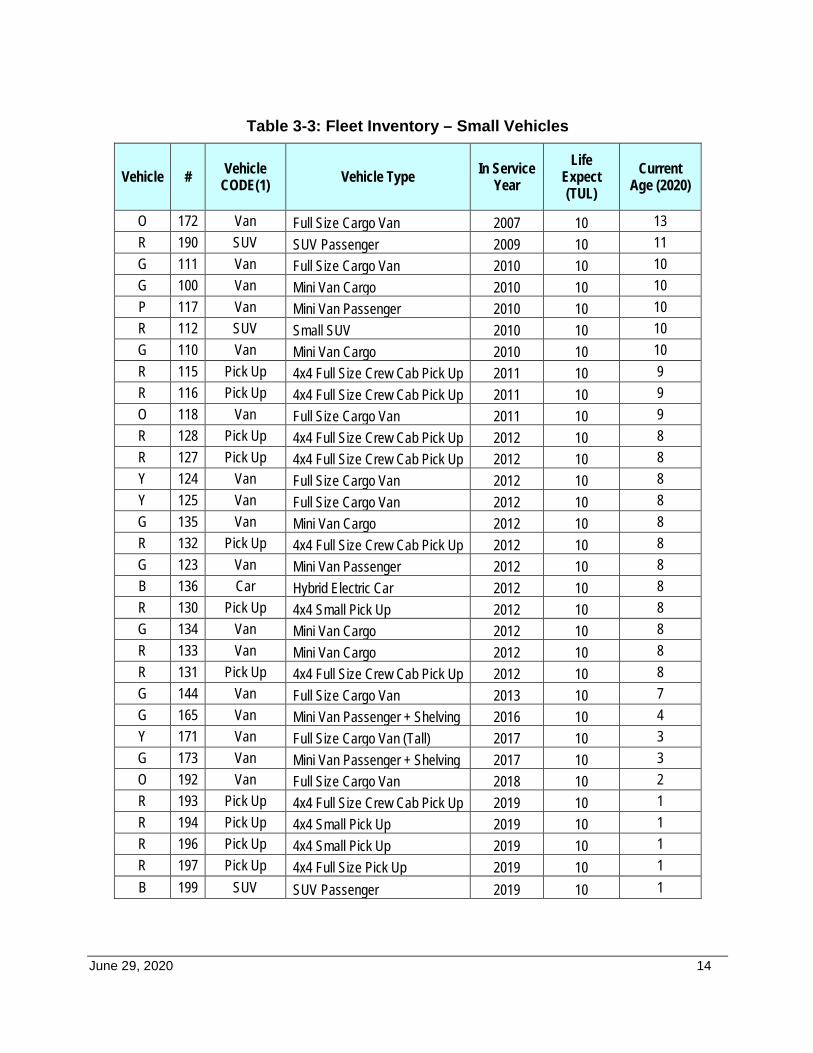
June 29, 2020 14
Table 3-3: Fleet Inventory – Small Vehicles
Vehicle # Vehicle CODE(1) Vehicle Type In Service
Year Life
Expect (TUL)
Current Age (2020)
O 172 Van Full Size Cargo Van 2007 10 13 R 190 SUV SUV Passenger 2009 10 11 G 111 Van Full Size Cargo Van 2010 10 10 G 100 Van Mini Van Cargo 2010 10 10 P 117 Van Mini Van Passenger 2010 10 10 R 112 SUV Small SUV 2010 10 10 G 110 Van Mini Van Cargo 2010 10 10 R 115 Pick Up 4x4 Full Size Crew Cab Pick Up 2011 10 9 R 116 Pick Up 4x4 Full Size Crew Cab Pick Up 2011 10 9 O 118 Van Full Size Cargo Van 2011 10 9 R 128 Pick Up 4x4 Full Size Crew Cab Pick Up 2012 10 8 R 127 Pick Up 4x4 Full Size Crew Cab Pick Up 2012 10 8 Y 124 Van Full Size Cargo Van 2012 10 8 Y 125 Van Full Size Cargo Van 2012 10 8 G 135 Van Mini Van Cargo 2012 10 8 R 132 Pick Up 4x4 Full Size Crew Cab Pick Up 2012 10 8 G 123 Van Mini Van Passenger 2012 10 8 B 136 Car Hybrid Electric Car 2012 10 8 R 130 Pick Up 4x4 Small Pick Up 2012 10 8 G 134 Van Mini Van Cargo 2012 10 8 R 133 Van Mini Van Cargo 2012 10 8 R 131 Pick Up 4x4 Full Size Crew Cab Pick Up 2012 10 8 G 144 Van Full Size Cargo Van 2013 10 7 G 165 Van Mini Van Passenger + Shelving 2016 10 4 Y 171 Van Full Size Cargo Van (Tall) 2017 10 3 G 173 Van Mini Van Passenger + Shelving 2017 10 3 O 192 Van Full Size Cargo Van 2018 10 2 R 193 Pick Up 4x4 Full Size Crew Cab Pick Up 2019 10 1 R 194 Pick Up 4x4 Small Pick Up 2019 10 1 R 196 Pick Up 4x4 Small Pick Up 2019 10 1 R 197 Pick Up 4x4 Full Size Pick Up 2019 10 1 B 199 SUV SUV Passenger 2019 10 1
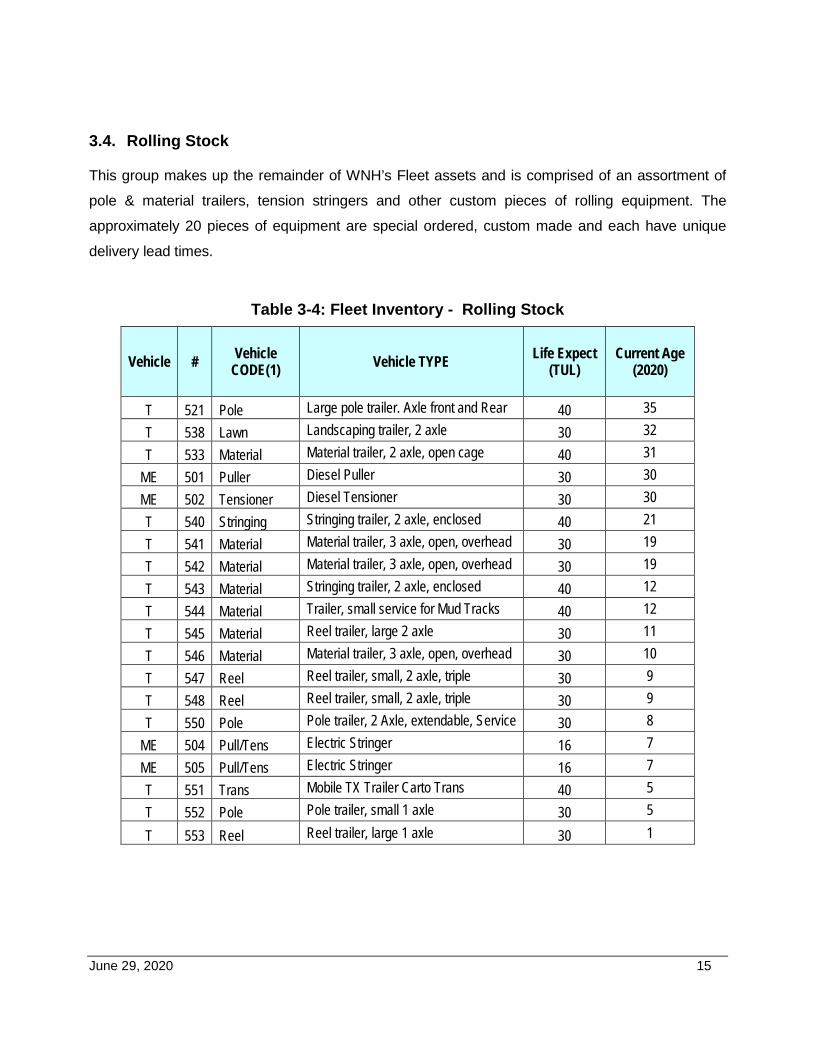
June 29, 2020 15
3.4. Rolling Stock
This group makes up the remainder of WNH’s Fleet assets and is comprised of an assortment of
pole & material trailers, tension stringers and other custom pieces of rolling equipment. The
approximately 20 pieces of equipment are special ordered, custom made and each have unique
delivery lead times.
Table 3-4: Fleet Inventory - Rolling Stock
Vehicle # Vehicle CODE(1) Vehicle TYPE Life Expect
(TUL) Current Age
(2020)
T 521 Pole Large pole trailer. Axle front and Rear 40 35 T 538 Lawn Landscaping trailer, 2 axle 30 32 T 533 Material Material trailer, 2 axle, open cage 40 31
ME 501 Puller Diesel Puller 30 30 ME 502 Tensioner Diesel Tensioner 30 30 T 540 Stringing Stringing trailer, 2 axle, enclosed 40 21 T 541 Material Material trailer, 3 axle, open, overhead 30 19 T 542 Material Material trailer, 3 axle, open, overhead 30 19 T 543 Material Stringing trailer, 2 axle, enclosed 40 12 T 544 Material Trailer, small service for Mud Tracks 40 12 T 545 Material Reel trailer, large 2 axle 30 11 T 546 Material Material trailer, 3 axle, open, overhead 30 10 T 547 Reel Reel trailer, small, 2 axle, triple 30 9 T 548 Reel Reel trailer, small, 2 axle, triple 30 9 T 550 Pole Pole trailer, 2 Axle, extendable, Service 30 8
ME 504 Pull/Tens Electric Stringer 16 7 ME 505 Pull/Tens Electric Stringer 16 7 T 551 Trans Mobile TX Trailer Carto Trans 40 5 T 552 Pole Pole trailer, small 1 axle 30 5
T 553 Reel Reel trailer, large 1 axle 30 1
June 29, 2020 16
4. FLEET ASSET CONDITION ASSESSMENTS
In the management of fleet assets, WNH uses an asset condition assessment process similar to that
used in the management of its distribution network assets.
Fleet assets are monitored from acquisition through to disposal and detailed records of all condition
assessments are kept. WNH’s fleet maintenance activities are planned to ensure the operational
effectiveness, longevity and safety of fleet assets.
Asset condition evaluation parameters have been developed for each asset class. The criteria are
based on degradation conditions that lead to the asset’s end of life and fall into 3 data type categories:
Registry Data (R): asset registry details including age, operating conditions, operating environment,
and nameplate data; may be current and/or historical in nature.
Measurement Data (M): tests which are usually quantitative in nature and assesses the conditions
of the asset.
Inspection Data (I): visual inspection and/or other information which is usually qualitative in nature
and assesses the conditions of the asset
Condition parameters were developed by WNH and are a function of manufacturer
recommendations, regulatory requirements, industry practices and the expertise and judgment of
WNH’s licenced vehicle maintenance staff. The evaluation parameters are ranked from A to E and
each rank corresponds to a numerical grade. A weighting factor is applied to each criteria indicating
the influence the criteria has on the overall asset health. Asset conditions are compared to the
evaluation criteria to develop a Health Score which represents a quantified condition score of the
asset. Health Scores are normalized and given as a percentage from 0% to 100%.
Table 4-1 illustrates the relationship between the asset health score, overall health category and
replacement guidelines.
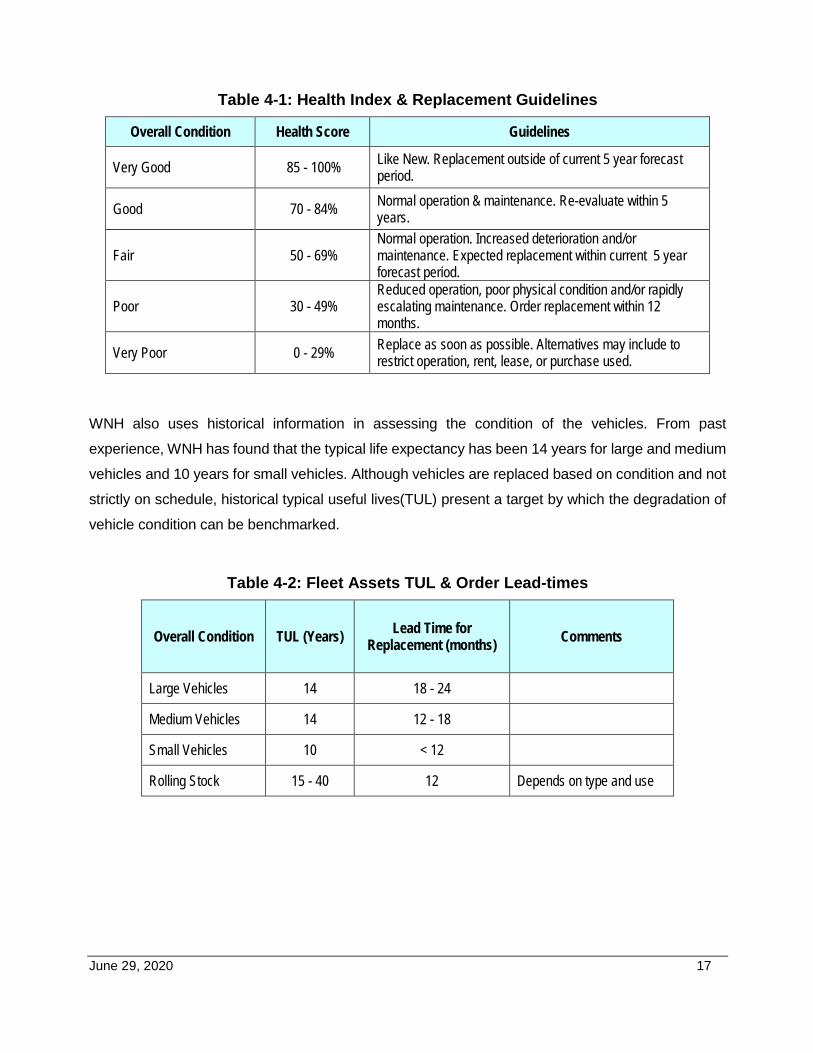
June 29, 2020 17
Table 4-1: Health Index & Replacement Guidelines
Overall Condition Health Score Guidelines
Very Good 85 - 100% Like New. Replacement outside of current 5 year forecast period.
Good 70 - 84% Normal operation & maintenance. Re-evaluate within 5 years.
Fair 50 - 69% Normal operation. Increased deterioration and/or maintenance. Expected replacement within current 5 year forecast period.
Poor 30 - 49% Reduced operation, poor physical condition and/or rapidly escalating maintenance. Order replacement within 12 months.
Very Poor 0 - 29% Replace as soon as possible. Alternatives may include to restrict operation, rent, lease, or purchase used.
WNH also uses historical information in assessing the condition of the vehicles. From past
experience, WNH has found that the typical life expectancy has been 14 years for large and medium
vehicles and 10 years for small vehicles. Although vehicles are replaced based on condition and not
strictly on schedule, historical typical useful lives(TUL) present a target by which the degradation of
vehicle condition can be benchmarked.
Table 4-2: Fleet Assets TUL & Order Lead-times
Overall Condition TUL (Years) Lead Time for Replacement (months) Comments
Large Vehicles 14 18 - 24
Medium Vehicles 14 12 - 18
Small Vehicles 10 < 12
Rolling Stock 15 - 40 12 Depends on type and use
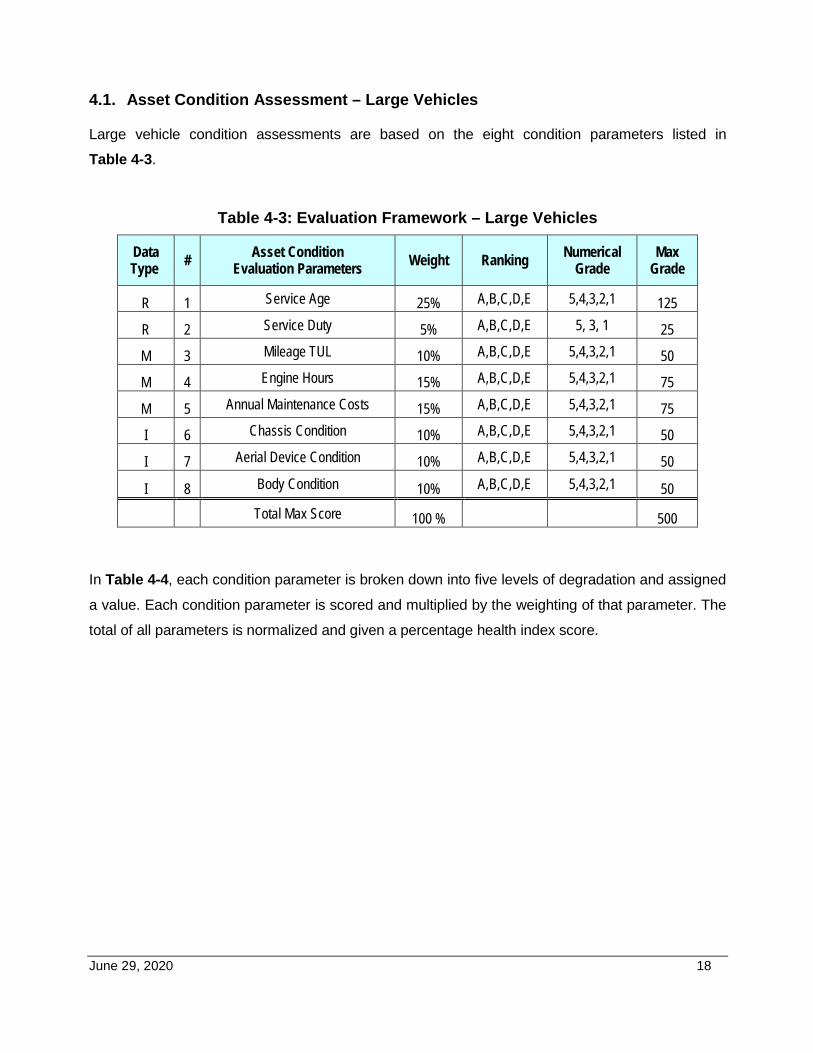
June 29, 2020 18
4.1. Asset Condition Assessment – Large Vehicles
Large vehicle condition assessments are based on the eight condition parameters listed in
Table 4-3.
Table 4-3: Evaluation Framework – Large Vehicles
Data Type # Asset Condition
Evaluation Parameters Weight Ranking Numerical Grade
Max Grade
R 1 Service Age 25% A,B,C,D,E 5,4,3,2,1 125
R 2 Service Duty 5% A,B,C,D,E 5, 3, 1 25
M 3 Mileage TUL 10% A,B,C,D,E 5,4,3,2,1 50
M 4 Engine Hours 15% A,B,C,D,E 5,4,3,2,1 75
M 5 Annual Maintenance Costs 15% A,B,C,D,E 5,4,3,2,1 75
I 6 Chassis Condition 10% A,B,C,D,E 5,4,3,2,1 50
I 7 Aerial Device Condition 10% A,B,C,D,E 5,4,3,2,1 50
I 8 Body Condition 10% A,B,C,D,E 5,4,3,2,1 50
Total Max Score 100 % 500
In Table 4-4, each condition parameter is broken down into five levels of degradation and assigned
a value. Each condition parameter is scored and multiplied by the weighting of that parameter. The
total of all parameters is normalized and given a percentage health index score.
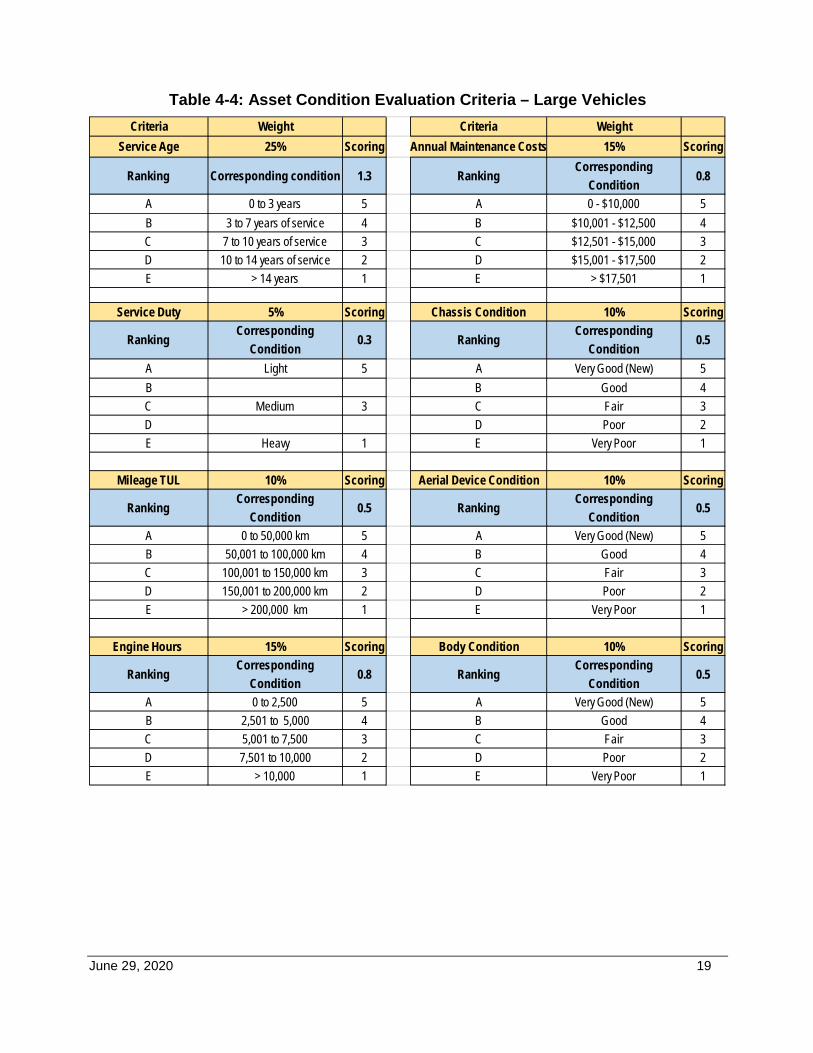
June 29, 2020 19
Table 4-4: Asset Condition Evaluation Criteria – Large Vehicles
Criteria Weight Criteria WeightService Age 25% Scoring Annual Maintenance Costs 15% Scoring
Ranking Corresponding condition 1.3 RankingCorresponding
Condition0.8
A 0 to 3 years 5 A 0 - $10,000 5B 3 to 7 years of service 4 B $10,001 - $12,500 4C 7 to 10 years of service 3 C $12,501 - $15,000 3D 10 to 14 years of service 2 D $15,001 - $17,500 2E > 14 years 1 E > $17,501 1
Service Duty 5% Scoring Chassis Condition 10% Scoring
RankingCorresponding
Condition0.3 Ranking
Corresponding Condition
0.5
A Light 5 A Very Good (New) 5B B Good 4C Medium 3 C Fair 3D D Poor 2E Heavy 1 E Very Poor 1
Mileage TUL 10% Scoring Aerial Device Condition 10% Scoring
RankingCorresponding
Condition0.5 Ranking
Corresponding Condition
0.5
A 0 to 50,000 km 5 A Very Good (New) 5B 50,001 to 100,000 km 4 B Good 4C 100,001 to 150,000 km 3 C Fair 3D 150,001 to 200,000 km 2 D Poor 2E > 200,000 km 1 E Very Poor 1
Engine Hours 15% Scoring Body Condition 10% Scoring
RankingCorresponding
Condition0.8 Ranking
Corresponding Condition
0.5
A 0 to 2,500 5 A Very Good (New) 5B 2,501 to 5,000 4 B Good 4C 5,001 to 7,500 3 C Fair 3D 7,501 to 10,000 2 D Poor 2E > 10,000 1 E Very Poor 1
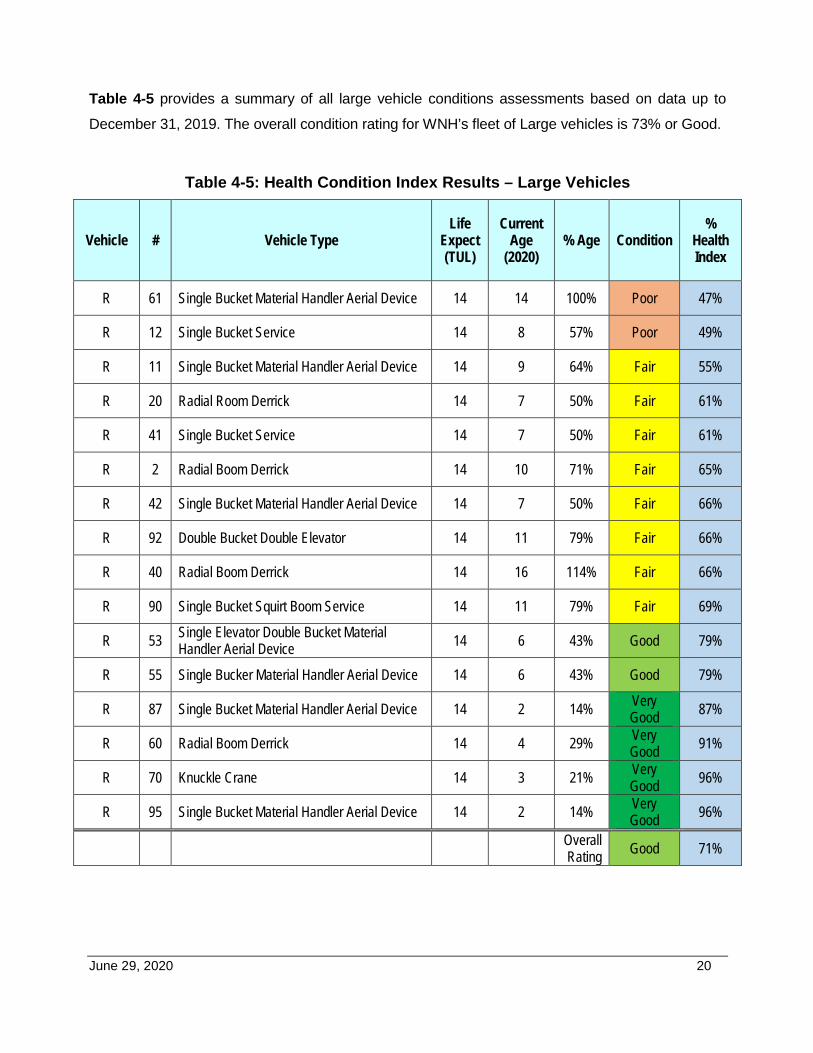
June 29, 2020 20
Table 4-5 provides a summary of all large vehicle conditions assessments based on data up to
December 31, 2019. The overall condition rating for WNH’s fleet of Large vehicles is 73% or Good.
Table 4-5: Health Condition Index Results – Large Vehicles
Vehicle # Vehicle Type Life
Expect (TUL)
Current Age
(2020) % Age Condition
% Health Index
R 61 Single Bucket Material Handler Aerial Device 14 14 100% Poor 47%
R 12 Single Bucket Service 14 8 57% Poor 49%
R 11 Single Bucket Material Handler Aerial Device 14 9 64% Fair 55%
R 20 Radial Room Derrick 14 7 50% Fair 61%
R 41 Single Bucket Service 14 7 50% Fair 61%
R 2 Radial Boom Derrick 14 10 71% Fair 65%
R 42 Single Bucket Material Handler Aerial Device 14 7 50% Fair 66%
R 92 Double Bucket Double Elevator 14 11 79% Fair 66%
R 40 Radial Boom Derrick 14 16 114% Fair 66%
R 90 Single Bucket Squirt Boom Service 14 11 79% Fair 69%
R 53 Single Elevator Double Bucket Material Handler Aerial Device 14 6 43% Good 79%
R 55 Single Bucker Material Handler Aerial Device 14 6 43% Good 79%
R 87 Single Bucket Material Handler Aerial Device 14 2 14% Very Good 87%
R 60 Radial Boom Derrick 14 4 29% Very Good 91%
R 70 Knuckle Crane 14 3 21% Very Good 96%
R 95 Single Bucket Material Handler Aerial Device 14 2 14% Very Good 96%
Overall Rating Good 71%
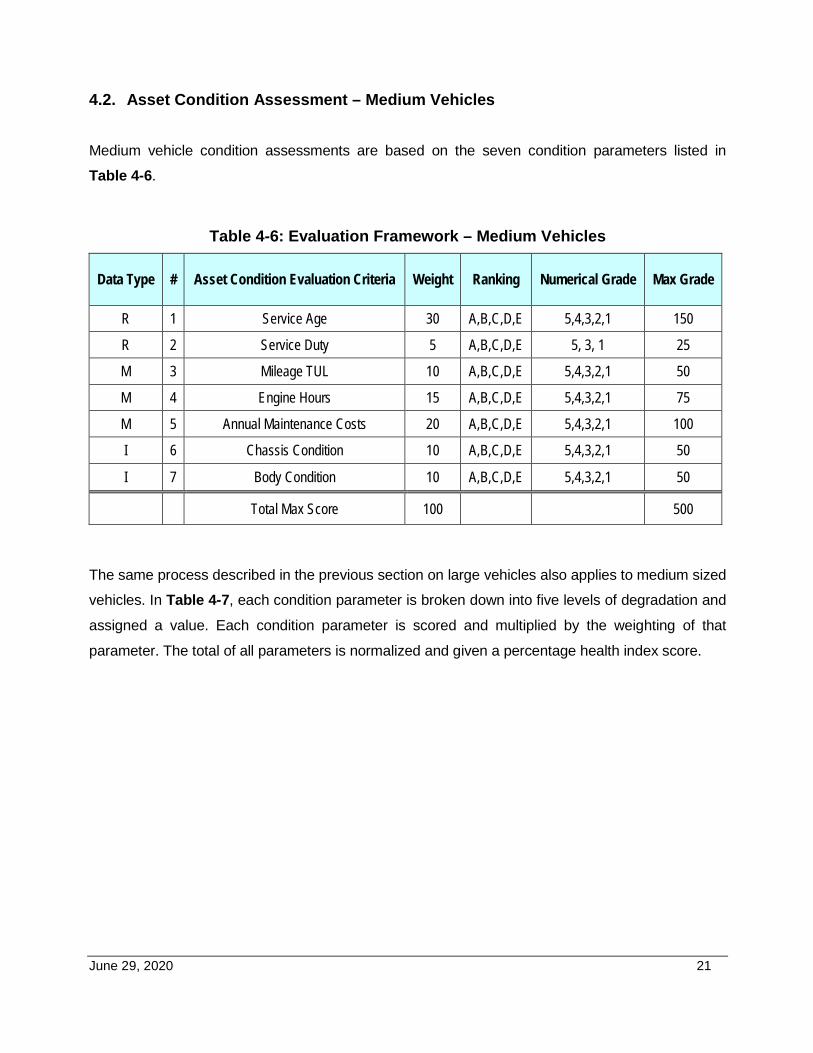
June 29, 2020 21
4.2. Asset Condition Assessment – Medium Vehicles
Medium vehicle condition assessments are based on the seven condition parameters listed in
Table 4-6.
Table 4-6: Evaluation Framework – Medium Vehicles
Data Type # Asset Condition Evaluation Criteria Weight Ranking Numerical Grade Max Grade
R 1 Service Age 30 A,B,C,D,E 5,4,3,2,1 150
R 2 Service Duty 5 A,B,C,D,E 5, 3, 1 25
M 3 Mileage TUL 10 A,B,C,D,E 5,4,3,2,1 50
M 4 Engine Hours 15 A,B,C,D,E 5,4,3,2,1 75
M 5 Annual Maintenance Costs 20 A,B,C,D,E 5,4,3,2,1 100
I 6 Chassis Condition 10 A,B,C,D,E 5,4,3,2,1 50
I 7 Body Condition 10 A,B,C,D,E 5,4,3,2,1 50
Total Max Score 100 500
The same process described in the previous section on large vehicles also applies to medium sized
vehicles. In Table 4-7, each condition parameter is broken down into five levels of degradation and
assigned a value. Each condition parameter is scored and multiplied by the weighting of that
parameter. The total of all parameters is normalized and given a percentage health index score.
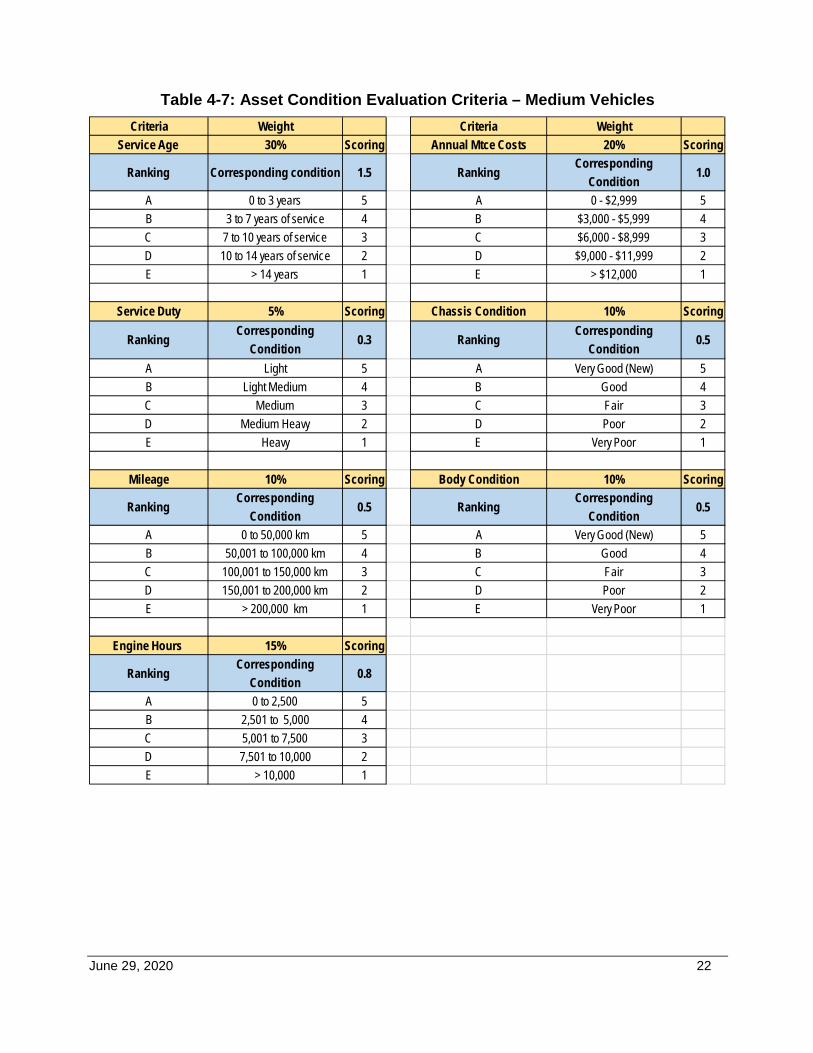
June 29, 2020 22
Table 4-7: Asset Condition Evaluation Criteria – Medium Vehicles
Criteria Weight Criteria WeightService Age 30% Scoring Annual Mtce Costs 20% Scoring
Ranking Corresponding condition 1.5 RankingCorresponding
Condition1.0
A 0 to 3 years 5 A 0 - $2,999 5B 3 to 7 years of service 4 B $3,000 - $5,999 4C 7 to 10 years of service 3 C $6,000 - $8,999 3D 10 to 14 years of service 2 D $9,000 - $11,999 2E > 14 years 1 E > $12,000 1
Service Duty 5% Scoring Chassis Condition 10% Scoring
RankingCorresponding
Condition0.3 Ranking
Corresponding Condition
0.5
A Light 5 A Very Good (New) 5B Light Medium 4 B Good 4C Medium 3 C Fair 3D Medium Heavy 2 D Poor 2E Heavy 1 E Very Poor 1
Mileage 10% Scoring Body Condition 10% Scoring
RankingCorresponding
Condition0.5 Ranking
Corresponding Condition
0.5
A 0 to 50,000 km 5 A Very Good (New) 5B 50,001 to 100,000 km 4 B Good 4C 100,001 to 150,000 km 3 C Fair 3D 150,001 to 200,000 km 2 D Poor 2E > 200,000 km 1 E Very Poor 1
Engine Hours 15% Scoring
RankingCorresponding
Condition0.8
A 0 to 2,500 5B 2,501 to 5,000 4C 5,001 to 7,500 3D 7,501 to 10,000 2E > 10,000 1
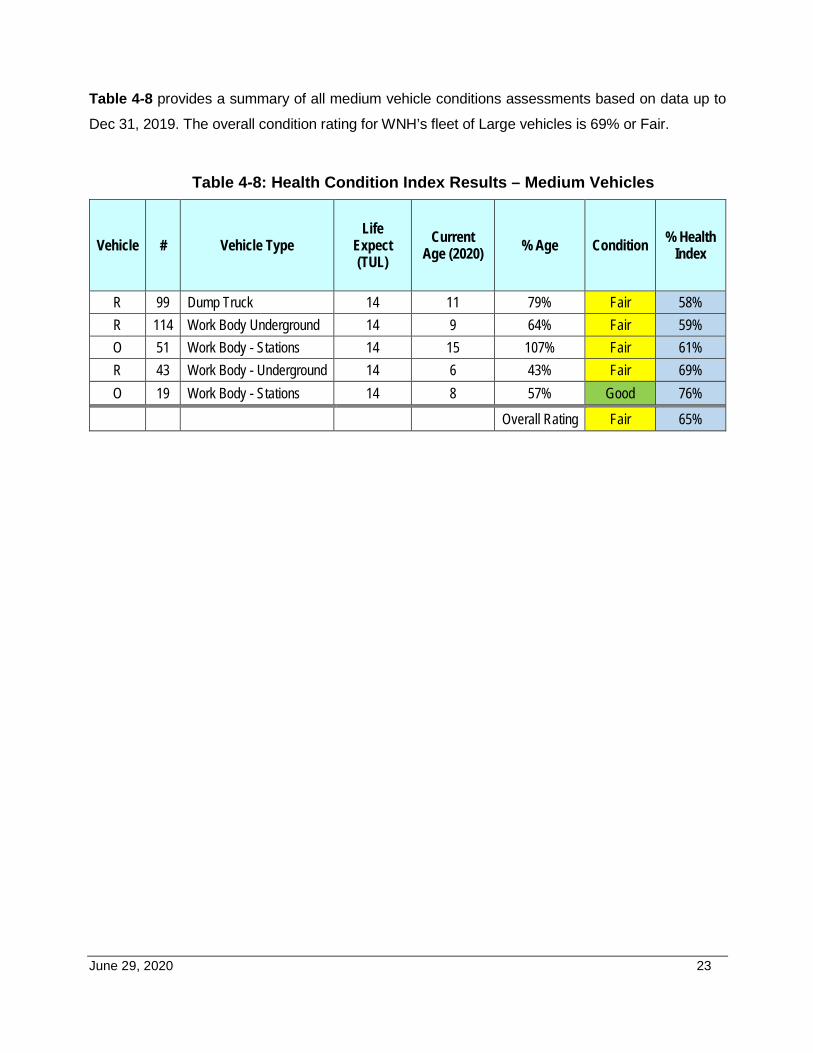
June 29, 2020 23
Table 4-8 provides a summary of all medium vehicle conditions assessments based on data up to
Dec 31, 2019. The overall condition rating for WNH’s fleet of Large vehicles is 69% or Fair.
Table 4-8: Health Condition Index Results – Medium Vehicles
Vehicle # Vehicle Type Life
Expect (TUL)
Current Age (2020) % Age Condition % Health
Index
R 99 Dump Truck 14 11 79% Fair 58% R 114 Work Body Underground 14 9 64% Fair 59% O 51 Work Body - Stations 14 15 107% Fair 61% R 43 Work Body - Underground 14 6 43% Fair 69% O 19 Work Body - Stations 14 8 57% Good 76%
Overall Rating Fair 65%
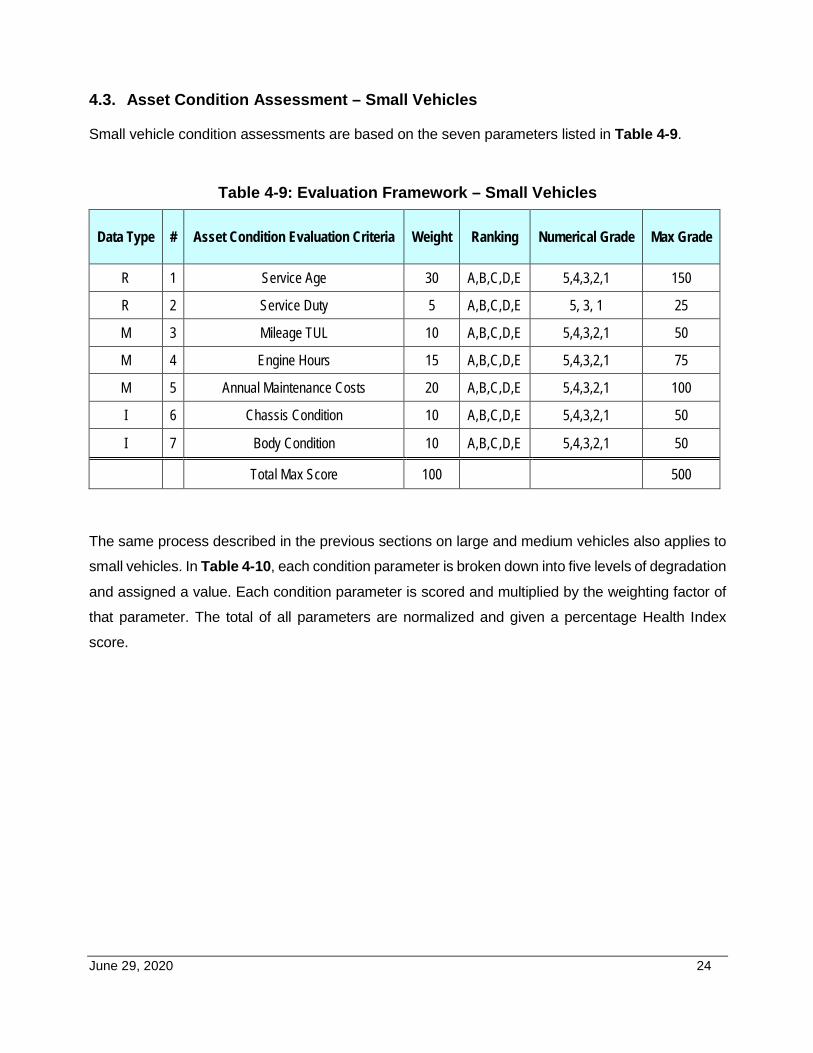
June 29, 2020 24
4.3. Asset Condition Assessment – Small Vehicles
Small vehicle condition assessments are based on the seven parameters listed in Table 4-9.
Table 4-9: Evaluation Framework – Small Vehicles
Data Type # Asset Condition Evaluation Criteria Weight Ranking Numerical Grade Max Grade
R 1 Service Age 30 A,B,C,D,E 5,4,3,2,1 150
R 2 Service Duty 5 A,B,C,D,E 5, 3, 1 25
M 3 Mileage TUL 10 A,B,C,D,E 5,4,3,2,1 50
M 4 Engine Hours 15 A,B,C,D,E 5,4,3,2,1 75
M 5 Annual Maintenance Costs 20 A,B,C,D,E 5,4,3,2,1 100
I 6 Chassis Condition 10 A,B,C,D,E 5,4,3,2,1 50
I 7 Body Condition 10 A,B,C,D,E 5,4,3,2,1 50
Total Max Score 100 500
The same process described in the previous sections on large and medium vehicles also applies to
small vehicles. In Table 4-10, each condition parameter is broken down into five levels of degradation
and assigned a value. Each condition parameter is scored and multiplied by the weighting factor of
that parameter. The total of all parameters are normalized and given a percentage Health Index
score.
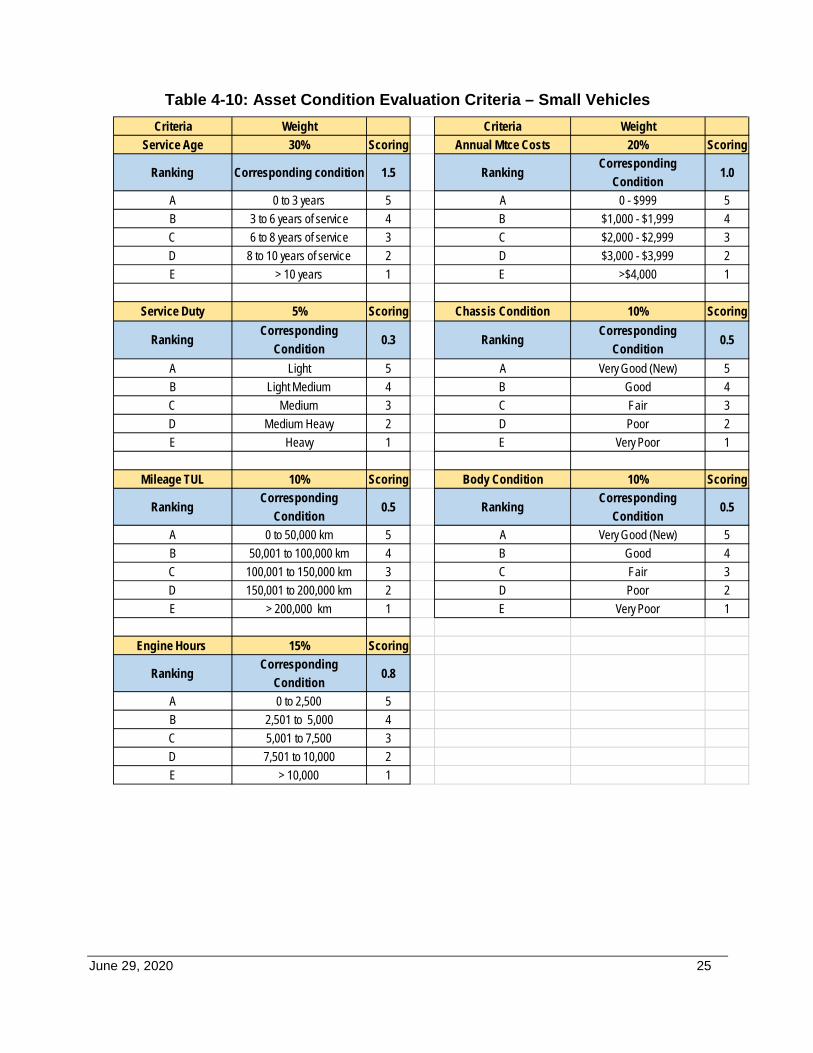
June 29, 2020 25
Table 4-10: Asset Condition Evaluation Criteria – Small Vehicles
Criteria Weight Criteria WeightService Age 30% Scoring Annual Mtce Costs 20% Scoring
Ranking Corresponding condition 1.5 RankingCorresponding
Condition1.0
A 0 to 3 years 5 A 0 - $999 5B 3 to 6 years of service 4 B $1,000 - $1,999 4C 6 to 8 years of service 3 C $2,000 - $2,999 3D 8 to 10 years of service 2 D $3,000 - $3,999 2E > 10 years 1 E >$4,000 1
Service Duty 5% Scoring Chassis Condition 10% Scoring
RankingCorresponding
Condition0.3 Ranking
Corresponding Condition
0.5
A Light 5 A Very Good (New) 5B Light Medium 4 B Good 4C Medium 3 C Fair 3D Medium Heavy 2 D Poor 2E Heavy 1 E Very Poor 1
Mileage TUL 10% Scoring Body Condition 10% Scoring
RankingCorresponding
Condition0.5 Ranking
Corresponding Condition
0.5
A 0 to 50,000 km 5 A Very Good (New) 5B 50,001 to 100,000 km 4 B Good 4C 100,001 to 150,000 km 3 C Fair 3D 150,001 to 200,000 km 2 D Poor 2E > 200,000 km 1 E Very Poor 1
Engine Hours 15% Scoring
RankingCorresponding
Condition0.8
A 0 to 2,500 5B 2,501 to 5,000 4C 5,001 to 7,500 3D 7,501 to 10,000 2E > 10,000 1
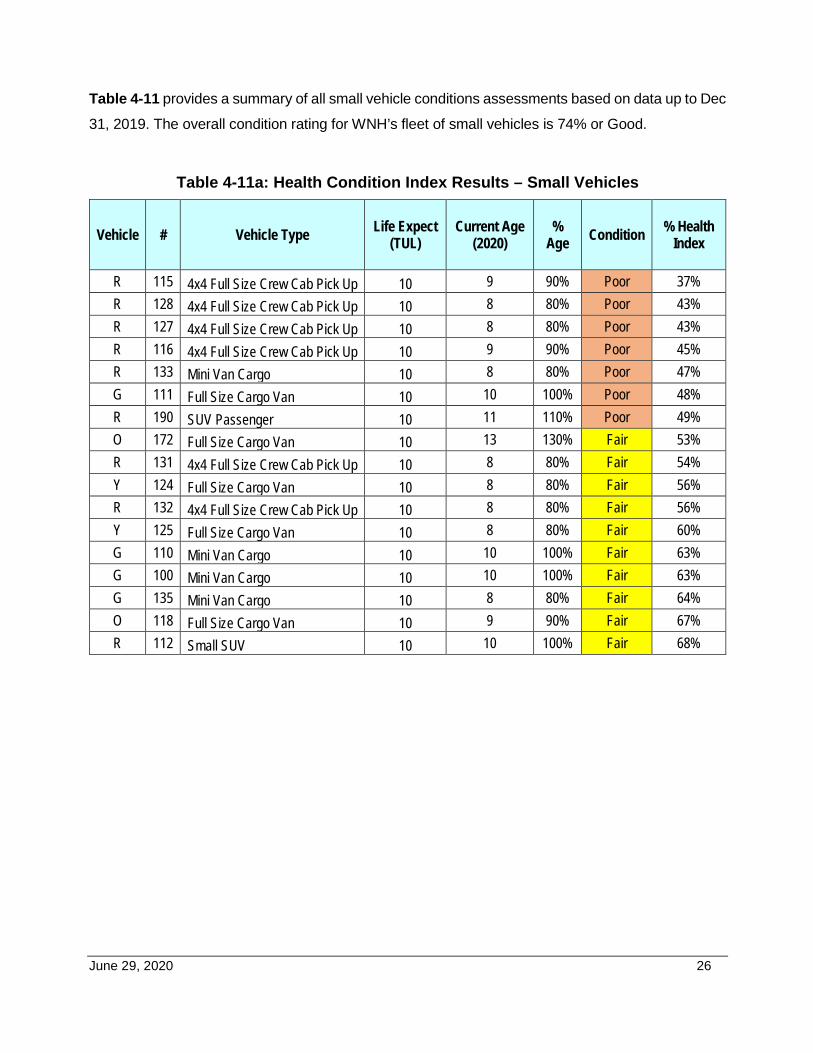
June 29, 2020 26
Table 4-11 provides a summary of all small vehicle conditions assessments based on data up to Dec
31, 2019. The overall condition rating for WNH’s fleet of small vehicles is 74% or Good.
Table 4-11a: Health Condition Index Results – Small Vehicles
Vehicle # Vehicle Type Life Expect (TUL)
Current Age (2020)
% Age Condition % Health
Index
R 115 4x4 Full Size Crew Cab Pick Up 10 9 90% Poor 37% R 128 4x4 Full Size Crew Cab Pick Up 10 8 80% Poor 43% R 127 4x4 Full Size Crew Cab Pick Up 10 8 80% Poor 43% R 116 4x4 Full Size Crew Cab Pick Up 10 9 90% Poor 45% R 133 Mini Van Cargo 10 8 80% Poor 47% G 111 Full Size Cargo Van 10 10 100% Poor 48% R 190 SUV Passenger 10 11 110% Poor 49% O 172 Full Size Cargo Van 10 13 130% Fair 53% R 131 4x4 Full Size Crew Cab Pick Up 10 8 80% Fair 54% Y 124 Full Size Cargo Van 10 8 80% Fair 56% R 132 4x4 Full Size Crew Cab Pick Up 10 8 80% Fair 56% Y 125 Full Size Cargo Van 10 8 80% Fair 60% G 110 Mini Van Cargo 10 10 100% Fair 63% G 100 Mini Van Cargo 10 10 100% Fair 63% G 135 Mini Van Cargo 10 8 80% Fair 64% O 118 Full Size Cargo Van 10 9 90% Fair 67% R 112 Small SUV 10 10 100% Fair 68%
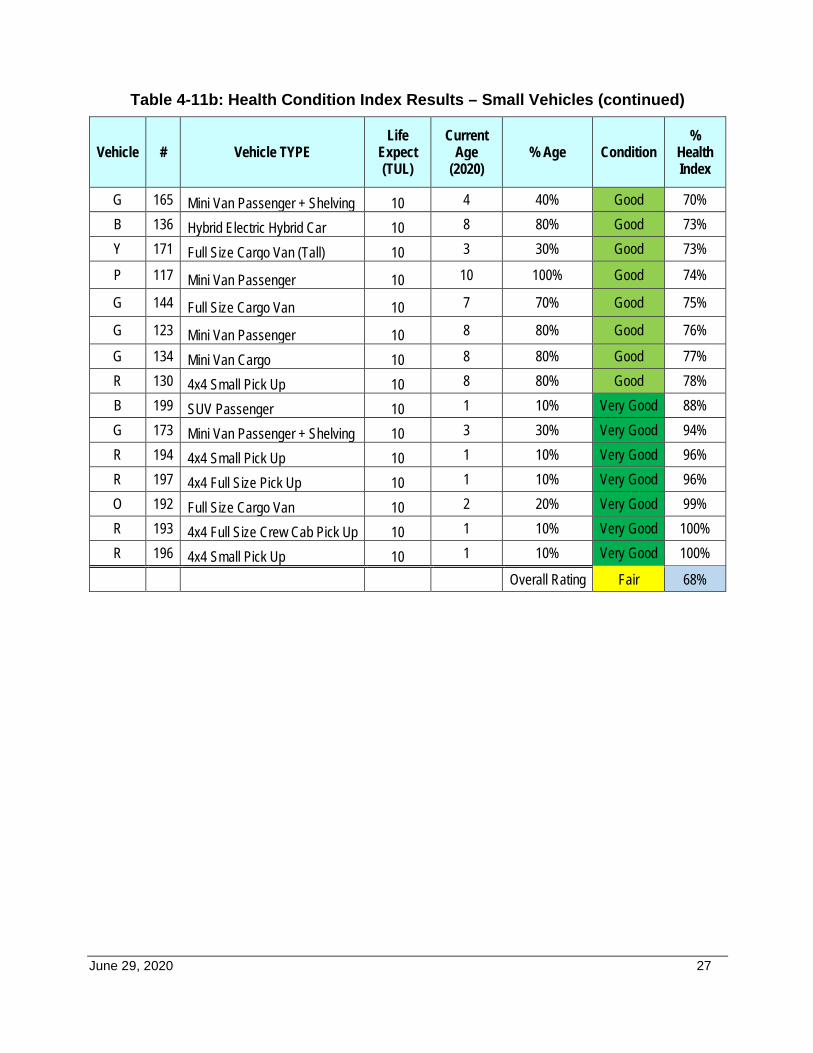
June 29, 2020 27
Table 4-11b: Health Condition Index Results – Small Vehicles (continued)
Vehicle # Vehicle TYPE Life
Expect (TUL)
Current Age
(2020) % Age Condition
% Health Index
G 165 Mini Van Passenger + Shelving 10 4 40% Good 70% B 136 Hybrid Electric Hybrid Car 10 8 80% Good 73% Y 171 Full Size Cargo Van (Tall) 10 3 30% Good 73%
P 117 Mini Van Passenger 10 10 100% Good 74%
G 144 Full Size Cargo Van 10 7 70% Good 75%
G 123 Mini Van Passenger 10 8 80% Good 76%
G 134 Mini Van Cargo 10 8 80% Good 77% R 130 4x4 Small Pick Up 10 8 80% Good 78% B 199 SUV Passenger 10 1 10% Very Good 88% G 173 Mini Van Passenger + Shelving 10 3 30% Very Good 94% R 194 4x4 Small Pick Up 10 1 10% Very Good 96% R 197 4x4 Full Size Pick Up 10 1 10% Very Good 96% O 192 Full Size Cargo Van 10 2 20% Very Good 99% R 193 4x4 Full Size Crew Cab Pick Up 10 1 10% Very Good 100% R 196 4x4 Small Pick Up 10 1 10% Very Good 100%
Overall Rating Fair 68%
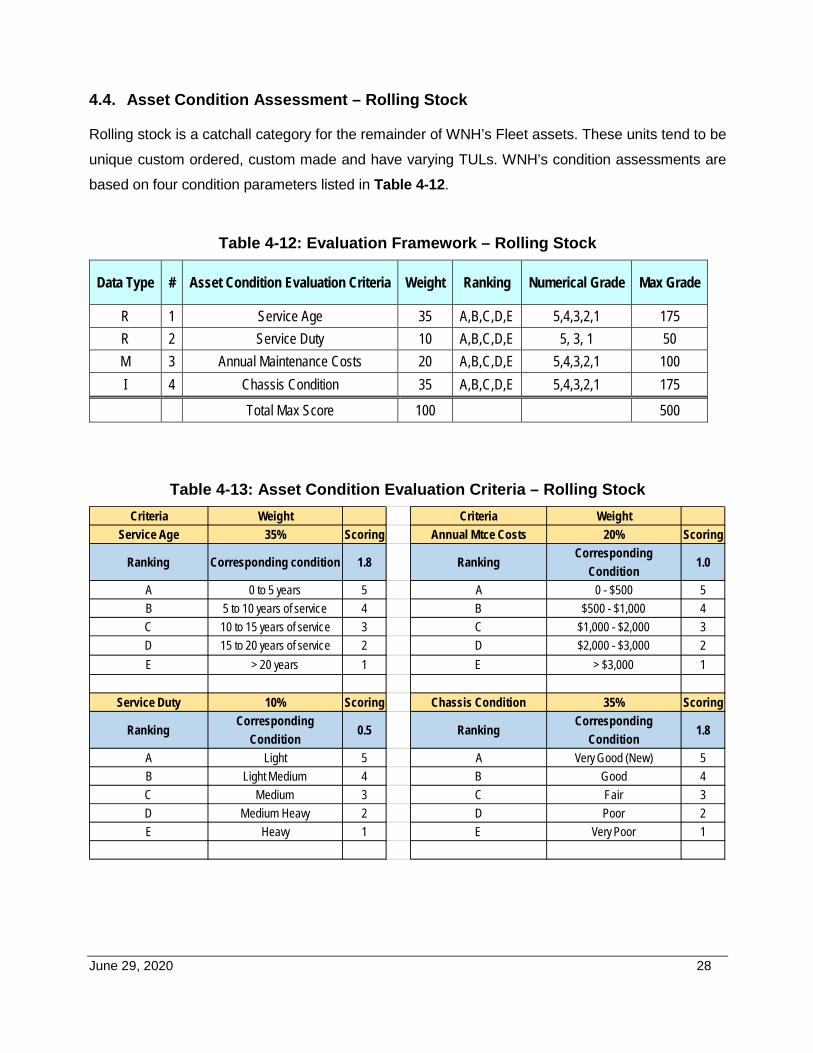
June 29, 2020 28
4.4. Asset Condition Assessment – Rolling Stock
Rolling stock is a catchall category for the remainder of WNH’s Fleet assets. These units tend to be
unique custom ordered, custom made and have varying TULs. WNH’s condition assessments are
based on four condition parameters listed in Table 4-12.
Table 4-12: Evaluation Framework – Rolling Stock
Data Type # Asset Condition Evaluation Criteria Weight Ranking Numerical Grade Max Grade
R 1 Service Age 35 A,B,C,D,E 5,4,3,2,1 175 R 2 Service Duty 10 A,B,C,D,E 5, 3, 1 50 M 3 Annual Maintenance Costs 20 A,B,C,D,E 5,4,3,2,1 100 I 4 Chassis Condition 35 A,B,C,D,E 5,4,3,2,1 175
Total Max Score 100 500
Table 4-13: Asset Condition Evaluation Criteria – Rolling Stock
Criteria Weight Criteria WeightService Age 35% Scoring Annual Mtce Costs 20% Scoring
Ranking Corresponding condition 1.8 RankingCorresponding
Condition1.0
A 0 to 5 years 5 A 0 - $500 5B 5 to 10 years of service 4 B $500 - $1,000 4C 10 to 15 years of service 3 C $1,000 - $2,000 3D 15 to 20 years of service 2 D $2,000 - $3,000 2E > 20 years 1 E > $3,000 1
Service Duty 10% Scoring Chassis Condition 35% Scoring
RankingCorresponding
Condition0.5 Ranking
Corresponding Condition
1.8
A Light 5 A Very Good (New) 5B Light Medium 4 B Good 4C Medium 3 C Fair 3D Medium Heavy 2 D Poor 2E Heavy 1 E Very Poor 1
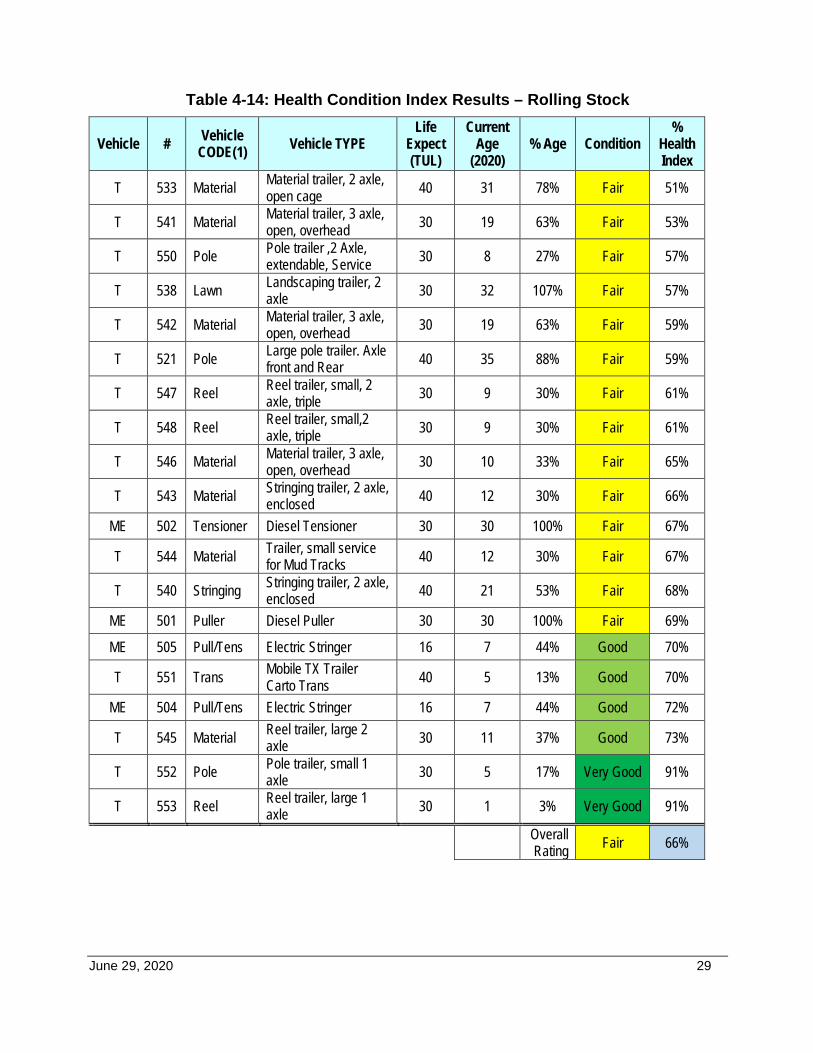
June 29, 2020 29
Table 4-14: Health Condition Index Results – Rolling Stock
Vehicle # Vehicle CODE(1) Vehicle TYPE
Life Expect (TUL)
Current Age
(2020) % Age Condition
% Health Index
T 533 Material Material trailer, 2 axle, open cage 40 31 78% Fair 51%
T 541 Material Material trailer, 3 axle, open, overhead 30 19 63% Fair 53%
T 550 Pole Pole trailer ,2 Axle, extendable, Service 30 8 27% Fair 57%
T 538 Lawn Landscaping trailer, 2 axle 30 32 107% Fair 57%
T 542 Material Material trailer, 3 axle, open, overhead 30 19 63% Fair 59%
T 521 Pole Large pole trailer. Axle front and Rear 40 35 88% Fair 59%
T 547 Reel Reel trailer, small, 2 axle, triple 30 9 30% Fair 61%
T 548 Reel Reel trailer, small,2 axle, triple 30 9 30% Fair 61%
T 546 Material Material trailer, 3 axle, open, overhead 30 10 33% Fair 65%
T 543 Material Stringing trailer, 2 axle, enclosed 40 12 30% Fair 66%
ME 502 Tensioner Diesel Tensioner 30 30 100% Fair 67%
T 544 Material Trailer, small service for Mud Tracks 40 12 30% Fair 67%
T 540 Stringing Stringing trailer, 2 axle, enclosed 40 21 53% Fair 68%
ME 501 Puller Diesel Puller 30 30 100% Fair 69%
ME 505 Pull/Tens Electric Stringer 16 7 44% Good 70%
T 551 Trans Mobile TX Trailer Carto Trans 40 5 13% Good 70%
ME 504 Pull/Tens Electric Stringer 16 7 44% Good 72%
T 545 Material Reel trailer, large 2 axle 30 11 37% Good 73%
T 552 Pole Pole trailer, small 1 axle 30 5 17% Very Good 91%
T 553 Reel Reel trailer, large 1 axle 30 1 3% Very Good 91%
Overall Rating Fair 66%
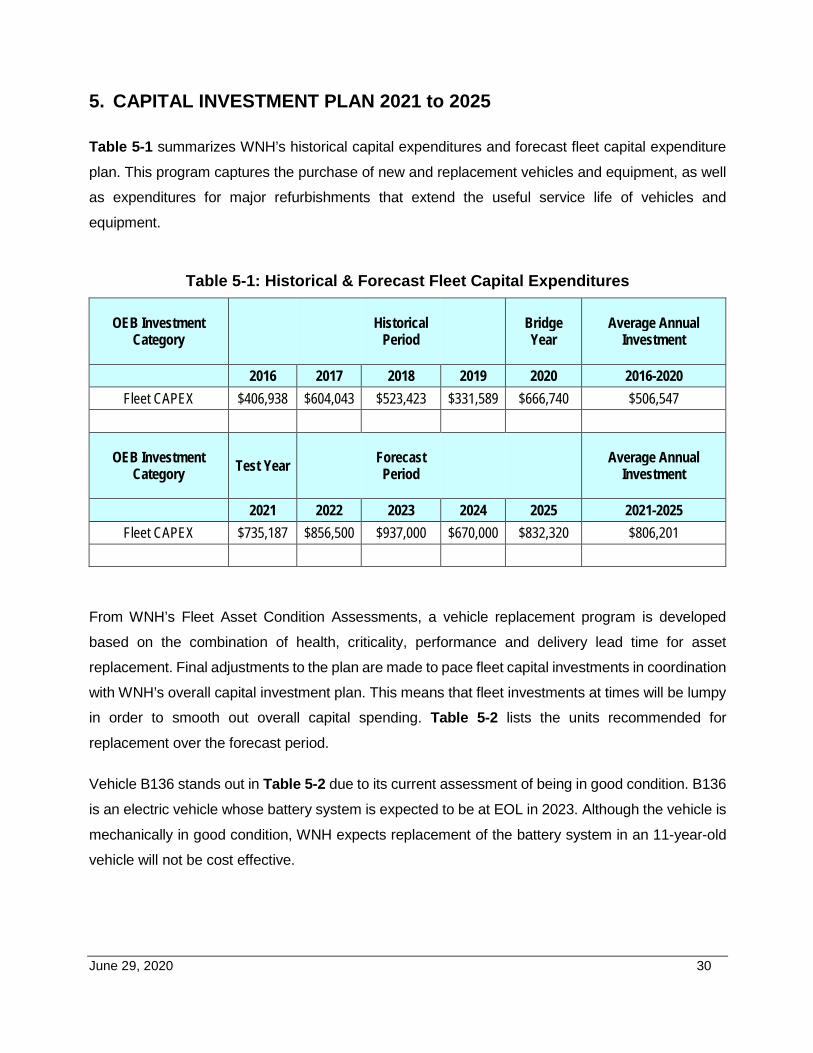
June 29, 2020 30
5. CAPITAL INVESTMENT PLAN 2021 to 2025
Table 5-1 summarizes WNH’s historical capital expenditures and forecast fleet capital expenditure
plan. This program captures the purchase of new and replacement vehicles and equipment, as well
as expenditures for major refurbishments that extend the useful service life of vehicles and
equipment.
Table 5-1: Historical & Forecast Fleet Capital Expenditures
OEB Investment Category Historical
Period Bridge Year
Average Annual Investment
2016 2017 2018 2019 2020 2016-2020 Fleet CAPEX $406,938 $604,043 $523,423 $331,589 $666,740 $506,547
OEB Investment Category Test Year Forecast
Period Average Annual Investment
2021 2022 2023 2024 2025 2021-2025 Fleet CAPEX $735,187 $856,500 $937,000 $670,000 $832,320 $806,201
From WNH’s Fleet Asset Condition Assessments, a vehicle replacement program is developed
based on the combination of health, criticality, performance and delivery lead time for asset
replacement. Final adjustments to the plan are made to pace fleet capital investments in coordination
with WNH’s overall capital investment plan. This means that fleet investments at times will be lumpy
in order to smooth out overall capital spending. Table 5-2 lists the units recommended for
replacement over the forecast period.
Vehicle B136 stands out in Table 5-2 due to its current assessment of being in good condition. B136
is an electric vehicle whose battery system is expected to be at EOL in 2023. Although the vehicle is
mechanically in good condition, WNH expects replacement of the battery system in an 11-year-old
vehicle will not be cost effective.
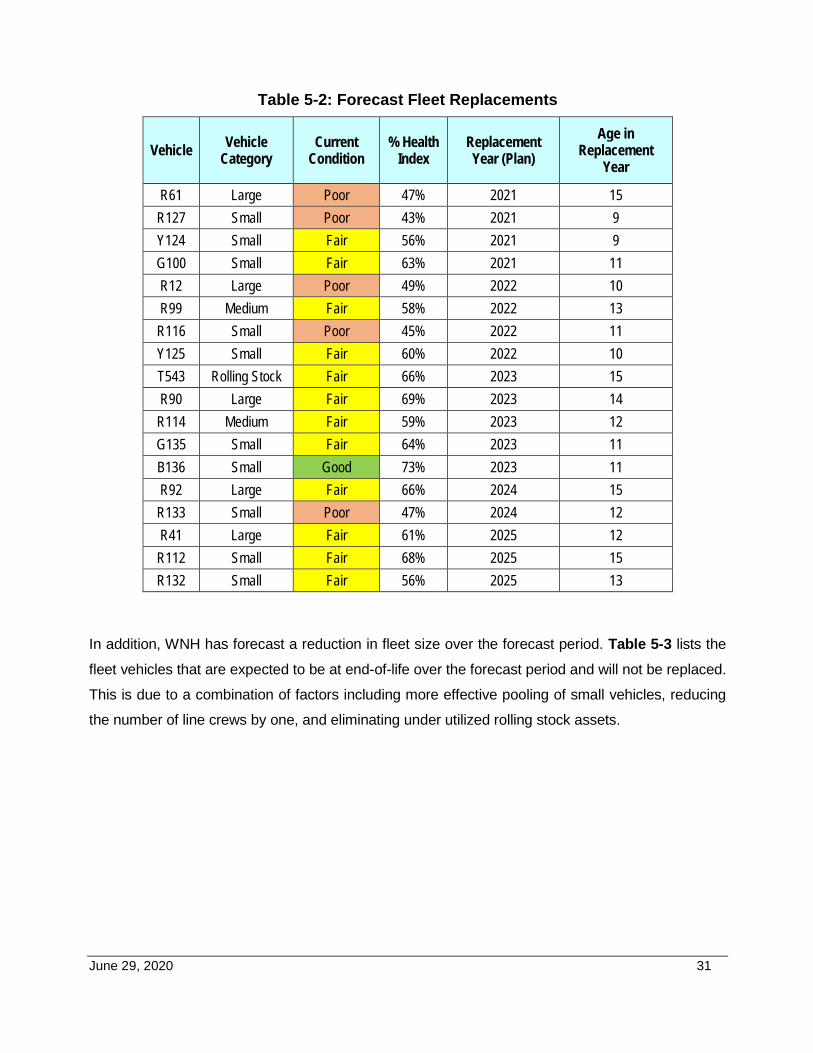
June 29, 2020 31
Table 5-2: Forecast Fleet Replacements
Vehicle Vehicle Category
Current Condition
% Health Index
Replacement Year (Plan)
Age in Replacement
Year
R61 Large Poor 47% 2021 15 R127 Small Poor 43% 2021 9 Y124 Small Fair 56% 2021 9 G100 Small Fair 63% 2021 11 R12 Large Poor 49% 2022 10 R99 Medium Fair 58% 2022 13
R116 Small Poor 45% 2022 11 Y125 Small Fair 60% 2022 10 T543 Rolling Stock Fair 66% 2023 15 R90 Large Fair 69% 2023 14
R114 Medium Fair 59% 2023 12 G135 Small Fair 64% 2023 11 B136 Small Good 73% 2023 11 R92 Large Fair 66% 2024 15
R133 Small Poor 47% 2024 12 R41 Large Fair 61% 2025 12
R112 Small Fair 68% 2025 15 R132 Small Fair 56% 2025 13
In addition, WNH has forecast a reduction in fleet size over the forecast period. Table 5-3 lists the
fleet vehicles that are expected to be at end-of-life over the forecast period and will not be replaced.
This is due to a combination of factors including more effective pooling of small vehicles, reducing
the number of line crews by one, and eliminating under utilized rolling stock assets.
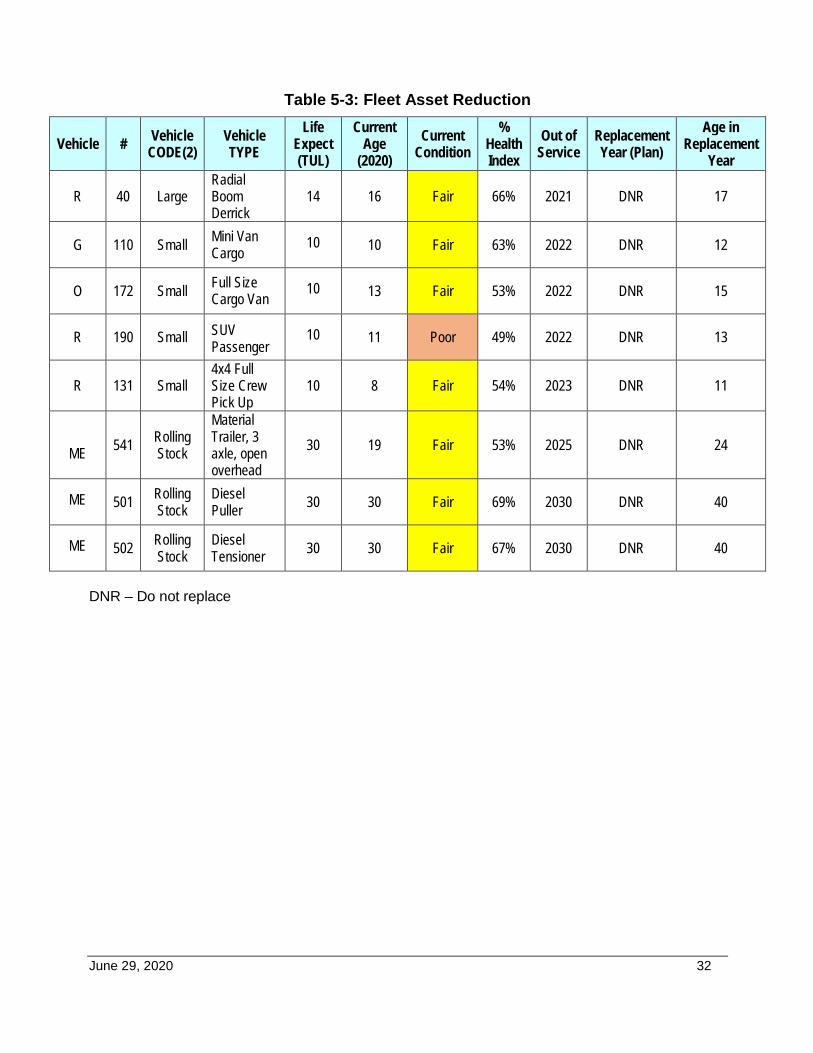
June 29, 2020 32
Table 5-3: Fleet Asset Reduction
Vehicle # Vehicle CODE(2)
Vehicle TYPE
Life Expect (TUL)
Current Age
(2020) Current
Condition %
Health Index
Out of Service
Replacement Year (Plan)
Age in Replacement
Year
R 40 Large Radial Boom Derrick
14 16 Fair 66% 2021 DNR 17
G 110 Small Mini Van Cargo
10
10 Fair 63% 2022 DNR 12
O 172 Small Full Size Cargo Van
10
13 Fair 53% 2022 DNR 15
R 190 Small SUV Passenger
10
11 Poor 49% 2022 DNR 13
R 131 Small 4x4 Full Size Crew Pick Up
10
8 Fair 54% 2023 DNR 11
ME
541 Rolling Stock
Material Trailer, 3 axle, open overhead
30 19 Fair 53% 2025 DNR 24
ME
501 Rolling Stock
Diesel Puller 30 30 Fair 69% 2030 DNR 40
ME
502 Rolling Stock
Diesel Tensioner 30 30 Fair 67% 2030 DNR 40
DNR – Do not replace

Appendix N:
WNH Information Technology Management Plan
WATERLOO NORTH HYDRO
IT Management Plan
June 21, 2020
Waterloo North Hydro IT Management Plan Page 2 of 11
CONTENTS
1. Purpose ........................................................................................................................ 3
2. Guiding Principles ......................................................................................................... 3
2.1. Self Service ............................................................................................................ 3
2.2. Digital Literacy ........................................................................................................ 4
2.3. Technical Talent Management ............................................................................... 4
2.4. Open Standards and Collaboration ......................................................................... 4
3. Long Term Technology Goals ...................................................................................... 5
4. Service Delivery and KPIs ............................................................................................ 5
5. Asset Life Cycle and Resource Requirements ............................................................. 5
5.1. Capital Costs and Asset Life-Cycle Planning .......................................................... 5
5.1.1. Inspections and Maintenance ........................................................................... 5
5.1.2. IT Hardware Asset Life-Cycle ........................................................................... 7
5.1.3. Major Software Assets ..................................................................................... 8
5.2. Business Driven Capital Projects .......................................................................... 10
5.3. Move from CapEx to OpEx and Cloud .................................................................. 11
Waterloo North Hydro IT Management Plan Page 3 of 11
1. Purpose
Waterloo North Hydro’s (WNH) Information Technology Services (ITS) include the planning,
design, development, application, implementation, support, and management of computer-
based information systems in support of WNH’s Mission, Vision and Strategic Imperatives.
ITS initiatives service both internal and external WNH customers. These services are
provided under the direction of the Vice President of Information and Technology Services.
The purpose of this report is to provide a consolidated view of WNH’s information technology
management strategy, objectives, assets under management, asset assessments and
investment plans for the years 2021 to 2025 inclusive. The information contained in this
report forms the basis on which ITS capital investment plans have been formulated.
The information in this report also informs WNH’s senior executive team (Executive) and
aides in the development of WNH’s Distribution System Plan (DSP) and supports WNH’s
2021 Cost of Service Application (Application).
All information contained in this report is current as of December 31, 2019.
2. Guiding Principles
WNH is committed to continuous improvement regarding digital technology services and
serving customers preferences where possible.
The following is a list of general concepts WNH uses to guide decisions around digital tools
and information technology.
2.1. Self Service
WNH believes that end users need smart, efficient and effective self-directed tools in order
to accomplish their tasks and extract information from WNH's varied and extensive
informational databases. Technology should not require specialized technical knowledge to
operate.
The following is a summary of our guiding principles for self-service from WNHs digital
strategy.
1. Standard System Architecture (consistent and predictable).
Waterloo North Hydro IT Management Plan Page 4 of 11
2. Data access and control (subject matter experts should have full control of their
data).
3. Data accuracy and integrity (define and value “the system or record”).
4. Reproducible standards and systems.
2.2. Digital Literacy
As digital tools and platforms become integrated into all areas of work, WNH recognizes the
potential knowledge gap created in the workforce caused by their adoption. WNH utilizes
the following strategies to mitigate the potential knowledge gap:
1. Integrate training with day to day work.
2. Invest in digital safety awareness.
3. Process and design thinking.
4. Expand competence and confidence in technology use.
2.3. Technical Talent Management
The following strategies summarize WNH’s plan to build and maintain a strong information
technical team.
1. Maintain a high level of employee engagement.
2. Promote continuous learning.
3. Make room for innovation when possible.
2.4. Open Standards and Collaboration
Open technologies, such as open source software and non-proprietary architecture, foster
collaboration through shared practices and enable standard ways of doing work. WNH has
demonstrated a preference towards systems of this nature whenever possible in the
following ways:
1. Prefer open system and software architecture.
2. Participate in the development, testing and establishment of open systems.
3. Prefer collaboration with other utilities, municipalities and vendors rather than
independent development.
Waterloo North Hydro IT Management Plan Page 5 of 11
3. Long Term Technology Goals
WNH’s long term technology goals are:
1. Full self-service customer experience (able to conduct all business online) 2. The move to adopt agile methods for project management, system architecture and
continuous improvement. 3. Increase transparency and visibility of all work (increased use of measures, KPIs,
real-time displays of work status).
4. Service Delivery and KPIs
The core functions of WNH’s technology group which are measured through KPIs:
1. Help Desk for Break/Fix issues 2. Change Management for Projects, features and unplanned work 3. Security operations 4. System operations 5. Project delivery 6. Unplanned work
5. Asset Life Cycle and Resource Requirements
Proper management of staff levels, contract resources and asset life-cycling is the
foundation of maintaining strong technical resources. This section will discuss the
methodology used to manage cost and asset health.
5.1. Capital Costs and Asset Life-Cycle Planning
WNH maintains technical capital assets such as servers, communications equipment, end
user devices and software assets such as core business systems.
5.1.1. Inspections and Maintenance
WNH’s methodology and inspection schedule for life-cycling all technology assets are as
follows.
Hardware assets are replacement factors
1. Mean time to failure (MTTF) as published by the manufacturer. 2. Health events on specific devices through monitoring. 3. Professional judgment of IT staff.
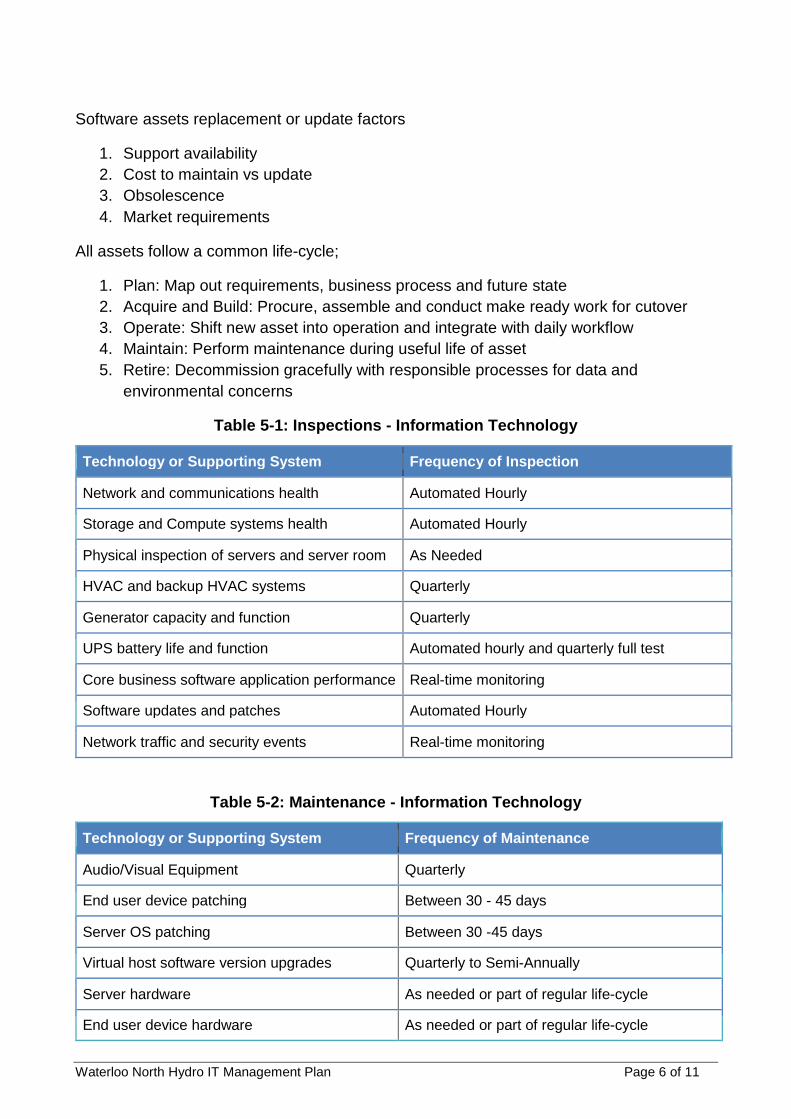
Waterloo North Hydro IT Management Plan Page 6 of 11
Software assets replacement or update factors
1. Support availability 2. Cost to maintain vs update 3. Obsolescence 4. Market requirements
All assets follow a common life-cycle;
1. Plan: Map out requirements, business process and future state 2. Acquire and Build: Procure, assemble and conduct make ready work for cutover 3. Operate: Shift new asset into operation and integrate with daily workflow 4. Maintain: Perform maintenance during useful life of asset 5. Retire: Decommission gracefully with responsible processes for data and
environmental concerns
Table 5-1: Inspections - Information Technology
Technology or Supporting System Frequency of Inspection
Network and communications health Automated Hourly
Storage and Compute systems health Automated Hourly
Physical inspection of servers and server room As Needed
HVAC and backup HVAC systems Quarterly
Generator capacity and function Quarterly
UPS battery life and function Automated hourly and quarterly full test
Core business software application performance Real-time monitoring
Software updates and patches Automated Hourly
Network traffic and security events Real-time monitoring
Table 5-2: Maintenance - Information Technology
Technology or Supporting System Frequency of Maintenance
Audio/Visual Equipment Quarterly
End user device patching Between 30 - 45 days
Server OS patching Between 30 -45 days
Virtual host software version upgrades Quarterly to Semi-Annually
Server hardware As needed or part of regular life-cycle
End user device hardware As needed or part of regular life-cycle
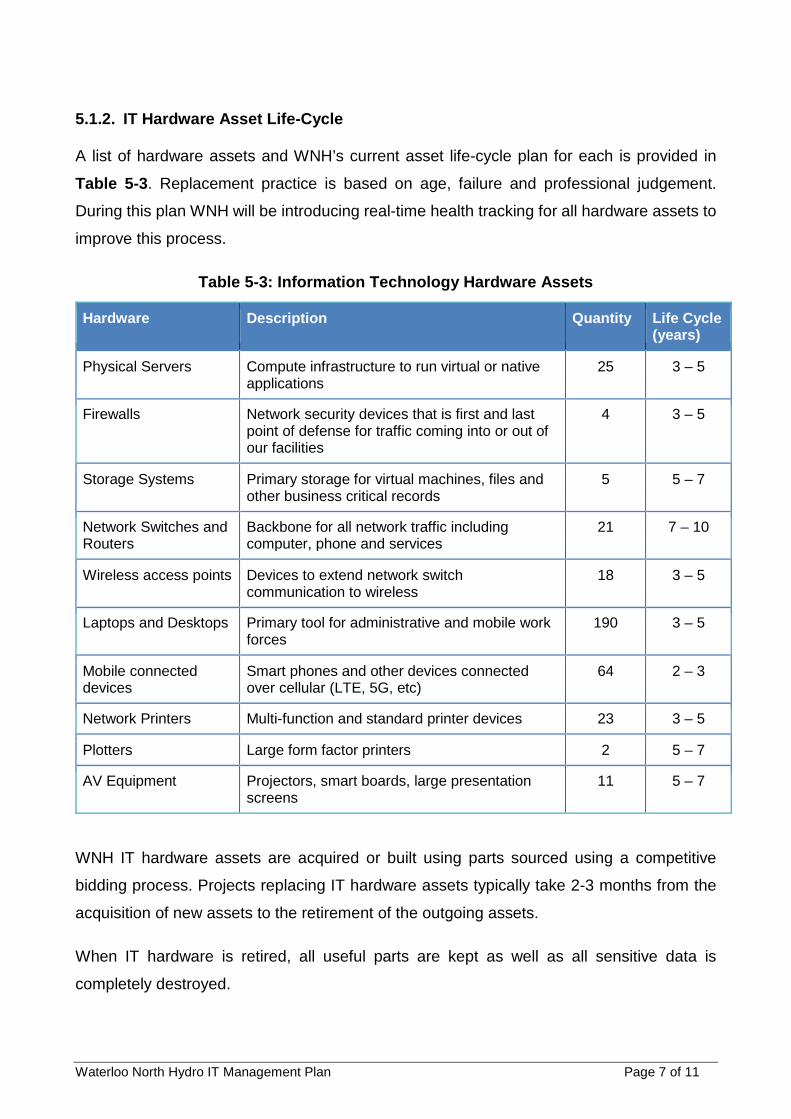
Waterloo North Hydro IT Management Plan Page 7 of 11
5.1.2. IT Hardware Asset Life-Cycle
A list of hardware assets and WNH’s current asset life-cycle plan for each is provided in
Table 5-3. Replacement practice is based on age, failure and professional judgement.
During this plan WNH will be introducing real-time health tracking for all hardware assets to
improve this process.
Table 5-3: Information Technology Hardware Assets
Hardware Description Quantity Life Cycle (years)
Physical Servers Compute infrastructure to run virtual or native applications
25 3 – 5
Firewalls Network security devices that is first and last point of defense for traffic coming into or out of our facilities
4 3 – 5
Storage Systems Primary storage for virtual machines, files and other business critical records
5 5 – 7
Network Switches and Routers
Backbone for all network traffic including computer, phone and services
21 7 – 10
Wireless access points Devices to extend network switch communication to wireless
18 3 – 5
Laptops and Desktops Primary tool for administrative and mobile work forces
190 3 – 5
Mobile connected devices
Smart phones and other devices connected over cellular (LTE, 5G, etc)
64 2 – 3
Network Printers Multi-function and standard printer devices 23 3 – 5
Plotters Large form factor printers 2 5 – 7
AV Equipment Projectors, smart boards, large presentation screens
11 5 – 7
WNH IT hardware assets are acquired or built using parts sourced using a competitive
bidding process. Projects replacing IT hardware assets typically take 2-3 months from the
acquisition of new assets to the retirement of the outgoing assets.
When IT hardware is retired, all useful parts are kept as well as all sensitive data is
completely destroyed.
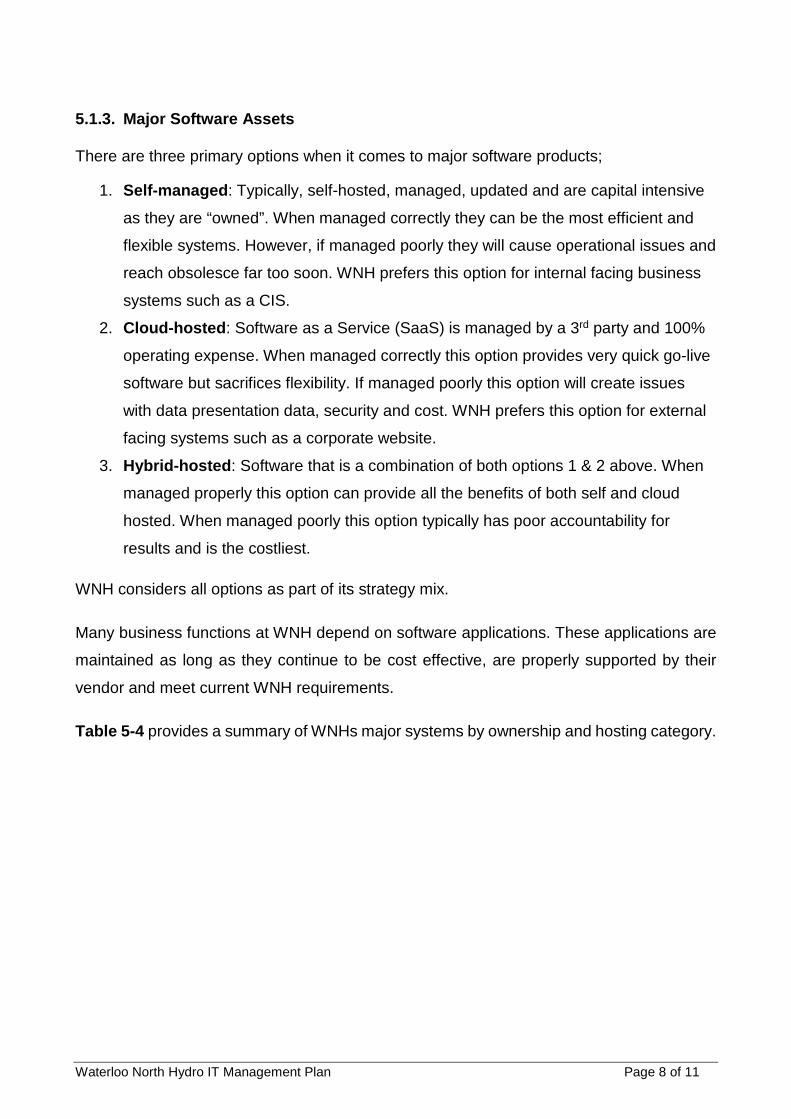
Waterloo North Hydro IT Management Plan Page 8 of 11
5.1.3. Major Software Assets
There are three primary options when it comes to major software products;
1. Self-managed: Typically, self-hosted, managed, updated and are capital intensive
as they are “owned”. When managed correctly they can be the most efficient and
flexible systems. However, if managed poorly they will cause operational issues and
reach obsolesce far too soon. WNH prefers this option for internal facing business
systems such as a CIS.
2. Cloud-hosted: Software as a Service (SaaS) is managed by a 3rd party and 100%
operating expense. When managed correctly this option provides very quick go-live
software but sacrifices flexibility. If managed poorly this option will create issues
with data presentation data, security and cost. WNH prefers this option for external
facing systems such as a corporate website.
3. Hybrid-hosted: Software that is a combination of both options 1 & 2 above. When
managed properly this option can provide all the benefits of both self and cloud
hosted. When managed poorly this option typically has poor accountability for
results and is the costliest.
WNH considers all options as part of its strategy mix.
Many business functions at WNH depend on software applications. These applications are
maintained as long as they continue to be cost effective, are properly supported by their
vendor and meet current WNH requirements.
Table 5-4 provides a summary of WNHs major systems by ownership and hosting category.
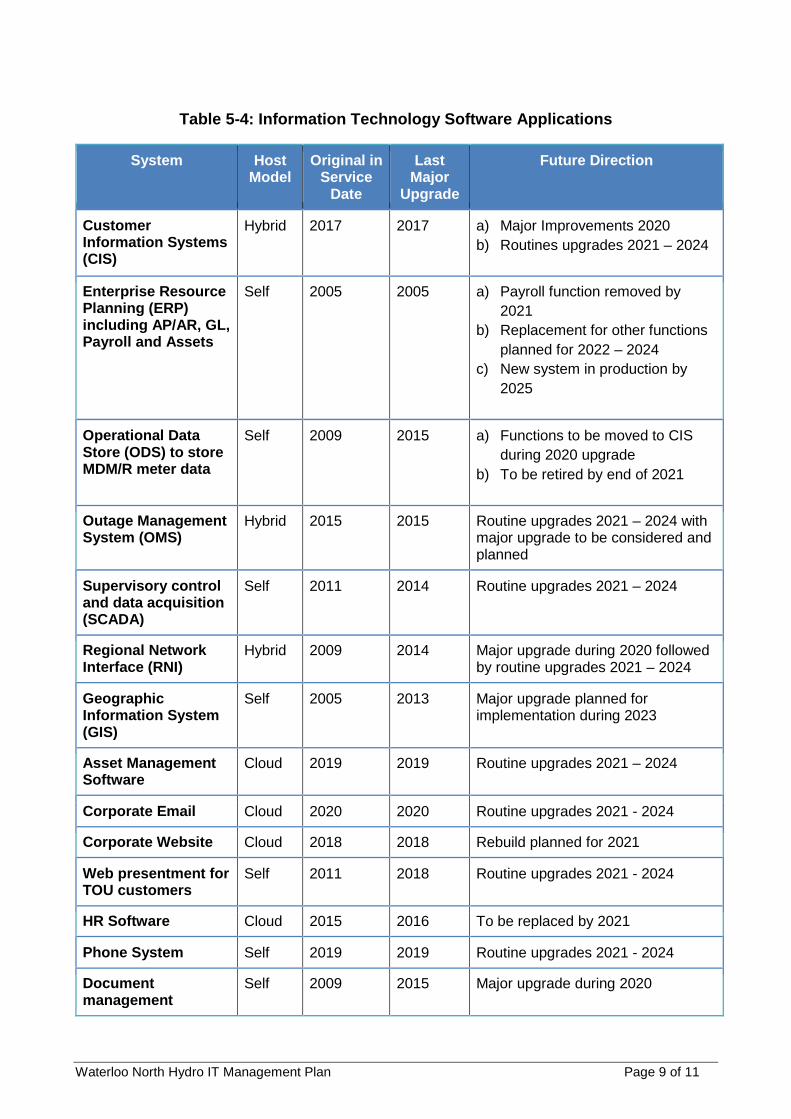
Waterloo North Hydro IT Management Plan Page 9 of 11
Table 5-4: Information Technology Software Applications
System Host Model
Original in Service
Date
Last Major
Upgrade
Future Direction
Customer Information Systems (CIS)
Hybrid 2017 2017 a) Major Improvements 2020 b) Routines upgrades 2021 – 2024
Enterprise Resource Planning (ERP) including AP/AR, GL, Payroll and Assets
Self 2005 2005 a) Payroll function removed by 2021
b) Replacement for other functions planned for 2022 – 2024
c) New system in production by 2025
Operational Data Store (ODS) to store MDM/R meter data
Self 2009 2015 a) Functions to be moved to CIS during 2020 upgrade
b) To be retired by end of 2021
Outage Management System (OMS)
Hybrid 2015 2015 Routine upgrades 2021 – 2024 with major upgrade to be considered and planned
Supervisory control and data acquisition (SCADA)
Self 2011 2014 Routine upgrades 2021 – 2024
Regional Network Interface (RNI)
Hybrid 2009 2014 Major upgrade during 2020 followed by routine upgrades 2021 – 2024
Geographic Information System (GIS)
Self 2005 2013 Major upgrade planned for implementation during 2023
Asset Management Software
Cloud 2019 2019 Routine upgrades 2021 – 2024
Corporate Email Cloud 2020 2020 Routine upgrades 2021 - 2024
Corporate Website Cloud 2018 2018 Rebuild planned for 2021
Web presentment for TOU customers
Self 2011 2018 Routine upgrades 2021 - 2024
HR Software Cloud 2015 2016 To be replaced by 2021
Phone System Self 2019 2019 Routine upgrades 2021 - 2024
Document management
Self 2009 2015 Major upgrade during 2020
Waterloo North Hydro IT Management Plan Page 10 of 11
While replacement rationale for software across all hosting models is the same, the logistics
of the work differ substantially.
1. Self-hosted replacement and upgrade projects are typically long, capital intensive
and infrequent
2. Cloud-hosted replacements and upgrades primarily involve process change often
with little or no technical effort beyond integration and security. Upgrades can be as
often as daily with no input or consent from WNH.
3. WNH has concluded that hybrid solutions are complicated, taking 2-3 times the
effort often requiring more technical effort than self-hosting and more process
change than cloud. For this reason, WNH is gradually moving away from hybrid
except in special circumstances.
5.2. Business Driven Capital Projects
During recent consultations, WNH customers indicated a preference to complete more of
their business transactions through digital methods. Examples of customer preferences for
ITS initiatives are listed below:
1. An automated outage notification system (automatically sends messages).
2. Reporting issues or making inquiries through an interactive website.
3. Automated alerts when electricity usage exceeds a prearranged threshold.
4. Having an online chat feature on the WNH website during business hours.
Table 5-4 listed in Section 5.1.3 outlines WNH’s core software business applications. One
application in particular, our Enterprise Resource Planning platform (ERP), is in need of
replacement due to obsolescence.
WNH’s current legacy product is 15 years old and dependent on mainframe technology
making it difficult to maintain. In addition, certain modules are beginning to fall behind market
requirements. The current ERP system looks after payroll, accounting, work and inventory
management as well as procurement. This system has been planned for replacement in the
2022 – 2023 timeframe.

Waterloo North Hydro IT Management Plan Page 11 of 11
5.3. Move from CapEx to OpEx and Cloud
WNH is monitoring the growing trend from the ownership and self-hosted model to a
Software as a Service cloud model (SaaS). Examples of this include platforms such as
Adobe creative cloud, Microsoft Office 365 and Compliance science.
FACILITIES BUILDING SYSTEMS PLAN
TABLE OF CONTENTS
BACKGROUND ............................................................................................................................................... 2
BUILDING SYSTEMS OPERATING, AND MAINTENANCE EXPENSES ............................................................... 4
BUILDING SYSTEMS CAPITAL EXPENSES ....................................................................................................... 5
2021 ...................................................................................................................................................... 5
2022 ...................................................................................................................................................... 5
2023 ...................................................................................................................................................... 5
2024 ...................................................................................................................................................... 6
2025 ...................................................................................................................................................... 6
BACKGROUND
1. Waterloo North Hydro Inc. (WNH) performs all of its distribution and administration functions from a central facility located at 526 Country Squire Road, Waterloo, Ontario. The service centre and head office occupies 105,000 square feet on 35 acres of land on two levels with 18 parking spaces for visitors and 130 employee parking spaces. This facility also includes a warehouse for inventory, a garage for vehicle and equipment storage/repair, trades workshops, control room, administrative offices, and training space. The building was built and occupied in 2011
2. The WNH Facilities department is responsible for operations and maintenance for the WNH head office, three Transformer Stations, five Municipal Stations and nine rural Distribution Stations
3. The most crucial aspect of facilities management is building maintenance. Keeping the buildings operating with minimum unplanned downtime is the goal of every building maintenance programme. WNH’s objectives for building maintenance are:
• To ensure that the buildings and its associated services are in a safe condition
• To ensure that the buildings are fit for its intended use • To ensure that the condition of the building meets all statutory requirements • To carry out the work necessary to maintain the value of the physical asset
and the quality of the building
However, to achieve these objectives, it is imperative that we maintain the building assets in such a way that problems are identified and resolved before they affect operations. An effective building maintenance programme is clearly defined by the maintenance strategies it employs. In general, building maintenance strategies fall into three categories: reactive, preventive and condition-based. Reactive maintenance, also referred to as “run-to-failure” strategy, focuses on asset repairs only once a failure occurs. This strategy is not effective and results in emergencies, down time and increased cost in the long term. Instead, WNH uses preventative maintenance and condition-based strategies in relation to the building systems to ensure efficient operation and to extend the life of current assets.
Preventive maintenance overcomes the ineffectiveness of a “run-to-failure” strategy by reducing the probability of failures and avoiding down time. Preventive maintenance tasks are performed in accordance with a predetermined plan at regular, fixed intervals such as heating and cooling equipment servicing. In addition, maintenance work can be planned ahead and performed when it is convenient to the building users.
Condition-based maintenance strategy recognizes that a change in condition and/or performance of an item is the principal reason for carrying out maintenance. Therefore, the optimal time to perform maintenance is ascertained from a condition assessment inspection or survey used to determine the actual state of each component item in a building. In this strategy, maintenance tasks are determined and planned by efficiently monitoring the building’s principal elements such as parking lots, walls, floors, roof, lighting, and mechanical equipment to identify which element or piece of equipment requires maintenance before a major failure occurs. Condition assessments can vary from simple visual inspections to more advanced inspections using a variety of condition monitoring tools and techniques.
4. The following are the key benefits of this strategy:
• Extending the functional life of an asset by reducing the need for replacements or repairs.
• Optimizing the asset’s efficiency and reducing energy costs. • Minimizing equipment downtime thereby lessening the frequency of large-scale
repairs. • Reducing disruption to operating schedules and production, as the planned
work is carried out during downtime or slower periods of the year. • Improving budget control as the planning, sourcing, and purchasing of
materials and services are done in advance. • Ensuring compliance with health and safety regulations. • Improving customer service and increases satisfaction via timely, continuous,
and efficient operations.
5. The Building System Categories referenced in this document are:
a. Building Exterior – includes parking lot, storage yard, security systems, fuel pumps, landscape, roof system, storm water management, lighting, and building shell.
b. Building Interior – includes heating, ventilation, air conditioning, plumbing flooring, paint, furniture, lighting, elevator, audio/visual, building automation system, telephones, information systems.
c. Building Operations – includes utilities, waste management, janitorial services, and snow removal.
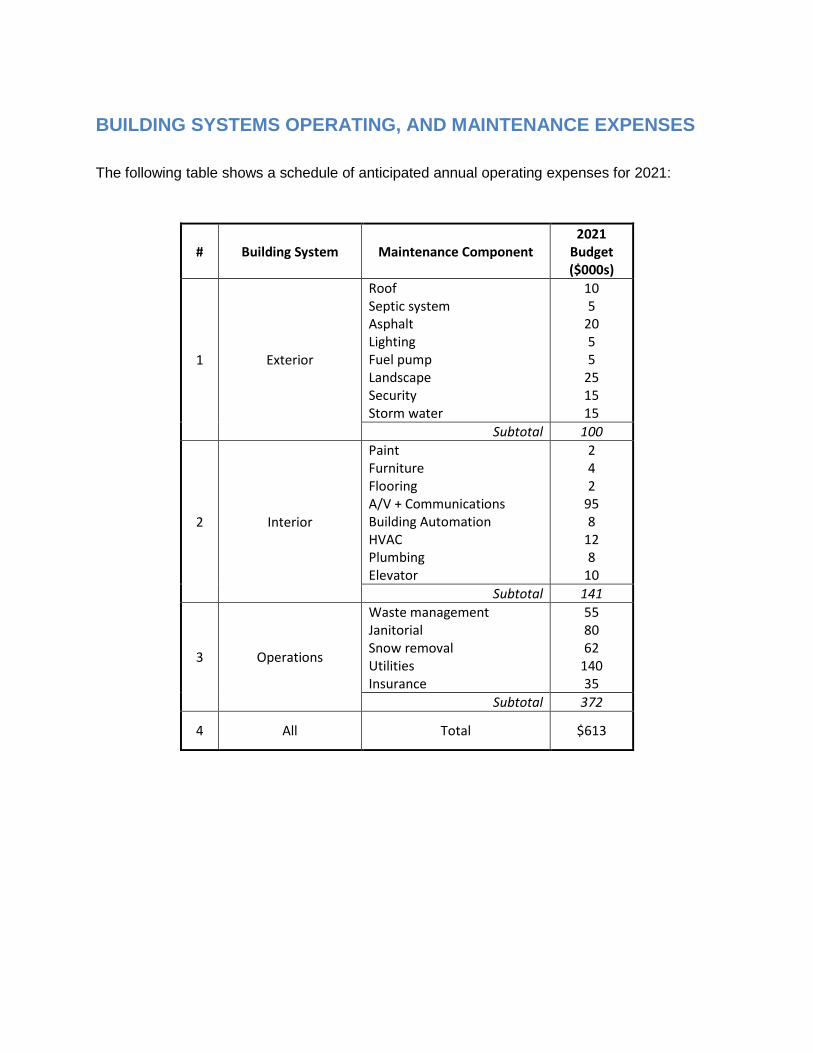
BUILDING SYSTEMS OPERATING, AND MAINTENANCE EXPENSES
The following table shows a schedule of anticipated annual operating expenses for 2021:
# Building System Maintenance Component 2021
Budget ($000s)
1 Exterior
Roof Septic system Asphalt Lighting Fuel pump Landscape Security Storm water
10 5
20 5 5
25 15 15
Subtotal 100
2 Interior
Paint Furniture Flooring A/V + Communications Building Automation HVAC Plumbing Elevator
2 4 2
95 8
12 8
10 Subtotal 141
3 Operations
Waste management Janitorial Snow removal Utilities Insurance
55 80 62
140 35
Subtotal 372
4 All Total $613
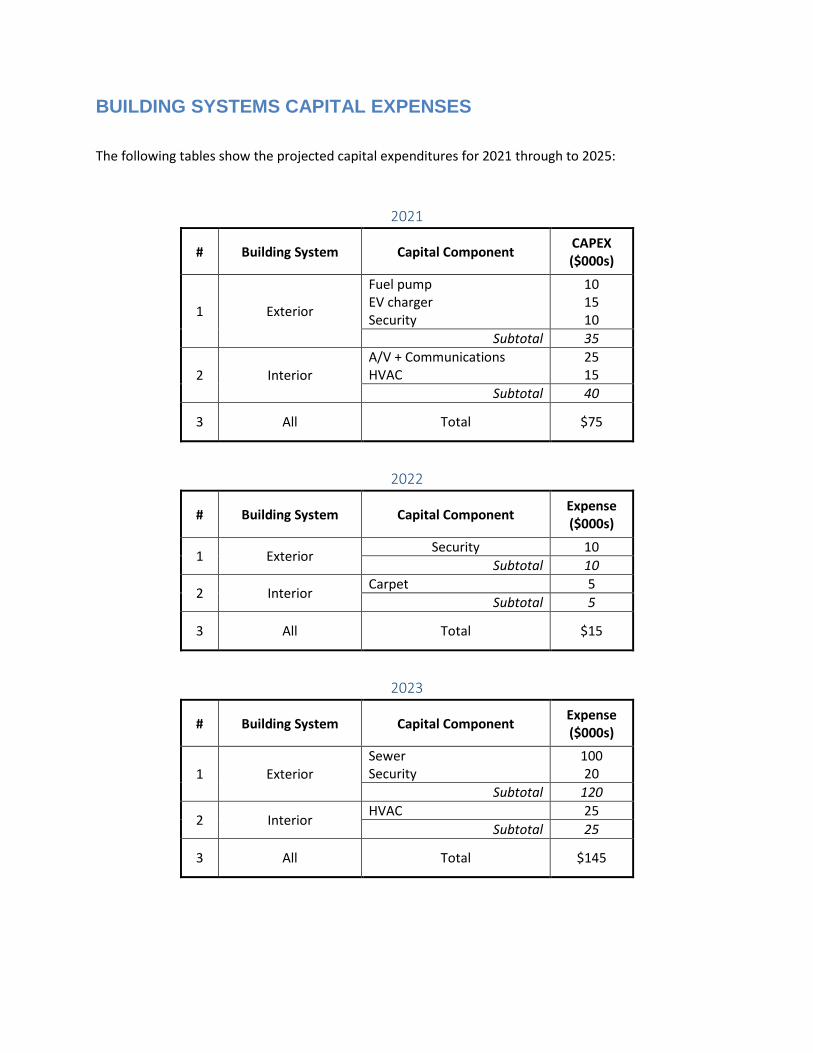
BUILDING SYSTEMS CAPITAL EXPENSES
The following tables show the projected capital expenditures for 2021 through to 2025:
2021
# Building System Capital Component CAPEX ($000s)
1 Exterior
Fuel pump EV charger Security
10 15 10
Subtotal 35
2 Interior A/V + Communications HVAC
25 15
Subtotal 40
3 All Total $75
2022
# Building System Capital Component Expense ($000s)
1 Exterior Security 10 Subtotal 10
2 Interior Carpet 5 Subtotal 5
3 All Total $15
2023
# Building System Capital Component Expense ($000s)
1 Exterior Sewer Security
100 20
Subtotal 120
2 Interior HVAC 25
Subtotal 25
3 All Total $145
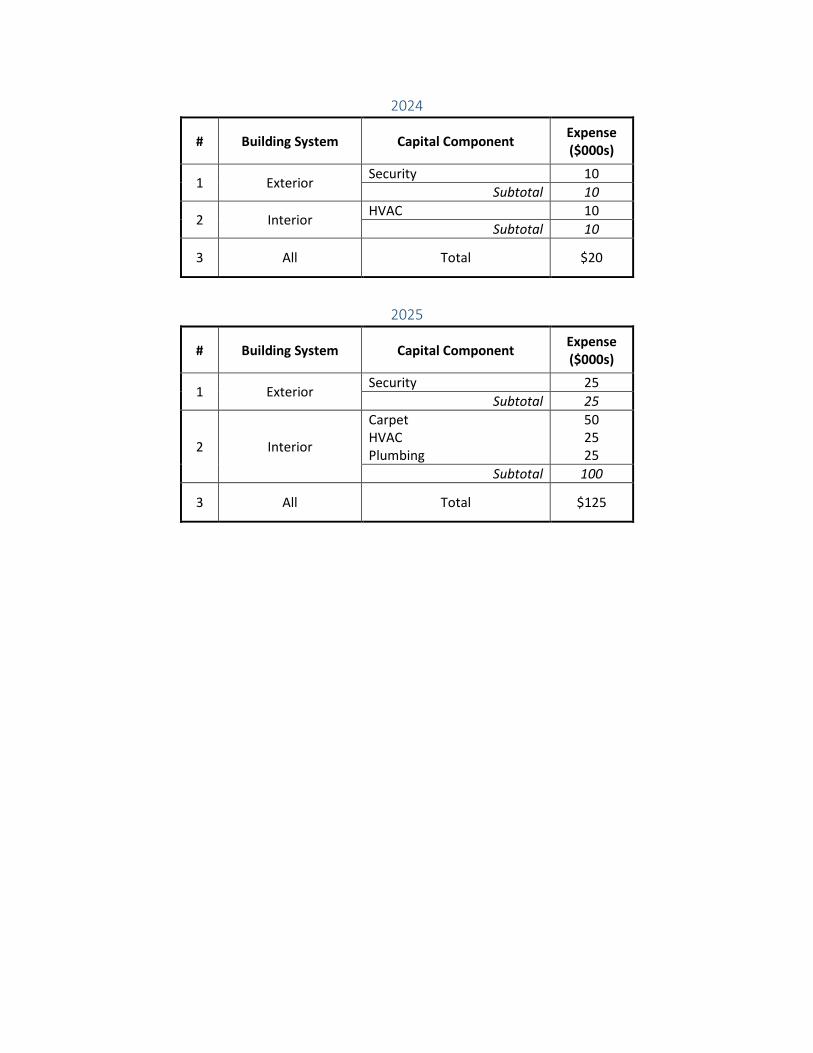
2024
# Building System Capital Component Expense ($000s)
1 Exterior Security 10 Subtotal 10
2 Interior HVAC 10 Subtotal 10
3 All Total $20
2025
# Building System Capital Component Expense ($000s)
1 Exterior Security 25 Subtotal 25
2 Interior
Carpet HVAC Plumbing
50 25 25
Subtotal 100
3 All Total $125
Operations Distribution System Annual Maintenance Report (2019)
Operations Distribution System Annual Maintenance Report (2019)
June 29, 2020 2
CONTENTS 1. Introduction ......................................................................................................................... 3
2. Overhead Systems .............................................................................................................. 4
2.1. Load Break Switch Maintenance .................................................................................. 5
2.2. Pole Testing ................................................................................................................. 5
2.3. Insulator Washing ........................................................................................................ 6
3. Underground Systems ......................................................................................................... 6
4. Forestry ............................................................................................................................... 7
5. Appendices ......................................................................................................................... 8
5.1. Annual Maintenance Program Project Plan .................................................................. 8
5.2. Urgent Repair Report ................................................................................................... 9
5.3. Service Crew Service Call Sheet – Repair Required ...................................................10
5.4. Streetlight Repair Sheet ..............................................................................................11
5.5. Feeder Patrol Requirements .......................................................................................12
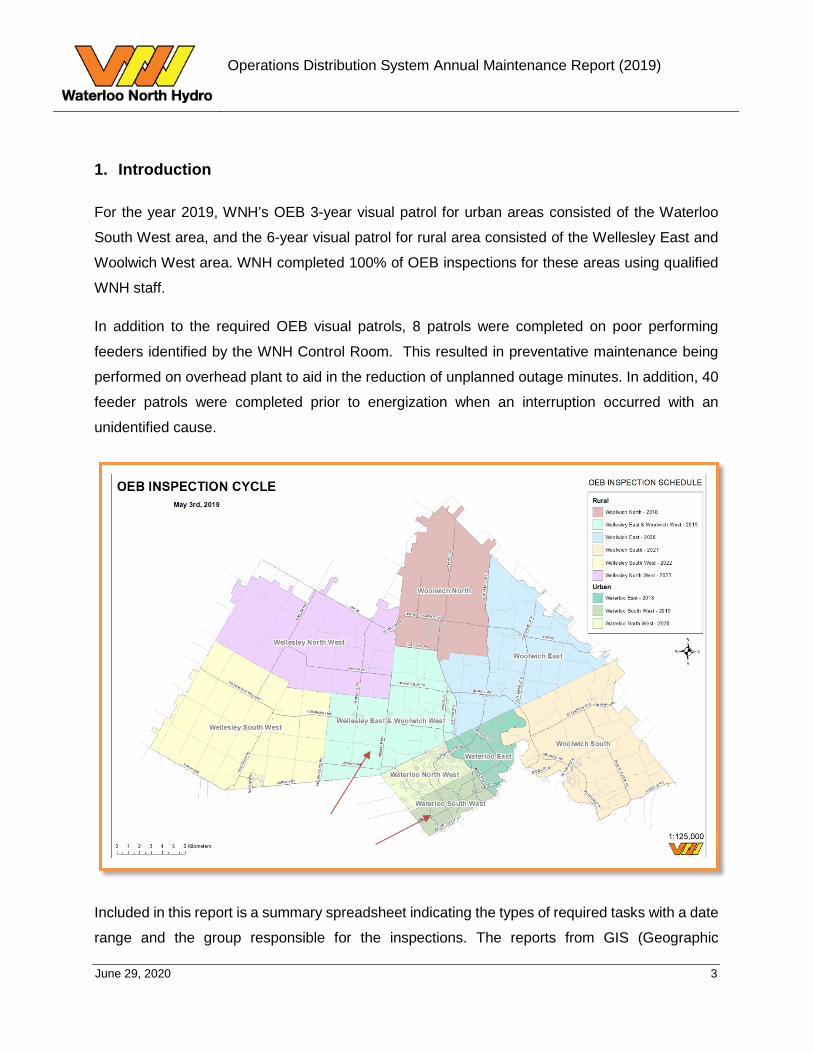
Operations Distribution System Annual Maintenance Report (2019)
June 29, 2020 3
1. Introduction
For the year 2019, WNH’s OEB 3-year visual patrol for urban areas consisted of the Waterloo
South West area, and the 6-year visual patrol for rural area consisted of the Wellesley East and
Woolwich West area. WNH completed 100% of OEB inspections for these areas using qualified
WNH staff.
In addition to the required OEB visual patrols, 8 patrols were completed on poor performing
feeders identified by the WNH Control Room. This resulted in preventative maintenance being
performed on overhead plant to aid in the reduction of unplanned outage minutes. In addition, 40
feeder patrols were completed prior to energization when an interruption occurred with an
unidentified cause.
Included in this report is a summary spreadsheet indicating the types of required tasks with a date
range and the group responsible for the inspections. The reports from GIS (Geographic
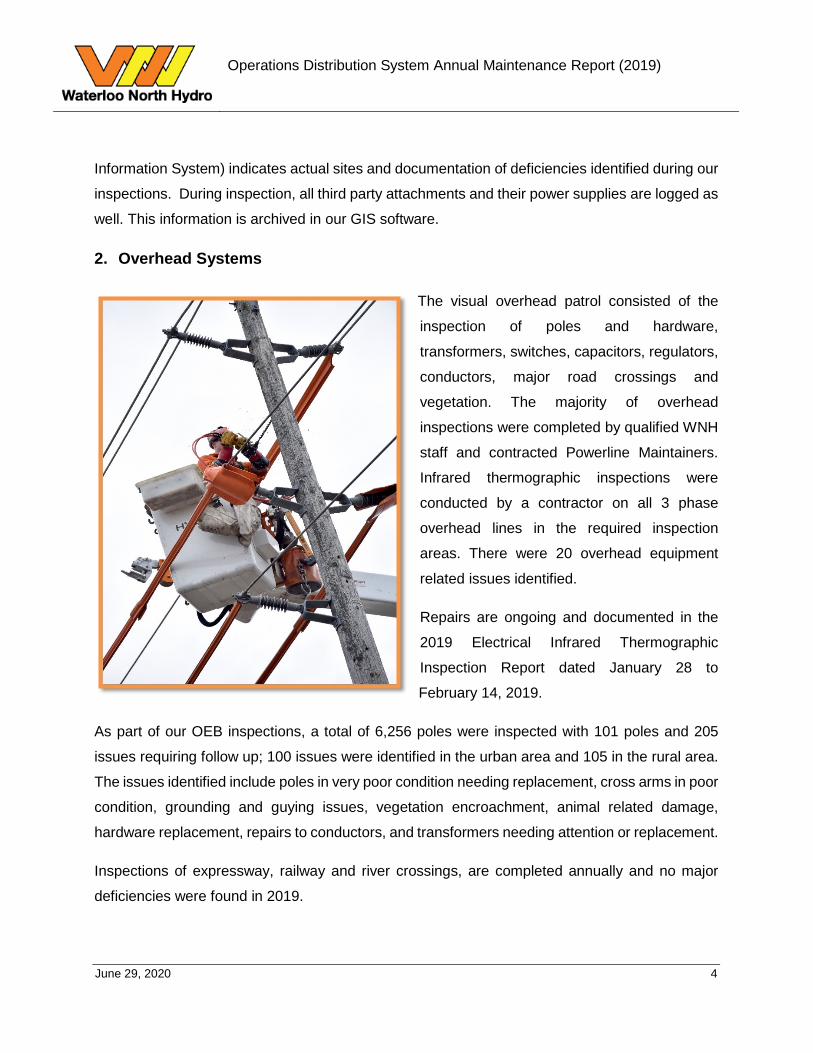
Operations Distribution System Annual Maintenance Report (2019)
June 29, 2020 4
Information System) indicates actual sites and documentation of deficiencies identified during our
inspections. During inspection, all third party attachments and their power supplies are logged as
well. This information is archived in our GIS software.
2. Overhead Systems
The visual overhead patrol consisted of the
inspection of poles and hardware,
transformers, switches, capacitors, regulators,
conductors, major road crossings and
vegetation. The majority of overhead
inspections were completed by qualified WNH
staff and contracted Powerline Maintainers.
Infrared thermographic inspections were
conducted by a contractor on all 3 phase
overhead lines in the required inspection
areas. There were 20 overhead equipment
related issues identified.
Repairs are ongoing and documented in the
2019 Electrical Infrared Thermographic
Inspection Report dated January 28 to
February 14, 2019.
As part of our OEB inspections, a total of 6,256 poles were inspected with 101 poles and 205
issues requiring follow up; 100 issues were identified in the urban area and 105 in the rural area.
The issues identified include poles in very poor condition needing replacement, cross arms in poor
condition, grounding and guying issues, vegetation encroachment, animal related damage,
hardware replacement, repairs to conductors, and transformers needing attention or replacement.
Inspections of expressway, railway and river crossings, are completed annually and no major
deficiencies were found in 2019.
Operations Distribution System Annual Maintenance Report (2019)
June 29, 2020 5
Inspections of overhead plant located in or adjacent to parks, playgrounds and schoolyards are
also completed annually and some minor issues were identified and corrective action was taken.
A total of 41 capacitor banks were inspected in 2019 and no deficiencies were identified.
A total of 10 polemount transformers were replaced due failure, damage or poor condition found
during inspections.
As part of WNH’s overall overhead inspection program, staff ensure proper nomenclature is in
place for all major equipment including switches, transformers, capacitors etc. is documented and
updated in our GIS system as required. Documented repairs and replacement of identified
deficiencies are completed. Necessary repairs are recorded on our Urgent Repair Required Form
via Tablet (Attachment 1) and assigned to a crew for repairs.
2.1. Load Break Switch Maintenance
A total of 120 load break switches in the required inspection area were inspected and as a result
5 manually operated load break switches were identified to be replaced under WNH’s proactive
capital replacement program and 10 required maintenance. The factors determining maintenance
versus replacement includes the conditions of switch and pole, damage identified to components
of the switch (porcelain insulators, rusted operating devices) and age of switch. All 5 manually
operated load break switches were replaced with new SCADA controlled vacuum
switches/reclosers (EVRs).
2.2. Pole Testing
In 2019, 4,161 poles were tested for remaining wood fiber strength by G-Tel Engineering,
including all poles purchased from Hydro One as a result of the elimination of long term load
transfers. The results of the pole testing are used to inform WNH’s Asset Condition Assessments.
More information on the results can be found in WNH’s Distribution System Plan, Appendix A -
WNH Asset Condition Assessment (ACA) Report.
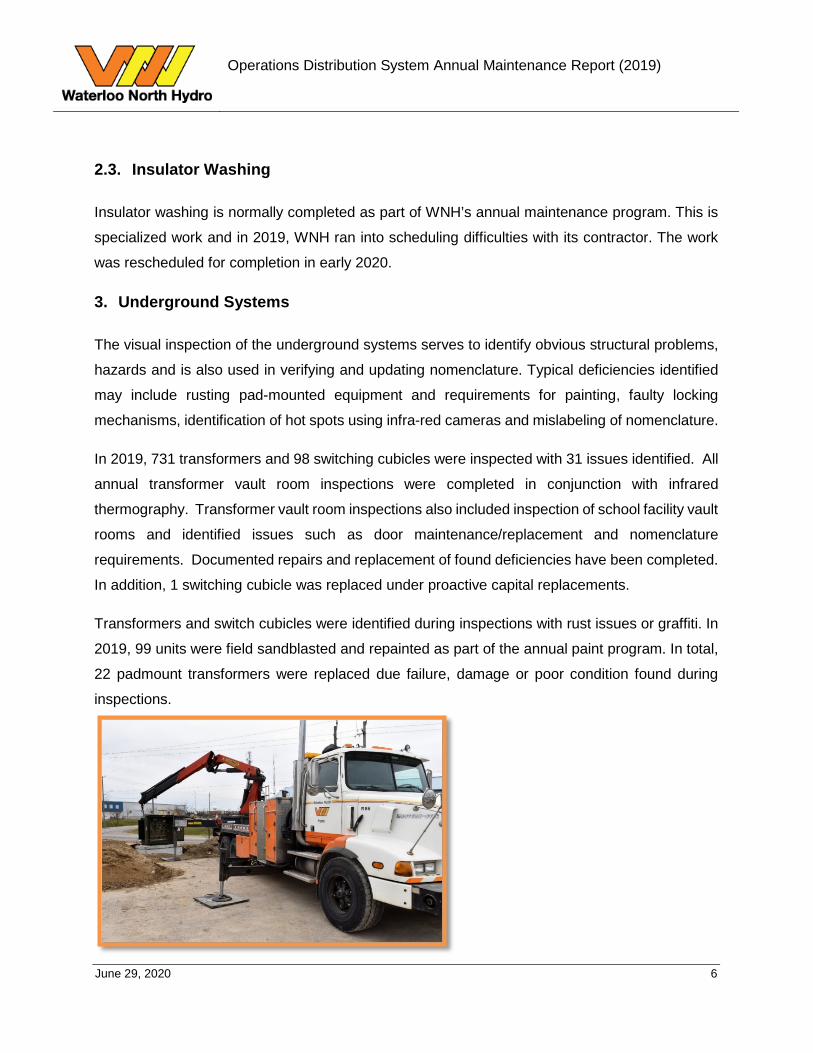
Operations Distribution System Annual Maintenance Report (2019)
June 29, 2020 6
2.3. Insulator Washing
Insulator washing is normally completed as part of WNH’s annual maintenance program. This is
specialized work and in 2019, WNH ran into scheduling difficulties with its contractor. The work
was rescheduled for completion in early 2020.
3. Underground Systems
The visual inspection of the underground systems serves to identify obvious structural problems,
hazards and is also used in verifying and updating nomenclature. Typical deficiencies identified
may include rusting pad-mounted equipment and requirements for painting, faulty locking
mechanisms, identification of hot spots using infra-red cameras and mislabeling of nomenclature.
In 2019, 731 transformers and 98 switching cubicles were inspected with 31 issues identified. All
annual transformer vault room inspections were completed in conjunction with infrared
thermography. Transformer vault room inspections also included inspection of school facility vault
rooms and identified issues such as door maintenance/replacement and nomenclature
requirements. Documented repairs and replacement of found deficiencies have been completed.
In addition, 1 switching cubicle was replaced under proactive capital replacements.
Transformers and switch cubicles were identified during inspections with rust issues or graffiti. In
2019, 99 units were field sandblasted and repainted as part of the annual paint program. In total,
22 padmount transformers were replaced due failure, damage or poor condition found during
inspections.
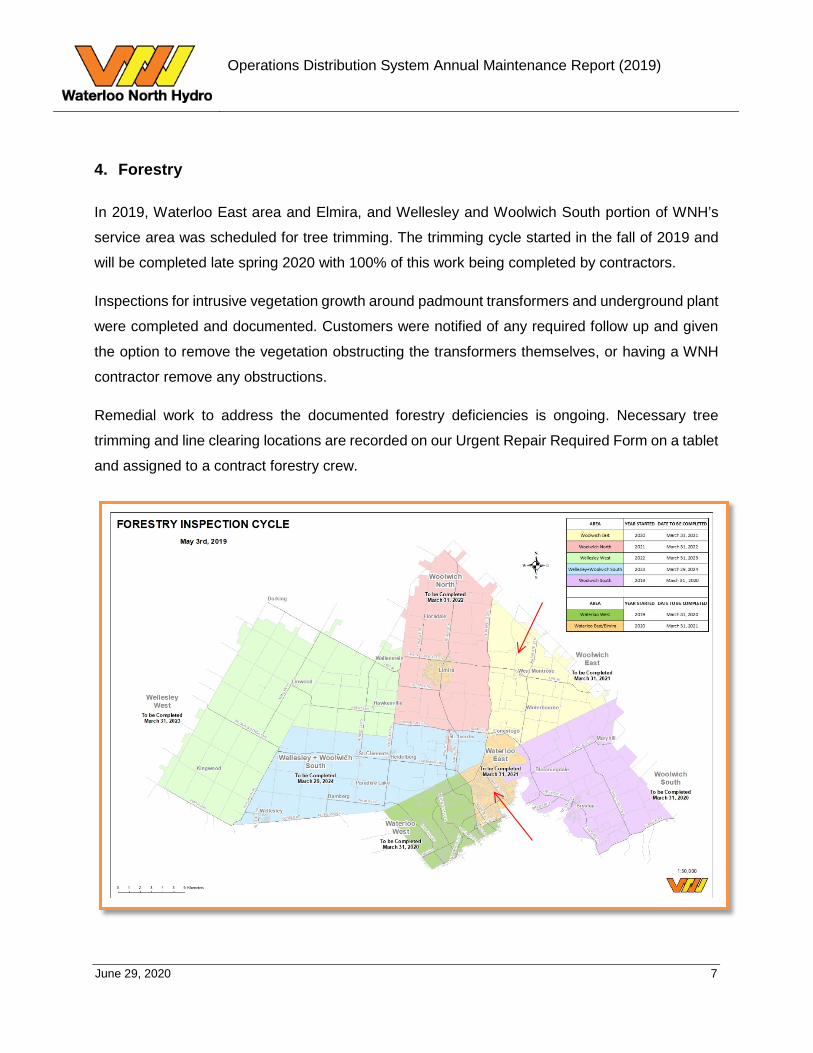
Operations Distribution System Annual Maintenance Report (2019)
June 29, 2020 7
4. Forestry
In 2019, Waterloo East area and Elmira, and Wellesley and Woolwich South portion of WNH’s
service area was scheduled for tree trimming. The trimming cycle started in the fall of 2019 and
will be completed late spring 2020 with 100% of this work being completed by contractors.
Inspections for intrusive vegetation growth around padmount transformers and underground plant
were completed and documented. Customers were notified of any required follow up and given
the option to remove the vegetation obstructing the transformers themselves, or having a WNH
contractor remove any obstructions.
Remedial work to address the documented forestry deficiencies is ongoing. Necessary tree
trimming and line clearing locations are recorded on our Urgent Repair Required Form on a tablet
and assigned to a contract forestry crew.
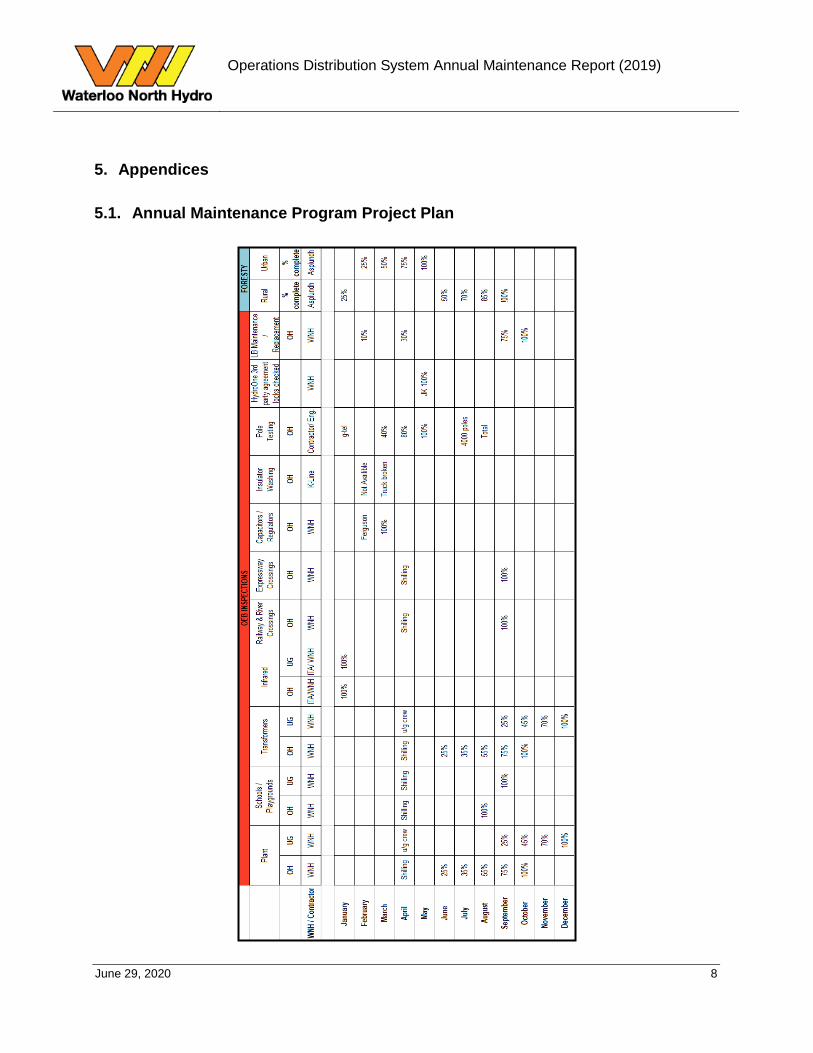
Operations Distribution System Annual Maintenance Report (2019)
June 29, 2020 8
5. Appendices
5.1. Annual Maintenance Program Project Plan
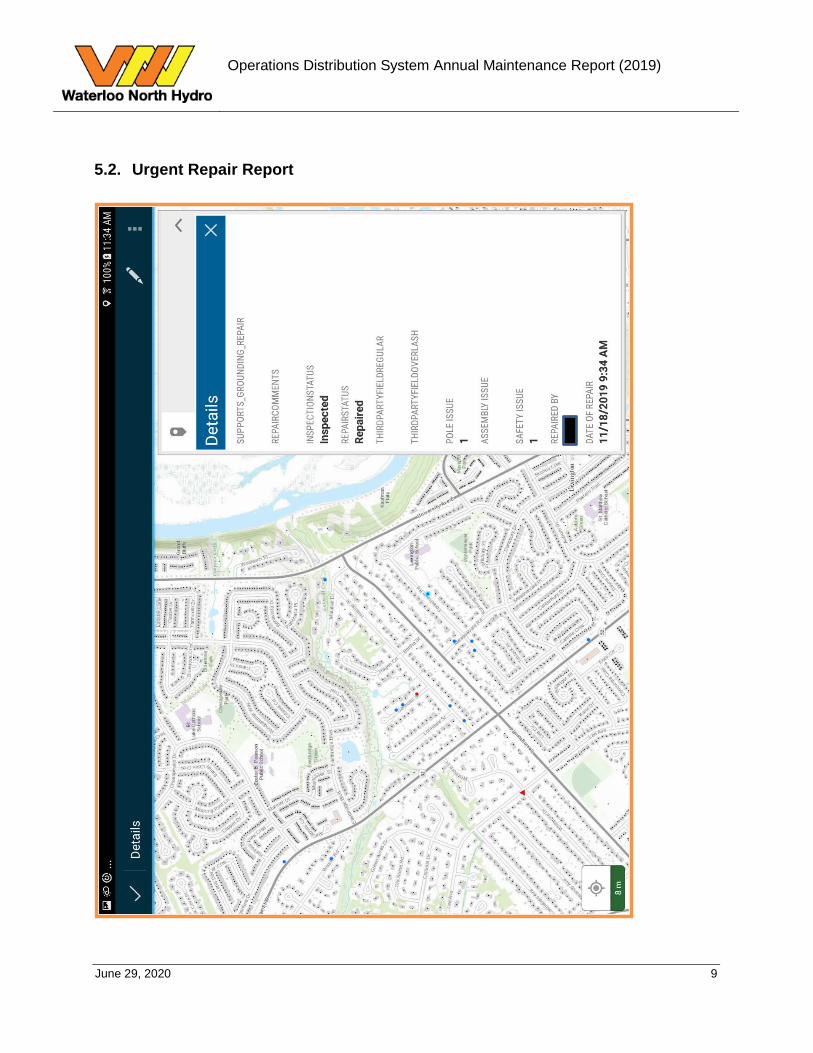
Operations Distribution System Annual Maintenance Report (2019)
June 29, 2020 9
5.2. Urgent Repair Report
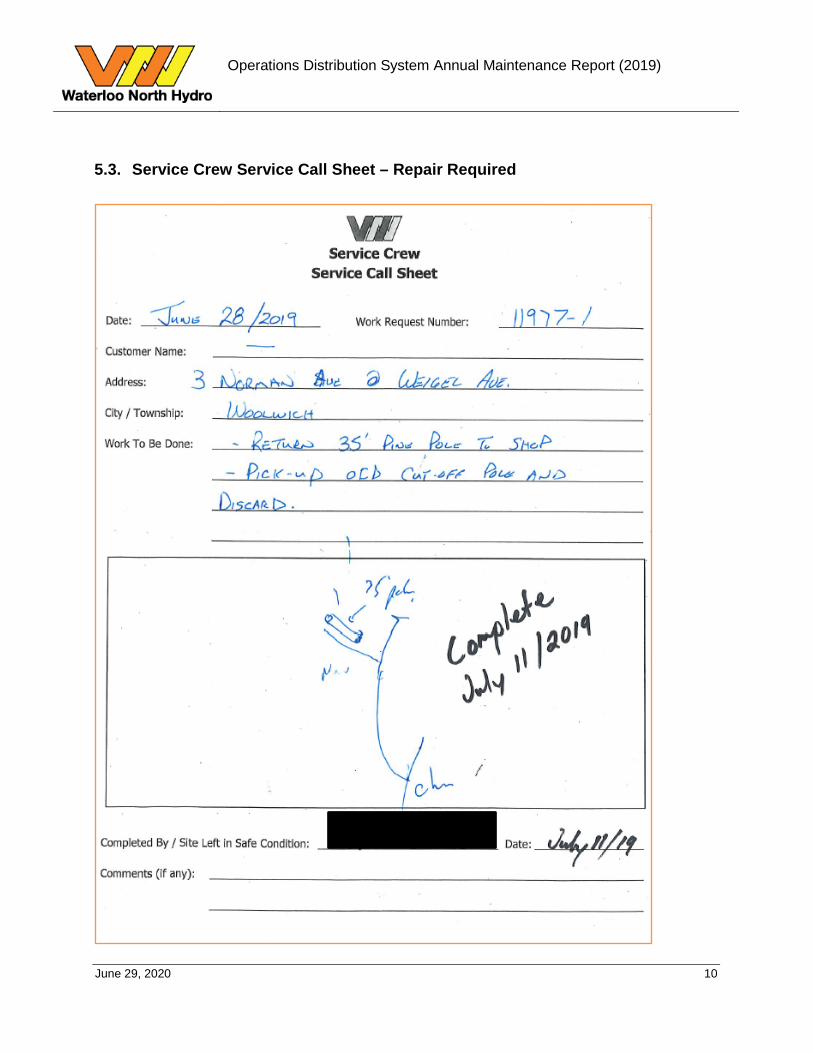
Operations Distribution System Annual Maintenance Report (2019)
June 29, 2020 10
5.3. Service Crew Service Call Sheet – Repair Required
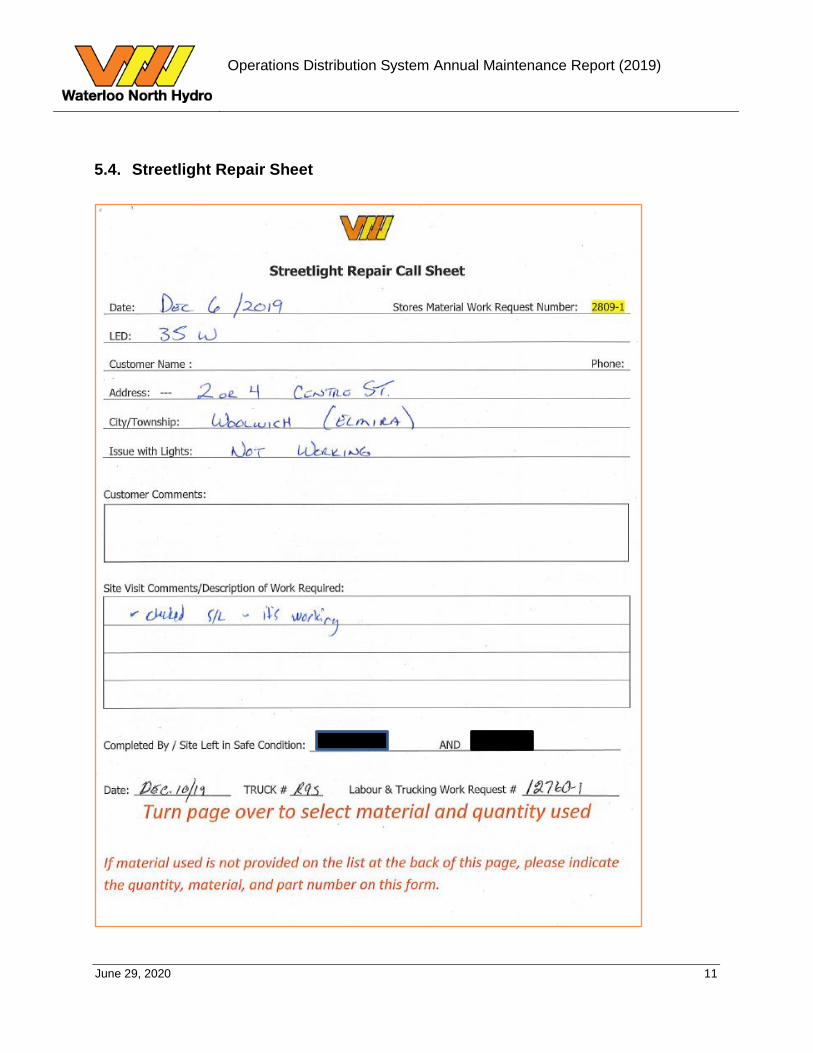
Operations Distribution System Annual Maintenance Report (2019)
June 29, 2020 11
5.4. Streetlight Repair Sheet
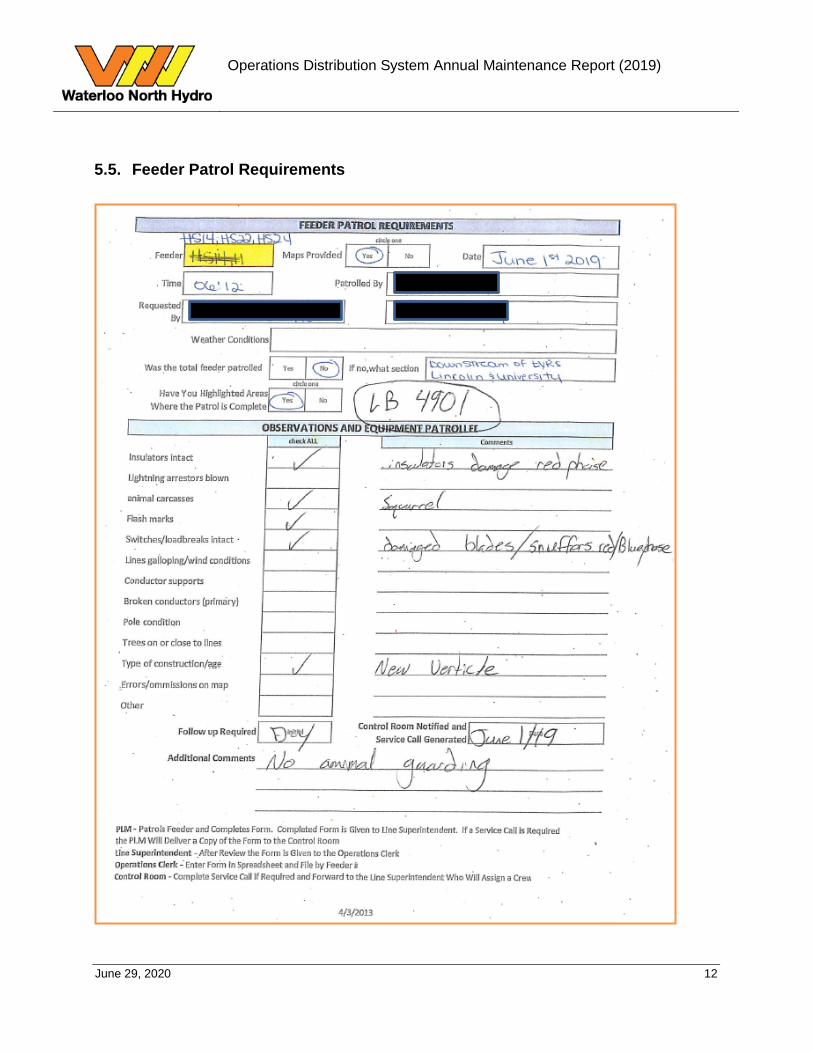
Operations Distribution System Annual Maintenance Report (2019)
June 29, 2020 12
5.5. Feeder Patrol Requirements

Appendix Q:
OEB Appendix 5-A Unit Cost Metrics
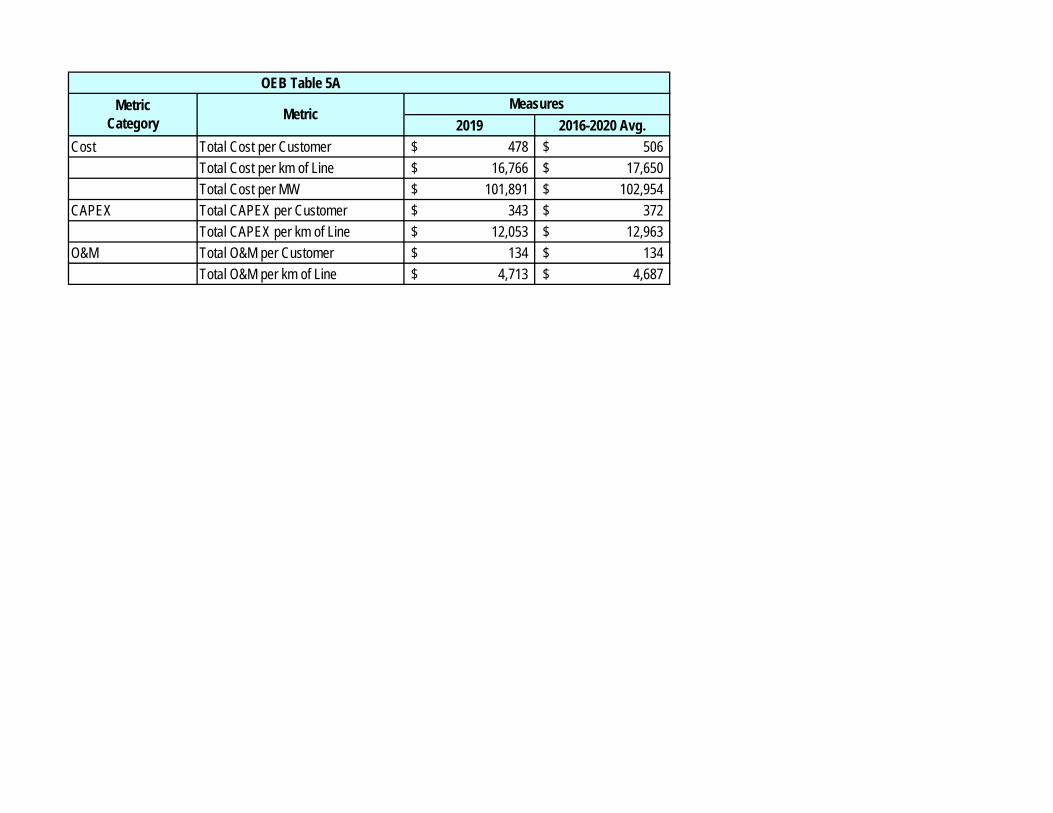
OEB Table 5A
2019 2016-2020 Avg.Cost Total Cost per Customer 478$ 506$
Total Cost per km of Line 16,766$ 17,650$ Total Cost per MW 101,891$ 102,954$
CAPEX Total CAPEX per Customer 343$ 372$ Total CAPEX per km of Line 12,053$ 12,963$
O&M Total O&M per Customer 134$ 134$ Total O&M per km of Line 4,713$ 4,687$
Metric Category Metric
Measures

Appendix R:
OEB Chapter 2 Appendix 2-AA
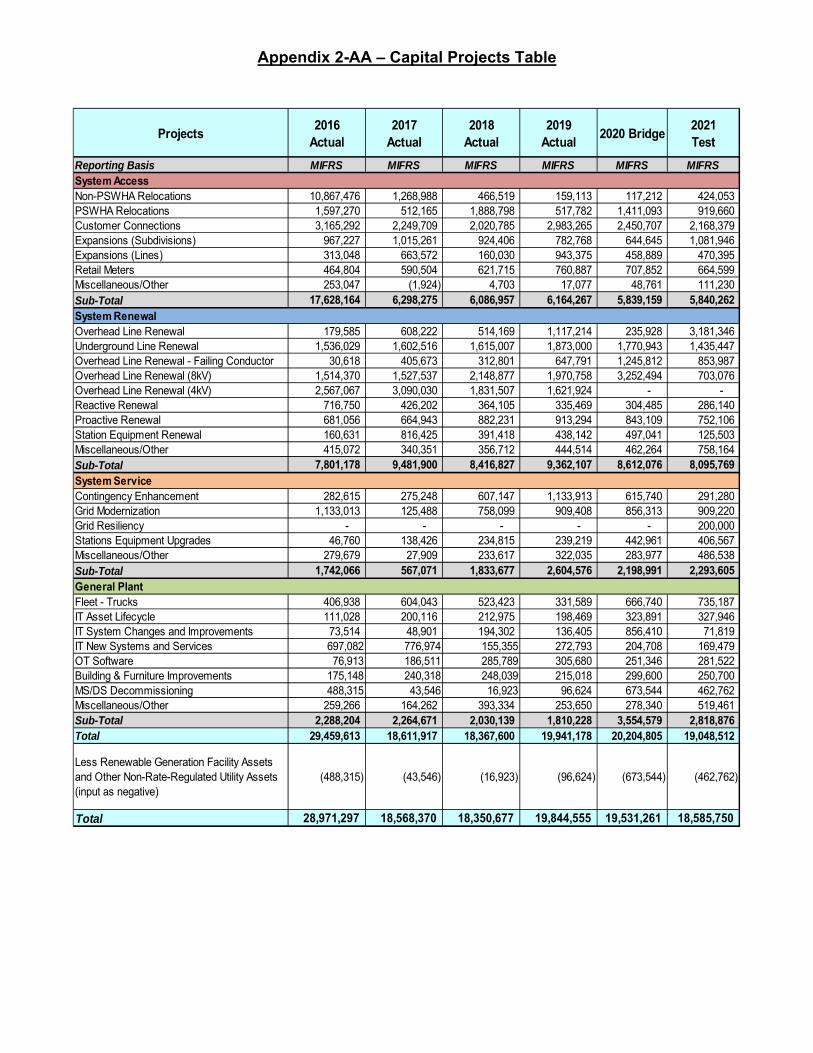
Appendix 2-AA – Capital Projects Table
Projects2016
Actual2017
Actual2018
Actual2019
Actual2020 Bridge
2021 Test
Reporting Basis MIFRS MIFRS MIFRS MIFRS MIFRS MIFRSSystem AccessNon-PSWHA Relocations 10,867,476 1,268,988 466,519 159,113 117,212 424,053 PSWHA Relocations 1,597,270 512,165 1,888,798 517,782 1,411,093 919,660 Customer Connections 3,165,292 2,249,709 2,020,785 2,983,265 2,450,707 2,168,379 Expansions (Subdivisions) 967,227 1,015,261 924,406 782,768 644,645 1,081,946 Expansions (Lines) 313,048 663,572 160,030 943,375 458,889 470,395 Retail Meters 464,804 590,504 621,715 760,887 707,852 664,599 Miscellaneous/Other 253,047 (1,924) 4,703 17,077 48,761 111,230 Sub-Total 17,628,164 6,298,275 6,086,957 6,164,267 5,839,159 5,840,262
System RenewalOverhead Line Renewal 179,585 608,222 514,169 1,117,214 235,928 3,181,346 Underground Line Renewal 1,536,029 1,602,516 1,615,007 1,873,000 1,770,943 1,435,447 Overhead Line Renewal - Failing Conductor 30,618 405,673 312,801 647,791 1,245,812 853,987 Overhead Line Renewal (8kV) 1,514,370 1,527,537 2,148,877 1,970,758 3,252,494 703,076 Overhead Line Renewal (4kV) 2,567,067 3,090,030 1,831,507 1,621,924 - - Reactive Renewal 716,750 426,202 364,105 335,469 304,485 286,140 Proactive Renewal 681,056 664,943 882,231 913,294 843,109 752,106 Station Equipment Renewal 160,631 816,425 391,418 438,142 497,041 125,503 Miscellaneous/Other 415,072 340,351 356,712 444,514 462,264 758,164 Sub-Total 7,801,178 9,481,900 8,416,827 9,362,107 8,612,076 8,095,769
System ServiceContingency Enhancement 282,615 275,248 607,147 1,133,913 615,740 291,280 Grid Modernization 1,133,013 125,488 758,099 909,408 856,313 909,220 Grid Resiliency - - - - - 200,000 Stations Equipment Upgrades 46,760 138,426 234,815 239,219 442,961 406,567 Miscellaneous/Other 279,679 27,909 233,617 322,035 283,977 486,538 Sub-Total 1,742,066 567,071 1,833,677 2,604,576 2,198,991 2,293,605
General PlantFleet - Trucks 406,938 604,043 523,423 331,589 666,740 735,187 IT Asset Lifecycle 111,028 200,116 212,975 198,469 323,891 327,946 IT System Changes and Improvements 73,514 48,901 194,302 136,405 856,410 71,819 IT New Systems and Services 697,082 776,974 155,355 272,793 204,708 169,479 OT Software 76,913 186,511 285,789 305,680 251,346 281,522 Building & Furniture Improvements 175,148 240,318 248,039 215,018 299,600 250,700 MS/DS Decommissioning 488,315 43,546 16,923 96,624 673,544 462,762 Miscellaneous/Other 259,266 164,262 393,334 253,650 278,340 519,461 Sub-Total 2,288,204 2,264,671 2,030,139 1,810,228 3,554,579 2,818,876 Total 29,459,613 18,611,917 18,367,600 19,941,178 20,204,805 19,048,512
Less Renewable Generation Facility Assets and Other Non-Rate-Regulated Utility Assets (input as negative)
(488,315) (43,546) (16,923) (96,624) (673,544) (462,762)
Total 28,971,297 18,568,370 18,350,677 19,844,555 19,531,261 18,585,750