Embed Size (px)
Citation preview

{00
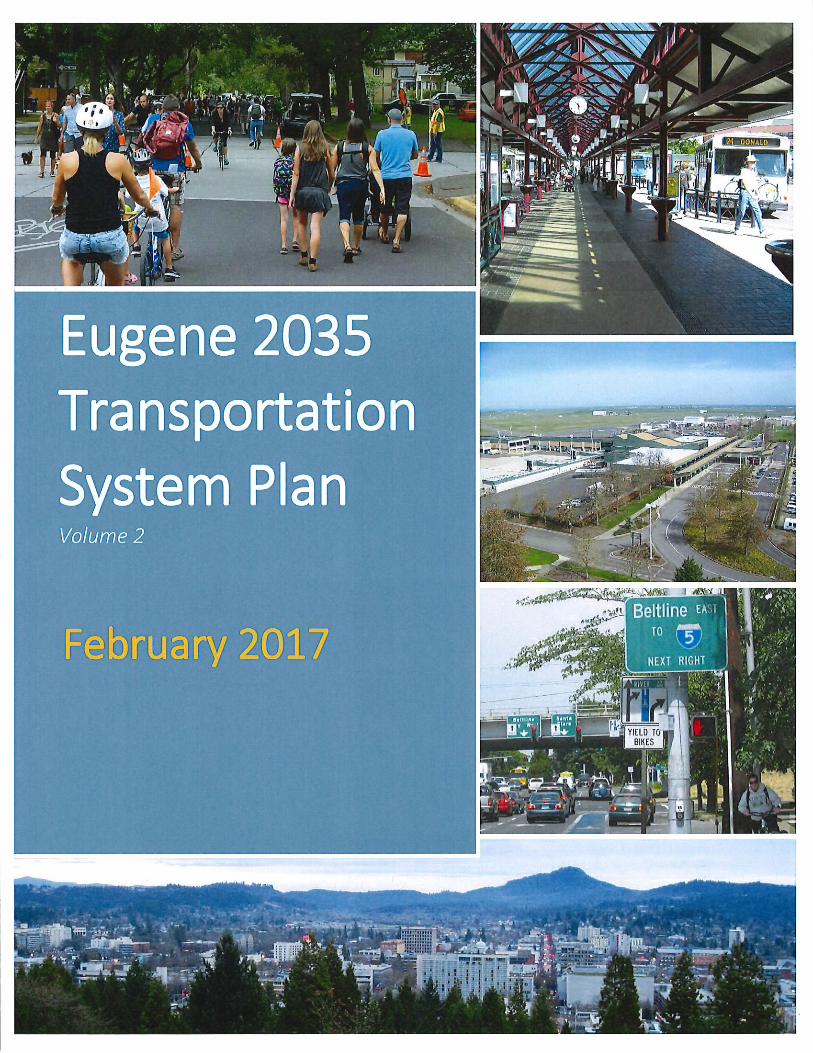
Volume 2

{00 B
Appendix A: Existing Conditions Inventory and Analysis

EUGENETSP_FINALEXISTINGCONDITIONSREPORT.DOC 1
F I N A L T E C H N I C A L M E M O R A N D U M # 1
Eugene Transportation System Plan: Existing Conditions and Deficiencies PREPARED FOR: Eugene TSP Project Management Team
PREPARED BY: Mariah VanZerr, CH2M HILL Jessica Roberts, Alta Planning + Design Dana Dickman, Alta Planning + Design Joe Bessman, Kittelson and Associates Serah Breakstone, Angelo Planning Group
CC: Theresa Carr, CH2M HILL Julia Kuhn, Kittelson & Associates Matt Hastie, Angelo Planning Group
DATE: March 4, 2011
This memorandum describes and analyzes the current (2010) transportation system in Eugene, including existing conditions and deficiencies. The report evaluates the roadway network, public transportation routes and service, bicycle facilities, pedestrian facilities, rail facilities, airports, and pipelines within the project study area. This memorandum also describes general land use patterns and major activity centers that generate traffic. The information used to describe the existing system and identify deficiencies in this report came from the City of Eugene, Lane County, the Oregon Department of Transportation (ODOT), Lane Transit District (LTD) and from the consultant team through a site visit on July 27-28, 2010.
While this document attempts to accurately reflect the existing conditions of the transportation system within Eugene, it is not meant to serve as an all-encompassing and comprehensive final assessment. Rather, the document is meant to serve as a starting point for discussion by the broader community, and will be used to help inform the development of the Eugene TSP (TSP). The memorandum is organized as follows:
Contents Study Area ...................................................................................................................................... 3 Land Use ........................................................................................................................................ 4
Land Use Analysis ............................................................................................................ 4 Demographic Analysis .................................................................................................. 13
Policy Context .............................................................................................................................. 15 Statewide Plans, Policies and Relevant Documents .................................................. 16 Regional Plans, Polices and Relevant Documents ..................................................... 32 Local Plans, Policies and Relevant Documents .......................................................... 36
Roadway Network and Conditions .......................................................................................... 41 Functional Classification ............................................................................................... 41
EUGENE TRANSPORTATION SYSTEM PLAN: EXISTING CONDITIONS AND DEFICIENCIES
EUGENETSP_FINALEXISTINGCONDITIONSREPORT.DOC 2
State Roadways ............................................................................................................... 42 Lane County Roadways ................................................................................................ 43 City of Eugene Roadways ............................................................................................. 44 Freight Routes ................................................................................................................. 53
Traffic Operational Analysis ...................................................................................................... 55 Design Hour Traffic Volumes ....................................................................................... 55 Intersection Operating Standards ................................................................................ 56 Intersection Operations Analyses ................................................................................ 57 Recurrent Congestion Sites ........................................................................................... 64
Safety Analysis ............................................................................................................................. 65 Intersection Crash Rates ................................................................................................ 66 Beltline Highway Safety Review .................................................................................. 75 Fatalities ......................................................................................................................... 76 Corridor Safety Needs ................................................................................................... 76
Pedestrian System ....................................................................................................................... 76 Pedestrian Facility Types ............................................................................................... 76 Existing Pedestrian Facilities and Conditions ............................................................ 77
Bicycle System .............................................................................................................................. 81 Bicycle Facility Types ..................................................................................................... 81 Existing Bicycle Facilities and Conditions .................................................................. 82
Transit Service and Facilities...................................................................................................... 86 Transit Service ................................................................................................................. 86
Rail System ................................................................................................................................... 94 Freight Rail ...................................................................................................................... 94 Intercity Passenger Rail ................................................................................................. 96
Eugene Airport ............................................................................................................................ 98 Facilities ......................................................................................................................... 98 Service and Usage ........................................................................................................... 99 Ground Transportation Options ................................................................................ 100
Waterways and Pipeline Facilities .......................................................................................... 101 Waterways ..................................................................................................................... 101 Pipelines ....................................................................................................................... 101
Summary of Deficiencies .......................................................................................................... 101 Traffic Operations and Safety Deficiencies ............................................................... 101 Pedestrian System Deficiencies .................................................................................. 103 Bicycle System Deficiencies ......................................................................................... 104 Transit Deficiencies ...................................................................................................... 106 Freight System Deficiencies ....................................................................................... 107 Rail System Deficiencies .............................................................................................. 107 Airport Deficiencies ..................................................................................................... 109
Next Steps ................................................................................................................................... 111
List of Figures Figure 1: Study Area Figure 2: MetroPlan Land Use Designations Figure 3: Base-Zoning
EUGENE TRANSPORTATION SYSTEM PLAN: EXISTING CONDITIONS AND DEFICIENCIES
EUGENETSP_FINALEXISTINGCONDITIONSREPORT.DOC 3
Figure 4a: Activity Areas and Mixed Use Development Areas/Central Eugene Figure 4b: Activity Areas and Mixed Use Development Areas/South Hills Figure 4c: Activity Areas and Mixed Use Development Areas/W Eugene/Bethel/ Danebo Figure 4d: Activity Areas and Mixed Use Development Areas/Northeast Eugene Figure 4e: Activity Areas and Mixed Use Development Areas/River Road/Santa Clara Figure 5: Roadway Functional Classification Figure 6: Freight Routes and Rail Facilities Figure 7: Study Intersections Figure 8: Intersection Performance Figure 9: Streets with Capacity Constraints Today and in the Future Figure 10: Intersection Safety Figure 11: Pedestrian Facilities Figure 12: Bicycle Facilities Figure 13: Transit Routes and Facilities Figure 14: EmX Routes Figure 15: Eugene Airport and Vicinity Figure 16: Waterway and Pipeline System
List of Tables Table 1: Select 2008 American Community Survey Demographic Characteristics Table 2: 2008 American Community Survey Commute Mode Split Table 3: Intersection Performance Summary for 30th Highest Hour Conditions Table 4: Intersection Crash Rates Table 5: Amtrak Intercity Bus Departures from Eugene Table 6: Departures from Eugene’s Greyhound Bus Station Table 7: Lane Transit District Fares Table 8: Lane Transit District Park-and-Ride Facilities within the City of Eugene Table 9: Transit Ridership in Eugene and Similar U.S. Cities Table 10: Amtrak Passenger Rail Service Table 11: Passenger Rail – Sample Ticket Prices and Trip Lengths from Eugene Station Table 12: Eugene Airport Top 10 Domestic Destinations
List of Appendixes Appendix A: Oregon Highway Plan Volume to Capacity Ratios Appendix B: ODOT Statewide Transportation Improvement Program List Appendix C: Lane County TSP Project List Appendix D: TransPlan Policies Appendix E: LTD Capital Improvements Program List Appendix F: City of Eugene Capital Improvements Program List Appendix G: Traffic Analysis Methodology Appendix H: Traffic Volumes Appendix I: Crash Data Appendix J: Existing Conditions Traffic Analysis Worksheets
EUGENE TRANSPORTATION SYSTEM PLAN: EXISTING CONDITIONS AND DEFICIENCIES
EUGENETSP_FINALEXISTINGCONDITIONSREPORT.DOC 4
Study Area The study area for the Eugene TSP is largely comprised of the existing Eugene/Springfield Urban Growth Boundary (UGB) west of Interstate 5, and extends to include the Eugene Airport. The study area is illustrated in Figure 1. In addition, the existing conditions analysis considers areas outside the direct study area (e.g., the City of Springfield, the City of Coburg) to the extent that they affect travel patterns and transportation-related needs for the City of Eugene.
Land Use The City of Eugene’s zoning code identifies the types of development and land uses that are currently allowed within a designated area. The City’s comprehensive plan provides a long-term vision for growth in the area and guides policy decisions within a city. The City of Eugene is currently updating its comprehensive plan through the Envision Eugene process (underway).
Metropolitan areas in Oregon are required to develop a regional transportation system plan. TransPlan, the current regional and local TSP adopted in 2001 (amended in 2002), introduced land use policies to create mixed-use development areas. These areas would have a mixture of land uses, supporting the use of alternative modes of transportation.
Figure 2 displays the land use designations outlined in the Eugene-Springfield’s Metropolitan Area General Plan (Metro Plan), the current comprehensive plan for the Eugene-Springfield metro area and Figure 3 displays the current zoning throughout the study area. Figures 4a-4e display the potential mixed-use development areas identified in TransPlan.
General Overview of Existing Land Use This section provides a general overview of existing and allowed land uses in the City of Eugene. It is intended not to be comprehensive but to inform the TSP team in identifying how current land uses affect current transportation conditions. For this effort, the City of Eugene was divided into five (5) geographic areas. The current zoning designations and land use patterns were reviewed, as well as activity areas identified, within the study area. Land use patterns are compared with the zoning code to identify areas where higher than expected traffic volumes or different traffic patterns may occur. The rest of this section is organized by the following five areas (shown in Figures 4a-4e): Central Eugene: This area comprises the central business district and inner Eugene
neighborhoods. It is bounded by the Willamette River to the north, Laurel Hill Valley to the east, the south hills to the south, and Chambers St. to the west.
South Hills: This area comprises the hills rising up to the south and east of Eugene.
West Eugene/Bethel/Danebo: This area includes neighborhoods north of the West Eugene Wetlands and west of Chambers Street and Northwest Expressway.
NE Eugene – Willakenzie/Ferry Street Bridge: This area is bounded by the Willamette River to the west and south, and by I-5/Springfield to the east.
EUGENE TRANSPORTATION SYSTEM PLAN: EXISTING CONDITIONS AND DEFICIENCIES
EUGENETSP_FINALEXISTINGCONDITIONSREPORT.DOC 5
River Road/Santa Clara: This area is bounded by Northwest Expressway to the west and the Willamette River to the east.
These areas were initially developed for the Eugene Pedestrian and Bicycle Master Plan analysis (November 2010). They were used for the land use analysis for this planning effort as they follow general land use patterns throughout the city and establish consistency between transportation planning efforts.
Mixed Use Development Areas TransPlan, the current regional and local TSP adopted in 2001 (amended in 2002), introduced a policy of nodal development in the Eugene/Springfield metropolitan area. The plan states that “nodal development supports mixed land uses in designated areas to increase opportunities for people to live near their jobs and to make shorter trips for a variety of purposes. Nodal development also supports the use of alternative modes of transportation.”(Chapter 2, Land Use Policy #1) TransPlan identified fifty-three potential nodal areas (also known as Mixed Use Centers) in the Eugene-Springfield area, thirty-nine of which are located within Eugene.
Of the thirty-nine mixed use development areas in Eugene, seven were visited as part of the existing conditions land use analysis and are described in this section. These areas were chosen for the purposes of focusing the analysis on areas that have differing land uses and activity generation, and were selected in coordination with City of Eugene staff. Each mixed use development area will be described within the geographic area subsection in which it is located. These development areas are displayed on Figures 4a - 4e.
Activity Areas Throughout Eugene there are several major destinations that attract people by personal vehicle, bicycle, and foot, and therefore, generate a significant amount of traffic. These uses attract both visitors from outside of Eugene and residents within Eugene. Major activity centers will be noted in the geographic area subsections and are also shown in Figures 4a – 4e. The list of activity areas presented in this section is not intended to be exhaustive but instead will provide an indication of many of the areas where activity occurs in the City of Eugene.
Central Eugene Central Eugene is comprised of the central downtown area, the University of Oregon, and the surrounding neighborhoods (see Figure 4a). This area of the city serves as a center for many civic, commercial, and sporting activities within the City of Eugene and is zoned to accommodate these uses. The University had an enrollment of more than 22,000 in 2009. With eight residence hall complexes and five apartment/home communities for only about 4,100 students, most students and employees must commute to this area. Other major attractors within Central Eugene include City Hall (8th Avenue and Pearl Street), Lane Transit District’s Eugene Station (10th Avenue and Willamette Street), Skinner Butte Park (along the Willamette River between Lincoln and High streets), and Hilyard Community Center/Amazon Community Center & Pool (Hilyard Street between 24th Avenue and 28th Avenue).
Central Eugene also hosts many events that attract regional attendance. Large sporting events for the University of Oregon are held in Central Eugene at Hayward Field (on the
EUGENE TRANSPORTATION SYSTEM PLAN: EXISTING CONDITIONS AND DEFICIENCIES
EUGENETSP_FINALEXISTINGCONDITIONSREPORT.DOC 6
13th Avenue looking west.
University of Oregon campus), MacArthur Court (also on the University of Oregon campus), and Matthew Knight Arena (13th Avenue and Franklin Boulevard – opened December 2010) and cultural events are held at the Hult Center (7th Avenue and Willamette Street) and Lane County Fairgrounds (13th Avenue and Monroe Street). Other community events that occurred in the downtown core throughout 2010 summer included the Saturday Market crafts and food fair; a Tuesday, Thursday, and Saturday Farmer’s Market; the Oregon Bach Festival; and many summer in the City events. Summer in the City is a series of outdoor events organized by the City and sponsored by community partners. 2010 Summer in the City events included the Eugene Celebration Raise the Roof; the KOOL 99.1 Dance Party & Theatre Teasers; No Shame Theatre; bicycle and walking breakfasts; and outdoor concerts.
The most common zoning designations within Central Eugene are low-, medium-, high-, and limited high-density residential; community and major commercial; and public land. This variety and the distribution of designations facilitate dense commercial and residential development in the downtown core area and residential development and parks throughout the remaining area. Land use throughout the Central Eugene area is primarily single- and multi-family residential, retail, services, offices, government, parks, and educational facilities. Other common uses include religious or non-profit uses and vacant land.
Central Eugene also contains six “special area” zones (SW Whiteaker Special Area zone, SF Fifth Avenue Special Area zone, S-DW Downtown Westside Special Area zone, S-JW Jefferson Westside Special Area zone, Riverfront Park Special Area zone, and S-HB Blair Boulevard Historic Commercial Special Area zone). These areas have special zoning requirements such as design requirements.
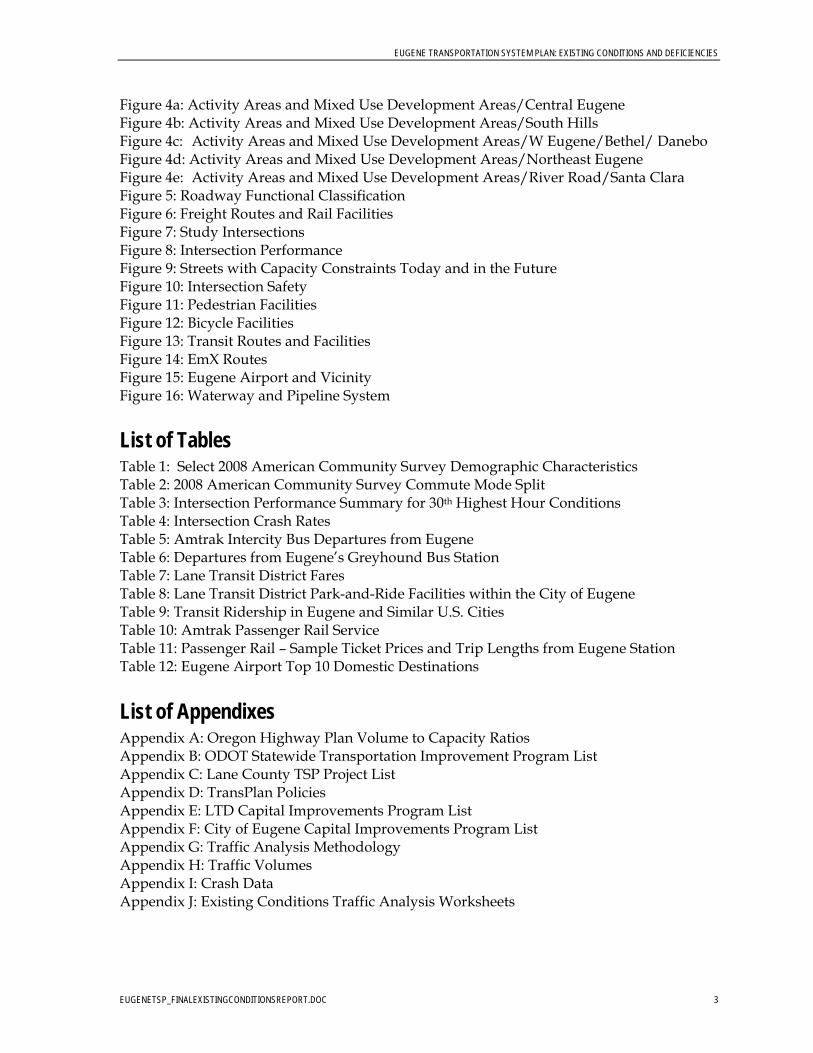
Land uses and zoning are generally in conformance with each other in the Central Eugene area. A few land uses were identified that may create higher traffic flows or different traffic patterns than would be expected with the uses that are normally occur within the designated zone. For example, multi-family housing was identified in a few locations zoned as major commercial. Although multi-family development is encouraged by city policy in this zone and allowed by the commercial zoning, these land uses may create different transportation system demands than commercial uses. Retail and service uses were also identified in areas zoned for industrial uses. These uses are allowed, with a conditional use permit, in an industrial zone but are noted as they may impact traffic patterns or volumes. Visited Mixed Use Development Area #1 – 13th Avenue from Ferry to Kincaid This area is located along 13th Avenue from Ferry Street to its terminus at the University of Oregon. The land uses within this area are primarily retail and service, although the development density and character varies throughout the area. The block between Alder and Kincaid streets provides a retail center that is friendly to pedestrians with wide sidewalks, pedestrian lighting and continuous storefronts. The volume of bicyclists and automobiles, coupled with a narrow street and
EUGENE TRANSPORTATION SYSTEM PLAN: EXISTING CONDITIONS AND DEFICIENCIES
EUGENETSP_FINALEXISTINGCONDITIONSREPORT.DOC 7
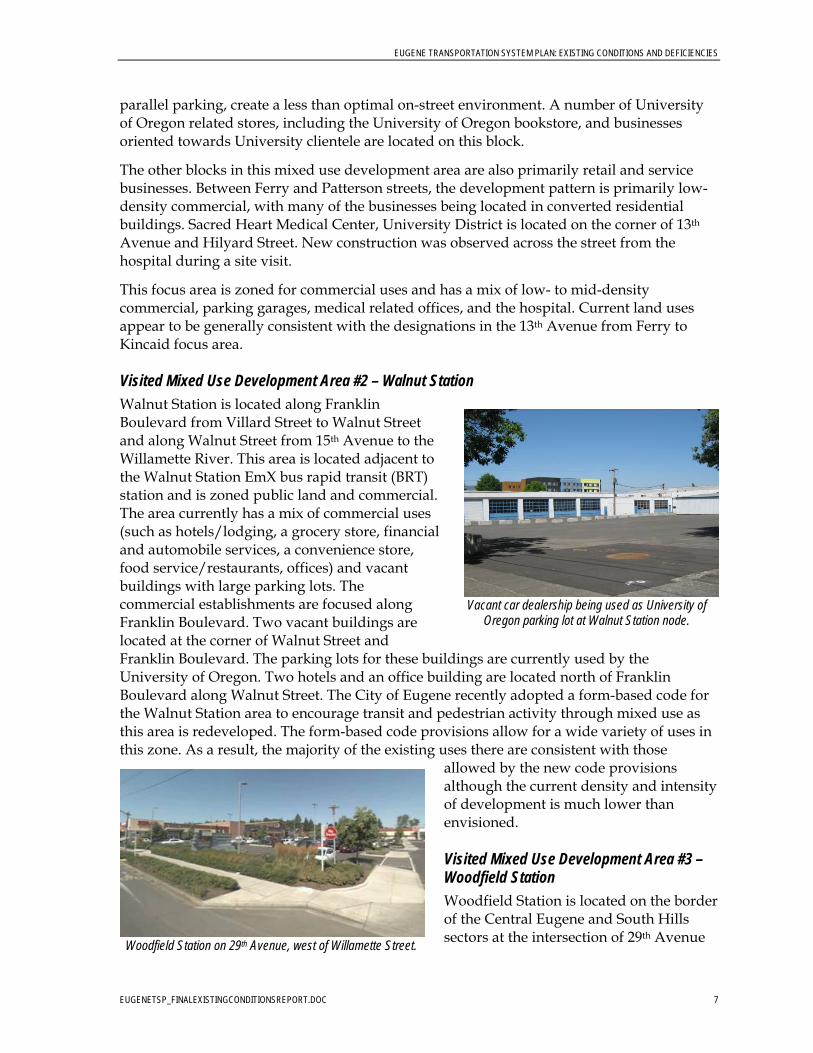
Vacant car dealership being used as University of Oregon parking lot at Walnut Station node.
parallel parking, create a less than optimal on-street environment. A number of University of Oregon related stores, including the University of Oregon bookstore, and businesses oriented towards University clientele are located on this block.
The other blocks in this mixed use development area are also primarily retail and service businesses. Between Ferry and Patterson streets, the development pattern is primarily low-density commercial, with many of the businesses being located in converted residential buildings. Sacred Heart Medical Center, University District is located on the corner of 13th Avenue and Hilyard Street. New construction was observed across the street from the hospital during a site visit.
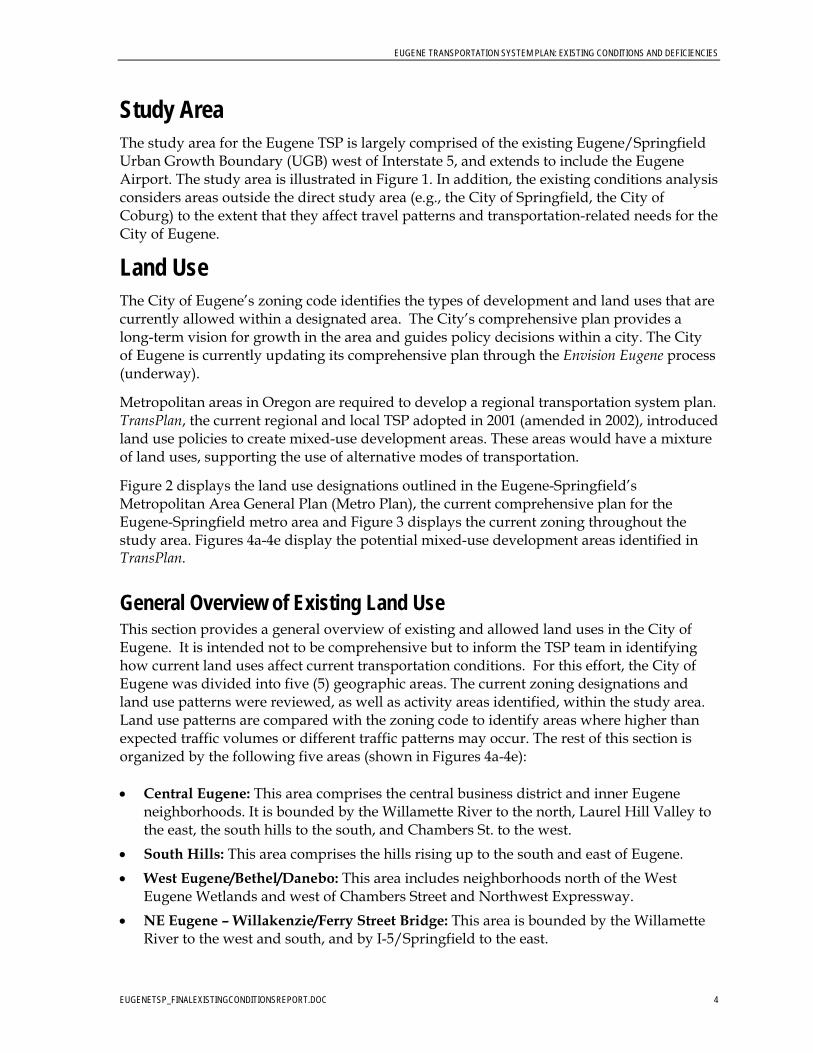
This focus area is zoned for commercial uses and has a mix of low- to mid-density commercial, parking garages, medical related offices, and the hospital. Current land uses appear to be generally consistent with the designations in the 13th Avenue from Ferry to Kincaid focus area. Visited Mixed Use Development Area #2 – Walnut Station Walnut Station is located along Franklin Boulevard from Villard Street to Walnut Street and along Walnut Street from 15th Avenue to the Willamette River. This area is located adjacent to the Walnut Station EmX bus rapid transit (BRT) station and is zoned public land and commercial. The area currently has a mix of commercial uses (such as hotels/lodging, a grocery store, financial and automobile services, a convenience store, food service/restaurants, offices) and vacant buildings with large parking lots. The commercial establishments are focused along Franklin Boulevard. Two vacant buildings are located at the corner of Walnut Street and Franklin Boulevard. The parking lots for these buildings are currently used by the University of Oregon. Two hotels and an office building are located north of Franklin Boulevard along Walnut Street. The City of Eugene recently adopted a form-based code for the Walnut Station area to encourage transit and pedestrian activity through mixed use as this area is redeveloped. The form-based code provisions allow for a wide variety of uses in this zone. As a result, the majority of the existing uses there are consistent with those
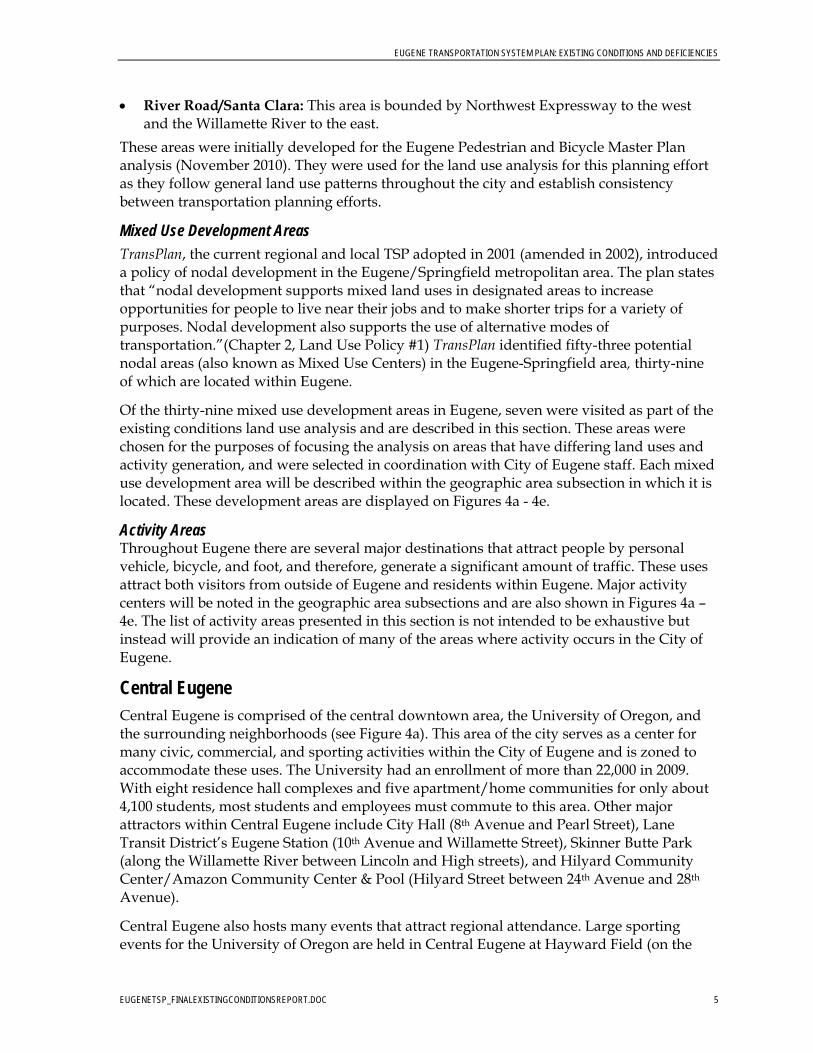
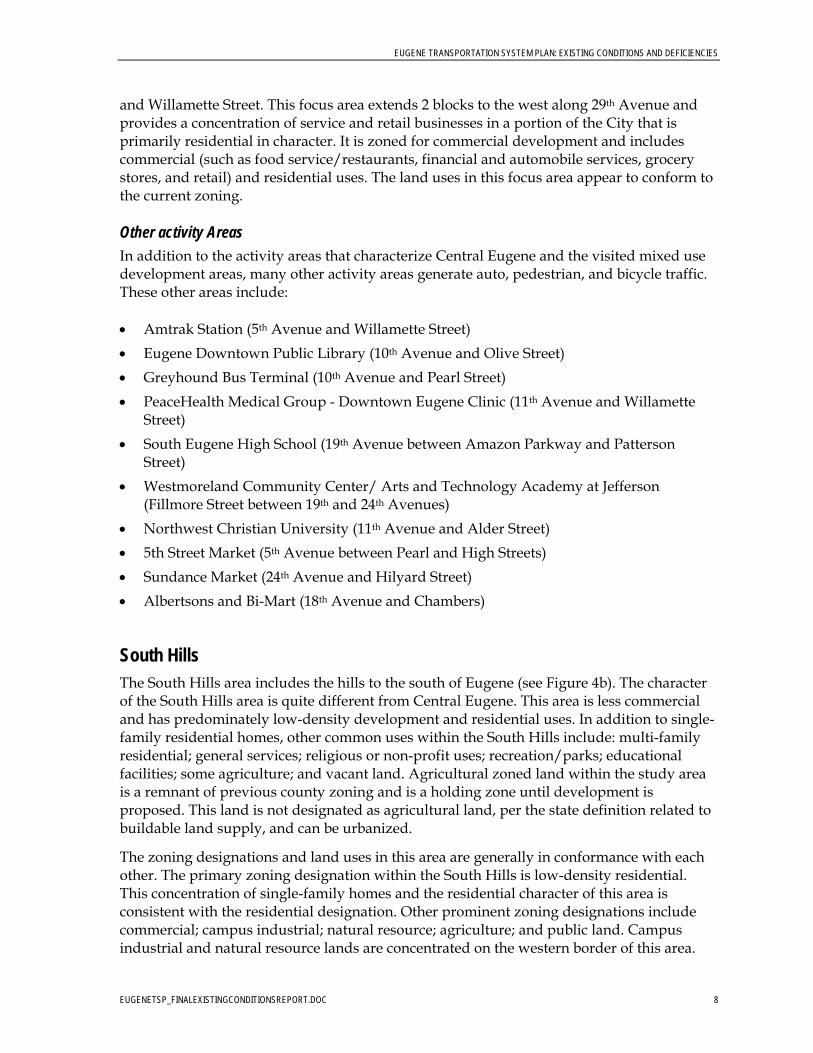
allowed by the new code provisions although the current density and intensity of development is much lower than envisioned. Visited Mixed Use Development Area #3 – Woodfield Station Woodfield Station is located on the border of the Central Eugene and South Hills sectors at the intersection of 29th Avenue
Woodfield Station on 29th Avenue, west of Willamette Street.
EUGENE TRANSPORTATION SYSTEM PLAN: EXISTING CONDITIONS AND DEFICIENCIES
EUGENETSP_FINALEXISTINGCONDITIONSREPORT.DOC 8
and Willamette Street. This focus area extends 2 blocks to the west along 29th Avenue and provides a concentration of service and retail businesses in a portion of the City that is primarily residential in character. It is zoned for commercial development and includes commercial (such as food service/restaurants, financial and automobile services, grocery stores, and retail) and residential uses. The land uses in this focus area appear to conform to the current zoning. Other activity Areas In addition to the activity areas that characterize Central Eugene and the visited mixed use development areas, many other activity areas generate auto, pedestrian, and bicycle traffic. These other areas include: Amtrak Station (5th Avenue and Willamette Street)
Eugene Downtown Public Library (10th Avenue and Olive Street)
Greyhound Bus Terminal (10th Avenue and Pearl Street)
PeaceHealth Medical Group - Downtown Eugene Clinic (11th Avenue and Willamette Street)
South Eugene High School (19th Avenue between Amazon Parkway and Patterson Street)
Westmoreland Community Center/ Arts and Technology Academy at Jefferson (Fillmore Street between 19th and 24th Avenues)
Northwest Christian University (11th Avenue and Alder Street)
5th Street Market (5th Avenue between Pearl and High Streets)
Sundance Market (24th Avenue and Hilyard Street)
Albertsons and Bi-Mart (18th Avenue and Chambers)
South Hills The South Hills area includes the hills to the south of Eugene (see Figure 4b). The character of the South Hills area is quite different from Central Eugene. This area is less commercial and has predominately low-density development and residential uses. In addition to single-family residential homes, other common uses within the South Hills include: multi-family residential; general services; religious or non-profit uses; recreation/parks; educational facilities; some agriculture; and vacant land. Agricultural zoned land within the study area is a remnant of previous county zoning and is a holding zone until development is proposed. This land is not designated as agricultural land, per the state definition related to buildable land supply, and can be urbanized.
The zoning designations and land uses in this area are generally in conformance with each other. The primary zoning designation within the South Hills is low-density residential. This concentration of single-family homes and the residential character of this area is consistent with the residential designation. Other prominent zoning designations include commercial; campus industrial; natural resource; agriculture; and public land. Campus industrial and natural resource lands are concentrated on the western border of this area.
EUGENE TRANSPORTATION SYSTEM PLAN: EXISTING CONDITIONS AND DEFICIENCIES
EUGENETSP_FINALEXISTINGCONDITIONSREPORT.DOC 9
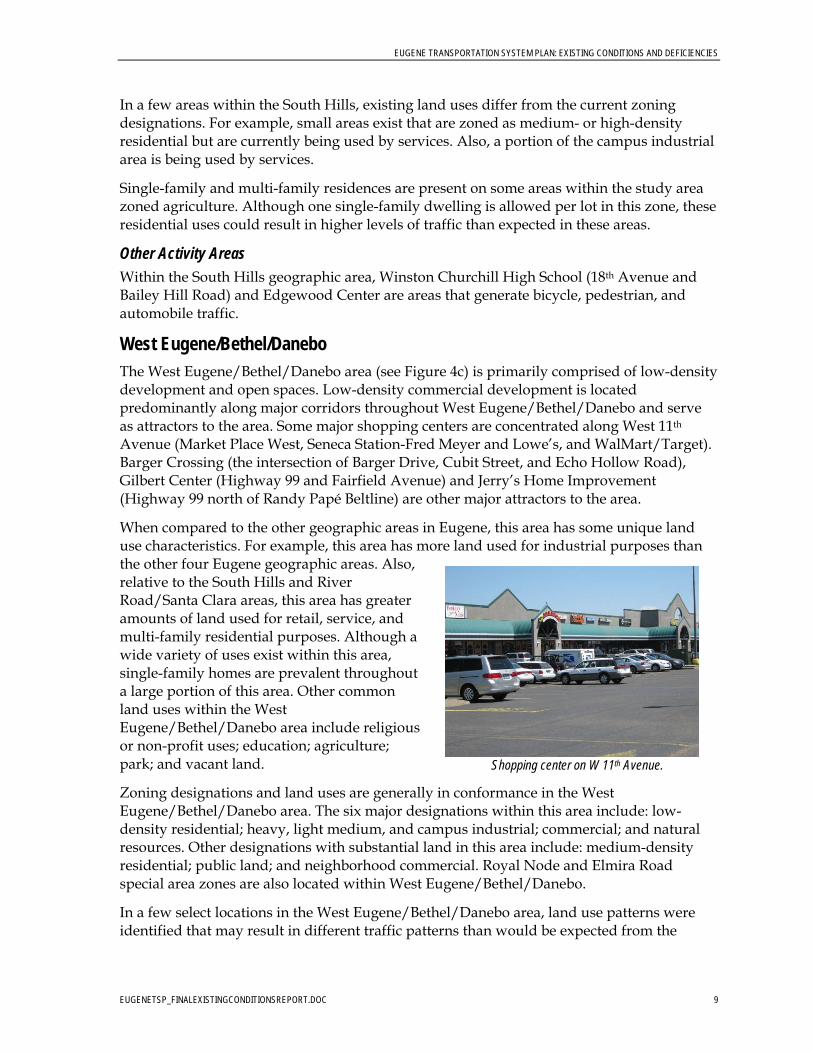
Shopping center on W 11th Avenue.
In a few areas within the South Hills, existing land uses differ from the current zoning designations. For example, small areas exist that are zoned as medium- or high-density residential but are currently being used by services. Also, a portion of the campus industrial area is being used by services.
Single-family and multi-family residences are present on some areas within the study area zoned agriculture. Although one single-family dwelling is allowed per lot in this zone, these residential uses could result in higher levels of traffic than expected in these areas.
Other Activity Areas Within the South Hills geographic area, Winston Churchill High School (18th Avenue and Bailey Hill Road) and Edgewood Center are areas that generate bicycle, pedestrian, and automobile traffic.
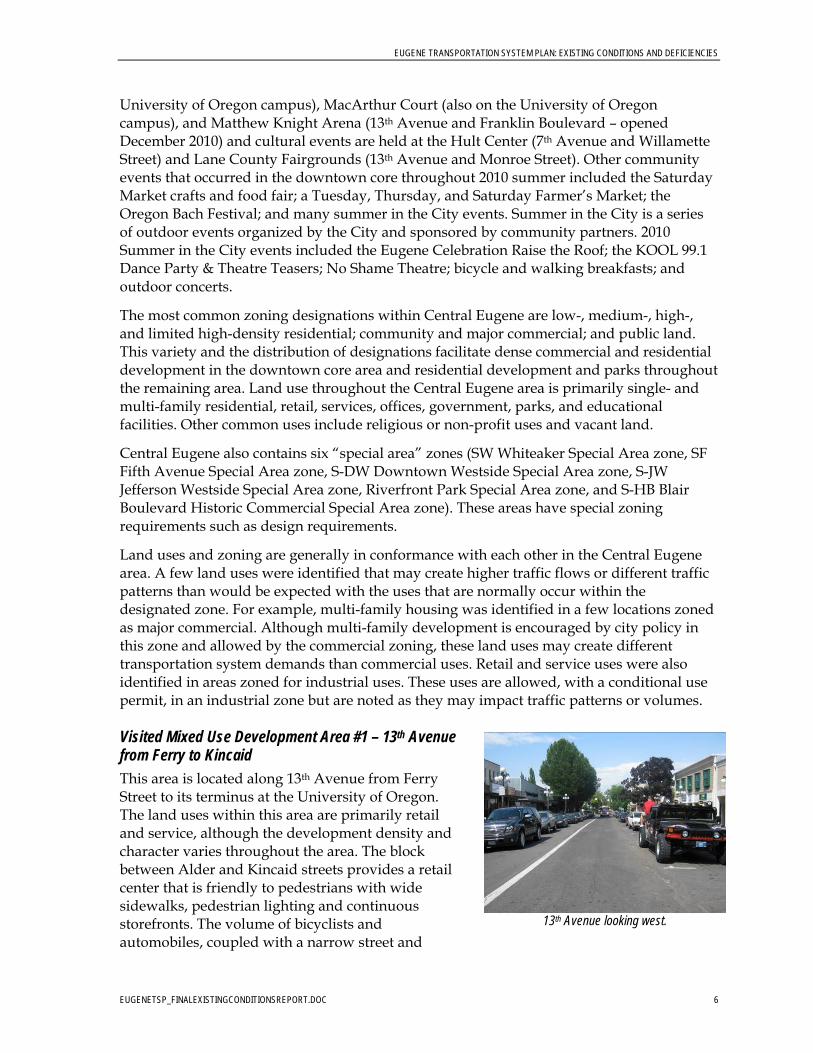
West Eugene/Bethel/Danebo The West Eugene/Bethel/Danebo area (see Figure 4c) is primarily comprised of low-density development and open spaces. Low-density commercial development is located predominantly along major corridors throughout West Eugene/Bethel/Danebo and serve as attractors to the area. Some major shopping centers are concentrated along West 11th
Avenue (Market Place West, Seneca Station-Fred Meyer and Lowe’s, and WalMart/Target). Barger Crossing (the intersection of Barger Drive, Cubit Street, and Echo Hollow Road), Gilbert Center (Highway 99 and Fairfield Avenue) and Jerry’s Home Improvement (Highway 99 north of Randy Papé Beltline) are other major attractors to the area.
When compared to the other geographic areas in Eugene, this area has some unique land use characteristics. For example, this area has more land used for industrial purposes than the other four Eugene geographic areas. Also, relative to the South Hills and River Road/Santa Clara areas, this area has greater amounts of land used for retail, service, and multi-family residential purposes. Although a wide variety of uses exist within this area, single-family homes are prevalent throughout a large portion of this area. Other common land uses within the West Eugene/Bethel/Danebo area include religious or non-profit uses; education; agriculture; park; and vacant land.
Zoning designations and land uses are generally in conformance in the West Eugene/Bethel/Danebo area. The six major designations within this area include: low-density residential; heavy, light medium, and campus industrial; commercial; and natural resources. Other designations with substantial land in this area include: medium-density residential; public land; and neighborhood commercial. Royal Node and Elmira Road special area zones are also located within West Eugene/Bethel/Danebo.
In a few select locations in the West Eugene/Bethel/Danebo area, land use patterns were identified that may result in different traffic patterns than would be expected from the
EUGENE TRANSPORTATION SYSTEM PLAN: EXISTING CONDITIONS AND DEFICIENCIES
EUGENETSP_FINALEXISTINGCONDITIONSREPORT.DOC 10
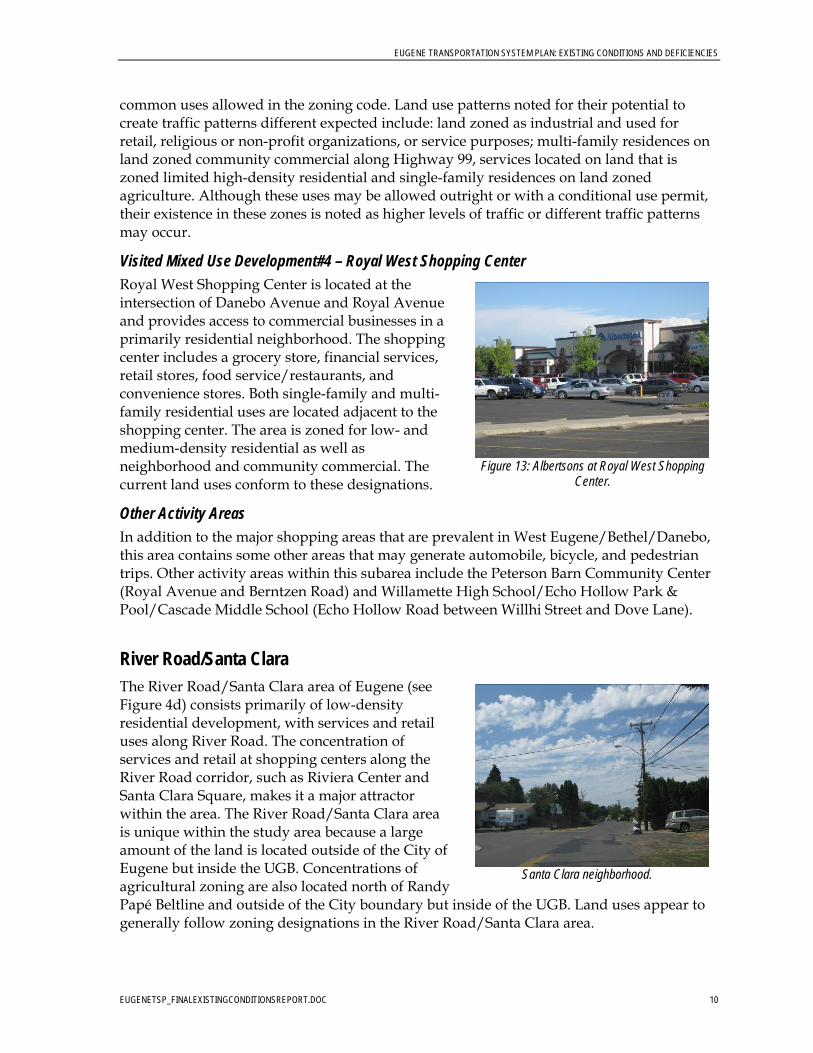
Figure 13: Albertsons at Royal West Shopping
Center.
Santa Clara neighborhood.
common uses allowed in the zoning code. Land use patterns noted for their potential to create traffic patterns different expected include: land zoned as industrial and used for retail, religious or non-profit organizations, or service purposes; multi-family residences on land zoned community commercial along Highway 99, services located on land that is zoned limited high-density residential and single-family residences on land zoned agriculture. Although these uses may be allowed outright or with a conditional use permit, their existence in these zones is noted as higher levels of traffic or different traffic patterns may occur.
Visited Mixed Use Development#4 – Royal West Shopping Center Royal West Shopping Center is located at the intersection of Danebo Avenue and Royal Avenue and provides access to commercial businesses in a primarily residential neighborhood. The shopping center includes a grocery store, financial services, retail stores, food service/restaurants, and convenience stores. Both single-family and multi-family residential uses are located adjacent to the shopping center. The area is zoned for low- and medium-density residential as well as neighborhood and community commercial. The current land uses conform to these designations.
Other Activity Areas In addition to the major shopping areas that are prevalent in West Eugene/Bethel/Danebo, this area contains some other areas that may generate automobile, bicycle, and pedestrian trips. Other activity areas within this subarea include the Peterson Barn Community Center (Royal Avenue and Berntzen Road) and Willamette High School/Echo Hollow Park & Pool/Cascade Middle School (Echo Hollow Road between Willhi Street and Dove Lane).
River Road/Santa Clara The River Road/Santa Clara area of Eugene (see Figure 4d) consists primarily of low-density residential development, with services and retail uses along River Road. The concentration of services and retail at shopping centers along the River Road corridor, such as Riviera Center and Santa Clara Square, makes it a major attractor within the area. The River Road/Santa Clara area is unique within the study area because a large amount of the land is located outside of the City of Eugene but inside the UGB. Concentrations of agricultural zoning are also located north of Randy Papé Beltline and outside of the City boundary but inside of the UGB. Land uses appear to generally follow zoning designations in the River Road/Santa Clara area.
EUGENE TRANSPORTATION SYSTEM PLAN: EXISTING CONDITIONS AND DEFICIENCIES
EUGENETSP_FINALEXISTINGCONDITIONSREPORT.DOC 11
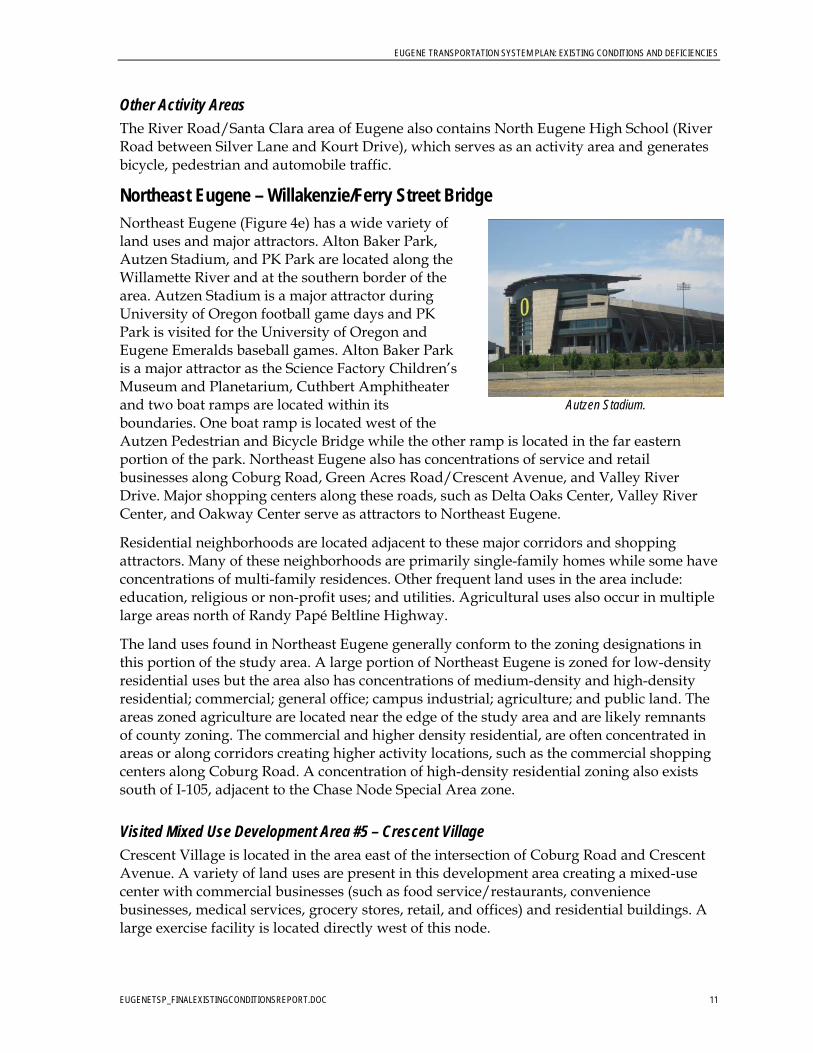
Autzen Stadium.
Other Activity Areas The River Road/Santa Clara area of Eugene also contains North Eugene High School (River Road between Silver Lane and Kourt Drive), which serves as an activity area and generates bicycle, pedestrian and automobile traffic.
Northeast Eugene – Willakenzie/Ferry Street Bridge Northeast Eugene (Figure 4e) has a wide variety of land uses and major attractors. Alton Baker Park, Autzen Stadium, and PK Park are located along the Willamette River and at the southern border of the area. Autzen Stadium is a major attractor during University of Oregon football game days and PK Park is visited for the University of Oregon and Eugene Emeralds baseball games. Alton Baker Park is a major attractor as the Science Factory Children’s Museum and Planetarium, Cuthbert Amphitheater and two boat ramps are located within its boundaries. One boat ramp is located west of the Autzen Pedestrian and Bicycle Bridge while the other ramp is located in the far eastern portion of the park. Northeast Eugene also has concentrations of service and retail businesses along Coburg Road, Green Acres Road/Crescent Avenue, and Valley River Drive. Major shopping centers along these roads, such as Delta Oaks Center, Valley River Center, and Oakway Center serve as attractors to Northeast Eugene.
Residential neighborhoods are located adjacent to these major corridors and shopping attractors. Many of these neighborhoods are primarily single-family homes while some have concentrations of multi-family residences. Other frequent land uses in the area include: education, religious or non-profit uses; and utilities. Agricultural uses also occur in multiple large areas north of Randy Papé Beltline Highway.
The land uses found in Northeast Eugene generally conform to the zoning designations in this portion of the study area. A large portion of Northeast Eugene is zoned for low-density residential uses but the area also has concentrations of medium-density and high-density residential; commercial; general office; campus industrial; agriculture; and public land. The areas zoned agriculture are located near the edge of the study area and are likely remnants of county zoning. The commercial and higher density residential, are often concentrated in areas or along corridors creating higher activity locations, such as the commercial shopping centers along Coburg Road. A concentration of high-density residential zoning also exists south of I-105, adjacent to the Chase Node Special Area zone.
Visited Mixed Use Development Area #5 – Crescent Village Crescent Village is located in the area east of the intersection of Coburg Road and Crescent Avenue. A variety of land uses are present in this development area creating a mixed-use center with commercial businesses (such as food service/restaurants, convenience businesses, medical services, grocery stores, retail, and offices) and residential buildings. A large exercise facility is located directly west of this node.
EUGENE TRANSPORTATION SYSTEM PLAN: EXISTING CONDITIONS AND DEFICIENCIES
EUGENETSP_FINALEXISTINGCONDITIONSREPORT.DOC 12
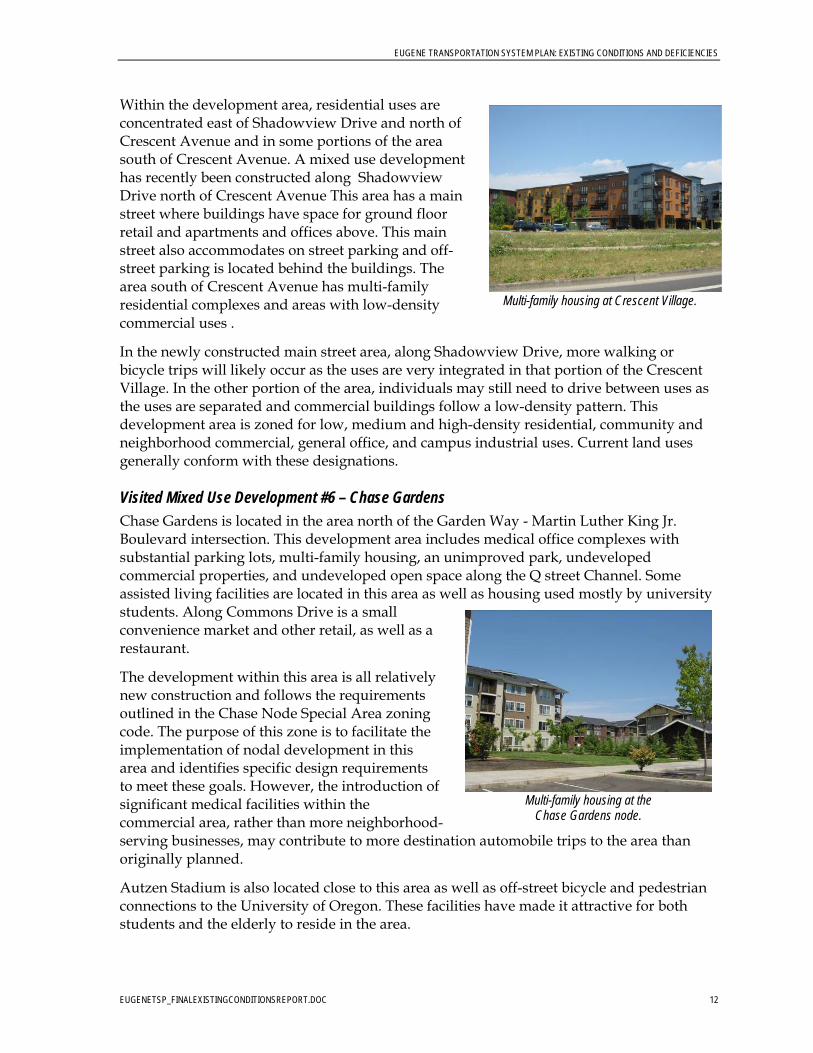
Multi-family housing at the
Chase Gardens node.
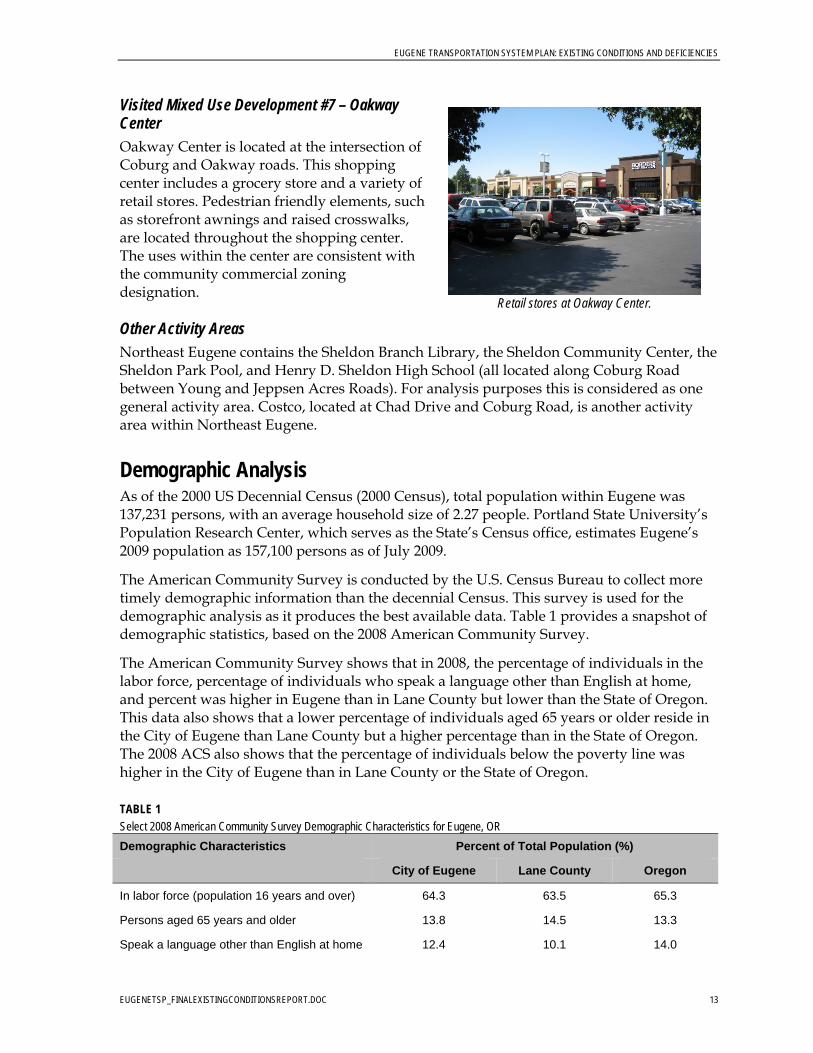
Within the development area, residential uses are concentrated east of Shadowview Drive and north of Crescent Avenue and in some portions of the area south of Crescent Avenue. A mixed use development has recently been constructed along Shadowview Drive north of Crescent Avenue This area has a main street where buildings have space for ground floor retail and apartments and offices above. This main street also accommodates on street parking and off-street parking is located behind the buildings. The area south of Crescent Avenue has multi-family residential complexes and areas with low-density commercial uses .
In the newly constructed main street area, along Shadowview Drive, more walking or bicycle trips will likely occur as the uses are very integrated in that portion of the Crescent Village. In the other portion of the area, individuals may still need to drive between uses as the uses are separated and commercial buildings follow a low-density pattern. This development area is zoned for low, medium and high-density residential, community and neighborhood commercial, general office, and campus industrial uses. Current land uses generally conform with these designations. Visited Mixed Use Development #6 – Chase Gardens Chase Gardens is located in the area north of the Garden Way - Martin Luther King Jr. Boulevard intersection. This development area includes medical office complexes with substantial parking lots, multi-family housing, an unimproved park, undeveloped commercial properties, and undeveloped open space along the Q street Channel. Some assisted living facilities are located in this area as well as housing used mostly by university students. Along Commons Drive is a small convenience market and other retail, as well as a restaurant.
The development within this area is all relatively new construction and follows the requirements outlined in the Chase Node Special Area zoning code. The purpose of this zone is to facilitate the implementation of nodal development in this area and identifies specific design requirements to meet these goals. However, the introduction of significant medical facilities within the commercial area, rather than more neighborhood-serving businesses, may contribute to more destination automobile trips to the area than originally planned.
Autzen Stadium is also located close to this area as well as off-street bicycle and pedestrian connections to the University of Oregon. These facilities have made it attractive for both students and the elderly to reside in the area.
Multi-family housing at Crescent Village.
EUGENE TRANSPORTATION SYSTEM PLAN: EXISTING CONDITIONS AND DEFICIENCIES
EUGENETSP_FINALEXISTINGCONDITIONSREPORT.DOC 13
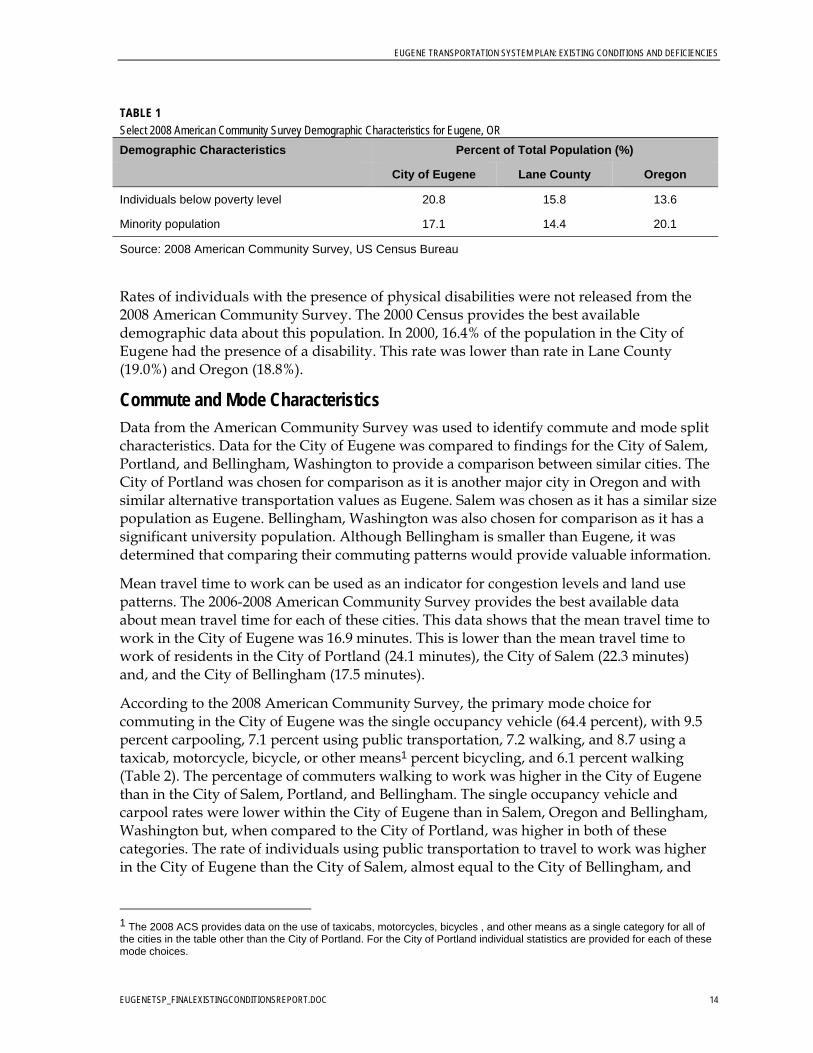
Retail stores at Oakway Center.
Visited Mixed Use Development #7 – Oakway Center Oakway Center is located at the intersection of Coburg and Oakway roads. This shopping center includes a grocery store and a variety of retail stores. Pedestrian friendly elements, such as storefront awnings and raised crosswalks, are located throughout the shopping center. The uses within the center are consistent with the community commercial zoning designation. Other Activity Areas Northeast Eugene contains the Sheldon Branch Library, the Sheldon Community Center, the Sheldon Park Pool, and Henry D. Sheldon High School (all located along Coburg Road between Young and Jeppsen Acres Roads). For analysis purposes this is considered as one general activity area. Costco, located at Chad Drive and Coburg Road, is another activity area within Northeast Eugene.
Demographic Analysis As of the 2000 US Decennial Census (2000 Census), total population within Eugene was 137,231 persons, with an average household size of 2.27 people. Portland State University’s Population Research Center, which serves as the State’s Census office, estimates Eugene’s 2009 population as 157,100 persons as of July 2009.
The American Community Survey is conducted by the U.S. Census Bureau to collect more timely demographic information than the decennial Census. This survey is used for the demographic analysis as it produces the best available data. Table 1 provides a snapshot of demographic statistics, based on the 2008 American Community Survey.
The American Community Survey shows that in 2008, the percentage of individuals in the labor force, percentage of individuals who speak a language other than English at home, and percent was higher in Eugene than in Lane County but lower than the State of Oregon. This data also shows that a lower percentage of individuals aged 65 years or older reside in the City of Eugene than Lane County but a higher percentage than in the State of Oregon. The 2008 ACS also shows that the percentage of individuals below the poverty line was higher in the City of Eugene than in Lane County or the State of Oregon.
TABLE 1
Select 2008 American Community Survey Demographic Characteristics for Eugene, OR Demographic Characteristics Percent of Total Population (%)
City of Eugene Lane County Oregon
In labor force (population 16 years and over) 64.3 63.5 65.3
Persons aged 65 years and older 13.8 14.5 13.3
Speak a language other than English at home 12.4 10.1 14.0
EUGENE TRANSPORTATION SYSTEM PLAN: EXISTING CONDITIONS AND DEFICIENCIES
EUGENETSP_FINALEXISTINGCONDITIONSREPORT.DOC 14
TABLE 1
Select 2008 American Community Survey Demographic Characteristics for Eugene, OR Demographic Characteristics Percent of Total Population (%)
City of Eugene Lane County Oregon
Individuals below poverty level 20.8 15.8 13.6
Minority population 17.1 14.4 20.1
Source: 2008 American Community Survey, US Census Bureau
Rates of individuals with the presence of physical disabilities were not released from the 2008 American Community Survey. The 2000 Census provides the best available demographic data about this population. In 2000, 16.4% of the population in the City of Eugene had the presence of a disability. This rate was lower than rate in Lane County (19.0%) and Oregon (18.8%).
Commute and Mode Characteristics Data from the American Community Survey was used to identify commute and mode split characteristics. Data for the City of Eugene was compared to findings for the City of Salem, Portland, and Bellingham, Washington to provide a comparison between similar cities. The City of Portland was chosen for comparison as it is another major city in Oregon and with similar alternative transportation values as Eugene. Salem was chosen as it has a similar size population as Eugene. Bellingham, Washington was also chosen for comparison as it has a significant university population. Although Bellingham is smaller than Eugene, it was determined that comparing their commuting patterns would provide valuable information.
Mean travel time to work can be used as an indicator for congestion levels and land use patterns. The 2006-2008 American Community Survey provides the best available data about mean travel time for each of these cities. This data shows that the mean travel time to work in the City of Eugene was 16.9 minutes. This is lower than the mean travel time to work of residents in the City of Portland (24.1 minutes), the City of Salem (22.3 minutes) and, and the City of Bellingham (17.5 minutes).
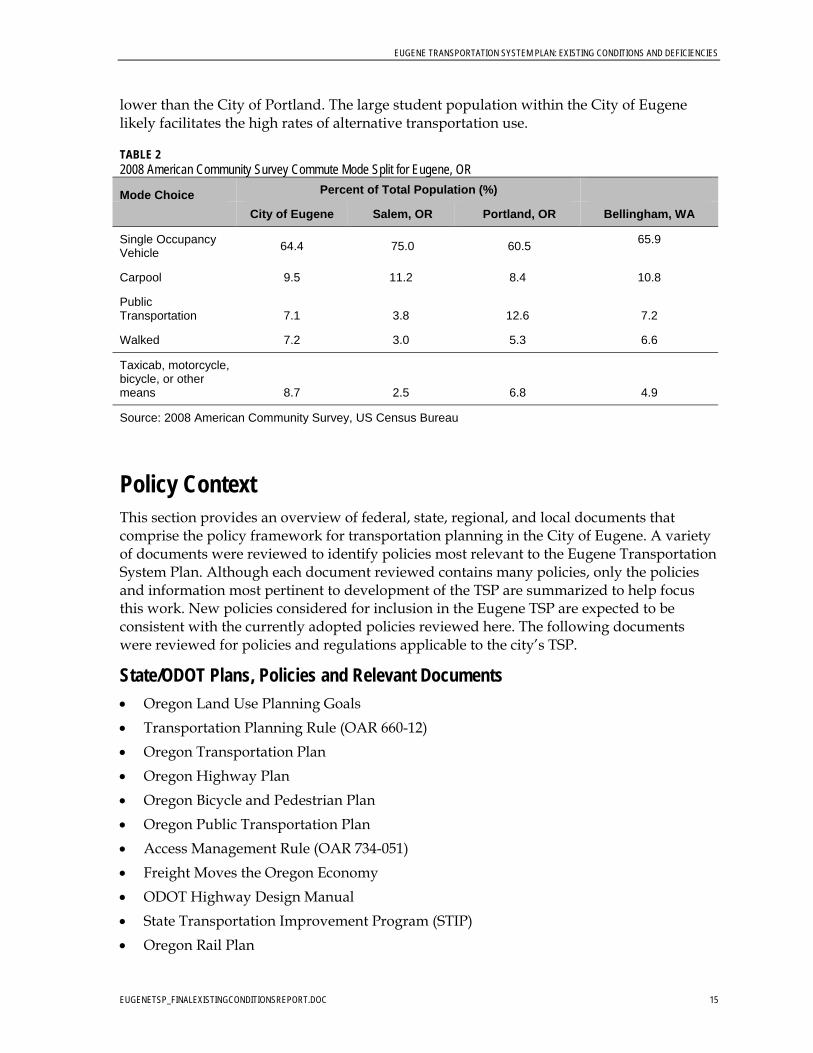
According to the 2008 American Community Survey, the primary mode choice for commuting in the City of Eugene was the single occupancy vehicle (64.4 percent), with 9.5 percent carpooling, 7.1 percent using public transportation, 7.2 walking, and 8.7 using a taxicab, motorcycle, bicycle, or other means1 percent bicycling, and 6.1 percent walking (Table 2). The percentage of commuters walking to work was higher in the City of Eugene than in the City of Salem, Portland, and Bellingham. The single occupancy vehicle and carpool rates were lower within the City of Eugene than in Salem, Oregon and Bellingham, Washington but, when compared to the City of Portland, was higher in both of these categories. The rate of individuals using public transportation to travel to work was higher in the City of Eugene than the City of Salem, almost equal to the City of Bellingham, and
1 The 2008 ACS provides data on the use of taxicabs, motorcycles, bicycles , and other means as a single category for all of the cities in the table other than the City of Portland. For the City of Portland individual statistics are provided for each of these mode choices.
EUGENE TRANSPORTATION SYSTEM PLAN: EXISTING CONDITIONS AND DEFICIENCIES
EUGENETSP_FINALEXISTINGCONDITIONSREPORT.DOC 15
lower than the City of Portland. The large student population within the City of Eugene likely facilitates the high rates of alternative transportation use.
TABLE 2 2008 American Community Survey Commute Mode Split for Eugene, OR
Mode Choice Percent of Total Population (%)
City of Eugene Salem, OR Portland, OR Bellingham, WA
Single Occupancy Vehicle
64.4 75.0 60.5 65.9
Carpool 9.5 11.2 8.4 10.8
Public Transportation 7.1 3.8 12.6 7.2
Walked 7.2 3.0 5.3 6.6
Taxicab, motorcycle, bicycle, or other means 8.7 2.5 6.8 4.9
Source: 2008 American Community Survey, US Census Bureau
Policy Context This section provides an overview of federal, state, regional, and local documents that comprise the policy framework for transportation planning in the City of Eugene. A variety of documents were reviewed to identify policies most relevant to the Eugene Transportation System Plan. Although each document reviewed contains many policies, only the policies and information most pertinent to development of the TSP are summarized to help focus this work. New policies considered for inclusion in the Eugene TSP are expected to be consistent with the currently adopted policies reviewed here. The following documents were reviewed for policies and regulations applicable to the city’s TSP.
State/ODOT Plans, Policies and Relevant Documents
Oregon Land Use Planning Goals
Transportation Planning Rule (OAR 660-12)
Oregon Transportation Plan
Oregon Highway Plan
Oregon Bicycle and Pedestrian Plan
Oregon Public Transportation Plan
Access Management Rule (OAR 734-051)
Freight Moves the Oregon Economy
ODOT Highway Design Manual
State Transportation Improvement Program (STIP)
Oregon Rail Plan
EUGENE TRANSPORTATION SYSTEM PLAN: EXISTING CONDITIONS AND DEFICIENCIES
EUGENETSP_FINALEXISTINGCONDITIONSREPORT.DOC 16
Oregon Aviation Plan
Oregon Transportation Safety Action Plan
Governor’s Executive Orders
Regional Plans, Policies and Relevant Documents Lane County TSP
Eugene-Springfield Metropolitan Area General Plan (Metro Plan)
TransPlan
Central Lane Metropolitan Planning Organization Regional Transportation Plan
Lane Transit District Capital Improvements Program
Local Plans, Policies and Relevant Documents Eugene Land Use Code
Eugene Growth Management Policies
Central Area Transportation Study
Eugene Pedestrian & Bicycle Strategic Plan
Eugene Arterial and Collector Street Plan
Eugene Parking Analysis, Final Report
Eugene Capital Improvements Program
West Eugene Collaborative Recommendations
Statewide Plans, Policies and Relevant Documents Statewide Planning Goals
Statewide Planning Goal 1: Citizen Involvement Goal 1, Citizen Involvement, requires that jurisdictions develop, adopt, and update comprehensive plans to provide the “opportunity for citizens to be involved in all phases of the planning process.” According to the goal, the planning process includes the preparation of plans and implementation measures, plan and implementation measure adoption, and minor and major amendments to adopted plans. Technical information associated with the planning process must be available to citizens in an understandable form, and accessible ways of providing feedback must also be available.
Development of the Eugene TSP will need to be consistent with the citizen involvement goal. As part of the public involvement element, Eugene and ODOT will identify individuals to serve on one of two advisory boards – a Technical Advisory Committee (TAC) or a Department Advisory Committee (DAC). The TAC will consist of informed agency stakeholders who will provide technical input at key milestones during the TSP development process. The DAC will consist of business owners, residents, and community leaders who will provide advice to the project team at key milestones. Public open houses,
EUGENE TRANSPORTATION SYSTEM PLAN: EXISTING CONDITIONS AND DEFICIENCIES
EUGENETSP_FINALEXISTINGCONDITIONSREPORT.DOC 17
briefings, and/or other meetings will also be held at key points to keep the community informed and provide an opportunity for input. Stakeholder interviews will also be conducted and information about the project will be available on a project website. The official adoption process for the TSP will also require public notification and hearings before the Planning Commission and City Council. Those hearings provide opportunities for citizens to give written and oral comments that become part of the record.
Statewide Planning Goal 2: Land Use Planning Goal 2, Land Use Planning, requires that a land use planning process and policy framework be established as a basis for all decisions and actions relating to the use of land. Goal 2 emphasizes the importance of planning coordination between those local governments and state agencies "which have programs, land ownerships, or responsibilities within the area included in the plan." In the case of the Eugene TSP, Goal 2 requires coordination between the cities of Eugene and Springfield, Lane County, LCOG, Lane Transit District (LTD) and ODOT; each have land use planning and transportation facility or service responsibilities in the planning area.
Statewide Planning Goal 5: Natural Resources, Scenic and Historic Areas, and Open Spaces The purpose of Goal 5, Natural Resources, Scenic and Historic Areas, and Open Spaces, is to “protect natural resources and conserve scenic and historic areas and open spaces.” This goal requires local governments to inventory natural and cultural resources in their jurisdictions and to develop and adopt programs to conserve and protect them. Amongst the resources to be inventoried are: riparian corridors, wetlands, federal Wild and Scenic Rivers, state Scenic Waterways, groundwater resources, wildlife habitat (e.g. upland habitat in addition to riparian habitat), natural areas, wilderness areas, open spaces, scenic views and sites, mineral and aggregate resource areas, energy sources, and historic and cultural areas. Techniques for implementing conservation and protection of these resources include fee acquisition, development rights acquisition, easements, preferential tax assessment, clustered development and other land use regulations.
Within the Eugene TSP planning area, there are some identified Goal 5 (and Goal 6, see below) resources, the most significant of which are the riparian areas surrounding the Willamette River. Goal 15 addresses the Willamette River Greenway in more detail and is reviewed in a subsequent section of this memorandum.
Statewide Planning Goal 6: Air, Water and Land Resources Quality Jurisdictions must comply with state and federal environmental regulations. Goal 6, Air, Water and Land Resources Quality, calls for jurisdictions to “maintain and improve the quality of the air, water and land resources of the state.” Waste and process discharges within a jurisdiction may not exceed the carrying capacity of the local air shed and water shed in the long-term, nor degrade the quality or otherwise threaten the availability of the air shed and water shed services.
Water resources, including the Willamette and McKenzie rivers and the metropolitan network of waterways and associated creeks and drainage ways are important features in the Eugene-Springfield metropolitan area and have the potential to be impacted by transportation decisions. This goal and corresponding policies in the area’s comprehensive
EUGENE TRANSPORTATION SYSTEM PLAN: EXISTING CONDITIONS AND DEFICIENCIES
EUGENETSP_FINALEXISTINGCONDITIONSREPORT.DOC 18
plan (Metro Plan) must be taken into account in developing and selecting preferred alternatives and implementation measures in the Eugene TSP.
Statewide Planning Goal 7: Areas Subject to Natural Hazards Goal 7, Areas Subject to Natural Hazards, was adopted to “protect people and property from natural hazards.” The goal requires local jurisdictions to adopt comprehensive plans, including inventories, policies, and implementation measures, for identifying natural hazard areas and prohibiting or limiting development in these areas. Although local jurisdictions may define others, the goal defines natural hazard areas as those subject to floods, tsunamis, landslides, coastal erosion, earthquakes and related activities, and wildfires.
Similar to Goal 5 resources, natural hazards in the planning area will need to be considered as part of the TSP development process. In the city of Eugene, stream flooding and steep slopes constitute the primary natural hazards.
Statewide Planning Goal 8: Recreational Needs Goal 8, Recreational Needs, was adopted to “satisfy the recreational needs of the citizens of the state and visitors, where appropriate, to provide for the siting of necessary recreational facilities including destination resorts.” The goal requires that local government conduct comprehensive recreational planning by identifying recreational needs, planning for facilities in sufficient quantities and locations to meet these needs, and working with private companies and other partners in meeting these needs. This goal will apply to the Eugene TSP insofar as multi-use trails and other paths function as both transportation facilities and recreational opportunities.
Statewide Planning Goal 9: Economic Development The intent of Goal 9, Economic Development, is to “provide adequate opportunities throughout the state for a variety of economic activities vital to the health, welfare, and prosperity of Oregon’s citizens.” Local comprehensive plans and policies must support this goal and should include an assessment of the jurisdiction’s existing economic conditions and comparative advantages. Plans should also include policies that address economic development and development opportunities, provide an adequate supply of sites with characteristics suitable for a variety of employment and economic development, and limit development around identified industrial sites to that which is compatible with uses allowed on the sites. The goal suggests implementation measures such as tax incentives and disincentives, preferential assessments, land use regulations, capital improvement planning and programming, and fee or partial fee acquisition.
The Eugene TSP must demonstrate the ways in which the preferred alternatives and projects selected for the TSP support this goal and the economic development policies adopted in the city’s comprehensive plan.
EUGENE TRANSPORTATION SYSTEM PLAN: EXISTING CONDITIONS AND DEFICIENCIES
EUGENETSP_FINALEXISTINGCONDITIONSREPORT.DOC 19
Statewide Planning Goal 10: Housing Goal 10, Housing, forms the basis for requiring a 20-year supply of land for housing – among other uses – within a city’s or metropolitan planning organization’s Urban Growth Boundary (UGB). The goal states that “plans shall encourage the availability of adequate numbers of needed housing units at price ranges and rent levels which are commensurate with the financial capabilities of Oregon households and allow for flexibility of housing location, type and density.” Any areas where increased housing density is planned within the existing UGB through either re-designations of lands or new regulations must have adequate transportation facilities, consistent with Goal 12. UGB expansions intended to provide sufficient amounts and types of housing must be coordinated with transportation planning; this relationship is also addressed by Goal 11, Public Facilities.
Statewide Planning Goal 11: Public Facilities Public facilities that are named in Statewide Planning Goal 11 include water, sewer, solid waste, and transportation facilities. Goal 11 requires the preparation of public facility plans for jurisdictions with populations greater 2,500. The public facility plan or plans are supporting documents to the jurisdiction’s comprehensive plan. As such, a TSP effectively serves as a jurisdiction’s public facility plan for transportation, although a TSP becomes an element of the comprehensive plan, not just a supporting document.
Transportation system planning is addressed further by Statewide Planning Goal 12 and the Transportation Planning Rule (TPR, described in the following section). However, Goal 11 is important because it calls for coordination between various public facility providers and between state agencies and jurisdictions to establish funding for water, sewer, solid waste, and transportation facility planning and development. The goal also highlights the importance of not using public facilities to inappropriately or prematurely urbanize an area or allowing public facilities to influence planning for the density and types of development.
Statewide Planning Goal 12: Transportation Statewide Planning Goal 12, Transportation, requires cities, counties, metropolitan planning organizations, and ODOT to provide and encourage a safe, convenient, and economic transportation system. This is accomplished through development of transportation system plans based on inventories of local, regional, and state transportation needs.
Goal 12 is implemented through OAR 660, Division 12, the Transportation Planning Rule (TPR). The TPR contains numerous requirements that regulate transportation planning and project development. Of particular relevance to the Eugene TSP are sections 660-012-0020 through -0045. Those sections establish the requirement for all jurisdictions to prepare a Transportation System Plan, outline elements that must be included in the Transportation System Plan, and provide guidance for implementation of a Transportation System Plan. The TPR requires local governments to adopt land use regulations consistent with state and federal requirements "to protect transportation facilities, corridors and sites for their identified functions.” This policy is achieved through a variety of measures, including:
Access control measures that are consistent with the functional classification of roads and consistent with limiting development on rural lands to rural uses and densities;
Standards to protect future operations of roads;
EUGENE TRANSPORTATION SYSTEM PLAN: EXISTING CONDITIONS AND DEFICIENCIES
EUGENETSP_FINALEXISTINGCONDITIONSREPORT.DOC 20
A process for coordinated review of future land use decisions affecting transportation facilities, corridors or sites;
A process to apply conditions to development proposals in order to minimize impacts and protect transportation facilities, corridors or sites;
Regulations to provide notice to ODOT of land use applications that require public hearings, involve land divisions, or affect private access to roads; and
Regulations assuring that amendments to land use designations, densities and design standards are consistent with the functions, capacities and performance standards of facilities identified in the Transportation System Plan. (See also OAR 660-012-0060.)
Prior to adoption, Eugene’s TSP and land use code will be reviewed for consistency with the TPR and the state’s access management requirements.
Statewide Planning Goal 13: Energy Conservation The objective of Goal 13 is to conserve energy. This goal requires land and land uses to “be managed and controlled so as to maximize the conservation of all forms of energy, based upon sound economic principles.” While land use planning can support transportation alternatives and measures to conserve energy, provisions for viable transportation alternatives and energy-conserving measures must also be included in the city’s Transportation System Plan.
Statewide Planning Goal 14: Urbanization Goal 14 regulates urban growth boundaries. The goal requires that establishment and change of a UGB shall be based upon, in part, consideration of the following four factors:
Efficient accommodation of identified land needs;
Orderly and economic provision of public facilities and services;
Comparative environmental, energy, economic, and social consequences;
Compatibility of the proposed urban uses with nearby agricultural and forest activities occurring on farm and forest land outside the UGB.
The orderly and economic provision of transportation facilities in cities is regulated largely by the TPR, which is summarized in a subsequent section of this memorandum.
Statewide Planning Goal 15: Willamette River Greenway
Goal 15 serves to “protect, conserve, enhance and maintain the natural, scenic, historical, agricultural, economic and recreational qualities of lands along the Willamette River as the Willamette River Greenway.” The Greenway Program is composed of coordinated state and local plans for protection of the resource through ordinances, rules, regulations, permits, grants as well as acquisition and development of property. This goal requires an inventory of resources, uses and rights associated with the river in order to determine which lands are suitable or necessary for inclusion into the Greenway Program. The goal also establishes implementation measures that must be included in local plans and regulations to ensure a balance of appropriate uses within the Greenway. Cities and counties in which the Greenway is located must show the location and boundaries of the Greenway on their comprehensive plans. The Metro Plan (Eugene’s comprehensive plan, reviewed in a subsequent section of this memorandum) shows the Greenway locations within the Eugene-
EUGENE TRANSPORTATION SYSTEM PLAN: EXISTING CONDITIONS AND DEFICIENCIES
EUGENETSP_FINALEXISTINGCONDITIONSREPORT.DOC 21
Springfield area. The Eugene TSP process will need to consider potential impacts to the Greenway when evaluating alternatives and policies.
Transportation Planning Rule (OAR 660-012) (Amended through 2006) The TPR implements Oregon Statewide Planning Goal 12, which supports transportation facilities and systems that are safe, efficient, and cost-effective and are designed to reduce automobile reliance. The objective of the TPR is to reduce air pollution, congestion, and other livability problems, and to maximize investments made in the transportation system. Specific provisions of the rules are described in the following sections. Eugene’s new TSP will need to be consistent with all of these provisions.
660-012-0015 Preparation and Coordination of Transportation System Plans This section of the TPR establishes the requirement for MPOs and cities to prepare transportation system plans within their planning jurisdiction and to adopt the TSP as an element of their comprehensive plan. This section also requires that development of the TSP be coordinated with affected state and federal agencies, local governments, special districts, and private providers of transportation services
660-012-0016 Coordination with Federally-Required Regional Transportation Plans in Metropolitan Areas Section -0016 requires that local governments prepare, adopt, amend and update transportation system plans in coordination with regional transportation plans prepared by MPOs. When an MPO adopts or amends a regional transportation plan, the affected local governments must review the regional plan and either make findings that the regional plan is consistent with the local plan or adopt amendments to the local plan to make them consistent.
660-012-0020 – Elements of Transportation System Plans All jurisdictions in Oregon must prepare a TSP unless, for areas of small population, exempted by the Director of the Department of Land Conservation and Development (DLCD). Section –0020 of the TPR specifies what is required in a TSP including the following elements:
Inventory and assessment of existing conditions
Forecasts of transportation needs
Road system plan
Public transportation plan
Bicycle and pedestrian plan
Air, rail, water, and pipeline plans as applicable
Transportation system and demand management plans
A parking plan
Financing program
Implementing policies and land use regulations.
EUGENE TRANSPORTATION SYSTEM PLAN: EXISTING CONDITIONS AND DEFICIENCIES
EUGENETSP_FINALEXISTINGCONDITIONSREPORT.DOC 22
660-012-0025 Complying with the Goals in Preparing Transportation System Plans The primary relevance of this section is that it requires that findings of compliance with applicable statewide planning goals and acknowledged comprehensive plan policies and land use regulations be developed in conjunction with the adoption of a transportation system plan.
660-012-0030 Determination of Transportation Needs Section -0030 requires that transportation system plans be developed based on an identification of transportation needs. The determination of transportation needs must be based on population and employment forecasts and distributions and must consider adopted measures to reduce reliance on the automobile.
660-012-0035 – Evaluation and Selection of Transportation System Alternatives. Section –0035 describes standards and alternatives available to agencies weighing and selecting transportation projects, including benefits to different modes, land use alternatives, and environmental and economic impacts. For MPOs, the RTP emphasizes alternatives that increase transportation choices and reduce reliance on the automobile. The most critical piece of this section is that it requires that the analysis be based on alternatives that can “reasonably be expected to meet the identified transportation needs in a safe manner and at a reasonable cost with available technology.” The following elements must be evaluated as components of systems alternatives:
Improvements to existing facilities or services;
New facilities and services, including different modes or combinations of modes that could reasonably meet identified transportation needs;
Transportation system management measures;
Demand management measures; and
A no-build system alternative required by the National
Metropolitan areas may also accomplish compliance with this section by demonstrating to that adopted plans and measures are likely to achieve a five percent reduction in VMT per capita over the 20-year planning period.
660-012-0040 Transportation Financing Program Section -0040 requires that areas within a UGB containing a population greater than 2,500 persons include a transportation financing program as part of the transportation system plan. The financing program must include a list of planned transportation facilities and improvements, a general estimate of timing and cost for planned projects, and policies to guide selection of projects for funding.
660-012-0045 – Implementation of the Transportation System Plan The TPR requires local governments to adopt land use regulations consistent with state and federal requirements "to protect transportation facilities, corridors and sites for their identified functions." This policy is achieved through a variety of measures described in this section.
EUGENE TRANSPORTATION SYSTEM PLAN: EXISTING CONDITIONS AND DEFICIENCIES
EUGENETSP_FINALEXISTINGCONDITIONSREPORT.DOC 23
660-012-0050 – Transportation Project Development Section –0050 requires that transportation projects be reviewed for compliance with local and regional plans and, when applicable, undergo a NEPA environmental review process.
660-012-0060 – Plan and Land Use Regulation Amendments Amendments made to Section –0060 in 2005 are among the most significant changes that have been made to the TPR since preparation of TransPlan. The amendments instruct local jurisdictions in how to determine whether an amendment to its adopted plans or land use regulations has a significant affect on a transportation facility.
Section –0060 specifies a category of facilities, improvements, and services that can be assumed to be “in-place” or committed and available to provide transportation capacity over a 20-year planning horizon. The TPR guides local jurisdictions in determining what transportation improvements are “reasonably likely to be provided by the end of the planning period” when considering amendments to local plans and land use regulations.
Oregon Transportation Plan (2006) The Oregon Transportation Plan (OTP) serves as the TSP for the state. It is a policy document developed by ODOT in response to federal and state mandates for systematic planning for the future of Oregon's transportation system. The OTP is intended to meet statutory requirements (ORS 184.618(1)) to develop a state transportation policy and comprehensive long-range plan for a multi-modal transportation system that addresses economic efficiency, orderly economic development, safety, and environmental quality. The 2006 OTP emphasizes maintaining assets2 in place, optimizing existing system performance through technology and better system integration, creating sustainable funding, and investing in strategic capacity enhancements.
The OTP’s goals, policies and strategies guide the development of state multimodal, modal/topic3 and facility plans and regional and local transportation system plans. The OTP provides the framework for prioritizing transportation improvements and funding, but it does not identify specific projects for development.4 As required by Oregon and federal statutes, the OTP guides development and investment in the transportation system through:
Transportation goals and policies,
Transportation investment scenarios and an implementation framework, and
Key initiatives to implement the vision and policies.
2 The OTP defines “asset management” as a “systematic process of maintaining, upgrading and operating physical assets cost-effectively. It combines engineering principles with sound business practices and economic theory, and it provides tools to facilitate a more organized, logical approach to decision-making. Asset management provides a framework for handling both short- and long-range planning.” 3 Modal or topic plans, as developed by ODOT and other state agencies, include plans for aviation, bicycle and pedestrian facilities, highways, marine ports and waterways, public transportation and rail. 4 Projects are identified through facility plans and regional and local transportation system plans, and sometimes through modal plans.
EUGENE TRANSPORTATION SYSTEM PLAN: EXISTING CONDITIONS AND DEFICIENCIES
EUGENETSP_FINALEXISTINGCONDITIONSREPORT.DOC 24
The Implementation Framework section of the OTP describes the implementation process and how state multimodal, modal/topic plans, regional and local transportation system plans and master plans will further refine the OTP’s broad policies and investment levels. The Eugene TSP will further OTP implementation by defining standards, instituting performance measures, and requiring that operational strategies be developed. As stated in the Implementation section of the OTP, requirements for regional and local Transportation System Plans are found in the Transportation Planning Rule (OAR 660-012). Regional and local Transportation System Plans must be consistent with the OTP, state multimodal, modal/topic and transportation facility plans. The modal elements of the OTP are airports, bicycle and pedestrian facilities, highways, pipelines, ports and waterways, public transportation and railroads.
1999 Oregon Highway Plan (amendments to 2010) The Oregon Highway Plan (OHP) was created in 1999 and reaffirmed as a modal element of the 2006 OTP. The OHP defines policies and investment strategies for Oregon’s state highway system. The plan contains three elements: a vision element that describes the broad goal for how the highway system should look in 20 years; a policy element that contains goals, policies, and actions to be followed by state, regional, and local jurisdictions; and a system element that includes an analysis of needs, revenues, and performance measures. It does not include projects.
The OHP addresses the following issues:
Efficient management of the system to increase safety, preserve the system, and extend its capacity
Increased partnerships, particularly with regional and local governments
Links between land use and transportation
Access management
Links with other transportation modes
Environmental and scenic resources
The policy element contains several policies and actions that are relevant to the Eugene Transportation System Plan, described in the following subsections.
Under Goal 1: System Definition, the following policies are applicable:
Policy 1A (State Highway Classification System) Action 1A.1 categorizes state highways for planning and management decisions.
Within the Eugene TSP planning area, there are several identified state highways, as shown on Figure 5.
I-5 and I-105 are designated Interstate Highways. Interstate Highways provide connections to major cities, regions of the state, and other states. A secondary function in urban areas is to provide connections for regional trips within the metropolitan area. Interstate Highways are major freight routes and their objective is to provide mobility.
EUGENE TRANSPORTATION SYSTEM PLAN: EXISTING CONDITIONS AND DEFICIENCIES
EUGENETSP_FINALEXISTINGCONDITIONSREPORT.DOC 25
Highways 126 and 569 are designated as Statewide Highways. Statewide Highways typically provide inter-urban and inter-regional mobility and provide connections to larger urban areas, ports, and major recreation areas that are not directly served by Interstate Highways. A secondary function is to provide connections for intra-urban and intra-regional trips.
Highway 99 is designated as a Regional Highway. Regional Highways typically provide connections and links to regional centers, Statewide or interstate Highways, or economic or activity centers of regional significance. The management objective is to provide safe and efficient, high-speed, continuous-flow operation in rural areas and moderate to high-speed operations in urban and urbanizing areas.
The Eugene TSP will support the existing highway classifications and will enhance the ability of identified highways to serve in their defined functions.
Policy 1B (Land Use and Transportation) Policy 1B, recognizes the need for coordination between state and local jurisdictions. Action 1B.7 gives special highway segment designations for specific types of land use patterns to foster compact development. The three segment designations available are Special Transportation Area, Commercial Center, and Urban Business Area. These designations may be considered in the Eugene TSP as solutions are developed.
Policy 1C (State Highway Freight System) Policy 1C addresses the need to balance the movement of goods and services with other uses. In addition, Action 1C.4 states that the timeliness of freight movements should be considered when developing and implementing plans and projects on freight routes. Within the Eugene TSP planning area, the following roadways are designated as freight routes per the OHP:
Interstate 5, from North UGB to South UGB
Interstate 105/OR 126, from 6th Avenue/7th Avenue to Interstate 5
Randy Papé Beltline, from W 11th Avenue to Interstate 5
Oregon Route 126/ W 11th Avenue, from West UGB to Randy Papé Beltline
Highway 99, from UGB to Randy Papé Beltline
The TSP will need to consider those designations and ensure consistency with the OHP policies on protecting the function of freight routes within the planning area.
Policy 1F (Highway Mobility Standards) Policy 1F sets mobility standards for ensuring a reliable and acceptable level of mobility on the highway system. Action 1F.1 requires that highways operate at a certain level of mobility, depending on their location and classification. Part of this action also requires that freeway interchanges be managed to maintain safe and efficient operation of the freeway through the interchange area.
EUGENE TRANSPORTATION SYSTEM PLAN: EXISTING CONDITIONS AND DEFICIENCIES
EUGENETSP_FINALEXISTINGCONDITIONSREPORT.DOC 26
OHP Table 6 (located in Appendix A) contains a list of maximum volume to capacity ratios for peak hour operating conditions. For the highways identified in the Eugene MPO, the standard varies between 0.80 and 0.85, depending on the highway classification and whether or not the highway has a Freight Route designation. These mobility standards will serve as a gauge for determining traffic deficiencies both under current (2010) and future (2030) no build conditions.
Policy 1G (Major Improvements) Policy 1G requires maintaining performance and improving safety by improving efficiency and management before adding capacity. Action 1G.1 directs agencies to make the fewest number of structural changes to a roadway system to address its identified needs and deficiencies through the 20-year planning horizon, and to protect the existing highway system before adding new facilities to it. The action ranks four priorities of projects, as follows:
Preserving the functionality of the existing system
Making minor improvements to improve the efficiency and capacity of the existing system
Adding capacity to the existing system
Building new transportation facilities
The intent of Action 1G.2 is to ensure that major improvement projects to state highway facilities have been through a planning process that involves coordination between state, regional, and local stakeholders and the public, and that there is substantial support for the proposed improvement.
Under Goal 2: System Management, the following policies are applicable:
Policy 2B (Off–System Improvements) Policy 2B helps local jurisdictions adopt land use and access management policies. The Eugene TSP will include sections describing existing and future land use patterns, access management, and implementation measures.
Policy 2D (Public Involvement) Public involvement in transportation and planning and project development will be a critical part of the TSP development process. A brief description of the public involvement process is provided under Statewide Planning Goal 1 in a previous section of this memorandum.
Policy 2F (Traffic Safety) Policy 2F identifies the need for projects in the state to improve safety for all users of the state highway system through engineering, education, enforcement, and emergency services. One component of the Eugene TSP is identification of existing crash patterns and rates and strategies to address safety issues. Proposed improvements will aim to reduce the vehicle crash potential and/or improve bicycle and pedestrian safety by providing upgraded facilities that meet current standards.
EUGENE TRANSPORTATION SYSTEM PLAN: EXISTING CONDITIONS AND DEFICIENCIES
EUGENETSP_FINALEXISTINGCONDITIONSREPORT.DOC 27
Under Goal 3: Access Management, the following policy is applicable:
Policy 3A (Classification and Spacing Standards) Policy 3A sets access spacing standards for driveways and approaches to the state highway system. Action 3A.1 directs access management along state highways based on access management guidelines. Action 3A.2 relates to establishing spacing standards on state highways. Action 3A.3 calls for management of location and spacing of traffic signals along state highways.
Under Goal 4: the following policies are applicable.
Policy 4B, Action 4B.4 Action 4B.4 requires that highway projects encourage the use of alternative passenger modes to reduce local trips.
The TSP will address ways to encourage the use of alternative passenger modes to reduce trips on highways and other facilities. This would include improvement to bicycle and pedestrian facilities and consideration of transit movement along roadways.
Oregon Bicycle and Pedestrian Plan (1995) The Oregon Bicycle and Pedestrian Plan is a modal element of the Oregon Transportation Plan that provides guidance for planning, design and operation of facilities for bicycle and pedestrian travel. The plan contains the standards and designs used on state highway projects for these facilities.
The plan includes two parts: the Policy and Action Plan and the Planning, Design, Maintenance, and Safety section. The policy section provides background information, including relevant state and federal laws, and contains the goals, actions, and implementation strategies proposed by ODOT to improve bicycle and pedestrian transportation.
The plan states that bikeway and walkway systems will be established on rural highways by widening shoulders as part of modernization projects, as well as on many preservation overlays, where warranted. For urban highways, implementation may take place:
As part of modernization projects (bike lanes and sidewalks will be included);
As part of preservation projects, where minor upgrades can be made;
By restriping roads with bike lanes;
With minor betterment projects, such as completing short missing segments of sidewalks;
As bikeway or walkway modernization projects;
By developers as part of permit conditions, where warranted. The second part (“Part Two”) of the Oregon Bicycle and Pedestrian Plan governs the design of bicycle and pedestrian facilities on state-owned facilities. ODOT is currently updating the design section of the Oregon Bicycle and Pedestrian Plan. Many new pedestrian and bicycle treatments have been developed and incorporated into the update. Once adopted, the
EUGENE TRANSPORTATION SYSTEM PLAN: EXISTING CONDITIONS AND DEFICIENCIES
EUGENETSP_FINALEXISTINGCONDITIONSREPORT.DOC 28
updated Oregon Bicycle and Pedestrian Plan Design Standards and Guidelines will be referenced where bicycle or pedestrian facilities are planned as part of the Transportation System Plan. In addition, the city is preparing the Eugene Pedestrian and Bicycle Master Plan. This effort, now underway, will develop a network of recommended bicycle and pedestrian improvements within Eugene. This plan will serve as the basis for the Bicycle and Pedestrian element of the Eugene TSP and will need to be consistent with the Oregon Bicycle and Pedestrian Plan as well as relevant provisions of the TPR.
Oregon Public Transportation Plan (1997) The Oregon Public Transportation Plan serves as the transit modal plan of the Oregon Transportation Plan. The vision guiding the Public Transportation Plan is as follows:
The public transportation plan builds on and begins implementing the OTP’s long-range vision for public transportation in the State of Oregon. That vision includes:
A comprehensive, interconnected and dependable public transportation system, with stable funding, that provides access and mobility in and between communities of Oregon in a convenient, reliable, and safe manner that encourages people to ride
A public transportation system that provides appropriate service in each area of the state, including service in urban areas that is an attractive alternative to the single-occupant vehicle, and high-quality, dependable service in suburban, rural, and frontier (remote) areas
A system that enables those who do not drive to meet their daily needs
A public transportation system that plays a critical role in improving the livability and economic prosperity for Oregonians.
The plan contains goals, policies, and strategies relating to the whole of the state’s public transportation system. The plan is intended to provide guidance for ODOT and public transportation agencies regarding the development of public transportation systems. The Eugene TSP will include a Transit Element that will need to be consistent with the goals and policies of the Oregon Public Transportation Plan. Coordination with the Lane Transit District will be necessary for development of the Transit Element.
Access Management Rule (OAR 734-051) The intention of ODOT’s Access Management Rule is to balance the safety and mobility needs of travelers along state highways with the access needs of property and business owners. ODOT’s rule sets guidelines for managing access to the state’s highway facilities in order to maintain highway function, operations, safety, and the preservation of public investment consistent with the policies of the 1999 OHP. Access management rules allow ODOT to control the issuing of permits for access to state highways, state highway rights of way and other properties under the state’s jurisdiction.
In addition, the ability to close existing approaches, set spacing standards and establish a formal appeals process in relation to access issues is identified. These rules enable the state to set policy and direct location and spacing of intersections and approaches on state highways, ensuring the relevance of the functional classification system and preserving the efficient operation of state routes.
EUGENE TRANSPORTATION SYSTEM PLAN: EXISTING CONDITIONS AND DEFICIENCIES
EUGENETSP_FINALEXISTINGCONDITIONSREPORT.DOC 29
There are two categories of standards included in the Access Management Rule – those applicable in urban areas and those applicable in rural areas. ODOT applies the urban access standards for state highways within the Eugene UGB. These standards will be used in the TSP to analyze the current access conditions, determine existing deficiencies, and provide direction for establishing a connectivity plan. These standards will be applied to all rights-of-way under the state’s jurisdiction in the City of Eugene.
Freight Moves the Oregon Economy (1999) While not a policy document, this report is useful because it summarizes a variety of information about issues and needs surrounding the transport of freight by roads, rail lines, waterways, aircraft, and pipelines. The document’s stated purpose is to demonstrate the importance of freight to the Oregon economy and identify concerns and needs regarding the maintenance and enhancement of current and future mobility within the state of Oregon.
The report describes the federal National Highway System (NHS), a classification system that identifies the most significant highways for moving people and freight. The report describes the State Highway Freight System as including all of the state’s interstate highways and selected other highways important to moving freight. The importance of freight movement will be a consideration during the Eugene TSP development as it pertains to access to I-5 and other designated freight routes, and how the local roadway system intersects with rail operations. In addition, per ORS 366.215, anything that could potentially be considered a reduction of capacity on a designated freight route needs to be approved by the Freight Committee.
ODOT Highway Design Manual This manual contains standards for the design of state highways and various highway elements. Elements such as general alignments, roadway widths, and criteria for installation of turn lanes will need to be considered for evaluating the feasibility of construction and determination of right of way needs for the Transportation System Plan.
Table 10-1 in the Highway Design Manual displays the maximum allowable volume to capacity ratios for the 30th highest annual hour of traffic for use in the design of highway projects. These standards are to be applied to conditions forecasted to exist 20 years after completion of the proposed improvement. If the applicable mobility standard cannot be met, a design exception could be sought.
Elements of alternatives developed that include the construction or modification of state facilities must be designed in accordance with the requirements of the Highway Design Manual. To ensure feasible construction of proposed alternatives, these design standards must be used when laying out roadway alignments, turn lanes, and other roadway elements. Also, the ability of proposed highway improvements to adequately accommodate future traffic demand will be evaluated through the use of the mobility standards from the Highway Design Manual, rather than those from the Oregon Highway Plan.
State Transportation Improvement Program (2008 - 2011) The State Transportation Improvement Program (STIP) is the programming and funding document for transportation projects and programs statewide. The projects and programs undergo a selection process managed by ODOT Regions or ODOT central offices. The
EUGENE TRANSPORTATION SYSTEM PLAN: EXISTING CONDITIONS AND DEFICIENCIES
EUGENETSP_FINALEXISTINGCONDITIONSREPORT.DOC 30
document covers a period of four years and is updated every two years. The STIP contains a number of projects within the city of Eugene; the TSP will need to be consistent with projects that are included in the STIP and the Draft 2010-2013 STIP that is scheduled for adoption in 2010. Once the TSP is adopted, the STIP will be updated to provide consistency between the two documents. Appendix B contains a list of projects from the 2008 – 2011 STIP that are relevant to the Eugene Transportation System Plan.
Oregon Rail Plan (2001) The Oregon Rail Plan serves as the Rail Element of the OTP and is a comprehensive assessment of the state’s rail planning, freight rail, and passenger rail systems. The Plan contains three elements, which summarize the state’s goals and objectives, measure the state’s performance to-date and refines the projected costs, revenues and investment needs with regard to rail transportation of people and goods. The elements are:
Rail Policies and the Planning Process
Freight Element
Passenger Element
The passenger element of the rail plan concentrates on intercity passenger service with some mention of commuter rail operations. It does not include light rail or other rail transit types. Figure 2-1 of the plan shows two types of rail lines within the Eugene TSP planning area: the Union Pacific line and the Central Oregon & Pacific (CORP) short line. The Union Pacific line has the highest density (Figure 2-2) with more than 20 million gross ton-miles in 1999 and the CORP line has lighter density with less than 5 million gross ton-miles. Figure 3-1 also indicates that the Amtrak passenger route passes through Eugene. According to ODOT’s Rail Section, Eugene serves as the southern terminus of the designated Cascadia high speed rail corridor which would provide a speed and reliability upgrade between the cities of Eugene, Portland, Seattle, and Vancouver, B.C.
Oregon Aviation Plan (2010) The Oregon Aviation Plan provides an overview of the airports in the state system and the jurisdictional responsibilities at all levels of government for the management, maintenance, operation, and funding of Oregon’s airports. The Oregon Aviation Plan includes policies and investment strategies for airports in Oregon.
The Eugene Airport is designated as a Category 1 airport per the plan. Category 1 airports are commercial service airports that are designed to accommodate scheduled major/national or regional/commuter commercial air carrier service. For guiding growth and development of the Eugene Airport, the city relies primarily on the Eugene Airport Master Plan which is consistent with policies of the Oregon Aviation Plan. The Eugene Airport Master Plan was updated in 2010 and serves as a development guide for the Airport's short-term (5 to 10 years) and long term (20 year) needs. The Airport Master Plan presents a 20-year development plan that is “technically correct, environmentally sound, financially viable, and implementable; and identifies the overall land requirements that will ensure the Airport's long-term operational viability”. The Master Plan will inform the airport element of the Eugene Transportation System Plan.
EUGENE TRANSPORTATION SYSTEM PLAN: EXISTING CONDITIONS AND DEFICIENCIES
EUGENETSP_FINALEXISTINGCONDITIONSREPORT.DOC 31
Oregon Transportation Safety Action Plan (2004 - 2006) The Oregon Transportation Safety Action Plan is the safety element for the OTP. As an OTP plan element, it defines in greater detail system improvements, legislative needs, and financial needs to improve safety conditions on the state highway system. The plan states that the focal point for transportation safety programs in ODOT is the Transportation Safety Division (TSD). This division, with guidance from the Oregon Transportation Safety Committee, carries out most of the responsibilities established in ORS 802.310.
The plan documents changes that must occur by the year 2014 and the year 2024 that will result in a safer transportation system for Oregon. It includes 69 actions organized by the framework provided in the OTP. The 69 actions constitute Oregon’s transportation safety agenda for the next 20 years. Nine of the actions are “Key Actions.” Key actions respond to the factors that contribute to the most transportation-related deaths and injuries -- impaired driving, not using safety restraints, speed, and inexperience -- and were identified as actions that should be implemented by the year 2014.
One action in the Transportation Safety Action Plan that has direct relevance to the Eugene TSP process and the physical planning for transportation facilities in Eugene is Action 18, which emphasizes the role of access management in highway safety. Action 18 states that ODOT, as part of planning and project development, will continue to consider access management techniques that show significant improvements in safety for the roadway user, including the use of city and county roads as an alternative to increased access on state facilities.
Governor’s Executive Orders
Executive Order No. EO 03-03: A Sustainable Oregon for the 21st Century. Governor Kulongoski’s executive order on sustainability states that economic recovery “will be aided by establishing a commitment to lasting solutions that simultaneously address economic, environmental and community well-being.” It charges state government to “define sustainability, produce goals within state government to achieve sustainability, identify challenges to achieving sustainability and measure performance based on sustainability.” While the sustainability order indirectly relates to transportation planning and implementation, it does not contain any action items that specifically target transportation. In keeping with the goals of the Oregon Sustainability Act adopted by the 2001 Legislature, the Eugene TSP should support this state initiative to move Oregon closer to a sustainable state.
Executive Order No. EO 00-23: Use of State Resources to Encourage the Development of Quality Communities. Former Governor Kitzhaber signed an executive order on quality communities that communicates the state goal of accommodating growth and development in a manner that “promotes quality communities, protects the land base for our farm and forest industries, and reduces the cost of public facilities and services.” This executive order acknowledges the necessity of coordinating state and local community development objectives. The directive is to ensure that state programs and activities help build and maintain quality communities, in part through development patterns that minimize public services costs and achieving a mix of land uses that support a balanced transportation system. The Quality
EUGENE TRANSPORTATION SYSTEM PLAN: EXISTING CONDITIONS AND DEFICIENCIES
EUGENETSP_FINALEXISTINGCONDITIONSREPORT.DOC 32
Development Objectives are intended to be used in “combination with state and local partnership principles and local development objectives to help build healthy and diverse communities and regions throughout Oregon.” They relate to promoting compact development, a mix of uses, energy efficient development, including alternative modes and ensuring that development is compatible with community goals, environmental constraints, sustainability practices and goals to reduce commuting.
TSP policies and implementation measures should support and complement these objectives by promoting “quality development” within Eugene.
Regional Plans, Polices and Relevant Documents Lane County TSP (2004) The Lane County TSP is the 20-year transportation planning document for the county, serving as the transportation element of the county’s Comprehensive Plan. The TSP establishes goals and policies for roads, bicycle and pedestrian facilities, public transportation, rail, air, water, and pipelines, land use and transportation, and financing and recommended improvements.
The plan also establishes functional classifications for county roads and standards for access management system performance (level of service) for county facilities, and refers to design standards that are specified in Lane Code Chapter 15.700. The plan recommends improvements, to be part of a 20-year project list and five-year Capital Improvement Programs, and financing for implementing the improvements.
The policies, regulations, and projects of the county TSP apply to county roads in Eugene or any parts of unincorporated areas within the Eugene-Springfield UGB. The Eugene TSP development process will need to be consistent with the policies of the Lane County TSP and coordinate with Lane County to address the planned projects listed in the county Transportation System Plan. Those projects are provided in Appendix C.
Eugene-Springfield Metropolitan Area General Plan (Metro Plan) (2004 – 2010) The Metro Plan is the official long-range comprehensive plan for metropolitan Lane County and the cities of Eugene and Springfield. The Metro Plan sets forth general planning policies and land use allocations and serves as the basis for the coordinated development of programs concerning the use and conservation of physical resources, furtherance of assets, and development or redevelopment of the metropolitan area. The Metro Plan also identifies the major public facilities required to meet the land use needs designated within the urban growth boundary.
Chapter II of the Metro Plan contains the fundamental principles, goals and policies for growth management in the Eugene metropolitan area. Growth management policies emphasize the need to minimize urban sprawl through compact urban development within the urban growth boundary. This section of the plan also identifies the land use designations that will apply within the planning area. Land use designations provide direction for decisions pertaining to appropriate reuse (redevelopment), urbanization of vacant parcels, and additional use of underdeveloped parcels.
EUGENE TRANSPORTATION SYSTEM PLAN: EXISTING CONDITIONS AND DEFICIENCIES
EUGENETSP_FINALEXISTINGCONDITIONSREPORT.DOC 33
Chapter III of the Metro Plan contains goals and policies for specific planning elements such as housing, the economy and transportation. This section is most relevant to the Eugene TSP development process because it contains the specific goals and policies with which the Eugene TSP must be consistent. Those policies most pertinent to the TSP are summarized below. It should be noted that Eugene is in the process of preparing a new Comprehensive Plan which will supersede the Metro Plan and that the policies listed below may change as a result of that update.
Economic Element
Policy B.18 is intended to encourage the development of transportation facilities that would improve access to industrial and commercial areas and improve freight movement capabilities.
Policy B.19 states that local jurisdictions will encourage the allocation of funds to improve transportation access to key industrial sites or areas through capital budgets and priorities.
Environmental Element
Policy C.22 states that the design of new street, highway, and transit facilities shall consider noise mitigation measures where appropriate.
Policy D.11 requires that an exception must be taken if a non-water-dependent transportation facility requires placing of fill within the Willamette River Greenway setback.
Environmental Design Element
Policy E.3 strongly encourages planting street trees, especially for all new developments and redeveloping areas (where feasible) and new streets and reconstruction of major arterials within the UGB.
Transportation Element
TransPlan provides the basis for the surface transportation portions of the Metro Plan. The goals and policies in TransPlan are the same as those contained in this Transportation Element. Because TransPlan is reviewed and summarized in the next section, relevant goals and policies are not repeated here.
Energy Element
Policy J.2 encourages careful control of energy related actions, such as automobile use, in order to minimize adverse air quality impacts. Trade-offs between air quality and energy actions shall be made with the best possible understanding of how one process affects the other.
Citizen Involvement Element
Policy K.2 requires that the city maintain and adequately fund a variety of programs and procedures for encouraging and providing opportunities for citizen involvement in metropolitan area planning issues. Such programs should provide for widespread citizen involvement, effective communication, access to technical information, and feedback mechanisms from policymakers.
EUGENE TRANSPORTATION SYSTEM PLAN: EXISTING CONDITIONS AND DEFICIENCIES
EUGENETSP_FINALEXISTINGCONDITIONSREPORT.DOC 34
Eugene-Springfield TSP (TransPlan), 2002 TransPlan guides regional transportation system planning and development in the Eugene-Springfield metropolitan area. The plan includes provisions for “meeting the transportation demand of residents over a 20-year planning horizon while addressing transportation issues and making changes that can contribute to improvements in the region’s quality of life and economic vitality.” TransPlan establishes the framework upon which all public agencies can make consistent and coordinated planning decisions regarding transportation. The regional planning process ensures that the planning activities and investments of the local jurisdictions are coordinated in terms of intent, timing, and effect. TransPlan also serves as the transportation element of the Metro Plan and as the local TSP for both Eugene and for Springfield. The Lane Council of Governments is currently working to prepare an updated regional transportation plan.
TransPlan consists of two primary components: the policy element and implementation actions. The implementation actions were developed with the intent of providing flexibility to local jurisdictions in implementing the regional policies established in TransPlan.
Chapter 2 of TransPlan contains goals and policies for transportation growth and development in the metro region. Because these policies are directly relevant to development of the Eugene TSP and are too numerous to summarize here, a consolidated list of TransPlan policies is attached to this memorandum as Appendix D. Generally, those policies emphasize the creation of compact, mixed-use (nodal) development with quality bicycle and pedestrian connections and access to public transit.
Chapter 3 of TransPlan contains actions that implement the policy framework set forth in Chapter 2 and includes elements related to plan implementation that are required by state legislation. The first part of this chapter provides lists of capital investment actions for transportation system improvements in several categories: roadways, transit and bicycle projects. The projects on these lists are selected for inclusion in the Financially Constrained 20-Year Capital Investment Actions to establish a network of facilities that meet overall transportation needs for the 20-year planning period. These projects are too numerous to summarize here. The complete list of projects can be found at this website: http://www.lcog.org/documents/TransPlan/Jul-02/Chap%203.pdf.
Part two of Chapter 3 presents the Financial Plan which includes the following:
A summary of the state regulations for financial constraint;
A summary of future cost and revenue estimate methodologies;
Forecasts of revenue from existing sources;
An assessment of the revenue shortfall;
A list of strategies to address the shortfall; and
Development of the Constrained Plan.
Part four of Chapter 3 provides a range of regionally significant planning, administrative, and support actions that might be used to implement TransPlan policies. Local jurisdictions can use their discretion to evaluate and prioritize planning and program action
EUGENE TRANSPORTATION SYSTEM PLAN: EXISTING CONDITIONS AND DEFICIENCIES
EUGENETSP_FINALEXISTINGCONDITIONSREPORT.DOC 35
implementation. Recommended implementation actions are organized into the following categories:
Land use
Transportation demand management
Transportation system improvements
- System-Wide
- Roadways
- Transit
- Bicycles
- Pedestrian
- Goods Movement
- Other Modes
Central Lane Metropolitan Planning Organization Regional Transportation Plan (2007) The Regional Transportation Plan (MPO RTP) guides the planning and development of the transportation system within the Central Lane Transportation Management Area. The federally-required MPO RTP includes provisions for meeting the transportation demand of residents over at least a 20-year planning horizon while addressing transportation issues and making changes that can contribute to improvements in the region’s quality of life and economic vitality. It includes consideration of all transportation modes: roadways, transit, bikeways and pedestrian circulation, as well as freight movement and regional aspects of air, rail and inter-city bus service.
Previously, TransPlan (reviewed above) served as both the federally-required Regional Transportation Plan and the state-required local TSP for Eugene/Springfield. Now, with the expansion of the MPO boundary to include Coburg, the MPO RTP serves as the federally required plan for the new MPO area, while TransPlan will continue to serve as the state-required plan for the Eugene/Springfield area.
The layout and content of the MPO RTP is very similar to that of the TransPlan and therefore is only briefly summarized here. Chapter 2 of the MPO RTP contains goals and policies for transportation growth management in the MPO. The policies are identical to those found in the TransPlan and are provided in Appendix D. Chapter 3 contains lists of capital investment actions for transportation system improvements in several categories: roadways, transit and bicycle projects. The complete list of projects can be found at this website: http://docs.lcog.org/mpo/PDF/rtp/2031/2031RTP_Chapter3_Nov-07Adoption_Corrected.pdf.
Lane Transit District Capital Improvements Program (2010 – 2017) The Lane Transit District (LTD) Capital Improvements Program (CIP) is a list of proposed projects that are intended to enhance transit within LTD’s service area. While funding is expected for these projects, it is not guaranteed. Projects may be changed or eliminated due
EUGENE TRANSPORTATION SYSTEM PLAN: EXISTING CONDITIONS AND DEFICIENCIES
EUGENETSP_FINALEXISTINGCONDITIONSREPORT.DOC 36
to changes in priority or funding. The program is updated annually by the Board of Directors. The CIP project list includes projects that are specific to Eugene and those that apply to the entire transit district. A complete list of projects is provided in Appendix E.
Local Plans, Policies and Relevant Documents Eugene Code Chapter 9 - Land Use (1971 – 2010) Chapter 9 of the Eugene Code contains standards and regulations for land use and development in Eugene. It is intended to implement the goals and policies of the Metro Plan, refinement plans and applicable state and federal land use laws. The land use code will also need to implement the Eugene TSP once it is adopted. As such, revisions to the code may be necessary as part of the TSP development process, especially to ensure compliance with the requirements of TPR 660-012-0045 which identifies land use regulations that must be adopted to implement Transportation System Plans.
The most relevant sections of the Eugene Code in terms of the TSP are Sections 9.6800 – 9.6875, which regulate streets, alleys and other public ways. These sections contain standards for block length, connectivity, access and street right-of-way width that will need to be reviewed for consistency with the new Transportation System Plan. Although the code was updated to help implement TransPlan policies, the Eugene TSP development process will identify further revisions to the Eugene Code that might be needed in order to implement the new TSP once adopted.
Eugene Growth Management Policies (1997) The Growth Management Policies were created by the Eugene Planning Commission and council liaisons based on a series of open houses, community workshops, tabloid responses, and surveys. These policies are intended to guide growth within the city of Eugene through the planning horizon. Policies especially relevant to the Eugene TSP are listed below.
Policy 1 - Support the existing Eugene Urban Growth Boundary by taking actions to increase density and use existing vacant land and under-used land within the boundary more efficiently.
Policy 2 - Encourage in-fill, mixed-use, redevelopment, and higher density development.
Policy 5 - Work cooperatively with Metro area partners (Springfield and Lane County) and other nearby cities to avoid urban sprawl and preserve the rural character in areas outside the urban growth boundaries.
Policy 10 - Encourage the creation of transportation-efficient land use patterns and implementation of nodal development concepts.
Policy 11 - Increase the use of alternative modes of transportation by improving the capacity, design, safety, and convenience of the transit, bicycle, and pedestrian transportation systems.
Policy 12 - Encourage alternatives to the use of single-occupant vehicles through demand management techniques.
Policy 13 - Focus future street improvements on relieving pressure on the City's most congested roadways and intersections to maintain an acceptable level of mobility for all modes of transportation.
EUGENE TRANSPORTATION SYSTEM PLAN: EXISTING CONDITIONS AND DEFICIENCIES
EUGENETSP_FINALEXISTINGCONDITIONSREPORT.DOC 37
Policy 14 - Development shall be required to pay the full cost of extending infrastructure and services, except that the City will examine ways to subsidize the costs of providing infrastructure or offer other incentives that support higher-density, in-fill, mixed-use, and redevelopment.
Policy 15 - Target publicly-financed infrastructure extensions to support development for higher densities, in-fill, mixed uses, and nodal development.
Central Area Transportation Study (1987 – 2004) The first Central Area Transportation Study (CATS) was completed in 1987, updated in 1993 and served as a technical element of the Central Eugene Parking and Traffic Circulation Plan, which was adopted by the Eugene City Council and the Lane Regional Air Pollution Authority. Its purpose has been to support maintenance and improvement of the city’s transportation and parking systems, and to preserve air quality within the CATS boundaries.
The 2004 CATS Update was initiated because most recommendations from the original study had been implemented and other planning efforts that affect downtown have been undertaken. The CATS Update was also meant to inform the update of the Downtown Plan in 2004.
The CATS study area, as established in the original study, encompasses Downtown, the University of Oregon, Sacred Heart General Hospital sites, the Riverfront Research Park, parts of the Jefferson-Westside Neighborhood and Fairmount Neighborhoods, the new Federal Courthouse site, and EWEB-owned property to the north of that site.
The CATS Update includes policies and implementation strategies. The policies address the area’s street system, pedestrian and bicycle facilities, transit system, vehicle parking, transportation demand management (TDM) programs, and the University of Oregon campus area. The policies are listed below.
Street System
Promote the development of a transportation system within the downtown area that supports the goals of the Downtown Plan, enhances the livability of downtown, preserves the livability and economic vitality of areas within and directly adjacent to the CATS boundary, and provides for the safe and efficient movement of motor vehicles, pedestrians, bicycles, and transit vehicles.
Maintain or improve the operation of the street system for pedestrians, bicycles, transit and automobiles. Balance the need for bicycle lanes on downtown streets with the need for on-street parking and transit facilities.
Pedestrian System
Improve the pedestrian system in the downtown area to encourage walking as a primary means of transportation within downtown.
Encourage and promote the creation of “great streets” within the downtown area that stimulate pedestrian activity while allowing for bicycles and slow-moving automobile traffic.
EUGENE TRANSPORTATION SYSTEM PLAN: EXISTING CONDITIONS AND DEFICIENCIES
EUGENETSP_FINALEXISTINGCONDITIONSREPORT.DOC 38
Bicycle Facilities
Improve the safety and efficiency of existing bikeways in the downtown area. Improve bicycle circulation within the downtown area and improve access to existing and planned routes extending outside of the downtown area.
Transit System
Support a frequent transit-based shuttle service in the greater downtown area to link major employment and activity centers and to provide an attractive, energy-efficient, low or no cost, transportation alternative for those who live, work or shop within the greater downtown area.
Vehicle Parking
Support intensive development in the downtown area by balancing new parking supply with specific area demands and ensure an adequate supply of parking is available downtown to meet the needs of residents, workers and customers of downtown facilities.
Make parking downtown convenient, affordable, safe and easy to use.
Transportation Demand Management (TDM) Program
Promote walking, bicycling, carpooling, and riding the bus through employer-based programs.
University of Oregon Campus Area
Support the transportation policies contained in the 1991 University of Oregon Long Range Campus Development Plan. [Note: The Campus Development Plan has been updated since CATS.]
The implementation schedule proposed in the study includes three categories, sometimes presented in phases: initial project planning, design, and public involvement; operational changes to the street system; and construction of new improvements or major modifications. The schedule spans mainly from 2004-2008, with a few recommended implementation strategies being carried out on an ongoing basis. Policies from this study will be reviewed by the DAC and PMT for the Eugene TSP and considered for policies of the TSP efforts.
Eugene Pedestrian & Bicycle Strategic Plan (2008) The Eugene Pedestrian and Bicycle Strategic Plan is a five-year guiding document for the City of Eugene focused on creating a walkable and bikeable city. The plan is not an adopted regulatory document, nor is it a capital improvement document detailing the costs and programming of specific improvements. The city is currently working to update the Eugene Pedestrian and Bicycle Plan and anticipates adoption in June 2011. The new plan will be the bicycle/pedestrian element of the TSP and will be an official policy document.
The plan was designed to be consistent with the OTP, the Oregon Bicycle and Pedestrian Plan, and the Central Area Transportation Study (CATS), and to implement TransPlan. It
EUGENE TRANSPORTATION SYSTEM PLAN: EXISTING CONDITIONS AND DEFICIENCIES
EUGENETSP_FINALEXISTINGCONDITIONSREPORT.DOC 39
implements Action 4.2.3 of TransPlan, which calls for developing an implementation strategy for TransPlan bicycle and pedestrian projects.
The strategic plan is structured around the five goals, and identifies strategies for each goal. Multiple actions are identified for each strategy, along with the lead organization, partner organizations, the relative level of priority of the action (scale of 1-5), and the relative level of resources required (scale of 1-3).
Eugene Arterial and Collector Street Plan (ACSP) (1999) The primary purpose of the ACSP is to provide Eugene with an updated street classification map and right-of-way map that identifies the community’s major streets, and with appropriate street design standards and guidelines to apply to construction, reconstruction and improvement of those streets (the Eugene Local Street Plan design standards are also incorporated in adoption of the ACSP). The ACSP focuses on “developing a transportation system that balances mobility and access needs, provides for integration of land use and transportation systems, and provides for choices in modes of travel”. It was developed to be consistent with TransPlan and to implement some of the action items identified in the Central Area Transportation Study.
The basic principles governing the design of arterials and collectors in the ACSP are:
Facilitate movement and enhance mobility through the region;
Create multi-modal streets to provide a range of transportation options;
Ensure adequate emergency vehicle response routes;
Accommodate and enhance economic vitality of the region;
Support and complement local business;
Consider individual characteristics of neighborhoods;
Be consistent with nodal development concepts;
Incorporate high-quality construction and design; and
Provide mobility and access for all modes of travel.
The appendices to the ACSP contain the bulk of the relevant information, including the street classification map, right-of-way map, bicycle/pedestrian facility maps, street cross-sections with right-of-way widths, and design standards for specific street elements such as bike lanes, sidewalks and street trees. These classifications are described in the roadway section of this memo. Following the development of project alternatives and selection of TSP recommendations, the Eugene TSP will review the classifications from the ACSP and update as appropriate. Changes will likely require an amendment to the ACSP.
Eugene Parking Analysis Final Report, 2002 - 2006 While not an adopted policy document, this report is relevant because it provides a block-by-block analysis of parking deficits and surpluses in the downtown Eugene area. The 2006 update expanded the study area and reevaluated parking needs based on uses and development that had occurred since the original study. Maps showing parking deficits and surpluses for each block in the study area are provided and indicate a wide range of parking situations within the downtown. The Parking Analysis will inform the TSP process when
EUGENE TRANSPORTATION SYSTEM PLAN: EXISTING CONDITIONS AND DEFICIENCIES
EUGENETSP_FINALEXISTINGCONDITIONSREPORT.DOC 40
considering any potential changes to the transportation system through these downtown blocks.
Eugene Capital Improvement Program 2010-15, February 2009 The City of Eugene’s Capital Improvement Program (CIP) forecasts the city's capital needs over a six-year period based on various long-range plans, goals and policies. The goals of the CIP are to:
Provide a balanced program for capital improvements given anticipated funding revenues over a six-year planning period;
Illustrate unmet capital needs based on anticipated funding levels, and;
Provide a plan for capital improvements that can be used in preparing the Capital Budget for the coming two fiscal years.
The CIP is updated every two years and lists projects by category such as parks, stormwater and transportation. For each category, the CIP includes lists of projects with secured or identified funding, projects with no identified funding, and placeholder projects. The Eugene TSP will need to be consistent with projects that are identified in the CIP and the converse will also need to be true.
A list of CIP projects in the Transportation category can be found in Appendix F.
West Eugene Collaborative Recommendations (2009) The West Eugene Collaborative (WEC) was formed in 2007 to “develop an integrated land use and transportation solution, supported by stakeholders, that will facilitate movement of people and commerce from/through/to west Eugene and west of Eugene while enhancing community, business and the environment.” The recommendations in the March 2009 WEC report focus on problems with West 11th Avenue and Highway 126, but overall address concerns in an “area of interest” that spans from Downtown Eugene and I-5 to Veneta, and from the Eugene airport to the South Hills ridgeline. The report’s recommendations were based upon eight principles that are listed below. It is important to note that these recommendations are not adopted policy, but are relevant in that they represent the views of a broad group of stakeholders within Eugene.
1. Improve efficiency of the transportation network.
2. Increase public transit.
3. Enhance pedestrian paths and bikeways.
4. Intensify development appropriately.
5. Relocate some land uses.
6. Enhance open space/natural resources.
7. Enhance natural watersheds.
8. Enhance appreciation and connections to natural resources.
EUGENE TRANSPORTATION SYSTEM PLAN: EXISTING CONDITIONS AND DEFICIENCIES
EUGENETSP_FINALEXISTINGCONDITIONSREPORT.DOC 41
The recommendations were grouped as short-, medium-, and long-range, and address transportation, land use, and environmental issues, and include such things as safety improvements to sidewalks and bike paths and support for mixed-use development and redevelopment.
Recommendations for implementation include adoption and/or enforcement of city policies and regulations to limit further encroachment into right-of-way along West 11th Avenue, and updates of the Metro Plan Diagram and city zoning map to identify protected natural areas as well as existing and planned wildlife habitat corridors. These recommendations were not adopted by Eugene City Council. They may be considered in the TSP though additional analysis would be required.
Roadway Network and Conditions This section describes the current roadway network within the study area, including functional classification, ownership, and conditions. The roadway network is depicted in Figure 5.
Functional Classification Functional classification defines a street’s role and context in the overall transportation system. In addition, it defines the desirable roadway width, right-of-way needs, access spacing and pedestrian and bicycle facilities. The City of Eugene has established a functional classification system for the roadways owned by the City. Figure 5 illustrates the existing classifications as described in the Eugene Arterial and Collector Street Plan (ASCP). Functional classifications assessed as part of this TSP include major and minor arterials and major and minor collectors; local roadways are not analyzed as part of the Transportation System Plan. Arterials The primary function of arterial streets is to provide a high degree of vehicular mobility; however, they may also serve a minor role to provide access to individual properties. The nature of arterial streets dictates that their designs typically limit property access and on-street parking to improve traffic capacity for through traffic. Arterial streets are used as primary bicycle, pedestrian, emergency response routes and transit routes.
There are two classifications of urban arterial streets: major arterials and minor arterials. Because the function of both types is similar, the designs of major and minor arterials are also usually similar. Exceptions to this rule are freeways and expressways. While freeways and expressways are typically classified as major arterials, they have unique geometric criteria that control their design, and highly regulated access controls that limit access to adjacent land uses. Collectors The primary function of collector streets is to assemble traffic from the interior of an area and deliver it to the closest arterial street. Collectors provide for both mobility and access to property and are designed to fulfill both functions. They usually serve shorter trip lengths and have lower traffic volumes than arterial streets. Collector streets are also used as important emergency response routes and are frequently used as transit routes.
EUGENE TRANSPORTATION SYSTEM PLAN: EXISTING CONDITIONS AND DEFICIENCIES
EUGENETSP_FINALEXISTINGCONDITIONSREPORT.DOC 42
There are two classifications of collector streets: major collectors and neighborhood collectors. While the function of both types is essentially the same, the neighborhood collector classification is applied only in residential neighborhoods. Standards for neighborhood collectors provide for design flexibility to preserve the livability and character of residential areas.
State Roadways ODOT owns the following roads within the Eugene TSP study area. Roadways are listed broken down by functional classification, as designated in the Eugene ACSP5.
Freeways/Expressways Randy Papé Beltline, from W 11th Avenue to Interstate 5
Interstate 105, from 6th Avenue/7th Avenueto Interstate 5
Interstate 5, from North UGB to South UGB
Other Major Arterials Highway 99N, from North UGB to Garfield Street
6th Avenue, from Garfield Street to Interstate 105
7th Avenue, Garfield Street to Interstate 105
W 11th Avenue, from West UGB to Randy Papé Beltline
Franklin Boulevard, from Walnut Street to Interstate 5
Delta Highway, portions of the Delta Highway interchange at Randy Papé Beltline
Minor Arterials Gilham Road, bridge structure at Randy Papé Beltline
Norkenzie Road, bridge structure at Randy Papé Beltline
Southwood Lane, from County Club Road to Coburg Road
Major Collectors Glenwood Boulevard, from Interstate 5 to the Interstate 5 off-ramp
Aside from Interstate 5, which has a speed of 60 mph through the study area, speed limits on ODOT owned facilities within the study area are generally 55 mph on freeways/expressways, 30-45 mph on other major arterials, and 35 – 40 mph on minor arterials and major collectors. All ODOT owned facilities are paved.
5 Eugene ACSP street classifications and right-of-way needs are designed to be in agreement with those adopted by Lane County and the State of Oregon. However, the agency with jurisdiction over a particular roadway has the final authority on classification and right-of-way needs.
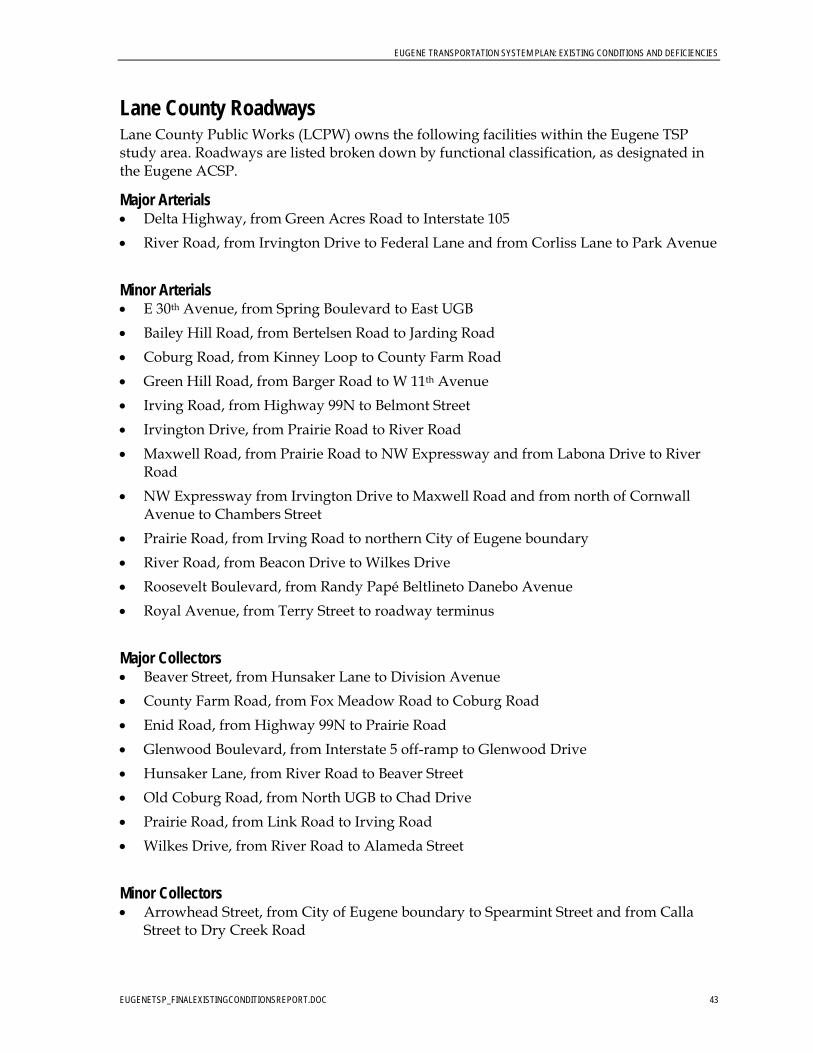
EUGENE TRANSPORTATION SYSTEM PLAN: EXISTING CONDITIONS AND DEFICIENCIES
EUGENETSP_FINALEXISTINGCONDITIONSREPORT.DOC 43
Lane County Roadways Lane County Public Works (LCPW) owns the following facilities within the Eugene TSP study area. Roadways are listed broken down by functional classification, as designated in the Eugene ACSP.
Major Arterials Delta Highway, from Green Acres Road to Interstate 105
River Road, from Irvington Drive to Federal Lane and from Corliss Lane to Park Avenue
Minor Arterials E 30th Avenue, from Spring Boulevard to East UGB
Bailey Hill Road, from Bertelsen Road to Jarding Road
Coburg Road, from Kinney Loop to County Farm Road
Green Hill Road, from Barger Road to W 11th Avenue
Irving Road, from Highway 99N to Belmont Street
Irvington Drive, from Prairie Road to River Road
Maxwell Road, from Prairie Road to NW Expressway and from Labona Drive to River Road
NW Expressway from Irvington Drive to Maxwell Road and from north of Cornwall Avenue to Chambers Street
Prairie Road, from Irving Road to northern City of Eugene boundary
River Road, from Beacon Drive to Wilkes Drive
Roosevelt Boulevard, from Randy Papé Beltlineto Danebo Avenue
Royal Avenue, from Terry Street to roadway terminus
Major Collectors Beaver Street, from Hunsaker Lane to Division Avenue
County Farm Road, from Fox Meadow Road to Coburg Road
Enid Road, from Highway 99N to Prairie Road
Glenwood Boulevard, from Interstate 5 off-ramp to Glenwood Drive
Hunsaker Lane, from River Road to Beaver Street
Old Coburg Road, from North UGB to Chad Drive
Prairie Road, from Link Road to Irving Road
Wilkes Drive, from River Road to Alameda Street
Minor Collectors Arrowhead Street, from City of Eugene boundary to Spearmint Street and from Calla
Street to Dry Creek Road
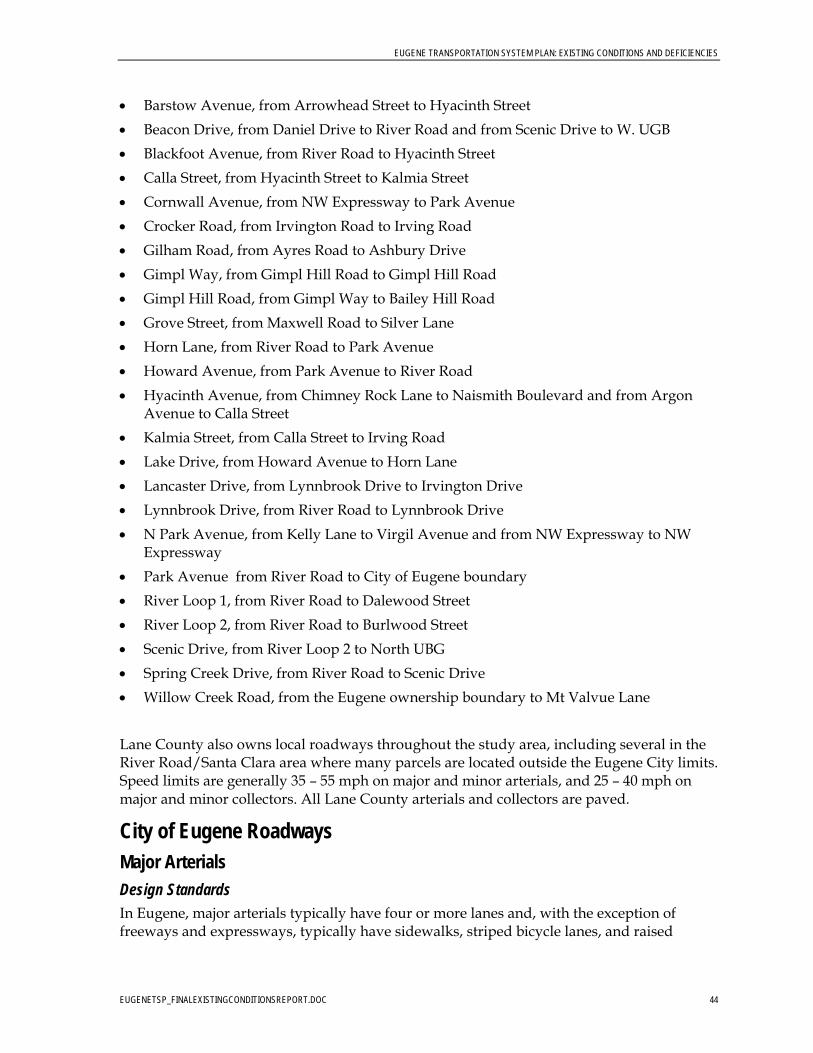
EUGENE TRANSPORTATION SYSTEM PLAN: EXISTING CONDITIONS AND DEFICIENCIES
EUGENETSP_FINALEXISTINGCONDITIONSREPORT.DOC 44
Barstow Avenue, from Arrowhead Street to Hyacinth Street
Beacon Drive, from Daniel Drive to River Road and from Scenic Drive to W. UGB
Blackfoot Avenue, from River Road to Hyacinth Street
Calla Street, from Hyacinth Street to Kalmia Street
Cornwall Avenue, from NW Expressway to Park Avenue
Crocker Road, from Irvington Road to Irving Road
Gilham Road, from Ayres Road to Ashbury Drive
Gimpl Way, from Gimpl Hill Road to Gimpl Hill Road
Gimpl Hill Road, from Gimpl Way to Bailey Hill Road
Grove Street, from Maxwell Road to Silver Lane
Horn Lane, from River Road to Park Avenue
Howard Avenue, from Park Avenue to River Road
Hyacinth Avenue, from Chimney Rock Lane to Naismith Boulevard and from Argon Avenue to Calla Street
Kalmia Street, from Calla Street to Irving Road
Lake Drive, from Howard Avenue to Horn Lane
Lancaster Drive, from Lynnbrook Drive to Irvington Drive
Lynnbrook Drive, from River Road to Lynnbrook Drive
N Park Avenue, from Kelly Lane to Virgil Avenue and from NW Expressway to NW Expressway
Park Avenue from River Road to City of Eugene boundary
River Loop 1, from River Road to Dalewood Street
River Loop 2, from River Road to Burlwood Street
Scenic Drive, from River Loop 2 to North UBG
Spring Creek Drive, from River Road to Scenic Drive
Willow Creek Road, from the Eugene ownership boundary to Mt Valvue Lane
Lane County also owns local roadways throughout the study area, including several in the River Road/Santa Clara area where many parcels are located outside the Eugene City limits. Speed limits are generally 35 – 55 mph on major and minor arterials, and 25 – 40 mph on major and minor collectors. All Lane County arterials and collectors are paved.
City of Eugene Roadways Major Arterials
Design Standards In Eugene, major arterials typically have four or more lanes and, with the exception of freeways and expressways, typically have sidewalks, striped bicycle lanes, and raised
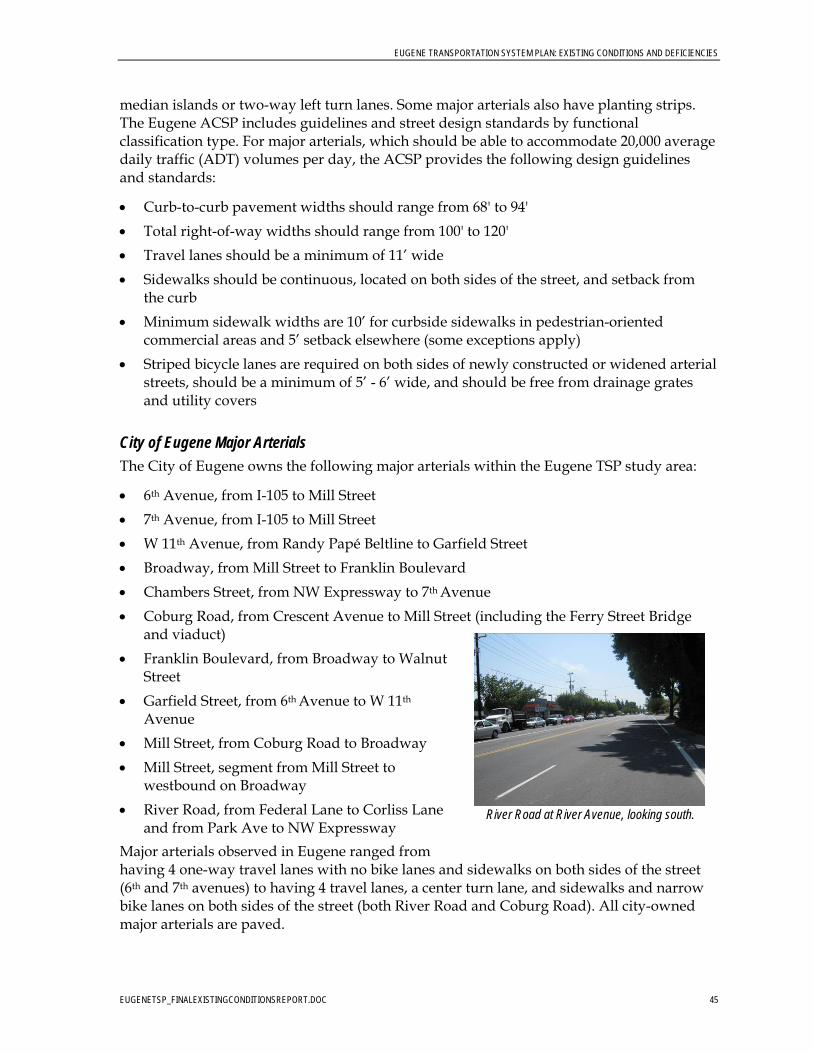
EUGENE TRANSPORTATION SYSTEM PLAN: EXISTING CONDITIONS AND DEFICIENCIES
EUGENETSP_FINALEXISTINGCONDITIONSREPORT.DOC 45
River Road at River Avenue, looking south.
median islands or two-way left turn lanes. Some major arterials also have planting strips. The Eugene ACSP includes guidelines and street design standards by functional classification type. For major arterials, which should be able to accommodate 20,000 average daily traffic (ADT) volumes per day, the ACSP provides the following design guidelines and standards:
Curb-to-curb pavement widths should range from 68' to 94'
Total right-of-way widths should range from 100' to 120'
Travel lanes should be a minimum of 11’ wide
Sidewalks should be continuous, located on both sides of the street, and setback from the curb
Minimum sidewalk widths are 10’ for curbside sidewalks in pedestrian-oriented commercial areas and 5’ setback elsewhere (some exceptions apply)
Striped bicycle lanes are required on both sides of newly constructed or widened arterial streets, should be a minimum of 5’ - 6’ wide, and should be free from drainage grates and utility covers
City of Eugene Major Arterials The City of Eugene owns the following major arterials within the Eugene TSP study area:
6th Avenue, from I-105 to Mill Street
7th Avenue, from I-105 to Mill Street
W 11th Avenue, from Randy Papé Beltline to Garfield Street
Broadway, from Mill Street to Franklin Boulevard
Chambers Street, from NW Expressway to 7th Avenue
Coburg Road, from Crescent Avenue to Mill Street (including the Ferry Street Bridge and viaduct)
Franklin Boulevard, from Broadway to Walnut Street
Garfield Street, from 6th Avenue to W 11th
Avenue
Mill Street, from Coburg Road to Broadway
Mill Street, segment from Mill Street to westbound on Broadway
River Road, from Federal Lane to Corliss Lane and from Park Ave to NW Expressway
Major arterials observed in Eugene ranged from having 4 one-way travel lanes with no bike lanes and sidewalks on both sides of the street (6th and 7th avenues) to having 4 travel lanes, a center turn lane, and sidewalks and narrow bike lanes on both sides of the street (both River Road and Coburg Road). All city-owned major arterials are paved.
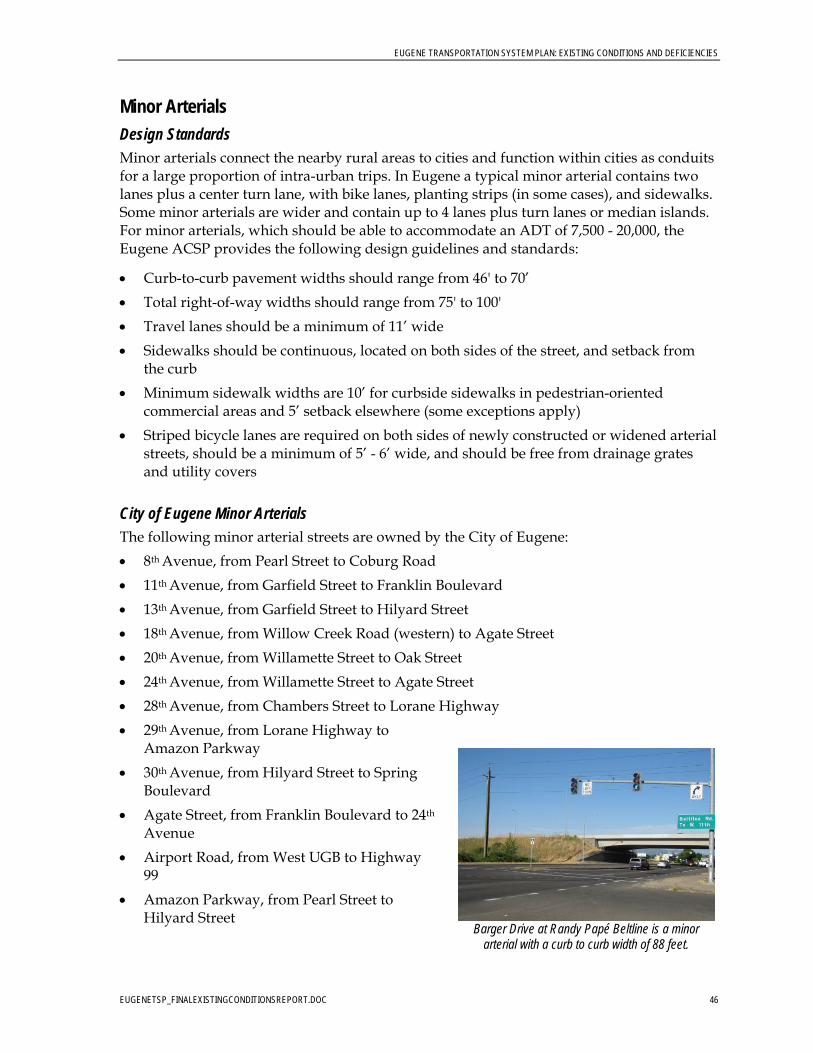
EUGENE TRANSPORTATION SYSTEM PLAN: EXISTING CONDITIONS AND DEFICIENCIES
EUGENETSP_FINALEXISTINGCONDITIONSREPORT.DOC 46
Barger Drive at Randy Papé Beltline is a minor arterial with a curb to curb width of 88 feet.
Minor Arterials
Design Standards Minor arterials connect the nearby rural areas to cities and function within cities as conduits for a large proportion of intra-urban trips. In Eugene a typical minor arterial contains two lanes plus a center turn lane, with bike lanes, planting strips (in some cases), and sidewalks. Some minor arterials are wider and contain up to 4 lanes plus turn lanes or median islands. For minor arterials, which should be able to accommodate an ADT of 7,500 - 20,000, the Eugene ACSP provides the following design guidelines and standards:
Curb-to-curb pavement widths should range from 46' to 70’
Total right-of-way widths should range from 75' to 100'
Travel lanes should be a minimum of 11’ wide
Sidewalks should be continuous, located on both sides of the street, and setback from the curb
Minimum sidewalk widths are 10’ for curbside sidewalks in pedestrian-oriented commercial areas and 5’ setback elsewhere (some exceptions apply)
Striped bicycle lanes are required on both sides of newly constructed or widened arterial streets, should be a minimum of 5’ - 6’ wide, and should be free from drainage grates and utility covers
City of Eugene Minor Arterials The following minor arterial streets are owned by the City of Eugene:
8th Avenue, from Pearl Street to Coburg Road
11th Avenue, from Garfield Street to Franklin Boulevard
13th Avenue, from Garfield Street to Hilyard Street
18th Avenue, from Willow Creek Road (western) to Agate Street
20th Avenue, from Willamette Street to Oak Street
24th Avenue, from Willamette Street to Agate Street
28th Avenue, from Chambers Street to Lorane Highway
29th Avenue, from Lorane Highway to Amazon Parkway
30th Avenue, from Hilyard Street to Spring Boulevard
Agate Street, from Franklin Boulevard to 24th
Avenue
Airport Road, from West UGB to Highway 99
Amazon Parkway, from Pearl Street to Hilyard Street
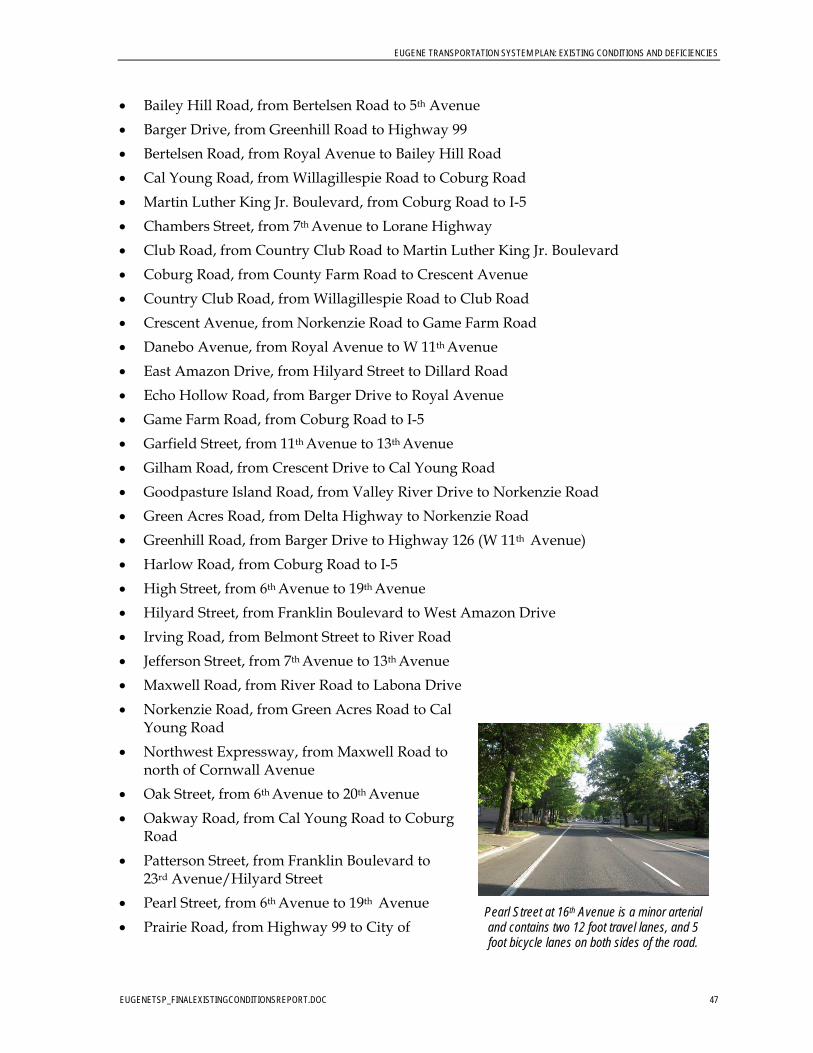
EUGENE TRANSPORTATION SYSTEM PLAN: EXISTING CONDITIONS AND DEFICIENCIES
EUGENETSP_FINALEXISTINGCONDITIONSREPORT.DOC 47
Pearl Street at 16th Avenue is a minor arterial and contains two 12 foot travel lanes, and 5 foot bicycle lanes on both sides of the road.
Bailey Hill Road, from Bertelsen Road to 5th Avenue
Barger Drive, from Greenhill Road to Highway 99
Bertelsen Road, from Royal Avenue to Bailey Hill Road
Cal Young Road, from Willagillespie Road to Coburg Road
Martin Luther King Jr. Boulevard, from Coburg Road to I-5
Chambers Street, from 7th Avenue to Lorane Highway
Club Road, from Country Club Road to Martin Luther King Jr. Boulevard
Coburg Road, from County Farm Road to Crescent Avenue
Country Club Road, from Willagillespie Road to Club Road
Crescent Avenue, from Norkenzie Road to Game Farm Road
Danebo Avenue, from Royal Avenue to W 11th Avenue
East Amazon Drive, from Hilyard Street to Dillard Road
Echo Hollow Road, from Barger Drive to Royal Avenue
Game Farm Road, from Coburg Road to I-5
Garfield Street, from 11th Avenue to 13th Avenue
Gilham Road, from Crescent Drive to Cal Young Road
Goodpasture Island Road, from Valley River Drive to Norkenzie Road
Green Acres Road, from Delta Highway to Norkenzie Road
Greenhill Road, from Barger Drive to Highway 126 (W 11th Avenue)
Harlow Road, from Coburg Road to I-5
High Street, from 6th Avenue to 19th Avenue
Hilyard Street, from Franklin Boulevard to West Amazon Drive
Irving Road, from Belmont Street to River Road
Jefferson Street, from 7th Avenue to 13th Avenue
Maxwell Road, from River Road to Labona Drive
Norkenzie Road, from Green Acres Road to Cal Young Road
Northwest Expressway, from Maxwell Road to north of Cornwall Avenue
Oak Street, from 6th Avenue to 20th Avenue
Oakway Road, from Cal Young Road to Coburg Road
Patterson Street, from Franklin Boulevard to 23rd Avenue/Hilyard Street
Pearl Street, from 6th Avenue to 19th Avenue
Prairie Road, from Highway 99 to City of
EUGENE TRANSPORTATION SYSTEM PLAN: EXISTING CONDITIONS AND DEFICIENCIES
EUGENETSP_FINALEXISTINGCONDITIONSREPORT.DOC 48
Eugene boundary
Roosevelt Boulevard, from Chambers Street to Randy Papé Beltlineand from Danebo Avenue to Terry Street
Royal Avenue, from Highway 99 to Terry Street
Seneca Road, from Roosevelt Boulevard to W 11th Avenue
Terry Street, from Barger Drive to Morely Loop
Valley River Drive, from Goodpasture Island Road to Willagillespie Road
Washington Street, from 7th Avenue to 13th Avenue
West Amazon Drive, from Hilyard Street to Fox Hollow Road
Willagillespie Road, from Cal Young Road to Country Club Road
Willamette Street, from 13th Avenue to South UGB
Willow Creek Road, from 11th Avenue to 18th Avenue
Minor arterials observed in Eugene ranged from having a curb to curb width of 33 feet (Pearl Street at 16th Avenue) to 88 feet (Barger Drive at Randy Papé Beltline). Some minor arterials contain two travel lanes (such as Hilyard Street at 22nd Avenue and Pearl Street at 16th Avenue) while others contain up to four travel lanes with a center turn lane (Barger Drive at Randy Papé Beltline). The majority of minor arterials observed contained sidewalks on both sides of the road that were a minimum of 5 feet in width. Bicycle lanes were also generally present on both sides of the road (with the exception of Hilyard Street at 22nd
Avenue) and were generally 5 feet in width. All city-owned minor arterials were paved and pavement quality ranges from good to like new.
Major Collectors
Design Standards In Eugene, major collectors frequently have continuous center turn lanes and are normally provided with sidewalks, planting strips, and striped bike lanes; provision for on-street parking varies by location. Major collectors may be designed with raised medians to reduce conflicts, provide a pedestrian refuge, restrict turning movements, limit land access, or to furnish an aesthetic separation between traffic lanes. For major collectors, which should be able to accommodate an ADT of 2,500 - 7,500, the Eugene ACSP provides the following design guidelines and standards:
Curb-to-curb pavement widths should range from 32' to 44’
Total right-of-way widths should range from 60' to 75'
Travel lanes should be a minimum of 10’ wide
Sidewalks should be continuous, located on both sides of the street, and setback from the curb
Minimum sidewalk widths are 10’ for curbside sidewalks in pedestrian-oriented commercial areas and 5’ setback elsewhere (some exceptions apply)
EUGENE TRANSPORTATION SYSTEM PLAN: EXISTING CONDITIONS AND DEFICIENCIES
EUGENETSP_FINALEXISTINGCONDITIONSREPORT.DOC 49
Striped bicycle lanes are required on both sides of newly constructed or widened collector streets, should be a minimum of 5’ - 6’ wide, and should be free from drainage grates and utility covers
City of Eugene Major Collectors The following major collectors are owned by the City of Eugene:
1st Avenue, from Seneca Road to Bertelsen Road
1st Avenue, from Washington Street to Van Buren Street/Railroad Boulevard
2nd Avenue, from Blair Boulevard To Garfield Street
3rdAvenue, from High Street to Coburg Road
Shelton McMurphey Boulevard, from Washington Street to Pearl Street
4th Avenue, from Pearl Street to Coburg Road
5th Avenue, from Bailey Hill Road to Highway 99
5th Avenue, from Blair Boulevard To Washington Street
7th Avenue, from Bailey Hill Road to Highway 99
13th Avenue, from Hilyard Street to Kincaid Street
19th Avenue, from Hilyard Street to Agate Street
19th Avenue, from Willamette Street to Hilyard Street
24th Avenue, from Chambers Street to Jefferson Street
27th Avenue, from Portland Street to Amazon Parkway
40th Avenue, from Willamette Street to Hilyard Street
Alder Street, from Broadway to 18th Avenue
Arthur Street, from 13th Avenue to 18th Avenue
Awbrey Lane, from Highway 99 to UGB
Ayres Road, from Delta Highway to Gilham Road
Blair Boulevard, from 2nd Avenue to Monroe Street
Chad Drive, from Coburg Road to Game Farm Road
City View Street, from 11th Avenue to 18th Avenue
City View Street, from 18th Avenue to 28th Avenue
County Farm Road, from Dale Avenue to Coburg Road
Delta Highway, from Green Acres Road to Ayres Road
Dillard Road, from East Amazon Drive to South UGB
Division Avenu, from Randy Papé Beltline to River Road
Donald StreetStreetSt,Street from Willamette Street to 40th Avenue
Fox Hollow Road, from West Amazon Drive to south UGB
Garden Way, from Martin Luther King Jr. Boulevard to Harlow Road
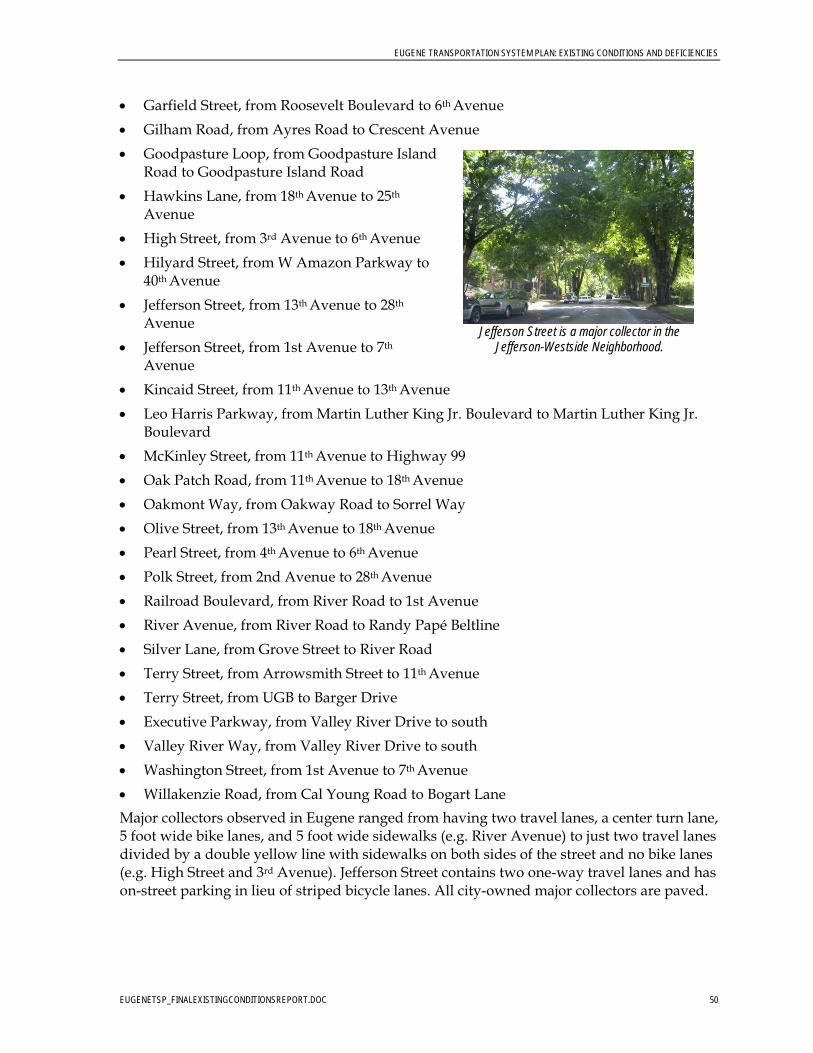
EUGENE TRANSPORTATION SYSTEM PLAN: EXISTING CONDITIONS AND DEFICIENCIES
EUGENETSP_FINALEXISTINGCONDITIONSREPORT.DOC 50
Jefferson Street is a major collector in the
Jefferson-Westside Neighborhood.
Garfield Street, from Roosevelt Boulevard to 6th Avenue
Gilham Road, from Ayres Road to Crescent Avenue
Goodpasture Loop, from Goodpasture Island Road to Goodpasture Island Road
Hawkins Lane, from 18th Avenue to 25th
Avenue
High Street, from 3rd Avenue to 6th Avenue
Hilyard Street, from W Amazon Parkway to 40th Avenue
Jefferson Street, from 13th Avenue to 28th
Avenue
Jefferson Street, from 1st Avenue to 7th
Avenue
Kincaid Street, from 11th Avenue to 13th Avenue
Leo Harris Parkway, from Martin Luther King Jr. Boulevard to Martin Luther King Jr. Boulevard
McKinley Street, from 11th Avenue to Highway 99
Oak Patch Road, from 11th Avenue to 18th Avenue
Oakmont Way, from Oakway Road to Sorrel Way
Olive Street, from 13th Avenue to 18th Avenue
Pearl Street, from 4th Avenue to 6th Avenue
Polk Street, from 2nd Avenue to 28th Avenue
Railroad Boulevard, from River Road to 1st Avenue
River Avenue, from River Road to Randy Papé Beltline
Silver Lane, from Grove Street to River Road
Terry Street, from Arrowsmith Street to 11th Avenue
Terry Street, from UGB to Barger Drive
Executive Parkway, from Valley River Drive to south
Valley River Way, from Valley River Drive to south
Washington Street, from 1st Avenue to 7th Avenue
Willakenzie Road, from Cal Young Road to Bogart Lane
Major collectors observed in Eugene ranged from having two travel lanes, a center turn lane, 5 foot wide bike lanes, and 5 foot wide sidewalks (e.g. River Avenue) to just two travel lanes divided by a double yellow line with sidewalks on both sides of the street and no bike lanes (e.g. High Street and 3rd Avenue). Jefferson Street contains two one-way travel lanes and has on-street parking in lieu of striped bicycle lanes. All city-owned major collectors are paved.
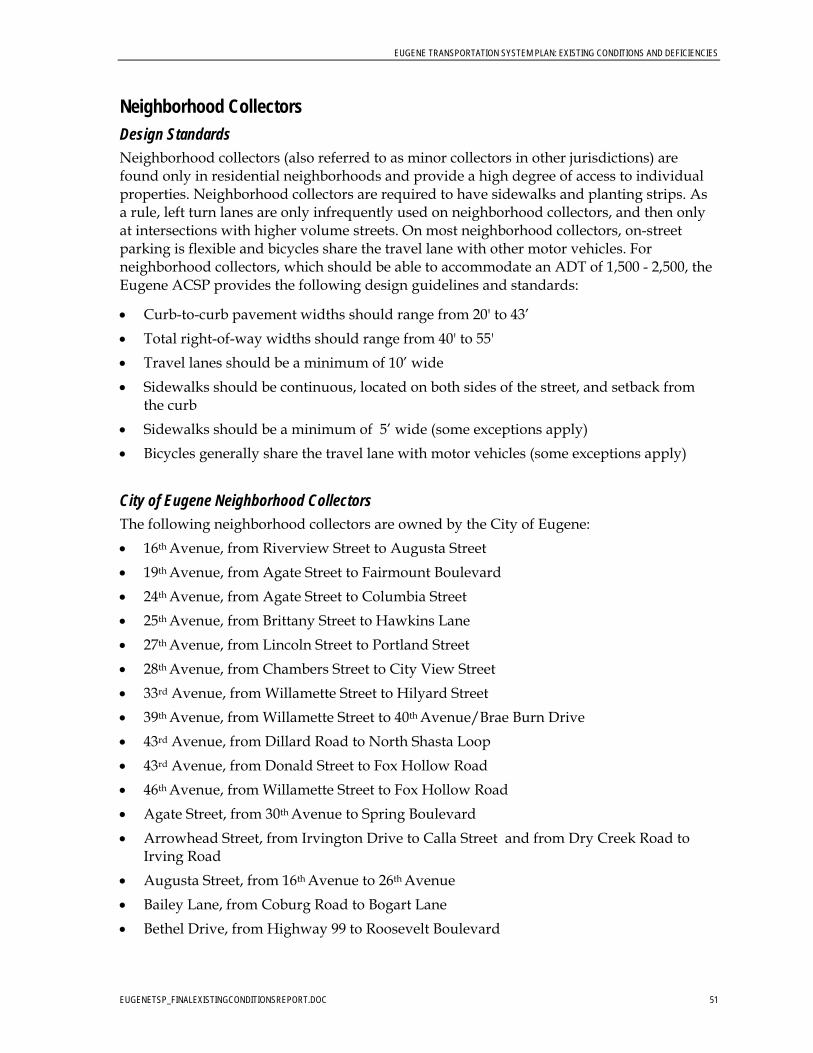
EUGENE TRANSPORTATION SYSTEM PLAN: EXISTING CONDITIONS AND DEFICIENCIES
EUGENETSP_FINALEXISTINGCONDITIONSREPORT.DOC 51
Neighborhood Collectors
Design Standards
Neighborhood collectors (also referred to as minor collectors in other jurisdictions) are found only in residential neighborhoods and provide a high degree of access to individual properties. Neighborhood collectors are required to have sidewalks and planting strips. As a rule, left turn lanes are only infrequently used on neighborhood collectors, and then only at intersections with higher volume streets. On most neighborhood collectors, on-street parking is flexible and bicycles share the travel lane with other motor vehicles. For neighborhood collectors, which should be able to accommodate an ADT of 1,500 - 2,500, the Eugene ACSP provides the following design guidelines and standards:
Curb-to-curb pavement widths should range from 20' to 43’
Total right-of-way widths should range from 40' to 55'
Travel lanes should be a minimum of 10’ wide
Sidewalks should be continuous, located on both sides of the street, and setback from the curb
Sidewalks should be a minimum of 5’ wide (some exceptions apply)
Bicycles generally share the travel lane with motor vehicles (some exceptions apply)
City of Eugene Neighborhood Collectors The following neighborhood collectors are owned by the City of Eugene:
16th Avenue, from Riverview Street to Augusta Street
19th Avenue, from Agate Street to Fairmount Boulevard
24th Avenue, from Agate Street to Columbia Street
25th Avenue, from Brittany Street to Hawkins Lane
27th Avenue, from Lincoln Street to Portland Street
28th Avenue, from Chambers Street to City View Street
33rd Avenue, from Willamette Street to Hilyard Street
39th Avenue, from Willamette Street to 40th Avenue/Brae Burn Drive
43rd Avenue, from Dillard Road to North Shasta Loop
43rd Avenue, from Donald Street to Fox Hollow Road
46th Avenue, from Willamette Street to Fox Hollow Road
Agate Street, from 30th Avenue to Spring Boulevard
Arrowhead Street, from Irvington Drive to Calla Street and from Dry Creek Road to Irving Road
Augusta Street, from 16th Avenue to 26th Avenue
Bailey Lane, from Coburg Road to Bogart Lane
Bethel Drive, from Highway 99 to Roosevelt Boulevard
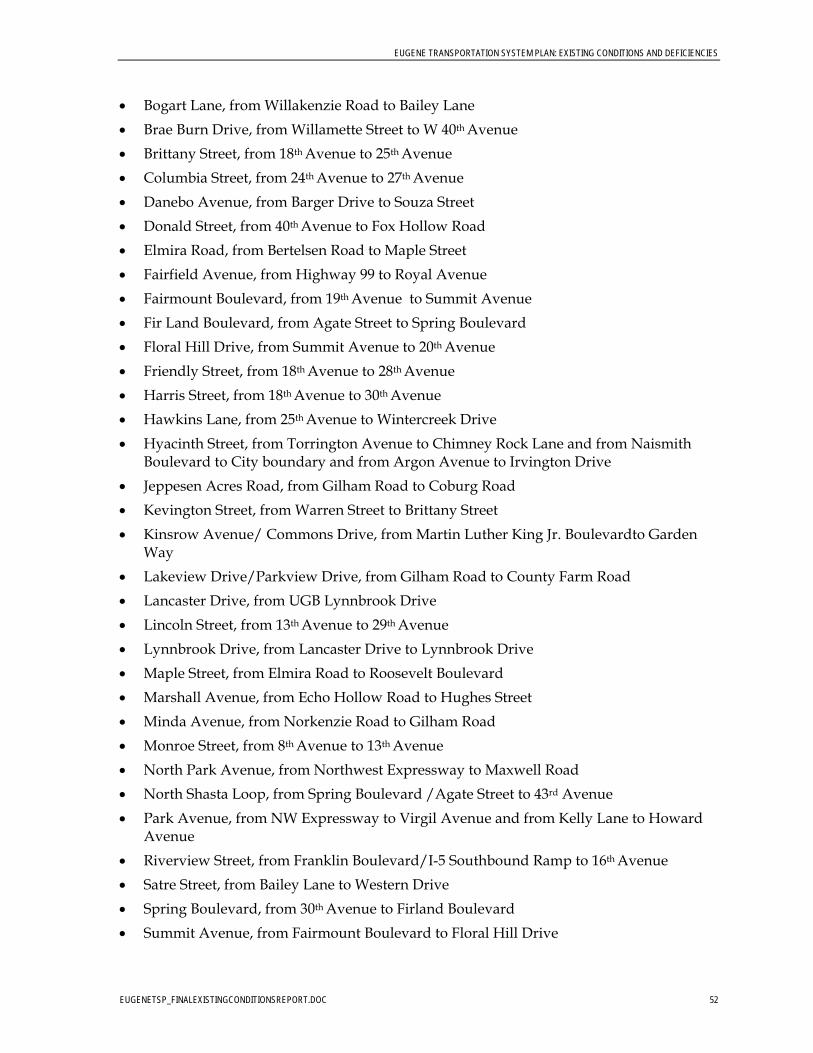
EUGENE TRANSPORTATION SYSTEM PLAN: EXISTING CONDITIONS AND DEFICIENCIES
EUGENETSP_FINALEXISTINGCONDITIONSREPORT.DOC 52
Bogart Lane, from Willakenzie Road to Bailey Lane
Brae Burn Drive, from Willamette Street to W 40th Avenue
Brittany Street, from 18th Avenue to 25th Avenue
Columbia Street, from 24th Avenue to 27th Avenue
Danebo Avenue, from Barger Drive to Souza Street
Donald Street, from 40th Avenue to Fox Hollow Road
Elmira Road, from Bertelsen Road to Maple Street
Fairfield Avenue, from Highway 99 to Royal Avenue
Fairmount Boulevard, from 19th Avenue to Summit Avenue
Fir Land Boulevard, from Agate Street to Spring Boulevard
Floral Hill Drive, from Summit Avenue to 20th Avenue
Friendly Street, from 18th Avenue to 28th Avenue
Harris Street, from 18th Avenue to 30th Avenue
Hawkins Lane, from 25th Avenue to Wintercreek Drive
Hyacinth Street, from Torrington Avenue to Chimney Rock Lane and from Naismith Boulevard to City boundary and from Argon Avenue to Irvington Drive
Jeppesen Acres Road, from Gilham Road to Coburg Road
Kevington Street, from Warren Street to Brittany Street
Kinsrow Avenue/ Commons Drive, from Martin Luther King Jr. Boulevardto Garden Way
Lakeview Drive/Parkview Drive, from Gilham Road to County Farm Road
Lancaster Drive, from UGB Lynnbrook Drive
Lincoln Street, from 13th Avenue to 29th Avenue
Lynnbrook Drive, from Lancaster Drive to Lynnbrook Drive
Maple Street, from Elmira Road to Roosevelt Boulevard
Marshall Avenue, from Echo Hollow Road to Hughes Street
Minda Avenue, from Norkenzie Road to Gilham Road
Monroe Street, from 8th Avenue to 13th Avenue
North Park Avenue, from Northwest Expressway to Maxwell Road
North Shasta Loop, from Spring Boulevard /Agate Street to 43rd Avenue
Park Avenue, from NW Expressway to Virgil Avenue and from Kelly Lane to Howard Avenue
Riverview Street, from Franklin Boulevard/I-5 Southbound Ramp to 16th Avenue
Satre Street, from Bailey Lane to Western Drive
Spring Boulevard, from 30th Avenue to Firland Boulevard
Summit Avenue, from Fairmount Boulevard to Floral Hill Drive
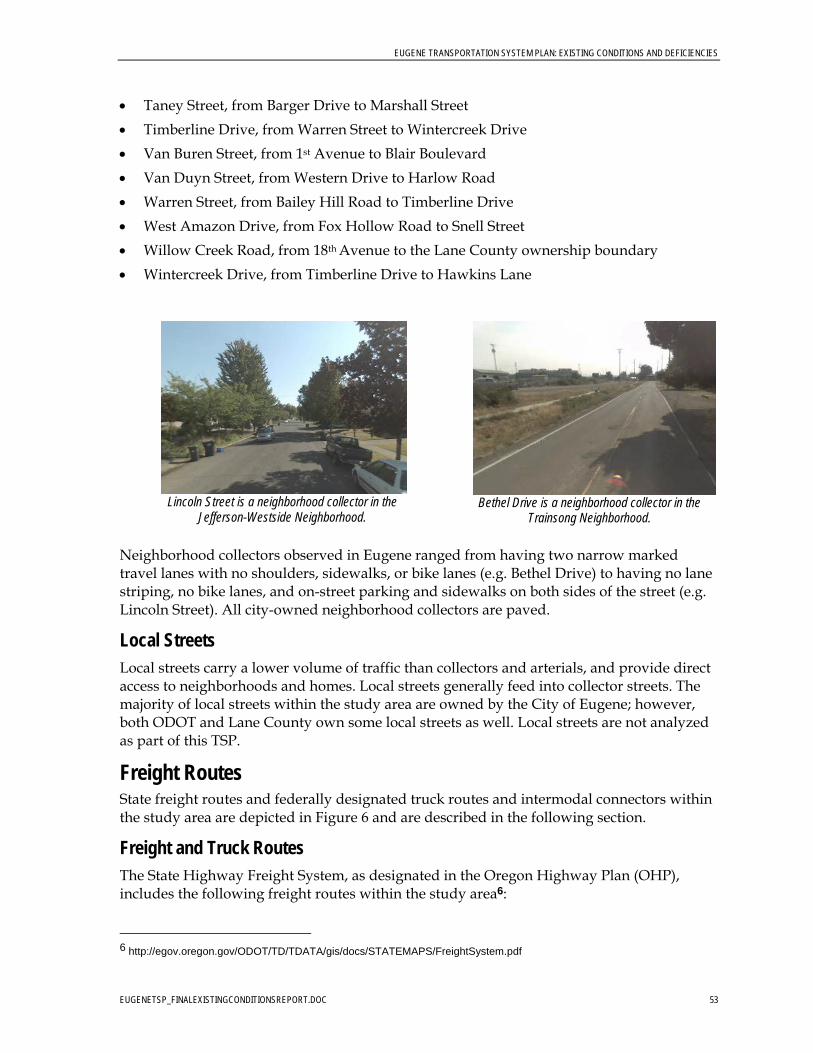
EUGENE TRANSPORTATION SYSTEM PLAN: EXISTING CONDITIONS AND DEFICIENCIES
EUGENETSP_FINALEXISTINGCONDITIONSREPORT.DOC 53
Bethel Drive is a neighborhood collector in the Trainsong Neighborhood.
Lincoln Street is a neighborhood collector in the
Jefferson-Westside Neighborhood.
Taney Street, from Barger Drive to Marshall Street
Timberline Drive, from Warren Street to Wintercreek Drive
Van Buren Street, from 1st Avenue to Blair Boulevard
Van Duyn Street, from Western Drive to Harlow Road
Warren Street, from Bailey Hill Road to Timberline Drive
West Amazon Drive, from Fox Hollow Road to Snell Street
Willow Creek Road, from 18th Avenue to the Lane County ownership boundary
Wintercreek Drive, from Timberline Drive to Hawkins Lane
Neighborhood collectors observed in Eugene ranged from having two narrow marked travel lanes with no shoulders, sidewalks, or bike lanes (e.g. Bethel Drive) to having no lane striping, no bike lanes, and on-street parking and sidewalks on both sides of the street (e.g. Lincoln Street). All city-owned neighborhood collectors are paved.
Local Streets Local streets carry a lower volume of traffic than collectors and arterials, and provide direct access to neighborhoods and homes. Local streets generally feed into collector streets. The majority of local streets within the study area are owned by the City of Eugene; however, both ODOT and Lane County own some local streets as well. Local streets are not analyzed as part of this TSP.
Freight Routes State freight routes and federally designated truck routes and intermodal connectors within the study area are depicted in Figure 6 and are described in the following section.
Freight and Truck Routes The State Highway Freight System, as designated in the Oregon Highway Plan (OHP), includes the following freight routes within the study area6:
6 http://egov.oregon.gov/ODOT/TD/TDATA/gis/docs/STATEMAPS/FreightSystem.pdf
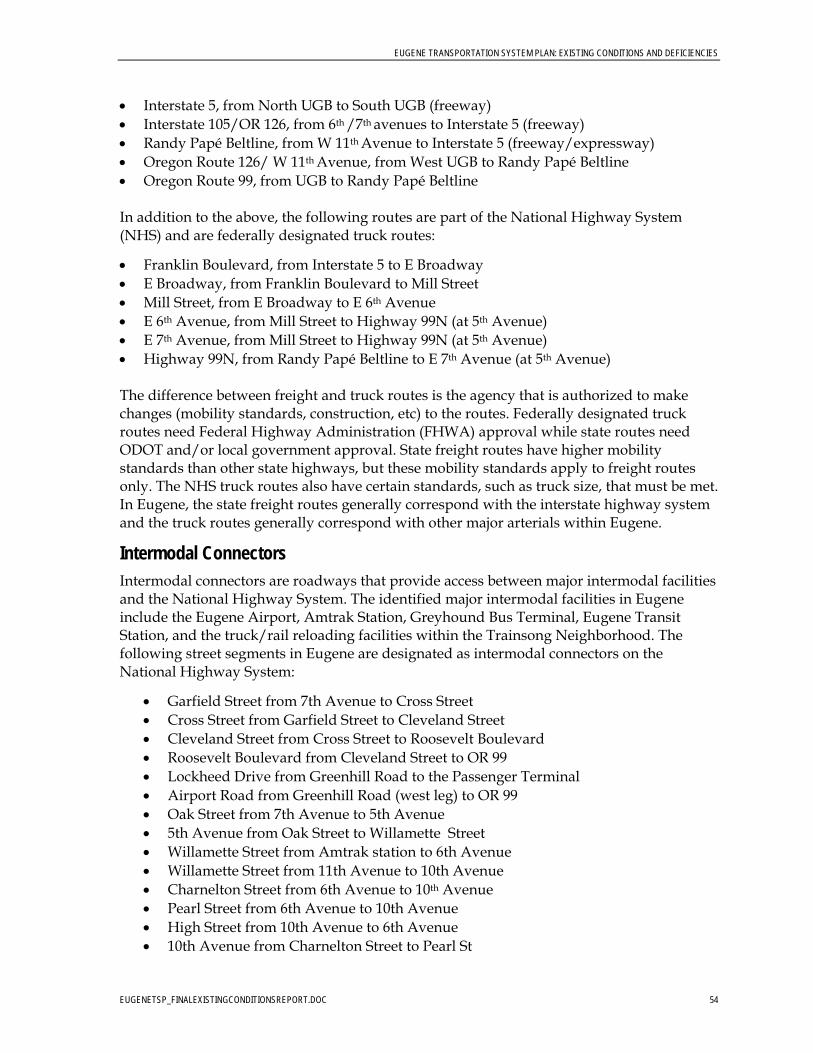
EUGENE TRANSPORTATION SYSTEM PLAN: EXISTING CONDITIONS AND DEFICIENCIES
EUGENETSP_FINALEXISTINGCONDITIONSREPORT.DOC 54
Interstate 5, from North UGB to South UGB (freeway) Interstate 105/OR 126, from 6th /7th avenues to Interstate 5 (freeway) Randy Papé Beltline, from W 11th Avenue to Interstate 5 (freeway/expressway) Oregon Route 126/ W 11th Avenue, from West UGB to Randy Papé Beltline Oregon Route 99, from UGB to Randy Papé Beltline In addition to the above, the following routes are part of the National Highway System (NHS) and are federally designated truck routes:
Franklin Boulevard, from Interstate 5 to E Broadway E Broadway, from Franklin Boulevard to Mill Street Mill Street, from E Broadway to E 6th Avenue E 6th Avenue, from Mill Street to Highway 99N (at 5th Avenue) E 7th Avenue, from Mill Street to Highway 99N (at 5th Avenue) Highway 99N, from Randy Papé Beltline to E 7th Avenue (at 5th Avenue) The difference between freight and truck routes is the agency that is authorized to make changes (mobility standards, construction, etc) to the routes. Federally designated truck routes need Federal Highway Administration (FHWA) approval while state routes need ODOT and/or local government approval. State freight routes have higher mobility standards than other state highways, but these mobility standards apply to freight routes only. The NHS truck routes also have certain standards, such as truck size, that must be met. In Eugene, the state freight routes generally correspond with the interstate highway system and the truck routes generally correspond with other major arterials within Eugene.
Intermodal Connectors Intermodal connectors are roadways that provide access between major intermodal facilities and the National Highway System. The identified major intermodal facilities in Eugene include the Eugene Airport, Amtrak Station, Greyhound Bus Terminal, Eugene Transit Station, and the truck/rail reloading facilities within the Trainsong Neighborhood. The following street segments in Eugene are designated as intermodal connectors on the National Highway System:
Garfield Street from 7th Avenue to Cross Street Cross Street from Garfield Street to Cleveland Street Cleveland Street from Cross Street to Roosevelt Boulevard Roosevelt Boulevard from Cleveland Street to OR 99 Lockheed Drive from Greenhill Road to the Passenger Terminal Airport Road from Greenhill Road (west leg) to OR 99 Oak Street from 7th Avenue to 5th Avenue 5th Avenue from Oak Street to Willamette Street Willamette Street from Amtrak station to 6th Avenue Willamette Street from 11th Avenue to 10th Avenue Charnelton Street from 6th Avenue to 10th Avenue Pearl Street from 6th Avenue to 10th Avenue High Street from 10th Avenue to 6th Avenue 10th Avenue from Charnelton Street to Pearl St
EUGENE TRANSPORTATION SYSTEM PLAN: EXISTING CONDITIONS AND DEFICIENCIES
EUGENETSP_FINALEXISTINGCONDITIONSREPORT.DOC 55
11th Avenue from Franklin Boulevard to Willamette Street Opportunities for improvements to the freight system identified in the Draft 2010 Oregon Freight Plan are discussed in the Freight System Deficiencies section.
Traffic Operational Analysis The TSP is intended to provide an understanding of regional needs and strategies to guide the management of the City’s transportation system. These efforts are not intended to provide a comprehensive listing of citywide improvement needs, but rather to identify some of the key roadway and intersection needs. To understand system needs, the operational and safety performance of the existing transportation system was reviewed at 50 intersections throughout the City. Study intersections were selected based on the following criteria:
Regionally significant facilities Intersections that may require future improvements and would therefore be part of a
Capital Improvements Program (as noted through field observations, previous studies, and/or conversations with city staff)
Land use, environmental and/or geometric opportunities and constraints, including those intersections that are already built out to the degree that may be feasible and/or desirable in the future
Data and analyses needs for the Envision Eugene process The location of the selected study intersections are shown in Figure 7. The vast majority of the study intersections (46 of 50) are controlled by traffic signals (herein referred to as “signalized”).
The following sections describe the operational and safety performance of each of the intersections. Additional documentation is provided in the following Appendices:
Appendix G: Technical Memorandum – Methods and Assumptions (Kittelson & Associates, Inc., October 2010)
Appendix H: Traffic Volume Data Appendix I: Crash Data Appendix J: Existing Condition Operational Analysis Worksheets During the development of the TSP it may be necessary to amend this initial listing of study intersections with other locations that are identified as critical in gaining an understanding of assessing the citywide needs.
Design Hour Traffic Volumes Traffic volumes throughout the City of Eugene were reviewed to understand how traffic flows vary throughout a typical weekday (e.g., Monday through Friday during months of the year when school and the University of Oregon is in session). Typically, traffic volumes peak during the weekday p.m. peak hour. This time period is representative of when travelers use the transportation system to travel to and from work, run errands, and travel
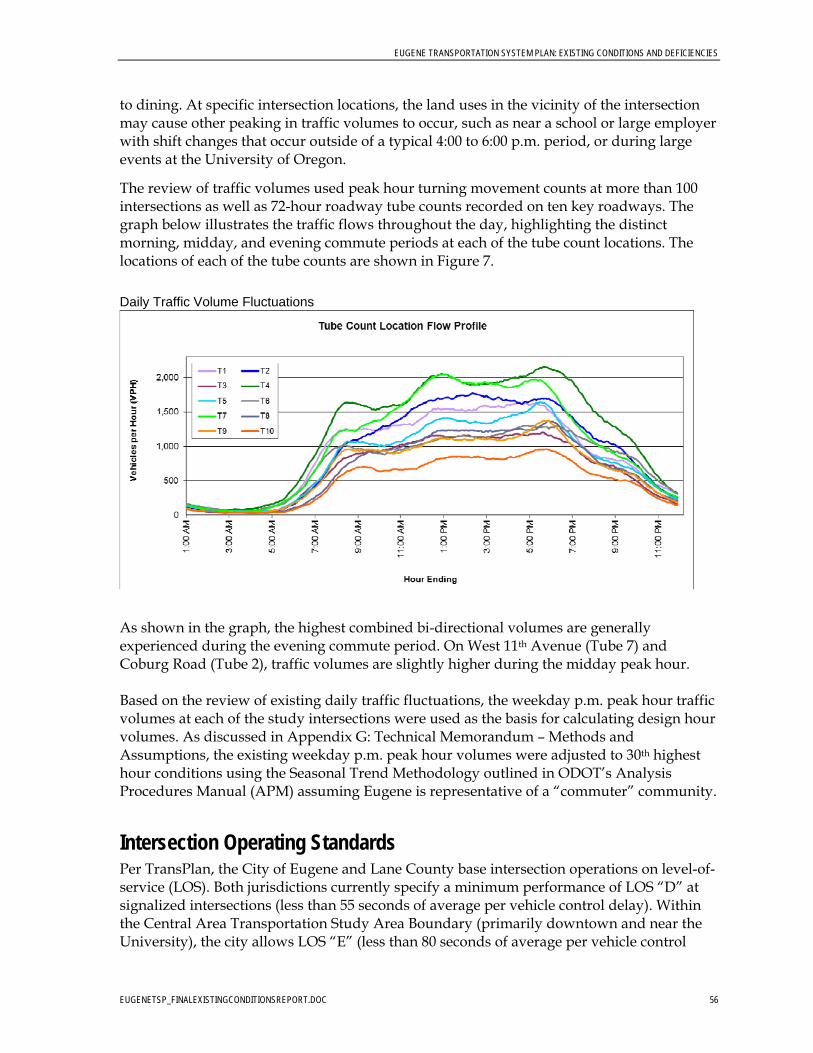
EUGENE TRANSPORTATION SYSTEM PLAN: EXISTING CONDITIONS AND DEFICIENCIES
EUGENETSP_FINALEXISTINGCONDITIONSREPORT.DOC 56
to dining. At specific intersection locations, the land uses in the vicinity of the intersection may cause other peaking in traffic volumes to occur, such as near a school or large employer with shift changes that occur outside of a typical 4:00 to 6:00 p.m. period, or during large events at the University of Oregon.
The review of traffic volumes used peak hour turning movement counts at more than 100 intersections as well as 72-hour roadway tube counts recorded on ten key roadways. The graph below illustrates the traffic flows throughout the day, highlighting the distinct morning, midday, and evening commute periods at each of the tube count locations. The locations of each of the tube counts are shown in Figure 7.
Daily Traffic Volume Fluctuations
As shown in the graph, the highest combined bi-directional volumes are generally experienced during the evening commute period. On West 11th Avenue (Tube 7) and Coburg Road (Tube 2), traffic volumes are slightly higher during the midday peak hour. Based on the review of existing daily traffic fluctuations, the weekday p.m. peak hour traffic volumes at each of the study intersections were used as the basis for calculating design hour volumes. As discussed in Appendix G: Technical Memorandum – Methods and Assumptions, the existing weekday p.m. peak hour volumes were adjusted to 30th highest hour conditions using the Seasonal Trend Methodology outlined in ODOT’s Analysis Procedures Manual (APM) assuming Eugene is representative of a “commuter” community.
Intersection Operating Standards Per TransPlan, the City of Eugene and Lane County base intersection operations on level-of-service (LOS). Both jurisdictions currently specify a minimum performance of LOS “D” at signalized intersections (less than 55 seconds of average per vehicle control delay). Within the Central Area Transportation Study Area Boundary (primarily downtown and near the University), the city allows LOS “E” (less than 80 seconds of average per vehicle control
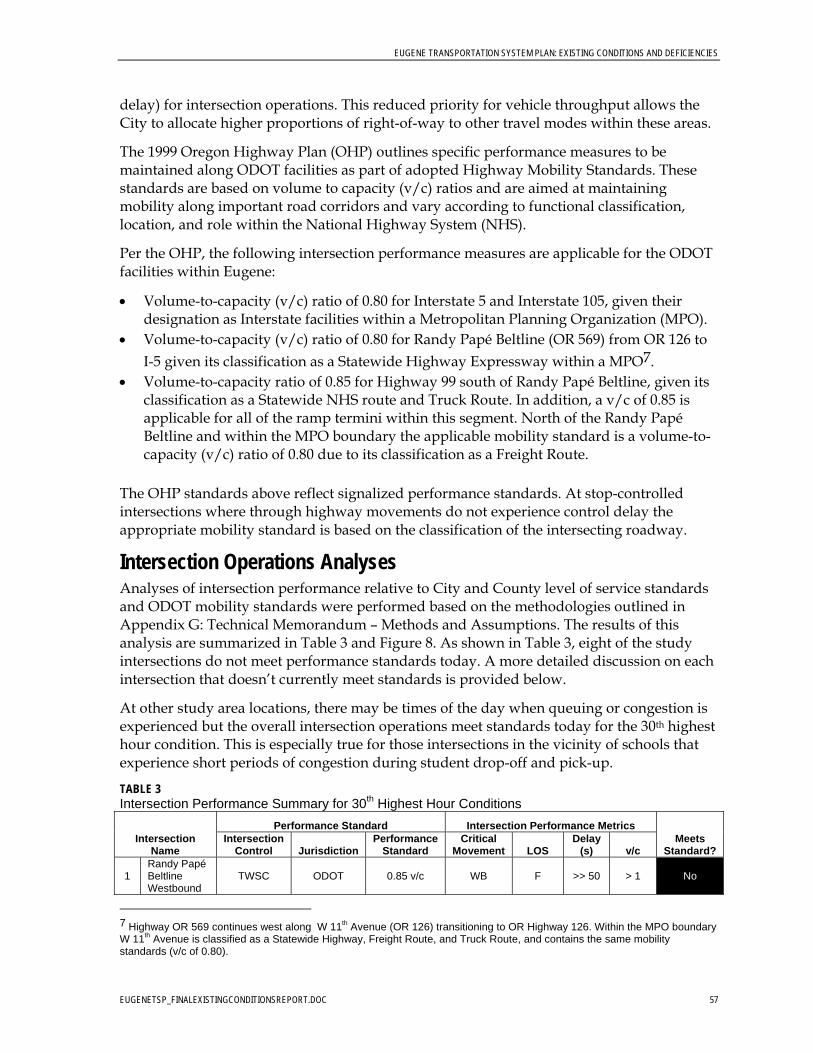
EUGENE TRANSPORTATION SYSTEM PLAN: EXISTING CONDITIONS AND DEFICIENCIES
EUGENETSP_FINALEXISTINGCONDITIONSREPORT.DOC 57
delay) for intersection operations. This reduced priority for vehicle throughput allows the City to allocate higher proportions of right-of-way to other travel modes within these areas.
The 1999 Oregon Highway Plan (OHP) outlines specific performance measures to be maintained along ODOT facilities as part of adopted Highway Mobility Standards. These standards are based on volume to capacity (v/c) ratios and are aimed at maintaining mobility along important road corridors and vary according to functional classification, location, and role within the National Highway System (NHS).
Per the OHP, the following intersection performance measures are applicable for the ODOT facilities within Eugene:
Volume-to-capacity (v/c) ratio of 0.80 for Interstate 5 and Interstate 105, given their designation as Interstate facilities within a Metropolitan Planning Organization (MPO).
Volume-to-capacity (v/c) ratio of 0.80 for Randy Papé Beltline (OR 569) from OR 126 to
I-5 given its classification as a Statewide Highway Expressway within a MPO7. Volume-to-capacity ratio of 0.85 for Highway 99 south of Randy Papé Beltline, given its
classification as a Statewide NHS route and Truck Route. In addition, a v/c of 0.85 is applicable for all of the ramp termini within this segment. North of the Randy Papé Beltline and within the MPO boundary the applicable mobility standard is a volume-to-capacity (v/c) ratio of 0.80 due to its classification as a Freight Route.
The OHP standards above reflect signalized performance standards. At stop-controlled intersections where through highway movements do not experience control delay the appropriate mobility standard is based on the classification of the intersecting roadway.
Intersection Operations Analyses Analyses of intersection performance relative to City and County level of service standards and ODOT mobility standards were performed based on the methodologies outlined in Appendix G: Technical Memorandum – Methods and Assumptions. The results of this analysis are summarized in Table 3 and Figure 8. As shown in Table 3, eight of the study intersections do not meet performance standards today. A more detailed discussion on each intersection that doesn’t currently meet standards is provided below.
At other study area locations, there may be times of the day when queuing or congestion is experienced but the overall intersection operations meet standards today for the 30th highest hour condition. This is especially true for those intersections in the vicinity of schools that experience short periods of congestion during student drop-off and pick-up.
TABLE 3 Intersection Performance Summary for 30th Highest Hour Conditions
Intersection Name
Performance Standard Intersection Performance Metrics Meets
Standard? Intersection
Control Jurisdiction Performance
Standard Critical
Movement LOS Delay
(s) v/c
1 Randy Papé Beltline Westbound
TWSC ODOT 0.85 v/c WB F >> 50 > 1 No
7 Highway OR 569 continues west along W 11th Avenue (OR 126) transitioning to OR Highway 126. Within the MPO boundary W 11th Avenue is classified as a Statewide Highway, Freight Route, and Truck Route, and contains the same mobility standards (v/c of 0.80).
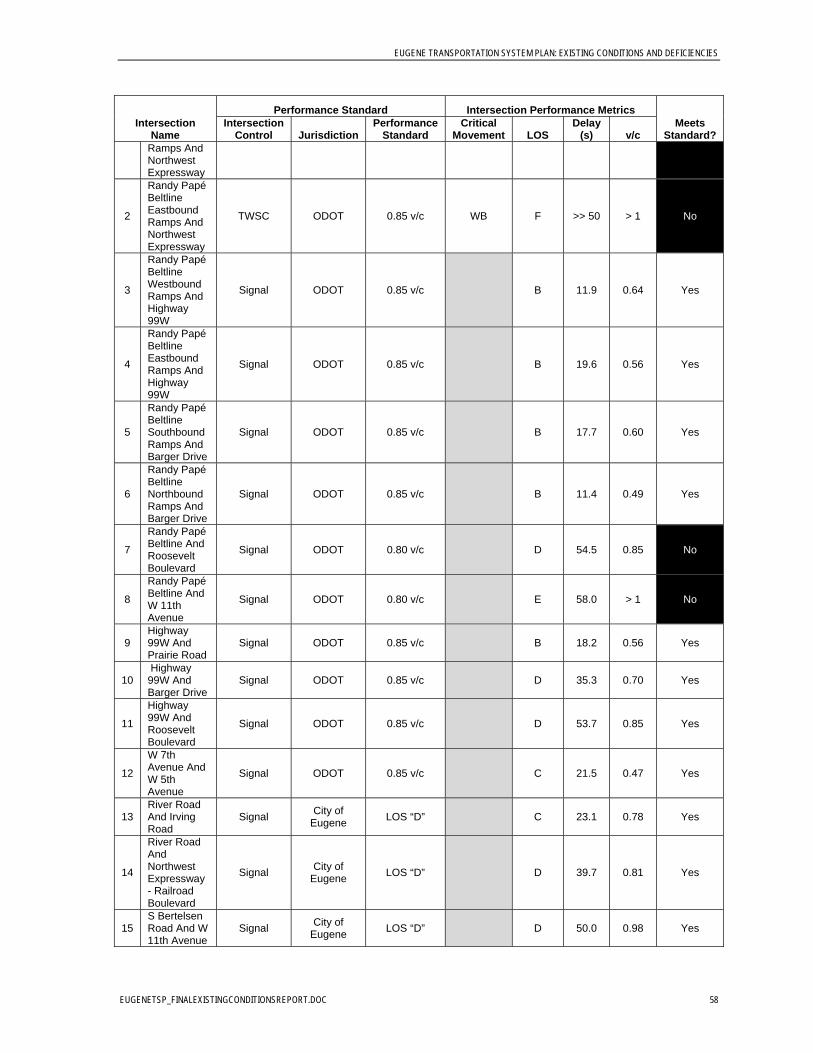
EUGENE TRANSPORTATION SYSTEM PLAN: EXISTING CONDITIONS AND DEFICIENCIES
EUGENETSP_FINALEXISTINGCONDITIONSREPORT.DOC 58
Intersection Name
Performance Standard Intersection Performance Metrics Meets
Standard? Intersection
Control Jurisdiction Performance
Standard Critical
Movement LOS Delay
(s) v/c Ramps And Northwest Expressway
2
Randy Papé Beltline Eastbound Ramps And Northwest Expressway
TWSC ODOT 0.85 v/c WB F >> 50 > 1 No
3
Randy Papé Beltline Westbound Ramps And Highway 99W
Signal ODOT 0.85 v/c B 11.9 0.64 Yes
4
Randy Papé Beltline Eastbound Ramps And Highway 99W
Signal ODOT 0.85 v/c B 19.6 0.56 Yes
5
Randy Papé Beltline Southbound Ramps And Barger Drive
Signal ODOT 0.85 v/c B 17.7 0.60 Yes
6
Randy Papé Beltline Northbound Ramps And Barger Drive
Signal ODOT 0.85 v/c B 11.4 0.49 Yes
7
Randy Papé Beltline And Roosevelt Boulevard
Signal ODOT 0.80 v/c D 54.5 0.85 No
8
Randy Papé Beltline And W 11th Avenue
Signal ODOT 0.80 v/c E 58.0 > 1 No
9 Highway 99W And Prairie Road
Signal ODOT 0.85 v/c B 18.2 0.56 Yes
10 Highway 99W And Barger Drive
Signal ODOT 0.85 v/c D 35.3 0.70 Yes
11
Highway 99W And Roosevelt Boulevard
Signal ODOT 0.85 v/c D 53.7 0.85 Yes
12
W 7th Avenue And W 5th Avenue
Signal ODOT 0.85 v/c C 21.5 0.47 Yes
13 River Road And Irving Road
Signal City of
Eugene LOS “D” C 23.1 0.78 Yes
14
River Road And Northwest Expressway - Railroad Boulevard
Signal City of
Eugene LOS “D” D 39.7 0.81 Yes
15 S Bertelsen Road And W 11th Avenue
Signal City of
Eugene LOS “D” D 50.0 0.98 Yes
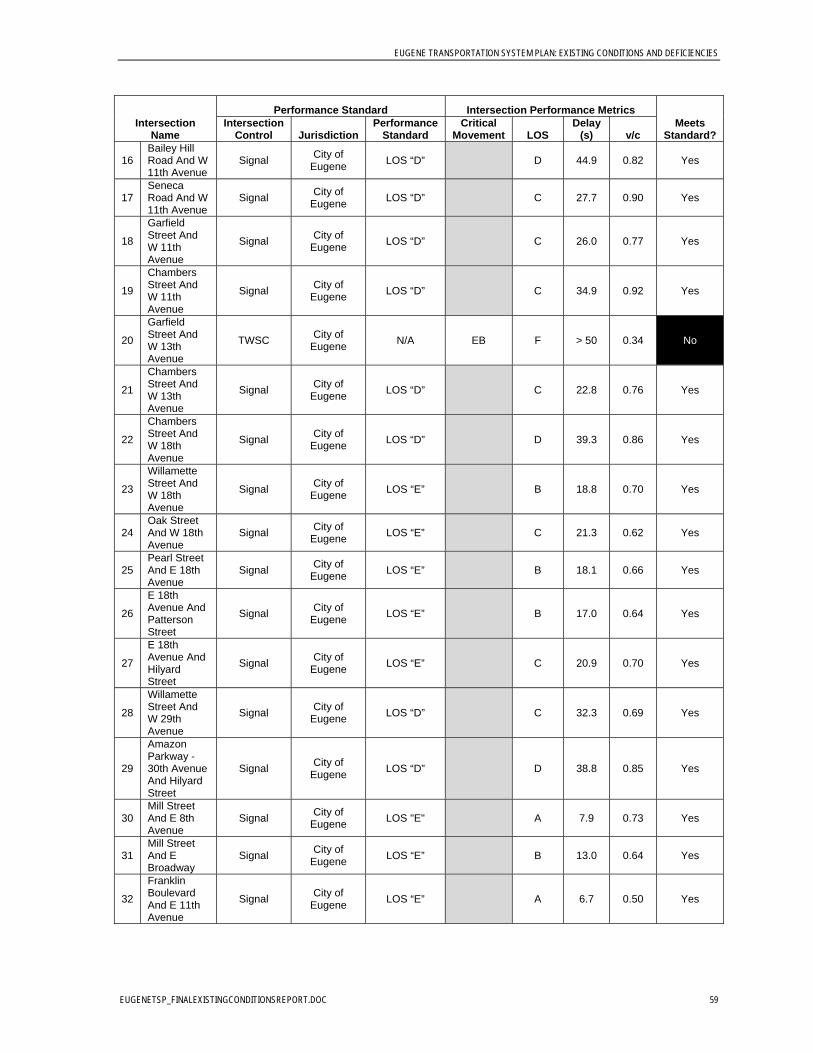
EUGENE TRANSPORTATION SYSTEM PLAN: EXISTING CONDITIONS AND DEFICIENCIES
EUGENETSP_FINALEXISTINGCONDITIONSREPORT.DOC 59
Intersection Name
Performance Standard Intersection Performance Metrics Meets
Standard? Intersection
Control Jurisdiction Performance
Standard Critical
Movement LOS Delay
(s) v/c
16 Bailey Hill Road And W 11th Avenue
Signal City of
Eugene LOS “D” D 44.9 0.82 Yes
17 Seneca Road And W 11th Avenue
Signal City of
Eugene LOS “D” C 27.7 0.90 Yes
18
Garfield Street And W 11th Avenue
Signal City of
Eugene LOS “D” C 26.0 0.77 Yes
19
Chambers Street And W 11th Avenue
Signal City of
Eugene LOS “D” C 34.9 0.92 Yes
20
Garfield Street And W 13th Avenue
TWSC City of
Eugene N/A EB F > 50 0.34 No
21
Chambers Street And W 13th Avenue
Signal City of
Eugene LOS “D” C 22.8 0.76 Yes
22
Chambers Street And W 18th Avenue
Signal City of
Eugene LOS “D” D 39.3 0.86 Yes
23
Willamette Street And W 18th Avenue
Signal City of
Eugene LOS “E” B 18.8 0.70 Yes
24 Oak Street And W 18th Avenue
Signal City of
Eugene LOS “E” C 21.3 0.62 Yes
25 Pearl Street And E 18th Avenue
Signal City of
Eugene LOS “E” B 18.1 0.66 Yes
26
E 18th Avenue And Patterson Street
Signal City of
Eugene LOS “E” B 17.0 0.64 Yes
27
E 18th Avenue And Hilyard Street
Signal City of
Eugene LOS “E” C 20.9 0.70 Yes
28
Willamette Street And W 29th Avenue
Signal City of
Eugene LOS “D” C 32.3 0.69 Yes
29
Amazon Parkway - 30th Avenue And Hilyard Street
Signal City of
Eugene LOS “D” D 38.8 0.85 Yes
30 Mill Street And E 8th Avenue
Signal City of
Eugene LOS "E" A 7.9 0.73 Yes
31 Mill Street And E Broadway
Signal City of
Eugene LOS “E” B 13.0 0.64 Yes
32
Franklin Boulevard And E 11th Avenue
Signal City of
Eugene LOS “E” A 6.7 0.50 Yes
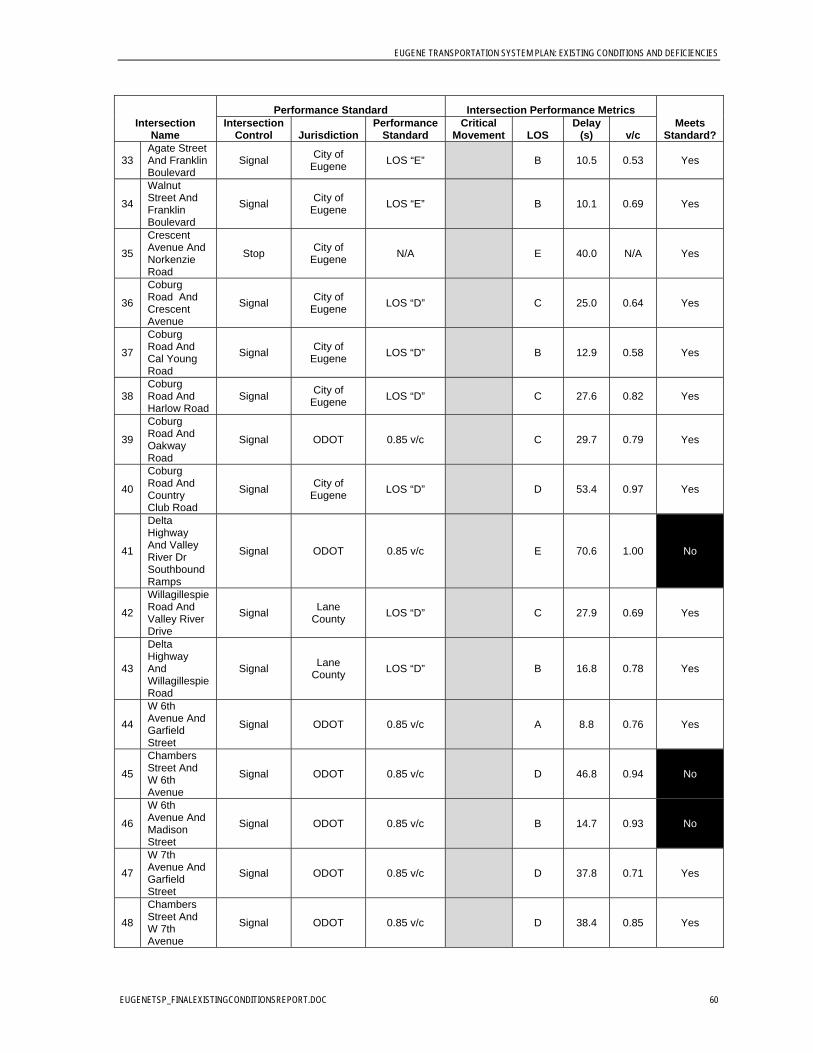
EUGENE TRANSPORTATION SYSTEM PLAN: EXISTING CONDITIONS AND DEFICIENCIES
EUGENETSP_FINALEXISTINGCONDITIONSREPORT.DOC 60
Intersection Name
Performance Standard Intersection Performance Metrics Meets
Standard? Intersection
Control Jurisdiction Performance
Standard Critical
Movement LOS Delay
(s) v/c
33 Agate Street And Franklin Boulevard
Signal City of
Eugene LOS “E” B 10.5 0.53 Yes
34
Walnut Street And Franklin Boulevard
Signal City of
Eugene LOS “E” B 10.1 0.69 Yes
35
Crescent Avenue And Norkenzie Road
Stop City of
Eugene N/A E 40.0 N/A Yes
36
Coburg Road And Crescent Avenue
Signal City of
Eugene LOS “D” C 25.0 0.64 Yes
37
Coburg Road And Cal Young Road
Signal City of
Eugene LOS “D” B 12.9 0.58 Yes
38 Coburg Road And Harlow Road
Signal City of
Eugene LOS “D” C 27.6 0.82 Yes
39
Coburg Road And Oakway Road
Signal ODOT 0.85 v/c C 29.7 0.79 Yes
40
Coburg Road And Country Club Road
Signal City of
Eugene LOS “D” D 53.4 0.97 Yes
41
Delta Highway And Valley River Dr Southbound Ramps
Signal ODOT 0.85 v/c E 70.6 1.00 No
42
Willagillespie Road And Valley River Drive
Signal Lane
County LOS “D” C 27.9 0.69 Yes
43
Delta Highway And Willagillespie Road
Signal Lane
County LOS “D” B 16.8 0.78 Yes
44
W 6th Avenue And Garfield Street
Signal ODOT 0.85 v/c A 8.8 0.76 Yes
45
Chambers Street And W 6th Avenue
Signal ODOT 0.85 v/c D 46.8 0.94 No
46
W 6th Avenue And Madison Street
Signal ODOT 0.85 v/c B 14.7 0.93 No
47
W 7th Avenue And Garfield Street
Signal ODOT 0.85 v/c D 37.8 0.71 Yes
48
Chambers Street And W 7th Avenue
Signal ODOT 0.85 v/c D 38.4 0.85 Yes
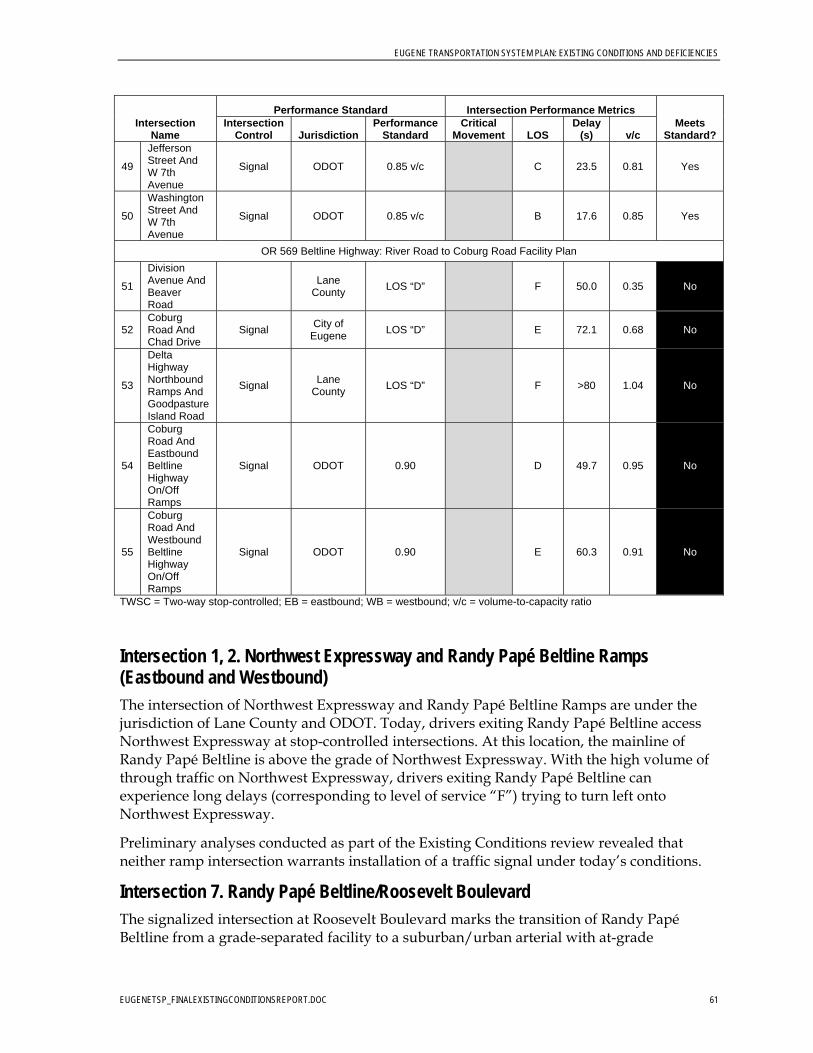
EUGENE TRANSPORTATION SYSTEM PLAN: EXISTING CONDITIONS AND DEFICIENCIES
EUGENETSP_FINALEXISTINGCONDITIONSREPORT.DOC 61
Intersection Name
Performance Standard Intersection Performance Metrics Meets
Standard? Intersection
Control Jurisdiction Performance
Standard Critical
Movement LOS Delay
(s) v/c
49
Jefferson Street And W 7th Avenue
Signal ODOT 0.85 v/c C 23.5 0.81 Yes
50
Washington Street And W 7th Avenue
Signal ODOT 0.85 v/c B 17.6 0.85 Yes
OR 569 Beltline Highway: River Road to Coburg Road Facility Plan
51
Division Avenue And Beaver Road
Lane
County LOS “D” F 50.0 0.35 No
52 Coburg Road And Chad Drive
Signal City of
Eugene LOS “D” E 72.1 0.68 No
53
Delta Highway Northbound Ramps And Goodpasture Island Road
Signal Lane
County LOS “D” F >80 1.04 No
54
Coburg Road And Eastbound Beltline Highway On/Off Ramps
Signal ODOT 0.90 D 49.7 0.95 No
55
Coburg Road And Westbound Beltline Highway On/Off Ramps
Signal ODOT 0.90 E 60.3 0.91 No
TWSC = Two-way stop-controlled; EB = eastbound; WB = westbound; v/c = volume-to-capacity ratio
Intersection 1, 2. Northwest Expressway and Randy Papé Beltline Ramps (Eastbound and Westbound) The intersection of Northwest Expressway and Randy Papé Beltline Ramps are under the jurisdiction of Lane County and ODOT. Today, drivers exiting Randy Papé Beltline access Northwest Expressway at stop-controlled intersections. At this location, the mainline of Randy Papé Beltline is above the grade of Northwest Expressway. With the high volume of through traffic on Northwest Expressway, drivers exiting Randy Papé Beltline can experience long delays (corresponding to level of service “F”) trying to turn left onto Northwest Expressway.
Preliminary analyses conducted as part of the Existing Conditions review revealed that neither ramp intersection warrants installation of a traffic signal under today’s conditions.
Intersection 7. Randy Papé Beltline/Roosevelt Boulevard The signalized intersection at Roosevelt Boulevard marks the transition of Randy Papé Beltline from a grade-separated facility to a suburban/urban arterial with at-grade
EUGENE TRANSPORTATION SYSTEM PLAN: EXISTING CONDITIONS AND DEFICIENCIES
EUGENETSP_FINALEXISTINGCONDITIONSREPORT.DOC 62
intersections. At this intersection, the posted speeds of both facilities are still typical of a grade-separated environment: Randy Papé Beltline is posted at 55 miles per hour and Roosevelt Boulevard is posted at 45 miles per hour. An off-street pedestrian/bicycle trail paralleling Roosevelt Boulevard provides access to crossing opportunities via the northeast and northwest corners of the intersection.
The intersection operates at level-of-service “D” but with a volume-to-capacity ratio of 0.85, which exceeds the ODOT standard of 0.80. There are dedicated turn lanes on each of the approaches for the intersection and Randy Papé Beltline has two through travel lanes in each direction and Roosevelt Boulevard has one through lane in each direction. Previous discussions and studies have identified the need for improved connectivity in this area of the City as well as increased transit service, which may help provide alternative routes and modes for travelers as the area continues to grow.
Intersection 8. Randy Papé Beltline/West 11th Avenue This intersection marks the terminus of Randy Papé Beltline at West 11th Avenue, though OR 569 continues west along OR 126W. The signalized intersection currently operates at capacity and level-of-service “E” conditions, given the high turning movement volumes that are facilitated at this location that result from limited travel route choices in this area. At the intersection, West 11th Avenue has two through lanes in each direction and a dedicated left-turn lane on the eastbound approach and a dedicated right-turn lane on the westbound approach. Randy Papé Beltline has a right-turn and a left-turn lane.
Two studies have recently been completed to assess needs along the West 11th Avenue corridor. The WEC Study (2009) identified a need for connectivity improvements, transit improvements, traffic signal improvements, and the construction of a multi-way boulevard in order to provide congestion relief to West 11th Avenue. The WEC study is completed but has not been adopted by City Council – any recommendations from the study would require further analysis and review. The West 11th Avenue corridor study completed in 2009 report focused on assessing intersection performance and mobility needs along the West 11th corridor.
Intersection 20. Garfield Street/West 13th Avenue The land uses surrounding this intersection are a mixture of residential and small commercial uses. The Unsignalized intersection of Garfield Street and W 13th Avenue is unconventionally configured to allow freeflow conditions for the higher volume southbound movement. The intersection contains extensive signs warning drivers of the transition from a southbound to westbound (one-way) alignment.
This intersection facilitates a fairly low volume of eastbound vehicles today although the per-vehicle delays are high. This intersection was analyzed as part of the West 11th Avenue Corridor Study for operations and safety. There is sufficient capacity at the intersection for the eastbound movement and a traffic signal is not warranted at this location based on the existing conditions review.
Intersection 41. Delta Highway Southbound Ramps/Valley River Drive This intersection provides access between the Delta Highway southbound on and off-ramps and connects to neighborhoods to the east with a Delta Highway overcrossing. Delta
EUGENE TRANSPORTATION SYSTEM PLAN: EXISTING CONDITIONS AND DEFICIENCIES
EUGENETSP_FINALEXISTINGCONDITIONSREPORT.DOC 63
Highway is a regionally significant facility that provides north-south freeway connectivity throughout the city and offers connections to Randy Papé Beltline, I-105, residential and commercial uses within the City, and the industrial areas in the County. The intersection with Valley River Drive occurs in a predominantly retail area. Residential uses and the Willagillespie Elementary School are located on the east side of the interchange. There is a retail access in the immediate vicinity of the intersection resulting in several access points along Valley River Drive between the Delta Highway ramps and Goodpasture Island Road.
The intersection currently operates at capacity and level-of-service “E.” There are turn lanes on all approaches and two through lanes on Valley River Drive at the intersection. Any mitigation-related measures for this intersection will need to consider the overall connectivity provided to neighborhoods to the east as well as to the regional highway system.
Intersection 45. Chambers Street/West 6th Avenue Within downtown Eugene, West 6th Avenue forms an east-west couplet with West 7th Avenue as part of Highway 99. The Chambers Street intersection is bounded by small retail uses that are provided access within the grid system of downtown streets. This intersection is outside of the Central Area Transportation Study boundaries. Although intersection delays correspond to level-of-service “D” conditions today, it does not meet ODOT mobility standards for Highway 99. There are turn lanes on each of the approaches and Chambers Street has two northbound through lanes and three southbound lanes (two becoming left-turn lanes at 7th Avenue) whereas West 6th Avenue has four through lanes (one way). Northbound Chambers Street has two lanes crossing and proceeding away from West 6th Avenue. Any future modifications will need to be considered within the context of the regional system, given the significance of Chambers Street and Highway 99 in providing multimodal mobility throughout Eugene and to areas outside the city.
Intersection 46. Madison Street/West 6th Avenue/I-105 Ramp This intersection provides access between westbound Highway 99 and southbound I-105. The western CATS boundary is Lincoln Street. The intersection operates at a level-of-service “B” but exceeds ODOT mobility standards. The off-ramp volumes are high and are given preferential treatment in the timing of the traffic signal but the movement operates close to capacity. As a result, the overall intersection delays are low but the v/c is high. The ability to make any geometric modifications at this intersection is somewhat constrained by the presence of I-105 and the viaduct.
The City is considering the removal of the westbound right-turn movement from West 6th Avenue that crosses the I-105 southbound off-ramp. This low-volume movement can be accommodated through alternative routes, and its removal would provide a substantial improvement in intersection operations. In addition, treatments have been considered to prohibit lane changes immediately west of the intersection either through signage or construction of channelizing islands to reduce the sideswipe collision history and improve operations.
EUGENE TRANSPORTATION SYSTEM PLAN: EXISTING CONDITIONS AND DEFICIENCIES
EUGENETSP_FINALEXISTINGCONDITIONSREPORT.DOC 64
OR 569 Beltline Highway: River Road to Coburg Road Facility Plan The Beltline Highway study identified five intersections that were exceeding intersection operations standards in 2008, as listed below.
Division Avenue And Beaver Road Coburg Road And Chad Drive Delta Highway Northbound Ramps And Goodpasture Island Road Coburg Road And Eastbound Beltline Highway On/Off Ramps Coburg Road And Westbound Beltline Highway On/Off Ramps
The Beltline corridor study did not identify near-term solutions as part of the existing conditions analysis, and the need for both system and point improvements to address these deficiencies are being incorporated into the long-term corridor plan.
Recurrent Congestion Sites In addition to the study intersections, several corridor segments were identified by City, County, and ODOT staff for consideration of treatment options within the future conditions analysis. These corridors are identified as Congestion Management Corridors within TransPlan.
1. Interstate 5, from OR 58 interchange at Goshen to north boundary of the Transportation Management Area (TMA) at Coburg Road
2. OR 126/I-105, from Garfield Street in Eugene to Main Street/McKenzie Highway in Springfield
a. 6th-7th couplet from Garfield to Jefferson b. Washington-Jefferson Bridge (I-105) from 7th to Delta Highway c. I-105 from Delta Highway to Interstate 5 d. Eugene-Springfield Highway from I-5 to Main Street/McKenzie Highway
3. Beltline Highway, from Highway 99 to Interstate 5 4. Main Street/McKenzie Highway, from Mill Street (downtown Springfield) to 70th Street
a. Broadway/Franklin Boulevard, from Mill St. (Eugene) to Springfield Bridge b. Broadway from Mill St. to Alder St. c. Franklin Boulevard from Alder St. to I-5 d. Franklin Boulevard from I-5 to Springfield Bridge
5. West 11th Avenue, from Terry Street to Chambers Street 6. Ferry Street Bridge/Coburg Road, from Broadway to Crescent Avenue 7. Southeast Eugene corridor (Hilyard-Patterson-Amazon Parkway-Willamette) from 13th
to 33rd Avenue 8. 18th Avenue, from Bertelsen Road to Agate Street
Streets with capacity constraints today and in the future are shown in Figure 9.
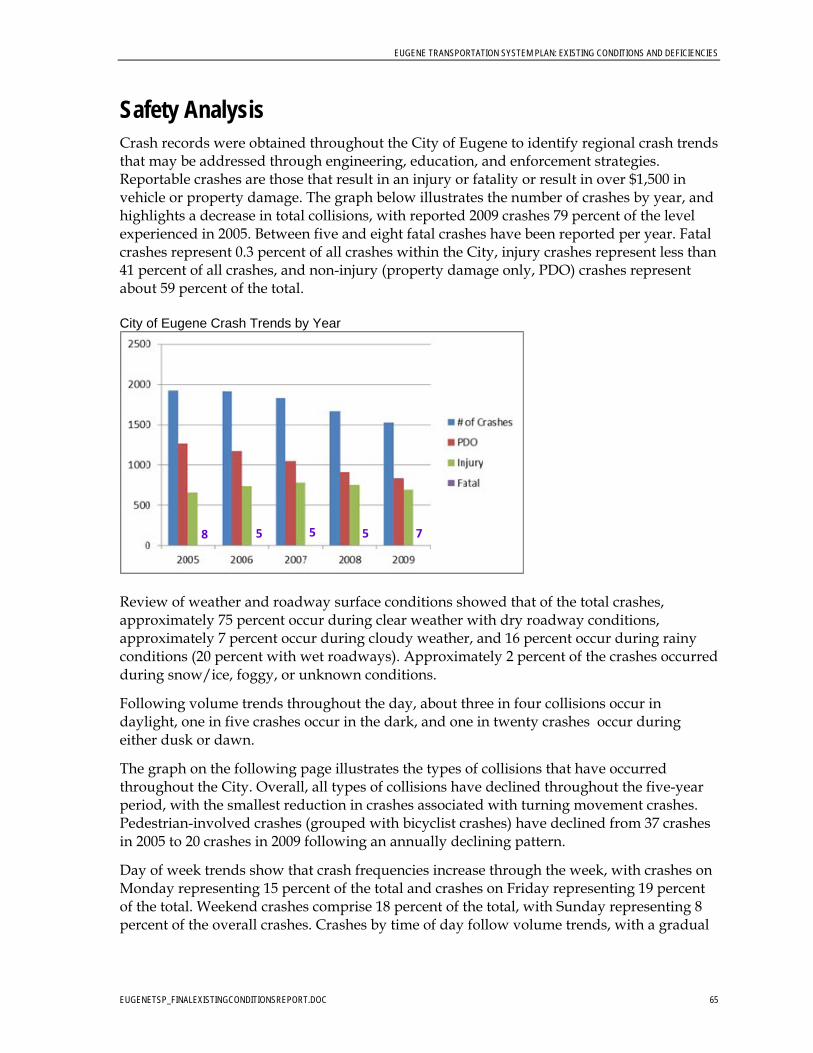
EUGENE TRANSPORTATION SYSTEM PLAN: EXISTING CONDITIONS AND DEFICIENCIES
EUGENETSP_FINALEXISTINGCONDITIONSREPORT.DOC 65
Safety Analysis Crash records were obtained throughout the City of Eugene to identify regional crash trends that may be addressed through engineering, education, and enforcement strategies. Reportable crashes are those that result in an injury or fatality or result in over $1,500 in vehicle or property damage. The graph below illustrates the number of crashes by year, and highlights a decrease in total collisions, with reported 2009 crashes 79 percent of the level experienced in 2005. Between five and eight fatal crashes have been reported per year. Fatal crashes represent 0.3 percent of all crashes within the City, injury crashes represent less than 41 percent of all crashes, and non-injury (property damage only, PDO) crashes represent about 59 percent of the total. City of Eugene Crash Trends by Year
Review of weather and roadway surface conditions showed that of the total crashes, approximately 75 percent occur during clear weather with dry roadway conditions, approximately 7 percent occur during cloudy weather, and 16 percent occur during rainy conditions (20 percent with wet roadways). Approximately 2 percent of the crashes occurred during snow/ice, foggy, or unknown conditions.
Following volume trends throughout the day, about three in four collisions occur in daylight, one in five crashes occur in the dark, and one in twenty crashes occur during either dusk or dawn.
The graph on the following page illustrates the types of collisions that have occurred throughout the City. Overall, all types of collisions have declined throughout the five-year period, with the smallest reduction in crashes associated with turning movement crashes. Pedestrian-involved crashes (grouped with bicyclist crashes) have declined from 37 crashes in 2005 to 20 crashes in 2009 following an annually declining pattern.
Day of week trends show that crash frequencies increase through the week, with crashes on Monday representing 15 percent of the total and crashes on Friday representing 19 percent of the total. Weekend crashes comprise 18 percent of the total, with Sunday representing 8 percent of the overall crashes. Crashes by time of day follow volume trends, with a gradual
5 5 75 8
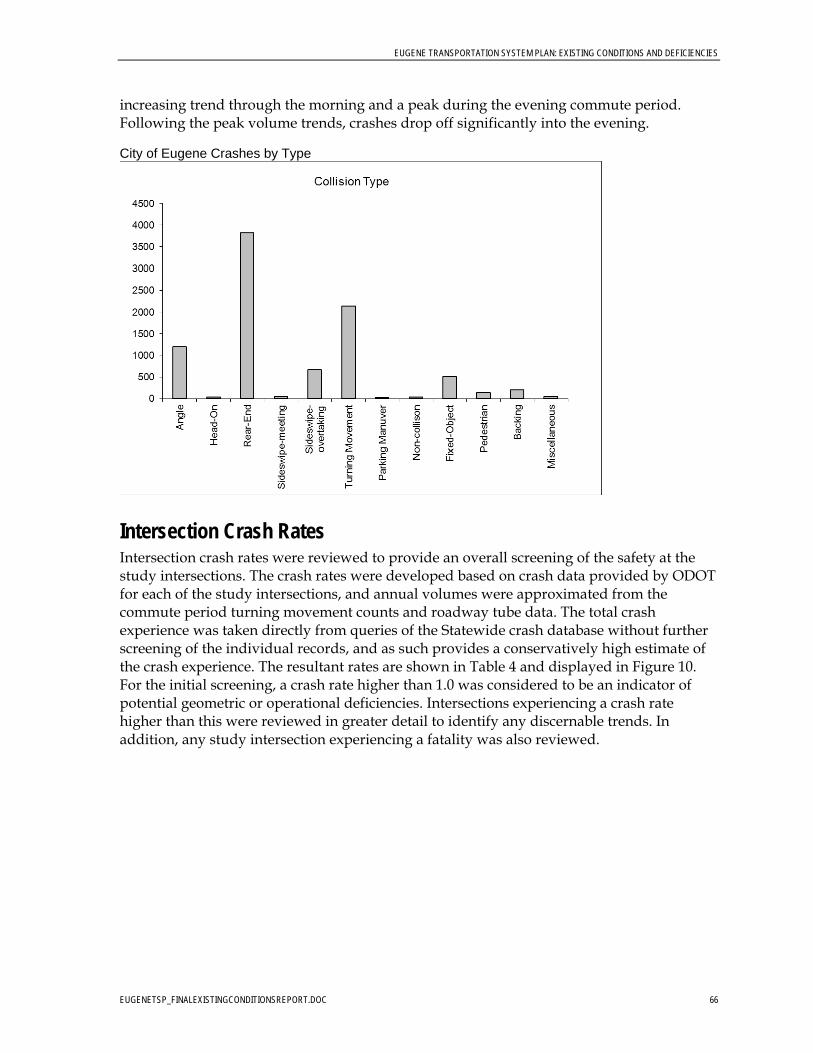
EUGENE TRANSPORTATION SYSTEM PLAN: EXISTING CONDITIONS AND DEFICIENCIES
EUGENETSP_FINALEXISTINGCONDITIONSREPORT.DOC 66
increasing trend through the morning and a peak during the evening commute period. Following the peak volume trends, crashes drop off significantly into the evening. City of Eugene Crashes by Type
Intersection Crash Rates Intersection crash rates were reviewed to provide an overall screening of the safety at the study intersections. The crash rates were developed based on crash data provided by ODOT for each of the study intersections, and annual volumes were approximated from the commute period turning movement counts and roadway tube data. The total crash experience was taken directly from queries of the Statewide crash database without further screening of the individual records, and as such provides a conservatively high estimate of the crash experience. The resultant rates are shown in Table 4 and displayed in Figure 10. For the initial screening, a crash rate higher than 1.0 was considered to be an indicator of potential geometric or operational deficiencies. Intersections experiencing a crash rate higher than this were reviewed in greater detail to identify any discernable trends. In addition, any study intersection experiencing a fatality was also reviewed.
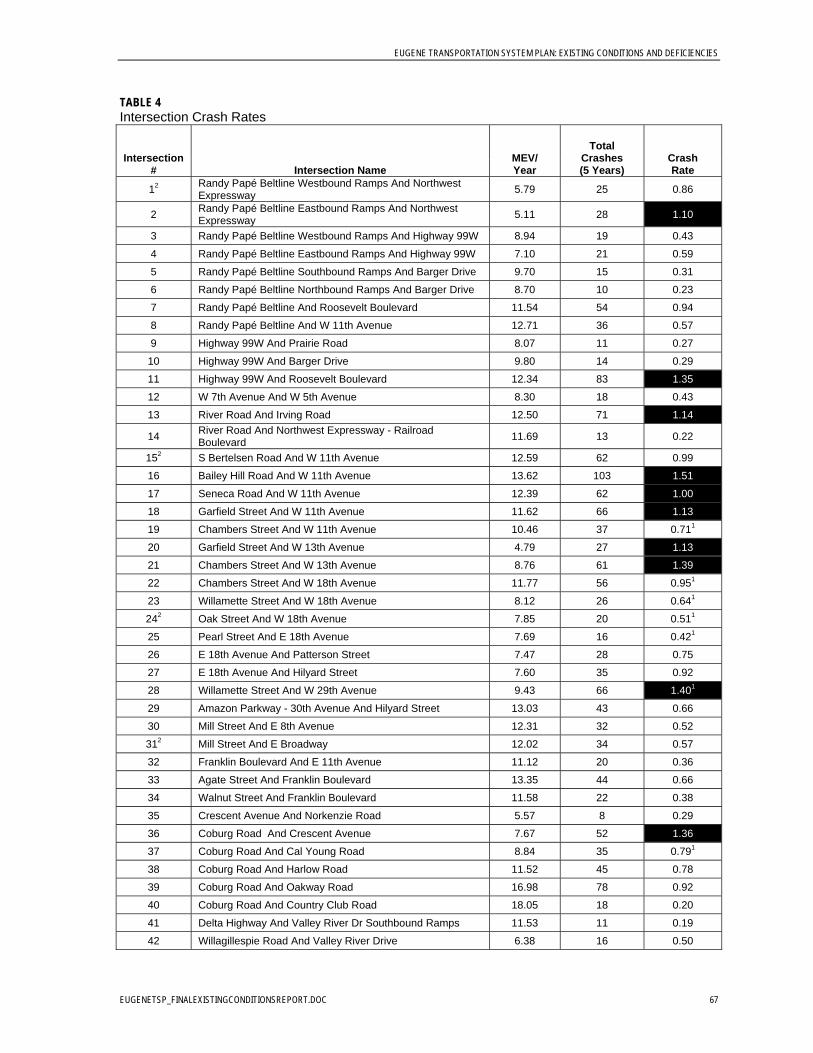
EUGENE TRANSPORTATION SYSTEM PLAN: EXISTING CONDITIONS AND DEFICIENCIES
EUGENETSP_FINALEXISTINGCONDITIONSREPORT.DOC 67
TABLE 4 Intersection Crash Rates
Intersection # Intersection Name
MEV/ Year
Total Crashes (5 Years)
Crash Rate
12 Randy Papé Beltline Westbound Ramps And Northwest Expressway
5.79 25 0.86
2 Randy Papé Beltline Eastbound Ramps And Northwest Expressway
5.11 28 1.10
3 Randy Papé Beltline Westbound Ramps And Highway 99W 8.94 19 0.43
4 Randy Papé Beltline Eastbound Ramps And Highway 99W 7.10 21 0.59
5 Randy Papé Beltline Southbound Ramps And Barger Drive 9.70 15 0.31
6 Randy Papé Beltline Northbound Ramps And Barger Drive 8.70 10 0.23
7 Randy Papé Beltline And Roosevelt Boulevard 11.54 54 0.94
8 Randy Papé Beltline And W 11th Avenue 12.71 36 0.57
9 Highway 99W And Prairie Road 8.07 11 0.27
10 Highway 99W And Barger Drive 9.80 14 0.29
11 Highway 99W And Roosevelt Boulevard 12.34 83 1.35
12 W 7th Avenue And W 5th Avenue 8.30 18 0.43
13 River Road And Irving Road 12.50 71 1.14
14 River Road And Northwest Expressway - Railroad Boulevard
11.69 13 0.22
152 S Bertelsen Road And W 11th Avenue 12.59 62 0.99
16 Bailey Hill Road And W 11th Avenue 13.62 103 1.51
17 Seneca Road And W 11th Avenue 12.39 62 1.00
18 Garfield Street And W 11th Avenue 11.62 66 1.13
19 Chambers Street And W 11th Avenue 10.46 37 0.711
20 Garfield Street And W 13th Avenue 4.79 27 1.13
21 Chambers Street And W 13th Avenue 8.76 61 1.39
22 Chambers Street And W 18th Avenue 11.77 56 0.951
23 Willamette Street And W 18th Avenue 8.12 26 0.641
242 Oak Street And W 18th Avenue 7.85 20 0.511
25 Pearl Street And E 18th Avenue 7.69 16 0.421
26 E 18th Avenue And Patterson Street 7.47 28 0.75
27 E 18th Avenue And Hilyard Street 7.60 35 0.92
28 Willamette Street And W 29th Avenue 9.43 66 1.401
29 Amazon Parkway - 30th Avenue And Hilyard Street 13.03 43 0.66
30 Mill Street And E 8th Avenue 12.31 32 0.52
312 Mill Street And E Broadway 12.02 34 0.57
32 Franklin Boulevard And E 11th Avenue 11.12 20 0.36
33 Agate Street And Franklin Boulevard 13.35 44 0.66
34 Walnut Street And Franklin Boulevard 11.58 22 0.38
35 Crescent Avenue And Norkenzie Road 5.57 8 0.29
36 Coburg Road And Crescent Avenue 7.67 52 1.36
37 Coburg Road And Cal Young Road 8.84 35 0.791
38 Coburg Road And Harlow Road 11.52 45 0.78
39 Coburg Road And Oakway Road 16.98 78 0.92
40 Coburg Road And Country Club Road 18.05 18 0.20
41 Delta Highway And Valley River Dr Southbound Ramps 11.53 11 0.19
42 Willagillespie Road And Valley River Drive 6.38 16 0.50
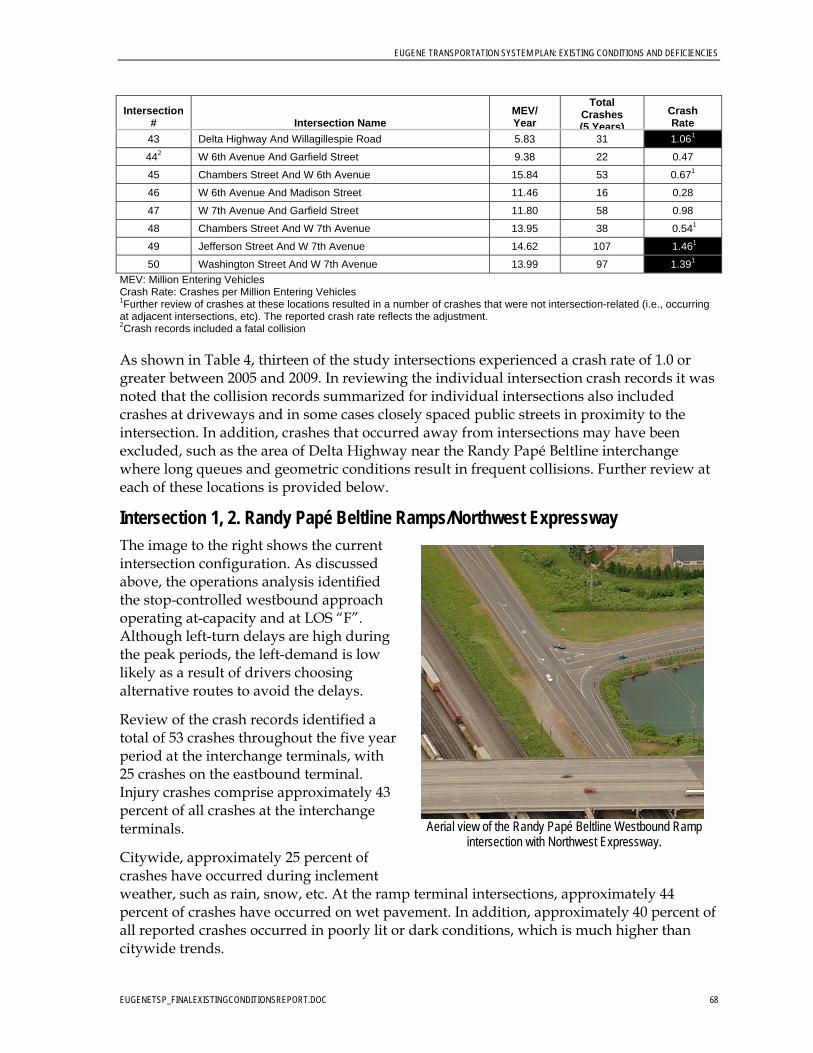
EUGENE TRANSPORTATION SYSTEM PLAN: EXISTING CONDITIONS AND DEFICIENCIES
EUGENETSP_FINALEXISTINGCONDITIONSREPORT.DOC 68
Intersection # Intersection Name
MEV/ Year
Total Crashes (5 Years)
Crash Rate
43 Delta Highway And Willagillespie Road 5.83 31 1.061
442 W 6th Avenue And Garfield Street 9.38 22 0.47
45 Chambers Street And W 6th Avenue 15.84 53 0.671
46 W 6th Avenue And Madison Street 11.46 16 0.28
47 W 7th Avenue And Garfield Street 11.80 58 0.98
48 Chambers Street And W 7th Avenue 13.95 38 0.541
49 Jefferson Street And W 7th Avenue 14.62 107 1.461
50 Washington Street And W 7th Avenue 13.99 97 1.391
MEV: Million Entering Vehicles Crash Rate: Crashes per Million Entering Vehicles 1Further review of crashes at these locations resulted in a number of crashes that were not intersection-related (i.e., occurring at adjacent intersections, etc). The reported crash rate reflects the adjustment. 2Crash records included a fatal collision
As shown in Table 4, thirteen of the study intersections experienced a crash rate of 1.0 or greater between 2005 and 2009. In reviewing the individual intersection crash records it was noted that the collision records summarized for individual intersections also included crashes at driveways and in some cases closely spaced public streets in proximity to the intersection. In addition, crashes that occurred away from intersections may have been excluded, such as the area of Delta Highway near the Randy Papé Beltline interchange where long queues and geometric conditions result in frequent collisions. Further review at each of these locations is provided below.
Intersection 1, 2. Randy Papé Beltline Ramps/Northwest Expressway The image to the right shows the current intersection configuration. As discussed above, the operations analysis identified the stop-controlled westbound approach operating at-capacity and at LOS “F”. Although left-turn delays are high during the peak periods, the left-demand is low likely as a result of drivers choosing alternative routes to avoid the delays.
Review of the crash records identified a total of 53 crashes throughout the five year period at the interchange terminals, with 25 crashes on the eastbound terminal. Injury crashes comprise approximately 43 percent of all crashes at the interchange terminals.
Citywide, approximately 25 percent of crashes have occurred during inclement weather, such as rain, snow, etc. At the ramp terminal intersections, approximately 44 percent of crashes have occurred on wet pavement. In addition, approximately 40 percent of all reported crashes occurred in poorly lit or dark conditions, which is much higher than citywide trends.
Aerial view of the Randy Papé Beltline Westbound Ramp
intersection with Northwest Expressway.
EUGENE TRANSPORTATION SYSTEM PLAN: EXISTING CONDITIONS AND DEFICIENCIES
EUGENETSP_FINALEXISTINGCONDITIONSREPORT.DOC 69
This data suggests that inclement weather and the lack of illumination may be affecting visibility. In addition, as discussed in the operations review, due to the high volume of through traffic there are limited gaps in traffic for vehicles to turn from the ramp onto Northwest Expressway. The crash experience suggests that vehicles may be accepting shorter gaps than are necessary to safely maneuver into the through traffic, especially during inclement weather conditions. Intersection improvements should consider both the operational and safety needs.
The one fatality within the crash records occurred in December 2007 and was reported as a single vehicle collision. Further review of the database revealed that the crash occurred on the Randy Papé Beltline mainline east of the diverge point for the westbound off-ramp. Accordingly, the fatal crash was not associated with the interchange ramps.
Intersection 11. Highway 99W/Roosevelt Boulevard At the Highway 99W intersection with Roosevelt Boulevard intersection, 83 crashes were reported during the past five years, with 53 percent of the crashes reported as injury crashes. Yearly crash experience has been relatively constant throughout this period, with rear-end and turning movement crashes comprising three-quarters of all reported collisions. Of the reported rear-end collisions, approximately 46 percent are associated with northbound vehicles, approximately 34 percent are associated with southbound vehicles, and the remainder are associated with eastbound or westbound vehicles. Two of the crashes at this intersection involved a pedestrian, both of which were classified as injury crashes. Review of the crash data did not identify any specific patterns or trends.
Geometric review of the intersection identified that the intersection is skewed at an approximately 30 degree angle, with channelized right-turn islands to provide an adequate turning radius on the southeast and northwest quadrants. Separate left-turn lanes are in place and provide protected signal phasing on all approaches. Private driveways are located within close proximity to the intersection, though the crash records show only two collisions that were recorded as driveway-related.
The City of Eugene has reviewed improvement options at this intersection to increase driver awareness on the northbound approach, where the majority of the rear-end crashes have occurred. The railroad overcrossing limits the available sight distance toward the back of queue on the northbound approach, so an overhead flashing warning sign was identified as the recommended mitigation. No funding has yet been secured for this improvement.
Intersection 13. River Road/Irving Street – Hunsaker Lane There were 71 reported crashes at the River Road/Irving Street intersection throughout the five year analysis. Ninety-percent of the reported crashes were either rear-end (52 percent) or turning movements (38 percent), and one-third of the reported crashes resulted in injuries.
Review of the crash records identified two pedestrian crashes that occurred within the intersection on the westbound exiting lane, one in September 2008 and one in August 2009. In the 2009 crash there were two pedestrians struck by a southbound right-turning vehicle. The crash records cited failure to yield right-of-way. The 2008 crash was coded as the fault of the pedestrian at an illegal crossing location.
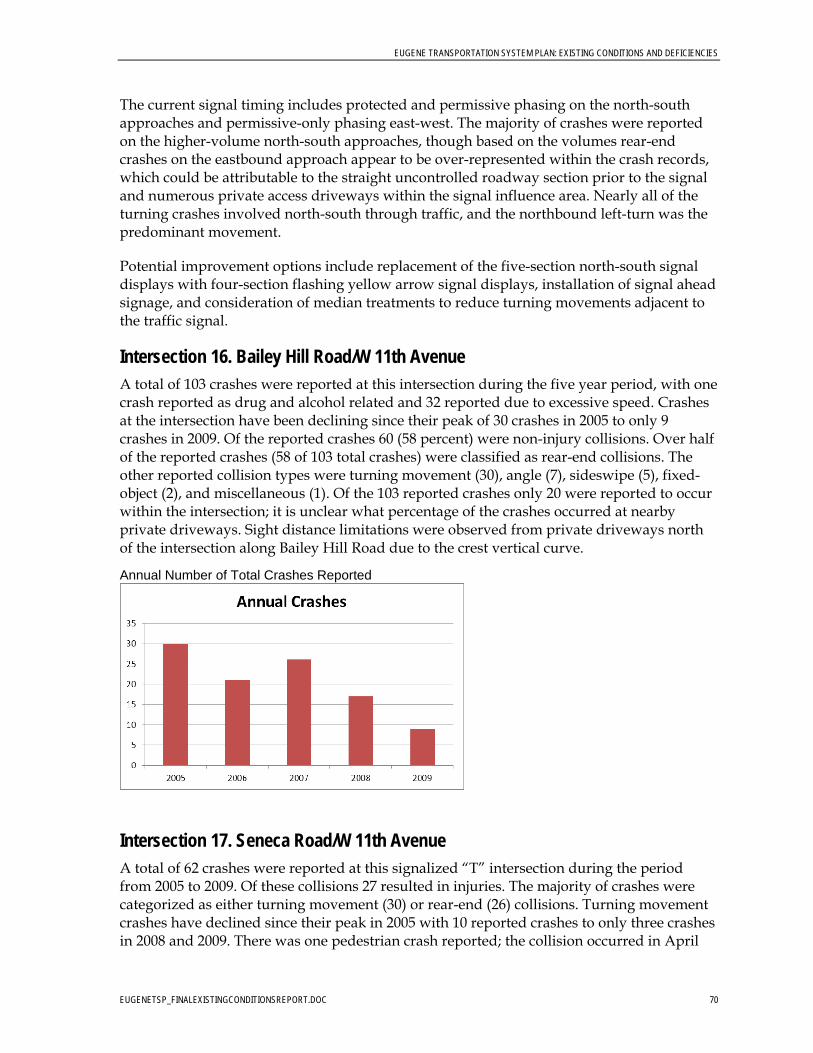
EUGENE TRANSPORTATION SYSTEM PLAN: EXISTING CONDITIONS AND DEFICIENCIES
EUGENETSP_FINALEXISTINGCONDITIONSREPORT.DOC 70
The current signal timing includes protected and permissive phasing on the north-south approaches and permissive-only phasing east-west. The majority of crashes were reported on the higher-volume north-south approaches, though based on the volumes rear-end crashes on the eastbound approach appear to be over-represented within the crash records, which could be attributable to the straight uncontrolled roadway section prior to the signal and numerous private access driveways within the signal influence area. Nearly all of the turning crashes involved north-south through traffic, and the northbound left-turn was the predominant movement.
Potential improvement options include replacement of the five-section north-south signal displays with four-section flashing yellow arrow signal displays, installation of signal ahead signage, and consideration of median treatments to reduce turning movements adjacent to the traffic signal.
Intersection 16. Bailey Hill Road/W 11th Avenue A total of 103 crashes were reported at this intersection during the five year period, with one crash reported as drug and alcohol related and 32 reported due to excessive speed. Crashes at the intersection have been declining since their peak of 30 crashes in 2005 to only 9 crashes in 2009. Of the reported crashes 60 (58 percent) were non-injury collisions. Over half of the reported crashes (58 of 103 total crashes) were classified as rear-end collisions. The other reported collision types were turning movement (30), angle (7), sideswipe (5), fixed-object (2), and miscellaneous (1). Of the 103 reported crashes only 20 were reported to occur within the intersection; it is unclear what percentage of the crashes occurred at nearby private driveways. Sight distance limitations were observed from private driveways north of the intersection along Bailey Hill Road due to the crest vertical curve.
Annual Number of Total Crashes Reported
Intersection 17. Seneca Road/W 11th Avenue A total of 62 crashes were reported at this signalized “T” intersection during the period from 2005 to 2009. Of these collisions 27 resulted in injuries. The majority of crashes were categorized as either turning movement (30) or rear-end (26) collisions. Turning movement crashes have declined since their peak in 2005 with 10 reported crashes to only three crashes in 2008 and 2009. There was one pedestrian crash reported; the collision occurred in April
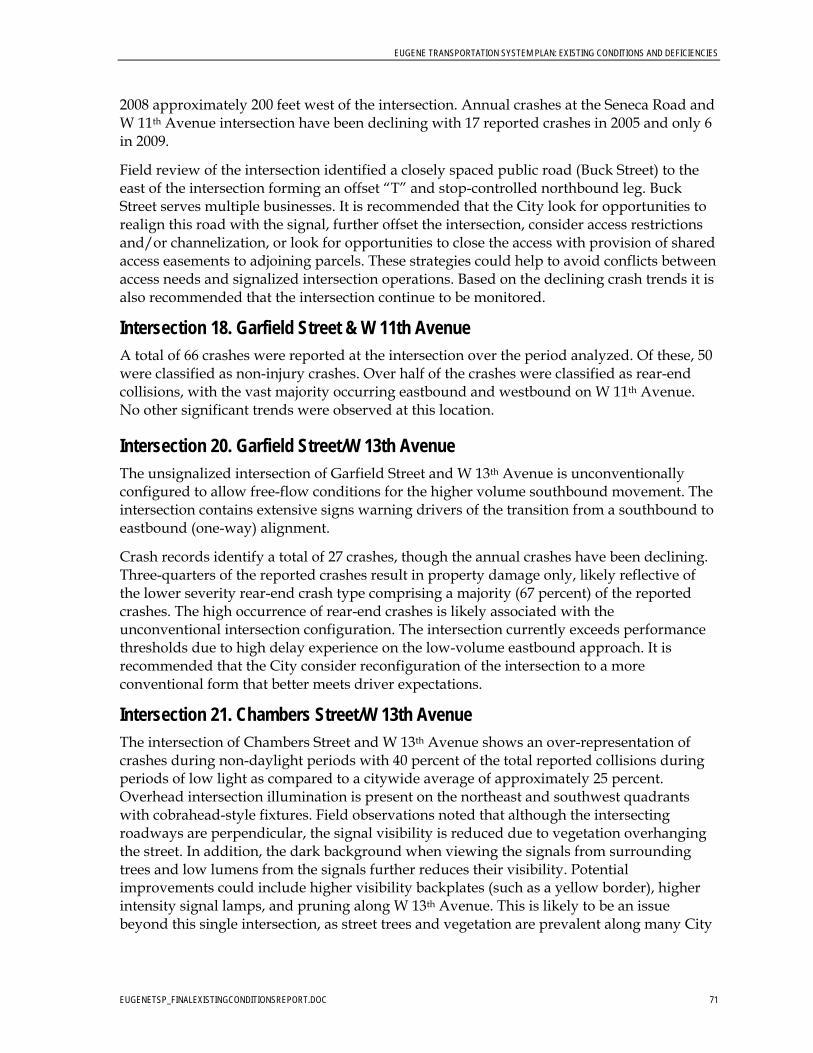
EUGENE TRANSPORTATION SYSTEM PLAN: EXISTING CONDITIONS AND DEFICIENCIES
EUGENETSP_FINALEXISTINGCONDITIONSREPORT.DOC 71
2008 approximately 200 feet west of the intersection. Annual crashes at the Seneca Road and W 11th Avenue intersection have been declining with 17 reported crashes in 2005 and only 6 in 2009.
Field review of the intersection identified a closely spaced public road (Buck Street) to the east of the intersection forming an offset “T” and stop-controlled northbound leg. Buck Street serves multiple businesses. It is recommended that the City look for opportunities to realign this road with the signal, further offset the intersection, consider access restrictions and/or channelization, or look for opportunities to close the access with provision of shared access easements to adjoining parcels. These strategies could help to avoid conflicts between access needs and signalized intersection operations. Based on the declining crash trends it is also recommended that the intersection continue to be monitored.
Intersection 18. Garfield Street & W 11th Avenue A total of 66 crashes were reported at the intersection over the period analyzed. Of these, 50 were classified as non-injury crashes. Over half of the crashes were classified as rear-end collisions, with the vast majority occurring eastbound and westbound on W 11th Avenue. No other significant trends were observed at this location.
Intersection 20. Garfield Street/W 13th Avenue The unsignalized intersection of Garfield Street and W 13th Avenue is unconventionally configured to allow free-flow conditions for the higher volume southbound movement. The intersection contains extensive signs warning drivers of the transition from a southbound to eastbound (one-way) alignment.
Crash records identify a total of 27 crashes, though the annual crashes have been declining. Three-quarters of the reported crashes result in property damage only, likely reflective of the lower severity rear-end crash type comprising a majority (67 percent) of the reported crashes. The high occurrence of rear-end crashes is likely associated with the unconventional intersection configuration. The intersection currently exceeds performance thresholds due to high delay experience on the low-volume eastbound approach. It is recommended that the City consider reconfiguration of the intersection to a more conventional form that better meets driver expectations.
Intersection 21. Chambers Street/W 13th Avenue The intersection of Chambers Street and W 13th Avenue shows an over-representation of crashes during non-daylight periods with 40 percent of the total reported collisions during periods of low light as compared to a citywide average of approximately 25 percent. Overhead intersection illumination is present on the northeast and southwest quadrants with cobrahead-style fixtures. Field observations noted that although the intersecting roadways are perpendicular, the signal visibility is reduced due to vegetation overhanging the street. In addition, the dark background when viewing the signals from surrounding trees and low lumens from the signals further reduces their visibility. Potential improvements could include higher visibility backplates (such as a yellow border), higher intensity signal lamps, and pruning along W 13th Avenue. This is likely to be an issue beyond this single intersection, as street trees and vegetation are prevalent along many City
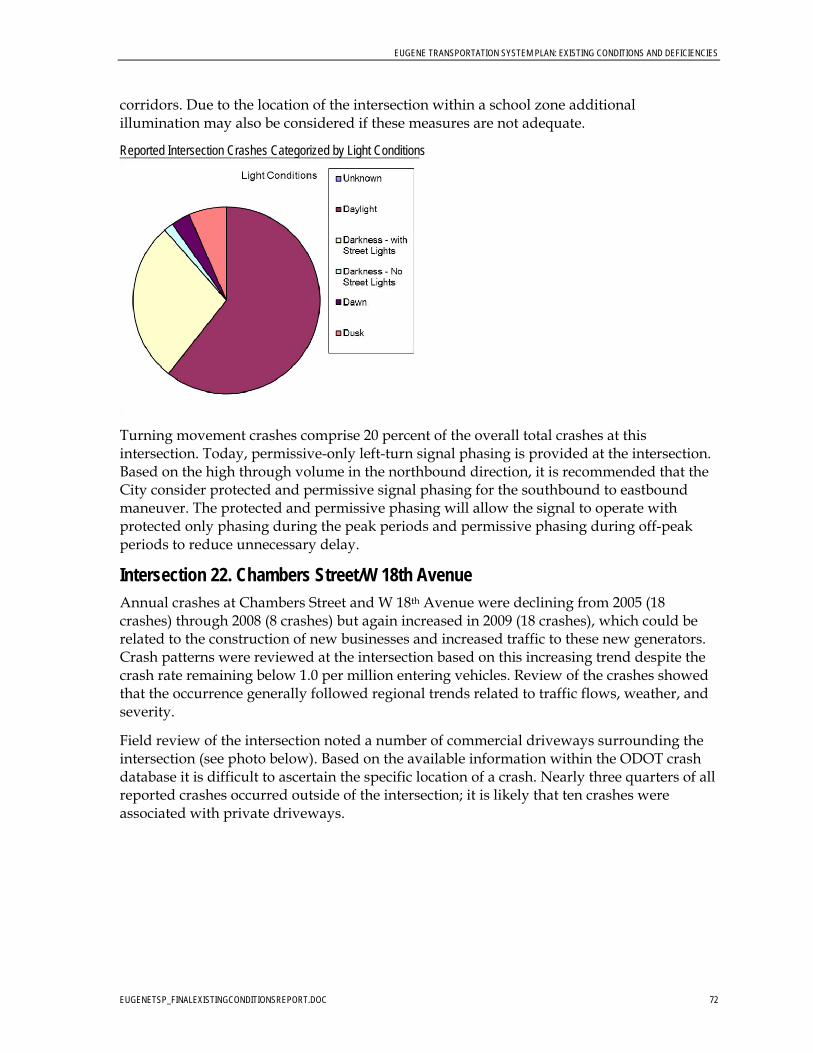
EUGENE TRANSPORTATION SYSTEM PLAN: EXISTING CONDITIONS AND DEFICIENCIES
EUGENETSP_FINALEXISTINGCONDITIONSREPORT.DOC 72
corridors. Due to the location of the intersection within a school zone additional illumination may also be considered if these measures are not adequate.
Reported Intersection Crashes Categorized by Light Conditions
Turning movement crashes comprise 20 percent of the overall total crashes at this intersection. Today, permissive-only left-turn signal phasing is provided at the intersection. Based on the high through volume in the northbound direction, it is recommended that the City consider protected and permissive signal phasing for the southbound to eastbound maneuver. The protected and permissive phasing will allow the signal to operate with protected only phasing during the peak periods and permissive phasing during off-peak periods to reduce unnecessary delay.
Intersection 22. Chambers Street/W 18th Avenue Annual crashes at Chambers Street and W 18th Avenue were declining from 2005 (18 crashes) through 2008 (8 crashes) but again increased in 2009 (18 crashes), which could be related to the construction of new businesses and increased traffic to these new generators. Crash patterns were reviewed at the intersection based on this increasing trend despite the crash rate remaining below 1.0 per million entering vehicles. Review of the crashes showed that the occurrence generally followed regional trends related to traffic flows, weather, and severity.
Field review of the intersection noted a number of commercial driveways surrounding the intersection (see photo below). Based on the available information within the ODOT crash database it is difficult to ascertain the specific location of a crash. Nearly three quarters of all reported crashes occurred outside of the intersection; it is likely that ten crashes were associated with private driveways.
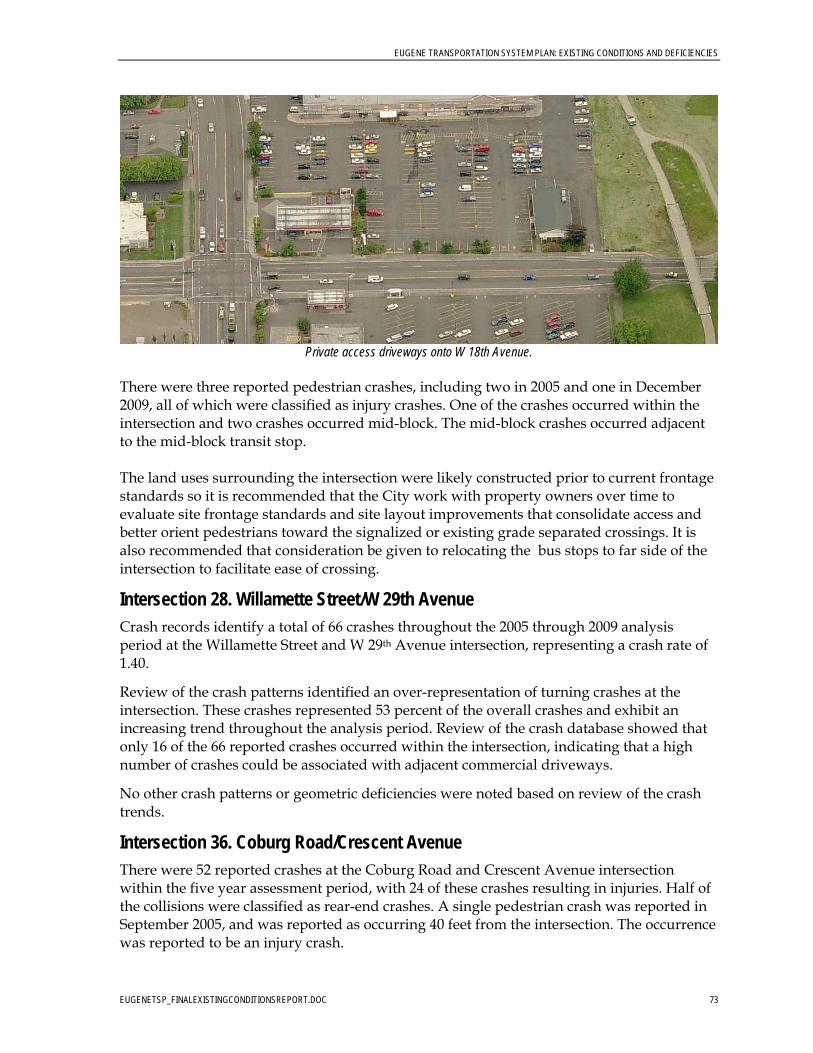
EUGENE TRANSPORTATION SYSTEM PLAN: EXISTING CONDITIONS AND DEFICIENCIES
EUGENETSP_FINALEXISTINGCONDITIONSREPORT.DOC 73
Private access driveways onto W 18th Avenue.
There were three reported pedestrian crashes, including two in 2005 and one in December 2009, all of which were classified as injury crashes. One of the crashes occurred within the intersection and two crashes occurred mid-block. The mid-block crashes occurred adjacent to the mid-block transit stop. The land uses surrounding the intersection were likely constructed prior to current frontage standards so it is recommended that the City work with property owners over time to evaluate site frontage standards and site layout improvements that consolidate access and better orient pedestrians toward the signalized or existing grade separated crossings. It is also recommended that consideration be given to relocating the bus stops to far side of the intersection to facilitate ease of crossing.
Intersection 28. Willamette Street/W 29th Avenue Crash records identify a total of 66 crashes throughout the 2005 through 2009 analysis period at the Willamette Street and W 29th Avenue intersection, representing a crash rate of 1.40.
Review of the crash patterns identified an over-representation of turning crashes at the intersection. These crashes represented 53 percent of the overall crashes and exhibit an increasing trend throughout the analysis period. Review of the crash database showed that only 16 of the 66 reported crashes occurred within the intersection, indicating that a high number of crashes could be associated with adjacent commercial driveways.
No other crash patterns or geometric deficiencies were noted based on review of the crash trends.
Intersection 36. Coburg Road/Crescent Avenue There were 52 reported crashes at the Coburg Road and Crescent Avenue intersection within the five year assessment period, with 24 of these crashes resulting in injuries. Half of the collisions were classified as rear-end crashes. A single pedestrian crash was reported in September 2005, and was reported as occurring 40 feet from the intersection. The occurrence was reported to be an injury crash.
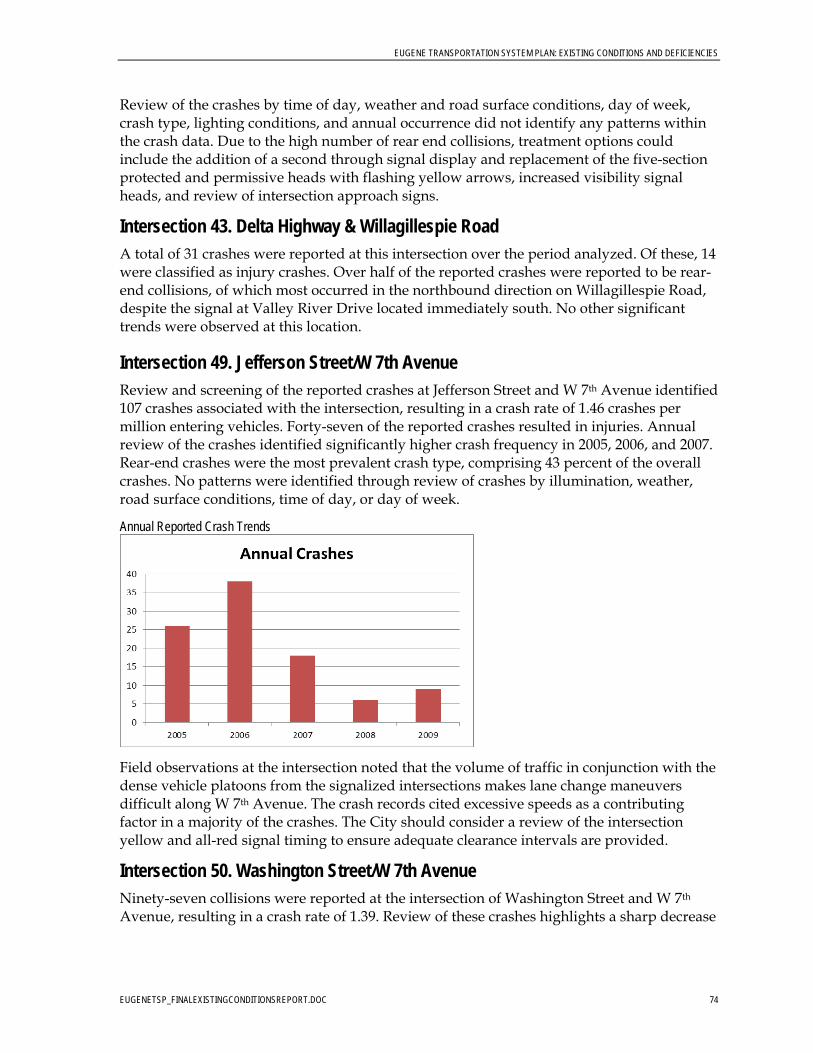
EUGENE TRANSPORTATION SYSTEM PLAN: EXISTING CONDITIONS AND DEFICIENCIES
EUGENETSP_FINALEXISTINGCONDITIONSREPORT.DOC 74
Review of the crashes by time of day, weather and road surface conditions, day of week, crash type, lighting conditions, and annual occurrence did not identify any patterns within the crash data. Due to the high number of rear end collisions, treatment options could include the addition of a second through signal display and replacement of the five-section protected and permissive heads with flashing yellow arrows, increased visibility signal heads, and review of intersection approach signs.
Intersection 43. Delta Highway & Willagillespie Road A total of 31 crashes were reported at this intersection over the period analyzed. Of these, 14 were classified as injury crashes. Over half of the reported crashes were reported to be rear-end collisions, of which most occurred in the northbound direction on Willagillespie Road, despite the signal at Valley River Drive located immediately south. No other significant trends were observed at this location.
Intersection 49. Jefferson Street/W 7th Avenue Review and screening of the reported crashes at Jefferson Street and W 7th Avenue identified 107 crashes associated with the intersection, resulting in a crash rate of 1.46 crashes per million entering vehicles. Forty-seven of the reported crashes resulted in injuries. Annual review of the crashes identified significantly higher crash frequency in 2005, 2006, and 2007. Rear-end crashes were the most prevalent crash type, comprising 43 percent of the overall crashes. No patterns were identified through review of crashes by illumination, weather, road surface conditions, time of day, or day of week.
Annual Reported Crash Trends
Field observations at the intersection noted that the volume of traffic in conjunction with the dense vehicle platoons from the signalized intersections makes lane change maneuvers difficult along W 7th Avenue. The crash records cited excessive speeds as a contributing factor in a majority of the crashes. The City should consider a review of the intersection yellow and all-red signal timing to ensure adequate clearance intervals are provided.
Intersection 50. Washington Street/W 7th Avenue Ninety-seven collisions were reported at the intersection of Washington Street and W 7th Avenue, resulting in a crash rate of 1.39. Review of these crashes highlights a sharp decrease
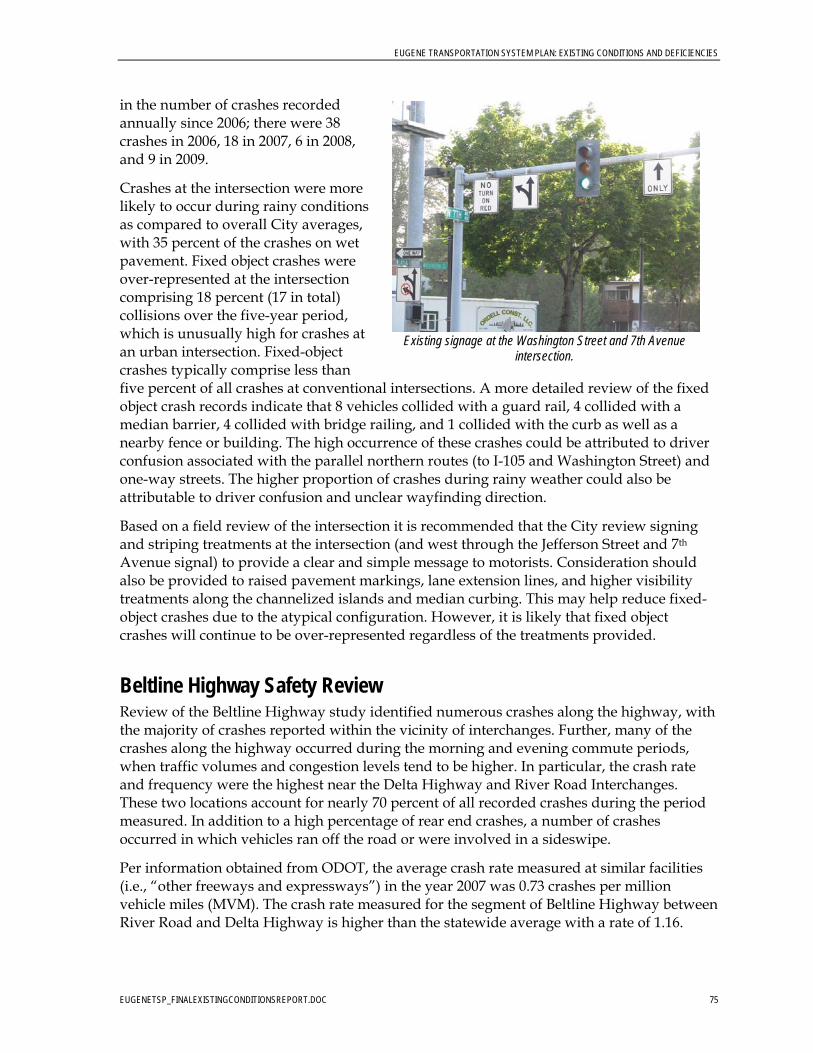
EUGENE TRANSPORTATION SYSTEM PLAN: EXISTING CONDITIONS AND DEFICIENCIES
EUGENETSP_FINALEXISTINGCONDITIONSREPORT.DOC 75
in the number of crashes recorded annually since 2006; there were 38 crashes in 2006, 18 in 2007, 6 in 2008, and 9 in 2009.
Crashes at the intersection were more likely to occur during rainy conditions as compared to overall City averages, with 35 percent of the crashes on wet pavement. Fixed object crashes were over-represented at the intersection comprising 18 percent (17 in total) collisions over the five-year period, which is unusually high for crashes at an urban intersection. Fixed-object crashes typically comprise less than five percent of all crashes at conventional intersections. A more detailed review of the fixed object crash records indicate that 8 vehicles collided with a guard rail, 4 collided with a median barrier, 4 collided with bridge railing, and 1 collided with the curb as well as a nearby fence or building. The high occurrence of these crashes could be attributed to driver confusion associated with the parallel northern routes (to I-105 and Washington Street) and one-way streets. The higher proportion of crashes during rainy weather could also be attributable to driver confusion and unclear wayfinding direction.
Based on a field review of the intersection it is recommended that the City review signing and striping treatments at the intersection (and west through the Jefferson Street and 7th Avenue signal) to provide a clear and simple message to motorists. Consideration should also be provided to raised pavement markings, lane extension lines, and higher visibility treatments along the channelized islands and median curbing. This may help reduce fixed-object crashes due to the atypical configuration. However, it is likely that fixed object crashes will continue to be over-represented regardless of the treatments provided.
Beltline Highway Safety Review Review of the Beltline Highway study identified numerous crashes along the highway, with the majority of crashes reported within the vicinity of interchanges. Further, many of the crashes along the highway occurred during the morning and evening commute periods, when traffic volumes and congestion levels tend to be higher. In particular, the crash rate and frequency were the highest near the Delta Highway and River Road Interchanges. These two locations account for nearly 70 percent of all recorded crashes during the period measured. In addition to a high percentage of rear end crashes, a number of crashes occurred in which vehicles ran off the road or were involved in a sideswipe.
Per information obtained from ODOT, the average crash rate measured at similar facilities (i.e., “other freeways and expressways”) in the year 2007 was 0.73 crashes per million vehicle miles (MVM). The crash rate measured for the segment of Beltline Highway between River Road and Delta Highway is higher than the statewide average with a rate of 1.16.
Existing signage at the Washington Street and 7th Avenue
intersection.
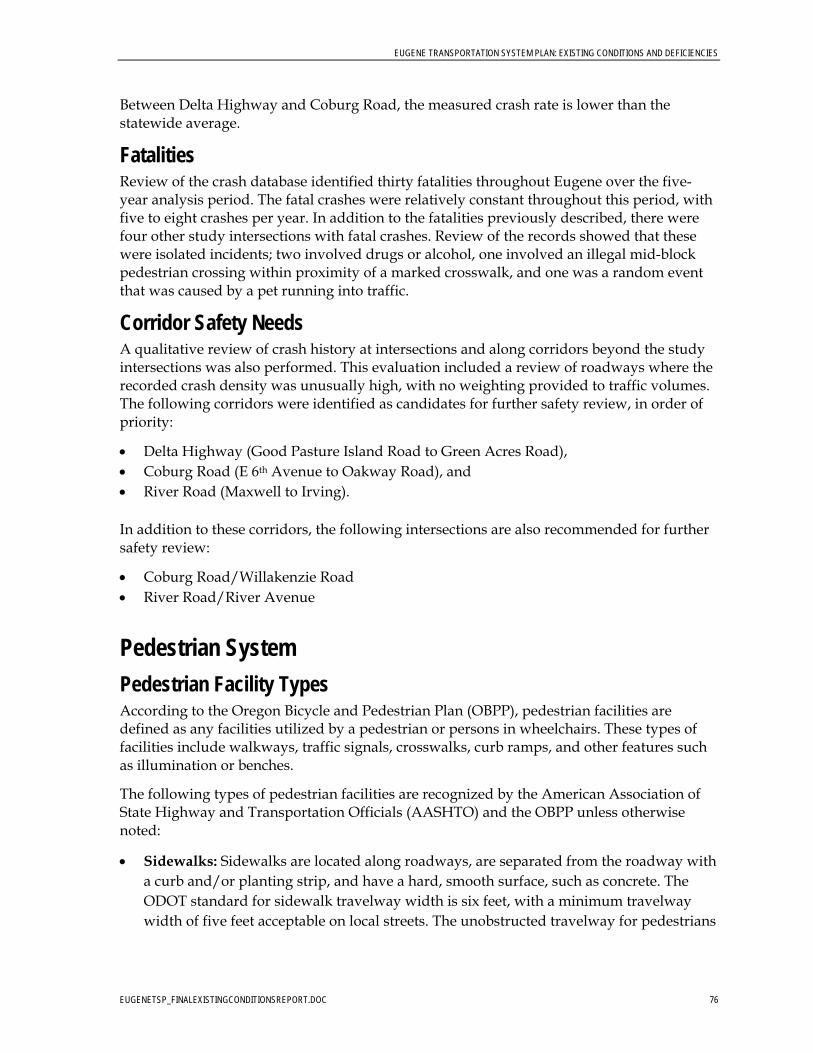
EUGENE TRANSPORTATION SYSTEM PLAN: EXISTING CONDITIONS AND DEFICIENCIES
EUGENETSP_FINALEXISTINGCONDITIONSREPORT.DOC 76
Between Delta Highway and Coburg Road, the measured crash rate is lower than the statewide average.
Fatalities Review of the crash database identified thirty fatalities throughout Eugene over the five-year analysis period. The fatal crashes were relatively constant throughout this period, with five to eight crashes per year. In addition to the fatalities previously described, there were four other study intersections with fatal crashes. Review of the records showed that these were isolated incidents; two involved drugs or alcohol, one involved an illegal mid-block pedestrian crossing within proximity of a marked crosswalk, and one was a random event that was caused by a pet running into traffic.
Corridor Safety Needs A qualitative review of crash history at intersections and along corridors beyond the study intersections was also performed. This evaluation included a review of roadways where the recorded crash density was unusually high, with no weighting provided to traffic volumes. The following corridors were identified as candidates for further safety review, in order of priority:
Delta Highway (Good Pasture Island Road to Green Acres Road), Coburg Road (E 6th Avenue to Oakway Road), and River Road (Maxwell to Irving).
In addition to these corridors, the following intersections are also recommended for further safety review:
Coburg Road/Willakenzie Road River Road/River Avenue
Pedestrian System
Pedestrian Facility Types According to the Oregon Bicycle and Pedestrian Plan (OBPP), pedestrian facilities are defined as any facilities utilized by a pedestrian or persons in wheelchairs. These types of facilities include walkways, traffic signals, crosswalks, curb ramps, and other features such as illumination or benches.
The following types of pedestrian facilities are recognized by the American Association of State Highway and Transportation Officials (AASHTO) and the OBPP unless otherwise noted:
Sidewalks: Sidewalks are located along roadways, are separated from the roadway with a curb and/or planting strip, and have a hard, smooth surface, such as concrete. The ODOT standard for sidewalk travelway width is six feet, with a minimum travelway width of five feet acceptable on local streets. The unobstructed travelway for pedestrians
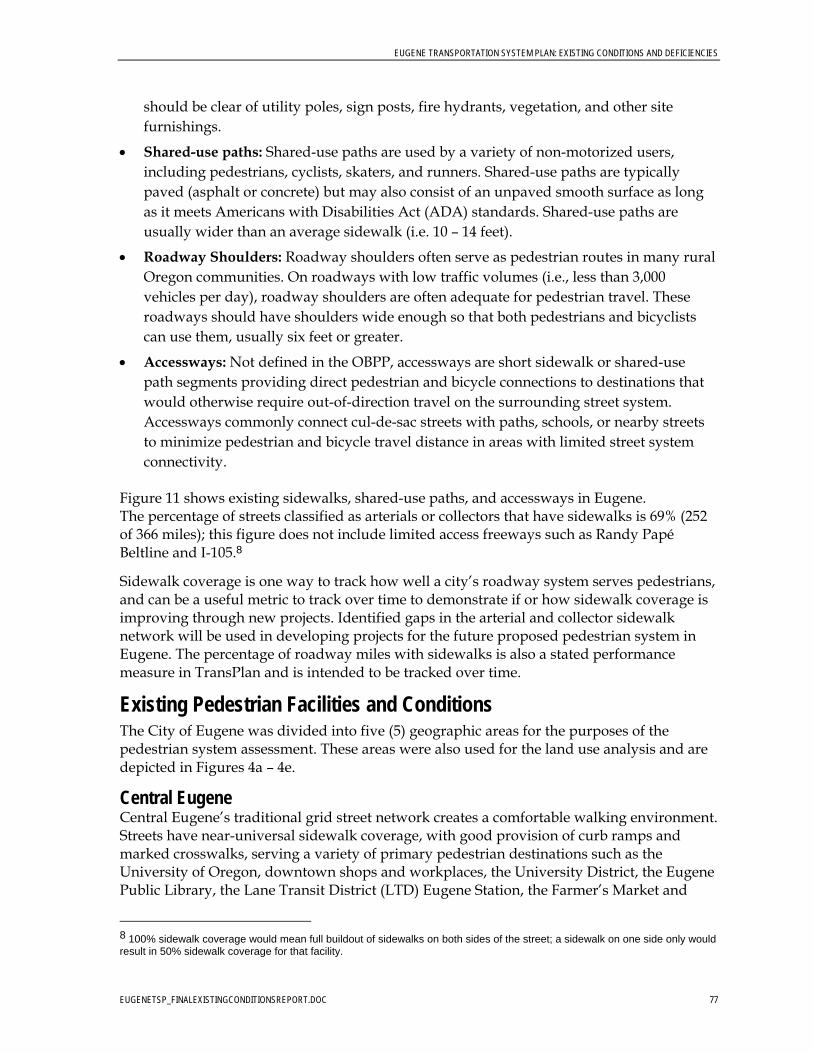
EUGENE TRANSPORTATION SYSTEM PLAN: EXISTING CONDITIONS AND DEFICIENCIES
EUGENETSP_FINALEXISTINGCONDITIONSREPORT.DOC 77
should be clear of utility poles, sign posts, fire hydrants, vegetation, and other site furnishings.
Shared-use paths: Shared-use paths are used by a variety of non-motorized users, including pedestrians, cyclists, skaters, and runners. Shared-use paths are typically paved (asphalt or concrete) but may also consist of an unpaved smooth surface as long as it meets Americans with Disabilities Act (ADA) standards. Shared-use paths are usually wider than an average sidewalk (i.e. 10 – 14 feet).
Roadway Shoulders: Roadway shoulders often serve as pedestrian routes in many rural Oregon communities. On roadways with low traffic volumes (i.e., less than 3,000 vehicles per day), roadway shoulders are often adequate for pedestrian travel. These roadways should have shoulders wide enough so that both pedestrians and bicyclists can use them, usually six feet or greater.
Accessways: Not defined in the OBPP, accessways are short sidewalk or shared-use path segments providing direct pedestrian and bicycle connections to destinations that would otherwise require out-of-direction travel on the surrounding street system. Accessways commonly connect cul-de-sac streets with paths, schools, or nearby streets to minimize pedestrian and bicycle travel distance in areas with limited street system connectivity.
Figure 11 shows existing sidewalks, shared-use paths, and accessways in Eugene. The percentage of streets classified as arterials or collectors that have sidewalks is 69% (252 of 366 miles); this figure does not include limited access freeways such as Randy Papé Beltline and I-105.8
Sidewalk coverage is one way to track how well a city’s roadway system serves pedestrians, and can be a useful metric to track over time to demonstrate if or how sidewalk coverage is improving through new projects. Identified gaps in the arterial and collector sidewalk network will be used in developing projects for the future proposed pedestrian system in Eugene. The percentage of roadway miles with sidewalks is also a stated performance measure in TransPlan and is intended to be tracked over time.
Existing Pedestrian Facilities and Conditions The City of Eugene was divided into five (5) geographic areas for the purposes of the pedestrian system assessment. These areas were also used for the land use analysis and are depicted in Figures 4a – 4e.
Central Eugene Central Eugene’s traditional grid street network creates a comfortable walking environment. Streets have near-universal sidewalk coverage, with good provision of curb ramps and marked crosswalks, serving a variety of primary pedestrian destinations such as the University of Oregon, downtown shops and workplaces, the University District, the Eugene Public Library, the Lane Transit District (LTD) Eugene Station, the Farmer’s Market and
8 100% sidewalk coverage would mean full buildout of sidewalks on both sides of the street; a sidewalk on one side only would result in 50% sidewalk coverage for that facility.
EUGENE TRANSPORTATION SYSTEM PLAN: EXISTING CONDITIONS AND DEFICIENCIES
EUGENETSP_FINALEXISTINGCONDITIONSREPORT.DOC 78
The LTD Eugene Station in downtown is a destination for pedestrians.
Many roads in Eugene’s South Hills lack sidewalks on one
or both sides.
Saturday Market, and parks such as Skinner Butte Park, Alton Baker Park, and Amazon Park. Many downtown employees arrive to work by transit, bicycle, or car and then make daytime trips on foot, contributing to a lively midday urban environment.
Central Eugene is served to the north by the Ruth Bascom Riverbank Path System along the Willamette River, with primary access points at Agate Street, Hilyard Street, and at the Ferry Street Bridge. To the south, the Amazon Path begins at South Eugene High School and continues south to Amazon Parkway and Tugman Park. To the east, the Fern Ridge Path begins at Westmoreland Park and continues east to the city limits.
South Hills This sector of Eugene features hilly topography and a non-grid street network, which create more challenging conditions for walking. Many roads in this part of Eugene were developed without sidewalks, and infill has been inconsistent, resulting in many roadways with no sidewalks or sidewalks on only one side of the street. Curb ramps and marked crosswalks are largely absent from this part of Eugene. Other through streets have sidewalks on one side only (e.g., Willamette Street and Fox Hollow Road). Certain pockets of residences, such as areas surrounding Friendly Street south of E 28th Avenue and surrounding Timberline Drive, have no sidewalks. It can be difficult to access some neighborhoods in the South Hills, such as Laurel Hill Valley, because of steep hills and a lack of walking facilities and connected streets.
Because much of Eugene’s South Hills are primarily residential, with few commercial destinations, pedestrian destinations in this part of town are primarily area schools, parks (such as Hendricks Park and Spencer Butte), and the soft-surface Ribbon Trail and Ridgeline Trail. The Amazon and Rexius Paths provide an important northbound route into and out of the South Hills.
West Eugene/Bethel/Danebo West Eugene has flat topography that facilitates walking, but the development patterns have left a legacy of cul-de-sac housing developments, disconnected streets, and high-speed/high-volume thoroughfares that make walking challenging and, in many cases, unpleasant. This sector of Eugene is bounded by Highway 99, the rail yards, and the Northwest Expressway along the northeastern border, presenting a largely impassable barrier to pedestrian travel into and out of the area. In addition, Randy Papé Beltline
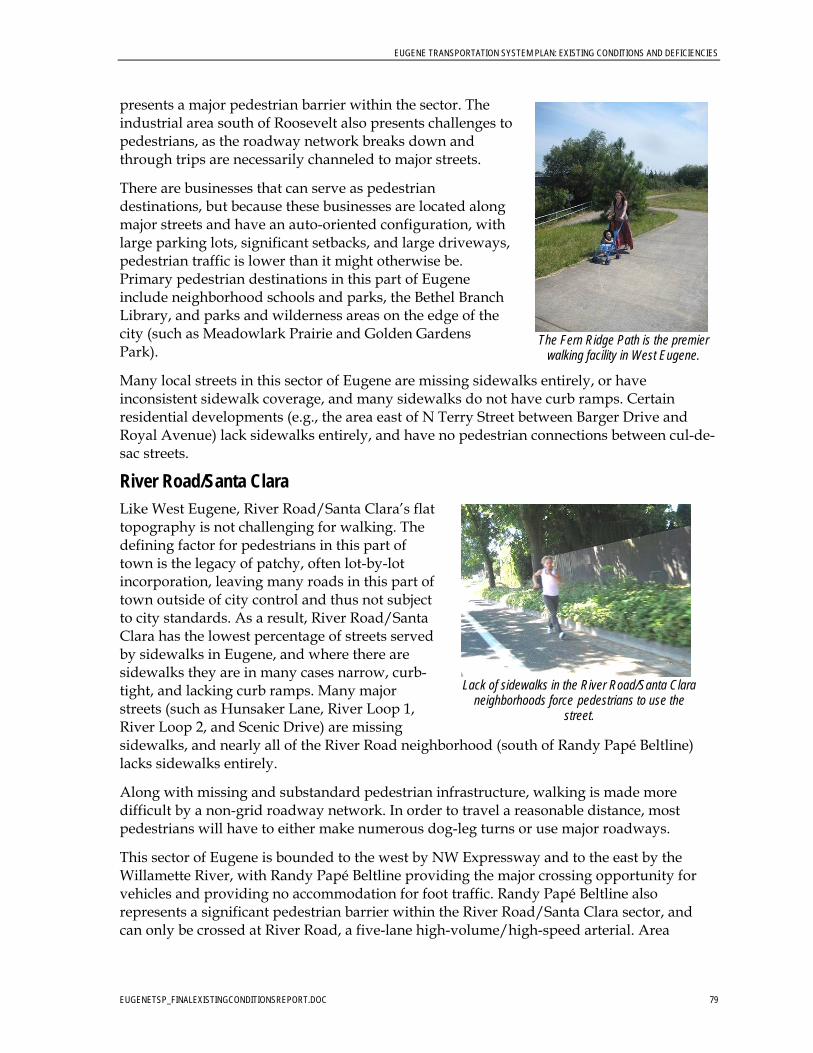
EUGENE TRANSPORTATION SYSTEM PLAN: EXISTING CONDITIONS AND DEFICIENCIES
EUGENETSP_FINALEXISTINGCONDITIONSREPORT.DOC 79
The Fern Ridge Path is the premier
walking facility in West Eugene.
presents a major pedestrian barrier within the sector. The industrial area south of Roosevelt also presents challenges to pedestrians, as the roadway network breaks down and through trips are necessarily channeled to major streets.
There are businesses that can serve as pedestrian destinations, but because these businesses are located along major streets and have an auto-oriented configuration, with large parking lots, significant setbacks, and large driveways, pedestrian traffic is lower than it might otherwise be. Primary pedestrian destinations in this part of Eugene include neighborhood schools and parks, the Bethel Branch Library, and parks and wilderness areas on the edge of the city (such as Meadowlark Prairie and Golden Gardens Park).
Many local streets in this sector of Eugene are missing sidewalks entirely, or have inconsistent sidewalk coverage, and many sidewalks do not have curb ramps. Certain residential developments (e.g., the area east of N Terry Street between Barger Drive and Royal Avenue) lack sidewalks entirely, and have no pedestrian connections between cul-de-sac streets.
River Road/Santa Clara Like West Eugene, River Road/Santa Clara’s flat topography is not challenging for walking. The defining factor for pedestrians in this part of town is the legacy of patchy, often lot-by-lot incorporation, leaving many roads in this part of town outside of city control and thus not subject to city standards. As a result, River Road/Santa Clara has the lowest percentage of streets served by sidewalks in Eugene, and where there are sidewalks they are in many cases narrow, curb-tight, and lacking curb ramps. Many major streets (such as Hunsaker Lane, River Loop 1, River Loop 2, and Scenic Drive) are missing sidewalks, and nearly all of the River Road neighborhood (south of Randy Papé Beltline) lacks sidewalks entirely.
Along with missing and substandard pedestrian infrastructure, walking is made more difficult by a non-grid roadway network. In order to travel a reasonable distance, most pedestrians will have to either make numerous dog-leg turns or use major roadways.
This sector of Eugene is bounded to the west by NW Expressway and to the east by the Willamette River, with Randy Papé Beltline providing the major crossing opportunity for vehicles and providing no accommodation for foot traffic. Randy Papé Beltline also represents a significant pedestrian barrier within the River Road/Santa Clara sector, and can only be crossed at River Road, a five-lane high-volume/high-speed arterial. Area
Lack of sidewalks in the River Road/Santa Clara
neighborhoods force pedestrians to use the street.
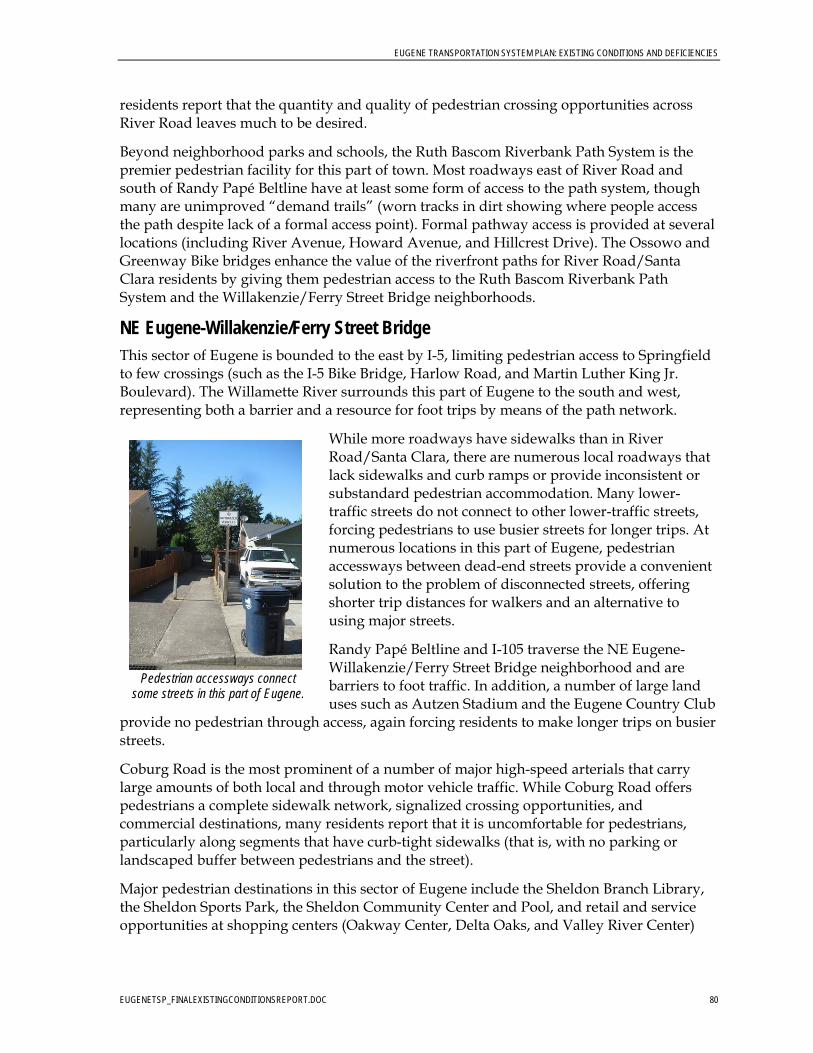
EUGENE TRANSPORTATION SYSTEM PLAN: EXISTING CONDITIONS AND DEFICIENCIES
EUGENETSP_FINALEXISTINGCONDITIONSREPORT.DOC 80
residents report that the quantity and quality of pedestrian crossing opportunities across River Road leaves much to be desired.
Beyond neighborhood parks and schools, the Ruth Bascom Riverbank Path System is the premier pedestrian facility for this part of town. Most roadways east of River Road and south of Randy Papé Beltline have at least some form of access to the path system, though many are unimproved “demand trails” (worn tracks in dirt showing where people access the path despite lack of a formal access point). Formal pathway access is provided at several locations (including River Avenue, Howard Avenue, and Hillcrest Drive). The Ossowo and Greenway Bike bridges enhance the value of the riverfront paths for River Road/Santa Clara residents by giving them pedestrian access to the Ruth Bascom Riverbank Path System and the Willakenzie/Ferry Street Bridge neighborhoods.
NE Eugene-Willakenzie/Ferry Street Bridge This sector of Eugene is bounded to the east by I-5, limiting pedestrian access to Springfield to few crossings (such as the I-5 Bike Bridge, Harlow Road, and Martin Luther King Jr. Boulevard). The Willamette River surrounds this part of Eugene to the south and west, representing both a barrier and a resource for foot trips by means of the path network.
While more roadways have sidewalks than in River Road/Santa Clara, there are numerous local roadways that lack sidewalks and curb ramps or provide inconsistent or substandard pedestrian accommodation. Many lower-traffic streets do not connect to other lower-traffic streets, forcing pedestrians to use busier streets for longer trips. At numerous locations in this part of Eugene, pedestrian accessways between dead-end streets provide a convenient solution to the problem of disconnected streets, offering shorter trip distances for walkers and an alternative to using major streets.
Randy Papé Beltline and I-105 traverse the NE Eugene-Willakenzie/Ferry Street Bridge neighborhood and are barriers to foot traffic. In addition, a number of large land uses such as Autzen Stadium and the Eugene Country Club
provide no pedestrian through access, again forcing residents to make longer trips on busier streets.
Coburg Road is the most prominent of a number of major high-speed arterials that carry large amounts of both local and through motor vehicle traffic. While Coburg Road offers pedestrians a complete sidewalk network, signalized crossing opportunities, and commercial destinations, many residents report that it is uncomfortable for pedestrians, particularly along segments that have curb-tight sidewalks (that is, with no parking or landscaped buffer between pedestrians and the street).
Major pedestrian destinations in this sector of Eugene include the Sheldon Branch Library, the Sheldon Sports Park, the Sheldon Community Center and Pool, and retail and service opportunities at shopping centers (Oakway Center, Delta Oaks, and Valley River Center)
Pedestrian accessways connect
some streets in this part of Eugene.
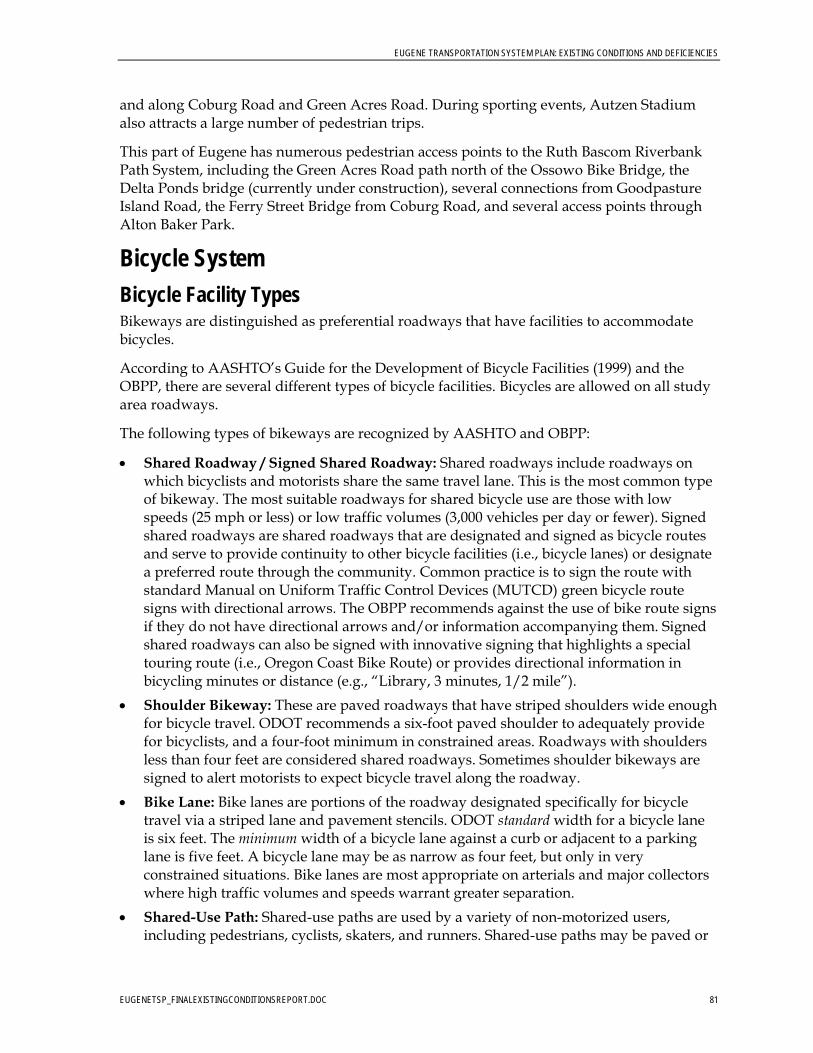
EUGENE TRANSPORTATION SYSTEM PLAN: EXISTING CONDITIONS AND DEFICIENCIES
EUGENETSP_FINALEXISTINGCONDITIONSREPORT.DOC 81
and along Coburg Road and Green Acres Road. During sporting events, Autzen Stadium also attracts a large number of pedestrian trips.
This part of Eugene has numerous pedestrian access points to the Ruth Bascom Riverbank Path System, including the Green Acres Road path north of the Ossowo Bike Bridge, the Delta Ponds bridge (currently under construction), several connections from Goodpasture Island Road, the Ferry Street Bridge from Coburg Road, and several access points through Alton Baker Park.
Bicycle System
Bicycle Facility Types Bikeways are distinguished as preferential roadways that have facilities to accommodate bicycles.
According to AASHTO’s Guide for the Development of Bicycle Facilities (1999) and the OBPP, there are several different types of bicycle facilities. Bicycles are allowed on all study area roadways.
The following types of bikeways are recognized by AASHTO and OBPP:
Shared Roadway / Signed Shared Roadway: Shared roadways include roadways on which bicyclists and motorists share the same travel lane. This is the most common type of bikeway. The most suitable roadways for shared bicycle use are those with low speeds (25 mph or less) or low traffic volumes (3,000 vehicles per day or fewer). Signed shared roadways are shared roadways that are designated and signed as bicycle routes and serve to provide continuity to other bicycle facilities (i.e., bicycle lanes) or designate a preferred route through the community. Common practice is to sign the route with standard Manual on Uniform Traffic Control Devices (MUTCD) green bicycle route signs with directional arrows. The OBPP recommends against the use of bike route signs if they do not have directional arrows and/or information accompanying them. Signed shared roadways can also be signed with innovative signing that highlights a special touring route (i.e., Oregon Coast Bike Route) or provides directional information in bicycling minutes or distance (e.g., “Library, 3 minutes, 1/2 mile”).
Shoulder Bikeway: These are paved roadways that have striped shoulders wide enough for bicycle travel. ODOT recommends a six-foot paved shoulder to adequately provide for bicyclists, and a four-foot minimum in constrained areas. Roadways with shoulders less than four feet are considered shared roadways. Sometimes shoulder bikeways are signed to alert motorists to expect bicycle travel along the roadway.
Bike Lane: Bike lanes are portions of the roadway designated specifically for bicycle travel via a striped lane and pavement stencils. ODOT standard width for a bicycle lane is six feet. The minimum width of a bicycle lane against a curb or adjacent to a parking lane is five feet. A bicycle lane may be as narrow as four feet, but only in very constrained situations. Bike lanes are most appropriate on arterials and major collectors where high traffic volumes and speeds warrant greater separation.
Shared-Use Path: Shared-use paths are used by a variety of non-motorized users, including pedestrians, cyclists, skaters, and runners. Shared-use paths may be paved or
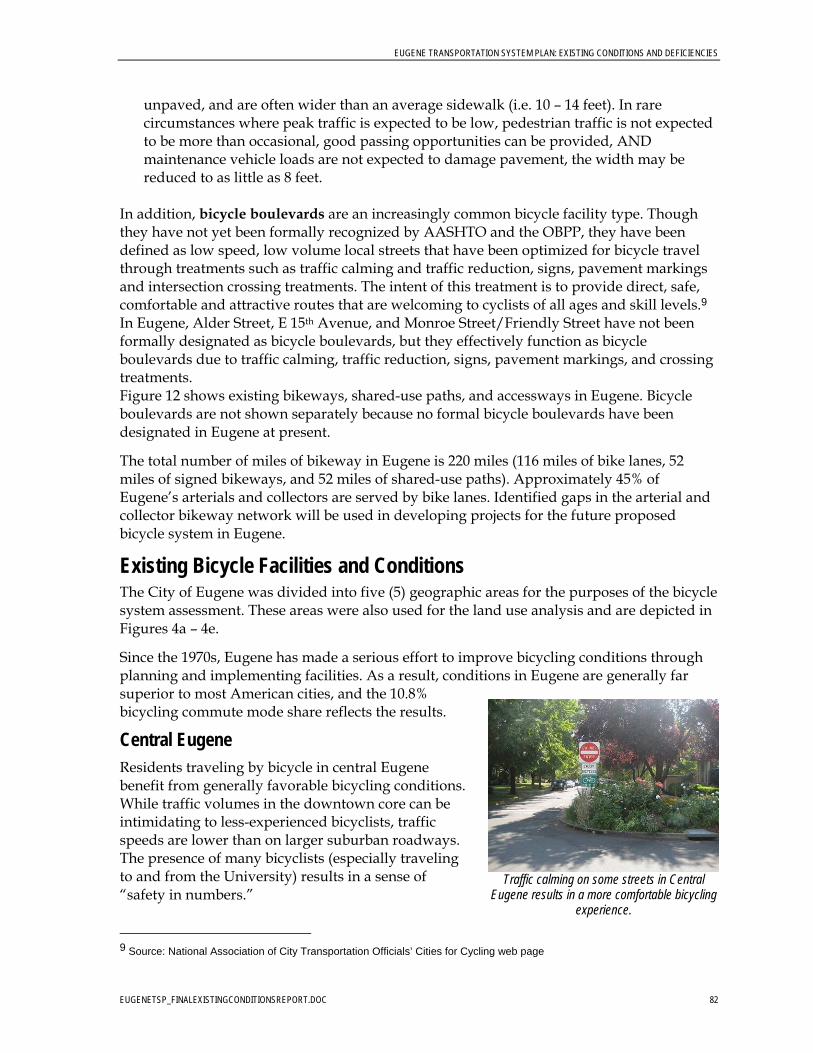
EUGENE TRANSPORTATION SYSTEM PLAN: EXISTING CONDITIONS AND DEFICIENCIES
EUGENETSP_FINALEXISTINGCONDITIONSREPORT.DOC 82
unpaved, and are often wider than an average sidewalk (i.e. 10 – 14 feet). In rare circumstances where peak traffic is expected to be low, pedestrian traffic is not expected to be more than occasional, good passing opportunities can be provided, AND maintenance vehicle loads are not expected to damage pavement, the width may be reduced to as little as 8 feet.
In addition, bicycle boulevards are an increasingly common bicycle facility type. Though they have not yet been formally recognized by AASHTO and the OBPP, they have been defined as low speed, low volume local streets that have been optimized for bicycle travel through treatments such as traffic calming and traffic reduction, signs, pavement markings and intersection crossing treatments. The intent of this treatment is to provide direct, safe, comfortable and attractive routes that are welcoming to cyclists of all ages and skill levels.9 In Eugene, Alder Street, E 15th Avenue, and Monroe Street/Friendly Street have not been formally designated as bicycle boulevards, but they effectively function as bicycle boulevards due to traffic calming, traffic reduction, signs, pavement markings, and crossing treatments. Figure 12 shows existing bikeways, shared-use paths, and accessways in Eugene. Bicycle boulevards are not shown separately because no formal bicycle boulevards have been designated in Eugene at present.
The total number of miles of bikeway in Eugene is 220 miles (116 miles of bike lanes, 52 miles of signed bikeways, and 52 miles of shared-use paths). Approximately 45% of Eugene’s arterials and collectors are served by bike lanes. Identified gaps in the arterial and collector bikeway network will be used in developing projects for the future proposed bicycle system in Eugene.
Existing Bicycle Facilities and Conditions The City of Eugene was divided into five (5) geographic areas for the purposes of the bicycle system assessment. These areas were also used for the land use analysis and are depicted in Figures 4a – 4e.
Since the 1970s, Eugene has made a serious effort to improve bicycling conditions through planning and implementing facilities. As a result, conditions in Eugene are generally far superior to most American cities, and the 10.8% bicycling commute mode share reflects the results.
Central Eugene Residents traveling by bicycle in central Eugene benefit from generally favorable bicycling conditions. While traffic volumes in the downtown core can be intimidating to less-experienced bicyclists, traffic speeds are lower than on larger suburban roadways. The presence of many bicyclists (especially traveling to and from the University) results in a sense of “safety in numbers.”
9 Source: National Association of City Transportation Officials’ Cities for Cycling web page
Traffic calming on some streets in Central
Eugene results in a more comfortable bicycling experience.
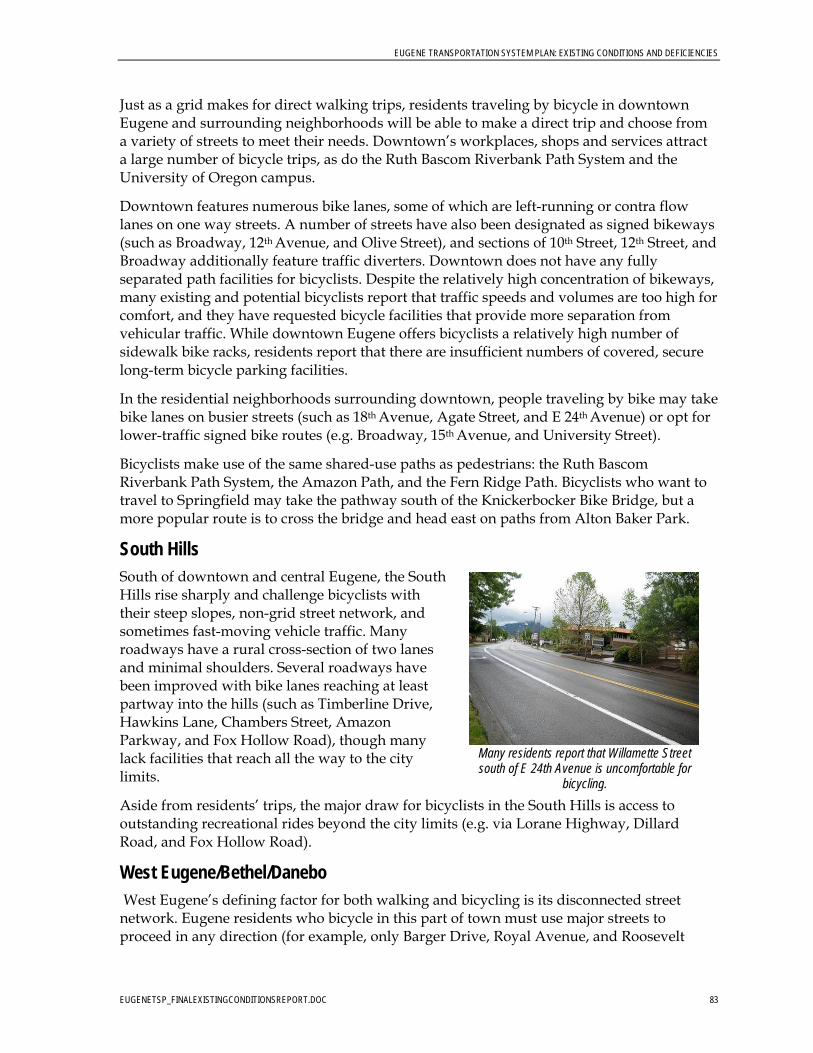
EUGENE TRANSPORTATION SYSTEM PLAN: EXISTING CONDITIONS AND DEFICIENCIES
EUGENETSP_FINALEXISTINGCONDITIONSREPORT.DOC 83
Just as a grid makes for direct walking trips, residents traveling by bicycle in downtown Eugene and surrounding neighborhoods will be able to make a direct trip and choose from a variety of streets to meet their needs. Downtown’s workplaces, shops and services attract a large number of bicycle trips, as do the Ruth Bascom Riverbank Path System and the University of Oregon campus.
Downtown features numerous bike lanes, some of which are left-running or contra flow lanes on one way streets. A number of streets have also been designated as signed bikeways (such as Broadway, 12th Avenue, and Olive Street), and sections of 10th Street, 12th Street, and Broadway additionally feature traffic diverters. Downtown does not have any fully separated path facilities for bicyclists. Despite the relatively high concentration of bikeways, many existing and potential bicyclists report that traffic speeds and volumes are too high for comfort, and they have requested bicycle facilities that provide more separation from vehicular traffic. While downtown Eugene offers bicyclists a relatively high number of sidewalk bike racks, residents report that there are insufficient numbers of covered, secure long-term bicycle parking facilities.
In the residential neighborhoods surrounding downtown, people traveling by bike may take bike lanes on busier streets (such as 18th Avenue, Agate Street, and E 24th Avenue) or opt for lower-traffic signed bike routes (e.g. Broadway, 15th Avenue, and University Street).
Bicyclists make use of the same shared-use paths as pedestrians: the Ruth Bascom Riverbank Path System, the Amazon Path, and the Fern Ridge Path. Bicyclists who want to travel to Springfield may take the pathway south of the Knickerbocker Bike Bridge, but a more popular route is to cross the bridge and head east on paths from Alton Baker Park.
South Hills South of downtown and central Eugene, the South Hills rise sharply and challenge bicyclists with their steep slopes, non-grid street network, and sometimes fast-moving vehicle traffic. Many roadways have a rural cross-section of two lanes and minimal shoulders. Several roadways have been improved with bike lanes reaching at least partway into the hills (such as Timberline Drive, Hawkins Lane, Chambers Street, Amazon Parkway, and Fox Hollow Road), though many lack facilities that reach all the way to the city limits.
Aside from residents’ trips, the major draw for bicyclists in the South Hills is access to outstanding recreational rides beyond the city limits (e.g. via Lorane Highway, Dillard Road, and Fox Hollow Road).
West Eugene/Bethel/Danebo West Eugene’s defining factor for both walking and bicycling is its disconnected street network. Eugene residents who bicycle in this part of town must use major streets to proceed in any direction (for example, only Barger Drive, Royal Avenue, and Roosevelt
Many residents report that Willamette Street south of E 24th Avenue is uncomfortable for
bicycling.
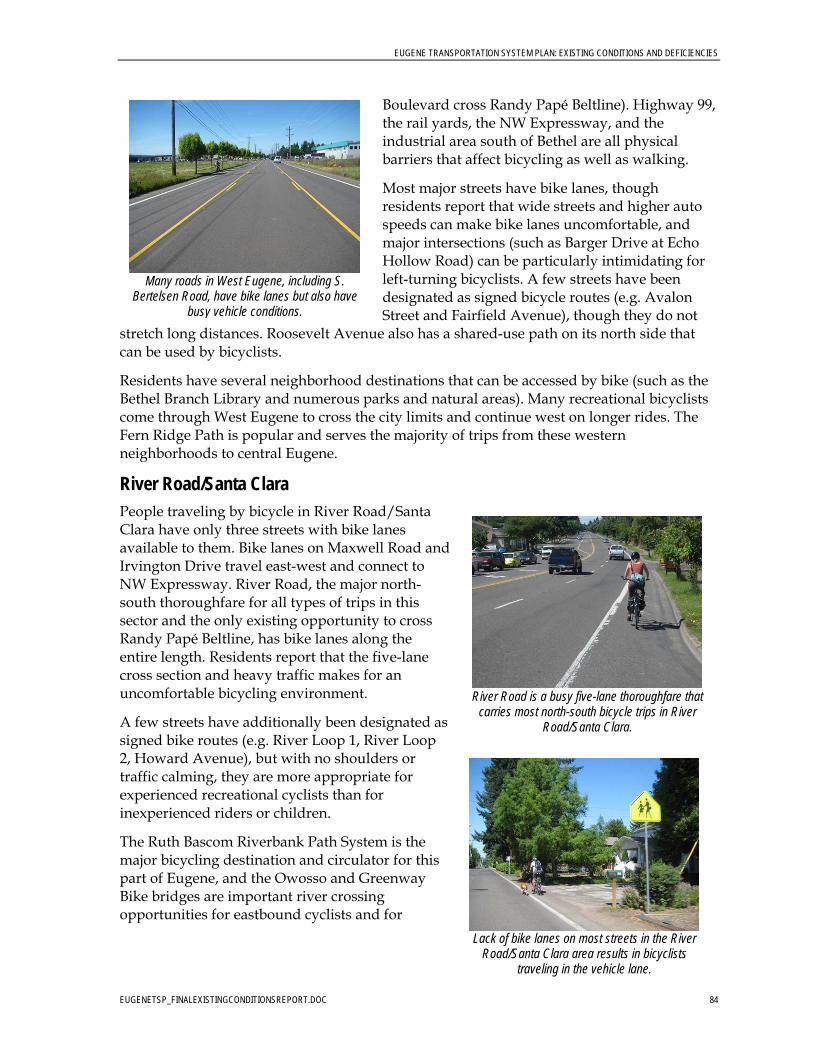
EUGENE TRANSPORTATION SYSTEM PLAN: EXISTING CONDITIONS AND DEFICIENCIES
EUGENETSP_FINALEXISTINGCONDITIONSREPORT.DOC 84
Boulevard cross Randy Papé Beltline). Highway 99, the rail yards, the NW Expressway, and the industrial area south of Bethel are all physical barriers that affect bicycling as well as walking.
Most major streets have bike lanes, though residents report that wide streets and higher auto speeds can make bike lanes uncomfortable, and major intersections (such as Barger Drive at Echo Hollow Road) can be particularly intimidating for left-turning bicyclists. A few streets have been designated as signed bicycle routes (e.g. Avalon Street and Fairfield Avenue), though they do not
stretch long distances. Roosevelt Avenue also has a shared-use path on its north side that can be used by bicyclists.
Residents have several neighborhood destinations that can be accessed by bike (such as the Bethel Branch Library and numerous parks and natural areas). Many recreational bicyclists come through West Eugene to cross the city limits and continue west on longer rides. The Fern Ridge Path is popular and serves the majority of trips from these western neighborhoods to central Eugene.
River Road/Santa Clara People traveling by bicycle in River Road/Santa Clara have only three streets with bike lanes available to them. Bike lanes on Maxwell Road and Irvington Drive travel east-west and connect to NW Expressway. River Road, the major north-south thoroughfare for all types of trips in this sector and the only existing opportunity to cross Randy Papé Beltline, has bike lanes along the entire length. Residents report that the five-lane cross section and heavy traffic makes for an uncomfortable bicycling environment.
A few streets have additionally been designated as signed bike routes (e.g. River Loop 1, River Loop 2, Howard Avenue), but with no shoulders or traffic calming, they are more appropriate for experienced recreational cyclists than for inexperienced riders or children.
The Ruth Bascom Riverbank Path System is the major bicycling destination and circulator for this part of Eugene, and the Owosso and Greenway Bike bridges are important river crossing opportunities for eastbound cyclists and for
River Road is a busy five-lane thoroughfare that
carries most north-south bicycle trips in River Road/Santa Clara.
Many roads in West Eugene, including S.
Bertelsen Road, have bike lanes but also have busy vehicle conditions.
Lack of bike lanes on most streets in the River
Road/Santa Clara area results in bicyclists traveling in the vehicle lane.
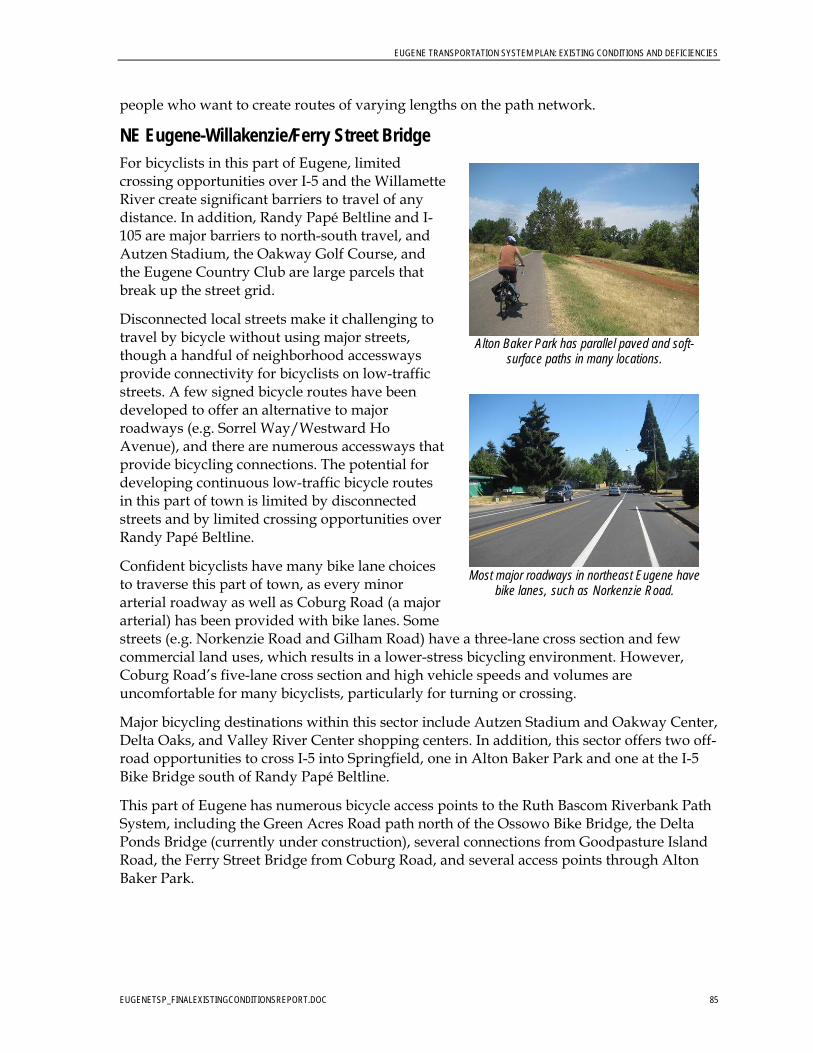
EUGENE TRANSPORTATION SYSTEM PLAN: EXISTING CONDITIONS AND DEFICIENCIES
EUGENETSP_FINALEXISTINGCONDITIONSREPORT.DOC 85
people who want to create routes of varying lengths on the path network.
NE Eugene-Willakenzie/Ferry Street Bridge For bicyclists in this part of Eugene, limited crossing opportunities over I-5 and the Willamette River create significant barriers to travel of any distance. In addition, Randy Papé Beltline and I-105 are major barriers to north-south travel, and Autzen Stadium, the Oakway Golf Course, and the Eugene Country Club are large parcels that break up the street grid.
Disconnected local streets make it challenging to travel by bicycle without using major streets, though a handful of neighborhood accessways provide connectivity for bicyclists on low-traffic streets. A few signed bicycle routes have been developed to offer an alternative to major roadways (e.g. Sorrel Way/Westward Ho Avenue), and there are numerous accessways that provide bicycling connections. The potential for developing continuous low-traffic bicycle routes in this part of town is limited by disconnected streets and by limited crossing opportunities over Randy Papé Beltline.
Confident bicyclists have many bike lane choices to traverse this part of town, as every minor arterial roadway as well as Coburg Road (a major arterial) has been provided with bike lanes. Some streets (e.g. Norkenzie Road and Gilham Road) have a three-lane cross section and few commercial land uses, which results in a lower-stress bicycling environment. However, Coburg Road’s five-lane cross section and high vehicle speeds and volumes are uncomfortable for many bicyclists, particularly for turning or crossing.
Major bicycling destinations within this sector include Autzen Stadium and Oakway Center, Delta Oaks, and Valley River Center shopping centers. In addition, this sector offers two off-road opportunities to cross I-5 into Springfield, one in Alton Baker Park and one at the I-5 Bike Bridge south of Randy Papé Beltline.
This part of Eugene has numerous bicycle access points to the Ruth Bascom Riverbank Path System, including the Green Acres Road path north of the Ossowo Bike Bridge, the Delta Ponds Bridge (currently under construction), several connections from Goodpasture Island Road, the Ferry Street Bridge from Coburg Road, and several access points through Alton Baker Park.
Most major roadways in northeast Eugene have
bike lanes, such as Norkenzie Road.
Alton Baker Park has parallel paved and soft-
surface paths in many locations.
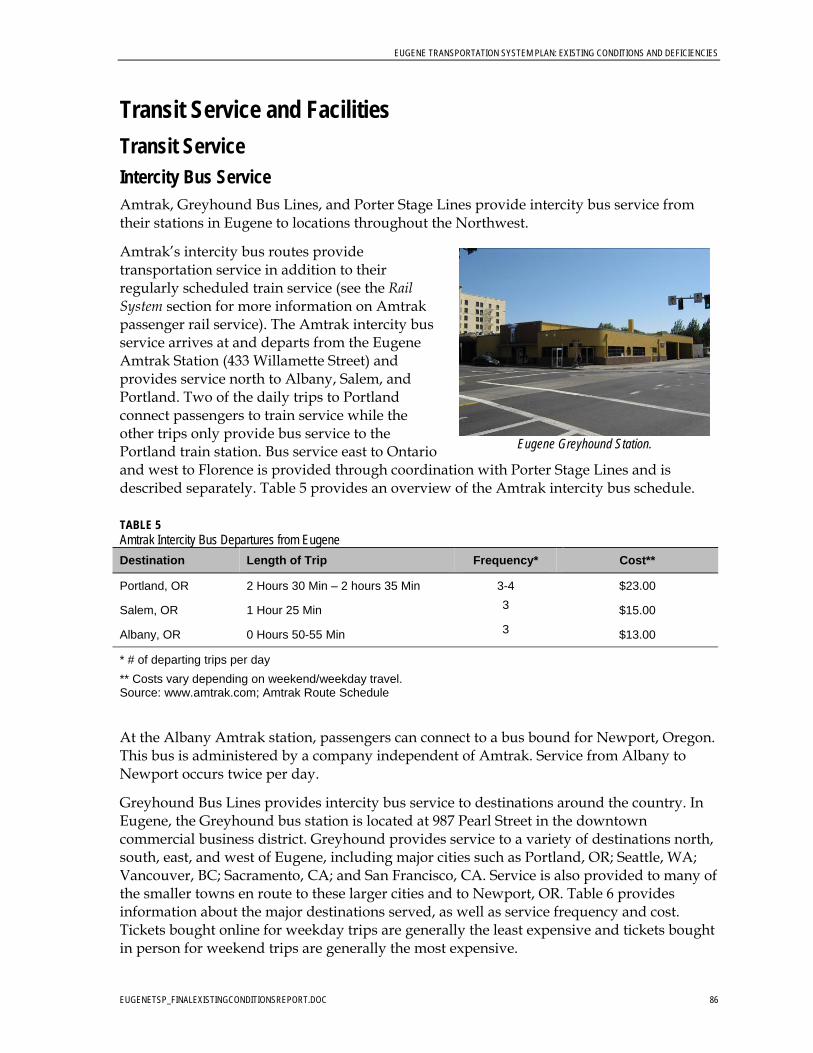
EUGENE TRANSPORTATION SYSTEM PLAN: EXISTING CONDITIONS AND DEFICIENCIES
EUGENETSP_FINALEXISTINGCONDITIONSREPORT.DOC 86
Transit Service and Facilities
Transit Service Intercity Bus Service Amtrak, Greyhound Bus Lines, and Porter Stage Lines provide intercity bus service from their stations in Eugene to locations throughout the Northwest.
Amtrak’s intercity bus routes provide transportation service in addition to their regularly scheduled train service (see the Rail System section for more information on Amtrak passenger rail service). The Amtrak intercity bus service arrives at and departs from the Eugene Amtrak Station (433 Willamette Street) and provides service north to Albany, Salem, and Portland. Two of the daily trips to Portland connect passengers to train service while the other trips only provide bus service to the Portland train station. Bus service east to Ontario and west to Florence is provided through coordination with Porter Stage Lines and is described separately. Table 5 provides an overview of the Amtrak intercity bus schedule.
TABLE 5 Amtrak Intercity Bus Departures from Eugene Destination Length of Trip Frequency* Cost**
Portland, OR 2 Hours 30 Min – 2 hours 35 Min 3-4 $23.00
Salem, OR 1 Hour 25 Min 3 $15.00
Albany, OR 0 Hours 50-55 Min 3 $13.00
* # of departing trips per day
** Costs vary depending on weekend/weekday travel. Source: www.amtrak.com; Amtrak Route Schedule
At the Albany Amtrak station, passengers can connect to a bus bound for Newport, Oregon. This bus is administered by a company independent of Amtrak. Service from Albany to Newport occurs twice per day.
Greyhound Bus Lines provides intercity bus service to destinations around the country. In Eugene, the Greyhound bus station is located at 987 Pearl Street in the downtown commercial business district. Greyhound provides service to a variety of destinations north, south, east, and west of Eugene, including major cities such as Portland, OR; Seattle, WA; Vancouver, BC; Sacramento, CA; and San Francisco, CA. Service is also provided to many of the smaller towns en route to these larger cities and to Newport, OR. Table 6 provides information about the major destinations served, as well as service frequency and cost. Tickets bought online for weekday trips are generally the least expensive and tickets bought in person for weekend trips are generally the most expensive.
Eugene Greyhound Station.
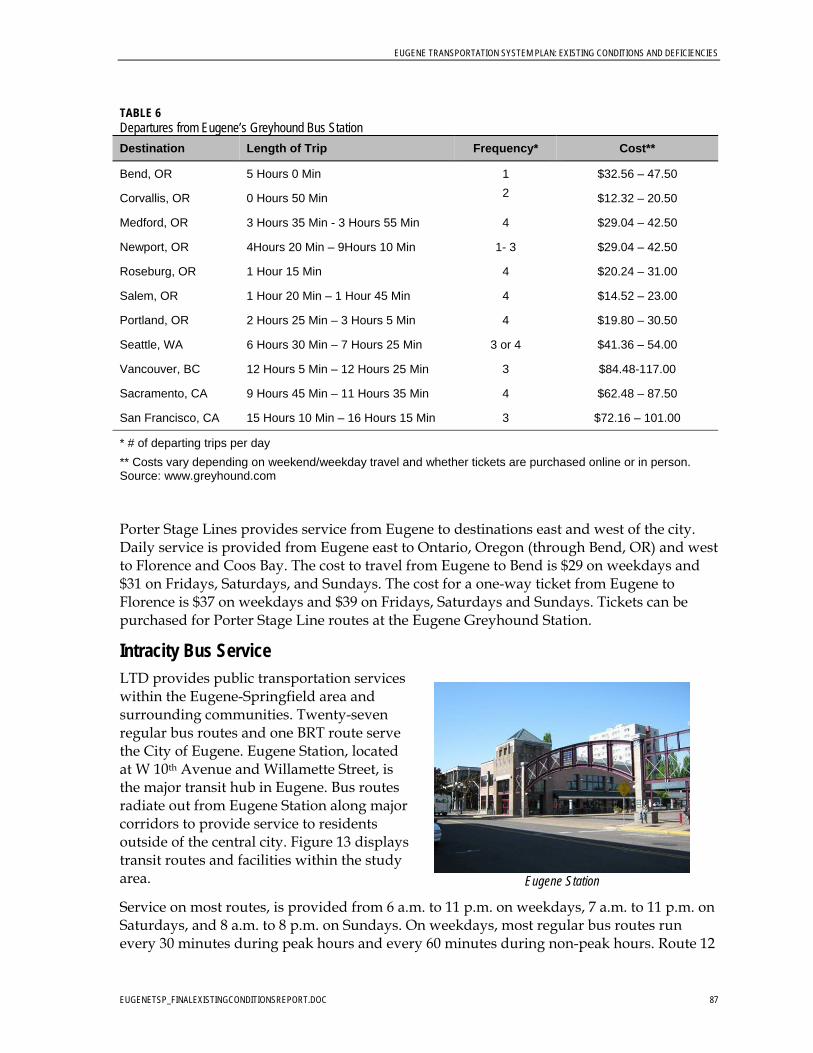
EUGENE TRANSPORTATION SYSTEM PLAN: EXISTING CONDITIONS AND DEFICIENCIES
EUGENETSP_FINALEXISTINGCONDITIONSREPORT.DOC 87
TABLE 6 Departures from Eugene’s Greyhound Bus Station Destination Length of Trip Frequency* Cost**
Bend, OR 5 Hours 0 Min 1 $32.56 – 47.50
Corvallis, OR 0 Hours 50 Min 2 $12.32 – 20.50
Medford, OR 3 Hours 35 Min - 3 Hours 55 Min 4 $29.04 – 42.50
Newport, OR 4Hours 20 Min – 9Hours 10 Min 1- 3 $29.04 – 42.50
Roseburg, OR 1 Hour 15 Min 4 $20.24 – 31.00
Salem, OR 1 Hour 20 Min – 1 Hour 45 Min 4 $14.52 – 23.00
Portland, OR 2 Hours 25 Min – 3 Hours 5 Min 4 $19.80 – 30.50
Seattle, WA 6 Hours 30 Min – 7 Hours 25 Min 3 or 4 $41.36 – 54.00
Vancouver, BC 12 Hours 5 Min – 12 Hours 25 Min 3 $84.48-117.00
Sacramento, CA 9 Hours 45 Min – 11 Hours 35 Min 4 $62.48 – 87.50
San Francisco, CA 15 Hours 10 Min – 16 Hours 15 Min 3 $72.16 – 101.00
* # of departing trips per day
** Costs vary depending on weekend/weekday travel and whether tickets are purchased online or in person. Source: www.greyhound.com
Porter Stage Lines provides service from Eugene to destinations east and west of the city. Daily service is provided from Eugene east to Ontario, Oregon (through Bend, OR) and west to Florence and Coos Bay. The cost to travel from Eugene to Bend is $29 on weekdays and $31 on Fridays, Saturdays, and Sundays. The cost for a one-way ticket from Eugene to Florence is $37 on weekdays and $39 on Fridays, Saturdays and Sundays. Tickets can be purchased for Porter Stage Line routes at the Eugene Greyhound Station.
Intracity Bus Service LTD provides public transportation services within the Eugene-Springfield area and surrounding communities. Twenty-seven regular bus routes and one BRT route serve the City of Eugene. Eugene Station, located at W 10th Avenue and Willamette Street, is the major transit hub in Eugene. Bus routes radiate out from Eugene Station along major corridors to provide service to residents outside of the central city. Figure 13 displays transit routes and facilities within the study area.
Service on most routes, is provided from 6 a.m. to 11 p.m. on weekdays, 7 a.m. to 11 p.m. on Saturdays, and 8 a.m. to 8 p.m. on Sundays. On weekdays, most regular bus routes run every 30 minutes during peak hours and every 60 minutes during non-peak hours. Route 12
Eugene Station
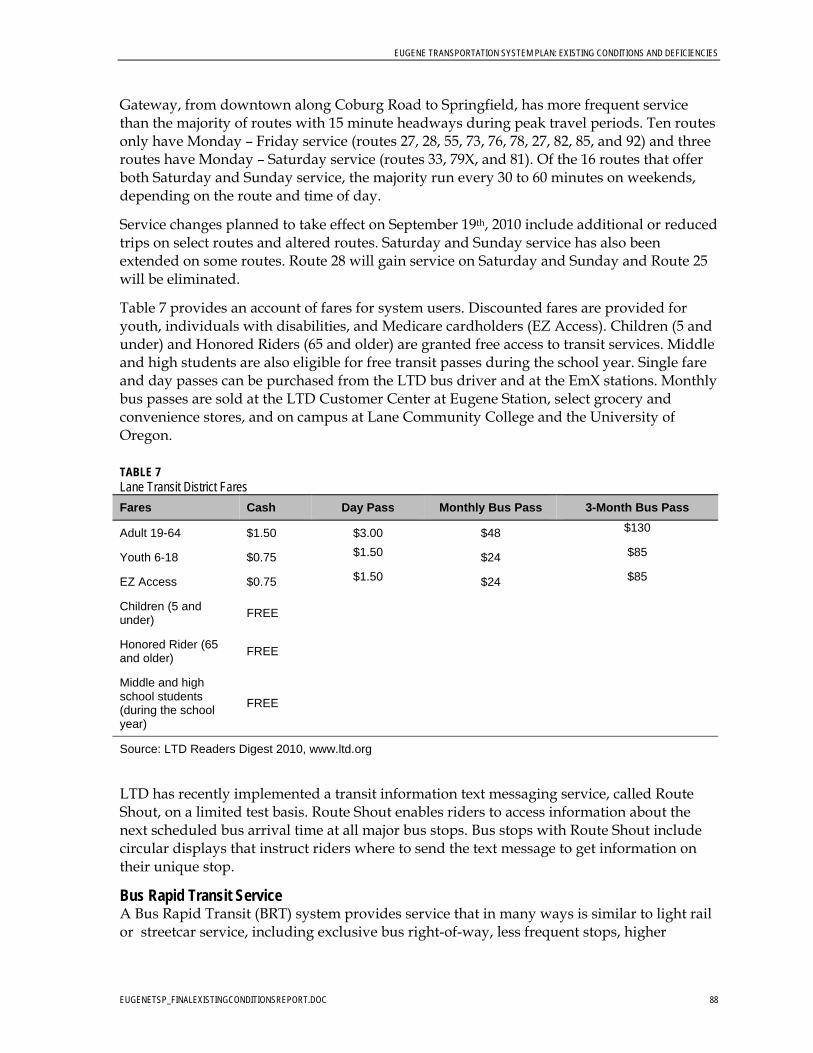
EUGENE TRANSPORTATION SYSTEM PLAN: EXISTING CONDITIONS AND DEFICIENCIES
EUGENETSP_FINALEXISTINGCONDITIONSREPORT.DOC 88
Gateway, from downtown along Coburg Road to Springfield, has more frequent service than the majority of routes with 15 minute headways during peak travel periods. Ten routes only have Monday – Friday service (routes 27, 28, 55, 73, 76, 78, 27, 82, 85, and 92) and three routes have Monday – Saturday service (routes 33, 79X, and 81). Of the 16 routes that offer both Saturday and Sunday service, the majority run every 30 to 60 minutes on weekends, depending on the route and time of day.
Service changes planned to take effect on September 19th, 2010 include additional or reduced trips on select routes and altered routes. Saturday and Sunday service has also been extended on some routes. Route 28 will gain service on Saturday and Sunday and Route 25 will be eliminated.
Table 7 provides an account of fares for system users. Discounted fares are provided for youth, individuals with disabilities, and Medicare cardholders (EZ Access). Children (5 and under) and Honored Riders (65 and older) are granted free access to transit services. Middle and high students are also eligible for free transit passes during the school year. Single fare and day passes can be purchased from the LTD bus driver and at the EmX stations. Monthly bus passes are sold at the LTD Customer Center at Eugene Station, select grocery and convenience stores, and on campus at Lane Community College and the University of Oregon.
TABLE 7 Lane Transit District Fares Fares Cash Day Pass Monthly Bus Pass 3-Month Bus Pass
Adult 19-64 $1.50 $3.00 $48 $130
Youth 6-18 $0.75 $1.50 $24 $85
EZ Access $0.75 $1.50 $24 $85
Children (5 and under)
FREE
Honored Rider (65 and older)
FREE
Middle and high school students (during the school year)
FREE
Source: LTD Readers Digest 2010, www.ltd.org
LTD has recently implemented a transit information text messaging service, called Route Shout, on a limited test basis. Route Shout enables riders to access information about the next scheduled bus arrival time at all major bus stops. Bus stops with Route Shout include circular displays that instruct riders where to send the text message to get information on their unique stop.
Bus Rapid Transit Service A Bus Rapid Transit (BRT) system provides service that in many ways is similar to light rail or streetcar service, including exclusive bus right-of-way, less frequent stops, higher
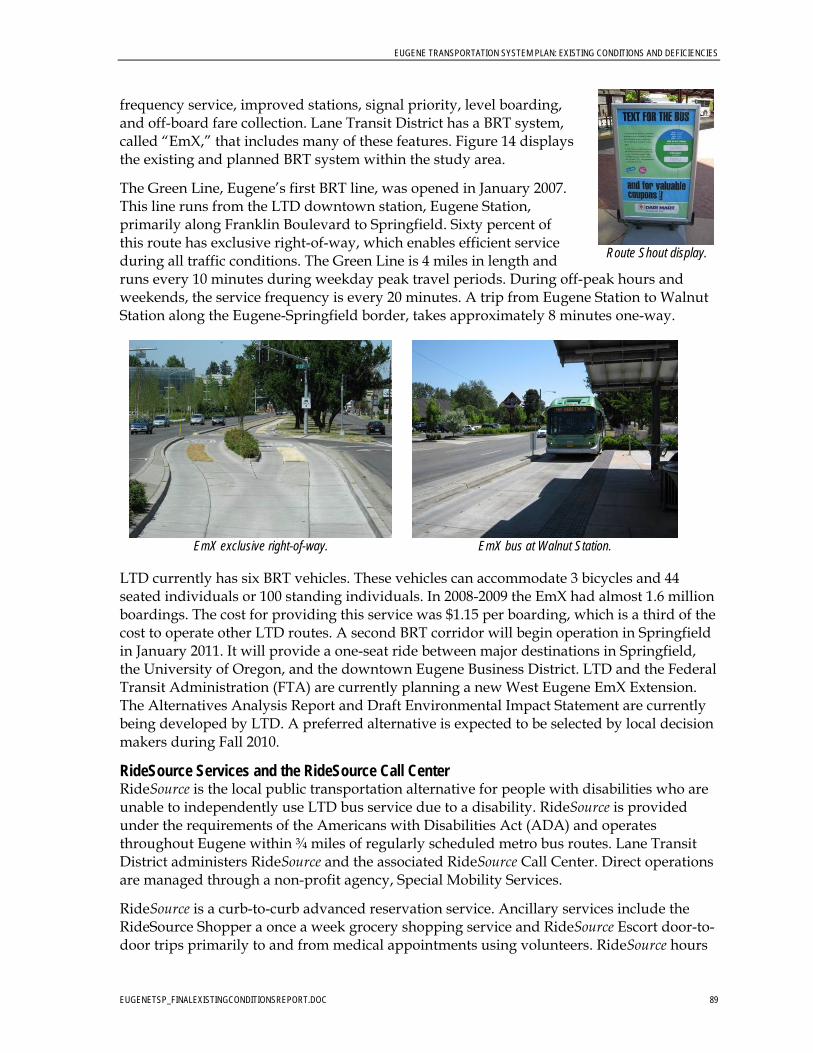
EUGENE TRANSPORTATION SYSTEM PLAN: EXISTING CONDITIONS AND DEFICIENCIES
EUGENETSP_FINALEXISTINGCONDITIONSREPORT.DOC 89
frequency service, improved stations, signal priority, level boarding, and off-board fare collection. Lane Transit District has a BRT system, called “EmX,” that includes many of these features. Figure 14 displays the existing and planned BRT system within the study area.
The Green Line, Eugene’s first BRT line, was opened in January 2007. This line runs from the LTD downtown station, Eugene Station, primarily along Franklin Boulevard to Springfield. Sixty percent of this route has exclusive right-of-way, which enables efficient service during all traffic conditions. The Green Line is 4 miles in length and runs every 10 minutes during weekday peak travel periods. During off-peak hours and weekends, the service frequency is every 20 minutes. A trip from Eugene Station to Walnut Station along the Eugene-Springfield border, takes approximately 8 minutes one-way.
LTD currently has six BRT vehicles. These vehicles can accommodate 3 bicycles and 44 seated individuals or 100 standing individuals. In 2008-2009 the EmX had almost 1.6 million boardings. The cost for providing this service was $1.15 per boarding, which is a third of the cost to operate other LTD routes. A second BRT corridor will begin operation in Springfield in January 2011. It will provide a one-seat ride between major destinations in Springfield, the University of Oregon, and the downtown Eugene Business District. LTD and the Federal Transit Administration (FTA) are currently planning a new West Eugene EmX Extension. The Alternatives Analysis Report and Draft Environmental Impact Statement are currently being developed by LTD. A preferred alternative is expected to be selected by local decision makers during Fall 2010.
RideSource Services and the RideSource Call Center RideSource is the local public transportation alternative for people with disabilities who are unable to independently use LTD bus service due to a disability. RideSource is provided under the requirements of the Americans with Disabilities Act (ADA) and operates throughout Eugene within ¾ miles of regularly scheduled metro bus routes. Lane Transit District administers RideSource and the associated RideSource Call Center. Direct operations are managed through a non-profit agency, Special Mobility Services.
RideSource is a curb-to-curb advanced reservation service. Ancillary services include the RideSource Shopper a once a week grocery shopping service and RideSource Escort door-to-door trips primarily to and from medical appointments using volunteers. RideSource hours
EmX bus at Walnut Station.
EmX exclusive right-of-way.
Route Shout display.
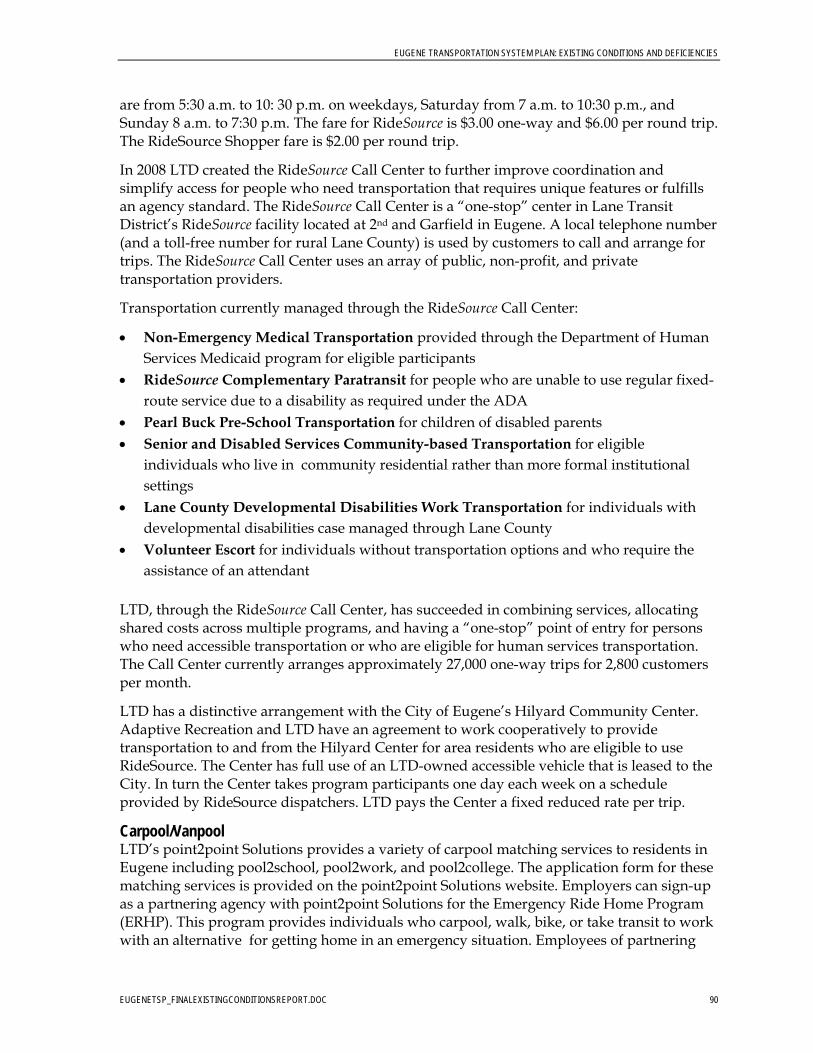
EUGENE TRANSPORTATION SYSTEM PLAN: EXISTING CONDITIONS AND DEFICIENCIES
EUGENETSP_FINALEXISTINGCONDITIONSREPORT.DOC 90
are from 5:30 a.m. to 10: 30 p.m. on weekdays, Saturday from 7 a.m. to 10:30 p.m., and Sunday 8 a.m. to 7:30 p.m. The fare for RideSource is $3.00 one-way and $6.00 per round trip. The RideSource Shopper fare is $2.00 per round trip.
In 2008 LTD created the RideSource Call Center to further improve coordination and simplify access for people who need transportation that requires unique features or fulfills an agency standard. The RideSource Call Center is a “one-stop” center in Lane Transit District’s RideSource facility located at 2nd and Garfield in Eugene. A local telephone number (and a toll-free number for rural Lane County) is used by customers to call and arrange for trips. The RideSource Call Center uses an array of public, non-profit, and private transportation providers.
Transportation currently managed through the RideSource Call Center:
Non-Emergency Medical Transportation provided through the Department of Human Services Medicaid program for eligible participants
RideSource Complementary Paratransit for people who are unable to use regular fixed-route service due to a disability as required under the ADA
Pearl Buck Pre-School Transportation for children of disabled parents Senior and Disabled Services Community-based Transportation for eligible
individuals who live in community residential rather than more formal institutional settings
Lane County Developmental Disabilities Work Transportation for individuals with developmental disabilities case managed through Lane County
Volunteer Escort for individuals without transportation options and who require the assistance of an attendant
LTD, through the RideSource Call Center, has succeeded in combining services, allocating shared costs across multiple programs, and having a “one-stop” point of entry for persons who need accessible transportation or who are eligible for human services transportation. The Call Center currently arranges approximately 27,000 one-way trips for 2,800 customers per month.
LTD has a distinctive arrangement with the City of Eugene’s Hilyard Community Center. Adaptive Recreation and LTD have an agreement to work cooperatively to provide transportation to and from the Hilyard Center for area residents who are eligible to use RideSource. The Center has full use of an LTD-owned accessible vehicle that is leased to the City. In turn the Center takes program participants one day each week on a schedule provided by RideSource dispatchers. LTD pays the Center a fixed reduced rate per trip.
Carpool/Vanpool LTD’s point2point Solutions provides a variety of carpool matching services to residents in Eugene including pool2school, pool2work, and pool2college. The application form for these matching services is provided on the point2point Solutions website. Employers can sign-up as a partnering agency with point2point Solutions for the Emergency Ride Home Program (ERHP). This program provides individuals who carpool, walk, bike, or take transit to work with an alternative for getting home in an emergency situation. Employees of partnering
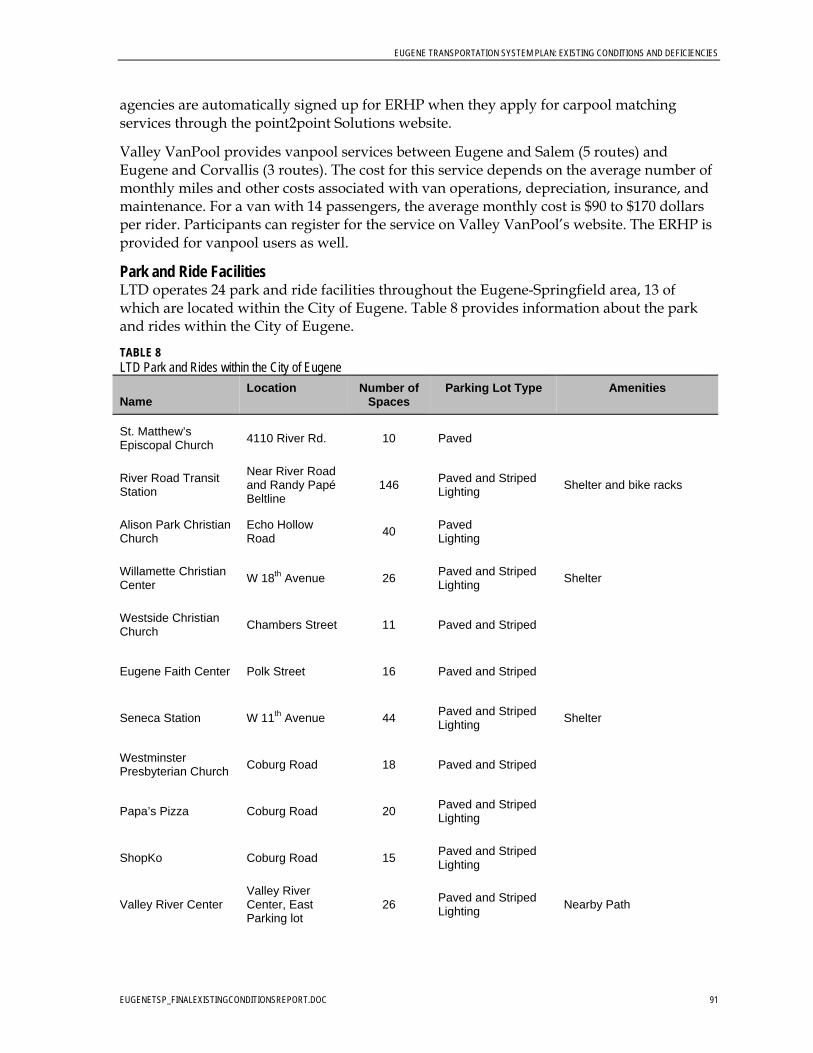
EUGENE TRANSPORTATION SYSTEM PLAN: EXISTING CONDITIONS AND DEFICIENCIES
EUGENETSP_FINALEXISTINGCONDITIONSREPORT.DOC 91
agencies are automatically signed up for ERHP when they apply for carpool matching services through the point2point Solutions website.
Valley VanPool provides vanpool services between Eugene and Salem (5 routes) and Eugene and Corvallis (3 routes). The cost for this service depends on the average number of monthly miles and other costs associated with van operations, depreciation, insurance, and maintenance. For a van with 14 passengers, the average monthly cost is $90 to $170 dollars per rider. Participants can register for the service on Valley VanPool’s website. The ERHP is provided for vanpool users as well.
Park and Ride Facilities LTD operates 24 park and ride facilities throughout the Eugene-Springfield area, 13 of which are located within the City of Eugene. Table 8 provides information about the park and rides within the City of Eugene.
TABLE 8 LTD Park and Rides within the City of Eugene
Name Location Number of
Spaces Parking Lot Type Amenities
St. Matthew’s Episcopal Church
4110 River Rd. 10 Paved
River Road Transit Station
Near River Road and Randy Papé Beltline
146 Paved and Striped Lighting
Shelter and bike racks
Alison Park Christian Church
Echo Hollow Road
40 Paved Lighting
Willamette Christian Center
W 18th Avenue 26 Paved and Striped Lighting
Shelter
Westside Christian Church
Chambers Street 11 Paved and Striped
Eugene Faith Center Polk Street 16 Paved and Striped
Seneca Station W 11th Avenue 44 Paved and Striped Lighting
Shelter
Westminster Presbyterian Church
Coburg Road 18 Paved and Striped
Papa’s Pizza Coburg Road 20 Paved and Striped Lighting
ShopKo Coburg Road 15 Paved and Striped Lighting
Valley River Center Valley River Center, East Parking lot
26 Paved and Striped Lighting
Nearby Path
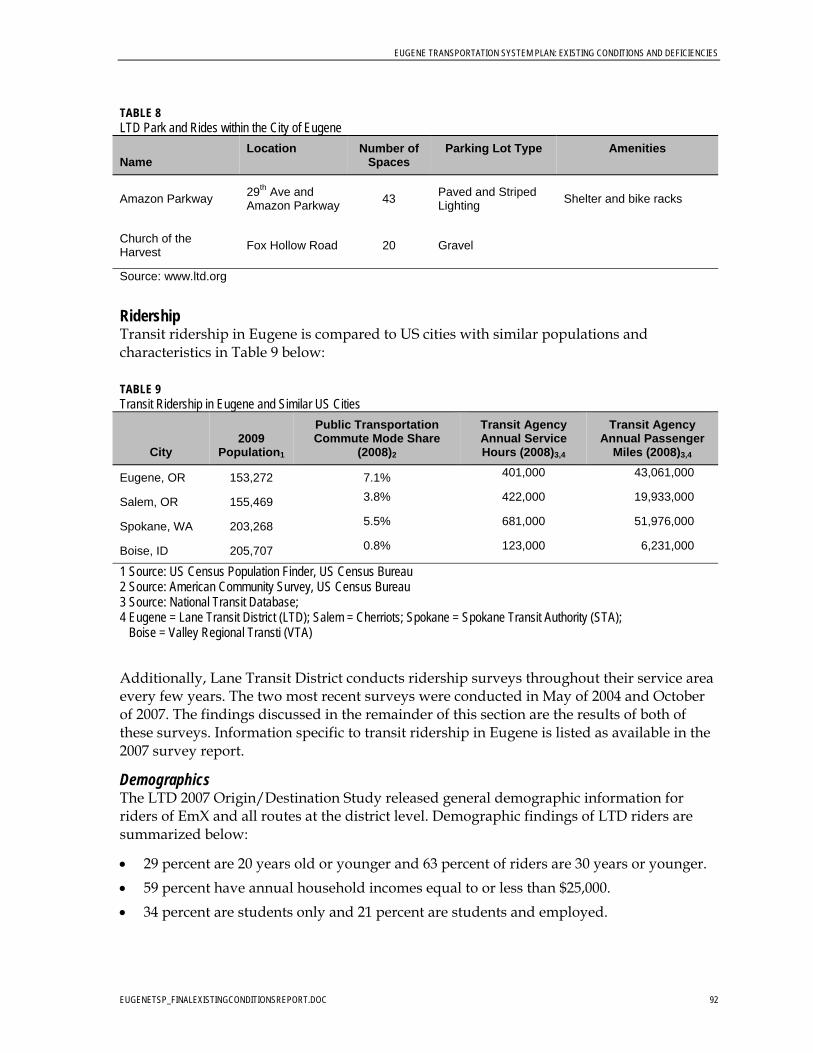
EUGENE TRANSPORTATION SYSTEM PLAN: EXISTING CONDITIONS AND DEFICIENCIES
EUGENETSP_FINALEXISTINGCONDITIONSREPORT.DOC 92
TABLE 8 LTD Park and Rides within the City of Eugene
Name Location Number of
Spaces Parking Lot Type Amenities
Amazon Parkway 29th Ave and Amazon Parkway
43 Paved and Striped Lighting
Shelter and bike racks
Church of the Harvest
Fox Hollow Road 20 Gravel
Source: www.ltd.org Ridership Transit ridership in Eugene is compared to US cities with similar populations and characteristics in Table 9 below:
TABLE 9 Transit Ridership in Eugene and Similar US Cities
City 2009
Population1
Public Transportation Commute Mode Share
(2008)2
Transit Agency Annual Service Hours (2008)3,4
Transit Agency Annual Passenger
Miles (2008)3,4
Eugene, OR 153,272 7.1% 401,000 43,061,000
Salem, OR 155,469 3.8% 422,000 19,933,000
Spokane, WA 203,268 5.5% 681,000 51,976,000
Boise, ID 205,707 0.8% 123,000 6,231,000
1 Source: US Census Population Finder, US Census Bureau 2 Source: American Community Survey, US Census Bureau 3 Source: National Transit Database; 4 Eugene = Lane Transit District (LTD); Salem = Cherriots; Spokane = Spokane Transit Authority (STA); Boise = Valley Regional Transti (VTA)
Additionally, Lane Transit District conducts ridership surveys throughout their service area every few years. The two most recent surveys were conducted in May of 2004 and October of 2007. The findings discussed in the remainder of this section are the results of both of these surveys. Information specific to transit ridership in Eugene is listed as available in the 2007 survey report.
Demographics The LTD 2007 Origin/Destination Study released general demographic information for riders of EmX and all routes at the district level. Demographic findings of LTD riders are summarized below:
29 percent are 20 years old or younger and 63 percent of riders are 30 years or younger.
59 percent have annual household incomes equal to or less than $25,000.
34 percent are students only and 21 percent are students and employed.
EUGENE TRANSPORTATION SYSTEM PLAN: EXISTING CONDITIONS AND DEFICIENCIES
EUGENETSP_FINALEXISTINGCONDITIONSREPORT.DOC 93
37 percent are transit dependent and 16 percent share a vehicle with another individual in their household.
EmX riders were found to be generally older than riders on other routes with a lower percentage of riders under 20 years old (20% of EmX riders compared to 31% of riders on other routes) and a higher percentage of riders 20-30 years old (37% compared to 33%) and 31-60 years old (41% compared to 31%).
Ridership trends The 2007 study also looked at ridership trends within the City of Eugene and the larger transit district between its study and the preceding survey from 2004. Ridership trends in Eugene include:
Seventy percent of LTD riders begin their trips in Eugene; this is a slight decrease from the 2004 rate of 75 percent.
Most LTD trips both begin and end in Eugene; this trend has been true since the 1999 ridership survey. In 2007, 60 percent of all trips both began and ended in Eugene and 9 percent of all trips began in Eugene and ended in Springfield.
In 2007, forty two percent all EmX trips both began and ended in Eugene. This means that 42 percent of all EmX riders used EmX to travel within Eugene and did not travel into Springfield.
Twenty two percent of riders who took trips beginning in Eugene were new riders; this is an increase from the 2004 rate of 10 percent10.
About 31 percent of riders who took trips beginning in Eugene indicated they rode transit more than in the previous year; a decrease from 41 percent in 2004.
The study also included a number of ridership statistics for the entire LTD service area. These characteristics include:
Twenty nine percent of all passengers took transit to commute to work and 31 percent took transit to commute to school.
A higher percentage of EmX riders use the service to commute to work than on other transit routes.
Rider Feedback The 2007 study also asked riders about their satisfaction with LTD service and desired service improvements. A summary of survey findings is listed below:
The majority of riders are satisfied with LTD service. The overall service quality rating was 5.6 out of 7.
Twenty three percent of riders indicated that the service was excellent (the highest rating); this represented a slight decrease from 25 percent in 2004.
10 Overall ridership increased from 2004 to 2007; however, the two surveys may not be directly comparable since the surveys took place at different times of the year.
EUGENE TRANSPORTATION SYSTEM PLAN: EXISTING CONDITIONS AND DEFICIENCIES
EUGENETSP_FINALEXISTINGCONDITIONSREPORT.DOC 94
EmX riders were generally more satisfied with the frequency of transit service, schedule reliability, and the speed of service.
The most desired service improvements are increased service frequency on weekends and later evening service.
LTD is currently in the process of creating a long-range transit plan. Once complete, the recommendations in the LTD long-range transit plan will be interwoven with the Eugene Transportation System Plan.
Rail System
Freight Rail Several railroads own tracks and/or operate in the City of Eugene, including Union Pacific (UP), Burlington Northern Santa Fe (BNSF), and Portland & Western. Additionally, Amtrak leases tracks from UP and operates a passenger rail service, which is discussed in more detail under Intercity Passenger Rail. The rail system is depicted in Figure 6, along with freight routes.
The following is a description of the facilities and active freight rail service provided by each railroad in Eugene:
Union Pacific (UP): UP owns the railroad tracks and storage yard that parallel the NW Expressway. The tracks run north to the Portland-Metro area and southeast through Springfield, Oakridge, Klamath Falls, and into California. A few spurs connect to businesses with active rail sidings just north and south of the storage yard. UP operates approximately 20 freight trains per day through Eugene along these tracks. UP also leases operating rights along these tracks to Amtrak, which provides passenger rail service north and south of Eugene. Approximately 3 passenger rail trains operate per day on these tracks. Additionally, UP owns and operates the tracks and several spurs that head west from the storage yard past Randy Papé Beltline to S. Danebo Avenue. UP operates approximately 1 train per day along these tracks to serve the businesses with rail sidings along the spurs. East of S. Danebo Avenue the tracks switch ownership and become inactive out to the coast.
Burlington Northern Santa Fe (BNSF): BNSF owns the railroad tracks and spurs that parallel Hwy 99N. The tracks run north to the Portland-Metro area and end in Eugene at Almaden Street and 5th Avenue in the Whiteaker Neighborhood. Several businesses have active rail sidings along these tracks. BNSF does not operate any trains on the tracks; rather, they lease the operating rights to Portland & Western.
Portland & Western (P&W): P&W operates approximately 2 trains per day on the tracks owned by BNSF.
While not a railroad, the Port of Coos Bay recently purchased a set of inactive railroad tracks that head west from Eugene out to the coast. These tracks were previously owned by the Central Oregon and Pacific Railroad (CORP), but were abandoned in September of 2007 due to deferred maintenance and safety concerns. Currently, the Port of Coos Bay is repairing these tracks using a $2.5 million American Recovery and Reinvestment Act (ARRA) grant and a $13.6 million TIGER 2 grant. Once the rail line is rehabilitated the Port of Coos Bay
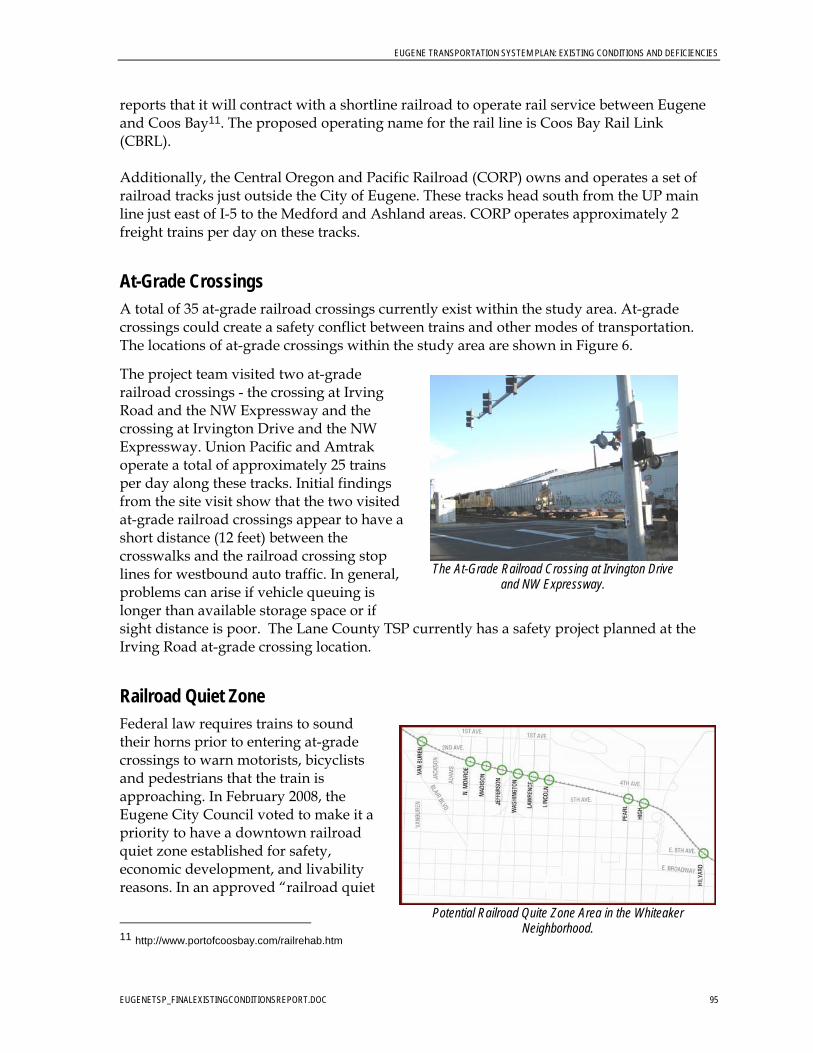
EUGENE TRANSPORTATION SYSTEM PLAN: EXISTING CONDITIONS AND DEFICIENCIES
EUGENETSP_FINALEXISTINGCONDITIONSREPORT.DOC 95
reports that it will contract with a shortline railroad to operate rail service between Eugene and Coos Bay11. The proposed operating name for the rail line is Coos Bay Rail Link (CBRL). Additionally, the Central Oregon and Pacific Railroad (CORP) owns and operates a set of railroad tracks just outside the City of Eugene. These tracks head south from the UP main line just east of I-5 to the Medford and Ashland areas. CORP operates approximately 2 freight trains per day on these tracks.
At-Grade Crossings A total of 35 at-grade railroad crossings currently exist within the study area. At-grade crossings could create a safety conflict between trains and other modes of transportation. The locations of at-grade crossings within the study area are shown in Figure 6.
The project team visited two at-grade railroad crossings - the crossing at Irving Road and the NW Expressway and the crossing at Irvington Drive and the NW Expressway. Union Pacific and Amtrak operate a total of approximately 25 trains per day along these tracks. Initial findings from the site visit show that the two visited at-grade railroad crossings appear to have a short distance (12 feet) between the crosswalks and the railroad crossing stop lines for westbound auto traffic. In general, problems can arise if vehicle queuing is longer than available storage space or if sight distance is poor. The Lane County TSP currently has a safety project planned at the Irving Road at-grade crossing location.
Railroad Quiet Zone Federal law requires trains to sound their horns prior to entering at-grade crossings to warn motorists, bicyclists and pedestrians that the train is approaching. In February 2008, the Eugene City Council voted to make it a priority to have a downtown railroad quiet zone established for safety, economic development, and livability reasons. In an approved “railroad quiet
11 http://www.portofcoosbay.com/railrehab.htm
Potential Railroad Quite Zone Area in the Whiteaker
Neighborhood.
The At-Grade Railroad Crossing at Irvington Drive
and NW Expressway.
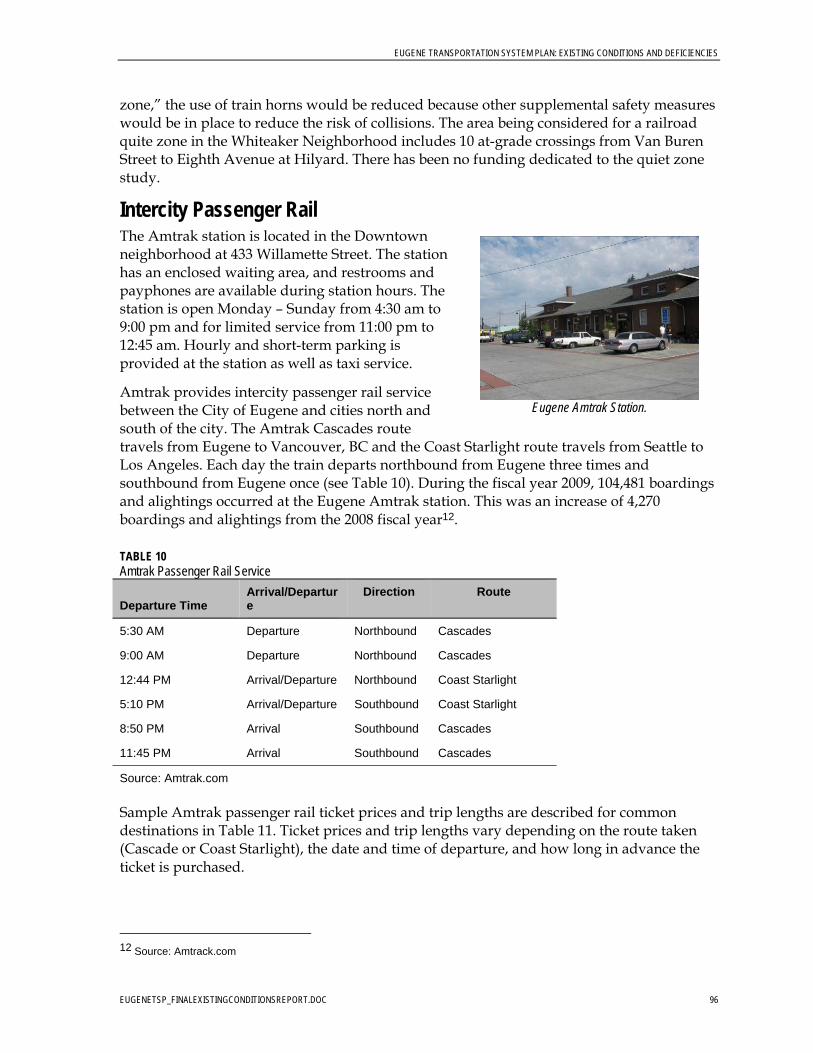
EUGENE TRANSPORTATION SYSTEM PLAN: EXISTING CONDITIONS AND DEFICIENCIES
EUGENETSP_FINALEXISTINGCONDITIONSREPORT.DOC 96
zone,” the use of train horns would be reduced because other supplemental safety measures would be in place to reduce the risk of collisions. The area being considered for a railroad quite zone in the Whiteaker Neighborhood includes 10 at-grade crossings from Van Buren Street to Eighth Avenue at Hilyard. There has been no funding dedicated to the quiet zone study.
Intercity Passenger Rail The Amtrak station is located in the Downtown neighborhood at 433 Willamette Street. The station has an enclosed waiting area, and restrooms and payphones are available during station hours. The station is open Monday – Sunday from 4:30 am to 9:00 pm and for limited service from 11:00 pm to 12:45 am. Hourly and short-term parking is provided at the station as well as taxi service.
Amtrak provides intercity passenger rail service between the City of Eugene and cities north and south of the city. The Amtrak Cascades route travels from Eugene to Vancouver, BC and the Coast Starlight route travels from Seattle to Los Angeles. Each day the train departs northbound from Eugene three times and southbound from Eugene once (see Table 10). During the fiscal year 2009, 104,481 boardings and alightings occurred at the Eugene Amtrak station. This was an increase of 4,270 boardings and alightings from the 2008 fiscal year12.
TABLE 10 Amtrak Passenger Rail Service
Departure Time Arrival/Departure
Direction Route
5:30 AM Departure Northbound Cascades
9:00 AM Departure Northbound Cascades
12:44 PM Arrival/Departure Northbound Coast Starlight
5:10 PM Arrival/Departure Southbound Coast Starlight
8:50 PM Arrival Southbound Cascades
11:45 PM Arrival Southbound Cascades
Source: Amtrak.com Sample Amtrak passenger rail ticket prices and trip lengths are described for common destinations in Table 11. Ticket prices and trip lengths vary depending on the route taken (Cascade or Coast Starlight), the date and time of departure, and how long in advance the ticket is purchased.
12 Source: Amtrack.com
Eugene Amtrak Station.
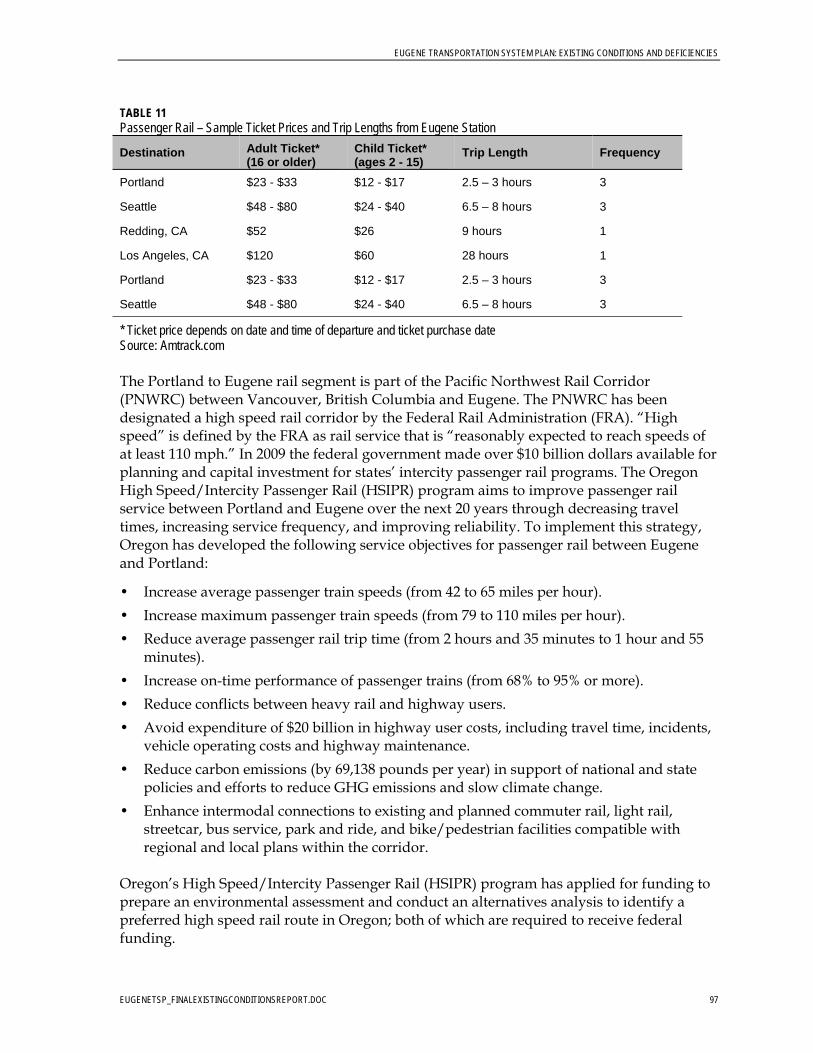
EUGENE TRANSPORTATION SYSTEM PLAN: EXISTING CONDITIONS AND DEFICIENCIES
EUGENETSP_FINALEXISTINGCONDITIONSREPORT.DOC 97
TABLE 11 Passenger Rail – Sample Ticket Prices and Trip Lengths from Eugene Station
Destination Adult Ticket* (16 or older)
Child Ticket* (ages 2 - 15)
Trip Length Frequency
Portland $23 - $33 $12 - $17 2.5 – 3 hours 3
Seattle $48 - $80 $24 - $40 6.5 – 8 hours 3
Redding, CA $52 $26 9 hours 1
Los Angeles, CA $120 $60 28 hours 1
Portland $23 - $33 $12 - $17 2.5 – 3 hours 3
Seattle $48 - $80 $24 - $40 6.5 – 8 hours 3
* Ticket price depends on date and time of departure and ticket purchase date Source: Amtrack.com
The Portland to Eugene rail segment is part of the Pacific Northwest Rail Corridor (PNWRC) between Vancouver, British Columbia and Eugene. The PNWRC has been designated a high speed rail corridor by the Federal Rail Administration (FRA). “High speed” is defined by the FRA as rail service that is “reasonably expected to reach speeds of at least 110 mph.” In 2009 the federal government made over $10 billion dollars available for planning and capital investment for states’ intercity passenger rail programs. The Oregon High Speed/Intercity Passenger Rail (HSIPR) program aims to improve passenger rail service between Portland and Eugene over the next 20 years through decreasing travel times, increasing service frequency, and improving reliability. To implement this strategy, Oregon has developed the following service objectives for passenger rail between Eugene and Portland:
• Increase average passenger train speeds (from 42 to 65 miles per hour).
• Increase maximum passenger train speeds (from 79 to 110 miles per hour).
• Reduce average passenger rail trip time (from 2 hours and 35 minutes to 1 hour and 55 minutes).
• Increase on-time performance of passenger trains (from 68% to 95% or more).
• Reduce conflicts between heavy rail and highway users.
• Avoid expenditure of $20 billion in highway user costs, including travel time, incidents, vehicle operating costs and highway maintenance.
• Reduce carbon emissions (by 69,138 pounds per year) in support of national and state policies and efforts to reduce GHG emissions and slow climate change.
• Enhance intermodal connections to existing and planned commuter rail, light rail, streetcar, bus service, park and ride, and bike/pedestrian facilities compatible with regional and local plans within the corridor.
Oregon’s High Speed/Intercity Passenger Rail (HSIPR) program has applied for funding to prepare an environmental assessment and conduct an alternatives analysis to identify a preferred high speed rail route in Oregon; both of which are required to receive federal funding.
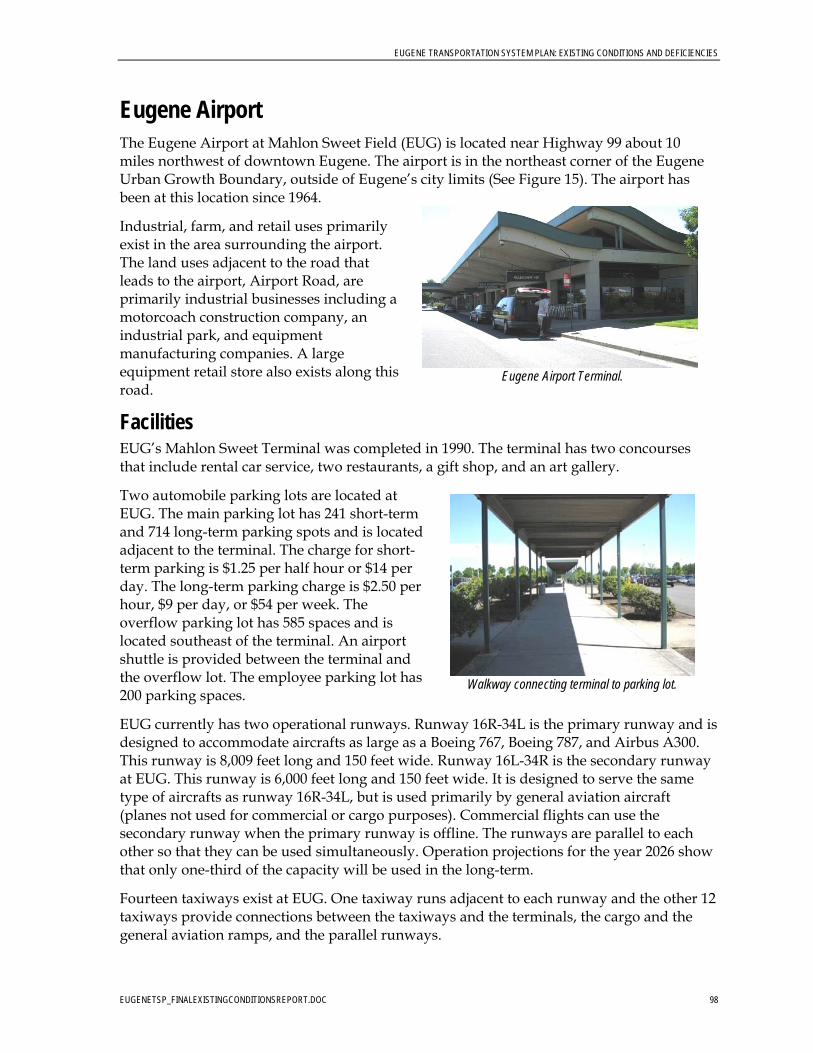
EUGENE TRANSPORTATION SYSTEM PLAN: EXISTING CONDITIONS AND DEFICIENCIES
EUGENETSP_FINALEXISTINGCONDITIONSREPORT.DOC 98
Eugene Airport The Eugene Airport at Mahlon Sweet Field (EUG) is located near Highway 99 about 10 miles northwest of downtown Eugene. The airport is in the northeast corner of the Eugene Urban Growth Boundary, outside of Eugene’s city limits (See Figure 15). The airport has been at this location since 1964.
Industrial, farm, and retail uses primarily exist in the area surrounding the airport. The land uses adjacent to the road that leads to the airport, Airport Road, are primarily industrial businesses including a motorcoach construction company, an industrial park, and equipment manufacturing companies. A large equipment retail store also exists along this road.
Facilities EUG’s Mahlon Sweet Terminal was completed in 1990. The terminal has two concourses that include rental car service, two restaurants, a gift shop, and an art gallery.
Two automobile parking lots are located at EUG. The main parking lot has 241 short-term and 714 long-term parking spots and is located adjacent to the terminal. The charge for short-term parking is $1.25 per half hour or $14 per day. The long-term parking charge is $2.50 per hour, $9 per day, or $54 per week. The overflow parking lot has 585 spaces and is located southeast of the terminal. An airport shuttle is provided between the terminal and the overflow lot. The employee parking lot has 200 parking spaces.
EUG currently has two operational runways. Runway 16R-34L is the primary runway and is designed to accommodate aircrafts as large as a Boeing 767, Boeing 787, and Airbus A300. This runway is 8,009 feet long and 150 feet wide. Runway 16L-34R is the secondary runway at EUG. This runway is 6,000 feet long and 150 feet wide. It is designed to serve the same type of aircrafts as runway 16R-34L, but is used primarily by general aviation aircraft (planes not used for commercial or cargo purposes). Commercial flights can use the secondary runway when the primary runway is offline. The runways are parallel to each other so that they can be used simultaneously. Operation projections for the year 2026 show that only one-third of the capacity will be used in the long-term.
Fourteen taxiways exist at EUG. One taxiway runs adjacent to each runway and the other 12 taxiways provide connections between the taxiways and the terminals, the cargo and the general aviation ramps, and the parallel runways.
Eugene Airport Terminal.
Walkway connecting terminal to parking lot.
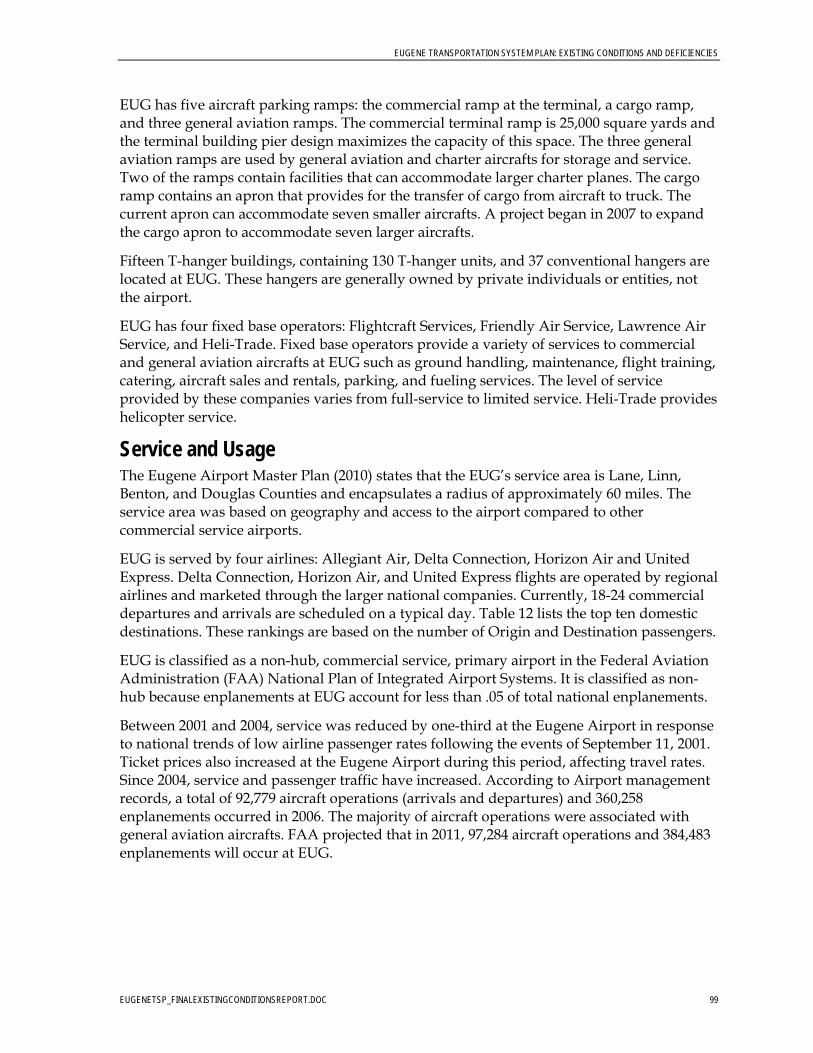
EUGENE TRANSPORTATION SYSTEM PLAN: EXISTING CONDITIONS AND DEFICIENCIES
EUGENETSP_FINALEXISTINGCONDITIONSREPORT.DOC 99
EUG has five aircraft parking ramps: the commercial ramp at the terminal, a cargo ramp, and three general aviation ramps. The commercial terminal ramp is 25,000 square yards and the terminal building pier design maximizes the capacity of this space. The three general aviation ramps are used by general aviation and charter aircrafts for storage and service. Two of the ramps contain facilities that can accommodate larger charter planes. The cargo ramp contains an apron that provides for the transfer of cargo from aircraft to truck. The current apron can accommodate seven smaller aircrafts. A project began in 2007 to expand the cargo apron to accommodate seven larger aircrafts.
Fifteen T-hanger buildings, containing 130 T-hanger units, and 37 conventional hangers are located at EUG. These hangers are generally owned by private individuals or entities, not the airport.
EUG has four fixed base operators: Flightcraft Services, Friendly Air Service, Lawrence Air Service, and Heli-Trade. Fixed base operators provide a variety of services to commercial and general aviation aircrafts at EUG such as ground handling, maintenance, flight training, catering, aircraft sales and rentals, parking, and fueling services. The level of service provided by these companies varies from full-service to limited service. Heli-Trade provides helicopter service.
Service and Usage The Eugene Airport Master Plan (2010) states that the EUG’s service area is Lane, Linn, Benton, and Douglas Counties and encapsulates a radius of approximately 60 miles. The service area was based on geography and access to the airport compared to other commercial service airports.
EUG is served by four airlines: Allegiant Air, Delta Connection, Horizon Air and United Express. Delta Connection, Horizon Air, and United Express flights are operated by regional airlines and marketed through the larger national companies. Currently, 18-24 commercial departures and arrivals are scheduled on a typical day. Table 12 lists the top ten domestic destinations. These rankings are based on the number of Origin and Destination passengers.
EUG is classified as a non-hub, commercial service, primary airport in the Federal Aviation Administration (FAA) National Plan of Integrated Airport Systems. It is classified as non-hub because enplanements at EUG account for less than .05 of total national enplanements.
Between 2001 and 2004, service was reduced by one-third at the Eugene Airport in response to national trends of low airline passenger rates following the events of September 11, 2001. Ticket prices also increased at the Eugene Airport during this period, affecting travel rates. Since 2004, service and passenger traffic have increased. According to Airport management records, a total of 92,779 aircraft operations (arrivals and departures) and 360,258 enplanements occurred in 2006. The majority of aircraft operations were associated with general aviation aircrafts. FAA projected that in 2011, 97,284 aircraft operations and 384,483 enplanements will occur at EUG.
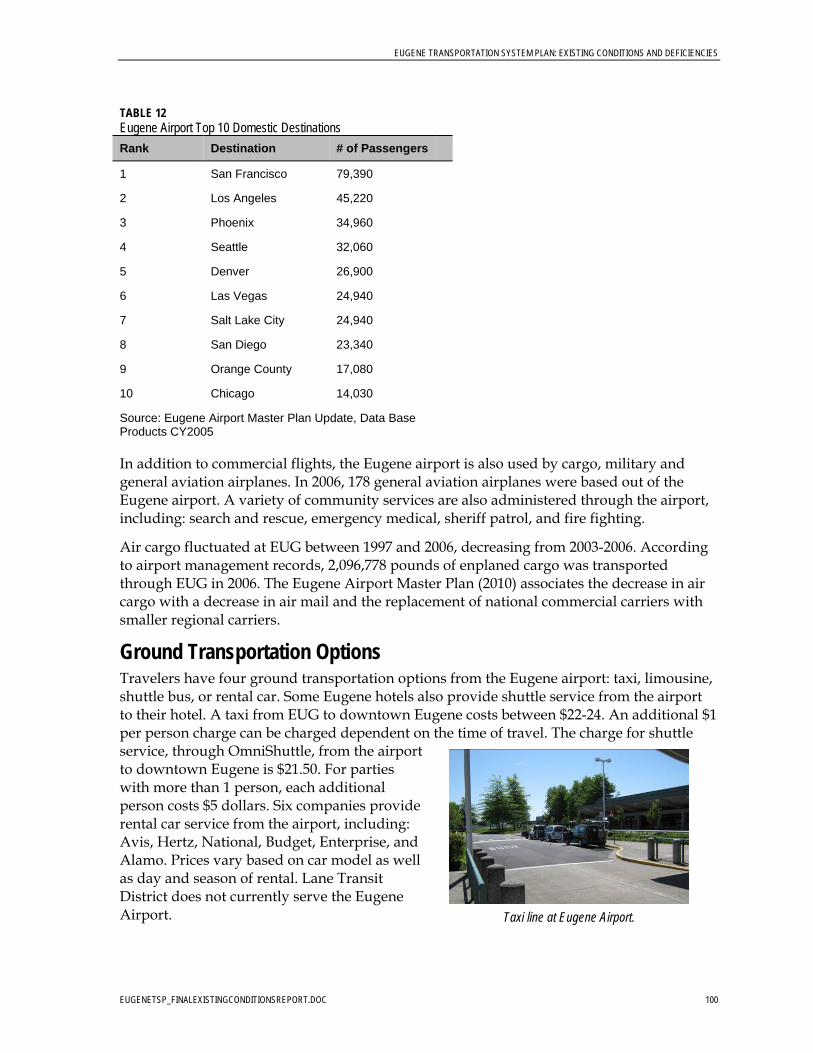
EUGENE TRANSPORTATION SYSTEM PLAN: EXISTING CONDITIONS AND DEFICIENCIES
EUGENETSP_FINALEXISTINGCONDITIONSREPORT.DOC 100
TABLE 12 Eugene Airport Top 10 Domestic Destinations Rank Destination # of Passengers
1 San Francisco 79,390
2 Los Angeles 45,220
3 Phoenix 34,960
4 Seattle 32,060
5 Denver 26,900
6 Las Vegas 24,940
7 Salt Lake City 24,940
8 San Diego 23,340
9 Orange County 17,080
10 Chicago 14,030
Source: Eugene Airport Master Plan Update, Data Base Products CY2005
In addition to commercial flights, the Eugene airport is also used by cargo, military and general aviation airplanes. In 2006, 178 general aviation airplanes were based out of the Eugene airport. A variety of community services are also administered through the airport, including: search and rescue, emergency medical, sheriff patrol, and fire fighting.
Air cargo fluctuated at EUG between 1997 and 2006, decreasing from 2003-2006. According to airport management records, 2,096,778 pounds of enplaned cargo was transported through EUG in 2006. The Eugene Airport Master Plan (2010) associates the decrease in air cargo with a decrease in air mail and the replacement of national commercial carriers with smaller regional carriers.
Ground Transportation Options Travelers have four ground transportation options from the Eugene airport: taxi, limousine, shuttle bus, or rental car. Some Eugene hotels also provide shuttle service from the airport to their hotel. A taxi from EUG to downtown Eugene costs between $22-24. An additional $1 per person charge can be charged dependent on the time of travel. The charge for shuttle service, through OmniShuttle, from the airport to downtown Eugene is $21.50. For parties with more than 1 person, each additional person costs $5 dollars. Six companies provide rental car service from the airport, including: Avis, Hertz, National, Budget, Enterprise, and Alamo. Prices vary based on car model as well as day and season of rental. Lane Transit District does not currently serve the Eugene Airport.
Taxi line at Eugene Airport.
EUGENE TRANSPORTATION SYSTEM PLAN: EXISTING CONDITIONS AND DEFICIENCIES
EUGENETSP_FINALEXISTINGCONDITIONSREPORT.DOC 101
Waterways and Pipeline Facilities Waterways and pipelines also provide transportation opportunities in Eugene. Figure 16 depicts navigable waterways and known pipelines within the study area.
Waterways Navigable Waterways The Willamette River is classified as a navigable waterway from river mile 187 (upstream from Eugene near the confluence of the Coast and Middle Forks) to river mile 0 (the confluence of the Willamette River with the Columbia River). Chapter 2 of TransPlan states that there are no maritime ports or navigational facilities within the Eugene TSP study area.
Water Trails The Willamette River is a designated water trail that extends from Portland to south of Eugene. The Willamette Riverkeepers produces maps of the water trail that contain information about navigational hazards, access points, on-shore facilities, and hiking opportunities13. Figure 16 displays the location of boat ramps along the trail.
Pipelines Two types of pipelines pass through the study area, a natural gas pipeline and a petroleum pipeline. These pipelines are shown in Figure 16 and are described below:
A natural gas pipeline system runs through the City of Eugene. The Williams Northwest Pipeline Corporation owns and maintains the pipeline system, monitors system capacity, and supplies NW Natural Gas with product to distribute.
The Kinder Morgan Energy Partners Pacific Pipeline carries petroleum gas from Portland to Eugene. The pipeline is 8 inches in diameter and made of steel. It enters Lane County north of Junction City and terminates in Eugene at their Prairie Road railroad terminal.
Summary of Deficiencies The following summarizes the deficiencies identified within the existing transportation network in Eugene.
Traffic Operations and Safety Deficiencies The existing conditions analysis is intended to define the scope and magnitude of safety and operational deficiencies at various locations throughout the City. The operational and safety review of the 50 study area intersections revealed that the following issues may merit further review.
The Randy Papé Beltline Ramp Termini (Eastbound and Westbound) at Northwest Expressway are stop controlled and both operating at capacity during the design hour
13 http://willamette-riverkeeper.org/WTrail/UpperSect/Section_jpgs/pages/pg18Key3_jpg.htm
EUGENE TRANSPORTATION SYSTEM PLAN: EXISTING CONDITIONS AND DEFICIENCIES
EUGENETSP_FINALEXISTINGCONDITIONSREPORT.DOC 102
and have experienced a higher than typical rate of crashes during the last five years. A traffic signal is not warranted at either ramp termini today. Intersection treatments to address safety and operational needs should be further considered.
Increased connectivity and multimodal options over the next several years will likely help to improve accessibility in western Eugene, especially at the Randy Papé Beltline/Roosevelt Boulevard and the Randy Papé Beltline/West 11th Avenue intersections.
Although no discernable trends or specific safety-related mitigation measures were identified, monitoring of crash experience at the following intersections is recommended: Highway 99W/Roosevelt Boulevard, Bailey Hill Road/West 11th Avenue, Willamette Street/West 29th Avenue, and Jefferson Street/West 7th Avenue.
At the Chambers Street/West 13th Avenue intersection, the city may want to consider improvements to improve signal visibility, including trimming of trees, higher visibility signal backplates and higher intensity signal lamps. In addition, additional illumination may be considered given the proximity to the school zone. This issue is prevalent at many other locations throughout the city.
At the Chambers Street/West 18th Avenue intersection, the city may want to consider working with property owners over time to facilitate access management and pedestrian-related improvements.
At the Coburg Road/Crescent Avenue intersection, an improvement in visibility could include the addition of a second through signal display and replacement of the five-section protected and permissive heads with flashing yellow arrows, increased visibility signal heads, and review of approach signs.
The City may want to continue monitoring the near capacity condition at the Coburg Road/Country Club Road/Martin Luther King Jr Boulevard intersection. Connectivity options in this area are fairly constrained by the presence of I-105 and the Willamette River.
Additional connectivity and multimodal options in the future may help to address the at capacity conditions at the Delta Highway Southbound Ramps/Valley River Drive intersection.
It is recommended that the signing and striping treatments be reviewed at the Washington Street/West 7th Avenue intersection (and west through the upstream Jefferson Street and 7th Avenue signal) to provide a clear and simple message reinforced through the signing and striping treatments. Consideration should also be provided to raised pavement markings, lane extension lines, and higher visibility treatments along the channelized islands and median curbing.
The 6th and 7th couplet in downtown may need further review in the context of multimodal access and circulation. In particular, operations at the Chambers Street/West 6th Avenue, and Madison Street/West 6th Avenue/I-105 Ramp intersections.
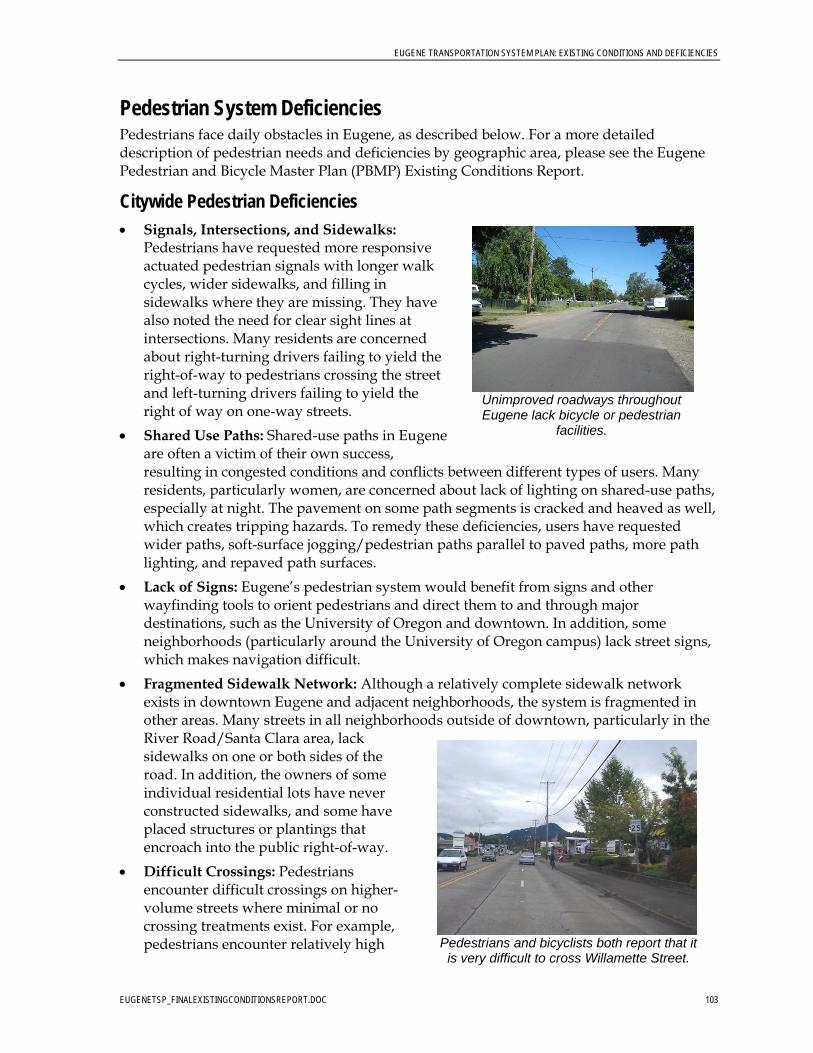
EUGENE TRANSPORTATION SYSTEM PLAN: EXISTING CONDITIONS AND DEFICIENCIES
EUGENETSP_FINALEXISTINGCONDITIONSREPORT.DOC 103
Pedestrian System Deficiencies Pedestrians face daily obstacles in Eugene, as described below. For a more detailed description of pedestrian needs and deficiencies by geographic area, please see the Eugene Pedestrian and Bicycle Master Plan (PBMP) Existing Conditions Report.
Citywide Pedestrian Deficiencies
Signals, Intersections, and Sidewalks: Pedestrians have requested more responsive actuated pedestrian signals with longer walk cycles, wider sidewalks, and filling in sidewalks where they are missing. They have also noted the need for clear sight lines at intersections. Many residents are concerned about right-turning drivers failing to yield the right-of-way to pedestrians crossing the street and left-turning drivers failing to yield the right of way on one-way streets.
Shared Use Paths: Shared-use paths in Eugene are often a victim of their own success, resulting in congested conditions and conflicts between different types of users. Many residents, particularly women, are concerned about lack of lighting on shared-use paths, especially at night. The pavement on some path segments is cracked and heaved as well, which creates tripping hazards. To remedy these deficiencies, users have requested wider paths, soft-surface jogging/pedestrian paths parallel to paved paths, more path lighting, and repaved path surfaces.
Lack of Signs: Eugene’s pedestrian system would benefit from signs and other wayfinding tools to orient pedestrians and direct them to and through major destinations, such as the University of Oregon and downtown. In addition, some neighborhoods (particularly around the University of Oregon campus) lack street signs, which makes navigation difficult.
Fragmented Sidewalk Network: Although a relatively complete sidewalk network exists in downtown Eugene and adjacent neighborhoods, the system is fragmented in other areas. Many streets in all neighborhoods outside of downtown, particularly in the River Road/Santa Clara area, lack sidewalks on one or both sides of the road. In addition, the owners of some individual residential lots have never constructed sidewalks, and some have placed structures or plantings that encroach into the public right-of-way.
Difficult Crossings: Pedestrians encounter difficult crossings on higher-volume streets where minimal or no crossing treatments exist. For example, pedestrians encounter relatively high
Unimproved roadways throughout Eugene lack bicycle or pedestrian
facilities.
Pedestrians and bicyclists both report that it
is very difficult to cross Willamette Street.
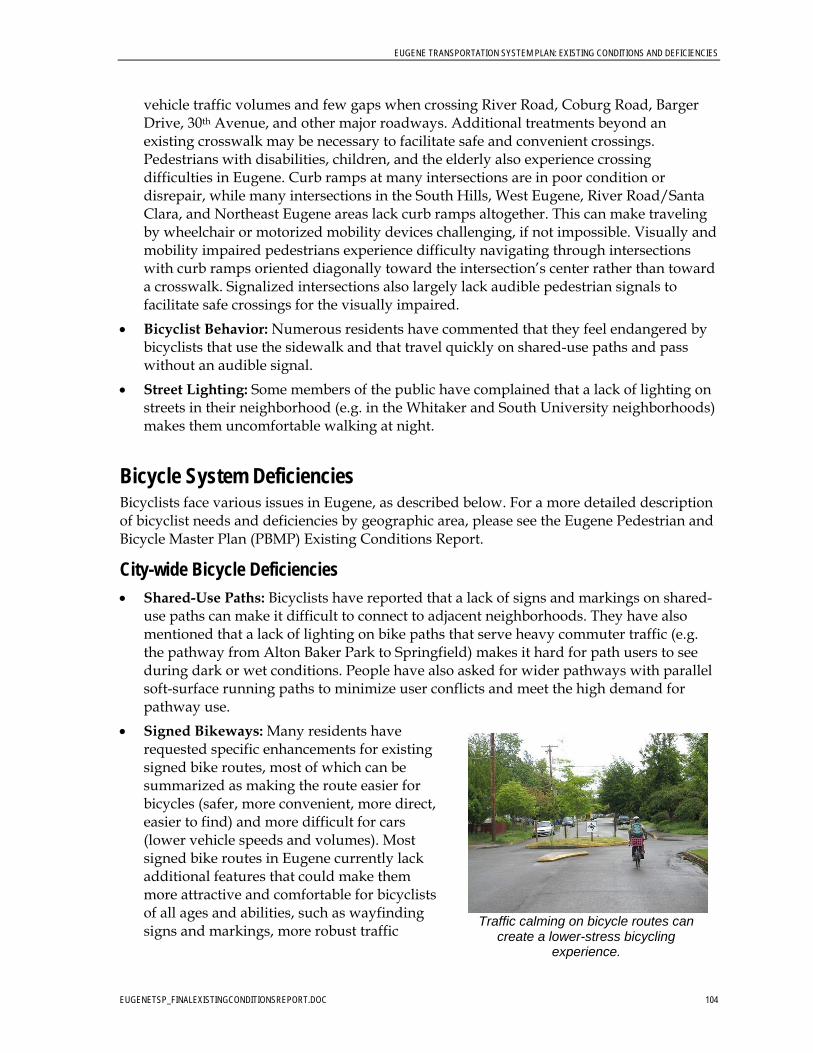
EUGENE TRANSPORTATION SYSTEM PLAN: EXISTING CONDITIONS AND DEFICIENCIES
EUGENETSP_FINALEXISTINGCONDITIONSREPORT.DOC 104
vehicle traffic volumes and few gaps when crossing River Road, Coburg Road, Barger Drive, 30th Avenue, and other major roadways. Additional treatments beyond an existing crosswalk may be necessary to facilitate safe and convenient crossings. Pedestrians with disabilities, children, and the elderly also experience crossing difficulties in Eugene. Curb ramps at many intersections are in poor condition or disrepair, while many intersections in the South Hills, West Eugene, River Road/Santa Clara, and Northeast Eugene areas lack curb ramps altogether. This can make traveling by wheelchair or motorized mobility devices challenging, if not impossible. Visually and mobility impaired pedestrians experience difficulty navigating through intersections with curb ramps oriented diagonally toward the intersection’s center rather than toward a crosswalk. Signalized intersections also largely lack audible pedestrian signals to facilitate safe crossings for the visually impaired.
Bicyclist Behavior: Numerous residents have commented that they feel endangered by bicyclists that use the sidewalk and that travel quickly on shared-use paths and pass without an audible signal.
Street Lighting: Some members of the public have complained that a lack of lighting on streets in their neighborhood (e.g. in the Whitaker and South University neighborhoods) makes them uncomfortable walking at night.
Bicycle System Deficiencies Bicyclists face various issues in Eugene, as described below. For a more detailed description of bicyclist needs and deficiencies by geographic area, please see the Eugene Pedestrian and Bicycle Master Plan (PBMP) Existing Conditions Report.
City-wide Bicycle Deficiencies
Shared-Use Paths: Bicyclists have reported that a lack of signs and markings on shared-use paths can make it difficult to connect to adjacent neighborhoods. They have also mentioned that a lack of lighting on bike paths that serve heavy commuter traffic (e.g. the pathway from Alton Baker Park to Springfield) makes it hard for path users to see during dark or wet conditions. People have also asked for wider pathways with parallel soft-surface running paths to minimize user conflicts and meet the high demand for pathway use.
Signed Bikeways: Many residents have requested specific enhancements for existing signed bike routes, most of which can be summarized as making the route easier for bicycles (safer, more convenient, more direct, easier to find) and more difficult for cars (lower vehicle speeds and volumes). Most signed bike routes in Eugene currently lack additional features that could make them more attractive and comfortable for bicyclists of all ages and abilities, such as wayfinding signs and markings, more robust traffic
Traffic calming on bicycle routes can
create a lower-stress bicycling experience.
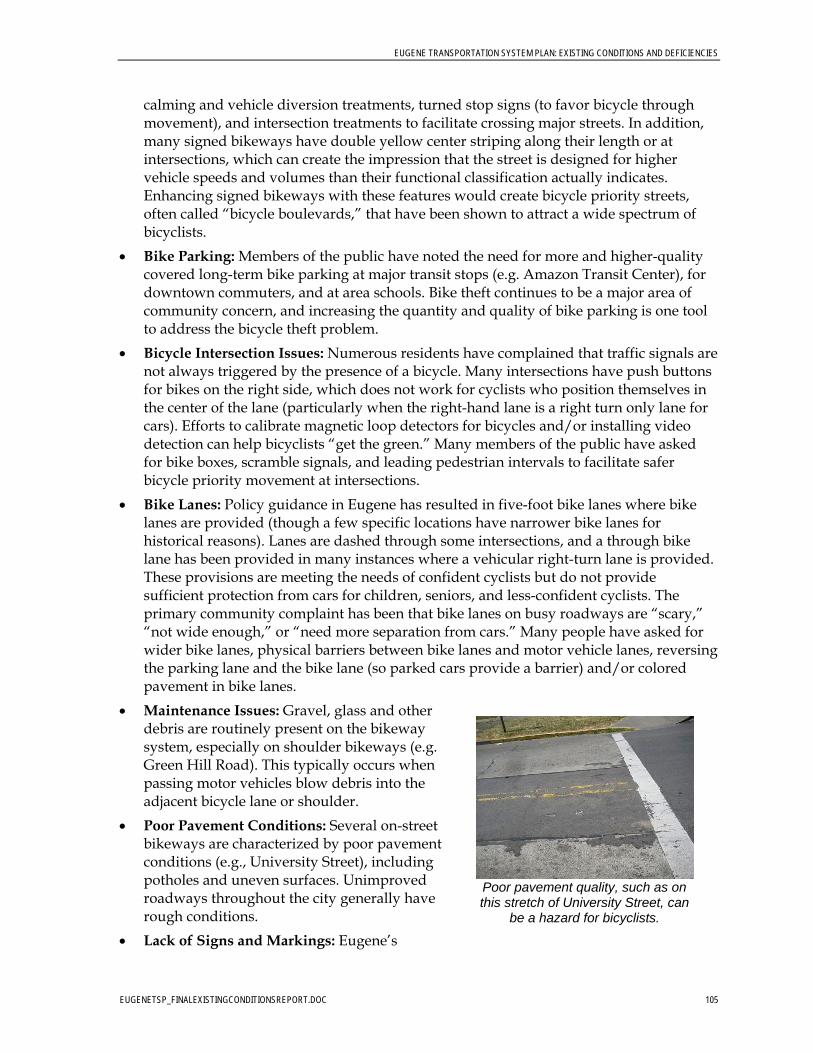
EUGENE TRANSPORTATION SYSTEM PLAN: EXISTING CONDITIONS AND DEFICIENCIES
EUGENETSP_FINALEXISTINGCONDITIONSREPORT.DOC 105
calming and vehicle diversion treatments, turned stop signs (to favor bicycle through movement), and intersection treatments to facilitate crossing major streets. In addition, many signed bikeways have double yellow center striping along their length or at intersections, which can create the impression that the street is designed for higher vehicle speeds and volumes than their functional classification actually indicates. Enhancing signed bikeways with these features would create bicycle priority streets, often called “bicycle boulevards,” that have been shown to attract a wide spectrum of bicyclists.
Bike Parking: Members of the public have noted the need for more and higher-quality covered long-term bike parking at major transit stops (e.g. Amazon Transit Center), for downtown commuters, and at area schools. Bike theft continues to be a major area of community concern, and increasing the quantity and quality of bike parking is one tool to address the bicycle theft problem.
Bicycle Intersection Issues: Numerous residents have complained that traffic signals are not always triggered by the presence of a bicycle. Many intersections have push buttons for bikes on the right side, which does not work for cyclists who position themselves in the center of the lane (particularly when the right-hand lane is a right turn only lane for cars). Efforts to calibrate magnetic loop detectors for bicycles and/or installing video detection can help bicyclists “get the green.” Many members of the public have asked for bike boxes, scramble signals, and leading pedestrian intervals to facilitate safer bicycle priority movement at intersections.
Bike Lanes: Policy guidance in Eugene has resulted in five-foot bike lanes where bike lanes are provided (though a few specific locations have narrower bike lanes for historical reasons). Lanes are dashed through some intersections, and a through bike lane has been provided in many instances where a vehicular right-turn lane is provided. These provisions are meeting the needs of confident cyclists but do not provide sufficient protection from cars for children, seniors, and less-confident cyclists. The primary community complaint has been that bike lanes on busy roadways are “scary,” “not wide enough,” or “need more separation from cars.” Many people have asked for wider bike lanes, physical barriers between bike lanes and motor vehicle lanes, reversing the parking lane and the bike lane (so parked cars provide a barrier) and/or colored pavement in bike lanes.
Maintenance Issues: Gravel, glass and other debris are routinely present on the bikeway system, especially on shoulder bikeways (e.g. Green Hill Road). This typically occurs when passing motor vehicles blow debris into the adjacent bicycle lane or shoulder.
Poor Pavement Conditions: Several on-street bikeways are characterized by poor pavement conditions (e.g., University Street), including potholes and uneven surfaces. Unimproved roadways throughout the city generally have rough conditions.
Lack of Signs and Markings: Eugene’s
Poor pavement quality, such as on this stretch of University Street, can
be a hazard for bicyclists.
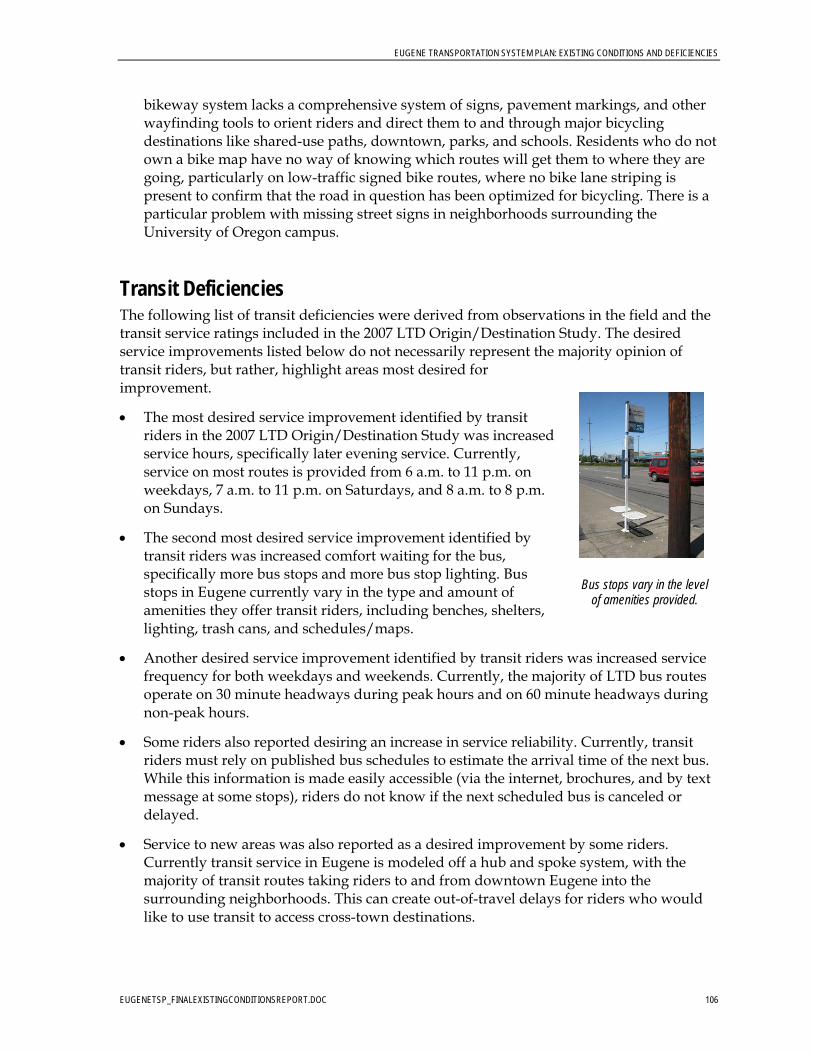
EUGENE TRANSPORTATION SYSTEM PLAN: EXISTING CONDITIONS AND DEFICIENCIES
EUGENETSP_FINALEXISTINGCONDITIONSREPORT.DOC 106
Bus stops vary in the level
of amenities provided.
bikeway system lacks a comprehensive system of signs, pavement markings, and other wayfinding tools to orient riders and direct them to and through major bicycling destinations like shared-use paths, downtown, parks, and schools. Residents who do not own a bike map have no way of knowing which routes will get them to where they are going, particularly on low-traffic signed bike routes, where no bike lane striping is present to confirm that the road in question has been optimized for bicycling. There is a particular problem with missing street signs in neighborhoods surrounding the University of Oregon campus.
Transit Deficiencies The following list of transit deficiencies were derived from observations in the field and the transit service ratings included in the 2007 LTD Origin/Destination Study. The desired service improvements listed below do not necessarily represent the majority opinion of transit riders, but rather, highlight areas most desired for improvement.
The most desired service improvement identified by transit riders in the 2007 LTD Origin/Destination Study was increased service hours, specifically later evening service. Currently, service on most routes is provided from 6 a.m. to 11 p.m. on weekdays, 7 a.m. to 11 p.m. on Saturdays, and 8 a.m. to 8 p.m. on Sundays.
The second most desired service improvement identified by transit riders was increased comfort waiting for the bus, specifically more bus stops and more bus stop lighting. Bus stops in Eugene currently vary in the type and amount of amenities they offer transit riders, including benches, shelters, lighting, trash cans, and schedules/maps.
Another desired service improvement identified by transit riders was increased service frequency for both weekdays and weekends. Currently, the majority of LTD bus routes operate on 30 minute headways during peak hours and on 60 minute headways during non-peak hours.
Some riders also reported desiring an increase in service reliability. Currently, transit riders must rely on published bus schedules to estimate the arrival time of the next bus. While this information is made easily accessible (via the internet, brochures, and by text message at some stops), riders do not know if the next scheduled bus is canceled or delayed.
Service to new areas was also reported as a desired improvement by some riders. Currently transit service in Eugene is modeled off a hub and spoke system, with the majority of transit routes taking riders to and from downtown Eugene into the surrounding neighborhoods. This can create out-of-travel delays for riders who would like to use transit to access cross-town destinations.
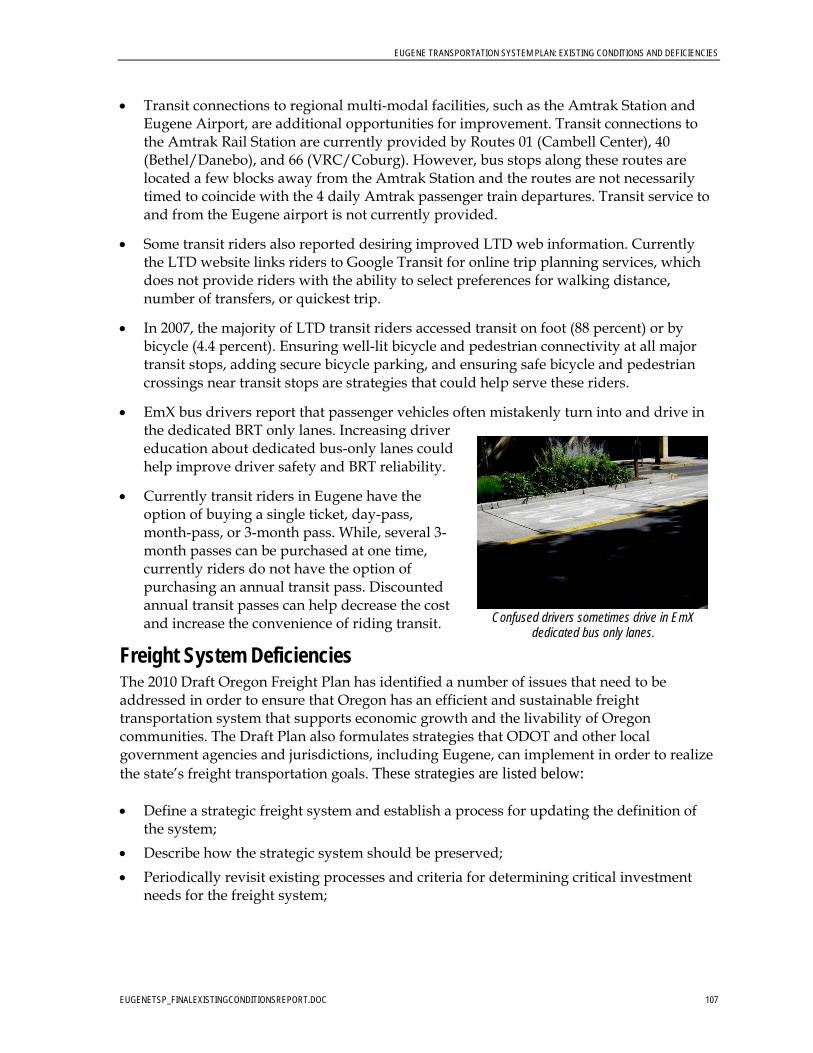
EUGENE TRANSPORTATION SYSTEM PLAN: EXISTING CONDITIONS AND DEFICIENCIES
EUGENETSP_FINALEXISTINGCONDITIONSREPORT.DOC 107
Confused drivers sometimes drive in EmX
dedicated bus only lanes.
Transit connections to regional multi-modal facilities, such as the Amtrak Station and Eugene Airport, are additional opportunities for improvement. Transit connections to the Amtrak Rail Station are currently provided by Routes 01 (Cambell Center), 40 (Bethel/Danebo), and 66 (VRC/Coburg). However, bus stops along these routes are located a few blocks away from the Amtrak Station and the routes are not necessarily timed to coincide with the 4 daily Amtrak passenger train departures. Transit service to and from the Eugene airport is not currently provided.
Some transit riders also reported desiring improved LTD web information. Currently the LTD website links riders to Google Transit for online trip planning services, which does not provide riders with the ability to select preferences for walking distance, number of transfers, or quickest trip.
In 2007, the majority of LTD transit riders accessed transit on foot (88 percent) or by bicycle (4.4 percent). Ensuring well-lit bicycle and pedestrian connectivity at all major transit stops, adding secure bicycle parking, and ensuring safe bicycle and pedestrian crossings near transit stops are strategies that could help serve these riders.
EmX bus drivers report that passenger vehicles often mistakenly turn into and drive in the dedicated BRT only lanes. Increasing driver education about dedicated bus-only lanes could help improve driver safety and BRT reliability.
Currently transit riders in Eugene have the option of buying a single ticket, day-pass, month-pass, or 3-month pass. While, several 3-month passes can be purchased at one time, currently riders do not have the option of purchasing an annual transit pass. Discounted annual transit passes can help decrease the cost and increase the convenience of riding transit.
Freight System Deficiencies The 2010 Draft Oregon Freight Plan has identified a number of issues that need to be addressed in order to ensure that Oregon has an efficient and sustainable freight transportation system that supports economic growth and the livability of Oregon communities. The Draft Plan also formulates strategies that ODOT and other local government agencies and jurisdictions, including Eugene, can implement in order to realize the state’s freight transportation goals. These strategies are listed below: Define a strategic freight system and establish a process for updating the definition of
the system;
Describe how the strategic system should be preserved;
Periodically revisit existing processes and criteria for determining critical investment needs for the freight system;
EUGENE TRANSPORTATION SYSTEM PLAN: EXISTING CONDITIONS AND DEFICIENCIES
EUGENETSP_FINALEXISTINGCONDITIONSREPORT.DOC 108
Describe how ODOT can work with partner agencies and other states, local agencies and the private sector to ensure a coordinated approach to freight transportation system planning;
Establish procedures to ensure the system operates efficiently;
Identify actions that can be taken to coordinate land use and freight transportation planning decisions;
Describe how regulatory programs can be coordinated with freight transportation needs; and
Describe approaches to addressing long-term funding needs for the freight transportation system.
The implementation of these strategies statewide will impact the freight system in Eugene and provides a framework for the City to support and improve freight connections within the study area over the next 20 years.
Rail System Deficiencies Freight Rail Strategies identified in the 2010 Oregon Rail Study for Oregon to preserve and expand freight rail access in Oregon include:
increasing capacity
developing hub facilities for transloading and aggregating shipments
providing equipment
maximizing the development of existing rail-friendly land
improving deteriorating infrastructure
growing intra-Oregon rail traffic
These strategies will likely impact the freight rail system in Eugene as the state works to improve and expand the rail system in Oregon over the next 20 years.
Passenger Rail To accommodate the desired improvements in passenger rail service identified by the HSIPR program, a preferred alignment will need to be identified and several improvements will need to be made to the rail corridor. The 2009 HSIPR Service Development Plan (SDP) identifies several needs, deficiencies, and capital improvements that would affect the rail system within the study area. These needs, deficiencies, and capital improvements are described below:
Provide rail capacity improvements between Portland to Eugene including track alignment, double track locations, crossing improvements or closures, bridge and track recapitalization allowing for high speed operations, station improvements, signal,
EUGENE TRANSPORTATION SYSTEM PLAN: EXISTING CONDITIONS AND DEFICIENCIES
EUGENETSP_FINALEXISTINGCONDITIONSREPORT.DOC 109
communications and positive train control, and maintenance facilities. (Project #9, HSIPR Service Development Plan)
Construct two stub tracks at the downtown Eugene passenger station to permit passenger trains to be parked overnight and eliminate the current practice of storing them at Eugene Yard, which requires extra time and expense to travel back and forth. (Project #8, HSIPR Service Development Plan)14
Install a new power-operated crossover between the main track and WP siding north of the passenger depot for enhanced freight access to Eugene Yard. (Project #8, HSIPR Service Development Plan)
Analyze Eugene Yard to determine if the yard configuration is sufficient for projected 2030 rail traffic levels. A new yard configuration may be necessary to accommodate yard and industrial switching in conjunction with the additional through trains.
At-Grade Crossings Observations of two at-grade railroad crossings at Irving Road and NW Expressway and Irvington Drive and NW Expressway show that the crossings appear to have a short distance (12 feet) between the crosswalks and the railroad crossing stop lines for westbound auto traffic. At-grade railroad crossings should be reviewed for vehicle queuing distance and storage space once the traffic data is available.
Airport Deficiencies The Eugene Airport Master Plan Update identified needs associated with a variety of airport facilities. The facilities relevant to the Eugene TSP include airport facilities, terminal facilities, air cargo facilities, general aviation facilities, and automobile parking and circulation.
Airport Facilities
The runway length of both runways was identified as a potential future deficiency. The extension of 16R-34L runway to 9,200 feet and the extension of 16L-34R to 6,500 feet would allow a greater range of aircrafts to be accommodated on each runway.
The airport currently has only one baggage claim and does not have a back-up baggage claim.
Air cargo facilities can only accommodate seven smaller aircrafts. In 2007, a project was started to construct facilities to accommodate seven larger aircrafts.
Surface Transportation and Auto Parking
Terminal curb front space is projected to be inadequate to meet demand sometime between 2016 and 2026.
Capacity at the parking lots adjacent to the terminal currently exceed capacity during peak times, resulting in drivers using the remote overflow parking lot. This parking lot
14 This is part of a larger project at the Eugene passenger station that will include an elevated platform for getting on and off the train.
EUGENE TRANSPORTATION SYSTEM PLAN: EXISTING CONDITIONS AND DEFICIENCIES
EUGENETSP_FINALEXISTINGCONDITIONSREPORT.DOC 110
is more expensive for the airport to administer as it requires a shuttle service and is less convenient for travelers. Public parking (parking adjacent to the terminal and overflow parking) is expected to be inadequate sometime between 2016 and 2026.
The demand for storage and service spaces for rental car companies currently exceeds capacity at EUG. The number of ready and return spaces currently meets the need for rental car companies but is projected to be insufficient sometime between 2016 and 2026.
Regularly scheduled transit service is not provided to and from this location. Most originating passengers at EUG use private automobiles to travel to the airport.
EUGENE TRANSPORTATION SYSTEM PLAN: EXISTING CONDITIONS AND DEFICIENCIES
EUGENETSP_FINALEXISTINGCONDITIONSREPORT.DOC 111
Next Steps The information gathered and presented in this report will be reviewed by a broader audience and the ensuing discussion will serve as the basis for developing the alternatives considered in the Eugene Transportation System Plan. Future goals and policies for the Eugene TSP will be developed with input from project stakeholders and the broader community and will serve as the basis for evaluating the project alternatives.
{00 C
Appendix C: No Build Analysis

TECHNICAL MEMORANDUM Eugene Transportation System Plan
Future Conditions Results - No Build Scenario
Date: September 18, 2012 Project #:10296
To:
Cc:
Eugene PMT, TAC and TCRG Kurt Yeiter, City of Eugene
Theresa Carr, CH2M Hill
From: Julia Kuhn, Joe Bessman & Matt Kittelson, Kittelson & Associates, Inc.
This technical memorandum presents the key findings related to the year 2035 No Build Analyses for
the Eugene Transportation System Plan (TSP). The following analyses relates only to the street system.
The quality of service related to active modes of travel (i.e., walking, cycling, and transit) is not directly
addressed within this memorandum; rather these modes are directly affected by the conditions
projected to occur along the streets and at intersections. Information contained in this memorandum
can be used to inform the identification and evaluation of future multimodal transportation system
alternatives that meet the goals and objectives guiding the TSP.
All of the technical analyses summarized herein assume that the City will continue to see growth in
employment and population between now and the year 2035 in a manner consistent with the existing
Comprehensive Plan land use designations, within the existing Urban Growth Boundary (UGB) and
consistent with the statewide and regional growth forecasts. At the same time, the analyses assume
that the street, transit, pedestrian and bicycle systems will remain as they exist today. This “do
nothing” approach from a transportation perspective is commonly used as a foundation by which cities
can test the effectiveness of potential projects, policies, and programs. This testing of alternatives
helps policy makers to weigh trade-offs regarding future funding priorities in a manner that ensures
that the transportation system supports and enhances the continued economic growth, and
contributes to the community vision in a manner that is safe, sustainable, fundable and diverse.
As will be discussed in this memorandum, the No Build analyses highlight the following primary
deficiencies within Eugene:
Localized intersection improvement needs,
Increasing congestion along the West 11th Avenue corridor,
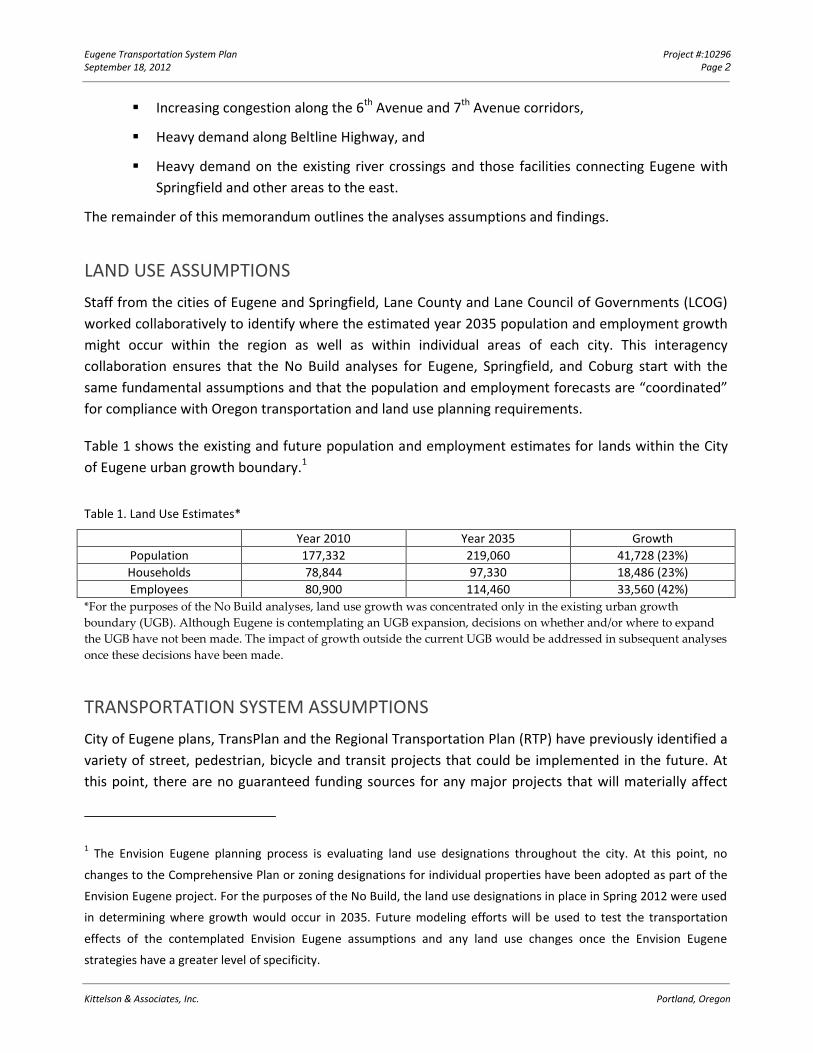
Eugene Transportation System Plan Project #:10296 September 18, 2012 Page 2
Kittelson & Associates, Inc. Portland, Oregon
Increasing congestion along the 6th Avenue and 7th Avenue corridors,
Heavy demand along Beltline Highway, and
Heavy demand on the existing river crossings and those facilities connecting Eugene with
Springfield and other areas to the east.
The remainder of this memorandum outlines the analyses assumptions and findings.
LAND USE ASSUMPTIONS
Staff from the cities of Eugene and Springfield, Lane County and Lane Council of Governments (LCOG)
worked collaboratively to identify where the estimated year 2035 population and employment growth
might occur within the region as well as within individual areas of each city. This interagency
collaboration ensures that the No Build analyses for Eugene, Springfield, and Coburg start with the
same fundamental assumptions and that the population and employment forecasts are “coordinated”
for compliance with Oregon transportation and land use planning requirements.
Table 1 shows the existing and future population and employment estimates for lands within the City
of Eugene urban growth boundary.1
Table 1. Land Use Estimates*
Year 2010 Year 2035 Growth
Population 177,332 219,060 41,728 (23%)
Households 78,844 97,330 18,486 (23%)
Employees 80,900 114,460 33,560 (42%)
*For the purposes of the No Build analyses, land use growth was concentrated only in the existing urban growth
boundary (UGB). Although Eugene is contemplating an UGB expansion, decisions on whether and/or where to expand
the UGB have not been made. The impact of growth outside the current UGB would be addressed in subsequent analyses
once these decisions have been made.
TRANSPORTATION SYSTEM ASSUMPTIONS
City of Eugene plans, TransPlan and the Regional Transportation Plan (RTP) have previously identified a
variety of street, pedestrian, bicycle and transit projects that could be implemented in the future. At
this point, there are no guaranteed funding sources for any major projects that will materially affect
1 The Envision Eugene planning process is evaluating land use designations throughout the city. At this point, no
changes to the Comprehensive Plan or zoning designations for individual properties have been adopted as part of the
Envision Eugene project. For the purposes of the No Build, the land use designations in place in Spring 2012 were used
in determining where growth would occur in 2035. Future modeling efforts will be used to test the transportation
effects of the contemplated Envision Eugene assumptions and any land use changes once the Envision Eugene
strategies have a greater level of specificity.
Eugene Transportation System Plan Project #:10296 September 18, 2012 Page 3
Kittelson & Associates, Inc. Portland, Oregon
traveler behaviors and traffic volumes on the city’s street network in the future. For this reason, the No
Build assumes that the existing street, pedestrian, bicycle and transit system is in-place in the year
2035 and that will not build any new transportation improvements (other than minor intersection
improvements) or implement new programs to lessen automobile traffic on the street system.
TRAFFIC VOLUME DEVELOPMENT
Based on estimates of future job and household growth and the No Build transportation network,
LCOG developed traffic volume forecasts for the city’s collector and arterial street system, using an
emme travel demand model.2 This model is calibrated to actual traffic volume counts recently
measured on streets within the city. In addition to land use and street network inputs, the model also
relies on information about existing traveler behavior and trip-making characteristics to understand
how people might use the transportation system in the future.
Based on information obtained from LCOG, coupled with measured traffic counts at intersections and
roadways within the city, year 2035 intersection and roadway volumes were developed using a
procedure consistent with guidance from ODOT’s Analysis Procedures Manual (APM).
INTERSECTION ANALYSES
Key street intersections are often the first points in the transportation system to exhibit congestion.
Review of these intersections can help inform the identification of localized improvement needs (such
as additional turn lanes, new traffic signals, etc.), and can serve as indicators for more significant street
network issues.
The No Build intersection analyses focuses on the peak fifteen minutes of the weekday evening
commute conditions, when traffic volumes throughout the City as a whole are highest during the day.
Although the evening commute period captures many of the system issues, different patterns and
needs may occur in the morning, mid-afternoon, or during weekends at specific locations based on
adjacent land use characteristics (e.g., school hours, employment shift changes outside of the typical
dayshift). Localized improvement needs that occur outside the evening commute period can be
evaluated in future corridor, subarea, and other plans prepared outside of the TSP efforts. These more
detailed studies can be incorporated into future TSP amendments and capital planning efforts as part
of periodic updates.
The Existing Conditions memorandum prepared for the TSP included analyses of 50 intersections
throughout the city. The No Build analyses assesses the performance of these same intersections and
2 LCOG will provide a memorandum detailing the assumptions included in the LCOG Travel Demand Forecasting
Modeling under separate cover.
Eugene Transportation System Plan Project #:10296 September 18, 2012 Page 4
Kittelson & Associates, Inc. Portland, Oregon
compares the expected intersection performance to adopted city and state standards. These analyses
were conducted in a manner consistent with the methodologies outlined in the Highway Capacity
Manual and guidance provided in the Analysis Procedures Manual (APM) prepared by ODOT. The City
may consider amendments to the adopted performance standards in the later phases of the TSP. For
the purposes of the No Build analyses the existing standards were assumed to be in-place.
As discussed in the Existing Conditions Memorandum, the Beltline Facility Plan planning efforts are
currently underway. The planning for this Facility Plan has included significant operational, safety and
geometric review of the interchanges and adjacent intersections. As part of the TSP No Build review,
the Beltline Facility Plan study area intersections were not reviewed. Rather, it is assumed that the
findings of the Facility Plan will be incorporated into future TSP efforts.
The year 2035 No Build intersection operations are shown in Table A in the Appendix and are exhibited
in Figure 2. For comparison, the Appendix also presents a graphic illustrating the existing conditions
findings, as shown in Figure 1. Within Figures 1 and 2, locations where the performance meets city and
state standards are colored as green; locations where the city and state standards are not met are
shown as red. Specific findings of the intersection analyses are discussed below.
CORRIDOR ANALYSES
For the purposes of identifying future transportation system alternatives, it is also helpful to look at a
holistic, corridor approach to understand the No Build deficiencies. This broader system approach can
be guided by the comparison of anticipated demand on key corridors within the city to planning-level
estimates of street capacity. Review of the street segments can identify network connectivity,
functional issues, potential corridor management strategies, and multimodal opportunities. This can
ensure that the future transportation system looks, feels and operates in a manner consistent with the
community’s vision.
To inform this assessment, the comparison of the year 2035 traffic demand to capacity for individual
arterial and collector streets within the city was assessed and then classified within three categories:
Streets that operate “well” – defined for the purposes of this memo as the No Build
demand is less than 80 percent of the capacity. These streets are shown in green in the
figures.
Streets that are “nearing capacity” under the No Build – the demand is between 80 and 100
percent of the capacity. These streets are shown in yellow in the figures.
Streets that are “over capacity” – the No Build demand exceeds the capacity, which is
shown in red on the figures.
The results of these analyses are shown in Figure 2. In reviewing Figures 1 and 2, it is helpful to note
that the corridor analyses consider a full hour of traffic demand during the weekday commute period
whereas the intersection analyses focus on the peak 15 minute time period.
Eugene Transportation System Plan Project #:10296 September 18, 2012 Page 5
Kittelson & Associates, Inc. Portland, Oregon
Together, with the intersection analyses results, the corridor analyses can be used to identify the No
Build street system deficiencies throughout Eugene. These deficiencies are described in more detail
below.
NO BUILD FINDINGS
W 11th Avenue Corridor
The W 11th Avenue corridor provides a connection from downtown Eugene and the University of
Oregon to the employment, commercial, and residential areas to the west as well as to outlying
communities and eventually to the Oregon coast. Today, this corridor experiences congestion due to
the local accessibility and regional and statewide mobility functions it serves.
Under the 2035 No Build analyses, undeveloped residential lands to the south of the West 11th Avenue
corridor, particularly near Crow Road are expected to experience considerable growth. The growth in
land uses served by the corridor as well as the increasing demand for regional and statewide traffic will
place additional pressures on the corridor. As shown in Figure 2, the W 11th Avenue corridor is shown
to operate near or over capacity from the UGB into the downtown. In addition, all of the study
intersections, except one, along this corridor are also shown to be over capacity. The inability of the W
11th Avenue corridor to serve all of the No Build traffic demand would result in traffic diverting to other
corridors, like W 18th Avenue.
In July 2012, the Lane Transit District (LTD) released the West Eugene EmX Extension Project
Environmental Assessment (EA) to construct bus rapid transit (EmX) in this corridor in the future. The
traffic analyses prepared to support the EA assumes that the projects identified in the RTP are in-place
under the EA’s No Build Alternative. Per this EA, even with the RTP projects and the implementation of
EmX, this corridor and many of the intersections along it are projected to experience significant
congestion in the year 2035.
The TSP and EA analyses suggest that a series of system, corridor management and demand
management strategies could help to address future multimodal needs along West 11th Avenue.
Examples of these types of strategies are outlined at the end of this document.
West 18th Avenue Corridor
Today, this corridor serves as a key facility in connecting pedestrian, bicycle and vehicular trips from
local streets to both the regional arterial network and into downtown and the University of Oregon.
Although this corridor isn’t congested from a vehicular standpoint today, its current configuration can
feel constrained to pedestrians and bicyclists, especially.
Under the 2035 No Build analyses, undeveloped residential lands to the south of the West 18th Avenue
corridor are expected to experience considerable growth. This growth, combined with the potential
Eugene Transportation System Plan Project #:10296 September 18, 2012 Page 6
Kittelson & Associates, Inc. Portland, Oregon
diversion of traffic to this corridor resulting from considerable congestion on West 11th Avenue, could
result in the demands for West 18th Avenue reaching or exceeding the available vehicular capacity. This
same demand-to-capacity forecast is also shown on Bailey Hill Road and on Bertelsen Road under the
No Build scenario.
Although the intersection analyses did not reveal specific intersection constraints, the findings suggest
that the demands for the West 11th and West 18th Avenue corridors in serving both local and regional
multimodal travel need to be taken into context together when considering possible solutions.
Highway 99
Highway 99 serves as one of the regional arterials within Eugene, connecting employment and
residential lands to the downtown. Highway 99, like other regional roadways (e.g., the Beltline
Highway, West 11th Avenue, I-105), also serves as a key corridor for freight movement within the city.
In addition, Highway 99 provides a connection between Eugene and Junction City to the north. Within
the vicinity of the Beltline ramps, Highway 99 begins to transition from a rural highway to a more
urbanized corridor. As such, most of the congestion expected along Highway 99 in the future occurs
south of Beltline Highway and increases as the highway approaches the downtown area.
Today and in the future, congestion occurs at the intersection of the Beltline ramps with Highway 99;
this congestion can also be problematic on weekends, given the proximity of commercial uses to the
interchange. Significant growth expected in Junction City (both residential and employment, such as
the hospital and state correctional facilities) will also increase the regional demand along this corridor
Further, intersections along the corridor to the south of Roosevelt Boulevard and transitioning into the
6th Avenue/7th Avenue couplet will be at or over capacity. Future improvements to this roadway should
consider how to maintain the regional mobility purpose of this facility through access management
strategies and/or localized improvements. Corridor-wide capacity improvements south of Roosevelt
Boulevard will be difficult and likely expensive given the existing railroad overcrossing. In reviewing
these findings, it is important to note that the No Build analyses do not include the proposed EmX
improvements or enhanced transit service in this corridor.
Northwest Expressway
Northwest Expressway serves as the transition between residential neighborhoods to the east and
employment uses and the railroad tracks to the west. This corridor is an access controlled roadway
connecting northwest Eugene south to River Road, providing an important albeit somewhat
underutilized freight connection. Under the No Build, the Northwest Expressway is expected to operate
below capacity over much of its length. The section between Irving Road and the Beltline ramp
intersections is anticipated to operate over capacity as are the two ramp intersections. The intersection
with River Road is also shown to experience over capacity conditions.
Eugene Transportation System Plan Project #:10296 September 18, 2012 Page 7
Kittelson & Associates, Inc. Portland, Oregon
River Road Corridor
River Road is a north-south arterial roadway that connects North Eugene travelers with destinations to
the south, including downtown Eugene and the University of Oregon. Some users may use Northwest
Expressway, or even Highway 99, as alternatives to River Road. However, these alternatives are often
out-of-direction for the traveler and River Road provides local access for a number of residences,
commercial districts, and schools, including North Eugene High School. Given the length and distinct
areas along the River Road corridor, the facility is discussed by segment in the subsections below.
Eugene City Limits to Beltline Highway
Along this northern stretch of River Road, the roadway feels and operates more like a two-lane rural
highway than a city street. South of the Eugene city limits, River Road quickly transitions to a suburban
arterial, connecting the neighborhoods and schools in Santa Clara with the regional transportation
system. Just north of Beltline Highway there are several commercial uses that attract both local and
more regional demand.
In the 2035 No Build conditions, growth in the Santa Clara area will increase the regional demand along
this corridor. Given that most users are traveling to and from the south, towards the Eugene city core
and Beltline Highway, traffic volumes increase along this segment toward the south. In fact, the
roadway is expected to exceed capacity between Irving Road and Beltline Highway.
As mentioned previously, the section of River Road near Beltline Highway is part of an ongoing Facility
Plan. As such, specific projects and planning strategies will be developed for this area, including this
portion of River Road and the River Road/Beltline Highway ramp intersections. The Beltline Facility
Plan will be completed separate from but coordinated with the TSP recommendations.
Beltline Highway to Northwest Expressway
This section of River Road generally includes two travel lanes in each direction plus a center turn lane
and serves mostly residential neighborhoods with a small mix of commercial uses. In general, the
roadway is expected to operate under capacity, though the River Road/Northwest Expressway
intersection is expected to exceed capacity.
South of Northwest Expressway
Just south of Northwest Expressway, River Road crosses the railroad tracks at a grade-separated
crossing. This crossing represents a critical link in the ability of Eugene’s transportation system to
provide reliable north-south access for emergency vehicle, regional travel and multimodal travel. There
are no alternate grade-separated rail crossings to the west for over 2.5 miles. Further, this connection
is especially important because of its proximity to the Emergency Services Training Center, Fire
Department logistics building, and Central Lane Communication 911 Center on Second Avenue and the
City Public Works yard on Roosevelt Boulevard.
Eugene Transportation System Plan Project #:10296 September 18, 2012 Page 8
Kittelson & Associates, Inc. Portland, Oregon
Given the attractiveness of this route, this section of River Road is expected to operate over capacity
under future conditions.
6th Avenue/ 7th Street Avenue
6th Avenue and 7th Avenue form a one-way couplet that provides access between Highway 99 and the
downtown area. In the east, 6th Avenue and 7th Avenue provide a connection to the Ferry Street Bridge
and Coburg Road. This corridor is a major east-west route serving the downtown area and is a major
commercial corridor within Eugene. This corridor is also an important freight corridor, playing a role in
the economic vitality of the community.
Under the 2035 No Build conditions, 6th Avenue and 7th Avenue are both expected to operate near or
over capacity throughout the entire corridor. In addition, most of the intersections studied along these
corridors would be over capacity under the No Build.
The existing grid system in the vicinity of the 6th Avenue and 7th Avenue corridors provide travelers with
a number of travel options. In addition, EmX is proposed along the corridor, although not included in
the No Build analyses as it is not currently funded for construction. The well-developed grid systems
creates opportunities for bicycles and pedestrians to travel along less congested roadways, providing a
safer and more attractive route than the major roadway system.
Franklin Boulevard
Franklin Boulevard connects downtown Eugene, the University of Oregon campus, I-5 and Springfield.
In the future, this corridor will play an important role in serving the redevelopment of both the EWEB
(Eugene Water and Electric Board) properties and the Walnut Station mixed use nodal area.
Under the 2035, much of Franklin Boulevard is shown to operate near or over capacity between the
downtown and I-5. The proximity of the University facilities to the corridor, especially athletic facilities,
also result in peak traffic demand that occur outside the weekday evening commute hour. These larger
events typically have event demand management strategies in place designed to maintain a
functioning transportation system during such times.
The Franklin Boulevard corridor has an existing EmX line in place. As the system is extended in the
future, travelers will be able use the system to travel to this area from farther distances.
Beltline Highway
Beltline Highway serves as a major connection for the West Eugene area to and from I-5 and the
northern parts of Springfield. It also provides one of the major river crossings for all of Eugene,
particularly for residents in the north. The land use and transportation context varies through the
corridor. For the purposes of highlighting the No Build finding, the corridor is discussed in subsections
below.
Eugene Transportation System Plan Project #:10296 September 18, 2012 Page 9
Kittelson & Associates, Inc. Portland, Oregon
As discussed previously, the section of the Beltline Highway between Coburg Road and River Road is
part of the ongoing Facility Plan being conducted by ODOT, the City of Eugene and the County. The
findings of this Plan will be incorporated into later TSP efforts. For the purposes of the No Build,
general observations from the corridor demand to capacity analyses are summarized below. The
details of specific analyses can be found in the Beltline Facility Plan.
I-5 to Delta Highway
East of I-5, the roadway operates as an at-grade highway within Springfield, meaning intersections, not
interchanges, provide access to adjacent roadways. At I-5, Beltline Highway transitions to a high
capacity, grade separated facility. Like today’s conditions, the Beltline Highway is expected to be
congested between Coburg Road and the Delta Highway.
The only interchange within this section is with the important north-south connection of Coburg Road.
The No Build analyses show that the Beltline ramp intersections will operate over capacity in the
future. This would also contribute to congestion along Coburg Road near the interchange.
Delta Highway to River Road
This section of the highway is included in the Beltline Facility Planning efforts. As discussed in the
Facility Plan and as shown in Figure 2 of this memorandum, over capacity conditions are expected
along this section of the highway, especially on the Willamette River Bridge. This bridge is the only
crossing of the Willamette River within all of north Eugene for both regional and local users. In
addition, there are a lot of vehicles entering and exiting the Beltline in this segment of the highway.
This creates significant “weaving” movements along the corridor as drivers change lanes to either exit
or enter the Beltline Highway in this segment. These weaving movements contribute to both
congestion and safety-related issues in this corridor. These issues will be exacerbated in the No Build
condition.
In addition to the highway itself, the three interchanges (Delta Highway, Division Avenue/River Avenue,
and River Road) are also shown to operate near or over capacity in the future. The type of interchange
in place today at the Delta Highway allows for higher-speed, free flow traffic movements between the
two roadways. Although this type of interchange has more capacity than the type found at River Road
(“a diamond” interchange), the need to serve commercial and residential lands to the north of Beltline
and to provide one of only two river crossings into the downtown provides additional pressures on the
Delta Highway, resulting in near and over capacity conditions.
The Beltline Highway ramps intersect River Road at traffic signals. There are a number of private
driveways serving commercial uses as well as a Lane Transit District park and ride within one-quarter
mile of the interchange. Serving the traffic demand associated with adjacent land uses as well as
regional traffic demand contribute to over capacity conditions at the ramp intersections under the No
Build.
Eugene Transportation System Plan Project #:10296 September 18, 2012 Page 10
Kittelson & Associates, Inc. Portland, Oregon
River Road to Barger Drive
Within this section, interchanges also provide access to the adjacent roadways. Unlike the section
between River Road and I-5, this section of the Beltline Highway is expected to operate under capacity
in the No Build. Despite this finding, the ramp intersections at the Northwest Expressway and at
Highway 99 are shown to operate over capacity.
South of Barger Drive
South of the Barger Drive interchange, Beltline Highway transitions to an arterial street with
intersections, not interchanges, provided for intersecting streets. Between Barger Drive and W 11th
Avenue, access to the Beltline Highway is only provided at key intersections, not at private driveways.
To the north of Roosevelt Boulevard, the Beltline has two travel lanes in each direction; to the south, it
narrows down to one lane in each direction. Between Barger Drive and Roosevelt Boulevard, the
Beltline Highway is expected to be under capacity; along the section to the south that is only one lane
in each direction, it is expected to operate near capacity in the No Build. In addition, the intersections
at Roosevelt Boulevard and W 11th Avenue are expected to operate over capacity.
Coburg Road
Coburg Road provides a regional connection between Eugene in the south and the cities of Coburg and
Harrisburg in the north. Within Eugene city limits, Coburg Road is a key regional and local street that
provides access to Beltline Highway, I-105, and downtown Eugene. The look and feel and role it serves
in the transportation system varies along its length; these key differences are described below.
Eugene City Limits to Beltline Highway
Between the Eugene City Limits and Beltline Highway, Coburg Road provides access to several
neighborhoods and commercial uses. Like River Road to the east, the traffic volumes along Coburg
Road increase the further south you go. Within this section of the street, both the Coburg
Road/Crescent Avenue intersection and the Beltline Highway ramp intersections are shown to operate
over capacity in the No Build. The deficiencies at the ramp intersections were also highlighted in the
Existing Conditions memorandum and the Beltline Facility Plan.
Beltline Highway to Harlow Road
South of the Beltline Highway, Coburg Road provides access to a number of neighborhoods as well as a
large commercial area in the vicinity of Willakenzie Road and Cal Young Road. Within this section,
Coburg Road is a 5-lane street that is serves both the local and regional travel needs. Under the No
Build, this section of Coburg Road is shown to operate under capacity.
Eugene Transportation System Plan Project #:10296 September 18, 2012 Page 11
Kittelson & Associates, Inc. Portland, Oregon
Harlow Road to Willamette River
This section of Coburg Road connects travelers from Springfield (via Harlow Road) into downtown
Eugene. Grade-separated access is provided under I-105 and over the Willamette River at the Ferry
Street Bridge. This section of the road is shown as overcapacity in the No Build. The Ferry Street Bridge
is one of only two bridges within the city that connects into the downtown.
In addition to serving regional travel, this section of Coburg Road also provides access to large retail
developments and some of the University of Oregon athletics facilities, including Autzen football
stadium and PK Park baseball field. As such, the roadway experiences high levels of demand when
events at these facilities take place, though traffic demand management strategies, such as offsite
shuttles, are typically implemented to offset some of the roadway congestion. The attractiveness of the
large retail users in this corridor also creates congestion on the weekends.
Amazon Parkway/30th Avenue Corridor
The Amazon Parkway corridor provides access between downtown Eugene, neighborhoods to the
south and eventually to I-5 and Lane Community College (LCC). Given the topography of this area,
travelers using Amazon Parkway have few alternative travel options. As such, this corridor is shown as
near or over capacity in the future. The Amazon Parkway/Hilyard Street/30th Avenue intersection is
also shown as over capacity.
River Crossings
The Willamette River flows through the Eugene area, providing the city with a beautiful scenic
resource. The river corridor is also the city’s mainline bike facility. The limited number of vehicular river
crossings both today and in the No Build, results in difficult connection and mobility issues. All four
river crossing locations within the city (Beltline Highway, Ferry Street Bridge, I-105, and I-5) are
expected to approach or exceed capacity in the future (as shown by the red on Figure 2 for all locations
except I-5, which is shown as yellow).
In addition to the river crossings within Eugene, the Main Street/S A Street bridges in Springfield are
also shown to be over capacity in the No Build. This means that all available river crossing options
within the larger urbanized area exceed capacity by 2035. This finding has implications for potential
evacuation route planning for emergency services.
DEMAND MANAGEMENT AND SYSTEM MANGEMENT STRATEGIES
Given the size of Eugene’s urban area and growing complexity of the transportation system, a set of
strategies that focus less on capital improvements and more on the efficient management of the
existing infrastructure and vehicular demand could be an integral part of the future functioning of the
system. There are a number of transportation system management and operations (TSMO) strategies
that can be used by Eugene in the future to lessen the demand for future automobile improvements
Eugene Transportation System Plan Project #:10296 September 18, 2012 Page 12
Kittelson & Associates, Inc. Portland, Oregon
and to make better use of the existing infrastructure. Examples of the types of strategies that could be
used are discussed below. Further detail regarding these strategies and their application to specific
areas within the city will be provided as part of future TSP memoranda.
Along many of the congested corridors, Eugene has a number of parallel streets and developed
grid system that can provide alternative routes for multimodal travel and localized trip making.
Finding ways to eliminate gaps in the grid system and to prioritize pedestrian and bicycle
treatments along the parallel facilities can help to relieve congested corridors and provide safe
and efficient travel for all modes.
Roadway and intersection safety improvements should be coordinated via a “data driven
evaluation system”. This allows the city to focus on specific improvements that benefit
multimodal travel along corridors and at specific intersections.
Accessible freight corridors are critical to support a well-functioning local economy. As such,
current and future freight corridors should maintain proper design standards to accommodate
larger freight vehicles. In addition, specific improvements, such as truck signage, can be used on
specific corridors, like the Northwest Expressway, to facilitate the efficient movement of goods.
Prioritization of “freight-friendly” improvements can incentivize freight to use specific corridors
and re-direct regional freight within specific subareas of the city. At the same time,
prioritization of treatments that are aimed at pedestrians, cyclists and transit could occur in
other adjacent corridors.
Intersection capacity needs can be met through the implementation of transit priority signal
timing, freight signal priority, transportation system management applications, adaptive signal
control, and roundabouts to enhance roadway character and improve access control.
Continued expansion of the EmX system will help to provide accessible travel options and to
reduce traffic demands over time.
The city’s roadway design standards and intersection level of service standards should be
flexible to recognize the constrained urban and natural environment and allocate the available
right-of-way to pedestrian, auto, bicycle, or transit mobility, or streetscape and parking needs,
based on specific facility goals.
The City is currently participating in the Regional Transportation Options Project (RTOP). This
project will provide the region with a series of strategies and programs that reduce the need for
single occupancy vehicle travel in the future. Implementation of these programs will be an
integral part of ensuring that the City’s transportation system continues to support economic
growth in a manner consistent with the overall vision for the community.
NEXT STEPS
The review of system needs under the No Build scenario will be compared with the findings of other
multimodal systems (transit, pedestrian/bicycle) to complement the list of alternatives considered. The
No Build and existing safety and operations analyses will help to inform and prioritize the development
of alternatives within subsequent memoranda.
FILENAME: H:\PROJFILE\10296 - CITY OF EUGENE TSP\NO BUILD\EUGENE DRAFT NO BUILD MEMO REVISED POST TAC.DOCX
Appendix 1 2035 No-Build Intersection
Performance Summary
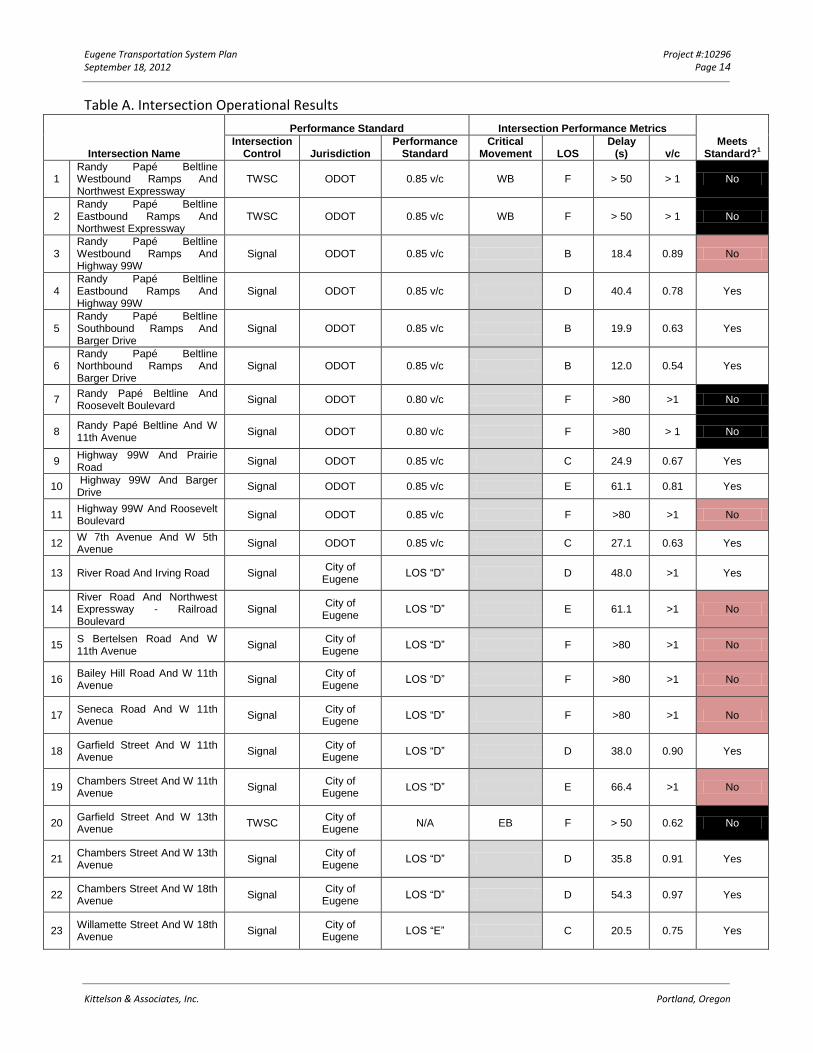
Eugene Transportation System Plan Project #:10296 September 18, 2012 Page 14
Kittelson & Associates, Inc. Portland, Oregon
Table A. Intersection Operational Results
Intersection Name
Performance Standard Intersection Performance Metrics
Meets Standard?
1
Intersection Control Jurisdiction
Performance Standard
Critical Movement LOS
Delay (s) v/c
1 Randy Papé Beltline Westbound Ramps And Northwest Expressway
TWSC ODOT 0.85 v/c WB F > 50 > 1 No
2 Randy Papé Beltline Eastbound Ramps And Northwest Expressway
TWSC ODOT 0.85 v/c WB F > 50 > 1 No
3 Randy Papé Beltline Westbound Ramps And Highway 99W
Signal ODOT 0.85 v/c B 18.4 0.89 No
4 Randy Papé Beltline Eastbound Ramps And Highway 99W
Signal ODOT 0.85 v/c D 40.4 0.78 Yes
5 Randy Papé Beltline Southbound Ramps And Barger Drive
Signal ODOT 0.85 v/c B 19.9 0.63 Yes
6 Randy Papé Beltline Northbound Ramps And Barger Drive
Signal ODOT 0.85 v/c B 12.0 0.54 Yes
7 Randy Papé Beltline And Roosevelt Boulevard
Signal ODOT 0.80 v/c F >80 >1 No
8 Randy Papé Beltline And W 11th Avenue
Signal ODOT 0.80 v/c F >80 > 1 No
9 Highway 99W And Prairie Road
Signal ODOT 0.85 v/c C 24.9 0.67 Yes
10 Highway 99W And Barger Drive
Signal ODOT 0.85 v/c E 61.1 0.81 Yes
11 Highway 99W And Roosevelt Boulevard
Signal ODOT 0.85 v/c F >80 >1 No
12 W 7th Avenue And W 5th Avenue
Signal ODOT 0.85 v/c C 27.1 0.63 Yes
13 River Road And Irving Road Signal City of
Eugene LOS “D” D 48.0 >1 Yes
14 River Road And Northwest Expressway - Railroad Boulevard
Signal City of
Eugene LOS “D” E 61.1 >1 No
15 S Bertelsen Road And W 11th Avenue
Signal City of
Eugene LOS “D” F >80 >1 No
16 Bailey Hill Road And W 11th Avenue
Signal City of
Eugene LOS “D” F >80 >1 No
17 Seneca Road And W 11th Avenue
Signal City of
Eugene LOS “D” F >80 >1 No
18 Garfield Street And W 11th Avenue
Signal City of
Eugene LOS “D” D 38.0 0.90 Yes
19 Chambers Street And W 11th Avenue
Signal City of
Eugene LOS “D” E 66.4 >1 No
20 Garfield Street And W 13th Avenue
TWSC City of
Eugene N/A EB F > 50 0.62 No
21 Chambers Street And W 13th Avenue
Signal City of
Eugene LOS “D” D 35.8 0.91 Yes
22 Chambers Street And W 18th Avenue
Signal City of
Eugene LOS “D” D 54.3 0.97 Yes
23 Willamette Street And W 18th Avenue
Signal City of
Eugene LOS “E” C 20.5 0.75 Yes
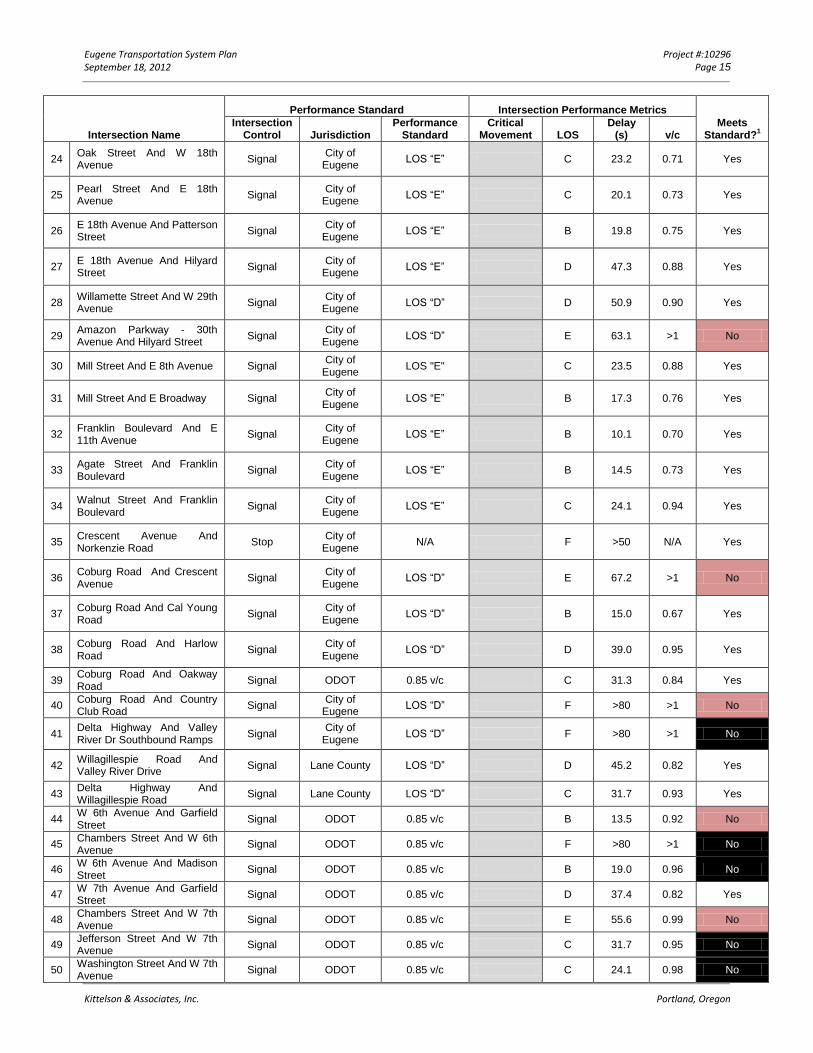
Eugene Transportation System Plan Project #:10296 September 18, 2012 Page 15
Kittelson & Associates, Inc. Portland, Oregon
Intersection Name
Performance Standard Intersection Performance Metrics
Meets Standard?
1
Intersection Control Jurisdiction
Performance Standard
Critical Movement LOS
Delay (s) v/c
24 Oak Street And W 18th Avenue
Signal City of
Eugene LOS “E” C 23.2 0.71 Yes
25 Pearl Street And E 18th Avenue
Signal City of
Eugene LOS “E” C 20.1 0.73 Yes
26 E 18th Avenue And Patterson Street
Signal City of
Eugene LOS “E” B 19.8 0.75 Yes
27 E 18th Avenue And Hilyard Street
Signal City of
Eugene LOS “E” D 47.3 0.88 Yes
28 Willamette Street And W 29th Avenue
Signal City of
Eugene LOS “D” D 50.9 0.90 Yes
29 Amazon Parkway - 30th Avenue And Hilyard Street
Signal City of
Eugene LOS “D” E 63.1 >1 No
30 Mill Street And E 8th Avenue Signal City of
Eugene LOS "E" C 23.5 0.88 Yes
31 Mill Street And E Broadway Signal City of
Eugene LOS “E” B 17.3 0.76 Yes
32 Franklin Boulevard And E 11th Avenue
Signal City of
Eugene LOS “E” B 10.1 0.70 Yes
33 Agate Street And Franklin Boulevard
Signal City of
Eugene LOS “E” B 14.5 0.73 Yes
34 Walnut Street And Franklin Boulevard
Signal City of
Eugene LOS “E” C 24.1 0.94 Yes
35 Crescent Avenue And Norkenzie Road
Stop City of
Eugene N/A F >50 N/A Yes
36 Coburg Road And Crescent Avenue
Signal City of
Eugene LOS “D” E 67.2 >1 No
37 Coburg Road And Cal Young Road
Signal City of
Eugene LOS “D” B 15.0 0.67 Yes
38 Coburg Road And Harlow Road
Signal City of
Eugene LOS “D” D 39.0 0.95 Yes
39 Coburg Road And Oakway Road
Signal ODOT 0.85 v/c C 31.3 0.84 Yes
40 Coburg Road And Country Club Road
Signal City of
Eugene LOS “D” F >80 >1 No
41 Delta Highway And Valley River Dr Southbound Ramps
Signal City of
Eugene LOS “D” F >80 >1 No
42 Willagillespie Road And Valley River Drive
Signal Lane County LOS “D” D 45.2 0.82 Yes
43 Delta Highway And Willagillespie Road
Signal Lane County LOS “D” C 31.7 0.93 Yes
44 W 6th Avenue And Garfield Street
Signal ODOT 0.85 v/c B 13.5 0.92 No
45 Chambers Street And W 6th Avenue
Signal ODOT 0.85 v/c F >80 >1 No
46 W 6th Avenue And Madison Street
Signal ODOT 0.85 v/c B 19.0 0.96 No
47 W 7th Avenue And Garfield Street
Signal ODOT 0.85 v/c D 37.4 0.82 Yes
48 Chambers Street And W 7th Avenue
Signal ODOT 0.85 v/c E 55.6 0.99 No
49 Jefferson Street And W 7th Avenue
Signal ODOT 0.85 v/c C 31.7 0.95 No
50 Washington Street And W 7th Avenue
Signal ODOT 0.85 v/c C 24.1 0.98 No
Eugene Transportation System Plan Project #:10296 September 18, 2012 Page 16
Kittelson & Associates, Inc. Portland, Oregon
1The salmon color indicates those intersections that fail to meet standards under only the No Build. Black indicates those
intersections that don’t meet standards under either the existing or No Build conditions.

9
65
4
28
2726252422
3433
3221
183130
12
39
38
37
4243
10
35
13
23
8
7
213
29
1920
171615
504946
4845
4744
40
41
1411
36
A
AA
A
A
A
AA
A
AA
A
Fern Ridge Reservoir
I-5
11TH AVE
HW
Y 99N
18TH AVE
RIV
ER
RD
I-105
CO
BU
RG
RD
30TH AVE
ROYAL AVE
GR
EE
N H
ILL
RD
6TH AVE
BARGER DR
CH
AM
BE
RS
ST
13TH AVE
WIL
LA
ME
TT
E S
T
ROOSEVELT BLVD
IRVING RD
BE
RT
EL
SE
N R
D
BA
ILE
Y H
ILL
RD
NORTHWEST EXPRESSW
AY
HARLOW RD
TE
RR
Y S
T
MAXWELL RD
DA
NE
BO
AV
E
CRESCENT AVE
24TH AVE
IRVINGTON DR
GA
TE
WA
Y S
T
28TH AVE
GIL
HA
M R
D
SE
NE
CA
RDHWY 126
HW
Y 9
9W
CENTENNIAL BLVD
GA
ME
FAR
M R
D
OA
KW
AY
RD
AM
AZ
ON
DR
PEARL ST
FRANKLIN BLVD
I-5
GIMPL HILL RD
CROW RD
PO
LK S
T
LORANE HWY
CLEAR LAKE RD
D ST
ROYAL AVE
FIR
BU
TT
E R
D
DO
NA
LD S
T
BEACON DR
BA
ILE
Y H
ILL
RD
BETHEL DR
MC
KE
NZ
IE V
IEW
DR
1ST AVE
AWBREY LN
GR
EE
N H
ILL
RD
PR
AIR
IE R
D
7TH PL
2ND
ST
FIS
HE
R R
D
Q ST
LIN
CO
LN
ST
CHAD DR
HORN LN
PIN
E G
RO
VE
RD
CREST DR
WILKES DR
PARK AVE
BODENHAMER RD
TAN
EY
ST
HOWARD AVE
WIL
LA
ME
TT
E S
T
HUNSAKER LN
AU
GU
ST
A S
T
5TH AVE
ED CONE BLVD
BR
AE
BU
RN
DR
ENID RD
TE
RR
Y S
T
PA
RK
AV
E
GR
EE
N H
ILL
RD
AA
A
A
Sources: USGS, ESRI, TANA, AND
City of Eugene TSP August 2012
0 1 2 3 MilesFigure
1
Intersection Meets StandardsYes
No
Link Volume to Capacity Ratio< 0.8
0.8 - 1.0
> 1.0
Eugene City Limits
UGB
H:\pr
ojfile
\1029
6 - C
ity of
Eug
ene T
SP\gi
s\01_
Exist
ing Tr
affic
Cond
itions
Wee
kday
PM
Peak
Hou
r.mxd
- jso
mmerv
ille -
2:08 P
M 8/2
1/201
2
Coordinate System: NAD 1983 HARN StatePlane Oregon South FIPS 3602 Feet Intl Data Source: City of Eugene
Existing Traffic ConditionsWeekday PM Peak Hour
#
#
Intersection Cross Streets1 Beltline Road Westbound Ramps And Northw est Expressw ay
2 Beltline Road Eastbound Ramps And Northw est Expressw ay
3 Beltline Road Westbound Ramps And Pacif ic Highw ay W
4 Beltline Road Eastbound Ramps And Pacif ic Highw ay W
5 Beltline Road Southbound Ramps And Barger Drive
6 Beltline Road Northbound Ramps And Barger Drive
7 Beltline Road And Roosevelt Boulevard
8 Beltline Road And W 11th Avenue
9 Pacif ic Highw ay W And Prairie Road
10 Pacif ic Highw ay W And Barger Drive
11 Pacif ic Highw ay W And Roosevelt Boulevard
12 W 7th Avenue And W 5th Avenue
13 River Road And Irving Road
14 River Road And Northw est Expressw ay - Railroad Boulevard
15 S Bertelsen Road And W 11th Avenue
16 Bailey Hill Road And W 11th Avenue
17 Seneca Road And W 11th Avenue
18 Garfield Street And W 11th Avenue
19 Chambers Street And W 11th Avenue
20 Garfield Street And W 13th Avenue
21 Chambers Street And W 13th Avenue
22 Chambers Street And W 18th Avenue
23 Willamette Street And W 18th Avenue
24 Oak Street And W 18th Avenue
25 Pearl Street And E 18th Avenue
26 E 18th Avenue And Patterson Street
27 E 18th Avenue And Hilyard Street
28 Willamette Street And W 29th Avenue
29 Amazon Parkw ay - 30th Avenue And Hilyard Street
30 Mill Street And E 8th Avenue
31 Mill Street And E Broadw ay
32 Franklin Boulevard And E 11th Avenue
33 Agate Street And Franklin Boulevard
34 Walnut Street And Franklin Boulevard
35 Crescent Avenue And Norkenzie Road
36 Coburg Road And Crescent Avenue
37 Coburg Road And Cal Young Road
38 Coburg Road And Harlow Road
39 Coburg Road And Oakw ay Road
40 Coburg Road And Country Club Road
41 Delta Highw ay And Valley River Dr Southbound Ramps
42 Willagillespie Road And Valley River Drive
43 Delta Highw ay And Willagillespie Road
44 W 6th Avenue And Garfield Street
45 Chambers Street And W 6th Avenue
46 W 6th Avenue And Madison Street
47 W 7th Avenue And Garfield Street
48 Chambers Street And W 7th Avenue
49 Jefferson Street And W 7th Avenue
50 Washington Street And W 7th Avenue
A From Beltline Facility Plan

9
65
4
28
2726252422
3433
3221
183130
12
39
38
37
4243
10
35
13
23
8
7
213
29
1920
171615
504946
4845
4744
40
41
1411
36
A
A
A
A
AA
A
AA
A
AA
Fern Ridge Reservoir
I-5
11TH AVE
HW
Y 99N
18TH AVE
RIV
ER
RD
I-105
CO
BU
RG
RD
30TH AVE
ROYAL AVE
GR
EE
N H
ILL
RD
6TH AVE
BARGER DR
CH
AM
BE
RS
ST
13TH AVE
WIL
LA
ME
TT
E S
T
ROOSEVELT BLVD
IRVING RD
BE
RT
EL
SE
N R
D
BA
ILE
Y H
ILL
RD
NORTHWEST EXPRESSW
AY
HARLOW RD
TE
RR
Y S
T
MAXWELL RD
DA
NE
BO
AV
E
CRESCENT AVE
24TH AVE
IRVINGTON DR
GA
TE
WA
Y S
T
28TH AVE
GIL
HA
M R
D
SE
NE
CA
RDHWY 126
HW
Y 9
9W
CENTENNIAL BLVD
GA
ME
FAR
M R
D
OA
KW
AY
RD
AM
AZ
ON
DR
PEARL ST
FRANKLIN BLVD
I-5
GIMPL HILL RD
CROW RD
PO
LK S
T
LORANE HWY
CLEAR LAKE RD
D ST
ROYAL AVE
FIR
BU
TT
E R
D
DO
NA
LD S
T
BEACON DR
BA
ILE
Y H
ILL
RD
BETHEL DR
MC
KE
NZ
IE V
IEW
DR
1ST AVE
AWBREY LN
GR
EE
N H
ILL
RD
PR
AIR
IE R
D
7TH PL
2ND
ST
FIS
HE
R R
D
Q ST
LIN
CO
LN
ST
CHAD DR
HORN LN
PIN
E G
RO
VE
RD
CREST DR
WILKES DR
PARK AVE
BODENHAMER RD
TAN
EY
ST
HOWARD AVE
WIL
LA
ME
TT
E S
T
HUNSAKER LN
AU
GU
ST
A S
T
5TH AVE
ED CONE BLVD
BR
AE
BU
RN
DR
ENID RD
TE
RR
Y S
T
PA
RK
AV
E
GR
EE
N H
ILL
RD
A
AA
A
Sources: USGS, ESRI, TANA, AND
City of Eugene TSP September 2012
0 1 2 3 MilesFigure
2
Intersection Meets StandardsYes
No
Link Volume to Capacity Ratio< 0.8
0.8 - 1.0
> 1.0
Eugene City Limits
UGB
H:\pr
ojfile
\1029
6 - C
ity of
Eug
ene T
SP\gi
s\01_
2035
Traff
ic Co
nditio
ns W
eekd
ay P
M Pe
ak H
our.m
xd - j
somm
erville
- 11
:17 AM
9/18
/2012
Coordinate System: NAD 1983 HARN StatePlane Oregon South FIPS 3602 Feet Intl Data Source: City of Eugene
2035 Traffic ConditionsWeekday PM Peak Hour
#
#
Intersection Cross Streets1 Beltline Road Westbound Ramps And Northw est Expressw ay
2 Beltline Road Eastbound Ramps And Northw est Expressw ay
3 Beltline Road Westbound Ramps And Pacif ic Highw ay W
4 Beltline Road Eastbound Ramps And Pacif ic Highw ay W
5 Beltline Road Southbound Ramps And Barger Drive
6 Beltline Road Northbound Ramps And Barger Drive
7 Beltline Road And Roosevelt Boulevard
8 Beltline Road And W 11th Avenue
9 Pacif ic Highw ay W And Prairie Road
10 Pacif ic Highw ay W And Barger Drive
11 Pacif ic Highw ay W And Roosevelt Boulevard
12 W 7th Avenue And W 5th Avenue
13 River Road And Irving Road
14 River Road And Northw est Expressw ay - Railroad Boulevard
15 S Bertelsen Road And W 11th Avenue
16 Bailey Hill Road And W 11th Avenue
17 Seneca Road And W 11th Avenue
18 Garfield Street And W 11th Avenue
19 Chambers Street And W 11th Avenue
20 Garfield Street And W 13th Avenue
21 Chambers Street And W 13th Avenue
22 Chambers Street And W 18th Avenue
23 Willamette Street And W 18th Avenue
24 Oak Street And W 18th Avenue
25 Pearl Street And E 18th Avenue
26 E 18th Avenue And Patterson Street
27 E 18th Avenue And Hilyard Street
28 Willamette Street And W 29th Avenue
29 Amazon Parkw ay - 30th Avenue And Hilyard Street
30 Mill Street And E 8th Avenue
31 Mill Street And E Broadw ay
32 Franklin Boulevard And E 11th Avenue
33 Agate Street And Franklin Boulevard
34 Walnut Street And Franklin Boulevard
35 Crescent Avenue And Norkenzie Road
36 Coburg Road And Crescent Avenue
37 Coburg Road And Cal Young Road
38 Coburg Road And Harlow Road
39 Coburg Road And Oakw ay Road
40 Coburg Road And Country Club Road
41 Delta Highw ay And Valley River Dr Southbound Ramps
42 Willagillespie Road And Valley River Drive
43 Delta Highw ay And Willagillespie Road
44 W 6th Avenue And Garfield Street
45 Chambers Street And W 6th Avenue
46 W 6th Avenue And Madison Street
47 W 7th Avenue And Garfield Street
48 Chambers Street And W 7th Avenue
49 Jefferson Street And W 7th Avenue
50 Washington Street And W 7th Avenue
A From Beltline Facility Plan
{00 D
Appendix C: 20-year Needs Analysis

FILENAME: H:\PROJFILE\10296 - CITY OF EUGENE TSP\PHASE 2\BUILD ANALYSIS\EUGENE DRAFT BUILD MEMO.DOCX
DRAFT TECHNICAL MEMORANDUM Eugene Transportation System Plan
Future Conditions Results - Build Scenario
Date: January 22, 2015 Project #:10296
To:
Cc:
Eugene PMT Kurt Yeiter, City of Eugene
Kristin Hull, CH2M Hill
From: Julia Kuhn, Matt Kittelson & Ashleigh Griffin, Kittelson & Associates, Inc.
This technical memorandum presents the year 2035 “build analyses” for the Eugene Transportation
System Plan (TSP). The enclosed analyses relate primarily to the quality of service experienced by
vehicular traffic. The future needs of “active modes” are addressed in separate documents. The build
analyses incorporate the assumptions outlined below.
The City and Region will continue to see growth in employment and population over the
next twenty years consistent with Envision Eugene (and the soon-to-be adopted
Comprehensive Plan), and the Springfield and Coburg Comprehensive Plans. Additionally,
growth in statewide traffic will continue to occur consistent with the Oregon Transportation
Plan.
The City will expand its Urban Growth Boundary (UGB) to accommodate additional growth
in population and employment over the next twenty years. This UGB expansion will be
incorporated into the soon-to-be adopted Comprehensive Plan.
Regional growth in population and employment will be supported by the transportation
system programs, policies and projects reflected in Springfield’s TSP as well as the following
categories of transportation system projects in Eugene:
o Projects to be completed within 20 years – frequent transit service improvements
including corridor improvements on six key arterials in the city, urbanization of key
existing collector and arterial streets to provide for multimodal travel, construction
of a local bridge to the north of the Randy Pape Beltline near River Road, roadway
capacity improvements at a small number of locations, passenger rail
Eugene Transportation System Plan Project #:10296 January 22, 2015 Page 2
Kittelson & Associates, Inc. Portland, Oregon
improvements at the Eugene Station, and two new roadways in the Clear Lake UGB
expansion area.
o 20-year Pedestrian and Bicycle System Improvements – this category incorporates
continued implementation of the City’s Pedestrian and Bicycle Master Plan. The
primary elements of the Master Plan will become part of Eugene’s TSP.
o Projects to Complete Upon Development – those that are likely needed as new
neighborhoods and employment areas develop or redevelop. The timing of these
projects is uncertain and they are unlikely to be advanced by the city in the absence
of specific private development activities. Typically, these projects address only
localized multimodal transportation needs associated with newly developing or
redevelopment areas.
o Operational Projects – those that are needed at specific intersections and/or
corridors to improve the quality of service provided to all modes. This may include
the use of technology, implementation of Transportation System and Management
Options (TSMO) strategies, signal corridor timing strategies, etc.
The TSP identifies a series of projects for future study to determine when and if a specific multimodal
system improvement is needed to address a future deficiency. These projects are not included in the
2035 travel demand model.
TRAFFIC VOLUME DEVELOPMENT AND OPERATIONS ANALYSES
Based on estimates of future job and household growth, LCOG developed traffic volume forecasts for
the city’s collector and arterial street system, using an emme travel demand model. Based on
information obtained from LCOG, coupled with measured traffic counts at intersections and roadways
within the city, Kittelson & Associates, Inc. (KAI) developed year 2035 intersection and roadway
volumes using a procedure consistent with guidance from ODOT’s Analysis and Procedures Manual
(APM).
The existing conditions and No Build memorandums prepared for the TSP included analyses of 50
intersections throughout the city. The build analysis includes evaluation of these same intersections
plus 12 additional intersections previously analyzed as part of the Beltline Facility Plan. The build
analysis compares the expected intersection performance to adopted city and state standards. KAI
conducted this analysis in a manner consistent with the methodologies outlined in the Highway
Capacity Manual and guidance provided in ODOT’s APM.
The year 2035 intersection operations are shown in Table A in the Appendix and illustrated in Figures 1
(No Build) and 2 (TSP Projects). Within the figures, those locations whose performance meets city and
state standards are colored as green; locations where the city and state standards are not met are
shown as red. Specific findings regarding the analysis are discussed below.
Eugene Transportation System Plan Project #:10296 January 22, 2015 Page 3
Kittelson & Associates, Inc. Portland, Oregon
Figures 1 and 2 also include a comparison of the year 2035 traffic demand to capacity for individual
arterial and collector streets within the city based on the three categories:
Streets that operate “well” – the vehicular demand is less than 80 percent of the capacity.
These streets are shown in green in the figures.
Streets that are “nearing capacity” – the vehicular demand is between 80 and 100 percent
of the capacity. These streets are shown in yellow in the figures.
Streets that are “over capacity” – the vehicular demand exceeds the capacity, which is
shown in red on the figures.
In reviewing the figures, it is helpful to note that the corridor analyses consider a full hour of traffic
demand (based on direct model output) during the weekday commute period. In looking at a full hour
of traffic demand, the corridor analyses may not reflect some of the queuing that occurs at
intersections. Conversely, the intersection analyses are based on traffic volumes that have been further
refined (“post processed” from the model outputs) and reflect conditions that occur during the peak 15
minute time period. Queuing on the roadway segments leading up to intersections would be expected
at those locations where intersection operations are shown to exceed standards.
SUMMARY OF NO BUILD FINDINGS
As a basis of comparison, the No Build memorandum highlighted the following key findings:
West 11th Avenue Corridor – both under existing and No Build conditions, the corridor
experiences congestion through much of its length and at many of its key intersections. This
corridor plays an important role in both regional and statewide mobility as well as local
accessibility to the downtown, University of Oregon, residential and employment areas.
West 18th Avenue – under the No Build, this corridor becomes congested primarily between
Bailey Hill Road and Pearl Street. This is likely attributable to the planned residential growth
in this area of the city as well as diversion of traffic from the congested West 11th Avenue
corridor.
Highway 99 – under existing and No Build, this corridor experiences congestion as it
transitions into downtown Eugene. In addition, congestion occurs under both conditions at
the Beltline ramp termini intersections, likely attributable in part to the commercial uses in
proximity of the interchange.
Northwest Expressway – for the most part, this corridor operates well under both existing
and No Build conditions, with two exceptions; the areas adjacent to and at the Beltline
ramp termini as well as to River Road are expected to experience congestion in the future.
River Road – Under the No Build, this corridor is expected to experience congestion
between Irving Road and River Avenue as well as at and south of the intersection with the
Northwest Expressway. The section between Irving Road and River Avenue will be
Eugene Transportation System Plan Project #:10296 January 22, 2015 Page 4
Kittelson & Associates, Inc. Portland, Oregon
influenced by the improvements that result from the ongoing Beltline Facility Plan. The
section south of Northwest Expressway includes a critical grade-separated crossing of the
railroad that represents the only crossing for over 2.5 miles to the west, thereby serving an
important role in emergency vehicle and freight and regional mobility needs.
6th and 7th Avenues – this one-way street pair is expected to operate at or over capacity
under No Build conditions throughout much of its length. The couplet provides an essential
connection into downtown as well as for regional and local freight mobility.
Franklin Boulevard – this corridor is expected to experience congestion between the
downtown and I-5 under the No Build. In addition, given its role in serving accessibility to
the University of Oregon (UO), will continue to experience congestion during peak event
times on-campus, of which the UO employs a variety of demand-management strategies to
mitigate.
Beltline Highway – the corridor serves as a major connection to West Eugene as well as
regional and statewide mobility and freight needs. As such, it is expected to continue to
experience congestion between I-5 and Northwest Expressway. In the No Build, the section
between Roosevelt Boulevard and West 11th Avenue is also expected to experience
congestion. The Beltline Facility Plan outlines a variety of strategies that may be
implemented over time to address the capacity and safety needs between River Road and
the Delta Highway.
Coburg Road – this regional corridor is expected to experience congestion in the vicinity of
the Beltline Highway as well as between Harlow Road and the downtown.
Amazon Parkway/30th Avenue – this corridor serves as an important connection between
the downtown and residents to the south as well as to I-5 and Lane Community College
(LCC) and is expected to see increasing levels of congestion.
River Crossings – under the No Build, all of the vehicular crossings of the Willamette River
are expected to be over capacity in Eugene and Springfield. This condition can affect
emergency response routes, freight mobility and economic development and regional and
local mobility and accessibility.
ANALYSIS OF THE 20 YEAR PROJECT LIST
Through input from the TCRG, regional and local stakeholders and public engagement events, the TSP
includes implementation of high frequency transit on six key corridors, pedestrian and bicycle
improvements, and roadway/intersections at select locations. Between now and 2035, the TSP
assumes implementation of the following categories of improvements:
Projects to be completed within 20 years;
Pedestrian and Bicycle System improvements;
Eugene Transportation System Plan Project #:10296 January 22, 2015 Page 5
Kittelson & Associates, Inc. Portland, Oregon
Projects to complete upon development; and,
Operational improvements to increase the efficiency of the existing roadway system
Many of the projects included in these lists serve primarily localized accessibility and connectivity
needs. Examples of projects that provide more regional multimodal capacity as compared to the No
Build include:
Frequent transit service improvements along the following corridors:
o West 11th Avenue, 6th Avenue and 7th Avenue EmX
o River Road
o Coburg Road
o Highway 99
o Martin Luther King Jr. Boulevard
o 30th Avenue/Amazon Parkway
Construction of a “local arterial” bridge and operational improvements to the Randy Pape
Beltline Highway/Delta Highway ramps
Widening of the Randy Pape Beltline Highway between Roosevelt Boulevard and West 11th
Avenue and associated intersection improvements.
With all of the 20 year TSP projects in-place, the corridors highlighted under the No Build analyses are
still anticipated to experience similar of slightly lower levels of congestion, as discussed below and
reflected in Figure 2.
West 11th Avenue Corridor – Even with the implementation of EmX, this corridor is expected
to experience congestion through much of its length and at many of its key intersections.
West 18th Avenue – with the TSP projects in-place, the corridor is expected to experience
similar levels of congestion as seen under the No Build although it operates primarily under
or near capacity.
Highway 99 – this corridor shows slight improvements in congestion levels as compared to
the No Build. Intersection improvements, such as installation of roundabouts at the Beltline
ramp termini could help mitigate localized congestion in their vicinity.
Northwest Expressway – with the TSP projects, the corridor is expected to operate
consistent with that seen under the No Build condition.
River Road – with the TSP projects, the corridor is also expected to operate consistent with
that seen under the No Build condition.
6th and 7th Avenues – Even with the implementation of EmX, this couplet is expected to
experience congestion through much of its length and at many of its key intersections.
Eugene Transportation System Plan Project #:10296 January 22, 2015 Page 6
Kittelson & Associates, Inc. Portland, Oregon
Franklin Boulevard – this corridor is expected to experience slight improvements in
congestion levels as compared to the No Build and operate primarily under or near
capacity.
Beltline Highway – with the construction of the local arterial bridge and other TSP projects,
this corridor could see minor improvements to congestion levels as compared to the No
Build. However, much of the corridor between I-5 and the Northwest Expressway is still
projected to operate at or over capacity. Widening of the corridor between Roosevelt and
West 11th Avenue could enable the corridor function under capacity along this segment.
Coburg Road – this regional corridor is expected to operate in a manner similar to that
described in the No Build.
Amazon Parkway/30th Avenue – this corridor is also expected to experience similar
congestion levels as shown in the No Build.
River Crossings – like the No Build, all of the vehicular crossings of the Willamette River are
expected to be at or over capacity in Eugene and Springfield even with implementation of
the TSP projects.
Like the corridors, many of the key intersections are expected to experience congestion and/or not
meet State or City operating standards. At some of these locations, the City and/or ODOT may want to
consider the adoption of alternative vehicular mobility standards and/or level of service standards in
attempts to balance multimodal quality of service and adjacent land use needs. These are outlined
below.
Highway 99/Randy Pape Beltline westbound ramp terminus – this signalized intersection is
projected to operate at a level of service (LOS) “B” and a volume-to-capacity ratio (v/c) of
0.91, exceeding ODOT’s mobility standard of 0.85 but still operating well within city LOS
standards.
Roosevelt Boulevard/Randy Pape Beltline – even with significant widening of the
intersection approaches, the intersection is projected to operate at LOS “E” and a volume-
to-capacity ratio of 0.93.
Roosevelt Boulevard/Highway 99 – if a second northbound left-turn is added, the
intersection is projected to operate at LOS “E” and a volume-to-capacity ratio of 0.95. This
still exceeds ODOT and City standards but still allows the intersection to operate below
capacity.
Coburg Road/Oakway Road– this signalized intersection is projected to operate at a level of
service (LOS) “D” and a volume-to-capacity ratio (v/c) of 0.94, exceeding ODOT’s mobility
standard of 0.85 but still meeting city LOS standards.
Coburg Road/Country Club Road– this signalized intersection is projected to operate at a
level of service (LOS) “F” and a volume-to-capacity ratio (v/c) of 1.09. This intersection
Eugene Transportation System Plan Project #:10296 January 22, 2015 Page 7
Kittelson & Associates, Inc. Portland, Oregon
would require significant reconstruction to meet standards if the traffic volumes reach the
forecast year 2035 levels.
6th and 7th Avenue couplet intersections – these corridors already have three to four
through lanes in the east-west direction at all of the locations studied. This couplet may
require additional signal timing and technological improvements to help with vehicular flow
without impacting the multimodal environment.
o Along 6th Avenue, the Garfield Street and Madison signalized intersections are
projected to operate at LOS “B” and under capacity but exceed ODOT’s 0.85
mobility standard.
o The intersection of 6th Avenue/Chambers Street is expected to operate at LOS “F”
and a volume-to-capacity ratio of 1.03.
o Along 7th Avenue, the Jefferson Street, Chambers Street, and Washington Street
intersections are projected to exceed ODOT’s mobility standard of 0.85 but operate
below capacity and with a LOS of “E” or better.
West 11th Avenue – many of the intersections between Beltline Highway and Chambers
Street are projected to operate at or over capacity and exceed the city’s LOS standard of
“D” even with implementation of EmX. The intersection results are slightly better than the
No Build. This corridor may require additional technological solutions to provide as efficient
of movements for vehicles as possible while preserving the cross-section identified during
the Environmental process. The projected intersection volume-to-capacity ratios are:
o Randy Pape Beltline/West 11th Avenue = 1.45
o S Bertleson Road/West 11th Avenue = 1.35
o Bailey Hill Road/West 11th Avenue = 1.25
o Seneca Road/West 11th Avenue = 1.1
o Chambers Street/West 11th Avenue = 1.03 although the delay is associated with
level of service “D”, thereby meeting city standards
Garfield/West 13th Avenue – this intersection is forecast to operate well over capacity in its
current configuration; the city may need to review alternative configurations at this
location as well as potential level-of-service considerations.
In addition to the alternative standards considerations, additional analysis will be needed to determine
the appropriate traffic control and lane configuration at the new local arterial bridge/Beltline
Westbound off-ramp terminal/Delta Highway intersection as part of the ongoing Beltline Facility
Planning efforts.
Eugene Transportation System Plan Project #:10296 January 22, 2015 Page 8
Kittelson & Associates, Inc. Portland, Oregon
CONCLUSIONS
The City of Eugene, City of Springfield, Lane County, Lane Transit District, Central Lane MPO, and ODOT
will need to continue to work together to investigate and implement future multimodal improvement
projects, policies and programs that provide for a balanced transportation system. On many of the key
city-wide and regional corridors, the high levels of projected vehicular travel demand will not be met by
the widening of roadways. As such, the City and ODOT should consider alternative mobility and/or
level-of-service standards at the locations outlined below.
State Facilities
Consider adopting a standard of 0.99, consistent with the Portland Metro region at the
following locations: Randy Pape Beltline/Highway 99 ramp termini; Randy Pape
Beltline/Roosevelt Boulevard; Highway 99/Roosevelt Boulevard; Coburg Road/Oakway
Road; 6th Avenue/Garfield Street; 6th Avenue/Madison Street; Chambers/7th Avenue;
Jefferson/7th Avenue; and Washington/7th Avenue.
Adopt a standard of greater than 1 at the following locations: 6th Avenue/Chambers Street;
Randy Pape Beltline/West 11th Avenue.
City Facilities
Consider adopting a level-of-service “F” standard at the following locations: S Bertelsen
Road/West 11th Avenue; Bailey Hill Road/West 11th Avenue; Seneca Road/West 11th
Avenue; Garfield Street/13th Avenue; and Coburg Road/Country Club Road.
Further, the efficiency of the existing transportation system will need to be maximized through
transportation system management (TSM) improvements, connectivity improvements, multimodal
improvements, and TDM strategies. These strategies, in combination with the identified TSP projects,
will provide benefits to the city’s and the regional multimodal Transportation System.
Appendix 1 2035 Performance Summary
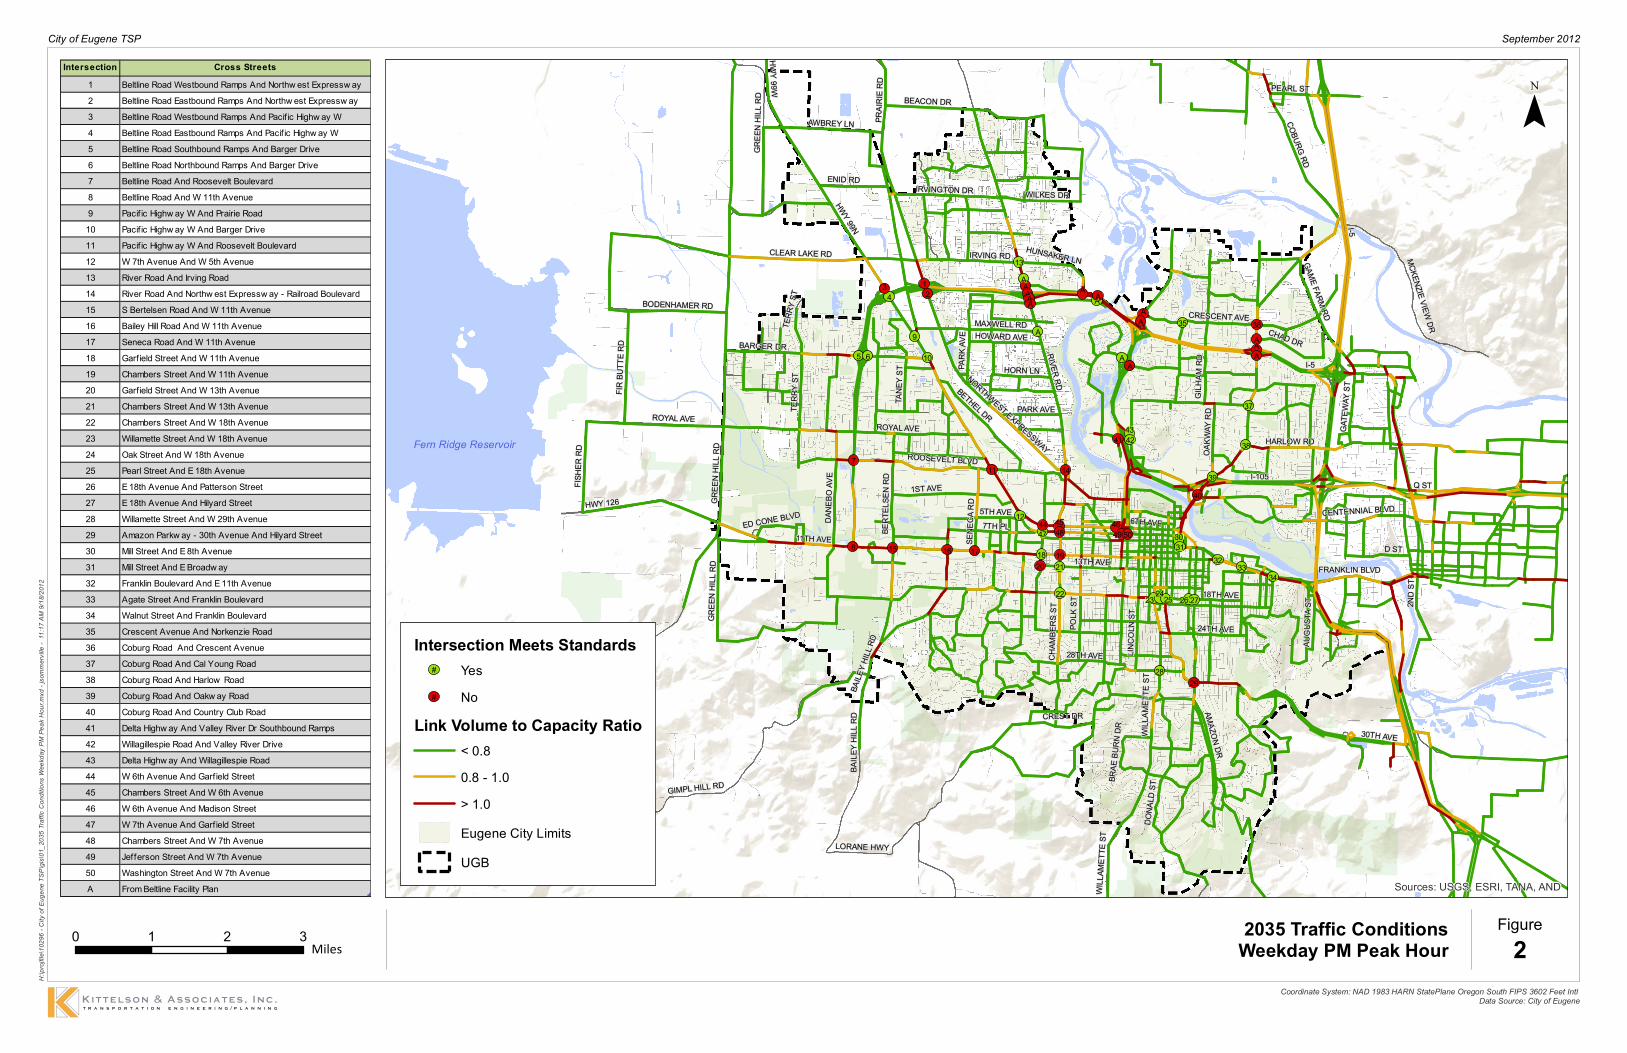
9
65
4
28
272625242234
33322118 31
30
12
39
38
37
4243
10
35
13
23
8
7
213
29
1920
1716155049
464845
4744
40
41
1411
36
A
A
A
A
AA
A
AA
AA
A
Fern Ridge Reservoir
I-5
11TH AVE
HWY 99N
18TH AVERIVER RD
I-105
COBURG RD
30TH AVE
ROYAL AVE
GREE
N HI
LL R
D
6TH AVE
BARGER DR
CHAM
BERS
ST
13TH AVE
WILL
AMET
TE ST
ROOSEVELT BLVD
IRVING RD
BERT
ELSE
N RD
BAILE
Y HILL
RD
NORTHWEST EXPRESSWAY HARLOW RD
TERR
Y ST
MAXWELL RD
DANE
BO AV
E
CRESCENT AVE
24TH AVE
IRVINGTON DR
GATE
WAY S
T
28TH AVE
GILH
AM R
D
SENE
CA R
DHWY 126
HWY 99W
CENTENNIAL BLVD
GAME FARM RD
OAKW
AY R
D
AMAZON DR
PEARL ST
FRANKLIN BLVD
I-5
GIMPL HILL RD
CROW RD POLK
ST
LORANE HWY
CLEAR LAKE RD
D ST
ROYAL AVE
FIR BU
TTE R
D
DONA
LD ST
BEACON DR
BAILE
Y HILL
RD
BETHEL DR
MCKENZIE VIEW DR
1ST AVE
AWBREY LN
GREE
N HI
LL R
D
PRAIR
IE RD
7TH PL
2ND
ST
FISHE
R RD
Q ST
LINCO
LN ST
CHAD DR
HORN LN
PINE G
ROVE
RD
CREST DR
WILKES DR
PARK AVE
BODENHAMER RD
TANE
Y ST
HOWARD AVE
WILL
AMET
TE ST
HUNSAKER LN
AUGU
STA S
T
5TH AVEED CONE BLVD
BRAE
BURN
DR
ENID RD
TERR
Y ST
PARK
AVE
GREE
N HI
LL R
D
A
AAA
Sources: USGS, ESRI, TANA, AND
City of Eugene TSP September 2012
0 1 2 3 MilesFigure
2
Intersection Meets StandardsYesNo
Link Volume to Capacity Ratio< 0.80.8 - 1.0> 1.0Eugene City LimitsUGB
H:\pr
ojfile
\1029
6 - C
ity of
Eug
ene T
SP\gi
s\01_
2035
Traff
ic Co
nditio
ns W
eekd
ay P
M Pe
ak H
our.m
xd - j
somm
erville
- 11
:17 AM
9/18
/2012
Coordinate System: NAD 1983 HARN StatePlane Oregon South FIPS 3602 Feet Intl Data Source: City of Eugene
2035 Traffic ConditionsWeekday PM Peak Hour
#
#
Intersection Cross Streets1 Beltline Road Westbound Ramps And Northw est Expressw ay2 Beltline Road Eastbound Ramps And Northw est Expressw ay3 Beltline Road Westbound Ramps And Pacif ic Highw ay W4 Beltline Road Eastbound Ramps And Pacif ic Highw ay W5 Beltline Road Southbound Ramps And Barger Drive6 Beltline Road Northbound Ramps And Barger Drive7 Beltline Road And Roosevelt Boulevard8 Beltline Road And W 11th Avenue9 Pacif ic Highw ay W And Prairie Road10 Pacif ic Highw ay W And Barger Drive11 Pacif ic Highw ay W And Roosevelt Boulevard12 W 7th Avenue And W 5th Avenue13 River Road And Irving Road14 River Road And Northw est Expressw ay - Railroad Boulevard15 S Bertelsen Road And W 11th Avenue16 Bailey Hill Road And W 11th Avenue17 Seneca Road And W 11th Avenue18 Garfield Street And W 11th Avenue19 Chambers Street And W 11th Avenue20 Garfield Street And W 13th Avenue21 Chambers Street And W 13th Avenue22 Chambers Street And W 18th Avenue23 Willamette Street And W 18th Avenue24 Oak Street And W 18th Avenue25 Pearl Street And E 18th Avenue26 E 18th Avenue And Patterson Street27 E 18th Avenue And Hilyard Street28 Willamette Street And W 29th Avenue29 Amazon Parkw ay - 30th Avenue And Hilyard Street30 Mill Street And E 8th Avenue31 Mill Street And E Broadw ay32 Franklin Boulevard And E 11th Avenue33 Agate Street And Franklin Boulevard34 Walnut Street And Franklin Boulevard35 Crescent Avenue And Norkenzie Road36 Coburg Road And Crescent Avenue37 Coburg Road And Cal Young Road38 Coburg Road And Harlow Road39 Coburg Road And Oakw ay Road40 Coburg Road And Country Club Road41 Delta Highw ay And Valley River Dr Southbound Ramps42 Willagillespie Road And Valley River Drive43 Delta Highw ay And Willagillespie Road44 W 6th Avenue And Garfield Street45 Chambers Street And W 6th Avenue46 W 6th Avenue And Madison Street47 W 7th Avenue And Garfield Street48 Chambers Street And W 7th Avenue49 Jefferson Street And W 7th Avenue50 Washington Street And W 7th AvenueA From Beltline Facility Plan
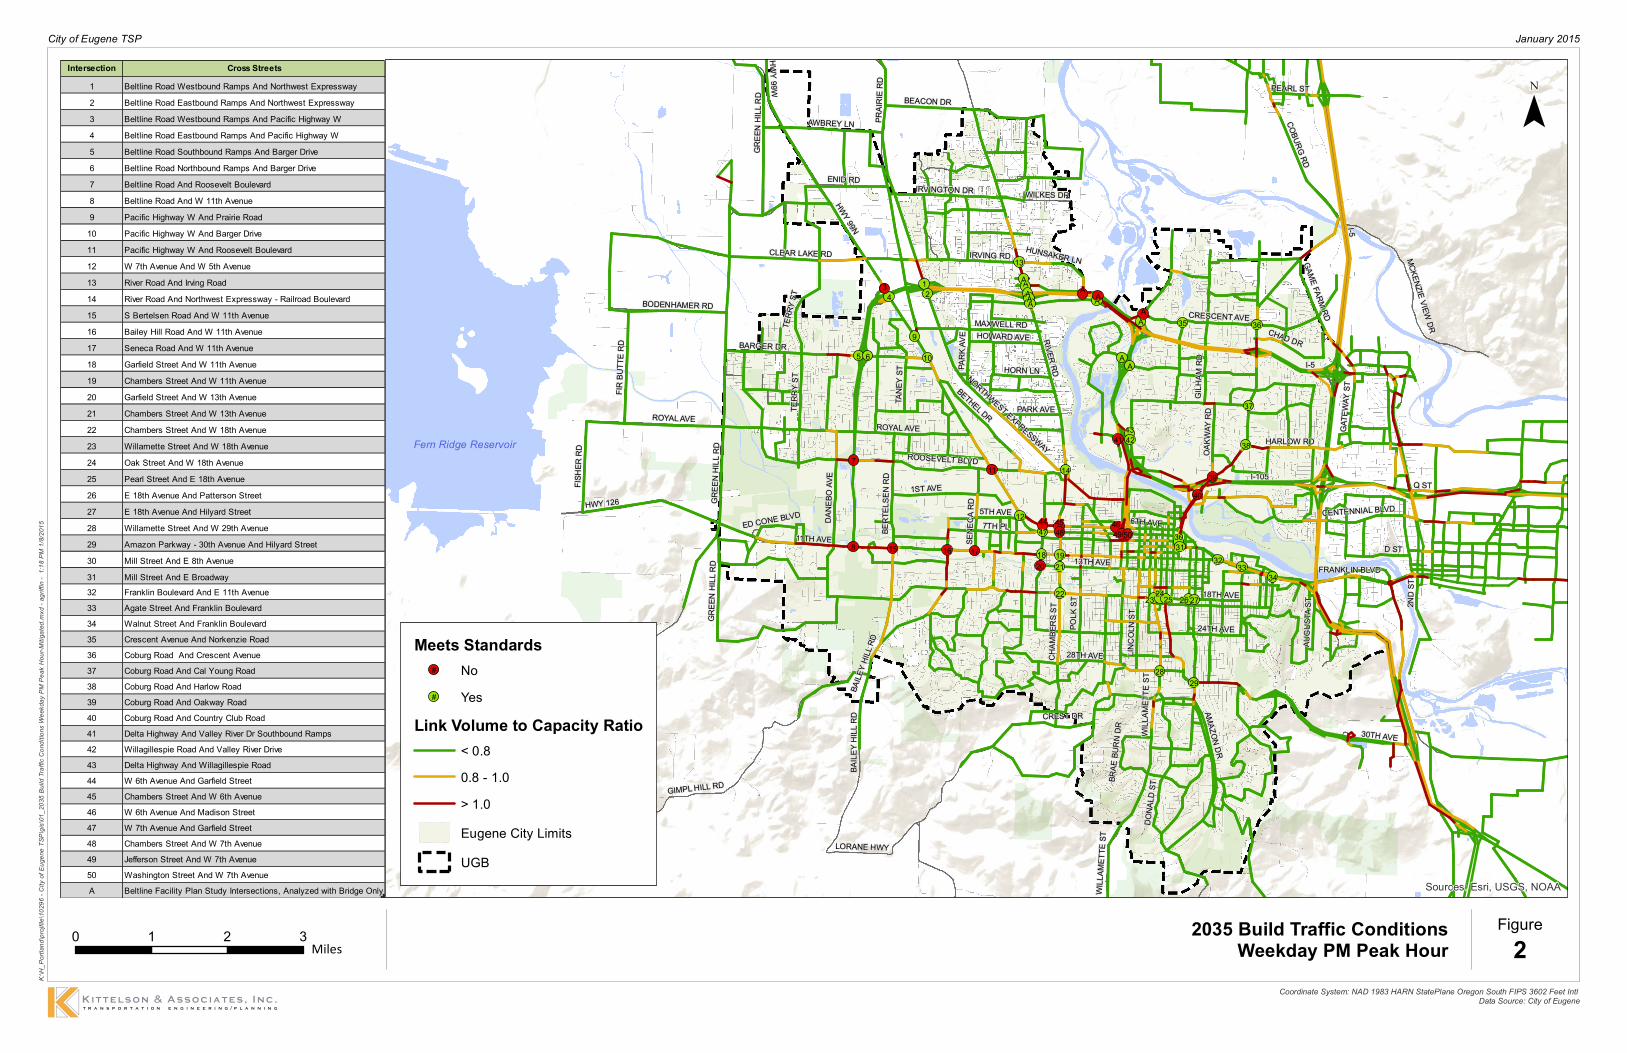
9
65
4
28
272625242234
33322118 31
30
12
39
38
37
4243
10
35
13
23
8
7
213
29
1920
1716155049
464845
4744
40
41
1411
36
AA
A
AAA
A
A
A
Fern Ridge Reservoir
I-5
11TH AVE
HWY 99N
18TH AVERIVER RD
I-105
COBURG RD
30TH AVE
ROYAL AVE
GREE
N HI
LL R
D
6TH AVE
BARGER DR
CHAM
BERS
ST
13TH AVE
WILL
AMET
TE ST
ROOSEVELT BLVD
IRVING RD
BERT
ELSE
N RD
BAILE
Y HILL
RD
NORTHWEST EXPRESSWAY HARLOW RD
TERR
Y ST
MAXWELL RD
DANE
BO AV
E
CRESCENT AVE
24TH AVE
IRVINGTON DR
GATE
WAY S
T
28TH AVE
GILH
AM R
D
SENE
CA R
DHWY 126
HWY 99W
CENTENNIAL BLVD
GAME FARM RD
OAKW
AY R
D
AMAZON DR
PEARL ST
FRANKLIN BLVD
I-5
GIMPL HILL RD
CROW RD POLK
ST
LORANE HWY
CLEAR LAKE RD
D ST
ROYAL AVE
FIR BU
TTE R
D
DONA
LD ST
BEACON DR
BAILE
Y HILL
RD
BETHEL DR
MCKENZIE VIEW DR
1ST AVE
AWBREY LN
GREE
N HI
LL R
D
PRAIR
IE RD
7TH PL
2ND
ST
FISHE
R RD
Q ST
LINCO
LN ST
CHAD DR
HORN LN
PINE G
ROVE
RD
CREST DR
WILKES DR
PARK AVE
BODENHAMER RD
TANE
Y ST
HOWARD AVE
WILL
AMET
TE ST
HUNSAKER LN
AUGU
STA S
T
5TH AVEED CONE BLVD
BRAE
BURN
DR
ENID RD
TERR
Y ST
PARK
AVE
GREE
N HI
LL R
D
A
AA
Sources: Esri, USGS, NOAA
City of Eugene TSP January 2015
¯
0 1 2 3 MilesFigure
2
Meets StandardsNoYes
Link Volume to Capacity Ratio< 0.80.8 - 1.0> 1.0Eugene City LimitsUGB
K:\H_
Portla
nd\pr
ojfile
\1029
6 - C
ity of
Eug
ene T
SP\gi
s\01_
2035
Buil
d Traf
fic C
ondit
ions W
eekd
ay P
M Pe
ak H
our-M
itigate
d.mxd
- agri
ffin -
1:18 P
M 1/8
/2015
Coordinate System: NAD 1983 HARN StatePlane Oregon South FIPS 3602 Feet Intl Data Source: City of Eugene
2035 Build Traffic ConditionsWeekday PM Peak Hour
#
#
Intersection Cross Streets1 Beltline Road Westbound Ramps And Northwest Expressway2 Beltline Road Eastbound Ramps And Northwest Expressway3 Beltline Road Westbound Ramps And Pacific Highway W4 Beltline Road Eastbound Ramps And Pacific Highway W5 Beltline Road Southbound Ramps And Barger Drive6 Beltline Road Northbound Ramps And Barger Drive7 Beltline Road And Roosevelt Boulevard8 Beltline Road And W 11th Avenue9 Pacific Highway W And Prairie Road
10 Pacific Highway W And Barger Drive11 Pacific Highway W And Roosevelt Boulevard12 W 7th Avenue And W 5th Avenue13 River Road And Irving Road14 River Road And Northwest Expressway - Railroad Boulevard15 S Bertelsen Road And W 11th Avenue16 Bailey Hill Road And W 11th Avenue17 Seneca Road And W 11th Avenue18 Garfield Street And W 11th Avenue19 Chambers Street And W 11th Avenue20 Garfield Street And W 13th Avenue21 Chambers Street And W 13th Avenue22 Chambers Street And W 18th Avenue23 Willamette Street And W 18th Avenue24 Oak Street And W 18th Avenue25 Pearl Street And E 18th Avenue26 E 18th Avenue And Patterson Street27 E 18th Avenue And Hilyard Street28 Willamette Street And W 29th Avenue29 Amazon Parkway - 30th Avenue And Hilyard Street30 Mill Street And E 8th Avenue31 Mill Street And E Broadway32 Franklin Boulevard And E 11th Avenue33 Agate Street And Franklin Boulevard34 Walnut Street And Franklin Boulevard35 Crescent Avenue And Norkenzie Road36 Coburg Road And Crescent Avenue37 Coburg Road And Cal Young Road38 Coburg Road And Harlow Road39 Coburg Road And Oakway Road40 Coburg Road And Country Club Road41 Delta Highway And Valley River Dr Southbound Ramps42 Willagillespie Road And Valley River Drive43 Delta Highway And Willagillespie Road44 W 6th Avenue And Garfield Street45 Chambers Street And W 6th Avenue46 W 6th Avenue And Madison Street47 W 7th Avenue And Garfield Street48 Chambers Street And W 7th Avenue49 Jefferson Street And W 7th Avenue50 Washington Street And W 7th AvenueA Beltline Facility Plan Study Intersections, Analyzed with Bridge Only

{00 E
Appendix D: Alternatives Evaluation Process

MEMORANDUM Eugene Transportation System Plan
Project Evaluation Approach
Date: January 8, 2014 Project #:10296 To: Cc:
Kurt Yeiter, City of Eugene Eugene PMT, TAC, and TCRG Terra Lingley and Kristin Hull, CH2M Hill
From: Julia Kuhn, Kittelson & Associates, Inc.
This memorandum describes the approach used to categorize and evaluate projects that may become the key elements of the recommended Transportation System Plan (TSP). The overall approach and categorization result from the TSP goals and objectives, and Eugene’s commitment to creating a plan that supports its sustainability goals including the sustainability Triple Bottom Line (TBL; environment, equity, and economy).
The following goals developed during Phase 1 of the TSP guide this process:
• Goal 1: Create an integrated multimodal transportation system that is safe and efficient; supports local land use and economic development plans; reduces reliance on single-occupancy automobiles; and enhances community livability.
• Goal 2: Advance regional sustainability by providing a transportation system that improves economic vitality, environmental health, social equity, and well-being.
• Goal 3: Strengthen community resilience to changes in climate, increases in fossil fuel prices, and economic fluctuations through adaptations to the transportation networks.
• Goal 4: Distribute the benefits and impacts of transportation decisions fairly and address the transportation needs and safety of all users, including youth, the elderly, people with disabilities, and people of all races, ethnicities and incomes.
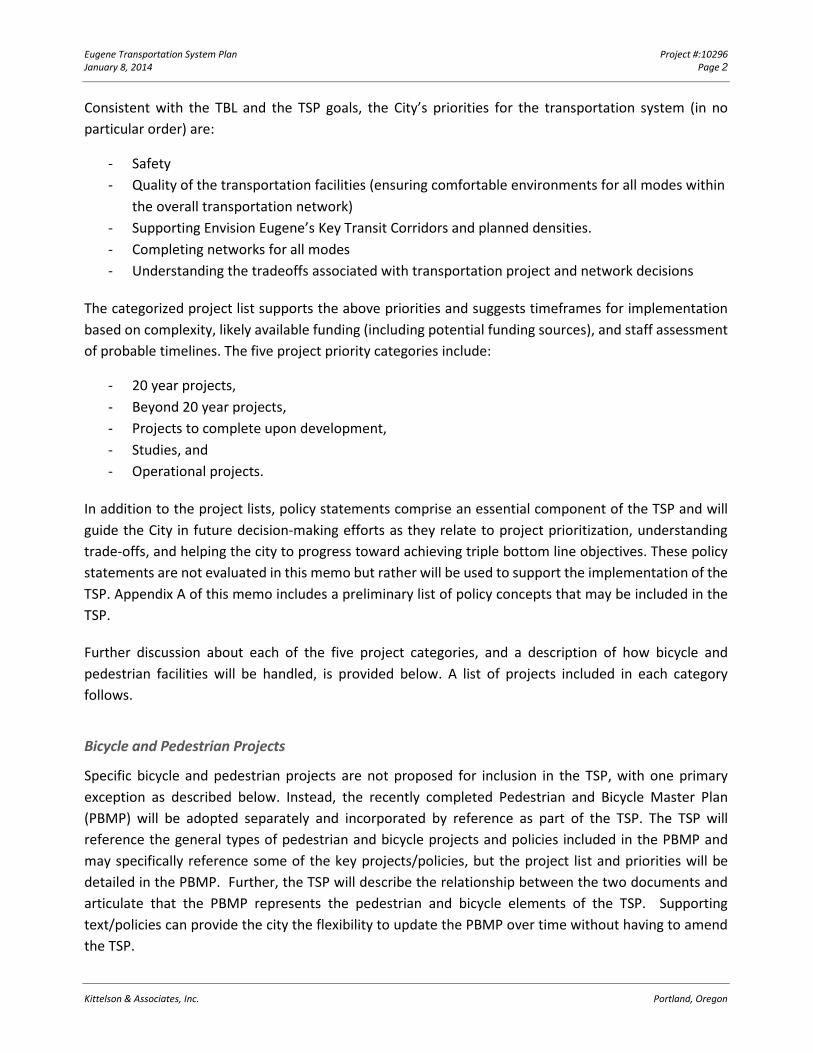
Eugene Transportation System Plan Project #:10296 January 8, 2014 Page 2
Consistent with the TBL and the TSP goals, the City’s priorities for the transportation system (in no particular order) are:
- Safety - Quality of the transportation facilities (ensuring comfortable environments for all modes within
the overall transportation network) - Supporting Envision Eugene’s Key Transit Corridors and planned densities. - Completing networks for all modes - Understanding the tradeoffs associated with transportation project and network decisions
The categorized project list supports the above priorities and suggests timeframes for implementation based on complexity, likely available funding (including potential funding sources), and staff assessment of probable timelines. The five project priority categories include:
- 20 year projects, - Beyond 20 year projects, - Projects to complete upon development, - Studies, and - Operational projects.
In addition to the project lists, policy statements comprise an essential component of the TSP and will guide the City in future decision-making efforts as they relate to project prioritization, understanding trade-offs, and helping the city to progress toward achieving triple bottom line objectives. These policy statements are not evaluated in this memo but rather will be used to support the implementation of the TSP. Appendix A of this memo includes a preliminary list of policy concepts that may be included in the TSP.
Further discussion about each of the five project categories, and a description of how bicycle and pedestrian facilities will be handled, is provided below. A list of projects included in each category follows.
Bicycle and Pedestrian Projects
Specific bicycle and pedestrian projects are not proposed for inclusion in the TSP, with one primary exception as described below. Instead, the recently completed Pedestrian and Bicycle Master Plan (PBMP) will be adopted separately and incorporated by reference as part of the TSP. The TSP will reference the general types of pedestrian and bicycle projects and policies included in the PBMP and may specifically reference some of the key projects/policies, but the project list and priorities will be detailed in the PBMP. Further, the TSP will describe the relationship between the two documents and articulate that the PBMP represents the pedestrian and bicycle elements of the TSP. Supporting text/policies can provide the city the flexibility to update the PBMP over time without having to amend the TSP.
Kittelson & Associates, Inc. Portland, Oregon
Eugene Transportation System Plan Project #:10296 January 8, 2014 Page 3
The potential for a grade-separated pedestrian/bicycle overcrossing of the Beltline Highway may be evaluated using TSP criteria and included explicitly in the TSP. This, the most expensive pedestrian and bicycle project being contemplated, fulfills a major gap in the existing pedestrian and bicycle system, and requires coordination with the street system and careful consideration of potential land use impacts.
Many of the projects identified in the TSP project lists will include pedestrian and bicycle components as part of the overall improvement and therefore be included in the TSP.
20 Year Projects and Upon Development Projects
Most of the projects in the 20 year and “upon development” categories provide incremental, local changes, and while they will improve specific areas, very few “move the dial” on achieving greenhouse gas reduction targets or other city-wide priorities. These projects will be evaluated by bundling them together to show the city-wide benefit of systematically implementing them over the 20 year planning horizon. Cost estimates and transportation modeling for the 20 year projects will help inform the evaluation discussions.
Projects that are to be completed upon development are those that are likely needed as properties in the urban growth boundary develop or redevelop. The timing of these projects is uncertain and they are unlikely to be advanced by the city in the absence of specific private development activities. Typically, these projects address only localized multimodal transportation needs associated with newly developing or redevelopment areas. These projects will be included in the transportation modeling and the cost estimating but most are not of the scale/nature that will inform the evaluation discussions.
The list of “upon development” projects reflects City staff’s current understanding of likely priorities in these areas. At the time that specific land use applications are submitted, additional or different provisions may be required as conditions of approval based on the specifics and timing of the actual development application. Further, the projects in this category may be funded through a variety of sources, such as urban renewal, proportionate sharing (based on level of anticipated impact of a specific development), etc.
Projects Beyond 20 Years
Projects beyond 20 years are still important to consider, as they are the larger more complex projects, or projects that could address future transportation issues that are not yet problematic. This provides a clear path for the City to work towards beyond the immediate plan priorities. Inclusion of projects in the beyond 20 year category provides the city flexibility to re-evaluate priorities and to pursue a variety of funding opportunities that may arise over the life of the TSP. In terms of projects beyond 20 years, the regional land use and transportation model may be used to provide a sensitivity analysis on the traffic benefits/impacts of a new river crossing in Eugene. No other beyond 20 year projects will be modeled.
Kittelson & Associates, Inc. Portland, Oregon
Eugene Transportation System Plan Project #:10296 January 8, 2014 Page 4
Study Projects
Study projects are those that need further analysis prior to identifying a specific project for implementation and inclusion within the TSP.
Operational Projects
Operational projects are typically intersection-related improvements that are individually lower in cost than other projects being contemplated and generally do not require right-of-way acquisition. The TSP is not all-inclusive of the operational projects the city will pursue over the life of the TSP. Rather, these projects represent those that the city can pursue to improve the operational efficiency of specific intersections and roadways. Further, a list of Transportation System Management and Options (TSMO) strategies will be included in the TSP to assist city staff and policy makers in future discussions regarding capital funding/project priorities.
PROJECT EVALUATION CRITERIA Evaluation criteria are used to differentiate and identify trade-offs among feasible ideas and determine how well a project meets TSP objectives. To be most effective, these criteria should be measurable and well-defined. This ensures a common understanding of each criterion’s meaning, and allows for a clear comparison among different ideas. The TSP criteria listed in Appendix B are organized by project objective, nested into the following eight categories:
1. Safety and health 2. Social equity 3. Access and mobility for all modes 4. Community context 5. Economic benefit 6. Cost effectiveness 7. Climate and energy 8. Ecological function
Kittelson & Associates, Inc. Portland, Oregon
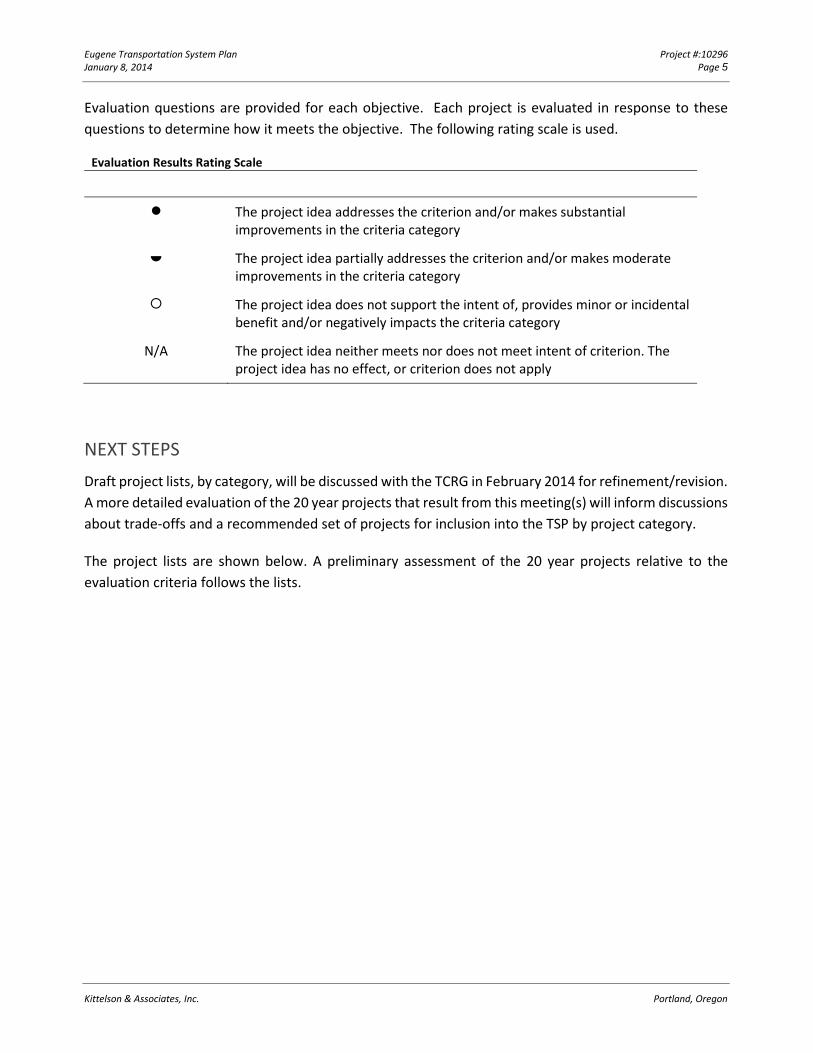
Eugene Transportation System Plan Project #:10296 January 8, 2014 Page 5
Evaluation questions are provided for each objective. Each project is evaluated in response to these questions to determine how it meets the objective. The following rating scale is used.
Evaluation Results Rating Scale
Rating Description
The project idea addresses the criterion and/or makes substantial improvements in the criteria category
The project idea partially addresses the criterion and/or makes moderate improvements in the criteria category
The project idea does not support the intent of, provides minor or incidental benefit and/or negatively impacts the criteria category
N/A The project idea neither meets nor does not meet intent of criterion. The project idea has no effect, or criterion does not apply
NEXT STEPS Draft project lists, by category, will be discussed with the TCRG in February 2014 for refinement/revision. A more detailed evaluation of the 20 year projects that result from this meeting(s) will inform discussions about trade-offs and a recommended set of projects for inclusion into the TSP by project category.
The project lists are shown below. A preliminary assessment of the 20 year projects relative to the evaluation criteria follows the lists.
Kittelson & Associates, Inc. Portland, Oregon
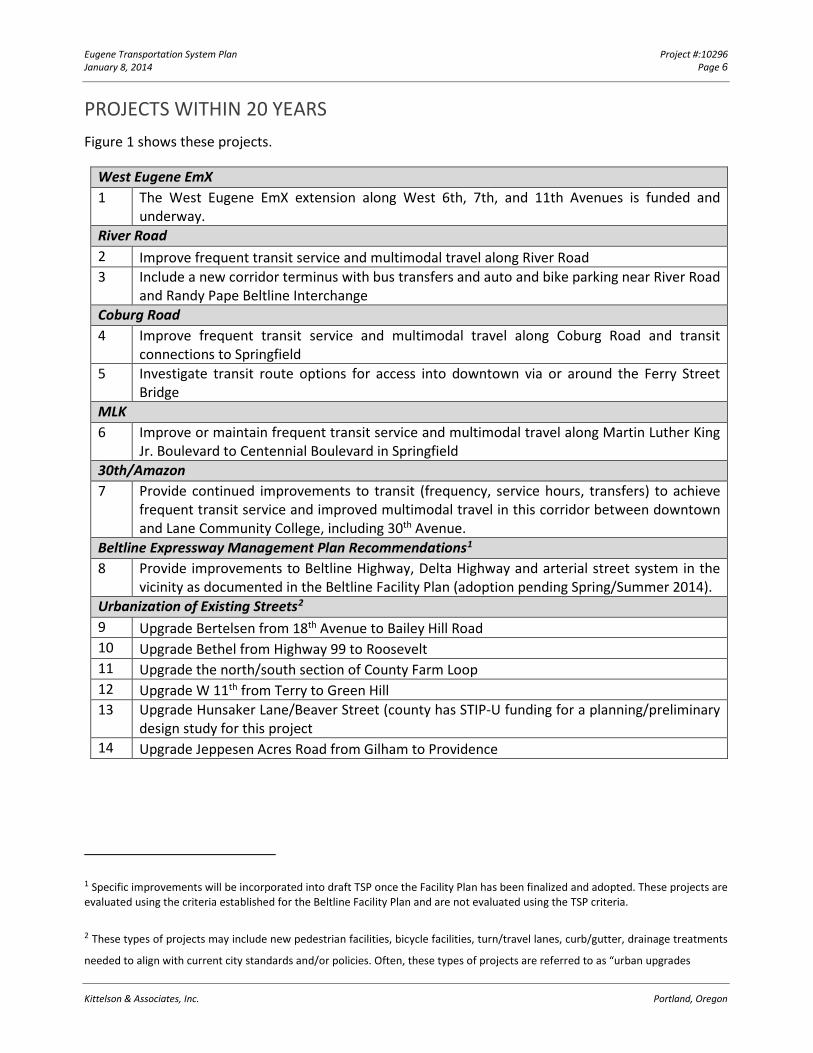
Eugene Transportation System Plan Project #:10296 January 8, 2014 Page 6
PROJECTS WITHIN 20 YEARS Figure 1 shows these projects.
West Eugene EmX 1 The West Eugene EmX extension along West 6th, 7th, and 11th Avenues is funded and
underway. River Road 2 Improve frequent transit service and multimodal travel along River Road 3 Include a new corridor terminus with bus transfers and auto and bike parking near River Road
and Randy Pape Beltline Interchange Coburg Road 4 Improve frequent transit service and multimodal travel along Coburg Road and transit
connections to Springfield 5 Investigate transit route options for access into downtown via or around the Ferry Street
Bridge MLK 6 Improve or maintain frequent transit service and multimodal travel along Martin Luther King
Jr. Boulevard to Centennial Boulevard in Springfield 30th/Amazon 7 Provide continued improvements to transit (frequency, service hours, transfers) to achieve
frequent transit service and improved multimodal travel in this corridor between downtown and Lane Community College, including 30th Avenue.
Beltline Expressway Management Plan Recommendations1 8 Provide improvements to Beltline Highway, Delta Highway and arterial street system in the
vicinity as documented in the Beltline Facility Plan (adoption pending Spring/Summer 2014). Urbanization of Existing Streets2 9 Upgrade Bertelsen from 18th Avenue to Bailey Hill Road 10 Upgrade Bethel from Highway 99 to Roosevelt 11 Upgrade the north/south section of County Farm Loop 12 Upgrade W 11th from Terry to Green Hill 13 Upgrade Hunsaker Lane/Beaver Street (county has STIP-U funding for a planning/preliminary
design study for this project 14 Upgrade Jeppesen Acres Road from Gilham to Providence
1 Specific improvements will be incorporated into draft TSP once the Facility Plan has been finalized and adopted. These projects are evaluated using the criteria established for the Beltline Facility Plan and are not evaluated using the TSP criteria.
2 These types of projects may include new pedestrian facilities, bicycle facilities, turn/travel lanes, curb/gutter, drainage treatments
needed to align with current city standards and/or policies. Often, these types of projects are referred to as “urban upgrades
Kittelson & Associates, Inc. Portland, Oregon
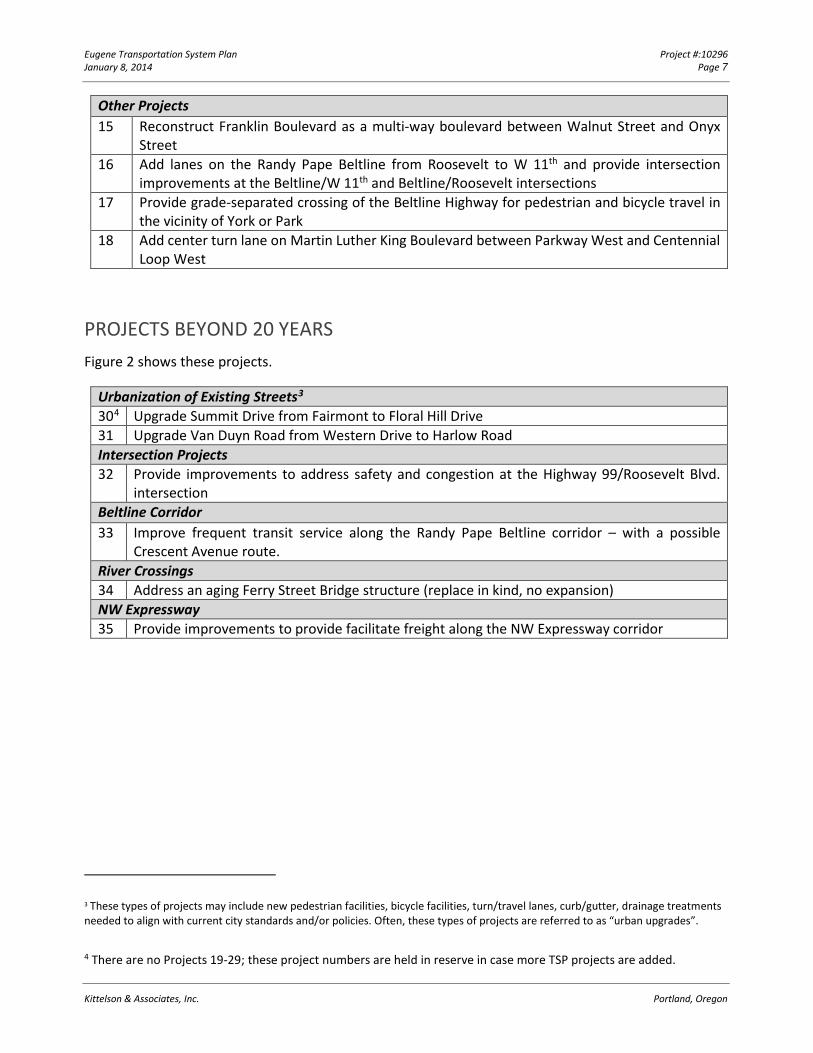
Eugene Transportation System Plan Project #:10296 January 8, 2014 Page 7
Other Projects 15 Reconstruct Franklin Boulevard as a multi-way boulevard between Walnut Street and Onyx
Street 16 Add lanes on the Randy Pape Beltline from Roosevelt to W 11th and provide intersection
improvements at the Beltline/W 11th and Beltline/Roosevelt intersections 17 Provide grade-separated crossing of the Beltline Highway for pedestrian and bicycle travel in
the vicinity of York or Park 18 Add center turn lane on Martin Luther King Boulevard between Parkway West and Centennial
Loop West
PROJECTS BEYOND 20 YEARS Figure 2 shows these projects.
Urbanization of Existing Streets3 304 Upgrade Summit Drive from Fairmont to Floral Hill Drive 31 Upgrade Van Duyn Road from Western Drive to Harlow Road Intersection Projects 32 Provide improvements to address safety and congestion at the Highway 99/Roosevelt Blvd.
intersection Beltline Corridor 33 Improve frequent transit service along the Randy Pape Beltline corridor – with a possible
Crescent Avenue route. River Crossings 34 Address an aging Ferry Street Bridge structure (replace in kind, no expansion) NW Expressway 35 Provide improvements to provide facilitate freight along the NW Expressway corridor
3 These types of projects may include new pedestrian facilities, bicycle facilities, turn/travel lanes, curb/gutter, drainage treatments needed to align with current city standards and/or policies. Often, these types of projects are referred to as “urban upgrades”.
4 There are no Projects 19-29; these project numbers are held in reserve in case more TSP projects are added.
Kittelson & Associates, Inc. Portland, Oregon
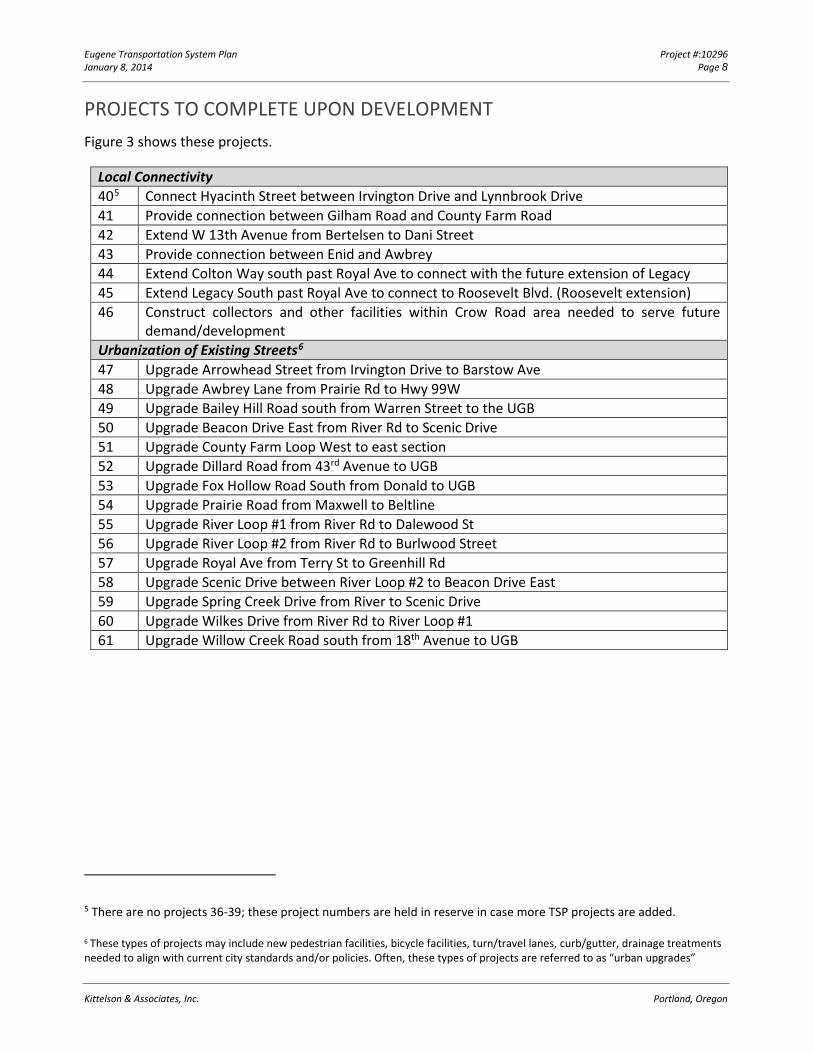
Eugene Transportation System Plan Project #:10296 January 8, 2014 Page 8
PROJECTS TO COMPLETE UPON DEVELOPMENT Figure 3 shows these projects.
Local Connectivity 405 Connect Hyacinth Street between Irvington Drive and Lynnbrook Drive 41 Provide connection between Gilham Road and County Farm Road 42 Extend W 13th Avenue from Bertelsen to Dani Street 43 Provide connection between Enid and Awbrey 44 Extend Colton Way south past Royal Ave to connect with the future extension of Legacy 45 Extend Legacy South past Royal Ave to connect to Roosevelt Blvd. (Roosevelt extension) 46 Construct collectors and other facilities within Crow Road area needed to serve future
demand/development Urbanization of Existing Streets6 47 Upgrade Arrowhead Street from Irvington Drive to Barstow Ave 48 Upgrade Awbrey Lane from Prairie Rd to Hwy 99W 49 Upgrade Bailey Hill Road south from Warren Street to the UGB 50 Upgrade Beacon Drive East from River Rd to Scenic Drive 51 Upgrade County Farm Loop West to east section 52 Upgrade Dillard Road from 43rd Avenue to UGB 53 Upgrade Fox Hollow Road South from Donald to UGB 54 Upgrade Prairie Road from Maxwell to Beltline 55 Upgrade River Loop #1 from River Rd to Dalewood St 56 Upgrade River Loop #2 from River Rd to Burlwood Street 57 Upgrade Royal Ave from Terry St to Greenhill Rd 58 Upgrade Scenic Drive between River Loop #2 to Beacon Drive East 59 Upgrade Spring Creek Drive from River to Scenic Drive 60 Upgrade Wilkes Drive from River Rd to River Loop #1 61 Upgrade Willow Creek Road south from 18th Avenue to UGB
5 There are no projects 36-39; these project numbers are held in reserve in case more TSP projects are added.
6 These types of projects may include new pedestrian facilities, bicycle facilities, turn/travel lanes, curb/gutter, drainage treatments needed to align with current city standards and/or policies. Often, these types of projects are referred to as “urban upgrades”
Kittelson & Associates, Inc. Portland, Oregon
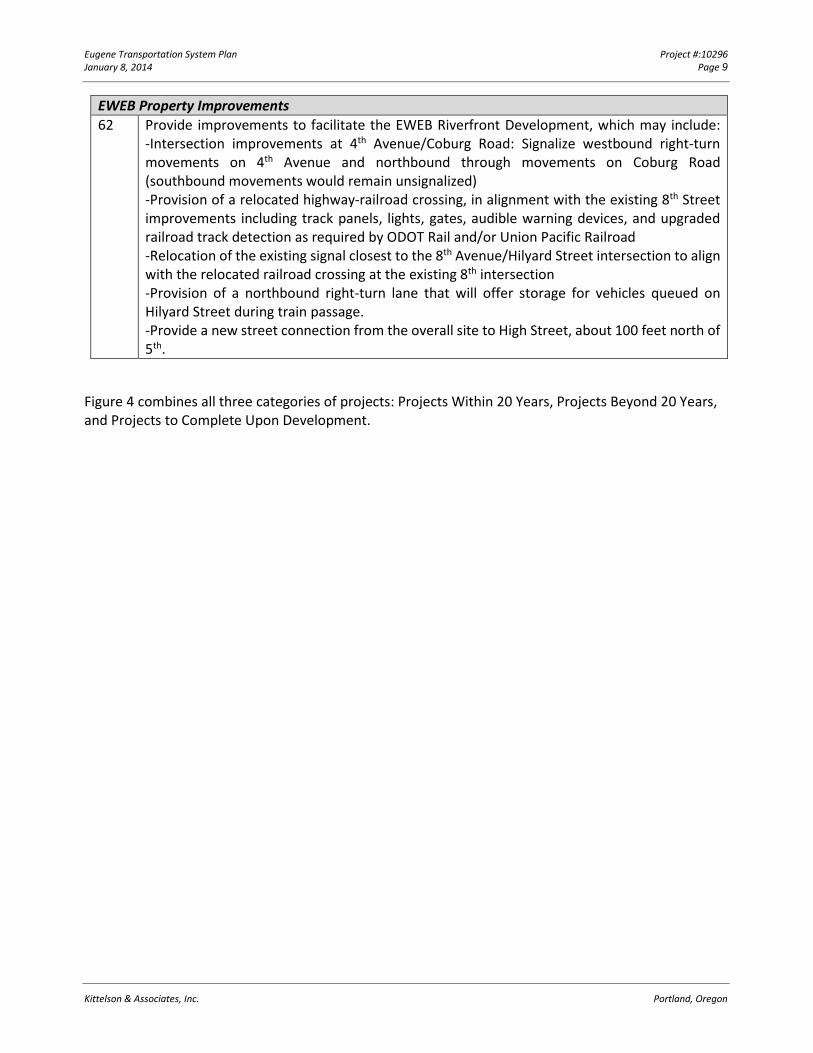
Eugene Transportation System Plan Project #:10296 January 8, 2014 Page 9
EWEB Property Improvements 62 Provide improvements to facilitate the EWEB Riverfront Development, which may include:
-Intersection improvements at 4th Avenue/Coburg Road: Signalize westbound right-turn movements on 4th Avenue and northbound through movements on Coburg Road (southbound movements would remain unsignalized) -Provision of a relocated highway-railroad crossing, in alignment with the existing 8th Street improvements including track panels, lights, gates, audible warning devices, and upgraded railroad track detection as required by ODOT Rail and/or Union Pacific Railroad -Relocation of the existing signal closest to the 8th Avenue/Hilyard Street intersection to align with the relocated railroad crossing at the existing 8th intersection -Provision of a northbound right-turn lane that will offer storage for vehicles queued on Hilyard Street during train passage. -Provide a new street connection from the overall site to High Street, about 100 feet north of 5th.
Figure 4 combines all three categories of projects: Projects Within 20 Years, Projects Beyond 20 Years, and Projects to Complete Upon Development.
Kittelson & Associates, Inc. Portland, Oregon
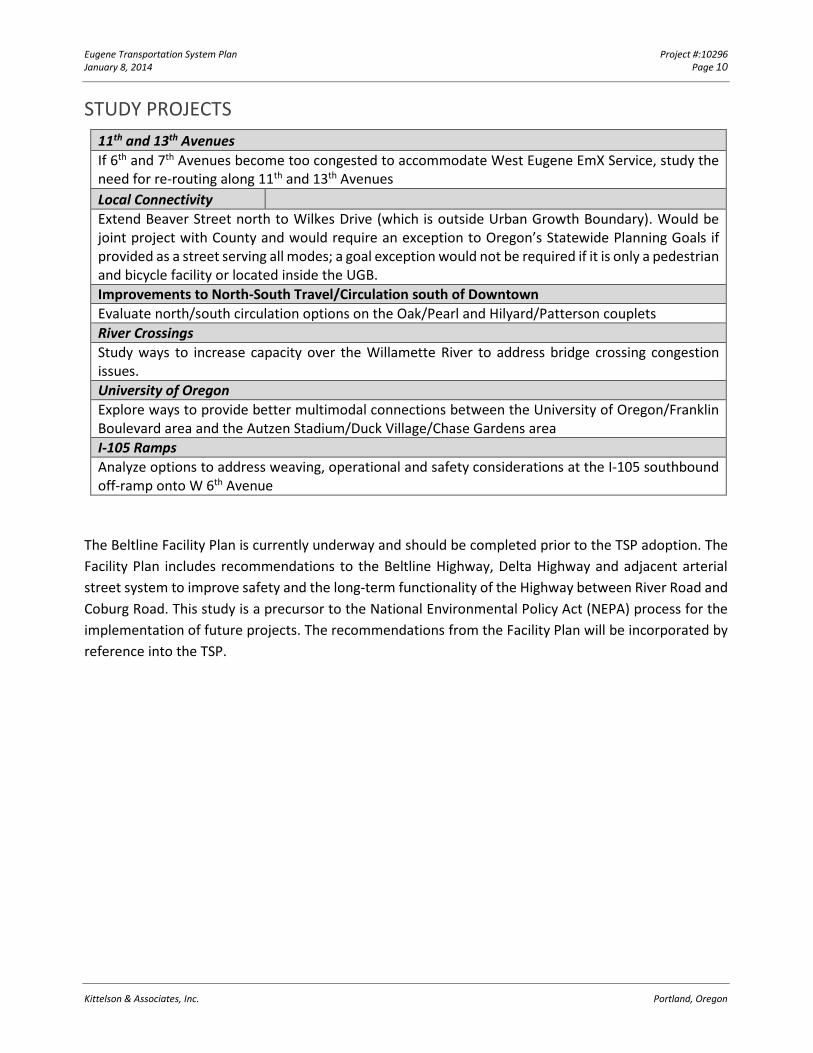
Eugene Transportation System Plan Project #:10296 January 8, 2014 Page 10
STUDY PROJECTS 11th and 13th Avenues If 6th and 7th Avenues become too congested to accommodate West Eugene EmX Service, study the need for re-routing along 11th and 13th Avenues Local Connectivity Extend Beaver Street north to Wilkes Drive (which is outside Urban Growth Boundary). Would be joint project with County and would require an exception to Oregon’s Statewide Planning Goals if provided as a street serving all modes; a goal exception would not be required if it is only a pedestrian and bicycle facility or located inside the UGB. Improvements to North-South Travel/Circulation south of Downtown Evaluate north/south circulation options on the Oak/Pearl and Hilyard/Patterson couplets River Crossings Study ways to increase capacity over the Willamette River to address bridge crossing congestion issues. University of Oregon Explore ways to provide better multimodal connections between the University of Oregon/Franklin Boulevard area and the Autzen Stadium/Duck Village/Chase Gardens area I-105 Ramps Analyze options to address weaving, operational and safety considerations at the I-105 southbound off-ramp onto W 6th Avenue
The Beltline Facility Plan is currently underway and should be completed prior to the TSP adoption. The Facility Plan includes recommendations to the Beltline Highway, Delta Highway and adjacent arterial street system to improve safety and the long-term functionality of the Highway between River Road and Coburg Road. This study is a precursor to the National Environmental Policy Act (NEPA) process for the implementation of future projects. The recommendations from the Facility Plan will be incorporated by reference into the TSP.
Kittelson & Associates, Inc. Portland, Oregon
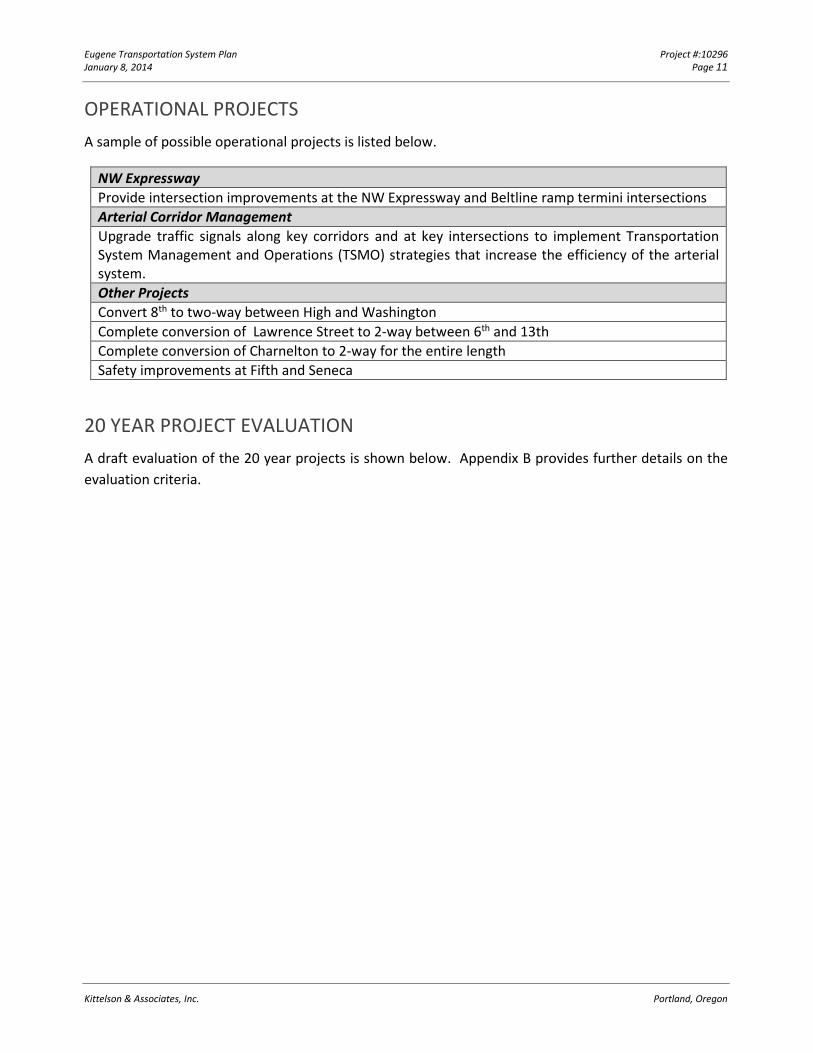
Eugene Transportation System Plan Project #:10296 January 8, 2014 Page 11
OPERATIONAL PROJECTS A sample of possible operational projects is listed below.
NW Expressway Provide intersection improvements at the NW Expressway and Beltline ramp termini intersections Arterial Corridor Management Upgrade traffic signals along key corridors and at key intersections to implement Transportation System Management and Operations (TSMO) strategies that increase the efficiency of the arterial system. Other Projects Convert 8th to two-way between High and Washington Complete conversion of Lawrence Street to 2-way between 6th and 13th Complete conversion of Charnelton to 2-way for the entire length Safety improvements at Fifth and Seneca
20 YEAR PROJECT EVALUATION A draft evaluation of the 20 year projects is shown below. Appendix B provides further details on the evaluation criteria.
Kittelson & Associates, Inc. Portland, Oregon
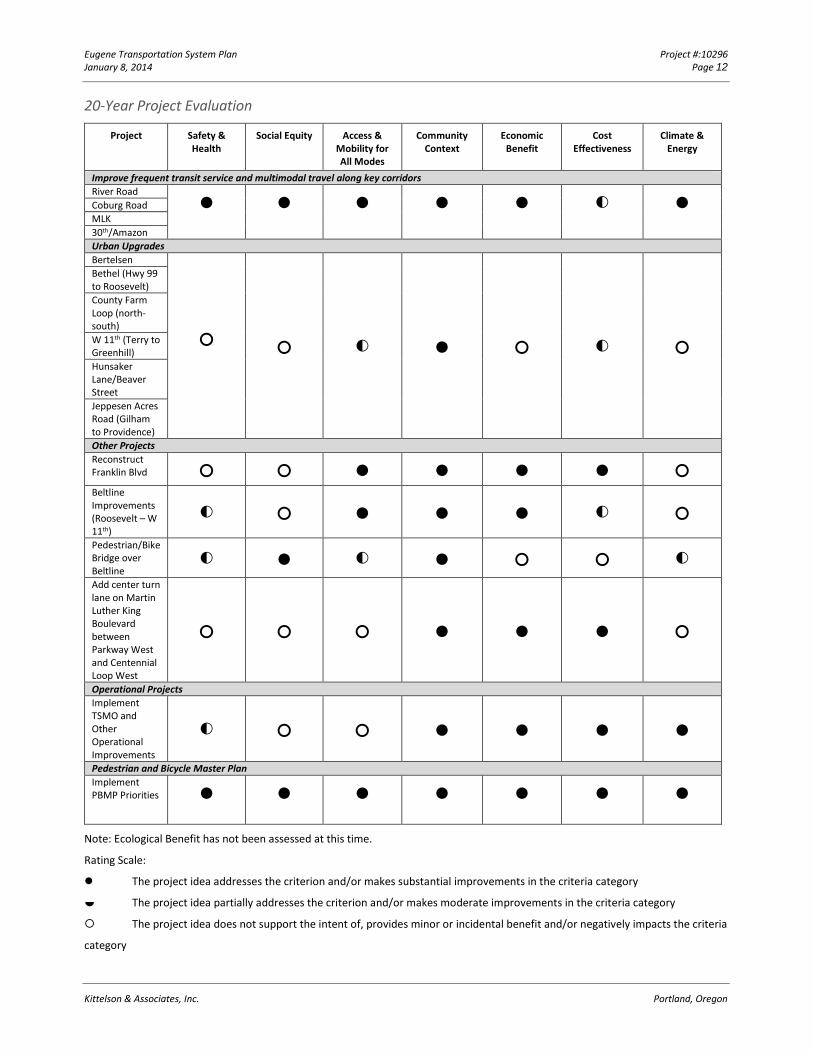
Eugene Transportation System Plan Project #:10296 January 8, 2014 Page 12
20-Year Project Evaluation
Project Safety & Health
Social Equity Access & Mobility for All Modes
Community Context
Economic Benefit
Cost Effectiveness
Climate & Energy
Improve frequent transit service and multimodal travel along key corridors River Road ● ● ● ● ● ◐ ● Coburg Road MLK 30th/Amazon Urban Upgrades Bertelsen
○ ○ ◐ ● ○ ◐ ○
Bethel (Hwy 99 to Roosevelt) County Farm Loop (north-south) W 11th (Terry to Greenhill) Hunsaker Lane/Beaver Street Jeppesen Acres Road (Gilham to Providence) Other Projects Reconstruct Franklin Blvd ○ ○ ● ● ● ● ○
Beltline Improvements (Roosevelt – W 11th)
◐ ○ ● ● ● ◐ ○
Pedestrian/Bike Bridge over Beltline
◐ ● ◐ ● ○ ○ ◐
Add center turn lane on Martin Luther King Boulevard between Parkway West and Centennial Loop West
○ ○ ○ ● ● ● ○
Operational Projects Implement TSMO and Other Operational Improvements
◐ ○ ○ ● ● ● ●
Pedestrian and Bicycle Master Plan Implement PBMP Priorities ● ● ● ● ● ● ●
Note: Ecological Benefit has not been assessed at this time.
Rating Scale:
The project idea addresses the criterion and/or makes substantial improvements in the criteria category
The project idea partially addresses the criterion and/or makes moderate improvements in the criteria category
The project idea does not support the intent of, provides minor or incidental benefit and/or negatively impacts the criteria
category
Kittelson & Associates, Inc. Portland, Oregon
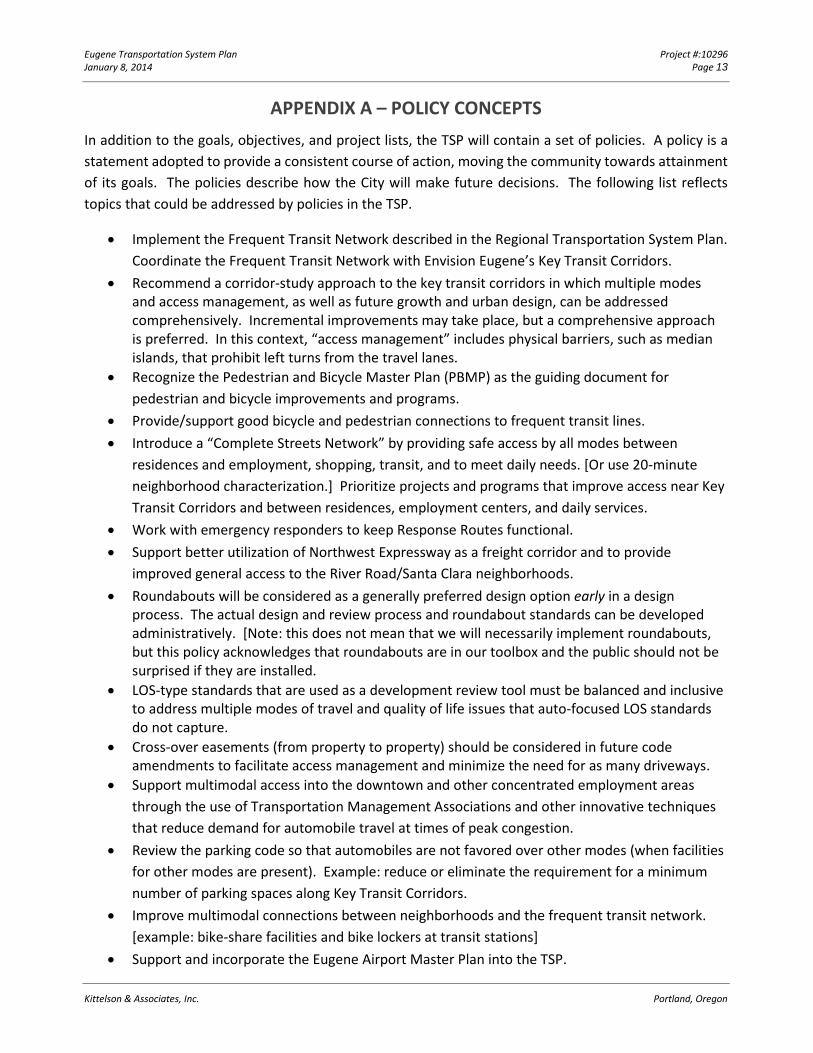
Eugene Transportation System Plan Project #:10296 January 8, 2014 Page 13
APPENDIX A – POLICY CONCEPTS In addition to the goals, objectives, and project lists, the TSP will contain a set of policies. A policy is a statement adopted to provide a consistent course of action, moving the community towards attainment of its goals. The policies describe how the City will make future decisions. The following list reflects topics that could be addressed by policies in the TSP.
• Implement the Frequent Transit Network described in the Regional Transportation System Plan. Coordinate the Frequent Transit Network with Envision Eugene’s Key Transit Corridors.
• Recommend a corridor-study approach to the key transit corridors in which multiple modes and access management, as well as future growth and urban design, can be addressed comprehensively. Incremental improvements may take place, but a comprehensive approach is preferred. In this context, “access management” includes physical barriers, such as median islands, that prohibit left turns from the travel lanes.
• Recognize the Pedestrian and Bicycle Master Plan (PBMP) as the guiding document for pedestrian and bicycle improvements and programs.
• Provide/support good bicycle and pedestrian connections to frequent transit lines. • Introduce a “Complete Streets Network” by providing safe access by all modes between
residences and employment, shopping, transit, and to meet daily needs. [Or use 20-minute neighborhood characterization.] Prioritize projects and programs that improve access near Key Transit Corridors and between residences, employment centers, and daily services.
• Work with emergency responders to keep Response Routes functional. • Support better utilization of Northwest Expressway as a freight corridor and to provide
improved general access to the River Road/Santa Clara neighborhoods. • Roundabouts will be considered as a generally preferred design option early in a design
process. The actual design and review process and roundabout standards can be developed administratively. [Note: this does not mean that we will necessarily implement roundabouts, but this policy acknowledges that roundabouts are in our toolbox and the public should not be surprised if they are installed.
• LOS-type standards that are used as a development review tool must be balanced and inclusive to address multiple modes of travel and quality of life issues that auto-focused LOS standards do not capture.
• Cross-over easements (from property to property) should be considered in future code amendments to facilitate access management and minimize the need for as many driveways.
• Support multimodal access into the downtown and other concentrated employment areas through the use of Transportation Management Associations and other innovative techniques that reduce demand for automobile travel at times of peak congestion.
• Review the parking code so that automobiles are not favored over other modes (when facilities for other modes are present). Example: reduce or eliminate the requirement for a minimum number of parking spaces along Key Transit Corridors.
• Improve multimodal connections between neighborhoods and the frequent transit network. [example: bike-share facilities and bike lockers at transit stations]
• Support and incorporate the Eugene Airport Master Plan into the TSP.
Kittelson & Associates, Inc. Portland, Oregon
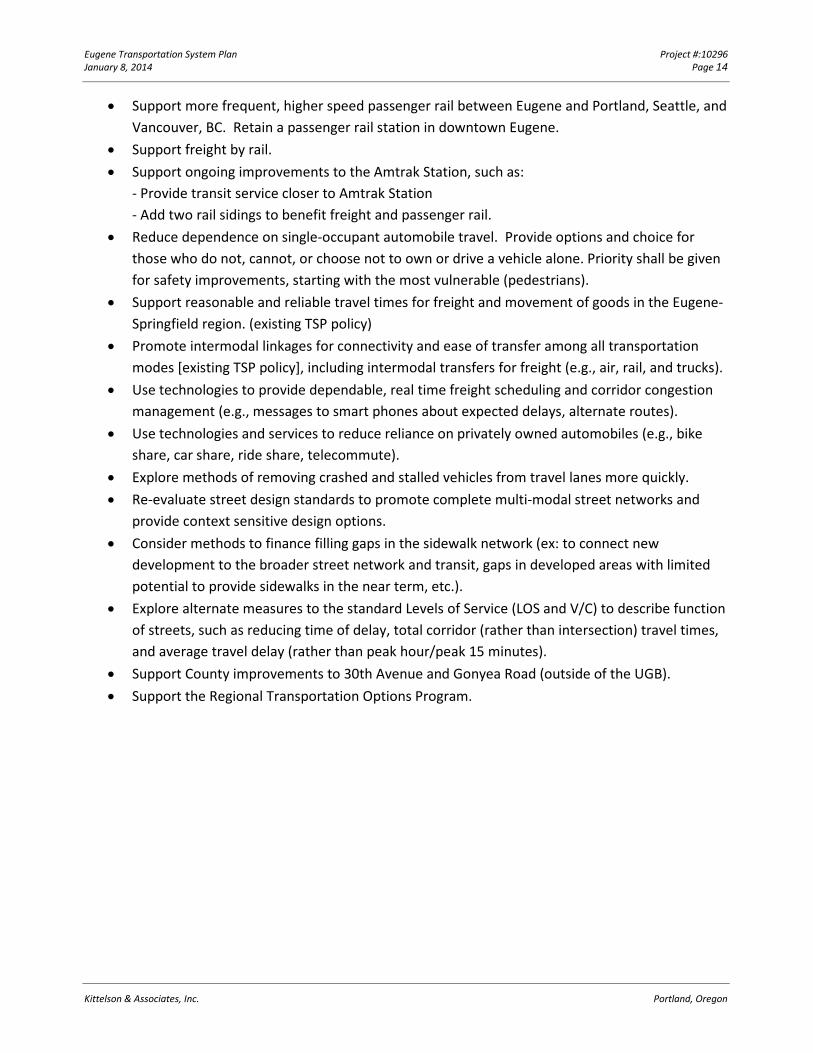
Eugene Transportation System Plan Project #:10296 January 8, 2014 Page 14
• Support more frequent, higher speed passenger rail between Eugene and Portland, Seattle, and Vancouver, BC. Retain a passenger rail station in downtown Eugene.
• Support freight by rail. • Support ongoing improvements to the Amtrak Station, such as:
- Provide transit service closer to Amtrak Station - Add two rail sidings to benefit freight and passenger rail.
• Reduce dependence on single-occupant automobile travel. Provide options and choice for those who do not, cannot, or choose not to own or drive a vehicle alone. Priority shall be given for safety improvements, starting with the most vulnerable (pedestrians).
• Support reasonable and reliable travel times for freight and movement of goods in the Eugene-Springfield region. (existing TSP policy)
• Promote intermodal linkages for connectivity and ease of transfer among all transportation modes [existing TSP policy], including intermodal transfers for freight (e.g., air, rail, and trucks).
• Use technologies to provide dependable, real time freight scheduling and corridor congestion management (e.g., messages to smart phones about expected delays, alternate routes).
• Use technologies and services to reduce reliance on privately owned automobiles (e.g., bike share, car share, ride share, telecommute).
• Explore methods of removing crashed and stalled vehicles from travel lanes more quickly. • Re-evaluate street design standards to promote complete multi-modal street networks and
provide context sensitive design options. • Consider methods to finance filling gaps in the sidewalk network (ex: to connect new
development to the broader street network and transit, gaps in developed areas with limited potential to provide sidewalks in the near term, etc.).
• Explore alternate measures to the standard Levels of Service (LOS and V/C) to describe function of streets, such as reducing time of delay, total corridor (rather than intersection) travel times, and average travel delay (rather than peak hour/peak 15 minutes).
• Support County improvements to 30th Avenue and Gonyea Road (outside of the UGB). • Support the Regional Transportation Options Program.
Kittelson & Associates, Inc. Portland, Oregon
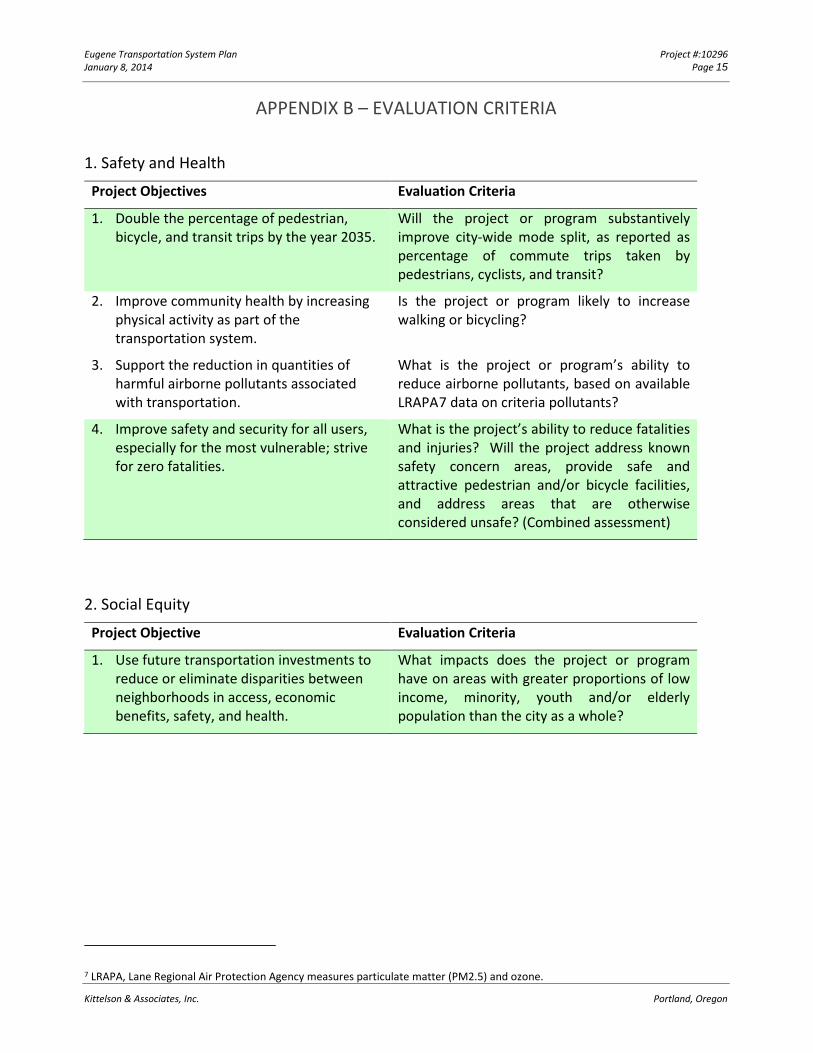
Eugene Transportation System Plan Project #:10296 January 8, 2014 Page 15
APPENDIX B – EVALUATION CRITERIA
1. Safety and Health
Project Objectives Evaluation Criteria
1. Double the percentage of pedestrian, bicycle, and transit trips by the year 2035.
Will the project or program substantively improve city-wide mode split, as reported as percentage of commute trips taken by pedestrians, cyclists, and transit?
2. Improve community health by increasing physical activity as part of the transportation system.
Is the project or program likely to increase walking or bicycling?
3. Support the reduction in quantities of harmful airborne pollutants associated with transportation.
What is the project or program’s ability to reduce airborne pollutants, based on available LRAPA7 data on criteria pollutants?
4. Improve safety and security for all users, especially for the most vulnerable; strive for zero fatalities.
What is the project’s ability to reduce fatalities and injuries? Will the project address known safety concern areas, provide safe and attractive pedestrian and/or bicycle facilities, and address areas that are otherwise considered unsafe? (Combined assessment)
2. Social Equity
Project Objective Evaluation Criteria
1. Use future transportation investments to reduce or eliminate disparities between neighborhoods in access, economic benefits, safety, and health.
What impacts does the project or program have on areas with greater proportions of low income, minority, youth and/or elderly population than the city as a whole?
7 LRAPA, Lane Regional Air Protection Agency measures particulate matter (PM2.5) and ozone. Kittelson & Associates, Inc. Portland, Oregon
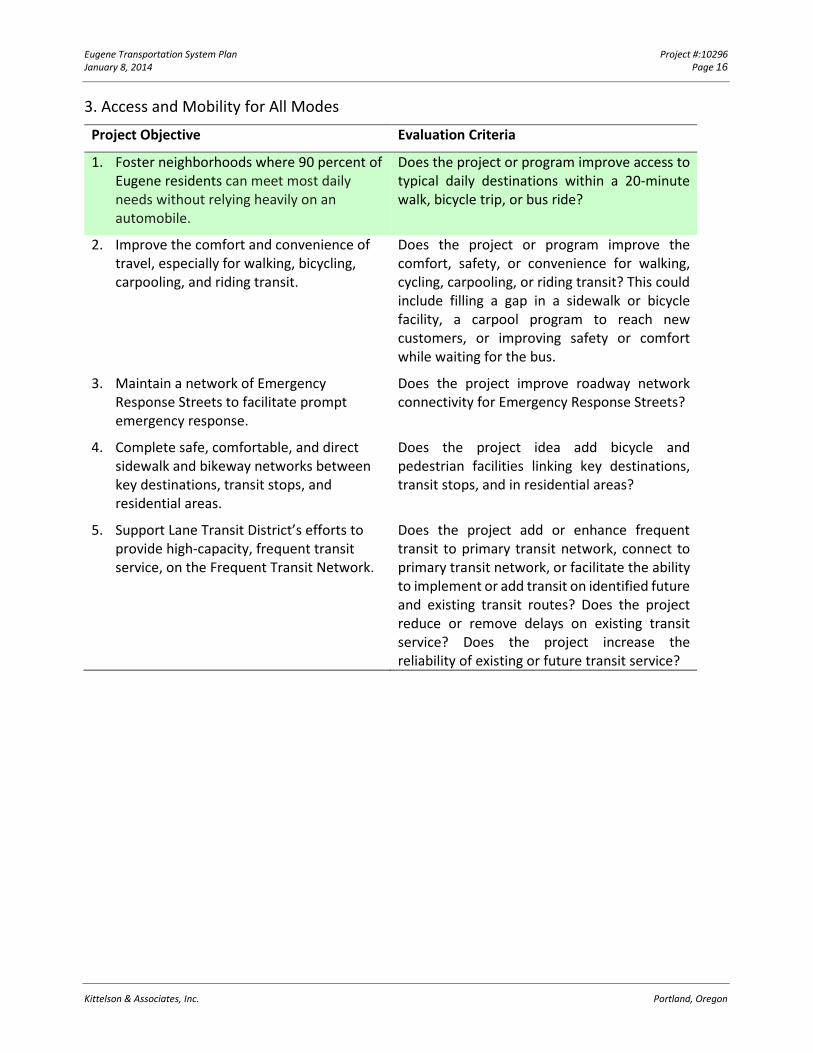
Eugene Transportation System Plan Project #:10296 January 8, 2014 Page 16
3. Access and Mobility for All Modes
Project Objective Evaluation Criteria
1. Foster neighborhoods where 90 percent of Eugene residents can meet most daily needs without relying heavily on an automobile.
Does the project or program improve access to typical daily destinations within a 20-minute walk, bicycle trip, or bus ride?
2. Improve the comfort and convenience of travel, especially for walking, bicycling, carpooling, and riding transit.
Does the project or program improve the comfort, safety, or convenience for walking, cycling, carpooling, or riding transit? This could include filling a gap in a sidewalk or bicycle facility, a carpool program to reach new customers, or improving safety or comfort while waiting for the bus.
3. Maintain a network of Emergency Response Streets to facilitate prompt emergency response.
Does the project improve roadway network connectivity for Emergency Response Streets?
4. Complete safe, comfortable, and direct sidewalk and bikeway networks between key destinations, transit stops, and residential areas.
Does the project idea add bicycle and pedestrian facilities linking key destinations, transit stops, and in residential areas?
5. Support Lane Transit District’s efforts to provide high-capacity, frequent transit service, on the Frequent Transit Network.
Does the project add or enhance frequent transit to primary transit network, connect to primary transit network, or facilitate the ability to implement or add transit on identified future and existing transit routes? Does the project reduce or remove delays on existing transit service? Does the project increase the reliability of existing or future transit service?
Kittelson & Associates, Inc. Portland, Oregon
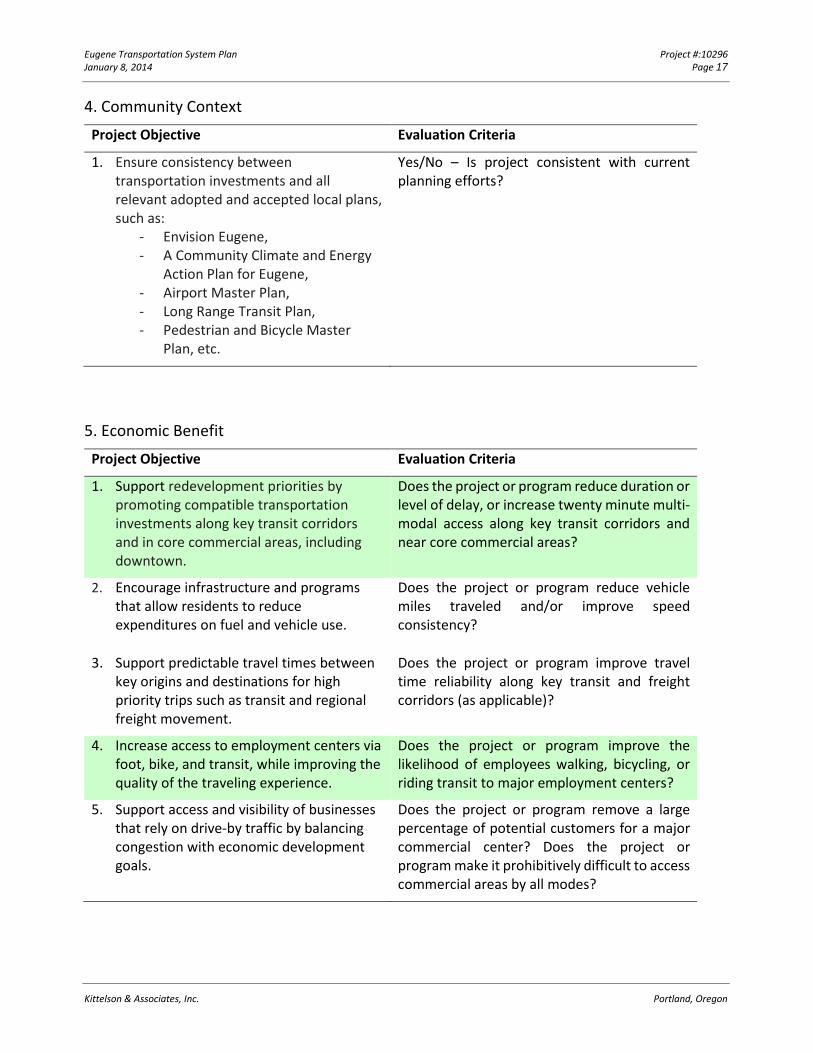
Eugene Transportation System Plan Project #:10296 January 8, 2014 Page 17
4. Community Context
Project Objective Evaluation Criteria
1. Ensure consistency between transportation investments and all relevant adopted and accepted local plans, such as:
- Envision Eugene, - A Community Climate and Energy
Action Plan for Eugene, - Airport Master Plan, - Long Range Transit Plan, - Pedestrian and Bicycle Master
Plan, etc.
Yes/No – Is project consistent with current planning efforts?
5. Economic Benefit
Project Objective Evaluation Criteria
1. Support redevelopment priorities by promoting compatible transportation investments along key transit corridors and in core commercial areas, including downtown.
Does the project or program reduce duration or level of delay, or increase twenty minute multi-modal access along key transit corridors and near core commercial areas?
2. Encourage infrastructure and programs that allow residents to reduce expenditures on fuel and vehicle use.
Does the project or program reduce vehicle miles traveled and/or improve speed consistency?
3. Support predictable travel times between key origins and destinations for high priority trips such as transit and regional freight movement.
Does the project or program improve travel time reliability along key transit and freight corridors (as applicable)?
4. Increase access to employment centers via foot, bike, and transit, while improving the quality of the traveling experience.
Does the project or program improve the likelihood of employees walking, bicycling, or riding transit to major employment centers?
5. Support access and visibility of businesses that rely on drive-by traffic by balancing congestion with economic development goals.
Does the project or program remove a large percentage of potential customers for a major commercial center? Does the project or program make it prohibitively difficult to access commercial areas by all modes?
Kittelson & Associates, Inc. Portland, Oregon
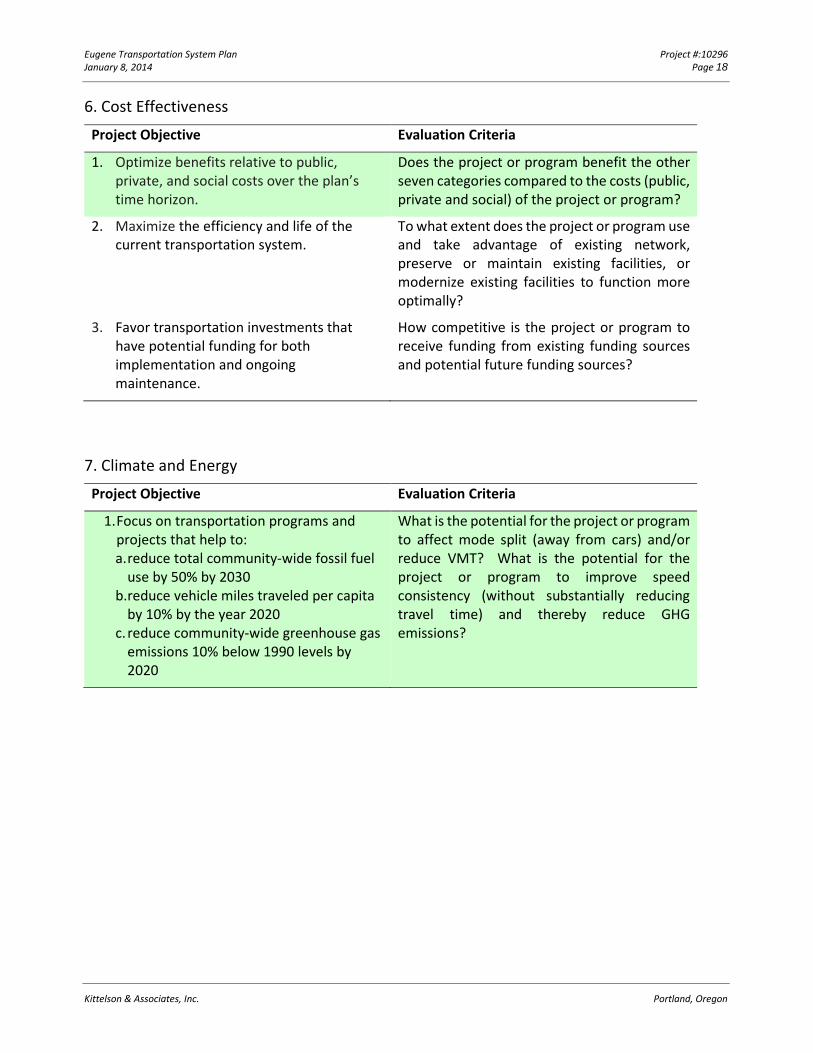
Eugene Transportation System Plan Project #:10296 January 8, 2014 Page 18
6. Cost Effectiveness
Project Objective Evaluation Criteria
1. Optimize benefits relative to public, private, and social costs over the plan’s time horizon.
Does the project or program benefit the other seven categories compared to the costs (public, private and social) of the project or program?
2. Maximize the efficiency and life of the current transportation system.
To what extent does the project or program use and take advantage of existing network, preserve or maintain existing facilities, or modernize existing facilities to function more optimally?
3. Favor transportation investments that have potential funding for both implementation and ongoing maintenance.
How competitive is the project or program to receive funding from existing funding sources and potential future funding sources?
7. Climate and Energy Project Objective Evaluation Criteria
1. Focus on transportation programs and projects that help to: a. reduce total community-wide fossil fuel
use by 50% by 2030 b.reduce vehicle miles traveled per capita
by 10% by the year 2020 c. reduce community-wide greenhouse gas
emissions 10% below 1990 levels by 2020
What is the potential for the project or program to affect mode split (away from cars) and/or reduce VMT? What is the potential for the project or program to improve speed consistency (without substantially reducing travel time) and thereby reduce GHG emissions?
Kittelson & Associates, Inc. Portland, Oregon
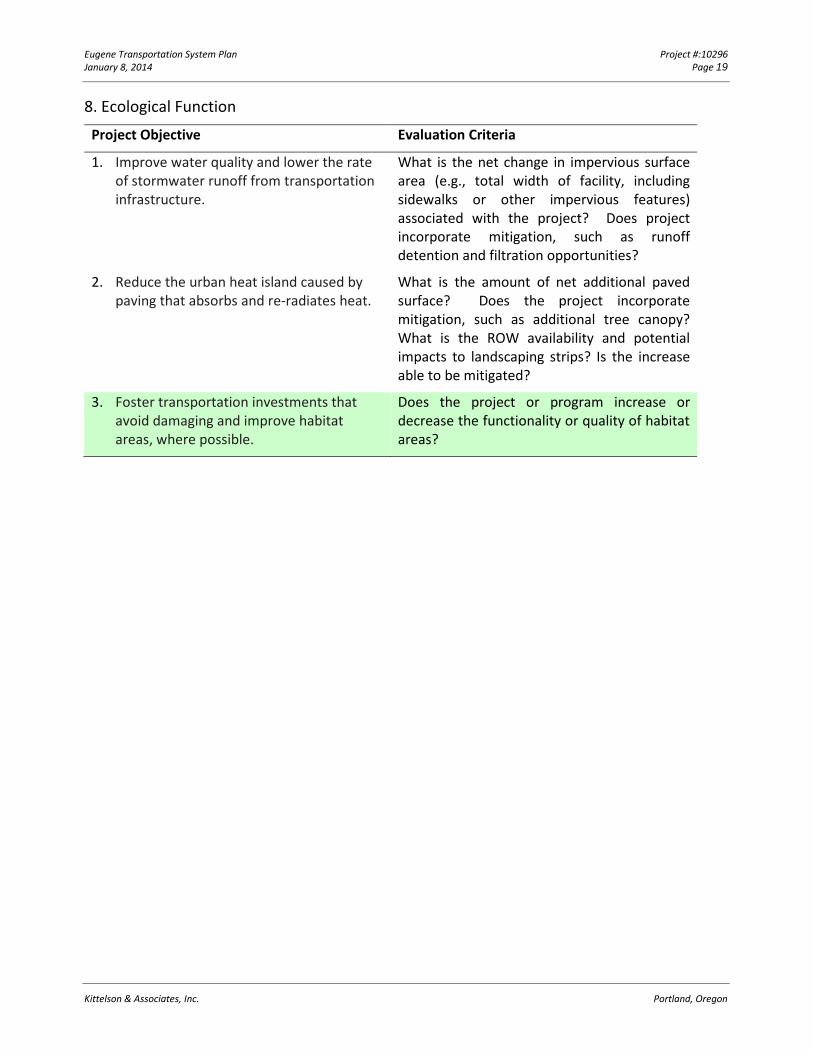
Eugene Transportation System Plan Project #:10296 January 8, 2014 Page 19
8. Ecological Function
Project Objective Evaluation Criteria
1. Improve water quality and lower the rate of stormwater runoff from transportation infrastructure.
What is the net change in impervious surface area (e.g., total width of facility, including sidewalks or other impervious features) associated with the project? Does project incorporate mitigation, such as runoff detention and filtration opportunities?
2. Reduce the urban heat island caused by paving that absorbs and re-radiates heat.
What is the amount of net additional paved surface? Does the project incorporate mitigation, such as additional tree canopy? What is the ROW availability and potential impacts to landscaping strips? Is the increase able to be mitigated?
3. Foster transportation investments that avoid damaging and improve habitat areas, where possible.
Does the project or program increase or decrease the functionality or quality of habitat areas?
Kittelson & Associates, Inc. Portland, Oregon

{00 F
Appendix E: Key Corridors Map

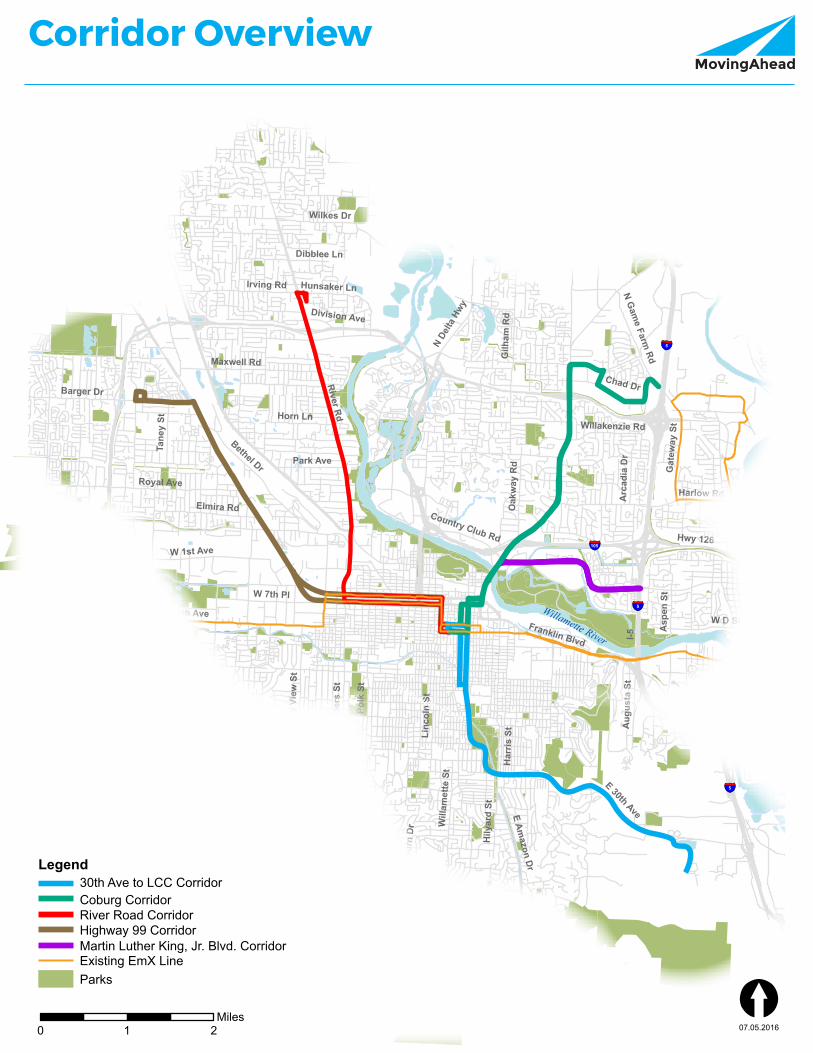
§̈¦5
§̈¦5
§̈¦5
§̈¦I-5 NB O
NRAMP
§̈¦105
I-5
Hwy 99N
River R
d
Coburg Rd
W 11th Ave
W 18th Ave
Ran
dy P
ape
Bel
tline
Hily
ard
St
5th
St
Polk
St
Will
amet
te S
t
Cha
mbe
rs S
t
Royal Ave
Irving Rd
Barger Dr
Don
ald
St
E 30th Ave
Harlow Rd
Beacon Dr
Gilh
am R
d
Bethel Dr
Hwy 126
Maxwell Rd
Har
ris S
t
Awbrey Ln
W D St
McK
enzie View D
r
Linc
oln
St
W 1st Ave
Gat
eway
St
City
Vie
w S
t
Prai
rie R
d
Chad Dr
Crest Dr
Elmira Rd
S 2nd St
Horn Ln
Wilkes Dr
E Enid Rd
Franklin Blvd
W 7th Pl
Park Ave
Oak
way
Rd
E Amazon Dr
Tane
y St
Asp
en S
t
Willakenzie Rd
Clear Lake Rd
N Gam
e Farm Rd
Division Ave
Hunsaker Ln
Arc
adia
Dr
Aug
usta
St
N De
lta H
wy
Timberline Dr
Bra
e B
urn
Dr
Country Club Rd
Dibblee Ln
I-5
McKenzie River
Willamette River
DeltaPonds
Willamette River
[
Corridor Overview
0 21Miles
Highway 99 Corridor
Legend
Coburg CorridorRiver Road Corridor
ParksExisting EmX LineMartin Luther King, Jr. Blvd. Corridor
07.05.2016
30th Ave to LCC Corridor
{00 G
Appendix F: Eugene Pedestrian and Bicycle Master Plan (2012)


The Eugene Pedestrian and Bicycle Master Plan can be found on the project website at the web address below.
https://www.eugene-or.gov/2690/Pedestrian-Bicycle-Master-Plan

{00 H
Appendix G: On the Move: Regional Transportation Options Plan (2014)


The On the Move Plan can be found on the project website at the web address below.
http://www.centrallanertsp.org/sites/default/files/AppendixH-RegionalTransportationOptionsPlan.pdf

{00 I
Appendix H: Design Standards and Guidelines for Eugene Streets, Sidewalks, Bikeways and Accessways (1999)

1
Design Standards and Guidelines For Eugene Streets,Sidewalks, Bikeways and Accessways
November 1999
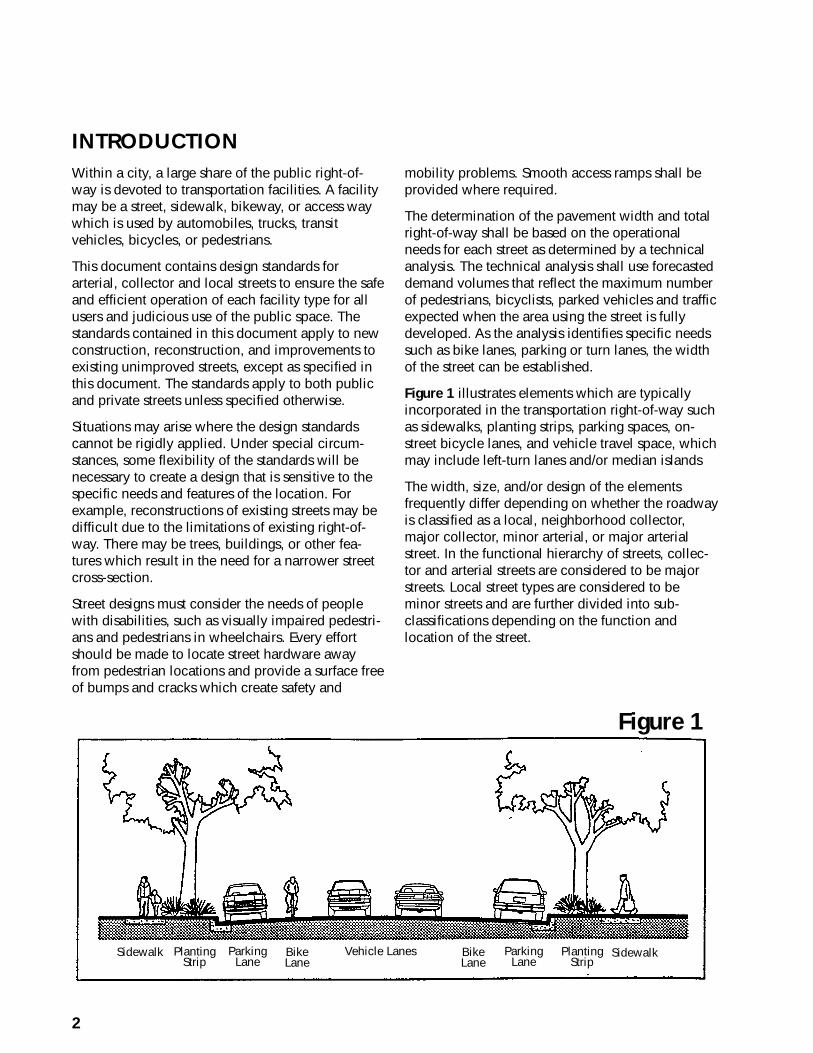
2
INTRODUCTIONWithin a city, a large share of the public right-of-way is devoted to transportation facilities. A facilitymay be a street, sidewalk, bikeway, or access waywhich is used by automobiles, trucks, transitvehicles, bicycles, or pedestrians.
This document contains design standards forarterial, collector and local streets to ensure the safeand efficient operation of each facility type for allusers and judicious use of the public space. Thestandards contained in this document apply to newconstruction, reconstruction, and improvements toexisting unimproved streets, except as specified inthis document. The standards apply to both publicand private streets unless specified otherwise.
Situations may arise where the design standardscannot be rigidly applied. Under special circum-stances, some flexibility of the standards will benecessary to create a design that is sensitive to thespecific needs and features of the location. Forexample, reconstructions of existing streets may bedifficult due to the limitations of existing right-of-way. There may be trees, buildings, or other fea-tures which result in the need for a narrower streetcross-section.
Street designs must consider the needs of peoplewith disabilities, such as visually impaired pedestri-ans and pedestrians in wheelchairs. Every effortshould be made to locate street hardware awayfrom pedestrian locations and provide a surface freeof bumps and cracks which create safety and
mobility problems. Smooth access ramps shall beprovided where required.
The determination of the pavement width and totalright-of-way shall be based on the operationalneeds for each street as determined by a technicalanalysis. The technical analysis shall use forecasteddemand volumes that reflect the maximum numberof pedestrians, bicyclists, parked vehicles and trafficexpected when the area using the street is fullydeveloped. As the analysis identifies specific needssuch as bike lanes, parking or turn lanes, the widthof the street can be established.
Figure 1 illustrates elements which are typicallyincorporated in the transportation right-of-way suchas sidewalks, planting strips, parking spaces, on-street bicycle lanes, and vehicle travel space, whichmay include left-turn lanes and/or median islands
The width, size, and/or design of the elementsfrequently differ depending on whether the roadwayis classified as a local, neighborhood collector,major collector, minor arterial, or major arterialstreet. In the functional hierarchy of streets, collec-tor and arterial streets are considered to be majorstreets. Local street types are considered to beminor streets and are further divided into sub-classifications depending on the function andlocation of the street.
Figure 1
PlantingStrip
ParkingLane
BikeLane
Vehicle LanesSidewalk BikeLane
ParkingLane
PlantingStrip
Sidewalk
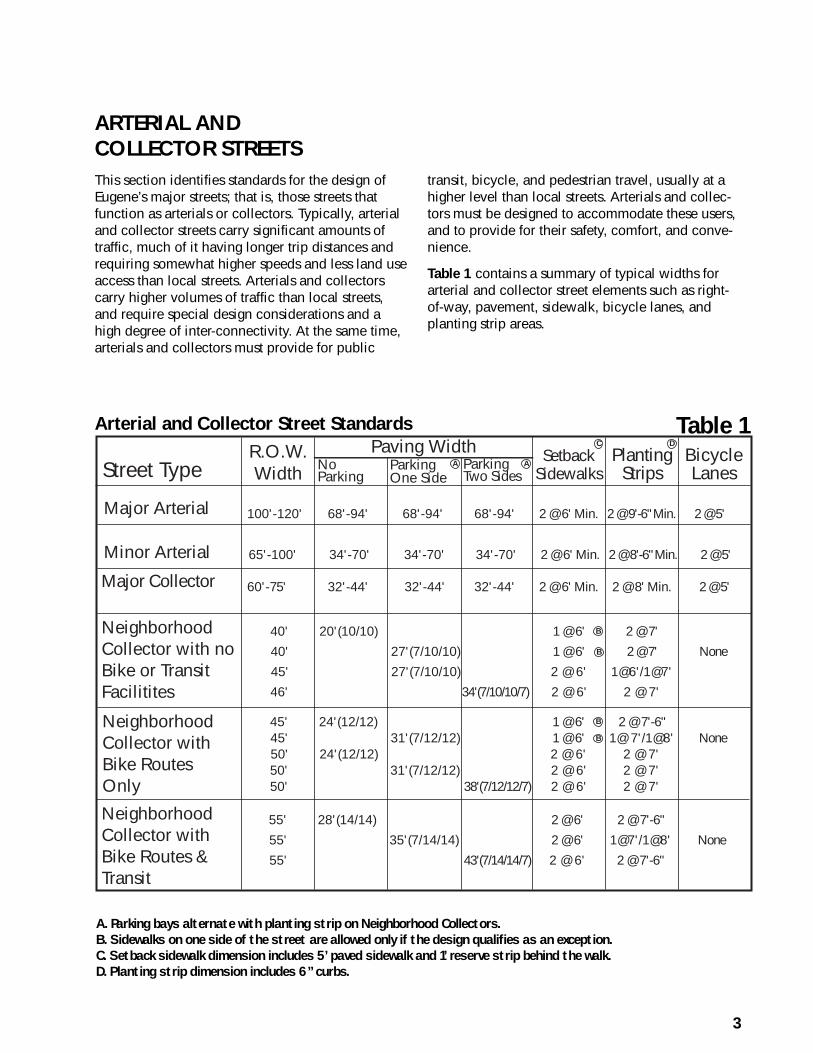
3
Street Type
Major Arterial
Minor Arterial
Major Collector
Neighborhood Collector with no Bike or Transit Facilitites
Neighborhood Collector with Bike Routes Only
Neighborhood Collector with Bike Routes & Transit
R.O.W.Width
Paving WidthNoParking
Parking One Side
Parking Two Sides
A ASetback
SidewalksPlanting
StripsBicycleLanes
C D
100'-120' 68'-94' 68'-94' 68'-94' 2 @ 6' Min. 2 @ 9'-6" Min. 2 @ 5'
65'-100' 34'-70' 34'-70' 34'-70' 2 @ 6' Min. 2 @ 8'-6" Min. 2 @ 5'
60'-75' 32'-44' 32'-44' 32'-44' 2 @ 6' Min. 2 @ 8' Min. 2 @ 5'
40' 20'(10/10) 1 @ 6' 2 @ 7'
40' 27'(7/10/10) 1 @ 6' 2 @ 7' None
45' 27'(7/10/10) 2 @ 6' 1@6'/1@7'
46' 34'(7/10/10/7) 2 @ 6' 2 @ 7'
45' 24'(12/12) 1 @ 6' 2 @ 7'-6"45' 31'(7/12/12) 1 @ 6' 1@ 7'/1@8' None50' 24'(12/12) 2 @ 6' 2 @ 7'50' 31'(7/12/12) 2 @ 6' 2 @ 7'50' 38'(7/12/12/7) 2 @ 6' 2 @ 7'
55' 28'(14/14) 2 @ 6' 2 @ 7'-6"
55' 35'(7/14/14) 2 @ 6' 1@7'/1@8' None
55' 43'(7/14/14/7) 2 @ 6' 2 @ 7'-6"
B
B
B
B
ARTERIAL ANDCOLLECTOR STREETSThis section identifies standards for the design ofEugene’s major streets; that is, those streets thatfunction as arterials or collectors. Typically, arterialand collector streets carry significant amounts oftraffic, much of it having longer trip distances andrequiring somewhat higher speeds and less land useaccess than local streets. Arterials and collectorscarry higher volumes of traffic than local streets,and require special design considerations and ahigh degree of inter-connectivity. At the same time,arterials and collectors must provide for public
transit, bicycle, and pedestrian travel, usually at ahigher level than local streets. Arterials and collec-tors must be designed to accommodate these users,and to provide for their safety, comfort, and conve-nience.
Table 1 contains a summary of typical widths forarterial and collector street elements such as right-of-way, pavement, sidewalk, bicycle lanes, andplanting strip areas.
Table 1
A. Parking bays alternate with planting strip on Neighborhood Collectors.
B. Sidewalks on one side of the street are allowed only if the design qualifies as an exception.
C. Setback sidewalk dimension includes 5’ paved sidewalk and 1’ reserve strip behind the walk.
D. Planting strip dimension includes 6” curbs.
Arterial and Collector Street Standards
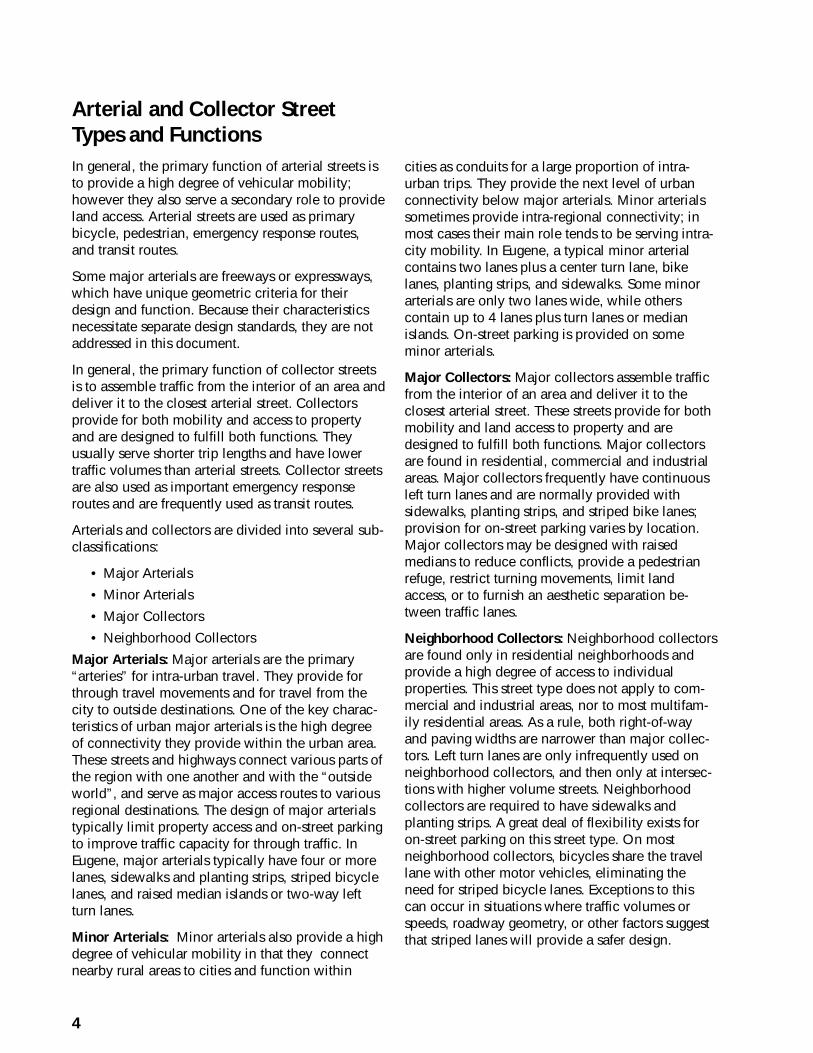
4
Arterial and Collector StreetTypes and FunctionsIn general, the primary function of arterial streets isto provide a high degree of vehicular mobility;however they also serve a secondary role to provideland access. Arterial streets are used as primarybicycle, pedestrian, emergency response routes,and transit routes.
Some major arterials are freeways or expressways,which have unique geometric criteria for theirdesign and function. Because their characteristicsnecessitate separate design standards, they are notaddressed in this document.
In general, the primary function of collector streetsis to assemble traffic from the interior of an area anddeliver it to the closest arterial street. Collectorsprovide for both mobility and access to propertyand are designed to fulfill both functions. Theyusually serve shorter trip lengths and have lowertraffic volumes than arterial streets. Collector streetsare also used as important emergency responseroutes and are frequently used as transit routes.
Arterials and collectors are divided into several sub-classifications:
• Major Arterials
• Minor Arterials
• Major Collectors
• Neighborhood Collectors
Major Arterials: Major arterials are the primary“arteries” for intra-urban travel. They provide forthrough travel movements and for travel from thecity to outside destinations. One of the key charac-teristics of urban major arterials is the high degreeof connectivity they provide within the urban area.These streets and highways connect various parts ofthe region with one another and with the “outsideworld”, and serve as major access routes to variousregional destinations. The design of major arterialstypically limit property access and on-street parkingto improve traffic capacity for through traffic. InEugene, major arterials typically have four or morelanes, sidewalks and planting strips, striped bicyclelanes, and raised median islands or two-way leftturn lanes.
Minor Arterials: Minor arterials also provide a highdegree of vehicular mobility in that they connectnearby rural areas to cities and function within
cities as conduits for a large proportion of intra-urban trips. They provide the next level of urbanconnectivity below major arterials. Minor arterialssometimes provide intra-regional connectivity; inmost cases their main role tends to be serving intra-city mobility. In Eugene, a typical minor arterialcontains two lanes plus a center turn lane, bikelanes, planting strips, and sidewalks. Some minorarterials are only two lanes wide, while otherscontain up to 4 lanes plus turn lanes or medianislands. On-street parking is provided on someminor arterials.
Major Collectors: Major collectors assemble trafficfrom the interior of an area and deliver it to theclosest arterial street. These streets provide for bothmobility and land access to property and aredesigned to fulfill both functions. Major collectorsare found in residential, commercial and industrialareas. Major collectors frequently have continuousleft turn lanes and are normally provided withsidewalks, planting strips, and striped bike lanes;provision for on-street parking varies by location.Major collectors may be designed with raisedmedians to reduce conflicts, provide a pedestrianrefuge, restrict turning movements, limit landaccess, or to furnish an aesthetic separation be-tween traffic lanes.
Neighborhood Collectors: Neighborhood collectorsare found only in residential neighborhoods andprovide a high degree of access to individualproperties. This street type does not apply to com-mercial and industrial areas, nor to most multifam-ily residential areas. As a rule, both right-of-wayand paving widths are narrower than major collec-tors. Left turn lanes are only infrequently used onneighborhood collectors, and then only at intersec-tions with higher volume streets. Neighborhoodcollectors are required to have sidewalks andplanting strips. A great deal of flexibility exists foron-street parking on this street type. On mostneighborhood collectors, bicycles share the travellane with other motor vehicles, eliminating theneed for striped bicycle lanes. Exceptions to thiscan occur in situations where traffic volumes orspeeds, roadway geometry, or other factors suggestthat striped lanes will provide a safer design.
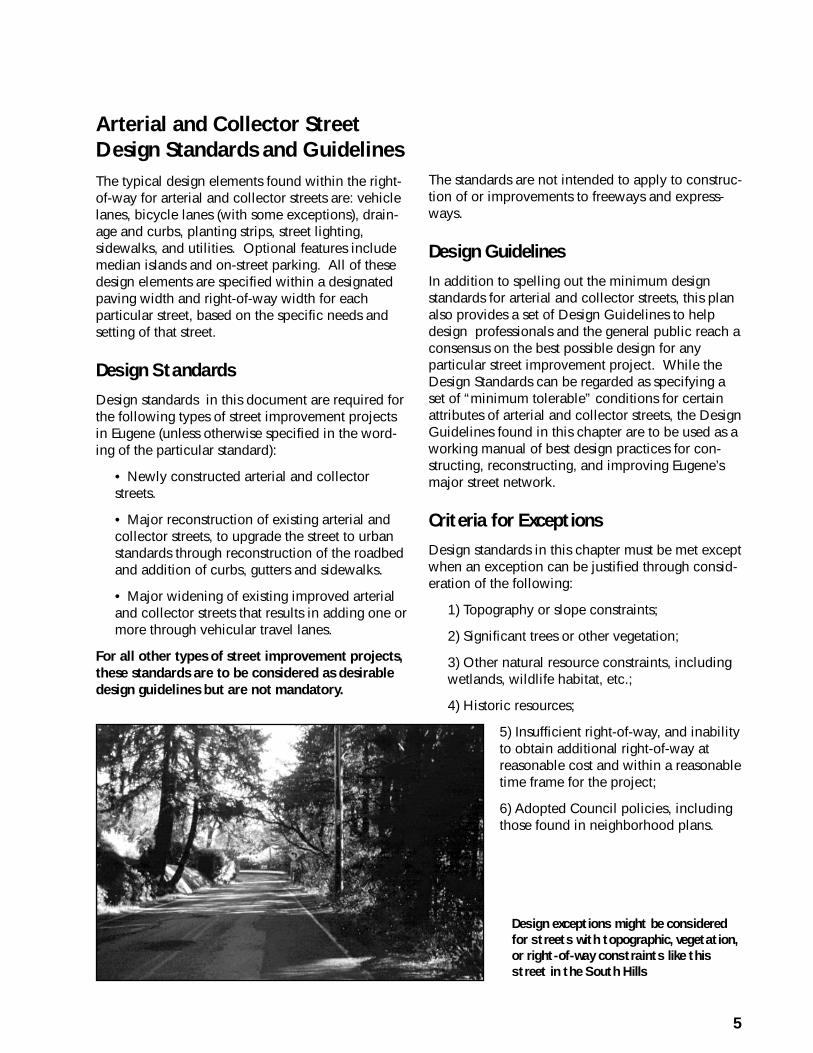
5
Arterial and Collector StreetDesign Standards and GuidelinesThe typical design elements found within the right-of-way for arterial and collector streets are: vehiclelanes, bicycle lanes (with some exceptions), drain-age and curbs, planting strips, street lighting,sidewalks, and utilities. Optional features includemedian islands and on-street parking. All of thesedesign elements are specified within a designatedpaving width and right-of-way width for eachparticular street, based on the specific needs andsetting of that street.
Design Standards
Design standards in this document are required forthe following types of street improvement projectsin Eugene (unless otherwise specified in the word-ing of the particular standard):
• Newly constructed arterial and collectorstreets.
• Major reconstruction of existing arterial andcollector streets, to upgrade the street to urbanstandards through reconstruction of the roadbedand addition of curbs, gutters and sidewalks.
• Major widening of existing improved arterialand collector streets that results in adding one ormore through vehicular travel lanes.
For all other types of street improvement projects,these standards are to be considered as desirabledesign guidelines but are not mandatory.
The standards are not intended to apply to construc-tion of or improvements to freeways and express-ways.
Design Guidelines
In addition to spelling out the minimum designstandards for arterial and collector streets, this planalso provides a set of Design Guidelines to helpdesign professionals and the general public reach aconsensus on the best possible design for anyparticular street improvement project. While theDesign Standards can be regarded as specifying aset of “minimum tolerable” conditions for certainattributes of arterial and collector streets, the DesignGuidelines found in this chapter are to be used as aworking manual of best design practices for con-structing, reconstructing, and improving Eugene’smajor street network.
Criteria for Exceptions
Design standards in this chapter must be met exceptwhen an exception can be justified through consid-eration of the following:
1) Topography or slope constraints;
2) Significant trees or other vegetation;
3) Other natural resource constraints, includingwetlands, wildlife habitat, etc.;
4) Historic resources;
5) Insufficient right-of-way, and inabilityto obtain additional right-of-way atreasonable cost and within a reasonabletime frame for the project;
6) Adopted Council policies, includingthose found in neighborhood plans.
Design exceptions might be considered
for streets with topographic, vegetation,
or right-of-way constraints like this
street in the South Hills
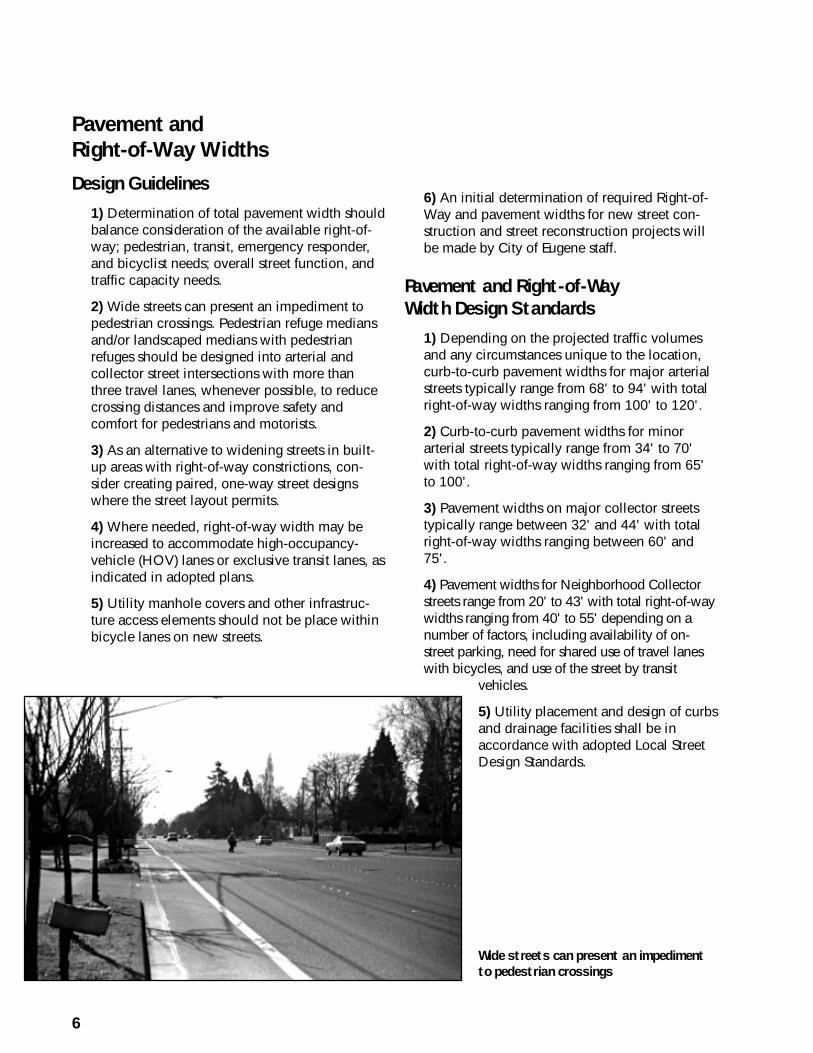
6
Wide streets can present an impediment
to pedestrian crossings
Pavement andRight-of-Way Widths
Design Guidelines
1) Determination of total pavement width shouldbalance consideration of the available right-of-way; pedestrian, transit, emergency responder,and bicyclist needs; overall street function, andtraffic capacity needs.
2) Wide streets can present an impediment topedestrian crossings. Pedestrian refuge mediansand/or landscaped medians with pedestrianrefuges should be designed into arterial andcollector street intersections with more thanthree travel lanes, whenever possible, to reducecrossing distances and improve safety andcomfort for pedestrians and motorists.
3) As an alternative to widening streets in built-up areas with right-of-way constrictions, con-sider creating paired, one-way street designswhere the street layout permits.
4) Where needed, right-of-way width may beincreased to accommodate high-occupancy-vehicle (HOV) lanes or exclusive transit lanes, asindicated in adopted plans.
5) Utility manhole covers and other infrastruc-ture access elements should not be place withinbicycle lanes on new streets.
6) An initial determination of required Right-of-Way and pavement widths for new street con-struction and street reconstruction projects willbe made by City of Eugene staff.
Pavement and Right-of-Way
Width Design Standards
1) Depending on the projected traffic volumesand any circumstances unique to the location,curb-to-curb pavement widths for major arterialstreets typically range from 68' to 94' with totalright-of-way widths ranging from 100' to 120'.
2) Curb-to-curb pavement widths for minorarterial streets typically range from 34' to 70'with total right-of-way widths ranging from 65'to 100'.
3) Pavement widths on major collector streetstypically range between 32' and 44' with totalright-of-way widths ranging between 60' and75'.
4) Pavement widths for Neighborhood Collectorstreets range from 20' to 43' with total right-of-waywidths ranging from 40' to 55' depending on anumber of factors, including availability of on-street parking, need for shared use of travel laneswith bicycles, and use of the street by transit
vehicles.
5) Utility placement and design of curbsand drainage facilities shall be inaccordance with adopted Local StreetDesign Standards.
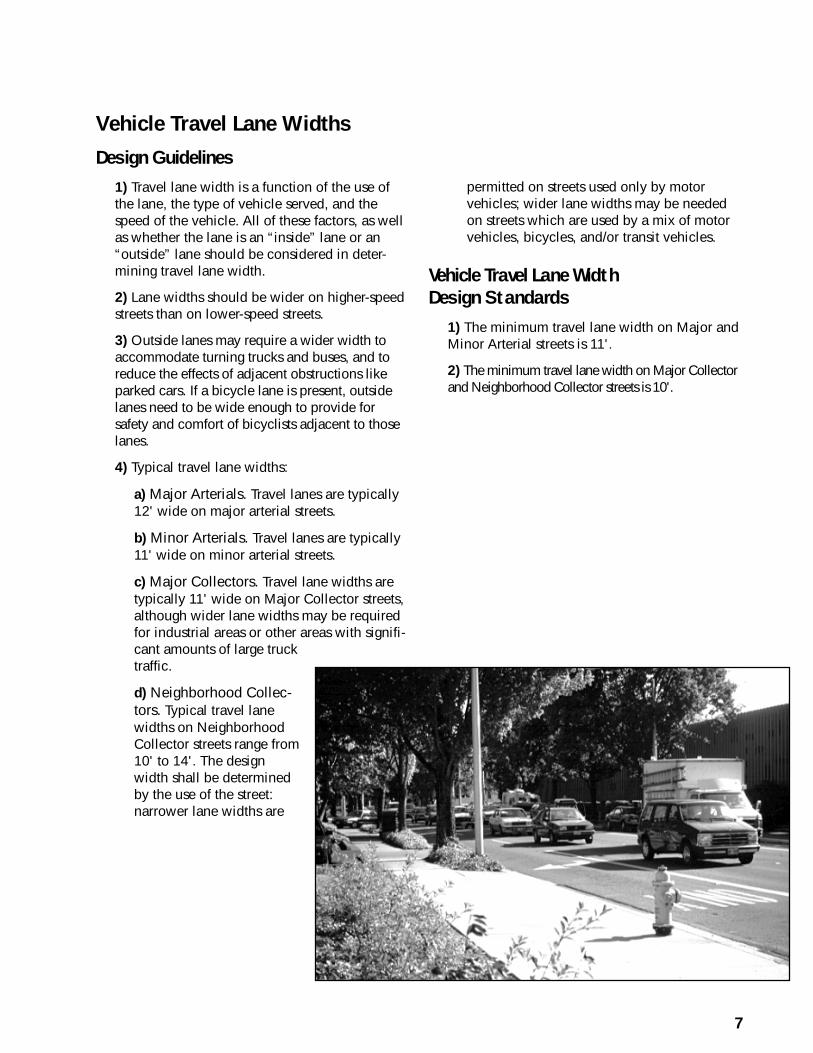
7
permitted on streets used only by motorvehicles; wider lane widths may be neededon streets which are used by a mix of motorvehicles, bicycles, and/or transit vehicles.
Vehicle Travel Lane Width
Design Standards
1) The minimum travel lane width on Major andMinor Arterial streets is 11'.
2) The minimum travel lane width on Major Collectorand Neighborhood Collector streets is 10'.
Vehicle Travel Lane Widths
Design Guidelines
1) Travel lane width is a function of the use ofthe lane, the type of vehicle served, and thespeed of the vehicle. All of these factors, as wellas whether the lane is an “inside” lane or an“outside” lane should be considered in deter-mining travel lane width.
2) Lane widths should be wider on higher-speedstreets than on lower-speed streets.
3) Outside lanes may require a wider width toaccommodate turning trucks and buses, and toreduce the effects of adjacent obstructions likeparked cars. If a bicycle lane is present, outsidelanes need to be wide enough to provide forsafety and comfort of bicyclists adjacent to thoselanes.
4) Typical travel lane widths:
a) Major Arterials. Travel lanes are typically12' wide on major arterial streets.
b) Minor Arterials. Travel lanes are typically11' wide on minor arterial streets.
c) Major Collectors. Travel lane widths aretypically 11' wide on Major Collector streets,although wider lane widths may be requiredfor industrial areas or other areas with signifi-cant amounts of large trucktraffic.
d) Neighborhood Collec-tors. Typical travel lanewidths on NeighborhoodCollector streets range from10' to 14'. The designwidth shall be determinedby the use of the street:narrower lane widths are
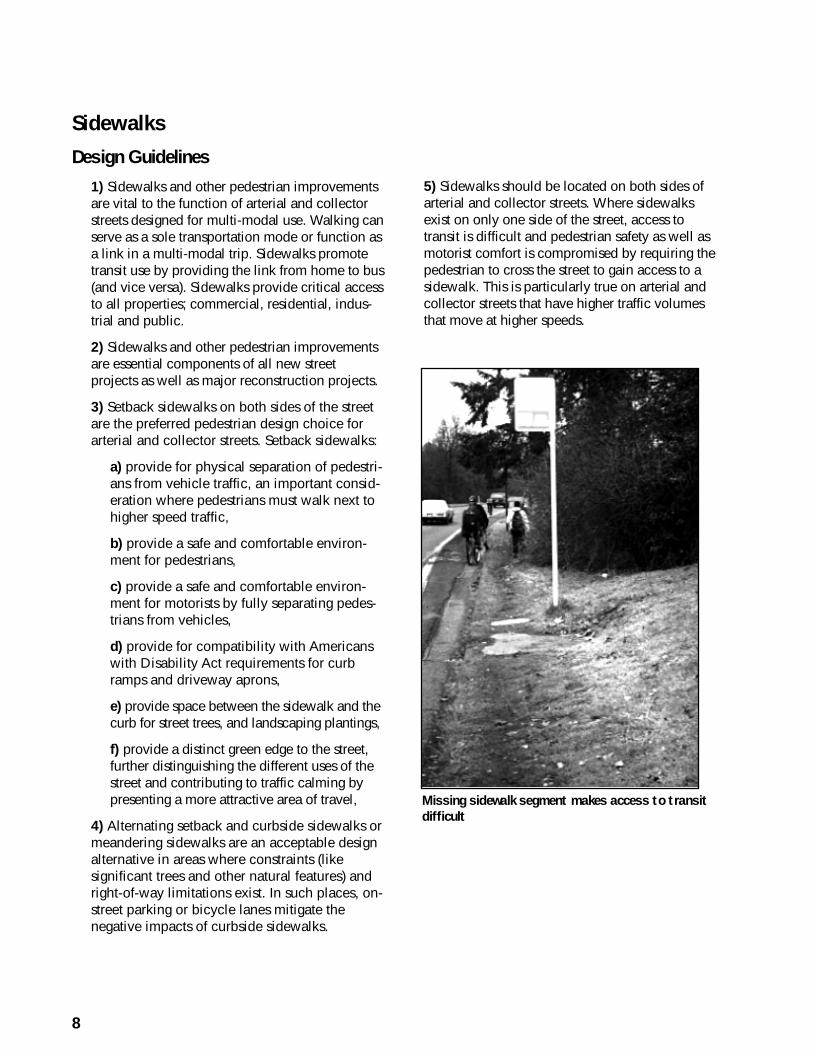
8
Sidewalks
Design Guidelines
1) Sidewalks and other pedestrian improvementsare vital to the function of arterial and collectorstreets designed for multi-modal use. Walking canserve as a sole transportation mode or function asa link in a multi-modal trip. Sidewalks promotetransit use by providing the link from home to bus(and vice versa). Sidewalks provide critical accessto all properties; commercial, residential, indus-trial and public.
2) Sidewalks and other pedestrian improvementsare essential components of all new streetprojects as well as major reconstruction projects.
3) Setback sidewalks on both sides of the streetare the preferred pedestrian design choice forarterial and collector streets. Setback sidewalks:
a) provide for physical separation of pedestri-ans from vehicle traffic, an important consid-eration where pedestrians must walk next tohigher speed traffic,
b) provide a safe and comfortable environ-ment for pedestrians,
c) provide a safe and comfortable environ-ment for motorists by fully separating pedes-trians from vehicles,
d) provide for compatibility with Americanswith Disability Act requirements for curbramps and driveway aprons,
e) provide space between the sidewalk and thecurb for street trees, and landscaping plantings,
f) provide a distinct green edge to the street,further distinguishing the different uses of thestreet and contributing to traffic calming bypresenting a more attractive area of travel,
4) Alternating setback and curbside sidewalks ormeandering sidewalks are an acceptable designalternative in areas where constraints (likesignificant trees and other natural features) andright-of-way limitations exist. In such places, on-street parking or bicycle lanes mitigate thenegative impacts of curbside sidewalks.
5) Sidewalks should be located on both sides ofarterial and collector streets. Where sidewalksexist on only one side of the street, access totransit is difficult and pedestrian safety as well asmotorist comfort is compromised by requiring thepedestrian to cross the street to gain access to asidewalk. This is particularly true on arterial andcollector streets that have higher traffic volumesthat move at higher speeds.
Missing sidewalk segment makes access to transit
difficult
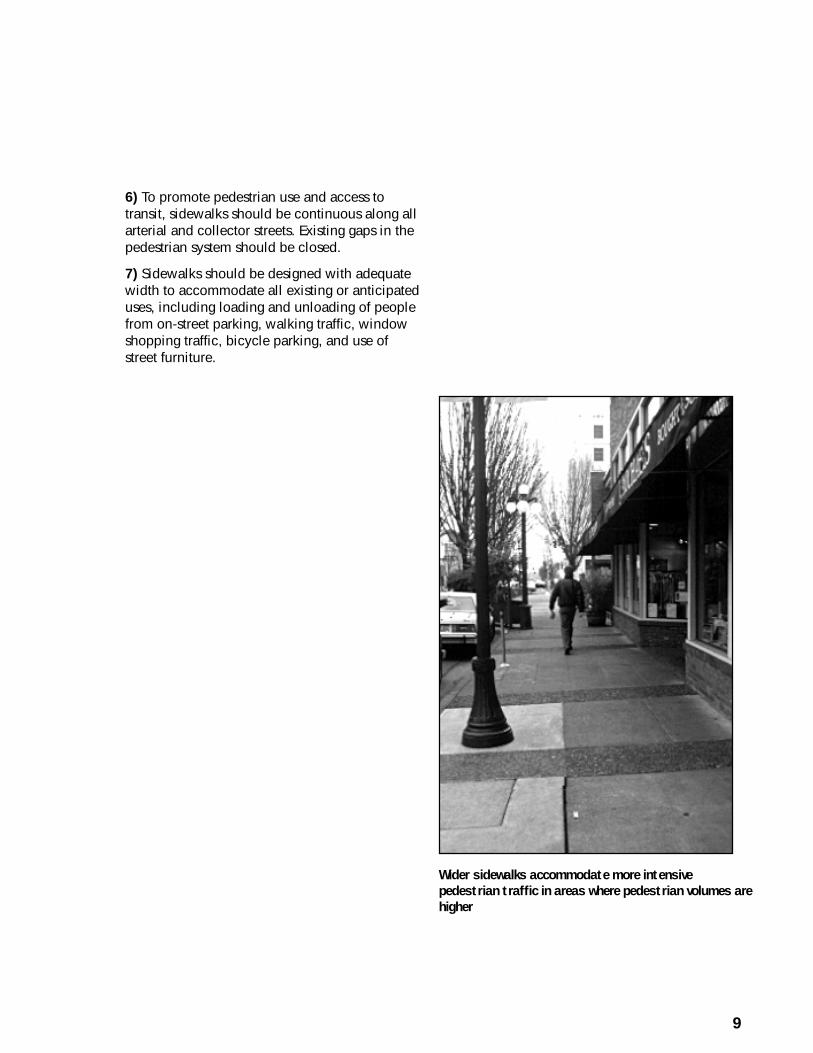
9
6) To promote pedestrian use and access totransit, sidewalks should be continuous along allarterial and collector streets. Existing gaps in thepedestrian system should be closed.
7) Sidewalks should be designed with adequatewidth to accommodate all existing or anticipateduses, including loading and unloading of peoplefrom on-street parking, walking traffic, windowshopping traffic, bicycle parking, and use ofstreet furniture.
Wider sidewalks accommodate more intensive
pedestrian traffic in areas where pedestrian volumes are
higher
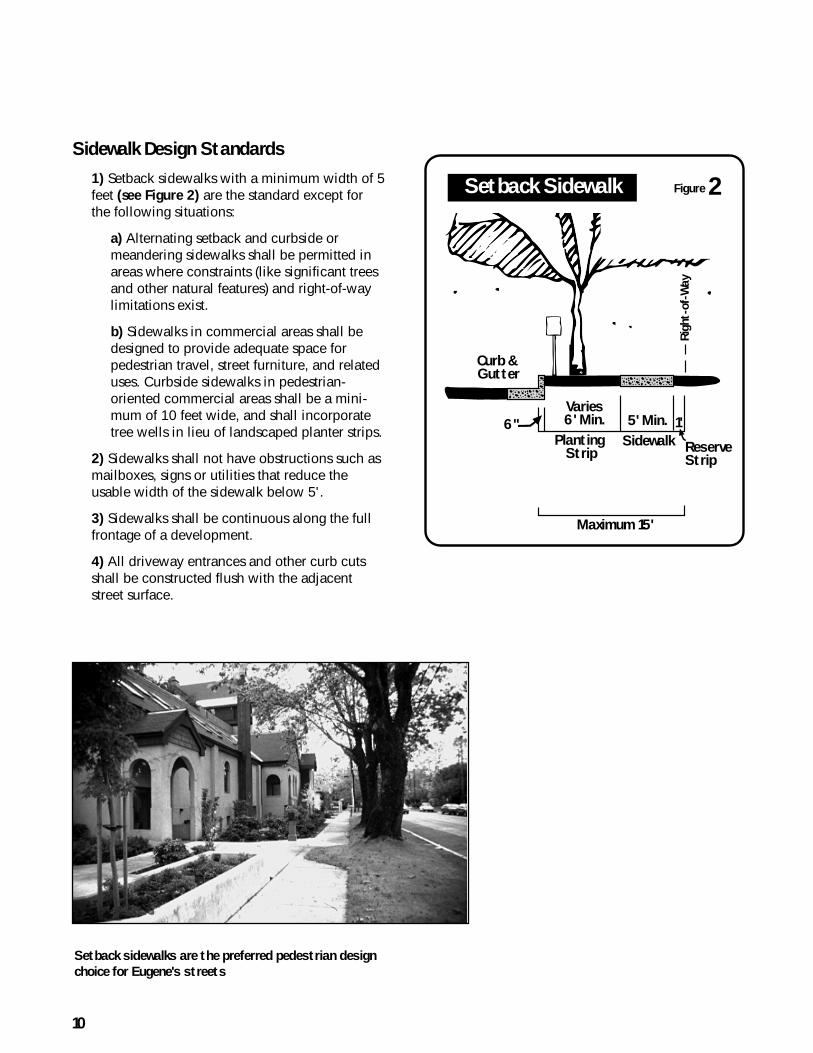
10
Sidewalk Design Standards
1) Setback sidewalks with a minimum width of 5feet (see Figure 2) are the standard except forthe following situations:
a) Alternating setback and curbside ormeandering sidewalks shall be permitted inareas where constraints (like significant treesand other natural features) and right-of-waylimitations exist.
b) Sidewalks in commercial areas shall bedesigned to provide adequate space forpedestrian travel, street furniture, and relateduses. Curbside sidewalks in pedestrian-oriented commercial areas shall be a mini-mum of 10 feet wide, and shall incorporatetree wells in lieu of landscaped planter strips.
2) Sidewalks shall not have obstructions such asmailboxes, signs or utilities that reduce theusable width of the sidewalk below 5'.
3) Sidewalks shall be continuous along the fullfrontage of a development.
4) All driveway entrances and other curb cutsshall be constructed flush with the adjacentstreet surface.
Setback sidewalks are the preferred pedestrian design
choice for Eugene's streets
Curb & Gutter
Setback Sidewalk
Rig
ht-
of-
Wa
y
Maximum 15'
Sidewalk
5' Min. 1'
Planting Strip
Varies6' Min.6"
ReserveStrip
Figure 2
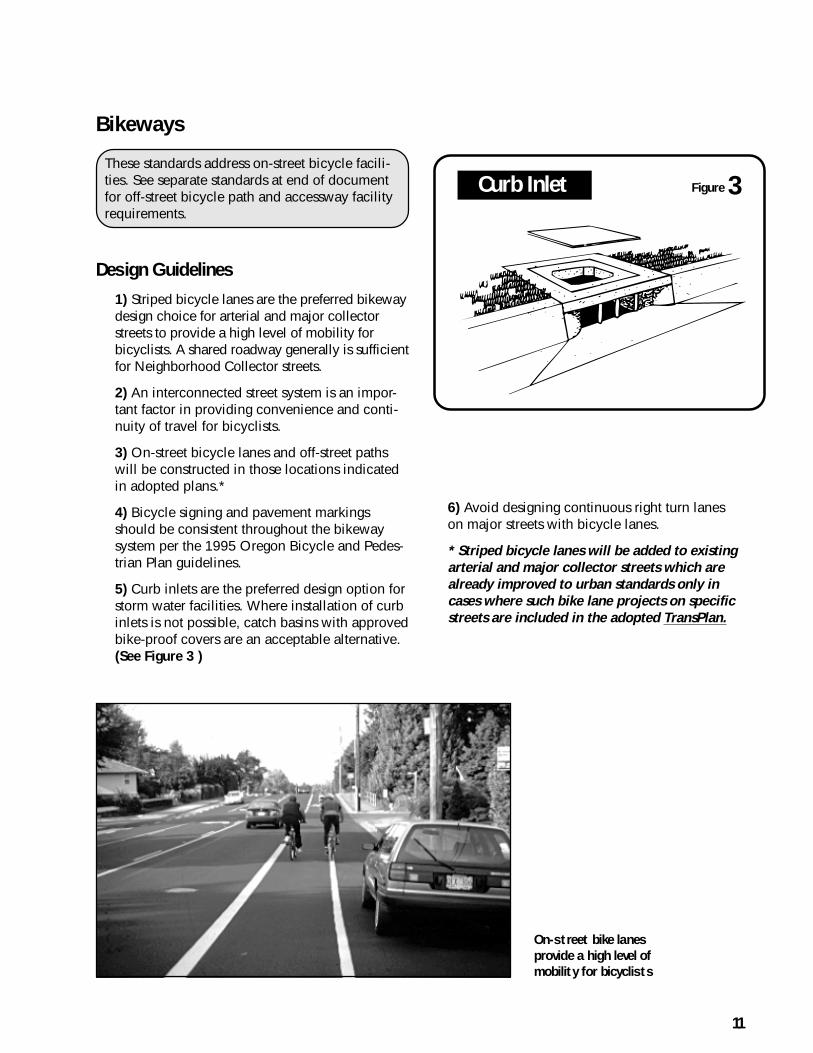
11
Bikeways
Design Guidelines
1) Striped bicycle lanes are the preferred bikewaydesign choice for arterial and major collectorstreets to provide a high level of mobility forbicyclists. A shared roadway generally is sufficientfor Neighborhood Collector streets.
2) An interconnected street system is an impor-tant factor in providing convenience and conti-nuity of travel for bicyclists.
3) On-street bicycle lanes and off-street pathswill be constructed in those locations indicatedin adopted plans.*
4) Bicycle signing and pavement markingsshould be consistent throughout the bikewaysystem per the 1995 Oregon Bicycle and Pedes-trian Plan guidelines.
5) Curb inlets are the preferred design option forstorm water facilities. Where installation of curbinlets is not possible, catch basins with approvedbike-proof covers are an acceptable alternative.(See Figure 3 )
On-street bike lanes
provide a high level of
mobility for bicyclists
These standards address on-street bicycle facili-ties. See separate standards at end of documentfor off-street bicycle path and accessway facilityrequirements.
6) Avoid designing continuous right turn laneson major streets with bicycle lanes.
* Striped bicycle lanes will be added to existingarterial and major collector streets which arealready improved to urban standards only incases where such bike lane projects on specificstreets are included in the adopted TransPlan.
Figure 3Curb Inlet
12
Bicycle Lane Design Standards
1) Striped bicycle lanes are required on Majorand Minor Arterial streets and Major Collectorstreets when those streets are newly constructed,are constructed to urban standards, or arewidened for major vehicular capacity increases.*(These situations are defined elsewhere in thisdocument as Major Projects, and are consideredprojects which may be initiated by the City ifthey have been included in the adoptedTransPlan.)
2) Bicycle lanes shall be a minimum of 5’ wideand shall be free from obstacles such as drainagegrates and utility covers.
* On Neighborhood Collector streets, bicyclesgenerally share the travel lane with motorvehicles, therefore, striped bicycle lanes are notusually required on these streets. Exceptions tothis standard may occur on particular Neigh-borhood Collector streets, if specified in city-adopted plans or policies.
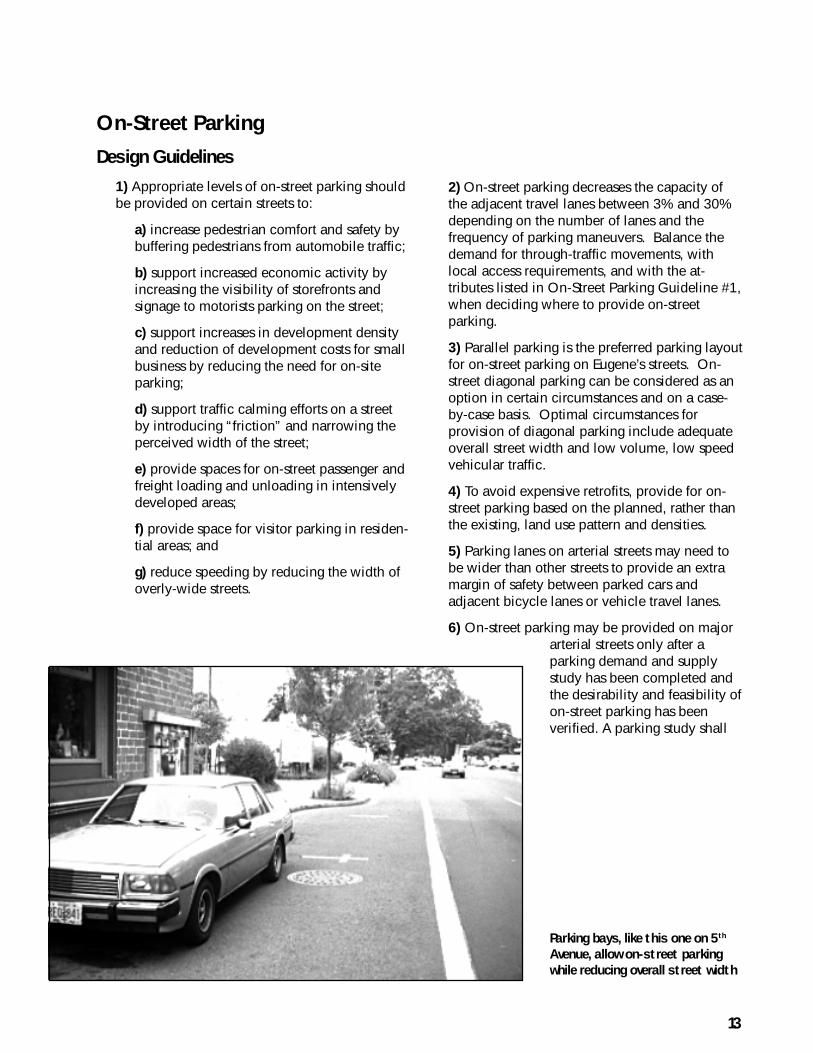
13
On-Street Parking
Design Guidelines
1) Appropriate levels of on-street parking shouldbe provided on certain streets to:
a) increase pedestrian comfort and safety bybuffering pedestrians from automobile traffic;
b) support increased economic activity byincreasing the visibility of storefronts andsignage to motorists parking on the street;
c) support increases in development densityand reduction of development costs for smallbusiness by reducing the need for on-siteparking;
d) support traffic calming efforts on a streetby introducing “friction” and narrowing theperceived width of the street;
e) provide spaces for on-street passenger andfreight loading and unloading in intensivelydeveloped areas;
f) provide space for visitor parking in residen-tial areas; and
g) reduce speeding by reducing the width ofoverly-wide streets.
2) On-street parking decreases the capacity ofthe adjacent travel lanes between 3% and 30%depending on the number of lanes and thefrequency of parking maneuvers. Balance thedemand for through-traffic movements, withlocal access requirements, and with the at-tributes listed in On-Street Parking Guideline #1,when deciding where to provide on-streetparking.
3) Parallel parking is the preferred parking layoutfor on-street parking on Eugene’s streets. On-street diagonal parking can be considered as anoption in certain circumstances and on a case-by-case basis. Optimal circumstances forprovision of diagonal parking include adequateoverall street width and low volume, low speedvehicular traffic.
4) To avoid expensive retrofits, provide for on-street parking based on the planned, rather thanthe existing, land use pattern and densities.
5) Parking lanes on arterial streets may need tobe wider than other streets to provide an extramargin of safety between parked cars andadjacent bicycle lanes or vehicle travel lanes.
6) On-street parking may be provided on majorarterial streets only after aparking demand and supplystudy has been completed andthe desirability and feasibility ofon-street parking has beenverified. A parking study shall
Parking bays, like this one on 5th
Avenue, allow on-street parking
while reducing overall street width
14
consider, among other factors, the nature ofadjacent land uses, the degree to which thestreet is nearing design capacity, and the pres-ence of bicycle lanes on the street.
7) As a general rule, parking lanes should bemarked at 7' to encourage motorists to parkcloser to the curb.
8) When parking is permitted on arterial orcollector streets, it may be provided in parkingbays which are interspersed with curb exten-sions and planting strips. The parking areas shallalternate with the planting strip areas as shownin Figure 4.
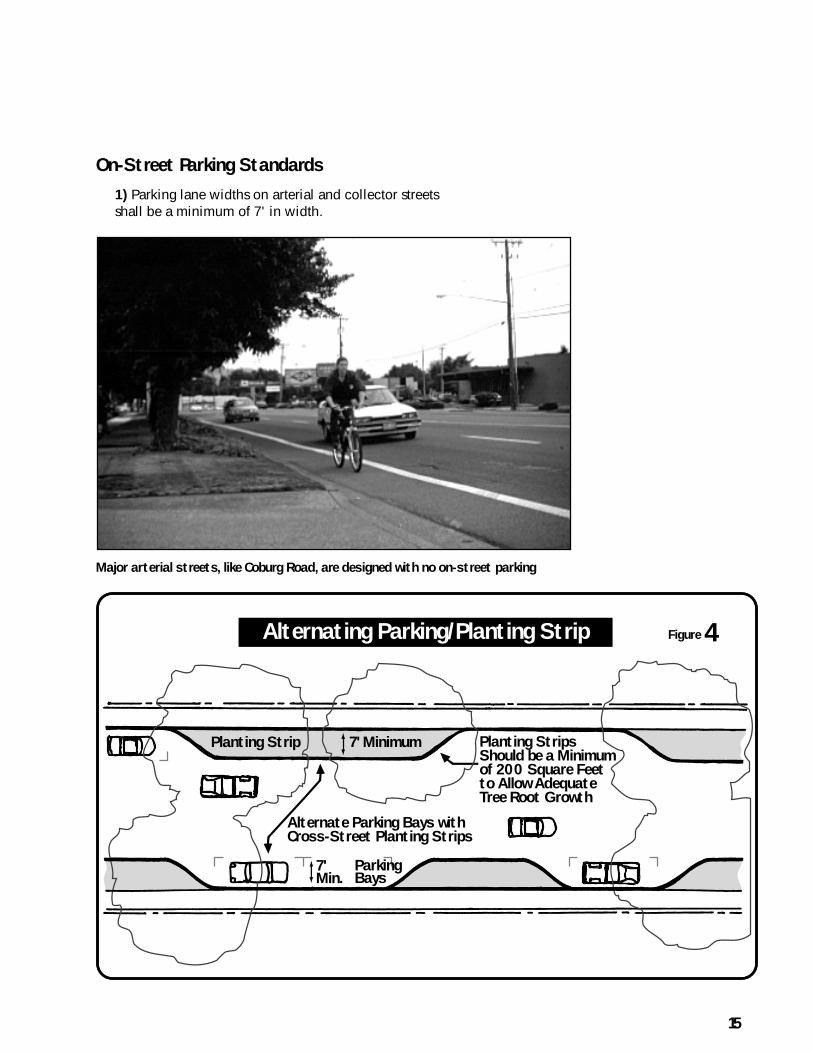
15
On-Street Parking Standards
1) Parking lane widths on arterial and collector streetsshall be a minimum of 7' in width.
Major arterial streets, like Coburg Road, are designed with no on-street parking
Alternating Parking/Planting Strip
Planting Strip 7' Minimum
Alternate Parking Bays with Cross-Street Planting Strips
Planting Strips Should be a Minimum of 200 Square Feet to Allow Adequate Tree Root Growth
7' Min.
ParkingBays
Figure 4
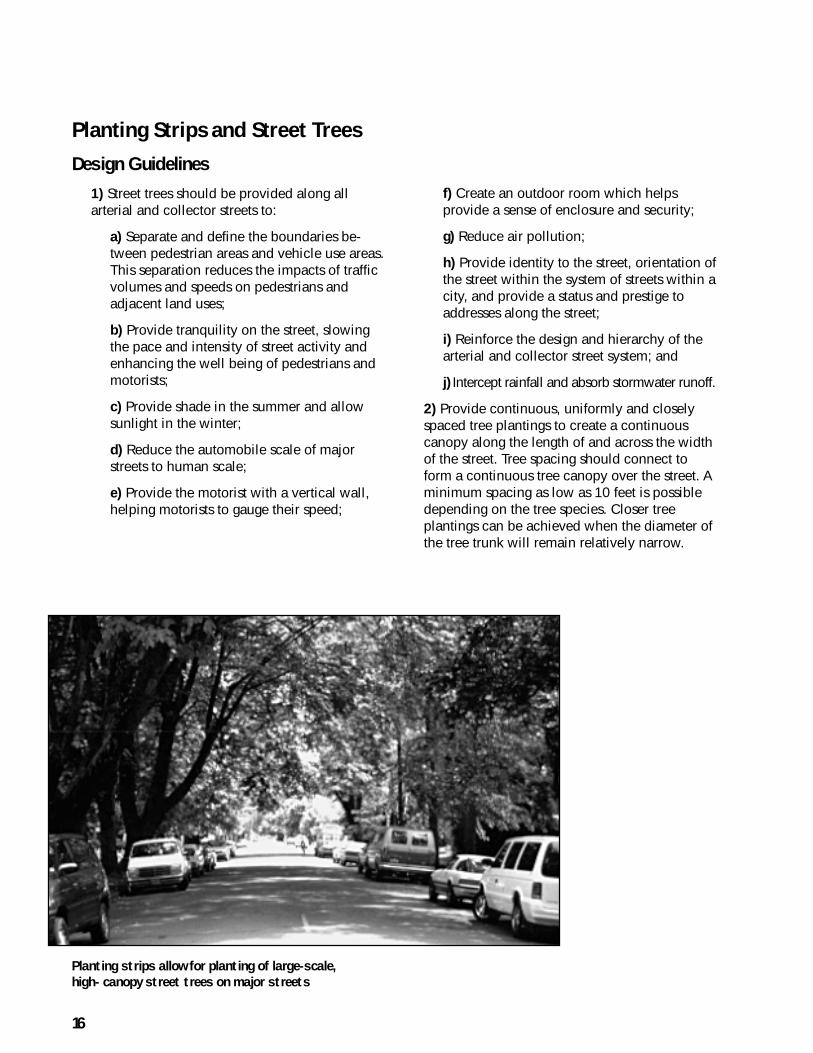
16
Planting Strips and Street Trees
Design Guidelines
1) Street trees should be provided along allarterial and collector streets to:
a) Separate and define the boundaries be-tween pedestrian areas and vehicle use areas.This separation reduces the impacts of trafficvolumes and speeds on pedestrians andadjacent land uses;
b) Provide tranquility on the street, slowingthe pace and intensity of street activity andenhancing the well being of pedestrians andmotorists;
c) Provide shade in the summer and allowsunlight in the winter;
d) Reduce the automobile scale of majorstreets to human scale;
e) Provide the motorist with a vertical wall,helping motorists to gauge their speed;
f) Create an outdoor room which helpsprovide a sense of enclosure and security;
g) Reduce air pollution;
h) Provide identity to the street, orientation ofthe street within the system of streets within acity, and provide a status and prestige toaddresses along the street;
i) Reinforce the design and hierarchy of thearterial and collector street system; and
j) Intercept rainfall and absorb stormwater runoff.
2) Provide continuous, uniformly and closelyspaced tree plantings to create a continuouscanopy along the length of and across the widthof the street. Tree spacing should connect toform a continuous tree canopy over the street. Aminimum spacing as low as 10 feet is possibledepending on the tree species. Closer treeplantings can be achieved when the diameter ofthe tree trunk will remain relatively narrow.
Planting strips allow for planting of large-scale,
high- canopy street trees on major streets
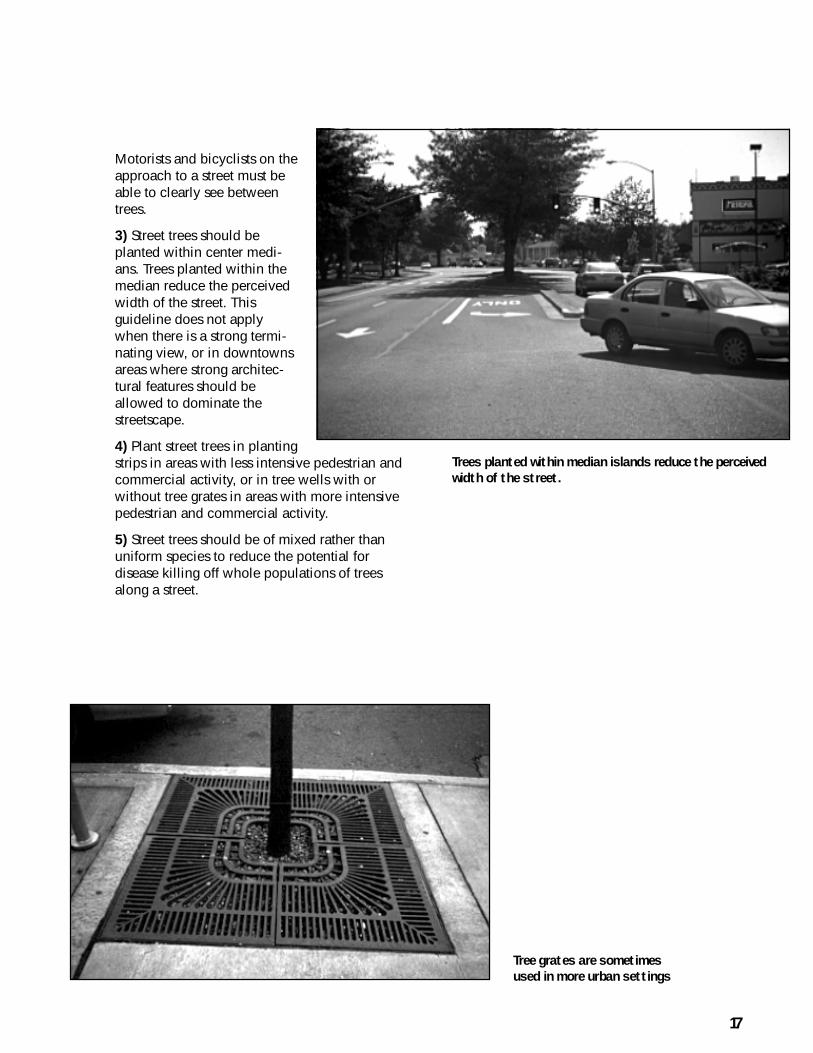
17
Motorists and bicyclists on theapproach to a street must beable to clearly see betweentrees.
3) Street trees should beplanted within center medi-ans. Trees planted within themedian reduce the perceivedwidth of the street. Thisguideline does not applywhen there is a strong termi-nating view, or in downtownsareas where strong architec-tural features should beallowed to dominate thestreetscape.
4) Plant street trees in plantingstrips in areas with less intensive pedestrian andcommercial activity, or in tree wells with orwithout tree grates in areas with more intensivepedestrian and commercial activity.
5) Street trees should be of mixed rather thanuniform species to reduce the potential fordisease killing off whole populations of treesalong a street.
Trees planted within median islands reduce the perceived
width of the street.
Tree grates are sometimes
used in more urban settings
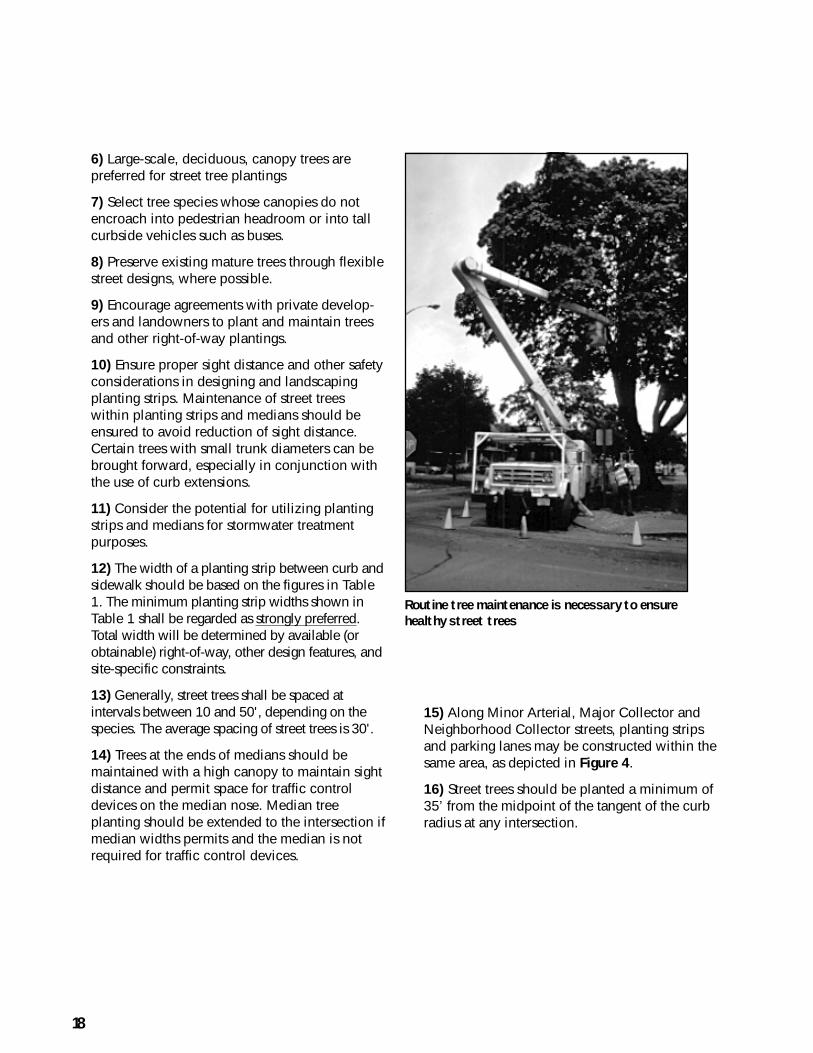
18
6) Large-scale, deciduous, canopy trees arepreferred for street tree plantings
7) Select tree species whose canopies do notencroach into pedestrian headroom or into tallcurbside vehicles such as buses.
8) Preserve existing mature trees through flexiblestreet designs, where possible.
9) Encourage agreements with private develop-ers and landowners to plant and maintain treesand other right-of-way plantings.
10) Ensure proper sight distance and other safetyconsiderations in designing and landscapingplanting strips. Maintenance of street treeswithin planting strips and medians should beensured to avoid reduction of sight distance.Certain trees with small trunk diameters can bebrought forward, especially in conjunction withthe use of curb extensions.
11) Consider the potential for utilizing plantingstrips and medians for stormwater treatmentpurposes.
12) The width of a planting strip between curb andsidewalk should be based on the figures in Table1. The minimum planting strip widths shown inTable 1 shall be regarded as strongly preferred.Total width will be determined by available (orobtainable) right-of-way, other design features, andsite-specific constraints.
13) Generally, street trees shall be spaced atintervals between 10 and 50', depending on thespecies. The average spacing of street trees is 30'.
14) Trees at the ends of medians should bemaintained with a high canopy to maintain sightdistance and permit space for traffic controldevices on the median nose. Median treeplanting should be extended to the intersection ifmedian widths permits and the median is notrequired for traffic control devices.
Routine tree maintenance is necessary to ensure
healthy street trees
15) Along Minor Arterial, Major Collector andNeighborhood Collector streets, planting stripsand parking lanes may be constructed within thesame area, as depicted in Figure 4.
16) Street trees should be planted a minimum of35’ from the midpoint of the tangent of the curbradius at any intersection.
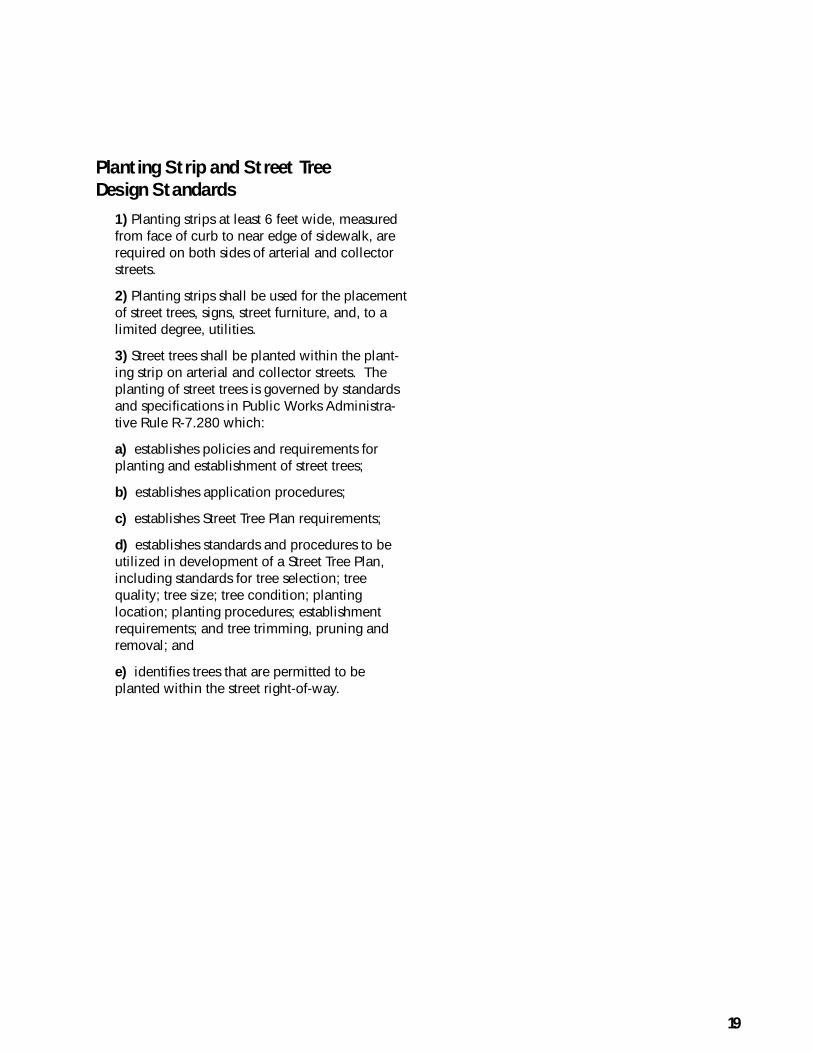
19
Planting Strip and Street Tree
Design Standards
1) Planting strips at least 6 feet wide, measuredfrom face of curb to near edge of sidewalk, arerequired on both sides of arterial and collectorstreets.
2) Planting strips shall be used for the placementof street trees, signs, street furniture, and, to alimited degree, utilities.
3) Street trees shall be planted within the plant-ing strip on arterial and collector streets. Theplanting of street trees is governed by standardsand specifications in Public Works Administra-tive Rule R-7.280 which:
a) establishes policies and requirements forplanting and establishment of street trees;
b) establishes application procedures;
c) establishes Street Tree Plan requirements;
d) establishes standards and procedures to beutilized in development of a Street Tree Plan,including standards for tree selection; treequality; tree size; tree condition; plantinglocation; planting procedures; establishmentrequirements; and tree trimming, pruning andremoval; and
e) identifies trees that are permitted to beplanted within the street right-of-way.
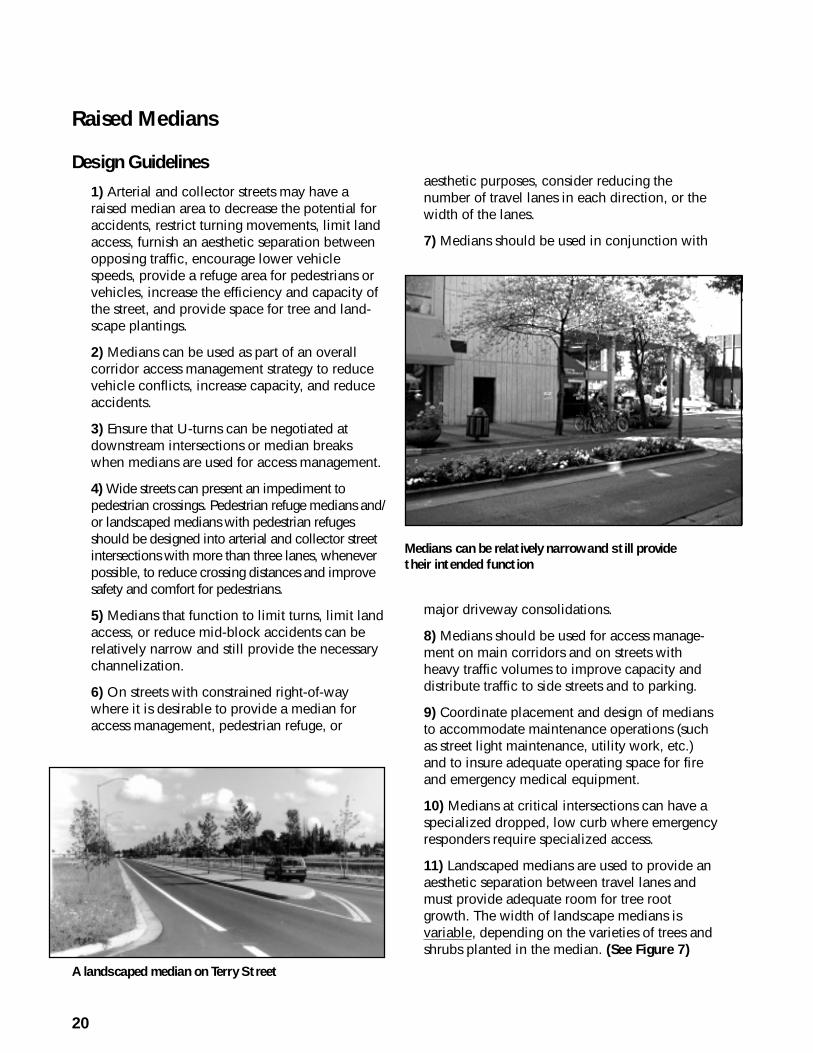
20
Raised Medians
Design Guidelines
1) Arterial and collector streets may have araised median area to decrease the potential foraccidents, restrict turning movements, limit landaccess, furnish an aesthetic separation betweenopposing traffic, encourage lower vehiclespeeds, provide a refuge area for pedestrians orvehicles, increase the efficiency and capacity ofthe street, and provide space for tree and land-scape plantings.
2) Medians can be used as part of an overallcorridor access management strategy to reducevehicle conflicts, increase capacity, and reduceaccidents.
3) Ensure that U-turns can be negotiated atdownstream intersections or median breakswhen medians are used for access management.
4) Wide streets can present an impediment topedestrian crossings. Pedestrian refuge medians and/or landscaped medians with pedestrian refugesshould be designed into arterial and collector streetintersections with more than three lanes, wheneverpossible, to reduce crossing distances and improvesafety and comfort for pedestrians.
5) Medians that function to limit turns, limit landaccess, or reduce mid-block accidents can berelatively narrow and still provide the necessarychannelization.
6) On streets with constrained right-of-waywhere it is desirable to provide a median foraccess management, pedestrian refuge, or
aesthetic purposes, consider reducing thenumber of travel lanes in each direction, or thewidth of the lanes.
7) Medians should be used in conjunction with
major driveway consolidations.
8) Medians should be used for access manage-ment on main corridors and on streets withheavy traffic volumes to improve capacity anddistribute traffic to side streets and to parking.
9) Coordinate placement and design of mediansto accommodate maintenance operations (suchas street light maintenance, utility work, etc.)and to insure adequate operating space for fireand emergency medical equipment.
10) Medians at critical intersections can have aspecialized dropped, low curb where emergencyresponders require specialized access.
11) Landscaped medians are used to provide anaesthetic separation between travel lanes andmust provide adequate room for tree rootgrowth. The width of landscape medians isvariable, depending on the varieties of trees andshrubs planted in the median. (See Figure 7)
A landscaped median on Terry Street
Medians can be relatively narrow and still provide
their intended function
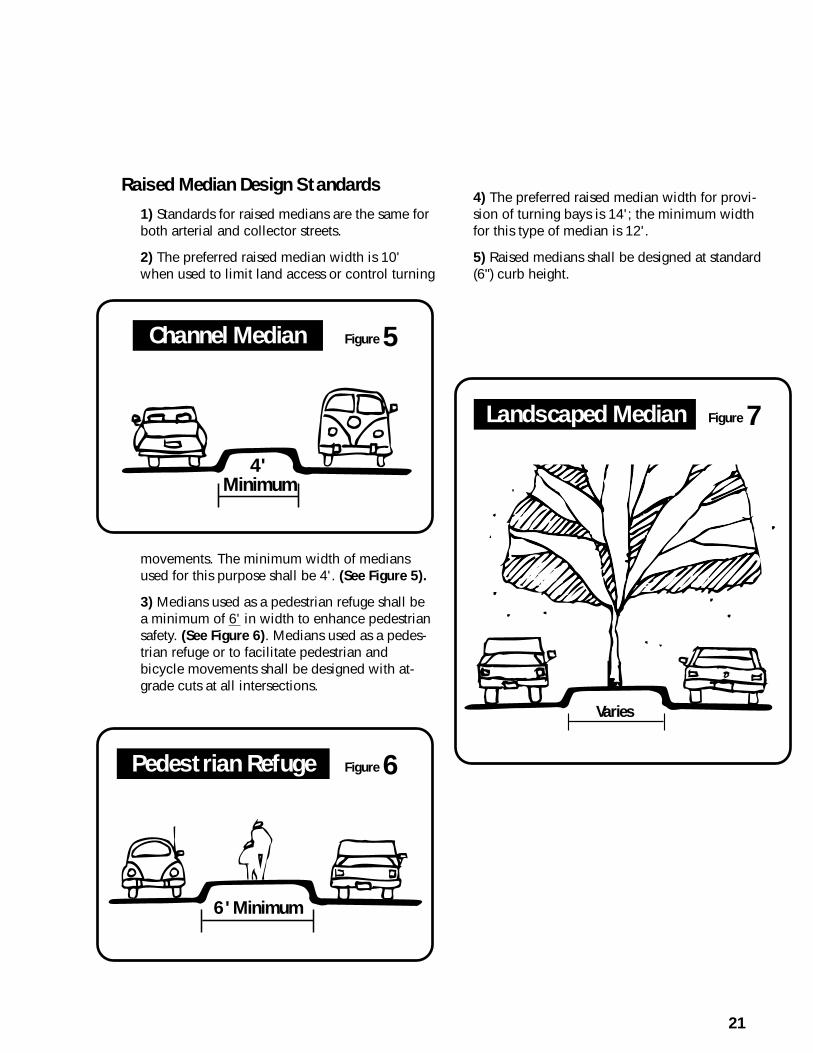
21
Raised Median Design Standards
1) Standards for raised medians are the same forboth arterial and collector streets.
2) The preferred raised median width is 10'when used to limit land access or control turning
movements. The minimum width of mediansused for this purpose shall be 4'. (See Figure 5).
3) Medians used as a pedestrian refuge shall bea minimum of 6' in width to enhance pedestriansafety. (See Figure 6). Medians used as a pedes-trian refuge or to facilitate pedestrian andbicycle movements shall be designed with at-grade cuts at all intersections.
Figure 5
4' Minimum
Channel Median
Figure 6Pedestrian Refuge
6' Minimum
Figure 7Landscaped Median
Varies
4) The preferred raised median width for provi-sion of turning bays is 14'; the minimum widthfor this type of median is 12'.
5) Raised medians shall be designed at standard(6") curb height.
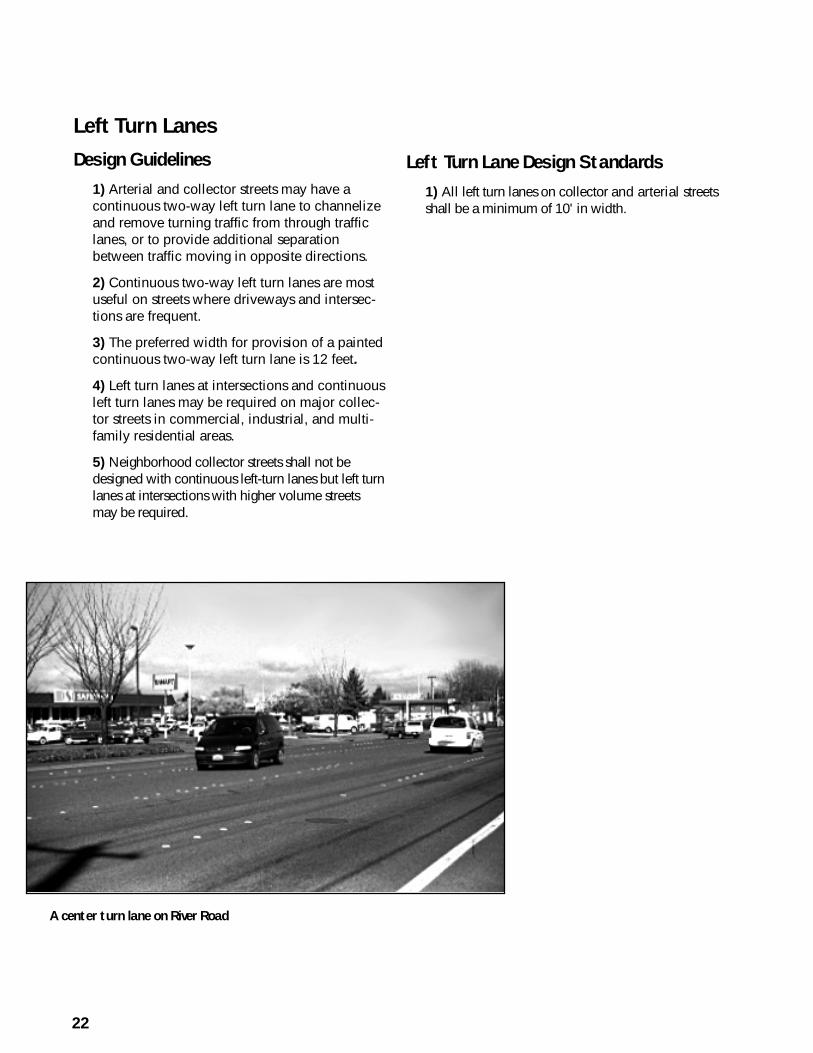
22
Left Turn Lanes
Design Guidelines
1) Arterial and collector streets may have acontinuous two-way left turn lane to channelizeand remove turning traffic from through trafficlanes, or to provide additional separationbetween traffic moving in opposite directions.
2) Continuous two-way left turn lanes are mostuseful on streets where driveways and intersec-tions are frequent.
3) The preferred width for provision of a paintedcontinuous two-way left turn lane is 12 feet.
4) Left turn lanes at intersections and continuousleft turn lanes may be required on major collec-tor streets in commercial, industrial, and multi-family residential areas.
5) Neighborhood collector streets shall not bedesigned with continuous left-turn lanes but left turnlanes at intersections with higher volume streetsmay be required.
Left Turn Lane Design Standards
1) All left turn lanes on collector and arterial streetsshall be a minimum of 10' in width.
A center turn lane on River Road
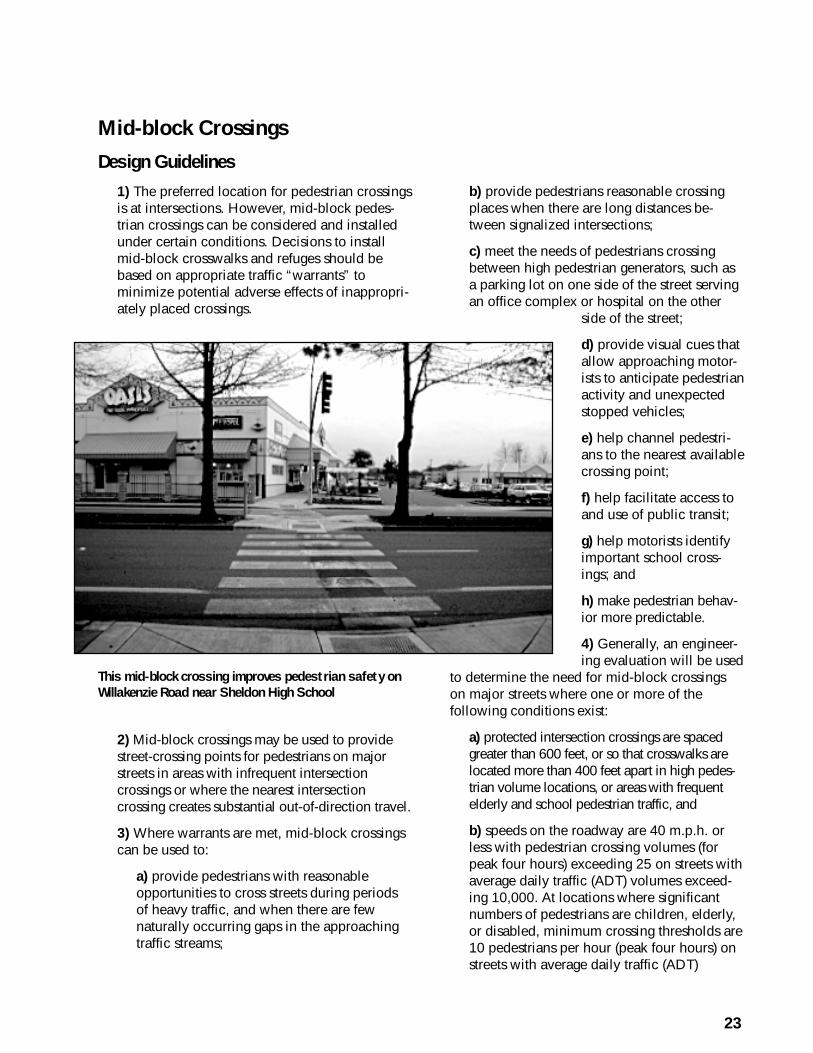
23
Mid-block Crossings
Design Guidelines
1) The preferred location for pedestrian crossingsis at intersections. However, mid-block pedes-trian crossings can be considered and installedunder certain conditions. Decisions to installmid-block crosswalks and refuges should bebased on appropriate traffic “warrants” tominimize potential adverse effects of inappropri-ately placed crossings.
2) Mid-block crossings may be used to providestreet-crossing points for pedestrians on majorstreets in areas with infrequent intersectioncrossings or where the nearest intersectioncrossing creates substantial out-of-direction travel.
3) Where warrants are met, mid-block crossingscan be used to:
a) provide pedestrians with reasonableopportunities to cross streets during periodsof heavy traffic, and when there are fewnaturally occurring gaps in the approachingtraffic streams;
This mid-block crossing improves pedestrian safety on
Willakenzie Road near Sheldon High School
b) provide pedestrians reasonable crossingplaces when there are long distances be-tween signalized intersections;
c) meet the needs of pedestrians crossingbetween high pedestrian generators, such asa parking lot on one side of the street servingan office complex or hospital on the other
side of the street;
d) provide visual cues thatallow approaching motor-ists to anticipate pedestrianactivity and unexpectedstopped vehicles;
e) help channel pedestri-ans to the nearest availablecrossing point;
f) help facilitate access toand use of public transit;
g) help motorists identifyimportant school cross-ings; and
h) make pedestrian behav-ior more predictable.
4) Generally, an engineer-ing evaluation will be used
to determine the need for mid-block crossingson major streets where one or more of thefollowing conditions exist:
a) protected intersection crossings are spacedgreater than 600 feet, or so that crosswalks arelocated more than 400 feet apart in high pedes-trian volume locations, or areas with frequentelderly and school pedestrian traffic, and
b) speeds on the roadway are 40 m.p.h. orless with pedestrian crossing volumes (forpeak four hours) exceeding 25 on streets withaverage daily traffic (ADT) volumes exceed-ing 10,000. At locations where significantnumbers of pedestrians are children, elderly,or disabled, minimum crossing thresholds are10 pedestrians per hour (peak four hours) onstreets with average daily traffic (ADT)
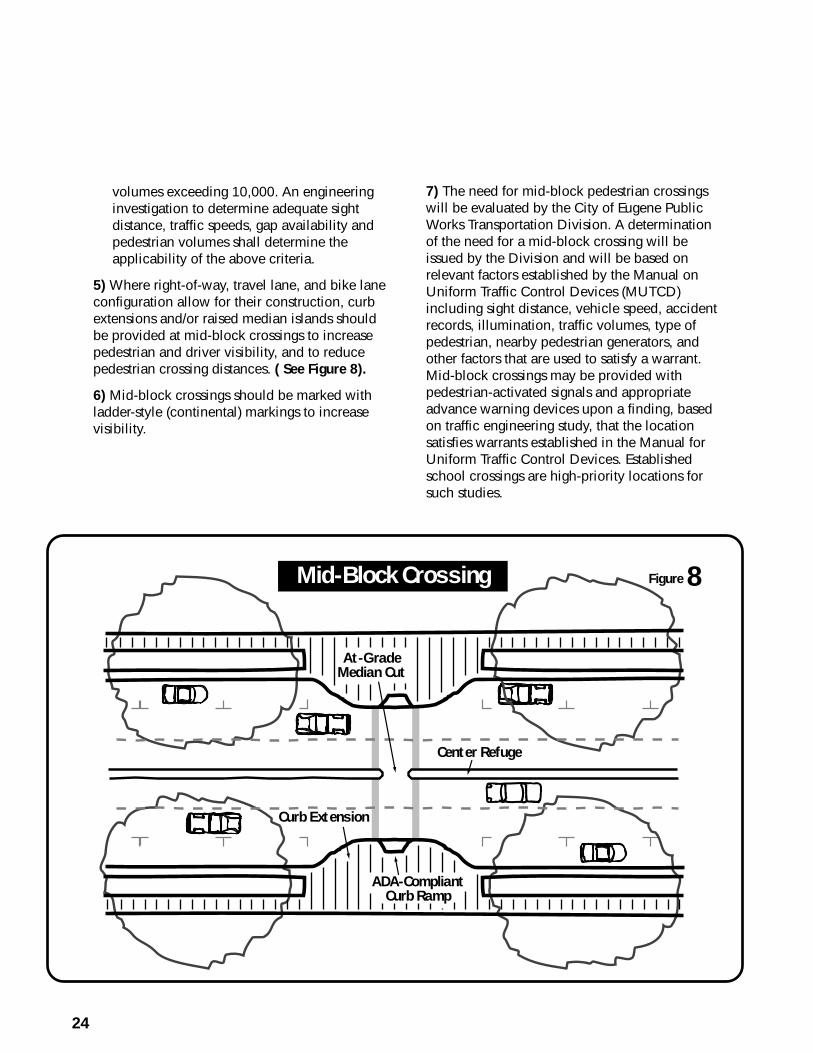
24
volumes exceeding 10,000. An engineeringinvestigation to determine adequate sightdistance, traffic speeds, gap availability andpedestrian volumes shall determine theapplicability of the above criteria.
5) Where right-of-way, travel lane, and bike laneconfiguration allow for their construction, curbextensions and/or raised median islands shouldbe provided at mid-block crossings to increasepedestrian and driver visibility, and to reducepedestrian crossing distances. ( See Figure 8).
6) Mid-block crossings should be marked withladder-style (continental) markings to increasevisibility.
7) The need for mid-block pedestrian crossingswill be evaluated by the City of Eugene PublicWorks Transportation Division. A determinationof the need for a mid-block crossing will beissued by the Division and will be based onrelevant factors established by the Manual onUniform Traffic Control Devices (MUTCD)including sight distance, vehicle speed, accidentrecords, illumination, traffic volumes, type ofpedestrian, nearby pedestrian generators, andother factors that are used to satisfy a warrant.Mid-block crossings may be provided withpedestrian-activated signals and appropriateadvance warning devices upon a finding, basedon traffic engineering study, that the locationsatisfies warrants established in the Manual forUniform Traffic Control Devices. Establishedschool crossings are high-priority locations forsuch studies.
Mid-Block Crossing
At-GradeMedian Cut
Center Refuge
Curb Extension
ADA-CompliantCurb Ramp
Figure 8
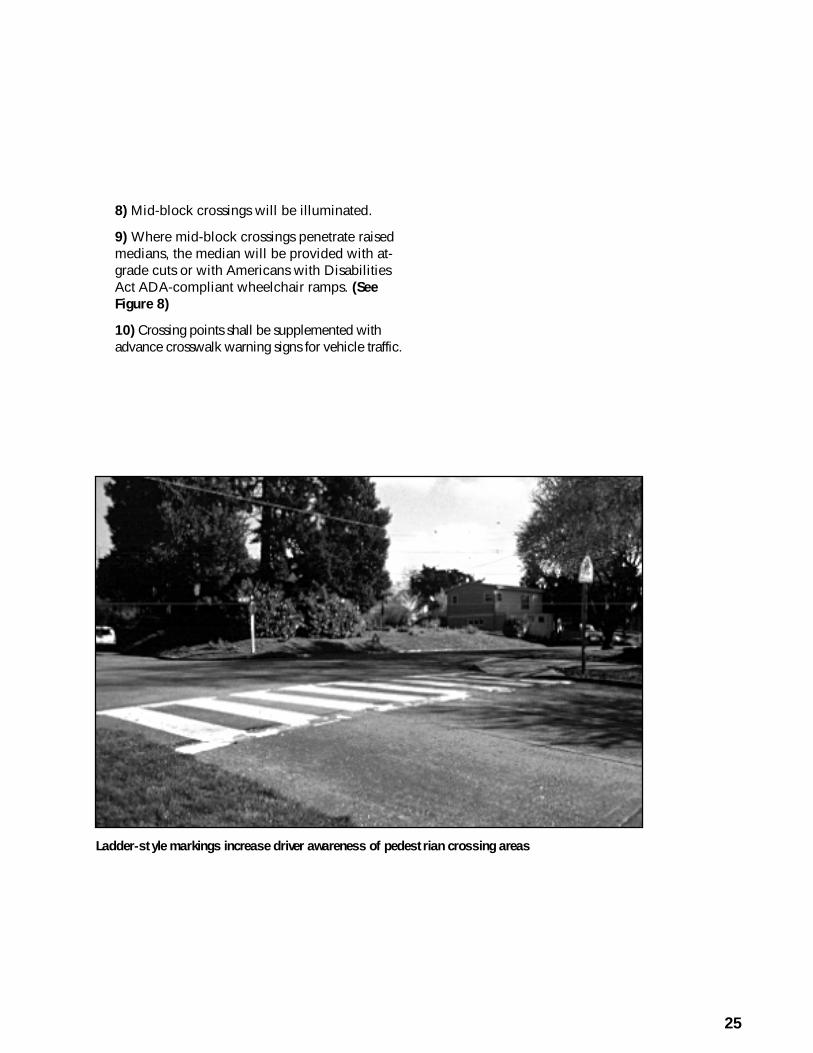
25
8) Mid-block crossings will be illuminated.
9) Where mid-block crossings penetrate raisedmedians, the median will be provided with at-grade cuts or with Americans with DisabilitiesAct ADA-compliant wheelchair ramps. (SeeFigure 8)
10) Crossing points shall be supplemented withadvance crosswalk warning signs for vehicle traffic.
Ladder-style markings increase driver awareness of pedestrian crossing areas
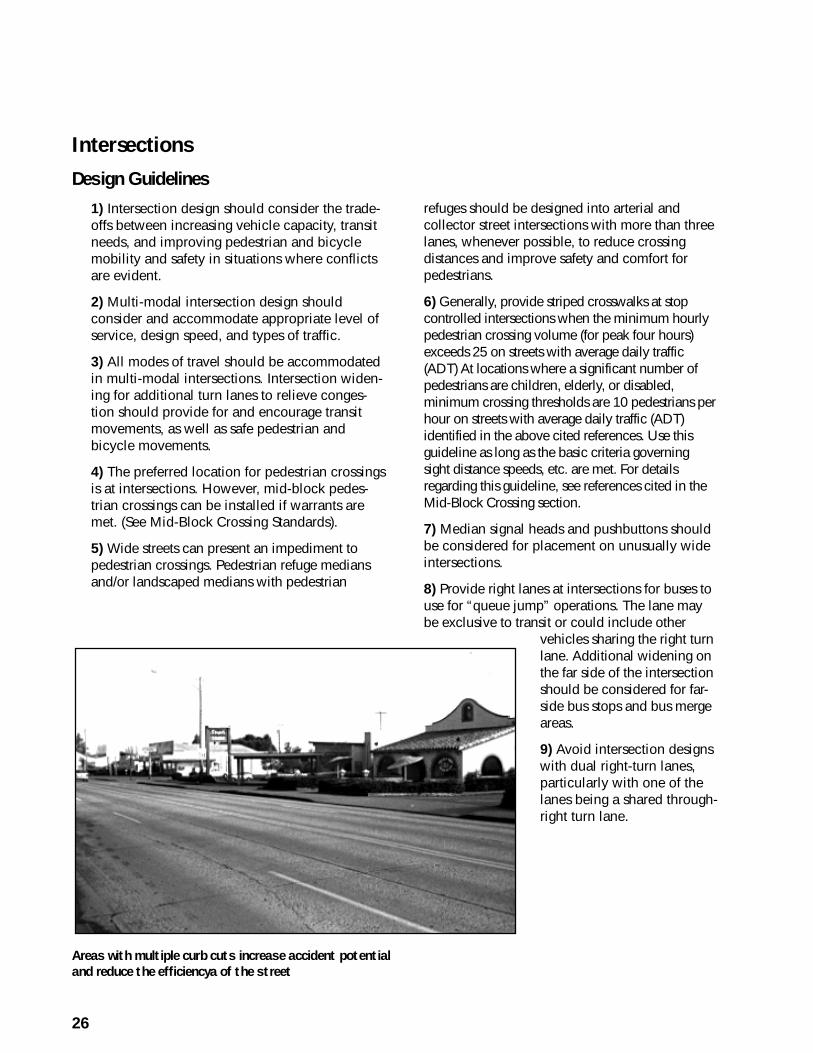
26
Intersections
Design Guidelines
1) Intersection design should consider the trade-offs between increasing vehicle capacity, transitneeds, and improving pedestrian and bicyclemobility and safety in situations where conflictsare evident.
2) Multi-modal intersection design shouldconsider and accommodate appropriate level ofservice, design speed, and types of traffic.
3) All modes of travel should be accommodatedin multi-modal intersections. Intersection widen-ing for additional turn lanes to relieve conges-tion should provide for and encourage transitmovements, as well as safe pedestrian andbicycle movements.
4) The preferred location for pedestrian crossingsis at intersections. However, mid-block pedes-trian crossings can be installed if warrants aremet. (See Mid-Block Crossing Standards).
5) Wide streets can present an impediment topedestrian crossings. Pedestrian refuge mediansand/or landscaped medians with pedestrian
refuges should be designed into arterial andcollector street intersections with more than threelanes, whenever possible, to reduce crossingdistances and improve safety and comfort forpedestrians.
6) Generally, provide striped crosswalks at stopcontrolled intersections when the minimum hourlypedestrian crossing volume (for peak four hours)exceeds 25 on streets with average daily traffic(ADT) At locations where a significant number ofpedestrians are children, elderly, or disabled,minimum crossing thresholds are 10 pedestrians perhour on streets with average daily traffic (ADT)identified in the above cited references. Use thisguideline as long as the basic criteria governingsight distance speeds, etc. are met. For detailsregarding this guideline, see references cited in theMid-Block Crossing section.
7) Median signal heads and pushbuttons shouldbe considered for placement on unusually wideintersections.
8) Provide right lanes at intersections for buses touse for “queue jump” operations. The lane maybe exclusive to transit or could include other
vehicles sharing the right turnlane. Additional widening onthe far side of the intersectionshould be considered for far-side bus stops and bus mergeareas.
9) Avoid intersection designswith dual right-turn lanes,particularly with one of thelanes being a shared through-right turn lane.
Areas with multiple curb cuts increase accident potential
and reduce the efficiencya of the street
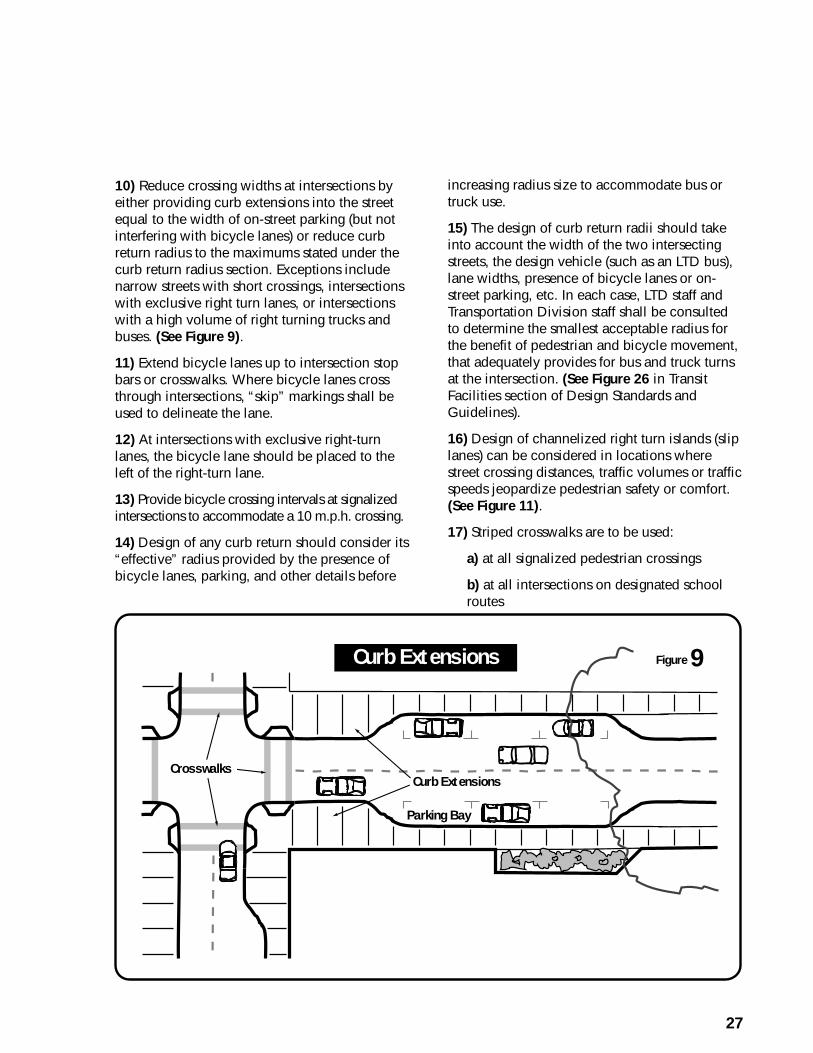
27
10) Reduce crossing widths at intersections byeither providing curb extensions into the streetequal to the width of on-street parking (but notinterfering with bicycle lanes) or reduce curbreturn radius to the maximums stated under thecurb return radius section. Exceptions includenarrow streets with short crossings, intersectionswith exclusive right turn lanes, or intersectionswith a high volume of right turning trucks andbuses. (See Figure 9).
11) Extend bicycle lanes up to intersection stopbars or crosswalks. Where bicycle lanes crossthrough intersections, “skip” markings shall beused to delineate the lane.
12) At intersections with exclusive right-turnlanes, the bicycle lane should be placed to theleft of the right-turn lane.
13) Provide bicycle crossing intervals at signalizedintersections to accommodate a 10 m.p.h. crossing.
14) Design of any curb return should consider its“effective” radius provided by the presence ofbicycle lanes, parking, and other details before
Curb Extensions
Parking Bay
CrosswalksCurb Extensions
Figure 9
increasing radius size to accommodate bus ortruck use.
15) The design of curb return radii should takeinto account the width of the two intersectingstreets, the design vehicle (such as an LTD bus),lane widths, presence of bicycle lanes or on-street parking, etc. In each case, LTD staff andTransportation Division staff shall be consultedto determine the smallest acceptable radius forthe benefit of pedestrian and bicycle movement,that adequately provides for bus and truck turnsat the intersection. (See Figure 26 in TransitFacilities section of Design Standards andGuidelines).
16) Design of channelized right turn islands (sliplanes) can be considered in locations wherestreet crossing distances, traffic volumes or trafficspeeds jeopardize pedestrian safety or comfort.(See Figure 11).
17) Striped crosswalks are to be used:
a) at all signalized pedestrian crossings
b) at all intersections on designated schoolroutes
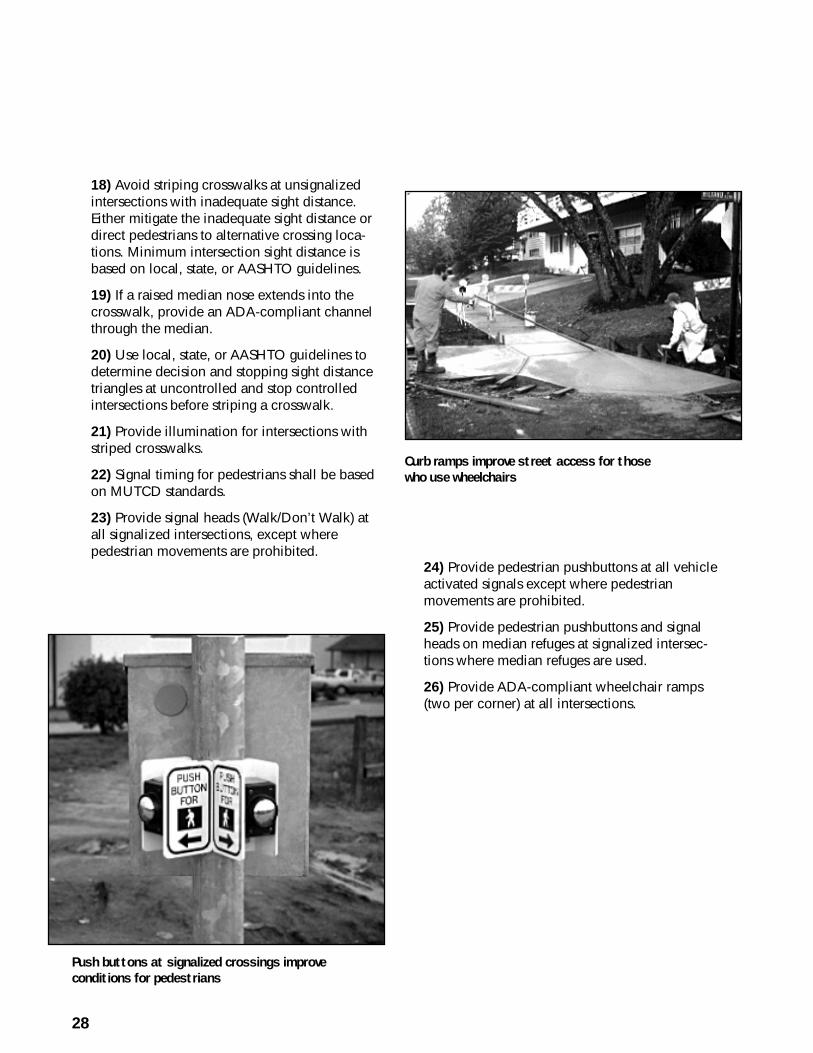
28
18) Avoid striping crosswalks at unsignalizedintersections with inadequate sight distance.Either mitigate the inadequate sight distance ordirect pedestrians to alternative crossing loca-tions. Minimum intersection sight distance isbased on local, state, or AASHTO guidelines.
19) If a raised median nose extends into thecrosswalk, provide an ADA-compliant channelthrough the median.
20) Use local, state, or AASHTO guidelines todetermine decision and stopping sight distancetriangles at uncontrolled and stop controlledintersections before striping a crosswalk.
21) Provide illumination for intersections withstriped crosswalks.
22) Signal timing for pedestrians shall be basedon MUTCD standards.
23) Provide signal heads (Walk/Don’t Walk) atall signalized intersections, except wherepedestrian movements are prohibited.
24) Provide pedestrian pushbuttons at all vehicleactivated signals except where pedestrianmovements are prohibited.
25) Provide pedestrian pushbuttons and signalheads on median refuges at signalized intersec-tions where median refuges are used.
26) Provide ADA-compliant wheelchair ramps(two per corner) at all intersections.
Push buttons at signalized crossings improve
conditions for pedestrians
Curb ramps improve street access for those
who use wheelchairs
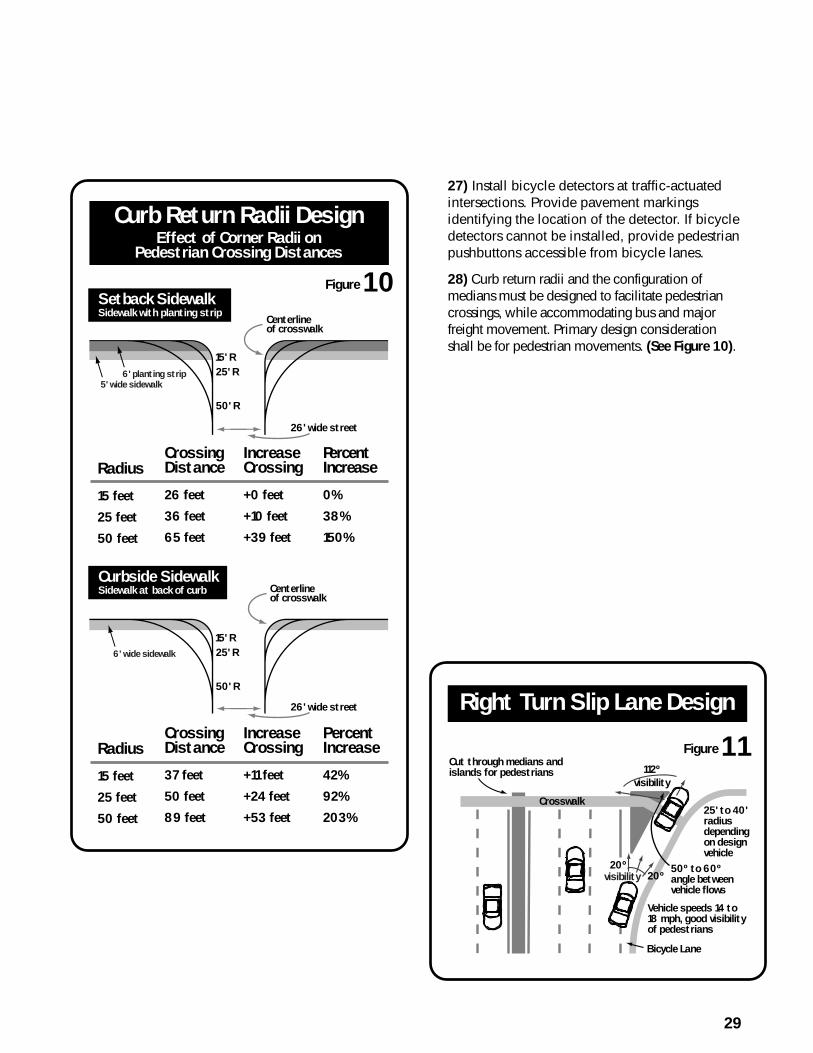
29
27) Install bicycle detectors at traffic-actuatedintersections. Provide pavement markingsidentifying the location of the detector. If bicycledetectors cannot be installed, provide pedestrianpushbuttons accessible from bicycle lanes.
28) Curb return radii and the configuration ofmedians must be designed to facilitate pedestriancrossings, while accommodating bus and majorfreight movement. Primary design considerationshall be for pedestrian movements. (See Figure 10).
Radius
15 feet
25 feet
50 feet
Crossing Distance
26 feet
36 feet
65 feet
IncreaseCrossing
+0 feet
+10 feet
+39 feet
PercentIncrease
0%
38%
150%
Radius
15 feet
25 feet
50 feet
Crossing Distance
37 feet
50 feet
89 feet
IncreaseCrossing
+11 feet
+24 feet
+53 feet
PercentIncrease
42%
92%
203%
Figure 10
Curb Return Radii DesignEffect of Corner Radii on
Pedestrian Crossing Distances
Setback SidewalkSidewalk with planting strip
Curbside SidewalkSidewalk at back of curb
15' R
25' R
50' R
26' wide street
Centerline of crosswalk
15' R
25' R
50' R
26' wide street
Centerline of crosswalk
6' planting strip
5' wide sidewalk
6' wide sidewalk
Figure 11
Right Turn Slip Lane Design
Cut through medians and islands for pedestrians
25' to 40' radius depending on design vehicle
50º to 60º angle between vehicle flows
Vehicle speeds 14 to 18 mph, good visibility of pedestrians
Bicycle Lane
112º
visibility
20º20º
Crosswalk
visibility
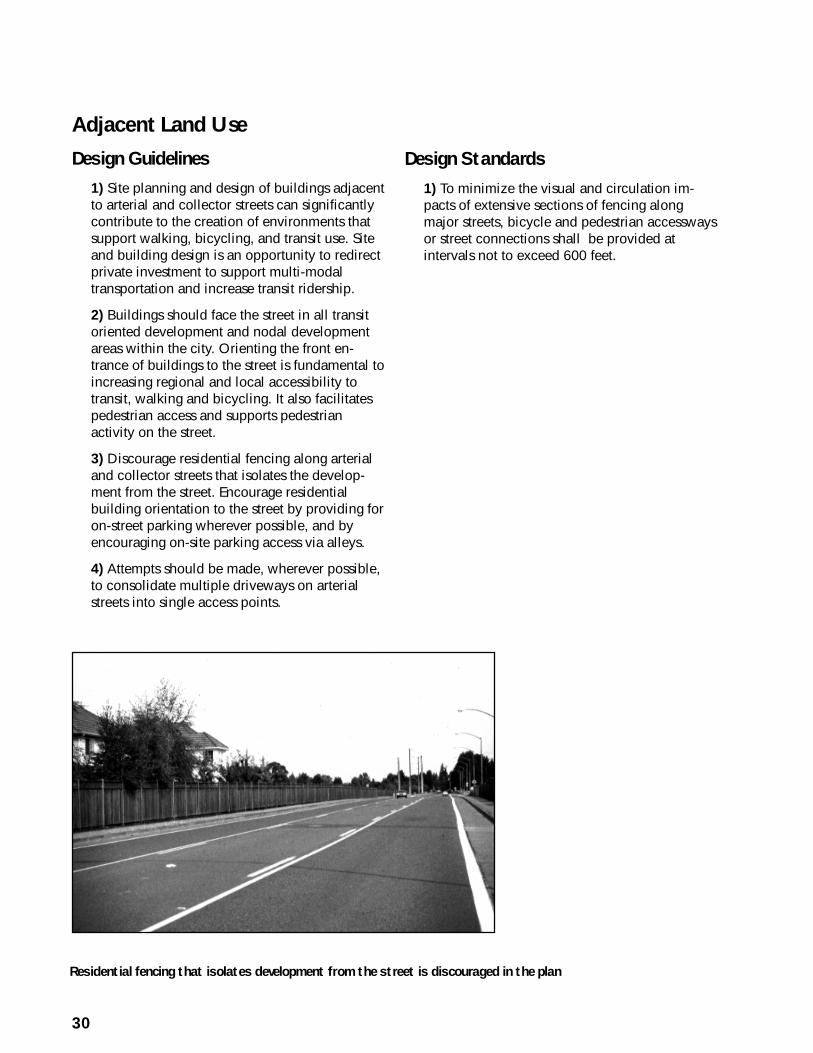
30
Adjacent Land Use
Design Guidelines
1) Site planning and design of buildings adjacentto arterial and collector streets can significantlycontribute to the creation of environments thatsupport walking, bicycling, and transit use. Siteand building design is an opportunity to redirectprivate investment to support multi-modaltransportation and increase transit ridership.
2) Buildings should face the street in all transitoriented development and nodal developmentareas within the city. Orienting the front en-trance of buildings to the street is fundamental toincreasing regional and local accessibility totransit, walking and bicycling. It also facilitatespedestrian access and supports pedestrianactivity on the street.
3) Discourage residential fencing along arterialand collector streets that isolates the develop-ment from the street. Encourage residentialbuilding orientation to the street by providing foron-street parking wherever possible, and byencouraging on-site parking access via alleys.
4) Attempts should be made, wherever possible,to consolidate multiple driveways on arterialstreets into single access points.
Design Standards
1) To minimize the visual and circulation im-pacts of extensive sections of fencing alongmajor streets, bicycle and pedestrian accesswaysor street connections shall be provided atintervals not to exceed 600 feet.
Residential fencing that isolates development from the street is discouraged in the plan
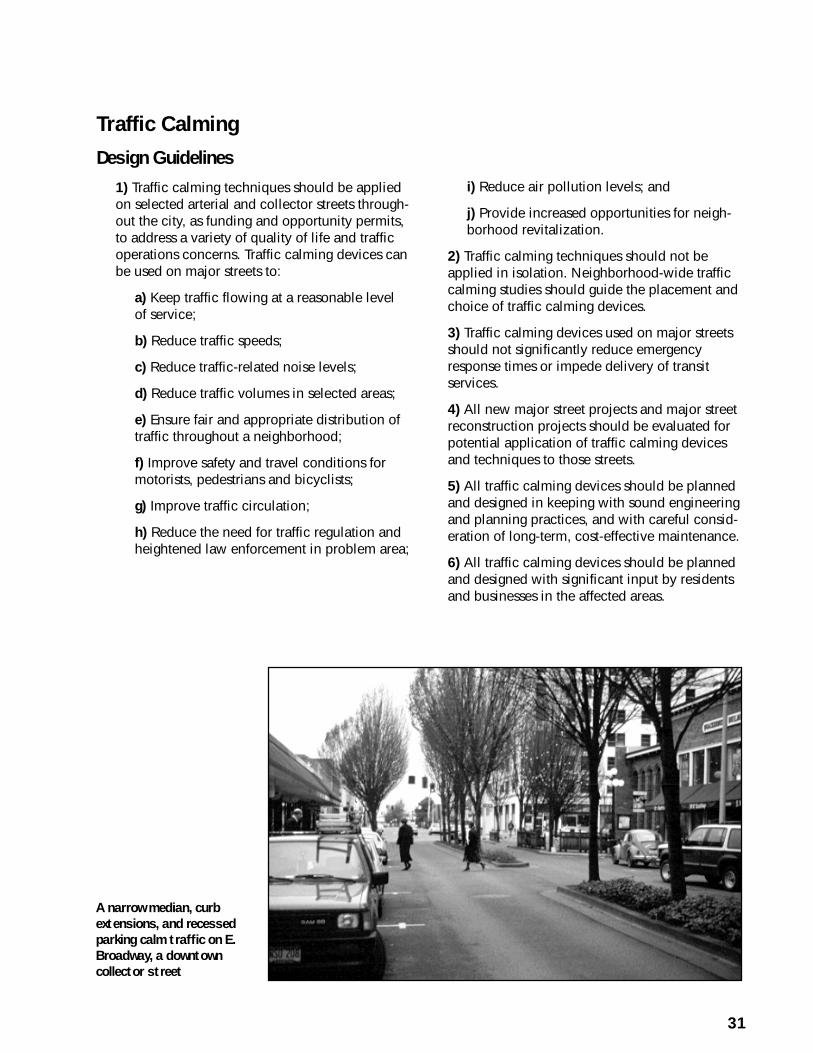
31
Traffic Calming
Design Guidelines
1) Traffic calming techniques should be appliedon selected arterial and collector streets through-out the city, as funding and opportunity permits,to address a variety of quality of life and trafficoperations concerns. Traffic calming devices canbe used on major streets to:
a) Keep traffic flowing at a reasonable levelof service;
b) Reduce traffic speeds;
c) Reduce traffic-related noise levels;
d) Reduce traffic volumes in selected areas;
e) Ensure fair and appropriate distribution oftraffic throughout a neighborhood;
f) Improve safety and travel conditions formotorists, pedestrians and bicyclists;
g) Improve traffic circulation;
h) Reduce the need for traffic regulation andheightened law enforcement in problem area;
i) Reduce air pollution levels; and
j) Provide increased opportunities for neigh-borhood revitalization.
2) Traffic calming techniques should not beapplied in isolation. Neighborhood-wide trafficcalming studies should guide the placement andchoice of traffic calming devices.
3) Traffic calming devices used on major streetsshould not significantly reduce emergencyresponse times or impede delivery of transitservices.
4) All new major street projects and major streetreconstruction projects should be evaluated forpotential application of traffic calming devicesand techniques to those streets.
5) All traffic calming devices should be plannedand designed in keeping with sound engineeringand planning practices, and with careful consid-eration of long-term, cost-effective maintenance.
6) All traffic calming devices should be plannedand designed with significant input by residentsand businesses in the affected areas.
A narrow median, curb
extensions, and recessed
parking calm traffic on E.
Broadway, a downtown
collector street
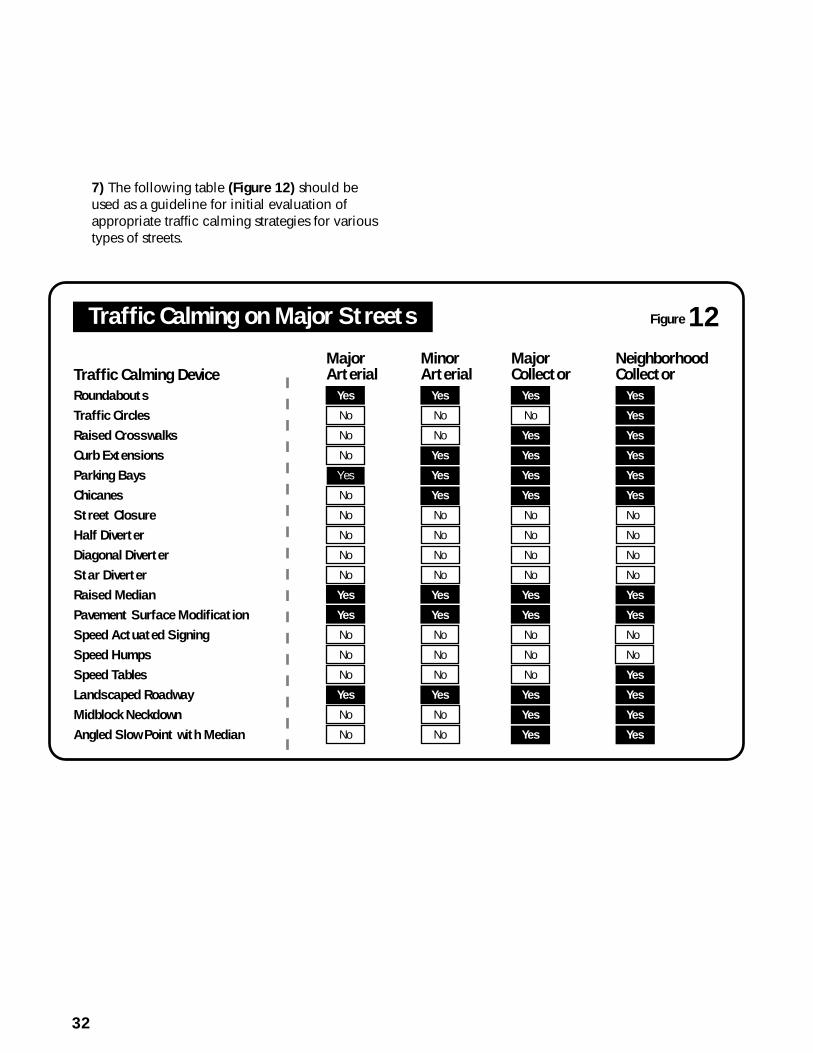
32
7) The following table (Figure 12) should beused as a guideline for initial evaluation ofappropriate traffic calming strategies for varioustypes of streets.
MajorArterial
Yes
No
No
No
Yes
No
No
No
No
No
Yes
Yes
No
No
No
Yes
No
No
MinorArterial
Yes
No
No
Yes
Yes
Yes
No
No
No
No
Yes
Yes
No
No
No
Yes
No
No
MajorCollector
Yes
No
Yes
Yes
Yes
Yes
No
No
No
No
Yes
Yes
No
No
No
Yes
Yes
Yes
NeighborhoodCollector
Yes
Yes
Yes
Yes
Yes
Yes
No
No
No
No
Yes
Yes
No
No
Yes
Yes
Yes
Yes
Traffic Calming Device
Roundabouts
Traffic Circles
Raised Crosswalks
Curb Extensions
Parking Bays
Chicanes
Street Closure
Half Diverter
Diagonal Diverter
Star Diverter
Raised Median
Pavement Surface Modification
Speed Actuated Signing
Speed Humps
Speed Tables
Landscaped Roadway
Midblock Neckdown
Angled Slow Point with Median
Figure 12Traffic Calming on Major Streets
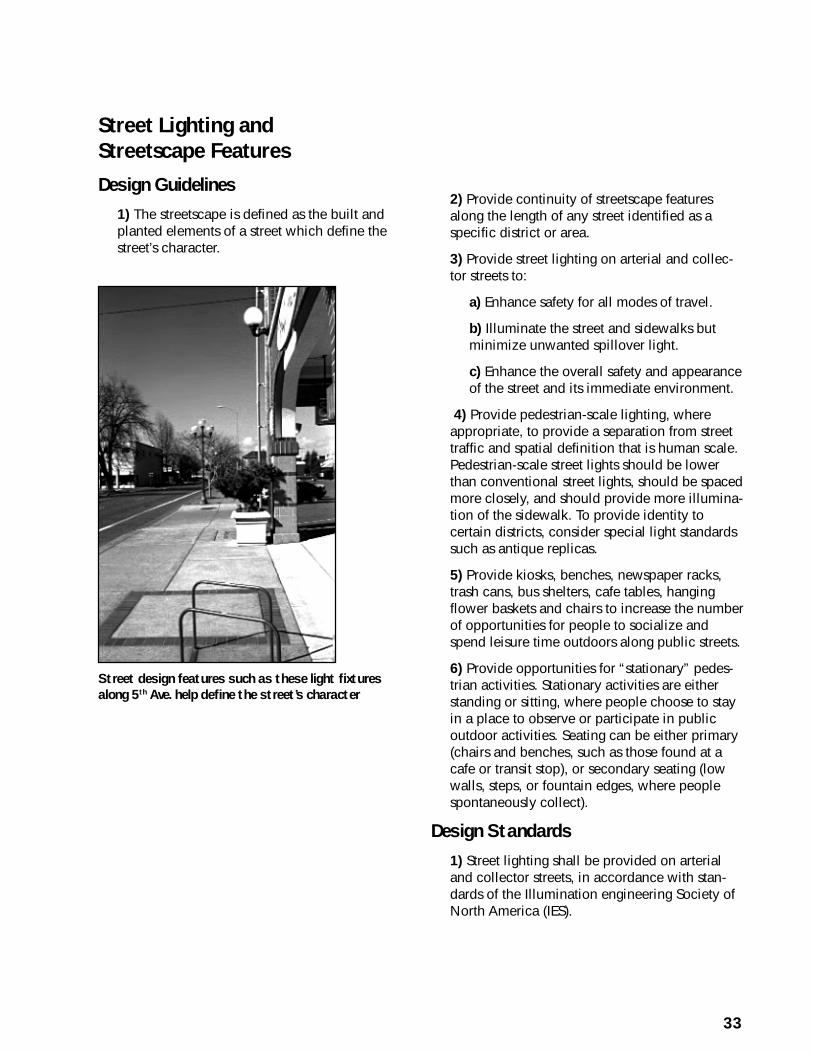
33
Street Lighting andStreetscape Features
Design Guidelines
1) The streetscape is defined as the built andplanted elements of a street which define thestreet’s character.
2) Provide continuity of streetscape featuresalong the length of any street identified as aspecific district or area.
3) Provide street lighting on arterial and collec-tor streets to:
a) Enhance safety for all modes of travel.
b) Illuminate the street and sidewalks butminimize unwanted spillover light.
c) Enhance the overall safety and appearanceof the street and its immediate environment.
4) Provide pedestrian-scale lighting, whereappropriate, to provide a separation from streettraffic and spatial definition that is human scale.Pedestrian-scale street lights should be lowerthan conventional street lights, should be spacedmore closely, and should provide more illumina-tion of the sidewalk. To provide identity tocertain districts, consider special light standardssuch as antique replicas.
5) Provide kiosks, benches, newspaper racks,trash cans, bus shelters, cafe tables, hangingflower baskets and chairs to increase the numberof opportunities for people to socialize andspend leisure time outdoors along public streets.
6) Provide opportunities for “stationary” pedes-trian activities. Stationary activities are eitherstanding or sitting, where people choose to stayin a place to observe or participate in publicoutdoor activities. Seating can be either primary(chairs and benches, such as those found at acafe or transit stop), or secondary seating (lowwalls, steps, or fountain edges, where peoplespontaneously collect).
Design Standards
1) Street lighting shall be provided on arterialand collector streets, in accordance with stan-dards of the Illumination engineering Society ofNorth America (IES).
Street design features such as these light fixtures
along 5th Ave. help define the street’s character
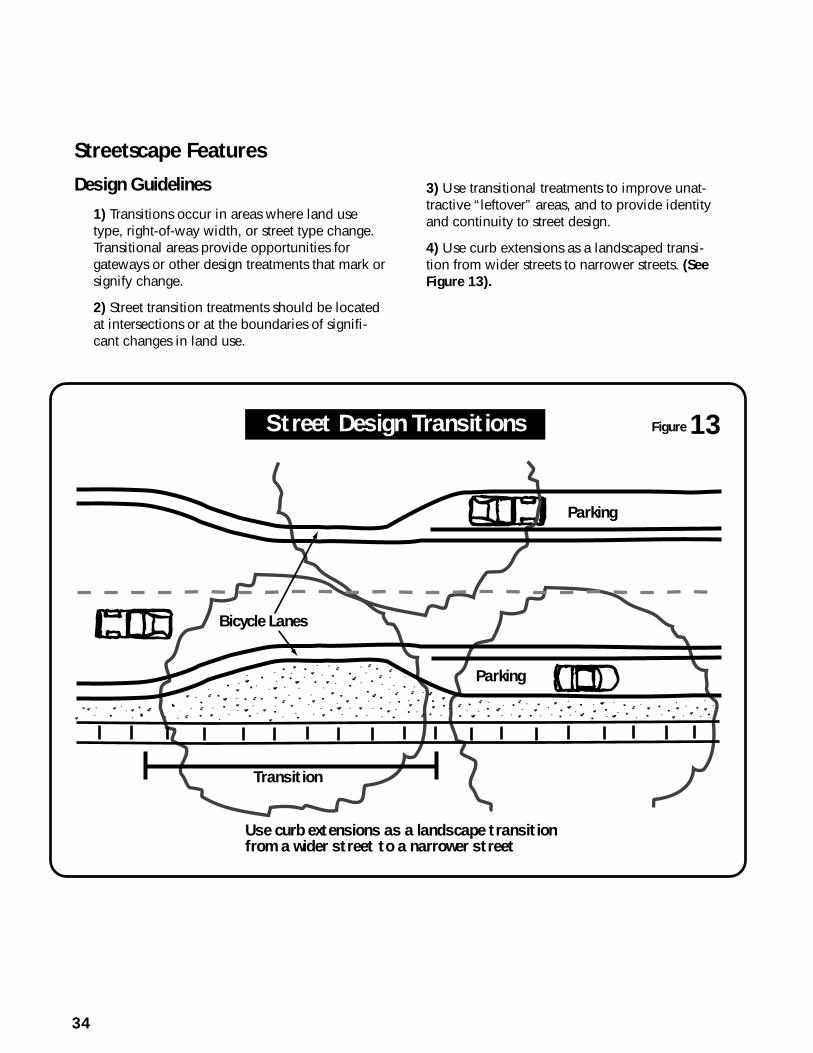
34
Street Design Transitions
Parking
Parking
Bicycle Lanes
Transition
Use curb extensions as a landscape transition from a wider street to a narrower street
Figure 13
Streetscape Features
Design Guidelines
1) Transitions occur in areas where land usetype, right-of-way width, or street type change.Transitional areas provide opportunities forgateways or other design treatments that mark orsignify change.
2) Street transition treatments should be locatedat intersections or at the boundaries of signifi-cant changes in land use.
3) Use transitional treatments to improve unat-tractive “leftover” areas, and to provide identityand continuity to street design.
4) Use curb extensions as a landscaped transi-tion from wider streets to narrower streets. (SeeFigure 13).
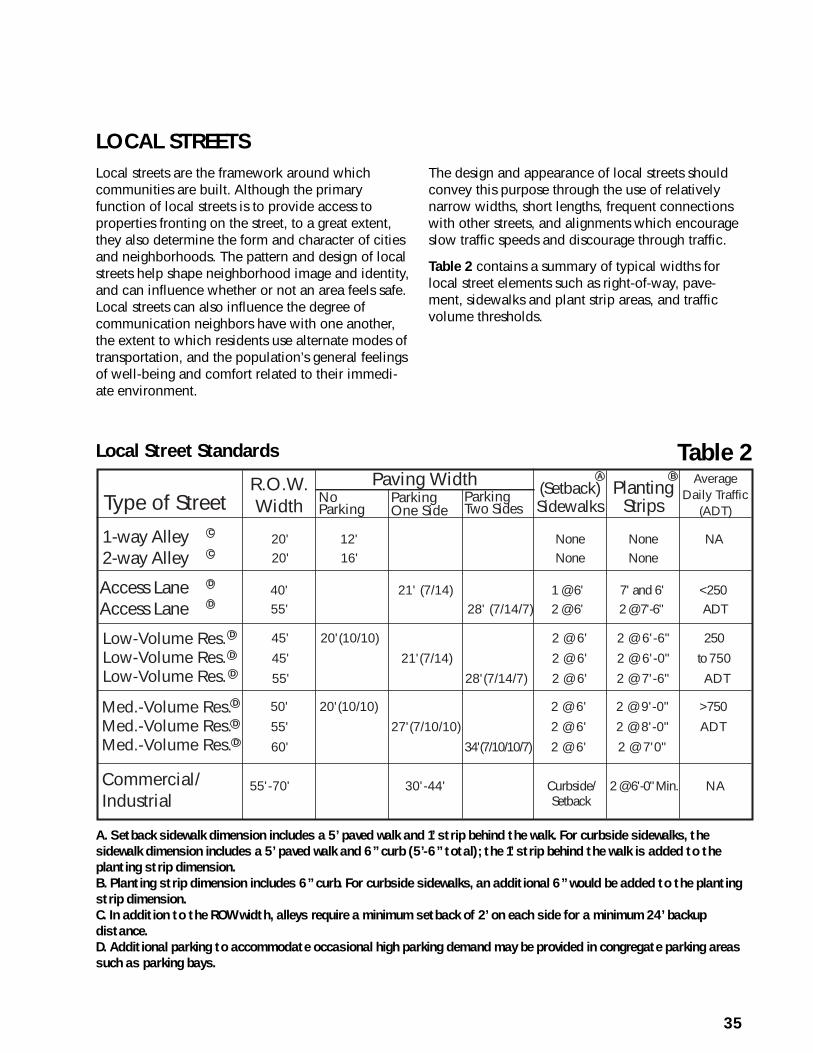
35
LOCAL STREETSLocal streets are the framework around whichcommunities are built. Although the primaryfunction of local streets is to provide access toproperties fronting on the street, to a great extent,they also determine the form and character of citiesand neighborhoods. The pattern and design of localstreets help shape neighborhood image and identity,and can influence whether or not an area feels safe.Local streets can also influence the degree ofcommunication neighbors have with one another,the extent to which residents use alternate modes oftransportation, and the population’s general feelingsof well-being and comfort related to their immedi-ate environment.
The design and appearance of local streets shouldconvey this purpose through the use of relativelynarrow widths, short lengths, frequent connectionswith other streets, and alignments which encourageslow traffic speeds and discourage through traffic.
Table 2 contains a summary of typical widths forlocal street elements such as right-of-way, pave-ment, sidewalks and plant strip areas, and trafficvolume thresholds.
Type of Street
Commercial/Industrial
1-way Alley2-way Alley
Low-Volume Res.Low-Volume Res.Low-Volume Res.
R.O.W.Width
Paving WidthNoParking
Parking One Side
Parking Two Sides
(Setback) Sidewalks
Planting Strips
Average Daily Traffic
(ADT)
A B
55'-70' 30'-44' Curbside/ 2 @ 6'-0" Min. NASetback
20' 12' None None NA20' 16' None None
45' 20'(10/10) 2 @ 6' 2 @ 6'-6" 250
45' 21'(7/14) 2 @ 6' 2 @ 6'-0" to 750
55' 28'(7/14/7) 2 @ 6' 2 @ 7'-6" ADT
Access LaneAccess Lane
40' 21' (7/14) 1 @ 6' 7' and 6' <25055' 28' (7/14/7) 2 @ 6' 2 @ 7'-6" ADT
C
C
D
D
D
D
D
Med.-Volume Res.Med.-Volume Res.Med.-Volume Res.
50' 20'(10/10) 2 @ 6' 2 @ 9'-0" >750
55' 27'(7/10/10) 2 @ 6' 2 @ 8'-0" ADT
60' 34'(7/10/10/7) 2 @ 6' 2 @ 7'0"
D
D
D
Table 2
A. Setback sidewalk dimension includes a 5’ paved walk and 1’ strip behind the walk. For curbside sidewalks, the
sidewalk dimension includes a 5’ paved walk and 6” curb (5’-6” total); the 1’ strip behind the walk is added to the
planting strip dimension.
B. Planting strip dimension includes 6” curb. For curbside sidewalks, an additional 6” would be added to the planting
strip dimension.
C. In addition to the ROW width, alleys require a minimum setback of 2’ on each side for a minimum 24’ backup
distance.
D. Additional parking to accommodate occasional high parking demand may be provided in congregate parking areas
such as parking bays.
Local Street Standards
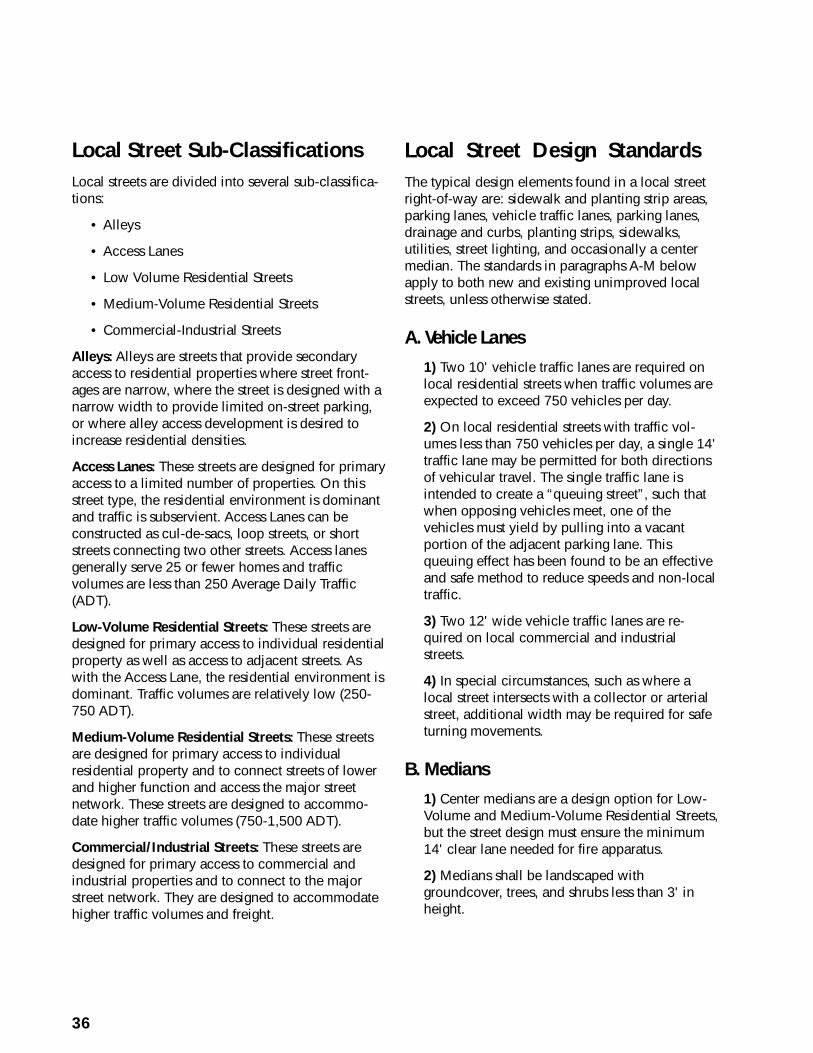
36
Local Street Sub-ClassificationsLocal streets are divided into several sub-classifica-tions:
• Alleys
• Access Lanes
• Low Volume Residential Streets
• Medium-Volume Residential Streets
• Commercial-Industrial Streets
Alleys: Alleys are streets that provide secondaryaccess to residential properties where street front-ages are narrow, where the street is designed with anarrow width to provide limited on-street parking,or where alley access development is desired toincrease residential densities.
Access Lanes: These streets are designed for primaryaccess to a limited number of properties. On thisstreet type, the residential environment is dominantand traffic is subservient. Access Lanes can beconstructed as cul-de-sacs, loop streets, or shortstreets connecting two other streets. Access lanesgenerally serve 25 or fewer homes and trafficvolumes are less than 250 Average Daily Traffic(ADT).
Low-Volume Residential Streets: These streets aredesigned for primary access to individual residentialproperty as well as access to adjacent streets. Aswith the Access Lane, the residential environment isdominant. Traffic volumes are relatively low (250-750 ADT).
Medium-Volume Residential Streets: These streetsare designed for primary access to individualresidential property and to connect streets of lowerand higher function and access the major streetnetwork. These streets are designed to accommo-date higher traffic volumes (750-1,500 ADT).
Commercial/Industrial Streets: These streets aredesigned for primary access to commercial andindustrial properties and to connect to the majorstreet network. They are designed to accommodatehigher traffic volumes and freight.
Local Street Design StandardsThe typical design elements found in a local streetright-of-way are: sidewalk and planting strip areas,parking lanes, vehicle traffic lanes, parking lanes,drainage and curbs, planting strips, sidewalks,utilities, street lighting, and occasionally a centermedian. The standards in paragraphs A-M belowapply to both new and existing unimproved localstreets, unless otherwise stated.
A. Vehicle Lanes
1) Two 10' vehicle traffic lanes are required onlocal residential streets when traffic volumes areexpected to exceed 750 vehicles per day.
2) On local residential streets with traffic vol-umes less than 750 vehicles per day, a single 14'traffic lane may be permitted for both directionsof vehicular travel. The single traffic lane isintended to create a “queuing street”, such thatwhen opposing vehicles meet, one of thevehicles must yield by pulling into a vacantportion of the adjacent parking lane. Thisqueuing effect has been found to be an effectiveand safe method to reduce speeds and non-localtraffic.
3) Two 12' wide vehicle traffic lanes are re-quired on local commercial and industrialstreets.
4) In special circumstances, such as where alocal street intersects with a collector or arterialstreet, additional width may be required for safeturning movements.
B. Medians
1) Center medians are a design option for Low-Volume and Medium-Volume Residential Streets,but the street design must ensure the minimum14' clear lane needed for fire apparatus.
2) Medians shall be landscaped withgroundcover, trees, and shrubs less than 3' inheight.
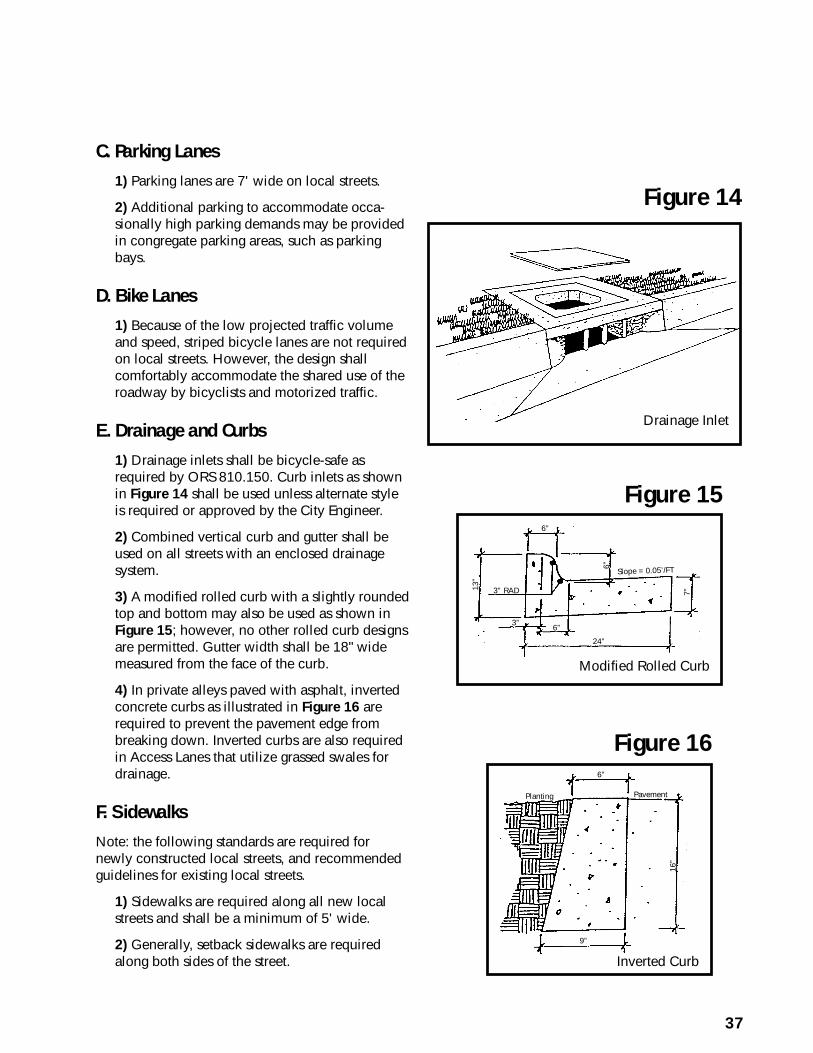
37
C. Parking Lanes
1) Parking lanes are 7' wide on local streets.
2) Additional parking to accommodate occa-sionally high parking demands may be providedin congregate parking areas, such as parkingbays.
D. Bike Lanes
1) Because of the low projected traffic volumeand speed, striped bicycle lanes are not requiredon local streets. However, the design shallcomfortably accommodate the shared use of theroadway by bicyclists and motorized traffic.
E. Drainage and Curbs
1) Drainage inlets shall be bicycle-safe asrequired by ORS 810.150. Curb inlets as shownin Figure 14 shall be used unless alternate styleis required or approved by the City Engineer.
2) Combined vertical curb and gutter shall beused on all streets with an enclosed drainagesystem.
3) A modified rolled curb with a slightly roundedtop and bottom may also be used as shown inFigure 15; however, no other rolled curb designsare permitted. Gutter width shall be 18" widemeasured from the face of the curb.
4) In private alleys paved with asphalt, invertedconcrete curbs as illustrated in Figure 16 arerequired to prevent the pavement edge frombreaking down. Inverted curbs are also requiredin Access Lanes that utilize grassed swales fordrainage.
F. Sidewalks
Note: the following standards are required fornewly constructed local streets, and recommendedguidelines for existing local streets.
1) Sidewalks are required along all new localstreets and shall be a minimum of 5' wide.
2) Generally, setback sidewalks are requiredalong both sides of the street.
Figure 14
Drainage Inlet
Figure 15
Slope = 0.05’/FT
6”
6”
6”
13”
3”
24”
3” RAD
Modified Rolled Curb
Figure 16
Inverted Curb
6”
9”
Planting Pavement
16”
7”
38
3) Setback sidewalks shall be set back from thestreet by a planting strip not less than 6' wide.
4) Sidewalks shall not have obstructions such asmailboxes, utility poles, or signs that reduce theusable width of the sidewalk below 5'.
5) Curbside sidewalks and sidewalks on one sideof the street are permitted for Access Lanes, inspecial circumstances, such as to reduce exces-sive impacts to topography, wetlands,drainageways, and other natural features; in infillsituations to match existing configurations; or onexisting unimproved streets. In these situations,the sidewalk may be placed adjacent to thestreet to reduce overall right-of-way. Curbsidesidewalks are also permitted for Commercial/Industrial Streets.
G. Utilities
1) The primary location for utilities is in a publicutility easement (PUE) adjacent to the right-of-way.
2) Utility facilities such as electric transformers,hydrants and junction boxes may be located inthe planting strip, but should be sited as close tothe property line as possible to avoid conflictswith street trees.
3) Utilities are required to avoid conflicts withstormwater-related conveyance and treatmentfacilities.
H. Street Lighting
1) Street lighting shall be provided on localstreets in accordance with IES standards.
I. Pavement and Right-of-Way Widths
1) Depending on the projected traffic volumesand any circumstances unique to the location,pavement widths for local residential streets (notincluding alleys) range from 20' to 34', with totalright-of-way widths ranging from 40' to 60'.
2) Pavement widths for local commercial andindustrial streets range from 30' to 44', with totalright-of-way widths ranging from 55' to 70'.
J. Cul-de-sacs
1) Maximum length for a cul-de-sac is 400 feet,measured from the centerline of the intersectingstreet to the radius point of the cul-de-sac bulb.
2) A cul-de-sac will normally terminate in astandard cul-de-sac bulb. In the event that astandard bulb is not feasible, a “Y” or “T”turnaround may be used.
3) Cul-de-sacs constructed with 20' of pavingand more than 150 feet in length must provide a12' emergency vehicle, bicycle, and pedestrianaccessway from the bulb to an adjacent street.
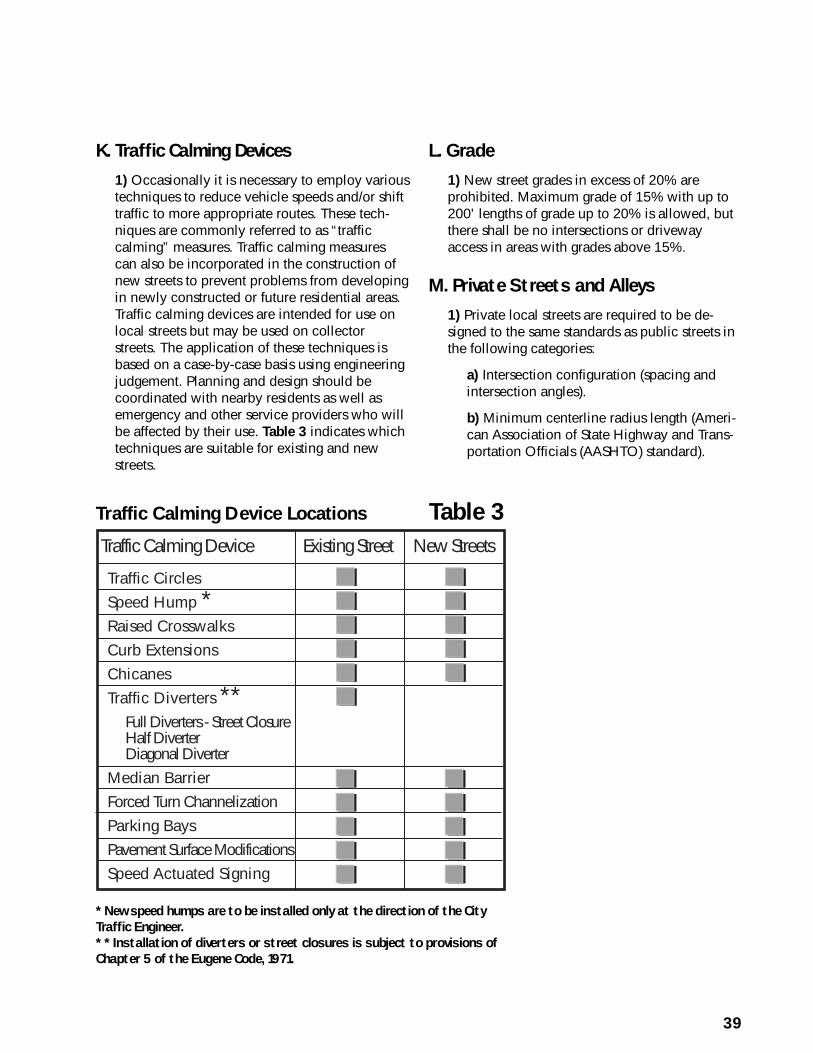
39
K. Traffic Calming Devices
1) Occasionally it is necessary to employ varioustechniques to reduce vehicle speeds and/or shifttraffic to more appropriate routes. These tech-niques are commonly referred to as “trafficcalming” measures. Traffic calming measurescan also be incorporated in the construction ofnew streets to prevent problems from developingin newly constructed or future residential areas.Traffic calming devices are intended for use onlocal streets but may be used on collectorstreets. The application of these techniques isbased on a case-by-case basis using engineeringjudgement. Planning and design should becoordinated with nearby residents as well asemergency and other service providers who willbe affected by their use. Table 3 indicates whichtechniques are suitable for existing and newstreets.
L. Grade
1) New street grades in excess of 20% areprohibited. Maximum grade of 15% with up to200' lengths of grade up to 20% is allowed, butthere shall be no intersections or drivewayaccess in areas with grades above 15%.
M. Private Streets and Alleys
1) Private local streets are required to be de-signed to the same standards as public streets inthe following categories:
a) Intersection configuration (spacing andintersection angles).
b) Minimum centerline radius length (Ameri-can Association of State Highway and Trans-portation Officials (AASHTO) standard).
Traffic Circles
Speed Hump *Raised Crosswalks
Curb Extensions
Chicanes
Traffic Diverters **Full Diverters - Street ClosureHalf DiverterDiagonal Diverter
Median Barrier
Forced Turn Channelization
Parking Bays
Pavement Surface Modifications
Speed Actuated Signing
Traffic Calming Device Existing Street New Streets
■■■■■■
■■■■■
■■■■■■
■■■■■
■■■■■
■■■■■
■■■■■
■■■■■
* New speed humps are to be installed only at the direction of the City
Traffic Engineer.
* * Installation of diverters or street closures is subject to provisions of
Chapter 5 of the Eugene Code, 1971.
Table 3Traffic Calming Device Locations
40
c) Grade: Maximum grade of 15% with up to200' lengths of grades up to 20%, but nointersections or driveway access in areas withgrades above 15%.
d) Sight distance.
e) Width: Minimum 20 feet
f) Curb height where necessary for roofdrains, safety or ADA requirements
g) Street alignments in relation to naturalresource sites and water-related features.
2) Sidewalks are required, but reduced sidewalkwidth is allowed, curbside or meanderingsidewalks that don’t parallel the street areallowed, and sidewalks are allowed on one sideof the street. Sidewalks must meet ADA require-ments, which allows a minimum width of 3'provided that “passing space” is provided atreasonable intervals, not to exceed 200 feet.
3) Private alleys are required to comply with thestandards for public alleys in the followingcategories:
a) Intersection configuration
b) Grade
c) Width and setback requirements
d) Curb requirements (if asphalt)
4) The structural design and construction inspec-tion for private streets and alleys shall remain thedevelopers responsibility. Certification by alicensed engineer that a structural design meet-ing the public design standards outlined abovehas been completed shall be submitted with theland use application.
Exceptions to Address Topography and
Natural Resources
Occasionally, streets are constructed in locationswhich require special accommodations such as inhilly areas, or near wetlands, canals, dense vegeta-tion, or sensitive plants and animals. In these cases,specific considerations should be made to minimizenegative impacts. For example, wide streets alongsteep slopes require much larger hillside cuts thannarrow streets.
Generally, the range of local street types make itpossible to construct or improve local streets inaccordance with the design standards. In certainsituations, however, exceptions should be made.Exceptions could result in construction of meander-ing sidewalks, sidewalks on only one side of thestreet, or curbside sidewalk segments instead ofsetback walks. Exceptions are allowed when one ormore of the following conditions exist.
1) Physical conditions that preclude develop-ment of a public street. Such conditions mayinclude, but are not limited to, topography or theexistence of natural resource areas such aswetlands, ponds, streams, channels, rivers, lakesor upland wildlife habitat areas, or a resource onthe National Wetland Inventory or under protec-tion by State or Federal law; or
2) Buildings or other existing development onadjacent lands, including previously subdividedbut vacant lots or parcels, physically preclude aconnection now or in the future, considering thepotential for redevelopment.
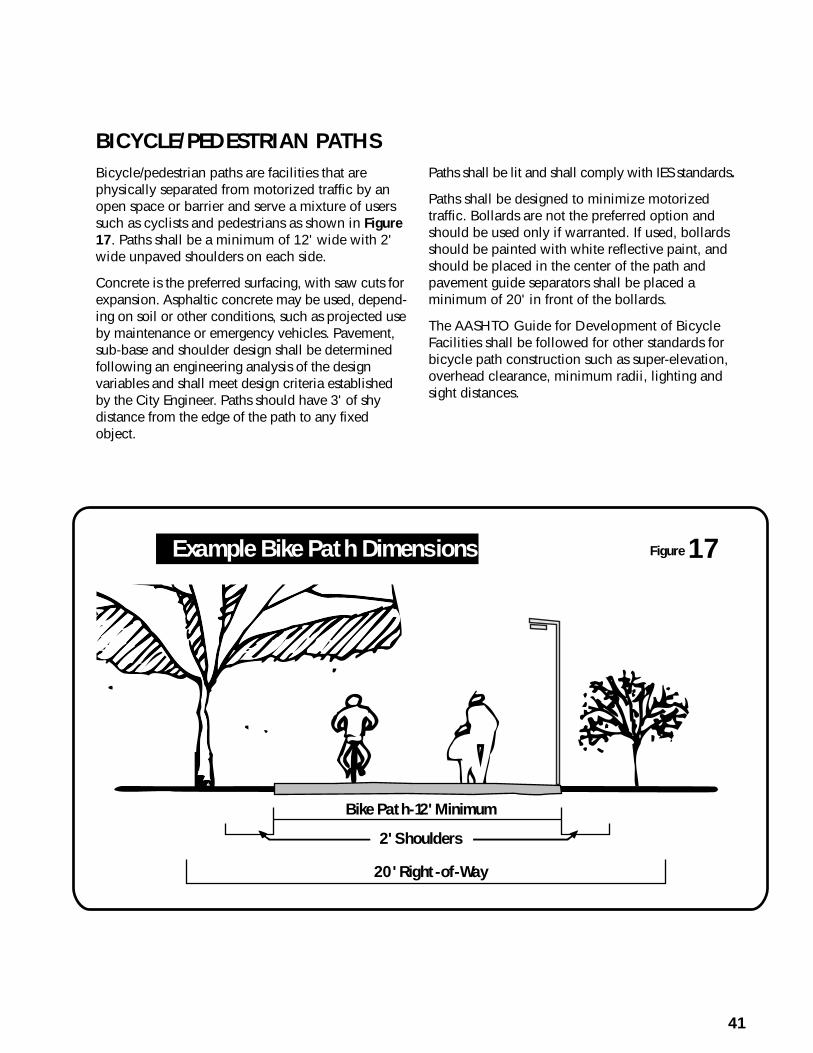
41
BICYCLE/PEDESTRIAN PATHSBicycle/pedestrian paths are facilities that arephysically separated from motorized traffic by anopen space or barrier and serve a mixture of userssuch as cyclists and pedestrians as shown in Figure17. Paths shall be a minimum of 12' wide with 2'wide unpaved shoulders on each side.
Concrete is the preferred surfacing, with saw cuts forexpansion. Asphaltic concrete may be used, depend-ing on soil or other conditions, such as projected useby maintenance or emergency vehicles. Pavement,sub-base and shoulder design shall be determinedfollowing an engineering analysis of the designvariables and shall meet design criteria establishedby the City Engineer. Paths should have 3' of shydistance from the edge of the path to any fixedobject.
Paths shall be lit and shall comply with IES standards.
Paths shall be designed to minimize motorizedtraffic. Bollards are not the preferred option andshould be used only if warranted. If used, bollardsshould be painted with white reflective paint, andshould be placed in the center of the path andpavement guide separators shall be placed aminimum of 20' in front of the bollards.
The AASHTO Guide for Development of BicycleFacilities shall be followed for other standards forbicycle path construction such as super-elevation,overhead clearance, minimum radii, lighting andsight distances.
20' Right-of-Way
Bike Path-12' Minimum
2' Shoulders
Example Bike Path Dimensions Figure 17
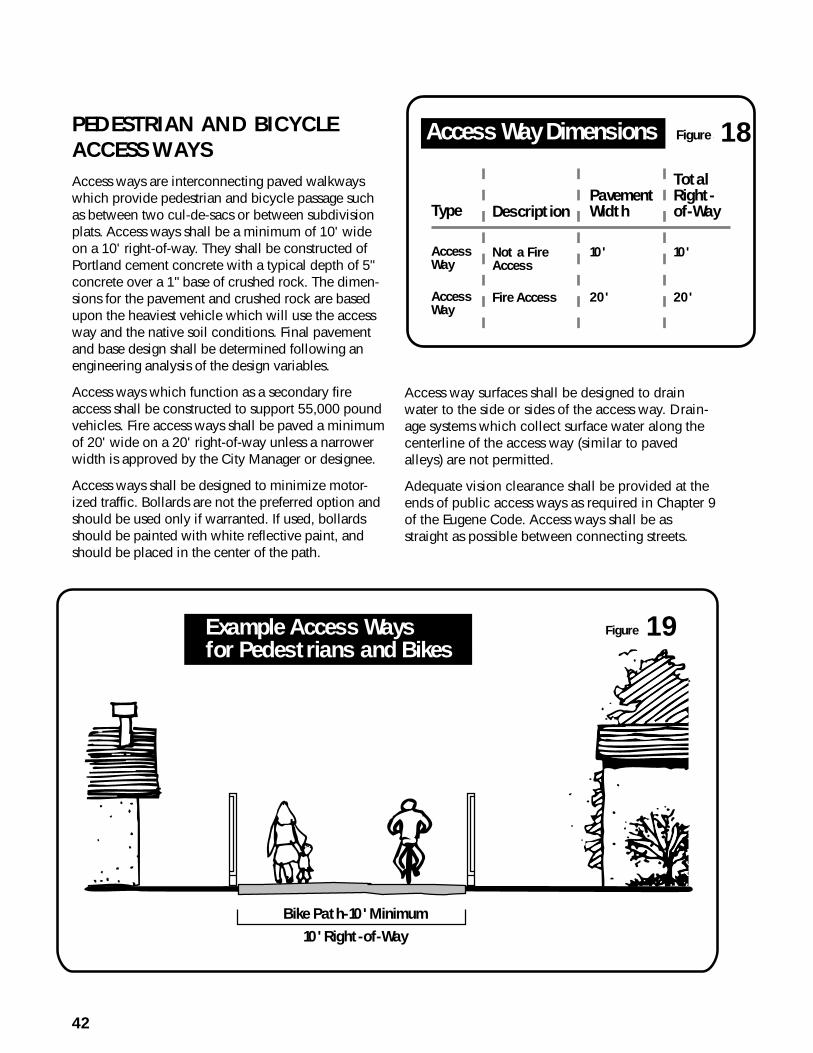
42
PEDESTRIAN AND BICYCLEACCESS WAYSAccess ways are interconnecting paved walkwayswhich provide pedestrian and bicycle passage suchas between two cul-de-sacs or between subdivisionplats. Access ways shall be a minimum of 10' wideon a 10' right-of-way. They shall be constructed ofPortland cement concrete with a typical depth of 5"concrete over a 1" base of crushed rock. The dimen-sions for the pavement and crushed rock are basedupon the heaviest vehicle which will use the accessway and the native soil conditions. Final pavementand base design shall be determined following anengineering analysis of the design variables.
Access ways which function as a secondary fireaccess shall be constructed to support 55,000 poundvehicles. Fire access ways shall be paved a minimumof 20' wide on a 20' right-of-way unless a narrowerwidth is approved by the City Manager or designee.
Access ways shall be designed to minimize motor-ized traffic. Bollards are not the preferred option andshould be used only if warranted. If used, bollardsshould be painted with white reflective paint, andshould be placed in the center of the path.
Access way surfaces shall be designed to drainwater to the side or sides of the access way. Drain-age systems which collect surface water along thecenterline of the access way (similar to pavedalleys) are not permitted.
Adequate vision clearance shall be provided at theends of public access ways as required in Chapter 9of the Eugene Code. Access ways shall be asstraight as possible between connecting streets.
Bike Path-10' Minimum
10' Right-of-Way
Example Access Ways for Pedestrians and Bikes
Figure 59
Description
Not a Fire Access
Fire Access
Figure 58Access Way Dimensions
Type
Access Way
Access Way
Pavement Width
10'
20'
Total Right-of-Way
10'
20'
18
19
{00 J
Appendix I: Eugene Transportation System Plan: Public Involvement Plan

M E M O R A N D U M
Eugene Transportation System Plan: Public Involvement Plan
PREPARED FOR: Eugene Transportation System Plan Project Management Team
PREPARED BY: Brandy Steffen, CH2M HILL Kristin Hull, CH2M HILL
CC: Theresa Carr, CH2M HILL
DATE: July 8, 2010
This memo describes the proposed public involvement plan for phase 1 and 2, to support development and adoption of the Eugene Transportation System Plan (TSP). Implementation of the plan will require the support of the City of Eugene, the Oregon Department of Transportation (ODOT), Department of Land Conservation and Development (DLCD), and the Lane Council of Governments (LCOG); as well as coordination with the projects listed above. Effective documentation of public input will make it easier for the project team to incorporate community ideas and concerns, and for community members to make a connection between their input and decisions.
Goals of the Public Involvement Plan The project is committed to an approach that is consistent with the Oregon Statewide Planning Goal 1 (Citizen Participation). The Eugene TSP public involvement approach:
• Provides early and ongoing opportunities for stakeholders to raise issues and concerns that can be considered through equitable and constructive two-way communication between the project team and the public.
• Provides complete and timely information to the public about ways to comment and help develop the TSP.
• Proactively informs and encourages the participation of all stakeholders regardless of race, ethnicity, age, disability, income, or primary language.
• Builds widespread community understanding of findings and decisions.
This document covers two components of the public involvement structure, the project teams’ decision process and structure, which will remain the same for the entire project lifespan, and the public involvement process and tools, which will change during the next phase of project work.
Decision Process and Structure This portion of the memo identifies the decision milestone, process, and decision-making structure. This information will not change over the life of the project.
7/19/2010 1
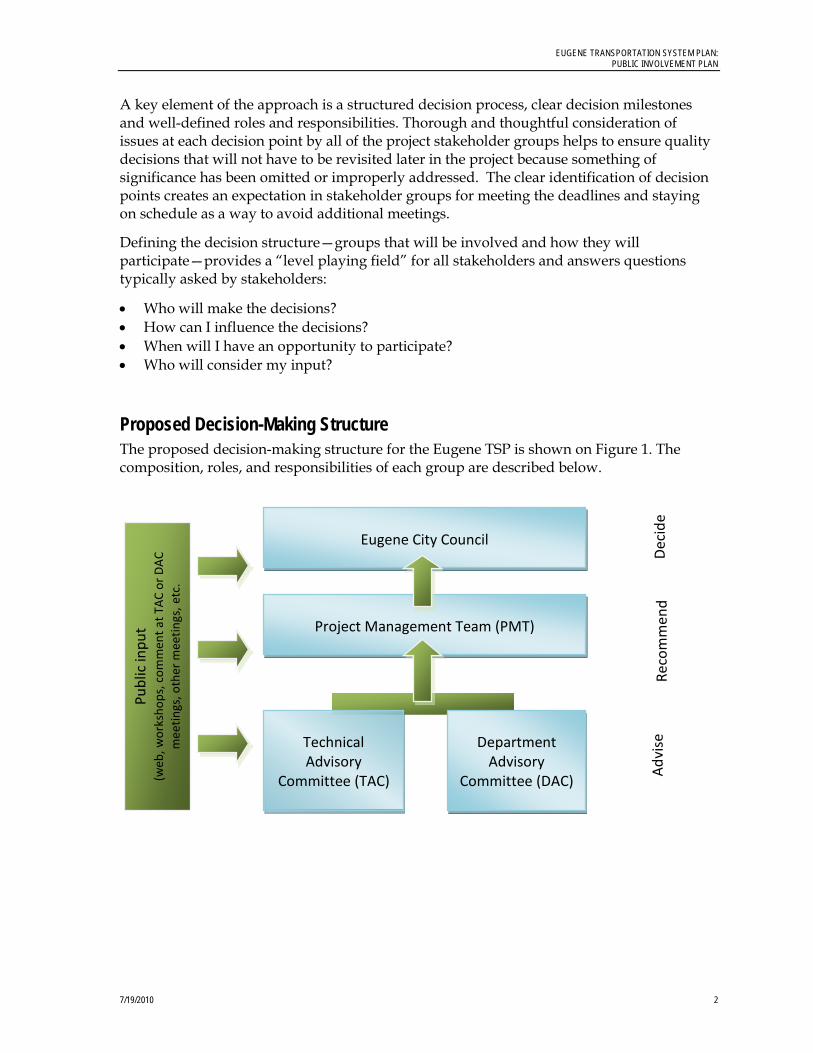
EUGENE TRANSPORTATION SYSTEM PLAN: PUBLIC INVOLVEMENT PLAN
A key element of the approach is a structured decision process, clear decision milestones and well-defined roles and responsibilities. Thorough and thoughtful consideration of issues at each decision point by all of the project stakeholder groups helps to ensure quality decisions that will not have to be revisited later in the project because something of significance has been omitted or improperly addressed. The clear identification of decision points creates an expectation in stakeholder groups for meeting the deadlines and staying on schedule as a way to avoid additional meetings.
Defining the decision structure—groups that will be involved and how they will participate—provides a “level playing field” for all stakeholders and answers questions typically asked by stakeholders:
• Who will make the decisions? • How can I influence the decisions? • When will I have an opportunity to participate? • Who will consider my input?
Proposed Decision-Making Structure The proposed decision-making structure for the Eugene TSP is shown on Figure 1. The composition, roles, and responsibilities of each group are described below.
Department Advisory
Committee (DAC)
Technical Advisory
Committee (TAC)
Project Management Team (PMT)
Eugene City Council
Publ
ic in
put
(web
, wor
ksho
ps, c
omm
ent a
t TAC
or D
AC
mee
tings
, oth
er m
eetin
gs, e
tc.
Deci
de
Advi
se
Reco
mm
end
7/19/2010 2
EUGENE TRANSPORTATION SYSTEM PLAN: PUBLIC INVOLVEMENT PLAN
FIGURE1 Decision-Making Structure
Eugene City Council The Eugene City Council will ultimately adopt the completed TSP. This will then be followed by Lane County co-adoption and acknowledgement by DLCD. Technical Advisory Committee
The Technical Advisory Committee (TAC) is expected to include representatives from the City of Eugene, ODOT, Lane Transit District, Lane County, and the Eugene/Springfield School District, among others. The City of Eugene will be responsible for compiling the TAC roster. Responsibilities of the TAC include:
• Provide technical feedback at key milestones, by reviewing and commenting on the key deliverables.
• Represent the interests of their agencies or jurisdictions in group deliberations.
• Communicate project progress to their fellow elected or appointed officials, and to their constituents.
• Provide input to the PMT on technical issues related to the planning efforts.
Department Advisory Committee The Department Advisory Committee (DAC) will provide a balanced representation of stakeholder interests, affected communities, and geographic areas as well as a communication link with those interests and communities. Members will include leaders of neighborhoods affected by the project, agency staff representatives, representatives of local and regional business groups and advocates for key interests, including different modes, environmental representatives and civic groups. The City of Eugene will be responsible for creating the DAC roster. Responsibilities of DAC members include:
• Represent their constituents’ perspectives during group deliberations.
• Communicate project progress with their constituents.
• Review and comment on the key deliverables (provide input to the PMT on policy issues).
• Support the public involvement process.
Project Management Team The Project Management Team (PMT) will be comprised of the ODOT Project Manager, the City of Eugene Project Manager, the LCOG Project Manager, and the consultant project manager, with participation from other key staff resources as needed. The PMT’s responsibilities include:
• Management of project scope, schedule, and budget at a day-to-day level.
• Direction, production, and quality assurance of technical and public/agency involvement work.
7/19/2010 3
EUGENE TRANSPORTATION SYSTEM PLAN: PUBLIC INVOLVEMENT PLAN
• Assurance of an open, transparent process that incorporates full consideration of public input.
• Develop recommendations to the City Council.
Proposed Decision Process The decision process for the Eugene TSP will be organized into the following decision points as described below:
• Prepare Goals and Objectives • Develop Performance Measures and Policies • Identify Existing and Future Need • Identify Alternatives • Evaluate Alternatives • Prepare Recommendations • Prepare and Adopt Plan
Prepare Goals and Objectives The consultant team will work with the PMT, the TAC, the DAC, and the community to develop goals and objectives for the TSP effort. These will include what the TSP is intended to address, and how it will be addressed. Goals and objectives will serve as the basis for the performance measures and will be used to evaluate alternatives.
Develop Performance Measures and Policies This next decision step creates supporting policies, based on goals and objectives, which serve as the basis of the TSP. It also develops performance measures to assist in evaluating and identifying alternatives. This will build from the goals and objectives and add qualitative and quantitative performance measures for gauging the effectiveness of alternatives—how well they solve the identified problems and how well they perform against the broad range of stakeholder values. The measures will be reviewed by the TAC and DAC, and discussed at a public workshop.
Identify Existing and Future Need This decision point will ask for agreement on the description of existing and future deficiencies to be addressed by the TSP, with input from the public. The TAC and DAC will also review this statement of need. This phase will also rely on the evaluation of existing and future conditions.
Identify Alternatives The PMT, DAC, and TAC will discuss ways to address needs through projects and programs, preferably in a workshop setting. At this point, all concepts -- alternatives or solutions that could potentially solve the identified problem – are considered. The aim is to ensure stakeholders have been consulted and all of their ideas get put “on the table.”
7/19/2010 4
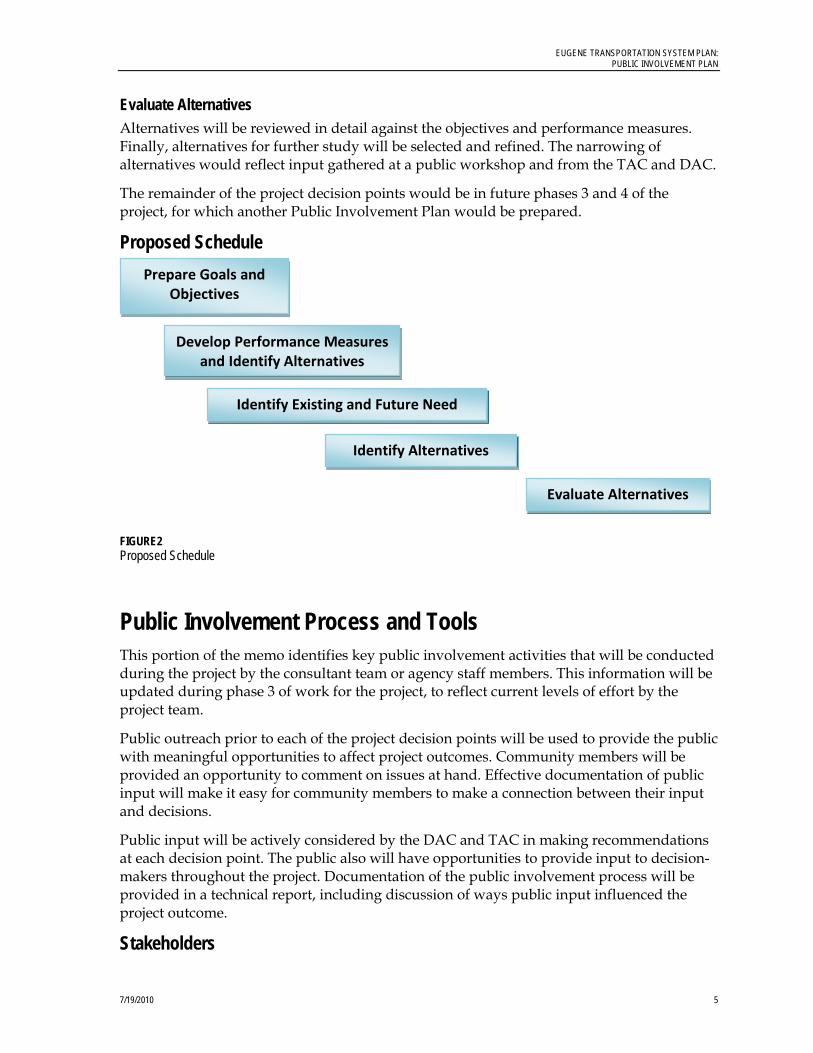
EUGENE TRANSPORTATION SYSTEM PLAN: PUBLIC INVOLVEMENT PLAN
Evaluate Alternatives Alternatives will be reviewed in detail against the objectives and performance measures. Finally, alternatives for further study will be selected and refined. The narrowing of alternatives would reflect input gathered at a public workshop and from the TAC and DAC.
The remainder of the project decision points would be in future phases 3 and 4 of the project, for which another Public Involvement Plan would be prepared.
Proposed Schedule
FIGURE2 Proposed Schedule
Public Involvement Process and Tools This portion of the memo identifies key public involvement activities that will be conducted during the project by the consultant team or agency staff members. This information will be updated during phase 3 of work for the project, to reflect current levels of effort by the project team.
Public outreach prior to each of the project decision points will be used to provide the public with meaningful opportunities to affect project outcomes. Community members will be provided an opportunity to comment on issues at hand. Effective documentation of public input will make it easy for community members to make a connection between their input and decisions.
Public input will be actively considered by the DAC and TAC in making recommendations at each decision point. The public also will have opportunities to provide input to decision-makers throughout the project. Documentation of the public involvement process will be provided in a technical report, including discussion of ways public input influenced the project outcome.
Stakeholders
Identify Existing and Future Need
Develop Performance Measures and Identify Alternatives
Prepare Goals and Objectives
Identify Alternatives
Evaluate Alternatives
7/19/2010 5
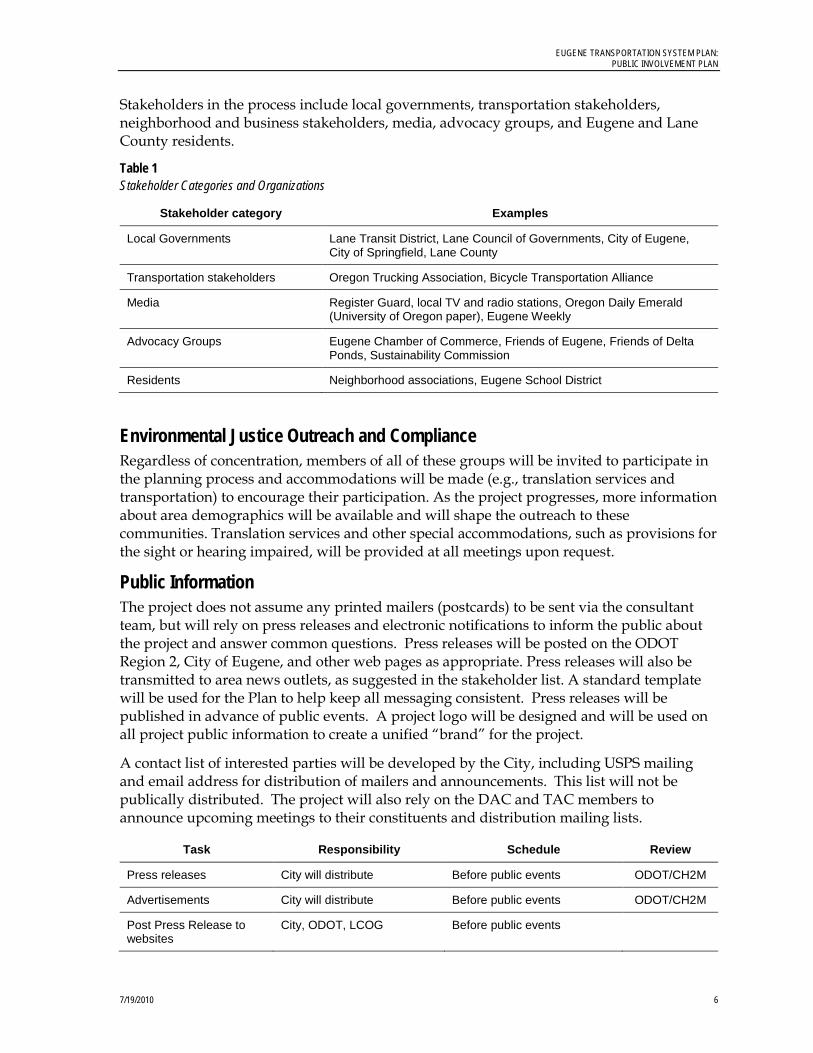
EUGENE TRANSPORTATION SYSTEM PLAN: PUBLIC INVOLVEMENT PLAN
Stakeholders in the process include local governments, transportation stakeholders, neighborhood and business stakeholders, media, advocacy groups, and Eugene and Lane County residents.
Table 1 Stakeholder Categories and Organizations
Stakeholder category Examples
Local Governments Lane Transit District, Lane Council of Governments, City of Eugene, City of Springfield, Lane County
Transportation stakeholders Oregon Trucking Association, Bicycle Transportation Alliance
Media Register Guard, local TV and radio stations, Oregon Daily Emerald (University of Oregon paper), Eugene Weekly
Advocacy Groups Eugene Chamber of Commerce, Friends of Eugene, Friends of Delta Ponds, Sustainability Commission
Residents Neighborhood associations, Eugene School District
Environmental Justice Outreach and Compliance Regardless of concentration, members of all of these groups will be invited to participate in the planning process and accommodations will be made (e.g., translation services and transportation) to encourage their participation. As the project progresses, more information about area demographics will be available and will shape the outreach to these communities. Translation services and other special accommodations, such as provisions for the sight or hearing impaired, will be provided at all meetings upon request.
Public Information The project does not assume any printed mailers (postcards) to be sent via the consultant team, but will rely on press releases and electronic notifications to inform the public about the project and answer common questions. Press releases will be posted on the ODOT Region 2, City of Eugene, and other web pages as appropriate. Press releases will also be transmitted to area news outlets, as suggested in the stakeholder list. A standard template will be used for the Plan to help keep all messaging consistent. Press releases will be published in advance of public events. A project logo will be designed and will be used on all project public information to create a unified “brand” for the project.
A contact list of interested parties will be developed by the City, including USPS mailing and email address for distribution of mailers and announcements. This list will not be publically distributed. The project will also rely on the DAC and TAC members to announce upcoming meetings to their constituents and distribution mailing lists.
Task Responsibility Schedule Review
Press releases City will distribute Before public events ODOT/CH2M
Advertisements City will distribute Before public events ODOT/CH2M
Post Press Release to websites
City, ODOT, LCOG Before public events
7/19/2010 6
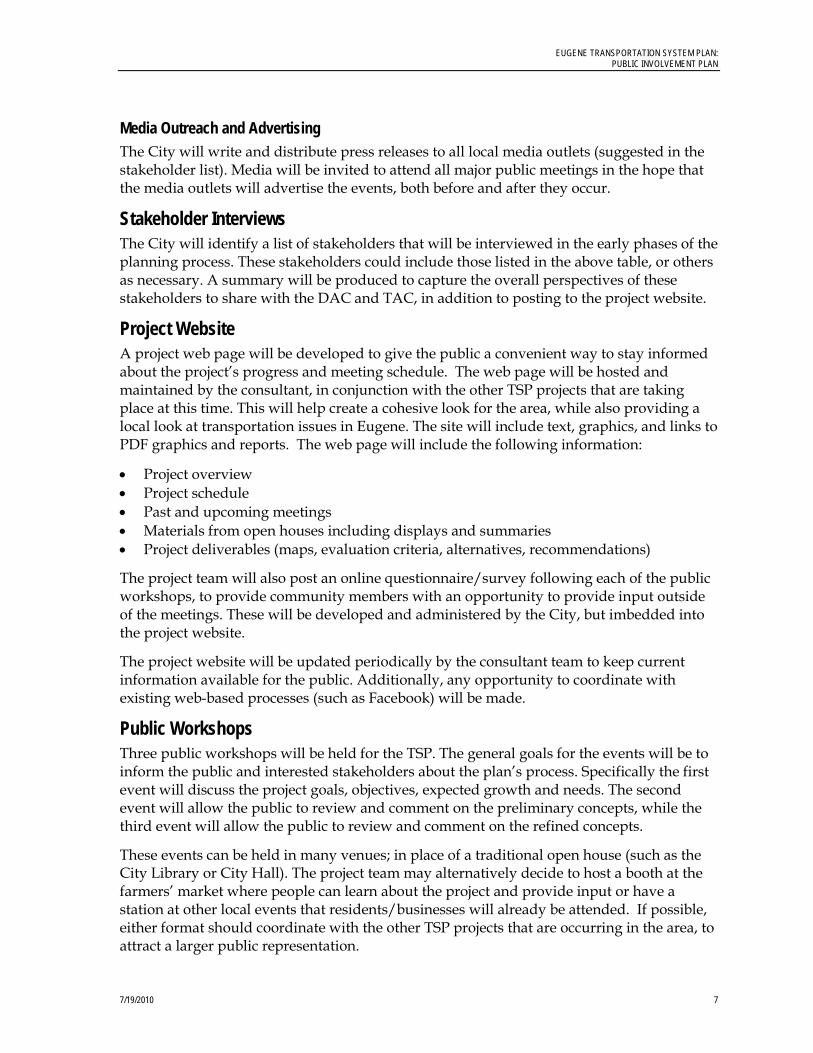
EUGENE TRANSPORTATION SYSTEM PLAN: PUBLIC INVOLVEMENT PLAN
Media Outreach and Advertising The City will write and distribute press releases to all local media outlets (suggested in the stakeholder list). Media will be invited to attend all major public meetings in the hope that the media outlets will advertise the events, both before and after they occur.
Stakeholder Interviews The City will identify a list of stakeholders that will be interviewed in the early phases of the planning process. These stakeholders could include those listed in the above table, or others as necessary. A summary will be produced to capture the overall perspectives of these stakeholders to share with the DAC and TAC, in addition to posting to the project website.
Project Website A project web page will be developed to give the public a convenient way to stay informed about the project’s progress and meeting schedule. The web page will be hosted and maintained by the consultant, in conjunction with the other TSP projects that are taking place at this time. This will help create a cohesive look for the area, while also providing a local look at transportation issues in Eugene. The site will include text, graphics, and links to PDF graphics and reports. The web page will include the following information:
• Project overview • Project schedule • Past and upcoming meetings • Materials from open houses including displays and summaries • Project deliverables (maps, evaluation criteria, alternatives, recommendations)
The project team will also post an online questionnaire/survey following each of the public workshops, to provide community members with an opportunity to provide input outside of the meetings. These will be developed and administered by the City, but imbedded into the project website.
The project website will be updated periodically by the consultant team to keep current information available for the public. Additionally, any opportunity to coordinate with existing web-based processes (such as Facebook) will be made.
Public Workshops Three public workshops will be held for the TSP. The general goals for the events will be to inform the public and interested stakeholders about the plan’s process. Specifically the first event will discuss the project goals, objectives, expected growth and needs. The second event will allow the public to review and comment on the preliminary concepts, while the third event will allow the public to review and comment on the refined concepts.
These events can be held in many venues; in place of a traditional open house (such as the City Library or City Hall). The project team may alternatively decide to host a booth at the farmers’ market where people can learn about the project and provide input or have a station at other local events that residents/businesses will already be attended. If possible, either format should coordinate with the other TSP projects that are occurring in the area, to attract a larger public representation.
7/19/2010 7
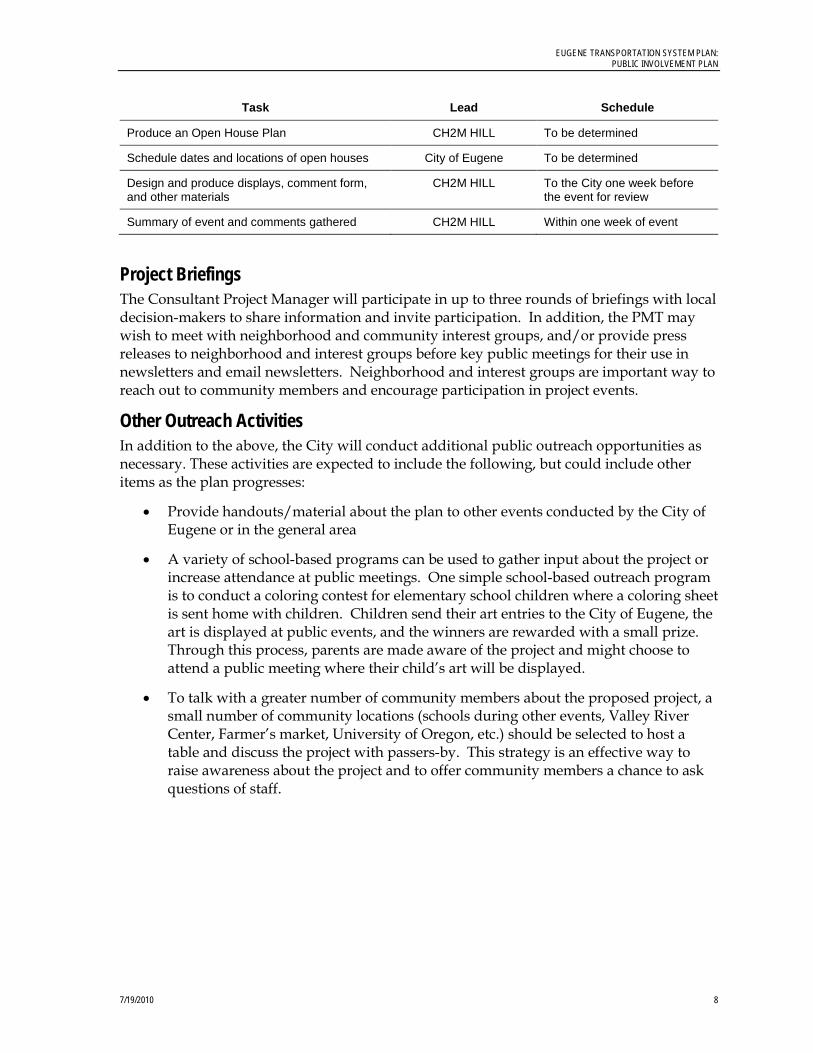
EUGENE TRANSPORTATION SYSTEM PLAN: PUBLIC INVOLVEMENT PLAN
Task Lead Schedule
Produce an Open House Plan CH2M HILL To be determined
Schedule dates and locations of open houses City of Eugene To be determined
Design and produce displays, comment form, and other materials
CH2M HILL To the City one week before the event for review
Summary of event and comments gathered CH2M HILL Within one week of event
Project Briefings The Consultant Project Manager will participate in up to three rounds of briefings with local decision-makers to share information and invite participation. In addition, the PMT may wish to meet with neighborhood and community interest groups, and/or provide press releases to neighborhood and interest groups before key public meetings for their use in newsletters and email newsletters. Neighborhood and interest groups are important way to reach out to community members and encourage participation in project events.
Other Outreach Activities In addition to the above, the City will conduct additional public outreach opportunities as necessary. These activities are expected to include the following, but could include other items as the plan progresses:
• Provide handouts/material about the plan to other events conducted by the City of Eugene or in the general area
• A variety of school-based programs can be used to gather input about the project or increase attendance at public meetings. One simple school-based outreach program is to conduct a coloring contest for elementary school children where a coloring sheet is sent home with children. Children send their art entries to the City of Eugene, the art is displayed at public events, and the winners are rewarded with a small prize. Through this process, parents are made aware of the project and might choose to attend a public meeting where their child’s art will be displayed.
• To talk with a greater number of community members about the proposed project, a small number of community locations (schools during other events, Valley River Center, Farmer’s market, University of Oregon, etc.) should be selected to host a table and discuss the project with passers-by. This strategy is an effective way to raise awareness about the project and to offer community members a chance to ask questions of staff.
7/19/2010 8
{00 K
Appendix J: Lane Transit District Long Range Transportation Plan (2014)


The LTD Long Range Transportation Plan can be found on the project website at the web address below.
http://www.centrallanertsp.org/sites/default/files/AppendixK-LTDLong%20RangeTransportationPlan-re.pdf

{00 L
Appendix K: Strategies for Transportation System Management and Operations (TSMO)

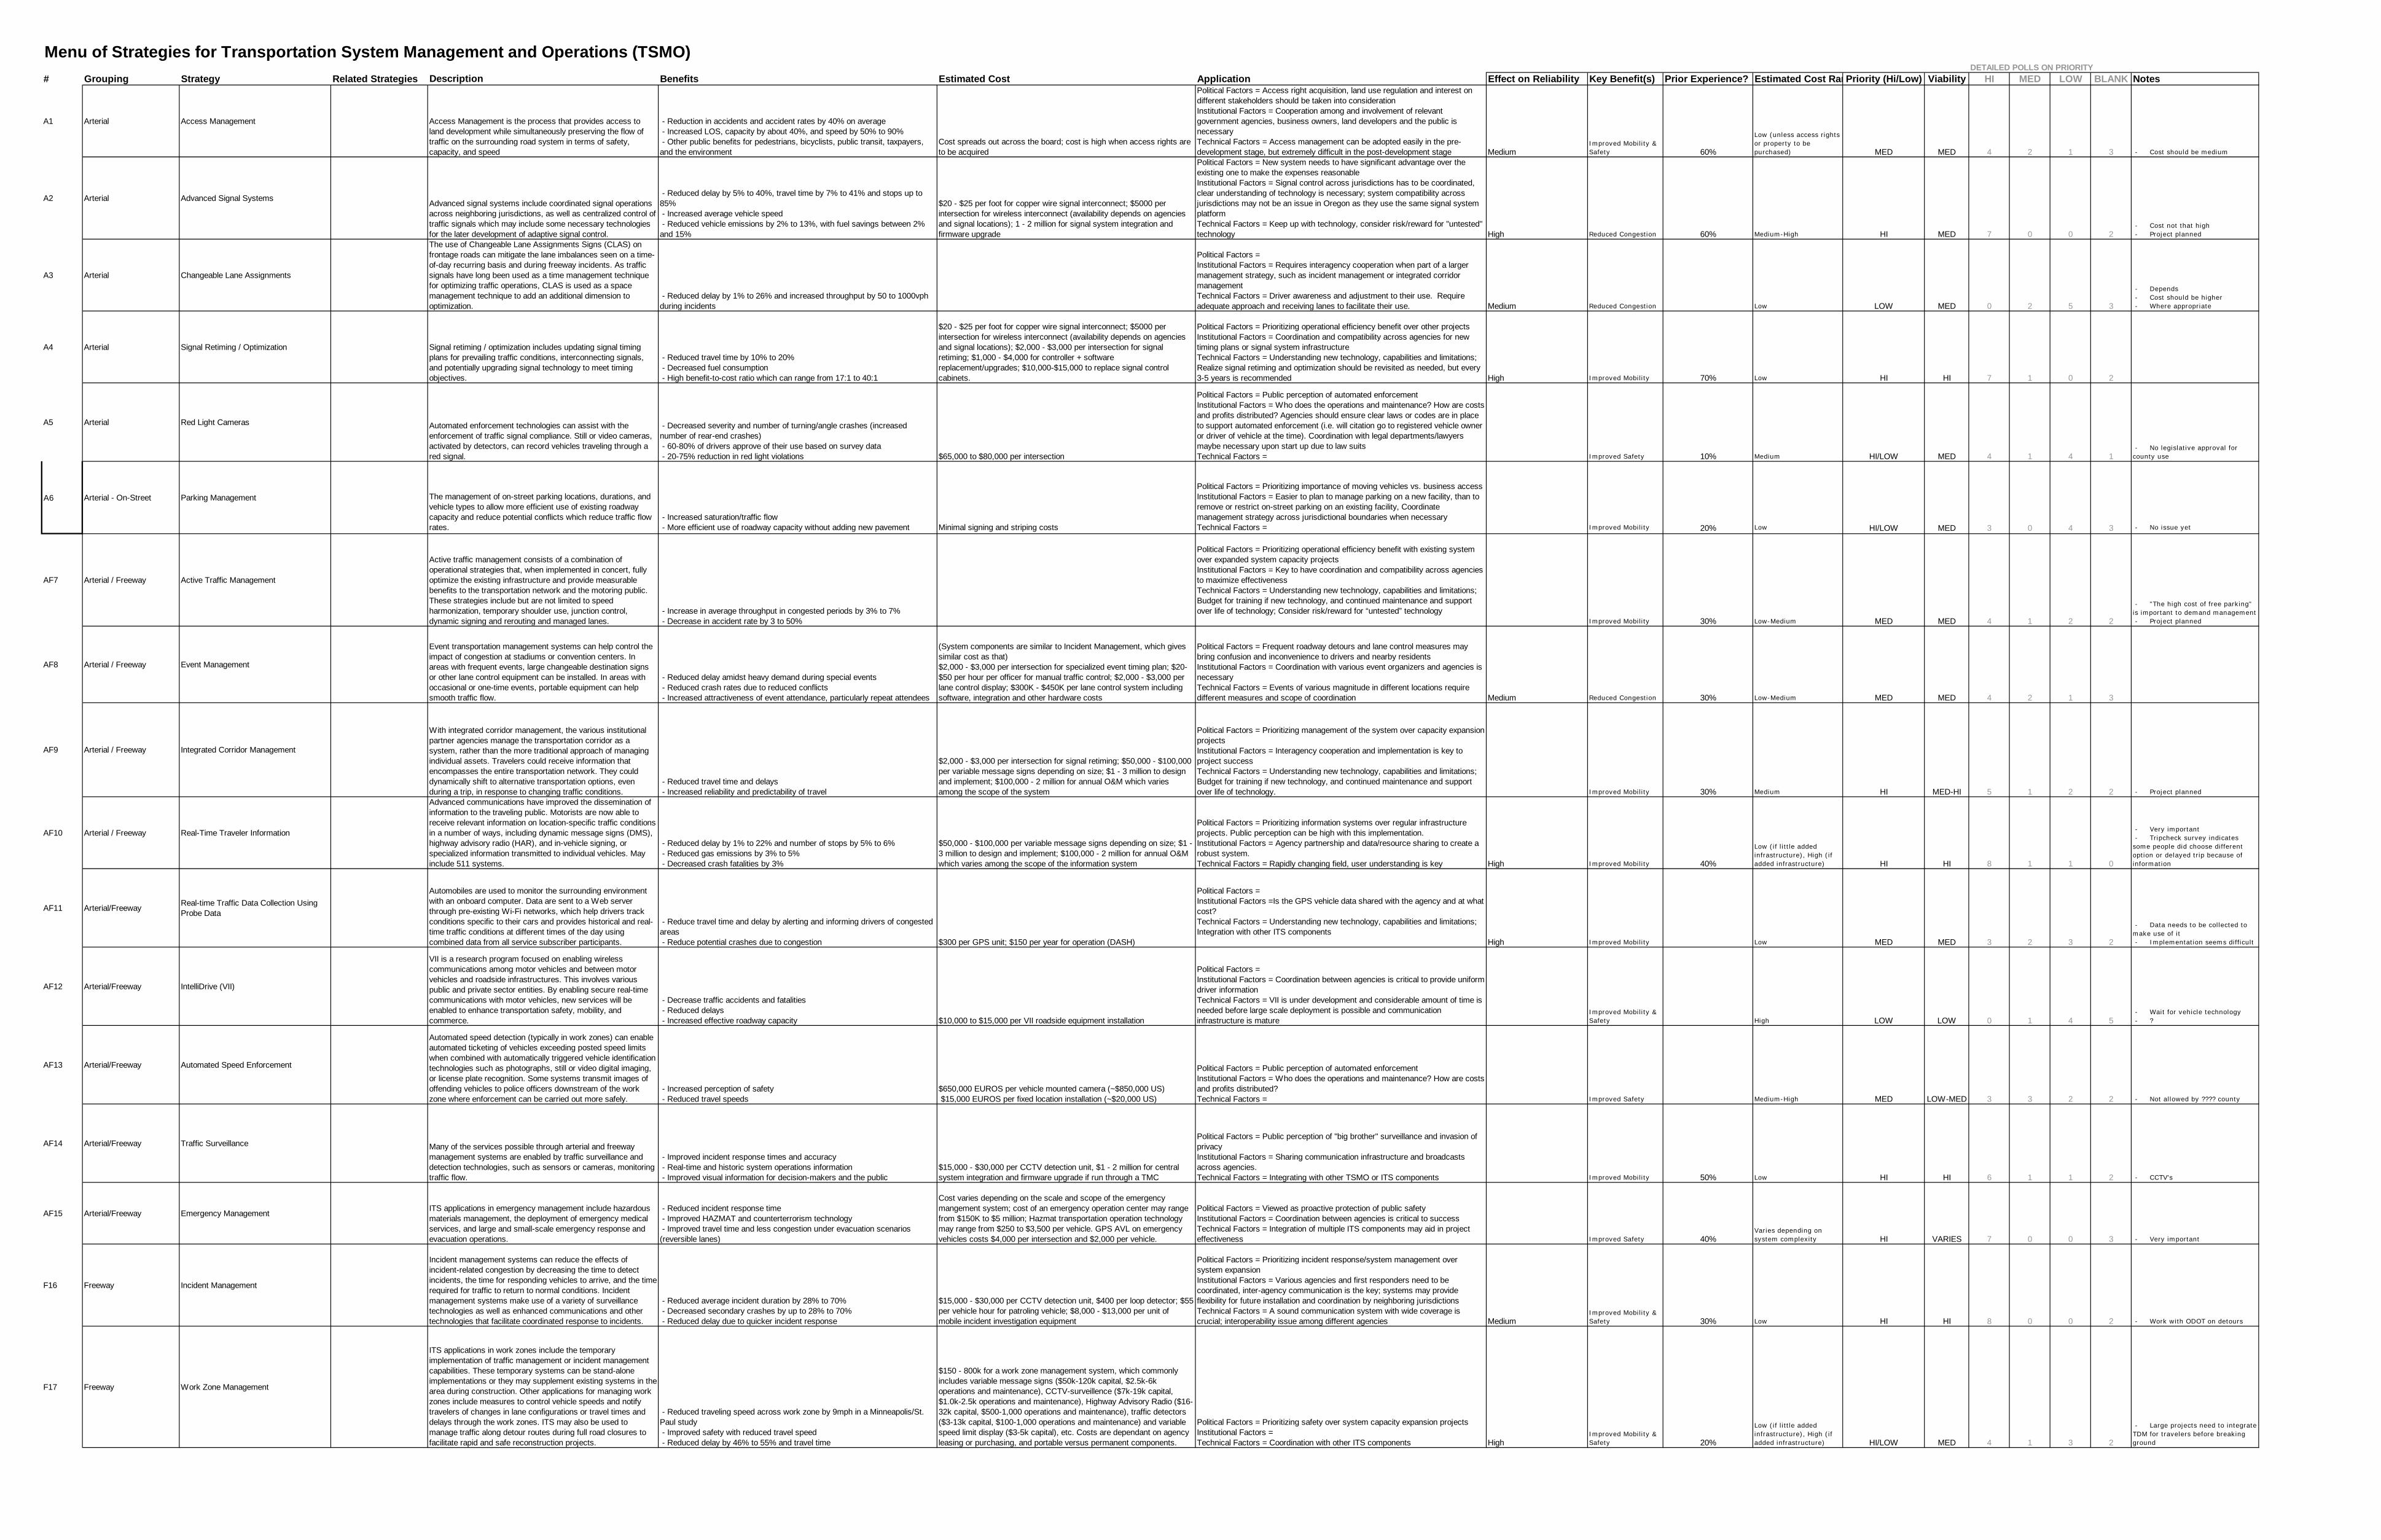
Menu of Strategies for Transportation System Management and Operations (TSMO)DETAILED POLLS ON PRIORITY
# Grouping Strategy Related Strategies Description Benefits Estimated Cost Application Effect on Reliability Key Benefit(s) Prior Experience? Estimated Cost RanPriority (Hi/Low) Viability HI MED LOW BLANK Notes
A1 Arterial Access Management Access Management is the process that provides access to land development while simultaneously preserving the flow of traffic on the surrounding road system in terms of safety, capacity, and speed
- Reduction in accidents and accident rates by 40% on average - Increased LOS, capacity by about 40%, and speed by 50% to 90% - Other public benefits for pedestrians, bicyclists, public transit, taxpayers, and the environment
Cost spreads out across the board; cost is high when access rights are to be acquired
Political Factors = Access right acquisition, land use regulation and interest on different stakeholders should be taken into considerationInstitutional Factors = Cooperation among and involvement of relevant government agencies, business owners, land developers and the public is necessaryTechnical Factors = Access management can be adopted easily in the pre-development stage, but extremely difficult in the post-development stage Medium
Improved Mobility & Safety 60%
Low (unless access rights or property to be purchased) MED MED 4 2 1 3 - Cost should be medium
A2 Arterial Advanced Signal SystemsAdvanced signal systems include coordinated signal operations across neighboring jurisdictions, as well as centralized control of traffic signals which may include some necessary technologies for the later development of adaptive signal control.
- Reduced delay by 5% to 40%, travel time by 7% to 41% and stops up to 85% - Increased average vehicle speed - Reduced vehicle emissions by 2% to 13%, with fuel savings between 2% and 15%
$20 - $25 per foot for copper wire signal interconnect; $5000 per intersection for wireless interconnect (availability depends on agencies and signal locations); 1 - 2 million for signal system integration and firmware upgrade
Political Factors = New system needs to have significant advantage over the existing one to make the expenses reasonableInstitutional Factors = Signal control across jurisdictions has to be coordinated, clear understanding of technology is necessary; system compatibility across jurisdictions may not be an issue in Oregon as they use the same signal system platformTechnical Factors = Keep up with technology, consider risk/reward for "untested" technology High Reduced Congestion 60% Medium-High HI MED 7 0 0 2
- Cost not that high - Project planned
A3 Arterial Changeable Lane Assignments
The use of Changeable Lane Assignments Signs (CLAS) on frontage roads can mitigate the lane imbalances seen on a time-of-day recurring basis and during freeway incidents. As traffic signals have long been used as a time management technique for optimizing traffic operations, CLAS is used as a space management technique to add an additional dimension to optimization.
- Reduced delay by 1% to 26% and increased throughput by 50 to 1000vph during incidents
Political Factors = Institutional Factors = Requires interagency cooperation when part of a larger management strategy, such as incident management or integrated corridor managementTechnical Factors = Driver awareness and adjustment to their use. Require adequate approach and receiving lanes to facilitate their use. Medium Reduced Congestion Low LOW MED 0 2 5 3
- Depends - Cost should be higher - Where appropriate
A4 Arterial Signal Retiming / Optimization Signal retiming / optimization includes updating signal timing plans for prevailing traffic conditions, interconnecting signals, and potentially upgrading signal technology to meet timing objectives.
- Reduced travel time by 10% to 20% - Decreased fuel consumption - High benefit-to-cost ratio which can range from 17:1 to 40:1
$20 - $25 per foot for copper wire signal interconnect; $5000 per intersection for wireless interconnect (availability depends on agencies and signal locations); $2,000 - $3,000 per intersection for signal retiming; $1,000 - $4,000 for controller + software replacement/upgrades; $10,000-$15,000 to replace signal control cabinets.
Political Factors = Prioritizing operational efficiency benefit over other projectsInstitutional Factors = Coordination and compatibility across agencies for new timing plans or signal system infrastructureTechnical Factors = Understanding new technology, capabilities and limitations; Realize signal retiming and optimization should be revisited as needed, but every 3-5 years is recommended High Improved Mobility 70% Low HI HI 7 1 0 2
A5 Arterial Red Light Cameras Automated enforcement technologies can assist with the enforcement of traffic signal compliance. Still or video cameras, activated by detectors, can record vehicles traveling through a red signal.
- Decreased severity and number of turning/angle crashes (increased number of rear-end crashes) - 60-80% of drivers approve of their use based on survey data - 20-75% reduction in red light violations $65,000 to $80,000 per intersection
Political Factors = Public perception of automated enforcementInstitutional Factors = Who does the operations and maintenance? How are costs and profits distributed? Agencies should ensure clear laws or codes are in place to support automated enforcement (i.e. will citation go to registered vehicle owner or driver of vehicle at the time). Coordination with legal departments/lawyers maybe necessary upon start up due to law suitsTechnical Factors = Improved Safety 10% Medium HI/LOW MED 4 1 4 1
- No legislative approval for county use
A6 Arterial - On-Street Parking Management The management of on-street parking locations, durations, and vehicle types to allow more efficient use of existing roadway capacity and reduce potential conflicts which reduce traffic flow rates.
- Increased saturation/traffic flow - More efficient use of roadway capacity without adding new pavement Minimal signing and striping costs
Political Factors = Prioritizing importance of moving vehicles vs. business accessInstitutional Factors = Easier to plan to manage parking on a new facility, than to remove or restrict on-street parking on an existing facility, Coordinate management strategy across jurisdictional boundaries when necessaryTechnical Factors = Improved Mobility 20% Low HI/LOW MED 3 0 4 3 - No issue yet
AF7 Arterial / Freeway Active Traffic Management
Active traffic management consists of a combination of operational strategies that, when implemented in concert, fully optimize the existing infrastructure and provide measurable benefits to the transportation network and the motoring public. These strategies include but are not limited to speed harmonization, temporary shoulder use, junction control, dynamic signing and rerouting and managed lanes.
- Increase in average throughput in congested periods by 3% to 7% - Decrease in accident rate by 3 to 50%
Political Factors = Prioritizing operational efficiency benefit with existing system over expanded system capacity projectsInstitutional Factors = Key to have coordination and compatibility across agencies to maximize effectivenessTechnical Factors = Understanding new technology, capabilities and limitations; Budget for training if new technology, and continued maintenance and support over life of technology; Consider risk/reward for “untested” technology
Improved Mobility 30% Low-Medium MED MED 4 1 2 2
- "The high cost of free parking" is important to demand management - Project planned
AF8 Arterial / Freeway Event Management
Event transportation management systems can help control the impact of congestion at stadiums or convention centers. In areas with frequent events, large changeable destination signs or other lane control equipment can be installed. In areas with occasional or one-time events, portable equipment can help smooth traffic flow.
- Reduced delay amidst heavy demand during special events - Reduced crash rates due to reduced conflicts - Increased attractiveness of event attendance, particularly repeat attendees
(System components are similar to Incident Management, which gives similar cost as that)$2,000 - $3,000 per intersection for specialized event timing plan; $20-$50 per hour per officer for manual traffic control; $2,000 - $3,000 per lane control display; $300K - $450K per lane control system including software, integration and other hardware costs
Political Factors = Frequent roadway detours and lane control measures may bring confusion and inconvenience to drivers and nearby residentsInstitutional Factors = Coordination with various event organizers and agencies is necessaryTechnical Factors = Events of various magnitude in different locations require different measures and scope of coordination Medium Reduced Congestion 30% Low-Medium MED MED 4 2 1 3
AF9 Arterial / Freeway Integrated Corridor Management
With integrated corridor management, the various institutional partner agencies manage the transportation corridor as a system, rather than the more traditional approach of managing individual assets. Travelers could receive information that encompasses the entire transportation network. They could dynamically shift to alternative transportation options, even during a trip, in response to changing traffic conditions.
- Reduced travel time and delays - Increased reliability and predictability of travel
$2,000 - $3,000 per intersection for signal retiming; $50,000 - $100,000 per variable message signs depending on size; $1 - 3 million to design and implement; $100,000 - 2 million for annual O&M which varies among the scope of the system
Political Factors = Prioritizing management of the system over capacity expansion projectsInstitutional Factors = Interagency cooperation and implementation is key to project successTechnical Factors = Understanding new technology, capabilities and limitations; Budget for training if new technology, and continued maintenance and support over life of technology. Improved Mobility 30% Medium HI MED-HI 5 1 2 2 - Project planned
AF10 Arterial / Freeway Real-Time Traveler Information
Advanced communications have improved the dissemination of information to the traveling public. Motorists are now able to receive relevant information on location-specific traffic conditions in a number of ways, including dynamic message signs (DMS), highway advisory radio (HAR), and in-vehicle signing, or specialized information transmitted to individual vehicles. May include 511 systems.
- Reduced delay by 1% to 22% and number of stops by 5% to 6% - Reduced gas emissions by 3% to 5% - Decreased crash fatalities by 3%
$50,000 - $100,000 per variable message signs depending on size; $1 - 3 million to design and implement; $100,000 - 2 million for annual O&M which varies among the scope of the information system
Political Factors = Prioritizing information systems over regular infrastructure projects. Public perception can be high with this implementation.Institutional Factors = Agency partnership and data/resource sharing to create a robust system.Technical Factors = Rapidly changing field, user understanding is key High Improved Mobility 40%
Low (if little added infrastructure), High (if added infrastructure) HI HI 8 1 1 0
- Very important - Tripcheck survey indicates some people did choose different option or delayed trip because of information
AF11 Arterial/FreewayReal-time Traffic Data Collection Using Probe Data
Automobiles are used to monitor the surrounding environment with an onboard computer. Data are sent to a Web server through pre-existing Wi-Fi networks, which help drivers track conditions specific to their cars and provides historical and real-time traffic conditions at different times of the day using combined data from all service subscriber participants.
- Reduce travel time and delay by alerting and informing drivers of congested areas - Reduce potential crashes due to congestion $300 per GPS unit; $150 per year for operation (DASH)
Political Factors = Institutional Factors =Is the GPS vehicle data shared with the agency and at what cost?Technical Factors = Understanding new technology, capabilities and limitations; Integration with other ITS components
High Improved Mobility Low MED MED 3 2 3 2
- Data needs to be collected to make use of it - Implementation seems difficult
AF12 Arterial/Freeway IntelliDrive (VII)
VII is a research program focused on enabling wireless communications among motor vehicles and between motor vehicles and roadside infrastructures. This involves various public and private sector entities. By enabling secure real-time communications with motor vehicles, new services will be enabled to enhance transportation safety, mobility, and commerce.
- Decrease traffic accidents and fatalities - Reduced delays - Increased effective roadway capacity $10,000 to $15,000 per VII roadside equipment installation
Political Factors = Institutional Factors = Coordination between agencies is critical to provide uniform driver informationTechnical Factors = VII is under development and considerable amount of time is needed before large scale deployment is possible and communication infrastructure is mature
Improved Mobility & Safety High LOW LOW 0 1 4 5
- Wait for vehicle technology - ?
AF13 Arterial/Freeway Automated Speed Enforcement
Automated speed detection (typically in work zones) can enable automated ticketing of vehicles exceeding posted speed limits when combined with automatically triggered vehicle identification technologies such as photographs, still or video digital imaging, or license plate recognition. Some systems transmit images of offending vehicles to police officers downstream of the work zone where enforcement can be carried out more safely.
- Increased perception of safety - Reduced travel speeds
$650,000 EUROS per vehicle mounted camera (~$850,000 US) $15,000 EUROS per fixed location installation (~$20,000 US)
Political Factors = Public perception of automated enforcementInstitutional Factors = Who does the operations and maintenance? How are costs and profits distributed?Technical Factors = Improved Safety Medium-High MED LOW-MED 3 3 2 2 - Not allowed by ???? county
AF14 Arterial/Freeway Traffic Surveillance Many of the services possible through arterial and freeway management systems are enabled by traffic surveillance and detection technologies, such as sensors or cameras, monitoring traffic flow.
- Improved incident response times and accuracy - Real-time and historic system operations information - Improved visual information for decision-makers and the public
$15,000 - $30,000 per CCTV detection unit, $1 - 2 million for central system integration and firmware upgrade if run through a TMC
Political Factors = Public perception of "big brother" surveillance and invasion of privacyInstitutional Factors = Sharing communication infrastructure and broadcasts across agencies.Technical Factors = Integrating with other TSMO or ITS components Improved Mobility 50% Low HI HI 6 1 1 2 - CCTV's
AF15 Arterial/Freeway Emergency ManagementITS applications in emergency management include hazardous materials management, the deployment of emergency medical services, and large and small-scale emergency response and evacuation operations.
- Reduced incident response time - Improved HAZMAT and counterterrorism technology - Improved travel time and less congestion under evacuation scenarios (reversible lanes)
Cost varies depending on the scale and scope of the emergency mangement system; cost of an emergency operation center may range from $150K to $5 million; Hazmat transportation operation technology may range from $250 to $3,500 per vehicle. GPS AVL on emergency vehicles costs $4,000 per intersection and $2,000 per vehicle.
Political Factors = Viewed as proactive protection of public safetyInstitutional Factors = Coordination between agencies is critical to successTechnical Factors = Integration of multiple ITS components may aid in project effectiveness Improved Safety 40%
Varies depending on system complexity HI VARIES 7 0 0 3 - Very important
F16 Freeway Incident Management
Incident management systems can reduce the effects of incident-related congestion by decreasing the time to detect incidents, the time for responding vehicles to arrive, and the time required for traffic to return to normal conditions. Incident management systems make use of a variety of surveillance technologies as well as enhanced communications and other technologies that facilitate coordinated response to incidents.
- Reduced average incident duration by 28% to 70% - Decreased secondary crashes by up to 28% to 70% - Reduced delay due to quicker incident response
$15,000 - $30,000 per CCTV detection unit, $400 per loop detector; $55 per vehicle hour for patroling vehicle; $8,000 - $13,000 per unit of mobile incident investigation equipment
Political Factors = Prioritizing incident response/system management over system expansionInstitutional Factors = Various agencies and first responders need to be coordinated, inter-agency communication is the key; systems may provide flexibility for future installation and coordination by neighboring jurisdictionsTechnical Factors = A sound communication system with wide coverage is crucial; interoperability issue among different agencies Medium
Improved Mobility & Safety 30% Low HI HI 8 0 0 2 - Work with ODOT on detours
F17 Freeway Work Zone Management
ITS applications in work zones include the temporary implementation of traffic management or incident management capabilities. These temporary systems can be stand-alone implementations or they may supplement existing systems in the area during construction. Other applications for managing work zones include measures to control vehicle speeds and notify travelers of changes in lane configurations or travel times and delays through the work zones. ITS may also be used to manage traffic along detour routes during full road closures to facilitate rapid and safe reconstruction projects.
- Reduced traveling speed across work zone by 9mph in a Minneapolis/St. Paul study - Improved safety with reduced travel speed - Reduced delay by 46% to 55% and travel time
$150 - 800k for a work zone management system, which commonly includes variable message signs ($50k-120k capital, $2.5k-6k operations and maintenance), CCTV-surveillence ($7k-19k capital, $1.0k-2.5k operations and maintenance), Highway Advisory Radio ($16-32k capital, $500-1,000 operations and maintenance), traffic detectors ($3-13k capital, $100-1,000 operations and maintenance) and variable speed limit display ($3-5k capital), etc. Costs are dependant on agency leasing or purchasing, and portable versus permanent components.
Political Factors = Prioritizing safety over system capacity expansion projectsInstitutional Factors = Technical Factors = Coordination with other ITS components High
Improved Mobility & Safety 20%
Low (if little added infrastructure), High (if added infrastructure) HI/LOW MED 4 1 3 2
- Large projects need to integrate TDM for travelers before breaking ground
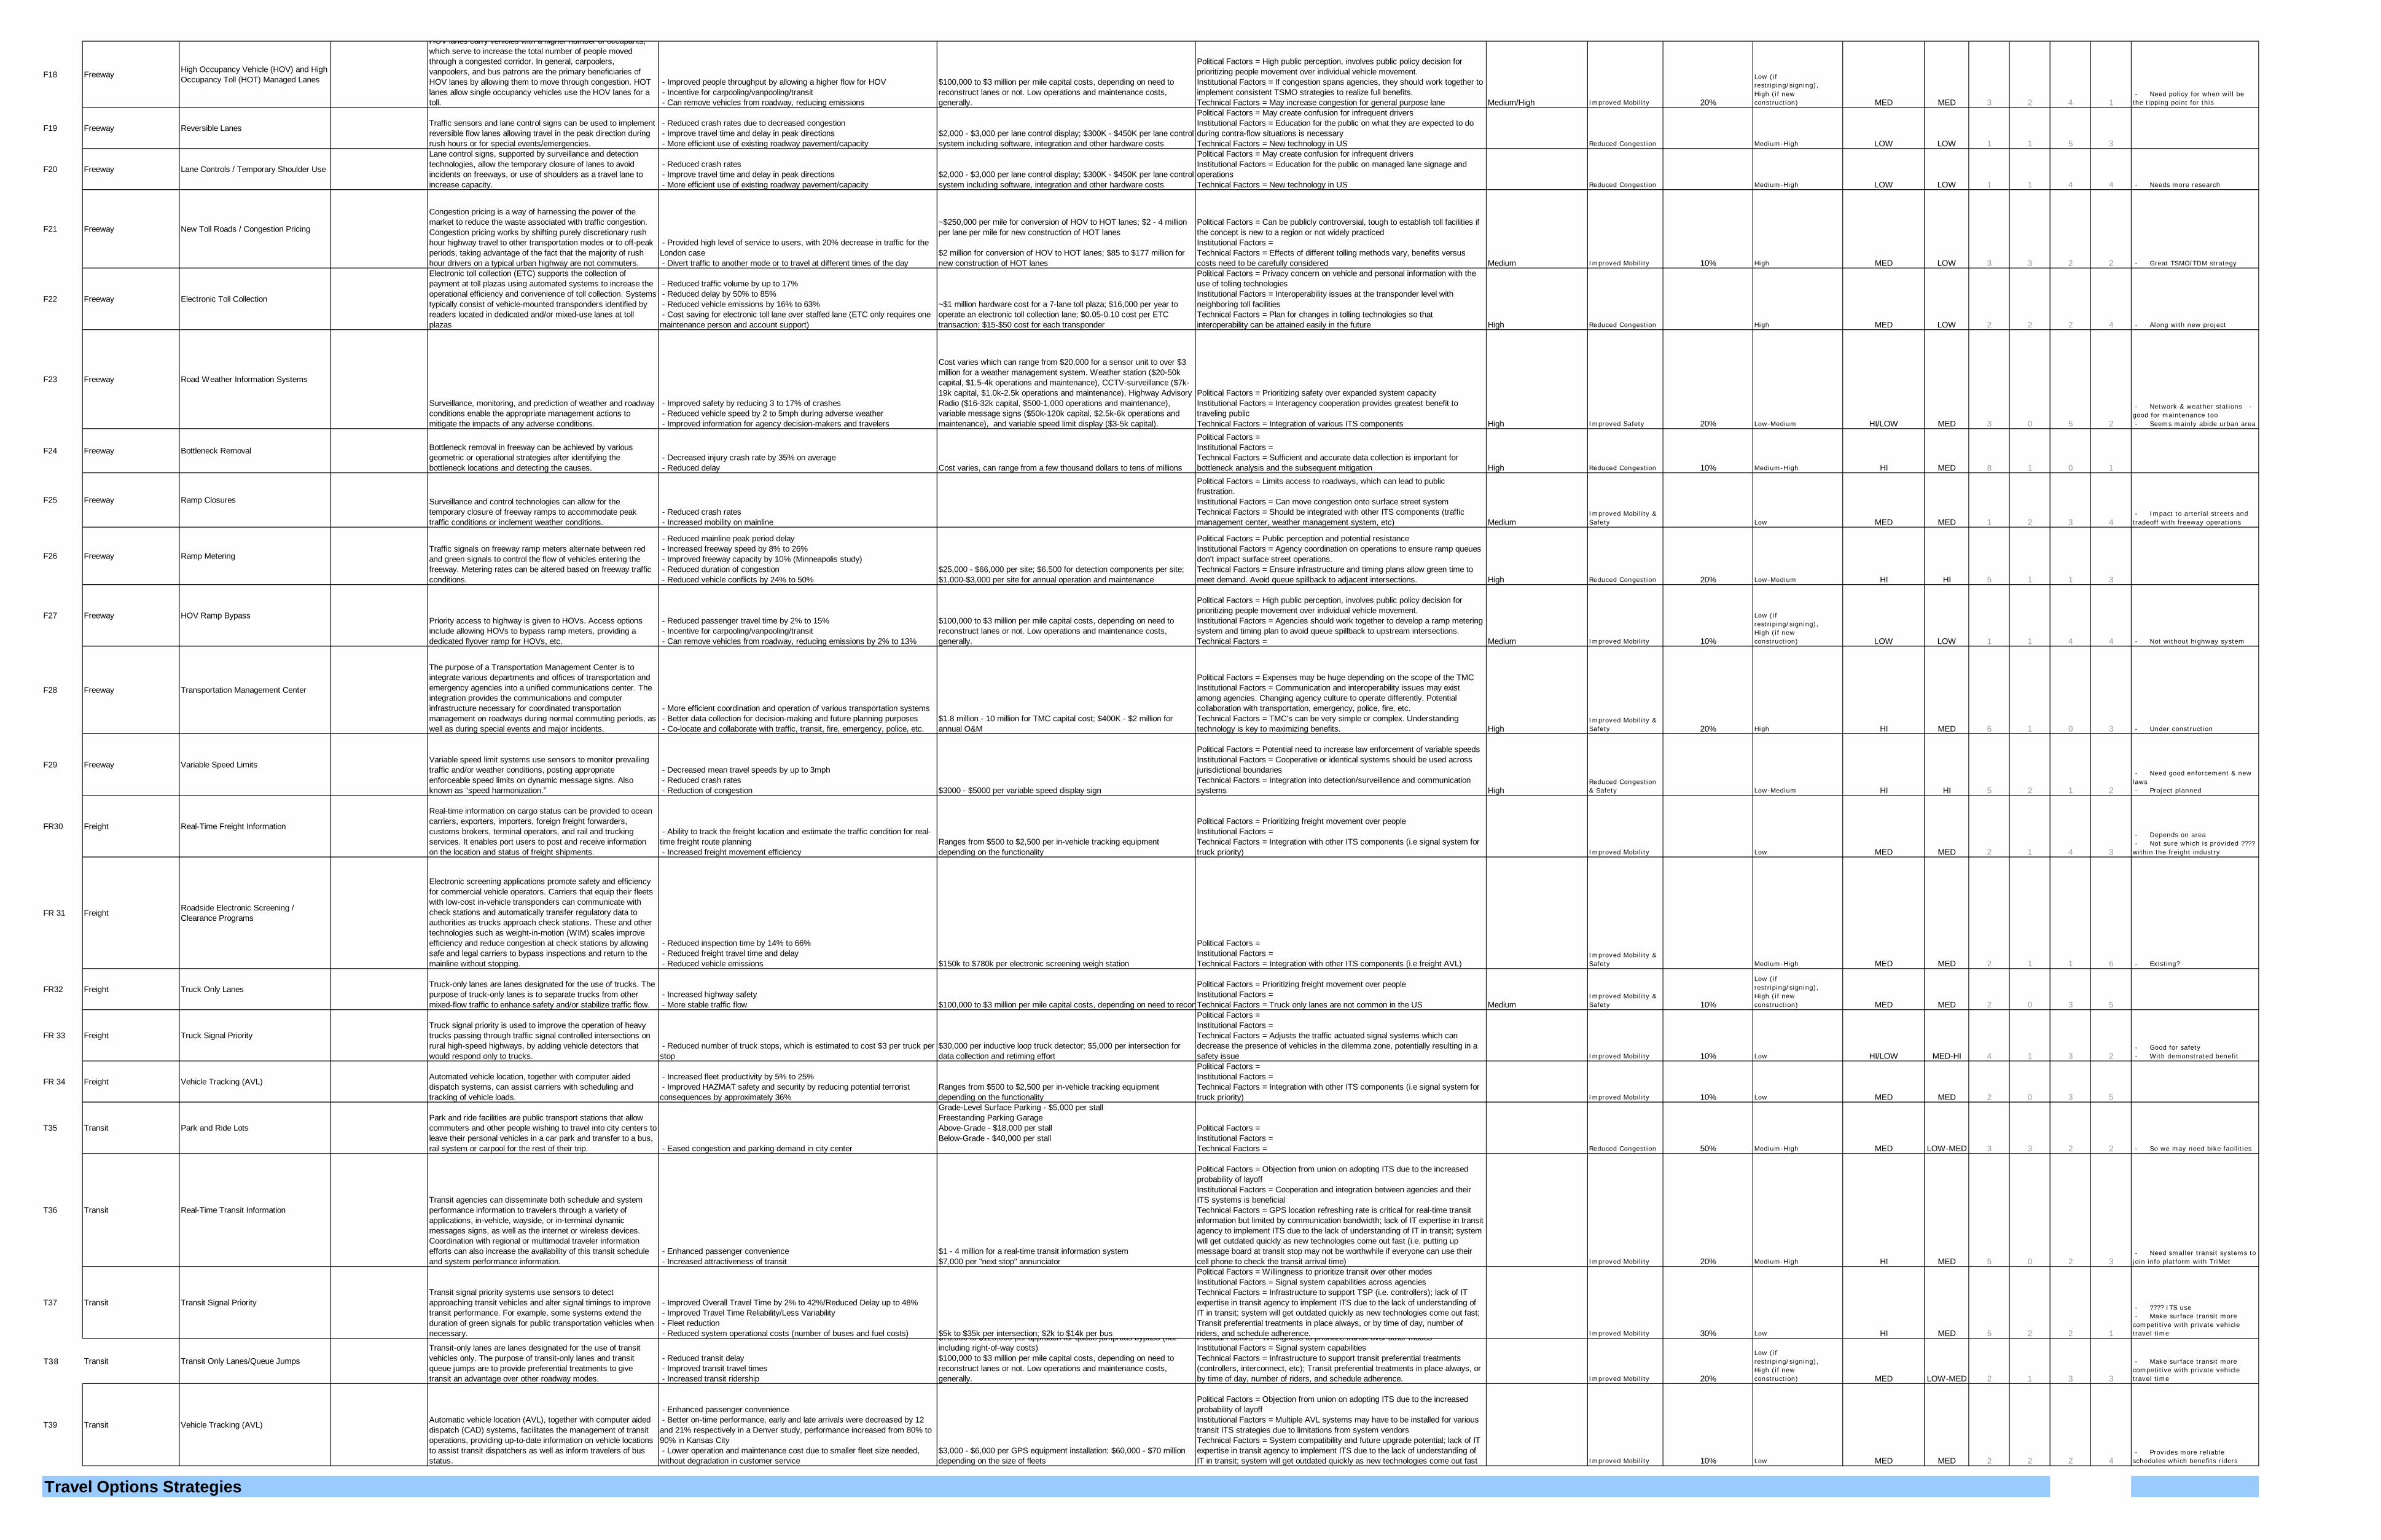
F18 FreewayHigh Occupancy Vehicle (HOV) and High Occupancy Toll (HOT) Managed Lanes
HOV lanes carry vehicles with a higher number of occupants, which serve to increase the total number of people moved through a congested corridor. In general, carpoolers, vanpoolers, and bus patrons are the primary beneficiaries of HOV lanes by allowing them to move through congestion. HOT lanes allow single occupancy vehicles use the HOV lanes for a toll.
- Improved people throughput by allowing a higher flow for HOV - Incentive for carpooling/vanpooling/transit - Can remove vehicles from roadway, reducing emissions
$100,000 to $3 million per mile capital costs, depending on need to reconstruct lanes or not. Low operations and maintenance costs, generally.
Political Factors = High public perception, involves public policy decision for prioritizing people movement over individual vehicle movement.Institutional Factors = If congestion spans agencies, they should work together to implement consistent TSMO strategies to realize full benefits.Technical Factors = May increase congestion for general purpose lane Medium/High Improved Mobility 20%
Low (if restriping/signing), High (if new construction) MED MED 3 2 4 1
- Need policy for when will be the tipping point for this
F19 Freeway Reversible LanesTraffic sensors and lane control signs can be used to implement reversible flow lanes allowing travel in the peak direction during rush hours or for special events/emergencies.
- Reduced crash rates due to decreased congestion - Improve travel time and delay in peak directions - More efficient use of existing roadway pavement/capacity
$2,000 - $3,000 per lane control display; $300K - $450K per lane control system including software, integration and other hardware costs
Political Factors = May create confusion for infrequent driversInstitutional Factors = Education for the public on what they are expected to do during contra-flow situations is necessaryTechnical Factors = New technology in US Reduced Congestion Medium-High LOW LOW 1 1 5 3
F20 Freeway Lane Controls / Temporary Shoulder Use
Lane control signs, supported by surveillance and detection technologies, allow the temporary closure of lanes to avoid incidents on freeways, or use of shoulders as a travel lane to increase capacity.
- Reduced crash rates - Improve travel time and delay in peak directions - More efficient use of existing roadway pavement/capacity
$2,000 - $3,000 per lane control display; $300K - $450K per lane control system including software, integration and other hardware costs
Political Factors = May create confusion for infrequent driversInstitutional Factors = Education for the public on managed lane signage and operationsTechnical Factors = New technology in US Reduced Congestion Medium-High LOW LOW 1 1 4 4 - Needs more research
F21 Freeway New Toll Roads / Congestion Pricing
Congestion pricing is a way of harnessing the power of the market to reduce the waste associated with traffic congestion. Congestion pricing works by shifting purely discretionary rush hour highway travel to other transportation modes or to off-peak periods, taking advantage of the fact that the majority of rush hour drivers on a typical urban highway are not commuters.
- Provided high level of service to users, with 20% decrease in traffic for the London case - Divert traffic to another mode or to travel at different times of the day
~$250,000 per mile for conversion of HOV to HOT lanes; $2 - 4 million per lane per mile for new construction of HOT lanes
$2 million for conversion of HOV to HOT lanes; $85 to $177 million for new construction of HOT lanes
Political Factors = Can be publicly controversial, tough to establish toll facilities if the concept is new to a region or not widely practiced Institutional Factors = Technical Factors = Effects of different tolling methods vary, benefits versus costs need to be carefully considered Medium Improved Mobility 10% High MED LOW 3 3 2 2 - Great TSMO/TDM strategy
F22 Freeway Electronic Toll Collection
Electronic toll collection (ETC) supports the collection of payment at toll plazas using automated systems to increase the operational efficiency and convenience of toll collection. Systems typically consist of vehicle-mounted transponders identified by readers located in dedicated and/or mixed-use lanes at toll plazas
- Reduced traffic volume by up to 17% - Reduced delay by 50% to 85% - Reduced vehicle emissions by 16% to 63% - Cost saving for electronic toll lane over staffed lane (ETC only requires one maintenance person and account support)
~$1 million hardware cost for a 7-lane toll plaza; $16,000 per year to operate an electronic toll collection lane; $0.05-0.10 cost per ETC transaction; $15-$50 cost for each transponder
Political Factors = Privacy concern on vehicle and personal information with the use of tolling technologiesInstitutional Factors = Interoperability issues at the transponder level with neighboring toll facilities Technical Factors = Plan for changes in tolling technologies so that interoperability can be attained easily in the future High Reduced Congestion High MED LOW 2 2 2 4 - Along with new project
F23 Freeway Road Weather Information Systems
Surveillance, monitoring, and prediction of weather and roadway conditions enable the appropriate management actions to mitigate the impacts of any adverse conditions.
- Improved safety by reducing 3 to 17% of crashes - Reduced vehicle speed by 2 to 5mph during adverse weather - Improved information for agency decision-makers and travelers
Cost varies which can range from $20,000 for a sensor unit to over $3 million for a weather management system. Weather station ($20-50k capital, $1.5-4k operations and maintenance), CCTV-surveillance ($7k-19k capital, $1.0k-2.5k operations and maintenance), Highway Advisory Radio ($16-32k capital, $500-1,000 operations and maintenance), variable message signs ($50k-120k capital, $2.5k-6k operations and maintenance), and variable speed limit display ($3-5k capital).
Political Factors = Prioritizing safety over expanded system capacityInstitutional Factors = Interagency cooperation provides greatest benefit to traveling publicTechnical Factors = Integration of various ITS components High Improved Safety 20% Low-Medium HI/LOW MED 3 0 5 2
- Network & weather stations - good for maintenance too - Seems mainly abide urban area
F24 Freeway Bottleneck Removal Bottleneck removal in freeway can be achieved by various geometric or operational strategies after identifying the bottleneck locations and detecting the causes.
- Decreased injury crash rate by 35% on average - Reduced delay Cost varies, can range from a few thousand dollars to tens of millions
Political Factors = Institutional Factors = Technical Factors = Sufficient and accurate data collection is important for bottleneck analysis and the subsequent mitigation High Reduced Congestion 10% Medium-High HI MED 8 1 0 1
F25 Freeway Ramp Closures Surveillance and control technologies can allow for the temporary closure of freeway ramps to accommodate peak traffic conditions or inclement weather conditions.
- Reduced crash rates - Increased mobility on mainline
Political Factors = Limits access to roadways, which can lead to public frustration.Institutional Factors = Can move congestion onto surface street systemTechnical Factors = Should be integrated with other ITS components (traffic management center, weather management system, etc) Medium
Improved Mobility & Safety Low MED MED 1 2 3 4
- Impact to arterial streets and tradeoff with freeway operations
F26 Freeway Ramp MeteringTraffic signals on freeway ramp meters alternate between red and green signals to control the flow of vehicles entering the freeway. Metering rates can be altered based on freeway traffic conditions.
- Reduced mainline peak period delay - Increased freeway speed by 8% to 26% - Improved freeway capacity by 10% (Minneapolis study) - Reduced duration of congestion - Reduced vehicle conflicts by 24% to 50%
$25,000 - $66,000 per site; $6,500 for detection components per site; $1,000-$3,000 per site for annual operation and maintenance
Political Factors = Public perception and potential resistanceInstitutional Factors = Agency coordination on operations to ensure ramp queues don't impact surface street operations.Technical Factors = Ensure infrastructure and timing plans allow green time to meet demand. Avoid queue spillback to adjacent intersections. High Reduced Congestion 20% Low-Medium HI HI 5 1 1 3
F27 Freeway HOV Ramp BypassPriority access to highway is given to HOVs. Access options include allowing HOVs to bypass ramp meters, providing a dedicated flyover ramp for HOVs, etc.
- Reduced passenger travel time by 2% to 15% - Incentive for carpooling/vanpooling/transit - Can remove vehicles from roadway, reducing emissions by 2% to 13%
$100,000 to $3 million per mile capital costs, depending on need to reconstruct lanes or not. Low operations and maintenance costs, generally.
Political Factors = High public perception, involves public policy decision for prioritizing people movement over individual vehicle movement.Institutional Factors = Agencies should work together to develop a ramp metering system and timing plan to avoid queue spillback to upstream intersections.Technical Factors = Medium Improved Mobility 10%
Low (if restriping/signing), High (if new construction) LOW LOW 1 1 4 4 - Not without highway system
F28 Freeway Transportation Management Center
The purpose of a Transportation Management Center is to integrate various departments and offices of transportation and emergency agencies into a unified communications center. The integration provides the communications and computer infrastructure necessary for coordinated transportation management on roadways during normal commuting periods, as well as during special events and major incidents.
- More efficient coordination and operation of various transportation systems - Better data collection for decision-making and future planning purposes - Co-locate and collaborate with traffic, transit, fire, emergency, police, etc.
$1.8 million - 10 million for TMC capital cost; $400K - $2 million for annual O&M
Political Factors = Expenses may be huge depending on the scope of the TMCInstitutional Factors = Communication and interoperability issues may exist among agencies. Changing agency culture to operate differently. Potential collaboration with transportation, emergency, police, fire, etc.Technical Factors = TMC's can be very simple or complex. Understanding technology is key to maximizing benefits. High
Improved Mobility & Safety 20% High HI MED 6 1 0 3 - Under construction
F29 Freeway Variable Speed LimitsVariable speed limit systems use sensors to monitor prevailing traffic and/or weather conditions, posting appropriate enforceable speed limits on dynamic message signs. Also known as “speed harmonization.”
- Decreased mean travel speeds by up to 3mph - Reduced crash rates - Reduction of congestion $3000 - $5000 per variable speed display sign
Political Factors = Potential need to increase law enforcement of variable speedsInstitutional Factors = Cooperative or identical systems should be used across jurisdictional boundariesTechnical Factors = Integration into detection/surveillence and communication systems High
Reduced Congestion & Safety Low-Medium HI HI 5 2 1 2
- Need good enforcement & new laws - Project planned
FR30 Freight Real-Time Freight Information
Real-time information on cargo status can be provided to ocean carriers, exporters, importers, foreign freight forwarders, customs brokers, terminal operators, and rail and trucking services. It enables port users to post and receive information on the location and status of freight shipments.
- Ability to track the freight location and estimate the traffic condition for real-time freight route planning - Increased freight movement efficiency
Ranges from $500 to $2,500 per in-vehicle tracking equipment depending on the functionality
Political Factors = Prioritizing freight movement over peopleInstitutional Factors =Technical Factors = Integration with other ITS components (i.e signal system for truck priority) Improved Mobility Low MED MED 2 1 4 3
- Depends on area - Not sure which is provided ???? within the freight industry
FR 31 FreightRoadside Electronic Screening / Clearance Programs
Electronic screening applications promote safety and efficiency for commercial vehicle operators. Carriers that equip their fleets with low-cost in-vehicle transponders can communicate with check stations and automatically transfer regulatory data to authorities as trucks approach check stations. These and other technologies such as weight-in-motion (WIM) scales improve efficiency and reduce congestion at check stations by allowing safe and legal carriers to bypass inspections and return to the mainline without stopping.
- Reduced inspection time by 14% to 66% - Reduced freight travel time and delay - Reduced vehicle emissions $150k to $780k per electronic screening weigh station
Political Factors = Institutional Factors =Technical Factors = Integration with other ITS components (i.e freight AVL)
Improved Mobility & Safety Medium-High MED MED 2 1 1 6 - Existing?
FR32 Freight Truck Only LanesTruck-only lanes are lanes designated for the use of trucks. The purpose of truck-only lanes is to separate trucks from other mixed-flow traffic to enhance safety and/or stabilize traffic flow.
- Increased highway safety - More stable traffic flow $100,000 to $3 million per mile capital costs, depending on need to recon
Political Factors = Prioritizing freight movement over peopleInstitutional Factors = Technical Factors = Truck only lanes are not common in the US Medium
Improved Mobility & Safety 10%
Low (if restriping/signing), High (if new construction) MED MED 2 0 3 5
FR 33 Freight Truck Signal PriorityTruck signal priority is used to improve the operation of heavy trucks passing through traffic signal controlled intersections on rural high-speed highways, by adding vehicle detectors that would respond only to trucks.
- Reduced number of truck stops, which is estimated to cost $3 per truck per stop
$30,000 per inductive loop truck detector; $5,000 per intersection for data collection and retiming effort
Political Factors = Institutional Factors = Technical Factors = Adjusts the traffic actuated signal systems which can decrease the presence of vehicles in the dilemma zone, potentially resulting in a safety issue Improved Mobility 10% Low HI/LOW MED-HI 4 1 3 2
- Good for safety - With demonstrated benefit
FR 34 Freight Vehicle Tracking (AVL)Automated vehicle location, together with computer aided dispatch systems, can assist carriers with scheduling and tracking of vehicle loads.
- Increased fleet productivity by 5% to 25% - Improved HAZMAT safety and security by reducing potential terrorist consequences by approximately 36%
Ranges from $500 to $2,500 per in-vehicle tracking equipment depending on the functionality
Political Factors = Institutional Factors =Technical Factors = Integration with other ITS components (i.e signal system for truck priority) Improved Mobility 10% Low MED MED 2 0 3 5
T35 Transit Park and Ride LotsPark and ride facilities are public transport stations that allow commuters and other people wishing to travel into city centers to leave their personal vehicles in a car park and transfer to a bus, rail system or carpool for the rest of their trip. - Eased congestion and parking demand in city center
Grade-Level Surface Parking - $5,000 per stall Freestanding Parking Garage Above-Grade - $18,000 per stall Below-Grade - $40,000 per stall
Political Factors = Institutional Factors = Technical Factors = Reduced Congestion 50% Medium-High MED LOW-MED 3 3 2 2 - So we may need bike facilities
T36 Transit Real-Time Transit InformationTransit agencies can disseminate both schedule and system performance information to travelers through a variety of applications, in-vehicle, wayside, or in-terminal dynamic messages signs, as well as the internet or wireless devices. Coordination with regional or multimodal traveler information efforts can also increase the availability of this transit schedule and system performance information.
- Enhanced passenger convenience - Increased attractiveness of transit
$1 - 4 million for a real-time transit information system$7,000 per "next stop" annunciator
Political Factors = Objection from union on adopting ITS due to the increased probability of layoffInstitutional Factors = Cooperation and integration between agencies and their ITS systems is beneficialTechnical Factors = GPS location refreshing rate is critical for real-time transit information but limited by communication bandwidth; lack of IT expertise in transit agency to implement ITS due to the lack of understanding of IT in transit; system will get outdated quickly as new technologies come out fast (i.e. putting up message board at transit stop may not be worthwhile if everyone can use their cell phone to check the transit arrival time) Improved Mobility 20% Medium-High HI MED 5 0 2 3
- Need smaller transit systems to join info platform with TriMet
T37 Transit Transit Signal PriorityTransit signal priority systems use sensors to detect approaching transit vehicles and alter signal timings to improve transit performance. For example, some systems extend the duration of green signals for public transportation vehicles when necessary.
- Improved Overall Travel Time by 2% to 42%/Reduced Delay up to 48% - Improved Travel Time Reliability/Less Variability - Fleet reduction - Reduced system operational costs (number of buses and fuel costs) $5k to $35k per intersection; $2k to $14k per bus
Political Factors = Willingness to prioritize transit over other modesInstitutional Factors = Signal system capabilities across agenciesTechnical Factors = Infrastructure to support TSP (i.e. controllers); lack of IT expertise in transit agency to implement ITS due to the lack of understanding of IT in transit; system will get outdated quickly as new technologies come out fast; Transit preferential treatments in place always, or by time of day, number of riders, and schedule adherence. Improved Mobility 30% Low HI MED 5 2 2 1
- ???? ITS use - Make surface transit more competitive with private vehicle travel time
T38 Transit Transit Only Lanes/Queue Jumps
Transit-only lanes are lanes designated for the use of transit vehicles only. The purpose of transit-only lanes and transit queue jumps are to provide preferential treatments to give transit an advantage over other roadway modes.
- Reduced transit delay - Improved transit travel times - Increased transit ridership
$75,000 to $125,000 per approach for queue jump/bus bypass (not including right-of-way costs)$100,000 to $3 million per mile capital costs, depending on need to reconstruct lanes or not. Low operations and maintenance costs, generally.
Political Factors = Willingness to prioritize transit over other modesInstitutional Factors = Signal system capabilitiesTechnical Factors = Infrastructure to support transit preferential treatments (controllers, interconnect, etc); Transit preferential treatments in place always, or by time of day, number of riders, and schedule adherence. Improved Mobility 20%
Low (if restriping/signing), High (if new construction) MED LOW-MED 2 1 3 3
- Make surface transit more competitive with private vehicle travel time
T39 Transit Vehicle Tracking (AVL)Automatic vehicle location (AVL), together with computer aided dispatch (CAD) systems, facilitates the management of transit operations, providing up-to-date information on vehicle locations to assist transit dispatchers as well as inform travelers of bus status.
- Enhanced passenger convenience - Better on-time performance, early and late arrivals were decreased by 12 and 21% respectively in a Denver study, performance increased from 80% to 90% in Kansas City - Lower operation and maintenance cost due to smaller fleet size needed, without degradation in customer service
$3,000 - $6,000 per GPS equipment installation; $60,000 - $70 million depending on the size of fleets
Political Factors = Objection from union on adopting ITS due to the increased probability of layoffInstitutional Factors = Multiple AVL systems may have to be installed for various transit ITS strategies due to limitations from system vendorsTechnical Factors = System compatibility and future upgrade potential; lack of IT expertise in transit agency to implement ITS due to the lack of understanding of IT in transit; system will get outdated quickly as new technologies come out fast Improved Mobility 10% Low MED MED 2 2 2 4
- Provides more reliable schedules which benefits riders
Travel Options Strategies
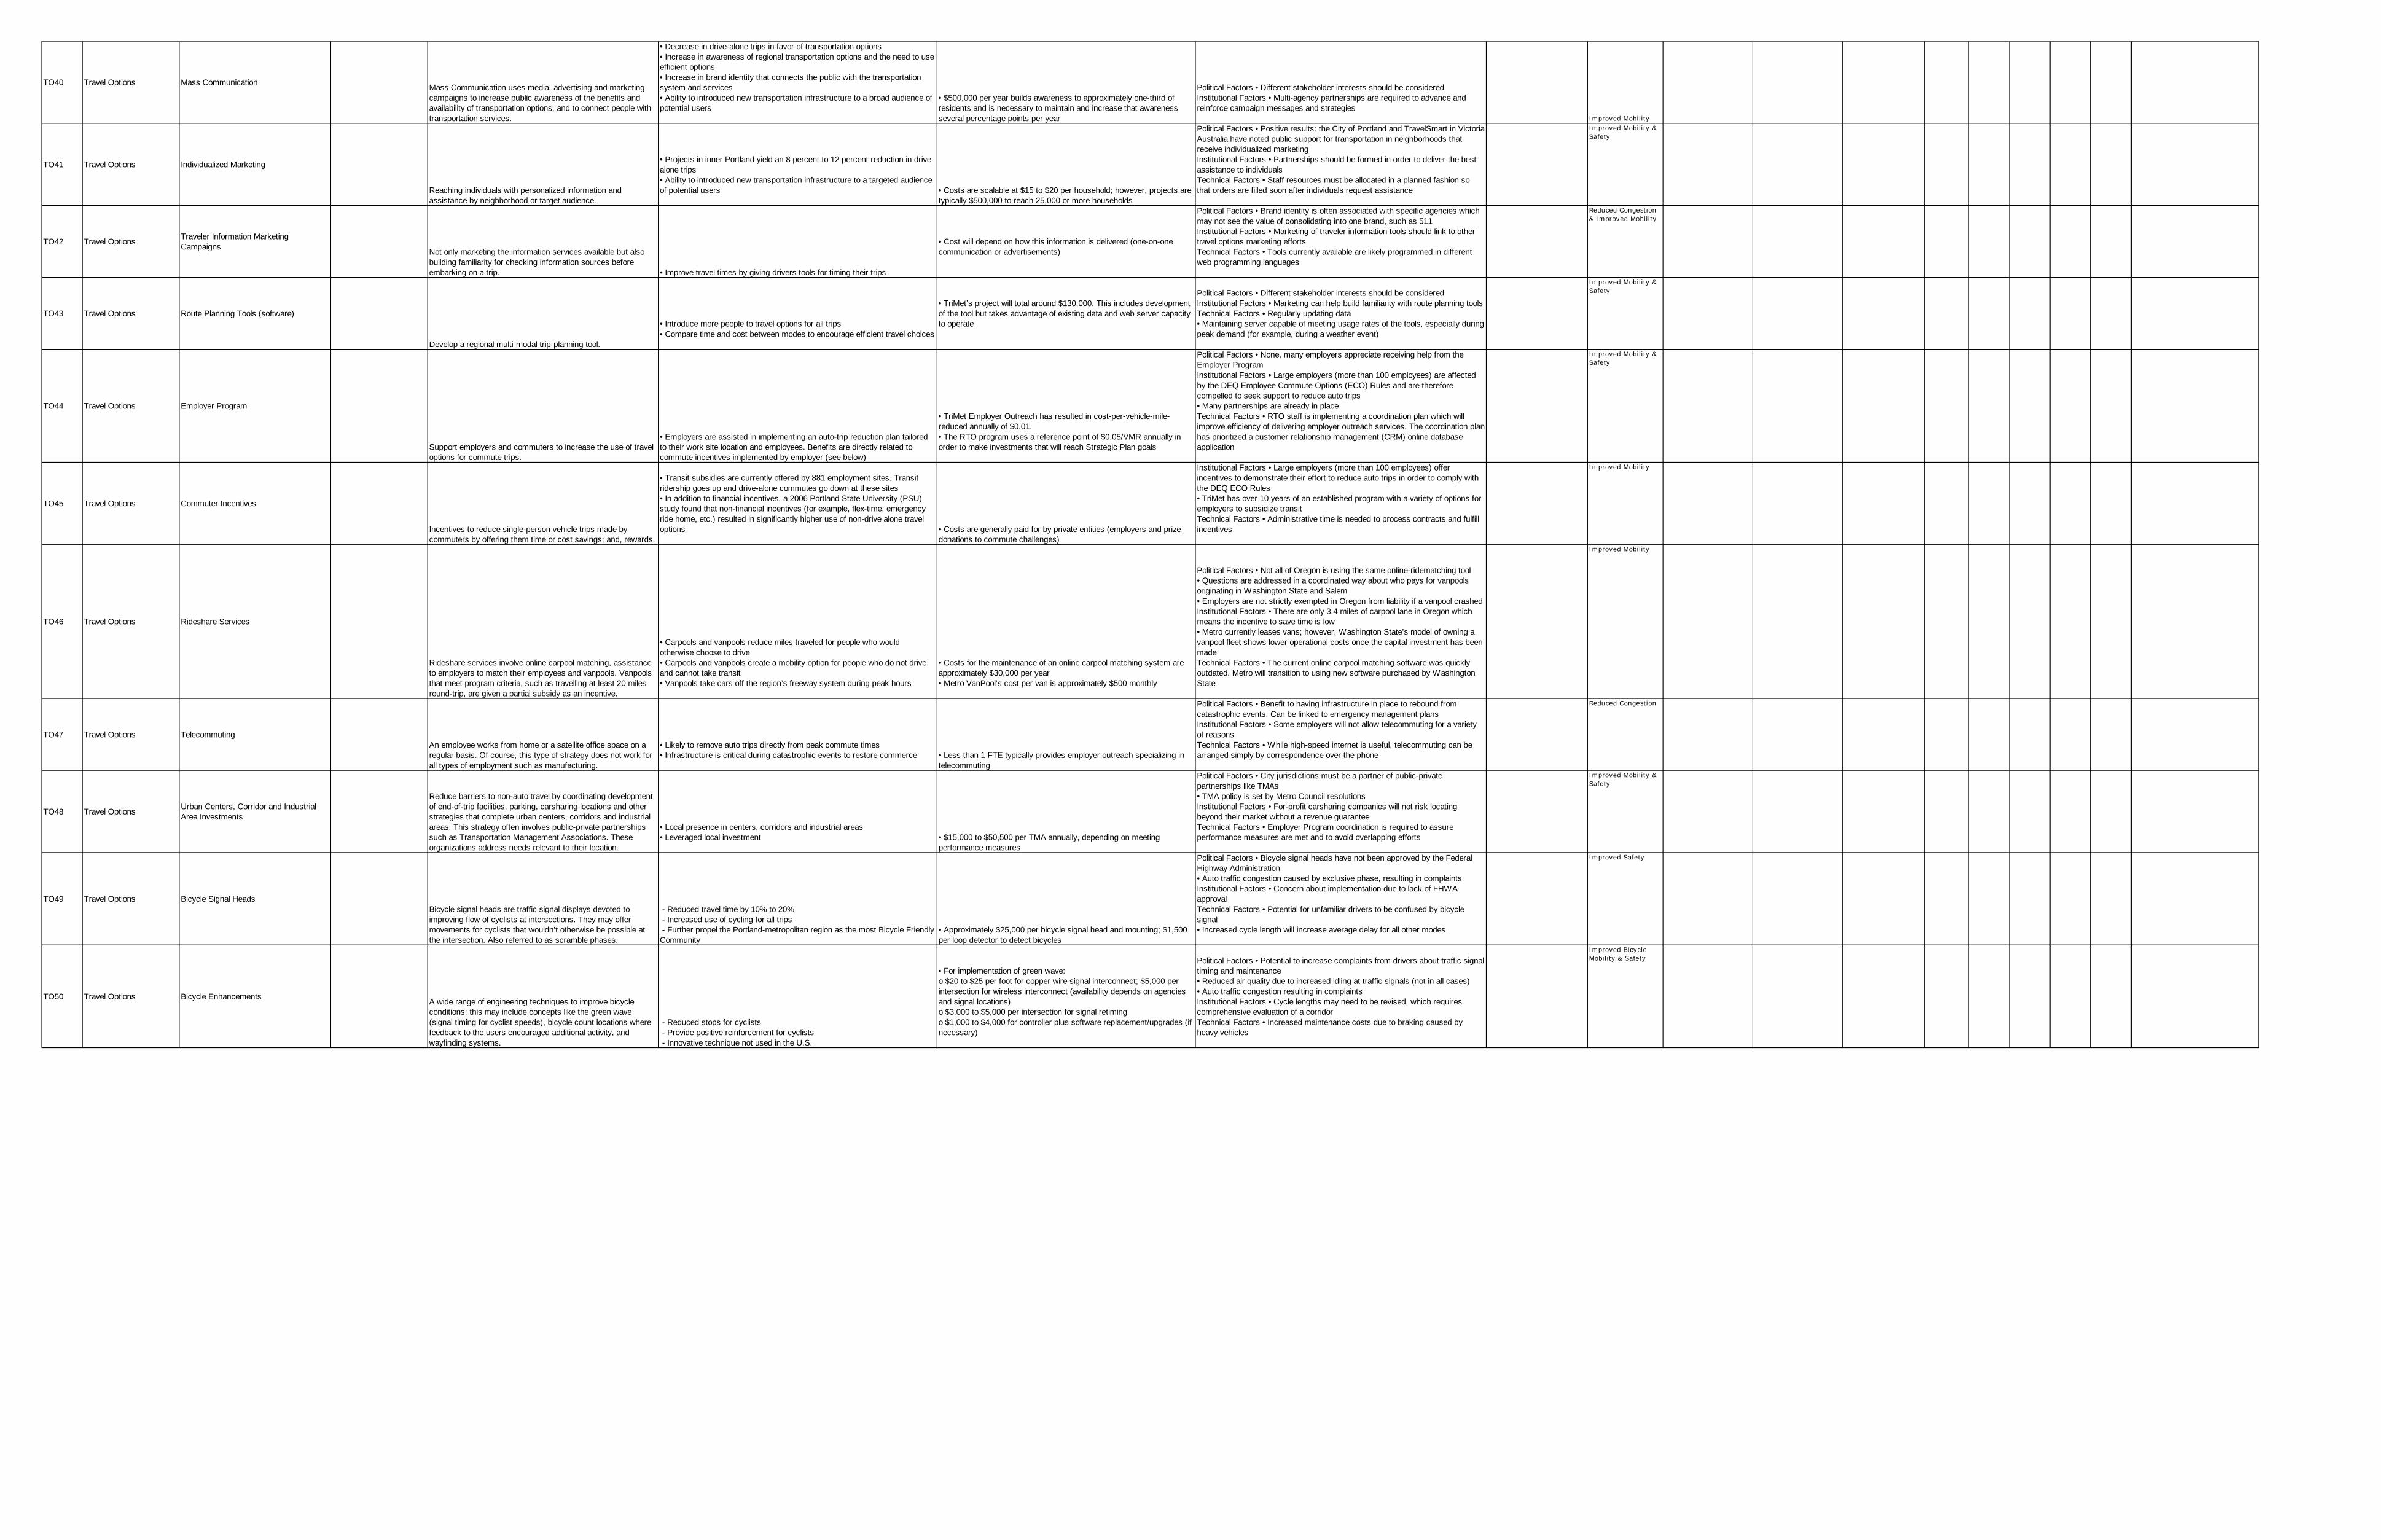
TO40 Travel Options Mass CommunicationMass Communication uses media, advertising and marketing campaigns to increase public awareness of the benefits and availability of transportation options, and to connect people with transportation services.
• Decrease in drive-alone trips in favor of transportation options• Increase in awareness of regional transportation options and the need to use efficient options• Increase in brand identity that connects the public with the transportation system and services• Ability to introduced new transportation infrastructure to a broad audience of potential users
• $500,000 per year builds awareness to approximately one-third of residents and is necessary to maintain and increase that awareness several percentage points per year
Political Factors • Different stakeholder interests should be consideredInstitutional Factors • Multi-agency partnerships are required to advance and reinforce campaign messages and strategies
Improved Mobility
TO41 Travel Options Individualized Marketing
Reaching individuals with personalized information and assistance by neighborhood or target audience.
• Projects in inner Portland yield an 8 percent to 12 percent reduction in drive-alone trips• Ability to introduced new transportation infrastructure to a targeted audience of potential users • Costs are scalable at $15 to $20 per household; however, projects are
typically $500,000 to reach 25,000 or more households
Political Factors • Positive results: the City of Portland and TravelSmart in Victoria Australia have noted public support for transportation in neighborhoods that receive individualized marketingInstitutional Factors • Partnerships should be formed in order to deliver the best assistance to individualsTechnical Factors • Staff resources must be allocated in a planned fashion so that orders are filled soon after individuals request assistance
Improved Mobility & Safety
TO42 Travel OptionsTraveler Information Marketing Campaigns
Not only marketing the information services available but also building familiarity for checking information sources before embarking on a trip. • Improve travel times by giving drivers tools for timing their trips
• Cost will depend on how this information is delivered (one-on-one communication or advertisements)
Political Factors • Brand identity is often associated with specific agencies which may not see the value of consolidating into one brand, such as 511Institutional Factors • Marketing of traveler information tools should link to other travel options marketing effortsTechnical Factors • Tools currently available are likely programmed in different web programming languages
Reduced Congestion & Improved Mobility
TO43 Travel Options Route Planning Tools (software)
Develop a regional multi-modal trip-planning tool.
• Introduce more people to travel options for all trips• Compare time and cost between modes to encourage efficient travel choices
• TriMet’s project will total around $130,000. This includes development of the tool but takes advantage of existing data and web server capacity to operate
Political Factors • Different stakeholder interests should be consideredInstitutional Factors • Marketing can help build familiarity with route planning toolsTechnical Factors • Regularly updating data• Maintaining server capable of meeting usage rates of the tools, especially during peak demand (for example, during a weather event)
Improved Mobility & Safety
TO44 Travel Options Employer Program
Support employers and commuters to increase the use of travel options for commute trips.
• Employers are assisted in implementing an auto-trip reduction plan tailored to their work site location and employees. Benefits are directly related to commute incentives implemented by employer (see below)
• TriMet Employer Outreach has resulted in cost-per-vehicle-mile-reduced annually of $0.01. • The RTO program uses a reference point of $0.05/VMR annually in order to make investments that will reach Strategic Plan goals
Political Factors • None, many employers appreciate receiving help from the Employer ProgramInstitutional Factors • Large employers (more than 100 employees) are affected by the DEQ Employee Commute Options (ECO) Rules and are therefore compelled to seek support to reduce auto trips• Many partnerships are already in placeTechnical Factors • RTO staff is implementing a coordination plan which will improve efficiency of delivering employer outreach services. The coordination plan has prioritized a customer relationship management (CRM) online database application
Improved Mobility & Safety
TO45 Travel Options Commuter Incentives
Incentives to reduce single-person vehicle trips made by commuters by offering them time or cost savings; and, rewards.
• Transit subsidies are currently offered by 881 employment sites. Transit ridership goes up and drive-alone commutes go down at these sites• In addition to financial incentives, a 2006 Portland State University (PSU) study found that non-financial incentives (for example, flex-time, emergency ride home, etc.) resulted in significantly higher use of non-drive alone travel options • Costs are generally paid for by private entities (employers and prize
donations to commute challenges)
Institutional Factors • Large employers (more than 100 employees) offer incentives to demonstrate their effort to reduce auto trips in order to comply with the DEQ ECO Rules• TriMet has over 10 years of an established program with a variety of options for employers to subsidize transitTechnical Factors • Administrative time is needed to process contracts and fulfill incentives
Improved Mobility
TO46 Travel Options Rideshare Services
Rideshare services involve online carpool matching, assistance to employers to match their employees and vanpools. Vanpools that meet program criteria, such as travelling at least 20 miles round-trip, are given a partial subsidy as an incentive.
• Carpools and vanpools reduce miles traveled for people who would otherwise choose to drive• Carpools and vanpools create a mobility option for people who do not drive and cannot take transit• Vanpools take cars off the region’s freeway system during peak hours
• Costs for the maintenance of an online carpool matching system are approximately $30,000 per year• Metro VanPool’s cost per van is approximately $500 monthly
Political Factors • Not all of Oregon is using the same online-ridematching tool• Questions are addressed in a coordinated way about who pays for vanpools originating in Washington State and Salem• Employers are not strictly exempted in Oregon from liability if a vanpool crashedInstitutional Factors • There are only 3.4 miles of carpool lane in Oregon which means the incentive to save time is low• Metro currently leases vans; however, Washington State’s model of owning a vanpool fleet shows lower operational costs once the capital investment has been madeTechnical Factors • The current online carpool matching software was quickly outdated. Metro will transition to using new software purchased by Washington State
Improved Mobility
TO47 Travel Options TelecommutingAn employee works from home or a satellite office space on a regular basis. Of course, this type of strategy does not work for all types of employment such as manufacturing.
• Likely to remove auto trips directly from peak commute times• Infrastructure is critical during catastrophic events to restore commerce • Less than 1 FTE typically provides employer outreach specializing in
telecommuting
Political Factors • Benefit to having infrastructure in place to rebound from catastrophic events. Can be linked to emergency management plansInstitutional Factors • Some employers will not allow telecommuting for a variety of reasonsTechnical Factors • While high-speed internet is useful, telecommuting can be arranged simply by correspondence over the phone
Reduced Congestion
TO48 Travel OptionsUrban Centers, Corridor and Industrial Area Investments
Reduce barriers to non-auto travel by coordinating development of end-of-trip facilities, parking, carsharing locations and other strategies that complete urban centers, corridors and industrial areas. This strategy often involves public-private partnerships such as Transportation Management Associations. These organizations address needs relevant to their location.
• Local presence in centers, corridors and industrial areas• Leveraged local investment • $15,000 to $50,500 per TMA annually, depending on meeting
performance measures
Political Factors • City jurisdictions must be a partner of public-private partnerships like TMAs• TMA policy is set by Metro Council resolutionsInstitutional Factors • For-profit carsharing companies will not risk locating beyond their market without a revenue guaranteeTechnical Factors • Employer Program coordination is required to assure performance measures are met and to avoid overlapping efforts
Improved Mobility & Safety
TO49 Travel Options Bicycle Signal HeadsBicycle signal heads are traffic signal displays devoted to improving flow of cyclists at intersections. They may offer movements for cyclists that wouldn’t otherwise be possible at the intersection. Also referred to as scramble phases.
- Reduced travel time by 10% to 20% - Increased use of cycling for all trips - Further propel the Portland-metropolitan region as the most Bicycle Friendly Community
• Approximately $25,000 per bicycle signal head and mounting; $1,500 per loop detector to detect bicycles
Political Factors • Bicycle signal heads have not been approved by the Federal Highway Administration• Auto traffic congestion caused by exclusive phase, resulting in complaintsInstitutional Factors • Concern about implementation due to lack of FHWA approvalTechnical Factors • Potential for unfamiliar drivers to be confused by bicycle signal• Increased cycle length will increase average delay for all other modes
Improved Safety
TO50 Travel Options Bicycle EnhancementsA wide range of engineering techniques to improve bicycle conditions; this may include concepts like the green wave (signal timing for cyclist speeds), bicycle count locations where feedback to the users encouraged additional activity, and wayfinding systems.
- Reduced stops for cyclists - Provide positive reinforcement for cyclists - Innovative technique not used in the U.S.
• For implementation of green wave:o $20 to $25 per foot for copper wire signal interconnect; $5,000 per intersection for wireless interconnect (availability depends on agencies and signal locations)o $3,000 to $5,000 per intersection for signal retiming o $1,000 to $4,000 for controller plus software replacement/upgrades (if necessary)
Political Factors • Potential to increase complaints from drivers about traffic signal timing and maintenance• Reduced air quality due to increased idling at traffic signals (not in all cases)• Auto traffic congestion resulting in complaintsInstitutional Factors • Cycle lengths may need to be revised, which requires comprehensive evaluation of a corridorTechnical Factors • Increased maintenance costs due to braking caused by heavy vehicles
Improved Bicycle Mobility & Safety

{00 M
Appendix L: Eugene Airport Master Plan (2010)


The Eugene Airport Plan can be found on the project website at the web address below.
http://www.centrallanertsp.org/sites/default/files/AppendixM-EugeneAirportMasterPlan-re.pdf