Embed Size (px)
Citation preview

Appendix
A.1 Units, Physical Quantities, and Physical Constants
The International System of Units (SI) provides the advantage of establishing
uniformity and consistency of units for physical quantities – a prerequisite for
communication in science.
Table A.2 Derived SI units with special names
Quantity Name Symbol
Expression in terms
of base units
Expression in terms of
other SI units
Frequency Hertz Hz s�1
Force Newton N m kg s�2 J m�1
Pressure Pascala Pa kg m�1 s�2 N m�2
Volume Liter l 10�3 m3
Energy Jouleb J m2 kg s�2 N m
Power Watt W m2 kg s�3 J s�1
Electric charge Coulomb C A s
Electric potential Volt V m2 kg A�1 s�3 W A�1
Magnetic flux density Tesla T kg A�1 s�2
a1 bar¼ 1000 mbar ¼ 105 Pa; 1 Torr¼ 133 Pa; 1 psi¼ 6895 Pa¼ 68.95 mbarb1 cal¼ 4.1868 J; 1 eV¼ 1.60219 � 10�19 J¼ 96.485 kJ mol�1
Table A.1 SI base units Physical base quantity SI unit Symbol
Length/distance Metera m
Mass Kilogramb kg
Time Second s
Electric current Ampere A
Thermodynamic temperature Kelvinc K
Amount of substance Mole mol
Luminous intensity Candela cda1 m ¼ 3.2808 ft.¼ 39.3701 in. 1 in¼ 2.54 cm; 1 ft.¼ 0.3048 mb1 kg¼ 2.2046 lb.; 1 lb.¼ 0.4536 kgcT[�C]¼T[K] – 273.15; T[�F]¼ 1.8�T[�C] + 32
# Springer International Publishing AG 2017
J.H. Gross, Mass Spectrometry, DOI 10.1007/978-3-319-54398-7927

A.2 Isotopic Composition of the Elements
Table A.5 comprises the stable elements from hydrogen to bismuth with the
radioactive elements technetium and promethium omitted. Natural variations in
isotopic composition of some elements such as carbon or lead do not allow for more
accurate values, a fact also reflected in the accuracy of their relative atomic mass.
However, exact masses of the isotopes are not affected by varying abundances. The
isotopic masses listed may differ up to some 10�6 u in other publications.
Table A.3 Physical constants and frequently used quantities (from NIST)
Physical constant/quantity Symbol Quantity
Charge of the electron e 1.60217648 � 10�19 C
Mass of the electron me 9.1093822 � 10�31 kg
Mass of the proton mp 1.67262164 � 10�27 kg
Mass of the neutron mn 1.67492721 � 10�27 kg
Unified atomic mass u 1.66053878 � 10�27 kg
Speed of light in vacuum c 2.99792458 � 108 m s�1
Planck’s constant h 6.62607004 � 10�34 J s or
4.13566766 � 10�15 eV s
Avogadro’s constant NA 6.02214179 � 1023 mol�1
Boltzmann constant kB 1.38065042 � 10�23 J K�1
Universal gas constant R 8.314459 J mol�1 K�1
Table A.4 SI number prefixes
a f p n μ m c d k M G T
Atto Femto Pico Nano Micro Milli Centi Deci Kilo Mega Giga Tera
10�18 10�15 10�12 10�9 10�6 10�3 10�2 10�1 103 106 109 1012
928 Appendix

Table A.5 Isotopic mass, isotopic composition, and relative atomic mass [u] of non-radioactive
elements. # IUPAC 2001
Atomic
symbol Name
Atomic
No.
Mass
No.
Isotopic
mass Isotopic comp.
Relative
atomic mass
H Hydrogen 1 1 1.007825 100 1.00795
2 2.014101 0.0115
He Helium 2 3 3.016029 0.000137 4.002602
4 4.002603 100
Li Lithium 3 6 6.015122 8.21 6.941
7 7.016004 100
Be Beryllium 4 9 9.012182 100 9.012182
B Boron 5 10 10.012937 24.8 10.812
11 11.009306 100
C Carbon 6 12 12.000000 100 12.0108
13 13.003355 1.08
N Nitrogen 7 14 14.003074 100 14.00675
15 15.000109 0.369
O Oxygen 8 16 15.994915 100 15.9994
17 16.999132 0.038
18 17.999161 0.205
F Fluorine 9 19 18.998403 100 18.998403
Ne Neon 10 20 19.992402 100 20.1798
21 20.993847 0.30
22 21.991386 10.22
Na Sodium 11 23 22.989769 100 22.989769
Mg Magnesium 12 24 23.985042 100 24.3051
25 24.985837 12.66
26 25.982593 13.94
Al Aluminium 13 27 26.981538 100 26.981538
Si Silicon 14 28 27.976927 100 28.0855
29 28.976495 5.0778
30 29.973770 3.3473
P Phosphorus 15 31 30.973762 100 30.973762
S Sulfur 16 32 31.972071 100 32.067
33 32.971459 0.80
34 33.967867 4.52
36 35.967081 0.02
Cl Chlorine 17 35 34.968853 100 35.4528
37 36.965903 31.96
Ar Argon 18 36 35.967546 0.3379 39.948
38 37.962776 0.0635
40 39.962383 100
K Potassium 19 39 38.963706 100 39.0983
40 39.963999 0.0125
41 40.961826 7.2167
(continued)
Appendix 929

Table A.5 (continued)
Atomic
symbol Name
Atomic
No.
Mass
No.
Isotopic
mass Isotopic comp.
Relative
atomic mass
Ca Calcium 20 40 39.962591 100 40.078
42 41.958618 0.667
43 42.958769 0.139
44 43.955481 2.152
46 45.953693 0.004
48 47.952534 0.193
Sc Scandium 21 45 44.955910 100 44.955910
Ti Titanium 22 46 45.952629 11.19 47.867
47 46.951764 10.09
48 47.947947 100
49 48.947871 7.34
50 49.944792 7.03
V Vanadium 23 50 49.947163 0.250 50.9415
51 50.943964 100
Cr Chromium 24 50 49.946050 5.187 51.9962
52 51.940512 100
53 52.940654 11.339
54 53.938885 2.823
Mn Manganese 25 55 54.938050 100 54.938050
Fe Iron 26 54 53.939615 6.37 55.845
56 55.934942 100
57 56.935399 2.309
58 57.933280 0.307
Co Cobalt 27 59 58.933200 100 58.933200
Ni Nickel 28 58 57.935348 100 58.6934
60 59.930791 38.5198
61 60.931060 1.6744
62 61.928349 5.3388
64 63.927970 1.3596
Cu Copper 29 63 62.929601 100 63.546
65 64.927794 44.57
Zn Zinc 30 64 63.929147 100 65.39
66 65.926037 57.37
67 66.927131 8.43
68 67.924848 38.56
70 69.925325 1.27
Ga Gallium 31 69 68.925581 100 69.723
71 70.924705 66.367
Ge Germanium 32 70 69.924250 56.44 72.61
72 71.922076 75.91
73 72.923459 21.31
74 73.921178 100
76 75.921403 20.98
(continued)
930 Appendix

Table A.5 (continued)
Atomic
symbol Name
Atomic
No.
Mass
No.
Isotopic
mass Isotopic comp.
Relative
atomic mass
As Arsenic 33 75 74.921596 100 74.921596
Se Selenium 34 74 73.922477 1.79 78.96
76 75.919214 18.89
77 76.919915 15.38
78 77.917310 47.91
80 79.916522 100
82 81.916700 17.60
Br Bromine 35 79 78.918338 100 79.904
81 80.916291 97.28
Kr Krypton 36 78 77.920387 0.61 83.80
80 79.916378 4.00
82 81.913485 20.32
83 82.914136 20.16
84 83.911507 100
86 85.910610 30.35
Rb Rubidium 37 85 84.911789 100 85.4678
87 86.909183 38.56
Sr Strontium 38 84 83.913425 0.68 87.62
86 85.909262 11.94
87 86.908879 8.48
88 87.905614 100
Y Yttrium 39 89 88.905848 100 88.905848
Zr Zirconium 40 90 89.904704 100 91.224
91 90.905645 21.81
92 91.905040 33.33
94 93.906316 33.78
96 95.908276 5.44
Nb Niobium 41 93 92.906378 100 92.906378
Mo Molybdenum 42 92 91.906810 61.50 95.94
94 93.905088 38.33
95 94.905841 65.98
96 95.904679 69.13
97 96.906021 39.58
98 97.905408 100
100 99.907478 39.91
Ru Ruthenium 44 96 95.907599 17.56 101.07
98 97.905288 5.93
99 98.905939 40.44
100 99.904229 39.94
101 100.905582 54.07
102 101.904350 100
104 103.905430 59.02
(continued)
Appendix 931

Table A.5 (continued)
Atomic
symbol Name
Atomic
No.
Mass
No.
Isotopic
mass Isotopic comp.
Relative
atomic mass
Rh Rhodium 45 103 102.905504 100 102.905504
Pd Palladium 46 102 101.905608 3.73 106.42
104 103.904036 40.76
105 104.905084 81.71
106 105.903484 100
108 107.903894 96.82
110 109.905151 42.88
Ag Silver 47 107 106.905094 100 107.8682
109 108.904756 92.90
Cd Cadmium 48 106 105.906459 4.35 112.412
108 107.904184 3.10
110 109.903006 43.47
111 110.904182 44.55
112 111.902757 83.99
113 112.904401 42.53
114 113.903358 100
116 115.904755 26.07
In Indium 49 113 112.904061 4.48 114.818
115 114.903879 100
Sn Tin 50 112 111.904822 2.98 118.711
114 113.902782 2.03
115 114.903346 1.04
116 115.901744 44.63
117 116.902954 23.57
118 117.901606 74.34
119 118.903309 26.37
120 119.902197 100
122 121.903440 14.21
124 123.905275 17.77
Sb Antimony 51 121 120.903818 100 121.760
123 122.904216 74.79
Te Tellurium 52 120 119.904021 0.26 127.60
122 121.903047 7.48
123 122.904273 2.61
124 123.902819 13.91
125 124.904425 20.75
126 125.903306 55.28
128 127.904461 93.13
130 129.906223 100
I Iodine 53 127 126.904468 100 126.904468
(continued)
932 Appendix

Table A.5 (continued)
Atomic
symbol Name
Atomic
No.
Mass
No.
Isotopic
mass Isotopic comp.
Relative
atomic mass
Xe Xenon 54 124 123.905896 0.33 131.29
126 125.904270 0.33
128 127.903530 7.14
129 128.904779 98.33
130 129.903508 15.17
131 130.905082 78.77
132 131.904154 100
134 133.905395 38.82
136 135.907221 32.99
Cs Cesium 55 133 132.905447 100 132.905447
Ba Barium 56 130 129.906311 0.148 137.328
132 131.905056 0.141
134 133.904503 3.371
135 134.905683 9.194
136 135.904570 10.954
137 136.905821 15.666
138 137.905241 100
La Lanthanum 57 138 137.907107 0.090 138.9055
139 138.906348 100
Ce Cerium 58 136 135.907145 0.209 140.116
138 137.905991 0.284
140 139.905434 100
142 141.909240 12.565
Pr Praseodymium 59 141 140.907648 100 140.907648
Nd Neodymium 60 142 141.907719 100 144.24
143 142.909810 44.9
144 143.910083 87.5
145 144.912569 30.5
146 145.913112 63.2
148 147.916889 21.0
150 149.920887 20.6
Sm Samarium 62 144 143.911995 11.48 150.36
147 146.914893 56.04
148 147.914818 42.02
149 148.917180 51.66
150 149.917271 27.59
152 151.919728 100
154 153.922205 85.05
Eu Europium 63 151 150.919846 91.61 151.964
153 152.921226 100
(continued)
Appendix 933

Table A.5 (continued)
Atomic
symbol Name
Atomic
No.
Mass
No.
Isotopic
mass Isotopic comp.
Relative
atomic mass
Gd Gadolinium 64 152 151.919788 0.81 157.25
154 153.920862 8.78
155 154.922619 59.58
156 155.922120 82.41
157 156.923957 63.00
158 157.924101 100
160 159.927051 88.00
Tb Terbium 65 159 158.925343 100 158.925343
Dy Dysprosium 66 156 155.924279 0.21 162.50
158 157.924405 0.35
160 159.925194 8.30
161 160.926930 67.10
162 161.926795 90.53
163 162.928728 88.36
164 163.929171 100
Ho Holmium 67 165 164.930319 100 164.930319
Er Erbium 68 162 161.928775 0.42 167.26
164 163.929197 4.79
166 165.930290 100
167 166.932045 68.22
168 167.932368 79.69
170 169.935460 44.42
Tm Thulium 69 169 168.934211 100 168.934211
Yb Ytterbium 70 168 167.933894 0.41 173.04
170 169.934759 9.55
171 170.936322 44.86
172 171.936378 68.58
173 172.938207 50.68
174 173.938858 100
176 175.942568 40.09
Lu Lutetium 71 175 174.940768 100 174.967
176 175.942682 2.66
Hf Hafnium 72 174 173.940040 0.46 178.49
176 175.941402 14.99
177 176.943220 53.02
178 177.943698 77.77
179 178.944815 38.83
180 179.946549 100
Ta Tantalum 73 180 179.947466 0.012 180.9479
181 180.947996 100
(continued)
934 Appendix

Table A.5 (continued)
Atomic
symbol Name
Atomic
No.
Mass
No.
Isotopic
mass Isotopic comp.
Relative
atomic mass
W Tungsten 74 180 179.946707 0.40 183.84
182 181.948206 86.49
183 182.950224 46.70
184 183.950933 100
186 185.954362 93.79
Re Rhenium 75 185 184.952956 59.74 186.207
187 186.955751 100
Os Osmium 76 184 183.952491 0.05 190.23
186 185.953838 3.90
187 186.955748 4.81
188 187.955836 32.47
189 188.958145 39.60
190 189.958445 64.39
192 191.961479 100
Ir Iridium 77 191 190.960591 59.49 192.217
193 192.962924 100
Pt Platinum 78 190 189.959931 0.041 195.078
192 191.961035 2.311
194 193.962664 97.443
195 194.964774 100
196 195.964935 74.610
198 197.967876 21.172
Au Gold 79 197 196.966552 100 196.966552
Hg Mercury 80 196 195.965815 0.50 200.59
198 197.966752 33.39
199 198.968262 56.50
200 199.968309 77.36
201 200.970285 44.14
202 201.970626 100
204 203.973476 23.00
Tl Thallium 81 203 202.972329 41.892 204.3833
205 204.974412 100
Pb Lead 82 204 203.973029 2.7 207.2
206 205.974449 46.0
207 206.975881 42.2
208 207.976636 100
Bi Bismuth 83 209 208.980383 100 208.980383
Th Thorium* 90 232 232.038050 100 232.038050
U Uranium* 92 234 234.040946 0.0055 238.0289
235 235.043923 0.73
238 238.050783 100
Appendix 935

A.3 Carbon Isotopic Patterns
Provided no other element contributing to M + 1 is present, reading out the PM+1/PMratio from a mass spectrum yields the approximate number of carbon atoms, nC,from nC � (PM+1/PM) � 91. If M + 1 has an intensity of 24% of that of M, for
example, we can calculate the presence of (24/100) � 91 � 22 carbons.
C5
0 1 2 3 4 5 6 0 1 2 3 4 5 6 0 1 2 3 4 5 6 0 1 2 3 4 5 6 0 1 2 3 4 5 6
C20 C60 C90 C120
Fig. A.1 Calculated isotopic patterns for carbon. Note the steadily expanding width of the pattern
as X + 2, X + 3, X + 4,... become visible. At about C90 the X + 1 peak reaches the same intensity as
the X peak. At higher carbon number it becomes the base peak of the pattern
Table A.6 Calculated
isotopic distributions for
carbon
Number of carbons X+ 1 X+ 2 X+ 3 X+ 4 X+ 5
1 1.1 0.00
2 2.2 0.01
3 3.3 0.04
4 4.3 0.06
5 5.4 0.10
6 6.5 0.16
7 7.6 0.23
8 8.7 0.33
9 9.7 0.42
10 10.8 0.5
12 13.0 0.8
15 16.1 1.1
20 21.6 2.2 0.1
25 27.0 3.5 0.2
30 32.3 5.0 0.5
40 43.2 9.0 1.3 0.1
50 54.1 14.5 2.5 0.2 0.1
60 65.0 20.6 4.2 0.6 0.2
90 97.2 46.8 14.9 3.5 0.6
120a 100.0 64.4 27.3 8.6 2.2aThe X peak has an intensity of 77.0% in that case
936 Appendix

A.4 Chlorine and Bromine Isotopic Patterns
For halogens theisotopic peaksare separated by2 u.
Br1
0 2 4 6 8 10 12
0 2 4 6 8 10 12 0 2 4 6 8 10 12 0 2 4 6 8 10 12 0 2 4 6 8 10 12 0 2 4 6 8 10 12
0 2 4 6 8 10 12 0 2 4 6 8 10 12 0 2 4 6 8 10 12 0 2 4 6 8 10 12
0 2 4 6 8 10 12 0 2 4 6 8 10 12 0 2 4 6 8 10 12
0 2 4 6 8 10 12
0 2 4 6 8 10 12 0 2 4 6 8 10 12 0 2 4 6 8 10 12 0 2 4 6 8 10 12 0 2 4 6 8 10 12
0 2 4 6 8 10 12 0 2 4 6 8 10 12
0 2 4 6 8 10 12
0 2 4 6 8 10 12
0 2 4 6 8 10 12 0 2 4 6 8 10 12 0 2 4 6 8 10 12
Br2 Br3
CI1Br3CI1Br2CI1Br1
CI2Br1
CI1
CI2
CI1Br4
CI2Br3CI2Br2
CI3Br1CI3 CI3Br3CI3Br2
CI4Br1CI4
CI5 CI6 CI7 CI8 CI9
CI4Br2
CI2Br4
Br4
Fig. A.2 Calculated isotopic patterns for combinations of bromine and chlorine. The peak shown
at zero position corresponds to the monoisotopic ion at m/z X. The isotopic peaks are then locatedat m/z ¼ X + 2, 4, 6, ... The numeric value of X is given by the mass number of the monoisotopic
combination, e.g., 70 u for Cl2
Appendix 937

A.5 Silicon and Sulfur Isotopic Patterns
Si1
0 2 4 6 0 2 4 6 0 2 4 6 0 2 4 6 0 2 4 6
Si2 Si3 Si4 Si5
Fig. A.3 Isotopic patterns for silicon. The peak at zero position corresponds to the monoisotopic
ion at m/z X. The isotopic peaks are then located at m/z ¼ X + 1, 2, 3, ...
0 2 4 6 0 2 4 6 0 2 4 6 0 2 4 6 0 2 4 6
S1 S2 S3 S4 S8
Fig. A.4 Isotopic patterns for sulfur. The peak at zero position corresponds to the monoisotopic
ion at m/z X. The isotopic peaks are then located at m/z ¼ X + 1, 2, 3, ...
938 Appendix

A.6 Reading Isotopic Patterns
This flow chart can be used as a guideline on how to read and interpret isotopic
patterns. The procedure is relevant irrespective of the ionization method employed.
Fig. A.5 Guideline for the identification of contributing elements based on isotopic pattern
analysis
Appendix 939

A.7 Isotopologs and Accurate Mass
If isotopolog ions are resolved and sufficient mass accuracy is available, the
distance between isotopic peaks can yield a new type of analytical information:
the differences between isotopic masses are characteristic for certain elements.
Table A.7 Characteristic
mass differences to identify
the presence of elements
Pair of isotopes or modification Δm [u]6Li vs. 7Li 1.000910B vs. 11B 0.996412C vs. 13C 1.003332S vs. 34S 1.995835Cl vs. 37Cl 1.997058Ni vs. 60Ni 1.995563Cu vs. 65Cu 1.998279Br vs. 81Br 1.9980191Ir vs. 193Ir 2.0023
gain or loss of H 1.0078
gain or loss of H2 2.0156
940 Appendix
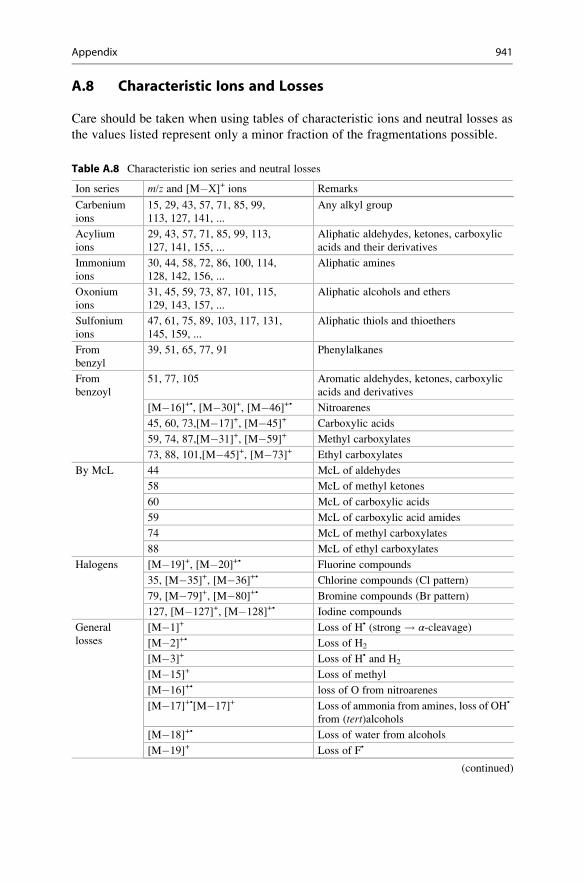
A.8 Characteristic Ions and Losses
Care should be taken when using tables of characteristic ions and neutral losses as
the values listed represent only a minor fraction of the fragmentations possible.
Table A.8 Characteristic ion series and neutral losses
Ion series m/z and [M�X]+ ions Remarks
Carbenium
ions
15, 29, 43, 57, 71, 85, 99,
113, 127, 141, ...
Any alkyl group
Acylium
ions
29, 43, 57, 71, 85, 99, 113,
127, 141, 155, ...
Aliphatic aldehydes, ketones, carboxylic
acids and their derivatives
Immonium
ions
30, 44, 58, 72, 86, 100, 114,
128, 142, 156, ...
Aliphatic amines
Oxonium
ions
31, 45, 59, 73, 87, 101, 115,
129, 143, 157, ...
Aliphatic alcohols and ethers
Sulfonium
ions
47, 61, 75, 89, 103, 117, 131,
145, 159, ...
Aliphatic thiols and thioethers
From
benzyl
39, 51, 65, 77, 91 Phenylalkanes
From
benzoyl
51, 77, 105 Aromatic aldehydes, ketones, carboxylic
acids and derivatives
[M�16]+•, [M�30]+, [M�46]+• Nitroarenes
45, 60, 73,[M�17]+, [M�45]+ Carboxylic acids
59, 74, 87,[M�31]+, [M�59]+ Methyl carboxylates
73, 88, 101,[M�45]+, [M�73]+ Ethyl carboxylates
By McL 44 McL of aldehydes
58 McL of methyl ketones
60 McL of carboxylic acids
59 McL of carboxylic acid amides
74 McL of methyl carboxylates
88 McL of ethyl carboxylates
Halogens [M�19]+, [M�20]+• Fluorine compounds
35, [M�35]+, [M�36]+• Chlorine compounds (Cl pattern)
79, [M�79]+, [M�80]+• Bromine compounds (Br pattern)
127, [M�127]+, [M�128]+• Iodine compounds
General
losses
[M�1]+ Loss of H• (strong ! α-cleavage)
[M�2]+• Loss of H2
[M�3]+ Loss of H• and H2
[M�15]+ Loss of methyl
[M�16]+• loss of O from nitroarenes
[M�17]+•[M�17]+ Loss of ammonia from amines, loss of OH•
from (tert)alcohols
[M�18]+• Loss of water from alcohols
[M�19]+ Loss of F•
(continued)
Appendix 941

Table A.8 (continued)
Ion series m/z and [M�X]+ ions Remarks
[M�20]+• Loss of HF
[M�27]+• Loss of HCN from heterocycles or HNC
from aromatic amines
[M�28]+• Loss of CO, C2H4 or N2
[M�29]+ Loss of CHO• or C2H5•
[M�30]+• Loss of H2CO from aromatic methyl ethers
etc.; check for nitroarenes
[M�31]+ Loss of MeO•
[M�32]+• Loss of MeOH, O2, (S)
[M�34]+• Loss of H2S
[M�35/37]+ Loss of Cl•
[M�36/38]+• Loss of HCl
[M�42]+• Loss of CH2CO or C3H6
[M�43]+ Loss of CH3CHO• or C3H7
•
[M�44]+• Loss of CO2
[M�45]+ Loss of COOH•, EtO•
[M�46]+• Loss of HCOOH, EtOH or NO2
[M�48]+• Loss of SO from sulfoxides
[M�56]+• Loss of CH3CHCO or C4H8
[M�57]+ Loss of EtCHO• or C4H9•
[M�59]+ Loss of COOMe• or CH2COOH•
[M�64]+• loss of SO2 from sulfolanes
[M�77]+ Loss of phenyl
[M�78]+ Loss of pyridyl
[M�79/81]+ Loss of Br•
[M�80/82]+• Loss of HBr
[M�91]+ Loss of benzyl or other C7H7•
[M�127]+ Loss of I•, rarely C10H7• (naphthyl)
[M�128]+• Loss of HI
942 Appendix
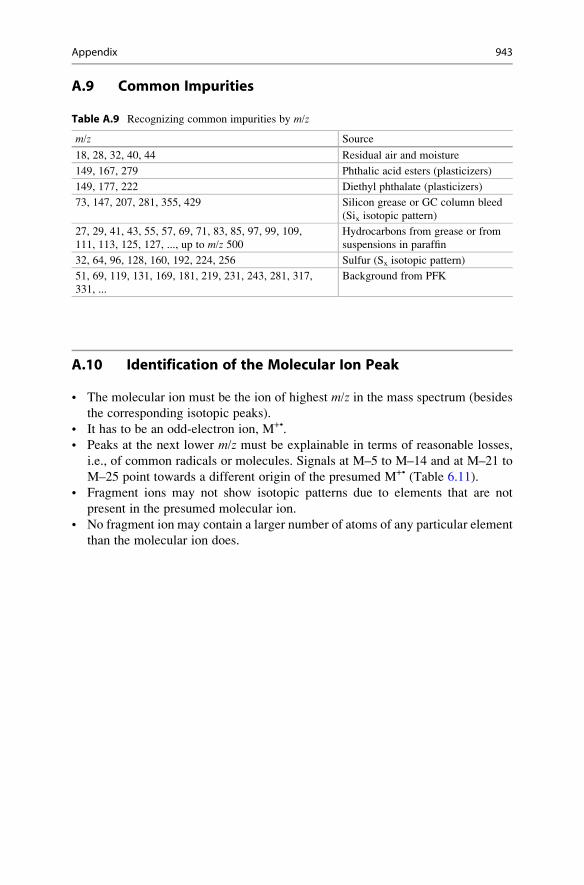
A.9 Common Impurities
A.10 Identification of the Molecular Ion Peak
• The molecular ion must be the ion of highest m/z in the mass spectrum (besides
the corresponding isotopic peaks).
• It has to be an odd-electron ion, M+•.
• Peaks at the next lower m/z must be explainable in terms of reasonable losses,
i.e., of common radicals or molecules. Signals at M–5 to M–14 and at M–21 to
M–25 point towards a different origin of the presumed M+• (Table 6.11).
• Fragment ions may not show isotopic patterns due to elements that are not
present in the presumed molecular ion.
• No fragment ion may contain a larger number of atoms of any particular element
than the molecular ion does.
Table A.9 Recognizing common impurities by m/z
m/z Source
18, 28, 32, 40, 44 Residual air and moisture
149, 167, 279 Phthalic acid esters (plasticizers)
149, 177, 222 Diethyl phthalate (plasticizers)
73, 147, 207, 281, 355, 429 Silicon grease or GC column bleed
(Six isotopic pattern)
27, 29, 41, 43, 55, 57, 69, 71, 83, 85, 97, 99, 109,
111, 113, 125, 127, ..., up to m/z 500Hydrocarbons from grease or from
suspensions in paraffin
32, 64, 96, 128, 160, 192, 224, 256 Sulfur (Sx isotopic pattern)
51, 69, 119, 131, 169, 181, 219, 231, 243, 281, 317,
331, ...
Background from PFK
Appendix 943

A.11 Rules for the Interpretation of Mass Spectra
• Identify the molecular ion! This is an important initial step, because it should
derive the molecular composition (Sect. 6.7). If the EI spectrum does not allow
for the identification of the molecular ion, soft ionization methods should be
employed in addition.
• The mass differences between the presumed molecular ion and primary
fragments must correspond to realistic chemical compositions (Sect. 6.7,
Table 6.11).
• The calculated and experimental isotopic patterns have to agree with the molec-
ular formula postulated (Sect. 3.2).
• The derived molecular formula must obey the nitrogen rule (Sect. 6.2.7). An
odd-numbered m/z value of the molecular ion requires 1, 3, 5, ... nitrogen atoms
to be contained, whereas an even m/z value belongs to 0, 2, 4, ... nitrogen atoms.
• Homolytic cleavages cause odd-numbered mass differences between fragment
and molecular ion (Sect. 6.2.7). Rearrangement fragmentations cause even-
Fig. A.6 Flow chart showing decisions and criteria for the identification of the molecular ion peak
944 Appendix

numbered mass differences. This rule toggles if odd numbers of nitrogen are
contained in the neutral loss.
• In general, fragmentations obey the even-electron rule (Sect. 6.1.3).
Odd-electron fragments from rearrangement fragmentations behave as if they
were molecular ions of the respective smaller molecule.
• The competition of homolytic cleavages is governed by Stevenson’s rule (Sect.
6.2.2). Thermodynamic stability of the pairs of products formed is decisive in
selecting the preferred fragmentation route.
• Calculate r + d to check formula proposals and to derive some structural
characteristics (Sect. 6.4.4).
• Write down a fragmentation scheme, thereby carefully tracking the origin of
primary fragment ions and of characteristic ions used for structure assignment.
From the purely analytical point of view this is very useful. However, one should
keep in mind that any proposed fragmentation scheme remains a working
hypothesis unless experimental confirmation is available.
• Employ additional techniques, such as measurement of accurate mass (Sect.
3.5), tandem mass spectrometry, or other spectroscopic methods to crosscheck
and to refine your assignments.
A.12 Systematic Approach to Mass Spectra
• Collect background information such as origin of the sample, presumed com-
pound class, solubility, thermal stability, or other spectroscopic information.
• Write m/z labels for all relevant peaks and calculate mass differences between
prominent peaks. Do you recognize characteristic ion series or mass differences
that point to common neutral losses?
• Check which ionization method was used and examine the general appearance of
the mass spectrum. Is the molecular ion peak intense (as with aromatic, hetero-
cyclic, polycyclic compounds) or weak (as with aliphatic and multifunctional
compounds)? Are there typical impurities (solvent, grease, plasticizers) or back-
ground signals (residual air, column bleed in GC-MS)?
• Is accurate mass data available for some of the peaks?
• Now, follow the above rules to proceed.
• Derive information on the presence/absence of functional groups.
• Be careful when using collections of common neutral losses and m/z-to-structurerelationship tables – they’re never comprehensive. Even worse, one tends to get
stuck on the first assumption.
• Put together the known structural features and try to assign the structure to the
unknown sample. Sometimes, only partial structures of the analyte can be
derived or isomers cannot be distinguished.
• Crosscheck proposed molecular structure and mass spectral data. This is also
recommended between the single steps of mass spectral interpretation.
Appendix 945

• Are there reference spectra available (at least of similar compounds) either from
the literature or from mass spectral databases (Sect. 5.9)?
• Never rigidly follow this scheme! Sometimes, a step back or forth may acceler-
ate the process or help to avoid pitfalls (Fig. A.7).
A.13 Method Selection Guide
This diagram (Fig. A.8) may help in selecting the right ionization method for
analysis of a sample by MS. Often, there are several reasonable choices and it is
advisable to make the best use possible of what is available at your local facility.
MS results also depend on user input. Discuss your options with the MS staff at your
facility.
Fig. A.7 Guide to mass spectral structure elucidation
946 Appendix

Fig.A.8
Methodselectionguide.Ionizationmethodswithbron
ze-colored
boxes
requiresampleevaporationpriorto
ionizationwhilemethodswithoran
geboxes
accomplish
transfer
from
thecondensedphasealongwithionization.Themassranges
aremeantas
guidelines
andin
noway
definestrict
limits
Appendix 947

A.14 How to Recognize Cationization
Soft ionization methods like FAB, FD, ESI, and MALDI often cause cationization
by Na+, K+, Cs+, and Ag+. Especially Na+, K+ adducts are almost omnipresent.
Other techniques like APCI and DART often yield NH4+ adducts in addition or
competition to molecular ions and/or protonated molecules (Fig. A.9). Searching a
spectrum for those characteristic Δ(m/z) values reveals the true molecular mass. It
is particularly useful to identify adducts by their accurate mass differences
(Table A.10).
a
d e f
b c
Fig. A.9 Signals representing the intact molecular mass in case of (a) molecular ion formation,
(b) protonation, (c) silver cationization, (d) molecular ion and protonation, (e) protonation plus
alkali cationization, and (f) protonation, ammonium plus alkali adduct formation. The relative
abundances of the respective contributions are subject to wide variations. The abscissa gives the
corresponding M+X nominal mass value; artificial isotopic patterns are added for more realistic
appearance
948 Appendix

Table A.10 Characteristic
mass differences to identify
frequent cation and anion
adducts
Pair of ions Δm [u]
M+• vs. 13C�M+• 1.0033
M+• vs. [M + H]+ 1.0078
[M + H]+ vs. [M + NH4]+ 17.0265
[M + H]+ vs. [M + Na]+ 21.9819
[M + H]+ vs. [M + K]+ 37.9559
[M + Na]+ vs. [M + K]+ 15.9739
M� • vs. 13C�M� • 1.0033
[M�H]� vs. M� • 1.0078
[M�H]� vs. [M + OH]� 18.0106
[M�H]� vs. [M + 35Cl]� 35.9767
[M�H]� vs. [M + COOH]� 46.0055
[M�H]� vs. [M + 79Br]� 79.9261
[M�H]� vs. [M + CF3COO]� 113.9928
Appendix 949

A.15 Amino Acids
Table A.11 Amino acids (by order of residue mass)
Amino acid Codes Polarity ChargeaFormula of
residue
Residue
nominal
mass [u]
Residue
accurate
mass [u]
Glycine Gly, G nonpolar Ο C2H3NO 57 57.0520
Alanine Ala, A nonpolar Ο C3H5NO 71 71.0371
Serine Ser, S polar Ο C3H5NO2 87 87.0320
Proline Pro, P nonpolar Ο C5H7NO 97 97.0528
Valine Val, V nonpolar Ο C5H9NO 99 99.0684
Threonine Thr, T polar Ο C4H7NO2 101 101.0477
Cysteine Cyc, C nonpolar Ο C2H5NOS 103 103.0092
Leucine Leu, L nonpolar Ο C6H11NO 113 113.0841
Isoleucine Ile, I nonpolar Ο C6H11NO 113 113.0841
Asparagine Asn, N polar Ο C4H6N2O2 114 114.0429
Aspartic acid Asp, D polar – C4H5NO3 115 115.0269
Glutamine Gln, Q polar Ο C5H8N2O2 128 128.0586
Lysine Lys, K polar + C6H12N2O 128 128.0950
Glutamic acid Glu, E polar – C5H7NO3 129 129.0426
Methionine Met, M nonp. Ο C5H9NOS 131 131.0405
Histidine His, H polar (+) C6H7N3O 137 137.0589
Phenylalanine Phe, F nonpolar Ο C9H9NO 147 147.0684
Arginine Arg, R polar + C6H12N4O 156 156.1011
Tyrosine Tyr, Y polar Ο C9H9NO2 163 163.0633
Tryptophan Trp, W nonpolar Ο C11H10N2O 186 186.0793aNeutral amino acids are marked by Ο, basic AAs (+) tend to assume positive charge from
protonation, acidic AAs (�) tend to be negative by dissociation of the acidic group
950 Appendix

A.16 Nobel Prizes for Mass Spectrometry
A.17 One Hundred Common Acronyms
ADC Analog-to-digital converter
AE Appearance energy
AMS Accelerator mass spectrometry
APCI Atmospheric pressure chemical ionization
API Atmospheric pressure ionization
AP-MALDI Atmospheric pressure matrix-assisted laser desorption/ionization
APPI Atmospheric pressure photoionization
ASAP Atmospheric solids analysis probe
B Magnetic sector (as part of an instrument configuration)
CE Capillary electrophoresis
CE Charge exchange (equivalent to CT)
CI Chemical ionization
CID Collision-induced dissociation
CT Charge transfer (formerly CE)
DART Direct analysis in real time
DCI Desorption (or direct) chemical ionization
DEI Desorption (or direct) electron ionization
DE Delayed extraction
DESI Desorption electrospray/ionization
DIP Direct insertion probe
E Electrostatic sector (as part of an instrument configuration, cf. ESA)
EA Electron affinity
EC Electron capture
ECD Electron capture dissociation
Table A.12 Nobel laureates highly regarded in mass spectrometry
Laureate
Category
and year Prize motivation
Joseph John Thomson Physics
1906
In recognition of the great merits of his theoretical and
experimental investigations on the conduction of
electricity by gases
Francis William Aston Chemistry
1922
For his discovery, by means of his mass spectrograph,
of isotopes in a large number of nonradioactive
elements, and for his enunciation of the whole-number
rule
Wolfgang Paul and
Hans G. Dehmelt
Physics
1989
For the development of the ion trap technique
John B. Fenn jointly
with Koichi Tanaka
Chemistry
2002
For their development of soft desorption ionization
methods for mass spectrometric analyses of biological
macromolecules
Appendix 951

EDD Electron detachment dissociation
EI Electron ionization
ESA Electrostatic analyzer (cf. E)
ESI Electrospray ionization
ETD Electron transfer dissociation
FAB Fast-atom bombardment
FD Field desorption
FI Field ionization
FT-ICR Fourier-transform ion cyclotron resonance
GB Gas phase basicity
GC Gas chromatography
GC-MS Gas chromatography-mass spectrometry
GD Glow discharge
HDX Hydrogen–deuterium exchange
HR High resolution
HV High vacuum
HV High voltage
ICP Inductively coupled plasma
ICR Ion cyclotron resonance
IE Ionization energy
IMS Ion mobility spectrometry
IR-MS Isotope-ratio mass spectrometry
IR-MALDI Infrared matrix-assisted laser desorption/ionization
IRMPD Infrared multiphoton dissociation
KER Kinetic energy release
LA Laser ablation
LC Liquid chromatography
LC-MS Liquid chromatography-mass spectrometry (includes HPLC and
UHPLC)
LDI Laser desorption/ionization
LIFDI Liquid injection field desorption/ionization
LIT Linear quadrupole ion trap
LOD Limit of detection
LR Low resolution
LSIMS Liquid secondary ion-mass spectrometry
MALDI Matrix-assisted laser desorption/ionization
MCP Microchannel plate
MID Multiple ion detection
MIKES Mass-analyzed ion kinetic energy spectroscopy
MS Mass spectrometry (not to be used for ‘mass spectrometer’ or ‘mass
spectrum’)
MS/MS Mass spectrometry/mass spectrometry or tandem mass
spectrometry
MRM Multiple reaction monitoring
MUPI Multiphoton ionization
952 Appendix

nanoESI Nano electrospray ionization
NCI Negative-ion chemical ionization.
NICI Negative-ion chemical ionization.
PA Proton affinity
PCI Positive-ion chemical ionization
PICI Positive-ion chemical ionization
PIE Pulsed ion extraction
PTR-MS Proton transfer reaction-mass spectrometry
Py Pyrolysis
Q Linear quadrupole (as part of an instrument configuration)
q RF-only linear quadrupole (as part of an instrument configuration)
QET Quasi equilibrium theory
QIT Quadrupole ion trap
RE Recombination energy
REMPI Resonance-enhanced multiphoton ionization
RF Radio frequency
RIC Reconstructed ion chromatogram
SEC Size exclusion chromatography
SEM Secondary electron multiplier
SIM Selected ion monitoring
SIMS Secondary-ion mass spectrometry
SRM Selected reaction monitoring
SSMS Spark source mass spectrometry
TI Thermal ionization
TIC Total ion chromatogram
TIMS Thermal ionization mass spectrometry
TMP Turbomolecular pump
TOF Time-of-flight (analyzer)
TWIG Traveling wave ion guide
UHR Ultrahigh resolution
UHV Ultrahigh vacuum
UV-MALDI Ultraviolet matrix-assisted laser desorption/ionization.
YIKES Well, after reading all that
ZEKE Zero kinetic energy electron
Appendix 953

Index
AAccumulation, of spectra, 849
Accurate mass measurement, 116
Activation energy of the reverse reaction, 57
Acylium ions, 338
ADC. See Analog-to-digital converter (ADC)ADI. See Ambient desorption/ionization (ADI)
Adiabatic ionization, 38
AE. See Appearance energy (AE)
Alkali adduct ions, of carbohydrates, 686
Allylic bond cleavage
of alkenes, 360
isomerization prior to, 360
α-cleavageof acetone, 332
of amines, ethers, and alcohols, 339
of halogenated hydrocarbons, 347
of ketones, 336
of thioethers, 346
Ambient desorption/ionization (ADI), 780
Ambient mass spectrometry, 780. See alsoAmbient desorption/ionization
Ammonium adducts
in APCI, 474
in DART, 811
amu. See Atomic mass unit (amu)
Analog-to-digital converter (ADC), 266
Analysis of complex mixtures, 831
Anion abstraction, 441
APCI. See Atmospheric pressure chemical
ionization (APCI)
API. See Atmospheric pressure ionization (API)
AP-MALDI. See Atmospheric pressure
MALDI (AP-MALDI)
Appearance energy (AE)
definition, 42
determination, 70
Appearance potential (AP). See Appearanceenergy (AE)
APPI. See Atmospheric pressure
photoionization (APPI)
Array detector, 272
ASAP. See Atmospheric pressure solids
analysis probe (ASAP)
Aspirin, analyzed by DESI, 788
Aston, F.W., 3
Atmospheric pressure chemical ionization
(APCI), 471
ion source, 471
negative ion formation, 475
positive ion formation, 472
spectra, 477
switching between methods, 480
on the way leading to ESI, 723
Atmospheric pressure, comparison to vacuum
ionization, 474
Atmospheric pressure ionization (API), 470
as collective term, 472, 723
interface for AP-MALDI, 703
Atmospheric pressure ionization methods, 721
Atmospheric pressure MALDI (AP-MALDI),
703
Atmospheric pressure photoionization (APPI),
479
relationship to ESI, 723
spectra, 482
switching between methods, 480
Atmospheric pressure solids analysis probe
(ASAP), 806
applications, 806
polystyrene analyis, 807
setup of source, 806
Atomic mass unit (amu), 90
Atomic number, 86
Atomic weight. See Relative atomic mass
Atropa belladonna, analyzed by DESI, 789
Autoprotonation, 443
Averaging, of spectra, 849
# Springer International Publishing AG 2017
J.H. Gross, Mass Spectrometry, DOI 10.1007/978-3-319-54398-7955

BBackground subtraction, from spectra, 849
Bar graph, representation of spectra, 14
Base peak chromatogram (BPC), 16
Base peak, definition, 11
Benzylic bond cleavage, 354
phenylalkanes, 354
Benzyl/tropylium isomerization, 356
BEqQ, 255
Bimolecular reactions
in APCI, 472
in DART, 810
Blackbody infrared radiative dissociation
(BIRD), 588
Block copolymer, by MALDI-TOF-MS, 692
Born-Oppenheimer approximation, 36
Bottom-up protein analysis, 681
BPC. See Base peak chromatogram (BPC)
Bradbury-Nielsen gate, 556
Breakdown graph, 71–72
CCA. See Collision-induced dissociation
Calibration file, 123252Californium plasma desorption (252Cf-PD),
638
Capillary columns, in gas chromatography, 837
Capillary zone electrophoresis (CZE), 728
Capillary zone electrophoresis-mass
spectrometry (CZE-MS), 831
Carbenium ions, 338
stability of isomers, 365
Carrier gas, for gas chromatography, 837
CE. See Charge exchangeCEM. See DetectorsCenter-of-mass collision energy, 547252Cf-PD. See 252Californium plasma
desorption (252Cf-PD)
Characteristic ions, 338
Charge deconvolution
display of spectra, 753
in ESI, 751
ESI of transferrin, 752
by high resolution, 754
Charge deconvolution software, 752
Charged-residue model, in ESI, 745
Charge exchange. See Charge transferCharge exchange chemical ionization
regio-and stereoselectivity, 459
selective ionization, 458
Charge localization, 34
Charge reduction electrospray, 756
Charge retention, 333
Charge transfer chemical ionization, 441, 486
energetics, 456
reagent gases, 457
Charge transfer ionization, 455
Chemical ionization (CI), 439
ion formation, 440
ion source, 441
reagent gas, 441
Chemi-ionization, 444
Chevron plate, 271
Chirp excitation. See Fourier transform ion
cyclotron resonance (FT-ICR)
Chromatogram, 836
Chromatographic column, 832
Chromatographic resolution, 835
Chromatography, origin of term, 832
CI. See Chemical ionization (CI)
CID. See Collision-induced dissociation (CID)
CIT. See Cylindrical ion trap (CIT)
Closed-shell ion. See Even-electron ion (EE)
Cluster ions
in FAB-MS, 622
for mass calibration, 622
Collisional activation. See Collision-induceddissociation
Collisional cooling, 198
Collisional focusing, 199
Collisionally activated dissociation. SeeCollision-induced dissociation
Collisional quenching, in APPI, 481
Collision cell, 197, 546
Collision gases, for CID, 549
Collision-induced dissociation (CID), 545
in API interfaces, 735
CO loss, 386
of arylmethylethers, 390
of carbonyl compounds, 393
differentiation from N2, C2H4, 394
of phenols, 386
of quinones, 388–389
of transition metal carbonyl complexes, 393
Column bleed, in GC-MS, 862
Composite metastable peak, 391
Comprehensive gas chromatography, 838
Constant neutral loss scan (CNL), 563, 567
Consumption of analyte, by MS in general, 10
Conversion dynode, 271–272
Cryopump, 274
C-trap, 250
ion injection into Orbitrap, 250
Curved-field reflectron, 557
Cylindrical ion trap (CIT), 221
956 Index

CZE. See Capillary zone electrophoresis (CZE)CZE-MS. See Capillary zone electrophoresis-
mass spectrometry (CZE-MS)
DDAD. See Diode array detectors (DAD)
Dalton (Da), 11
DAPCI. See Desorption atmospheric pressure
chemical ionization (DAPCI)
DAPPI. See Desorption atmospheric pressure
photoionization (DAPPI)
DART. See Direct analysis in real time
(DART)
Data reduction, 14, 15, 845
DBE. See Double bond equivalents (DBE)
DCI. SeeDesorption chemical ionization (DCI)
DE. See Delayed extraction (DE)
Deadly nightshade, analyzed by DESI, 788
Dead time, of a chromatographic column, 833
Dead volume, of a chromatographic column,
833
Degrees of freedom
external, 40
internal, 40
Degrees of freedom effect (DOF), 60
Delayed extraction (DE), 166
Deltamass, 142
Dendrimers, by MALDI-TOF-MS, 694
DEP. See Direct exposure probeDeprotonation, in NICI, 461
DESI. See Desorption electrospray ionization
(DESI)
Desorption atmospheric pressure chemical
ionization (DAPCI), 780, 791
Desorption atmospheric pressure
photoionization (DAPPI), 780, 792
Desorption chemical ionization (DCI), 311,
468
Desorption electron ionization (DEI), 468. SeealsoDirect electron ionization (DEI)
Desorption electrospray ionization (DESI),
779, 782
applications, 787
ion formation, 786
parameters, 783
sources, 783
Desorption/ionization on silicon (DIOS), 694
Desorption sonic spray ionization (DeSSI),
780, 795
Detection limit, 18
Detectors, 266
channel electron multiplier (CEM), 269
channeltrons, 269
in chromatography, 836
conversion dynode, 271–272
Faraday cup, 266
focal plane detector (FPD), 272
microchannel plate (MCP), 270
post-acceleration, 271
secondary electron multiplier (SEM), 268
Differential pumping, 545
Digital object identifiers (DOIs), in references,
5–6
Digitization, data points per peak, 693
Di-isotopic element, definition, 86
Diode array detectors (DAD), 836
DIOS. See Desorption/ionization on silicon
(DIOS)
DIP. See Direct insertion probe (DIP)
Direct analysis in real time (DART), 779, 808
applications, 815
articles of daily use, 818
color of discharge, 808
configurations, 813
detection of explosives, 817
fruit flies, 817
need for additional pumping stage, 813
negative ion formation, 812
operating conditions, 809
polydimethylsiloxanes, 818
positive ion formation, 810
related ionization techniques, 813
source, 808
Vapur Interface, 813
volatiles from garlic, 815
Direct electron ionization (DEI), 311
Direct exposure probe (DEP), 311, 468
Direct insertion probe (DIP), 302
applications, 305
AUDEVAP, 307
automated, 307
SIM atomated probe, 307
Dissolved organic matter (DOM), 877
Distonic ions, 351
formation, 352
Distribution coefficient, in chromatography,
833
DOF. See Degrees of freedom effect (DOF)
DOIs. See Digital object identifiers (DOIs)DOM. See Dissolved organic matter (DOM)
Double α-cleavageof alicyclic compounds, 349
identification of regioisomers, 350
Double bond equivalents (DBE), 359
Double-focusing. SeeMagnetic sector analyzer
Index 957

Doubly charged ion, in EI, 31
Drift tube ion mobility (DT-IMS), 265
Droplet jet fission, in ESI, 744
DT-IMS. See Drift tube ion mobility (DT-IMS)
Dual-target FAB probe (DTP), 632
Duoplasmatron source, 908
Duty cycle, 169
Dynamically harmonized ICR cell, 242
Dynamic range, 266
EEA. See Electron affinity (EA)
Easy ambient sonic-spray ionization. SeeDesorption sonic spray ionization
Easy sonic spray ionization (EASI), 780
EBqQ, 255
EC. See Electron capture (EC)
ECNI. See Electron capture negative ionization(ECNI)
EDD. See Electron detachment dissociation
(EDD)
EESI. See Extractive electrospray ionization
(EESI)
EHI. See Electrohydrodynamic ionization
(EHI)
EI. See Electron ionization (EI)
EIC. See Extracted ion chromatogram (EIC)
ELDI. See Electrospray-assisted laser
desorption/ionization (ELDI)
Electrohydrodynamic ionization (EHI),
724–725
Electron affinity (EA), 464
Electron attachment. See Electron capture (EC)Electron capture (EC), 32, 462
creating thermal electrons, 465
cross section, 583
energetics, 463
ionization process, 463
spectra, 468
Electron capture detector (ECD), 836
Electron capture dissociation (ECD), 583
in ICR cells, 589
peptide cleavage, 584
posttranslational peptide modifications, 589
Electron capture negative ionization (ECNI),
462
versus NICI, 462Electron detachment dissociation (EDD), 592
Electron impact. See Electron ionization (EI)
Electron ionization (EI), 30, 293
doubly charged ions, 30
fragmentation pathways, 56
fragment ions, 31
interpretation, 325
ionization process, 30
ion source, 294
contamination, 295
efficiency, 297
emission-controlled filament, 296
filament, 296
ionization chamber, 294
repeller, 294
low-energy, low-temperature, 314
mass spectral libraries, 316
measuring EI with DIP, 305
primary electrons, 296
rearrangement ions, 31
timescale, 52
Electron mass, in calculation of exact mass, 93
Electron monochromator, 66
Electron transfer dissociation (ETD), 591
Electrophilic addition, in PICI, 440, 486
Electrospray-assisted laser desorption/
ionization (ELDI), 797
Electrospray ionization (ESI), 71
analytes for ESI, 766
charge deconvolution, 751
charge reduction, 756
compared to APCI and APPI, 768
conventional vs. nanoESI, 737design of sprayers, 727
disintegration of droplets, 744
formation of a spray, 741
high-mass up to 1 Mu, 764
interface designs, 727
ion formation, 745
ionic metal complexes, 758
ion source/interface, 726
milestones leading to, 723
oligonucleotides and DNA, 759
oligosaccharides, 762
principle, 725
for protein complexes, 765
for pseudo–rotaxanes, 762
sample consumption, 768
small molecules, 757
surfactants, 759
switching between methods, 479
Taylor cone, 741
types of ions, 767
versatile interface, 471
Electrostatic analyzer (ESA), 181
energy dispersion, 182
Electrostatic sector. See Electrostatic analyzerElimination of carbon monoxide. See CO loss
958 Index
Elution, in chromatrography, 834
Emitter heating current (EHC), 518
End cap electrodes. See Quadrupole ion trap
(QIT)
Endgroup of polymer, determination, 691
Energy-sudden methods. See MALDI, FAB
ESI interface. See Electrospray ionization
ETD. See Electron-transfer dissociation (ETD)
70 eV EI, 39
Even-electron ion (EE), 31, 326
Even-electron rule, 329
Exact mass, definition, 93
External ion sources
in FT-ICR-MS, 243
for quadrupole ion trap, 222
External mass calibration, 124
Extracted ion chromatogram (EIC), 15
Extractive electrospray ionization (EESI), 780,
796
FFAB. See Fast atom bombardment (FAB)
Faraday cup. See DetectorsFAST. See Fragment analysis and structural
TOF (FAST)
Fast atom bombardment (FAB), 614, 625, 640
accurate mass, 632
criteria for the liquid matrix, 625
gas, 617
gun, 616
high-mass analytes, 631
ion formation, 621, 623
ionic analytes, 629
ion source, 616
low-temperature (LT) FAB, 633
low-to medium polarity analytes, 627
matrix, 624
matrix spectra, 626
peptide sequencing, 635
role of the liquid matrix, 624
side-reactions, 626
target, 620
types of ions, 636
Fast GC-MS, 863
FD. See Field desorption (FD)
FFR. See Field-free region (FFR)
FI. See Field ionization (FI)
FID. See Flame ionization detector (FID)
Field anode/emitter. See FI/FD ion source
Field asymmetric ion mobility (FAIMS), 265
Field desorption (FD), 497
best anode temperature (BAT), 518
cationization, 511
cluster ions, 514
emitter activation, 502
emitter handling, 504
emitter heating current (EHC), 503
field-induced desolvation, 512
ion evaporation, 512
ionic analytes, 515
liquid injection field desorption ionization
(LIFDI), 522
protonation, 511
spectra, 509
surface mobility, 509
wire emitters, 501
Field-free region (FFR), 542, 545, 559
Field ionization (FI), 497
electric field strength, 498
emitter activation, 502
field emitter/field anode, 499
field-induced dissociation, 507
mass spectra, 505
[M+H]+ ions, 506
multiply charged ions, 506
post-ionization, 506
process, 498
wire emitters, 501
FI/FD ion source, 499
counter electrode, 499
field emitter, 499
Flame ionization detector (FID), 836
Fourier transformation. See Fourier transformion cyclotron resonance (FT-ICR)
Fourier transform ion cyclotron resonance
(FT-ICR), 225
axial trapping, 237
cyclotron frequency, 226
cyclotron motion, 227
Fourier transformation, 239
free induction decay, 239
frequency domain, 239
frequency sweep (chirp), 236
image current detection, 240
infrared multiphoton dissociation
(IRMPD), 584
principle, 226
stored wavefrom inverse Fourier transform
(SWIFT), 236
sustained off-resonance irradiation (SORI),
581
time domain, 239
FPD. See DetectorsFragment analysis and structural TOF (FAST),
557
Index 959

Fragmentation pathways of peptide ions,
peptide sequencing, 681
Fragment ion peaks, definition, 11
Fragment ions, definition, 11
Franck-Condon factor, 36–37
Franck-Condon principle, 36
FT-ICR. See Fourier transform ion cyclotron
resonance (FT-ICR)
FT-MS, 245
Full width at half maximum (FWHM), 113
Gγ-H shift with β-cleavage. See McLafferty
rearrangement (McL)
Gas chromatography (GC), 832, 837
chromatograms, 14
columns
fused silica capillaries, 860
narrow bore capillaries, 864
Gas chromatography-mass spectrometry
(GC-MS), 831
Gas chromatography-mass spectrometry
coupling, 833
derivatization, 861
fast GC-MS, 864
narrow-bore columns, 864
Gas-liquid chromatography. See Gaschromatrography
Gas phase basicity (GB), 73
GC. See Gas chromatography (GC)
GC�GC. See Comprehensive gas
chromatography
GC-MS. See Gas chromatography-mass
spectrometry (GC-MS)
Gradient, solvent composition in LC, 842
Gummy bears, by MALDI-TOF-MS, 686
HHCN loss, 421, 423
HDX. See Hydrogen-deuterium exchange
(HDX)
Height equivalent of a theoretical plate
(HETP), 835
Helicobacter pylori, proteins by ESI, 764
Heterocyclic compounds, 416
aromatic heterocycles, 423
aromatic N-heterocycles, 421HCN loss, 421
saturated heterocycles, 416
Heterolytic bond dissociation, 43
HETP. See Height equivalent of a theoreticalplate (HETP)
High energy collisions, 549
High-performance liquid chromatography
(HPLC), 840
High-pressure liquid chromatography (HPLC),
840
High-resolution, 115
High-resolution SIM (HR-SIM), 850, 858
Histogram. See Bar graphH2O loss, of alkanols, 95
Homolytic bond cleavage, k(E) functions, 52Homolytic bond dissociation, 43
Hot hydrogen atom model, peptide cleavage by
ECD, 586
HR-MS, in FAB/LSIMS, 632
Hybrid instruments, 254, 265
Hydrogen-deuterium exchange (HDX), 596
Hyphenated methods, 831
IIE. See Ionization energy (IE)
IEM. See Ion evaporation model (IEM)
Image current detection, in ICR-MS, 230
Imaging mass spectrometry. See Mass spectral
imaging (MSI)
Immonium ions, 339, 342
IM-MS. See Ion mobility-mass spectrometry
(IM-MS)
IM-TOF-MS hybrid, 261
INC. See Ion-neutral complexes (INC)
Infrared matrix-assisted laser desorption/
ionization (IR-MALDI), 663
Infrared multiphoton dissociation (IRMPD),
582, 584
of deprotonated ganglioside, 587
in FT-ICR cells, 587
in quadrupole ion traps, 584
Infrared photodissociation spectroscopy
(IRPD), 588
Injector, in gas chromatography, 837
Inlet. See Inlet systemInlet system, 300
direct exposure probe (DEP), 310
direct insertion probe (DIP), 302
liquid introduction system, 301
reservoir inlet, 301
sample vials for DIP, 303
In-source decay (ISD), 557, 688
Intermolecular reactions, 74
Internal energy, 38
consequences, 56
influence on rate constants, 48
randomization, 45
Internal mass calibration, 128
Interpretation of EI mass spectra, 325
Ion beam, 154
960 Index

Ion-dipole interactions, 76
Ion evaporation model (IEM), in ESI, 745
Ion funnel, 731
Ion guides. See RF-only quadrupole
Ionization cross section, 39
Ionization efficiency, 39
Ionization energy (IE)
definition, 34
determination, 65
Ionization potential (IP). See Ionization energy
Ion mobility-mass spectrometry (IM-MS),
257
Ion mobility Q-TOF, 264
Ion mobility, separation, 259–260
Ion mobility spectrometry (IMS), 257
Ion mobility spectrometry-mass spectrometry,
applications, 869
Ion-molecule reactions, 76, 595
role in chemical ionization, 440
in tandem MS, 541
Ion-neutral complexes (INC), 77, 405
electrostatic attraction, 406
evidence, 406
as intermediate, 77
intermediates of onium reaction, 403
of radical ions, 408–409
reorientation criterion, 408
Ion-pair formation, in NICI, 461
Ion source, simple implementation, 154
Ion spray. See Pneumatically assisted ESI
Ion trajectory calculations, 294
IRMPD. See Infrared multiphoton dissociation
(IRMPD)
IR-MS. See Isotope ratio mass spectrometry
(IR-MS)
IRPD. See Infrared photodissociation
spectroscopy (IRPD)
ISD. See In-source decay (ISD)
Isobaric ions, 338
Isotope dilution, 857
Isotope effect, 60
determination, 62
intermolecular, 60
intramolecular, 60
kinetic, 60–61
primary, 61
secondary, 64
Isotope pattern. See Isotopic patternIsotope ratio mass spectrometry (IR-MS), 93,
890
Isotope ratios, determination, 889
Isotopes, definition, 86
Isotopic abundance, representation, 87
Isotopic compositions. See Isotopic abundanceIsotopic distribution. See Isotopic patternIsotopic enrichment, 110
Isotopic ions, 98
Isotopic labeling, 112
Isotopic mass, definition, 90, 116
Isotopic molecular ion, 98
Isotopic pattern, 88, 95
average molecular mass, 137
calculation, 95
carbon, 95
effect of charge state, 140
effect of resolution, 139
halogens, 98
linear TOF, 160
of multiply charged ions, 159
oxygen, silicon, sulfur, 104
polyisotopic elements, 102, 106, 109
at very high resolution, 132
KKendrick mass scale, 143
KER. See Kinetic energy release (KER)
k(E) function, 50Kinetic energy release (KER), 58, 561
Kinetic method, for detn. of GB, 597
Kinetic shift, 71
Kingdon trap, 247
LLaboratory frame of reference, 547
Ladder sequencing. See Peptide sequencingLaser ablation electrospray ionization
(LAESI), 799
Laser desorption/ionization (LDI), 675
applications, 675
LC. See Liquid chromatography (LC)
LC-MS, Liquid chromatography–mass
spectrometry (LC–MS)
LDI. See Laser desorption/ionization (LDI)
Limit of detection (LOD), 18, 857
Limit of quantitation (LOQ), 857
Linear quadrupole analyzer, 193
hyperbolic vs. cylindrical rods, 196principle, 190–191
properties, 190
triple quadrupole, 566
unit resolution, 196
Linear quadrupole ion trap (LIT), 201
Liquid chromatography (LC), 832
chromatograms, 14
Index 961

Liquid chromatography-mass spectrometry
(LC-MS), 831
Liquid chromatography-mass spectrometry
coupling, interfaces, 867
Liquid injection field desorption ionization
(LIFDI). See Field desorption
Liquid matrix, in FAB/LSIMS, 614
Liquid secondary ion mass spectrometry
(LSIMS), 614
ion source, 620
primary ions, 620
LIT. See Linear quadrupole ion trap (LIT)
LIT-ICR, 254, 256
Localization of double bonds, 362
Lock mass, in SIM, 850
LOD. See Limit of detection (LOD)
Loose transition state, 52
LOQ. See Limit of quantitation (LOQ)
Lorentz force, 178, 226
Low-energy collisions, 549
Low-energy EI spectra, 314
Low-temperature EI spectra, 314
LSIMS. See Liquid secondary ion mass
spectrometry (LSIMS)
MM+•. See Molecular ion (M+•)
Magnetic sector analyzer
Bainbridge-Jordan, 183
double-focusing, 183
forward geometry, 185
four-sector, 564
lamination of the yoke, 187
linked scans, 562
magnet scan, 183
Mattauch-Herzog, 183
Nier-Johnson, 183
principle, 179
reversed geometry, 185
setting resolution, 186
tandem MS, 559
Magnetic sector instrument. See Magnetic
sector analyzer
Magnetic sector-oaTOF, 254
Magnetic sector-QIT, 254
Magnetic sector-quadrupole hybrid, 254
Main beam, attenuation in CID, 551
MALDESI. See Matrix-assisted laser
desorption electrospray ionization
(MALDESI)
MALDI. See Matrix-assisted laser desorption/
ionization (MALDI)
Mass accuracy, 119
limits, 121
specification, 129
Mass-analyzed ion kinetic energy spectrometry
(MIKES), determination of KER,
561–563
Mass-analyzed ion kinetic energy spectrum
(MIKES), 560
Mass-analyzed threshold ionization (MATI),
68
Mass analyzer, 151
ideal, 153
Mass calibration, 123
compound, 123
reference list, 124
Mass defect. See Mass deficiency
Mass deficiency, 118
Mass-energy equivalence, 117
Massive cluster impact (MCI), 614, 637
Mass number, 86
in definition of m/z, 10Mass reference compound. See Mass
calibration, compound
Mass reference list, 124
Mass resolving power, minimum for separation
of isotopic peaks, 757
Mass-selective detector (MSD), 836
Mass spectral imaging (MSI), 697
Mass spectrograph, 180
term, 8
Mass spectrometer, 18
components of, 9
term, 8
Mass spectrometry
basic principle, 8
relevance and uses, 1
term, 8
Mass spectrometry/mass spectrometry. SeeTandem mass spectrometry
Mass spectroscopy. See Mass spectrometry
Mass spectrum, definition, 11
Mass-to-charge ratio (m/z), definition, 10Mathieu equations, 192, 213
MATI. SeeMass-analyzed threshold ionization
(MATI)
Matrix-assisted laser desorption electrospray
ionization (MALDESI), 798
Matrix-assisted laser desorption/ionization
(MALDI), 652
biotyping, 678
carbohydrates, 686
cationization, 670
characteristic fingerprint, 678
962 Index

delayed extraction, 653
dendrimer analysis, 694
desalting/cation exchange, 672, 689
detection limit, 705
expansion of plume, 657
for gummy bears, 686
imaging, 697
fingermarks, 700
instrumentation, 698
lateral resolution, 698
tissue, 698
ion formation, 654, 660
ion source, 652
laser fluence, 654
laser irradiance, 654
laser spot size, 655
MALDI target, 667
matrices in IR-MALDI, 663
matrices in UV-MALDI, 663
matrix spectra, 666
oligonucleotides and DNA, 689
oligosaccharide structures, 687
polymer endgroups, 692
role of the matrix, 663
sample holder, 667
sample introduction, 667
sample load, 705
sample preparation, 667
solvent-free preparation, 674
synthetic polymers, 690
thin layer technique, 669
tissuetyping, 700
types of ions in LDI/MALDI, 706
as vacuum ionization technique, 659
MBSA. See Molecular beam solid analysis
(MBSA)
MCI. See Massive cluster impact (MCI)
McLafferty rearrangement (McL), 370
of aldehydes and ketones, 371
of aromatic hydrocarbons, 376
of carboxylic acids and derivatives,
373–374
concerted/stepwise, 371
with double hydrogen transfer, 379
even-electron analogy, 398
frequent product ions, 377
requirements, 371
role of the γ-hydrogen, 373MCP. See DetectorsMeasurement, running EI with DIP, 306
Memory effect, 315
Metastable dissociation, 688
Metastable ions, 53, 557
in linear TOF, 161
in tandem MS, 545
Methane, C-H bond activation by Ni ions,
596
Mobile applications, 220
Molecular beam solid analysis (MBSA), 614,
615, 625, 640
Molecular ion (M+•), 30, 326
criteria, 368–369
definition, 11
recognition, 368
writing conventions, 357
Molecular ion peak, definition, 11
Molecular weight. See Relative molecular
mass
Monoisotopic elements, definition, 86
Monoisotopic mass, definition, 91
Most abundant mass, 98
Mouse liver tissue, analyzed by DESI, 789
MRM. See Multiple reaction monitoring
(MRM)
MSD. See Mass-selective detector (MSD)
MSI. See Mass spectral imaging (MSI)
MSn, 569
Multiple ion detection (MID). See Selected ion
monitoring (SIM)
Multiple reaction monitoring (MRM), 852
Multiplexing, 865
Multiply charged ions, isotopic patterns, 140
MULTUM Linear plus, 171
resolving power, 171
NNano-assisted laser desorption/ionization, 696
Nano-electrospray (nanoESI), 737
chip-based, 740
droplet size, 737
memory effects, 739
spray capillaries, 737
Negative-ion chemical ionization (NICI), 442,
461
Neutral, detection in linear TOF, 161
Neutralization-reionization mass spectrometry
(NR-MS), 599
NICI. See Negative-ion chemical ionization
(NICI)
“Nier-type” ion source, 296
NIST/EPA/NIH Mass Spectral Database, 316
Nitroarenes, 415
Nitrogen phosphorus detector (NPD), 836
Nitrogen rule, 343
effect of autoprotonation, 443
Index 963

Nominal mass
definition, 88
deviations, 118
Nonergodic process, 586
Non-targeted analysis, 851
Nozzle/skimmer CID. See Skimmer CID
Nozzle-skimmer system, in ESI source, 727
NPD. See Nitrogen phosphorus detector (NPD)NR-MS. See Neutralization-reionization mass
spectrometry (NR-MS)
Nucleon number, 86. See also Mass number
Nucleophilic addition, in NICI, 461
Number-average molecular weight, of
polymers, 691
Number of charges, in definition of m/z, 10
OoaTOF. See Orthogonal acceleration TOF
(oaTOF)
Odd-electron ion (OE), 31, 326
Oil diffusion pump, 274
Oligosaccharides, of a gummy bear, 687
Omegatron, 228
Onium ions, 398
immonium ions, 398
McLafferty rearrangement, 398, 399
onium reaction, 398, 403
oxonium ions, 398
sulfonium ions, 398
Open-shell ion, 31. See also Odd-electron ion
(OE)
Orbitrap, 246
vs. FT-ICR, 249ion injection, 249
as part of a hybrid, 251–252
principle of operation, 247
resolving power, 249
Orbitrap Fusion, 256
Organic salts, EI mass spectra, 397
Ortho effect. See Ortho elimination
Ortho elimination, 410
of aromatic molecular ions, 411
of even-electron ions, 413
of nitroarenes, 416
Orthogonal acceleration TOF (oaTOF), 167
Over-the-counter drug, analyzed by DESI, 788
Oxonium ions, 340, 345
PPA. See Proton affinity (PA)
Parabola spectrograph, 3
Paracell, 243
Parasite cells, MALDI biotyping, 678
PD. See 252Californium plasma desorption
PDB standard, 93
Peak capacity, 835
Peak shapes, and KER, 562
Penning cell. See Penning trap
Penning ionization, 32
in ambient MS, 812
in DART-MS, 810
in GD-MS, 899
Penning trap, for ICR, 241
Peptide backbone cleavages, 683
Peptide fragmentation, in tandem MS, 683
Peptide mass map, 681
Peptide sequencing, 635
Perfluorokerosene (PFK), 301
mass calibration in EI, 124
Perfluorokerosine, ECNI spectrum, 467
Perfluorotributylamine (PFTBA), 124, 301
PES. See Photoelectron spectroscopy (PES)
PFK. See PerfluorokerosenePFTBA. See Perfluorotributylamine (PFTBA)
Photodissociation, in APPI, 481
Photoelectron spectroscopy (PES), 68
Photoexcitation, in APPI, 480
Photoionization (PI)
in APPI, 481
for determination of IEs, 66
process, 66
Physical quantities, units for, 21, 927
PI. See Photoionization (PI)
PICI. See Positive-ion chemical ionization
(PICI)
PIE. See Pulsed ion extraction (PIE)
Pneumatically assisted ESI, 727
Polydispersity, of polymers, 691
Polyisotopic elements, definition, 87
Polymer endgroup determination, by MALDI-
TOF-MS, 692
Positive-ion chemical ionization (PICI), 440,
442, 486
ammonia reagent gas, 450
isobutane reagent gas, 450
methane reagent gas, 444, 448
Post-acceleration detectors. See DetectorsPost-source decay (PSD), 557, 688
ppb (parts-per-billion), 120
ppm (parts-per-million), 120
Precursor ion scans, 563, 567
Product ion scan, 567
Profile data, representation of spectra, 14
Proteomics, 681
964 Index

Proton affinity (PA), 73, 446
Protonation
in CI, 440
in PICI, 440
Proton transfer, in CI, 440, 486
PSD. See Post-source decay (PSD)
Pulsed ion extraction (PIE), 166
Pyrolysis DCI, 468
Pyrolysis mass spectrometry (Py-MS), 312
QQET. See Quasi-equilibrium theory (QET)
Qh-ICR, 256
QIT. See Quadrupole ion trap (QIT)
QITTOF, 254
QqICR, 255
QqLIT, 254
Qq-TOF hybrids, 255
Quadrupole analyzer. See Linear quadrupoleanalyzer
Quadrupole ion trap (QIT), 210
automatic gain control, 217
axial modulation, 216–217
mass-selective instability, 215
mass-selective stability, 214
MSn, 569
nonlinear resonances, 217–218
principle, 211
resonant ejection, 215
shape of electrodes, 211
trajectories, 214
Quadrupole mass filter. See Linear quadrupoleanalyzer
Quantitation, 855
calibration curve, 856
external standardization, 856
internal standardization, 857
isotope dilution, 857
Quasi-equilibrium theory (QET), 47
basic assumptions, 48
Quasi-molecular ions, 441
RRadical ion, 30, 326
Radical-site initiated process, 333
Rapid evaporative ionization mass
spectrometry (REIMS), 801
setup, 801
spectra, 801
in surgeries, 801
Rate constants, 48
of bi-and trimolecular reactions, 75
meaning, 50
Rayleigh limit, 725, 744
RDA. See Retro-Diels-Alder reaction (RDA)
Reagent gas, in chemical ionization, 440
Reagent ions, in chemical ionization, 440
Rearrangement fragmentation, k(E) functions,52
Recombination energy, 456
Reconstructed ion chromatogram (RIC), 15,
308, 845
Rectilinear ion trap (RIT), 220
Reduced mobility, in IMS, 259
Reference inlet system. See Reservoir inletsystem
Reflector, in TOF-MS, 163–164
Reflectron. See ReflectorREIMS. See Rapid evaporative ionization mass
spectrometry (REIMS)
Relative atomic mass
definition, 91
variations, 93
Relative intensity, definition, 11
Relative molecular mass, definition, 91
Reservoir inlet system, 301
Residual air, EI spectrum, 113
Resolution
determination, 113
full width at half maximum definition, 113
10 % valley definition, 112
Resolving power, 112
in FT-ICR-MS, 232
ultrahigh by FT-ICR, 135
Retention factor, 833
Retention time, in chromatography, 834
Retro-1,4-addition. See Ortho elimination
Retro-Diels-Alder reaction (RDA), 381
of isomeric ions, 385
of natural products, 384
requirements, 382–383
Retro-ene reaction, 38
Retrospective analysis, 851
Reversed phase, stationary phase in LC, 841
RF-only quadrupole, 197
collisional cooling, 198
collisional focusing, 199
RIC. See Reconstructed ion chromatogram
(RIC)
Rice-Ramsperger-Marcus-Kassel (RRKM)
theory, 47
Ring electrode. See Quadrupole ion trap (QIT)
Rings plus double bonds (r + d), 359
RIT. See Rectilinear ion trap (RIT)
Index 965
ROSETTA space mission, 173
RRKM theory. See Rice-Ramsperger-Marcus-
Kassel (RRKM) theory
Rules for interpretation, 425, 944
SSaddle field gun, 616
Sample introduction system, 300
Sample vial, 303
loading of sample, 305
Sampling cone, in ICP source, 903
S/B. See Signal-to-background ratio (S/B)
Scrambling, 356
Secondary ion mass spectrometry (SIMS), 613,
640
dynamic, 908
static, 908
Selected ion monitoring (SIM), 849
Selected reaction monitoring (SRM), 852
Self-chemical ionization (Self-CI), 443
SEM. See DetectorsSensitivity, 17
Septum bleed, in GC-MS, 862
SFC-MS. See Supercritical fluidchromatography-mass spectrometry
(SFC-MS)
Sheath flow, ESI sprayers for CZE, 728
SID. See Surface-induced dissociation (SID)
σ�bond cleavage
of functionalized molecules, 331
of non-functionalized molecules, 328
of saturated hydrocarbons, 363
Signal-to-background ratio (S/B), 18
Signal-to-noise ratio (S/N), 18, 849
SIM. See Selected ion monitoring (SIM)
SIMION, 297
SIMS. See Secondary ion mass spectrometry
(SIMS)
Single-crystal silicon nanowires (SiNWs), 695
SI units, 21
Skimmer CID, 35
S/N. See Signal-to-noise ratio (S/N)
SN2 reaction, in the gasphase, 76
Soft ionization
chemical ionization, 439
field desorption, 497
Sonic spray ionization (SSI), 795
SORI. See Fourier transform ion cyclotron
resonance
SpiralTOF
design of analyzer, 174
polymer analysis, 692
resolving power, 692
Spray capillary, in electrospray ionization, 726
SRIG. See Stacked ring ion guide (SRIG)
SRM. See Selected reaction monitoring (SRM)
SSI. See Sonic spray ionization (SSI)
Stability diagram. See also Linear quadrupole
analyzer
of two-dimensional quadrupole field,
192–193
Stable ions, 53
Stacked ring ion guide (SRIG), 261
Stevenson’s rule, 334
Sulfonium ions, 346, 347
Supercritical fluid chromatography-mass
spectrometry (SFC-MS), 831
Supersonic expansion
in FAB-MS, 623
in MALDI, 657
Surface-induced dissociation (SID), 551
device, 553
energy uptake, 553
of protein complexes, 555
on Synapt G2, 553
SWIFT. See Fourier transform ion cyclotron
resonance (FT-ICR)
Symbols, in MS, 21
Synapt series, 263
Systematic approach to interpretation, 426, 945
TTabular listing, representation of spectra, 14
Tandem-in-time, 569, 579
Tandem mass spectrometry, 539
of an octapeptide, 683
on a dual-LIT, 572
on FT-ICR instruments, 579
in mixture analysis, 831
on a QIT, 569
on quadrupole ion traps, 569
on ReTOF instruments, 557
in space, 540
for structure elucidation, 576
in time, 540
on TOF instruments, 543
on triple quadrupole instruments, 567
Target analysis, 849
Target compounds, 849
Taylor cone, in ESI, 741
TCD. See Thermal conductivity detector
(TCD)
TDC. See Time-to-digital converter (TDC)
Termolecular reactions, 75
966 Index

in APCI, 472
in DART, 810
Tetraiodoethene, NICI spectrum, 461
Thermal conductivity detector (TCD), 836
Thermal degradation
decarbonylation, 395
decarboxylation, 395
elimination of water, 395
of organic salts, 397
RDA reaction, 395
Thermokinetic method, for detn. of GB, 598
Thermospray (TSP), 723
Thin layer chromatography (TLC), analyzing
plates by DESI, 790
Thomson, J.J., 3, 11
Thomson Medal, 3
Three-dimensional quadrupole field. SeeQuadrupole ion trap (QIT)
Threshold laser irradiance, in MALDI, 654
TIC. See Total ion current (TIC)
TICC. See Total ion current chromatogram
(TICC)
Tight transition state, 52
Time lag focusing (TLF), 166
Time-of-flight (TOF) analyzer
flight times, 157
principle, 155
properties, 156
reflector TOF, 162–163
Time scale
of ion-activating events, 551
of MS, 53
Time-to-digital converter (TDC), 267
TIMS. See Trapped ion mobility spectrometry
(TIMS)
TLC. See Thin layer chromatography (TLC)
TLF. See Time lag focusing (TLF)
TOF analyzer
folded flight path, 171
LECO Pegasus HRT, 175
multi-reflecting, 174
zig-zag ion path, 174–175
Top-down protein analysis, 681
Total ion chromatogram, 15, 845
Total ion current (TIC), 15, 845
Total ion current chromatogram (TICC), 15
Transannular cleavages, 416
Trapped ion mobility, 264
Trapped ion mobility spectrometry (TIMS),
871
Traveling wave, 261
ion guide, 261
Travelling-wave ion mobility (TW-IMS), 265
Tribrid, 256
Trimolecular reaction. See Termolecular
reactions
Triple quadrupole analyzer. See Linearquadrupole analyzer
Triply charged ion, in EI, 31
Trypanosoma cruzi, MALDI biotyping, 678
Tryptic digest
peptide sequencing, 694
for proteomics, 681
TSP. See Thermospray (TSP)
Tuning, of the instrument, 298
Turbomolecular pump, 274
TW-IMS. See Travelling-wave ion mobility
(TW-IMS)
Two-dimensional chromatography. SeeComprehensive gas chromatography
Two-stage ion funnels, 733
off-axis alignment, 733
UUltrafine-metal-plus-liquid-matrix method, 651
Ultrahigh-pressure liquid chromatography
(UHPLC), 841
Ultrahigh resolution, 134
applications, 877
Ultra-performance liquid chromatography
(UPLC), 841
Ultrasonic expansion, in ESI, 727
Unified atomic mass (u), definition, 11, 90
Unimolecular reactions, 74
Unit resolution. See Linear quadrupoleanalyzer
Units, for physical quantities, 21, 927
Unstable ions, 53
UPLC. See Ultra-performance liquid
chromatography (UPLC)
UV detector, 836
UV-MALDI, 663
VVacuum, 273
cryopump, 273
oil diffusion pump, 273
pumping speed, 273
rotary vane pump, 273
turbomolecular pump, 73
Vacuum lock, 302
van Deemter equation, 835
Velocity of ions, 157
Vertical transitions, 36
Index 967

WWastewater analysis, 852
Weight-average molecular weight, of
polymers, 691
Wiley/NBS Mass Spectral Database, 316
ZZero kinetic energy photo-electron
spectroscopy (ZEKE-PES), 68
z-spray, 730z-stack, 270
968 Index


