Embed Size (px)
Citation preview
July 26, 2021
Submitted by Kitty Hawk Wind, LLC
Submitted to Bureau of Ocean Energy Management
Construction and Operations Plan
Appendix J - Preliminary Cable Burial Risk Assessment
Prepared by Tetra Tech, Inc.
1125 NW Couch Street, Suite 600 45600 Woodland Road 10 Post Office Square, 11th Floor Portland, Oregon 97209 Sterling, Virginia 20166 Boston, Massachusetts 02109
Kitty Hawk Offshore Wind Project KTH-GEN-CON-PLN-AGR-000067_017 Rev 01 Appendix J Preliminary Cable Burial Risk Assessment
Appendix J - Preliminary Cable Burial Risk Assessment
Document Reference: KTH-GEN-CON-PLN-AGR-000067_017 Rev 01
Prepared by: Checked by: Approved by:
December , 2020
Peter Hinchliffe December 11 2020 Christopher Morris
Revision Summary Rev Date Prepared by Checked by Approved by 01 Dec 2020 Tetra Tech, Inc.
Description of Revisions Rev Page Section Description
A A
1
Construction and Operations Plan Kitty Hawk Offshore Wind Project
Lease Area OCS-A 0508
Appendix J Preliminary Cable Burial Risk Assessment
Prepared for:
Kitty Hawk Wind, LLC1125 NW Couch Street, Suite 600
Portland, Oregon 97209
Prepared by:
Tetra Tech, Inc. 10 Post Office Square, 11th Floor
Boston, Massachusetts 02109
December 2020
Kitty Hawk Offshore Wind Project Lease Area OCS-A 0508 Construction and Operations Plan Appendix J – Preliminary Cable Burial Risk Assessment
EXECUTIVE SUMMARY
This document details the methodology and findings arising from an initial, high-level Cable Burial Risk Assessment of the offshore export cable corridor for the Kitty Hawk Offshore Wind Project.
The Pre-mitigation findings of this preliminary Cable Burial Risk Assessment are as follows:
There is risk arising from unexploded ordnance (UXO), particularly during the construction phase, in the areas in closest proximity to the former Dam Neck Gun Line. Based off of Tetra Tech, Inc.’s general knowledge of UXO in the area f rom previous work, it is suggested that the possibility of this risk should be considered ‘Significant’ from kilometer points (KPs) 0-25, ‘Possible’ from KP 25-38, and ‘Unknown’ for the rest of the route. A detailed UXO Desktop Study and Risk Analysis is strongly recommended to inform the Project’s overall UXO risk mitigation plan. A UXO survey and subsequent cable route micro-siting or intrusive investigation and neutralization may mitigate the risk f rom surficial items; however, as the majority of potential UXO items are small in size (e.g., not sea mines or large bombs), detecting them within the deeper seabed layers may be dif ficult with even advanced survey equipment.
The risk of occurrence of minor (i.e., <1 meter) seabed scour and erosion is considered ‘Serious to High’ along the entire cable route, with the areas of greatest risk between KP 0-6, KP 20-40, and KP 46-64.
The risk of occurrence of major (i.e., >1 meter) seabed scour and erosion is considered ‘High’ in KP 0-2, ‘Serious’ from KP 20-36, and ‘Low to Medium’ elsewhere. The middle span also has the highest likelihood of over-burial due to seabed mobility.
Dropped object risk is considered ‘Low to Medium’ along the entire route but is concentrated in the areas where vessels traverse most frequently – this includes KP 32-64 based on automatic identification system data. It also may include areas near beach nourishment activities (e.g., between the borrow areas, barge locations, and sand placement areas). Inside the Wind Development Area, the risk of dropped objects is also expected to increase, due to construction and maintenance operations.
Risk of dredging and dumping is considered ‘Serious’ from KP 0-8 in the vicinity to known borrow areas and beach nourishment projects, ‘Medium’ from KP 8-22 where potential sand resources are being investigated, and ‘Low’ elsewhere.
The of fshore export cable corridor traverses a busy military area (the Virginia Capes complex). The risk of military activities (including military vessels anchoring) is considered ‘Medium’ from KP 0-38 and ‘Low’ elsewhere. This risk is considered difficult to quantify as automatic identification system may not adequately capture all military vessel activity and anchoring. Liaison with the United States Department of Defense is highly recommended throughout the development and operations of the Project.
The potential probability of risk related to anchors deployed from commercial vessels (both intentional anchoring as well as accidental and emergency deployment) is considered ‘Low’ from KP 0-8, ‘Medium’ from KP 8-38 and KP 62-64, and ‘Serious’ from KP 38-62, reflecting the traffic of both larger vessels and more frequent traverses of the route.
Commercial fishing activity is relatively low along the offshore export cable corridor, and burial to mitigate anchor risk should also mitigate the threat from fishing gear. The likelihood of occurrence of commercial fishing is considered ‘Serious’ from KP 0-14, ‘Moderate’ from KP 14-24, and ‘Low’ elsewhere.
J-i
Kitty Hawk Offshore Wind Project Lease Area OCS-A 0508 Construction and Operations Plan Appendix J – Preliminary Cable Burial Risk Assessment
TABLE OF CONTENTS
J.1 Introduction.....................................................................................................................1 J.1.1 Preliminary Offshore Export Cable Corridor Overview................................................1 J.1.2 CableBurial Risk Assessment – An Overview...........................................................4 J.1.3 Objective and Scope of Study ................................................................................6
J.2 Regulations and Guidance................................................................................................7 J.2.1 Government Agencies...........................................................................................7
J.2.1.1 BOEM Construction and Operations Plan Guidelines......................................7 J.2.1.2 Bureau of Safety and Environmental Enforcement..........................................8
J.2.2 Other Bodies .......................................................................................................8 J.2.2.1 International Cable Protection Committee Recommendations ..........................8 J.2.2.2 DNV GL...................................................................................................9 J.2.2.3 Carbon Trust ............................................................................................9 J.2.2.4 The American Wind Energy Association .....................................................10
J.3 Methodology................................................................................................................. 10 J.4 Offshore Export Cable Corridor Alignment ......................................................................... 12 J.5 Data Review................................................................................................................. 14
J.5.1 Geotechnical and Geophysical Data...................................................................... 14 J.5.2 Shipping and NavigationData .............................................................................. 17
J.5.2.1 United States Coast Guard Vessel Traffic Service Information .......................17 J.5.2.2 Automatic Identification System Data .........................................................21
J.5.3 Commercial Fishing ............................................................................................21 J.5.4 Seabed Benthic Conditions..................................................................................23
J.6 Threat Assessment........................................................................................................ 24 J.6.1 Sediment Mobility...............................................................................................24 J.6.2 Anchors ............................................................................................................ 30 J.6.3 Dredging/Dumping..............................................................................................31 J.6.4 Other Seabed Assets..........................................................................................33 J.6.5 Unexploded Ordnance ........................................................................................33
J.6.5.1 Specif ic Danger Zones............................................................................. 36J.6.5.2 Historical Photos and Conceptual Model of VACAPES Range Operations .......37
J.6.6 Marine Debris .................................................................................................... 39 J.6.7 Cultural Resources .............................................................................................39 J.6.8 Prevailing Metocean Conditions............................................................................ 39
J.7 Cable Burial Assessment................................................................................................39 J.7.1 Summary .......................................................................................................... 39 J.7.2 Initial Risk Assessment Methodology..................................................................... 40
J.7.2.1 Exposure to Vessel Traff ic........................................................................ 40 J.7.2.2 Exposure to Vessels at Anchor.................................................................. 41J.7.2.3 Anchor Size and Penetration Estimation.....................................................42
J.7.3 Results ............................................................................................................. 43 J.8 SiteData Requirements for Full-Scope CBRA.................................................................... 46 J.9 References...................................................................................................................46
J-ii
Kitty Hawk Offshore Wind Project Lease Area OCS-A 0508 Construction and Operations Plan Appendix J – Preliminary Cable Burial Risk Assessment
FIGURES
Figure J-1 Offshore Project Overview.................................................................................... 2 Figure J-2. Onshore Project Overview.................................................................................... 3 Figure J-3. Trench Parameter Def initions (Carbon Trust 2015): (A) Recommended Minimum
Depth of Lowering; (B) Target Depth of Lowering; (C) Target Trench Depth; (D) Depth of Cover.................................................................................................... 5
Figure J-4. CBRA Methodology Flowchart (Carbon Trust 2015).................................................11 Figure J-5. Overview of the Lease Area and the Offshore Export Cable Survey Area with
Kilometer Points (KPs) Marked Along the Offshore Export Cable Corridor Centerline .........................................................................................................13
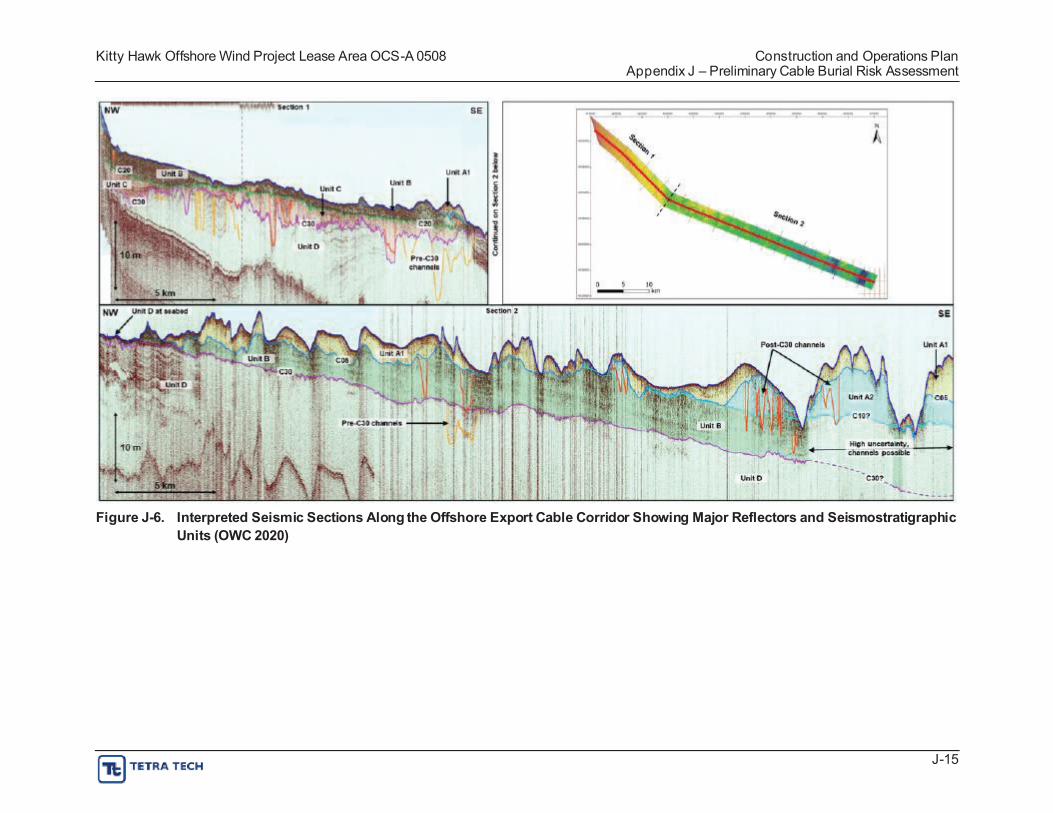
Figure J-6. Interpreted Seismic Sections Along the Offshore Export Cable Corridor Showing Major Reflectors and Seismostratigraphic Units (OWC 2020)....................................15
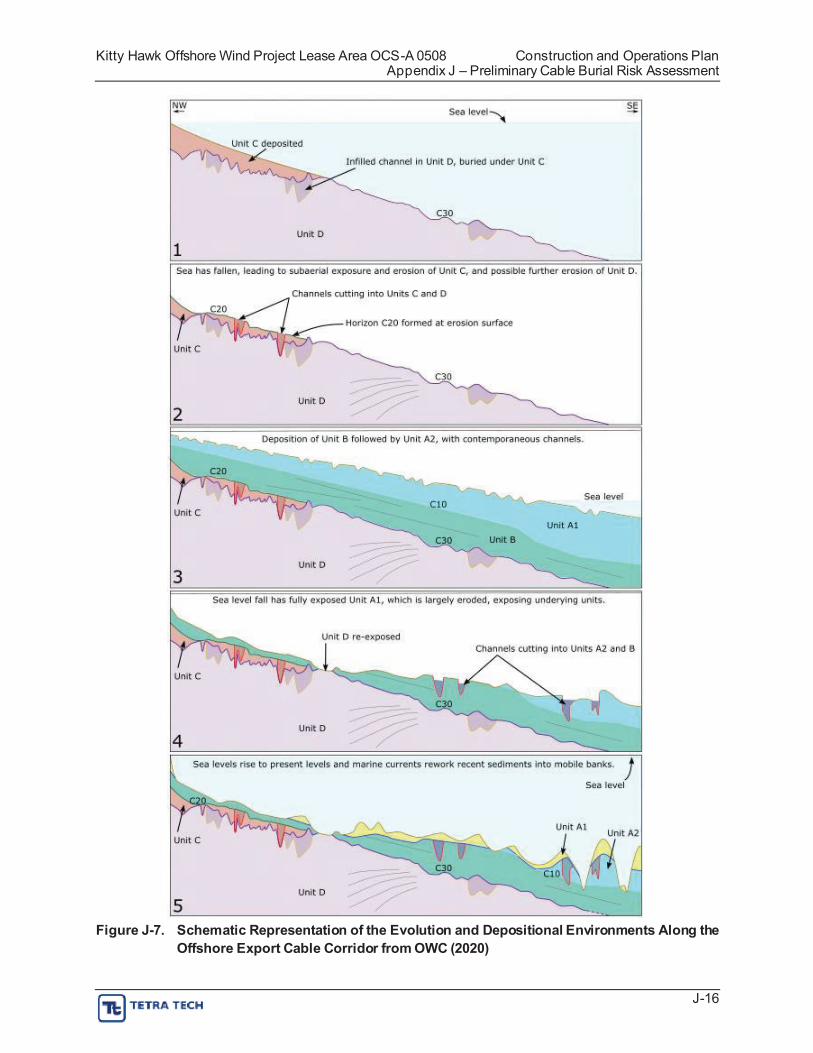
Figure J-7. Schematic Representation of the Evolution and Depositional Environments Along the Offshore Export Cable Corridor from OWC (2020)..............................................16
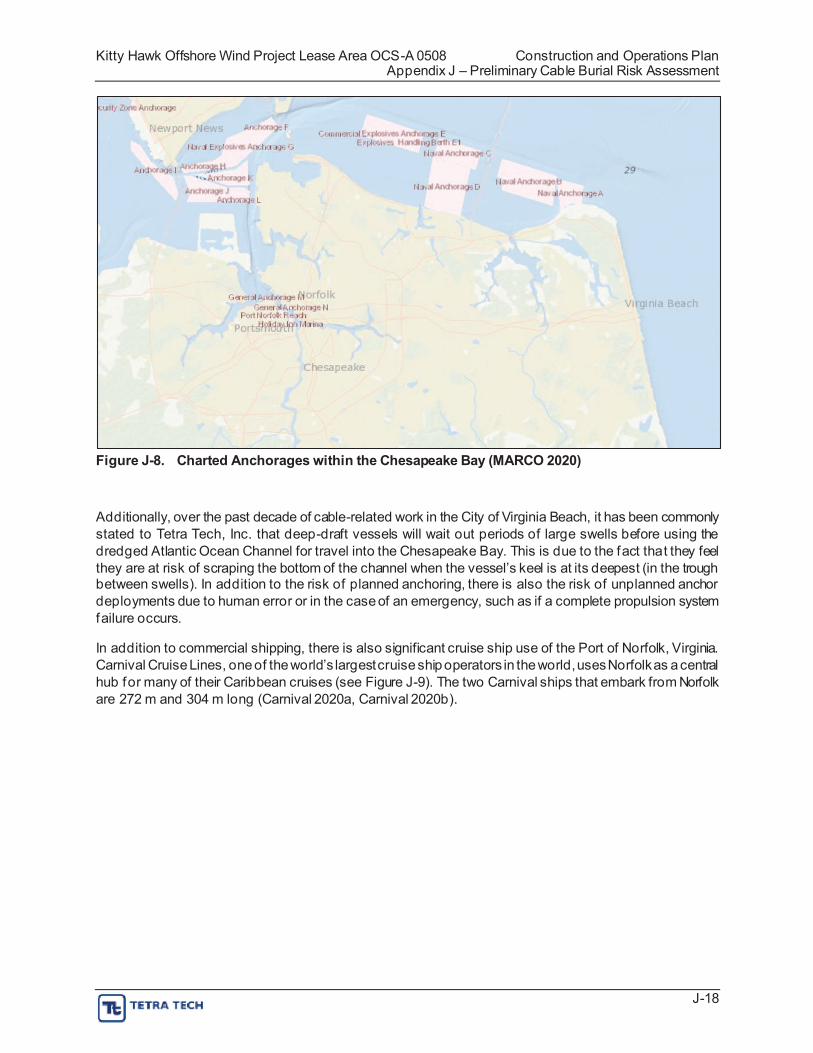
Figure J-8. Charted Anchorages within the ChesapeakeBay (MARCO 2020)..............................18 Figure J-9. Cruise Ships in Virginia (Crew-Center.com, n.d.).....................................................19 Figure J-10. Shipping Lanes off Virginia Beach, Virginia (NROC 2009).........................................20 Figure J-11. Proposed Fairways Adjacent to Offshore Project Area (USCG 2015)..........................20 Figure J-12. Highest Use Areas for Select Commercial Fishing Gear Types (Gillnets/ Pots and
Traps) (Virginia Coastal Zone Management Program 2016) with Dominion Projects Shown (as this Study Pre-dates the Project)...........................................................22
Figure J-13. Conceptual Geological Model of the Offshore Project Area f rom OWC (2020)..............25 Figure J-14. Overview of the Offshore Export Cable Bathymetry Survey with Corridor Centerline
and KPs Marked. The color-rendered bathymetry in the background gives a good context to the regional shoals. The colored dots represent a broad-scale dataset f rom the U.S. Geological Survey that looks at modeled seabed currents and sediments to evaluatepotential recurrence intervals forseabed mobility events. ..........26
Figure J-15. Conceptual Schematic Representation of a Cross-Section Along the Offshore Export Cable Corridor from the Landing to the Wind Development Area (OWC 2020), with an inset showing (color rendered with warmer colors indicating thicker sediments) the isopach thickness from the BOEM Marine Minerals Program. ..............27
Figure J-16. Example Cross Sectionof Potential Migratory Bedform Features...............................28 Figure J-17. Potential Scour Features in the Nearshore Area of the Offshore Export Cable
Corridor ............................................................................................................29 Figure J-18. Deeper Water Features Potentially Related to Seabed Fluid Expulsion and/or
Seabed Currents................................................................................................29 Figure J-19. Maersk Triple E-class Container Ship Anchor (Courtesy of Maersk) ...........................31 Figure J-20. Of fshore Export Cable Bathymetry Survey Area (Brown) Shown Alongside DNODS
(Charted) and Sand Borrow Areas (Red Polygons)..................................................32 Figure J-21. Restricted Zones and Warning Areas in the Context of Approximate Extents of the
Maximum Ranges of Weapons Historically Used at the Dam Neck Gun Line ...............34 Figure J-22. Offshore Project Area in Relation to the DoD Warning Areas.....................................35 Figure J-23. Photos of Various Guns on the Dam Neck Firing Line..............................................37 Figure J-24. Conceptual Image Showing Historical VACAPES Range Operations..........................38 Figure J-25. 2-km Lengths Along the Offshore Export Cable Corridor Centerline............................40 Figure J-26. 2-km by 6-km-wideBins Along the Offshore Export Cable Corridor Centerline.............41
J-iii
Kitty Hawk Offshore Wind Project Lease Area OCS-A 0508 Construction and Operations Plan Appendix J – Preliminary Cable Burial Risk Assessment
TABLES
Table J-1. Offshore Export Cable Maximum Design Parameters................................................ 4 Table J-2. Number of Trips of Various Vessel Types in the Port of Virginia, Norfolk, and
Newport News 2017 (USACE 2018)......................................................................17 Table J-3. Anchor Depths by Gross Tonnage ........................................................................42 Table J-4. Top 10 Largest Classes of Vessels Crossing the Offshore Export Cable Corridor .........43 Table J-5. Segment by Segment Qualitative Probability of Risk ................................................44 Table J-6. Segment by Segment Initial Recommendation for Depth of Lowering .........................45
ATTACHMENTS
Attachment J-1.Supplemental Vessel Data and Figures
J-iv
Kitty Hawk Offshore Wind Project Lease Area OCS-A 0508 Construction and Operations Plan Appendix J – Preliminary Cable Burial Risk Assessment
ACRONYMS AND ABBREVIATIONS
AIS automatic identification system BOEM Bureau of Ocean Energy Management CBRA Cable Burial Risk Assessment CFR Code of Federal Regulations Dam Neck Naval Air Station Oceana, Dam Neck Annex DNODS Dam Neck Ocean Disposal Site DNV GL Det Norsk Veritas Germanischer Lloyd DoD Unites States Department of Defense DOL Depth of Lowering DWT deadweight tonnage HDD horizontal directional drilling HRG high-resolution geophysical ICPC International Cable Protection Committee km kilometer KP kilometer point Lease Area designated Renewable Energy Lease Area OCS-A 0508 m meter MEC Munitions and Explosives of Concern OWC Offshore Wind Consultants Limited Project the Kitty Hawk Offshore Wind Project the Company Kitty Hawk Wind, LLC U.S. United States UK United Kingdom USACE United States Army Corps of Engineers USCG United States Coast Guard UXO unexploded ordnance VACAPES Virginia Capes Wind Development Area approximately 40 percent of the Lease Area in the northwest corner
closest to shore (19,814 hectares)
J-v
Kitty Hawk Offshore Wind Project Lease Area OCS-A 0508 Construction and Operations Plan Appendix J – Preliminary Cable Burial Risk Assessment
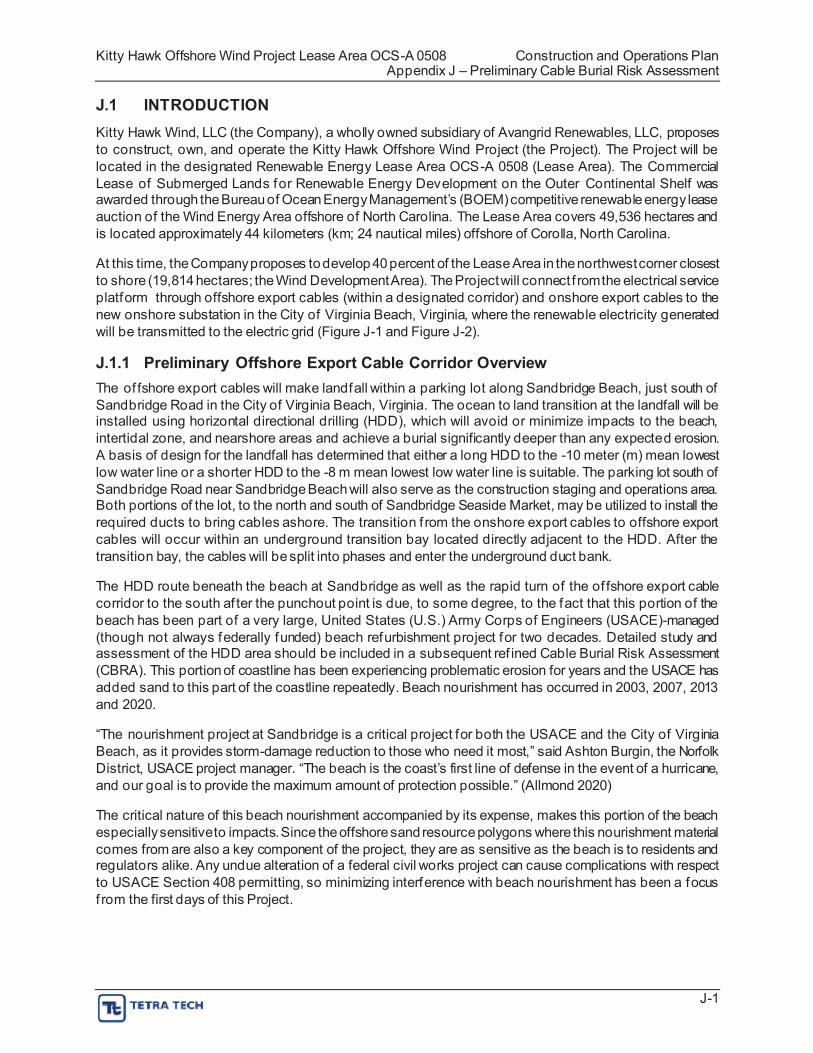
J.1 INTRODUCTION Kitty Hawk Wind, LLC (the Company), a wholly owned subsidiary of Avangrid Renewables, LLC, proposes to construct, own, and operate the Kitty Hawk Offshore Wind Project (the Project). The Project will be located in the designated Renewable Energy Lease Area OCS-A 0508 (Lease Area). The Commercial Lease of Submerged Lands for Renewable Energy Development on the Outer Continental Shelf was awarded through the Bureau of Ocean Energy Management’s (BOEM) competitive renewable energy lease auction of the Wind Energy Area offshore of North Carolina. The Lease Area covers 49,536 hectares and is located approximately 44 kilometers (km; 24 nautical miles) offshore of Corolla, North Carolina.
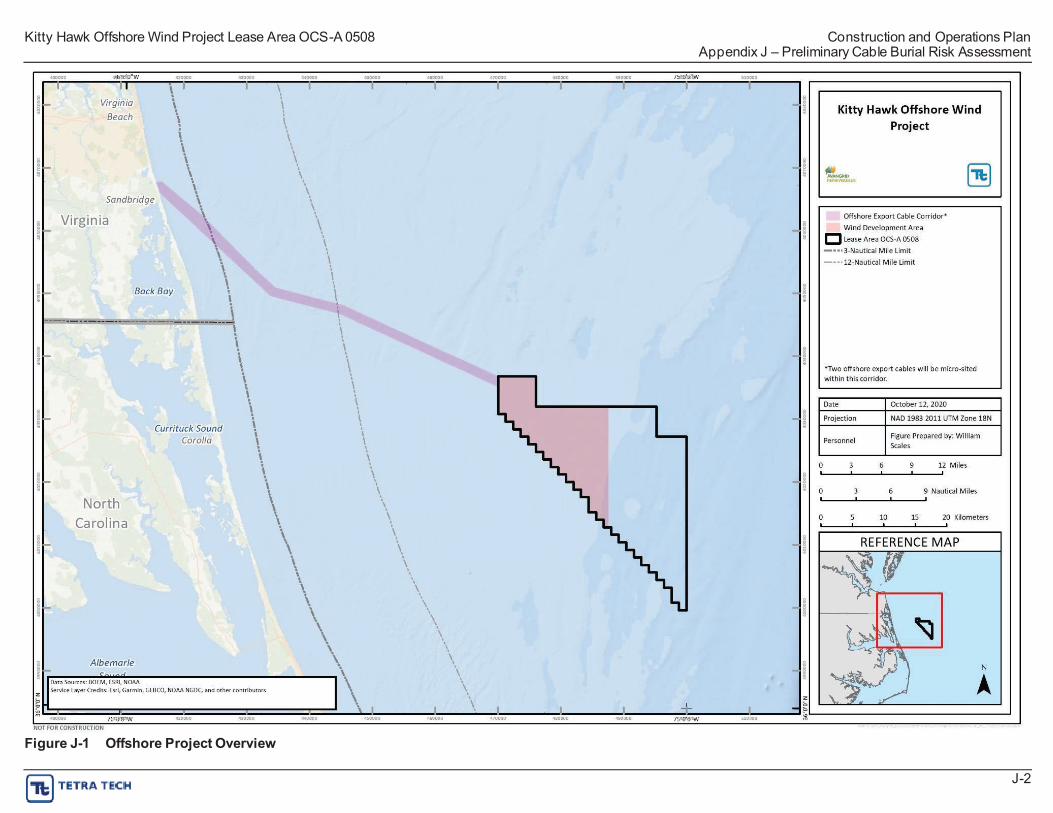
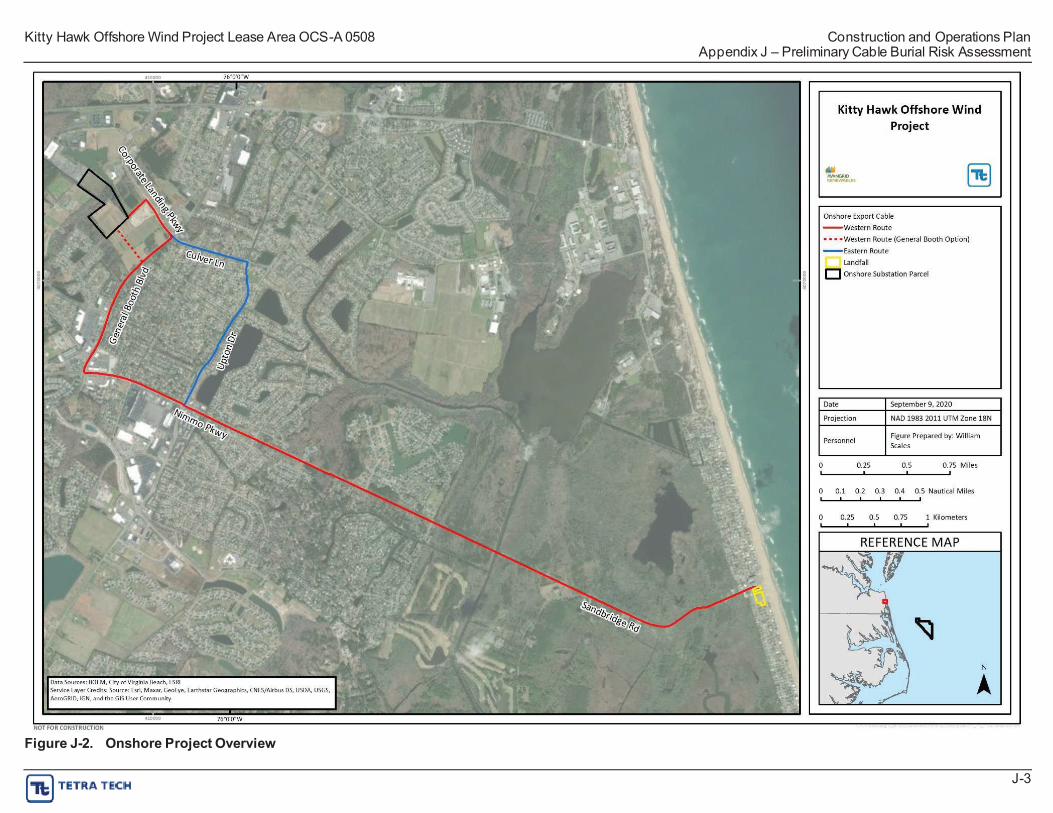
At this time, the Company proposes to develop 40 percent of the Lease Area in the northwest corner closest to shore (19,814 hectares; the Wind Development Area). The Project will connect f rom the electrical service platform through offshore export cables (within a designated corridor) and onshore export cables to the new onshore substation in the City of Virginia Beach, Virginia, where the renewable electricity generated will be transmitted to the electric grid (Figure J-1 and Figure J-2).
J.1.1 Preliminary Offshore Export Cable Corridor Overview The of fshore export cables will make landfall within a parking lot along Sandbridge Beach, just south of Sandbridge Road in the City of Virginia Beach, Virginia. The ocean to land transition at the landfall will be installed using horizontal directional drilling (HDD), which will avoid or minimize impacts to the beach, intertidal zone, and nearshore areas and achieve a burial significantly deeper than any expected erosion. A basis of design for the landfall has determined that either a long HDD to the -10 meter (m) mean lowest low water line or a shorter HDD to the -8 m mean lowest low water line is suitable. The parking lot south of Sandbridge Road near Sandbridge Beach will also serve as the construction staging and operations area. Both portions of the lot, to the north and south of Sandbridge Seaside Market, may be utilized to install the required ducts to bring cables ashore. The transition f rom the onshore export cables to offshore export cables will occur within an underground transition bay located directly adjacent to the HDD. After the transition bay, the cables will be split into phases and enter the underground duct bank.
The HDD route beneath the beach at Sandbridge as well as the rapid turn of the of fshore export cable corridor to the south af ter the punchout point is due, to some degree, to the fact that this portion of the beach has been part of a very large, United States (U.S.) Army Corps of Engineers (USACE)-managed (though not always federally funded) beach refurbishment project for two decades. Detailed study and assessment of the HDD area should be included in a subsequent ref ined Cable Burial Risk Assessment (CBRA). This portion of coastline has been experiencing problematic erosion for years and the USACE has added sand to this part of the coastline repeatedly. Beach nourishment has occurred in 2003, 2007, 2013 and 2020.
“The nourishment project at Sandbridge is a critical project for both the USACE and the City of Virginia Beach, as it provides storm-damage reduction to those who need it most,” said Ashton Burgin, the Norfolk District, USACE project manager. “The beach is the coast’s first line of defense in the event of a hurricane, and our goal is to provide the maximum amount of protection possible.” (Allmond 2020)
The critical nature of this beach nourishment accompanied by its expense, makes this portion of the beach especially sensitive to impacts. Since the offshore sand resource polygons where this nourishment material comes from are also a key component of the project, they are as sensitive as the beach is to residents and regulators alike. Any undue alteration of a federal civil works project can cause complications with respect to USACE Section 408 permitting, so minimizing interference with beach nourishment has been a focus f rom the first days of this Project.
J-1
Kitty Hawk Offshore Wind Project Lease Area OCS-A 0508 Construction and Operations Plan Appendix J – Preliminary Cable Burial Risk Assessment
Figure J-1 Offshore Project Overview
J-2
Kitty Hawk Offshore Wind Project Lease Area OCS-A 0508 Construction and Operations Plan Appendix J – Preliminary Cable Burial Risk Assessment
Figure J-2. Onshore Project Overview
J-3
Kitty Hawk Offshore Wind Project Lease Area OCS-A 0508 Construction and Operations Plan Appendix J – Preliminary Cable Burial Risk Assessment
The potential risk to the cables during the operations and maintenance phase of the Project can be reduced by raising awareness of the buried cables through marine liaison activities, ensuring cables are adequately charted, and potentially the marking of critical areas with buoys. This has also been suggested during stakeholder meetings with the Virginia Pilots Association and others. Additionally, temporary or permanent awareness solutions such as virtual automatic identification system (AIS) markers have been utilized to provide protection to cables. A virtual AIS system can broadcast AIS radio data packets from a shore-based station to create marker points which can be viewed on shipboard charting and radar systems that integrate AIS. Direct and ongoing outreach to the USACE, the state and local government agencies involved with beach nourishment, and individual dredging contractors should also be considered
The of fshore export cable corridor will consist of up to two, distinct, buried cables, each containing a three-core, 275-kilovolt high-voltage alternating-current cable containing one or more f iber optic packages. This cable corridor transits a former military gun line safety fan, so the risk of unexploded ordnance (UXO) is likely present. This is further detailed within Section J.6.
There are also threats to the cables from natural processes, fishing and shipping activity; the offshore export cable corridor passes south of the main shipping lanes transited by commercial vessels departing and arriving Norfolk, Virginia and Chesapeake Bay.
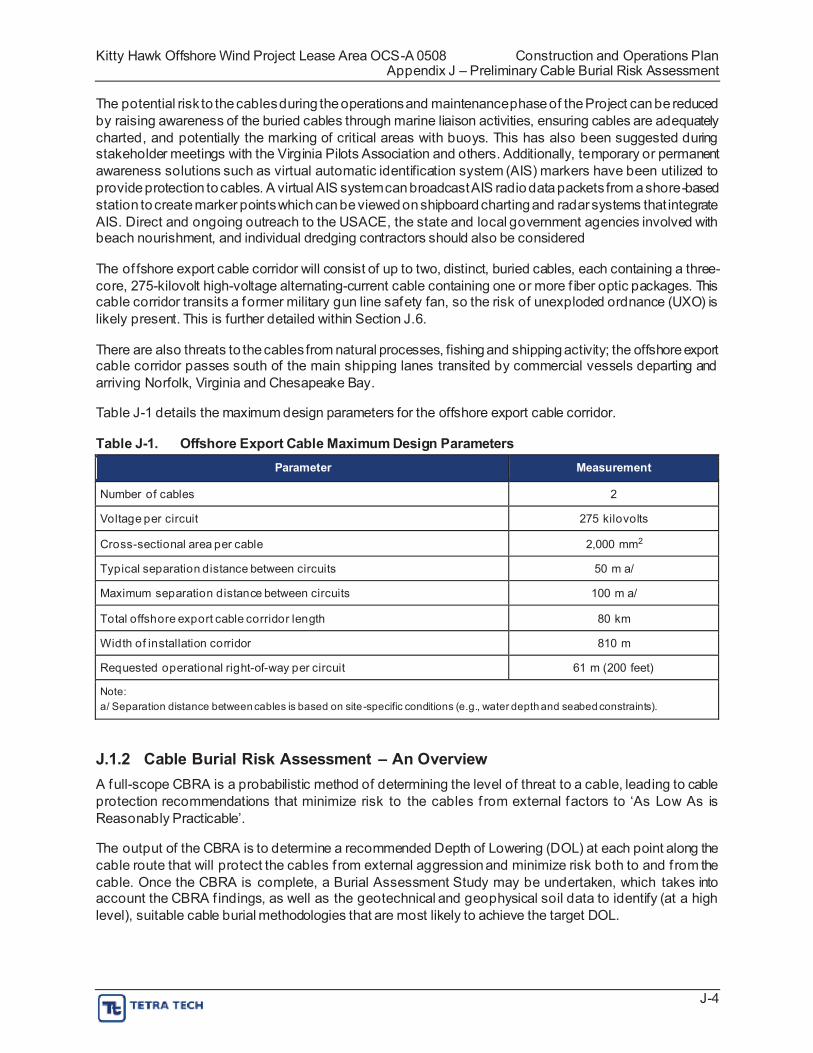
Table J-1 details the maximum design parameters for the offshore export cable corridor.
Table J-1. Offshore Export Cable Maximum Design Parameters Parameter Measurement
Number of cables 2
Voltage per circuit 275 kilovolts
Cross-sectional area per cable 2,000 mm2
Typical separation distance between circuits 50 m a/
Maximum separation distance between circuits 100 m a/
Total offshore export cable corridor length 80 km
Width of installation corridor 810 m
Requested operational right-of-way per circuit 61 m (200 feet)
Note: a/ Separation distance between cables is based on site-specific conditions (e.g., water depth and seabed constraints).
J.1.2 Cable Burial Risk Assessment – An Overview A full-scope CBRA is a probabilistic method of determining the level of threat to a cable, leading to cable protection recommendations that minimize risk to the cables f rom external factors to ‘As Low As is Reasonably Practicable’.
The output of the CBRA is to determine a recommended Depth of Lowering (DOL) at each point along the cable route that will protect the cables f rom external aggression and minimize risk both to and f rom the cable. Once the CBRA is complete, a Burial Assessment Study may be undertaken, which takes into account the CBRA f indings, as well as the geotechnical and geophysical soil data to identify (at a high level), suitable cable burial methodologies that are most likely to achieve the target DOL.
J-4
Kitty Hawk Offshore Wind Project Lease Area OCS-A 0508 Construction and Operations Plan Appendix J – Preliminary Cable Burial Risk Assessment
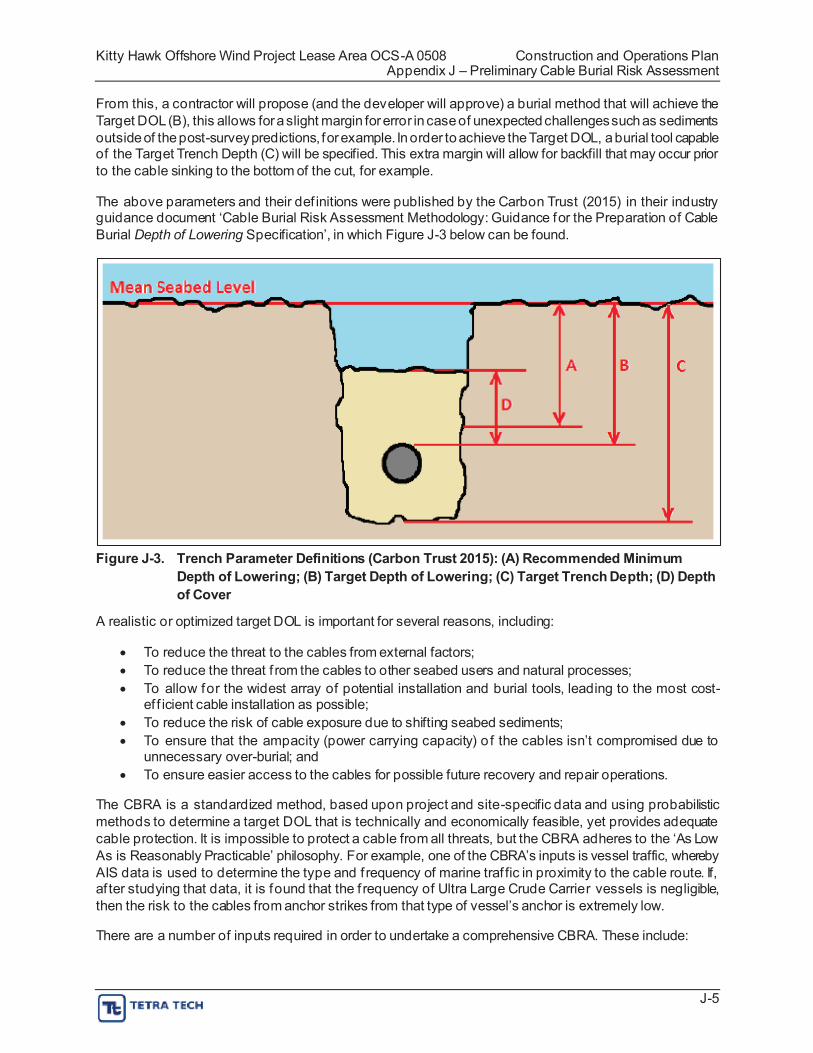
From this, a contractor will propose (and the developer will approve) a burial method that will achieve the Target DOL (B), this allows for a slight margin for error in case of unexpected challenges such as sediments outside of the post-survey predictions, for example. In order to achieve the Target DOL, a burial tool capable of the Target Trench Depth (C) will be specified. This extra margin will allow for backfill that may occur prior to the cable sinking to the bottom of the cut, for example.
The above parameters and their def initions were published by the Carbon Trust (2015) in their industry guidance document ‘Cable Burial Risk Assessment Methodology: Guidance for the Preparation of Cable Burial Depth of Lowering Specification’, in which Figure J-3 below can be found.
Figure J-3. Trench Parameter Definitions (Carbon Trust 2015): (A) Recommended Minimum Depth of Lowering; (B) Target Depth of Lowering; (C) Target Trench Depth; (D) Depth of Cover
A realistic or optimized target DOL is important for several reasons, including:
To reduce the threat to the cables from external factors; To reduce the threat f rom the cables to other seabed users and natural processes; To allow for the widest array of potential installation and burial tools, leading to the most cost-
ef f icient cable installation as possible; To reduce the risk of cable exposure due to shifting seabed sediments; To ensure that the ampacity (power carrying capacity) o f the cables isn’t compromised due to
unnecessary over-burial; and To ensure easier access to the cables for possible future recovery and repair operations.
The CBRA is a standardized method, based upon project and site-specific data and using probabilistic methods to determine a target DOL that is technically and economically feasible, yet provides adequate cable protection. It is impossible to protect a cable from all threats, but the CBRA adheres to the ‘As Low As is Reasonably Practicable’ philosophy. For example, one of the CBRA’s inputs is vessel traffic, whereby AIS data is used to determine the type and f requency of marine traf fic in proximity to the cable route. If, af ter studying that data, it is found that the f requency of Ultra Large Crude Carrier vessels is negligible, then the risk to the cables from anchor strikes from that type of vessel’s anchor is extremely low.
There are a number of inputs required in order to undertake a comprehensive CBRA. These include:
J-5
Kitty Hawk Offshore Wind Project Lease Area OCS-A 0508 Construction and Operations Plan Appendix J – Preliminary Cable Burial Risk Assessment
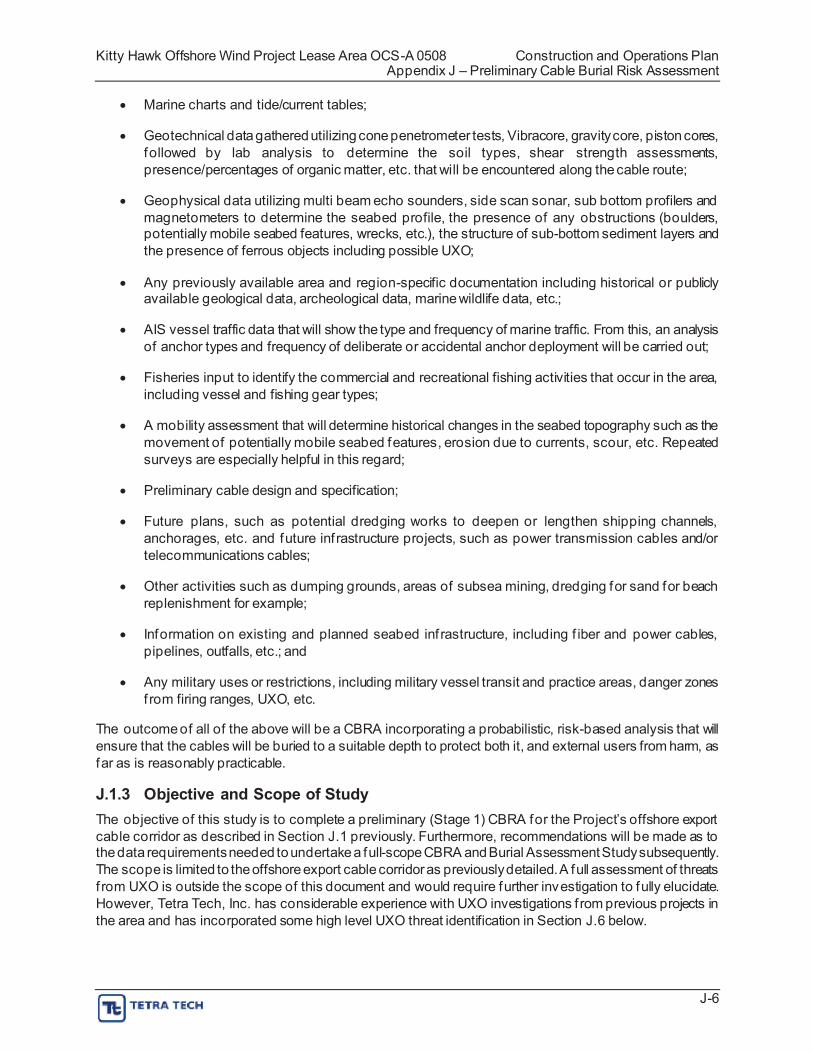
Marine charts and tide/current tables;
Geotechnical data gathered utilizing cone penetrometer tests, Vibracore, gravity core, piston cores, followed by lab analysis to determine the soil types, shear strength assessments, presence/percentages of organic matter, etc. that will be encountered along the cable route;
Geophysical data utilizing multi beam echo sounders, side scan sonar, sub bottom profilers and magnetometers to determine the seabed profile, the presence of any obstructions (boulders, potentially mobile seabed features, wrecks, etc.), the structure of sub-bottom sediment layers and the presence of ferrous objects including possible UXO;
Any previously available area and region-specific documentation including historical or publicly available geological data, archeological data, marine wildlife data, etc.;
AIS vessel traffic data that will show the type and frequency of marine traffic. From this, an analysis of anchor types and frequency of deliberate or accidental anchor deployment will be carried out;
Fisheries input to identify the commercial and recreational fishing activities that occur in the area, including vessel and fishing gear types;
A mobility assessment that will determine historical changes in the seabed topography such as the movement of potentially mobile seabed features, erosion due to currents, scour, etc. Repeated surveys are especially helpful in this regard;
Preliminary cable design and specification;
Future plans, such as potential dredging works to deepen or lengthen shipping channels, anchorages, etc. and future inf rastructure projects, such as power transmission cables and/or telecommunications cables;
Other activities such as dumping grounds, areas of subsea mining, dredging for sand for beach replenishment for example;
Information on existing and planned seabed inf rastructure, including f iber and power cables, pipelines, outfalls, etc.; and
Any military uses or restrictions, including military vessel transit and practice areas, danger zones f rom firing ranges, UXO, etc.
The outcome of all of the above will be a CBRA incorporating a probabilistic, risk-based analysis that will ensure that the cables will be buried to a suitable depth to protect both it, and external users from harm, as far as is reasonably practicable.
J.1.3 Objective and Scope of Study The objective of this study is to complete a preliminary (Stage 1) CBRA for the Project’s offshore export cable corridor as described in Section J.1 previously. Furthermore, recommendations will be made as to the data requirements needed to undertake a full-scope CBRA and Burial AssessmentStudy subsequently. The scope is limited to the offshore export cable corridor as previously detailed. A full assessment of threats f rom UXO is outside the scope of this document and would require further investigation to fully elucidate. However, Tetra Tech, Inc. has considerable experience with UXO investigations f rom previous projects in the area and has incorporated some high level UXO threat identification in Section J.6 below.
J-6
Kitty Hawk Offshore Wind Project Lease Area OCS-A 0508 Construction and Operations Plan Appendix J – Preliminary Cable Burial Risk Assessment
Due to the ongoing survey works, the continuing refinement of the ground model and understanding of the expected soil conditions, and the pending nature of a micro -sited route within the corridor, this report can only be considered a “preliminary” CBRA. Once the remaining data identified in Section J.8 is available, a full, quantitative CBRA can be created from this foundation in accordance with industry standard practices as detailed by The Carbon Trust and Company’s specific needs. This current study makes use of the datasets available at this stage of Project development to capture the current best understanding of the DOL and trends in the need for cable protection faced by the system. These findings will inform later stages of field investigation, technical analyses, installation planning, permitting, and stakeholder outreach.
J.2 REGULATIONS AND GUIDANCE There are a wide variety of sources that inform cable burial recommendations, ranging from governmental agencies to industry bodies that publish codes and best working practices.
It is common for submarine cable projects to receive burial depth requirements from the USACE as a part of the permitting process. These particularly pertain to areas where there are identif ied and maintained shipping navigation channels and anchorages. These specified burial depth requirements are intended to allow for future dredging activities (i.e., channel deepening, widening and lengthening).
Although the USACE determines the minimum acceptable burial depth in certain areas, there is also guidance available from a variety of other sources, including the International Cable Protection Committee (ICPC), BOEM, the Carbon Trust, the Bureau of Safety and Environmental Enforcement, and the American Wind Energy Association. The USACE determines minimum acceptable burial through an internal process of evaluating known risks and threats to the cable(s), the known, planned, and potential future expansion and deepening of federal navigation projects, and any other local factors.
J.2.1 Government Agencies
J.2.1.1 BOEM Construction and Operations Plan Guidelines BOEM is an agency within the U.S. Department of the Interior responsible for managing development of the nation’s offshore resources, in an environmentally and economically responsible way. The main document that offshore wind developers must assemble to BOEM’s satisfaction is the Construction and Operations Plan. Within BOEM’s Information Guidelines for a Renewable Energy Construction and Operations Plan (2020a), the following items are identified with respect to cable burial.
Attachment A: Best Management Practices Seaf loor habitats:
Lessees and grantees shall conduct seafloor surveys in the early phases of a project to ensure that the alternative energy project is sited appropriately to avoid or minimize potential impacts associated with seafloor instability or other hazards.
Lessees and grantees shall take all reasonable actions to minimize seabed disturbance and sediment dispersion during cable installation.
Fisheries:
Lessees and grantees shall avoid or minimize impacts to the commercial fishing industry by burying cables, where practicable, to avoid conflict with f ishing vessels and gear operation. If cables are buried, lessees and grantees shall inspect cable burial depth periodically during project operation to ensure that adequate coverage is maintained to avoid interference with fishing gear/activity.
J-7
Kitty Hawk Offshore Wind Project Lease Area OCS-A 0508 Construction and Operations Plan Appendix J – Preliminary Cable Burial Risk Assessment
Coastal habitats:
Lessees and grantees shall avoid hard-bottom habitats, including seagrass communities and kelp beds, where practicable, and restore any damage to those communities.
Attachment E: Information Requirements for the National Environmental Policy Act andOther Relevant Laws Other Potential Needs for Construction and Operations Plan Approval - Additional information may be needed to support the evaluation of hazards and physical impacts, including but not limited to:
Stability analysis of seafloor morphology; and Modeling of disturbances associated with foundation installation, cable jetting and burial, and cable
landfall.
J.2.1.2 Bureau of Safety and Environmental Enforcement The Bureau of Safety and Environmental Enforcement is an agency within the U.S. Department of the Interior that is responsible for promoting safety, protecting the environment and conserving offshore resources. The Energy Policy Act of 2005 authorized the Secretary of the Interior to issue leases on the Outer Continental Shelf for activities that produce or support the production, transportation or transmission of energy from sources other than oil and gas. The Act requires all such operations to be carried out in a manner that provides safety of operations and the protection of the environment.
As a part of its program, the Bureau of Safety and Environmental Enforcement has commissioned and undertaken many Technical Assessment Programs Projects, all of which are in the public domain. A few of the applicable ones are:
TAP 722 – Offshore Wind Submarine Spacing Guidance; and
TAP 671 – Offshore Electrical Cable Burial for Wind Farms: State of the Art: Standards and Guidance; Acceptable Burial Depths and Separation Distances; and Sand Wave Effects.
These documents, for the most part, summarize industry best-practices and contain general guidance for the Company to consider in both turbine layout designs as well as when considering cable burial.
J.2.2 Other Bodies
J.2.2.1 International Cable Protection Committee Recommendations The ICPC is an organization founded in 1958 that comprises of governmental agencies, commercial submarine cable system owners and operators, as well as other companies that are associated with the submarine cable industry. The primary mission of the organization is to increase the security of undersea cables by providing a forum in which technical, legal and environmental information can be exchanged, and guidance issued. The prime activities can be summarized as follows:
To promote awareness of submarine cables as critical inf rastructure to Governments and other users of the ocean floors;
To establish internationally agreed recommendations for cable installation, protection and maintenance;
To monitor international treaties and national legislation to help ensure that submarine cable interests are fully protected; and
To liaise with various United Nations bodies.
J-8
Kitty Hawk Offshore Wind Project Lease Area OCS-A 0508 Construction and Operations Plan Appendix J – Preliminary Cable Burial Risk Assessment
General Guidance Documents The ICPC recommendations are a set of industry best practices that serve as a guide for burial planning. Since the ICPC guidance (2019) is designed to be both generalized best practice as well as global in application, they do not publish a recommended depth of burial. It is widely understood that appropriate burial depth varies by risk profile and regulatory regime and a whole host of other factors. The following guidance does pertain to desktop studies and CBRAs such as this one.
ICPC Recommendations Document 9: Minimum Technical Requirements for a DesktopStudy This document outlines detailed recommendations for what should be considered in a desktop study (cable route study). It does not include specific guidance on how to deal with those factors. This guidance notes that a route planner must familiarize themselves with several regional parameters, including:
Geology; Climatology; Oceanography; Commercial Operations, Hazards and Restricted Areas (shipping, military, f ishing, research,
dredging, shipwrecks, etc.); Biological factors; and Permitting.
The guidance is designed to ensure that a Project has done its due diligence in advance such that the environment and the regulations are well understood prior to surveys, installation, and operations and maintenance.
J.2.2.2 DNV GL Det Norsk Veritas Germanischer Lloyd (DNV GL) is an international registrar and classification society headquartered in Norway.
DNV-GL-RP-0360 This recommended practice document provides guidance throughout a submarine power cable’s lifecycle. It focuses particularly on the risk analysis and mitigations most applicable to shallow water applications.
J.2.2.3 Carbon Trust The Carbon Trust is a United Kingdom (UK) based but global organization with the stated mission of accelerating the transition to a sustainable, low carbon economy. As a part of this, they formed the Carbon Trust Of fshore Wind Accelerator, a Joint Industry Project consisting of nine major of fshore wind project developers and a number of other associated organizations, including the UK and Scottish Governments. In the case of submarine cabling, the Offshore Wind Accelerator members all agreed that significant cost savings could be achieved without adding additional risk to the cabling by optimizing the DOL.
To achieve that, the Carbon Trust commissioned a wide-ranging study into the site investigations, trenching assessments and burial risk assessments that are undertaken at the design phase of offshore wind farm projects. There was a lot of input into this study from cable installation and trenching contractors, various consultancies involved with of fshore wind farm development, as well as the wind farm developers themselves.
J-9
Kitty Hawk Offshore Wind Project Lease Area OCS-A 0508 Construction and Operations Plan Appendix J – Preliminary Cable Burial Risk Assessment
J.2.2.4 The American Wind Energy Association The American Wind Energy Association is a trade association representing both the on and offshore wind industry. They are currently developing a set of Standards and Recommended Practices, including convening working groups under their Wind Standards Committee. One of those working groups is tasked with drawing information from existing regulations and guidance to create ‘Recommended Practice for Design, Deployment and Operation of Submarine Cables in the United States’. However, this document is still under development.
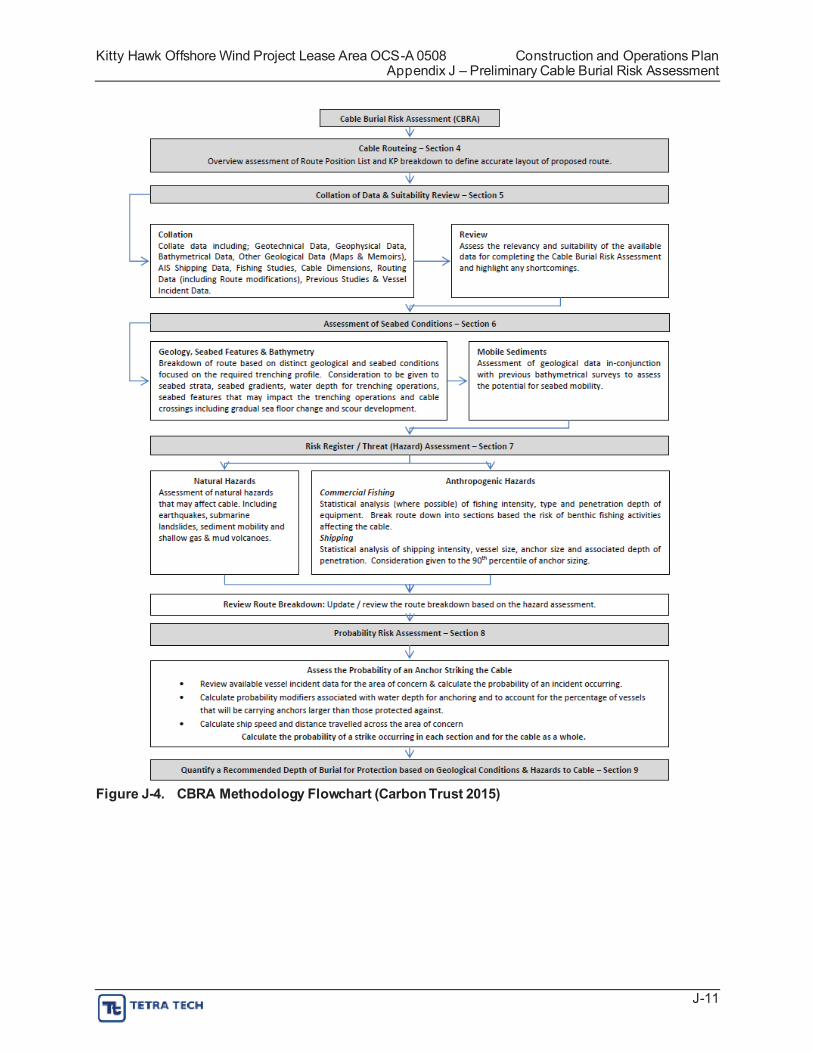
J.3 METHODOLOGY The methodology of this preliminary CBRA will, where possible, follow that of the Carbon Trust (Figure J-4), which has become the de facto industry standard for the determination of risk to cabling and associated DOL recommendations.
1. Create high-level overview and assessment of the proposed cable corridor.
2. Collate relevant data and review for suitability.
3. Assess the geotechnical and geophysical data and break the route down into sections sharing similar soil and seabed characteristics (not fully possible at this time).
4. Create a risk register of:
a. Natural hazards (seabed features, landslides, etc.); and
b. Anthropogenic hazards (shipping, fishing, UXO etc.).
5. Add risks to route breakdown.
6. Undertake probability risk assessment (not possible at this time).
7. Quantify a recommended DOL for each point along the cable route (not possible at this time).
As this is a preliminary assessment, the full probabilistic calculations cannot be undertaken until the data gaps are f illed. Therefore, the known risks will be described, and relevant conclusions and recommendations will be made.
Once the full survey data and f inalized Route Position List is available, a full -scope CBRA can be undertaken that will enable (for example) dredge volume calculations to be completed, the probabilistic risk calculations to be made and final burial recommendations to be made.
J-10
Kitty Hawk Offshore Wind Project Lease Area OCS-A 0508 Construction and Operations Plan Appendix J – Preliminary Cable Burial Risk Assessment
Figure J-4. CBRA Methodology Flowchart (Carbon Trust 2015)
J-11
Kitty Hawk Offshore Wind Project Lease Area OCS-A 0508 Construction and Operations Plan Appendix J – Preliminary Cable Burial Risk Assessment
J.4 OFFSHORE EXPORT CABLE CORRIDOR ALIGNMENT The of fshore export cable corridor analyzed in this report evolved as the Project moved through the various stages from initial concept through to more detailed engineering and permitting. Alternate routes and grid connection points were considered in both North Carolina and Virginia. However, as a part of the high-level concept planning, the North Carolina grid connections and accompanying submarine cable routing were deemed less preferable for the f irst stage of the Project due to offshore routing constraints, onshore grid interconnection inadequacies, stakeholder concerns associated with the sensitivity of the Outer Banks environment, as well as other factors considered.
The area occupied by the offshore export cables running on a northwest to southeast alignment between the Wind Development Area and Sandbridge, Virginia is heavily utilized by both commercial shipping and U.S. Naval vessels. In addition to known shipping lanes, there are areas used as anchorages for vessels waiting to transit the shipping lanes. There is both a Regulated Navigation Area and a Danger Zone/Restricted Area in the region of Virginia Beach, parts of which are traversed by the offshore export cable corridor.
Of f Sandbridge, the offshore export cable corridor transits outside of the Dam Neck Ocean Disposal Site (DNODS). This dumping ground has been in use since 1967 and is used to deposit approximately 0.9 million cubic meters of dredged material every two years. Much of this material comes f rom the Atlantic Ocean Channel between the entrance to Chesapeake Bay and the naturally deeper waters of the Atlantic shelf . The United States Environmental Protection Agency and USACE jointly manage this area as a part of their efforts to maintain ongoing dredging activities in federal shipping channels.
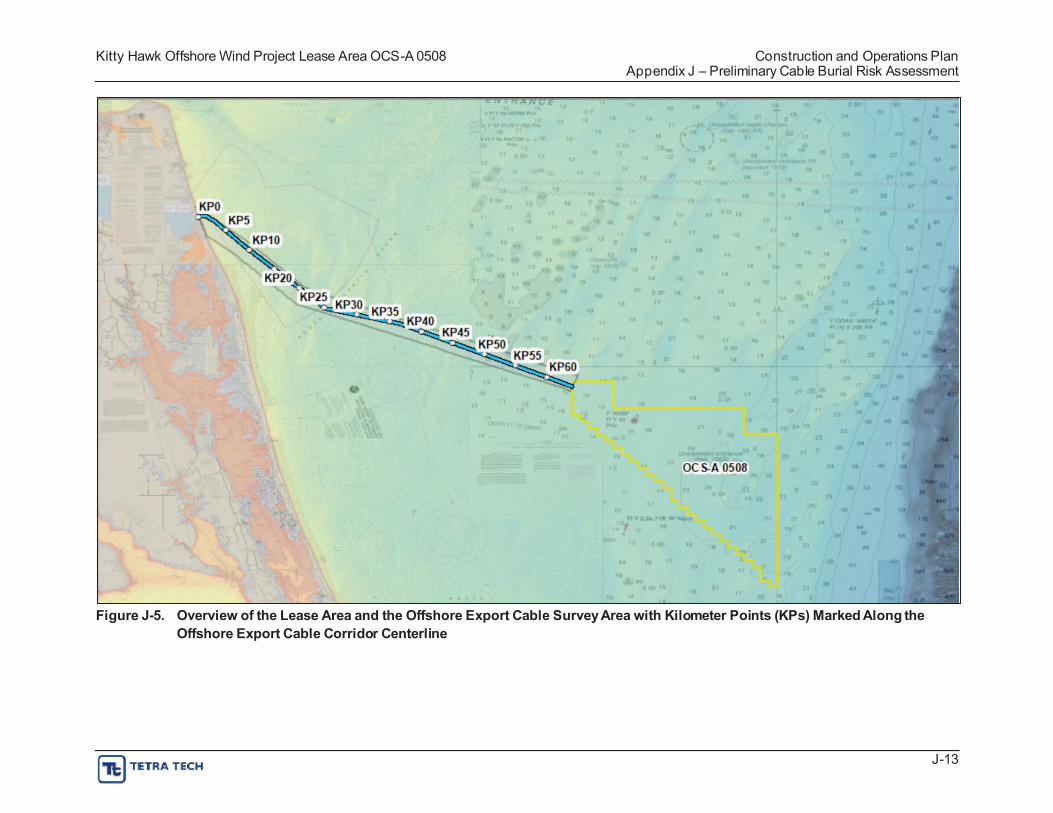
Overall, the of fshore export cable corridor (Figure J-5) was sited using best-available bathymetry and seabed data in concert with an evolving series of physical, environmental, regulatory, and stakeholder constraints. The initial routing was based upon a variety of constraints present along the routes, including but not limited to the following:
Areas where the United States Department of Defense (DoD) prohibits submarine cables; Shipping lanes; USACE dredge projects; Other submarine assets; Shallow water areas and sand resource areas; Charted and ad-hoc anchoring areas; Dredging and dumping areas; Danger areas; and Shipwrecks, obstructions, and charted hazards.
This list provides an indication of routing considerations and constraints present along the potential routes.
Traf f ic lanes, authorized channels, maintained channels, and anchorages may have requirements for deeper cable burial to ensure adequate cable protection f rom risks of external aggression, as well as to protect the navigation channel’s integrity and were, therefore, avoided. This document explores the more directly applicable cable burial constraints in terms of risk mitigations from the threats of external aggression that cannot be mitigated solely through routing.
J-12
Kitty Hawk Offshore Wind Project Lease Area OCS-A 0508 Construction and Operations Plan Appendix J – Preliminary Cable Burial Risk Assessment
Figure J-5. Overview of the Lease Area and the Offshore Export Cable Survey Area with Kilometer Points (KPs) Marked Along the Offshore Export Cable Corridor Centerline
J-13
Kitty Hawk Offshore Wind Project Lease Area OCS-A 0508 Construction and Operations Plan Appendix J – Preliminary Cable Burial Risk Assessment
J.5 DATA REVIEW
J.5.1 Geotechnical and Geophysical Data A significant reconnaissance level high-resolution geophysical (HRG) survey effort has been undertaken to characterize the Wind Development Area and the offshore export cable corridor. This HRG survey included the following: multibeam echo sounder, side scan sonar, magnetometer, and sub -bottom profiler data acquisition. This has allowed for the development of an initial ground model that maps and documents the seismo-stratigraphic context of the area. At the time of this study, reconnaissance HRG survey data collected by the Company was available; reconnaissance geotechnical data and more detailed HRG data will be available for future analysis
While there is little geotechnical data that allows direct observation of the characteristics of the lithologies of the sub-bottom at this time, the initial understanding of the depositional environments can be inferred f rom the unit geometry and seismic character (Figure J-6, Figure J-7). As summarized by Offshore Wind Consultants Limited (OWC), the conditions are as follows:
Each of the identified seismo-stratigraphic units (A1 to D) is expected to have been formed in a separate depositional event or series of events. However, similarities in the depositional environments that formed each of the units mean that all identified units are likely to contain a combination of sands, silts, and clays, with the potential for occasional occurrences of organic rich sediments (such as peat) and possibly gravels, including at the base of channels (OWC 2020).
This is consistent with the f indings for other studies that have looked at the marine geology in the region. The BOEM Open File Report 2019-2 (BOEM 2019) quoted below, evaluates the potential for sand resources in conjunction with the Virginia Department of Mines, Minerals and Energy. While they describe major seismo-stratigraphic units from A-D, they do it in the opposite sense of OWC, i.e., D-A from seabed to deeper subsurface.
Units B and C are likely equivalent to the Pleistocene-age Shirley and Tabb Formations, respectively. These units are dif ficult to distinguish in many of the seismic images. They are separated by ref lector 2, which is not evident in many of the images. The middle Pleistocene Shirley Formation was deposited in a marginal marine environment and consists of f luvial-estuarine facies that vary laterally and vertically (Powars and others, 2016 as cited in BOEM 2019). The late Pleistocene Tabb Formation consists of f luvial-estuarine f ining-upward sequences that typically grade upward from basal pebble-sand deposits to sandy and clayey silt. Neither of these units contain sufficient thicknesses of beach-quality sand to be considered in the resource estimates. The upper-most unit D is equivalent to Holocene-age sediments consisting mainly of f ine to coarse grained sand. It is separated from units C, B, and A, depending on the location, by reflectors 1, 2, or 3. The sediments in unit D occur as sheet sand and shoal deposits of variable thickness that range f rom thin (3-6 feet) to very thick (greater than 30 feet) on the crest of shoals. The mud content is low and there is no overburden. Unit D represents the primary beach-quality sand resource in both study areas. Ref lector 1 is continuous throughout the entire Sandbridge area, and in most of the Wallops resource area. Shideler and others (1972, as cited in BOEM 2019) reported a radiocarbon age of about 4,220 years Before Present for an articulated Mercenaria sp. extracted f rom a core at a depth of 1.7 m below the seafloor in the Sandbridge resource area. This unit was deposited and continues to be modified during the current transgression (Swift and others, 1977 as cited in BOEM 2019).
J-14
Kitty Hawk Offshore Wind Project Lease Area OCS-A 0508 Construction and Operations Plan Appendix J – Preliminary Cable Burial Risk Assessment
Figure J-6. Interpreted Seismic Sections Along the Offshore Export Cable Corridor Showing Major Reflectors and Seismostratigraphic Units (OWC 2020)
J-15
Kitty Hawk Offshore Wind Project Lease Area OCS-A 0508 Construction and Operations Plan Appendix J – Preliminary Cable Burial Risk Assessment
Figure J-7. Schematic Representation of the Evolution and Depositional Environments Along the Offshore Export Cable Corridor from OWC (2020)
J-16
Kitty Hawk Offshore Wind Project Lease Area OCS-A 0508 Construction and Operations Plan Appendix J – Preliminary Cable Burial Risk Assessment
J.5.2 Shipping and Navigation Data
J.5.2.1 United States Coast Guard Vessel Traffic Service Information The Port of Virginia includes the facilities of Norfolk and Newport News, with the Port of Norfolk accounting for approximately 95 percent of total trips transiting through the Port of Virginia (Table J-2; USACE 2018). Although the offshore export cables will not be landing in either of these port cities, vessels transiting the southern approaches will cross the of fshore export cable corridor as they depart or arrive at the Chesapeake Estuary.
Table J-2. Number of Trips of Various Vessel Types in the Port of Virginia, Norfolk, and NewportNews 2017 (USACE 2018)
Location Self propelled Vessels Non self-propelled Vessels Total Number
of Trips Dry Cargo Tanker Tow/Tug Dry Cargo Tanker Port of Virginia Inbound 2,333
Outbound 2,576
Total Trips 4,909
Norfolk Harbor Upbound 1,958
Downbound 2,089
Total Trips 4,047
- -
Port of Newport News Inbound 276
Outbound 387
261
218
479
225
246
471
34
27
5,738
2,053
7,791
3,807
3,529
7,336
1,987
1,890
1,407
1,192
2,599
1,609
1,380
2,989
17
19
915
926
1,841
810
968
1,778
107
98
10,544
6,865
17,409
8,409
8,212
16,621
2,412
2,421
Total Trips 663 61 3,877 36 205 4,833
“Inbound” refers to waterborne imports and inbound, in-transit merchandise, “outbound” refers to waterborne exports and outbound in-transit merchandise. Similarly, “upbound” refers to traffic that moves in an upstream direction, and “downbound” refers to traffic that moves in a downstream direction. In both ports, the majority of the reported vessel trips were towboats and tugboats, followed by dry cargo vessels. Tugboats and towboats are both secondary vessels that either aid in pushing/pulling or dragging another vessel to a desired location. Dry cargo ships typically carry solid dry goods with a higher tolerance to varying temperatures, whereas tanker ships carry liquefied cargo. The smallest dry cargo ships carry up to twenty deadweight tons (DWT) and the largest can carry up to four hundred DWT.
Anchors Data provided by the ICPC determined that, since 2007, 48 percent of submarine cable faults in the UK were caused by anchors, 33 percent from fishing, and 19 percent from “other”. During this time, each case of damage from anchors was the direct result of vessels deploying anchors while they were still underway (ICPC 2009). The export cable landfall is 13.5 nautical miles (25 km) from the entrance of the Chesapeake Bay with many vessels transiting in and out of the Bay bound for ports from Baltimore to Norfolk. There are no of ficially charted anchorages within close proximity to the export cable landfall (Figure J-8). However, vessels do routinely anchor close to the approaches of the shipping channels as they await a pilot, an of fload time, or for customs clearance.
J-17
Kitty Hawk Offshore Wind Project Lease Area OCS-A 0508 Construction and Operations Plan Appendix J – Preliminary Cable Burial Risk Assessment
Figure J-8. Charted Anchorages within the Chesapeake Bay (MARCO 2020)
Additionally, over the past decade of cable-related work in the City of Virginia Beach, it has been commonly stated to Tetra Tech, Inc. that deep-draft vessels will wait out periods of large swells before using the dredged Atlantic Ocean Channel for travel into the Chesapeake Bay. This is due to the fact that they feel they are at risk of scraping the bottom of the channel when the vessel’s keel is at its deepest (in the trough between swells). In addition to the risk of planned anchoring, there is also the risk of unplanned anchor deployments due to human error or in the case of an emergency, such as if a complete propulsion system failure occurs.
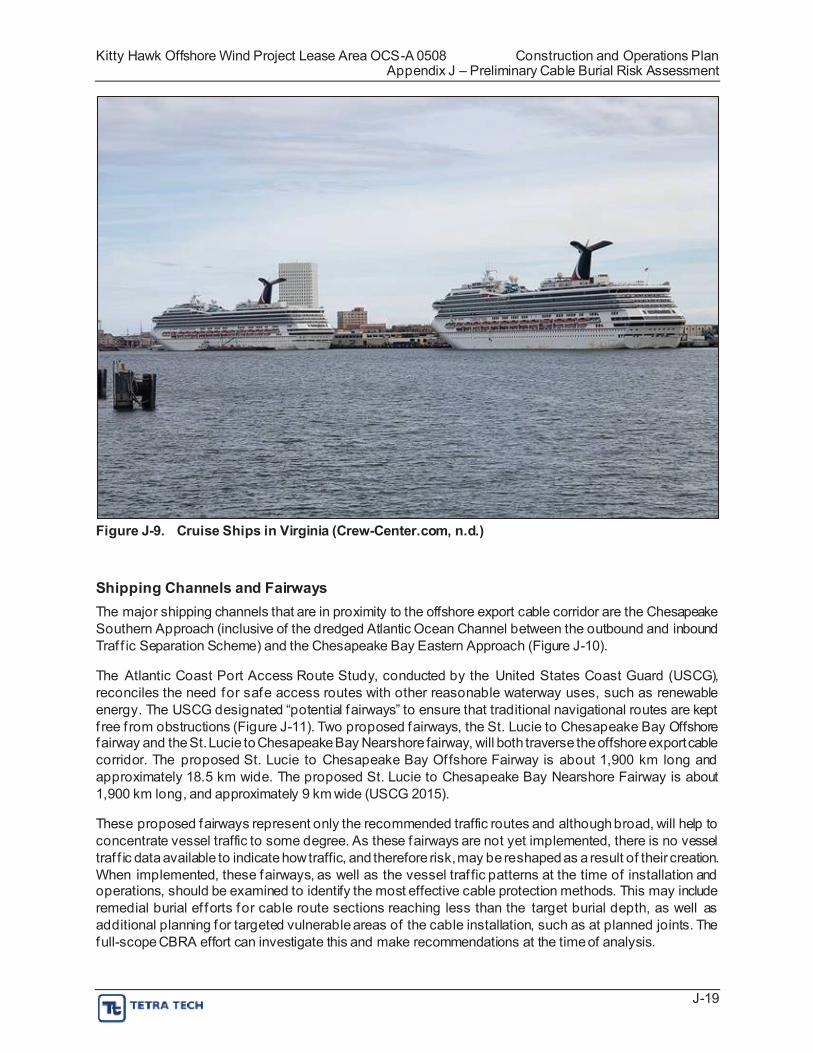
In addition to commercial shipping, there is also significant cruise ship use of the Port of Norfolk, Virginia. Carnival Cruise Lines, one of the world’s largest cruise ship operators in the world, uses Norfolk as a central hub for many of their Caribbean cruises (see Figure J-9). The two Carnival ships that embark from Norfolk are 272 m and 304 m long (Carnival 2020a, Carnival 2020b).
J-18
Kitty Hawk Offshore Wind Project Lease Area OCS-A 0508 Construction and Operations Plan Appendix J – Preliminary Cable Burial Risk Assessment
Figure J-9. Cruise Ships in Virginia (Crew-Center.com, n.d.)
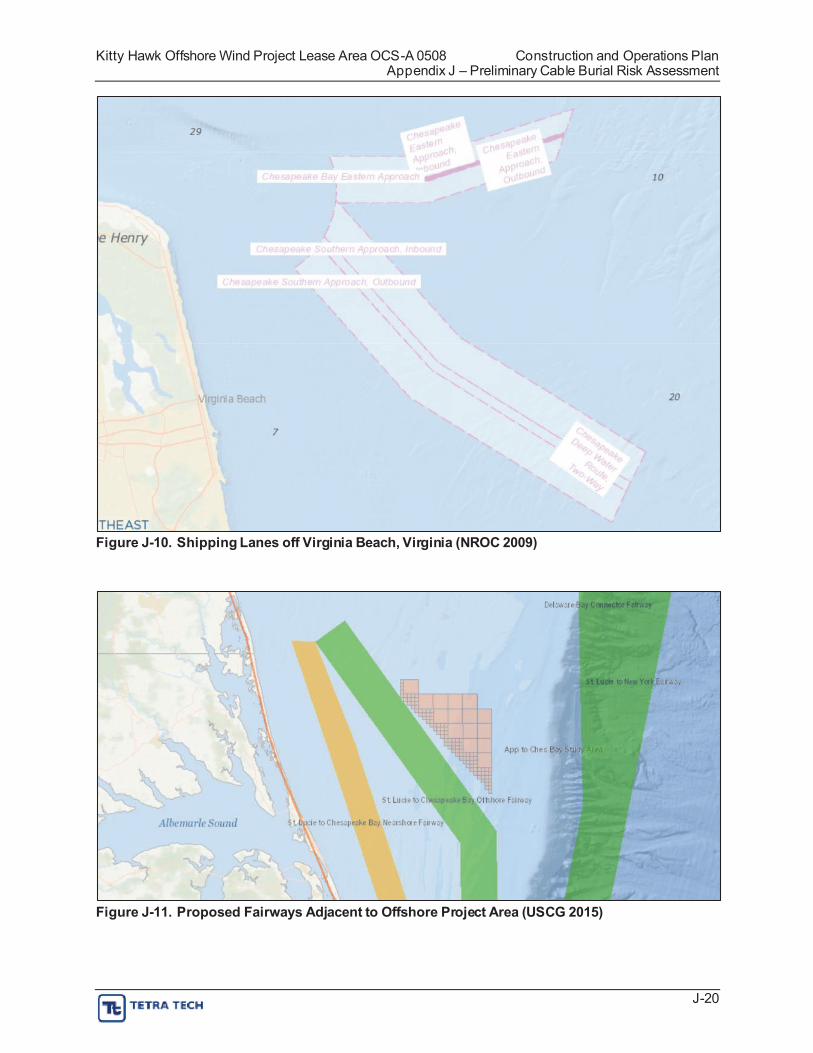
Shipping Channels and Fairways The major shipping channels that are in proximity to the offshore export cable corridor are the Chesapeake Southern Approach (inclusive of the dredged Atlantic Ocean Channel between the outbound and inbound Traf f ic Separation Scheme) and the Chesapeake Bay Eastern Approach (Figure J-10).
The Atlantic Coast Port Access Route Study, conducted by the United States Coast Guard (USCG), reconciles the need for safe access routes with other reasonable waterway uses, such as renewable energy. The USCG designated “potential fairways” to ensure that traditional navigational routes are kept f ree f rom obstructions (Figure J-11). Two proposed fairways, the St. Lucie to Chesapeake Bay Offshore fairway and the St. Lucie to Chesapeake Bay Nearshore fairway, will both traverse the offshore export cable corridor. The proposed St. Lucie to Chesapeake Bay Offshore Fairway is about 1,900 km long and approximately 18.5 km wide. The proposed St. Lucie to Chesapeake Bay Nearshore Fairway is about 1,900 km long, and approximately 9 km wide (USCG 2015).
These proposed fairways represent only the recommended traffic routes and although broad, will help to concentrate vessel traffic to some degree. As these fairways are not yet implemented, there is no vessel traf f ic data available to indicate how traffic, and therefore risk, may be reshaped as a result of their creation. When implemented, these fairways, as well as the vessel traf fic patterns at the time of installation and operations, should be examined to identify the most effective cable protection methods. This may include remedial burial ef forts for cable route sections reaching less than the target burial depth, as well as additional planning for targeted vulnerable areas of the cable installation, such as at planned joints. The full-scope CBRA effort can investigate this and make recommendations at the time of analysis.
J-19
Kitty Hawk Offshore Wind Project Lease Area OCS-A 0508 Construction and Operations Plan Appendix J – Preliminary Cable Burial Risk Assessment
Figure J-10. Shipping Lanes off Virginia Beach, Virginia (NROC 2009)
Figure J-11. Proposed Fairways Adjacent to Offshore Project Area (USCG 2015)
J-20
Kitty Hawk Offshore Wind Project Lease Area OCS-A 0508 Construction and Operations Plan Appendix J – Preliminary Cable Burial Risk Assessment
J.5.2.2 Automatic Identification System Data AIS data is a tracking method used by mariners as an anti-collision tool, supplementing marine radar by providing vessel information via a Very High Frequency radio signal. Logged AIS data also enables regulators and planners to monitor the number of vessels and establish traffic patterns within an area, including the location and speed of vessels. The AIS data system is capable of handling thousands of vessel positions per minute and updates as soon as every two seconds (USCG 2015). The Company may require operational AIS on all vessels associated with the construction, operation, and decommissioning of the Project, pursuant to USCG and AIS carriage requirements. Further, AIS data has been used later in this document to examine the distribution of risk due to vessel traffic.
J.5.3 Commercial Fishing In addition to the commercial vessels discussed elsewhere in this document, there is also commercial and recreational f ishing activity along the coast of Virginia and North Carolina, and within the waters of the of fshore Project Area. Information sharing and research on the commercial fishing industry is very important when making decisions about cable burial depth. Previous experience has shown that proper installation of submarine cables can often mitigate future external aggression risk, ensure the safety of the f ishermen in the region, and protect Project assets as well. Approximately 33 percent of all cable faults in the UK were caused by commercial f ishing activities (ICPC 2009). Thoughtful and intentional planning of cable burial specifics requires both familiarity with fishing techniques and patterns of use in the area.
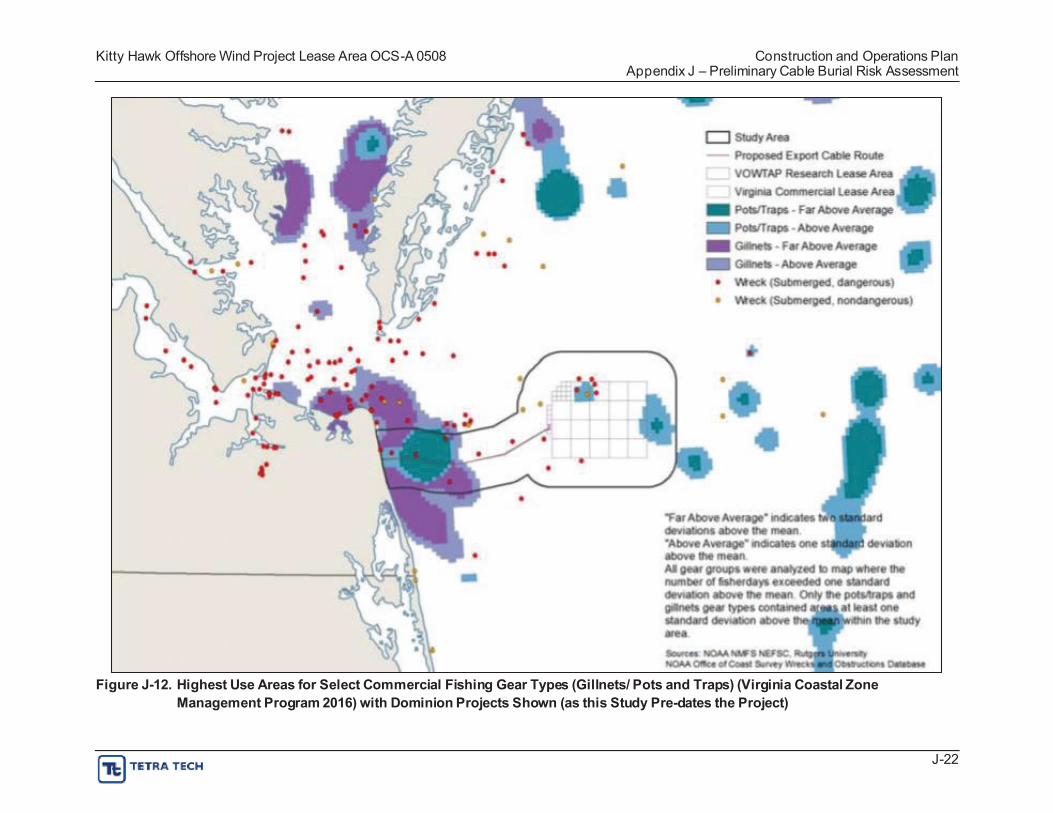
In 2016, BOEM, the Virginia Coastal Zone Management Program, and the Virginia Department of Mines, Minerals, and Energy collaborated to create the Virginia Wind Energy Area Collaborative Fisheries Planning Report. This report served to “identify f ishing communities potentially af fected by the Virginia wind area, establish a collaborative process for a two-way exchange of information, develop maps of important recreational, commercial, and charter f ishing areas around the wind area, build upon BOEM’s best management practices, and create best management practices regarding communicating, design, operation, and environmental monitoring of a commercial wind facility” (Virginia Coastal Zone Management Program 2016). Within the report, areas of high fishing activity were generated on maps that also identified the specific (fishing) gear type(s) in use, as well as determining areas that posed a potential higher risk of damage to installed submarine cables.
As shown in Figure J-12, commercial fishing in proximity to Coastal Virginia Offshore Wind export cable in Virginia was reported to be primarily by pots and traps, with minimal f ishing within the actual Wind Development Area. Additionally, it was discovered that the highest levels of f ishing within the offshore Project Area occurred in the vicinity of the of fshore export cable corridor (Virginia Coastal Zone Management Program 2016). A review of the top species and gear types used in the area of the Project is provided below.
J-21
Kitty Hawk Offshore Wind Project Lease Area OCS-A 0508 Construction and Operations Plan Appendix J – Preliminary Cable Burial Risk Assessment
Figure J-12. Highest Use Areas for Select Commercial Fishing Gear Types (Gillnets/ Pots and Traps) (Virginia Coastal Zone Management Program 2016) with Dominion Projects Shown (as this Study Pre-dates the Project)
J-22
Kitty Hawk Offshore Wind Project Lease Area OCS-A 0508 Construction and Operations Plan Appendix J – Preliminary Cable Burial Risk Assessment
Acknowledging the fishing industries presence in the offshore Project Area is critical to understanding which species are harvested and what type of gear will be used in the greater vicinity. Extensive research on commercial and recreational f ishing has been done in support of the Construction and Operations Plan. Further, the Company has engaged local f isheries experts as its Fisheries Liaison Officer and Fisheries Industry Representative.
In summary, the commercial fisheries that operate within the offshore Project Area are trending down from both a revenue and overall activity perspective. Additionally, many regulators and stakeholders have stated that the Wind Development Area is a very well-sited offshore wind location f rom a f isheries and maritime use perspective.
This opinion is based on several circumstances specific to the offshore Project Area, including but not limited to the following:
The offshore export cable corridor has the military warning areas to the north and east, where anchoring and bottom-contact fishing is already prohibited;
There are very few ports in the region, as the coastline is a contiguous beach with no harbors from Rudee Inlet south to Oregon Inlet (a distance of about 125 km to the south), making vessel access to the offshore export cable corridor difficult, limiting traffic;
The somewhat homogenous, sandy seabed in the region traversed by the offshore export cable corridor contains few features where f ish are known to gather in large numbers. There are a few known f ishing grounds nearby, but even these named locations aren’t as productive as the continental shelf break east of the offshore Project Area, nor the many known wrecks and the more dramatic bathymetry to the south, closer to Cape Hatteras; and
The gear types known to be deployed here are not designed to dig deeply into the sediment, relative to other gear, such as hydraulic clam dredges used in other locations.
These facts lead to the conclusion that the cable burial parameters designed to mitigate against other risks (anchoring and mobile seabed) will also be ample to mitigate against fishing risk.
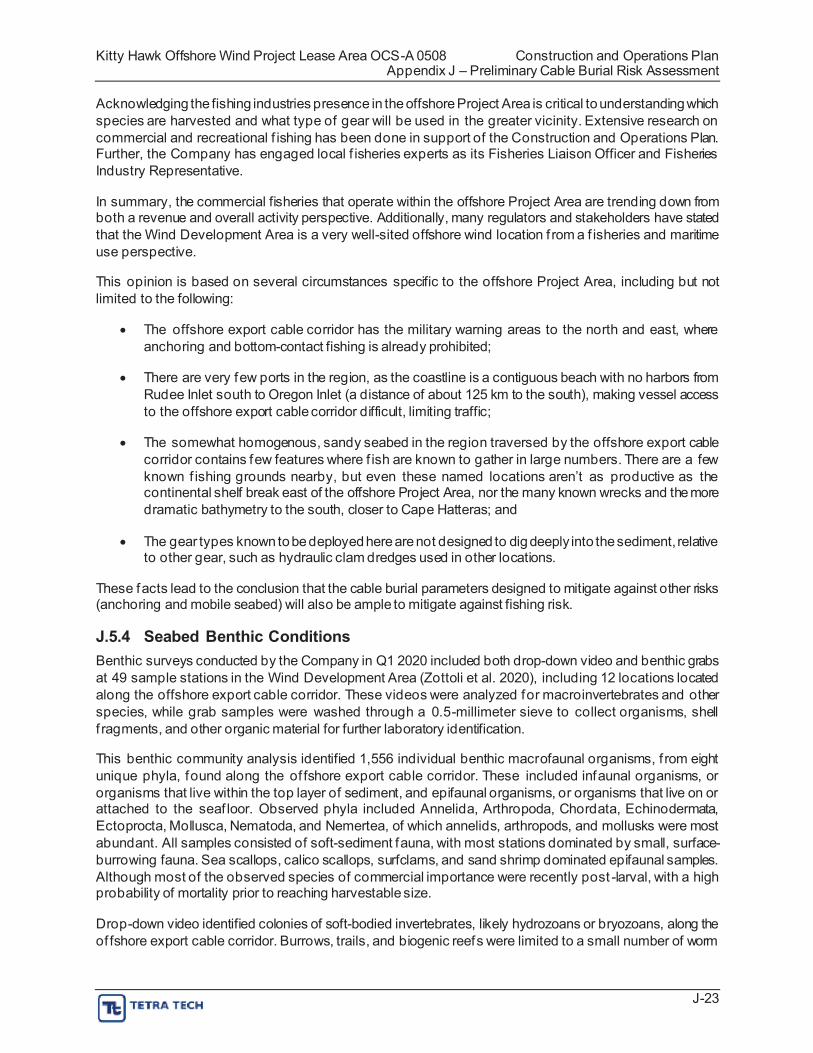
J.5.4 Seabed Benthic Conditions Benthic surveys conducted by the Company in Q1 2020 included both drop-down video and benthic grabs at 49 sample stations in the Wind Development Area (Zottoli et al. 2020), including 12 locations located along the offshore export cable corridor. These videos were analyzed for macroinvertebrates and other species, while grab samples were washed through a 0.5-millimeter sieve to collect organisms, shell f ragments, and other organic material for further laboratory identification.
This benthic community analysis identified 1,556 individual benthic macrofaunal organisms, f rom eight unique phyla, found along the of fshore export cable corridor. These included infaunal organisms, or organisms that live within the top layer of sediment, and epifaunal organisms, or organisms that live on or attached to the seaf loor. Observed phyla included Annelida, Arthropoda, Chordata, Echinodermata, Ectoprocta, Mollusca, Nematoda, and Nemertea, of which annelids, arthropods, and mollusks were most abundant. All samples consisted of soft-sediment fauna, with most stations dominated by small, surface-burrowing fauna. Sea scallops, calico scallops, surfclams, and sand shrimp dominated epifaunal samples. Although most of the observed species of commercial importance were recently post -larval, with a high probability of mortality prior to reaching harvestable size.
Drop-down video identified colonies of soft-bodied invertebrates, likely hydrozoans or bryozoans, along the of fshore export cable corridor. Burrows, trails, and biogenic reefs were limited to a small number of worm
J-23
Kitty Hawk Offshore Wind Project Lease Area OCS-A 0508 Construction and Operations Plan Appendix J – Preliminary Cable Burial Risk Assessment
tubes and one small burrow; no hardbottom, aquatic vegetation, or evidence of important biogenic habitat was observed. This corroborated grab sample results, which did not contain any mussels, corals, sponges, or other species known to create biogenic structural habitat.
Following the pre-lay grapnel run, cable-laying equipment will disturb the seaf loor along a narrow band where the export cable is to be buried. Invertebrates not already disturbed by the grapnel, such as burrowing surfclam, will be displaced by the jet plow (or other installation equipment) during cable installation. Most noble invertebrates will be able to avoid the slow-moving jet plow and likely escape injury. Although less mobile, soft-bodied invertebrates within the trenched area may be crushed or buried. Shelled mollusks (e.g., sea scallops, ocean quahogs, surfclam) will fare better than their soft-bodied counterparts. As jet plow presence in a given area will be limited to several hours, this will represent a transient impact on invertebrates. Surfclams, ocean quahogs, and other burrowing bivalves will be able to reposition themselves at the desired depth in the sediment after cable installation completion.
Construction activities will suspend softbottom sediment and increase turbidity within, and immediately adjacent, to the offshore export cable corridor for a limited period of time. Some bivalve species close their shells to reduce contact with unsuitable water, which temporarily impedes their ability to feed and excrete wastes (Roberts et al. 2016; Roberts and Elliot 2017). However, the suspended sediment plume raised by the jet plow may directly increase the density of benthic algae and detritus in the immediate area, indirectly benef itting surf clam, ocean quahog, and other suspension feeders in or near the of fshore export cable corridor. The nutritional value of suspended sediment near the seafloor has been shown to be two orders of magnitude greater than in the water column one meter above the seafloor (Munroe et al. 2013).
The of fshore export cable corridor was selected to avoid overlap with sensitive benthic habitats and the route will be further micro-sited within the corridor to avoid boulders and other habitat complexities where possible. This, coupled with the temporary nature of installation, will minimize potential impacts to benthic resources.
J.6 THREAT ASSESSMENT
J.6.1 Sediment Mobility Seabed mobility is a potential threat to the installed cables in two contexts. The f irst is that scour and erosion of the seabed may effectively lessen the DOL of the cable relative to the surrounding seabed. This removes the vital protection provided by cable burial and may leave the cable at risk of ex ternal aggression. In extreme cases, mobile seabed may leave a cable suspended causing accelerated wear of the cable and an increased potential for other seabed users to accidentally snag or damage the cable. The second risk is that in areas of mobile bedforms or accretionary seabed features, the depth of cover over the cables may increase, which can hinder future maintenance operations as well as impact the thermal properties of the cables, potentially reducing ampacity of the system to avoid damage to the cables.
While full geotechnical datasets have not yet been analyzed across the offshore export cable corridor, the HRG data collected by the Company can be evaluated in the context of regional trends and datasets to provide insights into the processes that may drive seabed mobility.
The initial ground model for the Project was developed by OWC utilizing the reconnaissance data from the Company’s HRG survey and associated reporting. This effort provides good insight into the seabed surface and potential conditions in the subsurface. While their ef fort did not specifically map areas of seabed mobility, the morphological terrain mapping in the ground model provides initial insight into the variability along the corridor.
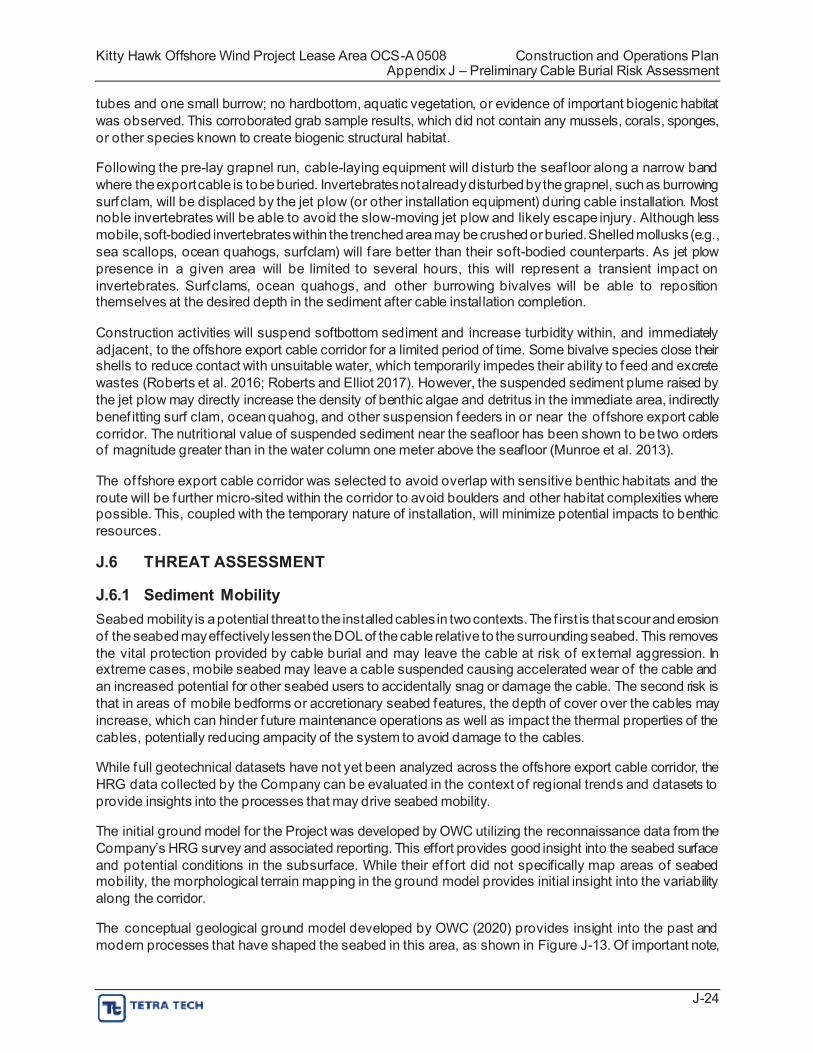
The conceptual geological ground model developed by OWC (2020) provides insight into the past and modern processes that have shaped the seabed in this area, as shown in Figure J-13. Of important note,
J-24
Kitty Hawk Offshore Wind Project Lease Area OCS-A 0508 Construction and Operations Plan Appendix J – Preliminary Cable Burial Risk Assessment
the Holocene marine sand deposits are the most likely areas for seabed mobility. Where these deposits are thin or absent, it may indicate the likelihood of the seabed being bypassed by modern sediment due to predominant current f low regimes and sediment supply. These areas also represent the places with an increased potential for scour and erosion, potentially leading to exposure of the cable.
Figure J-13. Conceptual Geological Model of the Offshore Project Area from OWC (2020)
The shallow shelf of the Mid-Atlantic is known to contain several orientations of shore-perpendicular, shore-parallel, and shore-oblique sand ridges. The nature, formation, and propensity of these features to migrate along the seabed has been a focus of study since the latter half of the last century.
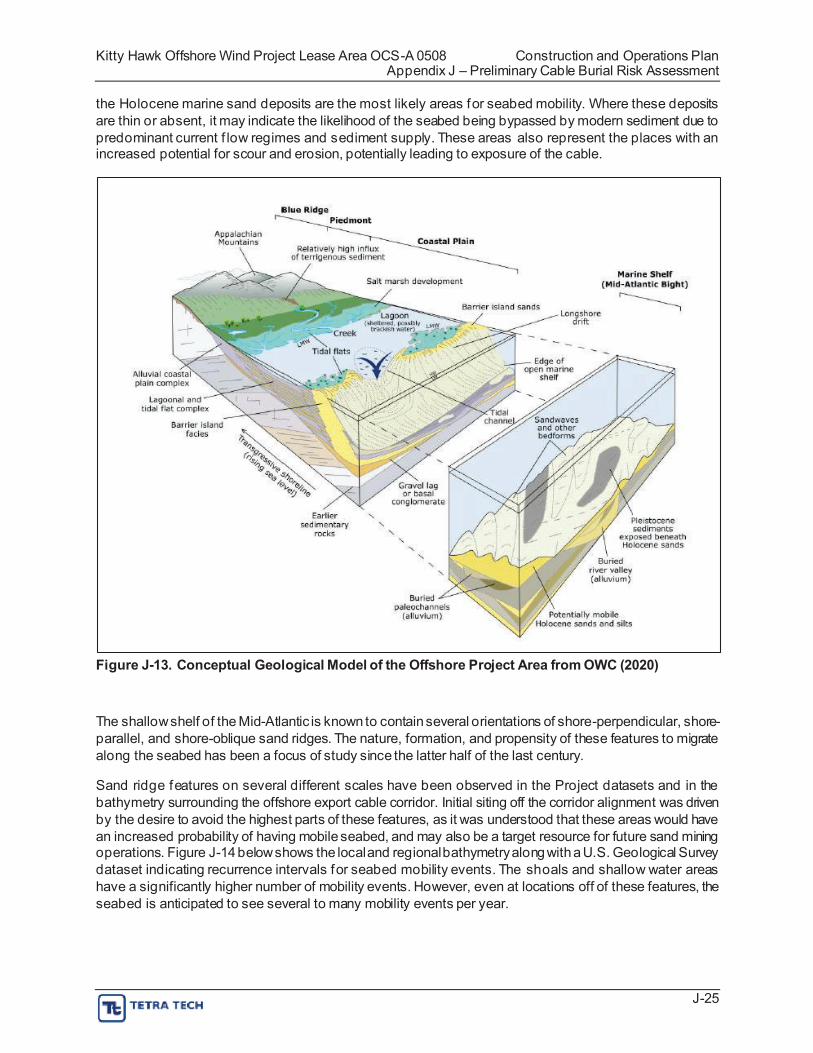
Sand ridge features on several different scales have been observed in the Project datasets and in the bathymetry surrounding the offshore export cable corridor. Initial siting off the corridor alignment was driven by the desire to avoid the highest parts of these features, as it was understood that these areas would have an increased probability of having mobile seabed, and may also be a target resource for future sand mining operations. Figure J-14 below shows the local and regional bathymetry along with a U.S. Geological Survey dataset indicating recurrence intervals for seabed mobility events. The shoals and shallow water areas have a significantly higher number of mobility events. However, even at locations off of these features, the seabed is anticipated to see several to many mobility events per year.
J-25
Kitty Hawk Offshore Wind Project Lease Area OCS-A 0508 Construction and Operations Plan Appendix J – Preliminary Cable Burial Risk Assessment
Figure J-14. Overview of the Offshore Export Cable Bathymetry Survey with Corridor Centerline and KPs Marked. The color-rendered bathymetry in the background gives a good context to the regional shoals. The colored dots represent a broad-scale dataset from the U.S. Geological Survey that looks at modeled seabed currents and sediments to evaluate potential recurrence intervals for seabed mobility events.
Recent ef forts by the BOEM Marine Minerals Program have mapped out contours and developed isopachs to display the thicknesses of sand accumulations in the vicinity of Sandbridge to serve as future sources for beach nourishment (BOEM 2020b).
Figure J-15 shows the conceptual geological cross-section along the of fshore export cable route as developed for the ground model report by OWC (2020). Data delivered to the Company allowed for the plotting of the isopach thickness data (color-rendered inset). There is a clear correspondence between the portion of the of fshore export cable corridor identified as having little-to-no surficial Holocene sediments and the thin spots in the BOEM dataset showing reduced Holocene sand bodies and lower potential sand resources. This area of bypass may be indicative of the potential for minor scour or non-deposition.
J-26
Kitty Hawk Offshore Wind Project Lease Area OCS-A 0508 Construction and Operations Plan Appendix J – Preliminary Cable Burial Risk Assessment
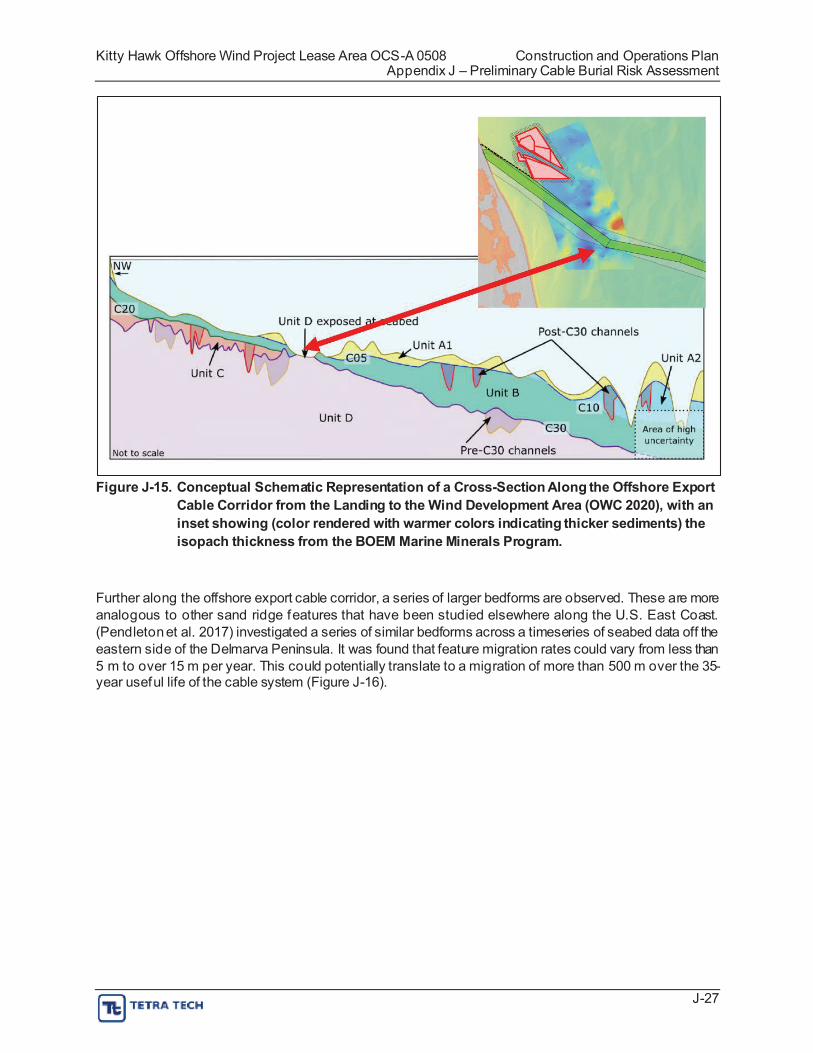
Figure J-15. Conceptual Schematic Representation of a Cross-Section Along the Offshore Export Cable Corridor from the Landing to the Wind Development Area (OWC 2020), with an inset showing (color rendered with warmer colors indicating thicker sediments) the isopach thickness from the BOEM Marine Minerals Program.
Further along the offshore export cable corridor, a series of larger bedforms are observed. These are more analogous to other sand ridge features that have been studied elsewhere along the U.S. East Coast. (Pendleton et al. 2017) investigated a series of similar bedforms across a timeseries of seabed data off the eastern side of the Delmarva Peninsula. It was found that feature migration rates could vary from less than 5 m to over 15 m per year. This could potentially translate to a migration of more than 500 m over the 35-year useful life of the cable system (Figure J-16).
J-27
Kitty Hawk Offshore Wind Project Lease Area OCS-A 0508 Construction and Operations Plan Appendix J – Preliminary Cable Burial Risk Assessment
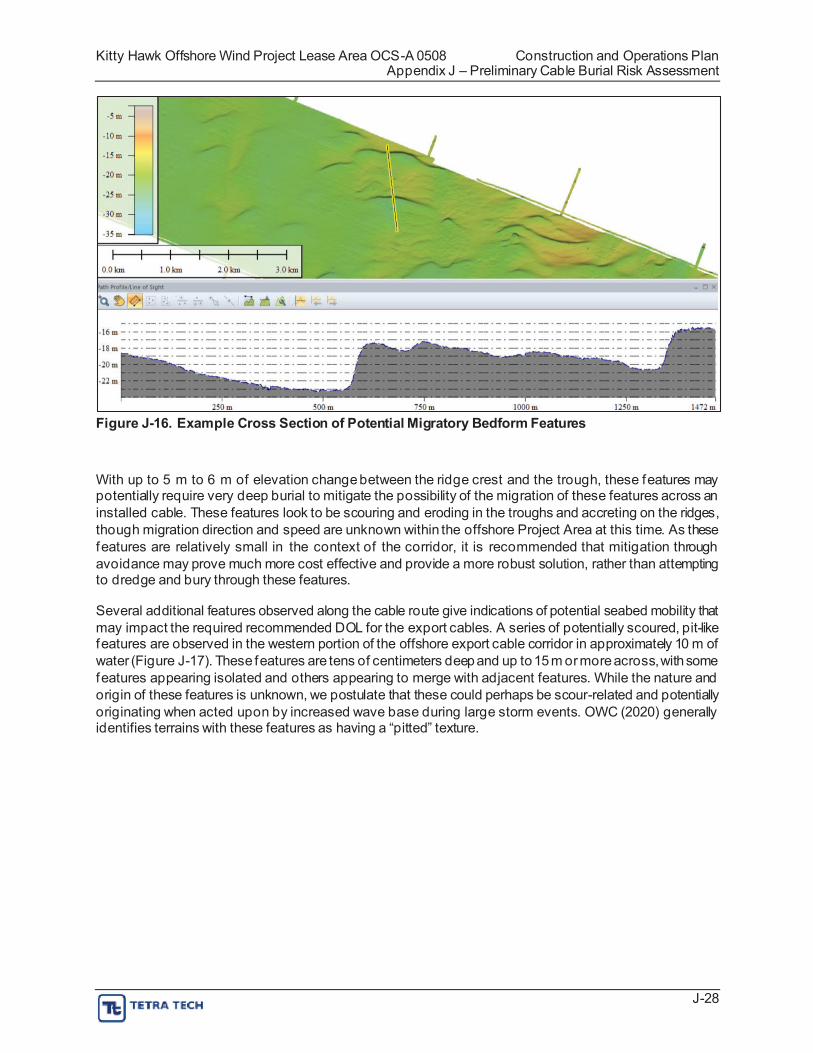
Figure J-16. Example Cross Section of Potential Migratory Bedform Features
With up to 5 m to 6 m of elevation change between the ridge crest and the trough, these features may potentially require very deep burial to mitigate the possibility of the migration of these features across an installed cable. These features look to be scouring and eroding in the troughs and accreting on the ridges, though migration direction and speed are unknown within the offshore Project Area at this time. As these features are relatively small in the context of the corridor, it is recommended that mitigation through avoidance may prove much more cost effective and provide a more robust solution, rather than attempting to dredge and bury through these features.
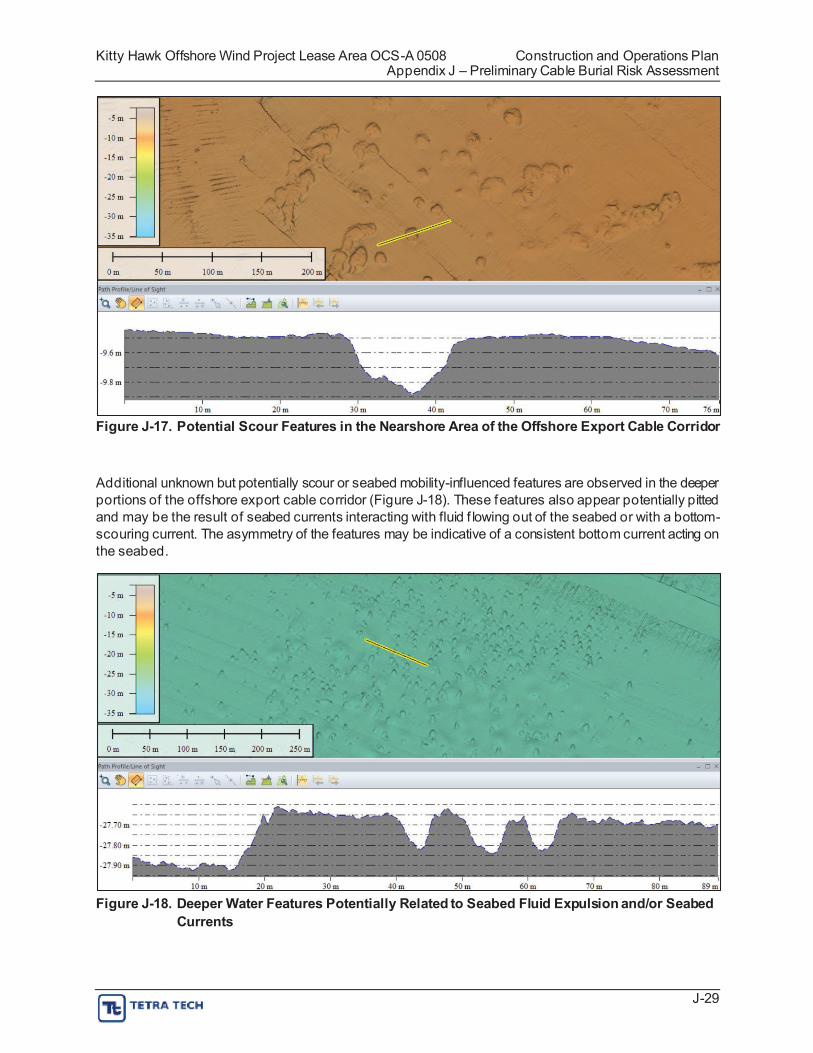
Several additional features observed along the cable route give indications of potential seabed mobility that may impact the required recommended DOL for the export cables. A series of potentially scoured, pit-like features are observed in the western portion of the offshore export cable corridor in approximately 10 m of water (Figure J-17). These features are tens of centimeters deep and up to 15 m or more across, with some features appearing isolated and others appearing to merge with adjacent features. While the nature and origin of these features is unknown, we postulate that these could perhaps be scour-related and potentially originating when acted upon by increased wave base during large storm events. OWC (2020) generally identifies terrains with these features as having a “pitted” texture.
J-28
Kitty Hawk Offshore Wind Project Lease Area OCS-A 0508 Construction and Operations Plan Appendix J – Preliminary Cable Burial Risk Assessment
Figure J-17. Potential Scour Features in the Nearshore Area of the Offshore Export Cable Corridor
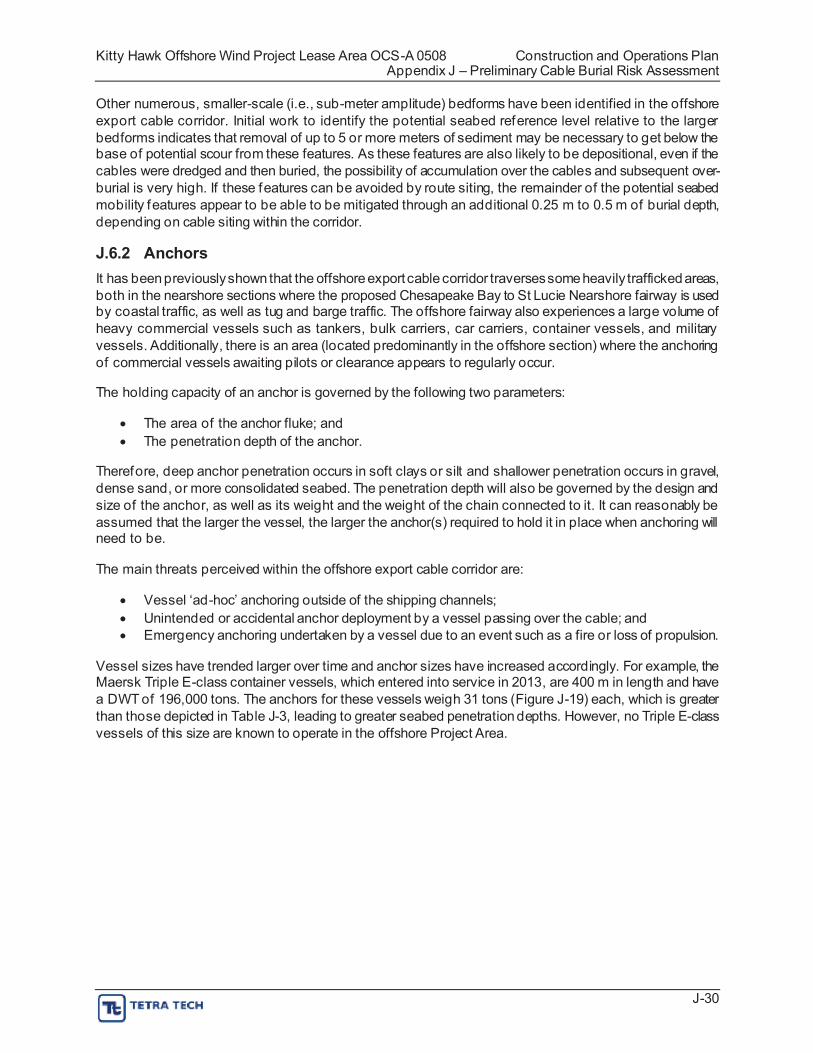
Additional unknown but potentially scour or seabed mobility-influenced features are observed in the deeper portions of the offshore export cable corridor (Figure J-18). These features also appear potentially pitted and may be the result of seabed currents interacting with fluid f lowing out of the seabed or with a bottom-scouring current. The asymmetry of the features may be indicative of a consistent bottom current acting on the seabed.
Figure J-18. Deeper Water Features Potentially Related to Seabed Fluid Expulsion and/or Seabed Currents
J-29
Kitty Hawk Offshore Wind Project Lease Area OCS-A 0508 Construction and Operations Plan Appendix J – Preliminary Cable Burial Risk Assessment
Other numerous, smaller-scale (i.e., sub-meter amplitude) bedforms have been identified in the offshore export cable corridor. Initial work to identify the potential seabed reference level relative to the larger bedforms indicates that removal of up to 5 or more meters of sediment may be necessary to get below the base of potential scour from these features. As these features are also likely to be depositional, even if the cables were dredged and then buried, the possibility of accumulation over the cables and subsequent over-burial is very high. If these features can be avoided by route siting, the remainder of the potential seabed mobility features appear to be able to be mitigated through an additional 0.25 m to 0.5 m of burial depth, depending on cable siting within the corridor.
J.6.2 Anchors It has been previously shown that the offshore exportcable corridor traverses some heavily trafficked areas, both in the nearshore sections where the proposed Chesapeake Bay to St Lucie Nearshore fairway is used by coastal traffic, as well as tug and barge traffic. The offshore fairway also experiences a large volume of heavy commercial vessels such as tankers, bulk carriers, car carriers, container vessels, and military vessels. Additionally, there is an area (located predominantly in the offshore section) where the anchoring of commercial vessels awaiting pilots or clearance appears to regularly occur.
The holding capacity of an anchor is governed by the following two parameters:
The area of the anchor fluke; and The penetration depth of the anchor.
Therefore, deep anchor penetration occurs in soft clays or silt and shallower penetration occurs in gravel, dense sand, or more consolidated seabed. The penetration depth will also be governed by the design and size of the anchor, as well as its weight and the weight of the chain connected to it. It can reasonably be assumed that the larger the vessel, the larger the anchor(s) required to hold it in place when anchoring will need to be.
The main threats perceived within the offshore export cable corridor are:
Vessel ‘ad-hoc’ anchoring outside of the shipping channels; Unintended or accidental anchor deployment by a vessel passing over the cable; and Emergency anchoring undertaken by a vessel due to an event such as a fire or loss of propulsion.
Vessel sizes have trended larger over time and anchor sizes have increased accordingly. For example, the Maersk Triple E-class container vessels, which entered into service in 2013, are 400 m in length and have a DWT of 196,000 tons. The anchors for these vessels weigh 31 tons (Figure J-19) each, which is greater than those depicted in Table J-3, leading to greater seabed penetration depths. However, no Triple E-class vessels of this size are known to operate in the offshore Project Area.
J-30
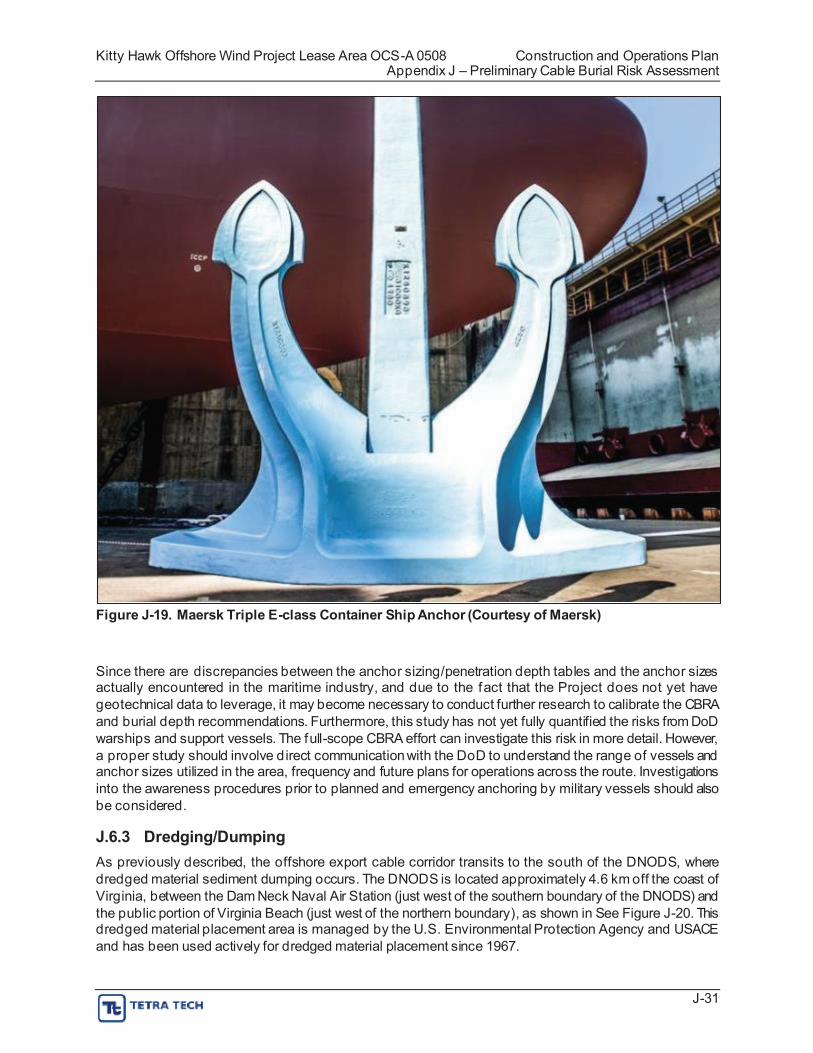
Kitty Hawk Offshore Wind Project Lease Area OCS-A 0508 Construction and Operations Plan Appendix J – Preliminary Cable Burial Risk Assessment
Figure J-19. Maersk Triple E-class Container Ship Anchor (Courtesy of Maersk)
Since there are discrepancies between the anchor sizing/penetration depth tables and the anchor sizes actually encountered in the maritime industry, and due to the fact that the Project does not yet have geotechnical data to leverage, it may become necessary to conduct further research to calibrate the CBRA and burial depth recommendations. Furthermore, this study has not yet fully quantified the risks from DoD warships and support vessels. The full-scope CBRA effort can investigate this risk in more detail. However, a proper study should involve direct communication with the DoD to understand the range of vessels and anchor sizes utilized in the area, frequency and future plans for operations across the route. Investigations into the awareness procedures prior to planned and emergency anchoring by military vessels should also be considered.
J.6.3 Dredging/Dumping As previously described, the offshore export cable corridor transits to the south of the DNODS, where dredged material sediment dumping occurs. The DNODS is located approximately 4.6 km off the coast of Virginia, between the Dam Neck Naval Air Station (just west of the southern boundary of the DNODS) and the public portion of Virginia Beach (just west of the northern boundary), as shown in See Figure J-20. This dredged material placement area is managed by the U.S. Environmental Protection Agency and USACE and has been used actively for dredged material placement since 1967.
J-31
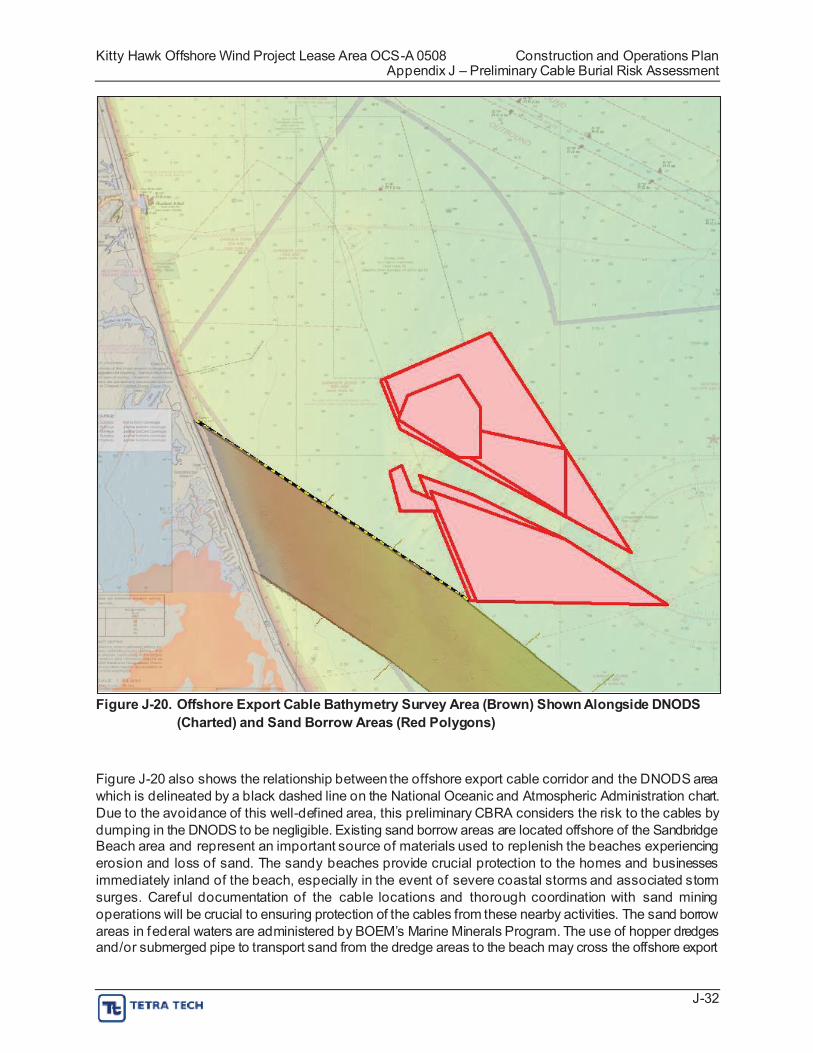
Kitty Hawk Offshore Wind Project Lease Area OCS-A 0508 Construction and Operations Plan Appendix J – Preliminary Cable Burial Risk Assessment
Figure J-20. Offshore Export Cable Bathymetry Survey Area (Brown) Shown Alongside DNODS (Charted) and Sand Borrow Areas (Red Polygons)
Figure J-20 also shows the relationship between the offshore export cable corridor and the DNODS area which is delineated by a black dashed line on the National Oceanic and Atmospheric Administration chart. Due to the avoidance of this well-defined area, this preliminary CBRA considers the risk to the cables by dumping in the DNODS to be negligible. Existing sand borrow areas are located offshore of the Sandbridge Beach area and represent an important source of materials used to replenish the beaches experiencing erosion and loss of sand. The sandy beaches provide crucial protection to the homes and businesses immediately inland of the beach, especially in the event of severe coastal storms and associated storm surges. Careful documentation of the cable locations and thorough coordination with sand mining operations will be crucial to ensuring protection of the cables from these nearby activities. The sand borrow areas in federal waters are administered by BOEM’s Marine Minerals Program. The use of hopper dredges and/or submerged pipe to transport sand from the dredge areas to the beach may cross the offshore export
J-32
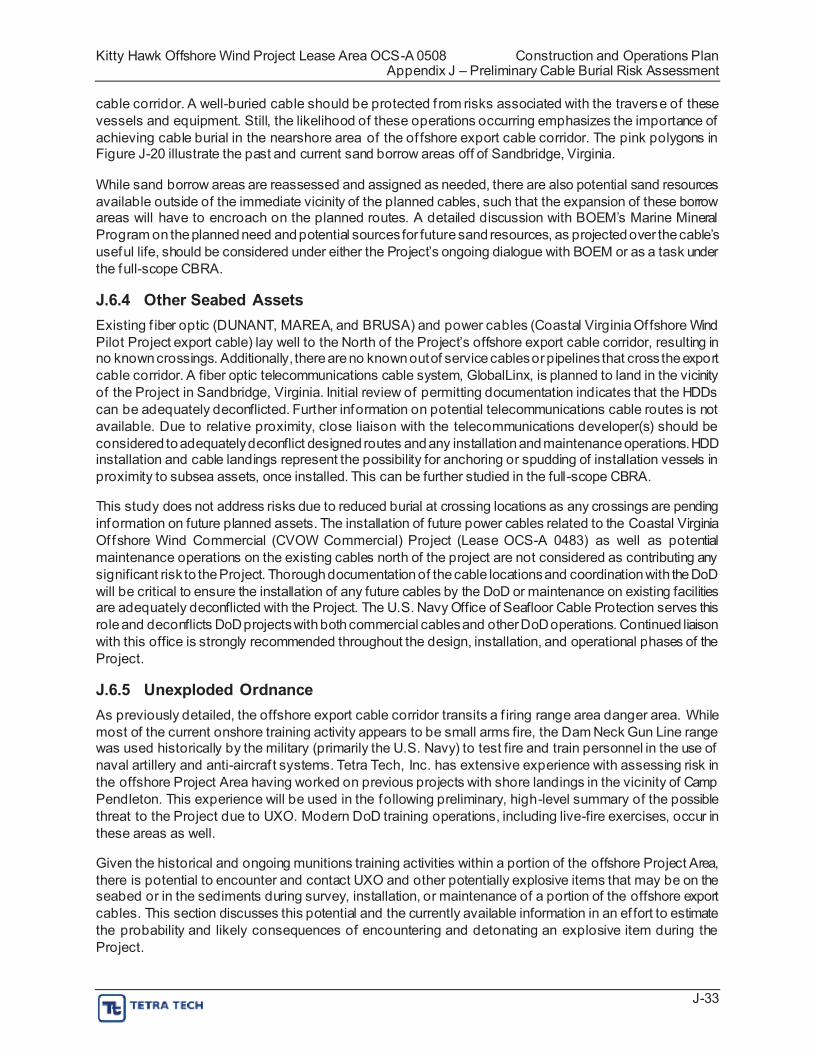
Kitty Hawk Offshore Wind Project Lease Area OCS-A 0508 Construction and Operations Plan Appendix J – Preliminary Cable Burial Risk Assessment
cable corridor. A well-buried cable should be protected f rom risks associated with the traverse of these vessels and equipment. Still, the likelihood of these operations occurring emphasizes the importance of achieving cable burial in the nearshore area of the of fshore export cable corridor. The pink polygons in Figure J-20 illustrate the past and current sand borrow areas off of Sandbridge, Virginia.
While sand borrow areas are reassessed and assigned as needed, there are also potential sand resources available outside of the immediate vicinity of the planned cables, such that the expansion of these borrow areas will have to encroach on the planned routes. A detailed discussion with BOEM’s Marine Mineral Program on the planned need and potential sources for future sand resources, as projected over the cable’s useful life, should be considered under either the Project’s ongoing dialogue with BOEM or as a task under the full-scope CBRA.
J.6.4 Other Seabed Assets Existing f iber optic (DUNANT, MAREA, and BRUSA) and power cables (Coastal Virginia Of fshore Wind Pilot Project export cable) lay well to the North of the Project’s offshore export cable corridor, resulting in no known crossings. Additionally, there are no known out of service cables or pipelines that cross the export cable corridor. A fiber optic telecommunications cable system, GlobalLinx, is planned to land in the vicinity of the Project in Sandbridge, Virginia. Initial review of permitting documentation indicates that the HDDs can be adequately deconflicted. Further information on potential telecommunications cable routes is not available. Due to relative proximity, close liaison with the telecommunications developer(s) should be considered to adequately deconflict designed routes and any installation and maintenance operations. HDD installation and cable landings represent the possibility for anchoring or spudding of installation vessels in proximity to subsea assets, once installed. This can be further studied in the full-scope CBRA.
This study does not address risks due to reduced burial at crossing locations as any crossings are pending information on future planned assets. The installation of future power cables related to the Coastal Virginia Of fshore Wind Commercial (CVOW Commercial) Project (Lease OCS-A 0483) as well as potential maintenance operations on the existing cables north of the project are not considered as contributing any significant risk to the Project. Thorough documentation of the cable locations and coordination with the DoD will be critical to ensure the installation of any future cables by the DoD or maintenance on existing facilities are adequately deconflicted with the Project. The U.S. Navy Office of Seafloor Cable Protection serves this role and deconflicts DoD projects with both commercial cables and other DoD operations. Continued liaison with this office is strongly recommended throughout the design, installation, and operational phases of the Project.
J.6.5 Unexploded Ordnance As previously detailed, the offshore export cable corridor transits a f iring range area danger area. While most of the current onshore training activity appears to be small arms fire, the Dam Neck Gun Line range was used historically by the military (primarily the U.S. Navy) to test fire and train personnel in the use of naval artillery and anti-aircraf t systems. Tetra Tech, Inc. has extensive experience with assessing risk in the offshore Project Area having worked on previous projects with shore landings in the vicinity of Camp Pendleton. This experience will be used in the following preliminary, high-level summary of the possible threat to the Project due to UXO. Modern DoD training operations, including live-fire exercises, occur in these areas as well.
Given the historical and ongoing munitions training activities within a portion of the offshore Project Area, there is potential to encounter and contact UXO and other potentially explosive items that may be on the seabed or in the sediments during survey, installation, or maintenance of a portion of the offshore export cables. This section discusses this potential and the currently available information in an ef fort to estimate the probability and likely consequences of encountering and detonating an explosive item during the Project.
J-33
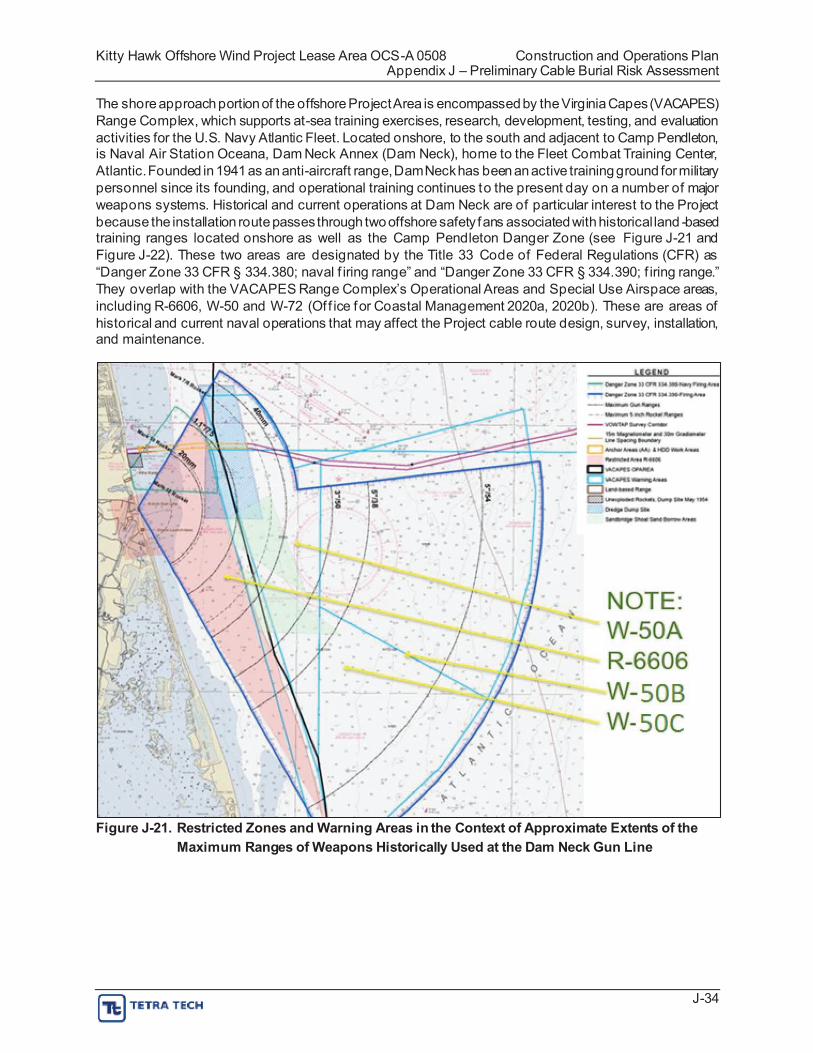
Kitty Hawk Offshore Wind Project Lease Area OCS-A 0508 Construction and Operations Plan Appendix J – Preliminary Cable Burial Risk Assessment
The shore approach portion of the offshore Project Area is encompassed by the Virginia Capes (VACAPES) Range Complex, which supports at-sea training exercises, research, development, testing, and evaluation activities for the U.S. Navy Atlantic Fleet. Located onshore, to the south and adjacent to Camp Pendleton, is Naval Air Station Oceana, Dam Neck Annex (Dam Neck), home to the Fleet Combat Training Center, Atlantic. Founded in 1941 as an anti-aircraft range, Dam Neck has been an active training ground for military personnel since its founding, and operational training continues to the present day on a number of major weapons systems. Historical and current operations at Dam Neck are of particular interest to the Project because the installation route passes through two offshore safety fans associated with historical land -based training ranges located onshore as well as the Camp Pendleton Danger Zone (see Figure J-21 and Figure J-22). These two areas are designated by the Title 33 Code of Federal Regulations (CFR) as “Danger Zone 33 CFR § 334.380; naval f iring range” and “Danger Zone 33 CFR § 334.390; f iring range.” They overlap with the VACAPES Range Complex’s Operational Areas and Special Use Airspace areas, including R-6606, W-50 and W-72 (Of f ice for Coastal Management 2020a, 2020b). These are areas of historical and current naval operations that may affect the Project cable route design, survey, installation, and maintenance.
Figure J-21. Restricted Zones and Warning Areas in the Context of Approximate Extents of the Maximum Ranges of Weapons Historically Used at the Dam Neck Gun Line
J-34
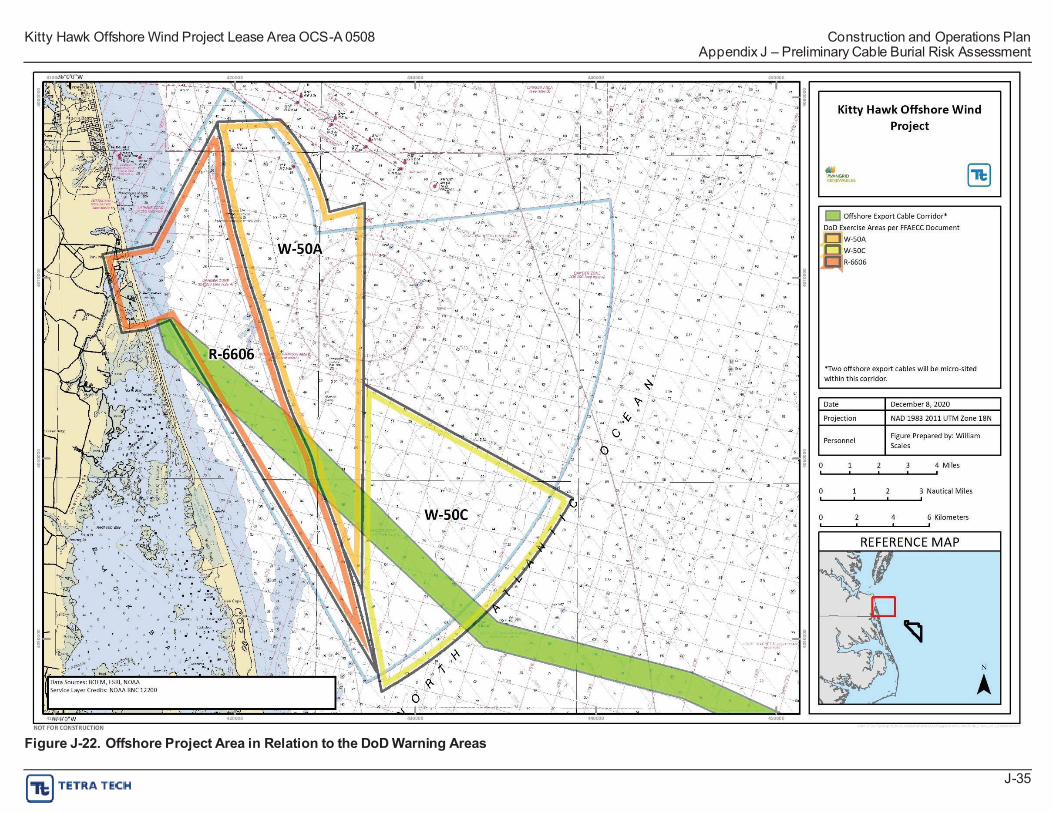
Kitty Hawk Offshore Wind Project Lease Area OCS-A 0508 Construction and Operations Plan Appendix J – Preliminary Cable Burial Risk Assessment
Figure J-22. Offshore Project Area in Relation to the DoD Warning Areas
J-35
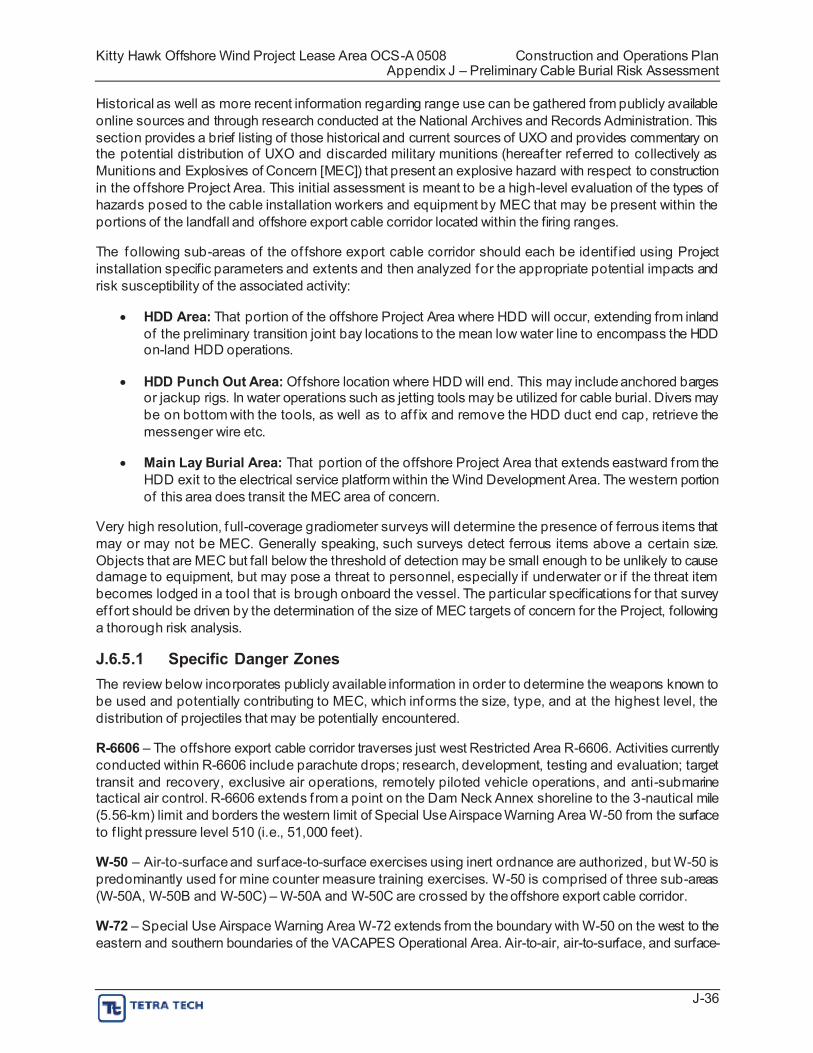
Kitty Hawk Offshore Wind Project Lease Area OCS-A 0508 Construction and Operations Plan Appendix J – Preliminary Cable Burial Risk Assessment
Historical as well as more recent information regarding range use can be gathered from publicly available online sources and through research conducted at the National Archives and Records Administration. This section provides a brief listing of those historical and current sources of UXO and provides commentary on the potential distribution of UXO and discarded military munitions (hereaf ter referred to collectively as Munitions and Explosives of Concern [MEC]) that present an explosive hazard with respect to construction in the of fshore Project Area. This initial assessment is meant to be a high-level evaluation of the types of hazards posed to the cable installation workers and equipment by MEC that may be present within the portions of the landfall and offshore export cable corridor located within the firing ranges.
The following sub-areas of the of fshore export cable corridor should each be identif ied using Project installation specific parameters and extents and then analyzed for the appropriate potential impacts and risk susceptibility of the associated activity:
HDD Area: That portion of the offshore Project Area where HDD will occur, extending from inland of the preliminary transition joint bay locations to the mean low water line to encompass the HDD on-land HDD operations.
HDD Punch Out Area: Of fshore location where HDD will end. This may include anchored barges or jackup rigs. In water operations such as jetting tools may be utilized for cable burial. Divers may be on bottom with the tools, as well as to af f ix and remove the HDD duct end cap, retrieve the messenger wire etc.
Main Lay Burial Area: That portion of the offshore Project Area that extends eastward f rom the HDD exit to the electrical service platform within the Wind Development Area. The western portion of this area does transit the MEC area of concern.
Very high resolution, full-coverage gradiometer surveys will determine the presence of ferrous items that may or may not be MEC. Generally speaking, such surveys detect ferrous items above a certain size. Objects that are MEC but fall below the threshold of detection may be small enough to be unlikely to cause damage to equipment, but may pose a threat to personnel, especially if underwater or if the threat item becomes lodged in a tool that is brough onboard the vessel. The particular specifications for that survey ef fort should be driven by the determination of the size of MEC targets of concern for the Project, following a thorough risk analysis.
J.6.5.1 Specific Danger Zones The review below incorporates publicly available information in order to determine the weapons known to be used and potentially contributing to MEC, which informs the size, type, and at the highest level, the distribution of projectiles that may be potentially encountered.
R-6606 – The offshore export cable corridor traverses just west Restricted Area R-6606. Activities currently conducted within R-6606 include parachute drops; research, development, testing and evaluation; target transit and recovery, exclusive air operations, remotely piloted vehicle operations, and anti-submarine tactical air control. R-6606 extends f rom a point on the Dam Neck Annex shoreline to the 3-nautical mile (5.56-km) limit and borders the western limit of Special Use Airspace Warning Area W-50 from the surface to f light pressure level 510 (i.e., 51,000 feet).
W-50 – Air-to-surface and surface-to-surface exercises using inert ordnance are authorized, but W-50 is predominantly used for mine counter measure training exercises. W-50 is comprised of three sub-areas (W-50A, W-50B and W-50C) – W-50A and W-50C are crossed by the offshore export cable corridor.
W-72 – Special Use Airspace Warning Area W-72 extends from the boundary with W-50 on the west to the eastern and southern boundaries of the VACAPES Operational Area. Air-to-air, air-to-surface, and surface-
J-36
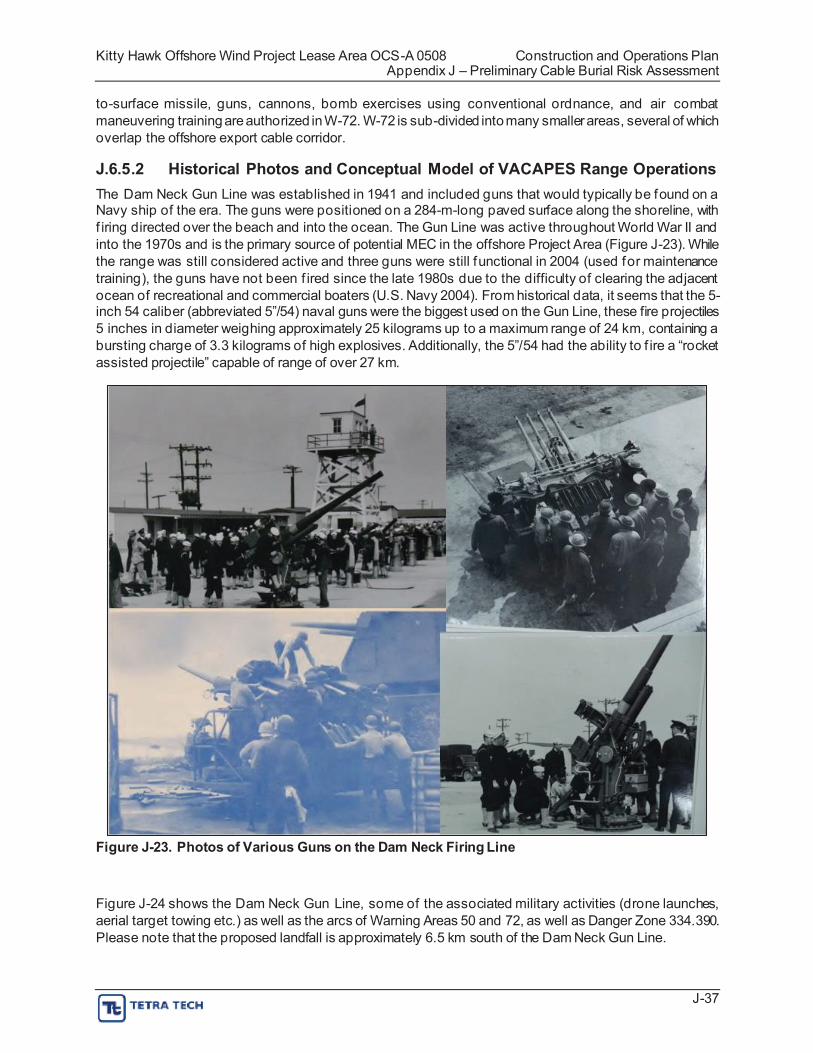
Kitty Hawk Offshore Wind Project Lease Area OCS-A 0508 Construction and Operations Plan Appendix J – Preliminary Cable Burial Risk Assessment
to-surface missile, guns, cannons, bomb exercises using conventional ordnance, and air combat maneuvering training are authorized in W-72. W-72 is sub-divided into many smaller areas, several of which overlap the offshore export cable corridor.
J.6.5.2 Historical Photos and Conceptual Model of VACAPES Range Operations The Dam Neck Gun Line was established in 1941 and included guns that would typically be found on a Navy ship of the era. The guns were positioned on a 284-m-long paved surface along the shoreline, with f iring directed over the beach and into the ocean. The Gun Line was active throughout World War II and into the 1970s and is the primary source of potential MEC in the offshore Project Area (Figure J-23). While the range was still considered active and three guns were still functional in 2004 (used for maintenance training), the guns have not been f ired since the late 1980s due to the difficulty of clearing the adjacent ocean of recreational and commercial boaters (U.S. Navy 2004). From historical data, it seems that the 5-inch 54 caliber (abbreviated 5”/54) naval guns were the biggest used on the Gun Line, these fire projectiles 5 inches in diameter weighing approximately 25 kilograms up to a maximum range of 24 km, containing a bursting charge of 3.3 kilograms of high explosives. Additionally, the 5”/54 had the ability to f ire a “rocket assisted projectile” capable of range of over 27 km.
Figure J-23. Photos of Various Guns on the Dam Neck Firing Line
Figure J-24 shows the Dam Neck Gun Line, some of the associated military activities (drone launches, aerial target towing etc.) as well as the arcs of Warning Areas 50 and 72, as well as Danger Zone 334.390. Please note that the proposed landfall is approximately 6.5 km south of the Dam Neck Gun Line.
J-37
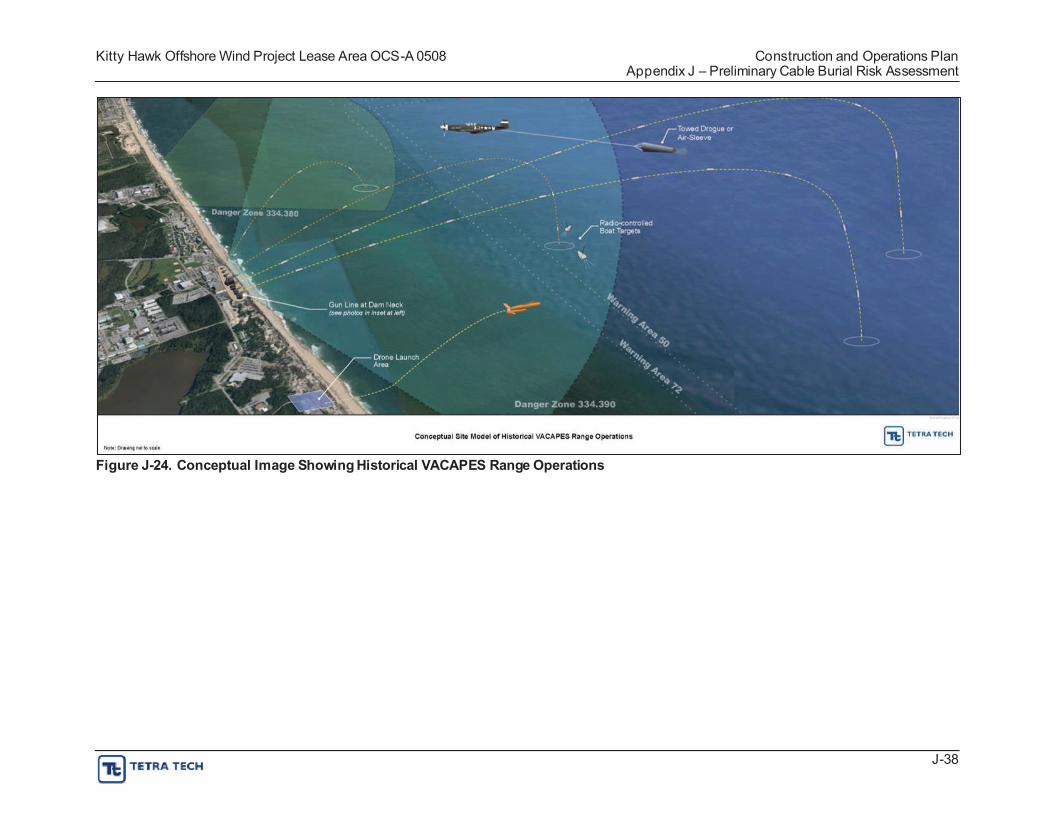
Kitty Hawk Offshore Wind Project Lease Area OCS-A 0508 Construction and Operations Plan Appendix J – Preliminary Cable Burial Risk Assessment
Figure J-24. Conceptual Image Showing Historical VACAPES Range Operations
J-38
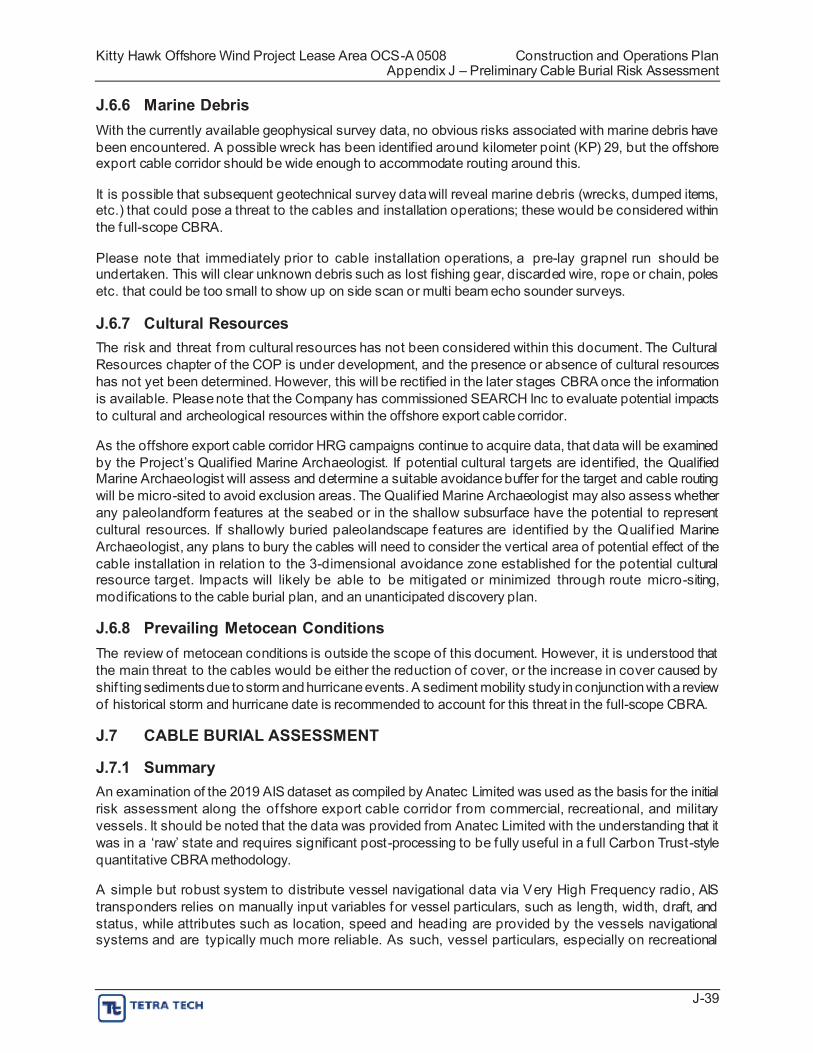
Kitty Hawk Offshore Wind Project Lease Area OCS-A 0508 Construction and Operations Plan Appendix J – Preliminary Cable Burial Risk Assessment
J.6.6 Marine Debris With the currently available geophysical survey data, no obvious risks associated with marine debris have been encountered. A possible wreck has been identified around kilometer point (KP) 29, but the offshore export cable corridor should be wide enough to accommodate routing around this.
It is possible that subsequent geotechnical survey data will reveal marine debris (wrecks, dumped items, etc.) that could pose a threat to the cables and installation operations; these would be considered within the full-scope CBRA.
Please note that immediately prior to cable installation operations, a pre-lay grapnel run should be undertaken. This will clear unknown debris such as lost fishing gear, discarded wire, rope or chain, poles etc. that could be too small to show up on side scan or multi beam echo sounder surveys.
J.6.7 Cultural Resources The risk and threat f rom cultural resources has not been considered within this document. The Cultural Resources chapter of the COP is under development, and the presence or absence of cultural resources has not yet been determined. However, this will be rectified in the later stages CBRA once the information is available. Please note that the Company has commissioned SEARCH Inc to evaluate potential impacts to cultural and archeological resources within the offshore export cable corridor.
As the offshore export cable corridor HRG campaigns continue to acquire data, that data will be examined by the Project’s Qualified Marine Archaeologist. If potential cultural targets are identified, the Qualified Marine Archaeologist will assess and determine a suitable avoidance buffer for the target and cable routing will be micro-sited to avoid exclusion areas. The Qualif ied Marine Archaeologist may also assess whether any paleolandform features at the seabed or in the shallow subsurface have the potential to represent cultural resources. If shallowly buried paleolandscape features are identified by the Qualif ied Marine Archaeologist, any plans to bury the cables will need to consider the vertical area of potential effect of the cable installation in relation to the 3-dimensional avoidance zone established for the potential cultural resource target. Impacts will likely be able to be mitigated or minimized through route micro-siting, modifications to the cable burial plan, and an unanticipated discovery plan.
J.6.8 Prevailing Metocean Conditions The review of metocean conditions is outside the scope of this document. However, it is understood that the main threat to the cables would be either the reduction of cover, or the increase in cover caused by shif ting sediments due to storm and hurricane events. A sediment mobility study in conjunction with a review of historical storm and hurricane date is recommended to account for this threat in the full-scope CBRA.
J.7 CABLE BURIAL ASSESSMENT
J.7.1 Summary An examination of the 2019 AIS dataset as compiled by Anatec Limited was used as the basis for the initial risk assessment along the of fshore export cable corridor f rom commercial, recreational, and military vessels. It should be noted that the data was provided from Anatec Limited with the understanding that it was in a ‘raw’ state and requires significant post-processing to be fully useful in a full Carbon Trust-style quantitative CBRA methodology.
A simple but robust system to distribute vessel navigational data via Very High Frequency radio, AIS transponders relies on manually input variables for vessel particulars, such as length, width, draft, and status, while attributes such as location, speed and heading are provided by the vessels navigational systems and are typically much more reliable. As such, vessel particulars, especially on recreational
J-39
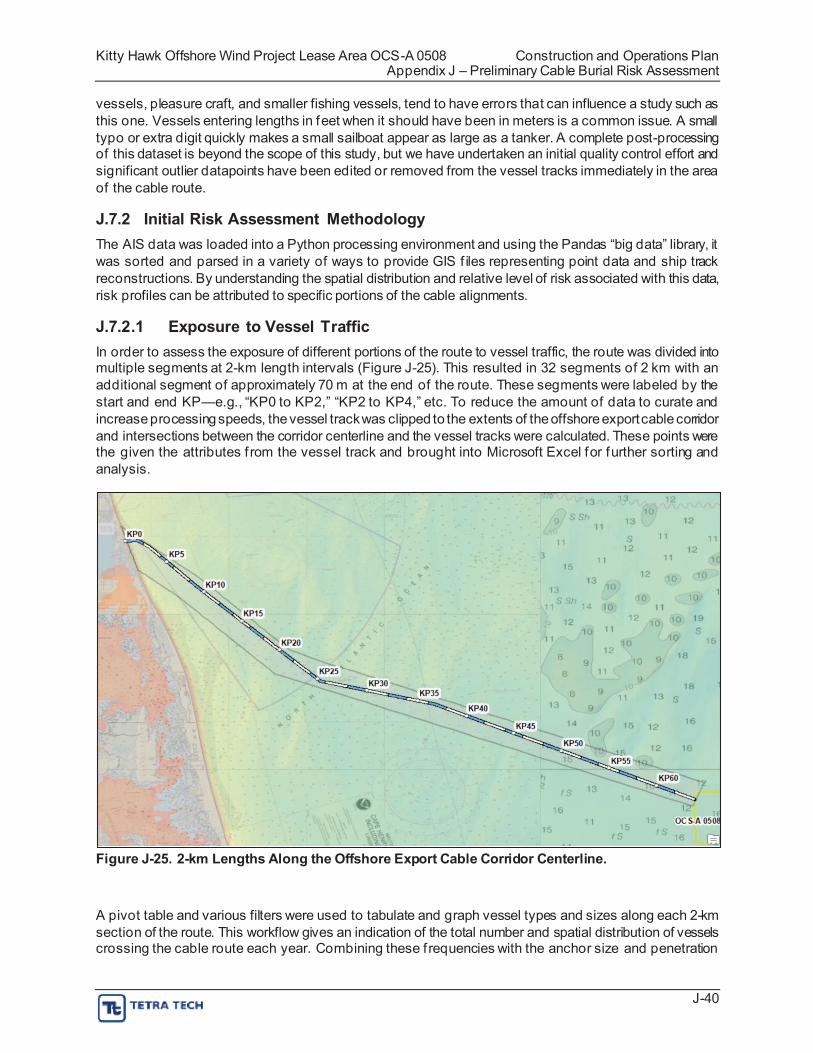
Kitty Hawk Offshore Wind Project Lease Area OCS-A 0508 Construction and Operations Plan Appendix J – Preliminary Cable Burial Risk Assessment
vessels, pleasure craft, and smaller fishing vessels, tend to have errors that can influence a study such as this one. Vessels entering lengths in feet when it should have been in meters is a common issue. A small typo or extra digit quickly makes a small sailboat appear as large as a tanker. A complete post-processing of this dataset is beyond the scope of this study, but we have undertaken an initial quality control effort and significant outlier datapoints have been edited or removed from the vessel tracks immediately in the area of the cable route.
J.7.2 Initial Risk Assessment Methodology The AIS data was loaded into a Python processing environment and using the Pandas “big data” library, it was sorted and parsed in a variety of ways to provide GIS f iles representing point data and ship track reconstructions. By understanding the spatial distribution and relative level of risk associated with this data, risk profiles can be attributed to specific portions of the cable alignments.
J.7.2.1 Exposure to Vessel Traffic In order to assess the exposure of different portions of the route to vessel traffic, the route was divided into multiple segments at 2-km length intervals (Figure J-25). This resulted in 32 segments of 2 km with an additional segment of approximately 70 m at the end of the route. These segments were labeled by the start and end KP—e.g., “KP0 to KP2,” “KP2 to KP4,” etc. To reduce the amount of data to curate and increase processing speeds, the vessel track was clipped to the extents of the offshore export cable corridor and intersections between the corridor centerline and the vessel tracks were calculated. These points were the given the attributes f rom the vessel track and brought into Microsoft Excel for further sorting and analysis.
Figure J-25. 2-km Lengths Along the Offshore Export Cable Corridor Centerline.
A pivot table and various filters were used to tabulate and graph vessel types and sizes along each 2-km section of the route. This workflow gives an indication of the total number and spatial distribution of vessels crossing the cable route each year. Combining these f requencies with the anchor size and penetration
J-40
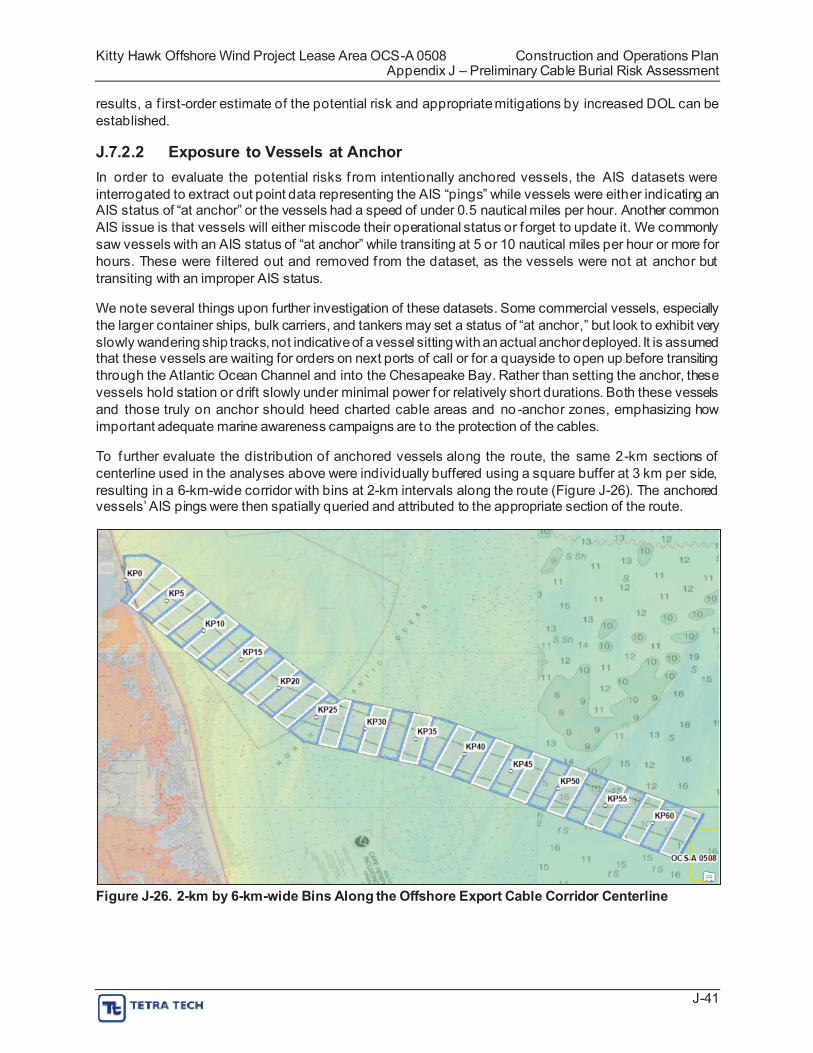
Kitty Hawk Offshore Wind Project Lease Area OCS-A 0508 Construction and Operations Plan Appendix J – Preliminary Cable Burial Risk Assessment
results, a f irst-order estimate of the potential risk and appropriate mitigations by increased DOL can be established.
J.7.2.2 Exposure to Vessels at Anchor In order to evaluate the potential risks f rom intentionally anchored vessels, the AIS datasets were interrogated to extract out point data representing the AIS “pings” while vessels were either indicating an AIS status of “at anchor” or the vessels had a speed of under 0.5 nautical miles per hour. Another common AIS issue is that vessels will either miscode their operational status or forget to update it. We commonly saw vessels with an AIS status of “at anchor” while transiting at 5 or 10 nautical miles per hour or more for hours. These were f iltered out and removed f rom the dataset, as the vessels were not at anchor but transiting with an improper AIS status.
We note several things upon further investigation of these datasets. Some commercial vessels, especially the larger container ships, bulk carriers, and tankers may set a status of “at anchor,” but look to exhibit very slowly wandering ship tracks, not indicative of a vessel sitting with an actual anchor deployed. It is assumed that these vessels are waiting for orders on next ports of call or for a quayside to open up before transiting through the Atlantic Ocean Channel and into the Chesapeake Bay. Rather than setting the anchor, these vessels hold station or drift slowly under minimal power for relatively short durations. Both these vessels and those truly on anchor should heed charted cable areas and no -anchor zones, emphasizing how important adequate marine awareness campaigns are to the protection of the cables.
To further evaluate the distribution of anchored vessels along the route, the same 2-km sections of centerline used in the analyses above were individually buffered using a square buffer at 3 km per side, resulting in a 6-km-wide corridor with bins at 2-km intervals along the route (Figure J-26). The anchored vessels’ AIS pings were then spatially queried and attributed to the appropriate section of the route.
Figure J-26. 2-km by 6-km-wide Bins Along the Offshore Export Cable Corridor Centerline
J-41
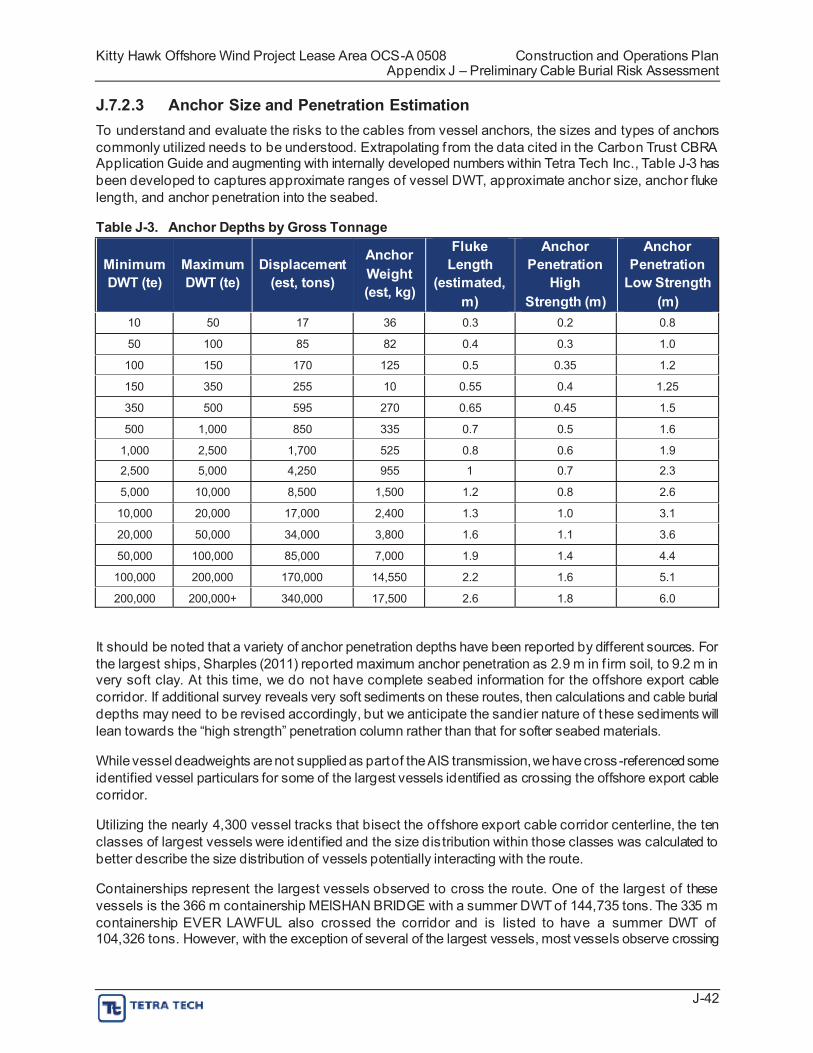
Kitty Hawk Offshore Wind Project Lease Area OCS-A 0508 Construction and Operations Plan Appendix J – Preliminary Cable Burial Risk Assessment
J.7.2.3 Anchor Size and Penetration Estimation To understand and evaluate the risks to the cables from vessel anchors, the sizes and types of anchors commonly utilized needs to be understood. Extrapolating f rom the data cited in the Carbon Trust CBRA Application Guide and augmenting with internally developed numbers within Tetra Tech Inc., Table J-3 has been developed to captures approximate ranges of vessel DWT, approximate anchor size, anchor fluke length, and anchor penetration into the seabed.
Table J-3. Anchor Depths by Gross Tonnage
Minimum DWT (te)
Maximum DWT (te)
Displacement (est, tons)
Anchor Weight (est, kg)
Fluke Length
(estimated, m)
Anchor Penetration
High Strength (m)
Anchor Penetration
Low Strength (m)
10
50
100
150
350
500
1,000
2,500
5,000
10,000
20,000
50,000
100,000
50
100
150
350
500
1,000
2,500
5,000
10,000
20,000
50,000
100,000
200,000
17
85
170
255
595
850
1,700
4,250
8,500
17,000
34,000
85,000
170,000
36
82
125
10
270
335
525
955
1,500
2,400
3,800
7,000
14,550
0.3
0.4
0.5
0.55
0.65
0.7
0.8
1
1.2
1.3
1.6
1.9
2.2
0.2
0.3
0.35
0.4
0.45
0.5
0.6
0.7
0.8
1.0
1.1
1.4
1.6
0.8
1.0
1.2
1.25
1.5
1.6
1.9
2.3
2.6
3.1
3.6
4.4
5.1
200,000 200,000+ 340,000 17,500 2.6 1.8 6.0
It should be noted that a variety of anchor penetration depths have been reported by different sources. For the largest ships, Sharples (2011) reported maximum anchor penetration as 2.9 m in f irm soil, to 9.2 m in very soft clay. At this time, we do not have complete seabed information for the offshore export cable corridor. If additional survey reveals very soft sediments on these routes, then calculations and cable burial depths may need to be revised accordingly, but we anticipate the sandier nature of these sediments will lean towards the “high strength” penetration column rather than that for softer seabed materials.
While vessel deadweights are not supplied as part of the AIS transmission, we have cross -referenced some identified vessel particulars for some of the largest vessels identified as crossing the offshore export cable corridor.
Utilizing the nearly 4,300 vessel tracks that bisect the of fshore export cable corridor centerline, the ten classes of largest vessels were identified and the size distribution within those classes was calculated to better describe the size distribution of vessels potentially interacting with the route.
Containerships represent the largest vessels observed to cross the route. One of the largest of these vessels is the 366 m containership MEISHAN BRIDGE with a summer DWT of 144,735 tons. The 335 m containership EVER LAWFUL also crossed the corridor and is listed to have a summer DWT of 104,326 tons. However, with the exception of several of the largest vessels, most vessels observe crossing
J-42
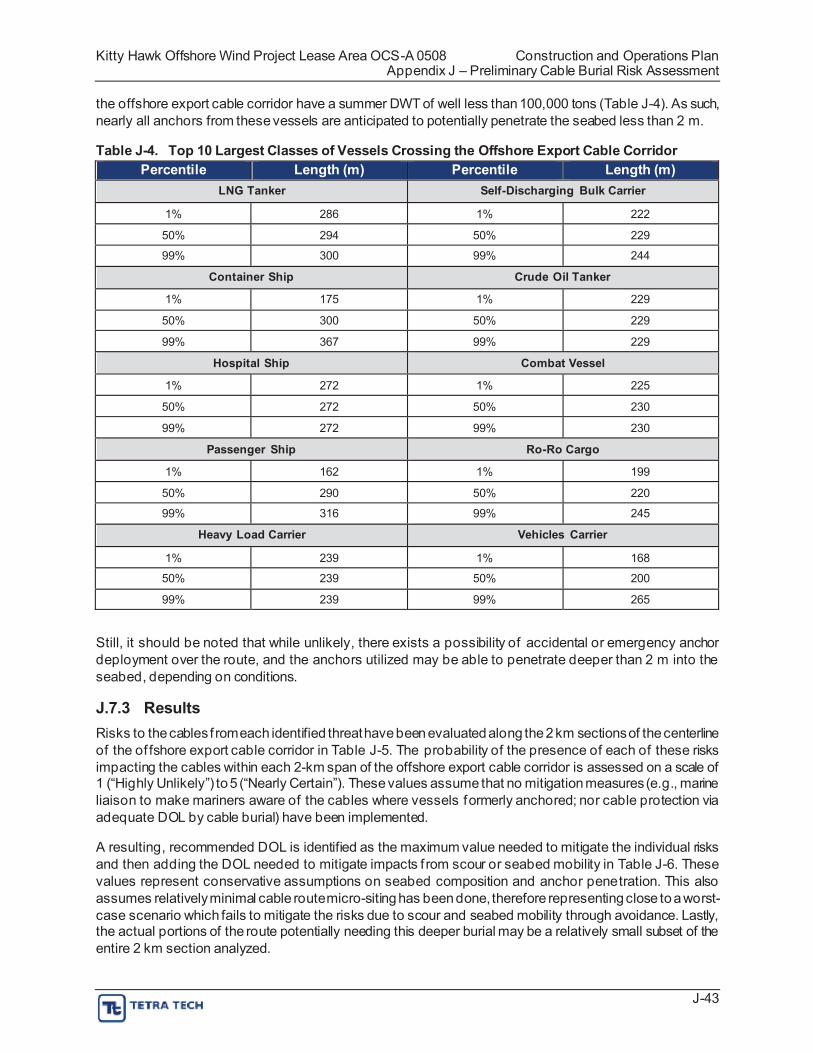
Kitty Hawk Offshore Wind Project Lease Area OCS-A 0508 Construction and Operations Plan Appendix J – Preliminary Cable Burial Risk Assessment
the offshore export cable corridor have a summer DWT of well less than 100,000 tons (Table J-4). As such, nearly all anchors from these vessels are anticipated to potentially penetrate the seabed less than 2 m.
Table J-4. Top 10 Largest Classes of Vessels Crossing the Offshore Export Cable Corridor Percentile Length (m) Percentile Length (m)
LNG Tanker Self-Discharging Bulk Carrier
1% 286 1% 222
50% 294 50% 229
99% 300 99% 244
Container Ship Crude Oil Tanker
1% 175 1% 229
50% 300 50% 229
99% 367 99% 229
Hospital Ship Combat Vessel
1% 272 1% 225
50% 272 50% 230
99% 272 99% 230
Passenger Ship Ro-Ro Cargo
1% 162 1% 199
50% 290 50% 220
99% 316 99% 245
Heavy Load Carrier Vehicles Carrier
1% 239 1% 168
50% 239 50% 200
99% 239 99% 265
Still, it should be noted that while unlikely, there exists a possibility of accidental or emergency anchor deployment over the route, and the anchors utilized may be able to penetrate deeper than 2 m into the seabed, depending on conditions.
J.7.3 Results Risks to the cables f rom each identified threat have been evaluated along the 2 km sections of the centerline of the of fshore export cable corridor in Table J-5. The probability of the presence of each of these risks impacting the cables within each 2-km span of the offshore export cable corridor is assessed on a scale of 1 (“Highly Unlikely”) to 5 (“Nearly Certain”). These values assume that no mitigation measures (e.g., marine liaison to make mariners aware of the cables where vessels formerly anchored; nor cable protection via adequate DOL by cable burial) have been implemented.
A resulting, recommended DOL is identified as the maximum value needed to mitigate the individual risks and then adding the DOL needed to mitigate impacts f rom scour or seabed mobility in Table J-6. These values represent conservative assumptions on seabed composition and anchor penetration. This also assumes relatively minimal cable route micro-siting has been done, therefore representing close to a worst-case scenario which fails to mitigate the risks due to scour and seabed mobility through avoidance. Lastly, the actual portions of the route potentially needing this deeper burial may be a relatively small subset of the entire 2 km section analyzed.
J-43
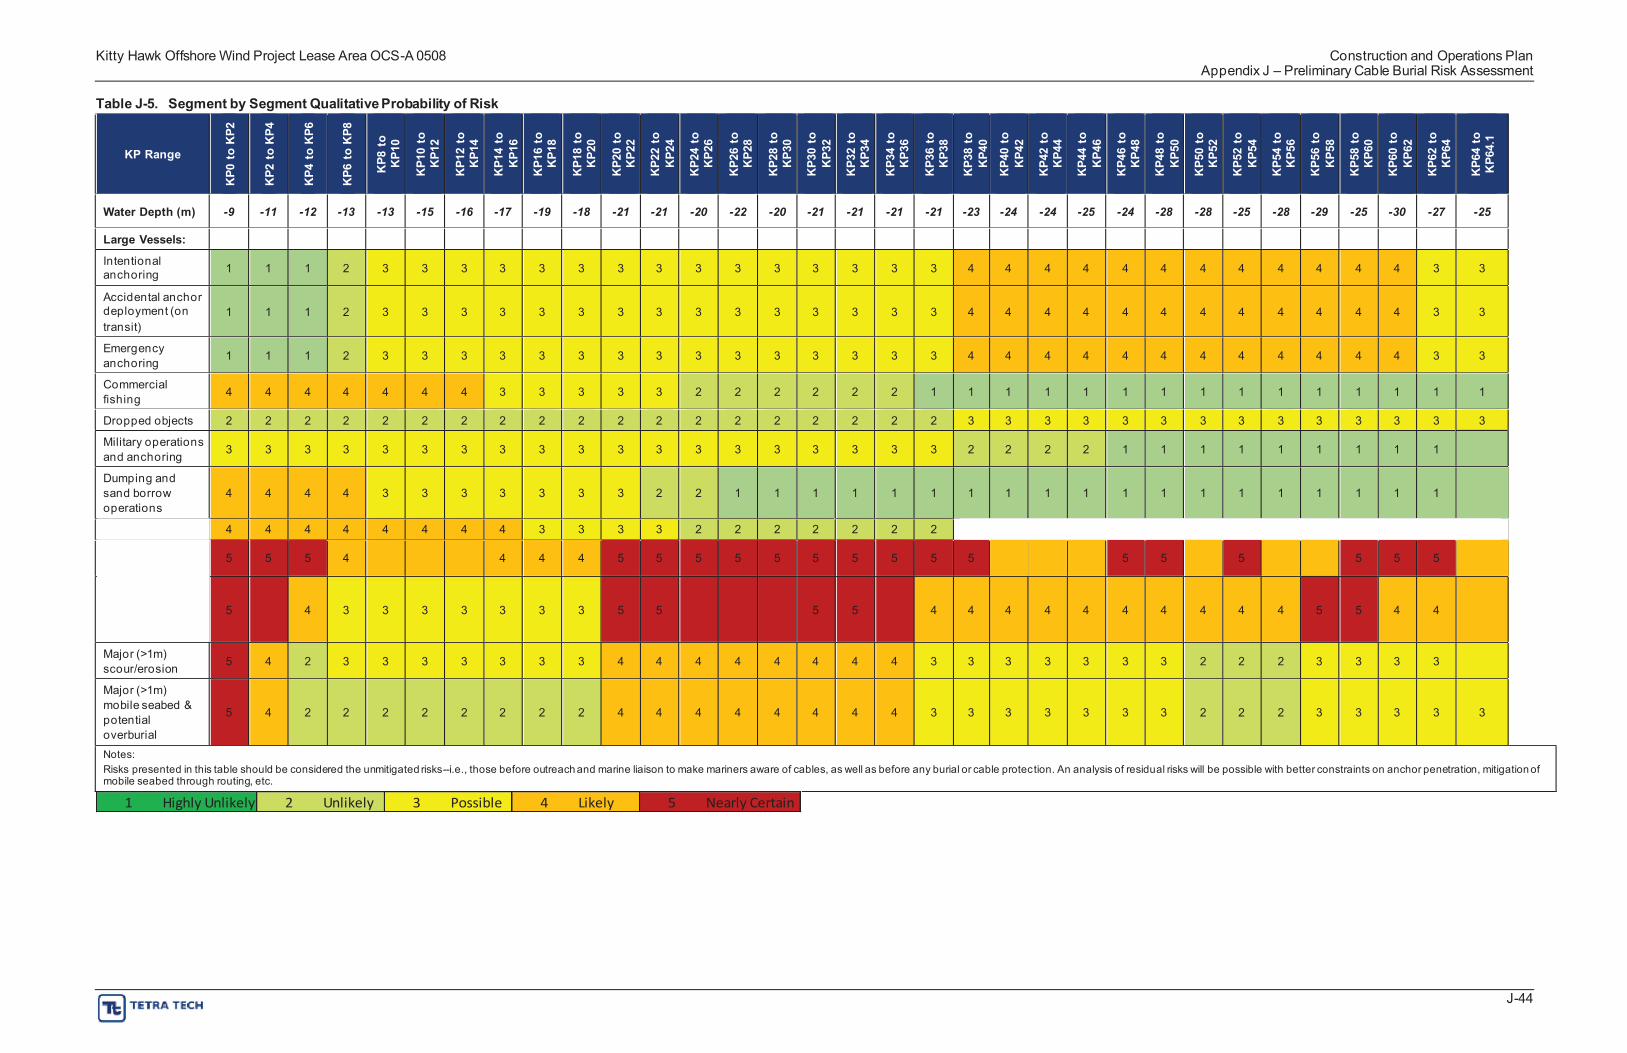
Kitty Hawk Offshore Wind Project Lease Area OCS-A 0508 Construction and Operations Plan Appendix J – Preliminary Cable Burial Risk Assessment
Table J-5. Segment by Segment Qualitative Probability of Risk
KP Range
KP0
to
KP2
KP2
to
KP4
KP4
to
KP6
KP6
to
KP8
KP8
to
KP
KP1
0 to
KP1
2
KP1
2 to
KP1
4
KP1
4 to
KP1
6
KP1
6 to
KP1
8
KP1
8 to
KP
KP2
0 to
KP2
2
KP2
2 to
KP2
4
KP2
4 to
KP2
6
KP2
6 to
KP2
8
KP2
8 to
KP
KP3
0 to
KP3
2
KP3
2 to
KP3
4
KP3
4 to
KP3
6
KP3
6 to
KP3
8
KP3
8 to
KP
KP4
0 to
KP4
2
KP4
2 to
KP4
4
KP4
4 to
KP4
6
KP4
6 to
KP4
8
KP4
8 to
KP
KP5
0 to
KP5
2
KP5
2 to
KP5
4
KP5
4 to
KP5
6
KP5
6 to
KP5
8
KP5
8 to
KP
KP6
0 to
KP6
2
KP6
2 to
KP6
4
KP6
4 to
KP6
4.1
Water Depth (m) -9 -11 -12 -13 -13 -15 -16 -17 -19 -18 -21 -21 -20 -22 -20 -21 -21 -21 -21 -23 -24 -24 -25 -24 -28 -28 -25 -28 -29 -25 -30 -27 -25
Large Vessels:
Intentional anchoring 1 1 1 2 3 3 3 3 3 3 3 3 3 3 3 3 3 3 3 4 4 4 4 4 4 4 4 4 4 4 4 3 3
Accidental anchor deployment (on transit)
1 1 1 2 3 3 3 3 3 3 3 3 3 3 3 3 3 3 3 4 4 4 4 4 4 4 4 4 4 4 4 3 3
Emergency anchoring 1 1 1 2 3 3 3 3 3 3 3 3 3 3 3 3 3 3 3 4 4 4 4 4 4 4 4 4 4 4 4 3 3
Commercial fishing 4 4 4 4 4 4 4 3 3 3 3 3 2 2 2 2 2 2 1 1 1 1 1 1 1 1 1 1 1 1 1 1 1
Dropped objects 2 2 2 2 2 2 2 2 2 2 2 2 2 2 2 2 2 2 2 3 3 3 3 3 3 3 3 3 3 3 3 3 3
Military operations and anchoring 3 3 3 3 3 3 3 3 3 3 3 3 3 3 3 3 3 3 3 2 2 2 2 1 1 1 1 1 1 1 1 1 1
Dumping and sand borrow operations
4 4 4 4 3 3 3 3 3 3 3 2 2 1 1 1 1 1 1 1 1 1 1 1 1 1 1 1 1 1 1 1 1
UXO risks 4 4 4 4 4 4 4 4 3 3 3 3 2 2 2 2 2 2 2 Unknown
Minor (<1 m) scour/erosion 5 5 5 4 4 4 4 4 4 4 5 5 5 5 5 5 5 5 5 5 4 4 4 5 5 4 5 4 4 5 5 5 4
Minor (<1 m) mobile seabed & potential overburial
5 5 4 3 3 3 3 3 3 3 5 5 5 5 5 5 5 5 4 4 4 4 4 4 4 4 4 4 5 5 4 4 4
Major (>1m) scour/erosion 5 4 2 3 3 3 3 3 3 3 4 4 4 4 4 4 4 4 3 3 3 3 3 3 3 2 2 2 3 3 3 3 3
10 20 30 40 50 60
Major (>1m) mobile seabed & 5 4 2 2 2 2 2 2 2 2 4 4 4 4 4 4 4 4 3 3 3 3 3 3 3 2 2 2 3 3 3 3 potential overburial Notes: Risks presented in this table should be considered the unmitigated risks--i.e., those before outreach and marine liaison to make mariners aware of cables, as well as before any burial or cable protection. An analysis of residual risks will be possibmobile seabed through routing, etc.
le with better constraints on anchor penetration, mitigation of
1 Highly Unlikely 2 Unlikely 3 Possible 4 Likely 5 Nearly Certain
3
J-44
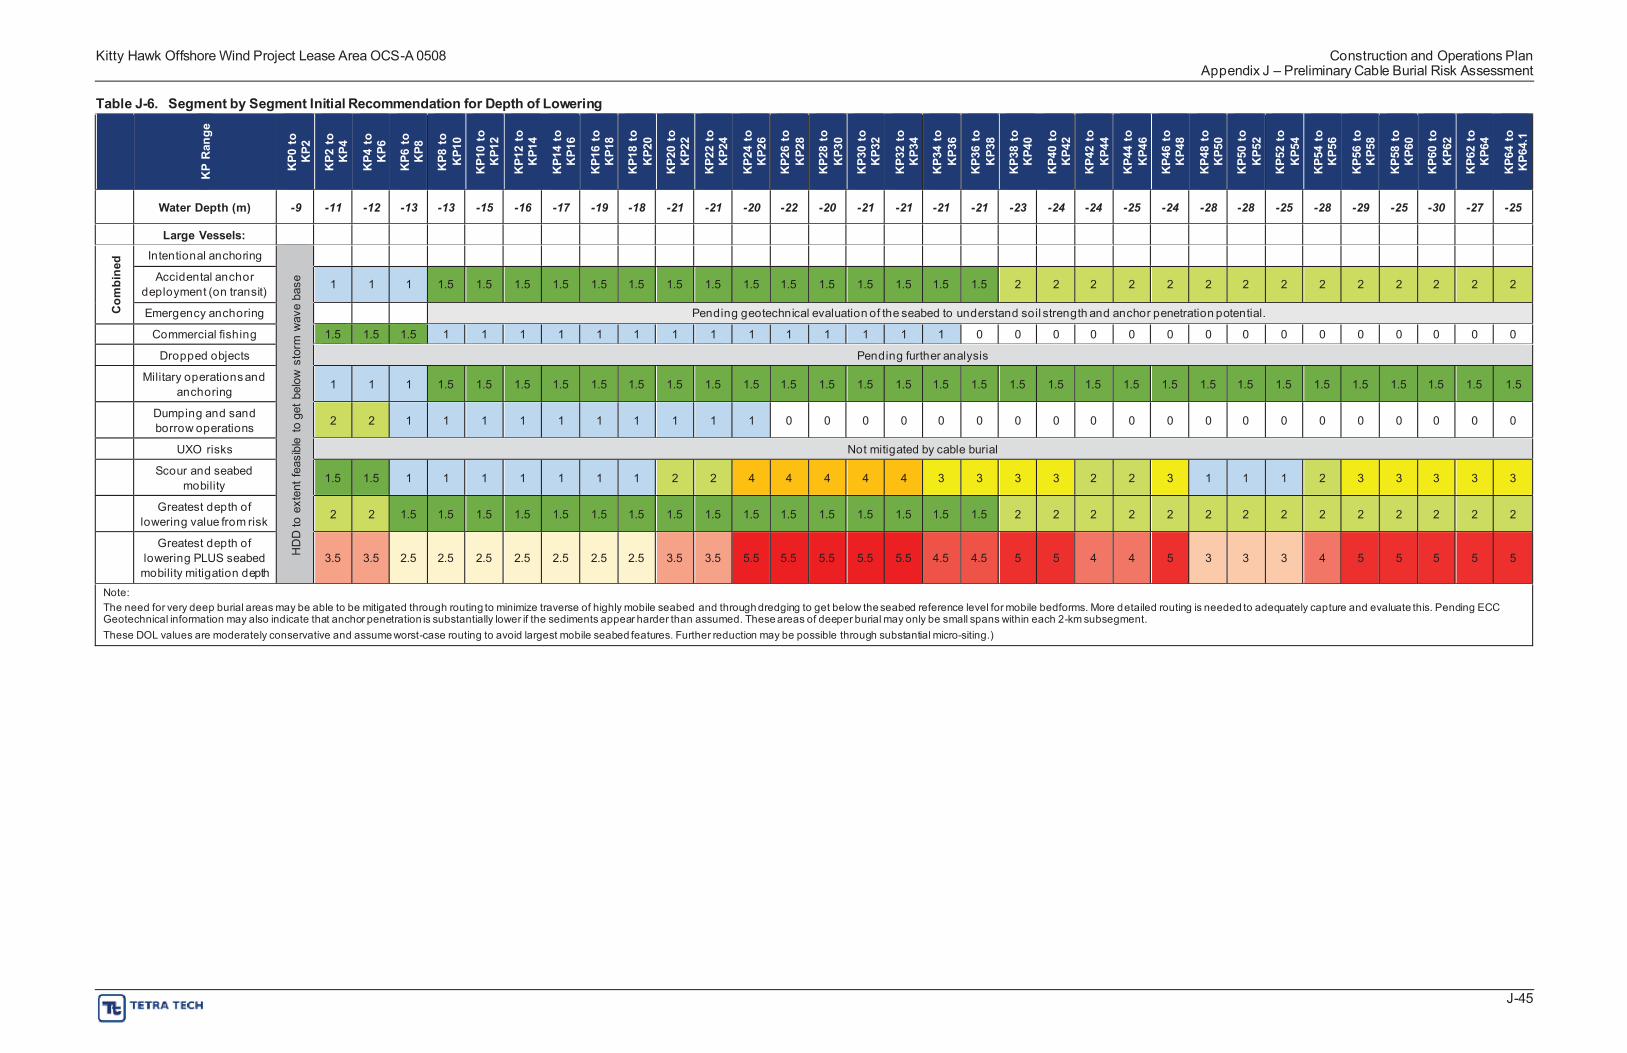
Kitty Hawk Offshore Wind Project Lease Area OCS-A 0508 Construction and Operations Plan Appendix J – Preliminary Cable Burial Risk Assessment
KP2
to
KP4
KP4
to
KP6
KP6
to
KP8
KP8
to
KP1
0
KP1
0 to
KP1
2
KP1
2 to
KP1
4
KP1
4 to
KP1
6
KP1
6 to
KP1
8
KP1
8 to
KP2
0
KP2
0 to
KP2
2
KP2
2 to
KP2
4
KP2
4 to
KP2
6
KP2
6 to
KP2
8
KP2
8 to
KP3
0
KP3
0 to
KP3
2
KP3
2 to
KP3
4
KP3
4 to
KP3
6
KP3
6 to
KP3
8
KP3
8 to
KP4
0
KP4
0 to
KP4
2
KP4
2 to
KP4
4
KP4
4 to
KP4
6
KP4
6 to
KP4
8
KP4
8 to
KP5
0
KP5
0 to
KP5
2
KP5
2 to
KP5
4
KP5
4 to
KP5
6
KP5
6 to
KP5
8
KP5
8 to
KP6
0
KP6
0 to
KP6
2
KP6
2 to
KP6
4
KP6
4 to
KP6
4.1
Table J-6. Segment by Segment Initial Recommendation for Depth of Lowering
KP
Ran
ge
KP0
to
KP2
Water Depth (m) -9 -11 -12 -13 -13 -15 -16 -17 -19 -18 -21 -21 -20 -22 -20 -21 -21 -21 -21 -23 -24 -24 -25 -24 -28 -28 -25 -28 -29 -25 -30 -27 -25
Large Vessels:
Com
bine
d Intentional anchoring
HD
D to
ext
ent f
easi
ble
to g
et b
elow
sto
rm w
ave
base
Accidental anchor deployment (on transit) 1 1 1 1.5 1.5 1.5 1.5 1.5 1.5 1.5 1.5 1.5 1.5 1.5 1.5 1.5 1.5 1.5 2 2 2 2 2 2 2 2 2 2 2 2 2 2
Emergency anchoring Pending geotechnical evaluation of the seabed to understand soil strength and anchor penetration potential.
Commercial fishing 1.5 1.5 1.5 1 1 1 1 1 1 1 1 1 1 1 1 1 1 0 0 0 0 0 0 0 0 0 0 0 0 0 0 0
Dropped objects Pending further analysis
Military operations and anchoring 1 1 1 1.5 1.5 1.5 1.5 1.5 1.5 1.5 1.5 1.5 1.5 1.5 1.5 1.5 1.5 1.5 1.5 1.5 1.5 1.5 1.5 1.5 1.5 1.5 1.5 1.5 1.5 1.5 1.5 1.5
Dumping and sand borrow operations 2 2 1 1 1 1 1 1 1 1 1 1 0 0 0 0 0 0 0 0 0 0 0 0 0 0 0 0 0 0 0 0
UXO risks Not mitigated by cable burial
Scour and seabed mobility 1.5 1.5 1 1 1 1 1 1 1 2 2 4 4 4 4 4 3 3 3 3 2 2 3 1 1 1 2 3 3 3 3 3
Greatest depth of lowering value from risk 2 2 1.5 1.5 1.5 1.5 1.5 1.5 1.5 1.5 1.5 1.5 1.5 1.5 1.5 1.5 1.5 1.5 2 2 2 2 2 2 2 2 2 2 2 2 2 2
Greatest depth of lowering PLUS seabed mobility mitigation depth
3.5 3.5 2.5 2.5 2.5 2.5 2.5 2.5 2.5 3.5 3.5 5.5 5.5 5.5 5.5 5.5 4.5 4.5 5 5 4 4 5 3 3 3 4 5 5 5 5 5
Note: The need for very deep burial areas may be able to be mitigated through routing to minimize traverse of highly mobile seabed and through dredging to get below the seabed reference level for mobile bedforms. More detailed routing is needed to adequately capture and evaluate this. Pending ECC Geotechnical information may also indicate that anchor penetration is substantially lower if the sediments appear harder than assumed. These areas of deeper burial may only be small spans within each 2-km subsegment. These DOL values are moderately conservative and assume worst-case routing to avoid largest mobile seabed features. Further reduction may be possible through substantial micro-siting.)
J-45
Kitty Hawk Offshore Wind Project Lease Area OCS-A 0508 Construction and Operations Plan Appendix J – Preliminary Cable Burial Risk Assessment
Evaluation of residual risk will be possible during later stages of the CBRA evaluation, when additional information about anchor penetration and seabed properties has been acquired. Any additional insight on the speed and direction of the mobile bedforms will further direct and constrain these mitigation measures.
J.8 SITE DATA REQUIREMENTS FOR FULL-SCOPE CBRA In order to facilitate the next stage of analysis for the CBRA, several additional datasets must be developed or further ref ined. The ongoing geophysical and geotechnical f ield work, along with next steps in the development of the ground model will be critical to capturing the geotechnical properties of the seabed along the of fshore export cable corridor. This will allow evaluation and ref inement of anchor penetration into the seabed as well as allow additional studies into the suitability of various cable burial tools needed to achieve recommended burial. While more difficult to bury through, harder more consolidated sediments in the seabed limit and reduce anchor penetration, allowing more protection at shallower depths of lowering. Understanding how the properties of the seabed vary along the cable route and with depth are critical to this task.
Thoroughly processed and cleaned AIS data, especially with vessels attributed with reliable DWT values, is necessary to adequately evaluate residual risks and recurrence intervals for potential cable faults. The initial “raw” AIS data allows excellent insights after some initial data cleaning and filtering, as shown in this ef fort, however significantly more quantitative analysis can be done with the cleaner and better attributed data.
Time series seabed data could be leveraged to identify trends and rates of migration of mobile seabed features. This could be very useful to serve as a bound on the inferred risk related to scour and mobile seabed. This may allow reduction of the DOL to mitigate impacts of mobile seabed, as well as allowing better targeted applications of deeper burial, limiting additional effort to only where it is most needed. Multiple bathymetric datasets over key features of concern can be acquired quickly and ef ficiently to facilitate temporal comparisons.
Further next steps should also include updating the cable routing to mitigate any findings of shallow hazards by the HRG survey, optimize the micro-sited cable routes to avoid areas of potentially difficult burial due to more consolidated seabed, and minimize the severity and lengths of mobile seabed features traversed by the routes.
J.9 REFERENCES Allmond, Andria. 2020. “Sandbridge Beach renourishment work underway .” U.S. Army Corps of
Engineers Norfolk District Website. 22 Apr 2020. Available online at: https://www.nao.usace.army.mil/Media/News-Stories/Article/2159967/sandbridge-beach-renourishment-work-underway/. Accessed 21 Oct 2020.
BOEM. 2019. Assessment of offshore sand resources for beach remediation in Virginia. Jessi S. Blanchette; William L. Lassetter. OPEN FILE REPORT 2019-02 July, 2019 Prepared under BOEM Cooperative Agreement M14AC00013. https://www.boem.gov/geological-and-geophysical-data-atlantic-ocs-region. Accessed 21 Oct 2020.
BOEM. 2020a. Information Guidelines for a Renewable Energy Construction and Operations Plan (COP). U.S. Department of the Interior, Bureau of Ocean Energy Management, Office of Renewable Energy Programs. Available online at: https://www.boem.gov/sites/default/files/documents/about-boem/COP%20Guidelines.pdf. Accessed 21 Oct 2020.
BOEM. 2020b. “Marine Minerals Information System.” Available online at: https://mmis.doi.gov/BOEMMMIS/. Accessed 21 Oct 2020.
J-46
Kitty Hawk Offshore Wind Project Lease Area OCS-A 0508 Construction and Operations Plan Appendix J – Preliminary Cable Burial Risk Assessment
Carbon Trust. 2015. Cable Burial Risk Assessment Methodology: Guidance for the Preparation of Cable Burial. Available online at: https://www.carbontrust.com/resources/cable-burial-risk-assessment-cbra-guidance-and-application-guide. Accessed 01 Dec 2020.
Carnival (Carnival Corporation). 2020a. “Carnival Sunrise.” Specifications. https://www.carnival.com/cruise-ships/carnival-sunrise.aspx. Accessed 02 Nov 2020.
Carnival. 2020b. “Carnival Magic.” Specifications. Available online at: https://www.carnival.com/cruise-ships/carnival-magic.aspx. Accessed 02 Nov 2020.
Crew-Center.com. No date. Photo of two large cruise ships in Virginia. Available online at: http://crew-center.com/. Accessed 21 Oct 2020.
ICPC (International Cable Protection Committee). 2009. Loss Prevention Bulletin: Damage to Submarine Cables Caused by Anchors. March 2009. Available online at: https://www.iscpc.org/documents/?id=139. Accessed 21 Oct 2020.
ICPC. 2019. ICPC Recommendations. Available online at: https://www.iscpc.org/publications/recommendations/. Accessed 21 Oct 2020.
MARCO (Mid-Atlantic Regional Council on the Ocean). 2020. Mid-Atlantic Ocean Data Portal. Available online at: https://portal.midatlanticocean.org/visualize/#x=-73.24&y=38.93&z=7&logo=true&controls=true&basemap=Ocean&tab=data&legends=false&layer s=true. Accessed 21 Oct 2020.
Munroe, D., E. Powell, R. Mann, J. Klinck, and E. Hofmann. 2013. “Underestimation of primary productivity on continental shelves: evidence from maximum size of extant surfclam (Spisula solidissima) populations.” Fisheries Oceanography 22(3):220-233. Retrieved from: https://doi.org/10.1111/fog.12016. Accessed 21 Oct 2020.
NROC (Northeast Regional Ocean Council). 2009. Northeast Ocean Data Portal, www.northeastoceandata.org. Accessed: 21 Oct 2020.
Of f ice for Coastal Management. 2020a. “Military Special Use Airspace: Atlantic / Gulf of Mexico.” Available online at: https://www.fisheries.noaa.gov/inport/item/48898. Accessed 30 Nov 2020.
Of f ice for Coastal Management. 2020b. “Danger Zones and Restricted Areas 2017.” Available online at: https://www.fisheries.noaa.gov/inport/item/48876. Accessed 30 Nov 2020.
OWC (Offshore Wind Consultants Limited.). 2020. Kitty Hawk Offshore Windfarm – Ground Model Development. Report OWC-LO-C1636-001R prepared for Avangrid Renewables. 88 pp.
Pendleton, Elizabeth A., Laura L. Brothers, E. Robert Thieler, and Edward M. Sweeney. 2017. “Sand ridge morphology and bedform migration patterns derived from bathymetry and backscatter on the inner-continental shelf offshore of Assateague Island, USA.” Continental Shelf Research, Volume 144, 2017, Pages 80-97.
Roberts, L., H. Harding, I. Voellmy, R. Bruintjes, S. Simpson, A. Radford, T. Breithaupt, and M. Elliot. 2016. “Exposure of benthic invertebrates to sediment vibration: From laboratory experiments to outdoor simulated pile-driving.” Proceedings of Meetings on Acoustics: Fourth International Conference on the Effects of Noise on Aquatic Life 27:1-10. Retrieved from: https://doi.org/10.1121/2.0000324. Accessed 21 Oct 2020.
Roberts, L. and M. Elliot. 2017. “Good or bad vibrations? Impacts of anthropogenic vibration on the marine epibenthos.” Science of the Total Environment 595:255-268. Retrieved from: http://dx.doi.org/10.1016/j.scitotenv.2017.03.117. Accessed 21 Oct 2020.
J-47
Kitty Hawk Offshore Wind Project Lease Area OCS-A 0508 Construction and Operations Plan Appendix J – Preliminary Cable Burial Risk Assessment
Sharples, M. 2011. “TAP-671-Offshore Electrical Cable Burial for Wind Farms: State of the Art, Standards and Guidance & Acceptable Burial Depths, Separation Distances and Sand Wave Effect. ” TAP Project No. 671 prepared by Risk & Technology Consulting, Inc. for the Bureau of Ocean Energy Management under Contract M10PC00102. Available online at: https://www.bsee.gov/research-record/tap-671-offshore-electrical-cable-burial-wind-farms-state-art-standards-and-guidance. Accessed 21 Oct 2020.
USACE (United States Army Corps of Engineers). 2018. “Waterborne commerce statistics for calendar year 2017: Waterborne commerce national totals and selected inland waterways for multiple years.” Waterborne Commerce Statistics Center. USACE Institute for Water Resources. Available online at: https://usace.contentdm.oclc.org/digital/collection/p16021coll2/id/3002/. Accessed 21 Oct 2020.
USCG (United States Coast Guard). 2015. Atlantic Coast Port Access Route Study Final Report. Available online at: https://www.navcen.uscg.gov/pdf/PARS/ACPARS_Final_Report_08Jul2015_Executive_Summary .pdf. Accessed 01 Dec 2020.
U.S. Navy. 2004. RSEPA RCA Phase II, Pre-Site Visit Information Collection Synopsis, Virginia Capes Complex. http://65.175.100.54/uxofiles/enclosures/VACAPES_RCA_Phase-II.pdf. Accessed 21 Oct 2020.
Virginia Coastal Zone Management Program. 2016. Collaborative Fisheries Planning for Virginia’s Offshore Wind Energy Area. U.S. Dept. of the Interior, Bureau of Ocean Energy Management, Of f ice of Renewable Energy Programs, Herndon. OCS Study BOEM 2016-040. 129 pp. Available online at: https://www.dmme.virginia.gov/de/LinkDocuments/OffshoreWind/Virginia-Wind-Energy-Area-Collaborative-Fisheries%20Planning-Final-Report.pdf. Accessed 21 Oct 2020.
Zottoli, J., S. Berkman, A. Morandi, A. Sousa, J. Rowe, and K. Ruckert. 2020. Kitty Hawk Wind Project Benthic Assessment Report – Phase 2 Reconnaissance. Prepared by RPS Ocean Science for TerraSond and Avangrid Renewables. Kitty Hawk Report 19-P-204565. 144 pp.
J-48
Kitty Hawk Offshore Wind Project Lease Area OCS-A 0508 Construction and Operations Plan Appendix J – Preliminary Cable Burial Risk Assessment
Attachment J-1. Supplemental Vessel Data and Figures
J-1-1
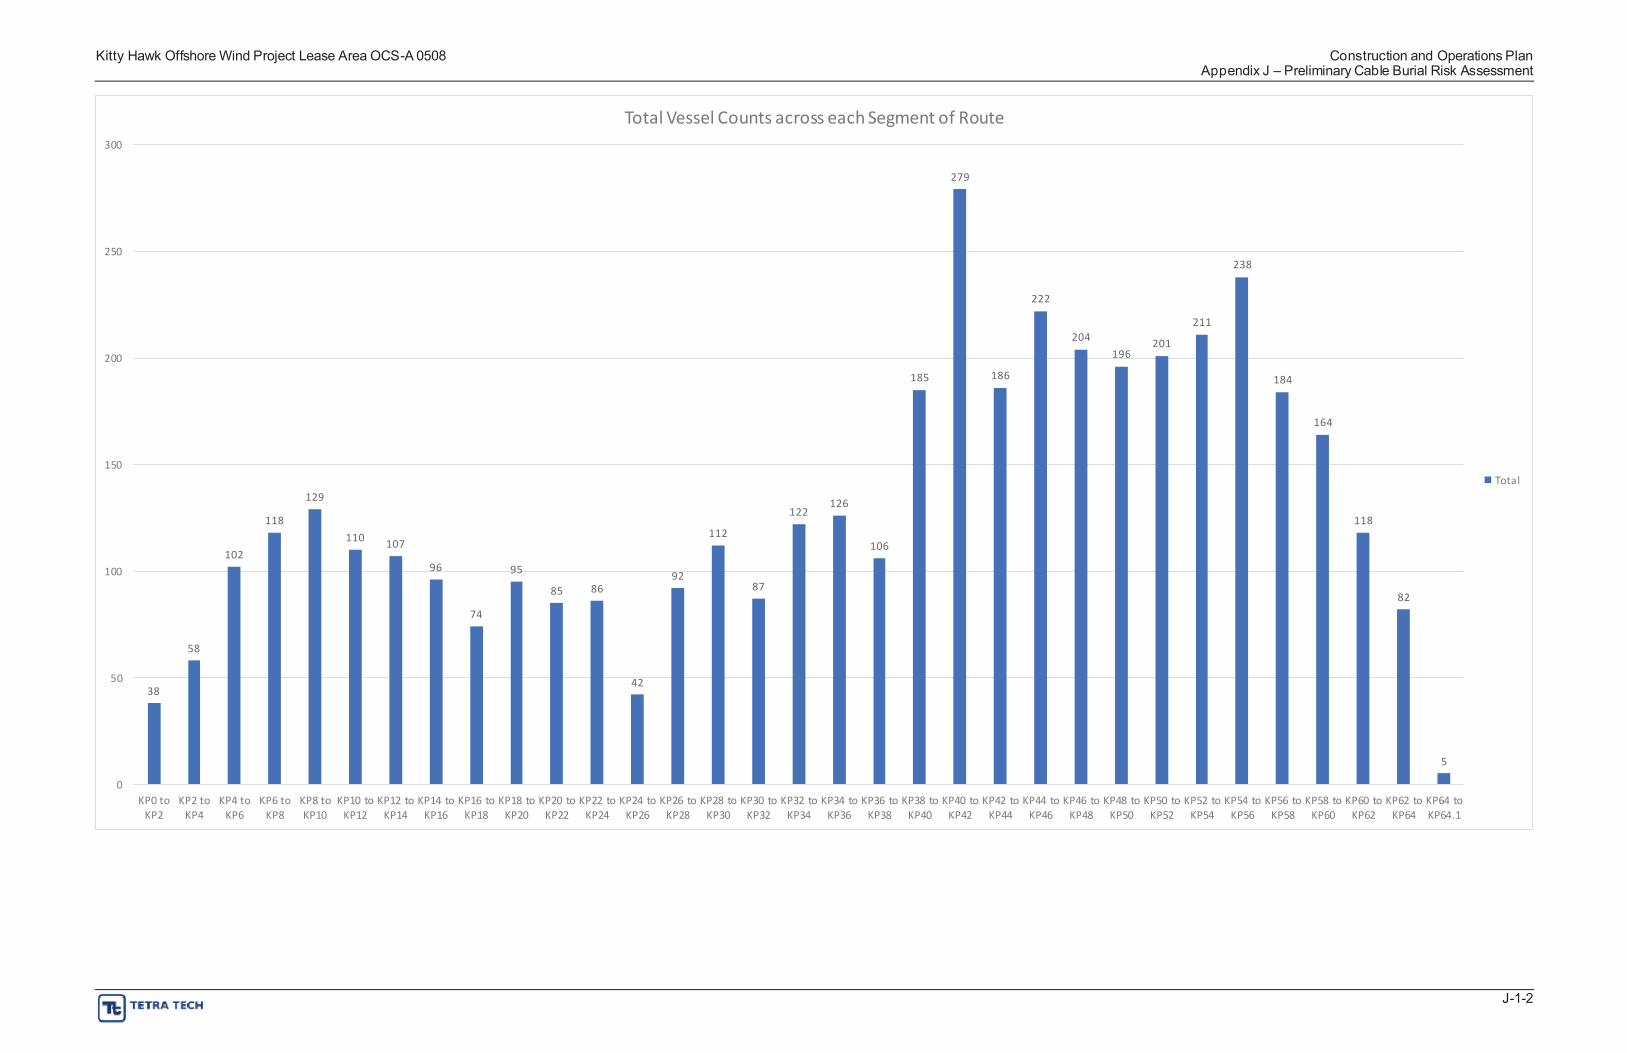
300
Kitty Hawk Offshore Wind Project Lease Area OCS-A 0508 Construction and Operations Plan Appendix J – Preliminary Cable Burial Risk Assessment
Total Vessel Counts across each Segment of Route
279
250 238
222
211 204 201
196200 186185 184
164
150
74
85 86
42
92 87
Total 129 126
122118 118
112110 107 106102
96 95100
82
58
50 38
5
0 KP0 to KP2 to KP4 to KP6 to KP8 to KP10 to KP12 to KP14 to KP16 to KP18 to KP20 to KP22 to KP24 to KP26 to KP28 to KP30 to KP32 to KP34 to KP36 to KP38 to KP40 to KP42 to KP44 to KP46 to KP48 to KP50 to KP52 to KP54 to KP56 to KP58 to KP60 to KP62 to KP64 to
KP2 KP4 KP6 KP8 KP10 KP12 KP14 KP16 KP18 KP20 KP22 KP24 KP26 KP28 KP30 KP32 KP34 KP36 KP38 KP40 KP42 KP44 KP46 KP48 KP50 KP52 KP54 KP56 KP58 KP60 KP62 KP64 KP64.1
J-1-2
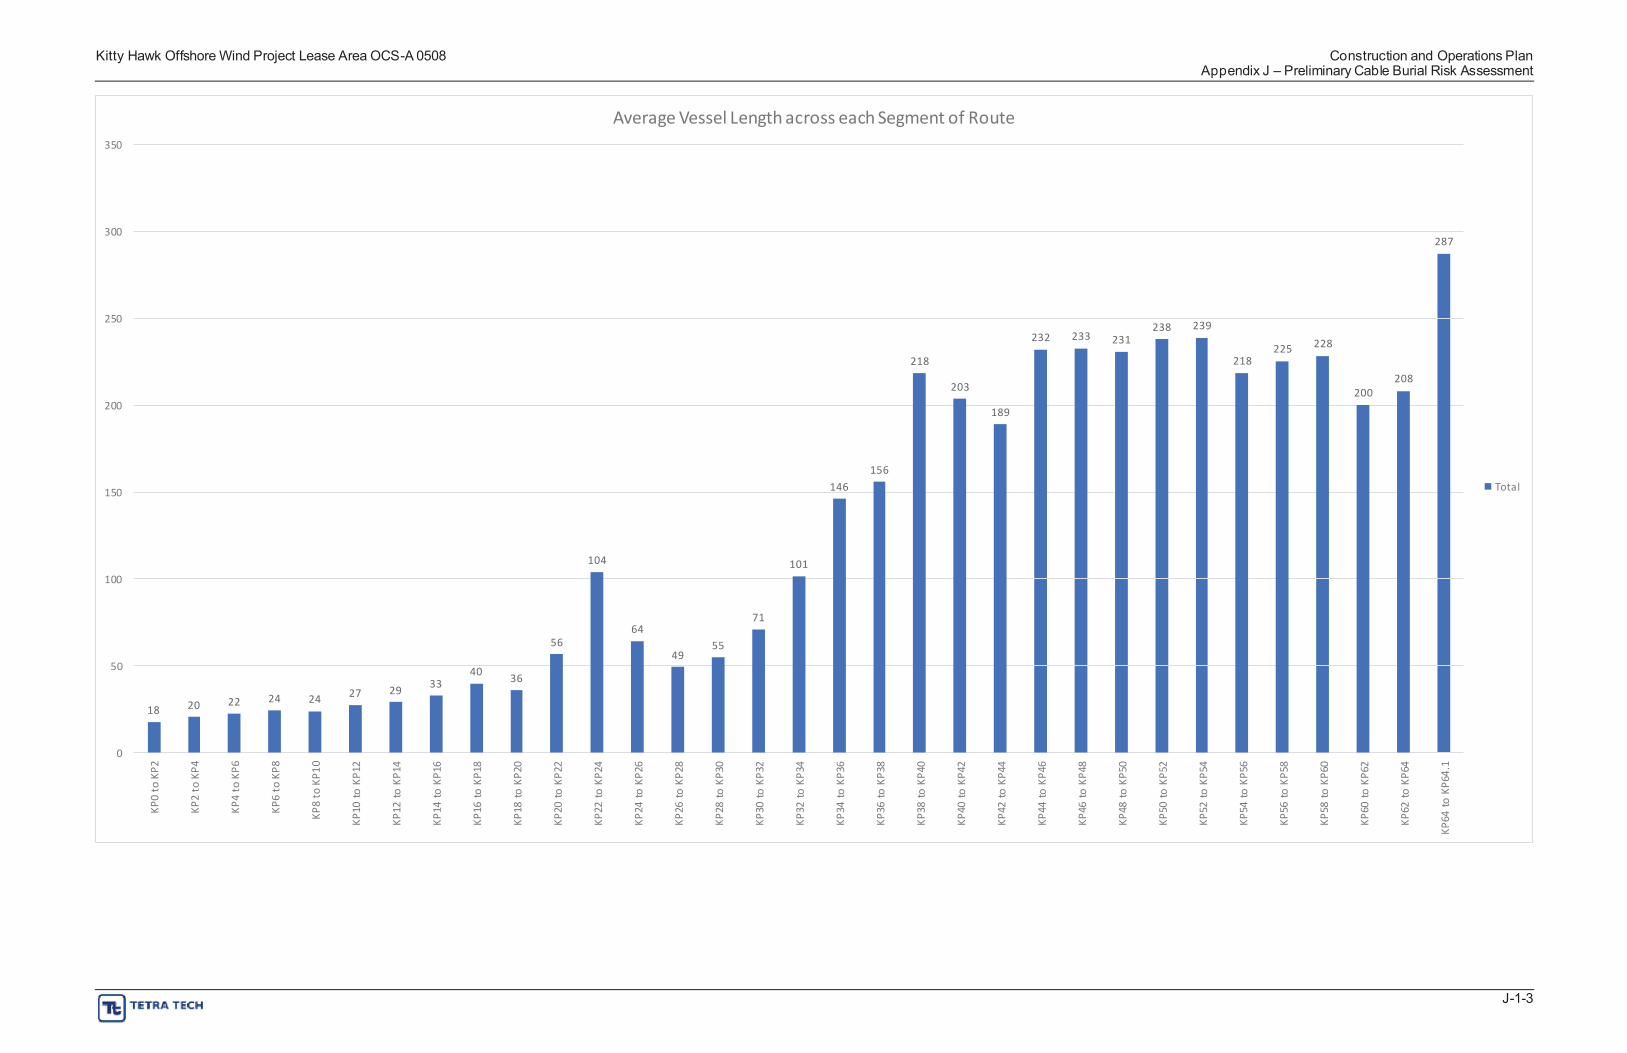
350
300 287
Kitty Hawk Offshore Wind Project Lease Area OCS-A 0508 Construction and Operations Plan Appendix J – Preliminary Cable Burial Risk Assessment
Average Vessel Length across each Segment of Route
250 238 239
232 233 231 228225 218218
208203 200
200 189
156 146 Total 150
104 101 100
71 64
56 55 49
50 40 3633292724 24222018
0
KP0
to K
P2
KP2
to K
P4
KP4
to K
P6
KP6
to K
P8
KP8
to K
P10
KP10
to K
P12
KP12
to K
P14
KP14
to K
P16
KP16
to K
P18
KP18
to K
P20
KP20
to K
P22
KP22
to K
P24
KP24
to K
P26
KP26
to K
P28
KP28
to K
P30
KP30
to K
P32
KP32
to K
P34
KP34
to K
P36
KP36
to K
P38
KP38
to K
P40
KP40
to K
P42
KP42
to K
P44
KP44
to K
P46
KP46
to K
P48
KP48
to K
P50
KP50
to K
P52
KP52
to K
P54
KP54
to K
P56
KP56
to K
P58
KP58
to K
P60
KP60
to K
P62
KP62
to K
P64
KP64
to K
P64.
1
J-1-3
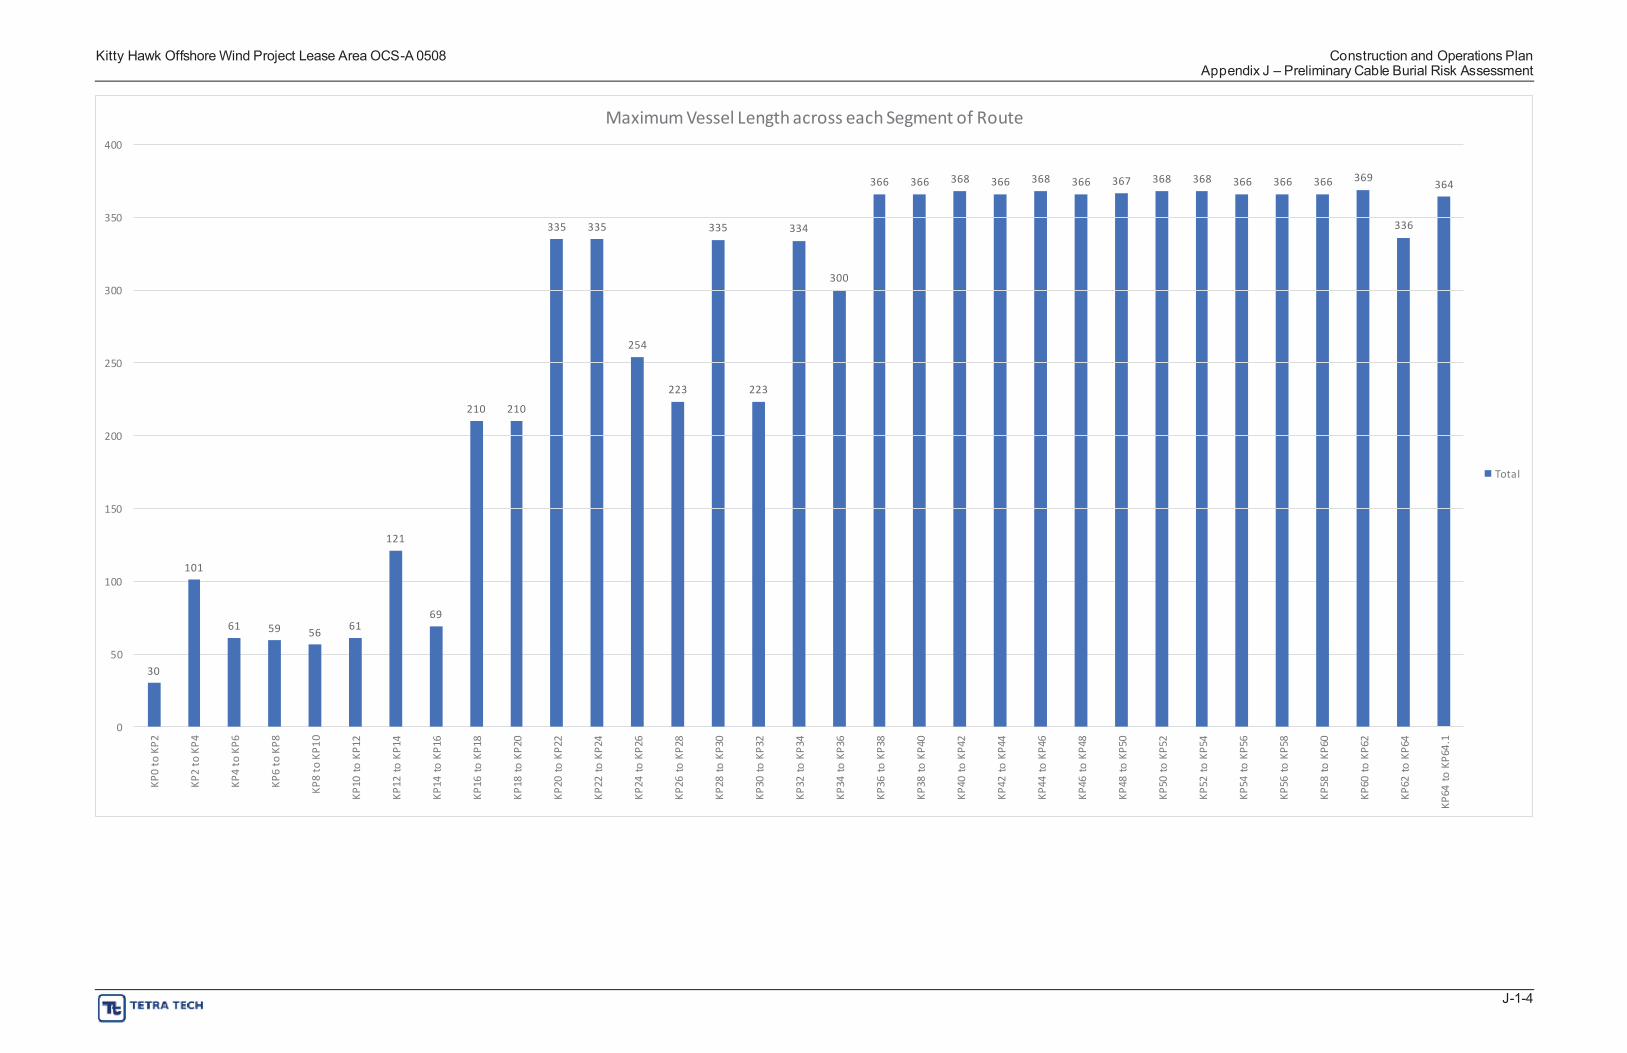
400
Kitty Hawk Offshore Wind Project Lease Area OCS-A 0508 Construction and Operations Plan Appendix J – Preliminary Cable Burial Risk Assessment
Maximum Vessel Length across each Segment of Route
369368 368 368 368366 366 366 366 367 366 366 366 364
350 336335 335 335 334
300 300
254 250
223 223
210 210
200
Total
150
121
101 100
69 61 6159 56
50 30
0
KP0
to K
P2
KP2
to K
P4
KP4
to K
P6
KP6
to K
P8
KP8
to K
P10
KP10
to K
P12
KP12
to K
P14
KP14
to K
P16
KP16
to K
P18
KP18
to K
P20
KP20
to K
P22
KP22
to K
P24
KP24
to K
P26
KP26
to K
P28
KP28
to K
P30
KP30
to K
P32
KP32
to K
P34
KP34
to K
P36
KP36
to K
P38
KP38
to K
P40
KP40
to K
P42
KP42
to K
P44
KP44
to K
P46
KP46
to K
P48
KP48
to K
P50
KP50
to K
P52
KP52
to K
P54
KP54
to K
P56
KP56
to K
P58
KP58
to K
P60
KP60
to K
P62
KP62
to K
P64
KP64
to K
P64.
1
J-1-4
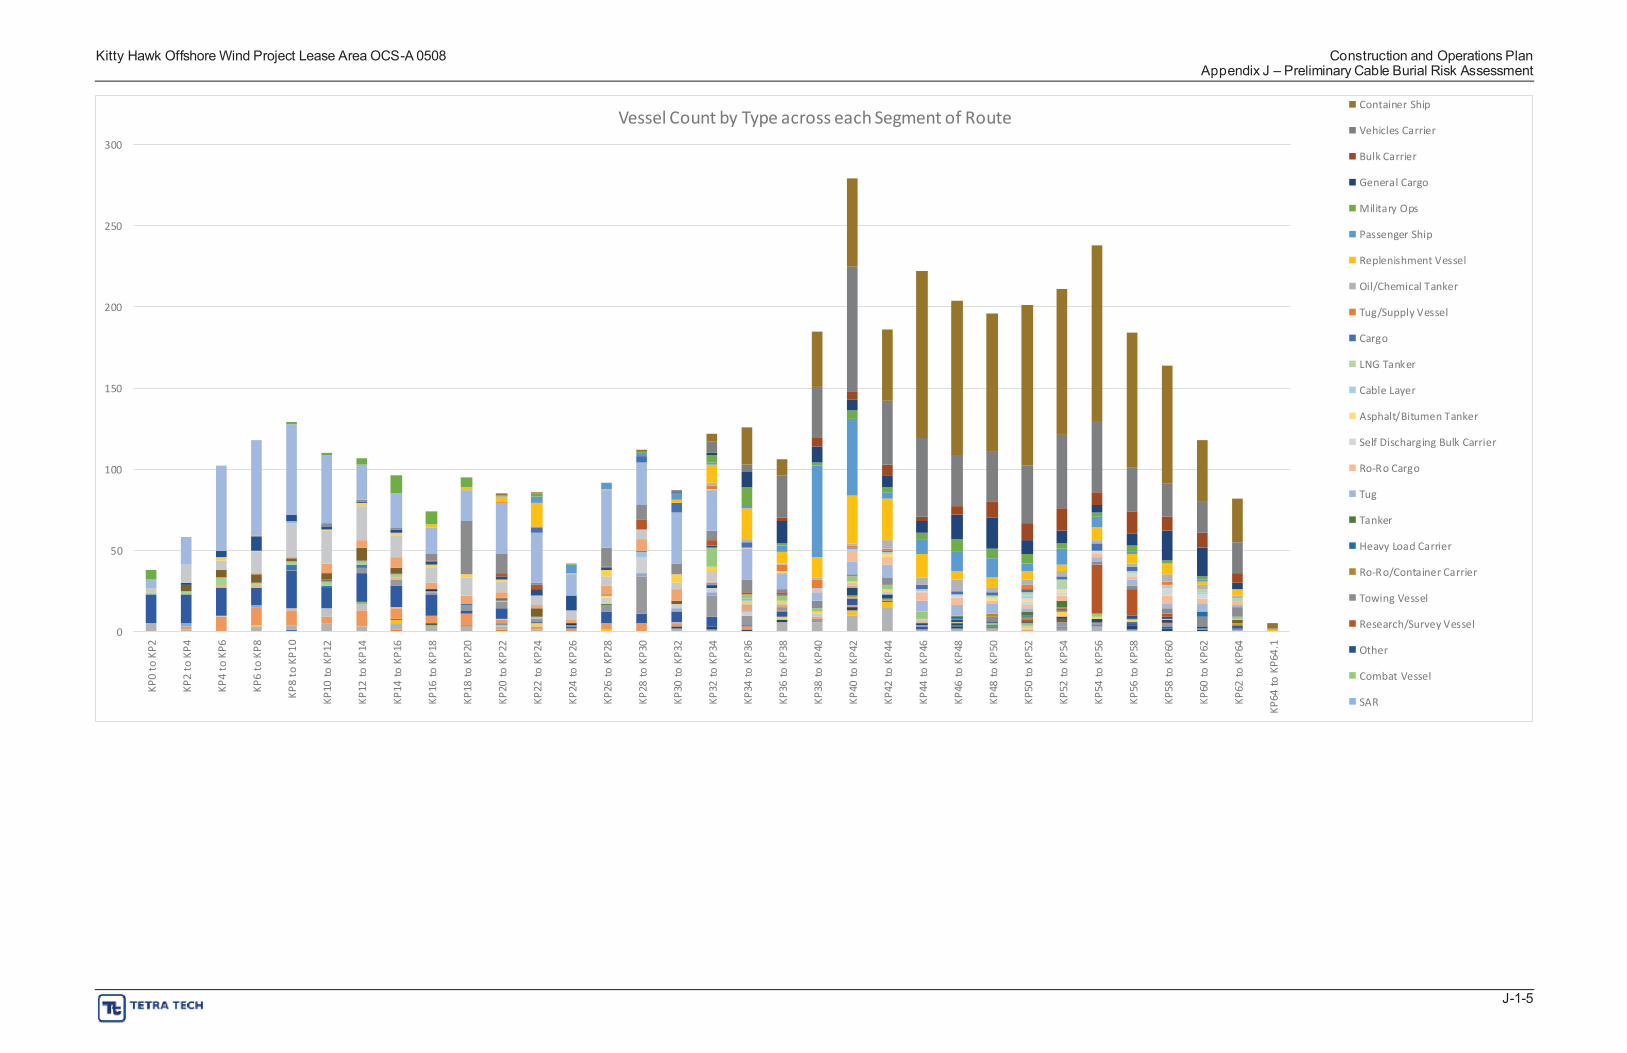
Kitty Hawk Offshore Wind Project Lease Area OCS-A 0508 Construction and Operations Plan Appendix J – Preliminary Cable Burial Risk Assessment
0
50
100
150
200
250
300 KP
0 to
KP2
KP2
to K
P4
KP4
to K
P6
KP6
to K
P8
KP8
to K
P10
KP10
to K
P12
KP12
to K
P14
KP14
to K
P16
KP16
to K
P18
KP18
to K
P20
KP20
to K
P22
KP22
to K
P24
KP24
to K
P26
KP26
to K
P28
KP28
to K
P30
KP30
to K
P32
KP32
to K
P34
KP34
to K
P36
KP36
to K
P38
KP38
to K
P40
KP40
to K
P42
KP42
to K
P44
KP44
to K
P46
KP46
to K
P48
KP48
to K
P50
KP50
to K
P52
KP52
to K
P54
KP54
to K
P56
KP56
to K
P58
KP58
to K
P60
KP60
to K
P62
KP62
to K
P64
KP64
to K
P64.
1
Vessel Count by Type across each Segment of Route Container Ship
Vehicles Carrier
Bulk Carrier
General Cargo
Military Ops
Passenger Ship
Replenishment Vessel
Oil/Chemical Tanker
Tug/Supply Vessel
Cargo
LNG Tanker
Cable Layer
Asphalt/Bitumen Tanker
Self Discharging Bulk Carrier
Ro-Ro Cargo
Tug
Tanker
Heavy Load Carrier
Ro-Ro/Container Carrier
Towing Vessel
Research/Survey Vessel
Other
Combat Vessel
SAR
J-1-5
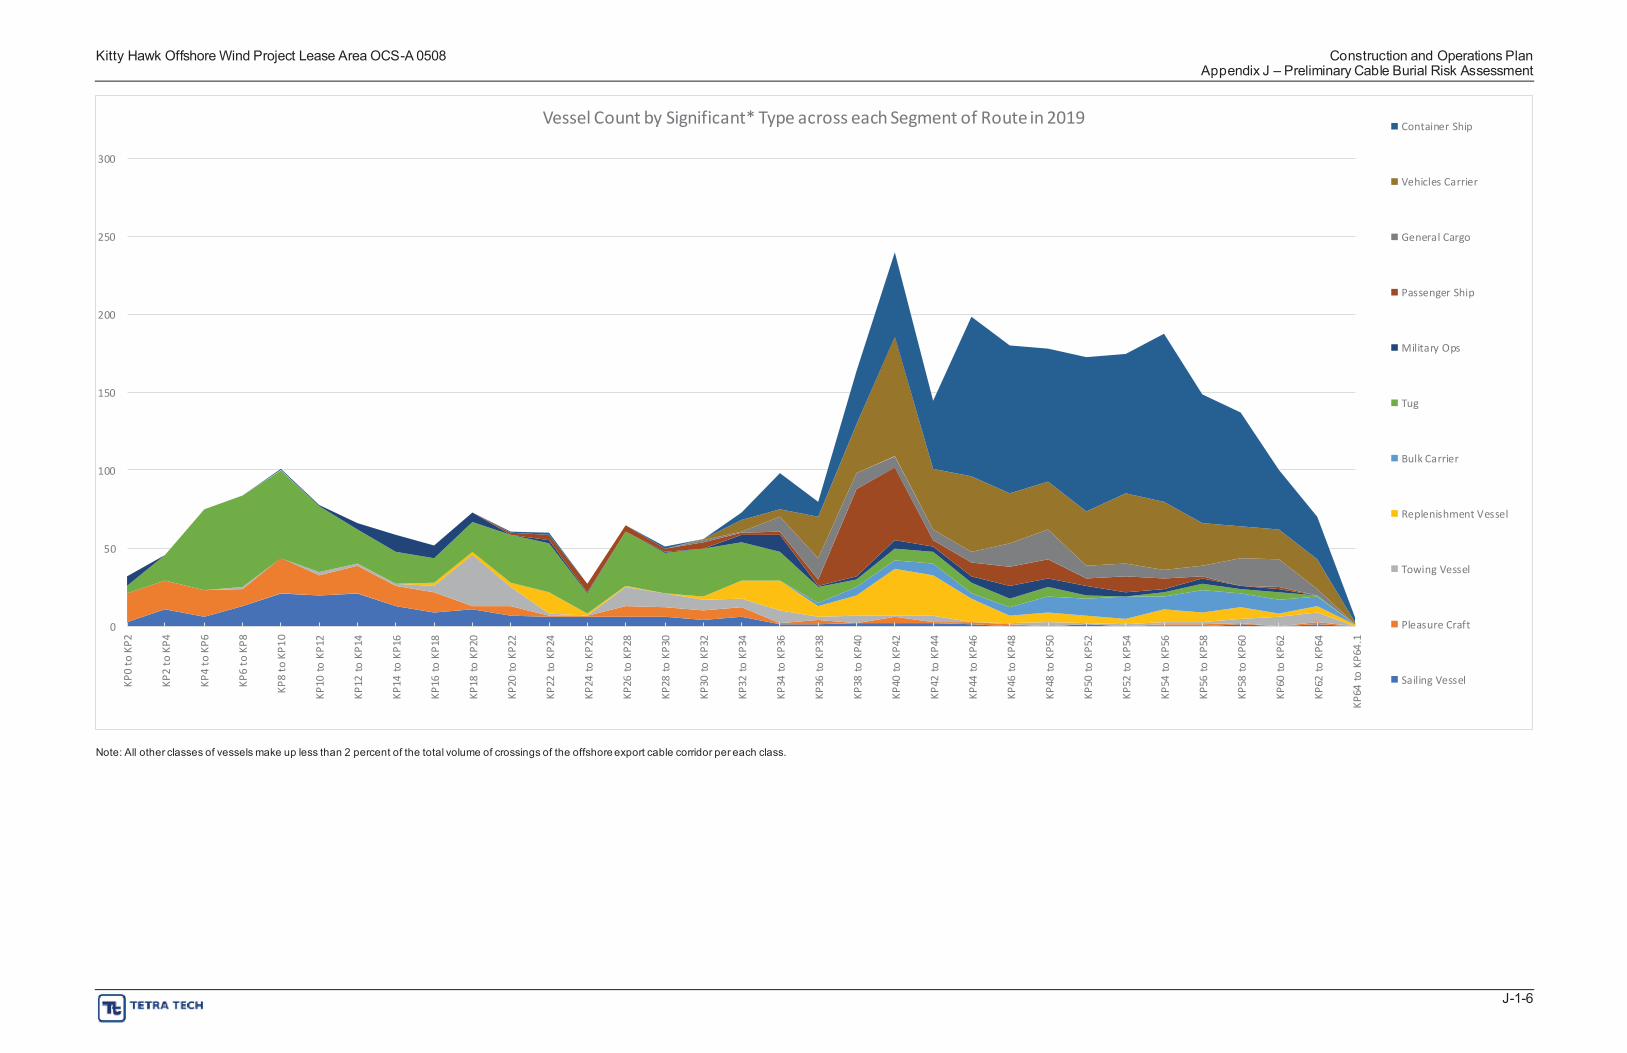
Kitty Hawk Offshore Wind Project Lease Area OCS-A 0508 Construction and Operations Plan Appendix J – Preliminary Cable Burial Risk Assessment
Container Ship
Vehicles Carrier
General Cargo
Passenger Ship
Military Ops
Tug
Bulk Carrier
Replenishment Vessel
Towing Vessel
Pleasure Craft
Sailing Vessel
0
50
100
150
200
250
300
Vessel Count by Significant* Type across each Segment of Route in 2019
KP
0 to
KP2
KP2
to K
P4
KP4
to K
P6
KP6
to K
P8
KP8
to K
P10
KP10
to K
P12
KP12
to K
P14
KP14
to K
P16
KP16
to K
P18
KP18
to K
P20
KP20
to K
P22
KP22
to K
P24
KP24
to K
P26
KP26
to K
P28
KP28
to K
P30
KP30
to K
P32
KP32
to K
P34
KP34
to K
P36
KP36
to K
P38
KP38
to K
P40
KP40
to K
P42
KP42
to K
P44
KP44
to K
P46
KP46
to K
P48
KP48
to K
P50
KP50
to K
P52
KP52
to K
P54
KP54
to K
P56
KP56
to K
P58
KP58
to K
P60
KP60
to K
P62
KP62
to K
P64
KP64
to K
P64.
1
Note: All other classes of vessels make up less than 2 percent of the total volume of crossings of the offshore export cable corridor per each class.
J-1-6
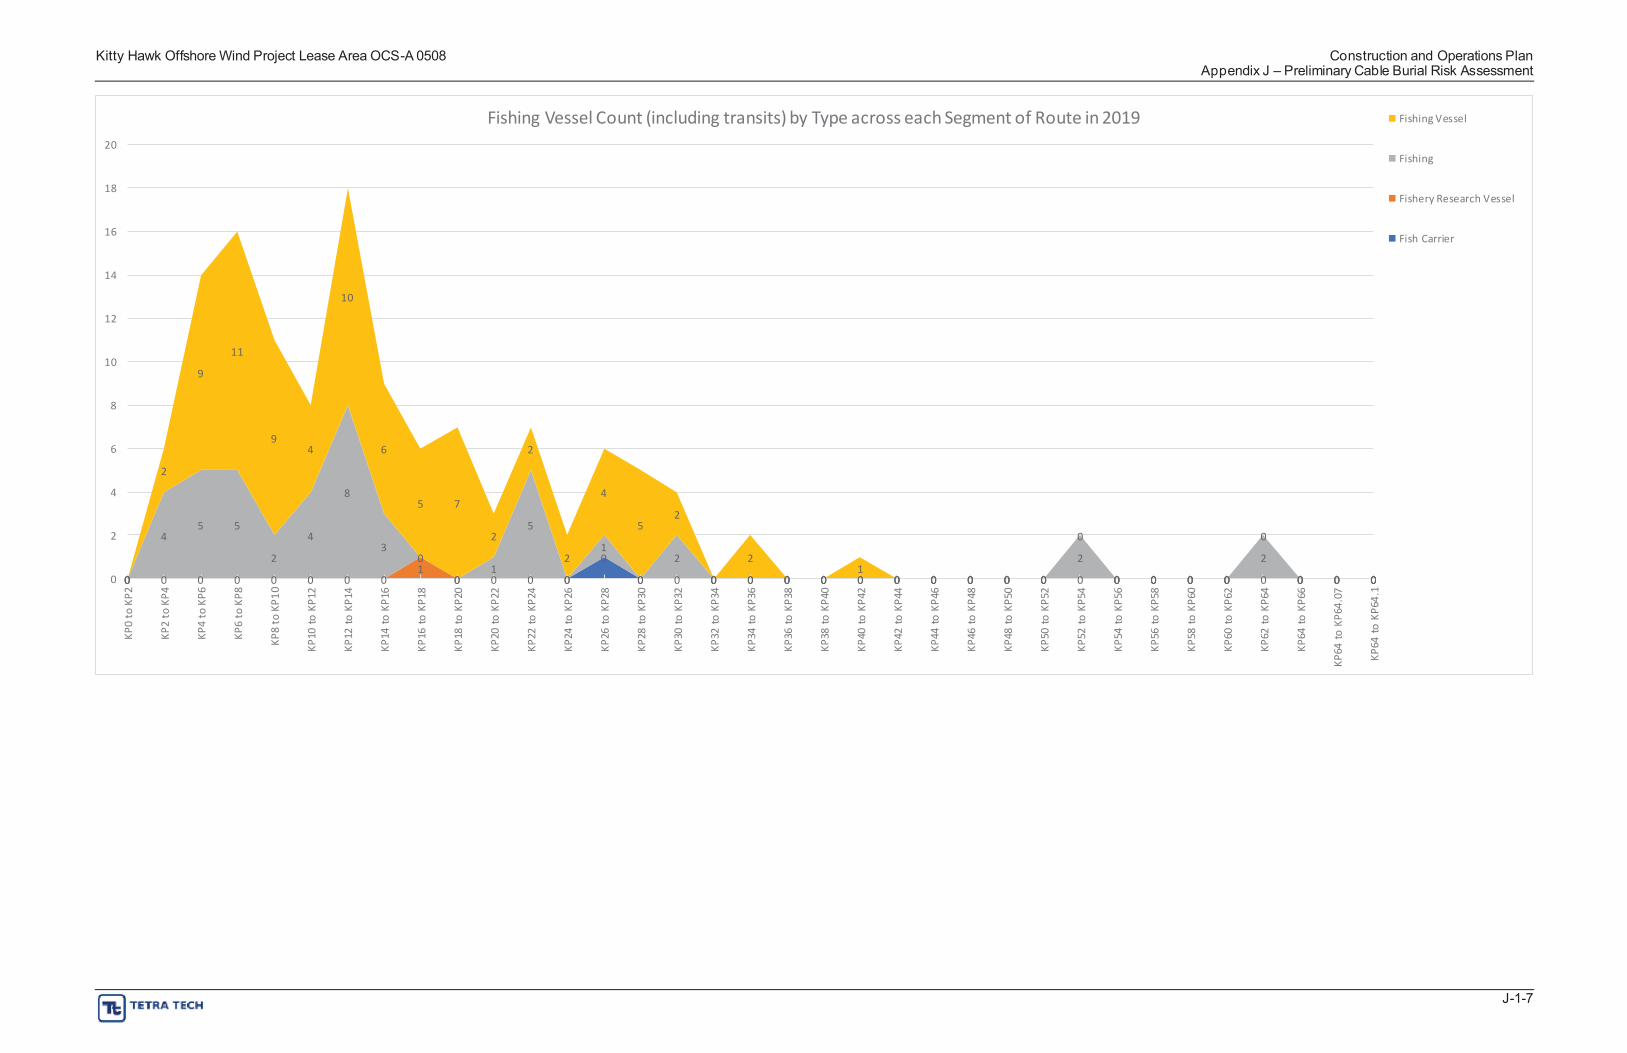
Kitty Hawk Offshore Wind Project Lease Area OCS-A 0508 Construction and Operations Plan Appendix J – Preliminary Cable Burial Risk Assessment
Fishing VesselFishing Vessel Count (including transits) by Type across each Segment of Route in 2019 20
Fishing
18
0 0 0 0 0 0 0 1
0 0 0 0
0
0 0 0 0 0 0 0 0 0 0 0 00 1 1
0 000 000 000 000 0 000 0
4 5 5
2
4
8
3 0
5
0
1
0
2
0 0 0 0 0 0 0 0 0 0
2 2
0
2
9
11
9 4
10
6
5 7
2
2
2
4
5 2
0
2
0 0 0 0 0 0 0
0 0
0
00 00
Fishery Research Vessel
16 Fish Carrier
14
12
10
8
6
4
2
0 0 0
KP0
to K
P2
KP2
to K
P4
KP4
to K
P6
KP6
to K
P8
KP8
to K
P10
KP10
to K
P12
KP12
to K
P14
KP14
to K
P16
KP16
to K
P18
KP18
to K
P20
KP20
to K
P22
KP22
to K
P24
KP24
to K
P26
KP26
to K
P28
KP28
to K
P30
KP30
to K
P32
KP32
to K
P34
KP34
to K
P36
KP36
to K
P38
KP38
to K
P40
KP40
to K
P42
KP42
to K
P44
KP44
to K
P46
KP46
to K
P48
KP48
to K
P50
KP50
to K
P52
KP52
to K
P54
KP54
to K
P56
KP56
to K
P58
KP58
to K
P60
KP60
to K
P62
KP62
to K
P64
KP64
to K
P66
KP64
to K
P64.
07
KP64
to K
P64.
1
J-1-7
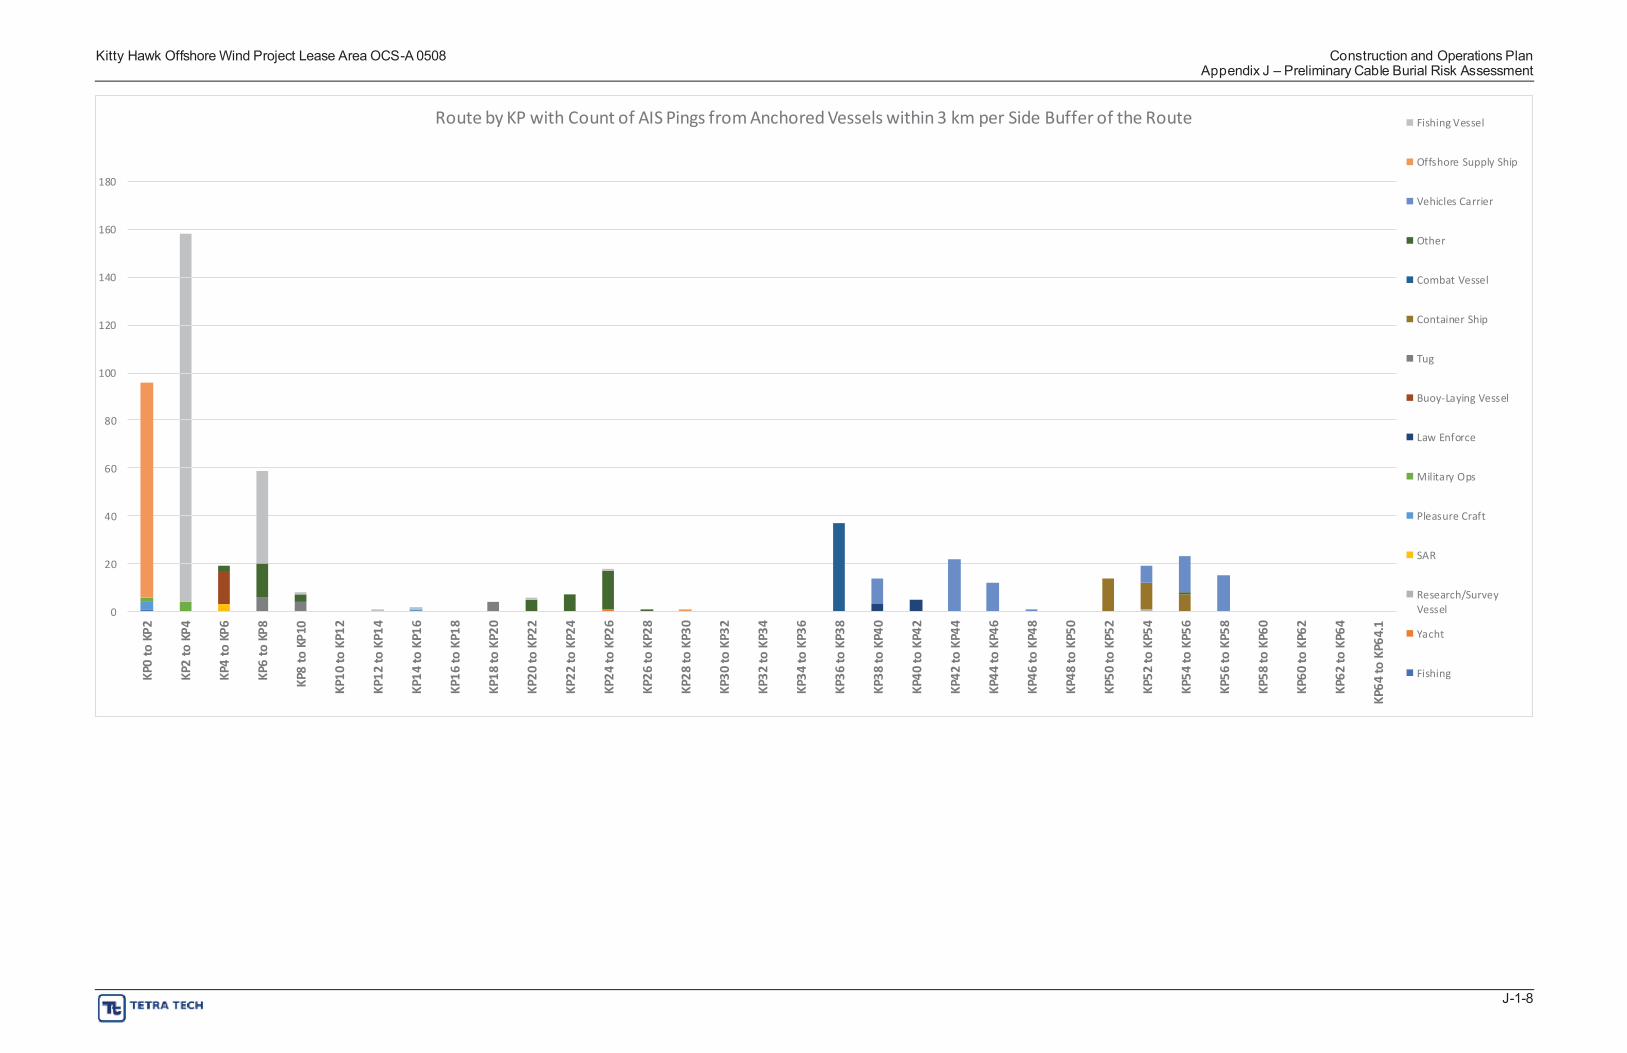
10 20 30 40 50 60
10 20 30 40 50 60
Kitty Hawk Offshore Wind Project Lease Area OCS-A 0508 Construction and Operations Plan Appendix J – Preliminary Cable Burial Risk Assessment
0
20
40
60
80
100
120
140
160
180
Route by KP with Count of AIS Pings from Anchored Vessels within 3 km per Side Buffer of the Route Fishing Vessel
Offshore Supply Ship
Vehicles Carrier
Other
Combat Vessel
Container Ship
Tug
Buoy-Laying Vessel
Law Enforce
Military Ops
Pleasure Craft
SAR
Research/Survey Vessel
Yacht
Fishing KP0
to KP
2
KP2
to KP
4
KP4
to KP
6
KP6
to KP
8
KP8
to KP
KP to
KP1
2
KP12
to K
P14
KP14
to K
P16
KP16
to K
P18
KP18
to K
P
KP to
KP2
2
KP22
to K
P24
KP24
to K
P26
KP26
to K
P28
KP28
to K
P
KP to
KP3
2
KP32
to K
P34
KP34
to K
P36
KP36
to K
P38
KP38
to K
P
KP to
KP4
2
KP42
to K
P44
KP44
to K
P46
KP46
to K
P48
KP48
to K
P
KP to
KP5
2
KP52
to K
P54
KP54
to K
P56
KP56
to K
P58
KP58
to K
P
KP to
KP6
2
KP62
to K
P64
KP64
to K
P64.1
J-1-8
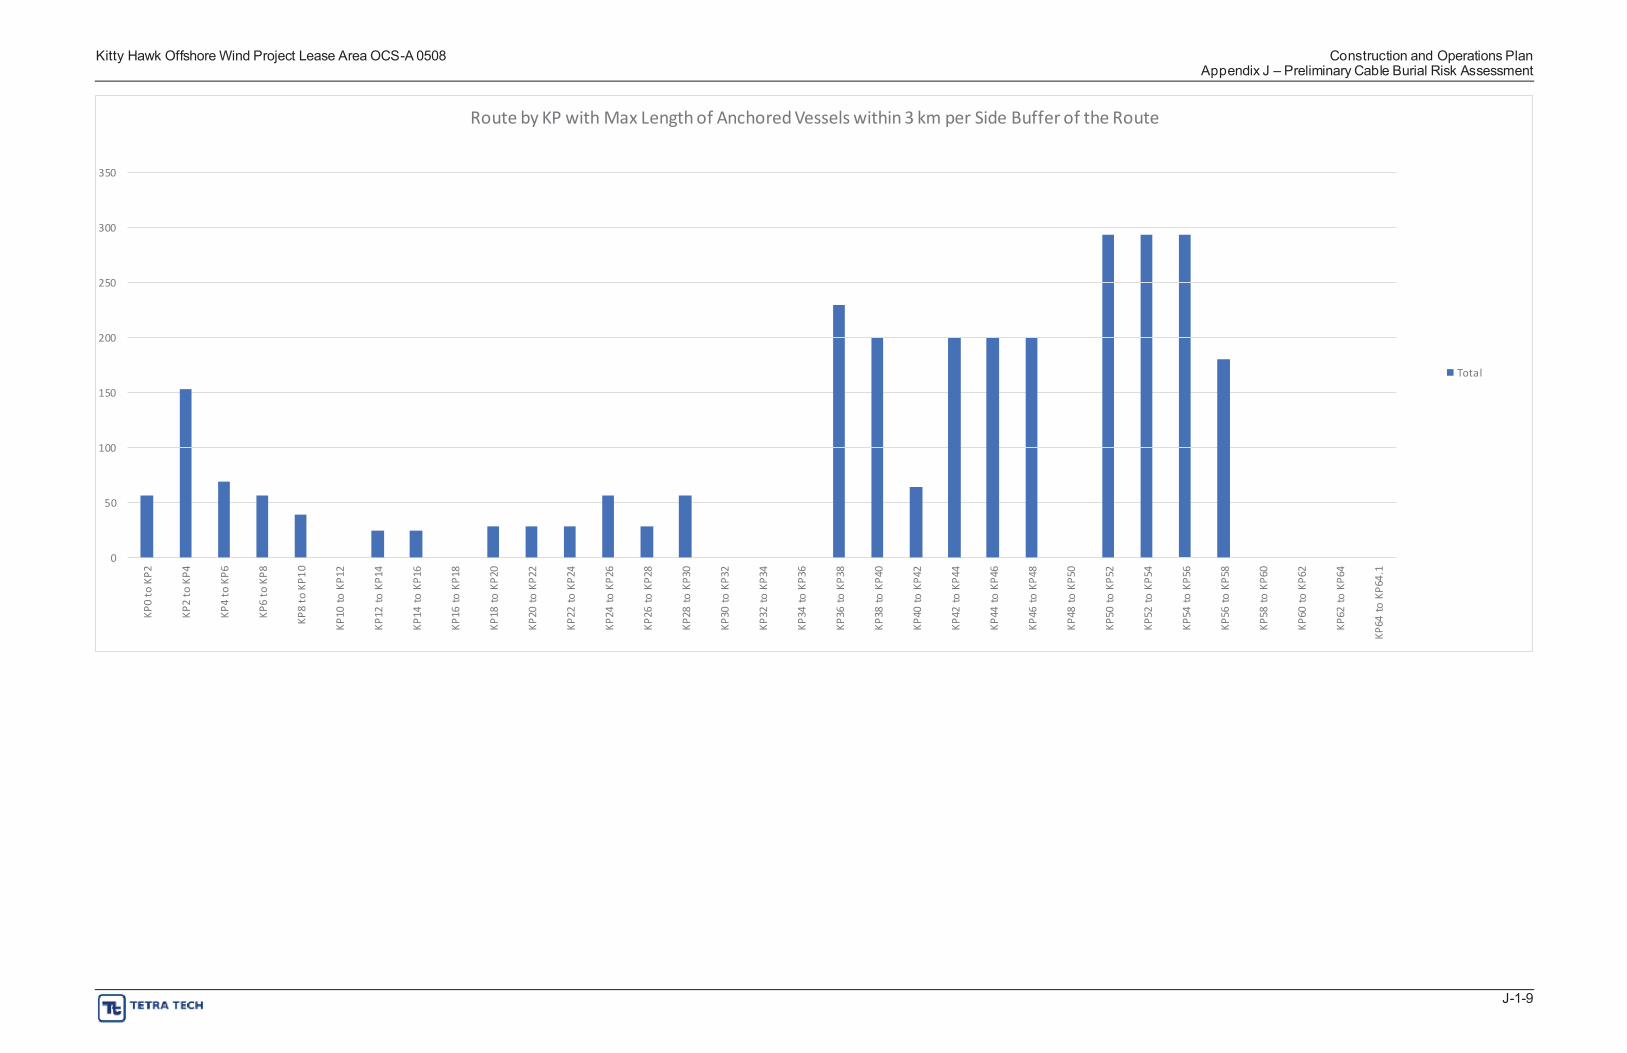
Kitty Hawk Offshore Wind Project Lease Area OCS-A 0508 Construction and Operations Plan Appendix J – Preliminary Cable Burial Risk Assessment
Route by KP with Max Length of Anchored Vessels within 3 km per Side Buffer of the Route
350
300
250
200
Total
150
100
50
0
KP0
to K
P2
KP2
to K
P4
KP4
to K
P6
KP6
to K
P8
KP8
to K
P10
KP10
to K
P12
KP12
to K
P14
KP14
to K
P16
KP16
to K
P18
KP18
to K
P20
KP20
to K
P22
KP22
to K
P24
KP24
to K
P26
KP26
to K
P28
KP28
to K
P30
KP30
to K
P32
KP32
to K
P34
KP34
to K
P36
KP36
to K
P38
KP38
to K
P40
KP40
to K
P42
KP42
to K
P44
KP44
to K
P46
KP46
to K
P48
KP48
to K
P50
KP50
to K
P52
KP52
to K
P54
KP54
to K
P56
KP56
to K
P58
KP58
to K
P60
KP60
to K
P62
KP62
to K
P64
KP64
to K
P64.
1
J-1-9
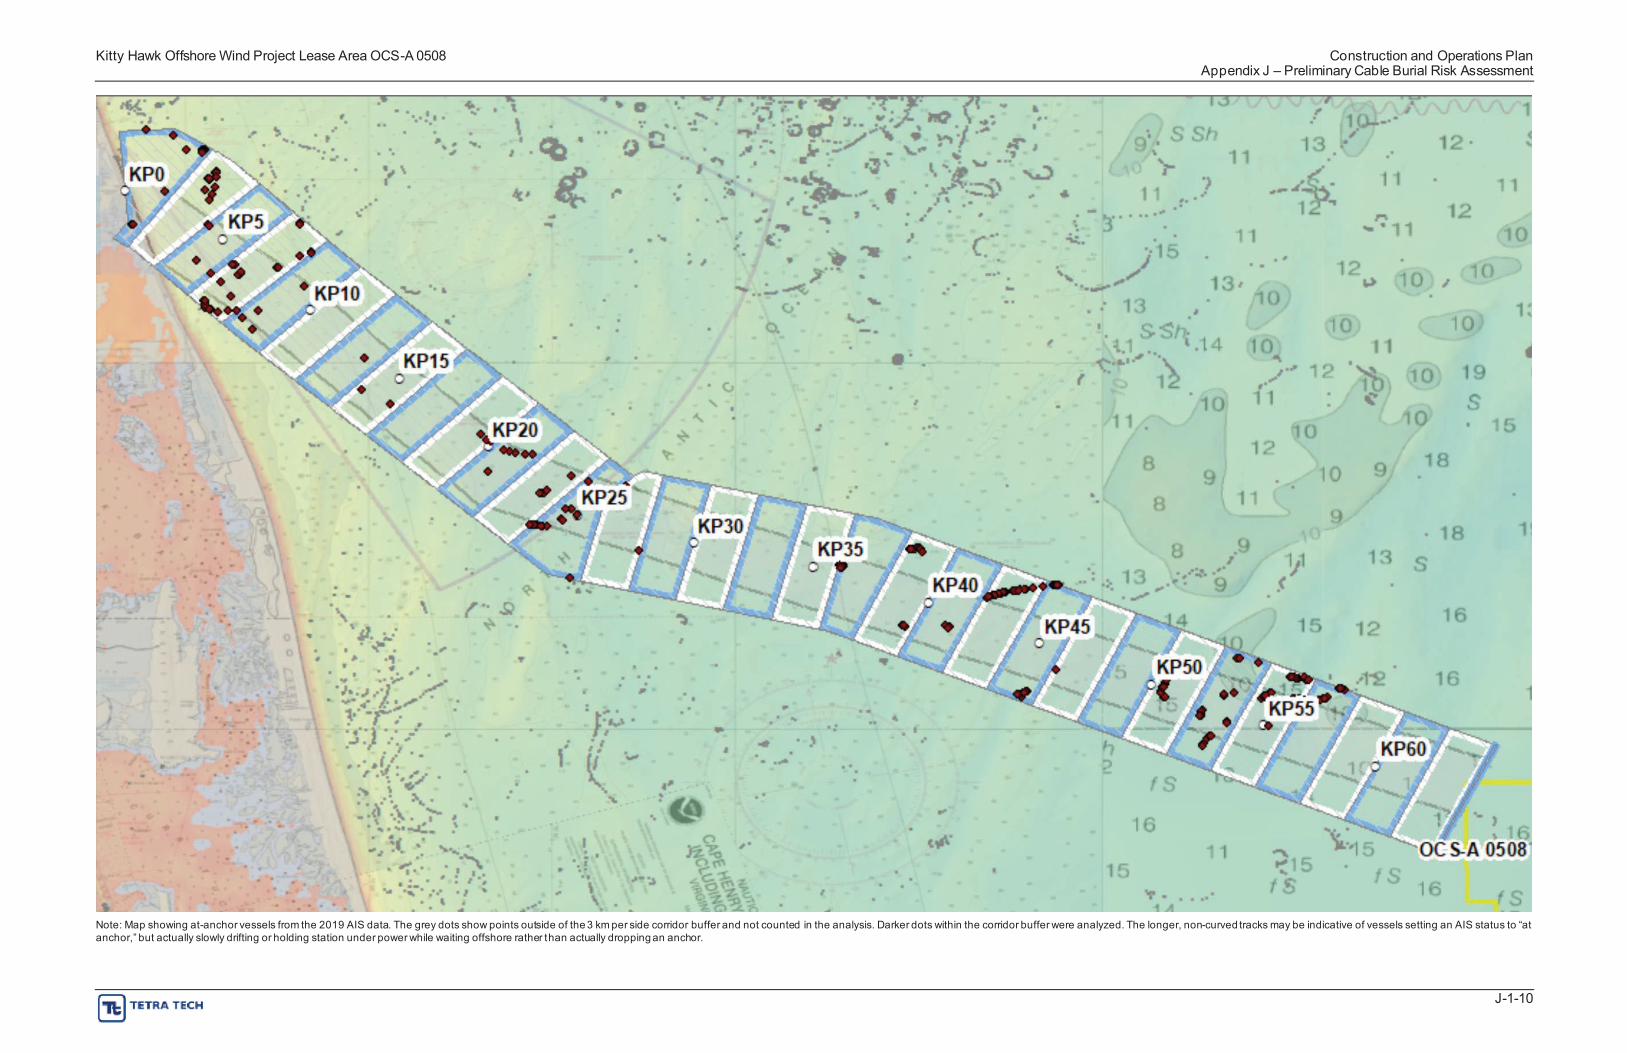
Kitty Hawk Offshore Wind Project Lease Area OCS-A 0508 Construction and Operations Plan Appendix J – Preliminary Cable Burial Risk Assessment
Note: Map showing at-anchor vessels from the 2019 AIS data. The grey dots show points outside of the 3 km per side corridor buffer and not counted in the analysis. Darker dots within the corridor buffer were analyzed. The longer, non-curved tracks may be indicative of vessels setting an AIS status to “at anchor,” but actually slowly drifting or holding station under power while waiting offshore rather than actually dropping an anchor.
J-1-10
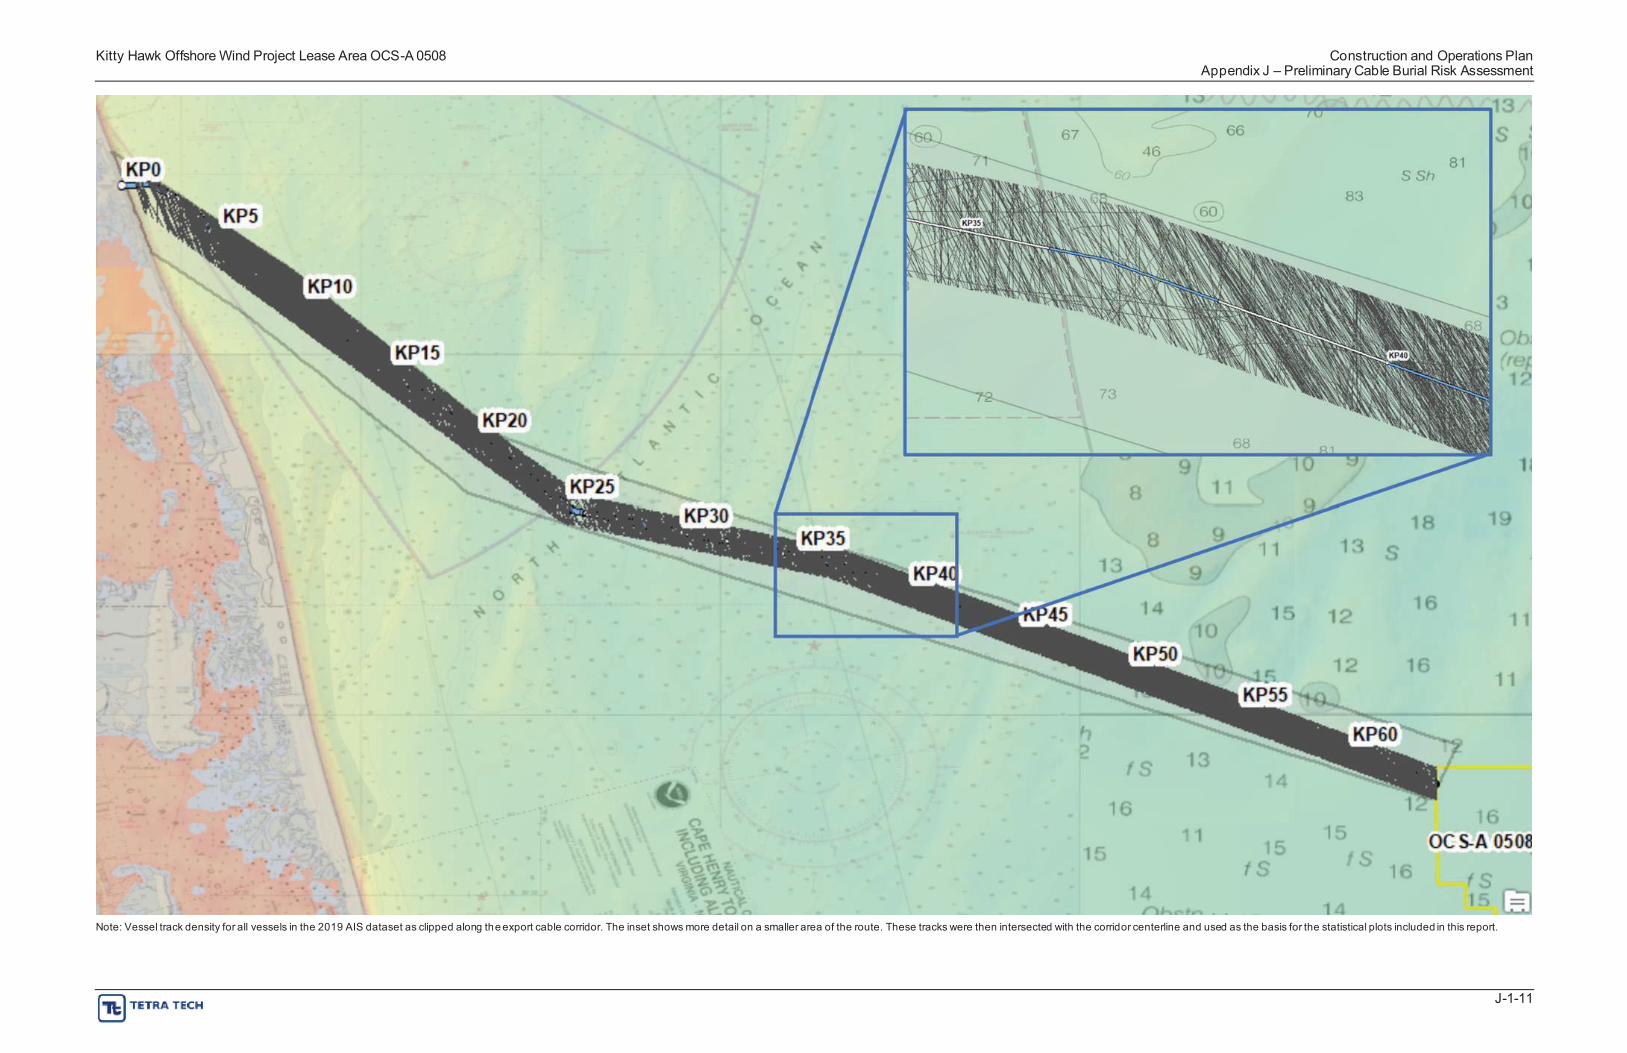
Kitty Hawk Offshore Wind Project Lease Area OCS-A 0508 Construction and Operations Plan Appendix J – Preliminary Cable Burial Risk Assessment
Note: Vessel track density for all vessels in the 2019 AIS dataset as clipped along the export cable corridor. The inset shows more detail on a smaller area of the route. These tracks were then intersected with the corridor centerline and used as the basis for the statistical plots included in this report.
J-1-11