Embed Size (px)
Citation preview
Application of AFLP1 technology to radiation hybrid mapping
C. Gorni1, J. L. Williams2, H. C. M. Heuven3, R. Negrini1, A. Valentini4, M. J. T. van Eijk3,D. Waddington2, M. Zevenbergen3, P. Ajmone Marsan1* & J. D. Peleman31Institute of Zootechnics, Catholic University of Sacred Heart, via E. Parmense, 84, 29100 Piacenza, Italy;Tel: þ 39 0523 599 205; Fax: þ 39 0523 599 276; E-mail: [email protected]; 2Roslin Institute(Edinburgh), Roslin, Midlothian, Scotland, EH25 9PS, U.K.; 3Keygene N.V., Agrobusiness Park 90,67080 PW, Wageningen, The Netherlands; 4Department of Animal Science, University of Tuscia,via C. De Lellis, 01100 Viterbo, Italy*Correspondence
Received 27 October 2003. Accepted for publication by Wendy Bickmore 25 November 2003
Key words: AFLP, cattle, DNA fingerprinting, radiation hybrid
Abstract
We have investigated the use of AFLP1 technology as a tool for the high throughput enrichment ofRadiation Hybrid (RH) maps. The 3000 rad TM112 bovine RH panel was assayed with 37 EcoRI/TaqIAFLP primer combinations. The number of selective nucleotides used during PCR was increased to seven,to reduce the complexity of the AFLP profile and minimise the overlap between hamster and bovine bandsco-amplified from hybrid cell clones. Seven-hundred-forty-seven bovine AFLP bands were amplified thatcould be distinguished following electrophoresis. Repeatability was tested within and between laboratorieson independent template preparations and an error rate of 1.3% found. Two-point linkage analysis clustered428 AFLP fragments in 39 linkage groups of at least 4 markers. Multi-point maps were constructed for5 sample linkage groups. The study demonstrated that the AFLP approach could be used to rapidly screenfor the most informative clones during panel construction and to increase the number of markers onRH maps, which could be useful for joining linkage groups formed by other markers. The use of AFLPmarkers as anchor points between existing RH maps and other physical maps, such as BAC contigs, isalso discussed.
Introduction
Radiation hybrid (RH) mapping provides apowerful tool to order a large number of mar-kers, and to construct high-resolution maps ofanimal genomes. This approach is based on thebreakage of a donor genome by radiation, fol-lowed by the fusion of irradiated cells withhamster recipient cells that are obliged toretain at least a portion of the donor genometo complement a conditional mutation and sur-vive in a selective medium. Map construction is
then accomplished by observing the co-retentionof markers in a panel of cell lines, rather thanallele co-segregation in populations, as forlinkage mapping. Hence, RH mapping isapplicable for non-polymorphic markers. RHpanels have recently been used to producemedium to high resolution maps for a numberof species, including human (Walter et al. 1994)mouse (McCarthy et al. 1997), rat (Watanabeet al. 1999), cattle (Womack et al. 1997,Williams et al. 2002), pig (Yerle et al. 1998),horse (Chowdhary et al. 2002), chicken
Chromosome Research 12: 285–297, 2004. 285# 2004 Kluwer Academic Publishers. Printed in the Netherlands
(Morisson et al. 2002), zebrafish (Geisler et al.1999), and dog (Priat et al. 1998).
Three RH panels are presently available for cat-tle: the Womack-5000 rad panel of 90 RH clones(Womack et al. 1997); the Womack-12000 radpanel of 180 clones (Rexroad et al. 2000) and theTM112-3000 rad panel of 94 Radiation Hybridclones (Williams et al. 2000). RH panels are gen-erally characterised and anchored to existinggenetic maps using microsatellite markers; how-ever the number of these markers is often insu⁄-cient to join all linkage groups and assemblecomplete maps, particularly for high-resolutionpanels. The development of additional anonymousmarkers can be a time-consuming task, andgenerally other types of markers, particularlyESTs, are used to saturate RH maps. These ESTsalso serve to link the RH map with maps in otherspecies (Schlapfer et al. 2002, Weikard et al.2002). However, ESTs are potentially di⁄cult tomap, if the primers co-amplify the hamster genes;in addition mapping the ESTs is time-consuming,as each marker has to be typed individually.
High-throughput AFLP1 technology (Zabeau& Vos, 1993, Vos et al. 1995) is widely used tocreate high-density genetic maps in plant species.By contrast, AFLP markers have not been widelyused for genetic mapping in animal species mainlybecause microsatellite-based linkage maps arealready available for many livestock, domestic andlaboratory species, which are adequate for geneticstudies. In addition, AFLP markers have a lowPolymorphism Information Content and behaveas dominant markers in most conditions. How-ever, advantages of AFLP markers are that noprior sequence knowledge is required for genotyp-ing, and that large numbers of AFLP loci can begenotyped simultaneously starting from smallamounts of genomic DNA. Therefore, the markerdensity on RH maps could be rapidly increasedusing AFLP markers. In this paper we haveapplied the AFLP1 technology for high-through-put typing of RH cell lines. Mapping AFLPs athigh density in RH maps can help with the con-struction of other physical maps, such as BAC con-tigs, as AFLPs with known location have beenused for ¢ngerprinting and anchoring large insert
clones to the genetic map in plants (Klein et al.2000).
Materials and methods
RH panel
The Bovine TM112-3000 rad RH panel wascreated from a primary fibroblast line, derivedfrom a male Holstein calf, which was irradiatedwith 3000 rad of X-rays and then fused withnon-irradiated hypoxanthine-guanine phosphori-bosyltransferase deficient (HPRT-) hamster reci-pient cells (Wg3H; Williams et al. 2000).
AFLP markers
AFLP markers were produced according to theprotocol described in Ajmone-Marsan et al.(1997) with the following modifications: (i) in thepre-amplification step the EcoRI primers carried2 selective nucleotides at their 30 end, instead of1, and (ii) in the final amplification step EcoRIprimers carried 4 selective nucleotides at their 30
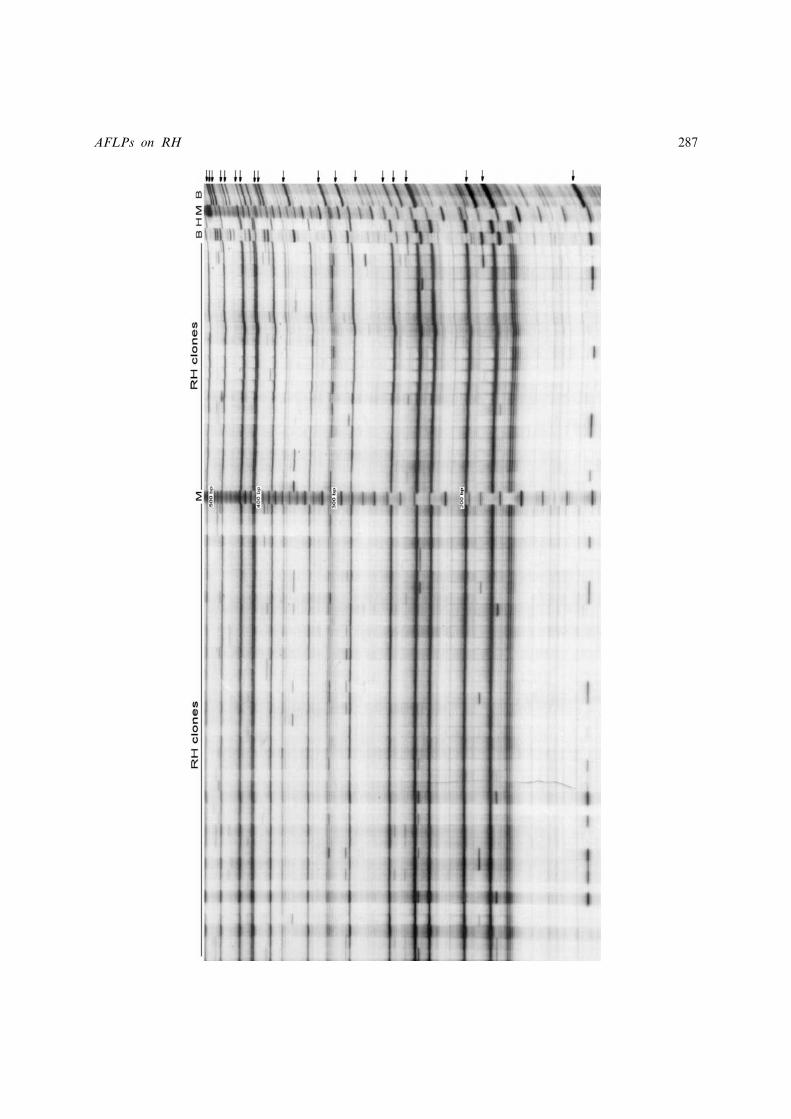
end, instead of 3. The use of these additionalselective nucleotides reduced the number of frag-ments amplified and so decreased the probabilityof overlapping of co-amplified fragments arisingfrom hamster and bovine genomes (Figure 1).The 33P-labelled amplification products wereseparated on acrylamide sequencing gels andrevealed either by autoradiography or scanningusing a Fuji BAS-2000 phosphoimager.
Thirty-seven EcoRI/TaqI primer pairs wereused to characterise the RH panel, including thebovine donor cell line and the hamster recipientcell line (Table 1). The AFLP ¢ngerprints were pro-duced by two independent laboratories, Piacenza(Italy) and Wageningen (The Netherlands). As aquality check, ¢ve primer pairs were duplicatedwithin a single laboratory and three betweenlaboratories.
In Wageningen, AFLPs were scored electro-nically, after collecting phosphoimage scans, usinga proprietary AFLP scoring software (Keygene
Figure 1. AFLP profile produced by EcoACAC/TaqAAG primer combination on the TM112 RH panel. B¼bovine parental,
H¼hamster parental; M¼molecular weight marker. Arrows point to bovine specific bands.
"
286 C. Gorni et al.
AFLPs on RH 287
NV) and a binary scoring system (1¼ bandpresence and 0¼ band absence). In Piacenza,AFLPs were scored by visual inspection. Onlyclear AFLP bands of bovine origin that did notoverlap with the hamster pro¢le were used in theanalysis. Inconsistencies between replicates werevisually re-evaluated by two experienced operatorsand corrected. Occasional faint bands were treatedas missing data (2¼missing).
Estimation of haploid AFLP bands
AFLPs are dominant markers and homozygousbands cannot be distinguished from heterozygousbands in the RH bovine parental. The identifica-tion of heterozygous AFLPs is neverthelessimportant, since they behave as haploid markersin the RH panel and may introduce errors orbias in mapping. We therefore attributed to each
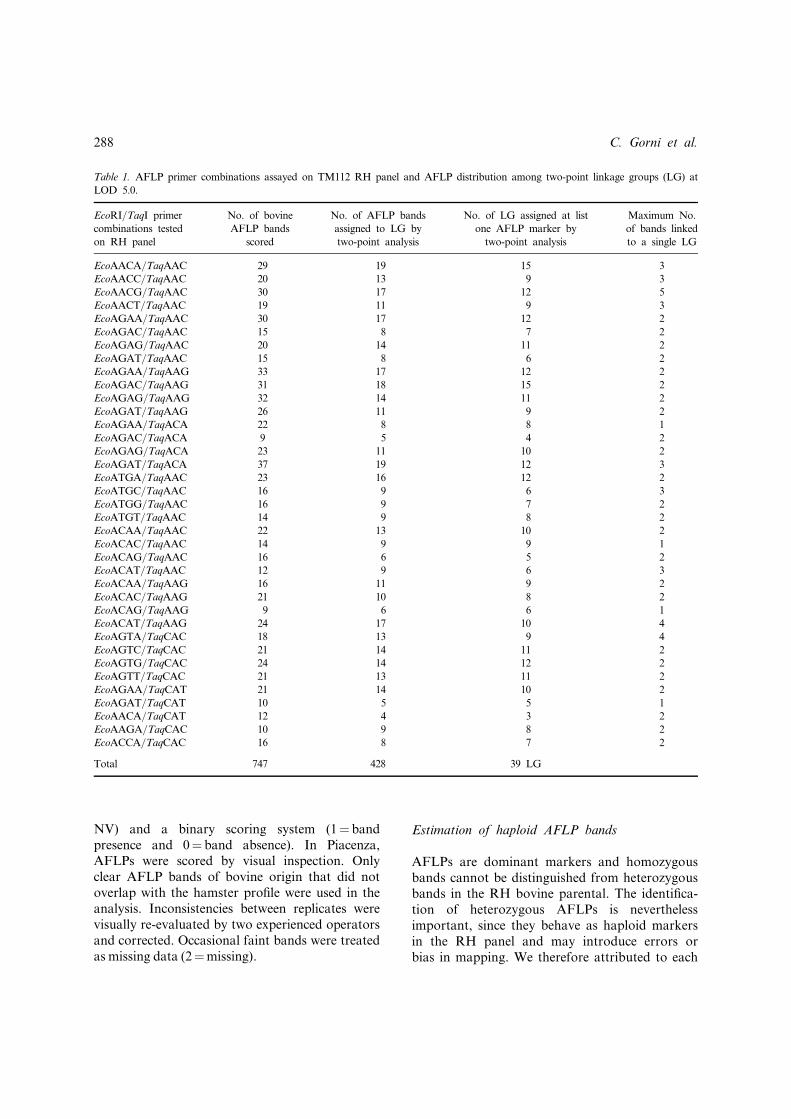
Table 1. AFLP primer combinations assayed on TM112 RH panel and AFLP distribution among two-point linkage groups (LG) at
LOD 5.0.
EcoRI/TaqI primer
combinations tested
on RH panel
No. of bovine
AFLP bands
scored
No. of AFLP bands
assigned to LG by
two-point analysis
No. of LG assigned at list
one AFLP marker by
two-point analysis
Maximum No.
of bands linked
to a single LG
EcoAACA/TaqAAC 29 19 15 3
EcoAACC/TaqAAC 20 13 9 3
EcoAACG/TaqAAC 30 17 12 5
EcoAACT/TaqAAC 19 11 9 3
EcoAGAA/TaqAAC 30 17 12 2
EcoAGAC/TaqAAC 15 8 7 2
EcoAGAG/TaqAAC 20 14 11 2
EcoAGAT/TaqAAC 15 8 6 2
EcoAGAA/TaqAAG 33 17 12 2
EcoAGAC/TaqAAG 31 18 15 2
EcoAGAG/TaqAAG 32 14 11 2
EcoAGAT/TaqAAG 26 11 9 2
EcoAGAA/TaqACA 22 8 8 1
EcoAGAC/TaqACA 9 5 4 2
EcoAGAG/TaqACA 23 11 10 2
EcoAGAT/TaqACA 37 19 12 3
EcoATGA/TaqAAC 23 16 12 2
EcoATGC/TaqAAC 16 9 6 3
EcoATGG/TaqAAC 16 9 7 2
EcoATGT/TaqAAC 14 9 8 2
EcoACAA/TaqAAC 22 13 10 2
EcoACAC/TaqAAC 14 9 9 1
EcoACAG/TaqAAC 16 6 5 2
EcoACAT/TaqAAC 12 9 6 3
EcoACAA/TaqAAG 16 11 9 2
EcoACAC/TaqAAG 21 10 8 2
EcoACAG/TaqAAG 9 6 6 1
EcoACAT/TaqAAG 24 17 10 4
EcoAGTA/TaqCAC 18 13 9 4
EcoAGTC/TaqCAC 21 14 11 2
EcoAGTG/TaqCAC 24 14 12 2
EcoAGTT/TaqCAC 21 13 11 2
EcoAGAA/TaqCAT 21 14 10 2
EcoAGAT/TaqCAT 10 5 5 1
EcoAACA/TaqCAT 12 4 3 2
EcoAAGA/TaqCAC 10 9 8 2
EcoACCA/TaqCAC 16 8 7 2
Total 747 428 39 LG
288 C. Gorni et al.
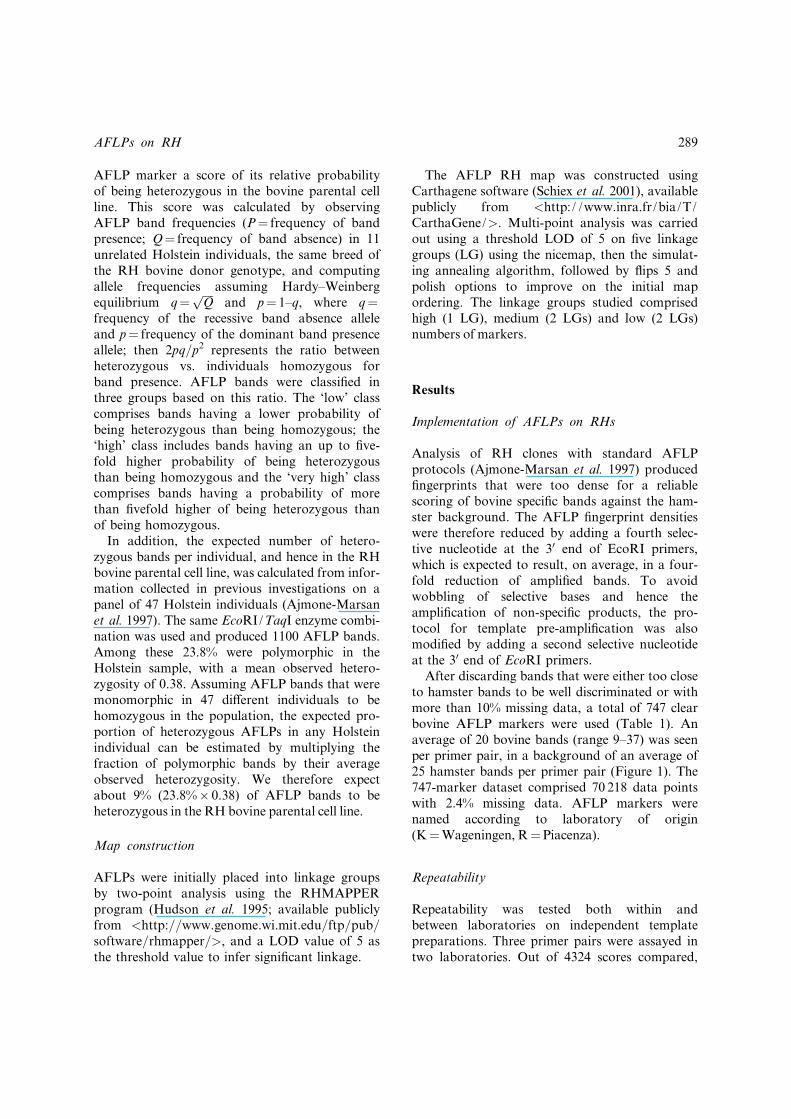
AFLP marker a score of its relative probabilityof being heterozygous in the bovine parental cellline. This score was calculated by observingAFLP band frequencies (P¼ frequency of bandpresence; Q¼ frequency of band absence) in 11unrelated Holstein individuals, the same breed ofthe RH bovine donor genotype, and computingallele frequencies assuming Hardy–Weinbergequilibrium q¼
ffiffiffiffi
Qp
and p¼ 1–q, where q¼frequency of the recessive band absence alleleand p¼ frequency of the dominant band presenceallele; then 2pq/p2 represents the ratio betweenheterozygous vs. individuals homozygous forband presence. AFLP bands were classified inthree groups based on this ratio. The ‘low’ classcomprises bands having a lower probability ofbeing heterozygous than being homozygous; the‘high’ class includes bands having an up to five-fold higher probability of being heterozygousthan being homozygous and the ‘very high’ classcomprises bands having a probability of morethan fivefold higher of being heterozygous thanof being homozygous.
In addition, the expected number of hetero-zygous bands per individual, and hence in the RHbovine parental cell line, was calculated from infor-mation collected in previous investigations on apanel of 47 Holstein individuals (Ajmone-Marsanet al. 1997). The same EcoRI/TaqI enzyme combi-nation was used and produced 1100 AFLP bands.Among these 23.8% were polymorphic in theHolstein sample, with a mean observed hetero-zygosity of 0.38. Assuming AFLP bands that weremonomorphic in 47 di¡erent individuals to behomozygous in the population, the expected pro-portion of heterozygous AFLPs in any Holsteinindividual can be estimated by multiplying thefraction of polymorphic bands by their averageobserved heterozygosity. We therefore expectabout 9% (23.8%� 0.38) of AFLP bands to beheterozygous in the RH bovine parental cell line.
Map construction
AFLPs were initially placed into linkage groupsby two-point analysis using the RHMAPPERprogram (Hudson et al. 1995; available publiclyfrom <http://www.genome.wi.mit.edu/ftp/pub/software/rhmapper/>, and a LOD value of 5 asthe threshold value to infer significant linkage.
The AFLP RH map was constructed usingCarthagene software (Schiex et al. 2001), availablepublicly from <http://www.inra.fr/bia/T/CarthaGene/>. Multi-point analysis was carriedout using a threshold LOD of 5 on ¢ve linkagegroups (LG) using the nicemap, then the simulat-ing annealing algorithm, followed by £ips 5 andpolish options to improve on the initial mapordering. The linkage groups studied comprisedhigh (1 LG), medium (2 LGs) and low (2 LGs)numbers of markers.
Results
Implementation of AFLPs on RHs
Analysis of RH clones with standard AFLPprotocols (Ajmone-Marsan et al. 1997) producedfingerprints that were too dense for a reliablescoring of bovine specific bands against the ham-ster background. The AFLP fingerprint densitieswere therefore reduced by adding a fourth selec-tive nucleotide at the 30 end of EcoRI primers,which is expected to result, on average, in a four-fold reduction of amplified bands. To avoidwobbling of selective bases and hence theamplification of non-specific products, the pro-tocol for template pre-amplification was alsomodified by adding a second selective nucleotideat the 30 end of EcoRI primers.
After discarding bands that were either too closeto hamster bands to be well discriminated or withmore than 10% missing data, a total of 747 clearbovine AFLP markers were used (Table 1). Anaverage of 20 bovine bands (range 9^37) was seenper primer pair, in a background of an average of25 hamster bands per primer pair (Figure 1). The747-marker dataset comprised 70 218 data pointswith 2.4% missing data. AFLP markers werenamed according to laboratory of origin(K¼Wageningen, R¼Piacenza).
Repeatability
Repeatability was tested both within andbetween laboratories on independent templatepreparations. Three primer pairs were assayed intwo laboratories. Out of 4324 scores compared,
AFLPs on RH 289
63 (1.5%) were inconsistent. Five primer pairsrepeated within the Piacenza laboratory pro-duced 7050 scores and revealed 86 incon-sistencies, giving an error rate of 1.2%.
Considering primer pairs repeated betweenand within laboratories, overall 9400 scoreswere duplicated (13.3% of all data); amongthese 123 inconsistent scores were found, resultingin an overall 1.3% error rate in scoring the AFLPbands.
AFLP classes
Out of 747 AFLPs, 619 (of which 589 weremonomorphic and 30 polymorphic in the Hol-stein sample) were classified in the ‘low’ class forprobability of heterozygosity, 45 (all polymorphicin the Holstein sample) in the class ‘high’, 30 (allpolymorphic) in the class ‘very high’ and 53remained missing data. Considering the smallnumber of Holstein animals analysed, this classi-fication is only approximate, however it is suffi-cient to discuss the behaviour of AFLP markersfor RH typing.
From AFLP data obtained previously from theHolstein breed (Ajmone-Marsan et al. 1997), weexpected 67 AFLP bands (9% of 747) to be hetero-zygous in the RH bovine parental, which is closeto the sum of the ‘high’ plus ‘very high’ classes(n¼ 75).
AFLP retention frequency
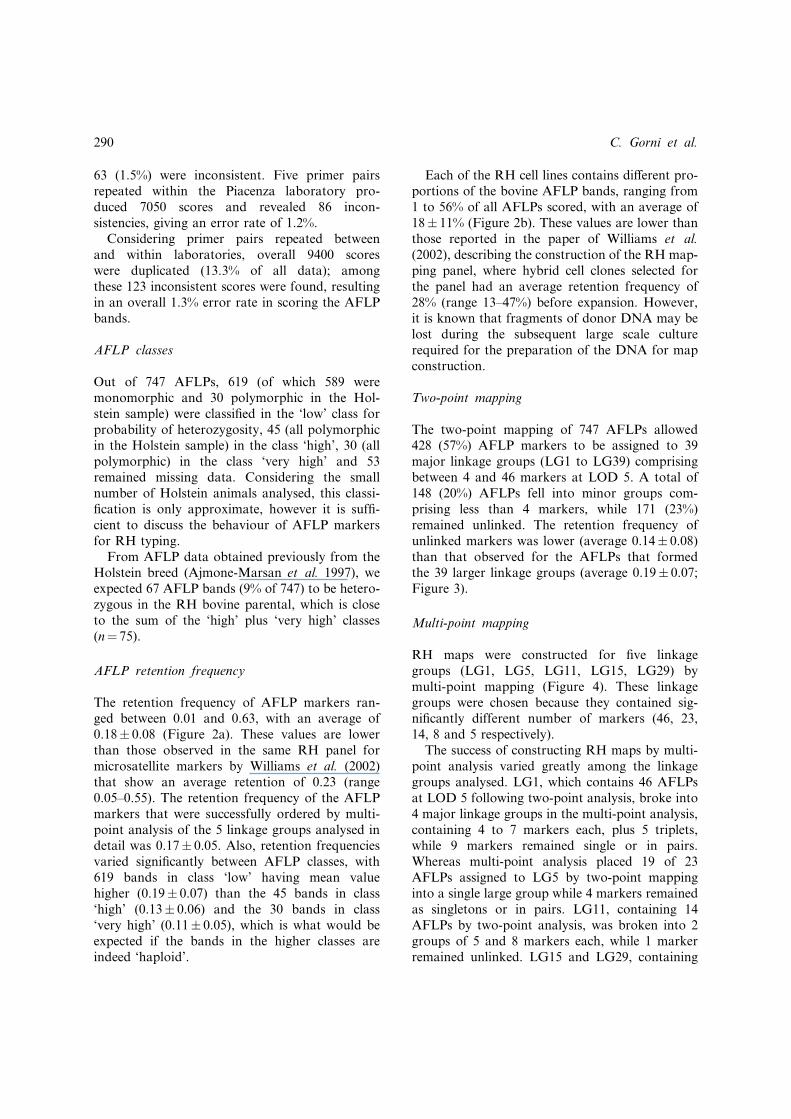
The retention frequency of AFLP markers ran-ged between 0.01 and 0.63, with an average of0.18� 0.08 (Figure 2a). These values are lowerthan those observed in the same RH panel formicrosatellite markers by Williams et al. (2002)that show an average retention of 0.23 (range0.05–0.55). The retention frequency of the AFLPmarkers that were successfully ordered by multi-point analysis of the 5 linkage groups analysed indetail was 0.17� 0.05. Also, retention frequenciesvaried significantly between AFLP classes, with619 bands in class ‘low’ having mean valuehigher (0.19� 0.07) than the 45 bands in class‘high’ (0.13� 0.06) and the 30 bands in class‘very high’ (0.11� 0.05), which is what would beexpected if the bands in the higher classes areindeed ‘haploid’.
Each of the RH cell lines contains di¡erent pro-portions of the bovine AFLP bands, ranging from1 to 56% of all AFLPs scored, with an average of18� 11% (Figure 2b). These values are lower thanthose reported in the paper of Williams et al.(2002), describing the construction of the RH map-ping panel, where hybrid cell clones selected forthe panel had an average retention frequency of28% (range 13^47%) before expansion. However,it is known that fragments of donor DNA may belost during the subsequent large scale culturerequired for the preparation of the DNA for mapconstruction.
Two-point mapping
The two-point mapping of 747 AFLPs allowed428 (57%) AFLP markers to be assigned to 39major linkage groups (LG1 to LG39) comprisingbetween 4 and 46 markers at LOD 5. A total of148 (20%) AFLPs fell into minor groups com-prising less than 4 markers, while 171 (23%)remained unlinked. The retention frequency ofunlinked markers was lower (average 0.14� 0.08)than that observed for the AFLPs that formedthe 39 larger linkage groups (average 0.19� 0.07;Figure 3).
Multi-point mapping
RH maps were constructed for five linkagegroups (LG1, LG5, LG11, LG15, LG29) bymulti-point mapping (Figure 4). These linkagegroups were chosen because they contained sig-nificantly different number of markers (46, 23,14, 8 and 5 respectively).
The success of constructing RH maps by multi-point analysis varied greatly among the linkagegroups analysed. LG1, which contains 46 AFLPsat LOD 5 following two-point analysis, broke into4 major linkage groups in the multi-point analysis,containing 4 to 7 markers each, plus 5 triplets,while 9 markers remained single or in pairs.Whereas multi-point analysis placed 19 of 23AFLPs assigned to LG5 by two-point mappinginto a single large group while 4 markers remainedas singletons or in pairs. LG11, containing 14AFLPs by two-point analysis, was broken into 2groups of 5 and 8 markers each, while 1 markerremained unlinked. LG15 and LG29, containing
290 C. Gorni et al.
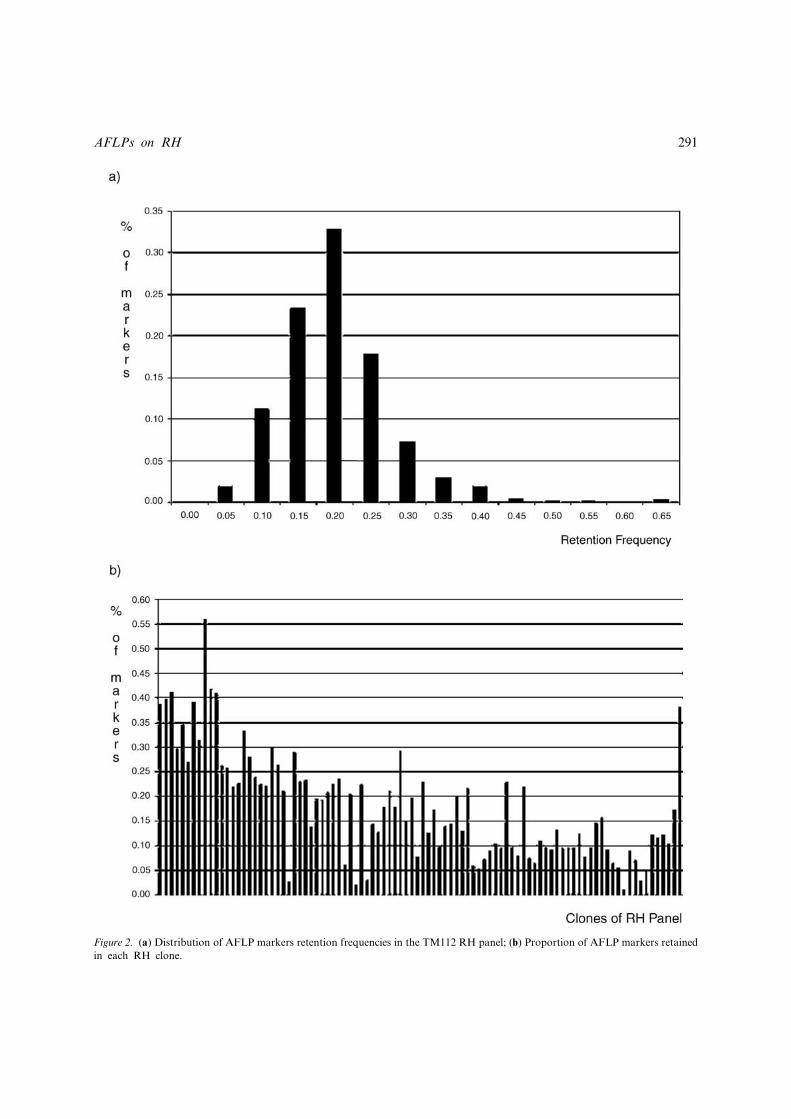
Figure 2. (a) Distribution of AFLP markers retention frequencies in the TM112 RH panel; (b) Proportion of AFLP markers retainedin each RH clone.
AFLPs on RH 291
respectively 8 and 5 markers from two-pointanalysis, remained as a single linkage group bymulti-point mapping (Figure 4).
Retention frequencies of markers retained in themulti-point map varied from 0.07 (K211, distalmarker in LG5) to 0.43 (K115, distal marker inLG1A). Retention Frequencies along linkagegroups are shown in Figure 4.
Mapping of haploid markers
Most AFLP markers ordered by multi-point ana-lysis were in the class ‘low’ (59 out of 67), how-ever 5 AFLPs (K301 in LG1C; K211, K56 andR272 in LG5; R114 in LG11A) classified in the‘high’ or ‘very high’ classes were still included inthe multi-point map. Retention frequencies of
these 5 markers varied from 0.07 in K211 to 0.14in R272. These AFLPs show a retention fre-quency lower than flanking markers, with K211and K56 on LG5, showing RF values (0.07 and0.11) 50% or less of flanking K279 marker(RF¼ 0.22; Figure 1), suggesting that they maybe haploid markers. With the exception of R114(RF¼ 0.13), markers classified in the ‘high’ or‘very high’ classes were located at or nearby theend of linkage groups.
AFLP marker distribution
Single AFLP primer pairs produced bands fallinginto between 3 (EcoAACA/TaqCAT) to 15(EcoAACA/TaqAAC) different linkage groups.The number of bands per linkage group for a
Figure 3. Distribution of retention frequencies of AFLP markers retained in the 39 major two-point linkage groups (black) and of
AFLP markers forming minor groups or remaining unlinked (white).
292 C. Gorni et al.
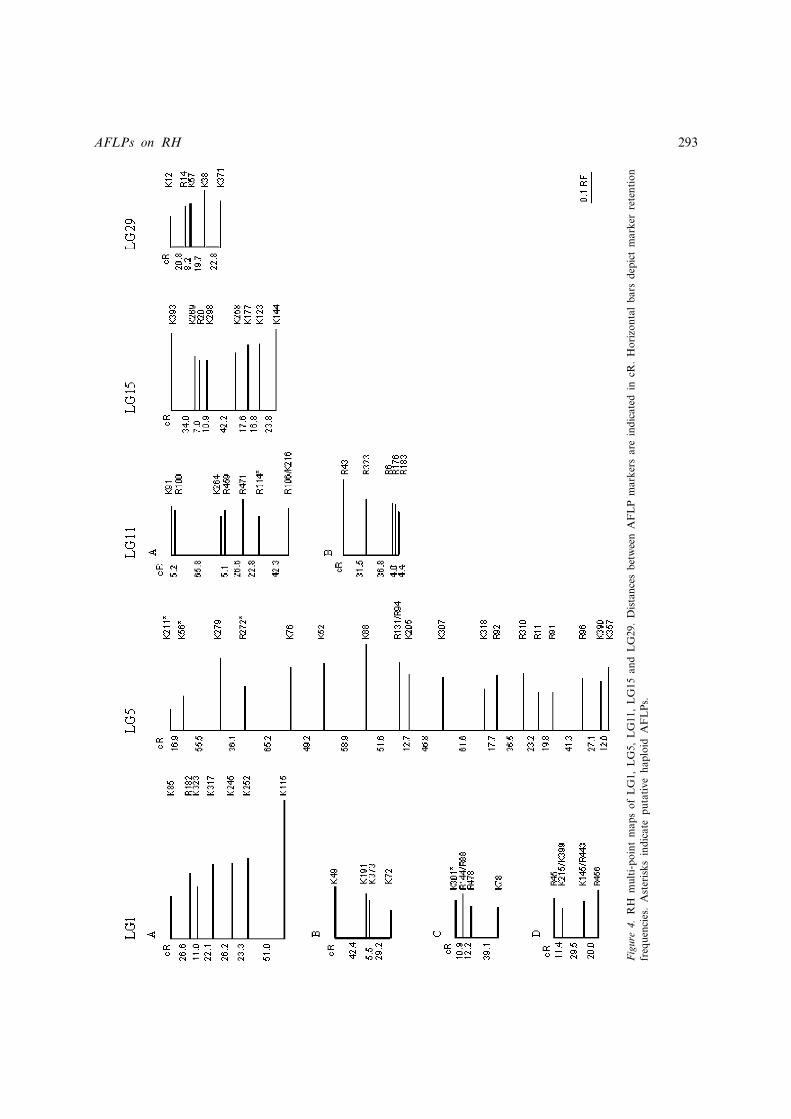
Figure
4.RHmulti-pointmapsofLG1,LG5,LG11,LG15andLG29.DistancesbetweenAFLPmarkersareindicated
incR.Horizontalbarsdepictmarkerretention
frequencies.AsterisksindicateputativehaploidAFLPs.
AFLPs on RH 293
primer depends on the number of bands amplified(Table 1), which suggests a random distribution ofAFLP markers across chromosomes. Single primerpairs generate AFLPs that frequently map to dif-ferent linkage groups, e.g., EcoAACG/TaqAACthat produced the largest number of bands in thesame linkage group (5) also amplified a large totalof 30 bands, which were distributed across 12different linkage groups (Table 1).
Discussion
RH panels are a valuable tool to construct high-resolution maps and are conveniently used tomap genes and ESTs, as no polymorphism isrequired to map markers. However, to constructhigh-resolution RH maps a large number of mar-kers are required to link markers across wholechromosomes, particularly in high radiation dosepanels. Microsatellite markers are routinely usedto anchor RH panels to existing genetic maps,however typing these markers on the RH panel isa cumbersome exercise. In this paper we reportthe testing of the AFLP1 technology to produceand type a large number of markers on an RHpanel in order to reach a saturated map morerapidly. The approach also provides the possibi-lity of linking the RH maps to other physicalmaps, such as the Bovine BAC contig that iscurrently being assembled, and thus assist andverify the contig assembly.
Implementation of AFLPs on RHs
Adjustment of the experimental conditions wasnecessary to adapt the AFLP procedure to theanalysis of the RH panel. Since restriction frag-ments of the donor and recipient genomes areco-amplified by the AFLP method, it was neces-sary to reduce the density of AFLP fragments sothat bovine and hamster bands could be dis-tinguished following electrophoresis. A fourthnucleotide was added at the 30 of EcoRI primerto reduce the complexity of the AFLP profileand allowed the majority of bovine specific bandsto be clearly resolved (Figure 1). This modifica-tion reduced the number of bands that wereamplified compared with the original protocol, so
that on average 20 instead of 69 bovine bandsper primer combination were observed (Ajmone-Marsan, unpublished observations), thus reducingthe likelihood of coincident hamster and bovinebands (Gort 2003). This illustrates how the num-ber of selective nucleotides of the AFLP primerscan be used to control the number of amplifiedfragments to be in line with the resolving powerof the detection platform.
Repeatability
Repeatability of AFLP scoring on the RH panelwas slightly higher within (98.8%) than between(98.5%) laboratories. The results are moreconsistent than expected, given that differentstrategies were used for scoring the markers(autoradiography and visual scoring in Piacenzavs. phosphoimage scanning and electronic analy-sis in Wageningen). Inconsistent scores were ran-domly distributed in the dataset, indicating thatnone of the markers was particularly unstable.Notably, 70% of inconsistent scores between thetwo labs were bands scored present in Piacenzabut absent in Wageningen. This suggests thatmanual and electronic scoring have different sen-sitivities that impacted most on the score attrib-uted to the less intense bands. This may in partexplain the low retention frequency observed andthe efficiency of mapping. However, there werevery few cases of inconsistencies over the wholedata set, even between laboratories (63 out of4324 scores), suggesting that this effect shouldnot affect greatly the joint mapping of AFLPdata obtained from different laboratories.
AFLP retention frequency
When selecting the primary cells to use in thefinal RH panel it is usual to type them with alimited number of markers to select those withthe highest retention of the donor genome. Theselection of markers and their limited numbermay give a biased impression of the quality of thepanel. The AFLP approach used here producedover 700 markers with retention frequenciesamong the cells of the TM112 panel rangingbetween 1 and 56% (Figure 2b). AFLPs could beused as a rapid screening tool to identify thoseRH clones containing the highest proportion of
294 C. Gorni et al.
the donor genome, and hence aid the selection ofthe optimum panel. The use of the AFLPapproach will allow for a better characterisationof the panel for a smaller effort than typingmicrosatellites or non-multiplexed markers.
The retention frequencies of the AFLP markersacross the panel and in each cell line wassigni¢cantly lower than that observed for the micro-satellite loci typed by Williams et al. (2002). Theaverage and range of values across the panel wererespectively 0.18 and 0.01^0.63 for AFLPs whereas0.23 and 0.05^0.55 was observed for microsatellitemarkers. It is di⁄cult to see why retention fre-quencies for theAFLPmarkersare lower.Onepossi-bility is that AFLP markers are dominant markersand when heterozygous in the bovine donorgenome, behaveashaploidmarkers inRHpanels.
However, the lower AFLP retention frequencycannot be attributed solely to the e¡ect of haploidmarkers, as we know from previous experiencethat in any individual only 9% of all AFLP bandsare expected to be heterozygous (Ajmone-Marsanet al. 1997). Therefore only 67 markers (9% of747) would be expected to be heterozygous in thedonor genome. The retention frequency for bandsclassi¢ed in the probability of heterozygosity class‘low’ gave only a slightly higher retention fre-quency (0.19), which is still lower than thatobserved with microsatellites. For the AFLP mar-kers retained in the multi-point map the RF was0.17, well below the average of the mapped micro-satellite loci (Williams et al. 2002). This suggeststhat there are additional reasons for the low RFfor the AFLPs. As the fragments of bovine gen-ome are progressively lost during hybrid cellgrowth, the individual ‘lines’ contain variableamounts of the donor genome fragments, whilemaintaining a complete recipient genome. In somecases only a small number of the cells in a ‘line’will carry particular bovine chromosomal frag-ments and hence the intensity of some of thebovine speci¢c AFLP bands may be low, especiallyin comparison with the bands arising from thehamster genome. It is possible that the sensitivityof detecting the AFLP fragments is lower than formicrosatellites and hence some fragments are notdetected.
The variable detection sensitivity of AFLP frag-ments between cell lines of the panel would not beexpected to have a major impact on the mapping
accuracy of AFLP fragments alone, because £ank-ing AFLP markers derived from the same donorsegment in the cell line would be equally repre-sented in the DNA sample of the line. However,RH maps built on a combination of AFLP mar-kers and microsatellites may be of greater concern,because ‘false negative’ AFLP scores are likely toin£ate the map.
Caution should therefore be exercised whencombining data produced by technologies havingdi¡erent sensitivities on a same RH panel.
Two point mapping
RH maps were built using the AFLP data toassess their utility for characterisation of newlyproduced RH panels. From the two-point analy-sis 428 out of 747 AFLPs (57%) were grouped in39 linkage groups containing 4 to 46 AFLPs, 148(20%) formed small groups of 2 or 3 markersand 171 (23%) remained unlinked. This is notsurprising as data from Williams et al. (2002)used 1238 STS to obtain single LOD 4 linkagegroups for most chromosomes, with 64 (5%)remaining unlinked. The human GB4 panel stilldoes not have all chromosomes included in singlelinkage groups, despite having several thousandmarkers typed, although this is a high resolutionpanel (Gyapay et al. 1996). AFLP markersunlinked by two-point analysis may be toodistant from the next marker to give significantlinkage at this marker density, may containerrors in typing, or may be haploid. Indeed,retention frequency of unlinked markers was low(0.14� 0.07) in relation to the average, andabout 50% of the bands having ‘high’ or ‘veryhigh’ probability of being haploid fell in thisgroup of unlinked.
The AFLP markers appear to randomly dis-tribute among LGs, with no primer pair targetingany speci¢c group (Table 1). Therefore there doesnot seem to be a bias in the distribution of theAFLPmarkers in the genome.
Multi-point maps
It was not possible to include all the markersassigned to a linkage group into a multi-pointmap, which is a common problem. When multi-point maps were constructed for 5 LGs, around
AFLPs on RH 295
30% of the markers could not be included in theordered maps for the linkage groups. Specifically,67 of 96 markers occurred in linkage groups of atleast four markers, 15 in triplets and the others inpairs or unlinked. Those excluded from the mapseem to have been included in the linkage groupbecause of strong linkage to only a single markerwithin the linkage group. In a few cases LGsidentified by two-point analysis could not beassembled into a coherent map, and multi-pointanalysis created a series of subgroups containinga small number of markers (e.g., LG1; Figure 4).It is therefore clear that the number of AFLPmarkers produced in this study is insufficient tosaturate the map and span whole chromosomesin single linkage groups, and the linkage groupsverified by multi-point mapping correspond toregions of chromosomes having variable length(Figure 4). Assuming the same map length(39 448 cR) obtained by Williams et al. (2002)using the same panel, and a random distributionof AFLPs across the genome, the use of 747 mar-kers would result in having on average 53 cRbetween adjacent markers, while the coherentSTS map contains 1174 markers, with an averagedistance between markers of about 34 cR. Never-theless, the advantage of the AFLP approach isthat the use of additional primers could readilyincrease the number of markers. This is in con-trast with other marker types where considerableeffort would be required to increase the numberof markers. Therefore doubling (or more) thenumber of AFLP markers described here wouldbe a relatively straightforward exercise.
Haploid markers
Williams et al. (2002) noted one microsatellitemarker displaying characteristics of being hap-loid (i.e. having a null allele) that was included intheir RH map at a position that was discordantwith the linkage map. Therefore, the investiga-tion of mapping behaviour of haploid markersis of interest, as it is not clear if they can beincluded in multi-point maps and how they affectmap construction.
We classi¢ed AFLPs according to their prob-ability of heterozygosity based on estimate ofAFLP allele frequencies in Holstein genotypes.Then, we investigated the behaviour of markers in
the ‘high’ and ‘very high’ classes as putative hap-loid markers. Many of these markers resultedunlinked in two-point mapping (36 out of 75), orwere subsequently excluded from the map bymulti-point analysis (3 out of 8 in the ¢ve two-point linkage groups investigated in detail).
All 5 putative haploid markers retained bymulti-point analysis were located at or near theends of linkage groups (Figure 4). This is in agree-ment with Williams et al. (2002), where it was sug-gested that haploid markers would either fail tolink to the map or map to an incorrect distant loca-tion. This is also in agreement with expectation, astwo markers in complete linkage, but one of whichwas diploid and the other haploid, may have asmany as 50% of the cells positive for the diploidmarker, negative for the haploid. The relative lownumber of haploid markers produced by AFLP1
technology are likely excluded from the multi-point map or eventually located at telomericpositions and thus should not be a major problemin map construction.
The next step will be to investigate the combina-tion of AFLP data with the existing microsatellitemapping data (Williams et al. 2002) and if possibleto construct an integrated chromosomal map withdecreased average distances between markers andhence likely better support for orientation of link-age groups and overall marker ordering. IndeedAFLP markers may allow the number of markersavailable on a RH map to be rapidly increased andhence permit the construction of more completeRH maps, particularly for high resolution 10 000or 12 000 rad panels.
Acknowledgments
This work has been supported by the EuropeanCommission (BovGen contract QLRI-CT-2002-02744). The content of the publication doesnot necessarily represent the views of theCommission or its services. AFLP1 is a regis-tered trademark of Keyegene NV.
References
Ajmone-Marsan P, Valentini A, Cassandro M, Vecchiotti-
Antaldi G, Bertoni G, Kuiper M (1997) AFLP markers for
DNA fingerprinting in cattle. Anim Genet 28: 418–426.
296 C. Gorni et al.
Chowdhary BP, Raudsepp T, Honeycutt D et al. (2002)
Construction of a 5000(rad) whole-genome radiation hybrid
panel in the horse and generation of a comprehensive and
comparative map for ECA11. Mamm Genome 13: 89–94.Geisler R, Rauch GJ, Baier H et al. (1999) A radiation hybrid
map of the zebrafish genome. Nat Genet 23: 86–89.Gort G (2003) Statistical properties of AFLP. Theme Con-
ference of the Royal Statistical Society, Statistical genetics
and bioinformatics, Limburgs Universitair Centrum,
Hasselt-Diepenbeek, Belgium.
Gyapay G, Schmit TK, Fizames C et al. (1996) A radiation hy-
brid map of the human genome. Hum Mol Genet 5: 339–346.Hudson TJ, Stein LD, Gerety SS et al. (1995) An STS-based
map of the human genome. Science 270: 1945–1954.Klein PE, Klein RR, Cartinhour SW et al. (2000) A high-
throughput AFLP-based method for constructing integrated
genetic and physical maps: progress toward a sorghum
genome map. Genome Res 10: 789–807.McCarthy LC, Terrett J, Davis ME et al. (1997) A first-
generation whole genome-radiation hybrid map spanning
the mouse genome. Genome Res 7: 1153–1161.Morisson M, Lemiere A, Bosc S et al. (2002) ChickRH6: a
chicken whole-genome radiation hybrid panel. Genet Sel
Evol 34: 521–533.Priat C, Hitte C, Vignaux F et al. (1998) A whole-genome
radiation hybrid map of the dog genome. Genomics 54:361–378.
Rexroad CE 3rd, Owens EK, Johnson JS, Womack JE (2000)
A 12,000 rad whole genome radiation hybrid panel for high
resolution mapping in cattle: characterization of the cen-
tromeric end of chromosome 1. Anim Genet 31: 262–265.Schiex T, Chabrier P, Bouchez M, Milan D (2001) Boosting
EM for Radiation Hybrid and Genetic mapping. Pro-
ceedings of WABI (First Workshop on Algorithms in
Bioinformatics), LNCS 2149.
Schlapfer J, Stahlberger-Saitbekova N, Comincini S et al.
(2002) A higher resolution radiation hybrid map of bovine
chromosome 13. Genet Sel Evol 34: 255–267.Vos P, Hogers R, Bleeker M et al. (1995) AFLP: a new
technique for DNA fingerprinting. Nucleic Acids Res 23:4407–4414.
Walter MA, Spillett DJ, Thomas P, Weissenbach J,
Goodfellow PN (1994) A method for constructing radiation
hybrid maps of whole genomes. Nat Genet 7: 22–28.Watanabe TK, Bihoreau MT, McCarthy LC et al. (1999) A
radiation hybrid map of the rat genome containing 5255
markers. Nat Genet 22: 27–36.Weikard R, Kuhn C, Goldammer T, Laurent P, Womack JE,
Schwerin M (2002) Targeted construction of a high-
resolution, integrated, comprehensive, and comparative map
for a region specific to bovine chromosome 6 based on
radiation hybrid mapping. Genomics 79: 768–776.Williams JL, Eggen A, Ferretti L et al. (2000) Development of
a bovine whole genome radiation hybrid panel map for
comparative mapping across species and the identification of
positional candidate genes for genetically mapped traits.
ISAG congress, abstract #A017.
Williams JL, Eggen A, Ferretti L et al. (2002) A bovine whole-
genome radiation hybrid panel and outline map. Mamm
Genome 13: 469–474.Womack JE, Johnson JS, Owens EK, Rexroad CE 3rd,
Schlapfer J, Yang YP (1997) A whole-genome radiation
hybrid panel for bovine gene mapping. Mamm Genome 8:854–856.
Yerle M, Pinton P, Robic A et al. (1998) Construction of a
whole-genome radiation hybrid panel for high-resolution
gene mapping in pigs. Cytogenet Cell Genet 82: 182–188.Zabeau M, Vos P (1993) Selective restriction amplification: A
general method for DNA fingerprinting. European Patent 0
534 858.
AFLPs on RH 297


