Embed Size (px)
Citation preview
ORIGINAL PAPER
Quantitative cDNA-AFLP analysis for genome-wide expression studies
Received: 30 October 2002 / Accepted: 5 February 2003 / Published online: 18 March 2003� Springer-Verlag 2003
Abstract AnimprovedcDNA-AFLPmethod for genome-wide expression analysis has been developed. Wedemonstrate that this method is an efficient tool forquantitative transcript profiling and a valid alternativeto microarrays. Unique transcript tags, generated fromreverse-transcribed messenger RNA by restriction en-zymes, were screened through a series of selective PCRamplifications. Based on in silico analysis, an enzymecombination was chosen that ensures that at least 60%of all the mRNAs were represented by an informativesequence tag. The sensitivity and specificity of themethod allows one to detect poorly expressed genes anddistinguish between homologous sequences. Accurategene expression profiles were determined by quantitativeanalysis of band intensities, and subtle differences intranscriptional activity were revealed. A detailed screenfor cell cycle-modulated genes in tobacco demonstratesthe usefulness of the technology for genome-wide ex-pression analysis.
Keywords Cell cycle Æ Functional genomics Æ Geneexpression Æ Microarrays Æ Transcriptome
Introduction
Large-scale genomic and cDNA sequencing projectshave identified numerous genes for which no biologicalfunction is known. Genome-wide expression analysis is avaluable tool for determining the functions of genes andtheir spatial and temporal expression patterns, as well aselucidating the genetic networks in which they partici-pate. Microarrays have been used successfully in anumber of studies addressing diverse questions (Breyneand Zabeau 2001) and are rapidly becoming the majortechnology for whole transcriptome analyses. Never-theless, their utility is currently restricted to a smallnumber of organisms and is, in several cases, limited bythe lack of a representative set of genes. Other currentdrawbacks of the method are its limited sensitivity anddifficulties encountered in distinguishing transcriptsfrom homologous genes, two problems that are intrinsicto hybridization-based techniques.
Alternative methods for genome-wide expressionanalysis, based on sequencing or PCR amplification oftranscript tags, overcome some of the limitations ofmicroarrays, and have been used successfully in manydifferent organisms (Breyne and Zabeau 2001). Thewidely used cDNA-AFLP method and related tech-niques have been employed for gene discovery (Durrantet al. 2000; Qin et al. 2000; Sutcliffe et al. 2000; van derBiezen et al. 2000; Kornmann et al. 2001) but not, so far,for global, quantitative gene expression analysis. Here,we describe how the original cDNA-AFLP method(Bachem et al. 1996) can be improved and adapted topermit its use as a robust and reproducible tool forquantitative transcript profiling. Using the plant cellcycle as model, we demonstrate that the method can beused to perform genome-wide expression studies anddiscuss its advantages over microarrays.
Recently, using microarrays, genome-wide expressionanalysis in yeast, bacteria, and human fibroblasts hasrevealed that approximately 10% of all transcripts ac-cumulate differentially during the mitotic cell cycle
Mol Gen Genomics (2003) 269: 173–179DOI 10.1007/s00438-003-0830-6
P. Breyne Æ R. Dreesen Æ B. Cannoot Æ D. Rombaut
K. Vandepoele Æ S. Rombauts Æ R. VanderhaeghenD. Inze Æ M. Zabeau
Communicated by R. G. Herrmann
P. Breyne Æ R. Dreesen Æ B. CannootD. Rombaut Æ K. Vandepoele Æ S. RombautsR. Vanderhaeghen Æ D. Inze (&) Æ M. ZabeauDepartment of Plant Systems Biology,Flanders Interuniversity Institute for Biotechnology,Ghent University, K.L. Ledeganckstraat 35,9000, Gent, BelgiumE-mail: [email protected].: +32-9-2645171Fax: +32-9-2645349
Present address: P. BreyneInstitute for Forestry and Game Management,9500, Geraardsbergen, Belgium
Present address: R. DreesenBetter3Fruit, W. de Croylaan 42,3001, Leuven, Belgium
(Spellman et al. 1998; Laub et al. 2000; Cho et al. 2001).Most genes that play a role in a particular process areexpressed strictly during or just before the cell cyclephase in which this process occurs and co-regulatedgenes follow the same expression profile. To assesstranscriptional modulation of gene activity during celldivision, highly synchronized cells in which discretefluctuations in mRNA levels can be monitored efficientlyare required. In plants, the tobacco (Nicotiana tabacum)cell line Bright Yellow-2 (BY2; Nagata et al. 1992) is stillthe preferred cell line in this respect and is, therefore, themost widely used system for cell cycle research. How-ever, the choice of the BY2 cell line as model system hasimplications for the design of experiments for genome-wide expression analysis. Microarrays are excluded sincefew cDNAs and genomic sequences are available fortobacco. This lack of molecular resources underlines theneed for alternative transcript profiling methods that donot require specific sequence information.
Materials and methods
Maintenance and synchronization of BY2 cells
Cultured cell suspensions of Nicotiana tabacum L. cv. Bright Yel-low 2 were maintained as described by Nagata et al. (1992). Forsynchronization, a 7-day-old stationary culture was diluted 10-foldin fresh medium supplemented with aphidicolin (Sigma-Aldrich, St.Louis, Mo.; 5 mg/l), which inhibits DNA polymerase a. After 24 h,cells were released from the block by washing several times withfresh medium and thus allowed to resume cell cycle progression.
Sampling of material and monitoring of synchrony
Samples were taken every hour for 11 h, starting at the time ofrelease from the aphidicolin block (time 0). A sub-sample was usedto check cell cycle progression and synchrony levels. After DNAstaining with 5 mg/l 4’,6-diamidino-2-phenylindole (Sigma-Ald-rich), the mitotic index was determined by counting the number ofcells undergoing mitosis by fluorescence microscopy. A mitoticpeak of approximately 40% was obtained 8 h after washing. Forflow cytometry, cells were first incubated in a buffered enzymesolution (2% cellulase and 0.1% pectolyase in 0.66 M sorbitol) for20 min at 37�C. After the suspension had been washed and resus-pended in Galbraith buffer (Galbraith et al. 1983), it was filteredthrough a 30-lm nylon mesh to purify the 4’,6-diamidino-2-phenylindole-stained nuclei. The fluorescence intensity was mea-sured using a BRYTE HS flow cytometer (Bio-Rad, Hercules,Calif.). Exit from S-phase was observed 4 h after release fromaphidicolin inhibition, and the level of synchrony was shown to besufficiently high throughout the time course.
RNA extraction and cDNA synthesis
Total RNA was prepared by LiCl precipitation (Sambrook et al.1989) and poly(A)+ RNA was extracted from 500-lg samples oftotal RNA using Oligotex columns (Qiagen, Hilden, Germany)according to the manufacturer’s instructions.
Starting from 1 lg of poly(A)+ RNA, first-strand cDNA wassynthesized by reverse transcription with a biotinylated oligo-dT25
primer (Genset, Paris, France) and Superscript II (Life Technolo-gies, Gaithersburg,Md.). Second-strand synthesis was performed bystrand displacement with Escherichia coli ligase (Life Technologies),DNA polymerase I (USB, Cleveland, Ohio) and RNase H (USB).
cDNA-AFLP analysis
Five hundred nanograms of double-stranded cDNA was used forAFLP analysis as described (Vos et al. 1995; Bachem et al. 1996)with modifications. The restriction enzymes used were BstYI andMseI (New England Biolabs, Beverly, Mass.) and the digestion wasperformed in two separate steps. After digestion with one of theenzymes, the 3¢ end fragments were collected on Dyna beads(Dynal, Oslo, Norway) by virtue of their biotinylated tails, whilethe other fragments were washed away. After digestion withthe second enzyme, the restriction fragments released from thebeads were collected and used as templates in the subsequentAFLP steps. The following adapters were used: for BstYI,5¢-CTCGTAGACTGCGTAGT-3¢ and 5¢-GATCACTACGCA-GTCTAC-3¢, and for MseI, 5¢-GACGATGAGTCCTGAG-3¢ and5¢-TACTCAGGACTCAT-3¢; the primers for BstYI and MseI were5¢-GACTGCGTAGTGATC(T/C)N1-2-3¢ and 5¢-GATGAGTCC-TGAGTAAN1-2-3¢, respectively, where N represents the selectivenucleotide(s). For preamplifications, an MseI primer without se-lective nucleotides was combined with a BstYI primer containingeither a T or a C at the 3¢ end. PCR conditions were as described(Vos et al. 1995). The amplification products were diluted 600-foldand 5-ll aliquots were used for selective amplifications using a33P-labeled BstYI primer and the Amplitaq-Gold polymerase(Roche Diagnostics, Brussels, Belgium). Amplification productswere separated on 5% polyacrylamide gels using the Sequigel sys-tem (Biorad). Dried gels were exposed to Kodak Biomax films andscanned with a phosphoImager (Amersham Biosciences, LittleChalfont, UK).
In silico cDNA-AFLP simulations
The sequences of a total of 5000 full-length cDNAs, provided byCERES, were analyzed with the AFLPinSilico program (Rombautset al. 2003) in order to simulate cDNA-AFLP transcript profilingexperiments. AFLPinSilico performs a screen of the input se-quences by looking for particular restriction sites and identifies theappropriate restriction fragments or transcript tags. Based on theoutcome of this analysis, distributions of the occurrence of tags inthe data set are calculated, which reflect the efficiency that may beexpected when genome-wide expression studies are performed withparticular enzyme combinations. The combinations of restrictionsites used here were GATC, TCGA, CTNAG, CCWGG,CCWWGG, RGATCY,or ACRYGT as first sites in combinationwith TTAA as second sites, or vice versa. Based on the results, wewere able to choose the optimal restriction enzyme combination forthe cDNA-AFLP experiments.
Characterization of AFLP fragments
Bands corresponding to differentially expressed transcripts were cutout from the gel and the DNA was eluted and reamplified under theconditions used for selective amplification. Sequence informationwas obtained by direct sequencing of the reamplified PCR productwith the selective BstYI primer, or by sequencing individual clonesafter cloning the fragments in the pGEM-T easy (Promega, Mad-ison, Wis.) vector. The sequences obtained were compared withnucleotide and protein sequences in the publicly available data-bases by BLAST sequence alignments (Altschul et al. 1997).
Quantitative measurements of expression profilesand data analysis
Scanned gel images were quantitatively analyzed using the AFLPQuantarPro image analysis software (Keygene N.V., Wageningen,The Netherlands). This software was designed for accurate lanedefinition, fragment detection, and quantification of band intensi-ties. All visible AFLP fragments were scored and individual band
174
intensities in each lane were measured. The raw data obtained werefirst corrected for differences in total lane intensities, which mayarise due to loading errors or differences in the efficiency of PCRamplification with a given primer combination for one or moretime points. The correction factors were calculated based on bandsthat remained constant throughout the time course. For eachprimer combination, a minimum of 10 invariable bands were se-lected and the intensity values were summed per lane. Each sum-med value was divided by the maximal summed value to give thecorrection factors. Finally, all raw values generated by QuantarProwere divided by these correction factors.
Subsequently, each individual gene expression profile wasvariance-normalized by standard statistical approaches as used formicroarray-derived data (Tavazoie et al. 1999). For each transcript,the mean expression value across the time course was subtractedfrom each individual data point, after which the value obtained wasdivided by the standard deviation. A coefficient of variation (CV)was calculated by dividing the standard deviation by the mean.This CV was used to establish a cut-off value, and all expressionprofiles with a CV less than 0.25 were considered to be constitutivethroughout the time course. The Cluster and TreeView software(Eisen et al. 1998) was used for average linkage hierarchical clus-tering.
Isolation of cDNA clones
A cDNA library with an average insert size of 1400 bp was made(Life Technologies) with poly(A)+ RNA isolated from activelydividing, non-synchronized BY2 cells. From this library, 46,000clones were selected, arrayed in 384-well microtiter plates, andsubsequently spotted in duplicate on nylon filters. The arrayedclones were screened using pools of several hundred radioactivelylabeled tags as probes. Positive clones were isolated, sequenced,and aligned with the tag sequences. Alternatively, tag-specificprimers were designed using the Primer3 program (http://www-genome.wi.mit.edu/genome_software/other/primer3.html) andused in combination with a common vector primer to amplifypartial cDNA inserts. Pools of DNA from 50,000, 100,000,150,000, and 300,000 cDNA clones were used as templates in thePCR amplifications. Amplification products were isolated fromagarose gels, cloned, sequenced, and aligned with the tags.
Results and discussion
Improved cDNA-AFLP-based transcript profiling
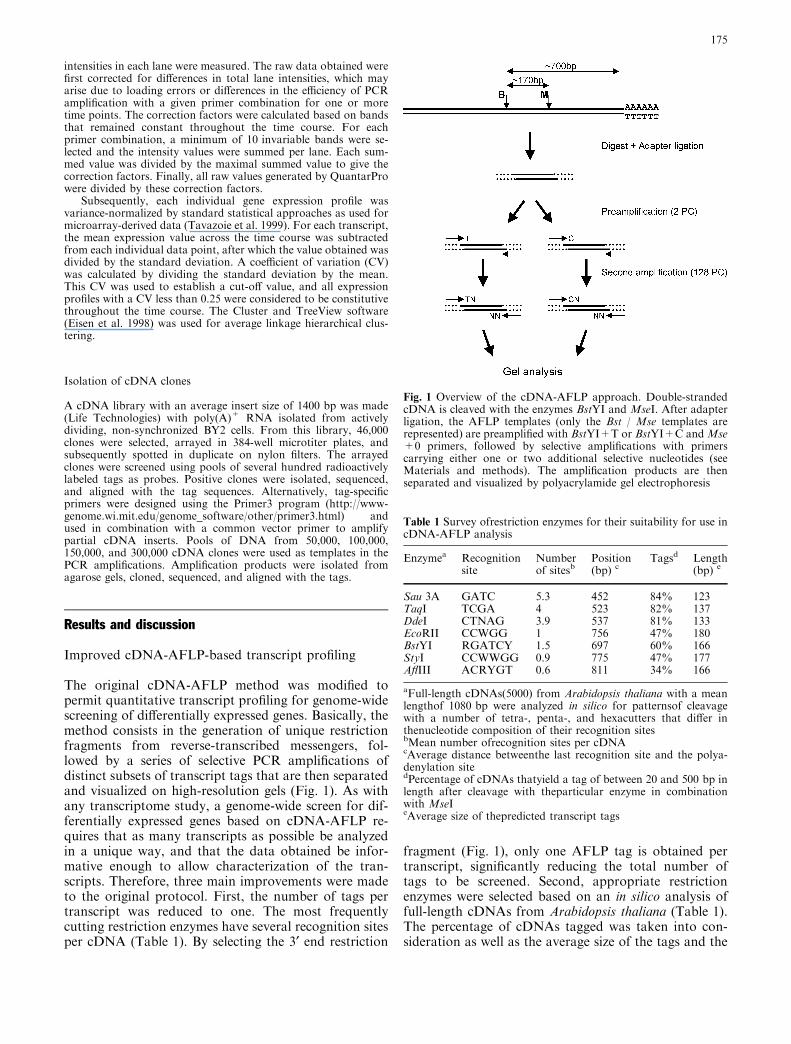
The original cDNA-AFLP method was modified topermit quantitative transcript profiling for genome-widescreening of differentially expressed genes. Basically, themethod consists in the generation of unique restrictionfragments from reverse-transcribed messengers, fol-lowed by a series of selective PCR amplifications ofdistinct subsets of transcript tags that are then separatedand visualized on high-resolution gels (Fig. 1). As withany transcriptome study, a genome-wide screen for dif-ferentially expressed genes based on cDNA-AFLP re-quires that as many transcripts as possible be analyzedin a unique way, and that the data obtained be infor-mative enough to allow characterization of the tran-scripts. Therefore, three main improvements were madeto the original protocol. First, the number of tags pertranscript was reduced to one. The most frequentlycutting restriction enzymes have several recognition sitesper cDNA (Table 1). By selecting the 3¢ end restriction
fragment (Fig. 1), only one AFLP tag is obtained pertranscript, significantly reducing the total number oftags to be screened. Second, appropriate restrictionenzymes were selected based on an in silico analysis offull-length cDNAs from Arabidopsis thaliana (Table 1).The percentage of cDNAs tagged was taken into con-sideration as well as the average size of the tags and the
Fig. 1 Overview of the cDNA-AFLP approach. Double-strandedcDNA is cleaved with the enzymes BstYI and MseI. After adapterligation, the AFLP templates (only the Bst / Mse templates arerepresented) are preamplified with BstYI+T or BstYI+C and Mse+0 primers, followed by selective amplifications with primerscarrying either one or two additional selective nucleotides (seeMaterials and methods). The amplification products are thenseparated and visualized by polyacrylamide gel electrophoresis
Table 1 Survey ofrestriction enzymes for their suitability for use incDNA-AFLP analysis
Enzymea Recognitionsite
Numberof sitesb
Position(bp) c
Tagsd Length(bp) e
Sau 3A GATC 5.3 452 84% 123TaqI TCGA 4 523 82% 137DdeI CTNAG 3.9 537 81% 133EcoRII CCWGG 1 756 47% 180BstYI RGATCY 1.5 697 60% 166StyI CCWWGG 0.9 775 47% 177AflIII ACRYGT 0.6 811 34% 166
aFull-length cDNAs(5000) from Arabidopsis thaliana with a meanlengthof 1080 bp were analyzed in silico for patternsof cleavagewith a number of tetra-, penta-, and hexacutters that differ inthenucleotide composition of their recognition sitesbMean number ofrecognition sites per cDNAcAverage distance betweenthe last recognition site and the polya-denylation sitedPercentage of cDNAs thatyield a tag of between 20 and 500 bp inlength after cleavage with theparticular enzyme in combinationwith MseIeAverage size of thepredicted transcript tags
175
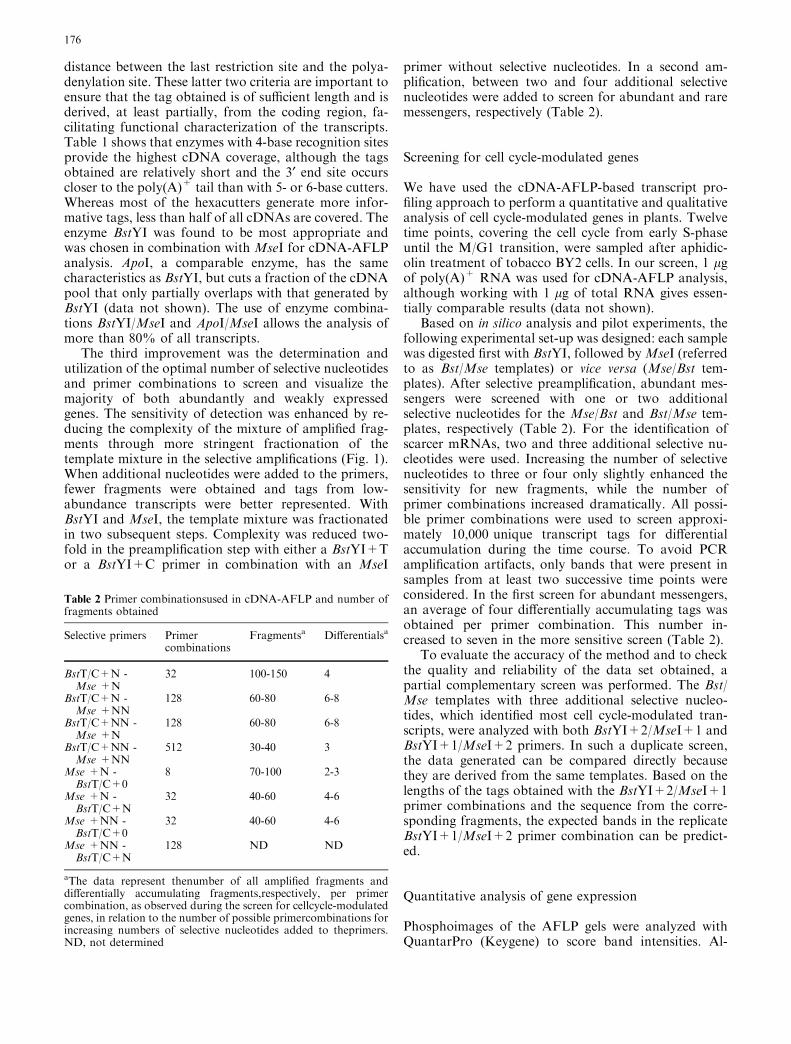
distance between the last restriction site and the polya-denylation site. These latter two criteria are important toensure that the tag obtained is of sufficient length and isderived, at least partially, from the coding region, fa-cilitating functional characterization of the transcripts.Table 1 shows that enzymes with 4-base recognition sitesprovide the highest cDNA coverage, although the tagsobtained are relatively short and the 3¢ end site occurscloser to the poly(A)+ tail than with 5- or 6-base cutters.Whereas most of the hexacutters generate more infor-mative tags, less than half of all cDNAs are covered. Theenzyme BstYI was found to be most appropriate andwas chosen in combination with MseI for cDNA-AFLPanalysis. ApoI, a comparable enzyme, has the samecharacteristics as BstYI, but cuts a fraction of the cDNApool that only partially overlaps with that generated byBstYI (data not shown). The use of enzyme combina-tions BstYI/MseI and ApoI/MseI allows the analysis ofmore than 80% of all transcripts.
The third improvement was the determination andutilization of the optimal number of selective nucleotidesand primer combinations to screen and visualize themajority of both abundantly and weakly expressedgenes. The sensitivity of detection was enhanced by re-ducing the complexity of the mixture of amplified frag-ments through more stringent fractionation of thetemplate mixture in the selective amplifications (Fig. 1).When additional nucleotides were added to the primers,fewer fragments were obtained and tags from low-abundance transcripts were better represented. WithBstYI and MseI, the template mixture was fractionatedin two subsequent steps. Complexity was reduced two-fold in the preamplification step with either a BstYI+Tor a BstYI+C primer in combination with an MseI
primer without selective nucleotides. In a second am-plification, between two and four additional selectivenucleotides were added to screen for abundant and raremessengers, respectively (Table 2).
Screening for cell cycle-modulated genes
We have used the cDNA-AFLP-based transcript pro-filing approach to perform a quantitative and qualitativeanalysis of cell cycle-modulated genes in plants. Twelvetime points, covering the cell cycle from early S-phaseuntil the M/G1 transition, were sampled after aphidic-olin treatment of tobacco BY2 cells. In our screen, 1 lgof poly(A)+ RNA was used for cDNA-AFLP analysis,although working with 1 lg of total RNA gives essen-tially comparable results (data not shown).
Based on in silico analysis and pilot experiments, thefollowing experimental set-up was designed: each samplewas digested first with BstYI, followed byMseI (referredto as Bst/Mse templates) or vice versa (Mse/Bst tem-plates). After selective preamplification, abundant mes-sengers were screened with one or two additionalselective nucleotides for the Mse/Bst and Bst/Mse tem-plates, respectively (Table 2). For the identification ofscarcer mRNAs, two and three additional selective nu-cleotides were used. Increasing the number of selectivenucleotides to three or four only slightly enhanced thesensitivity for new fragments, while the number ofprimer combinations increased dramatically. All possi-ble primer combinations were used to screen approxi-mately 10,000 unique transcript tags for differentialaccumulation during the time course. To avoid PCRamplification artifacts, only bands that were present insamples from at least two successive time points wereconsidered. In the first screen for abundant messengers,an average of four differentially accumulating tags wasobtained per primer combination. This number in-creased to seven in the more sensitive screen (Table 2).
To evaluate the accuracy of the method and to checkthe quality and reliability of the data set obtained, apartial complementary screen was performed. The Bst/Mse templates with three additional selective nucleo-tides, which identified most cell cycle-modulated tran-scripts, were analyzed with both BstYI+2/MseI+1 andBstYI+1/MseI+2 primers. In such a duplicate screen,the data generated can be compared directly becausethey are derived from the same templates. Based on thelengths of the tags obtained with the BstYI+2/MseI+1primer combinations and the sequence from the corre-sponding fragments, the expected bands in the replicateBstYI+1/MseI+2 primer combination can be predict-ed.
Quantitative analysis of gene expression
Phosphoimages of the AFLP gels were analyzed withQuantarPro (Keygene) to score band intensities. Al-
Table 2 Primer combinationsused in cDNA-AFLP and number offragments obtained
Selective primers Primercombinations
Fragmentsa Differentialsa
BstT/C+N -Mse +N
32 100-150 4
BstT/C+N -Mse +NN
128 60-80 6-8
BstT/C+NN -Mse +N
128 60-80 6-8
BstT/C+NN -Mse +NN
512 30-40 3
Mse +N -BstT/C+0
8 70-100 2-3
Mse +N -BstT/C+N
32 40-60 4-6
Mse +NN -BstT/C+0
32 40-60 4-6
Mse +NN -BstT/C+N
128 ND ND
aThe data represent thenumber of all amplified fragments anddifferentially accumulating fragments,respectively, per primercombination, as observed during the screen for cellcycle-modulatedgenes, in relation to the number of possible primercombinations forincreasing numbers of selective nucleotides added to theprimers.ND, not determined
176
though differential and constant bands can be discrimi-nated by visual scoring, automated analysis withQuantarPro analysis is more sensitive and reliable, andgenerates quantitative expression data. Differences inband intensity reflect fluctuations in transcript levels andallow the determination of the relative expression profileof the corresponding gene. All detectable AFLP frag-ments were scored and the intensity of each band in eachlane was measured. After normalization of the data (seeMaterials and methods), 2% of the transcript tags thathad been identified as cell cycle-modulated after visualscoring were excluded from the final data set becausethey had a variation coefficient smaller than 0.25 andwere considered to be constitutively expressed. On theother hand, approximately 5% more differential tran-scripts that had been missed by the visual scoring wereidentified.
In total, 2531 differential transcript tags were ob-tained. Due to redundancy in the data set, this numbercorresponds to approximately 1340 unique cell cycle-modulated genes. Overall, the expression profiles ofreplicate bands were highly comparable, with Pearsoncorrelation coefficients between 0.80 and 0.90. A detaileddescription of the transcript tags and their expressionprofiles is presented elsewhere (Breyne et al. 2002).
Characterization of differentially expressedtranscripts
Bands corresponding to differentially accumulatingtranscripts were isolated from the gels and sequenced.Direct sequencing of the PCR products gave good-quality sequences for approximately 65% of the frag-ments. For the remaining 35%, sequences were poorbecause the fragments were contaminated with co-mi-grating bands or were too small. After these bands hadbeen cloned, PCR products from six individual colonieswere sequenced. For most fragments, two to threedifferent sequences were obtained from the individualcolonies. In these cases, the identity of the transcript tagswas resolved unambiguously when the correspondingtag was found in the complementary screen. Alterna-tively, AFLP bands were isolated from PCR amplifica-tions performed on a pool of the 12 samples withselective MseI primers carrying one additional nucleo-tide. Because the complexity of the amplification mix-ture was reduced fourfold, fewer contaminating bandswere present and the success rate of direct sequencingincreased to approximately 80%.
The sequences obtained from the tags were comparedwith those present in the GenBank database. Of thesequenced tags, 36.5% were found to be similar to genesof known function, whereas 13% matched a gene ofunknown function. The remaining 50.5% showed nosequence homologies. To further characterize these tags,cDNA clones were isolated from a BY2 cDNA libraryby filter hybridization or PCR amplification (see Mate-rials and methods). Some 10% and 30%, respectively, of
the cDNA clones isolated by these means were com-pletely homologous to a tag sequence. The remainderwere partially homologous or cross-hybridizing unre-lated sequences. The low success rate was probably dueto the complexity of the tobacco genome (amphidiploidspecies, large number of paralogs) and the fact thatseveral tags were derived from scarce messengers.
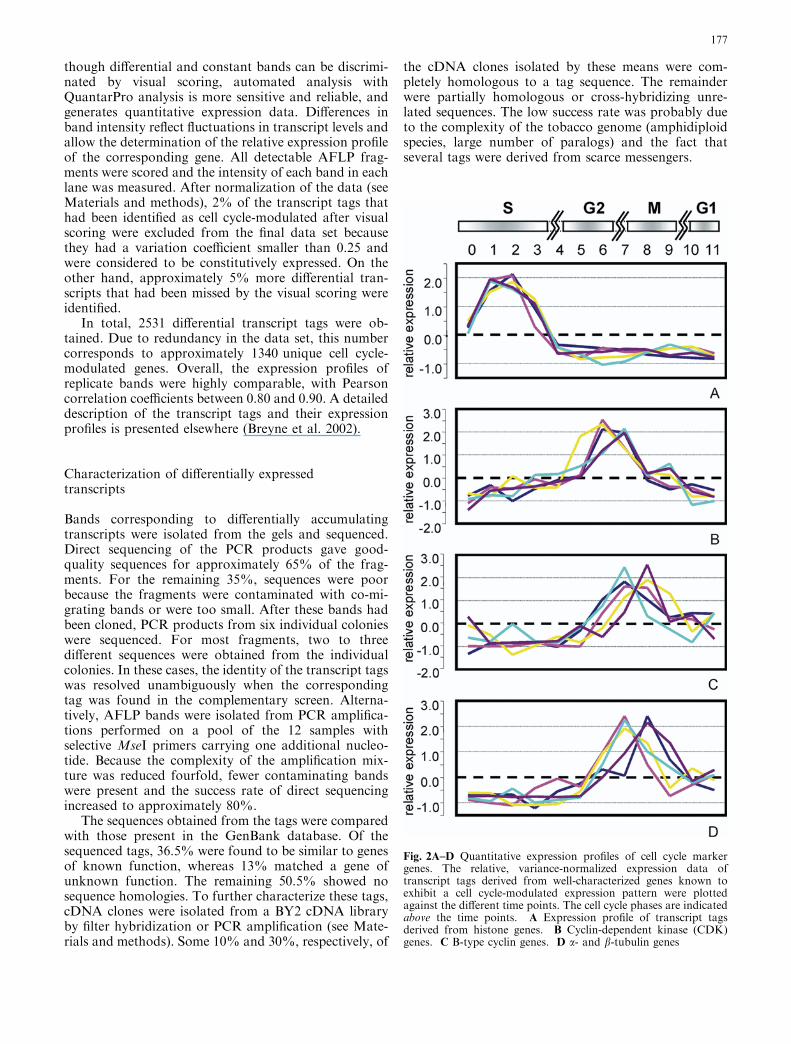
Fig. 2A–D Quantitative expression profiles of cell cycle markergenes. The relative, variance-normalized expression data oftranscript tags derived from well-characterized genes known toexhibit a cell cycle-modulated expression pattern were plottedagainst the different time points. The cell cycle phases are indicatedabove the time points. A Expression profile of transcript tagsderived from histone genes. B Cyclin-dependent kinase (CDK)genes. C B-type cyclin genes. D a- and b-tubulin genes
177
Of the 235 cDNAs obtained, only 23% of the tagswere derived entirely from the 3¢ untranslated region,whereas the other tags overlapped totally or partiallywith the coding sequences of the gene. Homologysearches allowed us to assign a function to 75% of them,indicating that no homology with the tags had beenfound because they were too short. This, in turn, con-vinced us that isolation of cDNA clones is a necessarystep in the characterization of cDNA-AFLP-derivedtranscript tags.
Evaluation of the methodology
Banding patterns generated independently by using thesame primer combination with the same RNA are foundupon comparison to be more than 95% identical. Thequantitative data obtained from the correspondingmarkers were highly similar as well (average Pearsoncorrelation coefficients 0.81, with a standard error of0.20), indicating the high reproducibility of the method.The cDNA-AFLP-based expression profiles of tran-script tags corresponding to some well-known cell cycle-modulated genes (Fig. 2) are in excellent agreement withpublished data, indicating the reliability of the dataobtained. Additional proof of the quality of the datagenerated is provided by the detailed analysis of a subsetof tags corresponding to histone genes. The differenthistone subtypes are encoded by multigene families andtheir differential expression during the cell cycle has been
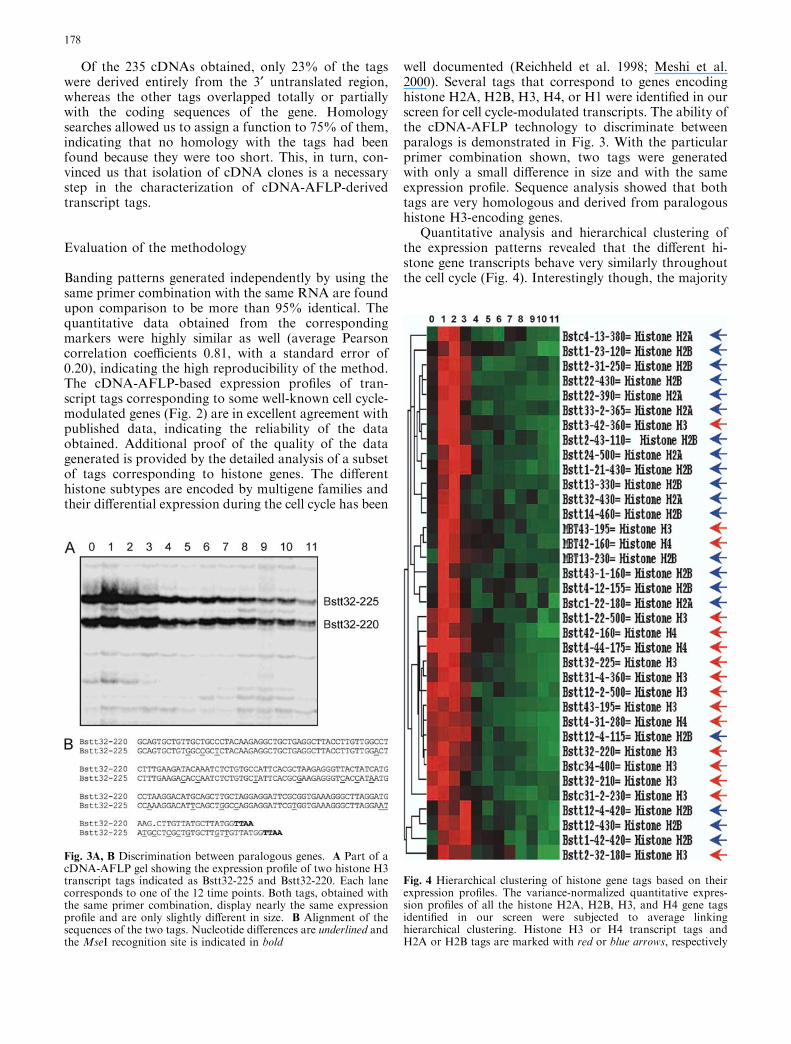
well documented (Reichheld et al. 1998; Meshi et al.2000). Several tags that correspond to genes encodinghistone H2A, H2B, H3, H4, or H1 were identified in ourscreen for cell cycle-modulated transcripts. The ability ofthe cDNA-AFLP technology to discriminate betweenparalogs is demonstrated in Fig. 3. With the particularprimer combination shown, two tags were generatedwith only a small difference in size and with the sameexpression profile. Sequence analysis showed that bothtags are very homologous and derived from paralogoushistone H3-encoding genes.
Quantitative analysis and hierarchical clustering ofthe expression patterns revealed that the different hi-stone gene transcripts behave very similarly throughoutthe cell cycle (Fig. 4). Interestingly though, the majority
Fig. 3A, B Discrimination between paralogous genes. A Part of acDNA-AFLP gel showing the expression profile of two histone H3transcript tags indicated as Bstt32-225 and Bstt32-220. Each lanecorresponds to one of the 12 time points. Both tags, obtained withthe same primer combination, display nearly the same expressionprofile and are only slightly different in size. B Alignment of thesequences of the two tags. Nucleotide differences are underlined andthe MseI recognition site is indicated in bold
Fig. 4 Hierarchical clustering of histone gene tags based on theirexpression profiles. The variance-normalized quantitative expres-sion profiles of all the histone H2A, H2B, H3, and H4 gene tagsidentified in our screen were subjected to average linkinghierarchical clustering. Histone H3 or H4 transcript tags andH2A or H2B tags are marked with red or blue arrows, respectively
178
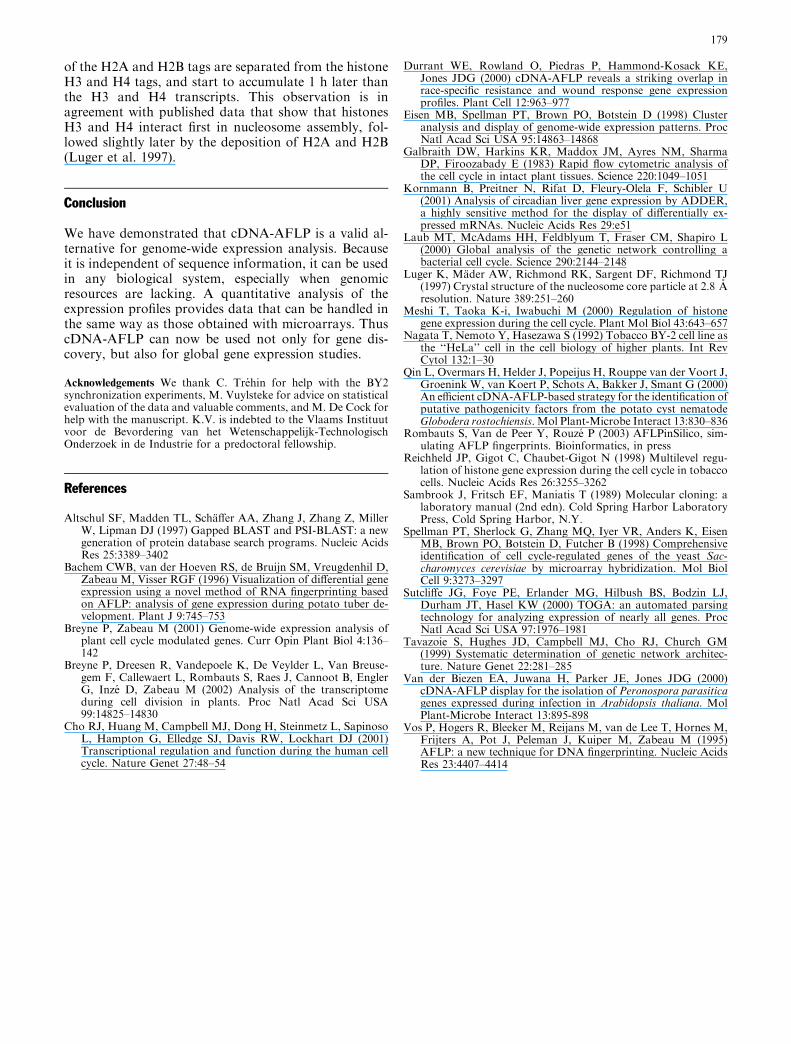
of the H2A and H2B tags are separated from the histoneH3 and H4 tags, and start to accumulate 1 h later thanthe H3 and H4 transcripts. This observation is inagreement with published data that show that histonesH3 and H4 interact first in nucleosome assembly, fol-lowed slightly later by the deposition of H2A and H2B(Luger et al. 1997).
Conclusion
We have demonstrated that cDNA-AFLP is a valid al-ternative for genome-wide expression analysis. Becauseit is independent of sequence information, it can be usedin any biological system, especially when genomicresources are lacking. A quantitative analysis of theexpression profiles provides data that can be handled inthe same way as those obtained with microarrays. ThuscDNA-AFLP can now be used not only for gene dis-covery, but also for global gene expression studies.
Acknowledgements We thank C. Trehin for help with the BY2synchronization experiments, M. Vuylsteke for advice on statisticalevaluation of the data and valuable comments, and M. De Cock forhelp with the manuscript. K.V. is indebted to the Vlaams Instituutvoor de Bevordering van het Wetenschappelijk-TechnologischOnderzoek in de Industrie for a predoctoral fellowship.
References
Altschul SF, Madden TL, Schaffer AA, Zhang J, Zhang Z, MillerW, Lipman DJ (1997) Gapped BLAST and PSI-BLAST: a newgeneration of protein database search programs. Nucleic AcidsRes 25:3389–3402
Bachem CWB, van der Hoeven RS, de Bruijn SM, Vreugdenhil D,Zabeau M, Visser RGF (1996) Visualization of differential geneexpression using a novel method of RNA fingerprinting basedon AFLP: analysis of gene expression during potato tuber de-velopment. Plant J 9:745–753
Breyne P, Zabeau M (2001) Genome-wide expression analysis ofplant cell cycle modulated genes. Curr Opin Plant Biol 4:136–142
Breyne P, Dreesen R, Vandepoele K, De Veylder L, Van Breuse-gem F, Callewaert L, Rombauts S, Raes J, Cannoot B, EnglerG, Inze D, Zabeau M (2002) Analysis of the transcriptomeduring cell division in plants. Proc Natl Acad Sci USA99:14825–14830
Cho RJ, Huang M, Campbell MJ, Dong H, Steinmetz L, SapinosoL, Hampton G, Elledge SJ, Davis RW, Lockhart DJ (2001)Transcriptional regulation and function during the human cellcycle. Nature Genet 27:48–54
Durrant WE, Rowland O, Piedras P, Hammond-Kosack KE,Jones JDG (2000) cDNA-AFLP reveals a striking overlap inrace-specific resistance and wound response gene expressionprofiles. Plant Cell 12:963–977
Eisen MB, Spellman PT, Brown PO, Botstein D (1998) Clusteranalysis and display of genome-wide expression patterns. ProcNatl Acad Sci USA 95:14863–14868
Galbraith DW, Harkins KR, Maddox JM, Ayres NM, SharmaDP, Firoozabady E (1983) Rapid flow cytometric analysis ofthe cell cycle in intact plant tissues. Science 220:1049–1051
Kornmann B, Preitner N, Rifat D, Fleury-Olela F, Schibler U(2001) Analysis of circadian liver gene expression by ADDER,a highly sensitive method for the display of differentially ex-pressed mRNAs. Nucleic Acids Res 29:e51
Laub MT, McAdams HH, Feldblyum T, Fraser CM, Shapiro L(2000) Global analysis of the genetic network controlling abacterial cell cycle. Science 290:2144–2148
Luger K, Mader AW, Richmond RK, Sargent DF, Richmond TJ(1997) Crystal structure of the nucleosome core particle at 2.8 Aresolution. Nature 389:251–260
Meshi T, Taoka K-i, Iwabuchi M (2000) Regulation of histonegene expression during the cell cycle. Plant Mol Biol 43:643–657
Nagata T, Nemoto Y, Hasezawa S (1992) Tobacco BY-2 cell line asthe ‘‘HeLa’’ cell in the cell biology of higher plants. Int RevCytol 132:1–30
Qin L, Overmars H, Helder J, Popeijus H, Rouppe van der Voort J,Groenink W, van Koert P, Schots A, Bakker J, Smant G (2000)An efficient cDNA-AFLP-based strategy for the identification ofputative pathogenicity factors from the potato cyst nematodeGlobodera rostochiensis. Mol Plant-Microbe Interact 13:830–836
Rombauts S, Van de Peer Y, Rouze P (2003) AFLPinSilico, sim-ulating AFLP fingerprints. Bioinformatics, in press
Reichheld JP, Gigot C, Chaubet-Gigot N (1998) Multilevel regu-lation of histone gene expression during the cell cycle in tobaccocells. Nucleic Acids Res 26:3255–3262
Sambrook J, Fritsch EF, Maniatis T (1989) Molecular cloning: alaboratory manual (2nd edn). Cold Spring Harbor LaboratoryPress, Cold Spring Harbor, N.Y.
Spellman PT, Sherlock G, Zhang MQ, Iyer VR, Anders K, EisenMB, Brown PO, Botstein D, Futcher B (1998) Comprehensiveidentification of cell cycle-regulated genes of the yeast Sac-charomyces cerevisiae by microarray hybridization. Mol BiolCell 9:3273–3297
Sutcliffe JG, Foye PE, Erlander MG, Hilbush BS, Bodzin LJ,Durham JT, Hasel KW (2000) TOGA: an automated parsingtechnology for analyzing expression of nearly all genes. ProcNatl Acad Sci USA 97:1976–1981
Tavazoie S, Hughes JD, Campbell MJ, Cho RJ, Church GM(1999) Systematic determination of genetic network architec-ture. Nature Genet 22:281–285
Van der Biezen EA, Juwana H, Parker JE, Jones JDG (2000)cDNA-AFLP display for the isolation of Peronospora parasiticagenes expressed during infection in Arabidopsis thaliana. MolPlant-Microbe Interact 13:895-898
Vos P, Hogers R, Bleeker M, Reijans M, van de Lee T, Hornes M,Frijters A, Pot J, Peleman J, Kuiper M, Zabeau M (1995)AFLP: a new technique for DNA fingerprinting. Nucleic AcidsRes 23:4407–4414
179


