Embed Size (px)
Citation preview

Does planar histogram classify human
posture disorders better than two
single-dimension histograms?
Raimundas JasineviciusKaunas University of Technology
Radvile Krusinskiene∗Kaunas University of Technology
Danguole SatkunskieneKaunas University of Technology
Vytautas PetrauskasKaunas University of Technology
Abstract: The time law of small vibrations of the center of pressure (COP) of humans instanding position (human posture) may provide useful information about health conditions ofan individual. Very popular method to analyze the posture stability is to draw planar or twosingle-dimension histograms of COP.
In this paper both types of histograms are used as a discriminative tool to distinguish twoclasses of subjects - healthy ones and those who suffer from multiple sclerosis disability. Gen-eral description of pattern recognition method based on solving linear programming problemis presented in this paper. The method was used for classification of COP histograms.
Experiments showed that planar histograms may be used as a discriminative tool toclassify subjects into two classes: healthy and suffering from multiple sclerosis disability. Aset of two single-dimension histograms failed to show this ability. This means that a set ofsingle-dimension histograms does not maintain discriminative power of such degree which hasplanar histograms.
The shorter version of this paper was presented in Vibroengineering conference, in Uni-versity of Klaipeda, Lithuania in 2009.
Keywords: Human posture classification, Stabilogram, Linear programming problem,Centre of pressure histogram.
TABLE of NOMENCLATURE and ABBREVIATIONS is abouthere
∗Corresponding author. E-mail: [email protected]
1

Figure 1: Movement of trajectory of COP of human body on a baseof support.
1. Introduction
Disorders of human posture highly influence standing stability [1],[2]. The problem becomes more important everyday as the societygets older and standing stability primarily influences the quality oflife [3]. One of the most popular ways to analyze standing stability isto register vibrations of COP of human body on a base of support [1]-[5]. These vibrations are recorded in M-L (from side to side) and A-P(forward-backward) directions. The resulting digitalized trajectoryof the COP is referred to as a stabilogram. Typical stabilogram of ahealthy subject is presented in Fig. 1.
The stabilogram is a collective outcome of activities of all systemsthat are responsible for maintaining the body in upright position. Inorder to describe and analyse features of a stabilogram histogramsof COP vibrations are calculated. Typical M-L direction and planarhistograms of healthy subject are presented in Fig. 2.
There were no attempts reported which intended to classify hu-man standing stability (or diagnose conditions which influence stableposture) by means of histograms calculated from COP vibrations.In this paper a formal method for pattern recognition, which em-ploys the LPP solution, is presented in order to classify objectsaccording to their distinctive features. General formulation of themethod is presented in the next chapter. The pattern recognitionmethod was used to classify stabilograms into two classes of sub-jects – healthy ones and those who suffer from MSD. Planar andtwo single-dimension histograms were used as distinctive features of
2

−5 −3 −1 1 3 5 70
500
1000
1500
2000
2500
Histogram bins
Tim
e sp
ent i
n bi
n, m
s
a)
b)
Figure 2: Typical histograms of COP vibrations of healthy subject:a) in M-L direction; b) planar.
3

individuals.
2. General Description of Pattern RecognitionMethod
Let us assume a class of objects which is described by a set of dis-tinctive features ([7], [8]) called pattern. Then the class recognitionproblem can be formulated as follows. There are p = 1, 2, . . . , Sclasses of objects, each class p having its own pattern. Each objectis described by n = 1, 2, . . . , i, j, . . . , N features. After extractionand measurement every feature must be normalized ([6]). The nor-malization of a feature xi is performed in order to have an abilityto compare significance (or intensity) of different features using thesame abstract dimension. A normalized value αi of xi is determinedas follows:
αi =xi − xi min
xi max − xi min
,∀i, where xi min ≤ xi ≤ xi max. (1)
After transformation (1) the ith feature of an object, belonging tothe class p (i.e. corresponding to the pattern p) can be representedby a real number αpi, which expresses normalized degree of inten-sity of this particular feature. Then the whole object is describedby a vector-row α= (αp1, αp2, . . . , αpi, . . . , αpN). Let us considerl = 1, 2, . . . , k, . . . , L objects from class p (i.e. they are born formthe pattern p). Then the class p is represented by a set of vectorsαl
p,∀l and classification of an unknown object x must be based on
information stored in sets αlp,∀p, l. Method which assigns unknown
object x to the one of the possible classes S is presented below.Usually better reasoning results are achieved when features of ob-
jects are not only normalized but centred as well ([6], [9]). Then theobject is represented by a vector-row α̃l
p = (α̃lp1, α̃
lp2, . . . , α̃
lpi, . . . , α̃
lpN)
with components calculated as follows:
α̃lpi = αl
pi −1
N
N∑
j=1
αlpj (2)
When the unknown centred object x̃ is considered, its degree ofbelonging to the class p can be evaluated by dependence function:
Φ (x̃) = x̃KTp =
N∑
i=1
x̃iKpi,∀p, (3)
4

where T stands for a transposition of row-vector Kp. Vector Kp
is called a generalized pattern of a class p and Φ (x̃) – degree ofsimilarity of object x̃ to a pattern of class p.
Let us randomly select one object α̃kp from class p and call him
central. Let us require to maximize degree of similarity Φ (α̃kp) by
finding values of Kpi ∀i:
Φ(α̃k
p
)=
N∑
i=1
α̃kpiKpi → max (4)
under the following constrains:
N∑
i=1
α̃lpiKpi ≥ γ
N∑
i=1
α̃kpiKpi,∀l, (5)
N∑
i=1
α̃lriKpi ≤ κ
N∑
i=1
α̃kpiKpi,∀r 6= p, ∀l. (6)
Inequality (5) describes a degree of lowest acceptable similarityof any object from class p with central object and inequality (6)represents a degree of highest permissible similarity between repre-sentatives of class p and objects from any other class.
Optimal values of γ and κ are recommended from the interval[0−1] and γ > κ ([6]). Particular values depend on the prior knowl-edge (or guess) concerning the class (or pattern) structure (inter-nal connections and dispersion of patterns features). The differencedetermines assumption of decision maker (human or machine) con-cerning a possible structure of classes under investigation and mustbe chosen on the base of some experience ([6]).
As it can be easily noticed the problem belongs to the class ofLPP where inequalities (5) and (6) need additional constrains:
0 ≤ Kpi ≤ A,∀i. (7)
A solution of LPP (4)-(7) for the class p consists of the obtainedvalue of the dependence (or similarity) function Φp together withgeneralized pattern vector Kp:
max Φp
(αk
p,Kp
)= Φp max. (8)
The procedure must be repeated for all S classes. In this way,the set of S solutions will be obtained and the recognition proceduremust be performed according to Fig. 3, taking into account the needof fulfilling proportionality condition:
c1Φ1max = · · · = cpΦp max = · · · = cSΦS max = B. (9)
5

Figure 3: Decision making algorithm.
From the philosophical point of view the objective of the classi-fication method is to find S hyperplanes in N dimensional space,which would separate each given class from all other classes.
3. Application of Pattern Recognition Methodto Human Posture Classification
The pattern recognition method was used to distinguish two groupsof individuals: healthy ones and those who suffer from multiplesclerosis disability. The classification was performed according toindividual stabilograms. All stabilograms used in this research wererecorded during clinical experiments. In the next chapter data ac-quisition, feature extraction and classification procedures are pre-sented.
3.1. Protocol of Clinical Experiments
Fifteen HL and fifteen MSD subjects (all female) aged 32 ± 2 (av-erage ± standard deviation) took part in clinical experiments. Sub-jects who suffer from MSD were chosen to take part in experimentsdue to the fact that this disease affects CNS and causes difficultiesto maintain the stable bipedal posture [10]. The diagnosis of eachparticipant was known in advance before the clinical and numeri-
6

Figure 4: Set up of clinical experiment.
cal experiments took place. A stabilogram was recorded for eachsubject. Participants were asked to stand on a base of support ina bipedal comfortable posture. The duration of the experimentswas 60 seconds with a sampling rate of 100 Hz. Stabilograms wererecorded using Kistler 9287B force platform [11]. The principal setup of clinical experiment is shown in Fig. 4.
3.2. Application of Pattern Recognition Method for Clas-sification of COP Histograms of Human Posture
All signals recorded during clinical experiments were centred inspace and in magnitude, i.e. the average position of COP signalhas coordinates (0, 0). A planar (2D) and two single-dimensionhistograms of each stabilogram were calculated. Typical single-direction histogram consisted from 5 bins, which were numeratedfrom left to right. Typical 2D histograms of HL and MSD subjectsconsisting of 25 bins (5 in M-L multiplied by 5 in A-P direction)are presented in Fig. 5. Bins were numbered as it is shown in Fig.5b. The darker box represents more time (in ms) of COP spent inthe bin and means higher intensity of a feature. Histograms wereconsidered as normalized objects since all beans of histogram havethe same physical meaning.
Two classes (S = 2), each having fifteen (L = 15) objects –histograms of HL and MSD individuals – were investigated. All his-tograms were assigned to the HL or MSD class prior to experimentaccording to clinical data. Every object was centred according toEq. 2. For histogram classification experiments lowest acceptablesimilarity of objects was set to γ = 0.8 and highest permitted sim-ilarity degree was set to κ = 0.3. For Eq. (7) the upper bound
7

a)
b)
Figure 5: Planar histogram of stabilogram: a) HL subject No. 15;b) MSD subject No. 22.
8

A = 25 was chosen. (It was selected only for practical convenienceas a certain scale factor.) An object No 14 was randomly selectedto play a role of central object of HL class and object No. 30 - forMSD class.
LPPs (Eq. (4)-(7)) for both classes were solved using Matlabfunction linprog :
minx
fT x such that
{D ·Kp ≤ b,
0 ≤ Kpi ≤ A,∀i (10)
Eqs. (4)-(7) were rewritten in function minimization form, ac-cording to the Eq. (10):
minKp
(−Φ(Kp, α̃lp)) such that
−Φ(Kp, α̃lp) + γΦ(Kp, α̃
kp) ≤ 0,
∀l = 1, 2, . . . , L,l 6= k;
Φ(Kp, α̃lr)− κΦ(Kp, α̃
kp) ≤ 0,
∀l = 1, 2, . . . , L,∀r = 1, 2, . . . , S,r 6= p;
0 ≤ Kpi ≤ A.
(11)
In this case matrix D from Eq.(10), when the central object num-ber k = 1, takes a form:
D =
∣∣∣∣∣∣∣∣∣∣∣∣∣
γα̃1p1 − αj
p1, . . . , γα̃1pi − αj
pi, . . . , γα̃1pN − αj
pN. . . , . . . , . . . , . . . , . . .
γα̃1p1 − αL
p1, . . . , γα̃1pi − αL
pi, . . . , γα̃1pN − αL
pN
α̃lr1 − κα1
p1, . . . , α̃lri − κα1
pi, . . . , α̃lrN − κα1
pN. . . , . . . , . . . , . . . , . . .
α̃lS1 − κα1
p1, . . . , α̃lSi − κα1
pi, . . . , α̃lSN − κα1
pN
∣∣∣∣∣∣∣∣∣∣∣∣∣
(12)
Matrix D has 29 rows and N columns. The exact number Ndepends on the numerical experiment: in the planar histogram caseN = 25; in two single-dimensions histogram case N = 10. Lenght ofcolumn-vector b from Eq. (10) is (L−1)+L(S−1) with coordinatesbi = 0,∀i.
In numerical experiments the procedure ”arbitrary selected” wasimplemented by Matlab function rand.
The goal of numerical experiments was to show the ability of clas-sification method to find N dimensional hyperplane which separatesHL and MSD classes. Two types of classification experiments wereconducted:
9

A) using planar histograms;
B) using single-dimension A-P and M-L - histograms.
The results of numerical experiments are presented in the next chap-ter.
3.3. On Reliability of LPP solution
Let us consider the situation when significance of ith feature of objectx between classes HL and MSD or the ith component of generalizedpattern differs less than one percent. Could this result be consid-ered by experts as reliable for medical diagnose? Definitely not.Therefore we introduce the minimal difference value ∆ which is aproduct of change of value of object feature and its’ significance byone percent:
∆ = ∆xi ·∆Kpi. (13)
In case of planar histograms ∆ = 60 · 0.25 = 15 and in case of a setof two single-dimension histograms ∆ = 120 · 0.1 = 12 . When LPPis solved but dependence function Φ absolute values do not exceedthe minimal difference value ∆, the result of numerical experimentcan not be treated as reliable.
4. Results of Numerical Experiments
4.1. Experiment A. Planar Histogram
As it was mentioned before, during this experiment all histogramswere assigned to HL or MSD class respectively according to clin-ical data. Order of placing bins into objects description (planarhistogram) for vector α is shown in Fig. 5b. Each object α hasN = 25 features - histogram bins.
The aim of this experiment was to find hyperplane which sep-arates 2D histograms into two classes. Components of generalizedpatterns KHL and KMSD are results of LPP solution (constructedaccording to Eq. (4)-(7)) and are presented in Table 1.
TABLE 1 is ABOUT HERE
Results presented in Table 2 confirm that the method correctlyclassified all histograms. Obtained values of dependence functionsΦHL and ΦMSD are several times higher than minimal differencevalues ∆. Therefore the results of this experiment can be treated asreliable.
10

TABLE 2 is ABOUT HERE
Results of the experiment A confirmed the hypothesis that sub-jects suffering form MSD have their own posture pattern which isdifferent from subjects of HL class. The pattern of planar histogrammay be a) identified by means of pattern recognition method andb) used as a discriminative tool for classification of human posture.
4.2. Experiment B. Two Single Dimension A-P and M-LHistograms
During this experiment description of an object consists of twosingle-dimension - A-P and M-L - histograms. Object descriptionwas constructed by appending M-L histogram to A-P histogram.Each object has N = 10 features in total. All histograms were as-signed to HL or MSD class respectively. The aim of the experimentwas to find hyperplane which separates objects into two classes.Components of generalized patterns KHL and KMSD were calculatedas a result of LPP solution (constructed according to Eq. (4)-(7))and are presented in Table 3.
TABLE 3 is ABOUT HERE
Table 4 presents results of classification of objects described bysets of two single-dimension - A-P and M-L - histograms. It may benoticed that the pattern recognition method failed to classify objectscorrectly. Thirteen objects were falsly clasified. Such number oferror is definitely too high. Values of dependence functions ΦHL
and ΦMSD are very close to each other (and almost equal to zero)and both were less than minimal difference values ∆ = 1.2 set forthis experiment. Therefore the results of this experiment can not betreated as reliable. These two facts lead to conclusion that single-dimension histograms do not maintain discriminative power whichhave planar histograms.
TABLE 4 is ABOUT HERE
Nevertheless, it may be noticed that in the case of MSD classmethod made fewer errors. This result supports hypothesis thatpeople suffering from MSD have more common pattern than healthyones even in single-dimension histograms.
The ability of LPP to find a hyperplane in 10-dimensional spaceis presented by the following example. Only part of objects fromboth classes (first five objects No. 1-5 for HL class and first five No.
11

16-20 for MSD class) were selected for solving LPP (i.e. for trainingpattern recognition tool).
TABLE 5 is ABOUT HERE
TABLE 6 is ABOUT HERE
In Tables 5 and 6 results of classification of objects describedby sets of two single-dimension – A-P and M-L – histograms arepresented. It can be noticed that LPP was solved correctly, its’results may be treated as reliable and the hyperplane separatingobjects from known classes was found. But this hyperplane can notseparate all objects correctly (a number of errors is nine).
5. Conclusions
In this paper general description of the pattern recognition methodbased on solving LPP was presented. The method was applied toclassify individuals into two - HL and MSD - classes. The classi-fication was performed using planar and two single-dimension his-tograms calculated from COP vibrations of a human body on a baseof support.
Numerical experiments showed that planar histograms had enoughdiscriminative power to distinguish between HL and MSD classes.Pairs of single-dimension histograms failed to classify individualsinto two classes correctly. This means that a set of single-dimensionhistograms does not maintain discriminative power of such degreewhich has planar histograms.
The further research in this field regarding the choice of repre-sentatives of a class, selection of optimal number of bins of planarhistograms or informativeness of a feature must be done.
12

References
[1] Collins J. J., Luca C. J. D., The effects of visual input on open-loop and closed-loop postural control mechanisms. Experimen-tal Brain Research, 1995. 103: pp. 151-163.
[2] Juodzbaliene V., Muckus K., Krisciukaitis A., Body Mass Cen-ter Sway of the Pupils With and Without Visual Impairment,Acta Kinesiologiae Universitatis Tartuensis, vol. 7, 2002 pp.89-93.
[3] Winter D. A., Human balance and posture control during stand-ing and walking. GaitPosture,1995. 3: pp. 193-214.
[4] Barauskas R., Krusinskien R., On parameters identification ofcomputational models of vibrations during quiet standing ofhumans, ScienceDirect, Journal of Sound and Vibration 308(2007) pp. 612-624.
[5] Baratto, L., et al., A new look at posturographic analysis inthe clinical context: sway-density vs. other parameterizationtechniques. Motor Control, 2002. 6: pp. 246-270.
[6] Jasinevicius R., Parallel Space-Time Computing Structures (inRussian), Mokslas, Vilnius, 1988 pp. 183.
[7] Duda R. O., Hart P. E., Stork D. G., Pattern Classification,John Wiley Sons, 2001, p. 637.
[8] Konar A., Computational Intelligence (Principles, Techniquesand Applications), Springer, 2005, p. 708.
[9] Jasinevicius R., Petrauskas V., Fuzzy expert maps: the new ap-proach, WCCI 2008 Proceedings: 2008 IEEE World Congresson Computational Intelligence, June 1-6, 2008, Hong Kong:2008 IEEE International Conference on Fuzzy Systems. 2008IEEE International Joint Conference on Neural Networks.2008 IEEE Congress on Evolutionary Computation. Piscat-away: IEEE, 2008. ISBN 978-1-4244-1819-0. pp. 1511-1517.
[10] Medicinos enciklopedija, ed. r.p. Grabauskas V. vol. 1. 1991,Vilnius: Enciklopedij leidykla. p. 544.
[11] Kistler Biomechanics: Measuring Systems for Per-formance Diagnostics and Gait and Balance Analy-sis in Sports and Medicine, 2007, [Internet access]http://www.kistler.com/mediaaccess/en-ex/600-350e-11.07.pdf
13

NOMENCLATURE
A maximal feature value (convenient real number)
B maximal similarity value (convenient real number)
c proportionality coefficient (convenient realnumber)
D matrixi , j , n indexes
Kp generalized pattern of pth class
Kpi components of generalized pattern (significance ofith feature) K
L number of objects taken to represent a classl , k object indexesN number of featuresp, r class indexS number of classesx description of object from unknown class
xi ith feature of object x (vector coordinate)xi min, xi max marginal values of feature xi
x̃ description of centered object
α description of object under investigation (vector)
αi ith feature of normalized object α (vectorcoordinate)
∆ minimal difference value∆xi change of object feature by one percent∆Kpi change of significance of object feature by one
percent
Φ dependence function (degree of similarity)κ highest permitted similarity degree between p of
other classes of objectsγ lowest acceptable similarity degree of objects from
class p
14
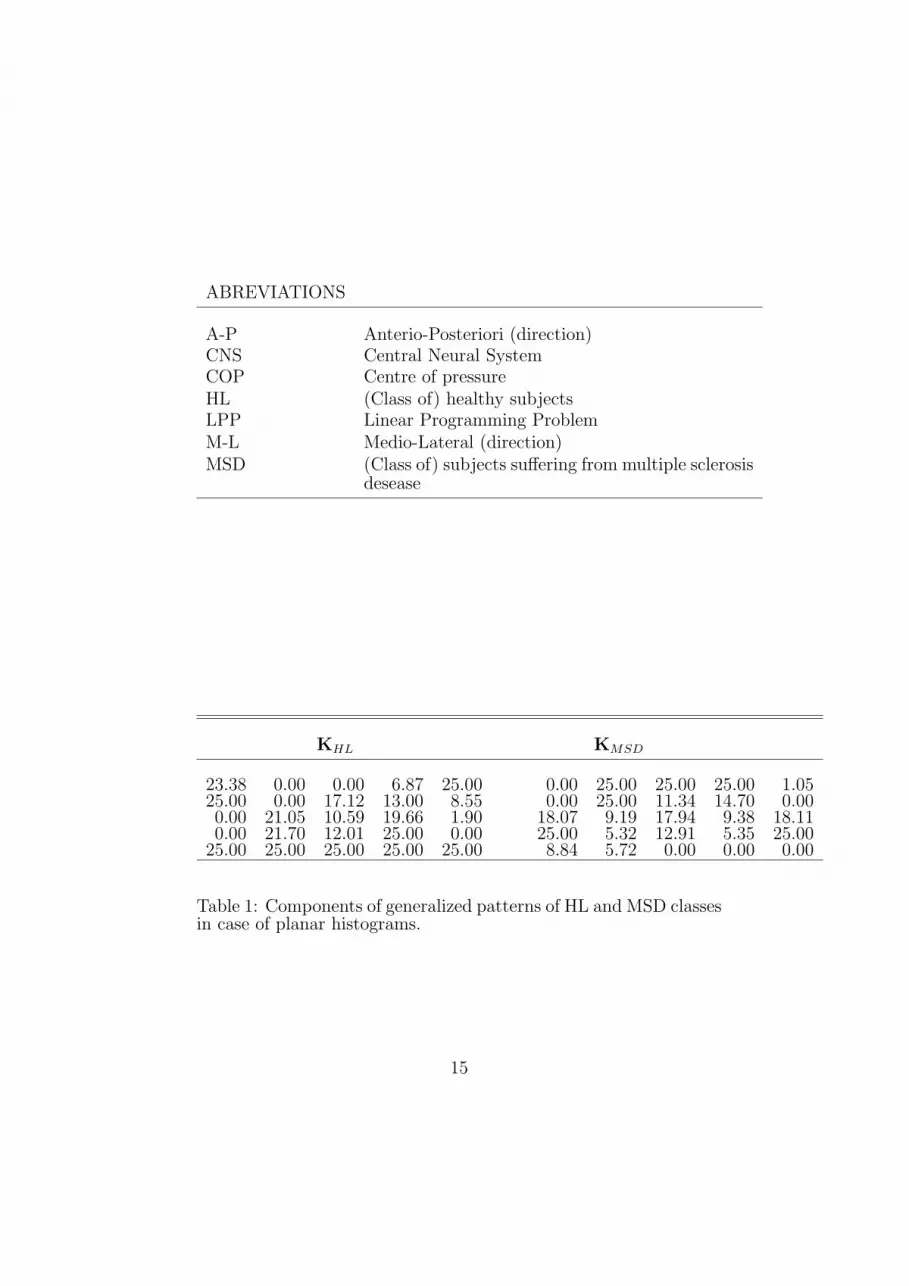
ABREVIATIONS
A-P Anterio-Posteriori (direction)CNS Central Neural SystemCOP Centre of pressureHL (Class of) healthy subjectsLPP Linear Programming ProblemM-L Medio-Lateral (direction)MSD (Class of) subjects suffering from multiple sclerosis
desease
KHL KMSD
23.38 0.00 0.00 6.87 25.00 0.00 25.00 25.00 25.00 1.0525.00 0.00 17.12 13.00 8.55 0.00 25.00 11.34 14.70 0.000.00 21.05 10.59 19.66 1.90 18.07 9.19 17.94 9.38 18.110.00 21.70 12.01 25.00 0.00 25.00 5.32 12.91 5.35 25.00
25.00 25.00 25.00 25.00 25.00 8.84 5.72 0.00 0.00 0.00
Table 1: Components of generalized patterns of HL and MSD classesin case of planar histograms.
15

Dependencefunction
ΦHL = 10087.43 ΦMSD = 8803.17
Normalizationcoefficient c1 = 1 c2 = 1.14
c1ΦHL c2ΦMSDDecision:max(c1ΦHL, c2ΦMSD)
Histograms:HL class
1 8069.94 3026.23 HL2 12096.70 3026.23 HL3 8069.94 3026.23 HL4 17592.51 -13124.55 HL5 11540.22 3026.23 HL6 8069.94 3026.23 HL7 19043.45 -9515.65 HL8 8069.94 3026.23 HL9 8069.94 3026.23 HL
10 13628.49 -7193.49 HL11 21215.48 -11388.51 HL12 35124.71 -26205.48 HL13 8069.94 3026.23 HL14 10087.43 -3463.13 HL15 17779.39 -10462.85 HL
MSD class16 -12466.47 22391.81 MSD17 -314.97 10602.41 MSD18 3026.23 8069.94 MSD19 -15149.95 24467.82 MSD20 -2780.15 15780.06 MSD21 3026.23 8069.94 MSD22 1079.17 8069.94 MSD23 -3892.17 19627.50 MSD24 3026.23 9512.49 MSD25 3026.23 8069.94 MSD26 -9373.07 19614.88 MSD27 -2244.26 11263.74 MSD28 3026.23 8069.94 MSD29 -2914.59 12705.14 MSD30 2915.28 10087.43 MSD
Table 2: Classification of subjects by means of planar histograms.
16

KHL KMSD
4.92 4.92 4.92 4.92 4.92 5.02 5.02 5.02 5.02 5.024.97 4.97 4.97 4.97 4.97 5.01 5.01 5.01 5.01 5.01
Table 3: Components of generalized patterns of HL and MSD classesin case of two sigle-dimension histograms (30 objects used for train-ing).
17
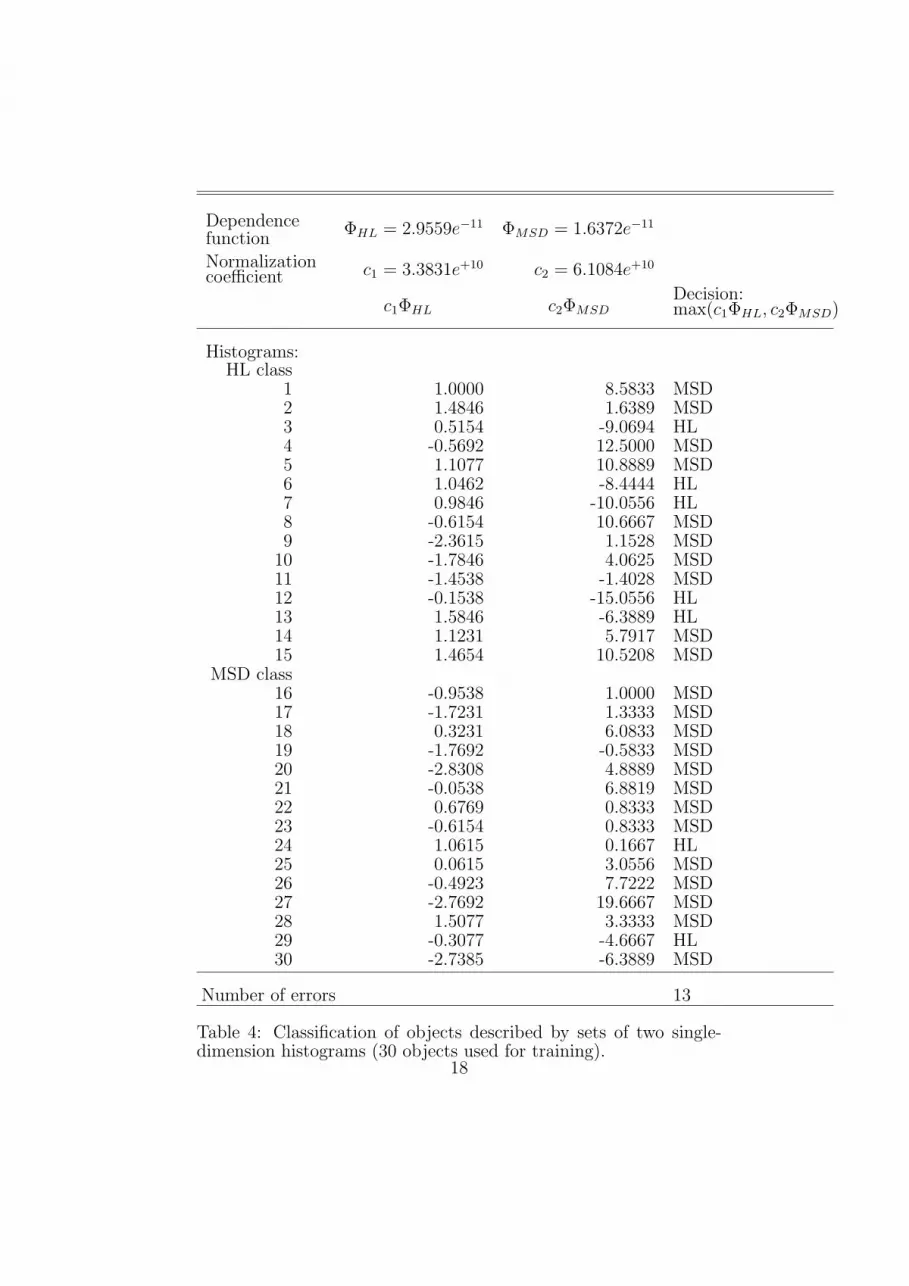
Dependencefunction
ΦHL = 2.9559e−11 ΦMSD = 1.6372e−11
Normalizationcoefficient c1 = 3.3831e+10 c2 = 6.1084e+10
c1ΦHL c2ΦMSDDecision:max(c1ΦHL, c2ΦMSD)
Histograms:HL class
1 1.0000 8.5833 MSD2 1.4846 1.6389 MSD3 0.5154 -9.0694 HL4 -0.5692 12.5000 MSD5 1.1077 10.8889 MSD6 1.0462 -8.4444 HL7 0.9846 -10.0556 HL8 -0.6154 10.6667 MSD9 -2.3615 1.1528 MSD
10 -1.7846 4.0625 MSD11 -1.4538 -1.4028 MSD12 -0.1538 -15.0556 HL13 1.5846 -6.3889 HL14 1.1231 5.7917 MSD15 1.4654 10.5208 MSD
MSD class16 -0.9538 1.0000 MSD17 -1.7231 1.3333 MSD18 0.3231 6.0833 MSD19 -1.7692 -0.5833 MSD20 -2.8308 4.8889 MSD21 -0.0538 6.8819 MSD22 0.6769 0.8333 MSD23 -0.6154 0.8333 MSD24 1.0615 0.1667 HL25 0.0615 3.0556 MSD26 -0.4923 7.7222 MSD27 -2.7692 19.6667 MSD28 1.5077 3.3333 MSD29 -0.3077 -4.6667 HL30 -2.7385 -6.3889 MSD
Number of errors 13
Table 4: Classification of objects described by sets of two single-dimension histograms (30 objects used for training).
18

KHL KMSD
10.00 0.00 2.96 6.45 0.00 0.00 10.00 10.00 8.04 10.002.44 0.94 9.16 3.84 3.75 6.86 7.05 6.04 4.70 1.34
Table 5: Components of generalized patterns of HL and MSD classesin case of two sigle-dimension histograms (10 objects used for train-ing).
19

Dependencefunction
ΦHL = 6.2923e3 ΦMSD = 1.1827e4
Normalizationcoefficient c1 = 1.5892e−4 c2 = 8.4550e−5
c1ΦHL c2ΦMSDDecision:max(c1ΦHL, c2ΦMSD)
Histograms:HL class
1 1.0000 0.1879 HL2 0.8000 0.3000 HL3 0.8000 -0.0739 HL4 0.8000 0.3000 HL5 0.8000 0.3000 HL6 1.5651 1.0724 HL7 -1.4675 0.6476 MSD8 0.0590 0.7907 MSD9 -0.6832 0.5722 MSD
10 -1.3374 0.4053 MSD11 0.3994 -1.4028 HL12 2.0240 -15.0556 HL13 1.7959 -6.3889 HL14 0.2056 5.7917 MSD15 -0.2572 10.5208 MSD
MSD class16 -0.8341 1.0000 MSD17 0.3000 0.8000 MSD18 0.3000 1.0598 MSD19 0.2521 1.0598 MSD20 -0.1449 1.3861 MSD21 2.0209 0.6918 HL22 -0.6990 0.5539 MSD23 -0.8077 1.4467 MSD24 0.5909 1.2221 MSD25 0.1840 0.3160 MSD26 -1.0417 1.0343 MSD27 0.8925 0.6065 HL28 0.4861 1.0831 MSD29 1.5518 0.7723 HL30 0.3773 1.2024 MSD
Number of errors 9
Table 6: Classification of objects described by sets of two single-dimension histograms(10 objects used for training).
20


