Embed Size (px)
Citation preview
HAL Id: tel-03517918https://tel.archives-ouvertes.fr/tel-03517918
Submitted on 8 Jan 2022
HAL is a multi-disciplinary open accessarchive for the deposit and dissemination of sci-entific research documents, whether they are pub-lished or not. The documents may come fromteaching and research institutions in France orabroad, or from public or private research centers.
L’archive ouverte pluridisciplinaire HAL, estdestinée au dépôt et à la diffusion de documentsscientifiques de niveau recherche, publiés ou non,émanant des établissements d’enseignement et derecherche français ou étrangers, des laboratoirespublics ou privés.
Apports de la Médecine de Précision à laNeurochirurgie : Applications aux Glioblastomes
Vianney Gilard
To cite this version:Vianney Gilard. Apports de la Médecine de Précision à la Neurochirurgie : Applications aux Glioblas-tomes. Sciences agricoles. Normandie Université, 2021. Français. NNT : 2021NORMR075. tel-03517918
THÈSEPour obtenir le diplôme de doctorat
Spécialité SCIENCES DE LA VIE ET DE LA SANTE
Préparée au sein de l'Université de Rouen Normandie
Αppοrts de la Μédecine de Ρrécisiοn à la Νeurοchirurgie :Αpplicatiοns aux Gliοblastοmes
Présentée et soutenue parVIANNEY GILARD
Thèse soutenue le 29/11/2021devant le jury composé de
M. MICHEL LEFRANCPROFESSEUR DES UNIV - PRATICIENHOSP., UNIVERSITE AMIENS PICARDIEJULES VERNE
Rapporteur du jury
M. ABDERRAHIM OUSSALAH PROFESSEUR DES UNIV - PRATICIENHOSP., UNIVERSITE DE LORRAINE Rapporteur du jury
MME EMELINE TABOURET MAITRE DE CONF UNIV. - PRATICIENHOSP., Aix-Marseille Université Membre du jury
M. ABDELLAH TEBANI MAITRE DE CONF UNIV. - PRATICIENHOSP., Université de Rouen Normandie Membre du jury
M. STÉPHANE MARRET PROFESSEUR DES UNIV - PRATICIENHOSP., Université de Rouen Normandie Directeur de thèse
MME SOUMEYA BEKRI PROFESSEUR DES UNIV - PRATICIENHOSP., Université de Rouen Normandie Co-directeur de thèse
Thèse dirigée par STÉPHANE MARRET et SOUMEYA BEKRI, GENOMICS ANDPERSONALIZED MEDICINE IN CANCER AND NEUROLOGICAL DISORDERS

Remerciements
Je remercie madame le Professeur Soumeya BEKRI, pour avoir accepté de diriger cette thèse. Je vous remercie de m’avoir fait découvrir et apprécier les Sciences Omiques ainsi que pour vos encouragements et la bienveillance que vous m’avez témoignée. Soyez assurée de mon profond respect.
Je remercie monsieur le Professeur Stéphane MARRET, pour avoir accepté de diriger cette thèse. Je vous remercie de m’avoir fait découvrir la recherche clinique et fondamentale ainsi que pour vos précieux conseils. Soyez assuré de mon profond respect.
A mes rapporteurs, monsieur le Professeur Michel LEFRANC (Université d’Amiens) et monsieur le Professeur Abderrahim OUSSALAH (Université de Nancy), mes sincères remerciements pour le temps consacré à la relecture de ce manuscrit. Je suis honoré de vous compter parmi mon jury.
A madame le Docteur Emeline TABOURET d’avoir accepté de participer à ce jury et nous faire partager ainsi votre expertise.
A monsieur le Docteur Abdellah TEBANI pour ton soutien sans faille tout au long de ce travail. Je te remercie pour ta patience et ta pédagogie. Nos réunions hebdomadaires m’ont été d’un grand soutien et source d’une inspiration permanente. Sois assuré de mon estime et de mon amitié.
Au laboratoire d’anatomopathologie du CHU de Rouen, madame le Professeur Annie LAQUERRIERE, monsieur le Dr Florent MARGUET et madame Carole BASSET pour leur participation active à ce travail et leurs encouragements.
A monsieur le Docteur Bruno GONZALEZ et monsieur le Professeur Carlos AFONSO, je vous adresse mes chaleureux remerciements pour m’avoir ouvert les portes de vos laboratoires et pour vos encouragements bienveillants.

Je remercie vivement madame Justine FERREY et madame Isabelle SCHMITZ-AFONSO du laboratoire COBRA qui m’ont initié à la métabolomique, pour leur patience à mon égard et leurs précieux conseils.
Un grand merci à toute l’équipe du laboratoire de Biochimie Métabolique du CHU de Rouen pour leur accueil (Isabelle CORDONNIER, Hélène DRANGUET, Loréna DUJARDIN, Céline LESUEUR, Isabelle TRAGIN, Carine PILON, Thomas PLICHET, Sarah SNANOUDJ et Bénédicte SUDRIE-ARNAUD) pour leur soutien tout au long de ce parcours et pour leur aide précieuse. A tous mes collègues de l’unité INSERM U1245 – Équipe "Genetics and Physiopathology of Neurodevelopmental Disorders" pour leurs encouragements et soutien dans ce parcours. Un remerciement particulier à Carole LAGNEL, Céline LESUEUR et Michelle HAUCHECORNE qui m’ont accueilli au laboratoire en Master 2 avec bienveillance. A tous mes collègues du service de Neurochirurgie dont je partage le quotidien depuis maintenant 10 ans.

Table des Matières
Remerciements Table des matières Publications et communications Liste des figures Liste des principales abréviations
INTRODUCTION GENERALE Préambule (p1)
CHAPITRE I : CHIRURGIE ET MEDECINE DE PRECISION
1.1 Perspectives historiques (p5) 1.1.1 La neurochirurgie dans l’histoire 1.1.2 Apports de la biologie moléculaire à la médecine
1.2 Sciences omiques (p13) 1.2.1 Génomique 1.2.2 Transcriptomique 1.2.3 Protéomique 1.2.4 Métabolomique
1.3 Article I : Precision Neurosurgery: A Path Forward.
CHAPITRE II : LES GLIOBLASTOMES
1.1 Épidémiologie (p34)1.2 Présentation clinique (p35)1.3 Diagnostic radiologique (p35)1.4 Histologie et biologie moléculaire (p39)1.5 Prise en charge chirurgicale (p41)1.6 Thérapeutiques médicales (p42)1.7 Nouvelles thérapies et perspectives (p45)
1.8 Article II : Diagnosis and Management of Glioblastoma: A Comprehensive Perspective.
CHAPITRE III : TRAVAIL EXPERIMENTAL
1.1 Définition du problème (p58)1.2 Mise en place du design expérimental (p59)1.3 Article III : Integrative Metabolomics Reveals Deep Tissue and Systemic Metabolic
Remodeling in Glioblastoma.
CONCLUSIONS ET PERSPECTIVES (p102)
Publications & Communications
(2018 – 2021)
Publications liées à la thèse
1. Gilard V, Derrey S, Marret S, Bekri S, Tebani A. Precision Neurosurgery: A Path Forward. Journal of Personalized Medicine. 2021. J Pers Med.
2. Gilard V, Tebani A, Dabaj I, Laquerrière A, Fontanilles M, Derrey S, Marret S, Bekri S. Diagnosis and Management of Glioblastoma: A Comprehensive Perspective. J Pers Med. 2021 Apr 1;11(4):258.
3. Gilard V, Ferey J, Marguet F, Fontanilles M, Ducatez F, Pilon C, Lesueur C, Pereira T, Basset C, Schmitz-Afonso I, Di Fioré F, Laquerrière A, C Afonso, Derrey S, Marret S, Bekri S, Tebani A. Integrative Metabolomics Reveals Deep Tissue and Systemic Metabolic Remodeling in Glioblastoma. 2021. Cancers.
Autres publications
1. Garrido E, Metayer T, Borha A, Langlois O, Curey S, Papagiannaki C, Di Palma C, Emery E, DerreyS, Gaberel T, Gilard V. Intracranial aneurysms in pediatric population: a two-center audit. ChildsNerv Syst. 2021 Aug;37(8):2567-2575.
2. Rault F, Terrier L, Leclerc A, Gilard V, Emery E, Derrey S, Briant AR, Gakuba C, Gaberel T.Decreased number of deaths related to severe traumatic brain injury in intensive care unit duringthe first lockdown in Normandy: at least one positive side effect of the COVID-19 pandemic. ActaNeurochir (Wien). 2021 Jul;163(7):1829-1836.
3. Olympios N, Gilard V, Marguet F, Clatot F, Di Fiore F, Fontanilles M. TERT Promoter Alterationsin Glioblastoma: A Systematic Review. Cancers (Basel). 2021 Mar 8;13(5):1147.
4. Dabaj I, Ferey J, Marguet F, Gilard V, Basset C, Bahri Y, Brehin AC, Vanhulle C, Leturcq F, MarretS, Laquerrière A, Schmitz-Afonso I, Afonso C, Bekri S, Tebani A. Muscle metabolic remodellingpatterns in Duchenne muscular dystrophy revealed by ultra-high-resolution mass spectrometryimaging.Sci Rep. 2021 Jan 21;11(1):1906.
5. Gilard V, Tebani A, Bekri S, Marret S. Intraventricular Hemorrhage in Very Preterm Infants: AComprehensive Review. J Clin Med. 2020. Jul 31;9(8):2447.
6. Horowitz A, Saugier-Veber P, Gilard V. Inference of Diagnostic Markers and Therapeutic TargetsFrom CSF Proteomics for the Treatment of Hydrocephalus. Front Cell Neurosci. 2020 Oct21;14:576028.
7. Méreaux JL, Gilard V, Le Goff F, Chastan N, Magne N, Gerardin E, Maltête D, Lebas A, DerreyS. Practice of stereoelectroencephalography (sEEG) in drug-resistant epilepsy: Retrospective serieswith surgery and thermocoagulation outcomes. Neurochirurgie. 2020 Jun;66(3):139-143.
8. Goldenberg A, Marguet F, Gilard V, Cardine AM, Hassani A, Doz F, Radi S, Vasseur S, Bou J,Branchaud M, Houdayer C, Baert-Desurmont S, Laquerriere A, Frebourg T. Mosaic PTEN alterationin the neural crest during embryogenesis results in multiple nervous system hamartomas. ActaNeuropathol Commun. 2019 Dec 3;7(1):191.
9. Gilard V, Beccaria K, Hartley JC, Blanot S, Marqué S, Bourgeois M, Puget S, Thompson D, ZerahM, Tisdall M. Brain abscess in children, a two-centre audit: outcomes and controversies. Arch DisChild. 2020 Mar;105(3):288-291.
10. Terrier L, Gilard V, Marguet F, Fontanilles M, Derrey S. Stereotactic brain biopsy: evaluation ofrobot-assisted procedure in 60 patients. Acta Neurochir (Wien). 2019 Mar;161(3):545-552.
11. Gilard V, Chadie A, Ferracci FX, Brasseur-Daudruy M, Proust F, Marret S, Curey S. Posthemorrhagic hydrocephalus and neurodevelopmental outcomes in a context of neonatalintraventricular hemorrhage: an institutional experience in 122 preterm children. BMC Pediatr. 2018Aug 31;18(1):288.
Communications orales
1. Gilard V. Metabolomics analysis in patients with high grade glioma. Congrès annuel de la Sociétéfrançaise de neurochirurgie. Nice Octobre 2021.
2. Gilard V. Post hemorrhagic hydrocephalus and neurodevelopmental outcomes in a context ofneonatal intraventricular hemorrhage: an institutional experience in 122 preterm children. Congrèsannuel de la Société française de neurochirurgie. Saint Malo 2020.
Communications affichées
1. Gilard V, Ferey J, Marguet F, Fontanilles M, Ducatez F, Pilon C, Lesueur C, Pereira T, Basset C,Schmitz-Afonso I, Di Fioré F, Laquerrière A, C Afonso, Derrey S, Marret S, Bekri S, Tebani A.Metabolomics Reveals Deep Tissue and Systemic Metabolic Remodeling in Glioblastoma. EMBLSymposium: Multiomics to Mechanisms: Challenges in Data Integration. September 2021.
Liste des figures
Figure 1. Photographie d’un crâne Inca ayant subi trois trépanations et survécu à la procédure comme en attestent les berges osseuses consolidées.
Figure 2. Photographie d’un cadre de stéréotaxie dit de Leksell permettant les biopsies et implantations d’électrodes cérébrales.
Figure 3. Représentation des techniques de biologie moléculaire des différentes sciences omiques.
Figure 4. Représentation schématique des différentes étapes d’une étude métabolomique.
Figure 5. IRM cérébrale en coupes axiales en séquence FLAIR (A) puis en pondération T1 avec injection de gadolinium (B) chez un patient présentant un GBM du carrefour droit.
Figure 6. IRM cérébrale en coupes axiales en pondération T1 avec injection de gadolinium chez différents patients présentant un GBM pour illustrer leur hétérogénéité morphologique.
Figure 7. IRM cérébrale en coupes axiales en séquence de perfusion chez un patient présentant un GBM du carrefour droit. A noter l’augmentation du volume sanguin cérébral au sein de la lésion.
Figure 8. IRM cérébrale avec séquences de spectrométrie révélant les pics normaux du cerveau sain (4A), la présence de lactates et de lipides au sein de la lésion témoins de la nécrose (4B) ainsi qu’une inversion du rapport choline/NAA (4C), caractéristique d’une lésion gliale de haut grade.
Figure 9. Vue microscopique d’un glioblastome IDH muté.
Figure 10. Schéma représentant l’arbre diagnostique de la classification OMS 2016.
Figure 11. Visualisation peropératoire d’une exérèse chirurgicale ; vue microscopique (7A) et sous fluorescence au 5-ALA (7B).
Figure 12. Illustration du traitement d’un patient atteint d’un glioblastome selon le protocole STUPP.
Figure 13. Critères IRM d'évaluation de la réponse en neuro-oncologie.
Liste des principales abréviations
ADN Acide désoxyribonucléique ARN Acide ribonucléique ARNm ARN messager CCS Collision Cross Section ESI ElectroSpray Ionisation FT-ICR Fourrier Transform-Ion Cyclotronic Resonance FT-MS Fourrier Transform-Mass Spectrometry GBM Glioblastome Multiforme HDMS High Definition Mass Spectrometry HGMD Human Gene Mutation Database HMDB Human Metabolome DataBase IMS Ion Mobility Spectrometry LC Liquid Chromatography min Minute MS Mass spectrometry ms Millisecond MS/MS Tandem Mass spectrometry m/z Rapport masse sur charge NMR Nuclear Magnetic Resonnance OMIM Online Mendelian Inheritance in Man PC Principal Component Q Quadripole s Second TOF Time of Flight tR Temps de rétention UHPLC Ultra-High Pression Liquid Chromatography

INTRODUCTION GENERALE
1
Préambule
Dans la continuité de la médecine de précision, la chirurgie de précision est un concept
émergent depuis une dizaine d’année. La chirurgie, qui dans l’histoire a été longtemps
une branche à part de la médecine, a mis du temps à s’approprier les énormes progrès
technologiques dont nous avons été témoins au cours des trois dernières décennies.
En effet, une grande partie de nos pratiques chirurgicales actuelles n'ont pas changées
depuis maintenant plusieurs décennies. Bien que nous ayons tenté de rendre les
procédures chirurgicales moins morbides en utilisant des voies d’abord mini-invasives
ou endoscopiques, lorsque cela était approprié, la technologie accompagnant ces
procédures peu invasives reste relativement rudimentaire. Ces avancées ont souvent
consisté en une « ouverture » moins large de notre patient, une plus grande prise en
compte des contraintes anatomiques naturelles ou le recours à des instruments
chirurgicaux plus adaptés et variés. Ce n'est que récemment que les techniques
d’ingénierie ont amélioré nos pratiques chirurgicales que ce soit par l’essor des robots
chirurgicaux ou des systèmes de navigation per opératoire qui permettent aux
chirurgiens d'effectuer des procédures parfois plus précises que la main humaine.
Grâce à la collaboration croissante entre l'ingénierie, l'informatique et les chirurgiens,
nous commençons à entrevoir un avenir passionnant et peut-être, une prochaine
révolution chirurgicale. L'avenir de la chirurgie tournera autour du thème central de
la chirurgie guidée par l'image, de la réalité augmentée, de la résolution des images à
la navigation et à l'intelligence artificielle, en passant par les résections guidées par des
2
données de biologie moderne. Néanmoins, un élément central mérite d’être souligné :
ces technologies sont des aides à la conception et à la réalisation de l’acte chirurgical
et elles ne sauraient se substituer à une connaissance anatomique et gestuelle
rigoureuses. Elles viennent faciliter ce geste et son enseignement. Ensuite, la chirurgie
de précision n’est pas à confondre avec la précision de l’acte chirurgical même si celui-
ci est un élément de ce progrès. Comme la médecine de précision, la chirurgie de
précision place le patient comme référentiel de lui-même plus que la procédure elle-
même, en y intégrant des données médicales et biologiques individuelles tout en
tenant compte de la grande diversité interindividuelle. Les chirurgies oncologiques,
mais pas seulement, se sont appropriées ce concept. Traditionnellement, l'évaluation
peropératoire de la résection tumorale dépendait largement de l'inspection visuelle,
de la palpation des tissus et plus récemment des données d’imagerie ou d’histologie
per ou post opératoire. L’apport de la chirurgie de précision a été par exemple de
proposer des résections assistées par un spectromètre de masse. Elle repose donc sur
de larges collections biologiques issues des sciences omiques (génomique,
transcriptomique, protéomique, métabolomique et phénomique) utilisées à l’échelle
de l’individu. Son émergence a été rendue possible par l’essor du big data et de
l’intelligence artificielle. La neurochirurgie s’est approprié relativement tôt ces
avancées technologiques et son développement coïncide avec ces bonds d’ingénierie
et de biologie. Elle a été l’une des premières chirurgies à utiliser le microscope
opératoire pour la chirurgie hypophysaire puis endocrânienne au sens large ; l’une des
premières à utiliser l’imagerie et la navigation peropératoire et les techniques mini-
3
invasives. Il est donc logique que la neurochirurgie s’enrichisse de ces données
nouvelles de biologie moléculaire issues du big data clinico-biologique pour
accompagner ce bond technologique vers la chirurgie de précision.
Cette thèse porte sur les apports et applications des sciences omiques aux pathologies
neurochirurgicales. Nous développerons les éléments diagnostiques en
métabolomiques appliqués au glioblastome, tumeur cérébrale maligne.
Les objectifs de ce travail de thèse sont définis comme suit :
1. Mise en place d’une méthodologie métabolomique non ciblée et ciblée basée sur
une stratégie analytique multidimensionnelle comportant la spectrométrie de
masse à haute et très haute résolution, la chromatographie liquide ultra-haute
performance et la mobilité ionique.
2. Mise en place de la méthodologie de prétraitement, d’analyse et d’exploitation
des données
3. Application à une pathologie neurochirurgicale qu’est le glioblastome.
Le manuscrit de cette thèse est structuré en trois parties, Neurochirurgie et chirurgie
de précision (Chapitre I), le glioblastome (Chapitre II) et le travail expérimental
(Chapitre III).
Le chapitre I comporte une introduction avec une perspective historique de la
naissance et pratique de la neurochirurgie ainsi que l’apport des techniques de biologie
moléculaire à la neurochirurgie moderne.

4
Le chapitre II comprend un état des lieux des connaissances actuelles sur l’objet
principal du projet de thèse que représente le glioblastome (basés sur une revue
publiée) et le chapitre III représente le travail expérimental. Celui-ci consiste en un
article (art 3) qui décrit les aspects méthodologiques métabolomiques appliquées au
glioblastome.
5
CHAPITRE I : CHIRURGIE ET MEDECINE DE PRECISION
1.1 Perspectives historiques
1.1.1 La neurochirurgie dans l’histoire
Des techniques et des Hommes
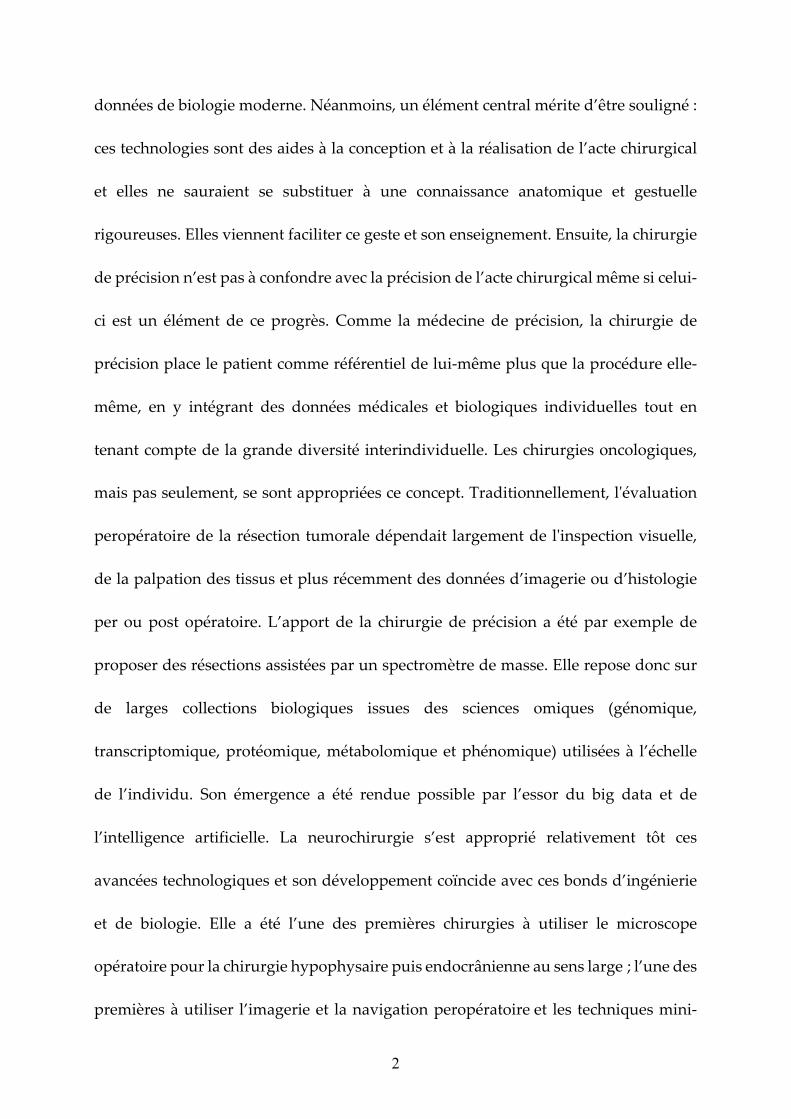
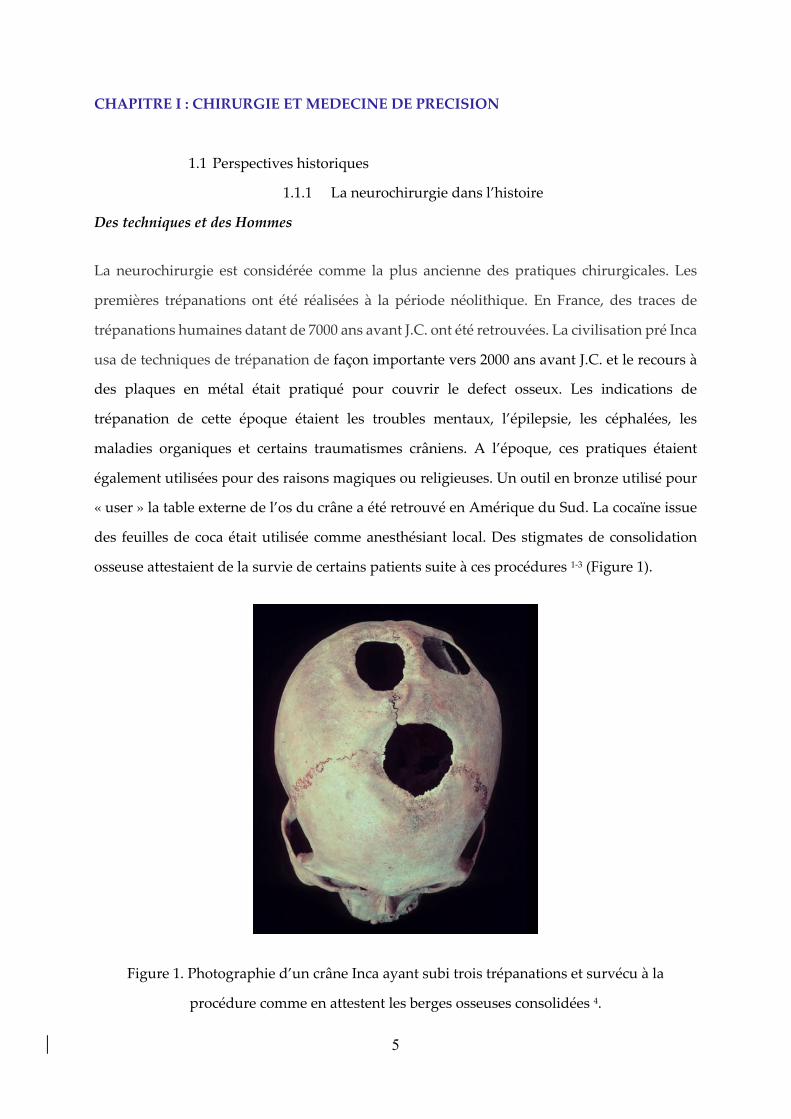
La neurochirurgie est considérée comme la plus ancienne des pratiques chirurgicales. Les
premières trépanations ont été réalisées à la période néolithique. En France, des traces de
trépanations humaines datant de 7000 ans avant J.C. ont été retrouvées. La civilisation pré Inca
usa de techniques de trépanation de façon importante vers 2000 ans avant J.C. et le recours à
des plaques en métal était pratiqué pour couvrir le defect osseux. Les indications de
trépanation de cette époque étaient les troubles mentaux, l’épilepsie, les céphalées, les
maladies organiques et certains traumatismes crâniens. A l’époque, ces pratiques étaient
également utilisées pour des raisons magiques ou religieuses. Un outil en bronze utilisé pour
« user » la table externe de l’os du crâne a été retrouvé en Amérique du Sud. La cocaïne issue
des feuilles de coca était utilisée comme anesthésiant local. Des stigmates de consolidation
osseuse attestaient de la survie de certains patients suite à ces procédures 1-3 (Figure 1).
Figure 1. Photographie d’un crâne Inca ayant subi trois trépanations et survécu à la
procédure comme en attestent les berges osseuses consolidées 4.
6
Hippocrate, médecin grec au IVe siècle avant J.C. considéré comme le père de la médecine
décrivit l’anatomie fonctionnelle du cerveau. Il enseignait à ses disciples que l’hémisphère
cérébral contrôlait l’hémicorps controlatéral et qu’ainsi la trépanation devait se pratiquer du
côté opposé aux symptômes. Il usait d’un trépan qui arrêtait son œuvre une fois le crâne ouvert
en préservant le cerveau sous-jacent. De telles procédures sont toujours couramment utilisées
avec des outils chirurgicaux très proches dans leur conception 1,5.
Ambroise Paré, chirurgien-barbier au XVIe siècle est l’un des fondateurs de la chirurgie
moderne. Opérant sur les champs de bataille, il décrit les techniques de cautérisation et de
ligature artérielle. Sa description de la trépanation conduit à une diminution des infections et
événements hémorragiques. Jean-Louis Petit, chirurgien et anatomiste du XVIIe siècle a décrit
l’hématome extradural avec la notion d’intervalle libre. Il décrivit également l’incision de la
dure-mère et les deux plans de cette méninge. Ces notions sont toujours enseignées à nos
étudiants actuellement. Un exemple classique de convergence entre neurochirurgie et histoire
de France est la mort d’Henri II, en 1559 6. Blessé par un fragment de lance lors d’un tournoi,
le roi de France meurt d’infection dans les jours suivant cette plaie oculaire. Ambroise Paré,
par sa description de l’autopsie du roi, décrivit le phénomène d’empyème cérébral lié à la
contamination d’une plaie.
Outre-Manche, le pionnier de la neurochirurgie moderne se nomme Sir Victor Horsley (1857-
1924). Il est chirurgien militaire et travaille au Queen Square Hospital à Londres. Appuyé par
ses collègues physiologistes, il émet l’hypothèse que l’épilepsie est une maladie du cortex
cérébral et que sa résection peut permettre de stopper le développement de l’épilepsie. Il
réalise sur des observations cliniques, les premières cortectomies cérébrales chez trois patients.
L’un des patients survécut à cette chirurgie avec une diminution de la fréquence des crises.
Cette procédure, bien qu’alimentée d’explorations d’imagerie et de physiologie, est
couramment pratiquée de nos jours 7,8.
Harvey Cushing (1869-1939), premier neurochirurgien américain à opérer des tumeurs
cérébrales, aurait pratiqué plus de 2000 interventions cérébrales. Sa description de ses voies
d’abord a permis d’améliorer la survie des patients de neurochirurgie 9. En France, les
pionniers de la neurochirurgie se nomment Clovis Vincent et Thierry de Martel. Formé à Paris,

7
Clovis Vincent fonda le service de neurochirurgie de la Pitié-Salpétrière. Neurologue de
formation, il fit progresser son art et forma de nombreux élèves de renom 10.
Malheureusement, la chirurgie porte encore le poids de son histoire. Du XIIe au XVIIIe siècle,
les chirurgiens-barbiers sont distincts des médecins. Les progrès médicaux réalisés en parallèle
de la pratique chirurgicale n’enrichissent que peu le savoir-faire chirurgical. Le principal écueil
de la neurochirurgie repose sur l’asepsie. La naissance de la neurochirurgie moderne post-
guerre a pu se développer grâce aux progrès des conditions per opératoires (asepsie et
anesthésie) et à une meilleure appréhension de la pathologie grâce aux progrès de l’imagerie
et de la neurophysiologie.
Les explorations en neurochirurgie
Très tôt, les neurochirurgiens se sont définis comme des médecins ayant une pratique
chirurgicale. Clovis Vincent disait que « La neurochirurgie, ce n'est pas seulement l'art
d'enlever les tumeurs du cerveau, mais c'est le moyen d'apprendre d'une façon précise les
fonctions du cerveau humain ». Il fut d’ailleurs le premier médecin-chef d’un service de
chirurgie. Au Canada, Wilder Penfield 11, également neurologue et neurochirurgien, décrivit
la somatotopie cérébrale. Il contribua, tout comme Clovis Vincent, élève de Babinski, à la
description des circuits de la mémoire. S’appuyant sur ses travaux, Harvey Cushing réalisa les
premières stimulations peropératoires pour explorer les fonctions des zones cérébrales
réséquées. Ces explorations historiques préfigurent le développement de la chirurgie éveillée.
L‘un des pans de la neurochirurgie moderne la plus liée à ces progrès techniques est
certainement la neurochirurgie fonctionnelle. Elle vise à ajuster certaines fonctions du névraxe
quand le traitement médicamenteux est insuffisant ou non recommandé. Classiquement
d’autres approches y sont associées telles que la stimulation cérébrale profonde, la chirurgie
de l’épilepsie, la chirurgie de la douleur et la radiochiurgie. Ses pionniers viennent d’horizons
divers. Lars Leksell (1907-1986) est physicien puis neurochirurgien suédois 12. Nous lui devons
l’un des premiers cadres de stéréotaxie (Figure 2) et l’invention de la radiochirurgie. La France
est là encore bien représentée : Jean Talaraich (1911-2007) est psychiatre puis neurochirurgien
13. Avec Jean Bancaud, neurologue, ils rédigent le premier atlas de stéréotaxie qui reste un
ouvrage de référence et proposent un cadre de stéréotaxie qui permet de réaliser implantation

8
d’électrodes et biopsie cérébrale avec une précision incomparable. Ces techniques
chirurgicales ont été développées avant le scanner cérébral (1970’s). Les repères anatomiques
étaient basés sur des abaques statistiques issus de centaines d’observations cadavériques et de
repères indirects. Ces abaques représentent une information stockée, quantifiable, normée et
mobilisable pour assister l’acte chirurgical. Conceptuellement, ces abaques sont les bases de
données informationnelles précurseurs du big data anatomo-clinico-biologiques actuel. En
effet, les repères indirects, avant l’avènement du scanner et de l’IRM, consistaient en une
ventriculographie gazeuse (inventée par Dandy) ou l’injection sous-arachnoïdienne de
lipiodol tel que décrit par Sicard en 1921 14. Il faut imaginer une opération de neurochirurgie
avant ces imageries et l’approximation que cela pouvait représenter ainsi que la morbidité
associée. La sémiologie clinique nous permettait et permet toujours d’émettre une hypothèse
topographique d’une lésion. Une ventriculographie (injection d’air ou de lipiodol) était
réalisée puis une radiographie de crâne standard laissait entrevoir la déviation du système
ventriculaire et ainsi la localisation supposée de cette lésion. Une « ouverture » du scalp large
était réalisée puis des trous de trépan étaient réalisés. Un volet crânien était taillé à la scie Gigli
(scie à ruban glissée d’un trou de trépan à un autre). En 1972, Godfrey Hounsfield 15 se voit
décerner le prix Nobel de médecine pour la découverte du premier scanner appelé
tomographie. De manière anecdotique, Sir Hounsfield était ingénieur chez EMI, société de
musique et d’électronique qui, grâce aux ventes record des Beatles dans les années 1960’s
finança les travaux de recherche de Hounsfield. Ce fut un bouleversement technologique pour
la neurochirurgie. Pour la première fois, nous pouvions voir le cerveau de manière directe sans
ouvrir la boite crânienne. Le scanner a progressivement amélioré sa résolution et l’arrivée de
l’IRM au début des années 1990’s a permis une technique non irradiante et beaucoup plus fine.
En seulement 30 ans, l’IRM est passée de sa naissance à une pratique courante qui parait
évidente à toute une génération.

9
Figure 2. Photographie d’un cadre de stéréotaxie dit de Leksell permettant les biopsies et
implantations d’électrodes cérébrales.
En parallèle, les progrès de la magnification optique et des techniques de neuro-endoscopie
ont amené à des progrès d’approches opératoires, de gestion de dissection ou d’hémostase
voire de nouvelles interventions (ventriculocysternostomie endoscopique par exemple) 16.
Depuis les années 2000, la robotique s’est invitée au bloc opératoire. Des robots chirurgicaux
(pour la stéréotaxie cérébrale ou rachidienne pour le moment), des systèmes de navigation
voire de réalité augmentée sont utilisés quotidiennement. Plus récemment, cette intégration
des progrès humains et techniques vient s’enrichir des progrès de la biologie moléculaire et
contribue au développement d’une nouvelle révolution qu’est la chirurgie de précision.
10
1.1.2. Apports de la biologie moléculaire à la médecine
La naissance de la biologie
Les philosophes grecs, voraces de curiosité, regardent avec intérêt l'éventail des créatures
vivantes, de la plante la plus humble à l'homme lui-même. Un nom grec a été inventé par un
naturaliste allemand au début du XIXe siècle pour cette étude de tous les aspects physiques
de la vie naturelle - la biologie, du bios (vie) et du logos (mot ou discours) 17,18. C'est un sujet
qui comporte des subdivisions claires, comme la botanique, la zoologie ou l'anatomie. Mais
tous s'intéressent aux organismes vivants. L’un des pères de la biologie est Alcmaeon de
Crotone 19, médecin, astronome et philosophe pythagoricien du Ve siècle avant J.C. Il
s’intéresse aux fluides corporels et émet l’hypothèse que les caractéristiques de ces fluides
pourraient être des marqueurs de pathologies plus globales : c’est le principe même d’un
biomarqueur tel qu’il se conçoit actuellement. Il est suivi un siècle plus tard par Aristote et
Théophraste qui développent respectivement la biologie animale et végétale. Dans son
ouvrage Historia animalium, Aristote 20 recense les caractéristiques biologiques propres à
chaque animal, car selon lui, « c’est par l’observation du normal et de ses caractéristiques
intrinsèques que l’on peut décrire le pathologique ». Là encore nous verrons tel que développé
plus loin dans ce manuscrit, qu’il s’agit d’un principe des sciences Omiques de caractériser sur
le plan phénotypique une population et d’établir le pathologique et son biomarqueur par
comparaison d’un groupe témoin de sujets indemnes de la pathologie qu’on cherche à
identifier. En 158 avant J.C. la ville de Pergame compte un nouveau médecin en chef des
gladiateurs. Il est un médecin grec du nom de Galien 21. Cette nomination lui donne l'occasion
d'étudier des blessures de toutes sortes. Sa connaissance des muscles lui permet d'avertir ses
patients du résultat probable de certaines opérations. Mais c'est la pratique de la dissection
des singes et des porcs qui donne à Galien des informations détaillées pour ses traités
médicaux. Près de 100 de ces ouvrages ont survécu. Ils deviennent la base de la grande
réputation de Galien dans la médecine médiévale, incontestée jusqu'aux travaux anatomiques
de Vésale. Grâce à ses expériences, Galien est capable de renverser de nombreuses croyances
de longue date, comme la théorie selon laquelle les artères contiennent de l'air et non du sang-
le transportant vers toutes les parties du corps depuis le cœur et les poumons. Cette croyance
est basée à l'origine sur les artères des animaux morts qui semblent vides. Galien démontra
11
par ses observations des plaies de gladiateurs que les artères vivantes contiennent du sang. Il
supposa par contre que le sang va et vient du cœur dans un mouvement de flux et de reflux.
Cette théorie a prévalu dans les cercles médicaux jusqu’au XVIe siècle.
Au cours des siècles profondément chrétiens du Moyen-Âge européen, l'ambiance qui prévaut
n'est pas propice à la recherche scientifique. Dieu sait ce qui est le mieux, et il devrait le faire -
puisqu'il a tout créé. Lorsque des connaissances pratiques sont nécessaires, il existe des
autorités anciennes dont les conclusions sont acceptées sans conteste - Ptolémée dans le
domaine de l'astronomie, Galien pour les questions anatomiques. Quelques savants atypiques
s'intéressent à la recherche scientifique. Le frère franciscain du XIIIe siècle, Roger Bacon, est
l'exemple le plus souvent cité 22-24, mais ses études portent aussi bien sur l'alchimie et
l'astrologie que sur l'optique et l'astronomie. Le scepticisme pratique requis pour la science
doit attendre la Renaissance.
Des progrès liés à l’imprimerie
En 1454, l’allemand Johannes Gutenberg invente les caractères mobiles. La mécanisation de
l’écriture permet une accélération des connaissances biologiques 25. Vers 1489, Léonard de
Vinci commence une série de dessins anatomiques 26,27. Pour la précision de l'observation, ils
sont bien en avance sur tout ce qui a été tenté auparavant. Au cours des vingt-cinq années
suivantes, il dissèque une trentaine de cadavres humains, dont beaucoup dans une morgue à
Rome - jusqu'à ce qu'en 1515, le pape Léon X lui ordonne d'arrêter. Ses dessins, au nombre de
750 environ, comprennent des études sur les structures osseuses, les muscles, les organes
internes, le cerveau et même la position du fœtus dans l'utérus. Ses études sur le cœur
suggèrent qu'il était sur le point de découvrir le concept de la circulation du sang. C'est une
coïncidence de grande valeur pour la biologie, dans laquelle l'observation est de première
importance, que le regain d'intérêt de la Renaissance pour la science coïncide avec l'invention
de l'imprimerie. Dès que les livres peuvent être publiés avec des illustrations gravées sur bois
parmi les textes imprimés, les naturalistes ont non seulement un nouveau lectorat important,
mais aussi la capacité de montrer ce qu'ils ont observé avec tant de soin. Le premier à utiliser
sérieusement cette possibilité est un botaniste, Otto Brunfels, dont les trois volumes Herbarum
vivae eicones sont publiés à Strasbourg entre 1530 et 1540 28. Un naturaliste français de cette
époque fournit un bon exemple de l'impulsion de la Renaissance à égaler et peut-être même à

12
surpasser les auteurs classiques. En 1546, Pierre Belon entreprend un voyage de deux ans
autour de la Méditerranée orientale dans le but précis de trouver et de représenter les animaux
et les plantes décrits par les écrivains anciens. A Bâle, en Suisse, Vésale publie en 1543 son
grand ouvrage - De humani corporis fabrica (La structure du corps humain) 29. Il s'agit d'un
ouvrage en sept volumes comprenant de nombreuses et magnifiques illustrations gravées sur
bois. Le livre connaît un succès immédiat, bien qu'il fasse naturellement l'envie des
traditionalistes qui suivent Galien. Les théories de Galien ont, après tout, le mérite évident de
l'ancienneté. Elles ont maintenant quelque 1400 ans. Ce souci de précision et d’exhaustivité
n’est pas sans rappeler les projets actuels que sont par exemple The Human Protein Atlas ou
le séquençage du génome humain 30,31. La continuité avec nos ancêtres est que la connaissance
biologique des éléments nous constituant nous permet de mieux appréhender et traiter les
maladies. Cela nécessite donc de visualiser l’infiniment petit.
La découverte du microscopique
Marcello Malpighi 32, professeur de médecine théorique à l'université de Bologne, a été le
pionnier de l'utilisation du microscope en biologie. Un soir de 1661, sur une colline près de
Bologne, il utilise le soleil couchant comme source de lumière, l'éclairant dans son objectif à
travers une fine section préparée d'un poumon de grenouille. Sur l'image agrandie, il est clair
que tout le sang est contenu dans de petits tubes. Malpighi devient ainsi le premier scientifique
à observer les capillaires, ces minuscules vaisseaux sanguins dans lesquels le sang circule à
travers la chair. Ils sont si fins, et si nombreux, que chacun de nos corps contient plus de 100
000 kilomètres de ces conduits microscopiques. Grâce à leur découverte, le chaînon manquant
dans la circulation sanguine de Harvey 33 a été mis en évidence. Car les capillaires sont
littéralement le lien par lequel le sang riche en oxygène des artères fournit d'abord son énergie
aux cellules du corps et trouve ensuite son chemin vers les veines pour être renvoyé au cœur.
Améliorant le travail de Malpighi avec le microscope, le chercheur néerlandais Anton van
Leeuwenhoek 34 atteint un très haut degré de précision et de clarté (certaines offrant un
grossissement de 300x). Avec de tels instruments, il est en mesure d'observer des phénomènes
jusqu'alors trop petits pour être vus 35,36. En 1674, il est le premier scientifique à donner une
description précise des globules rouges. En 1677, il observe et représente des spermatozoïdes
13
dans le sperme d'un chien. En 1683, il fournit un dessin des animalculae (ou bactéries) présents
dans la salive et la plaque dentaire.
Les siècles suivants, l’invention du microscope a permis de perfectionner la connaissance du
vivant et notre environnement tout en étayant les classifications pour conduire à la biologie
moderne que nous connaissons. Cette histoire est encore incomplète.
1.2. Sciences omiques
Au XXe siècle, la biologie a connu des avancées extraordinaires avec la découverte de l’acide
désoxyribonucléique (ADN) par Watson et Cricks en 1953 37. Le développement de la
Polymerase Chain Reaction (PCR) par Mullis en 1988 38 révolutionne la biologie moléculaire
et ouvre la voie aux sciences omiques. Le suffixe -omique fait référence à l’exhaustivité et le
haut débit de l’information moléculaire. Les sciences omiques peuvent être définies comme
une nouvelle branche de la biologie moléculaire qui repose sur des technologies permettant la
caractérisation et la quantification collectives de molécules à partir de différents échantillons
biologiques permettant ainsi d’appréhender la structure, fonction et dynamique d'un
organismes 39. Le terme « omics » est proposé pour la première fois par Wilkins, généticien de
formation en 1994 40. La nécessité de ces sciences nouvelles est apparue criante à l’issue du
projet génome humain (HGP) en 2001 41. Ce projet a permis une meilleure compréhension de
notre génome, mais également mis en exergue les rôles fondamentaux des autres processus de
régulation biologiques. Les sciences omiques nécessitent la gestion d’un très grand nombre de
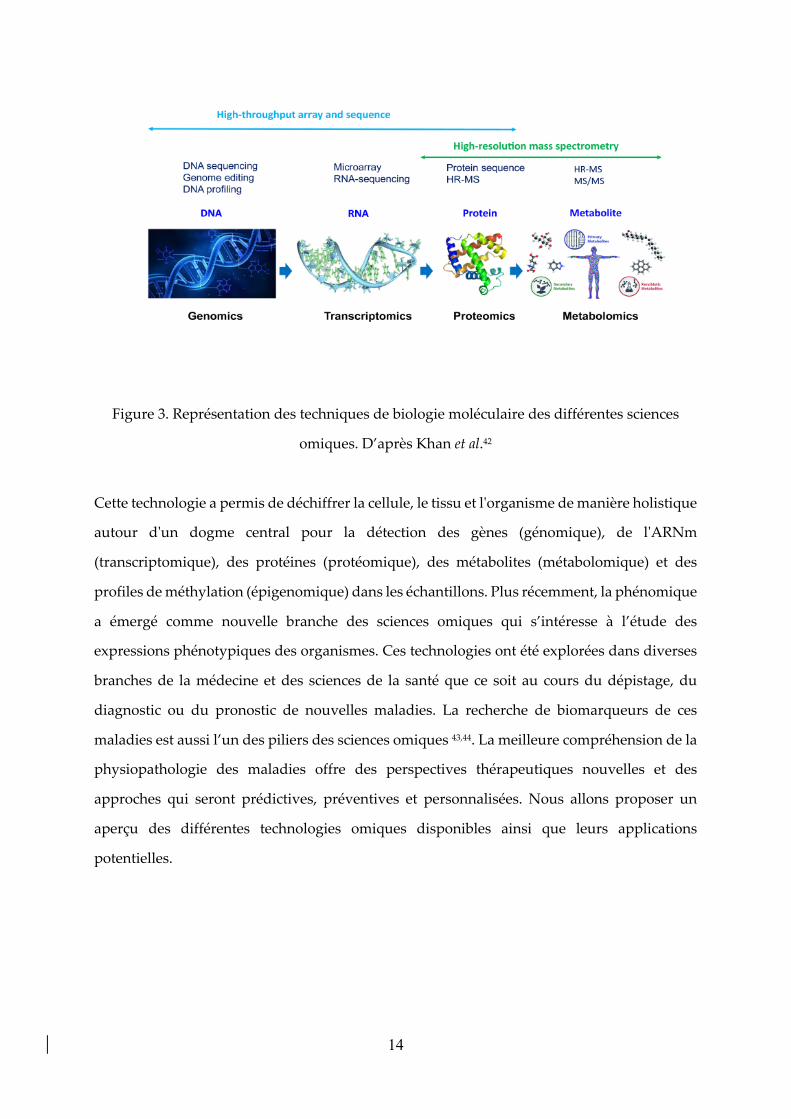
données et sont indissociables de la bio-informatique et du big data. La Figure 3 illustre les
progrès techniques de biologie moléculaire réalisés au XXe siècle.
14
Figure 3. Représentation des techniques de biologie moléculaire des différentes sciences
omiques. D’après Khan et al.42
Cette technologie a permis de déchiffrer la cellule, le tissu et l'organisme de manière holistique
autour d'un dogme central pour la détection des gènes (génomique), de l'ARNm
(transcriptomique), des protéines (protéomique), des métabolites (métabolomique) et des
profiles de méthylation (épigenomique) dans les échantillons. Plus récemment, la phénomique
a émergé comme nouvelle branche des sciences omiques qui s’intéresse à l’étude des
expressions phénotypiques des organismes. Ces technologies ont été explorées dans diverses
branches de la médecine et des sciences de la santé que ce soit au cours du dépistage, du
diagnostic ou du pronostic de nouvelles maladies. La recherche de biomarqueurs de ces
maladies est aussi l’un des piliers des sciences omiques 43,44. La meilleure compréhension de la
physiopathologie des maladies offre des perspectives thérapeutiques nouvelles et des
approches qui seront prédictives, préventives et personnalisées. Nous allons proposer un
aperçu des différentes technologies omiques disponibles ainsi que leurs applications
potentielles.
15
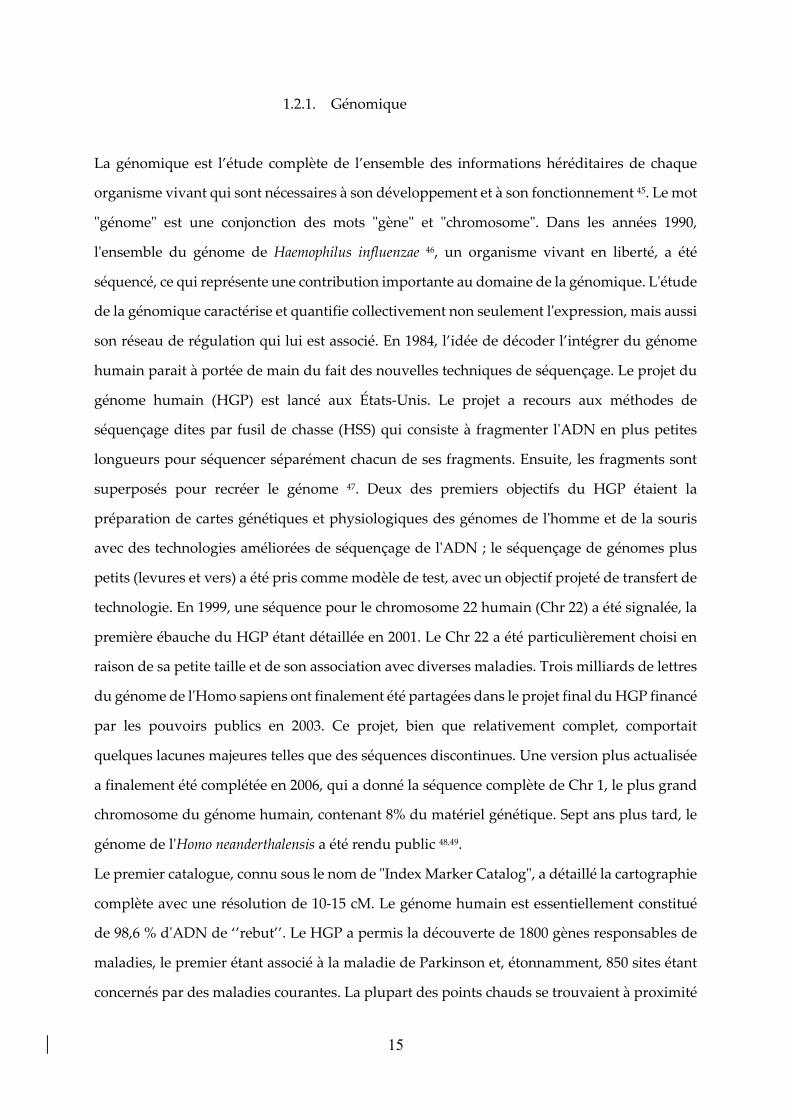
1.2.1. Génomique
La génomique est l’étude complète de l’ensemble des informations héréditaires de chaque
organisme vivant qui sont nécessaires à son développement et à son fonctionnement 45. Le mot
"génome" est une conjonction des mots "gène" et "chromosome". Dans les années 1990,
l'ensemble du génome de Haemophilus influenzae 46, un organisme vivant en liberté, a été
séquencé, ce qui représente une contribution importante au domaine de la génomique. L'étude
de la génomique caractérise et quantifie collectivement non seulement l'expression, mais aussi
son réseau de régulation qui lui est associé. En 1984, l’idée de décoder l’intégrer du génome
humain parait à portée de main du fait des nouvelles techniques de séquençage. Le projet du
génome humain (HGP) est lancé aux États-Unis. Le projet a recours aux méthodes de
séquençage dites par fusil de chasse (HSS) qui consiste à fragmenter l'ADN en plus petites
longueurs pour séquencer séparément chacun de ses fragments. Ensuite, les fragments sont
superposés pour recréer le génome 47. Deux des premiers objectifs du HGP étaient la
préparation de cartes génétiques et physiologiques des génomes de l'homme et de la souris
avec des technologies améliorées de séquençage de l'ADN ; le séquençage de génomes plus
petits (levures et vers) a été pris comme modèle de test, avec un objectif projeté de transfert de
technologie. En 1999, une séquence pour le chromosome 22 humain (Chr 22) a été signalée, la
première ébauche du HGP étant détaillée en 2001. Le Chr 22 a été particulièrement choisi en
raison de sa petite taille et de son association avec diverses maladies. Trois milliards de lettres
du génome de l'Homo sapiens ont finalement été partagées dans le projet final du HGP financé
par les pouvoirs publics en 2003. Ce projet, bien que relativement complet, comportait
quelques lacunes majeures telles que des séquences discontinues. Une version plus actualisée
a finalement été complétée en 2006, qui a donné la séquence complète de Chr 1, le plus grand
chromosome du génome humain, contenant 8% du matériel génétique. Sept ans plus tard, le
génome de l'Homo neanderthalensis a été rendu public 48,49.
Le premier catalogue, connu sous le nom de "Index Marker Catalog", a détaillé la cartographie
complète avec une résolution de 10-15 cM. Le génome humain est essentiellement constitué
de 98,6 % d'ADN de ‘’rebut’’. Le HGP a permis la découverte de 1800 gènes responsables de
maladies, le premier étant associé à la maladie de Parkinson et, étonnamment, 850 sites étant
concernés par des maladies courantes. La plupart des points chauds se trouvaient à proximité
16
des séquences adjacentes plutôt qu'à l'intérieur de celles-ci. Plus de mille tests génétiques et
trois cents produits issus de la biotechnologie ont résulté des essais cliniques basés sur les
données du HGP 50,51. À ce jour, les génomes de 6070 eucaryotes, 145 357 procaryotes, 17 614
virus, 12 924 plasmides et 11 732 organites ont été séquencés et sont facilement accessibles
dans le domaine public dans la base de données sur le génome du National Center for
Biotechnology Information (NCBI). Depuis quelques années, la génomique, qui a été la
première sciences omique, a permis le développement de thérapeutique innovante en
s’inscrivant dans la médecine de précision 52,53.
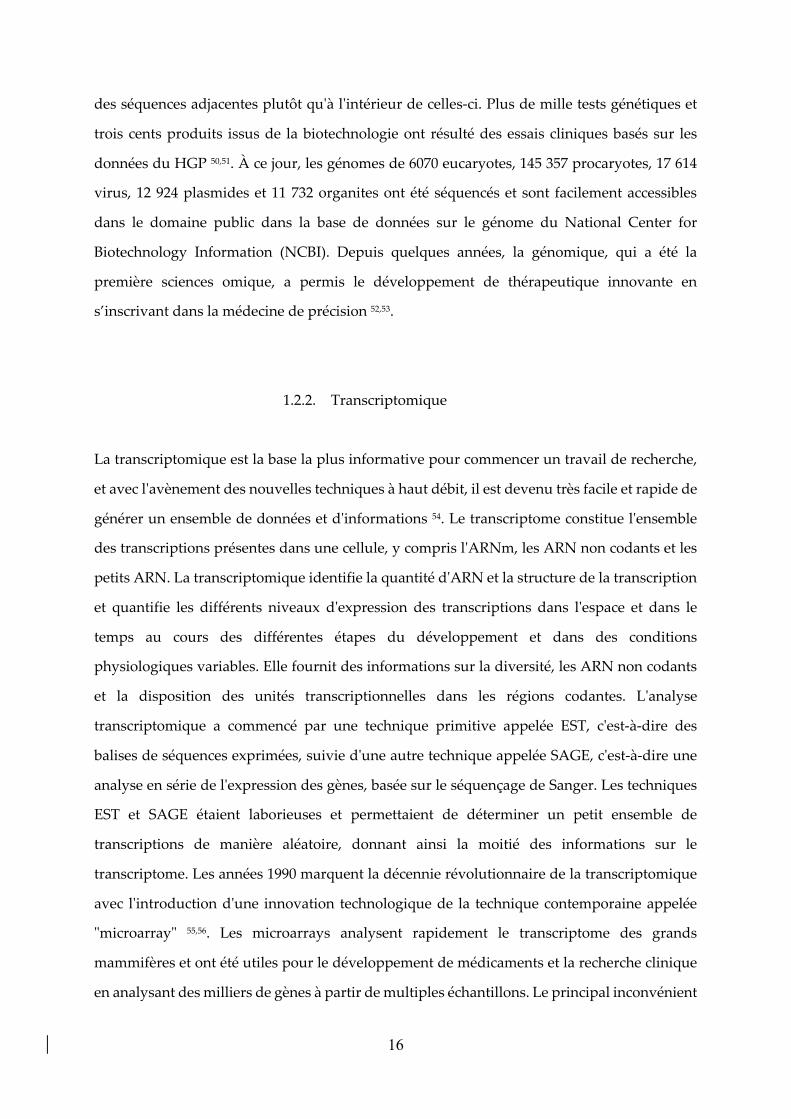
1.2.2. Transcriptomique
La transcriptomique est la base la plus informative pour commencer un travail de recherche,
et avec l'avènement des nouvelles techniques à haut débit, il est devenu très facile et rapide de
générer un ensemble de données et d'informations 54. Le transcriptome constitue l'ensemble
des transcriptions présentes dans une cellule, y compris l'ARNm, les ARN non codants et les
petits ARN. La transcriptomique identifie la quantité d'ARN et la structure de la transcription
et quantifie les différents niveaux d'expression des transcriptions dans l'espace et dans le
temps au cours des différentes étapes du développement et dans des conditions
physiologiques variables. Elle fournit des informations sur la diversité, les ARN non codants
et la disposition des unités transcriptionnelles dans les régions codantes. L'analyse
transcriptomique a commencé par une technique primitive appelée EST, c'est-à-dire des
balises de séquences exprimées, suivie d'une autre technique appelée SAGE, c'est-à-dire une
analyse en série de l'expression des gènes, basée sur le séquençage de Sanger. Les techniques
EST et SAGE étaient laborieuses et permettaient de déterminer un petit ensemble de
transcriptions de manière aléatoire, donnant ainsi la moitié des informations sur le
transcriptome. Les années 1990 marquent la décennie révolutionnaire de la transcriptomique
avec l'introduction d'une innovation technologique de la technique contemporaine appelée
"microarray" 55,56. Les microarrays analysent rapidement le transcriptome des grands
mammifères et ont été utiles pour le développement de médicaments et la recherche clinique
en analysant des milliers de gènes à partir de multiples échantillons. Le principal inconvénient
17
de cette technique est l'analyse des seules séquences connues et ne permet donc pas de détecter
les nouveaux transcrits. La dernière technologie en matière d'analyse du transcriptome est
l'ARN-Seq 57, basée sur une technologie de séquençage profond. Elle permet d'identifier le
gène et l'activité temporelle des gènes dans un génome. L'ARN-Seq in situ est une forme
avancée qui donne un aperçu d'une cellule individuelle dans un tissu fixe. De même,
l'information des gènes exprimés par une communauté microbienne est appelée
métatranscriptomique 58. La métatranscriptomique fournit un profil fonctionnel du
microbiome dans des conditions physiologiques variables 58. Les données générées sont utiles
pour l'analyse de l'enrichissement et l'analyse phylogénétique des microbes. Plusieurs
pipelines bioinformatiques sont actuellement conçus ou en cours de réalisation pour l'analyse
de l'ensemble des données du métatranscriptome 59.
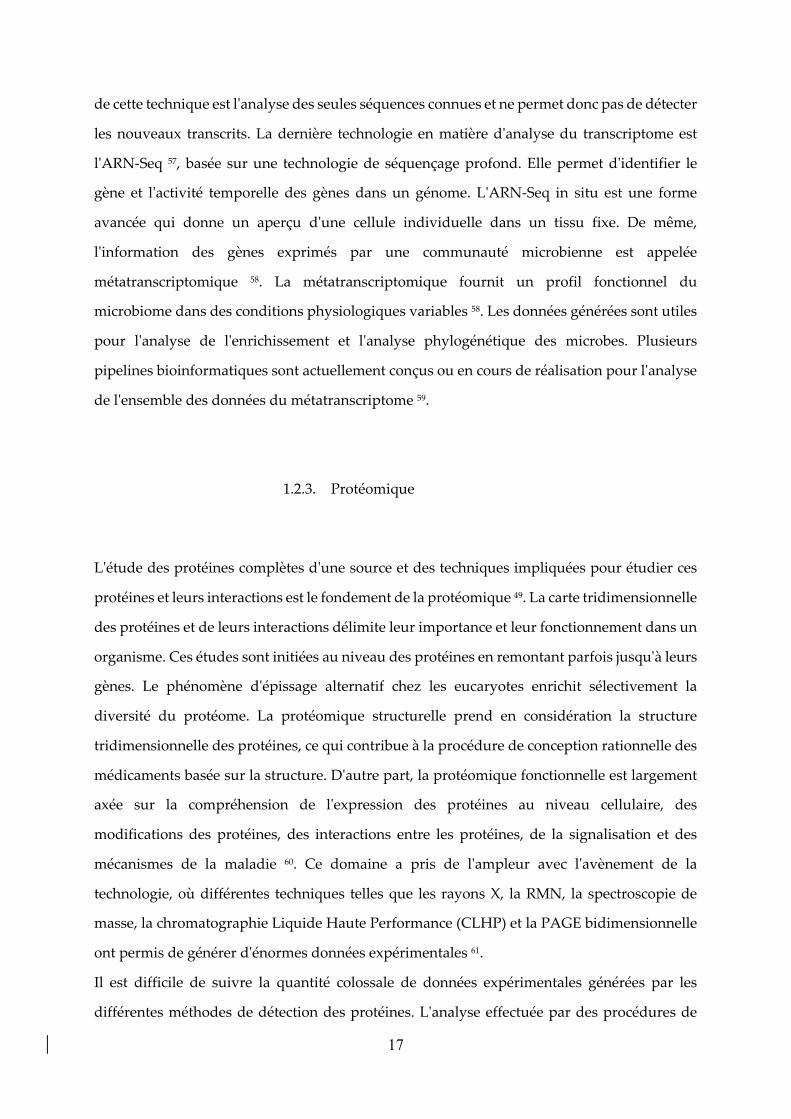
1.2.3. Protéomique
L'étude des protéines complètes d'une source et des techniques impliquées pour étudier ces
protéines et leurs interactions est le fondement de la protéomique 49. La carte tridimensionnelle
des protéines et de leurs interactions délimite leur importance et leur fonctionnement dans un
organisme. Ces études sont initiées au niveau des protéines en remontant parfois jusqu'à leurs
gènes. Le phénomène d'épissage alternatif chez les eucaryotes enrichit sélectivement la
diversité du protéome. La protéomique structurelle prend en considération la structure
tridimensionnelle des protéines, ce qui contribue à la procédure de conception rationnelle des
médicaments basée sur la structure. D'autre part, la protéomique fonctionnelle est largement
axée sur la compréhension de l'expression des protéines au niveau cellulaire, des
modifications des protéines, des interactions entre les protéines, de la signalisation et des
mécanismes de la maladie 60. Ce domaine a pris de l'ampleur avec l'avènement de la
technologie, où différentes techniques telles que les rayons X, la RMN, la spectroscopie de
masse, la chromatographie Liquide Haute Performance (CLHP) et la PAGE bidimensionnelle
ont permis de générer d'énormes données expérimentales 61.
Il est difficile de suivre la quantité colossale de données expérimentales générées par les
différentes méthodes de détection des protéines. L'analyse effectuée par des procédures de
18
bio-informatique impliquant des algorithmes, des bases de données et des pipelines pour
l'analyse informatique permet une analyse plus rapide et plus précise en quelques jours. Grâce
aux bases de données et aux portails de ressources, la gestion, le stockage et le partage des
données ont permis aux chercheurs d'obtenir et de rassembler plus facilement les données, ce
qui accélère la recherche en protéomique. La protéomique, en combinaison avec d'autres
technologies complémentaires comme la génomique et la transcriptomique (une approche au
niveau des systèmes), a un énorme potentiel pour répondre à plusieurs questions sans réponse
en biologie 49.
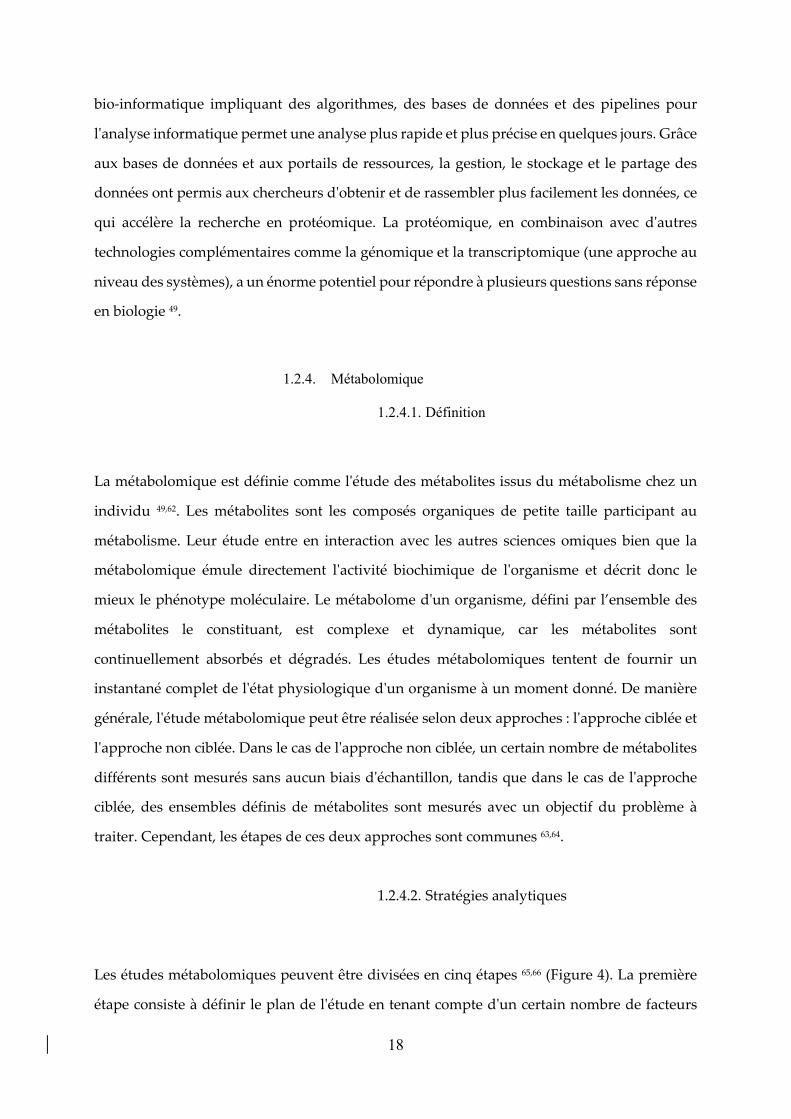
1.2.4. Métabolomique
1.2.4.1. Définition
La métabolomique est définie comme l'étude des métabolites issus du métabolisme chez un
individu 49,62. Les métabolites sont les composés organiques de petite taille participant au
métabolisme. Leur étude entre en interaction avec les autres sciences omiques bien que la
métabolomique émule directement l'activité biochimique de l'organisme et décrit donc le
mieux le phénotype moléculaire. Le métabolome d'un organisme, défini par l’ensemble des
métabolites le constituant, est complexe et dynamique, car les métabolites sont
continuellement absorbés et dégradés. Les études métabolomiques tentent de fournir un
instantané complet de l'état physiologique d'un organisme à un moment donné. De manière
générale, l'étude métabolomique peut être réalisée selon deux approches : l'approche ciblée et
l'approche non ciblée. Dans le cas de l'approche non ciblée, un certain nombre de métabolites
différents sont mesurés sans aucun biais d'échantillon, tandis que dans le cas de l'approche
ciblée, des ensembles définis de métabolites sont mesurés avec un objectif du problème à
traiter. Cependant, les étapes de ces deux approches sont communes 63,64.
1.2.4.2. Stratégies analytiques
Les études métabolomiques peuvent être divisées en cinq étapes 65,66 (Figure 4). La première
étape consiste à définir le plan de l'étude en tenant compte d'un certain nombre de facteurs
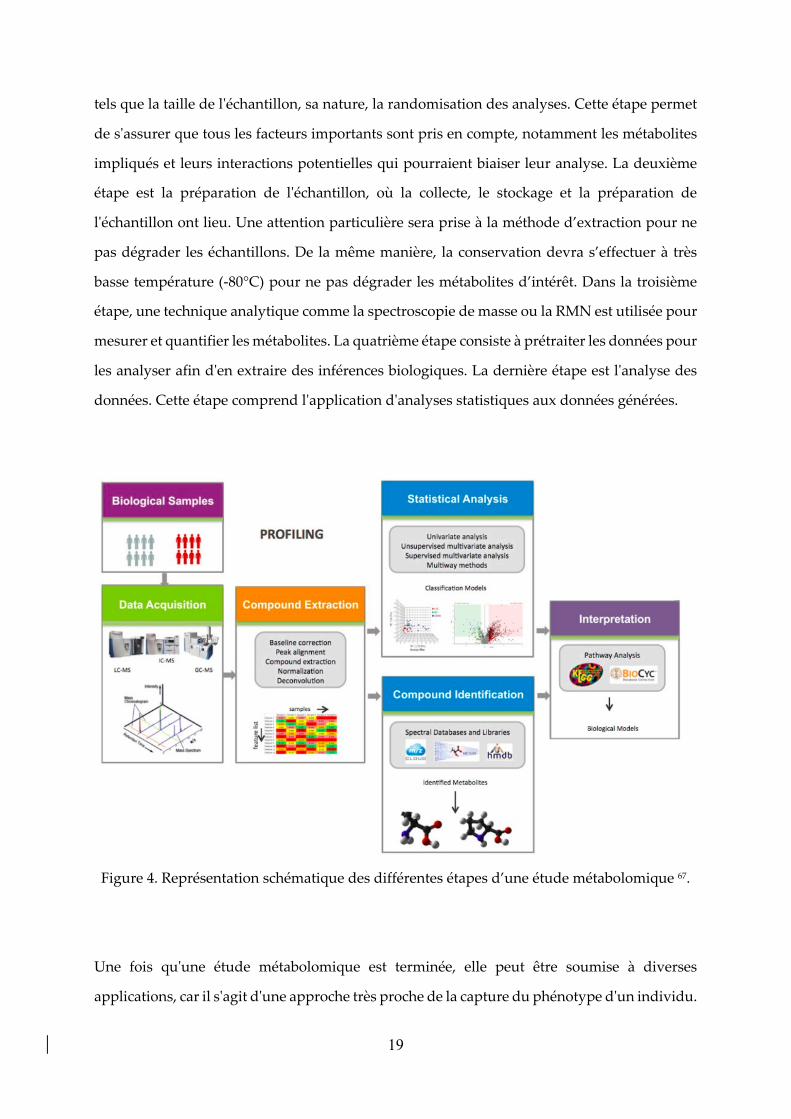
19
tels que la taille de l'échantillon, sa nature, la randomisation des analyses. Cette étape permet
de s'assurer que tous les facteurs importants sont pris en compte, notamment les métabolites
impliqués et leurs interactions potentielles qui pourraient biaiser leur analyse. La deuxième
étape est la préparation de l'échantillon, où la collecte, le stockage et la préparation de
l'échantillon ont lieu. Une attention particulière sera prise à la méthode d’extraction pour ne
pas dégrader les échantillons. De la même manière, la conservation devra s’effectuer à très
basse température (-80°C) pour ne pas dégrader les métabolites d’intérêt. Dans la troisième
étape, une technique analytique comme la spectroscopie de masse ou la RMN est utilisée pour
mesurer et quantifier les métabolites. La quatrième étape consiste à prétraiter les données pour
les analyser afin d'en extraire des inférences biologiques. La dernière étape est l'analyse des
données. Cette étape comprend l'application d'analyses statistiques aux données générées.
Figure 4. Représentation schématique des différentes étapes d’une étude métabolomique 67.
Une fois qu'une étude métabolomique est terminée, elle peut être soumise à diverses
applications, car il s'agit d'une approche très proche de la capture du phénotype d'un individu.

20
Cela en fait un outil précieux pour la recherche biomédicale. Des domaines avancés comme la
médecine personnalisée utilisent l'étude métabolomique pour le diagnostic et le pronostic
médical, utile pour l'identification de la maladie. La métabolomique est utile, car elle a la
capacité d'identifier et de caractériser différents métabolites, ce qui nous permet de mieux
comprendre les mécanismes de la maladie.
21
RÉFÉRENCES
1 Tsermoulas, G., Aidonis, A. & Flint, G. The skull of Chios: trepanation in Hippocratic medicine. J Neurosurg 121, 328-332, doi:10.3171/2014.4.JNS131886 (2014).
2 Katsevman, G. A. & Brandmeir, N. J. Trepanation of the Outer Table as a Treatment for Scalping Injuries: Historical Perspective and Modern Applications. World Neurosurg 145, 301-305, doi:10.1016/j.wneu.2020.09.147 (2021).
3 Greenblatt, S. H. A history of Neurosurgery : In Its Scientific and Professional Contexts. American Association of Neurological Surgeons edn, (1997).
4 Rifkinson-Mann, S. Cranial surgery in ancient Peru. Neurosurgery 23, 411-416, doi:10.1227/00006123-198810000-00001 (1988).
5 Ormond, D. R. & Hadjipanayis, C. G. The history of neurosurgery and its relation to the development and refinement of the frontotemporal craniotomy. Neurosurg Focus 36, E12, doi:10.3171/2014.2.FOCUS13548 (2014).
6 Faria, M. A., Jr. The death of Henry II of France. J Neurosurg 77, 964-969, doi:10.3171/jns.1992.77.6.0964 (1992).
7 Ellis, H. Sir Victor Horsley: pioneer neurosurgeon, physiologist and medical politician. Br J Hosp Med (Lond) 77, 304, doi:10.12968/hmed.2016.77.5.304 (2016).
8 Powell, M. P. Sir Victor Horsley at the birth of neurosurgery. Brain 139, 631-634, doi:10.1093/brain/awv345 (2016).
9 Ellis, H. Harvey Cushing: father of modern neurosurgery. Br J Hosp Med (Lond) 75, 597, doi:10.12968/hmed.2014.75.10.597 (2014).
10 Brunon, J. [The origins of the French neurosurgery]. Neurochirurgie 62, 119-127, doi:10.1016/j.neuchi.2016.01.008 (2016).
11 Leblanc, R. Wilder Penfield and the vascular hypothesis of focal epilepsy. J Neurosurg 131, 1947-1953, doi:10.3171/2018.8.JNS181990 (2019).
12 Lunsford, L. D. Lars Leksell. Notes at the side of a raconteur. Stereotact Funct Neurosurg 67, 153-168, doi:10.1159/000099445 (1996).
13 Benabid, A. L. Jean Talairach (1911-2007). Stereotact Funct Neurosurg 86, 62-63, doi:10.1159/000111141 (2008).
14 Steimle, R. Jean A. Sicard (1872-1929). J Neurol 260, 1946-1947, doi:10.1007/s00415-012-6822-x (2013).
15 Petrik, V., Apok, V., Britton, J. A., Bell, B. A. & Papadopoulos, M. C. GodfreyHounsfield and the dawn of computed tomography. Neurosurgery 58, 780-787;discussion 780-787, doi:10.1227/01.NEU.0000204309.91666.06 (2006).
16 Kriss, T. C. & Kriss, V. M. History of the operating microscope: from magnifying glassto microneurosurgery. Neurosurgery 42, 899-907; discussion 907-898,doi:10.1097/00006123-199804000-00116 (1998).
17 Baluška, F. e. & Sahi, V. P. in Plant Cell Monographs, 1 online resource (X, 290 pages219 illustrations, 211 illustrations in color (Springer International Publishing : Imprint:Springer,, Cham, 2018).
18 Sahi, V. P. Concepts in cell biology - history and evolution. 1st edition. edn, (SpringerBerlin Heidelberg, 2018).
19 Santacroce, L., Charitos, I. A., Topi, S. & Bottalico, L. The Alcmaeon's School ofCroton: Philosophy and Science. Open Access Maced J Med Sci 7, 500-503,doi:10.3889/oamjms.2019.072 (2019).
20 Cortes, M. E., Rodriguez, J. L., Rodriguez, M. I., Del Rio, J. P. & Vigil, P. [AristotleAnniversary Year: remembering the contributions to medicine and human biology of
22
this great polymath]. Rev Med Chil 144, 1498-1499, doi:10.4067/S0034-98872016001100021 (2016).
21 Hajar, R. The air of history: early medicine to galen (part I). Heart Views 13, 120-128, doi:10.4103/1995-705X.102164 (2012).
22 Sanford, F. "Roger Bacon Was Mistaken". Science 91, 384, doi:10.1126/science.91.2364.384 (1940).
23 Sidebottom, E. Roger Bacon and the beginnings of experimental science in Britain. J R Soc Med 106, 243-245, doi:10.1177/0141076813488482 (2013).
24 Williams, S. J. Roger Bacon and his edition of the pseudo-Aristotelian Secretum secretorum. Speculum 69, 57-73, doi:10.2307/2864785 (1994).
25 Tompkins, R. K. The surgical journal of the future: how will it appear? Surg Today 36, 403-406, doi:10.1007/s00595-005-3171-8 (2006).
26 Jones, R. Leonardo da Vinci: anatomist. Br J Gen Pract 62, 319, doi:10.3399/bjgp12X649241 (2012).
27 Kron, T. & Krishnan, P. Leonardo DaVinci's contributions to medical physics and biomedical engineering: celebrating the life of a 'Polymath'. Australas Phys Eng Sci Med 42, 403-405, doi:10.1007/s13246-019-00757-2 (2019).
28 Zunic, L., Skrbo, A. & Dobraca, A. Historical Contribution of Pharmaceutics to Botany and Pharmacognosy Development. Mater Sociomed 29, 291-300, doi:10.5455/msm.2017.29.291-300 (2017).
29 Toledo-Pereyra, L. H. De Humani Corporis Fabrica surgical revolution. J Invest Surg 21, 232-236, doi:10.1080/08941930802330830 (2008).
30 Ponten, F., Schwenk, J. M., Asplund, A. & Edqvist, P. H. The Human Protein Atlas as a proteomic resource for biomarker discovery. J Intern Med 270, 428-446, doi:10.1111/j.1365-2796.2011.02427.x (2011).
31 Uhlen, M. et al. Towards a knowledge-based Human Protein Atlas. Nat Biotechnol 28, 1248-1250, doi:10.1038/nbt1210-1248 (2010).
32 Pearce, J. M. Malpighi and the discovery of capillaries. Eur Neurol 58, 253-255, doi:10.1159/000107974 (2007).
33 Androutsos, G., Karamanou, M. & Stefanadis, C. William Harvey (1578-1657): discoverer of blood circulation. Hellenic J Cardiol 53, 6-9 (2012).
34 Gest, H. The discovery of microorganisms by Robert Hooke and Antoni Van Leeuwenhoek, fellows of the Royal Society. Notes Rec R Soc Lond 58, 187-201, doi:10.1098/rsnr.2004.0055 (2004).
35 Martins e Silva, J. From the discovery of the circulation of the blood to the first steps in hemorheology: part 2. Rev Port Cardiol 28, 1405-1439 (2009).
36 Martins e Silva, J. From the discovery of the circulation of the blood to the first steps in hemorheology: part 1. Rev Port Cardiol 28, 1245-1268 (2009).
37 Ghannam, J. Y., Wang, J. & Jan, A. in StatPearls (2021). 38 Schluger, N. W. & Rom, W. N. The polymerase chain reaction in the diagnosis and
evaluation of pulmonary infections. Am J Respir Crit Care Med 152, 11-16, doi:10.1164/ajrccm.152.1.7599808 (1995).
39 in Evolution of Translational Omics: Lessons Learned and the Path Forward (eds C. M. Micheel, S. J. Nass, & G. S. Omenn) (2012).
40 Manzoni, C. et al. Genome, transcriptome and proteome: the rise of omics data and their integration in biomedical sciences. Briefings in bioinformatics 19, 286-302, doi:10.1093/bib/bbw114 (2018).
41 Greenhalgh, T. The Human Genome Project. J R Soc Med 98, 545, doi:10.1258/jrsm.98.12.545 (2005).
23
42 Khan, M. S. Multiomics for biomedical applications. Journal of applied bioanalysis 6, 97-106, doi:10.17145/jab.20.012 (2020).
43 Campanella, R. et al. Personalized and translational approach for malignant braintumors in the era of precision medicine: the strategic contribution of an experiencedneurosurgery laboratory in a modern neurosurgery and neuro-oncology department. JNeurol Sci 417, 117083, doi:10.1016/j.jns.2020.117083 (2020).
44 Rai, V., Mukherjee, R., Ghosh, A. K., Routray, A. & Chakraborty, C. "Omics" in oralcancer: New approaches for biomarker discovery. Arch Oral Biol 87, 15-34,doi:10.1016/j.archoralbio.2017.12.003 (2018).
45 Roth, S. C. What is genomic medicine? J Med Libr Assoc 107, 442-448,doi:10.5195/jmla.2019.604 (2019).
46 Fleischmann, R. D. et al. Whole-genome random sequencing and assembly ofHaemophilus influenzae Rd. Science 269, 496-512, doi:10.1126/science.7542800(1995).
47 Sawicki, M. P., Samara, G., Hurwitz, M. & Passaro, E., Jr. Human Genome Project. AmJ Surg 165, 258-264, doi:10.1016/s0002-9610(05)80522-7 (1993).
48 Wilson, B. J. & Nicholls, S. G. The Human Genome Project, and recent advances inpersonalized genomics. Risk Manag Healthc Policy 8, 9-20,doi:10.2147/RMHP.S58728 (2015).
49 Arivaradarajan, P. & Misra, G. 1 online resource (XV, 148 pages 132 illustrations, 129illustrations in color (Springer Singapore : Imprint: Springer,, Singapore, 2018).
50 Bailey, J. N., Pericak-Vance, M. A. & Haines, J. L. The impact of the human genomeproject on complex disease. Genes (Basel) 5, 518-535, doi:10.3390/genes5030518(2014).
51 Gonzaga-Jauregui, C., Lupski, J. R. & Gibbs, R. A. Human genome sequencing inhealth and disease. Annu Rev Med 63, 35-61, doi:10.1146/annurev-med-051010-162644(2012).
52 Aronson, S. J. & Rehm, H. L. Building the foundation for genomics in precisionmedicine. Nature 526, 336-342, doi:10.1038/nature15816 (2015).
53 Roden, D. M. & Tyndale, R. F. Genomic medicine, precision medicine, personalizedmedicine: what's in a name? Clin Pharmacol Ther 94, 169-172,doi:10.1038/clpt.2013.101 (2013).
54 Marin de Evsikova, C., Raplee, I. D., Lockhart, J., Jaimes, G. & Evsikov, A. V. TheTranscriptomic Toolbox: Resources for Interpreting Large Gene Expression Datawithin a Precision Medicine Context for Metabolic Disease Atherosclerosis. J Pers Med9, doi:10.3390/jpm9020021 (2019).
55 Li, S., Todor, A. & Luo, R. Blood transcriptomics and metabolomics for personalizedmedicine. Comput Struct Biotechnol J 14, 1-7, doi:10.1016/j.csbj.2015.10.005 (2016).
56 Lowe, R., Shirley, N., Bleackley, M., Dolan, S. & Shafee, T. Transcriptomicstechnologies. PLoS Comput Biol 13, e1005457, doi:10.1371/journal.pcbi.1005457(2017).
57 Wang, Z., Gerstein, M. & Snyder, M. RNA-Seq: a revolutionary tool fortranscriptomics. Nat Rev Genet 10, 57-63, doi:10.1038/nrg2484 (2009).
58 Aguiar-Pulido, V. et al. Metagenomics, Metatranscriptomics, and MetabolomicsApproaches for Microbiome Analysis. Evol Bioinform Online 12, 5-16,doi:10.4137/EBO.S36436 (2016).
59 Gwak, H. J., Lee, S. J. & Rho, M. Application of computational approaches to analyzemetagenomic data. J Microbiol 59, 233-241, doi:10.1007/s12275-021-0632-8 (2021).
24
60 Hortin, G. L., Jortani, S. A., Ritchie, J. C., Jr., Valdes, R., Jr. & Chan, D. W. Proteomics: a new diagnostic frontier. Clin Chem 52, 1218-1222, doi:10.1373/clinchem.2006.067280 (2006).
61 Aslam, B., Basit, M., Nisar, M. A., Khurshid, M. & Rasool, M. H. Proteomics: Technologies and Their Applications. J Chromatogr Sci 55, 182-196, doi:10.1093/chromsci/bmw167 (2017).
62 Maramorosch, K., Shatkin, A. J. & Murphy, F. A. 1 online resource (viii, 273 p., 211 p (Academic Press,, Oxford, UK ; Burlington, MA, 2007).
63 Padmanabhan, S. Handbook of pharmacogenomics and stratified medicines. (Elsevier/AP, Academic Press is imprint of Elsevier, 2014).
64 Clish, C. B. Metabolomics: an emerging but powerful tool for precision medicine. Cold Spring Harb Mol Case Stud 1, a000588, doi:10.1101/mcs.a000588 (2015).
65 Wang, J. H., Byun, J. & Pennathur, S. Analytical approaches to metabolomics and applications to systems biology. Semin Nephrol 30, 500-511, doi:10.1016/j.semnephrol.2010.07.007 (2010).
66 Lindon, J. C. The handbook of metabolic phenotyping. 1st edition. edn, (Elsevier, 2018). 67 Alonso, A., Marsal, S. & Julia, A. Analytical methods in untargeted metabolomics: state
of the art in 2015. Front Bioeng Biotechnol 3, 23, doi:10.3389/fbioe.2015.00023 (2015).

25
L’article I présente les grandes avancées dans l’histoire de la neurochirurgie et de la biologie notamment
avec l’arrivée des sciences omiques. Il a pour but de montrer l’évolution de la neurochirurgie au XXIe
siècle et comment cette discipline s’est appuyée sur les données de biologie moléculaire pour proposer
une chirurgie de précision. Le prisme de la neuro-oncologie a été choisi, car elle illustre au mieux
l’interdisciplinarité et l’intégration des données omiques dans la pratique de la médecine personnalisée.
Article I: V Gilard, S Derrey, S Marret, S Bekri, A Tebani. Precision Neurosurgery: A Path Forward. Journal of Personalized Medicine. 2021;11(4):258.
J. Pers. Med. 2021, 11, x. https://doi.org/10.3390/xxxxx www.mdpi.com/journal/jpm
Review 1
Precision Neurosurgery: A Path Forward 2
Vianney Gilard 1*, Stéphane Derrey 2, Stéphane Marret 3, Soumeya Bekri 4 and Abdellah Tebani 4 3
1 Normandie Univ, UNIROUEN, CHU Rouen, INSERM U1245, Department of Neurosurgery, 76000, Rouen, 4 France; [email protected] (V.G.) 5
2 Normandie Univ, UNIROUEN, CHU Rouen, INSERM U1073, Department of Neurosurgery, 76000, Rouen, 6 France; [email protected] (S.D.) 7
3 Normandie Univ, UNIROUEN, CHU Rouen, INSERM U1245, Department of Neonatology, Pediatric Intensive 8 Care, and Neuropediatrics, 76000 Rouen, France; [email protected] (S.M.) 9
4 Normandie Univ, UNIROUEN, INSERM U1245, CHU Rouen, Department of Metabolic Biochemistry, 76000, 10 Rouen, France; [email protected] (A.T.), [email protected] (S.B.) 11
12 13
* Correspondence: [email protected] (V.G.) 14 15 16 17
Abstract: Since the inception of their profession, neurosurgeons have defined them- 18 selves as physicians with a surgical practice. Throughout time, neurosurgery always 19 take advantage of technological advances to provide better and safer care for patients. In 20 the ongoing precision medicine surge that drives the patient-centric healthcare, neuro- 21 surgery strives to effectively embrace this data-driven medicine era. Neuro-oncology 22 best illustrates this convergence between surgery and precision medicine with the ad- 23 vent of molecular profiling, imaging and data analytics. This convenient convergence 24 paves the way for new preventive, diagnostic, prognostic and targeted therapeutic 25 perspectives. The prominent advances in healthcare and big data utterly challenge the 26 medical community to deeply rethink current and future medical practice. This work 27 provides a historical perspective on neurosurgery. It also discusses the impact of preci- 28 sion medicine conceptual shifts on neurosurgery through neuro-oncology lenses. 29 30 Keywords: neuro-oncology; neurosurgery; precision medicine; personalized medicine; 31 omics; medical imaging 32 33 34
1. Introduction 35
Neurosurgery is considered as the oldest surgical practice. It has been reported that 36 the first trepanations were performed in the Neolithic period and traces of human 37 trepanations dating back to 7000 years BC have been found with bone consolidation 38 around the drill hole, proof of survival of these first patients [1,2]. Despite its long his- 39 tory, neurosurgery has been able to rely on the great technological advances of its time. 40 In recent years, with the emergence of omics-based biological lenses, precision medi- 41 cine has emerged as one of the great advances in various fields of medicine [3,4]. Its 42
Citation: Gilard et al. Precision Neu-
rosurgery: A Path Forward. J. Pers.
Med. 2021, 11, x.
https://doi.org/10.3390/xxxxx
Academic Editor: Firstname Last-
name
Received: date
Accepted: date
Published: date
Publisher’s Note: MDPI stays neutral
with regard to jurisdictional claims in
published maps and institutional
affiliations.
Copyright: © 2021 by the authors.
Submitted for possible open access
publication under the terms and
conditions of the Creative Commons
Attribution (CC BY) license
(http://creativecommons.org/licenses/
by/4.0/).
2 of 8
contribution can be found in the field of diagnosis with the development of biomarkers, but it also provides 43 prognostic elements and opens the way to new targeted therapies [5]. Neurosurgery is no exception and pre- 44 cision, or personalized medicine is present in our daily surgical practice. Precision medicine (PM) aims to 45 place the patient at the center of the healthcare pathway by integrating individual medical and biological data 46 while taking into account the great diversity between individuals. These new approaches invite us to reinvent 47 ourselves as neurosurgeons and to question our practice and profession. In line with the spirit and training of 48 our mentors, engineering, imaging and molecular biology techniques became more and more familiar com- 49 ponents of the operating room. They would not replace the fundamental principles of surgery, which are the 50 core of the operative indication, including a rigorous anatomy knowledge and flawless gestures hardly 51 earned through relentless and long practice in companionship. Nevertheless, these techniques have become 52 very useful in providing high quality and safe care to our patients. One of the fields that best illustrates the 53 contribution of new technologies and interdisciplinarity, in neurosurgery, is undoubtedly neuro-oncology. In 54 the following lines, we aim to give a historical perspective and discuss how neurosurgery is evolving towards 55 its next deep technological shift by fully embracing precision medicine particularly in the field of neu- 56 ro-oncology. 57
Neurosurgery: a short historical perspective 58
Even though the history of neurosurgery seems to begin in the Neolithic period, 5000 years later, it was the 59 pre-Inca civilizations that developed trepanning techniques. The indications of these trepanations were very 60 different from today and had a religious or magical tone [2,6]. Nevertheless, these procedures were also per- 61 formed in the context of cranial trauma, headaches, epilepsy and behavioral disorders. Later, the Incas have 62 raised to the rank of art their practice of cranial surgery. This is particularly highlighted by the diversity of 63 their metal-based instruments [7,8]. By looking at the survival rate following cranial surgery throughout his- 64 tory, Kushner et al. [2] showed that the Incas had a survival rate of 75% compared to 45% during the Ameri- 65 can Civil War. The main cause of mortality at the time was infection but the Incas applied ointments and met- 66 al prosthesis, ancestor of the current cranial vault plasties [7,8]. However, sole technical skills are not enough 67 to provide quality surgery. Understanding the brain physiology is, obviously, important to treat it more effec- 68 tively. The first Greek physicians helped to better understand these concepts. Hippocrates in the fourth cen- 69 tury BC [9,10], who considered as the father of medicine, explained in his omnia opera Hippocratis, that the 70 knowledge of physiology allowed for a better understanding of the gesture and that the technique alone was 71 not enough to guarantee high quality surgery. Galen, in the 2nd century A.D., elaborated on Hippocrates’ work. 72 In addition to perfecting anatomical knowledge through the observation of a large number of subjects and 73 taking care of injured gladiators [11]. Although ancient Greece practices, such as trepanations, were refined 74 over the centuries, endocranial surgery as such did not appeared until the 16th century. The cruelty of war al- 75 lowed significant medical leaps in the Middle Ages and the Renaissance. One of the leading figures of modern 76 surgery was undoubtedly Ambroise Paré (1510-1590) [12]. He perfected the trepanation techniques and vessel 77 ligation and introduced the notion of asepsis by using red iron cauterisation. A historical convergence be- 78 tween people’s lives and neurosurgery is the death of Henry II of Navarre, who died of an infection following 79 a craniocerebral wound during a tournament. Ambroise Paré, who performed the autopsy, described a cere- 80 bral empyema as the cause of death. Across the Channel, the pioneer of modern neurosurgery was Sir Victor 81 Horsley (1857-1924) [13,14]. He was a military surgeon working at the Queen Square Hospital in London. 82 With the support of his neurophysiologist colleagues, he hypothesized that epilepsy was a disease of the cer- 83 ebral cortex and that its resection could stop the development of epilepsy. Based on clinical observations, he 84 performed the first cerebral cortectomies on three patients. This procedure, although supported by imaging 85 and physiological investigations, is commonly performed today [6,7]. Harvey Cushing (1869-1939) [15] is the 86 first American neurosurgeon to operate on brain tumors. He has performed more than 2000 brain surgeries 87 and the description of his approaches led to improved survival of neurosurgical patients. Unfortunately, sur- 88 gery still carries the burden of its own history. From the 12th to the 18th century, barber-surgeons were dis- 89 tinct from physicians. The medical progress made in parallel with surgical practice only slightly enriched the 90 surgical know-how. The main pitfall of surgery is asepsis. As so was the case for neurosurgery. The birth of 91 modern post-war neurosurgery was possible through the progress of per operative conditions (asepsis and 92 anesthesia) and to a better understanding of the pathology and the progress in imaging and neurophysiology. 93
3 of 8
Advances in neurosurgery: first steps towards precision surgery 94
Very early on, neurosurgeons defined themselves as physicians with a surgical practice. "Neurosurgery is 95 not only the art of removing tumors from the brain, but it is the means to learn in a precise way the functions 96 of the human brain” once said the French neurosurgeon Clovis Vincent (1879-1947) [16]. He was the first phy- 97 sician in charge of a dedicated surgical department. In Canada, Wilder Penfield (1891-1976) [17], also a neu- 98 rologist and a neurosurgeon, described cerebral somatotopy. He contributed, as did Clovis Vincent, a student 99 of Babinski (1857-1932), to the description of memory circuits. Based on his work, Harvey Cushing performed 100 the first intraoperative stimulations to explore the functions of the resected brain areas. These historic explo- 101 rations prefigured the development of awake surgery. One of the aspects of modern neurosurgery most re- 102 lated to these technical advances is certainly functional neurosurgery. It aims at adjusting certain functions of 103 the neuraxis when drug treatment is insufficient or not recommended. Classically, it includes deep brain 104 stimulation, epilepsy surgery, pain surgery and radiosurgery. The pioneers come from various backgrounds. 105 Lars Leksell (1907-1986) was a Swedish physicist and neurosurgeon [18]. He is credited with one of the first 106 stereotaxis frameworks and the invention of radiosurgery. In France, Jean Talaraich (1911-2007) was a psychi- 107 atrist and then a neurosurgeon [19]. With Jean Bancaud (1921-1993), a neurologist, they wrote the first stereo- 108 taxis atlas, which remains a reference work. They proposed a stereotaxis framework that allows for the im- 109 plantation of electrodes and brain biopsy with flawless accuracy. Surgical precision and accuracy are at the 110 core of precision medicine because it relies on the development of engineering techniques. These surgical 111 techniques were developed before the brain scanner (1970's). The anatomical landmarks were based on statis- 112 tical charts derived from hundreds of cadaveric observations and indirect landmarks. These charts represent a 113 precious stored, quantifiable, standardized and ready-to-use information to assist the surgical act. Conceptu- 114 ally, these charts are the precursor informational databases of the current anatomical, clinical and biological 115 big data. In 1972, Godfrey Hounsfield (1919-2004) ( [20] was awarded the Nobel Prize in Medicine for the dis- 116 covery of the first computerized tomography (CT) scan. It was a technological breakthrough for neurosurgery. 117 For the first time we could, safely and non-invasively, see the brain directly without opening the skull. The 118 scanner resolution progressively improved and the surge of Magnetic Resonance Imaging (MRI) in the early 119 1990's allowed for a non-irradiating cleaner image. In only three decades, MRI has gone from innovation to a 120 common practice. At the same time, progress in optical magnification and neuro-endoscopy techniques led to 121 advances in operative approaches, dissection management or hemostasis, and even new interventions (i.e., 122 endoscopic ventriculocysternostomy) [21]. At the dawn of this millennium, robotics has entered the operating 123 room. Surgical robots (for cerebral or spinal stereotaxis for the moment), navigation and even augmented re- 124 ality systems are used on a daily basis. More recently, this integration of human and technical progress has 125 been enriched by advances in molecular biology and is substantially contributing to the development of mul- 126 timodal techniques paving the way to precision surgery [22]. 127
Precision medicine in daily neuro-oncology 128
Neurosurgery has always cultivated interdisciplinarity as described above. Some of its prominent mem- 129 bers came from different backgrounds. Lars Leksell for example was a physicist by training. So was also Jean 130 Talairach. The different branches of neurosurgery were enriched by their respective backgrounds. With the 131 advent of molecular biology techniques, precision medicine is no longer an outsider of the operating room but 132 became an active component. The most striking example is certainly neurosurgical oncology. This is particu- 133 larly highlighted through glioblastoma. Indeed, its management has made significant advance [23,24]. Glio- 134 blastoma, although the most common primary malignant tumor of the central nervous system, still lacks cu- 135 rative strategies. Its prognosis remains poor, even in case of complete surgical resection with a median sur- 136 vival of 15 months [25]. One of the reasons for treatment resistance in glioblastoma is its heterogeneity. Thus, 137 the integration of molecular biology, genomics and more recently metabolomics and transcriptomics data are 138 of interest and has led to a better understanding of glioblastoma heterogeneity and biological plasticity [26,27]. 139 The digital revolution and the multimodal Big Data surge have made it possible to characterize this tumor in 140 order to better understand its genesis, its clinical heterogeneity, its functional effects and the reasons under- 141 lying its resistance to treatment [28,29]. The main goals of precision medicine are to better understand glio- 142 blastoma signaling biological networks and to define common and distinct pathways that could explain their 143
4 of 8
clinical heterogeneity. This will allow for biomarker and prognostic discovery to open the way to targeted and 144 individualized therapies by targeting an alteration in these signaling pathways [30,31]. 145
Historically, the diagnosis of glioblastoma was based on the WHO classification originally derived from 146 histological criteria alone. The latest WHO classification of 2016 has integrated the latest molecular biology 147 data as well as prognostic elements and response to treatment related to their metabolic characteristics [32]. 148 Among the new features of the 2016 WHO classification is the mutation status (mutated or wild type) of the 149 IDH1 and IDH2 genes. It is postulated that IDH-mutated gliomas inhibit tumor suppressor oncogenes, induc- 150 ing the development of gliomas. Consequently, IDH-mutated status is an important prognostic factor for gli- 151 oblastomas [33]. The second component of classification of glial lesions is the presence or absence of a 1p/19q 152 codeletion. The 1p/19q co-deletion corresponds to the complete loss of 1p and 19q secondary to a transloca- 153 tion. It is associated with a better prognosis and a better response to chemotherapy for grades II and III glio- 154 mas [34]. Another recently described signaling pathway in glioblastoma is the telomerase-related senescence 155 escape pathways through mutation of the ATRX (alpha thalassemia/mental retardation syndrome X-linked) 156 gene or TERT (telomerase reverse transcriptase) promoter [27]. The ATRX gene was initially discovered in pa- 157 tients with X-linked mental retardation. The ATRX protein is a chromatin remodeling protein whose main 158 role is to maintain genomic stability. Thus, in case of ATRX variation, there is a telomerase lengthening al- 159 lowing glial cells to escape senescence. ATRX variation is a prognosis marker, rarely observed in IDH-wild 160 type glioblastoma. Variants in the TERT promoter or ATRX gene are present in 90% of mutated IDH gliomas 161 but are rarely associated. In recent series [35,36], it appears that TERT promoter gene mutation is associated 162 with poor outcomes in IDH wild type glioblastoma and favorable outcomes in IDH mutated glioblastoma. 163 Prognostic value of TERT promoter status is discussed due to its high frequency and confounding factors. For 164 example, the association with other molecular alteration such as O(6)-methylguanine-DNA methyltransferase 165 (MGMT) methylation is of interest. MGMT is an enzyme that repairs O6-methylguanine of DNA to guanine. 166 It protects the tumor cell against cytotoxic damage from alkylating chemotherapies, such as temozolomide 167 [37] [38]. As a consequence, methylation of the MGMT promoter leads to a decrease in MGMT expression and 168 in the repair of temozolomide-induced lesions. This status is a predictive marker for a better response to al- 169 kylating agents and an independent favorable prognostic marker in glioblastoma. Variants in genes encoding 170 histones, that are first identified in childhood glioma, are a promising avenue for a better understanding of 171 glioma signaling pathways [35]. Indeed, these variants are frequently found in various cancers and could 172 contribute to their epigenetic regulation. The heterogeneity of tumors and the large number of molecular bi- 173 ology discoveries yielded through omics highlights the need for a more personalized knowledge through in- 174 tegrative strategies to achieve precision medicine. 175
The search for a single biomarker for glioblastoma has been the focus of a sustained research for many 176 years [39]. Medical imaging and MRI spectroscopy, in particular, were main stream strategies in clinical prac- 177 tice [40]. It mainly consists in highlighting specific metabolic patterns in the tumor tissue. The development of 178 this technique required a large number of patients. The patient is, in this case, his own control because the 179 healthy brain parenchyma, usually contralateral, is used as a control tissue. Thus, MR spectroscopy in glio- 180 blastomas is characterized by a specific increase in choline/N-acetylaspartate and choline/creatinine ratios 181 [41]. In addition, an elevated peak of lactate and lipids as well as a decreased peak of myoinositol are reliable 182 information for the diagnosis of glioblastoma. With the advent of Big Data, radiological diagnosis continues to 183 progress. Recently, researchers at the University of Washington proposed an algorithm based on artificial in- 184 telligence and deep learning [42]. Their software has proven effective in diagnosing six categories of brain 185 tumours from conventional MRI sequences. This radiological marker cannot, currently, replace a histological 186 analysis. This highlights the urgent need for a sensitive blood biological signature. The use of large biobanks 187 has allowed for multi omics studies to propose biomarkers defined as a clinical, radiological and biological 188 signature allowing to define sub-groups of glioblastomas [43,44]. This refers to liquid biopsies whose aim is to 189 propose a diagnosis through a simple blood sample. Liquid biopsy has the advantage to prevent from inva- 190 sive procedure such as brain biopsy and can be repeated easily [29,45,46]. The development of such tech- 191 niques has its pitfalls even though the concept is still elegant. First, the heterogeneity of glial tumors makes it 192 difficult to find a single biomarker. Secondly, the blood-brain barrier is a powerful obstacle for the discovery 193 of a blood biomarker of an intraparenchymal processes. Finally, an ideal biomarker must allow for monitor- 194 ing of therapeutic efficacy or relapse. However, therapeutics can modify this biomarker. Thus, currently, de- 195
5 of 8
spite sustained research, there is no cleared blood biomarker for the diagnosis and follow-up of glioblastoma 196 patients. Nevertheless, recent analyses have highlighted genes or metabolites of interest in the diagnosis of 197 glioblastoma [45,47,48]. Some of them are also prognostic indicators and might pave the way to potential tar- 198 geted therapies. 199
Towards a precision surgery 200
Despite the above-mentioned progress, are we going to see the birth of precision surgery? At the dawn the 201 current century, the main progress in neurosurgery has been based on intraoperative navigation to better lo- 202 cate the tumor from preoperative imaging [49]. Awake surgery has increased the resection rate by decreasing 203 the morbidity of the surgical procedure [50]. Nowadays, imaging is performed during surgery and allows for 204 resection assessment in real time [51]. Augmented reality techniques allow for the smooth integration of these 205 imaging data into the surgeon's microscope to directly visualize the lesion and the peri-tumor area. More re- 206 cently, intraoperative analysis of resected tissue has been made possible by the miniaturization of omics tech- 207 niques. Thus, some teams have tested the integration of a mass spectrometer in the cavitronic ultrasound as- 208 pirator [52,53]. This allows to limit the resection to the tissue invaded by the tumor. One of the difficulties of 209 this technology is to define the metabolites of interest. These are different depending on whether they concern 210 the fleshy portion of the tumor, a possible cystic portion, the contrast medium or the peri-tumoral zone. Sec- 211 ondly, the contribution of mass spectrometry cannot be free of the functional limits linked to the tumor resec- 212 tion. The surgeon's hand is often stopped by the risk of morbidity of a resection. Nevertheless, in situ meta- 213 bolic phenotyping is a definite contribution and is a complement to navigation and microscopy techniques. 214 The miniaturization of this advanced imaging technologies makes its clinical use possible and opens the door 215 to a new way of understanding the procedure guided by molecular biology data. Conceptually, surgical pre- 216 cision and technological development are only two faces of the same coin: precision surgery. One of its fun- 217 damental principles is to put the patient at the center of healthcare to take into account individual and specific 218 biological and clinical attributes [54-56]. To do so, it is necessary to differentiate the normal from the patho- 219 logical, which relies on the development and analysis of large biobanks integrating the various multimodal 220 data. Worthless to note that in the current technology and regulatory state-of-the-art, these technological 221 shifts cannot yet replace the surgical decision, which still solely guided by the surgeon experience and dexter- 222 ity. 223
Conclusion 224
Neurosurgery is considered as one of the oldest surgical disciplines. Since ancient times, it has been able to 225 embrace major technological advances for the benefit of patients. Its progress has been made possible by the 226 knowledge of anatomy, the development of radiology, microscopy, robotics and, recently, big data. Indeed, 227 the development of the data-driven medicine has considerably modified clinical practice, in neuro-oncology 228 in particular. This has allowed a better pathogenesis understanding and thus opened the way for innovative 229 personalized therapies and disease management. The future of neurosurgery, and medical practice in general, 230 lies in the smooth integration of multidisciplinary perspectives in both translational and clinical neurosurgery 231 to achieve the promise of precision surgery. 232
233 Author Contributions: Conceptualization, V.G. and A.T.; writing—original draft preparation, V.G., A.T.; writing—review 234 and editing, S.D., S.M. and S.B; supervision, S.B. and S.M. All authors have read and agreed to the published version of 235 the manuscript. 236
Funding: This research received no external funding. 237
Institutional Review Board Statement: Not applicable. 238
Informed Consent Statement: Not applicable. 239 240 Data Availability Statement: Not applicable. 241 242 Conflicts of Interest: The authors declare no conflict of interest. 243
6 of 8
244
References 245 246 247 248
1. Greenblatt, S.H. A history of Neurosurgery : In Its Scientific and Professional Contexts, American Association of Neurological 249 Surgeons ed.; 1997; 10.1136/jnnp.64.2.284pp. 625. 250
2. Kushner, D.S.; Verano, J.W.; Titelbaum, A.R. Trepanation Procedures/Outcomes: Comparison of Prehistoric Peru with 251 Other Ancient, Medieval, and American Civil War Cranial Surgery. World Neurosurg 2018, 114, 245-251, 252 doi:10.1016/j.wneu.2018.03.143. 253
3. Khoury, M.J.; Iademarco, M.F.; Riley, W.T. Precision Public Health for the Era of Precision Medicine. Am J Prev Med 2016, 254 50, 398-401, doi:10.1016/j.amepre.2015.08.031. 255
4. Ginsburg, G.S.; Phillips, K.A. Precision Medicine: From Science To Value. Health Aff (Millwood) 2018, 37, 694-701, 256 doi:10.1377/hlthaff.2017.1624. 257
5. Sarma, A.; Calfee, C.S.; Ware, L.B. Biomarkers and Precision Medicine: State of the Art. Crit Care Clin 2020, 36, 155-165, 258 doi:10.1016/j.ccc.2019.08.012. 259
6. Katsevman, G.A.; Brandmeir, N.J. Trepanation of the Outer Table as a Treatment for Scalping Injuries: Historical 260 Perspective and Modern Applications. World Neurosurg 2021, 145, 301-305, doi:10.1016/j.wneu.2020.09.147. 261
7. Marino, R., Jr.; Gonzales-Portillo, M. Preconquest Peruvian neurosurgeons: a study of Inca and pre-Columbian 262 trephination and the art of medicine in ancient Peru. Neurosurgery 2000, 47, 940-950, 263 doi:10.1097/00006123-200010000-00028. 264
8. Rifkinson-Mann, S. Cranial surgery in ancient Peru. Neurosurgery 1988, 23, 411-416, doi:10.1227/00006123-198810000-00001. 265 9. Missios, S. Hippocrates, Galen, and the uses of trepanation in the ancient classical world. Neurosurg Focus 2007, 23, E11, 266
doi:10.3171/foc.2007.23.1.11. 267 10. Tsermoulas, G.; Aidonis, A.; Flint, G. The skull of Chios: trepanation in Hippocratic medicine. J Neurosurg 2014, 121, 268
328-332, doi:10.3171/2014.4.JNS131886. 269 11. Hajar, R. The air of history: early medicine to galen (part I). Heart Views 2012, 13, 120-128, doi:10.4103/1995-705X.102164. 270 12. Faria, M.A., Jr. The death of Henry II of France. J Neurosurg 1992, 77, 964-969, doi:10.3171/jns.1992.77.6.0964. 271 13. Ellis, H. Sir Victor Horsley: pioneer neurosurgeon, physiologist and medical politician. Br J Hosp Med (Lond) 2016, 77, 304, 272
doi:10.12968/hmed.2016.77.5.304. 273 14. Powell, M.P. Sir Victor Horsley at the birth of neurosurgery. Brain 2016, 139, 631-634, doi:10.1093/brain/awv345. 274 15. Ellis, H. Harvey Cushing: father of modern neurosurgery. Br J Hosp Med (Lond) 2014, 75, 597, 275
doi:10.12968/hmed.2014.75.10.597. 276 16. Brunon, J. [The origins of the French neurosurgery]. Neurochirurgie 2016, 62, 119-127, doi:10.1016/j.neuchi.2016.01.008. 277 17. Leblanc, R. Wilder Penfield and the vascular hypothesis of focal epilepsy. J Neurosurg 2019, 131, 1947-1953, 278
doi:10.3171/2018.8.JNS181990. 279 18. Lunsford, L.D. Lars Leksell. Notes at the side of a raconteur. Stereotact Funct Neurosurg 1996, 67, 153-168, 280
doi:10.1159/000099445. 281 19. Benabid, A.L. Jean Talairach (1911-2007). Stereotact Funct Neurosurg 2008, 86, 62-63, doi:10.1159/000111141. 282 20. Petrik, V.; Apok, V.; Britton, J.A.; Bell, B.A.; Papadopoulos, M.C. Godfrey Hounsfield and the dawn of computed 283
tomography. Neurosurgery 2006, 58, 780-787; discussion 780-787, doi:10.1227/01.NEU.0000204309.91666.06. 284 21. Shim, K.W.; Park, E.K.; Kim, D.S.; Choi, J.U. Neuroendoscopy: Current and Future Perspectives. J Korean Neurosurg Soc 285
2017, 60, 322-326, doi:10.3340/jkns.2017.0202.006. 286
2 of 8
22. Dorr, L.D.; Deshmane, P. Precision surgery. Orthopedics 2009, 32, doi:10.3928/01477447-20090728-26. 287 23. Ene, C.I.; Holland, E.C. Personalized medicine for gliomas. Surg Neurol Int 2015, 6, S89-95, doi:10.4103/2152-7806.151351. 288 24. Jain, K.K. A Critical Overview of Targeted Therapies for Glioblastoma. Front Oncol 2018, 8, 419, 289
doi:10.3389/fonc.2018.00419. 290 25. Alexander, B.M.; Cloughesy, T.F. Adult Glioblastoma. J Clin Oncol 2017, 35, 2402-2409, doi:10.1200/JCO.2017.73.0119. 291 26. Kowalczyk, T.; Ciborowski, M.; Kisluk, J.; Kretowski, A.; Barbas, C. Mass spectrometry based proteomics and 292
metabolomics in personalized oncology. Biochim Biophys Acta Mol Basis Dis 2020, 1866, 165690, 293 doi:10.1016/j.bbadis.2020.165690. 294
27. Kristensen, B.W.; Priesterbach-Ackley, L.P.; Petersen, J.K.; Wesseling, P. Molecular pathology of tumors of the central 295 nervous system. Ann Oncol 2019, 30, 1265-1278, doi:10.1093/annonc/mdz164. 296
28. Peeken, J.C.; Goldberg, T.; Pyka, T.; Bernhofer, M.; Wiestler, B.; Kessel, K.A.; Tafti, P.D.; Nusslin, F.; Braun, A.E.; Zimmer, 297 C., et al. Combining multimodal imaging and treatment features improves machine learning-based prognostic assessment 298 in patients with glioblastoma multiforme. Cancer Med 2019, 8, 128-136, doi:10.1002/cam4.1908. 299
29. Shen, J.; Song, R.; Hodges, T.R.; Heimberger, A.B.; Zhao, H. Identification of metabolites in plasma for predicting survival 300 in glioblastoma. Mol Carcinog 2018, 57, 1078-1084, doi:10.1002/mc.22815. 301
30. Touat, M.; Idbaih, A.; Sanson, M.; Ligon, K.L. Glioblastoma targeted therapy: updated approaches from recent biological 302 insights. Ann Oncol 2017, 28, 1457-1472, doi:10.1093/annonc/mdx106. 303
31. Truman, J.P.; Garcia-Barros, M.; Obeid, L.M.; Hannun, Y.A. Evolving concepts in cancer therapy through targeting 304 sphingolipid metabolism. Biochim Biophys Acta 2014, 1841, 1174-1188, doi:10.1016/j.bbalip.2013.12.013. 305
32. Banan, R.; Hartmann, C. The new WHO 2016 classification of brain tumors-what neurosurgeons need to know. Acta 306 Neurochir (Wien) 2017, 159, 403-418, doi:10.1007/s00701-016-3062-3. 307
33. Barritault, M.; Picart, T.; Poncet, D.; Fenouil, T.; d'Hombres, A.; Gabut, M.; Guyotat, J.; Jouanneau, E.; Ameli, R.; Joubert, B., 308 et al. Avoiding New Biopsies by Identification of IDH1 and TERT Promoter Mutation in Nondiagnostic Biopsies From 309 Glioma Patients. Neurosurgery 2020, 87, E513-E519, doi:10.1093/neuros/nyaa025. 310
34. Ahmed, K.A.; Chinnaiyan, P. Applying metabolomics to understand the aggressive phenotype and identify novel 311 therapeutic targets in glioblastoma. Metabolites 2014, 4, 740-750, doi:10.3390/metabo4030740. 312
35. Aldape, K.; Zadeh, G.; Mansouri, S.; Reifenberger, G.; von Deimling, A. Glioblastoma: pathology, molecular mechanisms 313 and markers. Acta Neuropathol 2015, 129, 829-848, doi:10.1007/s00401-015-1432-1. 314
36. Binabaj, M.M.; Bahrami, A.; ShahidSales, S.; Joodi, M.; Joudi Mashhad, M.; Hassanian, S.M.; Anvari, K.; Avan, A. The 315 prognostic value of MGMT promoter methylation in glioblastoma: A meta-analysis of clinical trials. J Cell Physiol 2018, 233, 316 378-386, doi:10.1002/jcp.25896. 317
37. Hegi, M.E.; Diserens, A.C.; Gorlia, T.; Hamou, M.F.; de Tribolet, N.; Weller, M.; Kros, J.M.; Hainfellner, J.A.; Mason, W.; 318 Mariani, L., et al. MGMT gene silencing and benefit from temozolomide in glioblastoma. N Engl J Med 2005, 352, 997-1003, 319 doi:10.1056/NEJMoa043331. 320
38. Le, N.Q.K.; Do, D.T.; Chiu, F.Y.; Yapp, E.K.Y.; Yeh, H.Y.; Chen, C.Y. XGBoost Improves Classification of MGMT Promoter 321 Methylation Status in IDH1 Wildtype Glioblastoma. J Pers Med 2020, 10, doi:10.3390/jpm10030128. 322
39. Geng, F.; Guo, D. Lipid droplets, potential biomarker and metabolic target in glioblastoma. Intern Med Rev (Wash D C) 323 2017, 3, doi:10.18103/imr.v3i5.443. 324
40. Galanaud, D.; Nicoli, F.; Figarella-Branger, D.; Roche, P.; Confort-Gouny, S.; Le Fur, Y.; Cozzone, P.J. [MR spectroscopy of 325 brain tumors]. J Radiol 2006, 87, 822-832, doi:10.1016/s0221-0363(06)74090-2. 326
3 of 8
41. Price, S.J.; Young, A.M.; Scotton, W.J.; Ching, J.; Mohsen, L.A.; Boonzaier, N.R.; Lupson, V.C.; Griffiths, J.R.; McLean, M.A.; 327 Larkin, T.J. Multimodal MRI can identify perfusion and metabolic changes in the invasive margin of glioblastomas. J Magn 328 Reson Imaging 2016, 43, 487-494, doi:10.1002/jmri.24996. 329
42. Chakrabarty, S.; Sotiras, A.; Milchenko, M.; LaMontagne, P.; Hileman, M.; Marcus, D. MRI-based Identification and 330 Classification of Major Intracranial Tumor Types Using a 3D Convolutional Neural Network: A Retrospective 331 Multi-Institutional Analysis. Radiology: Artificial Intelligence 2021, 10.1148/ryai.2021200301, doi:10.1148/ryai.2021200301. 332
43. Clavreul, A.; Soulard, G.; Lemee, J.M.; Rigot, M.; Fabbro-Peray, P.; Bauchet, L.; Figarella-Branger, D.; Menei, P.; network, 333 F.G.B. The French glioblastoma biobank (FGB): a national clinicobiological database. J Transl Med 2019, 17, 133, 334 doi:10.1186/s12967-019-1859-6. 335
44. Sasmita, A.O.; Wong, Y.P.; Ling, A.P.K. Biomarkers and therapeutic advances in glioblastoma multiforme. Asia Pac J Clin 336 Oncol 2018, 14, 40-51, doi:10.1111/ajco.12756. 337
45. Huang, J.; Weinstein, S.J.; Kitahara, C.M.; Karoly, E.D.; Sampson, J.N.; Albanes, D. A prospective study of serum 338 metabolites and glioma risk. Oncotarget 2017, 8, 70366-70377, doi:10.18632/oncotarget.19705. 339
46. Boire, A.; Brandsma, D.; Brastianos, P.K.; Le Rhun, E.; Ahluwalia, M.; Junck, L.; Glantz, M.; Groves, M.D.; Lee, E.Q.; Lin, 340 N., et al. Liquid biopsy in central nervous system metastases: a RANO review and proposals for clinical applications. 341 Neuro Oncol 2019, 21, 571-584, doi:10.1093/neuonc/noz012. 342
47. Marziali, G.; Signore, M.; Buccarelli, M.; Grande, S.; Palma, A.; Biffoni, M.; Rosi, A.; D'Alessandris, Q.G.; Martini, M.; 343 Larocca, L.M., et al. Metabolic/Proteomic Signature Defines Two Glioblastoma Subtypes With Different Clinical Outcome. 344 Sci Rep 2016, 6, 21557, doi:10.1038/srep21557. 345
48. Mitropoulos, K.; Katsila, T.; Patrinos, G.P.; Pampalakis, G. Multi-Omics for Biomarker Discovery and Target Validation in 346 Biofluids for Amyotrophic Lateral Sclerosis Diagnosis. OMICS 2018, 22, 52-64, doi:10.1089/omi.2017.0183. 347
49. Schulz, C.; Waldeck, S.; Mauer, U.M. Intraoperative image guidance in neurosurgery: development, current indications, 348 and future trends. Radiol Res Pract 2012, 2012, 197364, doi:10.1155/2012/197364. 349
50. Eseonu, C.I.; Rincon-Torroella, J.; ReFaey, K.; Lee, Y.M.; Nangiana, J.; Vivas-Buitrago, T.; Quinones-Hinojosa, A. Awake 350 Craniotomy vs Craniotomy Under General Anesthesia for Perirolandic Gliomas: Evaluating Perioperative Complications 351 and Extent of Resection. Neurosurgery 2017, 81, 481-489, doi:10.1093/neuros/nyx023. 352
51. Kiris, T.; Arica, O. Impact of a low-field intraoperative MRI on the surgical results for high-grade gliomas. Acta Neurochir 353 Suppl 2011, 109, 55-59, doi:10.1007/978-3-211-99651-5_9. 354
52. Schafer, K.C.; Balog, J.; Szaniszlo, T.; Szalay, D.; Mezey, G.; Denes, J.; Bognar, L.; Oertel, M.; Takats, Z. Real time analysis 355 of brain tissue by direct combination of ultrasonic surgical aspiration and sonic spray mass spectrometry. Anal Chem 2011, 356 83, 7729-7735, doi:10.1021/ac201251s. 357
53. Ifa, D.R.; Eberlin, L.S. Ambient Ionization Mass Spectrometry for Cancer Diagnosis and Surgical Margin Evaluation. Clin 358 Chem 2016, 62, 111-123, doi:10.1373/clinchem.2014.237172. 359
54. Deng, A.; Xiong, R.; Zeng, C. [Application of precision medicine in the field of surgery]. Nan Fang Yi Ke Da Xue Xue Bao 360 2015, 35, 1662-1665. 361
55. Zheng, F. The March Towards Precision Surgery. Am J Surg 2020, 10.1016/j.amjsurg.2020.11.020, 362 doi:10.1016/j.amjsurg.2020.11.020. 363
56. Lidsky, M.E.; D'Angelica, M.I. An outlook on precision surgery. Eur J Surg Oncol 2017, 43, 853-855, 364 doi:10.1016/j.ejso.2016.11.014. 365
366
34
CHAPITRE II : LES GLIOBLASTOMES
1.1 Épidémiologie
Le glioblastome est la tumeur cérébrale maligne primaire la plus fréquente chez l'adulte
1. Au cours des 20 dernières années, une incidence croissante des glioblastomes a été observée
en raison de l'augmentation de l'espérance de vie de la population générale et d'un meilleur
accès à des outils de diagnostic plus précis tels que l'IRM 2-4. Dans un article récent basé sur un
registre prospectif des tumeurs du système nerveux central (SNC) aux États-Unis 5, les
glioblastomes représentent 54% des gliomes du cerveau avec une incidence annuelle de 3,19
pour 100 000. Le pic d'incidence se situe dans la 6ème décennie pour les glioblastomes de type
sauvage IDH et plus tôt, vers la 4ème-5ème décennie, pour les glioblastomes IDH mutés 6. Malgré
de nombreux essais thérapeutiques 7-9 et des progrès dans la gestion de ces tumeurs, la survie
médiane reste faible, environ 14 à 20 mois, avec un taux de survie à cinq ans de 5% dépendant
de l'âge au moment du diagnostic, des caractéristiques moléculaires et de la gestion 10. Nous
passons ici en revue les données actuelles concernant la présentation clinique, le diagnostic et
la prise en charge des patients présentant un glioblastome.
Les facteurs de risque d'apparition de glioblastomes sont encore inconnus et les études
traitant de cette question manquent souvent de puissance. L'exposition aux rayonnements
ionisants pour le traitement d'une tumeur maligne pendant la petite enfance (12 ans) est un
facteur de risque très rare pour l'apparition d'un gliome. Le risque de développer une tumeur
cérébrale après radiothérapie est accru si les radiations se produisent à un âge plus jeune (<5
ans) et semblent liées au volume et à la dose, mais sans seuil clairement établi 11. L'incidence
accrue des glioblastomes 12,13 soulève la question des facteurs de risque environnementaux. Une
méta-analyse a établi un lien entre l'utilisation d'un téléphone portable et l'apparition de
glioblastomes 14. Cependant, ces résultats sont discordants et ont été contestés dans d'autres
études 15. Le rôle de l'exposition au tabagisme ou à des agents cancérigènes a été étudié sans

35
qu'il y ait d'association prouvée avec le glioblastome 16,17. Dans de très rares cas (<1%), il existe
une prédisposition génétique au développement de glioblastomes chez les patients atteints des
syndromes de Lynch, de Turcot de type 1 ou de Li Fraumeni 18.
1.2 Présentation clinique
La présentation clinique dépend de la localisation et de la taille de la tumeur au moment
du diagnostic. La présentation la plus courante au moment du diagnostic est le mal de tête et/ou
la nausée dans le contexte d'une tumeur de grande taille ou d'un œdème important. Les
symptômes liés à l'hypertension intracrânienne représentent 30 % des signes cliniques, suivis
du déficit moteur (20 %), de la perte de poids et de l'état du corps (17 %), de la confusion (15
%) et du déficit visuel ou de la parole (13 %) 19. L'épilepsie n'est pas rare (15 à 20 %) et est
facilement contrôlée par des thérapies anticonvulsives. L'épilepsie est associée à de meilleurs
résultats, probablement en raison de la localisation corticale des glioblastomes présentant une
crise 20. Ces symptômes sont souvent associés et conduisent à un diagnostic dans les semaines
ou les mois qui suivent leur apparition. Les glioblastomes sont localisés dans l'espace supra-
tentorial dans plus de 85% des cas, ce qui explique les symptômes mentionnés ci-dessus, et très
rarement dans le tronc cérébral et la moelle épinière (<5% chacun) ou dans le cervelet (<3%).
Jusqu'à 25 % des glioblastomes se produisent dans le lobe frontal 21, le plus grand lobe cérébral,
et sont donc responsables de troubles de l'humeur et de l'exécution chez 15 % des patients 22.
1.3 Diagnostic radiologique
Les caractéristiques typiques de l'imagerie par résonance magnétique (IRM) des
glioblastomes sont bien connues 21,23,24. Elles consistent en des lésions intraparenchymateuses
infiltrantes et hétérogènes qui surgissent et se propagent à partir de la substance blanche.
L'atteinte du corps calleux est fréquente. Les glioblastomes sont mal circonscrits et présentent
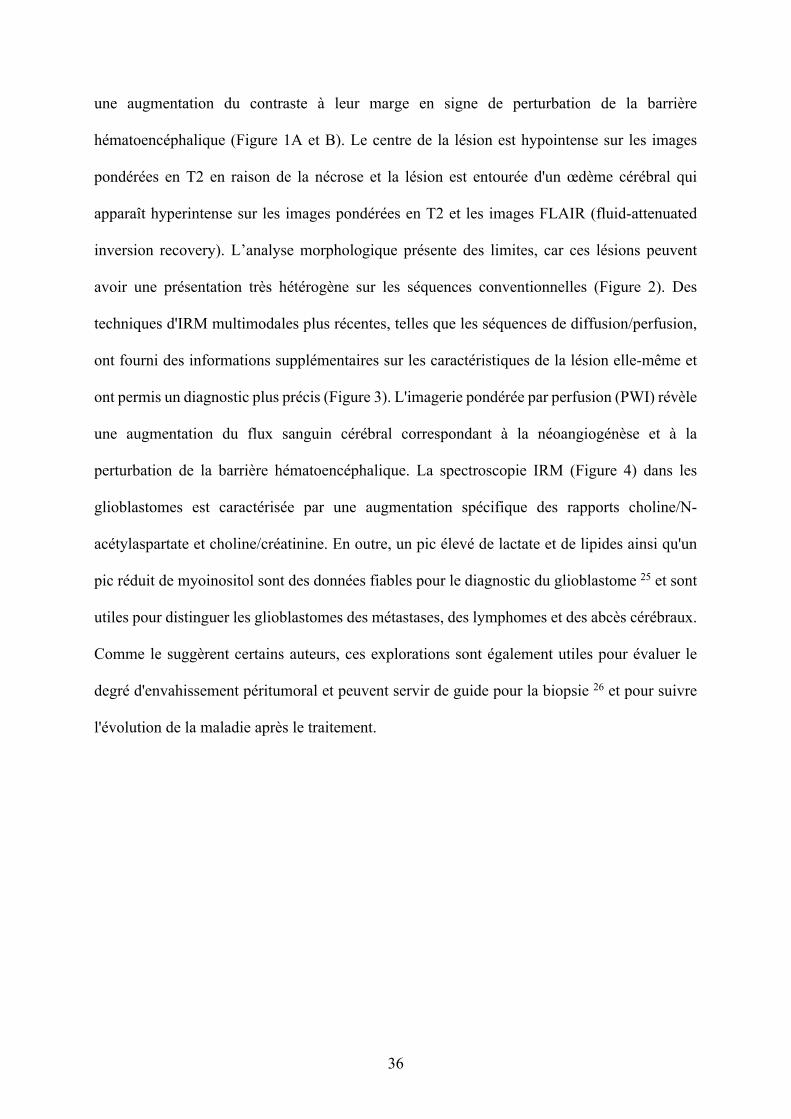
36
une augmentation du contraste à leur marge en signe de perturbation de la barrière
hématoencéphalique (Figure 1A et B). Le centre de la lésion est hypointense sur les images
pondérées en T2 en raison de la nécrose et la lésion est entourée d'un œdème cérébral qui
apparaît hyperintense sur les images pondérées en T2 et les images FLAIR (fluid-attenuated
inversion recovery). L’analyse morphologique présente des limites, car ces lésions peuvent
avoir une présentation très hétérogène sur les séquences conventionnelles (Figure 2). Des
techniques d'IRM multimodales plus récentes, telles que les séquences de diffusion/perfusion,
ont fourni des informations supplémentaires sur les caractéristiques de la lésion elle-même et
ont permis un diagnostic plus précis (Figure 3). L'imagerie pondérée par perfusion (PWI) révèle
une augmentation du flux sanguin cérébral correspondant à la néoangiogénèse et à la
perturbation de la barrière hématoencéphalique. La spectroscopie IRM (Figure 4) dans les
glioblastomes est caractérisée par une augmentation spécifique des rapports choline/N-
acétylaspartate et choline/créatinine. En outre, un pic élevé de lactate et de lipides ainsi qu'un
pic réduit de myoinositol sont des données fiables pour le diagnostic du glioblastome 25 et sont
utiles pour distinguer les glioblastomes des métastases, des lymphomes et des abcès cérébraux.
Comme le suggèrent certains auteurs, ces explorations sont également utiles pour évaluer le
degré d'envahissement péritumoral et peuvent servir de guide pour la biopsie 26 et pour suivre
l'évolution de la maladie après le traitement.
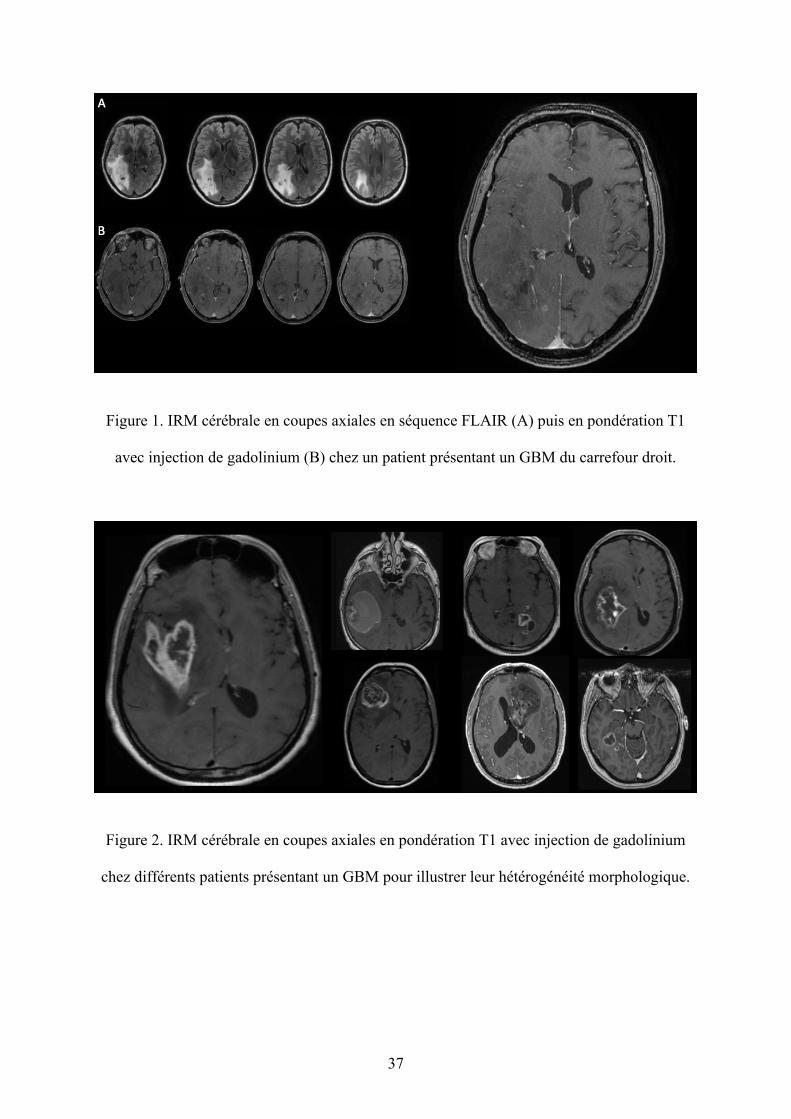
37
Figure 1. IRM cérébrale en coupes axiales en séquence FLAIR (A) puis en pondération T1
avec injection de gadolinium (B) chez un patient présentant un GBM du carrefour droit.
Figure 2. IRM cérébrale en coupes axiales en pondération T1 avec injection de gadolinium
chez différents patients présentant un GBM pour illustrer leur hétérogénéité morphologique.
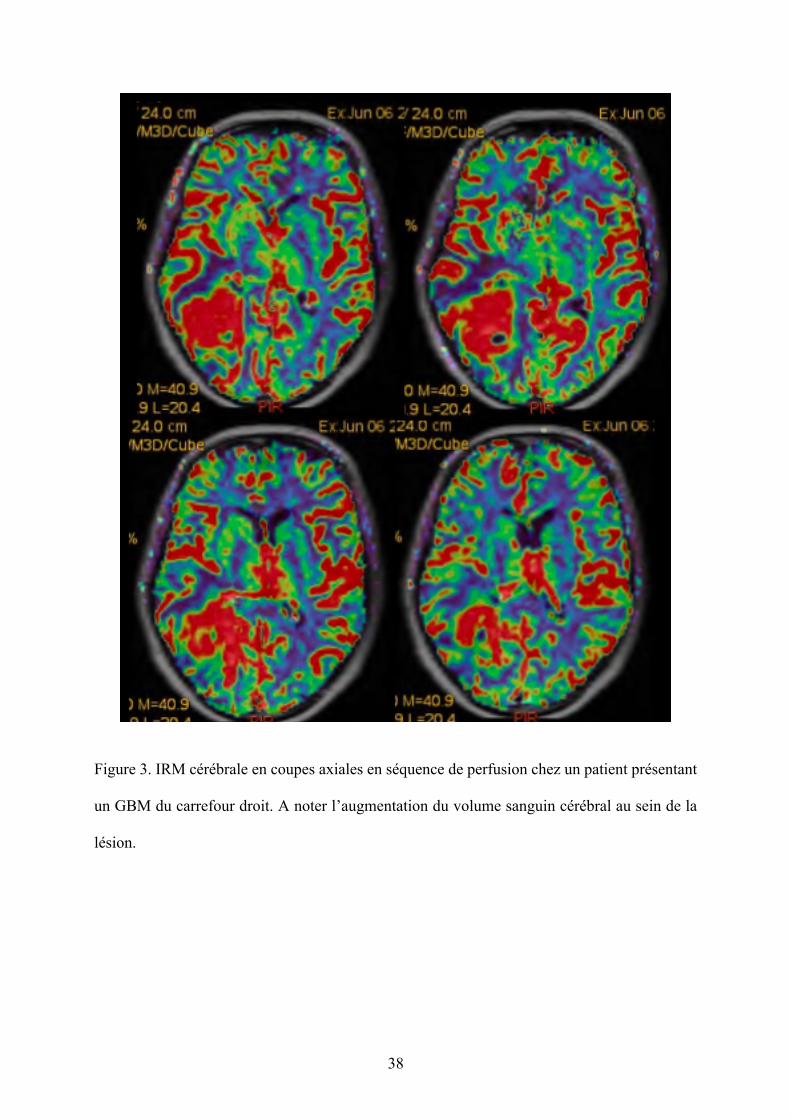
38
Figure 3. IRM cérébrale en coupes axiales en séquence de perfusion chez un patient présentant
un GBM du carrefour droit. A noter l’augmentation du volume sanguin cérébral au sein de la
lésion.
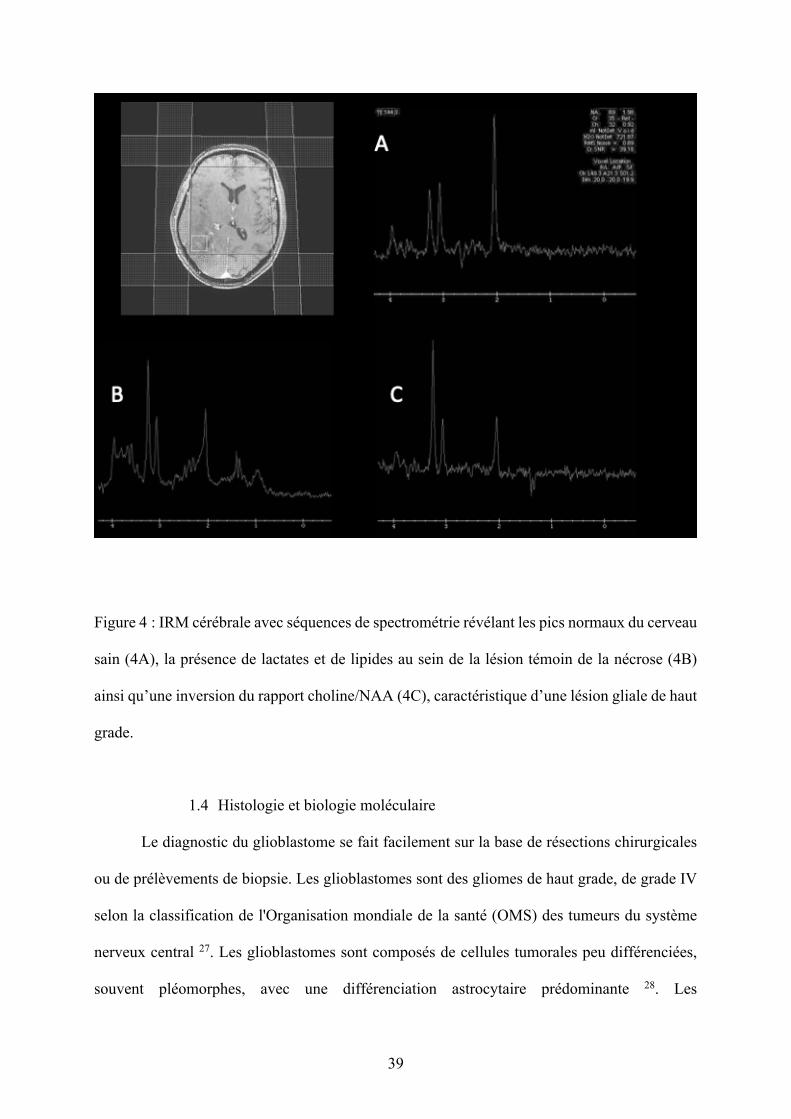
39
Figure 4 : IRM cérébrale avec séquences de spectrométrie révélant les pics normaux du cerveau
sain (4A), la présence de lactates et de lipides au sein de la lésion témoin de la nécrose (4B)
ainsi qu’une inversion du rapport choline/NAA (4C), caractéristique d’une lésion gliale de haut
grade.
1.4 Histologie et biologie moléculaire
Le diagnostic du glioblastome se fait facilement sur la base de résections chirurgicales
ou de prélèvements de biopsie. Les glioblastomes sont des gliomes de haut grade, de grade IV
selon la classification de l'Organisation mondiale de la santé (OMS) des tumeurs du système
nerveux central 27. Les glioblastomes sont composés de cellules tumorales peu différenciées,
souvent pléomorphes, avec une différenciation astrocytaire prédominante 28. Les
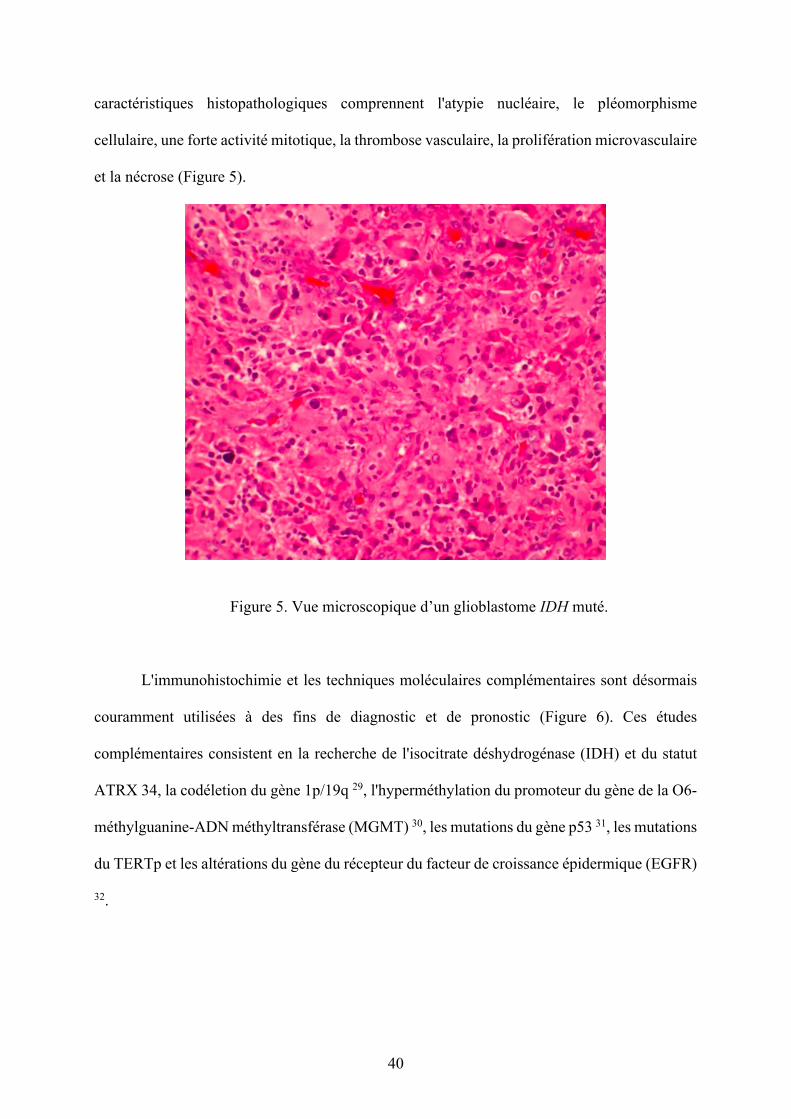
40
caractéristiques histopathologiques comprennent l'atypie nucléaire, le pléomorphisme
cellulaire, une forte activité mitotique, la thrombose vasculaire, la prolifération microvasculaire
et la nécrose (Figure 5).
Figure 5. Vue microscopique d’un glioblastome IDH muté.
L'immunohistochimie et les techniques moléculaires complémentaires sont désormais
couramment utilisées à des fins de diagnostic et de pronostic (Figure 6). Ces études
complémentaires consistent en la recherche de l'isocitrate déshydrogénase (IDH) et du statut
ATRX 34, la codéletion du gène 1p/19q 29, l'hyperméthylation du promoteur du gène de la O6-
méthylguanine-ADN méthyltransférase (MGMT) 30, les mutations du gène p53 31, les mutations
du TERTp et les altérations du gène du récepteur du facteur de croissance épidermique (EGFR)
32.
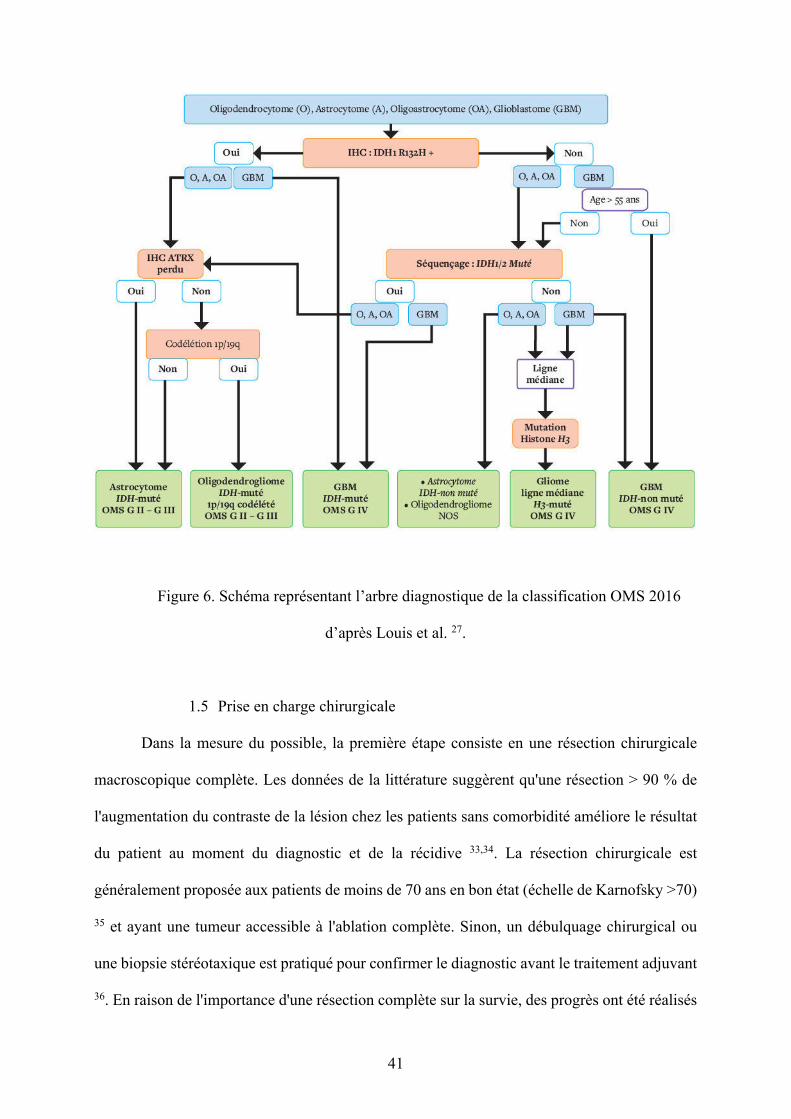
41
Figure 6. Schéma représentant l’arbre diagnostique de la classification OMS 2016
d’après Louis et al. 27.
1.5 Prise en charge chirurgicale
Dans la mesure du possible, la première étape consiste en une résection chirurgicale
macroscopique complète. Les données de la littérature suggèrent qu'une résection > 90 % de
l'augmentation du contraste de la lésion chez les patients sans comorbidité améliore le résultat
du patient au moment du diagnostic et de la récidive 33,34. La résection chirurgicale est
généralement proposée aux patients de moins de 70 ans en bon état (échelle de Karnofsky >70)
35 et ayant une tumeur accessible à l'ablation complète. Sinon, un débulquage chirurgical ou
une biopsie stéréotaxique est pratiqué pour confirmer le diagnostic avant le traitement adjuvant
36. En raison de l'importance d'une résection complète sur la survie, des progrès ont été réalisés
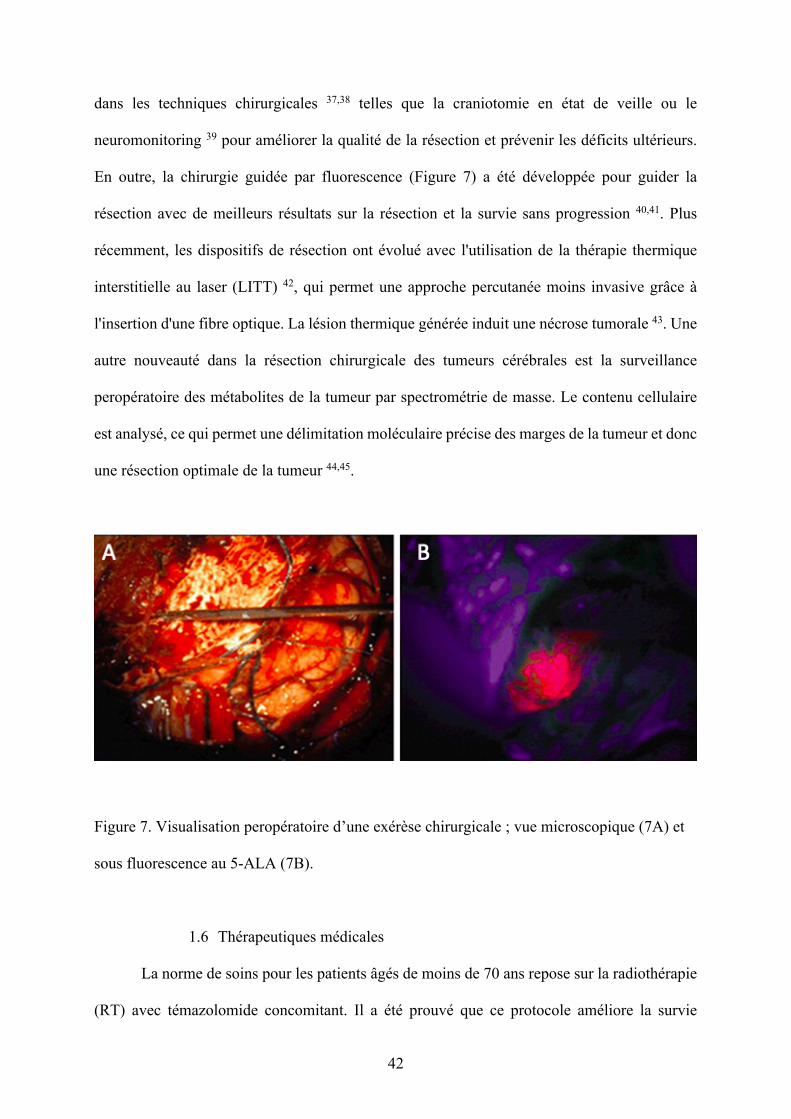
42
dans les techniques chirurgicales 37,38 telles que la craniotomie en état de veille ou le
neuromonitoring 39 pour améliorer la qualité de la résection et prévenir les déficits ultérieurs.
En outre, la chirurgie guidée par fluorescence (Figure 7) a été développée pour guider la
résection avec de meilleurs résultats sur la résection et la survie sans progression 40,41. Plus
récemment, les dispositifs de résection ont évolué avec l'utilisation de la thérapie thermique
interstitielle au laser (LITT) 42, qui permet une approche percutanée moins invasive grâce à
l'insertion d'une fibre optique. La lésion thermique générée induit une nécrose tumorale 43. Une
autre nouveauté dans la résection chirurgicale des tumeurs cérébrales est la surveillance
peropératoire des métabolites de la tumeur par spectrométrie de masse. Le contenu cellulaire
est analysé, ce qui permet une délimitation moléculaire précise des marges de la tumeur et donc
une résection optimale de la tumeur 44,45.
Figure 7. Visualisation peropératoire d’une exérèse chirurgicale ; vue microscopique (7A) et
sous fluorescence au 5-ALA (7B).
1.6 Thérapeutiques médicales
La norme de soins pour les patients âgés de moins de 70 ans repose sur la radiothérapie
(RT) avec témazolomide concomitant. Il a été prouvé que ce protocole améliore la survie
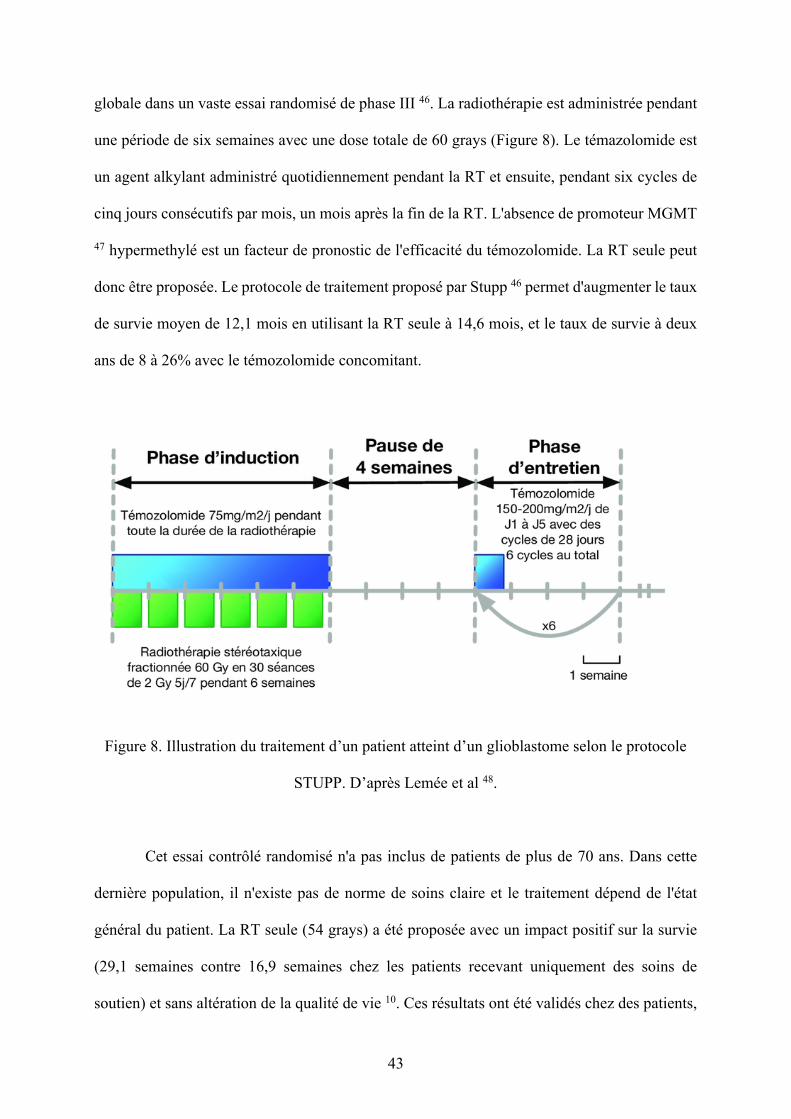
43
globale dans un vaste essai randomisé de phase III 46. La radiothérapie est administrée pendant
une période de six semaines avec une dose totale de 60 grays (Figure 8). Le témazolomide est
un agent alkylant administré quotidiennement pendant la RT et ensuite, pendant six cycles de
cinq jours consécutifs par mois, un mois après la fin de la RT. L'absence de promoteur MGMT
47 hypermethylé est un facteur de pronostic de l'efficacité du témozolomide. La RT seule peut
donc être proposée. Le protocole de traitement proposé par Stupp 46 permet d'augmenter le taux
de survie moyen de 12,1 mois en utilisant la RT seule à 14,6 mois, et le taux de survie à deux
ans de 8 à 26% avec le témozolomide concomitant.
Figure 8. Illustration du traitement d’un patient atteint d’un glioblastome selon le protocole
STUPP. D’après Lemée et al 48.
Cet essai contrôlé randomisé n'a pas inclus de patients de plus de 70 ans. Dans cette
dernière population, il n'existe pas de norme de soins claire et le traitement dépend de l'état
général du patient. La RT seule (54 grays) a été proposée avec un impact positif sur la survie
(29,1 semaines contre 16,9 semaines chez les patients recevant uniquement des soins de
soutien) et sans altération de la qualité de vie 10. Ces résultats ont été validés chez des patients,
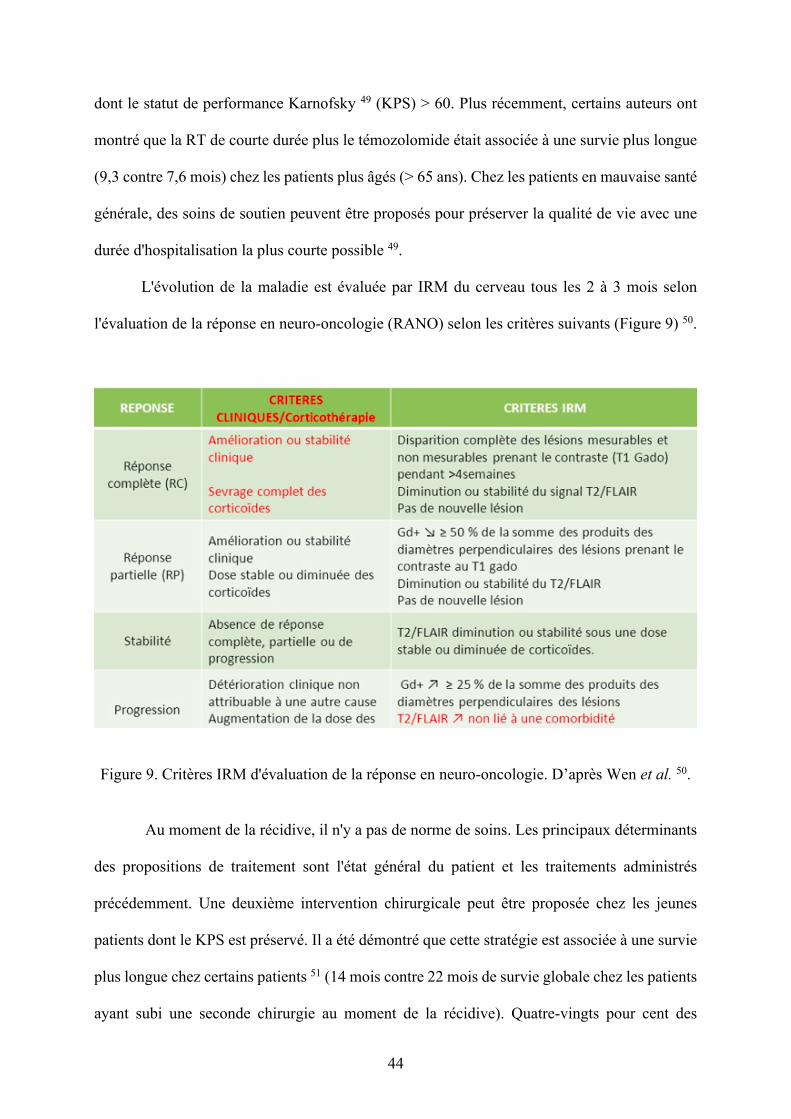
44
dont le statut de performance Karnofsky 49 (KPS) > 60. Plus récemment, certains auteurs ont
montré que la RT de courte durée plus le témozolomide était associée à une survie plus longue
(9,3 contre 7,6 mois) chez les patients plus âgés (> 65 ans). Chez les patients en mauvaise santé
générale, des soins de soutien peuvent être proposés pour préserver la qualité de vie avec une
durée d'hospitalisation la plus courte possible 49.
L'évolution de la maladie est évaluée par IRM du cerveau tous les 2 à 3 mois selon
l'évaluation de la réponse en neuro-oncologie (RANO) selon les critères suivants (Figure 9) 50.
Figure 9. Critères IRM d'évaluation de la réponse en neuro-oncologie. D’après Wen et al. 50.
Au moment de la récidive, il n'y a pas de norme de soins. Les principaux déterminants
des propositions de traitement sont l'état général du patient et les traitements administrés
précédemment. Une deuxième intervention chirurgicale peut être proposée chez les jeunes
patients dont le KPS est préservé. Il a été démontré que cette stratégie est associée à une survie
plus longue chez certains patients 51 (14 mois contre 22 mois de survie globale chez les patients
ayant subi une seconde chirurgie au moment de la récidive). Quatre-vingts pour cent des
45
patients n'ont pas eu besoin de réadaptation après une deuxième chirurgie. Chez des patients
sélectionnés, l'utilisation de plaquettes intracavitaires de carmustine (BCNU) a été proposée
lors de la première chirurgie ou en cas de récidive 52,53. L'efficacité et les effets indésirables de
cette thérapie restent un sujet de débat 54. En l'absence d'une résection possible sûre, une
chimiothérapie de deuxième ligne peut être proposée, comprenant des nitrosourées, du
témazolomide ou des médicaments antiangiogéniques tels que le bevacizumab, mais sans
résultats clairs en termes de bénéfice à ce jour et de mauvais résultats avec un taux de survie
global moyen de 6 mois à partir de la récurrence 55.
1.7 Nouvelles thérapies et perspectives
En raison de l'issue défavorable chez les patients atteints de glioblastome et de la
fréquence élevée de cette maladie, des thérapies innovantes sont testées dans différents essais
contrôlés randomisés 56-58. Avec le développement d'une meilleure compréhension des voies
moléculaires déclenchant la croissance des glioblastomes, l'approche traditionnelle de la
thérapie antitumorale est progressivement complétée par une approche plus personnalisée 59,60.
Les calendriers de traitement ont été repensés, ainsi que les médicaments eux-mêmes. Deux
inconvénients majeurs consistent en la difficulté pour la plupart des médicaments de passer à
travers la barrière hématoencéphalique (BHE) et de cibler les cellules tumorales en raison de la
présence de vaisseaux anormaux et de nécrose, ce qui empêche les médicaments d'être délivrés
à une concentration appropriée. Certaines techniques émergentes ont été proposées pour
améliorer la distribution de la thérapie antitumorale, notamment la conjugaison de médicaments
avec des protéines pour faciliter le mouvement à travers la BHE et cibler spécifiquement la
tumeur 61, l'utilisation de la délivrance par convection améliorée consistant en l'administration
directe à l'intérieur de la tumeur via un cathéter 62 et l'utilisation de nanoparticules.
L'augmentation de la perméabilité de la BHE pendant l'administration de la chimiothérapie par
46
des ultrasons focalisés est également testée 63. Entre-temps, les approches d'immunothérapie
sont connues depuis longtemps, avec des résultats prometteurs dans de nombreux cancers tels
que le mélanome, mais décevants chez les patients atteints de gliomes 64. La vaccination contre
le cancer a récemment été proposée en référence à l'activation d'une réponse immunitaire contre
les antigènes tumoraux. Ces nouvelles technologies ont été appliquées pour le traitement des
glioblastomes avec différents vecteurs 64-66. Deux modalités ont été testées : les vaccins
peptidiques ciblant les protéines EGFR, IDH1 ou de choc thermique, et les vaccins à base de
cellules consistant en l'injection de cellules modifiées ex vivo, principalement des cellules
dendritiques. Malgré des résultats encourageants dans les modèles animaux en termes de
contrôle de la maladie, la vaccination contre le cancer dans les glioblastomes n'a pas encore
prouvé son efficacité sur la survie globale dans les études de phase III. Stupp et al. ont
récemment mis au point une nouvelle modalité thérapeutique dans le traitement des
glioblastomes récurrents, consistant à délivrer localement des champs électriques de faible
intensité par l'intermédiaire d'un transducteur non invasif 57. Le dispositif (NovoTTF-100A) a
été testé dans une étude de phase III et randomisé avec une chimiothérapie active comme bras
alternatif. La survie globale a été similaire dans les deux bras (6 mois) avec moins d'effets
indésirables dans le groupe NovoTTF-100A et une meilleure qualité de vie.
47
RÉFÉRENCES 1 Bauchet, L. & Ostrom, Q. T. Epidemiology and Molecular Epidemiology. Neurosurg
Clin N Am 30, 1-16, doi:10.1016/j.nec.2018.08.010 (2019). 2 Negendank, W. G. et al. Proton magnetic resonance spectroscopy in patients with glial
tumors: a multicenter study. J Neurosurg 84, 449-458, doi:10.3171/jns.1996.84.3.0449 (1996).
3 Morgan, L. L. The epidemiology of glioma in adults: a "state of the science" review. Neuro Oncol 17, 623-624, doi:10.1093/neuonc/nou358 (2015).
4 Kowalczyk, T., Ciborowski, M., Kisluk, J., Kretowski, A. & Barbas, C. Mass spectrometry based proteomics and metabolomics in personalized oncology. Biochim Biophys Acta Mol Basis Dis 1866, 165690, doi:10.1016/j.bbadis.2020.165690 (2020).
5 Dolecek, T. A., Propp, J. M., Stroup, N. E. & Kruchko, C. CBTRUS statistical report: primary brain and central nervous system tumors diagnosed in the United States in 2005-2009. Neuro Oncol 14 Suppl 5, v1-49, doi:10.1093/neuonc/nos218 (2012).
6 Ostrom, Q. T. et al. The epidemiology of glioma in adults: a "state of the science" review. Neuro Oncol 16, 896-913, doi:10.1093/neuonc/nou087 (2014).
7 Lim, M., Xia, Y., Bettegowda, C. & Weller, M. Current state of immunotherapy for glioblastoma. Nat Rev Clin Oncol 15, 422-442, doi:10.1038/s41571-018-0003-5 (2018).
8 Touat, M., Idbaih, A., Sanson, M. & Ligon, K. L. Glioblastoma targeted therapy: updated approaches from recent biological insights. Ann Oncol 28, 1457-1472, doi:10.1093/annonc/mdx106 (2017).
9 Malkki, H. Trial Watch: Glioblastoma vaccine therapy disappointment in Phase III trial. Nat Rev Neurol 12, 190, doi:10.1038/nrneurol.2016.38 (2016).
10 Delgado-Lopez, P. D. & Corrales-Garcia, E. M. Survival in glioblastoma: a review on the impact of treatment modalities. Clin Transl Oncol 18, 1062-1071, doi:10.1007/s12094-016-1497-x (2016).
11 Connelly, J. M. & Malkin, M. G. Environmental risk factors for brain tumors. Curr Neurol Neurosci Rep 7, 208-214, doi:10.1007/s11910-007-0032-4 (2007).
12 Philips, A., Henshaw, D. L., Lamburn, G. & O'Carroll, M. J. Brain Tumours: Rise in Glioblastoma Multiforme Incidence in England 1995-2015 Suggests an Adverse Environmental or Lifestyle Factor. J Environ Public Health 2018, 7910754, doi:10.1155/2018/7910754 (2018).
13 Dobes, M. et al. Increasing incidence of glioblastoma multiforme and meningioma, and decreasing incidence of Schwannoma (2000-2008): Findings of a multicenter Australian study. Surg Neurol Int 2, 176, doi:10.4103/2152-7806.90696 (2011).
14 Karipidis, K. et al. Mobile phone use and incidence of brain tumour histological types, grading or anatomical location: a population-based ecological study. BMJ Open 8, e024489, doi:10.1136/bmjopen-2018-024489 (2018).
15 Repacholi, M. H. et al. Systematic review of wireless phone use and brain cancer and other head tumors. Bioelectromagnetics 33, 187-206, doi:10.1002/bem.20716 (2012).
16 Benke, G. et al. Occupational solvent exposure and risk of glioma in the INTEROCC study. Br J Cancer 117, 1246-1254, doi:10.1038/bjc.2017.285 (2017).
17 Parent, M. E. et al. Lifetime occupational exposure to metals and welding fumes, and risk of glioma: a 7-country population-based case-control study. Environ Health 16, 90, doi:10.1186/s12940-017-0300-y (2017).
48
18 Rice, T. et al. Understanding inherited genetic risk of adult glioma - a review. Neurooncol Pract 3, 10-16, doi:10.1093/nop/npv026 (2016).
19 Yuile, P., Dent, O., Cook, R., Biggs, M. & Little, N. Survival of glioblastoma patients related to presenting symptoms, brain site and treatment variables. J Clin Neurosci 13, 747-751, doi:10.1016/j.jocn.2005.10.011 (2006).
20 Vecht, C. J., Kerkhof, M. & Duran-Pena, A. Seizure prognosis in brain tumors: new insights and evidence-based management. Oncologist 19, 751-759, doi:10.1634/theoncologist.2014-0060 (2014).
21 Yan, J. L. et al. Multimodal MRI characteristics of the glioblastoma infiltration beyond contrast enhancement. Ther Adv Neurol Disord 12, 1756286419844664, doi:10.1177/1756286419844664 (2019).
22 Wirsching, H. G., Galanis, E. & Weller, M. Glioblastoma. Handb Clin Neurol 134, 381-397, doi:10.1016/B978-0-12-802997-8.00023-2 (2016).
23 Peeken, J. C. et al. Combining multimodal imaging and treatment features improves machine learning-based prognostic assessment in patients with glioblastoma multiforme. Cancer Med 8, 128-136, doi:10.1002/cam4.1908 (2019).
24 Law, M. et al. Gliomas: predicting time to progression or survival with cerebral blood volume measurements at dynamic susceptibility-weighted contrast-enhanced perfusion MR imaging. Radiology 247, 490-498, doi:10.1148/radiol.2472070898 (2008).
25 Lonjon, M., Mondot, L., Lonjon, N. & Chanalet, S. [Clinical factors in glioblastoma and neuroradiology]. Neurochirurgie 56, 449-454, doi:10.1016/j.neuchi.2010.07.016 (2010).
26 Price, S. J. et al. Multimodal MRI can identify perfusion and metabolic changes in the invasive margin of glioblastomas. J Magn Reson Imaging 43, 487-494, doi:10.1002/jmri.24996 (2016).
27 Louis DN, O. H., Wiestler OD, Cavenee WK. The 2016 World Health Organization Classification of Tumors of the Central Nervous System. 4th edn, Vol. 1 408 (IARC Publication, 2016).
28 Figarella-Branger, D., Bouvier, C., Moroch, J., Michalak, S. & Burel-Vandenbos, F. [Morphological classification of glioblastomas]. Neurochirurgie 56, 459-463, doi:10.1016/j.neuchi.2010.07.014 (2010).
29 Bobeff, E. J. et al. Plasma amino acids indicate glioblastoma with ATRX loss. Amino Acids 53, 119-132, doi:10.1007/s00726-020-02931-3 (2021).
30 Zhao, Y. H. et al. The Clinical Significance of O(6)-Methylguanine-DNA Methyltransferase Promoter Methylation Status in Adult Patients With Glioblastoma: A Meta-analysis. Front Neurol 9, 127, doi:10.3389/fneur.2018.00127 (2018).
31 He, H. et al. Method for lipidomic analysis: p53 expression modulation of sulfatide, ganglioside, and phospholipid composition of U87 MG glioblastoma cells. Anal Chem 79, 8423-8430, doi:10.1021/ac071413m (2007).
32 Aldape, K., Zadeh, G., Mansouri, S., Reifenberger, G. & von Deimling, A. Glioblastoma: pathology, molecular mechanisms and markers. Acta Neuropathol 129, 829-848, doi:10.1007/s00401-015-1432-1 (2015).
33 Lacroix, M. et al. A multivariate analysis of 416 patients with glioblastoma multiforme: prognosis, extent of resection, and survival. J Neurosurg 95, 190-198, doi:10.3171/jns.2001.95.2.0190 (2001).
34 Brown, T. J. et al. Association of the Extent of Resection With Survival in Glioblastoma: A Systematic Review and Meta-analysis. JAMA Oncol 2, 1460-1469, doi:10.1001/jamaoncol.2016.1373 (2016).
35 Chambless, L. B. et al. The relative value of postoperative versus preoperative Karnofsky Performance Scale scores as a predictor of survival after surgical resection
49
of glioblastoma multiforme. J Neurooncol 121, 359-364, doi:10.1007/s11060-014-1640-x (2015).
36 McGirt, M. J., Villavicencio, A. T., Bulsara, K. R. & Friedman, A. H. MRI-guided stereotactic biopsy in the diagnosis of glioma: comparison of biopsy and surgical resection specimen. Surgical Neurology 59, 279-283, doi:10.1016/s0090-3019(03)00048-x (2003).
37 Eseonu, C. I. et al. Awake Craniotomy vs Craniotomy Under General Anesthesia for Perirolandic Gliomas: Evaluating Perioperative Complications and Extent of Resection. Neurosurgery 81, 481-489, doi:10.1093/neuros/nyx023 (2017).
38 Foster, C. H., Morone, P. J. & Cohen-Gadol, A. Awake craniotomy in glioma surgery: is it necessary? J Neurosurg Sci 63, 162-178, doi:10.23736/S0390-5616.18.04590-3 (2019).
39 Obermueller, T. et al. Intraoperative neuromonitoring for function-guided resection differs for supratentorial motor eloquent gliomas and metastases. BMC Neurol 15, 211, doi:10.1186/s12883-015-0476-0 (2015).
40 Senders, J. T. et al. Agents for fluorescence-guided glioma surgery: a systematic review of preclinical and clinical results. Acta Neurochir (Wien) 159, 151-167, doi:10.1007/s00701-016-3028-5 (2017).
41 Cho, S. S., Salinas, R. & Lee, J. Y. K. Indocyanine-Green for Fluorescence-Guided Surgery of Brain Tumors: Evidence, Techniques, and Practical Experience. Front Surg 6, 11, doi:10.3389/fsurg.2019.00011 (2019).
42 Kamath, A. A. et al. Glioblastoma Treated With Magnetic Resonance Imaging-Guided Laser Interstitial Thermal Therapy: Safety, Efficacy, and Outcomes. Neurosurgery 84, 836-843, doi:10.1093/neuros/nyy375 (2019).
43 Norred, S. E. & Johnson, J. A. Magnetic resonance-guided laser induced thermal therapy for glioblastoma multiforme: a review. Biomed Res Int 2014, 761312, doi:10.1155/2014/761312 (2014).
44 Pirro, V. et al. Intraoperative assessment of tumor margins during glioma resection by desorption electrospray ionization-mass spectrometry. Proc Natl Acad Sci U S A 114, 6700-6705, doi:10.1073/pnas.1706459114 (2017).
45 Santagata, S. et al. Intraoperative mass spectrometry mapping of an onco-metabolite to guide brain tumor surgery. Proc Natl Acad Sci U S A 111, 11121-11126, doi:10.1073/pnas.1404724111 (2014).
46 Stupp, R. et al. Radiotherapy plus concomitant and adjuvant temozolomide for glioblastoma. N Engl J Med 352, 987-996, doi:10.1056/NEJMoa043330 (2005).
47 Binabaj, M. M. et al. The prognostic value of MGMT promoter methylation in glioblastoma: A meta-analysis of clinical trials. J Cell Physiol 233, 378-386, doi:10.1002/jcp.25896 (2018).
48 Lemee, J. M. et al. Characterizing the peritumoral brain zone in glioblastoma: a multidisciplinary analysis. J Neurooncol 122, 53-61, doi:10.1007/s11060-014-1695-8 (2015).
49 Heiland, D. H. et al. One decade of glioblastoma multiforme surgery in 342 elderly patients: what have we learned? J Neurooncol 140, 385-391, doi:10.1007/s11060-018-2964-8 (2018).
50 Wen, P. Y. et al. Updated response assessment criteria for high-grade gliomas: response assessment in neuro-oncology working group. J Clin Oncol 28, 1963-1972, doi:10.1200/JCO.2009.26.3541 (2010).
51 Wann, A. et al. Outcomes after second surgery for recurrent glioblastoma: a retrospective case-control study. J Neurooncol 137, 409-415, doi:10.1007/s11060-017-2731-2 (2018).
50
52 Sage, W. et al. Local alkylating chemotherapy applied immediately after 5-ALA guided resection of glioblastoma does not provide additional benefit. J Neurooncol 136, 273-280, doi:10.1007/s11060-017-2649-8 (2018).
53 Xing, W. K., Shao, C., Qi, Z. Y., Yang, C. & Wang, Z. The role of Gliadel wafers in the treatment of newly diagnosed GBM: a meta-analysis. Drug Des Devel Ther 9, 3341-3348, doi:10.2147/DDDT.S85943 (2015).
54 Grangeon, L. et al. How safe are carmustine wafers? Rev Neurol (Paris) 174, 346-351, doi:10.1016/j.neurol.2017.09.011 (2018).
55 Taal, W. et al. Single-agent bevacizumab or lomustine versus a combination of bevacizumab plus lomustine in patients with recurrent glioblastoma (BELOB trial): a randomised controlled phase 2 trial. The Lancet Oncology 15, 943-953, doi:10.1016/s1470-2045(14)70314-6 (2014).
56 Stupp, R. et al. Effect of Tumor-Treating Fields Plus Maintenance Temozolomide vs Maintenance Temozolomide Alone on Survival in Patients With Glioblastoma: A Randomized Clinical Trial. JAMA 318, 2306-2316, doi:10.1001/jama.2017.18718 (2017).
57 Stupp, R. et al. NovoTTF-100A versus physician's choice chemotherapy in recurrent glioblastoma: a randomised phase III trial of a novel treatment modality. Eur J Cancer 48, 2192-2202, doi:10.1016/j.ejca.2012.04.011 (2012).
58 Lombardi, G. et al. Regorafenib compared with lomustine in patients with relapsed glioblastoma (REGOMA): a multicentre, open-label, randomised, controlled, phase 2 trial. Lancet Oncol 20, 110-119, doi:10.1016/S1470-2045(18)30675-2 (2019).
59 Szopa, W., Burley, T. A., Kramer-Marek, G. & Kaspera, W. Diagnostic and Therapeutic Biomarkers in Glioblastoma: Current Status and Future Perspectives. Biomed Res Int 2017, 8013575, doi:10.1155/2017/8013575 (2017).
60 Sasmita, A. O., Wong, Y. P. & Ling, A. P. K. Biomarkers and therapeutic advances in glioblastoma multiforme. Asia Pac J Clin Oncol 14, 40-51, doi:10.1111/ajco.12756 (2018).
61 Harder, B. G. et al. Developments in Blood-Brain Barrier Penetrance and Drug Repurposing for Improved Treatment of Glioblastoma. Front Oncol 8, 462, doi:10.3389/fonc.2018.00462 (2018).
62 Parodi, A. et al. Established and Emerging Strategies for Drug Delivery Across the Blood-Brain Barrier in Brain Cancer. Pharmaceutics 11, doi:10.3390/pharmaceutics11050245 (2019).
63 Jahangiri, A. et al. Convection-enhanced delivery in glioblastoma: a review of preclinical and clinical studies. J Neurosurg 126, 191-200, doi:10.3171/2016.1.JNS151591 (2017).
64 Kong, Z., Wang, Y. & Ma, W. Vaccination in the immunotherapy of glioblastoma. Hum Vaccin Immunother 14, 255-268, doi:10.1080/21645515.2017.1388481 (2018).
65 Kong, D. S. et al. Phase III randomized trial of autologous cytokine-induced killer cell immunotherapy for newly diagnosed glioblastoma in Korea. Oncotarget 8, 7003-7013, doi:10.18632/oncotarget.12273 (2017).
66 Swartz, A. M., Batich, K. A., Fecci, P. E. & Sampson, J. H. Peptide vaccines for the treatment of glioblastoma. J Neurooncol 123, 433-440, doi:10.1007/s11060-014-1676-y (2015).
51
L’article II présente un état des lieux des connaissances sur le glioblastome. Les différentes données
épidémiologiques et physiopathologiques y sont décrites de même que la présentation clinique et les
caractéristiques radiologiques. Une attention particulière a été donnée aux nouvelles avancées
thérapeutiques et à l’impact des sciences omiques dans l’appréhension de cette pathologie.
Article II
Gilard V, Tebani A, Dabaj I, Laquerrière A, Fontanilles M, Derrey S, et al. Diagnosis and Management of Glioblastoma: A Comprehensive Perspective. J Pers Med. 2021;11(4):258.
Journal of
Personalized
Medicine
Review
Diagnosis and Management of Glioblastoma:A Comprehensive Perspective
Vianney Gilard 1,2,*, Abdellah Tebani 2,3 , Ivana Dabaj 3,4 , Annie Laquerrière 2,5, Maxime Fontanilles 6 ,Stéphane Derrey 1, Stéphane Marret 3,4 and Soumeya Bekri 2,3
Citation: Gilard, V.; Tebani, A.;
Dabaj, I.; Laquerrière, A.; Fontanilles,
M.; Derrey, S.; Marret, S.; Bekri, S.
Diagnosis and Management of
Glioblastoma: A Comprehensive
Perspective. J. Pers. Med. 2021, 11, 258.
https://doi.org/10.3390/jpm11040258
Academic Editors: Roberto Pallini
and Quintino Giorgio D’Alessandris
Received: 9 March 2021
Accepted: 30 March 2021
Published: 1 April 2021
Publisher’s Note: MDPI stays neutral
with regard to jurisdictional claims in
published maps and institutional affil-
iations.
Copyright: © 2021 by the authors.
Licensee MDPI, Basel, Switzerland.
This article is an open access article
distributed under the terms and
conditions of the Creative Commons
Attribution (CC BY) license (https://
creativecommons.org/licenses/by/
4.0/).
1 Department of Neurosurgery, Rouen University Hospital, 76000 Rouen, France;[email protected]
2 Normandie Univ, UNIROUEN, CHU Rouen, INSERM U1245, 76000 Rouen, France;[email protected] (A.T.); [email protected] (A.L.);[email protected] (S.B.)
3 Department of Metabolic Biochemistry, Rouen University Hospital, 76000 Rouen, France;[email protected] (I.D.); [email protected] (S.M.)
4 Department of Neonatology, Pediatric Intensive Care, and Pediatric Neurology, Rouen University Hospital,76000 Rouen, France
5 Department of Pathology, Rouen University Hospital, 76000 Rouen, France6 Department of Medical Oncology, Cancer Centre Henri Becquerel, 76038 Rouen, France;
[email protected]* Correspondence: [email protected]
Abstract: Glioblastoma is the most common malignant brain tumor in adults. The current manage-ment relies on surgical resection and adjuvant radiotherapy and chemotherapy. Despite advances inour understanding of glioblastoma onset, we are still faced with an increased incidence, an alteredquality of life and a poor prognosis, its relapse and a median overall survival of 15 months. For thepast few years, the understanding of glioblastoma physiopathology has experienced an exponentialacceleration and yielded significant insights and new treatments perspectives. In this review, throughan original R-based literature analysis, we summarize the clinical presentation, current standards ofcare and outcomes in patients diagnosed with glioblastoma. We also present the recent advancesand perspectives regarding pathophysiological bases as well as new therapeutic approaches such ascancer vaccination and personalized treatments.
Keywords: glioblastoma; molecular pathology; omics; pathogenesis; personalized therapies
1. Introduction
Glioblastoma is the most frequent primary malignant brain tumor in adults [1]. Overthe last 20 years, a growing incidence of glioblastomas has been observed due to an increasein general population life expectancy and a better access to more accurate diagnostic toolssuch as MRI [2–4]. In a recent article based on a prospective registry of central nervoussystem (CNS) tumors in the US [5], glioblastoma accounts for 54% of brain gliomas withan annual incidence of 3.19 per 100,000. The peak of incidence occurs in the 6th decadefor glioblastomas isocitrate dehydrogenase (IDH) wild type and earlier, around the 4th–5th decade, for glioblastomas IDH mutant [6]. Despite many therapeutic trials [7–9]and advances in the management of these tumors, the median survival remains poor,approximately 14 to 20 months, with a 5% five-year survival rate depending on age atdiagnosis, molecular characteristics and management [10]. Due to the poor outcomes ofthis pathology, there is a need for a better understanding of the pathogenesis and metabolicpathways of glioblastomas. For a few years, advances in the different areas brought newinsights and new therapeutic perspectives. Precision medicine, through the surge of omicstechnologies, offers new approaches for various oncology diseases [11,12]. Its main goal isto set a personalized perspective of the disease, taking into account individual variability
J. Pers. Med. 2021, 11, 258. https://doi.org/10.3390/jpm11040258 https://www.mdpi.com/journal/jpm

J. Pers. Med. 2021, 11, 258 2 of 14
of the patient along with his environment and predisposition. This approach requiresexhaustive collection of glioblastomas data. This work proposed an exhaustive semi-automated review of literature regarding clinical presentation, diagnosis and managementof patients presenting with glioblastoma. Moreover, we also emphasize the novelties andperspectives concerning this disease within the precision medicine era.
2. Materials and Methods2.1. Literature Analysis
In this study, we performed a programmatic literature search for a more efficient andreproducible review process using the Adjutant R package [13]. We searched for articlesrelated to glioblastoma, glioma physiopathology, diagnosis and treatments that were pub-lished between January 1990 and February 2020. We used only one query (glioblastoma).The resulting document corpus included articles metadata: PubMed IDs, year of publica-tion, authors, article titles, article abstracts and any associated Medical Subject Heading(MeSH) terms. Titles and abstracts were decomposed into single terms, stemmed andfiltered by Adjutant package. The term frequency inversed document frequency metricsfor each term and created a sparse Document Term Matrix (DTM) for further analysis.t-Distributed Stochastic Neighbor Embedding (t-SNE) and hdbscan algorithms were usedto perform unsupervised clustering using DTM data. The coordinates generated by t-SNEwere used in the hdbscan algorithm to derive the topic clusters. Each cluster was thenassigned a topic by using the five most frequent terms within the cluster.
2.2. Manual Curation: Inclusion and Exclusion Criteria
Following the topic clustering step, we validated our clusters using external manualcuration assessing the correspondence between articles and cluster topics. Each sampledarticle was examined and either considered acceptable for further analysis or rejected.Inclusion criteria were topic relevance assessed by a neurosurgeon specialized in neuro-oncology; article in English; human data; original research or clinical trial. We furtherrefined the corpus and cluster naming. Supplementary Table S1 contains a list of all thearticles along with their corresponding cluster.
2.3. Data Analysis
All the data analysis and visualization have been done using the R software [14].
3. Results3.1. Literature Mining and Topic Clusters
The first-round analysis generated a document corpus of 2799 articles related toglioblastoma published over the past 30 years (Supplementary Table S1). Using articletitles and abstracts, we derived topic clusters in an unsupervised manner, and classifiedarticles according to their clustering status. Articles that never formed part of a cluster wereremoved from further analysis, leaving 1314 documents that formed 27 clusters. Clustertopics were assigned using the five most frequent terms within the cluster along with amanual curation of the included articles (Figure 1). The full list of articles and relatedclusters are presented in Supplementary Table S1.

J. Pers. Med. 2021, 11, 258 3 of 14J. Pers. Med. 2021, 11, x FOR PEER REVIEW 3 of 14
Figure 1. Topic representation of the included literature related to glioblastoma. The figure high-lights twenty-seven clusters.
3.2. Pathogenesis of Glioblastoma 3.2.1. Risk Factors for High Grade Gliomas
Risk factors for glioblastoma onset are still unknown and studies dealing with this question frequently lack power. The exposure to ionizing radiation for the treatment of malignancy during infancy [15] is a very rare risk factor for the onset of glioma. The risk of developing a brain tumor after radiotherapy is increased if the radiation occurs at a younger age (<5 years) and seems volume- and dose-related but with no clear reported threshold [16,17]. The increased incidence of glioblastoma [18,19] raises the issue of envi-ronmental risk factors. The association between the use of mobile phone and the occur-rence of glioblastoma has been reported in a meta-analysis [20]. However, these results are discordant and have been challenged in other studies [21,22]. The role of exposure to smoking or carcinogenic agents has been studied with no proven association to glioblas-toma [23,24]. In very few cases (<1%), there is a genetic predisposition to glioblastoma development in patients with Lynch, Turcot type 1 or Li Fraumeni syndromes [25].
3.2.2. Clinical Presentation Clinical presentation depends on the tumor location and size at diagnosis. The most
common presentation at diagnosis is a headache and/or nausea in a context of a large tumor or significant edema. Symptoms related to intracranial hypertension represent 30% of clinical signs followed by motor deficit (20%), loss of body weight and condition (17%), confusion (15%) and visual or speech deficit (13%) [26]. Epilepsy is not uncommon (15–20%) and easily controlled by anticonvulsant therapies. Epilepsy is associated with better outcomes probably due to the cortical location of glioblastomas presenting with seizures [27]. These symptoms are often associated and lead to a diagnosis in the weeks or months following their onset. An overview of clinical presentation at diagnosis is summarized in Figure 2. Glioblastomas are located in the supra-tentorial space in more than 85% of the cases explaining the above-mentioned symptoms and very infrequently in the brainstem
Figure 1. Topic representation of the included literature related to glioblastoma. The figure highlightstwenty-seven clusters.
3.2. Pathogenesis of Glioblastoma3.2.1. Risk Factors for High Grade Gliomas
Risk factors for glioblastoma onset are still unknown and studies dealing with thisquestion frequently lack power. The exposure to ionizing radiation for the treatment ofmalignancy during infancy [15] is a very rare risk factor for the onset of glioma. The riskof developing a brain tumor after radiotherapy is increased if the radiation occurs at ayounger age (<5 years) and seems volume- and dose-related but with no clear reportedthreshold [16,17]. The increased incidence of glioblastoma [18,19] raises the issue of envi-ronmental risk factors. The association between the use of mobile phone and the occurrenceof glioblastoma has been reported in a meta-analysis [20]. However, these results are dis-cordant and have been challenged in other studies [21,22]. The role of exposure to smokingor carcinogenic agents has been studied with no proven association to glioblastoma [23,24].In very few cases (<1%), there is a genetic predisposition to glioblastoma development inpatients with Lynch, Turcot type 1 or Li Fraumeni syndromes [25].
3.2.2. Clinical Presentation
Clinical presentation depends on the tumor location and size at diagnosis. The mostcommon presentation at diagnosis is a headache and/or nausea in a context of a largetumor or significant edema. Symptoms related to intracranial hypertension represent30% of clinical signs followed by motor deficit (20%), loss of body weight and condition(17%), confusion (15%) and visual or speech deficit (13%) [26]. Epilepsy is not uncommon(15–20%) and easily controlled by anticonvulsant therapies. Epilepsy is associated withbetter outcomes probably due to the cortical location of glioblastomas presenting withseizures [27]. These symptoms are often associated and lead to a diagnosis in the weeksor months following their onset. An overview of clinical presentation at diagnosis issummarized in Figure 2. Glioblastomas are located in the supra-tentorial space in morethan 85% of the cases explaining the above-mentioned symptoms and very infrequentlyin the brainstem and spinal cord (<5% each) or in the cerebellum (<3%). Up to 25% of
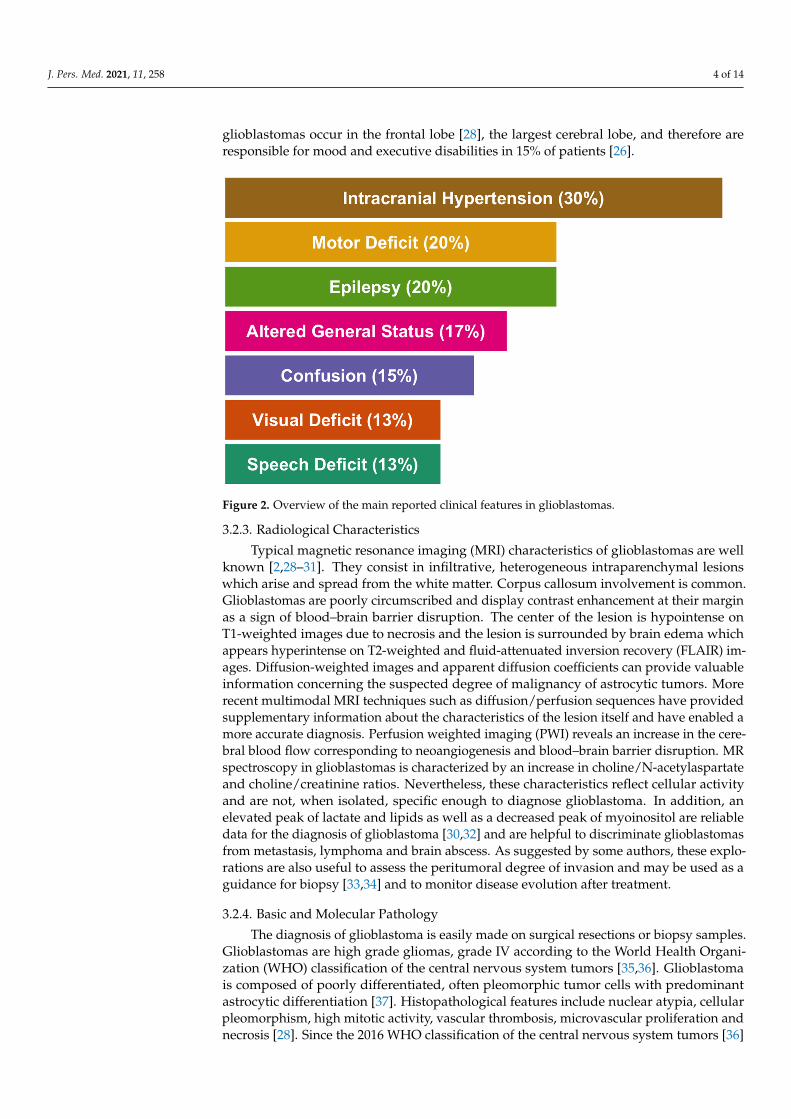
J. Pers. Med. 2021, 11, 258 4 of 14
glioblastomas occur in the frontal lobe [28], the largest cerebral lobe, and therefore areresponsible for mood and executive disabilities in 15% of patients [26].
J. Pers. Med. 2021, 11, x FOR PEER REVIEW 4 of 14
and spinal cord (<5% each) or in the cerebellum (<3%). Up to 25% of glioblastomas occur in the frontal lobe [28], the largest cerebral lobe, and therefore are responsible for mood and executive disabilities in 15% of patients [26].
Figure 2. Overview of the main reported clinical features in glioblastomas.
3.2.3. Radiological Characteristics Typical magnetic resonance imaging (MRI) characteristics of glioblastomas are well
known [2,28–31]. They consist in infiltrative, heterogeneous intraparenchymal lesions which arise and spread from the white matter. Corpus callosum involvement is common. Glioblastomas are poorly circumscribed and display contrast enhancement at their mar-gin as a sign of blood–brain barrier disruption. The center of the lesion is hypointense on T1-weighted images due to necrosis and the lesion is surrounded by brain edema which appears hyperintense on T2-weighted and fluid-attenuated inversion recovery (FLAIR) images. Diffusion-weighted images and apparent diffusion coefficients can provide valu-able information concerning the suspected degree of malignancy of astrocytic tumors. More recent multimodal MRI techniques such as diffusion/perfusion sequences have pro-vided supplementary information about the characteristics of the lesion itself and have enabled a more accurate diagnosis. Perfusion weighted imaging (PWI) reveals an increase in the cerebral blood flow corresponding to neoangiogenesis and blood–brain barrier dis-ruption. MR spectroscopy in glioblastomas is characterized by an increase in choline/N-acetylaspartate and choline/creatinine ratios. Nevertheless, these characteristics reflect cellular activity and are not, when isolated, specific enough to diagnose glioblastoma. In addition, an elevated peak of lactate and lipids as well as a decreased peak of myoinositol are reliable data for the diagnosis of glioblastoma [30,32] and are helpful to discriminate glioblastomas from metastasis, lymphoma and brain abscess. As suggested by some au-thors, these explorations are also useful to assess the peritumoral degree of invasion and may be used as a guidance for biopsy [33,34] and to monitor disease evolution after treat-ment.
3.2.4. Basic and Molecular Pathology The diagnosis of glioblastoma is easily made on surgical resections or biopsy sam-
ples. Glioblastomas are high grade gliomas, grade IV according to the World Health Or-
Figure 2. Overview of the main reported clinical features in glioblastomas.
3.2.3. Radiological Characteristics
Typical magnetic resonance imaging (MRI) characteristics of glioblastomas are wellknown [2,28–31]. They consist in infiltrative, heterogeneous intraparenchymal lesionswhich arise and spread from the white matter. Corpus callosum involvement is common.Glioblastomas are poorly circumscribed and display contrast enhancement at their marginas a sign of blood–brain barrier disruption. The center of the lesion is hypointense onT1-weighted images due to necrosis and the lesion is surrounded by brain edema whichappears hyperintense on T2-weighted and fluid-attenuated inversion recovery (FLAIR) im-ages. Diffusion-weighted images and apparent diffusion coefficients can provide valuableinformation concerning the suspected degree of malignancy of astrocytic tumors. Morerecent multimodal MRI techniques such as diffusion/perfusion sequences have providedsupplementary information about the characteristics of the lesion itself and have enabled amore accurate diagnosis. Perfusion weighted imaging (PWI) reveals an increase in the cere-bral blood flow corresponding to neoangiogenesis and blood–brain barrier disruption. MRspectroscopy in glioblastomas is characterized by an increase in choline/N-acetylaspartateand choline/creatinine ratios. Nevertheless, these characteristics reflect cellular activityand are not, when isolated, specific enough to diagnose glioblastoma. In addition, anelevated peak of lactate and lipids as well as a decreased peak of myoinositol are reliabledata for the diagnosis of glioblastoma [30,32] and are helpful to discriminate glioblastomasfrom metastasis, lymphoma and brain abscess. As suggested by some authors, these explo-rations are also useful to assess the peritumoral degree of invasion and may be used as aguidance for biopsy [33,34] and to monitor disease evolution after treatment.
3.2.4. Basic and Molecular Pathology
The diagnosis of glioblastoma is easily made on surgical resections or biopsy samples.Glioblastomas are high grade gliomas, grade IV according to the World Health Organi-zation (WHO) classification of the central nervous system tumors [35,36]. Glioblastomais composed of poorly differentiated, often pleomorphic tumor cells with predominantastrocytic differentiation [37]. Histopathological features include nuclear atypia, cellularpleomorphism, high mitotic activity, vascular thrombosis, microvascular proliferation andnecrosis [28]. Since the 2016 WHO classification of the central nervous system tumors [36]
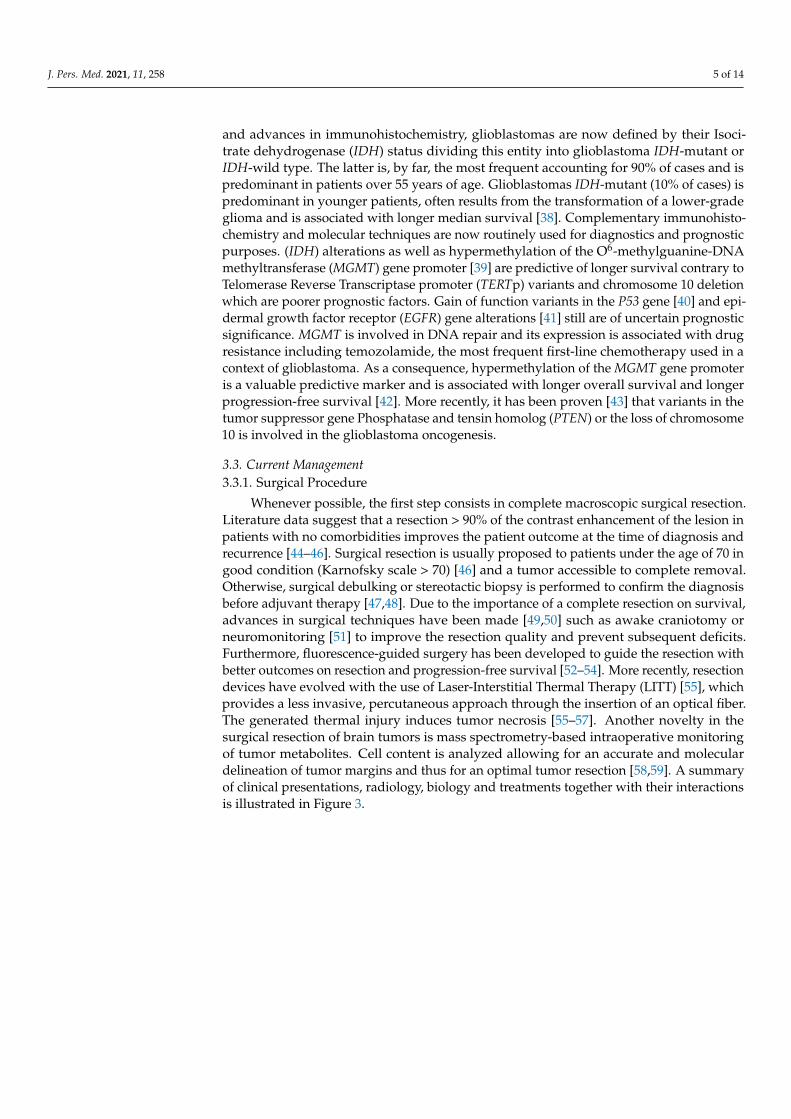
J. Pers. Med. 2021, 11, 258 5 of 14
and advances in immunohistochemistry, glioblastomas are now defined by their Isoci-trate dehydrogenase (IDH) status dividing this entity into glioblastoma IDH-mutant orIDH-wild type. The latter is, by far, the most frequent accounting for 90% of cases and ispredominant in patients over 55 years of age. Glioblastomas IDH-mutant (10% of cases) ispredominant in younger patients, often results from the transformation of a lower-gradeglioma and is associated with longer median survival [38]. Complementary immunohisto-chemistry and molecular techniques are now routinely used for diagnostics and prognosticpurposes. (IDH) alterations as well as hypermethylation of the O6-methylguanine-DNAmethyltransferase (MGMT) gene promoter [39] are predictive of longer survival contrary toTelomerase Reverse Transcriptase promoter (TERTp) variants and chromosome 10 deletionwhich are poorer prognostic factors. Gain of function variants in the P53 gene [40] and epi-dermal growth factor receptor (EGFR) gene alterations [41] still are of uncertain prognosticsignificance. MGMT is involved in DNA repair and its expression is associated with drugresistance including temozolamide, the most frequent first-line chemotherapy used in acontext of glioblastoma. As a consequence, hypermethylation of the MGMT gene promoteris a valuable predictive marker and is associated with longer overall survival and longerprogression-free survival [42]. More recently, it has been proven [43] that variants in thetumor suppressor gene Phosphatase and tensin homolog (PTEN) or the loss of chromosome10 is involved in the glioblastoma oncogenesis.
3.3. Current Management3.3.1. Surgical Procedure
Whenever possible, the first step consists in complete macroscopic surgical resection.Literature data suggest that a resection > 90% of the contrast enhancement of the lesion inpatients with no comorbidities improves the patient outcome at the time of diagnosis andrecurrence [44–46]. Surgical resection is usually proposed to patients under the age of 70 ingood condition (Karnofsky scale > 70) [46] and a tumor accessible to complete removal.Otherwise, surgical debulking or stereotactic biopsy is performed to confirm the diagnosisbefore adjuvant therapy [47,48]. Due to the importance of a complete resection on survival,advances in surgical techniques have been made [49,50] such as awake craniotomy orneuromonitoring [51] to improve the resection quality and prevent subsequent deficits.Furthermore, fluorescence-guided surgery has been developed to guide the resection withbetter outcomes on resection and progression-free survival [52–54]. More recently, resectiondevices have evolved with the use of Laser-Interstitial Thermal Therapy (LITT) [55], whichprovides a less invasive, percutaneous approach through the insertion of an optical fiber.The generated thermal injury induces tumor necrosis [55–57]. Another novelty in thesurgical resection of brain tumors is mass spectrometry-based intraoperative monitoringof tumor metabolites. Cell content is analyzed allowing for an accurate and moleculardelineation of tumor margins and thus for an optimal tumor resection [58,59]. A summaryof clinical presentations, radiology, biology and treatments together with their interactionsis illustrated in Figure 3.

J. Pers. Med. 2021, 11, 258 6 of 14
J. Pers. Med. 2021, 11, x FOR PEER REVIEW 6 of 14
Figure 3. Integrative visualization summary of main clinical symptoms and signs and their interactions with radiology, biology and treatment features. The box and annotation sizes are proportional to the item frequency. Clinical: blue, Biol-ogy: purple, Radiology: green, Treatment: orange.
3.3.2. Medical Treatment of Glioblastomas The standard of care for patients aged less than 70 relies on radiotherapy (RT) and
adjuvant temozolomide. This protocol improved the overall survival in a large random-ized phase III trial [60]. Radiotherapy is given for a six-week period with a total dose of 60 grays. Temozolomide is an alkylating agent administered daily during the RT and then, for six cycles of five consecutive days per month, one month after the end of the RT. The absence of hypermethylated MGMT promoter [61] is a negative prognostic and predictive factor of temozolomide efficiency. The treatment protocol proposed by Stupp allows for increasing the average survival rate from 12.1 months using RT alone to 14.6 months, and the two-year survival rate from 8 to 26% with concomitant temozolomide [60]. This ran-domized controlled trial did not include patients older than 70. In the latter population, the standard of care is based on hypofractionated radiotherapy and temozolomide [62] whenever feasible, but the treatment depends on the patient’s general condition. RT alone (54 grays) has been proposed with a positive impact on survival (29.1 weeks compared to 16.9 weeks in patients with supportive care alone) and with no alteration of the quality of life [63]. These results have been validated in patients with a Karnofsky [64] performance status (KPS) > 60. More recently, some authors have shown that short-course RT plus te-mozolomide was associated with longer survival (9.3 versus 7.6 months) in older patients (>65 years). Malmstrom et al. [65] randomized patients aged 60 years and older presenting with a glioblastoma to assess the optimal palliative treatment. The conclusion of the trial was that radiotherapy alone is associated with poor outcomes. On the contrary, both te-mozolamide and hypofractionated radiotherapy appeared as standards of care especially
Figure 3. Integrative visualization summary of main clinical symptoms and signs and their interactions with radiology,biology and treatment features. The box and annotation sizes are proportional to the item frequency. Clinical: blue, Biology:purple, Radiology: green, Treatment: orange.
3.3.2. Medical Treatment of Glioblastomas
The standard of care for patients aged less than 70 relies on radiotherapy (RT) andadjuvant temozolomide. This protocol improved the overall survival in a large randomizedphase III trial [60]. Radiotherapy is given for a six-week period with a total dose of 60grays. Temozolomide is an alkylating agent administered daily during the RT and then,for six cycles of five consecutive days per month, one month after the end of the RT. Theabsence of hypermethylated MGMT promoter [61] is a negative prognostic and predictivefactor of temozolomide efficiency. The treatment protocol proposed by Stupp allows forincreasing the average survival rate from 12.1 months using RT alone to 14.6 months,and the two-year survival rate from 8 to 26% with concomitant temozolomide [60]. Thisrandomized controlled trial did not include patients older than 70. In the latter population,the standard of care is based on hypofractionated radiotherapy and temozolomide [62]whenever feasible, but the treatment depends on the patient’s general condition. RT alone(54 grays) has been proposed with a positive impact on survival (29.1 weeks compared to16.9 weeks in patients with supportive care alone) and with no alteration of the quality oflife [63]. These results have been validated in patients with a Karnofsky [64] performancestatus (KPS) > 60. More recently, some authors have shown that short-course RT plustemozolomide was associated with longer survival (9.3 versus 7.6 months) in older patients
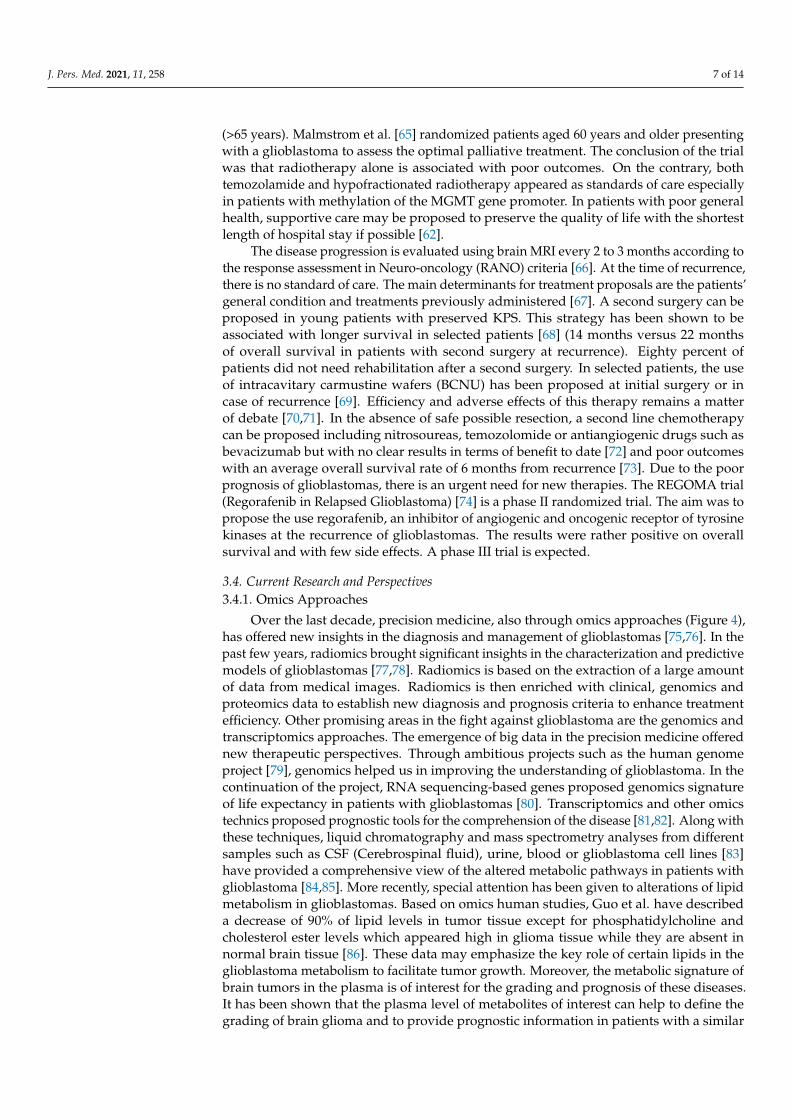
J. Pers. Med. 2021, 11, 258 7 of 14
(>65 years). Malmstrom et al. [65] randomized patients aged 60 years and older presentingwith a glioblastoma to assess the optimal palliative treatment. The conclusion of the trialwas that radiotherapy alone is associated with poor outcomes. On the contrary, bothtemozolamide and hypofractionated radiotherapy appeared as standards of care especiallyin patients with methylation of the MGMT gene promoter. In patients with poor generalhealth, supportive care may be proposed to preserve the quality of life with the shortestlength of hospital stay if possible [62].
The disease progression is evaluated using brain MRI every 2 to 3 months according tothe response assessment in Neuro-oncology (RANO) criteria [66]. At the time of recurrence,there is no standard of care. The main determinants for treatment proposals are the patients’general condition and treatments previously administered [67]. A second surgery can beproposed in young patients with preserved KPS. This strategy has been shown to beassociated with longer survival in selected patients [68] (14 months versus 22 monthsof overall survival in patients with second surgery at recurrence). Eighty percent ofpatients did not need rehabilitation after a second surgery. In selected patients, the useof intracavitary carmustine wafers (BCNU) has been proposed at initial surgery or incase of recurrence [69]. Efficiency and adverse effects of this therapy remains a matterof debate [70,71]. In the absence of safe possible resection, a second line chemotherapycan be proposed including nitrosoureas, temozolomide or antiangiogenic drugs such asbevacizumab but with no clear results in terms of benefit to date [72] and poor outcomeswith an average overall survival rate of 6 months from recurrence [73]. Due to the poorprognosis of glioblastomas, there is an urgent need for new therapies. The REGOMA trial(Regorafenib in Relapsed Glioblastoma) [74] is a phase II randomized trial. The aim was topropose the use regorafenib, an inhibitor of angiogenic and oncogenic receptor of tyrosinekinases at the recurrence of glioblastomas. The results were rather positive on overallsurvival and with few side effects. A phase III trial is expected.
3.4. Current Research and Perspectives3.4.1. Omics Approaches
Over the last decade, precision medicine, also through omics approaches (Figure 4),has offered new insights in the diagnosis and management of glioblastomas [75,76]. In thepast few years, radiomics brought significant insights in the characterization and predictivemodels of glioblastomas [77,78]. Radiomics is based on the extraction of a large amountof data from medical images. Radiomics is then enriched with clinical, genomics andproteomics data to establish new diagnosis and prognosis criteria to enhance treatmentefficiency. Other promising areas in the fight against glioblastoma are the genomics andtranscriptomics approaches. The emergence of big data in the precision medicine offerednew therapeutic perspectives. Through ambitious projects such as the human genomeproject [79], genomics helped us in improving the understanding of glioblastoma. In thecontinuation of the project, RNA sequencing-based genes proposed genomics signatureof life expectancy in patients with glioblastomas [80]. Transcriptomics and other omicstechnics proposed prognostic tools for the comprehension of the disease [81,82]. Along withthese techniques, liquid chromatography and mass spectrometry analyses from differentsamples such as CSF (Cerebrospinal fluid), urine, blood or glioblastoma cell lines [83]have provided a comprehensive view of the altered metabolic pathways in patients withglioblastoma [84,85]. More recently, special attention has been given to alterations of lipidmetabolism in glioblastomas. Based on omics human studies, Guo et al. have describeda decrease of 90% of lipid levels in tumor tissue except for phosphatidylcholine andcholesterol ester levels which appeared high in glioma tissue while they are absent innormal brain tissue [86]. These data may emphasize the key role of certain lipids in theglioblastoma metabolism to facilitate tumor growth. Moreover, the metabolic signature ofbrain tumors in the plasma is of interest for the grading and prognosis of these diseases.It has been shown that the plasma level of metabolites of interest can help to define thegrading of brain glioma and to provide prognostic information in patients with a similar
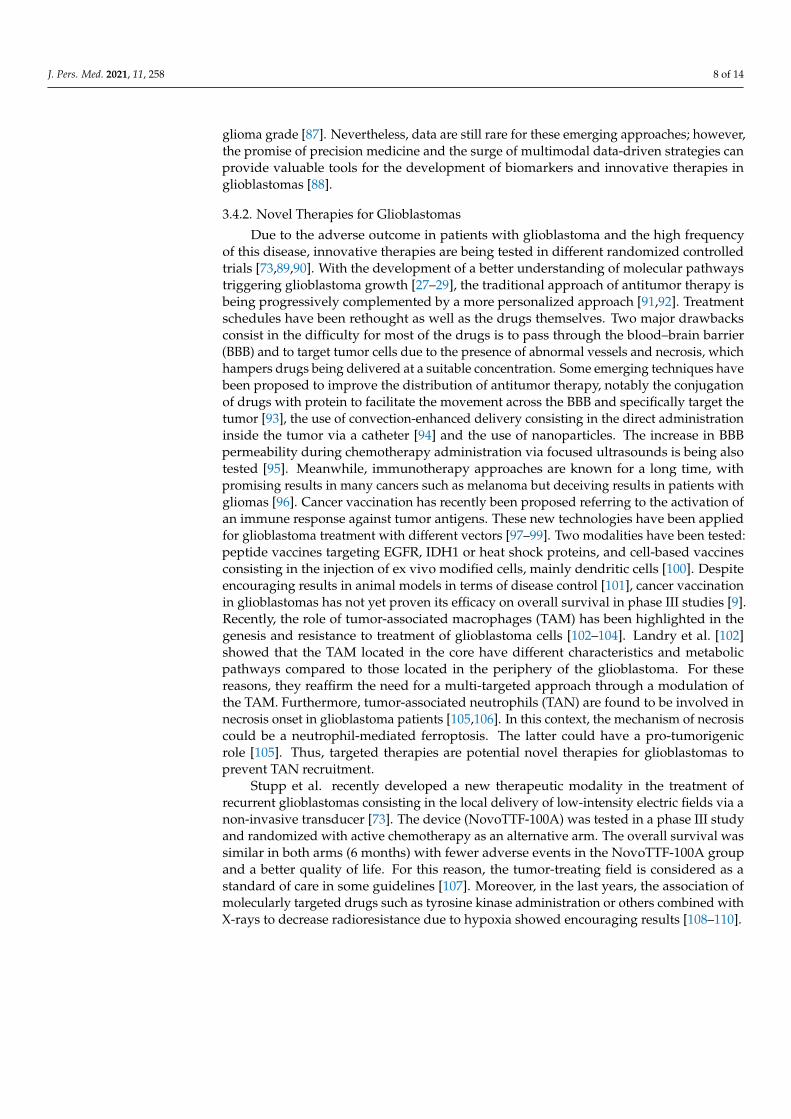
J. Pers. Med. 2021, 11, 258 8 of 14
glioma grade [87]. Nevertheless, data are still rare for these emerging approaches; however,the promise of precision medicine and the surge of multimodal data-driven strategies canprovide valuable tools for the development of biomarkers and innovative therapies inglioblastomas [88].
3.4.2. Novel Therapies for Glioblastomas
Due to the adverse outcome in patients with glioblastoma and the high frequencyof this disease, innovative therapies are being tested in different randomized controlledtrials [73,89,90]. With the development of a better understanding of molecular pathwaystriggering glioblastoma growth [27–29], the traditional approach of antitumor therapy isbeing progressively complemented by a more personalized approach [91,92]. Treatmentschedules have been rethought as well as the drugs themselves. Two major drawbacksconsist in the difficulty for most of the drugs is to pass through the blood–brain barrier(BBB) and to target tumor cells due to the presence of abnormal vessels and necrosis, whichhampers drugs being delivered at a suitable concentration. Some emerging techniques havebeen proposed to improve the distribution of antitumor therapy, notably the conjugationof drugs with protein to facilitate the movement across the BBB and specifically target thetumor [93], the use of convection-enhanced delivery consisting in the direct administrationinside the tumor via a catheter [94] and the use of nanoparticles. The increase in BBBpermeability during chemotherapy administration via focused ultrasounds is being alsotested [95]. Meanwhile, immunotherapy approaches are known for a long time, withpromising results in many cancers such as melanoma but deceiving results in patients withgliomas [96]. Cancer vaccination has recently been proposed referring to the activation ofan immune response against tumor antigens. These new technologies have been appliedfor glioblastoma treatment with different vectors [97–99]. Two modalities have been tested:peptide vaccines targeting EGFR, IDH1 or heat shock proteins, and cell-based vaccinesconsisting in the injection of ex vivo modified cells, mainly dendritic cells [100]. Despiteencouraging results in animal models in terms of disease control [101], cancer vaccinationin glioblastomas has not yet proven its efficacy on overall survival in phase III studies [9].Recently, the role of tumor-associated macrophages (TAM) has been highlighted in thegenesis and resistance to treatment of glioblastoma cells [102–104]. Landry et al. [102]showed that the TAM located in the core have different characteristics and metabolicpathways compared to those located in the periphery of the glioblastoma. For thesereasons, they reaffirm the need for a multi-targeted approach through a modulation ofthe TAM. Furthermore, tumor-associated neutrophils (TAN) are found to be involved innecrosis onset in glioblastoma patients [105,106]. In this context, the mechanism of necrosiscould be a neutrophil-mediated ferroptosis. The latter could have a pro-tumorigenicrole [105]. Thus, targeted therapies are potential novel therapies for glioblastomas toprevent TAN recruitment.
Stupp et al. recently developed a new therapeutic modality in the treatment ofrecurrent glioblastomas consisting in the local delivery of low-intensity electric fields via anon-invasive transducer [73]. The device (NovoTTF-100A) was tested in a phase III studyand randomized with active chemotherapy as an alternative arm. The overall survival wassimilar in both arms (6 months) with fewer adverse events in the NovoTTF-100A groupand a better quality of life. For this reason, the tumor-treating field is considered as astandard of care in some guidelines [107]. Moreover, in the last years, the association ofmolecularly targeted drugs such as tyrosine kinase administration or others combined withX-rays to decrease radioresistance due to hypoxia showed encouraging results [108–110].
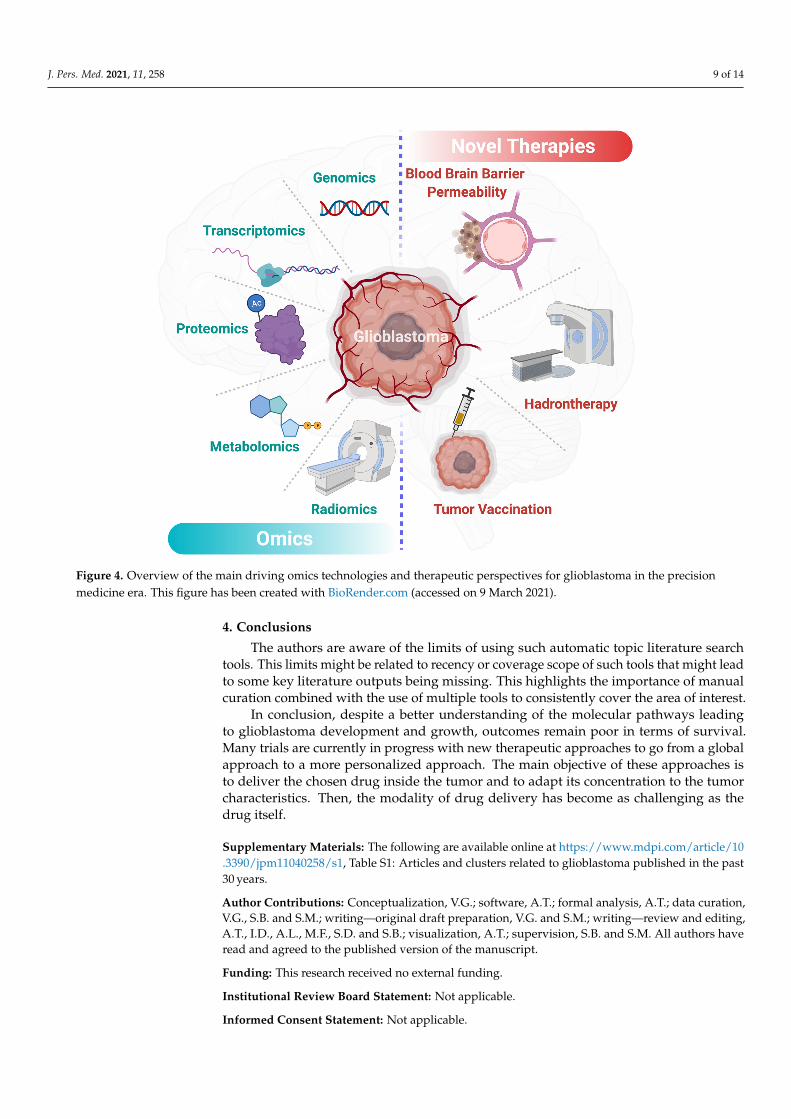
J. Pers. Med. 2021, 11, 258 9 of 14J. Pers. Med. 2021, 11, x FOR PEER REVIEW 9 of 14
Figure 4. Overview of the main driving omics technologies and therapeutic perspectives for glio-blastoma in the precision medicine era. This figure has been created with BioRender.com.
4. Conclusions The authors are aware of the limits of using such automatic topic literature search
tools. This limits might be related to recency or coverage scope of such tools that might lead to some key literature outputs being missing. This highlights the importance of man-ual curation combined with the use of multiple tools to consistently cover the area of in-terest.
In conclusion, despite a better understanding of the molecular pathways leading to glioblastoma development and growth, outcomes remain poor in terms of survival. Many trials are currently in progress with new therapeutic approaches to go from a global ap-proach to a more personalized approach. The main objective of these approaches is to deliver the chosen drug inside the tumor and to adapt its concentration to the tumor char-acteristics. Then, the modality of drug delivery has become as challenging as the drug itself.
Supplementary Materials: The following are available online at www.mdpi.com/xxx/s1, Table S1: Articles and clusters related to glioblastoma published in the past 30 years.
Author Contributions: Conceptualization, V.G.; software, A.T.; formal analysis, A.T.; data curation, V.G., S.B., S.M.; writing—original draft preparation, V.G., S.M.; writing—review and editing, A.T., I.D., A.L., M.F., S.D. and S.B.; visualization, A.T.; supervision, S.B. and S.M. All authors have read and agreed to the published version of the manuscript.
Funding: This research received no external funding.
Institutional Review Board Statement: Not applicable.
Informed Consent Statement: Not applicable.
Figure 4. Overview of the main driving omics technologies and therapeutic perspectives for glioblastoma in the precisionmedicine era. This figure has been created with BioRender.com (accessed on 9 March 2021).
4. Conclusions
The authors are aware of the limits of using such automatic topic literature searchtools. This limits might be related to recency or coverage scope of such tools that might leadto some key literature outputs being missing. This highlights the importance of manualcuration combined with the use of multiple tools to consistently cover the area of interest.
In conclusion, despite a better understanding of the molecular pathways leadingto glioblastoma development and growth, outcomes remain poor in terms of survival.Many trials are currently in progress with new therapeutic approaches to go from a globalapproach to a more personalized approach. The main objective of these approaches isto deliver the chosen drug inside the tumor and to adapt its concentration to the tumorcharacteristics. Then, the modality of drug delivery has become as challenging as thedrug itself.
Supplementary Materials: The following are available online at https://www.mdpi.com/article/10.3390/jpm11040258/s1, Table S1: Articles and clusters related to glioblastoma published in the past30 years.
Author Contributions: Conceptualization, V.G.; software, A.T.; formal analysis, A.T.; data curation,V.G., S.B. and S.M.; writing—original draft preparation, V.G. and S.M.; writing—review and editing,A.T., I.D., A.L., M.F., S.D. and S.B.; visualization, A.T.; supervision, S.B. and S.M. All authors haveread and agreed to the published version of the manuscript.
Funding: This research received no external funding.
Institutional Review Board Statement: Not applicable.
Informed Consent Statement: Not applicable.
J. Pers. Med. 2021, 11, 258 10 of 14
Data Availability Statement: Data supporting the finding are presented in the text and Supplemen-tary Material.
Conflicts of Interest: The authors declare no conflict of interest.
References1. Bauchet, L.; Ostrom, Q.T. Epidemiology and Molecular Epidemiology. Neurosurg. Clin. N. Am. 2019, 30, 1–16. [CrossRef]2. Negendank, W.G.; Sauter, R.; Brown, T.R.; Evelhoch, J.L.; Falini, A.; Gotsis, E.D.; Heerschap, A.; Kamada, K.; Lee, B.C.; Mengeot,
M.M.; et al. Proton magnetic resonance spectroscopy in patients with glial tumors: A multicenter study. J. Neurosurg. 1996, 84,449–458. [CrossRef]
3. Morgan, L.L. The epidemiology of glioma in adults: A “state of the science” review. Neuro Oncol. 2015, 17, 623–624. [CrossRef]4. Kowalczyk, T.; Ciborowski, M.; Kisluk, J.; Kretowski, A.; Barbas, C. Mass spectrometry based proteomics and metabolomics in
personalized oncology. Biochim. Biophys. Acta Mol. Basis Dis. 2020, 1866, 165690. [CrossRef]5. Dolecek, T.A.; Propp, J.M.; Stroup, N.E.; Kruchko, C. CBTRUS statistical report: Primary brain and central nervous system tumors
diagnosed in the United States in 2005–2009. Neuro Oncol. 2012, 14 (Suppl. 5), v1–v49. [CrossRef]6. Ostrom, Q.T.; Bauchet, L.; Davis, F.G.; Deltour, I.; Fisher, J.L.; Langer, C.E.; Pekmezci, M.; Schwartzbaum, J.A.; Turner, M.C.; Walsh,
K.M.; et al. The epidemiology of glioma in adults: A “state of the science” review. Neuro Oncol. 2014, 16, 896–913. [CrossRef]7. Lim, M.; Xia, Y.; Bettegowda, C.; Weller, M. Current state of immunotherapy for glioblastoma. Nat. Rev. Clin. Oncol. 2018, 15,
422–442. [CrossRef]8. Touat, M.; Idbaih, A.; Sanson, M.; Ligon, K.L. Glioblastoma targeted therapy: Updated approaches from recent biological insights.
Ann. Oncol. 2017, 28, 1457–1472. [CrossRef] [PubMed]9. Malkki, H. Trial Watch: Glioblastoma vaccine therapy disappointment in Phase III trial. Nat. Rev. Neurol. 2016, 12, 190. [CrossRef]
[PubMed]10. Delgado-Lopez, P.D.; Corrales-Garcia, E.M. Survival in glioblastoma: A review on the impact of treatment modalities. Clin. Transl.
Oncol. 2016, 18, 1062–1071. [CrossRef] [PubMed]11. Clish, C.B. Metabolomics: An emerging but powerful tool for precision medicine. Cold Spring Harb. Mol. Case Stud. 2015,
1, a000588. [CrossRef]12. Lopez de Maturana, E.; Alonso, L.; Alarcon, P.; Martin-Antoniano, I.A.; Pineda, S.; Piorno, L.; Calle, M.L.; Malats, N. Challenges
in the Integration of Omics and Non-Omics Data. Genes 2019, 10, 238. [CrossRef] [PubMed]13. Crisan, A.; Munzner, T.; Gardy, J.L.; Wren, J. Adjutant: An R-based tool to support topic discovery for systematic and literature
reviews. Bioinformatics 2019, 35, 1070–1072. [CrossRef] [PubMed]14. R Core Team. A Language and Environment for Statistical Computing; R Foundation: Vienna, Austria, 2020.15. Connelly, J.M.; Malkin, M.G. Environmental risk factors for brain tumors. Curr. Neurol. Neurosci. Rep. 2007, 7, 208–214. [CrossRef]
[PubMed]16. Wingren, C.; James, P.; Borrebaeck, C.A.K. Strategy for surveying the proteome using affinity proteomics and mass spectrometry.
Proteomics 2009, 9, 1511–1517. [CrossRef]17. Yamanaka, R.; Hayano, A.; Kanayama, T. Radiation-induced gliomas: A comprehensive review and meta-analysis. Neurosurg.
Rev. 2018, 41, 719–731. [CrossRef]18. Philips, A.; Henshaw, D.L.; Lamburn, G.; O’Carroll, M.J. Brain Tumours: Rise in Glioblastoma Multiforme Incidence in England
1995-2015 Suggests an Adverse Environmental or Lifestyle Factor. J. Environ. Public Health 2018, 2018, 7910754. [CrossRef]19. Dobes, M.; Khurana, V.G.; Shadbolt, B.; Jain, S.; Smith, S.F.; Smee, R.; Dexter, M.; Cook, R. Increasing incidence of glioblastoma
multiforme and meningioma, and decreasing incidence of Schwannoma (2000–2008): Findings of a multicenter Australian study.Surg. Neurol. Int. 2011, 2, 176. [CrossRef]
20. Yang, M.; Guo, W.; Yang, C.; Tang, J.; Huang, Q.; Feng, S.; Jiang, A.; Xu, X.; Jiang, G. Mobile phone use and glioma risk: Asystematic review and meta-analysis. PLoS ONE 2017, 12, e0175136. [CrossRef]
21. Karipidis, K.; Elwood, M.; Benke, G.; Sanagou, M.; Tjong, L.; Croft, R.J. Mobile phone use and incidence of brain tumourhistological types, grading or anatomical location: A population-based ecological study. BMJ Open 2018, 8, e024489. [CrossRef]
22. Repacholi, M.H.; Lerchl, A.; Roosli, M.; Sienkiewicz, Z.; Auvinen, A.; Breckenkamp, J.; d’Inzeo, G.; Elliott, P.; Frei, P.; Heinrich,S.; et al. Systematic review of wireless phone use and brain cancer and other head tumors. Bioelectromagnetics 2012, 33, 187–206.[CrossRef]
23. Benke, G.; Turner, M.C.; Fleming, S.; Figuerola, J.; Kincl, L.; Richardson, L.; Blettner, M.; Hours, M.; Krewski, D.; McLean, D.; et al.Occupational solvent exposure and risk of glioma in the INTEROCC study. Br. J. Cancer 2017, 117, 1246–1254. [CrossRef]
24. Parent, M.E.; Turner, M.C.; Lavoue, J.; Richard, H.; Figuerola, J.; Kincl, L.; Richardson, L.; Benke, G.; Blettner, M.; Fleming, S.; et al.Lifetime occupational exposure to metals and welding fumes, and risk of glioma: A 7-country population-based case-controlstudy. Environ. Health 2017, 16, 90. [CrossRef] [PubMed]
25. Rice, T.; Lachance, D.H.; Molinaro, A.M.; Eckel-Passow, J.E.; Walsh, K.M.; Barnholtz-Sloan, J.; Ostrom, Q.T.; Francis, S.S.; Wiemels,J.; Jenkins, R.B.; et al. Understanding inherited genetic risk of adult glioma—A review. Neurooncol. Pract. 2016, 3, 10–16.[CrossRef] [PubMed]
26. Yuile, P.; Dent, O.; Cook, R.; Biggs, M.; Little, N. Survival of glioblastoma patients related to presenting symptoms, brain site andtreatment variables. J. Clin. Neurosci. 2006, 13, 747–751. [CrossRef]
J. Pers. Med. 2021, 11, 258 11 of 14
27. Vecht, C.J.; Kerkhof, M.; Duran-Pena, A. Seizure prognosis in brain tumors: New insights and evidence-based management.Oncologist 2014, 19, 751–759. [CrossRef] [PubMed]
28. Wirsching, H.G.; Galanis, E.; Weller, M. Glioblastoma. Handb. Clin. Neurol. 2016, 134, 381–397. [CrossRef] [PubMed]29. Yan, J.L.; Li, C.; Boonzaier, N.R.; Fountain, D.M.; Larkin, T.J.; Matys, T.; van der Hoorn, A.; Price, S.J. Multimodal MRI
characteristics of the glioblastoma infiltration beyond contrast enhancement. Ther. Adv. Neurol. Disord. 2019, 12. [CrossRef][PubMed]
30. Peeken, J.C.; Goldberg, T.; Pyka, T.; Bernhofer, M.; Wiestler, B.; Kessel, K.A.; Tafti, P.D.; Nusslin, F.; Braun, A.E.; Zimmer, C.; et al.Combining multimodal imaging and treatment features improves machine learning-based prognostic assessment in patientswith glioblastoma multiforme. Cancer Med. 2019, 8, 128–136. [CrossRef]
31. Law, M.; Yang, S.; Wang, H.; Babb, J.S.; Johnson, G.; Cha, S.; Knopp, E.A.; Zagzag, D. Glioma grading: Sensitivity, specificity, andpredictive values of perfusion MR imaging and proton MR spectroscopic imaging compared with conventional MR imaging.AJNR Am. J. Neuroradiol. 2003, 24, 1989–1998.
32. Price, S.J.; Young, A.M.; Scotton, W.J.; Ching, J.; Mohsen, L.A.; Boonzaier, N.R.; Lupson, V.C.; Griffiths, J.R.; McLean, M.A.; Larkin,T.J. Multimodal MRI can identify perfusion and metabolic changes in the invasive margin of glioblastomas. J. Magn. Reson.Imaging 2016, 43, 487–494. [CrossRef]
33. Barajas, R.F., Jr.; Hodgson, J.G.; Chang, J.S.; Vandenberg, S.R.; Yeh, R.F.; Parsa, A.T.; McDermott, M.W.; Berger, M.S.; Dillon, W.P.;Cha, S. Glioblastoma multiforme regional genetic and cellular expression patterns: Influence on anatomic and physiologic MRimaging. Radiology 2010, 254, 564–576. [CrossRef]
34. Lonjon, M.; Mondot, L.; Lonjon, N.; Chanalet, S. Clinical factors in glioblastoma and neuroradiology. Neurochirurgie 2010, 56,449–454. [CrossRef]
35. Louis, D.N.; Perry, A.; Reifenberger, G.; von Deimling, A.; Figarella-Branger, D.; Cavenee, W.K.; Ohgaki, H.; Wiestler, O.D.;Kleihues, P.; Ellison, D.W. The 2016 World Health Organization Classification of Tumors of the Central Nervous System: Asummary. Acta Neuropathol. 2016, 131, 803–820. [CrossRef]
36. Louis, O.H.; Wiestler, O.D.; Cavenee, W.K. The 2016 World Health Organization Classification of Tumors of the Central Nervous System,4th ed.; IARC Publication: Geneva, Switzerland, 2016; Volume 1.
37. Figarella-Branger, D.; Bouvier, C.; Moroch, J.; Michalak, S.; Burel-Vandenbos, F. Morphological classification of glioblastomas.Neurochirurgie 2010, 56, 459–463. [CrossRef]
38. Banan, R.; Hartmann, C. The new WHO 2016 classification of brain tumors-what neurosurgeons need to know. Acta Neurochir.2017, 159, 403–418. [CrossRef]
39. Zhao, Y.H.; Wang, Z.F.; Cao, C.J.; Weng, H.; Xu, C.S.; Li, K.; Li, J.L.; Lan, J.; Zeng, X.T.; Li, Z.Q. The Clinical Significance ofO(6)-Methylguanine-DNA Methyltransferase Promoter Methylation Status in Adult Patients With Glioblastoma: A Meta-analysis.Front. Neurol. 2018, 9, 127. [CrossRef]
40. Zhang, Y.; Dube, C.; Gibert, M., Jr.; Cruickshanks, N.; Wang, B.; Coughlan, M.; Yang, Y.; Setiady, I.; Deveau, C.; Saoud, K.; et al.The p53 Pathway in Glioblastoma. Cancers 2018, 10, 297. [CrossRef] [PubMed]
41. Eskilsson, E.; Rosland, G.V.; Solecki, G.; Wang, Q.; Harter, P.N.; Graziani, G.; Verhaak, R.G.W.; Winkler, F.; Bjerkvig, R.; Miletic, H.EGFR heterogeneity and implications for therapeutic intervention in glioblastoma. Neuro Oncol. 2018, 20, 743–752. [CrossRef][PubMed]
42. Binabaj, M.M.; Bahrami, A.; ShahidSales, S.; Joodi, M.; Joudi Mashhad, M.; Hassanian, S.M.; Anvari, K.; Avan, A. The prognosticvalue of MGMT promoter methylation in glioblastoma: A meta-analysis of clinical trials. J. Cell Physiol. 2018, 233, 378–386.[CrossRef] [PubMed]
43. Benitez, J.A.; Ma, J.; D’Antonio, M.; Boyer, A.; Camargo, M.F.; Zanca, C.; Kelly, S.; Khodadadi-Jamayran, A.; Jameson, N.M.;Andersen, M.; et al. PTEN regulates glioblastoma oncogenesis through chromatin-associated complexes of DAXX and histoneH3.3. Nat. Commun. 2017, 8, 15223. [CrossRef] [PubMed]
44. Lacroix, M.; Abi-Said, D.; Fourney, D.R.; Gokaslan, Z.L.; Shi, W.; DeMonte, F.; Lang, F.F.; McCutcheon, I.E.; Hassenbusch, S.J.;Holland, E.; et al. A multivariate analysis of 416 patients with glioblastoma multiforme: Prognosis, extent of resection, andsurvival. J. Neurosurg. 2001, 95, 190–198. [CrossRef] [PubMed]
45. Brown, T.J.; Brennan, M.C.; Li, M.; Church, E.W.; Brandmeir, N.J.; Rakszawski, K.L.; Patel, A.S.; Rizk, E.B.; Suki, D.; Sawaya, R.;et al. Association of the Extent of Resection With Survival in Glioblastoma: A Systematic Review and Meta-analysis. JAMA Oncol.2016, 2, 1460–1469. [CrossRef] [PubMed]
46. Chambless, L.B.; Kistka, H.M.; Parker, S.L.; Hassam-Malani, L.; McGirt, M.J.; Thompson, R.C. The relative value of postoperativeversus preoperative Karnofsky Performance Scale scores as a predictor of survival after surgical resection of glioblastomamultiforme. J. Neurooncol. 2015, 121, 359–364. [CrossRef] [PubMed]
47. Marcus, H.J.; Vakharia, V.N.; Ourselin, S.; Duncan, J.; Tisdall, M.; Aquilina, K. Robot-assisted stereotactic brain biopsy: Systematicreview and bibliometric analysis. Childs Nerv. Syst. 2018, 34, 1299–1309. [CrossRef]
48. McGirt, M.J.; Villavicencio, A.T.; Bulsara, K.R.; Friedman, A.H. MRI-guided stereotactic biopsy in the diagnosis of glioma:Comparison of biopsy and surgical resection specimen. Surg. Neurol. 2003, 59, 279–283. [CrossRef]
49. Eseonu, C.I.; Rincon-Torroella, J.; ReFaey, K.; Lee, Y.M.; Nangiana, J.; Vivas-Buitrago, T.; Quinones-Hinojosa, A. AwakeCraniotomy vs Craniotomy Under General Anesthesia for Perirolandic Gliomas: Evaluating Perioperative Complications andExtent of Resection. Neurosurgery 2017, 81, 481–489. [CrossRef]
J. Pers. Med. 2021, 11, 258 12 of 14
50. Foster, C.H.; Morone, P.J.; Cohen-Gadol, A. Awake craniotomy in glioma surgery: Is it necessary? J. Neurosurg. Sci. 2019, 63,162–178. [CrossRef]
51. Obermueller, T.; Schaeffner, M.; Shiban, E.; Droese, D.; Negwer, C.; Meyer, B.; Ringel, F.; Krieg, S.M. Intraoperative neuromonitor-ing for function-guided resection differs for supratentorial motor eloquent gliomas and metastases. BMC Neurol. 2015, 15, 211.[CrossRef]
52. Senders, J.T.; Muskens, I.S.; Schnoor, R.; Karhade, A.V.; Cote, D.J.; Smith, T.R.; Broekman, M.L. Agents for fluorescence-guidedglioma surgery: A systematic review of preclinical and clinical results. Acta Neurochir. 2017, 159, 151–167. [CrossRef]
53. Cho, S.S.; Salinas, R.; Lee, J.Y.K. Indocyanine-Green for Fluorescence-Guided Surgery of Brain Tumors: Evidence, Techniques,and Practical Experience. Front. Surg. 2019, 6, 11. [CrossRef] [PubMed]
54. Stummer, W.; Pichlmeier, U.; Meinel, T.; Wiestler, O.D.; Zanella, F.; Reulen, H.-J. Fluorescence-guided surgery with 5-aminolevulinic acid for resection of malignant glioma: A randomised controlled multicentre phase III trial. Lancet Oncol. 2006, 7,392–401. [CrossRef]
55. Norred, S.E.; Johnson, J.A. Magnetic resonance-guided laser induced thermal therapy for glioblastoma multiforme: A review.BioMed Res. Int. 2014, 2014, 761312. [CrossRef] [PubMed]
56. Kamath, A.A.; Friedman, D.D.; Akbari, S.H.A.; Kim, A.H.; Tao, Y.; Luo, J.; Leuthardt, E.C. Glioblastoma Treated With MagneticResonance Imaging-Guided Laser Interstitial Thermal Therapy: Safety, Efficacy, and Outcomes. Neurosurgery 2019, 84, 836–843.[CrossRef] [PubMed]
57. Carpentier, A.; Chauvet, D.; Reina, V.; Beccaria, K.; Leclerq, D.; McNichols, R.J.; Gowda, A.; Cornu, P.; Delattre, J.Y. MR-guidedlaser-induced thermal therapy (LITT) for recurrent glioblastomas. Lasers Surg. Med. 2012, 44, 361–368. [CrossRef] [PubMed]
58. Pirro, V.; Alfaro, C.M.; Jarmusch, A.K.; Hattab, E.M.; Cohen-Gadol, A.A.; Cooks, R.G. Intraoperative assessment of tumor marginsduring glioma resection by desorption electrospray ionization-mass spectrometry. Proc. Natl. Acad. Sci. USA 2017, 114, 6700–6705.[CrossRef]
59. Santagata, S.; Eberlin, L.S.; Norton, I.; Calligaris, D.; Feldman, D.R.; Ide, J.L.; Liu, X.; Wiley, J.S.; Vestal, M.L.; Ramkissoon,S.H.; et al. Intraoperative mass spectrometry mapping of an onco-metabolite to guide brain tumor surgery. Proc. Natl. Acad. Sci.USA 2014, 111, 11121–11126. [CrossRef]
60. Stupp, R.; Mason, W.P.; van den Bent, M.J.; Weller, M.; Fisher, B.; Taphoorn, M.J.; Belanger, K.; Brandes, A.A.; Marosi, C.; Bogdahn,U.; et al. Radiotherapy plus concomitant and adjuvant temozolomide for glioblastoma. N. Engl. J. Med. 2005, 352, 987–996.[CrossRef]
61. Hegi, M.E.; Diserens, A.C.; Gorlia, T.; Hamou, M.F.; de Tribolet, N.; Weller, M.; Kros, J.M.; Hainfellner, J.A.; Mason, W.; Mariani,L.; et al. MGMT gene silencing and benefit from temozolomide in glioblastoma. N. Engl. J. Med. 2005, 352, 997–1003. [CrossRef][PubMed]
62. Perry, J.R.; Laperriere, N.; O’Callaghan, C.J.; Brandes, A.A.; Menten, J.; Phillips, C.; Fay, M.; Nishikawa, R.; Cairncross, J.G.; Roa,W.; et al. Short-Course Radiation plus Temozolomide in Elderly Patients with Glioblastoma. N. Engl. J. Med. 2017, 376, 1027–1037.[CrossRef]
63. Keime-Guibert, F.; Chinot, O.; Taillandier, L.; Cartalat-Carel, S.; Frenay, M.; Kantor, G.; Guillamo, J.S.; Jadaud, E.; Colin, P.;Bondiau, P.Y.; et al. Radiotherapy for glioblastoma in the elderly. N. Engl. J. Med. 2007, 356, 1527–1535. [CrossRef] [PubMed]
64. Mor, V.; Laliberte, L.; Morris, J.N.; Wiemann, M. The Karnofsky Performance Status Scale. An examination of its reliability andvalidity in a research setting. Cancer 1984, 53, 2002–2007. [CrossRef]
65. Malmstrom, A.; Gronberg, B.H.; Marosi, C.; Stupp, R.; Frappaz, D.; Schultz, H.; Abacioglu, U.; Tavelin, B.; Lhermitte, B.; Hegi,M.E.; et al. Temozolomide versus standard 6-week radiotherapy versus hypofractionated radiotherapy in patients older than 60years with glioblastoma: The Nordic randomised, phase 3 trial. Lancet Oncol. 2012, 13, 916–926. [CrossRef]
66. Chukwueke, U.N.; Wen, P.Y. Use of the Response Assessment in Neuro-Oncology (RANO) criteria in clinical trials and clinicalpractice. CNS Oncol. 2019, 8, CNS28. [CrossRef]
67. Weller, M.; Cloughesy, T.; Perry, J.R.; Wick, W. Standards of care for treatment of recurrent glioblastoma–are we there yet? NeuroOncol. 2013, 15, 4–27. [CrossRef] [PubMed]
68. Wann, A.; Tully, P.A.; Barnes, E.H.; Lwin, Z.; Jeffree, R.; Drummond, K.J.; Gan, H.; Khasraw, M. Outcomes after second surgeryfor recurrent glioblastoma: A retrospective case-control study. J. Neurooncol. 2018, 137, 409–415. [CrossRef]
69. Xing, W.K.; Shao, C.; Qi, Z.Y.; Yang, C.; Wang, Z. The role of Gliadel wafers in the treatment of newly diagnosed GBM: Ameta-analysis. Drug Des. Dev. Ther. 2015, 9, 3341–3348. [CrossRef]
70. Sage, W.; Guilfoyle, M.; Luney, C.; Young, A.; Sinha, R.; Sgubin, D.; McAbee, J.H.; Ma, R.; Jefferies, S.; Jena, R.; et al. Localalkylating chemotherapy applied immediately after 5-ALA guided resection of glioblastoma does not provide additional benefit.J. Neurooncol. 2018, 136, 273–280. [CrossRef]
71. Grangeon, L.; Ferracci, F.X.; Fetter, D.; Maltete, D.; Langlois, O.; Gilard, V. How safe are carmustine wafers? Rev. Neurol. 2018, 174,346–351. [CrossRef]
72. Taal, W.; Oosterkamp, H.M.; Walenkamp, A.M.E.; Dubbink, H.J.; Beerepoot, L.V.; Hanse, M.C.J.; Buter, J.; Honkoop, A.H.;Boerman, D.; de Vos, F.Y.F.; et al. Single-agent bevacizumab or lomustine versus a combination of bevacizumab plus lomustinein patients with recurrent glioblastoma (BELOB trial): A randomised controlled phase 2 trial. Lancet Oncol. 2014, 15, 943–953.[CrossRef]
J. Pers. Med. 2021, 11, 258 13 of 14
73. Stupp, R.; Wong, E.T.; Kanner, A.A.; Steinberg, D.; Engelhard, H.; Heidecke, V.; Kirson, E.D.; Taillibert, S.; Liebermann, F.; Dbaly,V.; et al. NovoTTF-100A versus physician’s choice chemotherapy in recurrent glioblastoma: A randomised phase III trial of anovel treatment modality. Eur. J. Cancer 2012, 48, 2192–2202. [CrossRef] [PubMed]
74. Lombardi, G.; De Salvo, G.L.; Brandes, A.A.; Eoli, M.; Ruda, R.; Faedi, M.; Lolli, I.; Pace, A.; Daniele, B.; Pasqualetti, F.; et al.Regorafenib compared with lomustine in patients with relapsed glioblastoma (REGOMA): A multicentre, open-label, randomised,controlled, phase 2 trial. Lancet Oncol. 2019, 20, 110–119. [CrossRef]
75. Szopa, W.; Burley, T.A.; Kramer-Marek, G.; Kaspera, W. Diagnostic and Therapeutic Biomarkers in Glioblastoma: Current Statusand Future Perspectives. BioMed Res. Int. 2017, 2017, 8013575. [CrossRef]
76. Sasmita, A.O.; Wong, Y.P.; Ling, A.P.K. Biomarkers and therapeutic advances in glioblastoma multiforme. Asia Pac. J. Clin. Oncol.2018, 14, 40–51. [CrossRef] [PubMed]
77. Chaddad, A.; Daniel, P.; Desrosiers, C.; Toews, M.; Abdulkarim, B. Novel Radiomic Features Based on Joint Intensity Matrices forPredicting Glioblastoma Patient Survival Time. IEEE J. Biomed. Health Inform. 2019, 23, 795–804. [CrossRef] [PubMed]
78. Chaddad, A.; Daniel, P.; Sabri, S.; Desrosiers, C.; Abdulkarim, B. Integration of Radiomic and Multi-omic Analyses PredictsSurvival of Newly Diagnosed IDH1 Wild-Type Glioblastoma. Cancers 2019, 11, 1148. [CrossRef]
79. Hood, L.; Rowen, L. The Human Genome Project: Big science transforms biology and medicine. Genome Med. 2013, 5, 79.[CrossRef] [PubMed]
80. Zuo, S.; Zhang, X.; Wang, L. A RNA sequencing-based six-gene signature for survival prediction in patients with glioblastoma.Sci. Rep. 2019, 9, 2615. [CrossRef]
81. Lin, W.; Huang, Z.; Xu, Y.; Chen, X.; Chen, T.; Ye, Y.; Ding, J.; Chen, Z.; Chen, L.; Qiu, X.; et al. A three-lncRNA signature predictsclinical outcomes in low-grade glioma patients after radiotherapy. Aging 2020, 12, 9188–9204. [CrossRef] [PubMed]
82. Stackhouse, C.T.; Gillespie, G.Y.; Willey, C.D. Exploring the Roles of lncRNAs in GBM Pathophysiology and Their TherapeuticPotential. Cells 2020, 9, 2369. [CrossRef]
83. Marziali, G.; Signore, M.; Buccarelli, M.; Grande, S.; Palma, A.; Biffoni, M.; Rosi, A.; D’Alessandris, Q.G.; Martini, M.; Larocca,L.M.; et al. Metabolic/Proteomic Signature Defines Two Glioblastoma Subtypes With Different Clinical Outcome. Sci. Rep. 2016,6, 21557. [CrossRef]
84. Zhai, X.H.; Xiao, J.; Yu, J.K.; Sun, H.; Zheng, S. Novel sphingomyelin biomarkers for brain glioma and associated regulationresearch on the PI3K/Akt signaling pathway. Oncol. Lett. 2019, 18, 6207–6213. [CrossRef] [PubMed]
85. Heiland, D.H.; Haaker, G.; Watzlawick, R.; Delev, D.; Masalha, W.; Franco, P.; Machein, M.; Staszewski, O.; Oelhke, O.; Nicolay,N.H.; et al. One decade of glioblastoma multiforme surgery in 342 elderly patients: What have we learned? J. Neurooncol. 2018,140, 385–391. [CrossRef] [PubMed]
86. Guo, D.; Bell, E.H.; Chakravarti, A. Lipid metabolism emerges as a promising target for malignant glioma therapy. CNS Oncol.2013, 2, 289–299. [CrossRef] [PubMed]
87. Moren, L.; Bergenheim, A.T.; Ghasimi, S.; Brannstrom, T.; Johansson, M.; Antti, H. Metabolomic Screening of Tumor Tissue andSerum in Glioma Patients Reveals Diagnostic and Prognostic Information. Metabolites 2015, 5, 502–520. [CrossRef]
88. Petralia, F.; Tignor, N.; Reva, B.; Koptyra, M.; Chowdhury, S.; Rykunov, D.; Krek, A.; Ma, W.; Zhu, Y.; Ji, J.; et al. IntegratedProteogenomic Characterization across Major Histological Types of Pediatric Brain Cancer. Cell 2020. [CrossRef]
89. Batchelor, T.T.; Mulholland, P.; Neyns, B.; Nabors, L.B.; Campone, M.; Wick, A.; Mason, W.; Mikkelsen, T.; Phuphanich, S.; Ashby,L.S.; et al. Phase III randomized trial comparing the efficacy of cediranib as monotherapy, and in combination with lomustine,versus lomustine alone in patients with recurrent glioblastoma. J. Clin. Oncol. 2013, 31, 3212–3218. [CrossRef]
90. Weller, M.; Butowski, N.; Tran, D.D.; Recht, L.D.; Lim, M.; Hirte, H.; Ashby, L.; Mechtler, L.; Goldlust, S.A.; Iwamoto, F.;et al. Rindopepimut with temozolomide for patients with newly diagnosed, EGFRvIII-expressing glioblastoma (ACT IV): Arandomised, double-blind, international phase 3 trial. Lancet Oncol. 2017, 18, 1373–1385. [CrossRef]
91. Jain, K.K. A Critical Overview of Targeted Therapies for Glioblastoma. Front. Oncol. 2018, 8, 419. [CrossRef]92. Ene, C.I.; Holland, E.C. Personalized medicine for gliomas. Surg. Neurol. Int. 2015, 6, S89–S95. [CrossRef]93. Harder, B.G.; Blomquist, M.R.; Wang, J.; Kim, A.J.; Woodworth, G.F.; Winkles, J.A.; Loftus, J.C.; Tran, N.L. Developments in
Blood-Brain Barrier Penetrance and Drug Repurposing for Improved Treatment of Glioblastoma. Front. Oncol. 2018, 8, 462.[CrossRef] [PubMed]
94. Jahangiri, A.; Chin, A.T.; Flanigan, P.M.; Chen, R.; Bankiewicz, K.; Aghi, M.K. Convection-enhanced delivery in glioblastoma: Areview of preclinical and clinical studies. J. Neurosurg. 2017, 126, 191–200. [CrossRef] [PubMed]
95. Parodi, A.; Rudzinska, M.; Deviatkin, A.; Soond, S.; Baldin, A.; Zamyatnin, A. Established and Emerging Strategies for DrugDelivery Across the Blood-Brain Barrier in Brain Cancer. Pharmaceutics 2019, 11, 245. [CrossRef]
96. Franklin, C.; Livingstone, E.; Roesch, A.; Schilling, B.; Schadendorf, D. Immunotherapy in melanoma: Recent advances and futuredirections. Eur. J. Surg. Oncol. 2017, 43, 604–611. [CrossRef] [PubMed]
97. Kong, Z.; Wang, Y.; Ma, W. Vaccination in the immunotherapy of glioblastoma. Hum. Vaccines Immunother. 2018, 14, 255–268.[CrossRef]
98. Kong, D.S.; Nam, D.H.; Kang, S.H.; Lee, J.W.; Chang, J.H.; Kim, J.H.; Lim, Y.J.; Koh, Y.C.; Chung, Y.G.; Kim, J.M.; et al. PhaseIII randomized trial of autologous cytokine-induced killer cell immunotherapy for newly diagnosed glioblastoma in Korea.Oncotarget 2017, 8, 7003–7013. [CrossRef]
J. Pers. Med. 2021, 11, 258 14 of 14
99. Swartz, A.M.; Batich, K.A.; Fecci, P.E.; Sampson, J.H. Peptide vaccines for the treatment of glioblastoma. J. Neurooncol. 2015, 123,433–440. [CrossRef]
100. Eagles, M.E.; Nassiri, F.; Badhiwala, J.H.; Suppiah, S.; Almenawer, S.A.; Zadeh, G.; Aldape, K.D. Dendritic cell vaccines forhigh-grade gliomas. Ther. Clin. Risk Manag. 2018, 14, 1299–1313. [CrossRef]
101. Mitchell, D.A.; Batich, K.A.; Gunn, M.D.; Huang, M.N.; Sanchez-Perez, L.; Nair, S.K.; Congdon, K.L.; Reap, E.A.; Archer, G.E.;Desjardins, A.; et al. Tetanus toxoid and CCL3 improve dendritic cell vaccines in mice and glioblastoma patients. Nature 2015,519, 366–369. [CrossRef]
102. Landry, A.P.; Balas, M.; Alli, S.; Spears, J.; Zador, Z. Distinct regional ontogeny and activation of tumor associated macrophages inhuman glioblastoma. Sci. Rep. 2020, 10, 19542. [CrossRef]
103. Gregoire, H.; Roncali, L.; Rousseau, A.; Cherel, M.; Delneste, Y.; Jeannin, P.; Hindre, F.; Garcion, E. Targeting Tumor AssociatedMacrophages to Overcome Conventional Treatment Resistance in Glioblastoma. Front. Pharmacol. 2020, 11, 368. [CrossRef]
104. Takenaka, M.C.; Gabriely, G.; Rothhammer, V.; Mascanfroni, I.D.; Wheeler, M.A.; Chao, C.C.; Gutierrez-Vazquez, C.; Kenison,J.; Tjon, E.C.; Barroso, A.; et al. Control of tumor-associated macrophages and T cells in glioblastoma via AHR and CD39. Nat.Neurosci. 2019, 22, 729–740. [CrossRef] [PubMed]
105. Yee, P.P.; Wei, Y.; Kim, S.Y.; Lu, T.; Chih, S.Y.; Lawson, C.; Tang, M.; Liu, Z.; Anderson, B.; Thamburaj, K.; et al. Neutrophil-inducedferroptosis promotes tumor necrosis in glioblastoma progression. Nat. Commun. 2020, 11, 5424. [CrossRef]
106. Wang, T.; Cao, L.; Dong, X.; Wu, F.; De, W.; Huang, L.; Wan, Q. LINC01116 promotes tumor proliferation and neutrophilrecruitment via DDX5-mediated regulation of IL-1beta in glioma cell. Cell Death Dis. 2020, 11, 302. [CrossRef] [PubMed]
107. Stupp, R.; Taillibert, S.; Kanner, A.; Read, W.; Steinberg, D.; Lhermitte, B.; Toms, S.; Idbaih, A.; Ahluwalia, M.S.; Fink, K.; et al.Effect of Tumor-Treating Fields Plus Maintenance Temozolomide vs. Maintenance Temozolomide Alone on Survival in PatientsWith Glioblastoma: A Randomized Clinical Trial. JAMA 2017, 318, 2306–2316. [CrossRef]
108. Cammarata, F.P.; Torrisi, F.; Forte, G.I.; Minafra, L.; Bravata, V.; Pisciotta, P.; Savoca, G.; Calvaruso, M.; Petringa, G.; Cirrone,G.A.P.; et al. Proton Therapy and Src Family Kinase Inhibitor Combined Treatments on U87 Human Glioblastoma MultiformeCell Line. Int. J. Mol. Sci. 2019, 20, 4745. [CrossRef]
109. Torrisi, F.; Minafra, L.; Cammarata, F.P.; Savoca, G.; Calvaruso, M.; Vicario, N.; Maccari, L.; Peres, E.A.; Ozcelik, H.; Bernaudin,M.; et al. SRC Tyrosine Kinase Inhibitor and X-rays Combined Effect on Glioblastoma Cell Lines. Int. J. Mol. Sci. 2020, 21, 3917.[CrossRef]
110. Torrisi, F.; Vicario, N.; Spitale, F.M.; Cammarata, F.P.; Minafra, L.; Salvatorelli, L.; Russo, G.; Cuttone, G.; Valable, S.; Gulino,R.; et al. The Role of Hypoxia and SRC Tyrosine Kinase in Glioblastoma Invasiveness and Radioresistance. Cancers 2020, 12, 2860.[CrossRef] [PubMed]
58
CHAPITRE III : TRAVAIL EXPERIMENTAL
1. Définition du problème
Le travail réalisé dans les deux premiers chapitres de cette thèse met en exergue plusieurs
problématiques. Dans le Chapitre I, nous avons montré par une perspective historique, comment la
neurochirurgie, qui est une discipline ancienne, a su s’approprier les grandes avancées
technologiques de chaque époque pour progresser. Ensuite, nous avons rappelé le rôle émergent
de la médecine de précision dans de nombreux domaines médicaux en insistant sur la neuro-
oncologie qui est aujourd’hui à l’orée d’une révolution grâce à l’interdisciplinarité et les outils du
big data qui permettent d’intégrer et exploiter les données des sciences omiques. L’exploitation de
ces informations va permettre de servir la neuro-oncologie et d’en faire une médecine de précision
centrée sur le patient. Dans de nombreux essais cliniques récents, les thérapies innovantes sont
fréquemment adaptées à chaque patient, se basant sur les caractéristiques intrinsèques de la tumeur
ce qui est l’essence même de la médecine personnalisée.
En parallèle de ce bond technologique, nous avons développé dans le Chapitre II un résumé
des connaissances actuelles du glioblastome. Cette pathologie est extrêmement complexe, infiltre la
substance blanche et s’accompagne ainsi d’une symptomatologie insidieuse. Historiquement, les
avancées sur cette pathologie se sont faites par des analyses de la sémiologie, de la radiologie et de
l’histologie rendues possibles par les progrès des techniques d’imagerie en coupes et de la
microscopie optique puis électronique. Depuis quelques années, la biologie moléculaire a modifié
les outils diagnostiques et bousculé les classifications établies. Néanmoins, le diagnostic, et la
thérapeutique du glioblastome passent par un geste chirurgical, invasif par définition et à risque de
morbidité. Sur le plan thérapeutique, la chirurgie doit s’accompagner d’une chimiothérapie et d’une
radiothérapie. Malgré ces traitements lourds, la médiane de survie est inférieure à 2 ans. Il y a donc
une nécessité d’une nouvelle approche pour améliorer le diagnostic de cette maladie et son
pronostic.
Le concept de biopsie liquide a émergé depuis quelques années. Son concept est de pouvoir
établir un diagnostic de manière non invasive pour le patient en évitant cette étape de chirurgie.
Les sciences omiques, et notamment la métabolomique, pourraient permettre de proposer ces
nouveaux outils diagnostiques. La petite taille des métabolites leur permet de franchir la barrière
hématoencéphalique et ainsi d’exprimer dans le plasma des patients, un profil métabolomique des
tumeurs intracérébrales telles que le glioblastome. L’objectif de notre travail expérimental était ainsi
de définir le profil métabolomique du glioblastome dans le plasma en le corrélant au tissu tumoral.
59
2 Mise en place du design expérimental
2.1 Sélection des patients contrôles
Notre étude reposant sur une étude métabolomique ciblée et non ciblée, la sélection d’un
groupe contrôle est une étape prépondérante dans la mise en place d’un tel type d’étude. Pour le
choix du tissu contrôle, une analyse de la littérature retrouvait comme principaux groupes contrôles
du cortex cérébral issu de cortectomies ou les méningiomes. Nous avons fait des études
préliminaires avec ces deux tissus et retenu le cortex cérébral. La principale raison est que même si
plus rare, le tissu est macroscopiquement similaire et le méningiome correspond à une lésion
extraparenchymateuse ce qui est moins proche du gliome, lésion par définition
intraparenchymateuse. Concernant le plasma, nous avons opté pour du plasma de sujets dits sains
issu du commerce. En effet, il est facilement accessible, relativement peu onéreux et le caractère
hautement symptomatique du glioblastome fait qu'il peut être supposé aisément les patients
comme indemnes d’un gliome.
2.2 Type d’étude métabolomique
Les études métabolomiques peuvent être ciblées ou non ciblées. La différence est le postulat des
métabolites d’intérêt. Ainsi, une étude métabolomique ciblée permettra de chercher au sein de
classes de métabolites (lipides par exemple), ceux qui diffèrent entre le groupe d’intérêt et le groupe
contrôle. Une étude non ciblée explorera le maximum de métabolites d’intérêt sans préjugés de
classes ou de tailles des métabolites. Ces études ont des avantages et inconvénients qui leur sont
propres. Une étude ciblée sera plus précise dans le screening, mais pourra écarter à tort des
métabolites hautement discriminants si le postulat de base est faux. A l’inverse une étude non ciblée
donnera une analyse moins fine des métabolites, mais en exclura moins. Nous avons opté pour
deux types d’analyses ciblées et non ciblées pour profiter de leurs avantages respectifs. Il s’agit
également d’une validité externe de notre étude de vérifier si les métabolites d’intérêt en analyse
non ciblée sont discriminants dans l‘analyse ciblée.
Enfin, notre schéma d’étude s’appuie sur l’imagerie métabolomique à l’aide de la technologie
FTICR (spectrométrie de masse à résonance cyclotronique ionique). La technique FTICR est une
technique à très haute résolution qui permet de déterminer les masses moléculaires avec une grande
précision. De nombreuses applications de la FTICR-MS utilisent cette précision des masses pour
aider à déterminer la composition des molécules sur la base de la masse exacte. Il s’agit d’une
technologie de pointe, encore peu répandue dans la recherche médicale, mais qui dispose d’un
60
potentiel significatif. L’intérêt est de permettre une analyse de coupes histologiques avec leurs
métabolites d’intérêt. De plus, après traitement des données, il est possible d’obtenir une analyse
spatiale des métabolites avec leur répartition au sein de la coupe étudiée. Ceci est particulièrement
intéressant pour l’analyse de phénomènes dynamiques, dans notre cas, la différence entre le
cerveau sain, le centre tumoral et la zone péri lésionnelle.
3 Application : Article III
Ce chapitre est présenté sous forme d’article accepté dans le journal Cancers.
Gilard V, Ferey J, Marguet F, Fontanilles M, Ducatez F, Pilon C, Lesueur C, Pereira T, Basset C, Schmitz-Afonso Iet al (2021) Integrative Metabolomics Reveals Deep Tissue and Systemic Metabolic Remodeling in Glioblastoma. Cancers. 2021:13, 20:5157. https://www.mdpi.com/2072-6694/13/20/5157.
cancers
Article
Integrative Metabolomics Reveals Deep Tissue and SystemicMetabolic Remodeling in Glioblastoma
Vianney Gilard 1, Justine Ferey 2, Florent Marguet 3, Maxime Fontanilles 4,5 , Franklin Ducatez 2,6 ,Carine Pilon 2, Céline Lesueur 2, Tony Pereira 4, Carole Basset 3, Isabelle Schmitz-Afonso 5 , Frédéric Di Fioré 7,8,Annie Laquerrière 3, Carlos Afonso 5 , Stéphane Derrey 9, Stéphane Marret 6 , Soumeya Bekri 2,*and Abdellah Tebani 2
Citation: Gilard, V.; Ferey, J.;
Marguet, F.; Fontanilles, M.; Ducatez,
F.; Pilon, C.; Lesueur, C.; Pereira, T.;
Basset, C.; Schmitz-Afonso, I.; et al.
Integrative Metabolomics Reveals
Deep Tissue and Systemic Metabolic
Remodeling in Glioblastoma. Cancers
2021, 13, 5157. https://doi.org/
10.3390/cancers13205157
Academic Editor: Peter Hau
Received: 8 September 2021
Accepted: 3 October 2021
Published: 14 October 2021
Publisher’s Note: MDPI stays neutral
with regard to jurisdictional claims in
published maps and institutional affil-
iations.
Copyright: © 2021 by the authors.
Licensee MDPI, Basel, Switzerland.
This article is an open access article
distributed under the terms and
conditions of the Creative Commons
Attribution (CC BY) license (https://
creativecommons.org/licenses/by/
4.0/).
1 Department of Neurosurgery, UNIROUEN, CHU Rouen, INSERM U1245, Normandie University,76000 Rouen, France; [email protected]
2 Department of Metabolic Biochemistry, UNIROUEN, CHU Rouen, INSERM U1245, Normandie University,76000 Rouen, France; [email protected] (J.F.); [email protected] (F.D.);[email protected] (C.P.); [email protected] (C.L.); [email protected] (A.T.)
3 Department of Pathology, UNIROUEN, CHU Rouen, INSERM U1245, Normandie University,76000 Rouen, France; [email protected] (F.M.); [email protected] (C.B.);[email protected] (A.L.)
4 Institut de Biologie Clinique, CHU Rouen, 76000 Rouen, France; [email protected] (M.F.);[email protected] (T.P.)
5 INSA Rouen, CNRS IRCOF, 1 Rue TesnieÌre, COBRA UMR 6014 Et FR 3038 University Rouen,Normandie University, CEDEX, 76821 Mont-Saint-Aignan, France;[email protected] (I.S.-A.); [email protected] (C.A.)
6 Intensive Care and Neuropediatrics, Department of Neonatal Pediatrics, INSERM U1245, CHU Rouen,UNIROUEN, Normandie University, 76000 Rouen, France; [email protected]
7 Normandy Centre for Genomic and Personalized Medicine, IRON Group, INSERM U1245, UNIROUEN,Normandie University, 76000 Rouen, France; [email protected]
8 Department of Medical Oncology, Cancer Centre Henri Becquerel, Rue d’Amiens, 76000 Rouen, France9 Department of Neurosurgery, CHU Rouen, INSERM U1073, UNIROUEN, Normandie University,
76000 Rouen, France; [email protected]* Correspondence: [email protected]
Simple Summary: This study aims to explore metabolic remodeling in plasma and tissue samplesin patients with glioblastoma through an integrated targeted and untargeted metabolomics-basedstrategy. We report phospholipids, sphingomyelins, acylcarnitines, and acylglycerols as key impairedmetabolic classes in glioblastoma.
Abstract: (1) Background: Glioblastoma is the most common malignant brain tumor in adults. Itsetiology remains unknown in most cases. Glioblastoma pathogenesis consists of a progressive infiltra-tion of the white matter by tumoral cells leading to progressive neurological deficit, epilepsy, and/orintracranial hypertension. The mean survival is between 15 to 17 months. Given this aggressiveprognosis, there is an urgent need for a better understanding of the underlying mechanisms ofglioblastoma to unveil new diagnostic strategies and therapeutic targets through a deeper under-standing of its biology. (2) Methods: To systematically address this issue, we performed targetedand untargeted metabolomics-based investigations on both tissue and plasma samples from pa-tients with glioblastoma. (3) Results: This study revealed 176 differentially expressed lipids andmetabolites, 148 in plasma and 28 in tissue samples. Main biochemical classes include phospholipids,acylcarnitines, sphingomyelins, and triacylglycerols. Functional analyses revealed deep metabolicremodeling in glioblastoma lipids and energy substrates, which unveils the major role of lipidsin tumor progression by modulating its own environment. (4) Conclusions: Overall, our studydemonstrates in situ and systemic metabolic rewiring in glioblastoma that could shed light on itsunderlying biological plasticity and progression to inform diagnosis and/or therapeutic strategies.
Cancers 2021, 13, 5157. https://doi.org/10.3390/cancers13205157 https://www.mdpi.com/journal/cancers
Cancers 2021, 13, 5157 2 of 22
Keywords: glioblastoma; high-grade glioma; brain tumor; neuro-oncology; metabolomics; omics;mass spectrometry; machine learning
1. Introduction
Glioblastoma (GBM) is the most common malignant brain tumor in adults [1]. Itsincidence, 2 to 5 per 100,000 [1,2], is still increasing [3,4], and its etiology remains un-known in most cases. Glioblastoma pathogenesis consists of a progressive infiltrationof the white matter by tumoral cells leading to progressive neurological deficit, epilepsy,and/or intracranial hypertension [5,6]. Multimodal magnetic resonance imaging (MRI) isthe first-line investigation to diagnose glioblastoma and guides treatment strategies [7].The current standard of care in the management of glioblastoma is based on surgical re-section or biopsy followed by adjuvant chemotherapy and radiotherapy [8–10]. Despitemany therapeutic trials [11–13], the prognosis of glioblastoma is poor, with a mean survivalbetween 15 to 17 months [14]. Given this poor prognosis, there is an urgent need for a betterunderstanding of the underlying mechanisms of glioblastoma to unveil new diagnosisstrategies and therapeutic targets through a deeper understanding of its biology. Duringthe last few years, Precision Medicine (PM) has been a new paradigm that has opened anew era in personalized diagnosis and therapeutic approaches in oncology [15–18]. It isa tailored approach in disease management driven by the patient’s attributes to deliverpersonalized healthcare. The concept of PM is penetrating steadily into the clinical settingwith increasing evidence in different areas, including oncology [15], autoimmunity [19], orinborn errors of metabolism [20]. The PM surge is shaped by omics-based technologiesand the data-driven medicine revolution [21–23]. Omics are technologies that allow fora multilayer molecular deciphering of the cell, tissue, and organism in a holistic fashion.These technologies have been explored in various avenues of medicine and health sciences,such as screening, diagnosis, and prognosis [24]. Given their capacity to interrogate biologyat an unprecedented depth and breath, omics are also reshaping the biomarker discoverylandscape [25]. Metabolomics, one of these technologies [26], directly emulates the bio-chemical activity of a biological system with high time sensitivity and spatial resolution.Metabolomics is the closest biological information layer to the phenotype, given its positionin the downstream information flow. Thus, interrogating the metabolome, which is aset of metabolites in a given biological system, is an appealing opportunity to parse thebiological process. Two main technologies are used in metabolomics: mass spectrometry(MS) and nucleic magnetic resonance (NMR) [27,28]. The latter is nondestructive androbust; however, the former exhibits higher sensitivity and broader metabolome coverage.High-resolution mass spectrometry (HRMS) coupled to other analytical modalities, suchas liquid chromatography (LC-MS) or MALDI-MS, offers a great opportunity to achievehigher metabolic coverage, thus, biological scope. Furthermore, ultra-high resolution massspectrometry instruments based on Fourier-transform ion cyclotron resonance (FTICR)exhibits unique resolution, sensitivity, and specificity [29–31]. Thus, this technology offersunprecedented exhaustive metabolome coverage and non-ambiguous molecular formulaassignments [31]. Thus, disease-related metabolic phenotype could be described by retriev-ing metabolomic profiles through biospecimens, such as blood, urine, tissue samples, orcerebrospinal fluid [32–34]. Previous human-based studies have described glioblastoma-related metabolites [35–43], and to the best of our knowledge, no study has reported resultsbased on both plasma and tissue analysis from the same glioblastoma patients. The aimof this study is to explore the glioblastoma biological landscape through an integratedmetabolomics analysis of plasma and tissue samples of glioblastoma patients. This strategypresents a great opportunity to explore both the in-situ and systemic metabolic phenotypesand unveil predictive metabolomic patterns that could help early non-invasive glioblas-toma diagnosis at presentation or recurrence. It might also provide new insights regardingglioblastoma biology and ultimately guide targeted treatment strategies.
Cancers 2021, 13, 5157 3 of 22
2. Materials and Methods2.1. Patients and Blood Samples
From January 2020 to November 2020, twenty-nine patients with histologically doc-umented glioblastoma were selected for the study. All patients were referred to ourneurosurgery department, and resection or biopsies of the tumor were performed in allcases. Plasma and tissue samples were collected at surgery before initiating any treatment.Medical charts were reviewed, and the following data were collected: gender, age at diagno-sis, past medical history, revealing symptoms, radiological characteristics, type of surgeryperformed, and histological and biological characteristics of the tumor. All samples used inthis study belong to a declared collection located in the Pathology Department (Prof. AnnieLaquerrière) of Rouen University Hospital in accordance with the relevant guidelines andregulations and with the permission of the local authorities. All procedures performed instudies involving human participants were in accordance with the ethical standards of theinstitutional and/or national research committee and with the 1964 Helsinki Declarationand its later amendments or comparable ethical standards.
2.2. Targeted Metabolomics2.2.1. Reagents
All reagents, internal and calibration standards, quality controls, test mix, and apatented 96-well filter plate required for the AbsoluteIDQ®p180 analysis are included inthe kit or provided by Biocrates Life Science AG (Innsbruck, Austria).
2.2.2. Sample Preparation
Sample preparation was carried out according to the manufacturer’s protocol [44,45].Briefly, 10 µL of plasma were transferred to the upper 96-well plate and dried undera nitrogen stream. Thereafter, 50 µL of a 5% PITC solution was added to derivatizeamino acids and biogenic amines. After incubation, the spots were dried again beforethe metabolites were extracted using 5 mM ammonium acetate in methanol (300 µL) intothe lower 96-well plate for analysis after further dilution using the MS running solventA. Quantification was carried out using internal standards and a calibration curve [44,45].The full list of 188 measured metabolites is presented in Table S1.
2.2.3. Liquid Chromatography and Tandem Mass Spectrometry
The AbsoluteIDQ® p180 kit is a fully automated assay based on phenyl isothiocyanate(PITC) derivatization of the target analytes in bodily fluids using internal standards forquantitation. Amino acids and biogenic amines are determined in LC-MS mode, acyl-carnitines, phospholipids, sphingomyelins, and the sum of hexoses are analyzed in flowinjection analysis (FIA). The analyses were performed following the instructions of the kitmanufacturer using the liquid chromatography instrument prominence Shimadzu UFLCSystem (Shimadzu, Prominence, Kyoto, Japan) coupled to the 4000 Qtrap mass spectrome-ter (Sciex, Framingham, MA, USA) with an electrospray ion source. A system suitabilitytest was conducted before each batch of the samples (analysis of a standard mixture)to warm up the LC-MS/MS system and check the inter-day performance of the system.Data acquisition and processing were performed using the Analyst 1.5 software (Sciex,Framingham, MA, USA). Twenty microliters of the sample extract were used in the flowinjection analysis (FIA) in positive mode to capture acylcarnitines, glycerophospholipids,and sphingolipids, while hexoses were monitored in a subsequent negative mode run. AllFIA injections were carried out using the Biocrates MS Running Solvent. All metaboliteswere identified and quantified using isotopically labeled internal standards and multiplereaction monitoring (MRM) as optimized and provided by Biocrates Life Sciences AG(Innsbruck, Austria).

Cancers 2021, 13, 5157 4 of 22
2.3. Untargeted Metabolic Phenotyping2.3.1. Reagents
Water, acetonitrile, isopropanol, and formic acid were optima LCMS grade and pur-chased from Fisher Chemicals. Ammonium formate was LCMS grade (Sigma–Aldrich,Saint-Quentin Fallavier, France). Leucine Enkephalin (Sigma–Aldrich, Saint-QuentinFallavier, France) at a concentration of 2 mg/mL (in isopropanol/water, 50/50) was usedas a reference for mass measurements. Poly-DL-alanine was prepared in 50:50 (v/v) wa-ter/acetonitrile at 10 mg/L and used for ion mobility cell calibration.
2.3.2. Sample Preparation
Human plasmas were prepared using a liquid biphasic approach. Lipids were ex-tracted from 100 µL of plasma by adding 280 µL chloroform, 140 µL methanol, and 84 µLwater. The mixtures were vortex-mixed, cooled in ice for 15 minutes, and centrifuged10 min at 12,000 rpm. The bottom phase was removed, transferred to glass UPLC vials,and N2 evaporated. The resulting phase was re-suspended in 200 µL ACN/H2O/IPrOH(1:1:1). A pooled quality control (QC) was prepared by mixing 5 µL of each plasma sample.Four QC dilutions at 1:2, 1:4, 1:8, and 1:16 were prepared from the QC sample. Sampleswere stored at −20C before use.
2.3.3. Chromatographic Conditions
The liquid chromatography separation was performed with a UHPLC system (DionexUltimate 3000 UPLC+, Thermo Scientific, San Jose, CA, USA). Separation was carried out at50 C using a 1.0 × 100 mm Acquity UPLC HSS T3 column (Waters), with a particle size of1.8 µm, equipped with a 0.2 µm prefilter. Mobile phase A consisted of ACN/H2O (40/60)containing 10 mM ammonium formate; mobile phase B consisted of IPrOH/ACN (90/10).Both solvents contained 0.1% formic acid. The flow rate was maintained at 100 µL min−1.A mobile phase gradient separation was performed over 20 min according to the followingsteps: 10% B at 0 min, 56% B at 2 min, 75% B at 10 min, 99% B at 12–15 min, 10% B at16–20 min. Sample analysis order was randomized to avoid the potential for confoundingcritical variables with analytical run order effects.
2.3.4. Ion Mobility and Mass Spectrometry
The U-HPLC system was coupled to a hybrid quadrupole orthogonal time-of-flight(TOF) mass spectrometer (SYNAPT G2 HDMS, Waters MS Technologies, Manchester, UK).The mass spectrometer was operated in both positive and negative electrospray ionizationmode. A mass range of m/z 50−1200 was used. The source and IMS parameters are summa-rized in Table S2. Leucine enkephalin was used as the lock mass [M + H]+ at m/z 556.2771and [M-H]− at m/z 554.26202. Sodium formate solution was used for external instrumentcalibration. The Synapt G2 HDMS was equipped with a traveling wave “Triwave™” ge-ometry, including an ion mobility cell (IMS T-wave). The TOF analyzer was operated inthe V resolution mode with an average mass resolution of m/∆m 20,000 (full-width at half-maximum definition). Data acquisition of an ion mobility experiment consisted of 200 bins.The cross-collision section (CCS) values, obtained in nitrogen, were experimentally de-termined using singly charged Poly-DL-alanine oligomers as the TWIM calibrant speciesfor ESI+. The CCS values were derived according to previously reported procedures [46]with the following general equation ln(CCS’) = xln(dt’) + ln(A). Calibration values andcurves are shown in the Supplementary Materials (Table S3). The ion mobility resolutionwas ~40 Ω/∆Ω (fwhm). The N2 CCS values reported were determined at the apex of theion-mobility peak.
2.3.5. Raw Data Processing
All LC-IM–MS raw data files data processing, peak detection, and peak matchingacross samples using retention time (tR) correction and chromatographic alignment alongwith drift time were performed using Progenesis QI (Waters MS Technologies, Manchester,
Cancers 2021, 13, 5157 5 of 22
UK) to yield a data matrix containing retention times, accurate masses, drift time, andpeak intensities. Experimental CCS were determined, as stated above, to include CCSinstead of drift time values in the data matrix. CCS errors between experimental andtheoretical values (%) were then calculated from the LipidsCCS Web Server (Zhu Lab) [47].The preprocessing step resulted in an X-matrix where tR, CCS, and m/z values wereconcatenated into “tR _m/z_CCS” features (in columns) present in each sample (in rows)with corresponding peak areas.
2.3.6. Quality Control
Aliquoted 10 µL extracts were mixed to generate pooled quality control samples (QCs).The QCs and solvent blank samples (mobile phase) were injected sequentially in-betweenthe plasma samples. In addition, a dilution series of QC samples (1:2, 1:4, 1:8, and 1:16original concentration) were used to assess the quality of the extracted features. In thisstudy, we used a filter strategy in which the features’ intensity must be correlated to thematrix concentrations in a series of diluted QC samples in order to be included in furtheranalysis. Feature groups with a correlation coefficient of less than 0.70 were removedfrom the dataset. Furthermore, datasets were refined by the removal of feature groupsthat did not meet the threshold of peak area measurement precision prior to data analysis.This approach used RSD values derived from repeated measurements of a pooled QCsample. The threshold was set to RSD < 25% to enhance the biological interpretation ofmetabolomics data.
2.4. Tissue Metabolic Phenotyping2.4.1. Reagents
MALDI matrices, including 2.5-dihydroxybenzoic acid (DHB) and 9-aminoacridinehydrochloride monohydrate (9-AA), were purchased from Sigma-Aldrich (St. Louis, MO,USA). Sodium trifluoroacetate (NaTFA, Sigma–Aldrich) at 0.1 mg mL−1 (ACN/H2O 50:50[v/v]) was used for external calibration before each analysis.
2.4.2. Sample Preparation
Fresh frozen 10-µm sections of human brain tissue were mounted on conductiveITO-coated glass slides 75 × 25 mm (Bruker, Bremen, Germany) and stored at −80 C untilanalysis. Matrix solutions were applied with an automatic micro sprayer HTX TM-Sprayer(HTX Imaging, Chapel Hill, NC, USA) as previously described [31]. In the positive-ionmode, the DHB matrix (30 mg mL−1 in MeOH/H2O 50:50 [v/v]) was deposited with thefollowing parameters: nozzle temperature 80 C, nozzle velocity 1200 mm min−1, N2pressure 10 psi, N2 flow rate 2 L min−1, number of passes 12, flow rate 100 µL min−1,and track spacing 3 mm. In negative-ion mode, 9-AA matrix (10 mg mL−1, EtOH/H2O70:30 [v/v]) was sprayed using the following parameters: nozzle temperature 90 C, nozzlevelocity 1200 mm min−1, N2 pressure 10 psi, N2 flow rate 3 L min−1, number of passes 2,flow rate 120 µl min−1, track spacing 3 mm, and drying time 30 s between passes. Eachslide was vacuum-dried before analysis.
2.4.3. Data Acquisition and Data Processing
Data were acquired on a FTICR instrument (SolariX XR, Bruker, Bremen, Germany)equipped with a 12-Tesla superconducting magnet and a dynamically harmonized ICRcell. This instrument was also equipped with both a laser desorption ionization source(Smartbeam II, Nd:YAG × 3 laser at 355 nm, Bruker, Bremen, Germany) and an electro-spray (ESI) source. Each MALDI spectrum for each position was the result of 1 scan and500 consecutive laser shots. Spectra were acquired over a 100 µm raster. Before imaginganalyses, the instrument was externally calibrated in the required mode by NaTFA infusionvia an ESI source, then internally calibrated by assigning known metabolites from m/z150–1000 via MALDI source. Thus, the instrument was auto calibrated during imageacquisition. In positive-ionization mode, calibration was performed by assigning C7H6O4
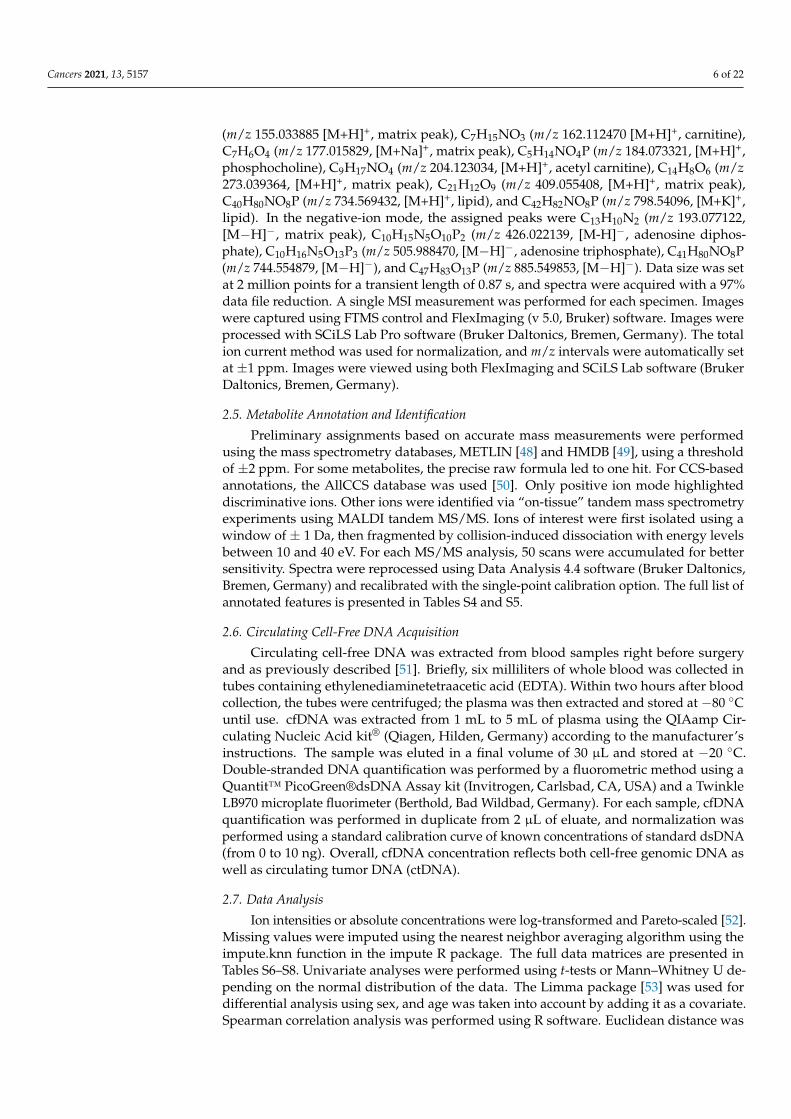
Cancers 2021, 13, 5157 6 of 22
(m/z 155.033885 [M+H]+, matrix peak), C7H15NO3 (m/z 162.112470 [M+H]+, carnitine),C7H6O4 (m/z 177.015829, [M+Na]+, matrix peak), C5H14NO4P (m/z 184.073321, [M+H]+,phosphocholine), C9H17NO4 (m/z 204.123034, [M+H]+, acetyl carnitine), C14H8O6 (m/z273.039364, [M+H]+, matrix peak), C21H12O9 (m/z 409.055408, [M+H]+, matrix peak),C40H80NO8P (m/z 734.569432, [M+H]+, lipid), and C42H82NO8P (m/z 798.54096, [M+K]+,lipid). In the negative-ion mode, the assigned peaks were C13H10N2 (m/z 193.077122,[M−H]−, matrix peak), C10H15N5O10P2 (m/z 426.022139, [M-H]−, adenosine diphos-phate), C10H16N5O13P3 (m/z 505.988470, [M−H]−, adenosine triphosphate), C41H80NO8P(m/z 744.554879, [M−H]−), and C47H83O13P (m/z 885.549853, [M−H]−). Data size was setat 2 million points for a transient length of 0.87 s, and spectra were acquired with a 97%data file reduction. A single MSI measurement was performed for each specimen. Imageswere captured using FTMS control and FlexImaging (v 5.0, Bruker) software. Images wereprocessed with SCiLS Lab Pro software (Bruker Daltonics, Bremen, Germany). The totalion current method was used for normalization, and m/z intervals were automatically setat ±1 ppm. Images were viewed using both FlexImaging and SCiLS Lab software (BrukerDaltonics, Bremen, Germany).
2.5. Metabolite Annotation and Identification
Preliminary assignments based on accurate mass measurements were performedusing the mass spectrometry databases, METLIN [48] and HMDB [49], using a thresholdof ±2 ppm. For some metabolites, the precise raw formula led to one hit. For CCS-basedannotations, the AllCCS database was used [50]. Only positive ion mode highlighteddiscriminative ions. Other ions were identified via “on-tissue” tandem mass spectrometryexperiments using MALDI tandem MS/MS. Ions of interest were first isolated using awindow of ± 1 Da, then fragmented by collision-induced dissociation with energy levelsbetween 10 and 40 eV. For each MS/MS analysis, 50 scans were accumulated for bettersensitivity. Spectra were reprocessed using Data Analysis 4.4 software (Bruker Daltonics,Bremen, Germany) and recalibrated with the single-point calibration option. The full list ofannotated features is presented in Tables S4 and S5.
2.6. Circulating Cell-Free DNA Acquisition
Circulating cell-free DNA was extracted from blood samples right before surgeryand as previously described [51]. Briefly, six milliliters of whole blood was collected intubes containing ethylenediaminetetraacetic acid (EDTA). Within two hours after bloodcollection, the tubes were centrifuged; the plasma was then extracted and stored at −80 Cuntil use. cfDNA was extracted from 1 mL to 5 mL of plasma using the QIAamp Cir-culating Nucleic Acid kit® (Qiagen, Hilden, Germany) according to the manufacturer’sinstructions. The sample was eluted in a final volume of 30 µL and stored at −20 C.Double-stranded DNA quantification was performed by a fluorometric method using aQuantit™ PicoGreen®dsDNA Assay kit (Invitrogen, Carlsbad, CA, USA) and a TwinkleLB970 microplate fluorimeter (Berthold, Bad Wildbad, Germany). For each sample, cfDNAquantification was performed in duplicate from 2 µL of eluate, and normalization wasperformed using a standard calibration curve of known concentrations of standard dsDNA(from 0 to 10 ng). Overall, cfDNA concentration reflects both cell-free genomic DNA aswell as circulating tumor DNA (ctDNA).
2.7. Data Analysis
Ion intensities or absolute concentrations were log-transformed and Pareto-scaled [52].Missing values were imputed using the nearest neighbor averaging algorithm using theimpute.knn function in the impute R package. The full data matrices are presented inTables S6–S8. Univariate analyses were performed using t-tests or Mann–Whitney U de-pending on the normal distribution of the data. The Limma package [53] was used fordifferential analysis using sex, and age was taken into account by adding it as a covariate.Spearman correlation analysis was performed using R software. Euclidean distance was
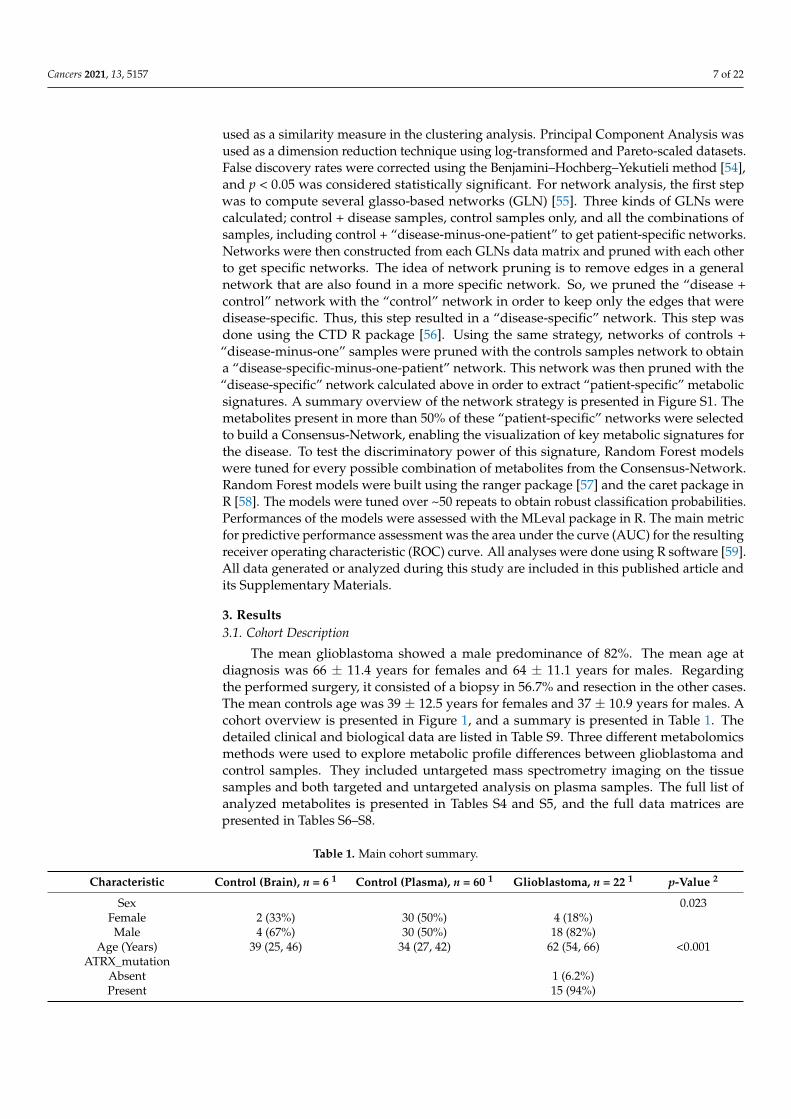
Cancers 2021, 13, 5157 7 of 22
used as a similarity measure in the clustering analysis. Principal Component Analysis wasused as a dimension reduction technique using log-transformed and Pareto-scaled datasets.False discovery rates were corrected using the Benjamini–Hochberg–Yekutieli method [54],and p < 0.05 was considered statistically significant. For network analysis, the first stepwas to compute several glasso-based networks (GLN) [55]. Three kinds of GLNs werecalculated; control + disease samples, control samples only, and all the combinations ofsamples, including control + “disease-minus-one-patient” to get patient-specific networks.Networks were then constructed from each GLNs data matrix and pruned with each otherto get specific networks. The idea of network pruning is to remove edges in a generalnetwork that are also found in a more specific network. So, we pruned the “disease +control” network with the “control” network in order to keep only the edges that weredisease-specific. Thus, this step resulted in a “disease-specific” network. This step wasdone using the CTD R package [56]. Using the same strategy, networks of controls +“disease-minus-one” samples were pruned with the controls samples network to obtaina “disease-specific-minus-one-patient” network. This network was then pruned with the“disease-specific” network calculated above in order to extract “patient-specific” metabolicsignatures. A summary overview of the network strategy is presented in Figure S1. Themetabolites present in more than 50% of these “patient-specific” networks were selectedto build a Consensus-Network, enabling the visualization of key metabolic signatures forthe disease. To test the discriminatory power of this signature, Random Forest modelswere tuned for every possible combination of metabolites from the Consensus-Network.Random Forest models were built using the ranger package [57] and the caret package inR [58]. The models were tuned over ~50 repeats to obtain robust classification probabilities.Performances of the models were assessed with the MLeval package in R. The main metricfor predictive performance assessment was the area under the curve (AUC) for the resultingreceiver operating characteristic (ROC) curve. All analyses were done using R software [59].All data generated or analyzed during this study are included in this published article andits Supplementary Materials.
3. Results3.1. Cohort Description
The mean glioblastoma showed a male predominance of 82%. The mean age atdiagnosis was 66 ± 11.4 years for females and 64 ± 11.1 years for males. Regardingthe performed surgery, it consisted of a biopsy in 56.7% and resection in the other cases.The mean controls age was 39 ± 12.5 years for females and 37 ± 10.9 years for males. Acohort overview is presented in Figure 1, and a summary is presented in Table 1. Thedetailed clinical and biological data are listed in Table S9. Three different metabolomicsmethods were used to explore metabolic profile differences between glioblastoma andcontrol samples. They included untargeted mass spectrometry imaging on the tissuesamples and both targeted and untargeted analysis on plasma samples. The full list ofanalyzed metabolites is presented in Tables S4 and S5, and the full data matrices arepresented in Tables S6–S8.
Table 1. Main cohort summary.
Characteristic Control (Brain), n = 6 1 Control (Plasma), n = 60 1 Glioblastoma, n = 22 1 p-Value 2
Sex 0.023Female 2 (33%) 30 (50%) 4 (18%)Male 4 (67%) 30 (50%) 18 (82%)
Age (Years) 39 (25, 46) 34 (27, 42) 62 (54, 66) <0.001ATRX_mutation
Absent 1 (6.2%)Present 15 (94%)
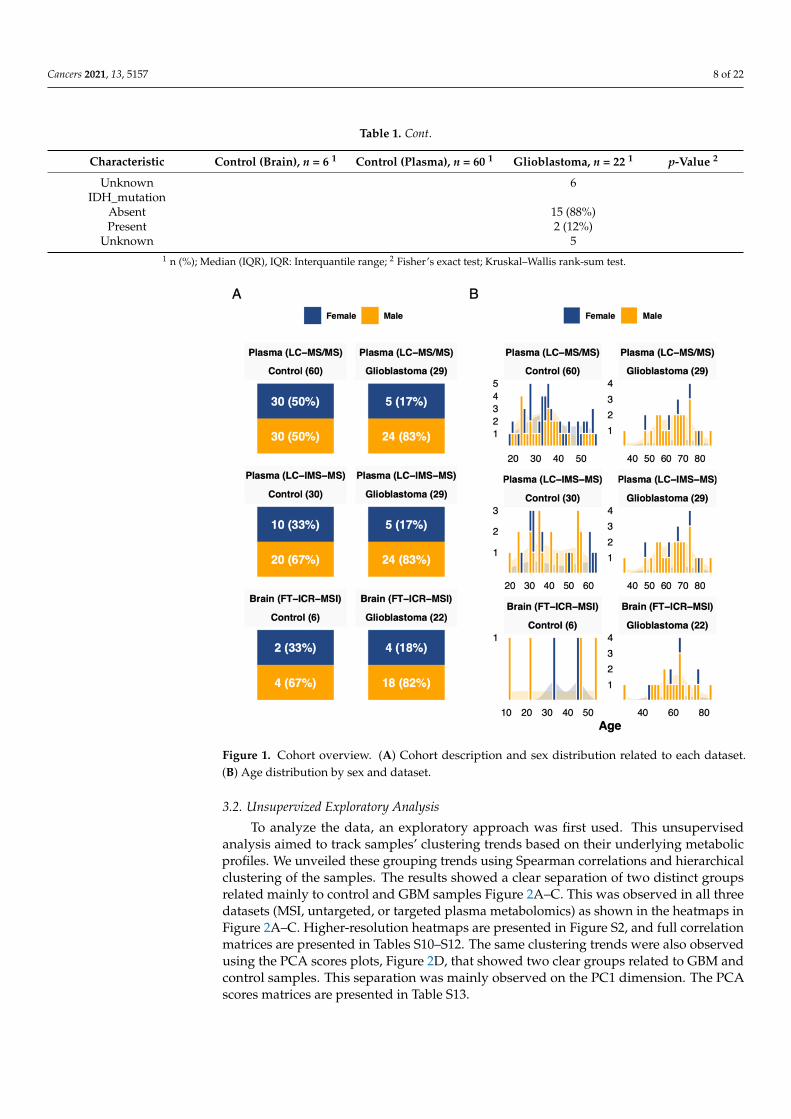
Cancers 2021, 13, 5157 8 of 22
Table 1. Cont.
Characteristic Control (Brain), n = 6 1 Control (Plasma), n = 60 1 Glioblastoma, n = 22 1 p-Value 2
Unknown 6IDH_mutation
Absent 15 (88%)Present 2 (12%)
Unknown 51 n (%); Median (IQR), IQR: Interquantile range; 2 Fisher’s exact test; Kruskal–Wallis rank-sum test.
Figure 1. Cohort overview. (A) Cohort description and sex distribution related to each dataset.(B) Age distribution by sex and dataset.
3.2. Unsupervized Exploratory Analysis
To analyze the data, an exploratory approach was first used. This unsupervisedanalysis aimed to track samples’ clustering trends based on their underlying metabolicprofiles. We unveiled these grouping trends using Spearman correlations and hierarchicalclustering of the samples. The results showed a clear separation of two distinct groupsrelated mainly to control and GBM samples Figure 2A–C. This was observed in all threedatasets (MSI, untargeted, or targeted plasma metabolomics) as shown in the heatmaps inFigure 2A–C. Higher-resolution heatmaps are presented in Figure S2, and full correlationmatrices are presented in Tables S10–S12. The same clustering trends were also observedusing the PCA scores plots, Figure 2D, that showed two clear groups related to GBM andcontrol samples. This separation was mainly observed on the PC1 dimension. The PCAscores matrices are presented in Table S13.
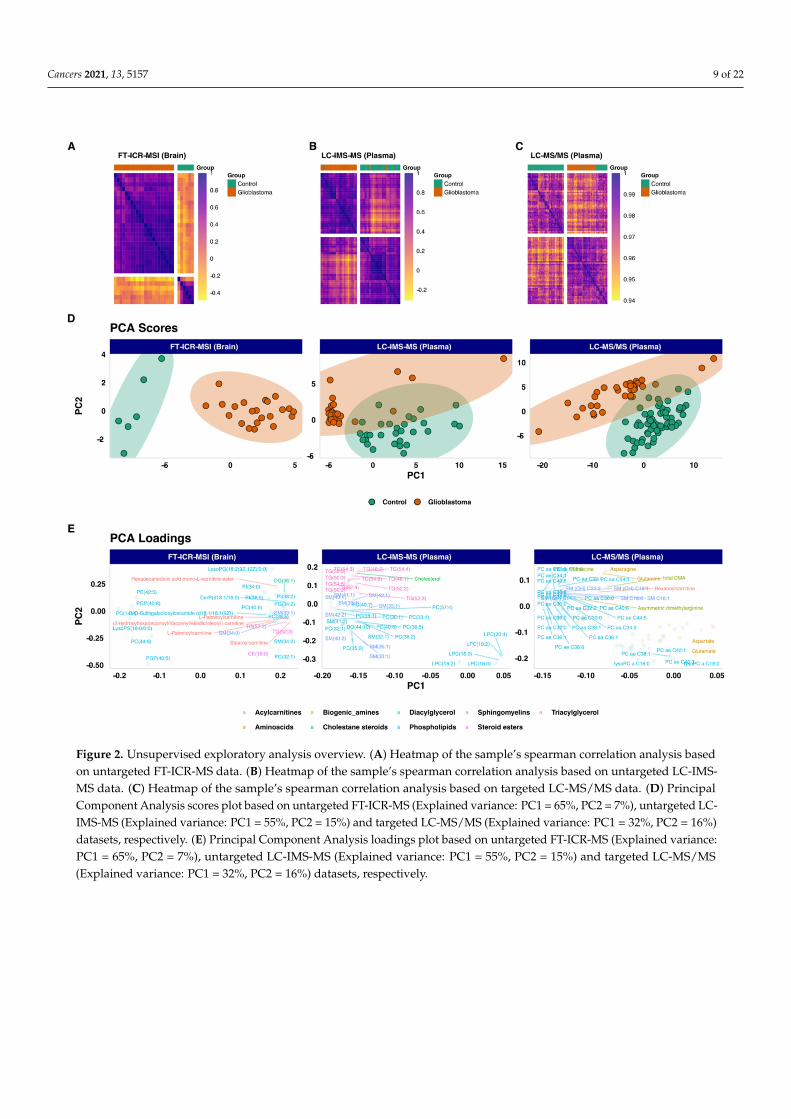
Cancers 2021, 13, 5157 9 of 22
Figure 2. Unsupervised exploratory analysis overview. (A) Heatmap of the sample’s spearman correlation analysis basedon untargeted FT-ICR-MS data. (B) Heatmap of the sample’s spearman correlation analysis based on untargeted LC-IMS-MS data. (C) Heatmap of the sample’s spearman correlation analysis based on targeted LC-MS/MS data. (D) PrincipalComponent Analysis scores plot based on untargeted FT-ICR-MS (Explained variance: PC1 = 65%, PC2 = 7%), untargeted LC-IMS-MS (Explained variance: PC1 = 55%, PC2 = 15%) and targeted LC-MS/MS (Explained variance: PC1 = 32%, PC2 = 16%)datasets, respectively. (E) Principal Component Analysis loadings plot based on untargeted FT-ICR-MS (Explained variance:PC1 = 65%, PC2 = 7%), untargeted LC-IMS-MS (Explained variance: PC1 = 55%, PC2 = 15%) and targeted LC-MS/MS(Explained variance: PC1 = 32%, PC2 = 16%) datasets, respectively.

Cancers 2021, 13, 5157 10 of 22
3.3. Differential Expression Analysis
To go further in the analysis, we performed a differential analysis between thetwo groups GBM versus Control, using each of the three datasets. The analysis identified176 annotated metabolites that were differentially expressed between GBM and control sam-ples. The plasma-based comparison yielded 148 metabolites, including 75 phospholipids(69 glycerophosphocholines, 4 phosphatidylcholines, and 2 phosphosphingolipids), 20 sph-ingomyelins, 15 acylcarnitines, 14 amino acids, 12 triacylglycerids, 10 biogenic amines,1 cholestan steroid, and 1 diacylglycerol. The tissue-based comparison unveiled 28 metabo-lites, including 17 phospholipids (4 glycerophosphocholines, 3 phosphoinositols, 1 phos-phatidylcholine, 2 phosphosphingolipids, 2 glycerophosphoglycerophaosphate, 2 glyc-erophosphoglycerid, 1 glycosphyngolipid, 1 glycerosphingoserine, and 1 glycerophospho-ethanolamine), 5 acylcarnitines, 1 diacylglycerol, 2 sphingomyelins, 2 triacylglycerols, and1 steroid ester. The summary results are presented in Figure 3A. The list of metabolitesand their statistics-related metrics is presented in Table S14. Furthermore, we comparedthe retrieved metabolites with previously reported human GBM metabolomics-based lit-erature [38–41,60]. The summary results are presented in Figure 3B, and the full resultsare presented in Table S15. The overlap with previously reported metabolites includes4 biogenic amines (Putrescine, cis-4-Hydroxyproline, trans-4-Hydroxyproline, Spermine),8 amino acids (Glutamine, Asparagine, Ornithine, Lysine, Tryptophan, Citrulline, Threo-nine, Valine), 1 steroid ester (CE(22:6)) and Carnitine. The related boxplots and correlationsare presented in Figures S3 and S4, respectively. In contrast, the metabolites that were notreported in the above-mentioned literature include mainly Acylcarnitines, Biogenic amines,Cholesterol, Phosphatidylcholines, and Triacylglycerols. Based on adjusted p-values, thetop metabolites are presented in Figure 4, and their Spearman correlations are presented inFigure S5.
3.4. Correlation Analysis
Given the opportunity to have in-tissue metabolomics with matched-plasma samples,we compared the plasma-based and tissue-based metabolic profiles and found ten lipidsthat overlap between the two lists. These include, phosphatidylcholines LPC(18:0), PC(36:5),PC(40:6), PC(32:1), sphingomyelins SM(33:1), SM(36:2) and triacylglycerides TG(56:7),TG(52:2), TG(52:4), TG(52:3). The boxplots of the top five lipids are presented in Figure 5.They include PC(40:6), PC(32:1), SM(33:1), TG(52:2), and TG(52:3). We also evaluatedthese lipid intercorrelations between tissue samples and their matched plasma samples.The figure did not show a high correlation between plasma and brain levels. However,the heatmap showed a high intra-matrix correlation. The top metabolites (abs(log foldchange > 1.5) and adjusted p-value < 0.01) are presented in Figure 5. Furthermore, weexplored the overall intra-GBM group variability using the coefficient of variation as a proxyin both tissue and plasma samples. The results showed high inter-tissue variability (CVmedian = 127 %) compared to plasma (CV median = 36%) (Figure S6A,B). This highlightsan inter-tumor metabolic heterogeneity. We also explored the variability of the above-mentioned overlap lipids that clearly showed the same observation (Figure S6C). The fullmetabolite correlation matrix is presented in Table S16.
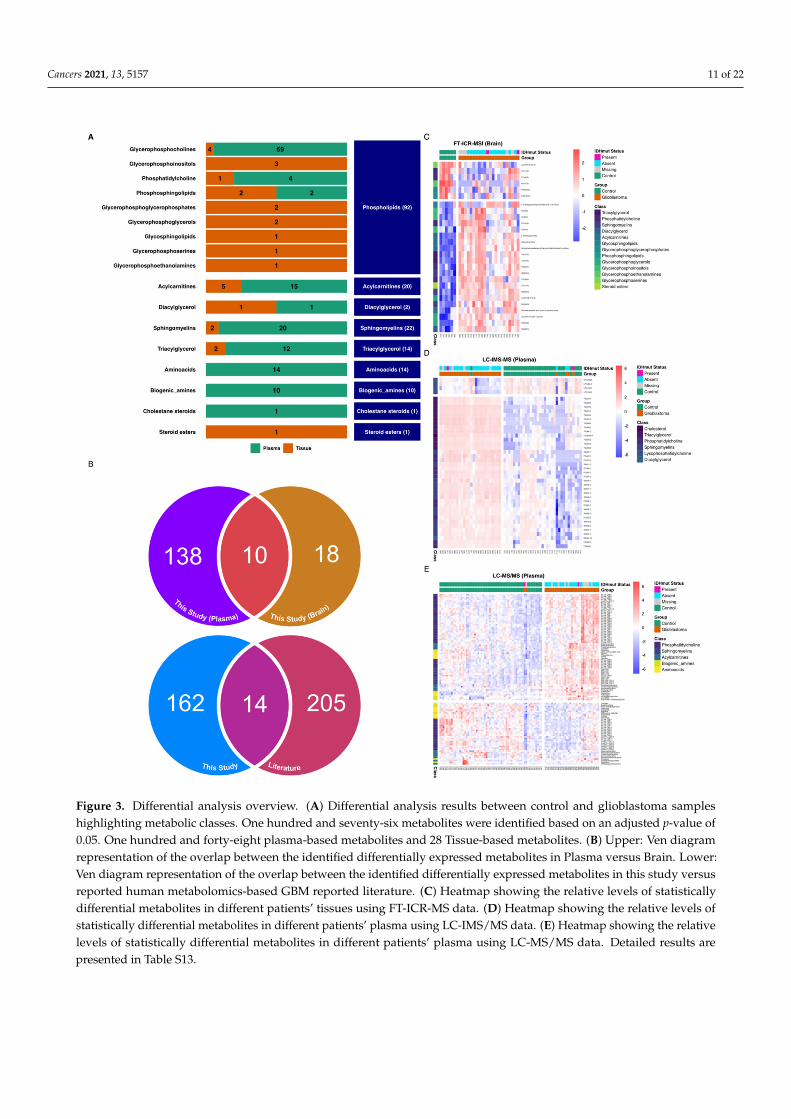
Cancers 2021, 13, 5157 11 of 22
Figure 3. Differential analysis overview. (A) Differential analysis results between control and glioblastoma sampleshighlighting metabolic classes. One hundred and seventy-six metabolites were identified based on an adjusted p-value of0.05. One hundred and forty-eight plasma-based metabolites and 28 Tissue-based metabolites. (B) Upper: Ven diagramrepresentation of the overlap between the identified differentially expressed metabolites in Plasma versus Brain. Lower:Ven diagram representation of the overlap between the identified differentially expressed metabolites in this study versusreported human metabolomics-based GBM reported literature. (C) Heatmap showing the relative levels of statisticallydifferential metabolites in different patients’ tissues using FT-ICR-MS data. (D) Heatmap showing the relative levels ofstatistically differential metabolites in different patients’ plasma using LC-IMS/MS data. (E) Heatmap showing the relativelevels of statistically differential metabolites in different patients’ plasma using LC-MS/MS data. Detailed results arepresented in Table S13.
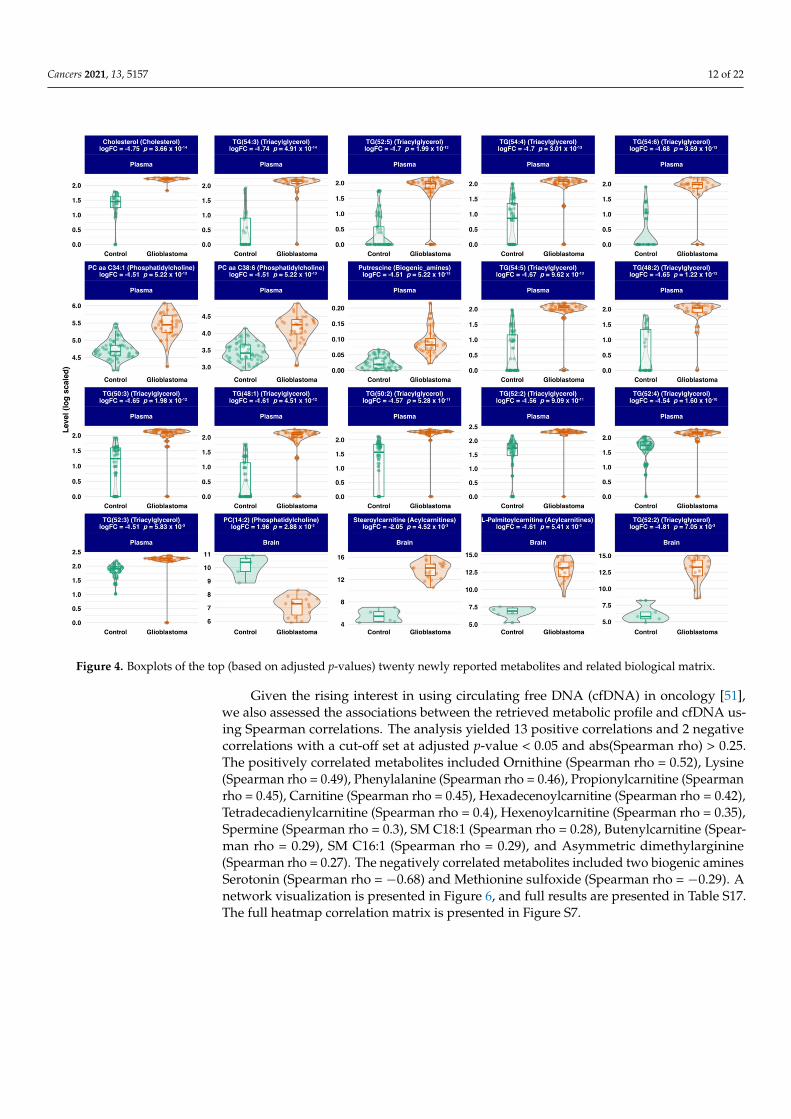
Cancers 2021, 13, 5157 12 of 22
Figure 4. Boxplots of the top (based on adjusted p-values) twenty newly reported metabolites and related biological matrix.
Given the rising interest in using circulating free DNA (cfDNA) in oncology [51],we also assessed the associations between the retrieved metabolic profile and cfDNA us-ing Spearman correlations. The analysis yielded 13 positive correlations and 2 negativecorrelations with a cut-off set at adjusted p-value < 0.05 and abs(Spearman rho) > 0.25.The positively correlated metabolites included Ornithine (Spearman rho = 0.52), Lysine(Spearman rho = 0.49), Phenylalanine (Spearman rho = 0.46), Propionylcarnitine (Spearmanrho = 0.45), Carnitine (Spearman rho = 0.45), Hexadecenoylcarnitine (Spearman rho = 0.42),Tetradecadienylcarnitine (Spearman rho = 0.4), Hexenoylcarnitine (Spearman rho = 0.35),Spermine (Spearman rho = 0.3), SM C18:1 (Spearman rho = 0.28), Butenylcarnitine (Spear-man rho = 0.29), SM C16:1 (Spearman rho = 0.29), and Asymmetric dimethylarginine(Spearman rho = 0.27). The negatively correlated metabolites included two biogenic aminesSerotonin (Spearman rho = −0.68) and Methionine sulfoxide (Spearman rho = −0.29). Anetwork visualization is presented in Figure 6, and full results are presented in Table S17.The full heatmap correlation matrix is presented in Figure S7.
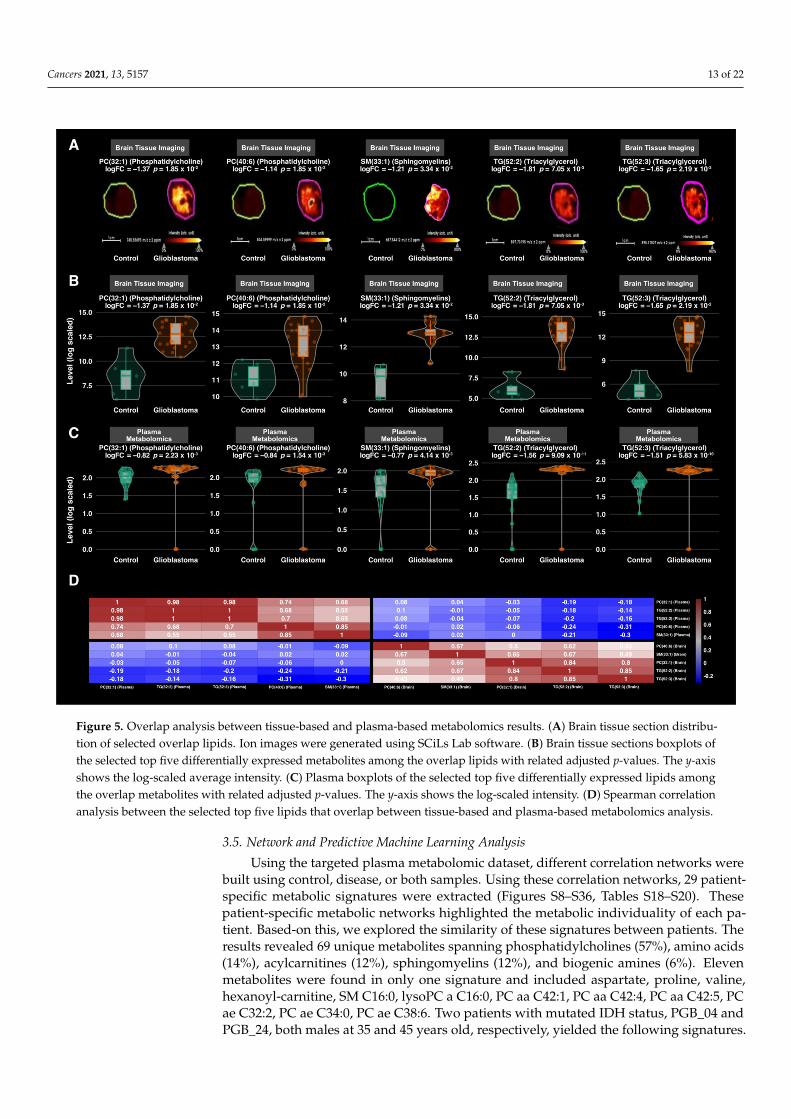
Cancers 2021, 13, 5157 13 of 22
Figure 5. Overlap analysis between tissue-based and plasma-based metabolomics results. (A) Brain tissue section distribu-tion of selected overlap lipids. Ion images were generated using SCiLs Lab software. (B) Brain tissue sections boxplots ofthe selected top five differentially expressed metabolites among the overlap lipids with related adjusted p-values. The y-axisshows the log-scaled average intensity. (C) Plasma boxplots of the selected top five differentially expressed lipids amongthe overlap metabolites with related adjusted p-values. The y-axis shows the log-scaled intensity. (D) Spearman correlationanalysis between the selected top five lipids that overlap between tissue-based and plasma-based metabolomics analysis.
3.5. Network and Predictive Machine Learning Analysis
Using the targeted plasma metabolomic dataset, different correlation networks werebuilt using control, disease, or both samples. Using these correlation networks, 29 patient-specific metabolic signatures were extracted (Figures S8–S36, Tables S18–S20). Thesepatient-specific metabolic networks highlighted the metabolic individuality of each pa-tient. Based-on this, we explored the similarity of these signatures between patients. Theresults revealed 69 unique metabolites spanning phosphatidylcholines (57%), amino acids(14%), acylcarnitines (12%), sphingomyelins (12%), and biogenic amines (6%). Elevenmetabolites were found in only one signature and included aspartate, proline, valine,hexanoyl-carnitine, SM C16:0, lysoPC a C16:0, PC aa C42:1, PC aa C42:4, PC aa C42:5, PCae C32:2, PC ae C34:0, PC ae C38:6. Two patients with mutated IDH status, PGB_04 andPGB_24, both males at 35 and 45 years old, respectively, yielded the following signatures.
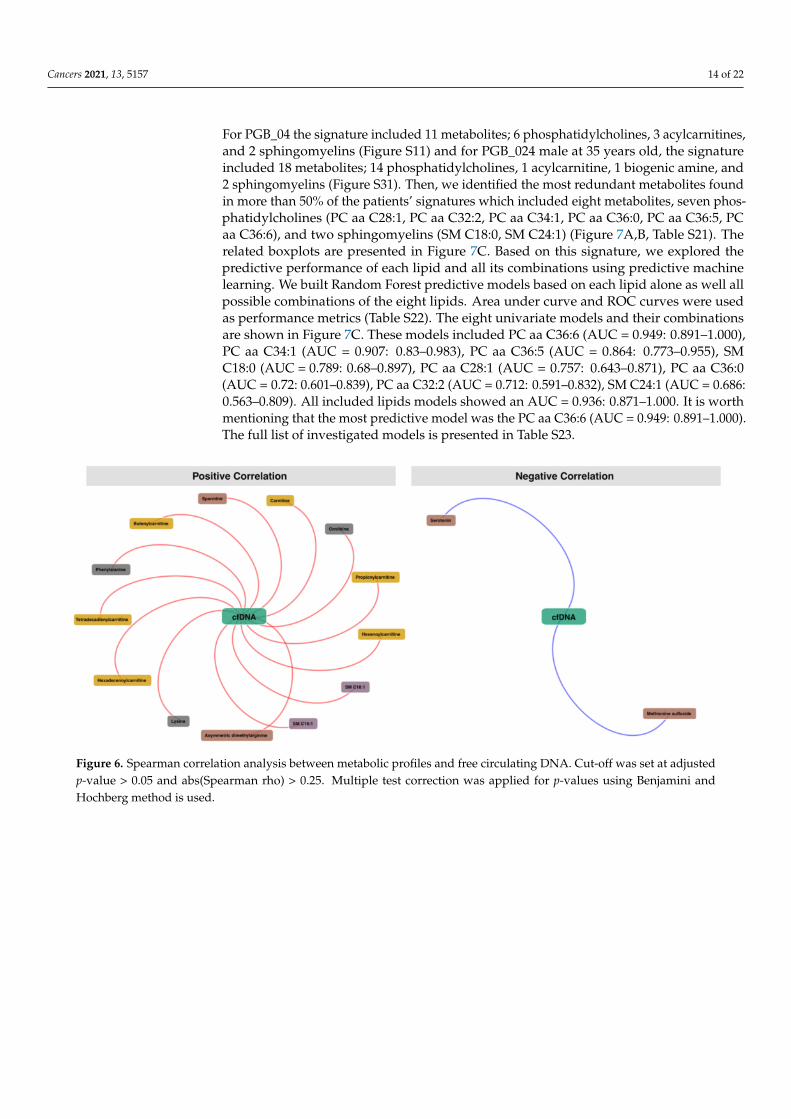
Cancers 2021, 13, 5157 14 of 22
For PGB_04 the signature included 11 metabolites; 6 phosphatidylcholines, 3 acylcarnitines,and 2 sphingomyelins (Figure S11) and for PGB_024 male at 35 years old, the signatureincluded 18 metabolites; 14 phosphatidylcholines, 1 acylcarnitine, 1 biogenic amine, and2 sphingomyelins (Figure S31). Then, we identified the most redundant metabolites foundin more than 50% of the patients’ signatures which included eight metabolites, seven phos-phatidylcholines (PC aa C28:1, PC aa C32:2, PC aa C34:1, PC aa C36:0, PC aa C36:5, PCaa C36:6), and two sphingomyelins (SM C18:0, SM C24:1) (Figure 7A,B, Table S21). Therelated boxplots are presented in Figure 7C. Based on this signature, we explored thepredictive performance of each lipid and all its combinations using predictive machinelearning. We built Random Forest predictive models based on each lipid alone as well allpossible combinations of the eight lipids. Area under curve and ROC curves were usedas performance metrics (Table S22). The eight univariate models and their combinationsare shown in Figure 7C. These models included PC aa C36:6 (AUC = 0.949: 0.891–1.000),PC aa C34:1 (AUC = 0.907: 0.83–0.983), PC aa C36:5 (AUC = 0.864: 0.773–0.955), SMC18:0 (AUC = 0.789: 0.68–0.897), PC aa C28:1 (AUC = 0.757: 0.643–0.871), PC aa C36:0(AUC = 0.72: 0.601–0.839), PC aa C32:2 (AUC = 0.712: 0.591–0.832), SM C24:1 (AUC = 0.686:0.563–0.809). All included lipids models showed an AUC = 0.936: 0.871–1.000. It is worthmentioning that the most predictive model was the PC aa C36:6 (AUC = 0.949: 0.891–1.000).The full list of investigated models is presented in Table S23.
Figure 6. Spearman correlation analysis between metabolic profiles and free circulating DNA. Cut-off was set at adjustedp-value > 0.05 and abs(Spearman rho) > 0.25. Multiple test correction was applied for p-values using Benjamini andHochberg method is used.
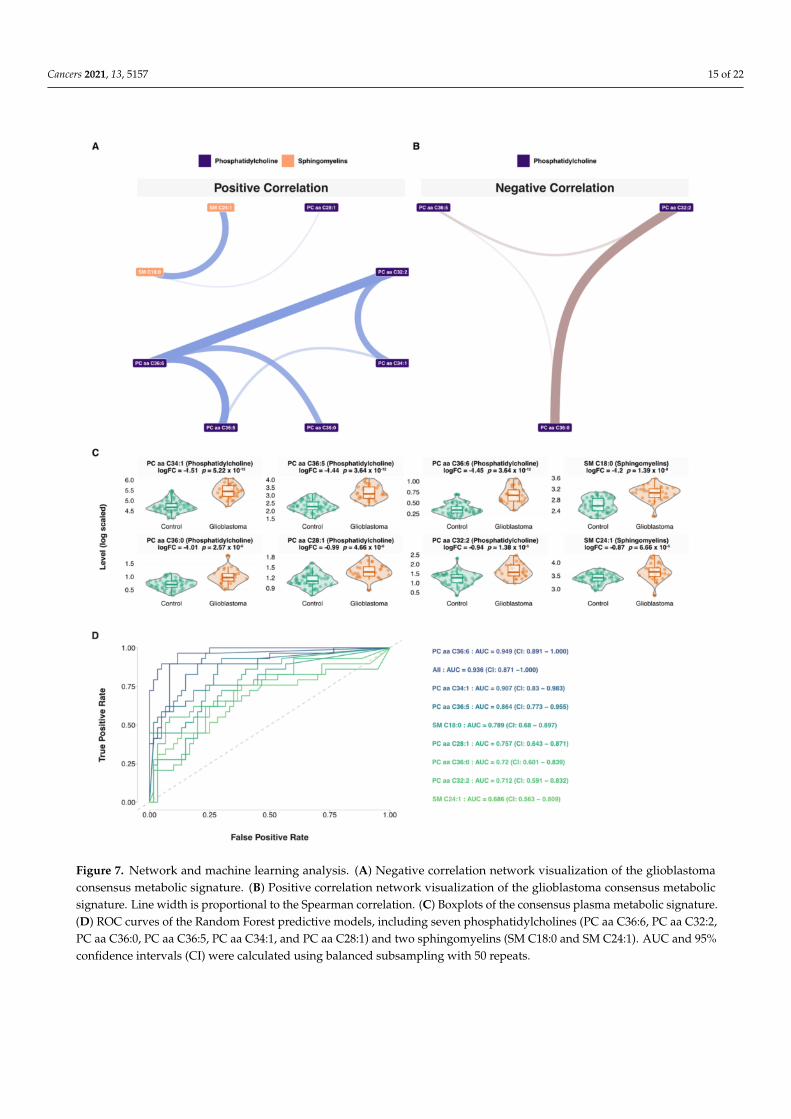
Cancers 2021, 13, 5157 15 of 22
Figure 7. Network and machine learning analysis. (A) Negative correlation network visualization of the glioblastomaconsensus metabolic signature. (B) Positive correlation network visualization of the glioblastoma consensus metabolicsignature. Line width is proportional to the Spearman correlation. (C) Boxplots of the consensus plasma metabolic signature.(D) ROC curves of the Random Forest predictive models, including seven phosphatidylcholines (PC aa C36:6, PC aa C32:2,PC aa C36:0, PC aa C36:5, PC aa C34:1, and PC aa C28:1) and two sphingomyelins (SM C18:0 and SM C24:1). AUC and 95%confidence intervals (CI) were calculated using balanced subsampling with 50 repeats.
Cancers 2021, 13, 5157 16 of 22
4. Discussion
Despite a sustained research effort in the fight against glioblastoma, the prognosisof this condition remains devastating, and its metabolic signaling pathways are barelyunderstood. To tackle this challenge, omics-based technologies could shed light on thisaggressive disease. Metabolic phenotyping through metabolomics is one of the promisingtools to interrogate functional metabolic readouts.
In this study, we identified four metabolites’ classes as proxies of deep metabolicremodeling in plasma and tissue samples from glioblastoma patients, which includedphospholipids, acylcarnitines, sphingomyelins, and Triacylglycerols. Some of the high-lighted metabolites in our study have been previously reported. This is the case for anumber of amino acids, such as asparagine, glutamine, lysine, citrulline, or valine, forexample (Figure 3) [38,39,41]. Indeed, amino acid metabolism is an area of interest in therace for new therapies for glioblastoma. The discovery of the Isocitrate Dehydrogenase(IDH) metabolic pathway has revived this antimetabolic approach, which aims at reducingthe synthesis of these molecules, which play an essential role in tumor development andprogression [61]. Recently differences in the levels of certain amino acids in the blood ofpatients with glioblastoma compared to healthy subjects have been demonstrated [62].These data empower the central role of amino acids in the genesis of glioblastoma. Inparallel to amino acid metabolism, our study also highlighted the role of lipids in thisdisease. Glycerophosphocholines (GPC) were one key class highlighted in this study. Mostprominent GPC were PC aa C34:1, PC aa C38:6, PC (14:2), PC aa C36:5, lysoPC a C18:0,PC aa C28:1, PC aa C32:2, PC aa C36:0, and PC aa C36:6 (Figures 3A, 4, 5 and 7). GPC areprecursors lipids of acetylcholine [63]. Cholines are important membrane componentsand known as markers of tumor progression [64]. A choline peak visualized by MRIspectroscopy is a diagnostic criterion for glioblastoma that has been used in clinical practicefor several years [38]. Similarly, it has been shown that choline blood levels in glioblas-toma patients are correlated with tumor progression [65]. More recently, following in-vivobrain micro dialysis studies [66], it appears that choline levels in the peri-tumor tissuealso correlate with its degree of invasion. One of the pathophysiological hypotheses isthat glioblastoma modifies its environment to make it favorable to its development andproliferation [67]. Furthermore, one of the key elements for glioblastoma progression isenergy substrate availability. The cerebral high lipid enrichment helps deliver the energynecessary for tumor growth [68]. Unlike normal cells, which deliver energy from mito-chondrial phosphorylation, tumoral glial cells get their energy from glycolysis and haveintense lipidogenesis. Taïb et al. [69] showed that oleic acid, a monounsaturated fatty acid,increases triacylglycerol production in malignant glial cells but not in normal glial cells, ar-guing for a metabolic reprogramming of the malignant glial cell environment to allow themto spread [70]. Sphingolipids are also involved in this phenomenon and were highlightedin our analysis through SM (0H) C22:2, SM (0H) C16:1, SM C18:0, and SM C18:1 and SMC24:1 (Figures 3A, 4, 5 and 7). These lipids are abundant in the brain and are essentialmembrane constituents highly expressed in glial cells. Alterations of the sphingolipidpathway resulting in lower levels of ceramides which have pro-apoptotic properties, arethought to play a role in malignant cell dissemination, and malignant glial cells have alsobeen reported to evade apoptosis by converting ceramides to sphingosine-1-phosphate,thus preventing apoptosis [71]. Thus, the action of oncological treatments of glioblastoma,which generate sphingomyelinases to lyse sphingomyelins into ceramides, escape this celldeath phenomenon [67]. The exact drivers of this process are not yet well understood.Steroylcarnitine and L-palmitoylcarnitine, which belong to the Acylcarnitines (AC) class,are also modulated during glioma genesis (Figures 3A and 5). AC primary function is toallow fatty acids transport to feed mitochondrial β-oxidation and thus ATP production.Based on a recent study on patient-derived xenograft models of GBM, it appears that ACare abundantly found within and at the edge of these tumors, and this may provide a fertileground for glioblastoma spread [72]. These advances on how glioblastoma modulates itsbiological environment to promote its spread, notably through lipid metabolism, opens,
Cancers 2021, 13, 5157 17 of 22
obviously, promising ways to new targeted therapeutic strategies and biomarker discovery.Interestingly, this study showed that circulating free DNA level was positively correlatedwith sphingomyelins (SM C16:1 and SM C18:1) and Acylcarnitines (Figure 6), which aremajor substrates of tumor progression by providing the glioblastoma with the energy.Lipid droplets (LDs) are organelles that are commonly found in fatty tissues storing lipids,triglycerol, and cholesterol esters. Recently, the presence of LDs has been demonstrated inglial and glioblastoma cell cultures in vivo [73]. These LDs are not only a simple reservoirof fatty acids but have an impact on important cell processes such as cell cycles, cell migra-tion of glial cells, and their resistance to apoptosis and conventional treatments [69]. LDsseem to be promising biomarkers to probe tumor progression [74]. It has been establishedfor a long time [75] that GBM diverts brain lipid metabolism to its advantage to sustain theenergy stores needed for their own expansion. By focusing on these LDs, it has been shownthat they play a central role in this lipid metabolism reprogramming [73]. Furthermore,it has been reported that autophagy-mediated hydrolysis of these LD maintains energyhomeostasis [76]. Thus, limiting the access of glioblastoma to this lipid stock represents apotentially innovative treatment avenue. Despite intensive chemoradiotherapy, the mediansurvival of patients with GBM remains at around 15 months. In recent years, lipidomics hasopened the way to new perspectives [77]. The goal is to prevent glial cells from spreadingby modulating their environment. Sphingolipids are one of these targets by promotingthe formation of apoptosis-inducing ceramides. The action of temozolomide, the first-linechemotherapy for glioblastoma, on the biological environment of glial cells is being activelystudied. Temozolomide modifies the extracellular vesicles both in size and content [78].These extracellular vesicles release fatty acids and proteins that modulate the action oftumor-associated macrophages [78]. Chemotherapy may thus have a modulating effect onthe environment of glial cells via these vesicles. The macrophages associated with tumorsare major components of tumor spread. Thus, targeting these macrophages could counter-act the chemo- and radio resistance of glial cells. As lipids are ubiquitous in the brain, theyhave been used as vectors for targeted therapies using CRISPR-Cas9 technology [79]. Basedon the seminal paper by Garofano et al. [80], a classification of glioblastomas based on cellsignaling pathways has revealed a therapeutic sensitivity in the mitochondrial glioblastomasubgroup. These preliminary results, although encouraging, need to be validated andreplicated in humans. Some limitations have to be noted regarding our study. The samplesize was limited for the tissue-based metabolomics which is mainly related to practicalconstraints and patients’ recruitment. Larger cohorts are needed to confirm the presentresults, ideally, including other bulk and/or single-cell panomics to have a broader view ofthe impaired biological pathways and their clinical effect.
5. Conclusions
In summary, our study demonstrated the potential of systems-based metabolomicsstrategies to holistically interrogate biological plasticity in glioblastoma and parse the roleof lipids in tumor progression by the modulation of its own environment. The next step ofour work would be the study of therapeutic modulations of these metabolic signatures inorder to probe treatment effectiveness. Applying these plasma metabolic patterns couldalso inform clinical practice to adapt treatment before MRI or clinical modification. Abetter understanding of metabolic impairments underlying glioblastoma spread wouldalso drive the development of targeted therapies to prevent glioblastoma from promotingits own extension to the surrounding tissues. Such systems-based strategies highlightthe importance of multi-omics and multimodal investigations to understand glial lesionsto pave the way to more personalized therapies and, ultimately, achieve the promise ofprecision medicine.
Cancers 2021, 13, 5157 18 of 22
Supplementary Materials: The following are available online at https://www.mdpi.com/article/10.3390/cancers13205157/s1, Figure S1: Network analysis overview. Networks are built using PartialCorrelation, Figure S2: Spearman correlations between samples, Figure S3: Boxplots of previously re-ported metabolites, Figure S4: Heatmap of Spearman correlations of previously reported metabolites,Figure S5: Heatmap of Spearman correlations of newly reported metabolites, Figure S6: Intra-group(GBM) variation, Figure S7: Heatmap of Spearman correlations between all significant metabolites,Figure S8: Network-based patient specific plasma metabolic signature (Patient PGB_01), Figure S9:Network-based patient specific plasma metabolic signature (Patient PGB_02), Figure S10: Network-based patient specific plasma metabolic signature (Patient PGB_03), Figure S11: Network-basedpatient specific plasma metabolic signature (Patient PGB_04), Figure S12: Network-based patient spe-cific plasma metabolic signature (Patient PGB_05), Figure S13: Network-based patient specific plasmametabolic signature (Patient PGB_06), Figure S14: Network-based patient specific plasma metabolicsignature (Patient PGB_07), Figure S15: Network-based patient specific plasma metabolic signature(Patient PGB_08), Figure S16: Network-based patient specific plasma metabolic signature (PatientPGB_09), Figure S17: Network-based patient specific plasma metabolic signature (Patient PGB_10),Figure S18: Network-based patient specific plasma metabolic signature (Patient PGB_11), Figure S19:Network-based patient specific plasma metabolic signature (Patient PGB_12), Figure S20: Network-based patient specific plasma metabolic signature (Patient PGB_13), Figure S21: Network-basedpatient specific plasma metabolic signature (Patient PGB_14), Figure S22: Network-based patientspecific plasma metabolic signature (Patient PGB_15), Figure S23: Network-based patient specificplasma metabolic signature (Patient PGB_16), Figure S24: Network-based patient specific plasmametabolic signature (Patient PGB_17), Figure S25: Network-based patient specific plasma metabolicsignature (Patient PGB_18), Figure S26: Network-based patient specific plasma metabolic signature(Patient PGB_19), Figure S27: Network-based patient specific plasma metabolic signature (PatientPGB_20), Figure S28: Network-based patient specific plasma metabolic signature (Patient PGB_21),Figure S29: Network-based patient specific plasma metabolic signature (Patient PGB_22), Figure S30:Network-based patient specific plasma metabolic signature (Patient PGB_23), Figure S31: Network-based patient specific plasma metabolic signature (Patient PGB_24), Figure S32: Network-basedpatient specific plasma metabolic signature (Patient PGB_25), Figure S33: Network-based patientspecific plasma metabolic signature (Patient PGB_26), Figure S34: Network-based patient specificplasma metabolic signature (Patient PGB_27), Figure S35: Network-based patient specific plasmametabolic signature (Patient PGB_28), Figure S36: Network-based patient specific plasma metabolicsignature (Patient PGB_29), Table S1: Metabolites List used in Targeted Metabolomics, Table S2:Sources and IMS parameters for Ion Mobility Mass Spectrometry analyses, Table S3: Cross CollisionSection Calculation Curve, Table S4: Variable metadata (Untargeted LC-IMS-MS Metabolomics),Table S5: Variable metadata (Untargeted FT-ICR-MS Metabolomics), Table S6: Data matrix (TargetedLC-MS/MS Metabolomics), Table S7: Data matrix (Untargeted LC-IMS-MS Metabolomics), Table S8:Data matrix (Untargeted FT-ICR-MS Metabolomics), Table S9: Cohorte Overview, Table S10: SampleSpearman correlation (Targeted LC-MS/MS Metabolomics), Table S11: Sample Spearman correla-tion (Untargeted LC-IMS-MS Metabolomics, Table S12: Sample Spearman correlation (UntargetedFT-ICR-MS Metabolomics), Table S13: Principal Component Analysis Scores, Table S14: DifferentialAnalysis Results, Table S15: Analysis of overlap with litterature, Table S16: Spearman MetaboliteCorrelation Matrix, Table S17: Spearman Correlations with circulating free DNA, Table S18: PartialCorrelation Matrix including all samples, Table S19: Pruned netwrok using all samples network,Table S20: Partial Correlation Matrix including only control samples, Table S21: Patient specficpruned networks, Table S22: Consensus network, Table S23: All Random Forest Models.
Author Contributions: Conceptualization: V.G., A.T., S.M., and S.B.; Data curation: F.M., M.F., F.D.,A.L., C.A., S.B., V.G., S.D., I.S.-A., J.F., C.P., C.L, T.P., C.B., F.D.F., and F.D.; Formal analysis: A.T. andF.D.; writing—original draft preparation: V.G., A.T., S.M., S.B.; Resources: S.B., C.A., and A.L.; Formalanalysis: I.S.-A., J.F., C.P., C.L., C.B., and F.D.; writing—original draft preparation. A.T. and S.B.;writing-review and editing, all authors; visualization, A.T. and F.D.; supervision, S.B., S.M., and A.T.;project administration, A.T., S.M., and S.B. All authors have read and agreed to the published versionof the manuscript.
Funding: This research received no external funding.
Cancers 2021, 13, 5157 19 of 22
Institutional Review Board Statement: All samples used in this study belong to a declared collectionlocated in the Pathology Department (Annie Laquerrière) of Rouen University Hospital in accordancewith the relevant guidelines and regulations and with permission of the local authorities.
Informed Consent Statement: Informed consent was obtained from all subjects involved in the study.
Data Availability Statement: Data supporting the finding are presented in the text and Supplemen-tary Material.
Acknowledgments: At COBRA laboratory, for MALDI-FTICR imaging and LC-IM-MS experiments,this work has been partially supported by the University of Rouen Normandy, INSA Rouen Normandy,the Centre National de la Recherche Scientifique (CNRS), European Regional Development Fund (ERDF),Labex SynOrg (ANR-11-LABX-0029), Carnot Institut I2C, the graduate school for research Xl-Chem(ANR-18-EURE-0020 XL CHEM), and by the Region Normandie. In addition, this work is supportedby the European Union’s Horizon 2020 Research Infrastructures program (Grant Agreement 731077).Access to a CNRS FTICR research infrastructure (FR3624) is gratefully acknowledged.
Conflicts of Interest: The authors have no conflict of interest to disclose.
References1. Bauchet, L.; Ostrom, Q.T. Epidemiology and molecular epidemiology. Neurosurg. Clin. N. Am. 2019, 30, 1–16. [CrossRef]2. Morgan, L.L. The epidemiology of glioma in adults: A “state of the science” review. Neuro-Oncology 2015, 17, 623–624. [CrossRef]3. Khurana, V.; Jain, S.; Smee, R.; Cook, R.; Dobes, M.; Shadbolt, B.; Smith, S.; Dexter, M. Increasing incidence of glioblastoma
multiforme and meningioma, and decreasing incidence of Schwannoma (2000–2008): Findings of a multicenter Australian study.Surg. Neurol. Int. 2011, 2, 176. [CrossRef]
4. Philips, A.; Henshaw, D.L.; Lamburn, G.; O’Carroll, M.J. Brain Tumours: Rise in Glioblastoma Multiforme Incidence in England1995–2015 Suggests an Adverse Environmental or Lifestyle Factor. J. Environ. Public Health 2018, 2018, 7910754. [CrossRef]
5. Vecht, C.J.; Kerkhof, M.; Duran-Pena, A. Seizure Prognosis in Brain Tumors: New Insights and Evidence-Based Management.Oncol. 2014, 19, 751–759. [CrossRef]
6. Yan, J.-L.; Li, C.; Boonzaier, N.R.; Fountain, D.M.; Larkin, T.J.; Matys, T.; Van Der Hoorn, A.; Price, S.J. Multimodal MRIcharacteristics of the glioblastoma infiltration beyond contrast enhancement. Ther. Adv. Neurol. Disord. 2019, 12. [CrossRef]
7. Law, M.; Yang, S.; Wang, H.; Babb, J.S.; Johnson, G.; Cha, S.; Knopp, E.A.; Zagzag, D. Glioma Grading: Sensitivity, Specificity, andPredictive Values of Perfusion MR Imaging and Proton MR Spectroscopic Imaging Compared with Conventional MR Imaging.Am. J. Neuroradiol. 2003, 24, 1989–1998.
8. Stupp, R.; Mason, W.P.; Bent, M.V.D.; Weller, M.; Fisher, B.; Taphoorn, M.J.; Belanger, K.; Brandes, A.; Marosi, C.; Bogdahn,U.; et al. Radiotherapy plus Concomitant and Adjuvant Temozolomide for Glioblastoma. N. Engl. J. Med. 2005, 352, 987–996.[CrossRef]
9. Brown, T.J.; Brennan, M.C.; Li, M.; Church, E.W.; Brandmeir, N.J.; Rakszawski, K.L.; Patel, A.S.; Rizk, E.B.; Suki, D.; Sawaya,R.; et al. Association of the extent of resection with survival in glioblastoma: A systematic review and meta-analysis. JAMA Oncol.2016, 2, 1460–1469. [CrossRef]
10. Bloch, O.; Han, S.J.; Cha, S.; Sun, M.Z.; Aghi, M.K.; McDermott, M.W.; Berger, M.S.; Parsa, A.T. Impact of extent of re-section forrecurrent glioblastoma on overall survival: Clinical article. J. Neurosurg. 2012, 117, 1032–1038. [CrossRef]
11. Lim, M.; Xia, Y.; Bettegowda, C.; Weller, M. Current state of immunotherapy for glioblastoma. Nat. Rev. Clin. Oncol. 2018, 15,422–442. [CrossRef]
12. Touat, M.; Idbaih, A.; Sanson, M.; Ligon, K.L. Glioblastoma targeted therapy: Updated approaches from recent biological insights.Ann. Oncol. 2017, 28, 1457–1472. [CrossRef]
13. Malkki, H. Trial watch: Glioblastoma vaccine therapy disappointment in phase iii trial. Nat. Rev. Neurol. 2016, 12, 190. [CrossRef]14. Delgado-López, P.D.; Corrales-García, E.M. Survival in glioblastoma: A review on the impact of treatment modalities. Clin. Transl.
Oncol. 2016, 18, 1062–1071. [CrossRef]15. Ius, T.; Ciani, Y.; Ruaro, M.E.; Isola, M.; Sorrentino, M.; Bulfoni, M.; Candotti, V.; Correcig, C.; Bourkoula, E.; Manini, I.; et al. An
nf-kappab signature predicts low-grade glioma prognosis: A precision medicine approach based on patient-derived stem cells.Neuro Oncol. 2018, 20, 776–787. [CrossRef]
16. Le Tourneau, C.; Borcoman, E.; Kamal, M. Molecular profiling in precision medicine oncology. Nat. Med. 2019, 25, 711–712.[CrossRef]
17. Ogrinc, N.; Saudemont, P.; Takats, Z.; Salzet, M.; Fournier, I. Cancer surgery 2.0: Guidance by real-time molecular tech-nologies.Trends Mol. Med. 2021. Available online: https://www.cell.com/trends/molecular-medicine/fulltext/S1471-4914(21)00096-4(accessed on 8 September 2021). [CrossRef]
18. Birzu, C.; French, P.; Caccese, M.; Cerretti, G.; Idbaih, A.; Zagonel, V.; Lombardi, G. Recurrent glioblastoma: From molec-ularlandscape to new treatment perspectives. Cancers 2020, 13, 47. [CrossRef]
19. Aletaha, D. Precision medicine and management of rheumatoid arthritis. J. Autoimmun. 2020, 110, 102405. [CrossRef]
Cancers 2021, 13, 5157 20 of 22
20. Tebani, A.; Afonso, C.; Bekri, S. Advances in metabolome information retrieval: Turning chemistry into biology. Part II: Biologicalinformation recovery. J. Inherit. Metab. Dis. 2017, 41, 393–406. [CrossRef]
21. Manzoni, C.; Kia, D.A.; Vandrovcova, J.; Hardy, J.; Wood, N.; Lewis, P.A.; Ferrari, R. Genome, transcriptome and proteome: Therise of omics data and their integration in biomedical sciences. Brief. Bioinform. 2016, 19, 286–302. [CrossRef]
22. McColl, E.R.; Asthana, R.; Paine, M.F.; Piquette-Miller, M. The age of omics-driven precision medicine. Clin. Pharmacol. Ther. 2019,106, 477–481. [CrossRef]
23. Lombardi, G.; De Salvo, G.L.; Brandes, A.A.; Eoli, M.; Rudà, R.; Faedi, M.; Lolli, I.; Pace, A.; Daniele, B.; Pasqualetti, F.; et al.Regorafenib compared with lomustine in patients with relapsed glioblastoma (REGOMA): A multicentre, open-label, randomised,controlled, phase 2 trial. Lancet Oncol. 2018, 20, 110–119. [CrossRef]
24. Arivaradarajan, P.; Misra, G. Omics Approaches, Technologies and Applications: Integrative Approaches for Understanding Omics Data,1st ed.; Springer: Singapore, 2018; p. 1. Available online: https://www.springer.com/gp/book/9789811329241 (accessed on8 September 2021).
25. Sarma, A.; Calfee, C.S.; Ware, L.B. Biomarkers and precision medicine: State of the art. Crit Care Clin. 2020, 36, 155–165. [CrossRef]26. Clish, C.B. Metabolomics: An emerging but powerful tool for precision medicine. Mol. Case Stud. 2015, 1, a000588. [CrossRef]
[PubMed]27. Tebani, A.; Afonso, C.; Bekri, S. Advances in metabolome information retrieval: Turning chemistry into biology. Part I: Analytical
chemistry of the metabolome. J. Inherit. Metab. Dis. 2018, 41, 393–406. [CrossRef] [PubMed]28. Nicholson, J.; Lindon, J.; Holmes, E. ‘Metabonomics’: Understanding the metabolic responses of living systems to pathophysiolog-
ical stimuli via multivariate statistical analysis of biological NMR spectroscopic data. Xenobiotica 1999, 29, 1181–1189. [CrossRef][PubMed]
29. Shaw, J.B.; Lin, T.-Y.; Leach, F.E., III; Tolmachev, A.V.; Tolic, N.; Robinson, E.W.; Koppenaal, D.W.; Paša-Tolic, L. 21 tesla fouriertransform ion cyclotron resonance mass spectrometer greatly expands mass spectrometry toolbox. J. Am. Soc. Mass Spectrom.2016, 27, 1929–1936. [CrossRef]
30. Kooijman, P.C.; Nagornov, K.O.; Kozhinov, A.N.; Kilgour, D.P.A.; Tsybin, Y.; Heeren, R.M.A.; Ellis, S.R. Increased throughput andultra-high mass resolution in DESI FT-ICR MS imaging through new-generation external data acquisition system and advanceddata processing approaches. Sci. Rep. 2019, 9, 1–11. [CrossRef]
31. Ferey, J.; Marguet, F.; Laquerrière, A.; Marret, S.; Schmitz-Afonso, I.; Bekri, S.; Afonso, C.; Tebani, A. A new optimization strategyfor MALDI FTICR MS tissue analysis for untargeted metabolomics using experimental design and data modeling. Anal. Bioanal.Chem. 2019, 411, 3891–3903. [CrossRef]
32. Ciocan-Cartita, C.A.; Jurj, A.; Buse, M.; Gulei, D.; Braicu, C.; Raduly, L.; Cojocneanu, R.; Pruteanu, L.L.; Iuga, C.A.; Coza, O.; et al.The Relevance of Mass Spectrometry Analysis for Personalized Medicine through Its Successful Application in Cancer “Omics”.Int. J. Mol. Sci. 2019, 20, 2576. [CrossRef]
33. Duarte, T.T.; Spencer, C.T. Personalized Proteomics: The Future of Precision Medicine. Proteomes 2016, 4, 29. [CrossRef] [PubMed]34. Rogachev, A.; Alemasov, N.; Ivanisenko, V.; Ivanisenko, N.; Gaisler, E.; Oleshko, O.; Cheresiz, S.; Mishinov, S.; Stupak, V.;
Pokrovsky, A. Correlation of Metabolic Profiles of Plasma and Cerebrospinal Fluid of High-Grade Glioma Patients. Metabolites2021, 11, 133. [CrossRef] [PubMed]
35. Pandey, R.; Caflisch, L.; Lodi, A.; Brenner, A.J.; Tiziani, S. Metabolomic signature of brain cancer. Mol. Carcinog. 2017, 56,2355–2371. [CrossRef]
36. Heiland, D.H.; Wörner, J.; Haaker, J.G.; Delev, D.; Pompe, N.; Mercas, B.; Franco, P.; Gäbelein, A.; Heynckes, S.; Pfeifer, D.; et al.The integrative metabolomic-transcriptomic landscape of glioblastome multiforme. Oncotarget 2017, 8, 49178–49190. [CrossRef][PubMed]
37. Huang, J.; Weinstein, S.J.; Kitahara, C.M.; Karoly, E.D.; Sampson, J.N.; Albanes, D. A prospective study of serum metab-olites andglioma risk. Oncotarget 2017, 8, 70366–70377. [CrossRef]
38. Hvinden, I.C.; Berg, H.E.; Sachse, D.; Skaga, E.; Skottvoll, F.S.; Lundanes, E.; Sandberg, C.J.; Vik-Mo, E.O.; Rise, F.; Wilson, S.R.Nuclear Magnetic Resonance Spectroscopy to Identify Metabolite Biomarkers of Nonresponsiveness to Targeted Therapy inGlioblastoma Tumor Stem Cells. J. Proteome Res. 2019, 18, 2012–2020. [CrossRef] [PubMed]
39. Kurake, N.; Ishikawa, K.; Tanaka, H.; Hashizume, H.; Nakamura, K.; Kajiyama, H.; Toyokuni, S.; Kikkawa, F.; Mizuno, M.;Hori, M. Non-thermal plasma-activated medium modified metabolomic profiles in the glycolysis of U251SP glioblastoma. Arch.Biochem. Biophys. 2018, 662, 83–92. [CrossRef] [PubMed]
40. Wang, L.-B.; Karpova, A.; Gritsenko, M.A.; Kyle, J.E.; Cao, S.; Li, Y.; Rykunov, D.; Colaprico, A.; Rothstein, J.H.; Hong, R.; et al.Proteogenomic and metabolomic characterization of human glioblastoma. Cancer Cell 2021, 39, 509–528. [CrossRef] [PubMed]
41. Wibom, C.; Surowiec, I.; Mörén, L.; Bergström, P.; Johansson, M.; Antti, H.; Bergenheim, A.T. Metabolomic Patterns in Glioblas-toma and Changes during Radiotherapy: A Clinical Microdialysis Study. J. Proteome Res. 2010, 9, 2909–2919. [CrossRef]
42. Yu, D.; Xuan, Q.; Zhang, C.; Hu, C.; Li, Y.; Zhao, X.; Liu, S.; Ren, F.; Zhang, Y.; Zhou, L.; et al. Metabolic Alterations Related toGlioma Grading Based on Metabolomics and Lipidomics Analyses. Metabolites 2020, 10, 478. [CrossRef] [PubMed]
43. Jaroch, K.; Modrakowska, P.; Bojko, B. Glioblastoma Metabolomics—In Vitro Studies. Metabolites 2021, 11, 315. [CrossRef][PubMed]
Cancers 2021, 13, 5157 21 of 22
44. Ramsay, S.L.; Guggenbichler, W.; Weinberger, K.M.; Graber, A.; Stoeggl, W.M. Device for quantitative analysis of a drug ormetabolite profile. Google Patents. 2012. Available online: https://patents.google.com/patent/RU2008102835A/en (accessed on8 September 2021).
45. Ramsay, S.L.; Stoeggl, W.M.; Weinberger, K.M.; Graber, A.; Guggenbichler, W. Apparatus and method for analyzing a metaboliteprofile. Google Patents. 2012. Available online: https://patents.google.com/patent/US8265877B2/en (accessed on 8 Septem-ber 2021).
46. Bush, M.F.; Campuzano, I.D.G.; Robinson, C.V. Ion Mobility Mass Spectrometry of Peptide Ions: Effects of Drift Gas andCalibration Strategies. Anal. Chem. 2012, 84, 7124–7130. [CrossRef] [PubMed]
47. Zhou, Z.; Tu, J.; Xiong, X.; Shen, X.; Zhu, Z.-J. LipidCCS: Prediction of Collision Cross-Section Values for Lipids with HighPrecision To Support Ion Mobility–Mass Spectrometry-Based Lipidomics. Anal. Chem. 2017, 89, 9559–9566. [CrossRef] [PubMed]
48. Smith, C.A.; O’Maille, G.; Want, E.J.; Qin, C.; Trauger, S.A.; Brandon, T.R.; Custodio, D.E.; Abagyan, R.; Siuzdak, G. Metlin: Ametabolite mass spectral database. Ther. Drug Monit. 2005, 27, 747. [CrossRef]
49. Wishart, D.S.; Jewison, T.; Guo, A.C.; Wilson, M.; Knox, C.; Liu, Y.; Djoumbou, Y.; Mandal, R.; Aziat, F.; Dong, E.; et al. Hmdb3.0—The human metabolome database in 2013. Nucleic Acids Res. 2013, 41, D801. [CrossRef]
50. Zhou, Z.; Luo, M.; Chen, X.; Yin, Y.; Xiong, X.; Wang, R.; Zhu, Z.-J. Ion mobility collision cross-section atlas for known andunknown metabolite annotation in untargeted metabolomics. Nat. Commun. 2020, 11, 1–13. [CrossRef]
51. Fontanilles, M.; Marguet, F.; Beaussire, L.; Magne, N.; Pépin, L.-F.; Alexandru, C.; Tennevet, I.; Hanzen, C.; Langlois, O.; Jardin,F.; et al. Cell-free DNA and circulating tert promoter mutation for disease monitoring in newly-diagnosed glio-blastoma. ActaNeuropathol. Commun. 2020, 8, 179. [CrossRef] [PubMed]
52. Van Den Berg, R.A.; Hoefsloot, H.C.; Westerhuis, J.A.; Smilde, A.K.; Van Der Werf, M.J. Centering, scaling, and trans-formations:Improving the biological information content of metabolomics data. BMC Genomics 2006, 7, 142. [CrossRef]
53. Ritchie, M.; Phipson, B.; Wu, D.; Hu, Y.; Law, C.W.; Shi, W.; Smyth, G.K. limma powers differential expression analyses forRNA-sequencing and microarray studies. Nucleic Acids Res. 2015, 43, e47. [CrossRef]
54. Benjamini, Y.; Hochberg, Y. Controlling the False Discovery Rate: A Practical and Powerful Approach to Multiple Testing. J. R.Stat. Soc. Ser. B Stat. Methodol. 1995, 57, 289–300. [CrossRef]
55. Liang, F.; Song, Q.; Qiu, P. An Equivalent Measure of Partial Correlation Coefficients for High-Dimensional Gaussian GraphicalModels. J. Am. Stat. Assoc. 2015, 110, 1248–1265. [CrossRef]
56. Thistlethwaite, L.R.; Petrosyan, V.; Li, X.; Miller, M.J.; Elsea, S.H.; Milosavljevic, A. CTD: An information-theoretic algorithmto interpret sets of metabolomic and transcriptomic perturbations in the context of graphical models. PLoS Comput. Biol. 2021,17, e1008550. [CrossRef]
57. Wright, M.N.; Ziegler, A. ranger: A Fast Implementation of Random Forests for High Dimensional Data in C++ and R. J. Stat.Softw. 2017, 77, 1–17. [CrossRef]
58. Kuhn, M. Caret: Classification and Regression Training. 2020. Available online: https://cran.r-project.org/web/packages/caret/caret.pdf (accessed on 8 September 2021).
59. R Core Team. R: A Language and Environment for Statistical Computing. R Foundation for Statistical Computing Website. 2020.Available online: https://www.gbif.org/zh/tool/81287/r-a-language-and-environment-for-statistical-computing (accessed on8 September 2021).
60. Kampa, J.M.; Kellner, U.; Marsching, C.; Ramallo Guevara, C.; Knappe, U.J.; Sahin, M.; Giampà, M.; Niehaus, K.; Bednarz, H.Glioblastoma multiforme: Metabolic differences to peritumoral tissue and idh-mutated gliomas revealed by mass spec-trometryimaging. Neuropathology 2020, 40, 546–558. [CrossRef] [PubMed]
61. Barritault, M.; Picart, T.; Poncet, D.; Fenouil, T.; D’Hombres, A.; Gabut, M.; Guyotat, J.; Jouanneau, E.; Ameli, R.; Joubert, B.; et al.Avoiding New Biopsies by Identification of IDH1 and TERT Promoter Mutation in Nondiagnostic Biopsies From Glioma Patients.Neurosurgery 2020, 87, E513–E519. [CrossRef]
62. Bobeff, E.J.; Szczesna, D.; Bienkowski, M.; Janczar, K.; Chmielewska-Kassassir, M.; Wisniewski, K.; Papierz, W.; Wozniak, L.A.;Jaskólski, D.J. Plasma amino acids indicate glioblastoma with ATRX loss. Amino Acids 2021, 53, 119–132. [CrossRef] [PubMed]
63. Rand, J.B. Acetylcholine. WormBook 2007, 1–21. [CrossRef]64. Sonkar, K.; Ayyappan, V.; Tressler, C.; Adelaja, O.; Cai, R.; Cheng, M.; Glunde, K. Focus on the glycerophosphocholine pathway
in choline phospholipid metabolism of cancer. NMR Biomed. 2018, 32, e4112. [CrossRef] [PubMed]65. Shimizu, H.; Kumabe, T.; Shirane, R.; Yoshimoto, T. Correlation between Choline Level Measured by Proton MR Spectroscopy
and Ki-67 Labeling Index in Gliomas. Am. J. Neuroradiol. 2000, 21, 659–665.66. Lima, E.; Otaduy, M.; Tsunemi, M.H.; Pincerato, R.; Cardoso, E.; Rosemberg, S.; de Aguiar, P.H.P.; Cerri, G.; Leite, C. The Effect of
Paramagnetic Contrast in Choline Peak in Patients with Glioblastoma Multiforme Might Not Be Significant. Am. J. Neuroradiol.2012, 34, 80–84. [CrossRef]
67. Van Brocklyn, J.R. Sphingolipid signaling pathways as potential therapeutic targets in gliomas. Mini Rev. Med. Chem. 2007, 7,984–990. [CrossRef]
68. Bruce, K.D.; Zsombok, A.; Eckel, R.H. Lipid processing in the brain: A key regulator of systemic metabolism. Front. Endocrinol.2017, 8, 60. [CrossRef]
69. Taïb, B.; Aboussalah, A.M.; Moniruzzaman, M.; Chen, S.; Haughey, N.J.; Kim, S.F.; Ahima, R.S. Lipid accumulation and oxidationin glioblastoma multiforme. Sci. Rep. 2019, 9, 1–14. [CrossRef]
Cancers 2021, 13, 5157 22 of 22
70. Zhou, L.; Wang, Z.; Hu, C.; Zhang, C.; Kovatcheva-Datchary, P.; Yu, D.; Liu, S.; Ren, F.; Wang, X.; Li, Y.; et al. IntegratedMetabolomics and Lipidomics Analyses Reveal Metabolic Reprogramming in Human Glioma with IDH1 Mutation. J. ProteomeRes. 2018, 18, 960–969. [CrossRef]
71. Hawkins, C.C.; Ali, T.; Ramanadham, S.; Hjelmeland, A.B. Sphingolipid Metabolism in Glioblastoma and Metastatic BrainTumors: A Review of Sphingomyelinases and Sphingosine-1-Phosphate. Biomolecules 2020, 10, 1357. [CrossRef] [PubMed]
72. Lin, H.; Patel, S.; Affleck, V.S.; Wilson, I.; Turnbull, D.; Joshi, A.R.; Maxwell, R.; Stoll, E.A. Fatty acid oxidation is required for therespiration and proliferation of malignant glioma cells. Neuro-Oncology 2016, 19, 43–54. [CrossRef]
73. Yuan, Y.; Shah, N.; Almohaisin, M.I.; Saha, S.; Lu, F. Assessing fatty acid-induced lipotoxicity and its therapeutic potential inglioblastoma using stimulated Raman microscopy. Sci. Rep. 2021, 11, 1–14. [CrossRef] [PubMed]
74. Geng, F.; Guo, D. Lipid droplets, potential biomarker and metabolic target in glioblastoma. Intern. Med. Rev. 2017, 3, 10–18103.75. Guo, D.; Bell, E.H.; Chakravarti, A. Lipid metabolism emerges as a promising target for malignant glioma therapy. CNS Oncol.
2013, 2, 289–299. [CrossRef] [PubMed]76. Wu, X.; Geng, F.; Cheng, X.; Guo, Q.; Zhong, Y.; Cloughesy, T.F.; Yong, W.H.; Chakravarti, A.; Guo, D. Lipid Droplets Maintain
Energy Homeostasis and Glioblastoma Growth via Autophagic Release of Stored Fatty Acids. iScience 2020, 23, 101569. [CrossRef]77. Antal, O.; Péter, M.; Hackler, L.; Mán, I.; Szebeni, G.J.; Ayaydin, F.; Hideghéty, K.; Vigh, L.; Kitajka, K.; Balogh, G.; et al. Lipidomic
analysis reveals a radiosensitizing role of gamma-linolenic acid in glioma cells. Biochim. Biophys. Acta BBA Mol. Cell Biol. Lipids2015, 1851, 1271–1282. [CrossRef] [PubMed]
78. Panzarini, E.; Tacconi, S.; Carata, E.; Mariano, S.; Tata, A.; Dini, L. Molecular Characterization of Temozolomide-Treated and NonTemozolomide-Treated Glioblastoma Cells Released Extracellular Vesicles and Their Role in the Macrophage Response. Int. J.Mol. Sci. 2020, 21, 8353. [CrossRef] [PubMed]
79. Rosenblum, D.; Gutkin, A.; Kedmi, R.; Ramishetti, S.; Veiga, N.; Jacobi, A.M.; Schubert, M.S.; Friedmann-Morvinski, D.; Cohen,Z.R.; Behlke, M.A.; et al. CRISPR-Cas9 genome editing using targeted lipid nanoparticles for cancer therapy. Sci. Adv. 2020,6, eabc9450. [CrossRef] [PubMed]
80. Garofano, L.; Migliozzi, S.; Oh, Y.T.; D’Angelo, F.; Najac, R.D.; Ko, A.; Frangaj, B.; Caruso, F.P.; Yu, K.; Yuan, J.; et al. Pathway-basedclassification of glioblastoma uncovers a mitochondrial subtype with therapeutic vulnerabilities. Nat. Rev. Cancer 2021, 2, 141–156.[CrossRef] [PubMed]

Supplementary material: Integrative Metabolomics Reveals
Deep Tissue and Systemic Metabolic Remodeling in
Glioblastoma
Vianney Gilard, Justine Ferey, Florent Marguet, Maxime Fontanilles, Franklin Ducatez, Carine Pilon, Céline
Lesueur, Tony Pereira, Carole Basset, Isabelle Schmitz‐Afonso, Frédéric Di Fioré, Annie Laquerrière, Carlos
Afonso, Stéphane Derrey, Stéphane Marret, Soumeya Bekri and Abdellah Tebani
Figure S1. Network analysis overview. Networks are built using Partial Correlation. The first network (“disease‐control”
network) is learned from disease profiles and control profiles. A second network composed of only control (“control‐only”
network). A third network is composed of control profiles and disease excluding one patient at a time (“Disease‐minus‐
one” network). This third network is built iteratively to cover all the patients. A final pruning stage subtracts edges from
the disease‐control network that are also found either in A) the control‐only network, outputting the disease‐specific
network B) “Disease‐minus‐one” specific network or C) Patient‐specific network.
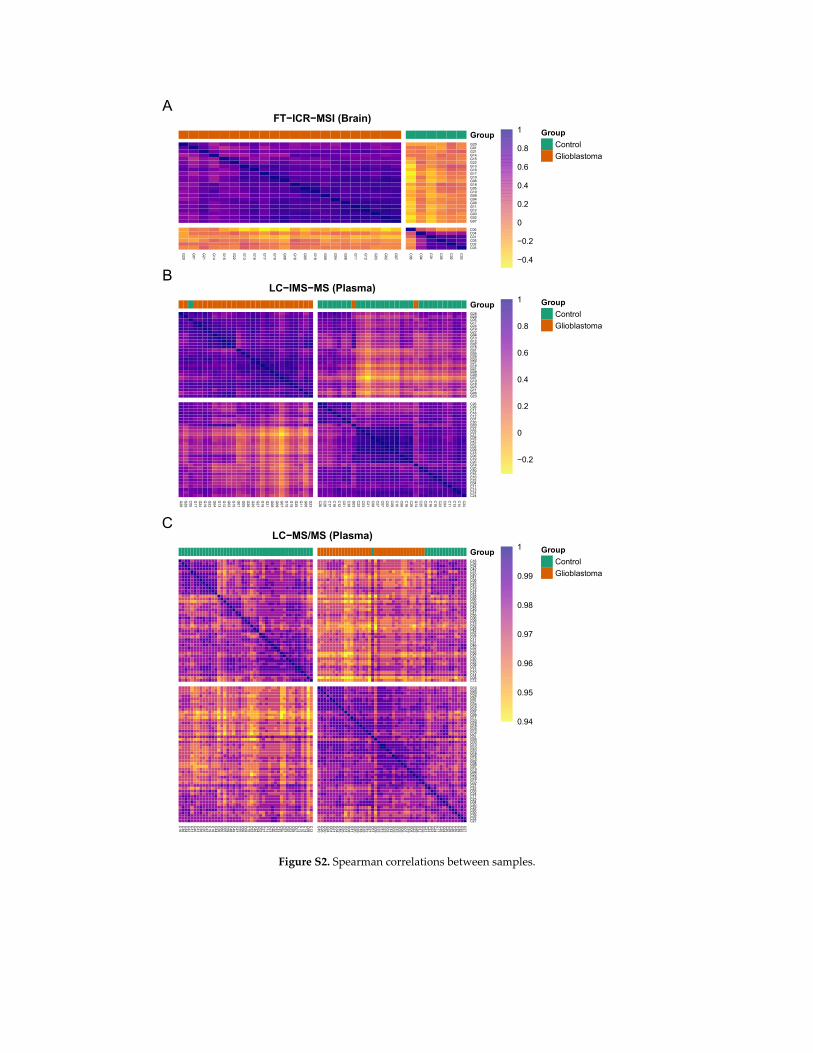
Figure S2. Spearman correlations between samples.
FT−ICR−MSI (Brain)
G20
G01
G21
G14
G15
G22
G13
G16
G17
G10
G06
G18
G05
G19
G09
G04
G08
G11
G12
G03
G02
G07
C06
C04
C01
C05
C02
C03
G20G01G21G14G15G22G13G16G17G10G06G18G05G19G09G04G08G11G12G03G02G07
C06C04C01C05C02C03
Group Group
Control
Glioblastoma
−0.4
−0.2
0
0.2
0.4
0.6
0.8
1
A
LC−IMS−MS (Plasma)
G28
G29
C05G17
G24
G19
G22
G04
G13
G12
G02
G15
G01
G05
G26
G20
G27
G16
G21
G08
G09
G07
G10
G18
G25
G11
G06
G23
C26C28C17C18C12C01C30G03
C22C03C21C08C27C07C02C09C15C06C19C20G14
C25C29C16C10C23C04C11C13C14C24
G28G29C05G17G24G19G22G04G13G12G02G15G01G05G26G20G27G16G21G08G09G07G10G18G25G11G06G23
C26C28C17C18C12C01C30G03C22C03C21C08C27C07C02C09C15C06C19C20G14C25C29C16C10C23C04C11C13C14C24
Group Group
Control
Glioblastoma
−0.2
0
0.2
0.4
0.6
0.8
1
B
LC−MS/MS (Plasma)
C16C36C34C42C31C40C41C38C35C43C19C18C44C28C60C05C59C48C49C47C55C06C09C15C52C45C54C02C37C11C51C46C32C33C56C57C50C53C58C07C13C10C14C08C12
G10
G26
G30
G24
G01
G21
G34
G16
G25
G31
G08
G11
G20
G29
G18
G35
G12
G27
C01G09
G33
G13
G23
G03
G14
G05
G15
G02
G06
G07
G19
G04
G22
G28
G17
G32
C21C23C03C24C17C25C04C20C29C26C30C39C22C27
C16C36C34C42C31C40C41C38C35C43C19C18C44C28C60C05C59C48C49C47C55C06C09C15C52C45C54C02C37C11C51C46C32C33C56C57C50C53C58C07C13C10C14C08C12
G10G26G30G24G01G21G34G16G25G31G08G11G20G29G18G35G12G27C01G09G33G13G23G03G14G05G15G02G06G07G19G04G22G28G17G32C21C23C03C24C17C25C04C20C29C26C30C39C22C27
Group Group
Control
Glioblastoma
0.94
0.95
0.96
0.97
0.98
0.99
1
C
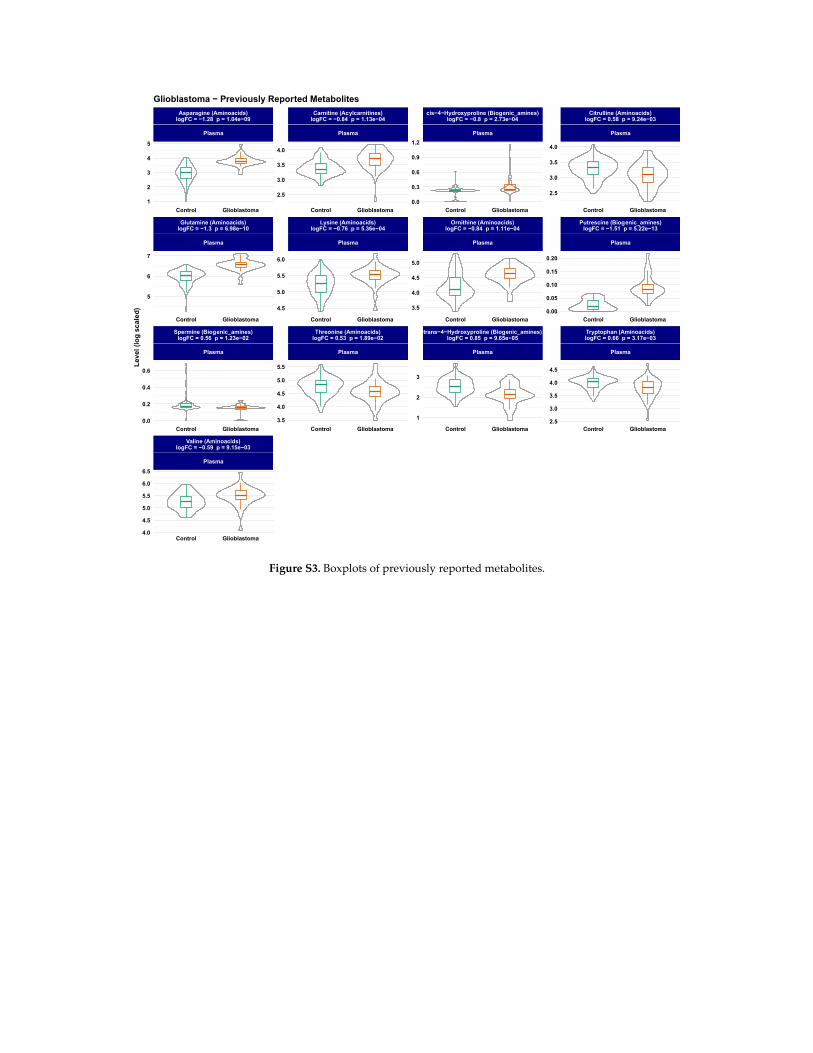
Figure S3. Boxplots of previously reported metabolites.
Valine (Aminoacids)logFC = −0.59 p = 9.15e−03
Plasma
Spermine (Biogenic_amines)logFC = 0.56 p = 1.23e−02
Plasma
Threonine (Aminoacids)logFC = 0.53 p = 1.89e−02
Plasma
trans−4−Hydroxyproline (Biogenic_amines)logFC = 0.85 p = 9.65e−05
Plasma
Tryptophan (Aminoacids)logFC = 0.66 p = 3.17e−03
Plasma
Glutamine (Aminoacids)logFC = −1.3 p = 6.98e−10
Plasma
Lysine (Aminoacids)logFC = −0.76 p = 5.36e−04
Plasma
Ornithine (Aminoacids)logFC = −0.84 p = 1.11e−04
Plasma
Putrescine (Biogenic_amines)logFC = −1.51 p = 5.22e−13
Plasma
Asparagine (Aminoacids)logFC = −1.28 p = 1.04e−09
Plasma
Carnitine (Acylcarnitines)logFC = −0.84 p = 1.13e−04
Plasma
cis−4−Hydroxyproline (Biogenic_amines)logFC = −0.8 p = 2.73e−04
Plasma
Citrulline (Aminoacids)logFC = 0.58 p = 9.24e−03
Plasma
Control Glioblastoma
Control Glioblastoma Control Glioblastoma Control Glioblastoma Control Glioblastoma
Control Glioblastoma Control Glioblastoma Control Glioblastoma Control Glioblastoma
Control Glioblastoma Control Glioblastoma Control Glioblastoma Control Glioblastoma
2.5
3.0
3.5
4.0
0.00
0.05
0.10
0.15
0.20
2.5
3.0
3.5
4.0
4.5
0.0
0.3
0.6
0.9
1.2
3.5
4.0
4.5
5.0
1
2
3
2.5
3.0
3.5
4.0
4.5
5.0
5.5
6.0
3.5
4.0
4.5
5.0
5.5
1
2
3
4
5
5
6
7
0.0
0.2
0.4
0.6
4.0
4.5
5.0
5.5
6.0
6.5
Lev
el (
log
sc
ale
d)
Glioblastoma − Previously Reported Metabolites
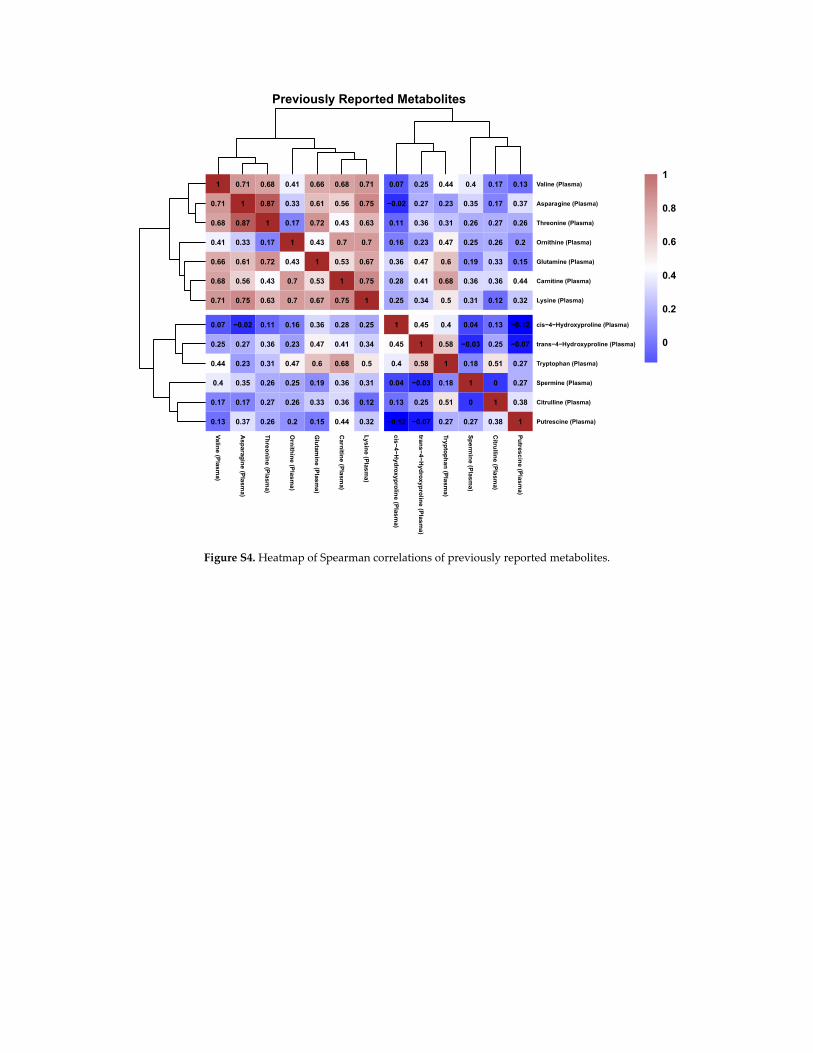
Figure S4. Heatmap of Spearman correlations of previously reported metabolites.
Previously Reported Metabolites
1
0.71
0.68
0.41
0.66
0.68
0.71
0.07
0.25
0.44
0.4
0.17
0.13
0.71
1
0.87
0.33
0.61
0.56
0.75
−0.02
0.27
0.23
0.35
0.17
0.37
0.68
0.87
1
0.17
0.72
0.43
0.63
0.11
0.36
0.31
0.26
0.27
0.26
0.41
0.33
0.17
1
0.43
0.7
0.7
0.16
0.23
0.47
0.25
0.26
0.2
0.66
0.61
0.72
0.43
1
0.53
0.67
0.36
0.47
0.6
0.19
0.33
0.15
0.68
0.56
0.43
0.7
0.53
1
0.75
0.28
0.41
0.68
0.36
0.36
0.44
0.71
0.75
0.63
0.7
0.67
0.75
1
0.25
0.34
0.5
0.31
0.12
0.32
0.07
−0.02
0.11
0.16
0.36
0.28
0.25
1
0.45
0.4
0.04
0.13
−0.12
0.25
0.27
0.36
0.23
0.47
0.41
0.34
0.45
1
0.58
−0.03
0.25
−0.07
0.44
0.23
0.31
0.47
0.6
0.68
0.5
0.4
0.58
1
0.18
0.51
0.27
0.4
0.35
0.26
0.25
0.19
0.36
0.31
0.04
−0.03
0.18
1
0
0.27
0.17
0.17
0.27
0.26
0.33
0.36
0.12
0.13
0.25
0.51
0
1
0.38
0.13
0.37
0.26
0.2
0.15
0.44
0.32
−0.12
−0.07
0.27
0.27
0.38
1
Va
line (P
lasm
a)
Asp
arag
ine
(Pla
sma
)
Th
reo
nin
e (Pla
sma)
Orn
ithin
e (P
las
ma
)
Glu
tamin
e (Plas
ma
)
Carn
itine
(Pla
sma)
Ly
sine (P
lasm
a)
cis−
4−H
ydro
xyp
rolin
e (Plas
ma)
trans−
4−
Hy
dro
xyp
rolin
e (P
las
ma
)
Tryp
top
han
(Pla
sma)
Sp
erm
ine (P
lasm
a)
Citru
lline
(Pla
sma)
Pu
tresc
ine
(Pla
sm
a)
Valine (Plasma)
Asparagine (Plasma)
Threonine (Plasma)
Ornithine (Plasma)
Glutamine (Plasma)
Carnitine (Plasma)
Lysine (Plasma)
cis−4−Hydroxyproline (Plasma)
trans−4−Hydroxyproline (Plasma)
Tryptophan (Plasma)
Spermine (Plasma)
Citrulline (Plasma)
Putrescine (Plasma)
0
0.2
0.4
0.6
0.8
1
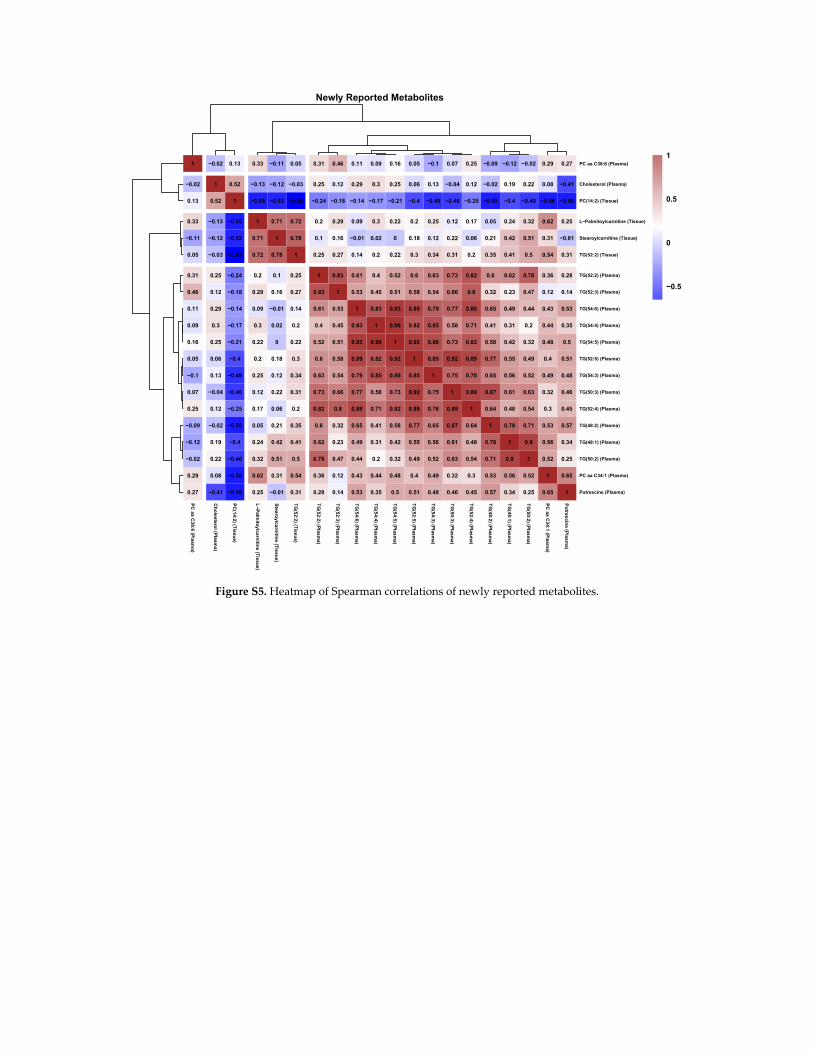
Figure S5. Heatmap of Spearman correlations of newly reported metabolites.
Newly Reported Metabolites
1
−0.02
0.13
0.33
−0.11
0.05
0.31
0.46
0.11
0.09
0.16
0.05
−0.1
0.07
0.25
−0.09
−0.12
−0.02
0.29
0.27
−0.02
1
0.52
−0.13
−0.12
−0.03
0.25
0.12
0.29
0.3
0.25
0.06
0.13
−0.04
0.12
−0.02
0.19
0.22
0.08
−0.41
0.13
0.52
1
−0.55
−0.53
−0.65
−0.24
−0.18
−0.14
−0.17
−0.21
−0.4
−0.49
−0.46
−0.25
−0.55
−0.4
−0.46
−0.56
−0.56
0.33
−0.13
−0.55
1
0.71
0.72
0.2
0.29
0.09
0.3
0.22
0.2
0.25
0.12
0.17
0.05
0.24
0.32
0.62
0.25
−0.11
−0.12
−0.53
0.71
1
0.78
0.1
0.16
−0.01
0.02
0
0.18
0.12
0.22
0.06
0.21
0.42
0.51
0.31
−0.01
0.05
−0.03
−0.65
0.72
0.78
1
0.25
0.27
0.14
0.2
0.22
0.3
0.34
0.31
0.2
0.35
0.41
0.5
0.54
0.31
0.31
0.25
−0.24
0.2
0.1
0.25
1
0.83
0.61
0.4
0.52
0.6
0.63
0.73
0.82
0.6
0.62
0.78
0.36
0.28
0.46
0.12
−0.18
0.29
0.16
0.27
0.83
1
0.53
0.45
0.51
0.58
0.54
0.66
0.8
0.32
0.23
0.47
0.12
0.14
0.11
0.29
−0.14
0.09
−0.01
0.14
0.61
0.53
1
0.83
0.93
0.89
0.79
0.77
0.88
0.65
0.49
0.44
0.43
0.53
0.09
0.3
−0.17
0.3
0.02
0.2
0.4
0.45
0.83
1
0.96
0.82
0.85
0.58
0.71
0.41
0.31
0.2
0.44
0.35
0.16
0.25
−0.21
0.22
0
0.22
0.52
0.51
0.93
0.96
1
0.92
0.86
0.73
0.82
0.58
0.42
0.32
0.48
0.5
0.05
0.06
−0.4
0.2
0.18
0.3
0.6
0.58
0.89
0.82
0.92
1
0.85
0.92
0.89
0.77
0.55
0.49
0.4
0.51
−0.1
0.13
−0.49
0.25
0.12
0.34
0.63
0.54
0.79
0.85
0.86
0.85
1
0.75
0.78
0.65
0.56
0.52
0.49
0.48
0.07
−0.04
−0.46
0.12
0.22
0.31
0.73
0.66
0.77
0.58
0.73
0.92
0.75
1
0.89
0.87
0.61
0.63
0.32
0.46
0.25
0.12
−0.25
0.17
0.06
0.2
0.82
0.8
0.88
0.71
0.82
0.89
0.78
0.89
1
0.64
0.48
0.54
0.3
0.45
−0.09
−0.02
−0.55
0.05
0.21
0.35
0.6
0.32
0.65
0.41
0.58
0.77
0.65
0.87
0.64
1
0.78
0.71
0.53
0.57
−0.12
0.19
−0.4
0.24
0.42
0.41
0.62
0.23
0.49
0.31
0.42
0.55
0.56
0.61
0.48
0.78
1
0.9
0.56
0.34
−0.02
0.22
−0.46
0.32
0.51
0.5
0.78
0.47
0.44
0.2
0.32
0.49
0.52
0.63
0.54
0.71
0.9
1
0.52
0.25
0.29
0.08
−0.56
0.62
0.31
0.54
0.36
0.12
0.43
0.44
0.48
0.4
0.49
0.32
0.3
0.53
0.56
0.52
1
0.65
0.27
−0.41
−0.56
0.25
−0.01
0.31
0.28
0.14
0.53
0.35
0.5
0.51
0.48
0.46
0.45
0.57
0.34
0.25
0.65
1
PC
aa C
38:6
(Plasm
a)
Ch
ole
sterol (P
lasm
a)
PC
(14:2
) (Tiss
ue)
L−
Palm
itoy
lcarn
itine (T
issu
e)
Stea
roylcarn
itine
(Tis
sue
)
TG
(52:2
) (Tiss
ue)
TG
(52:2
) (Plasm
a)
TG
(52:3
) (Plasm
a)
TG
(54:6
) (Plasm
a)
TG
(54:4
) (Plasm
a)
TG
(54:5
) (Plasm
a)
TG
(52:5
) (Plasm
a)
TG
(54:3
) (Plasm
a)
TG
(50:3
) (Plasm
a)
TG
(52:4
) (Plasm
a)
TG
(48:2
) (Plasm
a)
TG
(48:1
) (Plasm
a)
TG
(50:2
) (Plasm
a)
PC
aa C
34:1
(Plasm
a)
Pu
trescin
e (P
las
ma)
PC aa C38:6 (Plasma)
Cholesterol (Plasma)
PC(14:2) (Tissue)
L−Palmitoylcarnitine (Tissue)
Stearoylcarnitine (Tissue)
TG(52:2) (Tissue)
TG(52:2) (Plasma)
TG(52:3) (Plasma)
TG(54:6) (Plasma)
TG(54:4) (Plasma)
TG(54:5) (Plasma)
TG(52:5) (Plasma)
TG(54:3) (Plasma)
TG(50:3) (Plasma)
TG(52:4) (Plasma)
TG(48:2) (Plasma)
TG(48:1) (Plasma)
TG(50:2) (Plasma)
PC aa C34:1 (Plasma)
Putrescine (Plasma)
−0.5
0
0.5
1
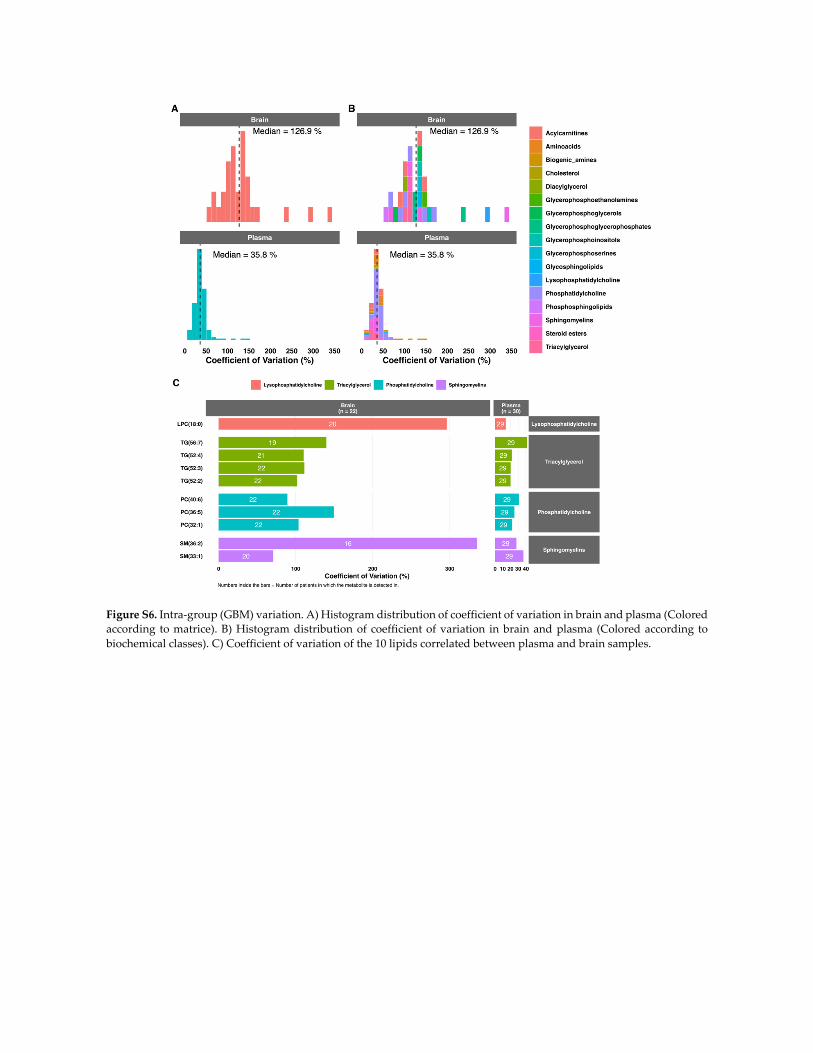
Figure S6. Intra‐group (GBM) variation. A) Histogram distribution of coefficient of variation in brain and plasma (Colored
according to matrice). B) Histogram distribution of coefficient of variation in brain and plasma (Colored according to
biochemical classes). C) Coefficient of variation of the 10 lipids correlated between plasma and brain samples.
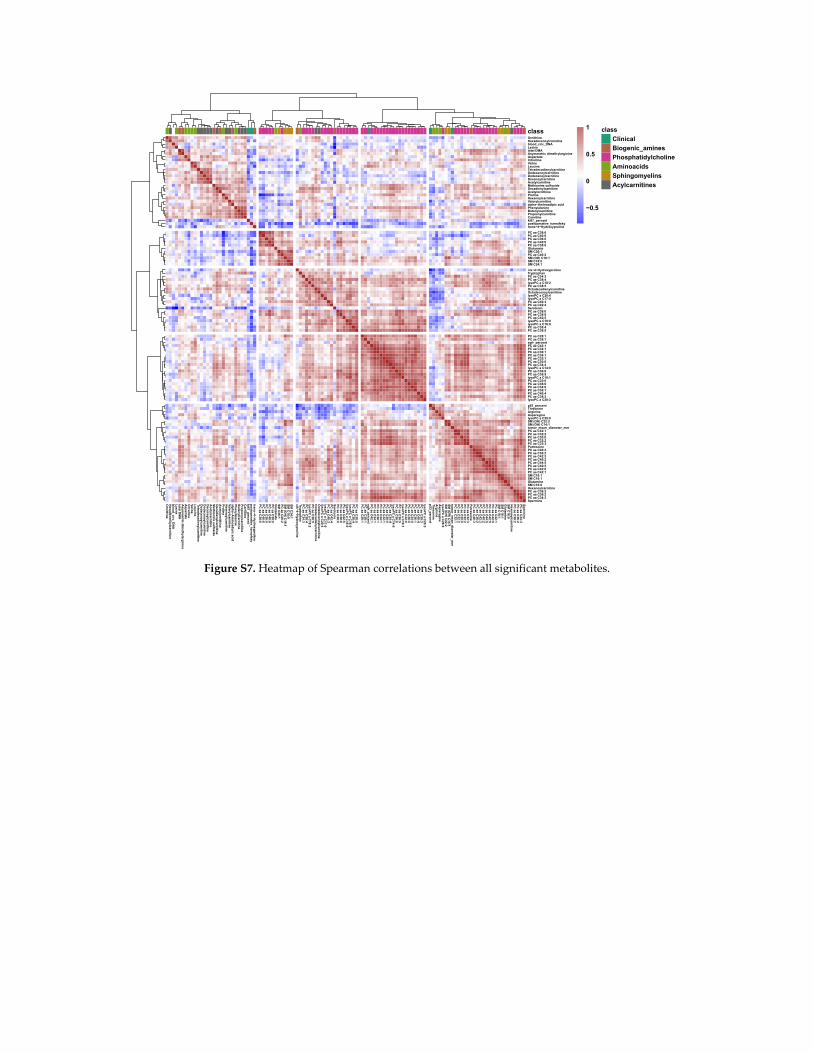
Figure S7. Heatmap of Spearman correlations between all significant metabolites.
Orn
ithin
eH
exad
ece
no
ylcarn
itine
blo
od
_circ_
DN
AL
ysine
total D
MA
As
ymm
etric dim
ethylarg
inin
eA
sp
artate
Citru
lline
Valin
eL
eucin
eT
etradeca
dien
ylcarn
itine
Do
dece
no
ylcarn
itine
Do
deca
no
ylcarn
itine
De
cen
oylca
rnitin
eA
cetylca
rnitin
eM
ethio
nin
e sulfo
xide
De
cad
ien
ylcarnitin
eA
cetylo
rnith
ine
Pro
line
He
xen
oylc
arnitin
eV
alerylcarn
itine
alp
ha−
Am
ino
adip
ic ac
idP
hen
ylalanin
eB
ute
nylc
arnitin
eP
rop
ion
ylcarn
itine
Ca
rnitin
ek
i67_p
ercen
tp
osto
perative
_karn
ofsky
tran
s−
4−H
ydro
xyp
rolin
e
PC
aa C
38:6
PC
aa C
40:6
PC
aa C
36:0
PC
ae C
40:6
PC
aa C
38:0
Glu
tamate
SM
C26
:1P
C a
e C40
:2S
M (O
H) C
16:1
SM
C18
:0S
M C
24:1
cis−
4−H
ydro
xypro
line
Trypto
ph
anP
C a
e C34
:3P
C a
e C38
:4lys
oP
C a
C18
:2P
C a
e C38
:5O
ctad
ecad
ien
ylcarnitin
eO
ctad
ecen
oylca
rnitin
elys
oP
C a
C20
:4lys
oP
C a
C17
:0P
C a
a C40
:3P
C a
a C42
:4S
ero
ton
inP
C a
e C38
:0P
C a
e C38
:6P
C a
a C42
:5lys
oP
C a
C18
:0lys
oP
C a
C16
:0P
C a
a C38
:4P
C a
a C38
:5
PC
aa C
28:1
PC
ae C
38:1
eg
fr_p
ercen
tP
C a
e C42
:1P
C a
a C34
:1P
C a
a C36
:1P
C a
e C34
:1P
C a
a C32
:1P
C a
a C30
:0P
C a
a C34
:4lys
oP
C a
C14
:0P
C a
a C36
:6P
C a
a C36
:5lys
oP
C a
C16
:1P
C a
a C32
:0P
C a
e C36
:0P
C a
e C34
:0P
C a
e C36
:1P
C a
a C40
:4P
C a
e C38
:3lys
oP
C a
C20
:3
p53
_perce
nt
Th
reo
nin
eA
rgin
ine
As
pa
rag
ine
lyso
PC
a C
28:0
SM
(OH
) C22
:2S
M (O
H) C
14:1
tum
or_
mean
_d
iameter_m
mP
C a
e C32
:1P
C a
e C32
:2P
C a
e C30
:0P
C a
a C32
:2P
C a
a C32
:3P
utres
cine
PC
ae C
40:3
PC
ae C
36:2
PC
ae C
42:3
PC
aa C
40:2
PC
ae C
44:5
PC
ae C
42:5
PC
aa C
42:0
PC
aa C
42:1
SM
C18
:1S
M C
16:1
Glu
tamin
eS
M C
16:0
He
xano
ylc
arn
itine
PC
ae C
38:2
PC
aa C
36:2
PC
aa C
34:3
Sp
ermin
e
OrnithineHexadecenoylcarnitineblood_circ_DNALysinetotal DMAAsymmetric dimethylarginineAspartateCitrullineValineLeucineTetradecadienylcarnitineDodecenoylcarnitineDodecanoylcarnitineDecenoylcarnitineAcetylcarnitineMethionine sulfoxideDecadienylcarnitineAcetylornithineProlineHexenoylcarnitineValerylcarnitinealpha−Aminoadipic acidPhenylalanineButenylcarnitinePropionylcarnitineCarnitineki67_percentpostoperative_karnofskytrans−4−Hydroxyproline
PC aa C38:6PC aa C40:6PC aa C36:0PC ae C40:6PC aa C38:0GlutamateSM C26:1PC ae C40:2SM (OH) C16:1SM C18:0SM C24:1
cis−4−HydroxyprolineTryptophanPC ae C34:3PC ae C38:4lysoPC a C18:2PC ae C38:5OctadecadienylcarnitineOctadecenoylcarnitinelysoPC a C20:4lysoPC a C17:0PC aa C40:3PC aa C42:4SerotoninPC ae C38:0PC ae C38:6PC aa C42:5lysoPC a C18:0lysoPC a C16:0PC aa C38:4PC aa C38:5
PC aa C28:1PC ae C38:1egfr_percentPC ae C42:1PC aa C34:1PC aa C36:1PC ae C34:1PC aa C32:1PC aa C30:0PC aa C34:4lysoPC a C14:0PC aa C36:6PC aa C36:5lysoPC a C16:1PC aa C32:0PC ae C36:0PC ae C34:0PC ae C36:1PC aa C40:4PC ae C38:3lysoPC a C20:3
p53_percentThreonineArginineAsparaginelysoPC a C28:0SM (OH) C22:2SM (OH) C14:1tumor_mean_diameter_mmPC ae C32:1PC ae C32:2PC ae C30:0PC aa C32:2PC aa C32:3PutrescinePC ae C40:3PC ae C36:2PC ae C42:3PC aa C40:2PC ae C44:5PC ae C42:5PC aa C42:0PC aa C42:1SM C18:1SM C16:1GlutamineSM C16:0HexanoylcarnitinePC ae C38:2PC aa C36:2PC aa C34:3Spermine
class class
Clinical
Biogenic_amines
Phosphatidylcholine
Aminoacids
Sphingomyelins
Acylcarnitines
−0.5
0
0.5
1
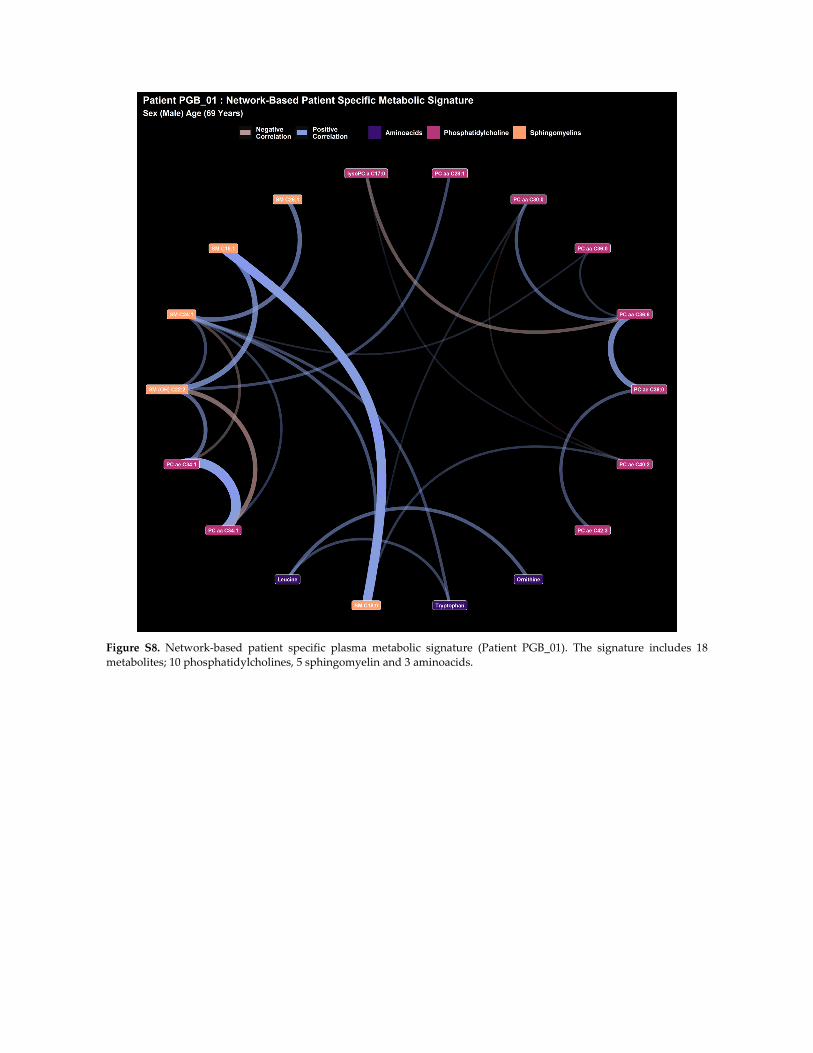
Figure S8. Network‐based patient specific plasma metabolic signature (Patient PGB_01). The signature includes 18
metabolites; 10 phosphatidylcholines, 5 sphingomyelin and 3 aminoacids.
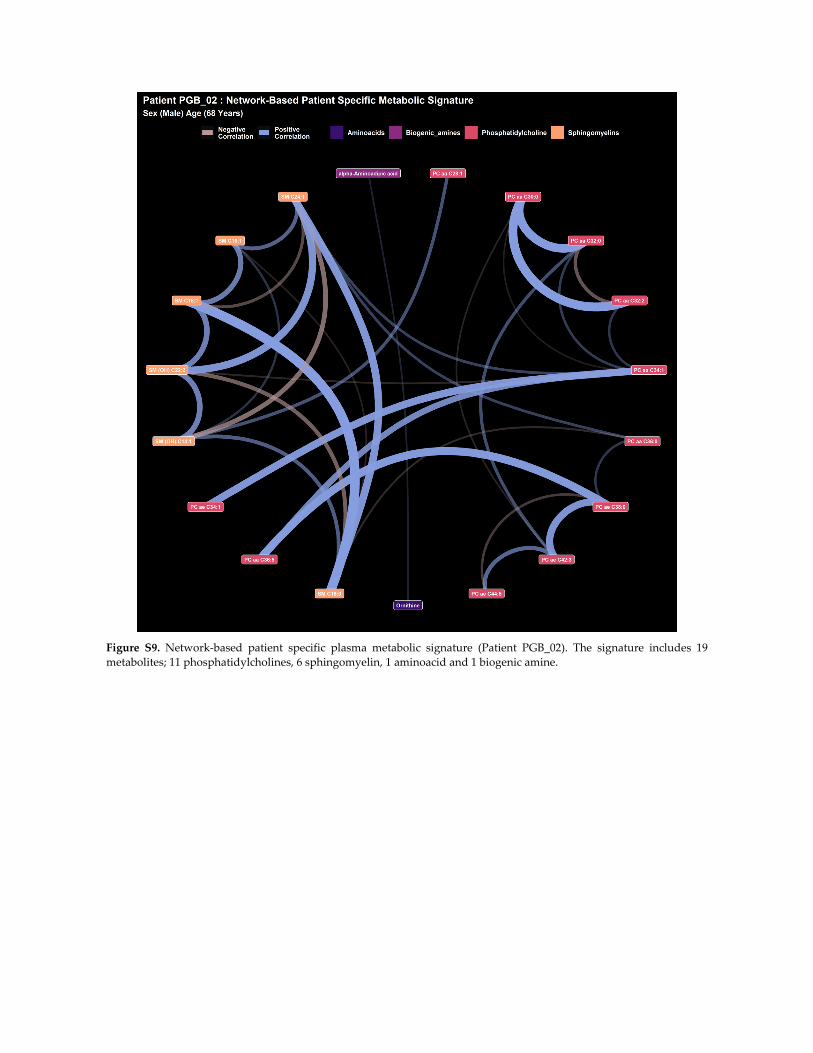
Figure S9. Network‐based patient specific plasma metabolic signature (Patient PGB_02). The signature includes 19
metabolites; 11 phosphatidylcholines, 6 sphingomyelin, 1 aminoacid and 1 biogenic amine.
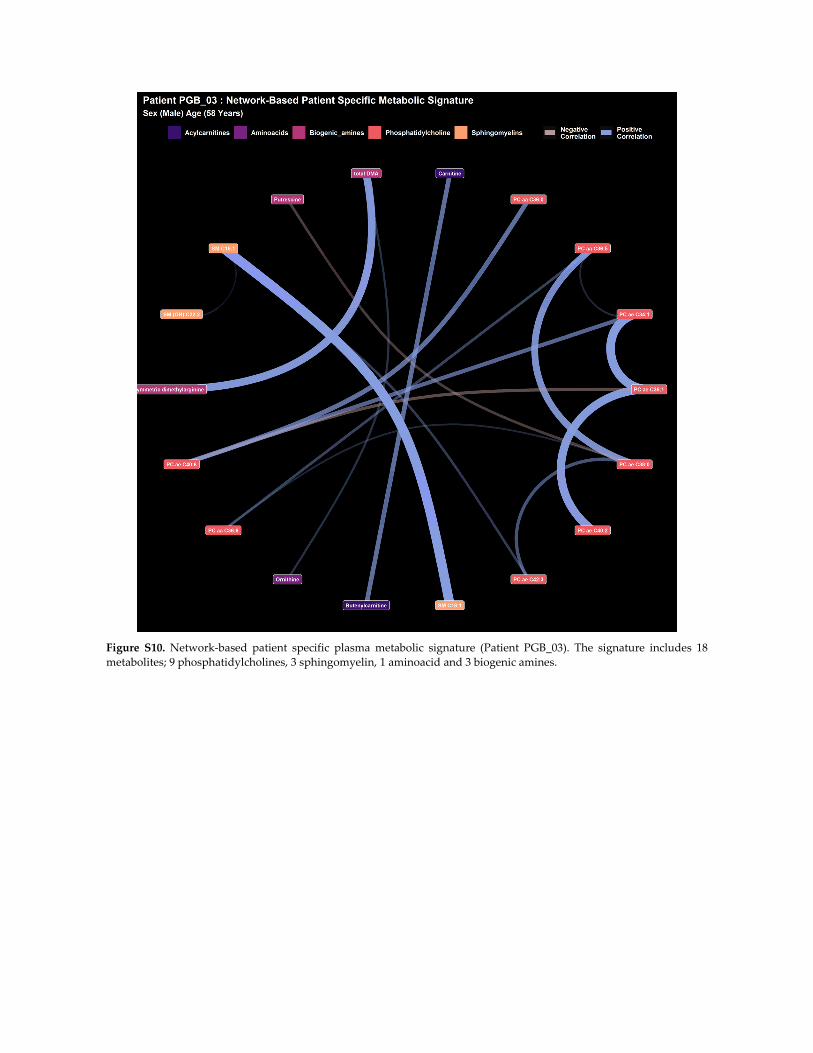
Figure S10. Network‐based patient specific plasma metabolic signature (Patient PGB_03). The signature includes 18
metabolites; 9 phosphatidylcholines, 3 sphingomyelin, 1 aminoacid and 3 biogenic amines.
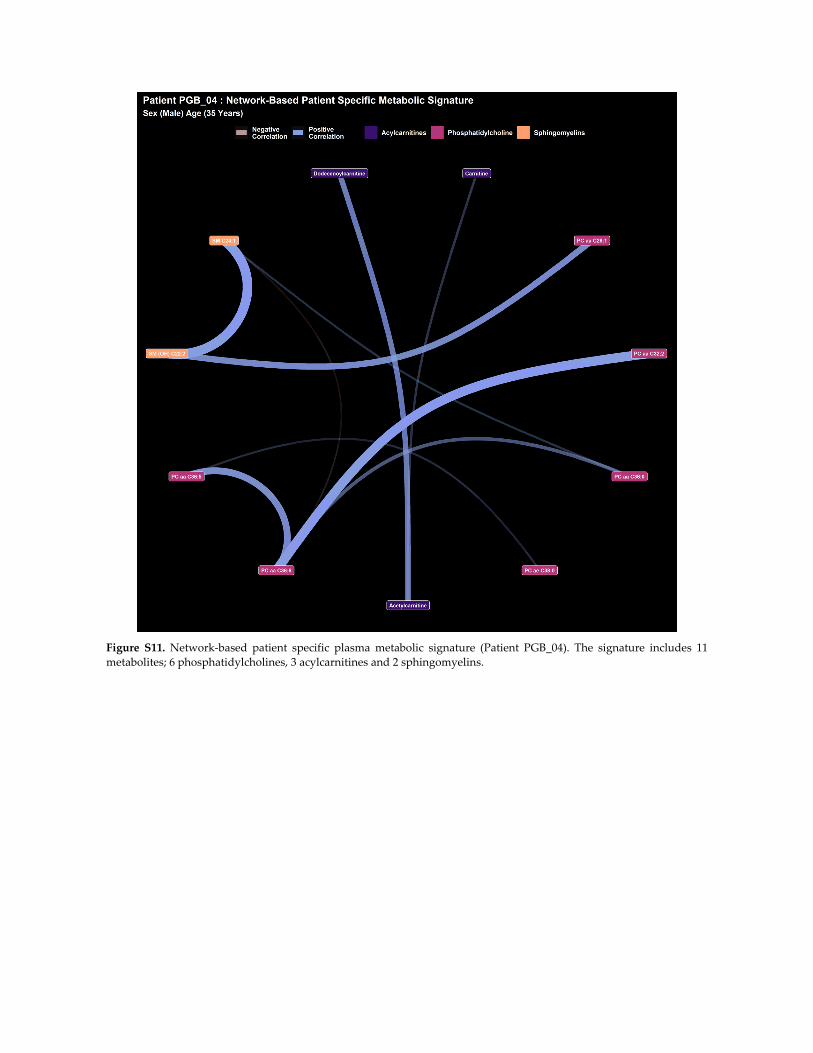
Figure S11. Network‐based patient specific plasma metabolic signature (Patient PGB_04). The signature includes 11
metabolites; 6 phosphatidylcholines, 3 acylcarnitines and 2 sphingomyelins.
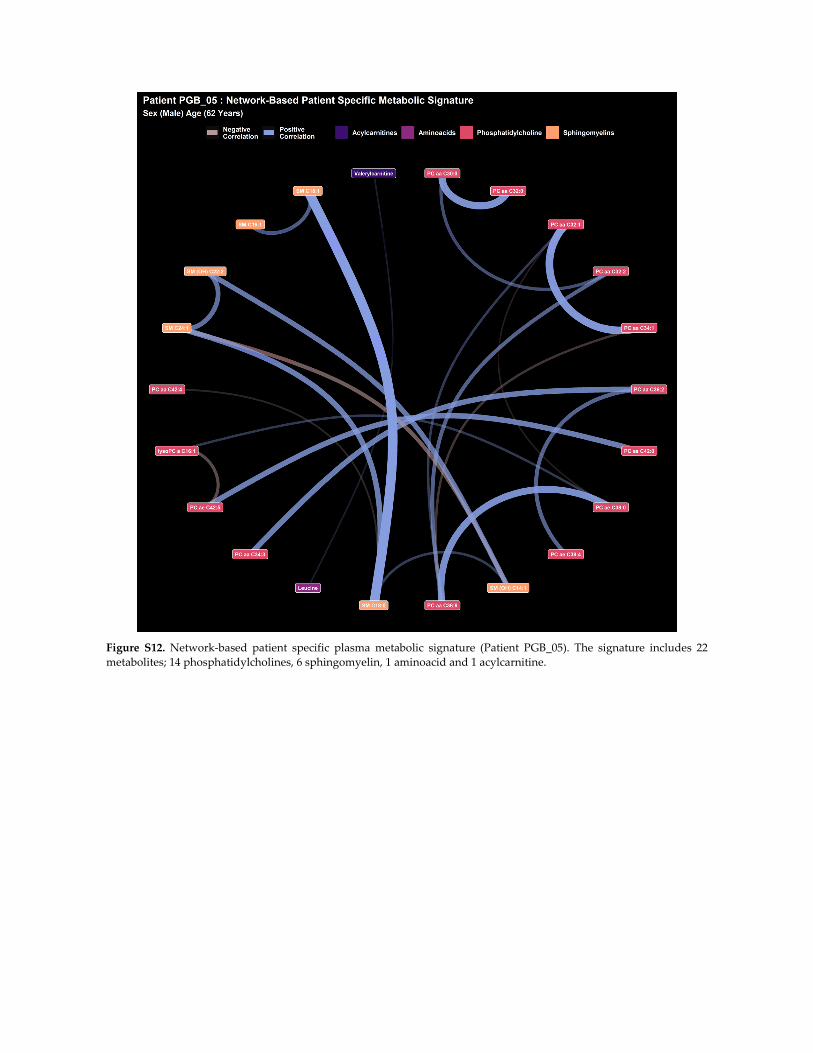
Figure S12. Network‐based patient specific plasma metabolic signature (Patient PGB_05). The signature includes 22
metabolites; 14 phosphatidylcholines, 6 sphingomyelin, 1 aminoacid and 1 acylcarnitine.
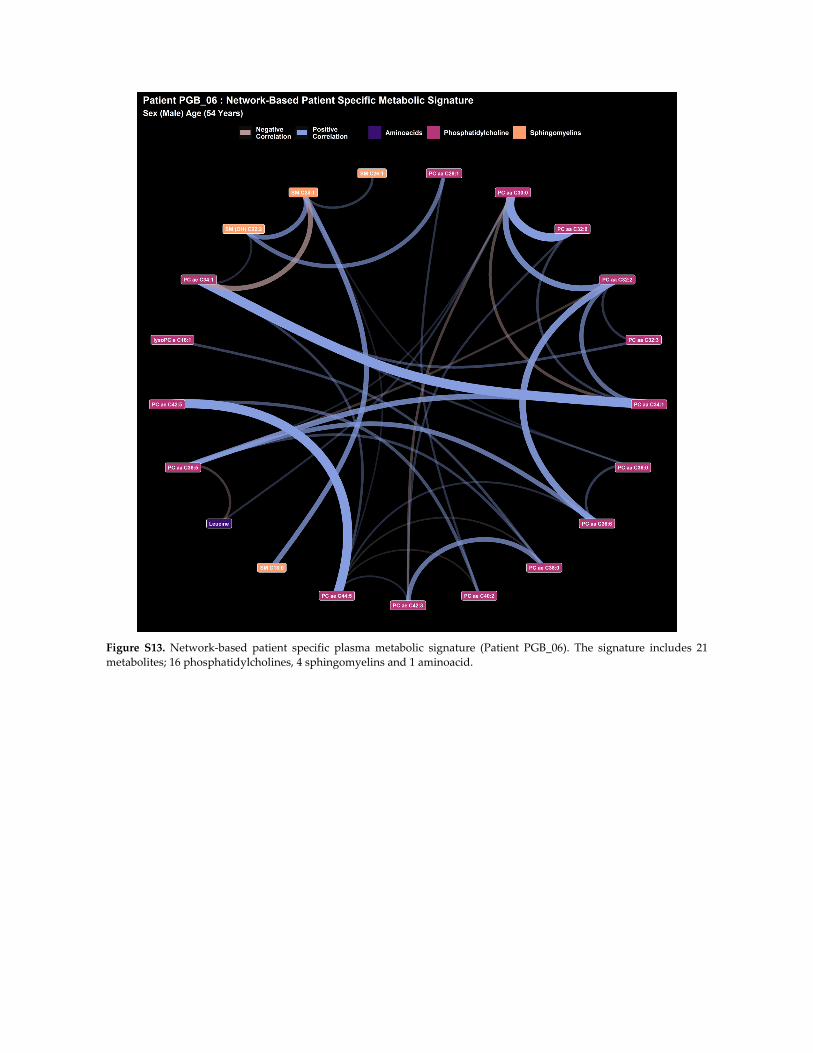
Figure S13. Network‐based patient specific plasma metabolic signature (Patient PGB_06). The signature includes 21
metabolites; 16 phosphatidylcholines, 4 sphingomyelins and 1 aminoacid.

Figure S14. Network‐based patient specific plasma metabolic signature (Patient PGB_07). The signature includes 24
metabolites; 16 phosphatidylcholines, 6 sphingomyelins and 2 biogenic amines.
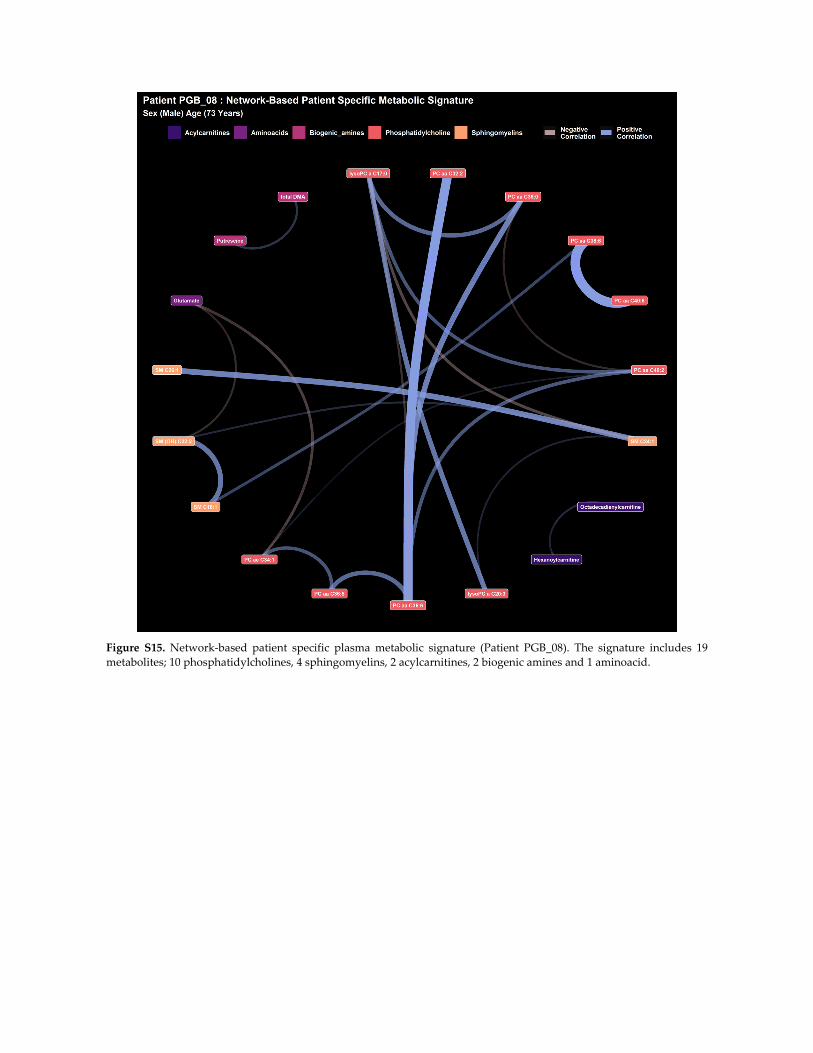
Figure S15. Network‐based patient specific plasma metabolic signature (Patient PGB_08). The signature includes 19
metabolites; 10 phosphatidylcholines, 4 sphingomyelins, 2 acylcarnitines, 2 biogenic amines and 1 aminoacid.
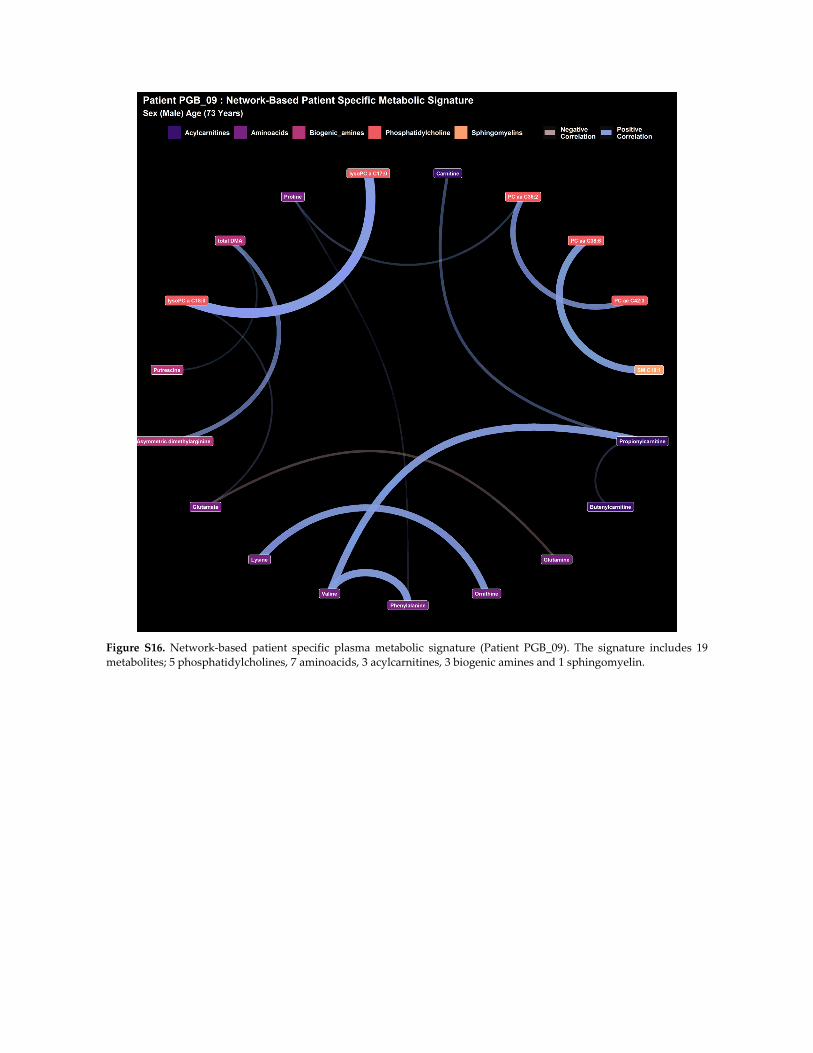
Figure S16. Network‐based patient specific plasma metabolic signature (Patient PGB_09). The signature includes 19
metabolites; 5 phosphatidylcholines, 7 aminoacids, 3 acylcarnitines, 3 biogenic amines and 1 sphingomyelin.
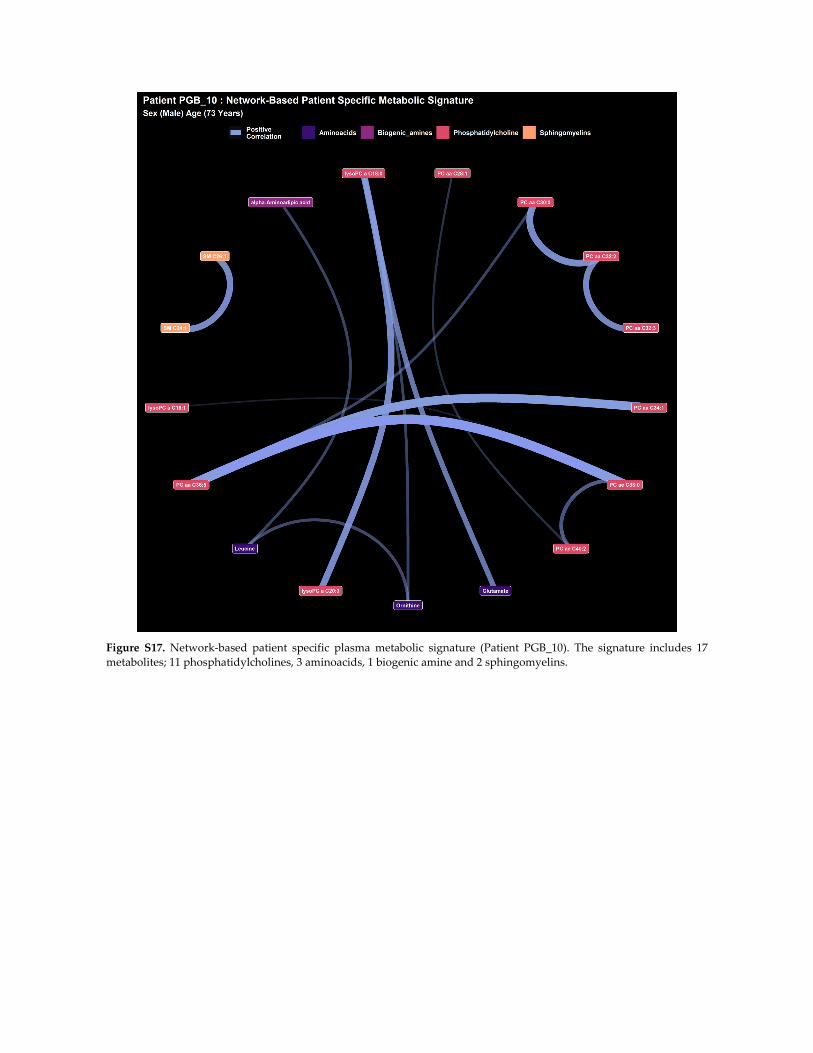
Figure S17. Network‐based patient specific plasma metabolic signature (Patient PGB_10). The signature includes 17
metabolites; 11 phosphatidylcholines, 3 aminoacids, 1 biogenic amine and 2 sphingomyelins.
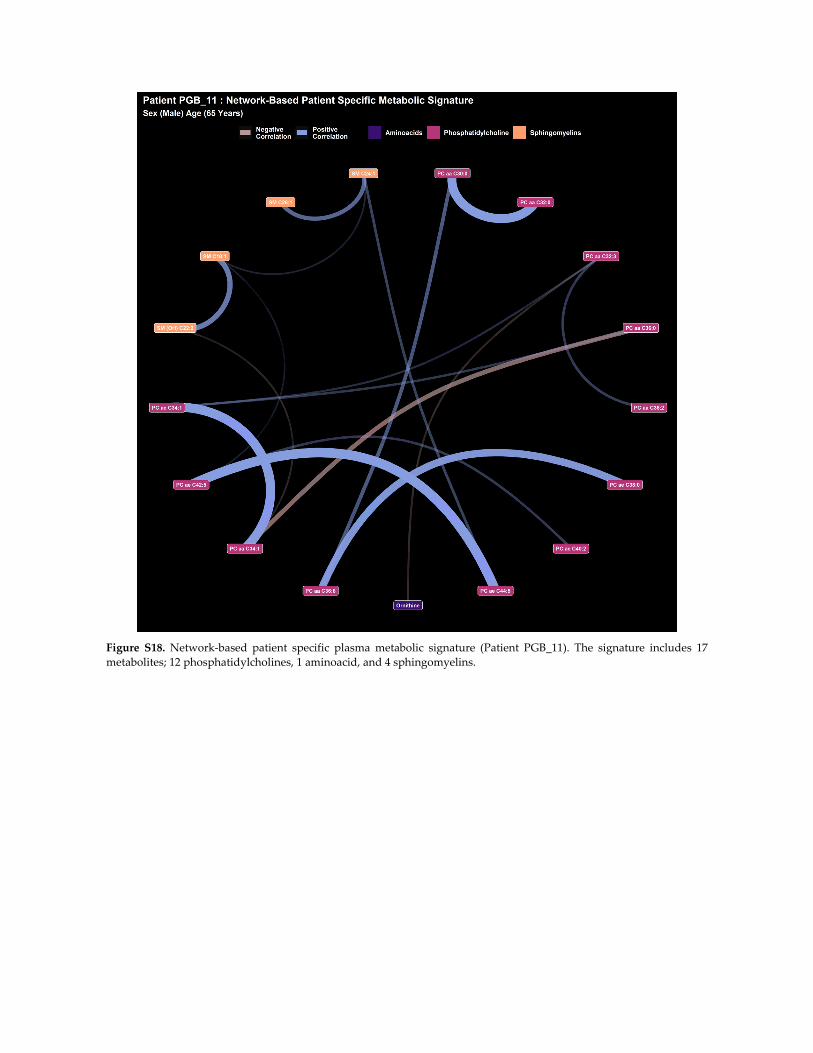
Figure S18. Network‐based patient specific plasma metabolic signature (Patient PGB_11). The signature includes 17
metabolites; 12 phosphatidylcholines, 1 aminoacid, and 4 sphingomyelins.

Figure S19. Network‐based patient specific plasma metabolic signature (Patient PGB_12). The signature includes 12
metabolites; 8 phosphatidylcholines, 2 aminoacids, 1 biogenic amine and 2 sphingomyelins.
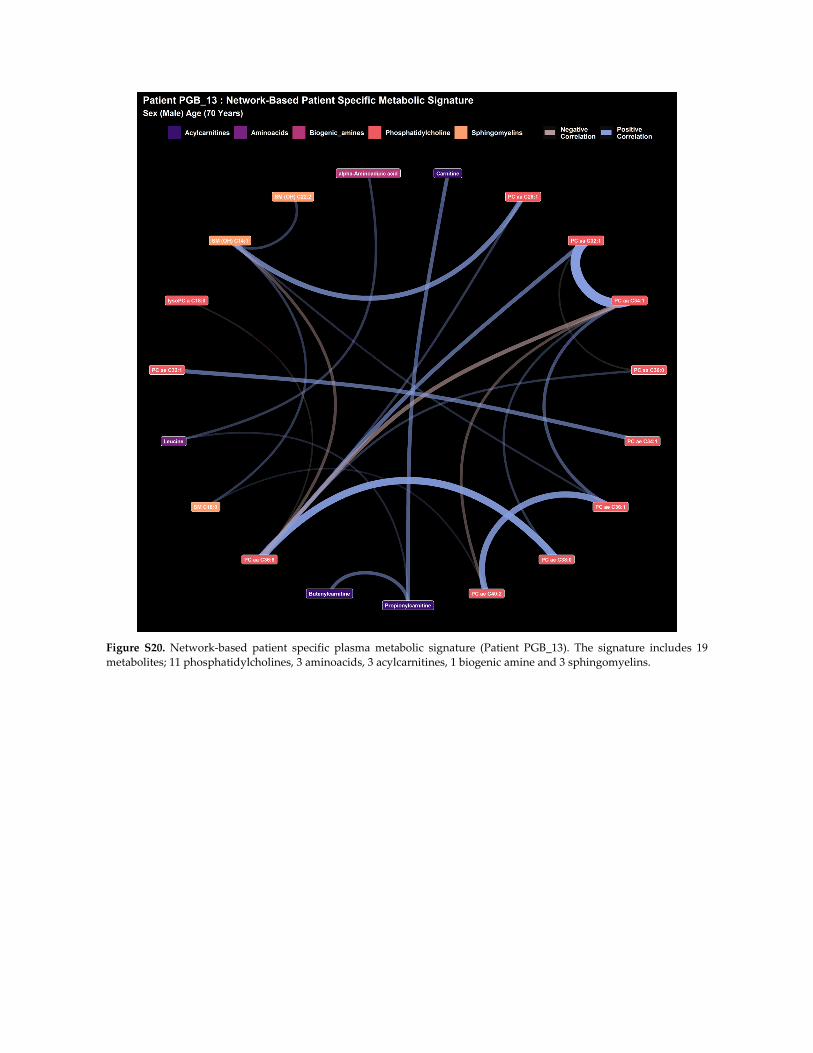
Figure S20. Network‐based patient specific plasma metabolic signature (Patient PGB_13). The signature includes 19
metabolites; 11 phosphatidylcholines, 3 aminoacids, 3 acylcarnitines, 1 biogenic amine and 3 sphingomyelins.
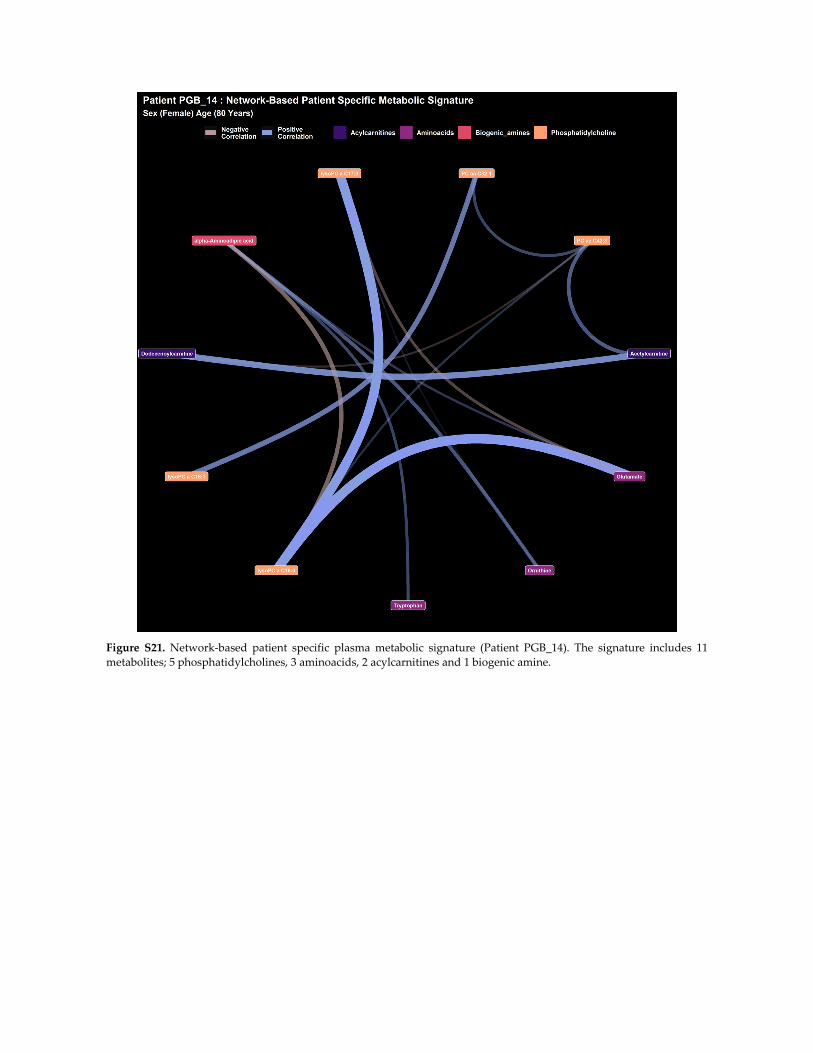
Figure S21. Network‐based patient specific plasma metabolic signature (Patient PGB_14). The signature includes 11
metabolites; 5 phosphatidylcholines, 3 aminoacids, 2 acylcarnitines and 1 biogenic amine.
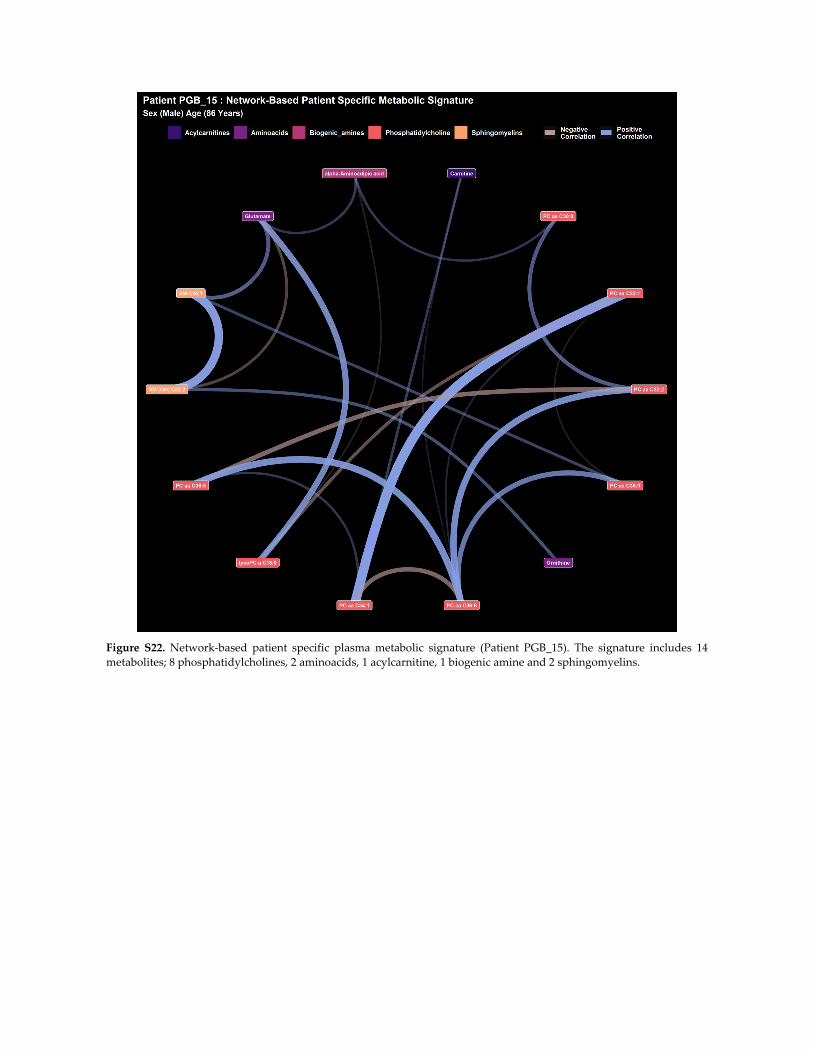
Figure S22. Network‐based patient specific plasma metabolic signature (Patient PGB_15). The signature includes 14
metabolites; 8 phosphatidylcholines, 2 aminoacids, 1 acylcarnitine, 1 biogenic amine and 2 sphingomyelins.
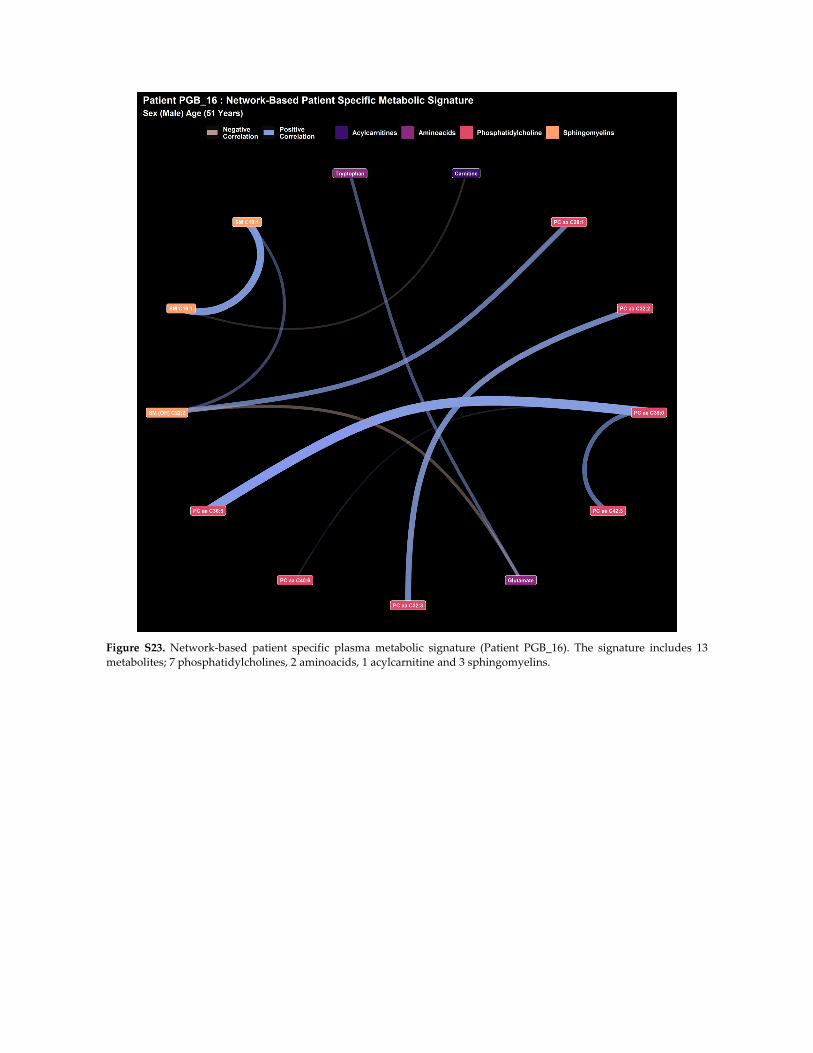
Figure S23. Network‐based patient specific plasma metabolic signature (Patient PGB_16). The signature includes 13
metabolites; 7 phosphatidylcholines, 2 aminoacids, 1 acylcarnitine and 3 sphingomyelins.
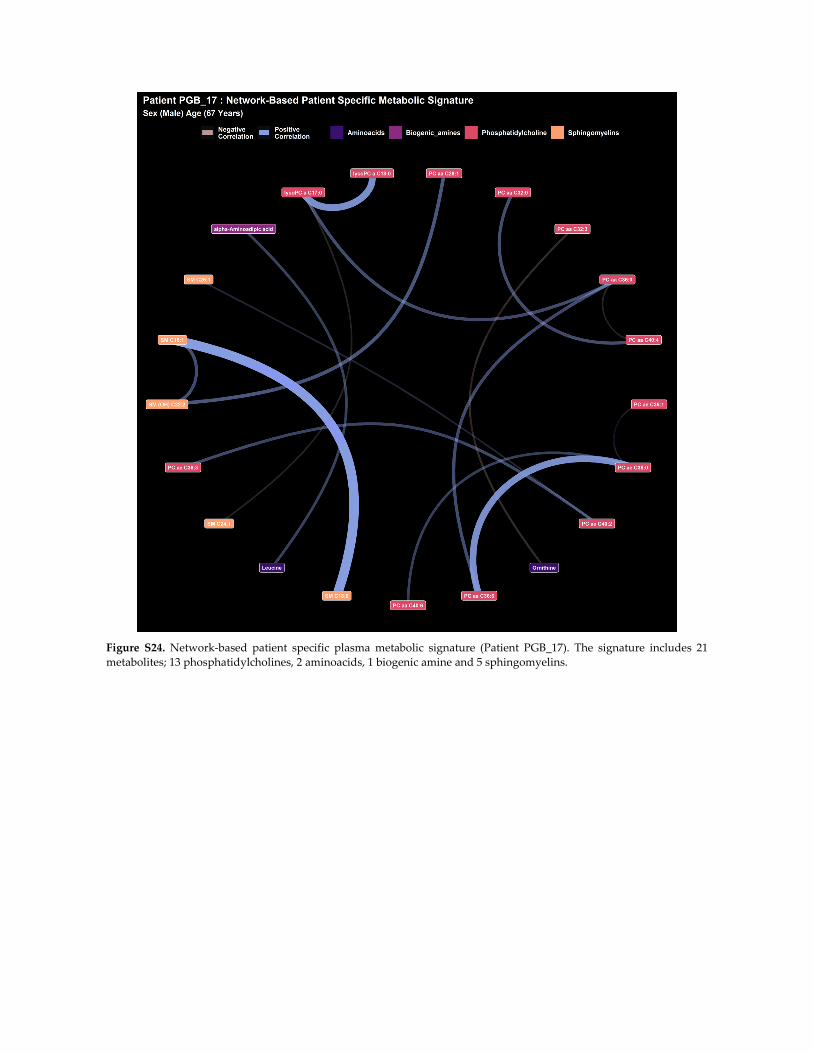
Figure S24. Network‐based patient specific plasma metabolic signature (Patient PGB_17). The signature includes 21
metabolites; 13 phosphatidylcholines, 2 aminoacids, 1 biogenic amine and 5 sphingomyelins.
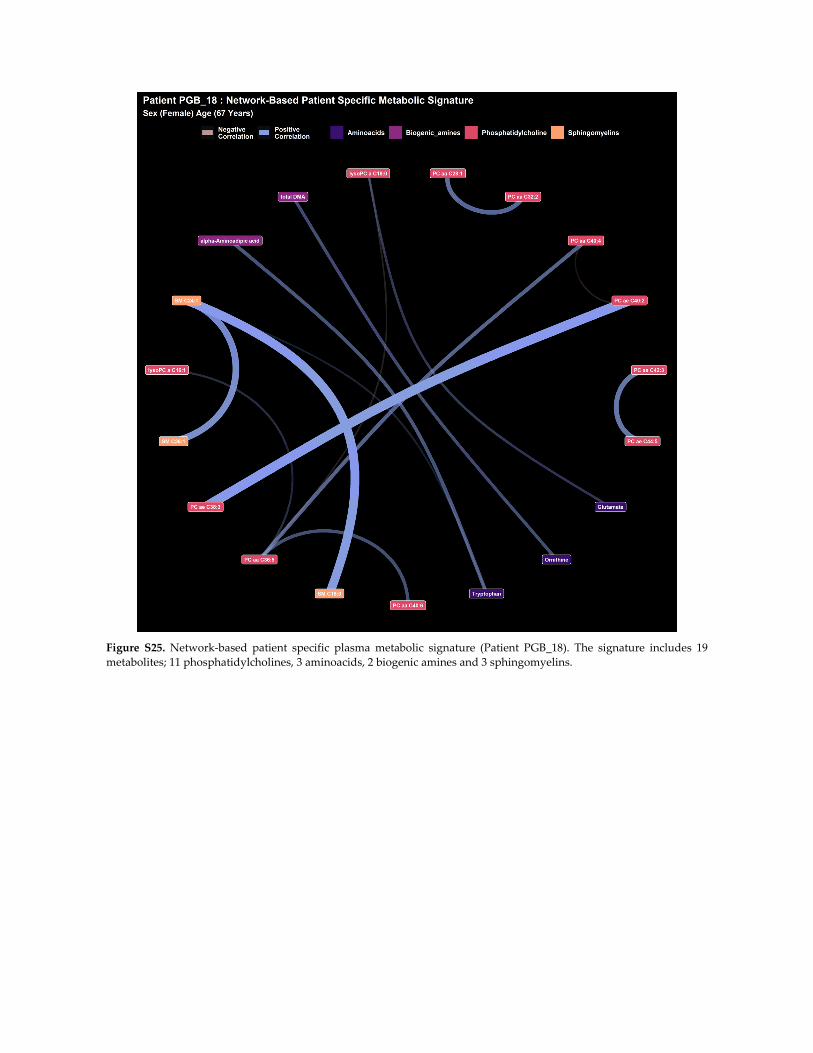
Figure S25. Network‐based patient specific plasma metabolic signature (Patient PGB_18). The signature includes 19
metabolites; 11 phosphatidylcholines, 3 aminoacids, 2 biogenic amines and 3 sphingomyelins.
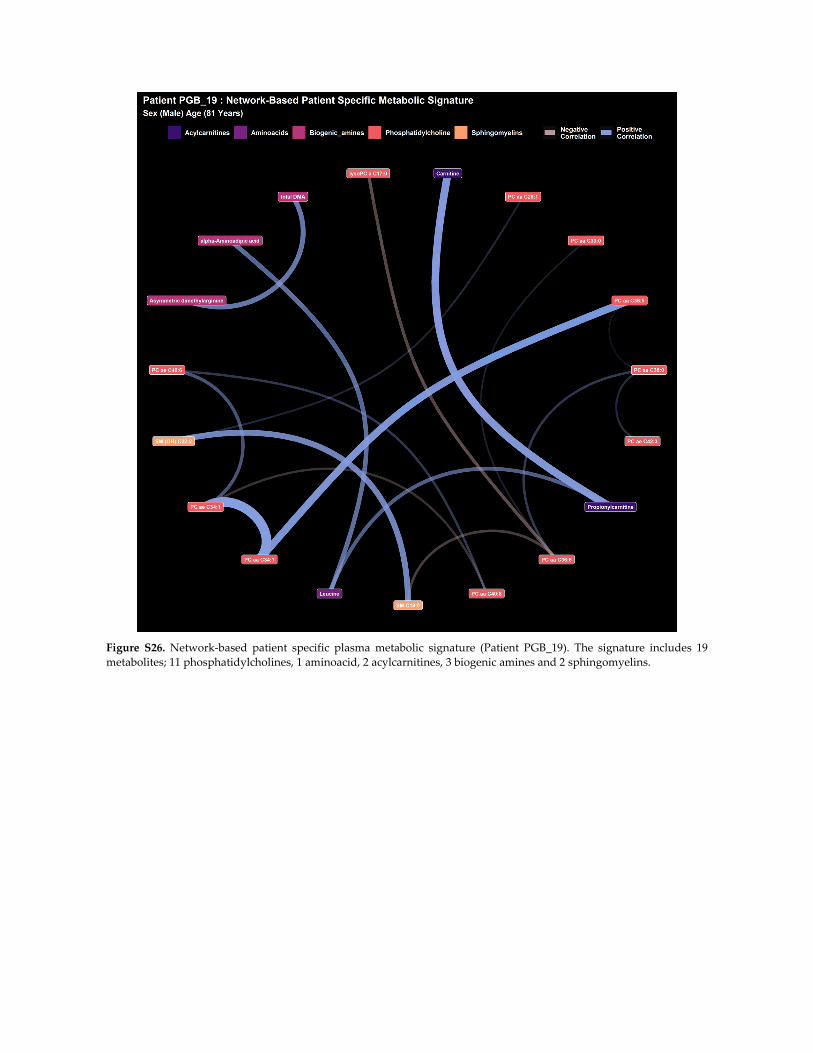
Figure S26. Network‐based patient specific plasma metabolic signature (Patient PGB_19). The signature includes 19
metabolites; 11 phosphatidylcholines, 1 aminoacid, 2 acylcarnitines, 3 biogenic amines and 2 sphingomyelins.
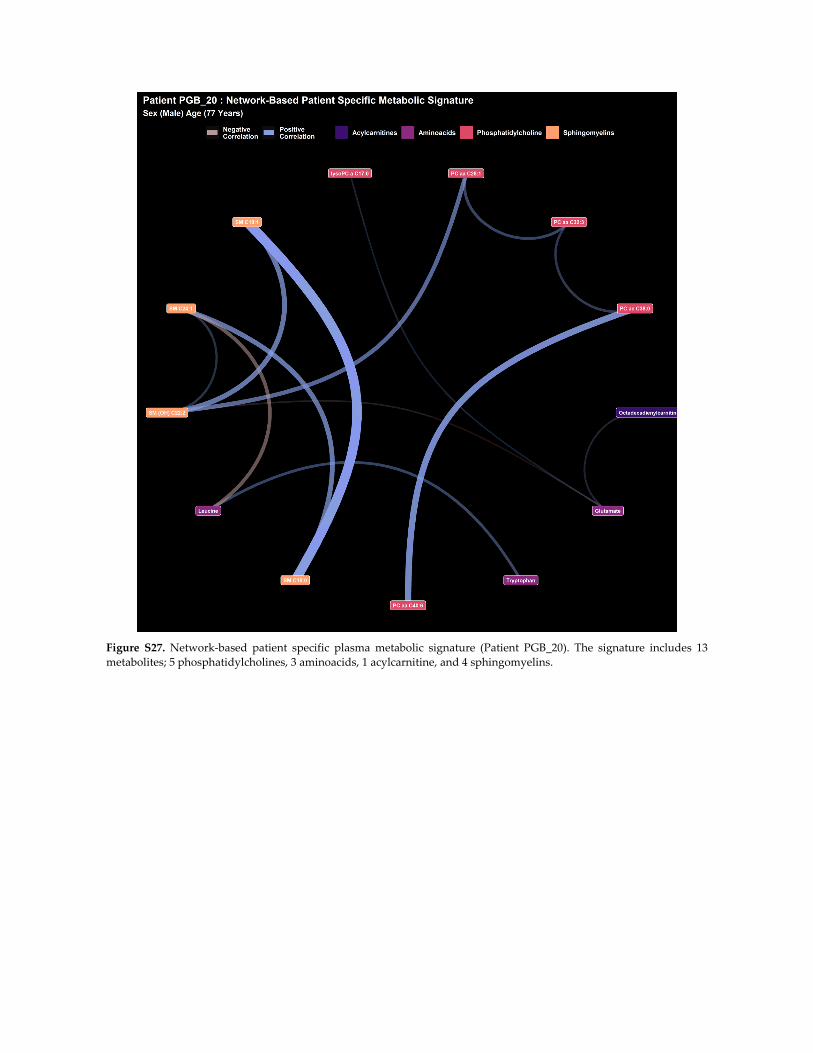
Figure S27. Network‐based patient specific plasma metabolic signature (Patient PGB_20). The signature includes 13
metabolites; 5 phosphatidylcholines, 3 aminoacids, 1 acylcarnitine, and 4 sphingomyelins.
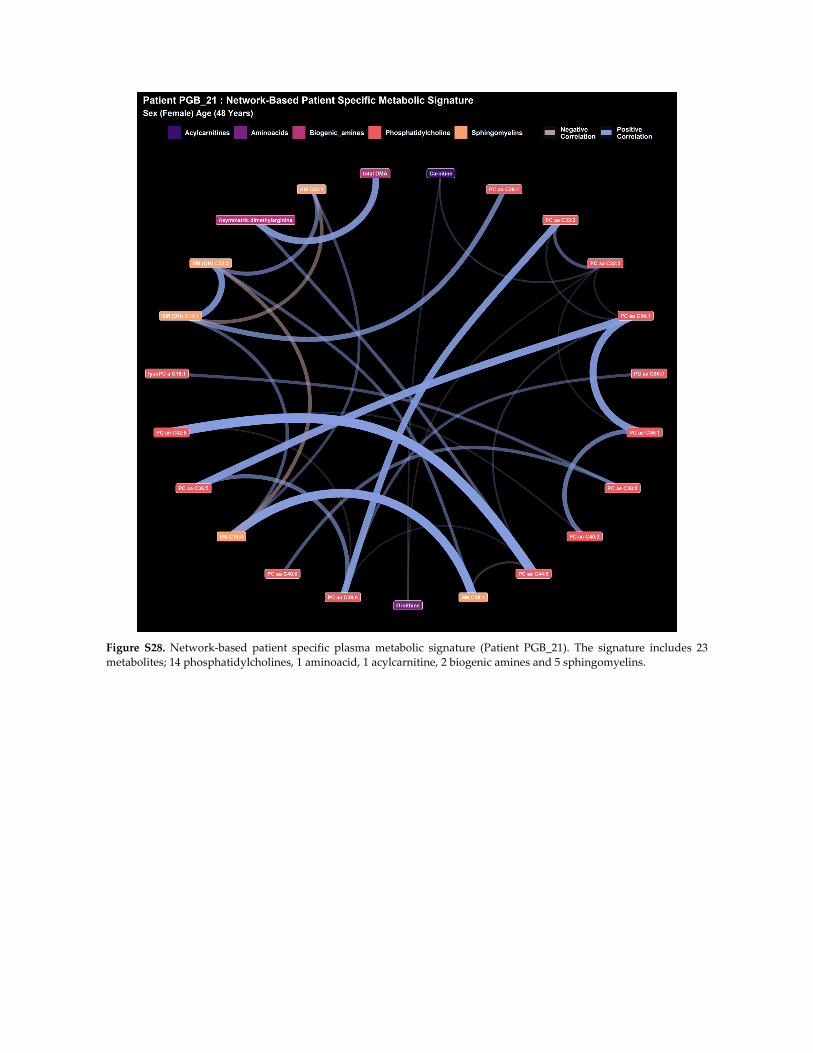
Figure S28. Network‐based patient specific plasma metabolic signature (Patient PGB_21). The signature includes 23
metabolites; 14 phosphatidylcholines, 1 aminoacid, 1 acylcarnitine, 2 biogenic amines and 5 sphingomyelins.
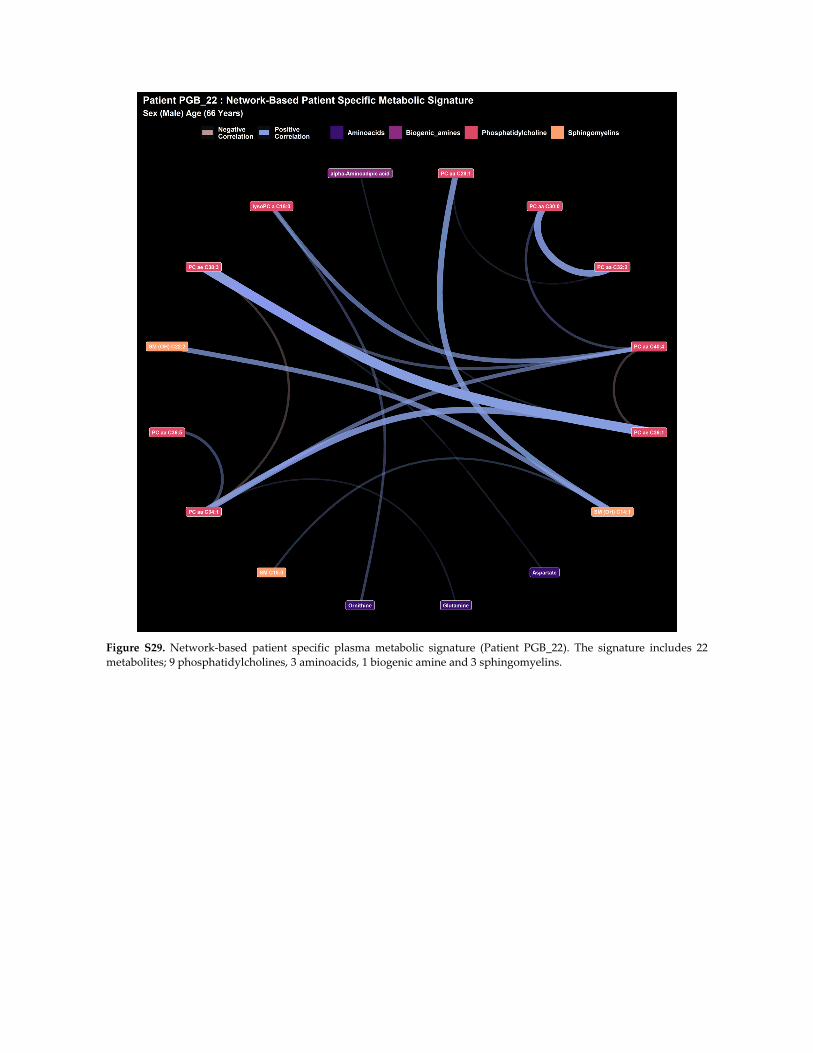
Figure S29. Network‐based patient specific plasma metabolic signature (Patient PGB_22). The signature includes 22
metabolites; 9 phosphatidylcholines, 3 aminoacids, 1 biogenic amine and 3 sphingomyelins.
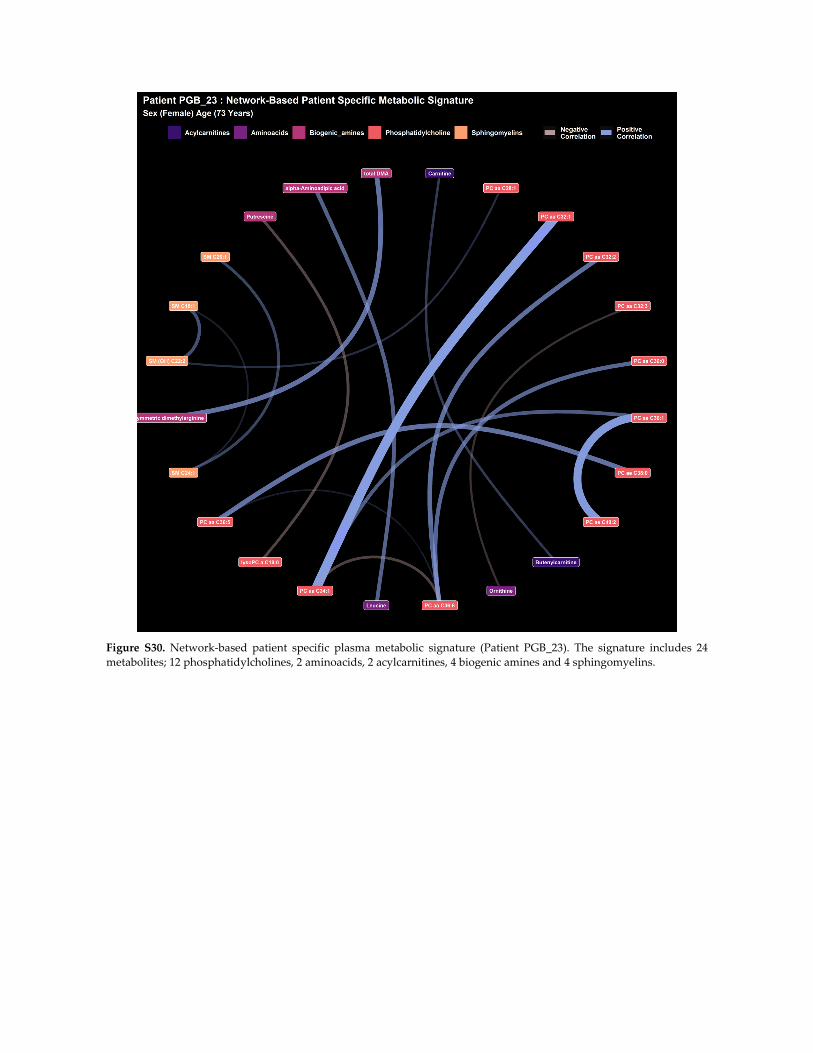
Figure S30. Network‐based patient specific plasma metabolic signature (Patient PGB_23). The signature includes 24
metabolites; 12 phosphatidylcholines, 2 aminoacids, 2 acylcarnitines, 4 biogenic amines and 4 sphingomyelins.
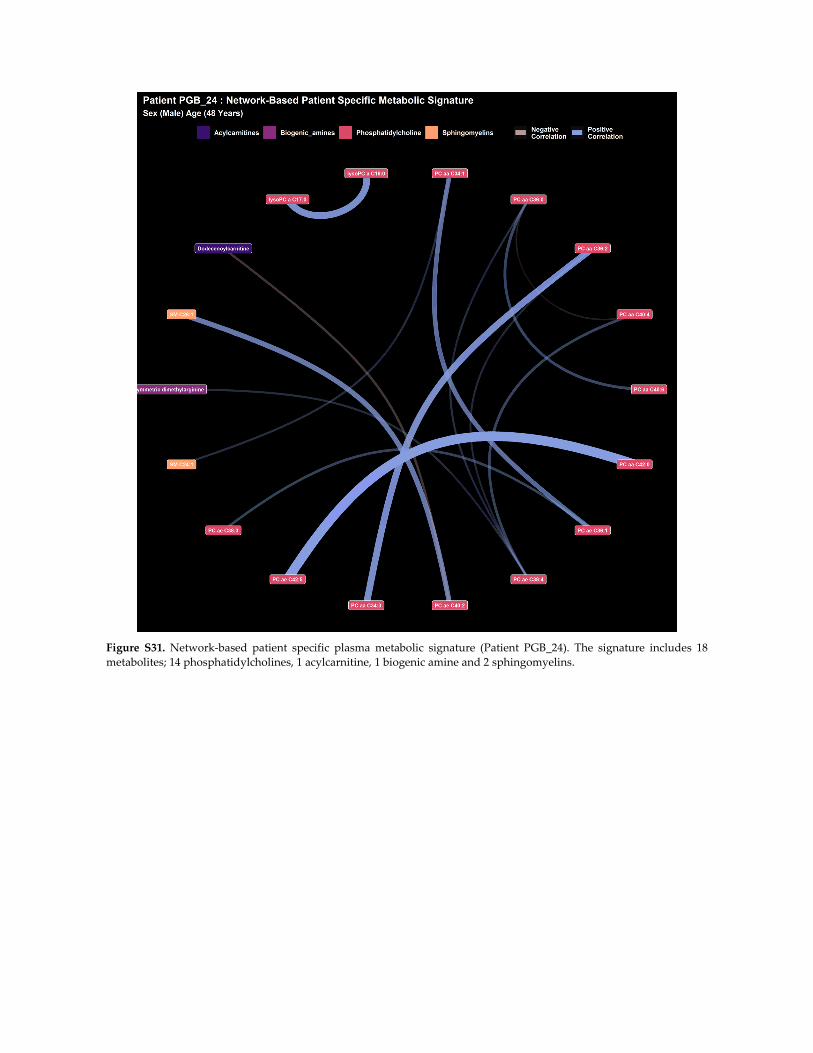
Figure S31. Network‐based patient specific plasma metabolic signature (Patient PGB_24). The signature includes 18
metabolites; 14 phosphatidylcholines, 1 acylcarnitine, 1 biogenic amine and 2 sphingomyelins.
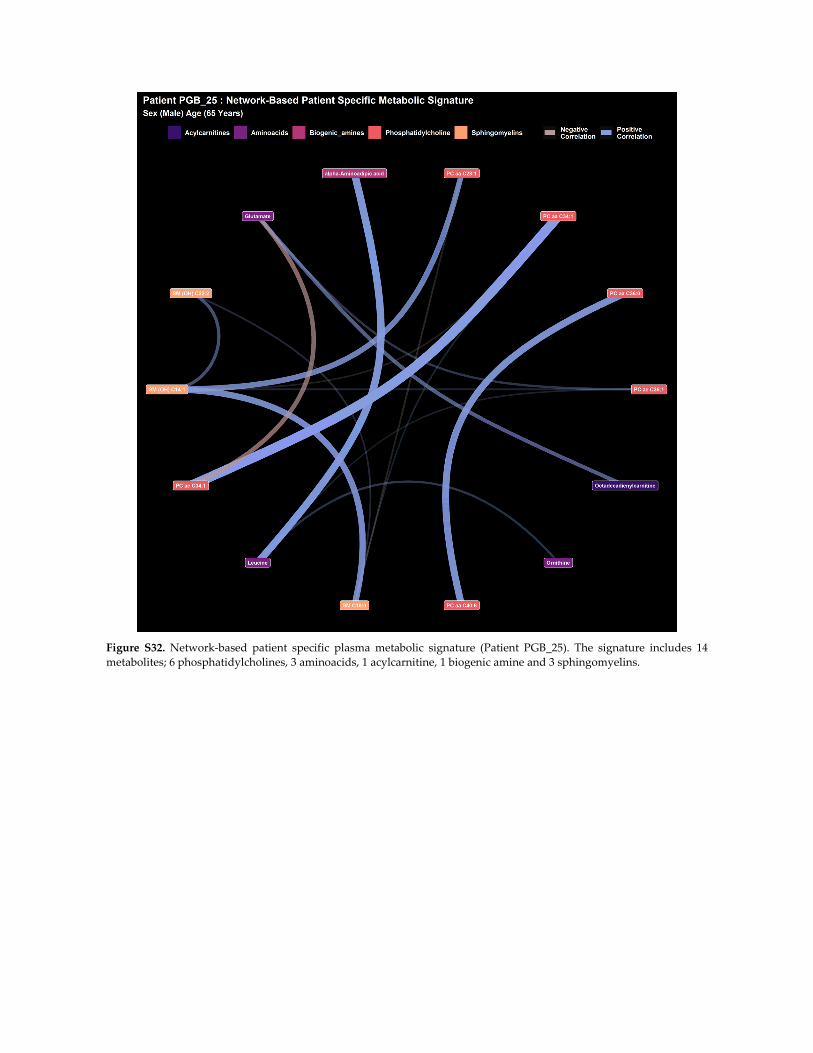
Figure S32. Network‐based patient specific plasma metabolic signature (Patient PGB_25). The signature includes 14
metabolites; 6 phosphatidylcholines, 3 aminoacids, 1 acylcarnitine, 1 biogenic amine and 3 sphingomyelins.
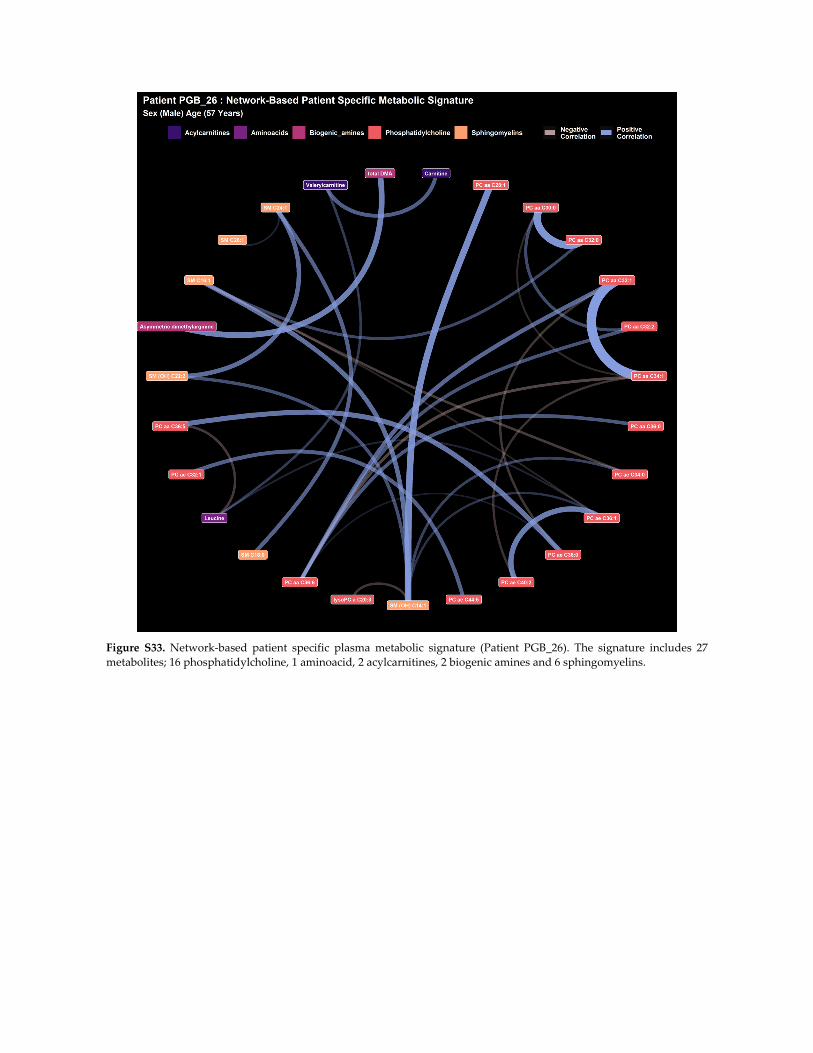
Figure S33. Network‐based patient specific plasma metabolic signature (Patient PGB_26). The signature includes 27
metabolites; 16 phosphatidylcholine, 1 aminoacid, 2 acylcarnitines, 2 biogenic amines and 6 sphingomyelins.
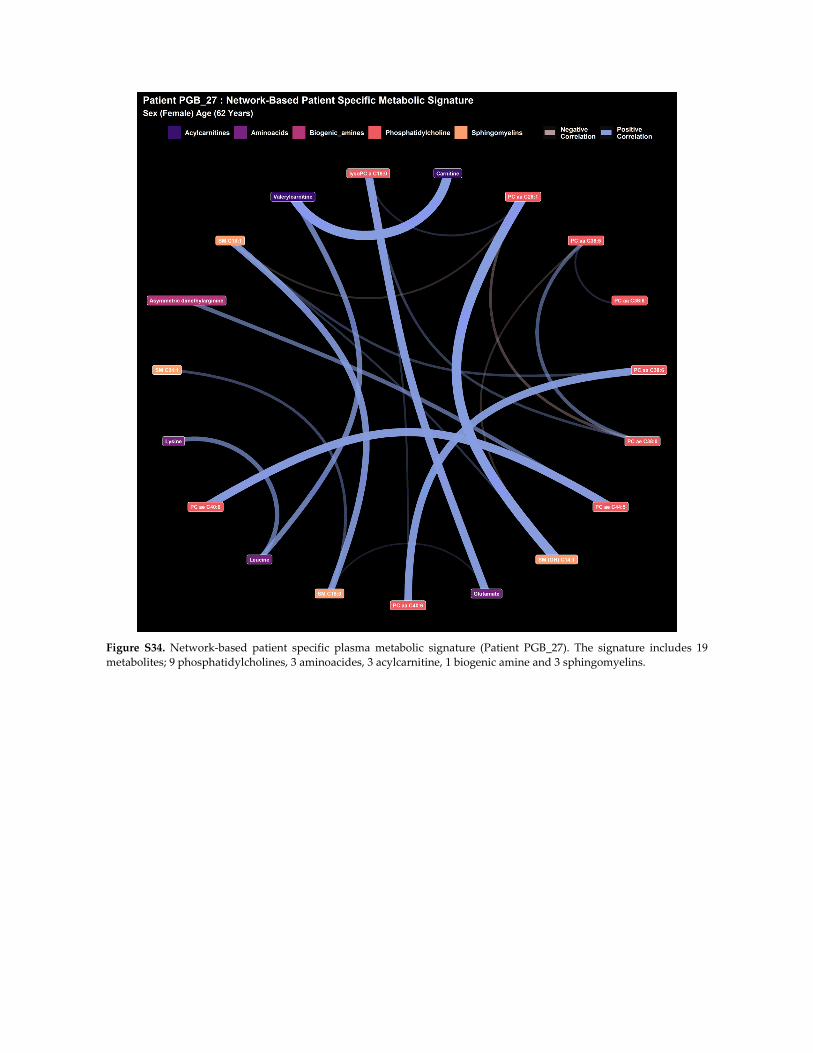
Figure S34. Network‐based patient specific plasma metabolic signature (Patient PGB_27). The signature includes 19
metabolites; 9 phosphatidylcholines, 3 aminoacides, 3 acylcarnitine, 1 biogenic amine and 3 sphingomyelins.
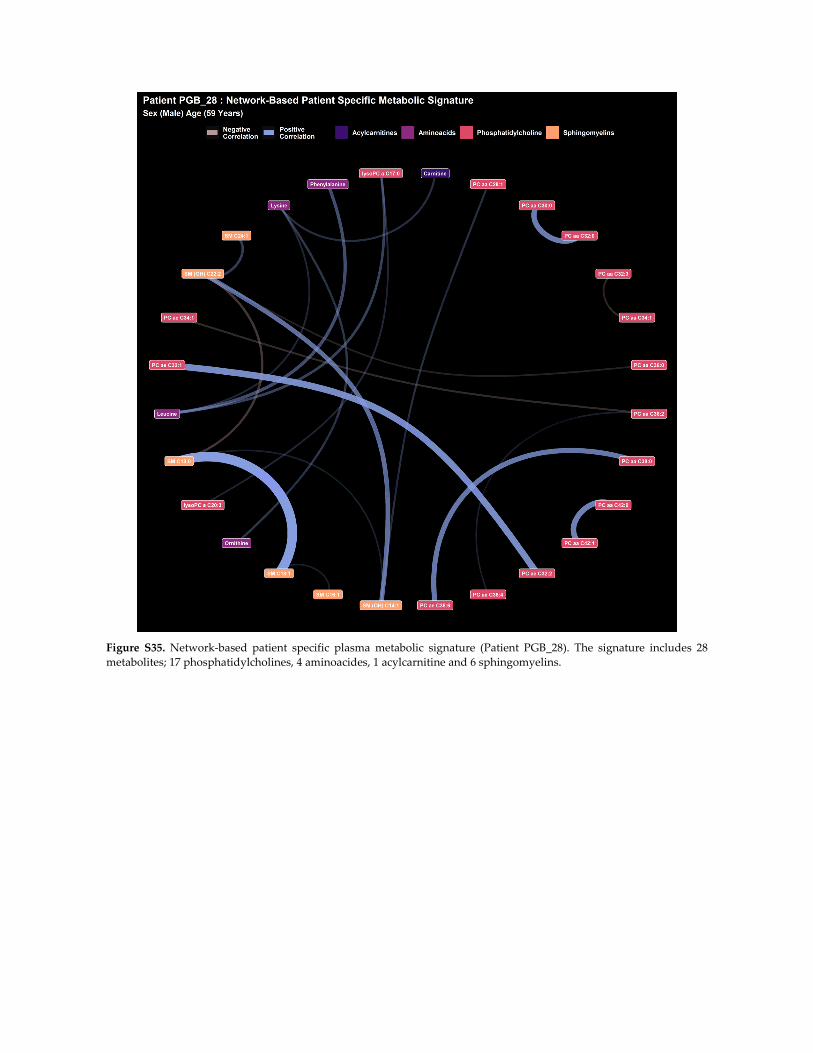
Figure S35. Network‐based patient specific plasma metabolic signature (Patient PGB_28). The signature includes 28
metabolites; 17 phosphatidylcholines, 4 aminoacides, 1 acylcarnitine and 6 sphingomyelins.
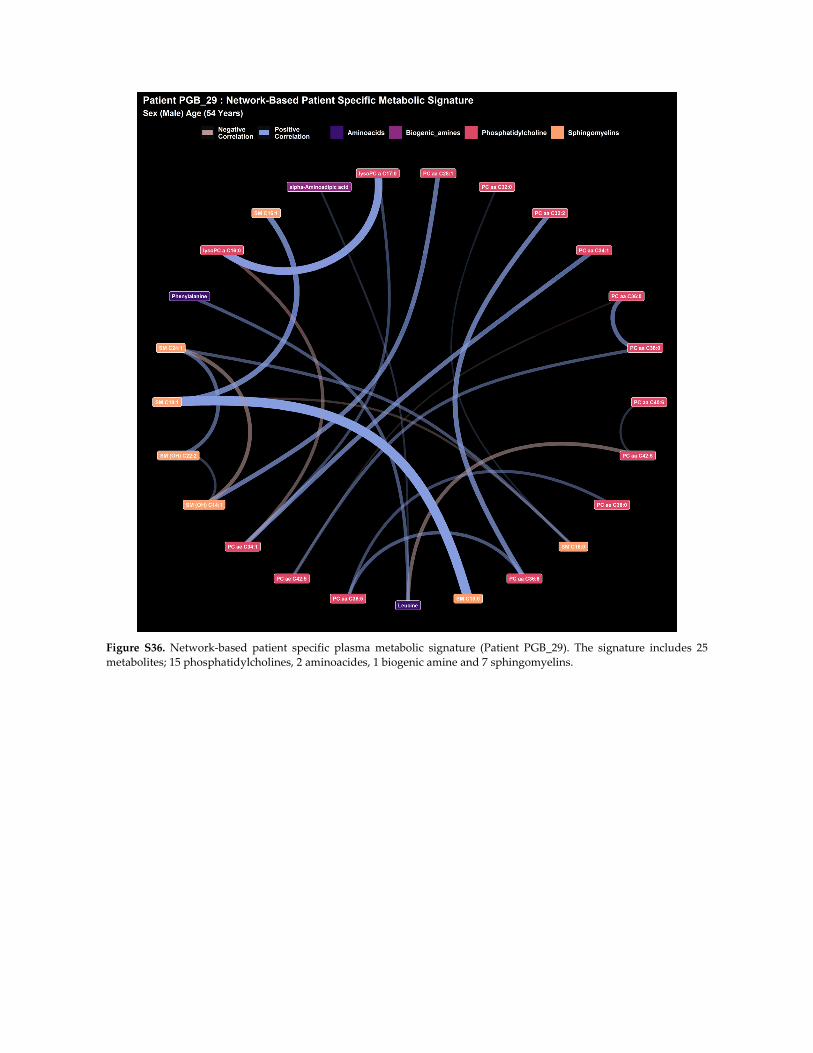
Figure S36. Network‐based patient specific plasma metabolic signature (Patient PGB_29). The signature includes 25
metabolites; 15 phosphatidylcholines, 2 aminoacides, 1 biogenic amine and 7 sphingomyelins.
102
CONCLUSIONS ET PERSPECTIVES
La neurochirurgie s’est enrichie de tout temps grâce aux progrès techniques de son
époque que ce soit par les avancées en radiologie, magnification optique ou de biologie. Un
domaine qui illustre au mieux cette interdisciplinarité est certainement la neuro-oncologie. Les
glioblastomes, qui sont les tumeurs cérébrales primitives les plus fréquentes s’accompagnent
toujours aujourd’hui d’un pronostic sombre, et ce malgré les travaux de recherche qui leur
sont consacrés. C’est pourquoi il y a une nécessité de repenser l’approche que l’on peut avoir
de cette pathologie en terme diagnostique et thérapeutique.
La médecine de précision propose une médecine centrée sur le patient avec des
approches personnalisées. Elle a contribué à des avancées dans de nombreux domaines de la
médecine. L’essor du Big Data permet d’intégrer aux données classiques médicales, les
différentes sciences Omiques. La métabolomique nous parait particulièrement intéressante,
car cette approche permet l'étude du produit final du métabolisme.
La compréhension des mécanismes métaboliques mis en jeu dans le cadre du Glioblastome
permettra à terme de proposer des stratégies diagnostiques et thérapeutiques. Le travail que
nous présentons dans cette thèse montre quels outils la biologie, et les sciences Omiques en
particulier, peuvent apporter à la neurochirurgie.
Les revues présentées sont une réflexion sur le changement de paradigme que connait
le neurochirurgien actuellement en s’appropriant une chirurgie de précision et en dressant un
état des connaissances de la lutte contre le Glioblastome. Notre travail expérimental, qui est
une étude multi-omique des patients présentant un Glioblastome a permis d’émettre des
hypothèses quant à la propagation des lésions gliales intracérébrales. L’un des déterminants
mis en évidence est la modulation par le Glioblastome de son environnement, notamment
énergétique, lui permettant de croître. Nous avons déterminé des perturbations dans le
métabolisme lipidique et relevé des métabolites d’intérêt dans le sérum et le tissu chez des
patients malades. Ces données pourraient permettre de proposer des marqueurs
diagnostiques après validation dans de plus grandes cohortes. La caractérisation plus précise
des lésions gliales est un prérequis indispensable pour proposer des biomarqueurs efficients
et ouvrir la voie à des thérapies ciblées, permettant ainsi de s’inscrire pleinement dans la
médecine de précision.
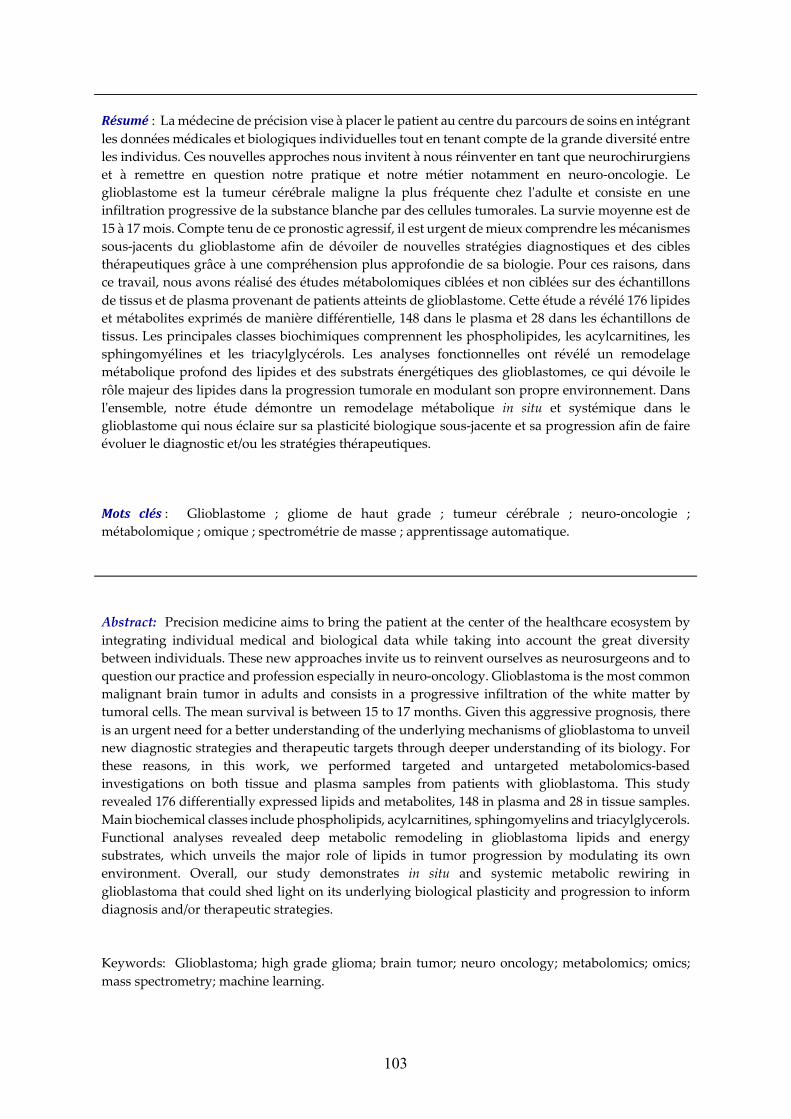
103
Résumé : La médecine de précision vise à placer le patient au centre du parcours de soins en intégrant les données médicales et biologiques individuelles tout en tenant compte de la grande diversité entre les individus. Ces nouvelles approches nous invitent à nous réinventer en tant que neurochirurgiens et à remettre en question notre pratique et notre métier notamment en neuro-oncologie. Le glioblastome est la tumeur cérébrale maligne la plus fréquente chez l'adulte et consiste en une infiltration progressive de la substance blanche par des cellules tumorales. La survie moyenne est de 15 à 17 mois. Compte tenu de ce pronostic agressif, il est urgent de mieux comprendre les mécanismes sous-jacents du glioblastome afin de dévoiler de nouvelles stratégies diagnostiques et des cibles thérapeutiques grâce à une compréhension plus approfondie de sa biologie. Pour ces raisons, dans ce travail, nous avons réalisé des études métabolomiques ciblées et non ciblées sur des échantillons de tissus et de plasma provenant de patients atteints de glioblastome. Cette étude a révélé 176 lipides et métabolites exprimés de manière différentielle, 148 dans le plasma et 28 dans les échantillons de tissus. Les principales classes biochimiques comprennent les phospholipides, les acylcarnitines, les sphingomyélines et les triacylglycérols. Les analyses fonctionnelles ont révélé un remodelage métabolique profond des lipides et des substrats énergétiques des glioblastomes, ce qui dévoile le rôle majeur des lipides dans la progression tumorale en modulant son propre environnement. Dans l'ensemble, notre étude démontre un remodelage métabolique in situ et systémique dans le glioblastome qui nous éclaire sur sa plasticité biologique sous-jacente et sa progression afin de faire évoluer le diagnostic et/ou les stratégies thérapeutiques.
Mots clés : Glioblastome ; gliome de haut grade ; tumeur cérébrale ; neuro-oncologie ; métabolomique ; omique ; spectrométrie de masse ; apprentissage automatique. Abstract: Precision medicine aims to bring the patient at the center of the healthcare ecosystem by integrating individual medical and biological data while taking into account the great diversity between individuals. These new approaches invite us to reinvent ourselves as neurosurgeons and to question our practice and profession especially in neuro-oncology. Glioblastoma is the most common malignant brain tumor in adults and consists in a progressive infiltration of the white matter by tumoral cells. The mean survival is between 15 to 17 months. Given this aggressive prognosis, there is an urgent need for a better understanding of the underlying mechanisms of glioblastoma to unveil new diagnostic strategies and therapeutic targets through deeper understanding of its biology. For these reasons, in this work, we performed targeted and untargeted metabolomics-based investigations on both tissue and plasma samples from patients with glioblastoma. This study revealed 176 differentially expressed lipids and metabolites, 148 in plasma and 28 in tissue samples. Main biochemical classes include phospholipids, acylcarnitines, sphingomyelins and triacylglycerols. Functional analyses revealed deep metabolic remodeling in glioblastoma lipids and energy substrates, which unveils the major role of lipids in tumor progression by modulating its own environment. Overall, our study demonstrates in situ and systemic metabolic rewiring in glioblastoma that could shed light on its underlying biological plasticity and progression to inform diagnosis and/or therapeutic strategies. Keywords: Glioblastoma; high grade glioma; brain tumor; neuro oncology; metabolomics; omics; mass spectrometry; machine learning.

104


