Embed Size (px)
Citation preview
http://jtlu.org. 3 . 1 [Spring 2010] pp. 113–138 doi: 10.5198/jtlu.v3i1.13
Assessing the impacts of Light Rail Transit on
urban land in Manila
Javier F. Pacheco-RaguzPlanning Division, TransLink a
Abstract: is paper presents an assessment of impacts of Light Rail Transit Line 1 (LRT1) in terms ofaccessibility and distance as they relate to variables such as land values, land uses, and population den-sities in Manila, Philippines. Using correlations and regressions, these variables are analyzed against anaccessibility index and network distances obtained from a model built within a Geographic Informa-tion System (GIS). Land values, land uses, and population densities are in uenced in a limited, thoughconsistent, way by the accessibility provided by LRT1 and the distance to it. e analysis of impactsa er the construction of LRT1 found that accessibility and distance were only consistent in uences forresidential land values, with marginal results for the rest of the variables. ese results, when contrastedwith the urban con guration of Manila and the studies reviewed, show that the limited impacts may bea consequence of good accessibility before LRT1 and the lack of complementary planning and policiesfor taking advantage of its in uence.
Keywords: LRT; Light Rail Transit; transport; land value; land use; population; network distance;accessibility.
1 Introduction
It is widely recognized that transport and urban land development are closely related. e spa-tial distribution of human activities such as living or working creates demand for the transportof people and goods. However, the converse impacts of the transport side are less understood.Changes in accessibility are likely to in uence the relative attractiveness of a location, poten-tially inducing shi s in land values, uses, or densities. ese changes are a result of the rela-tionship between transport, land, and human activities (housing, employment, industry, etc.),a tri-partite interaction that generates travel demand and the requirements for transport infras-tructure. Good management of urban growth and densities, as well as adjustments in land use,ease the ow of socio-economic resources. Part of this management involves adding new in-frastructure—housing, services, or transport—producing diverse impacts on urban land; thecomplexity of these impacts makes them difficult to assess.
Mass transport systems generate bene ts ranging froma reductionof pollution to theorder-liness of ows, shorter travel/dwell times, and a faster,more reliable service, handling peak owsof up to 60000 passengers/direction/hour. e provision of capacity for future growth is alsoessential for choosing such technologies (Pushkarev et al. 1982), as they are capital-intensive
Copyright 2010 Javier F. Pacheco-Raguz.Licensed under the Creative Commons Attribution – NonCommercial License 3.0.
()
with a long gestation period. Inmost cases, mass transport is the only reasonable alternative fora growing demand, requiring innovative funding as it ranges from tens to hundreds of millionsof dollars per kilometer (Japan International Cooperation Agency 1999; Wright and Hook2007). One of the most common is the LRT, with lower capacity than the heavier systems,though more exible and less expensive.
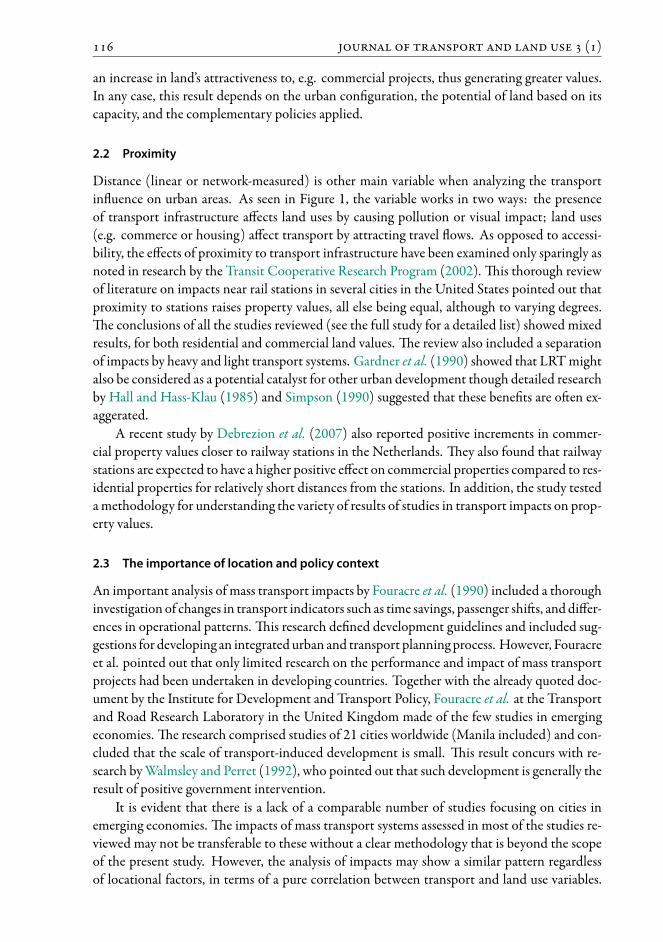
A studyby the Institute forDevelopment andTransportPolicy in theUnitedStates (Wrightand Hook 2007) identi ed some of the most important factors in uencing the selection of atransport system, grouped in categories such as cost, planning andmanagement, design, perfor-mance, and impacts. e last of these is the topic of this study and includes economic, social,and environmental impacts as well as direct in uence over urban areas. Some of the impacts ob-served are fostering/reduction of population density growth, change in operational patterns ofbus transport systems, and enhancement/depression of areaswithin the city (possibly includingeconomic revenues by changes in land uses and/or land values due to an improved accessibil-ity). On the negative side, visual impacts and noise are the most common considerations. As atype ofmass transport, LRTunavoidably affects urban land uses and activities, causing a varietyof negative or positive impacts.
2 Reviewing the transport and urban land relationship
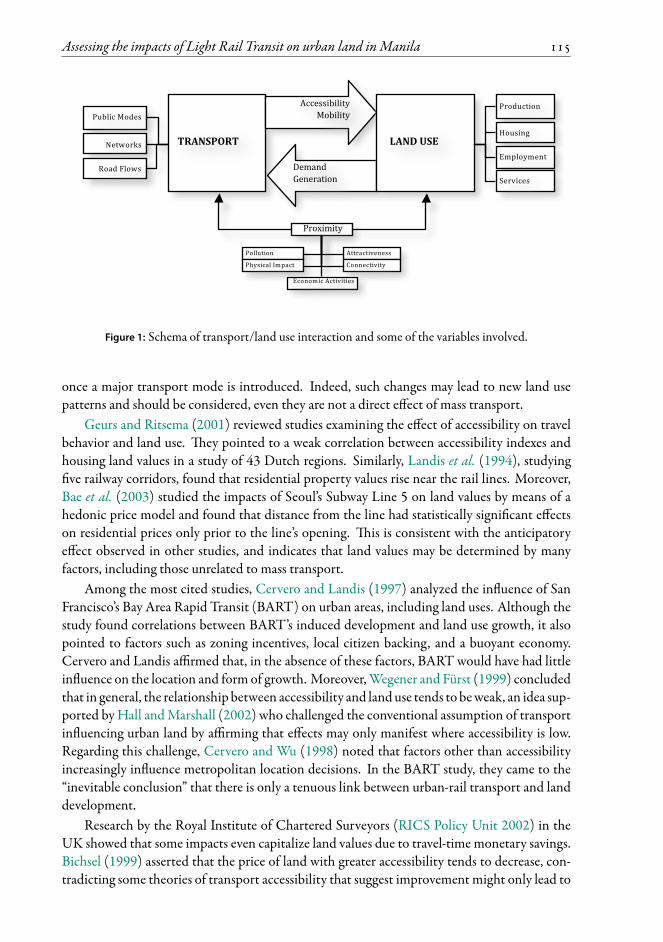
Planners have dedicated much effort to explaining the hidden connections between transportand land use. Figure 1 summarizes the relationship, showing the basic variables affected (posi-tively or negatively) by the relationship. From the transport side, the rst is accessibility, de nedas the ease with which activities may be reached from a given location by means of a particulartransport system (Morris et al. 1979). Another is proximity, based on the location of transportinfrastructure in urban areas. Proximity is measured in distance, whether linear (also calledEuclidean distance) or network-based (calculated using the road/path links). Changes in bothvariables (as well as in mobility) affect land uses and these also in uence transport by generat-ingmore demand, altering transport networks, shi ingmodes, and generating congestion. Pre-vious studies have demonstrated the importance of accessibility and proximity (among otherfactors) in urban areas, through their impacts on variables related to production, housing, em-ployment, and services in urban areas. Some studies are reviewed in this section and attentionis given to the location of the studies as well as the policy framework applied.
2.1 Accessibility
As accessibility increases, mobility becomes less costly—in time ormoney—and transport costsdecline. Giuliano (1995) affirms that mass transport improves accessibility to areas within thetransport corridor and increases their relative advantage compared to non-served areas. Hence,all else being equal, activities should shi towards stations along the corridor with increasedland values. However, the importance of the integration of rail and buses cannot be neglected.
anks to the current transport modes, the incidence of newly added accessibility is extendedto an area wider than the rail corridor. Giuliano explains that modifying a single link on thetransport network produces an overall impedance change (expressed in travel time) across theentire network, as the accessibility provided by existing transport is independent of that gener-ated by newmodes. It is undeniable that some bus routes may appear or change their itineraries
Assessing the impacts of Light Rail Transit on urban land in Manila
Proximity
Public Modes
Networks
Road Flows
TRANSPORT
Accessibility Mobility
Demand Generation
LAND USE
Production
Housing
Employment
Services
Pollution
Physical Impact
Attractiveness
Connectivity
Economic Activities
Figure 1: Schema of transport/land use interaction and some of the variables involved.
once a major transport mode is introduced. Indeed, such changes may lead to new land usepatterns and should be considered, even they are not a direct effect of mass transport.
Geurs and Ritsema (2001) reviewed studies examining the effect of accessibility on travelbehavior and land use. ey pointed to a weak correlation between accessibility indexes andhousing land values in a study of 43 Dutch regions. Similarly, Landis et al. (1994), studyingve railway corridors, found that residential property values rise near the rail lines. Moreover,
Bae et al. (2003) studied the impacts of Seoul’s Subway Line 5 on land values by means of ahedonic price model and found that distance from the line had statistically signi cant effectson residential prices only prior to the line’s opening. is is consistent with the anticipatoryeffect observed in other studies, and indicates that land values may be determined by manyfactors, including those unrelated to mass transport.
Among the most cited studies, Cervero and Landis (1997) analyzed the in uence of SanFrancisco’s Bay Area Rapid Transit (BART) on urban areas, including land uses. Although thestudy found correlations between BART’s induced development and land use growth, it alsopointed to factors such as zoning incentives, local citizen backing, and a buoyant economy.Cervero and Landis affirmed that, in the absence of these factors, BART would have had littlein uence on the location and form of growth. Moreover,Wegener and Fürst (1999) concludedthat in general, the relationship between accessibility and landuse tends to beweak, an idea sup-ported byHall andMarshall (2002) who challenged the conventional assumption of transportin uencing urban land by affirming that effects may only manifest where accessibility is low.Regarding this challenge, Cervero and Wu (1998) noted that factors other than accessibilityincreasingly in uence metropolitan location decisions. In the BART study, they came to the“inevitable conclusion” that there is only a tenuous link between urban-rail transport and landdevelopment.
Research by the Royal Institute of Chartered Surveyors (RICS Policy Unit 2002) in theUK showed that some impacts even capitalize land values due to travel-time monetary savings.Bichsel (1999) asserted that the price of land with greater accessibility tends to decrease, con-tradicting some theories of transport accessibility that suggest improvementmight only lead to
()
an increase in land’s attractiveness to, e.g. commercial projects, thus generating greater values.In any case, this result depends on the urban con guration, the potential of land based on itscapacity, and the complementary policies applied.
2.2 Proximity
Distance (linear or network-measured) is other main variable when analyzing the transportin uence on urban areas. As seen in Figure 1, the variable works in two ways: the presenceof transport infrastructure affects land uses by causing pollution or visual impact; land uses(e.g. commerce or housing) affect transport by attracting travel ows. As opposed to accessi-bility, the effects of proximity to transport infrastructure have been examined only sparingly asnoted in research by the Transit Cooperative Research Program (2002). is thorough reviewof literature on impacts near rail stations in several cities in the United States pointed out thatproximity to stations raises property values, all else being equal, although to varying degrees.
e conclusions of all the studies reviewed (see the full study for a detailed list) showed mixedresults, for both residential and commercial land values. e review also included a separationof impacts by heavy and light transport systems. Gardner et al. (1990) showed that LRTmightalso be considered as a potential catalyst for other urban development though detailed researchby Hall and Hass-Klau (1985) and Simpson (1990) suggested that these bene ts are o en ex-aggerated.
A recent study by Debrezion et al. (2007) also reported positive increments in commer-cial property values closer to railway stations in the Netherlands. ey also found that railwaystations are expected to have a higher positive effect on commercial properties compared to res-idential properties for relatively short distances from the stations. In addition, the study testedamethodology for understanding the variety of results of studies in transport impacts on prop-erty values.
2.3 The importance of location and policy context
An important analysis of mass transport impacts by Fouracre et al. (1990) included a thoroughinvestigation of changes in transport indicators such as time savings, passenger shi s, and differ-ences in operational patterns. is research de ned development guidelines and included sug-gestions for developing an integrated urban and transport planning process. However, Fouracreet al. pointed out that only limited research on the performance and impact of mass transportprojects had been undertaken in developing countries. Together with the already quoted doc-ument by the Institute for Development and Transport Policy, Fouracre et al. at the Transportand Road Research Laboratory in the United Kingdom made of the few studies in emergingeconomies. e research comprised studies of 21 cities worldwide (Manila included) and con-cluded that the scale of transport-induced development is small. is result concurs with re-search byWalmsley and Perret (1992), who pointed out that such development is generally theresult of positive government intervention.
It is evident that there is a lack of a comparable number of studies focusing on cities inemerging economies. e impacts of mass transport systems assessed in most of the studies re-viewed may not be transferable to these without a clear methodology that is beyond the scopeof the present study. However, the analysis of impacts may show a similar pattern regardlessof locational factors, in terms of a pure correlation between transport and land use variables.
Assessing the impacts of Light Rail Transit on urban land in Manila
Regardless of location, studies about the relationship of accessibility induced by transport im-provement and its effect on urban areas have shown that the extent of such impacts is limited.
is is to be expected, as urban areas are also in uenced by other factors, such as land use de-velopment, policies, or general economic factors. Where impacts have been considered signif-icant, both negative and positive impacts have been identi ed. e intervention of authoritiesor private stakeholders managing the development produced by changes in the transportationsystem—whether by policies, incentives, or direct investment—is considered decisive. Trans-portOrientedDevelopment (TOD) is one of the latest concepts related to taking advantage ofthese in uences, considering policy intervention andprivate participation (Lefaver 1997;Tran-sit Cooperative Research Program 2002). To the degree that TOD and its joint-developmentvariant confer travel-time savings and enhance accessibility, the theory holds that these private-sector bene ts will be capitalized into land values and market rents. Cervero (1984); Emerson(1990); Knight (1980) also identi ed the provision of public infrastructure and nancial in-centives as important to attract and support development around stations. Without a positiveintervention by authorities or stakeholders, Walmsley and Perret (1992) and Dabinett et al.(1999) claimed that transport investments are o en necessary but not sufficient to generatedevelopment. Well-developed transport facilities alone cannot explain the agglomeration ofeconomic activities due to the incapacity of transport facilities to provide users a utility per se(Bichsel 1999). Moreover, Hall andMarshall (2002) noted two particularly important contex-tual items regarding transport investment on development: rst, infrastructure investment hasled land use development in buoyant economies; second, the regulatory context (e.g. planningcontrols) implies that transport-led development tends to ourish where policies favor TOD.In this respect, the placewhere the analysis of transport and landuse is doneuse shouldpoint to-wardmore signi cant impacts in cities of the developedworld. However, Gakenheimer (1999)argued that there are stronger linkages between land use and transport in the developingworld,an idea that other studies do not support.
According to Dabinett et al. (1999), mass transport can have a strong in uence on the lo-cation, intensity, and timing of new development, especially when supported by positive in-centives and coordinated land use/transport planning. Greeneberg (1988) and Pill (1988)demonstrated the importance of the planning context. ey showed that authority-driven zon-ing bonuses for newurban land developments aroundToronto subway stations proved to be themost signi cant impacts over urban areaswhere stringent landuse controls directed the changes(Giuliano 1995).
2.4 Framework of the study
Most of the research assessing transport impacts on urban land use show that the most fre-quently recurring variables are accessibility and distance. ese variables were used together byRietveld and Nijkamp (2000) to demonstrate that a higher level of access and closer proxim-ity to transport may increase property values. e basic premise in this study is that changesin transport infrastructure will have an impact on the relative attractiveness of certain areas,and that this may, in turn, trigger changes in urban land use. Accessibility, de ned as the moststraightforward link between urban planning and transportation planning (Giuliano 1995),together with proximity in terms of distance, are the adequate indicators to determine impacts(Transit Cooperative Research Program 2002). In the present study, the before/a er accessi-
()
bility and the network distance to LRT1will determine if their changes are related to variationsin urban land variables.
3 Description of the study area
is section provides a brief description of Manila and the data collected. Some importantgures and characteristics of the study that will be useful for understanding the analysis and the
results obtained are shown here.
3.1 Manila in the early 1980s
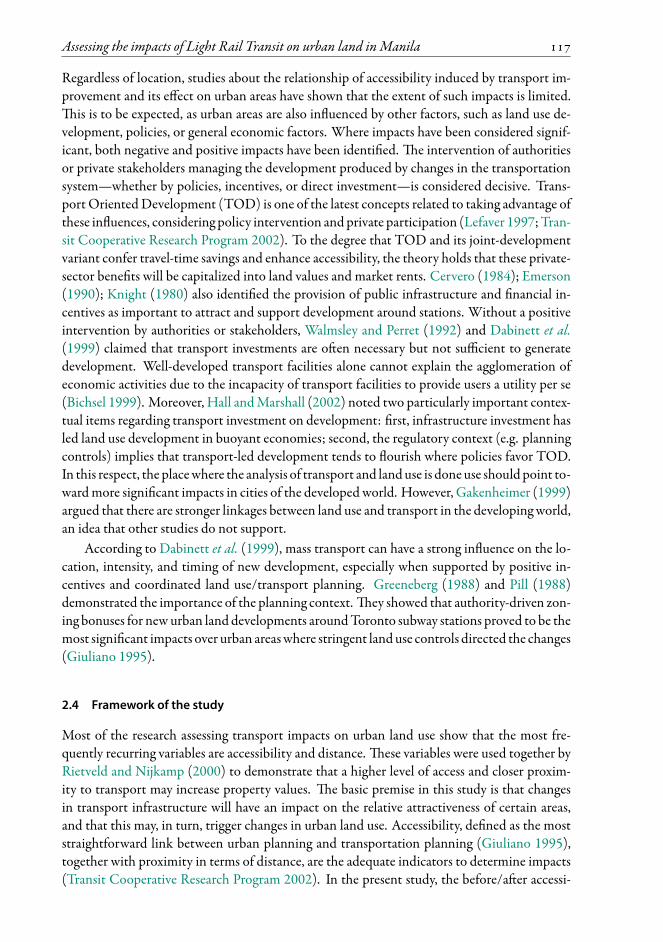
e model in Figure 1 represents Manila in 1980, having similarities with its urban con gu-ration as stated by Brunn and Williams (1983). Starting from the port area, there are severalconcentric rings characterized by mixed land use adjacent to the core port zone, which is at-tached to the Central Business District (CBD) with the main government area inside it. elocation of new housing and squatter areas outside the core re ects rapid urban growth at theexpense of agricultural areas, represented the fringe of the model (Market Gardening Zone).
Figure 2: Generalized model of major land use areas in a large Southeast Asian city (fromMcGee 1967).
Minor commercial centers have been steadily growing inside the core urban area. For in-stance, the areas of Baclaran andMonumento experienced progressive growth in the number ofbigmalls andminor businesses clustering aroundmajor transport terminals. To the city’s northin Kalookan municipality, Monumento, in the middle of the junction of EDSA and Rizal Av-enues are full of formal and informal transport terminals. ey are used by commuters from thenorthern zones, feeding the crescent of commercial activity. e southern terminal of Baclaranon Ta Avenue plays a similar role for the southern part of the city. In the early 1980s, theseterminals and the commercial areas next to the CBD (Carriedo and Blumentritt) were packedwith informal commerce.
Assessing the impacts of Light Rail Transit on urban land in Manila
e core area is formed by the municipalities of Manila, Kalookan, Pasay and Quezon,Makati,Mandaluyog, and San Juan. During the 1980s, theCBDwas attractingmore economicdevelopment, as it had become the center of a bigger area known as Metro Manila. e 1980sand 1990s were marked by a constant growth of commerce and a decrease in housing, as peo-ple preferred to live in new developments such as Calabarzon in the southern part of Manila(Magno-Ballesteros 2000).
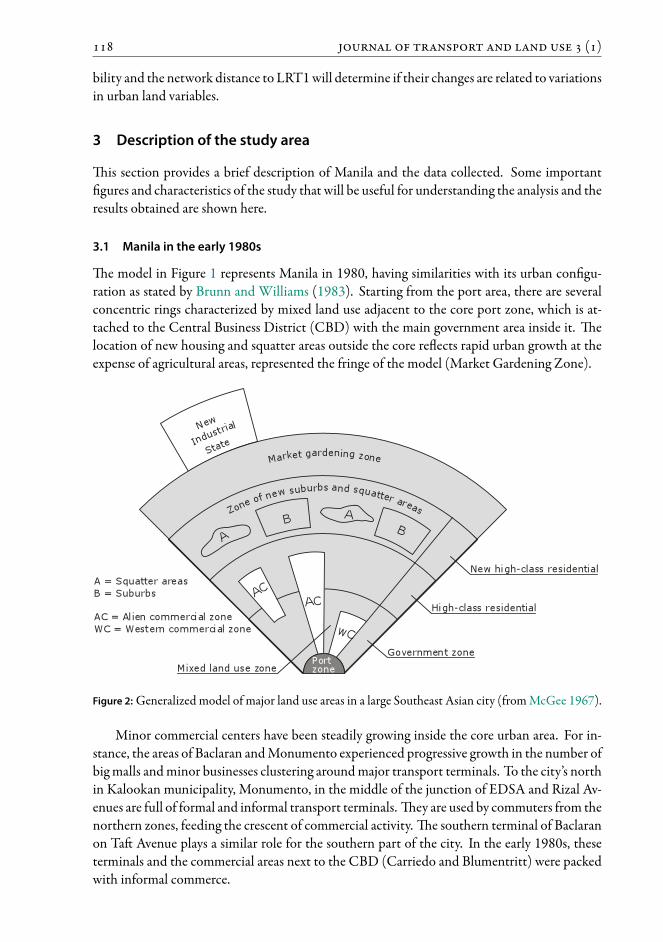
Since the early 1980s,Manila has become a huge urban area, among the largest in SoutheastAsia (Brunn and Williams 1983). e city’s core was almost completely built-up when theLRT1 started in 1984. In 1991, increments in land value outside the study area were around100–160 percent higher, for residential and commercial properties respectively and from 1993to 1996, land values remained practically equal. A er 1996, averages showed higher values inthe rest of Manila, with higher increments for the same period (Figure 2).
3.2 Characteristics of the transport
In the 1970s, transport in Manila was exclusively road-based, made up of jeepneys (a form ofparatransit), mini-buses, standard buses, taxis, motorbike tricycles, and bike-powered pedicabs.While large buses operated on arterial or primary roads, jeepneys served trunk and secondaryways. By feeding these twomodes, motorized tricycles and pedicabs provided a complementarytransport operation service,mainly fromestablished terminals near themost important centers.
From 10.6 million trips/day in 1980, the total increased to 17.5 million in 1996 (JapanInternational Cooperation Agency 1999). About 79 percent of residents made daily trips in1996, with an average number of trips of 2.3. Around 98 percent of this total travel demandowed by roads. Public transportation usage in the 1990s was very high, around 78 percent of
all public and semi-public trips (Japan InternationalCooperationAgency 1999). Jeepneyswerethe most popular mode regardless of trip purpose: 34 percent used them to go to work, 46 per-cent to go to school and 21 percent for business trips. Buses primarily served work trips (24%)and private purposes (13%). Tricycles were very popular for school (21%), business (13%) andprivate trips (12%) while taxis were mainly used for business trips (around 14%).
3.3 Introduction of the LRT1
In 1976, a study funded by theWorld Bank suggested the implementation of an at-street-levelLRT inManila, which was later changed to an elevated con guration due to the impacts at in-tersections. e project, called Metrorail, was to have revenues by 1993 and was expected topay for itself by 2005. Implemented in 3.5 years from 1981 to 1985, LRT1 (see Figure 3) wasinaugurated in December 1984 with half of the line (Baclaran to Central Station) complete;the full 15km length (toMonumento) was complete by 1985. It runs in the south-north direc-tion along the west side of Manila, crossing the CBD parallel to the bay area, initially with 64cars with a capacity of 374 passengers (81 seated and 293 standing at normal capacity). LRT1’sshare was initially calculated at around 9 to 10 percent of the total riders and it has a full capac-ity estimated to be 500000 pass/day at a rate of 27000 pass/hour/direction (18000 in 1985)with speeds of 60km/h (peak) and 30km/h (commercial). e dwell times started at 20–30seconds in 1985, decreasing later to 10–20 seconds. e at fare was initially set at 2.5 Philip-pine pesos (Php) and later increased to 12 Php. e line has 18 stations separated by 825meterson average, located mainly in major commercial (Carriedo, Blumentritt), educational (Pedro
()
Figure 3: Comparative changes in land values and population in the study area and in the rest of Manila
( gures include adjustments due to in ation).
Gil, Vito Cruz), and government (Central) centers. e south end is close to the internationalairport at Baclaran, in Pasay City, reaching the CBD near Intramuros and connecting Ta andRizal Avenues. e LRT1’s share was around 3 percent of to-work and to-school trips in 1996,which is considered high as the percentage represents only one transport corridor.
Assessing the impacts of Light Rail Transit on urban land in Manila
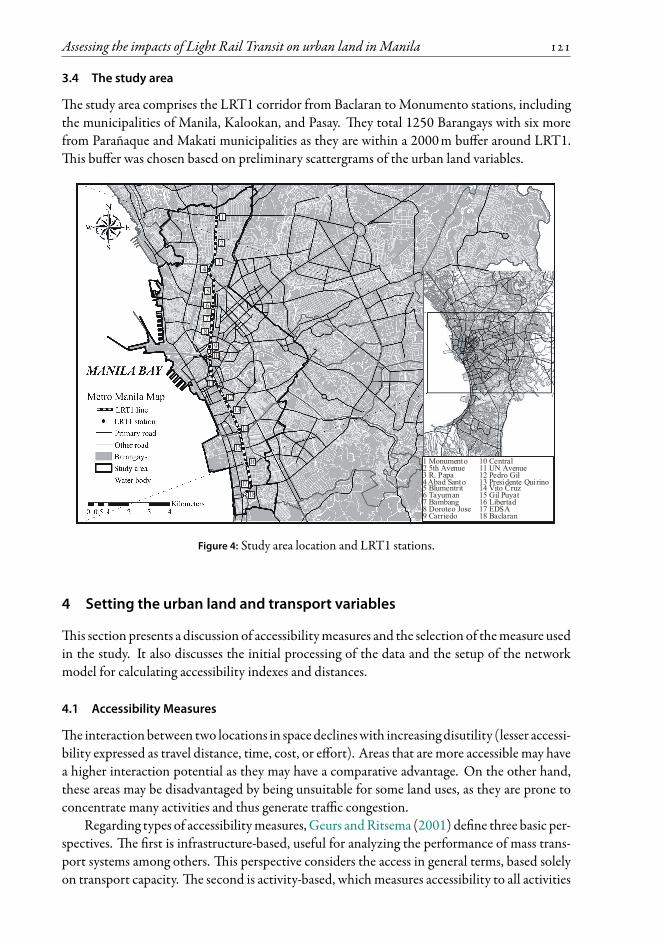
3.4 The study area
e study area comprises the LRT1 corridor from Baclaran toMonumento stations, includingthe municipalities of Manila, Kalookan, and Pasay. ey total 1250 Barangays with six morefrom Parañaque and Makati municipalities as they are within a 2000m buffer around LRT1.
is buffer was chosen based on preliminary scattergrams of the urban land variables.
Figure 4: Study area location and LRT1 stations.
4 Setting the urban land and transport variables
is section presents a discussion of accessibilitymeasures and the selection of themeasure usedin the study. It also discusses the initial processing of the data and the setup of the networkmodel for calculating accessibility indexes and distances.
4.1 Accessibility Measures
e interactionbetween two locations in space declineswith increasing disutility (lesser accessi-bility expressed as travel distance, time, cost, or effort). Areas that are more accessible may havea higher interaction potential as they may have a comparative advantage. On the other hand,these areas may be disadvantaged by being unsuitable for some land uses, as they are prone toconcentrate many activities and thus generate traffic congestion.
Regarding types of accessibilitymeasures, Geurs andRitsema (2001) de ne three basic per-spectives. e rst is infrastructure-based, useful for analyzing the performance of mass trans-port systems among others. is perspective considers the access in general terms, based solelyon transport capacity. e second is activity-based, whichmeasures accessibility to all activities
()
in which an individual engages, incorporating constraints (such as scheduling) and travel char-acteristics (such as trip chaining) (Dong et al.2006). is analysis ismore suitable for evaluatingaccess available to the population because itmeasures inhabitants’ ability to reach opportunitiesby means of a given transport mode. e third is utility-based, focused on analyzing the ben-e ts that people derive from access to spatially distributed activities; this perspective is mainlyapplied in economic studies (Geurs and vanWee 2004).
is study uses an infrastructure-based accessibility measure, as the objective is to deter-mine access at one location to all others inside the study area based on the performance of thenetwork before and a er the introduction of LRT1. According to Geurs and vanWee (2004),infrastructure-based accessibility measures play an important role in current transport policiesin many countries as several measures are used to describe the functioning of the transport sys-tem, such as travel times, congestion, and operating speed on the road network. Obviously,the advantages of this type of accessibility measure are its ease of implementation and commu-nicability; the necessary data and (transport) models are o en readily available and measuresare easy for researchers and policy makers to interpret. Because infrastructure-based accessibil-ity measures may not incorporate the land use component (or consider it homogeneous), thevariable produced better represents the performance of transport per se without the in uenceof other factors. is is useful for comparing pure transport indicators against other variablesrelated to urban areas.
Gutierrez et al. (1998) identi ed geographical location as a decisive in uencing factor re-garding accessibility indicators. e authors described several accessibility measures that provethe in uence of spatial determinants. Although these may be unsuitable for determining trans-port needs in a particular region, they are usefulwhen analyzing a scenario inwhich accessibilitychanges between two periods. is scenario matches the longitudinal schema and provides theideal framework for the empirical before/a er analysis proposed in the present study. Nev-ertheless, Gutierrez et al. also point out that this approach may not provide a measure of therelative ease of access—in terms of network efficiency—in each of the two points in time. Totackle this, the present study also includes (in addition to the scenario a er the introductionof LRT1) a scenario determined by the accessibility provided by jeepneys and buses prior tothe line’s opening in 1984. Both are assessed together with the rest of public transport (whichincludes walking to/from stops) using the same indicators and spatial units (the Barangays)within a network with impedances assigned for each link. e 1256 Barangays selected are thecenters of potential travel for which an accessibility index is calculated.
For thepresent accessibility analysis, an exponential distancedecay function is used. Fother-ingham (1982) establishes that exponential functions are more accurate for measuring tripsinside urban areas, while power functions perform better for the interurban level. erefore,accessibility is expressed as:
Ai =n∑
j=1
D j e−β·Li j (1)
where D j is the attractiveness of location j ,β is the distance decay coefficient (DDC), Li j thelength of link i j , and n the number of locations.
e aim of this study is to test the performance of the transport network before and af-ter the introduction of LRT. An indicator of how well the transport network (purely in thoseterms) provides access to all sampling areas is required, in order to see if changes in performance
Assessing the impacts of Light Rail Transit on urban land in Manila
correspond with changes in these areas. e calculation considers an equal D j attractivenessfactor for all sampling units. e attraction by the land use side can be attributed to severalfactors, including massive commercial or housing development. Moreover, data on changes inattraction for each sampling unit before and a er LRT1 were not available—and even if theyhad been available, their inclusion would have made it difficult to assess which improvementsin accessibility were due mainly to LRT1 (or at least to its in uence on the existing transportmodes). Besides, attractiveness factors per se would be enough for assessing the changes in landuse variables. By using an accessibility measure based on network performance, we can calcu-late the accessibility improvements generated solely by the LRT1 and later, assess whether theseimprovements correspond with changes in the land variables chosen.
e results will yield the accessibility value of each sampling unit (area) by means of thetransport network before and a er the addition of LRT. is is done to evaluate changes inland variables related to improvements introduced by the LRT itself (excluding natural changesin attraction by the land uses in the study area). e objective is the assessment of both thesituation before LRT1 and the added accessibility it introduced, measured as indicators.
e value of the DDC is determined by an exponential regression using travel distances(willingness to travel by mode) and the number of people traveling based on data from theMetro Manila Urban Transport Integration Study (Japan International Cooperation Agency1999). A generalized-cost model is adapted for calculating travel impedances for each link inthe network, with three components: travel time (including waiting time by mode), total de-lay time at intersections (by semaphores/turns), and monetary (out of pocket) costs. e last,averaged per length unit and differentiated by transport mode, ranges from zero for walkingto 6 PhP as a at fare (1 PhP = US$0.23 in 1996) for taking the LRT1. ese and other costswere converted to time using mean income per time unit for regular workers in Manila, whiletime impedances are added up directly. e nal formula, in which results are expressed in timeunits, is:
Ii j = Ti j +N j + Fm (2)
where N j represents mean time at node j (intersection) due to semaphores and/or congestionwhen crossing it, dependent on the road class; Ti j are the time units to travel the link (o enreferred to as in-vehicle time), which is:
Ti j =Li j
Sm(3)
where Li j represents the actual linkmeasure in longitude units and Sm is the speed bymode oftransport expressed in distance units over time and Fm is the monetary price for traveling thelink, averaged to longitude units by transport mode. It is expressed as:
Fm =Li j P
W(4)
where Li j is the length of the link i j ; P is the fare for a transport mode (in PhP per distanceunit); and W is the mean income per time unit for regular workers in Manila. e results ofthis calculation are in time units.
()
4.2 Building the transport network
e impedances are loaded onto the network according to the route systems for the two maintransport modes in the study area: buses and jeepneys. As the LRT1 has an elevated infrastruc-ture, special impedance values are set for links connecting the jeepneys/bus network (Figure 4),representing average access/egress characteristics to/from LRT1’s stations.
Network distances from each Barangay to the LRT1 line are also calculated and convertedinto classes (distance ranges) as the second independent variable. To assess impacts, both ac-cessibility indexes and the distances are compared against ve urban land variables: residentialand commercial land values; housing and commercial land use; and population density. eanalysis is carried out using statistical correlations and simple/multiple regressions.
4.3 Accessibility Results
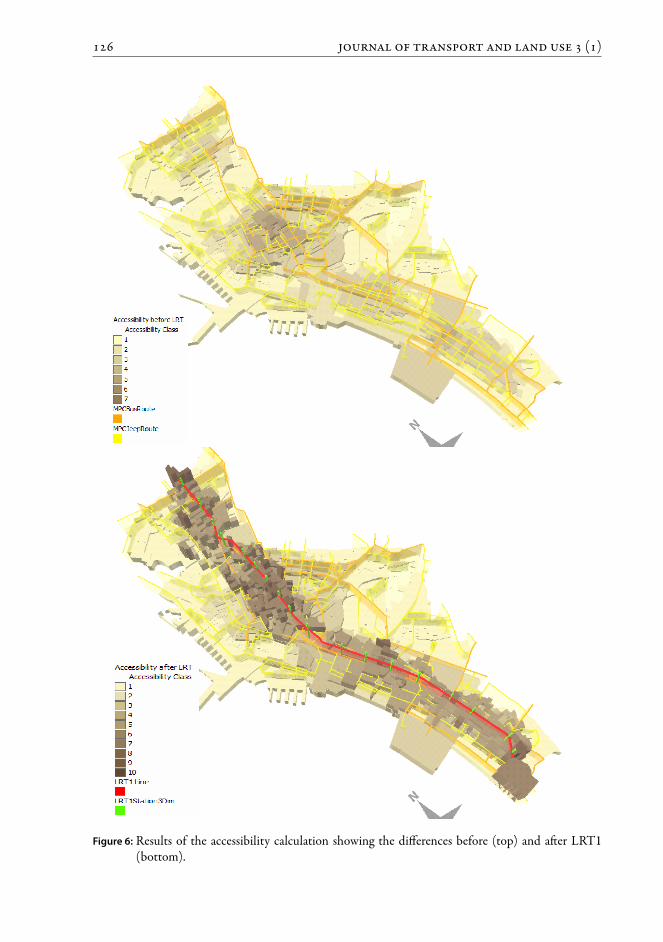
e differences in values for the scenarios before and a er LRT1 are evident, as are the relativelyhigh accessibility values north of the line due to the concentration of jeepney/bus terminals asone of the most important commuting points in Manila.
For a better graphic representation, the resulting indexes are organized in classes, set forboth accessibility before LRT1 and a er LRT1 (accessibility indexes by buses/jeepneys andLRT1 added together), as shown in Figure 5.
4.4 Setting the scenarios and the data
As independent variables, both the effect of accessibility (based on network impedances) andthe proximity (in terms of distance) are correlatedwith the urban land variables. is is done ina before-and-a er schema, representing scenarioswithout andwith the LRT1, respectively. edata were collected for different time series in a longitudinal analysis from 1986 to 1996 andthen processed to build a database at Barangay level, also including secondary data for settingup a transport network for the accessibility variable within GIS. Most of this data come fromthe extensive MMUTIS study (Japan International Cooperation Agency 1999) by NCTS .Other qualitative data were collected directly in the eld as well as a general overview of theperformance of the LRT1.
5 The impacts of LRT1 on urban land in Manila
e main analysis involves quantifying 15 combinations of variables as depicted in Table 1, us-ingPearson’s correlation and simple regression analysis for each combination. ree-dimensionalGIS maps help to visualize the relationships, if any. ese maps present two data variableswithin the same map: one via color and the other via volumetric shapes or extrusions, shownin perspective. In addition, and only for the variables that show consistency in the correlations,a single/multiple regression analysis (MRA) was applied, using both accessibility a er LRT1and distances as predictors.
e Bureau of Internal Revenue (BIR) provided land values by activity at street-level from 1989 to 1996. A1986 land-use map, geographic layers and transportation network/data came from MMUTIS. Population gureswere given by the National Statistics Office (NSO).
Minimal census and administrative unit in urban areas of the Philippines.National Centre for Transportation Studies, University of the Philippines—Diliman, Quezon City.
Assessing the impacts of Light Rail Transit on urban land in Manila
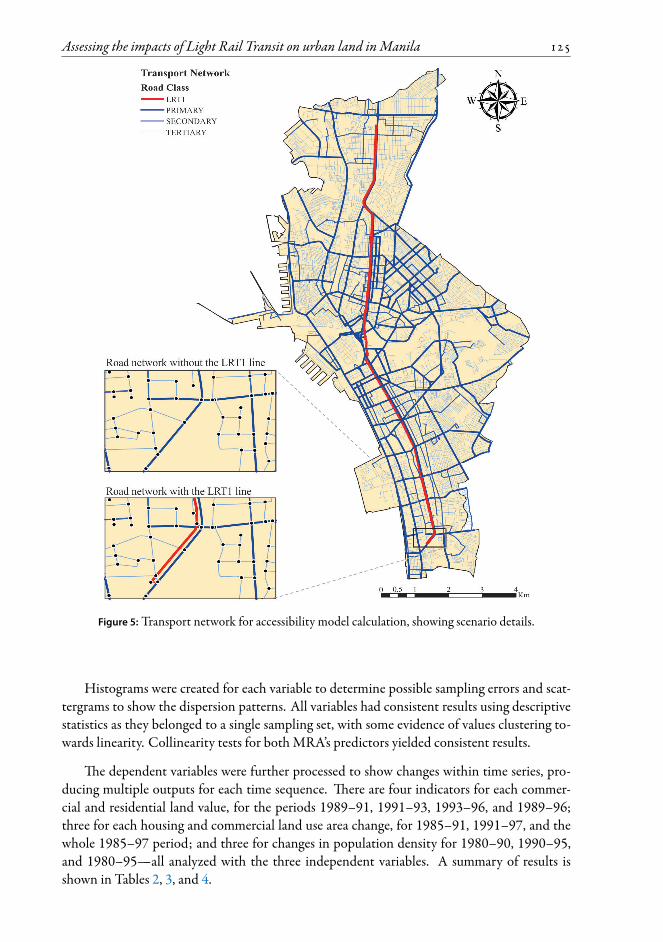
Figure 5: Transport network for accessibility model calculation, showing scenario details.
Histograms were created for each variable to determine possible sampling errors and scat-tergrams to show the dispersion patterns. All variables had consistent results using descriptivestatistics as they belonged to a single sampling set, with some evidence of values clustering to-wards linearity. Collinearity tests for bothMRA’s predictors yielded consistent results.
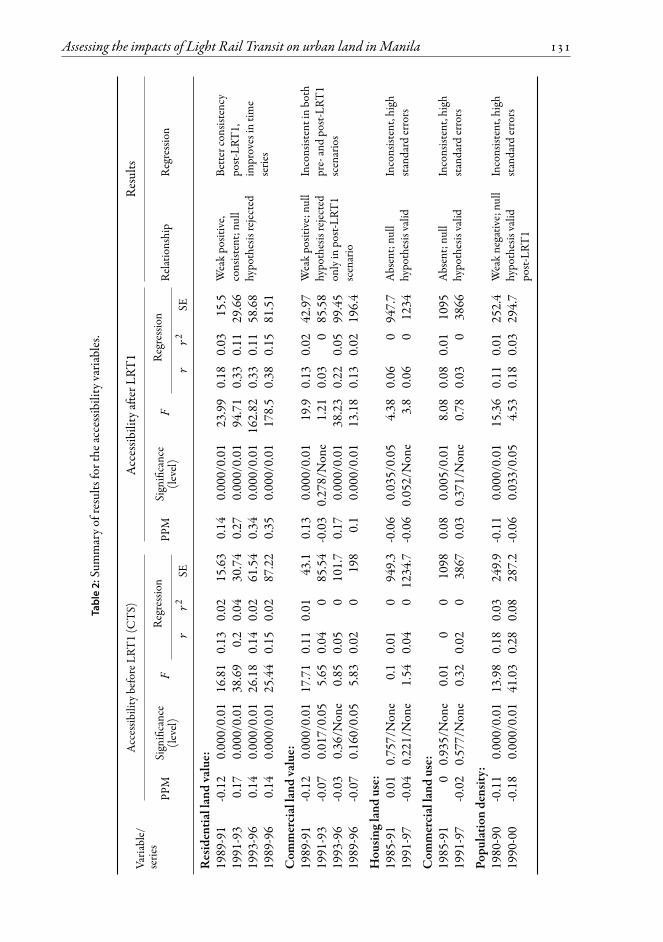
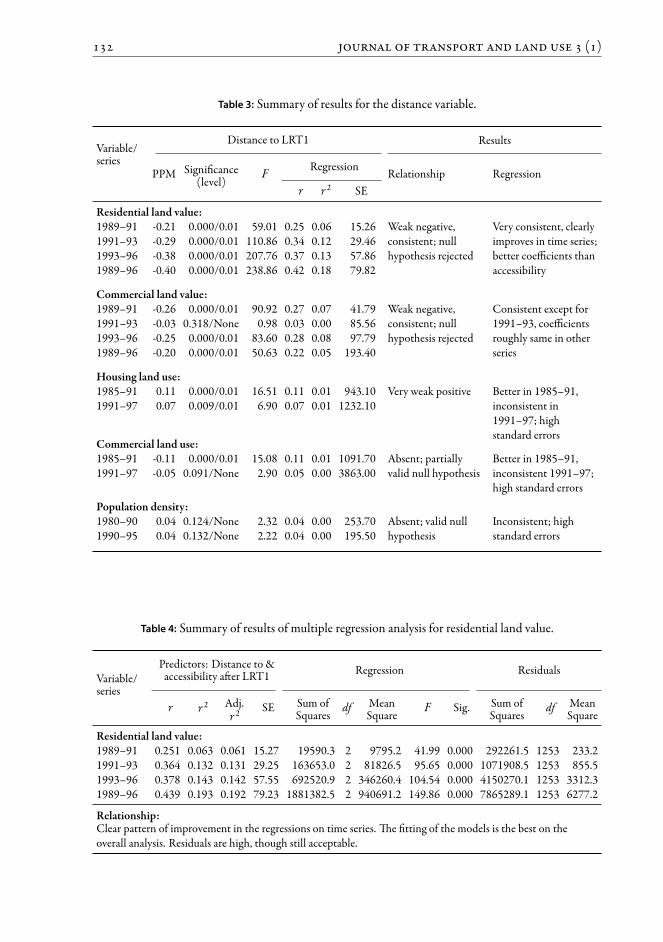
e dependent variables were further processed to show changes within time series, pro-ducing multiple outputs for each time sequence. ere are four indicators for each commer-cial and residential land value, for the periods 1989–91, 1991–93, 1993–96, and 1989–96;three for each housing and commercial land use area change, for 1985–91, 1991–97, and thewhole 1985–97 period; and three for changes in population density for 1980–90, 1990–95,and 1980–95—all analyzed with the three independent variables. A summary of results isshown in Tables 2, 3, and 4.
()
Figure 6: Results of the accessibility calculation showing the differences before (top) and a er LRT1
(bottom).
Assessing the impacts of Light Rail Transit on urban land in Manila
Table 1: Scheme of variables and relationships for impact analysis.
Accessibility Distanceto LRT1
Before LRT1 (CTS) A er LRT1
Land value:Residential * * *Commercial * * *Land use:Housing * * *Commercial * * *Density:Population * * *
5.1 Land value analysis
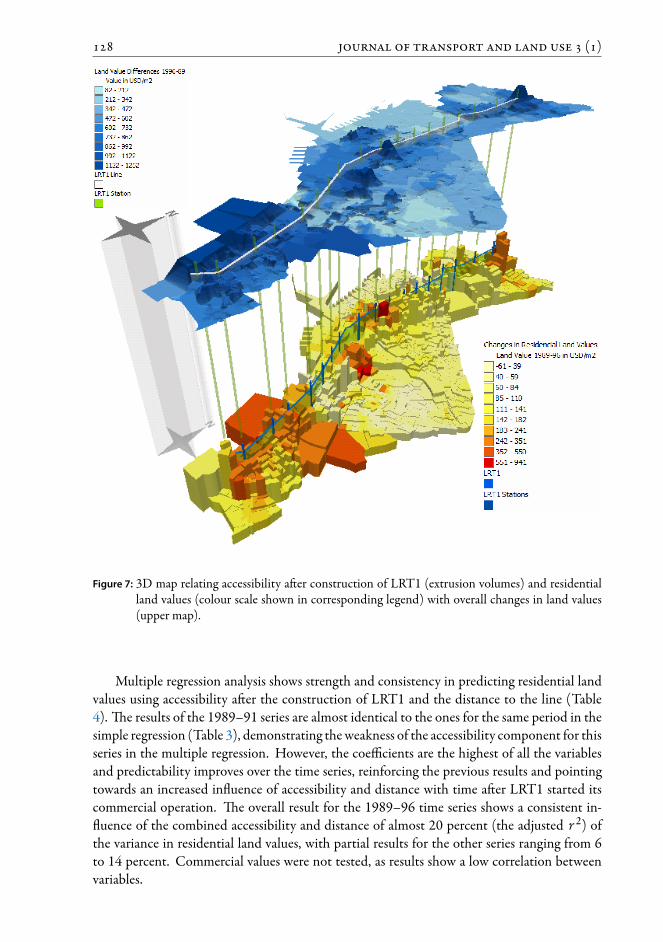
Land values have a better correlation with accessibility a er LRT, showing higher coefficientsthan in the pre-LRT1 scenario and rising coefficients along the time series (Table 2). e cor-relations for commercial land values show consistency except for the 1993–96 period⁴, thoughthe results are quite marginal and not as strong as the ones for residential values. e latteralso show a tendency to grow steadily in the time series, with the highest value in the overall1989–96 period. Compared to the pre-LRT1 scenario, the coefficients are not only strongerbut also positive, growing towards a stronger linearity in the time series. e regressions showthat there is only a limited possibility of predicting land values based on accessibility. is pre-dictability is only signi cant for residential land values, which have better coefficients overall.
Figure 7 shows the strength of the relationship between accessibility post-LRT1 and res-idential land values. Most of the high residential land values (darker tones) are clustered andrelated to high accessibility changes (higher extrusions), while lighter tones representing lowland values are generally associated with lower heights. Some evident mismatch between col-ors and extrusion heights (higher extrusions with lighter colors and vice versa) illustrates theweak correlation found.
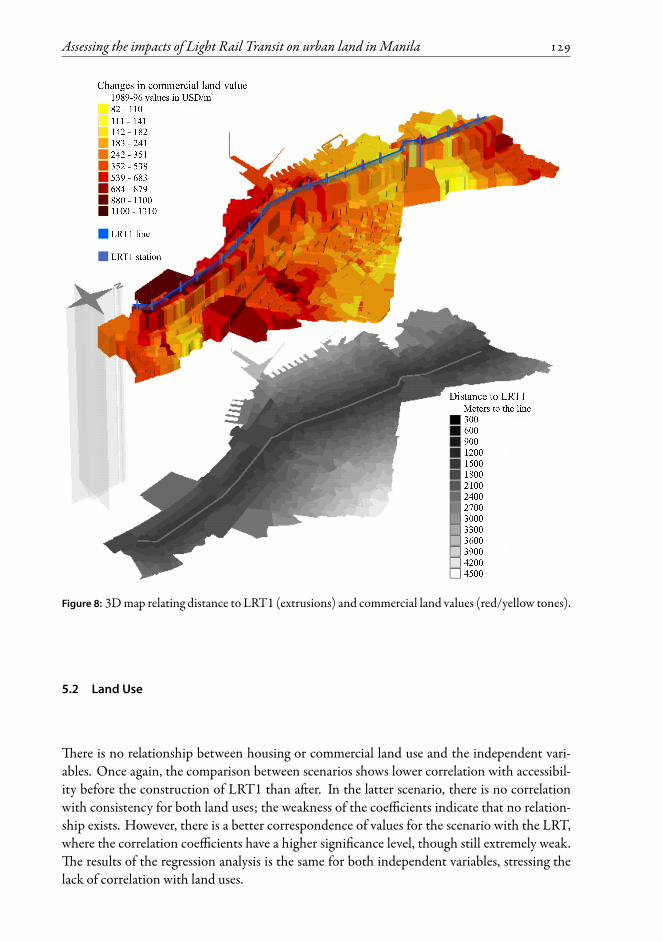
e analysis of distances to LRT1 and land values shows a strong negative relationship, aninverse correlationwith consistency (Table 3). e coefficients are also higher, showing the ten-dency for residential land values decrease with distance from LRT1. Once more, coefficientsget stronger as the time series progresses, meaning that the longer LRT1 operates in Manila,the lower the value of residential land close to it. Scattergrams show more negative residentialland value changes adjacent to the LRT1 line, especially in the 1993–96 and 1989–96 inter-vals (see Section 6.2). e results for commercial land values have far less consistency and thecorrelations have roughly the same value across the time series, though there is a slight decrease.Figure 8 illustrates the relationship between distance from LRT1 and commercial land values,showing the lack of a clear clustering pattern as all results point towards a lack of correlation(high volumes with darker tones and vice versa) between the two variables.
⁴ ismight be result of the political instability brought onby an attempted coupd’état against PresidentAquinoand the eruption ofMount Pinatubo followed by an earthquake inMetroManila affecting the Philippine economyin the early 1990s (Magno-Ballesteros 2000).
()
Figure 7: 3D map relating accessibility a er construction of LRT1 (extrusion volumes) and residential
land values (colour scale shown in corresponding legend) with overall changes in land values(upper map).
Multiple regression analysis shows strength and consistency in predicting residential landvalues using accessibility a er the construction of LRT1 and the distance to the line (Table4). e results of the 1989–91 series are almost identical to the ones for the same period in thesimple regression (Table 3), demonstrating theweakness of the accessibility component for thisseries in the multiple regression. However, the coefficients are the highest of all the variablesand predictability improves over the time series, reinforcing the previous results and pointingtowards an increased in uence of accessibility and distance with time a er LRT1 started itscommercial operation. e overall result for the 1989–96 time series shows a consistent in-uence of the combined accessibility and distance of almost 20 percent (the adjusted r 2) of
the variance in residential land values, with partial results for the other series ranging from 6to 14 percent. Commercial values were not tested, as results show a low correlation betweenvariables.
Assessing the impacts of Light Rail Transit on urban land in Manila
Figure 8: 3Dmap relating distance to LRT1 (extrusions) and commercial land values (red/yellow tones).
5.2 Land Use
ere is no relationship between housing or commercial land use and the independent vari-ables. Once again, the comparison between scenarios shows lower correlation with accessibil-ity before the construction of LRT1 than a er. In the latter scenario, there is no correlationwith consistency for both land uses; the weakness of the coefficients indicate that no relation-ship exists. However, there is a better correspondence of values for the scenario with the LRT,where the correlation coefficients have a higher signi cance level, though still extremely weak.
e results of the regression analysis is the same for both independent variables, stressing thelack of correlation with land uses.
()
5.3 Population Density
Contrary to the previous observations, the results show consistency for population density andaccessibility before LRT1 than a er it (Table 2). e negative correlation with accessibilitya er LRT1 is not only weak but also inconsistent for the 1990–95 time series. If consistent,this result could suggest that higher accessibility determines lower population densities and viceversa. However, all correlations between population density and distance to LRT1 show a clearlack of correspondence and the regression results support these ndings. e regressions showthe same the results and inconsistencies, pointing towards a lack of in uence of the independentvariables over changes in population inManila.
6 Discussion
6.1 Results in the context of the study area
As explained in Section 3, the city’s core was completely built up at the time LRT1 was im-plemented across this area, causing its impacts to be more complex and limited in extent. eland market in Manila constrained real estate development in the built-up area as opposed toareas around fringes of the city. However, not all land value changes outside the study area canbe compared, as the fringes have the lowest values prior to urban development. A preferencefor more space, free of pollution and traffic congestion would make them more attractive todevelopment. is scenario suggests a limited capability for land development in the city’s corewithin the time frame of this study, which may have affected the results.
e massive presence of dwellings in any urban area compared with commercial buildingshas provided a better way of correlating variables. Accessibility and distance, when related toland values, will always have a better level of comparability with more sampling present in thestudy area as is the case of residential land values. e smaller number of sampling units of com-mercial land values will therefore be less easy to correlate and its changes, even in a smaller scale,will have less consistency for the analysis. is may explain the lesser degree of correspondenceshown by this variable.
Moreover, themarginal results for commercial land usemay be attributable to location fac-tors, as commerce has great in uence through economies of agglomeration and speculation infocalized clusters. Despite this, amicro-urban analysis can distinguish somepatronage of LRT1stations over major changes in commercial areas. e stations at both line’s extremes (Baclaranand EDSA to the south, Monumento and Fi h Avenue to the north) have different extents oftheir adjacent commercial area, as well as by the LRT1’s center (Gil Puyat, Vito Cruz and Pres-ident Quirino stations). e most remarkable case is Monumento, where commercial land usechanges in surrounding neighborhood are among the highest in the study area due to the largevolume of commuting trips. Nevertheless, these areas are not large enough to reveal consistentrelationships with accessibility indexes at themacro-urban level and, as seen, major changes areweakly related to the whole LRT1 corridor.
Another in uencing factor is the progressive reduction in the amount of housing—andthus population density—in Manila’s core as intense commercial activities have pushed high-and mid-income classes to relocate away from their traditional dwellings. A rise in land valuesuch as that generated by commercial demand tends to trigger preferences for inexpensive hous-ing away from fast-growing (andpossibly constrained) commercial nodes in theCBD. ismay
Assessing the impacts of Light Rail Transit on urban land in Manila
Table2:Summaryo
fresultsforthe
accessibilityvariables.
Variable/
series
Accessib
ilitybeforeLR
T1(C
TS)
Accessib
ilityaerLR
T1
Results
PPM
Signicance
(level)
FRegression
PPM
Signicance
(level)
FRegression
Relationship
Regression
rr2
SEr
r2SE
Residentia
llandvalue:
1989-91
-0.12
0.000/0.01
16.81
0.13
0.02
15.63
0.14
0.000/0.01
23.99
0.18
0.03
15.5
Weakpositive,
consistent;nu
llhypothesisrejected
Betterconsistency
post-LRT
1,im
provesintim
eseries
1991-93
0.17
0.000/0.01
38.69
0.2
0.04
30.74
0.27
0.000/0.01
94.71
0.33
0.11
29.66
1993-96
0.14
0.000/0.01
26.18
0.14
0.02
61.54
0.34
0.000/0.01
162.82
0.33
0.11
58.68
1989-96
0.14
0.000/0.01
25.44
0.15
0.02
87.22
0.35
0.000/0.01
178.5
0.38
0.15
81.51
Com
mercialland
value:
1989-91
-0.12
0.000/0.01
17.71
0.11
0.01
43.1
0.13
0.000/0.01
19.9
0.13
0.02
42.97
Weakpositive;nu
llhypothesisrejected
onlyinpost-LRT
1scenario
Inconsistentinboth
pre-andpost-LRT
1scenarios
1991-93
-0.07
0.017/0.05
5.65
0.04
085.54
-0.03
0.278/None
1.21
0.03
085.58
1993-96
-0.03
0.36/N
one
0.85
0.05
0101.7
0.17
0.000/0.01
38.23
0.22
0.05
99.45
1989-96
-0.07
0.160/0.05
5.83
0.02
0198
0.1
0.000/0.01
13.18
0.13
0.02
196.4
Hou
singland
use:
1985-91
0.01
0.757/None
0.1
0.01
0949.3
-0.06
0.035/0.05
4.38
0.06
0947.7
Absent;nu
llhypothesisvalid
Inconsistent,high
standard
errors
1991-97
-0.04
0.221/None
1.54
0.04
01234.7
-0.06
0.052/None
3.8
0.06
01234
Com
mercialland
use:
1985-91
00.935/None
0.01
00
1098
0.08
0.005/0.01
8.08
0.08
0.01
1095
Absent;nu
llhypothesisvalid
Inconsistent,high
standard
errors
1991-97
-0.02
0.577/None
0.32
0.02
03867
0.03
0.371/None
0.78
0.03
03866
Popu
latio
ndensity
:1980-90
-0.11
0.000/0.01
13.98
0.18
0.03
249.9
-0.11
0.000/0.01
15.36
0.11
0.01
252.4
Weaknegative;nu
llhypothesisvalid
post-LRT
1
Inconsistent,high
standard
errors
1990-00
-0.18
0.000/0.01
41.03
0.28
0.08
287.2
-0.06
0.033/0.05
4.53
0.18
0.03
294.7
()
Table 3: Summary of results for the distance variable.
Variable/series
Distance to LRT1 Results
PPM Signi cance(level)
F Regression Relationship Regressionr r 2 SE
Residential land value:1989–91 -0.21 0.000/0.01 59.01 0.25 0.06 15.26 Weak negative,
consistent; nullhypothesis rejected
Very consistent, clearlyimproves in time series;better coefficients thanaccessibility
1991–93 -0.29 0.000/0.01 110.86 0.34 0.12 29.461993–96 -0.38 0.000/0.01 207.76 0.37 0.13 57.861989–96 -0.40 0.000/0.01 238.86 0.42 0.18 79.82
Commercial land value:1989–91 -0.26 0.000/0.01 90.92 0.27 0.07 41.79 Weak negative,
consistent; nullhypothesis rejected
Consistent except for1991–93, coefficientsroughly same in otherseries
1991–93 -0.03 0.318/None 0.98 0.03 0.00 85.561993–96 -0.25 0.000/0.01 83.60 0.28 0.08 97.791989–96 -0.20 0.000/0.01 50.63 0.22 0.05 193.40
Housing land use:1985–91 0.11 0.000/0.01 16.51 0.11 0.01 943.10 Very weak positive Better in 1985–91,
inconsistent in1991–97; highstandard errors
1991–97 0.07 0.009/0.01 6.90 0.07 0.01 1232.10
Commercial land use:1985–91 -0.11 0.000/0.01 15.08 0.11 0.01 1091.70 Absent; partially
valid null hypothesisBetter in 1985–91,inconsistent 1991–97;high standard errors
1991–97 -0.05 0.091/None 2.90 0.05 0.00 3863.00
Population density:1980–90 0.04 0.124/None 2.32 0.04 0.00 253.70 Absent; valid null
hypothesisInconsistent; highstandard errors1990–95 0.04 0.132/None 2.22 0.04 0.00 195.50
Table 4: Summary of results of multiple regression analysis for residential land value.
Variable/series
Predictors: Distance to &accessibility a er LRT1 Regression Residuals
r r 2 Adj.r 2 SE Sum of
Squaresdf Mean
SquareF Sig. Sum of
Squaresdf Mean
Square
Residential land value:1989–91 0.251 0.063 0.061 15.27 19590.3 2 9795.2 41.99 0.000 292261.5 1253 233.21991–93 0.364 0.132 0.131 29.25 163653.0 2 81826.5 95.65 0.000 1071908.5 1253 855.51993–96 0.378 0.143 0.142 57.55 692520.9 2 346260.4 104.54 0.000 4150270.1 1253 3312.31989–96 0.439 0.193 0.192 79.23 1881382.5 2 940691.2 149.86 0.000 7865289.1 1253 6277.2
Relationship:Clear pattern of improvement in the regressions on time series. e tting of the models is the best on theoverall analysis. Residuals are high, though still acceptable.
Assessing the impacts of Light Rail Transit on urban land in Manila
partly explain the small impact of LRT1on land uses, especially housing. Although somemajorchanges have occurred next to stations, this is just due to the commercial expansion at Baclaranor Gil Puyat stations mentioned above. is commercial growth depended on transport (bothprivate and public) and led to a reduction of housing and industrial areas as land was convertedto shopping malls in the 1990s (Magno-Ballesteros 2000).
Population density had a particular development in Manila during the time frame of thepresent study. As explained in Section 3, densities within the study area increased less than inthe rest of Manila. In the former, the Barangay density only increased to 180 hha. while in thelatter the population nearly doubled from a mean of 6102 to 11441 habitants per Barangay.
is may be evidence of a low level of housing development or of population displacements tolocations outside the study area by the time LRT1 entered service. e statistics also show adecrease in housing area, pointing towards a higher densi cation within existing dwellings tomaintain population levels. e inconsistencywhen correlating accessibility and distanceswithpopulation density changes could have an explanation as this highly in uenced environmentthat may have limited the LRT1’s effects.
6.2 Related theory and explanation of results
Asmentioned above, the displacement of housing from the central area to the newly developedouter parts of (among others) Quezon and Kalookan municipalities caused a decrease in pop-ulation gures around the LRT1 line. is change in the residential area preferences ofManilaresidents during the 1980s and 1990s was explained by Magno-Ballesteros (2000). As men-tioned in Section 2, increasing accessibility may not change previously existing tendencies butrather amplify them. If an area is undergoing expansion, mass transport can accelerate it, but ifan area is declining,mass transportmayhelp stabilizationbut it is unlikely to reverse the decline.
e pattern of population loss in Manila’s core continued a er the LRT1 entered service⁵.Most ndings show a correspondence with related theory in situations where mass trans-
port has demonstrated to generate impacts over urban land. In general, the studies reviewed inSection2—especially the research byCervero andWu(1998) andWegener andFürst (1999)—show that factors other than accessibility increasingly in uence metropolitan location deci-sions, concluding that the in uence of urban-rail transport on land development is very lim-ited. With respect to the weak correlations found, the small and variable impact of urban railinvestment is also in uenced by these non-accessibility factors as additional infrastructure (par-ticularly where networks are already well developed) has little effect on the overall level of ac-cessibility. e anticipated large accessibility increases due to the introduction of the LRT1had less in uence due to the fact that accessibility was already good before the LRT1 was in-troduced. In Manila during the 1980s and 1990s, the large number of small transport units(jeepneys, aircons, etc.) provided seamless accessibility (Wright and Hook 2007).
As seen in the studies reviewed, the effects identi ed may only be signi cant where acces-sibility is low and will have a limited in uence in areas that have relatively good access, theso-called “ubiquitous accessibility.” is is especially true for congested traditional cities, suchas Manila. Where time savings are made, property values are likely to increase. If the change inaccessibility is large enough—as in the case of the LRT1—time savings will be noticeable by at
⁵ Although itmay havemaintained population gures, this was not evidenced by the study as it would needmoredata.
()
least some population sectors, whereas public-transport investments that do not signi cantlyreduce travel times will have little in uence. is is logical in light of the limited relationshipbetweenurban land changes and accessibility/proximity variable for LRT1. In both cases, it im-plies that the brute mechanics of distance and transport cost may be declining in importance.
Transport investments such as LRT1 are o en necessary but not sufficient to generate de-velopment. is development would be considerable in the case of areas lacking transport in-frastructure or in “advanced” transport networks, where there is a signi cant step of accessi-bility change or solutions to major transport con icts, e.g. network bottlenecks. Hall andMarshall (2002) also noted two particularly important contextual items regarding transportinvestment on development: rst, infrastructure investment has led to land use developmentin buoyant economies; second, the regulatory context—such as planning controls—impliesthat public transport-led development tends to ourish where policies favor public TOD. Rel-evant contextual factors include complementary zoning, taxation policies, land availability, anda “hospitable” setting. In Manila, no such controls to pro t the improvements in accessibilityby LRT1 were applied. As the rst mass transport system in the Philippines, LRT1 may havesurprised institutions that were unaware of the need to set a TOD framework to favor this in-uence. It seems that the priority was given to the recovery of investment through fare box
revenues by demand catching, purely the transport planning point of view without an inte-grated perspective. In this sense, an appropriate environment for the maximization of urbanland changes due to the LRT1’s improvements is also necessary. According to the literaturereviewed in Section 2, LRT1 may have a strong in uence on the location, intensity, and tim-ing of new development if it had been supported by the appropriate planning guidelines. iscontext is of extreme importance and may only lead to positive new urban land developmentswhere stringent land use controls are employed to direct changes, which was not the case forthe LRT1 inManila.
Another decisive factormentioned in Section2 is the provision of public infrastructure andnancial incentives to attract and support development around stations, which unfortunately
was not done inManila. e development of economic activities cannot be solely explained bywell-developed transport facilities. is is due to the inability of transport facilities to provideusers a revenue per se. In addition, the lack of a TOD approach before and soon a er the con-struction of LRT1 (partially recti ed only when the line had been operating for several years)is in line with the limited the extent of impacts on urban land found in this study.
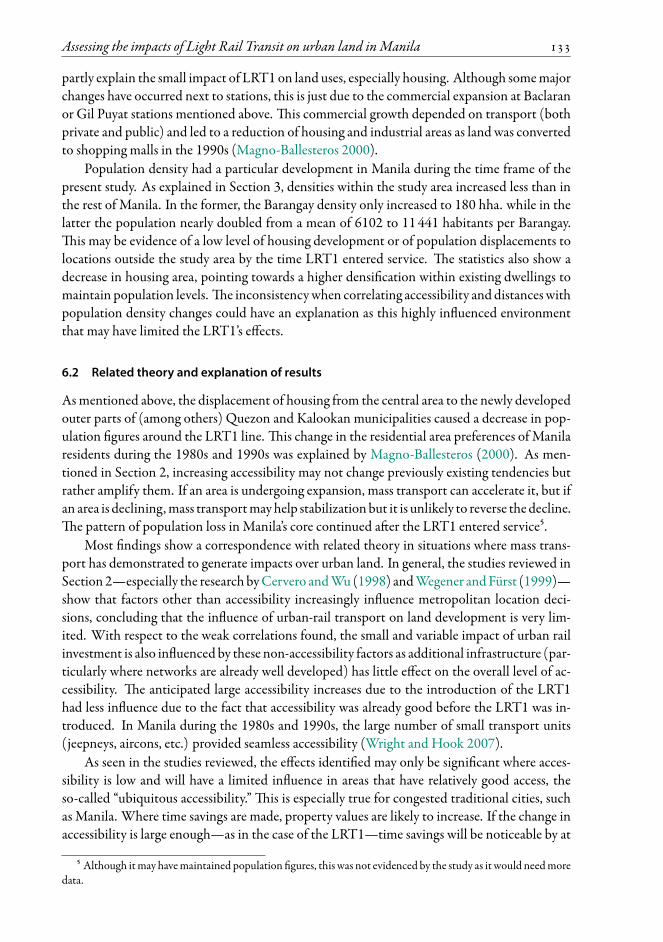
Finally, LRT1 may have had two different and opposing effects on residential land values.First, a closer proximity to the linemay increase property values, implying a declining price gra-dient on incremental distance from its stations. Second, properties adjacent to the line mayexperience nuisances that lower their value, evidenced in the correlations between distance tothe LRT1 line and residential land values (see Section 5.1). It is widely known that noise, vi-bration, congestion, visual impacts, and increasing commercial activity (among other factors)such as may be found next to a mass transport station may have some negative impacts on resi-dential land values. As shown in Figure 9, the analysis of the scattergrams of distance to LRT1and land values supports these observations. Changes in land values are negative immediatelyadjacent to the line (the curve below theY-axis); the negative effect weakenswith distance fromthe LRT1, until it disappears by the 900m range. ese observations highlight disbene ts forresidential activities generated by the opening of LRT1 in the early 1980s. A study by Landiset al. (1994) obtained a similar result, nding evidence of negative externalities within a few
Assessing the impacts of Light Rail Transit on urban land in Manila
hundred meters of stations. For commercial land values, these disbene ts are smaller, thoughstill considerable. However, in this case, some of the effects that would be disadvantages in res-idential areas could be seen as advantages: proximity to railway lines means more access andthus more potential pro tability in land use terms, especially for housing for low-income pop-ulations that are largely dependent on public transport. In that sense, Du and Mulley (2007),in research on house values and accessibility by metro lines in the Tyne andWear region in theUnited Kingdom, found no signi cant negative effects within 200m of a station. is con-tradiction emphasizes the variability of results across different study areas and the necessity ofincluding potential side effects, planning factors, and policies applied when analyzing the rela-tionship of transport and urban land, which has proved to be extremely complex.
Figure 9:Distances to LRT1 and residential land values and correspondence with other observed effects.Adapted from Geurs and Ritsema (2001).
7 Conclusions and further research
is study has found evidence of consistent relationships between LRT1 and some urban landindicators. Accessibility and distance have a consistent correlation with changes in the valueof land (particularly residential land) and improvements can be seen within time series. At
()
the same time, in the pre-LRT1 scenario (accessibility only by jeepneys/buses), this correlationis either absent or much weaker. Further, no correlation is evident between accessibility ordistance from LRT1 and changes in housing/commercial land uses or population density. isis in accordance with similar ndings in related research, which have ranged from a simple lackof systematic in uence to a weak though consistent link.
e assessment of LRT1’s in uence on land values proved to be limited. As seen in re-lated studies, accessibility and proximity to public transport are only part of the overall he-donic formula in uencing land values. is formula also includes factors such as consumerpreferences, proximity to public services (health, education, etc.), urban landscape, environ-ment/neighborhood quality, land’s economic potential, etc. On the other hand, themore com-plex land use factors of location (such as speculation or land availability) or failure to adequatelyapply TOD policies may have caused the inconsistency between the LRT1 indicators and landuse changes.
Similarly, population densities showed changes uncorrelated with these indicators. Loca-tion factors, such as preferences for open space free of congestion or pollution, drovemigrationout of Manila’s core (the study area) to newly developed northern and southern areas. Withno incentives, this trend could not be counteracted by LRT1 in uences; previous research hasalso shown that mass transport might not have the capacity to change such trends, though itmight further strengthen them. e incapacity of LRT1 to in uence settlement patterns byitself partly explains the absence of correlations with population densities. In general, the studymeasured the impacts of LRT1 on the selected urban land variables in the developing city ofManila, nding somedegree of strength in the correlations and regressionswith themodel used.
As this research only covered some transport-related variables, the next task would be to as-sess other particularly important factors. e list includes negative effects such as environmen-tal or traffic impacts. At themicro-urban scale, the analysis of pedestrian ows or bus terminalsaroundLRT1 stationsmay shed some light on the subject. To understand how the impacts varydepending on the economic setting of the study area, it may be advisable to focus on emergingeconomies, as there is more research on the impacts of mass transport in developed countries.Additionally, it would be important to differentiate typologies, conducting separate researchfor subways, grade-level systems, elevated lines, etc., as their impacts may be quite different.Other accessibility measures can be incorporated in future studies as well.
Finally, the evidenced impacts require a corresponding methodology for policy’s design.Further research must also address the related planning issues and outline the right frameworkto take advantage of the dynamic forces of TOD in urban areas. Consequently, research muststrive to support integrated, policy-oriented urban and transport planning in which participa-tory planning practices give equal consideration to the interests of developers, stakeholders, andthe general public.
References
Bae, C.-H.C.,M.-J. Jun, andH. Park. 2003. e impact of Seoul’s Subway Line 5 on residentialproperty values. Transport Policy, 10(2):85 – 94. doi: 10.1016/S0967-070X(02)00048-3.
Bichsel, R. 1999. A silver rule for nancing local transport facilities. Report, Départementd’Econométrie et d’Economie Politique, Université de Lausanne, Switzerland.
Assessing the impacts of Light Rail Transit on urban land in Manila
Brunn, S. and J.Williams. 1983. Cities of theWorld –World RegionalUrbanDevelopment. NewYork: Harper & Row.
Cervero, R. 1984. Journal Report: Light Rail Transit and Urban Development. Journal of theAmerican Planning Association, 50(2):133–147.
Cervero, R. and J. Landis. 1997. Twenty years of the Bay Area Rapid Transit system: Landuse and development impacts. Transportation Research Part A, 31(4):309 – 333. doi:10.1016/S0965-8564(96)00027-4.
Cervero, R. and K.-L. Wu. 1998. Sub-centring and commuting: Evidence from the San Fran-cisco Bay area, 1980–90. Urban Studies, 35(7):1059–1076.
Dabinett, G., T. Gore, R. Haywood, and P. Lawless. 1999. Transport investment and regen-eration. Sheffield: 1992–1997. Transport Policy, 6(2):123 – 134. doi: 10.1016/S0967-070X(99)00013-X.
Debrezion, G., E. Pels, and P. Rietveld. 2007. e impact of railway stations on residentialand commercial property value: A meta-analysis. e Journal of Real Estate Finance andEconomics, 35(2):161–180. doi: 10.1007/s11146-007-9032-z.
Dong, X., M. E. Ben-Akiva, J. L. Bowman, and J. L. Walker. 2006. Moving from trip-basedto activity-based measures of accessibility. Transportation Research Part A, 40(2):163–180.doi: 10.1016/j.tra.2005.05.002.
Du, H. and C. Mulley. 2007. Transport accessibility and land value: A case study of Tyneand Wear. RICS Research Paper Series Volume 7 Number 3, Royal Institute of CharteredSurveyors.
Emerson, D. 1990. Framework for analyzing the impact of xed-guideway transit projects onland use and urban development. Transportation Research Record, 1274:150–155.
Fotheringham, A. 1982. Distance-decay parameters: a reply. Annals of the Association of Amer-ican Geographers, 72(4):551–553.
Fouracre, P. R., R. J. Allport, and J. M. omson. 1990. e performance and impact of railmass transit in developing countries. Research report 278, Transport and Road ResearchLaboratory – Overseas Development Administration (TTR-ODA), London.
Gakenheimer, R. 1999. Urban mobility in the developing world. Transportation Research PartA, 33(7-8):671–689. doi: 10.1016/S0965-8564(99)00005-1.
Gardner, G., J. Rutter, and F. Kuhn. 1990. e performance and potential of light rail transit indeveloping countries. Technical report, Transport andRoadResearchLaboratory–OverseasDevelopment Administration (TTR-ODA), London.
Geurs, K. and J. Ritsema. 2001. Accessibility measures: Reviews and applications. Technicalreport, National Institute of Public Health and the Environment, Bilthoven, e Nether-lands.
Geurs, K. T. and B. van Wee. 2004. Accessibility evaluation of land-use and transport strate-gies: Review and research directions. Journal of Transport Geography, 12(2):127–140. doi:10.1016/j.jtrangeo.2003.10.005.
Giuliano, G. 1995. Land use impacts of transportation investments: Highway and transit. InS. Hanson, ed., e Geography of Urban Transportation, pp. 305–341. New York and Lon-don: e Guilford Press.
Greeneberg, K. 1988. Transit and changing urban character: e evolution of an intersectionin Toronto. In J. Dodgson and N. Topham, eds., Bus deregulation and privatisation: Aninternational perspective, pp. 47–54. Austin: University of Texas Press.
()
Gutierrez, J., A. Monzón, and J. Piñero. 1998. Accessibility, network efficiency and transportinfrastructure planning. Environmental and Planning A, pp. 1337–50.
Hall, P. andC.Hass-Klau. 1985. CanRail Save the City? e Impacts of Rail Rapid Transit andPedestrianisation on British and German Cities. Aldershot, UK: Gower.
Hall, P. and S.Marshall. 2002. e government’s 10 year transport plan – land use implications.Technical report, Independent Transport Commission, Southampton, UK.
Japan International Cooperation Agency. 1999. Metro Manila urban transportation integra-tion study. Unpublished.
Knight, R. 1980. e impact of rail transit on land use: Evidence and a change of perspective.Transport, 9(1):3–16.
Landis, J., S. Guathakurta, and M. Zhang. 1994. Capitalization of transportation investmentsinto single-family home prices. Working Paper 619, Institute of Urban and Regional Devel-opment, University of California, Berkeley.
Lefaver, S. 1997. Private land with public partnerships for transit based development. Report97-1, e Mineta Transportation Institute.
Magno-Ballesteros, M. 2000. e Urban Land and Real Estate Market in Metro Manila: ASocio-Economic Analysis. Ph.D. thesis, Katholieke Universiteit Nijmegen, e Netherlands.
McGee, T. 1967. e Southeast Asian City. New York: Praeger.Morris, J. M., P. L. Dumble, and M. R. Wigan. 1979. Accessibility indicators for transportplanning. Transportation Research Part A: General, 13(2):91–109. doi: 10.1016/0191-2607(79)90012-8.
Pill, J. 1988. Toronto: irty years of transit development. InW. Attoe, ed.,Transit, Land Useand Urban Form, pp. 57–62. Austin: University of Texas Press.
Pushkarev, B., J. Zupan, and R. Cumella. 1982. Urban Rail in America. Bloomington: IndianaUniversity Press.
RICS Policy Unit. 2002. Land value and public transport. Technical report, Office of theDeputy PrimeMinister, London.
Rietveld, P. and P. Nijkamp. 2000. Transport infrastructure and regional development. InJ. Polak and A. Heertie, eds., Analytical Transport Economics: An International Perspective,pp. 208–232. Cheltenham, UK: Edward Elgar.
Simpson, B. 1990. Urban rail transit: Costs and funding. Report, Transport andRoadResearchLaboratory, Crowthorne, UK.
Transit Cooperative Research Program. 2002. Transit-oriented development and joint devel-opment in the United States: A literature review. Research Results Digest, 52.
Walmsley, D. and K. Perret. 1992. e effects of rapid transit on public transport and urbandevelopment. Technical report, HMSO, London.
Wegener, M. and F. Fürst. 1999. Land-use transport interaction: State of the art. Technicalreport, Institut für Raumplanung Fakultät Raumplanung, Universität Dortmund, Germany.
Wright, L. andW. Hook. 2007. Bus Rapid Transit – Planning Guide. New York: Institute forTransportation and Development Policy, 3rd edition.