Embed Size (px)
Citation preview
CORP 2004 & Geomultimedia04 Ed. / Hg.: Manfred Schrenk, ISBN: 3-901673-11-2, www.corp.at 123
Community Design of a Light-Rail Transit Oriented Development using Casewise Visual Evaluation (CAVE)
Keiron BAILEY & Ted GROSSARDT Keiron Bailey, Department of Geography and Regional Development, University of Arizona, Tucson, AZ 85712;
Ted Grossardt, Kentucky Transportation Center, Lexington, KY 40506.
1 INTRODUCTION The Transit Authority of River City (TARC) is in the preliminary engineering phases of developing a light-rail transit system running from downtown Louisville, Kentucky to the city’s southern suburbs, a distance of approximately 15 miles [1]. In collaboration with the research team, TARC wished to test an innovative methodology for improving community participation in the design of a light rail transit-oriented development for the Smoketown/Shelby Park area. The Smoketown/Shelby Park neighborhood is a low-income area located to the south of the University of Louisville Medical Center. A suitable site for the station has been identified by TARC and its design partners, but no development has taken place yet. TARC has been conducting extensive outreach in this neighborhood over a span of several years and as a result the community is aware of the nature of the transit project, its purposes and benefits and has participated in the shaping of the route [2]. Given this context the primary purpose of the research was to assist community participants identify preferred design criteria for their local transit oriented area, defined as this particular transit station and a two-block radius around it. This paper sets forth the principles of a novel visual assessment methodology termed Casewise Visual Evaluation (CAVE), describes its application to this problem and summarizes the results.
2 VISUAL ASSESSMENT METHODOLOGIES This project required an analytic method of ordering visual representations (scenarios) by preference [3]. This section examines two approaches developed by landscape architects and decision theorists to quantify public preferences for scenarios and their constituent elements.
Nelessen designed a methodology for comparative landscape evaluation termed the Visual Preference Survey or VPS [4]. The VPS undergirds the implementation of a popular form of urban and suburban landscape planning termed New Urbanism. The VPS is intended to allow participants to “rank images of places, spaces, and land uses.” As Nelessen [4, p.83-84] says:
Images must reflect what people see when they move through the study area, along streets, sidewalks, and public spaces, all of the integral components of the public viewshed. They should illustrate such aspects as building form, density, a sense of enclosure, setback, scale, massing, spatial definition, architectural style, colors, textures, materials, landscaping, road types, streetscape elements, types of land use, level of human activity, and development density that occur both in the study area and elsewhere in the study region. A basic assumption is that each visual representation is a complex assembly of different components, termed design elements. The VPS consists of a survey instrument based on an optical bubble score sheet and a questionnaire administered to community members. The assessment criterion is an integer scale of preference 1 through 10 points. Although widely used, the VPS methodology does not specify analytically the elemental contributions to public preference. Thus, although one complete design scenario can be compared with another, it is not possible to determine which design elements influence public preference or by how much they do so. Decision theorists sometimes prefer to use pairwise comparison to build preference functions. This mode is used in Saaty’s [5,6,7] Analytic Hierarchy Process (AHP), a multicriteria decision methodology that is widely used as a foundation for decision support systems. For optimal quality, exhaustive pairwise comparison is required between each possible pair of design options. This mode is particularly efficient in discriminating between closely matched options. Pairwise comparison has also been employed by Whitmore et. al. for landscape assessment at public meetings [8]. In their study landscapes were shown as slide pairs to participant groups and preference was solicited. Marginal discrimination was not considered reliable, so instead of using a VPS-type integer scoring, preferences were restricted to an ordinal system in which either the right or left slides were scored as “preferred.” Participants had to be “discouraged from voting draws.” Further to encourage rapid and positive selection, the visual stimulus was presented for very short periods (8-10 seconds). Whitmore et. al. [4, p.32] believed that this would “minimize the respondents’ interjection of their personal experiences of the landscape and to help them focus on the landscape as a visual stimulus only.” Using an approach of analytic decomposition, in which each scenario is comprised of members in the combination subset (elements), they define the Combination Equation that specifies the number of slide pairs required for a complete comparison:
]1..[..........)!(!
!rnr
nCrn −=
where n gives the number of landscape types and r = members in the combination subset. Clearly n and r do not need to be large before C exceeds 100. Whitmore et. al’s study generated 406 scenarios, requiring months of public evaluation despite constrained voting procedures designed to accelerate meetings.
Faced with real constraints of arranging and scheduling forums for public input the research team decided the Whitmore et. al. approach was not feasible. However, the team did not believe that it was useful to restrict planners to very small numbers of design elements in order to permit an exhaustive set of pairwise comparisons. A reasonable, realistic number of design elements had to be considered. Therefore, a method was required that would generate the maximum useful information from a less than complete set of comparisons.
Keiron BAILEY & Ted GROSSARDT
124 MULTIMEDIAPLAN.AT & IEMAR 9th International Symposion on Planning & IT
The approach chosen was based on an expert system paradigm, in which the meeting participants were regarded as possessing the requisite knowledge. Their liking, or preference, for visual scenarios had to be quantified and translated into liking for specific design elements. Further, the preference increment or decrement for specific changes in elemental properties needed to be specified. For example, in a given situation exactly how much would an increase in building height affect public satisfaction with the project? Relationships between every design element had to be defined and stored in a preference knowledge base (PKB) that could be queried by planners and engineers, subject to resource constraints, to maximize public satisfaction with the design. Further, by giving the participants a sense that their opinions and judgments were helping directly to shape real designs, this approach was intended to address the frustrations that stakeholder groups often feel when infrastructure developments are discussed [9]. In sum, then, the visual assessment methodology had to satisfy two objectives within two constraints. The first objective was to establish a direct visual preference ordering among specific design options. The second was to perform a quantitative preference analysis based on the design elements. The first constraint was the inevitability of partial knowledge. The second was that the relationships between preference response to changing design elements could not be assumed to be additive. Preferences are non-linear. For example, changing the building height is not likely to produce the same preference increment when the other design features are varied simultaneously. The selected methodology was required to handle this non-linearity. Since the voting process required participants to score each scenario in turn, using a 1 to 10 point integer scale of visual preference as their scoring criterion, the methodology was termed Casewise Visual Evaluation.
PRINCIPLES OF CASEWISE VISUAL EVALUATION (CAVE) CAVE relies on a PKB that is designed and built using fuzzy set theory (FST). FST has a long history of effective use in engineering applications, particularly control system dynamics [10,11,12]. More recently, it has been applied to a variety of systems that share certain characteristics, such as Geographic Information System algorithms for spatial decision modeling, ecosystem modeling [13, 14, 15, 16, 17] and so forth. These systems all are difficult to model accurately because they are complex and non-linear. Not all relationships are known explicitly. Because our knowledge domain in these conditions is often small compared with the uncertainty, predictions based on “crisp” or “closed-form” system dynamic analyses exhibit a great instability and unpredictability. In some cases, even with perfect input data, mathematical solutions may not be defined. This is particularly true with higher-order ecological systems and socio-economic systems with multiple feedback mechanisms, such as the preferences under consideration. In this situation, traditional attempts at mathematical specification of each relationship would be at best impractical, if adequate input data could not be collected, and/or of questionable utility in the event of the lack of a crisp analytic solution. In contrast FST possesses several critical advantages. First, it offers robustness, or ability to discriminate reliably despite a lack of information. This characteristic has proved useful in systems modeling in diverse disciplines. This methodology was applied successfully to a complex reef ecosystem in Curacao, generating a reef growth model with reliable predictive capacity based on local expert opinion and very limited data [18]. Second, FST’s categories very effectively capture verbal comparisons. This application of linguistic terminology facilitates extraction of useful information even without quantitative audit data [19,20]. For example, a participant might not know the numerical specification of building density but she may be able to identify distinct and useful categories (in her judgment, she may have a clear idea what constitutes “dense” as opposed to “sparse”). Where quantitative information is available, this can also be input directly into the model. Even in the worst case, where response data for a system is of very poor quality, or very difficult or expensive to obtain, comparisons based on the responses to these adverbial categories allow satisfaction-enhancing design strategies to be defined. FST is entirely a quantitative methodology. Elemental membership in fuzzy sets is governed by a probability function and this function is numerically specified for every case. Set operations and data computations are governed by set theory identically to crisp sets. However, output takes the form of a probability function rather than a singular certainty [21,10,12]. The CAVE modeling process entails a transformation from numerical value to categorical value during fuzzy set input and PKB build and then from categorical value to numerical value when the PKB is queried. Using the FuzzyKnowledgeBuilder® software’s graphical output [22], when this PKB is interrogated with respect to two specific design elements, the shape (slope and height) of the preference surface provides designers with the information needed to maximize public satisfaction. At any point on the preference surface, if
),( yxfz = and F∇ is a vector showing the response to unit changes in i and j where i and j represent unit changes in x and y in direction indicated, then the partial directional derivative with respect to the visible input dimensions x and y can be specified:
=∇F jyfi
xf ..
∂∂
+∂∂
……………[2]
F∇ gives the direction of the gradient, and || F∇ || yields the gradient. Reading the numerical values for each of the coordinates allows functions such as marginal cost for preference increments to be specified precisely. This analysis enables an optimal design strategy to be defined in terms of changes in the x and y variables under consideration.
3 DEFINITION OF THE DESIGN VOCABULARY: ELEMENTS AND CLASSES The research team collaborated with the Urban Design Studio (UDS)1 to determine which design elements architects considered significant when modeling buildings and how these could be classified along linear scales (Table 1). This step allows an image
1 The UDS is a joint venture between the University of Kentucky College of Architecture, the University of Louisville Department of Urban and
Public Affairs, and city government's Louisville Development Authority.
Community Design of a Light-Rail Transit Oriented Development using Casewise Visual Evaluation (CAVE)
CORP 2004 & GeoMultimedia04 February 2004, Vienna, Austria 125
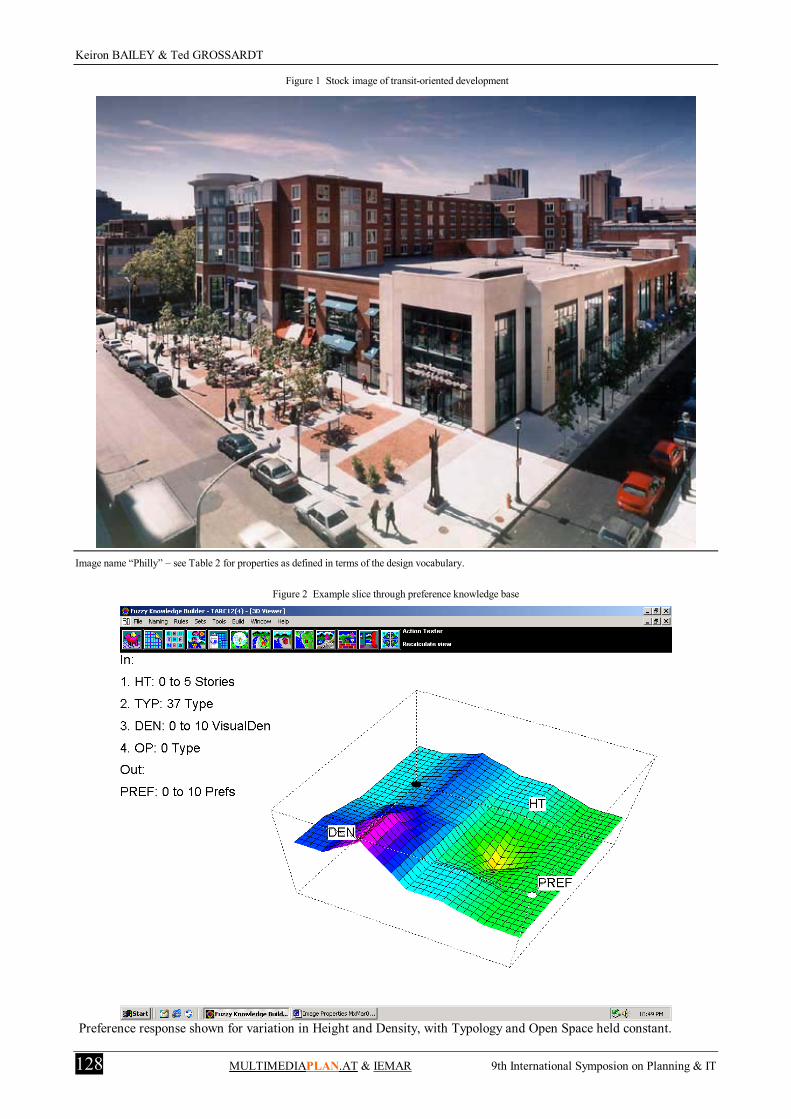
(scenario) to be classified in terms of its design properties. It is essential in formatting input for the fuzzy knowledge base and ensuring that the knowledge base can do useful work in real world applications. Each element has a potential range, encompassing several categories. For example, Height was considered an important design variable, and in the case of the images surveyed the team decided to divide Height into five classes: Low; Low-Medium; Medium; Medium-High; and High. Each of the verbal categories was assigned a numerical equivalent. Low height was considered to be any structure less than 1.5 floors high. Each of the other variables was similarly defined and classified and numerical ranges were specified for each class. The complete set of these elements and their classifications was termed the Design Vocabulary. The UDS then assisted the research team in choosing a sample of 15 stock images of such transit-oriented developments, covering a range of the possible elemental variables. Figure 1 shows one stock image.
4 EVALUATION OF IMAGES Public involvement consisted of a series of small focus group meetings held in accessible neighborhood locations, such as churches and middle school cafeterias. Each meeting followed the same format: the aims were explained, one by one the stock images were shown and a short period of facilitated discussion was encouraged, and then preference scores were gathered using the SharpeDecisions® electronic polling system [23].
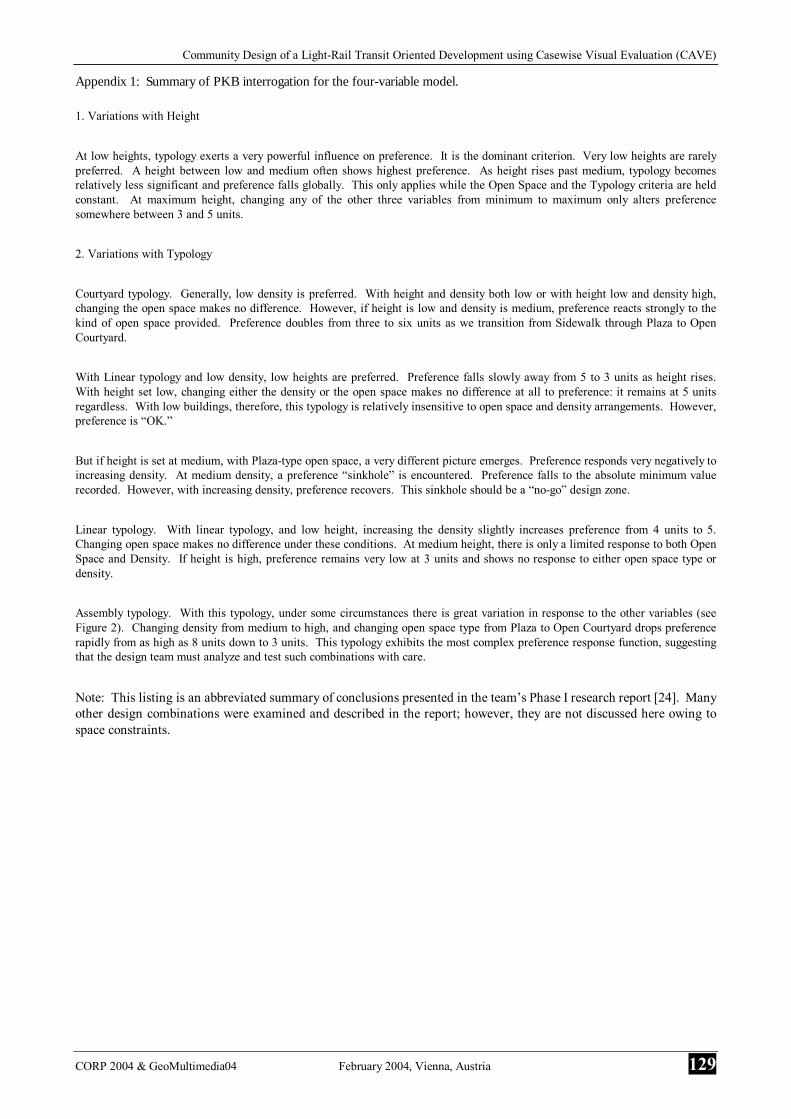
Table 2 describes the properties of each image and shows mean preference. For input into the fuzzy logic modeling software, mean preference was classified into categories. Mean image preference ranged from 2.29 to 8.36 units. While there is no a priori justification for setting specific ranges, it is better to take advantage of the software’s capacity to discriminate between small changes in the input criteria by using the extreme values to set the minimum and maximum preferences. For the pilot model, insufficient data existed to model all six variables with total confidence. After some iteration the research team confirmed that a four variable model was robust. Accordingly the UDS team was consulted and the four most critical variables were chosen: Height, Typology, Density and Open Space. A four variable fuzzy-logic model was then built and examined in detail using the FuzzyKnowledgeWalker and the 3-D surface slice tools. Figure 2 shows a two-dimensional slice through this four-dimensional knowledge base. Preference (z-axis) response to Density and Height variation is shown, with the Typology and Open Space held constant. Typology (TYP) is given as 37 units, which represents a Typology of “Assembly” class, while Open Space is of 0 (“Sidewalk”) type. Most of the surface area of this chart shows combinations that are colored green or blue (representing preference values from “OK” to “desirable”). The general pattern of preference change trending from left to right along the x-axis shows that moderately high density always shows high, while a preference “sinkhole” exists where density is moderately low in combination with medium height. Clearly, it is better to avoid this design combination if possible. The high point on this surface (color coded purple) occurs in a zone where density is moderately high and height is low. This can be thought of as a design “sweet spot.” The lowest preference on this surface is given by the yellow color in the bottom of the sinkhole, however, this is not the lowest preference possible (color red). Imagine moving across the preference surface from the lowest point on the sinkhole to the highest point on the peak. This transect trends from medium high density to medium low density while the height reduces from about 4 stories to between 2 and 3. This tradeoff zone is the most sensitive in the four-element model. Although Figure 2 shows one small slice through the four-dimensional knowledge base, there are many possible design permutations that cannot be seen here. However, the walker tool enables us to interrogate the knowledge base quickly. For example, if we want to see how preference changes in response to changing typology the input bars can be manipulated accordingly and corresponding changes in the output (preference) can be observed and documented. The PKB is being interrogated by the architectural design team and engineering partners to evaluate highly preferred potential design combinations. Appendix 1 summarizes preliminary conclusions derived from visual inspection of the preference surfaces and use of the knowledge walker tool. These data are being used to build 3D models and to create Virtual Reality visualizations. So far, the results are encouraging. Public participants have commented favorably, noting that they “have not seen this level of public involvement before” in infrastructure planning projects [24]. They have also noted their appreciation of the direct connection between their preferences and the characteristics of the architectural models presented for their final inspection.
5 ACKNOWLEDGEMENTS This research project is being funded by the Federal Transit Administration’s Transit-IDEA grant T-33 “Community Design of a Light-Rail Transit-Oriented Development” (Transit-IDEA grants are administered by the Transportation Research Board). The research team gratefully acknowledges the participation and contribution of the Urban Design Studio, led by Dr. Michaele Pride-Wells of the University of Kentucky College of Architecture; the Transit Authority of River City; and the Smoketown/Shelby park neighborhood residents who participated in the citizens’ focus groups between January and April 2002.
Keiron BAILEY & Ted GROSSARDT
126 MULTIMEDIAPLAN.AT & IEMAR 9th International Symposion on Planning & IT
GLOSSARY AHP Analytic Hierarchy Process. A multicriteria decision methodology developed by Dr. Saaty of the Wharton School. AHP is widely used by government and commercial organizations for procurement analysis as well as researchers for decision modeling and policy evaluation. CAVE Casewise Visual Evaluation. A visual assessment methodology developed by the author. FST Fuzzy Set Theory. A set of principles that structure the relationships between mathematical sets where membership functions are non-Boolean (i.e. an element’s degree of membership in a set is not given by zero or one, so elements are not either “in” or “out” of a set).
PKB Preference Knowledge Base. Describes the sum of the information stored when the fuzzy set theoretic modeling software defines rules and then forms a database around a small number of known preference points.
TARC Transit Authority of River City. Louisville’s transit authority, a partner in this research. Transit-IDEA T-33 Transit-Innovation Deserving Exploratory Analysis. Research grant originated by the Transportation Research Board. UDS Urban Design Studio. A joint venture between the University of Kentucky College of Architecture, the University of Louisville Department of Urban and Public Affairs, and the city government's Louisville Development Authority. VPS Visual Preference Survey. A visual assessment methodology designed by Dr. Anton Nelessen and widely used by consultants in the urban planning field.
REFERENCES [1] Transportation Tomorrow (2002) Greater Louisville’s Look at Light Rail, http://www.t-2.org. Accessed 24 August 2002. [2] Transit Authority of River City (2001) Light Rail, available at http://www.ridetarc.org/Light-Rail/default.htm. Accessed 24 August 2002. [3] Zube E, Sell J, and Taylor J. (1982) Landscape Perception: Research, Application and Theory, Landscape Planning 9, 1-33. [4] Nelessen A. (1994) Visions for a New American Dream: Process, Principles and an Ordinance to Plan and Design Small Communities.
Chicago and Washington DC: American Planning Association Press. [5] Saaty T. (1980), The Analytic Hierarchy Process. New York: McGraw Hill. [6] Saaty T. (1987) The Analytic Hierarchy Process: What it is and how it is used, Mathematical Modeling 9, 161-176. [7] Saaty T. (1996) Multicriteria Decision Making: The Analytic Hierarchy Process. Pittsburgh, PA. [8] Whitmore W, Cook E, and Steiner F. (1994) Public Involvement in Visual Assessment: The Verde River Corridor Study, Landscape Journal 27-
45. [9] Ridgley M, and Rijsbermann F. (1992) Multicriteria Evaluation in a Policy Analysis of a Rhine Estuary, Water Resources Bulletin 28:6, 1095-
1110. [10] Zadeh L. (1965) Fuzzy Sets, Information and Control 8, 3, 338-353. [11] Tyson P. (1996) North by whatever (fuzzy logic-based autonavigation system for boats) Technology Review 99, 11-13. [12] Zadeh L, Klir G, and Yuan B. (eds) (1996) Fuzzy Sets, Fuzzy Logic, and Fuzzy Systems: Selected Papers by Lotfi A. Zadeh (Advances in Fuzzy
Systems - Applications and Theory, Vol 6), World Scientific Publication Company. [13] Smithson M. (1987) Fuzzy Set Analysis for Behavioral and Social Sciences. NY: Springer-Verlag. [14] McNeill D, and Freiberger P. (1993) Fuzzy Logic. NY: Simon & Schuster. [15] Smith P. (1994) Application of Fuzzy Sets in the Environmental Evaluation of Projects, Journal of Environmental Management 42, 365-388. [16] Lee Y, Dahab M, and Bogardi I. (1994) Fuzzy Decision Making in Ground Water Nitrate Risk Management, Water Resources Bulletin 30:1,
135-148. [17] Bardossy A, and Duckstein L. (1995) Fuzzy Rule-Based Modeling with Applications to Geophysical, Biological, and Engineering Systems.
Boca Raton, FL: CRC Press. [18] Meesters E, Bak R, Westmacott S, Ridgley M, and Dollar S. (1998) A Fuzzy Logic Model to Predict Coral Reef Development under Nutrient
and Sediment Stress, Conservation Biology 12:5, 957-965. [19] Ridgley M, and Ruitenbeek R. (1999) Optimization of Economic Policies and Investment Projects Using a Fuzzy-Logic Based Cost-
Effectiveness Model of Coral Reef Quality: Empirical Results for Montego Bay, Jamaica Coral Reefs 18:4, 381-392. [20] Ridgley M, and Fernandes L. (1999) Multiple Criteria Analysis Integrates Economic, Ecological and Social Objectives for Coral Reef
Managers, Coral Reefs 18:4, 393-402. [21] Kosko B. (1993) Fuzzy Thinking, Hyperion. [22] Fuzzy Systems Engineering (1994, 1999) Fuzzy Knowledge Builder. Poway, CA. [23] SharpeDecisions (2002) SharpeDecisions Executive Workshop. Available at http://www.sharpedecisions.com/ accessed 24 August 2002.
[24] Grossardt T, and Bailey K. (2002) Transit-IDEA T-33 Preliminary Report: Neighborhood Panel Summary of Comments. Lexington, KY.
Community Design of a Light-Rail Transit Oriented Development using Casewise Visual Evaluation (CAVE)
CORP 2004 & GeoMultimedia04 February 2004, Vienna, Austria 127
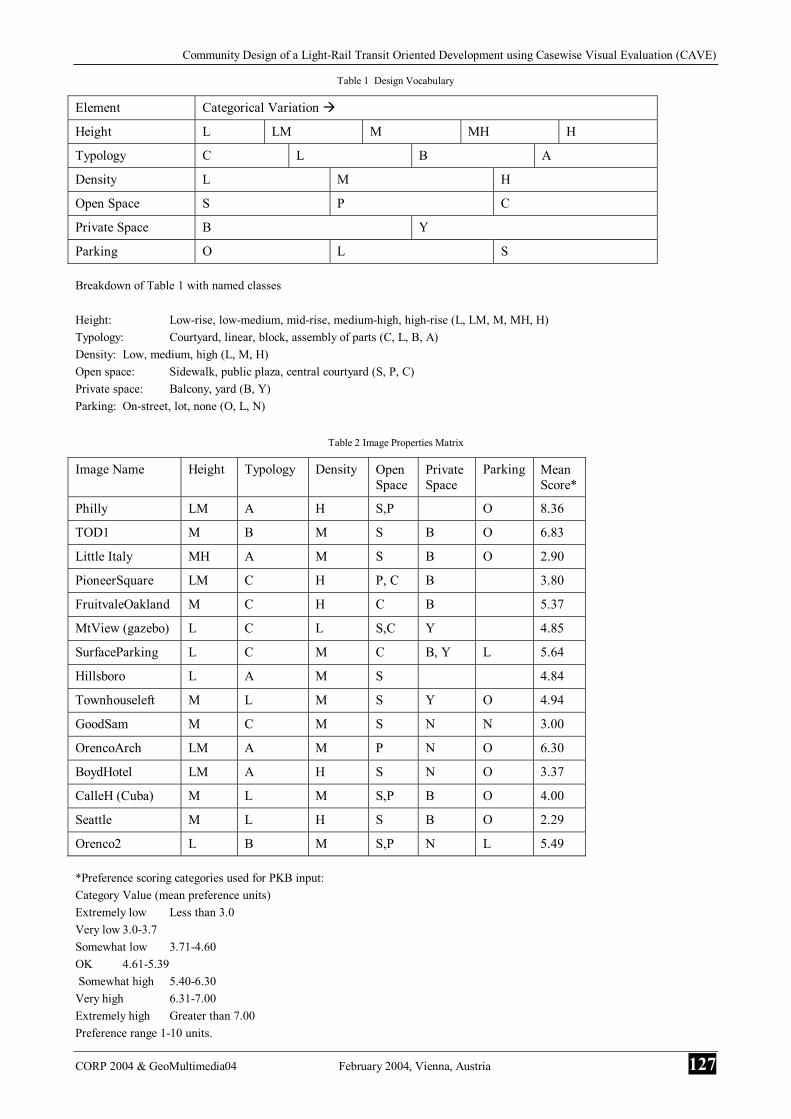
Table 1 Design Vocabulary
Element Categorical Variation
Height L LM M MH H
Typology C L B A
Density L M H
Open Space S P C
Private Space B Y
Parking O L S Breakdown of Table 1 with named classes Height: Low-rise, low-medium, mid-rise, medium-high, high-rise (L, LM, M, MH, H) Typology: Courtyard, linear, block, assembly of parts (C, L, B, A) Density: Low, medium, high (L, M, H) Open space: Sidewalk, public plaza, central courtyard (S, P, C) Private space: Balcony, yard (B, Y) Parking: On-street, lot, none (O, L, N)
Table 2 Image Properties Matrix
Image Name Height Typology Density Open Space
Private Space
Parking Mean Score*
Philly LM A H S,P O 8.36
TOD1 M B M S B O 6.83
Little Italy MH A M S B O 2.90
PioneerSquare LM C H P, C B 3.80
FruitvaleOakland M C H C B 5.37
MtView (gazebo) L C L S,C Y 4.85
SurfaceParking L C M C B, Y L 5.64
Hillsboro L A M S 4.84
Townhouseleft M L M S Y O 4.94
GoodSam M C M S N N 3.00
OrencoArch LM A M P N O 6.30
BoydHotel LM A H S N O 3.37
CalleH (Cuba) M L M S,P B O 4.00
Seattle M L H S B O 2.29
Orenco2 L B M S,P N L 5.49 *Preference scoring categories used for PKB input: Category Value (mean preference units) Extremely low Less than 3.0 Very low 3.0-3.7 Somewhat low 3.71-4.60 OK 4.61-5.39 Somewhat high 5.40-6.30 Very high 6.31-7.00 Extremely high Greater than 7.00 Preference range 1-10 units.
Keiron BAILEY & Ted GROSSARDT
128 MULTIMEDIAPLAN.AT & IEMAR 9th International Symposion on Planning & IT
Figure 1 Stock image of transit-oriented development
Image name “Philly” – see Table 2 for properties as defined in terms of the design vocabulary.
Figure 2 Example slice through preference knowledge base
Preference response shown for variation in Height and Density, with Typology and Open Space held constant.
Community Design of a Light-Rail Transit Oriented Development using Casewise Visual Evaluation (CAVE)
CORP 2004 & GeoMultimedia04 February 2004, Vienna, Austria 129
Appendix 1: Summary of PKB interrogation for the four-variable model. 1. Variations with Height
At low heights, typology exerts a very powerful influence on preference. It is the dominant criterion. Very low heights are rarely preferred. A height between low and medium often shows highest preference. As height rises past medium, typology becomes relatively less significant and preference falls globally. This only applies while the Open Space and the Typology criteria are held constant. At maximum height, changing any of the other three variables from minimum to maximum only alters preference somewhere between 3 and 5 units. 2. Variations with Typology
Courtyard typology. Generally, low density is preferred. With height and density both low or with height low and density high, changing the open space makes no difference. However, if height is low and density is medium, preference reacts strongly to the kind of open space provided. Preference doubles from three to six units as we transition from Sidewalk through Plaza to Open Courtyard. With Linear typology and low density, low heights are preferred. Preference falls slowly away from 5 to 3 units as height rises. With height set low, changing either the density or the open space makes no difference at all to preference: it remains at 5 units regardless. With low buildings, therefore, this typology is relatively insensitive to open space and density arrangements. However, preference is “OK.”
But if height is set at medium, with Plaza-type open space, a very different picture emerges. Preference responds very negatively to increasing density. At medium density, a preference “sinkhole” is encountered. Preference falls to the absolute minimum value recorded. However, with increasing density, preference recovers. This sinkhole should be a “no-go” design zone.
Linear typology. With linear typology, and low height, increasing the density slightly increases preference from 4 units to 5. Changing open space makes no difference under these conditions. At medium height, there is only a limited response to both Open Space and Density. If height is high, preference remains very low at 3 units and shows no response to either open space type or density. Assembly typology. With this typology, under some circumstances there is great variation in response to the other variables (see Figure 2). Changing density from medium to high, and changing open space type from Plaza to Open Courtyard drops preference rapidly from as high as 8 units down to 3 units. This typology exhibits the most complex preference response function, suggesting that the design team must analyze and test such combinations with care.
Note: This listing is an abbreviated summary of conclusions presented in the team’s Phase I research report [24]. Many other design combinations were examined and described in the report; however, they are not discussed here owing to space constraints.


