Embed Size (px)
Citation preview

Assessment of supercharging boosting component for heavily downsized gasoline engines A Romagnoli W S-I Wan-Salim B A Gurunathan R F Martinez-Botas Imperial College London London UK JWGTurner N Luard Powertrain Research and Technology Jaguar Land Rover Limited Coventry UK R Jackson L Matteucci Lotus Engineering Norwich UK C Copeland S Akehurst AG J Lewis CJ Brace University of Bath Bath UK ABSTRACT
Current trend on engine downsizing forces engine manufacturers to contemplate powertrains with more than one boosting device The presence of these devices leads to complex 1-D engine models which rely on performance maps provided by turbosupercharger manufacturers So far no detailed analysis has been carried out to understand how these maps affect engine performance simulation As part of the UltraBoost project (65 gasoline engine downsizing) Imperial College tested the boosting components of a turbo-super configuration The acquired data were used to assess the effectiveness of 1-D engine performance prediction and to contemplate the opportunity to exploit the boosting system and use it as engine charge air cooler in the form of an expander NOMENCLATURE ABBREVIATION Unit SUBSCRIPTS Unit BSFC Brake Specific Fuel
Consumption OUT Outlet
BMEP Brake Mean Effective Pressure
INL Inlet
C Flow velocity [ms] T Total cp Specific Heat
Constant Pressure [JkgK] S Static
ER Expansion Ratio SC Supercharger
HP High pressure TT Total-to-total
LP Low pressure m Mass Flow Rate [kgs] GREEK N Speed [rpm] ρ Density [kgm3] PR Pressure Ratio η Efficiency P Pressure [Pa bar] γ Specific
Heat Ratio
T Temperature [K] UB UltraBoost W Power [W] 1 INTRODUCTION
The need for more efficient more performing and less polluting engines is forcing OEMs to significantly downsize engine capacity The technical challenges associated with engine downsizing (typically of up to 40) are well understood and OEMs are acting to develop engine concepts capable of real world fuel economy improvements whilst delivering sufficient vehicle driveability and performance for example through turbocharging [1]
The UltraBoost programme is an ambitious project aiming to deliver a 20 Litre four cylinder gasoline downsized demonstrator engine capable of up to 35 bar Brake Mean Effective Pressure (BMEP) air pressure charging of up to 35 bar absolute and offering approximately up to 35 potential for the reduction of fuel consumption and CO2 emissions while still matching a JLRrsquos 50 litre V8 naturally aspirated (NA) engine performance figures (65 engine downsizing)
Figure 2 UB engine system layout [2]
The target power and torque curves are given in Fig 1 these have been used as baseline curves to build up all the analysis carried out in this paper In order to meet the targets outlined above a high level of boosting for the engine is required After an assessment phase looking at many different options (including electrification of some components) a two-stage series arrangement was selected This includes a LP stage (GT30R turbocharger by Garrett) and a HP stage mechanical supercharger from EATON (Fig 2) More specifically the supercharger is a Roots type Twin Vortices Series (EATON TVS R410) with a clutched single speed drive This supercharger is capable of running with high adiabatic efficiency over a wide range of operating conditions
The selection and matching of the boosting system was mainly supported by 1-D engine simulation (using GT-Power) Data for the baseline engine platform where made available by Jaguar Land Rover whereas for the selection of the boosting components (turbocharger and supercharger) the analysis relied on the performance maps provided by the manufacturers [3]
Engine models (1-D in nature) are being extensively used by engine makers since they provide simple fast but still physically based tools for preliminary engine design The theory behind engine software is not new and the main advantage is that its development relies on extensive database which come from many years of experimental activity and model optimization At present the output prediction from current models compares quite well with engine test bench data However the level of simplification intrinsically embedded in this software requires simulation engineers to calibrate these models in order to compensate for the lack of data and inadequate calculation routines in critical areas such as combustion knock surge turbine maps extrapolation etc In addition to this the rapid electrification of powertrain also requires development of mathematical models for electric
machines motors and generators which are not always available in standard software packages
Amongst the many areas which would require specific analysis the current paper intends to assess the impact on engine simulation output due to the presence of boosting devices In 1-D models turbochargers and superchargers represent two boundary conditions for the engine block since they determine the inlet pressure and temperature of the charge air feeding the engine However turbocharger turbines present a long standing issue which is related with the width of turbine performance maps provided by turbocharger manufacturers These maps (usually obtained with hot gas test stands) are narrow in range and force engine simulation software to rely on significant extrapolated map points In addition to this the advent of sequentialseries installation on the intake side forces the
Figure 1 UB target Power amp Torque
0
50
100
150
200
250
300
0
100
200
300
400
500
600
0 1000 2000 3000 4000 5000 6000 7000
ENG
INE
POW
ER [k
W]
ENG
INE
TORQ
UE
[Nm
] lll
oll
ENGINE SPEED (rpm)
Torque Power
Figure 3 Supercharger test rig overview
HP compressors to operate at different inlet pressures and temperatures to what they have been designed and tested for Again this poses a question on how well the HP compressors output parameters are predicted by current 1-D engine software 2 AIM amp OBJECTIVES The aim of this paper is to provide an insight into supercharging boosting technology in heavily downsized gasoline engines More in particular two main aspects of supercharging will be investigated - assessment of the impact of above-ambient inlet conditions on supercharger
performance prediction in current 1-D engine software Justification see Section 1 Implementation experimental analysis and comparison with GT-Power prediction
- assessment of supercharger performance when run as an expander (ie HP stage declutched and driven by the pressurized air inlet instead of the engine crankshaft) Justification when not in use the HP compressor could be contemplated as an additional cooler for the engine charge air Implementation experimental analysis
3 EXPERIMENTAL ANALYSIS 31 Experimental set up
All of the Ultraboost engine development work was undertaken in one of the University of Bath transient engine facilities The facility features a twin dynamometer arrangement with a 220kW AVL AC dynamometer supplemented by a Froude eddy current brake to allow additional absorption up to the expected torque and power rating of the Ultraboost engine Maintaining the AC dynamometer allowed motoring work to be undertaken for controller debugging and friction tests as well as improved transient response during time to torque testing All control and data acquisition was performed using a Sierra-CP CADET V-14 control system In addition to standard temperatures and pressures specific experimental hardware was used for measuring engine speed torque combustion parameters fuel flow emissions intake manifold and engine blowby Interfaces to the combustion analysis EMS emissions analysers CAN instruments conditioning of combustion air fuel and cooling circuits were all achieved through the CADET v-14 software [4 5]
As per the supercharger analysis a bespoke test facility was set up at Imperial College with a 100 kW electric motor (nominal speed of 1800 rpm) used as main drive The speed of the motor is well below the nominal speed of the EATON supercharger which is rated with a max speed of 24000 rpm Hence in order to achieve the required speed a system of step-up gears was included in the rig design (Fig 3) The power absorbed by the supercharger was measured with a torque meter positioned after the crankshaft pulley (Figs 3 amp 4) The pulleysbelt assembly on the supercharger side replicates the same layout as the UB engine using the same groove type pulley and belt (green box in Fig 4) At the inlet to the
ELECTRIC MOTOR
SUPERCHARGER EXIT
TORQUE METER
EATON TVS SUPERCHARGER
SUPERCHARGER INLET
supercharger mass flow rate pressure and temperature were measured using a V-cone (DP meter from ABLE) static pressure tappings (using a Scanivalve system) and K-type thermocouples respectively At the exit to the supercharger only pressure and temperature were measured (Fig 4)
The inlet to the supercharger was built in modular units allowing two types of tests Referring to the black box in Fig 4 Option 1 consists of letting the supercharger inlet exposed to ambient conditions (atmospheric pressure and temperature) whereas Option 2 allows the inlet pressure and temperature to the supercharger to be set by means of an inline heater and compressor Option 1 set up was used to generate standard supercharger performance maps (refer to Section 32) whereas Option 2 was used to generate test data for 1-D engine simulation comparison (Section 4 above ambient inlet conditions) and to assess the supercharger performance when run as an expander (Section 5) 32 Experimental
results In this section the
test results for the UB engine and the HP stage (supercharger) are reported
The UB engine was tested at full load conditions for a range of speeds going from 1000 rpm to 6000 rpm The engine set up included the boosting components (HP and LP stage) EGR
0
50
100
150
200
250
300
0
100
200
300
400
500
600
0 1000 2000 3000 4000 5000 6000 7000
ENG
INE
POW
ER [k
W]
ENG
INE
TORQ
UE
[Nm
]
ENGINE SPEED [rpm] )
Target TorqueExp TorqueTarget PowerExp Power
Figure 5 UB Target and Experimental Power amp Torque
Figure 4 Supercharger testing layout
(Exhaust Gas Recirculation) control strategy and water cooled exhaust manifold In Fig 5 the measured power and torque curves for the UB engine (experimental Torque and experimental Power) have been compared with those obtained from the baseline 50L engine (Target Torque and Target Power) The figure shows that the UB engine meets the requirements for power and torque The full load curves at high engine rpm have not been completed due to some issues which arose at the time of testing (even though a full sweep for power and torque is currently being done and it will be material for future publications) At low engine rpm instead (from 1000 rpm to 1250 rpm) the experimental torque shows significant deficit when compared to baseline engine (28 and 12 less torque and power respectively) This is due to the boost system not being able to deliver the target pressure as initially predicted by the simulation during the selection phase of the boosting components (for more details please refer to [3])
The HP stage was tested and its results compared with those provided by the manufacturer The isentropic efficiency (total-to-total) was calculated using the thermodynamic correlations in Eq 7 Besides the efficiency an additional parameter (here defined as Power Ratio) was also calculated This is defined as the ratio between the consumed power of the supercharger (WSC Eq 6) and the input power (WSHAFT Eq 5) provided by the electric motor (measured with the torque meter) Since the pulleysbelt assembly after the torque meter replicates the same layout as that of the UB engine the Power Ratio is intended to represent a pseudo-mechanical efficiency for the SP-EB-CB (green box in Fig 3) The Power Ratio values were then used to generate a look-up table for the UB engine model in order to determine the transmission losses occurring between the crankshaft and the supercharger
119879119879 = 119879119878 +1198622
2 ∙ 119888119901 (120785) 119875119879 = 119875119878 + 05 ∙ 120588 ∙ 1198622 (120786)
119882119878119867119860119865119879 = 120591119878119867119860119865119879 ∙ 119873119878119867119860119865119879 (120787) 119882119878119862 = 119868119873119871 ∙ 119888119901119879119879119874119880119879 minus 119879119879119868119873119871 (120788)
120578119879119879 =(119875119877)120574minus1 120574frasl minus 1
119879119879119874119880119879119879119879119868119873119871 minus 1 119908ℎ119890119903119890 119875119877119879119879 = 119875119879119874119880119879
119875119879119868119873119871 (120789)
119875119900119908119890119903119903119886119905119894119900 =119882119878119862
119882119878119867119860119865119879 (120790)
The measured mass flow rate and efficiency results have been plotted in Figs 6 amp 7 and compared with those provided by EATON From Fig 6 it can be seen that the mass flow rate values agree well with those measured by EATON The trend for the mass flow rate curves is consistent with the original maps from EATON and a difference in mass flow no larger than asymp4 could be found Different considerations have to be made for the 18krpm and 20krpm where a larger discrepancy between the mass flow rates (black and red points) was found This can probably be attributed to the higher temperatures experienced within the supercharger at higher rotational speeds this could lead to larger clearances between the supercharger lobes and the casing (due to thermal expansion) This explanation was partly supported by the supercharger manufacturer (EATON) which pointed out the fact that the unit tested at Imperial College was a one-off prototype with potentially different coating material for the lobes and hence with different response to thermal variations (no further indication has been provided in this direction)
As per the supercharger efficiency good agreement between the EATON and Imperial supercharger test data was also found (Fig 7) with thermal efficiencies beyond 70 In the secondary axis the Power Ratio values have also been reported (dashed lines) The curves show that for low rotational speeds (2krpm to 6krpm) the power ratio values fall below 75 However for rotational speeds which
Figure 6 Validation for supercharger mass flow rate measurements
Figure 7 Validation for supercharger efficiency measurements (primary axis) and plot of the Power ratio (secondary axis)
1
12
14
16
18
2
22
24
26
000 002 004 006 008 010 012 014 016
PRES
SURE
RAT
IO [T
T]
MASS FLOW RATE [kgs]
2krpm
EATON IMPERIAL
4krpm
6krpm
8krpm 10krpm 12krpm 14krpm 16krpm 18krpm 20krpm
50
55
60
65
70
75
80
85
90
0
10
20
30
40
50
60
70
80
90
100
000 002 004 006 008 010 012 014 016 018
POW
ER R
ATIO
EFFI
CIEN
CY [T
T]
MASS FLOW RATE [kgs] EATON IMPERIAL Power Ratio
12krpm
14krpm
16krpm
18krpm
20krpm
4krpm 6krpm
8krpm
10krpm
12krpm 14krpm
16krpm 18krpm 20krpm
2krpm
2krpm 4krpm 6krpm
8krpm
are more representative of the supercharger speeds in real engine operating conditions the power ratio climbs up to 85The speed ratio between engine crankshaft and supercharger speed is 588 This means that for supercharger speeds lower than asymp6000 rpm the engine would be running at speeds less than 1000 rpm operational speeds at which the supercharger will not be operating
4 COMPUTATIONAL ANALYSIS
The following paragraphs analyse the output of the GT-Power simulations for the HP stage performance This aim is to assess how well GT-Power simulation calculates the performance parameters when the input values are different than ambient The GT-Power analysis was done using a validated 1-D engine model for the UB engine (refer to Section 1) For validation the results for the 1-D engine model was compared to engine test bed results as described in Sections 1 and 32
41 Supercharger performance analysis
The supercharger was tested for rotational speeds inlet mass flows pressures and temperatures equivalent to those obtained from the UB engine at full load conditions The control strategy for the UB engine forces the supercharger to operate up to 3500 engine rpm (asymp 20580 supercharger rpm) However for the current testing programme it was chosen to not exceed 2500 engine rpm on the test bed in order to avoid damaging the supercharger as a consequence of the large inlet pressure and temperature The comparison for the supercharger inlet conditions between the 1-D simulation and the tests is given in Table 1 From the table it is apparent that the speed pressure temperature and mass flow rate have been set accordingly with a discrepancy no larger than 1
Table 1 Supercharger inlet conditions (1-D simulationImperial Tests) NEngine [rpm] 1250 1500 2000 2500 NSC [rpm] 73507359 88208844 1176011750 1470014742 Mass flow [kgs] 00600057 00939009 01800172 02650254 Inlet Pres [Pa] 14291434 1734173 23202321 2832278 Inlet Temp [K] 303302 320320 333332 347353
In Fig 8 the measured outlet conditions to the supercharger have been compared with those obtained with the simulation (SC outlet pressure SC outlet temperature SC power SC efficiency) Even though the trend of all the measurements is well captured by the simulation the test results show that there are some discrepancies between the measured and predicted data At higher engine rpm the measured and predicted outlet pressures diverge significantly with a variation of about asymp6 (ΔP=021 bar) As per the temperature there is no clear pattern between the measured and predicted values The same occurs for the SC power which shows larger variations as the engine speed increases (at 2500 rpm difference of about asymp307 ΔPower=353 kW) As per the efficiency the results are believed to be strongly biased by heat transfer effects Heat transfer effects on compression process for centrifugal machines were explained by the lead authors in [6] Calculating the supercharger isentropic efficiency (using Eq 7) when inlet temperature is higher than ambient is no longer appropriated since heat transfer through the casing affects the SC exit temperature (which could partly explain the disagreement observed between the predicted and measured outlet temperatures) A variation in outlet temperature of plusmn5ᵒC can lead to an efficiency variation of several percentage points
Figure 8 Comparison between measured and predicted SC data
5 SUPERCHARGER AS AN EXPANDER 51 Turbo-expansion initial simulation study
In pressure-charged engines intake air pressure is raised by a compressor in order to increase air density and therefore specific power output However the charge air temperature is also raised by the compression process thus making intercooling necessary to reject this heat to the environment However since heat exchangers have effectiveness below unity the temperature of the intake air will always be above ambient temperature in a pressure charged engine This increased air temperature can lower the knock limit of the engine - making it necessary for lower compression ratios or greater spark retard Both of these mechanisms for knock control can lead to compromises on fuel economy for a given BMEP target While there are other ways to improve knock tolerance in a pressure charged SI engine (increasing EGR rates and improved port and combustion chamber design) lowering charge temperature at start of compression could provide a direct route to improved fuel economy
The concept of turbo-expansion is not new ndash indeed it has been used widely to provide air conditioning to commercial aircraft for many years The idea is a simple one If there is energy available to over-boost an air charge this additional pressure can be expanded over a turbine (expander) to remove heat Therefore if the heat of compression is removed via a standard intercooler prior to expansion it is possible to cool the air charge below ambient temperature Due to the potential advantages of this approach there have been recent attempts to apply this concept to the air path of a SI engine Perhaps most notably the NOMAD engine
10
15
20
25
30
35
40
500 1000 1500 2000 2500 3000
SC O
UTL
ET P
RESS
URE
[bar
]
ENGINE SPEED [rpm]
1-D SimulationTests Imperial
350
355
360
365
370
375
380
385
500 1000 1500 2000 2500 3000
SC O
UTL
ET T
EMPE
RATU
RE [K
]
ENGINE SPEED [rpm]
1-D SimulationTests Imperial
0
2
4
6
8
10
12
500 1000 1500 2000 2500 3000
SC P
OW
ER [k
W]
ENGINE SPEED [rpm]
1-D SimulationTests Imperial
00
01
02
03
04
05
06
07
08
09
500 1000 1500 2000 2500 3000
EFFI
CIEN
CY
ENGINE SPEED [rpm]
1-D SimulationTests Imperial
development project by Lotus Engineering [7 8] sought to demonstrate the advantages of turbo-expansion using an Opcon mechanical twin-screw expander The concept and the T-S diagram from this work are shown in Fig 9
Figure 9 Turbo expansion process [7]
Whelan et al [9 10] proposed a slightly different turbo-expansion concept where a compressor and turbine are both placed in the intake flow path to raise and lower the intake pressure respectively By removing heat between the compressor and turbine stages with a second charge air cooler the expansion stage will lead to sub-ambient temperatures This approach was investigated using the UltraBoost GT-Power model as part of an initial study into the possible benefits of turbo-expansion to a highly downsized SI engine In the model arrangement the additional components were placed within the two stage superchargerturbocharger air path
This brief study considered a single engine speed at 2000rpm where the supercharger supplied an over-boost (pressure ratio +025) compared to standard operation The turbo-expander compressor provided final pressure ratio of 125 before rejecting heat through a heat exchanger (ε=085) and expanding through the fresh-air turbine (expansion ratio ~15) The turbo-expander performance was provided from scaled turbocharger maps which generated total to static efficiencies of ~75 Despite the additional parasitic loss of the supercharger (MEP= +08bar) this was more than offset by the benefit of being able to advance ignition timing due to the lower charge temperature at the end of the compression stroke In fact the full-load BSFC was predicted to improve by 4-5 due the sub-ambient air charge from the turbo-expander Although it was not explored in this study diminishing returns could be expected for reduced expansion efficiencies as noted by the work by Turner etal [8]
52 Eaton Supercharger as expander
The GT-Power simulation suggested that there could be significant benefits from turbo-expansion air charge cooling In addition since the UltraBoost arrangement places the supercharger downstream of the turbocharger this posed an interesting question namely could the Eaton supercharger be used as an effective expander While this would require additional boost from the turbocharger there are operating points where there is excess turbine energy that could be used to generate additional boost by modulating the wastegate In this situation a mechanical connected expander could present an indirect means to recover exhaust gas energy
Since to the authorsrsquo knowledge there is no available performance test data of an Eaton supercharger acting as an expander the experimental facility at Imperial College was used to test this capability As shown in Fig 4 the inlet to the supercharger was pressurized with a compressor and allowed to expand from inlet to exit The temperatures and pressures were recorded as before and the resultant torque and speed was measured Figure 10 shows the expansion ratio versus mass
flow for the Eaton device operating as an expander at constant speeds of 2000rpm 4000rpm and 8000rpm For reference the supercharging characteristics are also presented as delivering a lsquopressure ratiorsquo for speeds up to 10000rpm It can be immediately noted that to deliver a similar mass flow range to the engine the supercharger must spin at a slower rotational speed if it is to operate as an expander As an example if an expansion ratio of 14 is desired in order to deliver a similar engine mass flow the supercharger would have to spin at approximately half the speed compared to the operation as a compressor While this dual purpose is not possible with a fixed ratio drive model-based research into the use of a continuously variable transmission (CVT) supercharger has been carried out by the University of Bath in reference [11] Thus the possible switching between compressor and expander operations could be envisaged using such a variable ratio drive system
Figure 10 Pressure and Expansion Ratio of Eaton Supercharger versus Mass Flow Figure 11 demonstrates the total-to-total efficiency of the supercharger as an expander compared to the compressor operation The definition of expansion efficiency is simply taken from a turbine definition as shown in Eq 9 It is immediately clear from this data that a substantial drop in isentropic efficiency is to be expected from an attempt to use the EATON as an expander This is not surprising considering the design intent of the device was not to operate in this way The values are also reasonably consistent with those reported in reference [8]
120578119879119879 =1 minus 1198791198791198741198801198791198791198791198681198731 minus (1 (119864119877)120574minus1 120574fraslfrasl ) 119908ℎ119890119903119890 119864119877119879119879 = 119875119879119868119873
119875119879119874119880119879 (120791)
Finally Fig 12 demonstrates the power that can be generated and thus returned to the engine if it is operated as an expander Picking up the example earlier if an expansion ratio of 14 is desired approximately 1kW of power can be generated while simultaneously reducing the air charge temperature These results represent an intriguing new use of an Eaton supercharger and show that the device could be used as an expander in the series turbo-super arrangement if it were possible to change the drive ratio However it is also clear
10
12
14
16
18
20
22
10
12
14
16
18
20
22
000 001 002 003 004 005 006 007 008 009 010 011 012 013
EXPA
NSI
ON
RAT
IO
PRES
SURE
RAT
IO
MASS FLOW RATE [kgs] Imperial_4000rpm Imperial_6000rpm Imperial_8000rpm Imperial_10000rpm
Imperial_12000rpm SC_Expander_6000rpm SC_Expander_4000rpm SC_Expander_8000rpm
that operating as an expander the supercharger can only deliver isentropic efficiencies between 40-50 It is this rather poor expansion efficiency that may lead to diminishing returns from a sub-ambient intake air charge To understand the trade-off between additional turbocharger boost (turbine backpressure) and the benefits from turbo-expansion across a supercharger further modelling work must be carried out using the data presented here
Figure 11 Total to total isentropic efficiency of the supercharger operating as a compressor and expander
Figure 12 Power harvested from the supercharger operating as an expander 6 CONCLUSIONS
The current article describes the outcomes of a research conducted on a heavily downsized gasoline engine (UltraBoost project 65 engine downsizing) The
1000
1100
1200
1300
1400
1500
1600
1700
1800
1000
1100
1200
1300
1400
1500
1600
1700
1800
000 010 020 030 040 050 060 070 080
PRES
SURE
RAT
IO
EXPA
NSI
ON
RAT
IO
EFFICIENCY [TT] SC_Expander_4000rpm SC_Expander_6000rpm SC_Expander_8000rpmImperial_4000rpm Imperial_6000rpm Imperial_8000rpm
1000
1100
1200
1300
1400
1500
1600
1700
1800
-2000 -1500 -1000 -500 0
EXPA
NSI
ON
RAT
IO
POWER SHAFT[W] SC_Expander_2000rpm SC_Expander_4000rpmSC_Expander_6000rpm SC_Expander_8000rpm
engine boosting system layout is a two-stage series layout with a LP stage (turbocharger) and a HP stage (EATON TVS supercharger) The analysis focussed on the HP stage and is aimed at understanding the effectiveness of commercial 1-D engine software when predicting the performance of boosting elements (a supercharger in this case) with inlet conditions other than ambient (pressure and temperature beyond atmospheric)
The EATON TVS supercharger was tested with similar speed inlet pressure and temperature as those predicted by the engine model at the inlet to the supercharger The operating conditions considered for the supercharger analysis were equivalent to the engine running at full load conditions with speeds varying from 1000 rpm to 2500 rpm An agreement within 1 could be achieved for the inlet conditions between simulation and experiments As per the supercharger output values the test results showed that the 1-D engine software provides a good prediction for the supercharger outlet pressure (max discrepancy of 6 encountered at 2500 rpm only) As per the outlet temperature and supercharger power the simulation and experiments show similar trend even though the difference between measured and predicted values can be significant for some engine rpm For instance the measured supercharger power was found to be 307 higher than that predicted at 2500 rpm As per the supercharger efficiency no valid comparison could be brought forward since the measured efficiency was found to be significantly biased by heat transfer due to the heated air inlet temperature
In addition to the supercharger simulation prediction analysis an experimental study on the supercharger performance was also carried out in order to assess the opportunity to use the supercharger as an additional charger air cooler (ie supercharger was run as an expander) The experiments showed that there is a substantial drop in the supercharger isentropic efficiency when used in this way A penalty of more than 20 percentage points could be found (efficiencies less than 50) for the speeds under exam (supercharger speeds 4000 rpm to 8000 rpm) On the other hand the test results also showed that a non-negligible amount of power (more than 1kW) can be generated from the supercharger when run as an expander This suggests that besides serving as a charge air cooler the supercharger could also be contemplated as a power generation system These results are quite interesting and could potentially open the way to consider a supercharger as an enabler for enhanced engine fuel economy
ACKNOWLEDGEMENTS The authors would like to thank the UK Technology Strategy Board (TSB) for funding the UltraBoost project and all the consortium partners (Jaguar Land Rover Lotus Engineering Shell Global Solutions GE Precision Engineering CD-Adapco University of Bath and University of Leeds) for the support provided REFERENCE LIST [1] Improving Fuel Economy by 35 through combined Turbo and Supercharging
on a Spark Ignition Engine C Salamon M Mc Allister R Robinson S Richardson R Martinez-Botas A Romagnoli C Copeland J Turner 21st Aachen Colloquium Automobile and Engine Technology 2012
[2] UB200 Boosting Layout C Carey JLR Technical Presentation Jaguar Land Rover Coventry UK June 2011
[3] Copeland C Martinez-Botas R Turner J Pearson R Luard N Carey C Richardson S Di Martino P Chobola P 2012 Boost System Selection for Heavily Downsized Spark Ignition Prototype Engine 10th IMechE International Conference on turbochargers and turbocharging London
[4] Karl G Andrew L Sam A Chris B nick L 2012 The effect of advanced combustion control features on the performance of a highly downsized gasoline engine FISITA 2012 World Automotive Congress Beijing China F2012-A01-021
[5] Online source University of Bath website httpwwwbathacuk ndash Powertrain Vehicle amp Research Centre (PVRC)
[6] Romagnoli A Martinez-Botas RF 2012 Heat transfer analysis in a turbocharger turbine An experimental and computational evaluation Applied Thermal Engineering Vol38 1359-4311 Pages58-77
[7] Turner J Pearson R Bassett M and Oscarsson J ldquoPerformance and Fuel Economy Enhancement of Pressure Charged SI Engines through Turboexpansion ndash An Initial Studyrdquo SAE paper no 2003-01-0401
[8] Turner J Pearson R Bassett M and Blundell D W ldquoThe Turboexpansion Concept - Initial Dynamometer Resultsrdquo SAE paper no 2005-01-1853
[9] Whelans C Richards R ldquoTurbo-cooling applied to light duty vehicle enginesrdquo Congress 2005
[10] Whelans C Richards R Spence S Young A ldquoDesign and Development of a Turbo-expander for Charge Air Coolingrdquo IMECHE Turbochargers and Turbocharging 2010
[11] Rose A Akehurst S and Brace C ldquoInvestigation into the trade-off between the part-load fuel efficiency and the transient response for a highly boosted downsized gasoline engine with a supercharger driven through a continuously variable transmissionrdquo Proc of IMECHE Part D Journal of Auto Eng Sept 2013 DOI 1011770954407013492932
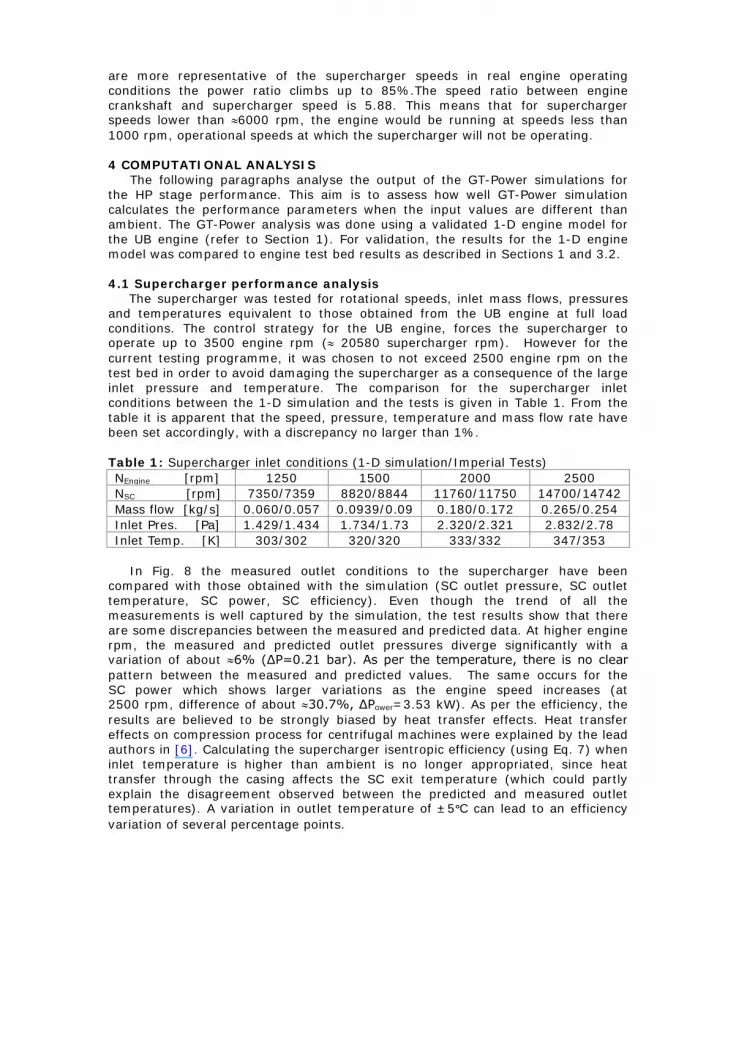