Embed Size (px)
Citation preview

Neurochemistry International 59 (2011) 686–694
Contents lists available at ScienceDirect
Neurochemistry International
journal homepage: www.elsevier .com/locate /nc i
Association between the activation of MCH and orexin immunorective neuronsand REM sleep architecture during REM rebound after a three day long REMdeprivation
Tamas Kitka a, Csaba Adori a,e, Zita Katai a, Szilvia Vas a, Eszter Molnar a, Rege S. Papp b, Zsuzsanna E. Toth b,Gyorgy Bagdy a,c,d,⇑a Department of Pharmacodynamics, Semmelweis University, Nagyvárad tér 4, H-1089 Budapest, Hungaryb Neuromorphological and Neuroendocrine Research Laboratory, Department of Anatomy, Histology and Embryology, Hungarian Academy of Sciences, Semmelweis University,T}uzoltó u. 58, H-1094 Budapest, Hungaryc Group of Neuropsychopharmacology, Hungarian Academy of Sciences, Semmelweis University, H-1083 Budapest, Hungaryd Group of Neurochemistry, Hungarian Academy of Sciences, Semmelweis University, H-1083 Budapest, Hungarye Department of Neuroscience, Karolinska Institutet, Retzius väg. 8, S-171 77 Stockholm, Sweden
a r t i c l e i n f o
Article history:Received 28 April 2011Received in revised form 16 June 2011Accepted 22 June 2011Available online 28 June 2011
Keywords:REM sleepMCHOrexinCARTEEGImmunohistochemistry
0197-0186/$ - see front matter � 2011 Elsevier B.V. Adoi:10.1016/j.neuint.2011.06.015
⇑ Corresponding author. Address: Department of PharmUniversity, Nagyvárad tér 4, H-1089 Budapest, Hungary.
E-mail address: [email protected] (G. Bagdy).
a b s t r a c t
Rapid eye movement (REM) sleep rebound following REM deprivation using the platform-on-watermethod is characterized by increased time spent in REM sleep and activation of melanin-concentratinghormone (MCH) expressing neurons. Orexinergic neurons discharge reciprocally to MCH-ergic neuronsacross the sleep-wake cycle. However, the relation between REM architecture and the aforementionedneuropeptides remained unclear. MCH-ergic neurons can be divided into two subpopulations regardingtheir cocaine- and amphetamine-regulated transcript (CART) immunoreactivity, and among them theactivation of CART-immunoreactive subpopulation is higher during the REM rebound. However, the pos-sible role of stress in this association has not been elucidated.
Our aims were to analyze the relationship between the architecture of REM rebound and the activationof hypothalamic MCH-ergic and orexinergic neurons. We also intended to separate the effect of stress andREM deprivation on the subsequent activation of subpopulations of MCH-ergic neurons. In order to detectneuronal activity, we performed MCH/cFos and orexin/cFos double immunohistochemistry on homecage, sleep deprived and sleep-rebound rats using the platform-on-water method with small and large(stress control) platforms. Furthermore, REM architecture was analyzed and a triple MCH/CART/cFosimmunohistochemistry was also performed on the rebound groups in the same animals.
We found that the activity of MCH- and orexin-immunoreactive neurons during REM rebound was pos-itively and negatively correlated with the number of REM bouts, respectively. A negative reciprocal cor-relation was also found between the activation of MCH- and orexin-immunoreactive neurons during REMrebound. Furthermore, difference between the activation of CART-immunoreactive (CART-IR) and non-CART-immunoreactive MCH-ergic neuron subpopulations was found only after selective REM depriva-tion, it was absent in the large platform (stress control) rebound group.
These results support the role of CART-IR subpopulation of MCH-ergic neurons and the inverse rela-tionship of MCH and orexin in the regulation of REM sleep after REM sleep deprivation.
� 2011 Elsevier B.V. All rights reserved.
1. Introduction
The ‘‘flower pot’’ or platform-on-water sleep deprivation proce-dure is a frequently used method for rapid eye movement (REM)sleep deprivation (Cohen and Dement, 1965; Jouvet et al., 1964;Sapin et al., 2010). The detailed architecture of sleep rebound fol-
ll rights reserved.
acodynamics, SemmelweisTel.: +36 1 459 14 95.
lowing flower pot REM sleep deprivation has been described inour recent paper (Kitka et al., 2009).
The role of orexin (hypocretin) and melanin-concentrating hor-mone (MCH) containing neurons in the regulation of REM sleep isextensively investigated. Despite of this, there is no data about therelation between the endogenous activation of these neurons andthe detailed architecture of REM sleep. The MCH containing neu-rons are predominantly located in the tuberal hypothalamus andin the zona/subzona incerta (Bittencourt et al., 1992). Neurochem-ically, these cells can be divided into two subpopulations:

T. Kitka et al. / Neurochemistry International 59 (2011) 686–694 687
CART-immunoreactive (CART-IR) and non-CART-IR neurons. Dur-ing the ontogenesis, CART-IR and non-CART-IR MCH-ergic neuronsappear at about the embryonic days 12–13 and 11, respectively.CART-IR subpopulation projects towards the cerebral cortex,hippocampus and medial septal complex but also sends descend-ing fibers mainly to the dorsal part of the paragigantocellular retic-ular nucleus (DPGi). At the other hand, non-CART-IR subpopulationof MCH-ergic neurons project to the lower brainstem and spinalcord (Brischoux et al., 2002; Cvetkovic et al., 2004). AlthoughCART-IR subpopulation of MCH-ergic neurons were found to bemore activated than the non-CART-IR neurons during REMrebound after small platform REM deprivation (Hanriot et al.,2007), it has to be noted that this protocol is stressful for the ani-mals (Coenen and van Luijtelaar, 1985; D’Almeida et al., 1997;Kovalzon and Tsibulsky, 1984; Suchecki et al., 1998), and MCHmay also play a role in the behavioural and thermoregulatory ef-fects of stress (Smith et al., 2009). However, the potential effectof stress and REM sleep deficit on the activation of these MCH neu-ron subpopulations during the rebound has not been separated yet.
The immediate early gene product ‘cFos’ is widely used to visu-alize neuronal activity (Kovacs, 2008). MCH-ergic neurons are ac-tive during sleep rebound following small platform sleepdeprivation using MCH/cFos double immunohistochemistry (Han-riot et al., 2007; Verret et al., 2003) and reach their maximal firingfrequency during REM sleep (Hassani et al., 2009). The role of MCHin the regulation of REM sleep is further supported by pharmaco-logical data: MCH injected intracerebroventricularly (icv) or intothe dorsal raphe nucleus increases the time spent in REM sleepand the number of REM sleep episodes (Lagos et al., 2009; Verretet al., 2003). In another paper, MCH injected into the nucleus pon-tis oralis of cat also increases the time spent in REM sleep. More-over, this effect is accompanied by a slight elevation in theaverage duration of REM sleep episodes (Torterolo et al., 2009).Conversely, Ahnaou and colleagues have found that two, chemi-cally related MCH receptor 1 (MCHR1) antagonists decrease thetime spent in REM sleep, and this effect was accompanied by a de-crease of both the number of REM sleep bouts and the averageduration of the REM sleep episodes (Ahnaou et al., 2008). Althoughall of these articles support a role of MCH in the elevation of timespent in REM, the data about REM sleep architecture are contradic-tory. In contrast, Able and colleagues have found no alteration ofsleep architecture following treatment with another MCHR1antagonist (chemically unrelated to the aforementioned two com-pounds) despite high receptor occupancy (Able et al., 2009).
The orexinergic neurons are situated in the dorsal lateral hypo-thalamic area (de Lecea et al., 1998). There is a reciprocal synapticconnection between orexinergic and MCH-ergic neuronal popula-tions (Guan et al., 2002). In line with this, the excitability of orex-inergic neurons were shown to be higher in MCH receptor 1knockout mice compared to their wild type siblings (Rao et al.,2008), while orexin A and B excites MCH-ergic neurons (van denPol et al., 2004). Icv injected orexin-A decreased the time spentin REM, and SB-334867-A, an orexin 1 receptor antagonist, re-versed this effect (Smith et al., 2003). In addition, knockdown ofprepro-orexin by siRNA increases the time spent in REM sleep(Chen et al., 2006).
Despite the well-established role of MCH-ergic and orexinergicneurons in the REM sleep regulation, important questions regard-ing the REM sleep architecture and subpopulations of MCH-ergic neurons remained still unclear. Here we partially repeatand extend previous studies on the electrophysiological andmorphologic-neurochemical examinations of orexinergic/MCH-er-gic neuronal populations. First, we included an additional largeplatform group as a stress control in our all experiments. We alsoperformed a quantitative survey on MCH/cFos, MCH/CART/cFosand orexin/cFos immunostainings in the relevant hypothalamic
subregions. In addition, double immunostainings were performedand EEG parameters were assessed in the same animals to makea better understanding of the interaction of orexinergic andMCH-ergic neuronal populations and their role in the regulationof the fine architecture of REM sleep during REM rebound.
2. Materials and methods
All animal experiments were carried out in accordance with theEuropean Communities Council Directive of 24 November 1986(86/609/EEC) and the National Institutes of Health ‘‘Principles ofLaboratory Animal Care’’ (NIH Publications No. 85-23, revised1985), as well as specific national laws (the Hungarian Govern-mental Regulations on animal studies, December 31, 1998). Per-mission was obtained from the local ethical committees. Animalswere male Wistar rats, weighing 269.19 ± 6.75 g (mean ± SEM) atthe start of the experiment.
2.1. Surgery
Rats were equipped with electroencephalographic (EEG) andelectromyographic (EMG) electrodes as described in an earlier arti-cle of our laboratory (Kantor et al., 2004). Briefly, stainless steelscrew electrodes were implanted epidurally over the left frontalcortex (lateral (L): 2.0 mm and anterior (A): 2.0 mm from bregma)and the left parietal cortex (L: 2.0 mm and A: 2.0 mm from lambda)for frontoparietal EEG recordings. The ground electrode was placedover the cerebellum. In addition, EMG electrodes (stainless steelspring electrodes embedded in silicon rubber, Plastics One Inc.,Roanoke, VA, USA; length = 50 mm, d = 1.2 mm with the siliconrubber) were placed into the muscles of the neck. Surgery was per-formed using a Kopf stereotaxic instrument under 2% halothaneanesthesia (using Fluotec 3 halothane vaporizer). After surgery,rats were kept in single cages in the recording chamber, main-tained at a 12/12 h light/dark cycle (lights on from 10:00 to22:00 h, daylight type fluorescent tubes, 18 W, approximately150 lx) at an ambient temperature of 21 ± 1 �C and relative humid-ity of 40–50%. After a 7-day recovery period, in order to habituatethe animals to the recording conditions, rats were attached to thepolygraph by a flexible recording cable and an electric swivel, fixedabove the cages, permitting free movement of the animals. To as-sess motor activity, electromagnetic transducers were used inwhich potentials were generated by movements of the recordingcable. Habituation period was 7 days long.
2.2. Groups
Animals were randomly divided into five groups as follows:home cage (HC) group (n = 7); small platform sleep deprived (SP)group (n = 7); large platform sleep deprived (LP) group (n = 8);small platform sleep deprived, sleep rebound (SPR) group (n = 9for sleep studies and correlations; n = 13 for double immunohisto-chemistry, n = 8 for triple immunohistochemistry); large platformsleep deprived, sleep rebound (LPR) group (n = 6 for sleep studiesand correlations; n = 7 for double immunohistochemistry, n = 5for triple immunohistochemistry). Food and water was availablead libitum for all animals throughout the whole experiment.
2.3. REM sleep deprivation
REM sleep deprivation was performed as described earlier (Kit-ka et al., 2009). Briefly, all animals were detached from the cableand animals in SP, LP, SPR and LPR groups were placed on a roundplatform situated in the middle of a round water tank at lights on.The diameter of the small and the large platform was 6.5 and

Fig. 1. Percentage of cFos-IR neurons within MCH-IR (A) and orexin-IR (B) cells.Data are expressed as mean ± SEM. HC: home cage (n = 7), SP: small pot deprived(n = 7), LP: large pot deprived (n = 8), SPR: small pot rebound (n = 12 for MCH/cFosimmunohistochemistry, n = 13 for orexin/cFos immunohistochemistry), LPR: largepot rebound (n = 7); #significant difference compared to home cage group,&significant difference compared to respective non-rebound group, ⁄significantdifference between SPR and LPR groups. 1 sign: p < 0.05, 2 signs: p < 0.01, 3 signs:p < 0.001.
688 T. Kitka et al. / Neurochemistry International 59 (2011) 686–694
13 cm, respectively, their height was 18.5 cm. The surface of bothplatforms was 0.5 cm above the water level. After spending 72 hon platforms, animals in SPR and LPR groups were reattached totheir home cage recording cable just after the lights on.
2.4. Recording, vigilance analysis and scoring
EEG, EMG and motor activity of SPR and LPR animals were re-corded for 3 h, starting immediately after reattaching the animalsto their home cage recording cable. Rats were not disturbedthroughout the recordings. Data were stored on computer for fur-ther analysis.
The vigilance states were classified by SleepSign for Animalsleep analysis software (Kissei Comtec America, Inc., USA) for 4 speriods over 3 h as follows: active wakefulness (AW), the EEG ischaracterized by low amplitude activity at beta (14–30 Hz) and al-pha (8–13 Hz) frequencies accompanied by high EMG and motoractivity; passive wakefulness (PW), the EEG is characterized bylow amplitude activity at beta (14–30 Hz) and alpha (8–13 Hz) fre-quencies accompanied by high EMG activity; light slow wave sleep(SWS1), high voltage slow cortical waves (0.5–4 Hz) interrupted bylow voltage fast EEG activity (spindles 6–15 Hz) accompanied byreduced EMG and motor activity; deep slow wave sleep (SWS2),continuous high amplitude slow cortical waves (0.5–4 Hz) with re-duced EMG and motor activity; intermediate stage of sleep (IS), abrief stage just prior to REM and sometimes just after it, character-ized by unusual association of high-amplitude spindles (mean12.5 Hz) and low-frequency (mean 5.4 Hz) theta rhythm; REMsleep, low amplitude and high frequency EEG activity with regulartheta waves (5–9 Hz) accompanied by silent EMG and motor activ-ity with occasional twitching (Kantor et al., 2004). After the auto-matic scoring, recordings were visually revised. The followingdata were calculated: time spent in each sleep stage per hour;average duration of REM episodes per hour; number of REM epi-sodes per hour (REM number). In order to exclude short REM at-tempts, a REM episode was defined as a period of REM lasting forP16 s and not interrupted by P16 s of other vigilance state(Gandolfo et al., 1996; Kitka et al., 2009; Vyazovskiy et al., 2007).
2.5. Immunohistochemistry
Immediately after removing the animals from the platforms atlights on (HC, SP and LP groups), or after the 3-hour sleep recording(SPR and LPR groups), the rats were anesthetized with sodium pen-tobarbital (Nembutal, 35 mg/kg, i.p., CEVA-Phylaxia), and transcar-dially perfused with 4% paraformaldehyde in 0.1 M phosphatebuffer, pH 7.4 (PB). The brains were removed, postfixed at 4 �Covernight and cryoprotected in 20% sucrose in PB overnight. Thehypothalami were cut and divided into four series of 50 lm-thickcoronal sections using a frigomobile (Frigomobile, Reichert-Jung,Vienna, Austria).
For the immunostainings the solutions were dissolved in PB, theprimary antibodies were applied for 2 days at 4 �C, all the otherincubations were performed at room temperature. The sectionswere washed extensively for 3 � 10 min in PB between the incuba-tion steps. In case of the cFos/MCH or cFos/orexin A double immu-nostainings, the sections were first permeabilized with 0.5% TritonX-100 for 1 h. Next, the endogenous peroxidase activity and thenon-specific antigen binding sites were blocked incubating the sec-tions in 3% hydrogen-peroxide solution and in 10% normal goatserum for 15 min and for 1 h, respectively. After these steps, thesections were incubated in rabbit anti-cFos (1:30,000, in PB, SantaCruz Biotechnology, Inc., Heidelberg, Germany) primary antibodyand then, in biotinylated goat anti-rabbit IgG (1:1000) and in avi-din-biotin-peroxidase complex (ABC, 1:500) for 1 h in both solu-tion (both from Vector Laboratories, Burlingame, CA, USA). The
immunostaining was visualized by nickel-enhanced diaminobenzi-dine (NiDAB). The second immunostainings were performed thesame way as the first one except using rabbit anti-MCH or rabbitanti-orexin A, as primary antibodies (1:10,000; or 1:5000, respec-tively, both in 3% BSA/0.5% Triton X-100 and both from PhoenixEurope GMBH, Karlsruhe, Germany) and DAB, as chromogen. Final-ly, the sections were collected on gelatin-coated slides, dehydrated,mounted with DPX Mountant (Sigma–Aldrich, Budapest, Hungary)mounting medium.
For the cFos/MCH/CART triple immunolabeling, the sectionswere treated with 3% hydrogen-peroxide and cryoprotected in5%, 10% and 20% of DMSO for 10 min in each solution. Then, thesections were freezed-thawed ten times by using liquid nitrogento enhance antibody penetration and the nonspecific binding siteswere blocked with 3% BSA for 1 h. The rabbit anti-cFos primaryantibody (1:20,000) was applied first and the reaction was devel-oped by using anti-rabbit Poly-HRP (Millipore Kft, Budapest, Hun-gary) secondary antibody for 2 h and FITC-Tyramide amplification(Invitrogen, Budapest, Hungary). To prevent the antibody cross-reaction and to block the HRP enzyme, the sections were micro-wave treated in 0.1 M citrate buffer (pH 6.0) (Toth et al., 2008).The sections were then incubated in 2% normal donkey serum(NDS) for 1 h and the second primary antibody, the rabbit anti-

T. Kitka et al. / Neurochemistry International 59 (2011) 686–694 689
CART (1:5000 in 5% NDS, Phoenix) was applied. The immunostain-ing was visualized by AlexaFluor 594-conjugated donkey anti-rab-bit secondary antibody (1:500, 1 h, Invitrogen). The sections wereblocked again with 10% normal horse serum (NHS) and incubatedin the third primary, the goat anti-MCH (1:100, in 10% NHS). TheMCH immunostaining was developed by using biotinylated horseanti-goat secondary antibody (1:1000, 1 h, Vector) and Streptavi-din-Pacific Blue (1:500, 2 h, Invitrogen). At the end, the sectionswere mounted on non-coated slides, coverslipped with Aqua-Poly/Mount (Polysciences Europe GMBH, Eppelheim, Germany)and examined by a Nikon Eclipse E 8000 confocal microscope.
Fig. 2. MCH/cFos DAB/NiDAB double immunostaining on the hypothalamus of a HC animpopulation was divided into four areas: MCH-IR neurons in the (1) zona incerta/subzonneuronal population around the III ventricle (PVA) (panel A). Note that MCH/cFos doubanimal (A–E, F–J, respectively). In contrast, a high amount of cFos-IR MCH neuron is foundboxed zones in panel A, F and K are shown in panels B–E, G–J and L–O, respectively. ScaleB–E, G–J and L–O.
2.6. Morphometry analysis of MCH/cFos and orexin/cFos doubleimmunolabelings and MCH/CART/cFos triple labeling
Based on the distribution/density of neurons, the hypothalamicMCH-immunoreactive (MCH-IR) cell population was divided intofour areas: (1) zona incerta/subzona incerta (ZI), (2) lateral hypo-thalamic area (LH), (3) periventricular area (PVA) of the tuberalhypothalamus and (4) perifornical area (PFA) (Fig. 2) (Paxinosand Watson, 2007). The amount of cFos-IR, MCH-IR/non-cFos-IRand MCH-IR/cFos-IR cells was determined in all of these areasbilaterally in at least five 50 lm thick coronal sections per case
al (A–E), a SP animal (F–J) and a SPR animal (K–O). The hypothalamic MCH-IR cela incerta (ZI), (2) perifornical area (PFA), (3) lateral hypothalamus (LH) (4) MCH-IRle labeled cells among MCH-IR neurons are almost absent in the HC and in the SPin the SPR animal in all the four examined areas (K–O). Higher magnifications of the
bar = 200 lm in panel A applies to A, F and K. Scale bar = 40 lm in panel D applies to
l
690 T. Kitka et al. / Neurochemistry International 59 (2011) 686–694
using a visopan microscope (Reichert, Austria, No. 361977). In eachregion of each section, four randomly-selected non-overlappingareas were selected (0.64 mm2 altogether) under 40� objectiveand the quantification was made by the same observer in all case.Finally, the number of cells was calculated to cell/mm2 values.
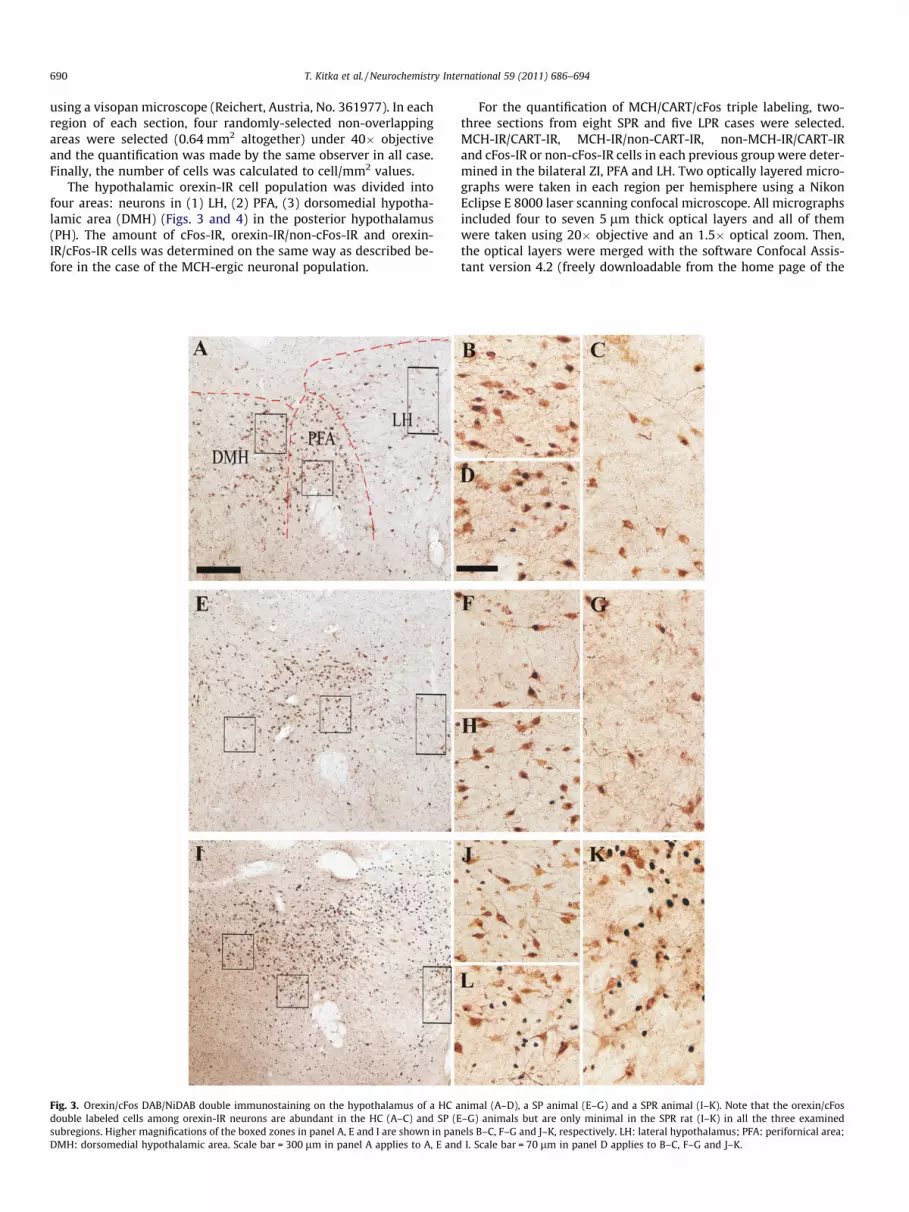
The hypothalamic orexin-IR cell population was divided intofour areas: neurons in (1) LH, (2) PFA, (3) dorsomedial hypotha-lamic area (DMH) (Figs. 3 and 4) in the posterior hypothalamus(PH). The amount of cFos-IR, orexin-IR/non-cFos-IR and orexin-IR/cFos-IR cells was determined on the same way as described be-fore in the case of the MCH-ergic neuronal population.
Fig. 3. Orexin/cFos DAB/NiDAB double immunostaining on the hypothalamus of a HC adouble labeled cells among orexin-IR neurons are abundant in the HC (A–C) and SP (Esubregions. Higher magnifications of the boxed zones in panel A, E and I are shown in panDMH: dorsomedial hypothalamic area. Scale bar = 300 lm in panel A applies to A, E and
For the quantification of MCH/CART/cFos triple labeling, two-three sections from eight SPR and five LPR cases were selected.MCH-IR/CART-IR, MCH-IR/non-CART-IR, non-MCH-IR/CART-IRand cFos-IR or non-cFos-IR cells in each previous group were deter-mined in the bilateral ZI, PFA and LH. Two optically layered micro-graphs were taken in each region per hemisphere using a NikonEclipse E 8000 laser scanning confocal microscope. All micrographsincluded four to seven 5 lm thick optical layers and all of themwere taken using 20� objective and an 1.5� optical zoom. Then,the optical layers were merged with the software Confocal Assis-tant version 4.2 (freely downloadable from the home page of the
nimal (A–D), a SP animal (E–G) and a SPR animal (I–K). Note that the orexin/cFos–G) animals but are only minimal in the SPR rat (I–K) in all the three examinedels B–C, F–G and J–K, respectively. LH: lateral hypothalamus; PFA: perifornical area;I. Scale bar = 70 lm in panel D applies to B–C, F–G and J–K.

Fig. 4. Demonstration of MCH/CART/cFos triple labeling in the hypothalamicperifornical area (PFA) of a LPR animal (A) and a SPR animal (B). (Red: CART, blue:MCH, green: cFos.) Note that the ratio of cFos IR cells within the MCH-labeledneurons is higher in the SPR group compared to the LPR group (B vs. A). Scale bar:100 lm.
T. Kitka et al. / Neurochemistry International 59 (2011) 686–694 691
University of Minnesota). The brightness/contrast and sharpness ofthe merged micrographs were slightly adjusted using the AdobePhotoshop 7.0 in each color channel and the counting of cellswas performed on screen by the same observer in all case. Finally,the number of neurons was counted in each region.
2.7. Statistical analysis
In case of the statistical analysis of all types of quantified immu-nohistochemical data, the number of labeled neurons of all exam-ined regions was summarized in each animal and the percentage ofdouble or triple labeled neurons was calculated.
Double immunohistochemistry: Values of all examined regionswere evaluated using one-way ANOVA with the factor ‘‘group’’(HC, SP, LP, SPR and LPR). Triple immunohistochemistry: Values wereevaluated using factorial ANOVA, with the factors ‘‘group’’ (SPR andLPR) and ‘‘CART-immunoreactivity’’. Post hoc analysis was per-formed using Tukey’s post hoc test only after a significant ANOVAeffect (p < 0.05).
Interindividual correlations were calculated using linear regres-sion. Since the ratio of cFos-IR cells within orexin-labeled neuronsformed an exponential-like curve in most correlations, we made allregressions for these cells using the logarithm with base 10.
Statistical analysis was carried out with STATISTICA 7.0 (Stat-soft Inc., Tulsa, OK, USA). Data in all figures are expressed asmean ± SEM.
Fig. 5. Percentage of cFos-IR cells within CART-IR and non-CART-IR MCH-labeledneurons. Data are expressed as mean ± SEM. SPR: small pot sleep rebound (n = 8),LPR: large pot sleep rebound (n = 5), ⁄⁄⁄p < 0.001 compared to SPR non-CART-IR cellpopulation, ##p < 0.01 compared to LPR CART-IR cell population.
3. Results
3.1. Morphological data
3.1.1. MCH/cFos double labeling and its quantitative evaluationMCH/cFos double labeled cells among MCH-IR neurons were al-
most absent in the HC group and neither small, nor large pot sleepdeprivation changed that ratio (Fig. 1A). The ratio of MCH/cFosdouble labeled cells among MCH-IR neurons was higher in both re-bound groups than in the sleep deprived (no rebound) and homecage groups (LPR: p < 0.005; SPR: p < 0.001 compared to sleep de-prived (no rebound) and home cage groups), and this ratio washigher in SPR group than in LPR group (p = 0.0001).
Means and SEMs of the percentage of cFos IR neurons were0.22 ± 0.05%, 0.06 ± 0.03%, 48.47 ± 1.76%, 0.13 ± 0.03% and17.03 ± 6.88% for HC, SP, SPR, LP and LPR groups, respectively(Figs. 1A, 2).
3.1.2. Orexin/cFos double labeling and its quantitative evaluationIn contrast to the MCH-IR neuronal population, orexin/cFos
double labeled cells among orexin-IR neurons were abundant in
the home cage group and sleep deprivation did not affect this ratioin case of either platform. Sleep rebound after a small or large plat-form markedly decreased the percentage of orexin/cFos double la-beled neurons among orexin-IR cells compared to home cage andtheir respective non-rebound groups (p < 0.05 compared to HCgroup, p < 0.001 compared to respective non-rebound group forboth rebound groups). In contrast to the MCH cells, this ratio didnot differ significantly between the SPR and LPR groups.
Means and SEMs of the percentage of cFos IR neurons were28.59 ± 7.5%, 33.68 ± 5.89%, 4.5 ± 0.97%, 37.46 ± 9.03% and3.86 ± 1.24% for HC, SP, SPR, LP and LPR groups, respectively(Figs. 1B, 3).
3.1.3. MCH/CART/cFos triple labeling and its quantitative evaluationMCH-IR neurons can be divided into two subpopulations based
on CART immunoreactivity: CART-IR and non-CART-IR neurons.The ratio of cFos-IR cells within the MCH-labeled neurons was
higher in the SPR group compared to the LPR group only withinthe CART-IR subpopulation (p = 0.001, Figs. 4 and 5).
Comparison of the ratio of cFos-IR cells among CART-IR andnon-CART-IR neurons resulted in a significant difference only inthe SPR group (p = 0.0004, Figs. 4 and 5).
Means and SEMs of the percentage of cFos IR neurons were75.55 ± 3.94%, 30.28 ± 1.97%, 30.77 ± 15.68% and 14.53 ± 7.49% forSPR CART-IR, SPR non-CART-IR, LPR CART-IR and LPR non-CART-IR populations, respectively.
3.2. Interindividual correlations between electrophysiological andquantified morphological data
To identify the potential relationship between MCH and orexinneurons and REM sleep in more details, we performed linearregression on the sleep parameters and quantified double immu-nohistochemical data of SPR animals. We found severalcorrelations:
3.2.1. Time spent in REMThe ratio of MCH/cFos double labeled cells among all MCH-IR
neurons showed a positive linear correlation with the time spentin REM (R2 = 0.779, p = 0.002; Fig. 6A).

692 T. Kitka et al. / Neurochemistry International 59 (2011) 686–694
We found negative linear correlation between the time spent inREM and the ratio of orexin/cFos double labeled cells among orex-in-IR neurons (R2 = 0.734, p = 0.003; Fig. 6B).
3.2.2. Number of REM episodesThe ratio of MCH/cFos double labeled cells among MCH-IR neu-
rons showed a positive linear correlation with the number of REMepisodes (R2 = 0.769, p = 0.002; Fig. 6C).
Fig. 6. Correlations between individual parameters in the SPR group. (A) Time spent in REthe MCH- IR cells, (B) time spent in REM during the 3 h rebound and the percentage of cduring the 3 h rebound and the percentage of cFos double-stained neurons within the Mof cFos double-stained neurons within the orexin-IR cells, (E) percentage of cFos double-neurons within the orexin-IR cells.
The activation of orexin-IR neurons showed a negative linearcorrelation with number of REM episodes (R2 = 0.569, p = 0.019,Fig. 6D).
3.2.3. Length of REM episodesThere was no significant correlation between the average length
of REM episodes and the immunohistochemical data (data notshown).
M during the 3 h rebound and the percentage of cFos double-stained neurons withinFos double-stained neurons within the orexin-IR cells, (C) number of REM episodesCH-IR cells, (D) number of REM episodes during the 3 h rebound and the percentagestained neurons within the MCH-IR cells and the percentage of cFos double-stained

T. Kitka et al. / Neurochemistry International 59 (2011) 686–694 693
3.3. Correlations between the quantified orexin and MCH data
Generally, we found a negative linear correlation comparing theratio of cFos-IR cells among orexin- and MCH-IR neurons(R2 = 0.538, p = 0.024, Fig. 6E).
4. Discussion
In the present study we examined the correlations between theelectrophysiological data on REM sleep and the quantified MCH/cFos and orexin/cFos double immunohistochemical data in detailsto reach a better understanding on the role of MCH-ergic and orex-inergic neurons in REM sleep regulation. In addition, we also exam-ined the correlations between the immunostainings of the twoneuronal populations.
In general, we have found that sleep deprivation itself did notaffect the activation of MCH-ergic or orexinergic neurons, basedon cFos immunoreactivity, either using the small or the large plat-form compared to the home cage group. In contrast, Verret and col-leagues have found that sleep deprivation increased the activity oforexin-IR neurons compared to the home cage group (Verret et al.,2003). This contradiction might be because of the different timingof the two studies. Namely, in the paper of Verret et al., rats wereperfused one hour before the end of the passive phase thus thehome caged animals were mainly sleeping in the preceding fewhours. In contrast, we perfused the animals at lights on. There isevidence that the activity of the rats is higher at this time point(Balogh et al., 2004).
We have found that sleep rebound after both small and largeplatform sleep deprivation increased the activity of the MCH-IRneurons and decreased the activity of orexin-IR cells. This resultis in line with previous studies (Verret et al., 2003). Furthermore,the percentage of cFos positivity within MCH-IR neurons was high-er in the SPR animals than that in the LPR (stress control) animals.This finding is in line with the literature, suggesting that the acti-vation of MCH-ergic neurons during the rebound is driven mainlyby the REM deficit. However, lower activation of MCH-ergic neu-rons can also be seen at LPR animals, raising the possibility ofthe involvement of stress in this phenomenon.
The MCH/cFos/CART triple immunostaining suggests functionaldifferences between CART-IR and non-CART-IR MCH-IR neurons.Although Hanriot and colleagues (Hanriot et al., 2007) have provedthat CART-IR subpopulation of MCH-ergic neurons are more acti-vated during REM sleep rebound, they did not assess whether thisphenomenon was the result of the REM deficit itself or the stresseffects caused by the REM-deprivation procedure. We have shownthat the CART-IR subpopulation is much more active than the non-CART-IR cell group during the rebound only following small plat-form sleep deprivation, and such difference was not found in thestress-control rebound (LPR) group. This result shows thatalthough both subpopulations of MCH-ergic neurons were moreor less activated after the stressful procedure itself, only theCART-IR subpopulation shows an enhanced response to the sleeprebound following selective REM-deprivation on the small plat-form. It suggests a major role of this subpopulation in the regula-tion of REM sleep. Our results raise the possibility that theactivation of CART-IR MCH neurons might contribute to the gener-ation of theta rhythms during REM sleep by their projections to themedial septal complex and hippocampus. Furthermore, DPGi hasalso been shown to have a dense innervation from the CART-IRMCH-ergic subpopulation (Cvetkovic et al., 2004). The REM-onGABA-ergic neurons of the DPGi start to discharge �15 s beforeREM onset and send projections to several REM-off regions includ-ing the locus coeruleus, dorsal raphe and ventrolateral periaqu-eductal grey (Goutagny et al., 2008). Based on our findings, we
suppose that the MCH-ergic neurons may take part in REM initial-ization through their descending projections to the DPGi.
Applying electrophysiological and immunohistochemical data,interindividual correlations revealed a positive association be-tween percentage of cFos/MCH double labeled neurons and twoREM parameters, namely time spent is REM sleep and number ofREM sleep episodes during the 3-hour rebound.
The role of MCH in the regulation of sleep is widely studied, andboth the number and average duration of REM sleep episodes werefound to be affected by MCH: number of REM episodes was in-creased by MCH injected icv or into the dorsal raphe nucleus (La-gos et al., 2009; Verret et al., 2003). In contrast, MCH injectedinto the nucleus pontis oralis increased the average duration ofREM sleep episodes in cat (Torterolo et al., 2009). Correspondingly,increased average duration of REM sleep episodes by fasting inwild-type mice is diminished in MCH KO animals (Willie et al.,2008). Our present results could not be confounded by the effectof food intake on the MCH-ergic and orexinergic neuronal activa-tion, since the animals were fed ad libitum throughout the experi-ment and food intake was not modified by the size of the platform(data not shown).
Orexin, however, is found to affect REM sleep by decreasing thenumber of REM sleep episodes. Orexin KO and siRNA orexin-si-lenced mice showed increased REM frequency compared to wild-type ones (Chen et al., 2006; Hunsley et al., 2006), and orexin Amicroinjected into the tegmentum of cats decreased the numberof REM sleep episodes and number of transitions from slow wavesleep to REM (Moreno-Balandran et al., 2008; Xi et al., 2001). Ourresults are in line with the aforementioned literature data: therewas a negative correlation between the activation of orexinergicneurons and number of REM episodes.
The reciprocal connection between MCH-ergic and orexinergicneuron populations was described earlier (Gao, 2009; Guan et al.,2002; Rao et al., 2008; van den Pol et al., 2004) and it is also knownthat the firing frequency of MCH-ergic and orexinergic neuronsshow an opposite pattern through the sleep-wake cycle (Hassaniet al., 2009; Lee et al., 2005). Our result, namely the negative cor-relation between the cFos immunoreactivity of MCH-IR and orex-in-IR cells gives a further evidence for the physiological relationbetween these neuron populations and that this relation is presentalso after prolonged REM deprivation.
In conclusion, our results give further evidences for the physio-logical connection between MCH-ergic and orexinergic systemsduring REM rebound, and suggest that the activity of these systemsare related to the frequency of REM sleep bouts but not to thelength of the certain REM periods. Furthermore, we propose thatthe CART-immunopositive subpopulation of MCH-IR neurons playsa much stronger role in the REM sleep rebound caused by selectiveREM sleep deprivation than the CART-immunonegativesubpopulation.
Acknowledgements
This study was supported by the 6th Framework Program of theEuropean Community LSHM-CT-2004-503474, the Hungarian Re-search Fund Grant T020500, the Ministry of Welfare ResearchGrant 460/2006, TAMOP-2.2.1. B-09/1/KMR-2010-0001 andETT495/05(Z.E.T.). Z.E. Tóth is supported by the Bolyai fellowship.
References
Able, S.L., Ivarsson, M., Fish, R.L., Clarke, T.L., McCourt, C., Duckworth, J.M., Napier, C.,Katugampola, S.D., 2009. Localisation of melanin-concentrating hormonereceptor 1 in rat brain and evidence that sleep parameters are not altereddespite high central receptor occupancy. Eur. J. Pharmacol. 616, 101–106.

694 T. Kitka et al. / Neurochemistry International 59 (2011) 686–694
Ahnaou, A., Drinkenburg, W.H., Bouwknecht, J.A., Alcazar, J., Steckler, T.,Dautzenberg, F.M., 2008. Blocking melanin-concentrating hormone MCH1receptor affects rat sleep-wake architecture. Eur. J. Pharmacol. 579, 177–188.
Balogh, B., Molnar, E., Jakus, R., Quate, L., Olverman, H.J., Kelly, P.A., Kantor, S., Bagdy,G., 2004. Effects of a single dose of 3,4-methylenedioxymethamphetamine oncircadian patterns, motor activity and sleep in drug-naive rats and ratspreviously exposed to MDMA. Psychopharmacology (Berl) 173, 296–309.
Bittencourt, J.C., Presse, F., Arias, C., Peto, C., Vaughan, J., Nahon, J.L., Vale, W.,Sawchenko, P.E., 1992. The melanin-concentrating hormone system of the ratbrain: an immuno- and hybridization histochemical characterization. J. Comp.Neurol. 319, 218–245.
Brischoux, F., Cvetkovic, V., Griffond, B., Fellmann, D., Risold, P.Y., 2002. Time ofgenesis determines projection and neurokinin-3 expression patterns ofdiencephalic neurons containing melanin-concentrating hormone. Eur. J.NeuroSci. 16, 1672–1680.
Chen, L., Thakkar, M.M., Winston, S., Bolortuya, Y., Basheer, R., McCarley, R.W., 2006.REM sleep changes in rats induced by siRNA-mediated orexin knockdown. Eur.J. NeuroSci. 24, 2039–2048.
Coenen, A.M., van Luijtelaar, E.L., 1985. Stress induced by three procedures ofdeprivation of paradoxical sleep. Physiol. Behav. 35, 501–504.
Cohen, H.B., Dement, W.C., 1965. Sleep: changes in threshold to electroconvulsiveshock in rats after deprivation of ‘‘paradoxical’’ phase. Science 150, 1318–1319.
Cvetkovic, V., Brischoux, F., Jacquemard, C., Fellmann, D., Griffond, B., Risold, P.Y.,2004. Characterization of subpopulations of neurons producing melanin-concentrating hormone in the rat ventral diencephalon. J. Neurochem. 91,911–919.
D’Almeida, V., Hipolide, D.C., Azzalis, L.A., Lobo, L.L., Junqueira, V.B., Tufik, S., 1997.Absence of oxidative stress following paradoxical sleep deprivation in rats.Neurosci. Lett. 235, 25–28.
de Lecea, L., Kilduff, T.S., Peyron, C., Gao, X., Foye, P.E., Danielson, P.E., Fukuhara, C.,Battenberg, E.L., Gautvik, V.T., Bartlett 2nd, F.S., Frankel, W.N., van den Pol, A.N.,Bloom, F.E., Gautvik, K.M., Sutcliffe, J.G., 1998. The hypocretins: hypothalamus-specific peptides with neuroexcitatory activity. Proc. Natl. Acad. Sci. USA 95,322–327.
Gandolfo, G., Gauthier, P., Arnaud, C., Gottesmann, C., 1996. Influence of paradoxicalsleep deprivation on the intermediate stage of sleep in the rat. Neurosci. Res. 25,123–127.
Gao, X.B., 2009. Electrophysiological effects of MCH on neurons in thehypothalamus. Peptides 30, 2025–2030.
Goutagny, R., Luppi, P.H., Salvert, D., Lapray, D., Gervasoni, D., Fort, P., 2008. Role ofthe dorsal paragigantocellular reticular nucleus in paradoxical (rapid eyemovement) sleep generation: a combined electrophysiological and anatomicalstudy in the rat. Neuroscience 152, 849–857.
Guan, J.L., Uehara, K., Lu, S., Wang, Q.P., Funahashi, H., Sakurai, T., Yanagizawa, M.,Shioda, S., 2002. Reciprocal synaptic relationships between orexin- andmelanin-concentrating hormone-containing neurons in the rat lateralhypothalamus: a novel circuit implicated in feeding regulation. Int. J. Obes.Relat. Metab. Disord. 26, 1523–1532.
Hanriot, L., Camargo, N., Courau, A.C., Leger, L., Luppi, P.H., Peyron, C., 2007.Characterization of the melanin-concentrating hormone neurons activatedduring paradoxical sleep hypersomnia in rats. J. Comp. Neurol. 505, 147–157.
Hassani, O.K., Lee, M.G., Jones, B.E., 2009. Melanin-concentrating hormone neuronsdischarge in a reciprocal manner to orexin neurons across the sleep-wake cycle.Proc. Natl. Acad. Sci. USA 106, 2418–2422.
Hunsley, M.S., Curtis, W.R., Palmiter, R.D., 2006. Behavioral and sleep/wakecharacteristics of mice lacking norepinephrine and hypocretin. Genes BrainBehav. 5, 451–457.
Jouvet, D., Vimont, P., Delorme, F., Jouvet, M., 1964. Study of selective deprivation ofthe paradoxal sleep phase in the cat.. C. R. Seances Soc. Biol. Fil. 158, 756–759.
Kantor, S., Jakus, R., Balogh, B., Benko, A., Bagdy, G., 2004. Increased wakefulness,motor activity and decreased theta activity after blockade of the 5-HT2B
receptor by the subtype-selective antagonist SB-215505. Br. J. Pharmacol. 142,1332–1342.
Kitka, T., Katai, Z., Pap, D., Molnar, E., Adori, C., Bagdy, G., 2009. Small platform sleepdeprivation selectively increases the average duration of rapid eye movementsleep episodes during sleep rebound. Behav. Brain Res. 205, 482–487.
Kovacs, K.J., 2008. Measurement of immediate-early gene activation-c-fos andbeyond. J. Neuroendocrinol. 20, 665–672.
Kovalzon, V.M., Tsibulsky, V.L., 1984. REM-sleep deprivation, stress and emotionalbehavior in rats. Behav. Brain Res. 14, 235–245.
Lagos, P., Torterolo, P., Jantos, H., Chase, M.H., Monti, J.M., 2009. Effects on sleep ofmelanin-concentrating hormone (MCH) microinjections into the dorsal raphenucleus. Brain Res. 1265, 103–110.
Lee, M.G., Hassani, O.K., Jones, B.E., 2005. Discharge of identified orexin/hypocretinneurons across the sleep-waking cycle. J. Neurosci. 25, 6716–6720.
Moreno-Balandran, E., Garzon, M., Bodalo, C., Reinoso-Suarez, F., de Andres, I., 2008.Sleep-wakefulness effects after microinjections of hypocretin 1 (orexin A) incholinoceptive areas of the cat oral pontine tegmentum. Eur. J. NeuroSci. 28,331–341.
Paxinos, G., Watson, C., 2007. The Rat Brain in Stereotaxic Coordinates, 6th ed.Academic Press, San Diego.
Rao, Y., Lu, M., Ge, F., Marsh, D.J., Qian, S., Wang, A.H., Picciotto, M.R., Gao, X.B., 2008.Regulation of synaptic efficacy in hypocretin/orexin-containing neurons bymelanin concentrating hormone in the lateral hypothalamus. J. Neurosci. 28,9101–9110.
Sapin, E., Berod, A., Leger, L., Herman, P.A., Luppi, P.H., Peyron, C., 2010. A very largenumber of GABAergic neurons are activated in the tuberal hypothalamus duringparadoxical (REM) sleep hypersomnia. PLoS ONE 5, e11766.
Smith, D.G., Hegde, L.G., Wolinsky, T.D., Miller, S., Papp, M., Ping, X., Edwards, T.,Gerald, C.P., Craig, D.A., 2009. The effects of stressful stimuli and hypothalamic-pituitary-adrenal axis activation are reversed by the melanin-concentratinghormone 1 receptor antagonist SNAP 94847 in rodents. Behav. Brain Res. 197,284–291.
Smith, M.I., Piper, D.C., Duxon, M.S., Upton, N., 2003. Evidence implicating a role fororexin-1 receptor modulation of paradoxical sleep in the rat. Neurosci. Lett. 341,256–258.
Suchecki, D., Lobo, L.L., Hipolide, D.C., Tufik, S., 1998. Increased ACTH andcorticosterone secretion induced by different methods of paradoxical sleepdeprivation. J. Sleep Res. 7, 276–281.
Torterolo, P., Sampogna, S., Chase, M.H., 2009. MCHergic projections to the nucleuspontis oralis participate in the control of active (REM) sleep. Brain Res. 1268,76–87.
Toth, Z.E., Zelena, D., Mergl, Z., Kirilly, E., Varnai, P., Mezey, E., Makara, G.B.,Palkovits, M., 2008. Chronic repeated restraint stress increases prolactin-releasing peptide/tyrosine-hydroxylase ratio with gender-related differences inthe rat brain. J. Neurochem. 104, 653–666.
van den Pol, A.N., Acuna-Goycolea, C., Clark, K.R., Ghosh, P.K., 2004. Physiologicalproperties of hypothalamic MCH neurons identified with selective expression ofreporter gene after recombinant virus infection. Neuron 42, 635–652.
Verret, L., Goutagny, R., Fort, P., Cagnon, L., Salvert, D., Leger, L., Boissard, R., Salin, P.,Peyron, C., Luppi, P.H., 2003. A role of melanin-concentrating hormoneproducing neurons in the central regulation of paradoxical sleep. BMCNeurosci. 4, 19.
Vyazovskiy, V.V., Achermann, P., Tobler, I., 2007. Sleep homeostasis in the rat in thelight and dark period. Brain Res. Bull. 74, 37–44.
Willie, J.T., Sinton, C.M., Maratos-Flier, E., Yanagisawa, M., 2008. Abnormal responseof melanin-concentrating hormone deficient mice to fasting: hyperactivity andrapid eye movement sleep suppression. Neuroscience 156, 819–829.
Xi, M.C., Morales, F.R., Chase, M.H., 2001. Effects on sleep and wakefulness of theinjection of hypocretin-1 (orexin-A) into the laterodorsal tegmental nucleus ofthe cat. Brain Res. 901, 259–264.


