Embed Size (px)
Citation preview

Progress In Electromagnetics Research C, Vol. 49, 19–29, 2014
Auto Reconfigurable Patch Antenna for Biomedical Single ChannelMulti-Frequency Microwave Radiometry Applications
Chris D. Nikolopoulos*, Anargyros T. Baklezos, and Christos N. Capsalis
Abstract—A small patch antenna is associated with passive (reactively loaded) elements (varactors) inorder to auto adjust the resonant frequency in a single-channel multi-frequency configuration appropriatefor biomedical applications. As a supplementary study of the authors in the field of detection oftemperature abnormalities in human tissue phantom using microwave radiometry, this paper adds acontribution to frequency readjustment when a shift occur due to the fact that the human body is acomplex and stratified dielectric object. The optimization of the array is performed using a GeneticAlgorithm (GA) tool as a method of choice. The adjustment in the measurement frequency is performedby altering the values of the passive elements according to the shift needed.
1. INTRODUCTION
Microwave radiometry can respond better to thermal radiation emitted several centimeters below theskin because of its wavelength spectrum and lower frequency range (between 300MHz and 300GHz).It is undoubtful, as shown in the Figure 1, that in the microwave range the intensity is about 10million (−70 dBW) times smaller than infrared radiation. Nevertheless, microwave radiation is lessattenuated in tissue, thus is suitable for measuring the temperature subcutaneously. By using microwaveradiometry, the power level of thermal radiation from a tissue region can be captured. Provided thatanatomical information of the region is known, then this information can be used with the radiometerpower measurements to detect temperature anomalies in the tissue.
The antenna should guarantee proper transmission or reception of electromagnetic signals, as anymistakes or faults at this stage greatly affect the effectiveness of the whole system. The requirementsand, accordingly, the specifications of the antennas are driven by the numerous applications arising,yielding a wide variety of antenna design types.
When referring to antenna parameters, such as impedance, bandwidth and efficiency, the referencecorresponds to those defined for the antenna located in free space. In biomedical radiometric sensingthe antennas of the radiometer are used in environments comprising the free space and lossy medium,which is typically human tissue. Thus, it is important to discuss parameters that describe wave behaviorin lossy medium.
Several studies have been conducted indicating that the dielectric properties of various biologicaltissues vary considerably depending on the water content. A key measurement parameter of microwaveproperties is the dielectric constant or permittivity, which is directly related to water content. Thepermittivity explains the material loss characteristics and ability to store energy when the material isplaced in an electric field [1]. Water molecules attempt to align themselves within an electric field,because of their polar nature. As a result, low water content tissues as bone and fat tend to presentlow permittivity, whilst high water content tissues, such as muscle, blood, and internal organs, highpermittivity [2–4]. The interaction of the lossy biological tissues with the microwave frequency may be
Received 19 February 2014, Accepted 16 March 2014, Scheduled 2 April 2014* Corresponding author: Chris D. Nikolopoulos ([email protected]).The authors are with the Division of Information Transmission Systems and Material Technology, School of Electrical and ComputerEngineering, National Technical University of Athens, 9, Iroon Polytechniou Str., Zografou, Athens 15773, Greece.

20 Nikolopoulos, Baklezos, and Capsalis
Figure 1. Skin depth versus frequency for some body-materials.
described by complex permittivity, ε∗, which is a complex quantity consisting of two separate parametersε′ and ε′′, and expressed as:
ε∗ = ε′ − jε′′ (1)
In the above equation, the real part dielectric constant ε′ is a measure of the ability of the tissue tostore energy from an external electric field, and is given by:
ε′ = εrε0 (2)
where εr is the dielectric constant of the material and ε0 the permittivity of free space [5]. The imaginarypart of loss factor indicates the energy amount that is converted into heat and dissipated, due todamping of the vibrating dipole moments. The Debye equation is often used to model the complexrelative permittivity and its frequency dependency [6]:
ε(ω) = ε∞ +εs − ε∞1 + jωτr
(3)
where εs and ε∞ are the low and high frequency limits of the dielectric constant, respectively. ω is theangular frequency of the applied field and τr the relaxation time. When splitting the above equationinto real and imaginary parts, the following two equations arise:
ε′(ω) = ε∞ +εs − ε∞1 + ω2τ2
r
and ε′′(ω) = +(εs − ε∞)ωτr
1 + ω2τ2r
(4)
Tissue materials are a composition of biological materials with different frequency dependence(dispersion) regions. The complexity of both structure and composition of the material is such thateach region with dispersion may be broadened [7, 8], caused by the multiple contributions to thedispersion region. In order to empirically quantify this broadening, a new parameter is introduced,called distribution parameter α. Its use leads to an alternative to the Debye equation, the so-calledCole-Cole equation [9]:
ε(ω) = ε∞ +εs − ε∞
1 + (jωτr)1−α(5)
A multiple Cole-Cole dispersion can be expressed by generalizing this equation to:
ε (ω) = ε∞ +∑
n
∆εn
1 + (jωτr,n)1−αn+
σi
jωε0(6)
where ∆ε = εs − ε∞, and σi is the static ionic conductivity. With a proper choice of parametersrelevant to each material, the latter equation can be used to model the dielectric properties over a given

Progress In Electromagnetics Research C, Vol. 49, 2014 21
frequency range. Debye relaxation equation can estimate the conductivity as the loss factor includesthe effect of conductivity, in terms of:
ε′′(ω) = σ/ε0ω (7)
As a result, the conductivity value for a given frequency is represented by:
σ =ε0(εs − ε∞)ω2τr
1 + ω2τ2r
(8)
The loss tangent is a parameter of a dielectric material that quantifies its inherent dissipation ofelectromagnetic energy. The term refers to the loss caused by the dissipation of the energy to thelossy medium and is expressed as
tan δ =ωε′′ + σ
ωε′(9)
where ω = 2πf is the angular frequency and σ is conductivity.When the antenna is located close to human body, the effective wavelength deviates from the free
space wavelength. This is typically observed as a shift of the antenna resonance frequency (this relevancedepicted in Figure 2). The permittivity affects the antenna resonance frequency fr as:
fr =c√εeff λ
(10)
where c is the velocity of light and λ the wavelength. Antenna reception depends on the distancebetween the antenna and the body, as well as the effective permittivity.
Another important parameter which is essential when studying electromagnetic propagation in amaterial is the skin depth, which is given by:
δm =1√
πfµσ(11)
where f is the frequency and µ the permeability of the material. The skin depth gives a measure ofthe average depth of penetration of the electromagnetic field. In low frequencies, the permittivity isrelatively high, thus the conductivity is low, and the electromagnetic wave can propagate through thetissues without too much attenuation. At higher frequencies, the loss is increased, hence the skin depthdecreases.
Microwave thermography, microwave hyperthermia and microwave tomographic systems, all rely onprocesses fundamentally determined by the high frequency electromagnetic properties of human tissues.As stated above, the vicinity to the human body introduces dielectric characteristics in front of anantenna which affects the resonant frequency (some MHz shift in central frequency) [10–12], which inturn affects the antenna input impedance. This leads finally to loss of matching, a fact that translatesinto additional losses in the radiometer system. Consequently, a number of recent works and studiesare directed to reconfigurable solutions, so that matching is always achieved.
For the reason mentioned above we propose in this study an auto reconfigurable patch antennawhich can auto adjust its resonant frequency depending on the dielectric properties of the medium. Asdescribed before and in case of a single channel measurement, the dielectric properties of the mediumchange (shift) the central frequency (the frequency in which we have matching the input impedance) ofthe channel, so if we have a common antenna system the measurement would not be accurate, and weuse the reconfigurable concept of a previous work of the authors [13] in which a set of varactor diodesare used to change the resonant frequency on demand [14–16].
2. ARCHITECTURE OF THE PATCH ANTENNA
The structure under consideration is depicted in Figure 3. The only active element consists of a topplate connected with the ground plane through a three shorting strips (reactance loaded) and one feedwire. By altering the dimensions of the top plates, the height above the ground plane and the sizeof the ground plane, the structure with the best impedance matching at the frequency of operation(1800MHz) and adequate bandwidth will be derived.

22 Nikolopoulos, Baklezos, and Capsalis
(a) (b)
Figure 2. Relative permittivity versus frequency for some body materials, Conductivity versusfrequency for some body materials.
Figure 3. Implementation and analysis of the patch antenna using wire segments and the SNECplatform.
The structure is generated with the use of SuperNEC simulation software package, and itsperformance is optimized by utilizing the Genetic Algorithms (GA) approach. Using the samemethodology as the previous work of the authors [13] a better antenna structure is achieved (dimensionsW : 0.046m×L: 0.054 m×H: 0.0083m) with an operative range between 1200 MHz–6650MHz (dependingon the values of the varactor diodes). A GA is capable of facing multi-variable problems, such as thedesign and synthesis of antennas, where a set of performance conditions (e.g., input impedance) shouldbe satisfied.
The SNEC results were evaluated via the Finite Elements Method using Asoft HFSS 3D simulationsoftware (High Frequency Structure Simulator — which offers a linear electromagnetic solution to thephysical specified structure based on the finite elements analysis). In the design process depicted inFigure 4(a), we use copper as the assigned material for both the upper plates and ground plane. Inaddition, in the sorting strips we add varactor — simulated elements (we model the varactor as resistance+ capacitance, for that reason a lumped RLC with proper characteristics was utilized to simulate theeffects of the varactor diode, taking into account the resonant frequency of 1.8 GHz). Finally as a fullport impedance, we use a resistance of 50 Ohms (to be consistent with the one selected in the SNECimplementation).
To add an auto reconfigurable performance in the antenna design, we propose a simple algorithm(Figure 6) which can affect the antenna performance with respect to the dielectric properties of thebody in front of the patch. With a proper closed loop system, the antenna can scan appropriate rangeof frequencies (specific channel, e.g., frequency range 1500 MHz–1600MHz) every 10MHz, then measurethe S11 parameter and compare with the previous measurement tuning in that way to the one with the

Progress In Electromagnetics Research C, Vol. 49, 2014 23
X j*
X j2*X j3*
1
(a) (b)
Figure 4. (a) The complete reconfigurable patch antenna layout using Ansoft HFSS 3D simulationsoftware and (b) the antenna structure constructed with copper sheets.
Figure 5. Measurement of the proposed antenna at 1250 MHz (X1 = −62, X2 = −28, X3 = −94).
Measure S
Select start frequency(from channel frequency
range)
Compare with previous measurement
If current measurement > than previousIncrease 10 MHz the
resonant Frequency
If current measurement < than previous
Tune in this freq.
11
Figure 6. The proposed closed loop algorithm.
best value. So a quick scan should be performed every time the radiometer operates in a different channel(according to the dielectric properties of the human tissue and because the impedance matching wouldchange, so a frequency shift will occur) to tune in the correct frequency. The implementation of thisroutine is performed with a simple microcontroller which can compare the values of S11 parameter andwhen find the best, from a database stored in a ram, would retrieve the values of the load reactance ofthe sorting strips (from a table like Table 2), and change the voltage of the varactor diodes accordingly.

24 Nikolopoulos, Baklezos, and Capsalis
3. OPTIMIZATION PROCEDURE OF THE PATCH ANTENNA
3.1. Optimization Parameters and Goals
The goal of the optimization procedure is to operate with maximum gain and minimum reflectioncoefficient at a band of frequencies (1.2 to 6.65 GHz, 50Ohm input impedance for a 50Ohm feedingtransmission line, depending on the values of the varactor diodes).
As already mentioned, optimization parameters include the height (h) and width (W ) of R-PIFA,and the reactive load values of the passive elements. However, each shorting pin is independently loaded;therefore, all three reactance values of the passive elements participate in the optimization procedure.The optimization parameters are tabulated in Table 1 further below. One GA firstly run to optimizethe dimensions of the antenna at the central frequency of 1.8 GHz. Afterwards numerous GA’s run tooptimize the impedance matching in any frequency between the 1 GHz–3 GHz (Table 2).
3.2. Objective Function of the First GA
The objective function (Of ) deployed to obtain desired input impedance level is expressed as:
Of = (VSWRDES/VSWR)2
where VSWR DES, VSWR are the desired and computed values, respectively [17, 18]. The constraintof VSWRDES was set equal to 1. The simulation frequency of the first GA was set to 1800MHz. Thetotal population consists of 250 generations with 60 chromosomes per generation. The selection methodwas population decimation, while adjacent fitness pairing was the mating scheme. The crossover pointwas chosen randomly, and each chromosome was divided at a gene level. The mutation probability wasequal to 0.15 [17–20]. As previously stated, Table 1 describes the variation of the parameters that tookpart in the GA optimization procedure. The proposed antenna dimensions are expressed in terms of thenumber of segments. Each segment length was selected to be equal to segment length = 0.025 ∗ λ. Theresults of the optimization implementation are exhibited in Table 1. The desired impedance bandwidthis determined by the band of frequencies where the value of the reflection coefficient at the feed pointis less than −10 dB, corresponding to a VSWR with a value of no more than 2, when a characteristicimpedance of 50 Ω is considered.
Table 1. Input parameters and results of the GA for the antenna at central freq. of 1.8 GHz(λ0 = 16, 655 cm) and variation of the load reactance of the sorting pins.
Parameter Variation Step GA ResultsPhysical
Dimensions
Length of the
upper plate (upLen)0.025 ∗ λo − 0.25 ∗ λo 0.025 ∗ λo 0.125 ∗ λo 2.08 cm
Width of the
upper plate (upWid)0.025∗λo − 0.25 ∗ λo 0.025 ∗ λo 0.125 ∗ λo 2.08 cm
Length of ground plane 0.125 ∗ λo − 0.75 ∗ λo 0.025 ∗ λo 0.325 ∗ λo 5.41 cm
Width of ground plane 0.125 ∗ λo − 0.75 ∗ λo 0.025 ∗ λo 0.275 ∗ λo 4.58 cm
Height of wires/shorting strips 0.025 ∗ λo − 0.125 ∗ λo 0.025 ∗ λo 0.05 ∗ λo 0.83 cm
1.8GHz
Load reactance of the
1st parasitic element (X1)−353j : 111j Ω 10j Ω −150j Ω
Load reactance of the
2nd parasitic element (X2)−353j : 111j Ω 10j Ω −60j Ω
Load reactance of the
3rd parasitic element (X3)−353j : 111j Ω 10j Ω −90j Ω

Progress In Electromagnetics Research C, Vol. 49, 2014 25
Table 2. Results of the GAs for the patch antenna with respect to the frequency and the load reactanceof the sorting pins.
Frequency
in MHz
Load reactance
of the 1st
parasitic element (X 1)
Load reactance
of the 2nd
parasitic element (X2)
Load reactance
of the 3rd
parasitic element (X3)
VSWR
parameter
1200 −57 −124 −115 2,2371
1300 −264 −72 −77 1,6837
1400 −69 110 −118 2,0293
1500 96 −120 −56 1,0846
1600 −76 110 −147 1,4359
1700 −76 −5 −154 1,6647
1800 −164 −91 −125 1,0701
1900 86 −105 −127 1,1367
2000 −84 82 −231 1,0677
2100 −84 −5 −236 1,0336
2200 −62 −109 −176 1,0111
2300 −247 −72 −65 1,0069
2400 −256 −89 −34 1,0093
2500 −62 −74 −319 1,0495
2600 −286 −135 −238 1,0146
2700 −215 −160 −214 1,3768
2800 −293 −153 −282 1,113
2900 −293 −167 −291 1,3696
3000 −336 −174 −327 1,4861
3100 81 68 11 1,12888
3200 96 39 0 1,2312
3300 94 3 11 1,2830
3400 109 −26 11 1,3604
3500 81 −73 102 1,3561
3600 −5 −33 68 1,64
3700 53 −62 24 1,6606
3800 98 −120 81 1,6941
3900 110 −148 110 1,7284
4000 104 −163 107 1,8191
4100 98 −177 96 1,9037
4200 100 −202 108 1,9775
4300 52 −203 91 2,0516
4400 24 −192 53 2,1244
4500 46 −228 50 2,1431
4600 53 −270 60 2,1657
4700 39 −293 53 2,1786
4800 7 −278 24 2,1734
4900 −4 −278 −5 2,1552
5000 −17 −306 −7 2,1168
5100 −35 −316 −19 2,068
5200 −51 −304 −41 2,0064

26 Nikolopoulos, Baklezos, and Capsalis
Frequency
in MHz
Load reactance
of the 1st
parasitic element (X 1)
Load reactance
of the 2nd
parasitic element (X2)
Load reactance
of the 3rd
parasitic element (X3)
VSWR
parameter
5300 −62 −305 −59 1,9353
5400 −92 −293 −68 1,856
5500 −113 −250 −88 1,7713
5600 −127 −221 −111 1,6858
5700 −147 −172 −135 1,6043
5800 −163 −153 −156 1,5308
5900 −192 −120 −173 1,4654
6000 −214 −120 −192 1,4226
6100 −233 −59 −236 1,3883
6200 −293 −120 −217 1,4223
6300 −303 −4 −300 1,3901
6400 −339 −4 −329 1,4057
6500 −350 −120 −329 1,591
6600 −350 −120 −350 1,7586
As previously mentioned, the scope of the paper is to design a reconfigurable antenna capable tooperate in a band of frequencies appropriate for microwave radiometry. Therefore, although the firstoptimization of the proposed antenna ran for the central resonant frequency of 1.8 GHz, a lot of GA tookplace afterwards with the same demands in order to calculate only the values of the reactive loads of theparasitic elements (X1, X2, X3) separately for a band of other frequencies (from 1.2 GHz to 6.65 GHz,with a step of 10 MHz) while keeping all the other parameters constant. In that way we can changethe resonant frequency by only controlling the values of the reactive loads of the shorting pins whilekeeping the geometry and physical size of the antenna constant. The result of these GA’s is exhibitedin Table 2 (step of 100 MHz).
4. NUMERICAL RESULTS
Two sets of Genetic Algorithms optimization routines ran, one to optimize the structure (size, VSWR,radiation Pattern) at the central frequency of 1.8 GHz, and the other is a set of numerous GA algorithmprocedures (one for each resonant frequency and the VSWR parameter for that range depicted in theFigure 8) with all the parameters constant (taken from the first GA) except for the 3 values of the loadreactance of the parasitic elements. The result of the second set of GA’s is depicted in Table 2.
Table 1 describes the variation of the parameters that took part in the GA optimization procedureat the central frequency of 1.8 GHz, and the respective radiation patterns is depicted in Figures 9, 10
Figure 7. Peak gain variation of the proposed patch antenna calculated by SNEC software in a rangeof frequencies from 1.5–3 GHz.
Progress In Electromagnetics Research C, Vol. 49, 2014 27
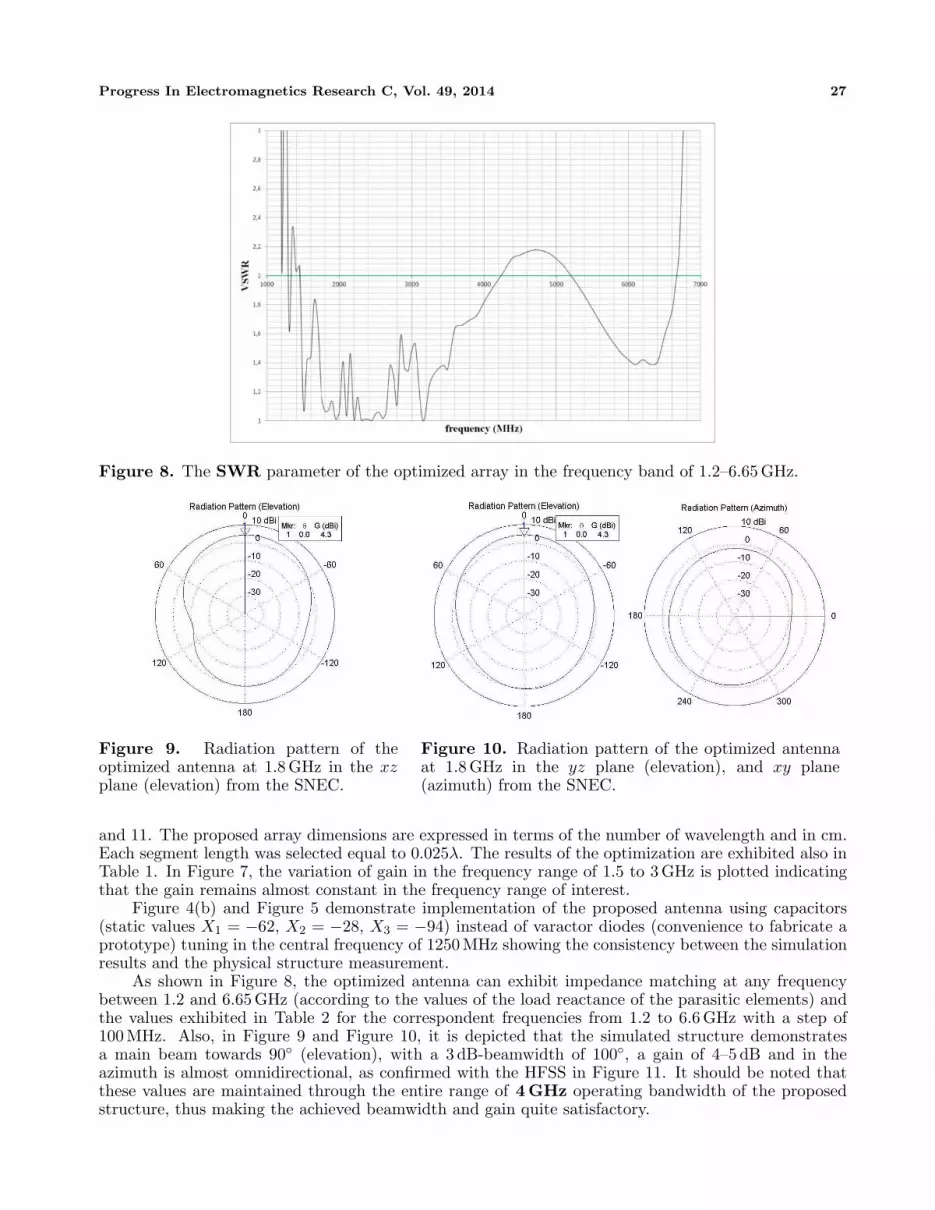
Figure 8. The SWR parameter of the optimized array in the frequency band of 1.2–6.65 GHz.
Figure 9. Radiation pattern of theoptimized antenna at 1.8 GHz in the xzplane (elevation) from the SNEC.
Figure 10. Radiation pattern of the optimized antennaat 1.8 GHz in the yz plane (elevation), and xy plane(azimuth) from the SNEC.
and 11. The proposed array dimensions are expressed in terms of the number of wavelength and in cm.Each segment length was selected equal to 0.025λ. The results of the optimization are exhibited also inTable 1. In Figure 7, the variation of gain in the frequency range of 1.5 to 3 GHz is plotted indicatingthat the gain remains almost constant in the frequency range of interest.
Figure 4(b) and Figure 5 demonstrate implementation of the proposed antenna using capacitors(static values X1 = −62, X2 = −28, X3 = −94) instead of varactor diodes (convenience to fabricate aprototype) tuning in the central frequency of 1250 MHz showing the consistency between the simulationresults and the physical structure measurement.
As shown in Figure 8, the optimized antenna can exhibit impedance matching at any frequencybetween 1.2 and 6.65 GHz (according to the values of the load reactance of the parasitic elements) andthe values exhibited in Table 2 for the correspondent frequencies from 1.2 to 6.6 GHz with a step of100MHz. Also, in Figure 9 and Figure 10, it is depicted that the simulated structure demonstratesa main beam towards 90 (elevation), with a 3 dB-beamwidth of 100, a gain of 4–5 dB and in theazimuth is almost omnidirectional, as confirmed with the HFSS in Figure 11. It should be noted thatthese values are maintained through the entire range of 4GHz operating bandwidth of the proposedstructure, thus making the achieved beamwidth and gain quite satisfactory.

28 Nikolopoulos, Baklezos, and Capsalis
Figure 11. A 2D and 3D Radiation pattern of the optimized antenna at 1.8 GHz using HFSS (elevation).
5. CONCLUSION
A low-profile small reconfigurable patch antenna was presented in this paper to add new perspectivesin the front end (antenna part) of a single channel microwave radiometer offering wider frequency rangeand detailed frequency tuning (in any central frequency, with a 40–80 MHz bandwidth) comparedto tunable/reconfigurable antennas (and to previous work of the authors), without having an ultra-wideband performance. The operational bandwidth performance was optimized using the technique ofthe genetic algorithms and the tuning of the resonant frequency achieved by controlling the values ofthe varacror diodes while the central aim in design was to receive microwave signals in the frequencyregion of few GHz (1.2 to 6.6GHz). The referred dynamic tuning range for the band of frequencies is293%, and from the authors’ knowledge there is no similar structure capable to achieve these goals insuch wide range. The in-band maximum gain is around 4–5 dB throughout the microwave radiometerspectrum. In this paper, the characteristics of a single element antenna were studied and analyzed whilea reconfigurable range of 4GHz is archived appropriately for use as the antenna part of a single-channelmicrowave radiometer.
REFERENCES
1. Sprawls, P., Physical Principles of Medical Imaging, Lippincott Williams and Wilkins, 1987.2. Nikawa, Y., M. Chino, and K. Kikuchi, “Soft and dry phantom modeling material using silicone
rubber with carbon fibre,” IEEE Trans. Microw. Theory Tech., Vol. 44, No. 10, 1949–1953, 1996.3. Lagendijk, J. J. W. and P. Nilsson, “Hyperthermia dough: A fat and bone equivalent phantom to
test microwave/radiofrequency hyperthermia heating systems,” Phys. Med. Biol., Vol. 30, No. 7,709–712, 1985.
4. Preece, A. W., J. L. Green, N. Pothecary, and R. H. Johnson, “Microwave imaging for tumourdetection,” IEE Colloquium on Radar and Microwave Imaging, 9/1–9/4, The Institution ofElectrical Engineers, Savoy Place, London WC2R OBL, UK, 1994.
5. Pozar, D. M., Microwave Engineering, 3rd Edition, John Wiley and Sons, 2004.6. Gabriel, S., R. W. Lau, and C. Gabriel, “The dielectric properties of biological tissues: III.
Parametric models for the dielectric spectrum of tissues,” Physics in Medicine and Biology, Vol. 41,No. 11, 2271–2293, 1996.
7. IFAC, “An internet resource for the calculation of the dielectric properties of body tissues,” ItalianNational Research Council Institute for Applied Physics, Sep. 2011.
8. Hurt, W. D., “Multiterm debye dispersion relations for permittivity of muscle,” IEEE Transactionson Biomedical Engineering, Vol. 32, No. 1, 60–64, Jan. 1985.
9. Cole, K. S. and R. H. Cole, “Dispersion and absorption in dielectrics. I. Alternating currentcharacteristics,” Journal Chem. Phyr., Vol. 9, 341–351, 1941.

Progress In Electromagnetics Research C, Vol. 49, 2014 29
10. Paulides, M. M., J. F. Bakker, N. Chavannes, and G. C. Van Rhoon, “A patch antenna designfor application in a phased-array head and neck hyperthermia applicator,” IEEE Transactions onBiomedical Engineering, Vol. 54, No. 11, 2057–2063, Nov. 2007.
11. Gabriel, C., S. Gabriely, and E. Corthout, “The dielectric properties of biological tissues: I.Literature survey,” Phys. Med. Biol., Vol. 41, 2231–2249, 1996.
12. Miklavcic, D., N. Pavselj, and F. X. Hart, “Electric properties of tissues,” Wiley Encyclopedia ofBiomedical Engineering, John Wiley & Sons, Inc., Copyright, 2006.
13. Nikolopoulos, C. D. and C. N. Capsalis, “A novel antenna system for body temperature changedetection appropriate for multi-channel microwave radiometry,” Progress In ElectromagneticsResearch M, Vol. 33, 197–209, 2013.
14. Liang, J. and H. Y. D. Yang, “Varactor loaded tunable printed PIFA,” Progress In ElectromagneticsResearch B, Vol. 15, 113–131, 2009.
15. El-Sharkawy, A. M., P. P. Sotiriadis, P. A. Bottomley, and E. Atalar, “A new RF radiometerfor absolute noninvasive temperature sensing in biomedical applications,” IEEE InternationalSymposium on Circuits and Systems, ISCAS 2007, 329–332, 2007.
16. Curto, S., P. McEvoy, X. Bao, and M. J. Ammann, “Compact patch antenna for electromagneticinteraction with human tissue at 434 MHz,” IEEE Transactions on Antennas and Propagation,Vol. 57, No. 9, 2564–2571, Sep. 2009.
17. Goldberg, D. E., Genetic Algorithms in Search, Optimization, and Machine Learning, Addison-Wesley Publishing Company, Inc., 1989.
18. “SuperNec v. 2.4 MOM technical reference manual,” Available at: http://www.supernec.com/man-uals/snmomtrm.htm.
19. Fourie, A. and D. Nitch, “SuperNEC: Antenna and indoor-propagation simulation program,” IEEEAntennas and Propagat. Mag., Vol. 42, No. 3, 31–48, Jun. 2000.
20. Rahmat-Samii, Y. and E. Michielssen, Electromagnetic Optimization by Genetic Algorithms, JohnWiley & Sons, Inc., 1999.


