Embed Size (px)
Citation preview

AUTOMATIC DETECTION OF DIABETIC EYEDISEASE THROUGH DEEP LEARNING USING
FUNDUS IMAGES
Thesis submitted in fulfilment of the requirements for the degree of
Doctor of Philosophy
College of Engineering and Science
Victoria University
by
Rubina Sarki
March 2021

© 2021 Rubina Sarki
ALL RIGHTS RESERVED

ABSTRACT
AUTOMATIC DETECTION OF DIABETIC EYE DISEASE THROUGH
DEEP LEARNING USING FUNDUS IMAGES
Rubina Sarki, Ph.D.
Victoria University 2021
Diabetes is a life-threatening disease that affects various human body or-
gans, including eye retina. Advanced Diabetic Eye disease (DED) leads to per-
manent vision loss; thus, early detection of DED symptoms is essential to pre-
vent disease escalation and timely treatment. Studies have shown that 90% of
DED cases can be avoided with early diagnosis and treatment. Ophthalmolo-
gists use fundus images for DED screening to identify the relevant DED lesions.
Due to the growing number of diabetic patients, it is becoming unaffordable for
the volume of fundus images to be manually examined. Moreover, changes in
the eye anatomy during its early stage are frequently untraceable by human eye
due to subtle nature of the features, and a large volume of fundus images puts
a significant strain on limited specialist resources, rendering manual analysis
practically infeasible. Therefore, considering the popularity of deep learning in
real-world applications, this research scrutinized deep learning-based methods
to facilitate early DED detection and address the issues currently faced. Despite
promising results on the binary classification of healthy and severe DED, highly
accurate detection of early anatomical changes in the eye using Deep Learning
remains a challenge in wide-scale practical application. Similarly, all previous
fundus retinal image classification studies assigned a multi-class classification
problems are still a challenge in Deep Learning. While studies conducted in the

past have released high classification performance outputs managed by hyper-
parameters settings, applying the binary classification model to the actual clini-
cal environment in which visiting patients suffer from different DED diseases is
technically tricky. Nevertheless, mild and multi-class DED classification aimed
studies have been very minimal. Furthermore, it is observed that previous re-
searches lack in addressing the development of automated detection of early
DED, jointly in one system. Detection of DED in one system is considered to
be essential for treatment in terms of specific lesions. Identification of the ab-
normalities in that specific retinal region can provide specific treatment to the
target region of the eye, which is mostly affected.
In this thesis, we explore different novel Deep Learning methods for au-
tomated detection of early (healthy and one mild) and multi-class (three or
more) DED employing retinal fundus images. For this purpose, we explore
transfer learning based models and build a new convolutional neural network
method in automatic feature extraction and classification, based on deep neu-
ral networks. To develop an enhanced system certain number of original deep
learning approach has been combined with various other advanced techniques
such as: (i) image pre-processing, (ii) data augmentation, (iii) DED feature extraction
and segmentation (iv) model fine-tune, and (v) model optimization selection. There-
fore, the results of the analysis of several retinal image features demonstrate that
deep learning can attend a state-of-the-art accuracy for early DED diagnosis.

DOCTOR OF PHILOSOPHY DECLARATION
I, Rubina Sarki, declare that the PhD thesis entitled Automatic Detection of Di-
abetic Eye Disease through Deep Learning using Fundus Images is no more than
100, 000 words in length including quotes and exclusive of tables, figures, ap-
pendices, bibliography, references and footnotes. This thesis contains no mate-
rial that has been submitted previously, in whole or in part, for the award of
any other academic degree or diploma. Except where otherwise indicated, this
thesis is my own work.
“I have conducted my research in alignment with the Australian Code for the
Responsible Conduct of Research and Victoria University’s Higher Degree by
Research Policy and Procedures.”
Signature Date 18/03/2021
5

DEDICATION
This thesis is dedicated to my parents for their love, endless support and
encouragement.
6

ACKNOWLEDGEMENTS
I owe my gratitude to all those who have made this thesis possible. I want to
thank my esteemed supervisor, Professor Yanchun Zhang, Director of the Cen-
tre for Applied Informatics, for invaluable supervision, advice, and continuous
support during my Ph.D. study. I am incredibly grateful to my associate su-
pervisors Professor Hua Wang and Dr. Khandakar Ahmed, for encouraging me
with your immense knowledge and ample experience in my research and daily
life. Thank you for allowing me to explore my ideas and choosing the specific
research topic that I had desired to pursue.
My gratitude extends to Dr. Khandakar Ahmed for shaping my experiment
methods and critiquing my results with your constructive and encouraging
feedback. Thank you for sharing many important professional and personal
advice throughout these years.
The research presented in this thesis was supported by International Post-
graduate Research Scholarship offered by Victoria University. This financial
support is gratefully acknowledged. I want to express my gratitude to Research
Dean Anne-Marie Hede, Elizabeth Smith, and Dr. Lesley Birch for their constant
support and proper guidance.
I would like to thank all my Ph.D. friends, Sheikha, Sandra, Sarathkumar,
Neda, and Dr. Sudha, who always helped me through my queries and for the
endless support.
I am forever grateful to my Dear friends, Angelina, Deshna, Upashna, and
Rihana for unconditional love and support in this long journey. Thanks, Eliz-
abeth for giving me some positive energies whenever I needed to rejuvenate
myself from stressful times. Profound gratitude to Dr. Dinesh and Dr. Saurav,
particularly for helping me during the initial stage of my life in Australia. I want
7

to thank Dr. Anish for motivating me and guiding me to prepare my research
proposal for my Ph.D. admission.
I am always grateful to my parents, who have sacrificed their life for me,
and for their unconditional love and generous support. Thank you, Baba, for
teaching me hard work and building my initial foundation. Thank you, Aama,
for your unconditional love and for giving me strength under challenging cir-
cumstances. Last but not least, I thank God for bestowing his grace upon me
throughout this Journey.
8

PUBLICATIONS
Based on this research work, the following articles, have been published or
submitted in International Journals and Conferences.
Journal Articles
1. Rubina Sarki, Khandakar Ahmed, Hua Wang and Yanchun Zhang,”Automatic
Detection of Diabetic Eye Disease Through Deep Learning Using Fundus
Images: A Survey,” in IEEE Access, vol. 8, pp. 151133-151149, 2020, doi:
10.1109/ACCESS.2020.3015258.
2. Rubina Sarki, Khandakar Ahmed, Hua Wang, and Yanchun Zhang,
”Automated detection of mild and multi-class diabetic eye dis-
eases using deep learning,” in Health Inf Sci Syst 8, 32, 2020.
https://doi.org/10.1007/s13755-020-00125-5.
3. Rubina Sarki, Khandakar Ahmed, Hua Wang, and Yanchun Zhang, ”Im-
age Preprocessing in Classification and Identification of Diabetic eye Dis-
eases,” (Accepted in Data Science and Engineering, 2021).
4. Rubina Sarki, Khandakar Ahmed, Yanchun Zhang, ”Early Detection
of Diabetic Eye Disease through Deep Learning using Fundus Images,”
PHAT, EAI, 2020, doi: 10.4108/eai.13-7-2018.164588.
International Conference Articles
1. Rubina Sarki, Khandakar Ahmed, Hua Wang, Sandra Michalska,
Yanchun Zhang . Early Detection of Diabetic Eye Disease from Fundus
Images with Deep Learning. In Australasian Database Conference 2020
Feb 3 (pp. 234-241). Springer, Cham.
iii
TABLE OF CONTENTS
Doctor of Philosophy Declaration . . . . . . . . . . . . . . . . . . . . . . 5Acknowledgements . . . . . . . . . . . . . . . . . . . . . . . . . . . . . . 6Publications . . . . . . . . . . . . . . . . . . . . . . . . . . . . . . . . . . iiiTable of Contents . . . . . . . . . . . . . . . . . . . . . . . . . . . . . . . ivList of Tables . . . . . . . . . . . . . . . . . . . . . . . . . . . . . . . . . . viiList of Figures . . . . . . . . . . . . . . . . . . . . . . . . . . . . . . . . . ix
1 Introduction 11.1 Background and Motivation . . . . . . . . . . . . . . . . . . . . . . 11.2 Research Problems . . . . . . . . . . . . . . . . . . . . . . . . . . . 41.3 Hypotheses . . . . . . . . . . . . . . . . . . . . . . . . . . . . . . . 71.4 Contributions and Significance . . . . . . . . . . . . . . . . . . . . 71.5 Thesis Outline . . . . . . . . . . . . . . . . . . . . . . . . . . . . . . 16
2 Literature Review 182.1 Prevalence and Types of Diabetic Eye Disease . . . . . . . . . . . . 18
2.1.1 Diabetic retinopathy . . . . . . . . . . . . . . . . . . . . . . 192.1.2 Diabtiec Macular Edema . . . . . . . . . . . . . . . . . . . . 212.1.3 Glaucoma . . . . . . . . . . . . . . . . . . . . . . . . . . . . 212.1.4 Cataract . . . . . . . . . . . . . . . . . . . . . . . . . . . . . 22
2.2 Diabetic Eye Disease Datasets . . . . . . . . . . . . . . . . . . . . . 272.2.1 Retinal Imaging for DED . . . . . . . . . . . . . . . . . . . 282.2.2 Dataset Characteristics . . . . . . . . . . . . . . . . . . . . . 31
2.3 Image Preprocessing Techniques . . . . . . . . . . . . . . . . . . . 332.3.1 Image Quality Enhancement . . . . . . . . . . . . . . . . . 332.3.2 Image Augmentation . . . . . . . . . . . . . . . . . . . . . . 342.3.3 Region of Interest based Segmentation . . . . . . . . . . . . 36
2.4 Machine Learning in Diabetic Eye Disease Classification . . . . . 362.4.1 Image Feature Analysis . . . . . . . . . . . . . . . . . . . . 372.4.2 Review of machine learning algorithms . . . . . . . . . . . 39
2.5 Deep Learning in Diabetic Eye Disease Classification . . . . . . . 492.5.1 Convolutional Neural Networks . . . . . . . . . . . . . . . 492.5.2 Transfer Knowledge . . . . . . . . . . . . . . . . . . . . . . 532.5.3 Combined Deep Leaning and Machine Learning . . . . . . 582.5.4 Analysis and Review of Performance Evaluation metrics . 61
2.6 Discussion and Observations . . . . . . . . . . . . . . . . . . . . . 622.7 Chapter Summary . . . . . . . . . . . . . . . . . . . . . . . . . . . . 64
3 Deep learning for Mild Diabetic Retinopathy Classification and De-tection 663.1 Introduction . . . . . . . . . . . . . . . . . . . . . . . . . . . . . . . 673.2 Methodology . . . . . . . . . . . . . . . . . . . . . . . . . . . . . . 70
iv

3.2.1 Image Data Collection . . . . . . . . . . . . . . . . . . . . . 713.2.2 Image Data Pre-processing . . . . . . . . . . . . . . . . . . 723.2.3 Model Construction . . . . . . . . . . . . . . . . . . . . . . 763.2.4 Performance Evaluation . . . . . . . . . . . . . . . . . . . . 77
3.3 Experiment and Analysis . . . . . . . . . . . . . . . . . . . . . . . 793.3.1 Experiment Design . . . . . . . . . . . . . . . . . . . . . . . 793.3.2 Model and Optimiser Selection . . . . . . . . . . . . . . . . 793.3.3 Improvement Techniques Comparison . . . . . . . . . . . 813.3.4 System Evaluation . . . . . . . . . . . . . . . . . . . . . . . 823.3.5 Performance Analysis . . . . . . . . . . . . . . . . . . . . . 84
3.4 Summary of Findings . . . . . . . . . . . . . . . . . . . . . . . . . . 87
4 Role of Image processing in detecting Mild DED Classification andDetection 894.1 Introduction . . . . . . . . . . . . . . . . . . . . . . . . . . . . . . . 904.2 Literature Survey . . . . . . . . . . . . . . . . . . . . . . . . . . . . 934.3 Methodology . . . . . . . . . . . . . . . . . . . . . . . . . . . . . . 96
4.3.1 Image Data Collection . . . . . . . . . . . . . . . . . . . . . 964.3.2 Image Pre-processing . . . . . . . . . . . . . . . . . . . . . 984.3.3 Model Development . . . . . . . . . . . . . . . . . . . . . . 1064.3.4 Proposed CNN Model . . . . . . . . . . . . . . . . . . . . . 1084.3.5 Performance Evaluation . . . . . . . . . . . . . . . . . . . . 110
4.4 Experiment Design and Analysis . . . . . . . . . . . . . . . . . . . 1114.4.1 Experiment Design . . . . . . . . . . . . . . . . . . . . . . . 1114.4.2 Model Training . . . . . . . . . . . . . . . . . . . . . . . . . 1124.4.3 Performance Analysis . . . . . . . . . . . . . . . . . . . . . 114
4.5 Summary of Findings . . . . . . . . . . . . . . . . . . . . . . . . . . 124
5 Automatic Identification of Mild DED and Multi-Class DED usingPre-trained CNN models 1265.1 Introduction . . . . . . . . . . . . . . . . . . . . . . . . . . . . . . . 1275.2 Literature Review . . . . . . . . . . . . . . . . . . . . . . . . . . . . 1295.3 Dataset . . . . . . . . . . . . . . . . . . . . . . . . . . . . . . . . . . 131
5.3.1 Data Collection . . . . . . . . . . . . . . . . . . . . . . . . . 1315.3.2 Data Pre-processing . . . . . . . . . . . . . . . . . . . . . . 132
5.4 Model Construction . . . . . . . . . . . . . . . . . . . . . . . . . . . 1335.4.1 Model Specification . . . . . . . . . . . . . . . . . . . . . . 1345.4.2 Classification Performance Analysis . . . . . . . . . . . . . 135
5.5 Experimental Design . . . . . . . . . . . . . . . . . . . . . . . . . . 1375.5.1 Performance enhancement . . . . . . . . . . . . . . . . . . 1385.5.2 Training and Prediction Results . . . . . . . . . . . . . . . . 1405.5.3 Accuracy Evaluation . . . . . . . . . . . . . . . . . . . . . . 141
5.6 Summary of Findings . . . . . . . . . . . . . . . . . . . . . . . . . . 142
v
6 Automated Classification and Detection of Multi-Class DED usingproposed CNN 1446.1 Introduction . . . . . . . . . . . . . . . . . . . . . . . . . . . . . . . 1456.2 Literature Review . . . . . . . . . . . . . . . . . . . . . . . . . . . . 1476.3 Data Collection . . . . . . . . . . . . . . . . . . . . . . . . . . . . . 148
6.3.1 Data Enhancement . . . . . . . . . . . . . . . . . . . . . . . 1496.4 Study Design . . . . . . . . . . . . . . . . . . . . . . . . . . . . . . 150
6.4.1 Model development . . . . . . . . . . . . . . . . . . . . . . 1516.4.2 Classification Description . . . . . . . . . . . . . . . . . . . 1546.4.3 Classification Performance Analysis . . . . . . . . . . . . . 154
6.5 Experimental Design . . . . . . . . . . . . . . . . . . . . . . . . . . 1566.5.1 Performance enhancement . . . . . . . . . . . . . . . . . . 156
6.6 Results . . . . . . . . . . . . . . . . . . . . . . . . . . . . . . . . . . 1586.6.1 Visualizing feature map . . . . . . . . . . . . . . . . . . . . 1596.6.2 Explaining Proposed Model using Grad-CAM . . . . . . . 159
6.7 Summary of Findings . . . . . . . . . . . . . . . . . . . . . . . . . . 162
7 Conclusion and Future Work 1647.1 Summary of Contributions . . . . . . . . . . . . . . . . . . . . . . . 1647.2 Study Limitations . . . . . . . . . . . . . . . . . . . . . . . . . . . . 1717.3 Future Research Directions . . . . . . . . . . . . . . . . . . . . . . . 172
Bibliography 175
vi

LIST OF TABLES
2.1 Selected articles for common objectives (review target). . . . . . . 282.2 Datasets available for automatic Diabetes Eye Detection with
source (link). . . . . . . . . . . . . . . . . . . . . . . . . . . . . . . 292.3 Image preprocessing techniques employed in selected studies. . 302.4 Different hyperparameters used in the selected studies. . . . . . . 352.5 Studies employing new network for automatic DED detection. . 522.6 Studies employing combined DL and ML for automatic DED de-
tection. . . . . . . . . . . . . . . . . . . . . . . . . . . . . . . . . . . 532.7 Studies employing TL for automatic DED detection. . . . . . . . 592.8 Performance metrices employed in selected studies. . . . . . . . . 61
3.1 The DR severity levels according to ETDRS and the number ofimages used in each experiment. . . . . . . . . . . . . . . . . . . . 73
3.2 The CNN models pre-trained on ImageNet and their character-istics (source: https://keras.io/applications). . . . . . . . . . . . 77
3.3 The accuracy comparison of pre-trained CNN models. . . . . . . 803.4 The Optimisers performance evaluation. . . . . . . . . . . . . . . 813.5 The effect of data augmentation (Scenario I) and contrast en-
hancement (Scenario II). . . . . . . . . . . . . . . . . . . . . . . . . 823.6 Proposing New CNN on (Scenario II). . . . . . . . . . . . . . . . . 82
4.1 Three CNN models pre-trained on ImageNet and their charac-teristics (source: https://keras.io/applications) . . . . . . . . . . 108
4.2 Hyper-parameters of the build CNN model and preferredweights in this study. . . . . . . . . . . . . . . . . . . . . . . . . . . 109
4.3 Confusion Matrix . . . . . . . . . . . . . . . . . . . . . . . . . . . . 1114.4 Average performance of the models on original images . . . . . . 1144.5 Average performance of the VGG16 model on pre-processed im-
ages . . . . . . . . . . . . . . . . . . . . . . . . . . . . . . . . . . . 1144.6 Average performance of the New proposed model on original
images . . . . . . . . . . . . . . . . . . . . . . . . . . . . . . . . . . 1154.7 Average performance of the new proposed model on pre-
processed images . . . . . . . . . . . . . . . . . . . . . . . . . . . . 115
5.1 The layers and layer parameters of the VGG16 model . . . . . . . 1365.2 Parameters of the VGG16 model and preferred weights in this
study. . . . . . . . . . . . . . . . . . . . . . . . . . . . . . . . . . . 1375.3 Parameters of the InceptionV3 model and preferred weights in
this study. . . . . . . . . . . . . . . . . . . . . . . . . . . . . . . . . 1375.4 Average performance of the models in mild DED classification
(mild multi-classes). . . . . . . . . . . . . . . . . . . . . . . . . . . 1395.5 Average performance of the models in multi-class DED classifi-
cation. . . . . . . . . . . . . . . . . . . . . . . . . . . . . . . . . . . 139
vii

6.1 Hyper-parameters of the build CNN model and preferredweights in this study. . . . . . . . . . . . . . . . . . . . . . . . . . . 154
6.2 Confusion Matrix . . . . . . . . . . . . . . . . . . . . . . . . . . . . 1546.3 Average performance of the models in multi-class DED classifi-
cation. . . . . . . . . . . . . . . . . . . . . . . . . . . . . . . . . . . 158
viii

LIST OF FIGURES
1.1 Overall thesis contribution. . . . . . . . . . . . . . . . . . . . . . . 91.2 Examples of a publicly available data set (Kaggle Data). (A) Un-
der exposure fundus image; (B) Over exposure fundus image;(C) Unrelated artifacts and (D) Blurriness. . . . . . . . . . . . . . 11
1.3 Contrast Limited Adaptive Histogram Equalization enhancescontrast in an image: A. Before and B. After CLAHE application. 12
1.4 Learning features and knowledge transferred using Convolu-tional Neural Network for detection of DED. . . . . . . . . . . . . 14
2.1 Anatomical structures of the retina. . . . . . . . . . . . . . . . . . 202.2 Complications of DED in retina; A. Microaneurysms, narrow
bulges (Diabetic Retinopathy), B. Optic nerve damage (Glau-coma), C. Exudates with retinal thickening (Diabetic MacularEdema), D. Degeneration of lens (Cataract). . . . . . . . . . . . . 20
2.3 Search and filter results: A. Query1 (Q1) = diabetic eye disease,fundus images, image processing, image classification, deep learning,transfer learning; B. Query2 (Q2) = diabetic retinopathy, fundus im-ages, image processing, image classification, deep learning, transferlearning; C. Query3 (Q3) = glaucoma, fundus images, image process-ing, image classification, deep learning, transfer learning; D. Query4(Q4) = diabetic macular edema, fundus images, image processing, im-age classification, deep learning, transfer learning; E. Query5 (Q5) =cataract, fundus images, image processing, image classification, deeplearning, transfer learning. . . . . . . . . . . . . . . . . . . . . . . . 26
2.4 Research method flowchart. . . . . . . . . . . . . . . . . . . . . . . 262.5 Classic Machine Learning Framework. . . . . . . . . . . . . . . . 36
3.1 The examples of different stages of DR advancement on fun-dus images. A. No DR – healthy retina; B. Mild DR – abnor-mal growth of blood vessels and ‘cotton wool’ spots formation(early indication); C. Moderate DR – abnormal growth of bloodvessels and ‘cotton wool’ spots formation (mid-stage indication);D. Severe DR – hard exudates, aneurysms and hemorrhages (ad-vanced indication). . . . . . . . . . . . . . . . . . . . . . . . . . . . 70
3.2 The high-level process pipeline. . . . . . . . . . . . . . . . . . . . 713.3 The examples of data augmentation steps performed on Mild DR
fundus image from Kaggle dataset. (A) Original; (B) Crop; (C)Rotate 90◦;(D) Rotate 120◦; (E) Rotate 180◦; (F) Rotate 270◦; (G)Mirror. . . . . . . . . . . . . . . . . . . . . . . . . . . . . . . . . . . 74
3.4 Contrast enhancement using CLAHE: A and C: before, B and D:after. . . . . . . . . . . . . . . . . . . . . . . . . . . . . . . . . . . . 76
3.5 Validation accuracy achieved for the respective epochs. (A) De-fault; (B) Fine-tuning. . . . . . . . . . . . . . . . . . . . . . . . . . 81
ix

3.6 Confusion matrices for Scenario I and Scenario II. . . . . . . . . . 83
4.1 Early DED complication in retina (A) Anatomical structure ofthe retina; (B) Microaneurysms - narrow bulges in blood vessels(diabetic retinopathy); (C) Soft exudates in macula (diabetic mac-ular edema); (D) Optic nerve damage (glaucoma); and (E) cataract 90
4.2 The high-level process pipeline . . . . . . . . . . . . . . . . . . . . 974.3 The flowchart. . . . . . . . . . . . . . . . . . . . . . . . . . . . . . 994.4 The proposed CNN model . . . . . . . . . . . . . . . . . . . . . . 1084.5 VGG16 model peformance in Diabetic Retinopathy . . . . . . . . 1164.6 VGG16 model peformance in Diabetic Macular Edema . . . . . . 1174.7 VGG16 model peformance in Glaucoma . . . . . . . . . . . . . . 1184.8 Build CNN model performance in Diabetic Retinopathy . . . . . 1194.9 Build CNN model performance in Diabetic Macular Edema . . . 1204.10 Build CNN model performance in Glaucoma . . . . . . . . . . . . 121
5.1 Complications of DED in fundus images; A. Microaneurysms;narrow bulges in the side of the blood vessel(Diabetic Retinopa-thy) B. Progressive damage of optic nerve damage(Glaucoma)C. Exudates formation in macular region and thickening of mac-ula(Diabetic Macular Edema) D. Degeneration of lens (Cataract). 127
5.2 Transfer Learning process. . . . . . . . . . . . . . . . . . . . . . . 1295.3 Data Distribution . . . . . . . . . . . . . . . . . . . . . . . . . . . . 1325.4 Contrast Enhancement (A) Original and (B) Enhanced Diabetic
Retinopathy; (C) Original and (D) Enhanced Glaucoma; (E) Orig-inal and (F) Enhanced Diabetic Macular Edema; (G) Original and(H) Enhanced Cataract . . . . . . . . . . . . . . . . . . . . . . . . . 133
5.5 Confusion Matrix in VGG16 + Adam (A) scenario I and (B) Sce-nario II. . . . . . . . . . . . . . . . . . . . . . . . . . . . . . . . . . 140
6.1 Data Distribution . . . . . . . . . . . . . . . . . . . . . . . . . . . . 1496.2 Confusion Matrix and ROC Curve obtained by proposed CNN . 1586.3 Visual feature maps in first layer and deep layer . . . . . . . . . . 1606.4 Visualisation on fundus retinal images of Normal / DR/ DME/
Glaucoma/ Cataract infected using Grad-CAM on the proposedmodel. . . . . . . . . . . . . . . . . . . . . . . . . . . . . . . . . . . 161
x

CHAPTER 1
INTRODUCTION
1.1 Background and Motivation
Diabetes mellitus, widely known as diabetes, is a disease in which a person has
an excessive blood sugar levels due to insufficient insulin secretion, inappropri-
ate body cells responses to insulin, or both. Diabetes is a significant worldwide
health complications, and is largely due to a sedentary lifestyle, being over-
weight, aging and poor eating habits. The prevalence of diabetes is increasing
exponentially as average lifespan is increasing. With 116 million individuals
suffering diabetes, China has the largest number of diabetes cases in the world.
China is followed by India (77 million people) and the United States (31 mil-
lion people) according to the International Diabetes Federation (IDF, 2019). The
IDF’s 2020 statement predicts that, globally, by 2045, approximately 700 million
people will have developed diabetes [60]. Several other medical complications
arise due to diabetes, including cardiovascular disease, diabetic eye disease,
nerve damage, and kidney failure.
Diabetic eye disease (DED), one of the products of neglected and untreated
diabetes, which can cause permanent vision loss. It is observed that the leading
cause of vision impairment and blindness in the working-age class is DED. DED
is comprised of diabetic retinopathy (DR), diabetic macular edema (DME), glau-
coma (Gl), and cataract (ca) [25,40,58,97,101,126]. The symptoms of DED can be
seen in different parts of the human eye’s retina. These include the irregular de-
velopment and rupture of the blood vessels, degradation of the lens, breakage
of the optic nerve due to intraocular pressure, and formation of hard exudates
1

near the macula region causing swelling in the macula. Owing to its increased
worldwide incidence, DR has been listed as a chronic eye disease by the World
Health Organization (WHO). It is observed that the risk of DED is linked to
glycemic regulation, the presence of arterial hypertension and the duration of
the disease; with type 1 diabetes being the greatest risk. After a decade of type
2 diabetes, DED impacts approximately 80 % of suffers [112]. Some extremely
effective DED treatments have been developed. These include corticosteroids,
laser photocoagulation, and the intravitreal injection of anti-vascular endothe-
lial growth factor (VEGF) agents. However, the efficacy of these approaches in
preventing vision loss is dependent on early DED diagnosis. In particular, in the
preliminary stage, individuals experience no symptoms. That is why screening
for DED in diabetic patients is highly recommended worldwide, as illustrated
in international and regional guidelines [224].
Detecting these anatomical changes with fundus photography has a num-
ber of challenges. First, the continuous expansion of the patient’s medical in-
formation, such as fundus images, creates ongiong challenges for examination,
diagnosis and treatment. Manual extraction of features from a large volume
of fundus images and subsequent diagnosis result in a loss of time between
detection and treatment. Ophthalmologists often take days to study normal im-
ages. Ophthalmologists also take days to review DED disease images [181]. A
further downside of an ophthalmologists’ manual fundus retinal image anal-
ysis and DED evaluation is that they may not always achieve accurate results
as even the most excellent specialist and professional ophthalmologist may not
track tiny changes in eye anatomy. An automated DED diagnosis system that
classifies and identifies DED lesions in less computational time would provide
early treatment and prevent vision loss. Therefore, automated DED detection
2
techniques are necessary to address this problem.
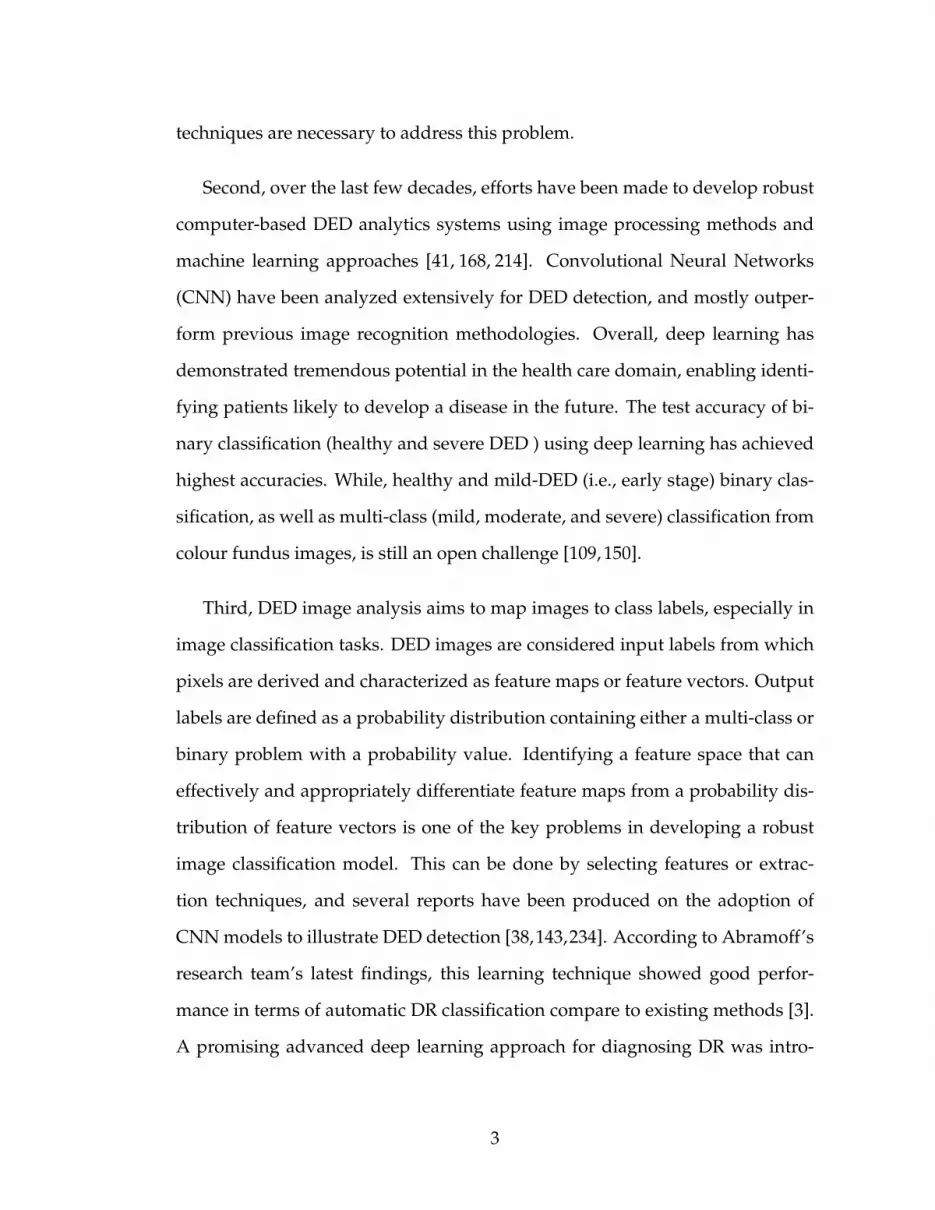
Second, over the last few decades, efforts have been made to develop robust
computer-based DED analytics systems using image processing methods and
machine learning approaches [41, 168, 214]. Convolutional Neural Networks
(CNN) have been analyzed extensively for DED detection, and mostly outper-
form previous image recognition methodologies. Overall, deep learning has
demonstrated tremendous potential in the health care domain, enabling identi-
fying patients likely to develop a disease in the future. The test accuracy of bi-
nary classification (healthy and severe DED ) using deep learning has achieved
highest accuracies. While, healthy and mild-DED (i.e., early stage) binary clas-
sification, as well as multi-class (mild, moderate, and severe) classification from
colour fundus images, is still an open challenge [109, 150].
Third, DED image analysis aims to map images to class labels, especially in
image classification tasks. DED images are considered input labels from which
pixels are derived and characterized as feature maps or feature vectors. Output
labels are defined as a probability distribution containing either a multi-class or
binary problem with a probability value. Identifying a feature space that can
effectively and appropriately differentiate feature maps from a probability dis-
tribution of feature vectors is one of the key problems in developing a robust
image classification model. This can be done by selecting features or extrac-
tion techniques, and several reports have been produced on the adoption of
CNN models to illustrate DED detection [38,143,234]. According to Abramoff’s
research team’s latest findings, this learning technique showed good perfor-
mance in terms of automatic DR classification compare to existing methods [3].
A promising advanced deep learning approach for diagnosing DR was intro-
3

duced by the Google research team [75]. How to build a robust model for DED
detection is, however, a problem that remains unsolved.
Finally, our research focuses on exploring the research gaps in developing
an early DED (healthy and mild-DED) and multi-class DED classification sys-
tem based on deep learning, and designing a framework. From our literature
review, it is noted that no prior studies address both the mild classification and
detection of DED, (diabetic retinopathy, glaucoma, diabetic macular edema, and
cataract) in a single system. Several research studies [9, 38, 77, 122, 135, 152, 153,
166,223,241,249] have aimed to classify the stages of DR, i.e normal to severe. In
our research study, we aimed to develop a binary and categorical classification
system for all DED. Mild DED identification with one system is an essential.
Identifying the lesions in a specific area or region of eye anatomy can provide
specific treatment for the eye’s most affected target region.
1.2 Research Problems
Deep Neural Network models use advanced mathematical activity to process
pixel values in the image [150] where training is performed with diverse exam-
ples integrated into the network, as opposed to the solid rule-based program-
ming underlying traditional methodologies [65]. CNN have been thoroughly
explored in the imaging domain [6, 38, 122, 153, 163, 223], surpassing previous
methodologies, namely the recognition of images [223]. Neural networks seek
to learn the profound features to identify the sophisticated dimension of mild
DED images [153]. Deep learning consistently offers high performance in severe
DED cases. At the same time, mild and multi-class detection of DED remains a
4

challenge. Our study questions have been formulated to address this challenge:
Research Question 1: What deep learning approaches provide the highest
accuracy for the classification of mild and multi-class DED features, and how
can they be further enhanced?
Automated disease detection systems have become an essential solution
over the past decade; reducing the workload of manual detection and providing
a cost-effective method. The initial challenge in designing an automated system
can be insufficient image data and pre-processing images to identify vital med-
ical features (e.g., Mild DEDs) to develop early treatment solutions. For severe
cases, a state-of-the-art system with high performance precision has been devel-
oped; mild cases remain a challenge. Therefore, the state-of-the-art pre-trained
deep learning models will be built and tested against themselves and the con-
ventional image processing algorithms. The most sophisticated methods (i.e.
fine-tune, optimizer and selection of hyper-parameters) will be implemented
to enhance performance. After that, we will introduce a robust deep learning
model to evaluate against supervised transfer learning’s efficacy on the classi-
fication of DED fundus images. Question 2, therefore, focuses on conventional
image processing algorithms to enhance the image quality and evaluates a deep
learning system’s performance improvement. Consequently, Question 3 focuses
on the specification, evaluation and enhancement of the state-of-the-art meth-
ods and building a new model in DED detection. Ultimately, the developed
method, to validate the effectiveness of the proposed methods, will be deployed
in medical condition.
Research Question 2: How the quality and quantity of the retinal fundus’
images influence the deep learning techniques’ precision?
5
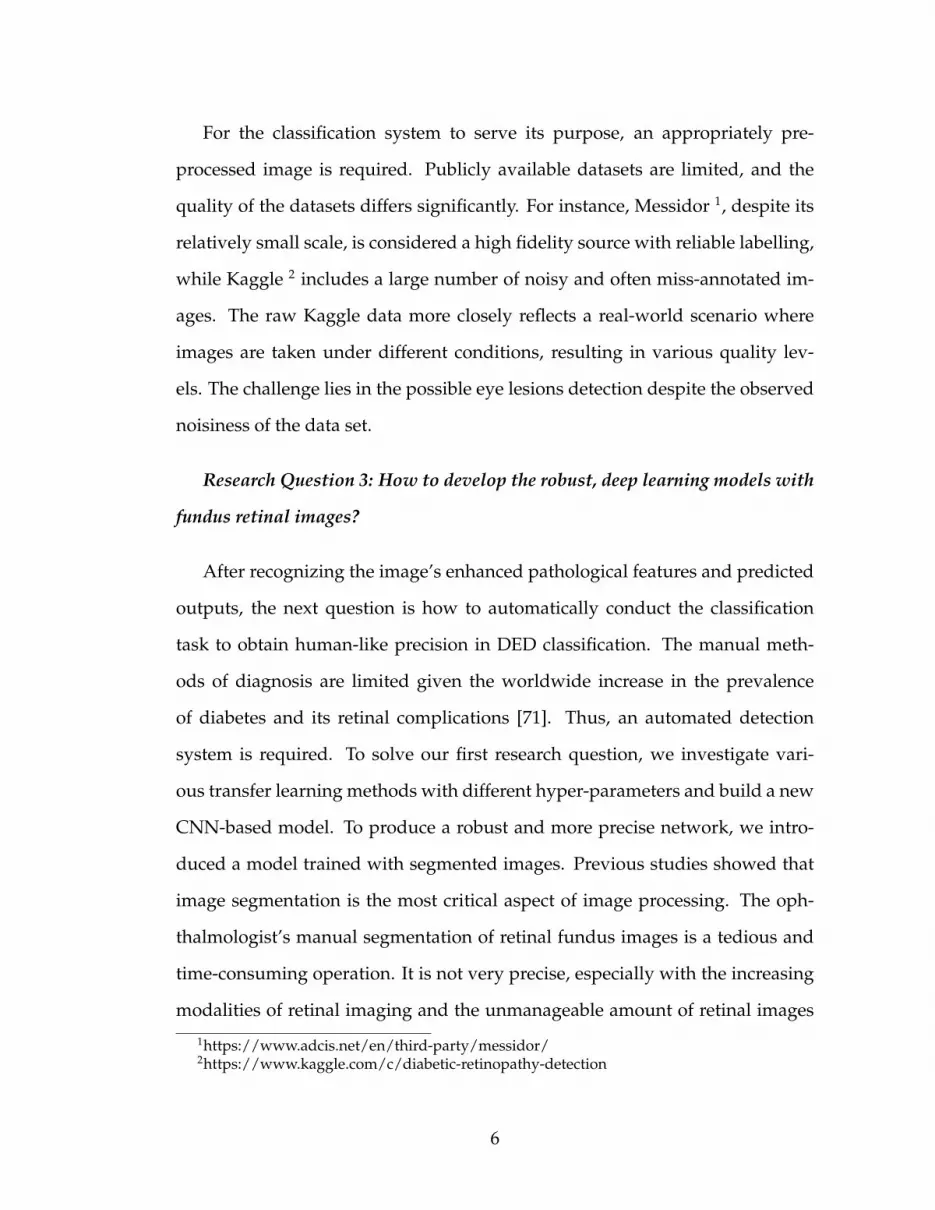
For the classification system to serve its purpose, an appropriately pre-
processed image is required. Publicly available datasets are limited, and the
quality of the datasets differs significantly. For instance, Messidor 1, despite its
relatively small scale, is considered a high fidelity source with reliable labelling,
while Kaggle 2 includes a large number of noisy and often miss-annotated im-
ages. The raw Kaggle data more closely reflects a real-world scenario where
images are taken under different conditions, resulting in various quality lev-
els. The challenge lies in the possible eye lesions detection despite the observed
noisiness of the data set.
Research Question 3: How to develop the robust, deep learning models with
fundus retinal images?
After recognizing the image’s enhanced pathological features and predicted
outputs, the next question is how to automatically conduct the classification
task to obtain human-like precision in DED classification. The manual meth-
ods of diagnosis are limited given the worldwide increase in the prevalence
of diabetes and its retinal complications [71]. Thus, an automated detection
system is required. To solve our first research question, we investigate vari-
ous transfer learning methods with different hyper-parameters and build a new
CNN-based model. To produce a robust and more precise network, we intro-
duced a model trained with segmented images. Previous studies showed that
image segmentation is the most critical aspect of image processing. The oph-
thalmologist’s manual segmentation of retinal fundus images is a tedious and
time-consuming operation. It is not very precise, especially with the increasing
modalities of retinal imaging and the unmanageable amount of retinal images
1https://www.adcis.net/en/third-party/messidor/2https://www.kaggle.com/c/diabetic-retinopathy-detection
6

that must be examined. Therefore, it is vital to evaluate current image segmen-
tation methodologies using automated algorithms that are precise and involve
as little human intervention as possible, particularly for retinal fundus images.
Finally, the most sophisticated conventional feature segmentation methods are
integrated with deep learning to provide a robust system.
1.3 Hypotheses
The following hypotheses are developed to answer the aforementioned research
questions:
1. Deep Learning models can accurately (accuracy > 90%) diagnose mild
DED from the publicly available raw datasets and outperform the con-
ventional classifiers.
2. The development of a deep Learning model trained on segmented features
(region of interest) of large image datasets can further enhance classifica-
tion performance and accuracy.
3. Developing a new CNN with combined advanced methods of traditional
image preprocessing techniques can solve mild and multi-class image-
classification problems.
1.4 Contributions and Significance
This section begins by discussing the scientific contribution that this work seeks
to achieve by identifying gaps in current techniques used to detect early DED
7

using medical images, and describing its practical benefits. Despite the increas-
ing popularity of automated disease detection systems using medical images,
research related to the early mild DED domain is limited. This research pro-
poses a high performing system (accuracy >90 percent). It validates a deep
learning-based system to automatically classify retinal fundus images to im-
prove the effectiveness of early and multi-class DED classification and detection
for timely treatment.
This thesis aims to construct an automated classifier with a effective DED
classification using DL-based techniques. The classification model should verify
classification accuracy coefficients (close to or outperform than human perfor-
mance) and provide healthcare professionals with detailed information about
the essential aspects taken into consideration by the model to reach each specific
end. Deep learning models utilize black-box inference systems to work. They
can achieve high analytical trust when educated correctly, but they do not offer
reasons behind each action. It is important to understand the reasons behind a
diagnosis in medical imaging since part of the localized abnormalities may be
linked to some treatment of the correlative elements of the DED. Therefore, our
DED disease detection goal is to assist with the lesion location process, tracing
subsequent abnormality changes to aid in surgery or other treatments. The the-
sis contribution is presented in Fig.1.1. Corresponding to the study goals, the
primary anticipated contributions of this research can be outlined in the follow-
ing:
Development and evaluation of data-driven deep learning classifier as a
novel diagnostic method for automatic DED detection.
Most importantly, a comprehensive literature review was performed to
8

Figure 1.1: Overall thesis contribution.
achieve the research objective. From a theoretical point of view, we focus on
knowledge-based learning, employing transfer learning to DED images. Af-
ter that, we suggest a new conceptual structure to identify the findings to that
guide our research directions. This review covers different research gaps found
in previous studies on DED detection. Thorough research is essential to study
the research gap and provide the solutions to develop a more robust deep neu-
ral network for early DED detection. Therefore, this thesis focuses on designing
automated classification algorithms based on deep neural networks capable of
achieving high performance levels like those achieved by ophthalmologists. It
is observed that the quality and quantity of the dataset have a considerable im-
pact on the development of robust models. Therefore, to reflect the real-life sce-
narios, our models were trained with retinal fundus images. Publicly available
9

images consist of low fidelity data, as they were taken with a variety of fun-
dus cameras leading to considerable variation in image quality, size and shape.
An intensive search was performed to collect data suitable for this research.
After data collection, various image processing algorithms were introduced to
enhance the quality and quantity of the images. Finally, this research integrates
the traditional image processing and image segmentation methods with deep
learning to achieve high accuracy.
Study of the effectiveness of traditional image processing algorithms in
deep learning performance.
Gradual progressions in deep learning and appliance competence advance-
ments, including computational power, storage capacity, and energy use, en-
hance the efficiency and cost-effectiveness of further speeding up vision-based
applications. Compared to conventional image processing techniques, deep
learning allows computer vision designers to obtain high precision in image
analysis, image classification, image recognition tasks, and concurrent mapping
and localization. However, image processing outcomes using DL are based on
image resolution. Achieving an acceptable output in lesion detection involves
high-resolution images – with the subsequent rise in the quantity of data need-
ing to be analyzed, preserved, and distributed. Image resolution is extremely
important for applications used to identify and analyze tiny lesions in the med-
ical images, e.g., swelling in the blood vessels. Image size reduction techniques,
edge detection techniques, data augmentation, and the identification of a region
of interest are all useful for image resolution and reduce the time and data re-
quired for training. Therefore, image pre-processing before training deep learn-
ing is considered crucial for classification performance enhancement. The fun-
10
dus images available to the public consist of low fidelity data, and the fundus
images were taken with different fundus cameras, which causes variability in
quality which can be observed in Fig 1.2. Thus, the following steps are used to
enhance the quality of the dataset.
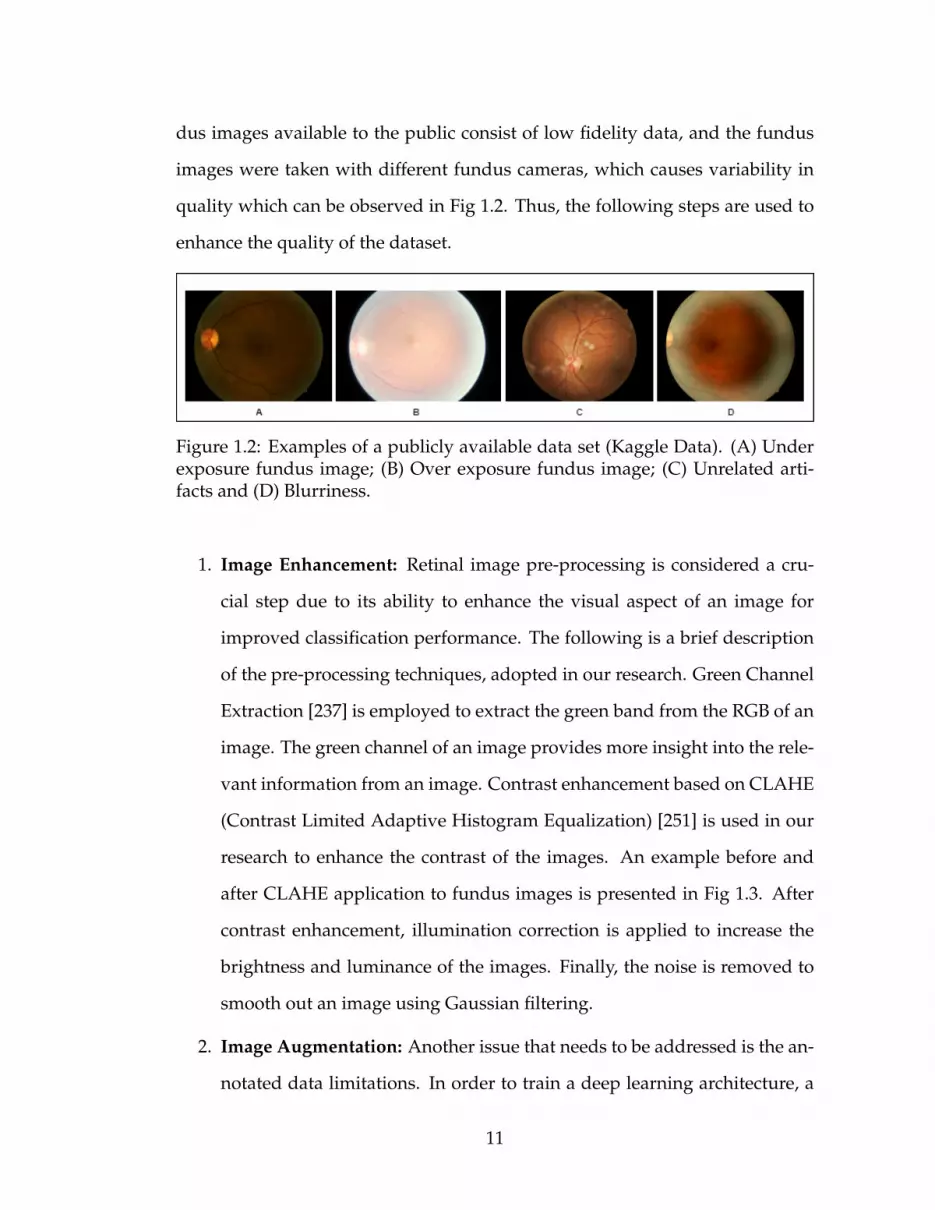
Figure 1.2: Examples of a publicly available data set (Kaggle Data). (A) Underexposure fundus image; (B) Over exposure fundus image; (C) Unrelated arti-facts and (D) Blurriness.
1. Image Enhancement: Retinal image pre-processing is considered a cru-
cial step due to its ability to enhance the visual aspect of an image for
improved classification performance. The following is a brief description
of the pre-processing techniques, adopted in our research. Green Channel
Extraction [237] is employed to extract the green band from the RGB of an
image. The green channel of an image provides more insight into the rele-
vant information from an image. Contrast enhancement based on CLAHE
(Contrast Limited Adaptive Histogram Equalization) [251] is used in our
research to enhance the contrast of the images. An example before and
after CLAHE application to fundus images is presented in Fig 1.3. After
contrast enhancement, illumination correction is applied to increase the
brightness and luminance of the images. Finally, the noise is removed to
smooth out an image using Gaussian filtering.
2. Image Augmentation: Another issue that needs to be addressed is the an-
notated data limitations. In order to train a deep learning architecture, a
11

Figure 1.3: Contrast Limited Adaptive Histogram Equalization enhances con-trast in an image: A. Before and B. After CLAHE application.
large set of data is required. If the training sample size is insufficient, the
model can easily overfit the data resulting in poor classification perfor-
mance on unseen fundus images. This problem can be solved by apply-
ing data augmentation methods such as cropping, rotating and mirroring.
Data augmentation can also be used to solve the imbalanced data prob-
lem. Another method used to increase the data set volume is combining
labelled data from different sources to increase the data set’s volume. For
example, the number of normal-labelled Kaggle image set K0 images can
be combined with the number of normal-labelled Messidor image set M0
(Equation 1.1). Similarly, the number of mild-labelled Kaggle image set K1
can be combined with the number of mild-labelled Messidor image set M1
(Equation 1.2).
K0
⋃M0 = x : ∀x ∈ K0 or ∀x ∈ M0 (1.1)
K1
⋃M1 = x : ∀x ∈ K1 or ∀x ∈ M1 (1.2)
Hence, we can input K0⋃
M0 and K1⋃
M1 number of images into our
model while training to increase the performance accuracy.
3. Image Segmentation This thesis adopts the image segmentation algo-
12

rithms to segment various parts of fundus images with lesions. For in-
stance, blood vessels are segmented to detect early signs of DR, and the
optic disc is segmented for identifying Gl, and macular edema for detect-
ing exudates for diabetic macular edema. This study is intended to ex-
amine whether particular regions may help predict DED correctly, which
means identifying the right region in retinal fundus images to improve the
predictive capacity of DED classification models.
Design of automated DED classifiers based on ensemble traditional image
processing and deep learning to improve performance accuracy.
Distorted, blurred, overexposed and underexposed fundus images have al-
ways been the issue in the publicly available datasets. Several efforts have been
made to address this issue when building a robust deep learning model. One
of them is the fine-tuning of the neural network, which has been the subject
of studies [246, 248] to create a noise-robust deep learning model, and authors
like [52] proposed the improvement of the neural network model’s architecture
by adding a new module for image processing ahead of the neural process-
ing model network. Therefore, in this study, we concentrate on traditional im-
age preprocessing methods to enhance real-world images captured using var-
ious fundus image capturing devices. In this thesis, we will demonstrate that
the traditional techniques of image processing can improve the neural network
model’s performance. Since there are very deep layers in the most current neu-
ral network models and have different filters that can derive the image’s dif-
ferent spatial properties, in this case, conventional denoising filters on a deep
neural network may not work correctly. Therefore, we employ three traditional
image pre-processing methods to prepare the dataset before training the neural
13

network.
Experimental analysis of knowledge transfer and optimization techniques
for binary and multi-class DED classification models.
Knowledge transfer or transfer learning has been employed for identifying
mild and multi-class retinal disease classification, but has not shown promising
results as addressed by authors [109], and [42]. In this thesis, we introduced
13 pre-trained architectures with a combination of seven different optimizers
to evaluate the efficiency of transfer learning in DED classification. Prior re-
search shows transfer learning is not suitable for detecting subtle abnormalities
in medical images as they were initially developed for generic image identifica-
tion, such as images of animals, foods, cars, etc. The concept uses information
gained on primary tasks and its reuse to secondary tasks is shown in Figure 1.4.
Transfer learning is beneficial in deep learning applications that involve a large
amount of data and considerable computing resources.
Figure 1.4: Learning features and knowledge transferred using ConvolutionalNeural Network for detection of DED.
As part of this analysis, following the transfer learning principle, the state-
of-the-art CNN models were pre-trained on the broad public image repository.
The top layers of the neural networks were trained for personalized binary and
14

multi-class classification from publicly accessible fundus image corpora using
the weights initialized. Unlike existing methods, the research performed in
this study focuses solely on instances of early DED and multi-class DED - cur-
rently challenging to classify. First, based on the comprehensive experiments
performed using 13 pre-trained models, namely: VGG16, VGG19, ResNet50, In-
ception V3, InceptionResNet V2, Xception, MobileNET, MobileNET V2, DenseNet
121, DenseNet 169, DenseNet 201, NASNetMobile, and NASNetLarge, with fine-
tuning, and 7 optimizer selection, the highest performing pre-trained CNN
model (transfer learning) is chosen. Second, the number of efficiency enhance-
ments, including data increase and contrast adjustment, is evaluated. Third, the
most compelling scenario (in terms of accuracy achieved) is chosen to promote
the creation of an accessible and efficient fully automated deep learning system
in order to improve accessibility to mass screening services for at-risk popula-
tions. The concept of knowledge transfer from source task to target task can be
useful in limited training data. We conclude that the results of this research will
contribute to the increasing body of literature in knowledge transfer systems on
DED images.
Design of the new convolutional neural network model to learn the DED
features from fundus images to achieve highest accuracy.
Another option is to develop and train the CNN model entirely from scratch,
without reliance on the pre-trained architectures adopted from transfer learn-
ing. This approach necessitates a large number of annotated data which can
also be generated through appropriate augmentation techniques, e.g. mirroring
and rotating. To increase the performance of the classifier one can increase the
computational power by increasing the size of the network. Still, an extensive
15

evaluation has to be conducted to provide empirical validation for their prac-
tical use due to the increased computational resources required for new CNN
network development.
1.5 Thesis Outline
The rest of the thesis is organized as follows:
Chapter 2 summarizes the previous research on the broader prevalence of
DED and the impacts of the multiple detection approaches undertaken by dif-
ferent researchers and reviews on the role of image processing in developing
robust automated detection systems. This study addresses the different types
and sources of data required to quantify DED, and the impacts are summarised
briefly with other quantitative studies using DED data.
Chapter 3 presents an approach for “Early DR classification and detection”
using retinal fundus images. First, retinal fundus images are collected from a
publicly available source which is labelled by a qualified ophthalmologist. Data
are labelled as either “Normal” or “Mild DR” for binary classification. Retinal
features are enhanced from the raw images for training. Deep learning mod-
els are adopted as state-of-the-art classification approaches. The performance
of the proposed techniques is measured against the 13 different deep learning
architecture with seven different optimizers to extract and detect of the features.
Furthermore, the most informative and distinctive features between “Normal”
and “Mild DR” posts are highlighted for valuable insight into the DED detection
problem.
16
Chapter 4 proposes the various image pre-processing algorithms involved in
automated DED detection systems for accuracy enhancement, integration with
the state-of-the-art deep learning and transfer learning techniques, and perfor-
mance evaluation in DED content classification tasks. Next is the development
of the new CNN and trained with pre-processed images.
Chapter 5 introduces a method for the diagnosis of “Multi-class classifica-
tion of Diabetic Eye disease”, offering insight into irreversible DED conditions.
In this study, we trained the three state-of-the-art deep learning models. The
accuracy and precision achieved are contrasted for the top three deep learning
architectures. The image pre-processing for a region of interest is applied dur-
ing model training for a further feature extraction phase to validate the models’
effectiveness in improving classification efficiency.
Chapter 6 proposes the system for “automatic classification and detection of
multi-class DED using newly built CNN” from the available online dataset. The
data is collected from an open source, annotated by ophthalmologists and were
divided into five categories, as per the procedure explained in Chapter 4. The
experiment is conducted with the newly built CNN to study its performance
accuracy and validate it against other models’ in Chapter 5 performances. The
image enhancement techniques are used for better feature extraction. Finally,
the automated classification of the DED system is developed using the newly
built CNN.
Chapter 7 summaries the results and evaluates the results obtained from the
combined framework and indicates directions for future improvements.
17

CHAPTER 2
LITERATURE REVIEW
This chapter describes the DED background, its occurrence and severity, its
high prevalence and observed effects, and finally, the different automated strate-
gies for classification, detection, and prediction. People suffering from diabetes
are at high risk of developing various eye diseases over time. As a result of
advances in machine learning techniques, early detection of diabetic eye dis-
ease using an automated system brings substantial benefits over manual de-
tection. A variety of advanced studies relating to the detection of diabetic eye
disease have recently been published. This chapter presents a systematic sur-
vey of automated approaches to diabetic eye disease detection from several as-
pects, namely: i) available datasets, ii) image preprocessing techniques, iii) deep
learning models and iv) performance evaluation metrics. The survey provides
a comprehensive synopsis of diabetic eye disease detection approaches, includ-
ing state of the art field approaches, which aim to provide valuable insight into
research communities, healthcare professionals and patients with diabetes.
2.1 Prevalence and Types of Diabetic Eye Disease
DED comprises a group of eye conditions, which include Diabetic Retinopathy,
Diabetic Macular Edema, Glaucoma and Cataract [89]. All types of DED have
the potential to cause severe vision loss and blindness in patients from 20 to
74 years of age. According to the International Diabetes Federation (IDF) state-
ment, about 425 million citizens worldwide suffered from diabetes in 2017. By
2045, this is forecast to increase to 692 million [59]. Medical, social and economic
complications of diabetes impact substantially on public health, with diabetes
18

being the world’s fourth-largest cause of death [202]. The effects of diabetes
can be observed in different parts of a person’s body, including the retina. Fig.
2.1 shows the normal anatomical structures of the retina. Fig. 2.2 illustrates a
complication of DED in a retina. Serious DED begins with an irregular devel-
opment of blood vessels, damage of the optic nerve and the formation of hard
exudates in the macula region. Four types of DED threaten eye vision, and they
are briefly described in the following subsection.
2.1.1 Diabetic retinopathy
DR is caused by damage to blood vessels of the light sensitive tissue (retina) at
the back of the eye. The retina is responsible for sensing light and sending a
signal to brain. The brain decodes those signals to see the objects around [104].
There are two stages of DR: early DR and advanced DR. In early DR, new blood
vessels do not developing (proliferating) and this is generally known as non-
proliferative diabetic retinopathy (NPDR). The walls of the blood vessels inside
the retina weaken due to NPDR. Narrower bulges (microaneurysms) protrude
from the narrower vessel surfaces, often dripping fluid and blood into the eye.
Large retinal vessels also start dilating and become irregular in diameter. As
more blood vessels become blocked, NPDR progresses from mild to severe. De-
pending on the severity, the retina’s nerve fibres may begin to swell. The central
part of the retina (macula) often swells (macular edema); a disease requiring
treatment. NPDR is divided into three stages, namely: mild, moderate and
severe [74]. Advanced DR is called proliferative diabetic retinopathy (PDR). In
this case, the damaged blood vessels leak the transparent jelly-like fluid that fills
the centre of the eye (vitreous) causing the development of abnormal blood ves-
19
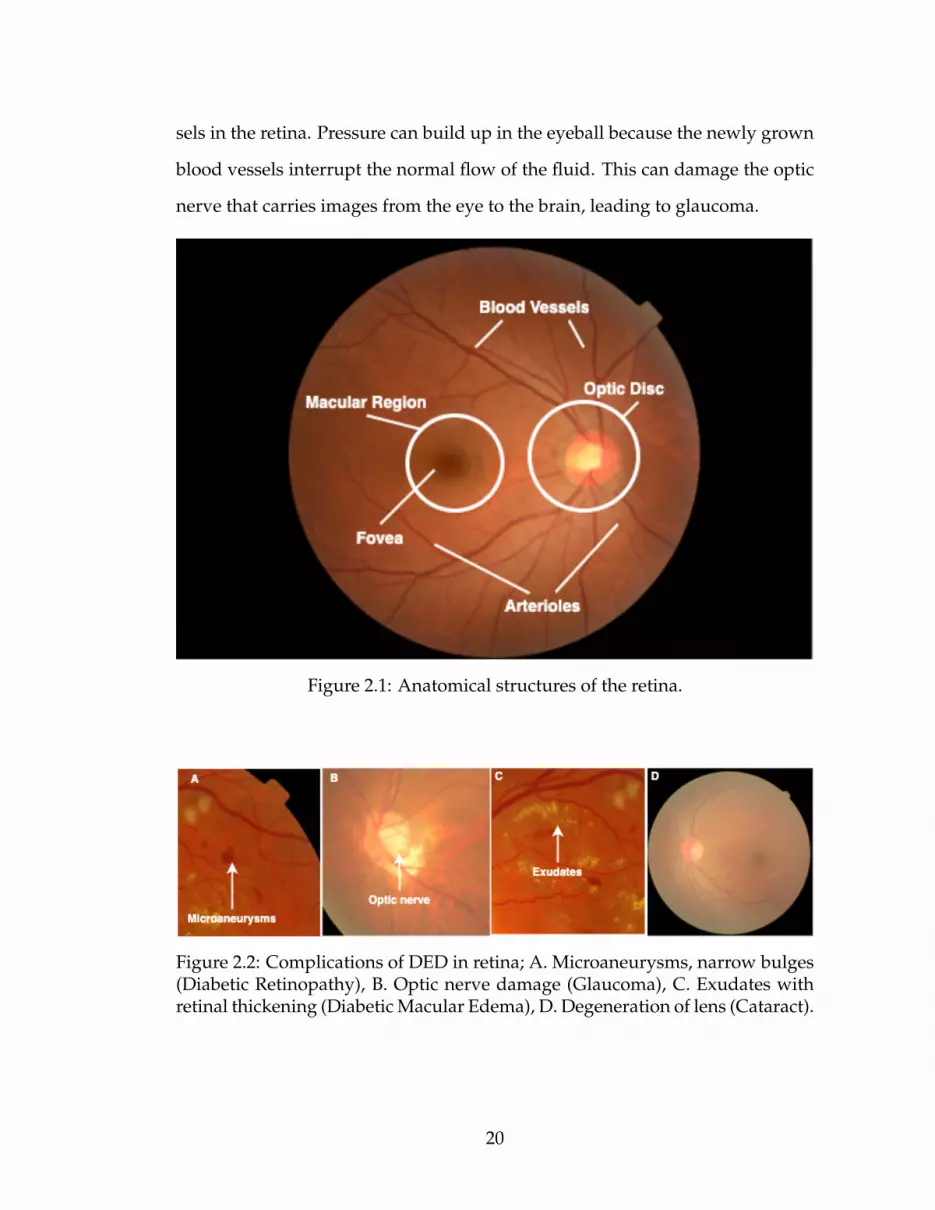
sels in the retina. Pressure can build up in the eyeball because the newly grown
blood vessels interrupt the normal flow of the fluid. This can damage the optic
nerve that carries images from the eye to the brain, leading to glaucoma.
Figure 2.1: Anatomical structures of the retina.
Figure 2.2: Complications of DED in retina; A. Microaneurysms, narrow bulges(Diabetic Retinopathy), B. Optic nerve damage (Glaucoma), C. Exudates withretinal thickening (Diabetic Macular Edema), D. Degeneration of lens (Cataract).
20

2.1.2 Diabtiec Macular Edema
Diabetic Macular Edema (DME) occurs when fluid builds up in the centre of the
retina (macula) due to damage to the blood vessels. The macula is responsible
for sharp, straight-ahead vision. Fluid buildup causes swelling and thickening
of the macula which distorts vision [104]. The stages of DME can be categorized
into mild, moderate and severe based on the following points [76]:
• Retinal thickening of the fovea at or below 500 µ or 1/3 of its disc diameter;
• Hard exudates, with subsequent retinal thickening, at or within 500 µ of
the fovea;
• Retinal thickening at a size that is greater than one disc diameter (1500 µ),
and which is within one fovea disc diameter.
2.1.3 Glaucoma
Glaucoma (Gl) is an ocular disease that damages the optic nerve that links the
eye to the brain. When the fluid pressure inside the eye, known as intraocular
pressure (IOP), is high, the optic nerve is impaired [217]. An increase in blood
sugar doubles the chances of Gl, which leads to blindness and a loss of vision
if not detected early. Gl can be classified into three types based on the size of
the enlarged optic nerve head or optic disc and Cup-to-Disc Ratio (CDR), or
cupping. The stages of Gl are mild, moderate and severe [12].
21

2.1.4 Cataract
Cataract (Ca) is the degeneration of the lens protein due to high sugar level
causing blurry lens growth, which in turn leads to blurred vision. Diabetic peo-
ple are more prone to growing cloudy lenses and developing Ca earlier than
non-diabetic people. Usually Ca is graded into four classes: non-cataractous,
mild, moderate and severe [242].
Patients suffering from diabetes display a significantly higher predisposition
develop DED. As a consequence, early detection of DED has become paramount
in preventing vision loss in adults and children. Studies have already shown
that 90% of patients with diabetes can avoid DED development through early
detection [218]. Manual detection of DED involves no computer assistance, re-
sulting in longer waiting times between early diagnosis and treatment. More-
over, the initial signs of DED are so minute that even an expert may struggle
with its identification.
Advancements in Artificial Intelligence (AI) offer many advantages to auto-
mated DED detection over the manual approach. They include a reduction in
human error, time-efficiency and detection of minute abnormalities with greater
ease. Automated DED detection systems can be assembled through joint im-
age processing techniques using either Machine Learning (ML) or Deep Learn-
ing techniques (DL). In DL approaches, images with DED and without DED
are collected. Then, the image preprocessing techniques are applied to reduce
noise from the images and prepare for the feature extraction process. The pre-
processed images are input to DL architecture for the automatic extraction of
features and their associated weights to learn the classification rules. The fea-
tures weights are optimized recursively to ensure the best classification results.
22

Finally, the optimized weights are tested on an unseen set of images. This type
of architecture demands a large number of images for training. Therefore, a
limited number of images can severely restrict its performance.
DL techniques require a substantial amount of computational memory and
power. Normally, to develop and evaluate the classification model, DL architec-
ture requires a Graphical Processing Unit (GPU). In real world DL applications,
this assumption does not always hold. Training images using the DL model can
be costly, challenging in terms of annotated data collection, and time and power
consuming. To account for the above mentioned shortcomings, the approach
called Transfer Learning (TL), or Knowledge Transfer (KT), has been introduced
by the researchers. In TL, previously derived knowledge (e.g. in terms of fea-
tures extracted) can be re-adapted to solve new problems. Not only does TL
drastically reduce the training time, it also reduces the need for a large amounts
of data. The latter point proves particularly convenient in niche applications
where high-quality input images annotated by specialists are often limited or
expensive to obtain.
Motivation: As mentioned above, DL and TL techniques have their advan-
tages and disadvantages however, several researchers have used these meth-
ods to build automatic DED detection systems in recent years. Overall, there
are very few review studies published in academic databases which simultane-
ously address all of the types of DED detection. Thus, this literature review is
essential to collate the work in the DED detection field.
Ting et al. [210] published a review article focusing on eye conditions such as
diabetic retinopathy, glaucoma, and age-related macular diseases. They selected
papers published between 2016 and 2018 and summarised them in their report.
23

They summarized those papers which used fundus and optical coherence to-
mography images, and TL methods. Their research did not include current
(2019-2020) publications that incorporated TL methods into their approach, and
they omitted the identification of eye cataract disease from their study scope.
Similarly, Hogarty et al. [85] provided a review of current state articles using
AI in Ophthalmology, but their focus lacked comprehensive AI methodologies.
Mookiah et al. [125], reviewed computer aided DR detection studies, which are
largely DR lesion based. Another author, Ishtiaq et al. [91], reviewed compre-
hensive DR detection methods from 2013 to 2018 but their review lacked studies
from 2019 to 2020. Hagiwara et al. [77], reviewed an article for the computer
aided diagnosis of Gl using fundus images. They addressed computer aided
systems and systems focused on optical disc segmentation. There are a variety
of studies using DL and TL methods for Gl detection that have not discussed
in their review paper. It is, therefore, important to review papers that consider
existing approaches to DED diagnostics. In fact, most scholars in their review
article did not address the period of publication years covered by their studies.
Current reviews were too narrow, either in terms of disease (DR, Gl, DME and
Ca) or in aspects of methodology (DL and ML). Therefore, to address the limi-
tations of the above-mentioned studies, this chapter offers a thorough analysis
of both DL and TL approaches to automated DED detection published between
2014 and 2020 to cover the current DR detection methods built through DL or
TL based approaches.
Contribution: To provide a structured and comprehensive overview of the
state of the art in DED detection systems using DL, the proposed chapter sur-
veys the literature from the following perspectives:
24

1. Datasets available for DED;
2. Preprocessing techniques applied to fundus images for DED detection;
3. DL approaches proposed for DED detection;
4. Performance measures for DED detection algorithm evaluation.
Research Method: The overall research method followed is shown in Fig.
2.4. Initially, a keyword search was conducted using 10 academic databases
considering our specific review target. Seven filters were applied to select the
primary review target. Afterwards, the selected articles were critically analysed
and grouped into three categories based on the following aspects, namely: (i) pa-
pers employing TL, (ii) papers proposing a new DL network and (iii) papers discussing
with DL and ML combined.
Selection of Articles A systematic review of automated detection methods
of various Diabetic Eye Diseases from databases including IEEE Xplore, Med-
Line, Scopus, Science Direct, Springer, ACM Digital Library, PubMed, Web of Science
and Google Scholar was performed. The subsequent seven filters applied were:
(i) Target keywords, (ii) Publication year, (iii) Publication type, (iv) Duplicate check,
(v) Article title, Abstract and Keyword screening for article selection, (vi) References of
selected articles checked and (vii) Final quality assessment of selected article. Review
target keywords were searched using ’AND’ Boolean operator and included:
”deep learning”, ”transfer learning”, ”image processing”, ”image classification”, ”fun-
dus images”, ”diabetic eye disease”, ” diabetic retinal disease”, ”diabetic retinopathy”,
”glaucoma”, ”diabetic macular edema” and ”cataract”.
Papers published between 2014 and 2020 were considered eligible for this
study due to rapid advances in the field. We then narrowed our search to Con-
25

Figure 2.3: Search and filter results: A. Query1 (Q1) = diabetic eye disease, fun-dus images, image processing, image classification, deep learning, transfer learning; B.Query2 (Q2) = diabetic retinopathy, fundus images, image processing, image classifi-cation, deep learning, transfer learning; C. Query3 (Q3) = glaucoma, fundus images,image processing, image classification, deep learning, transfer learning; D. Query4(Q4) = diabetic macular edema, fundus images, image processing, image classification,deep learning, transfer learning; E. Query5 (Q5) = cataract, fundus images, imageprocessing, image classification, deep learning, transfer learning.
Figure 2.4: Research method flowchart.
26

ference Papers and Journal Articles. After the selection process, we encountered
several duplicates as a result of using 10 different databases. After duplicates
removal, titles, abstracts and conclusions of the remaining publications were
carefully read. 69 articles were obtained focusing on fundus images, DL meth-
ods and classification of DED. We studied the bibliography and citation of the
selected 69 articles, in which we found 7 more articles for the potential inclu-
sion. Finally, during a quality assessment by reading 76 papers, our selection
was narrowed down to 65 studies. The details of the process followed during
our systematic review are presented in Fig. 2.3. We subsequently distributed the
final sample of articles into three target groups. The distribution of 65 articles
concerning the review target is represented in Table 2.1. The first group includes
papers that use a pretrained network also referred to as the TL Approach. The
second group categorizes articles that use their own built in DL network to de-
tect DEDs. Finally, the third group summarises the articles that use combined
DL and ML methods.
2.2 Diabetic Eye Disease Datasets
The authors of the selected articles use private and public datasets which are
divided into training and testing examples. The most common datasets used
for the detection of DR are Kaggle and Messidor [50]. Authors in [48, 55, 66,
68, 73, 75, 94, 114, 121, 147, 153, 157, 161, 172, 187, 215, 229, 232] used Kaggle data
and [1, 14, 114, 116, 136, 212, 215] used Messidor [50] data. The Kaggle dataset
consists of 88,702 images, of which 35,126 are used for training and 53,576 are
used for testing. Messidor [50] is the most widely used dataset which consist
1,200 fundus images. The Kaggle and Messidor dataset, is labeled for DR stages.
27
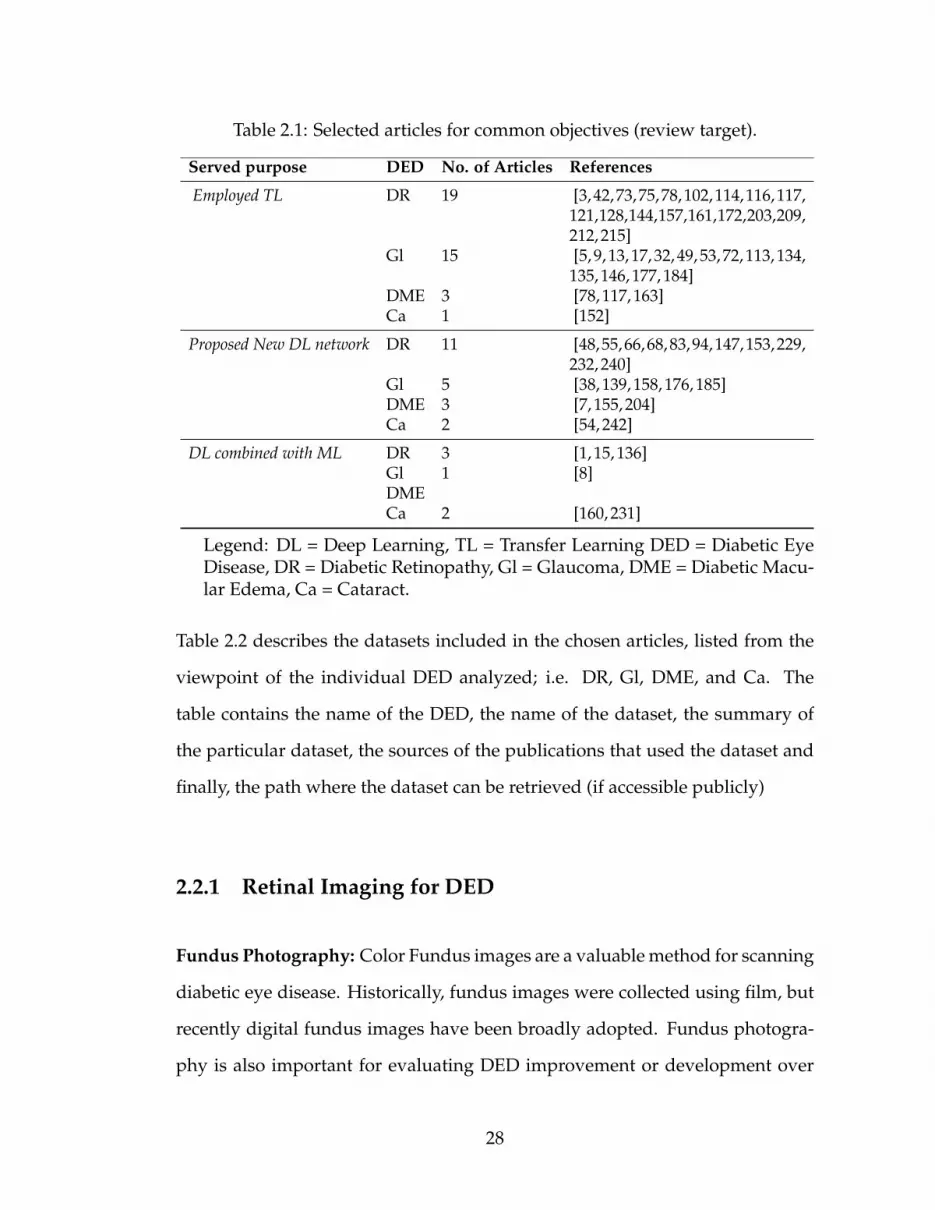
Table 2.1: Selected articles for common objectives (review target).
Served purpose DED No. of Articles References
Employed TL DR 19 [3,42,73,75,78,102,114,116,117,121,128,144,157,161,172,203,209,212, 215]
Gl 15 [5, 9, 13, 17, 32, 49, 53, 72, 113, 134,135, 146, 177, 184]
DME 3 [78, 117, 163]Ca 1 [152]
Proposed New DL network DR 11 [48,55,66,68,83,94,147,153,229,232, 240]
Gl 5 [38, 139, 158, 176, 185]DME 3 [7, 155, 204]Ca 2 [54, 242]
DL combined with ML DR 3 [1, 15, 136]Gl 1 [8]DMECa 2 [160, 231]
Legend: DL = Deep Learning, TL = Transfer Learning DED = Diabetic EyeDisease, DR = Diabetic Retinopathy, Gl = Glaucoma, DME = Diabetic Macu-lar Edema, Ca = Cataract.
Table 2.2 describes the datasets included in the chosen articles, listed from the
viewpoint of the individual DED analyzed; i.e. DR, Gl, DME, and Ca. The
table contains the name of the DED, the name of the dataset, the summary of
the particular dataset, the sources of the publications that used the dataset and
finally, the path where the dataset can be retrieved (if accessible publicly)
2.2.1 Retinal Imaging for DED
Fundus Photography: Color Fundus images are a valuable method for scanning
diabetic eye disease. Historically, fundus images were collected using film, but
recently digital fundus images have been broadly adopted. Fundus photogra-
phy is also important for evaluating DED improvement or development over
28

Table 2.2: Datasets available for automatic Diabetes Eye Detection with source(link).
DED Dataset Description Reference Link
DR Kaggle Dataset made available by EyePACS. It consists of 35,126 training images and 53,576testing images (total of 88,702). These images are labelled with stages.
[48,55,66,68,73,75,94,114,121, 128, 147, 153, 157, 161,172, 187, 215, 229, 232]
urlhttps://www.kaggle.com/c/diabetic-retinopathy-detection/data
Messidor Dataset consists of 1,200 fundus images. The images were obtained from three ophthal-mological branches in France. Of the 1,200 images, 800 images are with pupil dilation,while 400 are without pupil dilation. Images are labelled with DR stages. Decenciereet al. [50]
[1, 14, 83, 114, 116, 136, 212,215]
https://www.adcis.net/en/Download-Third-Party/Messidor.html
Messidor-2 Dataset consists of 1,748 fundus images. Camera used was Topcon TRC NW6 non-mydriatic with 45 degrees field of view. Images are labelled with DR stages. Decenciereet al. [50].
[3] urlhttp://www.latim.univ-brest.fr/indexfce0.html
STARE Dataset consists of 400 fundus images. The images were taken with Topcon TRV-50with 35 degrees field of view. Farnell et al. [57]
[42, 212] http://www.cecas.clemson.edu/
˜ahoover/stare/DR1 Dataset is presented by the Department of Ophthalmology, Federal University of Sao
Paulo, Brazil and consists of 1,014 color fundus images (687 - normal, 327 - abnormal).Abnormal images are further split into 191 with red lesions, 245 with bright lesionsand 109 with both red and bright lesions.
[114, 116] http://www.recod.ic.unicamp.br/site/asdr
APTOS The APTOS 2019 repository incorporates 3662 fundus images classified into five levels(normal - 0, mild - 1, moderate - 2, extreme non-proliferative DR - 3, and proliferativeDR - 4) as per the severity of DR labelled.
[102] https://www.kaggle.com/c/aptos2019-blindness-detection/data
E-optha This dataset consists 47 images with exudates, 148 with microaneurysms and 268 im-ages with no lesion.
[240] http://www.adcis.net/en/third-party/e-ophtha/
DeepDR Dataset include 2696 images from 748 patients for classification of DR [243] https://isbi.deepdr.org/data.html
Gl RIGA Dataset contains three different sources: 1) MESSIDOR (dataset consists of 460 origi-nal images marked manually by six different ophthalmologists (total of 3220 markedimages); 2) Bin Rushed (dataset contains 195 original images marked by six differentophthalmologists (total of 1,365 images); 3) Magrabi Eye Center (dataset contains 95original images marked by six different ophthalmologists (total of 665 images). Al-mazroa et al. [11]
[9] https://deepblue.lib.umich.edu/data/concern/data_sets/3b591905z?locale=en
ORIGA A quantified objective benchmarking method was proposed, focusing on optic discand cup segmentation and Cup-to-Disc Ratio (CDR). ORIGA(-light) contains 650 reti-nal images annotated by trained professionals from Singapore Eye Research Institute.A wide collection of image signs, critical for Gl diagnosis were annotated Zhang etal. [244].
[38] Publicly unavailable.
Drishti-GS Dataset contains a total of 101 images. The images were divided into 51 testing and 50training examples. The images were marked by four eye experts and collected fromAravind Eye Hospital. Sivaswamy et al. [190]
[135, 139] http://cvit.iiit.ac.in/projects/mip/drishti-gs/mip-Dataset2/Dataset_description.php
BIOMISA Dataset contains 462 images collected a local hospital. TopCon TRC 50EX camera wasused. Hassan et al. [79].
[103] http://biomisa.org/index.php/glaucoma-database/
REFUGE This dataset consist of 1200 color fundus images divided into 1:1:1 ratio for training,validation, and testing. [134]
[176] http://ai.baidu.com/broad/download?dataset=gon
ODIR-2019
This dataset consist of eight types of ocular disease, consisting of 207 training classes,30 off-site testing cases, 58 on-site testing cases.
[92] https://odir2019.grand-challenge.org/dataset/
DRIONS Dataset consists of 110 colour digital retinal images from Ophthalmology Service atMiguel Servet Hospital, Saragossa (Spain). Carmona et al. [30].
[1, 139] http://www.ia.uned.es/˜ejcarmona/DRIONS-DB.html
RIM-ONE(r1), RIM-ONE (r2),RIM-ONE(r3)
Dataset details: (i) r1 40 Gl and 118 Non-Gl images, (ii) r2 200 Gl and 225 Non-Glimages and (iii) r3 74 Gl and 85 Non-Gl images. Fumero et al. [62]
[32, 139] http://people.ee.ethz.ch/
˜cvlsegmentation/driu/downloads.html
HRF Contains fundus images by patient condition containing 15 healthy, 15 DR, and 15glaucoma.
[32] https://www5.cs.fau.de/research/data/fundus-images/
DME HEI-MED Dataset was obtained from Hamilton Eye Institute Macular Edema Data-set (HEI-MED). Dataset contains 169 fundus images to test and train for the detection of ex-udates and DME. Giancardo et al. [69].
[114] https://github.com/lgiancaUTH/HEI-MED
IDRiD Dataset contains 516 images with both DME and DR cases. The severity of macularedema is based on the existence of hard exudates closer to fovea (macula center) region.This dataset contents 80 hard exudates images. Porwal et al. [151].
[123] https://idrid.grand-challenge.org/Data/
DRiDB The retinal fundus databases including a description of all main anatomical structuresincluding macula, blood vessels and optic disc is annotated. Prentavsic et al. [156].
[155] https://ipg.fer.hr/ipg/resources/image_database
CLEOPATRACLEOPATRA was a three phase randomised, parallel and single clinical experimentfrom fifteen opthalmic centres in the United Kingdom. Sivaprasad et al. [189].
[204] unavailable
DigifundusLtd, Fin-land
Dataset is non-open, anonymous retinal data-set of diabetic patients. Dataset contains41,122 labelled retinal color fundus images from 14,624 patients. Sahlsten et al. [163].
[163] Publicly unavailable.
Ca BeijingTongrenHospital.
Dataset is composed of 5,620 standard fundus images from Beijing Tongren Eye Center [242] Publicly unavailable.
Not Dis-closed byAuthors
Study consists of 5,408 preprocessed images as experimental dataset. Dataset contains1,948 noncataractous images: 1,268 slightly mild, 496 mild, 616 medium, 540 slightlysevere and 540 severe images.
[160] Publicly Unavailable.
PictureArchivingand Com-municationSystem(PACS)
In this dataset each fundus image is manually graded by the ophthalmologist as non,mild, moderate, or severe cataract. There are 767 noncataractous, 246 mild, 128 mod-erate and 98 severe images (total of 1,239).
[231] Publicly Unavailable.
29

Table 2.3: Image preprocessing techniques employed in selected studies.
GCE HE ROI CLAHE CE Re Au GSC BVS IR IC GF References
3 7 3 3 7 3 3 7 7 7 7 7 Li et al. [114]7 7 7 7 7 3 7 7 7 7 7 7 X. Li et al. [116], Al-Bander
et al. [7]3 7 7 7 7 3 3 7 7 7 3 7 Zhang et al. [242]7 7 7 7 7 7 7 7 7 7 3 7 Ran et al. [160]3 3 7 7 3 3 7 7 7 7 7 7 Shaharum et al. [175]7 7 3 7 7 7 7 7 7 7 7 7 Abbas et al. [1], Yu et al.
[240], Diaz et al. [53], De etal. [49], Gomez et al. [72]
3 3 7 7 7 7 7 7 7 7 7 7 Yang et al. [231], Pratap etal. [152], Doshi et al. [55]
7 7 7 7 7 3 7 3 7 7 7 7 Sahlsten et al. [163]3 3 7 7 7 3 7 7 7 7 7 7 Sisodia et al. [187]7 7 3 7 7 7 7 7 7 7 7 7 Antal et al. [14]3 7 3 7 7 7 7 7 3 7 3 7 Orlando et al. [136]7 7 3 7 7 7 7 7 7 7 7 7 Almazroa et al. [11]7 7 3 7 7 7 3 7 7 7 7 7 Chen et al. [38], Ceretinia
et al. [32], Perdomo et al[144]
7 7 3 3 7 7 7 7 7 7 7 7 Orlando et al. [135]7 7 7 7 7 3 7 7 7 3 7 7 Phan et al. [146]7 3 7 7 7 3 7 3 7 3 7 7 Dong et al. [54]7 7 7 7 7 7 3 7 7 7 7 7 Asaoka et al. [17], An et
al. [13], Nguyen et al. [128],Xu et al. [229]
7 7 3 7 7 7 7 3 7 7 7 7 Pal et al. [139]7 3 7 3 7 7 7 7 7 7 7 7 Hemanth et al. [83]7 7 7 3 3 3 7 7 7 7 7 7 Gondal et al. [73]7 7 3 7 7 3 7 7 7 7 7 3 Mansour et al. [121]7 7 7 7 7 3 3 7 7 7 7 3 Quellec et al. [157]7 7 7 7 3 3 3 7 7 7 7 3 Van et al. [215]3 7 7 3 3 7 7 7 7 7 3 7 Umapathy et al. [212]7 7 7 7 7 3 7 7 7 7 7 7 Diaz et al. [53]7 7 7 7 7 3 3 7 7 7 7 7 Gargeya et al. [66], Ghosh
et al. [68]7 3 7 7 7 3 7 7 7 7 7 7 Jiang et al. [94]7 7 3 3 7 3 7 7 7 7 7 7 Yang et al. [232]7 3 7 7 3 7 3 7 7 7 7 7 Pires et al. [147]7 7 7 3 7 7 7 7 7 7 7 7 Singh et al. [184]7 7 7 7 7 7 3 7 7 7 7 7 Singh et al. [5]
30

time. There are various types of fundus images, such as: normal, wide-field,
and stereoscopic. Digital fundus images allow an instant and straightforward
analysis of images, transparent image enhancement, and the ability to manip-
ulate and improve images effectively. Most of the studies used fundus image
technology to develop DED detection system. Normal imaging of the macu-
lar fundus captures 30◦ of the eye’s posterior pole, including the macula and
the optic nerve. This type of digital photography benefits involve efficient and
highly usable, which can be used for documentation assistance [164].
Fluorescein Angiography: Fluorescein Angiography (FA) is currently the
gold standard for assessing the retinal blood vessels, the retina portion mostly
suffering from diabetes, FA is useful in evaluating diabetic eye disease. A va-
riety of possible side effects also arise with fluorescein angiography. Transient
nausea, which occurs in about 2.9 percent of patients, and vomiting in 1.2 per-
cent of patients, are the most common complications [108].
Optical Coherence Tomography: Optical coherence tomography (OCT) is
an imaging method designed to measure, with microscopic precision, retinal
morphology. OCT becomes more helpful in assessing and quantifying macular
edema in diabetics, and it has become the most useful imaging method in the
treatment of diabetic macular edema patients.
2.2.2 Dataset Characteristics
Most diabetic retinopathy datasets are collected at a particular device or at var-
ious websites using the same system, whereas others are acquired at a specific
website or several sites with different devices. The tools used to capture an im-
31

age can be divided into two different groups, called uniform and non-uniform
systems.
In uniform system and uniform site dataset, the data were acquired at a sin-
gle location or hospital with the same unit. For example, Jichi Medical Univer-
sity Japan’s exclusive dataset used by Takahashi, Tampo [203] contained 4709
images. These images were taken using a camera from the Fundus, i.e., AFC-
230; May 2011 to June 2015: NIDEK Co., Ltd., Aichi, Japan.
The images in uniform system and non-uniform site dataset were collected
on multiple sites using the same system. Antal and Hajdu [14], for example,
used Messidor’s data. This dataset includes 1200 images taken with the Topcon
TRC NW6 non-mydriatic colour video 3CCD camera by three ophthalmology
departments in France.
The images in non-uniform system and uniform site datasets were collected
on a single site with multiple cameras. There is no single research that comes
under this category.
The images in non-uniform system and non-uniform site datasets were col-
lected using multiple system at multiple sites. About half of the review papers
selected in this thesis come under this category because of the single, distributed
dataset or many datasets. The single dataset containing 298 images used [87],
and it was collected at fifteen different locations, and ten various types of cam-
eras were used. Similarly, the datasets used by Fraz, Jahangir [61], consisting
of 4 publicly accessible datasets, were obtained at various locations and filmed,
compared to each other, with multiple cameras. A number of studies were per-
formed in datasets where the images were collected at a single location using
32

the same system. Six studies were designed on datasets in which the images
were collected from the same system but at different locations or clinics. No
study was performed in which the data were collected but at the same site or
clinic with different equipment.
2.3 Image Preprocessing Techniques
Images are subjected to numerous image preprocessing steps for visualization
enhancement. Once the images are brighter and clearer, a network can extract
more salient and unique features. A brief description of the preprocessing tech-
niques used by the researchers addressed in this section. Green channel on the
RGB color space provides a better contrast when compared to the other chan-
nels. In most of the image preprocessing techniques, green channel extraction is
employed. The green channel image produces more information than blue and
red channels. For instance, Li et al. [114] extracted the green channel of the im-
age for exudates detection, where the exudates reveal better contrast from the
background.
2.3.1 Image Quality Enhancement
Another popular image preprocessing technique is contrast enhancement. The
application of contrast enhancement further improves the contrast on a green
channel image. To improve the contrast of the image, contrast enhancement
is employed to the green channel of the image. For example, again Li et al.
[114] have enhanced the contrast on the extracted green channel by employing
33

the Contrast Limited Adaptive Histogram Equalization (CLAHE) method. This
enhances the visibility of exudates of a green channel image. Normally, after
contrast enhancement, illumination correction is implemented to improve the
luminance and brightness of the image. A noise removal filter like Gaussian
Filtering is then applied to smooth out the image.
2.3.2 Image Augmentation
The resizing of an image is another popular method of image preprocessing.
The image is scaled down to a low resolution image according to the appro-
priate system. Li et al. [114] resized their images with various sizes to the same
pixel resolution of 512×512. Similarly, X. Li [116] resized their image to 224×224
pixel resolution, for all the pretrained CNN models that used 224×224 size reso-
lution images. The resolution of an image is resized into the resolution required
by the network in use.
Researchers often have to eradicate and mask the blood vessels and optical
discs so that they are not classified as wrong DED lesions. Many DED datasets
consist of images with a black border, with researchers generally preferring to
segment the meaningless black border to focus on the ROI. For example, Li
et al. [114] removed the black border of fundus images using the thresholding
method to further focus on the Region Of Interest (ROI).
Image augmentation is applied when there is an image imbalance (as typi-
cally observed in real world settings). Images are mirrored, rotated, resized and
cropped to produce cases of the selected images for a class where the number
of images is lower than the other large proportion of healthy retina images in
34

comparison with DED retina images. Augmentation is a common strategy for
enhancing outcomes and preventing overfitting. It is observed that the distri-
bution of the Kaggle dataset is uneven. The Kaggle dataset includes 35,126 fun-
dus images annotated as No DR (25810), Mild DR (2443), Moderate DR(5292),
Severe DR(873) and Proliferative DR(708). Thus, Li et al. [114], An et al. [13],
Nguyen et al. [128], Xu et al. [229], Pires et al. [147], Gargeya et al. [66], Ghosh
et al. [68], Van et al. [215], Quellec et al. [157] used the Kaggle dataset and the
adopted augmentation technique to balance the dataset. Sometimes the RGB
image is transformed into a greyscale image accompanied by further process-
ing. Grayscale conversion is mostly used in approaches where ML is used.
Table 2.4: Different hyperparameters used in the selected studies.
R1 R2 R3 R4 R5 R6 References
VGG19 224 × 224 - 50 SGD 1e − 6 [42]o O 448 × 448 36 - Adam 1e − 4 [157]o O 512 × 512 - 150 Adam 1e − 2 [73]AlexNet 512 × 512 - 130 - 1e − 2 [114]LeNet 48 × 48 64 30 - 1e − 2 [145]OxfordNet 41 × 41 256 60 - 1e − 5 [215]InceptionV4 779 × 779 - - - - [172]VGG19, ResNet152 256 × 256, 512 × 512 - - - - [146]DenseNet201VGG16 779 × 779 - 12 Adam, SGD 1e − 3, 1e − 4 [9]ResNet 224 × 224 64 - SGD 1e − 3 [17]VGG16, VGG19 224 × 224, 299 × 299 8 100 SGD 1e − 4 [53]ResNet50, Inceptionv3XceptionOverFeat, VGG-S 231 × 231, 224 × 224 - - - - [135]Standard CNN 231 × 231 64 50 SGD 1e − 4 [72]VGG19, RESNET50 231 × 231 32 100; 80; 25 SGD 1e − 4 [72]GoogLeNet, DENETInceptionV3 2095 × 2095 15 - - - [163]InceptionV3 224 × 224 - 14 Gradient Descent 1e − 5 [5]CNN 224 × 224 - 600 - 1e − 2 [94]CNN 512 × 512 15 300 Adam 3 × 1e − 4 [48]CNN 128 × 128 - 250; 150; 70 Adam 1e − 3; 1e − 4, 1e − 5 [147]CNN 64 × 64 - 20 Adam 1e − 5 [83]CNN 256 × 256 - 100 - 1e − 2; 1e − 3; 1e − 4 [158]CNN 256 × 256 15 200 Adam 1e − 5 [176]CNN 512 × 512 15 200,250 SGD 3 × 1e − 4; 3 × 1e − 5 [7]CNN 51 × 51 10 60 Adam 1e − 2 [204]
Legend: R1 = Model, R2 = Image Size, R3 = Mini Batch Size, R4 = Epoch, R5= Optimizers, R6 = Initial Learning Rate.
35

2.3.3 Region of Interest based Segmentation
As it is called ROI extraction, the main objective of this phase is to retrieve the
retinal anatomical structure of interest in order to minimise computational costs
and boost overall performance; if a window is extracted around the raw reti-
nal image’s target anatomical structure area, then the pre-processing steps are
applied to it. Each retinal anatomical structure has specific features and charac-
teristics, so certain steps in pre-processing can be different.
2.4 Machine Learning in Diabetic Eye Disease Classification
The ML techniques employed for DED diagnosis are discussed in this section.
For DED detection, the generic ML method is shown in Fig. 2.5. Firstly, labeled
image data (training image dataset) for developing the DED detection model is
gathered. The training collection consists of images belonging to various DED
categories.
Figure 2.5: Classic Machine Learning Framework.
Afterward, to eliminate unwanted feature representations from the obtained
image, multiple image preprocessing algorithms are employed. Later, different
methods of extraction of features are used to discover the most discriminatory
features from the preprocessed photos. The product of this step is the mas-
ter feature vector (MFV). Upon understanding the classification rules from the
MFV, this MFV is being given as an input to the ML model to create the DED
36

detection algorithm. The developed DR classification algorithm’s efficiency is
then tested on unseen unlabeled images (test image dataset). Therefore, in this
section, we discuss the analysis of various feature and ML techniques used to
develop and validate the DED detection algorithm on DED image datasets. The
following subsections contain descriptions of these elements of the study.
2.4.1 Image Feature Analysis
A characteristic is a visible component of the overall operation that is under
consideration in the areas of image classification and machine learning. In gen-
eral, image processing and image segmentation in literature are well studied.
For example, in [39], the researchers segmented images based on maximum
feature coverage, while in [239], the authors explicitly suggested the Active
Contour Model (ACM) for the image segmentation. Likewise, the researchers
used region-based ACM for medical image segmentation in [238] via neigh-
boring pixels’ connection. Characteristics of DED may involve if the lesions
(including blood vessel rupture, hard exudates, microaneurysms, soft exudates,
haemorrhages, optic nerve damage) are present in the fundus image for diabetic
retinopathy detection algorithms. A significant task is the choice of character-
istics so that the network’s learning becomes successful and precise. Indepen-
dent scholars have reported and used various features in chosen research papers
to detect DED. These characteristics comprise features based on structure and
shape, features based on color, features based on strength, statistical features,
and features based on texture. Also, as a single structure and shape-based func-
tion, the authors even integrated microaneurysm and haemorrhages [186]. A
brief overview of these features is provided in the following paragraphs:
37

Feature based on Structure and Shape The structure and shape of different
DED lesions, including haemorrhages, optic nerve damage, hard and soft ex-
udates (yellow fluid), and microaneurysms, contain these characteristics. For
example, perimeter and area, length axis, compactness, and circularity were
the shape-based characteristics employed by Zhou et.al. [247] to detect microa-
neurysms.
Feature based on Color Here characteristics are based on the image’s RGB
colors. Jaya et al.[36] employed four color-based characteristics of color fundus
images to identify hard exudates. Employing RGB color-space, they produced
histograms. These would be the values of ’R’ and ’G’ normalized extraction of
color-space luminosity and the channel ’Red-Green’.
Features with Intensity Intensity is the intensity of pixels represented in the
planes of R, G, and B. For example, for identifying cotton-wool spots in DR
pictures, Bui et al. [27] utilized features with intensity. Likewise, by measuring
min and max pixels levels of intensity to identify soft and hard exudates, Joshi
et al. [95] utilized intensity characteristics.
Statistical characteristics For statistical approaches of the pixels in dia-
betic eye disease images, statistical characteristics are being employed. Xiao
et al. [227] employed statistical parameters and color characteristics to diagnose
haemorrhages in fundus photographs. Mean, max, min, and deviation values
were the statistical characteristics used.
Characteristics dependent on textures These characteristics provide valu-
able details about the texture of the photos of diabetic retinopathy. Many au-
thors use color fundus image gray levels of intensity via GLCM (Gray Level
38

Co-occurrence Matrix). 4 GLCM-based characteristics, namely entropy, cluster
hue, disparity, and similarity, have been used by Vanithamani et al. [216]. Like-
wise, GLCM was used to extract textural features by Nijalingappa et al. [129],
including correlation, difference variance, energy, sum variance, homogeneity,
entropy, sum entropy, contrast, sum average, difference entropy, an opposite
period of variance.
The authors used distinct characteristics in machine learning techniques
in the selected studies, namely appearance, color, strength, quantitative and
texture-based characteristics. Statistical and shape-based features are the most
commonly used combination of features. With this knowledge, we can infer that
the most discriminatory features in DED detection algorithms are form, quan-
titative and texture-dependent characteristics that can yield impressive results
for researchers in DED classification and detection based on machine learning.
2.4.2 Review of machine learning algorithms
The authors used various machine learning techniques to build the DED classi-
fication model in the selected primary studies about ML approaches. This seg-
ment is therefore committed to addressing the techniques of machine learning
utilized in chosen research papers. Many of the researchers in previous work
have utilized 11 discrete machine learning models, such as (RF) Random Forest,
Support Vector Machine (SVM), k-Nearest Neighbor (kNN), Naive Bayes (NB),
Local Linear Discrimination Analysis (LLDA), Decision Tree (DT), Artificial
Neural Networks (ANN), Self-adaptive Resource Allocation Network (SRAN),
AdaBoost (AB), Ensemble Classifiers and Unsupervised Classifiers (UC). The
39

following section discusses the specifics of these techniques.
Random Forest Algorithm: One of the most common and efficient classifi-
cation algorithms for machine learning is RF. It produces forests with DT. More
the number of trees, in general, the more stable the prediction is. Each tree pro-
vides a classification vote to identify a new model based on characteristics, and
the design saved with the tree name. The forest determines the category with
the most enormous amount of votes. In many other terms, the algorithm for RF
classification is identical to the bagging strategy. In RF, a training set sub-set is
generated for each sub-set a DT is developed. So all the DTs identify each in-
put sequence for the test set, the forest eventually selects the one with the most
votes. Xiao et al. [227] employed RF classifier in retinal fundus images for haem-
orrhage detection. They utilized the DIARETDB1 dataset, which contained 55
images and other 35 images from a unique dataset. They utilized 70 percent of
the total images for the training of the machine learning framework, and the 30
percent images have been used for RF model for validation and categorization.
Test results demonstrated good sensitivity by utilizing the RF algorithm.
Support Vector Machine Algorithm: A SVM is a machine learning algo-
rithm that is used for classification purposes. It traces a distance measure (hy-
perplane) in the dataset close to the points located (support vectors). There
have been two groups, A (+ve) and (-ve), describing the nearest distance to the
extreme positives and negatives. The area that divides classes A (+ve) and (-ve)
is generally referred to as the hyper-plane, in which part of the field comprises
class A (+ve) while the other comprises class A (-ve).
For example, across several research [34, 127, 187, 197, 228], the researchers
used SVM algorithms to identify various lesions of DED. Furthermore, using
40

the SVM, the authors have recorded better classification results. The efficiency
of SVM, Scaled Conjugate Gradient Back Propagation Network and General-
ized Regression Neural Network models for detecting and classification of ex-
udates in retinopathy images was compared by Vanithamani et al. [216]. The
researchers used the DIARETDB1 dataset containing 40 train images and 40
test images in the experimental setup. The experimental results showed that
compared to Scaled Conjugate Gradient Back Propagation Network and Gen-
eralized Regression Neural Network algorithms, the SVM algorithm achieved
better classification effectiveness. To identify hard exudates, Jaya et al. [93] em-
ployed a Fuzzy SVM algorithm using a complete dataset of diabetic retinopa-
thy retinal fundus images obtained from various clinical imaging centers. The
repository contains 200 eye retinal fundus images. Their machine learning net-
work was trained on 75 images and checked on all 200 images.
As per the observational data, relative to conventional SVM, Fuzzy SVM had
better discriminatory capacity. Two classification methods, specifically, DT and
SVM, were used by Carrera et al. [] to classify diabetic retinopathy into four
groups. They utilized a subset of 400 images of Messidor’s dataset, and the re-
sults showed that SVM outperformed DT. A section of Messidor’s dataset con-
sisting of 370 images was also used by Mahendran et al. [120] to identify them
according to their severities. They utilized 150 images for instruction in their
studies, while 220 images were used for research purposes. Individuals ana-
lyzed the accuracy achieved by SVM and Probabilistic Neural Network, where
better classification efficiency was shown by the SVM algorithm. Wu et al. [226]
used the ROC dataset to compare the SVM, kNN, and LLDA microaneurysm
recognition algorithms’ performance. Their experimental procedure included
50 images for training and 50 test images of their algorithm. Their findings
41

showed that, compared to kNN and LLDA, the SVM classifier’s efficiency was
much higher.
k-nearest neighbor Algorithm: kNN method is the primary and most
straightforward classification algorithm for machine learning. It categorizes ar-
tifacts in the feature vector present in the training dataset, depending on the
closest instances. ”k” indicates the proportion of neighbors nearest to the clas-
sification model to make its prediction.
Among the forty machine learning papers chosen, the kNN algorithm was
used in many studies. For the classification of diabetic retinopathy into its sever-
ity ranges, Nijalingappa et al. [129] employed kNN algorithms. In their ex-
periments, 169 images were used, namely DIARETDB1 and Messidor, and an
entire dataset from two public datasets. With 119 images, they trained the ma-
chine learning model and evaluated them on the other 50 image data. With the
kNN algorithm, the classification results obtained are very satisfactory. Wang
et al. [220] correlated kNN, NB and SVM, classification algorithms in fundus
images to localize microaneurysms.
They used three datasets for research, including DIARETDB1, ROC, and a
complete dataset from Moorfields Eye Clinic. The test results demonstrated that
the other two machine learning algorithms, NB and SVM, were outperformed
by the kNN algorithm. Likewise, in two public datasets of diabetic retinopathy,
namely DIARETDB0 and DIARETDB1, Rahim et al. [159] contrasted the find-
ings of DT, kNN, and SVM for microaneurysm detection. In contrast with SVM,
the obtained results showed that kNN and DT performed better.
Local linear discrimination analysis One of the most widely used tech-
42

niques of classification and dimensional reduction is LLDA. It is used to dis-
criminate between different classes. LLDA projects a line that necessarily re-
tains ways that are essential for the classification of data. It requires projection
to a line so that information from various groups are segregated.
In the chosen primary machine learning tests, LLDA was used only once.
Wu et al. [226] used the LLDA algorithm for detecting microaneurysms and
compare these results on the ROC dataset with two other machine learning al-
gorithms, namely SVM and kNN. The LLDA method was unable to function
effectively, as per their experimental findings, and when compared to LLDA
and kNN, SVM demonstrated high performance.
Naive bayes The classification technique for NB is a probability-based algo-
rithm. It operates on numerical information, and that in the categories generates
a probabilistic model. It only requires a small amount of numerical information
for the classification prediction. It is, therefore, a fast and convenient algorithm
for classification.
In the selected studies, the NB method was also utilized once only. Wang
et al. [220] analyzed three identification techniques to predict microaneurysms,
namely kNN, SVM, and NB. In two public and exclusive data collection, they
conducted their experiments. The NB algorithm was unable to classify images
of microaneurysms better than conventional classification techniques, and in
their experimental conditions, kNN was more suitable.
Artificial neural networks There are typically three main layers of the ANN,
called the input, hidden, and output layer. There are several nodes in the input
and hidden layers, and the output layer includes just one node. An activation
43

node is a neuron in a neural network. The input layer forwards patterns where
actual processing is performed to the hidden layer. In the hidden layer, arbitrary
weights are allocated to the nodes. The hidden layer is attached to the output
layer that the result is responsible. This can be regarded as a sigmoid function,
which generates one output and takes multiple inputs. In the relevant literature,
different varieties of ANN were used by different authors, including,
• Generalized Regression Neural Network;
• Scaled Conjugate Gradient Back Propagation Network;
• Probabilistic Neural Network;
• Multi-Layer Perceptron (MLP) and Lattice Neural Network;
• Pattern Recognition network;
• Levenberg-Marquardt neural network;
• Hopfield Neural Network;
• Probabilistic Neural Network;
• Feedforward Backpropagation Neural Network;
• Radial Basis exact fit;
• Radial Basis fewer neurons;
• Meta-cognitive Neural Network;
• Radial Basis Neural Network.
A specific ANN classification method on fundus retinal images has been
used by several authors and achieved more reliable results. Authors have used
a single ANN algorithm in [10, 27, 95] and have stated this to be a more robust
44

classification technique in the diabetic retinopathy image classification domain.
Shirbahadurkar et al. [180] contrasted Levenberg-Marquardt NN with SVM and
demonstrated that the Levenberg-Marquardt neural network algorithm’s clas-
sification efficiency was superior in their experimental design. They used the
DIARETDB1 database and carried out their lesion-level experiments. Using
652 specimens derived from the corpus, they trained their machine learning
model and evaluated them with the same number of specimens. The test results
demonstrated that with greater precision, the Levenberg-Marquardt neural net-
work algorithm outperformed the support vector machine. Santhi et al. [167]
and Ganesan et al. [63] contrasted the Probabilistic NN to various classifiers, and
they reported after experimenting that the efficiency of the Probabilistic Neural
Network classification model in their experimental design was more substantial
than the others.
Decision tree Algorithm A DT is a general technique which is used partic-
ularly for problems with classification. This one has a tree structure, in which a
node represents a reflection of an attributes test, a section signifies a test result,
and a class mark is included in the terminal node. A root-node is the top-most
node in a tree. A DT is used in strategic planning to describe the decisions. In
DT, grouping, in a tree-like framework, is performed hierarchically. A few of the
benefits of DT is that it includes little to no preparation of data. The drawback of
DT is that over-complex DTs are often made, also recognized as overfitting. DTs
can become unpredictable because merely the absence in the data can generate
a complete variance in the information. Thus, several trees-based frameworks
were implemented for improving performance of DTs, i.e. RF. Rahim et al. [159]
measured the effectiveness of decision tree, k-near neighbor, and support vector
machine to identify microaneurysms employing DIARETDB0 and DIARETDB1
45
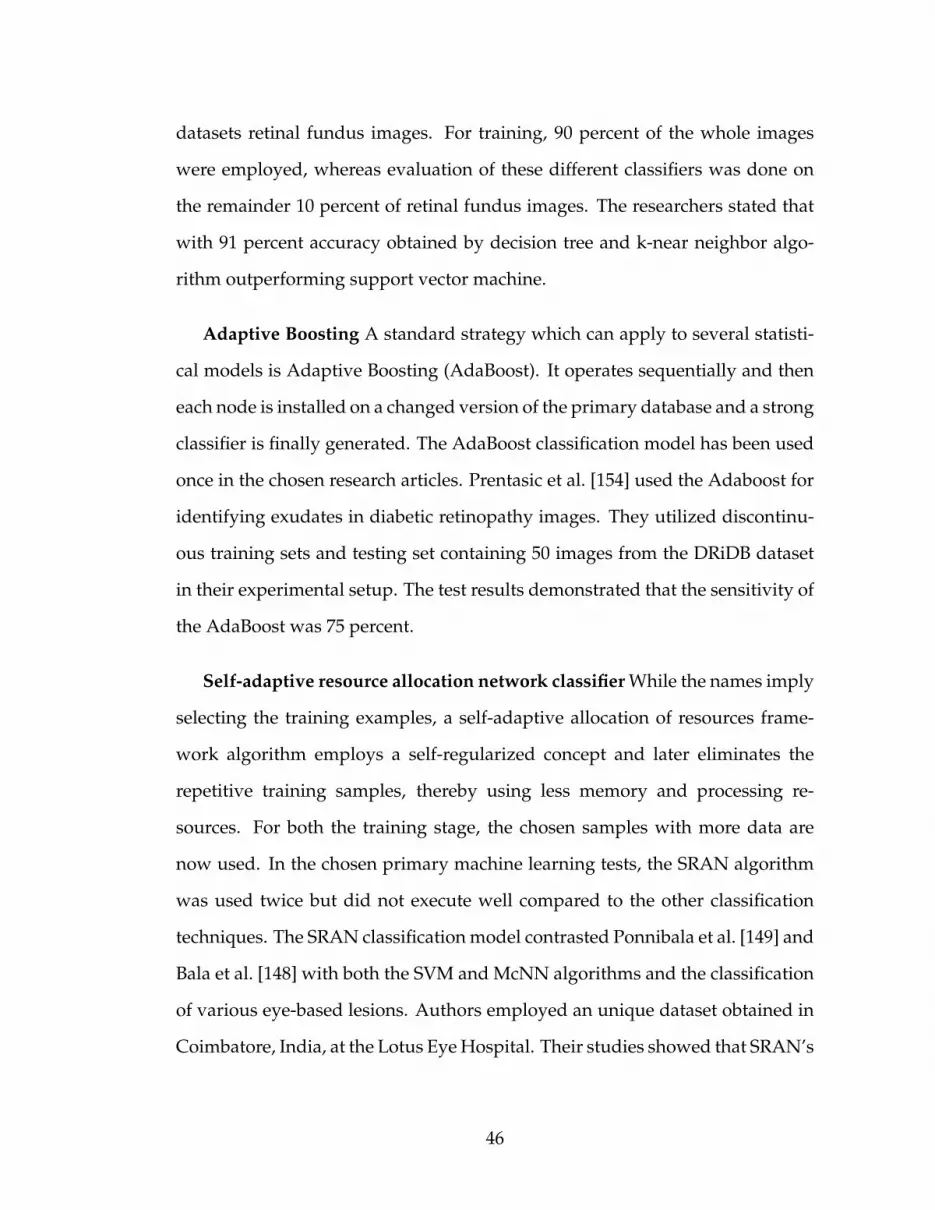
datasets retinal fundus images. For training, 90 percent of the whole images
were employed, whereas evaluation of these different classifiers was done on
the remainder 10 percent of retinal fundus images. The researchers stated that
with 91 percent accuracy obtained by decision tree and k-near neighbor algo-
rithm outperforming support vector machine.
Adaptive Boosting A standard strategy which can apply to several statisti-
cal models is Adaptive Boosting (AdaBoost). It operates sequentially and then
each node is installed on a changed version of the primary database and a strong
classifier is finally generated. The AdaBoost classification model has been used
once in the chosen research articles. Prentasic et al. [154] used the Adaboost for
identifying exudates in diabetic retinopathy images. They utilized discontinu-
ous training sets and testing set containing 50 images from the DRiDB dataset
in their experimental setup. The test results demonstrated that the sensitivity of
the AdaBoost was 75 percent.
Self-adaptive resource allocation network classifier While the names imply
selecting the training examples, a self-adaptive allocation of resources frame-
work algorithm employs a self-regularized concept and later eliminates the
repetitive training samples, thereby using less memory and processing re-
sources. For both the training stage, the chosen samples with more data are
now used. In the chosen primary machine learning tests, the SRAN algorithm
was used twice but did not execute well compared to the other classification
techniques. The SRAN classification model contrasted Ponnibala et al. [149] and
Bala et al. [148] with both the SVM and McNN algorithms and the classification
of various eye-based lesions. Authors employed an unique dataset obtained in
Coimbatore, India, at the Lotus Eye Hospital. Their studies showed that SRAN’s
46

performance in their experiments was unsatisfactory, although McNN provided
them with better precision.
Unsupervised classifiers Unsupervised classification is currently used
where existing information is not available. Just the set of data and the features
corresponding to such cases are identified in that scenario. A very methodol-
ogy is intended to examine groups of items in the pixel values in unsupervised
learning, generally achieved with protocols for clustering.
In the selected studies, unsupervised classification algorithms were em-
ployed many times. Zhou et al. [247] used an unsupervised microaneurysm
identification classification using the ROC database comprising 100 images.
They used half the pictures in their tests for preparation and a half for eval-
uation. The study noted that, in their observational data, unsupervised clas-
sification methods obtained fair efficiency. Likewise, Kusakunniran [106] and
Biyani [23] used an unsupervised classification model to identify exudates in
diabetic retinopathy images and recorded that the unsupervised classification
algorithms provided 89 percent and 88 percent of sensitivities.
Ensemble classifiers The learning algorithm may be referred to as group
learning, in which many classification techniques merge to construct a more
precise model. This can be achieved, i.e., bagging and enhancing, in 2 ways.
Numerous classification methods work in parallel during bagging and eventu-
ally decide the most reliable one. The final classification model becomes one
with a plurality vote. Similar classification algorithms are used in series dur-
ing boosting. The weights are modified based on the previous model for each
model. Firstly, the dataset is partitioned into several sections, and using others,
one of them is validated and so on.
47
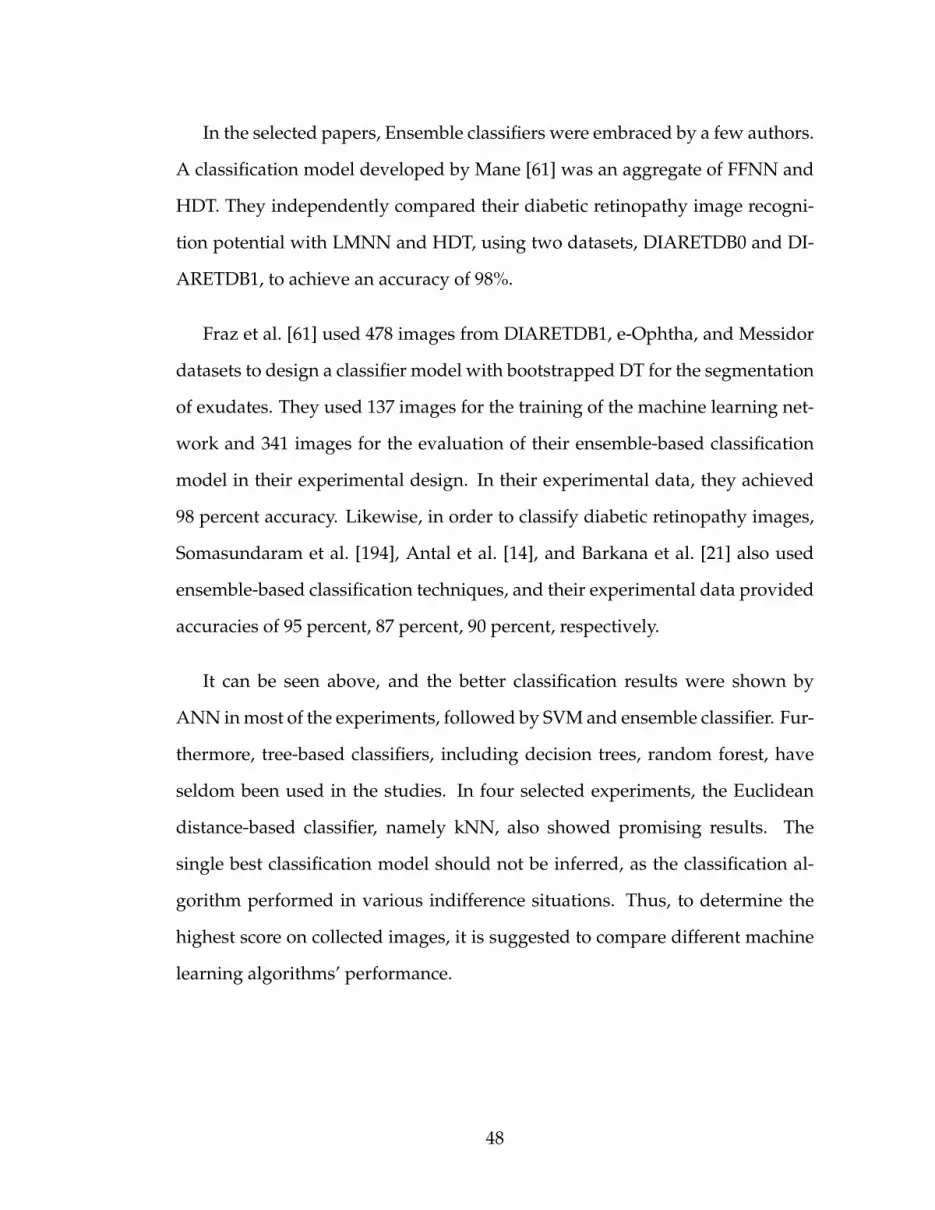
In the selected papers, Ensemble classifiers were embraced by a few authors.
A classification model developed by Mane [61] was an aggregate of FFNN and
HDT. They independently compared their diabetic retinopathy image recogni-
tion potential with LMNN and HDT, using two datasets, DIARETDB0 and DI-
ARETDB1, to achieve an accuracy of 98%.
Fraz et al. [61] used 478 images from DIARETDB1, e-Ophtha, and Messidor
datasets to design a classifier model with bootstrapped DT for the segmentation
of exudates. They used 137 images for the training of the machine learning net-
work and 341 images for the evaluation of their ensemble-based classification
model in their experimental design. In their experimental data, they achieved
98 percent accuracy. Likewise, in order to classify diabetic retinopathy images,
Somasundaram et al. [194], Antal et al. [14], and Barkana et al. [21] also used
ensemble-based classification techniques, and their experimental data provided
accuracies of 95 percent, 87 percent, 90 percent, respectively.
It can be seen above, and the better classification results were shown by
ANN in most of the experiments, followed by SVM and ensemble classifier. Fur-
thermore, tree-based classifiers, including decision trees, random forest, have
seldom been used in the studies. In four selected experiments, the Euclidean
distance-based classifier, namely kNN, also showed promising results. The
single best classification model should not be inferred, as the classification al-
gorithm performed in various indifference situations. Thus, to determine the
highest score on collected images, it is suggested to compare different machine
learning algorithms’ performance.
48

2.5 Deep Learning in Diabetic Eye Disease Classification
In this section, we review the DL based approaches for DED detection. DL is
defined as the extension of the ML with a multilayer network for extracting fea-
tures. In DL architecture the term ”deep” refers to the depth of the layers. The
classification process is as follows: (i) The annotated dataset is split into test-
ing and training samples for DL architecture, (ii) The dataset is preprocessed
using image preprocessing techniques for quality enhancement and (iii) The
preprocessed images are fed into DL architecture for features extraction and
subsequent classification. Each layer in DL architecture considers the output
of the previous layer as its input, processes it and passes it onto the next layer.
Many authors fine tune the hyperparameters of existing DL algorithms, such
as VGG16 or CNN, to improve classification performance. Hyperparameter ob-
served in this study is shown in Table 2.4. Finally, the last layer of the archi-
tecture produces the required result, i.e. classification of DED as for the scope
of the study. Out of 65 studies, 38 used TL, 21 used their proposed DL and six
used a combination of DL and ML classifiers such as RF, SVM, Backpropagation
Neural Network (BPNN).
2.5.1 Convolutional Neural Networks
An alternative to TL is the new network development by the researchers. Out
of 65 studies, 21 of them have designed their DL architectures for automated
detection of DED. Table 2.5 presents the list of studies, where the researchers
have employed their own built DL models with the classifier indicated, number
of layers, model used and results obtained.
49

Diabetic Retinopathy Doshi et al. [55] detected the severity of diabetic
retinopathy using the 29 layers CNN model and detected five stages of DR, and
three CNN achieved an accuracy of 39.96% on kappa matrix. Gargeya et al. [66]
identified diabetic retinopathy using the DL approach. They achieved AUC of
94%, specificity of 87% and sensitivity of 93%. Ghosh et al. [68] employed a 28
layers CNN for two and five class classification of diabetic retinopathy. Using
Softmax they achieved an accuracy of 95% for two class and 85% of accuracy for
five class classification. Jiang et al [94] classified two classes of diabetic retinopa-
thy using fundus images. They used 17 layers deep CNN on the Caffe frame-
work and achieved an accuracy of 75.7%. Pratt et al. [153] employed a CNN
architecture to identify the severity level of DR. They achieved an accuracy of
75%, specificity of 30% and sensitivity of 95% using Softmax classifier. Xu et
al. [229] employed a 16 layer model for early detection of DR. Using Softmax
classifier they achieved an accuracy of 94.50%. Yang et al. [232] employed local
and global CNN architectures. Local CNN (10 layers) was used for lesion de-
tection and the global CNN (26 layers) for grading DR. The authors achieved
an AUC of 0.9687, specificity of 89.80% and sensitivity of 95.90%. Yu et al. [240]
detected exudates using 16 layers CNN. With Softmax classifier, they achieved
an accuracy of 91.92%, specificity of 96% and sensitivity of 88.85%. Torre et
al. [48] used 17 layered CNN architecture obtaining specificity of 90.8% and
sensitivity of 91.1%. Pires et al. [147] proposed 16 layer CNN architecture. They
used Messidor-2 and DR2 dataset to test the model. With the neural networks
classifier, they achieved AUC of 96.3% in the DR2 dataset and AUC of 98.2% in
Messidor-2 and with the Random Forests classifier, they achieved AUC of 96.1%
in DR2 dataset and AUC of 97.9% in Messidor-2.
Hemanth et al. [83] proposed a hybrid method based on using both image
50

processing and DL for improved results. using 400 retinal fundus images within
the MESSIDOR [50] database and average values for different performance
evaluation parameters were obtained an accuracy 97%, sensitivity (recall) 94%,
specificity 98%, precision 94%, FScore 94% and geometric mean (GMean) 95%.
Glaucoma Chen et al. [38] developed six layer CNN model. With the Soft-
max classifier they achieved an AUC of 83.1% and 88.7% in ORIGA [244] and
SCES datasets. Raghavendra et al. [158] build an eighteen layer CNN frame-
work to diagnose Gl using 1426 fundus images in where 589 were normal
and 937 were with glaucoma. They achieved an accuracy of 98.13%, sensitiv-
ity of 98% and specificity of 98.3%. Abhishek et al. [139] introduced a novel
multi-model DL network named G-EyeNet for glaucoma detection using DRI-
ONS [30] and Drishti-GS [190] datasets. Their experimental findings revealed
an AUC of 92.3%.
Diabetic Macular Edema Al-Bander et al. [7] proposed a CNN system to
grade the severity of DME using fundus images using the MESSIDOR [50]
dataset of 1200images. They obtained an accuracy of 88.8%, sensitivity of
74.7% and specificity of 96.5% respectively. Prentavsic et al. [155] introduced
a novel supervised CNN based exudate detection method using the DRiDB
dataset [156]. The proposed network consists of 10 alternating convolutional
and max-pooling layers. They achieved sensitivity of 78%, Positive Predic-
tive Value (PPV) of 78% and FSc of 78% respectively. Tan et al. [204] used
the CLEOPATRA [189] image dataset. They obtained sensitivity of 87.58% and
specificity of 98.73% respectively.
Cataract Zhang et al. [242] proposed eight layers of DCNN architecture.
With Softmax classifier, they achieved an accuracy of 93.52% and 86.69%. Dong
51

et al. [54] used Softmax classifier with five layer CNN architecture and achieved
an accuracy of 94.07% and 81.91%, respectively.
Table 2.5: Studies employing new network for automatic DED detection.
DED Classifier Model Layers Ref. Results
DR Softmax CNN 29 [55] KS c = 39.96%Decision Trees CNN 6 [66] AUC = 94%, S E = 93%, S P =
87%Softmax CNN 28 [68] ACC = 85%, KS c = 75.4%, Prec =
88.20%, S E = 95%Softmax CNN 17 [94] ACC = 75.70%Softmax CNN 13 [153] S E = 95%, S P = 30%Softmax CNN 16 [229] ACC = 94.5%Softmax CNN 10 [232] AUC = 96.87%, S E = 95.90%,
S P = 89.90%Softmax CNN 16 [240] ACC = 91.92%, S E = 88.85%,
S P = 96%Softmax CNN 17 [48] S E = 91.1%, S P = 90.8%Softmax CNN 16 [147] AUC = 96.1%Softmax CNN 8 [83] ACC = 97%, S E = 94%, S P =
98%, Prec = 94%, FS c = 94%,GMean = 95%
Gl Softmax CNN 6 [38] AUC = 83.1%, 88.7%Softmax CNN 18 [158] ACC = 98.13%, S E = 98%, S P =
98.3%Softmax CNN 6 [139] AUC = 92.3%Softmax CNN 6 [176] ACC = 90%, S E = 96%, S P =
84%Softmax CNN 12 [185] AUC = 8.31%, 88.7%
DME Softmax CNN 13 [7] ACC = 88.8%, S E = 74.7%, S P =
96.5%Softmax CNN 10 [155] S E = 78%, PPV = 78%, FS c =
78%Softmax CNN 10 [204] S E = 87.58%, S P = 98.73%
Ca Softmax CNN 8 [242] AUC = 93.52%Softmax CNN 5 [54] ACC = 94.07%, 81.91%
Legend: CNN = Convolutional Neural Network, SSAE = Stacked SparseAuto Encoder, ACC = Accuracy, SE = Sensitivity, SP = Specificity, AUC =Area Under Curve, FSc = F-Score, KSc = Kappa Score, Prec = Precision, PPV= Positive Predictive Value, GMean = Geometric mean.
52

Table 2.6: Studies employing combined DL and ML for automatic DED detec-tion.
DED Model Layers Features Ref. Classifier Results
DR CNN 3 DColor-SIFT, GLOH [1] Softmax AUC = 92.4%, S E =
92.18%, S P = 94.50%CNN 10 Shape, Intensity [136] RF AUC = 93.47%, S E =
97.21%DBN 3 Shape, Intensity [15] SVM ACC = 96.73%, S E =
79.32%, S P = 97.89%
Gl CNN 23 - [8] RF ACC = 88.2%, S E = 85%,S P = 90.8%
Ca DCNN 17 Shallow, residual, pooling [160] RF ACC = 90.69%CNN 2 Wavelet, Sketch, Texture [231] SVM, BPNN ACC = 93.2%, 84.5%
Legend: CNN = Convolutional Neural Network, DBN = Deep Belief Net-work, RF = Random Forests, SVM = Support Vector Machine, BPNN = Back-Propagation Neural Network, SE = Sensitivity, SP = Specificity, AUC = AreaUnder Curve, Acc = Accuracy, DColor-SIFT = Dense Color Scale-InvariantFeature Transform, GLOH = Gradient Location Orientation Histogram.
2.5.2 Transfer Knowledge
The concept of TL is based on the reuse of the features learned by DL models on
the primary task and its adaptation to the secondary task. The idea is to reduce
the computational complexity while training Neural Network architecture (re-
source intensive). Additionally, TL is found to be beneficial in cases where there
is insufficient data to train a Neural Network from scratch (high volume of data
required). Using TL, the parameters are initialized from the prior learning in-
stead of random generation. Intuitively, the first layers learn to extract basic
features such as edges, textures, etc., while the top layers are more specific to
the task, e.g. blood vessels and exudates. Therefore, TL is commonly adopted
in image recognition applications as the initial features extracted are shared re-
gardless of the tasks. Table 2.7 shows the records of works, which applied TL for
the detection of DED. The details regarding a particular type of DED recogni-
tion, network architecture and model used were further extracted. Additionally,
53

the classification results were retrieved for the comparison between the studies
and state of the art overview. Overall, 38 of the 65 studies adopted the TL ap-
proach for the detection of DED through DL (19-DR, 15-Gl, 3-DME and 1-Ca).
Diabetic Retinopathy Abramoff et al. [3] used a CNN model based on
AlexNet with RF classifier for the detection of DR. Using Messidor-2 data they
achieved AUC of 98.0%, sensitivity of 96.8%, specificity of 87.0% and the pre-
dictive negative value was 99.0%. Choi et al. [42] used a STARE dataset [57] to
perform the binary classification (normal and abnormal) for 10 retinal diseases.
They used VGG-19 architecture with SGD optimizer with Random Forests clas-
sifier and achieved AUC of 90.3%, sensitivity of 80.3% and specificity of 85.5%.
Ting et al. [209] used VGGNet architecture to classify DR and other diseases
like Age-related Macular Degeneration (AMD) and Gl. They collected dataset
from the Singapore National Diabetic Retinopathy Screening Program (SIDRP)
from 2010 to 2013 and achieved AUC of 93%, specificity of 91.6% and sensitiv-
ity of 90.5%. For the Gl, they achieved AUC of 94.2%, specificity of 87.2% and
sensitivity of 96.4%. Last, for the referable DME, they achieved sensitivity of
92%. Quellec et al. [157] and Gondal et al. [73] used a 26 layered o O solution
proposed by Bruggemann and Antony 1, which ranked second in DR Kaggle
competition. [157] achieved AUC of 95.4% on the Kaggle dataset and on the e-
ophtha dataset they obtained AUC of 94.9%. Similarly, Gondal [73] used o O
solution to detect DR lesions such as red dots, soft exudates, hemorrhages and
microaneurysms. They replaced the last dense layer to the global average pool-
ing layer. They achieved AUC of 95.4% on the DIARETDB1 dataset. Gulshan et
al. [75] detected DR using Inception-v3 on the Kaggle dataset and also datasets
collected from three Indian hospitals. They achieved specificity of 98.2% and
1https://www.kaggle.com/c/diabetic-retinopathy-detection/discussion/15617
54

sensitivity of 90.1% for a moderate and worse stage of DR respectively. Man-
sour et al. [121] modified AlexNet for the classification of 5 stages of DR. They
achieved an accuracy of 97.93%, specificity of 93% and sensitivity of 100% on the
Kaggle dataset. Roy et al. [161] used the Random Forest classifier on the Kag-
gle dataset and achieved a Kappa Score 2 (KSc) of 86%. Li et al. [114] detected
exudates using a modified U-Net. U-Net was designed for the segmentation
of neuronal membranes. They modified the architecture using unpooling lay-
ers rather than deconvolutional layers of U-Net. The authors trained the model
using the e-ophtha dataset and achieved AUC of 96% on DIARETDB1. X. Li
et al. [116] used various pretrained CNN models such as AlexNet, GoogLeNet
and VGGNet. They achieved an AUC of 98.34%, accuracy of 92.01%, specificity
of 97.11% and sensitivity of 86.03%. They achieved an AUC of 97.8% and KSc
of 77.59%, following accuracy of 95.21%, specificity of 97.80% and sensitivity
of 77.79%, respectively. Perdomo et al. [144] classified normal DR images and
images with exudates using LeNet architecture. Using the e-ophtha dataset the
authors achieved an accuracy of 99.6%, specificity of 99.6% and sensitivity of
99.8%. Takahashi et al. [203] applied a modified GoogLeNet for detecting vari-
ous stages of DR. They modified GoogLeNet by deleting the five accuracy layers
and reduced the batch size to four and achieved an accuracy of 81% and Kappa
value of 74%. Van et al. [215] used a nine layered CNN, which consisted of
five convolution layers with 32 filters inspired by OxfordNet. They achieved
AUC of 97.2%, specificity of 91.40% and sensitivity of 91.90% using the Messi-
dor dataset [50]. Sayres et al. [172] classified five different stages of DR with an
accuracy of 88.4%. The accuarcy on the normal images was 96.9% and accuracy
on images with mild and worse NPDR was 57.9%. Umapathy et al. [212] used
2Diabetic Retinopathy Detection, Evaluation Available; https://www.kaggle.com/c/diabetic-retinopathy-detection/overview/evaluation
55

images from STARE [57], HRE, MESSIDOR [50] and images acquired from the
Retina Institute of Karnataka datasets. The authors proposed two methods for
automated detection, Decision Trees classifier and TL. They retrained the last
layer of Inception-V3 to classify the normal and DR images. They achieved an
accuracy of 88.8%. Nguyen et al. presented an automated method of DR screen-
ing using DL models such as CNN, VGG-16 and VGG-19. The system classifies
five categories of DR range 0-4, in which 0 is no DR and 4 is PDR. They ob-
tained an AUC of 90.4%, sensitivity of 80%, specificity of 82% and accuracy of
82% respectively.
Glaucoma A number of studies have been conducted for the automated de-
tection of Gl using TL. Phan et al. [146] applied the Deep Convolutional Neural
Network to 3,312 images, which consisted of 369 images of Gl eyes, 256 Gl-
suspected images and 2687 images of non-glaucoma eyes 3. The AUC achieved
was 90%. Ghamdi et al. [9] presented a semi-supervised TL CNN model for
automatic detection of Gl. They used the RIM-ONE [62] database and achieved
an accuracy of 92.4%, specificity of 93.3% and sensitivity of 91.7%. Asaoka et
al. [17] used ResNet architecture and tested two datasets obtained from multi-
ple institutes. They used the method of data augmentation to increase the data
volume and measure their accuracy using the area under the receiver operat-
ing characteristic curve (AROC). Hence, they obtained two results, an AROC
of 94.8% in an augmented dataset and an AROC of 99.7% in a dataset with-
out augmentation. An et al. [13] used TL to detect Gl using color fundus im-
ages and 3 dimensional optical coherence tomography (OCT). To evaluate the
model AUC the tenfold cross-validation (CV) was used. The Random Forest
combined with five separate CNN models improved tenfold CV AUC to 96.3%.
3Data Collected; Yamanashi University glaucoma outpatient clinic and Yamanashi KoseirenHospital
56
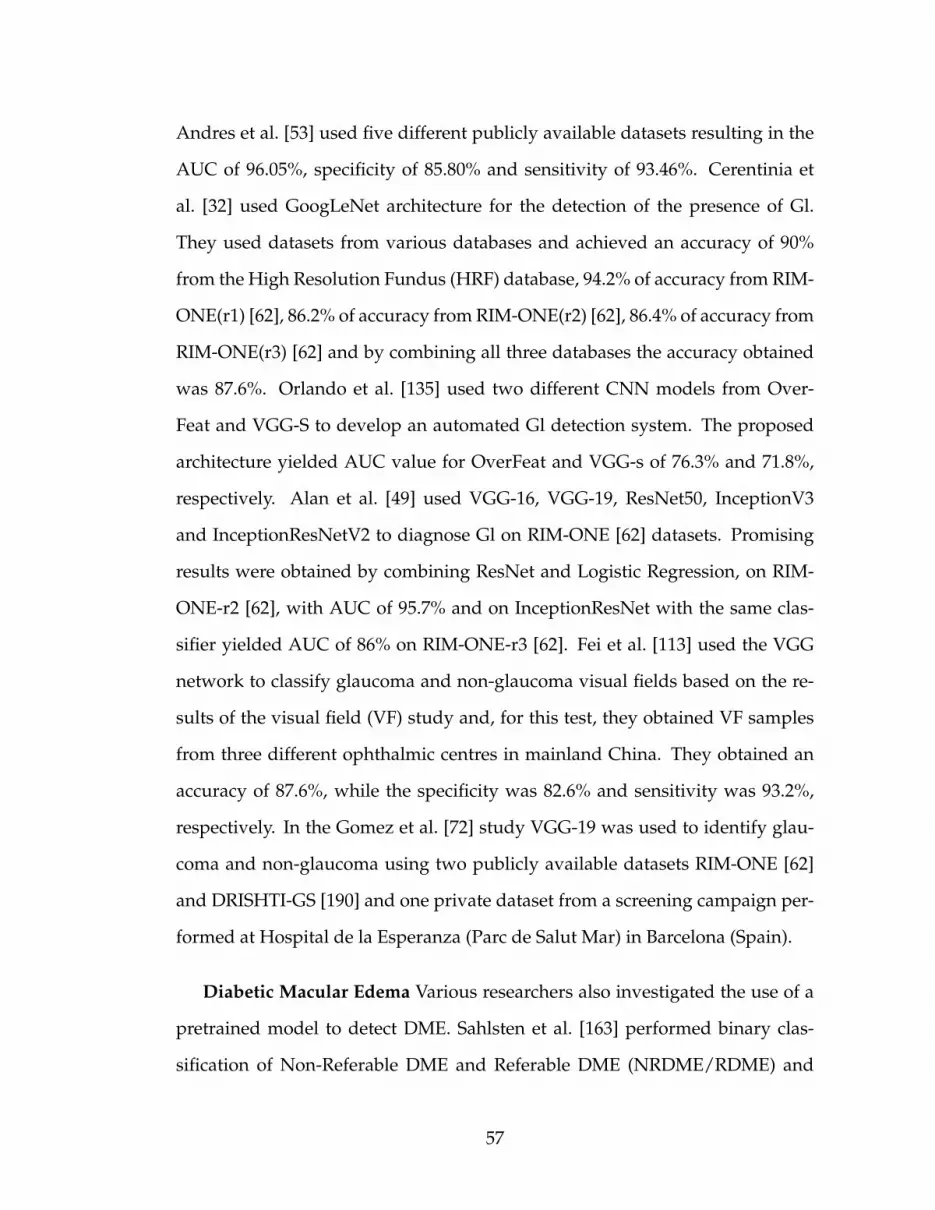
Andres et al. [53] used five different publicly available datasets resulting in the
AUC of 96.05%, specificity of 85.80% and sensitivity of 93.46%. Cerentinia et
al. [32] used GoogLeNet architecture for the detection of the presence of Gl.
They used datasets from various databases and achieved an accuracy of 90%
from the High Resolution Fundus (HRF) database, 94.2% of accuracy from RIM-
ONE(r1) [62], 86.2% of accuracy from RIM-ONE(r2) [62], 86.4% of accuracy from
RIM-ONE(r3) [62] and by combining all three databases the accuracy obtained
was 87.6%. Orlando et al. [135] used two different CNN models from Over-
Feat and VGG-S to develop an automated Gl detection system. The proposed
architecture yielded AUC value for OverFeat and VGG-s of 76.3% and 71.8%,
respectively. Alan et al. [49] used VGG-16, VGG-19, ResNet50, InceptionV3
and InceptionResNetV2 to diagnose Gl on RIM-ONE [62] datasets. Promising
results were obtained by combining ResNet and Logistic Regression, on RIM-
ONE-r2 [62], with AUC of 95.7% and on InceptionResNet with the same clas-
sifier yielded AUC of 86% on RIM-ONE-r3 [62]. Fei et al. [113] used the VGG
network to classify glaucoma and non-glaucoma visual fields based on the re-
sults of the visual field (VF) study and, for this test, they obtained VF samples
from three different ophthalmic centres in mainland China. They obtained an
accuracy of 87.6%, while the specificity was 82.6% and sensitivity was 93.2%,
respectively. In the Gomez et al. [72] study VGG-19 was used to identify glau-
coma and non-glaucoma using two publicly available datasets RIM-ONE [62]
and DRISHTI-GS [190] and one private dataset from a screening campaign per-
formed at Hospital de la Esperanza (Parc de Salut Mar) in Barcelona (Spain).
Diabetic Macular Edema Various researchers also investigated the use of a
pretrained model to detect DME. Sahlsten et al. [163] performed binary clas-
sification of Non-Referable DME and Referable DME (NRDME/RDME) and
57

achieved AUC of 98.7%, specificity of 97.4% and sensitivity of 89.6% in binary
classification using TL.
Cataract Finally, cataract detection using DL was performed by Pratap et
al. [152]. Authors have collected data from various sources such as HRF, STARE
[57], DIARETDB0, MESSIDOR [50], FIRE, etc. In total, they collected 800 images
(200 - normal, 200 - mild, 200 - moderate, 200 - severe). The accuracy achieved
was 92.91%.
2.5.3 Combined Deep Leaning and Machine Learning
Out of 65 studies, six proposed a combination of DL and ML classifiers. Ta-
ble 2.6 shows the studies in which the authors applied a combination of DL
and ML classifiers namely: RF, SVM and BPNN based architectures for DED
detection. Abbas et al. [1] developed a DL Neural Network (DLNN) to dis-
cover the severity degree of DR in fundus images using studying Deep Visual
Features (DVFs). For feature extraction, they used Gradient Location Orien-
tation Histogram (GLOH) and Dense Color Scale Invariant Feature Transform
(DColor-SIFT). They converted the features through the use of Principle Com-
ponent Analysis (PCA). Afterwards, a three layer deep neural network was
used to learn these features and subsequently, an SVM classifier was applied
for the classification of DR fundus images into five severity stages, includ-
ing no-DR, moderate, mild, severe NPDR (Nonproliferative Diabetic Retinopa-
thy) and PDR (Proliferative Diabetic Retinopathy). They obtained sensitivity
of 92.18%, specificity of 94.50% and AUC of 92.4% on three publicly available
datasets (Foveal Avascular Zone Messidor [50], DIARETDB1) and one extraor-
58

Table 2.7: Studies employing TL for automatic DED detection.
DED Architecture Model Ref. Results
DR AlexNet CNN [3] AUC = 98.0%, S E = 96.8%, S P =
87.0%VGGNet CNN [42] AUC = 90.3%, S E = 80.3%, S P =
85.5%VGGNet CNN [209] AUC = 93.6%, S E = 90.5%, S P =
91.6%o OS olution CNN [73] AUC = 95.4%, S E = 93.6%, S P =
97.6%Inception-V3 CNN [75] S E = 90.1%, S P = 98.2%AlexNet CNN [121] ACC = 97.93%, S E = 100%,
S P = 93%o OS olution CNN [157] AUC = 95.4%ImageNet CNN [161] KS c = 86%U-Net CNN [114] AUC = 96%AlexNet, GoogLeNet, VGGNets CNN [116] AUC = 98.34%, ACC = 92.01%,
S E = 86.03%, S P = 97.11%LeNet CNN [144] ACC = 99.6%, S E = 99.8%, S P =
99.6%GoogLeNet CNN [203] ACC = 81%, PABAK = 74%OxfordNet CNN [215] AUC = 97.2%, S E = 91.90%,
S P = 91.40%Inception-V4 CNN [172] ACC = 88.4%Inception-V3 CNN [212] ACC = 88.8%VGG-16, VGG-19 CNN [128] AUC = 90.4%, ACC = 82%, S E =
80%, S P = 82%ResNet50 CNN [117] ACC = 96.3%, AUC = 92.6%AlexNet CNN [78] ACC = 90.07%
Gl VGG19, ResNet152, DenseNet201 CNN [146] AUC = 90%VGG-16 CNN [9] ACC = 92.4%, S E = 91.7%, S P =
93.3%ResNet CNN [17] AUC = 99.7%VGG-19 CNN [13] AUC = 96.3%VGG-16,VGG-19, Inception-V3, ResNet50, Xception CNN [53] AUC = 96.05%, S E = 93.46%,
S P = 85.80%GoogLeNet CNN [32] ACC = 90.0%, 94.2%, 86.2%,
86.4%, 87.3%OverFeat, VGG-S CNN [135] AUC = 76.3%, 71.8%VGG-16, VGG-19, ResNet50, InceptionV3, InceptionResNetV2 CNN [49] AUC = 95.7%, 86.0%VGG CNN [113] ACC = 87.6%, S E = 82.6% ,S P =
93.2%VGG-19 CNN [72] AUC = 94%, S E = 87.01%, S P =
89.01%ResNet50, 101, 152 CNN [134] AUC = 84.58%, S E = 72.50%Xception CNN [134] AUC = 93.48%, S E = 85.00%VGG19 CNN [134] AUC = 88.06%, S E = 73.18%ResNet18, CatGAN CNN [134] AUC = 95.55%, S E = 89.18%ResNet CNN [134] AUC = 95.24%, S E = 85%SENet CNN [134] AUC = 95.87%, S E = 89.17%ResNet50 CNN [134] AUC = 98.17%, S E = 97.60%ResNet101, 152, DensNet169, 201 CNN [134] AUC = 93.27%, S E = 92.50%DeepLabv3 CNN [134] AUC = 95.08%, S E = 87.50%ResNet CNN [177] AUC = 96.5%InceptionV3 CNN [184] -InceptionV3 CNN [5] AUC = 92.2%, AUC =
88.6%, AUC = 87.9%
DME Inception-V3 CNN [163] AUC = 98.7%, S E = 89.6%, S P =
97.4%AlexNet CNN [102] ACC = 97.9%ResNet50 CNN [117] ACC = 91.2%, AUC = 92.4%AlexNet CNN [78] ACC = 96.85%
Ca AlexNet CNN [152] ACC = 92.91%
59

dinary dataset (from the, Hospital Universitario Puerta del Mar, HUPM, Cadiz,
Spain). Orlando et al. [136] combined ML and DL for the detection of lesions
(red). They used three public datasets, namely Messidor [50], DIARETDB1
and e-ophtha. They extracted intensity and shape as features using knowledge
transferred LeNet architecture, which consists of 10 layers. They achieved AUC
of 93.47% and sensitivity of 97.21%, respectively. Arunkumar et al. [15] em-
ployed a Deep Belief Network (DBN) for diabetic retinal image classification.
At first, with three hidden layers, the deep features were extracted with Deep
Belief Network (DBN), then those features were decreased by applying the Gen-
eralised Regression Neural Network (GRNN) technique and finally, the retinal
images were classified using SVM. On their publicly available ARIA dataset, the
authors achieved an accuracy of 96.73%, specificity of 97.89% and sensitivity of
79.32%, respectively. Al-Bander [8] used CNN for feature extraction and SVM
for Gl and non Gl classification. They achieved an accuracy of 88.2%, speci-
ficity of 90.8% and sensitivity of 85%, respectively. Ran et al. [160] used a 17
layer DCNN feature extractor, which adopts a residual network to learn more
detailed features of fundus images. The DCNN contains three modules, namely
shallow, residual and pooling. Here, the shallow and residual modules extract
features on a deep, medium and shallow level and the final feature vectors for
Random Forests are output from the pooling module. The authors detected
six classes of cataract with an accuracy of 90.69%. Last, [232] proposed 2 layers
stacking architecture with Support Vector Machine and backpropagation neural
network classifier. The ensemble classifier achieved an accuracy of 93.2% and
84.5%.
60

Table 2.8: Performance metrices employed in selected studies.
ACC AUC SE SP KSc FSc Prec PPV Pabak GMean References
3 7 3 3 7 7 7 7 7 7 [7–9, 15, 54, 113, 121, 144,158, 176, 240]
7 3 3 3 7 7 7 7 7 7 [1, 3, 42, 53, 66, 72, 73, 136,209, 215, 232]
7 7 3 3 7 7 7 7 7 7 [48, 75, 153, 204]7 7 7 7 3 7 7 7 7 7 [55, 161]3 7 3 7 3 7 3 7 7 7 [68]7 7 3 7 7 3 7 3 7 7 [155]3 7 3 3 7 3 3 7 7 3 [83]3 7 7 7 7 7 7 7 3 7 [203]3 3 3 3 7 7 7 7 7 7 [116, 128]3 7 7 7 7 7 7 7 7 7 [54, 78, 78, 94, 102, 152, 160,
172, 212, 229, 231]7 3 7 7 7 7 7 7 7 7 [5,13,17,38,49,114,135,139,
146, 147, 157, 242]
Legend: ACC = Accuracy, AUC = Area Under Curve, SE = Sensitivity, SP =Specificity, KSc = Kappa Score, FSc = F-Score , Prec = Precision, PPV = Posi-tive Predictive Value, Pabak = Prevalence And Bias Adjusted Fleiss’ Kappa,GMean = Geometric Mean.
2.5.4 Analysis and Review of Performance Evaluation metrics
Detailed description of performance measures, namely: specificity, sensitivity,
accuracy, AUC, precision, f-score, and positive predictive value can be found
in [192]. Likewise, Kappa Score, PABAK Index discussions can be found in [36],
respectively. In the majority of listed academic papers, the authors used speci-
ficity, sensitivity, accuracy and AUC as their assessment metrics to evaluate the
effectiveness of the classifier. The combined effect of performance metrics found
to be used frequently was Sensitivity, Specificity and Accuracy. This variation
was used 12 times out of a total 60 trials, accompanied by 12 uses of and sensi-
tivity, specificity, AUC and two use of sensitivity, specificity, accuracy and AUC.
Instead of Sensitivity, some researchers used Recall. We accommodated Recall
under Sensitivity, rather than using it as another success indicator. The perfor-
mance measurements frequently used include Sensitivity (32 times), Specificity
61

(25 times), Accuracy (26 times), and AUC (25 times). Other performance met-
rics not commonly used by research groups were: F-Score (twice), Precision
(twice), PABAK (once), Kappa Score (3 times), Positive Predictive Value (once)
and GMean (once).
2.6 Discussion and Observations
AI is one of the most intriguing technologies used in the material science toolset
in recent decades. This compendium of statistical techniques has already shown
that it is capable of significantly accelerating both fundamental and applied re-
search. ML, already has a rich history in biology [206, 245] and chemistry [130],
and it has recently gained prominence in the field of solid state materials sci-
ence. Presently, DL models in ML are effectively used in imaging for classifica-
tion, detection [20], segmentation [141] and pre-possessing. The most famous
and commonly employed DL architecture in the selected 65 studies is CNN,
which is used in 64 cases, while DBN is implemented once. We can infer that
CNN is currently the most preferred deep neural network, particularly for the
detection of DED as well as the diagnosis of other pathological indications from
the medical images.
We have noticed that DL performed well on binary classification tasks (eg.
DR and Non DR), whereas its performance significantly dropped when the
number of classes increased. As an example, Ghosh et al. [68] obtained an ac-
curacy of 95% on DR and Non DR classification task and accuracy of 85% on
a multi class problem (five stages of severity), with 10% loss in accuracy. Else,
Choi et al. [42] classified 10 distinct retinal diseases and achieved an accuracy
62

of 30.5%. Also, Dong et al. [54] performed cataract classification based on two
features, namely: i) features extracted using DL and ii) features extracted us-
ing wavelet. Classification for the binary problem (Cataract and Non Cataract)
achieved an accuracy of 94.07% and 81.91%. Then, the authors performed the
classification of four classes of cataract and obtained an accuracy of 90.82% and
84.17%. This shows that features extracted using wavelet increased an accuracy
of the Softmax classifier by 4% in the four class problem. Still, the overall highest
accuracy was observed for a binary classification task.
This study reveals the research gap for more rigorous approaches to the de-
velopment of multiclass DED classification problems. Furthermore, we have
observed that binary classification is mostly conducted between the normal and
the affected DED cases. For instance, Ghosh et al. [68] and Choi et al. [42] classi-
fied DR and Non-DR. Also, Al-bander et al. [8] and Phan et al. [146], identified
glaucomatous and nonglaucomatous retinal images, while Dong et al. [54] de-
tected cataract and noncataract conditions. The methods used in these articles
are effectively identifying the vast proportion of severe cases where pathologi-
cal signs are more prominent. Thus, there is a need for classifiers that perform
equally well for mild stages of DED developments, where the lesions are tiny
and difficult to detect.
Early detection of DED or mild DED is especially necessary to take effective
preventive steps and to avoid possible blindness due to deterioration condition
over time. As we can see, DL has shown an extensive capacity in the field of
health care and especially in the field of DED detection. However, there are
some limitations in its large-scale implementation. In terms of the validation
of the proposed methods, the authors predominantly used Accuracy, Specificity
63

and Sensitivity to report their classification performance. For instance, Perdomo
et al. [144] used LeNet CNN to detect exudates and reported accuracy (99.6%),
specificity (99.6%) and sensitivity (99.8%) for the approach proposed. Another
widely used metric was AUC, accuracy and sensitivity. This combination is ap-
propriate in DL methods where image classes are imbalanced. However, data
imbalance has been solved using geometric transformation (augmentation tech-
niques) or re-sampling images from each class. For example, Chen et al. [38]
used augmentation to overcome the overfitting on image data and obtained
AUC (83.10%), and AUC (88.7%)on the ORIGA and SCES datasets. Other met-
rics have been used to measure performance such as Kappa Score (Ksc) used
by Roy et al. [161], AROC used by Asaoka et al. [17], and Prevalence And Bias
Adjusted Fleiss’ Kappa (PABAK) used by Takahashi et al. [203].
2.7 Chapter Summary
This review chapter provides a comprehensive overview of the state of the art
on DED detection methods. To achieve this goal, a rigorous systematic review
of relevant publications was conducted. After the final selection of relevant
records, following the inclusion criteria and quality assessment, the studies
have been analyzed from the perspectives of 1) Datasets used, 2) Image prepro-
cessing techniques adopted and 3) Classification method employed. The works
were categorized into the specific DED types, i.e. DR, Gl, DME and Ca for clar-
ity and comparison. In terms of classification techniques, our review included
studies that 1) Adopted TL, 2) Build DL network architecture and 3) Used com-
bined DL and ML approach. Details of the findings obtained are included in
Section 2.6.
64

We have also identified several limitations associated with our study. First,
we narrowed down the review conducted from April 2014 - January 2020 due
to rapid advances in the field. Second, we limited our review to DL based ap-
proaches due to their state of the art performance, in particular on the image
classification task. Finally, our review focused on a collection of predefined key-
words that provides a thorough coverage of the DED area of detection but may
not be exhaustive. Furthermore, we hope that our research can be further ex-
panded in the future to include an all encompassing and up-to-date overview
of the rapidly developing and challenging field of DED detection.
65

CHAPTER 3
DEEP LEARNING FOR MILD DIABETIC RETINOPATHY
CLASSIFICATION AND DETECTION
The previous chapter discusses the background of automated classification
and detection of DED, its occurrence and severity, its high prevalence, and ob-
served effects. This chapter discusses various computational techniques like
image pre-processing, image augmentation, and pre-trained DL techniques to
detect early DR (one of the DED).
Diabetes and the associated DR instances are currently increasing at an
alarming rate, followed by an extensive research in DR detection from fundus
photography. The classification of severe cases of pathological indications in the
eye has already achieved over 90% accuracy. Still, the mild cases are challeng-
ing to detect due to model’s inability to identify the subtle features, discrimna-
tive of a disease. Thus, in this thesis, a comprehensive evaluation of numerous
CNN architectures was conducted in order to facilitate an early DR detection.
Furthermore, several performance improvement techniques were applied to ad-
dress existing CNN limitation in subtle eye lesions identification. The data used,
i.e. annotated fundus photographies, was obtained from two publicly available
sources - Messidor and Kaggle. The experiments were conducted on 13 CNN
models, pre-trained on large-scale ImageNet database as part of the Transfer
Learning approach implementation. Several performance improvement tech-
niques were adopted, including: (i) fine-tuning, (ii) optimiser selection, (iii) data
augmentation, and (iv) contrast enhancement. Maximum accuracy of 89% on
No DR/Mild DR classification task was obtained for ResNet50 model with fine-
tuning and RMSProp Optimiser trained on augmented and enhanced Messidor
66

and Kaggle data sets.
3.1 Introduction
Approximately 420 million people worldwide have been diagnosed with Dia-
betes [31], and its prevalence has doubled in the past 30 years [133]. The number
of people affected is only expected to increase, particularly in Asia [33]. Nearly
30% of those suffering from Diabetes are expected to develop the DR - a chronic
eye disease that is considered a leading cause of vision loss among working-age
adults [31,44]. The eventual blindness resulting from DR is irreversible, though
it can be prevented through regular fundus examination [243].
Effective treatment is available for patients identified through early DR iden-
tification [225]. Needless to say, a timely detection of pathological indication
in the eye leading to DR is critical. It not only allows to avoid the late inva-
sive treatments and high medical expenses, but most importantly - to reduce
the risk of potential sight loss. The manual methods of diagnosis prove limited
given the worldwide increase in prevalence of both Diabetes and its retinal com-
plications [71]. Currently, the ophthalmologist-to-patient ratio is approx. 1:1000
in China [243]. Furthermore, the traditional approaches reliant on human as-
sessment require high expertise, as well as promote inconsistency among the
readers [31]. Labour and time-consuming nature of manual screening services
has motivated the development of automated detection methods [188], in par-
ticular early stages of DR and other diabetic related eye disease [169]. DNN
model is a sequence of mathematical operations applied to the input, such as
pixel value in the image [150], where the training is performed by presenting
the network with multiple examples, as opposed to unflexible rule-based pro-
67

gramming underlying the conventional methodologies [65].
Deep learning, in particular CNN, has been widely explored in the field of
DR detection [122,153,155,166,222], largely surpassing previous image recogni-
tion methodologies [222]. Overall, Deep learning has demonstrated tremendous
potential in healthcare domain, enabling the identification of patients likely to
develop a disease in the future [170,225]. In terms of DR, the applications range
from binary classification (No DR/DR), to multi-level classification based on
condition severity scale (No DR/Mild DR/Moderate DR/Severe DR). CNNs,
with their multi-layer feature representations, have already shown outstanding
results in discovering the intricate structures in high-dimensional datasets. The
models have proven successful at learning the most discriminative, and often
abstract aspects of the image, while remaining insensitive to irrelevant details
such as orientation, illumination or background.
Motivation: The diagnosis for DR is particularly difficult for patients in early
stage, which is the challenge identified in prior literature [31]. As highlighted by
Pratt et al. [153], Neural Networks struggle to learn sufficient deep features to
detect intricate aspects of Mild DR. In the same study, approx. 93% of mild cases
were incorrectly classified as healthy eye instances. A problem is illustrated in
Fig. 3.1, displaying various stages of DR and the associated visibility of the
features. Numerous accuracy improvement techniques such as dimensionality
reduction or feature augmentation have been proposed in the literature. Still,
the studies using deep learning for DR detection consistently report high per-
formance on binary classification (No DR/ Severe DR) cases, while classification
of (No DR/ Mild DR) cases still remains a challenge. This limitation impedes
wider application of fully automated mass-screening due to potential omission
68
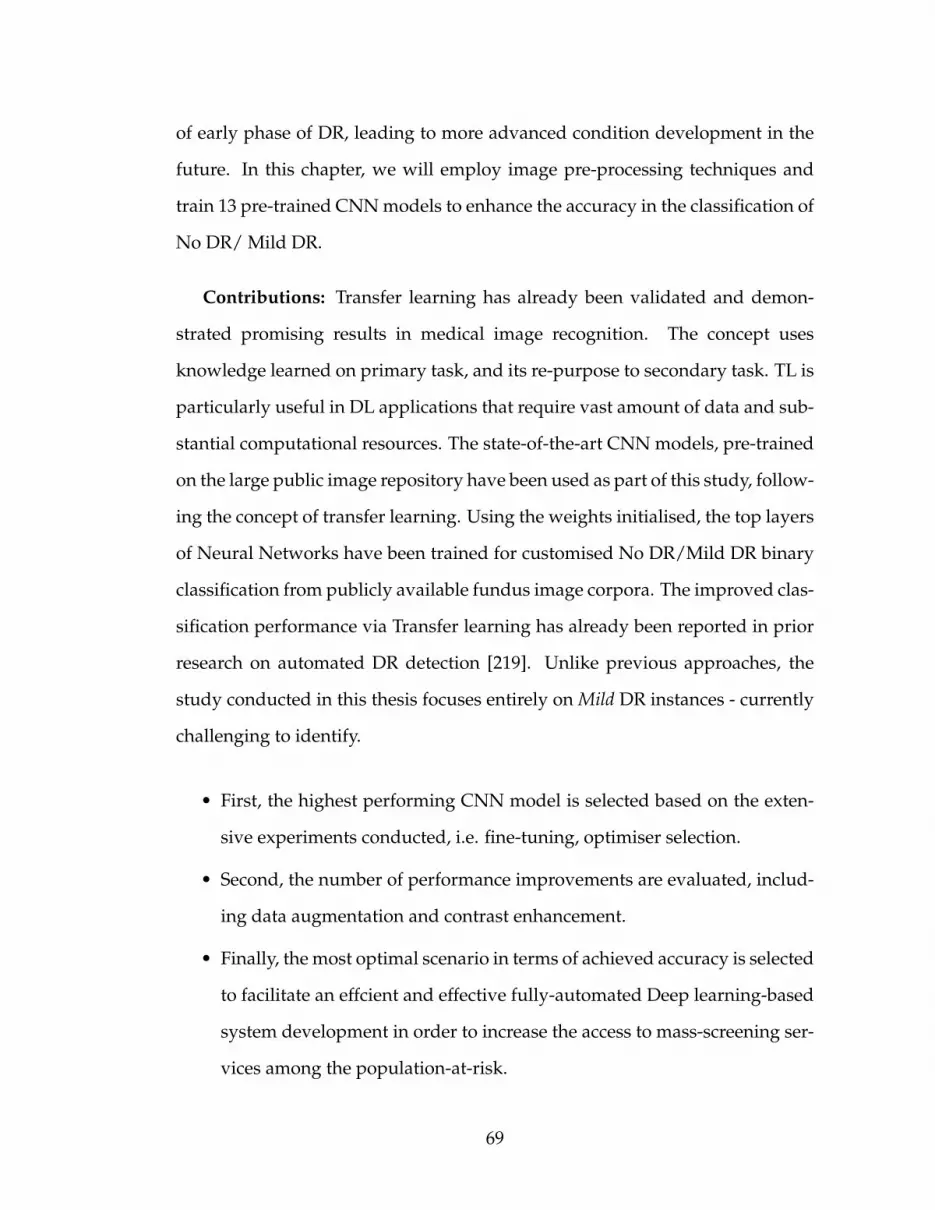
of early phase of DR, leading to more advanced condition development in the
future. In this chapter, we will employ image pre-processing techniques and
train 13 pre-trained CNN models to enhance the accuracy in the classification of
No DR/ Mild DR.
Contributions: Transfer learning has already been validated and demon-
strated promising results in medical image recognition. The concept uses
knowledge learned on primary task, and its re-purpose to secondary task. TL is
particularly useful in DL applications that require vast amount of data and sub-
stantial computational resources. The state-of-the-art CNN models, pre-trained
on the large public image repository have been used as part of this study, follow-
ing the concept of transfer learning. Using the weights initialised, the top layers
of Neural Networks have been trained for customised No DR/Mild DR binary
classification from publicly available fundus image corpora. The improved clas-
sification performance via Transfer learning has already been reported in prior
research on automated DR detection [219]. Unlike previous approaches, the
study conducted in this thesis focuses entirely on Mild DR instances - currently
challenging to identify.
• First, the highest performing CNN model is selected based on the exten-
sive experiments conducted, i.e. fine-tuning, optimiser selection.
• Second, the number of performance improvements are evaluated, includ-
ing data augmentation and contrast enhancement.
• Finally, the most optimal scenario in terms of achieved accuracy is selected
to facilitate an effcient and effective fully-automated Deep learning-based
system development in order to increase the access to mass-screening ser-
vices among the population-at-risk.
69
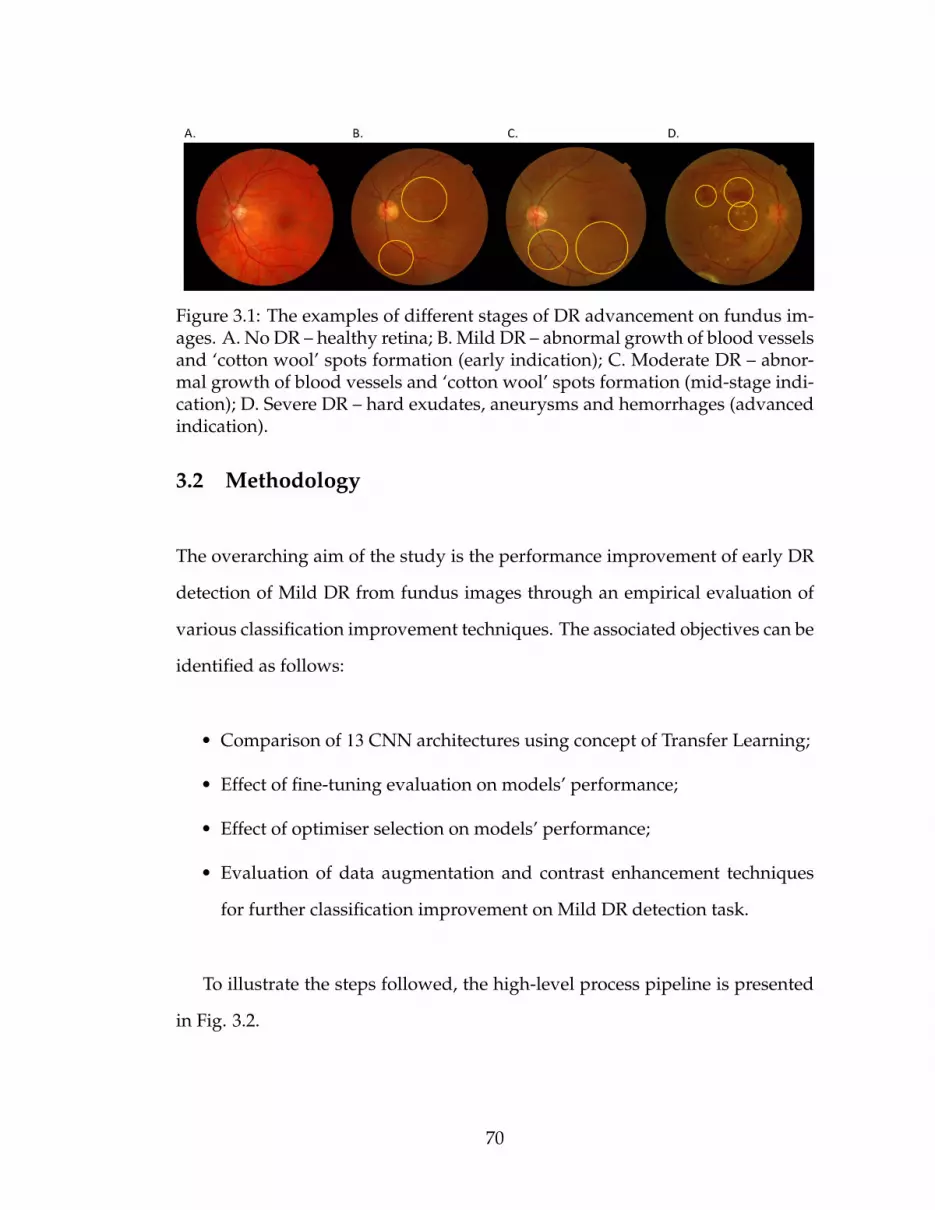
Figure 3.1: The examples of different stages of DR advancement on fundus im-ages. A. No DR – healthy retina; B. Mild DR – abnormal growth of blood vesselsand ‘cotton wool’ spots formation (early indication); C. Moderate DR – abnor-mal growth of blood vessels and ‘cotton wool’ spots formation (mid-stage indi-cation); D. Severe DR – hard exudates, aneurysms and hemorrhages (advancedindication).
3.2 Methodology
The overarching aim of the study is the performance improvement of early DR
detection of Mild DR from fundus images through an empirical evaluation of
various classification improvement techniques. The associated objectives can be
identified as follows:
• Comparison of 13 CNN architectures using concept of Transfer Learning;
• Effect of fine-tuning evaluation on models’ performance;
• Effect of optimiser selection on models’ performance;
• Evaluation of data augmentation and contrast enhancement techniques
for further classification improvement on Mild DR detection task.
To illustrate the steps followed, the high-level process pipeline is presented
in Fig. 3.2.
70

Figure 3.2: The high-level process pipeline.
3.2.1 Image Data Collection
Data was acquired from publicly available corpora, i.e. Kaggle and Messidor.
Kaggle data set contains 35, 126 fundus images annotated as No DR, Mild DR,
Moderate DR, Severe DR, Proliferative DR (5-class in total), while Messidor data
set contains 1, 200 fundus images annotated as No DR, Mild DR, Moderate DR,
and Severe DR (4-class in total). Both data sets consist of colour photographs
of right and left eye. The images dimensions vary between low-hundreds to
71

low-thousands. The quality of data differs significantly between the data sets.
Messidor, despite its relatively small scale, is considered a high fidelity source
with reliable labelling, while Kaggle includes a large number of noisy and often
misannotated images. The raw Kaggle data more closely reflects a real-world
scenario, where images are taken under different conditions, thus resulting in
various quality levels. The challenge lies in the potential eye lesions detection
despite the observed noisiness in the data set.
3.2.2 Image Data Pre-processing
Data augmentation: Deep learning benefits from high-volume data. The larger
number of both No DR as well as Mild DR instances can increase model’s re-
liability and allow for more distinctive patterns detection. Thus, the small-
scale Messidor dataset has been combined with large-scale Kaggle dataset, i.e.
the respective No DR and Mild DR classes have been merged together. Table
3.1 presents the number of images for each class used in each scenario (be-
fore and after augmentation), along with the descriptions of the particular DR
stages. The severity scale used is in accordance with the Early Treatment Dia-
betic Retinopathy Study (ETDRS) [243].
Given the large volume and proportion of No DR to Mild DR instances of
Kaggle data, subsequent augmentation was performed to alleviate the result-
ing data imbalance issue. Data imbalance is generally encountered in machine
learning implementations [115]. Another reason for using data augmentation is
relaitively low fidelity character of Kaggle data set. The Kaggle images were
captured with different fundus cameras, resulting in various quality levels.
72

Table 3.1: The DR severity levels according to ETDRS and the number of imagesused in each experiment.
Severity level Id Description M K K M + K(raw) (aug) (aug)
No DR 0 No abnormalities. 546 25810 50976 51522Mild DR 1 Microaneurysms only. 153 2443 55410 55563Moderate DR 2 More than just microa-
neurysms, but less than se-vere NPDR.
247 5292 - -
Severe DR 3 Any of the following andno signs of proliferativeretinopathy: (1) severeintraretinal hemorrhagesand microaneusrysms ineach of four quadrants; (2)definite venous beading intwo or more quadranta; (3)prominent IRMA in one ormore quadrants.
254 873 - -
Proliferative DR 4 One or both of the follow-ing: (1) neovascularisation;(2) vitreous/preretinalhemorrhage.
- 708 - -
M - Messidor, K - Kaggle, NPDR - Non-Proliferative Diabetic Retinopathy,IRMA - Intraretinal Microvascular Abnormalities.
The relatively noisy character of images is observed through their blurriness,
under/over-exposure, presence of unrelated artifacts, and so on. The raw for-
mat of Kaggle data set closely reflects the nature of DR detection in real-world
settings, where substantial variability in data quality is observed between the
practitioners.
In order to evaluate the potential classification improvement due to pre-
processing techniques applied, the following steps have been performed: (1)
crop, (2) resize, (3) rotate and (4) mirror. The example of the original image, and
the augmentation steps implemented are presented in Fig. 3.3. Cropping and
73

resizing (1 + 2) allows to focus on pathological indications with greater level of
detail, which proves important for DR discrimination. Additionally, the subse-
quent rotating and mirroring (3 + 4) substantially expands the dataset, alleviating
the imbalance issues between the classes.
Figure 3.3: The examples of data augmentation steps performed on Mild DRfundus image from Kaggle dataset. (A) Original; (B) Crop; (C) Rotate 90◦;(D)Rotate 120◦; (E) Rotate 180◦; (F) Rotate 270◦; (G) Mirror.
Contrast Enhancement: Applying CLAHE on each component of RGB color
corrupts its originality. A more coherent approach is the uniform dispersion of
colour intensities, while leaving the colours (e.g. hues) unchanged. However,
CLAHE on RGB image proves much more luminous and unnatural. Further-
more, the inevitable improvement of noise in smooth area is identified. Thus,
contrast enhancement is performed by converting RGB to HSV colour space,
and then CLAHE is applied on HSV colour model. HSV colour characterise col-
ors in Hue (H), Saturation (S) and Value (V). This model was introduced by A.R.
Smith [191], and is as follows (3.1, 3.2, 3.3):
V = max(R,G, B); (3.1)
Let, m = V − min(R,G, B); (3.2)
74
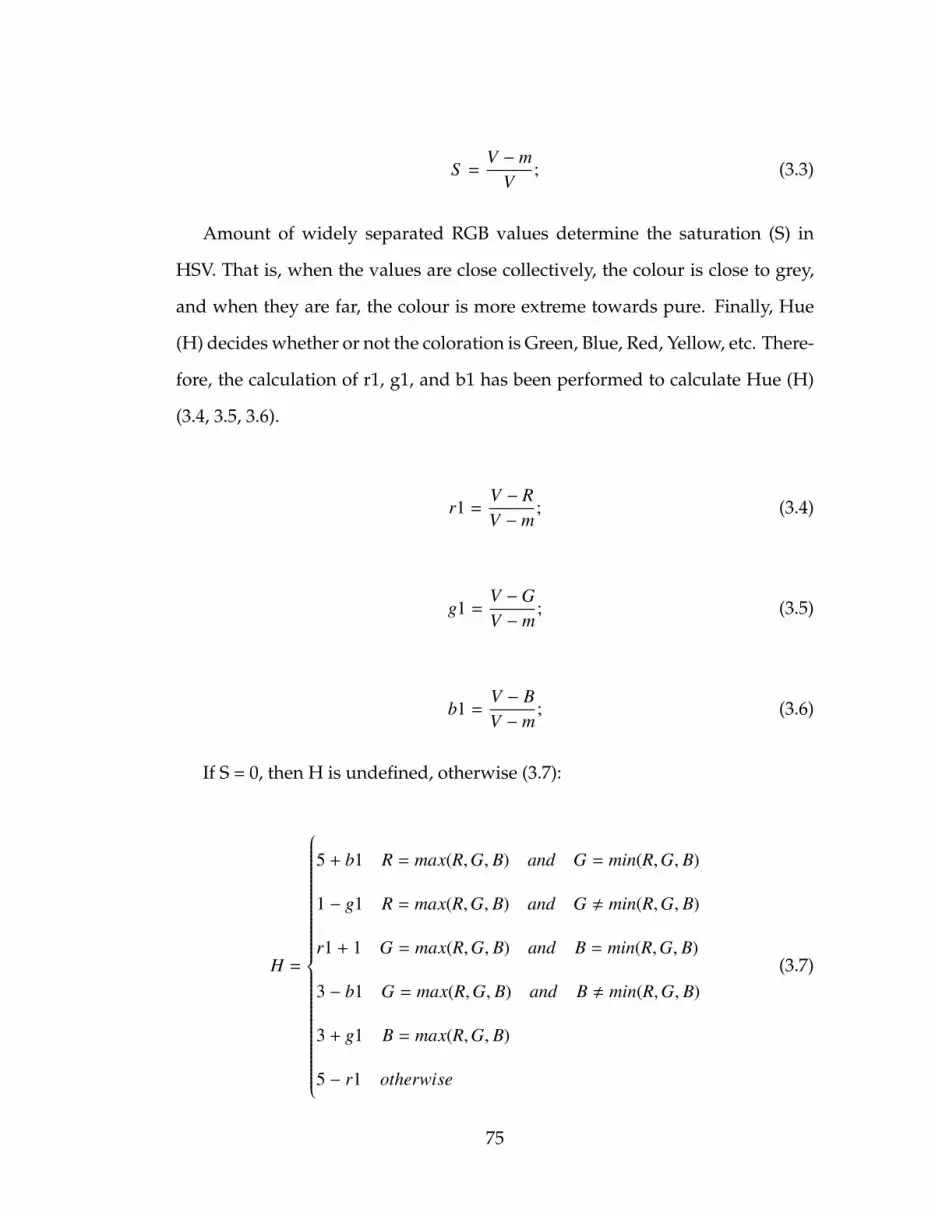
S =V − m
V; (3.3)
Amount of widely separated RGB values determine the saturation (S) in
HSV. That is, when the values are close collectively, the colour is close to grey,
and when they are far, the colour is more extreme towards pure. Finally, Hue
(H) decides whether or not the coloration is Green, Blue, Red, Yellow, etc. There-
fore, the calculation of r1, g1, and b1 has been performed to calculate Hue (H)
(3.4, 3.5, 3.6).
r1 =V − RV − m
; (3.4)
g1 =V −GV − m
; (3.5)
b1 =V − BV − m
; (3.6)
If S = 0, then H is undefined, otherwise (3.7):
H =
5 + b1 R = max(R,G, B) and G = min(R,G, B)
1 − g1 R = max(R,G, B) and G , min(R,G, B)
r1 + 1 G = max(R,G, B) and B = min(R,G, B)
3 − b1 G = max(R,G, B) and B , min(R,G, B)
3 + g1 B = max(R,G, B)
5 − r1 otherwise
(3.7)
75

Thus, Hue discontinuity can be observed around 360◦, therefore it is difficult
to perform arithmetic operations in all of the HSV components. Hence, CLAHE
is applied on S and V and it is shown in Fig. 3.4.
Figure 3.4: Contrast enhancement using CLAHE: A and C: before, B and D:after.
3.2.3 Model Construction
The knowledge transfer from primary to secondary task frequently acts as an
only solution in highly-specialised disciplines, where the availability of large-
scale quality data proves challenging. The adoption of already pre-trained
models is not only the efficient optimisation procedure, but frequently supports
the classification improvement. The first layers of CNN learn to recognise the
generic features such as edges, patterns or textures, whereas the top layers focus
on more abstract and task-specific aspects of the image, such as blood vessels
or hemorrhages. Training only the top layers of target dataset, while using the
initialised parameters for the remaining ones is the commonly employed ap-
proach, in particular in computer vision domain. Apart from efficiency gains,
fewer parameters to train also reduce the risk of overfitting, which is a major
problem in Neural Networks training process [153]. The CNN models used in
the experiments along with their characteristics are presented in Table.3.2.
76
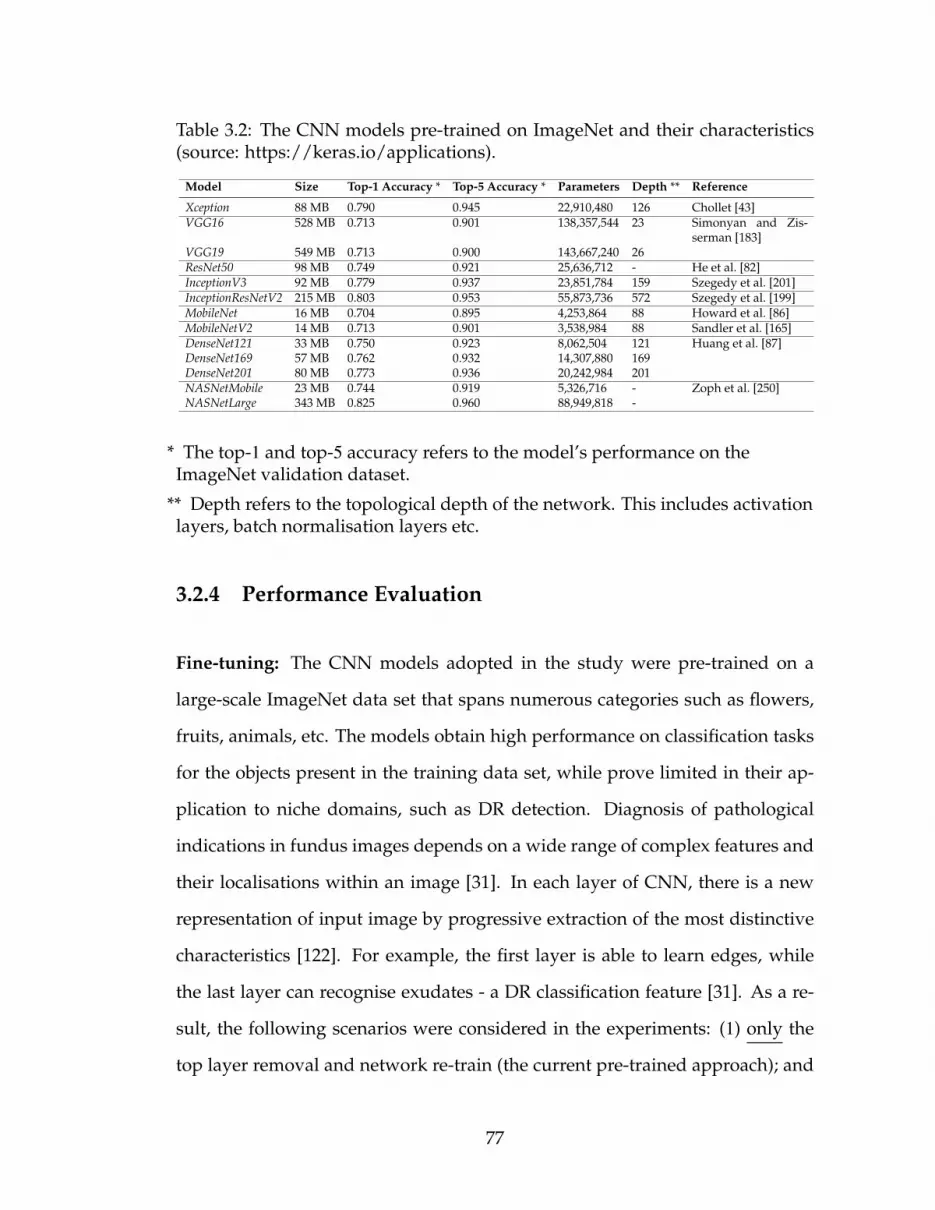
Table 3.2: The CNN models pre-trained on ImageNet and their characteristics(source: https://keras.io/applications).
Model Size Top-1 Accuracy * Top-5 Accuracy * Parameters Depth ** Reference
Xception 88 MB 0.790 0.945 22,910,480 126 Chollet [43]VGG16 528 MB 0.713 0.901 138,357,544 23 Simonyan and Zis-
serman [183]VGG19 549 MB 0.713 0.900 143,667,240 26ResNet50 98 MB 0.749 0.921 25,636,712 - He et al. [82]InceptionV3 92 MB 0.779 0.937 23,851,784 159 Szegedy et al. [201]InceptionResNetV2 215 MB 0.803 0.953 55,873,736 572 Szegedy et al. [199]MobileNet 16 MB 0.704 0.895 4,253,864 88 Howard et al. [86]MobileNetV2 14 MB 0.713 0.901 3,538,984 88 Sandler et al. [165]DenseNet121 33 MB 0.750 0.923 8,062,504 121 Huang et al. [87]DenseNet169 57 MB 0.762 0.932 14,307,880 169DenseNet201 80 MB 0.773 0.936 20,242,984 201NASNetMobile 23 MB 0.744 0.919 5,326,716 - Zoph et al. [250]NASNetLarge 343 MB 0.825 0.960 88,949,818 -
* The top-1 and top-5 accuracy refers to the model’s performance on theImageNet validation dataset.
** Depth refers to the topological depth of the network. This includes activationlayers, batch normalisation layers etc.
3.2.4 Performance Evaluation
Fine-tuning: The CNN models adopted in the study were pre-trained on a
large-scale ImageNet data set that spans numerous categories such as flowers,
fruits, animals, etc. The models obtain high performance on classification tasks
for the objects present in the training data set, while prove limited in their ap-
plication to niche domains, such as DR detection. Diagnosis of pathological
indications in fundus images depends on a wide range of complex features and
their localisations within an image [31]. In each layer of CNN, there is a new
representation of input image by progressive extraction of the most distinctive
characteristics [122]. For example, the first layer is able to learn edges, while
the last layer can recognise exudates - a DR classification feature [31]. As a re-
sult, the following scenarios were considered in the experiments: (1) only the
top layer removal and network re-train (the current pre-trained approach); and
77

(2) the n top layers removal and network re-train (the proposed approach). The
parameter n vary across the CNNs used and depends on the total number of
layers present in each model structure. The threshold of 100 was selected, and
the subsequent layers of each model were ’un-frozen’ and fine-tuned. The ini-
tial 100 layers were treated as a fixed feature extractor [132], while the remaining
layers were adapted to specific characteristics of fundus photography. The po-
tential classification improvement on DR detection task was evaluated as a re-
sult of the proposed models customisation. In the study conducted by Zhang et
al. [243], the performance accuracy of Deep learning-based DR detection system
improved from 95.68% to 97.15% as a result of fine-tuning.
Optimiser selection: During the training process, the weights of Neural
Network nodes are adjusted accordingly in order to minimise the loss func-
tion. However, the magnitude and direction of weights adjustment is strongly
dependent on the Optimiser used. The most important parameters that deter-
mine the Optimiser’s performance are: Learning rate and Regularisation. Too
large/too small value of Learning rate results in either non-convergence of the
loss function, or in the reach of the local, but not absolute minima, respectively.
At the same time, the Regularisation allows to avoid model overfitting by penal-
ising the dominating weight values for the correct predictions. Consequently,
the classifier generalisation capability improves, when exposed to a new data.
The Optimisers used in the experiments were as follows: (1) RMSprop, (2) SGD,
(3) Adagrad, (4) Adadelta, (5) Adam, (6) Adamax and (7) Nadam.
78

3.3 Experiment and Analysis
The algorithms were implemented using Keras library1, with TensorFlow2 as
a back-end. The images resolution has been standardised to a uniform size
in accordance with input requirements of each model. The number of epochs,
i.e. complete forward and backward passes through the network, was set to 20
due to the already pre-trained models use. The training/testing split was set to
80/20. The stratified random sampling was performed to ensure proportional
class distribution. Mini-batch size was set to 32, and the cross-entropy loss func-
tion was selected due to its suitability for binary classification task. The default
Optimiser was RMSProp. The standard evaluation metric of Accuracy, Sensitiv-
ity and Specificity on testing data set was used for final results validation.
3.3.1 Experiment Design
The algorithms is implemented using MatLab for contrast enhancement, and
Keras 2.3 library, with TensorFlow 2 as a back-end and Python 3.8 programming
language in jupyter notebook with a processor of 2.3 GHz Intel Core i9 and RAM
of 16 GB 2400 MHz DDR4 with Intel UHD Graphics 630 1536 MB.
3.3.2 Model and Optimiser Selection
The 13 pre-trained CNNs were compared in terms of yielded accuracy on testing
data set (Table. 3.3). Additionally, the fine-tuning was applied as an alternative
1https://keras.io/2https://www.tensorflow.org/guide/keras
79

to the default option. After removal and re-training of n layers from 100 on-
wards (n was CNN-dependent), the performance obtained for each model was
used for comparison purposes. The fine-tuning effect was calculated in terms of
percentage accuracy increase/decrease. Then, the maximum accuracy was se-
lected for each model (either default or after fine-tuning). Finally, the top 3 CNN
architectures with highest classification performance on Messidor data set pro-
gressed to the subsequent optimisation step, as set out in process pipeline (Fig.
3.2).
Table 3.3: The accuracy comparison of pre-trained CNN models.
Model Accuracy Accuracy(F-T*)
F-T*effect
Accuracy(max)
Xception 0.809 0.809 ±00.0% 0.809VGG16 0.809 0.809 ±00.0% 0.809VGG19 0.813 0.813 ±00.0% 0.813ResNet50 0.813 0.816 +00.4% 0.816InceptionV3 0.806 0.795 −01.3% 0.806InceptionResNetV2 0.812 0.582 −28.4% 0.812MobileNet 0.583 0.556 −04.7% 0.583MobileNetV2 0.781 0.656 −16.0% 0.781DenseNet121 0.795 0.778 −02.2% 0.795DenseNet169 0.569 0.642 +12.8% 0.642DenseNet201 0.797 0.795 −00.2% 0.797NASNetMobile 0.799 0.802 +00.4% 0.802NASNetLarge 0.813 0.809 −00.4% 0.813
* Fine-Tuning
The accuracy after each epoch was further plotted in order to investigate the
models convergence capabilities in the default and fine-tuning scenario (Fig.
3.5). As a result, the computational intensity was additionally evaluated.
Following the top 3 CNN models selection (Table. 3.3), the 7 most common
in Deep learning applications Optimisers were evaluated as part of the opti-
80

Figure 3.5: Validation accuracy achieved for the respective epochs. (A) Default;(B) Fine-tuning.
miser selection process (Table. 3.4). The most robust Optimiser in terms of vali-
dation accuracy for each of the 3 models was indicated. The highest performing
model+Optimiser was selected for further data augmentation step.
Table 3.4: The Optimisers performance evaluation.
VGG19 ResNet50 NASNetLarge
Optimiser Accuracy Accuracy AccuracyRMSprop * 0.813 0.816 0.813SGD 0.812 0.812 0.812Adagrad 0.812 0.802 0.815Adadelta 0.812 0.812 0.812Adam 0.812 0.812 0.792Adamax 0.812 0.739 0.802Nadam 0.812 0.756 0.809
* default
3.3.3 Improvement Techniques Comparison
The respective classes of both Messidor and Kaggle data sets (M0+K0,M1+K1)
were merged together and used to train the max-accuracy model, as deter-
81

mined. The increase in data set volume was expected to contribute towards
performance improvement. Next, the augmentation of imbalanced low quality
Kaggle data was conducted to further evaluate impact of image pre-processing
on classification accuracy. The results of both scenarios (i.e. (I) Messidor + Kag-
gle (augmented) data; and (II) Messidor + Kaggle (augmented) + enhanced) are
presented in Table. 3.5.
Table 3.5: The effect of data augmentation (Scenario I) and contrast enhance-ment (Scenario II).
Dataset Accuracy Sensitivity Specificity
Scenario I Messidor + Kaggle (aug) 86.42% 0.87 0.86Scenario II Messidor + Kaggle (aug +
enh)89.15% 0.88 0.91
Table 3.6: Proposing New CNN on (Scenario II).
Dataset Accuracy Sensitivity Specificity
Scenario II Messidor + Kaggle (aug +enh)
100% 100 100
3.3.4 System Evaluation
Increasing life expectancy, popular indulgent lifestyles and other contributing
factors indicate that the number of people with Diabetes is projected to raise
[153, 173]. This in turn places an enormous amount of pressure on available re-
sources and infrastructure [186]. For instance, most of the patients with DR in
China often neglect their condition and fail to secure timely interventions re-
sulting in severe state development [243]. Early identification of pathological
indications effectively prevents further condition aggravation, and its impact
on the affected individuals, their families, and associated medical expenses.
82

(a) Data augmentation (Scenario I)
(b) Contrast enhancement (Scenario II)
Figure 3.6: Confusion matrices for Scenario I and Scenario II.
Thus, DR detection system allows to either (i) fully-automate the eye-screening
process; or (ii) semi-automate the eye-screening process. First option requires
sufficient level of accuracy, equivalent to that of retinal experts. According to
British Diabetic Association (BDA) guidelines, a minimum standard of 80% sen-
83

sitivity and 95% specificity must be obtained for sight-threatening DR detection
by any method [18]. After evaluation of our approach on Mild DR detection
task, the maximum sensitivity of 88% and the maximum specificity of 91% were
obtained. Thus, the early DR detection proved sufficient given the BDA stan-
dards, but still falling 4% short in terms of its specificity. Second option allows
to downsize the large-scale mass-screening outputs to the potential DR cases,
followed by human examination. Both scenarios significantly reduce the bur-
den on skilled ophthalmologists and specialised facilities, making the process
accessible to wider population, especially in low-resource settings.
3.3.5 Performance Analysis
The first part of the experiment included feature extraction initialised via Trans-
fer learning using the pre-trained CNN models, followed by the removal of
the top layer (existing approach). The comprehensive evaluation of 13 CNN
architectures (including state-of-the-art) was performed. In the second part,
the N layers were ’un-frozen’ (over the threshold of 100), and subsequently re-
trained to better adapt to the specifics of the application case-study (proposed
approach). The combination of Messidor and Kaggle datasets was conducted
to further support model generalisation, given the variety of images provided
for system training, as well as to benefit the model performance due to higher
volume of training examples. The size of data used in training greatly affects
the outcome of Neural Networks process [65]. The numerous pre-processing
steps were implemented to measure potential accuracy improvement for No
DR/Mild DR image classification. As Mild DR proves extremely challenging to
differentiate from healthy retina due to only subtle indications of the disease,
84

the data augmentation undertaken was expected to enhance pathological fea-
tures visibility (e.g. zoom and crop).
The top 3 CNN architectures with the top layer removed and re-trained were
VGG19, ResNet50 and NASNetLarge, yielding the accuracy of 81.3% for each (Ta-
ble. 3.3). The lowest performance was obtained by DenseNet169 (56.9%) and Mo-
bileNet (58.3%), respectively. In terms of DenseNet169, the characteristic feature
of its structure that connects each layer to every other layer in a feed-forward
manner did not prove to enhance the performance on No DR/Mild DR classifi-
cation task. As for MobileNet, the results only confirmed its intended purpose for
mobile applications due to its lightweight and streamlined architecture, which
comes at a cost of the accuracy.
The effect of fine-tuning (un-freezing the layers from 100 onwards) differed
across the models. Accuracy improvement observed was only minor, suggest-
ing the relative suitability of default pre-trained models to DR detection task.
In other words, the CNN models were able to identify Mild DR from healthy
retina despite being trained on un-related pictures from ImageNet repository. If
no accuracy increase is achieved, the un-freezing of further layers is not recom-
mended due to unnecessary computational time and cost incurred.
To complete the analysis on the effect of fine-tuning, the graphs depicting
each CNN architecture performance at the respective epochs (single pass of the
full training set) has been performed, as illustrated in Fig. 3.5. Despite no ma-
jor influence on the classification accuracy, faster model’s convergence was ob-
served following the fine-tuning. The higher number of layers un-frozen and
re-trained made the models more task-specific, leading to an improved use of
resources due to reduced training time for the most optimal performance. The
85

finding was particularly noticable for the following models Xception, MobileNet
and DenseNet169.
Next, the various optimisers have been evaluated on the top 3 CNN architec-
tures (Table. 3.4). While there was no major impact on the classification perfor-
mance for VGG19, the higher variability was observed for ResNet50, proving its
sensitivity to the most suitable optimiser selection. Overall, RMSProp proved
the most optimal choice for 2 out of 3 models. ResNet50+RMSProp was selected
as the max-accuracy model+optimiser option for No DR/Mild DR classification
task.
In the final step, the 2 scenarios were considered, namely (i) data augmen-
tation, and (ii) contrast enhancement. As expected, data augmentation applied
to lower quality Kaggle data, and its combination with Messidor data resulted
in classification accuracy improvement from 81.6% to 86.4%. Images augmen-
tation (i.e. crop, zoom, mirror, rotate) also helped to address data imbalance
problem due to large number of healthy retina instances. The improved accu-
racy can further be attributed to greater variability in terms of training examples
that in turn impact the generalisability of the approach. Additionally, contrast
enhancement was applied on the augmented images, which has increased the
classification performance to 89.3% (the maxium accuracy achieved). As a re-
sult, the max classification accuracy on No DR/Mild DR classification task was
achieved for ResNet50 model with fine-tuning and RMSProp optimiser trained
on the combined Messidor + Kaggle (aug) + (enh) data sets.
Future work: As it is the initial study focusing on binary No DR/Mild DR
classification, future work will cover finer-grained information extraction from
cases previously identified as Mild DR. For instance, upon sufficient data avail-
86

ability, the model will allow to recognise the particular lesions such as exudates
or aneurysms. The more in-depth classification will further assist the retinal
practitioners in more efficient eye-screening procedure. Also, the highly varied
input data (e.g. in terms of ethnicity, age group, level of lighting) will support
model robustness and flexibility. Additionally, different scenarios with respect
to the number of layers and nodes will be evaluated as increased convolution
layers are expected to learn deeper features by the model [65, 153]. This in turn
will enable the most optimal CNN architecture design (depth and width of the
network) for maximum classification accuracy. An increase network dimen-
sionality is the most direct way to enhance model performance [219]. Future
work will also place more emphasis on outputs visualisation in order to obtain
greater insight into the models internal workings. In particular, the identifica-
tion of exact image regions that are associated with specific classification results
will be highlighted, as well as the magnitude of each feature intensity (so called
attention/saliency maps [150]). Improved understanding of algorithm work-
ings will facilitate the automated system wider adoption and acceptance among
physicians [225]. Finally, the experiments with ensemble approach will be con-
ducted, where the results of Neural Network models trained on the same data
will be averaged in order to evaluate further classification accuracy gains.
3.4 Summary of Findings
Early detection and immediate treatment of DR is considered critical for ir-
reversible vision loss prevention. The automated DR recognition has been a
subject of many studies in the past, with main focus on binary No DR/DR
classification [153]. According to the results, an identification of moderate to
87

severe indications do not pose major difficulties due to pathological features
high visibility. The issue arises with Mild DR instances recognition, where only
minute lesions prove indicative of the condition, frequently undetected by the
classifiers. Mild DR cases prediction is further challenged by the low quality
of fundus photography that additionally complicates the recognition of subtle
lesions in the eye. Thus, the study proposed the system that focuses entirely
on Mild DR detection among the No DR instances, as unaddressed sufficiently
in prior literature. Given the empirical nature of Deep learning, the numerous
performance improvement techniques have been applied (i.e. (i) fine-tuning,
(ii) optimiser selection, (iii) data augmentation, and (iii) contrast enhancement).
Additional benefit of Deep learning incorporates the automatic features detec-
tion that are most discriminative between the classes. Such approach allows to
avoid the shortcomings associated with empirical, and often subjective manual
feature extraction methods. Furthermore, the study used the combined datasets
from various sources to evaluate system robustness in its ability to adapt to the
real-world scenarios. As stated by Wan et al. [219], the single data collection
environment poses difficulty in accurate model validation. The system success-
fully facilitates the streamlining of labour-intensive eye-screening procedure,
and serves as an auxiliary diagnostic reference whilst avoiding human subjec-
tivity.
88
CHAPTER 4
ROLE OF IMAGE PROCESSING IN DETECTING MILD DED
CLASSIFICATION AND DETECTION
DED is a cluster of eye problem that affects diabetic patients. Identifying DED
is a crucial activity when using retinal fundus images because early diagno-
sis and treatment can eventually minimize the risk of visual impairment. The
retinal fundus image plays a significant role in early DED classification and
identification. The development of an accurate diagnostic model using a reti-
nal fundus image depends highly on image quality and quantity. Therefore,
this chapter presents a methodical study on the significance of image process-
ing for DED classification with a compelling image processing technique that
will enhance the classification system’s performance. The proposed automated
classification framework for DED was achieved through several steps: image
quality enhancement, image segmentation (region of interest), image augmen-
tation (geometric transformation), and classification. The dataset was obtained
from various open sources. The optimal results were obtained using traditional
image processing methods with a newly built CNN architecture. The classifica-
tion outcomes were highly dependent on image processing. The transfer learn-
ing based on VGG-16 integrated with the traditional image processing approach
provided an accuracy of 83.43% for diabetic retinopathy (DR), 89.13% for dia-
betic macular edema (DME), and 88% for glaucoma (GL). However, the newly
built CNN combined with the traditional image processing approach presented
the best performance with an accuracy of 93.33% for DR, 91.43% for DME, 100%
for GL in the early stage of DED classification. The results of the experiments
conducted show the necessary accuracy, specificity, and sensitivity.
89

4.1 Introduction
DED is the most common complication in diabetes, for which retinal fundus
imaging is the most commonly adopted procedure because of its sensitivity in
the diagnosis of DED [88]. The analysis of the severity and intensity of DED
correlated with a patient having diabetes is typically conducted by ophthalmol-
ogists based on the lesion present in retinal fundus images [207]. For instance,
Fig. 4.1 presents the details on lesions that must be identified from retinal im-
ages: (i) extra growth of blood vessels and damage or rupture in the tiny blood
vessels in the retina (microaneurysms), often known as an early stage of DR;
(ii) built-up fluid causing swelling in the macular region or often forming soft
exudates known as DME, the common reason for blindness and vision loss, and
(iii) damage to the optic nerve and blood vessel rupture causing intraocular
pressure that damages the optic nerve causing Gl which is irreversible.
Figure 4.1: Early DED complication in retina (A) Anatomical structure of theretina; (B) Microaneurysms - narrow bulges in blood vessels (diabetic retinopa-thy); (C) Soft exudates in macula (diabetic macular edema); (D) Optic nervedamage (glaucoma); and (E) cataract
90
While the number of diabetic patients is growing exponentially, there is also
a rise in the number of retinal fundus images obtained from screening cam-
paigns, which, has resulted in considerable labour-intensive, time-consuming
and complex work for medical experts. This complexity has driven the devel-
opment of an automated retinal lesions detection system. In the past few years,
a CNN in the DL system has played a significant role in medical image classi-
fication. CNN’s widespread use in image classification came after Krizhevsky
et al. [105] won the 2012 Imagenet [162] Large Scale Visual Recognition Chal-
lenge (ILSVRC) with a CNN with an error rate of 15%. The studies employing
DL for DED detection demonstrate maximum performance in binary classifica-
tion (normal / severe) cases. Lam et al. [109] used the GoogLeNet model and
obtained a maximum sensitivity of 95% and specificity of 96% using real-time
data augmentation with preprocessing techniques.
In DL, a pre-trained CNN can be used to transfer learning from source task to
target task with a limited number of images or minimise training time. The most
popular transfer learning method is to fine-tune the pretrained network. Regard-
less of the nature of the training model (pre-trained model or a new model),
image data sets are typically pre-processed prior to training CNN architectures
in various ways, such as image resizing, image quantity, image standardisation,
and image enhancement. Improving the classification performance of the CNN
model is limitless, and the image quality in the data set has a significant impact
on the overall performance of the architecture.
Motivation: DL has had a significant impact on a number of scientific fields
over the last few years. These include advancements in image and speech recog-
nition, the ability to train artificial data that beat human players in games like
91

ATARIS [124] and GO [182], and the development of new creative images using
methods like Generative Adversarial Networks (GAN) [205], and music [26].
Several of these activities were considered onerous, needing to be accomplished
by algorithms before the development of DL. The DL framework is also ex-
tremely relevant for imaging. Image detection, recognition, segmentation, reg-
istration, and computer-aided diagnosis are some of the areas that have been
primarily affected by its rapid development.
However, in medical imaging (e.g., retinal fundus images), early-stage iden-
tification of lesions and abnormalities is still an open issue reported in previous
literature by Lam. et al. [109]. Pratt et al. [153] and Carson et al. [109] mentioned
that deep neural networks are struggling to learn enough in-depth features to
identify aspects of mild disease, with 93% of mild cases are wrongly classified
as a healthy eye. Therefore, this research presents a system in which traditional
image processing techniques and state-of-the-art CNN are combined to analyze
early-DED disease. This chapter presents a research study using a small volume
of the open-source retinal images for in-depth learning evaluation for normal
and mild DED classification.
Contribution: Therefore, in this thesis, the main objective is to achieve the
highest accuracy, sensitivity, and specificity compared to existing deep learning
models. The technique used is a combination of traditional image processing
methods for image enhancement and segmentation, and then training in DL al-
gorithms. We explore the significance of traditional image pre-processing for
enhancing early stage DED detection accuracy using DL models. The advance-
ment of this technology does not indicate the complete substitution of an oph-
thalmologist. Rather, it allows ophthalmologists to more reliably diagnose DED.
92

The contribution of this chapter in the diagnosis of early DED can be classified
into the following:
• Image enhancement: green channel extraction, contrast limited adaptive
histogram equalization (CLAHE), and illumination correction were used
to enhance the original image
• Image segmentation: Regions of Interest (ROI) such as blood vessels, mac-
ular region and optic nerve segmented from retinal fundus images
• Pre-trained model: High-performance models were selected to classify the
processed and segmented retinal fundus images
• Build a new CNN model and train the model from scratch with processed
and segmented retinal fundus images.
4.2 Literature Survey
Early detection of DED in retinal fundus images relies on a clinical technique
to visualize a comprehensive set of features and localization within the image.
Detection is challenging for diabetic patients with early DED stages because it
depends on the existence of microaneurysms (bulges in blood vessels), fluid
leakage from blood vessels, soft exudates formation, and damage to the optic
nerve. The stages of diabetic eye disease are shown in Fig.4.1.
In the past, automated DED diagnostics have been explored to ease the bur-
den on ophthalmologists and minimise diagnostic inconsistencies [125]. Stud-
ies, have used lesion-based detection. Gharaibeh et al. [67] presented a new
93

approach to detect microaneurysms in retinal fundus images. Their work in-
cludes pre-processing methods like blood vessel segmentation, fovea localiza-
tion, and elimination. They used a combination of neural networks and fuzzy
logical models for feature extraction and classification. Their study addressed
the binary classification of DR into two categories (microaneurysms and non-
microaneurysms). Moreover, a range of features other than microaneurysms
are appropriate for the diagnosis of DED.
Similarly, Kaur et al. [100] proposed region-based segmentation and detec-
tion of the lesion and then classified it using pixel-based classification to deter-
mine the severity level of the retinal disease. Karegowda et al. [98] detected
exudates in DR using decision tree and GA-CFS techniques as input to back-
propagation neural network. They classified the normal eye and eye with ex-
udate. The results obtained were insufficient to provide reliable classification
accuracy and did not result in efficient noise removal. Sopharak et al. [195] pre-
sented a fuzzy C-means and clustering-based exudate identification method.
Their work mostly relied on the identification of optic disc and the elimination
of blood vessels. According to the results obtained, the exudates are identified
without their characteristics. Jenuja et al. [96] presented a method based on the
optic disc and optic cup segmentation. The proposed method uses dual neural
networks that operate in combination with the optical cup and disc parts. The
aim of this proposed method is to efficiently segment the optic cup and disc of
a retinal fundus image. The results of the classification of various stages of GL
are not given. Earlier, Gulshan et al. [75] and Gargeya et al [66] presented CNN
for DR detection using fundus images. They achieved specificity and sensitivity
in the range of 90% for (normal/mild to moderate/severe) binary classification
in private wider data sets comprising 80,000 to 120,000 fundus images.
94

There are many traditional strategies for DED diagnosis and classification.
Most techniques use neural networks, mathematical morphology, region of in-
terest techniques, pattern recognition, clustering of fuzzy C-means, and Gabor
filter techniques. Chaudhuri et al. [35] used 2D matched filters, to detect the
blood vessels present in the retina. Vallabha et al. [213] used Gabor filter bank
outputs to identify the mild, moderate, and extreme stages of retinopathy. Auto-
mated detection and classification of abnormalities present in the vascular net-
work are carried out. Sinthanayothin et al. [186] detected haemorrhages, mi-
croaneurysms, and exudates, by developing a system based on recursive area
growth and Moat operator. Numerous methods have been suggested for optic
disc detection. PCA is one of the methods by which the clustering of brighter
pixels shows the candidate regions for the optical disc. Noronha et al. [131]
used Hough Transform for Optic Disc detection. For the detection of exudates,
a NN-based approach is used by Gardner et al. [65]. A fuzzy C-means clustering
method was employed by Bezdek et al. [22] and a computational intelligence-
based approach by Osareh et al. [137]. The automatic classification of normal,
mild, moderate, severe, and proliferative DR was carried out by measuring the
areas of several characteristics, such as haemorrhages, microaneurysms, exu-
dates, and blood vessels classified by the support vector machine [4].
However, the accuracy metrics for the diagnosis of the four categories of DR
(i.e., no DR, mild, moderate, and severe), are based on disease-grade selection
ratios. Although the no DR and severe stages are likely to achieve high sensi-
tivity, the mild and moderate recall levels are often deficient. Research stud-
ies using publicly available datasets reveal difficulties in detecting early stage
DEDs.
95

4.3 Methodology
This study’s overarching objective is to improve the performance of early de-
tection of DED from fundus images through the empirical assessment of image
preprocessing and classification improvement techniques. The related objec-
tives can be described as follows:
• Implementing traditional image processing techniques such as (i) image
Enhancement, (ii) image Augmentation, (iii) image Segmentation
• Implementing various hyperparameters and evaluating their effect on
CNN model performance
• Evaluating the accuracy obtained by pre-trained CNN models: ResNet50,
VGG-16, and Xception with original and preprocessed fundus images
• Developing a new CNN model to train preprocessed fundus images for
classification accuracy improvement
• Evaluating the results of the pre-trained and new CNN model by perfor-
mance metrics.
The process pipeline is shown in Fig. 4.2.
4.3.1 Image Data Collection
Data was collected from publicly accessible sources, i.e., Messidor, Messidor-
2, DRISHTI-GS, and the Retinal Dataset from GitHub. This section explains
the data sets used in this chapter. The labelling of each image is generated
96

Figure 4.2: The high-level process pipeline
by the ophthalmologist. Depending on the number of haemorrhages, microa-
neurysms, and the presence of neovascularisation, each image is classified
as one of three lesion grades. The Messidor Dataset was formed to promote
computer-assisted DED studies. It contains 1200 retinal fundus images of the
posterior pole from three departments of ophthalmology using a 3CCD colour
video camera placed on a Topcon TRC NW6 non- retinograph with a 45◦ field
of view (FOV). The medical experts offered two diagnostics for each image:
Retinopathy grade and Macular edema risk. The Messidor-2 Dataset is a publicly
accessible dataset used by individuals to evaluate DED algorithm performance.
Messidor-2 comprised of 1,748 colour retina images of 874 subjects. Messidor-2
varies from the actual Messidor dataset of 1200 images and ensures that it has
two images for each subject; one for each eye. Using the previously published
ICDR and DME gradings, Messidor-2 provided four disease rates for each sub-
ject. DRISHTI-GS Dataset [190] There are 101 retinal images in the Drishti-GS1
dataset with 31 normal images and 70 GL lesion images. Due to the limited
images obtained from DRISHTI-GS, we considered the GL dataset from the
GitHub 1 Retina Dataset which contains 100 retinal images indicating GL lesions.
1https : //github.com/yiweichen04/retinadataset/tree/master/dataset
97

Therefore, imbalance in the dataset caused us to perform under-sampling of the
dataset. Thus, we selected 100 images from each class to perform our experi-
ment.
4.3.2 Image Pre-processing
The preprocessing step is used to eliminate noise/variation in the retinal fundus
image and improve the quality and contrast of the image. Apart from contrast
enhancement and noise reduction, the preprocessing step can be used for image
normalization and non-uniform intensity correction to eliminate artifacts and
increase the accuracy of the process steps. Furthermore, DED features are lo-
calized, extracted and segmented from fundus images for further classification
in pre-trained models. The pre-processing techniques utilized in this article are
briefly discussed in this section.
Image enhancement: To enhance the original images’ appearance and infor-
mation value before processing, we used popular image enhancing techniques:
contrast enhancement, and illumination correction. Contrast enhancement:
Contrast limited adaptive histogram equalization (CLAHE) [251] is utilized to
improve the visibility of images. CLAHE is an adapted part of the Adaptive
Histogram Equalization (AHE) process. In this method, the enhancing function
is introduced to all neighbourhood pixels, and the transformation function is de-
rived. This is distinct from AHE for its limited contrast. In CLAHE, the contrast
of the image is improved by implementing contrast limited histogram equaliza-
tion (CLHE) to small data areas called tiles rather than the entire image. The
resulting adjacent tiles are then perfectly stitched back utilising bilinear inter-
98

Figure 4.3: The flowchart.
polation. CLAHE is applied to greyscale retinal images. The ’cliplimit’ function
is applied to limit noise in an image. Create grey level mapping and clip the
histogram. In the contextual area, pixel numbers are divided equally at each
grey level so that the average number of pixels is grey as follows:
navg =nCR−xp ∗ nCR−yp
ngray(4.1)
Where, navg= average number of pixels, ngray= number of gray level in con-
textual region,
nCR−xp= number of pixels in x direction of contextual region
99

nCR−yp= number of pixels in y direction of contextual region after that calcu-
late the actual cliplimit.
nCL = nCLIP ∗ navg (4.2)
CLAHE [251] is an useful technique in biomedical image processing because
it is very effective at making the normally important salient sections more ac-
cessible.
Illumination correction: This pre-processing method aims to reduce the sce-
nario effect caused by the uneven illumination of retinal images. Every pixel
intensity is calculated using the following equation:
p′ = p + µD − µL (4.3)
Where p, p′ is the initial and the latest pixel size values, respectively, µD is the
desired average intensity, and µL is the local average intensity [237]. Microa-
neurysms forming on the surface of the retina are enhanced with this method.
Image segmentation: To build an effective deep learning-based classifica-
tion system for detecting mild DED, we need to consider the importance of the
architecture of the network as well as the importance of input data. To obtain
efficient results, input images play a significant role. In retinal fundus images,
variability such as the number of images, luminosity, contrast, and anatomi-
cal features, determines the result of the automatic disease detection algorithm.
Therefore, features segmentation enhances the value of the images for classifi-
cation and contribute to better accuracy. The process and associated theory is
explained in the following sections.
100

Blood vessels extraction: For the detecting early stages of DR, the blood ves-
sels are one of the most significant anatomical features in retinal images. Thus,
retinal blood vessel segmentation is performed with following steps: (i) image
enhancement, (ii) Tyler Coye algorithm [45] and (iii) morphological operation
for further improvement in results.
We performed image enhancement techniques as mentioned above, green
channel of the RGB colour space presents better contrast between vessels
network and background. The variation of contrast and luminosity in the
background of a fundus image, can be estimate using method introduced by
Zuiderveld [251] and Youssif et al. [237]. After contrast and luminosity adjust-
ment, ISODATA used in Tyler Coye algorithm is used to extract the threshold
level. After the Tyler Coye algorithm, morphological operation (erosion and di-
lation) is used for further enhancement. Using these two essential fundamental
operations, we reduce noise or remove of gaps in the background and fore-
ground. Erosion is a procedure used to eliminate or spike the edge of the area,
which is represented in the following equation:
A � B = {p|Bp ⊆ A} (4.4)
Dilation is a procedure employed to broaden the rim of the background or fore-
ground image configuration. This procedure is widely used to fill a gap, and
can be defined in the following equation:
A ⊕ B = {x|Bx ∩ X , 0} (4.5)
.
Closing is to perform the dilation, followed by erosion, to create a relation
between each pixel of the image in order to bring them closer to one another.
This procedure can be defined in the following equation:
101

A · B = (A ⊕ B) B (4.6)
Where, ⊕ denote the dilation; denote the erosion; A = Structuring element and
B = the erosion of the dilation of that set. However, several gaps remain in Tyler
Coye algorithm. This morphological process is to fill these small gaps in order
to cover some of the required regions of the blood vessels.
Optic disc detection and extraction: GL occurs when the optic nerve is dam-
aged so segmentation of the optic disc (OD) helps to obtain a clearer view of the
anatomical changes in the optic nerve. Fig. 4.1 shows a fundus image of an
eye from our collected data set with anatomical parts showing OD. To segment
the OD, we applied the following steps: (i)image enhancement, (ii) Circular
Hough Transform (CHT) to detect circular object, (iii) median filter to reduce
noise, and (iv) optic disc segmentation using the threshold values. Image pro-
cessing attempts to improve the quality of the retinal fundus image to enable
the identification of clinical features for DED. A flowchart of the image process-
ing and image segmentation approach is depicted in Fig. 2.3. CLAHE can not
be employed in the entire image, but only on a specific area ’tile’ of the image.
Image enhancement calculation is adjusted on the basis of the user-specific
maximum contrast rate level by setting its rate to l, 0 ≤ l ≤ l [193]. Further
contrast enhancement is performed in those images which have low contrast
estimated by
φ(i, j) =
(µ(i, j) − ∆
δ − ∆
)(Γ − 1) (4.7)
Where, φ(i, j) and µ(i, j) are pixels after transformed and pixels before trans-
formed in (i, j) coordinates, respectively; ∆ is maximum pixel value; δ is mini-
mum pixel value of input image and Γ is maximum value of gray scale.
102

The median filtering has a strong noise reduction efficiency and it is very
common in image processing for noise removal. Mean filtering replaces the
pixel value in the middle of the sliding window with the median value of the
pixels in the window. Mathematically median filtering is represented by:
f (x, y) = median(s,t)∈S xy{g(s, t)}. (4.8)
Segmentation is a pixel classification method for extracting objects or seg-
menting regions with a similar to the background [178]. Therefore, we used the
Circular Hough Transform (i.e. CHT) method for optical disc detection. The
CHT method is often used to identify the circular shape in an image. The key
benefit of the CHT approach is that it is sensitive of differences in feature spec-
ification descriptions as well as being largely unaffected by image noise. The
CHT is provided by the equation:
(x − a)2 + (y − b)2 = c2 (4.9)
The procedure to detect circles involves the following steps:(i) obtain a binary
edge map of the image, (ii) values for a and b are set, (iii) obtain the value of c
radius that satisfies Equation 4.7, (iii) adjust the accumulator corresponding to
(a,b,c), (iv) change the values for a and b within the scope of interest and return
to Phase (iii).
Exudate localization and detection: Exudates in two-dimensional retinal
images acquired via a digital fundus camera, usually appear as a bright area
with varying scale, brightness, position and form. Precise exudate segmenta-
tion is a difficult activity given the large variety of scale, intensity, contrast and
shape. It comprises of three major processing stages: (i) image enhancement;
(ii) optic disc detection and removal; (iii) blood vessel removal; and (iv) exudate
103

extraction. When exudate are acquired from the mild dataset, the classification
of the DME can be performed according to the grading criteria mention in the
messidor dataset. Early DME can be diagnose early by detecting the presence of
exudates in fundus images. Fig. 4.1 shows the exudates formation in the mac-
ular region. After optic disc detection and removal performed, Otsu thresholding
is applied to obtain candidate areas of exudates. Threshold value T relying on
the input image is estimated by Ostu method, automatically. First, the intensity
value i of histogram is calculated using Equation 4.10:
p(i) =ni
N, p(i) ≥ 0,
256∑1
p(i) = 1 (4.10)
The number of pixel images N and the number of pixels ni with I intensity.
Subject weight and background are described in Equations 4.12 and 4.13:
w1(t) =
t∑i=1
p(i) (4.11)
w2(t) =
L∑i=t+1
p(i) = 1 − w1(t) (4.12)
Here, the number of the gray level is L. The mean of the object and the
background is then determined using Equations 4.14 and 4.15:
m1(t) =
t∑i=1
i.p(i)/w1(t) (4.13)
m2(t) =
t∑i=1
i.p(i)/w2(t) (4.14)
Hence, variance is estimated by Equations 4.16 and 4.16, while the total of vari-
ance is expressed in Equation 4.18 as follows.
104
σ21(t) =
t∑i=1
(1 − m1)2.p(i)
w1(t)(4.15)
σ22(t) =
t∑i=t+1
(1 − m2)2.p(i)
w2(t)(4.16)
σ2(t) = σ2w(t) + σ2
B(t) (4.17)
Here, σ2w is called as within-class variance (WVC) that is expressed in
Equation4.19, while σ2B called between-class variance (BVC) that is expressed
in Equation4.20. WVC is the amount of individually class variance that has
been weighted with probability of each class. Average total is calculated using
Equation4.21 . Threshold value can be obtained from the minimisation of WVC
or maximisation of BVC; but BVC has less computation time:
sigma2w(t) = w1(t).σ1(t)2 + w2(t).σ2(t)2 (4.18)
σ2B(t) = w1. [m1(t) − mT ]2 + w2. [m2(t) − mT ]2 (4.19)
mT =
N∑i=1
i.p(i) (4.20)
Morphological is a set of discrete coordinates that are related to a pixel ob-
ject of an image that involves a logical operation, such as “or” and “and”. The
opening operation aims to refine the object contour and repair the object contour
with an eliminated pixel area that is smaller than the structure element.
105

AoB = (AΘB) ⊕ B (4.21)
Image Augmentation: DL models perform well with high volume training
data. Therefore, data augmentation is comprised of a collection of techniques
that improve the quantity of training data without actively acquiring new data.
Thus, the image augmentation algorithms addressed in this chapter include ge-
ometric transformations such as flipping, rotating, mirroring, and cropping. We
used the Keras ImageDataGenerator 2 class for real-time image augmentation,
which ensures that the selected model will obtain variations of the images at
every epoch. The advantage of using the ImageDataGenerator class in our work
is that transformed images will not add to the range of original images, which
avoid overfitting the selected model.
4.3.3 Model Development
In this research, we are using CNN-based transfer learning to implement the
DED retinal fundus image classification. To accomplish the absolute best clas-
sification outcomes, we explore pre-trained CNN model transfer learning tech-
niques. The precise details of the pre-trained models will be presented in this
section.
According to Pan et al. [140] transfer learning is defined as; D = Φ, P(X) with
X = x1, x2, . . . , xn ε Φ, where, D is domain, Φ is feature space and P(X) is the
marginal probability distribution. Given, T = Y, F(∗) where, T is given task,
Y is refers to a label space and F(∗) is an objective predictive function that is
2https://keras.io/api/preprocessing/image/
106

learned from the feature vector and label pairs. Specifically, given a source do-
main Ds with learning task Ts and a target domain Dt with learning task Tt, then
transfer learning is the process of improving the learning of the target predic-
tive function Ft(∗) in Dt based on the knowledge learned from source domain
Ds and learning task Ts, where Dt , Dt, or Ts , Tt. It should be noted that the
single source domain described above can be expanded across multiple source
domains.
The concept behind transfer learning for the classification of images is that,
if a network is typically trained on a broad scale and enough data set (e.g., Im-
ageNet), it can effectively train in the particular target task, which has fewer
labelled examples than the pre-training dataset. One can benefit from these
learned feature maps without training a large model from scratch on a large
dataset.
In this chapter, we will customize pre-trained models in two ways: (i) Feature
Extraction: features learned from the source task to extract useful features from
the target task. We added a new classifier, which can be trained from scratch to
the top of the pre-trained network to modify the features maps initially learned
for the sample. (ii) Fine-Tuning: unfreeze some of the last layers of the frozen
base network and collectively train the last layers of the base network and the
newly added classifier layers. This helps to ”fine-tune” the higher-order char-
acter representations in the base network to make them more appropriate to
the target task. We fine-tune three pre-trained CNNs (Xception, VGG-16, and
DenseNet21) to implement DED image classification. Three CNN pre-trained
networks on ImageNet and their characteristics are described in Table 4.1.
107
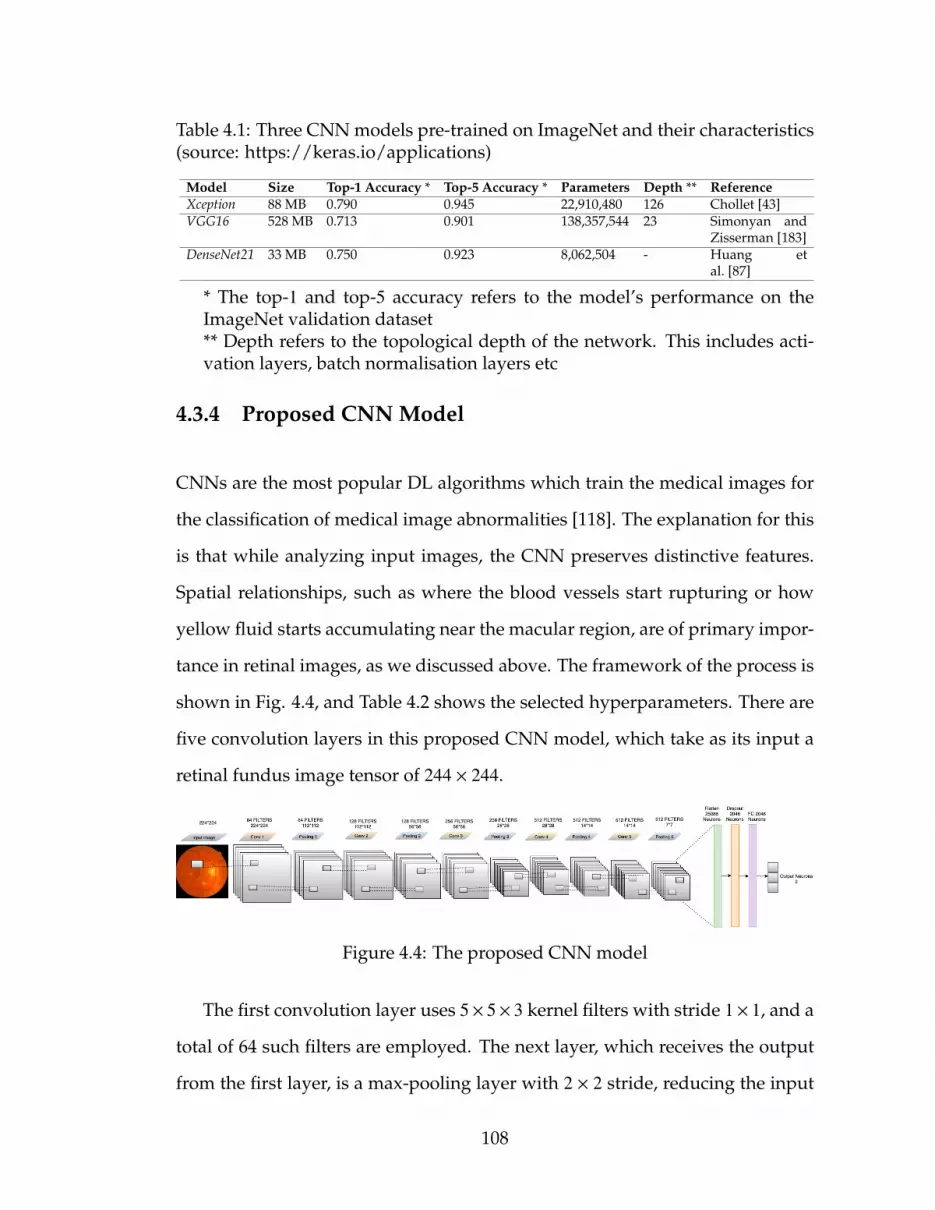
Table 4.1: Three CNN models pre-trained on ImageNet and their characteristics(source: https://keras.io/applications)
Model Size Top-1 Accuracy * Top-5 Accuracy * Parameters Depth ** ReferenceXception 88 MB 0.790 0.945 22,910,480 126 Chollet [43]VGG16 528 MB 0.713 0.901 138,357,544 23 Simonyan and
Zisserman [183]DenseNet21 33 MB 0.750 0.923 8,062,504 - Huang et
al. [87]
* The top-1 and top-5 accuracy refers to the model’s performance on theImageNet validation dataset** Depth refers to the topological depth of the network. This includes acti-vation layers, batch normalisation layers etc
4.3.4 Proposed CNN Model
CNNs are the most popular DL algorithms which train the medical images for
the classification of medical image abnormalities [118]. The explanation for this
is that while analyzing input images, the CNN preserves distinctive features.
Spatial relationships, such as where the blood vessels start rupturing or how
yellow fluid starts accumulating near the macular region, are of primary impor-
tance in retinal images, as we discussed above. The framework of the process is
shown in Fig. 4.4, and Table 4.2 shows the selected hyperparameters. There are
five convolution layers in this proposed CNN model, which take as its input a
retinal fundus image tensor of 244 × 244.
Figure 4.4: The proposed CNN model
The first convolution layer uses 5× 5× 3 kernel filters with stride 1× 1, and a
total of 64 such filters are employed. The next layer, which receives the output
from the first layer, is a max-pooling layer with 2 × 2 stride, reducing the input
108

Table 4.2: Hyper-parameters of the build CNN model and preferred weights inthis study.
R1 R2 R3 R4 R5 R6 R7 R8CNN 224*224 RMSprop 32 10-fold 3e-4 BCE 50
Legend: R1 - Model, R2 - Image Size, R3 - Optimizers, R4 - Mini Batch Size,R5 - Cross validation, R6 - Initial Learning Rate, R7 - Loss function, R8 -Epoch, BCE - Binary cross-entropy
to half of its size 112 × 112. For all layers, the output from the pooling layer
passes through the ReLU activation feature. The nonlinear output obtained is
now fed into the next convolution layer with 5 × 5 × 64 with 128 filters, and the
stride value is the same 1 × 1. The obtained output pass through a max-pooling
layer with the same 2 × 2 strides, which again reduces the input to half of its
size 56 × 56. After the output passes through ReLU activation, it is fed into the
third convolution layer with 256 filters and the kernel size 5 × 5 × 128 with 1 × 1
stride. The output is passed to a max-pooling layer, which results in a tensor of
shape 28 × 28. Again, the output passes through ReLU activation, fed into the
fourth convolution layer with 512 filters and kernel size 5× 5× 256 and with the
same stride 1 × 1. The output from the fourth convolution is max-pooled to a
size of 14 × 14. After ReLU is activated and it is passed to a fifth convolution
layer with 512 filters and 14 × 14 × 512 kernel size to accommodate the output
of all the filters from previously configured layers, and max-pooling of output
from that layer with a stride of size 2×2 produces an output of size 14×14. Now
the resulting tensor has the shape 7 × 7 × 512. The obtained tensor is flattened
with 25,088 neurons. The weighed values that emerge as neurons demonstrate
the proximity to the symptoms of DED. The dropout layer is applied here to
drop values to handle network overfitting. In this work, we used a dropout
rate of 0.5 during training. The fully connected layer converts the tensor with
25,088 neurons to 64 neurons and adds ReLU activation to the output. These
109

64 neurons is the product of the fully connected layers; these 64 neurons are
translated into neuron counts equal to the number of categories to which the
retinal image belongs: healthy, DR, GL, and DME.
4.3.5 Performance Evaluation
Different metrics have been used to evaluate the effectiveness of the highest
performing DL model. To calculate the true or false classification of the DED
diagnosed in the fundus images evaluation is as follows. Initially, the cross-
validation estimator [192] is adopted and plotted in a confusion matrix as shown
in Table 4.3. The confusion matrix has the following four predicted outcomes.
True Positive (TP) has been identified with the right diagnosis and a variety of
abnormalities. True Negative (TN) is an erroneously calculated number of peri-
odic instances. False positives (FP) are a set of periodic instances. The following
performance metrics are used to calculate the values of possible outcomes in the
confusion matrix.
Accuracy: Accuracy is an essential metric for the evaluation of the results of
DL classifiers. It is a summary of the true positive and true negatives divided
by the confusion of the matrix components’ total values. The most accurate
model is an excellent one, but it is imperative to ensure that symmetric sets of
data with almost equal false positive values and false negative values. Thus, the
elements of the confusion matrix mentioned above will be calculated to evaluate
the effectiveness of our proposed classification model for the DED dataset:
Accuracy(%) =T P + T N
T P + FN + T N + FP100%. (4.22)
110

Table 4.3: Confusion Matrix
P PositiveP Negative TotalA Positive T P FN T P + FNA Negative FP T N FP + T N
Total S e S p
Legend: A Positive = Actual Positive, A Negative = Actual Negative, P Positive= Predicted Positive, P Negative = Predicted Negative, TP = True Positive, FN= False Negative, FP = False Positive, TN = True Negative, Se = TP + FP, Sp =FN + TN
Sensitivity (Recall): Sensitivity is measured as the number of accurate pos-
itive predictions divided by the sum of positive. The best sensitivity is 1.0,
whereas the worst is 0.0. We calculate sensitivity using following equation:
S ensitivity =T P
T P + FN(4.23)
Specificity: Specificity is measured as the number of correct negative predic-
tions divided by the sum of negatives. The best specificity is 1.0, and the worst
is 0.0. We calculate sensitivity using the following equation:
S peci f icity =T N
T N + FP(4.24)
4.4 Experiment Design and Analysis
4.4.1 Experiment Design
All the experiments were implemented using MatLab, Python, Keras library1,
with TensorFlow2 as a back-end and Python 3.8 programming language in a
111

Jupyter Notebook with a processor 2.3 GHz Intel Core i9 and RAM of 16 GB 2400
MHz DDR4 with Intel UHD Graphics 630 1536 MB. The training/testing data
split was set at 80/20. The segregated generic selection was conducted to ensure
an approximately equal distribution of the class. Mini-batch size was set to 32,
and the cross-entropy loss function was chosen due to its suitability for binary
classification tasks. The Optimiser was set as default (Adam) and RMSprop for
build CNN. The standard performance evaluation metric accuracy, sensitivity
and specificity of the test dataset were used to validate the results.
4.4.2 Model Training
We compared and analysed performance accuracy for three distinct pre-trained
DL models with the newly built CNN model. The three pre-trained mod-
els, namely; Xception, VGG16, and DenseNet21 and five-layered convolutional
model were evaluated for test data set accuracy (Table 4.1). The pre-trained
models adopted for this research were trained and tested with large-scale Ima-
geNet data, covering a wide range of categories such as cars, animals, flowers,
etc. Models acquire excellent performance image classification for objects while
demonstrating a limitation in their application to narrow product areas, such
as medical lesion (DED) detection. The prognosis of pathological indications in
the retinal fundus images depends on various complex characteristics and le-
sion localization in the retinal fundus image. There is a new representation of
the input image in each CNN layer by progressive extraction of the most dis-
tinctive features. For instance, the first layer is capable of learning edges, while
the last layer can identify a lesion as a DED classification feature. As a result,
the following scenarios were considered in the experiments: Region of Interest
112

such as blood vessels, macular regions and the optic disc were detected, local-
ized and segmented.
We employed a combination of multiple traditional image segmentation al-
gorithms for each phase of the proposed system. All of these algorithms pro-
vided effective results in the segmentation of the Region of Interest. We per-
formed a series of procedures to build a high-performance system, such as im-
age enhancement, blood vessel segmentation, identification and then extraction
of optic discs, extraction of macular region, blood vessels removal, elimination
of optic discs, extraction of features, and classification of features. After seg-
mentation, the image size of the images has been optimised to a suitable size
following the input specifications of each network. To minimise the risk of
model overfitting, the imbalance dataset was augmented using the real-time
augmentation ImageDataGenerator class from Keras. Fine-tuning was used for
pre-trained models after eliminating and re-training n layers (n was CNN layer-
dependent). The final output acquired for each model was used for comparison
in terms of percentage accuracy, and these are represented in Tables 4.4 and Ta-
ble 4.5. VGG16 classification surpassed the other two fully-trained DL models,
Xception and DenseNet121. Similarly, among all pre-trained models, the newly
built CNN model using pre-processed retinal images performed well. Tables
4.6 and Table4.7 compare the accuracy of results. The built CNN’s accuracy
surpasses all the models used for classification.
To detect retinal anomalies, we developed more general screening classifi-
cation models. The confusion matrix and ROC curves of each pre-trained deep
learning model and a build CNN model for binary classification of healthy and
other DED disease status are shown in Fig. 4.5, 4.6, 4.7, and Fig. 4.8, 4.9, 4.10.
113

Table 4.4: Average performance of the models on original images
DED Model Accuracy Sensitivity Specificity Precision
Normal/MildDR
Xception 60.87% 67% 58% 43%
VGG16 80.43% 76.92% 85% 74%DenseNet121 56.67% 71.43% 53.85% 96%
Normal/MildDME
Xception 62.07% 65% 60% 52%
VGG16 85.79% 90% 81% 78%DenseNet121 51.72% 100% 51% 28%
Normal/MildGL
Xception 63.41% 85.71% 58.82% 95%
VGG16 87.80% 94.12% 83.33% 95%DenseNet121 80.49% 77% 84% 76%
Legend: DED = Diabetic Eye Disease DR = Diabetic Retinopathy, DME =Diabetic Macular Edema, GL = Glaucoma.
Table 4.5: Average performance of the VGG16 model on pre-processed images
DED Model Accuracy Sensitivity Specificity Precision
Normal/Mild DR
VGG16 83.43% 86% 85.71% 78%
Normal/Mild DME
VGG16 89.13% 85% 95% 96%
Normal/Mild GL
VGG16 88% 95% 90% 90%
Legend: DED = Diabetic Eye Disease DR = Diabetic Retinopathy, DME =Diabetic Macular Edema, GL = Glaucoma.
4.4.3 Performance Analysis
This research is a study of binary classification DL algorithms to identify three
mild diabetic eye diseases automatically. This research has shown that the com-
plexity of the DL algorithms arises from the quality and quantity of data (fundus
images), not from the algorithm. In this research, we used publicly available an-
114

Table 4.6: Average performance of the New proposed model on original images
DED Model Accuracy Sensitivity Specificity Precision
Normal/Mild DR
CNN 63.33% 53.33% 73.33% 61%
Normal/Mild DME
CNN 82.86% 83.33% 82.35% 82%
Normal/Mild GL
CNN 96.77% 100% 93.75% 100%
Legend: DED = Diabetic Eye Disease DR = Diabetic Retinopathy, DME =Diabetic Macular Edema, GL = Glaucoma.
Table 4.7: Average performance of the new proposed model on pre-processedimages
DED Model Accuracy Sensitivity Specificity Precision
Normal/Mild DR
CNN 93.33% 100% 86.67% 100%
Normal/Mild DME
CNN 91.43% 94.44% 88.24% 94%
Normal/Mild GL
CNN 100% 100% 100% 100%
Legend: DED = Diabetic Eye Disease DR = Diabetic Retinopathy, DME =Diabetic Macular Edema, GL = Glaucoma.
notated data (fundus images). For a computer-aided clinical application, more
robust, practical, and realistic results can be obtained using labelled hospital
fundus images. Indeed, this chapter recommends that the automatic classifier
strive to classify against the binary classification of at least average, DR, DME,
and GL due to each disease’s significance. These three diseases are the major
retinal diseases caused by diabetes. Unless an initial evaluation is conducted,
these diseases always cause severe damage to the visual acuity, and it is irre-
versible [24, 153].
Growing life expectancy, busy lifestyles, and other factors suggest that the
number of people with diabetes will increase [153]. For example, many pa-
115

(a) Confusion Matrix
(b) ROC-AUC
Figure 4.5: VGG16 model peformance in Diabetic Retinopathy
tients with DED in China often overlook their situation and lack timely treat-
ment leading to serious state development of DR [243]. Early intervention of
abnormal signs prevents further deterioration of the condition and its effect on
the impacted individuals and related medical costs. Therefore, the DED identifi-
cation system enables either a completely automated the eye-screening process
or semi-automated eye-screening system. The first method requires a reason-
able degree of accuracy which is similar to that of the retinal experts. As per the
British Diabetic Association (BDA) guidelines, a minimum level of 95% speci-
116

(a) Confusion Matrix
(b) ROC-AUC
Figure 4.6: VGG16 model peformance in Diabetic Macular Edema
ficity and 80% sensitivity for sight-threatening DR detection must be obtained
by the applied method [18]. Second option allows the downsizing of large-scale
mass-screening outputs to potential DED cases, followed by human examina-
tion. Both scenarios significantly reduce the burden on skilled ophthalmolo-
gists and specialised facilities, making the process accessible to the population,
especially in low-resource settings.
The application of DL to the clinical practice still has many challenges. An
earlier research dealt with the ethical and political concerns in terms of database
117

(a) Confusion Matrix
(b) ROC-AUC
Figure 4.7: VGG16 model peformance in Glaucoma
creation [2]. For this purpose, it has been difficult to obtain large-scale data
for many diabetic eye diseases. Another challenge is that mild (early) clas-
sification problems consist of real clinical problems. Binary classification for
DED prediction was the subject of previous studies. Even though Google has
built a DL model that works better than ophthalmologists, their ’Inception-v3’
model was optimised for binary classification for DR identification based on the
GoogLeNet structure Gulshan et al. [75]. This framework was evaluated after
adding a wide image database gathered for only healthy and non-healthy DR
118

(a) Confusion Matrix
(b) ROC-AUC
Figure 4.8: Build CNN model performance in Diabetic Retinopathy
screening of diabetes patients. For binary disease classification, Gulshan et al.
stated a 93-96 % recall but noted that recall is not enhanced while practicing
with 60,000 image samples contrasted with 120,000 image samples employing a
private dataset.
Visual representations of the features acquired by CNNs demonstrate that
the patterns being used for classification are a part of the image fully visible to
the observer [236]. The moderate and severe class of the diabetic retinal images
119

(a) Confusion Matrix
(b) ROC-AUC
Figure 4.9: Build CNN model performance in Diabetic Macular Edema
include macroscopic features on a scale designed for classification by current
CNN architectures such as those accessible from the ImageNet visual database.
On the other hand, less than 1 % of the overall pixel volume, a degree of slight
that is often difficult for human interpreters to identify, is the characteristics that
differentiate mild disease from the normal.
This research indicates that mild-class DED classification should be estab-
lished through further studies on automatic diagnosis using retinal fundus
120

(a) Confusion Matrix
(b) ROC-AUC
Figure 4.10: Build CNN model performance in Glaucoma
imaging. The first part of the experiment includes traditional image processing
for enhancing mild DED features. Various conventional techniques for image
processing have been implemented to extract DED lesions. Pre-trained CNN
models using transfer learning provides excellent performance with object-
oriented images such as flowers, cars and animals, but is not efficient for lesion
based medical images. So, in this research we aim to objectify mild DED lesions
by segmenting the region of interest and transferfing it to transfer learning and
building CNN for further feature extraction. Following with the elimination
121

of the top layer (existing approach) a detailed review of three CNN architec-
tures (including state-of-the-art architectures) was conducted. Secondly, the n
layers were ’unfrozen’ and then re-trained to respond effectively to the details
of the case study of the application (proposed approach). The Messidor and
Messidor-2, retinal datasets were used for system training. Two training sets
were prepared with the available dataset before, and after pre-processing to
measure potential accuracy improvement for normal/mild DED image classi-
fication.
As mild DED tends to be incredibly difficult to discern from a normal retina
due to only a few subtle indications of the impairment, an increase in data qual-
ity was supposed to improve the visibility of pathological features. The top
1 CNN architectures with the top layer removed and re-trained were VGG16,
yielding the accuracy of 83.43%, 89.13%, 88% for each disease (Table. 4.5). The
lowest performance was obtained by Xception and DenseNet21, respectively. The
impact of fine tuning varied across the models. The observed improvement in
accuracy was only minor, indicating the relative appropriateness of default pre-
trained networks for DED classification tasks. In other words, the CNNs net-
works were able to identify mild DED from a healthy retina despite having been
trained on different images from the ImageNet repository. If no improvement
in accuracy is obtained, the unfreezing is not advised as it results in unneces-
sary computational costs and time accrued. The built CNN model yielded the
accuracy of 93.33%, 91.43%, 100% respectively.
To compare the performance of the employed models, two scenarios were
considered: (i) before image preprocessing, and (ii) after image preprocessing.
In the before pre-processing scenario, we trained our models with a raw dataset
122

with data augmentation (geometric transformation) applied to the Messidor,
Messidor-2, and DRISTI-GS datasets, to avoid overfitting. In the after image
pre-processing scenario, the datasets were pre-processed using various tradi-
tional image processing techniques which increased the classification perfor-
mance to 100% (the maximum accuracy achieved for Gl).
After evaluation of our high performed approach on the Mild DR, Mild DME
and Mild GL detection tasks, the maximum sensitivity of 100%, 94.44%, 100%
and the maximum specificity of 86.67%, 88.24%, 100% were obtained. Thus,
early DED detection proved sufficient given the BDA standards, but still fell 9%
and 6% short in terms of specificity.
Approach limitations: Several research deficiencies have been established.
First, the datasets acquired for this experiment were obtained from publicly
available which limits the number of high quality mild DED images, only lim-
ited to-moderate data set sizes were employed in the research. The approach
also emphasises the value of an effective annotation process as having a di-
rect effect on the output of the classifier. The Messidor and Messidor-2, reti-
nal datasets have been validated and marked by professional ophthalmologists.
Transfer learning is used as a compensation procedure. Pre-trained CNN mod-
els in the wide-scale ImageNet database have been adopted in this study. To in-
crease the size of the training sample set and to ease the data imbalance problem
data were rotated, flipped, mirrored, etc. Second, the default model parameters
were adopted for the classification task (i.e. dropout, batch size, loss function,
optimizer, etc.). Finally, the ”black-box” nature of DL-based solutions is often
criticized, causing resistance in the broader approach adopted by practitioners.
However, with a CNN built using binary classifiers, we achieved state-of-the-
123

art accuracy, the model performance degrades with the use of transfer learning.
However, it is striving to ensure that training with more data might be more
robust. Previous field research has confirmed that the CNN’s ability to accom-
modate differences in size is limited and some have indicated that more data
can not complement this inherent weakness in the case of retinal images [75].
4.5 Summary of Findings
Effective identification and prompt diagnosis of DED is deemed essential for the
prevention of permanent vision loss. Automated DED identification has been
the topic of a variety of studies in the past, with the main emphasis on binary
normal / severe DR image classification [153]. The results show that the identi-
fication of normal to severe indications does not present major difficulties due
to the high visibility of the pathological features. The problem occurs with the
mild DED identification of instances where very few degree specimens prove
representative of the condition, which is often unnoticed by classifiers. Mild
DED instances prediction has been further questioned by the poor quality of
fundus images which further complicates the identification of delicate lesions
in the retinal images. Thus, this research proposes an approach that focuses
specifically on the identification of mild DED among normal instances as not
adequately discussed in previous literature.
According to the analytical aspect of DL, a variety of performance opti-
mization techniques have been employed (i) image enhancement, (ii) feature
enhancement, (iii) data balance, and (iv ) fine-tuning. The additional advan-
tage of DL involves automatic recognition capabilities that are most selective
124

between categories. Such an approach makes it possible to avoid technological
constraints with the analytical, and sometimes subjective, approach of manual
extraction of features.
In addition , the analysis used composite data sets from various sources to
determine the robustness of the system and its capacity to respond to real-world
scenarios. As Wan et al. [219] pointed out, the single data collection framework
poses difficulties in the validation of accurate models. The developed system
enables the standardisation of labour-intensive eye-screening processes and sat-
isfies as an auxiliary diagnosing reference, while avoiding human subjectivity.
125

CHAPTER 5
AUTOMATIC IDENTIFICATION OF MILD DED AND MULTI-CLASS
DED USING PRE-TRAINED CNN MODELS
Diabetic eye disease is a collection of ocular problems that affect patients with
diabetes. Thus, timely screening enhances the chances of timely treatment and
prevents permanent vision impairment. Retinal fundus images are a useful re-
source to diagnose retinal complications for ophthalmologists. However, man-
ual detection can be laborious and time-consuming. Therefore, developing an
automated diagnose system reduces the time and workload for ophthalmolo-
gists. Recently, the image classification using Deep Learning(DL) in between
healthy or diseased retinal fundus image classification already achieved a state
of the art performance. While the classification of mild and multi-class dis-
eases remains an open challenge, therefore, this research aimed to build an au-
tomated classification system considering two scenarios: (i) mild multi-class Di-
abetic Eye Disease(DED), and (ii) multi-class DED. Our model tested on various
datasets, annotated by an opthalmologist. The experiment conducted employ-
ing the top two pretrained convolutional neural network(CNN) models on Im-
ageNet. Furthermore, various performance improvement techniques were em-
ployed, i.e., fine-tune, optimization, and contrast enhancement. Maximum accuracy
of 88.3% obtained on the VGG16 model for multi-class classification and 85.95%
for mild multi-class classification.
126

Figure 5.1: Complications of DED in fundus images; A. Microaneurysms; nar-row bulges in the side of the blood vessel(Diabetic Retinopathy) B. Progressivedamage of optic nerve damage(Glaucoma) C. Exudates formation in macularregion and thickening of macula(Diabetic Macular Edema) D. Degeneration oflens (Cataract).
5.1 Introduction
The World Health Organisation (WHO) reports, 2.2 billion individuals globally
have a blindness or vision loss, of which at least 1 billion have impaired vi-
sion, which could have been reversed1. One of the reasons for this blindness
is identified as diabetes mellitus or diabetes. Approximately one-third of those
with diabetes expected to diagnosed with a DED, a chronic eye disease that
can cause permanent visual impairment if left unattended [44]. DED includes
diabetic retinopathy (DR), glaucoma (Gl), diabetic macular edema (DME), and
cataract2 (Ca) (see Fig. 5.1). It is crucial to identify and diagnose these diseases
for the treatment.
Motivated by the necessity of active strategies for diagnosis, and prevention
to implement the broad spectrum of needs associated with retinal disorders and
visual impairments throughout the lifespan. Automated DED diagnostic tech-
niques using DL are vital to addressing these issues [2, 75]. Timely screening of
1https://www.who.int/en/news-room/fact-sheets/detail/blindness-and-visual-impairment
2The National Institute of Diabetes and Digestive and Kidney Diseases
127

DED, which is crucial to effective prognosis based on professional ophthalmol-
ogist, is time and labor intensive [66].
Although DL has generally achieved high validation accuracies for healthy
and diseased (binary) classification, the results of mild and multi-class classifi-
cation are less impressive, particularly for early stage impairment. Therefore, in
this chapter, we present a Deep Convolutional Neural Network(DCNN) based
automatic DED classification model that can classify healthy images from dis-
ease pathologies. To identify the best performing framework for the mild and
multi-class DED classification tasks, we initially evaluate different DCNN archi-
tectures. We aim to achieve the highest performance levels than reported in the
previous works. Thus, we trained and tested mild and multi-class classification
models to improve sensitivities for the different DED classes, incorporating dif-
ferent preprocessing and augmentation approaches to boost the accuracy of the
result and enhance adequate sample volume for the dataset.
Early rectification of retinal diseases is vital, but the diagnosis of these dis-
eases utilizing neural networks requires a substantial amount of time and mem-
ory. Additional data must supply to enhance the precision, but this requires
high computational power and a massive amount of time investment. Thus, a
comparatively pretrained model can benefit the process as it adapts the design
to reduce losses. Pretrained models or Transfer Learning(TL) [211] models has
already been demonstrated and validated promising results in medical image
classification and detection [20, 99, 116, 125]. As part of this analysis, we used
the state of the art CNN models, pretrained on the broad public image repos-
itory ImageNet, following the TL principle. The top layers of the deep neural
network were learned from the publicly accessible fundus image corpora for
128

Figure 5.2: Transfer Learning process.
mild and multi-class classification by using initialized weights. The research
performed in this chapter focuses solely on different DED instances, actually
challenging to classify as opposed to previous approaches. Initially, the highest-
performing CNN model is selected based on a comprehensive experiment con-
ducted. Lastly, it evaluates the set of performance improvements, including
fine-tuning, and optimizer selection. Finally, an ideal intermediate scenario of
accuracy achieved is selected to facilitate efficient and effective fully automated
DL based system development to improve outcomes to mass screening services
among the at risk population.
5.2 Literature Review
Several previous research work concentrated on automated retinal disease de-
tection by using machine learning algorithms [15, 46, 47, 221] to classify a
substantial number of fundus images captured from retinal screening pro-
129

grams [29, 235]. Multiple machine learning techniques: Artificial Neural Net-
work(ANN), K-nearest neighbour algorithm, Support Vector Machine(SVM),
and Naive Bayes classifier, were implemented to the automated identification
of retinal diseases [125]. Many studies implemented ANN models to identify
the disparity between glaucoma and non glaucoma [38, 234]. A glaucoma re-
search team observed visual field evaluation by discovering preperimetric glau-
coma utilising DL feedforward neural networks(FNN) [16]. For the grading in-
tensity of the nuclear cataract [64], an artificial DCNN has been applied. DL
emerges as popular solution for various classification problems in the field of
ML techniques [70, 81, 110, 119]. The Google research group has developed
the advanced DL model capable of diagnosing Diabetes Mellitus Retinopa-
thy(DMR) [75]. The study of the Age-related Macular degeneration(AMD) was
carried out using similar DL methods, fundus photographs and optical coher-
ence tomography [28, 111]. However, all retinal image classification studies se-
lected binary classification through which problems of normal versus one dis-
ease were solved [107]. Furthermore, in order to classify mild and multi-class
diabetic retinopathy, Lam et al. [109] employed pretrained networks (GoogleNet
and AlexNet) in the Messidor dataset, authors applied selective contrast-limited
adaptive histogram equalization(CLAHE) and documented improvement in the
identification of subtle features. Multi-class DL algorithms for automatic detec-
tion of ten retinal disorders were studied by Choi et al. [42]. The results of this
work showed that current DL algorithms were unsuccessful in classifying reti-
nal images from small datasets of multiple groups. While research conducted in
this area have published the result that high classification performance in stan-
dardized experimental settings, it is fundamentally difficult to implement the
binary classification model to the actual medical practice where patients visit-
130

ing are suffering from various DED. Indeed, studies have been very limited on
mild and multi-class classification aimed at recognising DED.
In this research, we adapted TL in mild and multi-class DED settings using
a state of the art CNN for fundus image analysis. This chapter articulates a pilot
study planned with the use of small open source fundus retinal image database
for TL evaluation on mild and multi-class classification.
5.3 Dataset
Retinal fundus images are independently extracted from various publicly avail-
able datasets. The following sections discuss the data collection, selection and
pre-processing employed in this study.
5.3.1 Data Collection
Data were obtained from the open source, including Messidor, Messidor-2,
DRISHTI-GS, and retina datasets, which are publicly available. Messidor
dataset includes high fidelity images with reliable labeling despite its relatively
small scale. Similarly, Messidor-2 is a public database used by other individual
people to evaluate DED algorithm performance. The database consists of 1,748
images of 874 subjects. Messidor-2 differs from the initial 1200 image Messidor
set of data, and it has two images for each item, one for each eye. The Drishti-
GS dataset contains 101 retinal images, with 31 normal images and 70 lesion
images. Cataract dataset acquired from retina dataset Github3. This dataset
3https://github.com/yiweichen04/retina dataset
131

Figure 5.3: Data Distribution
consists of 100 cataract images.
5.3.2 Data Pre-processing
Data imbalance is the common problem encountered in machine learning ap-
plications and real-world data mining [115]. Image preprocessing plays a sig-
nificant role: If the dataset have a small number of samples, in one or more cat-
egories that lead to the problem of misclassification. In this study, methods like
under-sampling and over-sampling are performed to avoid misclassification.
We implemented both the methodologies throughout the dataset better results
obtained using the under-sampling method. Followed by morphological top-
hat and bottom-hat transform to enhance the contrast [208] (see Fig. 5.4). Two
morphological transformations, top-hat and bottom-hat, are commonly used
for image enhancement. These are a very effective tool for improving clarity in
the presence of shading or dark areas in medical imaging. The top-hat method
is defined as the difference between the input image and its opening, whereas
the bottom-hat is the difference between the input image and the closing. By
implementing top-hat, we can extract objects or elements smaller than the SE
and brighter than their environment. On the other hand, bottom-hat produces
132

Figure 5.4: Contrast Enhancement (A) Original and (B) Enhanced DiabeticRetinopathy; (C) Original and (D) Enhanced Glaucoma; (E) Original and (F)Enhanced Diabetic Macular Edema; (G) Original and (H) Enhanced Cataract .
objects more trivial than the SE and darker than their environment. So we can
take advantage of these two operators by adding the top-hat and subtracting
the bottom-hat result.
5.4 Model Construction
This study’s real objective is the performance enhancement of mild and multi-
class DED identification via an experimental evaluation of various techniques
for improving the classification. The associated goals and objectives can be iden-
tified as follows.
1. Comparative analysis of two CNN frameworks using TL concept,
2. Impact of a fine-tuning analysis on the performance of frameworks,
3. Impact of an optimizer analysis on the performance of frameworks,
133

4. Analysis of data improvement and contrast enhancement techniques for
further classification improvements on mild and multi-class DED detec-
tion task.
The TL process is illustrated (see Fig. 5.2), to demonstrate the steps that fol-
lowed.
5.4.1 Model Specification
In this study, we employ pretrained CNNs to incorporate the classification of
the DED dataset. A deep convolutional neural network (CNN) converts a fea-
ture vector with a defined weight matrix to obtain particular feature represen-
tations without missing information about the spatial arrangement [230]. The
concept uses features learned on the source task and its reuse to target jobs. TL
is beneficial in areas of research that involve large quantities of data and signif-
icant computational resources [179]. Thus, we are exploring pretrained models
to achieve the best possible classification outcomes. This section presents the
specific information of the pretrained models.
Visual Geometry Group (VGG16): VGG was designed based on the deep
convolutional neural network model in Oxford Robotics Institute by Andrew
Zisserman and Karen Simonyan [183]. VGG became popular at the Large Scale
Visual Recognition Challenge in 2014 (ILSVRC2014). The VGGNet operated
well on the dataset of the ImageNet. To enhance the image extraction efficiency,
the VGGNet used smaller 3 × 3 filters compared to the 11 × 11 AlexNet filters.
There are two different versions of this deep network architecture (VGG16 and
VGG19), which have different layers and depths. Moreover, the number of pa-
134

rameters for VGG19 is larger and more complex than VGG16 to train the model.
Table.5.2 Explains the parameters we used to train a system.
InceptionV3: Inception network or GoogLeNet was 22 layers network and
won 2014 Image net challenge with 93.3% top-5 accuracy [36]. Later versions
are referred to as InceptionVN, where, V is the version and N is the number
so inceptionV1, inceptionV2 and inceptionV3. The InceptionV3 network has
several symmetrical and asymmetrical building blocks, where each block has
several branches of convolutions, average pooling, max-pooling, concatenated,
dropouts, and fully-connected layers. In our dataset, VGG16 obtained high ac-
curacy than other models. Table.5.3 Explains the parameters we used to train a
system.
5.4.2 Classification Performance Analysis
The efficiency of each CNN is measured by different metrics applied to calculate
the true and/or false classification for the diagnosed DED in the retinal fundus
images evaluated as follows. First, the cross-validation estimator [192] is be-
ing used and resulted in a confusion matrix Table.6.2. When the classification
model correctly classifies samples associated with a particular class, such sam-
ples placed in the TP indices. The other samples that relate to some other classes
correctly identified are in the TN indices of the confusion matrix. Similarly, the
FP and FN indices in the uncertainty matrix refer to the number of samples
incorrectly estimated by the classifier. Thus, the following equations are used
with which a diagnostic test correctly identifies and excludes a certain ailment
measured.
135

Table 5.1: The layers and layer parameters of the VGG16 model
Layers layer Type OutputShape
Trainableparame-ters
1 Cov2d [224, 224,64]
1792
2 Cov2d [224, 224,64]
36928
4 Cov2d [112, 112,128]
73856
5 Cov2d [112, 112,128]
147585
6 Cov2d [56, 56,256]
295168
7 Cov2d [56, 56,256]
590080
8 Cov2d [56, 56,256]
590080
9 Cov2d [56, 56,256]
590080
10 Cov2d [28, 28,512]
1180160
11 Cov2d [28, 28,512]
2359808
12 Cov2d [28, 28,512]
2359808
13 Cov2d [14, 14,512]
2359808
14 Cov2d [14, 14,512]
2359808
15 Cov2d [14, 14,512]
2359808
16 Cov2d [14, 14,512]
2359808
136

Table 5.2: Parameters of the VGG16 model and preferred weights in this study.
Model PlatformUsed
ImageSize
Optimizer Mini-BatchSize
fine-tune LearningRate
VGG16 Anaconda 224*224 ADAM 32 15 1e-3Python RMSProp 1e-3Keras SGD 1e-3Tensorflow AdamGrad 1e-3
Table 5.3: Parameters of the InceptionV3 model and preferred weights in thisstudy.
Model PlatformUsed
ImageSize
Optimizer Mini-BatchSize
fine-tune LearningRate
InceptionV3Anaconda 224*224 ADAM 32 100 1e-3Python RMSProp 1e-3Keras SGD 1e-3Tensorflow AdamGrad 1e-3
Accuracy(%) =T P + T N
T P + FN + T N + FP. (5.1)
Similarly, Recall:
S ensitivity(Recall) =T P
T P + FN(5.2)
Precision:
Precision =T P
T P + FP(5.3)
5.5 Experimental Design
All the studies conducted used Python, Keras library, TensorFlow as a back-end.
The resolution of the images has been standardized to a uniform size, follow-
ing each model’s input requirements. The epoch number set at 15 because of
137

the use of pretrained weights in our experiments. The distribution of train-
ing/testing dataset at 80/20. Stratified standard preference made to ensure a
nearly similar dispersion of the class. Mini-batch size set to 32, and the categor-
ical cross-entropy loss function was selected due to its suitability for multi-class
classification tasks. The default ADAM was the Optimiser. The primary assess-
ment metric for accuracy, specificity, and sensitivity of test data was used for
final scores validation.
5.5.1 Performance enhancement
Fine-tune: The neural networks used in this chapter were pretrained on a
large-scale ImageNet dataset covering 1000 classes, including birds, animals,
and flowers. Systems obtain the highest performance in the classification tasks
for objects with labeled datasets while demonstrating restricted in their assess-
ment to specialty areas of study, such as DED detection. The diagnosis and
treatment of possible pathological signs in the fundus images are based on a
large number of complex characteristics and their orientation inside the fun-
dus images [109]. There is a new representation of the feature vector on every
layer of CNN by progressive extraction of the most distinguishing characteris-
tics of [122]. The following constraints considered in the experimental work:
(i) Eliminating the fully connected nodes at the end of the layer(where the true
label class predictions made) and substitute the modules fully connected with
those newly initialized (current pre-training approach); and (ii) eliminating the
n layers and re-training the network (the suggested approach). The range of pa-
rameters used across CNN depends on the total hidden layers present on every
system model. The possible classification enhancement of the DED detection
138

task assessed as a result of the models’ proposed customization options. In the
analysis with Zhang et al. [243] DL based DR detection device performance ac-
curacy improved from 95.68% to 97.15% as a result of fine-tuning.
Table 5.4: Average performance of the models in mild DED classification (mildmulti-classes).
Model Optimiser LearningRate
Accuracy* Accuracy**
VGG16 Adam 1e-3 82.42% 85.94%RMSprop 1e-3 83.52% 83.98%SGD 1e-3 75% 82.03%Adagrad 1e-3 75% 75.23%
InceptionV3 Adam 1e-3 74% 75%RMSprop 1e-3 71% 73%SGD 1e-3 78.52% 78.52%Adagrad 1e-3 76% 79.17%
Legend: Accuracy* = Results Before fine-tuning, Accuracy** = Results afterfine-tuning.
Table 5.5: Average performance of the models in multi-class DED classification.
Model Optimiser LearningRate
Accuracy* Accuracy**
VGG16 Adam 1e-3 84.88% 88.3%RMSprop 1e-3 74% 80%SGD 1e-3 80% 80%Adagrad 1e-3 79.95% 80%
InceptionV3 Adam 1e-3 79% 81%RMSprop 1e-3 65% 78%SGD 1e-3 63% 63%Adagrad 1e-3 58% 64%
Legend: Accuracy* = Results Before fine-tuning, Accuracy** = Results afterfine-tuning.
Optimizer Selection: In the training phase, the neural net nodes’ parameters
are updated automatically to reduce the loss function. However, the direction
139

Figure 5.5: Confusion Matrix in VGG16 + Adam (A) scenario I and (B) ScenarioII.
and magnitude of the parameter adjustment are highly dependant on the opti-
mizer utilized. The most significant weight that evaluates the performance of
the Optimiser is Regularisation and Learning Rate. Too high/too lower learn-
ing rate results either in non-convergence of the loss function or in the range of
the local, but not the absolute minimum. Meanwhile, Regularisation makes it
possible to avoid overfitting the model by penalizing the dominant weighting
factors for correct predictions. As a consequence, the generalization capability
of the classifier increases when exposed to new data. The optimization tech-
niques used for the experiments were as follows : (1) RMSprop, (2) SGD, (3)
Adagrad, (4) Adam.
5.5.2 Training and Prediction Results
The two pretrained CNN models were compared with the yielded accuracy on
the test dataset. Also, fine-tuning was used as a substitute for the default set-
ting. After deletion and retraining of n layers (n was CNN-dependent), the
140

efficiency acquired by each model was used for comparative purposes. The
fine-tuning effect was evaluated in terms of accuracy (%) increment or reduc-
tion. The highest accuracy was identified by each model (either through default
or after fine-tuning) in four different optimizers. Finally, the top 1 CNN archi-
tectures + optimizers with the higher accuracy performance for the target task
have been selected in Table.5.4 and Table.5.5.
This study is an investigation of mild and multi-class DL algorithms for
automated detection of DED. As per the British Diabetic Association (BDA)
standards, a minimum amount of 80% sensitivity and 95% specificity for sight-
threatening DED detection must be achieved by any method [18]. After testing
our approach in DED detection tasks, the scenario I achieved maximum sen-
sitivity of 85% and a maximum specificity of 96%. Similarly, the sensitivity of
85% and specificity of 98% for scenario II, respectively. Thus, according to the
BDA standards, mild and multi-class DED detection is sufficient, in terms of its
sensitivity and specificity.
5.5.3 Accuracy Evaluation
This study focuses on DL algorithms to automatically identify mild and multi-
class DED. Previous researches in this topic showed the ineffectiveness of the
latest DL algorithms in classifying fundus images from small datasets. It failed
to demonstrate practical and effective results for a computer-aided medical ap-
plications. Therefore, this article adapted optimized DL architectures for the au-
tomated classification of normal, DR, DME, GL and Ca due to the significance
of each disease in order to create an automated model for the classification.
141

The performance of DL models was dropped by 3%, in early stage multi-
class DED classification. This finding is apparently very normal since early
stage DED fundus images consist of subtle features that can be crucial for diag-
nosis. Interestingly, the architectures most commonly deployed were designed
to identify object based features like those present in the ImageNet dataset.
Then we may need a new paradigm such as lesion based (e.g. exudates) for di-
agnosing diseases through CNN models. Our future goals include DED lesion
segmentation (region of interest) [141, 142, 233] for enhancing the identification
of mild disease and moving to more complex and advantageous identification
of multi-grade diseases.
5.6 Summary of Findings
Early identification and prompt diagnosis of DED are considered crucial to
the prevention of permanent vision loss. Automated DED recognition has
been the topic of several studies in the past, with the main emphasis on
healthy/unhealthy binary retinal classification [153]. The results show that the
identification of moderate to severe indications does not present significant dif-
ficulties due to the high visibility of the pathological features. The issue occurs
with the mild identification of DED cases, in which only small lesions prove
representative of the condition, sometimes undetected by the classifiers. Mild
DED cases prognostication further questioned by the poor quality of fundus
photography, which further complicates the recognition of subtle lesions in the
eye. In the case of multi-class classification, the performance of DL models has
been reduced as categories have multiplied. When categories increased, the
predicted precision of the random distribution decreased. This finding corre-
142

sponded to the previous studies [51]. Recent research using the GoogLeNet
model to identify skin cancer has shown that increase in the number of classes
has underperformed (with an accuracy of 72.1% for a three class problem and
55.4% for a nine class problem) [56]. Thus it is essential to create disease-specific
strategies to differentiate between DED to enhance the efficiency of multi-class
classification. Therefore, the research proposed a system that focuses entirely on
the identification of mild and multi-class DED among healthy instances, as dis-
cussed in previous studies. According to the empiric nature of DL, a variety of
performance optimization techniques have been applied (i) fine-tuning, (ii) op-
timizer choice, (iii ) data increase, and (iii) contrast enhancement. Besides, the
study used combined datasets from different sources to evaluate the system’s
robustness in its flexibility to cope with real world scenarios. As Wan et al. [219]
have pointed out, the single data collection environment presents difficulties in
the validation of accurate models [171].
143

CHAPTER 6
AUTOMATED CLASSIFICATION AND DETECTION OF MULTI-CLASS
DED USING PROPOSED CNN
A key tool commonly used for the initial diagnosis of patients with Diabetic
Eye Disease (DED) or other eye disorders is the screening of retinal fundus im-
ages. In recent years, the methodology of deep learning has demonstrated im-
pressive benefits in clinical practice. To detect retinal eye diseases from retinal
fundus photographs, researchers have attempted to use Deep Learning (DL)
methods.Prompt examination, therefore, increases the chances of effective treat-
ment and reduces permanent deterioration of vision. Manual detection, how-
ever, can be labor-intensive and time-consuming. Furthermore, for ophthalmol-
ogists, the implementation of an automated diagnostic device reduces time and
workload. The DL techniques in Machine Learning (ML) has achieved a state
of the art performance in binary classification between healthy or diseased reti-
nal fundus image. The classification of multi-class retinal eye diseases remains
an open challenge, multi-class DED is therefore considered in this study to de-
veloped an automated classification framework for DED. Therefore, detecting
multiple diabetic eye diseases from retinal fundus images is an important re-
search topic with practical consequences. Our proposed model tested on vari-
ous retinal fundus images gathered from the publicly available dataset, which
is annotated by an opthalmologist. This experiment is conducted employing
proposed convolutional neural network (CNN) model. Maximum accuracy of
81.33%, sensitivity of 100%, and specificity of 100% of obtained on our proposed
model for multi-class classification.
144

6.1 Introduction
A category of eye disorders that can affect people with diabetes is a diabetic eye
disease. Diabetic retinopathy, diabetic macular edema, glaucoma, and cataract
are among these diseases. Diabetes can cause eye damage over time, resulting
in blurred vision or even vision impairment. However, by keeping track of dia-
betes, one can avoid DED or keep it from getting worse [44]. Around one-third
of people with diabetes are likely to be diagnosed with DED. 2.2 billion people
worldwide are confirmed by the World Health Organization (WHO) to have
blindness or vision loss, of which at least 1 billion have a vision impairment,
which could have been reversed1. Identifying and diagnosing these diseases
for treatment is critical.
Motivated by the need for successful development of detection and preven-
tive measures to implement the wide range of lifespan needs associated with
retinal conditions and visual impairments. For solving these problems, auto-
mated DED diagnostic techniques using DL are vital [2, 75]. The time and labor
intensive [66] nature of screening of DED make it a crucial inaccurate progno-
sis based on a competent ophthalmologist. While DL has generally achieved
high accuracy of validity for healthy and diseased (binary) classification, the re-
sults of multi-class classification, particularly for early-stage disability, are less
impressive. We, therefore, present in this chapter an automated DED classifica-
tion model based on the Deep Convolutional Neural Network (DCNN) that can
distinguish healthy images from disease pathology.
Initially, various DCNN architectures are evaluated to determine the best
1https://www.who.int/en/news-room/fact-sheets/detail/blindness-and-visual-impairment
145

performing system for the mild and multi-class DED classification tasks [169].
We aspire to achieve the highest standards of output that the previous works
have recorded. In order to enhance sensitivities for the various DED levels, we
trained the proposed CNN model and tested a multi-class classification model,
integrating different preprocessing models to improve sensitivities for the dif-
ferent DED classes, incorporating different preprocessing and augmentation ap-
proaches to boost the accuracy of the result and enhance adequate sample vol-
ume for the dataset.
Early amplification of retinal diseases is important; however, it takes a
tremendous amount of time and memory to diagnose these diseases using neu-
ral networks. To improve accuracy, additional data must be given, but this re-
quires high computing capacity and a large amount of time spent. Therefore,
the method will benefit from a comparatively pre-trained model as it adapts
the design to minimize losses. Pretrained models or models for Transfer Learn-
ing(TL) [211] have already shown and validated promising results in the clas-
sification and detection of medical images [20, 99, 116, 125]. As the phase of
this research, following the TL theory, we used the state-of-the-art CNN mod-
els, pre-trained on the sizeable public image repository ImageNet in our pre-
vious study [169]. The deep neural network’s top layers were learned from
the publicly available fundus image corpora using initialized weights for mild
and multi-class classification. In this study we proposed a new CNN model to
slove the problem of multi-class classification. Initially, the highest-performing
CNN model is developed based on a comprehensive experiment conducted in
previous studies. Secondly, it evaluates the set of performance improvements,
including image-processing and optimizer selection. Finally, an ideal specificity
and sensitivity are achieved by the proposed model to facilitate efficient and ef-
146

fective fully automated DL-based system development to improve outcomes to
mass screening services among the at-risk population.
6.2 Literature Review
By using machine learning algorithms [15,46,47,221] to identify a huge propor-
tion of fundus images captured from ocular scanning programs [29,235], several
previous researches focused on automatic retinal disease detection. Various ma-
chine learning techniques have been introduced for the automatic detection of
retinal diseases [125]: Artificial Neural Network(ANN), K-nearest neighbor al-
gorithm, Support Vector Machine(SVM), and Naive Bayes classifier. To define
the difference between glaucoma and non-glaucoma [38, 234], multiple studies
have introduced ANN models. By finding preperimetric glaucoma using DL
feedforward neural networks(FNN) [16], a glaucoma research team observed
visual field assessment. An artificial DCNN was applied for the grading sensi-
tivity of nuclear cataracts [64]. In the field of ML techniques, DL emerges as a
common solution for different classification issues [70,81,110,119]. An advanced
DL model capable of diagnosing Diabetes Mellitus Retinopathy(DMR) [75] has
been developed by the Google research community. Using identical DL tech-
niques, fundus photographs and optical coherence tomography [28, 111], the
Age-related Macular Degeneration(AMD) research was performed. However,
binary classification was chosen by all retinal image classification studies from
which problems with normal versus one disease were resolved [107]. Besides,
Lam et al. [109] used pre-trained networks (GoogleNet and AlexNet) in the
Messidor dataset to distinguish mild and multi-class diabetic retinopathy, re-
searchers developed selective contrast-limited adaptive histogram equalization
147
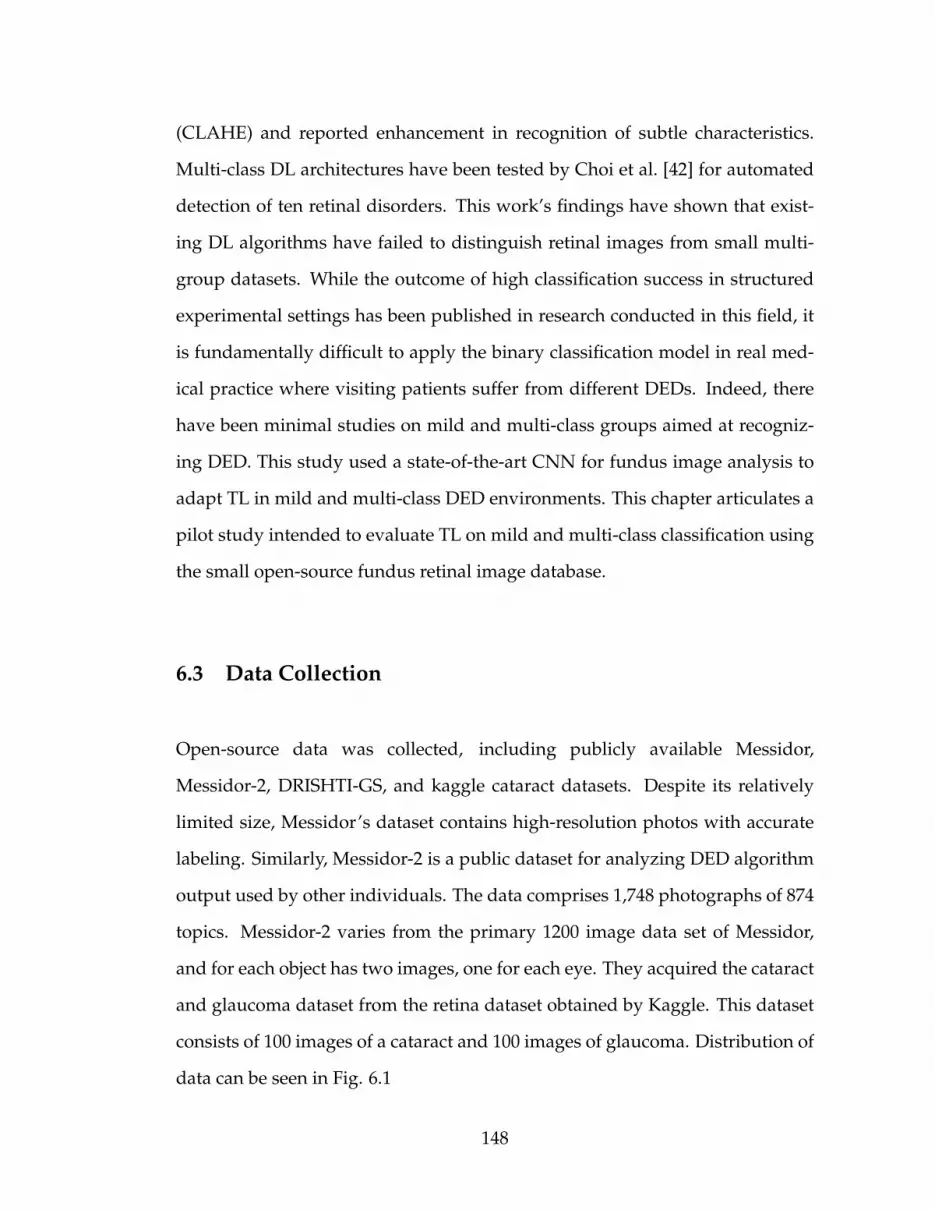
(CLAHE) and reported enhancement in recognition of subtle characteristics.
Multi-class DL architectures have been tested by Choi et al. [42] for automated
detection of ten retinal disorders. This work’s findings have shown that exist-
ing DL algorithms have failed to distinguish retinal images from small multi-
group datasets. While the outcome of high classification success in structured
experimental settings has been published in research conducted in this field, it
is fundamentally difficult to apply the binary classification model in real med-
ical practice where visiting patients suffer from different DEDs. Indeed, there
have been minimal studies on mild and multi-class groups aimed at recogniz-
ing DED. This study used a state-of-the-art CNN for fundus image analysis to
adapt TL in mild and multi-class DED environments. This chapter articulates a
pilot study intended to evaluate TL on mild and multi-class classification using
the small open-source fundus retinal image database.
6.3 Data Collection
Open-source data was collected, including publicly available Messidor,
Messidor-2, DRISHTI-GS, and kaggle cataract datasets. Despite its relatively
limited size, Messidor’s dataset contains high-resolution photos with accurate
labeling. Similarly, Messidor-2 is a public dataset for analyzing DED algorithm
output used by other individuals. The data comprises 1,748 photographs of 874
topics. Messidor-2 varies from the primary 1200 image data set of Messidor,
and for each object has two images, one for each eye. They acquired the cataract
and glaucoma dataset from the retina dataset obtained by Kaggle. This dataset
consists of 100 images of a cataract and 100 images of glaucoma. Distribution of
data can be seen in Fig. 6.1
148

Figure 6.1: Data Distribution
6.3.1 Data Enhancement
To accomplish contrast enhancement in the retinal images, mathematical mor-
phology has been used. Mathematical morphology approaches work hinged on
the structural values of objects. To pull out the elements of an image, these meth-
ods use relationships between classes and mathematical fundamentals, which
help explain areas. In morphological operators, the input consists of two data
sets. The original image is included in the first set, and the second one illustrates
the structural element (SE), which is also called a mask. The original image is in
grey level or binary, and the mask is a 0s and 1s value matrix [198]. In morpho-
logical operators, if the gray-level image matrix id represented by I(x, y) and the
SE by S (u, v), the erosion and dilation operators are defined as Equation 6.1 and
6.2 [80].
IΘS = minu,v{I(x + u, y + v) − S (u, v)} (6.1)
I ⊕ S = maxu,v{I(x − u, y − v) + S (u, v)} (6.2)
The erosion operator decreases the objects’ size and increases the size of an
image’s holes and eliminates very tiny information from that image. It makes
the final image appear darker than the original image by removing bright areas
under the SE. The dilation operator operates in reverse; in other words, the size
149

of objects increases and holes in the image decreases, respectively. Therefore,
the opening operator is similar to implementing the dilation and erosion opera-
tions on the same image Equation 6.3, while the closing operator acts in reverse
Equation 6.3.
I ◦ S = (IΘS ) ⊕ S (6.3)
I • S = (I ⊕ S )ΘS (6.4)
The opening operator eliminates poor relations between artifacts and small
information, while small gaps are eliminated, and the closing operator fills
cracks. The size and shape of a SE are usually chosen arbitrarily; however, disk-
shaped SE is used more frequently than other masks for medical images.
6.4 Study Design
The real aim of this study is to increase performance in automated multi-class
DED classification and detection through an experimental assessment of differ-
ent classification improvement techniques. It is possible to define the related
priorities and goals are as follows.
1. Performance analysis of proposed CNN framework with multiple datasets
collected from multiple sources,
2. Impact of an optimizer on the performance of proposed frameworks,
3. Visual representation of the performance of the model using heat-map.
4. Analysis of image quality improvement using contrast enhancement tech-
niques for further classification improvements on multi-class DED detec-
tion task.
150

6.4.1 Model development
This layer comprises a filter set (kernel). Each filter is convoluted against the
input image and then extract features by creating a new layer. Each layer sig-
nifies some of the important features or characteristics of the input image. The
∗ symbol identifies the operation of the convolution. The output (or function
map) F(t) is defined below when input In(t) is convoluted with a filter or f (a)
kernel.
F(t) = (In ∗ f )(t). (6.5)
If t can only accept integer values, the following discrete convolution is pro-
vided by the following equation:
F(t) =∑
a
In(a) · f (t − a) . (6.6)
The above assumes a one-dimensional convolutional operation. A two di-
mension convolution operation with input In(m, n) and a kernel f (a, b) is defined
as:
F(t) =∑
a
∑b
In (a, b) · f (m − a, n − b). (6.7)
By the commutative law, the kernel is flipped and the above is equivalent to:
F(t) =∑
a
∑b
In (m − a, n − b) · f (a, b). (6.8)
Neural networks implement the cross-correlation function, which is the same as
convolution but without flipping the kernel.
F(t) =∑
a
∑b
In (m + a, n + b) · f (a, b). (6.9)
151

Rectified Linear Unit (ReLU) Layer
This layer is an activation function that sets the negative input value to zero,
which optimizes and speeds up analyses and training, and helps prevent the
gradient from disappearing. Mathematically, this described as:
R(x) = max(0, x). (6.10)
In which x is input to the neuron.
Maxpooling Layer
This Layer is a sample-based discretization method. It is employed to down-
sample an input design (input image, hidden-layers, output matrix, etc.), and
compressing it is dimensionality and enabling assumptions about the compo-
nents available in the binned sub-regions to be made. This will decrease the
size of learning parameters and provide fundamental interpretation invariance
to internal depiction, thus further reducing the cost of computation. Our model
adopted the kernel size of 3 × 3 during the Maxpooling process. After the final
convolution block, the network flattened to one dimension.
Batch Normalization
Batch normalization enables every layer of the network to learn a little more in-
dependently of the other layers. It also normalizes the output from the previous
activation layer by subtracting the batch mean and dividing the batch standard
deviation [90] to improve the steadiness of the neural network.
152

Fully Connected Layer
This layer takes the output of the previous layer (Convolutional, ReLU, or Pool-
ing) as its input and calculates the probability values for classification into the
various groups.
Loss Function
This layer applies a soft-max function to the input data sample. This layer is
used for the final prediction. Therefore, our loss function is given as:
Li = − log(
eβy∑cj eβ j
)(6.11)
Where β j is the jth element of the vector of class scores β, βy is the CNN score
for the positive class and c is classes for each image. The softmax ensures a
proper prediction probability in the log of the equation.
Regularization
An efficient regularization method named as a dropout is employed. This strat-
egy was being proposed by Srivastava et al. [196]. During the training process,
the dropout is conducted by maintaining the neuron active with a certain proba-
bility P or by setting it to 0. In our study, we set hyperparameter to 0.50 because
it outputs in the maximum amount of regularization [19].
153

Table 6.1: Hyper-parameters of the build CNN model and preferred weights inthis study.
R1 R2 R3 R4 R5 R6 R7 R8CNN 224*224 RMSprop 32 10-fold 3e-4 BCE 50
Legend: R1 - Model, R2 - Image Size, R3 - Optimizers, R4 - Mini Batch Size,R5 - cross validation, R6 - Initial Learning Rate, R7 - Loss function, R8 -Epoch, BCE - Binary cross-entropy.
Table 6.2: Confusion Matrix
Predictive PositivePredictive Negative TotalActual Positive T P FN T P + FNActual Negative FP T N FP + T N
Total T P + FP FN + T N
Legend: TP = True Positive, FN = False Negative, FP = False Positive, TN =True Negative.
6.4.2 Classification Description
Training and testing performed by new CNN architecture, as mentioned above,
in Scenario I classification models.
• S cenario I: In this scenario, we will classify five classes of DED, such as
healthy, DR, DME, Gl, and Ca retinal fundus images (multi-class classifi-
cation)
6.4.3 Classification Performance Analysis
Retinal fundus images are evaluated as follows, the efficacy of each CNN is cal-
culated by various metrics implemented to measure the true and false category
for the diagnosed DED. Next, the cross-validation estimator [192] is used, re-
sulting in a Table.6.2 confusion matrix. If the classification algorithm accurately
154

categorizes samples based on a specific category, they are included in the TP in-
dices. The TN indices of the confusion matrix contain the other samples which
relate correctly to some other classes defined. Similarly, in the confusion ma-
trix, the FP and FN indices represent the number of samples that the classifier
wrongly estimates. As a result, the equations below are employed to ensure that
a diagnostic test correctly detects and excludes a specific condition.
Accuracy(%) =T P + T N
T P + FN + T N + FP. (6.12)
For experimental analytics, output parameters derived from the confusion
matrix are used. Accuracy in eq 6.12 is essentially the fraction of the uncertainty
matrix’s total values between true positive and true negative. Therefore, the
above elements of the confusion matrix should determine the classifier’s effi-
cacy in our present framework.
Similarly, we employed, following equations,
S ensitivity(Recall) =T P
T P + FN(6.13)
S peci f icity =T N
T N + FP(6.14)
Precision =T P
T P + FP(6.15)
ROC curve: A ROC (receiver operating characteristic curve) curve is a graph-
ical representation that demonstrates how a test’s specificity and sensitivity dif-
fer concerning each other. Using the test, samples considered to be true or false
155

are calculated to create a ROC curve. To offer a graph identical to the one below,
the TPR (sensitivity) is mapped against the FPR (1 - specificity) for specified cut-
off values. Preferably, a point is selected across the curve’s shoulder, reducing
false positives while optimizing real positives.
6.5 Experimental Design
All the studies conducted used Python, Keras library, TensorFlow as a back-end.
The resolution of the images has been standardized to a uniform size, following
each model’s input requirements. The epoch number set at 50 because of the use
of new CNN trained on weights in our experiments. The distribution of train-
ing/testing dataset at 80/20. Stratified standard preference made to ensure a
nearly similar dispersion of the class. Mini-batch size set to 32, and the categor-
ical cross-entropy loss function was selected due to its suitability for multi-class
classification tasks. The default RMSProp was the Optimiser. The primary as-
sessment metric for accuracy, specificity, and sensitivity of test data was used
for final scores validation.
6.5.1 Performance enhancement
In this article, CNN recommended that the classification of the DED dataset be
included. A deep convolutionary neural network (CNN) converts a function
vector with a fixed weight matrix to obtain specific representations of features
without losing spatial arrangement information [230]. Optimizer selection is a
vital component of the neural network, helping to pick which one to use for the
156

model by understanding how they function. Several hyperparameters could
be modified to increase the efficiency of the neural network. Not all of them,
however, have a significant influence on the efficiency of the network. Not all of
them, however, have a significant influence on the efficiency of the network. The
optimizer is one of the parameters that could allow the adjustment between the
algorithm assemblies or set-off. There are different optimizers we have picked
from, the most widely used ones.
RMSprop Optimizer The RMSprop is an unpublished method proposed by
Geoff Hinton based on adaptive learning rate [84]. The RMSprop optimizer
is equivalent with momentum to the gradient descent algorithm. In the verti-
cal direction, this optimizer limits the oscillations. Thus, we can maximize our
learning rate, and our algorithm will take larger steps to converge faster in the
horizontal direction. The discrepancy in how the gradients are measured is be-
tween RMSprop. For the RMSprop with momentum, the following equations
illustrate how the gradients are determined. Hinton suggested the momentum
value is normally set to 0.9 and a good default value for the learning rate η is
0.001.
D[ f 2]t = 0.9D[ f 2]t−1 + 0.1 f 2t (6.16)
βt+1 = βt −η√
D[ f 2]t + εft (6.17)
RMSprop’s gist is to maintain a moving average of the gradient square and
divide the gradient by the root of this average 2.
2https://keras.io/api/optimizers/rmsprop/
157

Table 6.3: Average performance of the models in multi-class DED classification.
Model Optimiser LearningRate
Accuracy Sensitivity Specificity
CNN RMSprop 1e-3 81.33% 100% 100%
Figure 6.2: Confusion Matrix and ROC Curve obtained by proposed CNN
6.6 Results
The proposed CNN model has obtained accuracy in the test dataset. The ef-
ficiency acquired by the model has been used to demonstrate That multi-class
classification in DED can be improved by improving the quality of the training
images and using the right parameters for the model. The highest sensitivity
and specificity was identified by proposed model in RMSprop optimizer. Fi-
nally, the accuracy obtained is shown in Table.6.3.
This analysis is a study of multi-class DED classification using the DL algo-
rithm. A minimum of 80 percent sensitivity and 95 percent precision for sight-
threatening DED identification must be obtained by any method [18] under the
British Diabetic Association (BDA) guidelines. In scenario I, we achieved a max-
158

imum sensitivity of 100 percent and a maximum specificity of 100 percent, re-
spectively, after checking our strategy in DED detection tasks. Thus, according
to the BDA criteria, multi-class DED detection is adequate for its sensitivity and
specificity.
6.6.1 Visualizing feature map
The feature maps, or activation maps, record the input applied with filters, such
as the source images or other feature maps. The purpose of visualizing a feature
map for particular source images would explain what attributes in the feature
maps are observed or retained. The idea would be that the feature maps near
the input detect fine-grained or small information while featuring maps near the
model output to capture more distinctive characteristics. The first layer of CNN
always learns features like edges, line patterns, color, and deeper layer network
to identify more complex features like pathological lesions. Later layers con-
struct their features by merging features from previous layers. To analyze the
visualization of feature maps, we used the highest performed model with fun-
dus retinal images, i.e., proposed CNN model, and used to create activations.
The activations for CNN network models shown in Fig. 6.3.
6.6.2 Explaining Proposed Model using Grad-CAM
To make deep learning more practical and explainable, a range of work was per-
formed. It is also essential to make the deep neural network more interpretative
in various deep learning applications linked to medical imaging. A technique
159

Figure 6.3: Visual feature maps in first layer and deep layer
of Gradient Weighted Class Activation Mapping (Grad-CAM) is developed by
Selvaraju et al. [174], which provides an illustrative view of deep learning tech-
niques. The technique of Grad-CAM offers a visual description for any deeply
related neural network. This helps to decide more about the model when con-
ducting identification or prediction tasks. The simple retinal fundus image is
given as input and uses the proposed model as a detection method. After calcu-
lating the predicted label using the full model, Grad-CAM is applied to the last
Convolution layer. Fig. 6.4 shows the heatmap visualization on various retinal
fundus images by the proposed model.
160

Figure 6.4: Visualisation on fundus retinal images of Normal / DR/ DME/Glaucoma/ Cataract infected using Grad-CAM on the proposed model.
161

6.7 Summary of Findings
Automated DED recognition has been the topic of several studies in the past,
with the main emphasis on healthy/unhealthy binary retinal classification [153].
In the case of multi-class classification, DL models’ performance has been re-
duced as categories have multiplied. When categories increased, the predicted
precision of the random distribution decreased. This finding corresponded to
the previous studies [51]. Recent research using the GoogLeNet model to iden-
tify skin cancer has shown that an increase in the number of classes has under-
performed (with an accuracy of 72.1% for a three-class problem and 55.4% for a
nine-class problem) [56]. Thus it is essential to create disease-specific strategies
to differentiate between DED to enhance multi-class classification efficiency.
Therefore, this research proposed a system that focuses entirely on identifying
multi-class DED among healthy instances, as discussed in previous studies. Ac-
cording to the empiric nature of DL, a variety of performance optimization tech-
niques have been applied (i) optimizer choice, (ii) data augmentation, and (iii)
contrast enhancement. The study also used combined datasets from different
sources to evaluate the system’s robustness in its flexibility to cope with real-
world scenarios. As Wan et al. [219] have pointed out, the single data collection
environment presents difficulties in the validation of accurate models [171].
Images of the retinal fundus are a popular and useful instrument and are
used to provide accurate DED details. Such photographs can easily show in-
juries, anomalies and help to prevent permanent loss of vision. However, it is
challenging to identify diabetic eye diseases through retinal fundus images ac-
curately, and even highly experienced ophthalmologists are prone to misdiag-
nosis of eye lesions. Severe diabetic eye diseases, which require rapid diagnosis
162

and treatment, cause irreversible vision loss, visual imparities, and vision dis-
tortion disorders. Consequently, to assist in the diagnosis, it is essential to use
deep learning methods. Multiple diseases may represent one collection of fun-
dus photos. Using a single picture for diagnosis in a fundus image, which is
well examined in traditional methods, is inaccurate. Besides, it requires a large
amount of time to mark a series of retinal fundus images one by one. For this
analysis, we, therefore, used publicly accessible and annotated photographs of
the fundus. This research suggested a model that learns the characteristics of
fundus images in retinal fundus photography and their feature dependencies
for multi-class classification. We have grouped images of the retinal fundus into
five types of diabetic eye disease. The findings presented in this work show that
deep learning algorithms can automatically identify the form of diabetic eye dis-
ease. This technology may have a possible clinical application and may enhance
healthcare delivery by identifying different acute DED diseases.
163

CHAPTER 7
CONCLUSION AND FUTURE WORK
This chapter presents the study’s key contributions, including the drawbacks,
potential directions, and its wider influence in the research field of computa-
tional health science.
7.1 Summary of Contributions
Diabetes is a life-threatening illness that affects multiple organs of the human
body, including the eye’s retina and causes DED disorder. Advanced DED leads
to permanent vision loss, thus early detection of DED symptoms is essential to
preventing disease escalation and ensuring timely treatment. This thesis ad-
dresses the research challenges in mild and multi-class DED detection reported
in previous studies [42, 109]. Changes in eye anatomy during the early stages
of DED are frequently untraceable by the human eye due to the subtle nature
of their features. Large volumes of fundus images put a significant strain on
limited specialist resources, rendering manual analysis practically infeasible. In
response, this thesis introduced deep learning-based methods to facilitate early
DED detection and address the current issues. Although deep learning appli-
cations have been used to detect severe anatomical changes to the eye, the de-
tection of mild and multi-class disease has remained a problem. Consequently,
in this thesis, we aim to address the main research gaps and propose a frame-
work for mild and multi-class automated DED detection systems using fundus
images through Deep Learning.
164

Detection of anatomical changes in the eye using fundus photography has
brought up several challenges:
• The continuously increasing amount of information on patients’ health,
such as medical images, poses a significant strain on limited specialist di-
agnosis, treatment, and check-ups resources. Manual identification of fea-
tures from high volumes of retinal images causes unnecessary time delays
between detection and treatment. Diagnosis time taken further depends
on specialists’ years of practice experience
• Manual retinal image analysis and grading of DED performed by the oph-
thalmologist does not always produce accurate results as the very minute
changes in the eye anatomy are not always detectable by the human eye
• Human evaluation tends to suffer from subjectivity leading to potentially
inconsistent diagnoses across practices. At this point, early automated
detection proves essential to providing early treatment and minimizing
the risk of future vision loss
• Automated retinal image analysis plays an important role in screening for
early DED detection.
In the last few decades, much efforts has been expended to establish reli-
able computer-based DED analysis systems. With the help of image processing
techniques and deep learning methods, the workload associated with manual
detection can be avoided, reducing the time and cost associated with DED di-
agnosis. The most common binary classification of severe-DED and non-DED
using deep learning has already achieved high validation accuracy. Therefore,
this research aimed to develop a robust system for mild and multi-class DED
classification using colour fundus images.
165

The literature review revealed that previous work focuses on developing a
classification system for the severity level of DR (mild, moderate, severe), and
that classification of all four DED (DR, DME, Gl, Ca) jointly in one system is
lacking. Detection of all four DED in one system is considered a crucial factor
for treatment because it helps to specify the areas of abnormalities. Thus, we
aimed to develop a system where mild and multi-class DED can be classified
and detected effectively. In order to address the current challenges in automatic
DED detection using deep learning, this thesis set out the main research ques-
tion as a response: ” What deep learning approaches provide the highest accuracy for
the classification task of mild and multi-class DED features, and how can they be fur-
ther enhanced for clinical practice?.” The thesis focused on creating an advanced
classification method to enhance the efficacy of the DED classification system in
order to answer the question asked. Thus, the research goals were as follows:
• To develop an approach for retinal image enhancement to improve the
validation accuracy before deep learning
• To introduce a robust framework for automatic classification and identifi-
cation of mild DED
• To propose a new deep learning method for automated DED detection
systems to achieve accuracy for clinical practice.
To achieve the goals set, the thesis proposed different image processing tech-
niques in retinal fundus images, with the extensive study of 13 different pre-
trained deep learning techniques with seven different optimizers in fundus im-
ages. In addition, we built a new deep learning framework and trained it from
the scratch with the same retinal images. We used supervised methods of deep
166

learning for this research. These parameterized algorithms are capable of learn-
ing the patterns in the data, which must be considered carefully to distinguish
the images and provided a class distinction based on empirical characteristics
found in the data. Convolutional neural networks, powerful computational
models designed to exploit high local correlations that exist in images, are em-
ployed in this thesis.
Machine learning techniques, particularly deep learning, are models that
learn from data in general. Therefore, a primary aspect of success is to provide
a statistically relevant sample dataset from which we can forecast a particular
class of disease. To construct models with good generalization, it is essential
to have a labelled dataset with appropriate samples (that is, the order of mag-
nitude of thousands of elements per class). For this reason, we used various
public datasets. In Chapter 2 this dataset is defined.
In Chapter 3 we implemented pre-trained deep learning methods for normal
and mild DR classification. In this case, different high-resolution image val-
ues are obtained from the original images. Ideally, the use of images with the
highest available resolution is interesting, but the processing and memory time
needed make it challenging to use CNN architectures in such circumstances. In
addition, the architecture of neural networks is a parameterized structures that
requires regular input size. Moreover, with more adequate resolutions, abnor-
malities existing in images can be identified through presumed classification.
In this chapter we also discuss the use of various input sizes, combinations
of datasets, data augmentation approaches, fine-tuning, and optimization tech-
niques which form the basis for choosing the right hyper-parameters. Ensemble
methods are often used to enhance outcomes, averaging a range of estimates
167

from the measurement of different distorted representations of the same input
image and image enhancement, comparing one patient’s eye predictions with
probability distributions of developing the disease by other. A near-human-
level output model is derived from this preliminary work. The loss feature
used for neural network parameter optimization in this chapter is the proven
mild-DR classification norm, i.e. loss of logarithmics.
It is advantageous to use an immense amount of data, when building neural
networks. The greater the number of instances of both No DR and Mild DR
the better the model’s validity, enabling the identification of more distinctive
patterns. The small-scale Messidor dataset was then merged with the massive
Kaggle dataset, i.e., the healthy and mild DR groups were merged in Chapter
3. Despite the enormous amount and ratio of Kaggle data from healthy to mild
DR cases, resulting augmentation was conducted to mitigate the resulting prob-
lem of data imbalance. The following pre-processing steps were performed to
improve classification: (1) crop, (2) resize, (3) rotate and (4) mirror. The device
effectively promotes the standardization of the labour-intensive ocular process,
while avoiding human subjectivity, acts as an auxiliary diagnostic reference.
Chapter 4 presents a way to use traditional image processing techniques for
the performance enhancement of neural networks. Various image segmenta-
tion algorithms were combined to facilitate its usage with neural network pre-
trained and build methods. These studies show that further research on au-
tomatic diagnosis utilizing fundus image analysis could define the mild DED
classification. Traditional image processing to enhance mild DED characteris-
tics was the first part of the experiment. Since mild DED appears to be ex-
tremely difficult to distinguish from a normal retina due to a few subtle signs
168

of deficiency, pathological features’ visibility was expected to be increased by
an increase in quality data. VGG16 were the top 1 CNN architectures with the
top layer removed and retrained, yielding an accuracy of 83.43%, 89.13%, 88%
respectively. Xception and DenseNet21 obtained the lowest results. Across the
versions, the influence of fine-tuning varied. The observed increase in accu-
racy was only slight, suggesting the relative appropriateness for DED classi-
fication tasks of default pre-trained networks for DED classification tasks. In
other words, despite having been educated on various images from the Ima-
geNet repository, the CNN networks were able to distinguish mild DED from
a healthy retina. If no progress in precision is made, unfreezing is not recom-
mended, resulting in an excessive cost of measurement and time accumulated.
The accuracy of 93.33%, 91.43%, 100%, was achieved for the CNN model build.
The maximum sensitivity of 100 %, 94.44%, 100% and the maximum specificity
of 86.67%, 88.24%, 100% was obtained after testing our high-performance ap-
proach on the detection task of mild DR, mild DME and mild GL. Thus, the
early DED detection proved adequate, but still fell 9% and 6% short in terms of
its specificity.
Chapter 5 concentrates on deep learning algorithms to classify mild and
multi-class DEDs automatically. Previous studies in this field found that the
new deep learning algorithms are ineffective in classifying DED disease from
small datasets. For computer-aided medical applications, new deep learning
algorithms failed to produce realistic and efficient results with less datasets.
Therefore, because of each disease’s significance, this research adapted the op-
timized deep learning architectures for the automated classification of healthy,
DR, DME, GL, and Ca to construct an automated framework for the classifica-
tion. The performance of deep learning models was dropped by 3%, in early
169

stage multi-class DED classification. This finding is apparently very normal
since early stage DED fundus images consist of subtle features that can be cru-
cial for diagnosis. Interestingly, the architectures most commonly deployed
were designed to identify object based features like those present in the Ima-
geNet dataset.A new paradigm such as lesion-based (e.g., exudates) were em-
ployed to diagnose multi-class DED using deep learning models. Following the
work performed in this thesis, we can conclude that constructed frameworks
can be used effectively as a diagnostic tool of high confidence to help clinical
experts in mild DED diagnostic and reduce DED disease occurrence in the gen-
eral population.
Chapter 6 Automated DED recognition has been the topic of several stud-
ies in the past, with the main emphasis on healthy/unhealthy binary retinal
classification [153]. In the case of multi-class classification, the performance of
pre-trained deep learning models reduces as categories multiply. In Chapter
5, it is observed that the predicted precision of the random distribution de-
creased when categories increase. This finding corresponded to the previous
study by [51]. Thus, it is essential to create disease-specific strategies to differ-
entiate between DED to enhance multi-class classification efficiency. Therefore,
this research proposed a system that focuses entirely on identifying multi-class
DED among healthy instances. According to the empiric nature of deep learn-
ing, a new built deep learning model with variety of performance optimization
techniques have been applied (i) batch-size, (ii) epochs, (iii) learning rates and
(iv) loss functions. Besides, this research used combined datasets from different
sources to evaluate the system’s robustness in its flexibility to cope with real-
world scenarios. As Wan et al. [219] have pointed out, the single data collection
environment presents difficulties in the validation of accurate models [171].
170
7.2 Study Limitations
Dataset Size: Several deficiencies of the research have been established. First,
the datasets acquired for this experiment were publicly available which limited
the number of high quality mild DED images. Only limited to moderate data set
sizes were employed in the research. This approach also emphasises the value
of an effective annotation process as having a direct effect on the output of the
classifier. The Kaggle, Messidor, and Messidor-2, retinal datasets were validated
and marked by professional ophthalmologists.
Dataset Source: Numerous datasets used in selected primary studies for
DED detection suffer from a data imbalance problem in which images are not
distributed uniformly throughout groups. The Kaggle data is a publicly accessi-
ble dataset, and the training data set is equipped with class labels. The training
dataset consists of 35,126 images, and there are 53,576 images of the eye fundus
in the test set. The training dataset given is imbalanced in such a way that there
are 25,810 fundus images with class label 0 (normal diabetic retinopathy 73.5%),
2443 with label 1 (mild diabetic retinopathy 6.90%), 5292 with label 2 (moder-
ate diabetic retinopathy 15.10%), 873 with label 3 (severe diabetic retinopathy
2.50%), and 708 with label 4 (proliferative diabetic retinopathy 2.00%). Such im-
balanced data requires that the researcher either reduce the training data (result-
ing in a loss of extensive data) or update some specific class’s training data using
some image augmentation technique (resulting in biased classification results).
The technique of image augmentation to deal with data imbalance is sufficient
for better classification performance. However, only in the training set, and not
the testing, image augmentation used. If the test set gives a higher classification
accuracy (with no augmented images), then the results of the classification can
171

be used on a broader scale.
Technique Novelty: Transfer learning is used as a compensation proce-
dure. Pre-trained CNN models in the wide-scale ImageNet database have been
adopted in this study. To increase the size of the training sample set and to
ease the data imbalance problem, data were rotated, flipped, mirrored, etc. Sec-
ond, the default model parameters were adopted for the classification task (i.e.
dropout, batch size, loss function, optimizer etc.). Finally, the ’black-box’ nature
of the deep learning-based solution is often criticized, causing resistance in the
broader approach adopted by practitioners. However, with a CNN build using
binary classifiers, we achieved state-of-the-art accuracy; the model performance
degrades with the use of transfer learning. However, it is tough to ensure that
more data help in developing more robust model. Previous field research has
confirmed that CNN’s ability to accommodate differences in size is limited, and
some have indicated that more data can not overcome this inherent weakness
in the case of retinal images [75].
7.3 Future Research Directions
This segment poses numerous research issues that researchers have not been
able to solve in previous DED detection studies. Significant research is, there-
fore, needed to improve the effectiveness of various DED detection techniques.
The gaps and research challenges that need to be addressed are set out below.
Developing stronger deep learning models: Deep learning has already
shown extremely promising success in binary classification in the field of med-
ical imaging and retinal disease diagnosis. To further refine and create more
172

effective deep neural networks for multiclass classification, another solution
may be to increase computational power by increasing the capacity of the net-
work [183, 200]. Another approach could be to create a different object-based
model rather than an image-based model. For example, if researchers are inter-
ested in detecting a region of interest (e.g. optic nerve only), they could design
such a deep convolutional neural network that only learns with the optic nerve.
It is argued in [138] that object-based identification is more effective than image-
based identification.
Training on minimal data: deep learning software typically involves a large
number of retinal fundus images for learning. If the training set is small, it
may not produce satisfactory results in terms of accuracy. There are two solu-
tions available. First, using a range of enhancement methods including image
augmentation. Second, employ transfer learning algorithms to retrieve learned
parameters and use these in the target task. Further, investigations shows Gen-
erative Adversal Network (GAN) is useful for the generation of training data,
so that the DL architecture can be trained with robustness and more distinctive
features [37].
Similar deep learning architecture for medical imaging: Several transfer
learning frameworks for object recognition are available for retraining on a new
collection of images such as medical images. These architectures are less suit-
able for medical images. This is because such TL frameworks are designed for
objects such as animals, flowers, etc. As a result, such frameworks may be un-
suitable for real time medical images. Potential study could implement a TL ar-
chitectural design which has been learned on appropriate medical images rather
than objects, functioning as a generic architecture, and eventually retrained to
173

improve the accuracy of medical image classification.
Automated choice of the optimum values for deep learning architectures:
Neural networks have provided promising results primarily in the area of com-
puter vision and particularly in DED detection, but the complexity of modulat-
ing is not well known and is considered to be a black box. It is, therefore, hard
to determine the effective model and optimum values for the number of layers
and modules. Thus, in the future, automated optimization algorithms could
be proposed to find optimal rates for various DL architectures on various DED
datasets and other similar resources for medical images.
Integrating deep learning with telehealth and cloud computing: For re-
mote regions in particular, mobile health can play an essential role in overcom-
ing isolation. Neural networks in mobile devices can be used in the future to di-
agnose DED from eye fundus images. For example, in remote communities, the
patient could use their mobile phone with a mobile camera to capture an image
of the eye fundus. This image could also be classified using a DED detection
model (constructed through a machine learning or deep learning approach).
The configured system could identify DED from the image file and return the
detection results.
174

BIBLIOGRAPHY
[1] Qaisar Abbas, Irene Fondon, Auxiliadora Sarmiento, Soledad Jimenez,and Pedro Alemany. Automatic recognition of severity level for diagno-sis of diabetic retinopathy using deep visual features. Medical & biologicalengineering & computing, 55(11):1959–1974, 2017.
[2] Michael D Abramoff, Meindert Niemeijer, and Stephen R Russell. Auto-mated detection of diabetic retinopathy: barriers to translation into clini-cal practice. Expert review of medical devices, 7(2):287–296, 2010.
[3] Michael David Abramoff, Yiyue Lou, Ali Erginay, Warren Clarida, RyanAmelon, James C Folk, and Meindert Niemeijer. Improved automateddetection of diabetic retinopathy on a publicly available dataset throughintegration of deep learning. Investigative ophthalmology & visual science,57(13):5200–5206, 2016.
[4] Udyavara R Acharya, Choo M Lim, E Yin Kwee Ng, Caroline Chee,and Toshiyo Tamura. Computer-based detection of diabetes retinopathystages using digital fundus images. Proceedings of the institution of mechani-cal engineers, part H: journal of engineering in medicine, 223(5):545–553, 2009.
[5] Jin Mo Ahn, Sangsoo Kim, Kwang-Sung Ahn, Sung-Hoon Cho, Kwan BokLee, and Ungsoo Samuel Kim. A deep learning model for the detection ofboth advanced and early glaucoma using fundus photography. PloS one,13(11):e0207982, 2018.
[6] Jin Mo Ahn, Sangsoo Kim, Kwang-Sung Ahn, Sung-Hoon Cho, Kwan BokLee, and Ungsoo Samuel Kim. Correction: A deep learning model for thedetection of both advanced and early glaucoma using fundus photogra-phy. PloS one, 14(1):e0211579, 2019.
[7] Baidaa Al-Bander, Waleed Al-Nuaimy, Majid A Al-Taee, Bryan MWilliams, and Yalin Zheng. Diabetic macular edema grading based ondeep neural networks. Proceedings of the Ophthalmic Medical Image Analy-sis Third International Workshop (OMIA 2016), 2016.
[8] Baidaa Al-Bander, Waleed Al-Nuaimy, Majid A Al-Taee, and Yalin Zheng.Automated glaucoma diagnosis using deep learning approach. In 201714th International Multi-Conference on Systems, Signals & Devices (SSD),pages 207–210. IEEE, 2017.
175

[9] Manal Al Ghamdi, Mingqi Li, Mohamed Abdel-Mottaleb, and Mo-hamed Abou Shousha. Semi-supervised transfer learning for convolu-tional neural networks for glaucoma detection. In ICASSP 2019-2019 IEEEInternational Conference on Acoustics, Speech and Signal Processing (ICASSP),pages 3812–3816. IEEE, 2019.
[10] Mohammad A Al-Jarrah and Hadeel Shatnawi. Non-proliferative diabeticretinopathy symptoms detection and classification using neural network.Journal of medical engineering & technology, 41(6):498–505, 2017.
[11] Ahmed Almazroa, Sami Alodhayb, Essameldin Osman, Eslam Ramadan,Mohammed Hummadi, Mohammed Dlaim, Muhannad Alkatee, Kaam-ran Raahemifar, and Vasudevan Lakshminarayanan. Retinal fundus im-ages for glaucoma analysis: the riga dataset. In Medical Imaging 2018:Imaging Informatics for Healthcare, Research, and Applications, volume 10579,page 105790B. International Society for Optics and Photonics, 2018.
[12] Ahmed Almazroa, Ritambhar Burman, Kaamran Raahemifar, and Va-sudevan Lakshminarayanan. Optic disc and optic cup segmentationmethodologies for glaucoma image detection: a survey. Journal of oph-thalmology, 2015, 2015.
[13] Guangzhou An, Kazuko Omodaka, Kazuki Hashimoto, Satoru Tsuda,Yukihiro Shiga, Naoko Takada, Tsutomu Kikawa, Hideo Yokota,Masahiro Akiba, and Toru Nakazawa. Glaucoma diagnosis with machinelearning based on optical coherence tomography and color fundus im-ages. Journal of Healthcare Engineering, 2019, 2019.
[14] Balint Antal and Andras Hajdu. An ensemble-based system for automaticscreening of diabetic retinopathy. Knowledge-based systems, 60:20–27, 2014.
[15] R Arunkumar and P Karthigaikumar. Multi-retinal disease classificationby reduced deep learning features. Neural Computing and Applications,28(2):329–334, 2017.
[16] Ryo Asaoka, Hiroshi Murata, Aiko Iwase, and Makoto Araie. Detectingpreperimetric glaucoma with standard automated perimetry using a deeplearning classifier. Ophthalmology, 123(9):1974–1980, 2016.
[17] Ryo Asaoka, Masaki Tanito, Naoto Shibata, Keita Mitsuhashi, KenichiNakahara, Yuri Fujino, Masato Matsuura, Hiroshi Murata, Kana Tokumo,and Yoshiaki Kiuchi. Validation of a deep learning model to screen for
176

glaucoma using images from different fundus cameras and data augmen-tation. Ophthalmology Glaucoma, 2019.
[18] British Diabetic Association et al. Retinal photography screening for dia-betic eye disease. London: BDA, 1997.
[19] Pierre Baldi and Peter J Sadowski. Understanding dropout. In Advancesin neural information processing systems, pages 2814–2822, 2013.
[20] Ghazal Bargshady, Xujuan Zhou, Ravinesh C Deo, Jeffrey Soar, FrankWhittaker, and Hua Wang. Enhanced deep learning algorithm develop-ment to detect pain intensity from facial expression images. Expert Systemswith Applications, 149:113305, 2020.
[21] Buket D Barkana, Inci Saricicek, and Burak Yildirim. Performance anal-ysis of descriptive statistical features in retinal vessel segmentation viafuzzy logic, ann, svm, and classifier fusion. Knowledge-Based Systems,118:165–176, 2017.
[22] James C Bezdek, James Keller, Raghu Krisnapuram, and Nikhil Pal. Fuzzymodels and algorithms for pattern recognition and image processing, volume 4.Springer Science & Business Media, 1999.
[23] RS Biyani and BM Patre. A clustering approach for exudates detection inscreening of diabetic retinopathy. In 2016 International Conference on Signaland Information Processing (IConSIP), pages 1–5. IEEE, 2016.
[24] Patrick Bond. South africa’s vulnerability to the world capitalist crisis:How it worsened and how it might be reversed. OF THE NATION, page609.
[25] Rupert RA Bourne, Jost B Jonas, Alain M Bron, Maria Vittoria Cicinelli,Aditi Das, Seth R Flaxman, David S Friedman, Jill E Keeffe, John HKempen, Janet Leasher, et al. Prevalence and causes of vision loss inhigh-income countries and in eastern and central europe in 2015: mag-nitude, temporal trends and projections. British Journal of Ophthalmology,102(5):575–585, 2018.
[26] Jean-Pierre Briot, Gaetan Hadjeres, and Francois-David Pachet. Deeplearning techniques for music generation–a survey. arXiv preprintarXiv:1709.01620, 2017.
177

[27] Toan Bui, Noppadol Maneerat, and Ukrit Watchareeruetai. Detection ofcotton wool for diabetic retinopathy analysis using neural network. In2017 IEEE 10th International Workshop on Computational Intelligence and Ap-plications (IWCIA), pages 203–206. IEEE, 2017.
[28] Philippe Burlina, David E Freund, Neil Joshi, Y Wolfson, and Neil MBressler. Detection of age-related macular degeneration via deep learn-ing. In 2016 IEEE 13th International Symposium on Biomedical Imaging (ISBI),pages 184–188. IEEE, 2016.
[29] Miguel Caixinha and Sandrina Nunes. Machine learning techniques inclinical vision sciences. Current eye research, 42(1):1–15, 2017.
[30] Enrique J Carmona, Mariano Rincon, Julian Garcıa-Feijoo, and Jose MMartınez-de-la Casa. Identification of the optic nerve head with geneticalgorithms. Artificial Intelligence in Medicine, 43(3):243–259, 2008.
[31] Darvin Yi Carson Lam, Margaret Guo, and Tony Lindsey. Automateddetection of diabetic retinopathy using deep learning. AMIA Summits onTranslational Science Proceedings, 2017:147, 2018.
[32] Allan Cerentinia, Daniel Welfera, Marcos Cordeiro d’Ornellasa, Carlos Je-sus Pereira Haygertb, and Gustavo Nogara Dottob. Automatic identifica-tion of glaucoma sing deep learning methods u. In MEDINFO 2017: Pre-cision Healthcare Through Informatics: Proceedings of the 16th World Congresson Medical and Health Informatics, volume 245, page 318. IOS Press, 2018.
[33] Juliana CN Chan, Vasanti Malik, Weiping Jia, Takashi Kadowaki, Chit-taranjan S Yajnik, Kun-Ho Yoon, and Frank B Hu. Diabetes in asia: epi-demiology, risk factors, and pathophysiology. Jama, 301(20):2129–2140,2009.
[34] CP Reshma Chand and J Dheeba. Automatic detection of exudates incolor fundus retinopathy images. Indian Journal of Science and Technology,8(26), 2015.
[35] Subhasis Chaudhuri, Shankar Chatterjee, Norman Katz, Mark Nelson,and Michael Goldbaum. Detection of blood vessels in retinal images us-ing two-dimensional matched filters. IEEE Transactions on medical imaging,8(3):263–269, 1989.
[36] Guanmin Chen, Peter Faris, Brenda Hemmelgarn, Robin L Walker, andHude Quan. Measuring agreement of administrative data with chart data
178
using prevalence unadjusted and adjusted kappa. BMC medical researchmethodology, 9(1):5, 2009.
[37] Hanlin Chen and Peng Cao. Deep learning based data augmentation andclassification for limited medical data learning. In 2019 IEEE InternationalConference on Power, Intelligent Computing and Systems (ICPICS), pages 300–303. IEEE, 2019.
[38] Xiangyu Chen, Yanwu Xu, Damon Wing Kee Wong, Tien Yin Wong, andJiang Liu. Glaucoma detection based on deep convolutional neural net-work. In 2015 37th annual international conference of the IEEE engineering inmedicine and biology society (EMBC), pages 715–718. IEEE, 2015.
[39] Xiao Chen, Fazhi He, and Haiping Yu. A matting method based on fullfeature coverage. Multimedia Tools and Applications, 78(9):11173–11201,2019.
[40] Ching-Yu Cheng, Ningli Wang, Tien Y Wong, Nathan Congdon, Ming-guang He, Ya Xing Wang, Tasanee Braithwaite, Robert J Casson,Maria Vittoria Cicinelli, Aditi Das, et al. Prevalence and causes of vi-sion loss in east asia in 2015: magnitude, temporal trends and projections.British Journal of Ophthalmology, 104(5):616–622, 2020.
[41] Carol Y Cheung, Fangyao Tang, Daniel Shu Wei Ting, Gavin Siew WeiTan, and Tien Yin Wong. Artificial intelligence in diabetic eye diseasescreening. The Asia-Pacific Journal of Ophthalmology, 8(2):158–164, 2019.
[42] Joon Yul Choi, Tae Keun Yoo, Jeong Gi Seo, Jiyong Kwak, Terry Tae-woong Um, and Tyler Hyungtaek Rim. Multi-categorical deep learningneural network to classify retinal images: a pilot study employing smalldatabase. PloS one, 12(11):e0187336, 2017.
[43] Francois Chollet. Xception: Deep learning with depthwise separable con-volutions. In Proceedings of the IEEE conference on computer vision and pat-tern recognition, pages 1251–1258, 2017.
[44] Nathan G Congdon, David S Friedman, and Thomas Lietman. Importantcauses of visual impairment in the world today. Jama, 290(15):2057–2060,2003.
[45] Tyler Coye. A novel retinal blood vessel segmentation algorithm for fun-dus images. MATLAB Central File Exchange (Jan 2017), 2015.
179

[46] Jeffrey De Fauw, Pearse Keane, Nenad Tomasev, Daniel Visentin, Georgevan den Driessche, Mike Johnson, Cian O Hughes, Carlton Chu, JosephLedsam, Trevor Back, et al. Automated analysis of retinal imaging usingmachine learning techniques for computer vision. F1000Research, 5, 2016.
[47] Jeffrey De Fauw, Joseph R Ledsam, Bernardino Romera-Paredes, StanislavNikolov, Nenad Tomasev, Sam Blackwell, Harry Askham, Xavier Glorot,Brendan O’Donoghue, Daniel Visentin, et al. Clinically applicable deeplearning for diagnosis and referral in retinal disease. Nature medicine,24(9):1342–1350, 2018.
[48] Jordi de La Torre, Aida Valls, and Domenec Puig. A deep learning inter-pretable classifier for diabetic retinopathy disease grading. Neurocomput-ing, 2019.
[49] Alan Carlos de Moura Lima, Lucas Bezerra Maia, Roberto Matheus Pin-heiro Pereira, Geraldo Braz Junior, Joao Dallyson Sousa de Almeida, andAnselmo Cardoso de Paiva. Glaucoma diagnosis over eye fundus imagethrough deep features. In 2018 25th International Conference on Systems,Signals and Image Processing (IWSSIP), pages 1–4. IEEE, 2018.
[50] Etienne Decenciere, Xiwei Zhang, Guy Cazuguel, Bruno Lay, BeatriceCochener, Caroline Trone, Philippe Gain, Richard Ordonez, PascaleMassin, Ali Erginay, et al. Feedback on a publicly distributed imagedatabase: the messidor database. Image Analysis & Stereology, 33(3):231–234, 2014.
[51] Jia Deng, Alexander C Berg, Kai Li, and Li Fei-Fei. What does classify-ing more than 10,000 image categories tell us? In European conference oncomputer vision, pages 71–84. Springer, 2010.
[52] Steven Diamond, Vincent Sitzmann, Stephen Boyd, Gordon Wetzstein,and Felix Heide. Dirty pixels: Optimizing image classification architec-tures for raw sensor data. arXiv preprint arXiv:1701.06487, 2017.
[53] Andres Diaz-Pinto, Sandra Morales, Valery Naranjo, Thomas Kohler,Jose M Mossi, and Amparo Navea. Cnns for automatic glaucoma assess-ment using fundus images: an extensive validation. Biomedical engineeringonline, 18(1):29, 2019.
[54] Yanyan Dong, Qinyan Zhang, Zhiqiang Qiao, and Ji-Jiang Yang. Classi-fication of cataract fundus image based on deep learning. In 2017 IEEE
180

International Conference on Imaging Systems and Techniques (IST), pages 1–5.IEEE, 2017.
[55] Darshit Doshi, Aniket Shenoy, Deep Sidhpura, and Prachi Gharpure. Di-abetic retinopathy detection using deep convolutional neural networks.In 2016 International Conference on Computing, Analytics and Security Trends(CAST), pages 261–266. IEEE, 2016.
[56] Andre Esteva, Brett Kuprel, Roberto A Novoa, Justin Ko, Susan M Swet-ter, Helen M Blau, and Sebastian Thrun. Dermatologist-level classifica-tion of skin cancer with deep neural networks. Nature, 542(7639):115–118,2017.
[57] Damian JJ Farnell, FN Hatfield, P Knox, M Reakes, S Spencer, D Parry,and Simon P Harding. Enhancement of blood vessels in digital fundusphotographs via the application of multiscale line operators. Journal of theFranklin institute, 345(7):748–765, 2008.
[58] Robert P Finger, Rolf Fimmers, Frank G Holz, and Hendrik PN Scholl.Incidence of blindness and severe visual impairment in germany: projec-tions for 2030. Investigative ophthalmology & visual science, 52(7):4381–4389,2011.
[59] Nita Gandhi Forouhi and Nicholas J Wareham. Epidemiology of diabetes.Medicine, 38(11):602–606, 2010.
[60] Nita Gandhi Forouhi and Nicholas J Wareham. Epidemiology of diabetes.Medicine, 47(1):22–27, 2019.
[61] M Moazam Fraz, Waqas Jahangir, Saqib Zahid, Mian M Hamayun, andSarah A Barman. Multiscale segmentation of exudates in retinal imagesusing contextual cues and ensemble classification. Biomedical Signal Pro-cessing and Control, 35:50–62, 2017.
[62] Francisco Fumero, Silvia Alayon, Jose L Sanchez, Jose Sigut, andM Gonzalez-Hernandez. Rim-one: An open retinal image database foroptic nerve evaluation. In 2011 24th international symposium on computer-based medical systems (CBMS), pages 1–6. IEEE, 2011.
[63] Karthikeyan Ganesan, Roshan Joy Martis, U Rajendra Acharya,Chua Kuang Chua, Lim Choo Min, EYK Ng, and Augustinus Laude.Computer-aided diabetic retinopathy detection using trace transforms
181

on digital fundus images. Medical & biological engineering & computing,52(8):663–672, 2014.
[64] Xinting Gao, Stephen Lin, and Tien Yin Wong. Automatic feature learningto grade nuclear cataracts based on deep learning. IEEE Transactions onBiomedical Engineering, 62(11):2693–2701, 2015.
[65] GG Gardner, D Keating, Tom H Williamson, and Alex T Elliott. Auto-matic detection of diabetic retinopathy using an artificial neural network:a screening tool. British journal of Ophthalmology, 80(11):940–944, 1996.
[66] Rishab Gargeya and Theodore Leng. Automated identification of diabeticretinopathy using deep learning. Ophthalmology, 124(7):962–969, 2017.
[67] Nasr Y Gharaibeh. A novel approach for detection of microaneurysmsin diabetic retinopathy disease from retinal fundus images. Computer andInformation Science, 10(1):1–15, 2017.
[68] Ratul Ghosh, Kuntal Ghosh, and Sanjit Maitra. Automatic detection andclassification of diabetic retinopathy stages using cnn. In 2017 4th Interna-tional Conference on Signal Processing and Integrated Networks (SPIN), pages550–554. IEEE, 2017.
[69] Luca Giancardo, Fabrice Meriaudeau, Thomas P Karnowski, Yaqin Li,Seema Garg, Kenneth W Tobin Jr, and Edward Chaum. Exudate-baseddiabetic macular edema detection in fundus images using publicly avail-able datasets. Medical image analysis, 16(1):216–226, 2012.
[70] Evgin Goceri and Numan Goceri. Deep learning in medical image analy-sis: recent advances and future trends. 2017.
[71] James Kang Hao Goh, Carol Y Cheung, Shaun Sebastian Sim, Pok ChienTan, Gavin Siew Wei Tan, and Tien Yin Wong. Retinal imaging techniquesfor diabetic retinopathy screening. Journal of diabetes science and technology,10(2):282–294, 2016.
[72] Juan J Gomez-Valverde, Alfonso Anton, Gianluca Fatti, Bart Liefers, Ale-jandra Herranz, Andres Santos, Clara I Sanchez, and Marıa J Ledesma-Carbayo. Automatic glaucoma classification using color fundus imagesbased on convolutional neural networks and transfer learning. Biomedicaloptics express, 10(2):892–913, 2019.
182

[73] Waleed M Gondal, Jan M Kohler, Rene Grzeszick, Gernot A Fink, andMichael Hirsch. Weakly-supervised localization of diabetic retinopathylesions in retinal fundus images. In 2017 IEEE International Conference onImage Processing (ICIP), pages 2069–2073. IEEE, 2017.
[74] Early Treatment Diabetic Retinopathy Study Research Group et al. Grad-ing diabetic retinopathy from stereoscopic color fundus photographs—anextension of the modified airlie house classification: Etdrs report number10. Ophthalmology, 98(5):786–806, 1991.
[75] Varun Gulshan, Lily Peng, Marc Coram, Martin C Stumpe, Derek Wu,Arunachalam Narayanaswamy, Subhashini Venugopalan, Kasumi Wid-ner, Tom Madams, Jorge Cuadros, et al. Development and validation ofa deep learning algorithm for detection of diabetic retinopathy in retinalfundus photographs. Jama, 316(22):2402–2410, 2016.
[76] Fatih C Gundogan, Umit Yolcu, Fahrettin Akay, Abdullah Ilhan, GokhanOzge, and Salih Uzun. Diabetic macular edema. Pakistan journal of medicalsciences, 32(2):505, 2016.
[77] Yuki Hagiwara, Joel En Wei Koh, Jen Hong Tan, Sulatha V Bhandary, Au-gustinus Laude, Edward J Ciaccio, Louis Tong, and U Rajendra Acharya.Computer-aided diagnosis of glaucoma using fundus images: A review.Computer methods and programs in biomedicine, 165:1–12, 2018.
[78] Balazs Harangi, Janos Toth, Agnes Baran, and Andras Hajdu. Automaticscreening of fundus images using a combination of convolutional neu-ral network and hand-crafted features. In 2019 41st Annual InternationalConference of the IEEE Engineering in Medicine and Biology Society (EMBC),pages 2699–2702. IEEE, 2019.
[79] Taimur Hassan, M Usman Akram, M Furqan Masood, and UbaidullahYasin. Biomisa retinal image database for macular and ocular syndromes.In International Conference Image Analysis and Recognition, pages 695–705.Springer, 2018.
[80] Hamid Hassanpour, Najmeh Samadiani, and SM Mahdi Salehi. Usingmorphological transforms to enhance the contrast of medical images. TheEgyptian Journal of Radiology and Nuclear Medicine, 46(2):481–489, 2015.
[81] Jinyuan He, Jia Rong, Le Sun, Hua Wang, Yanchun Zhang, and JiangangMa. A framework for cardiac arrhythmia detection from iot-based ecgs.World Wide Web, pages 1–16, 2020.
183

[82] Kaiming He, Xiangyu Zhang, Shaoqing Ren, and Jian Sun. Deep residuallearning for image recognition. In Proceedings of the IEEE conference oncomputer vision and pattern recognition, pages 770–778, 2016.
[83] D Jude Hemanth, Omer Deperlioglu, and Utku Kose. An enhanced dia-betic retinopathy detection and classification approach using deep convo-lutional neural network. Neural Computing and Applications, 32(3):707–721,2020.
[84] Geoffrey Hinton, Nitish Srivastava, and Kevin Swersky. Neural networksfor machine learning lecture 6a overview of mini-batch gradient descent.Cited on, 14(8), 2012.
[85] Daniel T Hogarty, David A Mackey, and Alex W Hewitt. Current stateand future prospects of artificial intelligence in ophthalmology: a review.Clinical & experimental ophthalmology, 47(1):128–139, 2019.
[86] Andrew G Howard, Menglong Zhu, Bo Chen, Dmitry Kalenichenko, Wei-jun Wang, Tobias Weyand, Marco Andreetto, and Hartwig Adam. Mo-bilenets: Efficient convolutional neural networks for mobile vision appli-cations. arXiv preprint arXiv:1704.04861, 2017.
[87] Gao Huang, Zhuang Liu, Laurens Van Der Maaten, and Kilian Q Wein-berger. Densely connected convolutional networks. In Proceedings of theIEEE conference on computer vision and pattern recognition, pages 4700–4708,2017.
[88] A Hutchinson, A McIntosh, J Peters, C O’keeffe, K Khunti, R Baker, andA Booth. Effectiveness of screening and monitoring tests for diabeticretinopathy–a systematic review. Diabetic medicine, 17(7):495–506, 2000.
[89] National Eye institute. Facts About Diabetic Eye Disease. https://nei.nih.gov/health/diabetic/retinopathy, 2015. [Online; LastReviewed: September-2015].
[90] Sergey Ioffe and Christian Szegedy. Batch normalization: Acceleratingdeep network training by reducing internal covariate shift. arXiv preprintarXiv:1502.03167, 2015.
[91] Uzair Ishtiaq, Sameem Abdul Kareem, Erma Rahayu Mohd Faizal Abdul-lah, Ghulam Mujtaba, Rashid Jahangir, and Hafiz Yasir Ghafoor. Diabeticretinopathy detection through artificial intelligent techniques: a reviewand open issues. Multimedia Tools and Applications, pages 1–44, 2019.
184

[92] Md Tariqul Islam, Sheikh Asif Imran, Asiful Arefeen, Mahmudul Hasan,and Celia Shahnaz. Source and camera independent ophthalmic diseaserecognition from fundus image using neural network. In 2019 IEEE In-ternational Conference on Signal Processing, Information, Communication &Systems (SPICSCON), pages 59–63. IEEE, 2019.
[93] T Jaya, J Dheeba, and N Albert Singh. Detection of hard exudates in colourfundus images using fuzzy support vector machine-based expert system.Journal of Digital Imaging, 28(6):761–768, 2015.
[94] Yuping Jiang, Huiqun Wu, and Jiancheng Dong. Automatic screeningof diabetic retinopathy images with convolution neural network based oncaffe framework. In Proceedings of the 1st International Conference on Medicaland Health Informatics 2017, pages 90–94. ACM, 2017.
[95] Shilpa Joshi and PT Karule. A review on exudates detection methods fordiabetic retinopathy. Biomedicine & Pharmacotherapy, 97:1454–1460, 2018.
[96] Mamta Juneja, Shaswat Singh, Naman Agarwal, Shivank Bali, ShubhamGupta, Niharika Thakur, and Prashant Jindal. Automated detection ofglaucoma using deep learning convolution network (g-net). MultimediaTools and Applications, pages 1–23, 2019.
[97] Rim Kahloun, Moncef Khairallah, Serge Resnikoff, Maria Vittoria Ci-cinelli, Seth R Flaxman, Aditi Das, Jost B Jonas, Jill E Keeffe, John H Kem-pen, Janet Leasher, et al. Prevalence and causes of vision loss in northafrica and middle east in 2015: magnitude, temporal trends and projec-tions. British Journal of Ophthalmology, 103(7):863–870, 2019.
[98] Asha Gowda Karegowda, Asfiya Nasiha, MA Jayaram, and AS Manju-nath. Exudates detection in retinal images using back propagation neuralnetwork. International Journal of Computer Applications, 25(3):25–31, 2011.
[99] Sri Phani Krishna Karri, Debjani Chakraborty, and Jyotirmoy Chatterjee.Transfer learning based classification of optical coherence tomographyimages with diabetic macular edema and dry age-related macular degen-eration. Biomedical optics express, 8(2):579–592, 2017.
[100] Manpreet Kaur and Mandeep Kaur. A hybrid approach for automaticexudates detection in eye fundus image. Int. J., 5(6):411–417, 2015.
[101] Jill Elizabeth Keeffe, Robert J Casson, Konrad Pesudovs, Hugh R Taylor,Maria Vittoria Cicinelli, Aditi Das, Seth R Flaxman, Jost B Jonas, John H
185

Kempen, Janet Leasher, et al. Prevalence and causes of vision loss insouth-east asia and oceania in 2015: magnitude, temporal trends and pro-jections. British Journal of Ophthalmology, 103(7):878–884, 2019.
[102] Nour Eldeen M Khalifa, Mohamed Loey, Mohamed Hamed N Taha, andHamed Nasr Eldin T Mohamed. Deep transfer learning models for medi-cal diabetic retinopathy detection. Acta Informatica Medica, 27(5):327, 2019.
[103] Tehmina Khalil, Muhammad Usman Akram, Samina Khalid, and Am-ina Jameel. Improved automated detection of glaucoma from fundus im-age using hybrid structural and textural features. IET Image Processing,11(9):693–700, 2017.
[104] Helga Kolb. Simple anatomy of the retina by helga kolb. Webvision: TheOrganization of the Retina and Visual System, 2011.
[105] Alex Krizhevsky, Ilya Sutskever, and Geoffrey E Hinton. Imagenet clas-sification with deep convolutional neural networks. In Advances in neuralinformation processing systems, pages 1097–1105, 2012.
[106] Worapan Kusakunniran, Qiang Wu, Panrasee Ritthipravat, and JianZhang. Hard exudates segmentation based on learned initial seeds anditerative graph cut. Computer methods and programs in biomedicine, 158:173–183, 2018.
[107] Arkadiusz Kwasigroch, Bartlomiej Jarzembinski, and Michal Gro-chowski. Deep cnn based decision support system for detection and as-sessing the stage of diabetic retinopathy. In 2018 International Interdisci-plinary PhD Workshop (IIPhDW), pages 111–116. IEEE, 2018.
[108] Kris A Kwiterovich, Maureen G Maguire, Robert P Murphy, Andrew PSchachat, Neil M Bressler, Susan B Bressler, and Stuart L Fine. Frequencyof adverse systemic reactions after fluorescein angiography: results of aprospective study. Ophthalmology, 98(7):1139–1142, 1991.
[109] Carson Lam, Darvin Yi, Margaret Guo, and Tony Lindsey. Automateddetection of diabetic retinopathy using deep learning. AMIA Summits onTranslational Science Proceedings, 2018:147, 2018.
[110] Yann LeCun, Yoshua Bengio, and Geoffrey Hinton. Deep learning. nature,521(7553):436–444, 2015.
186

[111] Cecilia S Lee, Doug M Baughman, and Aaron Y Lee. Deep learning iseffective for classifying normal versus age-related macular degenerationoct images. Ophthalmology Retina, 1(4):322–327, 2017.
[112] Ryan Lee, Tien Y Wong, and Charumathi Sabanayagam. Epidemiology ofdiabetic retinopathy, diabetic macular edema and related vision loss. Eyeand vision, 2(1):1–25, 2015.
[113] Fei Li, Zhe Wang, Guoxiang Qu, Diping Song, Ye Yuan, Yang Xu, Kai Gao,Guangwei Luo, Zegu Xiao, Dennis SC Lam, et al. Automatic differentia-tion of glaucoma visual field from non-glaucoma visual filed using deepconvolutional neural network. BMC medical imaging, 18(1):35, 2018.
[114] Guo Li, Shibao Zheng, and Xinzhe Li. Exudate detection in fundus imagesvia convolutional neural network. In International Forum on Digital TV andWireless Multimedia Communications, pages 193–202. Springer, 2017.
[115] Hu Li, Ye Wang, Hua Wang, and Bin Zhou. Multi-window based ensem-ble learning for classification of imbalanced streaming data. World WideWeb, 20(6):1507–1525, 2017.
[116] Xiaogang Li, Tiantian Pang, Biao Xiong, Weixiang Liu, Ping Liang, andTianfu Wang. Convolutional neural networks based transfer learning fordiabetic retinopathy fundus image classification. In 2017 10th InternationalCongress on Image and Signal Processing, BioMedical Engineering and Infor-matics (CISP-BMEI), pages 1–11. IEEE, 2017.
[117] Xiaomeng Li, Xiaowei Hu, Lequan Yu, Lei Zhu, Chi-Wing Fu, and Pheng-Ann Heng. Canet: Cross-disease attention network for joint diabeticretinopathy and diabetic macular edema grading. IEEE transactions onmedical imaging, 2019.
[118] Geert Litjens, Thijs Kooi, Babak Ehteshami Bejnordi, ArnaudArindra Adiyoso Setio, Francesco Ciompi, Mohsen Ghafoorian,Jeroen Awm Van Der Laak, Bram Van Ginneken, and Clara I Sanchez.A survey on deep learning in medical image analysis. Medical imageanalysis, 42:60–88, 2017.
[119] Jiangang Ma, Le Sun, Hua Wang, Yanchun Zhang, and Uwe Aickelin.Supervised anomaly detection in uncertain pseudoperiodic data streams.ACM Transactions on Internet Technology (TOIT), 16(1):1–20, 2016.
187
[120] G Mahendran and R Dhanasekaran. Investigation of the severity level ofdiabetic retinopathy using supervised classifier algorithms. Computers &Electrical Engineering, 45:312–323, 2015.
[121] Romany F Mansour. Deep-learning-based automatic computer-aided di-agnosis system for diabetic retinopathy. Biomedical engineering letters,8(1):41–57, 2018.
[122] Muhammad Mateen, Junhao Wen, Sun Song, Zhouping Huang, et al. Fun-dus image classification using vgg-19 architecture with pca and svd. Sym-metry, 11(1):1, 2019.
[123] Prasanna Porwal; Samiksha Pachade; Ravi Kamble; Manesh Kokare;Girish Deshmukh; Vivek Sahasrabuddhe; Fabrice Meriaudeau. Indian di-abetic retinopathy image dataset (idrid), 2018.
[124] Volodymyr Mnih, Koray Kavukcuoglu, David Silver, Andrei A Rusu, JoelVeness, Marc G Bellemare, Alex Graves, Martin Riedmiller, Andreas KFidjeland, Georg Ostrovski, et al. Human-level control through deep re-inforcement learning. nature, 518(7540):529–533, 2015.
[125] Muthu Rama Krishnan Mookiah, U Rajendra Acharya, Chua KuangChua, Choo Min Lim, EYK Ng, and Augustinus Laude. Computer-aideddiagnosis of diabetic retinopathy: A review. Computers in biology andmedicine, 43(12):2136–2155, 2013.
[126] Vinay Nangia, Jost B Jonas, Ronnie George, Vijaya Lingam, Leon Ellwein,Maria Vittoria Cicinelli, Aditi Das, Seth R Flaxman, Jill E Keeffe, John HKempen, et al. Prevalence and causes of blindness and vision impair-ment: magnitude, temporal trends and projections in south and centralasia. British Journal of Ophthalmology, 103(7):871–877, 2019.
[127] Syed Ali Gohar Naqvi, Muhammad Faisal Zafar, and Ihsan ul Haq. Re-ferral system for hard exudates in eye fundus. Computers in biology andmedicine, 64:217–235, 2015.
[128] Quang H Nguyen, Ramasamy Muthuraman, Laxman Singh, Gopa Sen,Anh Cuong Tran, Binh P Nguyen, and Matthew Chua. Diabetic retinopa-thy detection using deep learning. In Proceedings of the 4th InternationalConference on Machine Learning and Soft Computing, pages 103–107, 2020.
[129] Pradeep Nijalingappa and B Sandeep. Machine learning approach for theidentification of diabetes retinopathy and its stages. In 2015 International
188

Conference on Applied and Theoretical Computing and Communication Technol-ogy (iCATccT), pages 653–658. IEEE, 2015.
[130] Jan H Noordik. Cheminformatics Developments: History, Reviews and CurrentResearch. IOS Press, 2004.
[131] Kevin Noronha, Jagadish Nayak, and SN Bhat. Enhancement of retinalfundus image to highlight the features for detection of abnormal eyes. InTENCON 2006-2006 IEEE Region 10 Conference, pages 1–4. IEEE, 2006.
[132] Maxime Oquab, Leon Bottou, Ivan Laptev, and Josef Sivic. Learning andtransferring mid-level image representations using convolutional neuralnetworks. In Proceedings of the IEEE conference on computer vision and patternrecognition, pages 1717–1724, 2014.
[133] World Health Organization et al. Global report on diabetes. 2016.
[134] Jose Ignacio Orlando, Huazhu Fu, Joao Barbossa Breda, Karel van Keer,Deepti R Bathula, Andres Diaz-Pinto, Ruogu Fang, Pheng-Ann Heng, Jey-oung Kim, JoonHo Lee, et al. Refuge challenge: A unified frameworkfor evaluating automated methods for glaucoma assessment from fundusphotographs. Medical image analysis, 59:101570, 2020.
[135] Jose Ignacio Orlando, Elena Prokofyeva, Mariana del Fresno, andMatthew B Blaschko. Convolutional neural network transfer for auto-mated glaucoma identification. In 12th international symposium on medicalinformation processing and analysis, volume 10160, page 101600U. Interna-tional Society for Optics and Photonics, 2017.
[136] Jose Ignacio Orlando, Elena Prokofyeva, Mariana del Fresno, andMatthew B Blaschko. An ensemble deep learning based approach forred lesion detection in fundus images. Computer methods and programs inbiomedicine, 153:115–127, 2018.
[137] Alireza Osareh, Majid Mirmehdi, Bari Thomas, and Richard Markham.Automated identification of diabetic retinal exudates in digital colour im-ages. British Journal of Ophthalmology, 87(10):1220–1223, 2003.
[138] Wanli Ouyang, Ping Luo, Xingyu Zeng, Shi Qiu, Yonglong Tian, Hong-sheng Li, Shuo Yang, Zhe Wang, Yuanjun Xiong, Chen Qian, et al. Deepid-net: multi-stage and deformable deep convolutional neural networks forobject detection. arXiv preprint arXiv:1409.3505, 2014.
189

[139] Abhishek Pal, Manav Rajiv Moorthy, and A Shahina. G-eyenet: A convo-lutional autoencoding classifier framework for the detection of glaucomafrom retinal fundus images. In 2018 25th IEEE International Conference onImage Processing (ICIP), pages 2775–2779. IEEE, 2018.
[140] Sinno Jialin Pan and Qiang Yang. A survey on transfer learning. IEEETransactions on knowledge and data engineering, 22(10):1345–1359, 2009.
[141] Dinesh Pandey, Xiaoxia Yin, Hua Wang, Min-Ying Su, Jeon-Hor Chen,Jianlin Wu, and Yanchun Zhang. Automatic and fast segmentation ofbreast region-of-interest (roi) and density in mris. Heliyon, 4(12):e01042,2018.
[142] Dinesh Pandey, Xiaoxia Yin, Hua Wang, and Yanchun Zhang. Accuratevessel segmentation using maximum entropy incorporating line detectionand phase-preserving denoising. Computer Vision and Image Understand-ing, 155:162–172, 2017.
[143] Sumaiya Pathan, Preetham Kumar, Radhika M Pai, and Sulatha VBhandary. Automated segmentation and classifcation of retinal fea-tures for glaucoma diagnosis. Biomedical Signal Processing and Control,63:102244, 2021.
[144] Oscar Perdomo, John Arevalo, and Fabio A Gonzalez. Convolutional net-work to detect exudates in eye fundus images of diabetic subjects. In 12thInternational Symposium on Medical Information Processing and Analysis, vol-ume 10160, page 101600T. International Society for Optics and Photonics,2017.
[145] Oscar Perdomo, Sebastian Otalora, Francisco Rodrıguez, John Arevalo,and Fabio A Gonzalez. A novel machine learning model based on exudatelocalization to detect diabetic macular edema. 2016.
[146] Sang Phan, Shin’ichi Satoh, Yoshioki Yoda, Kenji Kashiwagi, Tetsuro Os-hika, Japan Ocular Imaging Registry Research Group, et al. Evaluationof deep convolutional neural networks for glaucoma detection. Japanesejournal of ophthalmology, pages 1–8, 2019.
[147] Ramon Pires, Sandra Avila, Jacques Wainer, Eduardo Valle, Michael DAbramoff, and Anderson Rocha. A data-driven approach to referable di-abetic retinopathy detection. Artificial Intelligence in Medicine, 2019.
190

[148] M Ponni Bala and S Vijayachitra. Early detection and classificationof microaneurysms in retinal fundus images using sequential learningmethods. International Journal of Biomedical Engineering and Technology,15(2):128–143, 2014.
[149] M Ponnibala and S Vijayachitra. A sequential learning method for de-tection and classification of exudates in retinal images to assess diabeticretinopathy. Journal of Biological Systems, 22(03):413–428, 2014.
[150] Ryan Poplin, Avinash V Varadarajan, Katy Blumer, Yun Liu, Michael VMcConnell, Greg S Corrado, Lily Peng, and Dale R Webster. Predictionof cardiovascular risk factors from retinal fundus photographs via deeplearning. Nature Biomedical Engineering, 2(3):158, 2018.
[151] Prasanna Porwal, Samiksha Pachade, Ravi Kamble, Manesh Kokare,Girish Deshmukh, Vivek Sahasrabuddhe, and Fabrice Meriaudeau. In-dian diabetic retinopathy image dataset (idrid): A database for diabeticretinopathy screening research. Data, 3(3):25, 2018.
[152] Turimerla Pratap and Priyanka Kokil. Computer-aided diagnosis ofcataract using deep transfer learning. Biomedical Signal Processing and Con-trol, 53:101533, 2019.
[153] Harry Pratt, Frans Coenen, Deborah M Broadbent, Simon P Harding, andYalin Zheng. Convolutional neural networks for diabetic retinopathy. Pro-cedia Computer Science, 90:200–205, 2016.
[154] Pavle Prentasic and Sven Loncaric. Weighted ensemble based automaticdetection of exudates in fundus photographs. In 2014 36th Annual Inter-national Conference of the IEEE Engineering in Medicine and Biology Society,pages 138–141. IEEE, 2014.
[155] Pavle Prentasic and Sven Loncaric. Detection of exudates in fundus pho-tographs using deep neural networks and anatomical landmark detectionfusion. Computer methods and programs in biomedicine, 137:281–292, 2016.
[156] Pavle Prentasic, Sven Loncaric, Zoran Vatavuk, Goran Bencic, MarkoSubasic, Tomislav Petkovic, Lana Dujmovic, Maja Malenica-Ravlic,Nikolina Budimlija, and Raseljka Tadic. Diabetic retinopathy imagedatabase (dridb): a new database for diabetic retinopathy screening pro-grams research. In 2013 8th International Symposium on Image and SignalProcessing and Analysis (ISPA), pages 711–716. IEEE, 2013.
191

[157] Gwenole Quellec, Katia Charriere, Yassine Boudi, Beatrice Cochener, andMathieu Lamard. Deep image mining for diabetic retinopathy screening.Medical image analysis, 39:178–193, 2017.
[158] U Raghavendra, Hamido Fujita, Sulatha V Bhandary, Anjan Gudigar,Jen Hong Tan, and U Rajendra Acharya. Deep convolution neural net-work for accurate diagnosis of glaucoma using digital fundus images. In-formation Sciences, 441:41–49, 2018.
[159] Sarni Suhaila Rahim, Chrisina Jayne, Vasile Palade, and James Shuttle-worth. Automatic detection of microaneurysms in colour fundus im-ages for diabetic retinopathy screening. Neural computing and applications,27(5):1149–1164, 2016.
[160] Jing Ran, Kai Niu, Zhiqiang He, Hongyan Zhang, and Hongxin Song.Cataract detection and grading based on combination of deep convolu-tional neural network and random forests. In 2018 International Confer-ence on Network Infrastructure and Digital Content (IC-NIDC), pages 155–159. IEEE, 2018.
[161] Pallab Roy, Ruwan Tennakoon, Khoa Cao, Suman Sedai, DwarikanathMahapatra, Stefan Maetschke, and Rahil Garnavi. A novel hybrid ap-proach for severity assessment of diabetic retinopathy in colour fundusimages. In 2017 IEEE 14th International Symposium on Biomedical Imaging(ISBI 2017), pages 1078–1082. IEEE, 2017.
[162] Olga Russakovsky, Jia Deng, Hao Su, Jonathan Krause, Sanjeev Satheesh,Sean Ma, Zhiheng Huang, Andrej Karpathy, Aditya Khosla, MichaelBernstein, et al. Imagenet large scale visual recognition challenge. In-ternational journal of computer vision, 115(3):211–252, 2015.
[163] Jaakko Sahlsten, Joel Jaskari, Jyri Kivinen, Lauri Turunen, Esa Jaanio, Kus-taa Hietala, and Kimmo Kaski. Deep learning fundus image analysis fordiabetic retinopathy and macular edema grading. Scientific reports, 9(1):1–11, 2019.
[164] Patrick J Saine and Marshall E Tyler. Ophthalmic photography: retinal pho-tography, angiography, and electronic imaging, volume 132. Butterworth-Heinemann Boston, 2002.
[165] Mark Sandler, Andrew Howard, Menglong Zhu, Andrey Zhmoginov, andLiang-Chieh Chen. Mobilenetv2: Inverted residuals and linear bottle-
192

necks. In Proceedings of the IEEE Conference on Computer Vision and PatternRecognition, pages 4510–4520, 2018.
[166] M Sankar, K Batri, and R Parvathi. Earliest diabetic retinopathy classifica-tion using deep convolution neural networks. pdf. Int. J. Adv. Eng. Technol,10:M9, 2016.
[167] D Santhi, D Manimegalai, S Parvathi, and S Karkuzhali. Segmentationand classification of bright lesions to diagnose diabetic retinopathy in reti-nal images. Biomedical Engineering/Biomedizinische Technik, 61(4):443–453,2016.
[168] Iqbal H Sarker, Md Faisal Faruque, Hamed Alqahtani, and Asra Kalim. K-nearest neighbor learning based diabetes mellitus prediction and analysisfor ehealth services.
[169] Rubina Sarki, Khandakar Ahmed, Hua Wang, and Yanchun Zhang. Auto-mated detection of mild and multi-class diabetic eye diseases using deeplearning. Health Information Science and Systems, 8(1):1–9, 2020.
[170] Rubina Sarki, Khandakar Ahmed, Hua Wang, and Yanchun Zhang. Auto-matic detection of diabetic eye disease through deep learning using fun-dus images: A survey. IEEE Access, 8:151133–151149, 2020.
[171] Rubina Sarki, Khandakar Ahmed, and Yanchun Zhang. Early detectionof diabetic eye disease through deep learning using fundus images. EAIEndorsed Transactions on Pervasive Health and Technology, 6(22), 5 2020.
[172] Rory Sayres, Ankur Taly, Ehsan Rahimy, Katy Blumer, David Coz, NaamaHammel, Jonathan Krause, Arunachalam Narayanaswamy, Zahra Raste-gar, Derek Wu, et al. Using a deep learning algorithm and integratedgradients explanation to assist grading for diabetic retinopathy. Ophthal-mology, 126(4):552–564, 2019.
[173] Strategic Policy Sector et al. State of the nation 2012. 2013.
[174] Ramprasaath R Selvaraju, Michael Cogswell, Abhishek Das, RamakrishnaVedantam, Devi Parikh, and Dhruv Batra. Grad-cam: Visual explanationsfrom deep networks via gradient-based localization. In Proceedings of theIEEE international conference on computer vision, pages 618–626, 2017.
[175] Syamimi Mardiah Shaharum, Nurul Hajar Hashim, Nurhafizah Abu
193

Talip, Mohamad Shaiful Abdul Karim, Ahmad Afif Mohd Faudzi, et al.Automatic detection of diabetic retinopathy retinal images using artificialneural network. In Proceedings of the 10th National Technical Seminar onUnderwater System Technology 2018, pages 495–503. Springer, 2019.
[176] Ambika Sharma, Monika Agrawal, Sumantra Dutta Roy, and VivekGupta. Automatic glaucoma diagnosis in digital fundus images usingdeep cnns. In Advances in Computational Intelligence Techniques, pages 37–52. Springer, Singapore, 2020.
[177] Naoto Shibata, Masaki Tanito, Keita Mitsuhashi, Yuri Fujino, Masato Mat-suura, Hiroshi Murata, and Ryo Asaoka. Development of a deep residuallearning algorithm to screen for glaucoma from fundus photography. Sci-entific reports, 8(1):1–9, 2018.
[178] Frank Y Shih. Image processing and pattern recognition: fundamentals andtechniques. John Wiley & Sons, 2010.
[179] Hoo-Chang Shin, Holger R Roth, Mingchen Gao, Le Lu, Ziyue Xu, Is-abella Nogues, Jianhua Yao, Daniel Mollura, and Ronald M Summers.Deep convolutional neural networks for computer-aided detection: Cnnarchitectures, dataset characteristics and transfer learning. IEEE transac-tions on medical imaging, 35(5):1285–1298, 2016.
[180] SD Shirbahadurkar, Vijay M Mane, and Dattatray V Jadhav. Early stagedetection of diabetic retinopathy using an optimal feature set. In Inter-national Symposium on Signal Processing and Intelligent Recognition Systems,pages 15–23. Springer, 2017.
[181] Nathan Silberman, Kristy Ahrlich, Rob Fergus, and LakshminarayananSubramanian. Case for automated detection of diabetic retinopathy. In2010 AAAI Spring Symposium Series, 2010.
[182] David Silver, Aja Huang, Chris J Maddison, Arthur Guez, Laurent Sifre,George Van Den Driessche, Julian Schrittwieser, Ioannis Antonoglou,Veda Panneershelvam, Marc Lanctot, et al. Mastering the game of go withdeep neural networks and tree search. nature, 529(7587):484–489, 2016.
[183] Karen Simonyan and Andrew Zisserman. Very deep convolutional net-works for large-scale image recognition. arXiv preprint arXiv:1409.1556,2014.
194

[184] Amitojdeep Singh, Sourya Sengupta, and Vasudevan Lakshminarayanan.Glaucoma diagnosis using transfer learning methods. In Applications ofMachine Learning, volume 11139, page 111390U. International Society forOptics and Photonics, 2019.
[185] Law Kumar Singh, Hitendra Garg, et al. Automated glaucoma type iden-tification using machine learning or deep learning techniques. In Advance-ment of Machine Intelligence in Interactive Medical Image Analysis, pages 241–263. Springer, Singapore, 2020.
[186] Chanjira Sinthanayothin, James F Boyce, Tom H Williamson, Helen LCook, Evelyn Mensah, Shantanu Lal, and David Usher. Automated de-tection of diabetic retinopathy on digital fundus images. Diabetic medicine,19(2):105–112, 2002.
[187] Dilip Singh Sisodia, Shruti Nair, and Pooja Khobragade. Diabetic retinalfundus images: Preprocessing and feature extraction for early detectionof diabetic retinopathy. Biomedical and Pharmacology Journal, 10(2):615–626,2017.
[188] Siuly Siuly, Smith K Khare, Varun Bajaj, Hua Wang, and Yanchun Zhang.A computerized method for automatic detection of schizophrenia usingeeg signals. IEEE Transactions on Neural Systems and Rehabilitation Engi-neering, 2020.
[189] Sobha Sivaprasad, Joana C Vasconcelos, A Toby Prevost, Helen Holmes,Philip Hykin, Sheena George, Caroline Murphy, Joanna Kelly, Geoffrey BArden, Frank Ahfat, et al. Clinical efficacy and safety of a light mask forprevention of dark adaptation in treating and preventing progression ofearly diabetic macular oedema at 24 months (cleopatra): a multicentre,phase 3, randomised controlled trial. The Lancet Diabetes & Endocrinology,6(5):382–391, 2018.
[190] Jayanthi Sivaswamy, SR Krishnadas, Gopal Datt Joshi, Madhulika Jain,and A Ujjwaft Syed Tabish. Drishti-gs: Retinal image dataset for opticnerve head (onh) segmentation. In 2014 IEEE 11th international symposiumon biomedical imaging (ISBI), pages 53–56. IEEE, 2014.
[191] Alvy Ray Smith. Color gamut transform pairs. ACM Siggraph ComputerGraphics, 12(3):12–19, 1978.
[192] Marina Sokolova and Guy Lapalme. A systematic analysis of perfor-
195

mance measures for classification tasks. Information processing & manage-ment, 45(4):427–437, 2009.
[193] Chris Solomon and Toby Breckon. Fundamentals of Digital Image Processing:A practical approach with examples in Matlab. John Wiley & Sons, 2011.
[194] SK Somasundaram and P Alli. A machine learning ensemble classifierfor early prediction of diabetic retinopathy. Journal of Medical Systems,41(12):1–12, 2017.
[195] Akara Sopharak and Bunyarit Uyyanonvara. Automatic exudates de-tection from diabetic retinopathy retinal image using fuzzy c-means andmorphological methods. In Proceedings of the third IASTED internationalconference Advances in Computer Science and Technology, pages 359–364,2007.
[196] Nitish Srivastava, Geoffrey Hinton, Alex Krizhevsky, Ilya Sutskever, andRuslan Salakhutdinov. Dropout: a simple way to prevent neural networksfrom overfitting. The journal of machine learning research, 15(1):1929–1958,2014.
[197] Ruchir Srivastava, Lixin Duan, Damon WK Wong, Jiang Liu, and Tien YinWong. Detecting retinal microaneurysms and hemorrhages with robust-ness to the presence of blood vessels. Computer methods and programs inbiomedicine, 138:83–91, 2017.
[198] KQ Sun and N Sang. Morphological enhancement of vascular angiogramwith multiscale detected by gabor filters. Electronics Letters, 44(2):86–87,2008.
[199] Christian Szegedy, Sergey Ioffe, Vincent Vanhoucke, and Alexander AAlemi. Inception-v4, inception-resnet and the impact of residual connec-tions on learning. In Thirty-First AAAI Conference on Artificial Intelligence,2017.
[200] Christian Szegedy, Wei Liu, Yangqing Jia, Pierre Sermanet, Scott Reed,Dragomir Anguelov, Dumitru Erhan, Vincent Vanhoucke, and AndrewRabinovich. Going deeper with convolutions. In Proceedings of the IEEEconference on computer vision and pattern recognition, pages 1–9, 2015.
[201] Christian Szegedy, Vincent Vanhoucke, Sergey Ioffe, Jon Shlens, and Zbig-niew Wojna. Rethinking the inception architecture for computer vision. In
196

Proceedings of the IEEE conference on computer vision and pattern recognition,pages 2818–2826, 2016.
[202] Syed Amin Tabish. Is diabetes becoming the biggest epidemic of thetwenty-first century? International Journal of health sciences, 1(2):V, 2007.
[203] Hidenori Takahashi, Hironobu Tampo, Yusuke Arai, Yuji Inoue, andHidetoshi Kawashima. Applying artificial intelligence to disease stag-ing: Deep learning for improved staging of diabetic retinopathy. PloS one,12(6):e0179790, 2017.
[204] Jen Hong Tan, Hamido Fujita, Sobha Sivaprasad, Sulatha V Bhandary,A Krishna Rao, Kuang Chua Chua, and U Rajendra Acharya. Automatedsegmentation of exudates, haemorrhages, microaneurysms using singleconvolutional neural network. Information sciences, 420:66–76, 2017.
[205] Wei Ren Tan, Chee Seng Chan, Hernan E Aguirre, and Kiyoshi Tanaka.Artgan: Artwork synthesis with conditional categorical gans. In 2017IEEE International Conference on Image Processing (ICIP), pages 3760–3764.IEEE, 2017.
[206] Ning Tang, Fei Zhou, Zhaorui Gu, Haiyong Zheng, Zhibin Yu, and BingZheng. Unsupervised pixel-wise classification for chaetoceros image seg-mentation. Neurocomputing, 318:261–270, 2018.
[207] Roy Taylor and Deborah Batey. Handbook of retinal screening in diabetes.Wiley Online Library, 2006.
[208] Suman Thapar and Shevani Garg. Study and implementation of variousmorphology based image contrast enhancement techniques. InternationalJournal of Computing and Business Research, pages 2229–6166, 2012.
[209] Daniel Shu Wei Ting, Carol Yim-Lui Cheung, Gilbert Lim, Gavin Siew WeiTan, Nguyen D Quang, Alfred Gan, Haslina Hamzah, Renata Garcia-Franco, Ian Yew San Yeo, Shu Yen Lee, et al. Development and validationof a deep learning system for diabetic retinopathy and related eye dis-eases using retinal images from multiethnic populations with diabetes.Jama, 318(22):2211–2223, 2017.
[210] Daniel Shu Wei Ting, Louis R Pasquale, Lily Peng, John Peter Campbell,Aaron Y Lee, Rajiv Raman, Gavin Siew Wei Tan, Leopold Schmetterer,Pearse A Keane, and Tien Yin Wong. Artificial intelligence and deep
197

learning in ophthalmology. British Journal of Ophthalmology, 103(2):167–175, 2019.
[211] Lisa Torrey and Jude Shavlik. Transfer learning. In Handbook of research onmachine learning applications and trends: algorithms, methods, and techniques,pages 242–264. IGI Global, 2010.
[212] Anjana Umapathy, Anusha Sreenivasan, Divya S Nairy, S Natarajan, andB Rao. Image processing, textural feature extraction and transfer learn-ing based detection of diabetic retinopathy. In Proceedings of the 2019 9thInternational Conference on Bioscience, Biochemistry and Bioinformatics, pages17–21. ACM, 2019.
[213] Deepika Vallabha, Ramprasath Dorairaj, Kamesh Namuduri, and HilaryThompson. Automated detection and classification of vascular abnormal-ities in diabetic retinopathy. In Conference Record of the Thirty-Eighth Asilo-mar Conference on Signals, Systems and Computers, 2004., volume 2, pages1625–1629. IEEE, 2004.
[214] P Vamsi and Anjali Chahuan. Machine learning based hybrid model forfault detection in wireless sensors data. EAI Endorsed Transactions on Scal-able Information Systems, 7(24), 2020.
[215] Mark JJP van Grinsven, Bram van Ginneken, Carel B Hoyng, ThomasTheelen, and Clara I Sanchez. Fast convolutional neural network train-ing using selective data sampling: Application to hemorrhage detectionin color fundus images. IEEE transactions on medical imaging, 35(5):1273–1284, 2016.
[216] RRCR Vanithamani and R Renee Christina. Exudates in detection andclassification of diabetic retinopathy. In International Conference on SoftComputing and Pattern Recognition, pages 252–261. Springer, 2016.
[217] Rohit Varma, Paul P Lee, Ivan Goldberg, and Sameer Kotak. An assess-ment of the health and economic burdens of glaucoma. American journalof ophthalmology, 152(4):515–522, 2011.
[218] Praveen Vashist, Sameeksha Singh, Noopur Gupta, and Rohit Saxena.Role of early screening for diabetic retinopathy in patients with diabetesmellitus: an overview. Indian journal of community medicine: official publica-tion of Indian Association of Preventive & Social Medicine, 36(4):247, 2011.
198

[219] Shaohua Wan, Yan Liang, and Yin Zhang. Deep convolutional neural net-works for diabetic retinopathy detection by image classification. Comput-ers & Electrical Engineering, 72:274–282, 2018.
[220] Su Wang, Hongying Lilian Tang, Yin Hu, Saeid Sanei, George MichaelSaleh, Tunde Peto, et al. Localizing microaneurysms in fundus imagesthrough singular spectrum analysis. IEEE Transactions on Biomedical Engi-neering, 64(5):990–1002, 2016.
[221] Yu Wang, Yaonan Zhang, Zhaomin Yao, Ruixue Zhao, and FengfengZhou. Machine learning based detection of age-related macular degen-eration (amd) and diabetic macular edema (dme) from optical coherencetomography (oct) images. Biomedical optics express, 7(12):4928–4940, 2016.
[222] Zhiguang Wang and Jianbo Yang. Diabetic retinopathy detection via deepconvolutional networks for discriminative localization and visual expla-nation. arXiv preprint arXiv:1703.10757, 2017.
[223] Zhiguang Wang and Jianbo Yang. Diabetic retinopathy detection via deepconvolutional networks for discriminative localization and visual expla-nation. In Workshops at the Thirty-Second AAAI Conference on Artificial In-telligence, 2018.
[224] Tien Y Wong, Jennifer Sun, Ryo Kawasaki, Paisan Ruamviboonsuk, NeeruGupta, Van Charles Lansingh, Mauricio Maia, Wanjiku Mathenge, SunilMoreker, Mahi MK Muqit, et al. Guidelines on diabetic eye care: theinternational council of ophthalmology recommendations for screening,follow-up, referral, and treatment based on resource settings. Ophthalmol-ogy, 125(10):1608–1622, 2018.
[225] Tien Yin Wong and Neil M Bressler. Artificial intelligence with deeplearning technology looks into diabetic retinopathy screening. Jama,316(22):2366–2367, 2016.
[226] Jiayi Wu, Jingmin Xin, Lai Hong, Jane You, and Nanning Zheng. Newhierarchical approach for microaneurysms detection with matched filterand machine learning. In 2015 37th Annual International Conference of theIEEE Engineering in Medicine and Biology Society (EMBC), pages 4322–4325.IEEE, 2015.
[227] Di Xiao, Shuang Yu, Janardhan Vignarajan, Dong An, Mei-Ling Tay-Kearney, and Yogi Kanagasingam. Retinal hemorrhage detection by rule-based and machine learning approach. In 2017 39th Annual International
199

Conference of the IEEE Engineering in Medicine and Biology Society (EMBC),pages 660–663. IEEE, 2017.
[228] Zhitao Xiao, Xinpeng Zhang, Lei Geng, Fang Zhang, Jun Wu, Jun Tong,Philip O Ogunbona, and Chunyan Shan. Automatic non-proliferative dia-betic retinopathy screening system based on color fundus image. Biomed-ical engineering online, 16(1):1–19, 2017.
[229] Kele Xu, Dawei Feng, and Haibo Mi. Deep convolutional neural network-based early automated detection of diabetic retinopathy using fundus im-age. Molecules, 22(12):2054, 2017.
[230] Rikiya Yamashita, Mizuho Nishio, Richard Kinh Gian Do, and Kaori To-gashi. Convolutional neural networks: an overview and application inradiology. Insights into imaging, 9(4):611–629, 2018.
[231] Ji-Jiang Yang, Jianqiang Li, Ruifang Shen, Yang Zeng, Jian He, Jing Bi,Yong Li, Qinyan Zhang, Lihui Peng, and Qing Wang. Exploiting ensemblelearning for automatic cataract detection and grading. Computer methodsand programs in biomedicine, 124:45–57, 2016.
[232] Yehui Yang, Tao Li, Wensi Li, Haishan Wu, Wei Fan, and WenshengZhang. Lesion detection and grading of diabetic retinopathy via two-stages deep convolutional neural networks. In International Conference onMedical Image Computing and Computer-Assisted Intervention, pages 533–540. Springer, 2017.
[233] Xiaoxia Yin, Brian WH Ng, Jing He, Yanchun Zhang, and Derek Abbott.Accurate image analysis of the retina using hessian matrix and binarisa-tion of thresholded entropy with application of texture mapping. PLoSOne, 9(4):e95943, 2014.
[234] Tae Keun Yoo and Samin Hong. Artificial neural network approach fordifferentiating open-angle glaucoma from glaucoma suspect without avisual field test. Investigative Ophthalmology & Visual Science, 56(6):3957–3966, 2015.
[235] Tae Keun Yoo and Eun-Cheol Park. Diabetic retinopathy risk predictionfor fundus examination using sparse learning: a cross-sectional study.BMC medical informatics and decision making, 13(1):106, 2013.
[236] Jason Yosinski, Jeff Clune, Anh Nguyen, Thomas Fuchs, and Hod Lip-
200

son. Understanding neural networks through deep visualization. arXivpreprint arXiv:1506.06579, 2015.
[237] Aliaa AA Youssif, Atef Z Ghalwash, Amr S Ghoneim, et al. Compara-tive study of contrast enhancement and illumination equalization meth-ods for retinal vasculature segmentation. In Cairo International BiomedicalEngineering Conference, pages 1–5, 2006.
[238] Haiping Yu, Fazhi He, and Yiteng Pan. A novel region-based active con-tour model via local patch similarity measure for image segmentation.Multimedia Tools and Applications, 77(18):24097–24119, 2018.
[239] Haiping Yu, Fazhi He, and Yiteng Pan. A novel segmentation model formedical images with intensity inhomogeneity based on adaptive pertur-bation. Multimedia Tools and Applications, 78(9):11779–11798, 2019.
[240] Shuang Yu, Di Xiao, and Yogesan Kanagasingam. Exudate detection fordiabetic retinopathy with convolutional neural networks. In 2017 39th An-nual International Conference of the IEEE Engineering in Medicine and BiologySociety (EMBC), pages 1744–1747. IEEE, 2017.
[241] Hongyan Zhang, Kai Niu, Yanmin Xiong, Weihua Yang, ZhiQiang He,and Hongxin Song. Automatic cataract grading methods based on deeplearning. Computer methods and programs in biomedicine, 182:104978, 2019.
[242] Linglin Zhang, Jianqiang Li, He Han, Bo Liu, Jijiang Yang, Qing Wang,et al. Automatic cataract detection and grading using deep convolutionalneural network. In 2017 IEEE 14th International Conference on Networking,Sensing and Control (ICNSC), pages 60–65. IEEE, 2017.
[243] Wei Zhang, Jie Zhong, Shijun Yang, Zhentao Gao, Junjie Hu, YuanyuanChen, and Zhang Yi. Automated identification and grading system of di-abetic retinopathy using deep neural networks. Knowledge-Based Systems,175:12–25, 2019.
[244] Zhuo Zhang, Feng Shou Yin, Jiang Liu, Wing Kee Wong, Ngan Meng Tan,Beng Hai Lee, Jun Cheng, and Tien Yin Wong. Origa-light: An onlineretinal fundus image database for glaucoma analysis and research. In2010 Annual International Conference of the IEEE Engineering in Medicine andBiology, pages 3065–3068. IEEE, 2010.
[245] Haiyong Zheng, Ruchen Wang, Zhibin Yu, Nan Wang, Zhaorui Gu, andBing Zheng. Automatic plankton image classification combining multiple
201

view features via multiple kernel learning. BMC bioinformatics, 18(16):570,2017.
[246] Stephan Zheng, Yang Song, Thomas Leung, and Ian Goodfellow. Improv-ing the robustness of deep neural networks via stability training. In Pro-ceedings of the ieee conference on computer vision and pattern recognition, pages4480–4488, 2016.
[247] Wei Zhou, Chengdong Wu, Dali Chen, Yugen Yi, and Wenyou Du. Au-tomatic microaneurysm detection using the sparse principal componentanalysis-based unsupervised classification method. IEEE access, 5:2563–2572, 2017.
[248] Yiren Zhou, Sibo Song, and Ngai-Man Cheung. On classification of dis-torted images with deep convolutional neural networks. In 2017 IEEEInternational Conference on Acoustics, Speech and Signal Processing (ICASSP),pages 1213–1217. IEEE, 2017.
[249] Yue Zhou, Guoqi Li, and Huiqi Li. Automatic cataract classification usingdeep neural network with discrete state transition. IEEE transactions onmedical imaging, 2019.
[250] Barret Zoph, Vijay Vasudevan, Jonathon Shlens, and Quoc V Le. Learningtransferable architectures for scalable image recognition. In Proceedings ofthe IEEE conference on computer vision and pattern recognition, pages 8697–8710, 2018.
[251] Karel Zuiderveld. Contrast limited adaptive histogram equalization. InGraphics gems IV, pages 474–485. Academic Press Professional, Inc., 1994.
202


