Embed Size (px)
Citation preview

Autophagy and mitochondrial remodelling in
mouse mesenchymal stromal cells challenged with
Staphylococcus epidermidis
Nikolai V. Gorbunov a,*, Dennis P. McDaniel b, Min Zhai a, Pei-Jyun Liao a,Bradley R. Garrison a, Juliann G. Kiang a, c, d
a Radiation Combined Injury Program, Armed Forces Radiobiology Research Institute, Bethesda, MD, USAb Biomedical Instrumentation Center, Uniformed Services University of the Health Sciences, Bethesda, MD, USAc Department of Radiation Biology, Uniformed Services University of the Health Sciences, Bethesda, MD, USA
d Department of Medicine, Uniformed Services University of the Health Sciences, Bethesda, MD, USA
Received: June 9, 2014; Accepted: November 7, 2014
Abstract
The bone marrow stroma constitutes the marrow-blood barrier, which sustains immunochemical homoeostasis and protection of the haemato-poietic tissue in sequelae of systemic bacterial infections. Under these conditions, the bone marrow stromal cells affected by circulating bacte-rial pathogens shall elicit the adaptive stress-response mechanisms to maintain integrity of the barrier. The objective of this communicationwas to demonstrate (i) that in vitro challenge of mesenchymal stromal cells, i.e. colony-forming unit fibroblasts (CFU-F), with Staphylococcusepidermidis can activate the autophagy pathway to execute antibacterial defence response, and (ii) that homoeostatic shift because of the bacte-ria-induced stress includes the mitochondrial remodelling and sequestration of compromised organelles via mitophagy. Implication of Drp1 andPINK1–PARK2-dependent mechanisms in the mitophagy turnover of the aberrant mitochondria in mesenchymal stromal cells is investigatedand discussed.
Keywords: mesenchymal stromal cells� Staphylococcus epidermidis� stress response� autophagy�mitochondria
Introduction
Immunosuppression and impairment of immune barriers often resultin translocation of resident microorganisms such as Gram-positiveStaphylococcus epidermidis, which can appear in the peripheral bloodand then in vital organs and tissues [1]. In bone marrow, the immunehomoeostasis and defence response to blood pathogens are mediatedby the marrow-blood barrier, which is comprised of endothelial, retic-uloendothelial and mesenchymal stromal cell lineages [2–5]. In vivoassessment of bacterial effects on the marrow-blood barrier sup-ported by these cell lineages is a difficult task because of the com-plexity of spatial–temporal interactions of the cells in the tissue [2, 4].
However, it is reasonable to assume that the stress responses origi-nating from each of the stromal cell lineages experiencing bacterialimpact are integrated in the stromal tissue to form a general defenceresponse of the ‘barrier singularity’. Therefore, the results of in vitrodifferential assessment of antibacterial responses of the stromal celllineages might be further ‘translated’ for picturing events initiated inthe stromal tissue [6].
We recently reported that bone marrow mesenchymal stromalcells (BMSCs) challenged in vitro with Gram-negative Escherichia colican up-regulate autolysosomal machinery decomposing the phagocy-tized microorganisms [6]. These events are accompanied by activa-tion of a battery of stress-response mechanisms, which makesBMSCs resistant to the bacterial pathogens [6]. Effects of a Gram-positive organism on BMSCs are poorly investigated. The focus of thestudy presented in this paper was towards elucidation of the role ofmacroautophagy (thereafter, autophagy) in antibacterial defenceresponse and mitochondrial remodelling associated with the
*Correspondence to: Nikolai V. GORBUNOV,
Current address: Department of Anesthesiology, Uniformed Services
University of the Health Sciences, Bethesda, Maryland, USA
Tel.: 1-301-295-9642Fax: 01-301-295-2200
E-mail: [email protected]
ª 2015 The Authors.
Journal of Cellular and Molecular Medicine published by John Wiley & Sons Ltd and Foundation for Cellular and Molecular Medicine.
This is an open access article under the terms of the Creative Commons Attribution License, which permits use,
distribution and reproduction in any medium, provided the original work is properly cited.
doi: 10.1111/jcmm.12518
J. Cell. Mol. Med. Vol XX, No X, 2015 pp. 1-18

pathogen-induced stress in murine clonal BMSCs challenged withGram-positive S. epidermidis, i.e. a species commonly present onskin and easily penetrating into the internal body through wounds.
The autophagy–autolysosomal pathway is considered to be anevolutionarily developed pro-survival mechanism, which is essentialfor removal of unnecessary cellular constituents and pathogens[7–11]. Although autophagy has been originally defined as a non-specific degradation process, one line of evidence suggests that someautophagy pathways (such as sequestration of invading bacteria andautophagy of damaged organelles) selectively execute quality controlof the cell environment [11, 12]. We hypothesized that a challenge ofBMSCs with S. epidermidis can induce a set of complex pro-survivalresponses that include the autophagy-selective degradation of thephagocytized microorganisms (i.e. xenophagy), remodelling of mito-chondrial network via fission/fusion mechanisms, and autophagy ofaberrant mitochondria (i.e. mitophagy).
While the detailed mechanisms driving selective autophagy at thesite of microbial phagocytosis remain under investigation, it isbroadly accepted that activation of the pattern recognition elements(PREs), the damage-associated molecular patterns (DAMPs), such ashigh-mobility group protein B1 (HMGB1) and immunity-relatedGTPase family M protein (IRGM) can trigger xenophagy events andcascades of adaptive responses mediated by transcriptional stressfactors [6, 11, 13–16]. The initial autophagy step is defined as induc-tion of phagophores and their elongation to autophagosomal mem-branes. These events proceed via a cascade mechanism, whichrequires activation of (i) the Ulk1–Atg13–FIP200 kinase complex, (ii)the autophagy-specific class III PI3-kinase/Vps34/p150/Beclin 1 com-plex (I), (iii) the PI3P-binding Atg2/Atg18 complex, (iv) protein kinaseD (PKD), a redox-sensitive activator of Vps34 and (v) the two ubiqu-itin-like conjugation systems: Atg5-Atg12/Atg16L1, and ATG8/LC3(MAP1). The associated recognition of ubiquitinated bacterial cargoand its enclosure into autophagosome occurs via adaptor/cargo-receptor proteins (such as p62/SQSTM) followed by autophagosomalfusion with lysosomes and further maturation mediated by Vps34/Be-clin 1/UVRAG complex (II) [11–14, 17]. The sequestered bacterialcargo is decomposed within autolysosomes.
Surprisingly, numerous data interconnect the cell antibacterialmechanisms mediated by PREs, DAMPs, IRGM and autophagy withthe pathogen/inflammagen-induced mitochondrial remodelling [6, 11,13, 15–17]. In this light, interplay between xenophagy and mitophagymay play the crucial role in the cell defence response [7, 8, 11, 13,15–20]. Thus, it has been suggested that mitochondrial fission andmitophagy of the compromised organelles are pre-requisites for suc-cessful cell survival [7,8,18,19]. In these events, mitochondrial fissionplays a crucial role in (i) segregation of aberrant mitochondrial frag-ments from the rest of tubular network and (ii) providing membranesources for autophagosomal biogenesis [7, 8, 18, 21–24]. Mitochon-drial fission is regulated by Drp1 and Fis1 proteins, which are pre-dominantly localized in cytoplasm and on the mitochondrial outermembrane (MOM), respectively [23, 25]. The interaction betweenDrp1 and Fis1 and subsequent mitochondrial fission occurs whenpost-translationally modified Drp1 protein is recruited to MOM [22,23, 26]. A priming of damaged mitochondria for mitophagy canimplicate NIX, BNIP3, FUNDC1 or PINK1 (i.e. MOM-located
PTEN-induced putative kinase 1) and PARK2 (i.e. E3-ubiquitin ligaseParkin)-dependent mechanisms [9]. In the PINK1/PARK2-dependentmechanism, mitochondrial damage and depolarization triggers: (i)impaired stabilization of PINK1 in mitochondria; (ii) PINK1-dependentrecruitment of PARK2 to mitochondria and (iii) PARK2-dependentpoly-ubiquitination of proteins (e.g. voltage-dependent anion channelVDAC1) [9, 17, 24, 27, 28]. The poly-ubiquitinated mitochondrial pro-teins are then recognized by the autophagic adapter protein SQSTM1/p62, which has a structural motif (WXXL) compatible with LC3 II, atarget protein on nascent autophagosomal membrane [11, 12, 29,30]. Eventually, this sequence of events results in autophagosomalenclosure of the impaired mitochondria mediated by the SQSTM1/p62-LC3 II-cargo-receptor complex; while the cargo-clearance occursafter autophagosomal fusion with lysosomes and further maturationmediated by Vps34/Beclin 1/UVRAG complex (II) [7, 11, 12, 24, 30].
The recently well-described proteins involved in mitochondrialfusion events are mitofusins (Mfn1 and Mfn2) and optic atrophy pro-tein 1 (Opa1) [19, 21–23]. Mnf1 and Mnf2 are outer mitochondrialmembrane proteins that mediate fusion through their cytoplasm-exposed GTPase domains allowing adhesion and fusion of outer mito-chondrial membranes. Opa1 is an inner mitochondrial membrane pro-tein, which subsequently enables fusion of inner mitochondrialmembranes [19, 21, 22]. This fusion mechanism promotes formationof long tubular mitochondria with their further interconnection intoreticular structures extending in three dimensions over the cell vol-ume [19].
Overall, according to recent paradigm, the pathogen-inducedmitochondrial remodelling can be considered as a part of the globalcell signalling system, which orchestrates defence responses to dan-ger and injury [9, 10, 17, 18, 20, 31–33].
In this report, we provide evidence that BMSCs challenged withS. epidermidis can activate a complex of antibacterial defence mech-anisms and stress responses including up-regulation of phagocyto-sis and the autophagy/autolysosomal machinery. These events wereaccompanied by structural alterations in the mitochondrial networkand by increases in (i) translocation of Drp1 and PARK2 proteintowards mitochondria, (ii) interaction of the mitophagy-mediatedproteins, such as SQSTM1/p62, and LC3, with mitochondria and (iii)biodegradation of aberrant mitochondria via the mitophagy pathway.
Materials and methods
Mouse BMSCs
The cultures of bone marrow stromal cells (CFU-F) were establishedand expanded as described previously [6]. Briefly, bone marrow was
obtained from 3- to 4-month-old B6D2F1/J female mice using a proto-
col adapted from STEMCELL Technologies, Inc. (www.stemcell.com/~/media/Technical%20Resources/0/0/29018_Mesenchymal.pdf).
The mesenchymal stromal cells were expanded and cultivated in
hypoxic conditions (5% O2, 10% CO2, 85% N2) for approximately
30 days in Mesencult medium (STEMCELL Technologies, Inc.) in thepresence of antibiotics. After five passages and formation of BMSC
colonies (Supplement A), three selected colonies were collected, and
2 ª 2015 The Authors.
Journal of Cellular and Molecular Medicine published by John Wiley & Sons Ltd and Foundation for Cellular and Molecular Medicine.

trypsinized; then the cell suspensions (approximately 5 cells/ml) werealiquoted in three 96-well plates (0.1 ml/well) for cloning as described
previously [34]. After 2-week cultivation of the cells in the plates, a
clone from a selected well was collected and expanded during another
2 weeks [34]. The phenotype of the obtained clonal BMSCs (Supple-ment B) was assessed with flow cytometry and immunofluorescence
imaging using positive and negative markers for mesenchymal stromal
cells as suggested in (www.rdsystems.com/Products/SC018) (seebelow).
Phenotype assessment of clonal BMSCs
Phenotyping of the cultured cells was conducted using immunofluores-
cence labelling of cell surface proteins with antibodies against conven-tional positive markers of BMSCs (i.e. Sca-1, CD44 and CD105) and
negative markers (i.e. CD4, CD34 and myeloperoxidase). That was fol-
lowed by either flow cytometry or fluorescence microscopy analysis(see Materials and methods below).
For flow cytometric analysis, the harvested cells (three specimens
per group) were re-suspended in Hank’s Balanced Salt Solution contain-
ing 10% foetal bovine serum using polypropylene tubes. Then, the cellswere incubated either with rat IgG-biotin against mouse CD44 (BioLeg-
end, San Diego, CA, USA), or with rat IgG-biotin against mouse Ly-6A/E
(Sca-1) (BioLegend), or with rat IgG against mouse CD4 conjugated
with Pacific BlueTM (BioLegend), or mouse IgG against CD34 conjugatedwith Alexa Fluor� 647 (eBioscience, San Diego, CA, USA), or rat IgG-
biotin against mouse CD117 (eBioscience) for 20 min. at room temper-
ature. Isotype controls were mouse IgG conjugated with Alexa Fluor�
647 (BioLegend), rat IgG conjugated with Pacific BlueTM (BioLegend),and rat IgG-biotin (BioLegend). Biotin counter-conjugates were strepta-
vidin-Pacific BlueTM conjugate and streptavidin- Alexa Fluor�647 conju-
gate from Life Technologies Inc., Grand Island, NY, USA. Positivemarker-specific immunofluorescence of BMSCs was distinguished from
the isotype immunofluorescence (negative control for non-specific im-
munoadherence) in all samples. The cells were analysed with the BDTM
LSRII Flow Cytometer (BD Biosciences Co., www.bdbiosciences.com).The histogram data represent cell counts per 10,000 events. The figures
are shown in Supplements C-H.
Challenge of BMSCs with bacteria
Bone marrow mesenchymal stromal cells cultures (approximately 90%
confluency) were challenged with S. epidermidis (5 9 107 bacteria/ml)
for 3 hrs in antibiotic-free Mesencult MSC Medium (STEMCELL Technolo-
gies, Inc.) (Supplement I). Then, the incubation media was replaced withfresh medium containing penicillin and streptavidin antibiotics, and
BMSCs were further incubated until cell collection [6]. The cells were har-
vested at 3, 5 and 24 hrs following bacterial challenge. The cells displayed
remarkable resistance to the bacterial challenge and sustained confluencyover the period of observation (Supplement J). For interference with the
autophagosomal/lysosomal fusion promoted by the bacterial challenge,
BMSCs were either pre-incubated with 50 lM vinblastine (Cat. # V1377;Sigma-Aldrich Corp., St. Louis, MO, USA) for 6 hrs before fixation, or
transfected with siRNA targeting mouse Rab 7 (Cat. # 4390771; Life Tech-
nologies, Inc. Grand Island, NY, USA) using Lipofectamine�RNAiMAX
Transfection Reagent (Cat. # 13778030; Life Technologies, Inc. GrandIsland, NY, USA) as per the manufacturer’s instructions (www.lifetechnol-
ogies.com/order/catalog/product/13778030). Inhibition of cell signalling
pathways downstream of NFjB and PI3K/AKT activated by pattern recog-nition receptors in the challenged BMSCs was produced in the presence
of 10 lM pyrrolidine dithiocarbamate (PDTC; Cat. P8765; Sigma-Aldrich
Corp., St. Louis, MO, USA) and 200 nM Wortmannin (Cat. #9951; Cell
Signaling Technology Inc.). L-N6 -(1-iminoethyl)lysine (LNIL, Cat. #I8021;Sigma-Aldrich Corp., St. Louis, MO, USA), a selective inhibitor of iNOS,
was used for suppression of nitric oxide production in the cells. To inter-
fere with post-transcriptional synthesis, the cells were pre-incubated with10 lM 5-Azacytidine (5-AzaC) which is incorporated into RNA disrupting
nucleic acid and protein metabolism (Cat. # A2385; Sigma-Aldrich Corp.,
St. Louis, MO, USA.).
Bone marrow mesenchymal stromal cells were analysed for (i) viabil-ity, pro-apoptotic alterations, integrity of cell monolayers and colony-
forming activity; (ii) bacterial phagocytosis and autophagy; (iii) response
of stress proteins and (iv) remodelling of mitochondrial network and
mitophagy, using quantitative real-time PCR technique (qRT-PCR), fluo-rescence confocal imaging, protein immunoblotting, bright-field micros-
copy and transmission electron microscopy (TEM).
The apoptotic response in BMSCs was determined by immunoblotanalysis of caspase-3, a marker of apoptosis.
The images presented in Supplements I-J indicate that the BMSC
cultures challenged with bacteria were also able to sustain integrity of
confluent monolayers; there were no signs of pro-apoptotic alterationsin BMSCs (see below).
BMSC protein expression analysis using qRT-PCR
Up-regulation of gene expression of was assessed with the qRT-PCR
technique. BMSCs were collected at 3, 5 and 24 hrs following bacterial
challenge and subsequently subjected to lysis. Total cellular RNA wasisolated from the cell lysates using the Qiagen RNeasy miniprep kit
(Cat. # 74104; Qiagen Co.), quantified by measuring the absorbance at
260 nm, and qualified by electrophoresis on a 1.2% agarose gel. cDNA
was synthesized using Superscript II (Cat. #18064-014; InvitrogenTM)and qRT-PCR was performed with SYBR Green iQ Supermix (Cat. #
170-8880; Bio-Rad Laboratories, Inc.), each according to the manufac-
turers’ instructions. A set of primers used for qRT-PCR is presented in
Table 1; the primers were purchased from Integrated DNA Technolo-gies, Inc. (www.idtdna.com). The quality of qRT-PCR data were verified
by melt curve analysis, efficiency determination and agarose gel electro-
phoresis. Relative gene expression was calculated by the method ofPfaffl using the formula 2�DDCt.
Analysis of the cell proteins
Proteins from BMSCs were extracted in accordance with the protocol
described previously [6]. Aliquots of proteins were resolved on SDS-
polyacrylamide slab gels (NuPAGE 4–12% Bis-Tris; Cat.# NP0322BOX;
Life Technologies, Inc.). After electrophoresis, proteins were blottedonto a PDVF membrane and the blots were incubated with antibodies
(1 lg/ml) raised against MAP LC3 (Cat.# L8918; Sigma-Aldrich Corp.,
St. Louis, MO, USA), Lamp1 (Cat. # NB100-77683; Novus Biologicals,LLC) rat IgG, HMGB1 (Cat.# PAB12414; Abnova Co.), Drp1 (Cat.# 3455;
Cell Signaling Technology, Inc. Beverly, MA, USA), PINK1 (Cat.# sc33796;
Santa Cruz Biotechnology, Inc. Dallas, TX, USA), Park2 (Cat.#ab15954;
Abcam Plc.), Sirt3a (Cat.#ab86671; Abcam Plc., Cambridge, MA, USA),
ª 2015 The Authors.
Journal of Cellular and Molecular Medicine published by John Wiley & Sons Ltd and Foundation for Cellular and Molecular Medicine.
3
J. Cell. Mol. Med. Vol XX, No X, 2015

SUMO1 (Cat.#4940; Cell Signaling Technology, Inc. Beverly, MA, USA),p62/SQSTM1 (Cat.# ab91526; Abcam Plc., Cambridge, MA, USA), Mfn1
(Cat.#sc50330; Santa Cruz Biotechnology, Inc. Dallas, TX, USA), IGRM
(Cat. # LS-B2732; LifeSpan BioSciences, Inc., Seattle, WA, USA) rabbit
IgG, Tom20 (Cat.# WH0009804M1; Sigma-Aldrich Corp., St. Louis,MO, USA), HSP70 (Cat.#sc33375; Santa Cruz Biotechnology, Inc. Dal-
las, TX, USA), Casp-3 (d.b.a. EMD Millipore, Cat. #04-439) and actin
(Cat.# A5441; Sigma-Aldrich Corp., St. Louis, MO, USA) mouse IgGfollowed by incubation with species-specific IgG peroxidase conjugate.
LC3I and LC3II proteins were identified using mouse brain protein
extract (Cat.#78501; Thermo Fisher Scientific Inc., Danvers, MA, USA)
as a positive control.
Immunoprecipitation (IP)
Tissue lysates containing 300 lg protein were incubated with antibod-
ies against Tom20 (i.e. translocase of outer mitochondrial membrane20; Cat.#WH0009804M1; Sigma-Aldrich Co.), chilled on ice for 1 hr,
mixed with protein A/G agarose beads (50 ll; Cat.#sc2003; Santa
Cruz Biotechnology), and incubated overnight at 4°C. The immunopre-
cipitate was collected by centrifugation at 12,500 9 g for 10 min.,washed twice with 500 ll RIPA stop buffer (Cat.#R0278; Sigma-
Aldrich Co.) and once with 500 ll PBS (Cat.#10010; Life Technolo-
gies Corporation) wash buffer. The pellet was re-suspended in
32.5 ll PBS (Cat.#10010; Life Technologies Corporation), 12.5 ll 49LDS sample buffer (Cat.# NP0007; Life Technologies Corporation) and
5 ll Sample Reducing Agent (Cat.# NP0009; Life Technologies Corpo-
ration), boiled for 5 min. and then centrifuged for 30 sec. to remove
the agarose beads. The supernatant containing mitochondrial proteinsimmunoprecipitated in complexes with Tom20 [such as PINK1 (Cat.#
sc33796; Santa Cruz Biotechnology, Inc.) and PARK2 (Cat.#ab15954;
Abcam Plc.)] were then analysed with immunoblotting, as describedabove. To test whether mitochondrial impairment up-regulates the
interaction of PARK2 with mitochondria, and thus leads to increase in
co-immunoprecipitation of PARK2 with mitochondrial PINK1, we
induced the depolarization of mitochondrial membrane by incubationof BMSCs with 10 lM carbonyl cyanide 3-chlorophenylhydrazone
(CCCP; Cat. #C2759; Sigma-Aldrich Co.), a mitochondrial uncoupler
[15, 23].
Immunofluorescence techniques and imageanalysis
For immunofluorescence confocal imaging, BMSCs (five specimens per
group) were grown on chambered coverglasses (Thermo Fisher Scien-
tific, Inc.). BMSCs were fixed in 2% paraformaldehyde, processed forimmunofluorescence analysis and analysed with fluorescence confocal
microscopy [6]. Normal donkey serum and antibody were diluted in
PBS containing 0.5% BSA and 0.15% glycine. Any non-specific binding
was blocked by incubating the samples with purified normal donkeyserum (Cat.#2044; Santa Cruz Biotechnology, Inc.) diluted 1:20. Pri-
mary antibodies were against CD105 rat biotin-IgG (cat #120404; Bio-
Legend, Inc.), myeloperoxidase (Cat.# sc-16128; Santa CruzBiotechnology, Inc.) rabbit IgG, Tom 20 (Cat.# 56783; Abcam Plc.,
Cambridge, MA, USA) mouse IgG, Drp1 (Cat.# 3455; Cell Signaling
Technology, Inc.), Park2 (Cat.# 15954; Abcam Plc.), Mfn1 (Cat.#
50330; Santa Cruz Biotechnology, Inc.), MAP LC3 (Cat.# L8918;Sigma-Aldrich Co.) rabbit IgG, IRGM (Cat. # LS-B2732; LifeSpan Bio-
Sciences, Inc.) rabbit IgG, SQSTM1/p62 (Cat.# ab91526; Abcam Plc)
rabbit IgG, HMGB1 (Cat. #PAB18868; Abnova, Co.) rabbit IgG, Atg5
(Cat.# sc-8666; Santa Cruz Biotechnology, Inc.) goat IgG. That was fol-lowed by incubation with secondary fluorochrome-conjugated antibody
and/or streptavidin-AlexaFluor 610 conjugate (Cat. #S32359; Molecular
Probes, Inc.), and with Heochst 33258 (Cat.#H1398; Molecular Probes,Inc.) diluted 1:3000. Secondary antibodies used were Alexa Fluor 488�
and Alexa Fluor� 594 conjugated donkey IgG (Cat.# A2106, A11058,
A11055, A21207; Molecular Probes Inc.). Negative controls for non-
specific binding included normal goat serum without primary antibodyor with secondary antibody alone. Five confocal fluorescence
images were captured with a Zeiss LSM 710 microscope (Carl Zeiss
Table 1 A list of primers applied for assessment of transcriptional gene activation in BMSCs challenged with Staphylococcus epidermidis
Gene Forward Reverse
IRGM GAGAGAGAGAGCAGGGCAC AGCATAATGGGTCTCTGCCA
NOS2 CAGCTGGGCTGTACAAACCTT CATTGGAAGTGAAGCGTTTCG
IL1a CGGGTGACAGTATCAGCAAC GACAAACTTCTGCCTGACGA
p65-NFkB GCGGCCAAGCTTAAGATCTGC CGCTGCTCTAGAGAACACAATG
Atg5 CCTGAAGATGGAGAGAAGAG GGACAATGCTAATATGAAGAAAG
Atg8 AGGCCATETTCCTGTTTGTG GTGTTCTCTCCGCTGTAGGC
Mfn1 ACAAGCTTGCTGTCATTGGG GCATTGCATTGATGACAGAGC
PARK2 GAGCTTCCGAATCACCTGAC CCCTCCAGATGCATTTGTTT
Pink1 TGCCTGAGATGCCTGAGTC GCAGCACATTTGCAGCTAAG
p62/SQSTM1 CGAGTGGCTGTGCTGTTC AGCCATTGTCAGCTCCTCAT
4 ª 2015 The Authors.
Journal of Cellular and Molecular Medicine published by John Wiley & Sons Ltd and Foundation for Cellular and Molecular Medicine.

Microscopy GmbH, Jena, Germany). The immunofluorescence imageanalysis was conducted as described previously [6]. The index of spa-
tial correlation (R) of proteins was determined by multiple pixel analy-
sis for pairwise signal interactions in green and red channels using
Simple PCI High Performance Imaging software (Compix Inc., Cran-berry Township, PA, USA) and ImageJ image analysis software (http://
rsb.info.nih.gov).
Autophagic flux was determined by evaluating the punctuated patternof MAP-LC3/Fluor 488� in the immunostained cells (punctae/cell were
counted).
Transmission electron microscopy (TEM)
Mesenchymal stromal cells in culture were fixed in 4% formaldehyde
and 4% glutaraldehyde (catalog # 16000; Electron Microscopy Sciences,
Hatfield, PA, USA) in PBS overnight, post-fixed in 2% osmium tetroxide(catalog # 19150; Electron Microscopy Sciences) in PBS, dehydrated in
a graduated series of ethanol solutions, and embedded in Spurr’s epoxy
resin (catalog # 14300; Electron Microscopy Sciences). Blocks wereprocessed as described previously [6]. The sections of embedded speci-
mens were analysed with a Philips CM100 electron microscope.
Statistical analysis
The data were expressed as means � SEM. Statistical significance was
determined using Student’s t-test (two-tailed) for independent samples.
Significance was reported at a level of P < 0.05.
Results
Phagocytosis and autolysosomal degradation ofS. epidermidis by BMSCs
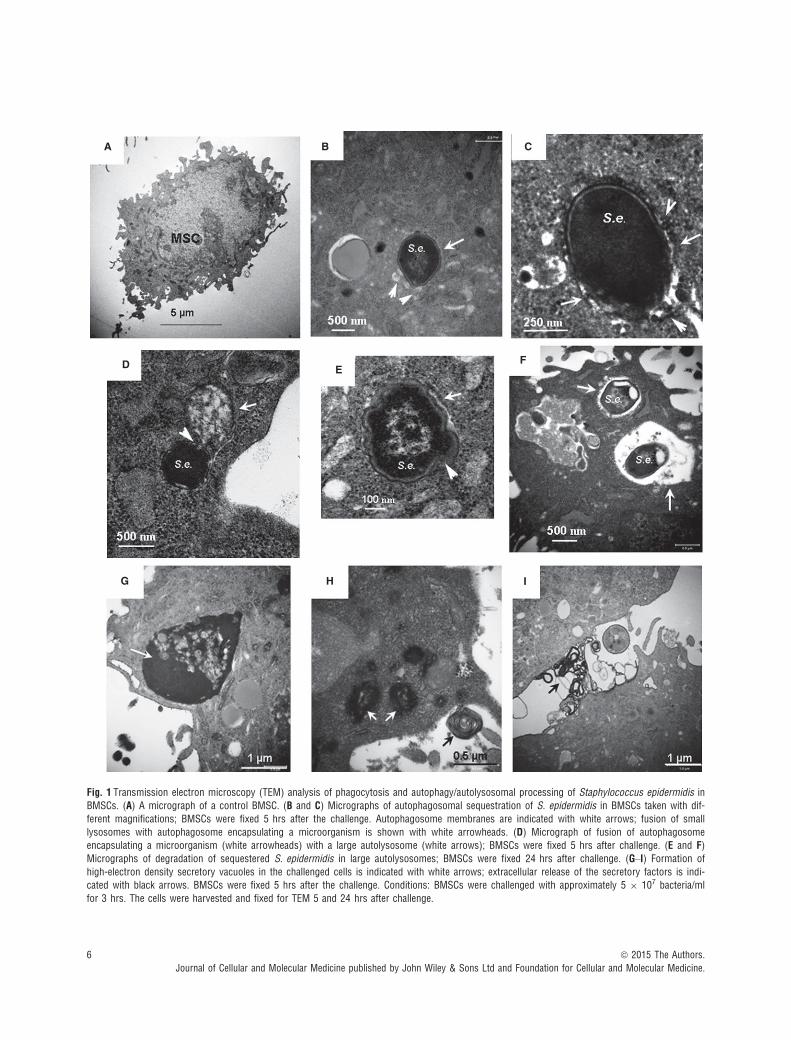
Phagocytosis and autolysosomal degradation of S. epidermidis byBMSCs was analysed with TEM as recommended and published pre-viously [6, 29]. The presence of high-contrast constituents in micro-organisms can provide a unique opportunity for TEM observation ofbacterial autophagy (or xenophagy) and biodegradation of autolysos-omal contents.
Transmission electron microscopy images presented in Figure 1show a control cell (Fig. 1A) and BMSCs subjected to bacterial chal-lenge; the latter represents different stages of xenophagy and decom-position of microorganisms (Fig. 1B–F). The events encompassedengulfing of the microorganisms into double-membrane autophago-somes (Fig. 1B and C); the observed xenophagy was accompanied byfusion of autophagosomes with small lysosomes (20–30 nm in size;Fig. 1B and C), indicating completion of autophagy flux. It should benoted that the assessment of autophagy flux was further conductedwith immunofluorescence techniques and results of this assessmentare discussed below. As shown in Figure 1B and C, the autophago-somes engulfing the microorganisms were much larger (�500 nm insize) than those formed during degradation of cellular organelles (e.g.
mitochondria, �200 nm size, see below), suggesting that the elonga-tion step of the autophagosome membrane is involved in the bacterialsequestration. The TEM image presented in Figure 1D indicates thatthe autophagy-sequestered microorganisms can fuse with large auto-lysosomes (>500 nm). The following autolysosomal degradation ofthe sequestered microorganisms was characterized by fragmentationof bacterial constituents and abnormal notchings of bacterial shells(Fig. 1E and F). As shown in the TEM micrographs (Fig. 1G and H),the response of the cells to bacterial challenge was also accompaniedby a massive formation of high-electron density secretory granulesreleased into extracellular space (Fig. 1I). Note, increase in secretoryactivity in the host cells may lead to the endoplasmic reticulum stress(ER stress) and/or activation of the ER–mitochondria axis in the hostcells [35].
The observed activation of xenophagy was likely driven by stress/danger-responding mechanisms triggered by PREs. To address thisassumption, we further analysed stress- and autophagy-related pro-teins in BMSCs challenged with S. epidermidis.
Alterations in stress and autophagy-relatedproteins in BMSCs challenged withS. epidermidis
Recently, it has been demonstrated that S. epidermidis-derived in-flammagens are potent in evoking numerous danger signals in thehost phagocytic cells [36–38]. Another line of evidence indicates thatBMSCs display high levels of constitutively present adaptogens (e.g.HSP70, Sirt3), and can respond to bacterial inflammagens by induc-tion and nuclear translocation of stress-response elements such asNFkB, TRX1, Ref1, Nrf2, FoxO3a, HO1, and activation of autophagyand mitochondrial remodelling [39]. Therefore, it was reasonable toassume that the challenge of BMSCs with S. epidermidis could leadto up-regulation of a number of stress-responsive genes and mito-phagy-related genes to sustain the cellular defence mechanisms.
A summary of quantitative assessments of these alterations ispresented in Tables 2 and 3. The challenge with S. epidermidisresulted in a significant transcriptional activation of the stress-respon-sive genes (such as IRGM, NFjB, NOS2; Table 2) and the mitophagy-related genes [such as ATG5, ATG8 (MAP-LC3), PARK2, PINK1,SQSTM1, Mfn1; Table 2]. Note, the transactivation of these genes inthe host cells is often associated with pro-survival mechanisms medi-ated by the NFjB and PI3K/AKT pathways; while their suppressioncan be induced by inhibitors of the NFjB and PI3K/AKT responses,e.g. by PDTC and Wortmannin (individually or in combination).
Indeed, pre-incubation of BMSCs with a combination of 10 lMPDTC and 200 nM Wortmannin produced dramatic effects on theanalysed stress-responsive genes. Thus, the drastic expression ofNOS2 induced by S. epidermidis was suppressed by 66.7-fold in thepresence of the inhibitors. Likewise, transcription of IL1A, NFkB andIRGM was suppressed, respectively, by: 183-fold; 5.9-fold and 15-fold. Pre-incubation of the cells with 5-AzaC reduced the transcrip-tional activation of ATG5, ATG8, PARK2 and NOS2 in the challengedBMSCs in 6-, 4.3-, 3.6- and 64-fold respectively.
ª 2015 The Authors.
Journal of Cellular and Molecular Medicine published by John Wiley & Sons Ltd and Foundation for Cellular and Molecular Medicine.
5
J. Cell. Mol. Med. Vol XX, No X, 2015
A B C
D EF
G H I
Fig. 1 Transmission electron microscopy (TEM) analysis of phagocytosis and autophagy/autolysosomal processing of Staphylococcus epidermidis in
BMSCs. (A) A micrograph of a control BMSC. (B and C) Micrographs of autophagosomal sequestration of S. epidermidis in BMSCs taken with dif-
ferent magnifications; BMSCs were fixed 5 hrs after the challenge. Autophagosome membranes are indicated with white arrows; fusion of small
lysosomes with autophagosome encapsulating a microorganism is shown with white arrowheads. (D) Micrograph of fusion of autophagosomeencapsulating a microorganism (white arrowheads) with a large autolysosome (white arrows); BMSCs were fixed 5 hrs after challenge. (E and F)Micrographs of degradation of sequestered S. epidermidis in large autolysosomes; BMSCs were fixed 24 hrs after challenge. (G–I) Formation of
high-electron density secretory vacuoles in the challenged cells is indicated with white arrows; extracellular release of the secretory factors is indi-cated with black arrows. BMSCs were fixed 5 hrs after the challenge. Conditions: BMSCs were challenged with approximately 5 9 107 bacteria/ml
for 3 hrs. The cells were harvested and fixed for TEM 5 and 24 hrs after challenge.
6 ª 2015 The Authors.
Journal of Cellular and Molecular Medicine published by John Wiley & Sons Ltd and Foundation for Cellular and Molecular Medicine.

The data on gene transcriptional activation in the challengedBMSCs were consistent with the observed up-regulation of therespective proteins analysed by immunoblotting. Substantialincreases in levels of the stress-response proteins (IRGM, SQSTM1/p62, iNOS, HMGB1, SUMO1), autolysosomal proteins (Atg12-Atg5,MAP/LC3(Atg8), and mitophagy-related proteins (PINK1 and PARK2)were observed at 24 hrs following bacterial challenge (Fig. 2A–F).Moreover, the balance between LC3-I and LC3-II isoforms was dra-matically shifted towards the lipidated isoform, LC3-II (Fig. 2C).Indeed, the ratio of immunoblot bands of LC3-II and LC3-I (i.e. LC3-II/LC3-I) in control cells was 0.45 � 0.05 a.u. compared to
1.57 � 0.32 a.u. in the challenged cells (P < 0.03; n = 3; Fig. 2C).This effect can be associated with increases in the Atg4-dependentconversion of LC3-I to LC3-II, which is essential for the autophago-some formation [28]. Therefore, accumulation of LC3-II in BMSCscould likely reflect up-regulation of autophagy following the observedbacterial phagocytosis. However, as the cell steady-state balance ofLC3-II per se does not reflect the dynamics of the autophagy flux, theefficacy of autolysosomal events can also affect the LC3-II levels(note, as shown in Fig. 3C, BMSCs exhibit a high expression ofLAMP1, a marker of lysosomes). Indeed, when LC3-I is converted toLC3-II, the latter binds to the expanding phagophore/auophagosomeand remains within autophagosomes even after fusion with lyso-somes. Then, LC3-II can be either delipidated and recycled ordegraded by hydrolytic enzymes in the autolysosome [29]. At thisstage, inhibition and/or impairment of the auophagosomal/lysosomalfusion can result in accumulation of autophagosomes in cells andraise the amount of LC3-II protein. Therefore, for clarification of LC3dynamics, we further (below) conducted monitoring of autophagicflux during auophagosomal/lysosomal fusion.
Interestingly, the BMSC response to the bacterial challengecaused a drastic increase in expression of iNOS (Table 2 and Fig. 2),which produces nitric oxide and thus, mediates microbiostaticdefence mechanism. However, the side effect of nitric oxide produc-tion in the cells was nitroxidative stress to the cellular constituents(shown below). Evidently, the stress-adaptive mechanisms expressedunder the above experimental conditions may allow the cells to avoid‘self-inflicted’ oxidative injury and activation of apoptosis as recentlyreported [39]. In this light, the presence of high levels of constitu-tively expressed HSP70, which can suppress the processing of cas-pase 3 (Casp-3, a marker of apoptosis), would explain a failure todetect activated Casp-3 protein in the challenged cells (Fig. 2).
Autolysosomal Activity in BMSCs Following theChallenge with S. epidermidis
The levels of LC3-II (measured by immunoblotting) and LC3-positivepuncta (assessed by fluorescent imaging) are commonly used formonitoring of autophagosomal activity. Ultimately, the mature auto-phagosomes carrying cargos (e.g. bacteria or impaired organelles)for lysosomal destruction have to be fused with lysosomes to formautolysosomes. The autophagosomal–lysosomal fusion and lysis ofthe microorganisms are shown in TEM micrographs of BMSCs(Fig. 1). This fusion step is a part of autophagic flux associated withautolysosomal activity. In contrast, inhibition of fusion of maturedautophagosomes with lysosomes results in accumulation of LC3-positive puncta that, in turn, can be used as an index of autolysoso-mal activity [35].
As shown in Figure 3A1 and B1, the bacterial challenge resultedin a significant increase in the amount of LC3-positive punctate foci inthe cells; that is from 9 � 3 puncta/cell (control) to 34 � 11 puncta/cell (challenge); P < 0.01, n = 20). This effect was accompanied byan increase in LC3-related immunofluorescence in the challengedcells (Fig. 3A2 and B2). As shown in Figure 3B1, the phagocytizedbacteria (identified by fluorescence of the stained DNA) were encap-
Table 2 Assessment of transcriptional activation of stress-
responsive genes in BMSCs challenged with Staphylococcus
epidermidis
Genes
S. epidermidischallenge.Increase inexpression (A.U.)
PDTC+Wortmannintreatment andS. epidermidis challenge.Increase in expression (A.U.)
NFkB 11.2 � 3.9 1.9 � 0.5 (*)
NOS2 1867 � 909 28 � 12 (*)
IL1A 238 � 73 1.3 � 0.4 (*)
IRGM 4.8 � 0.9 0.32 � 0.09 (*)
S. epidermidis-induced gene expression is presented as arbitraryunits of relative expression over control ‘non-challenged’ group. Thepresented data are means � S.E.M., n = 3. The gene expression datareported in the table are statistically significant with a confidence levelof P < 0.05.The statistical significance of inhibition of gene expression wasassessed by using one-way ANOVA with Tukey’s post hoc HSD test.The observed differences between respective groups [i.e. inhibitorsapplied (n = 3) versus no inhibitors (n = 3)] were reported statisti-cally significant (*) with a confidence level of P < 0.05.
Table 3 Assessment of transcriptional activation of autophagy-
related genes in BMSCs challenged with Staphylococcus
epidermidis
Genes S. epidermidis challenge
ATG5 8.3 � 3.7
ATG8 (LC3) 7.4 � 3.1
Mfn1 3.8 � 1.4
PARK2 10.1 � 6.1
Pink1 2.3 � 0.4
SQSTM1 5.8 � 2.2
The presented data are means � SD, calculated from three indepen-dent experiments. We reported that expression response was statisti-cally significant with a confidence level of P < 0.05.
ª 2015 The Authors.
Journal of Cellular and Molecular Medicine published by John Wiley & Sons Ltd and Foundation for Cellular and Molecular Medicine.
7
J. Cell. Mol. Med. Vol XX, No X, 2015

A
B
C
D
E
F
Fig. 2 Immunoblot analysis of autophagy
and stress-response proteins in BMSCs
challenged with Staphylococcus epidermi-dis. The protein extracts were obtained
from the BMSC cultures 24 hrs after a
challenge with S. epidermidis, except the
cells pre-treated with 10 lM PDTC and200 nM Wortmannin (see Materials and
methods) were collected at 5 hrs post-
challenge. (A) Immunoblot bands of
stress-responding proteins. (B) Densito-metrical analysis of the protein bands
shown in A; the displayed data are ratio of
the protein band densities to the densitiesof the respective actin bands. (C) Immu-
noblot bands of autolysosomal proteins.
(D) Densitometrical analysis of Atg12-
Atg5 and LC3(II) bands shown in C; thedisplayed data are ratio of the protein
band densities to the densities of the
respective actin bands. (E) Immunoblot
bands of mitochondrial and mitophagy-related proteins. (F) Densitometrical analy-
sis of PINK1 and PARK2 bands shown in
E; the displayed data are ratio of the pro-tein band densities to the densities of the
respective actin bands.
Fig. 3 Spatial alterations in autophagosomal LC3 in the presence of microtubule-interfering agents. Assessment of autophagic flux in BMSCs chal-
lenged with Staphylococcus epidermidis. Analysis of immunoreactivity of LC3 protein in BMSC cells is shown in A–D. BMSC mitochondria were
visualized with immunofluorescence of Tom20, a mitochondrial marker. The images shown in the figure are representative ones of analyses of threespecimens obtained from three experiments. (A1) LC3-projections (green channel) in control BMSCs. (B1) LC3-projections (green channel) in
BMSCs fixed at 24 hrs following the bacterial challenge. (C1) Same as (B1), but BMSCs were incubated with 50 lM vinblastine for 6 hrs before fix-
ation. Accumulation of LC3-positive puncta appeared in images displayed in B1 and C1. (A2–C2) Relative intensities of the LC3-immunofluorescence
projections presented in the respective panels (A1–C1) Projection of the nuclear DNA appeared in blue (counterstaining of nuclei with Hoechst33342) in A1, A3, B1, B3, C1, C3 and C4. Spatial interactions of bacterial DNA with LC3-positive puncta appears in turquoise as result of interfer-
ence of green and blue colours (indicated with pink arrows in B1 and C3). Projections of Tom20 (red channel) and LC3 (green channel) are dis-
played in panels A3, B3 and C4. Co-localization of LC3-positive puncta with Tom20 appeared in yellow (as result of interference of green and red)
and is indicated with white arrows in B3 and C4. The confocal images were taken with pinhole setup to obtain 0.3 lm Z-sections. For assessmentof the amounts of LC3-positive puncta, only puncta with diameter ≥0.2 lm were counted. (D) Immunoblot assessment of effect of Rab7 siRNA on
amount of LC3I/LC3II in BMSCs challenged with S. epidermidis. The cells were treated with lipofectamine in the absence (-) or presence (+) of 10nM Rab7 siRNA overnight, (http://tools.lifetechnologies.com/content/sfs/manuals/cms_084833.pdf). The protein extracts were obtained from theBMSC cultures 24 hrs after a challenge with S. epidermidis.
8 ª 2015 The Authors.
Journal of Cellular and Molecular Medicine published by John Wiley & Sons Ltd and Foundation for Cellular and Molecular Medicine.

sulated into LC3-positive vesicles. Increases in spatial co-localizationof LC3 with mitochondrial Tom20 is shown in Figure 3B3, i.e.R = 0.30 compared to R = 0.13 in control. The steady-state balanceof LC3-positive puncta was drastically affected in the presence of
vinblastine, a microtubule depolymerizing agent that induces theaccumulation of autophagic vacuoles by preventing their lysosomalfusion and degradation. Indeed, the effect of vinblastine wasassociated with a twofold increase in amounts of LC3-positive puncta
A1A3
A2
B1
B3
C3
C4
C1C2
D
B2
ª 2015 The Authors.
Journal of Cellular and Molecular Medicine published by John Wiley & Sons Ltd and Foundation for Cellular and Molecular Medicine.
9
J. Cell. Mol. Med. Vol XX, No X, 2015
in the challenged cells (i.e. 74 � 12 puncta/cell; P < 0.01, n = 20;compared to those without the inhibitor, i.e. 34 � 11 puncta/cell)(Fig. 3B1, C1, B2, C2). Moreover, as shown in Figure 3, the LC3-positive puncta was co-localized with the bacterial DNA (C3) andmitochondrial Tom20 (C4), i.e. R = 0.65 compared to R = 0.13 withcontrol Tom20 (A3). Overall, the above data indicate the presence ofautophagic flux in the bacteria-challenged cells.
It has been well documented that numerous molecular compo-nents regulate autophagic/lysosomal fusion. For example, it has beenshown recently that Rab 7, the small GTPase associated with vesicu-lar membranes, is essential for autolysosomal progression and auto-phagic flux [40]. To interfere with the Rab7-mediated autolysosomalpathway, we transfected BMSCs with Rab7 siRNA to suppress theRAB7 gene. The effect of this interference was assessed with immu-noblotting of LC3 protein in the cells. As shown in Figure 3D, interfer-ence with Rab7-mediated events resulted in a substantialaccumulation of LC3I/LC3II in the bacteria-challenged cells.
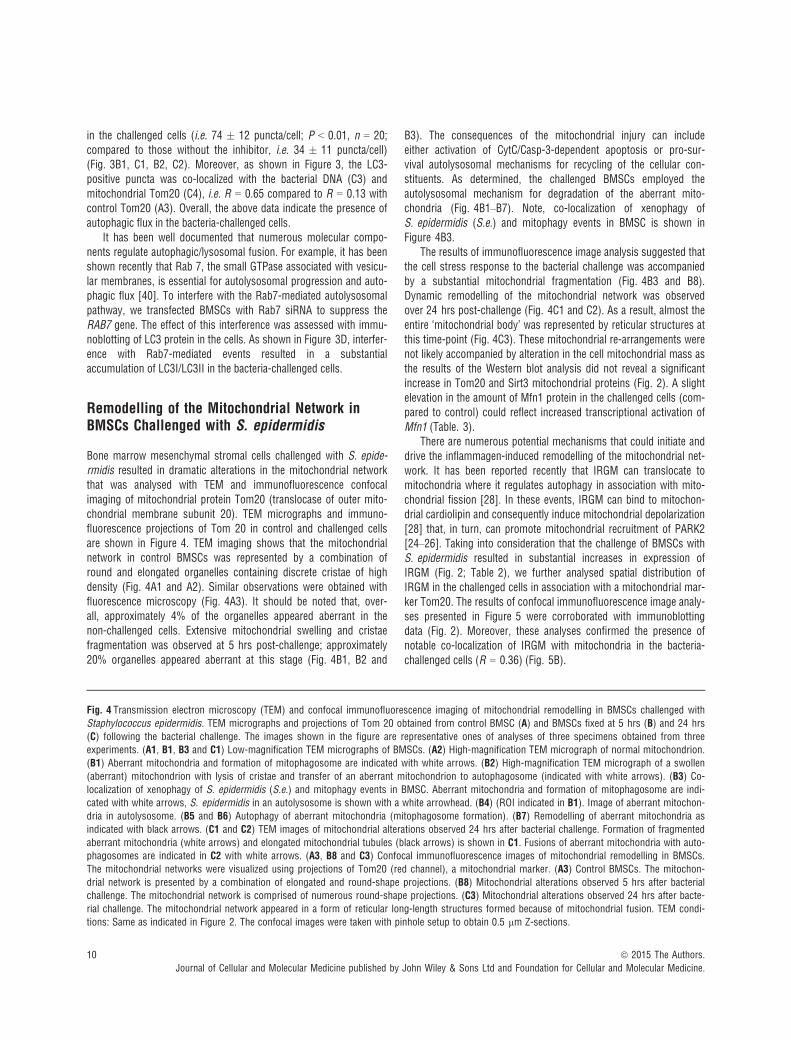
Remodelling of the Mitochondrial Network inBMSCs Challenged with S. epidermidis
Bone marrow mesenchymal stromal cells challenged with S. epide-rmidis resulted in dramatic alterations in the mitochondrial networkthat was analysed with TEM and immunofluorescence confocalimaging of mitochondrial protein Tom20 (translocase of outer mito-chondrial membrane subunit 20). TEM micrographs and immuno-fluorescence projections of Tom 20 in control and challenged cellsare shown in Figure 4. TEM imaging shows that the mitochondrialnetwork in control BMSCs was represented by a combination ofround and elongated organelles containing discrete cristae of highdensity (Fig. 4A1 and A2). Similar observations were obtained withfluorescence microscopy (Fig. 4A3). It should be noted that, over-all, approximately 4% of the organelles appeared aberrant in thenon-challenged cells. Extensive mitochondrial swelling and cristaefragmentation was observed at 5 hrs post-challenge; approximately20% organelles appeared aberrant at this stage (Fig. 4B1, B2 and
B3). The consequences of the mitochondrial injury can includeeither activation of CytC/Casp-3-dependent apoptosis or pro-sur-vival autolysosomal mechanisms for recycling of the cellular con-stituents. As determined, the challenged BMSCs employed theautolysosomal mechanism for degradation of the aberrant mito-chondria (Fig. 4B1–B7). Note, co-localization of xenophagy ofS. epidermidis (S.e.) and mitophagy events in BMSC is shown inFigure 4B3.
The results of immunofluorescence image analysis suggested thatthe cell stress response to the bacterial challenge was accompaniedby a substantial mitochondrial fragmentation (Fig. 4B3 and B8).Dynamic remodelling of the mitochondrial network was observedover 24 hrs post-challenge (Fig. 4C1 and C2). As a result, almost theentire ‘mitochondrial body’ was represented by reticular structures atthis time-point (Fig. 4C3). These mitochondrial re-arrangements werenot likely accompanied by alteration in the cell mitochondrial mass asthe results of the Western blot analysis did not reveal a significantincrease in Tom20 and Sirt3 mitochondrial proteins (Fig. 2). A slightelevation in the amount of Mfn1 protein in the challenged cells (com-pared to control) could reflect increased transcriptional activation ofMfn1 (Table. 3).
There are numerous potential mechanisms that could initiate anddrive the inflammagen-induced remodelling of the mitochondrial net-work. It has been reported recently that IRGM can translocate tomitochondria where it regulates autophagy in association with mito-chondrial fission [28]. In these events, IRGM can bind to mitochon-drial cardiolipin and consequently induce mitochondrial depolarization[28] that, in turn, can promote mitochondrial recruitment of PARK2[24–26]. Taking into consideration that the challenge of BMSCs withS. epidermidis resulted in substantial increases in expression ofIRGM (Fig. 2; Table 2), we further analysed spatial distribution ofIRGM in the challenged cells in association with a mitochondrial mar-ker Tom20. The results of confocal immunofluorescence image analy-ses presented in Figure 5 were corroborated with immunoblottingdata (Fig. 2). Moreover, these analyses confirmed the presence ofnotable co-localization of IRGM with mitochondria in the bacteria-challenged cells (R = 0.36) (Fig. 5B).
Fig. 4 Transmission electron microscopy (TEM) and confocal immunofluorescence imaging of mitochondrial remodelling in BMSCs challenged with
Staphylococcus epidermidis. TEM micrographs and projections of Tom 20 obtained from control BMSC (A) and BMSCs fixed at 5 hrs (B) and 24 hrs
(C) following the bacterial challenge. The images shown in the figure are representative ones of analyses of three specimens obtained from threeexperiments. (A1, B1, B3 and C1) Low-magnification TEM micrographs of BMSCs. (A2) High-magnification TEM micrograph of normal mitochondrion.
(B1) Aberrant mitochondria and formation of mitophagosome are indicated with white arrows. (B2) High-magnification TEM micrograph of a swollen
(aberrant) mitochondrion with lysis of cristae and transfer of an aberrant mitochondrion to autophagosome (indicated with white arrows). (B3) Co-localization of xenophagy of S. epidermidis (S.e.) and mitophagy events in BMSC. Aberrant mitochondria and formation of mitophagosome are indi-cated with white arrows, S. epidermidis in an autolysosome is shown with a white arrowhead. (B4) (ROI indicated in B1). Image of aberrant mitochon-
dria in autolysosome. (B5 and B6) Autophagy of aberrant mitochondria (mitophagosome formation). (B7) Remodelling of aberrant mitochondria as
indicated with black arrows. (C1 and C2) TEM images of mitochondrial alterations observed 24 hrs after bacterial challenge. Formation of fragmented
aberrant mitochondria (white arrows) and elongated mitochondrial tubules (black arrows) is shown in C1. Fusions of aberrant mitochondria with auto-phagosomes are indicated in C2 with white arrows. (A3, B8 and C3) Confocal immunofluorescence images of mitochondrial remodelling in BMSCs.
The mitochondrial networks were visualized using projections of Tom20 (red channel), a mitochondrial marker. (A3) Control BMSCs. The mitochon-
drial network is presented by a combination of elongated and round-shape projections. (B8) Mitochondrial alterations observed 5 hrs after bacterialchallenge. The mitochondrial network is comprised of numerous round-shape projections. (C3) Mitochondrial alterations observed 24 hrs after bacte-
rial challenge. The mitochondrial network appeared in a form of reticular long-length structures formed because of mitochondrial fusion. TEM condi-
tions: Same as indicated in Figure 2. The confocal images were taken with pinhole setup to obtain 0.5 lm Z-sections.
10 ª 2015 The Authors.
Journal of Cellular and Molecular Medicine published by John Wiley & Sons Ltd and Foundation for Cellular and Molecular Medicine.

The multifactorial response of BMSCs to the bacterial chal-lenge included a drastic increase in expression of iNOS (see dataabove), which can produce a massive amount of nitric oxide. Thereleased nitric oxide is known to cause nitrosative stress and pro-mote mitochondrial fission, which is associated with the releaseof superoxide [15, 16, 36]. Under these conditions, one would
expect the formation of peroxynitrite from nitric oxide and super-oxide, and the subsequent peroxynitrite-mediated nitroxidation oftyrosine in mitochondrial proteins to form 3-nitrotyrosine (3-NTyr).Indeed, immunofluorescence analysis of BMSCs showed a remark-able increase in 3-NTyr immunoreactivity co-localized with mito-chondria that occurred after the challenge with S. epidermidis
A1 A2
A3
B1
B3 B4
B5
B6
B7
B8
B2 C1
C2
C3
ª 2015 The Authors.
Journal of Cellular and Molecular Medicine published by John Wiley & Sons Ltd and Foundation for Cellular and Molecular Medicine.
11
J. Cell. Mol. Med. Vol XX, No X, 2015

(Fig. 6). It should be noted that 3-Ntyr-positive organelles wereround-shaped and the mitochondrial reticulum was fragmented(Fig. 6B4).
Overall, both IRGM and oxidative injury could, at least in part,contribute to the mechanisms driving mitochondrial remodelling upondevelopment of the BMSC stress response.
Dynamics of Drp1 and PARK2 Proteins in BMSCsChallenged with S. epidermidis
It is well documented that mitochondrial fission and the PINK1–PARK2-mediated mitophagy require recruitment of Drp1 and PARK2proteins to the targeted mitochondria; characteristic images of these
A1 B1
A2 B2
Fig. 5 Immunofluorescence confocal image analysis of spatial localization of IRGM in BMSCs challenged with Staphylococcus epidermidis. (A1) Con-trol BMSCs. Mitochondrial network was visualized by projections of Tom20 (red channel), a mitochondrial marker, projections of IRGM proteinappear in green. Projections of the nuclear DNA appear in blue (counterstaining of nuclei with Hoechst 33342). Index of spatial correlation of IRGM
and Tom20 was defined as R = 0.25 (see Materials and methods). (B1) Alterations in mitochondrial translocation of IRGM (green channel) observed
24 hrs after bacterial challenge. Mitochondrial network was visualized by projections of Tom20 (red channel). Index of spatial correlation of IRGM
and Tom20 is defined as R = 0.36 (see Materials and methods). (A2 and B2) Relative intensities of the IRGM-immunofluorescence projections pre-sented in the respective A1 and B1. Note: Spatial co-localization of IRGM and Tom20 appears in yellow as result of interference of green and red
colours. The confocal images were taken with pinhole setup to obtain 0.3 lm Z-sections. The images shown in the figure are representative ones of
analyses of three specimens obtained from three experiments.
Fig. 6 Immunofluorescence confocal image analysis of 3-nitrotyrosine (3-NTyr) in mitochondrial proteins in BMSCs challenged with S. epidermidis.
The mitochondrial network was visualized by projections of Tom20 (red channel), a mitochondrial marker (projections of 3-NTyr appear in green).
Projections of the nuclear DNA are displayed in blue (counterstaining of nuclei with Hoechst 33342). Spatial co-localization of 3-NTyr and Tom20appears in yellow as result of interference of green and red colours. The confocal images were taken with pinhole setup to obtain 0.3 lm Z-sec-
tions. The images shown in the figure are representative ones of analyses of three specimens obtained from three experiments. (A1, B1 and C1)Projections of Tom20 and 3-NTyr in control BMSCs (A1), BMSCs challenged with S. epidermidis (B1), and BMSCs challenged with S. epidermidis in
the presence of 100 lM LNIL, an inhibitor of iNOS (C1). (B4) Magnification of the selected AOI is indicated with a square in B1. (A2, B2, C2 andB5) Immunofluorescence of 3-NTyr in the images shown in A1, B1, C1 and B4 respectively. (A3, B3 and C3) Histograms representing relative inten-
sities of immunofluorescence of 3-NTyr shown in A2, B2 and C2 respectively.
12 ª 2015 The Authors.
Journal of Cellular and Molecular Medicine published by John Wiley & Sons Ltd and Foundation for Cellular and Molecular Medicine.

A1 A2
A3
B1 B2
B4 B5
B3
C1 C2
C3
ª 2015 The Authors.
Journal of Cellular and Molecular Medicine published by John Wiley & Sons Ltd and Foundation for Cellular and Molecular Medicine.
13
J. Cell. Mol. Med. Vol XX, No X, 2015

events have been presented in numerous reports [18–25]. Drp1translocation to mitochondria is accompanied by assembly of circularoligomers involving Drp1 attached to the outer membrane-anchoredmitochondrial fission factor protein followed by excision of the mito-chondrial tubules perpendicular to the cylinder axis; this effect isshown in Figure 4B6. Binding of the activated mitochondrial kinasePINK1 to the Tom20 complex and PINK1-mediated phosphorylationof the PARK2 ubiquitin-like domain trigger translocation of PARK2from cytosol to mitochondria, thereby priming mitophagy in the depo-larized mitochondria [12, 25, 31].
The results of immunofluorescence confocal imaging of Drp1,PARK2 and Tom20 are shown in Figures 7 and 8. Analysis of theprojections of Tom20 and Drp1 indicates that, indeed, the bacte-rial challenge to BMSCs was accompanied by increased transloca-tion of Drp1 to mitochondria (Fig. 7). Thus, while the spatialcorrelation of Drp1 and Tom20 in control cells was R = 0.23(Fig. 7A), the R-values increased to 0.48 and 0.47, 5 and 24 hrsafter challenge respectively (Figure 7B and C). A similar effectwas observed in the dynamics of PARK2 protein Fig. 8). Analysisof the projections of Tom20 and PARK2 indicated that in controlBMSCs, the spatial correlation of PARK2 and Tom20 wasR = 0.11; and PARK2 protein was predominantly bound to thecytoskeletal filaments (Fig. 8A) in a manner similar to the obser-vation reported recently by Huynh et al. [32]. A response to thestress induced by the bacterial challenge was associated withPARK2 translocation from the cytoskeletal filaments to mitochon-dria increasing the spatial correlation between PARK2 and Tom20proteins, 5 hrs (R = 0.26) and 24 hrs (R = 0.61) post-treatment(Fig. 8B and C).
The results of immunofluorescence analysis of Drp1 and PARK2are corroborated with the immunoblotting data presented and dis-cussed above (Fig. 2E). Indeed, Drp1 and PARK2 are constitutivelyexpressed in BMSCs; therefore, they could be promptly recruited tomitochondria upon respective stimuli. The increase in PARK2 pres-ence at mitochondria was confirmed using immunoprecipitationanalysis of complexes of the mitochondria-specific proteins Tom20and PINK1 with PARK2 (Fig. 8D–F). Interestingly, this effect was alsoaccompanied by (i) the appearance of co-localization of LC3-positivevesicles with PARK2-positive mitochondria (Fig. 8F) and (ii) increasesin the mitochondrial presence of SQSTM1/p62 (Fig. 8D) andSQSTM1/p62 co-precipitation with mitochondrial PINK1 and PARK2(Fig. 8G). It was noted that the amount of the autophagic adapter pro-tein SQSTM1/p62 was slightly increased in the challenged cells(Fig. 2). Thus, the arbitrary density of immunoblot bands of SQSTM1/p62 (normalized to actin; Fig. 2) in the challenged cells was0.35 � 0.02 a.u., while the same parameter in the control cells was0.24 � 0.01 a.u. (P < 0.03, n = 3).
Overall, the above observations implicated the PINK1/PARK2mechanism in the observed remodelling of the BMSC mitochondrialnetwork following the bacterial challenge.
Discussion
Extracellular and intracellular antibacterial mechanisms constitutecomplex lines of the host–cell defence barriers that sustain immunehomoeostasis of multicellular organisms [6, 30, 33]. Various celllineages employ autophagy for the terminal elimination of phagocy-
A B C
Fig. 7 Immunofluorescence confocal image analysis of mitochondrial translocation of Drp1 fission protein in BMSCs challenged with Staphylococcus
epidermidis. (A) Control BMSCs. The mitochondrial network was visualized using projections of Tom20 (red channel), a mitochondrial marker. Pro-jections of Drp1 protein appear in green. Projections of the nuclear DNA appear in blue (counterstaining of nuclei with Hoechst 33342). Index of
spatial correlation of Tom20 and Drp1 is defined as R = 0.23 (see Materials and methods). (B) Alterations in mitochondrial translocation of Drp1
(green channel) observed 5 hrs after bacterial challenge. The mitochondrial network is displayed as projections of Tom20 (red channel). Index of
spatial correlation of Tom20 and Drp1 is defined as R = 0.48 (see Materials and methods). (C) Alterations in mitochondrial translocation of Drp1(green channel) observed 24 hrs after bacterial challenge. The mitochondrial network appears as long-length thread-like projections of Tom20 (red
channel). Index of spatial correlation of Tom20 and Drp1 is defined as R = 0.47. The presence of interaction between Drp1 and Tom20 appears in
yellow as result of interference of red and green colours. The confocal images were taken with pinhole setup to obtain 0.3 lm Z-sections. The
images shown in the figure are representative ones of analyses of three specimens obtained from three experiments.
14 ª 2015 The Authors.
Journal of Cellular and Molecular Medicine published by John Wiley & Sons Ltd and Foundation for Cellular and Molecular Medicine.

A B C
D
G H
EF
Fig. 8 Immunofluorescence confocal image analysis of mitochondrial translocation of PARK2 protein in BMSCs challenged with Staphylococcus epi-
dermidis. The mitochondrial network was visualized with projections of Tom20 (red channel), a mitochondrial marker. Projections of PARK2 proteinappear in green in A, B, C and in blue in F. Projection of the nuclear DNA appears in blue (counterstaining of nuclei with Hoechst 33342) in A, B, C.Spatial co-localization of Tom20 and PARK2 appears in yellow in A, B, C as result of interference of red and green colours. Spatial co-localization of
Tom20 and PARK2 appears in pink colour in F as result of interference of red and blue colours. (A) Control BMSCs. Index of spatial correlation ofTom20 and PARK2 was determined as R = 0.11 (see Materials and methods). (B) Alterations in mitochondrial translocation of PARK2 (green chan-
nel) observed 5 hrs after bacterial challenge. The mitochondrial network appears as numerous round-shape projections of Tom20 (red channel).
Index of spatial correlation of Tom20 and PARK2 determined as R = 0.26 (see Materials and methods). (C) Alterations in mitochondrial transloca-
tion of PARK2 (green channel) observed 24 hrs after bacterial challenge. The mitochondrial network appears as long-length thread-like projectionsof Tom20 (red channel). Index of spatial correlation of Tom20 and PARK2 was determined as R = 0.61. The confocal images were taken with pin-
hole setup to obtain 0.3 lm Z-sections. The images shown in the figure are representative ones of analyses of three specimens obtained from three
experiments. (D) Immunoblotting analysis of Pink1, PARK2 and proteins co-immunoprecipitated with Tom20 protein. Immunoprecipitation (IP)
assessment of the protein interaction on the BMSC mitochondria 24 hrs after bacterial challenge. (E) Densitometrical analysis of the protein bandsshown in D; the displayed data are ratio of the protein band densities to the densities of the respective Tom20 bands. (F) Immunofluorescence
assessment of spatial interaction of PARK2 (blue channel) and LC3 (green channel) with mitochondrial Tom20 (red channel) in BMSC subjected the
bacterial challenge (24 hrs). Co-localization of Tom20 with PARK2 and LC3 appears in form of white circles, i.e. mitophagosomes (indicated with
white arrows) as result of interference of blue, green and red colours. (G) Immunoblotting analysis of PINK1 and PARK2 proteins co-immunoprecip-itated with SQSTM1/p62 protein. IP assessment of the protein interaction on the BMSC mitochondria 24 hrs after bacterial challenge. (H) Immuno-
blotting analysis of PARK2 protein co-immunoprecipitated with mitochondrial Pink1protein. IP-assessment of increase in interaction of Pink1 with
PARK2 in the BMSC mitochondria after mitochondrial depolarization by treatment with 10 lM CCCP, a mitochondrial uncoupler, for 6 hrs.
ª 2015 The Authors.
Journal of Cellular and Molecular Medicine published by John Wiley & Sons Ltd and Foundation for Cellular and Molecular Medicine.
15
J. Cell. Mol. Med. Vol XX, No X, 2015

tized microorganisms, and, in many cases, this autophagy route iscrucial for the host resistance to bacterial translocation and propaga-tion [6, 27, 30]. With consideration of the above, we assumed thatassessment of the autophagy/autolysosomal pathway in challengedBMSCs could shed light on the role of the ubiquitous mesenchymalstromal cells in the barrier response mechanisms implementedagainst invading S. epidermidis.
Staphylococcus epidermidis is one of the most common microor-ganisms colonizing the epithelial surfaces [36, 41]. Impairment of tis-sue barriers frequently causes chronic infections with S. epidermidis,which demonstrates a pronounced capacity to evade host defencesand to inactivate white blood cells. Thereby, bacteraemia because ofS. epidermidis can cause long-term effects on immune tissuesincluding bone marrow, while sepsis becomes a potentially fatal issue[36–38, 41].
Evidently, the challenge of BMSCs with bacteria produced the in-flammagenic stress mediated by the PRE/DAMP response elementsand was accompanied by metabolic stress. It has been proposedrecently, that a pattern of these events, can be associated with recon-stitution and remodelling of the entire ER–mitochondrial network andprovoke mitochondrial dysfunction [6, 14, 15, 35]. This assumptionis corroborated by numerous observations indicating that activationof IRGM, ER stress, or redox stress can trigger mitochondrial mem-brane depolarization, permeabilization, and swelling, and thus pro-mote mitochondria-dependent apoptotic cell death [15, 17, 35, 42].All of the above make mitochondria crucial players in the current par-adigm for cellular homoeostasis and survival [16, 17, 35, 42, 43].
Mitochondria-driven cell death is one of the most common innatedefence mechanisms against invading pathogens. However, somemicroorganisms can subvert these death mechanisms and maintainviability of the host cells for the ultimate enhancement of their replica-tion and propagation [44]. Translating these scenarios to bactera-emia, the affected cells may potentiate septicaemia caused by thebacterial inflammogens, because of the ability of impaired mitochon-dria released by affected cells to operate as paracrine mediators ofdanger or inflammation [17, 43] unless the impaired organelles aredestroyed with autolysosomes.
Recent time-lapse microscopy data indicate that mitochondria areextremely dynamic organelles; they constantly undergo fusion andfission processes, which regulate architecture and efficiency of mito-chondrial tubular networks as well as excision of compromised mito-chondrial sections [7–11]. These events are followed by removal anddegradation of the aberrant organelles via mitophagy/autolysosomalmechanisms [10, 12, 13]. We demonstrated that BMSCs constitu-tively express proteins which sustain signalling modules essential foractivation and execution of mitochondrial remodelling and mitophagy.These proteins include (but are not limited to) Mfn1, Drp1, PINK1,PARK2, SUMO1, SQSTM1/p62 and LC3 proteins. The challenge ofBMSCs with S. epidermidis resulted in (i) the formation of aberrantmitochondria in the cells, (ii) an increase in both expression of the mi-tophagy-mediated proteins (e.g. PARK2, SQSTM1/p62 and LC3) andtheir interaction with mitochondria and (iii) autophagosomal seques-tration of aberrant mitochondria.
Overall, the BMSCs challenged with the S. epidermidis microor-ganisms experienced dramatic stress and mitochondrial injury. How-ever, the cells neither became infected nor underwent apoptosis, butrather activated (i) stress-response adaptive mechanisms, (ii) anti-bacterial xenophagy, (iii) mitochondrial remodelling and (iv) mito-phagy. In this respect, the subsequent autolysosomal recycling of theaberrant mitochondria could both suppress the mitochondria-depen-dent apoptosis and reduce the risk of release of mitochondria-origi-nated stress factors. Therefore, we postulate that the observed up-regulation of mitophagy can be considered as a pro-survival homoeo-static mechanism implemented by the challenged BMSCs. From abiomedical perspective, the reported BMSC effects can contribute tothe innate defence response of bone marrow stroma to the sepsisassociated with radiation-induced injury and trauma [1, 45].
Acknowledgements
The authors thank Dr. T.B. Elliott for his helpful comments and discussion.
This work was supported by NIAID AI080553 (to JGK) and NIAID YI-AI-5045-
04 (to JGK).
Disclaimer
The opinions or assertions contained herein are the authors privateviews and are not to be construed as official or reflecting the views ofthe Uniformed Services University of the Health Sciences, ArmedForces Radiobiology Research Institute, the U.S. Department ofDefense, or the National Institutes of Health. The commercial prod-ucts identified in this paper do not imply recommendation or endorse-ment by the federal government and do not imply that the productsidentified are necessarily the best available for the purpose.
Conflicts of interest
The authors declare that they have no conflict of interests.
Author contribution
N. V. Gorbunov and J. G. Kiang contributed equally to the presentedwork.
Supporting information
Additional Supporting Information may be found in the onlineversion of this article:
Figure S1 Bright-field microscopy of bone marrow stromal cell, i.e.CFU-F, culture; clonal cell phenotyping; and assessment of the cellmonolayers challenged with S. epidermidis.
16 ª 2015 The Authors.
Journal of Cellular and Molecular Medicine published by John Wiley & Sons Ltd and Foundation for Cellular and Molecular Medicine.

References
1. Kiang JG, Jiao W, Cary L, et al. Woundtrauma increases radiation-induced mortality
by increasing iNOS, cytokine concentrations,
and bacterial infections. Radiat Res. 2010;
173: 319–32.2. Owen M, Friedenstein AJ. Stromal stem
cells: marrow-derived osteogenic precur-
sors. Ciba Found Symp. 1988; 136: 42–60.3. Krebsbach PH, Kuznetsov SA, Bianco P,
et al. Bone marrow stromal cells: character-
ization and clinical application. Crit Rev Oral
Biol Med. 1999; 10: 165–81.4. Balduino A, Hurtado SP, Fraz~ao P, et al.
Bone marrow subendosteal microenviron-
ment harbours functionally distinct haemo-
supportive stromal cell populations. CellTissue Res. 2005; 319: 255–66.
5. Greenberger JS, Epperly M. Bone marrow-
derived stem cells and radiation response.
Semin Radiat Oncol. 2009; 19: 133–9.6. Gorbunov NV, Garrison BR, Zhai M, et al.
Autophagy-mediated defense response of
mouse mesenchymal stromal cells (MSCs)to challenge with Escherichia coli. In: Cai J,
editor. Protein interaction/book 1. Rijeka: In-
Tech Open Access Publisher; 2013. pp. 23–44. ISBN 979-953-307-577-7.
7. Bereiter-Hahn J, Voth M. Dynamics of mito-
chondria in living cells: shape changes, dislo-
cations, fusion, and fission of mitochondria.
Microsc Res Tech. 1994; 27: 198–219.8. Vendelin M, Beraud N, Guerrero K, et al.
Mitochondrial regular arrangement in mus-
cle cells: a “crystal-like” pattern. Am J Phys-iol Cell Physiol. 2005; 288: C757–67.
9. De Vos KJ, Allan VJ, Grierson AJ, et al.Mitochondrial function and actin regulate
dynamin-related protein 1-dependent mito-chondrial fission. Curr Biol. 2005; 15: 678–83.
10. Novak I. Mitophagy: a complex mechanism
of mitochondrial removal. Antioxid RedoxSignal. 2012; 17: 794–802.
11. Sukhorukov VM, Dikov D, Reichert AS,et al. Emergence of the mitochondrial retic-
ulum from fission and fusion dynamics.PLoS Comput Biol. 2012; 8: e1002745.
Doi:10.1371/journal.pcbi.1002745.
12. Wang K, Klionsky DJ. Mitochondria removalby autophagy. Autophagy. 2011; 7: 297–300.
13. Ashrafi G, Schwarz TL. The pathways of mi-
tophagy for quality control and clearance of
mitochondria. Cell Death Differ. 2013; 20:31–42.
14. Ding WX, Yin XM. Mitophagy: mechanisms,
pathophysiological roles, and analysis. Biol
Chem. 2012; 393: 547–64.
15. Wang Y, Nartiss Y, Steipe B, et al. ROS-induced mitochondrial depolarization initi-
ates PARK2/PARKIN-dependent mitochon-
drial degradation by autophagy. Autophagy.
2012; 8: 1462–76.16. West AP, Brodsky IE, Rahner C, et al. TLR
signalling augments macrophage bacterici-
dal activity through mitochondrial ROS. Nat-
ure. 2011; 472: 476–80.17. Galluzzi L, Kepp O, Kroemer G. Mitochon-
dria: master regulators of danger signalling.
Nat Rev Mol Cell Biol. 2012; 13: 780–8.18. Smirnova E, Griparic L, Shurland DL, et al.
Dynamin-related protein Drp1 is required for
mitochondrial division in mammalian cells.
Mol Biol Cell. 2001; 12: 2245–56.19. Chen H, Detmer SA, Ewald AJ, et al. Mi-
tofusins Mfn1 and Mfn2 coordinately regu-
late mitochondrial fusion and are essential
for embryonic development. J Cell Biol.2003; 160: 189–200.
20. Zungu M, Schisler J, Willis MS. All the littlepieces. -Regulation of mitochondrial fusionand fission by ubiquitin and small ubiquitin-
like modifer and their potential relevance in
the heart. Circ J. 2011; 75: 2513–21.21. Elgass K, Pakay J, Ryan MT, et al. Recent
advances into the understanding of mito-
chondrial fission. Biochim Biophys Acta.
2013; 1833: 150–61.22. Santel A, Frank S. Shaping mitochondria:
The complex posttranslational regulation of
the mitochondrial fission protein DRP1.
IUBMB Life. 2008; 60: 448–55.23. Ding WX, Guo F, Ni HM, et al. Parkin and
mitofusins reciprocally regulate mitophagy
and mitochondrial spheroid formation. J Biol
Chem. 2012; 287: 42379–88.24. Geisler S, Holmstr€om KM, Skujat D, et al.
PINK1/Parkin-mediated mitophagy is depen-
dent on VDAC1 and p62/SQSTM1. Nat Cell
Biol. 2010; 12: 119–31.25. Lazarou M, Jin SM, Kane LA, et al. Role of
PINK1 binding to the TOM complex and
alternate intracellular membranes in recruit-
ment and activation of the E3 ligase Parkin.Dev Cell. 2012; 22: 320–33.
26. Yang JY, Yang WY. Spatiotemporally con-
trolled initiation of Parkin-mediated mito-phagy within single cells. Autophagy. 2011;
7: 1230–8.27. Murrow L, Debnath J. Autophagy as a stress-
response and quality-control mechanism:implications for cell injury and human
disease. Annu Rev Pathol. 2013; 8: 105–37.28. Singh SB, Ornatowski W, Vergne I, et al.
Human IRGM regulates autophagy and
cell-autonomous immunity functions throughmitochondria. Nat Cell Biol. 2010; 12:
1154–65.29. Klionsky DJ, Abdalla FC, Abeliovich H,
et al. Guidelines for the use and interpreta-tion of assays for monitoring autophagy.
Autophagy. 2012; 8: 445–544.30. Dupont N, Temime-Smaali N, Lafont F.
How ubiquitination and autophagy partici-pate in the regulation of the cell response to
bacterial infection. Biol Cell. 2010; 102: 621–34.
31. Shiba-Fukushima K, Imai Y, Yoshida S,et al. PINK1-mediated phosphorylation of
the Parkin ubiquitin-like domain primes
mitochondrial translocation of Parkin andregulates mitophagy. Sci Rep. 2012; 2:
1002. Doi:10.1038/srep01002.
32. Huynh DP, Scoles DR, Ho TH, et al. Parkinis associated with actin filaments in neuronaland non-neural cells. Ann Neurol. 2000; 48:
737–44.33. von K€ockritz-Blickwede M, Nizet V. Innate
immunity turned inside-out: antimicrobial
defense by phagocyte extracellular traps. J
Mol Med (Berl). 2009; 87: 775–83.34. Gorbunov NV, Morris JE, Greenberger JS,
et al. Establishment of a novel clonal murine
bone marrow stromal cell line for assess-
ment of p53 responses to genotoxic stress.
Toxicology. 2002; 179: 257–66.35. Malhotra JD, Kaufman RJ. ER stress and its
functional link to mitochondria: role in cell
survival and death. Cold Spring Harb Per-spect Biol. 2011; 3: a004424. Doi:10.1101/
cshperspect.a004424.
36. Otto M. Staphylococcus epidermidis patho-
genesis. Methods Mol Biol. 2014; 1106: 17–31.
37. Cheung GY, Rigby K, Wang R, et al. Staph-ylococcus epidermidis strategies to avoid
killing by human neutrophils. PLoS Pathog.2010; 6: e1001133. Doi:10.1371/journal.
ppat.1001133.
38. Mehlin C, Headley CM, Klebanoff SJ. Aninflammatory polypeptide complex fromStaphylococcus epidermidis: isolation and
characterization. J Exp Med. 1999; 189:
907–18.39. Gorbunov NV, Garrison BR, McDaniel
DP, et al. Adaptive redox response of
mesenchymal stromal cells to stimulation
with lipopolysaccharide inflammagen:mechanisms of remodeling of tissue bar-
riers in sepsis. Oxid Med Cell Longev.
2013; 2013: 186795. Doi:10.1155/2013/
186795.
ª 2015 The Authors.
Journal of Cellular and Molecular Medicine published by John Wiley & Sons Ltd and Foundation for Cellular and Molecular Medicine.
17
J. Cell. Mol. Med. Vol XX, No X, 2015

40. Xie R, Nguyen S, McKeehan WL, et al.Acetylated microtubules are required for
fusion of autophagosomes with lysosomes.
BMC Cell Biol. 2010; 11: 89. Doi:10.1186/
1471-2121-11-89.41. Strunk T, Richmond P, Prosser A, et al.
Method of bacterial killing differentially
affects the human innate immune responseto Staphylococcus epidermidis. Innate
Immun. 2011; 17: 508–16.
42. Kim R, Emi M, Tanabe K. Role ofmitochondria as the gardens of cell death.
Cancer Chemother Pharmacol. 2006; 57:
545–53.43. Oka T, Hikoso S, Yamaguchi O, et al. Mito-
chondrial DNA that escapes from autophagy
causes inflammation and heart failure. Nat-
ure. 2012; 485: 251–5.44. Ashida H, Mimuro H, Ogawa M, et al. Cell
death and infection: a double-edged sword
for host and pathogen survival. J Cell Biol.2011; 195: 931–42.
45. Kiang JG, Zhai M, Liao PJ, et al. PegylatedG-CSF inhibits blood cell depletion,
increases platelets, blocks splenomegaly,and improves survival after whole-body ion-
izing irradiation but not after irradiation com-
bined with burn. Oxid Med Cell Longev.2014; 2014: 481392. Doi:10.1155/2014/
481392.
18 ª 2015 The Authors.
Journal of Cellular and Molecular Medicine published by John Wiley & Sons Ltd and Foundation for Cellular and Molecular Medicine.


