Embed Size (px)
Citation preview

Annual Long Report and Audited Financial StatementsYear ended31 May 2021
AXA Distribution Investment ICVC

Contents Page
AXA Distribution Investment ICVC Page
Directory* 3
Report of the Directors of AXA Distribution Investment ICVC* 5
Fund Investment Commentaries* and Financial Statements
AXA Defensive Distribution Fund 6
AXA Distribution Fund 32
AXA Ethical Distribution Fund 58
AXA Global Distribution Fund 81
AXA Lifetime Distribution Fund 118
Accounting Policies 145
Statement of the Authorised Corporate Director's ("ACD") Responsibilities 149
Statement of the Depositary's Responsibilities 150
Report of the Independent Auditor 151
Further Information * 154
* Collectively, these comprise the Authorised Corporate Director’s Report.
AXA Distribution Investment ICVC
Issued by AXA Investment Managers UK Limited authorised andregulated by the Financial Conduct Authority
More detailed information about AXA Investment Managers’ UK funds is available on the Fund Centre of our website where you
can find the Prospectus, Key Investor Information Document (KIID), annual reports and monthly fund factsheets at: https://retail.axa -im.co.uk/fund-centre
2

Directory
The Company and Head Office
AXA Distribution Investment ICVC
22 Bishopsgate
London, EC2N 4BQ
Authorised Corporate Director ("ACD")
AXA Investment Managers UK Limited
22 Bishopsgate
London, EC2N 4BQ
www.axa‐im.co.uk
Authorised and regulated by the Financial Conduct Authority in the conduct of investment business.
Registered in England and Wales No. 01431068.
The company is a wholly owned subsidiary of AXA S.A., incorporated in France.
Member of the Investment Association (IA)
The Administrator and address for inspection of Register
SS&C Financial Services International Limited and SS&C Financial Services Europe Limited
SS&C House
St Nicholas Lane
Basildon
Essex, SS15 5FS
Authorised and regulated by the Financial Conduct Authority.
Sub‐Investment Managers
AXA Rosenberg Investment Management LLC
4 Orinda Way
Building E
Orinda
California
USA 94563
AXA Investment Managers Asia (Singapore) Limited
133 Cecil Street
Suite 100
# 15‐02 Keck Seng Tower
Singapore 069535
Legal Advisers
Eversheds LLP
One Wood Street
London, EC2V 7WS
Fund Accounting Administrator
State Street Bank & Trust Company
20 Churchill Place
London, E14 5HJ
Authorised and regulated by the Financial Conduct Authority.
AXA Distribution Investment ICVC
3

Directory
AXA Distribution Investment ICVC
Depositary
HSBC Bank plc,
8 Canada Square,
London, E14 5HQ
HSBC Bank plc is a subsidiary of HSBC Holdings plc.
Authorised by the Prudential Regulation Authority and regulated by the Financial Conduct Authority and the
Prudential Regulation Authority.
Independent Auditors' *
Ernst & Young LLP
Atria One
144 Morrison Street
Edinburgh, EH3 8EX
* Please note that effective 1st January 2021, our Independent Auditors for the fund range changed from PricewaterhouseCoopers
LLP to Ernst & Young LLP.
4

AXA Distribution Investment ICVC
Report of the Directors of AXA Distribution Investment ICVC
AXA Distribution Investment ICVC (“the Company”) is an investment company with variable capital incorporated in England and Wales and authorised by the Financial Conduct Authority (“FCA”).
Shareholders are not liable for the debts of the Company.
There are five sub‐funds which are currently available in the Company (each a “Fund”), and in the future there may be other sub‐funds in the Company.
Each Fund has the investment powers equivalent to those of a UCITS (Undertakings for Collective Investment in Transferrable Securities) under the FCA’s Collective Investment Schemes Sourcebook (“COLL”). The Funds are segregated portfolios of assets and, accordingly, the assets of a Fund belong exclusively to that Fund and shall not be used or made available to discharge (directly or indirectly) the liabilities of, or claims against, any other person or body, including the Company and any other Fund, and shall not be available for any such purpose. Further details in relation to the segregated nature of the Funds can be found in the Prospectus.
None of the sub‐funds included within this report have holdings in any of the Company's other sub‐funds.
Important Events During the Year
During the period from 1st June 2020 to 31st May 2021 there were no significant changes to the Prospectus or the Instrument of Incorporation.
Since 4 January 2021, AXA changed their registered office address from 155 Bishopsgate London, EC2M 3XJ to 22 Bishopsgate London, EC2N 4BQ.
Effective 1st January 2021, our Independent Auditors for the fund range changed from PricewaterhouseCoopers LLP to Ernst & Young LLP.
5

AXA Defensive Distribution Fund
Investment Manager's ReportFor the year ended 31 May 2021
Lower Risk Higher Risk
1 2 3 4 5 6 7
Why is this Fund in this category?
As at 31 May 2021
Potentially lower reward Potentially higher reward
AXA Distribution Investment ICVC
The risk category is calculated using historical performance data and may not be a reliable indicator of the Fund’s future risk
profile. The risk category shown is not guaranteed and may shift over time. The lowest category does not mean risk free.
The capital of the Fund is not guaranteed. The Fund is invested in financial markets and uses techniques and instruments which
are subject to some levels of variation, which may result in gains or losses.
Additional risks
Under normal market conditions the Fund’s key risk factors are:
• Interest rate risk ‐ is the risk that the market value of bonds held by the Fund could fall as a result of higher market rates
(yields). Yields can change as a result of, among other things, the economic and inflation outlook which also affects supply and
demand as well as future interest rate expectations, without necessarily a change in official central bank short term interest
rates. Higher yields result in a decline in the value of bonds. Conversely, lower yields tend to increase the value of bonds.
Duration (a measure based on the coupon and maturity payments schedule of a bond) is an important concept in understanding
how the price of that bond might change for a 1% move in its redemption yield. A bond with a longer duration is more sensitive
to a change in yields and, generally speaking, will experience more volatility in its market value than bonds with shorter
durations.
Investment Objective
Investment Policy
Risk and Reward Profile
The Manager has full discretion to select investments for the Fund in line with the above investment policy and in doing so may
take into consideration a composite benchmark made up of the following indices in the stated proportions: 29% FTSE All Share
Index; 27.5% FTSE Index Linked all Stocks; 27.5% FTSE Index Linked < 5 Years; 3.5% FTSE Gilts All Stocks; 3.5% FTSE Gilts < 5
years; 9% LIBID 7 Day (cash) (the “Benchmark”). This Benchmark best represents the types of bonds and companies in which the
Fund predominantly invests.
The aim of this Fund is to provide income with some prospect for long‐term capital growth.
The Fund invests in a mix of UK Government bonds, the majority of which are linked to the rate of inflation, shares in large and
medium sized UK listed companies, and cash. The Fund's typical asset mix would have at least a minimum investment in UK
Government bonds and cash of 60%. As a result of this asset mix Fund's value should be less volatile than a fund with a higher
proportion of its investments in shares. The Manager selects shares in companies based upon their prospects for future growth
in dividend payments following an in depth analysis of their financial status, quality of business model and corporate governance
arrangements. Investments in UK Government bonds are diversified across a range of maturities (i.e., the length of time for full
repayment of the bond by the Government).
This Fund is actively managed in reference to the Benchmark, which may be used by investors to compare the Fund's
performance.
By investing in a fund which invests primarily in fixed interest stocks you are likely to be looking for an investment which has
reduced risk and you are prepared to accept less potential reward than is the case with other funds. You are willing to accept
that your investment will fall and rise in value and that you could get back less than you invest. Typically, you would prefer an
investment with less risk than that of a fund which invests significantly in equities or overseas.
6

AXA Defensive Distribution Fund
Investment Manager's ReportFor the year ended 31 May 2021
AXA Distribution Investment ICVC
Index‐linked bonds bought in the secondary market (i.e., not directly from the issuer) whose capital values have been adjusted
upward due to inflation since issuance, may decline in value if there is a subsequent period of deflation.
Due to the sensitivity of these bonds to interest rates and expectations of future inflation, there is no guarantee that the value
of these bonds will correlate with inflation rates in the short to medium term.
Index‐linked bonds risk is an inherent risk of investing in index‐linked bonds. Exposure to this risk is managed by the allocation
decision on the proportion of the portfolio to invest in index‐linked bonds, as well as the amount of remaining maturity of these
bonds, which will affect their sensitivity in value, to changes in expected inflation levels.
Internal investment guidelines are set if necessary to ensure interest rate risk is maintained within a range deemed suitable
based on the individual fund’s investment objectives and investment policy. These guidelines could include measures of
sensitivity to changes of interest rates.
• Index‐linked bonds risk ‐ are fixed interest securities whose capital repayment amounts and interest payments are adjusted in
line with movements in inflation indices. They are designed to mitigate the effects of inflation on the value of a portfolio. The
market value of index‐linked bonds is determined by the market’s expectations of future movements in both interest rates and
inflation rates.
As with other bonds, the value of index‐linked bonds will generally fall when expectations of interest rates rise and vice versa.
However, when the market anticipates a rise in inflation rates, index‐linked bonds will generally outperform other bonds, and
vice versa.
• Risks linked to investment in sovereign debt ‐ the Fund may invest in bonds issued by countries and governments (sovereign
debt). The governmental entity that controls the repayment of sovereign debt may not be able or willing to repay the capital
and/or interest when due in accordance with the terms of such debt. In such a scenario, the value of investments of the Fund
may be adversely affected. A governmental entity’s willingness or ability to repay capital and interest due in a timely manner
may be affected by, among other factors, its cash flow situation, the extent of its foreign currency reserves, the availability of
sufficient foreign exchange on the date a payment is due, the relative size of the debt service burden to the economy as a
whole, the governmental entity’s policy towards the International Monetary Fund and the political constraints to which a
governmental entity may be subject. Governmental entities may also be dependent on expected disbursements from foreign
governments, multilateral agencies and others abroad to reduce principal and interest on their debt. In addition, there are no
bankruptcy proceedings for such issuers under which money to pay the debt obligations may be collected in whole or in part.
Holders may be requested to participate in the rescheduling of such sovereign debt and to extend further loans to the issuers.
Certain countries are especially large debtors to commercial banks and foreign governments. Investment in sovereign debt
issued or guaranteed by such countries (or their governments or governmental entities) involves a higher degree of risk than
investment in other sovereign debt.
Certain funds may be further subject to the risk of high concentration in bonds issued by and/or guaranteed by a single
sovereign issuer which is below investment grade and/or unrated which is also subject to higher credit risk. In the event of a
default of the sovereign issuer, the Fund may suffer significant loss.
This is an inherent risk for funds invested within sovereign bonds. Internal investment guidelines, scenario testing as well as
other regular monitoring seek to ensure the level of risk is aligned with each individual fund’s investment objectives and
investment policy.
• Equity risk ‐ the value of shares in which the Fund invests fluctuate pursuant to market expectations. The value of such shares
will go up and down and equity markets have historically been more volatile than fixed interest markets. Should the price of
shares in which the Fund has invested fall, the Net Asset Value of the Fund will also fall.
Funds investing in shares are generally more volatile than funds investing in bonds or a combination of shares and bonds, but
may also achieve greater returns.
7

AXA Defensive Distribution Fund
Investment Manager's ReportFor the year ended 31 May 2021
AXA Distribution Investment ICVC
• Counterparty risk ‐ at any one time, the Fund may be exposed to the creditworthiness and stability of the counterparties to
transactions entered into by the Fund (including derivative and stock lending and repo/reverse repo transactions). The Fund will
be subject to the risk of the inability of its counterparties to perform its obligations under such transactions (default), whether
due to insolvency, bankruptcy or other causes. In the event of the insolvency of a counterparty, the Fund might not be able to
recover cash or assets of equivalent value, to that invested, in full. The Fund may receive assets or cash from the counterparty
(collateral) to protect against any such adverse effect. Where relevant, a counterparty will forfeit its collateral if it defaults on
the transaction with the Fund. However, if the collateral is in the form of securities, there is a risk that when it is sold, it will
realise insufficient cash to settle the counterparty’s debt to the Fund under a transaction or to purchase replacement securities
that were lent to the counterparty under a stock lending arrangement. In relation to stock lending arrangements, there is also
the risk that while cash is recovered in the event of a default, the actual stock cannot be repurchased. Furthermore, to the
extent that collateral is not present to cover part or all of the debt, a counterparty default may result in losses for the affected
Fund. To assist in managing these types of risks, the ACD sets criteria around the types of eligible collateral the Fund may accept.
Please see the paragraph entitled “Treatment of Collateral” in the “Investment and borrowing powers applicable to the Funds”
section in Appendix II of the Prospectus for more information.
Transactions in securities that the Fund may enter into expose it to the risk that the counterparty will not deliver the investment for a purchase or cash for a sale after the Fund has contracted to fulfil its responsibilities. This is minimised by the practice in the majority of markets of delivery versus payment and short settlement periods.
Important Information
Derivatives transactions may be used in the Fund for meeting the investment objectives of the Fund. The use of derivatives in this manner is not expected to change the risk profile of the Fund.
Market Review
One year ago, this report referenced the mounting death toll from coronavirus which, at the time, was still spreading voraciously across the globe. Today, deaths worldwide are approaching four million and many developing nations are still suffering terribly from its impact. Within developed markets, we have benefited from the phenomenal efforts made by scientists, regulators and governments to research, develop and produce multiple vaccines that have substantially reduced the harming effects of the virus. After a long, long time spent restricted in each of our daily lives we are approaching a return to normal life.
Internal investment guidelines are set, if necessary, to ensure equity risk is maintained within a range deemed suitable based on
the individual fund’s investment objectives and investment policy.
Other risks which could have an impact in extreme market conditions include:
• Liquidity risk ‐ under certain market conditions, it may be difficult to buy or sell investments for the Fund. For example, smaller
company shares may trade infrequently and in small volumes and corporate and emerging market bonds may be affected by the
demand in the market for such securities carrying credit risk, particularly in times of significant market stress. As a result, it may
not be possible to buy or sell such investments at a preferred time, close to the last market price quoted or in the volume
desired. The Manager may be forced to buy or sell such investments as a consequence of Unitholders buying or selling Units in
the Fund. Depending on market conditions at the time, this could lead to a significant drop in the Fund’s value.
Monthly monitoring is conducted, using an in‐house liquidity tool, to ensure a high degree of confidence that Fund liquidity will
meet the Fund’s expected liquidity requirements. Any concerns indicated by the tool are analysed by the Manager’s risk team
who may also discuss the results with portfolio management staff, or other senior professionals within the firm, as needed, to
ensure an appropriate scrutiny.
Based on the analysis, the Manager believes that the liquidity profile of the Fund is appropriate.
Further explanation of the risks associated with an investment in this Fund can be found in the prospectus.
8

AXA Defensive Distribution Fund
Investment Manager's ReportFor the year ended 31 May 2021
AXA Distribution Investment ICVC
As economies around the world re‐open, investors have been questioning what the post‐lockdown world will look like. New
working practices, increased reliance on technology, less use of cash as a means of payment, growth in pet ownership, increased
domestic travel and many other factors will shape the post‐COVID‐19 world. Undoubtedly, following the temporary hibernation
of the global economy, there is a level of optimism about the coming months and possibly years and reference to the ‘roaring
20s’ points to the release of the pent up demand and ambition of populations around the world.
A saying coined (and often shared) by a well‐known fund manager and former colleague that ‘things will not become better or
worse but different’ rings true and investment markets have certainly been grappling with this in recent months.
For the Fund, market conditions over the past six months have been generally positive as investors have looked forward to a
normalisation of economic conditions. Since the beginning of December, conditions impacting investment markets have
followed in much the same vein as during the last reporting period. In short, conditions have been volatile. Equities have made
solid progress while fixed income has been challenged by the positive investor view of life in a post‐lockdown world. The FTSE All‐
Share Index (on a Total Return basis) rose 15.2% with the FTSE 100 (+14.09%) underperforming the mid cap (+18.43%) and the
FTSE Small Cap (ex‐Investment Companies) (+35.87%) indices. The FTSE UK Gilts All Stocks (TR) fell 4.82% over the six‐month
period, while the FTSE UK Gilts Index‐Linked (TR) All stocks index outperformed its conventional peer and falling 2.35%.
The prospect of a resurgent UK economy following the long months of lockdown has helped push the FTSE All‐Share Index higher – although it remains some way below its all‐time highs, unlike many international bourses. As life returns to normal, the tailwinds of pent‐up consumer demand, record business investment intentions, a buoyant residential property market and low interest rates are directing economists to project GDP growth of over 7% in 2021. However, with oil, commodity and other raw material prices pushing inflation up from very low levels, markets have been tying themselves up in knots about the potential for the years of supportive central bank policy being reversed and used to cool the economy. For the first time in years, the spectre of inflation has become a central concern for investors.
The combination of equities and inflation‐linked sovereign bonds, that continues to define the Distribution range of funds, position them ideally for the on‐going market conditions.
The quantum of money pumped into the financial system over the past 18 months has paled into insignificance the financial backing the same organisations gave following the global financial crisis. Unquestionably, this support has enabled the economy to keep going and saved many jobs from being lost. It also provided a strong underpin to fixed income markets as central banks reiterated their ‘lower for longer’ mantra. However, the impact of the vaccine rollout has brought economic optimism back to market and while we had been anticipating a modest move higher in yields over the course of 2021, the adjustment in Q1 2021 happened quicker and in a larger magnitude than we had been anticipating. Markets quickly priced in a continuation of the strong economic rebound and is currently anticipating two rate hikes from the US Federal Reserve by Q1 2023, while in GBP rates, the market is pricing in one hike by Q1 2023.
The bearish* momentum for bonds has stabilised for now but would anticipate a modest move higher in yields later in the summer as speculation around tapering of asset purchases is likely to rise. However, with much of the good news on the economy fully priced, positioning and the knock‐on implications to risk assets via higher discounting rates and tighter financial conditions will require close attention.
In our view, yield levels continue to offer some additional level of protection for the portfolios as the technical backdrop remains supportive, with global central banks continuing their asset purchase programmes. In addition, central banks have been explicit in their guidance on short rates, which will remain anchored until inflation is above their target for a sustained period. This backdrop should continue to be supportive for breakevens and inflation‐linked bonds.
9

AXA Defensive Distribution Fund
Investment Manager's ReportFor the year ended 31 May 2021
AXA Distribution Investment ICVC
Another factor having a significant impact on the UK equity market has been the growth of investor interest in environmental, social and governance (ESG) issues. The growing awareness of consumers, and in turn companies, of product provenance, the environmental impact and corporate behaviours is being reflected increasingly in sales rates. Within the portfolio, this is impacting every company we hold from Great Portland Estates to BP. Sustainability reports, carbon reduction targets and positive societal change are now the norm amongst the high‐quality businesses the fund invests in. On behalf of our unitholders, we have continued our investment and efforts in ESG and produce a monthly report covering a wide range of ESG metrics. These include measuring the Fund’s carbon and water intensity, monitoring the proportion of female executives on our holdings’ Boards, monitoring for controversies, scoring individual company holdings and assessing the overall ESG score of the Fund. Our intention is to expand the reporting of these, and other measures, in the years ahead.
Our positive view of the prospect for UK equities in 2021 has been reinforced by the takeover and IPO activity that have also
characterised the year to date. At the time of writing this report buyout transactions involving over £25bn in value of UK‐listed
companies have been announced (this does not include the unsuccessful approaches for several other companies).
Concurrently, there has been a long, and growing, list of companies revealing an intention to seek a public listing in the UK.
Significantly, the vast majority of the new listings have been successful and share prices have risen to a premium to their IPO
price which has encouraged more companies to follow. In the meantime, the UK government appears to be closing in on some
significant international trade agreements following Brexit, providing a further potential tailwind for the economy.
We have added to the Fund’s holding of Hill & Smith during the period where we see positive structural and cyclical drivers providing tailwinds for the business. On the structural side they are positioned well to make a positive contribution to issues including climate change, health & safety, population growth, increased urbanisation, infrastructure safety and vision zero (no road deaths). On the cyclical side, we think that the company is an excellent way to play the increased government spending on infrastructure and, in particular, President Biden’s US infrastructure package. This, however, is considered the icing on the cake as there are already large spending plans in place, such as Texas spending $77bn on their roads alone. Hill & Smith has also been quick to highlight the environmental benefits of galvanising as opposed to painting steel, thanks to its longevity and ability to be reused.
The new CEO Paul Simmons is bringing years of experience from Halma and applying it to the not‐too‐dissimilar Hill & Smith decentralised business model. We are particularly pleased that he has clarified the role and type of M&A he wants to achieve and expect to see a more rigorous approach to portfolio management and innovation. All of this means that we anticipate seeing a more consistent, higher level of organic growth than the Group has historically been able to produce and with it a likely higher rating.
Outlook
We remain positive about the prospects for UK equities over the period ahead. Valuations, in aggregate, remain attractive on both an absolute and relative (to international markets) basis. We are seeing a strong level of M&A activity which we anticipate will continue and new, interesting and attractively priced IPOs are offering new opportunities.
While it is inevitable that conditions will remain volatile, we continue to believe that macro events cannot be accurately nor consistently predicted. As such, the Fund retains a preference for longer‐term structural trends and quality companies that can deliver robust, reliable and consistent growth, supported by a simple government bond and cash hedge.
10

AXA Defensive Distribution Fund
Investment Manager's ReportFor the year ended 31 May 2021
AXA Distribution Investment ICVC
Performance
Past performance is not a guide for future performance.
Cost (£'000) Proceeds (£'000)
● UK Treasury 4.25% 07/06/32 6,393 4,413
● UK Treasury 0.125% IL 22/03/26 4,218 4,000
● UK Treasury 4.25% 07/12/40 3,005 3,359
● UK Treasury 0.125% IL 22/03/29 2,769 2,988
● UK Treasury 0.125% IL 10/08/31 2,663 2,576
AXA Investment Managers UK Limited
The performance of the equity holdings within the portfolio continued to outperform the FTSE All‐Share Index during the period under review. Equity holdings in the Technology and Consumer Services sectors were the main contributors to the outperformance. Just Group Plc and Luceco were among the main contributors to performance in the period. We participated in several IPOs during the review period including that of Moonpig. The company is the UK’s market‐leading online greetings cards e‐commerce operator. The business currently comprises its UK division with a 60% market share in the UK and, under the Greetz brand in the Netherlands, enjoys 65% market share. The business offers investors an appealing combination of highly-visible double digit growth, high operating margins and cash generation. Growth is underpinned by: 1) online shift at 10‐15% p.a., 2) growth‐driving initiatives (e.g. shifting customers onto market‐leading app and reminders), and 3) driving increases inthe gift attach rate, from 16% up towards the industry average of 70%. W H Smith (+19.0%), which owns online card retailerfunkypigeon.com, was boosted by interest in the online card segment as well as the prospects for a re‐opening economy.
Major Sales
● UK Treasury 1.875% IL 22/11/22
● UK Treasury 2% 22/07/20
● Codemasters
● UK Treasury 0.5% IL 22/03/50
● GlaxoSmithKline
Jamie Forbes‐Wilson, Matthew Huddart
31 May 2021
Major Purchases
All performance data source: AXA Investment Managers and Morningstar.
* In broad terms, rising prices indicate bullish market sentiment, while falling prices indicate bearish market sentiment.
11

Portfolio Statement Market Value % of Total
As at 31 May 2021 Holding £’000 Net Assets
BONDS 61.14% (31/05/20: 60.53%)
Corporate Bonds 0.00% (31/05/20: 0.00%)
Lambay Capital Securities FRN Perpetual ** 337,000 ‐ ‐
Index Linked Government Bonds 53.83% (31/05/20: 55.78%)
UK Treasury 0.125% IL 22/03/24 26,046,083 35,173 14.54
UK Treasury 0.125% IL 22/03/26 10,000,000 13,418 5.55
UK Treasury 0.125% IL 10/08/28 1,280,000 1,686 0.70
UK Treasury 0.125% IL 22/03/29 1,750,000 2,739 1.13
UK Treasury 0.125% IL 10/08/31 2,000,000 2,675 1.11
UK Treasury 0.125% IL 22/03/44 2,014,923 4,131 1.71
UK Treasury 0.125% IL 22/03/46 733,580 1,465 0.61
UK Treasury 0.125% IL 22/11/56 700,000 1,676 0.69
UK Treasury 0.125% IL 22/03/58 549,455 1,403 0.58
UK Treasury 0.125% IL 22/11/65 947,000 2,803 1.16
UK Treasury 0.125% IL 22/03/68 1,087,143 3,616 1.50
UK Treasury 0.25% IL 22/03/52 1,504,395 3,696 1.53
UK Treasury 0.375% IL 22/03/62 1,265,361 4,038 1.67
UK Treasury 0.5% IL 22/03/50 807,083 2,275 0.94
UK Treasury 0.625% IL 22/03/40 678,056 1,565 0.65
UK Treasury 0.625% IL 22/11/42 2,072,670 5,162 2.13
UK Treasury 0.75% IL 22/03/34 2,132,690 4,051 1.68
UK Treasury 0.75% IL 22/11/47 1,555,791 4,506 1.86
UK Treasury 1.125% IL 22/11/37 1,274,343 3,202 1.32
UK Treasury 1.25% IL 22/11/27 692,873 1,380 0.57
UK Treasury 1.25% IL 22/11/32 1,718,983 3,561 1.47
UK Treasury 1.25% IL 22/11/55 271,685 1,120 0.46
UK Treasury 1.875% IL 22/11/22 5,500,000 8,658 3.58
UK Treasury 2% IL 26/01/35 881,745 2,561 1.06
UK Treasury 2.5% IL 17/07/24 2,648,119 9,467 3.92
UK Treasury 4.125% IL 22/07/30 1,118,053 4,141 1.71
Traditional Government Bonds 7.31% (31/05/20: 4.75%)
UK Treasury 0% 07/06/21 5,027,381 5,027 2.08
UK Treasury 3.25% 22/01/44 1,151,427 1,588 0.66
UK Treasury 3.75% 22/07/52 183,548 298 0.12
UK Treasury 4.25% 07/06/32 4,720,913 6,350 2.63
UK Treasury 4.25% 07/03/36 400,000 570 0.23
UK Treasury 4.25% 07/12/40 2,105,913 3,196 1.32
UK Treasury 4.5% 07/12/42 239,224 383 0.16
UK Treasury 4.75% 07/12/38 173,575 271 0.11
TOTAL BONDS 147,851 61.14
BASIC MATERIALS 1.93% (31/05/20: 1.64%*)
Industrial Metals & Mining 1.93% (31/05/20: 1.64%*)
Hill & Smith 76,516 1,174 0.48
Rio Tinto 43,060 2,606 1.08
Trifast 575,767 893 0.37
TOTAL BASIC MATERIALS 4,673 1.93
AXA Distribution Investment ICVC
AXA Defensive Distribution Fund
12

Portfolio Statement Market Value % of Total
As at 31 May 2021 Holding £’000 Net Assets
AXA Distribution Investment ICVC
AXA Defensive Distribution Fund
CONSUMER DISCRETIONARY 9.84% (31/05/20: 7.48%*)
Household Goods & Home Construction 1.83% (31/05/20: 1.58%)
Countryside Properties 265,910 1,344 0.56
Redrow 223,609 1,526 0.63
Watkin Jones 703,930 1,552 0.64
Leisure Goods 0.55% (31/05/20: 1.21%)
Games Workshop 11,181 1,334 0.55
Media 0.47% (31/05/20: 0.40%*)
Everyman Media 758,000 1,137 0.47
Retailers 3.39% (31/05/20: 1.02%*)
Dunelm 78,944 1,157 0.48
Howden Joinery 171,549 1,371 0.57
Moonpig 320,015 1,463 0.60
Pets at Home 409,948 1,840 0.76
Virgin Wines UK 640,714 1,474 0.61
Wickes 350,000 900 0.37
Travel & Leisure 3.60% (31/05/20: 3.27%*)
Domino's Pizza 287,067 1,062 0.44
Gym 897,284 2,490 1.03
Loungers 887,647 2,352 0.97
On the Beach 286,863 1,173 0.49
TEN Entertainment 486,133 1,220 0.50
Trainline 140,709 400 0.17
TOTAL CONSUMER DISCRETIONARY 23,795 9.84
CONSUMER STAPLES 0.45% (31/05/20: 1.07%*)
Beverages 0.45% (31/05/20: 1.07%)
Diageo 32,294 1,097 0.45
TOTAL CONSUMER STAPLES 1,097 0.45
ENERGY 0.83% (31/05/20: 1.53%*)
Oil, Gas & Coal 0.83% (31/05/20: 1.53%*)
BP 246,593 756 0.31
Royal Dutch Shell 'A' Shares 45,901 621 0.26
Royal Dutch Shell 'B' Shares 48,448 624 0.26
TOTAL ENERGY 2,001 0.83
FINANCIALS 7.16% (31/05/20: 8.96%*)
Banks 0.52% (31/05/20: 1.21%)
Barclays 309,478 573 0.24
HSBC 149,070 683 0.28
Closed End Investments 0.35% (31/05/20: 0.44%*)
Syncona 402,324 855 0.35
13
Portfolio Statement Market Value % of Total
As at 31 May 2021 Holding £’000 Net Assets
AXA Distribution Investment ICVC
AXA Defensive Distribution Fund
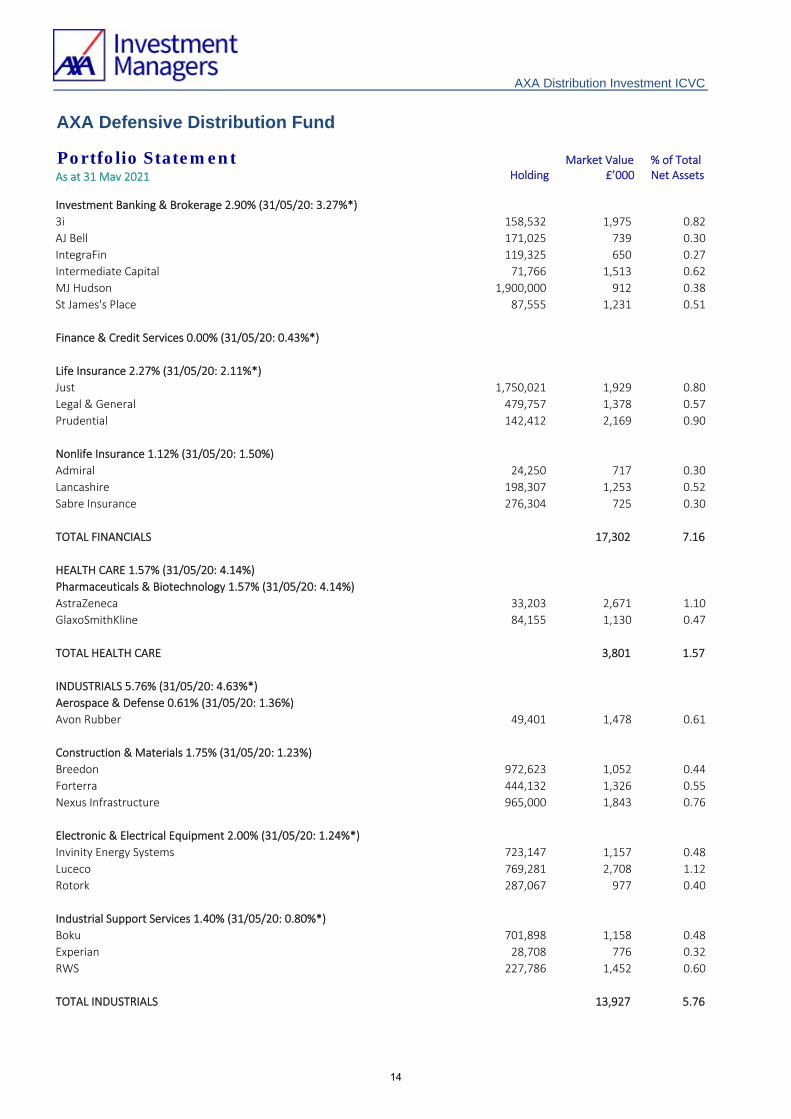
Investment Banking & Brokerage 2.90% (31/05/20: 3.27%*)
3i 158,532 1,975 0.82
AJ Bell 171,025 739 0.30
IntegraFin 119,325 650 0.27
Intermediate Capital 71,766 1,513 0.62
MJ Hudson 1,900,000 912 0.38
St James's Place 87,555 1,231 0.51
Finance & Credit Services 0.00% (31/05/20: 0.43%*)
Life Insurance 2.27% (31/05/20: 2.11%*)
Just 1,750,021 1,929 0.80
Legal & General 479,757 1,378 0.57
Prudential 142,412 2,169 0.90
Nonlife Insurance 1.12% (31/05/20: 1.50%)
Admiral 24,250 717 0.30
Lancashire 198,307 1,253 0.52
Sabre Insurance 276,304 725 0.30
TOTAL FINANCIALS 17,302 7.16
HEALTH CARE 1.57% (31/05/20: 4.14%)
Pharmaceuticals & Biotechnology 1.57% (31/05/20: 4.14%)
AstraZeneca 33,203 2,671 1.10
GlaxoSmithKline 84,155 1,130 0.47
TOTAL HEALTH CARE 3,801 1.57
INDUSTRIALS 5.76% (31/05/20: 4.63%*)
Aerospace & Defense 0.61% (31/05/20: 1.36%)
Avon Rubber 49,401 1,478 0.61
Construction & Materials 1.75% (31/05/20: 1.23%)
Breedon 972,623 1,052 0.44
Forterra 444,132 1,326 0.55
Nexus Infrastructure 965,000 1,843 0.76
Electronic & Electrical Equipment 2.00% (31/05/20: 1.24%*)
Invinity Energy Systems 723,147 1,157 0.48
Luceco 769,281 2,708 1.12
Rotork 287,067 977 0.40
Industrial Support Services 1.40% (31/05/20: 0.80%*)
Boku 701,898 1,158 0.48
Experian 28,708 776 0.32
RWS 227,786 1,452 0.60
TOTAL INDUSTRIALS 13,927 5.76
14

Portfolio Statement Market Value % of Total
As at 31 May 2021 Holding £’000 Net Assets
AXA Distribution Investment ICVC
AXA Defensive Distribution Fund
REAL ESTATE 0.37% (31/05/20: 0.52%*)
Real Estate Investment & Services 0.37% (31/05/20: 0.52%)
Grainger 310,697 894 0.37
TOTAL REAL ESTATE 894 0.37
TECHNOLOGY 4.13% (31/05/20: 2.65%*)
Software & Computer Services 2.70% (31/05/20: 1.85%*)
Auction Technology 54,384 620 0.26
AVEVA 47,206 1,643 0.68
Bytes Technology 185,000 923 0.38
Eckoh ^ 1,536,465 1,014 0.42
Future 47,187 1,393 0.58
GB 100,000 926 0.38
Technology Hardware & Equipment 1.43% (31/05/20: 0.80%*)
IQE 1,330,683 717 0.30
TT Electronics 1,088,884 2,744 1.13
TOTAL TECHNOLOGY 9,980 4.13
TELECOMMUNICATIONS 0.67% (31/05/20: 0.63%)
Telecommunications Equipment 0.29% (31/05/20: 0.00%)
Spirent Communications 281,270 704 0.29
Telecommunications Service Providers 0.38% (31/05/20: 0.63%*)
Telecom Plus 78,815 930 0.38
TOTAL TELECOMMUNICATIONS 1,634 0.67
UTILITIES 0.58% (31/05/20: 0.64%)
Electricity 0.58% (31/05/20: 0.64%)
SSE 89,710 1,395 0.58
TOTAL UTILITIES 1,395 0.58
Portfolio of investments 228,350 94.43
Net other assets 13,458 5.57
Total net assets 241,808 100.00
All investments are ordinary shares unless otherwise stated.
All bonds are denominated in Sterling (unless otherwise indicated).
^ These are AIM (Alternative Investment Market) holdings.
** These stocks have either been suspended, delisted or are in liquidation. They are included at the Manager’s valuation.
* Since the previous report, the portfolio classifications and prior year comparative figures have been updated to reflect the
recent changes in the Industry Classification Benchmark (ICB) standard.
15

Comparative TablesAs at 31 May 2021
31/05/2021 31/05/2020 31/05/2019 31/05/2021 31/05/2020 31/05/2019
Change in net assets per share (p) (p) (p) (p) (p) (p)
Opening net asset value per share † 120.90 121.74 118.71 112.87 115.24 114.51
Return before operating charges ^ 11.70 (0.20) 3.64 10.90 (0.16) 3.47
Operating charges ^ (0.66) (0.64) (0.61) (0.61) (0.60) (0.59)
Return after operating charges ^ 11.04 (0.84) 3.03 10.29 (0.76) 2.88
Distributions (0.46) (1.74) (2.23) (0.43) (1.61) (2.15)
Retained distributions on accumulation
shares0.46 1.74 2.23 ‐ ‐ ‐
Closing net asset value per share † 131.94 120.90 121.74 122.73 112.87 115.24
*^ after direct transaction costs of: 0.03 0.07 0.01 0.02 0.07 0.01
Performance
Return after operating charges 9.13% ‐0.69% 2.55% 9.12% ‐0.66% 2.52%
Other information
Closing net asset value (£) † 2,805,273 2,884,889 2,669,985 63,508 58,808 59,908
Closing number of shares 2,126,157 2,386,080 2,193,246 51,748 52,103 51,985
Operating charges ^ 0.53% 0.53% 0.52% 0.53% 0.53% 0.52%
Direct transaction costs * 0.02% 0.06% 0.01% 0.02% 0.06% 0.01%
Prices
Highest share price # 132.30 126.40 121.80 123.20 118.50 116.30
Lowest share price # 120.60 102.90 113.30 112.60 96.17 108.50
31/05/2021 31/05/2020 31/05/2019 31/05/2021 31/05/2020 31/05/2019
Change in net assets per share (p) (p) (p) (p) (p) (p)
Opening net asset value per share † 136.01 136.81 133.27 118.48 120.85 119.97
Return before operating charges ^ 13.17 (0.22) 4.09 11.45 (0.17) 3.62
Operating charges ^ (0.60) (0.58) (0.55) (0.52) (0.51) (0.50)
Return after operating charges ^ 12.57 (0.80) 3.54 10.93 (0.68) 3.12
Distributions (0.52) (1.92) (2.51) (0.45) (1.69) (2.24)
Retained distributions on accumulation
shares0.52 1.92 2.51 ‐ ‐ ‐
Closing net asset value per share † 148.58 136.01 136.81 128.96 118.48 120.85
*^ after direct transaction costs of: 0.03 0.08 0.02 0.02 0.07 0.01
Performance
Return after operating charges 9.24% ‐0.58% 2.66% 9.23% ‐0.56% 2.60%
Other information
Closing net asset value (£) † 186,394,636 184,315,754 204,755,170 1,838,369 1,987,641 2,159,873
Closing number of shares 125,454,251 135,513,040 149,660,744 1,425,541 1,677,577 1,787,191
Operating charges ^ 0.43% 0.43% 0.42% 0.43% 0.43% 0.42%
Direct transaction costs * 0.02% 0.06% 0.01% 0.02% 0.06% 0.01%
Prices
Highest share price # 148.90 142.10 136.90 129.50 124.40 122.00
Lowest share price # 135.70 115.70 127.20 118.20 100.90 113.70
AXA Distribution Investment ICVC
A Gross Accumulation A Gross Income
B Gross Accumulation B Gross Income
AXA Defensive Distribution Fund
16
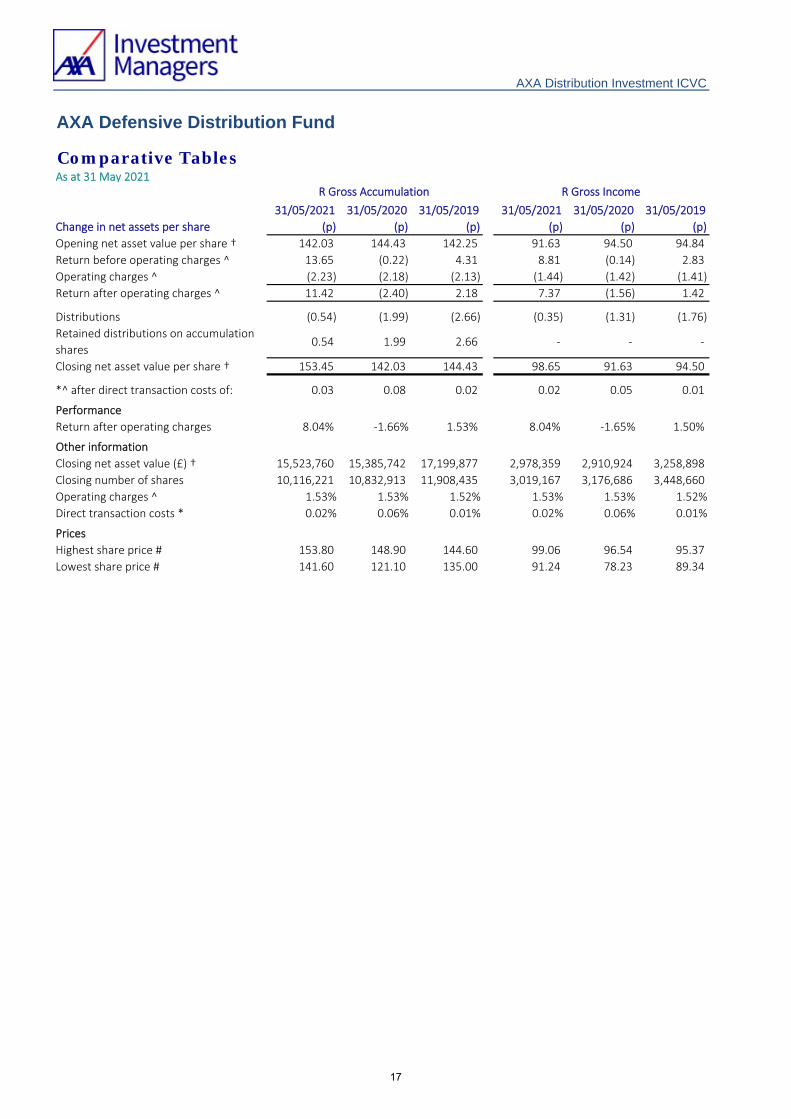
Comparative TablesAs at 31 May 2021
AXA Distribution Investment ICVC
AXA Defensive Distribution Fund
31/05/2021 31/05/2020 31/05/2019 31/05/2021 31/05/2020 31/05/2019
Change in net assets per share (p) (p) (p) (p) (p) (p)
Opening net asset value per share † 142.03 144.43 142.25 91.63 94.50 94.84
Return before operating charges ^ 13.65 (0.22) 4.31 8.81 (0.14) 2.83
Operating charges ^ (2.23) (2.18) (2.13) (1.44) (1.42) (1.41)
Return after operating charges ^ 11.42 (2.40) 2.18 7.37 (1.56) 1.42
Distributions (0.54) (1.99) (2.66) (0.35) (1.31) (1.76)
Retained distributions on accumulation
shares0.54 1.99 2.66 ‐ ‐ ‐
Closing net asset value per share † 153.45 142.03 144.43 98.65 91.63 94.50
*^ after direct transaction costs of: 0.03 0.08 0.02 0.02 0.05 0.01
Performance
Return after operating charges 8.04% ‐1.66% 1.53% 8.04% ‐1.65% 1.50%
Other information
Closing net asset value (£) † 15,523,760 15,385,742 17,199,877 2,978,359 2,910,924 3,258,898
Closing number of shares 10,116,221 10,832,913 11,908,435 3,019,167 3,176,686 3,448,660
Operating charges ^ 1.53% 1.53% 1.52% 1.53% 1.53% 1.52%
Direct transaction costs * 0.02% 0.06% 0.01% 0.02% 0.06% 0.01%
Prices
Highest share price # 153.80 148.90 144.60 99.06 96.54 95.37
Lowest share price # 141.60 121.10 135.00 91.24 78.23 89.34
R Gross Accumulation R Gross Income
17

Comparative TablesAs at 31 May 2021
AXA Distribution Investment ICVC
AXA Defensive Distribution Fund
31/05/2021 31/05/2020 31/05/2019 31/05/2021 31/05/2020 31/05/2019
Change in net assets per share (p) (p) (p) (p) (p) (p)
Opening net asset value per share † 207.31 209.25 204.55 98.65 100.98 100.59
Return before operating charges ^ 20.03 (0.33) 6.26 9.51 (0.15) 3.02
Operating charges ^ (1.67) (1.61) (1.56) (0.79) (0.77) (0.76)
Return after operating charges ^ 18.36 (1.94) 4.70 8.72 (0.92) 2.26
Distributions (0.79) (2.92) (3.84) (0.37) (1.41) (1.87)
Retained distributions on accumulation
shares0.79 2.92 3.84 ‐ ‐ ‐
Closing net asset value per share † 225.67 207.31 209.25 107.00 98.65 100.98
*^ after direct transaction costs of: 0.04 0.12 0.02 0.02 0.06 0.01
Performance
Return after operating charges 8.86% ‐0.93% 2.30% 8.84% ‐0.91% 2.25%
Other information
Closing net asset value (£) † 30,059,776 29,354,017 34,441,617 2,143,845 2,383,737 2,776,720
Closing number of shares 13,320,531 14,159,732 16,459,382 2,003,571 2,416,306 2,749,859
Operating charges ^ 0.78% 0.78% 0.77% 0.78% 0.78% 0.77%
Direct transaction costs * 0.02% 0.06% 0.01% 0.02% 0.06% 0.01%
Prices
Highest share price # 226.20 216.80 209.40 107.40 103.70 101.90
Lowest share price # 206.80 176.40 194.90 98.41 84.10 95.16
† Valued at bid‐market prices.
# High and low price disclosures are based on quoted share prices (Mid Market Price). Therefore the opening and closing NAV
prices may fall outside the high / low price threshold.
The figures used within the table have been calculated against the average net asset value for the accounting year.
* Direct transaction costs include fees, commissions, transfer taxes and duties in the purchasing and selling of investments,
within the accounting year.
Z Gross Accumulation Z Gross Income
^ Operating charges include indirect costs incurred in the maintenance and running of the Fund, as disclosed in the detailed
expenses within the Statement of Total Return.
18

AXA Defensive Distribution Fund
Statement of Total ReturnFor the year ended 31 May 2021
Note £'000 £'000 £'000 £'000
Income:Net capital gains/(losses) 2 20,992 (4,324)Revenue 3 941 3,680
Expenses 4 (1,317) (1,400)Interest payable and similar charges ‐ ‐
Net (expense)/revenue before taxation (376) 2,280
Taxation 5 (12) (22)
Net (expense)/revenue after taxation (388) 2,258
Total return before distributions 20,604 (2,066)
Distributions 6 (864) (3,596)
Change in net assets attributable to Shareholders
from investment activities 19,740 (5,662)
Statement of Change in Net Assets Attributable to Shareholders For the year ended 31 May 2021
£'000 £'000 £'000 £'000
Opening net assets attributable to Shareholders 239,282 267,322
Amounts receivable on issue of shares 3,623 2,529 Amounts payable on cancellation of shares (21,671) (28,339)
(18,048) (25,810)
Change in net assets attributable to Shareholdersfrom investment activities (see above) 19,740 (5,662)
Retained distributions on accumulation shares 834 3,432
Closing net assets attributable to Shareholders 241,808 239,282
AXA Distribution Investment ICVC
31/05/21 31/05/20
31/05/21 31/05/20
19

AXA Defensive Distribution Fund
Balance SheetAs at 31 May
Note £'000 £'000Assets:
Fixed assets:
Investments 228,350 225,921
Current assets:
Debtors 7 2,149 513
Cash and bank balances 8 12,017 13,208
Total assets 242,516 239,642
Liabilities:
Creditors:
Distribution payable (12) (11)
Other creditors 9 (696) (349)
Total liabilities (708) (360)
Net assets attributable to Shareholders 241,808 239,282
31/05/21 31/05/20
AXA Distribution Investment ICVC
20
AXA Defensive Distribution Fund
Notes to the Financial Statements For the year ended 31 May 2021
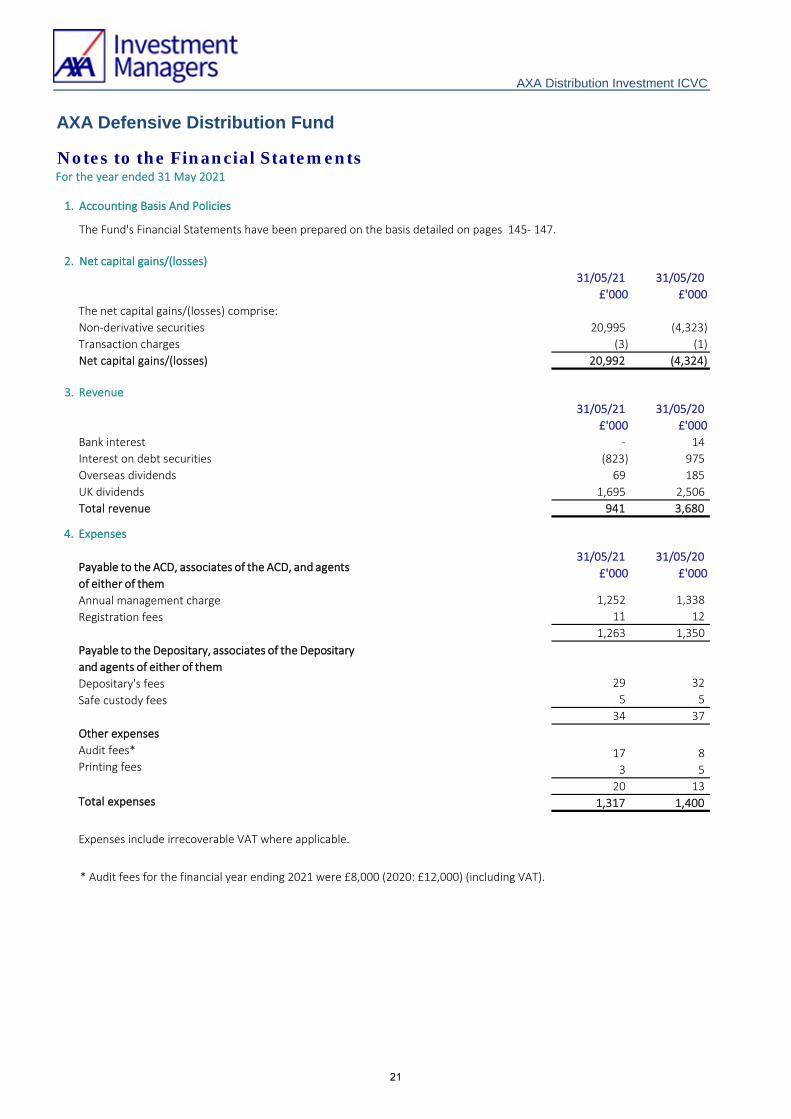
31/05/21 31/05/20
£'000 £'000
The net capital gains/(losses) comprise:
Non‐derivative securities 20,995 (4,323)
Transaction charges (3) (1)
Net capital gains/(losses) 20,992 (4,324)
3. Revenue
31/05/21 31/05/20
£'000 £'000
Bank interest ‐ 14
Interest on debt securities (823) 975
Overseas dividends 69 185
UK dividends 1,695 2,506
Total revenue 941 3,680
31/05/21 31/05/20
£'000 £'000
1,252 1,338
11 12
1,263 1,350
29 32
5 5
34 37
17 8
3 5
20 13
1,317 1,400
AXA Distribution Investment ICVC
1. Accounting Basis And Policies
The Fund's Financial Statements have been prepared on the basis detailed on pages 145- 147.
2. Net capital gains/(losses)
4. Expenses
Payable to the ACD, associates of the ACD, and agents
of either of them
Annual management charge
Registration fees
Payable to the Depositary, associates of the Depositary
and agents of either of them
Depositary's fees
Safe custody fees
Other expenses
Audit fees*Printing fees
Total expenses
Expenses include irrecoverable VAT where applicable.
* Audit fees for the financial year ending 2021 were £8,000 (2020: £12,000) (including VAT).
21

AXA Defensive Distribution Fund
Notes to the Financial Statements For the year ended 31 May 2021
AXA Distribution Investment ICVC
5. Taxation
31/05/21 31/05/20
£'000 £'000
(a) Analysis of the tax charge in the year
Irrecoverable overseas tax 12 22
(b) Factors affecting tax charge for the year
31/05/21 31/05/20
£'000 £'000
Net (expense)/revenue before taxation (376) 2,280
Net (expense)/revenue for the year multiplied by the standard rate of corporation tax (75) 456
Effects of:
Irrecoverable overseas tax 12 22
Movement in excess management expenses 1,135 442
Relief for indexation on UK Gilts (707) (360)
Revenue not subject to corporation tax (353) (538)
Current tax charge for the year 12 22
(c) Deferred taxation:
(d) Factors that may affect future tax charges
There is no provision required for deferred taxation at the balance sheet date in the current year or prior year.
OEICs are exempt from tax on capital gains in the UK. Therefore, any capital return is not included within the reconciliation
above.
The tax assessed for the year is higher than the standard rate of corporation tax for an open ended investment company of
20% (2020: 20%) is applied to the net (expense)/revenue before taxation. The differences are explained below:
At the year end, after offset against revenue taxable on receipt, there is a potential deferred tax asset of £19,986,703 (2020:
£18,851,367) in relation to surplus management expenses. It is unlikely that the Fund will generate sufficient taxable profits
in the future to utilise this amount and therefore no deferred tax asset has been recognised in the year.
22

AXA Defensive Distribution Fund
Notes to the Financial Statements For the year ended 31 May 2021
AXA Distribution Investment ICVC
6. Distributions
31/05/21 31/05/20
£'000 £'000
First interim 311 1,366
Second interim 11 984
Third interim 130 825
Final 407 368
Add: Revenue paid on cancellation of shares 8 59
Deduct: Revenue received on creation of shares (3) (6)
Net distribution for the year 864 3,596
Reconciliation of net (expense)/revenue after taxation to distributions
Net (expense)/revenue after taxation (388) 2,258
Expenses charged to capital 1,252 1,338
Net distribution for the year 864 3,596
7. Debtors 31/05/21 31/05/20
£'000 £'000
Amounts receivable for creation of shares 412 16
Sales awaiting settlement 1,245 ‐
Accrued revenue 472 469
Overseas tax recoverable 20 28
Total debtors 2,149 513
8. Cash and bank balances 31/05/21 31/05/20
£'000 £'000
Cash and bank balances 12,017 13,208
Total cash and bank balances 12,017 13,208
9. Other creditors 31/05/21 31/05/20
£'000 £'000
Amounts payable for cancellation of shares 467 130
Accrued annual management charge 202 198
Accrued other expenses 27 21
Total other creditors 696 349
10. Related party transactions
Monies received and paid by the ACD through the creation and cancellation of shares are disclosed in the Statement of
Change in Shareholders’ Net Assets and amounts due at the year end are disclosed in Notes 7 and 9.
Annual management charge paid to the ACD and Registration fees are disclosed in Note 4 and amounts due at the year end
are disclosed in Note 9.
The distributions take account of revenue received on the creation of shares and revenue deducted on the cancellation of
shares, and comprise:
The ACD and its associates (including other authorised investment Funds managed by the ACD) have no shareholdings in the
Company at the year end.
The ACD is related to the Fund as defined by Financial Reporting Standard 102.33 ‘Related Party Disclosures’.
23

AXA Defensive Distribution Fund
Notes to the Financial Statements For the year ended 31 May 2021
AXA Distribution Investment ICVC
11. Share classes
Annual
management
charge rate
(%) 31/05/20 Issued Cancelled Converted 31/05/21
A Gross Accumulation 0.50 2,386,080 302,629 (562,552) ‐ 2,126,157
A Gross Income 0.50 52,103 1,485 (1,840) ‐ 51,748
B Gross Accumulation 0.40 135,513,040 158,832 (10,217,621) ‐ 125,454,251
B Gross Income 0.40 1,677,577 2,185 (254,221) ‐ 1,425,541
R Gross Accumulation 1.50 10,832,913 421,023 (1,137,715) ‐ 10,116,221
R Gross Income 1.50 3,176,686 12,015 (169,534) ‐ 3,019,167
Z Gross Accumulation 0.75 14,159,732 1,035,381 (1,874,582) ‐ 13,320,531
Z Gross Income 0.75 2,416,306 79,326 (492,061) ‐ 2,003,571
12. Commitments, contingent liabilities and contingent assets
13. Derivatives and other financial instruments
The functional currency of the Fund is Sterling. There was immaterial direct foreign currency exposure within the Fund at
the balance sheet date.
A 10% increase in the value of the Fund’s portfolio would have the effect of increasing the return and net assets by
£22,835,008 (2020: £22,592,092). A 10% decrease would have an equal and opposite effect.
Market price risk sensitivity
Market price risk
The Fund invests principally in equity and fixed income securities. The value of the Fund’s investment portfolio is not fixed
and may go down as well as up. This may be as a result of a specific factor affecting the value of an individual company or
may be caused by general market factors (such as government policy or the health of the underlying economy) which can
affect the entire portfolio. The Fund seeks to manage these risks by adhering to investment guidelines and to investment
and borrowing powers set out in the Prospectus. In addition, the Fund complies with the Collective Investment Schemes
sourcebook (“COLL”), which include rules relating to investment holdings that are designed to place limits on the Fund’s
investment concentration (same as at 31 May 2020).
The main risks from the Fund's holding of financial instruments, together with the ACD’s policy for managing these risks, are
outlined below.
Foreign currency risk
The reconciliation of the opening and closing numbers of shares of each class, along with the ACD’s annual management
charges applicable to each class, is shown below:
There are no commitments, contingent liabilities and contingent assets as at the balance sheet date (2020: nil).
24

AXA Defensive Distribution Fund
Notes to the Financial Statements For the year ended 31 May 2021
AXA Distribution Investment ICVC
The table below shows the interest rate risk profile at the balance sheet date:
Floating rate
financial
assets
Fixed rate
financial
assets
Financial
assets not
carrying
interest Total
Currency Assets £'000 £'000 £'000 £'000
31/05/21
Pound sterling 12,017 147,851 82,603 242,471
Euro ‐ ‐ 20 20
US dollar ‐ ‐ 25 25
Total 12,017 147,851 82,648 242,516
31/05/20
Pound sterling 13,208 144,833 81,514 239,555
Euro ‐ ‐ 21 21
US dollar ‐ ‐ 66 66
Total 13,208 144,833 81,601 239,642
Floating rate
financial
liabilities
Fixed rate
financial
liabilities
Financial
liabilities not
carrying
interest Total
Currency Liabilities £'000 £'000 £'000 £'000
31/05/21
Pound sterling ‐ ‐ (708) (708)
Total ‐ ‐ (708) (708)
31/05/20
Pound sterling ‐ ‐ (360) (360)
Total ‐ ‐ (360) (360)
Fixed interest securities are particularly affected by trends in interest rates and inflation. If interest rates go up, the value of
capital may fall, and vice versa. Inflation will also decrease the real value of capital, with the exception of index linked bonds
which are protected against the effect of inflation.
Interest rate risk
Changes in interest rates or changes in expectations of future interest rates may result in an increase or decrease in the market value of the investments held. A 1% increase in interest rates would have the effect of decreasing the return and net assets £18,171,590 (2020: £18,836,338) . A 1% decrease would have an equal and opposite effect.
25

AXA Defensive Distribution Fund
Notes to the Financial Statements For the year ended 31 May 2021
AXA Distribution Investment ICVC
31/05/21 31/05/20
Market Value % Market Value %
£’000 £’000
147,851 61.14 144,833 60.53
147,851 61.14 144,833 60.53
14. Portfolio transaction costs
Net purchase
cost
Commissions
paid Taxes
Total
purchase cost
31/05/2021 £'000 £'000 % £'000 % £'000
Analysis of purchases
Bonds 22,921 ‐ ‐ ‐ ‐ 22,921
Equities 12,682 4 0.03 28 0.22 12,714Total 35,603 4 28 35,635
Net sale
proceeds
Commissions
paid Taxes
Total sale
proceeds
31/05/2021 £'000 £'000 % £'000 % £'000
Analysis of sales
Bonds 15,429 ‐ ‐ ‐ ‐ 15,429
Collective Investment Schemes 309 ‐ ‐ ‐ ‐ 309
Equities 36,615 (15) (0.04) ‐ ‐ 36,600Total 52,353 (15) ‐ 52,338
The Fund runs a very low credit risk in respect of unsettled investment transactions as these are normally settled as cash
against delivery.
Fixed interest investments are exposed to credit risk which reflects the ability of the bond issuer to meet its obligations.
Generally, the higher the rate of interest, the higher the perceived credit risk of the issuer. The ACD monitors the credit
quality and risk of the portfolio as a part of the overall investment process and in accordance with the objective and policy
of each fund.
Transactions in securities may expose a fund to the risk that the counterparty will not settle the transaction or do so on a
timely basis.
All transactions in the funds are conducted through counterparties approved by the ACD.
A breakdown of the investment portfolio by credit rating is disclosed on the table below:
Credit Rating Investment grade (BBB- credit rating and above)Total value of bonds
Credit risk
26

AXA Defensive Distribution Fund
Notes to the Financial Statements For the year ended 31 May 2021
AXA Distribution Investment ICVC
Net purchase
cost
Commissions
paid Taxes
Total
purchase cost
31/05/2020 £'000 £'000 % £'000 % £'000
Analysis of purchases
Bonds 52,269 ‐ ‐ ‐ ‐ 52,269
Collective Investment Schemes 283 ‐ ‐ ‐ ‐ 283
Equities 33,198 14 0.04 121 0.36 33,333Total 85,750 14 121 85,885
Net sale
proceeds
Commissions
paid Taxes
Total sale
proceeds
31/05/2020 £'000 £'000 % £'000 % £'000
Analysis of sales
Bonds 84,133 ‐ ‐ ‐ ‐ 84,133
Equities 28,985 (11) (0.04) ‐ ‐ 28,974Total 113,118 (11) ‐ 113,107
31/05/21 31/05/20
Transaction costs as percentage of average net asset value % %
Commissions 0.01 0.01
Taxes 0.01 0.05
At the balance sheet date the average portfolio dealing spread was 0.36% (2020: 0.30%).
15. Post balance sheet events
16. Fair value disclosure
Assets Liabilities Assets Liabilities
Valuation technique £'000 £'000 £'000 £'000
Level 1 ^ 228,350 ‐ 225,921 ‐
Level 2 ^^ ‐ ‐ ‐ ‐
Level 3 ^^^ ‐ ‐ ‐ ‐
228,350 ‐ 225,921 ‐
^ Level 1: The unadjusted quoted price in an active market for identical assets or liabilities that the entity can access at the
measurement date. ^^ Level 2: Inputs other than quoted prices included within Level 1 that are observable (i.e. developed using market data)
for the asset or liability, either directly or indirectly.
^^^ Level 3: Inputs are unobservable (i.e. for which market data is unavailable) for the asset or liability.
The fair value of the Fund's investments has been determined using the hierarchy above.
31/05/21 31/05/20
There are no post balance sheet events which require adjustments at the year end.
27

AXA Defensive Distribution Fund
As at 31 May 2021
First Distribution in pence per shareGroup 1 Shares purchased prior to 1 June 2020Group 2 Shares purchased on or after 1 June 2020 to 31 August 2020
Distribution DistributionNet paid paid
revenue Equalisation 30/10/20 31/10/19(p) (p) (p) (p)
Share Class A Gross AccumulationGroup 1 0.162 ‐ 0.162 0.673 Group 2 0.115 0.047 0.162 0.673
Share Class A Gross IncomeGroup 1 0.152 ‐ 0.152 0.611 Group 2 0.152 ‐ 0.152 0.611
Share Class B Gross AccumulationGroup 1 0.182 ‐ 0.182 0.721 Group 2 0.148 0.034 0.182 0.721
Share Class B Gross IncomeGroup 1 0.158 ‐ 0.158 0.639 Group 2 0.115 0.043 0.158 0.639
Share Class R Gross AccumulationGroup 1 0.190 ‐ 0.190 0.737 Group 2 0.164 0.026 0.190 0.737
Share Class R Gross IncomeGroup 1 0.122 ‐ 0.122 0.499 Group 2 0.122 ‐ 0.122 0.499
Share Class Z Gross AccumulationGroup 1 0.277 ‐ 0.277 1.100 Group 2 0.209 0.068 0.277 1.100
Share Class Z Gross IncomeGroup 1 0.132 ‐ 0.132 0.538 Group 2 0.116 0.016 0.132 0.538
AXA Distribution Investment ICVC
Distribution Tables
28

AXA Defensive Distribution Fund
As at 31 May 2021
AXA Distribution Investment ICVC
Distribution Tables
Second Distribution in pence per shareGroup 1 Shares purchased prior to 1 September 2020Group 2 Shares purchased on or after 1 September 2020 to 30 November 2020
Distribution DistributionNet paid paid
revenue Equalisation 29/01/21 31/01/20(p) (p) (p) (p)
Share Class A Gross AccumulationGroup 1 0.006 ‐ 0.006 0.475 Group 2 ‐ 0.006 0.006 0.475
Share Class A Gross IncomeGroup 1 0.006 ‐ 0.006 0.446 Group 2 0.006 ‐ 0.006 0.446
Share Class B Gross AccumulationGroup 1 0.006 ‐ 0.006 0.531 Group 2 ‐ 0.006 0.006 0.531
Share Class B Gross IncomeGroup 1 0.006 ‐ 0.006 0.467 Group 2 ‐ 0.006 0.006 0.467
Share Class R Gross AccumulationGroup 1 0.007 ‐ 0.007 0.556 Group 2 ‐ 0.007 0.007 0.556
Share Class R Gross IncomeGroup 1 0.004 ‐ 0.004 0.364 Group 2 ‐ 0.004 0.004 0.364
Share Class Z Gross AccumulationGroup 1 0.010 ‐ 0.010 0.811 Group 2 ‐ 0.010 0.010 0.811
Share Class Z Gross IncomeGroup 1 0.005 ‐ 0.005 0.390 Group 2 ‐ 0.005 0.005 0.390
29

AXA Defensive Distribution Fund
As at 31 May 2021
AXA Distribution Investment ICVC
Distribution Tables
Third Distribution in pence per shareGroup 1 Shares purchased prior to 1 December 2020Group 2 Shares purchased on or after 1 December 2020 to 28 February 2021
Distribution DistributionNet paid paid
revenue Equalisation 30/04/21 30/04/20(p) (p) (p) (p)
Share Class A Gross AccumulationGroup 1 0.070 ‐ 0.070 0.405 Group 2 0.034 0.036 0.070 0.405
Share Class A Gross IncomeGroup 1 0.066 ‐ 0.066 0.380 Group 2 0.066 ‐ 0.066 0.380
Share Class B Gross AccumulationGroup 1 0.079 ‐ 0.079 0.455 Group 2 0.050 0.029 0.079 0.455
Share Class B Gross IncomeGroup 1 0.069 ‐ 0.069 0.398 Group 2 0.050 0.019 0.069 0.398
Share Class R Gross AccumulationGroup 1 0.082 ‐ 0.082 0.477 Group 2 0.066 0.016 0.082 0.477
Share Class R Gross IncomeGroup 1 0.053 ‐ 0.053 0.309 Group 2 0.045 0.008 0.053 0.309
Share Class Z Gross AccumulationGroup 1 0.120 ‐ 0.120 0.694 Group 2 0.083 0.037 0.120 0.694
Share Class Z Gross IncomeGroup 1 0.057 ‐ 0.057 0.332 Group 2 0.044 0.013 0.057 0.332
30

AXA Defensive Distribution Fund
As at 31 May 2021
AXA Distribution Investment ICVC
Distribution Tables
Final Distribution in pence per shareGroup 1 Shares purchased prior to 1 March 2021Group 2 Shares purchased on or after 1 March 2021 to 31 May 2021
Distribution DistributionNet payable paid
revenue Equalisation 30/07/21 31/07/20(p) (p) (p) (p)
Share Class A Gross AccumulationGroup 1 0.222 ‐ 0.222 0.186 Group 2 0.100 0.122 0.222 0.186
Share Class A Gross IncomeGroup 1 0.207 ‐ 0.207 0.174 Group 2 0.207 ‐ 0.207 0.174
Share Class B Gross AccumulationGroup 1 0.250 ‐ 0.250 0.209 Group 2 0.141 0.109 0.250 0.209
Share Class B Gross IncomeGroup 1 0.217 ‐ 0.217 0.183 Group 2 0.094 0.123 0.217 0.183
Share Class R Gross AccumulationGroup 1 0.258 ‐ 0.258 0.219 Group 2 0.056 0.202 0.258 0.219
Share Class R Gross IncomeGroup 1 0.166 ‐ 0.166 0.141 Group 2 0.166 ‐ 0.166 0.141
Share Class Z Gross AccumulationGroup 1 0.380 ‐ 0.380 0.319 Group 2 0.050 0.330 0.380 0.319
Share Class Z Gross IncomeGroup 1 0.180 ‐ 0.180 0.152 Group 2 0.054 0.126 0.180 0.152
31

AXA Distribution Fund
Investment Manager's ReportFor the year ended 31 May 2021
Lower Risk Higher Risk
1 2 3 4 5 6 7
Why is this Fund in this category?
The Manager has full discretion to select investments for the Fund in line with the above investment policy and in doing so may
take into consideration a composite benchmark made up of the following indices in the stated proportions: 55% FTSE All‐Share
Index; 17.5% FTSE Index Linked All Stocks; 17.5% FTSE Index Linked < 5 Years; 3.5% FTSE Gilts All Stocks; 3.5% FTSE Gilts < 5
Years; 3% LIBID 7 Day (cash) (the “Benchmark”). This Benchmark best represents the types of bonds and companies in which the
Fund predominantly invests.
As at 31 May 2021
Potentially lower reward Potentially higher reward
The Fund invests in a mix of shares in UK listed companies, UK Government bonds (the majority of which are linked to the rate
of inflation) and cash. The Fund's typical asset mix would range between 50‐60% investment in shares and 40‐50% in UK
Government bonds and cash. The Manager selects shares in companies based upon their prospects for future growth of capital
and dividend payments following an in depth analysis of the quality of their business model, financial status, and corporate
governance arrangements. Investments in UK Government bonds are diversified across a range of maturities (i.e., the length of
time for full repayment of the bond by the Government).
By investing in a fund which can invest up to 60% in equities you are likely to be looking for an investment which has lower risk
than a pure equity based fund but you are prepared to accept some risk for potential reward. You are willing to accept that your
investment will fall and rise in value and that you could get back less than you invest. Typically, you would prefer an investment
with less risk than that of a fund which invests predominantly in equities or overseas.
AXA Distribution Investment ICVC
The capital of the Fund is not guaranteed. The Fund is invested in financial markets and uses techniques and instruments which
are subject to some level of variation which, may result in gains or losses.
Additional risks
Under normal market conditions the Fund’s key risk factors are:
• Interest rate risk ‐ is the risk that the market value of bonds held by the Fund could fall as a result of higher market rates
(yields). Yields can change as a result of, among other things, the economic and inflation outlook which also affects supply and
demand as well as future interest rate expectations, without necessarily a change in official central bank short term interest
rates. Higher yields result in a decline in the value of bonds. Conversely, lower yields tend to increase the value of bonds.
Duration (a measure based on the coupon and maturity payments schedule of a bond) is an important concept in understanding
how the price of that bond might change for a 1% move in its redemption yield. A bond with a longer duration is more sensitive
to a change in yields and, generally speaking, will experience more volatility in its market value than bonds with shorter
durations.
Investment Objective
Investment Policy
Risk and Reward Profile
The risk category is calculated using historical performance data and may not be a reliable indicator of the Fund’s future risk
profile.The risk category shown is not guaranteed and may shift over time. The lowest category does not mean risk free. The risk
category is recalculated weekly and for the period under review the risk category changed from a category 4 to a category 5.
The aim of this Fund is to provide income with some prospect for long‐term capital growth.
32

AXA Distribution Fund
Investment Manager's ReportFor the year ended 31 May 2021
AXA Distribution Investment ICVC
Funds investing in shares are generally more volatile than funds investing in bonds or a combination of shares and bonds, but
may also achieve greater returns.
Internal investment guidelines are set, if necessary, to ensure equity risk is maintained within a range deemed suitable based on
the individual fund’s investment objectives and investment policy.
• Risks linked to investment in sovereign debt ‐ the Fund may invest in bonds issued by countries and governments (sovereign
debt). The governmental entity that controls the repayment of sovereign debt may not be able or willing to repay the capital
and/or interest when due in accordance with the terms of such debt. In such a scenario, the value of investments of the Fund
may be adversely affected. A governmental entity’s willingness or ability to repay capital and interest due in a timely manner
may be affected by, among other factors, its cash flow situation, the extent of its foreign currency reserves, the availability of
sufficient foreign exchange on the date a payment is due, the relative size of the debt service burden to the economy as a
whole, the governmental entity’s policy towards the International Monetary Fund and the political constraints to which a
governmental entity may be subject. Governmental entities may also be dependent on expected disbursements from foreign
governments, multilateral agencies and others abroad to reduce principal and interest on their debt. In addition, there are no
bankruptcy proceedings for such issuers under which money to pay the debt obligations may be collected in whole or in part.
Holders may be requested to participate in the rescheduling of such sovereign debt and to extend further loans to the issuers.
Certain countries are especially large debtors to commercial banks and foreign governments. Investment in sovereign debt
issued or guaranteed by such countries (or their governments or governmental entities) involves a higher degree of risk than
investment in other sovereign debt.
Certain funds may be further subject to the risk of high concentration in bonds issued by and/or guaranteed by a single
sovereign issuer which is below investment grade and/or unrated which is also subject to higher credit risk. In the event of a
default of the sovereign issuer, the Fund may suffer significant loss.
• Equity risk ‐ the value of shares in which the Fund invests fluctuate pursuant to market expectations. The value of such shares
will go up and down and equity markets have historically been more volatile than fixed interest markets. Should the price of
shares in which the Fund has invested fall, the Net Asset Value of the Fund will also fall.
Index‐linked bonds bought in the secondary market (i.e., not directly from the issuer) whose capital values have been adjusted
upward due to inflation since issuance, may decline in value if there is a subsequent period of deflation.
Due to the sensitivity of these bonds to interest rates and expectations of future inflation, there is no guarantee that the value
of these bonds will correlate with inflation rates in the short to medium term.
Index‐linked bonds risk is an inherent risk of investing in index‐linked bonds. Exposure to this risk is managed by the allocation
decision on the proportion of the portfolio to invest in index‐linked bonds, as well as the amount of remaining maturity of these
bonds, which will affect their sensitivity in value, to changes in expected inflation levels.
Internal investment guidelines are set if necessary to ensure interest rate risk is maintained within a range deemed suitable
based on the individual fund’s investment objectives and investment policy. These guidelines could include measures of
sensitivity to changes of interest rates.
• Index‐linked bonds risk ‐ are fixed interest securities whose capital repayment amounts and interest payments are adjusted in
line with movements in inflation indices. They are designed to mitigate the effects of inflation on the value of a portfolio. The
market value of index‐linked bonds is determined by the market’s expectations of future movements in both interest rates and
inflation rates.
As with other bonds, the value of index‐linked bonds will generally fall when expectations of interest rates rise and vice versa.
However, when the market anticipates a rise in inflation rates, index‐linked bonds will generally outperform other bonds, and
vice versa.
33

AXA Distribution Fund
Investment Manager's ReportFor the year ended 31 May 2021
AXA Distribution Investment ICVC
• Liquidity risk ‐ under certain market conditions, it may be difficult to buy or sell investments for the Fund. For example, smaller
company shares may trade infrequently and in small volumes and corporate and emerging market bonds may be affected by the
demand in the market for such securities carrying credit risk, particularly in times of significant market stress. As a result, it may
not be possible to buy or sell such investments at a preferred time, close to the last market price quoted or in the volume
desired. The Manager may be forced to buy or sell such investments as a consequence of Unitholders buying or selling Units in
the Fund. Depending on market conditions at the time, this could lead to a significant drop in the Fund’s value.
Further explanation of the risks associated with an investment in this Fund can be found in the prospectus.
• Counterparty risk ‐ at any one time, the Fund may be exposed to the creditworthiness and stability of the counterparties to
transactions entered into by the Fund (including derivative and stock lending and repo/reverse repo transactions). The Fund will
be subject to the risk of the inability of its counterparties to perform its obligations under such transactions (default), whether
due to insolvency, bankruptcy or other causes. In the event of the insolvency of a counterparty, the Fund might not be able to
recover cash or assets of equivalent value, to that invested, in full. The Fund may receive assets or cash from the counterparty
(collateral) to protect against any such adverse effect. Where relevant, a counterparty will forfeit its collateral if it defaults on
the transaction with the Fund. However, if the collateral is in the form of securities, there is a risk that when it is sold, it will
realise insufficient cash to settle the counterparty’s debt to the Fund under a transaction or to purchase replacement securities
that were lent to the counterparty under a stock lending arrangement. In relation to stock lending arrangements, there is also
the risk that while cash is recovered in the event of a default, the actual stock cannot be repurchased. Furthermore, to the
extent that collateral is not present to cover part or all of the debt, a counterparty default may result in losses for the affected
Fund. To assist in managing these types of risks, the ACD sets criteria around the types of eligible collateral the Fund may accept.
Please see the paragraph entitled “Treatment of Collateral” in the “Investment and borrowing powers applicable to the Funds”
section in Appendix II of this Prospectus for more information.
This is an inherent risk for funds invested within sovereign bonds. Internal investment guidelines, scenario testing as well as
other regular monitoring seek to ensure the level of risk is aligned with each individual fund’s investment objectives and
investment policy.
Other risks which could have an impact in extreme market conditions include:
Monthly monitoring is conducted, using an in‐house liquidity tool, to ensure a high degree of confidence that Fund liquidity will
meet the Fund’s expected liquidity requirements. Any concerns indicated by the tool are analysed by the Manager’s risk team
who may also discuss the results with portfolio management staff, or other senior professionals within the firm, as needed, to
ensure an appropriate scrutiny.
Based on the analysis, the Manager believes that the liquidity profile of the Fund is appropriate.
Transactions in securities that the Fund may enter into expose it to the risk that the counterparty will not deliver the investment for a purchase or cash for a sale after the Fund has contracted to fulfil its responsibilities. This is minimised by the practice in the majority of markets of delivery versus payment and short settlement periods.
Important Information
Derivatives transactions may be used in the Fund for meeting the investment objectives of the Fund. The use of derivatives in this manner is not expected to change the risk profile of the Fund.
Market Review
One year ago, this report referenced the mounting death toll from coronavirus which, at the time, was still spreading voraciously across the globe. Today, deaths worldwide are approaching four million and many developing nations are still suffering terribly from its impact. Within developed markets, we have benefited from the phenomenal efforts made by scientists, regulators and governments to research, develop and produce multiple vaccines that have substantially reduced the harming effects of the virus. After a long, long time spent restricted in each of our daily lives we are approaching a return to normal life.
34

AXA Distribution Fund
Investment Manager's ReportFor the year ended 31 May 2021
AXA Distribution Investment ICVC
As economies around the world re‐open, investors have been questioning what the post‐lockdown world will look like. New
working practices, increased reliance on technology, less use of cash as a means of payment, growth in pet ownership, increased
domestic travel and many other factors will shape the post‐COVID‐19 world. Undoubtedly, following the temporary hibernation
of the global economy, there is a level of optimism about the coming months and possibly years and reference to the ‘roaring
20s’ points to the release of the pent up demand and ambition of populations around the world.
A saying coined (and often shared) by a well‐known fund manager and former colleague that ‘things will not become better or
worse but different’ rings true and investment markets have certainly been grappling with this in recent months.
For the Fund, market conditions over the past six months have been generally positive as investors have looked forward to a
normalisation of economic conditions. Since the beginning of December, conditions impacting investment markets have
followed in much the same vein as during the last reporting period. In short, conditions have been volatile. Equities have made
solid progress while fixed income has been challenged by the positive investor view of life in a post‐lockdown world. The FTSE All‐
Share Index (on a Total Return basis) rose 15.2% with the FTSE 100 (+14.09%) underperforming the mid cap (+18.43%) and the
FTSE Small Cap (ex‐Investment Companies) (+35.87%) indices. The FTSE UK Gilts All Stocks (TR) fell 4.82% over the six‐month
period, while the FTSE UK Gilts Index‐Linked (TR) All stocks index outperformed its conventional peer and falling 2.35%.
The prospect of a resurgent UK economy following the long months of lockdown has helped push the FTSE All‐Share Index higher – although it remains some way below its all‐time highs, unlike many international bourses. As life returns to normal, the tailwinds of pent‐up consumer demand, record business investment intentions, a buoyant residential property market and low interest rates are directing economists to project GDP growth of over 7% in 2021. However, with oil, commodity and other raw material prices pushing inflation up from very low levels, markets have been tying themselves up in knots about the potential for the years of supportive central bank policy being reversed and used to cool the economy. For the first time in years, the spectre of inflation has become a central concern for investors.
The combination of equities and inflation‐linked sovereign bonds, that continues to define the Distribution range of funds, position them ideally for the on‐going market conditions.
The quantum of money pumped into the financial system over the past 18 months has paled into insignificance the financial backing the same organisations gave following the global financial crisis. Unquestionably, this support has enabled the economy to keep going and saved many jobs from being lost. It also provided a strong underpin to fixed income markets as central banks reiterated their ‘lower for longer’ mantra. However, the impact of the vaccine rollout has brought economic optimism back to market and while we had been anticipating a modest move higher in yields over the course of 2021, the adjustment in Q1 2021 happened quicker and in a larger magnitude than we had been anticipating. Markets quickly priced in a continuation of the strong economic rebound and is currently anticipating two rate hikes from the US Federal Reserve by Q1 2023, while in GBP rates, the market is pricing in one hike by Q1 2023.
The bearish momentum for bonds has stabilised for now but would anticipate a modest move higher in yields later in the summer as speculation around tapering of asset purchases is likely to rise. However, with much of the good news on the economy fully priced, positioning and the knock‐on implications to risk assets via higher discounting rates and tighter financial conditions will require close attention.
In our view, yield levels continue to offer some additional level of protection for the portfolios as the technical backdrop remains supportive, with global central banks continuing their asset purchase programmes. In addition, central banks have been explicit in their guidance on short rates, which will remain anchored until inflation is above their target for a sustained period. This backdrop should continue to be supportive for breakevens and inflation‐linked bonds.
Our positive view of the prospect for UK equities in 2021 has been reinforced by the takeover and IPO activity that have also characterised the year to date. At the time of writing this report buyout transactions involving over £25bn in value of UK‐listed companies have been announced (this does not include the unsuccessful approaches for several other companies). Concurrently, there has been a long, and growing, list of companies revealing an intention to seek a public listing in the
35

AXA Distribution Fund
Investment Manager's ReportFor the year ended 31 May 2021
AXA Distribution Investment ICVC
Cost (£'000) Proceeds (£'000)
● UK Treasury 0.125% IL 22/03/29 14,220 13,770
● UK Treasury 4.25% 07/06/32 12,279 10,411
● Hargreaves Lansdown 8,374 9,440
● UK Treasury 0.125% IL 22/03/26 7,927 8,251
● AstraZeneca 5,017 6,847
AXA Investment Managers UK Limited
Another factor having a significant impact on the UK equity market has been the growth of investor interest in environmental, social and governance (ESG) issues. The growing awareness of consumers, and in turn companies, of product provenance, the environmental impact and corporate behaviours is being reflected increasingly in sales rates. Within the portfolio, this is impacting every company we hold from Great Portland Estates to BP. Sustainability reports, carbon reduction targets and positive societal change are now the norm amongst the high‐quality businesses the fund invests in. On behalf of our unitholders, we have continued our investment and efforts in ESG and produce a monthly report covering a wide range of ESG metrics. These include measuring the Fund’s carbon and water intensity, monitoring the proportion of female executives on our holdings’ Boards, monitoring for controversies, scoring individual company holdings and assessing the overall ESG score of the Fund. Our intention is to expand the reporting of these, and other measures, in the years ahead.
UK. Significantly, the vast majority of the new listings have been successful and share prices have risen to a premium to their IPO price which has encouraged more companies to follow. In the meantime, the UK government appears to be closing in on some significant international trade agreements following Brexit, providing a further potential tailwind for the economy.
Major Sales
● Barrick Gold
● UK Treasury 1.875% IL 22/11/22
● Royal Dutch Shell
● Countryside Proper es
● Rio Tinto
Jamie Forbes‐Wilson, Matthew Huddart
31 May 2021
Major Purchases
We have added to the Fund’s holding of Hill & Smith during the period where we see strong structural and cyclical drivers providing tailwinds for the business. On the structural side they are positioned well to make a positive contribution to issues including climate change, health & safety, population growth, increased urbanisation, infrastructure safety and vision zero (no road deaths). On the cyclical side, we think that the company is an excellent way to play the increased government spending on infrastructure and, in particular, President Biden’s US infrastructure package. This, however, is considered the icing on the cake as there are already large spending plans in place, such as Texas spending $77bn on their roads alone. Hill & Smith has also been quick to highlight the environmental benefits of galvanising as opposed to painting steel, thanks to its longevity and ability to be reused.
The new CEO Paul Simmons is bringing years of experience from Halma and applying it to the not‐too‐dissimilar Hill & Smith decentralised business model. We are particularly pleased that he has clarified the role and type of M&A he wants to achieve and expect to see a more rigorous approach to portfolio management and innovation. All of this means that we anticipate seeing a more consistent, higher level of organic growth than the Group has historically been able to produce and with it a likely higher rating.
Outlook
We remain positive about the prospects for UK equities over the period ahead. Valuations, in aggregate, remain attractive on both and absolute and relative (to international markets) basis. We are seeing a strong level of M&A activity which we anticipate will continue and new, interesting and attractively priced IPOs are offering new opportunities.
While it is inevitable that conditions will remain volatile, we continue to believe that macro events cannot be accurately nor consistently predicted. As such, the Fund retains a preference for longer‐term structural trends and quality companies that can deliver robust, reliable and consistent growth, supported by a simple government bond and cash hedge.
All performance data source: AXA Investment Managers and Morningstar.
Past performance is not a guide for future performance.
36

Portfolio Statement Market Value % of Total
As at 31 May 2021 Holding £’000 Net Assets
EQUITIES 57.67% (31/05/20: 58.00%)
BASIC MATERIALS 4.29% (31/05/20: 6.01%*)
Industrial Metals & Mining 4.29% (31/05/20: 4.02%*)
Central Asia Metals 1,465,000 3,977 0.60
Hill & Smith 500,000 7,670 1.15
Rio Tinto 280,000 16,948 2.54
Precious Metals & Mining 0.00% (31/05/20: 1.99%*)
TOTAL BASIC MATERIALS 28,595 4.29
CONSUMER DISCRETIONARY 6.41% (31/05/20: 4.45%*)
Automobiles & Parts 0.94% (31/05/20: 0.34%)
TI Fluid Systems 2,065,031 6,288 0.94
Household Goods & Home Construction 1.13% (31/05/20: 1.31%*)
Bellway 210,000 7,533 1.13
Retailers 2.93% (31/05/20: 1.97%*)
Dunelm 550,000 8,063 1.21
JD Sports Fashion 1,200,000 11,438 1.72
Travel & Leisure 1.41% (31/05/20: 0.83%)
Loungers 1,300,000 3,445 0.52
Whitbread 185,000 5,935 0.89
TOTAL CONSUMER DISCRETIONARY 42,702 6.41
CONSUMER STAPLES 4.87% (31/05/20: 5.12%*)
Beverages 2.29% (31/05/20: 1.97%)
Diageo 450,000 15,291 2.29
Personal Care, Drug & Grocery 2.58% (31/05/20: 3.15%*)
Reckitt Benckiser 200,000 12,718 1.91
Tesco 2,000,000 4,470 0.67
TOTAL CONSUMER STAPLES 32,479 4.87
ENERGY 3.65% (31/05/20: 5.12%*)
Oil, Gas & Coal 3.65% (31/05/20: 5.12%*)
BP 4,500,000 13,799 2.07
Diversified Energy 2,973,849 3,140 0.47
Longboat Energy 250,000 193 0.03
Royal Dutch Shell 200,000 2,578 0.39
Serica Energy 3,989,250 4,604 0.69
TOTAL ENERGY 24,314 3.65
AXA Distribution Investment ICVC
AXA Distribution Fund
37

Portfolio Statement Market Value % of Total
As at 31 May 2021 Holding £’000 Net Assets
AXA Distribution Investment ICVC
AXA Distribution Fund
FINANCIALS 13.75% (31/05/20: 11.48%*)
Banks 2.33% (31/05/20: 2.09%)
Lloyds Banking 12,500,000 6,219 0.93
Standard Chartered 1,800,000 9,295 1.40
Closed End Investments 0.24% (31/05/20: 0.39%*)
Syncona 750,000 1,594 0.24
Finance & Credit Services 1.02% (31/05/20: 0.00%)
London Stock Exchange 90,000 6,773 1.02
Investment Banking & Brokerage 4.20% (31/05/20: 3.65%*)
3i 1,100,000 13,706 2.06
Argentex 1,350,000 1,681 0.25
Hargreaves Lansdown 550,000 9,207 1.38
TP ICAP 1,595,198 3,402 0.51
Life Insurance 4.94% (31/05/20: 4.44%)
Just 10,000,000 11,020 1.65
Legal & General 4,500,000 12,929 1.94
Phoenix 600,000 4,441 0.67
Prudential 300,000 4,569 0.68
Non‐Life Insurance 1.02% (31/05/20: 0.91%)
Sabre Insurance 2,600,000 6,825 1.02
TOTAL FINANCIALS 91,661 13.75
HEALTH CARE 8.83% (31/05/20: 9.20%)
Medical Equipment & Services 2.28% (31/05/20: 2.67%*)
Abingdon Health 2,800,000 1,568 0.24
ConvaTec 4,000,000 9,424 1.41
Smith & Nephew 275,000 4,213 0.63
Pharmaceuticals & Biotechnology 6.55% (31/05/20: 6.53%)
AstraZeneca 180,000 14,477 2.17
Genus 180,000 9,081 1.36
GlaxoSmithKline 1,175,000 15,780 2.37
Vectura 2,750,000 4,329 0.65
TOTAL HEALTH CARE 58,872 8.83
INDUSTRIALS 7.94% (31/05/20: 7.56%*)
Aerospace & Defense 0.00% (31/05/20: 0.77%)
Construction & Materials 1.68% (31/05/20: 0.44%)
Forterra 2,250,000 6,716 1.01
Marshalls 600,000 4,464 0.67
38

Portfolio Statement Market Value % of Total
As at 31 May 2021 Holding £’000 Net Assets
AXA Distribution Investment ICVC
AXA Distribution Fund
General Industrials 2.88% (31/05/20: 2.93%)
Coats 8,000,000 5,296 0.79
DS Smith 1,350,000 5,667 0.85
Melrose Industries 4,750,000 8,277 1.24
Industrial Support Services 1.52% (31/05/20: 1.30%)
Experian 375,000 10,133 1.52
Industrial Engineering 0.00% (31/05/20: 0.29%*)
Industrial Transportation 1.86% (31/05/20: 1.83%*)
Ashtead 240,000 12,432 1.86
TOTAL INDUSTRIALS 52,985 7.94
REAL ESTATE 2.91% (31/05/20: 3.23%*)
Real Estate Investment & Services 1.26% (31/05/20: 1.85%*)
Rightmove 1,400,000 8,422 1.26
Real Estate Investment Trusts 1.65% (31/05/20: 1.38%)
Great Portland Estates 850,000 6,116 0.92
PRS 5,000,000 4,850 0.73
TOTAL REAL ESTATE 19,388 2.91
TECHNOLOGY 0.93% (31/05/20: 1.28%*)
Software & Computer Services 0.93% (31/05/20: 1.28%*)
AVEVA 177,777 6,188 0.93
TOTAL TECHNOLOGY 6,188 0.93
TELECOMMUNICATIONS 1.35% (31/05/20: 2.22%)
Telecommunications Service Providers 1.35% (31/05/20: 2.22%*)
Vodafone 7,000,000 9,005 1.35
TOTAL TELECOMMUNICATIONS 9,005 1.35
UTILITIES 2.74% (31/05/20: 2.33%)
Electricity 1.05% (31/05/20: 0.65%)
SSE 450,000 6,998 1.05
Gas, Water & Multiutilities 1.69% (31/05/20: 1.68%)
National Grid 1,200,000 11,288 1.69
TOTAL UTILITIES 18,286 2.74
39

Portfolio Statement Market Value % of Total
As at 31 May 2021 Holding £’000 Net Assets
AXA Distribution Investment ICVC
AXA Distribution Fund
GOVERNMENT BONDS 37.53% (31/05/20: 37.96%)
Index Linked Government Bonds 32.80% (31/05/20: 34.73%)
UK Treasury 0.125% IL 22/03/24 44,535,500 60,141 9.02
UK Treasury 0.125% IL 22/03/26 16,800,000 22,542 3.38
UK Treasury 0.125% IL 10/08/28 3,000,000 3,952 0.59
UK Treasury 0.125% IL 22/03/29 9,000,000 14,087 2.11
UK Treasury 0.125% IL 22/03/44 2,642,800 5,419 0.81
UK Treasury 0.125% IL 22/03/46 1,300,000 2,596 0.39
UK Treasury 0.125% IL 22/11/56 1,200,000 2,874 0.43
UK Treasury 0.125% IL 22/03/58 960,129 2,452 0.37
UK Treasury 0.125% IL 22/11/65 1,640,000 4,853 0.73
UK Treasury 0.125% IL 22/03/68 2,366,600 7,871 1.18
UK Treasury 0.25% IL 22/03/52 2,282,917 5,608 0.84
UK Treasury 0.375% IL 22/03/62 1,293,253 4,127 0.62
UK Treasury 0.5% IL 22/03/50 1,465,548 4,130 0.62
UK Treasury 0.625% IL 22/03/40 982,496 2,268 0.34
UK Treasury 0.625% IL 22/11/42 3,200,000 7,970 1.20
UK Treasury 0.75% IL 22/03/34 1,990,000 3,780 0.57
UK Treasury 0.75% IL 22/11/47 1,899,000 5,501 0.83
UK Treasury 1.125% IL 22/11/37 2,200,000 5,528 0.83
UK Treasury 1.25% IL 22/11/27 1,184,400 2,359 0.35
UK Treasury 1.25% IL 22/11/32 1,500,000 3,107 0.47
UK Treasury 1.25% IL 22/11/55 588,230 2,425 0.36
UK Treasury 1.875% IL 22/11/22 10,000,000 15,742 2.36
UK Treasury 2% IL 26/01/35 2,614,000 7,593 1.14
UK Treasury 2.5% IL 17/07/24 4,373,000 15,633 2.35
UK Treasury 4.125% IL 22/07/30 1,646,000 6,096 0.91
Traditional Government Bonds 4.73% (31/05/20: 3.23%)
UK Treasury 0% 07/06/21 1,000,000 1,000 0.15
UK Treasury 0.875% 22/10/29 2,040,000 2,060 0.31
UK Treasury 2% 07/09/25 273,000 293 0.04
UK Treasury 2.5% 22/07/65 74,000 106 0.02
UK Treasury 3.25% 22/01/44 2,600,000 3,585 0.54
UK Treasury 3.5% 22/01/45 350,000 505 0.08
UK Treasury 3.5% 22/07/68 125,000 228 0.03
UK Treasury 3.75% 22/07/52 282,000 458 0.07
UK Treasury 4% 22/01/60 217,000 400 0.06
UK Treasury 4.25% 07/12/27 27,500 34 0.01
UK Treasury 4.25% 07/06/32 8,700,000 11,702 1.75
UK Treasury 4.25% 07/03/36 2,000,000 2,848 0.43
UK Treasury 4.25% 07/09/39 252,000 377 0.06
UK Treasury 4.25% 07/12/40 1,890,000 2,868 0.43
UK Treasury 4.25% 07/12/46 271,000 442 0.07
UK Treasury 4.25% 07/12/49 100,000 170 0.03
UK Treasury 4.25% 07/12/55 200,000 365 0.05
UK Treasury 4.5% 07/09/34 1,850,120 2,636 0.39
UK Treasury 4.5% 07/12/42 150,000 240 0.04
40

Portfolio Statement Market Value % of Total
As at 31 May 2021 Holding £’000 Net Assets
AXA Distribution Investment ICVC
AXA Distribution Fund
UK Treasury 4.75% 07/12/30 300,000 408 0.06
UK Treasury 4.75% 07/12/38 277,000 433 0.06
UK Treasury 5% 07/03/25 190,000 224 0.03
UK Treasury 6% 07/12/28 87,000 121 0.02
TOTAL GOVERNMENT BONDS 250,157 37.53
Portfolio of investments 634,632 95.20
Net other assets 31,987 4.80
Total net assets 666,619 100.00
All investments are ordinary shares unless otherwise stated.
All bonds are denominated in Sterling (unless otherwise indicated).
* Since the previous report, the portfolio classifications and prior year comparative figures have been updated to reflect the
recent changes in the Industry Classification Benchmark (ICB) standard.
41

Comparative TablesAs at 31 May 2021
31/05/2021 31/05/2020 31/05/2019 31/05/2021 31/05/2020 31/05/2019
Change in net assets per share (p) (p) (p) (p) (p) (p)
Opening net asset value per share † 120.64 122.42 121.69 107.19 111.25 113.89
Return before operating charges ^ 14.52 (1.14) 1.35 12.79 (0.96) 1.21
Operating charges ^ (0.65) (0.64) (0.62) (0.57) (0.57) (0.58)
Return after operating charges ^ 13.87 (1.78) 0.73 12.22 (1.53) 0.63
Distributions (1.92) (2.81) (3.53) (1.69) (2.53) (3.27)
Retained distributions on accumulation
shares1.92 2.81 3.53 ‐ ‐ ‐
Closing net asset value per share † 134.51 120.64 122.42 117.72 107.19 111.25
*^ after direct transaction costs of: 0.05 0.08 0.08 0.04 0.08 0.07
Performance
Return after operating charges 11.50% ‐1.45% 0.60% 11.40% ‐1.38% 0.55%
Other information
Closing net asset value (£) † 5,697,313 5,850,481 6,127,728 356,604 308,373 357,889
Closing number of shares 4,235,604 4,849,447 5,005,519 302,929 287,690 321,712
Operating charges ^ 0.52% 0.51% 0.52% 0.52% 0.51% 0.52%
Direct transaction costs * 0.04% 0.07% 0.06% 0.04% 0.07% 0.06%
Prices
Highest share price # 134.60 132.90 124.00 118.40 119.20 114.70
Lowest share price # 116.70 100.80 112.10 103.20 90.07 103.60
31/05/2021 31/05/2020 31/05/2019 31/05/2021 31/05/2020 31/05/2019
Change in net assets per share (p) (p) (p) (p) (p) (p)
Opening net asset value per share † 140.08 142.00 141.01 114.87 119.10 121.81
Return before operating charges ^ 16.86 (1.32) 1.57 13.72 (1.02) 1.29
Operating charges ^ (0.61) (0.60) (0.58) (0.49) (0.50) (0.50)
Return after operating charges ^ 16.25 (1.92) 0.99 13.23 (1.52) 0.79
Distributions (2.23) (3.26) (4.09) (1.82) (2.71) (3.50)
Retained distributions on accumulation
shares2.23 3.26 4.09 ‐ ‐ ‐
Closing net asset value per share † 156.33 140.08 142.00 126.28 114.87 119.10
*^ after direct transaction costs of: 0.06 0.10 0.09 0.05 0.08 0.08
Performance
Return after operating charges 11.60% ‐1.35% 0.70% 11.52% ‐1.28% 0.65%
Other information
Closing net asset value (£) † 363,719,180 349,973,708 387,428,167 2,273,459 2,285,690 2,702,378
Closing number of shares 232,654,527 249,843,892 272,838,324 1,800,320 1,989,784 2,269,015
Operating charges ^ 0.42% 0.42% 0.42% 0.42% 0.42% 0.42%
Direct transaction costs * 0.04% 0.07% 0.06% 0.04% 0.07% 0.06%
Prices
Highest share price # 156.50 154.20 143.90 127.10 127.70 122.60
Lowest share price # 135.60 117.00 130.00 110.60 96.51 110.90
AXA Distribution Investment ICVC
A Accumulation A Income
B Accumulation B Income
AXA Distribution Fund
42

Comparative TablesAs at 31 May 2021
AXA Distribution Investment ICVC
AXA Distribution Fund
31/05/2021 31/05/2020 31/05/2019 31/05/2021 31/05/2020 31/05/2019
Change in net assets per share (p) (p) (p) (p) (p) (p)
Opening net asset value per share † 211.10 216.36 217.22 112.51 117.94 121.96
Return before operating charges ^ 25.24 (1.97) 2.36 13.34 (0.98) 1.25
Operating charges ^ (3.30) (3.29) (3.22) (1.75) (1.78) (1.79)
Return after operating charges ^ 21.94 (5.26) (0.86) 11.59 (2.76) (0.54)
Distributions (3.34) (4.94) (6.26) (1.77) (2.67) (3.48)
Retained distributions on accumulation
shares3.34 4.94 6.26 ‐ ‐ ‐
Closing net asset value per share † 233.04 211.10 216.36 122.33 112.51 117.94
*^ after direct transaction costs of: 0.09 0.15 0.14 0.05 0.08 0.08
Performance
Return after operating charges 10.39% ‐2.43% ‐0.40% 10.30% ‐2.34% ‐0.44%
Other information
Closing net asset value (£) † 156,641,717 155,822,968 177,988,890 6,982,256 7,434,929 8,711,409
Closing number of shares 67,217,307 73,813,070 82,266,228 5,707,490 6,608,198 7,386,350
Operating charges ^ 1.52% 1.51% 1.52% 1.52% 1.51% 1.52%
Direct transaction costs * 0.04% 0.07% 0.06% 0.04% 0.07% 0.06%
Prices
Highest share price # 233.20 233.30 219.40 123.10 125.50 122.60
Lowest share price # 203.40 176.70 199.00 107.90 94.72 110.30
R Accumulation R Income
43

Comparative TablesAs at 31 May 2021
AXA Distribution Investment ICVC
AXA Distribution Fund
31/05/2021 31/05/2020 31/05/2019 31/05/2021 31/05/2020 31/05/2019
Change in net assets per share (p) (p) (p) (p) (p) (p)
Opening net asset value per share † 236.67 240.76 239.91 125.68 130.76 134.20
Return before operating charges ^ 28.42 (2.23) 2.66 14.97 (1.11) 1.41
Operating charges ^ (1.87) (1.86) (1.81) (0.99) (1.00) (1.00)
Return after operating charges ^ 26.55 (4.09) 0.85 13.98 (2.11) 0.41
Distributions (3.76) (5.51) (6.95) (1.98) (2.97) (3.85)
Retained distributions on accumulation
shares3.76 5.51 6.95 ‐ ‐ ‐
Closing net asset value per share † 263.22 236.67 240.76 137.68 125.68 130.76
*^ after direct transaction costs of: 0.10 0.17 0.15 0.05 0.09 0.08
Performance
Return after operating charges 11.22% ‐1.70% 0.35% 11.12% ‐1.61% 0.31%
Other information
Closing net asset value (£) † 109,014,845 116,254,447 127,257,886 21,933,719 23,456,230 28,971,099
Closing number of shares 41,415,616 49,120,368 52,857,305 15,931,110 18,663,831 22,156,087
Operating charges ^ 0.77% 0.76% 0.77% 0.77% 0.76% 0.77%
Direct transaction costs * 0.04% 0.07% 0.06% 0.04% 0.07% 0.06%
Prices
Highest share price # 263.40 260.90 244.00 138.50 139.90 135.00
Lowest share price # 228.70 197.80 220.70 120.90 105.70 121.90
† Valued at bid‐market prices.
# High and low price disclosures are based on quoted share prices (Mid Market Price). Therefore the opening and closing NAV
prices may fall outside the high / low price threshold.
The figures used within the table have been calculated against the average net asset value for the accounting year.
* Direct transaction costs include fees, commissions, transfer taxes and duties in the purchasing and selling of investments,
within the accounting year.
Z Accumulation Z Income
^ Operating charges include indirect costs incurred in the maintenance and running of the Fund, as disclosed in the detailed
expenses within the Statement of Total Return.
44

AXA Distribution Fund
Statement of Total ReturnFor the year ended 31 May 2021
Note £'000 £'000 £'000 £'000
Income:Net capital gains/(losses) 2 64,549 (22,318)Revenue 3 10,140 16,419
Expenses 4 (4,967) (5,469)Interest payable and similar charges ‐ ‐
Net revenue before taxation 5,173 10,950
Taxation 5 (54) (83)
Net revenue after taxation 5,119 10,867
Total return before distributions 69,668 (11,451)
Distributions 6 (9,974) (16,223)
Change in net assets attributable to Shareholders
from investment activities 59,694 (27,674)
Statement of Change in Net Assets Attributable to Shareholders For the year ended 31 May 2021
£'000 £'000 £'000 £'000
Opening net assets attributable to Shareholders 661,387 739,545
Amounts receivable on issue of shares 4,971 8,412 Amounts payable on cancellation of shares (68,812) (74,101)
(63,841) (65,689)
Change in net assets attributable to Shareholdersfrom investment activities (see above) 59,694 (27,674)
Retained distributions on accumulation shares 9,378 15,203
Unclaimed distributions 1 2
Closing net assets attributable to Shareholders 666,619 661,387
AXA Distribution Investment ICVC
31/05/21 31/05/20
31/05/21 31/05/20
45

AXA Distribution Fund
Balance SheetAs at 31 May
Note £'000 £'000Assets:
Fixed assets:
Investments 634,632 634,697
Current assets:
Debtors 7 2,905 2,334
Cash and bank balances 8 31,426 26,071
Total assets 668,963 663,102
Liabilities:
Creditors:
Distribution payable (169) (191)
Other creditors 9 (2,175) (1,524)
Total liabilities (2,344) (1,715)
Net assets attributable to Shareholders 666,619 661,387
31/05/21 31/05/20
AXA Distribution Investment ICVC
46

AXA Distribution Fund
Notes to the Financial Statements For the year ended 31 May 2021
31/05/21 31/05/20
£'000 £'000
The net capital gains/(losses) comprise:
Non‐derivative securities 64,545 (22,294)
Currency gains/(losses) 6 (20)
Transaction charges (2) (4)
Net capital gains/(losses) 64,549 (22,318)
3. Revenue
31/05/21 31/05/20
£'000 £'000
Bank interest ‐ 39
Interest on debt securities (902) 1,660
Overseas dividends 510 539
UK dividends 10,175 13,903
Property revenue from REITs 357 278
Total revenue 10,140 16,419
31/05/21 31/05/20
£'000 £'000
4,855 5,356
47 50
4,902 5,406
29 32
17 17
46 49
16 8
3 6
19 14
4,967 5,469
AXA Distribution Investment ICVC
1. Accounting Basis And Policies
The Fund's Financial Statements have been prepared on the basis detailed on pages 145- 147.
2. Net capital gains/(losses)
4. Expenses
Payable to the ACD, associates of the ACD, and agents of either of them
Annual management charge
Registration fees
Payable to the Depositary, associates of the Depositary and agents of either of them
Depositary's fees
Safe custody fees
Other expenses
Audit fees*Printing fees
Total expenses
Expenses include irrecoverable VAT where applicable.
* Audit fees for the financial year ending 2021 were £8,000 (2020: £12,000) (including VAT).
47

AXA Distribution Fund
Notes to the Financial Statements For the year ended 31 May 2021
AXA Distribution Investment ICVC
5. Taxation
31/05/21 31/05/20
£'000 £'000
(a) Analysis of the tax charge in the year
Irrecoverable overseas tax 54 83
(b) Factors affecting tax charge for the year
31/05/21 31/05/20
£'000 £'000
Net revenue before taxation 5,173 10,950
Net revenue for the year multiplied by the standard rate of corporation tax 1,035 2,190
Effects of:
Irrecoverable overseas tax 54 83
Movement in excess management expenses 2,398 1,345
Relief for indexation on UK Gilts (1,251) (626)
Revenue not subject to corporation tax (2,182) (2,909)
Current tax charge for the year 54 83
(c) Deferred taxation:
(d) Factors that may affect future tax charges
There is no provision required for deferred taxation at the balance sheet date in the current year or prior year.
OEICs are exempt from tax on capital gains in the UK. Therefore, any capital return is not included within the reconciliation
above.
The tax assessed for the year is lower than the standard rate of corporation tax for an open ended investment company of
20% (2020: 20%) is applied to the net revenue before taxation. The differences are explained below:
At the year end, after offset against revenue taxable on receipt, there is a potential deferred tax asset of £26,421,986 (2020:
£24,023,491) in relation to surplus management expenses. It is unlikely that the Fund will generate sufficient taxable profits
in the future to utilise this amount and therefore no deferred tax asset has been recognised in the year.
48

AXA Distribution Fund
Notes to the Financial Statements For the year ended 31 May 2021
AXA Distribution Investment ICVC
6. Distributions
31/05/21 31/05/20
£'000 £'000
First interim 3,077 4,926
Second interim 1,434 4,559
Third interim 1,803 2,816
Final 3,550 3,746
Add: Revenue paid on cancellation of shares 118 202
Deduct: Revenue received on creation of shares (8) (26)
Net distribution for the year 9,974 16,223
Reconciliation of net revenue after taxation to distributions
Net revenue after taxation 5,119 10,867
Expenses charged to capital 4,855 5,356
Net distribution for the year 9,974 16,223
7. Debtors 31/05/21 31/05/20
£'000 £'000
Amounts receivable for creation of shares 119 68
Sales awaiting settlement 1,216 ‐
Accrued revenue 1,570 2,255
Income tax recoverable ‐ 4
Overseas tax recoverable ‐ 7
Total debtors 2,905 2,334
8. Cash and bank balances 31/05/21 31/05/20
£'000 £'000
Cash and bank balances 31,426 26,071
Total cash and bank balances 31,426 26,071
9. Other creditors 31/05/21 31/05/20
£'000 £'000
Amounts payable for cancellation of shares 1,360 725
Accrued annual management charge 777 766
Accrued other expenses 38 33
Total other creditors 2,175 1,524
The distributions take account of revenue received on the creation of shares and revenue deducted on the cancellation of
shares, and comprise:
49

AXA Distribution Fund
Notes to the Financial Statements For the year ended 31 May 2021
AXA Distribution Investment ICVC
10. Related party transactions
11. Share classes
Annual
management
charge rate
(%) 31/05/20 Issued Cancelled Converted 31/05/21
A Accumulation 0.50 4,849,447 847,435 (1,461,278) ‐ 4,235,604
A Income 0.50 287,690 36,853 (21,614) ‐ 302,929
B Accumulation 0.40 249,843,892 81,866 (17,253,099) (18,132) 232,654,527
B Income 0.40 1,989,784 2,055 (191,519) ‐ 1,800,320
R Accumulation 1.50 73,813,070 295,531 (6,813,263) (78,031) 67,217,307
R Income 1.50 6,608,198 1,010 (901,718) ‐ 5,707,490
Z Accumulation 0.75 49,120,368 855,643 (8,640,565) 80,170 41,415,616
Z Income 0.75 18,663,831 816,282 (3,559,324) 10,321 15,931,110
12. Commitments, contingent liabilities and contingent assets
13. Derivatives and other financial instruments
The functional currency of the Fund is Sterling. All assets and liabilities of the Fund are denominated in Pound sterling.
There was no direct foreign currency exposure within the Fund at the balance sheet date.
A 10% increase in the value of the Fund’s portfolio would have the effect of increasing the return and net assets by
£63,463,164 (2020: £63,469,684). A 10% decrease would have an equal and opposite effect.
Market price risk sensitivity
Market price risk
The Fund invests principally in equity and fixed income securities. The value of the Fund’s investment portfolio is not fixed
and may go down as well as up. This may be as a result of a specific factor affecting the value of an individual company or
may be caused by general market factors (such as government policy or the health of the underlying economy) which can
affect the entire portfolio. The Fund seeks to manage these risks by adhering to investment guidelines and to investment
and borrowing powers set out in the Prospectus. In addition, the Fund complies with the Collective Investment Schemes
sourcebook (“COLL”), which include rules relating to investment holdings that are designed to place limits on the Fund’s
investment concentration (same as at 31 May 2020).
Monies received and paid by the ACD through the creation and cancellation of shares are disclosed in the Statement of
Change in Shareholders’ Net Assets and amounts due at the year end are disclosed in Notes 7 and 9.
Annual management charge paid to the ACD and Registration fees are disclosed in Note 4 and amounts due at the year end
are disclosed in Note 9.
The main risks from the Fund's holding of financial instruments, together with the ACD’s policy for managing these risks, are
outlined below.
Foreign currency risk
The ACD and its associates (including other authorised investment Funds managed by the ACD) have no shareholdings in the
Company at the year end.
The reconciliation of the opening and closing numbers of shares of each class, along with the ACD’s annual management
charges applicable to each class, is shown below:
There are no commitments, contingent liabilities and contingent assets as at the balance sheet date (2020: nil).
The ACD is related to the Fund as defined by Financial Reporting Standard 102.33 ‘Related Party Disclosures’.
50

AXA Distribution Fund
Notes to the Financial Statements For the year ended 31 May 2021
AXA Distribution Investment ICVC
The table below shows the interest rate risk profile at the balance sheet date:
Floating rate
financial
assets
Fixed rate
financial
assets
Financial
assets not
carrying
interest Total
Currency Assets £'000 £'000 £'000 £'000
31/05/21
Pound sterling 31,426 250,157 387,105 668,688
US dollar ‐ ‐ 275 275
Total 31,426 250,157 387,380 668,963
31/05/20
Pound sterling 26,071 251,010 372,246 649,327
Canadian dollar ‐ ‐ 13,149 13,149
US dollar ‐ ‐ 626 626
Total 26,071 251,010 386,021 663,102
Floating rate
financial
liabilities
Fixed rate
financial
liabilities
Financial
liabilities not
carrying
interest Total
Currency Liabilities £'000 £'000 £'000 £'000
31/05/21
Pound sterling ‐ ‐ (2,344) (2,344)
Total ‐ ‐ (2,344) (2,344)
31/05/20
Pound sterling ‐ ‐ (1,715) (1,715)
Total ‐ ‐ (1,715) (1,715)
Fixed interest securities are particularly affected by trends in interest rates and inflation. If interest rates go up, the value of
capital may fall, and vice versa. Inflation will also decrease the real value of capital, with the exception of index linked bonds
which are protected against the effect of inflation.
Interest rate risk
Changes in interest rates or changes in expectations of future interest rates may result in an increase or decrease in the market value of the investments held. A 1% increase in interest rates would have the effect of decreasing the return and net assets £30,612,918 (2020: £32,501,647) . A 1% decrease would have an equal and opposite effect.
51

AXA Distribution Fund
Notes to the Financial Statements For the year ended 31 May 2021
AXA Distribution Investment ICVC
31/05/21 31/05/20
Market Value % Market Value %
£’000 £’000
250,157 37.53 251,010 37.96
250,157 37.53 251,010 37.96
14. Portfolio transaction costs
Net purchase
cost
Commissions
paid Taxes
Total
purchase cost
31/05/2021 £'000 £'000 % £'000 % £'000
Analysis of purchases
Bonds 53,783 ‐ ‐ ‐ ‐ 53,783
Equities 48,106 20 0.04 179 0.37 48,305Total 101,889 20 179 102,088
Net sale
proceeds
Commissions
paid Taxes
Total sale
proceeds
31/05/2021 £'000 £'000 % £'000 % £'000
Analysis of sales
Bonds 46,560 ‐ ‐ ‐ ‐ 46,560
Collective Investment Schemes 1,331 (1) (0.05) ‐ ‐ 1,330
Equities 114,377 (56) (0.05) ‐ ‐ 114,321Total 162,268 (57) ‐ 162,211
The Fund runs a very low credit risk in respect of unsettled investment transactions as these are normally settled as cash
against delivery.
Fixed interest investments are exposed to credit risk which reflects the ability of the bond issuer to meet its obligations.
Generally, the higher the rate of interest, the higher the perceived credit risk of the issuer. The ACD monitors the credit
quality and risk of the portfolio as a part of the overall investment process and in accordance with the objective and policy
of each fund.
Transactions in securities may expose a fund to the risk that the counterparty will not settle the transaction or do so on a
timely basis.
All transactions in the funds are conducted through counterparties approved by the ACD.
A breakdown of the investment portfolio by credit rating is disclosed on the table below:
Credit Rating Investment grade (BBB- credit rating and above) Total value of bonds
Credit risk
52

AXA Distribution Fund
Notes to the Financial Statements For the year ended 31 May 2021
AXA Distribution Investment ICVC
Net purchase
cost
Commissions
paid Taxes
Total
purchase cost
31/05/2020 £'000 £'000 % £'000 % £'000
Analysis of purchases
Bonds 96,746 ‐ ‐ ‐ ‐ 96,746
Collective Investment Schemes 2,969 1 0.05 ‐ ‐ 2,970
Equities 86,066 41 0.05 403 0.47 86,510Total 185,781 42 403 186,226
Net sale
proceeds
Commissions
paid Taxes
Total sale
proceeds
31/05/2020 £'000 £'000 % £'000 % £'000
Analysis of sales
Bonds 145,871 ‐ ‐ ‐ ‐ 145,871
Equities 97,364 (42) (0.04) ‐ ‐ 97,322Total 243,235 (42) ‐ 243,193
31/05/21 31/05/20
Transaction costs as percentage of average net asset value % %
Commissions 0.01 0.01
Taxes 0.03 0.06
At the balance sheet date the average portfolio dealing spread was 0.16% (2020: 0.17%).
15. Post balance sheet events
16. Fair value disclosure
Assets Liabilities Assets Liabilities
Valuation technique £'000 £'000 £'000 £'000
Level 1 ^ 634,632 ‐ 634,697 ‐
Level 2 ^^ ‐ ‐ ‐ ‐
Level 3 ^^^ ‐ ‐ ‐ ‐
634,632 ‐ 634,697 ‐
^ Level 1: The unadjusted quoted price in an active market for identical assets or liabilities that the entity can access at the
measurement date.
^^ Level 2: Inputs other than quoted prices included within Level 1 that are observable (i.e. developed using market data)
for the asset or liability, either directly or indirectly.
^^^ Level 3: Inputs are unobservable (i.e. for which market data is unavailable) for the asset or liability.
The fair value of the Fund's investments has been determined using the hierarchy above.
31/05/21 31/05/20
There are no post balance sheet events which require adjustments at the year end.
53

AXA Distribution Fund
As at 31 May 2021
First Distribution in pence per shareGroup 1 Shares purchased prior to 1 June 2020Group 2 Shares purchased on or after 1 June 2020 to 31 August 2020
Distribution DistributionNet paid paid
revenue Equalisation 31/10/20 31/10/19(p) (p) (p) (p)
Share Class A AccumulationGroup 1 0.573 ‐ 0.573 0.839 Group 2 0.287 0.286 0.573 0.839
Share Class A IncomeGroup 1 0.510 ‐ 0.510 0.760 Group 2 0.510 ‐ 0.510 0.760
Share Class B AccumulationGroup 1 0.666 ‐ 0.666 0.971 Group 2 0.450 0.216 0.666 0.971
Share Class B IncomeGroup 1 0.546 ‐ 0.546 0.812 Group 2 0.546 ‐ 0.546 0.812
Share Class R AccumulationGroup 1 1.002 ‐ 1.002 1.476 Group 2 0.577 0.425 1.002 1.476
Share Class R IncomeGroup 1 0.534 ‐ 0.534 0.800 Group 2 0.277 0.257 0.534 0.800
Share Class Z AccumulationGroup 1 1.125 ‐ 1.125 1.642 Group 2 0.798 0.327 1.125 1.642
Share Class Z IncomeGroup 1 0.597 ‐ 0.597 0.889 Group 2 0.421 0.176 0.597 0.889
AXA Distribution Investment ICVC
Distribution Tables
54
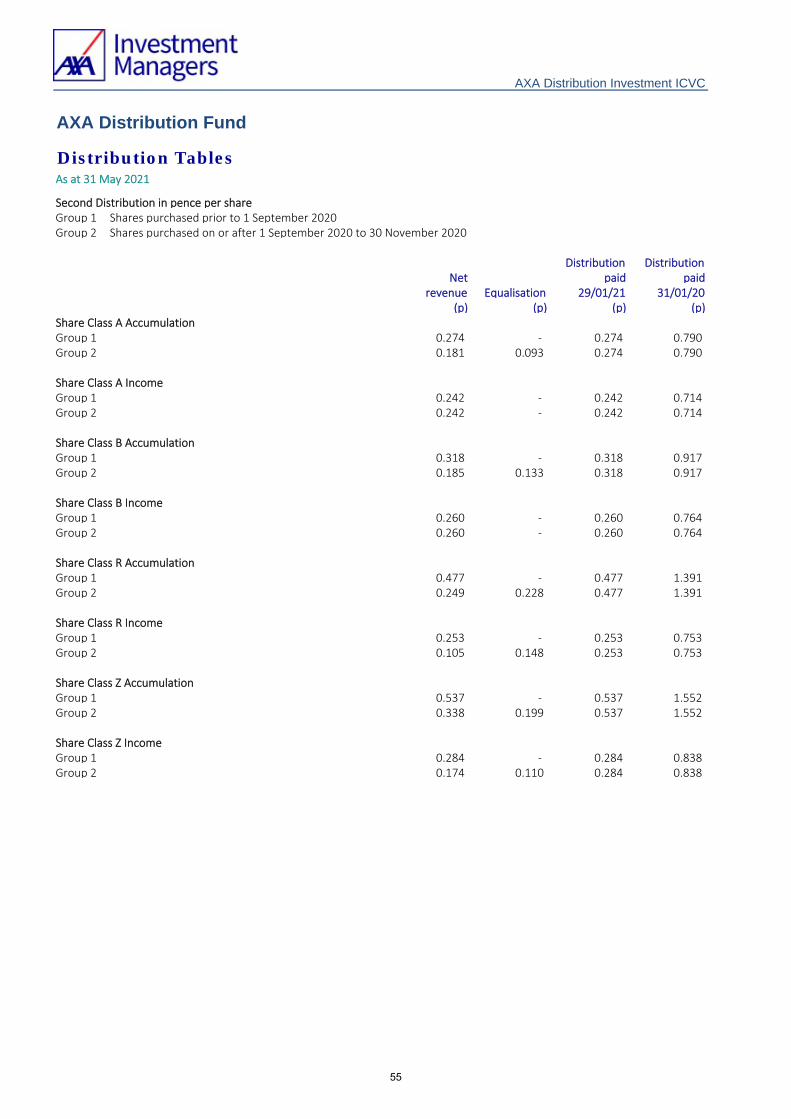
AXA Distribution Fund
As at 31 May 2021
AXA Distribution Investment ICVC
Distribution Tables
Second Distribution in pence per shareGroup 1 Shares purchased prior to 1 September 2020Group 2 Shares purchased on or after 1 September 2020 to 30 November 2020
Distribution DistributionNet paid paid
revenue Equalisation 29/01/21 31/01/20(p) (p) (p) (p)
Share Class A AccumulationGroup 1 0.274 ‐ 0.274 0.790 Group 2 0.181 0.093 0.274 0.790
Share Class A IncomeGroup 1 0.242 ‐ 0.242 0.714 Group 2 0.242 ‐ 0.242 0.714
Share Class B AccumulationGroup 1 0.318 ‐ 0.318 0.917 Group 2 0.185 0.133 0.318 0.917
Share Class B IncomeGroup 1 0.260 ‐ 0.260 0.764 Group 2 0.260 ‐ 0.260 0.764
Share Class R AccumulationGroup 1 0.477 ‐ 0.477 1.391 Group 2 0.249 0.228 0.477 1.391
Share Class R IncomeGroup 1 0.253 ‐ 0.253 0.753 Group 2 0.105 0.148 0.253 0.753
Share Class Z AccumulationGroup 1 0.537 ‐ 0.537 1.552 Group 2 0.338 0.199 0.537 1.552
Share Class Z IncomeGroup 1 0.284 ‐ 0.284 0.838 Group 2 0.174 0.110 0.284 0.838
55

AXA Distribution Fund
As at 31 May 2021
AXA Distribution Investment ICVC
Distribution Tables
Third Distribution in pence per shareGroup 1 Shares purchased prior to 1 December 2020Group 2 Shares purchased on or after 1 December 2020 to 28 February 2021
Distribution DistributionNet paid paid
revenue Equalisation 30/04/21 30/04/20(p) (p) (p) (p)
Share Class A AccumulationGroup 1 0.354 ‐ 0.354 0.497 Group 2 0.204 0.150 0.354 0.497
Share Class A IncomeGroup 1 0.312 ‐ 0.312 0.447 Group 2 0.201 0.111 0.312 0.447
Share Class B AccumulationGroup 1 0.411 ‐ 0.411 0.577 Group 2 0.214 0.197 0.411 0.577
Share Class B IncomeGroup 1 0.335 ‐ 0.335 0.478 Group 2 0.151 0.184 0.335 0.478
Share Class R AccumulationGroup 1 0.615 ‐ 0.615 0.873 Group 2 0.398 0.217 0.615 0.873
Share Class R IncomeGroup 1 0.326 ‐ 0.326 0.471 Group 2 0.138 0.188 0.326 0.471
Share Class Z AccumulationGroup 1 0.693 ‐ 0.693 0.976 Group 2 0.370 0.323 0.693 0.976
Share Class Z IncomeGroup 1 0.365 ‐ 0.365 0.524 Group 2 0.121 0.244 0.365 0.524
56

AXA Distribution Fund
As at 31 May 2021
AXA Distribution Investment ICVC
Distribution Tables
Final Distribution in pence per shareGroup 1 Shares purchased prior to 1 March 2021Group 2 Shares purchased on or after 1 March 2021 to 31 May 2021
Distribution DistributionNet payable paid
revenue Equalisation 31/07/21 31/07/20(p) (p) (p) (p)
Share Class A AccumulationGroup 1 0.716 ‐ 0.716 0.683 Group 2 0.398 0.318 0.716 0.683
Share Class A IncomeGroup 1 0.630 ‐ 0.630 0.610 Group 2 0.630 ‐ 0.630 0.610
Share Class B AccumulationGroup 1 0.832 ‐ 0.832 0.793 Group 2 0.419 0.413 0.832 0.793
Share Class B IncomeGroup 1 0.676 ‐ 0.676 0.654 Group 2 0.676 ‐ 0.676 0.654
Share Class R AccumulationGroup 1 1.242 ‐ 1.242 1.197 Group 2 0.650 0.592 1.242 1.197
Share Class R IncomeGroup 1 0.656 ‐ 0.656 0.642 Group 2 0.148 0.508 0.656 0.642
Share Class Z AccumulationGroup 1 1.401 ‐ 1.401 1.340 Group 2 0.615 0.786 1.401 1.340
Share Class Z IncomeGroup 1 0.737 ‐ 0.737 0.716 Group 2 0.277 0.460 0.737 0.716
57
AXA Ethical Distribution Fund
Investment Manager's ReportFor the year ended 31 May 2021
Lower Risk Higher Risk
1 2 3 4 5 6 7
Why is this Fund in this category?
As at 31 May 2021
Potentially lower reward Potentially higher reward
This Fund is actively managed in reference to the Benchmark, which may be used by investors to compare the Fund's
performance.
Due to the ethical constraints placed on this Fund, which exclude over half of the FTSE All‐Share Index, the value of the Fund
may fluctuate more than a Fund which is invested in a more diversified portfolio of UK equities. The value of investments and
the income from them is not guaranteed and can go down as well as up.
AXA Distribution Investment ICVC
The risk category is calculated using historical performance data and may not be a reliable indicator of the Fund’s future risk
profile. The risk category shown is not guaranteed and may shift over time. The lowest category does not mean risk free.
The capital of the Fund is not guaranteed. The Fund is invested in financial markets and uses techniques and instruments which
are subject to some level of variation which, may result in gains or losses.
Investment Objective
Investment Policy
Risk and Reward Profile
The aim of this Fund is to provide income with some prospect for long‐term capital growth.
The latest ethical policy for the Fund can be found on https://adviser.axa‐im.co.uk/fund‐centre/‐/funds‐center/axa‐
ethicaldistribution‐fund‐b‐gbp‐acc‐53826#/literature
The Fund invests in a mix of shares in UK listed companies, UK Government Bonds, the majority of which are linked to the rate of
inflation, and cash. The Fund's typical asset mix would range between 50‐60% investment in shares and 40‐50% in UK
Government bonds and cash. In accordance with the Manager's ethical screening criteria, the Fund invests in companies
identified in relation to their approach to: environmental issues (including biodiversity, ozone depleting substances, climate
change, fossil fuels, energy intensive industries, mining and quarrying, nuclear power, pollution and sustainable timber); human
rights violations; and, other corporate responsibility issues (including animal testing, gambling, intensive farming, military sales,
pornography and adult entertainment services, activities deemed detrimental to developing economies and tobacco sale and
production).
The Manager has full discretion to select investments for the Fund in line with the above investment policy and in doing so may
take into consideration a composite benchmark made up of the following indices in the stated proportions: 55% FTSE All Share
Index; 17.5% FTSE Index Linked All Stocks; 17.5% FTSE Index Linked < 5 Years 3.5% FTSE Gilts All Stocks; 3.5% FTSE Gilts < 5
Years; 3% LIBID 7 Day (cash) (monthly rebalance) (the “Benchmark”). This Benchmark best represents the types of bonds and
companies in which the Fund predominantly invests.
Eligible shares in companies for investment are then selected based upon their prospects for future growth in dividend
payments following an in depth analysis of their financial status, quality of business model and corporate governance
arrangements. Investments in UK Government bonds are diversified across a range of maturities (i.e., the length of time for full
repayment of the bond by the Government).
58

AXA Ethical Distribution Fund
Investment Manager's ReportFor the year ended 31 May 2021
AXA Distribution Investment ICVC
Internal investment guidelines are set if necessary to ensure interest rate risk is maintained within a range deemed suitable
based on the individual fund’s investment objectives and investment policy.These guidelines could include measures of
sensitivity to changes of interest rates.
• Index‐linked bonds ‐ index‐linked bonds are fixed interest securities whose capital repayment amounts and interest payments
are adjusted in line with movements in inflation indices. They are designed to mitigate the effects of inflation on the value of a
portfolio. The market value of index‐linked bonds is determined by the market’s expectations of future movements in both
interest rates and inflation rates.
As with other bonds, the value of index‐linked bonds will generally fall when expectations of interest rates rise and vice versa.
However, when the market anticipates a rise in inflation rates, index‐linked bonds will generally outperform other bonds, and
vice versa.
Additional risks
Under normal market conditions the Fund’s key risk factors are:
• Equity risk ‐ the value of shares in which the Fund invests fluctuate pursuant to market expectations. The value of such shares
will go up and down and equity markets have historically been more volatile than fixed interest markets. Should the price of
shares in which the Fund has invested fall, the Net Asset Value of the Fund will also fall.
Funds investing in shares are generally more volatile than funds investing in bonds or a combination of shares and bonds, but
may also achieve greater returns.
Internal investment guidelines are set, if necessary, to ensure equity risk is maintained within a range deemed suitable based on
the individual fund’s investment objectives and investment policy.
• Interest rate risk ‐ is the risk that the market value of bonds held by the Fund could fall as a result of higher market rates
(yields). Yields can change as a result of, among other things, the economic and inflation outlook which also affects supply and
demand as well as future interest rate expectations, without necessarily a change in official central bank short term interest
rates. Higher yields result in a decline in the value of bonds. Conversely, lower yields tend to increase the value of bonds.
Duration (a measure based on the coupon and maturity payments schedule of a bond) is an important concept in understanding
how the price of that bond might change for a 1% move in its redemption yield. A bond with a longer duration is more sensitive
to a change in yields and, generally speaking, will experience more volatility in its market value than bonds with shorter
durations.
Index‐linked bonds bought in the secondary market (i.e., not directly from the issuer) whose capital values have been adjusted
upward due to inflation since issuance, may decline in value if there is a subsequent period of deflation.
Due to the sensitivity of these bonds to interest rates and expectations of future inflation, there is no guarantee that the value
of these bonds will correlate with inflation rates in the short to medium term.
Index‐linked bonds risk is an inherent risk of investing in index‐linked bonds. Exposure to this risk is managed by the allocation
decision on the proportion of the portfolio to invest in index‐linked bonds, as well as the amount of remaining maturity of these
bonds, which will affect their sensitivity in value, to changes in expected inflation levels.
• Risks linked to investment in sovereign debt ‐ the Fund may invest in bonds issued by countries and governments (sovereign
debt). The governmental entity that controls the repayment of sovereign debt may not be able or willing to repay the capital
and/or interest when due in accordance with the terms of such debt. In such a scenario, the value of investments of the Funds
may be adversely affected. A governmental entity’s willingness or ability to repay capital and interest due in a timely manner
may be affected by, among other factors, its cash flow situation, the extent of its foreign currency reserves, the availability of
sufficient foreign exchange on the date a payment is due, the relative size of the debt service burden to the economy as a
whole, the governmental entity’s policy towards the International Monetary Fund and the political constraints to which a
governmental entity may be subject. Governmental entities may also be dependent on expected disbursements from foreign
governments, multilateral agencies and others abroad to reduce principal and interest on their debt. In addition, there are no
bankruptcy proceedings for such issuers under which money to pay the debt obligations may be collected in whole or in part.
Holders may be requested to participate in the rescheduling of such sovereign debt and to extend further loans to the issuers.
59

AXA Ethical Distribution Fund
Investment Manager's ReportFor the year ended 31 May 2021
AXA Distribution Investment ICVC
Important Information
Derivatives transactions may be used in the Fund for meeting the investment objectives of the Fund. The use of derivatives in
this manner is not expected to change the risk profile of the Fund.
Certain countries are especially large debtors to commercial banks and foreign governments. Investment in sovereign debt
issued or guaranteed by such countries (or their governments or governmental entities) involves a higher degree of risk than
investment in other sovereign debt.
Certain funds may be further subject to the risk of high concentration in bonds issued by and/or guaranteed by a single
sovereign issuer which is below investment grade and/or unrated which is also subject to higher credit risk. In the event of a
default of the sovereign issuer, a Fund may suffer significant loss.
This is an inherent risk for funds invested within sovereign bonds. Internal investment guidelines, scenario testing as well as
other regular monitoring seek to ensure the level of risk is aligned with each individual fund’s investment objectives and
investment policy
Other risks which could have an impact in extreme market conditions include:
• Liquidity risk ‐ under certain market conditions, it may be difficult to buy or sell investments for the Fund. For example, smaller
company shares may trade infrequently and in small volumes and corporate and emerging market bonds may be affected by the
demand in the market for such securities carrying credit risk, particularly in times of significant market stress. As a result, it may
not be possible to buy or sell such investments at a preferred time, close to the last market price quoted or in the volume
desired. The Manager may be forced to buy or sell such investments as a consequence of shareholders buying or selling shares
in the Fund. Depending on market conditions at the time, this could lead to a significant drop in the Fund’s value.
Monthly monitoring is conducted, using an in‐house liquidity tool, to ensure a high degree of confidence that Fund liquidity will
meet the Fund’s expected liquidity requirements. Any concerns indicated by the tool are analysed by the Manager’s risk team
who may also discuss the results with portfolio management staff, or other senior professionals within the firm, as needed, to
ensure an appropriate scrutiny.
• Counterparty risk ‐ at any one time, a Fund may be exposed to the creditworthiness and stability of the counterparties to
transactions entered into by the Fund (including derivative and stock lending and repo/reverse repo transactions). The Fund will
be subject to the risk of the inability of its counterparties to perform its obligations under such transactions (default), whether
due to insolvency, bankruptcy or other causes. In the event of the insolvency of a counterparty, the Fund might not be able to
recover cash or assets of equivalent value, to that invested, in full. The Fund may receive assets or cash from the counterparty
(collateral) to protect against any such adverse effect. Where relevant, a counterparty will forfeit its collateral if it defaults on
the transaction with the Fund. However, if the collateral is in the form of securities, there is a risk that when it is sold, it will
realise insufficient cash to settle the counterparty’s debt to the Fund under a transaction or to purchase replacement securities
that were lent to the counterparty under a stock lending arrangement. In relation to stock lending arrangements, there is also
the risk that while cash is recovered in the event of a default, the actual stock cannot be repurchased. Furthermore, to the
extent that collateral is not present to cover part or all of the debt, a counterparty default may result in losses for the affected
Fund. To assist in managing these types of risks, the ACD sets criteria around the types of eligible collateral a Fund may accept.
Please see the paragraph entitled “Treatment of Collateral” in the “Investment and borrowing powers applicable to the Funds”
section in Appendix II of this Prospectus for more information.
Transactions in securities that the Fund may enter into expose it to the risk that the counterparty will not deliver the investment
for a purchase or cash for a sale after the Fund has contracted to fulfil its responsibilities. This is minimised by the practice in the
majority of markets of delivery versus payment and short settlement periods.
Based on the analysis, the Manager believes that the liquidity profile of the Fund is appropriate.
Further explanation of the risks associated with an investment in this Fund can be found in the prospectus.
60

AXA Ethical Distribution Fund
Investment Manager's ReportFor the year ended 31 May 2021
AXA Distribution Investment ICVC
A saying coined (and often shared) by a well‐known fund manager and former colleague that ‘things will not become better or
worse but different’ rings true and investment markets have certainly been grappling with this in recent months.
One year ago, this report referenced the mounting death toll from coronavirus which, at the time, was still spreading voraciously
across the globe. Today, deaths worldwide are approaching four million and many developing nations are still suffering terribly
from its impact. Within developed markets, we have benefited from the phenomenal efforts made by scientists, regulators and
governments to research, develop and produce multiple vaccines that have substantially reduced the harming effects of the
virus. After a long, long time spent restricted in each of our daily lives we are approaching a return to normal life.
As economies around the world re‐open, investors have been questioning what the post‐lockdown world will look like. New
working practices, increased reliance on technology, less use of cash as a means of payment, growth in pet ownership, increased
domestic travel and many other factors will shape the post‐COVID‐19 world. Undoubtedly, following the temporary hibernation
of the global economy, there is a level of optimism about the coming months and possibly years and reference to the ‘roaring
20s’ points to the release of the pent up demand and ambition of populations around the world.
For the Fund, market conditions over the past six months have been generally positive as investors have looked forward to a normalisation of economic conditions. Since the beginning of December, conditions impacting investment markets have followed in much the same vein as during the last reporting period. In short, conditions have been volatile. Equities have made solid progress while fixed income has been challenged by the positive investor view of life in a post‐lockdown world. The FTSE All‐Share Index (on a Total Return basis) rose 15.2% with the FTSE 100 (+14.09%) underperforming the mid cap (+18.43%) and the FTSE Small Cap (ex‐Investment Companies) (+35.87%) indices. The FTSE UK Gilts All Stocks (TR) fell 4.82% over the six‐month period, while the FTSE UK Gilts Index‐Linked (TR) All stocks index outperformed its conventional peer and falling 2.35%.
The prospect of a resurgent UK economy following the long months of lockdown has helped push the FTSE All‐Share Index higher – although it remains some way below its all‐time highs, unlike many international bourses. As life returns to normal, the tailwinds of pent‐up consumer demand, record business investment intentions, a buoyant residential property market and low interest rates are directing economists to project GDP growth of over 7% in 2021. However, with oil, commodity and other raw material prices pushing inflation up from very low levels, markets have been tying themselves up in knots about the potential for the years of supportive central bank policy being reversed and used to cool the economy. For the first time in years, the spectre of inflation has become a central concern for investors.
The combination of equities and inflation‐linked sovereign bonds, that continues to define the Distribution range of funds, position them ideally for the on‐going market conditions.
The quantum of money pumped into the financial system over the past 18 months has paled into insignificance the financial backing the same organisations gave following the global financial crisis. Unquestionably, this support has enabled the economy to keep going and saved many jobs from being lost. It also provided a strong underpin to fixed income markets as central banks reiterated their ‘lower for longer’ mantra. However, the impact of the vaccine rollout has brought economic optimism back to market and while we had been anticipating a modest move higher in yields over the course of 2021, the adjustment in Q1 2021 happened quicker and in a larger magnitude than we had been anticipating. Markets quickly priced in a continuation of the strong economic rebound and is currently anticipating two rate hikes from the US Federal Reserve by Q1 2023, while in GBP rates, the market is pricing in one hike by Q1 2023.
The bearish momentum for bonds has stabilised for now but would anticipate a modest move higher in yields later in the summer as speculation around tapering of asset purchases is likely to rise. However, with much of the good news on the economy fully priced, positioning and the knock‐on implications to risk assets via higher discounting rates and tighter financial conditions will require close attention.
In our view, yield levels continue to offer some additional level of protection for the portfolios as the technical backdrop remains supportive, with global central banks continuing their asset purchase programmes. In addition, central banks have been explicit in their guidance on short rates, which will remain anchored until inflation is above their target for a sustained period. This backdrop should continue to be supportive for breakevens and inflation‐linked bonds.
Market Review
61

AXA Ethical Distribution Fund
Investment Manager's ReportFor the year ended 31 May 2021
AXA Distribution Investment ICVC
Our positive view of the prospect for UK equities in 2021 has been reinforced by the takeover and IPO activity that have also
characterised the year to date. At the time of writing this report buyout transactions involving over £25bn in value of UK‐listed
companies have been announced (this does not include the unsuccessful approaches for several other companies).
Concurrently, there has been a long, and growing, list of companies revealing an intention to seek a public listing in the UK.
Significantly, the vast majority of the new listings have been successful and share prices have risen to a premium to their IPO
price which has encouraged more companies to follow. In the meantime, the UK government appears to be closing in on some
significant international trade agreements following Brexit, providing a further potential tailwind for the economy.
Another factor having a significant impact on the UK equity market has been the growth of investor interest in environmental, social and governance (ESG) issues. The growing awareness of consumers, and in turn companies, of product provenance, the environmental impact and corporate behaviours is being reflected increasingly in sales rates. Within the portfolio, this is impacting every company we hold from Great Portland Estates to BP. Sustainability reports, carbon reduction targets and positive societal change are now the norm amongst the high‐quality businesses the fund invests in. On behalf of our unitholders, we have continued our investment and efforts in ESG and produce a monthly report covering a wide range of ESG metrics. These include measuring the Fund’s carbon and water intensity, monitoring the proportion of female executives on our holdings’ Boards, monitoring for controversies, scoring individual company holdings and assessing the overall ESG score of the Fund. Our intention is to expand the reporting of these, and other measures, in the years ahead.
We have added to the Fund’s holding of Hill & Smith during the period where we see strong structural and cyclical drivers providing tailwinds for the business. On the structural side they are positioned well to make a positive contribution to issues including climate change, health & safety, population growth, increased urbanisation, infrastructure safety and vision zero (no road deaths). On the cyclical side, we think that the company is an excellent way to play the increased government spending on infrastructure and, in particular, President Biden’s US infrastructure package. This, however, is considered the icing on the cake as there are already large spending plans in place, such as Texas spending $77bn on their roads alone. Hill & Smith has also been quick to highlight the environmental benefits of galvanising as opposed to painting steel, thanks to its longevity and ability to be reused.
The new CEO Paul Simmons is bringing years of experience from Halma and applying it to the not‐too‐dissimilar Hill & Smith decentralised business model. We are particularly pleased that he has clarified the role and type of M&A he wants to achieve and expect to see a more rigorous approach to portfolio management and innovation. All of this means that we anticipate seeing a more consistent, higher level of organic growth than the Group has historically been able to produce and with it a likely higher rating.
Outlook
We remain positive about the prospects for UK equities over the period ahead. Valuations, in aggregate, remain attractive on both and absolute and relative (to international markets) basis. We are seeing a strong level of M&A activity which we anticipate will continue and new, interesting and attractively priced IPOs are offering new opportunities.
While it is inevitable that conditions will remain volatile, we continue to believe that macro events cannot be accurately nor consistently predicted. As such, the Fund retains a preference for longer‐term structural trends and quality companies that can deliver robust, reliable and consistent growth, supported by a simple government bond and cash hedge.
Performance
The performance of the equity holdings within the portfolio continued to outperform the FTSE All‐Share Index during the period under review. As ever, there were individual holdings that proved challenging and, in particular, the London Stock Exchange contributed negatively over the half year. Following several strong years of performance, the London Stock Exchange surprised the market with its announcement of a significantly larger than expected investment it will be making in its newly acquired Refinitiv business. The shares were weak on the back of the news; however, we continue to see value in the business and have held the position. The portfolio’s largest relative position, Games Workshop, also detracted from performance over the period.
62

AXA Ethical Distribution Fund
Investment Manager's ReportFor the year ended 31 May 2021
AXA Distribution Investment ICVC
Cost (£'000) Proceeds (£'000)
● UK Treasury 4.25% 07/06/32 5,207 3,140
● UK Treasury 0.125% IL 22/03/26 4,741 2,537
● UK Treasury 0.125% IL 22/03/24 3,029 2,518
● UK Treasury 0.125% IL 10/08/31 2,130 2,499
● UK Treasury 0.125% IL 10/08/28 1,999 2,038
AXA Investment Managers UK Limited
● Ascental
● UK Treasury 3.75% 07/09/20
● HSBC
● Barclays
Matthew Huddart, Jamie Forbes‐Wilson
31 May 2021
Major Purchases
All performance data source: AXA Investment Managers and Morningstar.
By contrast, Future Plc and Gym Group were among the best performers in the period. Future Plc is a media company which publishes more than 50 magazines in a range of fields including technology, music, photography and the home. The company has successfully transitioned in recent years from print to becoming a digital business and has reaped the rewards through consistent earnings growth. It has made a number of accretive acquisitions that have further bolstered the company’s growth. Gym Group plc is one of the leading low‐cost fitness centres in the UK. Following a difficult time in 2020 when its premises were forced to close due to COVID‐19 restrictions, the company has seen a strong surge in demand in 2021. The company has ambitions growth plans and we believe it could be positioned well in a post-pandemic world.
Major Sales
● UK Treasury 1.875% IL 22/11/22
Past performance is not a guide for future performance.
63

Portfolio Statement Market Value % of Total
As at 31 May 2021 Holding £’000 Net Assets
EQUITIES 66.26% (31/05/20: 57.36%)
BASIC MATERIALS 1.46% (31/05/20: 1.25%*)
Industrial Metals & Mining 1.46% (31/05/20: 1.25%*)
Hill & Smith 129,239 1,983 0.92
Trifast 750,000 1,163 0.54
TOTAL BASIC MATERIALS 3,146 1.46
CONSUMER DISCRETIONARY 20.03% (31/05/20: 18.80%*)
Consumer Services 0.58% (31/05/20: 0.99%*)
HomeServe 133,762 1,247 0.58
Household Goods & Home Construction 2.30% (31/05/20: 2.03%)
Berkeley 35,670 1,678 0.78
Redrow 312,111 2,130 0.99
Vistry 87,010 1,156 0.53
Leisure Goods 2.08% (31/05/20: 1.96%)
Games Workshop 37,762 4,505 2.08
Media 2.00% (31/05/20: 2.70%*)
Bloomsbury Publishing 601,051 1,863 0.86
RELX 133,762 2,467 1.14
Retailers 5.95% (31/05/20: 4.34%*)
B&M European Value Retail 424,223 2,472 1.14
Dunelm 178,349 2,615 1.21
Howden Joinery 267,524 2,138 0.99
JD Sports Fashion 267,524 2,550 1.18
Pets at Home 686,645 3,082 1.43
Travel & Leisure 7.12% (31/05/20: 6.78%)
Domino's Pizza 642,057 2,374 1.10
Gym 1,410,723 3,915 1.81
Hollywood Bowl 1,238,156 3,083 1.43
Hostelworld 1,339,543 1,319 0.61
On the Beach 441,067 1,804 0.83
SSP 369,323 1,055 0.49
TEN Entertainment 728,764 1,829 0.85
TOTAL CONSUMER DISCRETIONARY 43,282 20.03
CONSUMER STAPLES 3.07% (31/05/20: 3.20%*)
Beverages 3.07% (31/05/20: 3.20%)
Diageo 195,293 6,636 3.07
TOTAL CONSUMER STAPLES 6,636 3.07
AXA Distribution Investment ICVC
AXA Ethical Distribution Fund
64

Portfolio Statement Market Value % of Total
As at 31 May 2021 Holding £’000 Net Assets
AXA Distribution Investment ICVC
AXA Ethical Distribution Fund
FINANCIALS 14.21% (31/05/20: 15.56%*)
Banks 0.60% (31/05/20: 2.69%)
Natwest 624,223 1,303 0.60
Finance & Credit Services 1.52% (31/05/20: 2.69%*)
London Stock Exchange 43,695 3,288 1.52
Investment Banking & Brokerage 4.55% (31/05/20: 3.58%*)
3i 280,900 3,500 1.62
Intermediate Capital 151,597 3,196 1.48
St James's Place 222,937 3,133 1.45
Life Insurance 4.88% (31/05/20: 3.83%*)
Just 2,318,542 2,555 1.18
Legal & General 891,747 2,562 1.19
Prudential 356,700 5,433 2.51
Non‐Life Insurance 2.66% (31/05/20: 2.77%)
Admiral 62,422 1,846 0.86
Lancashire 356,700 2,254 1.04
Sabre Insurance 624,223 1,639 0.76
TOTAL FINANCIALS 30,709 14.21
INDUSTRIALS 9.80% (31/05/20: 8.40%*)
Construction & Materials 1.61% (31/05/20: 1.35%)
Galliford Try 151,597 196 0.09
Polypipe 512,755 3,287 1.52
Electronic & Electrical Equipment 3.89% (31/05/20: 2.96%*)
Luceco 400,000 1,408 0.65
Oxford Instruments 155,916 3,235 1.50
Porvair 289,361 1,644 0.76
Rotork 624,223 2,125 0.98
General Industrials 0.00% (31/05/20: 0.98%)
Industrial Support Services 4.30% (31/05/20: 3.11%*)
Electrocomponents 191,725 1,903 0.88
Experian 89,174 2,409 1.11
RWS 470,320 2,998 1.39
Speedy Hire 2,633,711 1,983 0.92
TOTAL INDUSTRIALS 21,188 9.80
REAL ESTATE 2.94% (31/05/20: 3.79%*)
Real Estate Investment & Services 1.22% (31/05/20: 1.48%)
Grainger 915,526 2,633 1.22
65

Portfolio Statement Market Value % of Total
As at 31 May 2021 Holding £’000 Net Assets
AXA Distribution Investment ICVC
AXA Ethical Distribution Fund
Real Estate Investment Trusts 1.72% (31/05/20: 2.31%)
Segro 133,762 1,392 0.64
UNITE 205,101 2,335 1.08
TOTAL REAL ESTATE 6,360 2.94
TECHNOLOGY 6.21% (31/05/20: 5.34%*)
Software & Computer Services 3.12% (31/05/20: 3.06%*)
Aptitude Software 320,617 1,937 0.90
Future 115,736 3,417 1.58
GB 150,000 1,389 0.64
Technology Hardware & Equipment 3.09% (31/05/20: 2.28%*)
DiscoverIE 403,548 3,087 1.43
TT Electronics 1,421,116 3,581 1.66
TOTAL TECHNOLOGY 13,411 6.21
TELECOMMUNICATIONS 0.70% (31/05/20: 1.02%)
Telecommunications Service Providers 0.70% (31/05/20: 1.02%*)
Telecom Plus 128,401 1,515 0.70
TOTAL TELECOMMUNICATIONS 1,515 0.70
GOVERNMENT BONDS 37.65% (31/05/20: 37.95%) Index Linked Government Bonds 31.92% (31/05/20: 33.05%)
UK Treasury 0.125% IL 22/03/24 12,540,000 16,934 7.84
UK Treasury 0.125% IL 22/03/26 7,700,000 10,332 4.78
UK Treasury 0.125% IL 10/08/28 1,510,000 1,989 0.92
UK Treasury 0.125% IL 22/03/29 1,285,000 2,011 0.93
UK Treasury 0.125% IL 10/08/31 1,600,000 2,140 0.99
UK Treasury 0.125% IL 22/11/36 873,000 1,471 0.68
UK Treasury 0.125% IL 22/03/44 940,000 1,927 0.89
UK Treasury 0.125% IL 22/03/46 777,000 1,552 0.72
UK Treasury 0.125% IL 22/11/56 486,000 1,164 0.54
UK Treasury 0.125% IL 22/03/58 524,844 1,341 0.62
UK Treasury 0.125% IL 22/11/65 615,000 1,820 0.84
UK Treasury 0.125% IL 22/03/68 400,400 1,332 0.62
UK Treasury 0.25% IL 22/03/52 605,000 1,486 0.69
UK Treasury 0.375% IL 22/03/62 587,904 1,876 0.87
UK Treasury 0.5% IL 22/03/50 323,500 912 0.42
UK Treasury 0.625% IL 22/03/40 115,000 265 0.12
UK Treasury 0.625% IL 22/11/42 599,000 1,492 0.69
UK Treasury 0.75% IL 22/03/34 430,000 817 0.38
UK Treasury 0.75% IL 22/11/47 603,300 1,748 0.81
UK Treasury 1.125% IL 22/11/37 650,000 1,633 0.76
UK Treasury 1.25% IL 22/11/27 692,000 1,378 0.64
UK Treasury 1.25% IL 22/11/32 1,429,000 2,960 1.37
UK Treasury 1.25% IL 22/11/55 104,565 431 0.20
UK Treasury 1.875% IL 22/11/22 2,149,500 3,384 1.57
66

Portfolio Statement Market Value % of Total
As at 31 May 2021 Holding £’000 Net Assets
AXA Distribution Investment ICVC
AXA Ethical Distribution Fund
UK Treasury 2% IL 26/01/35 216,000 627 0.29
UK Treasury 2.5% IL 17/07/24 1,406,000 5,026 2.33
UK Treasury 4.125% IL 22/07/30 240,000 889 0.41
Traditional Government Bonds 5.73% (31/05/20: 4.90%)
UK Treasury 0% 07/06/21 1,775,000 1,775 0.82
UK Treasury 0.875% 22/10/29 900,000 909 0.42
UK Treasury 1.25% 22/07/27 210,000 219 0.10
UK Treasury 2% 07/09/25 1,087,000 1,167 0.54
UK Treasury 2.5% 22/07/65 12,000 17 0.01
UK Treasury 3.25% 22/01/44 28,000 39 0.02
UK Treasury 3.5% 22/01/45 70,000 101 0.05
UK Treasury 3.5% 22/07/68 80,000 146 0.07
UK Treasury 3.75% 22/07/52 59,000 96 0.04
UK Treasury 4% 22/01/60 76,000 140 0.06
UK Treasury 4.25% 07/06/32 3,650,000 4,910 2.27
UK Treasury 4.25% 07/03/36 155,000 221 0.10
UK Treasury 4.25% 07/12/40 74,000 112 0.05
UK Treasury 4.25% 07/12/46 1,143,000 1,865 0.86
UK Treasury 4.25% 07/12/49 38,000 65 0.03
UK Treasury 4.25% 07/12/55 89,000 162 0.07
UK Treasury 4.5% 07/12/42 50,000 80 0.04
UK Treasury 4.75% 07/12/30 184,000 250 0.12
UK Treasury 4.75% 07/12/38 50,000 78 0.04
UK Treasury 5% 07/03/25 41,000 48 0.02
TOTAL GOVERNMENT BONDS 81,337 37.65
Portfolio of investments 207,584 96.07
Net other assets 8,492 3.93
Total net assets 216,076 100.00
All investments are ordinary shares unless otherwise stated.
All bonds are denominated in Sterling (unless otherwise indicated).
* Since the previous report, the portfolio classifications and prior year comparative figures have been updated to reflect therecent changes in the Industry Classification Benchmark (ICB) standard.
67
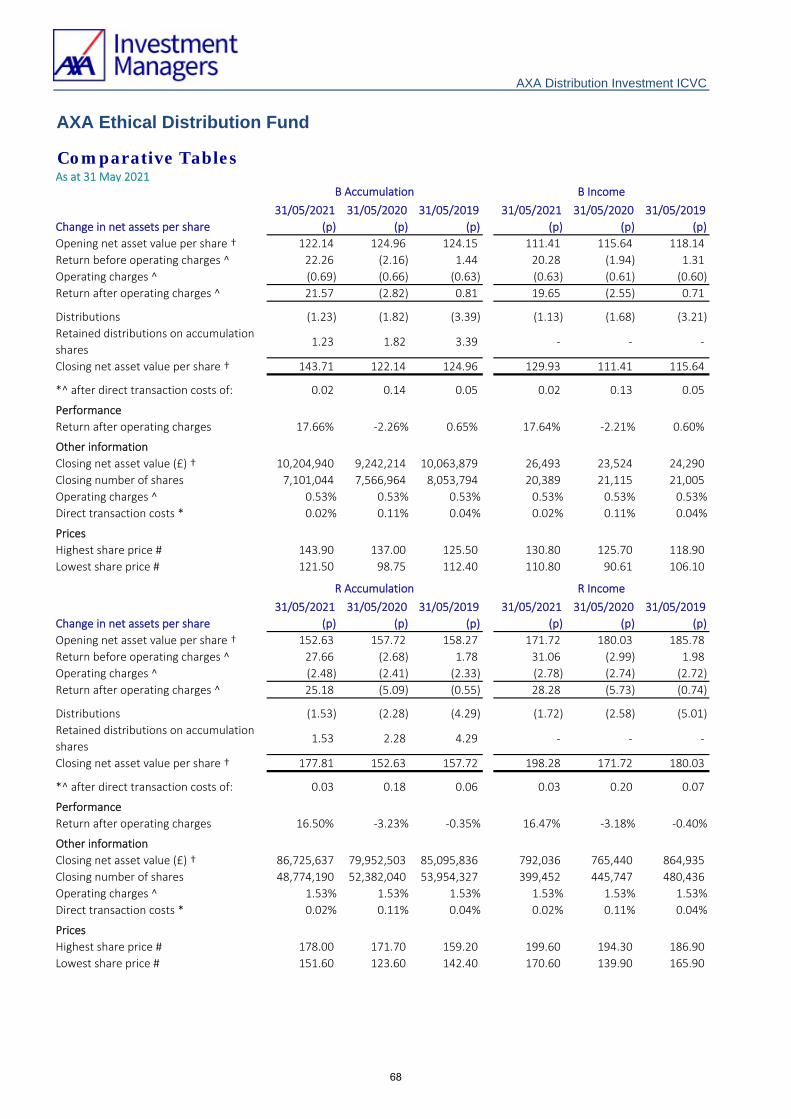
Comparative TablesAs at 31 May 2021
31/05/2021 31/05/2020 31/05/2019 31/05/2021 31/05/2020 31/05/2019
Change in net assets per share (p) (p) (p) (p) (p) (p)
Opening net asset value per share † 122.14 124.96 124.15 111.41 115.64 118.14
Return before operating charges ^ 22.26 (2.16) 1.44 20.28 (1.94) 1.31
Operating charges ^ (0.69) (0.66) (0.63) (0.63) (0.61) (0.60)
Return after operating charges ^ 21.57 (2.82) 0.81 19.65 (2.55) 0.71
Distributions (1.23) (1.82) (3.39) (1.13) (1.68) (3.21)
Retained distributions on accumulation
shares1.23 1.82 3.39 ‐ ‐ ‐
Closing net asset value per share † 143.71 122.14 124.96 129.93 111.41 115.64
*^ after direct transaction costs of: 0.02 0.14 0.05 0.02 0.13 0.05
Performance
Return after operating charges 17.66% ‐2.26% 0.65% 17.64% ‐2.21% 0.60%
Other information
Closing net asset value (£) † 10,204,940 9,242,214 10,063,879 26,493 23,524 24,290
Closing number of shares 7,101,044 7,566,964 8,053,794 20,389 21,115 21,005
Operating charges ^ 0.53% 0.53% 0.53% 0.53% 0.53% 0.53%
Direct transaction costs * 0.02% 0.11% 0.04% 0.02% 0.11% 0.04%
Prices
Highest share price # 143.90 137.00 125.50 130.80 125.70 118.90
Lowest share price # 121.50 98.75 112.40 110.80 90.61 106.10
31/05/2021 31/05/2020 31/05/2019 31/05/2021 31/05/2020 31/05/2019
Change in net assets per share (p) (p) (p) (p) (p) (p)
Opening net asset value per share † 152.63 157.72 158.27 171.72 180.03 185.78
Return before operating charges ^ 27.66 (2.68) 1.78 31.06 (2.99) 1.98
Operating charges ^ (2.48) (2.41) (2.33) (2.78) (2.74) (2.72)
Return after operating charges ^ 25.18 (5.09) (0.55) 28.28 (5.73) (0.74)
Distributions (1.53) (2.28) (4.29) (1.72) (2.58) (5.01)
Retained distributions on accumulation
shares1.53 2.28 4.29 ‐ ‐ ‐
Closing net asset value per share † 177.81 152.63 157.72 198.28 171.72 180.03
*^ after direct transaction costs of: 0.03 0.18 0.06 0.03 0.20 0.07
Performance
Return after operating charges 16.50% ‐3.23% ‐0.35% 16.47% ‐3.18% ‐0.40%
Other information
Closing net asset value (£) † 86,725,637 79,952,503 85,095,836 792,036 765,440 864,935
Closing number of shares 48,774,190 52,382,040 53,954,327 399,452 445,747 480,436
Operating charges ^ 1.53% 1.53% 1.53% 1.53% 1.53% 1.53%
Direct transaction costs * 0.02% 0.11% 0.04% 0.02% 0.11% 0.04%
Prices
Highest share price # 178.00 171.70 159.20 199.60 194.30 186.90
Lowest share price # 151.60 123.60 142.40 170.60 139.90 165.90
AXA Distribution Investment ICVC
B Accumulation B Income
R Accumulation R Income
AXA Ethical Distribution Fund
68

Comparative TablesAs at 31 May 2021
AXA Distribution Investment ICVC
AXA Ethical Distribution Fund
31/05/2021 31/05/2020 31/05/2019 31/05/2021 31/05/2020 31/05/2019
Change in net assets per share (p) (p) (p) (p) (p) (p)
Opening net asset value per share † 173.55 178.00 177.29 185.13 192.64 197.30
Return before operating charges ^ 31.58 (3.06) 2.04 33.63 (3.23) 2.17
Operating charges ^ (1.44) (1.39) (1.33) (1.53) (1.50) (1.48)
Return after operating charges ^ 30.14 (4.45) 0.71 32.10 (4.73) 0.69
Distributions (1.75) (2.61) (4.83) (1.86) (2.78) (5.35)
Retained distributions on accumulation
shares1.75 2.61 4.83 ‐ ‐ ‐
Closing net asset value per share † 203.69 173.55 178.00 215.37 185.13 192.64
*^ after direct transaction costs of: 0.03 0.20 0.07 0.04 0.21 0.08
Performance
Return after operating charges 17.37% ‐2.50% 0.40% 17.34% ‐2.46% 0.35%
Other information
Closing net asset value (£) † 100,272,168 87,535,940 86,955,404 18,054,471 20,601,373 25,964,221
Closing number of shares 49,227,400 50,438,880 48,852,233 8,383,046 11,128,138 13,478,235
Operating charges ^ 0.78% 0.78% 0.78% 0.78% 0.78% 0.78%
Direct transaction costs * 0.02% 0.11% 0.04% 0.02% 0.11% 0.04%
Prices
Highest share price # 203.90 194.80 178.80 216.80 209.00 198.50
Lowest share price # 172.60 140.40 160.20 184.10 150.60 176.90
Z Accumulation
† Valued at bid‐market prices.
# High and low price disclosures are based on quoted share prices (Mid Market Price). Therefore the opening and closing NAV
prices may fall outside the high / low price threshold.
The figures used within the table have been calculated against the average net asset value for the accounting year.
^ Operating charges include indirect costs incurred in the maintenance and running of the Fund, as disclosed in the detailed
expenses within the Statement of Total Return.
* Direct transaction costs include fees, commissions, transfer taxes and duties in the purchasing and selling of investments,
within the accounting year.
Z Income
69
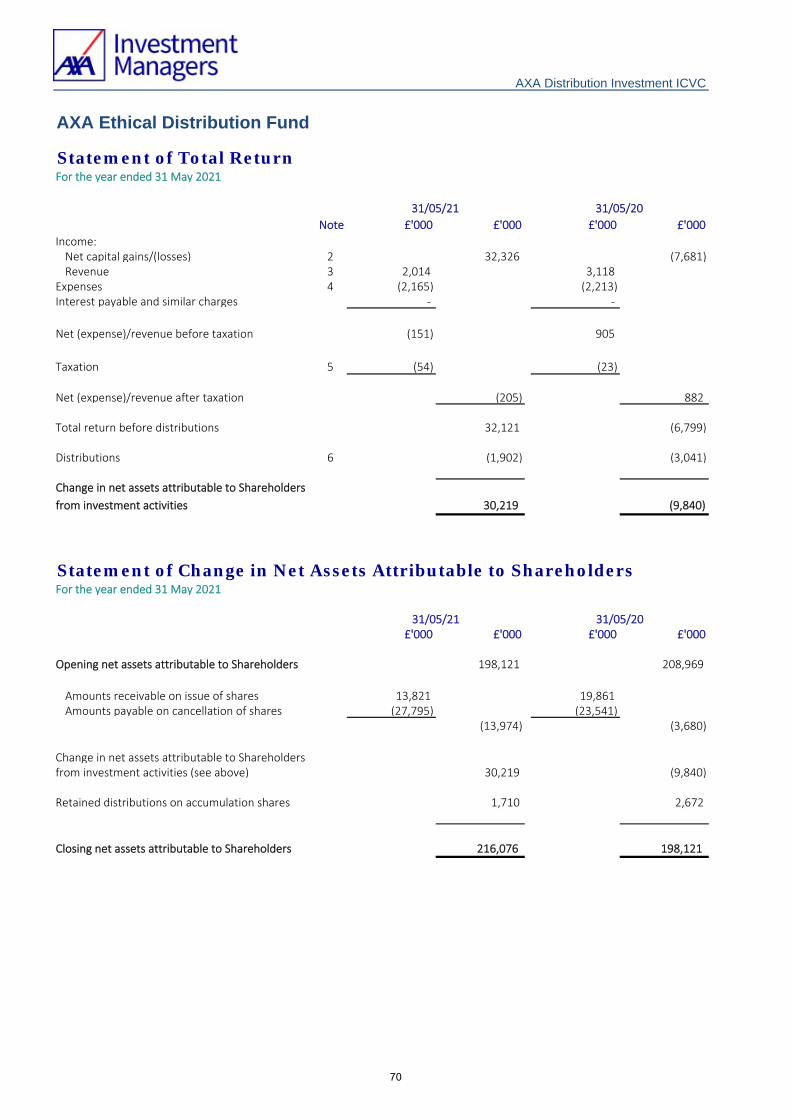
AXA Ethical Distribution Fund
Statement of Total ReturnFor the year ended 31 May 2021
Note £'000 £'000 £'000 £'000
Income:Net capital gains/(losses) 2 32,326 (7,681)Revenue 3 2,014 3,118
Expenses 4 (2,165) (2,213)Interest payable and similar charges ‐ ‐
Net (expense)/revenue before taxation (151) 905
Taxation 5 (54) (23)
Net (expense)/revenue after taxation (205) 882
Total return before distributions 32,121 (6,799)
Distributions 6 (1,902) (3,041)
Change in net assets attributable to Shareholders
from investment activities 30,219 (9,840)
Statement of Change in Net Assets Attributable to Shareholders For the year ended 31 May 2021
£'000 £'000 £'000 £'000
Opening net assets attributable to Shareholders 198,121 208,969
Amounts receivable on issue of shares 13,821 19,861 Amounts payable on cancellation of shares (27,795) (23,541)
(13,974) (3,680)
Change in net assets attributable to Shareholdersfrom investment activities (see above) 30,219 (9,840)
Retained distributions on accumulation shares 1,710 2,672
Closing net assets attributable to Shareholders 216,076 198,121
AXA Distribution Investment ICVC
31/05/21 31/05/20
31/05/21 31/05/20
70

AXA Ethical Distribution Fund
Balance SheetAs at 31 May
Note £'000 £'000Assets:
Fixed assets:
Investments 207,584 188,837
Current assets:
Debtors 7 887 679
Cash and bank balances 8 8,499 9,428
Total assets 216,970 198,944
Liabilities:
Creditors:
Distribution payable (103) (125)
Other creditors 9 (791) (698)
Total liabilities (894) (823)
Net assets attributable to Shareholders 216,076 198,121
31/05/21 31/05/20
AXA Distribution Investment ICVC
71

AXA Ethical Distribution Fund
Notes to the Financial Statements For the year ended 31 May 2021
31/05/21 31/05/20
£'000 £'000
The net capital gains/(losses) comprise:
Non‐derivative securities 32,327 (7,681)
Transaction charges (1) ‐
Net capital gains/(losses) 32,326 (7,681)
3. Revenue
31/05/21 31/05/20
£'000 £'000
Bank interest ‐ 12
Interest on debt securities (408) 268
Overseas dividends 436 187
UK dividends 1,929 2,577
Property revenue from REITs 57 74
Total revenue 2,014 3,118
31/05/21 31/05/20
£'000 £'000
2,107 2,159
5 5
2,112 2,164
29 32
5 5
34 37
16 7
3 4
19 11
2,165 2,213
AXA Distribution Investment ICVC
1. Accounting Basis And Policies
The Fund's Financial Statements have been prepared on the basis detailed on pages 145- 147.
2. Net capital gains/(losses)
4. Expenses
Payable to the ACD, associates of the ACD, and agents
of either of them
Annual management charge
Registration fees
Payable to the Depositary, associates of the Depositary
and agents of either of them
Depositary's fees
Safe custody fees
Other expenses
Audit fees*Printing fees
Total expenses
Expenses include irrecoverable VAT where applicable.
*Audit fees for the financial year ending 2021 were £8,000 (2020: £12,000) (including VAT).
72

AXA Ethical Distribution Fund
Notes to the Financial Statements For the year ended 31 May 2021
AXA Distribution Investment ICVC
5. Taxation
31/05/21 31/05/20
£'000 £'000
(a) Analysis of the tax charge in the year
Irrecoverable overseas tax 54 23
(b) Factors affecting tax charge for the year
31/05/21 31/05/20
£'000 £'000
Net (expense)/revenue before taxation (151) 904
Net (expense)/revenue for the year multiplied by the standard rate of corporation tax (30) 181
Effects of:
Irrecoverable overseas tax 54 23
Movement in excess management expenses 871 544
Relief for indexation on UK Gilts (366) (170)
Revenue not subject to corporation tax (475) (555)
Current tax charge for the year 54 23
(c) Deferred taxation:
(d) Factors that may affect future tax charges
6. Distributions
31/05/21 31/05/20
£'000 £'000
Interim 707 1,851
Final 1,173 1,153
Add: Revenue paid on cancellation of shares 59 116
Deduct: Revenue received on creation of shares (37) (79)
Net distribution for the year 1,902 3,041
Reconciliation of net (expense)/revenue after taxation to distributions
Net (expense)/revenue after taxation (205) 881
Expenses charged to capital 2,107 2,159
Net distribution for the year 1,902 3,041
There is no provision required for deferred taxation at the balance sheet date in the current year or prior year.
OEICs are exempt from tax on capital gains in the UK. Therefore, any capital return is not included within the reconciliation
above.
The tax assessed for the year is higher than the standard rate of corporation tax for an open ended investment company of20% (2020: 20%) is applied to the net revenue before taxation. The differences are explained below:
At the year end, after offset against revenue taxable on receipt, there is a potential deferred tax asset of £5,583,089 (2020:
£4,712,402) in relation to surplus management expenses. It is unlikely that the Fund will generate sufficient taxable profits
in the future to utilise this amount and therefore no deferred tax asset has been recognised in the year.
The distributions take account of revenue received on the creation of shares and revenue deducted on the cancellation of
shares, and comprise:
73

AXA Ethical Distribution Fund
Notes to the Financial Statements For the year ended 31 May 2021
AXA Distribution Investment ICVC
7. Debtors 31/05/21 31/05/20
£'000 £'000
Amounts receivable for creation of shares 490 310
Accrued revenue 397 368
Total debtors 887 679
8. Cash and bank balances 31/05/21 31/05/20
£'000 £'000
Cash and bank balances 8,499 9,428
Total cash and bank balances 8,499 9,428
9. Other creditors 31/05/21 31/05/20
£'000 £'000
Amounts payable for cancellation of shares 415 363
Accrued annual management charge 351 316
Accrued other expenses 25 19
Total other creditors 791 698
10. Related party transactions
11. Share classes
Annual
management
charge rate
(%) 31/05/20 Issued Cancelled Converted 31/05/21
B Accumulation 0.50 7,566,964 39,016 (504,936) ‐ 7,101,044
B Income 0.50 21,115 2,143 (2,869) ‐ 20,389
R Accumulation 1.50 52,382,040 1,708,057 (5,278,892) (37,015) 48,774,190
R Income 1.50 445,747 8,928 (47,673) (7,550) 399,452
Z Accumulation 0.75 50,438,880 4,904,578 (6,148,551) 32,493 49,227,400
Z Income 0.75 11,128,138 944,179 (3,696,229) 6,958 8,383,046
12. Commitments, contingent liabilities and contingent assets
Monies received and paid by the ACD through the creation and cancellation of shares are disclosed in the Statement of
Change in Shareholders’ Net Assets and amounts due at the year end are disclosed in Notes 7 and 9.
Annual management charge paid to the ACD and Registration fees are disclosed in Note 4 and amounts due at the year end
are disclosed in Note 9.
The ACD and its associates (including other authorised investment Funds managed by the ACD) have no shareholdings in the
Company at the year end.
The reconciliation of the opening and closing numbers of shares of each class, along with the ACD’s annual management
charges applicable to each class, is shown below:
There are no commitments, contingent liabilities and contingent assets as at the balance sheet date (2020: nil).
The ACD is related to the Fund as defined by Financial Reporting Standard 102.33 ‘Related Party Disclosures’.
74

AXA Ethical Distribution Fund
Notes to the Financial Statements For the year ended 31 May 2021
AXA Distribution Investment ICVC
13. Derivatives and other financial instruments
Floating rate
financial
assets
Fixed rate
financial
assets
Financial
assets not
carrying
interest Total
Currency Assets £'000 £'000 £'000 £'000
31/05/21
Pound sterling 8,499 81,337 127,134 216,970
Total 8,499 81,337 127,134 216,970
31/05/20
Pound sterling 9,428 75,195 114,321 198,944
Total 9,428 75,195 114,321 198,944
The main risks from the Fund's holding of financial instruments, together with the ACD’s policy for managing these risks, areoutlined below.
Market price risk
The Fund invests principally in equity and fixed income securities. The value of the Fund’s investment portfolio is not fixedand may go down as well as up. This may be as a result of a specific factor affecting the value of an individual company ormay be caused by general market factors (such as government policy or the health of the underlying economy) which canaffect the entire portfolio. The Fund seeks to manage these risks by adhering to investment guidelines and to investment
and borrowing powers set out in the Prospectus. In addition, the Fund complies with the Collective Investment Schemes
sourcebook (“COLL”), which include rules relating to investment holdings that are designed to place limits on the Fund’sinvestment concentration (same as at 31 May 2020).
Market price risk sensitivity
A 10% increase in the value of the Fund’s portfolio would have the effect of increasing the return and net assets by£20,758,382 (2020: £18,883,693). A 10% decrease would have an equal and opposite effect.
Foreign currency risk
The functional currency of the Fund is Sterling. All assets and liabilities of the Fund are denominated in Pound sterling.There was no direct foreign currency exposure within the Fund at the balance sheet date.
Interest rate risk
Fixed interest securities are particularly affected by trends in interest rates and inflation. If interest rates go up, the value ofcapital may fall, and vice versa. Inflation will also decrease the real value of capital, with the exception of index linked bondswhich are protected against the effect of inflation.
Changes in interest rates or changes in expectations of future interest rates may result in an increase or decrease in themarket value of the investments held. A 1% increase in interest rates would have the effect of decreasing the return and netassets £9,714,285 (2020: £9,773,950) . A 1% decrease would have an equal and opposite effect.
The table below shows the interest rate risk profile at the balance sheet date:
75

AXA Ethical Distribution Fund
Notes to the Financial Statements For the year ended 31 May 2021
AXA Distribution Investment ICVC
Floating rate
financial
liabilities
Fixed rate
financial
liabilities
Financial
liabilities not
carrying
interest Total
Currency Liabilities £'000 £'000 £'000 £'000
31/05/21
Pound sterling ‐ ‐ (894) (894)
Total ‐ ‐ (894) (894)
31/05/20
Pound sterling ‐ ‐ (823) (823)
Total ‐ ‐ (823) (823)
31/05/21 31/05/20
Market Value % Market Value %
£’000 £’000
77,422 35.84 75,195 37.95
3,915 1.81 ‐ ‐
81,337 37.65 75,195 37.95
The Fund runs a very low credit risk in respect of unsettled investment transactions as these are normally settled as cash
against delivery.
Fixed interest investments are exposed to credit risk which reflects the ability of the bond issuer to meet its obligations.
Generally, the higher the rate of interest, the higher the perceived credit risk of the issuer. The ACD monitors the credit
quality and risk of the portfolio as a part of the overall investment process and in accordance with the objective and policy
of each fund.
Transactions in securities may expose a fund to the risk that the counterparty will not settle the transaction or do so on a
timely basis.
All transactions in the funds are conducted through counterparties approved by the ACD.
A breakdown of the investment portfolio by credit rating is disclosed on the table below:
Credit Rating Investment grade (BBB- credit rating and above) Unrated
Total value of bonds
Credit risk
76

AXA Ethical Distribution Fund
Notes to the Financial Statements For the year ended 31 May 2021
AXA Distribution Investment ICVC
14. Portfolio transaction costs
Net purchase
cost
Commissions
paid Taxes
Total
purchase cost
31/05/2021 £'000 £'000 % £'000 % £'000
Analysis of purchases
Equities 7,413 3 0.04 23 0.31 7,439
Bonds 19,944 ‐ ‐ ‐ ‐ 19,944Total 27,357 3 23 27,383
Net sale
proceeds
Commissions
paid Taxes
Total sale
proceeds
31/05/2021 £'000 £'000 % £'000 % £'000
Analysis of sales
Equities 28,402 (12) (0.04) ‐ (0.00) 28,390
Bonds 11,252 ‐ ‐ ‐ ‐ 11,252Total 39,654 (12) ‐ 39,642
Net purchase
cost
Commissions
paid Taxes
Total
purchase cost
31/05/2020 £'000 £'000 % £'000 % £'000
Analysis of purchases
Equities 43,411 21 0.05 195 0.45 43,627
Bonds 25,077 ‐ ‐ ‐ ‐ 25,077Total 68,488 21 195 68,704
Net sale
proceeds
Commissions
paid Taxes
Total sale
proceeds
31/05/2020 £'000 £'000 % £'000 % £'000
Analysis of sales
Equities 37,876 (16) (0.04) ‐ ‐ 37,860
Bonds 35,433 ‐ ‐ ‐ ‐ 35,433Total 73,309 (16) ‐ 73,293
31/05/21 31/05/20
Transaction costs as percentage of average net asset value % %
Commissions 0.01 0.02
Taxes 0.01 0.09
At the balance sheet date the average portfolio dealing spread was 0.22% (2020: 0.36%).
77

AXA Ethical Distribution Fund
Notes to the Financial Statements For the year ended 31 May 2021
AXA Distribution Investment ICVC
15. Post balance sheet events
Share class
B Accumulation
B Income
R Accumulation
R Income
Z Accumulation
Z Income
16. Fair value disclosure
Assets Liabilities Assets Liabilities
Valuation technique £'000 £'000 £'000 £'000
Level 1 ^ 207,584 ‐ 188,837 ‐
Level 2 ^^ ‐ ‐ ‐ ‐
Level 3 ^^^ ‐ ‐ ‐ ‐
207,584 ‐ 188,837 ‐
Price per share as at
28.05.21*Movement
143.90
^^ Level 2: Inputs other than quoted prices included within Level 1 that are observable (i.e. developed using market data)
for the asset or liability, either directly or indirectly.
Subsequent to the year end, on 17th September 2021 the Net Asset Value ("NAV") per share has increased above 5% onshare classes when compared to the year end date. The movements for each share class are shown below:
The fair value of the Fund's investments has been determined using the hierarchy above.
^^^ Level 3: Inputs are unobservable (i.e. for which market data is unavailable) for the asset or liability.
^ Level 1: The unadjusted quoted price in an active market for identical assets or liabilities that the entity can access at the
measurement date.
31/05/21 31/05/20
*Prices disclosed are based on quoted share prices and will therefore differ to net asset value per share shown in the
comparative tables which are valued at bid‐market prices.
6.05%130.80 5.50%178.00 5.79%199.60 5.21%203.90 6.03%216.80
Price per share as at
17.09.21152.60138.00188.30210.00216.20228.60 5.44%
78

AXA Ethical Distribution Fund
As at 31 May 2021
Interim Distribution in pence per shareGroup 1 Shares purchased prior to 1 June 2020Group 2 Shares purchased on or after 1 June 2020 to 30 November 2020
Distribution DistributionNet paid paid
revenue Equalisation 29/01/21 31/01/20(p) (p) (p) (p)
Share Class B AccumulationGroup 1 0.454 ‐ 0.454 1.108 Group 2 0.226 0.228 0.454 1.108
Share Class B IncomeGroup 1 0.417 ‐ 0.417 1.025 Group 2 0.417 ‐ 0.417 1.025
Share Class R AccumulationGroup 1 0.566 ‐ 0.566 1.396 Group 2 0.238 0.328 0.566 1.396
Share Class R IncomeGroup 1 0.637 ‐ 0.637 1.577 Group 2 0.142 0.495 0.637 1.577
Share Class Z AccumulationGroup 1 0.645 ‐ 0.645 1.603 Group 2 0.237 0.408 0.645 1.603
Share Class Z IncomeGroup 1 0.688 ‐ 0.688 1.697 Group 2 0.301 0.387 0.688 1.697
AXA Distribution Investment ICVC
Distribution Tables
79

AXA Ethical Distribution Fund
As at 31 May 2021
AXA Distribution Investment ICVC
Distribution Tables
Final Distribution in pence per shareGroup 1 Shares purchased prior to 1 December 2020Group 2 Shares purchased on or after 1 December 2020 to 31 May 2021
Distribution DistributionNet payable paid
revenue Equalisation 30/07/21 31/07/20(p) (p) (p) (p)
Share Class B AccumulationGroup 1 0.779 ‐ 0.779 0.708 Group 2 0.337 0.442 0.779 0.708
Share Class B IncomeGroup 1 0.713 ‐ 0.713 0.654 Group 2 0.713 ‐ 0.713 0.654
Share Class R AccumulationGroup 1 0.966 ‐ 0.966 0.888 Group 2 0.475 0.491 0.966 0.888
Share Class R IncomeGroup 1 1.083 ‐ 1.083 1.005 Group 2 0.718 0.365 1.083 1.005
Share Class Z AccumulationGroup 1 1.104 ‐ 1.104 1.010 Group 2 0.591 0.513 1.104 1.010
Share Class Z IncomeGroup 1 1.174 ‐ 1.174 1.081 Group 2 0.614 0.560 1.174 1.081
80

AXA Global Distribution Fund
Investment Manager's ReportFor the year ended 31 May 2021
Lower Risk Higher Risk
1 2 3 4 5 6 7
Why is this Fund in this category?
As at 31 May 2021
Potentially lower reward Potentially higher reward
AXA Distribution Investment ICVC
The risk category is calculated using historical performance data and may not be a reliable indicator of the Fund’s future risk
profile. The risk category shown is not guaranteed and may shift over time. The lowest category does not mean risk free.
The capital of the Fund is not guaranteed. The Fund is invested in financial markets and uses techniques and instruments which
are subject to some levels of variation, which may result in gains or losses.
Additional risks
Under normal market conditions the Fund’s key risk factors are:
• Equity risk ‐ the value of shares in which the Fund invests fluctuate pursuant to market expectations. The value of such shares
will go up and down and equity markets have historically been more volatile than fixed interest markets. Should the price of
shares in which the Fund has invested fall, the Net Asset Value of the Fund will also fall.
Investment Objective
Investment Policy
Risk and Reward Profile
Funds investing in shares are generally more volatile than funds investing in bonds or a combination of shares and bonds, but
may also achieve greater returns.
Internal investment guidelines are set, if necessary, to ensure equity risk is maintained within a range deemed suitable based on
the individual fund’s investment objectives and investment policy.
The Fund invests in a mix of shares in listed companies worldwide and bonds issued by governments of major developed
countries worldwide (which are linked to the rate of inflation in those countries) and cash. The Fund's typical asset mix would
range between 50‐60% investment in shares and 40‐50% in Government bonds and cash.
The aim of this Fund is to provide income with some prospect for long‐term capital growth.
In constructing the Fund's portfolio of shares, the Manager references a composite benchmark made up of the following indices
in the stated proportions: 55% MSCI AC World Total Return Net; 45% ICE BofAML Global Govt Inflation Linked (the
“Benchmark”) which means that, while the Manager has discretion to select the shares for the Fund, the Fund's divergence from
the Benchmark is controlled. The Benchmark is designed to measure the performance of small to large‐cap stocks from a
number of developed and emerging markets as selected by the Benchmark provider and index‐linked bonds issued by
governments of major developed countries. This Benchmark best represents the types of bonds and companies in which the
Fund predominantly invests. The Fund may also invest at the Manager's discretion in other transferable securities, cash,
deposits, units in collective investment schemes and money market instruments. The Fund may use derivatives for investment
purposes as well as for Efficient Portfolio Management. Use may be made of borrowing, cash holdings, hedging and other
investment techniques permitted in the applicable Financial Conduct Authority rules. The Benchmark may be used by investors
to compare the Fund's performance.
By investing in a fund which can invest up to 60% in equities you are likely to be looking for an investment which has lower risk
than a pure equity based fund but you are prepared to accept some risk for potential reward. You are willing to accept that your
investment will fall and rise in value and that you could get back less than you invest. Typically, you would prefer an investment
with less risk than that of a fund which invests predominantly in equities. You are aware that investing in a fund which has a
global remit can increase risk because of currency movements in return for greater potential reward.
81

AXA Global Distribution Fund
Investment Manager's ReportFor the year ended 31 May 2021
AXA Distribution Investment ICVC
Internal investment guidelines are set if necessary to ensure interest rate risk is maintained within a range deemed suitable
based on the individual fund’s investment objectives and investment policy. These guidelines could include measures of
sensitivity to changes of interest rates.
• Index‐linked bonds risk ‐ index‐linked bonds are fixed interest securities whose capital repayment amounts and interest
payments are adjusted in line with movements in inflation indices. They are designed to mitigate the effects of inflation on the
value of a portfolio. The market value of index‐linked bonds is determined by the market’s expectations of future movements in
both interest rates and inflation rates.
As with other bonds, the value of index‐linked bonds will generally fall when expectations of interest rates rise and vice versa.
However, when the market anticipates a rise in inflation rates, index‐linked bonds will generally outperform other bonds, and
vice versa.
• Interest rate risk ‐ is the risk that the market value of bonds held by the Fund could fall as a result of higher market rates
(yields). Yields can change as a result of, among other things, the economic and inflation outlook which also affects supply and
demand as well as future interest rate expectations, without necessarily a change in official central bank short term interest
rates. Higher yields result in a decline in the value of bonds. Conversely, lower yields tend to increase the value of bonds.
Duration (a measure based on the coupon and maturity payments schedule of a bond) is an important concept in understanding
how the price of that bond might change for a 1% move in its redemption yield. A bond with a longer duration is more sensitive
to a change in yields and, generally speaking, will experience more volatility in its market value than bonds with shorter
durations.
Index‐linked bonds bought in the secondary market (i.e., not directly from the issuer) whose capital values have been adjusted
upward due to inflation since issuance, may decline in value if there is a subsequent period of deflation.
Due to the sensitivity of these bonds to interest rates and expectations of future inflation, there is no guarantee that the value
of these bonds will correlate with inflation rates in the short to medium term.
Index‐linked bonds risk is an inherent risk of investing in index‐linked bonds. Exposure to this risk is managed by the allocation
decision on the proportion of the portfolio to invest in index‐linked bonds, as well as the amount of remaining maturity of these
bonds, which will affect their sensitivity in value, to changes in expected inflation levels.
• Risks linked to investment in sovereign debt ‐ the Fund may invest in bonds issued by countries and governments (sovereign
debt). The governmental entity that controls the repayment of sovereign debt may not be able or willing to repay the capital
and/or interest when due in accordance with the terms of such debt. In such a scenario, the value of investments of the Fund
may be adversely affected. A governmental entity’s willingness or ability to repay capital and interest due in a timely manner
may be affected by, among other factors, its cash flow situation, the extent of its foreign currency reserves, the availability of
sufficient foreign exchange on the date a payment is due, the relative size of the debt service burden to the economy as a
whole, the governmental entity’s policy towards the International Monetary Fund and the political constraints to which a
governmental entity may be subject. Governmental entities may also be dependent on expected disbursements from foreign
governments, multilateral agencies and others abroad to reduce principal and interest on their debt. In addition, there are no
bankruptcy proceedings for such issuers under which money to pay the debt obligations may be collected in whole or in part.
Holders may be requested to participate in the rescheduling of such sovereign debt and to extend further loans to the issuers.
Certain countries are especially large debtors to commercial banks and foreign governments. Investment in sovereign debt
issued or guaranteed by such countries (or their governments or governmental entities) involves a higher degree of risk than
investment in other sovereign debt.
Certain funds may be further subject to the risk of high concentration in bonds issued by and/or guaranteed by a single
sovereign issuer which is below investment grade and/or unrated which is also subject to higher credit risk. In the event of a
default of the sovereign issuer, the Fund may suffer significant loss.
This is an inherent risk for funds invested within sovereign bonds. Internal investment guidelines, scenario testing as well as
other regular monitoring seek to ensure the level of risk is aligned with each individual fund’s investment objectives and
investment policy.
82

AXA Global Distribution Fund
Investment Manager's ReportFor the year ended 31 May 2021
AXA Distribution Investment ICVC
a) accounting, auditing and financial reporting standards, practices and disclosure requirements comparable to those applicable
to companies in developed markets;
b) the same level of government supervision and regulation of stock exchanges as countries with more advanced securities
markets.
Accordingly, certain emerging markets may not afford the same level of investor protection as would apply in more developed
jurisdictions.
• Investment model risk ‐ in seeking to achieve the investment objectives of the AXA Global Distribution Fund, the ACD and the
Sub‐Investment Managers use stock recommendations generated by proprietary quantitative analytical models owned and
operated by the AXA IM Group. Quantitative modelling is a very complex process involving hundreds of thousands of data points
and settings encoded in computer software, and the ACD and its affiliates review these codes and the various components to
the models with a view to ensuring that they are appropriately adapted and calibrated to reflect the ACD’s and the Sub‐
Investment Managers’ views as to the potential implications of evolving external events and factors, including constantly
changing economic, financial market and other conditions. This process involves the exercise of judgments and a number of
inherent uncertainties. The ACD’s and Sub‐Investment Managers’ views, including those related to the optimal configuration,
calibration and adaptation of the models, may change over time depending on evolving circumstances, on information that
becomes available to the ACD and its affiliates and on other factors.
While the ACD attempts to ensure that the models are appropriately developed, operated and implemented on a continuing
basis, sub‐optimal calibrations of the models and similar issues may arise from time to time, and neither the ACD nor any of its
affiliates can guarantee that the models are in an optimal state of calibration and configuration at all times. Further, inadvertent
human errors, trading errors, software development and implementation errors, and other types of errors are an inherent risk in
complex quantitative investment management processes of the type that the ACD employs. While the ACD’s policy is to
promptly address any such errors when identified, there can be no guarantee that the overall investment process will be
without error or that it will produce the desired results. There can be no guarantee that the ACD or the Sub‐Investment
Managers will be able to implement their quantitative strategies on an ongoing basis.
The ACD and the Fund Investment Managers have established systematic rules, reviews and processes for monitoring client
portfolios to assure that they are managed in a manner consistent with their investment objectives.
• Emerging Markets risk ‐ investment in emerging markets (countries that are transitioning towards more advanced financial
and economic structures) may involve a higher risk than those inherent in established markets. Emerging markets and their
currencies may experience unpredictable and dramatic fluctuations from time to time. Investors should consider whether or not
investment in such Funds is either suitable for or should constitute a substantial part of an investor’s portfolio.
Companies in emerging markets may not be subject to:
Restrictions on foreign investment in emerging markets may preclude investment in certain securities by the Funds referred to
above and, as a result, limit investment opportunities for those Funds. Substantial government involvement in, and influence on,
the economy, as well as a lack of political or social stability, may affect the value of securities in certain emerging markets.
The reliability of trading and settlement systems in some emerging markets may not be equal to that available in more
developed markets, which may result in delays in realising investments.
Lack of liquidity and efficiency in certain of the stock markets or foreign exchange markets in certain emerging markets may
mean that from time to time the ACD may experience more difficulty in purchasing or selling holdings of securities than it would
in a more developed market.
This is an inherent risk for funds invested within Emerging Markets. Internal investment guidelines (such a diversification
measures), scenario testing as well as other regular monitoring seek to ensure the level of risk is aligned with each individual
fund’s investment objectives and investment policy.
83

AXA Global Distribution Fund
Investment Manager's ReportFor the year ended 31 May 2021
AXA Distribution Investment ICVC
In practice, the Fund mitigates the above risks by the relatively small proportion of the fund which is invested using the Hong
Kong Stock Connect. For making new or increased investments, it is also notable that the portfolio manager has access to a
broad range of opportunities elsewhere in the market.
Operational risk
The Stock Connect program is premised on the functioning of the operational systems of the relevant market participants.
Market participants are permitted to participate in this program subject to meeting certain operational and risk management
requirements. The securities regimes and legal systems of Hong Kong stock exchange and the mainland China stock exchanges
differ significantly and market participants may need to address issues arising from the differences on an on‐going basis.
There is no assurance that the system of the stock exchanges and market participants will function properly or will continue to
be adapted to changes and developments in both markets. In the event that the relevant systems fail to function properly,
trading in both markets through the program could be disrupted. A Fund’s ability to access the China A share market and pursue
its investment strategy may be adversely affected.
The Manager monitors the normal functioning of trading activity on an ongoing basis.
• Investment in China A Shares via the Stock Connect program risk ‐ some Funds may invest in China A shares (shares issued by
domestic markets in mainland China in Chinese renminbi) through the Stock Connect program. China A shares are generally only
available for investment by residents of mainland China or by foreign investors through tightly regulated structures. The Stock
Connect program is one structure through which foreign investors can invest in China A shares by providing mutual market
access via the Hong Kong Stock Exchange, Shanghai Stock Exchange and Shenzhen Stock Exchange. In addition to the risks
disclosed under Emerging Markets Risk and Political, Economic, Convertibility and Regulatory Risk, investment by the Funds via
the Stock Connect program also involves the following risks.
Some geographical areas in which the Fund may invest (including but not limited to Asia, the Eurozone and the US) may be
affected by economic or political events or measures, changes in government policies, laws or tax regulations, currency
convertibility, or by currency redenomination, restrictions on foreign investments, and more generally by economic and financial
difficulties. In such contexts, volatility, liquidity, credit and currency risks may increase and adversely impact the Net Asset Value
of the Fund.
Investment limitations
The Stock Connect program is subject to quota limitations applying across all participants and utilised on a first‐come‐first‐
served basis. Once the quota is exceeded, buy orders will be rejected although sell orders would not be impacted. Such quota
limitations may restrict a Fund’s ability to invest in China A shares through the Stock Connect program on a timely basis, and the
Fund may not be able to effectively pursue its investment strategy.
In addition a particular stock may be recalled from the scope of eligible stocks for trading via the Stock Connect program and in
such a case a Fund would not be able to buy that stock (although it could sell it). This may affect the ability of the Fund to
implement its investment strategy.
Each of the stock exchanges participating in the Stock Connect program reserves the right to suspend trading if necessary for
ensuring an orderly and fair market and that risks are managed prudently. Consent from the relevant regulator would be sought
before a suspension is triggered. A suspension could adversely affect a Fund’s ability to access the mainland China stock
markets.
The Stock Connect program only operates on days when both the Chinese and Hong Kong markets are open for trading and
when banks in both markets are open on the corresponding settlement days. As a result there may be occasions when it is a
normal trading day for the mainland China market but a Fund cannot trade China A Shares via the Stock Connect program as
that day is not a trading day in Hong Kong. The Fund would be subject to a risk of price fluctuations in China A Shares for the
period it cannot trade via the Stock Connect program.
84

AXA Global Distribution Fund
Investment Manager's ReportFor the year ended 31 May 2021
AXA Distribution Investment ICVC
Ownership of Stock Connect securities
The Manager performs ongoing transaction cost analysis to ensure that all brokers used continue to provide value for their
services.
The Stock Connect program permits trades to be executed through one or multiple brokers that are market participants. Given
the custody requirements for the Funds, the ACD may determine that it is in the interest of a Fund that it only executes trades
via the Stock Connect program through a market participant that is part of the Depositary’s sub‐custodian network. In that
situation, whilst the ACD will be cognisant of its best execution obligations, it will not have the ability to trade through multiple
brokers and any switch to a new broker will not be possible without a commensurate change to the Depositary’s sub‐custody
arrangements.
Execution issues
China A shares purchased via the Stock Connect program are held by the sub‐custodian in accounts in the clearing system of Hong Kong’s central securities Depository. The Hong Kong central securities Depository, in turn, holds the China A shares as nominee through an omnibus securities account in its name registered with the Chinese central securities Depository. This means that there are multiple legal frameworks involved in establishing legal title to the China A shares and there are increased exposed to the credit risk of both the Hong Kong and Chinese central securities Depository but neither the ACD nor the Depositary have a legal relationship with such Depository’s and therefore have no direct recourse in the event of suffering a loss resulting from their performance or insolvency. While the Stock Connect program recognises the Fund’s beneficial ownership of the China A shares, there is a risk that the nominee structure may not be recognised under Chinese law and, in the event of the insolvency of the Hong Kong central securities Depository, there is uncertainty as to whether the Fund’s China A shares would be available to creditors of the Hong Kong central securities Depository or regarded as held on behalf of the Fund. Trading via the Stock Connect program is not covered by investor protection/compensation funds in either Hong Kong or mainland China.
Such risks are mitigated by the low proportion of the fund which is typically invested via the Hong Kong Stock Connect.
Other risks which could have an impact in extreme market conditions include:
• Currency risk ‐ assets of the Fund (including cash), and any income paid on those assets, may be denominated in a currency
other than the base currency of the Fund. Changes in the exchange rate between the base currency and the currency of an
asset may cause the value of the asset/income (expressed in the base currency) to fall as well as rise even if there is no change
of the value of such assets in its local currency. This may also cause additional volatility in the Fund’s Price. It may not be
possible or practicable to hedge against such exchange rate risk.
The ACD aims to reduce the risk of movements in exchange rates on the value of all or part of the assets of the Fund through the use of currency exchange transactions. The Fund may enter into currency exchange transactions either on a spot basis (i.e., exchanging at the current price) or through forward currency transactions (i.e., agreeing to purchase the currency at an agreed price at a future date). Neither spot transactions nor forward currency transactions will completely eliminate fluctuations in the prices of the Fund’s securities or in foreign exchange rates, or prevent loss if the prices of these securities should decline. The performance of a Fund may be strongly influenced by movements in foreign exchange rates because currency positions held by the Fund may not correspond with the securities positions held.
Although these transactions are intended to minimise the risk of loss due to a decline in the value of the hedged currency, they also limit any potential gain that might be realised should the value of the hedged currency increase. Forward currency transactions may also have the effect of reducing or enhancing the Fund’s performance due to the difference between the exchange rate available on such transactions compared to the current (spot) exchange rate. Under normal market conditions this
85

AXA Global Distribution Fund
Investment Manager's ReportFor the year ended 31 May 2021
AXA Distribution Investment ICVC
Transactions in securities that the Fund may enter into expose it to the risk that the counterparty will not deliver the investment
for a purchase or cash for a sale after the Fund has contracted to fulfil its responsibilities. This is minimised by the practice in the
majority of markets of delivery versus payment and short settlement periods.
Important Information
Derivatives transactions may be used in the Fund for meeting the investment objectives of the Fund. The use of derivatives in
this manner is not expected to change the risk profile of the Fund.
difference in exchange rates is mainly caused by the different short term interest rates applicable to the currency of the assets and the base currency of the Fund. Where the interest rate applying to the foreign currency is higher than that of the Fund’s base currency, this can reduce the Fund’s performance and vice‐versa. This impact on performance is usually far less pronounced than the effect of fluctuations of exchange rates that the use of such transactions is intended to reduce, but the impact can be significant over time, particularly where there is a wide gap between the interest rates applicable to the two currencies. The precise matching of the relevant contract amounts and the value of the securities involved will not generally be possible because the future value of such securities will change as a consequence of market movements in the value of such securities between the date when the relevant contract is entered into and the date when it matures. Therefore, the successful execution of a hedging strategy which matches exactly the profile of the investments of any fund cannot be assured. Furthermore, it may not be possible to hedge against generally anticipated exchange or interest rate fluctuations at a price sufficient to protect the Fund from the anticipated decline in value of its assets as a result of such fluctuations.
Internal investment guidelines are set, if necessary, to ensure currency risk is maintained within a range deemed suitable based
on the individual fund’s investment objectives and investment policy.
• Counterparty risk ‐ at any one time, the Fund may be exposed to the creditworthiness and stability of the counterparties to
transactions entered into by the Fund (including derivative and stock lending and repo/reverse repo transactions). The Fund will
be subject to the risk of the inability of its counterparties to perform its obligations under such transactions (default), whether
due to insolvency, bankruptcy or other causes. In the event of the insolvency of a counterparty, the Fund might not be able to
recover cash or assets of equivalent value, to that invested, in full. The Fund may receive assets or cash from the counterparty
(collateral) to protect against any such adverse effect. Where relevant, a counterparty will forfeit its collateral if it defaults on
the transaction with the Fund. However, if the collateral is in the form of securities, there is a risk that when it is sold, it will
realise insufficient cash to settle the counterparty’s debt to the Fund under a transaction or to purchase replacement securities
that were lent to the counterparty under a stock lending arrangement. In relation to stock lending arrangements, there is also
the risk that while cash is recovered in the event of a default, the actual stock cannot be repurchased. Furthermore, to the
extent that collateral is not present to cover part or all of the debt, a counterparty default may result in losses for the affected
Fund. To assist in managing these types of risks, the ACD sets criteria around the types of eligible collateral the Fund may accept.
Please see the paragraph entitled “Treatment of Collateral” in the “Investment and borrowing powers applicable to the Funds”
section in Appendix II of the Prospectus for more information.
• Liquidity risk ‐ under certain market conditions, it may be difficult to buy or sell investments for the Fund. For example, smaller
company shares may trade infrequently and in small volumes and corporate and emerging market bonds may be affected by the
demand in the market for such securities carrying credit risk, particularly in times of significant market stress. As a result, it may
not be possible to buy or sell such investments at a preferred time, close to the last market price quoted or in the volume
desired. The Manager may be forced to buy or sell such investments as a consequence of Unitholders buying or selling Units in
the Fund. Depending on market conditions at the time, this could lead to a significant drop in the Fund’s value.
Monthly monitoring is conducted, using an in‐house liquidity tool, to ensure a high degree of confidence that Fund liquidity will
meet the Fund’s expected liquidity requirements. Any concerns indicated by the tool are analysed by the Manager’s risk team
who may also discuss the results with portfolio management staff, or other senior professionals within the firm, as needed, to
ensure an appropriate scrutiny.
Based on the analysis, the Manager believes that the liquidity profile of the Fund is appropriate.
Further explanation of the risks associated with an investment in this Fund can be found in the prospectus.
86

AXA Global Distribution Fund
Investment Manager's ReportFor the year ended 31 May 2021
AXA Distribution Investment ICVC
Market Review
One year ago, this report referenced the mounting death toll from coronavirus which, at the time, was still spreading voraciously
across the globe. Today, deaths worldwide are approaching four million and many developing nations are still suffering terribly
from its impact. Within developed markets, we have benefited from the phenomenal efforts made by scientists, regulators and
governments to research, develop and produce multiple vaccines that have substantially reduced the harming effects of the
virus. After a long, long time spent restricted in each of our daily lives we are approaching a return to normal life.
As economies around the world re‐open, investors have been questioning what the post‐lockdown world will look like. New
working practices, increased reliance on technology, less use of cash as a means of payment, growth in pet ownership, increased
domestic travel and many other factors will shape the post‐COVID‐19 world. Undoubtedly, following the temporary hibernation
of the global economy, there is a level of optimism about the coming months and possibly years and reference to the ‘roaring
20s’ points to the release of the pent up demand and ambition of populations around the world.
A saying coined (and often shared) by a well‐known Fund manager and former colleague that ‘things will not become better or worse but different’ rings true and investment markets have certainly been grappling with this in recent months.
For the Fund, market conditions over the past six months have been generally positive as investors have looked forward to a normalisation of economic conditions. Since the beginning of December, conditions impacting investment markets have followed in much the same vein as during the last reporting period. In short, conditions have been volatile. Equities have made solid progress while fixed income has been challenged by the positive investor view of life in a post-lockdown world. Looking a little further into the past, over the past year global equity indices have rebounded strongly from the Covid-19 induced slump they had suffered in the first quarter of 2020. The enforced shutdown of large parts of the global economy funnelled investors into some specific areas of the equity market and the re-opening process has reversed, to an extent, that process. Investors are now grappling with the spectre of inflation, the timing of central bank support being withdrawn and the implications that will have on interest rates. The June outcome of the FOMC meeting, for example, proved to be more eventful than most investors had been anticipating. Fed officials adopted a more hawkish stance, their “dot plot” reflecting the risks of potentially earlier rate increases, predicting 2 rate hikes by end of 2023, with several members signalling a rate hike as early as 2022. Consequently, we see ‘normalisation’ of monetary policy as the big challenge being faced by markets.
However, as we transition to a post-lockdown world, investors are grappling with what the new normal will look like. When economies are re-opened, they bring sharply improving economic data and central banks are having to navigate short-term spikes in inflation in order to forecast longer term trends. Corporates are delivering earnings that are justifying their historically generous ratings and conditions suggest the equity market is well-set for the remainder of the year. However, conditions have become more volatile and, with confidence remaining fragile, we are anticipating bumps along the way.
The combination of equities and inflation‐linked sovereign bonds, that continues to define the Distribution range of funds, position them ideally for the on‐going market conditions.
The quantum of money pumped into the financial system over the past 18 months has paled into insignificance the financial backing the same organisations gave following the global financial crisis. Unquestionably, this support has enabled the economy to keep going and saved many jobs from being lost. It also provided a strong underpin to fixed income markets as central banks reiterated their ‘lower for longer’ mantra. However, the impact of the vaccine rollout has brought economic optimism back to market and while we had been anticipating a modest move higher in yields over the course of 2021, the adjustment in Q1 2021 happened quicker and in a larger magnitude than we had been anticipating. Markets quickly priced in a continuation of the strong economic rebound and is currently anticipating two rate hikes from the US Federal Reserve by Q1 2023, while in GBP rates, the market is pricing in one hike by Q1 2023.
The bearish momentum for bonds has stabilised for now but would anticipate a modest move higher in yields later in the summer as speculation around tapering of asset purchases is likely to rise. However, with much of the good news on the economy fully priced, positioning and the knock‐on implications to risk assets via higher discounting rates and tighter financial conditions will require close attention.
87

AXA Global Distribution Fund
Investment Manager's ReportFor the year ended 31 May 2021
AXA Distribution Investment ICVC
In our view, yield levels continue to offer some additional level of protection for the portfolios as the technical backdrop remains
supportive, with global central banks continuing their asset purchase programmes. In addition, central banks have been explicit
in their guidance on short rates, which will remain anchored until inflation is above their target for a sustained period. This
backdrop should continue to be supportive for breakevens and inflation‐linked bonds.
Our positive view of the prospect for UK equities in 2021 has been reinforced by the takeover and IPO activity that have also
characterised the year to date. At the time of writing this report buyout transactions involving over £25bn in value of UK‐listed
companies have been announced (this does not include the unsuccessful approaches for several other companies).
Concurrently, there has been a long, and growing, list of companies revealing an intention to seek a public listing in the UK.
Significantly, the vast majority of the new listings have been successful and share prices have risen to a premium to their IPO
price which has encouraged more companies to follow. In the meantime, the UK government appears to be closing in on some
significant international trade agreements following Brexit, providing a further potential tailwind for the economy.
Another factor having a significant impact on the UK equity market has been the growth of investor interest in environmental, social and governance (ESG) issues. The growing awareness of consumers, and in turn companies, of product provenance, the environmental impact and corporate behaviours is being reflected increasingly in sales rates. Within the portfolio, this is impacting every company we hold from Great Portland Estates to BP. Sustainability reports, carbon reduction targets and positive societal change are now the norm amongst the high‐quality businesses the Fund invests in. On behalf of our unitholders, we have continued our investment and efforts in ESG and produce a monthly report covering a wide range of ESG metrics. These include measuring the Fund’s carbon and water intensity, monitoring the proportion of female executives on our holdings’ Boards, monitoring for controversies, scoring individual company holdings and assessing the overall ESG score of the Fund. Our intention is to expand the reporting of these, and other measures, in the years ahead.
We have added to the Fund’s holding of Hill & Smith during the period where we see strong structural and cyclical drivers providing tailwinds for the business. On the structural side they are positioned well to make a positive contribution to issues including climate change, health & safety, population growth, increased urbanisation, infrastructure safety and vision zero (no road deaths). On the cyclical side, we think that the company is an excellent way to play the increased government spending on infrastructure and, in particular, President Biden’s US infrastructure package. This, however, is considered the icing on the cake as there are already large spending plans in place, such as Texas spending $77bn on their roads alone. Hill & Smith has also been quick to highlight the environmental benefits of galvanising as opposed to painting steel, thanks to its longevity and ability to be reused.
The new CEO Paul Simmons is bringing years of experience from Halma and applying it to the not‐too‐dissimilar Hill & Smith decentralised business model. We are particularly pleased that he has clarified the role and type of M&A he wants to achieve and expect to see a more rigorous approach to portfolio management and innovation. All of this means that we anticipate seeing a more consistent, higher level of organic growth than the Group has historically been able to produce and with it a likely higher rating.
Outlook
We remain positive about the prospects for equities over the period ahead. Valuations, in aggregate, remain attractive on both and absolute and relative (to international markets) basis. We are seeing a strong level of M&A activity which we anticipate will continue and new, interesting and attractively priced IPOs are offering new opportunities.
While it is inevitable that conditions will remain volatile, we continue to believe that macro events cannot be accurately nor consistently predicted. As such, the Fund retains a preference for longer‐term structural trends and quality companies that can deliver robust, reliable and consistent growth, supported by a simple government bond and cash hedge.
88

AXA Global Distribution Fund
Investment Manager's ReportFor the year ended 31 May 2021
AXA Distribution Investment ICVC
Performance
Past performance is not a guide for future performance.
Cost (£'000) Proceeds (£'000)
● UK Treasury 0.125% IL 22/03/26 14,266 7,124
● UK Treasury 0.125% IL 22/03/29 13,066 4,708
● UK Treasury 0.125% IL 10/08/31 11,316 3,516
● US Treasury 0.125% IL 15/01/30 11,300 3,394
● UK Treasury 0.125% IL 10/08/28 9,297 3,254
AXA Investment Managers UK Limited
Post the global recession of 2020, economic growth is set to rebound strongly in 2021 as economies re‐open on the back of
vaccination programmes. Economic support has generally been generous in many countries, allowing a rapid recovery towards
normal economic levels. Consumers have been forced to save (limited opportunities to consume/spend plus economic support
programmes), giving them substantial fire power to spend once economies re‐open. With a recovery in economic activity, a
central question is the impact on inflation, both in the short term and long term. Inflation is set to rise over 2021, as we lap
deflationary commodity prices and restrictions on opening‐up may cause temporary shortages. Longer term, many of the
deflationary forces that existed prior to the pandemic remain, while current unemployment levels are not expected to fall below
2019 levels until 2023 at the earliest.
Major Sales
● US Treasury 0.125% IL 15/04/21
● US Treasury 0.625% IL 15/01/26
● Adobe
● NVIDIA
● Royal Bank of Canada
Matthew Huddart, Jamie Forbes‐Wilson
31 May 2021
Major Purchases
All performance data source: AXA Investment Managers and Morningstar.
The equity holdings within the portfolio struggled to keep up with the strong growth tilt within equity markets in 2020, especially
so in the US. During 2021, that style has shifted into the Fund’s favour and relative performance has improved.
89

Portfolio Statement Market Value % of Total
As at 31 May 2021 Holding £’000 Net Assets
AUSTRALIA 1.28% (31/05/20: 0.69%)
INDEX LINKED GOVERNMENT BONDS 0.15% (31/05/20: 0.19%)
Australia (Government of) 1.25% IL 21/02/22 AUD 482,000 311 0.08
Australia (Government of) 2.5% IL 20/09/30 AUD 312,000 270 0.07
EQUITIES 1.13% (31/05/20: 0.50%)
BlueScope Steel 24,511 285 0.07
Commonwealth Bank of Australia 5,344 292 0.07
Computershare 15,444 136 0.03
Fortescue Metals 71,170 857 0.21
Goodman # 48,250 507 0.13
Rio Tinto (Sydney Quoted) 15,378 1,030 0.26
Wesfarmers 42,189 1,275 0.32
Woodside Petroleum 12,764 154 0.04
TOTAL AUSTRALIA 5,117 1.28
AUSTRIA 0.16% (31/05/20: 0.13%)
OMV 15,422 629 0.16
TOTAL AUSTRIA 629 0.16
BELGIUM 0.21% (31/05/20: 0.34%)
Ageas 8,290 381 0.09
Etablissements Franz Colruyt 6,503 279 0.07
Solvay 2,138 205 0.05
TOTAL BELGIUM 865 0.21
BERMUDA 0.08% (31/05/20: 0.16%)
Invesco 17,100 343 0.08
TOTAL BERMUDA 343 0.08
BRAZIL 0.31% (31/05/20: 0.11%)
Banco Santander Brasil 154,200 836 0.21
BB Seguridade Participacoes 54,500 172 0.04
WEG 51,200 226 0.06
TOTAL BRAZIL 1,234 0.31
CANADA 3.30% (31/05/20: 2.23%)
INDEX LINKED GOVERNMENT BONDS 0.50% (31/05/20: 0.66%)
Canada (Government of) 1.5% IL 01/12/44 CAD 268,000 242 0.06
Canada (Government of) 2% IL 01/12/41 CAD 282,000 282 0.07
Canada (Government of) 3% IL 01/12/36 CAD 169,000 196 0.05
Canada (Government of) 4% IL 01/12/31 CAD 93,000 122 0.03
Canada (Government of) 4.25% IL 01/12/21 CAD 197,000 199 0.05
Canada (Government of) 4.25% IL 01/12/26 CAD 813,000 987 0.24
AXA Distribution Investment ICVC
AXA Global Distribution Fund
90

Portfolio Statement Market Value % of Total
As at 31 May 2021 Holding £’000 Net Assets
AXA Distribution Investment ICVC
AXA Global Distribution Fund
EQUITIES 2.80% (31/05/20: 1.57%)
B2Gold 46,300 165 0.04
Bank of Montreal 10,100 741 0.18
Canadian Tire 2,600 313 0.08
CGI 11,500 714 0.18
Gildan Activewear Inc 6,200 156 0.04
iA Financial 4,700 191 0.05
Kinross Gold 56,100 314 0.08
Loblaw 16,900 728 0.18
Manulife Financial 117,300 1,721 0.43
National Bank of Canada 15,200 855 0.21
Nutrien 7,400 321 0.08
Pembina Pipeline 7,800 178 0.05
Quebecor 11,300 216 0.05
Rogers Communications 10,700 386 0.10
Royal Bank of Canada 6,200 455 0.11
Thomson Reuters 24,400 1,667 0.41
Toronto‐Dominion Bank/The 42,600 2,150 0.53
TOTAL CANADA 13,299 3.30
CAYMAN ISLANDS 0.99% (31/05/20: 1.02%)
Alibaba ADR 9,700 1,456 0.36
Herbalife Nutrition 5,100 190 0.05
MGM China 91,600 103 0.03
SITC International 105,000 261 0.06
Tencent 29,500 1,612 0.40
Xinyi Glass 134,000 370 0.09
TOTAL CAYMAN ISLANDS 3,992 0.99
CHINA (INCLUDING HONG KONG) 1.71% (31/05/20: 1.97%)
Anhui Conch Cement 87,500 382 0.10
Bank of China 2,220,000 593 0.15
Bank of Communications 384,000 183 0.05
China CITIC Bank 2,444,000 939 0.23
China Construction Bank 1,188,000 690 0.17
China Everbright Bank 494,000 148 0.04
China Railway 696,000 259 0.06
China Southern Airlines 220,000 110 0.03
Hong Kong Exchanges & Clearing 39,800 1,727 0.43
New China Life Insurance 232,800 618 0.15
PICC Property & Casualty 1,022,000 702 0.17
Sinopharm 135,600 319 0.08
Sinotruk Hong Kong 120,000 203 0.05
TOTAL CHINA (INCLUDING HONG KONG) 6,873 1.71
DENMARK 0.49% (31/05/20: 0.57%)
AP Moller ‐ Maersk 449 834 0.21
Carlsberg 2,162 280 0.07
91

Portfolio Statement Market Value % of Total
As at 31 May 2021 Holding £’000 Net Assets
AXA Distribution Investment ICVC
AXA Global Distribution Fund
Novo Nordisk 15,287 854 0.21
TOTAL DENMARK 1,968 0.49
FINLAND 0.05% (31/05/20: 0.18%)
Orion 7,138 222 0.05
TOTAL FINLAND 222 0.05
FRANCE 6.06% (31/05/20: 6.22%)
INDEX LINKED GOVERNMENT BONDS 4.46% (31/05/20: 5.05%)
France OAT 0.1% IL 01/03/25 EUR 1,147,000 1,201 0.30
France OAT 0.1% IL 01/03/28 EUR 1,945,000 1,944 0.48
France OAT 0.1% IL 25/07/36 EUR 9,900,000 10,534 2.62
France OAT 0.1% IL 25/07/47 EUR 2,150,000 2,439 0.61
France OAT 0.25% IL 25/07/24 EUR 896,660 890 0.22
France OAT 1.1% IL 25/07/22 EUR 913,219 935 0.23
EQUITIES 1.60% (31/05/20: 1.17%)
BioMerieux 2,819 229 0.06
Carrefour 17,763 255 0.06
Edenred 3,940 153 0.04
Kering 1,797 1,149 0.29
L'Oreal 3,716 1,178 0.29
Publicis 8,785 421 0.10
Sanofi 13,106 984 0.24
Schneider Electric 17,620 1,968 0.49
Sodexo 1,908 131 0.03
TOTAL FRANCE 24,411 6.06
GERMANY 1.71% (31/05/20: 1.78%)
INDEX LINKED GOVERNMENT BONDS 0.47% (31/05/20: 0.65%)
Deutsche Bundesrepublik 0.1% IL 15/04/23 EUR 940,000 919 0.23
Deutsche Bundesrepublik 0.1% IL 15/04/26 EUR 1,041,000 954 0.24
EQUITIES 1.24% (31/05/20: 1.13%)
Allianz 10,874 2,038 0.50
Bechtle 1,696 231 0.06
Brenntag 7,523 496 0.12
Covestro 5,492 272 0.07
Daimler 4,241 281 0.07
Deutsche Lufthansa 13,039 120 0.03
SAP 15,945 1,570 0.39
TOTAL GERMANY 6,881 1.71
GUERNSEY 0.07% (31/05/20: 0.09%)
Amdocs 5,300 291 0.07
TOTAL GUERNSEY 291 0.07
92

Portfolio Statement Market Value % of Total
As at 31 May 2021 Holding £’000 Net Assets
AXA Distribution Investment ICVC
AXA Global Distribution Fund
INDONESIA 0.00% (31/05/20: 0.10%)
IRELAND 0.95% (31/05/20: 1.48%)
CRH 11,808 437 0.11
DCC 5,173 313 0.08
Johnson Controls International 24,200 1,130 0.28
Linde 1,500 318 0.08
Medtronic 11,600 1,023 0.26
Pentair 7,700 377 0.09
Perrigo 6,700 217 0.05
TOTAL IRELAND 3,815 0.95
ISRAEL 0.25% (31/05/20: 0.35%)
Bank Leumi Le‐Israel 64,705 365 0.09
Check Point Software Technologies 5,700 468 0.12
Israel Discount Bank 50,412 182 0.04
TOTAL ISRAEL 1,015 0.25
ITALY 0.29% (31/05/20: 0.17%)
Hera 63,057 189 0.05
Poste Italiane 61,047 607 0.15
Telecom Italia 987,649 371 0.09
TOTAL ITALY 1,167 0.29
JAPAN 3.91% (31/05/20: 5.36%)
INDEX LINKED GOVERNMENT BONDS 0.25% (31/05/20: 0.47%)
Japan Government 0.1% IL 10/03/24 JPY 13,100,000 89 0.02
Japan Government 0.1% IL 10/09/24 JPY 25,000,000 164 0.04
Japan Government 0.1% IL 10/03/27 JPY 147,000,000 781 0.19
EQUITIES 3.66% (31/05/20: 4.89%)
Aisin 10,300 318 0.08
ANA 15,300 261 0.06
Asahi Kasei 34,100 271 0.07
Astellas Pharma 46,800 529 0.13
Canon 19,300 325 0.08
ENEOS 50,100 146 0.04
FUJIFILM 10,500 511 0.13
Fujitsu 9,800 1,128 0.28
Hitachi 21,100 786 0.20
Honda Motor 79,100 1,760 0.44
Hulic 23,200 185 0.05
Idemitsu Kosan 7,200 121 0.03
Inpex 27,500 133 0.03
Kajima 24,500 241 0.06
KDDI 42,400 1,020 0.25
Kirin 13,200 188 0.05
Mitsubishi Chemical 57,500 329 0.08
93

Portfolio Statement Market Value % of Total
As at 31 May 2021 Holding £’000 Net Assets
AXA Distribution Investment ICVC
AXA Global Distribution Fund
Mitsubishi Electric 111,300 1,227 0.30
Mitsubishi UFJ Financial 72,900 295 0.07
NEC 6,500 214 0.05
Nintendo 600 262 0.07
Nippon Telegraph & Telephone 53,100 1,012 0.25
Nitto Denko 4,900 274 0.07
Nomura 152,100 591 0.15
ORIX 50,100 627 0.16
Otsuka 18,000 532 0.13
Resona 71,900 219 0.05
Sompo 13,700 390 0.10
Sumitomo Chemical 85,000 334 0.08
T&D 23,600 227 0.06
Teijin 8,000 93 0.02
Tosoh 14,000 176 0.04
TOTAL JAPAN 15,759 3.91
JERSEY 0.28% (31/05/20: 0.08%)
Ferguson 11,750 1,134 0.28
TOTAL JERSEY 1,134 0.28
MALAYSIA 0.04% (31/05/20: 0.10%)
RHB Bank 182,000 166 0.04
TOTAL MALAYSIA 166 0.04
MEXICO 0.04% (31/05/20: 0.12%)
Kimberly‐Clark de Mexico 115,800 145 0.04
TOTAL MEXICO 145 0.04
NETHERLANDS 1.49% (31/05/20: 1.23%)
Akzo Nobel 10,022 901 0.22
ASM 1,991 434 0.11
ASML 5,138 2,419 0.60
Koninklijke Ahold Delhaize 19,907 407 0.10
Koninklijke Philips 8,125 323 0.08
NN 7,186 259 0.06
QIAGEN 6,310 220 0.06
Signify 3,300 144 0.04
Wolters Kluwer 13,191 894 0.22
TOTAL NETHERLANDS 6,001 1.49
NEW ZEALAND 0.07% (31/05/20: 0.23%)
Fisher & Paykel Healthcare 18,374 274 0.07
TOTAL NEW ZEALAND 274 0.07
94

Portfolio Statement Market Value % of Total
As at 31 May 2021 Holding £’000 Net Assets
AXA Distribution Investment ICVC
AXA Global Distribution Fund
NORWAY 0.17% (31/05/20: 0.00%)
Gjensidige Forsikring 24,731 394 0.10
Orkla 36,824 272 0.07
TOTAL NORWAY 666 0.17
PANAMA 0.05% (31/05/20: 0.00%)
Carnival 9,200 194 0.05
TOTAL PANAMA 194 0.05
PAPUA NEW GUINEA 0.03% (31/05/20: 0.00%)
Oil Search 58,460 118 0.03
TOTAL PAPUA NEW GUINEA 118 0.03
PHILIPPINES 0.03% (31/05/20: 0.12%)
Globe Telecom 4,000 107 0.03
TOTAL PHILIPPINES 107 0.03
POLAND 0.00% (31/05/20: 0.04%)
PUERTO RICO 0.04% (31/05/20: 0.03%)
Popular 3,100 179 0.04
TOTAL PUERTO RICO 179 0.04
RUSSIAN FEDERATION 0.00% (31/05/20: 0.14%)
SINGAPORE 0.13% (31/05/20: 0.16%)
Flex 20,600 267 0.07
Singapore Exchange 43,000 238 0.06
TOTAL SINGAPORE 505 0.13
SOUTH AFRICA 0.16% (31/05/20: 0.23%)
Impala Platinum 29,908 369 0.09
Kumba Iron Ore 8,322 261 0.07
TOTAL SOUTH AFRICA 630 0.16
SOUTH KOREA 0.93% (31/05/20: 0.23%)
Hana Financial 10,671 307 0.08
KB Financial 18,416 664 0.17
Kia 8,280 443 0.11
LG Electronics 4,772 456 0.11
LG Household & Health Care 433 419 0.10
Samsung Electro‐Mechanics 1,935 206 0.05
Shinhan Financial 25,767 688 0.17
SK Hynix 3,601 285 0.07
95

Portfolio Statement Market Value % of Total
As at 31 May 2021 Holding £’000 Net Assets
AXA Distribution Investment ICVC
AXA Global Distribution Fund
SK Innovation 879 152 0.04
S‐Oil 2,328 140 0.03
TOTAL SOUTH KOREA 3,760 0.93
SPAIN 0.47% (31/05/20: 0.64%)
ACS Actividades de Construccion y Servicios 7,951 175 0.04
EDP Renovaveis 24,539 409 0.10
Iberdrola 72,711 706 0.18
Red Electrica 25,118 354 0.09
Repsol 27,442 258 0.06
TOTAL SPAIN 1,902 0.47
SWEDEN 0.94% (31/05/20: 0.88%)
INDEX LINKED GOVERNMENT BONDS 0.09% (31/05/20: 0.16%)
Sweden (Kingdom of) 0.25% IL 01/06/22 SEK 940,000 88 0.02
Sweden (Kingdom of) 3.5% IL 01/12/28 SEK 1,875,000 297 0.07
EQUITIES 0.85% (31/05/20: 0.72%)
Atlas Copco 13,587 583 0.15
Boliden 10,696 300 0.07
Electrolux 13,805 275 0.07
Husqvarna 27,758 286 0.07
Sandvik 13,267 249 0.06
Securitas 14,000 162 0.04
Skanska 13,077 261 0.07
SKF 20,800 399 0.10
Telefonaktiebolaget LM Ericsson 94,749 898 0.22
TOTAL SWEDEN 3,798 0.94
SWITZERLAND 0.68% (31/05/20: 1.40%)
Adecco 7,783 381 0.10
Geberit 1,052 535 0.13
Logitech 6,679 573 0.14
Roche 5,024 1,236 0.31
TOTAL SWITZERLAND 2,725 0.68
TAIWAN 1.96% (31/05/20: 1.04%)
ASE Technology 129,000 361 0.09
Asustek Computer 33,000 328 0.08
Cathay Financial 623,000 878 0.22
China Life Insurance 164,045 103 0.02
CTBC Financial 879,000 513 0.13
Fubon Financial 482,000 881 0.22
Hon Hai Precision Industry 96,000 270 0.07
MediaTek 11,000 269 0.07
Novatek Microelectronics 29,000 372 0.09
Pou Chen 122,000 119 0.03
96

Portfolio Statement Market Value % of Total
As at 31 May 2021 Holding £’000 Net Assets
AXA Distribution Investment ICVC
AXA Global Distribution Fund
Quanta Computer 107,000 239 0.06
Taiwan Semiconductor Manufacturing 155,000 2,325 0.58
Uni‐President Enterprises 182,000 336 0.08
United Microelectronics 371,000 493 0.12
Yuanta Financial 652,080 424 0.10
TOTAL TAIWAN 7,911 1.96
THAILAND 0.10% (31/05/20: 0.00%)
Charoen Pokphand Foods NVDR 334,800 206 0.05
Kasikornbank NVDR 72,700 196 0.05
TOTAL THAILAND 402 0.10
UNITED KINGDOM 22.58% (31/05/20: 14.69%)
INDEX LINKED GOVERNMENT BONDS 20.58% (31/05/20: 13.40%)
UK Treasury 0.125% IL 22/03/24 3,800,969 5,133 1.27
UK Treasury 0.125% IL 22/03/26 9,500,000 12,747 3.17
UK Treasury 0.125% IL 10/08/28 7,000,000 9,222 2.29
UK Treasury 0.125% IL 22/03/29 8,600,690 13,462 3.34
UK Treasury 0.125% IL 10/08/31 8,500,000 11,371 2.82
UK Treasury 0.125% IL 22/03/44 788,503 1,617 0.40
UK Treasury 0.125% IL 22/03/46 600,711 1,200 0.30
UK Treasury 0.125% IL 10/08/48 1,770,000 3,487 0.87
UK Treasury 0.125% IL 22/03/58 352,915 901 0.22
UK Treasury 0.125% IL 22/11/65 1,200,000 3,551 0.88
UK Treasury 0.125% IL 22/03/68 442,091 1,470 0.37
UK Treasury 0.25% IL 22/03/52 802,455 1,971 0.49
UK Treasury 0.375% IL 22/03/62 790,701 2,523 0.63
UK Treasury 0.5% IL 22/03/50 816,054 2,300 0.57
UK Treasury 0.625% IL 22/03/40 253,817 586 0.15
UK Treasury 0.625% IL 22/11/42 346,479 863 0.21
UK Treasury 0.75% IL 22/03/34 700,917 1,331 0.33
UK Treasury 0.75% IL 22/11/47 637,517 1,847 0.46
UK Treasury 1.125% IL 22/11/37 567,394 1,426 0.35
UK Treasury 1.25% IL 22/11/27 328,331 654 0.16
UK Treasury 1.25% IL 22/11/32 309,093 640 0.16
UK Treasury 1.25% IL 22/11/55 362,413 1,494 0.37
UK Treasury 2% IL 26/01/35 619,411 1,799 0.45
UK Treasury 2.5% IL 17/07/24 231,194 826 0.21
UK Treasury 4.125% IL 22/07/30 125,000 463 0.11
EQUITIES 2.00% (31/05/20: 1.29%)
3i 41,082 512 0.13
Aviva 187,950 781 0.19
Coca‐Cola Europacific Partners 9,000 381 0.10
easyJet 20,311 206 0.05
HSBC 61,293 281 0.07
Legal & General 292,523 840 0.21
M&G 119,494 293 0.07
Nielsen 15,600 302 0.08
97

Portfolio Statement Market Value % of Total
As at 31 May 2021 Holding £’000 Net Assets
AXA Distribution Investment ICVC
AXA Global Distribution Fund
Persimmon 16,174 514 0.13
Rio Tinto (London Quoted) 11,445 693 0.17
Royal Dutch Shell 107,302 1,467 0.36
Unilever (EUR) 29,398 1,241 0.31
Unilever (GBP) 12,718 537 0.13
TOTAL UNITED KINGDOM 90,932 22.58
UNITED STATES 46.21% (31/05/20: 53.46%)
INDEX LINKED GOVERNMENT BONDS 15.74% (31/05/20: 19.80%)
US Treasury 0.125% IL 15/07/22 USD 5,000,000 4,226 1.05
US Treasury 0.125% IL 15/01/23 USD 9,897,900 8,404 2.09
US Treasury 0.125% IL 15/07/26 USD 5,121,000 4,412 1.10
US Treasury 0.125% IL 15/01/30 USD 13,200,000 10,519 2.61
US Treasury 0.125% IL 15/01/31 USD 3,500,000 2,751 0.68
US Treasury 0.25% IL 15/01/25 USD 8,800,000 7,579 1.88
US Treasury 0.375% IL 15/01/27 USD 3,055,000 2,639 0.65
US Treasury 0.375% IL 15/07/27 USD 3,100,000 2,661 0.66
US Treasury 0.625% IL 15/02/43 USD 4,511,300 4,248 1.05
US Treasury 0.75% IL 15/02/42 USD 5,022,300 4,930 1.22
US Treasury 0.75% IL 15/02/45 USD 2,710,000 2,559 0.64
US Treasury 0.875% IL 15/02/47 USD 2,520,000 2,410 0.60
US Treasury 1.375% IL 15/02/44 USD 1,456,100 1,562 0.39
US Treasury 2.125% IL 15/02/41 USD 1,136,800 1,433 0.36
US Treasury 2.5% IL 15/01/29 USD 2,730,000 3,071 0.76
EQUITIES 30.47% (31/05/20: 33.66%)
3M 5,600 802 0.20
AbbVie 11,500 911 0.23
Advanced Micro Devices 19,700 1,089 0.27
AECOM 6,600 305 0.08
AGCO 3,600 352 0.09
Akamai Technologies 8,500 687 0.17
Alaska Air 2,100 104 0.03
Alphabet 2,600 4,321 1.07
Amazon.com 2,092 4,766 1.18
Amedisys 900 166 0.04
American International 25,000 929 0.23
Apple 82,900 7,326 1.82
Archer‐Daniels‐Midland 28,700 1,348 0.33
Arrow Electronics 3,700 316 0.08
Arthur J Gallagher 9,200 950 0.24
Autodesk 3,100 627 0.16
Autoliv 4,300 323 0.08
Automatic Data Processing 2,900 403 0.10
AutoNation 3,800 276 0.07
Avantor 21,300 480 0.12
Baker Hughes 30,500 523 0.13
Bank of America 35,500 1,065 0.26
Bank of New York Mellon 50,100 1,841 0.46
Becton Dickinson 4,200 714 0.18
98

Portfolio Statement Market Value % of Total
As at 31 May 2021 Holding £’000 Net Assets
AXA Distribution Investment ICVC
AXA Global Distribution Fund
Berkshire Hathaway 5,800 1,181 0.29
Best Buy 11,800 983 0.24
Booz Allen Hamilton 6,200 374 0.09
BorgWarner 9,100 330 0.08
Bristol‐Myers Squibb 13,200 611 0.15
Broadridge Financial Solutions 1,500 169 0.04
Brown & Brown 7,800 288 0.07
Brunswick 3,500 252 0.06
Campbell Soup 5,400 182 0.05
Cardinal Health 8,800 348 0.09
Cerner 12,600 696 0.17
CH Robinson Worldwide 6,900 473 0.12
Churchill Downs 1,600 229 0.06
Cincinnati Financial 8,300 707 0.18
Cisco Systems 48,861 1,823 0.45
Citigroup 5,000 278 0.07
Colgate‐Palmolive 21,300 1,257 0.31
ConocoPhillips 9,400 368 0.09
Crane 2,100 143 0.04
Cummins 7,700 1,408 0.35
Deckers Outdoor 1,300 311 0.08
Delta Air Lines 3,900 132 0.03
DENTSPLY SIRONA 9,100 426 0.11
Devon Energy 9,600 180 0.04
Dolby Laboratories 3,700 252 0.06
Dover 2,700 286 0.07
DR Horton 9,500 640 0.16
Dropbox 20,100 394 0.10
Eastman Chemical 6,600 582 0.14
Edison International 18,200 711 0.18
Entegris 5,100 409 0.10
EOG Resources 4,900 278 0.07
EPAM Systems 1,900 632 0.16
Equitable 19,700 444 0.11
Etsy 1,700 200 0.05
Expeditors International of Washington 8,400 741 0.18
Facebook 14,800 3,468 0.86
Fair Isaac 1,400 495 0.12
Fidelity National Information Services 4,000 422 0.10
First American Financial 4,300 193 0.05
First Solar 4,600 249 0.06
FleetCor Technologies 900 174 0.04
Ford Motor 104,800 1,099 0.27
Fortinet 4,200 641 0.16
Franklin Resources 23,200 559 0.14
Gaming and Leisure Properties # 8,100 263 0.07
Generac 2,900 666 0.17
General Mills 23,000 1,010 0.25
General Motors 54,800 2,308 0.57
Gilead Sciences 23,050 1,070 0.27
Global Payments Inc 2,200 300 0.07
99
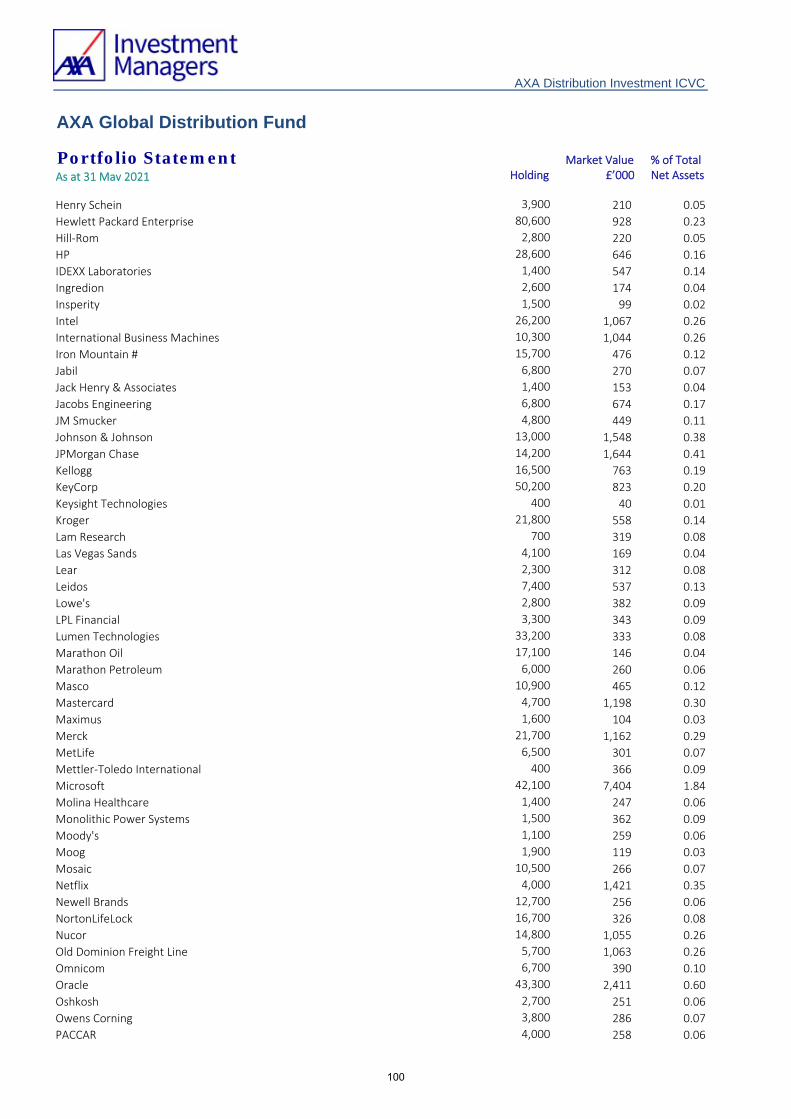
Portfolio Statement Market Value % of Total
As at 31 May 2021 Holding £’000 Net Assets
AXA Distribution Investment ICVC
AXA Global Distribution Fund
Henry Schein 3,900 210 0.05
Hewlett Packard Enterprise 80,600 928 0.23
Hill‐Rom 2,800 220 0.05
HP 28,600 646 0.16
IDEXX Laboratories 1,400 547 0.14
Ingredion 2,600 174 0.04
Insperity 1,500 99 0.02
Intel 26,200 1,067 0.26
International Business Machines 10,300 1,044 0.26
Iron Mountain # 15,700 476 0.12
Jabil 6,800 270 0.07
Jack Henry & Associates 1,400 153 0.04
Jacobs Engineering 6,800 674 0.17
JM Smucker 4,800 449 0.11
Johnson & Johnson 13,000 1,548 0.38
JPMorgan Chase 14,200 1,644 0.41
Kellogg 16,500 763 0.19
KeyCorp 50,200 823 0.20
Keysight Technologies 400 40 0.01
Kroger 21,800 558 0.14
Lam Research 700 319 0.08
Las Vegas Sands 4,100 169 0.04
Lear 2,300 312 0.08
Leidos 7,400 537 0.13
Lowe's 2,800 382 0.09
LPL Financial 3,300 343 0.09
Lumen Technologies 33,200 333 0.08
Marathon Oil 17,100 146 0.04
Marathon Petroleum 6,000 260 0.06
Masco 10,900 465 0.12
Mastercard 4,700 1,198 0.30
Maximus 1,600 104 0.03
Merck 21,700 1,162 0.29
MetLife 6,500 301 0.07
Mettler‐Toledo International 400 366 0.09
Microsoft 42,100 7,404 1.84
Molina Healthcare 1,400 247 0.06
Monolithic Power Systems 1,500 362 0.09
Moody's 1,100 259 0.06
Moog 1,900 119 0.03
Mosaic 10,500 266 0.07
Netflix 4,000 1,421 0.35
Newell Brands 12,700 256 0.06
NortonLifeLock 16,700 326 0.08
Nucor 14,800 1,055 0.26
Old Dominion Freight Line 5,700 1,063 0.26
Omnicom 6,700 390 0.10
Oracle 43,300 2,411 0.60
Oshkosh 2,700 251 0.06
Owens Corning 3,800 286 0.07
PACCAR 4,000 258 0.06
100
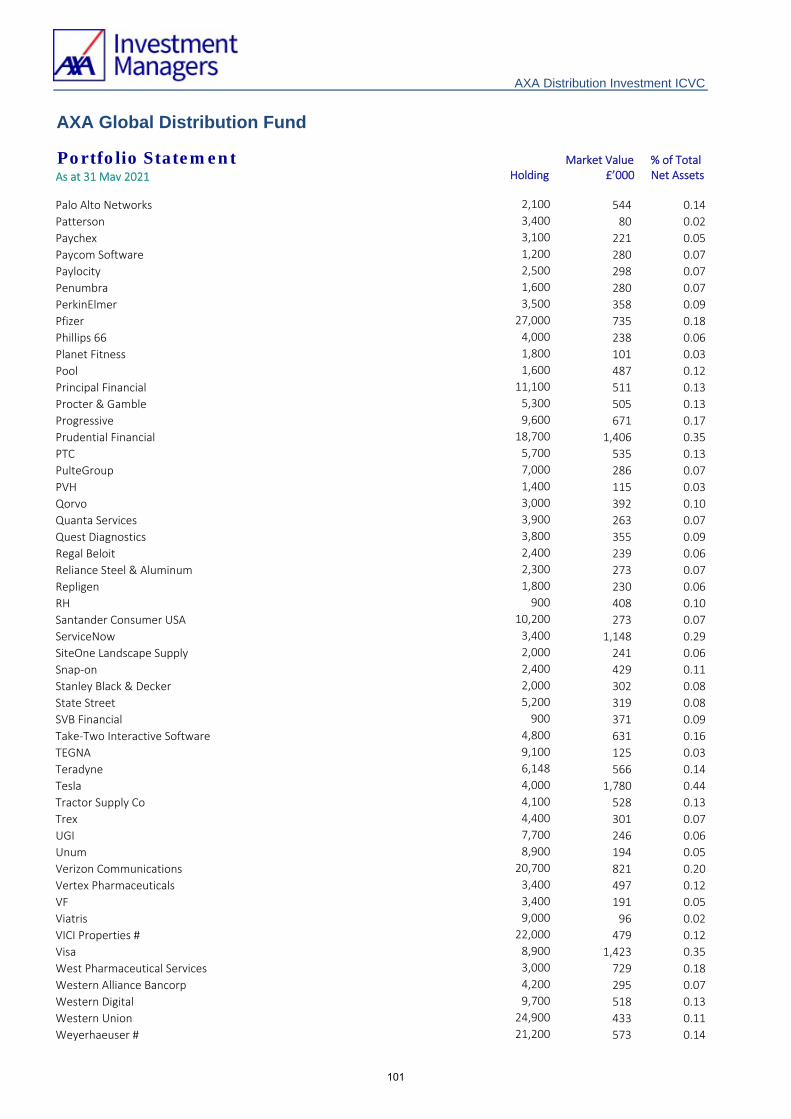
Portfolio Statement Market Value % of Total
As at 31 May 2021 Holding £’000 Net Assets
AXA Distribution Investment ICVC
AXA Global Distribution Fund
Palo Alto Networks 2,100 544 0.14
Patterson 3,400 80 0.02
Paychex 3,100 221 0.05
Paycom Software 1,200 280 0.07
Paylocity 2,500 298 0.07
Penumbra 1,600 280 0.07
PerkinElmer 3,500 358 0.09
Pfizer 27,000 735 0.18
Phillips 66 4,000 238 0.06
Planet Fitness 1,800 101 0.03
Pool 1,600 487 0.12
Principal Financial 11,100 511 0.13
Procter & Gamble 5,300 505 0.13
Progressive 9,600 671 0.17
Prudential Financial 18,700 1,406 0.35
PTC 5,700 535 0.13
PulteGroup 7,000 286 0.07
PVH 1,400 115 0.03
Qorvo 3,000 392 0.10
Quanta Services 3,900 263 0.07
Quest Diagnostics 3,800 355 0.09
Regal Beloit 2,400 239 0.06
Reliance Steel & Aluminum 2,300 273 0.07
Repligen 1,800 230 0.06
RH 900 408 0.10
Santander Consumer USA 10,200 273 0.07
ServiceNow 3,400 1,148 0.29
SiteOne Landscape Supply 2,000 241 0.06
Snap‐on 2,400 429 0.11
Stanley Black & Decker 2,000 302 0.08
State Street 5,200 319 0.08
SVB Financial 900 371 0.09
Take‐Two Interactive Software 4,800 631 0.16
TEGNA 9,100 125 0.03
Teradyne 6,148 566 0.14
Tesla 4,000 1,780 0.44
Tractor Supply Co 4,100 528 0.13
Trex 4,400 301 0.07
UGI 7,700 246 0.06
Unum 8,900 194 0.05
Verizon Communications 20,700 821 0.20
Vertex Pharmaceuticals 3,400 497 0.12
VF 3,400 191 0.05
Viatris 9,000 96 0.02
VICI Properties # 22,000 479 0.12
Visa 8,900 1,423 0.35
West Pharmaceutical Services 3,000 729 0.18
Western Alliance Bancorp 4,200 295 0.07
Western Digital 9,700 518 0.13
Western Union 24,900 433 0.11
Weyerhaeuser # 21,200 573 0.14
101

Portfolio Statement Market Value % of Total
As at 31 May 2021 Holding £’000 Net Assets
AXA Distribution Investment ICVC
AXA Global Distribution Fund
Whirlpool 3,100 528 0.13
WW Grainger 1,200 389 0.10
Zoetis 6,400 788 0.20
Zynga 41,400 314 0.08
TOTAL UNITED STATES 186,106 46.21
FORWARD FX 0.29% (31/05/20: (0.27%))
Bought USD101,000,000 for GBP71,256,669 Settlement 04/06/21 (17) ‐
Sold USD101,000,000 for GBP72,423,898 Settlement 04/06/21 1,184 0.29
Sold USD103,000,000 for GBP72,664,124 Settlement 06/07/21 17 ‐
TOTAL FORWARD FX 1,184 0.29
Portfolio of investments 396,720 98.51
Net other assets 5,994 1.49
Total net assets 402,714 100.00
All investments are ordinary shares unless otherwise stated.
All bonds are denominated in Sterling (unless otherwise indicated).
Stocks shown as ADR's represent American Depositary Receipts.
Stocks shown as NVDR's represent Non‐Voting Depositary Receipts.
# Real Estate Investment Trust.
102
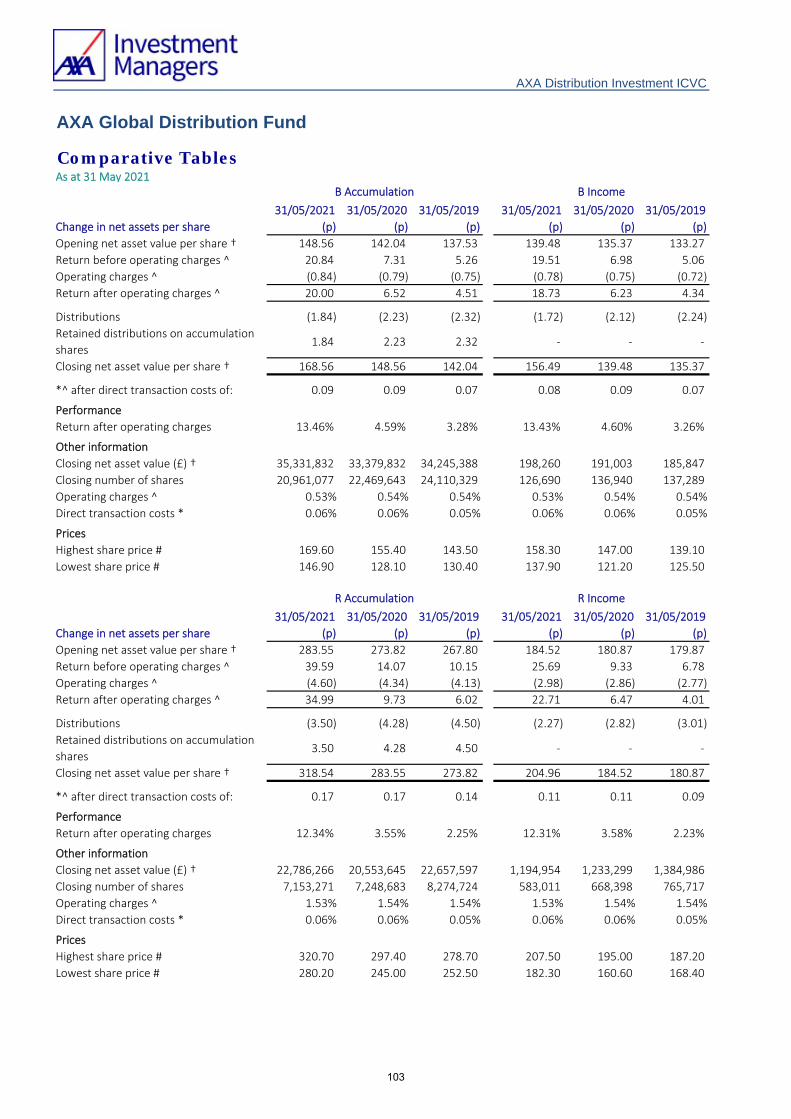
Comparative TablesAs at 31 May 2021
31/05/2021 31/05/2020 31/05/2019 31/05/2021 31/05/2020 31/05/2019
Change in net assets per share (p) (p) (p) (p) (p) (p)
Opening net asset value per share † 148.56 142.04 137.53 139.48 135.37 133.27
Return before operating charges ^ 20.84 7.31 5.26 19.51 6.98 5.06
Operating charges ^ (0.84) (0.79) (0.75) (0.78) (0.75) (0.72)
Return after operating charges ^ 20.00 6.52 4.51 18.73 6.23 4.34
Distributions (1.84) (2.23) (2.32) (1.72) (2.12) (2.24)
Retained distributions on accumulation
shares1.84 2.23 2.32 ‐ ‐ ‐
Closing net asset value per share † 168.56 148.56 142.04 156.49 139.48 135.37
*^ after direct transaction costs of: 0.09 0.09 0.07 0.08 0.09 0.07
Performance
Return after operating charges 13.46% 4.59% 3.28% 13.43% 4.60% 3.26%
Other information
Closing net asset value (£) † 35,331,832 33,379,832 34,245,388 198,260 191,003 185,847
Closing number of shares 20,961,077 22,469,643 24,110,329 126,690 136,940 137,289
Operating charges ^ 0.53% 0.54% 0.54% 0.53% 0.54% 0.54%
Direct transaction costs * 0.06% 0.06% 0.05% 0.06% 0.06% 0.05%
Prices
Highest share price # 169.60 155.40 143.50 158.30 147.00 139.10
Lowest share price # 146.90 128.10 130.40 137.90 121.20 125.50
31/05/2021 31/05/2020 31/05/2019 31/05/2021 31/05/2020 31/05/2019
Change in net assets per share (p) (p) (p) (p) (p) (p)
Opening net asset value per share † 283.55 273.82 267.80 184.52 180.87 179.87
Return before operating charges ^ 39.59 14.07 10.15 25.69 9.33 6.78
Operating charges ^ (4.60) (4.34) (4.13) (2.98) (2.86) (2.77)
Return after operating charges ^ 34.99 9.73 6.02 22.71 6.47 4.01
Distributions (3.50) (4.28) (4.50) (2.27) (2.82) (3.01)
Retained distributions on accumulation
shares3.50 4.28 4.50 ‐ ‐ ‐
Closing net asset value per share † 318.54 283.55 273.82 204.96 184.52 180.87
*^ after direct transaction costs of: 0.17 0.17 0.14 0.11 0.11 0.09
Performance
Return after operating charges 12.34% 3.55% 2.25% 12.31% 3.58% 2.23%
Other information
Closing net asset value (£) † 22,786,266 20,553,645 22,657,597 1,194,954 1,233,299 1,384,986
Closing number of shares 7,153,271 7,248,683 8,274,724 583,011 668,398 765,717
Operating charges ^ 1.53% 1.54% 1.54% 1.53% 1.54% 1.54%
Direct transaction costs * 0.06% 0.06% 0.05% 0.06% 0.06% 0.05%
Prices
Highest share price # 320.70 297.40 278.70 207.50 195.00 187.20
Lowest share price # 280.20 245.00 252.50 182.30 160.60 168.40
AXA Distribution Investment ICVC
B Accumulation B Income
R Accumulation R Income
AXA Global Distribution Fund
103

Comparative TablesAs at 31 May 2021
AXA Distribution Investment ICVC
AXA Global Distribution Fund
31/05/2021 31/05/2020 31/05/2019 31/05/2021 31/05/2020 31/05/2019
Change in net assets per share (p) (p) (p) (p) (p) (p)
Opening net asset value per share † 316.90 303.75 294.86 207.11 201.51 198.89
Return before operating charges ^ 44.43 15.63 11.24 28.96 10.40 7.54
Operating charges ^ (2.63) (2.48) (2.35) (1.72) (1.64) (1.58)
Return after operating charges ^ 41.80 13.15 8.89 27.24 8.76 5.96
Distributions (3.93) (4.80) (4.97) (2.56) (3.16) (3.34)
Retained distributions on accumulation
shares3.93 4.80 4.97 ‐ ‐ ‐
Closing net asset value per share † 358.70 316.90 303.75 231.79 207.11 201.51
*^ after direct transaction costs of: 0.19 0.19 0.15 0.12 0.13 0.10
Performance
Return after operating charges 13.19% 4.33% 3.01% 13.15% 4.35% 3.00%
Other information
Closing net asset value (£) † 307,673,375 218,209,032 159,083,425 35,529,050 30,592,350 30,852,578
Closing number of shares 85,775,464 68,856,437 52,372,828 15,327,908 14,771,151 15,310,798
Operating charges ^ 0.78% 0.79% 0.79% 0.78% 0.79% 0.79%
Direct transaction costs * 0.06% 0.06% 0.05% 0.06% 0.06% 0.05%
Prices
Highest share price # 361.00 331.70 307.50 234.60 218.50 207.40
Lowest share price # 313.30 273.40 279.20 204.70 180.00 187.00
Z Accumulation
† Valued at bid‐market prices.
# High and low price disclosures are based on quoted share prices (Mid Market Price). Therefore the opening and closing NAV
prices may fall outside the high / low price threshold.
The figures used within the table have been calculated against the average net asset value for the accounting year.
* Direct transaction costs include fees, commissions, transfer taxes and duties in the purchasing and selling of investments,
within the accounting year.
Z Income
^ Operating charges include indirect costs incurred in the maintenance and running of the Fund, as disclosed in the detailed
expenses within the Statement of Total Return.
104

AXA Global Distribution Fund
Statement of Total ReturnFor the year ended 31 May 2021
Note £'000 £'000 £'000 £'000
Income:Net capital gains 2 41,596 9,110 Revenue 3 4,617 4,876
Expenses 4 (2,775) (2,277)Interest payable and similar charges (8) (7)
Net revenue before taxation 1,834 2,592
Taxation 5 (494) (534)
Net revenue after taxation 1,340 2,058
Total return before distributions 42,936 11,168
Distributions 6 (4,034) (4,238)
Change in net assets attributable to Shareholders
from investment activities 38,902 6,930
Statement of Change in Net Assets Attributable to Shareholders For the year ended 31 May 2021
£'000 £'000 £'000 £'000
Opening net assets attributable to Shareholders 304,159 248,410
Amounts receivable on issue of shares 96,502 66,904 Amounts payable on cancellation of shares (40,659) (22,047)
55,843 44,857
Change in net assets attributable to Shareholdersfrom investment activities (see above) 38,902 6,930
Retained distributions on accumulation shares 3,810 3,962
Closing net assets attributable to Shareholders 402,714 304,159
AXA Distribution Investment ICVC
31/05/21 31/05/20
31/05/21 31/05/20
105

AXA Global Distribution Fund
Balance SheetAs at 31 May
Note £'000 £'000Assets:
Fixed assets:
Investments 396,737 297,365
Current assets:
Debtors 7 2,520 1,763
Cash and bank balances 8 10,902 6,576
Total assets 410,159 305,704
Liabilities:
Investment liabilities (17) (817)
Creditors:
Distribution payable (207) (246)
Other creditors 9 (7,221) (482)
Total liabilities (7,445) (1,545)
Net assets attributable to Shareholders 402,714 304,159
31/05/21 31/05/20
AXA Distribution Investment ICVC
106

AXA Global Distribution Fund
Notes to the Financial Statements For the year ended 31 May 2021
31/05/21 31/05/20
£'000 £'000
The net capital gains comprise:
Non‐derivative securities 33,656 11,052
Currency (losses)/gains (1,460) 1,018
Forward currency contracts 9,419 (2,946)
Transaction charges (19) (14)
Net capital gains 41,596 9,110
3. Revenue
31/05/21 31/05/20
£'000 £'000
Bank interest 1 10
Interest on debt securities 163 623
Offshore funds dividends 8 20
Overseas dividends 4,210 4,019
Scrip dividends 12 ‐
UK dividends 223 204
Total revenue 4,617 4,876
31/05/21 31/05/20
£'000 £'000
2,694 2,180
8 8
2,702 2,188
29 32
25 26
54 58
17 9
2 4
‐ 12
‐ 6
19 31
2,775 2,277
AXA Distribution Investment ICVC
1. Accounting Basis And Policies
The Fund's Financial Statements have been prepared on the basis detailed on pages 145- 147.
2. Net capital gains
4. Expenses
Payable to the ACD, associates of the ACD, and agents
of either of them
Annual management charge
Registration fees
Payable to the Depositary, associates of the Depositary
and agents of either of them
Depositary's fees
Safe custody fees
Other expenses
Audit fees*Printing fees
Issuance fee
Professional fees
Total expenses
Expenses include irrecoverable VAT where applicable.
* Audit fees for the financial year ending 2021 were £8,000 (2020: £13,000) (including VAT).
107

AXA Global Distribution Fund
Notes to the Financial Statements For the year ended 31 May 2021
AXA Distribution Investment ICVC
5. Taxation
31/05/21 31/05/20
£'000 £'000
(a) Analysis of the tax charge in the year
Irrecoverable overseas tax 494 534
(b) Factors affecting tax charge for the year
31/05/21 31/05/20
£'000 £'000
Net revenue before taxation 1,834 2,592
Net revenue for the year multiplied by the standard rate of corporation tax 367 518
Effects of:
Irrecoverable overseas tax 494 534
Movement in excess management expenses 864 357
Relief for indexation on UK Gilts (358) (82)
Revenue not subject to corporation tax (870) (785)
Overseas tax expensed (3) (8)
Current tax charge for the year 494 534
(c) Deferred taxation:
(d) Factors that may affect future tax charges
6. Distributions
31/05/21 31/05/20
£'000 £'000
Interim 1,968 2,145
Final 2,242 2,317
Add: Revenue paid on cancellation of shares 211 110
Deduct: Revenue received on creation of shares (387) (334)
Net distribution for the year 4,034 4,238
Reconciliation of net revenue after taxation to distributions
Net revenue after taxation 1,340 2,058
Expenses charged to capital 2,694 2,180
Net distribution for the year 4,034 4,238
There is no provision required for deferred taxation at the balance sheet date in the current year or prior year.
OEICs are exempt from tax on capital gains in the UK. Therefore, any capital return is not included within the reconciliation
above.
The tax assessed for the year is higher than the standard rate of corporation tax for an open ended investment company of
20% (2020: 20%) is applied to the net revenue before taxation. The differences are explained below:
At the year end, after offset against revenue taxable on receipt, there is a potential deferred tax asset of £2,875,339 (2020:
£2,011,176) in relation to surplus management expenses. It is unlikely that the Fund will generate sufficient taxable profits
in the future to utilise this amount and therefore no deferred tax asset has been recognised in the year.
The distributions take account of revenue received on the creation of shares and revenue deducted on the cancellation of
shares, and comprise:
108

AXA Global Distribution Fund
Notes to the Financial Statements For the year ended 31 May 2021
AXA Distribution Investment ICVC
7. Debtors 31/05/21 31/05/20
£'000 £'000
Amounts receivable for creation of shares 1,807 970
Accrued revenue 650 730
Overseas tax recoverable 63 63
Total debtors 2,520 1,763
8. Cash and bank balances 31/05/21 31/05/20
£'000 £'000
Cash and bank balances 10,902 6,576
Total cash and bank balances 10,902 6,576
9. Other creditors 31/05/21 31/05/20
£'000 £'000
Amounts payable for cancellation of shares 158 86
Purchases awaiting settlement 6,535 ‐
Accrued annual management charge 483 358
Accrued other expenses 45 38
Total other creditors 7,221 482
10. Related party transactions
11. Share classes
Annual
management
charge rate
(%) 31/05/20 Issued Cancelled Converted 31/05/21
B Accumulation 0.50 22,469,643 116,890 (1,625,456) ‐ 20,961,077
B Income 0.50 136,940 1,391 (11,641) ‐ 126,690
R Accumulation 1.50 7,248,683 753,942 (827,158) (22,196) 7,153,271
R Income 1.50 668,398 35,607 (120,994) ‐ 583,011
Z Accumulation 0.75 68,856,437 26,321,269 (9,422,059) 19,817 85,775,464
Z Income 0.75 14,771,151 2,200,195 (1,643,438) ‐ 15,327,908
12. Commitments, contingent liabilities and contingent assets
Monies received and paid by the ACD through the creation and cancellation of shares are disclosed in the Statement of
Change in Shareholders’ Net Assets and amounts due at the year end are disclosed in Notes 7 and 9.
Annual management charge paid to the ACD and Registration fees are disclosed in Note 4 and amounts due at the year end
are disclosed in Note 9.
The ACD and its associates (including other authorised investment Funds managed by the ACD) have no shareholdings in the
Company at the year end.
The reconciliation of the opening and closing numbers of shares of each class, along with the ACD’s annual management
charges applicable to each class, is shown below:
There are no commitments, contingent liabilities and contingent assets as at the balance sheet date (2020: nil).
The ACD is related to the Fund as defined by Financial Reporting Standard 102.33 ‘Related Party Disclosures’.
109

AXA Global Distribution Fund
Notes to the Financial Statements For the year ended 31 May 2021
AXA Distribution Investment ICVC
13. Derivatives and other financial instruments
31/05/21 31/05/20
Currency £'000 £'000
Australian dollar 5,271 2,095
Brazilian real 1,250 355
Canadian dollar 13,350 6,832
Danish krone 1,978 1,757
Euro 46,105 33,263
Hong Kong dollar 9,300 7,972
Hungarian forint 1 1
Indonesian rupiah ‐ 299
Japanese yen 16,243 16,618
Malaysian ringgit 166 309
Mexican peso 149 375
New Israeli shekel 549 571
New Taiwan dollar 7,924 3,187
New Zealand dollar 276 693
Norwegian krone 668 1
Philippine peso 108 360
Polish zloty 1 132
Singapore dollar 242 205
South African rand 631 715
South Korean won 3,760 709
Swedish krona 3,885 2,659
Swiss franc 2,724 4,247
Thailand baht 406 ‐
US dollar 116,775 116,632
Total 231,762 199,987
Net foreign currency
exposure
The main risks from the Fund's holding of financial instruments, together with the ACD’s policy for managing these risks, areoutlined below.
Market price risk
The Fund invests principally in equity and fixed income securities. The value of the Fund’s investment portfolio is not fixedand may go down as well as up. This may be as a result of a specific factor affecting the value of an individual company ormay be caused by general market factors (such as government policy or the health of the underlying economy) which canaffect the entire portfolio. The Fund seeks to manage these risks by adhering to investment guidelines and to investment
and borrowing powers set out in the Prospectus. In addition, the Fund complies with the Collective Investment Schemes
sourcebook (“COLL”), which include rules relating to investment holdings that are designed to place limits on the Fund’sinvestment concentration (same as at 31 May 2020).
Market price risk sensitivity
A 10% increase in the value of the Fund’s portfolio would have the effect of increasing the return and net assets by£39,553,585 (2020: £29,736,564). A 10% decrease would have an equal and opposite effect.
Foreign currency risk
The table below shows the foreign currency risk profile at the balance sheet date:
110

AXA Global Distribution Fund
Notes to the Financial Statements For the year ended 31 May 2021
AXA Distribution Investment ICVC
The table below shows the interest rate risk profile at the balance sheet date:
Floating rate
financial
assets
Fixed rate
financial
assets
Financial
assets not
carrying
interest Total
Currency Assets £'000 £'000 £'000 £'000
31/05/21
Pound sterling 7,161 82,884 7,968 98,013
Australian dollar 37 581 4,654 5,272
Brazilian real ‐ ‐ 1,250 1,250
Canadian dollar 616 2,028 11,320 13,964
Danish krone 2 ‐ 1,976 1,978
Euro 1,327 19,816 25,508 46,651
Hong Kong dollar 15 ‐ 9,285 9,300
Hungarian forint 1 ‐ ‐ 1
Japanese yen 297 1,034 14,911 16,242
Malaysian ringgit ‐ ‐ 166 166
Mexican peso 4 ‐ 145 149
New Israeli shekel 1 ‐ 547 548
New Taiwan dollar 15 ‐ 7,910 7,925
New Zealand dollar 2 ‐ 274 276
Norwegian krone 2 ‐ 666 668
Philippine peso ‐ ‐ 108 108
Polish zloty 1 ‐ ‐ 1
Singapore dollar 3 ‐ 238 241
South African rand 2 ‐ 630 632
South Korean won ‐ ‐ 3,760 3,760
Swedish krona 409 385 3,416 4,210
Swiss franc 2 ‐ 2,723 2,725
Thailand baht ‐ ‐ 406 406
US dollar 1,007 63,404 131,262 195,673
Total 10,904 170,132 229,123 410,159
Foreign exchange risk sensitivity
Fixed interest securities are particularly affected by trends in interest rates and inflation. If interest rates go up, the value of
capital may fall, and vice versa. Inflation will also decrease the real value of capital, with the exception of index linked bonds
which are protected against the effect of inflation.
Assuming all other factors remain stable, if GBP strengthens by 10% the resulting change in the net assets attributable to
shareholders of the Fund would be a decrease of approximately £23,176,221 (2020: £19,998,660). A 10% weakening in GBP
would have an equal but opposite effect.
Interest rate risk
Changes in interest rates or changes in expectations of future interest rates may result in an increase or decrease in the market value of the investments held. A 1% increase in interest rates would have the effect of decreasing the return and net assets £21,038,582 (2020: £16,343,632) . A 1% decrease would have an equal and opposite effect.
111

AXA Global Distribution Fund
Notes to the Financial Statements For the year ended 31 May 2021
AXA Distribution Investment ICVC
31/05/20
Pound sterling 5,505 40,764 4,517 50,786
Australian dollar 1 567 1,527 2,095
Brazilian real ‐ ‐ 355 355
Canadian dollar 1 2,000 4,830 6,831
Danish krone 3 ‐ 1,754 1,757
Euro 823 17,357 15,080 33,260
Hong Kong dollar 2 ‐ 7,969 7,971
Hungarian forint 1 ‐ ‐ 1
Indonesian rupiah ‐ ‐ 299 299
Japanese yen 94 1,422 15,103 16,619
Malaysian ringgit ‐ ‐ 308 308
Mexican peso 1 ‐ 373 374
New Israeli sheqel 2 ‐ 569 571
New Taiwan dollar 8 ‐ 3,178 3,186
New Zealand dollar 2 ‐ 691 693
Norwegian krone 1 ‐ ‐ 1
Philippine peso ‐ ‐ 360 360
Polish zloty 2 ‐ 130 132
Singapore dollar 1 ‐ 205 206
South African rand 3 ‐ 713 716
South Korean won ‐ ‐ 710 710
Swedish krona 2 473 2,184 2,659
Swiss franc 1 ‐ 4,247 4,248
US dollar 124 60,209 111,233 171,566
Total 6,577 122,792 176,335 305,704
Floating rate
financial
liabilities
Fixed rate
financial
liabilities
Financial
liabilities not
carrying
interest Total
Currency Liabilities £'000 £'000 £'000 £'000
31/05/21
Pound sterling ‐ ‐ (892) (892)
Canadian dollar ‐ ‐ (615) (615)
Euro ‐ ‐ (546) (546)
Swedish krona ‐ ‐ (325) (325)
US dollar ‐ ‐ (5,067) (5,067)
Total ‐ ‐ (7,445) (7,445)
31/05/20
Pound sterling ‐ ‐ (728) (728)
US dollar ‐ ‐ (817) (817)
Total ‐ ‐ (1,545) (1,545)
112

AXA Global Distribution Fund
Notes to the Financial Statements For the year ended 31 May 2021
AXA Distribution Investment ICVC
31/05/21 31/05/20
Market Value % Market Value %
£’000 £’000
170,132 42.24 122,792 40.38
170,132 42.24 122,792 40.38
Financial derivative instrument risk exposure
31/05/21 31/05/20
Exposure Exposure
(a) Forwards £’000 £’000
State Street Bank 215,127 54,933
215,127 54,933
14. Portfolio transaction costs
Net purchase
cost
Commissions
paid Taxes
Total
purchase cost
31/05/2021 £'000 £'000 % £'000 % £'000
Analysis of purchases
Bonds 86,704 ‐ ‐ ‐ ‐ 86,704
Equities 250,704 41 0.02 81 0.03 250,826Total 337,408 41 81 337,530
Net sale
proceeds
Commissions
paid Taxes
Total sale
proceeds
31/05/2021 £'000 £'000 % £'000 % £'000
Analysis of sales
Bonds 32,048 ‐ ‐ ‐ ‐ 32,048
Collective Investment Schemes 1,292 ‐ ‐ ‐ ‐ 1,292
Equities 239,356 (38) (0.02) (34) (0.01) 239,284Total 272,696 (38) (34) 272,624
The Fund runs a very low credit risk in respect of unsettled investment transactions as these are normally settled as cash
against delivery.
Fixed interest investments are exposed to credit risk which reflects the ability of the bond issuer to meet its obligations.
Generally, the higher the rate of interest, the higher the perceived credit risk of the issuer. The ACD monitors the credit
quality and risk of the portfolio as a part of the overall investment process and in accordance with the objective and policy
of each fund.
Transactions in securities may expose a fund to the risk that the counterparty will not settle the transaction or do so on a
timely basis.
All transactions in the funds are conducted through counterparties approved by the ACD.
A breakdown of the investment portfolio by credit rating is disclosed on the table below:
Credit Rating Investment grade (BBB- credit rating and above) Total value of bonds
Credit risk
Total value of derivatives
The exposure obtained through financial derivative instruments and identity of counterparties was as follows:
113

AXA Global Distribution Fund
Notes to the Financial Statements For the year ended 31 May 2021
AXA Distribution Investment ICVC
Net purchase
cost
Commissions
paid Taxes
Total
purchase cost
31/05/2020 £'000 £'000 % £'000 % £'000
Analysis of purchases
Bonds 38,562 ‐ ‐ ‐ ‐ 38,562
Equities 236,012 44 0.02 62 0.03 236,118Total 274,574 44 62 274,680
Net sale
proceeds
Commissions
paid Taxes
Total sale
proceeds
31/05/2020 £'000 £'000 % £'000 % £'000
Analysis of sales
Bonds 30,757 ‐ ‐ ‐ ‐ 30,757
Equities 200,633 (39) (0.02) (26) (0.01) 200,568Total 231,390 (39) (26) 231,325
31/05/21 31/05/20
Transaction costs as percentage of average net asset value % %
Commissions 0.02 0.03
Taxes 0.04 0.03
At the balance sheet date the average portfolio dealing spread was 0.10% (2020: 0.14%).
15. Post balance sheet events
Share class
B AccumulationB IncomeR AccumulationR IncomeZ AccumulationZ Income
Subsequent to the year end, on 17th September 2021 the Net Asset Value ("NAV") per share has increased above 5% onshare classes when compared to the year end date. The movements for each share class are shown below:
Price per share as at
28.05.21*Movement
168.60
*Prices disclosed are based on quoted share prices and will therefore differ to net asset value per share shown in the
comparative tables which are valued at bid‐market prices.
358.90 5.27%233.20 4.67%
5.40%157.40 4.76%318.70 5.02%206.20
Price per share as at
17.09.21177.70164.90334.70215.40377.80244.10
4.46%
114

AXA Global Distribution Fund
Notes to the Financial Statements For the year ended 31 May 2021
AXA Distribution Investment ICVC
16. Fair value disclosure
Assets Liabilities Assets Liabilities
Valuation technique £'000 £'000 £'000 £'000
Level 1 ^ 394,570 ‐ 296,325 ‐
Level 2 ^^ 2,167 (17) 1,040 (817)
Level 3 ^^^ ‐ ‐ ‐ ‐
396,737 (17) 297,365 (817)
The fair value of the Fund's investments has been determined using the hierarchy above.
^^ Level 2: Inputs other than quoted prices included within Level 1 that are observable (i.e. developed using market data)
for the asset or liability, either directly or indirectly.
^^^ Level 3: Inputs are unobservable (i.e. for which market data is unavailable) for the asset or liability.
^ Level 1: The unadjusted quoted price in an active market for identical assets or liabilities that the entity can access at the
measurement date.
31/05/21 31/05/20
115

AXA Global Distribution Fund
As at 31 May 2021
Interim Distribution in pence per shareGroup 1 Shares purchased prior to 1 June 2020Group 2 Shares purchased on or after 1 June 2020 to 30 November 2020
Distribution DistributionNet paid paid
revenue Equalisation 29/01/21 31/01/20(p) (p) (p) (p)
Share Class B AccumulationGroup 1 0.904 ‐ 0.904 1.104 Group 2 0.283 0.621 0.904 1.104
Share Class B IncomeGroup 1 0.849 ‐ 0.849 1.053 Group 2 0.849 ‐ 0.849 1.053
Share Class R AccumulationGroup 1 1.722 ‐ 1.722 2.119 Group 2 0.792 0.930 1.722 2.119
Share Class R IncomeGroup 1 1.123 ‐ 1.123 1.404 Group 2 0.225 0.898 1.123 1.404
Share Class Z AccumulationGroup 1 1.937 ‐ 1.937 2.383 Group 2 0.384 1.553 1.937 2.383
Share Class Z IncomeGroup 1 1.262 ‐ 1.262 1.569 Group 2 0.441 0.821 1.262 1.569
AXA Distribution Investment ICVC
Distribution Tables
116

AXA Global Distribution Fund
As at 31 May 2021
AXA Distribution Investment ICVC
Distribution Tables
Final Distribution in pence per shareGroup 1 Shares purchased prior to 1 December 2020Group 2 Shares purchased on or after 1 December 2020 to 31 May 2021
Distribution DistributionNet payable paid
revenue Equalisation 30/07/21 31/07/20(p) (p) (p) (p)
Share Class B AccumulationGroup 1 0.937 ‐ 0.937 1.129 Group 2 0.410 0.527 0.937 1.129
Share Class B IncomeGroup 1 0.874 ‐ 0.874 1.069 Group 2 0.874 ‐ 0.874 1.069
Share Class R AccumulationGroup 1 1.775 ‐ 1.775 2.160 Group 2 0.843 0.932 1.775 2.160
Share Class R IncomeGroup 1 1.150 ‐ 1.150 1.415 Group 2 0.252 0.898 1.150 1.415
Share Class Z AccumulationGroup 1 1.996 ‐ 1.996 2.412 Group 2 0.981 1.015 1.996 2.412
Share Class Z IncomeGroup 1 1.297 ‐ 1.297 1.589 Group 2 0.730 0.567 1.297 1.589
117

AXA Lifetime Distribution Fund
Investment Manager's ReportFor the year ended 31 May 2021
Lower Risk Higher Risk
1 2 3 4 5 6 7
Why is this Fund in this category?
The aim of this Fund is to provide income with some prospect for long‐term capital growth.
The Fund invests in a mix of shares in UK listed companies and UK Government bonds (the majority of which are linked to the
rate of inflation). The Fund's typical asset mix would range between 50‐60% investment in shares and 40‐50% in UK Government
bonds. The Manager selects shares in companies based upon their prospects for future growth in dividend payments following
an in depth analysis of their financial status, quality of business model and corporate governance arrangements. Investments in
UK Government bonds are diversified across a range of maturities (i.e., the length of time for full repayment of the bond by the
Government), with a bias towards bonds with longer maturities.
By investing in a fund which can invest up to 60% in equities you are likely to be looking for an investment which has lower risk
than a pure equity based fund but you are prepared to accept some risk for potential reward. You are willing to accept that your
investment will fall and rise in value and that you could get back less than you invest. Typically, you would prefer an investment
with less risk than that of a fund which invests predominantly in equities or overseas.
AXA Distribution Investment ICVC
The risk category is calculated using historical performance data and may not be a reliable indicator of the Fund’s future risk
profile. The risk category shown is not guaranteed and may shift over time. The lowest category does not mean risk free. The
risk category is recalculated weekly and for the period under review the risk category changed from a category 4 to a category 5.
The capital of the Fund is not guaranteed. The Fund is invested in financial markets and uses techniques and instruments which
are subject to some level of variation which, may result in gains or losses.
Additional risks
Under normal market conditions the Fund’s key risk factors are:
• Equity risk ‐ the value of shares in which the Fund invests fluctuate pursuant to market expectations. The value of such shares
will go up and down and equity markets have historically been more volatile than fixed interest markets. Should the price of
shares in which the Fund has invested fall, the Net Asset Value of the Fund will also fall.
Investment Objective
Investment Policy
Risk and Reward Profile
Funds investing in shares are generally more volatile than funds investing in bonds or a combination of shares and bonds, but
may also achieve greater returns.
Internal investment guidelines are set, if necessary, to ensure equity risk is maintained within a range deemed suitable based on
the individual fund’s investment objectives and investment policy.
The Manager has full discretion to select investments for the Fund in line with the above investment policy and in doing so may
take into consideration a composite benchmark made up of the following indices in the stated proportions: 55% FTSE All‐Share
Index; 45% FTSE Index Linked Govt All Stocks (the “Benchmark”). This Benchmark best represents the types of bonds and
companies in which the Fund predominantly invests.
This Fund is actively managed in reference to the Benchmark, which may be used by investors to compare the Fund's
performance.
As at 31 May 2021
Potentially lower reward Potentially higher reward
118

AXA Lifetime Distribution Fund
Investment Manager's ReportFor the year ended 31 May 2021
AXA Distribution Investment ICVC
As with other bonds, the value of index‐linked bonds will generally fall when expectations of interest rates rise and vice versa.
However, when the market anticipates a rise in inflation rates, index‐linked bonds will generally outperform other bonds, and
vice versa.
Index‐linked bonds bought in the secondary market (i.e., not directly from the issuer) whose capital values have been adjusted
upward due to inflation since issuance, may decline in value if there is a subsequent period of deflation.
Due to the sensitivity of these bonds to interest rates and expectations of future inflation, there is no guarantee that the value
of these bonds will correlate with inflation rates in the short to medium term.
Index‐linked bonds risk is an inherent risk of investing in index‐linked bonds. Exposure to this risk is managed by the allocation
decision on the proportion of the portfolio to invest in index‐linked bonds, as well as the amount of remaining maturity of these
bonds, which will affect their sensitivity in value, to changes in expected inflation levels.
• Risks linked to investment in sovereign debt ‐ the Fund may invest in bonds issued by countries and governments (sovereign
debt). The governmental entity that controls the repayment of sovereign debt may not be able or willing to repay the capital
and/or interest when due in accordance with the terms of such debt. In such a scenario, the value of investments of the Fund
may be adversely affected. A governmental entity’s willingness or ability to repay capital and interest due in a timely manner
may be affected by, among other factors, its cash flow situation, the extent of its foreign currency reserves, the availability of
sufficient foreign exchange on the date a payment is due, the relative size of the debt service burden to the economy as a
whole, the governmental entity’s policy towards the International Monetary Fund and the political constraints to which a
governmental entity may be subject. Governmental entities may also be dependent on expected disbursements from foreign
governments, multilateral agencies and others abroad to reduce principal and interest on their debt. In addition, there are no
bankruptcy proceedings for such issuers under which money to pay the debt obligations may be collected in whole or in part.
Holders may be requested to participate in the rescheduling of such sovereign debt and to extend further loans to the issuers.
Certain countries are especially large debtors to commercial banks and foreign governments. Investment in sovereign debt
issued or guaranteed by such countries (or their governments or governmental entities) involves a higher degree of risk than
investment in other sovereign debt.
Certain funds may be further subject to the risk of high concentration in bonds issued by and/or guaranteed by a single
sovereign issuer which is below investment grade and/or unrated which is also subject to higher credit risk. In the event of a
default of the sovereign issuer, the Fund may suffer significant loss.
• Interest rate risk ‐ is the risk that the market value of bonds held by the Fund could fall as a result of higher market rates
(yields). Yields can change as a result of, among other things, the economic and inflation outlook which also affects supply and
demand as well as future interest rate expectations, without necessarily a change in official central bank short term interest
rates. Higher yields result in a decline in the value of bonds. Conversely, lower yields tend to increase the value of bonds.
Duration (a measure based on the coupon and maturity payments schedule of a bond) is an important concept in understanding
how the price of that bond might change for a 1% move in its redemption yield. A bond with a longer duration is more sensitive
to a change in yields and, generally speaking, will experience more volatility in its market value than bonds with shorter
durations.
Internal investment guidelines are set if necessary to ensure interest rate risk is maintained within a range deemed suitable
based on the individual fund’s investment objectives and investment policy. These guidelines could include measures of
sensitivity to changes of interest rates.
• Index‐linked bonds risk ‐ index‐linked bonds are fixed interest securities whose capital repayment amounts and interest
payments are adjusted in line with movements in inflation indices. They are designed to mitigate the effects of inflation on the
value of a portfolio. The market value of index‐linked bonds is determined by the market’s expectations of future movements in
both interest rates and inflation rates.
119
AXA Lifetime Distribution Fund
Investment Manager's ReportFor the year ended 31 May 2021
AXA Distribution Investment ICVC
Monthly monitoring is conducted, using an in‐house liquidity tool, to ensure a high degree of confidence that Fund liquidity will
meet the Fund’s expected liquidity requirements. Any concerns indicated by the tool are analysed by the Manager’s risk team
who may also discuss the results with portfolio management staff, or other senior professionals within the firm, as needed, to
ensure an appropriate scrutiny.
Based on the analysis, the Manager believes that the liquidity profile of the Fund is appropriate.
This is an inherent risk for funds invested within sovereign bonds. Internal investment guidelines, scenario testing as well as
other regular monitoring seek to ensure the level of risk is aligned with each individual fund’s investment objectives and
investment policy.
Other risks which could have an impact in extreme market conditions include:
• Liquidity risk ‐ under certain market conditions, it may be difficult to buy or sell investments for the Fund. For example, smaller
company shares may trade infrequently and in small volumes and corporate and emerging market bonds may be affected by the
demand in the market for such securities carrying credit risk, particularly in times of significant market stress. As a result, it may
not be possible to buy or sell such investments at a preferred time, close to the last market price quoted or in the volume
desired. The Manager may be forced to buy or sell such investments as a consequence of Unitholders buying or selling Units in
the Fund. Depending on market conditions at the time, this could lead to a significant drop in the Fund’s value.
Further explanation of the risks associated with an investment in this Fund can be found in the prospectus.
• Counterparty risk ‐ at any one time, the Fund may be exposed to the creditworthiness and stability of the counterparties to
transactions entered into by the Fund (including derivative and stock lending and repo/reverse repo transactions). The Fund will
be subject to the risk of the inability of its counterparties to perform its obligations under such transactions (default), whether
due to insolvency, bankruptcy or other causes. In the event of the insolvency of a counterparty, the Fund might not be able to
recover cash or assets of equivalent value, to that invested, in full. The Fund may receive assets or cash from the counterparty
(collateral) to protect against any such adverse effect. Where relevant, a counterparty will forfeit its collateral if it defaults on
the transaction with the Fund. However, if the collateral is in the form of securities, there is a risk that when it is sold, it will
realise insufficient cash to settle the counterparty’s debt to the Fund under a transaction or to purchase replacement securities
that were lent to the counterparty under a stock lending arrangement. In relation to stock lending arrangements, there is also
the risk that while cash is recovered in the event of a default, the actual stock cannot be repurchased. Furthermore, to the
extent that collateral is not present to cover part or all of the debt, a counterparty default may result in losses for the affected
Fund. To assist in managing these types of risks, the ACD sets criteria around the types of eligible collateral the Fund may accept.
Please see the paragraph entitled “Treatment of Collateral” in the “Investment and borrowing powers applicable to the Funds”
section in Appendix II of the Prospectus for more information.
Transactions in securities that the Fund may enter into expose it to the risk that the counterparty will not deliver the investment for a purchase or cash for a sale after the Fund has contracted to fulfil its responsibilities. This is minimised by the practice in the majority of markets of delivery versus payment and short settlement periods.
Important Information
Derivatives transactions may be used in the Fund for meeting the investment objectives of the Fund. The use of derivatives in this manner is not expected to change the risk profile of the Fund.
Market Review
One year ago, this report referenced the mounting death toll from coronavirus which, at the time, was still spreading voraciously across the globe. Today, deaths worldwide are approaching four million and many developing nations are still suffering terribly from its impact. Within developed markets, we have benefited from the phenomenal efforts made by scientists, regulators and governments to research, develop and produce multiple vaccines that have substantially reduced the harming effects of the virus. After a long, long time spent restricted in each of our daily lives we are approaching a return to normal life.
120

AXA Lifetime Distribution Fund
Investment Manager's ReportFor the year ended 31 May 2021
AXA Distribution Investment ICVC
As economies around the world re‐open, investors have been questioning what the post‐lockdown world will look like. New
working practices, increased reliance on technology, less use of cash as a means of payment, growth in pet ownership, increased
domestic travel and many other factors will shape the post‐COVID‐19 world. Undoubtedly, following the temporary hibernation
of the global economy, there is a level of optimism about the coming months and possibly years and reference to the ‘roaring
20s’ points to the release of the pent up demand and ambition of populations around the world.
A saying coined (and often shared) by a well‐known fund manager and former colleague that ‘things will not become better or
worse but different’ rings true and investment markets have certainly been grappling with this in recent months.
For the Fund, market conditions over the past six months have been generally positive as investors have looked forward to a
normalisation of economic conditions. Since the beginning of December, conditions impacting investment markets have
followed in much the same vein as during the last reporting period. In short, conditions have been volatile. Equities have made
solid progress while fixed income has been challenged by the positive investor view of life in a post‐lockdown world. The FTSE All‐
Share Index (on a Total Return basis) rose 15.2% with the FTSE 100 (+14.09%) underperforming the mid cap (+18.43%) and the
FTSE Small Cap (ex‐Investment Companies) (+35.87%) indices. The FTSE UK Gilts All Stocks (TR) fell 4.82% over the six‐month
period, while the FTSE UK Gilts Index‐Linked (TR) All stocks index outperformed its conventional peer and falling 2.35%.
The prospect of a resurgent UK economy following the long months of lockdown has helped push the FTSE All‐Share Index higher – although it remains some way below its all‐time highs, unlike many international bourses. As life returns to normal, the tailwinds of pent‐up consumer demand, record business investment intentions, a buoyant residential property market and low interest rates are directing economists to project GDP growth of over 7% in 2021. However, with oil, commodity and other raw material prices pushing inflation up from very low levels, markets have been tying themselves up in knots about the potential for the years of supportive central bank policy being reversed and used to cool the economy. For the first time in years, the spectre of inflation has become a central concern for investors.
The combination of equities and inflation‐linked sovereign bonds, that continues to define the Distribution range of funds, position them ideally for the on‐going market conditions.
The quantum of money pumped into the financial system over the past 18 months has paled into insignificance the financial backing the same organisations gave following the global financial crisis. Unquestionably, this support has enabled the economy to keep going and saved many jobs from being lost. It also provided a strong underpin to fixed income markets as central banks reiterated their ‘lower for longer’ mantra. However, the impact of the vaccine rollout has brought economic optimism back to market and while we had been anticipating a modest move higher in yields over the course of 2021, the adjustment in Q1 2021 happened quicker and in a larger magnitude than we had been anticipating. Markets quickly priced in a continuation of the strong economic rebound and is currently anticipating two rate hikes from the US Federal Reserve by Q1 2023, while in GBP rates, the market is pricing in one hike by Q1 2023.
The bearish momentum for bonds has stabilised for now but would anticipate a modest move higher in yields later in the summer as speculation around tapering of asset purchases is likely to rise. However, with much of the good news on the economy fully priced, positioning and the knock‐on implications to risk assets via higher discounting rates and tighter financial conditions will require close attention.
In our view, yield levels continue to offer some additional level of protection for the portfolios as the technical backdrop remains supportive, with global central banks continuing their asset purchase programmes. In addition, central banks have been explicit in their guidance on short rates, which will remain anchored until inflation is above their target for a sustained period. This backdrop should continue to be supportive for breakevens and inflation‐linked bonds.
121

AXA Lifetime Distribution Fund
Investment Manager's ReportFor the year ended 31 May 2021
AXA Distribution Investment ICVC
We have added to the Fund’s holding of Hill & Smith during the period where we see strong structural and cyclical drivers providing tailwinds for the business. On the structural side they are positioned well to make a positive contribution to issues including climate change, health & safety, population growth, increased urbanisation, infrastructure safety and vision zero (no road deaths). On the cyclical side, we think that the company is an excellent way to play the increased government spending on infrastructure and, in particular, President Biden’s US infrastructure package. This, however, is considered the icing on the cake as there are already large spending plans in place, such as Texas spending $77bn on their roads alone. Hill & Smith has also been quick to highlight the environmental benefits of galvanising as opposed to painting steel, thanks to its longevity and ability to be reused.
The new CEO Paul Simmons is bringing years of experience from Halma and applying it to the not‐too‐dissimilar Hill & Smith decentralised business model. We are particularly pleased that he has clarified the role and type of M&A he wants to achieve and expect to see a more rigorous approach to portfolio management and innovation. All of this means that we anticipate seeing a more consistent, higher level of organic growth than the Group has historically been able to produce and with it a likely higher rating.
Outlook
We remain positive about the prospects for UK equities over the period ahead. Valuations, in aggregate, remain attractive on both and absolute and relative (to international markets) basis. We are seeing a strong level of M&A activity which we anticipate will continue and new, interesting and attractively priced IPOs are offering new opportunities.
While it is inevitable that conditions will remain volatile, we continue to believe that macro events cannot be accurately nor consistently predicted. As such, the Fund retains a preference for longer‐term structural trends and quality companies that can deliver robust, reliable and consistent growth, supported by a simple government bond and cash hedge.
Performance
Banks and Mining were the main sectors to detract from performance during the period under review. We have an underweight position in the banks sector, preferring financial exposure from life insurance and specialist financial businesses such as Legal & General and 3i Plc. Within the wider financials sector, the London Stock Exchange contributed negatively over the half year. Following several strong years of performance, the London Stock Exchange surprised the market with its announcement of a significantly larger than expected investment it will be making in its newly acquired Refinitiv business. The shares were weak on the back of the news; however, we continue to see value in the business and have held the position. Our exposure to the mining sector is predominantly via Rio Tinto but there is also exposure to copper through the holding in Central Asia Metals.
Another factor having a significant impact on the UK equity market has been the growth of investor interest in environmental, social and governance (ESG) issues. The growing awareness of consumers, and in turn companies, of product provenance, the environmental impact and corporate behaviours is being reflected increasingly in sales rates. Within the portfolio, this is impacting every company we hold from Great Portland Estates to BP. Sustainability reports, carbon reduction targets and positive societal change are now the norm amongst the high‐quality businesses the fund invests in. On behalf of our unitholders, we have continued our investment and efforts in ESG and produce a monthly report covering a wide range of ESG metrics. These include measuring the Fund’s carbon and water intensity, monitoring the proportion of female executives on our holdings’ Boards, monitoring for controversies, scoring individual company holdings and assessing the overall ESG score of the Fund. Our intention is to expand the reporting of these, and other measures, in the years ahead.
Our positive view of the prospect for UK equities in 2021 has been reinforced by the takeover and IPO activity that have also
characterised the year to date. At the time of writing this report buyout transactions involving over £25bn in value of UK‐listed
companies have been announced (this does not include the unsuccessful approaches for several other companies).
Concurrently, there has been a long, and growing, list of companies revealing an intention to seek a public listing in the UK.
Significantly, the vast majority of the new listings have been successful and share prices have risen to a premium to their IPO
price which has encouraged more companies to follow. In the meantime, the UK government appears to be closing in on some
significant international trade agreements following Brexit, providing a further potential tailwind for the economy.
122

AXA Lifetime Distribution Fund
Investment Manager's ReportFor the year ended 31 May 2021
AXA Distribution Investment ICVC
Past performance is not a guide for future performance.
Cost (£'000) Proceeds (£'000)
● Hargreaves Lansdown 10,695 17,383
● AstraZeneca 8,054 12,019
● UK Treasury 0.125% IL 10/08/31 6,989 10,512
● UK Treasury 0.125% IL 22/03/51 5,455 7,737
● AVEVA 4,488 7,178
Major Sales
● Barrick Gold
● Royal Dutch Shell
● Countryside Proper es
● BT
● Ascen al
Jamie Forbes‐Wilson, Matthew Huddart
31 May 2021
Major Purchases
All performance data source: AXA Investment Managers and Morningstar.
In healthcare, several UK‐listed companies received bid approaches and the portfolio benefitted from the recent announcement
of an agreed bid approach for Vectura by Carlyle Europe Partners valuing the business at 155p cash per share. In addition,
GlaxoSmithKline’s share price bounced higher following news that Elliott Management has bought a multi‐billion‐pound stake in
the company.
AXA Investment Managers UK Limited
123

Portfolio Statement Market Value % of Total
As at 31 May 2021 Holding £’000 Net Assets
EQUITIES 57.03% (31/05/20: 57.45%)
BASIC MATERIALS 4.32% (31/05/20: 5.75%*)
Industrial Metals & Mining 4.32% (31/05/20: 3.83%*)
Central Asia Metals 1,820,000 4,941 0.57
Hill & Smith 650,000 9,971 1.14
Rio Tinto 375,000 22,699 2.61
Precious Metals & Mining 0.00% (31/05/20: 1.92%*)
TOTAL BASIC MATERIALS 37,611 4.32
CONSUMER DISCRETIONARY 6.23% (31/05/20: 4.33%*)
Automobiles & Parts 0.87% (31/05/20: 0.28%)
TI Fluid Systems 2,500,000 7,613 0.87
Household Goods & Home Construction 1.09% (31/05/20: 1.29%*)
Bellway 265,000 9,506 1.09
Retailers 2.93% (31/05/20: 1.93%*)
Dunelm 700,000 10,262 1.18
JD Sports Fashion 1,600,000 15,251 1.75
Teachers Media ^ 670,000 ‐ ‐
Travel & Leisure 1.34% (31/05/20: 0.83%)
Loungers 1,625,000 4,306 0.49
Whitbread 230,000 7,378 0.85
TOTAL CONSUMER DISCRETIONARY 54,316 6.23
CONSUMER STAPLES 5.11% (31/05/20: 5.34%*)
Beverages 2.44% (31/05/20: 2.10%)
Diageo 625,000 21,238 2.44
Personal Care, Drug & Grocery 2.67% (31/05/20: 3.24%*)
Reckitt Benckiser 260,000 16,533 1.90
Tesco 3,000,000 6,705 0.77
TOTAL CONSUMER STAPLES 44,476 5.11
ENERGY 3.53% (31/05/20: 4.94%*)
Oil, Gas & Coal 3.53% (31/05/20: 4.94%*)
BP 5,500,000 16,866 1.94
Diversified Energy 3,965,132 4,187 0.48
Longboat Energy 250,000 192 0.02
Royal Dutch Shell 200,000 2,578 0.30
Serica Energy 6,000,000 6,924 0.79
TOTAL ENERGY 30,747 3.53
AXA Distribution Investment ICVC
AXA Lifetime Distribution Fund
124

Portfolio Statement Market Value % of Total
As at 31 May 2021 Holding £’000 Net Assets
AXA Distribution Investment ICVC
AXA Lifetime Distribution Fund
FINANCIALS 13.72% (31/05/20: 11.39%*)
Banks 2.37% (31/05/20: 2.04%)
Lloyds Banking 15,500,000 7,711 0.89
Standard Chartered 2,500,000 12,910 1.48
Closed End Investments 0.21% (31/05/20: 0.30%*)
Syncona 850,000 1,806 0.21
Finance & Credit Services 1.04% (31/05/20: 0.00%)
London Stock Exchange 120,000 9,031 1.04
Investment Banking & Brokerage 4.20% (31/05/20: 3.92%*)
3i 1,450,000 18,067 2.07
Argentex 1,800,000 2,241 0.26
Hargreaves Lansdown 700,000 11,718 1.34
TP ICAP 2,163,953 4,615 0.53
Life Insurance 4.91% (31/05/20: 4.25%)
Just 12,250,000 13,499 1.55
Legal & General 6,000,000 17,238 1.98
Phoenix 800,000 5,922 0.68
Prudential 400,000 6,092 0.70
Non‐Life Insurance 0.99% (31/05/20: 0.88%)
Sabre Insurance 3,300,000 8,663 0.99
TOTAL FINANCIALS 119,513 13.72
HEALTH CARE 8.51% (31/05/20: 8.96%)
Medical Equipment & Services 2.04% (31/05/20: 2.76%*)
ConvaTec 5,250,000 12,369 1.42
Inspiration Healthcare 50,000 71 0.01
Smith & Nephew 350,000 5,362 0.61
Pharmaceuticals & Biotechnology 6.47% (31/05/20: 6.20%)
AstraZeneca 230,000 18,499 2.12
Genus 250,000 12,612 1.45
GlaxoSmithKline 1,500,000 20,145 2.31
Vectura 3,250,000 5,116 0.59
TOTAL HEALTH CARE 74,174 8.51
INDUSTRIALS 8.14% (31/05/20: 8.49%*)
Aerospace & Defense 0.00% (31/05/20: 0.73%)
Construction & Materials 2.01% (31/05/20: 1.51%)
Forterra 3,000,000 8,955 1.03
Marshalls 1,150,000 8,556 0.98
125

Portfolio Statement Market Value % of Total
As at 31 May 2021 Holding £’000 Net Assets
AXA Distribution Investment ICVC
AXA Lifetime Distribution Fund
General Industrials 2.80% (31/05/20: 2.96%)
Coats 10,000,000 6,620 0.76
DS Smith 1,750,000 7,346 0.84
Melrose Industries 6,000,000 10,455 1.20
Industrial Engineering 0.00% (31/05/20: 0.30%*)
Industrial Support Services 1.55% (31/05/20: 1.16%*)
Experian 500,000 13,510 1.55
Industrial Transportation 1.78% (31/05/20: 1.83%*)
Ashtead 300,000 15,540 1.78
TOTAL INDUSTRIALS 70,982 8.14
REAL ESTATE 2.56% (31/05/20: 2.71%*)
Real Estate Investment & Services 0.90% (31/05/20: 1.30%*)
Rightmove 1,300,000 7,821 0.90
Real Estate Investment Trusts 1.66% (31/05/20: 1.41%)
Great Portland Estates 1,200,000 8,634 0.99
PRS 6,000,000 5,820 0.67
TOTAL REAL ESTATE 22,275 2.56
TECHNOLOGY 1.00% (31/05/20: 1.16%*)
Software & Computer Services 1.00% (31/05/20: 1.16%*)
AVEVA 250,000 8,703 1.00
TOTAL TECHNOLOGY 8,703 1.00
TELECOMMUNICATIONS 1.33% (31/05/20: 2.06%)
Telecommunications Service Providers 1.33% (31/05/20: 2.06%*)
Vodafone 9,000,000 11,578 1.33
TOTAL TELECOMMUNICATIONS 11,578 1.33
UTILITIES 2.58% (31/05/20: 2.32%)
Electricity 1.07% (31/05/20: 0.71%)
SSE 600,000 9,330 1.07
Gas, Water & Multiutilities 1.51% (31/05/20: 1.61%)
National Grid 1,400,000 13,170 1.51
TOTAL UTILITIES 22,500 2.58
GOVERNMENT BONDS 39.18% (31/05/20: 39.76%)
Index Linked Government Bonds 39.18% (31/05/20: 39.76%)
UK Treasury 0.125% IL 22/03/24 10,823,000 14,615 1.68
UK Treasury 0.125% IL 22/03/26 12,300,000 16,504 1.89
UK Treasury 0.125% IL 10/08/28 11,020,000 14,517 1.67
126

Portfolio Statement Market Value % of Total
As at 31 May 2021 Holding £’000 Net Assets
AXA Distribution Investment ICVC
AXA Lifetime Distribution Fund
UK Treasury 0.125% IL 22/03/29 10,750,490 16,827 1.93
UK Treasury 0.125% IL 10/08/31 5,200,000 6,956 0.80
UK Treasury 0.125% IL 22/11/36 8,524,000 14,359 1.65
UK Treasury 0.125% IL 10/08/41 8,400,000 14,293 1.64
UK Treasury 0.125% IL 22/03/44 7,002,170 14,358 1.65
UK Treasury 0.125% IL 22/03/46 7,082,000 14,143 1.62
UK Treasury 0.125% IL 10/08/48 7,660,000 15,091 1.73
UK Treasury 0.125% IL 22/03/51 3,000,000 5,765 0.66
UK Treasury 0.125% IL 22/11/56 6,520,000 15,615 1.79
UK Treasury 0.125% IL 22/03/58 6,100,000 15,581 1.79
UK Treasury 0.25% IL 22/03/52 5,920,000 14,543 1.67
UK Treasury 0.5% IL 22/03/50 5,582,000 15,732 1.80
UK Treasury 0.625% IL 22/03/40 6,238,000 14,397 1.65
UK Treasury 0.625% IL 22/11/42 6,502,080 16,194 1.86
UK Treasury 0.75% IL 22/03/34 7,273,000 13,815 1.59
UK Treasury 0.75% IL 22/11/47 4,950,000 14,338 1.65
UK Treasury 1.125% IL 22/11/37 4,302,140 10,811 1.24
UK Treasury 1.25% IL 22/11/27 6,953,240 13,850 1.59
UK Treasury 1.25% IL 22/11/32 6,990,570 14,480 1.66
UK Treasury 1.25% IL 22/11/55 3,488,000 14,377 1.65
UK Treasury 1.875% IL 22/11/22 3,106,000 4,890 0.56
UK Treasury 2% IL 26/01/35 1,795,000 5,214 0.60
UK Treasury 2.5% IL 17/07/24 1,413,000 5,051 0.58
UK Treasury 4.125% IL 22/07/30 1,358,000 5,029 0.58
TOTAL GOVERNMENT BONDS 341,345 39.18
Portfolio of investments 838,220 96.21
Net other assets 33,007 3.79
Total net assets 871,227 100.00
All investments are ordinary shares unless otherwise stated.
All bonds are denominated in Sterling (unless otherwise indicated).
^ These stocks have either been suspended, delisted or are in liquidation. They are included at the Manager’s valuation.
* Since the previous report, the portfolio classifications and prior year comparative figures have been updated to reflect the
recent changes in the Industry Classification Benchmark (ICB) standard.
127

Comparative TablesAs at 31 May 2021
31/05/2021 31/05/2020 31/05/2019 31/05/2021 31/05/2020 31/05/2019
Change in net assets per share (p) (p) (p) (p) (p) (p)
Opening net asset value per share † 128.29 128.85 126.40 114.39 117.50 117.81
Return before operating charges ^ 14.51 (0.16) 2.84 12.82 (0.07) 2.57
Operating charges ^ (0.41) (0.40) (0.39) (0.36) (0.37) (0.36)
Return after operating charges ^ 14.10 (0.56) 2.45 12.46 (0.44) 2.21
Distributions (1.96) (2.95) (2.72) (1.74) (2.67) (2.52)
Retained distributions on accumulation
shares1.96 2.95 2.72 ‐ ‐ ‐
Closing net asset value per share † 142.39 128.29 128.85 125.11 114.39 117.50
*^ after direct transaction costs of: 0.05 0.10 0.09 0.05 0.09 0.09
Performance
Return after operating charges 10.99% ‐0.43% 1.94% 10.89% ‐0.37% 1.88%
Other information
Closing net asset value (£) † 1,411,199 1,248,424 3,046,166 22,007 31,432 42,845
Closing number of shares 991,053 973,161 2,364,058 17,589 27,479 36,463
Operating charges ^ 0.31% 0.31% 0.31% 0.31% 0.31% 0.31%
Direct transaction costs * 0.04% 0.07% 0.08% 0.04% 0.07% 0.08%
Prices
Highest share price # 142.50 140.30 129.70 125.40 126.00 118.80
Lowest share price # 124.10 103.70 117.60 110.00 92.98 108.30
31/05/2021 31/05/2020 31/05/2019
Change in net assets per share (p) (p) (p)
Opening net asset value per share † 124.96 125.26 122.67
Return before operating charges ^ 14.17 (0.17) 2.76
Operating charges ^ (0.13) (0.13) (0.17)
Return after operating charges ^ 14.04 (0.30) 2.59
Distributions (1.91) (2.87) (2.64)
Retained distributions on accumulation
shares1.91 2.87 2.64
Closing net asset value per share † 139.00 124.96 125.26
*^ after direct transaction costs of: 0.05 0.09 0.09
Performance
Return after operating charges 11.24% ‐0.24% 2.11%
Other information
Closing net asset value (£) † 869,784,041 860,315,996 941,226,697
Closing number of shares 625,749,700 688,446,647 751,441,838
Operating charges ^ 0.10% 0.10% 0.14%+
Direct transaction costs * 0.04% 0.07% 0.08%
Prices
Highest share price # 139.10 136.60 126.10
Lowest share price # 121.00 101.00 114.20
AXA Distribution Investment ICVC
A Accumulation A Income
I Accumulation
AXA Lifetime Distribution Fund
128

Comparative TablesAs at 31 May 2021
AXA Distribution Investment ICVC
AXA Lifetime Distribution Fund
31/05/2021 31/05/2020 31/05/2019 31/05/2021 31/05/2020 31/05/2019
Change in net assets per share (p) (p) (p) (p) (p) (p)
Opening net asset value per share † 101.53 102.12 100.31 96.08 98.84 99.23
Return before operating charges ^ 11.50 (0.12) 2.26 10.78 (0.12) 2.12
Operating charges ^ (0.48) (0.47) (0.45) (0.45) (0.42) (0.44)
Return after operating charges ^ 11.02 (0.59) 1.81 10.33 (0.54) 1.68
Distributions (1.56) (2.34) (2.17) (1.46) (2.22) (2.07)
Retained distributions on accumulation
shares1.56 2.34 2.17 ‐ ‐ ‐
Closing net asset value per share † 112.55 101.53 102.12 104.95 96.08 98.84
*^ after direct transaction costs of: 0.04 0.08 0.07 0.04 0.07 0.07
Performance
Return after operating charges 10.85% ‐0.58% 1.80% 10.75% ‐0.55% 1.69%
Other information
Closing net asset value (£) † 4,998 4,997 4,996 4,988 4,980 4,984
Closing number of shares 4,440 4,921 4,892 4,753 5,183 5,042
Operating charges ^ 0.46% 0.46% 0.46% 0.46% 0.46% 0.46%
Direct transaction costs * 0.04% 0.07% 0.08% 0.04% 0.07% 0.08%
Prices
Highest share price # 112.60 111.10 102.80 105.20 105.90 99.97
Lowest share price # 98.14 82.11 93.23 92.37 78.12 91.15
+ The ACD fee changed on 1 April 2019 from 0.14% to 0.09%, the estimated ongoing charge taking into account the ACD %
change would be 0.10%.
Z Income
# High and low price disclosures are based on quoted share prices (Mid Market Price). Therefore the opening and closing NAV
prices may fall outside the high / low price threshold.
The figures used within the table have been calculated against the average net asset value for the accounting year.
^ Operating charges include indirect costs incurred in the maintenance and running of the Fund, as disclosed in the detailed
expenses within the Statement of Total Return.
* Direct transaction costs include fees, commissions, transfer taxes and duties in the purchasing and selling of investments,
within the accounting year.
Z Accumulation
† Valued at bid‐market prices.
129

AXA Lifetime Distribution Fund
Statement of Total ReturnFor the year ended 31 May 2021
Note £'000 £'000 £'000 £'000
Income:Net capital gains/(losses) 2 79,107 (20,401)Revenue 3 12,751 21,028
Expenses 4 (837) (897)Interest payable and similar charges ‐ ‐
Net revenue before taxation 11,914 20,131
Taxation 5 (138) (128)
Net revenue after taxation 11,776 20,003
Total return before distributions 90,883 (398)
Distributions 6 (12,544) (20,835)
Change in net assets attributable to Shareholders
from investment activities 78,339 (21,233)
Statement of Change in Net Assets Attributable to Shareholders For the year ended 31 May 2021
£'000 £'000 £'000 £'000
Opening net assets attributable to Shareholders 861,606 944,326
Amounts receivable on issue of shares 1,259 1,069 Amounts payable on cancellation of shares (82,446) (83,285)
(81,187) (82,216)
Change in net assets attributable to Shareholdersfrom investment activities (see above) 78,339 (21,233)
Retained distributions on accumulation shares 12,469 20,729
Closing net assets attributable to Shareholders 871,227 861,606
AXA Distribution Investment ICVC
31/05/21 31/05/20
31/05/21 31/05/20
130

AXA Lifetime Distribution Fund
Balance SheetAs at 31 May
Note £'000 £'000Assets:
Fixed assets:
Investments 838,220 837,558
Current assets:
Debtors 7 2,709 6,593
Cash and bank balances 8 31,838 18,895
Total assets 872,767 863,046
Liabilities:
Creditors:
Other creditors 9 (1,540) (1,440)
Total liabilities (1,540) (1,440)
Net assets attributable to Shareholders 871,227 861,606
31/05/21 31/05/20
AXA Distribution Investment ICVC
131

AXA Lifetime Distribution Fund
Notes to the Financial Statements For the year ended 31 May 2021
31/05/21 31/05/20
£'000 £'000
The net capital gains/(losses) comprise:
Non‐derivative securities 78,989 (20,405)
Currency gains 120 9
Transaction charges (2) (5)
Net capital gains/(losses) 79,107 (20,401)
3. Revenue
31/05/21 31/05/20
£'000 £'000
Bank interest ‐ 41
Interest on debt securities (1,417) 2,660
Overseas dividends 664 677
UK dividends 13,053 17,293
Property revenue from REITs 451 357
Total revenue 12,751 21,028
31/05/21 31/05/20
£'000 £'000
768 832
768 832
29 33
22 21
51 54
17 7
1 4
18 11
837 897
AXA Distribution Investment ICVC
1. Accounting Basis And Policies
The Fund's Financial Statements have been prepared on the basis detailed on pages 145- 147.
2. Net capital gains/(losses)
4. Expenses
Payable to the ACD, associates of the ACD, and agents
of either of them
Annual management charge
Payable to the Depositary, associates of the Depositary
and agents of either of them
Depositary's fees
Safe custody fee
Other expenses
Audit fees*Printing fees
Total expenses
Expenses include irrecoverable VAT where applicable.
* Audit fees for the financial year ending 2021 were £8,000 (2020: £12,000) (including VAT).
132

AXA Lifetime Distribution Fund
Notes to the Financial Statements For the year ended 31 May 2021
AXA Distribution Investment ICVC
5. Taxation
31/05/21 31/05/20
£'000 £'000
(a) Analysis of the tax charge in the year
Irrecoverable overseas tax 138 128
(b) Factors affecting tax charge for the year
31/05/21 31/05/20
£'000 £'000
Net revenue before taxation 11,914 20,131
Net revenue for the year multiplied by the standard rate of corporation tax 2,383 4,026
Effects of:
Irrecoverable overseas tax 138 128
Movement in excess management expenses 2,190 425
Relief for indexation on UK Gilts (1,775) (816)
Revenue not subject to corporation tax (2,798) (3,635)
Current tax charge for the year 138 128
(c) Deferred taxation:
(d) Factors that may affect future tax charges
OEICs are exempt from tax on capital gains in the UK. Therefore, any capital return is not included within the reconciliation
above.
The tax assessed for the year is lower than the standard rate of corporation tax for an open ended investment company of
20% (2020: 20%) is applied to the net revenue before taxation. The differences are explained below:
At the year end, after offset against revenue taxable on receipt, there is a potential deferred tax asset of £12,189,574 (2020:
£10,000,040) in relation to surplus management expenses. It is unlikely that the Fund will generate sufficient taxable profits
in the future to utilise this amount and therefore no deferred tax asset has been recognised in the year.
There is no provision required for deferred taxation at the balance sheet date in the current year or prior year.
133

AXA Lifetime Distribution Fund
Notes to the Financial Statements For the year ended 31 May 2021
AXA Distribution Investment ICVC
6. Distributions
31/05/21 31/05/20
£'000 £'000
First interim 388 4,318
Second interim 514 263
Third interim 3,156 4,106
Fourth interim 398 1,095
Fifth interim 240 1,391
Sixth interim 1,234 2,439
Seventh interim 674 770
Eighth interim 143 81
Ninth interim 1,143 1,751
Tenth interim 1,271 531
Eleventh interim 1,927 1,287
Final 1,382 2,697
Add: Revenue paid on cancellation of shares 78 107
Deduct: Revenue received on creation of shares (4) (1)
Net distribution for the year 12,544 20,835
Reconciliation of net revenue after taxation to distributions
Net revenue after taxation 11,776 20,003
Expenses charged to capital 768 832
Net distribution for the year 12,544 20,835
7. Debtors 31/05/21 31/05/20
£'000 £'000
Amounts receivable for creation of shares 20 ‐
Sales awaiting settlement 1,216 4,034
Accrued revenue 1,473 2,559
Total debtors 2,709 6,593
8. Cash and bank balances 31/05/21 31/05/20
£'000 £'000
Cash and bank balances 31,838 18,895
Total cash and bank balances 31,838 18,895
9. Other creditors 31/05/21 31/05/20
£'000 £'000
Amounts payable for cancellation of shares 1,383 1,290
Accrued annual management charge 124 121
Accrued other expenses 33 29
Total other creditors 1,540 1,440
The distributions take account of revenue received on the creation of shares and revenue deducted on the cancellation of
shares, and comprise:
134

AXA Lifetime Distribution Fund
Notes to the Financial Statements For the year ended 31 May 2021
AXA Distribution Investment ICVC
10. Related party transactions
11. Share classes
Annual
management
charge rate
(%) 31/05/20 Issued Cancelled Converted 31/05/21
A Accumulation 0.30 973,161 150,929 (133,037) ‐ 991,053
A Income 0.30 27,479 2,509 (12,399) ‐ 17,589
I Accumulation 0.09 688,446,647 827,960 (63,524,907) ‐ 625,749,700
Z Accumulation 0.45 4,921 2,711 (3,192) ‐ 4,440
Z Income 0.45 5,183 2,895 (3,325) ‐ 4,753
12. Commitments, contingent liabilities and contingent assets
13. Derivatives and other financial instruments
The ACD and its associates (including other authorised investment Funds managed by the ACD) have no shareholdings in the
Company at the year end.
The reconciliation of the opening and closing numbers of shares of each class, along with the ACD’s annual management
charges applicable to each class, is shown below:
There are no commitments, contingent liabilities and contingent assets as at the balance sheet date (2020: nil).
The ACD is related to the Fund as defined by Financial Reporting Standard 102.33 ‘Related Party Disclosures’.
Monies received and paid by the ACD through the creation and cancellation of shares are disclosed in the Statement of
Change in Shareholders’ Net Assets and amounts due at the year end are disclosed in Notes 7 and 9.
Annual management charge paid to the ACD and Registration fees are disclosed in Note 4 and amounts due at the year end
are disclosed in Note 9.
The main risks from the Fund's holding of financial instruments, together with the ACD’s policy for managing these risks, are
outlined below.
Foreign currency risk
A 10% increase in the value of the Fund’s portfolio would have the effect of increasing the return and net assets by
£83,822,049 (2020: £83,755,755). A 10% decrease would have an equal and opposite effect.
Market price risk sensitivity
Market price risk
The Fund invests principally in equity and fixed income securities. The value of the Fund’s investment portfolio is not fixed
and may go down as well as up. This may be as a result of a specific factor affecting the value of an individual company or
may be caused by general market factors (such as government policy or the health of the underlying economy) which can
affect the entire portfolio. The Fund seeks to manage these risks by adhering to investment guidelines and to investment
and borrowing powers set out in the Prospectus. In addition, the Fund complies with the Collective Investment Schemes
sourcebook (“COLL”), which include rules relating to investment holdings that are designed to place limits on the Fund’s
investment concentration (same as at 31 May 2020).
The functional currency of the Fund is Sterling. All assets and liabilities of the Fund are denominated in Pound sterling.
There was no direct foreign currency exposure within the Fund at the balance sheet date.
135

AXA Lifetime Distribution Fund
Notes to the Financial Statements For the year ended 31 May 2021
AXA Distribution Investment ICVC
The table below shows the interest rate risk profile at the balance sheet date:
Floating rate
financial
assets
Fixed rate
financial
assets
Financial
assets not
carrying
interest Total
Currency Assets £'000 £'000 £'000 £'000
31/05/21
Pound sterling 31,838 341,345 499,250 872,433
US dollar ‐ ‐ 334 334
Total 31,838 341,345 499,584 872,767
31/05/20
Pound sterling 18,895 342,540 484,305 845,740
Canadian dollar ‐ ‐ 16,558 16,558
US dollar ‐ ‐ 748 748
Total 18,895 342,540 501,611 863,046
Floating rate
financial
liabilities
Fixed rate
financial
liabilities
Financial
liabilities not
carrying
interest Total
Currency Liabilities £'000 £'000 £'000 £'000
31/05/21
Pound sterling ‐ ‐ (1,540) (1,540)
Total ‐ ‐ (1,540) (1,540)
31/05/20
Pound sterling (1,440) (1,440)
Total ‐ ‐ (1,440) (1,440)
Interest rate risk
Changes in interest rates or changes in expectations of future interest rates may result in an increase or decrease in the market value of the investments held. A 1% increase in interest rates would have the effect of decreasing the return and net assets £64,195,398 (2020: £69,666,397) . A 1% decrease would have an equal and opposite effect.
Fixed interest securities are particularly affected by trends in interest rates and inflation. If interest rates go up, the value of
capital may fall, and vice versa. Inflation will also decrease the real value of capital, with the exception of index linked bonds
which are protected against the effect of inflation.
136

AXA Lifetime Distribution Fund
Notes to the Financial Statements For the year ended 31 May 2021
AXA Distribution Investment ICVC
31/05/21 31/05/20
Market Value % Market Value %
£’000 £’000
328,624 37.72 329,796 38.28
12,721 1.46 12,744 1.48
341,345 39.18 342,540 39.76
14. Portfolio transaction costs
Net purchase
cost
Commissions
paid Taxes
Total
purchase cost
31/05/2021 £'000 £'000 % £'000 % £'000
Analysis of purchases
Bonds 32,928 ‐ ‐ ‐ ‐ 32,928
Equities 60,398 26 0.04 236 0.39 60,660Total 93,326 26 236 93,588
Net sale
proceeds
Commissions
paid Taxes
Total sale
proceeds
31/05/2021 £'000 £'000 % £'000 % £'000
Analysis of sales
Bonds 22,895 ‐ ‐ ‐ ‐ 22,895
Collective Investment Schemes 1,062 (1) (0.05) ‐ ‐ 1,061
Equities 143,150 (73) (0.05) ‐ ‐ 143,077Total 167,107 (74) ‐ 167,033
Credit risk
A breakdown of the investment portfolio by credit rating is disclosed on the table below:
Credit Rating Investment grade (BBB- credit rating and above) Unrated
Total value of bonds
The Fund runs a very low credit risk in respect of unsettled investment transactions as these are normally settled as cash
against delivery.
Fixed interest investments are exposed to credit risk which reflects the ability of the bond issuer to meet its obligations.
Generally, the higher the rate of interest, the higher the perceived credit risk of the issuer. The ACD monitors the credit
quality and risk of the portfolio as a part of the overall investment process and in accordance with the objective and policy
of each fund.
Transactions in securities may expose a fund to the risk that the counterparty will not settle the transaction or do so on a
timely basis.
All transactions in the funds are conducted through counterparties approved by the ACD.
137

AXA Lifetime Distribution Fund
Notes to the Financial Statements For the year ended 31 May 2021
AXA Distribution Investment ICVC
Net purchase
cost
Commissions
paid Taxes
Total
purchase cost
31/05/2020 £'000 £'000 % £'000 % £'000
Analysis of purchases
Bonds 62,569 - - - - 62,569
Equities 125,407 59 0.05 573 0.46 126,039Total 187,976 59 573 188,608
Net sale
proceeds
Commissions
paid Taxes
Total sale
proceeds
31/05/2020 £'000 £'000 % £'000 % £'000
Analysis of sales
Bonds 136,317 - - - - 136,317
Equities 108,836 (45) (0.04) - - 108,791Total 245,153 (45) - 245,108
31/05/21 31/05/20
Transaction costs as percentage of average net asset value % %
Commissions 0.01 0.01
Taxes 0.03 0.06
At the balance sheet date the average portfolio dealing spread was 0.14% (2020: 0.18%).
15. Post balance sheet events
There are no post balance sheet events which require adjustments at the year end.
16. Fair value disclosure
Assets Liabilities Assets Liabilities
Valuation technique £'000 £'000 £'000 £'000
Level 1 ^ 838,220 - 837,558 -
Level 2 ^^ - - - -
Level 3 ^^^ - - - -
838,220 - 837,558 -
^ Level 1: The unadjusted quoted price in an active market for identical assets or liabilities that the entity can access at the
measurement date.
^^ Level 2: Inputs other than quoted prices included within Level 1 that are observable (i.e. developed using market data)
for the asset or liability, either directly or indirectly.
^^^ Level 3: Inputs are unobservable (i.e. for which market data is unavailable) for the asset or liability.
The fair value of the Fund's investments has been determined using the hierarchy above.
31/05/21 31/05/20
138
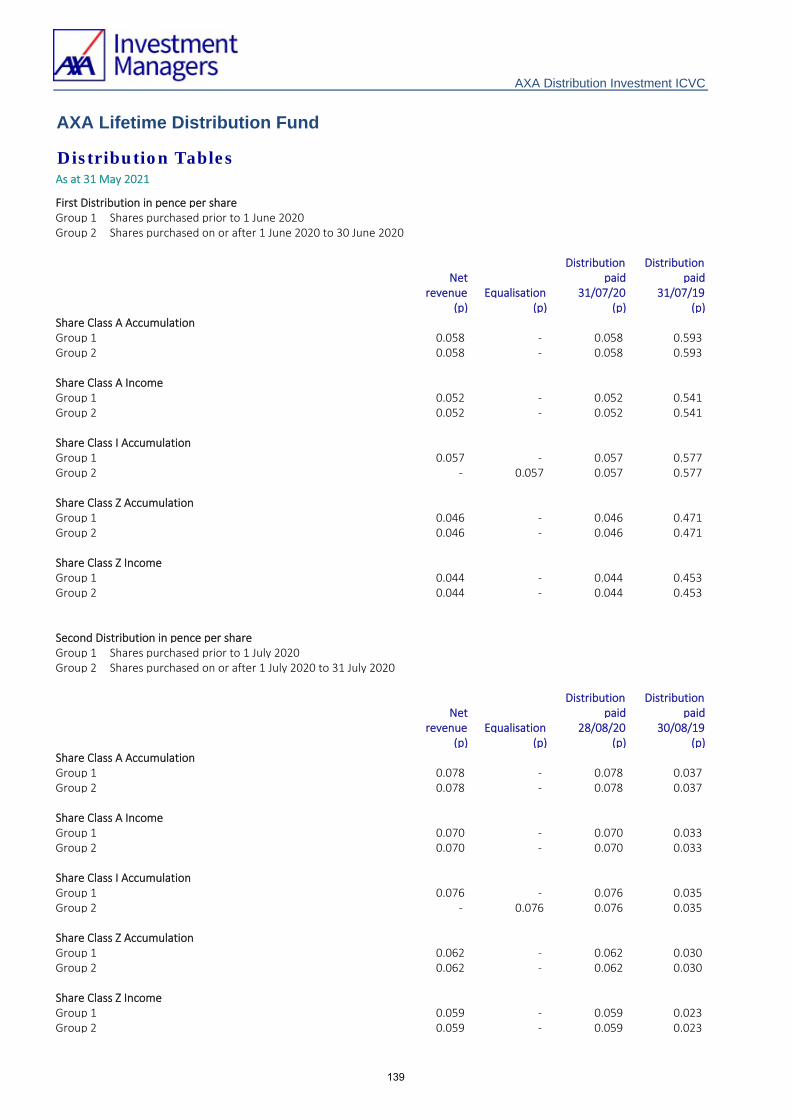
AXA Lifetime Distribution Fund
As at 31 May 2021
First Distribution in pence per shareGroup 1 Shares purchased prior to 1 June 2020Group 2 Shares purchased on or after 1 June 2020 to 30 June 2020
Distribution DistributionNet paid paid
revenue Equalisation 31/07/20 31/07/19(p) (p) (p) (p)
Share Class A AccumulationGroup 1 0.058 ‐ 0.058 0.593 Group 2 0.058 ‐ 0.058 0.593
Share Class A IncomeGroup 1 0.052 ‐ 0.052 0.541 Group 2 0.052 ‐ 0.052 0.541
Share Class I AccumulationGroup 1 0.057 ‐ 0.057 0.577 Group 2 ‐ 0.057 0.057 0.577
Share Class Z AccumulationGroup 1 0.046 ‐ 0.046 0.471 Group 2 0.046 ‐ 0.046 0.471
Share Class Z IncomeGroup 1 0.044 ‐ 0.044 0.453 Group 2 0.044 ‐ 0.044 0.453
Second Distribution in pence per shareGroup 1 Shares purchased prior to 1 July 2020Group 2 Shares purchased on or after 1 July 2020 to 31 July 2020
Distribution DistributionNet paid paid
revenue Equalisation 28/08/20 30/08/19(p) (p) (p) (p)
Share Class A AccumulationGroup 1 0.078 ‐ 0.078 0.037 Group 2 0.078 ‐ 0.078 0.037
Share Class A IncomeGroup 1 0.070 ‐ 0.070 0.033 Group 2 0.070 ‐ 0.070 0.033
Share Class I AccumulationGroup 1 0.076 ‐ 0.076 0.035 Group 2 ‐ 0.076 0.076 0.035
Share Class Z AccumulationGroup 1 0.062 ‐ 0.062 0.030 Group 2 0.062 ‐ 0.062 0.030
Share Class Z IncomeGroup 1 0.059 ‐ 0.059 0.023 Group 2 0.059 ‐ 0.059 0.023
AXA Distribution Investment ICVC
Distribution Tables
139

AXA Lifetime Distribution Fund
As at 31 May 2021
AXA Distribution Investment ICVC
Distribution Tables
Third Distribution in pence per shareGroup 1 Shares purchased prior to 1 August 2020Group 2 Shares purchased on or after 1 August 2020 to 31 August 2020
Distribution DistributionNet paid paid
revenue Equalisation 30/09/20 30/09/19(p) (p) (p) (p)
Share Class A AccumulationGroup 1 0.479 ‐ 0.479 0.573 Group 2 0.479 ‐ 0.479 0.573
Share Class A IncomeGroup 1 0.428 ‐ 0.428 0.520 Group 2 0.428 ‐ 0.428 0.520
Share Class I AccumulationGroup 1 0.467 ‐ 0.467 0.557 Group 2 0.036 0.431 0.467 0.557
Share Class Z AccumulationGroup 1 0.381 ‐ 0.381 0.455 Group 2 0.381 ‐ 0.381 0.455
Share Class Z IncomeGroup 1 0.360 ‐ 0.360 0.431 Group 2 0.360 ‐ 0.360 0.431
Fourth Distribution in pence per shareGroup 1 Shares purchased prior to 1 September 2020Group 2 Shares purchased on or after 1 September 2020 to 30 September 2020
Distribution DistributionNet paid paid
revenue Equalisation 30/10/20 31/10/19(p) (p) (p) (p)
Share Class A AccumulationGroup 1 0.061 ‐ 0.061 0.154 Group 2 0.061 ‐ 0.061 0.154
Share Class A IncomeGroup 1 0.055 ‐ 0.055 0.140 Group 2 0.055 ‐ 0.055 0.140
Share Class I AccumulationGroup 1 0.059 ‐ 0.059 0.149 Group 2 ‐ 0.059 0.059 0.149
Share Class Z AccumulationGroup 1 0.048 ‐ 0.048 0.121 Group 2 0.048 ‐ 0.048 0.121
Share Class Z IncomeGroup 1 0.045 ‐ 0.045 0.116 Group 2 0.045 ‐ 0.045 0.116
140

AXA Lifetime Distribution Fund
As at 31 May 2021
AXA Distribution Investment ICVC
Distribution Tables
Fifth Distribution in pence per shareGroup 1 Shares purchased prior to 1 October 2020Group 2 Shares purchased on or after 1 October 2020 to 31 October 2020
Distribution DistributionNet paid paid
revenue Equalisation 30/11/20 29/11/19(p) (p) (p) (p)
Share Class A AccumulationGroup 1 0.037 ‐ 0.037 0.197 Group 2 0.037 ‐ 0.037 0.197
Share Class A IncomeGroup 1 0.033 ‐ 0.033 0.179 Group 2 0.033 ‐ 0.033 0.179
Share Class I AccumulationGroup 1 0.036 ‐ 0.036 0.192 Group 2 0.008 0.028 0.036 0.192
Share Class Z AccumulationGroup 1 0.030 ‐ 0.030 0.156 Group 2 0.030 ‐ 0.030 0.156
Share Class Z IncomeGroup 1 0.029 ‐ 0.029 0.149 Group 2 0.029 ‐ 0.029 0.149
Sixth Distribution in pence per shareGroup 1 Shares purchased prior to 1 November 2020Group 2 Shares purchased on or after 1 November 2020 to 30 November 2020
Distribution DistributionNet paid paid
revenue Equalisation 31/12/20 31/12/19(p) (p) (p) (p)
Share Class A AccumulationGroup 1 0.192 ‐ 0.192 0.348 Group 2 0.085 0.107 0.192 0.348
Share Class A IncomeGroup 1 0.171 ‐ 0.171 0.315 Group 2 0.171 ‐ 0.171 0.315
Share Class I AccumulationGroup 1 0.187 ‐ 0.187 0.339 Group 2 0.146 0.041 0.187 0.339
Share Class Z AccumulationGroup 1 0.152 ‐ 0.152 0.275 Group 2 0.152 ‐ 0.152 0.275
Share Class Z IncomeGroup 1 0.143 ‐ 0.143 0.263 Group 2 0.143 ‐ 0.143 0.263
141
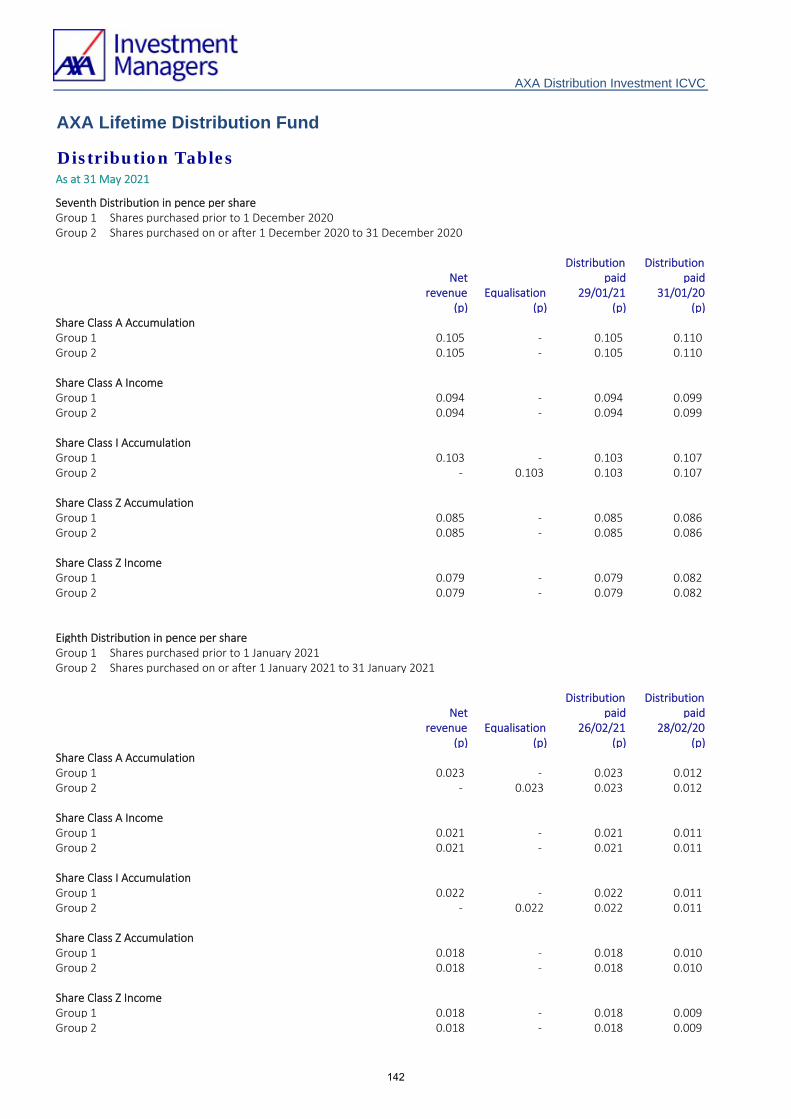
AXA Lifetime Distribution Fund
As at 31 May 2021
AXA Distribution Investment ICVC
Distribution Tables
Seventh Distribution in pence per shareGroup 1 Shares purchased prior to 1 December 2020Group 2 Shares purchased on or after 1 December 2020 to 31 December 2020
Distribution DistributionNet paid paid
revenue Equalisation 29/01/21 31/01/20(p) (p) (p) (p)
Share Class A AccumulationGroup 1 0.105 ‐ 0.105 0.110 Group 2 0.105 ‐ 0.105 0.110
Share Class A IncomeGroup 1 0.094 ‐ 0.094 0.099 Group 2 0.094 ‐ 0.094 0.099
Share Class I AccumulationGroup 1 0.103 ‐ 0.103 0.107 Group 2 ‐ 0.103 0.103 0.107
Share Class Z AccumulationGroup 1 0.085 ‐ 0.085 0.086 Group 2 0.085 ‐ 0.085 0.086
Share Class Z IncomeGroup 1 0.079 ‐ 0.079 0.082 Group 2 0.079 ‐ 0.079 0.082
Eighth Distribution in pence per shareGroup 1 Shares purchased prior to 1 January 2021Group 2 Shares purchased on or after 1 January 2021 to 31 January 2021
Distribution DistributionNet paid paid
revenue Equalisation 26/02/21 28/02/20(p) (p) (p) (p)
Share Class A AccumulationGroup 1 0.023 ‐ 0.023 0.012 Group 2 ‐ 0.023 0.023 0.012
Share Class A IncomeGroup 1 0.021 ‐ 0.021 0.011 Group 2 0.021 ‐ 0.021 0.011
Share Class I AccumulationGroup 1 0.022 ‐ 0.022 0.011 Group 2 ‐ 0.022 0.022 0.011
Share Class Z AccumulationGroup 1 0.018 ‐ 0.018 0.010 Group 2 0.018 ‐ 0.018 0.010
Share Class Z IncomeGroup 1 0.018 ‐ 0.018 0.009 Group 2 0.018 ‐ 0.018 0.009
142

AXA Lifetime Distribution Fund
As at 31 May 2021
AXA Distribution Investment ICVC
Distribution Tables
Ninth Distribution in pence per shareGroup 1 Shares purchased prior to 1 February 2021Group 2 Shares purchased on or after 1 February 2021 to 28 February 2021
Distribution DistributionNet paid paid
revenue Equalisation 31/03/21 31/03/20(p) (p) (p) (p)
Share Class A AccumulationGroup 1 0.181 ‐ 0.181 0.255 Group 2 0.181 ‐ 0.181 0.255
Share Class A IncomeGroup 1 0.161 ‐ 0.161 0.229 Group 2 0.161 ‐ 0.161 0.229
Share Class I AccumulationGroup 1 0.177 ‐ 0.177 0.248 Group 2 0.163 0.014 0.177 0.248
Share Class Z AccumulationGroup 1 0.144 ‐ 0.144 0.201 Group 2 0.144 ‐ 0.144 0.201
Share Class Z IncomeGroup 1 0.135 ‐ 0.135 0.191 Group 2 0.135 ‐ 0.135 0.191
Tenth Distribution in pence per shareGroup 1 Shares purchased prior to 1 March 2021Group 2 Shares purchased on or after 1 March 2021 to 31 March 2021
Distribution DistributionNet paid paid
revenue Equalisation 30/04/21 30/04/20(p) (p) (p) (p)
Share Class A AccumulationGroup 1 0.204 ‐ 0.204 0.078 Group 2 0.204 ‐ 0.204 0.078
Share Class A IncomeGroup 1 0.181 ‐ 0.181 0.070 Group 2 0.181 ‐ 0.181 0.070
Share Class I AccumulationGroup 1 0.199 ‐ 0.199 0.076 Group 2 ‐ 0.199 0.199 0.076
Share Class Z AccumulationGroup 1 0.163 ‐ 0.163 0.062 Group 2 0.163 ‐ 0.163 0.062
Share Class Z IncomeGroup 1 0.152 ‐ 0.152 0.059 Group 2 0.152 ‐ 0.152 0.059
143

AXA Distribution Investment ICVC
Distribution DistributionNet paid paid
revenue Equalisation 28/05/21 29/05/20(p) (p) (p) (p)
0.312 ‐ 0.312 0.190 0.312 ‐ 0.312 0.190
0.276 ‐ 0.276 0.171 0.276 ‐ 0.276 0.171
0.305 ‐ 0.305 0.185 0.015 0.290 0.305 0.185
0.247 ‐ 0.247 0.152 0.247 ‐ 0.247 0.152
0.231 ‐ 0.231 0.144 0.231 ‐ 0.231 0.144
Distribution DistributionNet payable paid
revenue Equalisation 30/06/21 30/06/20(p) (p) (p) (p)
0.226 ‐ 0.226 0.401 0.028 0.198 0.226 0.401
0.199 ‐ 0.199 0.360 0.199 ‐ 0.199 0.360
0.220 ‐ 0.220 0.391 0.060 0.160 0.220 0.391
0.179 ‐ 0.179 0.319 0.179 ‐ 0.179 0.319
0.167 ‐ 0.167 0.303
AXA Lifetime Distribution Fund
Distribution TablesAs at 31 May 2021
Eleventh Distribution in pence per shareGroup 1 Shares purchased prior to 1 April 2021Group 2 Shares purchased on or after 1 April 2021 to 30 April 2021
Share Class A AccumulationGroup 1Group 2
Share Class A IncomeGroup 1Group 2
Share Class I AccumulationGroup 1Group 2
Share Class Z AccumulationGroup 1Group 2
Share Class Z IncomeGroup 1Group 2
Final Distribution in pence per shareGroup 1 Shares purchased prior to 1 May 2021Group 2 Shares purchased on or after 1 May 2021 to 31 May 2021
Share Class A AccumulationGroup 1Group 2
Share Class A IncomeGroup 1Group 2
Share Class I AccumulationGroup 1Group 2
Share Class Z AccumulationGroup 1Group 2
Share Class Z IncomeGroup 1Group 2 0.167 ‐ 0.167 0.303
144

For the year ended 31 May 2021
1. Accounting Basis and Policies
(a) Basis of accounting
(b) Recognition of revenue
(c) Treatment of special dividends
Accounting Policies
The Financial Statements of the Company comprise the Financial Statements of each of the sub‐funds and have been
prepared on a historical cost basis, as modified by the revaluation of investments, and in accordance with Financial
Reporting Standard 102 ("FRS 102") and the Statement of Recommended Practice for Authorised Funds issued by the
Investment Management Association ("IMA") in May 2014, and amended in June 2017. The Financial Statements are
prepared in accordance with the Instrument of Incorporation and the Financial Conduct Authority’s Collective Investment
Schemes Sourcebook (“COLL”).
Dividends on quoted equities and preference shares are recognised when the securities are quoted ex‐dividend and are
recognised net of attributable tax credits.
Revenue on debt securities (including allowance for interest bought and sold) is accounted for on an accruals basis. Where
it is considered that a bond has a likelihood of default appropriate provisions are made against any accrued revenue.
Revenue from debt securities is accounted for on a basis which takes account of the amortisation of any discount or
premium between the purchase price and the expected final maturity price over the remaining life of the security. Accrued
interest on purchase and sale contracts is recognised as revenue and transferred to revenue or capital as appropriate.
Indexation on UK index‐linked bonds is accrued monthly to the sub‐fund and forms part of the distributable income.
Interest on bank and other cash deposits is recognised on an accruals basis.
Returns on derivative transactions have been treated as either revenue or capital depending on the motives and
circumstances on acquisition. Where positions generate total returns, returns are apportioned between capital and
revenue to reflect the nature of the transaction.
There are no material events that have been identified that may cast significant doubt about the sub‐funds’ ability to
continue as a going concern for at least the next twelve months from the date these financial statements are authorised for
issue. The ACD believes that the sub‐funds have adequate resources to continue in operational existence for the
foreseeable future and, following consideration of the impact of COVID‐19, they continue to adopt the going concern basis
in preparing the financial statements.
Dividends from Real Estate Investment Trusts ('REITs') are recognised as distributable income when the securities are
quoted ex‐dividend.
Special dividends are reviewed on a case by case basis in determining whether the dividend is to be treated as revenue or
capital. Amounts recognised as revenue will form part of the distributable revenue. The tax treatment follows the
treatment of the principal amount.
Dividends received from US Real Estate Investment Trusts ('REITs') are recognised as revenue when the security is quoted
ex‐dividend. An assesment of capital/income split is performed, based on prior year dividend announcement for each
security. The capital element of the dividend is reallocated to the capital of the sub‐fund. Subsequently, when the
capital/income split is announced for the dividend a final assessment is performed to determine the correct distribution to
unitholders.
AXA Distribution Investment ICVC
145

For the year ended 31 May 2021
Accounting Policies
AXA Distribution Investment ICVC
(d) Treatment of expenses
(e) Allocation of revenue and expenses to multiple share classes
(f) Taxation
(g) Distribution policy
(h) Basis of valuation of investments
(i) Exchange rates
Tax is provided for using tax rates and laws which have been enacted or substantively enacted at the balance sheet date.
In addition, the portfolio transaction charges will be charged wholly to the capital of all sub‐funds.
The net revenue after taxation, as disclosed in the Financial Statements, after adjustment for items of a capital nature, is
distributable to Shareholders as dividend distributions. Any revenue deficit is deducted from capital.
At the end of the reporting period all investments have been measured at their fair value using the prices and the portfolio
holdings determined at 12 noon on 28 May 2021, being the last valuation point of the accounting period, as this is not
materially different from a valuation carried out at close of business on the balance sheet date.
Deferred tax is provided using the liability method on all timing differences arising on the treatment of certain items for
taxation and accounting purposes, calculated at the rate at which it is anticipated the timing differences will reverse.
Deferred tax assets are recognised only when, on the basis of available evidence, it is more likely than not that there will be
taxable profits in the future against which the deferred tax asset can be offset.
Any revenue or expenses not directly attributable to a particular share class will normally be allocated pro‐rata to the net
assets of the relevant share classes.
Corporation tax is provided for on the income liable to corporation tax less deductible expenses.
Expenses of the sub‐funds are charged against revenue except for costs associated with the purchase and sale of
investments and ACD fees which are allocated to the capital of the sub‐funds.
Transactions in foreign currencies are recorded in Sterling at the rate ruling at the date of the transactions. Assets and
liabilities expressed in foreign currencies at the end of the accounting period are translated into Sterling at the closing mid
market exchange rates ruling on that date.
Where the revenue from investments exceeds the expenses of a sub‐fund half yearly distributions (quarterly for Defensive
Distribution Fund and UK Distribution Fund, and monthly for Lifetime Distribution Fund) are paid to all holders of income
shares. Transfers are made to capital on behalf of all holders of accumulation shares. In all cases tax vouchers will be issued
to Shareholders.
ACD fees are offset against capital for the purposes of calculating the amount available for distribution. Accordingly, the
imposition of such charges may constrain the capital growth of every sub‐fund.
The listed investments of the sub‐funds are valued at bid‐market prices ruling at 12 noon on the last business day of the
accounting year. Where certain securities are listed on global markets which are closed at the 12 noon valuation point, the
last available closing bid‐price will be utilised, subject to the application of any fair value pricing adjustment. The fair value
of unlisted securities, and unquoted securities where the quotation has been suspended, is estimated by the Manager,
using independent sources where available.
Market value is defined by the SORP as fair value which is the bid value of each security.
146

For the year ended 31 May 2021
Accounting Policies
AXA Distribution Investment ICVC
(j) Equalisation
2. Derivatives and other financial instruments
(a) Foreign currency risk
(b) Interest rate risk profile of financial assets and liabilities
(c) Inflation risk
(d) Credit risk
(e) Liquidity risk
Equalisation applies only to shares purchased during the distribution period (Group 2 shares). It represents the accrued
revenue included in the purchase price of the shares.
After averaging it is returned with the distribution as a capital repayment. It is not liable to income tax but must be
deducted from the cost of the shares for Capital Gains tax purposes.
The majority of the sub‐funds financial assets are considered to be readily realisable in accordance with the market
practices of the exchange on which they are traded. In general, sales and purchases of financial assets are managed so that
the sub‐funds cash requirement is kept to a minimum. The sub‐funds main financial liability relates to the potential
commitment to meet any cancellation of shares. In order to manage this risk the sub‐fund maintains a cash balance to
cover any known liabilities, with any cancellation of shares being covered by the sale of investments. Where investments
cannot be realised in time to meet a liability the ACD will utilise the company’s overdraft facility with HSBC.
The Company may find that companies in which it invests fail to settle their debts on a timely basis. The value of securities
issued by such companies may fall as a result of the perceived increase in credit risk. Adhering to investment guidelines and
avoiding excessive exposure to one particular issuer can limit credit risk.
Interest rate risk is analysed within the financial statements of each individual sub‐fund.
Inflation Linked Bond Risk: unlike other bonds, an inflation protected security (such as index linked gilts) reduces the
negative effect of inflation on its real value. The market value of such securities will be affected both by the market's
perception of future movements in interest rates and the future rate of inflation. Therefore the market value of such
securities (and the value of the sub‐fund) may not move in line with inflation rates in the short to medium term.
The interest rate risk is the risk that the value of the Company's investments will fluctuate due to changes in the interest
rate. Cashflows from floating rate securities, bank balances, or bank overdrafts will be affected by the changes in interest
rates. As the Company's objective is to seek capital growth, these cashflows are considered to be of secondary importance
and are not actively managed.
The Company did not have any long term financial liabilities at the balance sheet date.
A significant portion of the Company’s assets may be denominated in a currency other than the base currency of the
Company or Class. There is the risk that the value of such assets and/or the value of any distributions from such assets may
decrease if the underlying currency in which assets are traded falls relative to the base currency in which shares of the
relevant sub‐funds are valued and priced. Foreign currency risk is analysed within the financial statements of each
individual sub‐fund.
In pursuing the investment objectives a number of financial instruments are held which may comprise securities and other
investments, cash balances and debtors and creditors that arise directly from operations. Derivatives, such as futures or
forward currency contracts, may be utilised for hedging purposes.
The main risks from the Company's holdings of financial instruments are discussed below, the ACD's policy for managing
these risks are shown in the individual Fund Investment Manager's Report.
147

For the year ended 31 May 2021
Accounting Policies
AXA Distribution Investment ICVC
(f) Market price risk
(g) Counterparty risk
All of the sub‐funds' financial liabilities are payable in less than one year.
The Company invests principally in equity and fixed income securities. The value of the sub‐funds investment portfolio is
not fixed and may go down as well as up. This may be as a result of a specific factor affecting the value of an individual sub‐
fund or may be caused by general market factors (such as government policy or the health of the underlying economy)
which can affect the entire portfolio. The ACD seeks to manage these risks by adhering to investment guidelines and to
investment and borrowing powers set out in the Prospectus. In addition, the management of the Company complies with
the Collective Investment Schemes sourcebook (“COLL”), which include rules relating to investment holdings that are
designed to place limits on the sub‐funds investment concentration.
Transactions in securities entered into by the Company give rise to exposure to the risk that the counterparties may not be
able to fulfil their responsibility by completing their side of the transaction. The Investment Manager minimises this risk by
conducting trades through only the most reputable counterparties.
Counterparty risk is also managed by limiting the exposure to individual counterparties through adherence to the
investment spread restrictions included within the Company’s prospectus and COLL.
148

Directors approval
John Stainsby Director
22nd September 2021
Amanda Prince Director
22nd September 2021
In accordance with the requirements of the Financial Conduct Authority Sourcebook, the contents of this report have been
approved on behalf of AXA Investment Managers UK Limited by:
The ACD is responsible for the management of each portfolio in accordance with the Instrument of Incorporation, Prospectus
and COLL.
The ACD is also responsible for taking reasonable steps for the prevention and detection of fraud and other irregularities.
AXA Distribution Investment ICVC
The Open‐Ended Investment Companies Regulations 2001 and the Collective Investment Schemes sourcebook (“COLL”) require
the ACD to prepare financial statements for each annual accounting period which give a true and fair view of the financial
position of the Company and of its net revenue and the net capital gains/(losses) on the property of the Company for the period.
In preparing the financial statements the ACD is required to:
• Select suitable accounting policies and then apply them consistently;
• Conform with the disclosure requirements of the Statement of Recommended Practice ‐ Financial statements of UK Authorised
Funds issued by the Investment Management Association (“IMA SORP 2014”) in May 2014, and amended in June 2017;
• Follow generally accepted accounting principles and applicable accounting standards;
• Keep proper accounting records which enable it to demonstrate that the financial statements as prepared comply with the
above requirements.
• Prepare the financial statements on the going concern basis unless it is inappropriate to presume that the Company will
continue in operation.
The maintenance and integrity of the AXA Investment Managers UK Limited website is the responsibility of the directors; the work carried out by the auditors does not involve consideration of these matters and, accordingly, the auditors accept no responsibility for any changes that may have occurred to the financial statements since they were initially presented on the
website.
Legislation in the United Kingdom governing the preparation and dissemination of financial statements may differ from
legislation in other jurisdictions.
Statement of the Authorised Corporate Director's ("ACD") Responsibilities
149

HSBC Bank PLC
22nd September 2021
Having carried out such procedures as we consider necessary to discharge our responsibilities as depositary of the Company, it
is our opinion, based on the information available to us and the explanations provided, that in all material respects the
Company, acting through the AFM:
(i) has carried out the issue, sale, redemption and cancellation, and calculation of the price of the Company’s shares and the
application of the Company’s income in accordance with the Regulations and the Scheme documents of the Company; and
(ii) has observed the investment and borrowing powers and restrictions applicable to the Company.
AXA Distribution Investment ICVC
• the Company’s cash flows are properly monitored and that cash of the Company is booked into the cash accounts in
accordance with the Regulations;
• the sale, issue, repurchase, redemption and cancellation of shares are carried out in accordance with the Regulations;
• the value of shares of the Company are calculated in accordance with the Regulations;
• any consideration relating to transactions in the Company’s assets is remitted to the Company within the usual time limits;
• the Company’s income is applied in accordance with the Regulations; and
• the instructions of the Authorised Fund Manager (“the AFM”), which is the UCITS Management Company, are carried out
(unless they conflict with the Regulations).
The Depositary also has a duty to take reasonable care to ensure that Company is managed in accordance with the Regulations
and Scheme documents in relation to the investment and borrowing powers applicable to the Company.
Statement of the Depositary’s Responsibilities in Respect of the Scheme and Report of the Depositary to the Shareholders of the AXA Distribution Investment ICVC (“the Company”) for the year ended 31st May 2021.
The Depositary must ensure that the Company is managed in accordance with the Financial Conduct Authority’s Collective Investment Schemes Sourcebook, the Open‐Ended Investment Companies Regulations 2001 (SI 2001/1228), as amended, the Financial Services and Markets Act 2000, as amended, (together “the Regulations”), the Company’s Instrument of Incorporation and Prospectus (together “the Scheme documents”) as detailed below.
The Depositary must in the context of its role act honestly, fairly, professionally, independently and in the interests of the Company and its investors.
The Depositary is responsible for the safekeeping of all custodial assets and maintaining a record of all other assets of the Company in accordance with the Regulations.
The Depositary must ensure that:
150

Opinion
We have audited the financial statements of AXA Distribution Investment ICVC (“the Company”) for the year ended 31 May 2021, which comprise the Statement of Total Return, the Statement of Changes in Net Assets Attributable to shareholders, the Balance Sheet, the related notes and the Distribution Tables, and the accounting policies and distribution policies of the Company. The financial reporting framework that has been applied in their preparation is applicable law and United Kingdom Accounting Standards (United Kingdom Generally Accepted Accounting Practice) including FRS 102 ‘The Financial Reporting Standard applicable to the UK and Republic of Ireland’.
In our opinion, the financial statements:
• give a true and fair view of the financial position of the Company comprising each of its sub‐funds as at 31 May 2021 and ofthe net revenue/expense and the net capital gains/losses on the scheme property of the Company comprising each of its sub‐funds for the year then ended; and
• have been properly prepared in accordance with United Kingdom Generally Accepted Accounting Practice.
Basis for opinion
We conducted our audit in accordance with International Standards on Auditing (UK) (“ISAs (UK)”) and applicable law. Our responsibilities under those standards are further described in the Auditor’s responsibilities for the audit of the financial statements section of our report below. We are independent of the Company in accordance with the ethical requirements that are relevant to our audit of the financial statements in the UK, including the Financial Reporting Council’s (the “FRC”) Ethical Standard, and we have fulfilled our other ethical responsibilities in accordance with these requirements.
We believe that the audit evidence we have obtained is sufficient and appropriate to provide a basis for our opinion.
Conclusions relating to going concern
In auditing the financial statements, we have concluded that the Authorised Corporate Director’s (“the ACD”) use of the going concern basis of accounting in the preparation of the financial statements is appropriate.
Based on the work we have performed, we have not identified any material uncertainties relating to events or conditions that,
individually or collectively, may cast significant doubt on the remaining sub‐funds’ ability to continue as a going concern for a
period assessed by the ACD, being the period of twelve months from when the financial statements are authorised for issue.
Our responsibilities and the responsibilities of the ACD with respect to going concern are described in the relevant sections of
this report. However, because not all future events or conditions can be predicted, this statement is not a guarantee as to the
Company’s ability to continue as a going concern.
Other Information
The other information comprises the information included in the Annual Report other than the financial statements and our
auditor’s report thereon. The ACD is responsible for the other information contained within the Annual Report.
Our opinion on the financial statements does not cover the other information and, except to the extent otherwise explicitly
stated in this report, we do not express any form of assurance conclusion thereon.
AXA Distribution Investment ICVC
Independent Auditor's Report to the Shareholders of AXA Distribution Investment ICVC
151
AXA Distribution Investment ICVC
Independent Auditor's Report to the Shareholders of AXA Distribution Investment ICVC
Our responsibility is to read the other information and, in doing so, consider whether the other information is materially
inconsistent with the financial statements or our knowledge obtained in the audit or otherwise appears to be materially
misstated. If we identify such material inconsistencies or apparent material misstatements, we are required to determine
whether this gives rise to a material misstatement in the financial statements themselves. If, based on the work we have
performed, we conclude that there is a material misstatement of the other information, we are required to report that fact.
We have nothing to report in this regard.
Opinions on other matters prescribed by the rules of the Collective Investment Schemes Sourcebook of the
Financial Conduct Authority (the “FCA”)
In our opinion:
• the financial statements have been properly prepared in accordance with the Statement of Recommended Practice relatingto Authorised Funds, the rules of the Collective Investment Schemes Sourcebook of the Financial Conduct Authority and theInstrument of Incorporation;
• there is nothing to indicate that adequate accounting records have not been kept or that the financial statements are not inagreement with those records; and
• the information given in the ACD’s report for the financial year for which the financial statements are prepared isconsistent with the financial statements.
Matters on which we are required to report by exception
We have nothing to report in respect of the following matter in relation to which the Collective Investment Schemes
Sourcebook of the Financial Conduct Authority requires us to report to you if, in our opinion:
• we have not received all the information and explanations which, to the best of our knowledge and belief, are necessary for
the purposes of our audit
Responsibilities of the ACD
As explained more fully in the ACD’s responsibilities statement set out on page 150 the ACD is responsible for the preparation of the financial statements and for being satisfied that they give a true and fair view, and for such internal control as the ACD determines is necessary to enable the preparation of financial statements that are free from material misstatement, whether due to fraud or error.
In preparing the financial statements, the ACD is responsible for assessing the Company’s ability to continue as a going concern, disclosing, as applicable, matters related to going concern and using the going concern basis of accounting unless the ACD either intends to wind up or terminate the Company or to cease operations, or has no realistic alternative but to do so.
Auditor’s responsibilities for the audit of the financial statements
Our objectives are to obtain reasonable assurance about whether the financial statements as a whole are free from material
misstatement, whether due to fraud or error, and to issue an auditor’s report that includes our opinion. Reasonable assurance
is a high level of assurance but is not a guarantee that an audit conducted in accordance with ISAs (UK) will always detect a
material misstatement when it exists. Misstatements can arise from fraud or error and are considered material if, individually
or in the aggregate, they could reasonably be expected to influence the economic decisions of users taken on the basis of
these financial statements.
Explanation as to what extent the audit was considered capable of detecting irregularities, including fraud
Irregularities, including fraud, are instances of non‐compliance with laws and regulations. We design procedures in line with
our responsibilities, outlined above, to detect irregularities, including fraud. The risk of not detecting a material misstatement
due to fraud is higher than the risk of not detecting one resulting from error, as fraud may involve deliberate concealment by,
for example, forgery or intentional misrepresentations, or through collusion. The extent to which our procedures are capable
of detecting irregularities, including fraud is detailed below. However, the primary responsibility for the prevention and
detection of fraud rests with both those charged with governance of the entity and management.
152

AXA Distribution Investment ICVC
Independent Auditor's Report to the Shareholders of AXA Distribution Investment ICVC
Our approach was as follows:
• We obtained an understanding of the legal and regulatory frameworks that are applicable to the Company and determined
that the most significant are United Kingdom Generally Accepted Accounting Practice the Investment Management
Association’s Statement of Recommended Practice (“IMA SORP”), the FCA Collective Investment Schemes Sourcebook, theOEIC Regulations, the Company’s Instrument of Incorporation and the Prospectus.
• We understood how the Company is complying with those frameworks through discussions with the ACD and the Company’s
administrators and a review of the Company’s documented policies and procedures.
• We assessed the susceptibility of the Company’s financial statements to material misstatement, including how fraud might
occur by considering the risk of management override, specifically management’s propensity to influence revenue andamounts available for distribution. We identified a fraud risk with respect to the incomplete or inaccurate income recognitionthrough incorrect classification of special dividends and the resulting impact to amounts available for distribution. We testedthe appropriateness of management’s classification of material special dividends as either a capital or revenue return.
• Based on this understanding we designed our audit procedures to identify non‐compliance with such laws and regulations.Our procedures involved review of the reporting to the ACD with respect to the application of the documented policies andprocedures and review of the financial statements to test compliance with the reporting requirements of the Company.
• Due to the regulated nature of the Company, the Statutory Auditor considered the experience and expertise of theengagement team to ensure that the team had the appropriate competence and capabilities to identify non‐compliance withthe applicable laws and regulations.
A further description of our responsibilities for the audit of the financial statements is located on the Financial Reporting
Council’s website at https://www.frc.org.uk/auditorsresponsibilities . This description forms part of our auditor’s report.
Use of our report
This report is made solely to the Company’s Shareholders as a body, pursuant to Paragraph 4.5.12 of the rules of the Collective
Investment Schemes Sourcebook of the Financial Conduct Authority. Our audit work has been undertaken so that we might
state to the Company’s Shareholders those matters we are required to state to them in an auditor’s report and for no other
purpose. To the fullest extent permitted by law, we do not accept or assume responsibility to anyone other than the Company
and the Company’s Shareholders as a body, for our audit work, for this report, or for the opinions we have formed
Ernst & Young LLP
Statutory Auditor
Edinburgh
22nd September 2021
153

Classes of Shares
Valuation Point
Remuneration policy of the ACD
Details of the up to date Global Remuneration Policy are published online at www.axa‐im‐international.com/remuneration. This
includes the description of how remuneration and benefits are awarded for employees, and further information on the AXA IM
remuneration committee. A paper copy of the up to date Global Remuneration Policy is also available from the ACD free of
charge upon request.
Further Information
Significant Information
AXA IM’s Global Remuneration Policy, which has been approved by the AXA IM Remuneration Committee, sets out the
principles relating to remuneration within all entities of AXA IM (including the ACD) and takes into account AXA IM’s business
strategy, objectives, and risk tolerance, as well as the long‐term interests of AXA IM’s shareholders, employees and clients
(including the Funds). The AXA IM Remuneration Committee is responsible for determining and reviewing the AXA IM
remuneration guidelines, including the AXA IM Global Remuneration Policy, as well as reviewing the annual remuneration of
senior executives of the AXA IM Group and senior officers in control functions.
AXA IM provides both fixed and variable remuneration. An employee’s fixed remuneration is structured to reward
organisational responsibility, professional experience and the individual’s capability to perform the duties of the role. Variable
remuneration is based on performance and may be awarded annually on both a non‐deferred and, for certain employees, a
deferred basis. Non‐deferred variable remuneration may be awarded in cash or, where appropriate and subject to local laws
and regulation, in instruments linked to the performance of AXA IM funds. Deferred remuneration is awarded through various
instruments structured to reward medium and long‐term value creation for clients and AXA IM and long‐term value creation for
the AXA Group. AXA IM ensures appropriate balances between fixed and variable remuneration and deferred and non‐deferred
AXA Distribution Investment ICVC
The Company can issue different classes of shares in respect of any Fund. Holders of Income shares are entitled to be paid the
revenue attributable to such shares, in respect of each annual or accounting period. Holders of Accumulation shares are not
entitled to be paid the revenue attributable to such shares, but that revenue is retained and accumulated for the benefit of
shareholders and is reflected in the price of shares.
The valuation point for each Fund is 12 noon on each dealing day (being each day which is a business day in London). Valuations
may be made at other times under the terms contained within the Prospectus.
The ACD has approved and adopted AXA IM’s Global Remuneration Policy, in accordance with the Regulations, which is
consistent with, and promotes, sound and effective risk management; does not encourage risk‐taking which is inconsistent with
the risk profiles of the Funds or the Instrument of Incorporation, and does not impair compliance of the ACD’s duty to act in the
best interests of each of the Funds.
154

Further Information
AXA Distribution Investment ICVC
(1) Excluding social charges
Remuneration to Identified Employee:
Risk Takers Senior Management Total
Fixed Pay and Variable Remuneration (£'000) 96,583 89,301 185,884
Number of employees 224 88 312
UK Identified Employee Remuneration:
Risk Takers Senior Management Total
Fixed Pay and Variable Remuneration (£'000) 20,696 13,192 33,888
Number of employees 48 13 61
Other Information
Report
Interim accounts period ended 30 November
Annual accounts year ended 31 May
Following the implementation of UCITS V in 2016, all authorised UCITS Managers are required to disclose information relating to
the remuneration paid to its staff for the financial year. The tables below provide an overview:
(3) Variable compensation, includes:
‐ the amounts awarded for the performance of the previous year and fully paid over the financial year under review,
‐ deferred variable remuneration,
‐ and long‐term incentives set up by the AXA Group.
Total amount of remuneration paid and / or allocated to all staff
for the year ended December 31, 2020(1)
Fixed Pay (2) (£'000) 211,310
Aggregate amount of compensation paid and / or allocated to risk takers and senior management whose activities have a
significant impact on the risk profile of investment vehicles
Aggregate amount of compensation paid and / or allocated to risk takers and senior management whose activities have a
significant impact on the risk profile of investment vehicles
Variable Pay (3) (£'000) 235,553
Number of employees (4) 2,516
(2)Fixed Pay Fixed Pay amount is based on 2019/20 compensation review final data
(4) Number of employees includes Permanent and Temporary contracts excluding internships (based on Staff list as of
31/12/2020)
The Instrument of Incorporation, Prospectus and the most recent and annual reports may be inspected at the office of the ACD which is also the Head Office of the Company and copies may be obtained upon application. Shareholders who have any complaints about the operation of the Company should contact the ACD or the Depositary in the first instance. In the event that a shareholder finds the response unsatisfactory they may make their complaint direct to the Financial Ombudsman Service at Exchange Tower, London E14 9SR.
The annual report of the Company will be published within four months of each annual accounting period and the report will be
published within two months of each accounting period.
155

Further Information
AXA Distribution Investment ICVC
Data Protection
Effects of Personal Taxation
Risk Warning
The Securities Financing Transactions Regulation
Annual Management Charge
Preliminary Charge
Value Assessment
There is currently no initial charge on Class Z Shares, Class R Shares, Class I Shares, Class B Shares or Class A Shares.
Investors should be aware that unless their shares are held within an ISA, or switched between Funds in this OEIC, selling shares
is treated as a disposal for the purpose of Capital Gains tax.
An investment in an Open Ended Investment Company should be regarded as a medium to long term investment. Investors
should be aware that the price of shares and the income from them may fall as well as rise and investors may not receive back
the full amount invested. Past performance is not a guide to future performance. Investments denominated in currencies other
than the base currency of a fund are subject to fluctuation in exchange rates, which may be favourable or unfavourable.
The Securities Financing Transactions Regulation, as published by the European Securities and Markets Authority, aims to improve the transparency of the securities financing markets. Disclosures regarding exposure to Securities Financing Transactions (SFTs) or total return swaps required on all reports & accounts published after 13 January 2017. During the year to 31 May 2021 and at the balance sheet date, the Company did not use SFTs or total return swaps, as such no disclosure is
required.
AXA Investment Managers UK Limited, as ACD, will receive an Annual Management Charge out of the property for Defensive
Distribution Fund and Distribution Fund at the rate of 1.50% per annum for Class R Shares, 0.75% per annum for Class Z Shares,
0.40% per annum for Class B Shares, 0.50% per annum for Class A Shares, for Global Distribution Fund and Ethical Distribution
Fund at the rate of 1.50% per annum for Class R Shares, 0.75% per annum for Class Z Shares, 0.50% per annum for Class B
Shares and for Lifetime Distribution Fund at the rate of 0.45% per annum for Class Z Shares, 0.09% per annum for Class I Shares,
0.30% per annum for Class A Shares based on the net asset value of the relevant Fund calculated on a mid‐market basis. The
Annual Management Charge accrues monthly and is payable monthly in arrears. The maximum permitted Annual Management
Charge payable to the ACD is 2% per annum for Class R, Class Z and Class B Shares.
The details you have provided will be held on computer by the Funds’ Registrar but will not be used for any purpose except to
fulfil its obligations to shareholders.
It is our duty as Authorised Fund Manager (“AFM”) to act in the best interests of our investors. As part of fulfilling this duty, we need to consider whether the charges taken from our funds are justified in the context of the overall service and value that we provide to our investors.
The FCA have introduced new rules requiring the Boards of AFMs to consider robustly and in detail whether they are delivering value for money to their investors and to explain the assessment annually in a Value Statement made available to the public.
The Value Statement report is available on the AXA IM website: https://retail.axa‐im.co.uk/fund‐centre
157


