Embed Size (px)
Citation preview
Ayman Khedr & Samir Sabry.
1 International Journal of Artificial Intelligence and Expert Systems (IJAE), Volume (2): Issue (3)
Data mining visualization to support biochemical markers for
liver fibrosis in patients with chronic hepatitis C virus
Dr. Ayman Khedr [email protected]
Faculty of Computers and Information / Information System department Helwan University Cairo, 11795, Egypt
Samir Sabry [email protected]
Electricity Hospital / Laboratory department Ministry of Electricity & Energy Cairo, Egypt
Abstract
The reference diagnostic test to detect fibrosis is liver biopsy (LB), a procedure subject to various limitations, including risk of patient injury and sampling error. FibroTest (FT) and ActiTest (AT) are biochemical markers (noninvasive tests) used in determining the level of fibrosis and the degree of necroinflammatory activity in the liver [1]. The objective of this work is to discover the differences in the temporal patterns between noninvasive tests and liver biopsy by visualization tools, which made it easier to understand the relations of the complicated rules. This Study ware focused on the major serum fibrosis markers (FT/AT). The test uses a combination of serum biochemical markers with visualization technique to evaluate whether biochemical markers can be used to estimate the stage of liver fibrosis and necro-inflammatory activity in the liver. Keywords: Data mining, Visualization, Hepatitis C, Serum markers, Liver fibrosis.
Ayman Khedr & Samir Sabry.
2 International Journal of Artificial Intelligence and Expert Systems (IJAE), Volume (2): Issue (3)
1. INTRODUCTION Artificial intelligence (AI) research in medicine is an excellent area that combines sophisticated representational and computing techniques with the insights of expert physicians to produce tools for improving health care. It can be observed that the focus on expert systems (ES) in medicine in early days of AI has been changed to intelligent data analysis (IDA) in medicine, especially data mining techniques [2]. Visual data mining is another area that greatly contributes to medical information systems. Appropriate visualization can support deeper understanding of patterns discovered in data, or to uncover their hidden relations [3]. The Arab Republic of Egypt has the highest prevalence of hepatitis C in the world. The national prevalence rate of hepatitis C virus (HCV) antibody positivity has been estimated to be between 10-13% according to a study published on August 2010 in the National Academy of Sciences. Chronic HCV is the main cause of liver cirrhosis and liver cancer in Egypt and, indeed, one of the top five leading causes of death. Genotype 4 represents over 90% of cases in Egypt.
Liver biopsy is important diagnostic tool in chronic liver diseases (CLD), cirrhosis and hepatocellular carcinoma but had its limitation and risks [4], [5]. Unfortunately, liver biopsy is often painful, requires bed rest for at least six hours, and is associated with a small but definite mortality. Among the complications of percutaneous liver biopsy are pain (10%-30%), bleeding (which may be severe and necessitate blood transfusion or emergency surgery). Accidental needle puncture of the lung, intestines, gallbladder, or kidney. Abdominal infection may accrue with pain. Furthermore, Subjective to many factors difference in the biopsy sampling size may miss the diseased part of the liver may require repetition of the samples (20%) is due to liver biopsy failure (small length).The risk of death from the biopsy is less than 1 in 1,000.[6] ,[7]
In the recent years, there has been an increasing interest in identifying and describing liver fibrosis through noninvasive surrogate markers measurable in the peripheral blood. Serum markers of liver fibrosis offer an attractive alternative [8]. They are less invasive than biopsy, with no risk of complications which is in the case of liver biopsy. Noninvasive tests are needed to avoid the dangerous side effects that can occur with a liver biopsy and to avoid the discomfort and expense of repeat biopsies [9]. According to BioPredictive [10] FT/AT has higher diagnostic values than several other markers, whether isolated or combined and unlike biopsy, the test can provide a non-invasive assessment of the stage of fibrosis and grade of necro-inflammatory activity by a numerical quantitative estimate of liver fibrosis ranging from 0.00–1.00 [11] (corresponding to stages F0-F4 and grades A0-A3 of the METAVIR scoring system [12], [13]
2. PREVIOUS WORKS Data mining techniques (such as visualization) often used to create and deploy successful business intelligence solutions. By applying visualizations and data mining techniques, we can fully exploit data to discover previously unknown trends. In the medical industry uses data mining to predict the effectiveness of surgical procedures, medical tests and medications [14].Data visualization played an important role in health care. For instance in cancer microarray studies, (Khan, et al., 2001) summarized their analysis results in a planar visualization that shows a clear separation of diagnostic cases. FibroTest and ActiTest In previous study, Bourliere et al. (2006) assessed the diagnostic accuracy of noninvasive indexes in comparison with liver histology performed in HCV infected patients (n=235) and Forns score were assessed with liver histology performed on the same day. The authors reported that performing all the tests, and liver biopsy, improved the diagnostic accuracy (96%) for liver fibrosis in HCV patients without comorbidities. The authors state that any single test could not be a gold standard. The combination of all tests without liver biopsy allowed 81.3% of the patients to be correctly classified. Liver biopsy was mandatory in 18.7% of the patients.
Ayman Khedr & Samir Sabry.
3 International Journal of Artificial Intelligence and Expert Systems (IJAE), Volume (2): Issue (3)
3. RESEARCH METHODOLOGY
3.1 Data Mining Visualization
In healthcare, data mining is becoming increasingly popular, if not increasingly essential. Several factors have motivated the use of data mining in medical applications. Visual data mining techniques have proven to be of high value in exploratory data analysis. According to Friedman “the main goal of data visualization is to communicate information clearly and effectively through graphical means” [15]. The visualizations of the data allow the user to gain insight into the data and come up with new hypotheses. Visualization technique helps users understand their data. Visualization makes the bridge from text based to graphical presentation. Such things as decision tree, rule, cluster and pattern visualization help users see data relationships rather than read about them. We used the Weka 3.6 software which is a collection of machine learning algorithms for data mining tasks. The algorithms can either be applied directly to a dataset or called from your own code. Weka contains tools for data pre-processing, classification, regression, clustering, association rules, and visualization. We also used the Grapheur software which takes data that is organized by rows and columns, visualizes them in a variety of ways, and helps you to discover patterns and similarities, to find causes and explanations. We also used Microsoft Excel to collect laboratory data but the input data file needs to be organized in the form of ARFF in order to be processed in the Weka environment. The root node is the Biopsy Fibrosis with five branches which present the 5 levels where the different laboratory values and patient characteristic are assigned one level at a time (figures 5, 6 and 7).
3.2 Case Study
3.2.1 Patients
A total number of 158 serum samples were collected from patients with (CHC). Serum samples were obtained and liver needle biopsy was performed on the same day. Levels of fibrosis in FibroTest and levels of activity in ActiTest, both determined via serum biochemical markers, were compared with levels of fibrosis and activity in histopathological examination. The study group consisted of 158 patients (120 males and 38 females) with no prior antiviral treatment were included; All patients had positive HCV- RNA (genotype 4). The mean age of the patients was 50.4±10.3 years, ranging from 18 to 65 years. Biochemical assays are usually performed with fresh serum. Serum can be decanted and stored at –80°C, although freezing and thawing can only be done once.
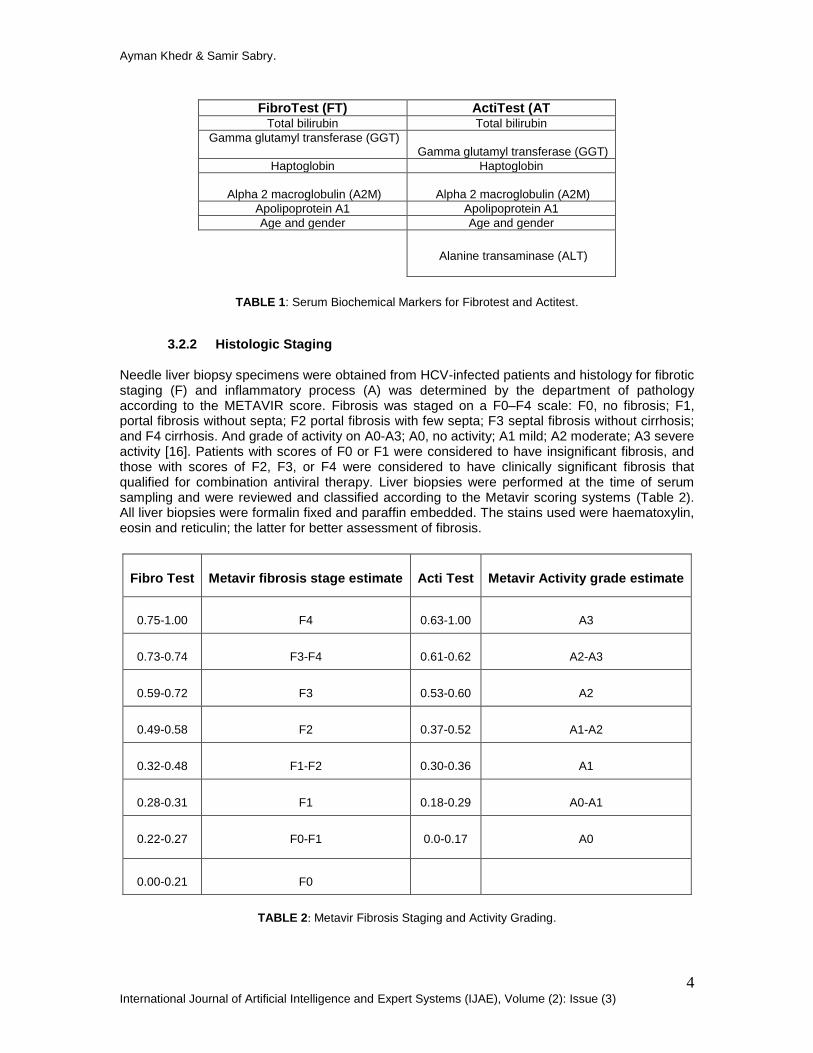
Results of liver function tests within 4 weeks before biopsy were used for the analysis. Bilirubin, total protein, albumin, alanine transaminase (ALT), and alkaline phosphatase (ALP) were measured by OLYMPUS AU640 Chemistry Analyzer. Serum levels of (6 components of FibroTest-Acti Test) (Table 1) were measured using OLYMPUS AU640 Chemistry Analyzer and the complete blood count was measured using Hematology Analyzer (ABBOTT CELL-DYN 3700). Serum levels Detection of HCV RNA and HBV DNA was done by semiquantitative polymerase chain reaction.
Ayman Khedr & Samir Sabry.
4 International Journal of Artificial Intelligence and Expert Systems (IJAE), Volume (2): Issue (3)
FibroTest (FT) ActiTest (AT Total bilirubin Total bilirubin
Gamma glutamyl transferase (GGT) Gamma glutamyl transferase (GGT)
Haptoglobin Haptoglobin
Alpha 2 macroglobulin (A2M)
Alpha 2 macroglobulin (A2M)
Apolipoprotein A1 Apolipoprotein A1
Age and gender Age and gender
Alanine transaminase (ALT)
TABLE 1: Serum Biochemical Markers for Fibrotest and Actitest.
3.2.2 Histologic Staging
Needle liver biopsy specimens were obtained from HCV-infected patients and histology for fibrotic staging (F) and inflammatory process (A) was determined by the department of pathology according to the METAVIR score. Fibrosis was staged on a F0–F4 scale: F0, no fibrosis; F1, portal fibrosis without septa; F2 portal fibrosis with few septa; F3 septal fibrosis without cirrhosis; and F4 cirrhosis. And grade of activity on A0-A3; A0, no activity; A1 mild; A2 moderate; A3 severe activity [16]. Patients with scores of F0 or F1 were considered to have insignificant fibrosis, and those with scores of F2, F3, or F4 were considered to have clinically significant fibrosis that qualified for combination antiviral therapy. Liver biopsies were performed at the time of serum sampling and were reviewed and classified according to the Metavir scoring systems (Table 2). All liver biopsies were formalin fixed and paraffin embedded. The stains used were haematoxylin, eosin and reticulin; the latter for better assessment of fibrosis.
Fibro Test Metavir fibrosis stage estimate Acti Test Metavir Activity grade estimate
0.75-1.00 F4 0.63-1.00 A3
0.73-0.74 F3-F4 0.61-0.62 A2-A3
0.59-0.72 F3 0.53-0.60 A2
0.49-0.58 F2 0.37-0.52 A1-A2
0.32-0.48 F1-F2 0.30-0.36 A1
0.28-0.31 F1 0.18-0.29 A0-A1
0.22-0.27 F0-F1 0.0-0.17 A0
0.00-0.21 F0
TABLE 2: Metavir Fibrosis Staging and Activity Grading.
Ayman Khedr & Samir Sabry.
5 International Journal of Artificial Intelligence and Expert Systems (IJAE), Volume (2): Issue (3)
4. RESULTS
4.1 FibroTest and Actitest
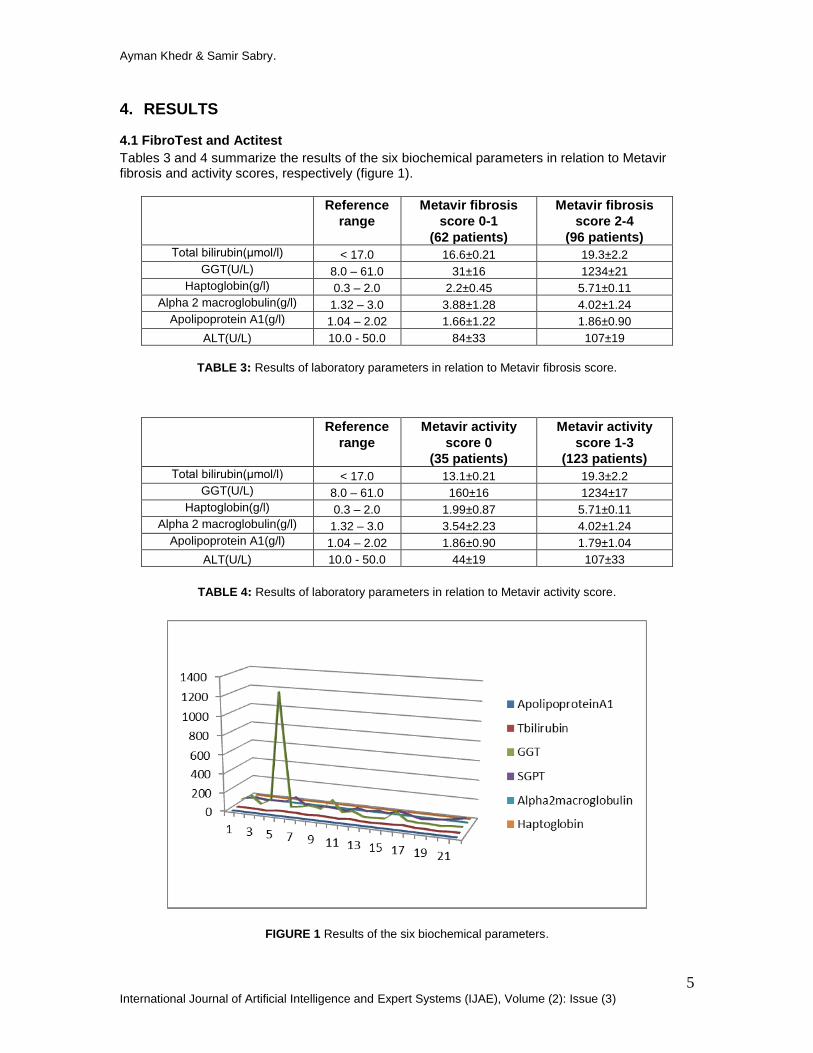
Tables 3 and 4 summarize the results of the six biochemical parameters in relation to Metavir fibrosis and activity scores, respectively (figure 1).
Reference
range
Metavir fibrosis
score 0-1
(62 patients)
Metavir fibrosis
score 2-4
(96 patients) Total bilirubin(μmol/l) < 17.0 16.6±0.21 19.3±2.2
GGT(U/L) 8.0 – 61.0 31±16 1234±21
Haptoglobin(g/l) 0.3 – 2.0 2.2±0.45 5.71±0.11
Alpha 2 macroglobulin(g/l) 1.32 – 3.0 3.88±1.28 4.02±1.24
Apolipoprotein A1(g/l) 1.04 – 2.02 1.66±1.22 1.86±0.90
ALT(U/L) 10.0 - 50.0 84±33 107±19
TABLE 3: Results of laboratory parameters in relation to Metavir fibrosis score.
Reference
range
Metavir activity
score 0
(35 patients)
Metavir activity
score 1-3
(123 patients) Total bilirubin(μmol/l) < 17.0 13.1±0.21 19.3±2.2
GGT(U/L) 8.0 – 61.0 160±16 1234±17
Haptoglobin(g/l) 0.3 – 2.0 1.99±0.87 5.71±0.11
Alpha 2 macroglobulin(g/l) 1.32 – 3.0 3.54±2.23 4.02±1.24
Apolipoprotein A1(g/l) 1.04 – 2.02 1.86±0.90 1.79±1.04
ALT(U/L) 10.0 - 50.0 44±19 107±33
TABLE 4: Results of laboratory parameters in relation to Metavir activity score.
FIGURE 1 Results of the six biochemical parameters.
Ayman Khedr & Samir Sabry.
6 International Journal of Artificial Intelligence and Expert Systems (IJAE), Volume (2): Issue (3)
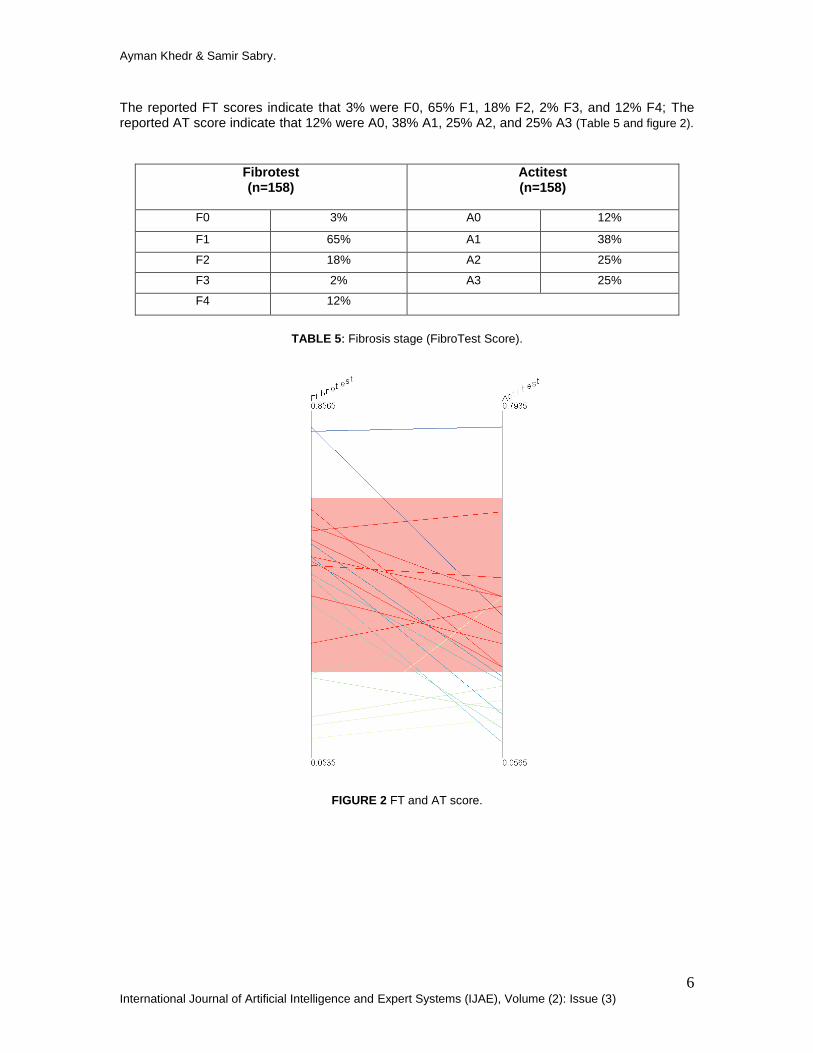
The reported FT scores indicate that 3% were F0, 65% F1, 18% F2, 2% F3, and 12% F4; The reported AT score indicate that 12% were A0, 38% A1, 25% A2, and 25% A3 (Table 5 and figure 2).
Fibrotest (n=158)
Actitest (n=158)
F0 3% A0 12%
F1 65% A1 38%
F2 18% A2 25%
F3 2% A3 25%
F4 12%
TABLE 5: Fibrosis stage (FibroTest Score).
FIGURE 2 FT and AT score.
Ayman Khedr & Samir Sabry.
7 International Journal of Artificial Intelligence and Expert Systems (IJAE), Volume (2): Issue (3)
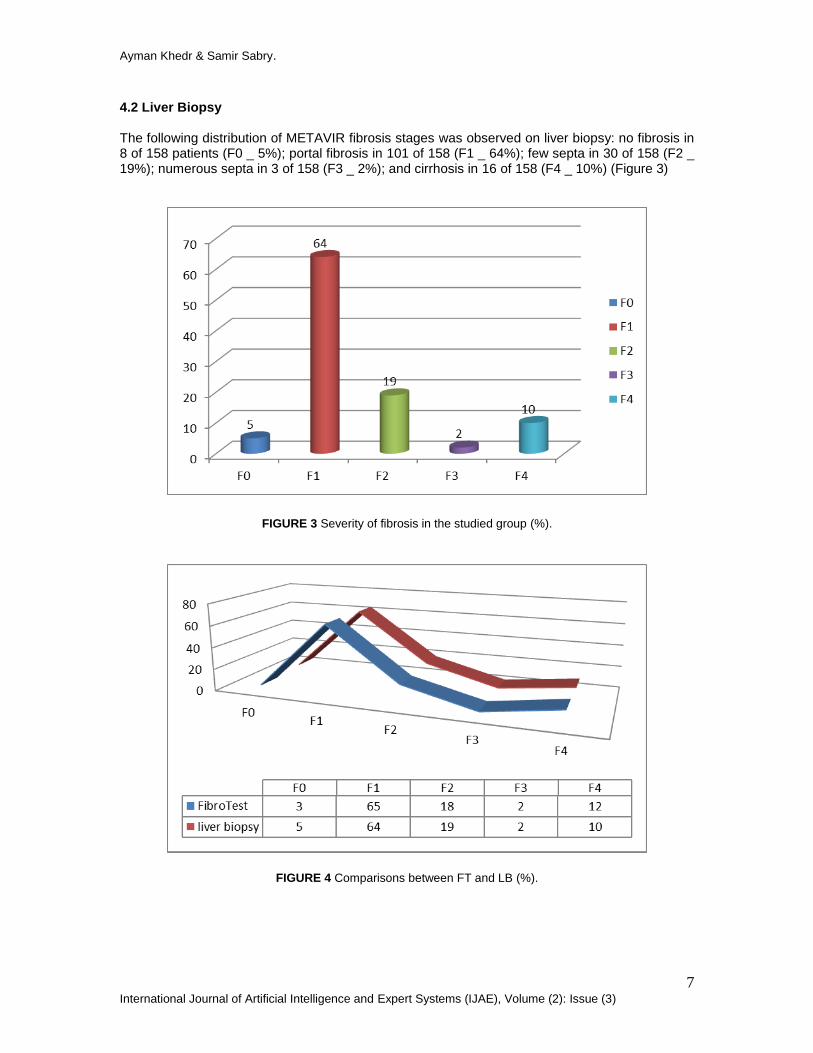
4.2 Liver Biopsy The following distribution of METAVIR fibrosis stages was observed on liver biopsy: no fibrosis in 8 of 158 patients (F0 _ 5%); portal fibrosis in 101 of 158 (F1 _ 64%); few septa in 30 of 158 (F2 _ 19%); numerous septa in 3 of 158 (F3 _ 2%); and cirrhosis in 16 of 158 (F4 _ 10%) (Figure 3)
FIGURE 3 Severity of fibrosis in the studied group (%).
FIGURE 4 Comparisons between FT and LB (%).
Ayman Khedr & Samir Sabry.
8 International Journal of Artificial Intelligence and Expert Systems (IJAE), Volume (2): Issue (3)
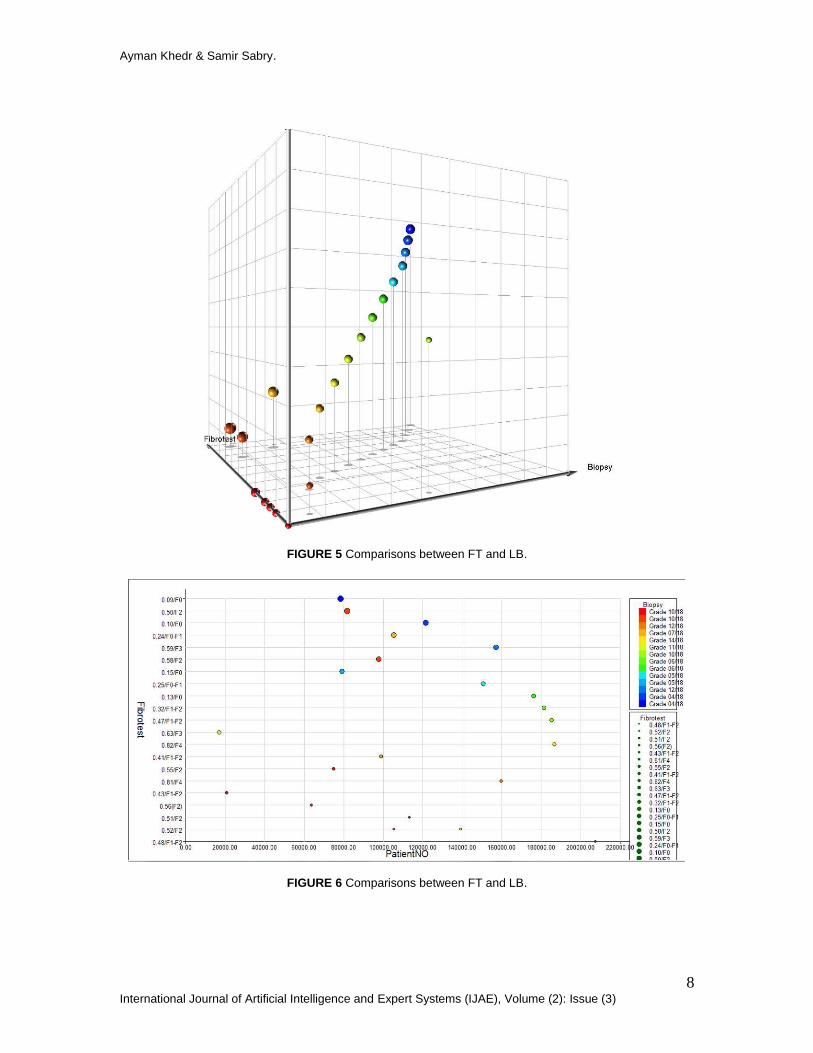
FIGURE 5 Comparisons between FT and LB.
FIGURE 6 Comparisons between FT and LB.
Ayman Khedr & Samir Sabry.
9 International Journal of Artificial Intelligence and Expert Systems (IJAE), Volume (2): Issue (3)
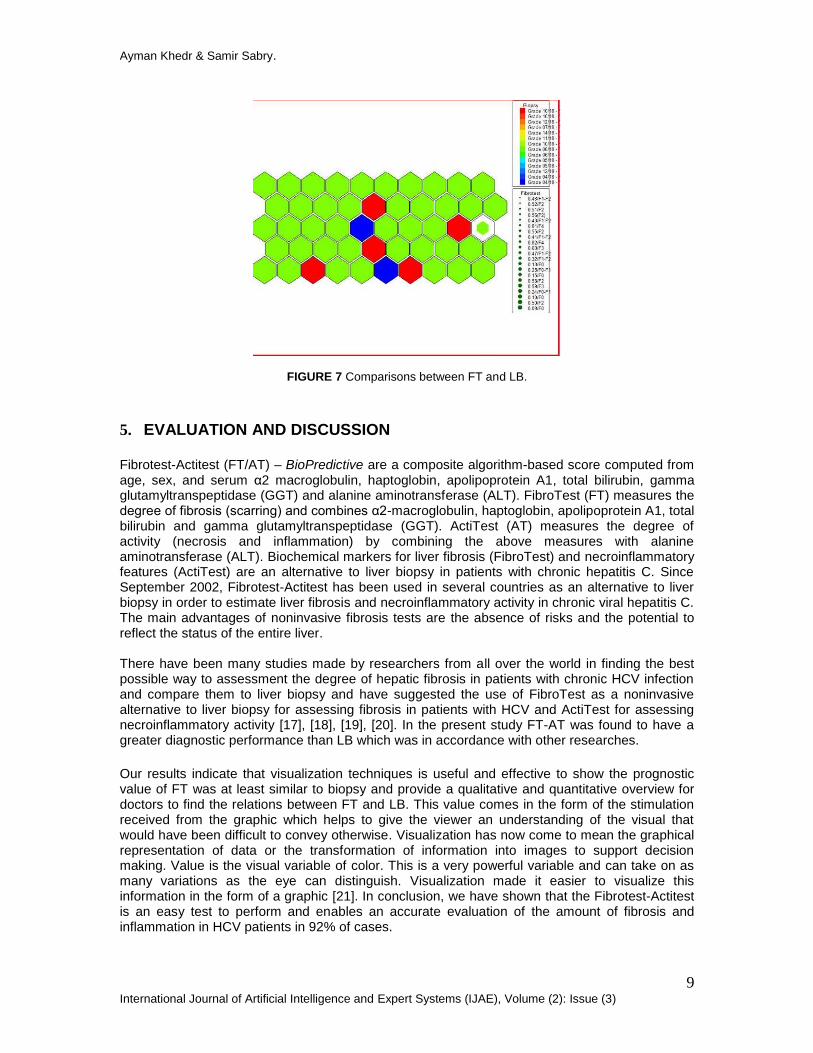
FIGURE 7 Comparisons between FT and LB.
5. EVALUATION AND DISCUSSION Fibrotest-Actitest (FT/AT) – BioPredictive are a composite algorithm-based score computed from age, sex, and serum α2 macroglobulin, haptoglobin, apolipoprotein A1, total bilirubin, gamma glutamyltranspeptidase (GGT) and alanine aminotransferase (ALT). FibroTest (FT) measures the degree of fibrosis (scarring) and combines α2-macroglobulin, haptoglobin, apolipoprotein A1, total bilirubin and gamma glutamyltranspeptidase (GGT). ActiTest (AT) measures the degree of activity (necrosis and inflammation) by combining the above measures with alanine aminotransferase (ALT). Biochemical markers for liver fibrosis (FibroTest) and necroinflammatory features (ActiTest) are an alternative to liver biopsy in patients with chronic hepatitis C. Since September 2002, Fibrotest-Actitest has been used in several countries as an alternative to liver biopsy in order to estimate liver fibrosis and necroinflammatory activity in chronic viral hepatitis C. The main advantages of noninvasive fibrosis tests are the absence of risks and the potential to reflect the status of the entire liver. There have been many studies made by researchers from all over the world in finding the best possible way to assessment the degree of hepatic fibrosis in patients with chronic HCV infection and compare them to liver biopsy and have suggested the use of FibroTest as a noninvasive alternative to liver biopsy for assessing fibrosis in patients with HCV and ActiTest for assessing necroinflammatory activity [17], [18], [19], [20]. In the present study FT-AT was found to have a greater diagnostic performance than LB which was in accordance with other researches.
Our results indicate that visualization techniques is useful and effective to show the prognostic value of FT was at least similar to biopsy and provide a qualitative and quantitative overview for doctors to find the relations between FT and LB. This value comes in the form of the stimulation received from the graphic which helps to give the viewer an understanding of the visual that would have been difficult to convey otherwise. Visualization has now come to mean the graphical representation of data or the transformation of information into images to support decision making. Value is the visual variable of color. This is a very powerful variable and can take on as many variations as the eye can distinguish. Visualization made it easier to visualize this information in the form of a graphic [21]. In conclusion, we have shown that the Fibrotest-Actitest is an easy test to perform and enables an accurate evaluation of the amount of fibrosis and inflammation in HCV patients in 92% of cases.
Ayman Khedr & Samir Sabry.
10 International Journal of Artificial Intelligence and Expert Systems (IJAE), Volume (2): Issue (3)
6. CONSLUSION Data mining visualization can provide an excellent approach to knowledge discovery and provide a clear visual differentiation between biochemical markers and liver biopsy. Based on these results, the use of the biochemical markers of liver fibrosis (FibroTest) and necrosis (ActiTest) can be recommended as an alternative to liver biopsy for the assessment of liver injury in patients with chronic hepatitis C. The main advantages of noninvasive fibrosis tests are the absence of risks and the potential to reflect the status of the entire liver. Fibrotest is a simple and effective method to assess liver fibrosis, inflammation, and has the same diagnostic value as a biopsy, while being noninvasive and easily repeatable.
7. ACKNOWLEDGEMENT We would like to thank all the medical staff of Laboratory Unit and Anti-fibrosis Hepatology Unit at Electricity hospital for their guidance and collaboration.
8. REFERENCES 1 Imbert- Bismut F, Ratziu V, Pieroni L, Charlotte F, Benhamou Y, Poynard T. “Biochemical markers of liver fibrosis in patients with hepatitis C virus infection : a prospective study”. Lancet, 2001, 357, 9262, 1069-1075. 2 Lavrak N, “Selected techniques for data mining in medicine", Artificial Intelligence in Medicine, 16, 2{23, 125{134, 1999
3 Nguyen, D.D., Ho, T.B., Kawasaki, S., “Knowledge visualization in Hepatitis Study", Asia Pacic Symposium on Information Visualization APVIS'06, 59{62, 2006
4 Fontana RJ, Goodman ZD, Dienstag JL, Bonkovsky HL, Naishadham D, Sterling RK, Su GL, et al. “Relationship of serum fibrosis markers with liver fibrosis stage and collagen content in patients with advanced chronic hepatitis C”. Hepatology 2008; 47(3):789-798. 5 White IR, Patel K, Symonds WT, Dev A, Griffin P, Tsokanas N, Skehel M, et al. “Serum proteomic analysis focused on fibrosis in patients with hepatitis C virus infection” J Transl Med 2007; 5:33.
6 McGill DB, Rakela J, Zinsmeister AR, Ott BJ. “A 21-year experience with major hemorrhage after percutaneous liver biopsy”.Gastroenterology 1990; 99: 1396-1400 7 Van Thiel DH, Gavaler JS, Wright H, Tzakis A. “Liver biopsy.Its safety and complications as seen at a liver transplant center”. Transplantation 1993; 55: 1087-1090 8 Stauber RE, Lackner C. “Noninvasive diagnosis of hepatic fibrosis in chronic hepatitis C”. World J Gastroenterol 2007 August 28; 13(32): 4287-4294 9 Shahzad Ashraf. “Noninvasive evaluation of liver fibrosis in patients with chronic hepatitis B and C“.PhD Thesis, Baqai Medical University, 2006 10 The Fibrotest-Actitest-HCV FIBROSURE Available from: URL: http://www.biopredictive.com/intl/physician/fibrotest-for-hcv/view?set_language=en
Ayman Khedr & Samir Sabry.
11 International Journal of Artificial Intelligence and Expert Systems (IJAE), Volume (2): Issue (3)
11 Accessed February 4, 2011.Available at URL address: https://www.labcorp.com/pdf/08_HCV_Fibrosure_TR_1080.pdf 12 Knodell RG, Ishak KG, Black WC, et al. “Formulation and application 3of a numerical scoring
system for assessing histological activity in asymptomatic chronic active hepatitis”.Hepatology 1981;1(5):431-5
13 Bedossa P, Poynard T. “An algorithm for the grading of activity 4. In chronic hepatitis C. the METAVIR cooperative study group”. Hepatology 1996; 24(2):289-93. 14 T. Soukup and I. Davidson “Visual Data Mining: Techniques and Tools for Data Visualization and Mining”, John Willey & Sons Inc, pp.5-7 (2002)
15 Vitaly Friedman (2008) "Data Visualization and Infographics" in: Graphics, Monday Inspiration, January 14th, 2008 16 FI-BROCHURE: The Fibrotest-Actitest-HCV FIBROSURE Investigator's Brochure. Available from: URL: http://www. biopredictive.com
17 Gebo KA, Herlong HF, Torbenson MS, Jenckes MW, Chander G, Ghanem KG, et al. Role of liver biopsy in management of Chronic hepatitis C: A systematic review. Hepatology 2002; 36:S161-72.
18 Poynard T, McHutchison J, Manns M, Myers RP, Albrecht J. Biochemical surrogate markers of liver fibrosis and activity in a randomized trial of peginterferon alfa-2b and ribavirin. Hepatology 2003; 38:481-92. 19 Poynard T, Munteanu M, Imbert-Bismut F, Charlotte F, Thabut D, Le Calvez S, et al. Prospective analysis of discordant results between biochemical markers and biopsy in patients with chronic hepatitis C. Clin Chem 2004;50:1344-55. 20 Munteanu M, Messous D, Thabut D, Imbert-Bismut F, Jouys M, Massard J, et al. Intra-individual fasting versus postprandial variation of biochemical markers of liver fibrosis (Fibrotest) and activity (Actitest). Comp Hepatol 2004; 3:3.
21 Bertin, J. 1983. Semiology of Graphics, University of Wisconsin Press


