Embed Size (px)
Citation preview
Department of Business Administration
Business Development and Internationalisation M.Sc. and Marketing M.Sc.
Master Thesis in Business Administration III, 30 hp, Spring 2020
Supervisor: Vladimir Vanyushyn
Barriers of Traveling with Sustainable Transportation
Vehicles
A comparative empirical analysis of leisure travelers’ behavior in Sweden, Germany, and Iran
Robin Julian Herbert, Fateme Sohrabi
Summary This master thesis analyzes the influence of psychological barriers of consumers from Germany, Sweden, and Iran for using sustainable transportation modes. Climate change has started to change the way people travel. Yet prior research has shown that consumers from all over the world lack consistency between their behavioral intention and their actual behavior. In the case of traveling, this means that a significant number of consumers intends to use sustainable transportation modes, but fails to use them in the end. The reasons for this so-called intention-behavior gap in consumers' minds have been researched successfully and frequently in the past two decades. The novelty of this present thesis is the international comparison of travelers from three different countries and the explicit focus on voluntary travel. The according research questions are:
RQ 1: To what extent is there a gap between the intention and behavior of leisure travelers regarding choosing sustainable transportation vehicles?
RQ 2: Which group of consumers (inclined abstainers or disinclined actors1) plays the bigger role in creating this gap?
RQ 3: What are the determinants and barriers of using more sustainable transportation vehicles in leisure transportation?
RQ 4: How is the sustainable behavior of leisure travelers in Sweden, Germany, and Iran different?
To answer the research questions, an online survey in Swedish (n1 = 130), German (n2 = 128), and Persian (n3 = 127) language was carried out ( ∑ n = 385) in April 2020 with a convenience sampling method and analyzed in May 2020. The results show that there is a slightly positive intention-behavior gap in the Swedish sample and a slightly negative intention-behavior gap in the Iranian sample. In the German sample, no significant intention-behavior gap has been found. Moreover, a higher level of environmental attitude, a higher level of environmental knowledge, a higher level of perceived effectiveness (of the consumers' own actions), and a higher level of social norms increases the intention of leisure travelers in Sweden, Germany, and Iran to use sustainable vehicles for leisure traveling - both for short and for long trips. The impact of perceived value and perceived price of sustainable transportation modes, as well as the impact of consumers' sustainable lifestyle on the on the travel intention are not supported in all three countries. Additionally, distance between origin and destination has been found to moderate the impact of determinants on intention. The moderating role of distance also varies in different countries.
Keywords: consumer behavior, intention-behavior gap, theory of planned behavior, leisure travel, sustainable transportation, international comparison, climate change, aviation industry, perceived effectiveness, social norms, perceived value, sustainable lifestyle, environmental knowledge, environmental concern, perceived price, travel distance
1 See the literature review chapter for an explanation
Acknowledgments We would like to express our gratitude to our supervisor, Prof. Vladimir Vanyushyn, who supported us and answered many important questions in the last few months notwithstanding the pandemic. We would like to thank Leo El Ghoul for translating the survey we set up for this thesis. Moreover, thanks to Dr. Rob Britton and Maunu von Lueders for their thoughts and comments. We would also like to thank all participants of the survey in Sweden, Germany, and Iran, without whom it wouldn’t have been possible to conduct research the way we intended
Robin Julian Herbert & Fateme Sohrabi
Die Abgabe meiner Masterarbeit bedeutet für mich nicht nur den erfolgreichen Abschluss einer herausfordernden Aufgabe, sondern in erster Linie den erfolgreichen Abschluss meines gesamten Studiums. Ich habe mein Studium vor sieben Jahren begonnen und hatte damals keine Ahnung, wie man studiert. Die mit meinem Studium einhergehenden Strapazen haben mich so sehr mitgenommen, dass ich im Sommer 2016 kurz davor war, aufzugeben. Doch nun ist die Tatsache, dass ich diese Zeilen schreiben darf, die beste aller erdenklichen Bestätigungen dafür, dass es die richtige Entscheidung war, nie komplett hinzuschmeißen. Auf dem Weg zu meinem Ziel gab es endlos viele wunderbare Menschen, die mir geholfen haben, als ich Hilfe brauchte. So viele, dass ich sie hier nicht alle nennen kann. Ich möchte dennoch meine Eltern Monika und Jürgen aus der Gruppe der wunderbaren Menschen herausheben, da sie ihr Leben lang gearbeitet haben, um mir meine Ausbildung zu finanzieren. Es vergeht kein Tag, an dem ich dieses ungeheuerliche Privileg nicht zu schätzen weiß. Ich bin Euch für immer dankbar und fühle mich geehrt, Euch meinen Teil dieser Arbeit zu widmen.
Robin Julian Herbert
Umeå, Tuesday, May 26, 2020
II
Table of Contents List of Appendices ................................................................................................................ III List of Figures ....................................................................................................................... IV List of Tables ........................................................................................................................ IV List of Abbreviations ............................................................................................................. V 1 Introduction ..................................................................................................................... 1
1.1 Background: air traffic and environment ................................................................. 1 1.2 The phenomenon and its magnitude ........................................................................ 4 1.3 Problem discussion .................................................................................................. 6 1.4 Knowledge gap and research questions ................................................................... 7 1.5 Empirical implications of the study ......................................................................... 8 1.6 Thesis disposition ..................................................................................................... 9
2 Scientific Method .......................................................................................................... 10 2.1 Research Philosophy .............................................................................................. 10 2.2 Research Approach ................................................................................................ 11 2.3 Research Design ..................................................................................................... 12 2.4 Research Strategy ................................................................................................... 12
3 Literature Review .......................................................................................................... 14 3.1 Sustainable Consumption ....................................................................................... 14 3.2 Sustainable Transportation ..................................................................................... 16 3.3 Green Marketing .................................................................................................... 18 3.4 Theory of Bounded Rationality ............................................................................. 19 3.5 Theory of Reasoned Action ................................................................................... 19 3.6 Theory of Planned Behavior .................................................................................. 20 3.7 Intention Behavior Gap .......................................................................................... 21 3.8 Barriers in the intention-behavior consistency ...................................................... 24 3.9 Towards a conceptual model: relevant determinants ............................................. 25 3.10 Conceptual model .................................................................................................. 32
4 Practical Method ........................................................................................................... 34 4.1 Data Collection Method .............................................................................................. 34 4.2 Target population ........................................................................................................ 34 4.3 Sampling ..................................................................................................................... 37 4.4 Survey Construction .................................................................................................... 38
III
4.5 Pre-test of the Survey .................................................................................................. 42 4.6 Ethical Considerations ................................................................................................ 42
5 Data Analysis ................................................................................................................ 43 5.1 Data Preparation .......................................................................................................... 43 5.2 Data Loss .................................................................................................................... 44 5.3 Demographics ............................................................................................................. 44 5.4 Statistical Reliability ................................................................................................... 49
6 Results and Discussion .................................................................................................. 51 6.1 Intention Behavior Gap ............................................................................................... 51 6.2 Determinants of traveling by more sustainable vehicles ............................................ 56 6.3 Summary of Results .................................................................................................... 80
7 Conclusion ..................................................................................................................... 84 7.1 Theoretical Contributions ........................................................................................... 84 7.2 Limitations .................................................................................................................. 85 7.3 Future Research .......................................................................................................... 86 7.4 Managerial Implications ............................................................................................. 87 7.5 Societal and Ethical Implications ................................................................................ 89
References ............................................................................................................................ 91 Appendix ............................................................................................................................ 112
List of Appendices Appendix 1: Swedish Survey ............................................................................................. 112Appendix 2: German Survey .............................................................................................. 115Appendix 3: Persian Survey ............................................................................................... 118Appendix 4: Descriptive analysis of data ........................................................................... 122Appendix 5: Total worldwide passengers in airplanes per year ......................................... 124Appendix 6: Number of passengers at selected Swedish airports ...................................... 125
IV
List of Figures Figure 1: conceptual model .................................................................................................. 32 Figure 2: Comparison of Hofstede's cultural dimensions in Sweden, Germany, and Iran ... 36 Figure 3: The indirect effect of environmental attitude on the behavior of leisure travelers in average condition .................................................................................................................. 59 Figure 4: The indirect effect of leisure travelers’ knowledge on their average behavior ..... 62 Figure 5: The indirect effect of perceived price on the leisure travelers’ average behavior 66 Figure 6: Indirect effect of lifestyle and habits on the leisure travelers’ average behavior .. 70 Figure 7: Indirect effect of perceived effectiveness on the leisure travelers’ average behavior ................................................................................................................................ 73 Figure 8: Indirect effect of social norms on the leisure travelers’ average behavior ........... 76 Figure 9: Indirect effect of perceived value on the leisure travelers’ average behavior ....... 79
List of Tables Table 1: Greenhouse gas emissions and energy efficiency of different types of transportation .......................................................................................................................... 3 Table 2: Classification of IBGs (IBGs in bold) .................................................................... 23 Table 3: Constructs in the conceptual model and their indicators in the survey .................. 39 Table 4: Demographic statistics ........................................................................................... 46 Table 5: Descriptive measures of each construct ................................................................. 48 Table 6: Assessment of Constructs’ Internal Consistency ................................................... 49 Table 7: Results of hypotheses H1-1 and H1-2 in the short journeys .................................. 52 Table 8: Classification of IBGs and different types of consumers (Scenario 1) .................. 52 Table 9: Results of hypotheses H1-1 and H1-2 in the long-distance journeys ..................... 53 Table 10: Classification of IBGs and different types of consumers (Scenario 2) ................ 54 Table 11: Results of hypotheses H1-1 and H1-2 in the average condition .......................... 55 Table 12: Classification of IBGs and different types of consumers (average scenario) ...... 56 Table 13: Impact of environmental attitude on the intention (Scenario1) ............................ 57 Table 14: Impact of environmental attitude on the intention (Scenario2) ............................ 58 Table 15: Impact of environmental attitude on the average intention .................................. 59 Table 16: Impact of environmental knowledge on the intention (Scenario1) ...................... 60 Table 17: Impact of environmental knowledge on the intention (Scenario2) ...................... 61 Table 18: Impact of environmental knowledge on the average intention ............................ 62 Table 19: Impact of perceived price on the intention (Scenario1) ....................................... 64 Table 20: Impact of perceived price on the intention (Scenario2) ....................................... 65 Table 21: Impact of perceived price on the average intention ............................................. 66 Table 22: Impact of lifestyle and habits on the intention (Scenario1) .................................. 67 Table 23: Impact of lifestyle and habits on the intention (Scenario2) .................................. 68
V
Table 24: Impact of lifestyle and habits on the average intention ........................................ 69 Table 25: Impact of perceived effectiveness on the intention (Scenario1) .......................... 71 Table 26: Impact of perceived effectiveness on the intention (Scenario2) .......................... 71 Table 27: Impact of perceived effectiveness on the average intention ................................. 72 Table 28: Impact of social norms on the intention (Scenario1) ........................................... 74 Table 29: Impact of social norms on the intention (Scenario2) ........................................... 75 Table 30: Impact of social norms on the average intention .................................................. 76 Table 31: Impact of perceived value on the intention (Scenario1) ....................................... 77 Table 32: Impact of perceived value on the intention (Scenario2) ....................................... 78 Table 33: Impact of perceived value on the average intention ............................................. 79 Table 34: Descriptive analysis of data ................................................................................ 122
List of Abbreviations BBC British Broadcasting Corporation CEO Chief Executive Officer CFO Confirmatory Factor Analysis CH4 Carbon tetrahydride (Methane) CI Confidence Interval CO2 Carbon dioxide D.C. District of Columbia DEM German Mark EASA European Union Aviation Safety Agency E.g. for Example EIA Energy Information Administration EPI Environmental Performance Index etc. et cetera EU European Union
VI
FIFA Féderation Internationale de Football Association g Gram GDP Gross Domestic Product h Hour H Hypothesis IBG Intention Behavior Gap i.e. id est IATA International Air Transport Association IEA International Energy Agency IPCC International Panel on Climate Change KLM Koninklijke Luchtvaart Maatschappij km Kilometer kW Kilowatt kWh Kilowatt Hour LOHAS Lifestyle of Health and Sustainability NGO Non-governmental organization N2O Dinitrogen monoxide (Laughing gas) OECD Organization for economic cooperation and development O&D Origin and Destination P Probability Pedelec Pedal Electric Cycle PPI Purchasing Power Index Q/q Question RQ Research Question
VII
SEK Swedish Crowns SPSS Statistical Product and Service Solutions TPB Theory of planned behavior UK United Kingdom UN United Nations UNECE United Nations Economic Commission for Europe US United States USA United States of America USD United States Dollar YJC Young Journalists Club α Cronbach’s Alpha
1
1 Introduction This first chapter is supposed to slowly tie the reader to the topic that has been chosen for this thesis. The chapter starts with an historic illumination of the problem, followed by the phenomenon’s relevance for today’s society. Next, it is described what research does not know yet and the research questions are formulated. Finally, the outline of the whole thesis is presented.
1.1 Background: air traffic and environment In neoclassical theory, it is assumed that individuals make decisions with the goal to maximize the decisions’ utility for them (Strotz, 1955). Maximizing utility in the coherence of traveling often means to reduce the time spent while traveling (Brownstone et al., 2003; Fickling et al., 2008; Metz, 2008). That is because the less time one spends while traveling, the more time one is able to spend time at the destination - assuming that arriving at the destination is desired. Having that in mind, it is obvious why traveling by airplane often emerges as the nonplusultra for travelers: normally, an airplane can bring travelers to their destination as fast as possible. Furthermore, traveling by airplane is low-priced and safe (Nazeri et al., 2008, p. 185). Since the commercialization and deregulation of public aviation between the 1950s and 1980s, the number of operated flights has risen all around the world. An example: When the German national football team participated in the 1962 FIFA World Cup in Chile, the flight from Frankfurt to Santiago was so extraordinary that journalists had to fly in the same aircraft as the team. A ticket cost roughly the price of a Volkswagen Beetle and the trip included stops in Dakar and Buenos Aires for filling up the tanks (Strasser, 2018). Nowadays, the price for flying from Frankfurt to Santiago is more affordable (around 6000 SEK), operated daily, and only involves a stop for changing aircraft, not for filling up the tanks (Skyscanner, 2020). More general numbers are presented in appendix 5. It shows that the growth rate of passenger transports in airplanes has never been bigger than now. That is mostly due to the growth rates from highly populated Arabic and Asian countries that have become wealthier in the last 20 years (World Bank Data, 2018). The growing wealth of those countries’ populations has enabled travelers to afford airplane tickets. If this information about the growing importance of air traffic stood alone, it wouldn’t be more relevant than information about other growing industries like the gaming industry or the pharmaceutical industry (Bottazzi & Secchi, 2005; Sheng & Gu, 2018). But as the majority of airplanes runs on fossil fuels, the growing importance of air traffic stands in the light of climate change and environment protection (Höök & Tang, 2013, p. 13). Therefore, it has led to discussions in different parts of society.
2
The environmental footprint of a flight depends on many variables: the fuel efficiency of the aircraft’s engine, the wind, the number of passengers, the distance to the destination, and other factors. Moreover, the greenhouse effect in the atmosphere is reinforced by different types of gases, such as CO2, CH4, and N2O (Robertson et al., 2000). It would go beyond the scope of this paper to analyze the environmental footprint of different types of greenhouse gases. Every gas has different impacts on the greenhouse gas effect and the different impacts have mostly chemical or physical character. In order to keep the paper focused on economic research, it does not differentiate between different types of gases. Studies have compared the environmental impact2 of different types of transportations. It is sure that the airplane, under average conditions, is the type of transportation that has the biggest negative impact on the environment (see Table 1). This is not due to a higher fuel consumption per capita and kilometer, as one may assume. The fuel consumption of airplanes per capita and kilometer is in fact relatively low (EASA, 2019, p. 24). Airplanes’ negative impact on the environment is rather due to the fact that the greenhouse gases are emitted in the sky, where they do more damage than on the earth’s surface (Müller-Görnert, 2020). Table 1 visualizes that traveling by airplane is, under average circumstances, about 1,5 times as air polluting as traveling by car and about seven times as air-polluting as traveling by long-distance train. However, as stated above, it needs to be remarked that these numbers can vary, depending on the occupancy rate, the wind, the distance, the cruising altitude, etc. For example, it may be more air-polluting to drive a bus without passengers than to fly in a modern, fully booked airplane. The numbers used for this calculation are based on average numbers in German traffic over the last decades and can, therefore, be seen as representative (Umweltbundesamt, 2020). For example, the German Federal Environment Agency (Umweltbundesamt) has, over the course of several decades, observed that 1,5 persons sit in a car in Germany on average. The rate “grams per kilometer and capita” are calculated according to this average occupancy rate of 1,5 persons on average. It would not be sufficient to judge the environmental impacts of different types of transportation by only looking at their respective greenhouse gas emissions. That is because the environment is impacted by several characteristics of different types of transportation. Therefore, the following paragraph elaborates on the energy consumption and energy efficiency of different types of transportation. The energy consumption and energy efficiency of different types of transportations is, like their greenhouse gas emissions, relevant for climate change. That is due to the fact that most types of transportation are not operated with renewable energy. At the moment, most types of transportation are operated with non-renewable energy (EIA, 2016). The use of non-renewable energy sources can, under certain circumstances, vitiate natural habitats for flora and fauna, e.g. in the oceans (Troisi et al., 2016). This vitiation of natural habits is able to accelerate climate change (Pyke et al., 2016).
2 i.e. the amount of different types of emitted greenhouse gases per person and distance for different types of transportations.
3
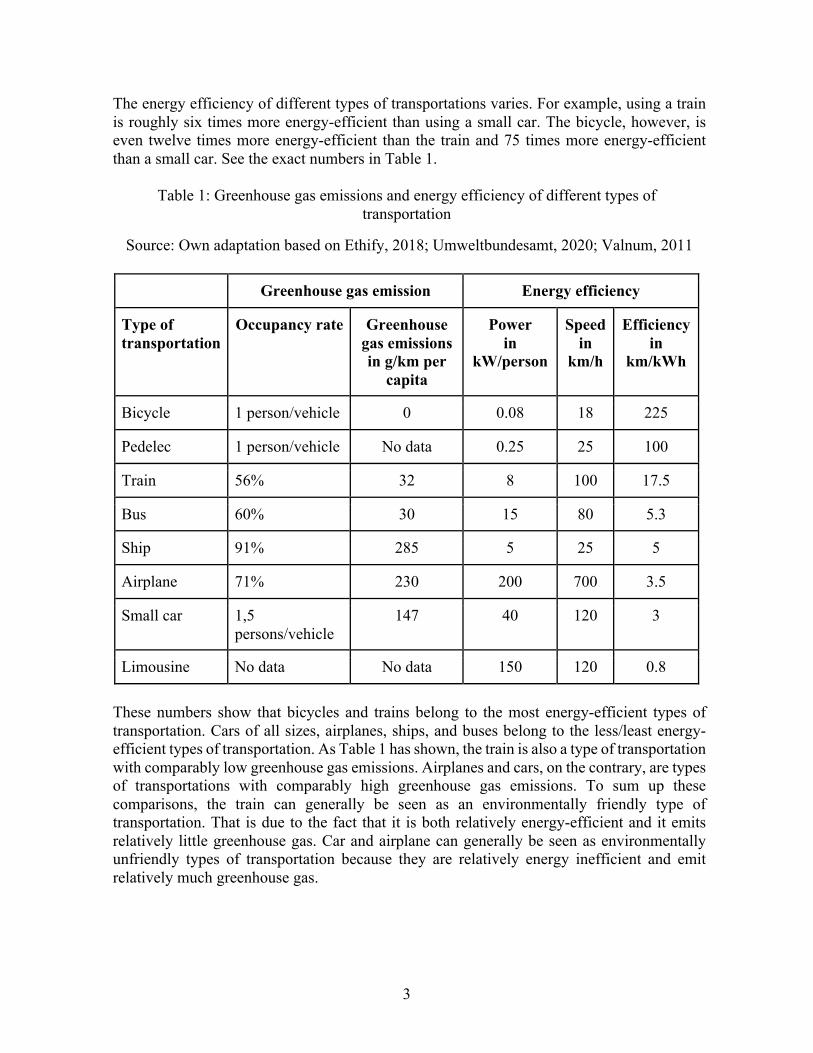
The energy efficiency of different types of transportations varies. For example, using a train is roughly six times more energy-efficient than using a small car. The bicycle, however, is even twelve times more energy-efficient than the train and 75 times more energy-efficient than a small car. See the exact numbers in Table 1.
Table 1: Greenhouse gas emissions and energy efficiency of different types of transportation
Source: Own adaptation based on Ethify, 2018; Umweltbundesamt, 2020; Valnum, 2011
Greenhouse gas emission Energy efficiency
Type of transportation
Occupancy rate Greenhouse gas emissions in g/km per
capita
Power in
kW/person
Speed in
km/h
Efficiency in
km/kWh
Bicycle 1 person/vehicle 0 0.08 18 225
Pedelec 1 person/vehicle No data 0.25 25 100
Train 56% 32 8 100 17.5
Bus 60% 30 15 80 5.3
Ship 91% 285 5 25 5
Airplane 71% 230 200 700 3.5
Small car 1,5 persons/vehicle
147 40 120 3
Limousine No data No data 150 120 0.8
These numbers show that bicycles and trains belong to the most energy-efficient types of transportation. Cars of all sizes, airplanes, ships, and buses belong to the less/least energy-efficient types of transportation. As Table 1 has shown, the train is also a type of transportation with comparably low greenhouse gas emissions. Airplanes and cars, on the contrary, are types of transportations with comparably high greenhouse gas emissions. To sum up these comparisons, the train can generally be seen as an environmentally friendly type of transportation. That is due to the fact that it is both relatively energy-efficient and it emits relatively little greenhouse gas. Car and airplane can generally be seen as environmentally unfriendly types of transportation because they are relatively energy inefficient and emit relatively much greenhouse gas.
4
The environmental impact of buses is ambiguous. On the one hand, the energy efficiency of buses is comparably low, on the other hand, the greenhouse gas emissions are low as well. Therefore, it is not possible to generally judge the environmental impact of buses.
1.2 The phenomenon and its magnitude
“Today we know aviation comes with big responsibility - to make sure our children have a planet to explore as well.
We invite all air travelers to make responsible decisions about flying.”
Pieter Elbers, President and CEO, KLM Royal Dutch Airlines Even though the different environmental impacts of different types of transportations have been known for some time, most people seem not to have adapted their behavior according to the environmental impacts. The number of flight passengers kept rising all around the world (World Bank Data, 2018) until August 2018. That was when Greta Thunberg, at that time a 15-year-old pupil from Stockholm, stopped going to school but instead started a sitting strike for the climate in front of the Swedish parliament building (Dagens Nyheter, 2018). She said that the Swedish government was menacing her generation’s future by not acting according to the Paris climate goals from 2015 (Dagens Nyheter, 2018). In the meantime, Greta Thunberg became internationally known as a climate activist and initiator of the movement “Fridays for Future” that organizes climate strikes around the world (Wahlström et al., 2019). On March 15, 2019, the movement organized a worldwide strike that involved almost 1,8 million people (Fridays for Future, 2020). Since her initial strike, Thunberg has been a speaker at the United Nations and the World Economic Forum (Carrington, 2018). She also won the Right Livelihood Award in 2019 (Right Livelihood Award, 2020). Amongst other things, Thunberg keeps appealing to people all over the world to stop using fossil fuels because of the emissions that are created during the burning of fossil fuels. Thunberg personally has stopped using airplanes in general and caught attention by sailing over the Atlantic ocean in order to attend a conference in the United States (Parker, 2019). The idea of boycotting travels by airplane for climate protection has commonly been referred to as the “Greta effect”. Thunberg’s appeals have led to negative results for airlines and positive results for train companies, that are presumably the biggest competitor of airlines. This is mostly the case in Europe, where traveling by high-speed train is possible due to high technological development, tight network of rails, and relatively short distances compared to other continents. For example, domestic travels by airplane in the United States lack train alternatives. The distances in the United States are arguably too long for train rides. Moreover, the Greta effect is mostly seen in Europe because of the citizens’ wealth. High purchase power is necessary to afford train tickets that are more expensive than airplane tickets. Some examples of the Greta effect: The Austrian Federal Railways have relaunched their night train program and have rising numbers of passengers on their international connections
5
(Galindo, 2020). In 2019, the Swedish State Railways recorded a 10% increase in bookings compared to 2018 (Berg Eidebo, 2020). The German Federal Railways recently benefited from a tax reduction on their ticket prices, resulting in a higher ticket demand (Spiegel, 2020). On the other side, the Swedish aviation industry reports a decline in passenger numbers. People in Sweden went on 11.2 million overseas trips in 2018, which was a decrease from the 11.7 million trips carried out in 2017 (The Local, 2019). Swedavia airports have had 4% fewer passengers in 2019 than in 2018 (Pletzin, 2020). Importantly, not just the number of passengers, but also the number of landings at Swedavia airports has decreased overall - against the growth trend from two decades before (Swedavia, 2020). The development of passenger numbers is illustrated in appendix 6. In fact, every Swedavia airport recorded fewer passengers in 2019 than in 2018, especially on the domestic routes (Swedavia, 2020). Even the CEO of KLM has taken initiative and published a statement on KLM’s website (see citation above) concerning climate change, alongside a broadly discussed advertising for more responsible flying (KLM, 2019). However, most other countries around the world, especially developing countries, are likely going to report ongoing increasing numbers of flights and flight passengers in the future (Britton, 2020). One could argue that the transportation industry is not the most relevant industry to investigate in the coherence of climate change, because the transportation industry is not the most energy-consuming or greenhouse gas emitting industry that exists. There are other industries that consume more energy and/or emit more greenhouse gases than the transportation industry, for example, the production industry, the building industry or the agricultural industry, depending on which source one relies on (Bilgen, 2014, p. 897; Britton, 2020; IEA, 2017; IPCC, 2014, p. 9; Nejat et al., 2015). This thesis nevertheless investigates the transportation industry, because it is an industry that presumably concerns almost all consumers on the planet. Almost all consumers on the planet travel from time to time. Thus, all consumers have, theoretically, the possibility to impact climate change - depending on which type of transportation and which frequency of traveling they choose. The fact that all consumers have the possibility to impact climate change simplifies the data collection of the empirical part of the thesis: The survey can be answered by anybody. More importantly, everybody’s answers in the survey will be relevant for the results. Moreover, one could argue that the focus on air traffic in this introduction might be too strong. In fact, most of the transportation all around the world is still carried out on the roads, mostly by light vehicles (Davis & Boundy, 2019). It is expressly not the aim of this thesis to defame the numerous advantages of air traffic, such as speed, safety, comfort, and pricing or to defame air traffic in itself. The strong focus on air traffic in this introduction is just due to the fact that it is pithy. Especially the latest decline of air travelers in Sweden and the Fridays for Future movement has been a solid footing to delineate the magnitude of the phenomenon in a memorable way.
6
1.3 Problem discussion
As illustrated above, with the exception of some wealthy consumers in Europe, most consumers on the whole planet do not (voluntarily) choose sustainable types of transportation - and that against the clear prompts from science, the United Nations, and NGOs to work against climate change. Consequently, the important question arises: How come that consumers do not choose sustainable types of transportation?
The answer to this question is multilayered and this thesis cannot formulate a finite answer either. The differences in supply and demand in different countries of the world, the income differences between consumers, the available infrastructure, etc. are just a few of the reasons why this thesis cannot finitely answer the question. What the thesis can do is to contribute to the ongoing research and help to better understand the phenomenon. One central insight of research in the last years has partly answered the question: Consumers do not always do what they say or think (Homer & Kahle, 1988; Simon, 1972). Most consumers are aware of the need to behave more sustainably, but they are not willing to change their behavior accordingly (Baker et al., 2014, Mohr et al., 2001).
When researchers ask consumers about the importance of green3 products, more than 80% of consumers claim that companies should produce green products (McVeigh, 2017). Moreover, consumers prefer buying green products rather than regular products because they partly believe that their consumption behavior can make a difference. However, purchasing statistics show that the number of consumers who buy green products is lower than the number of consumers that intend to buy green products. Even in the most sustainable countries, there is a gap between consumers’ purchase intention and purchase behavior towards green products. This gap is in research commonly referred to as the green intention behavior gap (IBG). 70 % of consumers in Nordic countries believe that their choices “are not as environmentally friendly as they would like them to be” (Nordic Ecolabelling, n.d.).
Generally, the IBG is a psychological construct based on different basic psychological theories, such as the theory of bounded rationality (Simon, 1972), the theory of reasoned action (Ajzen & Fishbein, 1977; Fishbein, 1979) or the theory of planned behavior (Ajzen, 1991). These underlying theories will be explained in the literature review part of this thesis. The creator of the theory of bounded rationality, Herbert A. Simon, won the 1978 Prize in Economic Sciences in Memory of Alfred Nobel. That illustrates the high importance of psychological theories not only for research on consumer behavior, but for economic research in general.
First research approaches have mostly focused on IBGs in an exclusively psychological context (Sheeran, 2002, p. 3), as the IBG is first and foremost a psychological phenomenon. The focus laid on commonly controversially discussed topics such as smoking (Norman et al., 1999), pregnancy and abortion (Davidson & Morrison, 1983), or physical activity and diets (Conner & Sparks, 1996). As research on IBGs was expanded to business and economy research, the focus first laid on IBGs concerning buying decisions for products, mostly organic food (Hughner et al., 2007; Moser, 2015; Nguyen et al., 2019) and organic clothing
3 One might also say sustainable or organic products.
7
(Diddi et al., 2019; Khare & Varshneya, 2017). Several studies have been working on the factors that create this gap for green product purchases such as product price, product quality, product availability and consumers’ environmental knowledge and concern (Chandon et al., 2005; Gleim et al., 2013; Khare & Varshneya, 2017; Švecová & Odehnalová, 2019), just to name a few.
However, there are relatively few studies that investigate IBGs for (sustainable) services. Two papers discussed an IBG in the recycling of electronic waste (Echegaray & Hansstein, 2017; Rosenthal, 2018). Other research topics for IBGs in services have been sustainable tourism (Graci, 2006; Hedlund, 2013; Lee et al., 2014) or traveling and transportation in general (Blainey et al., 2012; Lanzini & Khan, 2017; Wiedmann et al., 2011).
Researchers agree that IBGs in sustainable transportation are built on various psychological factors (Joshi & Rahman, 2015). For example, consumers’ habits play a role in their choice of transportation type (Blainey et al., 2012). If retired consumers have been taking the car for grocery shopping for their whole lives, they are unlikely to start taking the bike one day. Another factor is that some consumers don’t believe in the effectiveness of their own actions (Semenza et al., 2008, p. 483). Most people are convinced that their personal influence on climate change is so low that it doesn’t really matter what they do. Moreover, the safety of public (i.e. sustainable) transportation can be an issue: Especially people older than 60 years do not necessarily feel safe in public (Peck, 2010). A factor mentioned by almost all papers that conducted research on IBGs is the high price of sustainable alternatives. High prices prevent a closer relationship between purchase intention and purchase behavior (Joshi & Rahman, 2015, p. 134). More specific insights about the current state of research concerning IBGs in (sustainable) services will be presented in the literature review chapter.
1.4 Knowledge gap and research questions
Several papers have discovered the main psychological barriers to use sustainable alternatives. The identified barriers, e.g. price, habit, or safety have been confirmed by the following research. One can say that there is a consensus about the relevant barriers (Joshi & Rahman, 2015).However, research lacks a comparison between the situations in different countries, especially a comparison between countries of different situations of welfare. It may be that the IBG in wealthier countries is lower than in less wealthy countries, but it may also be higher than in less wealthy countries, for example because there is more supply for consumers in wealthy countries. Therefore, this paper aims to compare the situations in Sweden, the country of the authors’ alma mater, Germany, and Iran, the authors’ respective motherlands. Sweden and Germany rank under the top 20 countries on the list of GDP per capita worldwide and can, therefore, be seen as wealthy countries. Iran, however, can be found in the midfield of this list. Depending on the source, it lays between places 62 and 95, close to the worldwide average. Therefore, Iran can be seen as a developing country on the rise. Due to these welfare differences, one may expect similar results from Germany and Sweden with a difference to the results from Iran. This thesis studies consumers’ sustainable transportation behavior and examines the gap between intention and behavior of leisure travelers to use more sustainable transportation vehicles, e.g. trains instead of cars or airplanes. The focus lies on leisure travelers only, because it is not guaranteed that travelers
8
in business situations have a choice between different types of transportation. Most business travelers only need to be fast and are therefore forced to choose the fastest type of transportation. Travelers who travel for vacation, education, or family and friends are more likely to have choice freedom. Furthermore, leisure travel concerns presumably all people at a certain point in their lives. Therefore, the empirical part of this paper is aimed at all people. That will probably lead to a big survey sample.
Based on these preceded argumentations, the research questions of this thesis are:
RQ 1: To what extent is there a gap between the intention and behavior of leisure travelers regarding choosing sustainable transportation vehicles?
RQ 2: Which group of consumers (inclined abstainers or disinclined actors4) plays the bigger role in creating this gap?
RQ 3: What are the determinants/barriers of using more sustainable transportation vehicles in leisure transportation?
RQ 4: How is the sustainable behavior of leisure travelers in Sweden, Germany, and Iran different?
This thesis answers calls for further research by devoting itself to these questions (Joshi & Rahman, 2015, p. 129). Particularly, researchers have called for comparisons between different populations/societies (Lanzini & Khan, 2017, p. 22) and for examining the questionable influence of peer pressure and other social factors (Hedlund, 2013, p. 77). The conceptual model integrates an examination of social factors in H6 (see conceptual model chapter). Thereby, the relevance of this kind of research is elucidated from two sides: One side is the call from prior research, the other side is the call from climate change for humanity to adapt its behavior.
1.5 Empirical implications of the study This thesis aims to provide implications for society, managers, and research. The implications for research mostly depict propositions for further research. I.e., the results of the empirical part are likely to lead to new research questions that cannot be answered with the present sample and/or methodology. Both the implications for managers and for society depend on the results of the empirical part. The implications strive to be helpful for understanding IBGs better, and perhaps to be helpful to lead managers and consumers over IBGs. The reduction of IBGs in purchasing decisions would simplify the work of marketers and companies in general.
4 See the literature review chapter for an explanation
9
1.6 Thesis disposition The thesis first discusses different scientific methods behind the work. The scientific methods chapter is followed by a review of the literature that has been published. The explanation of evidence, the explanation of different theories that are subject to this thesis, and the connection between different theories will be in the foreground of this chapter. The literature review finally aims to justify the hypotheses and smoothly lead into the conceptual model for the empirical part. Chapter 4 clarifies the methodology used for the empirical part. The results of the survey and the according interpretations can be found in chapters 5 and 6. The final chapter 7 summarizes the results and provides implications for research, management, and society. Last but not least, this paper will also bring up new questions for further research that are going to be discussed at the very end of the thesis.
10
2 Scientific Method
“I think it is insane that people are gathered here to talk about the climate and they arrive here in private jets.”
Greta Thunberg, climate activist, at the World Economic Forum 2019, Davos, Switzerland
Before conducting research with the thoroughness that meets the requirements of a master thesis, it is important to discuss and explain how research itself is viewed and treated by the authors. Without a discussion of views on research, the probability of misunderstandings while reading the thesis would rise. Therefore, this chapter gives an overview of the mental approach to the paper.
2.1 Research Philosophy Research philosophy, arguably the most intangible idea of scientific constructs, gives information about how researchers view the world (Saunders et al., 2009). More particularly, this means that research philosophy is about how a given study perceived knowledge and reality (Saunders et al., 2009, p. 108). This is important to define since research is, after all, a try to gain and share knowledge (Saunders et al., 2007, p. 130). The most important determinants for building a research philosophy are ontology, epistemology, and axiology (Saunders et al., 2007). Ontology aims at describing how one sees the world and the things that are being researched. Epistemology concerns the researchers’ assumptions about knowledge and finally, axiology describes which role values and ethics have in the mind of researchers (Saunders et al., 2007). Together, ontology, epistemology, and axiology can form a more or less complete research philosophy. When it comes to ontology, this paper is based on the belief that only one reality exists and that researchers are able to observe and interpret reality. Accordingly, the epistemological idea behind this thesis is that observations are possible and measurable. Setting up a conceptual model based on accepted constructs and theories ensures the measurability of the observations. This thesis’s view on axiology (values) is that values are decisive for the outcome of the empirical analysis (Hedlund, 2013). That is because the cultural values in the three different analyzed countries are different. It is therefore not possible to exclude values from the research philosophy for this thesis - as a natural scientist would probably do it (Saunders et al., 2007). Quite the reverse, values are essential for the empirical part and the integration of values into the conclusions is necessary. When it comes to the authors’ values and how these values influence the overall procedure and results, the goal has been to exclude personal values as much as possible. But that is probably not completely possible, since the topic choice was made by the authors and that already can be interpreted as an influence of personal values (Heron, 1996). All in all, it can be said that the ontological and the epistemological ideas behind this thesis follow a relatively objective ideal, whereas the axiology leans towards a subjective view on knowledge and research. Such a hybrid view on objectivity and subjectivity research philosophies goes hand in hand with other researchers’
11
views on social science (Bernstein, 2011). It is arguably almost impossible to reach complete objectivity in social science studies (Bernstein, 2011). The major philosophies in research are positivism, critical realism, interpretivism, postmodernism, and pragmatism (Saunders et al., 2007, p. 144). While positivism postulates a radically objective and non-interpreted view on research, the other listed philosophies gradually increase in subjective views until postmodernism, which is a completely subjective and interpreted view on research and especially on data (Saunders et al., 2007, p. 145). Finally, pragmatism tries to transport a flexible view of researchers that are sometimes more objective and sometimes more subjective, depending on the research question. Positivism is not a completely adequate research philosophy for this thesis, since, as argued above, values and the interpretation of values is a focal point for the empirical part. On the other side, a postmodernism philosophy doesn’t seem adequate either, because of the ontological and epistemological standpoints from the above paragraph. Therefore, the best way to describe the research philosophy of this thesis is the critical realism philosophy. It means that the authors are ontologically and epistemologically convinced by a real, observable and objective truth behind science, but the axiological implications are subjective - values play a role (Saunders et al., 2007, p. 144).
2.2 Research Approach As Saunders et al. (2007, p. 152) argue, once the research philosophy has been elaborated, researchers ought to discuss the way they approach research. Research approaches can have inductive, deductive, or abductive character (Saunders et al., 2007, p.152). An inductive research approach means that the goal of the research is to build up theory after the researchers have analyzed data (Saunders et al., 2007, p. 153). The new theory is logically derived from the results of the data collection, thus giving the theory a pars pro toto kind of reasoning (Saunders et al., 2007, p. 153). Correspondingly, a deductive research approach means that an already existing theory is becoming examined by the researchers (Saunders et al., 2007, p. 153). The goal of data analysis is then to verify or falsify the existing theory and not to set up a new theory like with the inductive approach. Thus, one can say that deduction is described as a totum pro parte research approach (Saunders et al., 2007, p. 153). Finally, abduction (sometimes called retroduction) means to combine deduction and induction (Suddaby, 2006). An abduction is a research approach that is often seen in management research, where scholars collect data to form a theory. This theory is then examined by another data collection and thus can be verified or falsified (Saunders et al., 2007, p. 160). Since this thesis is built on existing theories like TPB and the theory of IBG, the data collection and analysis has the goal to verify or falsify theories and hypotheses according to these theories. It is expressly not the goal to develop new theories. Therefore, the research approach of this paper clearly has a deductive character.
12
2.3 Research Design This thesis is based on a critical realism research philosophy and generally has a deductive character. In order to collect data that enables a deduction that is appropriate for falsifying or verifying hypotheses, it is adequate to collect quantitative data (David & Sutton, 2011). By collecting and analyzing quantitative data, deductions can come closer to generalizability than by using qualitative data (David & Sutton, 2011). On the other side, the strength of qualitative studies is the possibility to focus on details. Furthermore, qualitative scholars have a relatively low risk of misunderstandings and misinterpretations (Saunders et al., 2007). Nevertheless, since the goal of this thesis is to add knowledge to the existing body of research concerning barriers of using sustainable transportation, it makes sense to aim at the generalizability of the findings. To achieve this generalizability, primary quantitative empirical data is gathered and used as a basis for deductions. Moreover, the research design can be classified into three groups, regarding the purpose of the research: exploratory, descriptive, and explanatory (Saunders et al., 2009, p. 139). Exploratory research is meant to provide new or updated evidence on a certain topic. As discussed above, however, there already exists a whole body of research on the topic of this thesis. It is unlikely to create new knowledge in a field that already has been broadly researched. On the other side, it is important to mention that another purpose of this paper is to compare findings from three different countries in three different cultural contexts. Comparing different groups of age, ethnicity, income, etc. has been an important motive in research before in order to gain a deeper understanding of phenomena (Cui et al., 2020; Etzioni, 1975). This comparison could somehow also be seen as an exploratory goal. Therefore, a clear statement concerning the exploratory character of the work is not possible. When it comes to explanatory characteristics, a clear judgment is not practicable either. On the one hand side, the explanation of behavioral theories like TPB or IBG is not targeted in business science. On the other hand, the conclusions that the data enables definitely have the goal to explain what motivates the sample, what the barriers for using sustainable transportation are in the respondents’ cases. One can argue that the paper mostly has a descriptive purpose since the descriptions of the empirical evidence ought to pave the way for implications. I.e., the answers of the survey respondents enable the authors to formulate implications. At the same time, it does not seem possible to clearly say if the design of this scholar is exploratory, descriptive, or explanatory. As argued above, there are chances that all of the three designs are important, but none of them is necessarily important.
2.4 Research Strategy The final decision around the theoretical basis of research, the last brick of the bridge between theory and practice, is the research strategy. The research strategy is supposed to evolve logically from the prior conclusions about philosophy, approach, and design of research (Saunders et al., 2009). Possible research strategies are, e.g., interviews, surveys, experiments, or case studies (Saunders et al., 2007, p. 130). In the context of business science, surveys, and case studies depict a qualitative design (David & Sutton, 2011). But since this thesis has a quantitative design, interviews, or case studies are not appropriate research strategies. Therefore, data collection will be implemented through an online survey.
13
Moreover, surveys enable a relatively fast data collection that is accompanied by a relatively good chance for generalizing results (van Enckevort & Ansari-Dunkes, 2013, p. 19). The fact that the survey will be conducted online ensures the feasibility of the project in the given time frame. This feasibility stems from the high degree of speed and the low degree of difficulty that comes with an online survey. To sum up this chapter about the scientific methods behind the thesis, it can be said that the research philosophy is best described by critical realism, the research approach is deductive, the data collection has quantitative character and the strategy for the data collection is an online survey.
14
3 Literature Review This chapter implements the literature review that is necessary for setting up the conceptual model, that later allows the empirical analysis. The conceptual model is developed by step-by-step perusing the existing literature that might contribute to a suitable conceptual model. Within this process of perusing the literature, the hypotheses for the empirical analysis are elaborated. Finally, subchapter 10 will visualize the conceptual model and repeat the priorly formed hypotheses in order to give an overview. In order to provide the reader with a detailed literature review that meets the requirements of a master thesis, the following literature review includes basic psychological theories from the 1980s and 1990s. Those theories are, e.g., the theory of planned behavior and the theory of bounded rationality. It is necessary to explain these basic theories because they are partly integrated into the IBG theory. Therefore, the literature review is built on some basic theories from psychology research. Concerning IBGs, the literature review started by analyzing review papers such as Joshi & Rahman (2015) and Blainey et al. (2012). These papers list and organize recent papers about IBGs. Those recent papers have subsequently been scrutinized in order to find reliable sources for IBG determinants and their definitions.
3.1 Sustainable Consumption
“Everyone in the commercial aviation ecosystem understands the impact of flying. We are working to reduce that impact.
At the same time, we need a balanced view (benefits and costs) of all the good things that airlines enable.”
Dr. Rob Britton, Adjunct Professor, Georgetown University, Washington D.C., USA
Former Managing Director, Marketing, American Airlines (1987-2009) In order to facilitate a sustainable future, both supply and demand for sustainable products and sustainable services have to grow. In other words, sustainability can only become real when consumption becomes sustainable. Sustainable consumption can be defined as consumption with the help of which “humans can survive without jeopardizing the continued survival of future generations of humans in a healthy environment” (Brown et al., 1987, p. 717). How exactly sustainable consumption can be reached in different parts of society is part of an ongoing discussion in research, entrepreneurship, and general business practice. The central matters in this discussion are the use of renewable energy sources (Owusu & Asumadu-Sarkodie, 2016), waste management (Kaza et al., 2018) and in general reusing and recycling resources (Garcia & Robertson, 2017). But also less intuitively sustainable ways
15
have been developed in the last years, for example the sharing economy concept with business models like Airbnb or BlaBlaCar. Digital business models have in general supported sustainable consumption, since they often don’t require many physical resources (Luz Martín-Peña et al., 2018). However, since this thesis broaches the issue of the transportation industry, this chapter will not focus on overall sustainable consumption. Instead, the following paragraphs ought to explain the ongoing developments in the transportation industry only. The sustainability pivot in the transportation industry has taken place both on the suppliers’ and on the demanders’ side. As pointed out above, this simultaneous adaptation of practice on both sides is necessary for successful sustainable consumption. First, a look on the side of suppliers: E.g., the aviation industry has implemented climate-compensation offers that try to even out the air pollution caused by flying. For example, it is possible to pay a price surplus for a flight ticket that the airline directly invests in environment protection programs (Rousse, 2008). Furthermore, technology development has propelled the use of more and more fuel-efficient aircraft turbines in the last years. Even though airplanes have become more fuel-efficient, the absolute amount of emissions keeps rising due to the rise of passenger numbers (Rutherford, 2011, p. 11 f.). However, the amount of emissions is expected to stagnate from 2040 on, due to ongoing technological development (Rutherford, 2011, p. 13). Signs for a sustainability shift in the minds of transportation suppliers can also be seen in other situations. Regular ethanol with 5% organic sources is not the only supplied ethanol anymore. Gas stations in various countries also offer ethanol with 10% organic sources (Rabe, 2011). The German railways have started to increase the share of renewable energy sources in the electricity used for their trains. The long-distance trains already operate with renewable energy only (Grunberg, 2020). On the side of demand, the terms green consumer or sustainable consumer have been developed. Green consumers mean those consumers who are “concerned about the environment in their purchase behavior, activities associated with the marketplace and consumption habits and consider the effect of their behavior on the natural environment around them” (Shabani et al., 2013, p. 1880). However, these concerns are not only about the consumers’ physical goods choices but also about their service choices. In general, consumers who show environmentally friendly behavior are called green consumers (Shabani et al., 2013). The impact of such green consumers can be seen in different sectors of the economy. In the transportation sector it can be seen, for example, that the number of sold Tesla cars has risen. This has been due to climate change and the need to reduce emissions. The fact that Tesla cars are getting sold is proof of the rethinking processes in some consumers’ minds or in some politicians’ minds. Norway has incentivized sales of electric cars by lowering taxes (Holtsmark & Skonhoft, 2014), thus creating incentives for consumers who are not sustainability early adopters. If climate change didn’t exist, electric cars would most probably not have been sold that often. Their comparably high prices and low ranges would make them too unattractive compared to fossil fuel vehicles. But relatively many early adopters believe that protecting the environment can justify a price surplus (Vassileva & Campillo, 2017). Moreover, the market launch of Pedelecs has most likely ousted some fuel-run cars or
16
scooters, thus leading to less fuel demand and better air quality in urban areas (Peterman et al., 2016). Sustainable consumption does not only show on the roads. In wealthy European countries, travelers have also adapted their behavior in favor of the railroads in the last years. The Austrian Federal Railways have relaunched their night train program and have rising numbers of passengers on their international connections (Galindo, 2020). In 2019, the Swedish State Railways recorded a 10% increase in bookings compared to 2018 (Berg Eidebo, 2020). The German Federal Railways recently benefited from a tax reduction on their ticket prices, resulting in a higher ticket demand (Spiegel, 2020). The Nordic countries (Sweden, Norway, Denmark, Iceland, and Finland) take a special role in the sustainable consumption movement. Two thirds of nordic consumers believe that climate change threatens the future and one third of the consumers are willing to pay more for sustainable solutions (Nordic Ecolabelling, n.d.). Moreover, in contrast to other consumer groups around the world, the majority of consumers in the Nordic countries believe that their choice can make a difference (Nordic Ecolabelling, n.d.). On the other side, consumers from less wealthy countries arguably have fewer possibilities for spending money on sustainability. As argued above, most sustainable products and services are more expensive than regular products and services. Therefore, the less purchasing power consumers have, the less they can engage in sustainable consumption. To sum up, it can be said that sustainable consumption has started to influence consumers and suppliers in most parts of the world. On this occasion, countries or regions with high purchasing power have accepted the new offers faster than countries or regions with low purchasing power. The fear that sustainable products and services hinder firms’ profitability has been and still is a limiting factor in the implementation of sustainable consumption. There are certain examples of sustainable and profitable business models (Elkington, 2013; Renault, 2020), but not all business models have been able to convince ecologically and economically at the same time.
3.2 Sustainable Transportation Even though research on sustainable consumption has mostly focused on products, consumption is not limited to products only. We argue that the focus on sustainable services is both possible and important because services are getting more and more important in the worldwide economy (OECD, 2020). The importance of services can be observed well in the traveling industry because people from all parts of the world are traveling more and more (Shabani et al., 2013; World Bank Data, 2018). That is the main reason why this thesis focuses on sustainable transportation. Sustainable consumption has been defined as consumption with the help of which “humans can survive without jeopardizing the continued survival of future generations of humans in a healthy environment” (Brown et al., 1987, p. 717). What does this mean for the definition of sustainable transportation? It means that it is necessary to take the environmental impacts of different transportations into account and categorize different types of transportation
17
regarding their impact on the environment. This impact is a combination of different qualities of transportation, such as the amount of energy use, the energy sources, greenhouse gas emissions, use of land, noise, and in certain circumstances physical leftovers of transportation, e.g. waste (Dudow, 1998). According to a classification of this kind, sustainable transportation is transportation “that has a lesser or reduced negative impact on human health and the natural environment when compared with competing transportation services that serve the same purpose” (Björklund, 2011, p. 12). According to the parameters listed by Dudow (1998), this chapter will classify different types of transportation regarding their environmental impacts. Since this thesis analyses the traveling behavior for voluntary/leisure time travels, one may argue that it is relevant to include all types of transportation into the classification. However, it makes more sense to leave out transportation types like walking, motorcycles, pedelecs, roller skates, scooters, bicycles, segways, and other types of transportations that have similarly short ranges. It may be possible to travel long distances with such small types of transportation and some consumers may do that. But the number of consumers who use these small types of transportation for vacation and long-distance traveling is so marginal that these small types of transportation are excluded from the analysis in this thesis. Transportation on ships and boats can be important for long-distance travel in regions that are close to water, especially in island countries. But since neither Sweden nor Germany nor Iran are island countries, ships and boats are not a part of this classification either. Instead, the analysis will categorize the four most used transportation types in Sweden, Germany, and Iran: airplanes, cars, trains, and buses. When it comes to physical leftovers, transportation is a service that almost has no impact on the environment in that regard. Tires of cars, airplanes, and buses get rubbed off when they are used, but not in a way that would harm the environment in the long run. Other than that, not leaving physical things behind can be seen as an environmental advantage of traveling in general. On the contrary, noise pollution is a parameter that plays a role in cars as for buses, trains, and airplanes. Being exposed to frequent loud noises has been proven to be damaging the environment, for example it influences the development of children (Evans et al., 1998). Not only does noise impede the development of children, but it also causes stress for people of any age (Ising & Kruppa, 2004). But because some people live close to rails, airports or roads and some people live far away from them, it is not possible to say that the noises of a specific type of transportation are more problematic than the noises of another type of transportation. For example, airports are presumably louder than roads but the noise at airports is not as permanent as the noise of roads and rails. Therefore, a classification of noises in a way that is representative of all consumers is not possible. A classification that is possible is the classification of different types of transportation regarding their greenhouse gas emissions and their energy use. This classification can be found in table 1 on page 3. The summary of the classification is that the train can generally be seen as an environmentally friendly type of transportation. That is due to the fact that it is both relatively energy-efficient and it emits relatively little greenhouse gas. Cars and airplanes can generally be seen as environmentally unfriendly types of transportation, because they are relatively energy inefficient and emit relatively much greenhouse gas. The environmental impact of buses is ambiguous. On the one hand, the energy efficiency of buses is comparably low, on the other hand, the greenhouse gas emissions are low as well.
18
Therefore, it is not possible to generally judge the environmental impact of buses. Taking these different analyses into account, it can be concluded that the list from the most sustainable to the least sustainable type of transportation is: train, bus, car, airplane.
3.3 Green Marketing When sustainable products and services are brought to the market, they often are being marketed in a different way than ordinary products and services (Boztepe, 2012). That is due to the fact that sustainability can depict a competitive advantage, especially in countries and regions where consumers have high purchasing power and education about sustainability. The definition of green marketing has been part of a debate in marketing science. Researchers mainly have been debating because of the different theoretical forms of green marketing. On the one hand, green marketing can be seen as a strategy of marketing sustainable products and services. It includes the processes of producing, packaging, pricing, promoting, and selling environmentally safe products and services (Chen & Chang, 2012; Dahlstrom, 2011). On the other side, green marketing can also refer to the sustainability of the marketing concepts themselves, such as the packaging (waste problematic) or corporate climate compensations. Corporate social responsibility can also be linked to a firm’s green marketing initiatives. Due to this multi-layered relevance of marketing, the definition for this thesis is a rather broad one: “Green marketing consists of all activities designed to generate and facilitate any exchanges intended to satisfy human needs or wants, such that the satisfaction of these needs and wants occurs, with a minimal detrimental impact on the natural environment” (Majid et al., 2016, p. 3). When it comes to sustainable products and services, consumers have been lacking trustworthy sources of information about production processes. I.e., companies have been able to market their products and services as sustainable for many years, even though in some cases, the statements about sustainability were either euphemisms or lies (Bruce, 2009). This so-called greenwashing has had an impact on consumers around the world (Parguel et al., 2011). In order to avoid such corporate tricks, the importance of eco-labels has risen in the last years (Thøgersen et al., 2010). Such eco-labels are supposed to certify that a company, product, or service is developed under regularly controlled sustainability standards. These standards vary from label to label. Even though eco-labels are not a guarantee for accelerating sales (Banerjee & Solomon, 2003), they are at least some kind of reference for consumers, who otherwise wouldn’t be able to overlook production processes. Green marketing and eco-labels play a significant role in the promotion of sustainable transportation services. The consumers should be informed by the suppliers in an honest and trustworthy way. If it wasn’t for sustainability, many expensive transportation services would struggle to justify their prices. Therefore, it can be argued that green marketing is integrated into the conceptual model for the empirical analysis, for example in the hypotheses three and four (see the chapter about the conceptual model).
19
3.4 Theory of Bounded Rationality For many years during the 20th century, the behavior of consumers was forecasted by the expectation that consumers would always behave rationally. Firms and researchers assumed that consumers tend to use their (purchasing) behavior as a tool for maximizing utility. For example, when consumers decided to buy windows for their new houses, the window supplier assumed that the consumers chose this supplier because it offered the best windows according to their needs. Or, as economists would say, the choice of this supplier maximized the consumers’ utility. However, Herbert Simon argued that this rationality of choice may be limited by either (1) a lack of information, (2) the role of risks and uncertainties in the consumers’ choice or (3) the complexity of the decision (Simon, 1972, p. 163 f.). Coming back to the window example, this would mean that the consumers may not have done enough research on window producers and their offers, so that the final choice is made with limited information and thus becomes suboptimal for an omniscient person. Naturally, uncertainty and lack of information hinder any decision to a certain extent (Simon, 1972, p. 163). But also the complexity of a decision in itself, without risks or lack of information, impedes rational decision-making (Simon, 1972, p. 164). This is one of the reasons why a chess game isn’t boring for interested players: Chess has around 10120 possible constellations, assuming that every player makes 40 moves (Simon, 1972, p. 166). No player will ever be able to memorize all these different possibilities when making a move, because it is too complex to do that. That’s why chess players can never make a completely rational decision. Additionally, the lack of information about the opponent’s choice makes rational decisions even more difficult (Simon, 1972, p. 169). One could argue that it is rational to behave according to intention. Thus, a discrepancy between intention and behavior can be seen as a sign of bounded rationality. Therefore, the theory of bounded rationality is the most basic hint at the existence of IBGs, even though IBGs have not been a psychological research topic at the time when the bounded rationality theory was introduced. Nowadays we know that Herbert Simon’s work paved the way for researching IBGs, for example because IBGs do occur due to lack of information or complexity of decisions (Joshi & Rahman, 2015). Methods to overcome bounded rationality, e.g. attempts to gather all relevant information, have also been a foundation for developing methods for bridging IBGs (Gigerenzer & Selten, 2002).
3.5 Theory of Reasoned Action In the light of the bounded rationality theory, psychologists of the 1970s and 1980s have started researching and discussing relationships between intention and action/behavior in human decision making (Ajzen & Fishbein, 1977, p. 888). A central insight of this research period was that intention can but does not necessarily predict behavior (Ajzen & Fishbein, 1973). More specifically, the consistency between intention and behavior depends on the correspondence between the entities that affect intention and behavior. For example, a study asked white students about their attitudes towards black people. Then, the students were asked to sign a petition that a black person sitting next to them had signed
20
before. Results showed that this lack of correspondence - attitude towards black people and signing a petition - avoided a correlation between intention and behavior (Himelstein & Moore, 1963). On the other side, when there is a correspondence between the entities that affect intention and behavior, people are likely to act according to their intention. For example, consumers who say they like a certain ice cream also tend to consume a lot of ice cream (Nisbett, 1968). High and low correspondence between entities that affect intention and behavior is not strictly separable from each other. There are also studies that scrutinize medium levels of correspondence between the measured entities (Ajzen & Fishbein, 1977, p. 903) or ambiguous levels of correspondence between the measured entities (Ajzen & Fishbein, 1977, p. 911). For example, when people ask their neighbors for a donation for sick children, the neighbors might donate because it is the neighbor who asks or because the donation is for children or both. To sum up, it can be said that a “person's attitude has a consistently strong relation with his or her behavior when it is directed at the same target and when it involves the same action” (Ajzen & Fishbein, 1977, p. 912). If these conditions are met, attitude or intention can predict or reason human behavior. The likelihood of predicting behavior is high, nonetheless, it is not guaranteed. What does this imply for IBGs in sustainable transportation? Are the conditions for the theory of reasoned action met or not? Arguably, the conditions are not met, because target and action are different between attitude and behavior. Probably, choosing (behavioral action) a train ride instead of a car ride (behavioral target) is too unrelated to the intention of protecting (intentional action) the environment (intentional target). Moreover, according to the theory of reasoned action, intention is not only formed by somebody’s personal beliefs, but also by the beliefs of others, so-called subjective norms (Fishbein, 1967). For example, it could be that a child is influenced by the way its parents think about environment protection. To better understand the process of forming intentions in the consumers’ minds, subjective norms are integrated into the conceptual model later presented in this chapter.
3.6 Theory of Planned Behavior The theory of reasoned action (Ajzen & Fishbein, 1977) has been revised by its authors several times, according to criticism that had raised both from theoretical and empirical standpoints. The authors were not satisfied with the reliability of the theory of reasoned action to predict human behavior. The revisions concluded in a new name for the same but adapted theory. The new name was the theory of planned behavior (Ajzen, 1991). The theory of planned behavior forecasts human behavior better than the theory of reasoned action (Chang, 1998; Madden et al., 1992). Compared to the theory of reasoned action, the theory of planned behavior has one more predictor for behavioral intention, namely perceived behavioral control (Ajzen, 1991, p. 181). It is argued that behavioral intention can only predict behavior if the acting person has the ability to control the action and decide the action (Ajzen, 1991, p. 181 f.). One example of the importance of behavioral control can sometimes be seen when married couples want to buy a new car. It may be that these people believe that a new car is
21
desirable (positive attitude) and their friends think it is desirable too (positive subjective norms), but their wife or husband is in charge of the financial decisions. In this case, the people who want to buy a car are not capable of deciding and therefore their behavioral intention does not predict their behavior in a good manner. Analogically, another classic situation for lack of behavioral control is the behavioral intention of children, who arguably almost never have enough money to do a purchase. However, not only financial issues can influence behavioral control, but also other factors like time or skills (Ajzen, 1991, p. 182). Attitude, subjective norm, and perceived behavioral control together form a person’s behavioral intention. In this case, it is likely that behavioral intention forecasts actual behavior. The stronger the intention, the more likely it is according to behavior (Ajzen, 1991, p. 188). Moreover, the different weightings of attitude, subjective norms, and perceived behavioral control can vary. Which determinant is the most important for shaping intention depends on the situation (Ajzen, 1991, p. 188). These varying weightings are represented by the connecting arrows between the three determinants. The final not intuitive arrow in the figure is a dashed arrow between perceived behavioral control and behavior. This arrow has the goal to express that perceived behavioral control can, in special situations, directly influence behavior, without taking intention into account (Ajzen, 1991, p. 184). For example, in addictive scenarios such as smoking, the perceived behavioral control might be so low that it avoids the behavior (stopping to smoke), no matter how strong the intention might be. The theory of planned behavior has often been confirmed as a helpful tool for predicting behavior, especially in health-related topics like contraception and physical activity (Allahverdipour et al., 2012; Molla et al., 2007). Nevertheless, not all behavior can be explained by this theory (Ajzen, 1991, p. 187). Some weak correlations between measured intention and behavior (IBGs) have proven that the concept is not applicable for every decision a human makes. Limitations of the theory of planned behavior have been detected by other researchers and the theory’s author himself. To the biggest part, the theory has been criticized because it does not involve any emotional factors, but rather goes in line with the homo oeconomicus view on consumers (Sniehotta et al., 2014, p. 2). Moreover, empirical research has shown that habits and past behavior are strongly responsible for future behavior (Joshi & Rahman, 2015). One could argue that habits and past behavior are integrated into the determinant attitude, because attitude can only be formed by experiences that lie in the past. But even in the case that habits are seen as a part of the attitude, the influence of habit on attitude cannot be explained by the theory. Therefore, the conceptual model of this thesis also contains habitual matters as a determinant amongst other determinants. The conceptual model with all determinants is explained at the end of this chapter.
3.7 Intention Behavior Gap The theories explained above have been good predictors of the relationship between intention and behavior in consumer decision making. But at the same time, the theories never were able to forecast all types of behaviors. For the cases where broadly accepted psychological theories were not able to explain behavior, researchers have shaped the term Intention
22
Behavior Gap. The Intention Behavior Gap (IBG) or Attitude Behavior Gap is a psychological phenomenon that also applies to sustainable consumption (Joshi & Rahman, 2015). In simple words, it describes the situation when people do not do what they intend or say they would do. This discrepancy can be regarded as one of many paradox observations in human decision making, such as the Ellsberg paradox or the prisoner’s dilemma. These kinds of paradox behaviors of consumers have been supporting scientific criticism of the homo oeconomicus concept, such as the theory of bounded rationality by Herbert Simon (Simon, 1972) or the theories by John Maynard Keynes. While IBGs have first been researched in mainly psychological contexts such as smoking (Norman et al., 1999), pregnancy and abortion (Davidson & Morrison, 1983) or physical activity and diets (Conner & Sparks, 1996), the last ten years have shown a rising interest of IBGs in business and economics research. This business interest in IBGs has risen because IBGs impede the understanding of purchasing decisions. Since purchasing decisions are crucial for the profits of firms, research on IBGs is an important part of consumer behavior research. By researching IBGs and eliminating the reasons for IBGs, figuratively called gap bridging, researchers could help companies to make a profit more easily (Carrington et al., 2014, p. 2759; Fennis et al., 2011). Research on IBGs in business coherences has, to a big extent, focused on environmental IBGs, because that is where many IBGs have been observed (Echegaray & Hansstein, 2017; Moser, 2015). Within this body of research on environmental IBGs, most papers have analyzed consumer behavior for buying physical products, but not for services, such as sustainable transportation (Joshi & Rahman, 2015). Therefore, the first two hypotheses of this thesis will be: H1-1: Intention of leisure travelers to use sustainable vehicles is positively correlated with their choice of sustainable vehicles. H1-2: There is a gap between the intention of leisure travelers to use sustainable vehicles and their behavior of traveling by sustainable vehicles. When researching IBGs, it makes sense to discuss the classifications of IBGs before doing empirical research. That is because the intuitive type of IBG - people/consumers say they would act a certain way, but they actually don’t - is in fact not the only IBG that may exist. It may also be that people/consumers say they would not act a certain way, but they actually do. This “inverted” IBG has been addressed and emphasized by Sheeran (2002). The author argues that it is reasonable to look at IBGs in a 2x2 matrix, as both intention and behavior can be positive and negative and thus create different types of gaps (Table 2). In this classification table, people with positive intentions and positive behavior (i.e. acting) are called inclined actors. Accordingly, people with negative intentions and negative behavior (i.e. not acting) are called disinclined abstainers. Those two groups of people show consistency between intention and behavior and can therefore not be responsible for any IBG. Consequently, that means that inclined actors and disinclined abstainers are only partly relevant for the empirical research of this paper. More relevant for the empirical research of this paper are those people who are responsible for IBGs, i.e. people with positive intentions
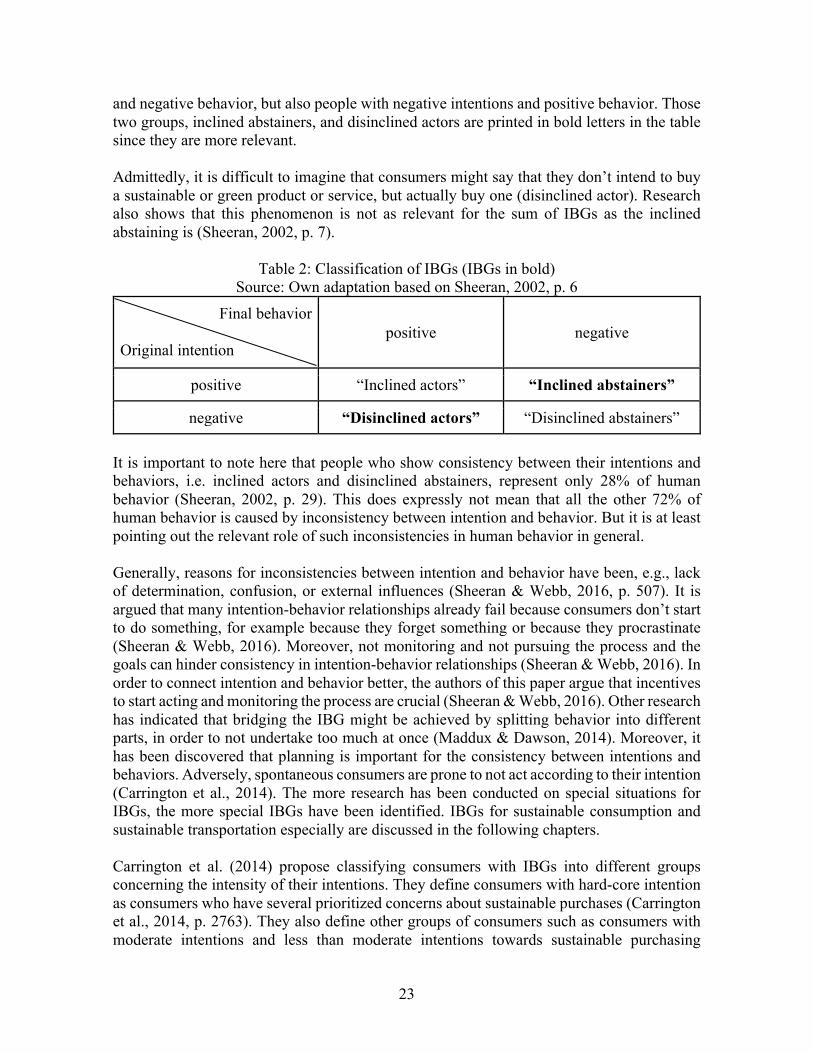
23
and negative behavior, but also people with negative intentions and positive behavior. Those two groups, inclined abstainers, and disinclined actors are printed in bold letters in the table since they are more relevant. Admittedly, it is difficult to imagine that consumers might say that they don’t intend to buy a sustainable or green product or service, but actually buy one (disinclined actor). Research also shows that this phenomenon is not as relevant for the sum of IBGs as the inclined abstaining is (Sheeran, 2002, p. 7).
Table 2: Classification of IBGs (IBGs in bold) Source: Own adaptation based on Sheeran, 2002, p. 6
Final behavior Original intention
positive negative
positive “Inclined actors” “Inclined abstainers”
negative “Disinclined actors” “Disinclined abstainers” It is important to note here that people who show consistency between their intentions and behaviors, i.e. inclined actors and disinclined abstainers, represent only 28% of human behavior (Sheeran, 2002, p. 29). This does expressly not mean that all the other 72% of human behavior is caused by inconsistency between intention and behavior. But it is at least pointing out the relevant role of such inconsistencies in human behavior in general. Generally, reasons for inconsistencies between intention and behavior have been, e.g., lack of determination, confusion, or external influences (Sheeran & Webb, 2016, p. 507). It is argued that many intention-behavior relationships already fail because consumers don’t start to do something, for example because they forget something or because they procrastinate (Sheeran & Webb, 2016). Moreover, not monitoring and not pursuing the process and the goals can hinder consistency in intention-behavior relationships (Sheeran & Webb, 2016). In order to connect intention and behavior better, the authors of this paper argue that incentives to start acting and monitoring the process are crucial (Sheeran & Webb, 2016). Other research has indicated that bridging the IBG might be achieved by splitting behavior into different parts, in order to not undertake too much at once (Maddux & Dawson, 2014). Moreover, it has been discovered that planning is important for the consistency between intentions and behaviors. Adversely, spontaneous consumers are prone to not act according to their intention (Carrington et al., 2014). The more research has been conducted on special situations for IBGs, the more special IBGs have been identified. IBGs for sustainable consumption and sustainable transportation especially are discussed in the following chapters. Carrington et al. (2014) propose classifying consumers with IBGs into different groups concerning the intensity of their intentions. They define consumers with hard-core intention as consumers who have several prioritized concerns about sustainable purchases (Carrington et al., 2014, p. 2763). They also define other groups of consumers such as consumers with moderate intentions and less than moderate intentions towards sustainable purchasing
24
decisions (Carrington et al., 2014, p. 2763). This classification will not play a role in the empirical part of this thesis since information about the intensity of intentions would not help to bridge IBGs.
3.8 Barriers in the intention-behavior consistency Since IBGs hamper the work of researchers and marketers, it has been important to identify specific reasons for IBGs. These reasons have also been called barriers for intention-behavior consistency (Blainey et al., 2012; Semenza et al., 2008). Only when barriers can be identified, marketers would be able to work against those barriers, i.e. bridging the IBGs. In the sustainable consumption context, previous studies have found several determinants that can impede green purchasing behavior. Those determinants will be mentioned here shortly in order to give an overview. Thereafter, leading towards the explanation of the conceptual model, the determinants that are relevant for this thesis will be described in more detail. Firstly, scholars have found out that environmental concern and environmental attitude influences the relationship between intentions and behaviors (Makatouni, 2002; McEachern et al., 2005; Zhao et al., 2014). It is also relevant to how much consumers know about the environment (Chan & Lau, 2000; Connell, 2010; Eze & Ndubisi, 2013). A special role is taken by habit and past experience. Habit and past experience determine future behavior in many regards (Carrington et al., 2014; McEachern et al., 2005; Tsakiridou et al., 2008; Vermeir & Verbeke, 2006). Furthermore, it is important if consumers believe that their behavior would be effective. This determinant is called the perceived effectiveness of consumers’ behavior (Gleim et al., 2013; Gupta & Ogden, 2009). Similarly, consumers have also shown that they need to be in control of their behavior in order to perform it. This determinant is called perceived behavioral control (Wang et al., 2014). Other determinants have been environmental and ethical values (Chen & Chang, 2012; Gleim et al., 2013; Wang et al., 2014; Young et al., 2010), altruism and benevolence (Doran, 2009; Mondelaers et al., 2009; Mostafa, 2006; Padel & Foster, 2005), and trust in offered services or their providers (Chen & Chang, 2012; Gupta & Ogden, 2009; Krystallis et al., 2008; Tung et al., 2012; Vermeir & Verbeke, 2008). How much these different determinants influence the relationship between intention and behavior depends on the respective study. It is not possible to generally comment on the importance of different determinants. It is substantial to note here that the determinants mentioned in the paragraph above have mostly been identified by research that analyzed sustainable/green products and the according intention-behavior relationship. Research is continuously lacking evidence from sustainable services and the determinants that play a role in service purchasing behavior. One of the few papers that did examine sustainable services dealt with the recycling industry and waste management in Brazil (Echegaray & Hansstein, 2017). This paper has shown a possible way of adapting the theory of planned behavior to the service context. On the one hand, the model by Echegaray & Hansstein (2017) incorporates three basic determinants for behavioral intention, attitude, subjective norms, and perceived behavioral control that are taken over from the original model (Ajzen, 1991). On the other side, the researchers have added three other determinants. Those three determinants are socio-demographic and socio-economic factors, awareness towards environmental problems, and finally personal environmental assessment. The additional determinants are related to the environmental knowledge
25
construct that other scholars have identified (Echegaray & Hansstein, 2017, p. 183; Eze & Ndubisi, 2013). As this adapted theory of planned behavior illustrates, it makes sense to adapt the original theory to specific IBGs in the sustainable service context. Therefore, the model by Echergary & Hansstein (2017) has laid the foundations for the conceptual model of this thesis.
3.9 Towards a conceptual model: relevant determinants After having presented the psychological theories that are relevant for IBGs and after having discussed their importance for the conceptual model, this chapter will guide the reader towards the conceptual model for this thesis. This guide is built up in the way that different determinants for behavioral intention are being presented and defined. Those determinants have already been identified as relevant for IBGs (Joshi & Rahman, 2015). It is argued why the determinants are also relevant for this thesis and finally, the hypotheses are elaborated. Firstly, environmental attitude will be defined as “a psychological tendency that is expressed by evaluating perceptions of or beliefs regarding the natural environment [...] with some degree of favour or disfavour“ (Milfont, 2007, p. 12). In more simple words, this means that consumers who care about the environment are more likely to behave according to their environmental attitude. It can be said that attitude towards the environment and sustainability has been found to be a determinant for behavioral intention (Joshi & Rahman, 2015, p. 132; Kanchanapibul et al., 2014; Padel & Foster, 2005; Zhao et al., 2014). It has also been a determinant for green purchasing behavior (Joshi & Rahman, 2015, p. 132). There has been a scientific discussion about the synonymous character of the expressions “environmental attitude” and “environmental concern”. As Milfont (2007, p. 11) points out, the expression of environmental concern might easily be judged as a type of worrying. A worrying image of environmental concern would be misleading, as the determinant is supposed to describe opinions in general. Therefore, this determinant will be called environmental attitude. Research has shown that consumers who believe that environment protection is important may rather travel by train than by airplane (Semenza et al., 2008, p. 483). This is closely related to altruist beliefs in the theory of planned behavior (Ajzen, 1991). Being willing to protect the environment means, in the long run, to care for the following generations. Consumers who care about the welfare of others and about nature are more likely to be green consumers compared to consumers whose values are based on their personal interests (Dietz et al., 1998; Stern & Dietz, 1994; Stern et al., 1995). However, it is not completely sure how traveling is an exception for consumers’ environmental attitudes. It has been found that tourists have a lower concern about environmental issues and are less inclined to eco-label products compared to average consumers (Sharpley, 2001). That might be related to the idea of the vacation, where consumers sometimes actively ignore their environmental attitudes and want to live as luxuriously as possible, arguing that it is just so few days that they have for vacation. Some of the tourists might generally behave sustainably in their everyday life, but in the few days of vacation, they are averse to limiting themselves (Hedlund, 2013). On the other side, Hedlund (2013) emphasizes that not every tourist behaves in the same way, and not every tourist thinks of vacation as an exception from sustainable behavior. Tourists’ behavior depends on circumstances, knowledge, or past experience (Hedlund, 2013, p. 73 f.).
26
Moreover, since this thesis is not focused on tourism only, but on any kind of voluntary travel, the findings about the behavior of tourists cannot be unrestrictedly taken over. It is less dangerous to rely on the findings concerning behavioral intention for sustainable purchases (Joshi & Rahman, 2015; Kanchanapibul et al., 2014). Those scholars clearly state the positive influence of environmental attitude on behavior. There are a few studies that did not discover an impact of environmental attitude on transportation choices (Chen et al., 2011; Garvill et al., 2006). Chen et al. (2011) conducted a survey in the departure halls of Taoyuan International Airport in Taiwan (n=210). In this study, the behavior of the sample was not measured, since all respondents were air travelers. Nevertheless, the authors observed a relatively high environmental attitude amongst the sample (Chen et al., 2011, p. 85). Consequently, it was summarized that environmental attitude is not affecting behavior in a significant way (Chen et al., 2011, p. 82). Garvill et al. (2006) have remarked that environmental concern does not make consumers leave their cars at home. The consumers in the sample kept using their cars even though they showed relatively high environmental concerns (Garvill et al., 2006). However, the number of studies that do not attest to the environmental attitude to have an impact on behavioral intention/behavior is so small that they do not need to be represented in the hypothesis. Weighing the insights from prior research, the following hypothesis is set up: H2: Environmental Attitude of leisure travelers toward sustainability and environmental issues positively impacts on their choice of sustainable vehicles. The next determinant that will be integrated into the conceptual model is knowledge about the environment and environment protection. Knowledge will be defined as “a means to overcome psychological barriers such as ignorance and misinformation” (Frick et al., 2004, p. 1598). In environmental coherences, knowledge can be divided into three different types, that together form the consumers’ overall environmental knowledge (Frick et al., 2004, p. 1599): First, system knowledge, i.e. knowledge about the systematic structure of ecosystems. For example, it is considered system knowledge if consumers know that CO2 is a greenhouse gas. Second, action-related knowledge, i.e., how to act correctly to protect the environment. For example, if consumers know how they can decrease their personal CO2-emissions, it comes from their action-related knowledge. Finally, the third and most complex type of environmental knowledge is called effectiveness knowledge. If consumers know about environmental effectiveness, they are able to rank and accordingly implement different actions concerning environment protection. For example, consumers with effectiveness knowledge understand that it is more effective to leave the car in the garage and use public transport instead, rather than filling the car’s tank with ecological ethanol and using it. Another barrier for the connection between sustainable intention and sustainable behavior is little knowledge about sustainable technologies (Wiedmann et al., 2011, p. 1205). The authors recommend policy instruments in order to foster the growth of the gas-powered car industry. If consumers don’t have enough information about sustainable traveling options, the consumers tend to not choose sustainable options (Akbari et al., 2009; Baba Akbari Sari et al., 2009; Becken, 2007; Prillwitz & Barr, 2009, p. 9). In the same way that knowledge is relevant for tourists as they plan their vacation (Hedlund, 2013), lacking knowledge about sustainable practices has also been identified as a barrier for sustainable tourism in general
27
(Graci, 2006; Jarvis et al., 2010). The consumers’ lack of knowledge about sustainable traveling has especially been observed in airplanes (Cocolas et al., 2020, p. 331). According to this study, airlines provide information about air traffic sustainability that can lead to confusion in the consumers’ mindsets. Consequently, consumers are prone to misjudge the real environmental impact of air traffic (Cocolas et al., 2020, p. 331). One study even argues that the air traffic industry deliberately tries to veil the negative impacts of flying (Gössling & Peeters, 2007). Even though research has not led to equivocal results in regard to environmental knowledge (Joshi & Rahman, 2015, p. 133), the following hypothesis is introduced for the international comparison that this thesis aims at. H3: Knowledge of leisure travelers about sustainability and environmental issues positively impacts on their choice of sustainable vehicles. The perceived price will be defined as the by consumers’ perceived “monetary sacrifice for obtaining a product” or service (Kim et al., 2012, p. 241). The price of sustainable services is a determinant for consumers’ behavioral intentions. Generally, it can be said that high prices make sustainable solutions less attractive by “outweighing ethical considerations” (Joshi & Rahman, 2015, p. 134). However, the real price doesn’t always have to be the price that consumers recall (Zeithaml, 1982), as sustainable products and services are often marketed as premium products. Therefore, consumers tend to think that sustainable solutions are more expensive than other solutions (Choi & Ng, 2011). As the price perceived by customers is arguably more important for a purchase decision than the real price (Lee et al., 2011), the determinant will be called “perceived price” and not “price”. The accessibility of public transport is usually worse for people with lower incomes than for people with higher incomes. That means that improving the accessibility of public transport for low-income customers has a higher profit potential for the industry than improving the accessibility of public transport for high-income customers (Cui et al., 2020, p. 15). Note here that Cui et al. (2020) do not specify if their price discussions are related to customers’ purchasing power or the perceived prices for public transport. Even though the definitions by Cui et al. (2020) leave these questions open, the findings might still be of importance because low purchasing power affects consumers’ perception and opinion of prices (Jaafar et al., 2012). High prices are a barrier for intention-behavior consistency that is identified in different surveys (Akbari et al., 2009; Baba Akbari Sari et al., 2009; Blainey et al., 2012, p. 678 f.; Semenza et al., 2008). Roughly 11 % of consumers in the metropolitan areas of Houston and Portland have stated that they can’t adapt their behavior towards sustainability because of the high prices that come with sustainability (Semenza et al., 2008, p. 483). Blainey et al. (2012) have reviewed evidence from samples that were mostly concerning the population of the UK. Prices have been found to be a barrier of intention-behavior consistency that is more difficult to overcome than other barriers of the intention-behavior consistency (Blainey et al., 2012, p. 692). The barrier has been identified for switching between cars and trains and for switching between airplanes and trains (Mandel, 1999; Starkie, 2002). Mandel (1999) has simulated an additional flat fee for the users of the airport in Hamburg (price: 50 DEM). This fee has caused consumers to choose trains and road transportation modes instead of flying (Starkie, 2002, p. 69). On the other side, low prices do
28
not necessarily lead to more demand (Blainey et al., 2012, De Witte et al., 2008). De Witte et al. (2008) have analyzed the behavior of 1276 commuters in the Brussels metropolitan area. Only 9 % of the sample was willing to use public transport more often if it was gratis. The other 91 % demanded more removed barriers than just the removed price in order to switch to public transport for commuting (De Witte et al., 2008, p. 223). Considering the evidence from prior research, the hypothesis that concerns prices is the following: H4: The perceived price of sustainable transportation mode negatively impacts on the leisure travelers’ choice of sustainable vehicles.
“We are all creatures of habit.”
Gustav Freytag, 1816-1895, German author The next determinant is called “lifestyle and habits” and will be defined as “a pattern of repeated acts that are both dynamic and to some degree hidden to the individual” (Jensen, 2009, p. 225). The way that consumers are used to living their lives influences their purchasing behavior, especially their overall habits and their past behavior (Carrus et al., 2008, p. 59; Hedlund, 2013; Joshi & Rahman, 2015, p. 132 f.). Habits are important since they can reduce risks and their consequences are generally overseeable (Gärling & Axhausen, 2003, p. 2). That means, for example, that elderly people act according to habits because the habits enable them to assess dangers. On the contrary, the danger of an unusual behavior might either not be overseeable or too high. It is important to note that the definition of lifestyle and habits is not obvious and different researchers have defined the terms in different contexts. On the one hand side, environmental habits have been regarded as past behavior when choosing sustainable transportation (Blainey et al., 2012). In this context, habits are problematic for behavior change because consumers tend to stick to their habits under average conditions (Thøgersen & Møller, 2008). So, if consumers usually use non-sustainable transportation, they are likely to maintain the habit. That is why habits are an identified barrier for switching travel modes (Blainey et al., 2012, p. 688; Lanzini & Khan, 2017, p. 22; Prillwitz & Barr, 2009, p. 9; Thøgersen, 2006). Vice versa, if consumers are used to traveling by sustainable transportation, they are expected to stick to this behavior as well (Carrus et al., 2008, p. 56). These kinds of habits are less relevant when an external shock occurs, e.g. moving to another place or finding a new job. In those situations, habits are more likely to get changed or have less influence on the consumers’ decisions (Friedrichsmeier et al., 2013). Moreover, habits play a more important role for commuters rather than for people who travel for vacation (Prillwitz & Barr, 2009, p. 9). I.e., the more seldomly consumers decide about a certain type of movement, the less they are influenced by a related habit. Last but not least, the evidence from prior research on traveling habits has only concerned non-voluntarily traveling such as commuting to the workplace (Prillwitz & Barr, 2009; Thøgersen, 2006). It is important to integrate such habits into the conceptual model because this thesis scrutinizes voluntary
29
traveling and not non-voluntary traveling. That means that, in regard to voluntary travels, this thesis can expand existing knowledge. On the other hand side, environmental habits have been regarded as past behavior that is not directly related to sustainable transportation. For example, habits might also be different behaviors that support choosing sustainable transportation such as recycling bottles, cans, etc. or buying organic products (Pickett-Baker & Ozaki, 2008). Another study has found that 80 % of consumers who engage in the club “Lifestyle of Health and Sustainability” (LOHAS) spent 300 billion USD on sustainable purchases in 2008 (Cooney, 2010). Spanish consumers from Zaragoza (n=573) have shown that their overall ecological lifestyle (avoid eating red meat, physical activity, buy recycled products etc.) impacts their buying behavior when it comes to sustainable purchases (Fraj & Martinez, 2006, p. 141). Indian students (n=153) have also shown that a general sustainable lifestyle has positive effects on future buying behaviors (Adnan et al., 2017, p. 366). Therefore, the view of habits concerning general sustainable behavior as support for sustainable transportation choices will also be part of the survey and analysis. Finally, for the aforementioned reasons, the hypothesis concerning lifestyle and habits will be the following: H5: Lifestyle and habits of leisure travelers regarding green products and services positively impact on their choice of sustainable vehicles. Another determinant that has been researched frequently is the perceived effectiveness of the consumers’ decisions (Joshi & Rahman, 2015 p. 133). Perceived effectiveness will be defined as “a measure of the extent to which the individual perceives he [or she] can be effective” in protecting the environment by using sustainable transportation (Webster Jr, 1975, p. 189). When consumers are getting asked why they don’t buy sustainable products, some of them answer that they, as a single person, can not make a difference in the big picture of sustainability (Gleim et al., 2013; Gupta & Ogden, 2009). They believe that environment protection would be more efficient and/or effective if more powerful market participants, such as firms, behaved sustainably. As much as the belief in making a difference can drive consumers’ behavior, the disbelief in making a difference can cause inactivity (Semenza et al., 2008, p. 483). There is scientific consensus that consumers who think they can make a difference behave more sustainably (Joshi & Rahman, 2015, p. 133). However, this consensus is mostly built on purchasing decisions for products and not for services (Joshi & Rahman, 2015, p. 133). Gleim et al. (2013, p. 49) have analyzed the green purchasing behavior of 638 US-American consumers. They found a positive correlation between perceived effectiveness and purchasing intention for consumers of retail outlets (Gleim et al., 2013, p. 50). Similarly, Gupta & Ogden (2009, p. 382) observed an influence of perceived consumer effectiveness on purchasing decisions for light bulbs. The sample consisted of 321 US-American consumers that filled out an online questionnaire (Gupta & Ogden, 2009, p. 382). The connection between perceived effectiveness and behavior is actually one of the oldest researched determinants for green purchasing behavior (Roberts, 1996). In order to confirm the evidence from product purchasing research for service purchasing research, the following hypothesis is: H6: Perceived effectiveness of using sustainable transportation mode positively impacts on the leisure travelers’ choice of sustainable vehicles.
30
Social norms will be defined as “an influence to conform with the positive expectations of another person or group” (Deutsch & Gerard, 1955, p. 629). Some consumers feel pressured by the opinion of other people when it comes to sustainable purchasing decisions (Eze & Ndubisi, 2013; Lee, 2009). This is a direct confirmation of the theory of planned behavior that proposes external influence as a determinant for behavioral intention (Ajzen, 1991). Peer pressure has been found to increase sustainable product purchases (Eze & Ndubisi, 2013, Welsch & Kühling, 2009). Eze & Ndubisi (2013) observed a correlation between peer pressure and buying behavior of green products in a sample of Malaysian young adults (n=227). Welsch & Kühling (2009) have analyzed the purchasing behavior of German consumers (n=494). They conclude that the behavior and opinion of others influence the sample’s behavior of installing solar panels and buying organic food (Welsch & Kühling, 2009, p. 166). Especially in the case of organic food purchasing decisions, social norms have shown to positively influence consumer behavior (Welsch & Kühling, 2009, p. 173). Within the club LOHAS, the influence of family and friends has caused consumers to buy more sustainable products (Cooney, 2010). In another case, social norms have decreased sustainable product purchases (Connell, 2010). 26 consumers in Texas were interviewed about their purchasing decisions. It was found that some of them didn’t buy second-hand clothes for the working environment because their colleagues would judge them (Connell, 2010, p. 284). The equivocal evidence around social norms as a determinant for behavioral intention gives reason to include the determinant into the conceptual model. Moreover, social norms as a determinant of sustainable travel intention in this study is important, because this thesis compares samples from three different countries. As social norms are closely dependent on culture, one can expect diverse results from the three different countries (Mc Breen et al., 2011). Scholars have already hinted at the importance of social norms in Iran and Germany (Akbari et al., 2009; Baba Akbari Sari et al., 2009; Welsch & Kühling, 2009). H7: Social norms positively impact on the leisure travelers’ choice of sustainable vehicles. The final determinant for the conceptual model will be called “perceived value” and defined as “the consumer’s overall assessment of the utility of a product [or service] based on perceptions of what is received and what is given” (Zeithaml, 1988, p. 14). For conducting research on sustainable services, it is necessary to consider the relationship between expenditures and yield for the consumers (Beirão & Cabral, 2007, p. 487 f.; Grewal et al., 1998; Semenza et al., 2008, p. 483; Zhuang et al., 2010). That is because sustainable services often have disadvantages: For example, a train ride in Europe often comes with high ticket prices and loss of time. Consequently, if consumers choose sustainable services instead of ordinary services, they must have overcome the disadvantages of sustainability. Blainey et al. (2012) conclude that the barriers to using trains can be both tangible and intangible. Intangible barriers are e.g. crowding, comfort, weather, habit. Tangible barriers are e.g. price, access, safety, ticketing complexity. Importantly, the authors emphasize that a theoretical removal of barriers would not necessarily lead to a behavior change of consumers (p. 693). Missing comfort and missing safety have also been identified as barriers for
31
sustainable traveling by other researchers (Prillwitz & Barr, 2009, p. 7; Steg & Gifford, 2005). According to Peck (2010), people of 65 and more years of age are concerned to use public transport because they don’t always feel safe. Some respondents thought that access to public transport is too bad or that they are too used to driving their car so they won’t use public transport. Some of them were scared of the day they would become physically unable to drive their car. But it is not just the thought of safety that can influence the relationship between expenditures and yield. The low density of gas stations that sell natural gas as an alternative for petrol and diesel is a barrier for people to buy gas cars (Wiedmann et al., 2011, p. 1205). Another important influence is the price (dis)advantage of sustainable transportation. When students get the chance to use public transportation for a reduced price, their opinion of public transportation improves over time and their opinion of using their own car worsens over time (Heath & Gifford, 2002, p. 2179). The lasting use of public transportation leads to a sustainable image improvement (Bamberg, 1995). Some of the (dis)advantages of sustainable transportation in the paragraph above are already integrated into the conceptual model by the use of other hypotheses. For example, the perceived price already has its own hypothesis, so does habits and lifestyle But this final determinant does not concern isolated disadvantages, but the overall sum of advantages and disadvantages of sustainable transportation. The practice of integrating isolated and cumulated determinants in the very same conceptual model has been done before and showed justifications (Joshi & Rahman, 2015). H8: Perceived value of sustainable transportation mode positively impacts on the leisure travelers’ choice of sustainable vehicles. Last but not least, the data collection includes a demographic section. That is because one of the goals of this thesis is to compare the environmental intentions and behaviors of different consumer groups. One way to divide consumers into groups is nationality (Swedish, German, Iranian), but nationality is not the only criterion that might be important. It may also be the age of the respondents (Schmehl et al., 2011) and the consequent life experience and values. Older consumers have shown to care more about the environment than younger consumers (Chen et al., 2011, p. 82). Another study has shown that it is mostly young consumers who engage in environmental purchases (Adnan et al., 2017). The overall ambiguous evidence concerning sample age gives reason to integrate the age question into the questionnaire of this paper. Moreover, research has shown that females tend to engage more in environmental activities than males, for example in recycling activities and traveling behavior (Chen et al., 2011; Echegaray & Hansstein, 2017). That is why the questionnaire also asks for the respondents’ gender. Other relevant demographic variables have been the income level (Cui et al., 2020; Domazet et al., 2014) or the marital status (Rettie et al., 2012). It has been found that Canadian consumers with relatively low income tend to use public transportation more often than relatively wealthy people (Cui et al., 2020, p. 15). Another study has compared the environmental orientation of consumers in Europe (Domazet et al., 2014). It shows that there is a correlation between sustainability interest and income, e.g., consumers from the Nordic countries and from Switzerland have shown most environmental concern (Domazet et al., 2014, p. 169). Moreover, consumers from the UK have shown that the way they buy bottled water depends on their marital status (Rettie et al., 2012, p. 433). According to that study, singles and married consumers are more likely to buy bottled water than widowed or
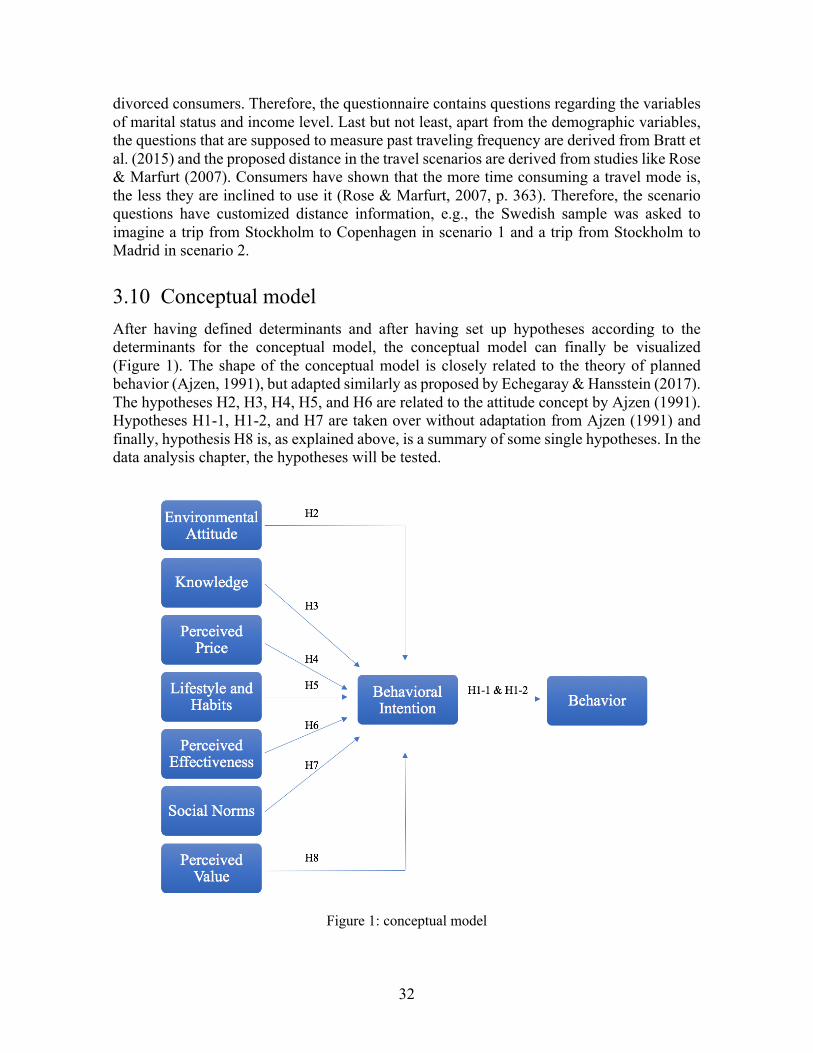
32
divorced consumers. Therefore, the questionnaire contains questions regarding the variables of marital status and income level. Last but not least, apart from the demographic variables, the questions that are supposed to measure past traveling frequency are derived from Bratt et al. (2015) and the proposed distance in the travel scenarios are derived from studies like Rose & Marfurt (2007). Consumers have shown that the more time consuming a travel mode is, the less they are inclined to use it (Rose & Marfurt, 2007, p. 363). Therefore, the scenario questions have customized distance information, e.g., the Swedish sample was asked to imagine a trip from Stockholm to Copenhagen in scenario 1 and a trip from Stockholm to Madrid in scenario 2.
3.10 Conceptual model After having defined determinants and after having set up hypotheses according to the determinants for the conceptual model, the conceptual model can finally be visualized (Figure 1). The shape of the conceptual model is closely related to the theory of planned behavior (Ajzen, 1991), but adapted similarly as proposed by Echegaray & Hansstein (2017). The hypotheses H2, H3, H4, H5, and H6 are related to the attitude concept by Ajzen (1991). Hypotheses H1-1, H1-2, and H7 are taken over without adaptation from Ajzen (1991) and finally, hypothesis H8 is, as explained above, is a summary of some single hypotheses. In the data analysis chapter, the hypotheses will be tested.
Figure 1: conceptual model
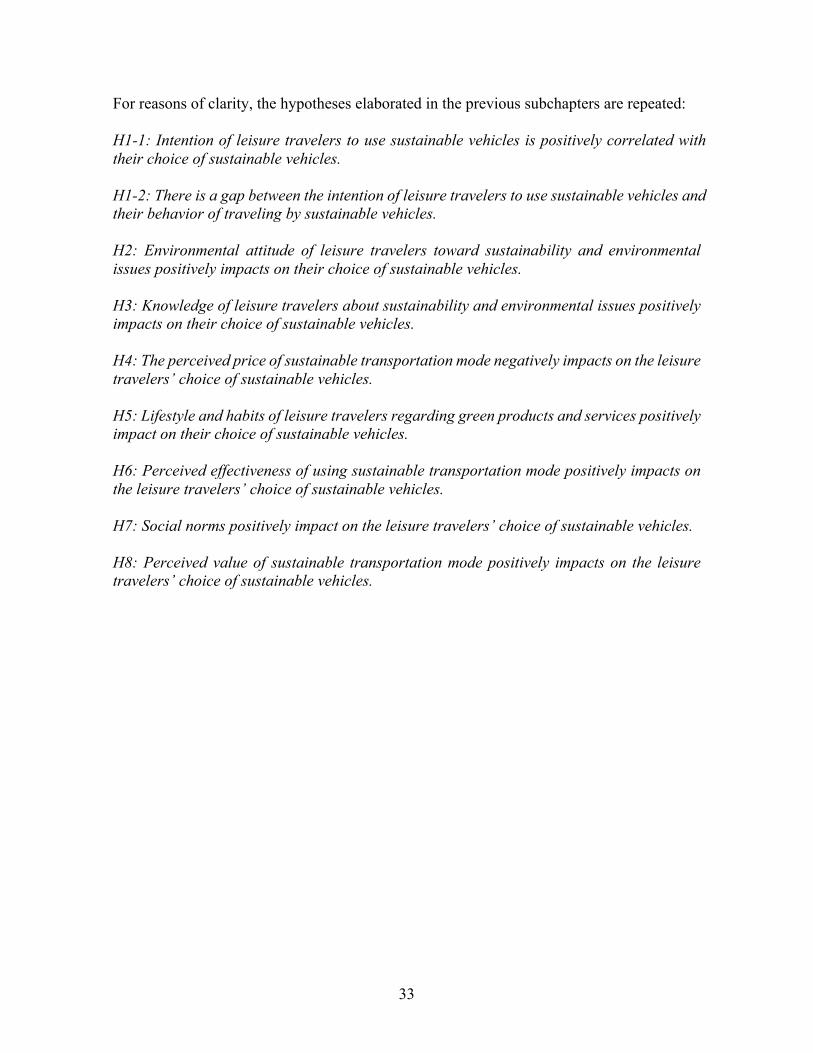
33
For reasons of clarity, the hypotheses elaborated in the previous subchapters are repeated: H1-1: Intention of leisure travelers to use sustainable vehicles is positively correlated with their choice of sustainable vehicles. H1-2: There is a gap between the intention of leisure travelers to use sustainable vehicles and their behavior of traveling by sustainable vehicles. H2: Environmental attitude of leisure travelers toward sustainability and environmental issues positively impacts on their choice of sustainable vehicles. H3: Knowledge of leisure travelers about sustainability and environmental issues positively impacts on their choice of sustainable vehicles. H4: The perceived price of sustainable transportation mode negatively impacts on the leisure travelers’ choice of sustainable vehicles. H5: Lifestyle and habits of leisure travelers regarding green products and services positively impact on their choice of sustainable vehicles. H6: Perceived effectiveness of using sustainable transportation mode positively impacts on the leisure travelers’ choice of sustainable vehicles. H7: Social norms positively impact on the leisure travelers’ choice of sustainable vehicles. H8: Perceived value of sustainable transportation mode positively impacts on the leisure travelers’ choice of sustainable vehicles.
34
4 Practical Method This chapter explains how this study practically addresses the research questions and the underlying purpose. Information on the choice of practical method, survey construction, and preparation of the questionnaire is considered. Further, the target population, sampling method, and access to the participants in this study is presented. Lastly, ethical consideration in constructing the survey and participation of the sample population is discussed.
4.1 Data Collection Method Data collection is an essential part of a study and there are various approaches to collect the necessary data for answering a research question. Since this study uses a critical realism approach, the data is collected by quantitative methods. Two different methods, self-administered survey, and conjoint analysis were discussed for collecting data. Each of these approaches has its pros and cons. Since the conceptual model in this study includes nine variables, the possible combination of these variables to encompass various scenarios creates a too-long list of options, potentially making respondents bored and careless in selecting last choices (Johnson & Orme, 1996). On the other hand, the most important challenge with using a self-administered questionnaire is measuring the real behavior of leisure travelers. This issue is solved by using pre-tested constructs, which is completely explained in the survey construct. However, due to the current situation of traveling5preferences of leisure travelers might have changed, creating some biases in the study. Besides, the objective of conjoint analysis is to find out which attribute or variable is more influential on the respondent’s choice of traveling vehicles (Green & Srinivasan, 1978) whereas the purpose of this study is to examine whether each of the variables impacts the intention or decision of using traveling vehicles. Therefore, using pre-tested constructs in a survey is more appropriate than building scenarios in a conjoint analysis for this study.
4.2 Target population The target of this survey is leisure travelers in Sweden, Germany, and Iran. There are several reasons for studying the behavior of travelers in these countries. First, the knowledge of consumers regarding green products is varying in different EU countries. Almost 60 percent of European consumers are aware of green products (Wunsch, 2020). While 40 percent of Swedes are familiar with EU ecolabels, only 24 percent of consumers in Germany are aware of EU ecolabels (Eurobarometer 468, 2017). On the other hand, in a study of 416 Iranian consumers, almost 60 percent of respondents stated that they are familiar with organic farming (Baba-Akbari Sari et al., 2009).
5 Due to the spread of the coronavirus, most of the traveling plans have been canceled and are in some cases illegal.
35
Second, the role that ecolabels and environmental sustainability play in the purchasing decision of consumers differs in different countries. In a survey of EU residents who had seen or heard about any of the ecolabels, 67 percent of respondents in Luxembourg have bought a product carrying the EU ecolabel, while this percentage for Swedish and German respondents is 25 and 15 respectively (Eurobarometer 468, 2017). Moreover, at one extreme among EU residents, 70% of respondents in Sweden posit that ecolabels play an important part in their purchasing decisions, whereas 40 percent in Germany and 12 percent in Bulgaria have the same opinion. There is no similar study to compare the behavior of Iranian consumers in that matter. However, considering the differences between Sweden and Germany it is expected that the behavior of leisure travelers in these countries is different in terms of sustainability. Moreover, the level of environmental attitude toward the importance of green purchases varies considerably by country. EU residents, especially Swedes and Germans consider climate change and air pollution as the most significant environmental issue (Eurobarometer 468, 2017). Besides, “almost all Europeans agree that big polluters have primary responsibility for repairing the damage they cause”; The highest levels of agreement can be seen in Sweden (Eurobarometer 468, 2017). Additionally, previous studies show that culture and socioeconomic status impact the consumption of green products (e.g. Ritter et al., 2015). Researchers (e.g. Cho et al., 2013) usually analyze the cultural influence on the consumers’ behavior based on Hofstede's cultural dimensions including masculinity, power distance, individualism, uncertainty avoidance, long term orientation, indulgence (Hofstede, 2001). The impact of cultural dimensions on consumers’ behavior is indirect; cultural dimensions influence the factors that directly impact on the green purchase behavior (Liobikienė et al., 2016). For instance, Cho et al. (2013) claim that collectivism and individualism influence perceived consumer effectiveness, which impacts on the green purchase decision. However, since there are only a few studies investigating the barriers of sustainable traveling, there is a gap in the literature regarding the impact of cultural aspects on the IBG in leisure traveling. Figure 2 shows how six Hofstede's cultural dimensions are different in these three countries. Therefore, it could be interesting to find out whether the result of this study is different for people with different cultures.
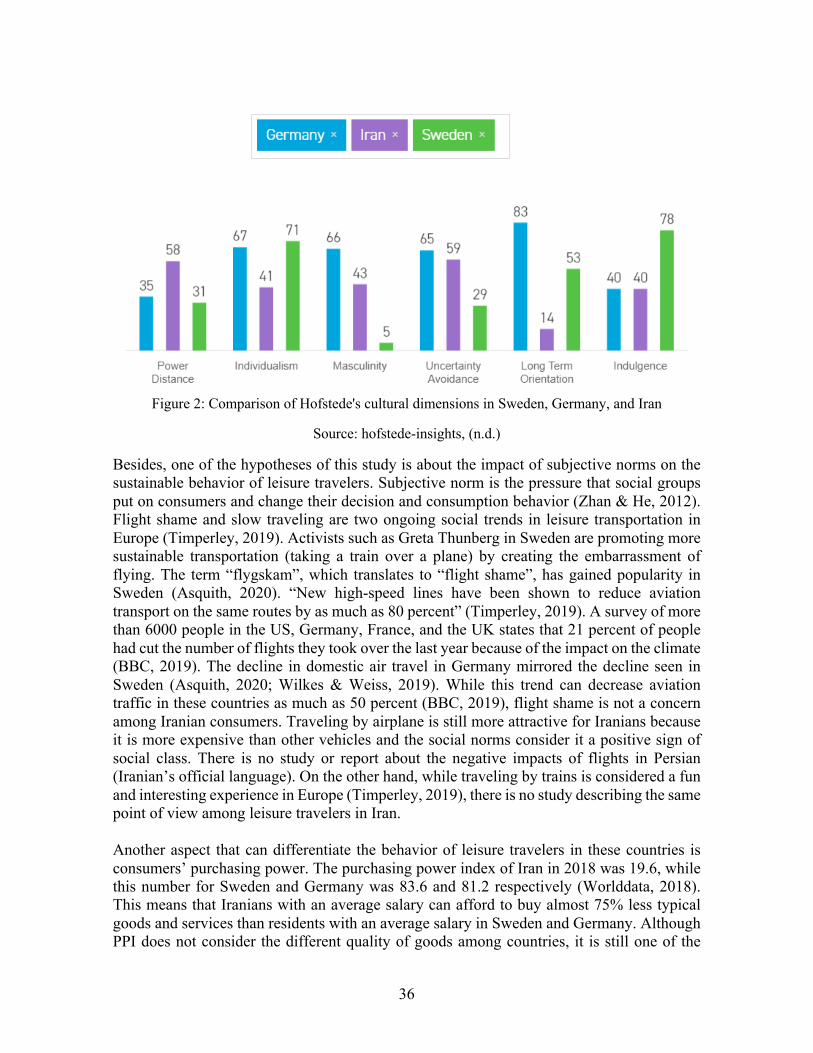
36
Figure 2: Comparison of Hofstede's cultural dimensions in Sweden, Germany, and Iran
Source: hofstede-insights, (n.d.)
Besides, one of the hypotheses of this study is about the impact of subjective norms on the sustainable behavior of leisure travelers. Subjective norm is the pressure that social groups put on consumers and change their decision and consumption behavior (Zhan & He, 2012). Flight shame and slow traveling are two ongoing social trends in leisure transportation in Europe (Timperley, 2019). Activists such as Greta Thunberg in Sweden are promoting more sustainable transportation (taking a train over a plane) by creating the embarrassment of flying. The term “flygskam”, which translates to “flight shame”, has gained popularity in Sweden (Asquith, 2020). “New high-speed lines have been shown to reduce aviation transport on the same routes by as much as 80 percent” (Timperley, 2019). A survey of more than 6000 people in the US, Germany, France, and the UK states that 21 percent of people had cut the number of flights they took over the last year because of the impact on the climate (BBC, 2019). The decline in domestic air travel in Germany mirrored the decline seen in Sweden (Asquith, 2020; Wilkes & Weiss, 2019). While this trend can decrease aviation traffic in these countries as much as 50 percent (BBC, 2019), flight shame is not a concern among Iranian consumers. Traveling by airplane is still more attractive for Iranians because it is more expensive than other vehicles and the social norms consider it a positive sign of social class. There is no study or report about the negative impacts of flights in Persian (Iranian’s official language). On the other hand, while traveling by trains is considered a fun and interesting experience in Europe (Timperley, 2019), there is no study describing the same point of view among leisure travelers in Iran. Another aspect that can differentiate the behavior of leisure travelers in these countries is consumers’ purchasing power. The purchasing power index of Iran in 2018 was 19.6, while this number for Sweden and Germany was 83.6 and 81.2 respectively (Worlddata, 2018). This means that Iranians with an average salary can afford to buy almost 75% less typical goods and services than residents with an average salary in Sweden and Germany. Although PPI does not consider the different quality of goods among countries, it is still one of the
37
reliable indices to compare purchasing power and willingness to pay of people in different regions. Lower purchasing power may decrease Iranian consumers’ willingness to pay for green services and products. However, 70 percent of respondents in a study of Iranian consumers claimed that they are ready to pay extra for organic products (Baba-Akbari Sari et al., 2009). Consequently, it is interesting to examine the behavior of people in different countries with different economic powers. The 2016 Global Environmental Performance Index ranks Iran 80th, Germany 13th, and Sweden fifth among 180 countries (EPI, 2018). All in all, with the whole differences that these countries have in terms of culture, social norms, and economy it is expected that the green behavior of consumers in these countries will be different. Last but not least, the background of this thesis’s authors in Germany and Iran and their current residence in Sweden give them access to consumers in these three countries, and familiarity with their culture, norms, and economy. That makes it easier to investigate the consumers’ behavior in these regions.
4.3 Sampling Apart from nationality, this study examines the behavior of travelers in a certain age group. Children under 15 years old are usually not buyers who select the transportation vehicle. Moreover, people younger than 15 years old are not encompassing a significant segment of solo travelers and therefore are usually a member of a group traveling (Pike et al., 2017). On the other hand, the minimum age required for getting a driving license is 18 years old in these countries (Drive Smart, n.d.). Therefore, travelers younger than 18 years are not able to fully compare transportation methods in this study in terms of sustainability, accessibility, etc. Additionally, this study aims at investigating the behavior of leisure travelers, not business travelers. Leisure and business travelers have different needs and behaviors (Lavanchy, 2018). Due to factors such as the importance of time, and business payment the value of various traveling vehicles and criteria for choosing a traveling method are different for these groups. The purpose of this study is to examine the reasons why people do not choose more sustainable traveling vehicles when it is possible. Since compared to business travelers, leisure travelers have more freedom to select their transportation method and compare the value of different options this study targets leisure travelers. To answer the research questions and meet the purpose of the study it is necessary to select the right sample from the target population. Two main sampling techniques are probability and nonprobability sampling methods. While in probability sampling each member of the population has an equal chance to be selected, in nonprobability sampling members do not have the same chance (Saunders et al., 2009, p. 213). Due to the time limit and feasibility of access to the target population in three countries the sampling method used in this study is convenience sampling, which is a nonprobability sampling technique (Saunders et al., 2009, p. 241). The data is collected online, via social media platforms and messaging applications. Reaching the target population through social networks is selected since the authors have access to the respondents in these countries through their personal networks. The data selection process is continuing until the sample size is sufficient for analysis.
38
4.4 Survey Construction To develop the survey and to collect reliable and valid data for research, it is necessary to define the variables consistent with previous literature. The survey in this study is divided into two sections: demographic data and questions regarding constructs and hypotheses in the conceptual model. The demographic section encompasses age, gender, marital status, and income. This section plays two roles in this study. First, describing the sample of the study and its compatibility with the target population in order to be sure that the sample could be representative of the target population. The second goal of demographic variables is to examine whether they play a moderating role in the conceptual model or not. Age groups have been selected based on the usual distribution of age groups in previous studies. However, the minimum age in the first group is modified based on the limit in the target group - the minimum age to have access to all options is 18 years. Marital status in this study is divided into two groups: single (living alone) and cohabiting. Previous studies used various forms of categories for this question. However, what this study aims to investigate is whether living alone or cohabiting impacts the decision of traveling vehicles. The question regarding income uses income levels in Hedlund’s study about green tourism in Sweden (Hedlund, 2013). These groups are representative of low, average, and high-income levels in Sweden. Similar income levels are defined for Iranian and German Respondents based on the Numbeo comparison tool (Numbeo, n.d.). Since this study compares the behavior of leisure travelers in Sweden, Germany, and Iran, another demographic variable that could be relevant is nationality. In these countries live immigrants such as international students and they might live a few years in the new country and not behave like native residents. For instance, an international student who came to Sweden last year might have different values, concerns, needs, and behavior compared to people who are living in Sweden permanently. To resolve these two problems and decrease the number of people who are not entitled to fill out the questionnaire (people without the respective nationality and/or citizenship), the English questions in Table 3 are translated into Swedish, German, and Persian. Additionally, each questionnaire is distributed in various distinctive channels in each country. Therefore, only people who know Swedish and live in Sweden can fill the Swedish questionnaire. These solutions decrease the number of people who are not relevant to each sample population. The behavioral section aims at investigating the variables in the conceptual model, for each three to four questions are selected based on pretested valid scales in the previous studies. Moreover, this study aims at investigating whether the behavior of leisure travelers changes depending on the frequency of travel. The annual average overseas traveling rate of Swedes is around 1.5 trips per citizen, which puts Sweden in the fourth rank in the world (Roden, 2017). Considering around 7 million one-way domestic trips (Kamb & Larsson, 2019), on average residents in Sweden travel twice per year. Therefore, the options in the question related to traveling frequency are distributed around this average number. Table 3 contains all the questions of the survey and their references.
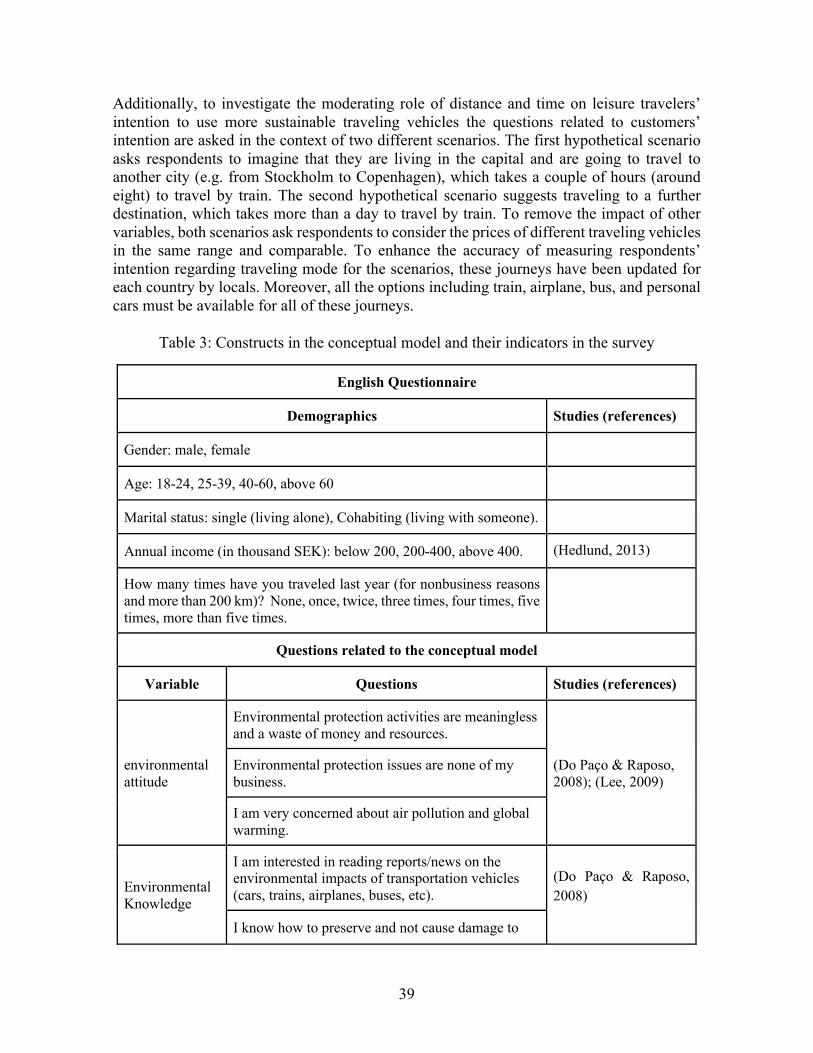
39
Additionally, to investigate the moderating role of distance and time on leisure travelers’ intention to use more sustainable traveling vehicles the questions related to customers’ intention are asked in the context of two different scenarios. The first hypothetical scenario asks respondents to imagine that they are living in the capital and are going to travel to another city (e.g. from Stockholm to Copenhagen), which takes a couple of hours (around eight) to travel by train. The second hypothetical scenario suggests traveling to a further destination, which takes more than a day to travel by train. To remove the impact of other variables, both scenarios ask respondents to consider the prices of different traveling vehicles in the same range and comparable. To enhance the accuracy of measuring respondents’ intention regarding traveling mode for the scenarios, these journeys have been updated for each country by locals. Moreover, all the options including train, airplane, bus, and personal cars must be available for all of these journeys.
Table 3: Constructs in the conceptual model and their indicators in the survey
English Questionnaire
Demographics Studies (references)
Gender: male, female
Age: 18-24, 25-39, 40-60, above 60
Marital status: single (living alone), Cohabiting (living with someone).
Annual income (in thousand SEK): below 200, 200-400, above 400. (Hedlund, 2013)
How many times have you traveled last year (for nonbusiness reasons and more than 200 km)? None, once, twice, three times, four times, five times, more than five times.
Questions related to the conceptual model
Variable Questions Studies (references)
environmental attitude
Environmental protection activities are meaningless and a waste of money and resources.
(Do Paço & Raposo, 2008); (Lee, 2009)
Environmental protection issues are none of my business.
I am very concerned about air pollution and global warming.
Environmental Knowledge
I am interested in reading reports/news on the environmental impacts of transportation vehicles (cars, trains, airplanes, buses, etc).
(Do Paço & Raposo, 2008)
I know how to preserve and not cause damage to
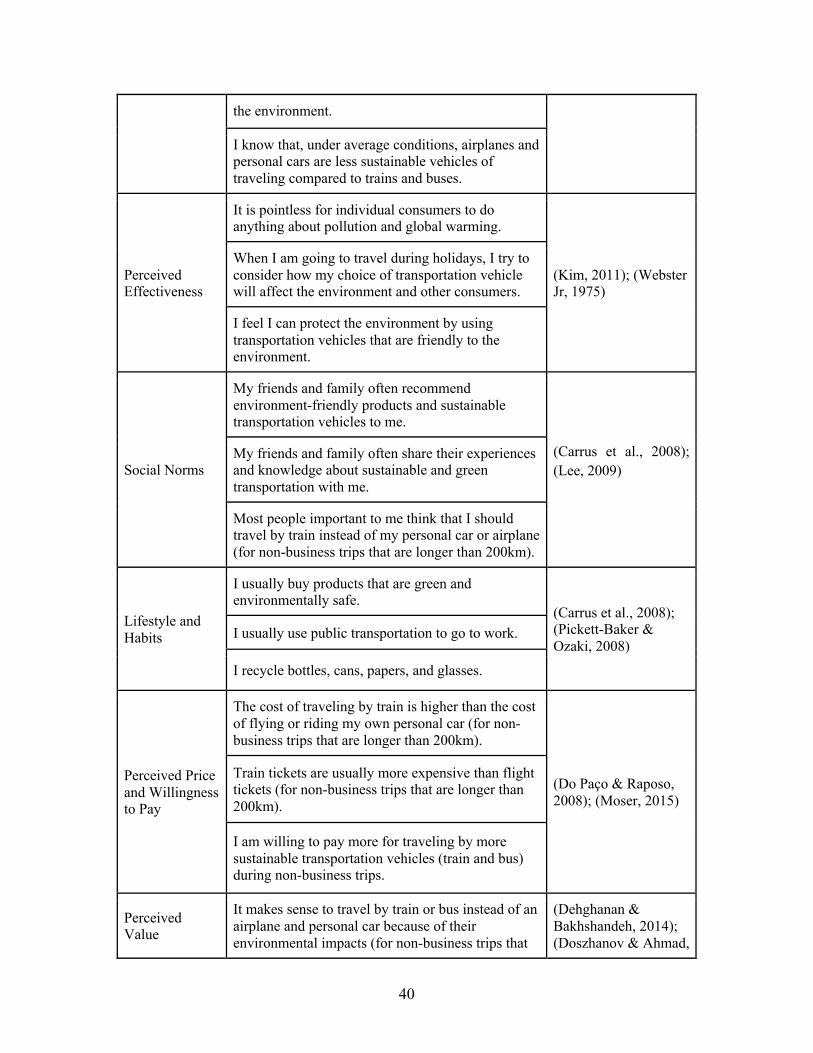
40
the environment.
I know that, under average conditions, airplanes and personal cars are less sustainable vehicles of traveling compared to trains and buses.
Perceived Effectiveness
It is pointless for individual consumers to do anything about pollution and global warming.
(Kim, 2011); (Webster Jr, 1975)
When I am going to travel during holidays, I try to consider how my choice of transportation vehicle will affect the environment and other consumers.
I feel I can protect the environment by using transportation vehicles that are friendly to the environment.
Social Norms
My friends and family often recommend environment-friendly products and sustainable transportation vehicles to me.
(Carrus et al., 2008); (Lee, 2009)
My friends and family often share their experiences and knowledge about sustainable and green transportation with me.
Most people important to me think that I should travel by train instead of my personal car or airplane (for non-business trips that are longer than 200km).
Lifestyle and Habits
I usually buy products that are green and environmentally safe.
(Carrus et al., 2008); (Pickett-Baker & Ozaki, 2008)
I usually use public transportation to go to work.
I recycle bottles, cans, papers, and glasses.
Perceived Price and Willingness to Pay
The cost of traveling by train is higher than the cost of flying or riding my own personal car (for non-business trips that are longer than 200km).
(Do Paço & Raposo, 2008); (Moser, 2015)
Train tickets are usually more expensive than flight tickets (for non-business trips that are longer than 200km).
I am willing to pay more for traveling by more sustainable transportation vehicles (train and bus) during non-business trips.
Perceived Value
It makes sense to travel by train or bus instead of an airplane and personal car because of their environmental impacts (for non-business trips that
(Dehghanan & Bakhshandeh, 2014); (Doszhanov & Ahmad,
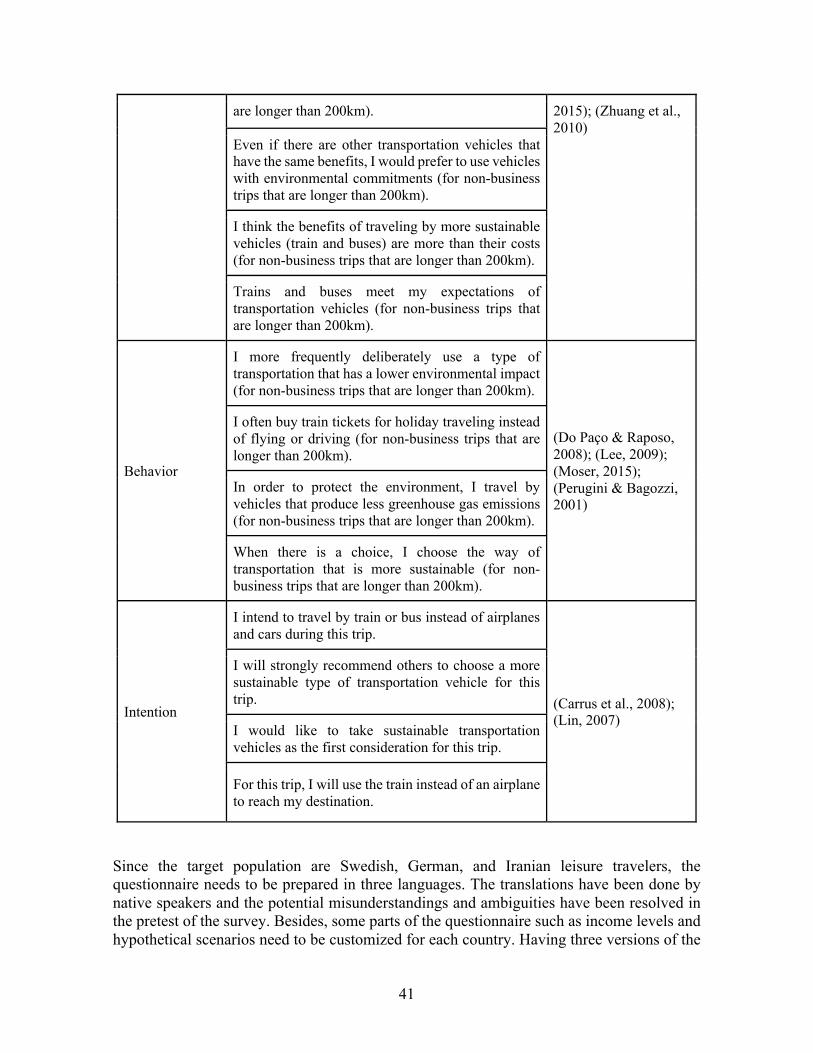
41
Since the target population are Swedish, German, and Iranian leisure travelers, the questionnaire needs to be prepared in three languages. The translations have been done by native speakers and the potential misunderstandings and ambiguities have been resolved in the pretest of the survey. Besides, some parts of the questionnaire such as income levels and hypothetical scenarios need to be customized for each country. Having three versions of the
are longer than 200km). 2015); (Zhuang et al., 2010)
Even if there are other transportation vehicles that have the same benefits, I would prefer to use vehicles with environmental commitments (for non-business trips that are longer than 200km).
I think the benefits of traveling by more sustainable vehicles (train and buses) are more than their costs (for non-business trips that are longer than 200km).
Trains and buses meet my expectations of transportation vehicles (for non-business trips that are longer than 200km).
Behavior
I more frequently deliberately use a type of transportation that has a lower environmental impact (for non-business trips that are longer than 200km).
(Do Paço & Raposo, 2008); (Lee, 2009); (Moser, 2015); (Perugini & Bagozzi, 2001)
I often buy train tickets for holiday traveling instead of flying or driving (for non-business trips that are longer than 200km).
In order to protect the environment, I travel by vehicles that produce less greenhouse gas emissions (for non-business trips that are longer than 200km).
When there is a choice, I choose the way of transportation that is more sustainable (for non-business trips that are longer than 200km).
Intention
I intend to travel by train or bus instead of airplanes and cars during this trip.
(Carrus et al., 2008); (Lin, 2007)
I will strongly recommend others to choose a more sustainable type of transportation vehicle for this trip.
I would like to take sustainable transportation vehicles as the first consideration for this trip.
For this trip, I will use the train instead of an airplane to reach my destination.
42
questionnaire can cause biases in the results that will be examined in later chapters. However, some solutions have been considered to partially remove biases coming from customization and translation of questions. For instance, using general choices such as medium, low, and high instead of mentioning exact prices removes potential errors from customization of prices for each economy. The study adopted a five-point Likert scale, from 1 for “strongly disagree” to 5 for “strongly agree”, for all the behavioral questions extracted from previous studies. Using the same scale for all questions makes it easier for respondents to answer questions. Additionally, since the questionnaire includes 39 questions, it has been divided into different sections to make it easier for respondents to go through. Finally, to remove biases from the order of the questions, the questions in each section are randomly distributed.
4.5 Pre-test of the Survey
Since this questionnaire is translated into German and Persian, it is necessary to test it before launch in order to correct any potential misunderstanding and inefficiency (Birks & Malhotra, 2006, p. 345). This pre-test has been done through some of the colleagues and friends and their data is not included in the final sample of the study. The result of this pre-test allows us to modify inconsistencies among three versions of the questionnaire and be sure that the constructs are valid and reliable.
4.6 Ethical Considerations To protect customers' privacy the data is collected anonymously. Also, to remove the possibility that someone finds the respondent by his or her unique response the data is not published publicly, only the results of the survey will be published. Besides, the study removes personal and sensitive questions as much as possible. Indeed, any sensitive and unnecessary question has been removed from the questionnaire. Additionally, the link shared in online groups via social media and participation in the study was optional. Therefore, no one needs to enter unreal data in the survey because they have to fill the form. Moreover, a short explanation at the beginning of the survey about the content of the survey, age limit, its goals, and the estimated time to fill the form helps respondents to be sure whether they want to participate in this study and to not start answering questions if they do not like to finish it.
43
5 Data Analysis In this chapter the quantitative results will be presented and analyzed. The first two sections will shed light on the data preparation process and data loss. Further, respondents’ demographics are discussed, and different segments of participants are described. Next, descriptive statistics are used to compare the value of each variable construct in different samples. Table 34 in Appendix 4 provides an overview of the descriptive statistics of each question in the survey. Lastly, statistical reliability and internal consistency of variable constructs are considered.
5.1 Data Preparation After closing the survey, the data has been extracted to SPSS. Then the data from three different languages is unified with the same coded numbers. The demographics and nominal variables are used to describe the sample population. For each nominal variable the frequency of each option, its percentage of total responses, and the mean value of the variable are measured and compared between Sweden, Germany, and Iran. This is done to ensure contrasting findings of the target population in each country. Additionally, these nominal variables are tested in chapter 6 to examine whether they play a moderator role in the conceptual model. On the other hand, multi-item scales are transformed to unidimensional constructs to test the stated hypotheses by statistical measures. Multiple item scales are quantified based on 1 for minimum (strongly disagree), 5 for maximum (strongly agree), and 3 as neutral. The value of some questions in the survey needs to be reversed to be consistent with other questions in the scale. For instance, three questions are used to measure environmental concern of respondents; “Environmental protection activities are meaningless and a waste of money and resources.”, “Environmental protection issues are none of my business.”, and “I am very concerned about air pollution and global warming.”. While the lower value in the first two questions shows higher environmental concern, the higher value in the third question means the respondent has a higher concern about environmental issues. Therefore, to correctly measure respondents’ level of environmental concern the value of the first and second questions of this scale needs to be reversed. Similarly, values collected for the first question in perceived effectiveness construct need to be reversed to correctly measure respondents’ perception of the effect of sustainable traveling. The numbers used in tables and figures in chapters 5 and 6 are calculated after reversing the value from these questions. In chapter 5 the validity and internal consistency of multiple-item scales used in the questionnaire are examined by Cronbach’s alpha. Besides, to test the relationship between each independent variable and dependent variable linear regression analysis is used in chapter 6. The significant relationship between each dependent and each independent variable is measured by P-values. To test the proposed mediation-moderation model, SPSS Macro (PROCESS) (Montoya & Hayes, 2017) was adopted.
44
5.2 Data Loss There are several reasons for losing part of the data collected by online questionnaires. For instance, some respondents might lose their internet connection before submitting the form. Besides, the questionnaire includes 39 questions and some respondents might get bored and quit the link before answering all questions. In total, 385 filled questionnaires including 130 Swedish, 128 German, and 127 Persian questionnaires are gathered, from which two values are missing. Both missing values are from demographic variables. However, it is possible to use the rest of the data of these two respondents to analyze their behavior. For other analyses that are dependent on these variables (with missing values), these two incomplete questionnaires are removed from the data. In that case, the rate of data loss is less than 1 percent, which is higher than the expected responsiveness (Fincham, 2008). There are several reasons behind this very high responsiveness rate including some modifications in the survey during the pre-test of the survey. First, the introduction to the survey is before starting to answer questions and it is completely explaining the type of questions and their topics, age limitation, and the goal of the survey. Therefore, if some respondents are not interested in filling out the questionnaire, they can quit before starting it and their record is not included in the data set. Second, the required time for filling the questionnaire is written in an overestimated way in the introduction. Therefore, respondents start answering questions with the right perception and are less likely to get bored in the middle of the process. Third, to increase the response rate responding to all the questions in the questionnaires is obligatory to submit the form. If some questions were not obligatory, respondents could submit their response form without answering those questions, increasing the number of missing values. Therefore, if someone does not intend to fill the questionnaire, they are not able to submit the form. Fourth, during the pre-test of the survey with locals in Sweden, Germany, and Iran several ambiguities and potential misinterpretations in the questions that might make confusion in respondents are resolved. As a result, it gets more convenient and faster for respondents to finish the survey.
5.3 Demographics Of the total of 385 respondents, 59 percent are female, and 41 percent are male. The share of women in data from Sweden, Germany, and Iran is 65.4%, 55.5%, and 56% respectively. According to Curtin et al. (2000), women are more likely to participate in surveys than men. The most frequently distributed age group is 25-39 years. This group encompasses more than half of the total respondents. One reason behind that could be the sampling technique. Both authors are in this age group and since the questionnaires are distributed through their network, the sample could be biased toward this age range. Besides, previous studies state that younger people are more likely to participate in surveys than older people (Moore & Tarnai, 2002). The distribution of the age range of respondents in the Swedish and German samples almost fit the bell curve. However, only 8 percent of Persian respondents are older than 40 years. Apart from the mentioned reasons, this is probably because the penetration rate of social networks and the internet is much lower among older people in Iran. While less than 22 percent of people older than 55 years in Iran are internet users this ratio for people in the same age range in Sweden and Germany is 93 and 82 percent respectively (UNECE, 2019; YJC, 2016).
45
Of total responses, 34.2 percent are single or living alone and 65.8 percent are married or live with other people. The ratio of people who are living alone in Sweden, Germany, and Iran is 49.2 %, 29.7 %, and 23.3 % respectively. There are several reasons for this difference. First of all, the target population in these countries does not have the same lifestyle. Indeed, the ratio of single households to total households in Sweden, Germany, and Iran is different. According to Eurostat (2017), over half of the households in Sweden (52 percent of all households) in 2016 were single households, while in Germany this ratio is around 40 percent. On the other hand, the results of the general census of population and housing of Iranians in 2017 show that the share of single-family households in the total number of households in the country is 8.46 percent (Tasnim, 2018). There are various reasons justifying these different numbers including culture and economy. In Iran, the younger generation mostly lives with their family before getting married because it is culturally acceptable and they cannot afford the expenses of a separate life (Tabnak, 2010; YJC, 2019). The most common age to leave home in Sweden is between 18 and 19, compared to the EU average of 26; these Swedes mostly live alone after leaving home (Savage, 2019). The age of respondents in Sweden is distributed normally and almost in each age group, except people in the age range of 18-24 years, 50 percent of respondents are single, and 50 percent are living with other people. Therefore, the ratio of people who are living alone to the total sample size in Sweden seems reasonable and similar to the real ratio in Sweden, which is 52 percent (Eurostat, 2017). However, almost half of the respondents in Germany are older than 40. It is more likely that single people live with their partner and children after getting 40 years old than when they are younger. Besides, this sample is biased toward students and they might cohabit with other people who are not their family members. As a result, the percentage of single people in the sample is lower than the real number in the country, which is 40 percent (Eurostat, 2017). The reason why the ratio of people who are living alone to the total sample of Iranians is higher than the real ratio in the country (8.46 percent) is that this sample is biased toward the younger generation who is more likely to live alone than people who are older than 40. Besides, due to the sampling method respondents in this study are probably students who might have to live alone and apart from their families in other cities. The data proves this rationale as all the Iranian respondents who are older than 40 years old are married. The last demographic variable in this study is income. The total sample is almost equally divided between these three income levels: low, medium, and high. The exact numbers can be found in table 4. Among respondents in Iran and Sweden people with higher levels of income encompasses less than 30 percent of the total population. Since the sample of this study is biased toward students and younger generations this result is logical. However, 47.7 percent of German respondents are in the high-income group. Since the German sample is older than two other samples and older people in all samples have higher income therefore this difference is partially justifiable. However, in each age range still, the percentage of people who belong to the higher income group is higher in the German sample compared to the Swedish and Iranian samples. It means that probably the German sample is biased toward people with higher incomes. Since the sampling technique is not completely random it is understandable.
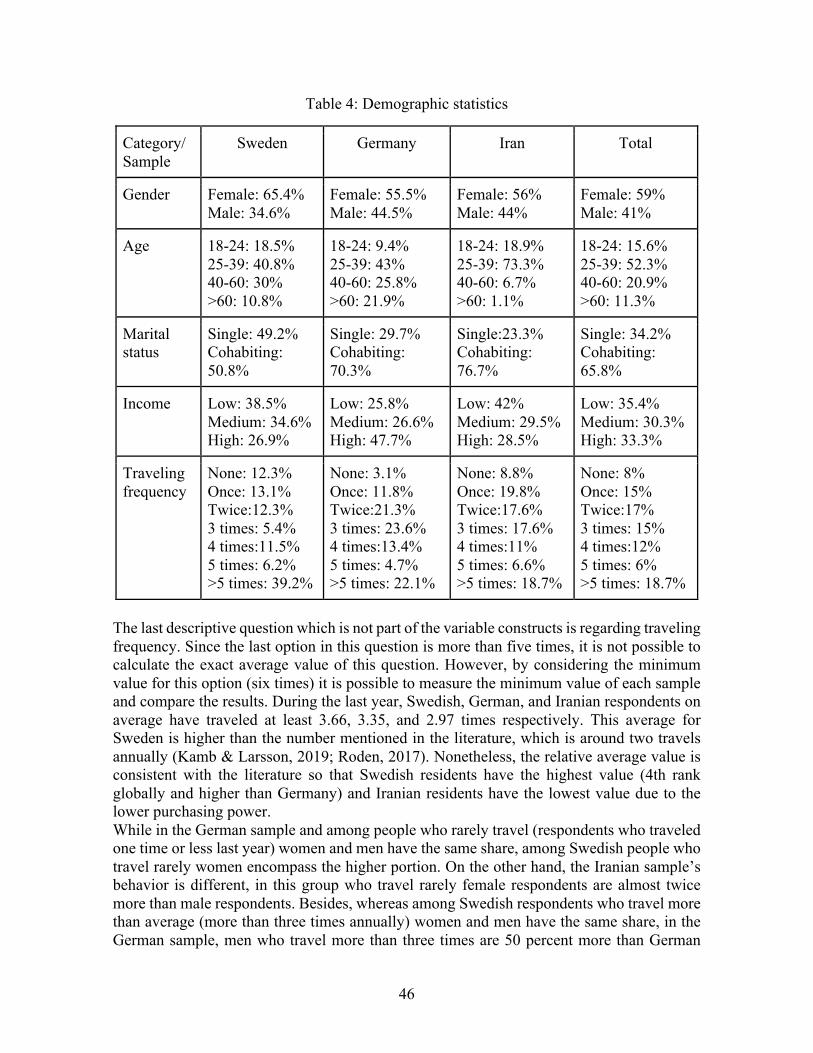
46
Table 4: Demographic statistics
Category/ Sample
Sweden Germany Iran Total
Gender Female: 65.4% Male: 34.6%
Female: 55.5% Male: 44.5%
Female: 56% Male: 44%
Female: 59% Male: 41%
Age 18-24: 18.5% 25-39: 40.8% 40-60: 30% >60: 10.8%
18-24: 9.4% 25-39: 43% 40-60: 25.8% >60: 21.9%
18-24: 18.9% 25-39: 73.3% 40-60: 6.7% >60: 1.1%
18-24: 15.6% 25-39: 52.3% 40-60: 20.9% >60: 11.3%
Marital status
Single: 49.2% Cohabiting: 50.8%
Single: 29.7% Cohabiting: 70.3%
Single:23.3% Cohabiting: 76.7%
Single: 34.2% Cohabiting: 65.8%
Income Low: 38.5% Medium: 34.6% High: 26.9%
Low: 25.8% Medium: 26.6% High: 47.7%
Low: 42% Medium: 29.5% High: 28.5%
Low: 35.4% Medium: 30.3% High: 33.3%
Traveling frequency
None: 12.3% Once: 13.1% Twice:12.3% 3 times: 5.4% 4 times:11.5% 5 times: 6.2% >5 times: 39.2%
None: 3.1% Once: 11.8% Twice:21.3% 3 times: 23.6% 4 times:13.4% 5 times: 4.7% >5 times: 22.1%
None: 8.8% Once: 19.8% Twice:17.6% 3 times: 17.6% 4 times:11% 5 times: 6.6% >5 times: 18.7%
None: 8% Once: 15% Twice:17% 3 times: 15% 4 times:12% 5 times: 6% >5 times: 18.7%
The last descriptive question which is not part of the variable constructs is regarding traveling frequency. Since the last option in this question is more than five times, it is not possible to calculate the exact average value of this question. However, by considering the minimum value for this option (six times) it is possible to measure the minimum value of each sample and compare the results. During the last year, Swedish, German, and Iranian respondents on average have traveled at least 3.66, 3.35, and 2.97 times respectively. This average for Sweden is higher than the number mentioned in the literature, which is around two travels annually (Kamb & Larsson, 2019; Roden, 2017). Nonetheless, the relative average value is consistent with the literature so that Swedish residents have the highest value (4th rank globally and higher than Germany) and Iranian residents have the lowest value due to the lower purchasing power. While in the German sample and among people who rarely travel (respondents who traveled one time or less last year) women and men have the same share, among Swedish people who travel rarely women encompass the higher portion. On the other hand, the Iranian sample’s behavior is different, in this group who travel rarely female respondents are almost twice more than male respondents. Besides, whereas among Swedish respondents who travel more than average (more than three times annually) women and men have the same share, in the German sample, men who travel more than three times are 50 percent more than German
47
women in the same category. In the Iranian sample, this proportion is reversed, women who travel more than three times are 70 percent more than men who are traveling more than three times annually. There is no significant difference between single and married (cohabitating) respondents in Sweden and Germany in terms of traveling frequency. In other words, the number of times that Swedes and Germans who are living alone and who have not traveled last year is similarly distributed. However, in the Iranian sample, people who live alone traveled less than others. While the answers of single Iranians to this question is more inclined toward lower options, Iranians who are living with their family have more often selected higher options. Therefore, there is a correlation between living alone and the traveling frequency among Iranian respondents. One of the reasons why Iranian families travel more is cultural values, Iranians usually believe that traveling in groups and with their family is more fun and economical (Moradi, 2019). There is not any obvious distinctive pattern in the traveling frequency behavior of German and Iranian respondents who have different levels of income. However, in the Swedish sample, respondents who have higher income behave differently in terms of traveling frequency. While 16 percent of Swedes in the lower-income group and 17 percent of Swedes in the lower-income group did not travel during last year, none of the Swedish respondents in the higher income group selected this option. On the other hand, while almost 59 percent of Swedish respondents with higher income levels have traveled more than five times during the last year this percentage for low- and Medium-income groups is 34 and 31 percent respectively. As a result, there can be a relationship between traveling frequency and income level in Sweden. Table 5 describes the mean value and standard deviation of all the constructs in the survey in the Swedish, German, Iranian, and total samples respectively. Since sustainable travel intention is measured in two different scenarios the descriptive measures are calculated for intention (scenario 1), intention (scenario 2), and average intention. Since, the third question measuring price is not consistent with the other two questions in this scale (Low Cronbach’s alpha in table 6) the third question is removed from this scale. The results of this table will be used in the discussion of results in chapter 6. some interesting findings can be extracted from this table. First, although because of the higher index of sustainability in Sweden (EPI, 2018) and social trend of “flygskam” it was expected that compared to other samples, people in Sweden more frequently suggest sustainable traveling to each other. However, the results of table 5 show that Swedish respondents feel lower pressure from social groups to travel by sustainable vehicles. Second, while the sustainability index of Sweden and Germany is much higher than Iran and Swedes and Germans’ lifestyle is more sustainable (table 5), Iranians’ environmental concern is higher than two other countries. Additionally, While Swedes and Germans’ perception is that train tickets are more expensive than flight tickets, in Iran people’s perception is that train tickets are less expensive. These different perceptions will have some implications for the analyses of hypotheses in chapter 6.
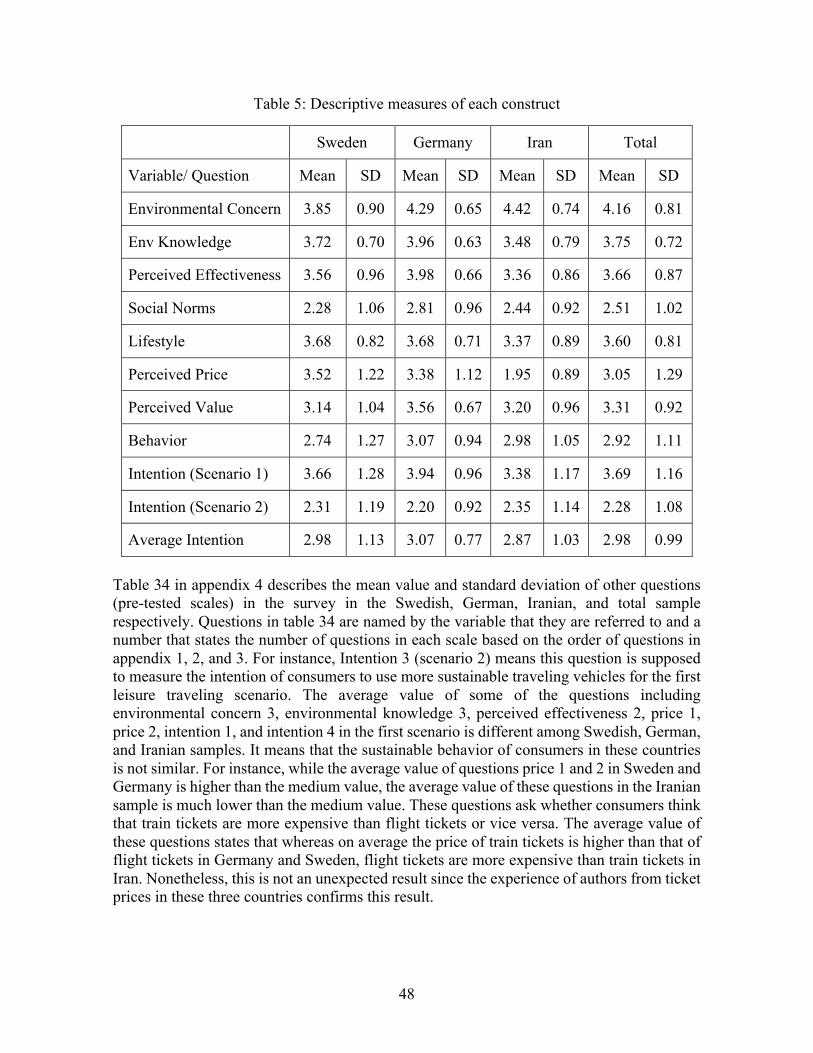
48
Table 5: Descriptive measures of each construct
Sweden Germany Iran Total
Variable/ Question Mean SD Mean SD Mean SD Mean SD
Environmental Concern 3.85 0.90 4.29 0.65 4.42 0.74 4.16 0.81
Env Knowledge 3.72 0.70 3.96 0.63 3.48 0.79 3.75 0.72
Perceived Effectiveness 3.56 0.96 3.98 0.66 3.36 0.86 3.66 0.87
Social Norms 2.28 1.06 2.81 0.96 2.44 0.92 2.51 1.02
Lifestyle 3.68 0.82 3.68 0.71 3.37 0.89 3.60 0.81
Perceived Price 3.52 1.22 3.38 1.12 1.95 0.89 3.05 1.29
Perceived Value 3.14 1.04 3.56 0.67 3.20 0.96 3.31 0.92
Behavior 2.74 1.27 3.07 0.94 2.98 1.05 2.92 1.11
Intention (Scenario 1) 3.66 1.28 3.94 0.96 3.38 1.17 3.69 1.16
Intention (Scenario 2) 2.31 1.19 2.20 0.92 2.35 1.14 2.28 1.08
Average Intention 2.98 1.13 3.07 0.77 2.87 1.03 2.98 0.99
Table 34 in appendix 4 describes the mean value and standard deviation of other questions (pre-tested scales) in the survey in the Swedish, German, Iranian, and total sample respectively. Questions in table 34 are named by the variable that they are referred to and a number that states the number of questions in each scale based on the order of questions in appendix 1, 2, and 3. For instance, Intention 3 (scenario 2) means this question is supposed to measure the intention of consumers to use more sustainable traveling vehicles for the first leisure traveling scenario. The average value of some of the questions including environmental concern 3, environmental knowledge 3, perceived effectiveness 2, price 1, price 2, intention 1, and intention 4 in the first scenario is different among Swedish, German, and Iranian samples. It means that the sustainable behavior of consumers in these countries is not similar. For instance, while the average value of questions price 1 and 2 in Sweden and Germany is higher than the medium value, the average value of these questions in the Iranian sample is much lower than the medium value. These questions ask whether consumers think that train tickets are more expensive than flight tickets or vice versa. The average value of these questions states that whereas on average the price of train tickets is higher than that of flight tickets in Germany and Sweden, flight tickets are more expensive than train tickets in Iran. Nonetheless, this is not an unexpected result since the experience of authors from ticket prices in these three countries confirms this result.
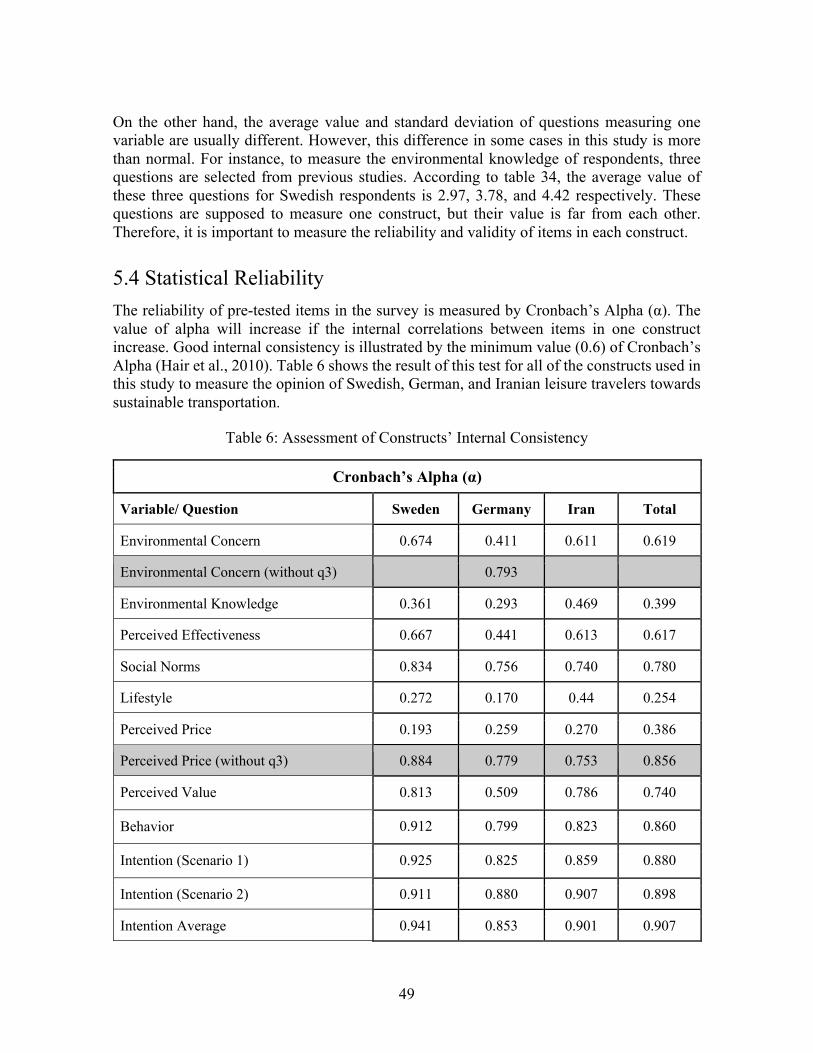
49
On the other hand, the average value and standard deviation of questions measuring one variable are usually different. However, this difference in some cases in this study is more than normal. For instance, to measure the environmental knowledge of respondents, three questions are selected from previous studies. According to table 34, the average value of these three questions for Swedish respondents is 2.97, 3.78, and 4.42 respectively. These questions are supposed to measure one construct, but their value is far from each other. Therefore, it is important to measure the reliability and validity of items in each construct.
5.4 Statistical Reliability The reliability of pre-tested items in the survey is measured by Cronbach’s Alpha (α). The value of alpha will increase if the internal correlations between items in one construct increase. Good internal consistency is illustrated by the minimum value (0.6) of Cronbach’s Alpha (Hair et al., 2010). Table 6 shows the result of this test for all of the constructs used in this study to measure the opinion of Swedish, German, and Iranian leisure travelers towards sustainable transportation.
Table 6: Assessment of Constructs’ Internal Consistency
Cronbach’s Alpha (α)
Variable/ Question Sweden Germany Iran Total
Environmental Concern 0.674 0.411 0.611 0.619
Environmental Concern (without q3) 0.793
Environmental Knowledge 0.361 0.293 0.469 0.399
Perceived Effectiveness 0.667 0.441 0.613 0.617
Social Norms 0.834 0.756 0.740 0.780
Lifestyle 0.272 0.170 0.44 0.254
Perceived Price 0.193 0.259 0.270 0.386
Perceived Price (without q3) 0.884 0.779 0.753 0.856
Perceived Value 0.813 0.509 0.786 0.740
Behavior 0.912 0.799 0.823 0.860
Intention (Scenario 1) 0.925 0.825 0.859 0.880
Intention (Scenario 2) 0.911 0.880 0.907 0.898
Intention Average 0.941 0.853 0.901 0.907
50
Based on table 6 there are three different types of variables in terms of internal consistency. The first group of variables including intention (scenario 1), intention (scenario 2), average intention, behavior, and social norms has a Cronbach alpha above 0.6 for all sample groups. Therefore, the scales used for measuring these constructs are reliable and internally consistent. The second group of variables does not have an acceptable Cronbach alpha. However, if one of the questions is removed from the scale, the new construct will be reliable. For instance, to investigate the perceived price of leisure traveling vehicles three questions have been selected from previous studies. The value of Cronbach’s alpha for the Swedish, German, and Iranian samples is 0.193, 0.259, and 0.270 respectively. These values show that internal consistency between these three questions to measure one construct is low and not acceptable. However, if the third question is removed from this scale the new values for Cronbach’s alpha will be 0.884, 0.779, and 0.753 respectively. The new values are acceptable and the first and the second question are consistently measuring perceived price. Indeed, the third question is measuring something slightly different. While the first two questions are asking about the cost and price of traveling by each vehicle the third question is more inclined toward measuring willingness to pay of respondents and the extra money that they are ready to pay to use more sustainable traveling vehicles for traveling during holidays. Similarly, Cronbach’s alpha of the environmental concern in the German sample is 0.411, which is below the acceptable value. There are three questions measuring environmental concern in the questionnaire. If the third question is removed from this scale the new value of Cronbach’s alpha will improve; the new value is 0.793. Although the third question is selected from previous studies and seems relevant to two other questions measuring environmental concern, data from these questions are not consistent in the German sample. It means that German respondents' view of global warming and air pollution is different from their concern regarding environmental protection issues. Therefore, the variables in this category will be modified in chapter 6 to test the hypotheses in the conceptual model. The last group includes variables whose Cronbach alpha stays below 0.6 even if some questions are removed from the scale. Environmental knowledge and lifestyle are two constructs that have low internal inconsistency; their Cronbach alpha for all the sample groups is below 0.6 (Table 6). Moreover, the value of Cronbach's alpha for perceived effectiveness and perceived value in the German sample is below acceptable (0.6). These variables are considered as first-order formative constructs in terms of the direction of causality. While in a reflective construct causality flows from construct to indicators the direction of change in the formative constructs is reversed; a change in the indicators of the formative construct results in the change in the construct under study (Coltman et al., 2008). Items in a formative construct could be related but not interchangeable. Additionally, since indicators define a formative construct, the domain of the construct is dependent on the number and type of indicators; adding or removing an indicator or changing domain and type of an indicator may change the domain of the formative construct (Coltman et al., 2008). However, since the indicators are selected from previous studies, they can be considered adequate for the domain of this study. Cronbach's alpha and Confirmatory Factor Analysis are not appropriate criteria for measuring the reliability and validity of the formative constructs.
51
6 Results and Discussion In this chapter the quantitative results and their connection to the existing literature are discussed. In the first section, each hypothesis is analyzed in light of the precedent theories and discussed whether it confirms or deviates from the findings of the previous relevant studies. Further, in analyzing the results of each hypothesis, differences in the behavior of travelers in various countries, and the impact of destination and time on their behavior are examined. The second part summarizes the findings of this study in answering four research questions.
6.1 Intention Behavior Gap The first research question of this study is whether there is a gap between intention and behavior of leisure travelers toward traveling by more sustainable vehicles. Previous studies examining green behavior of consumers state that some people who intend to purchase sustainable products do not select sustainable options at purchasing points (e.g. Moser, 2015). Additionally, the second research question of this study is which segment of leisure travelers according to the study of Sheeran (2002) are responsible for creating the IBG. In that regard the first two hypotheses of this thesis are: H1-1: Intention of leisure travelers to use sustainable vehicles is positively correlated with their choice of sustainable vehicles.
H1-2: There is a gap between the intention of leisure travelers to use sustainable vehicles and their behavior of traveling by sustainable vehicles.
In order to investigate the intention behavior gap toward sustainable traveling (H1-2) the correlation between these two variables and their values needs to be investigated (H1-1). Tables 7, 9, and 11 summarize the results of these analyses for respondents in each country and the total sample. Table 7 explains the relationship between intention and behavior of respondents in the first scenario. The first scenario is a customized example of a short distance journey in each country and is going to investigate the traveling vehicle that respondents select for such trips. In the total sample, the intention and behavior of respondents to travel by more sustainable vehicles in short trips are strongly correlated (β = 0.611; p = 0.001). Although the relationship between intention and behavior of Swedish respondents is stronger than in the two other countries, the difference between the coefficients of this relationship in these three groups is not significant. Therefore, hypothesis H1-1 in short distance journeys is supported.
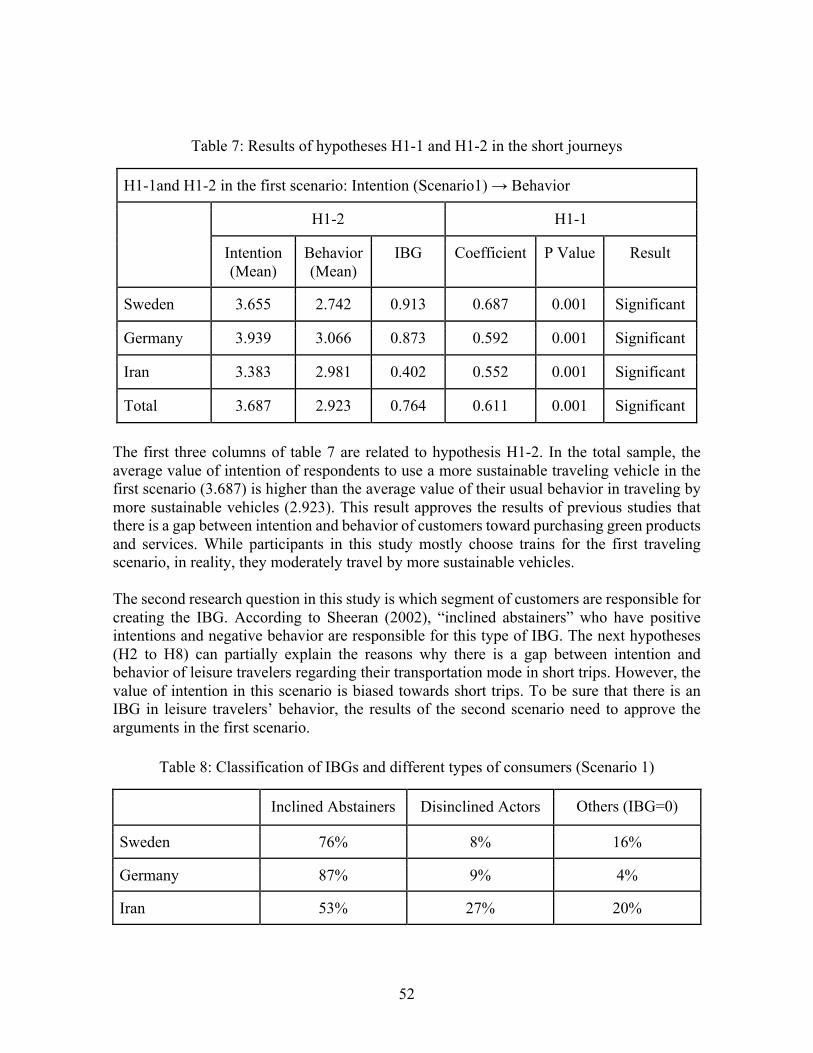
52
Table 7: Results of hypotheses H1-1 and H1-2 in the short journeys
H1-1and H1-2 in the first scenario: Intention (Scenario1) → Behavior
H1-2 H1-1
Intention (Mean)
Behavior (Mean)
IBG Coefficient P Value Result
Sweden 3.655 2.742 0.913 0.687 0.001 Significant
Germany 3.939 3.066 0.873 0.592 0.001 Significant
Iran 3.383 2.981 0.402 0.552 0.001 Significant
Total 3.687 2.923 0.764 0.611 0.001 Significant The first three columns of table 7 are related to hypothesis H1-2. In the total sample, the average value of intention of respondents to use a more sustainable traveling vehicle in the first scenario (3.687) is higher than the average value of their usual behavior in traveling by more sustainable vehicles (2.923). This result approves the results of previous studies that there is a gap between intention and behavior of customers toward purchasing green products and services. While participants in this study mostly choose trains for the first traveling scenario, in reality, they moderately travel by more sustainable vehicles. The second research question in this study is which segment of customers are responsible for creating the IBG. According to Sheeran (2002), “inclined abstainers” who have positive intentions and negative behavior are responsible for this type of IBG. The next hypotheses (H2 to H8) can partially explain the reasons why there is a gap between intention and behavior of leisure travelers regarding their transportation mode in short trips. However, the value of intention in this scenario is biased towards short trips. To be sure that there is an IBG in leisure travelers’ behavior, the results of the second scenario need to approve the arguments in the first scenario.
Table 8: Classification of IBGs and different types of consumers (Scenario 1)
Inclined Abstainers Disinclined Actors Others (IBG=0)
Sweden 76% 8% 16%
Germany 87% 9% 4%
Iran 53% 27% 20%
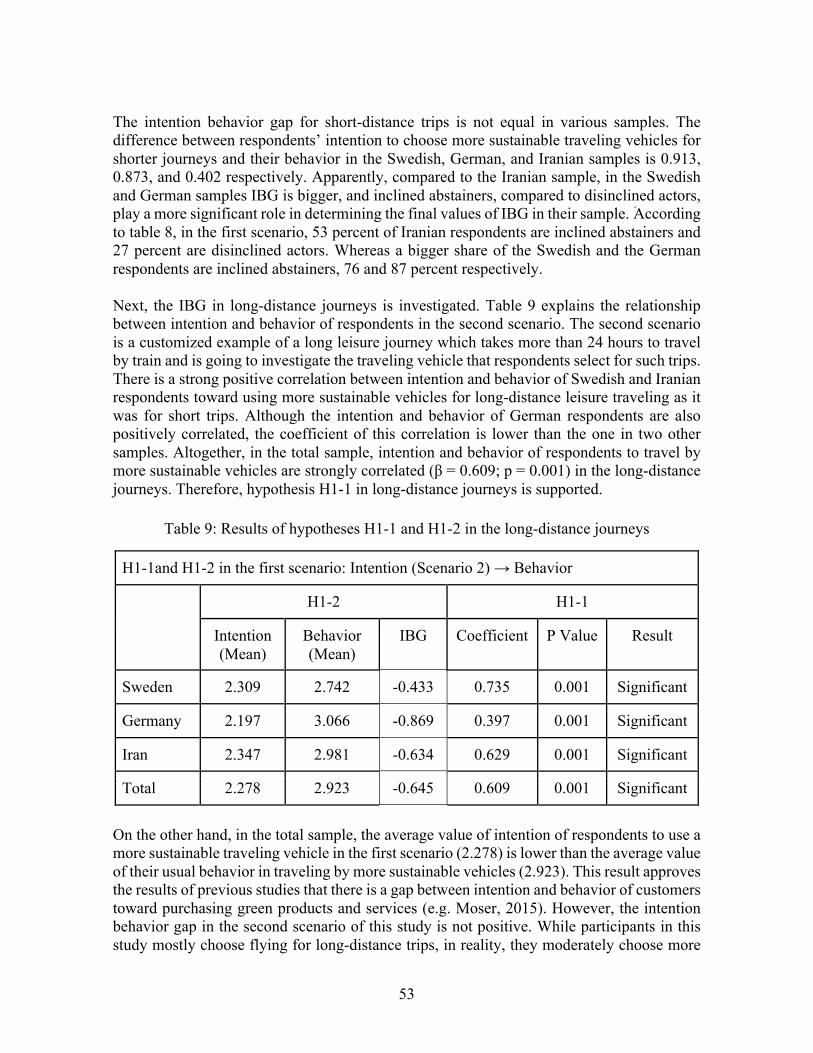
53
The intention behavior gap for short-distance trips is not equal in various samples. The difference between respondents’ intention to choose more sustainable traveling vehicles for shorter journeys and their behavior in the Swedish, German, and Iranian samples is 0.913, 0.873, and 0.402 respectively. Apparently, compared to the Iranian sample, in the Swedish and German samples IBG is bigger, and inclined abstainers, compared to disinclined actors, play a more significant role in determining the final values of IBG in their sample. َAccording to table 8, in the first scenario, 53 percent of Iranian respondents are inclined abstainers and 27 percent are disinclined actors. Whereas a bigger share of the Swedish and the German respondents are inclined abstainers, 76 and 87 percent respectively. Next, the IBG in long-distance journeys is investigated. Table 9 explains the relationship between intention and behavior of respondents in the second scenario. The second scenario is a customized example of a long leisure journey which takes more than 24 hours to travel by train and is going to investigate the traveling vehicle that respondents select for such trips. There is a strong positive correlation between intention and behavior of Swedish and Iranian respondents toward using more sustainable vehicles for long-distance leisure traveling as it was for short trips. Although the intention and behavior of German respondents are also positively correlated, the coefficient of this correlation is lower than the one in two other samples. Altogether, in the total sample, intention and behavior of respondents to travel by more sustainable vehicles are strongly correlated (β = 0.609; p = 0.001) in the long-distance journeys. Therefore, hypothesis H1-1 in long-distance journeys is supported.
Table 9: Results of hypotheses H1-1 and H1-2 in the long-distance journeys
H1-1and H1-2 in the first scenario: Intention (Scenario 2) → Behavior
H1-2 H1-1
Intention (Mean)
Behavior (Mean)
IBG Coefficient P Value Result
Sweden 2.309 2.742 -0.433 0.735 0.001 Significant
Germany 2.197 3.066 -0.869 0.397 0.001 Significant
Iran 2.347 2.981 -0.634 0.629 0.001 Significant
Total 2.278 2.923 -0.645 0.609 0.001 Significant On the other hand, in the total sample, the average value of intention of respondents to use a more sustainable traveling vehicle in the first scenario (2.278) is lower than the average value of their usual behavior in traveling by more sustainable vehicles (2.923). This result approves the results of previous studies that there is a gap between intention and behavior of customers toward purchasing green products and services (e.g. Moser, 2015). However, the intention behavior gap in the second scenario of this study is not positive. While participants in this study mostly choose flying for long-distance trips, in reality, they moderately choose more
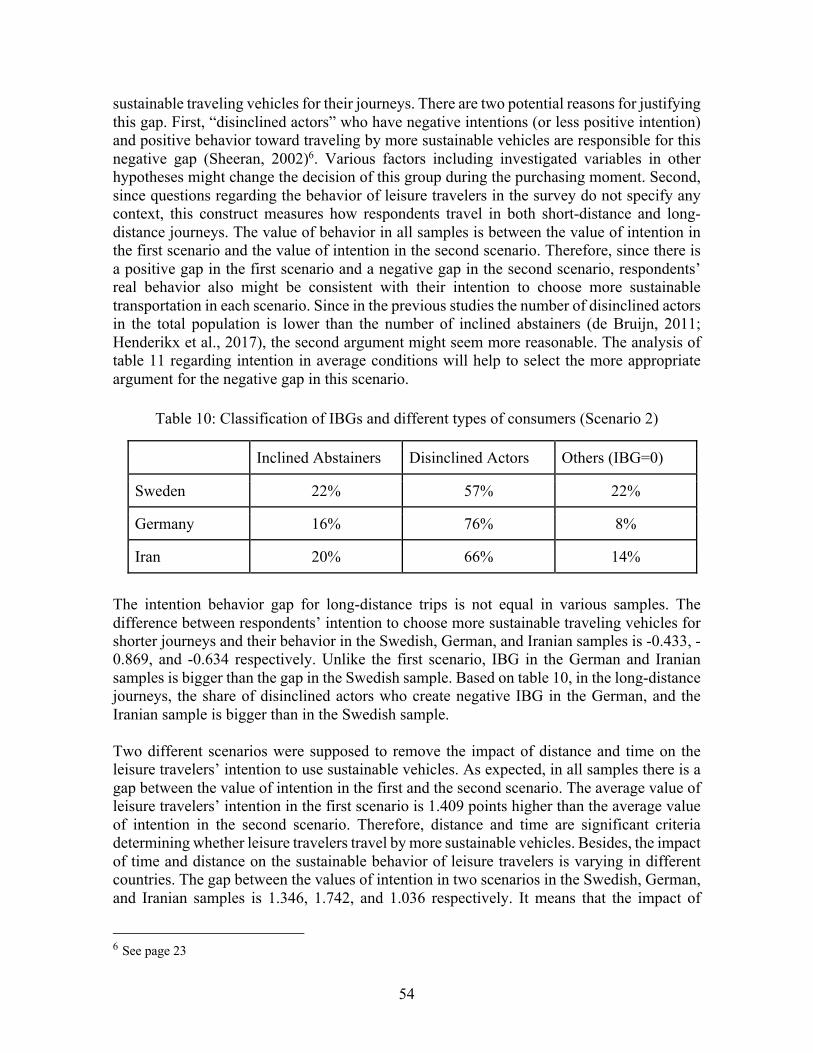
54
sustainable traveling vehicles for their journeys. There are two potential reasons for justifying this gap. First, “disinclined actors” who have negative intentions (or less positive intention) and positive behavior toward traveling by more sustainable vehicles are responsible for this negative gap (Sheeran, 2002)6. Various factors including investigated variables in other hypotheses might change the decision of this group during the purchasing moment. Second, since questions regarding the behavior of leisure travelers in the survey do not specify any context, this construct measures how respondents travel in both short-distance and long-distance journeys. The value of behavior in all samples is between the value of intention in the first scenario and the value of intention in the second scenario. Therefore, since there is a positive gap in the first scenario and a negative gap in the second scenario, respondents’ real behavior also might be consistent with their intention to choose more sustainable transportation in each scenario. Since in the previous studies the number of disinclined actors in the total population is lower than the number of inclined abstainers (de Bruijn, 2011; Henderikx et al., 2017), the second argument might seem more reasonable. The analysis of table 11 regarding intention in average conditions will help to select the more appropriate argument for the negative gap in this scenario.
Table 10: Classification of IBGs and different types of consumers (Scenario 2)
Inclined Abstainers Disinclined Actors Others (IBG=0)
Sweden 22% 57% 22%
Germany 16% 76% 8%
Iran 20% 66% 14%
The intention behavior gap for long-distance trips is not equal in various samples. The difference between respondents’ intention to choose more sustainable traveling vehicles for shorter journeys and their behavior in the Swedish, German, and Iranian samples is -0.433, -0.869, and -0.634 respectively. Unlike the first scenario, IBG in the German and Iranian samples is bigger than the gap in the Swedish sample. Based on table 10, in the long-distance journeys, the share of disinclined actors who create negative IBG in the German, and the Iranian sample is bigger than in the Swedish sample. Two different scenarios were supposed to remove the impact of distance and time on the leisure travelers’ intention to use sustainable vehicles. As expected, in all samples there is a gap between the value of intention in the first and the second scenario. The average value of leisure travelers’ intention in the first scenario is 1.409 points higher than the average value of intention in the second scenario. Therefore, distance and time are significant criteria determining whether leisure travelers travel by more sustainable vehicles. Besides, the impact of time and distance on the sustainable behavior of leisure travelers is varying in different countries. The gap between the values of intention in two scenarios in the Swedish, German, and Iranian samples is 1.346, 1.742, and 1.036 respectively. It means that the impact of
6 See page 23
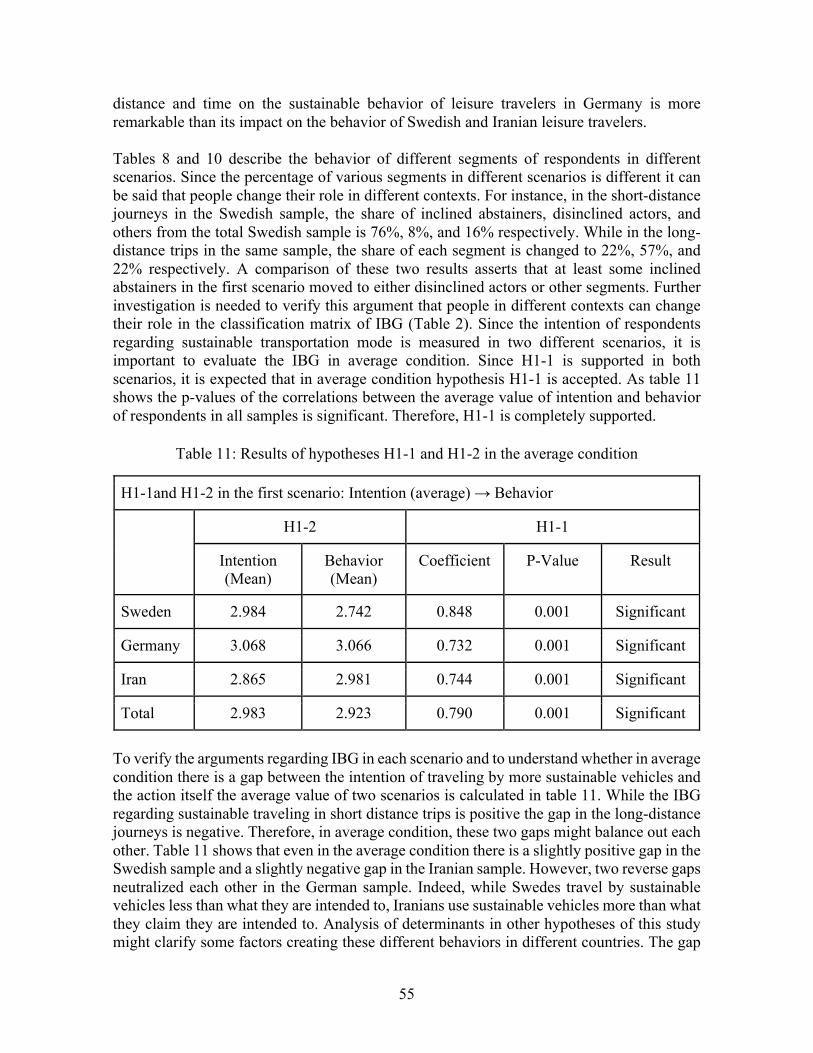
55
distance and time on the sustainable behavior of leisure travelers in Germany is more remarkable than its impact on the behavior of Swedish and Iranian leisure travelers. Tables 8 and 10 describe the behavior of different segments of respondents in different scenarios. Since the percentage of various segments in different scenarios is different it can be said that people change their role in different contexts. For instance, in the short-distance journeys in the Swedish sample, the share of inclined abstainers, disinclined actors, and others from the total Swedish sample is 76%, 8%, and 16% respectively. While in the long-distance trips in the same sample, the share of each segment is changed to 22%, 57%, and 22% respectively. A comparison of these two results asserts that at least some inclined abstainers in the first scenario moved to either disinclined actors or other segments. Further investigation is needed to verify this argument that people in different contexts can change their role in the classification matrix of IBG (Table 2). Since the intention of respondents regarding sustainable transportation mode is measured in two different scenarios, it is important to evaluate the IBG in average condition. Since H1-1 is supported in both scenarios, it is expected that in average condition hypothesis H1-1 is accepted. As table 11 shows the p-values of the correlations between the average value of intention and behavior of respondents in all samples is significant. Therefore, H1-1 is completely supported.
Table 11: Results of hypotheses H1-1 and H1-2 in the average condition
H1-1and H1-2 in the first scenario: Intention (average) → Behavior
H1-2 H1-1
Intention (Mean)
Behavior (Mean)
Coefficient P-Value Result
Sweden 2.984 2.742 0.848 0.001 Significant
Germany 3.068 3.066 0.732 0.001 Significant
Iran 2.865 2.981 0.744 0.001 Significant
Total 2.983 2.923 0.790 0.001 Significant
To verify the arguments regarding IBG in each scenario and to understand whether in average condition there is a gap between the intention of traveling by more sustainable vehicles and the action itself the average value of two scenarios is calculated in table 11. While the IBG regarding sustainable traveling in short distance trips is positive the gap in the long-distance journeys is negative. Therefore, in average condition, these two gaps might balance out each other. Table 11 shows that even in the average condition there is a slightly positive gap in the Swedish sample and a slightly negative gap in the Iranian sample. However, two reverse gaps neutralized each other in the German sample. Indeed, while Swedes travel by sustainable vehicles less than what they are intended to, Iranians use sustainable vehicles more than what they claim they are intended to. Analysis of determinants in other hypotheses of this study might clarify some factors creating these different behaviors in different countries. The gap
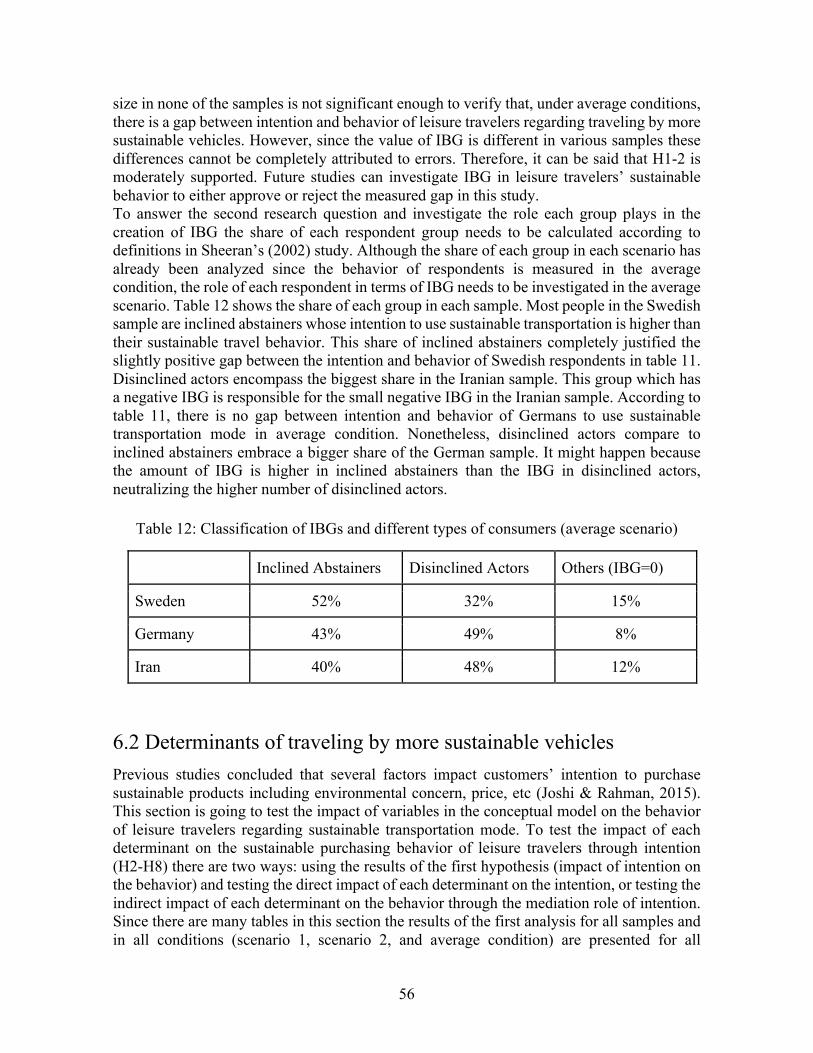
56
size in none of the samples is not significant enough to verify that, under average conditions, there is a gap between intention and behavior of leisure travelers regarding traveling by more sustainable vehicles. However, since the value of IBG is different in various samples these differences cannot be completely attributed to errors. Therefore, it can be said that H1-2 is moderately supported. Future studies can investigate IBG in leisure travelers’ sustainable behavior to either approve or reject the measured gap in this study. To answer the second research question and investigate the role each group plays in the creation of IBG the share of each respondent group needs to be calculated according to definitions in Sheeran’s (2002) study. Although the share of each group in each scenario has already been analyzed since the behavior of respondents is measured in the average condition, the role of each respondent in terms of IBG needs to be investigated in the average scenario. Table 12 shows the share of each group in each sample. Most people in the Swedish sample are inclined abstainers whose intention to use sustainable transportation is higher than their sustainable travel behavior. This share of inclined abstainers completely justified the slightly positive gap between the intention and behavior of Swedish respondents in table 11. Disinclined actors encompass the biggest share in the Iranian sample. This group which has a negative IBG is responsible for the small negative IBG in the Iranian sample. According to table 11, there is no gap between intention and behavior of Germans to use sustainable transportation mode in average condition. Nonetheless, disinclined actors compare to inclined abstainers embrace a bigger share of the German sample. It might happen because the amount of IBG is higher in inclined abstainers than the IBG in disinclined actors, neutralizing the higher number of disinclined actors.
Table 12: Classification of IBGs and different types of consumers (average scenario)
Inclined Abstainers Disinclined Actors Others (IBG=0)
Sweden 52% 32% 15%
Germany 43% 49% 8%
Iran 40% 48% 12%
6.2 Determinants of traveling by more sustainable vehicles
Previous studies concluded that several factors impact customers’ intention to purchase sustainable products including environmental concern, price, etc (Joshi & Rahman, 2015). This section is going to test the impact of variables in the conceptual model on the behavior of leisure travelers regarding sustainable transportation mode. To test the impact of each determinant on the sustainable purchasing behavior of leisure travelers through intention (H2-H8) there are two ways: using the results of the first hypothesis (impact of intention on the behavior) and testing the direct impact of each determinant on the intention, or testing the indirect impact of each determinant on the behavior through the mediation role of intention. Since there are many tables in this section the results of the first analysis for all samples and in all conditions (scenario 1, scenario 2, and average condition) are presented for all
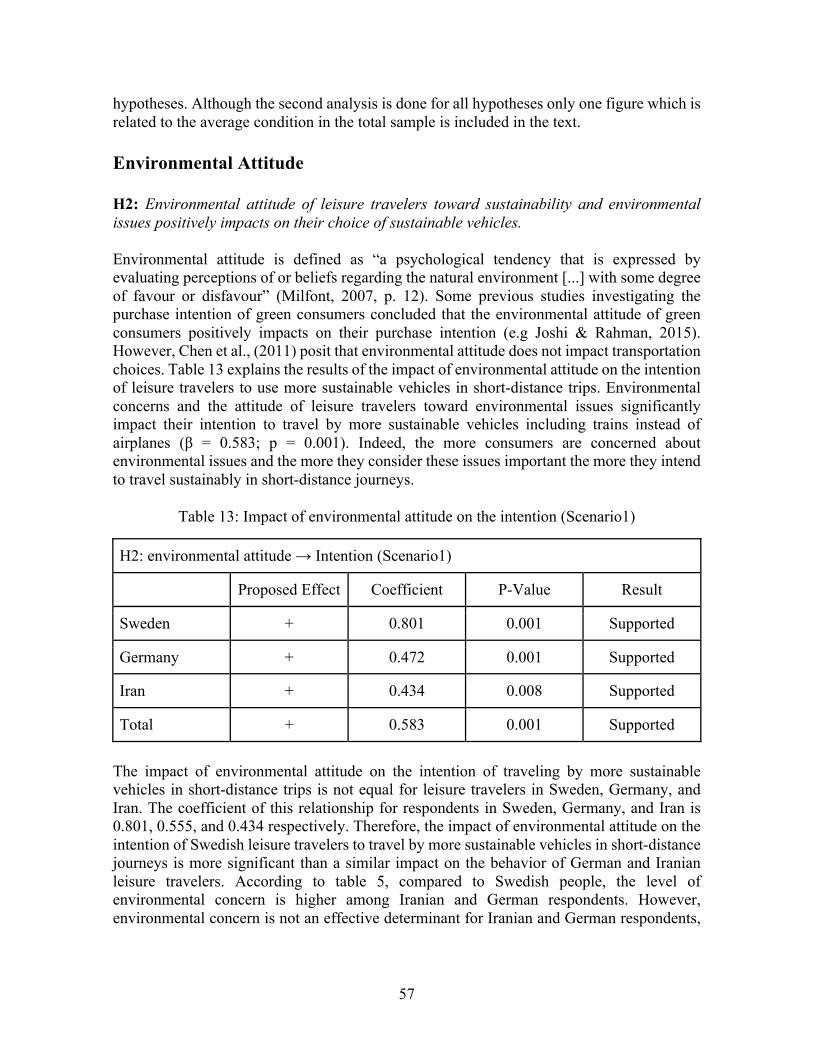
57
hypotheses. Although the second analysis is done for all hypotheses only one figure which is related to the average condition in the total sample is included in the text. Environmental Attitude H2: Environmental attitude of leisure travelers toward sustainability and environmental issues positively impacts on their choice of sustainable vehicles. Environmental attitude is defined as “a psychological tendency that is expressed by evaluating perceptions of or beliefs regarding the natural environment [...] with some degree of favour or disfavour” (Milfont, 2007, p. 12). Some previous studies investigating the purchase intention of green consumers concluded that the environmental attitude of green consumers positively impacts on their purchase intention (e.g Joshi & Rahman, 2015). However, Chen et al., (2011) posit that environmental attitude does not impact transportation choices. Table 13 explains the results of the impact of environmental attitude on the intention of leisure travelers to use more sustainable vehicles in short-distance trips. Environmental concerns and the attitude of leisure travelers toward environmental issues significantly impact their intention to travel by more sustainable vehicles including trains instead of airplanes (β = 0.583; p = 0.001). Indeed, the more consumers are concerned about environmental issues and the more they consider these issues important the more they intend to travel sustainably in short-distance journeys.
Table 13: Impact of environmental attitude on the intention (Scenario1)
H2: environmental attitude → Intention (Scenario1)
Proposed Effect Coefficient P-Value Result
Sweden + 0.801 0.001 Supported
Germany + 0.472 0.001 Supported
Iran + 0.434 0.008 Supported
Total + 0.583 0.001 Supported The impact of environmental attitude on the intention of traveling by more sustainable vehicles in short-distance trips is not equal for leisure travelers in Sweden, Germany, and Iran. The coefficient of this relationship for respondents in Sweden, Germany, and Iran is 0.801, 0.555, and 0.434 respectively. Therefore, the impact of environmental attitude on the intention of Swedish leisure travelers to travel by more sustainable vehicles in short-distance journeys is more significant than a similar impact on the behavior of German and Iranian leisure travelers. According to table 5, compared to Swedish people, the level of environmental concern is higher among Iranian and German respondents. However, environmental concern is not an effective determinant for Iranian and German respondents,
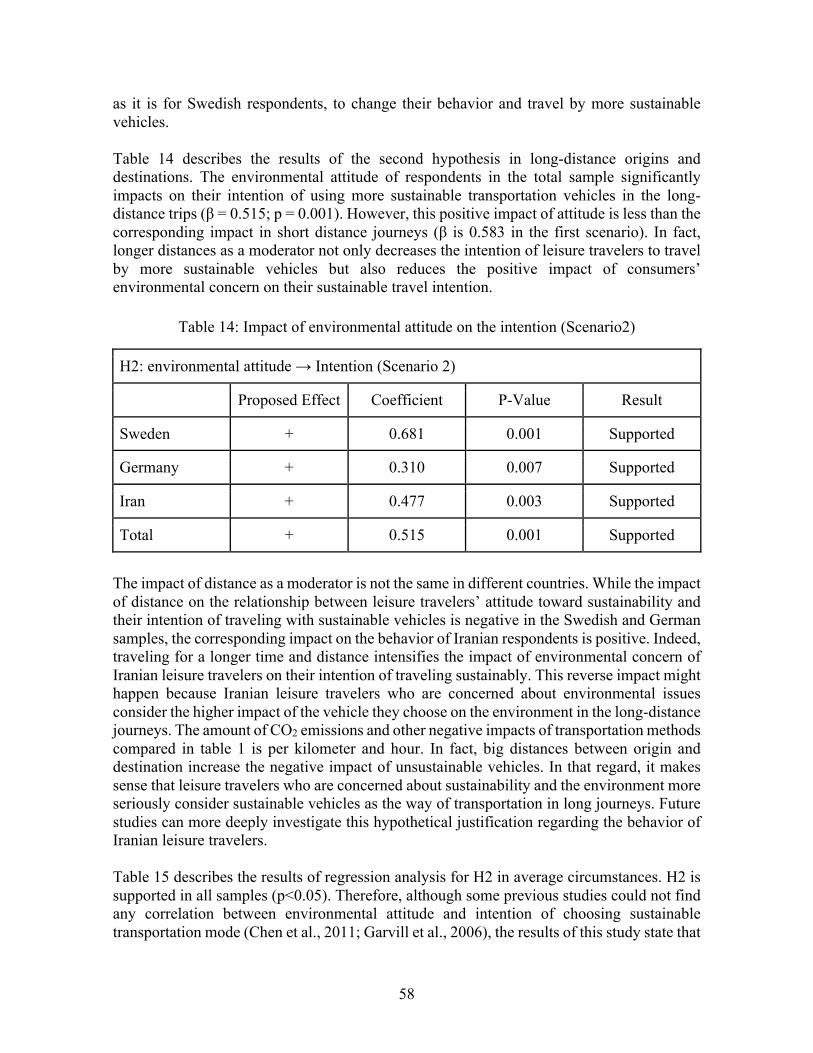
58
as it is for Swedish respondents, to change their behavior and travel by more sustainable vehicles. Table 14 describes the results of the second hypothesis in long-distance origins and destinations. The environmental attitude of respondents in the total sample significantly impacts on their intention of using more sustainable transportation vehicles in the long-distance trips (β = 0.515; p = 0.001). However, this positive impact of attitude is less than the corresponding impact in short distance journeys (β is 0.583 in the first scenario). In fact, longer distances as a moderator not only decreases the intention of leisure travelers to travel by more sustainable vehicles but also reduces the positive impact of consumers’ environmental concern on their sustainable travel intention.
Table 14: Impact of environmental attitude on the intention (Scenario2)
H2: environmental attitude → Intention (Scenario 2)
Proposed Effect Coefficient P-Value Result
Sweden + 0.681 0.001 Supported
Germany + 0.310 0.007 Supported
Iran + 0.477 0.003 Supported
Total + 0.515 0.001 Supported
The impact of distance as a moderator is not the same in different countries. While the impact of distance on the relationship between leisure travelers’ attitude toward sustainability and their intention of traveling with sustainable vehicles is negative in the Swedish and German samples, the corresponding impact on the behavior of Iranian respondents is positive. Indeed, traveling for a longer time and distance intensifies the impact of environmental concern of Iranian leisure travelers on their intention of traveling sustainably. This reverse impact might happen because Iranian leisure travelers who are concerned about environmental issues consider the higher impact of the vehicle they choose on the environment in the long-distance journeys. The amount of CO2 emissions and other negative impacts of transportation methods compared in table 1 is per kilometer and hour. In fact, big distances between origin and destination increase the negative impact of unsustainable vehicles. In that regard, it makes sense that leisure travelers who are concerned about sustainability and the environment more seriously consider sustainable vehicles as the way of transportation in long journeys. Future studies can more deeply investigate this hypothetical justification regarding the behavior of Iranian leisure travelers. Table 15 describes the results of regression analysis for H2 in average circumstances. H2 is supported in all samples (p<0.05). Therefore, although some previous studies could not find any correlation between environmental attitude and intention of choosing sustainable transportation mode (Chen et al., 2011; Garvill et al., 2006), the results of this study state that
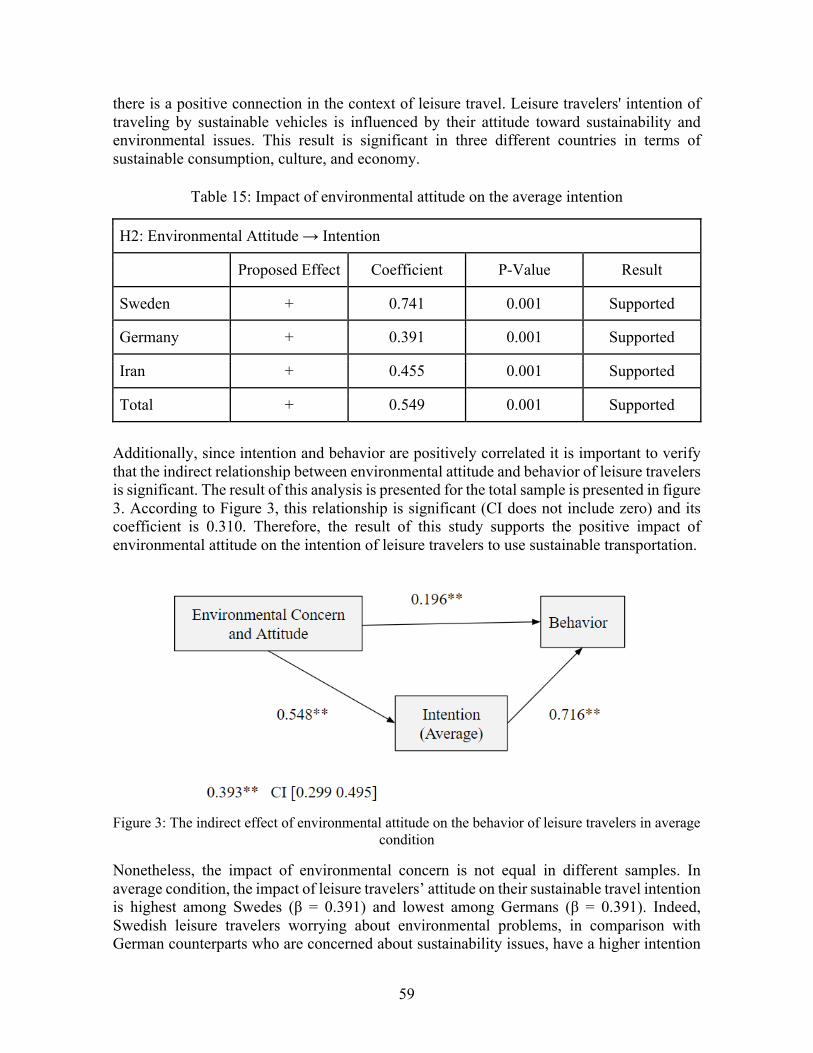
59
there is a positive connection in the context of leisure travel. Leisure travelers' intention of traveling by sustainable vehicles is influenced by their attitude toward sustainability and environmental issues. This result is significant in three different countries in terms of sustainable consumption, culture, and economy.
Table 15: Impact of environmental attitude on the average intention
H2: Environmental Attitude → Intention
Proposed Effect Coefficient P-Value Result
Sweden + 0.741 0.001 Supported
Germany + 0.391 0.001 Supported
Iran + 0.455 0.001 Supported
Total + 0.549 0.001 Supported
Additionally, since intention and behavior are positively correlated it is important to verify that the indirect relationship between environmental attitude and behavior of leisure travelers is significant. The result of this analysis is presented for the total sample is presented in figure 3. According to Figure 3, this relationship is significant (CI does not include zero) and its coefficient is 0.310. Therefore, the result of this study supports the positive impact of environmental attitude on the intention of leisure travelers to use sustainable transportation.
Figure 3: The indirect effect of environmental attitude on the behavior of leisure travelers in average
condition
Nonetheless, the impact of environmental concern is not equal in different samples. In average condition, the impact of leisure travelers’ attitude on their sustainable travel intention is highest among Swedes (β = 0.391) and lowest among Germans (β = 0.391). Indeed, Swedish leisure travelers worrying about environmental problems, in comparison with German counterparts who are concerned about sustainability issues, have a higher intention
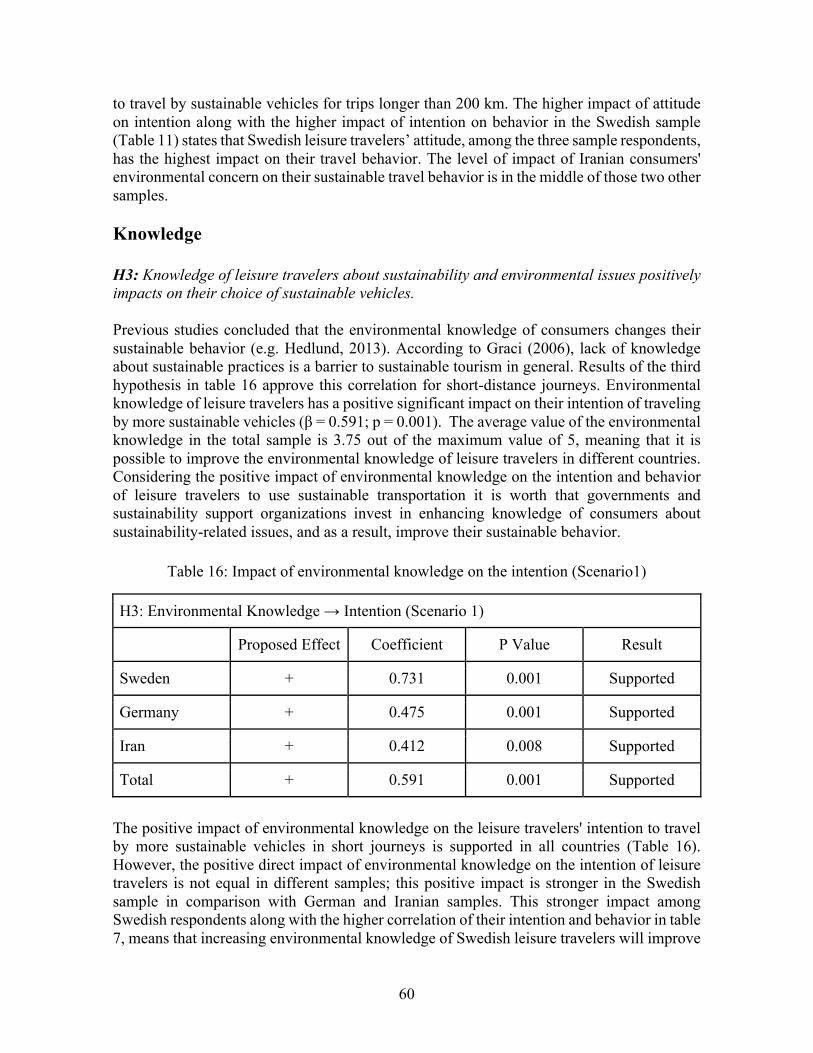
60
to travel by sustainable vehicles for trips longer than 200 km. The higher impact of attitude on intention along with the higher impact of intention on behavior in the Swedish sample (Table 11) states that Swedish leisure travelers’ attitude, among the three sample respondents, has the highest impact on their travel behavior. The level of impact of Iranian consumers' environmental concern on their sustainable travel behavior is in the middle of those two other samples. Knowledge H3: Knowledge of leisure travelers about sustainability and environmental issues positively impacts on their choice of sustainable vehicles. Previous studies concluded that the environmental knowledge of consumers changes their sustainable behavior (e.g. Hedlund, 2013). According to Graci (2006), lack of knowledge about sustainable practices is a barrier to sustainable tourism in general. Results of the third hypothesis in table 16 approve this correlation for short-distance journeys. Environmental knowledge of leisure travelers has a positive significant impact on their intention of traveling by more sustainable vehicles (β = 0.591; p = 0.001). The average value of the environmental knowledge in the total sample is 3.75 out of the maximum value of 5, meaning that it is possible to improve the environmental knowledge of leisure travelers in different countries. Considering the positive impact of environmental knowledge on the intention and behavior of leisure travelers to use sustainable transportation it is worth that governments and sustainability support organizations invest in enhancing knowledge of consumers about sustainability-related issues, and as a result, improve their sustainable behavior.
Table 16: Impact of environmental knowledge on the intention (Scenario1)
H3: Environmental Knowledge → Intention (Scenario 1)
Proposed Effect Coefficient P Value Result
Sweden + 0.731 0.001 Supported
Germany + 0.475 0.001 Supported
Iran + 0.412 0.008 Supported
Total + 0.591 0.001 Supported
The positive impact of environmental knowledge on the leisure travelers' intention to travel by more sustainable vehicles in short journeys is supported in all countries (Table 16). However, the positive direct impact of environmental knowledge on the intention of leisure travelers is not equal in different samples; this positive impact is stronger in the Swedish sample in comparison with German and Iranian samples. This stronger impact among Swedish respondents along with the higher correlation of their intention and behavior in table 7, means that increasing environmental knowledge of Swedish leisure travelers will improve
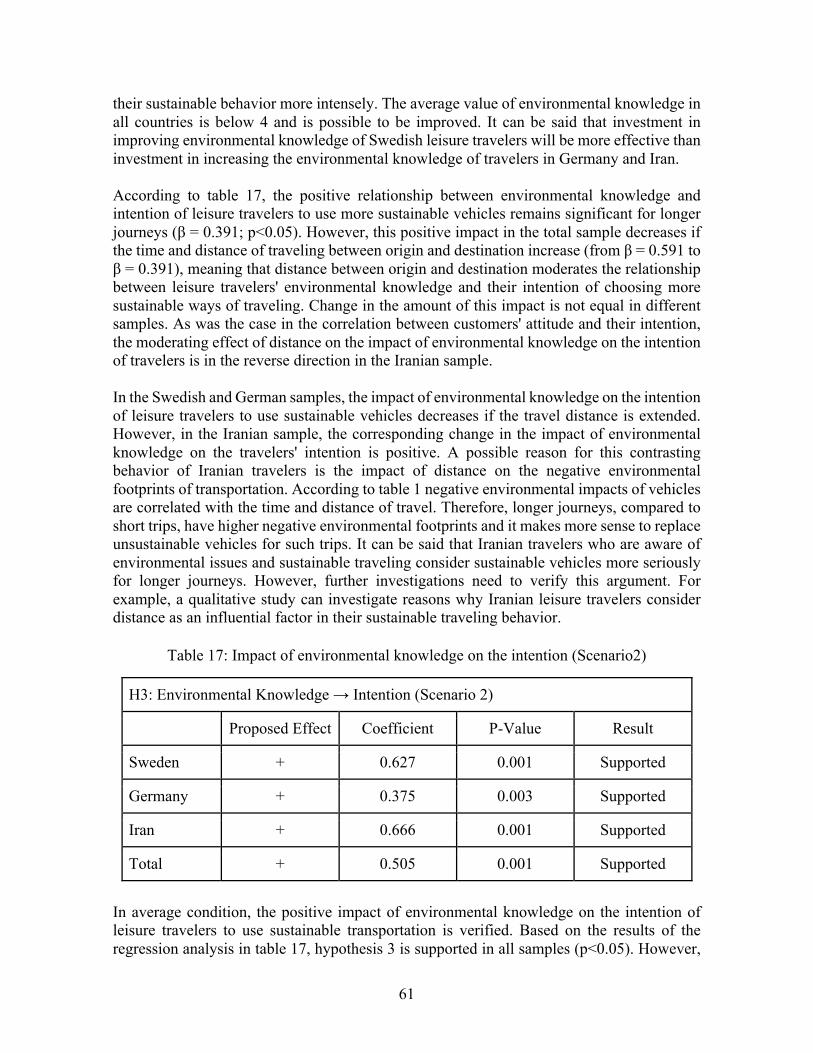
61
their sustainable behavior more intensely. The average value of environmental knowledge in all countries is below 4 and is possible to be improved. It can be said that investment in improving environmental knowledge of Swedish leisure travelers will be more effective than investment in increasing the environmental knowledge of travelers in Germany and Iran. According to table 17, the positive relationship between environmental knowledge and intention of leisure travelers to use more sustainable vehicles remains significant for longer journeys (β = 0.391; p<0.05). However, this positive impact in the total sample decreases if the time and distance of traveling between origin and destination increase (from β = 0.591 to β = 0.391), meaning that distance between origin and destination moderates the relationship between leisure travelers' environmental knowledge and their intention of choosing more sustainable ways of traveling. Change in the amount of this impact is not equal in different samples. As was the case in the correlation between customers' attitude and their intention, the moderating effect of distance on the impact of environmental knowledge on the intention of travelers is in the reverse direction in the Iranian sample. In the Swedish and German samples, the impact of environmental knowledge on the intention of leisure travelers to use sustainable vehicles decreases if the travel distance is extended. However, in the Iranian sample, the corresponding change in the impact of environmental knowledge on the travelers' intention is positive. A possible reason for this contrasting behavior of Iranian travelers is the impact of distance on the negative environmental footprints of transportation. According to table 1 negative environmental impacts of vehicles are correlated with the time and distance of travel. Therefore, longer journeys, compared to short trips, have higher negative environmental footprints and it makes more sense to replace unsustainable vehicles for such trips. It can be said that Iranian travelers who are aware of environmental issues and sustainable traveling consider sustainable vehicles more seriously for longer journeys. However, further investigations need to verify this argument. For example, a qualitative study can investigate reasons why Iranian leisure travelers consider distance as an influential factor in their sustainable traveling behavior.
Table 17: Impact of environmental knowledge on the intention (Scenario2)
H3: Environmental Knowledge → Intention (Scenario 2)
Proposed Effect Coefficient P-Value Result
Sweden + 0.627 0.001 Supported
Germany + 0.375 0.003 Supported
Iran + 0.666 0.001 Supported
Total + 0.505 0.001 Supported
In average condition, the positive impact of environmental knowledge on the intention of leisure travelers to use sustainable transportation is verified. Based on the results of the regression analysis in table 17, hypothesis 3 is supported in all samples (p<0.05). However,
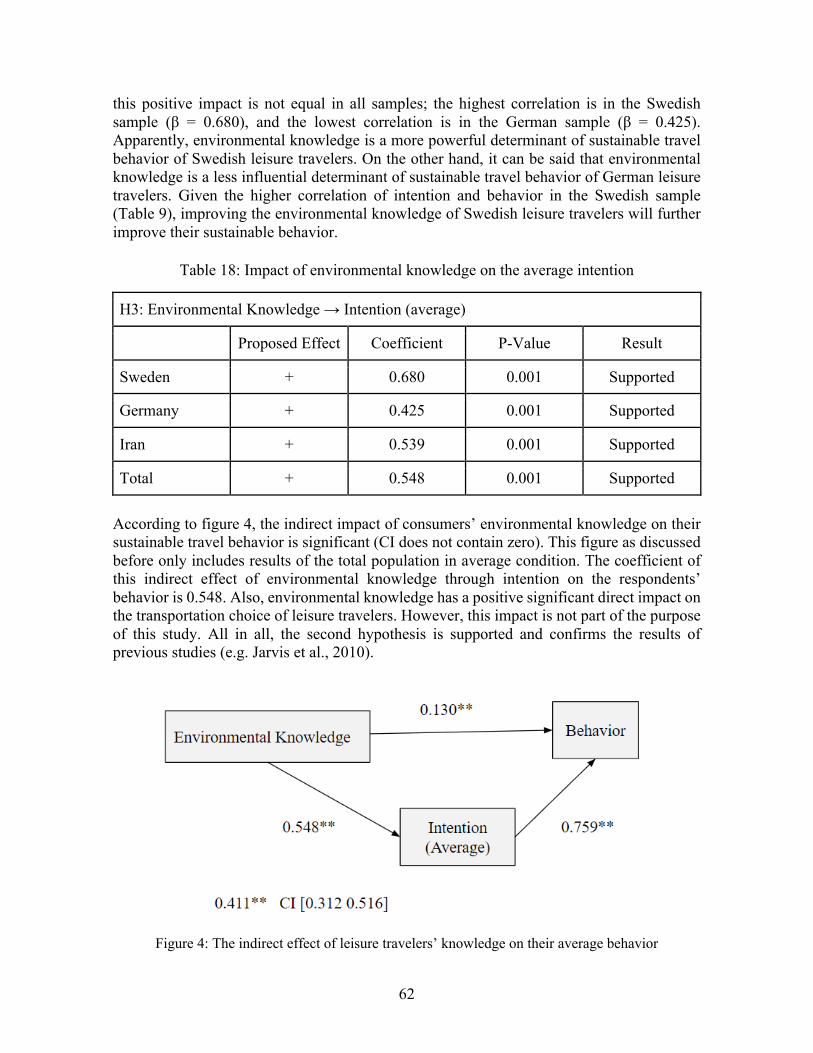
62
this positive impact is not equal in all samples; the highest correlation is in the Swedish sample (β = 0.680), and the lowest correlation is in the German sample (β = 0.425). Apparently, environmental knowledge is a more powerful determinant of sustainable travel behavior of Swedish leisure travelers. On the other hand, it can be said that environmental knowledge is a less influential determinant of sustainable travel behavior of German leisure travelers. Given the higher correlation of intention and behavior in the Swedish sample (Table 9), improving the environmental knowledge of Swedish leisure travelers will further improve their sustainable behavior.
Table 18: Impact of environmental knowledge on the average intention
H3: Environmental Knowledge → Intention (average)
Proposed Effect Coefficient P-Value Result
Sweden + 0.680 0.001 Supported
Germany + 0.425 0.001 Supported
Iran + 0.539 0.001 Supported
Total + 0.548 0.001 Supported
According to figure 4, the indirect impact of consumers’ environmental knowledge on their sustainable travel behavior is significant (CI does not contain zero). This figure as discussed before only includes results of the total population in average condition. The coefficient of this indirect effect of environmental knowledge through intention on the respondents’ behavior is 0.548. Also, environmental knowledge has a positive significant direct impact on the transportation choice of leisure travelers. However, this impact is not part of the purpose of this study. All in all, the second hypothesis is supported and confirms the results of previous studies (e.g. Jarvis et al., 2010).
Figure 4: The indirect effect of leisure travelers’ knowledge on their average behavior
63
Perceived Price H4: The perceived price of sustainable transportation mode negatively impacts on the leisure travelers’ choice of sustainable vehicles. The price perceived by customers is called “perceived price” and it is the “monetary sacrifice for obtaining a product” or service (Kim et al., 2012, p. 241). The price perceived by customers is arguably more important for a purchase decision than the real price (Lee et al., 2011). While the higher price is a barrier of purchase intention, low price does not necessarily increase demand for a product or service (Blainey et al., 2012). Table 19 shows the results of the fourth hypothesis in short-distance trips. H4 is rejected in the total sample (p>0.05), there is no meaningful correlation between leisure travelers' perceived price of transportation mode and the intention to use more sustainable vehicles in short trips. To find the reason, it is useful to investigate the sustainable behavior of leisure travelers in each country. According to table 19, Swedish leisure travelers’ perception of price is negatively correlated with their intention to travel by sustainable vehicles in short trips (β = -0.222; p = 0.016). Based on table 5, Swedish leisure travelers think that train tickets are more expensive than flight tickets in short-distance journeys. This perception of a higher price of trains prevents Swedes from purchasing train tickets instead of flight tickets. Therefore, to promote traveling by more sustainable vehicles including trains it is important to change the perception of Swedes of the train ticket price. As it is stated, the perceived price is not necessarily equal to the actual price. This change in the perception of transportation cost can be done through either price changes or branding to explain the benefits of sustainable transportation compared to its costs. Consumers perceive the price of a product/service by comparing the price of that product/service to its competitors (Heda et al., 2017). Therefore, one solution to promote sustainable transportation mode in short trips is increasing the price of flights by some regulations or decreasing the price of train tickets by some subsidy. According to table 5, the Germans’ perception of ticket prices is that train tickets are more expensive than flights. According to table 19, this higher price negatively correlated with german leisure travelers’ intention of traveling by sustainable vehicles on short trips. However because this correlation is not significant (p > 0.05), nothing can be concluded about the impact of perceived price on the German’ intention of sustainable travel. On the other hand, the perceived price of transportation mode is different in Iran. Based on the average values of questions price 1 and price 2 in table 5, Iranian consumers think that the price of train tickets is lower than that of flight tickets. That explains why the coefficient of correlation between perceived price and customers’ intention is positive in table 19 - this value for two other samples is negative. Indeed, conversely to prices in Sweden and Germany, flight tickets are more expensive than train tickets for Iranians (Flytoday, 2019). As was the case with the German sample, the results of H4 for the Iranian sample are not significant (p > 0.05). Therefore, no conclusion can be stated regarding the impact of Iranian travelers' perceived price on their intention of traveling by sustainable vehicles on short trips.
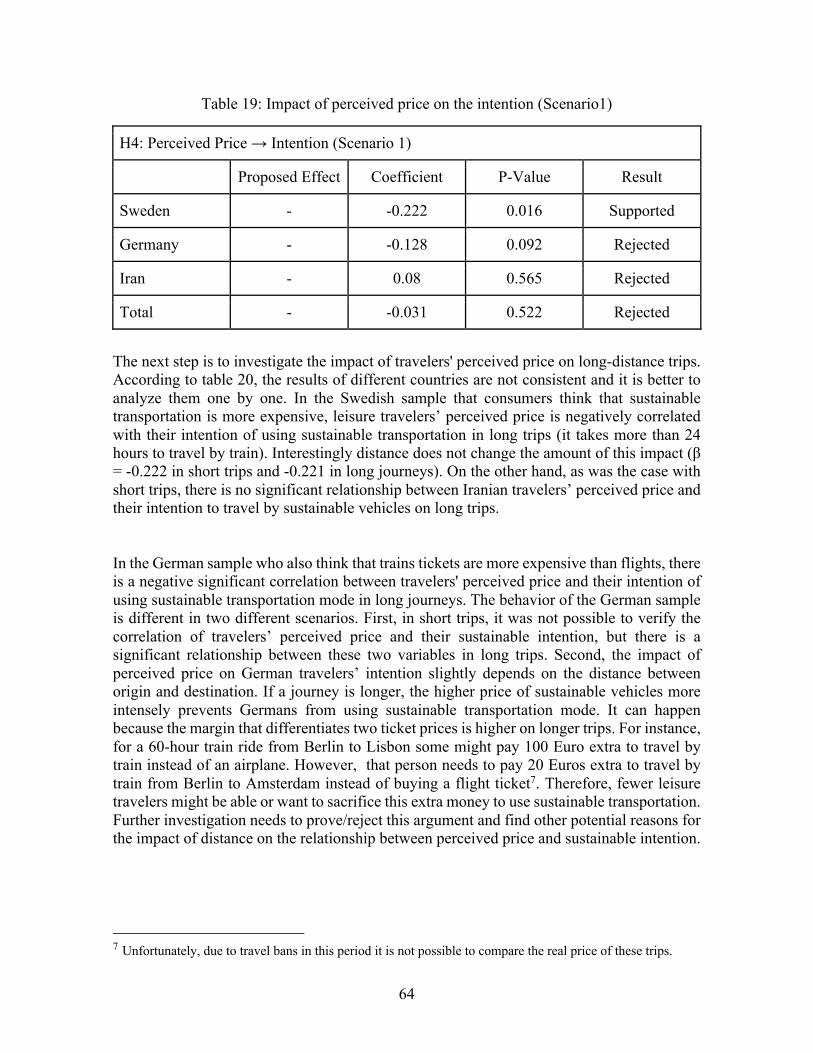
64
Table 19: Impact of perceived price on the intention (Scenario1)
H4: Perceived Price → Intention (Scenario 1)
Proposed Effect Coefficient P-Value Result
Sweden - -0.222 0.016 Supported
Germany - -0.128 0.092 Rejected
Iran - 0.08 0.565 Rejected
Total - -0.031 0.522 Rejected
The next step is to investigate the impact of travelers' perceived price on long-distance trips. According to table 20, the results of different countries are not consistent and it is better to analyze them one by one. In the Swedish sample that consumers think that sustainable transportation is more expensive, leisure travelers’ perceived price is negatively correlated with their intention of using sustainable transportation in long trips (it takes more than 24 hours to travel by train). Interestingly distance does not change the amount of this impact (β = -0.222 in short trips and -0.221 in long journeys). On the other hand, as was the case with short trips, there is no significant relationship between Iranian travelers’ perceived price and their intention to travel by sustainable vehicles on long trips. In the German sample who also think that trains tickets are more expensive than flights, there is a negative significant correlation between travelers' perceived price and their intention of using sustainable transportation mode in long journeys. The behavior of the German sample is different in two different scenarios. First, in short trips, it was not possible to verify the correlation of travelers’ perceived price and their sustainable intention, but there is a significant relationship between these two variables in long trips. Second, the impact of perceived price on German travelers’ intention slightly depends on the distance between origin and destination. If a journey is longer, the higher price of sustainable vehicles more intensely prevents Germans from using sustainable transportation mode. It can happen because the margin that differentiates two ticket prices is higher on longer trips. For instance, for a 60-hour train ride from Berlin to Lisbon some might pay 100 Euro extra to travel by train instead of an airplane. However, that person needs to pay 20 Euros extra to travel by train from Berlin to Amsterdam instead of buying a flight ticket7. Therefore, fewer leisure travelers might be able or want to sacrifice this extra money to use sustainable transportation. Further investigation needs to prove/reject this argument and find other potential reasons for the impact of distance on the relationship between perceived price and sustainable intention.
7 Unfortunately, due to travel bans in this period it is not possible to compare the real price of these trips.
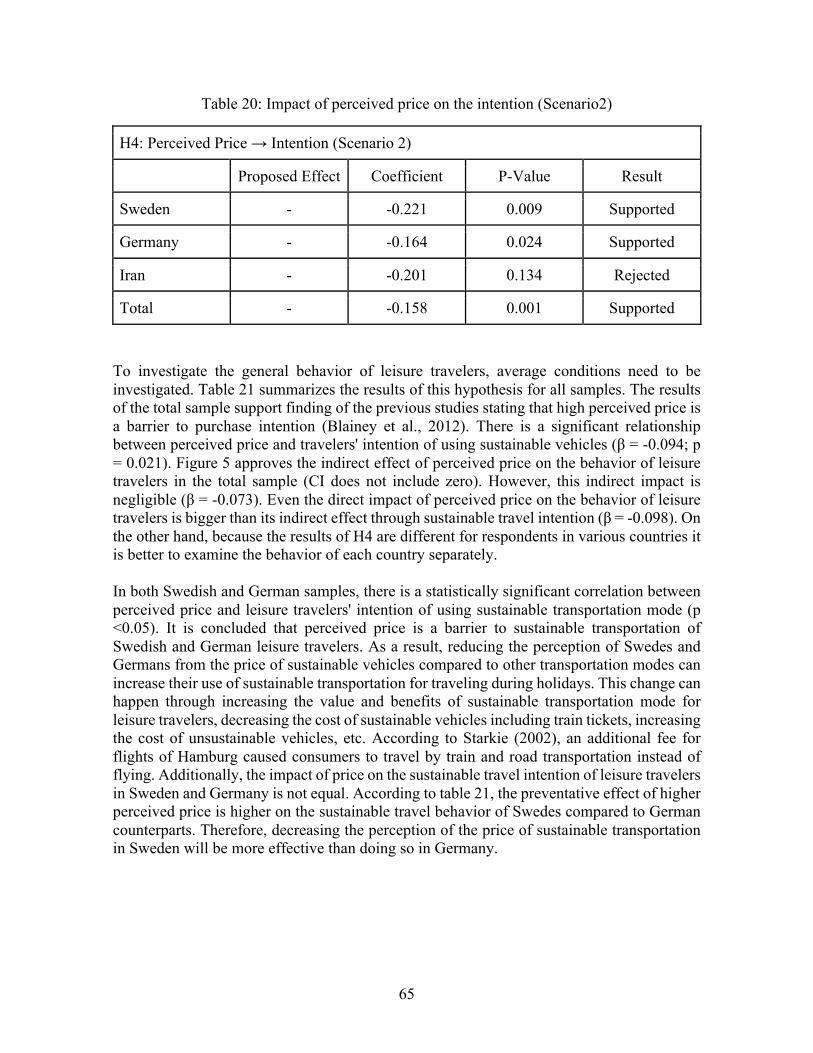
65
Table 20: Impact of perceived price on the intention (Scenario2)
H4: Perceived Price → Intention (Scenario 2)
Proposed Effect Coefficient P-Value Result
Sweden - -0.221 0.009 Supported
Germany - -0.164 0.024 Supported
Iran - -0.201 0.134 Rejected
Total - -0.158 0.001 Supported
To investigate the general behavior of leisure travelers, average conditions need to be investigated. Table 21 summarizes the results of this hypothesis for all samples. The results of the total sample support finding of the previous studies stating that high perceived price is a barrier to purchase intention (Blainey et al., 2012). There is a significant relationship between perceived price and travelers' intention of using sustainable vehicles (β = -0.094; p = 0.021). Figure 5 approves the indirect effect of perceived price on the behavior of leisure travelers in the total sample (CI does not include zero). However, this indirect impact is negligible (β = -0.073). Even the direct impact of perceived price on the behavior of leisure travelers is bigger than its indirect effect through sustainable travel intention (β = -0.098). On the other hand, because the results of H4 are different for respondents in various countries it is better to examine the behavior of each country separately. In both Swedish and German samples, there is a statistically significant correlation between perceived price and leisure travelers' intention of using sustainable transportation mode (p <0.05). It is concluded that perceived price is a barrier to sustainable transportation of Swedish and German leisure travelers. As a result, reducing the perception of Swedes and Germans from the price of sustainable vehicles compared to other transportation modes can increase their use of sustainable transportation for traveling during holidays. This change can happen through increasing the value and benefits of sustainable transportation mode for leisure travelers, decreasing the cost of sustainable vehicles including train tickets, increasing the cost of unsustainable vehicles, etc. According to Starkie (2002), an additional fee for flights of Hamburg caused consumers to travel by train and road transportation instead of flying. Additionally, the impact of price on the sustainable travel intention of leisure travelers in Sweden and Germany is not equal. According to table 21, the preventative effect of higher perceived price is higher on the sustainable travel behavior of Swedes compared to German counterparts. Therefore, decreasing the perception of the price of sustainable transportation in Sweden will be more effective than doing so in Germany.
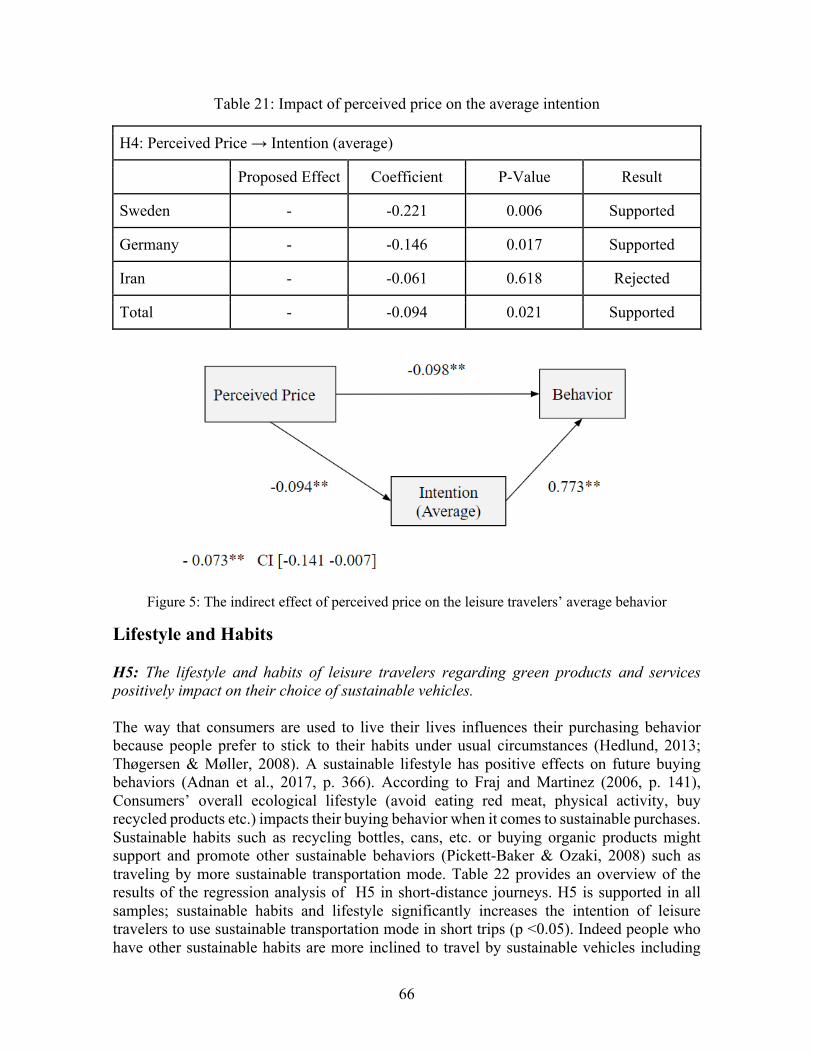
66
Table 21: Impact of perceived price on the average intention
H4: Perceived Price → Intention (average)
Proposed Effect Coefficient P-Value Result
Sweden - -0.221 0.006 Supported
Germany - -0.146 0.017 Supported
Iran - -0.061 0.618 Rejected
Total - -0.094 0.021 Supported
Figure 5: The indirect effect of perceived price on the leisure travelers’ average behavior
Lifestyle and Habits H5: The lifestyle and habits of leisure travelers regarding green products and services positively impact on their choice of sustainable vehicles. The way that consumers are used to live their lives influences their purchasing behavior because people prefer to stick to their habits under usual circumstances (Hedlund, 2013; Thøgersen & Møller, 2008). A sustainable lifestyle has positive effects on future buying behaviors (Adnan et al., 2017, p. 366). According to Fraj and Martinez (2006, p. 141), Consumers’ overall ecological lifestyle (avoid eating red meat, physical activity, buy recycled products etc.) impacts their buying behavior when it comes to sustainable purchases. Sustainable habits such as recycling bottles, cans, etc. or buying organic products might support and promote other sustainable behaviors (Pickett-Baker & Ozaki, 2008) such as traveling by more sustainable transportation mode. Table 22 provides an overview of the results of the regression analysis of H5 in short-distance journeys. H5 is supported in all samples; sustainable habits and lifestyle significantly increases the intention of leisure travelers to use sustainable transportation mode in short trips (p <0.05). Indeed people who have other sustainable habits are more inclined to travel by sustainable vehicles including
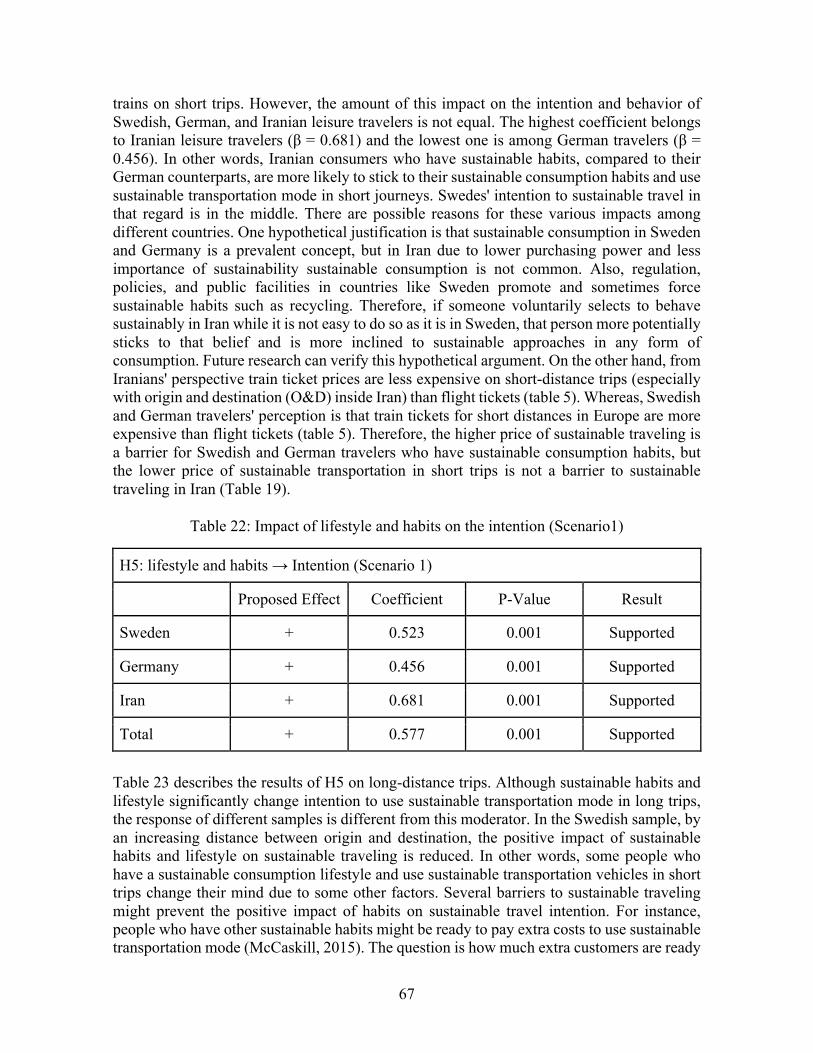
67
trains on short trips. However, the amount of this impact on the intention and behavior of Swedish, German, and Iranian leisure travelers is not equal. The highest coefficient belongs to Iranian leisure travelers (β = 0.681) and the lowest one is among German travelers (β = 0.456). In other words, Iranian consumers who have sustainable habits, compared to their German counterparts, are more likely to stick to their sustainable consumption habits and use sustainable transportation mode in short journeys. Swedes' intention to sustainable travel in that regard is in the middle. There are possible reasons for these various impacts among different countries. One hypothetical justification is that sustainable consumption in Sweden and Germany is a prevalent concept, but in Iran due to lower purchasing power and less importance of sustainability sustainable consumption is not common. Also, regulation, policies, and public facilities in countries like Sweden promote and sometimes force sustainable habits such as recycling. Therefore, if someone voluntarily selects to behave sustainably in Iran while it is not easy to do so as it is in Sweden, that person more potentially sticks to that belief and is more inclined to sustainable approaches in any form of consumption. Future research can verify this hypothetical argument. On the other hand, from Iranians' perspective train ticket prices are less expensive on short-distance trips (especially with origin and destination (O&D) inside Iran) than flight tickets (table 5). Whereas, Swedish and German travelers' perception is that train tickets for short distances in Europe are more expensive than flight tickets (table 5). Therefore, the higher price of sustainable traveling is a barrier for Swedish and German travelers who have sustainable consumption habits, but the lower price of sustainable transportation in short trips is not a barrier to sustainable traveling in Iran (Table 19).
Table 22: Impact of lifestyle and habits on the intention (Scenario1)
H5: lifestyle and habits → Intention (Scenario 1)
Proposed Effect Coefficient P-Value Result
Sweden + 0.523 0.001 Supported
Germany + 0.456 0.001 Supported
Iran + 0.681 0.001 Supported
Total + 0.577 0.001 Supported
Table 23 describes the results of H5 on long-distance trips. Although sustainable habits and lifestyle significantly change intention to use sustainable transportation mode in long trips, the response of different samples is different from this moderator. In the Swedish sample, by an increasing distance between origin and destination, the positive impact of sustainable habits and lifestyle on sustainable traveling is reduced. In other words, some people who have a sustainable consumption lifestyle and use sustainable transportation vehicles in short trips change their mind due to some other factors. Several barriers to sustainable traveling might prevent the positive impact of habits on sustainable travel intention. For instance, people who have other sustainable habits might be ready to pay extra costs to use sustainable transportation mode (McCaskill, 2015). The question is how much extra customers are ready
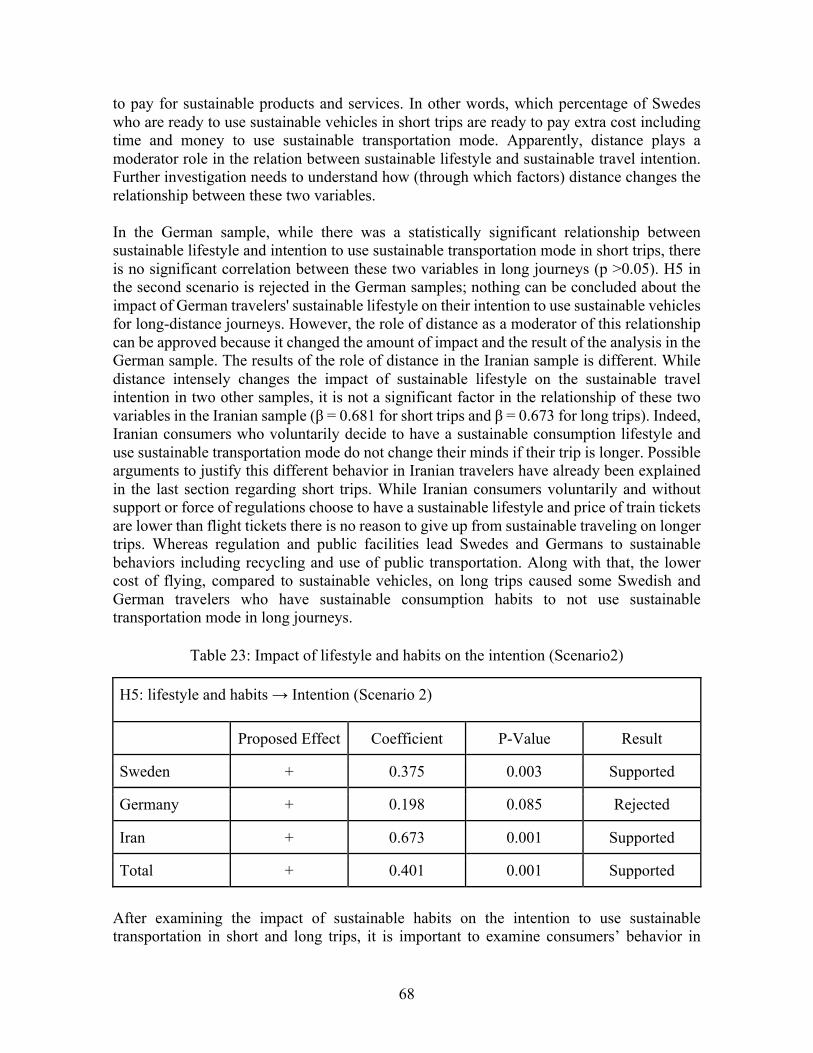
68
to pay for sustainable products and services. In other words, which percentage of Swedes who are ready to use sustainable vehicles in short trips are ready to pay extra cost including time and money to use sustainable transportation mode. Apparently, distance plays a moderator role in the relation between sustainable lifestyle and sustainable travel intention. Further investigation needs to understand how (through which factors) distance changes the relationship between these two variables. In the German sample, while there was a statistically significant relationship between sustainable lifestyle and intention to use sustainable transportation mode in short trips, there is no significant correlation between these two variables in long journeys (p >0.05). H5 in the second scenario is rejected in the German samples; nothing can be concluded about the impact of German travelers' sustainable lifestyle on their intention to use sustainable vehicles for long-distance journeys. However, the role of distance as a moderator of this relationship can be approved because it changed the amount of impact and the result of the analysis in the German sample. The results of the role of distance in the Iranian sample is different. While distance intensely changes the impact of sustainable lifestyle on the sustainable travel intention in two other samples, it is not a significant factor in the relationship of these two variables in the Iranian sample (β = 0.681 for short trips and β = 0.673 for long trips). Indeed, Iranian consumers who voluntarily decide to have a sustainable consumption lifestyle and use sustainable transportation mode do not change their minds if their trip is longer. Possible arguments to justify this different behavior in Iranian travelers have already been explained in the last section regarding short trips. While Iranian consumers voluntarily and without support or force of regulations choose to have a sustainable lifestyle and price of train tickets are lower than flight tickets there is no reason to give up from sustainable traveling on longer trips. Whereas regulation and public facilities lead Swedes and Germans to sustainable behaviors including recycling and use of public transportation. Along with that, the lower cost of flying, compared to sustainable vehicles, on long trips caused some Swedish and German travelers who have sustainable consumption habits to not use sustainable transportation mode in long journeys.
Table 23: Impact of lifestyle and habits on the intention (Scenario2)
H5: lifestyle and habits → Intention (Scenario 2)
Proposed Effect Coefficient P-Value Result
Sweden + 0.375 0.003 Supported
Germany + 0.198 0.085 Rejected
Iran + 0.673 0.001 Supported
Total + 0.401 0.001 Supported
After examining the impact of sustainable habits on the intention to use sustainable transportation in short and long trips, it is important to examine consumers’ behavior in
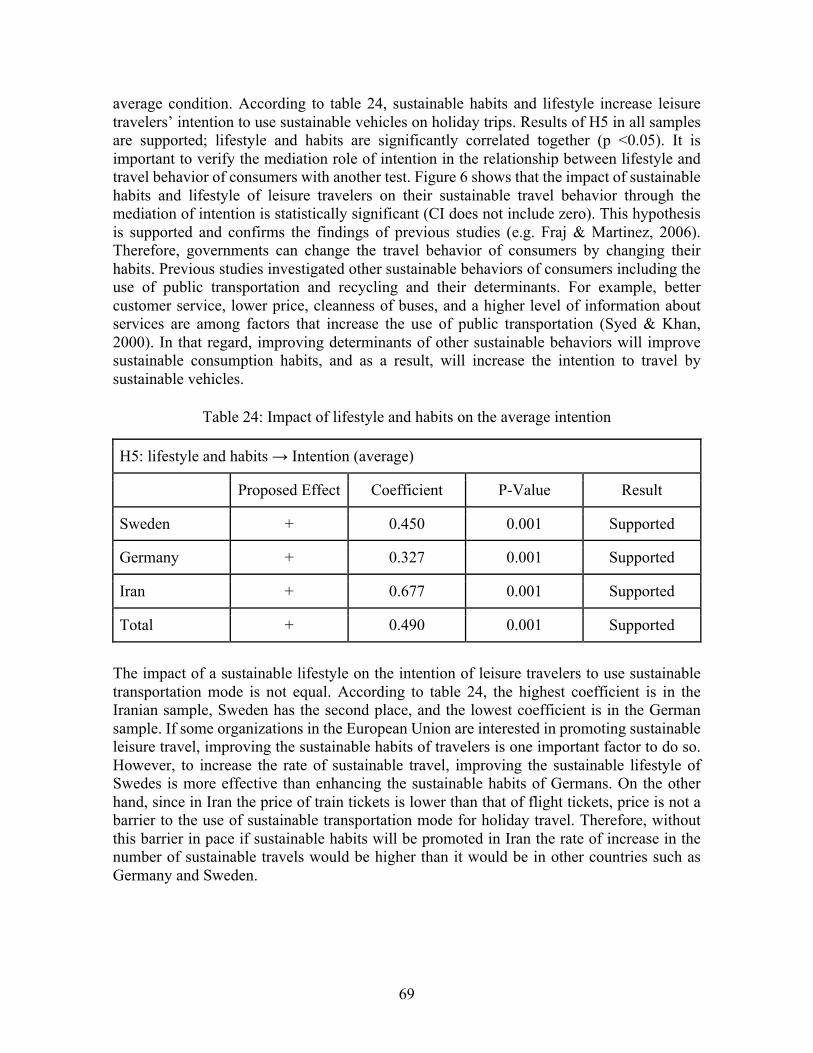
69
average condition. According to table 24, sustainable habits and lifestyle increase leisure travelers’ intention to use sustainable vehicles on holiday trips. Results of H5 in all samples are supported; lifestyle and habits are significantly correlated together (p <0.05). It is important to verify the mediation role of intention in the relationship between lifestyle and travel behavior of consumers with another test. Figure 6 shows that the impact of sustainable habits and lifestyle of leisure travelers on their sustainable travel behavior through the mediation of intention is statistically significant (CI does not include zero). This hypothesis is supported and confirms the findings of previous studies (e.g. Fraj & Martinez, 2006). Therefore, governments can change the travel behavior of consumers by changing their habits. Previous studies investigated other sustainable behaviors of consumers including the use of public transportation and recycling and their determinants. For example, better customer service, lower price, cleanness of buses, and a higher level of information about services are among factors that increase the use of public transportation (Syed & Khan, 2000). In that regard, improving determinants of other sustainable behaviors will improve sustainable consumption habits, and as a result, will increase the intention to travel by sustainable vehicles.
Table 24: Impact of lifestyle and habits on the average intention
H5: lifestyle and habits → Intention (average)
Proposed Effect Coefficient P-Value Result
Sweden + 0.450 0.001 Supported
Germany + 0.327 0.001 Supported
Iran + 0.677 0.001 Supported
Total + 0.490 0.001 Supported
The impact of a sustainable lifestyle on the intention of leisure travelers to use sustainable transportation mode is not equal. According to table 24, the highest coefficient is in the Iranian sample, Sweden has the second place, and the lowest coefficient is in the German sample. If some organizations in the European Union are interested in promoting sustainable leisure travel, improving the sustainable habits of travelers is one important factor to do so. However, to increase the rate of sustainable travel, improving the sustainable lifestyle of Swedes is more effective than enhancing the sustainable habits of Germans. On the other hand, since in Iran the price of train tickets is lower than that of flight tickets, price is not a barrier to the use of sustainable transportation mode for holiday travel. Therefore, without this barrier in pace if sustainable habits will be promoted in Iran the rate of increase in the number of sustainable travels would be higher than it would be in other countries such as Germany and Sweden.
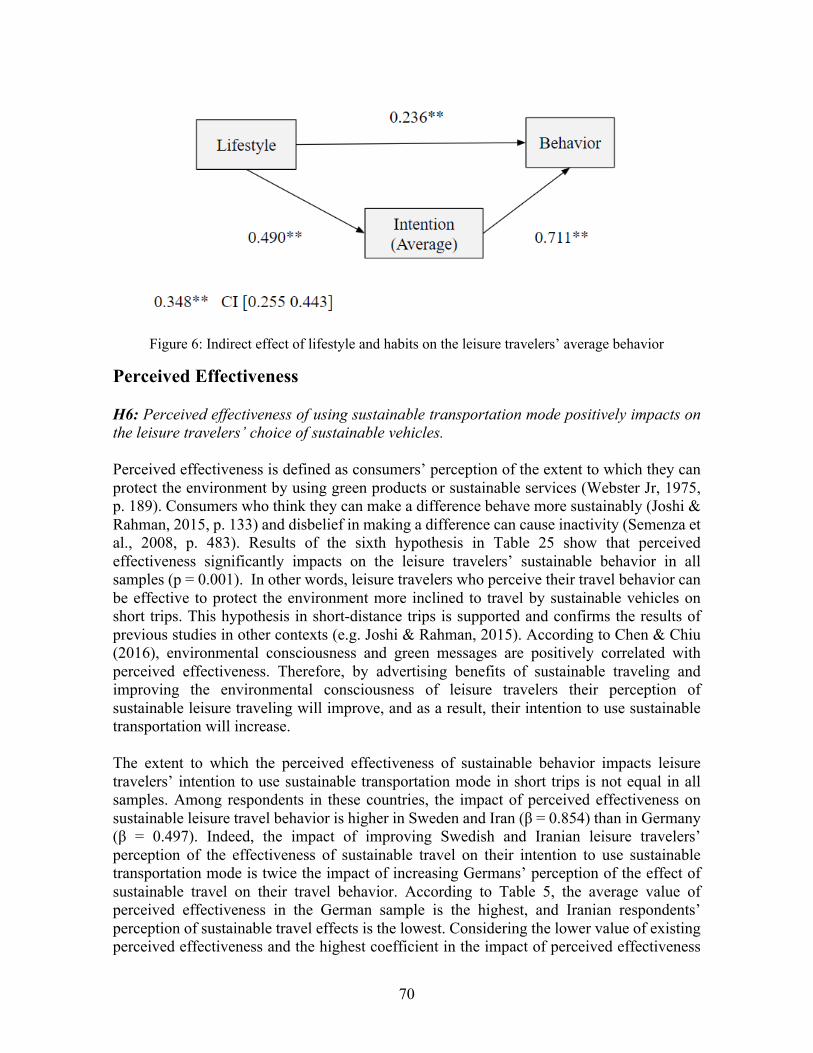
70
Figure 6: Indirect effect of lifestyle and habits on the leisure travelers’ average behavior
Perceived Effectiveness H6: Perceived effectiveness of using sustainable transportation mode positively impacts on the leisure travelers’ choice of sustainable vehicles. Perceived effectiveness is defined as consumers’ perception of the extent to which they can protect the environment by using green products or sustainable services (Webster Jr, 1975, p. 189). Consumers who think they can make a difference behave more sustainably (Joshi & Rahman, 2015, p. 133) and disbelief in making a difference can cause inactivity (Semenza et al., 2008, p. 483). Results of the sixth hypothesis in Table 25 show that perceived effectiveness significantly impacts on the leisure travelers’ sustainable behavior in all samples (p = 0.001). In other words, leisure travelers who perceive their travel behavior can be effective to protect the environment more inclined to travel by sustainable vehicles on short trips. This hypothesis in short-distance trips is supported and confirms the results of previous studies in other contexts (e.g. Joshi & Rahman, 2015). According to Chen & Chiu (2016), environmental consciousness and green messages are positively correlated with perceived effectiveness. Therefore, by advertising benefits of sustainable traveling and improving the environmental consciousness of leisure travelers their perception of sustainable leisure traveling will improve, and as a result, their intention to use sustainable transportation will increase. The extent to which the perceived effectiveness of sustainable behavior impacts leisure travelers’ intention to use sustainable transportation mode in short trips is not equal in all samples. Among respondents in these countries, the impact of perceived effectiveness on sustainable leisure travel behavior is higher in Sweden and Iran (β = 0.854) than in Germany (β = 0.497). Indeed, the impact of improving Swedish and Iranian leisure travelers’ perception of the effectiveness of sustainable travel on their intention to use sustainable transportation mode is twice the impact of increasing Germans’ perception of the effect of sustainable travel on their travel behavior. According to Table 5, the average value of perceived effectiveness in the German sample is the highest, and Iranian respondents’ perception of sustainable travel effects is the lowest. Considering the lower value of existing perceived effectiveness and the highest coefficient in the impact of perceived effectiveness
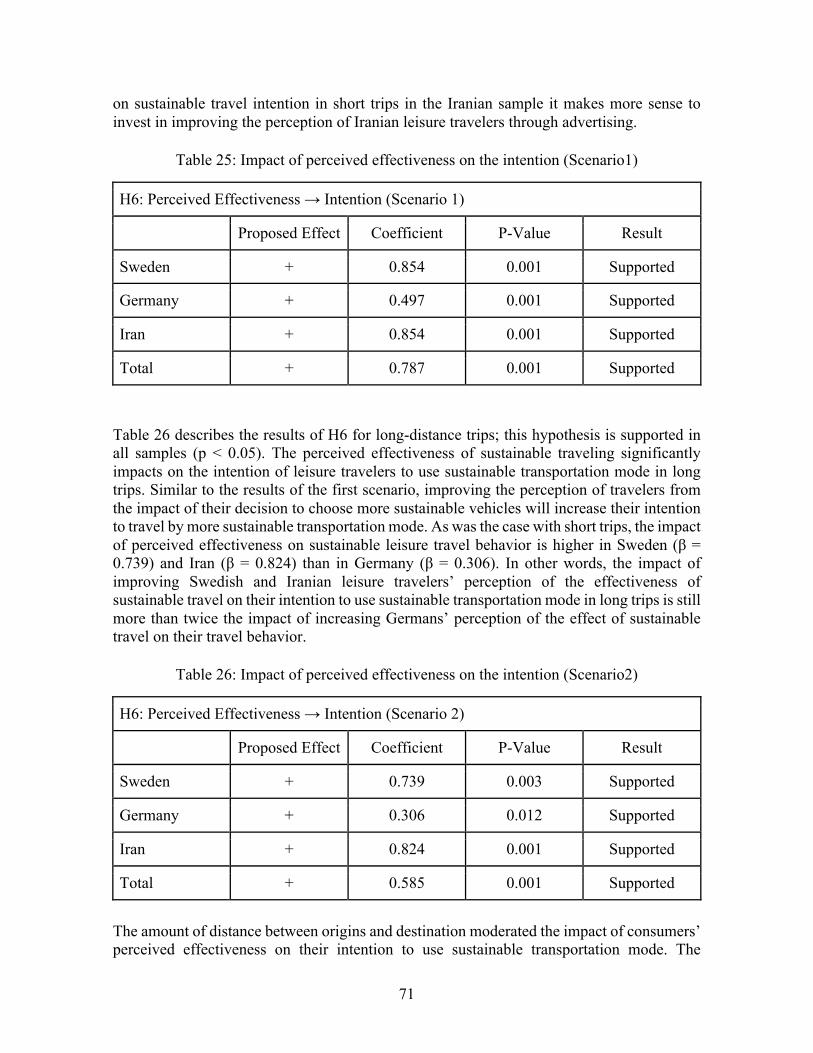
71
on sustainable travel intention in short trips in the Iranian sample it makes more sense to invest in improving the perception of Iranian leisure travelers through advertising.
Table 25: Impact of perceived effectiveness on the intention (Scenario1)
H6: Perceived Effectiveness → Intention (Scenario 1)
Proposed Effect Coefficient P-Value Result
Sweden + 0.854 0.001 Supported
Germany + 0.497 0.001 Supported
Iran + 0.854 0.001 Supported
Total + 0.787 0.001 Supported
Table 26 describes the results of H6 for long-distance trips; this hypothesis is supported in all samples (p < 0.05). The perceived effectiveness of sustainable traveling significantly impacts on the intention of leisure travelers to use sustainable transportation mode in long trips. Similar to the results of the first scenario, improving the perception of travelers from the impact of their decision to choose more sustainable vehicles will increase their intention to travel by more sustainable transportation mode. As was the case with short trips, the impact of perceived effectiveness on sustainable leisure travel behavior is higher in Sweden (β = 0.739) and Iran (β = 0.824) than in Germany (β = 0.306). In other words, the impact of improving Swedish and Iranian leisure travelers’ perception of the effectiveness of sustainable travel on their intention to use sustainable transportation mode in long trips is still more than twice the impact of increasing Germans’ perception of the effect of sustainable travel on their travel behavior.
Table 26: Impact of perceived effectiveness on the intention (Scenario2)
H6: Perceived Effectiveness → Intention (Scenario 2)
Proposed Effect Coefficient P-Value Result
Sweden + 0.739 0.003 Supported
Germany + 0.306 0.012 Supported
Iran + 0.824 0.001 Supported
Total + 0.585 0.001 Supported
The amount of distance between origins and destination moderated the impact of consumers’ perceived effectiveness on their intention to use sustainable transportation mode. The
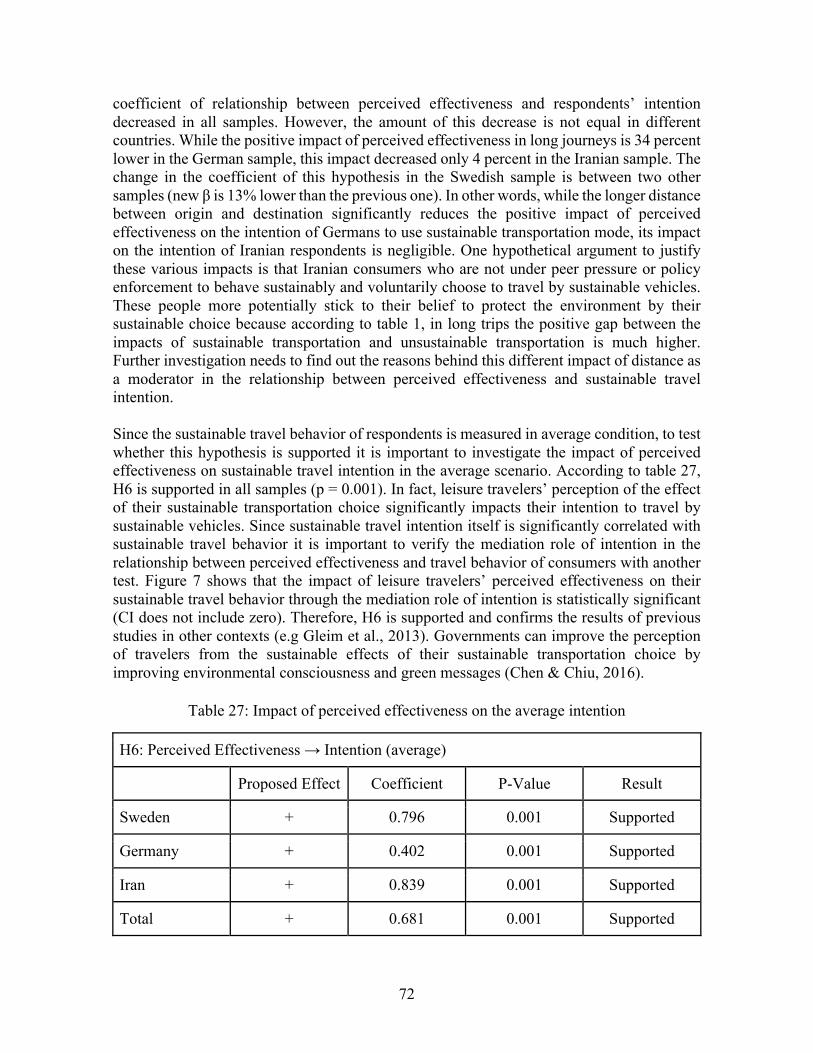
72
coefficient of relationship between perceived effectiveness and respondents’ intention decreased in all samples. However, the amount of this decrease is not equal in different countries. While the positive impact of perceived effectiveness in long journeys is 34 percent lower in the German sample, this impact decreased only 4 percent in the Iranian sample. The change in the coefficient of this hypothesis in the Swedish sample is between two other samples (new β is 13% lower than the previous one). In other words, while the longer distance between origin and destination significantly reduces the positive impact of perceived effectiveness on the intention of Germans to use sustainable transportation mode, its impact on the intention of Iranian respondents is negligible. One hypothetical argument to justify these various impacts is that Iranian consumers who are not under peer pressure or policy enforcement to behave sustainably and voluntarily choose to travel by sustainable vehicles. These people more potentially stick to their belief to protect the environment by their sustainable choice because according to table 1, in long trips the positive gap between the impacts of sustainable transportation and unsustainable transportation is much higher. Further investigation needs to find out the reasons behind this different impact of distance as a moderator in the relationship between perceived effectiveness and sustainable travel intention. Since the sustainable travel behavior of respondents is measured in average condition, to test whether this hypothesis is supported it is important to investigate the impact of perceived effectiveness on sustainable travel intention in the average scenario. According to table 27, H6 is supported in all samples (p = 0.001). In fact, leisure travelers’ perception of the effect of their sustainable transportation choice significantly impacts their intention to travel by sustainable vehicles. Since sustainable travel intention itself is significantly correlated with sustainable travel behavior it is important to verify the mediation role of intention in the relationship between perceived effectiveness and travel behavior of consumers with another test. Figure 7 shows that the impact of leisure travelers’ perceived effectiveness on their sustainable travel behavior through the mediation role of intention is statistically significant (CI does not include zero). Therefore, H6 is supported and confirms the results of previous studies in other contexts (e.g Gleim et al., 2013). Governments can improve the perception of travelers from the sustainable effects of their sustainable transportation choice by improving environmental consciousness and green messages (Chen & Chiu, 2016).
Table 27: Impact of perceived effectiveness on the average intention
H6: Perceived Effectiveness → Intention (average)
Proposed Effect Coefficient P-Value Result
Sweden + 0.796 0.001 Supported
Germany + 0.402 0.001 Supported
Iran + 0.839 0.001 Supported
Total + 0.681 0.001 Supported
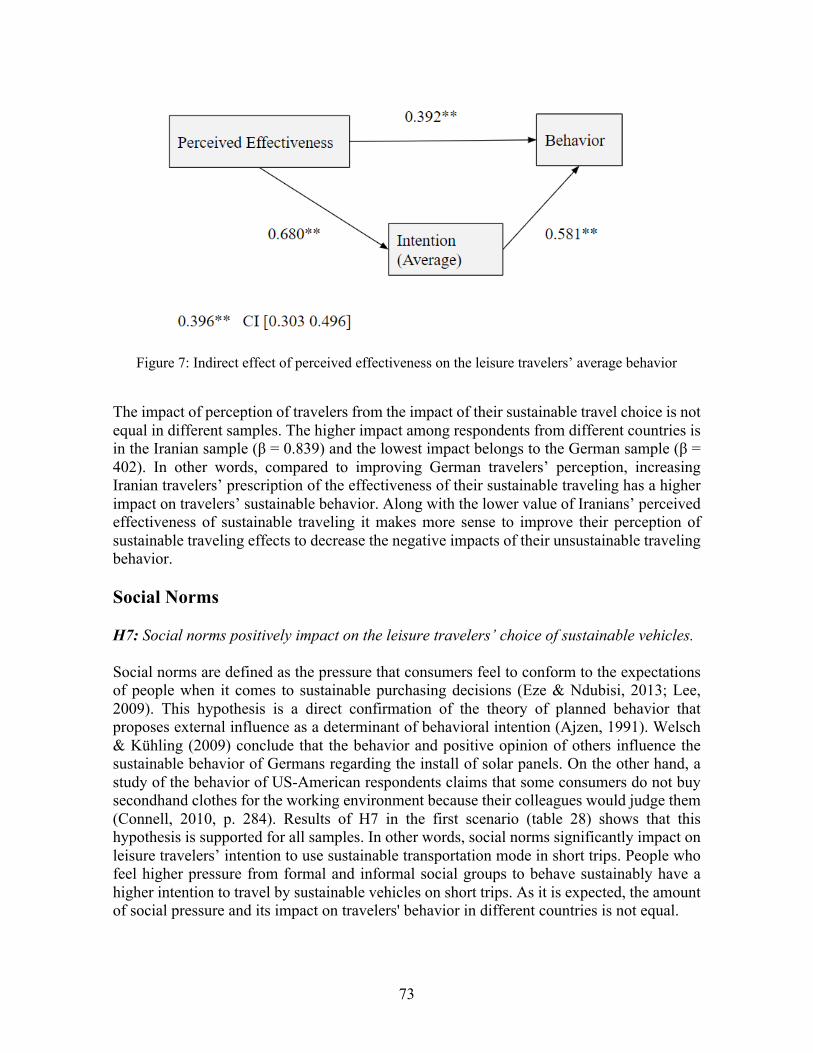
73
Figure 7: Indirect effect of perceived effectiveness on the leisure travelers’ average behavior
The impact of perception of travelers from the impact of their sustainable travel choice is not equal in different samples. The higher impact among respondents from different countries is in the Iranian sample (β = 0.839) and the lowest impact belongs to the German sample (β = 402). In other words, compared to improving German travelers’ perception, increasing Iranian travelers’ prescription of the effectiveness of their sustainable traveling has a higher impact on travelers’ sustainable behavior. Along with the lower value of Iranians’ perceived effectiveness of sustainable traveling it makes more sense to improve their perception of sustainable traveling effects to decrease the negative impacts of their unsustainable traveling behavior. Social Norms H7: Social norms positively impact on the leisure travelers’ choice of sustainable vehicles. Social norms are defined as the pressure that consumers feel to conform to the expectations of people when it comes to sustainable purchasing decisions (Eze & Ndubisi, 2013; Lee, 2009). This hypothesis is a direct confirmation of the theory of planned behavior that proposes external influence as a determinant of behavioral intention (Ajzen, 1991). Welsch & Kühling (2009) conclude that the behavior and positive opinion of others influence the sustainable behavior of Germans regarding the install of solar panels. On the other hand, a study of the behavior of US-American respondents claims that some consumers do not buy secondhand clothes for the working environment because their colleagues would judge them (Connell, 2010, p. 284). Results of H7 in the first scenario (table 28) shows that this hypothesis is supported for all samples. In other words, social norms significantly impact on leisure travelers’ intention to use sustainable transportation mode in short trips. People who feel higher pressure from formal and informal social groups to behave sustainably have a higher intention to travel by sustainable vehicles on short trips. As it is expected, the amount of social pressure and its impact on travelers' behavior in different countries is not equal.
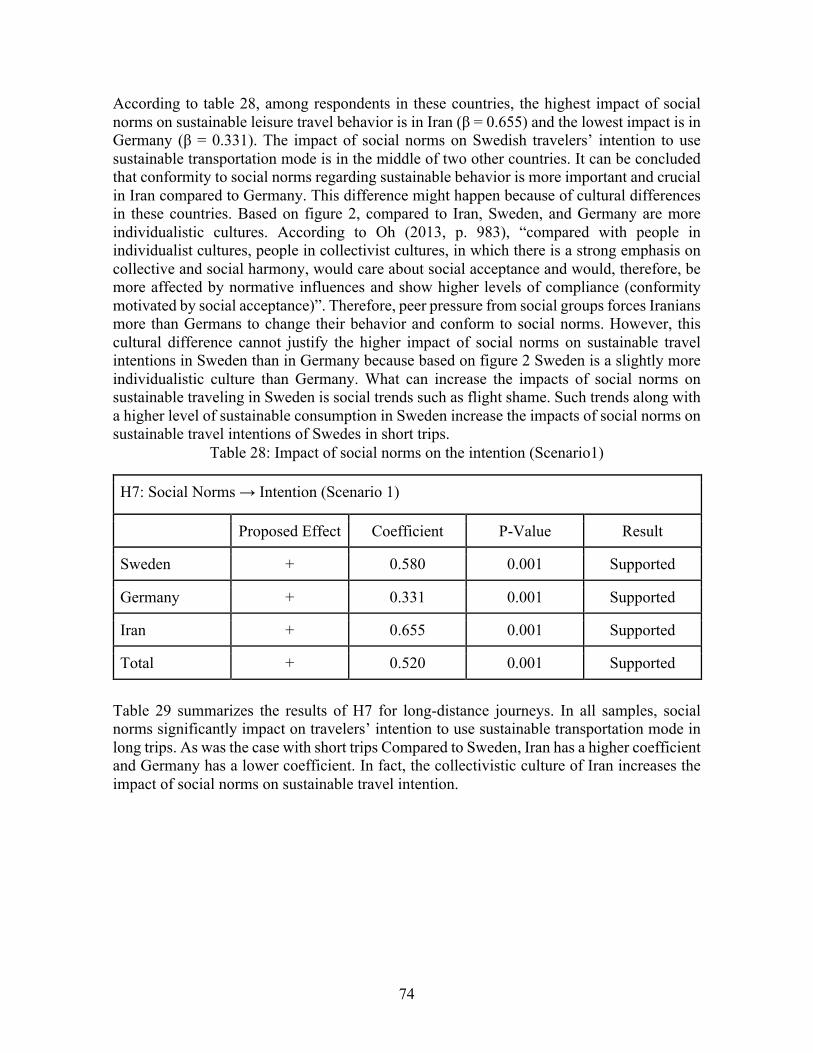
74
According to table 28, among respondents in these countries, the highest impact of social norms on sustainable leisure travel behavior is in Iran (β = 0.655) and the lowest impact is in Germany (β = 0.331). The impact of social norms on Swedish travelers’ intention to use sustainable transportation mode is in the middle of two other countries. It can be concluded that conformity to social norms regarding sustainable behavior is more important and crucial in Iran compared to Germany. This difference might happen because of cultural differences in these countries. Based on figure 2, compared to Iran, Sweden, and Germany are more individualistic cultures. According to Oh (2013, p. 983), “compared with people in individualist cultures, people in collectivist cultures, in which there is a strong emphasis on collective and social harmony, would care about social acceptance and would, therefore, be more affected by normative influences and show higher levels of compliance (conformity motivated by social acceptance)”. Therefore, peer pressure from social groups forces Iranians more than Germans to change their behavior and conform to social norms. However, this cultural difference cannot justify the higher impact of social norms on sustainable travel intentions in Sweden than in Germany because based on figure 2 Sweden is a slightly more individualistic culture than Germany. What can increase the impacts of social norms on sustainable traveling in Sweden is social trends such as flight shame. Such trends along with a higher level of sustainable consumption in Sweden increase the impacts of social norms on sustainable travel intentions of Swedes in short trips.
Table 28: Impact of social norms on the intention (Scenario1)
H7: Social Norms → Intention (Scenario 1)
Proposed Effect Coefficient P-Value Result
Sweden + 0.580 0.001 Supported
Germany + 0.331 0.001 Supported
Iran + 0.655 0.001 Supported
Total + 0.520 0.001 Supported
Table 29 summarizes the results of H7 for long-distance journeys. In all samples, social norms significantly impact on travelers’ intention to use sustainable transportation mode in long trips. As was the case with short trips Compared to Sweden, Iran has a higher coefficient and Germany has a lower coefficient. In fact, the collectivistic culture of Iran increases the impact of social norms on sustainable travel intention.
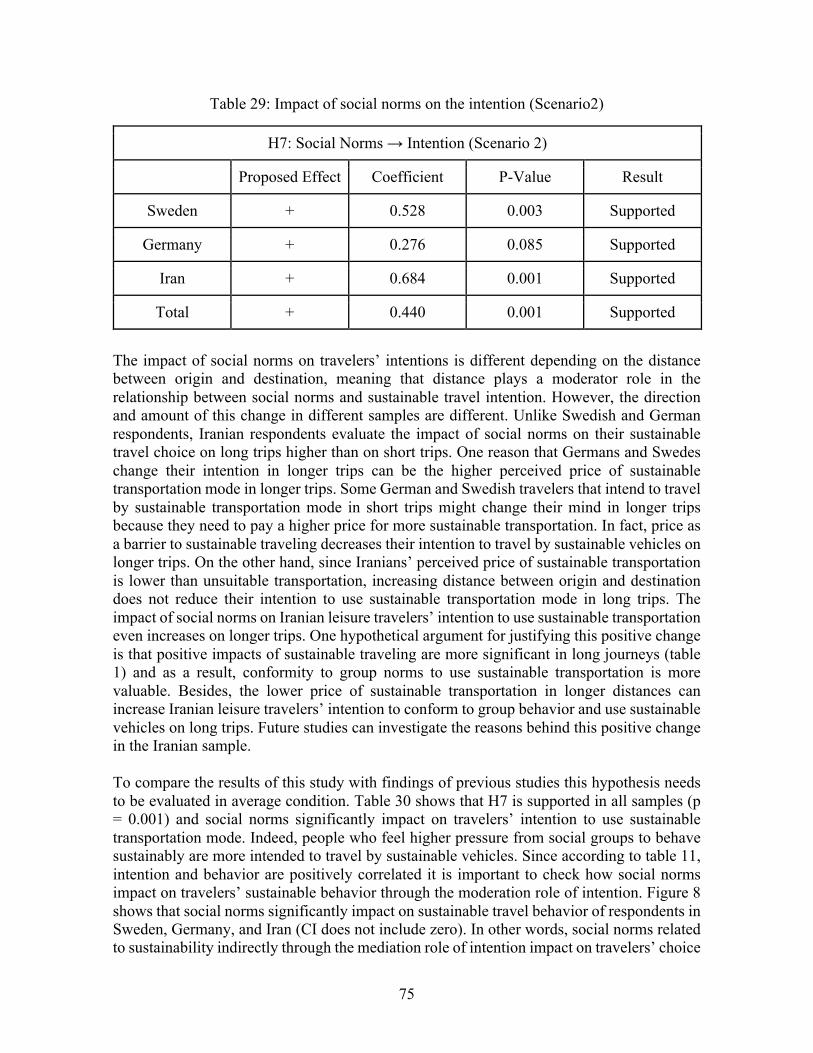
75
Table 29: Impact of social norms on the intention (Scenario2)
H7: Social Norms → Intention (Scenario 2)
Proposed Effect Coefficient P-Value Result
Sweden + 0.528 0.003 Supported
Germany + 0.276 0.085 Supported
Iran + 0.684 0.001 Supported
Total + 0.440 0.001 Supported
The impact of social norms on travelers’ intentions is different depending on the distance between origin and destination, meaning that distance plays a moderator role in the relationship between social norms and sustainable travel intention. However, the direction and amount of this change in different samples are different. Unlike Swedish and German respondents, Iranian respondents evaluate the impact of social norms on their sustainable travel choice on long trips higher than on short trips. One reason that Germans and Swedes change their intention in longer trips can be the higher perceived price of sustainable transportation mode in longer trips. Some German and Swedish travelers that intend to travel by sustainable transportation mode in short trips might change their mind in longer trips because they need to pay a higher price for more sustainable transportation. In fact, price as a barrier to sustainable traveling decreases their intention to travel by sustainable vehicles on longer trips. On the other hand, since Iranians’ perceived price of sustainable transportation is lower than unsuitable transportation, increasing distance between origin and destination does not reduce their intention to use sustainable transportation mode in long trips. The impact of social norms on Iranian leisure travelers’ intention to use sustainable transportation even increases on longer trips. One hypothetical argument for justifying this positive change is that positive impacts of sustainable traveling are more significant in long journeys (table 1) and as a result, conformity to group norms to use sustainable transportation is more valuable. Besides, the lower price of sustainable transportation in longer distances can increase Iranian leisure travelers’ intention to conform to group behavior and use sustainable vehicles on long trips. Future studies can investigate the reasons behind this positive change in the Iranian sample. To compare the results of this study with findings of previous studies this hypothesis needs to be evaluated in average condition. Table 30 shows that H7 is supported in all samples (p = 0.001) and social norms significantly impact on travelers’ intention to use sustainable transportation mode. Indeed, people who feel higher pressure from social groups to behave sustainably are more intended to travel by sustainable vehicles. Since according to table 11, intention and behavior are positively correlated it is important to check how social norms impact on travelers’ sustainable behavior through the moderation role of intention. Figure 8 shows that social norms significantly impact on sustainable travel behavior of respondents in Sweden, Germany, and Iran (CI does not include zero). In other words, social norms related to sustainability indirectly through the mediation role of intention impact on travelers’ choice
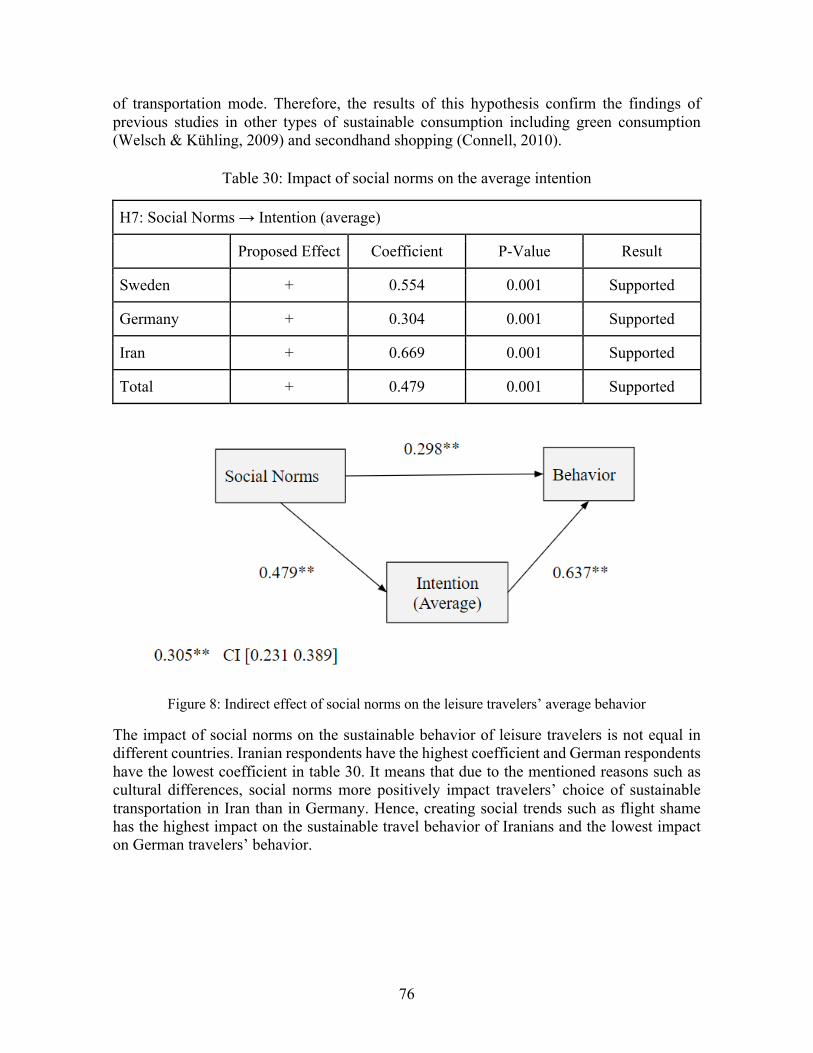
76
of transportation mode. Therefore, the results of this hypothesis confirm the findings of previous studies in other types of sustainable consumption including green consumption (Welsch & Kühling, 2009) and secondhand shopping (Connell, 2010).
Table 30: Impact of social norms on the average intention
H7: Social Norms → Intention (average)
Proposed Effect Coefficient P-Value Result
Sweden + 0.554 0.001 Supported
Germany + 0.304 0.001 Supported
Iran + 0.669 0.001 Supported
Total + 0.479 0.001 Supported
Figure 8: Indirect effect of social norms on the leisure travelers’ average behavior
The impact of social norms on the sustainable behavior of leisure travelers is not equal in different countries. Iranian respondents have the highest coefficient and German respondents have the lowest coefficient in table 30. It means that due to the mentioned reasons such as cultural differences, social norms more positively impact travelers’ choice of sustainable transportation in Iran than in Germany. Hence, creating social trends such as flight shame has the highest impact on the sustainable travel behavior of Iranians and the lowest impact on German travelers’ behavior.
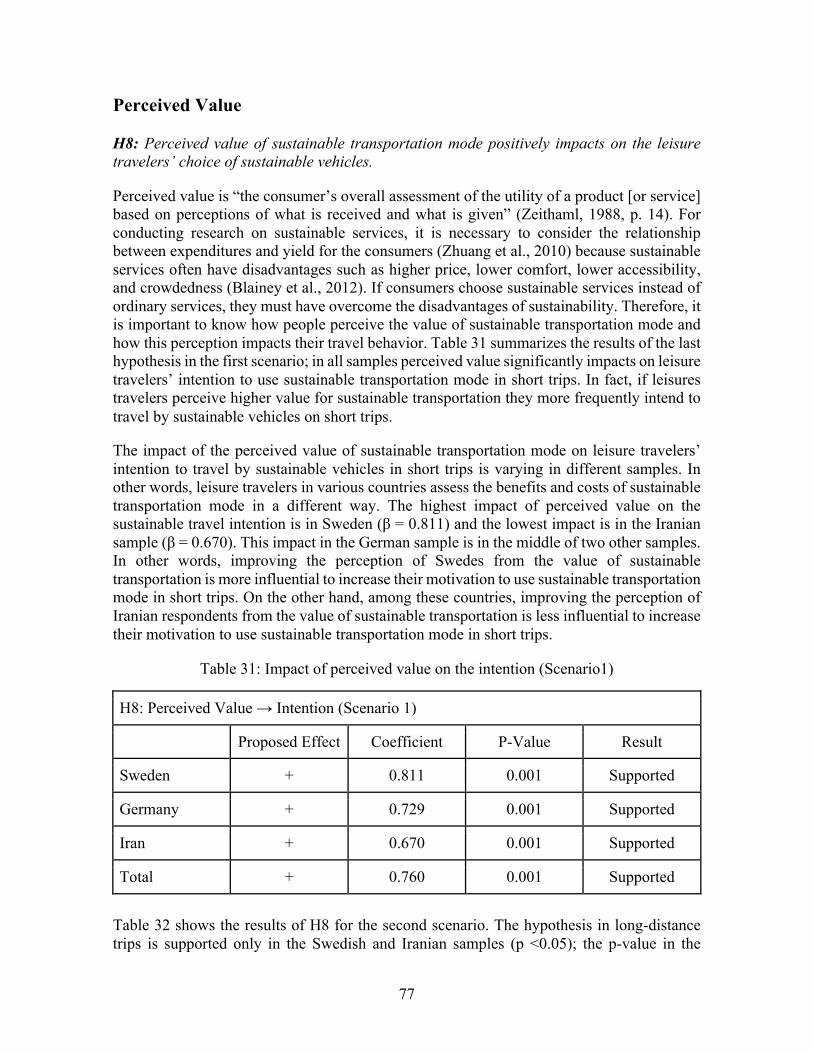
77
Perceived Value H8: Perceived value of sustainable transportation mode positively impacts on the leisure travelers’ choice of sustainable vehicles.
Perceived value is “the consumer’s overall assessment of the utility of a product [or service] based on perceptions of what is received and what is given” (Zeithaml, 1988, p. 14). For conducting research on sustainable services, it is necessary to consider the relationship between expenditures and yield for the consumers (Zhuang et al., 2010) because sustainable services often have disadvantages such as higher price, lower comfort, lower accessibility, and crowdedness (Blainey et al., 2012). If consumers choose sustainable services instead of ordinary services, they must have overcome the disadvantages of sustainability. Therefore, it is important to know how people perceive the value of sustainable transportation mode and how this perception impacts their travel behavior. Table 31 summarizes the results of the last hypothesis in the first scenario; in all samples perceived value significantly impacts on leisure travelers’ intention to use sustainable transportation mode in short trips. In fact, if leisures travelers perceive higher value for sustainable transportation they more frequently intend to travel by sustainable vehicles on short trips.
The impact of the perceived value of sustainable transportation mode on leisure travelers’ intention to travel by sustainable vehicles in short trips is varying in different samples. In other words, leisure travelers in various countries assess the benefits and costs of sustainable transportation mode in a different way. The highest impact of perceived value on the sustainable travel intention is in Sweden (β = 0.811) and the lowest impact is in the Iranian sample (β = 0.670). This impact in the German sample is in the middle of two other samples. In other words, improving the perception of Swedes from the value of sustainable transportation is more influential to increase their motivation to use sustainable transportation mode in short trips. On the other hand, among these countries, improving the perception of Iranian respondents from the value of sustainable transportation is less influential to increase their motivation to use sustainable transportation mode in short trips.
Table 31: Impact of perceived value on the intention (Scenario1)
H8: Perceived Value → Intention (Scenario 1)
Proposed Effect Coefficient P-Value Result
Sweden + 0.811 0.001 Supported
Germany + 0.729 0.001 Supported
Iran + 0.670 0.001 Supported
Total + 0.760 0.001 Supported
Table 32 shows the results of H8 for the second scenario. The hypothesis in long-distance trips is supported only in the Swedish and Iranian samples (p <0.05); the p-value in the
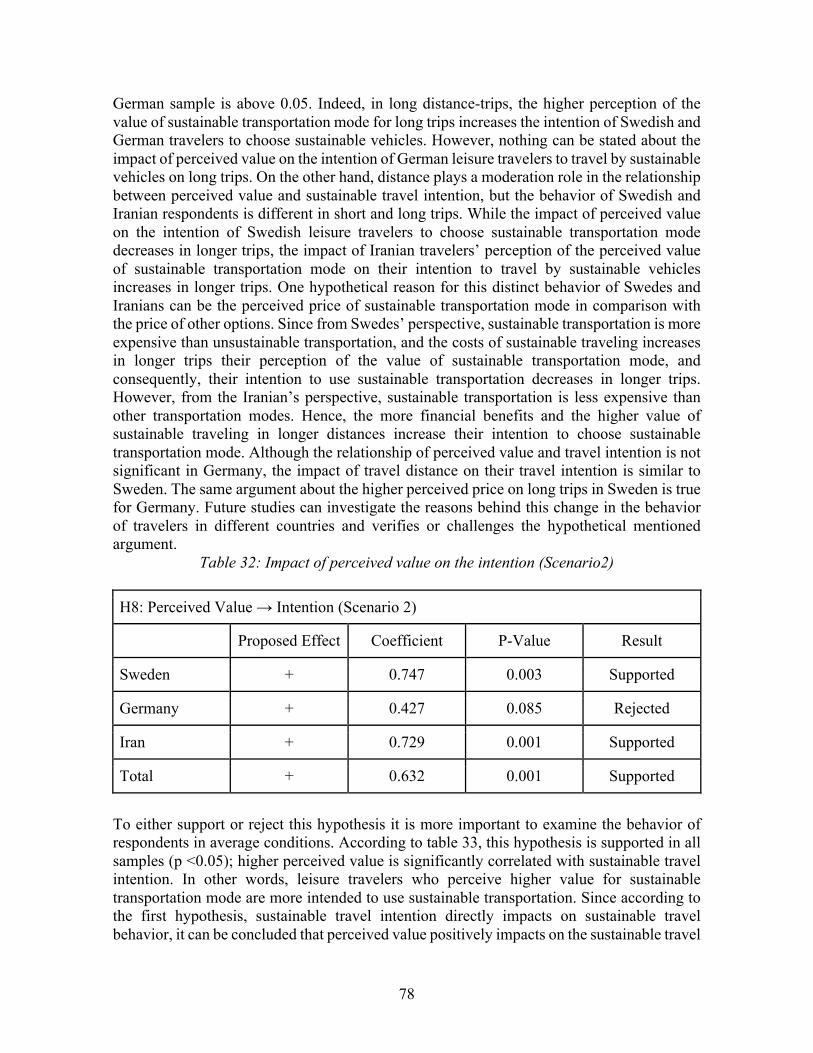
78
German sample is above 0.05. Indeed, in long distance-trips, the higher perception of the value of sustainable transportation mode for long trips increases the intention of Swedish and German travelers to choose sustainable vehicles. However, nothing can be stated about the impact of perceived value on the intention of German leisure travelers to travel by sustainable vehicles on long trips. On the other hand, distance plays a moderation role in the relationship between perceived value and sustainable travel intention, but the behavior of Swedish and Iranian respondents is different in short and long trips. While the impact of perceived value on the intention of Swedish leisure travelers to choose sustainable transportation mode decreases in longer trips, the impact of Iranian travelers’ perception of the perceived value of sustainable transportation mode on their intention to travel by sustainable vehicles increases in longer trips. One hypothetical reason for this distinct behavior of Swedes and Iranians can be the perceived price of sustainable transportation mode in comparison with the price of other options. Since from Swedes’ perspective, sustainable transportation is more expensive than unsustainable transportation, and the costs of sustainable traveling increases in longer trips their perception of the value of sustainable transportation mode, and consequently, their intention to use sustainable transportation decreases in longer trips. However, from the Iranian’s perspective, sustainable transportation is less expensive than other transportation modes. Hence, the more financial benefits and the higher value of sustainable traveling in longer distances increase their intention to choose sustainable transportation mode. Although the relationship of perceived value and travel intention is not significant in Germany, the impact of travel distance on their travel intention is similar to Sweden. The same argument about the higher perceived price on long trips in Sweden is true for Germany. Future studies can investigate the reasons behind this change in the behavior of travelers in different countries and verifies or challenges the hypothetical mentioned argument.
Table 32: Impact of perceived value on the intention (Scenario2)
H8: Perceived Value → Intention (Scenario 2)
Proposed Effect Coefficient P-Value Result
Sweden + 0.747 0.003 Supported
Germany + 0.427 0.085 Rejected
Iran + 0.729 0.001 Supported
Total + 0.632 0.001 Supported
To either support or reject this hypothesis it is more important to examine the behavior of respondents in average conditions. According to table 33, this hypothesis is supported in all samples (p <0.05); higher perceived value is significantly correlated with sustainable travel intention. In other words, leisure travelers who perceive higher value for sustainable transportation mode are more intended to use sustainable transportation. Since according to the first hypothesis, sustainable travel intention directly impacts on sustainable travel behavior, it can be concluded that perceived value positively impacts on the sustainable travel
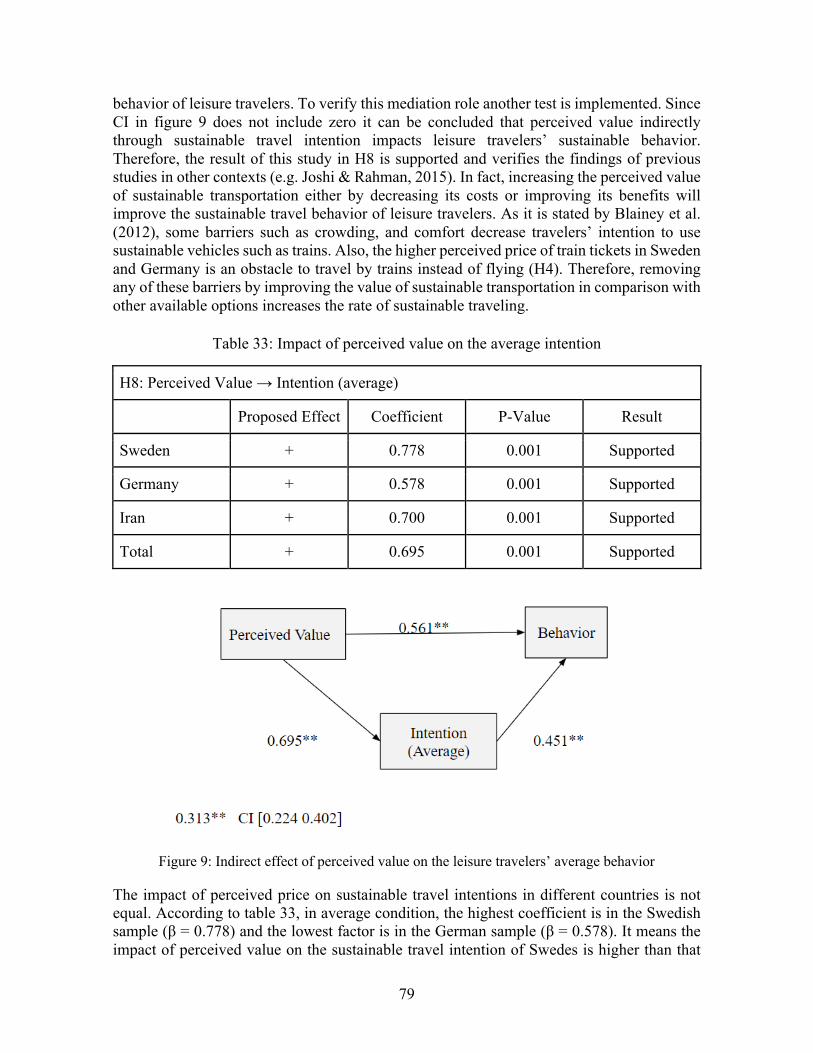
79
behavior of leisure travelers. To verify this mediation role another test is implemented. Since CI in figure 9 does not include zero it can be concluded that perceived value indirectly through sustainable travel intention impacts leisure travelers’ sustainable behavior. Therefore, the result of this study in H8 is supported and verifies the findings of previous studies in other contexts (e.g. Joshi & Rahman, 2015). In fact, increasing the perceived value of sustainable transportation either by decreasing its costs or improving its benefits will improve the sustainable travel behavior of leisure travelers. As it is stated by Blainey et al. (2012), some barriers such as crowding, and comfort decrease travelers’ intention to use sustainable vehicles such as trains. Also, the higher perceived price of train tickets in Sweden and Germany is an obstacle to travel by trains instead of flying (H4). Therefore, removing any of these barriers by improving the value of sustainable transportation in comparison with other available options increases the rate of sustainable traveling.
Table 33: Impact of perceived value on the average intention
H8: Perceived Value → Intention (average)
Proposed Effect Coefficient P-Value Result
Sweden + 0.778 0.001 Supported
Germany + 0.578 0.001 Supported
Iran + 0.700 0.001 Supported
Total + 0.695 0.001 Supported
Figure 9: Indirect effect of perceived value on the leisure travelers’ average behavior
The impact of perceived price on sustainable travel intentions in different countries is not equal. According to table 33, in average condition, the highest coefficient is in the Swedish sample (β = 0.778) and the lowest factor is in the German sample (β = 0.578). It means the impact of perceived value on the sustainable travel intention of Swedes is higher than that
80
impact on the German travelers’ sustainable travel intention. In other words, if one Swedish traveler and one German traveler have the same perception of the value of sustainable transportation mode in comparison with other types of transportation, the Swedish traveler more probably intends to travel by sustainable vehicles. On the other hand, based on table 5, German respondents’ perception of the value of sustainable transportation is higher than the perceived value from the Swedish respondents’ view. So, even if compared to Swedes, Germans perceived higher value for sustainable transportation they are less intended to travel by more sustainable vehicles. Altogether if some organizations in Europe do investments to promote sustainable transportation, it would be more effective if they invest in the increasing value of sustainable transportation for Swedes than for Germans.
The coefficient of this relationship for Iranian respondents is lower than the coefficient in the Swedish sample and higher than the coefficient in the German sample. Their perception of the value of sustainable transportation is also in the middle of values for other samples. So, it can be concluded that investment in improving the value of sustainable transportation for Iranian travelers, either through an increase in benefits or decrease in costs, is also more beneficial than investing in improving the perception of Germans.
6.3 Summary of Results This research is done to answer four research questions regarding the sustainable behavior of leisure travelers in Sweden, Germany, and Iran. Following, the results of this study in response to each question are summarized.
RQ 1: To what extent is there a gap between the intention and behavior of leisure travelers regarding choosing sustainable transportation vehicles?
To verify that whether there is a gap between intention and behavior of leisure travelers first it is required to prove that intention of leisure travelers to use sustainable transportation mode and their real sustainable travel behavior are directly correlated. Results of H1-1 in tables 7, 9, and 11 states that sustainable travel intention and behavior of leisure travelers in all samples are significantly correlated. Since the sustainable travel intention of respondents is measured in two different scenarios but their travel behavior is measured in average condition, results of H2-2 in average condition is considered valid to measure the amount of IBG. The result of H1-2 in table 11 shows that there is a slightly positive gap between intention and behavior of Swedes and there is a slightly negative gap between intention and behavior of Iranian travelers to use sustainable transportation mode. The positive gap in the Swedish sample means that Swedish leisure travelers use sustainable transportation less than what they intended to. On the other hand, the negative gap in the Iranian sample means that Iranian leisure travelers use sustainable transportation more than what they intended to. Several determinants in H2 to H8 are investigated to find the determinants of this gap. For instance, while the higher price of train tickets than flight tickets from Swedes’ perspective is a barrier to their use of sustainable transportation, the lower price of train tickets in comparison with flight tickets in Iran is a motivation to buy train tickets for leisure travels. The amount of gap in the German sample is almost zero. However, based on table 12, it does not necessarily mean that there is no gap between the sustainable travel intention and behavior of each German respondent.
81
RQ 2: Which group of consumers plays (inclined abstainers or disinclined actors) the bigger role in creating this gap?
Inclined abstainers are leisure travelers whose sustainable travel behavior is less than their sustainable travel intention. Conversely, disinclined actors are leisure travelers whose sustainable travel intention is less than their sustainable travel behavior. Since there is a positive IBG in the Swedish sample it is expected that the number of inclined abstainers is more than disinclined actors in this sample. Results of analysis in table 12 shows that inclined abstainers and disinclined actors embrace 52 and 32 percent of the Swedish sample respectively. Therefore, as it is expected, inclined abstainers are responsible for creating a small positive IBG in the Swedish sample. On the other hand, since there is a negative IBG in the Iranian sample it is expected that the number of disinclined actors is more than inclined abstainers in this sample. Results of analysis in table 12 shows that disinclined actors and inclined abstainers encompass 48 and 40 percent of the Iranian sample respectively. Therefore, as it is expected, disinclined actors are responsible for creating a small negative IBG in the Iranian sample. Although there is not a gap between the average intention and behavior of German respondents, the share of inclined abstainers and disinclined actors from the whole German sample is not equal. According to table 12, disinclined actors and inclined abstainers encompass 49 and 43 percent of the German sample respectively. Therefore, in each sample at least 88 percent of the respondents state that there is a gap between their sustainable travel intention and behavior; making it necessary to find out determinants of this IBG in the next research questions.
RQ 3: What are the determinants of/barriers to using more sustainable transportation vehicles in leisure transportation?
H2 to H8 in this study aims at investigating the factors that impact on sustainable travel intentions of leisure travelers in these countries. All factors except perceived price are suggested that positively impact on sustainable travel intentions of leisure travelers. To test whether these factors significantly impact on sustainable travel intention and consequently on sustainable travel behavior of respondents, regression and mediation analyses in the first scenario, second scenario, and the average scenario is applied. A higher level of attitude and environmental concern, a higher level of environmental knowledge, the lower perceived price of sustainable transportation mode, other sustainable habits and sustainable lifestyle, a higher level of perceived effectiveness, in line social norms, the higher perceived value of sustainable transportation mode increases intention of leisure travelers in Sweden to use sustainable vehicles on both short and long trips.
Determinant factors of sustainable travel behavior are different in Germany. It is concluded that a higher level of attitude and environmental concern, a higher level of environmental knowledge, a higher level of perceived effectiveness, and in line social norms increase the intention of German leisure travelers to use sustainable vehicles on both short and long trips. The positive impact of perceived value and sustainable habits and lifestyle on the intention of German leisure travelers is only supported in short trips and rejected on the long-distance scenario. Conversely, the negative impact of the higher price of sustainable transportation as a barrier to travel by sustainable vehicles is only supported on longer trips and is rejected in short distance scenarios.
82
Lastly, all hypotheses except H4 are accepted in the Iranian sample. A higher level of attitude and environmental concern, a higher level of environmental knowledge, other sustainable habits and sustainable lifestyle, a higher level of perceived effectiveness, in line social norms, the higher perceived value of sustainable transportation mode increases intention of Iranian leisure travelers to use sustainable vehicles on both short and long trips. The results of this study show that perceived price is not a determinant of Iranian leisure travelers’ intention either on short trips nor on longer journeys. It shows that although Iranians have a lower purchasing power (Worlddata, 2018), the perceived price of transportation mode is not a significant factor in their decision to travel by sustainable vehicles.
RQ 4: How is the sustainable behavior of leisure travelers in Sweden, Germany, and Iran different?
The different behavior of leisure travelers in response to research questions 1 to 3 has been partially explained. However, following other findings related to various behavior of travelers in these countries will be stated. First, although H2 is supported in all samples, the extent to which attitude and environmental concern impact sustainable travel intention is varying in different countries. The highest impact of this factor is on the travel behavior of Swedish respondents and the lowest impact is on the travel behavior of German respondents. In other words, one Swedish leisure traveler and one German leisure traveler that has the same level of environmental attitude have different levels of sustainable travel behavior. Compared to its German counterpart, such a Swedish leisure traveler is more intended to use sustainable transportation mode on both short and long trips. The behavior of Iranian respondents is in the middle of two other samples. It means that compared to a German traveler with the same level of environmental concern, an Iranian leisure traveler is more intended to use sustainable transportation. Similarly the impact of other factors is also different in these countries; details of this analysis are presented in chapter 6. From different angles such as purchasing power, cultural dimensions, and sustainability performance Germany and Sweden are close to each other, and Iran is different. However, compared to German travelers, the behavior of leisure travelers in Sweden and Iran is more similar in terms of the impact of mentioned factors on their sustainable travel intention.
Additionally, different variables in the conceptual model have different values in various countries (Table 6). Since the 2016 Global Environmental Performance Index ranks Iran 80th, Germany 13th, and Sweden fifth among 180 countries (EPI, 2018) it was expected that the value of constructs related to sustainable behavior is different in these countries. However, this order is not exactly consistent with the results of this study in table 6. For instance, in terms of sustainable travel behavior and level of environmental knowledge, German respondents get the highest point and Swedes get the lowest point. On the other hand, Iranians have the highest level of environmental concern among respondents from these countries. However, in some attributes such as sustainable lifestyle Iranian respondents get the lower value which is consistent with the EPI index.
On the other hand, because of the social trend of flight shame and low speed traveling in Sweden and Germany it was expected that travelers in these countries feel more pressure from social groups to travel by sustainable transportation mode. However, according to table 6, the value of pressure from social groups in Iran is higher than the amount of pressure that
83
Swedes feel from their social groups. One reason for this difference is that compared to Sweden and Germany, Iran has a collectivist culture (figure 2), and people in collectivist cultures more care about social harmony and social acceptance (Oh, 2013, P. 983). In that regard, German respondents that their culture is less individualistic than Swedish culture and has the social trend of flight shame feel the highest pressure from social groups to travel sustainably. Therefore, since social norms positively impact on the sustainable travel behavior, it is expected that in countries that have collectivistic culture and social trends such as flight shame travelers are more intended to use sustainable transportation mode.
Finally, the moderation role of distance is also different in various countries and different hypotheses. Distance and time between the origin and destination of a trip play a moderation role in the impact of different variables on sustainable travel intention. However, the direction and the amount of this impact is not similar in different samples. For instance, the impact of perceived effectiveness of sustainable traveling on the sustainable travel intention of leisure travelers in Sweden, Germany, and Iran is significant. However, not only the coefficient of this relationship is different in different countries but also the amount of this impact is different for short and long trips in each sample. The coefficient of this hypothesis (β) in short trips and long trips for Sweden is 0.854 and 0.739 respectively, β in short trips and long trips for Germany is 0.497 and 0.306 respectively, and corresponding numbers in the Iranian sample are 0.854 and 0.824 respectively. The amount of change because of an increase in distance in the Swedish, German, and Iranian samples is 13, 34, and 4 percent, respectively. Therefore, an increase in distance and time of traveling more intensely decreases the positive impact of the perceived effectiveness of sustainable transportation mode on the intention of leisure travelers in Germany than in Iran. On the other hand, for some other hypotheses not only the amount of change in the coefficient of relationship but also the direction of change is varying in different samples. For instance, while with an increase of distance, the impact of social norms on the intention of Swedish and German leisure travelers decreases, in the Iranian, sample the impact of social norms is more positive on longer journeys. The moderation role of distance on the impact of each determinant of sustainable travel intention is thoroughly explained for each hypothesis in the previous section.
84
7 Conclusion
“Aviation contributes to climate change just like most other human activities. However, aviation is one of the few industries that has already taken and continues taking concrete, purposeful and successful steps to reduce its
emissions and impact to the environment.”
Maunu von Lueders, former Regional Vice President Asia-Pacific (2011-2014), IATA
This chapter concludes the findings by answering the purpose of this study and theoretical contributions. Further, limitations of the study and future research opportunities are considered. Lastly, the managerial and societal contribution of this study is discussed.
7.1 Theoretical Contributions
Research on IBGs and research on barriers for using sustainable transportation has been published regularly in scientific journals in the last two decades (Joshi & Rahman, 2015; Prillwitz & Barr, 2009). In the IBG context, as in numerous other research fields, the majority of scholars have focused on products and not on services (Joshi & Rahman, 2015). This thesis expands the existing knowledge about IBGs by addressing (sustainable) services. Moreover, the time frame that was given for this thesis (four months) gave the authors the chance to collect and analyze data from three different countries. International samples and/or analyzes have not been found in the literature search. These two characteristics of the present paper - the focus on IBGs in services and the international comparison - depict the contributions to the research area.
The results of this study confirm that there is a small positive IBG in the Swedish sample and, consistently, inclined abstainers who have a positive IBG hold the biggest share of consumers in this country. On the other hand, there is a slightly negative IBG in the Iranian sample, and consistently disinclined actors who have a negative IBG embrace the biggest share of consumers in the Iranian sample. However, no significant IBG is found in the German sample. Besides, factors investigated in this study are mostly significant determinants of the behavior of leisure travelers in Sweden, Germany, and Iran. Indeed, a higher level of attitude and environmental concern, a higher level of environmental knowledge, a higher level of perceived effectiveness, and in line social norms increase the intention of leisure travelers in Sweden, Germany, and Iran to use sustainable transportation mode on both short and long trips.
The impact of perceived price, perceived value, and sustainable lifestyle are only supported in some countries and some travel distances. Additionally, the results of this study show that travel distance is a significant factor in the sustainable travel choice of leisure travelers in all investigated countries and moderates the impact of supported determinants on the sustainable travel intention of leisure travelers. Lastly, comparing the behavior of leisure travelers in
85
Sweden, Germany, and Iran showed that sustainable travel behavior of leisure travelers in these countries is different in terms of the factors that impact their sustainable travel intention, the extent to which each factor impacts their intention and the moderation impact of distance.
Generally, it can be said that the majority of hypotheses have been verified by the data analysis. In other words, predetermined factors that impact on sustainable purchase intention of consumers can also impact on leisure travelers’ sustainable travel intention depending on the culture, geography, economy, and travel distance.
7.2 Limitations Although a huge effort is put into this thesis to conduct the most valuable and insightful study in this specific context, this study still contains some limitations that should be addressed. It is important to consider the limitations while reading this study and use them as an opportunity to guide future research in this topic. First, during the time when the survey of this thesis was carried out (April 2020), the world was not in an ordinary situation. The outbreak of the coronavirus pandemic and the subsequent restrictions in public forced millions of people to stay at home. That inevitably led to a decrease in traffic all around the world. It is sure that the survey sample was at least partly, if not overall, affected by the restrictions. In order to get generalizable answers, the survey stated clearly that the participants ought to answer the questions without considering the restrictions. Nevertheless, the overall extraordinary situation might have biased the answers from the participants, perhaps even subconsciously. Additionally, due to travel bans in Europe and other regions in this time it was not possible to compare train and flight ticket prices to verify whether train tickets are more expensive than flight tickets in defined scenarios and other O&Ds. Second, to find out the most relevant respondents in each sample the questionnaire is translated into three different languages. Three natives from Sweden, Germany, and Iran translated the English survey into Swedish, German, and English. Since three different people translated these three questionnaires, some words might have lost their original meaning in the translation process. Although part of these errors is identified through the pre-test of the survey, since the respondents are not the authors of this thesis and are not familiar with the purpose of this study, they might not have noticed all misunderstandings. Additionally, to measure sustainable travel intentions of respondents, two different scenarios are defined in the survey; one scenario is representative of short trips which takes six to eight hours by train, and the other one which is representative for long journeys might take one to two days to travel by train. To find out O&D that make sense for respondents in each country, origins and destinations in these scenarios are customized for each country depending on culture and geographic position. Although conditions of each scenario are considered by the authors and the comparability of scenarios is taken into consideration, different scenarios might still cause some biases in the study. The current solution was the best idea of the authors to investigate the behavior of respondents in different regions. Future studies might find a better solution to design a scenario that is both customized and without any bias.
86
The sampling method used in this study is a nonprobability method called convenience sampling; each member of the population does not have the same chance to participate in this study. This sampling method has some biases and makes it hard to generalize the results of the study. Since the questionnaire in this study is distributed through the authors’ personal connection, the sample might be biased toward some demographics. For instance, the German sample in this study is biased toward older people and the Iranian sample is biased toward the younger generation. It is difficult to collect data from older people in Iran by an online questionnaire because the penetration rate is low among older Iranians. Although the mentioned biases do not make the results of this study unreliable, it is not correct to generalize the results of this study to the whole population of these countries. Future studies can use probability sampling methods to verify the findings of this study. Lastly, the first research question of this study investigates the IBG in leisure traveling. To measure sustainable travel intention and behavior of respondents in each country, pre-tested scales are used in the questionnaire. To measure the sustainable travel behavior, four questions are selected that ask about the average transportation behavior of respondents in travels longer than 200 km. However, to measure the intention of respondents to use sustainable transportation mode for trips longer than 200 km, two scenarios are defined - one scenario for short trips and one scenario for longer trips - and four questions from previous studies are selected to measure the intention of leisure travelers. Since the behavior is measured in average condition, to find the gap between intention and travel behavior of leisure travelers only the average value of intention from two scenarios is precisely comparable with their average behavior. Although the IBG in two other scenarios is also analyzed in chapter 6, further investigation is needed to verify those results. Apparently, the distance between origin and destination changes the intention and behavior of leisure travelers to use sustainable transportation mode. Hence, future studies can separately measure the behavior of leisure travelers in short and long trips and find more accurate IBG in each scenario.
7.3 Future Research Apart from opportunities that have already been mentioned regarding limitations in this study, there are some other possibilities to extend the contributions of this study and improve its findings. First, this study only investigates some of the determinants of sustainable travel intention and there are many other identified determinants and barriers to sustainable behavior in the previous studies including trust, the brand image of sustainable product/ service providers, product/service quality (Joshi & Rahman, 2015). Most of these variables are investigated in the context of green products and there are only a limited number of studies that investigate whether these variables impact sustainable travel behavior. The scope and time limit of this study avoided including all variables. Future studies can expand the conceptual model of this study by considering other variables. Second, Blainey et al. (2012, p. 693) emphasize that a theoretical removal of barriers for traveling by train would not necessarily lead to a behavior change of consumers. Therefore, the removal of barriers and the following investigation of the effects of removing barriers would be an important contribution to further research. This research may discover that the
87
barriers listed by consumers are rather excuses than actual barriers. It can be assumed that laziness, a barrier quite unpleasant to admit, plays a role in consumers’ decisions, no matter if admitted or not (Rana & Paul, 2017). A Belgian study found out that only 9% of consumers would switch from using their own cars to using public transport if public transport was completely free of charge (De Witte et al., 2008). Additionally, this study implemented a quantitative method and a positivist approach to answer research questions. This method is appropriate for this study because it uses existing theories to expand knowledge of sustainable travel behavior, extends existing knowledge in other fields of sustainable behavior to sustainable travel decisions, investigates several causal relationships, and seeks to generalize findings and results. However, a qualitative study can help understand and interpret the results of this study more comprehensively. For instance, the results of this study state that in longer-distance trips positive impacts of social norms on the sustainable travel intention of Swedish and German leisure travelers increases, but its impact decreases on the Iranian leisure travelers’ intention. Some hypothetical reasons are mentioned in chapter 6 to justify this different impact. Nonetheless, some qualitative studies can help to understand why this impact is different in different cultures, and how leisure travelers think in different countries. Another example is the impact of sustainable habits and lifestyle on the intention of leisure travelers to use sustainable transportation mode. The results of this study show that compared to leisure travelers in Sweden and Germany, people who have sustainable habits and a sustainable lifestyle are more intended to use sustainable transportation mode on short trips. Finally, this study investigates the behavior of leisure travelers, not business travelers. Leisure and business travelers have different needs and behaviors (Lavanchy, 2018). Therefore, factors investigated in this study might not be determinants of sustainable travel behavior of people who travel for work reasons. For instance, the cost that business travelers use for travel is not from their personal budget. Their perception of the price and value of different transportation methods is different from leisure travelers and consequently the extent to which price changes their intention to use suitable transportation mode might be different. Similarly, distance and time play a moderating role in the impact of determinants. Time can be a very important factor in the decision to work travelers and limit their options more seriously. Hence, further investigation is required to investigate the behavior of work/ business travelers.
7.4 Managerial Implications According to Eurobarometer 468 (2017), almost half of the people in European countries think that the air quality in their country has worsened over the last ten years, and they consider climate change and air pollution as the most important environmental issues. Therefore, they are concerned about climate change issues and are interested in protecting the environment. Indeed, 94 percent of European citizens say that the protection of the environment is important to them personally and 87 percent of them believe they can play a role in protecting the environment (Eurobarometer 468, 2017). Waste management, energy management, using public transportation, and purchasing green products and services are some examples of the roles that consumers can play in protecting the environment. As a
88
result, the demand for green products and services for both customers and business clients should be increasing. However, two-thirds of respondents feel that they are not doing enough to protect the environment (Eurobarometer 468, 2017). Furthermore, the global market share for green products is only 4 percent (Gleim et al, 2013). The global transportation market including air, rail, road, and water transportation services is expected to grow to nearly $9,540 billion by 2022 (Business Research Company, 2019). On the other hand, the transportation sector “takes a major share of a nation’s GDP for investment, revenue generation, and employment creation of countries” (Vashistha, 2019). In 2018, the contribution of the travel and tourism industry to GDP (% of GDP) of Sweden and Germany was 9.4 and 8.6 percent respectively (World Data Atlas, n.d.). Similarly, Iran's travel and tourism sector took 6.5 percent of the overall GDP and 5.4 percent of the total employment of Iran in 2018 (Financialtribune, 2019). Due to the incremental value of the transportation services and the significant share of this market in the GDP and economy of these countries it is important to investigate the dynamic of this growing market. Companies are always looking for opportunities to be more competitive and they believe that considering sustainability and environmental issues in their strategy and practices would reinforce their brand image (Chen, 2010; Phau & Ong, 2007). “Almost all Europeans agree that big polluters have primary responsibility for repairing the damage they cause” (Eurobarometer 468, 2017). Also, 79 percent of European citizens state that big companies and industries are not doing enough to protect the environment (Eurobarometer 468, 2017). As society is becoming more concerned with environmental issues and expects more from producers and service owners, businesses are modifying their behavior in an attempt to address society's new concerns (Cannis, 2001). The results of this study help businesses to enhance their brand image by offering more sustainable services. On the other hand, most people consider environmental benefits an important factor in purchasing a product (Chen, 2010) and more than 80 percent of consumers claim that companies should produce green products (McVeigh, 2017). Green products increase the value for consumers who are aware of environmental issues and, therefore, they are ready to pay a higher price for the green product with the same quality as similar options (Laroche et al., 2001; Loureiro et al., 2002). Consequently, offering a green product or service allows the company to charge a higher price for the product and increase its profitability. Media coverage of climate change raises awareness towards environmental issues among consumers and has a significant effect on their purchase intention (Qader & Zainuddin, 2011). On the other hand, media coverage and scandals about negative environmental footprints of companies force firms to consider sustainability and environmental issues in their strategy and tactics (eg: Volkswagen emissions scandal). In that matter, the media has generally been regarded as sources of information. Additionally, 67 percent of people in Europe believe that governments are not doing enough to protect the environment (Eurobarometer 468, 2017). As the importance of sustainable production and consumption is increasing the rules and regulations which promote sustainable consumption and prohibiting environmentally harmful production are becoming more prevalent. For instance, regulation (EU) No 598/2014 on noise-related operating
89
restrictions at Union airports (Council of the European Union, 2014). Due to media pressure and regulations, considering sustainability issues and decreasing negative environmental footprints is becoming a point of parity for businesses in the near future. Consequently, it is important for businesses to know how they can attract green consumers by understanding the determinants of their behavior. The results of this study also help governments to modify their policies and take essential actions to guide leisure travelers toward more sustainable transportation. Some might say that decreasing the number of flights has some negative impacts because people have this chance to share their time with their family and friends and learn from people with different religions and cultures during their traveling (Asquith, 2020). However, this study and the trend of flight shame and slow traveling are not about decreasing the number of travel times, it is about changing transportation vehicles. Moreover, using trains instead of flights would help people to have more time to exploit the mentioned experiences. On the other side, the air traffic industry is definitely not sure to fail either, not even in wealthy countries, as long as it keeps its promise and continues to reduce its environmental impact (Britton, 2020; Rutherford, 2011, p. 13). Finally, this study investigates the barriers of using more sustainable transportation vehicles in leisure traveling. More sustainable vehicles use less energy, reduce CO2 emission, and decrease other negative environmental footprints such as noise disturbance. Understanding the determinants of consumers’ behavior helps businesses and governments to lead the transportation behavior of leisure travelers toward more sustainable approaches. Therefore, saving energy and reducing CO2 emissions will support solving climate change issues and save the environment and resources for future generations.
7.5 Societal and Ethical Implications The results of this thesis have implications for society in general, but more specifically for the societies in Sweden, Germany, and Iran. In the regard of climate change, the societal implications of scientific findings are closely related to ethical considerations too. That is because any question around sustainable consumption has an ethical context (Fridays for Future, 2020). First of all, the results give chance to assume that the importance of sustainable travel choices is continuously rising in the three countries. In the case of Iran, that is more likely going to happen than in Germany or Sweden, since train tickets in Iran are cheaper than flying tickets. Moreover, one can expect that the purchasing power of Iranian consumers will rise in the upcoming years, making exclusive products and services more accessible. But also Swedish and German consumers are not going to get deterred by expensive train rides, whose prices have started to decrease because of the higher demands (Spiegel, 2020). Second, it is important to note that the focus on leisure traveling only is by far not sufficient when it comes to societal implications. Non-voluntary travels should also be considered for society, because the environment does not make a difference between emissions that stem from a weekend trip or emissions that stem from driving to work. Covid-19 crashed into this whole context of sustainable transportation modes and left an historic crisis, putting nearly all long-distance travel supplies on hold for months. As much
90
as the upcoming system reboot depicts an unique chance to not go back to 'business as usual', as much it is almost impossible to predict if the sustainable or the unsustainable suppliers will have the better start. One can only guess that this might be different from country to country, from lobbyists to lobbyists, from ethical considerations to economic considerations. Consequently, the coronavirus has enlarged the uncertainty under which any societal implication of this thesis can be formulated. Sadly, it is less uncertain to estimate the number of friends that corona took away from us. Fridays for Future demonstrations and other environmental movements have gained popularity until the pandemic started. As Britton (2020) points out, many of the activists' standpoints have partly only pointed at the air traffic industry and exposed it as the black sheep of travel suppliers. The authors, doing their best to stay neutral, consider it as their ethical duty to distance themselves from judging air traffic in general. The fact that airplanes have been regarded as the most problematic transportation mode in this thesis has been due to the results from table 1, i.e. the pure focus on measurable environmental impacts. Other characteristics of airplane traveling, as advantageous as they might be, have not been considered, because they would not have been relevant for the research questions.
91
References Adnan, A., Ahmad, A., & Khan, M. N. (2017). Examining the role of consumer lifestyles on ecological behavior among young Indian consumers. Young Consumers. Ajzen, I., & Fishbein, M. (1973). Attitudinal and normative variables as predictors of specific behavior. Journal of personality and Social Psychology, 27(1), 41. Ajzen, I., & Fishbein, M. (1977). Attitude-behavior relations: A theoretical analysis and review of empirical research. Psychological bulletin, 84(5), 888. Ajzen, I. (1991). The theory of planned behavior. Organizational behavior and human decision processes, 50(2), 179-211. Akbari, M., Baba-Akbari Sari, M., Fakharzadeh, A., Iravani, H., Alambeigi, A., & Namdar, M., (2009). Investigation of Agricultural Experts' Attitude toward the Effective Components of Organic Crop Consumption. Allahverdipour, H., Jalilian, F., & Shaghaghi, A. (2012). Vulnerability and the intention to anabolic steroids use among Iranian gym users: An application of the theory of planned behavior. Substance use & misuse, 47(3), 309-317. Asquith, J., (2020). The Spread Of Flight Shame In Europe—Is Greta Thunberg The Reason Why?. Available via: https://www.forbes.com/sites/jamesasquith/2020/01/13/the-spread-of-flight-shame-in-europe-is-greta-thunberg-the-reason-why/#3988485e69bd [Retrieved 2020-02-27]. Baba-Akbari Sari, M., Asadi, A., Akbari, M., Fakharzadeh, A., & Sokhtanloo M., (2009). Investigation of Consumer Attitudes and Factors Affecting Acceptance of Organic Agricultural Products. Iranian Journal of Agricultural Economics and Development Research, 39 (1). Baker, M. A., Davis, E. A., & Weaver, P. A. (2014). Eco-friendly attitudes, barriers to participation, and differences in behavior at green hotels. Cornell Hospitality Quarterly, 55(1), 89-99. Bamberg, S. (1995). When does the car-user change to the bus? Problems and results of an application of the theory of planned behavior in the context of practical traffic planning. Zeitschrift fur Sozialpsychologie, 26(4), 243-262. Banerjee, A., & Solomon, B. D. (2003). Eco-labeling for energy efficiency and sustainability: a meta-evaluation of US programs. Energy policy, 31(2), 109-123. BBC, (2019). 'Flight shame' could halve growth in air traffic. Internet Source. Available via: https://www.bbc.com/news/business-49890057 [Retrieved 2020-03-11].
92
Becken, S. (2007). Tourists' perception of international air travel's impact on the global climate and potential climate change policies. Journal of sustainable tourism, 15(4), 351-368.
Beirão, G., & Cabral, J. S. (2007). Understanding attitudes towards public transport and private car: A qualitative study. Transport policy, 14(6), 478-489. Berg Eidebo, J. (2020, February 12). Få tågförseningar – trots rekordmånga resenärer. Aftonbladet, [Online]. Available via: https://www.aftonbladet.se/resa/a/K37y85/fa-tagforseningar--trots-rekordmanga-resenarer. [Retrieved 2020-02-17]. Bernstein, R. J. (2011). Beyond objectivism and relativism: Science, hermeneutics, and praxis. University of Pennsylvania Press. Bilgen, S. (2014). Structure and environmental impact of global energy consumption. Renewable and Sustainable Energy Reviews, 38, 890-902. Birks, D.F., & Malhotra, N.K. (2006). Marketing Research: an applied approach. Pearson Education UK. Björklund, M., (2011). Influence from the business environment on environmental purchasing—Drivers and hinders of purchasing green transportation services. Journal of Purchasing and Supply Management, 17(1), pp.11-22. Blainey, S., Hickford, A., & Preston, J. (2012). Barriers to passenger rail use: a review of the evidence. Transport Reviews, 32(6), 675-696. Bottazzi, G., & Secchi, A. (2005). Growth and diversification patterns of the worldwide pharmaceutical industry. Review of industrial Organization, 26(2), 195-216. Boztepe, A. (2012). Green marketing and its impact on consumer buying behavior. European Journal of Economic & Political Studies, 5(1). Bratt, C., Stern, P. C., Matthies, E., & Nenseth, V. (2015). Home, car use, and vacation: The structure of environmentally significant individual behavior. Environment and Behavior, 47(4), 436-473. Britton, R. (2020). Interview about the current situation in the aviation industry. [E-Mail] (personal communication, February 10, 2020). Brown, B. J., Hanson, M. E., Liverman, D. M., & Merideth, R. W. (1987). Global sustainability: toward definition. Environmental management, 11(6), 713-719. Brownstone, D., Ghosh, A., Golob, T. F., Kazimi, C., & Van Amelsfort, D. (2003). Drivers’ willingness-to-pay to reduce travel time: evidence from the San Diego I-15 congestion pricing project. Transportation Research Part A: Policy and Practice, 37(4), 373-387.
93
Bruce, B. (2009, November 25). McDonald’s logo going green in Europe. Online Source. Available via: https://www.foodbev.com/news/mcdonalds-logo-going-green-in-europe/. [Retrieved 2020-04-27]. Business Research Company, (2019). Available via: https://www.prnewswire.com/news-releases/the-transport-services-market-value-is-expected-to-grow-to-9-540-billion-by-2022-by-the-business-research-company-300894702.html [Retrieved 2020-03-07]. Cannis, J., (2001). Green IC packaging. Advanced Packaging, 8, pp.33-38. Carrington, D. (2018). 'Our leaders are like children,' school strike founder tells climate summit. The Guardian, [Online] December 4. Available via: https://www.theguardian.com/environment/2018/dec/04/leaders-like-children-school-strike-founder-greta-thunberg-tells-un-climate-summit. [Retrieved 2020-02-17]. Carrington, M. J., Neville, B. A., & Whitwell, G. J. (2014). Lost in translation: Exploring the ethical consumer intention–behavior gap. Journal of Business Research, 67(1), 2759-2767. Carrus, G., Passafaro, P., & Bonnes, M. (2008). Emotions, habits and rational choices in ecological behaviours: The case of recycling and use of public transportation. Journal of environmental psychology, 28(1), 51-62. Chan, R. Y., & Lau, L. B. (2000). Antecedents of greenpurchases: a survey in China. Journal of consumer marketing, 17(4), 338-357. Chandon, P., Morwitz, V. G., & Reinartz, W. J. (2005). Do intentions really predict behavior? Self-generated validity effects in survey research. Journal of Marketing, 69(2), 1-14. Chang, M. K. (1998). Predicting unethical behavior: a comparison of the theory of reasoned action and the theory of planned behavior. Journal of business ethics, 17(16), 1825-1834. Chen, F. Y., Hsu, P. Y., & Lin, T. W. (2011). Air Travelers' environmental consciousness: A preliminary investigation in Taiwan. International Journal of Business and Management, 6(12), 78. Chen, M. Y., & Chiu, C. I. (2016). Go green: how to influence the perceived effectiveness of a green product?. International Journal of Advertising, 35(4), 622-641. Chen, Y.S., (2010). The drivers of green brand equity: Green brand image, green satisfaction, and green trust. Journal of Business ethics, 93(2), pp.307-319. Chen, Y.S., & Chang, C.H., (2012). Enhance green purchase intentions. Management Decision. Cho, Y.N., Thyroff, A., Rapert, M.I., Park, S.Y. & Lee, H.J., (2013). To be or not to be green: Exploring individualism and collectivism as antecedents of environmental behavior. Journal of Business Research, 66(8), pp.1052-1059.
94
Choi, S., & Ng, A. (2011). Environmental and economic dimensions of sustainability and price effects on consumer responses. Journal of business ethics, 104(2), 269-282. Cocolas, N., Walters, G., Ruhanen, L., & Higham, J. (2020). Air travel attitude functions. Journal of Sustainable Tourism, 28(2), 319-336. Coltman, T., Devinney, T. M., Midgley, D. F., & Venaik, S. (2008). Formative versus reflective measurement models: Two applications of formative measurement. Journal of Business Research, 61(12), pp. 1250-1262. Connell, K. Y. H. (2010). Internal and external barriers to eco-conscious apparel acquisition. International Journal of Consumer Studies, 34(3), 279-286. Conner, M., & Sparks, P. (1996). The theory of planned behaviour and health behaviours In: Conner M, Norman P (Eds.), Predicting Health Behaviour: Research and Practice with Social Cognition Models. Cooney, S. (2010, June). LOHAS releases annual consumer trend database. In The Annual LOHAS Conference (pp. 23-25). Council of the European Union, (2014). Regulation (EU) No 598/2014 of the European Parliament and of the Council of 16 April 2014 on the establishment of rules and procedures with regard to the introduction of noise-related operating restrictions at Union airports within a Balanced Approach and repealing Directive 2002/30/EC. Available at: https://op.europa.eu/en/publication-detail/-/publication/b6947ca7-f1f6-11e3-8cd4-01aa75ed71a1/language-en [Retrieved 2020-03-12]. Cui, B., Boisjoly, G., Miranda-Moreno, L., & El-Geneidy, A. (2020). Accessibility matters: Exploring the determinants of public transport mode share across income groups in Canadian cities. Transportation Research Part D: Transport and Environment, 80, 102276. Curtin, R., Presser, S. & Singer, E., 2000. The effects of response rate changes on the index of consumer sentiment. Public opinion quarterly, 64(4), pp.413-428. Dagens Nyheter, (2018, August 21). 15-åriga Greta skolstrejkar för klimatets skull. Dagens Nyheter. Available via: https://www.dn.se/sthlm/15-ariga-greta-skolstrejkar-for-klimatets-skull/. [Retrieved 2020-02-16]. Dahlstrom, R., (2011). Green Marketing, Theory, Practice and Strategies. Delhi: Cengage Learning India Private Ltd. David, M., & Sutton, C. D. (2011). Social research: An introduction. Sage. Davidson, A. R., & Morrison, D. M. (1983). Predicting contraceptive behavior from attitudes: a comparison of within-versus across-subjects procedures. Journal of Personality and Social Psychology, 45(5), 997.
95
Davis, S., & Boundy, R. G. (2019). Lessons to be Learned: More than One Million Plug-in EVs Sold in the US. Transmission & Distribution World, 2019 (July). de Bruijn, G. J. (2011). Exercise habit strength, planning and the theory of planned behaviour: An action control approach. Psychology of Sport and Exercise, 12(2), 106-114. Dehghanan, H., & Bakhshandeh, G., (2014). The impact of green perceived value and green perceived risk on green purchase behavior of Iranian consumers. International journal of Management and Humanity sciences, 3(2), pp.1349-1357. Deutsch, M., & Gerard, H. B. (1955). A study of normative and informational social influences upon individual judgment. The journal of abnormal and social psychology, 51(3), 629. De Witte, A., Macharis, C., & Mairesse, O. (2008). How persuasive is ‘free’public transport?: a survey among commuters in the Brussels Capital Region. Transport Policy, 15(4), 216-224. Diddi, S., Yan, R. N., Bloodhart, B., Bajtelsmit, V., & McShane, K. (2019). Exploring young adult consumers’ sustainable clothing consumption intention-behavior gap: A Behavioral Reasoning Theory perspective. Sustainable Production and Consumption, 18, 200-209. Dietz, T., Stern, P.C., & Guagnano, G.A., (1998). Social structural and social psychological bases of environmental concern. Environment and behavior, 30(4), pp.450-471. Domazet, M., Ančić, B., & Brajdić Vuković, M. (2014). Prosperity and environmental sacrifice in Europe: Importance of income for sustainability-orientation. Do Paço, A.M.F., & Raposo, M.L.B., (2008). Determining the characteristics to profile the “green” consumer: an exploratory approach. International review on public and nonprofit marketing, 5(2), pp.129-140. Doran, C. J. (2009). The role of personal values in fair trade consumption. Journal of Business Ethics, 84(4), 549-563. Doszhanov, A., & Ahmad, Z.A., (2015). Customers’ intention to use green products: The impact of green brand dimensions and green perceived value. In SHS Web of Conferences (Vol. 18, p. 01008). EDP Sciences. Drive Smart, (n.d.), Minimum Driving Age by Country. Available at: https://www.rhinocarhire.com/Drive-Smart-Blog/Minimum-Driving-Age-Country.aspx#/searchcars [Retrieved 2020-04-01]. Dudow, A., (1998). Eco-Logistics: Incorporating business transport issues into environmental management systems. International Institute for Industrial Environmental Economics. Lund University, Lund, Sweden.
96
EASA, (2019). Aviation Environmental Report. Available at: https://ec.europa.eu/transport/sites/transport/files/2019-aviation-environmental-report.pdf. [Retrieved 2020-02-15]. Echegaray, F., & Hansstein, F. V. (2017). Assessing the intention-behavior gap in electronic waste recycling: the case of Brazil. Journal of Cleaner Production, 142, 180-190. EIA, (2016). Transportation sector energy consumption. Available via: https://www.eia.gov/outlooks/ieo/pdf/transportation.pdf. [Retrieved 2020-03-09]. Elkington, J. (2013). Enter the triple bottom line. In The triple bottom line (pp. 23-38). Routledge. EPI, (2018). 2018 EPI Results. Available at: https://epi.envirocenter.yale.edu/epi-topline?country=&order=field_epi_rank_new&sort=asc [Retrieved 2020-03-05]. Ethify, (2018). Ethify your life. Internet source, Available via: https://ethify.org/node/795 [Retrieved 2020-03-10]. Etzioni, A. (1975). Comparative analysis of complex organizations, rev. Simon and Schuster. Eurobarometer 468, (2017). Attitude of European Citizens Towards the Environment. Special Eurobarometer 468. Available at: https://ec.europa.eu/commfrontoffice/publicopinion/index.cfm/ResultDoc/download/DocumentKy/81259 [Retrieved 2020-03-02]. Eurostat, (2017). Over half of Sweden's households made up of one person. Available at: https://ec.europa.eu/eurostat/web/products-eurostat-news/-/DDN-20170905-1?inheritRedirect=true [Retrieved 2020-04-20]. Evans, G. W., Bullinger, M., & Hygge, S. (1998). Chronic noise exposure and physiological response: A prospective study of children living under environmental stress. Psychological science, 9(1), 75-77. Eze, U. C., & Ndubisi, N. O. (2013). Green buyer behavior: Evidence from Asia consumers. Journal of Asian and African Studies, 48(4), 413-426. Fennis, B. M., Adriaanse, M. A., Stroebe, W., & Pol, B. (2011). Bridging the intention–behavior gap: Inducing implementation intentions through persuasive appeals. Journal of Consumer Psychology, 21(3), 302-311. Fickling, R., Gunn, H., Kirby, H., Bradley, M., & Heywood, C. (2008). The productive use of rail travel time and value of travel time saving for travellers in the course of work. In European Transport Conference 2008; Proceedings.
97
Financialtribune, (2019). Iran Tourism Grows 1.9% to Account for 6.5% of GDP. Available via: https://financialtribune.com/articles/domestic-economy/98599/iran-tourism-grows-19-to-account-for-65-of-gdp [Retrieved 2020-03-12]. Fincham, J.E., (2008). Response rates and responsiveness for surveys, standards, and the Journal. American journal of pharmaceutical education, 72(2), p.43.
Fishbein, M. (1967). Attitude and the prediction of behavior. In M. Fishbein (Ed.), Readings in attitude theory and measurement. New York: Wiley.
Fishbein, M. (1979). A theory of reasoned action: some applications and implications. Flytoday, (2019). Travel by train or plane; which one is better?. Available via: https://www.flytoday.ir/blog/%D8%B3%D9%81%D8%B1-%D8%A8%D8%A7-%D9%82%D8%B7%D8%A7%D8%B1-%D9%87%D9%88%D8%A7%D9%BE%DB%8C%D9%85%D8%A7%D8%9B-%DA%A9%D8%AF%D8%A7%D9%85-%D8%A8%D9%87%D8%AA%D8%B1-%D8%A7%D8%B3%D8%AA%D8%9F/ [Retrieved 2020-05-13]. Fraj, E., & Martinez, E. (2006). Environmental values and lifestyles as determining factors of ecological consumer behaviour: an empirical analysis. Journal of Consumer Marketing. Frick, J., Kaiser, F. G., & Wilson, M. (2004). Environmental knowledge and conservation behavior: Exploring prevalence and structure in a representative sample. Personality and Individual differences, 37(8), 1597-1613. Fridays for Future, (2020, February 17). List of participants of Fridays for Future strikes around the world. Available via: https://fridaysforfuture.org/statistics/list-towns. [Retrieved 2020-02-17]. Friedrichsmeier, T., Matthies, E., & Klöckner, C. A. (2013). Explaining stability in travel mode choice: An empirical comparison of two concepts of habit. Transportation research part F: traffic psychology and behaviour, 16, 1-13. Galindo, G. (2020). Brussels-Vienna night train increases frequency from late 2020. The Brussels Times, [Online] February 17. Available via: https://www.brusselstimes.com/belgium/95437/increased-frequency-on-brussels-vienna-night-train-from-late-2020-nightjet-december-2020-sleeper-train-gare-midi-germany-austria/. [Retrieved 2020-02-17].
Garcia, J. M., & Robertson, M. L. (2017). The future of plastics recycling. Science, 358(6365), 870-872.
Garvill, J., Eriksson, L., & Nordlund, A. (2006, September 11-16). Effects of environmental concern, problem awareness, and norms on environmentally significant behaviours. IAPS Conference “Environment, Health and Sustainable Development” (The International Association of People-Environment Studies) Conference Proceedings, Rome, Italy.
98
Gigerenzer, G., & Selten, R. (Eds.). (2002). Bounded rationality: The adaptive toolbox. MIT press.
Gleim, M.R., Smith, J., Andrews, D., & Cronin Jr., J.J., (2013). Against the green: a multimethod examination of the barriers to green consumption. J. Retail. 89 (1), 44–61. Graci, S. (2006). Accommodating green: Examining barriers to sustainable tourism development. In TTRA Canada Conference Proceedings (pp. 15-17). Green, P.E., & Srinivasan, V., (1978). Conjoint analysis in consumer research: issues and outlook. Journal of consumer research, 5(2), pp.103-123. Grewal, D., Monroe, K. B., & Krishnan, R. (1998). The effects of price-comparison advertising on buyers’ perceptions of acquisition value, transaction value, and behavioral intentions. Journal of marketing, 62(2), 46-59. Grunberg, S. (2020). Starke Schiene: DB auf Kurs zur Klimaneutralität. Available via: https://www.deutschebahn.com/de/presse/suche_Medienpakete/medienpaket_klimaschutzziel-1201550. [Retrieved 2020-04-26]. Gupta, S., & Ogden, D. T. (2009). To buy or not to buy? A social dilemma perspective on green buying. Journal of consumer marketing. Gärling, T., & Axhausen, K. W. (2003). Introduction: Habitual travel choice. Transportation, 30(1), 1-11. Gössling, S., & Peeters, P. (2007). ‘It does not harm the environment!’An analysis of industry discourses on tourism, air travel and the environment. Journal of Sustainable Tourism, 15(4), 402-417. Hair, J. F., Anderson, R. E., Babin, B. J., & Black, W. C. (2010). Multivariate data analysis: A global perspective (Vol. 7): Pearson Upper Saddle River. Heath, Y., & Gifford, R. (2002). Extending the theory of planned behavior: Predicting the use of public transportation 1. Journal of Applied Social Psychology, 32(10), 2154-2189. Heda, S., Mewborn, S. & Caine, S., (2017). How Customers Perceive a Price Is as Important as the Price Itself. Available via: https://hbr.org/2017/01/how-customers-perceive-a-price-is-as-important-as-the-price-itself. [Retrieved 2020-05-07]. Hedlund, T., (2013). Tourists' vacation choice structure: Influence of values and implications for green tourism (Doctoral dissertation, Umeå universitet). Henderikx, M.A., Kreijns, K., & Kalz, M., (2017). Refining success and dropout in massive open online courses based on the intention–behavior gap. Distance Education, 38(3), pp.353-368.
99
Heron, J. (1996). Co-operative inquiry: Research into the human condition. Sage.
Himelstein, P., & Moore, J. C. (1963). Racial attitudes and the action of Negro- and white-background figures as factors in petition signing. Journal of Social Psychology, 61, 267-272.
Hofstede, G., (2001). Culture's consequences: Comparing values, behaviors, institutions and organizations across nations. Sage publications. Hofstede-insights.n (n.d.) Compare Countries. Available via: https://www.hofstede-insights.com/product/compare-countries/ [Retrieved 2020-03-07]. Holtsmark, B., & Skonhoft, A. (2014). The Norwegian support and subsidy policy of electric cars. Should it be adopted by other countries?. Environmental science & policy, 42, 160-168. Homer, P. M., & Kahle, L. R. (1988). A structural equation test of the value-attitude-behavior hierarchy. Journal of Personality and social Psychology, 54(4), 638. Hughner, R. S., McDonagh, P., Prothero, A., Shultz, C. J., & Stanton, J. (2007). Who are organic food consumers? A compilation and review of why people purchase organic food. Journal of Consumer Behaviour: An International Research Review, 6(2-3), 94-110. Höök, M., & Tang, X. (2013). Depletion of fossil fuels and anthropogenic climate change—A review. Energy policy, 52, 797-809. IEA, (2017). Statistics about energy consumption worldwide. Available via: https://www.iea.org/data-and-statistics?country=WORLD&fuel=Energy%20consumption&indicator=Total%20final%20consumption%20(TFC)%20by%20sector. [Retrieved 2020-03-11]. IPCC, (2014). Climate Change 2014, Mitigation of Climate Change. Available via: https://www.ipcc.ch/site/assets/uploads/2018/02/ipcc_wg3_ar5_full.pdf. [Retrieved 2020-03-11]. Ising, H., & Kruppa, B. (2004). Health effects caused by noise: evidence in the literature from the past 25 years. Noise and Health, 6(22), 5. Jaafar, S. N., Lalp, P. E., & Naba, M. M. (2012). Consumers’ perceptions, attitudes and purchase intention towards private label food products in Malaysia. Asian Journal of Business and Management Sciences, 2(8), 73-90. Jarvis, N., Weeden, C., & Simcock, N. (2010). The benefits and challenges of sustainable tourism certification: A case study of the Green Tourism Business Scheme in the West of England. Journal of Hospitality and Tourism Management, 17(1), 83-93. Jensen, M. (2009). Lifestyle: suggesting mechanisms and a definition from a cognitive science perspective. Environment, development and sustainability, 11(1), 215-228.
100
Johnson, R.M., & Orme, B.K., (1996). How many questions should you ask in choice-based conjoint studies. In Art Forum, Beaver Creek (pp. 1-23). Joshi, Y., & Rahman, Z. (2015). Factors affecting green purchase behaviour and future research directions. International Strategic management review, 3(1-2), 128-143. Kamb, A., & Larsson, J., (2019). Climate footprint from Swedish residents’ air travel. Kanchanapibul, M., Lacka, E., Wang, X., & Chan, H. K. (2014). An empirical investigation of green purchase behaviour among the young generation. Journal of Cleaner Production, 66, 528-536. Kaza, S., Yao, L., Bhada-Tata, P., & Van Woerden, F. (2018). What a waste 2.0: a global snapshot of solid waste management to 2050. The World Bank. Khare, A., & Varshneya, G. (2017). Antecedents to organic cotton clothing purchase behaviour: study on Indian youth. Journal of Fashion Marketing and Management: An International Journal. Kim, H. W., Xu, Y., & Gupta, S. (2012). Which is more important in Internet shopping, perceived price or trust?. Electronic Commerce Research and Applications, 11(3), 241-252. Kim, Y. (2011). Understanding green purchase: The influence of collectivism, personal values and environmental attitudes, and the moderating effect of perceived consumer effectiveness. KLM, (2019, June 28). KLM Fly Responsibly. Internet advertising. Available via: https://www.youtube.com/watch?v=L4htp2xxhto. [Retrieved 2020-02-17].
Krystallis, A., Vassallo, M., Chryssohoidis, G., & Perrea, T. (2008). Societal and individualistic drivers as predictors of organic purchasing revealed through a portrait value questionnaire (PVQ)based inventory. Journal of Consumer Behaviour, 7(2), 164-187.
Lanzini, P., & Khan, S. A. (2017). Shedding light on the psychological and behavioral determinants of travel mode choice: A meta-analysis. Transportation research part F: traffic psychology and behaviour, 48, 13-27.
Laroche, M., Bergeron, J., & Barbaro-Forleo, G., (2001). Targeting consumers who are willing to pay more for environmentally friendly products. Journal of consumer marketing, 18(6), pp.503-520.
Lavanchy, D., (2018). Understanding the difference between business and leisure travelers. Available via: https://www.gbnews.ch/understanding-the-difference-between-business-and-leisure-travellers/. [Retrieved 2020-03-17].
101
Lee, C. K., Mjelde, J. W., Kim, T. K., & Lee, H. M. (2014). Estimating the intention–behavior gap associated with a mega event: The case of the Expo 2012 Yeosu Korea. Tourism Management, 41, 168-177.
Lee, K. (2009). Gender differences in Hong Kong adolescent consumers' green purchasing behavior. Journal of consumer marketing.
Lee, S., Illia, A., & Lawson-Body, A. (2011). Perceived price fairness of dynamic pricing. Industrial Management & Data Systems.
Lin, H. F. (2007). Predicting consumer intentions to shop online: An empirical test of competing theories. Electronic Commerce Research and Applications, 6(4), 433-442.
Liobikienė, G., Mandravickaitė, J., & Bernatonienė, J., (2016). Theory of planned behavior approach to understand the green purchasing behavior in the EU: A cross-cultural study. Ecological Economics, 125, pp.38-46.
Loureiro, M.L., McCluskey, J.J., & Mittelhammer, R.C., (2002). Will consumers pay a premium for eco-labeled apples?. Journal of Consumer Affairs, 36(2), pp.203-219.
Luz Martín-Peña, M., Díaz-Garrido, E., & Sánchez-López, J. M. (2018). The digitalization and servitization of manufacturing: A review on digital business models. Strategic Change, 27(2), 91-99.
Madden, T. J., Ellen, P. S., & Ajzen, I. (1992). A comparison of the theory of planned behavior and the theory of reasoned action. Personality and social psychology Bulletin, 18(1), 3-9. Maddux, J. E., & Dawson, K. A. (2014). Predicting and changing exercise behavior: Bridging the information-intention-behavior gap. Majid, J., Amin, S., & Kansana, K., (2016). Green Marketing: Sustainable Economy, Environment & Society-Concept & Challenges. Makatouni, A. (2002). What motivates consumers to buy organic food in the UK?. British Food Journal. Mandel, B. (1999). Measuring competition: approaches for (de-) regulated markets. Airports & Air Traffic: Regulation, Privatisation and Competition, 71-92. Mc Breen, J., Di Tosto, G., Dignum, F., & Hofstede, G. J. (2011, October). Linking norms and culture. In 2011 Second International Conference on Culture and Computing (pp. 9-14). IEEE.
102
McCaskill, A., (2015). Consumer-goods’ brands that demonstrate commitment to sustainability outperform those that don't. Available at: https://www.nielsen.com/us/en/press-releases/2015/consumer-goods-brands-that-demonstrate-commitment-to-sustainability-outperform/ [Retrieved 2020-05-15]. McEachern, M., Seaman, C., Padel, S., & Foster, C. (2005). Exploring the gap between attitudes and behaviour. British food journal. McVeigh, N., (2017). Case Study: Sustainability & Responsibility in Marketing. Online. Available at: Case Study [Retrieved 2020-02-15]. Metz, D. (2008). The myth of travel time saving. Transport reviews, 28(3), 321-336. Milfont, T. L. (2007). Psychology of environmental attitudes: A cross-cultural study of their content and structure (Doctoral dissertation, ResearchSpace@ Auckland). Mohr, L. A., Webb, D. J., & Harris, K. E. (2001). Do consumers expect companies to be socially responsible? The impact of corporate social responsibility on buying behavior. Journal of Consumer affairs, 35(1), 45-72. Molla, M., Nordrehaug Åstrøm, A., & Brehane, Y. (2007). Applicability of the theory of planned behavior to intended and self-reported condom use in a rural Ethiopian population. AIDs care, 19(3), 425-431. Mondelaers, K., Verbeke, W., & Van Huylenbroeck, G. (2009). Importance of health and environment as quality traits in the buying decision of organic products. British Food Journal, 111(10), 1120-1139. Montoya, A.K., & Hayes, A.F. (2017). Two-condition within-participant statistical mediation analysis: A path-analytic framework. Psychological Methods, 22(1), 6. Moore, D.L., & Tarnai, J., (2002). Evaluating nonresponse error in mail surveys. Survey nonresponse, pp.197-211. Moradi, H., (2019). Why is it more economical to travel in a group? Available via https://gadgetnews.net/400664/%D8%B3%D9%81%D8%B1-%D8%AF%D8%B3%D8%AA%D9%87-%D8%AC%D9%85%D8%B9%DB%8C-%D8%A8%D8%A7-%D9%BE%DB%8C%D9%86%D9%88%D8%B1%D8%B3%D8%AA/. [Retrieved 2020-04-25]. Moser, A. K. (2015). Thinking green, buying green? Drivers of pro-environmental purchasing behavior. Journal of Consumer Marketing. Mostafa, M. M. (2006). Antecedents of Egyptian consumers' green purchase intentions: a hierarchical multivariate regression model. Journal of International Consumer Marketing, 19(2), 97-126.
103
Müller-Görnert, M., (2020). Verkehrsmittel im Vergleich. Verkehrsclub Deutschland. Available via https://www.vcd.org/themen/klimafreundliche-mobilitaet/verkehrsmittel-im-vergleich/. [Retrieved 2020-02-15].
Nazeri, Z., Donohue, G., & Sherry, L. (2008). Analyzing relationships between aircraft accidents and incidents. In Proceedings of the International Conference on Research in Air Transportation, Fairfax, Virginia, USA.
Nejat, P., Jomehzadeh, F., Taheri, M. M., Gohari, M., & Majid, M. Z. A. (2015). A global review of energy consumption, CO2 emissions and policy in the residential sector (with an overview of the top ten CO2 emitting countries). Renewable and sustainable energy reviews, 43, 843-862.
Nguyen, H. V., Nguyen, C. H., & Hoang, T. T. B. (2019). Green consumption: Closing the intention-behavior gap. Sustainable Development, 27(1), 118-129.
Nisbett, R. E. (1968). Taste, deprivation, and weight determinants of eating behavior. Journal of Personality and Social Psychology, 10, 107-116.
Nordic Ecolabelling, (n.d.). Sustainable consumerism in the Nordic region. Online. Available via: https://ust.is/library/Skrar/Einstaklingar/Umhverfismerki/Svanurinn/Sustainable-Consumerism-in-the-Nordic-region-The-Report-by-Nordic-Ecolabelling.pdf. [Retrieved 2020-04-26].
Norman, P., Conner, M., & Bell, R. (1999). The theory of planned behavior and smoking cessation. Health psychology, 18(1), 89. Numbeo, (n.d.). Numbeo comparison tool. Available at: https://www.numbeo.com/cost-of-living/comparison.jsp. [Retrieved 2020-04-05]. OECD, (2020). OECD Services Trade Restrictiveness Index: Policy trends up to 2020. Online Source. Available via: https://www.oecd.org/trade/topics/services-trade/documents/oecd-stri-policy-trends-up-to-2020.pdf. [Retrieved 2020-04-29]. Oh, S. H. (2013). Do collectivists conform more than individualists? Cross-cultural differences in compliance and internalization. Social Behavior and Personality: an international journal, 41(6), 981-994. Owusu, P. A., & Asumadu-Sarkodie, S. (2016). A review of renewable energy sources, sustainability issues and climate change mitigation. Cogent Engineering, 3(1), 1167990. Padel, S., & Foster, C. (2005). Exploring the gap between attitudes and behaviour: Understanding why consumers buy or do not buy organic food. British food journal, 107(8), 606-625.
104
Parguel, B., Benoît-Moreau, F., & Larceneux, F. (2011). How sustainability ratings might deter ‘greenwashing’: A closer look at ethical corporate communication. Journal of business ethics, 102(1), 15. Parker, C. (2019). Swedish climate activist Greta Thunberg is sailing to America amid a storm of online attacks. Washington Post, [Online] August 15. Available via: https://www.washingtonpost.com/world/2019/08/15/swedish-climate-activist-greta-thunberg-is-sailing-america-amid-storm-criticism/. [Retrieved 2020-02-17]. Peck, M. D. (2010). Barriers to using fixed-route public transit for older adults (No. CA-MTI-10-2402). Mineta Transportation Institute. Perugini, M., & Bagozzi, R. P. (2001). The role of desires and anticipated emotions in goal-directed behaviours: Broadening and deepening the Theory of Planned Behaviour. British Journal of Social Psychology, 40, 79–98. Peterman, J. E., Morris, K. L., Kram, R., & Byrnes, W. C. (2016). Pedelecs as a physically active transportation mode. European journal of applied physiology, 116(8), 1565-1573. Phau, I., & Ong, D., (2007). An investigation of the effects of environmental claims in promotional messages for clothing brands. Marketing Intelligence & Planning. Pickett-Baker, J., & Ozaki, R. (2008). Pro-environmental products: marketing influence on consumer purchase decision. Journal of Consumer Marketing. 25 (5): 281-293. Pike, J., Turner, M., & Leposa, A., (2017). Selling Solo Travel. Available via: https://www.travelagentcentral.com/running-your-business/selling-solo-travel. [Retrieved 2020-03-27]. Pletzin, R. (2020, February 13). Swedavias Bokslutskommuniké 2019: Stabilt resultat trots färre resenärer. Available via: https://www.swedavia.se/om-swedavia/swedavias-nyhetsrum/. [Retrieved 2020-02-17]. Prillwitz, J., & Barr, S. (2009). Motivations and barriers to adopting sustainable travel behaviour. Pyke, G. H., Thomson, J. D., Inouye, D. W., & Miller, T. J. (2016). Effects of climate change on phenologies and distributions of bumble bees and the plants they visit. Ecosphere, 7(3), 01267. Qader, I.K.A., & Zainuddin, Y.B., (2011). The impact of media exposure on intention to purchase green electronic products amongst lecturers. International Journal of Business and Management, 6(3), p.240. Rabe, M. (2011, February 16). E10-bensin ersätter vanlig 95-oktanig. Online source. Available via: https://teknikensvarld.se/e10-bensin-ersatter-vanlig-95-oktanig-125437/. [Retrieved 2020-04-26].
105
Rana, J., & Paul, J. (2017). Consumer behavior and purchase intention for organic food: A review and research agenda. Journal of Retailing and Consumer Services, 38, 157-165. Renault, (2020). Èconomie circulaire. Online source. Available via: https://group.renault.com/nos-engagements/respect-de-lenvironnement/economie-circulaire/. [Retrieved 2020-04-27]. Rettie, R., Burchell, K., & Riley, D. (2012). Normalising green behaviours: A new approach to sustainability marketing. Journal of Marketing Management, 28(3-4), 420-444. Right Livelihood Award, (2020). Laureate Greta Thunberg. Available via: https://www.rightlivelihoodaward.org/laureates/greta-thunberg/. [Retrieved 2020-02-17]. Ritter, Á.M., Borchardt, M., Vaccaro, G.L., Pereira, G.M., & Almeida, F., (2015). Motivations for promoting the consumption of green products in an emerging country: exploring attitudes of Brazilian consumers. Journal of Cleaner Production, 106, pp.507-520. Roberts, J. A., (1996), “Green Consumers in the 1990: Profile and Implications for Advertising,” Journal of Business Research, 36, 217–31. Robertson, G. P., Paul, E. A., & Harwood, R. R. (2000). Greenhouse gases in intensive agriculture: contributions of individual gases to the radiative forcing of the atmosphere. Science, 289(5486), 1922-1925. Roden, L., (2017). Swedes the fourth 'best-travelled' in the world: report. Available at: https://www.thelocal.se/20170925/swedes-the-fourth-best-travelled-in-the-world-report. [Retrieved 2020-02-26]. Rose, G., & Marfurt, H. (2007). Travel behaviour change impacts of a major ride to work day event. Transportation Research Part A: Policy and Practice, 41(4), 351-364. Rosenthal, S. (2018). Procedural information and behavioral control: Longitudinal analysis of the intention-behavior gap in the context of recycling. Recycling, 3(1), 5. Rousse, O. (2008). Environmental and economic benefits resulting from citizens’ participation in CO2 emissions trading: An efficient alternative solution to the voluntary compensation of CO2 emissions. Energy Policy, 36(1), 388-397. Rutherford, T. (2011). Air transport statistics. UK House of Commons Library. Retrieved Sept, 5, 2018. Saunders, M., Lewis, P., & Thornhill, A. (2007). Research methods. Business Students 4th edition Pearson Education Limited, England. Saunders, M., Lewis, P. & Thornhill, A., (2009). Research Methods for Business Students. 5th ed. Essex: Pearson Eduction Ldt.
106
Savage, M., (2019). Swedes typically stop living with their parents earlier than anywhere else in Europe. But can leaving home at a young age have a dark side? Available at: https://www.bbc.com/worklife/article/20190821-why-so-many-young-swedes-live-alone. [Retrieved 2020-04-20].
Schmehl, S., Deutsch, S., Schrammel, J., Paletta, L., & Tscheligi, M. (2011, September). Directed cultural probes: detecting barriers in the usage of public transportation. In IFIP Conference on Human-Computer Interaction (pp. 404-411). Springer, Berlin, Heidelberg.
Semenza, J. C., Hall, D. E., Wilson, D. J., Bontempo, B. D., Sailor, D. J., & George, L. A. (2008). Public perception of climate change: voluntary mitigation and barriers to behavior change. American journal of preventive medicine, 35(5), 479-487. Shabani, N., Ashoori, M., Taghinejad, M., Beyrami, H., & Fekri, M.N., (2013). The study of green consumers’ characteristics and available green sectors in the market. International Research Journal of Applied and Basic Sciences, 4(7), pp.1880-1883. Sharpley, R., (2001). The consumer behaviour context of ecolabelling. Tourism ecolabelling: Certification and promotion of sustainable management, pp. 41-55. Sheeran, P. (2002). Intention—behavior relations: a conceptual and empirical review. European review of social psychology, 12(1), 1-36. Sheeran, P., & Webb, T. L. (2016). The intention–behavior gap. Social and personality psychology compass, 10(9), 503-518. Sheng, M., & Gu, C. (2018). Economic growth and development in Macau (1999–2016): The role of the booming gaming industry. Cities, 75, 72-80. Simon, H. A. (1972). Theories of bounded rationality. Decision and organization, 1(1), 161-176. Skyscanner (2020, February 11). Information about flights from Frankfurt to Santiago de Chile. Skyscanner. Available at: https://www.skyscanner.se/transport/fluge/fra/scl/200622/200803/?adultsv2=1&childrenv2=&cabinclass=economy&rtn=1&preferdirects=false&outboundaltsenabled=false&inboundaltsenabled=false&qp_prevProvider=ins_month&qp_prevCurrency=EUR&qp_prevPrice=636&priceSourceId=taps-taps&priceTrace=202002061122*I*FRA*SCL*20200622*iber*IB%7C202002061122*I*SCL*FRA*20200803*iber*IB. [Retrieved 2020-02-11]. Sniehotta, F. F., Presseau, J., & Araújo-Soares, V. (2014). Time to retire the theory of planned behaviour.
107
Spiegel (2020). Bahn meldet für Januar Plus von rund einer Million Fahrgästen. Der Spiegel, [Online], February 17. Available via: https://www.spiegel.de/reise/deutschland/deutsche-bahn-richard-lutz-meldet-fuer-januar-plus-von-rund-einer-million-fahrgaesten-a-155e7d44-f844-412e-8307-722efb4414d1. [Retrieved 2020-02-17]. Starkie, D. (2002). Airport regulation and competition. Journal of air Transport management, 8(1), 63-72. Steg, L., & Gifford, R. (2005). Sustainable transportation and quality of life. Journal of transport geography, 13(1), 59-69. Stern, P.C., & Dietz, T., (1994). The value basis of environmental concern. Journal of social issues, 50(3), pp.65-84. Stern, P.C., Kalof, L., Dietz, T., & Guagnano, G.A., (1995). Values, beliefs, and proenvironmental action: Attitude formation toward emergent attitude objects. 1. Journal of applied social psychology, 25(18), pp.1611-1636. Strasser, P. (2018). Interview mit Reporter-Legende Scherzer: "Der Flug kostete 1962 fast so viel wie ein VW Käfer". Abendzeitung, [Online] July 12. Available at: https://www.abendzeitung-muenchen.de/inhalt.interview-mit-reporter-legende-scherzer-der-flug-kostete-1962-fast-so-viel-wie-ein-vw-kaefer.966691dc-069e-4c90-bb75-c59b3c3a08d0.html. [Retrieved 2020-02-11]. Strotz, R. H. (1955). Myopia and inconsistency in dynamic utility maximization. The review of economic studies, 23(3), 165-180. Suddaby, R. (2006). From the editors: What grounded theory is not. Švecová, J., & Odehnalová, P. (2019). The determinants of consumer behaviour of students from Brno when purchasing organic food. Review of Economic Perspectives, 19(1), 49-64. Swedavia, (2020). Statistics about Swedavia airports. Available at: https://www.swedavia.se/om-swedavia/statistik/. [Retrieved 2020-02-17]. Syed, S. I., & Khan, A. M. (2000). Factor analysis for the study of determinants of public transit ridership. Journal of Public Transportation, 3(3), 1. Tabnak, (2010). A phenomenon called "independent children". Available at: https://www.tabnak.ir/fa/news/137790/%D9%BE%D8%AF%DB%8C%D8%AF%D9%87%E2%80%8C%D8%A7%DB%8C-%D8%A8%D9%87-%D9%86%D8%A7%D9%85-%D9%81%D8%B1%D8%B2%D9%86%D8%AF%D8%A7%D9%86-%D9%85%D8%B3%D8%AA%D9%82%D9%84. [Retrieved 2020-04-20].
108
Tasnim, (2018). How many million single-family households does Iran have? Available at: https://www.tasnimnews.com/fa/news/1396/04/26/1466494/%D8%A7%DB%8C%D8%B1%D8%A7%D9%86-%DA%86%D9%86%D8%AF-%D9%85%DB%8C%D9%84%DB%8C%D9%88%D9%86-%D8%AE%D8%A7%D9%86%D9%88%D8%A7%D8%B1-1-%D9%86%D9%81%D8%B1%D9%87-%D8%AF%D8%A7%D8%B1%D8%AF. [Retrieved 2020-04-20]. The Local, (2019). Why people in Sweden are breaking a steady trend and travelling less. Available at: https://www.thelocal.se/20190409/why-swedes-are-breaking-a-steady-trend-and-travelling-less [Retrieved 2020-02-11]. Thøgersen, J. (2006). Understanding repetitive travel mode choices in a stable context: A panel study approach. Transportation Research Part A: Policy and Practice, 40(8), 621-638. Thøgersen, J., Haugaard, P., & Olesen, A. (2010). Consumer responses to ecolabels. European Journal of Marketing. Thøgersen, J., & Møller, B. (2008). Breaking car use habits: The effectiveness of a free one-month travelcard. Transportation, 35(3), 329-345. Timperley. J., (2019). Why ‘flight shame’ is making people swap planes for trains. Available at: https://www.bbc.com/future/article/20190909-why-flight-shame-is-making-people-swap-planes-for-trains. [Retrieved 2020-02-15]. Troisi, G., Barton, S., & Bexton, S. (2016). Impacts of oil spills on seabirds: Unsustainable impacts of non-renewable energy. international journal of hydrogen energy, 41(37), 16549-16555. Tsakiridou, E., Boutsouki, C., Zotos, Y., & Mattas, K. (2008). Attitudes and behaviour towards organic products: an exploratory study. International Journal of Retail & Distribution Management, 36(2), 158-175. Tung, S. J., Shih, C. C., Wei, S., & Chen, Y. H. (2012). Attitudinal inconsistency toward organic food in relation to purchasing intention and behavior: An illustration of Taiwan consumers. British Food Journal, 114(7), 997-1015. Umweltbundesamt, (2020, January 15). Emissionsdaten. Available at: https://www.umweltbundesamt.de/themen/verkehr-laerm/emissionsdaten#handbuch-fur-emissionsfaktoren-hbefa. [Retrieved 2020-02-15]. UNECE, (2019). Internet use by age and sex. Available at: https://w3.unece.org/PXWeb2015/pxweb/en/STAT/STAT__30-GE__09-Science_ICT/02_en_GEICT_InternetUse_r.px/. [Retrieved 2020-04-15].
109
Valnum, H. J., (2011). Energy use and CO2 emissions from cruise ships — A discussion of methodological issues. Western Norway Research Institute. Online source, available via: https://www.vestforsk.no/sites/default/files/migrate_files/vf-notat-2-2011-cruise.pdf. [Retrieved 2020-05-18]. van Enckevort, K., & Ansari-Dunkes, J. (2013). Facebook & Brand Equity: Firm-created advertising and its effects on the consumer mindset. Master thesis. Umeå: Umeå University. Vashistha, P., (2019). Future and Growth of Transportation Market by 2020. Available at: https://www.entrepreneur.com/article/326552. [Retrieved 2020-02-29]. Vassileva, I., & Campillo, J. (2017). Adoption barriers for electric vehicles: Experiences from early adopters in Sweden. Energy, 120, 632-641. Vermeir, I., & Verbeke, W. (2006). Sustainable food consumption: Exploring the consumer “attitude–behavioral intention” gap. Journal of Agricultural and Environmental Ethics, 19(2), 169-194. Wahlström, M., Sommer, M., Kocyba, P., de Vydt, M., De Moor, J., Davies, S., & Saunders, C. (2019). Protest for a future: Composition, mobilization and motives of the participants in Fridays For Future climate protests on 15 March, 2019 in 13 European cities. Wang, P., Liu, Q., & Qi, Y. (2014). Factors influencing sustainable consumption behaviors: a survey of the rural residents in China. Journal of Cleaner Production, 63, 152-165. Webster Jr., F. E. (1975). Determining the characteristics of the socially conscious consumer. Journal of consumer research, 2(3), 188-196. Welsch, H., & Kühling, J. (2009). Determinants of pro-environmental consumption: The role of reference groups and routine behavior. Ecological economics, 69(1), 166-176. Wiedmann, K. P., Hennigs, N., Pankalla, L., Kassubek, M., & Seegebarth, B. (2011). Adoption barriers and resistance to sustainable solutions in the automotive sector. Journal of Business Research, 64(11), 1201-1206. Wilkes, W., & Weiss, R., (2019). German Air Travel Slump Points to Spread of Flight Shame. Available at: https://www.bloomberg.com/news/articles/2019-12-19/german-air-travel-slump-points-to-spread-of-flight-shame [Retrieved 2020-03-11]. World Bank Data (2018). Statistics about air passenger transportation worldwide from 1970 until 2018. World Bank Data. Available at: https://data.worldbank.org/indicator/IS.AIR.PSGR?end=2018&name_desc=false&start=1970&view=chart [Retrieved 2020-02-11]. Worlddata, (2018). Comparison of worldwide cost of living. Available at: https://www.worlddata.info/cost-of-living.php [Retrieved 2020-03-11].
110
World Data Atlas. (n.d.). Contribution of travel and tourism to GDP as a share of GDP. Available at: https://knoema.com/atlas/Sweden/topics/Tourism/Travel-and-Tourism-Total-Contribution-to-GDP/Contribution-of-travel-and-tourism-to-GDP-percent-of-GDP. [Retrieved 2020-03-11]. Wunsch, N.G., (2020). Organic food market in Europe - Statistics and Facts. Available at: https://www.statista.com/topics/3446/organic-food-market-in-europe/. [Retrieved 2020-03-11]. YJC, (2016). Which age group uses mobile and internet the most? Available at: https://www.yjc.ir/fa/news/5840032/%DA%A9%D8%AF%D8%A7%D9%85-%DA%AF%D8%B1%D9%88%D9%87-%D8%B3%D9%86%DB%8C-%D8%A8%DB%8C%D8%B4%D8%AA%D8%B1-%D8%A7%D8%B2-%D9%85%D9%88%D8%A8%D8%A7%DB%8C%D9%84-%D9%88-%D8%A7%DB%8C%D9%86%D8%AA%D8%B1%D9%86%D8%AA-%D8%A7%D8%B3%D8%AA%D9%81%D8%A7%D8%AF%D9%87-%D9%85%DB%8C%E2%80%8C%DA%A9%D9%86%D9%86%D8%AF [Retrieved 2020-04-15]. YJC, (2019). Why is independence from the family no longer attractive to Iranian youth? Available at: https://www.yjc.ir/fa/news/7049826/%DA%86%D8%B1%D8%A7-%D8%AF%DB%8C%DA%AF%D8%B1-%D8%A7%D8%B3%D8%AA%D9%82%D9%84%D8%A7%D9%84-%D8%A7%D8%B2-%D8%AE%D8%A7%D9%86%D9%88%D8%A7%D8%AF%D9%87-%D8%A8%D8%B1%D8%A7%DB%8C-%D8%AC%D9%88%D8%A7%D9%86%D8%A7%D9%86-%D8%A7%DB%8C%D8%B1%D8%A7%D9%86%DB%8C-%D8%AC%D8%B0%D8%A7%D8%A8-%D9%86%DB%8C%D8%B3%D8%AA [Retrieved 2020-04-25]. Young, W., Hwang, K., McDonald, S., & Oates, C. J. (2010). Sustainable consumption: green consumer behaviour when purchasing products. Sustainable Development, 18(1), 20-31. Zeithaml, V. A. (1982). Consumer response to in-store price information environments. Journal of consumer research, 8(4), 357-369. Zeithaml, V. A. (1988). Consumer perceptions of price, quality, and value: a means-end model and synthesis of evidence. Journal of marketing, 52(3), 2-22. Zhan, L., & He, Y., (2012). Understanding luxury consumption in China: Consumer perceptions of best-known brands. Journal of Business Research, 65(10), pp.1452-1460. Zhao, H. H., Gao, Q., Wu, Y. P., Wang, Y., & Zhu, X. D. (2014). What affects green consumer behavior in China? A case study from Qingdao. Journal of Cleaner Production, 63, 143-151.

111
Zhuang, W., Cumiskey, K.J., Xiao, Q., & Alford, B.L., (2010). The impact of perceived value on behavior intention: an empirical study. Journal of Global Business Management, 6(2), p.1.
112
Appendix Appendix 1: Swedish Survey
Hej,
Denna studie har som syfte att undersöka hur vuxna svenskar reser. Resultaten av denna studie kommer att delvis användas i forskning på Umeå universitet. Denna enkät är helt anonym och tar ungefär fem minuter att fylla i.
Covid-19 kan påverka ens resevanor, och hur man reser. Vi ber er att tänka på hur ni normalt reser under normala förhållanden när ni svarar på frågorna.
Tack för er tid!
1. Hur många gånger har du rest under det senaste året (icke-arbetsrelaterade anledningar och mer än 200km)? 0, 1, 2, 3, 4, 5, eller mer än 5. 2. Miljöskyddsaktiviteter är meningslösa och ett slöseri av pengar och resurser. 3. Miljöskyddsfrågor är inget jag bryr mig om. 4. Jag är väldigt orolig över luftföroreningar och global uppvärmning. 5. Jag är intresserad av att läsa rapporter/nyheter om hur fordon (bilar, tåg, flygplan, bussar, etc.) påverkar miljön. 6. Jag vet hur man bevarar och inte skadar miljön. 7. Jag vet att under normala omständigheter är flygplan och personliga bilar mindre hållbara fordon jämfört med tåg och bussar. 8. Det är meningslöst för individer att göra något åt föroreningar och global uppvärmning. 9. När jag reser under högtider, har jag i åtanke hur mitt transportmedel påverkar miljön och andra personer. 10. Jag känner att jag kan skydda miljön genom att använda miljövänliga transportmedel. 11. Min familj och vänner rekommenderar miljövänliga produkter och hållbara transportmedel till mig. 12. Min familj och vänner delar ofta med sig om erfarenheter och kunskap kring hållbar och grön transport med mig. 13. De flesta perosner jag bryr mig om tycker att jag borde resa med tåg istället för en personlig bil eller flygplan (för icke-arbetsrelaterade resor som är längre än 200km) 14. Jag köper oftast gröna och miljövänliga produkter. 15. Jag använder oftast kommunaltrafiken för att ta mig till jobbet. 16. Jag återvinner flaskar, burkar, papper, och glas. 17. Det kostar mer att åka med tåg, än att åka med flyg eller min egna personliga bil (för icke-arbetsrelaterade resor som är längre än 200km).
113
18. Tågbiljetter är oftast dyrare än flygbiljetter (för icke-arbetsrelaterade resor som är längre än 200km). 19. Jag är villig att betala mer för att resa med mer hållbara transportmedel (tåg och buss) under icke-arbetsrelaterade resor. 20. Det är rimligt att åka med tåg eller bus istället för flygplan eller personlig bil på grund av deras miljöpåverkan (för icke-arbetsrelaterade resor som är längre än 200km). 21. Även om det finns andra transportmedel med samma fördelar, föredrar jag att använda fordon med miljöåtaganden (för icke-arbetsrelaterade resor som är längre än 200km). 22. Jag tror att fördelarna med att resa med mer hållbara fordon (tåg och buss) är värt mer än deras kostnad (för icke-arbetsrelaterade resor som är längre än 200km). 23. Tåg och buss når upp till mina förväntningar kring transportmedel (för icke-arbetsrelaterade resor som är längre än 200km). 24. Jag använder medvetet oftare en typ av transport som har en mindre miljöpåverkan (för icke-arbetsrelaterade resor som är längre än 200km). 25. Jag köper oftast tågbiljetter för högtidsresor istället för att flyga eller köra (för icke-arbetsrelaterade resor som är längre än 200km). 26. För att skydda miljön, reser jag oftast med fordon som producerar mindre växthusgaser (för icke-arbetsrelaterade resor som är längre än 200km). 27. När det finns ett val, väljer jag den transport som är mer hållbar (för icke-arbetsrelaterade resor som är längre än 200km).
För att svara på de kommande frågorna, tänk dig att du bor i Stockholm och ska resa till Köpenhamn under påskhögtiden 2021. Du har ett flertal valmöjligheter som inkluderar flyg, tåg, personlig bil, och buss. Dessa valmöjligheter har diverse fördelar. Tänk dig att deras priser är jämförbara. Varje valmöjlighet har olika nivåer av miljöpåverkan, CO2 utsläpp, energiförbrukning, och bullerproduktion.
28. Jag tänker resa med tåg eller bus istället för flygplan eller bil under denna resa. 29. Jag vill starkt rekommendera andra att välja ett mer hållbart transportmedel för denna resa. 30. Jag vill ta hållbara transportmedel som mitt första val under denna resa. 31. Jag kommer använda tåget istället för ett flygplan för att nå min destination under denna resa.
För att svara på de kommande frågorna, tänk dig att du bor i Stockholm och ska resa till Madrid under påskhögtiden 2021. Du har ett flertal valmöjligheter som inkluderar flyg, tåg, personlig bil, och buss. Dessa val har diverse fördelar. Tänk dig att deras priser är jämförbara. Varje transportmedel har olika nivåer av miljöpåverkan, CO2 utsläpp, energiförbrukning, och bullerproduktion.
32. Jag tänker resa med tåg eller buss istället för flygplan eller bil under denna resa.
114
33. Jag vill starkt rekommendera andra att välja en mer hållbar typ av transportmedel för denna resa. 34. Jag vill ta hållbara transportmedel som mitt första val under denna resa. 35. Jag kommer använda tåg istället för flygplan för att nå min destination under denna resa. 36. Kön: man, kvinna 37. Ålder: 18–24, 25–39, 40–60, över 60 38. Äktenskaplig status: single (bor ensam), sambo (bor med någon). 39. Årlig inkomst (i 1000 SEK): Under 200, 200–400, över 400
115
Appendix 2: German Survey Hallo, diese Umfrage untersucht das Reiseverhalten von Deutschen, die 18 Jahre alt oder älter sind. Das Ergebnis der Umfrage wird teilweise für ein Forschungsprojekt der Universität in Umeå verwendet. Sie können den Fragebogen vollkommen anonym in fünf Minuten ausfüllen. Aufgrund der Coronavirus-Pandemie könnten sich Ihr Verhalten und Ihre Bedenken in den letzten Tagen verändert haben. Bitte lassen Sie sich bei Ihren Antworten nicht von der Pandemie beeinflussen, sondern beantworten Sie die Fragen so, als wären die Umstände ganz normal. Vielen Dank für Ihre Mühe! 1. Wie oft sind Sie letztes Jahr verreist (aus nicht-geschäftlichen Gründen und weiter als 200 km)? Keinmal, einmal, zweimal, dreimal, viermal, fünfmal, häufiger als fünfmal. 2. Umweltschutzinitiativen sind bedeutungslos und eine Verschwendung von Geld und Ressourcen. 3. Umweltschutzinitiativen gehen mich nichts an. 4. Ich bin sehr besorgt über Luftverschmutzung und globale Erwärmung. 5. Ich bin daran interessiert, Berichte oder Nachrichten über die Umwelteinflüsse von verschiedenen Verkehrsmitteln zu lesen (Autos, Züge, Flugzeuge, Busse etc.) 6. Ich weiß, wie man Umweltverschmutzung verhindern kann. 7. Ich weiß, dass Flugzeuge und Autos unter durchschnittlichen Bedingungen weniger nachhaltig für Reisen sind als Züge und Busse. 8. Für individuelle Konsumenten ist es nutzlos, sich gegen Verschmutzung und die globale Erwärmung einzusetzen. 9. Wenn ich frei habe und auf Reisen bin, überlege ich mir, welche Auswirkungen die Wahl meines Verkehrsmittels auf die Umwelt und andere Konsumenten hat. 10. Ich glaube, dass ich die Umwelt schützen kann, wenn ich umweltfreundliche Verkehrsmittel benutze. 11. Meine Freunde und meine Familie empfehlen mir häufig umweltfreundliche Produkte und umweltfreundliche Verkehrsmittel. 12. Meine Freunde und meine Familie teilen häufig ihr Wissen zu und ihre Erfahrungen mit umweltfreundlichen Verkehrsmitteln mit mir. 13. Die meisten Leute, die mir wichtig sind, denken, dass ich eher mit dem Zug anstatt mit dem Auto oder Flugzeug verreisen sollte (für nicht-geschäftliche Reisen und weiter als 200 km). 14. Normalerweise kaufe ich Produkte, die für die Umwelt unbedenklich sind. 15. Normalerweise benutze ich öffentliche Verkehrsmittel, um zur Arbeit zu kommen. 16. Ich recycle Flaschen, Dosen, Papier und Glas. 17. Die Kosten für eine Zugreise sind höher als die Kosten für eine Flugreise oder eine Reise mit dem Auto (für nicht-geschäftliche Reisen und weiter als 200 km). 18. Zugtickets sind normalerweise teurer als Flugtickets (für nicht-geschäftliche Reisen und weiter als 200 km). 19. Ich bin bereit, für nicht-geschäftliche Reisen mehr zu bezahlen, wenn die Reisen dadurch umweltfreundlicher sind (Zug oder Bus).
116
20. Es ist wegen des Umweltschutzes sinnvoll, mit dem Zug oder Bus zu verreisen anstatt mit Flugzeug oder Auto (für nicht-geschäftliche Reisen und weiter als 200 km). 21. Auch wenn andere Verkehrsmittel dieselben Vorteile hätten, würde ich es bevorzugen, mit umweltfreundlichen Verkehrsmitteln zu verreisen (für nicht-geschäftliche Reisen und weiter als 200 km). 22. Ich denke, dass die Vorteile von umweltfreundlichen Verkehrsmitteln (Zug und Bus) wichtiger sind ihre Ticketpreise (für nicht-geschäftliche Reisen und weiter als 200 km). 23. Züge und Busse erfüllen meine Erwartungen an Verkehrsmittel (für nicht-geschäftliche Reisen und weiter als 200 km). 24. Ich benutze bewusst häufiger Verkehrsmittel, die der Umwelt wenig schaden (für nicht-geschäftliche Reisen und weiter als 200 km). 25. Ich kaufe häufig Zugtickets für Urlaubsreisen anstatt zu fliegen oder mit dem Auto zu fahren (für nicht-geschäftliche Reisen und weiter als 200 km). 26. Ich verreise mit Verkehrsmitteln, die wenig Treibhausgase ausstoßen, um die Umwelt zu schützen (für nicht-geschäftliche Reisen und weiter als 200 km). 27. Wenn ich eine Wahl habe, wähle ich dasjenige Verkehrsmittel, das umweltfreundlicher ist (für nicht-geschäftliche Reisen und weiter als 200 km).
Um die nächsten Fragen zu beantworten, stellen Sie sich vor, dass Sie in Berlin leben und in den Osterferien 2021 nach Amsterdam reisen wollen. Sie haben verschiedene Optionen für die Wahl des Verkehrsmittels: Flugzeug, Zug, Auto, Reisebus. Diese Optionen haben verschiedene Vorteile. Bitte nehmen Sie an, dass die (Ticket)Preise vergleichbar sind. Jedes dieser Verkehrsmittel hat unterschiedliche Einflüsse auf die Umwelt, wie zum Beispiel CO2-Ausstoß, Energieverbrauch und Lärm. 28. Ich tendiere dazu, für diese Reise den Zug oder den Bus anstatt Flugzeug oder Auto zu nehmen. 29. Ich würde anderen sehr empfehlen, dass sie ein nachhaltiges Verkehrsmittel für diese Reise benutzen. 30. Ich würde zunächst nur nachhaltige Verkehrsmittel für diese Reise in Betracht ziehen. 31. Für diese Reise würde ich den Zug und nicht das Flugzeug benutzen.
Um die nächsten Fragen zu beantworten, stellen Sie sich vor, dass Sie in Berlin leben und in den Osterferien 2021 nach Lissabon reisen wollen. Sie haben verschiedene Optionen für die Wahl des Verkehrsmittels: Flugzeug, Zug, Auto, Reisebus. Diese Optionen haben verschiedene Vorteile. Bitte nehmen Sie an, dass die (Ticket)Preise vergleichbar sind. Jedes dieser Verkehrsmittel hat unterschiedliche Einflüsse auf die Umwelt, wie zum Beispiel CO2-Ausstoß, Energieverbrauch und Lärm. 32. Ich tendiere dazu, für diese Reise den Zug oder den Bus anstatt Flugzeug oder Auto zu nehmen. 33. Ich würde anderen sehr empfehlen, dass sie ein nachhaltiges Verkehrsmittel für diese Reise benutzen.

117
34. Ich würde zunächst nur nachhaltige Verkehrsmittel für diese Reise in Betracht ziehen. 35. Für diese Reise würde ich den Zug und nicht das Flugzeug benutzen. 36. Geschlecht: männlich, weiblich 37. Alter: 18-24, 25-39, 40-60, über 60 38. Beziehungsstatus: Single (lebe alleine), Vergeben (lebe mit jemandem zusammen) 39. Jährliches Einkommen (in EUR): unter 16.000, 16.000-32.000, über 32.000

118
Appendix 3: Persian Survey ،مالس اب
فدھ اب و دشرا یسانشراک ھمان نایاپ ماجنا روظنم ھب ھمانشسرپ نیا ندرک رپ .دوش یم ماجنا لاس 18 یالاب نایناریا یترفاسم راتفر یسررب
امش تاعالطا و دریگ یم نامز امش زا ھقیقد 5 زا رت مک ھمانشسرپ نیا .ددرگ یم تبث سانشان الماک تروص ھب یجنسرظن نیا رد
تسا نکمم رضاح لاح رد یترفاسم یاھ تیدودحم و انورک سوریو شرتسگ خساپ ماگنھ ًافطل .دشاب ھتشاذگ رثا امش یاھ ینارگن و راتفر یور رظن رد ار انورک زا شیپ لومعم طیارش ،ھمانشسرپ نیا تالاؤس ھب نداد .دیریگب
ساپس اب زا شیب و یراک ریغ یاھرفس( ؟دیا هدرک رفس راب دنچ ھتشذگ لاس .1
)رتمولیک 200 ، راب ھس ، راب ود ، راب کی ،ما ھتشادن طیارش نیا اب یترفاسم الصا .راب جنپ زا شیب ،راب جنپ ،راب راھچ نداد ردھ و ینعم یب نم رظن زا تسیز طیحم زا تظافح یاھ تیلاعف .2 .تسا عبانم و لوپ .تسین طوبرم نم ھب تسیز طیحم زا تظافح ھب طوبرم لئاسم .3 .متسھ نیمز هرک ندش مرگ و اوھ یگدولآ نارگن نم .4 تسیز تارثا ھب طوبرم رابخا /اھ شرازگ ندناوخ ھب دنم ھقالع نم .5 .متسھ )هریغ و سوبوتا ،امیپاوھ ،راطق ،لیبموتا( ھیلقن لیاسو یطیحم نآ ھب و درک ظفح ار تسیز طیحم ناوت یم ھنوگچ ھک مناد یم نم .6 .دناسرن بیسآ یصخش یاھ لیبموتا و اھامیپاوھ ،نیگنایم تروص ھب ھک مناد یم نم .7 .دنراد یرتشیب یطیحم تسیز یاھ بیسآ سوبوتا و راطق ھب تبسن و یگدولآ دروم رد یراک دنناوت یمن یدرف تروص ھب ناگدننک فرصم .8 .دنھد ماجنا نیمز هرک ندش مرگ مریگیم رظن رد ،مورب ترفاسم ھب تالیطعت لوط رد تسا رارق یتقو .9 و تسیز طیحم رب یریثات ھچ منکیم رفس نآ اب ھک یا ھیلقن ھلیسو ھک .تشاذگ دھاوخ ناگدننک فرصم ریاس
ھب ھک یا ھیلقن لیاسو زا هدافتسا اب مناوت یم منک یم ساسحا .10 .منک تظفاحم تسیز طیحم زا دننز یم بیسآ رتمک تسیز طیحم
لقن و لمح لیاسو و کیناگرا تالوصحم بلغا نم هداوناخ و ناتسود .11 .دننک یم ھیصوت نم ھب ار )تسیز طیحم ھب رتمک بیسآ( رادیاپ

119
لمح دروم رد ار دوخ شناد و تایبرجت بلغا نم هداوناخ و ناتسود .12 و لمح زا یعون( .دنراذگ یم کارتشا ھب نم اب زبس و رادیاپ لقن و )دراد یرتمک یطیحم تسیز یاھ نایز ھک لقن
ھب دیاب ھک دننک یم رکف دنتسھ مھم نم یارب ھک یدارفا رتشیب .13 منک رفس سوبوتا ای راطق اب امیپاوھ ای یصخش نیشام اب رفس یاج .)رتمولیک 200 زا شیب یراک ریغ یاھرفس(
رطخ یب و کیناگرا ھک منک یم یرادیرخ ار یتالوصحم ًالومعم نم .14 .دنتسھ تسیز طیحم یارب
یمومع لقن و لمح لیاسو زا راک لحم ھب نتفر یارب ًالومعم نم .15 .منک یم هدافتسا
.منک یم کیکفت تفایزاب یارب ار زلف و ھشیش ،ذغاک ،کیتسالپ نم .16 ھنیزھ ،دنتسھ رتمولیک 200 زا شیب ھک یراک ریغ یاھرفس یارب .17 تسا یصخش لیبموتا و امیپاوھ اب رفس ھنیزھ زا رتشیب راطق اب رفس .)تسا … و یناور ،ینامز ،یلام ھنیزھ عاونا ھنیزھ زا روظنم(
یارب( .دنتسھ رت نارگ امیپاوھ طیلب زا ًالومعم راطق یاھ طیلب .18
)دنتسھ رتمولیک 200 زا رتشیب ھک یراک ریغ یاھ ترفاسم ھیلقن لیاسو زا اما مزادرپب یرتشیب یلام ھنیزھ متسھ رضاح نم .19 هدافتسا )سوبوتا و راطق( دننز یم تسیز طیحم ھب یرتمک بیسآ ھک یا )رتمولیک 200 زا شیب ھک یراک ریغ یاھرفس یارب( .منک
ھب یصخش نیشام و امیپاوھ یاج ھب سوبوتا ای راطق اب ترفاسم .20 یاھرفس یارب( .تسا رت یقطنم اھنآ یطیحم تسیز تبثم تاریثات لیلد )رتمولیک 200 زا شیب یراک ریغ
،دنشاب ھتشاد دوجو ھباشم یایازم اب یرگید ھیلقن لیاسو رگا یتح .21 هدافتسا یطیحم تسیز تادھعت اب ھیلقن لیاسو زا مھد یم حیجرت نم )رتمولیک 200 زا شیب یراک ریغ یاھرفس یارب( .منک
رادیاپ ھیلقن لیاسو اب رفس )تبثم تاکن( یایازم منک یم رکف نم .22 ،ینامز ،یلام ھنیزھ عاونا( اھنآ ھنیزھ زا رتشیب )سوبوتا و راطق(
)رتمولیک 200 زا شیب یراک ریغ یاھرفس یارب( .تسا )… و یناور یترفاسم ھیلقن لیاسو زا نم تاراظتنا سوبوتا و راطق اب ترفاسم .23
)رتمولیک 200 زا شیب یراک ریغ یاھرفس یارب( .دننک یم هدروآرب ار یرتمک یطیحم تسیز تارثا یاراد ھک یلقن و لمح لیاسو ًالومعم نم .24
200 زا شیب یراک ریغ یاھرفس یارب( .منک یم باختنا ار دنتسھ )رتمولیک
نیشام اب یگدننار ای امیپاوھ تیلب دیرخ یاج ھب ًالومعم نم .25 ریغ یاھرفس یارب( .مرخ یم راطق تیلب تالیطعت رد ترفاسم یارب یراوس )رتمولیک 200 زا شیب یراک
ھک یا ھیلقن لیاسو اب نم ،تسیز طیحم زا تظفاحم روظنم ھب .26 یاھرفس یارب( منک یم رفس دننک یم دیلوت یرتمک یا ھناخلگ یاھزاگ )رتمولیک 200 زا شیب یراک ریغ

120
و لمح شور ،مراد باختنا قح نم و دراد دوجو ھنیزگ نیا یتقو .27 .منک یم باختنا ار )تسیز طیحم یارب یرتمک نایز اب ( رترادیاپ لقن )رتمولیک 200 زا شیب یراک ریغ یاھرفس یارب( و دینک یم یگدنز نارھت رد ھک دینک روصت دعب تالاؤس ھب خساپ یارب
.دینک رفس دھشم ھب 1400 لاس رد زورون تالیطعت لوط رد دیراد دصق نیشام ،راطق ،امیپاوھ ھلمج زا یفلتخم یاھ ھنیزگ دھشم ات رفس یارب بیاعم و ایازم یاراد اھ ھنیزگ نیا .دنتسھ سرتسد رد سوبوتا و یصخش ھیلقن لیاسو نیا زا کی رھ نینچمھ .دنتسھ امش هاگدید زا یفلتخم فرصم ، CO2 راشتنا ھلمج زا یطیحم تسیز تارثا فلتخم حوطس یاراد رظن رد دعب تالاوس ھب خساپ یارب .دشاب یم یتوص یگدولآ و یژرنا .درادن ینادنچ توافت ھیلقن لیاسو نیا اب رفس تمیق ھک دیریگب
امیپاوھ یاج ھب سوبوتا ای راطق زا رفس نیا یارب مراد دصق نم .28 .منک هدافتسا یراوس لیبموتا و
بیسآ اب( رادیاپ ھیلقن لیاسو ھک منک یم ھیصوت نارگید ھب نم .29 .دننک باختنا رفس نیا یارب ار )تسیز طیحم ھب رتمک
ھنیزگ نیلوا ناونع ھب ار رادیاپ ھیلقن لیاسو ھک مراد لیامت نم .30 .مھد رارق رظندم رفس نیا یارب
راطق زا امیپاوھ یاج ھب نم ،رفس نیا رد دصقم ھب ندیسر یارب .31 .منک یم هدافتسا
و دینک یم یگدنز نارھت رد ھک دینک روصت دعب تالاوس ھب خساپ یارب .دینک رفس لوبناتسا ھب 1400 لاس رد زورون تالیطعت لوط رد دیراد دصق ،راطق ،امیپاوھ ھلمج زا یفلتخم یاھ ھنیزگ لوبناتسا ات رفس یارب و ایازم یاراد اھ ھنیزگ نیا .دنتسھ سرتسد رد سوبوتا و یصخش نیشام لیاسو نیا زا کی رھ نینچمھ .دنتسھ امش هاگدید زا یفلتخم بیاعم ، CO2 راشتنا ھلمج زا یطیحم تسیز تارثا فلتخم حوطس یاراد ھیلقن رد دعب تالاوس ھب خساپ یارب .دشاب یم یتوص یگدولآ و یژرنا فرصم .درادن ینادنچ توافت ھیلقن لیاسو نیا اب رفس تمیق ھک دیریگب رظن
امیپاوھ یاج ھب سوبوتا ای راطق زا رفس نیا یارب مراد دصق نم .32 .منک هدافتسا یراوس لیبموتا و
بیسآ اب( رادیاپ ھیلقن لیاسو ھک منک یم ھیصوت نارگید ھب نم .33 .دننک باختنا رفس نیا یارب ار )تسیز طیحم ھب رتمک
نیلوا ناونع ھب ار رادیاپ ھیلقن لیاسو ھک مراد لیامت نم .34 .مھد رارق رظندم رفس نیا یارب ھنیزگ

121
راطق زا امیپاوھ یاج ھب نم ،رفس نیا رد دصقم ھب ندیسر یارب .35 .منک یم هدافتسا
نز ،درم :تیسنج .36 60 زا شیب ,60-40 ,39-25 ,24-18 :نس .37 لھاتم ،)منکیم یگدنز اھنت( درجم :لھات تیعضو .38 نویلیم 4 ات 2 نیب ،ناموت نویلیم 2 زا رتمک :ھناھام دمآرد .39 ناموت نویلیم 4 زا شیب ،ناموت
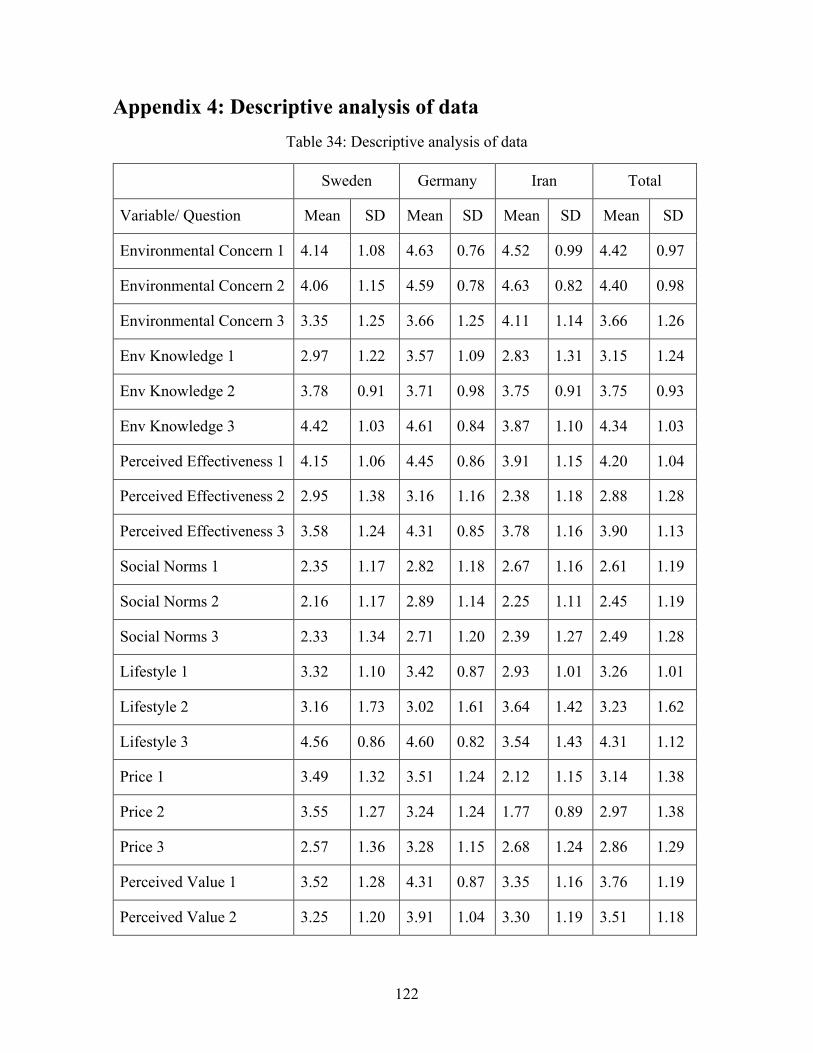
122
Appendix 4: Descriptive analysis of data Table 34: Descriptive analysis of data
Sweden Germany Iran Total
Variable/ Question Mean SD Mean SD Mean SD Mean SD
Environmental Concern 1 4.14 1.08 4.63 0.76 4.52 0.99 4.42 0.97
Environmental Concern 2 4.06 1.15 4.59 0.78 4.63 0.82 4.40 0.98
Environmental Concern 3 3.35 1.25 3.66 1.25 4.11 1.14 3.66 1.26
Env Knowledge 1 2.97 1.22 3.57 1.09 2.83 1.31 3.15 1.24
Env Knowledge 2 3.78 0.91 3.71 0.98 3.75 0.91 3.75 0.93
Env Knowledge 3 4.42 1.03 4.61 0.84 3.87 1.10 4.34 1.03
Perceived Effectiveness 1 4.15 1.06 4.45 0.86 3.91 1.15 4.20 1.04
Perceived Effectiveness 2 2.95 1.38 3.16 1.16 2.38 1.18 2.88 1.28
Perceived Effectiveness 3 3.58 1.24 4.31 0.85 3.78 1.16 3.90 1.13
Social Norms 1 2.35 1.17 2.82 1.18 2.67 1.16 2.61 1.19
Social Norms 2 2.16 1.17 2.89 1.14 2.25 1.11 2.45 1.19
Social Norms 3 2.33 1.34 2.71 1.20 2.39 1.27 2.49 1.28
Lifestyle 1 3.32 1.10 3.42 0.87 2.93 1.01 3.26 1.01
Lifestyle 2 3.16 1.73 3.02 1.61 3.64 1.42 3.23 1.62
Lifestyle 3 4.56 0.86 4.60 0.82 3.54 1.43 4.31 1.12
Price 1 3.49 1.32 3.51 1.24 2.12 1.15 3.14 1.38
Price 2 3.55 1.27 3.24 1.24 1.77 0.89 2.97 1.38
Price 3 2.57 1.36 3.28 1.15 2.68 1.24 2.86 1.29
Perceived Value 1 3.52 1.28 4.31 0.87 3.35 1.16 3.76 1.19
Perceived Value 2 3.25 1.20 3.91 1.04 3.30 1.19 3.51 1.18
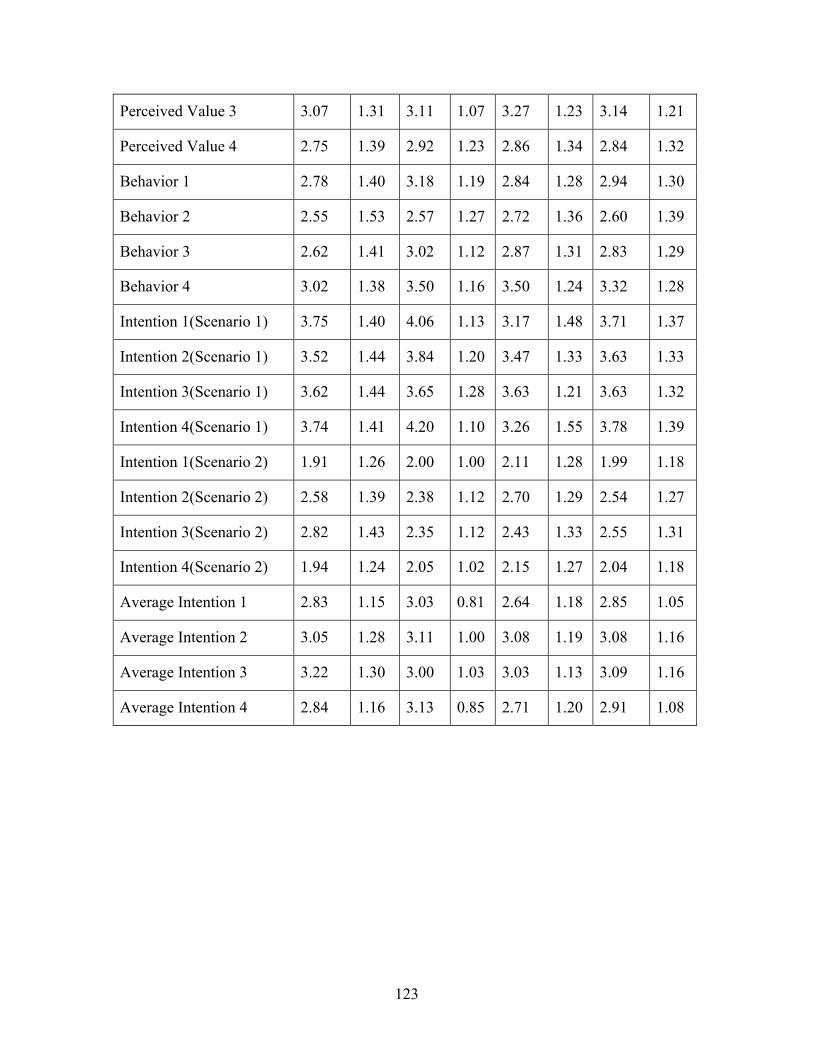
123
Perceived Value 3 3.07 1.31 3.11 1.07 3.27 1.23 3.14 1.21
Perceived Value 4 2.75 1.39 2.92 1.23 2.86 1.34 2.84 1.32
Behavior 1 2.78 1.40 3.18 1.19 2.84 1.28 2.94 1.30
Behavior 2 2.55 1.53 2.57 1.27 2.72 1.36 2.60 1.39
Behavior 3 2.62 1.41 3.02 1.12 2.87 1.31 2.83 1.29
Behavior 4 3.02 1.38 3.50 1.16 3.50 1.24 3.32 1.28
Intention 1(Scenario 1) 3.75 1.40 4.06 1.13 3.17 1.48 3.71 1.37
Intention 2(Scenario 1) 3.52 1.44 3.84 1.20 3.47 1.33 3.63 1.33
Intention 3(Scenario 1) 3.62 1.44 3.65 1.28 3.63 1.21 3.63 1.32
Intention 4(Scenario 1) 3.74 1.41 4.20 1.10 3.26 1.55 3.78 1.39
Intention 1(Scenario 2) 1.91 1.26 2.00 1.00 2.11 1.28 1.99 1.18
Intention 2(Scenario 2) 2.58 1.39 2.38 1.12 2.70 1.29 2.54 1.27
Intention 3(Scenario 2) 2.82 1.43 2.35 1.12 2.43 1.33 2.55 1.31
Intention 4(Scenario 2) 1.94 1.24 2.05 1.02 2.15 1.27 2.04 1.18
Average Intention 1 2.83 1.15 3.03 0.81 2.64 1.18 2.85 1.05
Average Intention 2 3.05 1.28 3.11 1.00 3.08 1.19 3.08 1.16
Average Intention 3 3.22 1.30 3.00 1.03 3.03 1.13 3.09 1.16
Average Intention 4 2.84 1.16 3.13 0.85 2.71 1.20 2.91 1.08
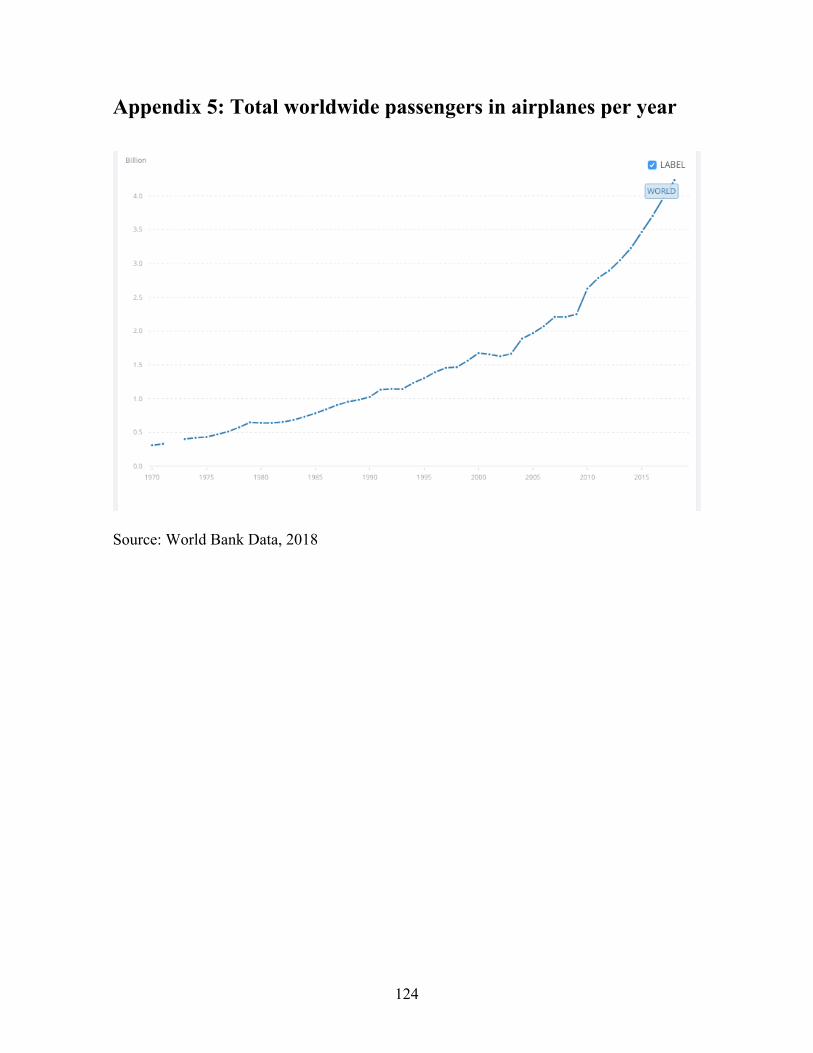
124
Appendix 5: Total worldwide passengers in airplanes per year
Source: World Bank Data, 2018
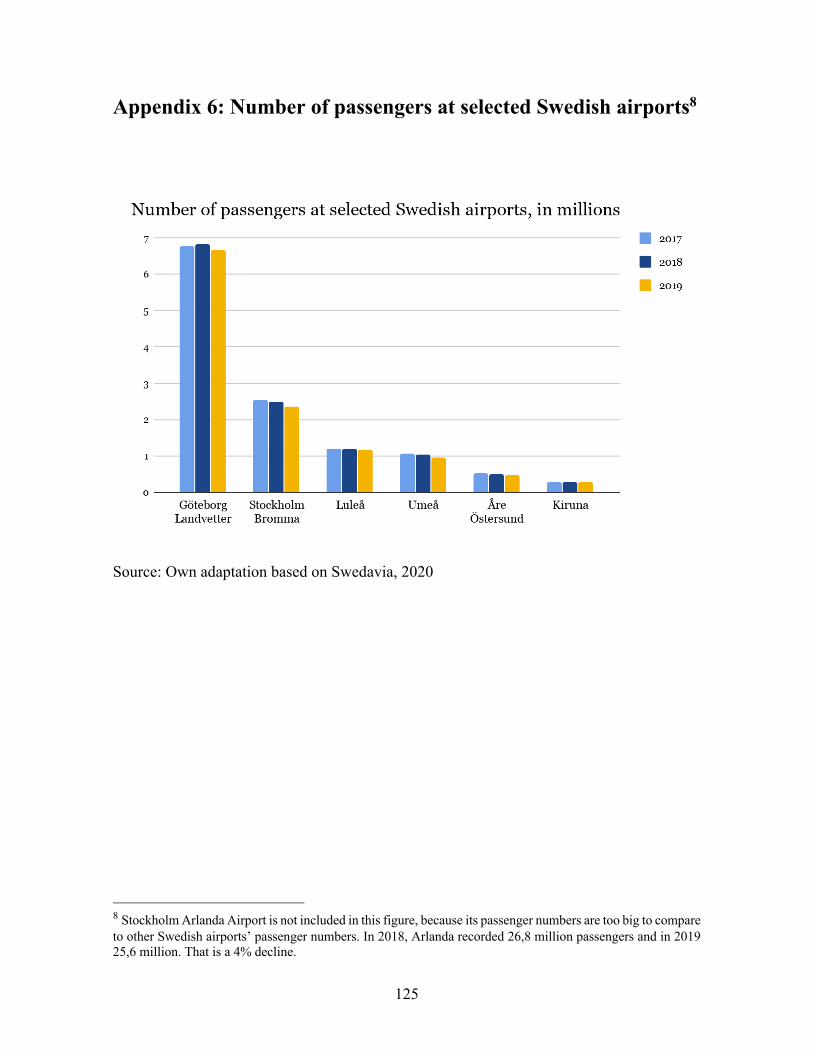
125
Appendix 6: Number of passengers at selected Swedish airports8
Source: Own adaptation based on Swedavia, 2020
8 Stockholm Arlanda Airport is not included in this figure, because its passenger numbers are too big to compare to other Swedish airports’ passenger numbers. In 2018, Arlanda recorded 26,8 million passengers and in 2019 25,6 million. That is a 4% decline.

Business Administration SE-901 87 Umeå www.usbe.umu.se


