Embed Size (px)
Citation preview

Alzheimer’s & Dementia 9 (2013) 488–498
Behavioral correlates of cerebrospinal fluid amino acid and biogenicamine neurotransmitter alterations in dementia
Yannick Vermeirena, Nathalie Le Bastarda, An Van Hemelrijcke, Wilhelmus H. Drinkenburge,Sebastiaan Engelborghsa,b, Peter P. De Deyna,b,c,d,*
aLaboratory of Neurochemistry and Behavior, Reference Center for Biological Markers of Dementia (BIODEM), University of Antwerp, Antwerp, BelgiumbDepartment of Neurology and Memory Clinic, Hospital Network Antwerp (ZNA) Middelheim and Hoge Beuken, Antwerp, Belgium
cDepartment of Neurology and Alzheimer Research Center, University Medical Center Groningen (UMCG), Groningen, The NetherlandsdBiobank, Institute Born–Bunge, University of Antwerp, Antwerp, Belgium
eJohnson & Johnson Pharmaceutical Research & Development, a division of Janssen Pharmaceutica NV, Beerse, Belgium
Abstract Background: Behavioral and psychological signs and symptoms of dementia (BPSD) are a hetero-
*Corresponding au
E-mail address: de
1552-5260/$ - see fro
http://dx.doi.org/10.10
geneous group of behavioral and psychiatric disturbances occurring in dementia patients of any eti-ology. Research suggests that altered activities of dopaminergic, serotonergic, (nor)adrenergic, aswell as amino acid neurotransmitter systems play a role in the etiopathogenesis of BPSD. In this studywe attempted to identify cerebrospinal fluid (CSF) neurochemical correlates of BPSD to provide fur-ther insight into its underlying neurochemical pathophysiological mechanisms.Methods: Patients with probable Alzheimer’s disease (AD; n5 202), probable AD with cerebrovas-cular disease (n5 37), probable frontotemporal dementia (FTD; n5 32), and probable dementia withLewy bodies (DLB; n5 26) underwent behavioral assessment and lumbar puncture. CSF levels of sixamino acids and several biogenic amines and metabolites were analyzed using ultraperformance liq-uid chromatography with fluorescence detection and reversed-phase high-performance liquid chro-matography with fluorescence detection.Results: In the AD patients, CSF homovanillic acid/5-hydroxyindoleacetic acid (HVA/5HIAA)ratios correlated positively with anxieties/phobias, whereas CSF levels of taurine correlated nega-tively with depression and behavioral disturbances in general. In FTD patients, CSF levels of gluta-mate correlated negatively with verbally agitated behavior. In DLB patients, CSF levels of HVAcorrelated negatively with hallucinations.Conclusions: Several neurotransmitter systems can be linked to one specific behavioral syndromedepending on the dementia subtype. In addition to biogenic amines and metabolites, amino acidsseem to play a major role in the neurochemical etiology of BPSD as well.� 2013 The Alzheimer’s Association. All rights reserved.
Keywords: Alzheimer’s disease; Dementia; BPSD; Biogenic amines and metabolites; Amino acids; Neurochemistry;
Cerebrospinal fluid
1. Introduction
Behavioral and psychological signs and symptoms ofdementia (BPSD) are a heterogeneous group of behavioral,psychological, and psychiatric disturbances occurring in50%–80% of dementia patients of any etiology [1]. Thesebehavioral symptoms are generally categorized into seven
thor. Tel: 132-3-2652620. Fax: 132-3-2652618.
nt matter � 2013 The Alzheimer’s Association. All rights r
16/j.jalz.2012.06.010
main subtypes: paranoid and delusional ideation; hallucina-tions; activity disturbances; aggressiveness; diurnal rhythmdisturbances; affective disturbances; and anxieties/phobias[2]. BPSD often lead to a greater amount of caregiver dis-tress, diminished quality of life for both patient and care-giver, greater cognitive impairment [3], prematureinstitutionalization, frequent (re)hospitalizations, and in-creased secondary morbidity and mortality [4]. Importantly,BPSD also have a significant and increasing socioeconomicimpact [5].
eserved.

Y. Vermeiren et al. / Alzheimer’s & Dementia 9 (2013) 488–498 489
Research has repeatedly suggested that there is a neuro-chemical basis underlying BPSD although its pathophysiolog-icalmechanisms are still notwell understood [6].Alterations incentral noradrenergic [6–9], serotonergic [6,10,11], anddopaminergic [6,9] neurotransmitter systems were found toplay a critical role in BPSD manifestation. In particular, thebalance between those different neurotransmitter systemsseems to be of importance, as it is conceivable, due to theneurochemical complexity and diversity of BPSD, that morethan one neurotransmitter system contributes to a particularbehavioral syndrome [9]. Studying neurotransmitter systemsin isolation cannot fully explain changes in behavior, giventhat many neurotransmitter systems work in conjunction witheach other [6,9]. In spite of this difficulty, the neurochemicalmechanisms underlying BPSD are proven to be both BPSD-and dementia-specific [6], so that dementia-specific neuro-chemical alterations might be found.
Nonetheless, this BPSD-related neurochemical basisneeds to be examined further in a broader study populationthat comprises Alzheimer’s disease (AD) as well as non-AD dementia patients, as most BPSD-related neurochemicalstudies are strictly confined to AD. Moreover, current phar-macological treatment options of BPSD are limited and non-specific. Besides these alterations in monoaminergicneurotransmission, there is also some evidence suggestingthat amino acids play a functional role in the neurochemicalpathophysiology of BPSD [12–15]. However, this aminoacid–based etiology of BPSD requires even furtherelucidation.
Therefore, in this study we assessed well-characterizedpatients with several forms of degenerative and mixed de-generative–vascular dementias to identify neurochemicalcorrelates of BPSD and to increase our insight in its under-lying pathophysiological mechanisms.
2. Methods
2.1. Study population
The study population consisted of 297 consecutively hos-pitalized outpatients who had been recruited at the MemoryClinic of Hospital Network Antwerp (ZNA-Middelheim andHoge Beuken) for diagnostic work-up of dementia. Diagno-ses consisted of: probable AD (n5 202); probable AD withcerebrovascular disease (CVD) (AD1CVD; n 5 37); prob-able frontotemporal dementia (FTD; n 5 32); and probabledementia with Lewy bodies (DLB; n 5 26). Diagnosis ofprobable AD was made according to the criteria of theNational Institute of Neurological and CommunicativeDisorders and Stroke-Alzheimer’s Disease and RelatedDisorders Association (NINCDS-ADRDA) [16], althoughall patients also fulfilled the criteria of the Diagnostic andStatistical Manual of Mental Disorders, 4th edition (DSM-IV) [17]. AD1CVD was diagnosed when patients fulfilledthe criteria of probable AD according to the NINCDS-ADRDA criteria and, in addition, displayed CVD on brain
computed tomography (CT) and/or magnetic resonance im-aging (MRI). However, CT and/or MRI images did not meetthe criteria of relevant CVD according to the vascular de-mentia criteria of the NINCDS–Association Internationalepour la Recherche et l’Enseignement en Neurosciences(NINCDS-AIREN) [18], thus excluding multiple large-vessel infarcts, strategically placed infarcts, multiple basalganglia, and white-matter lacunae or extensive white-matter lesions. All FTD patients fulfilled the core diagnosticfeatures and several supportive diagnostic features of theclinical diagnostic criteria for FTD [19]. Diagnosis of prob-able DLB was made according to the criteria of McKeithet al [20,21].
All patients were clinically followed up, which added tothe certainty of clinical diagnosis. In cases of patient death,an autopsy was performed to allow neuropathological confir-mation of clinical diagnosis. So far, 38 of the 297 patients in-cluded underwent autopsy, which resulted in a diagnosis ofdefinite AD, FTD, DLB, and AD1CVD in 27, 7, 1, and 3 pa-tient(s), respectively.
The age at dementia onset was estimated by the clinician,based on interviews with the patient’s main caregiver.
The local ethics committee approved this study. All pa-tients and their caregivers gave informed consent for partic-ipation to the study.
2.2. Behavioral assessment
Behavior was assessed at baseline, covering a period of 2weeks prior to inclusion and using a battery of behavioral as-sessment scales, including: the Middelheim Frontality Score(MFS) [22]; Behavioral Pathology in Alzheimer’s DiseaseRating Scale (Behave-AD) [2]; Cohen–Mansfield AgitationInventory (CMAI) [23]; and Cornell Scale for Depression inDementia (CSDD) [24].
TheMFS is a validated clinical and behavioral assessmentscale that measures frontal lobe features with good inter- andintrarater reliability [22]. Each of the 10 items were given ascore of either 0 (absent) or 1 (present), yielding a maximumtotal score of 10. The Behave-AD is a 25-item scale thatmea-sures behavioral symptoms in seven clusters (paranoid anddelusional ideation; hallucinations; activity disturbances;aggressiveness; diurnal rhythm disturbances; affective dis-turbances; and anxieties/phobias) with each item scored ona four-point scale of increasing severity [2]. Besides a totalscore, a global rating score concerning caregiver burden isprovided. The CMAI assesses 29 agitated behaviors on aseven-point scale of increasing severity [23]. CMAI clusterscores include aggressive behavior (cluster 1), physicallynon-aggressive behavior (cluster 2), and verbally agitatedbehavior (cluster 3); a total score is calculated as well. TheCSDD is a 19-item depression scale that is rated on a three-point score of absent, mild or intermittent, and severe [24].
Information was obtained through interview with the pro-fessional and/or main caregiver, interview with the patient,clinical files, and behavioral observation.

Y. Vermeiren et al. / Alzheimer’s & Dementia 9 (2013) 488–498490
Staging of dementia was assessed by means of the GlobalDeterioration Scale (GDS) [25].
2.3. Cerebrospinal fluid sampling
Cerebrospinal fluid (CSF) sampling was performed ac-cording to a standard procedure no more than 2 weeks beforebaseline behavioral rating. CSF was obtained at baseline us-ing lumbar puncture (LP) at the L3/L4 or L4/L5 interspace.LP was performed between 8:00 and 10:00 a.m. after over-night fasting and after having abstained from smoking forat least 12 hours. Approximately 16mL of CSFwas collectedin an orderedmanner:C1 (4.5mL),C2 (1.5mL),C3 (1.5mL),C4 (4.5mL), and finalC5 (4.5mL) fractions in polypropylenevials (Nalgene; VWR, Leuven, Belgium) were obtained.Fractions C1–C4were immediately frozen in liquid nitrogen.The C5 fraction was centrifuged for 10 minutes at 3000 rpm(Centrifuge 5702, rotor A-4-38; Eppendorf, Hamburg,Germany) and the supernatant was then distributed in differ-ent polypropylene vials and frozen in liquid nitrogen. Forneurochemical analyses, the C5 fraction was always used.
All CSF samples were stored at the Biobank facilities ofthe Institute Born–Bunge (Antwerp, Belgium) at –80�C untilanalysis.
2.4. Neurochemical analyses
The amino acids aspartate, glutamate, glutamine, glycine,taurine, and proline were analyzed using ultraperformanceliquid chromatography (UPLC; Acquity; Waters) coupledwith a fluorescence detector (Waters) and precolumn deriv-atization with 6-aminoquinolyl-N-hydroxysuccinimidyl car-bamate (AQC). Samples were derivatized as describedpreviously [26]. Twenty microliters of the sample or stan-dard was mixed with 60 mL 0.2 mol/L borate buffer (pH8.8), containing 25 mmol/L a-aminobutyric acid as internalstandard. Derivatization was carried out by adding 20-mLAQC reagents to the buffered mixture. The final mixturewas heated at 55�C for 10 minutes. The buffer consisted ofa mixture of 140 mmol/L sodium acetate and 7 mmol/L trie-thanolamine, and set at pH 5.7. The mobile phase was a mix-ture of buffer with acetonitrile. Chromatographic separationwas achieved by gradient elution on a UPLC column (C18,2.1 mm inner diameter! 50 mm, 1.8 mm; HSS T3 Acquity;Waters). A 0.2-mmfilter (2.1 mm inner diameter) was used infront of the column. The column temperature was 60�C. Theflow rate was 1.2 mL/min and run-time was 8 minutes.Excitation and emission wavelengths were set at 250 nmand 395 nm, respectively.
Monoamine norepinephrine (NE) and the biogenicamine metabolite of serotonin, 5HT (i.e., 5-hydroxyindole-acetic acid [5HIAA]), and dopamine, DA (i.e., 3,4-dihydro-xyphenylacetic acid [DOPAC]), were analyzed using theAcquity UPLC system coupled to a fluorescence detector(Waters) and precolumn derivatization with benzylamineand 1,2-diphenylethyleendiamine (DPE). Samples were de-
rivatized as described previously [27]. Ten microliters ofisoproterenol as internal standard was added to 20 mL ofstandard or sample. Then, 20 mL of benzylamine derivatiza-tion reagent solution was added. The mixture was allowed toreact for 2 minutes at room temperature; thereafter, 20 mL ofDPE reagent was added and the final mixture was heated at50�C for 20 minutes. Separation was achieved by gradientelution using a mixture of acetonitrile and 15 mmol/L ace-tate buffer (pH 4.5) containing 1 mmol/L octanesulfonicacid sodium salt on a reversed-phase column (C18, 2.1mm inner diameter ! 100 mm, 1.7 mm; Acquity UPLCBEH Shield; Waters). Column temperature was 60�C. Theflow rate was 0.7 mL/min and run-time was 8 minutes.Excitation and emission wavelengths were set at 345 nmand 480 nm, respectively.
Homovanillic acid (HVA), another metabolite of DA, wasanalyzed using a high-performance liquid chromatography(HPLC) system (Alliance HT 2795; Waters) equipped witha fluorescence detector (Model 2475; Waters). Separationwas achieved by isocratic elution using a 75-mmol/L sodiumacetate buffer (pH 5.0) on a reversed-phase column (C18, 2.1mm inner diameter ! 50 mm, 3 mm; Atlantis; Waters) witha precolumn (C18, 2.1 mm inner diameter! 10 mm, 3 mm;Atlantis). Because no derivatization step preceded HVA in-jection, the addition of an extra internal standard was there-fore redundant. The flow rate was 1 mL/min and run-timewas 10 minutes. Excitation and emission wavelengthswere set at 275 nm aand 345 nm, respectively.
Detection limits for the monoamines and metaboliteswere around 50 pmol/L, whereas, for the amino acids, detec-tion limits of approximately 3–7 nmol/L were found.
All data were analyzed using Empower 2.0 (Waters) soft-ware run on an Intel Pentium processor. The monoamines,amino acids, and acetonitrile were purchased from Sigma–Aldrich (Bornem, Belgium). Other products were purchasedfromMerck (Brussels, Belgium). All chemicals and solventswere at least of analytical grade. All solutions were preparedin ultrapure MilliQ water (MilliQ Academic; Millipore,Bedford, MA) and filtered over a 0.22-mm filter (Millipore).
2.5. Statistical analyses
A one-way analysis of variance (ANOVA) with post hocDunnett’s procedurewas used to compare demographic, clin-ical, behavioral, and neurochemical data of the different dis-ease groups with the AD group. Chi-square statistics wereapplied to compare male:female ratios. Unpaired Student’st-tests were used for comparison of neurocognitive, behav-ioral, and neurochemical data between patients receivinga specific psychotropic pharmacological treatment and un-treated patients. In all cases, P , .05 was considered signifi-cant. To calculate correlations, Spearman’s rank-orderstatisticswere applied followedby totalBonferroni correctionfor multiple comparisons. Only correlations remaining statis-tically significant after total Bonferroni correctionwere takeninto account. Missing values were excluded pairwise.

Y. Vermeiren et al. / Alzheimer’s & Dementia 9 (2013) 488–498 491
All analyses were performed using SPSS 20.0 for Win-dows (SPSS, Inc., Chicago, IL).
3. Results
3.1. Baseline demographic, clinical, and behavioral data
Baseline demographic, clinical, and behavioral data aresummarized in Tables 1 and 2.
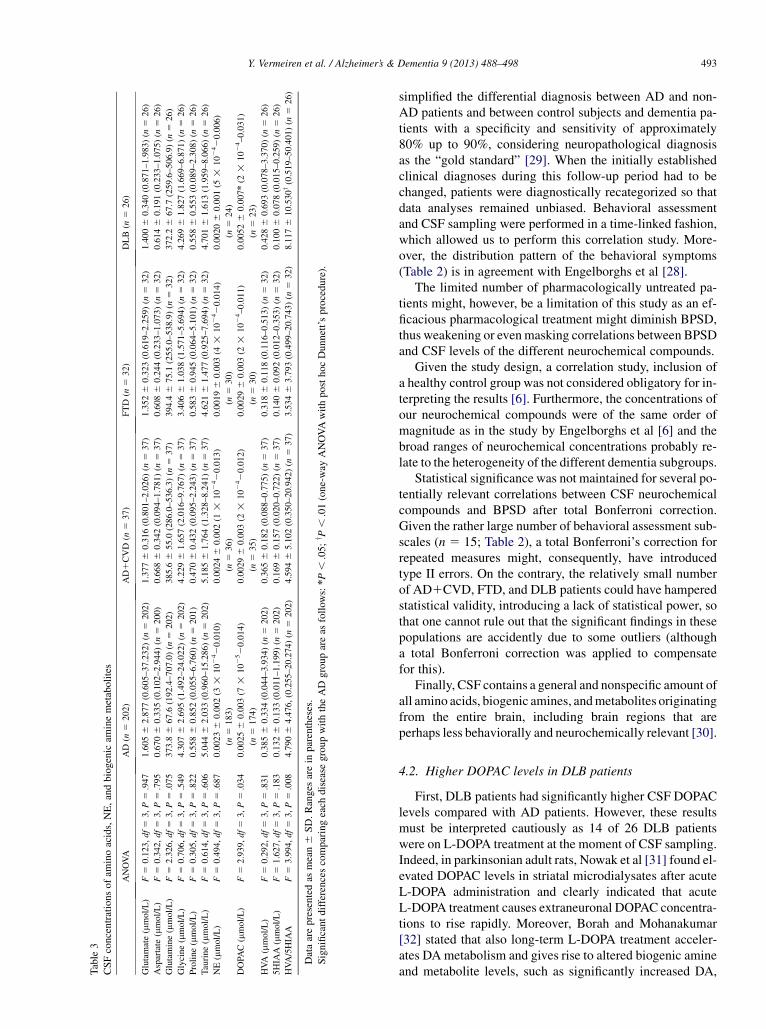
3.2. CSF concentrations of amino acids, NE, and biogenicamine metabolites
DLB patients had significantly higher DOPAC concentra-tions and significantly higher HVA/5HIAA ratios comparedwith AD patients (P 5 .010 and P 5 .008, respectively)(Table 3).
3.3. Correlations between CSF levels of different aminoacids, NE, and different biogenic amine metabolites withneurocognitive and disease-stage data of AD patients
In theADpatients, CSF levels of aspartate and taurine cor-related positively with Mini-Mental State Examination(MMSE) scores (aspartate: n5 195, r5 0.218,P5.002; tau-rine: n 5 197, r5 0.224, P5 .002), whereas NE levels cor-related negatively (n 5 179, r 5 20.238, P 5 .001).Moreover, CSF taurine levels correlated negatively withGDS scores (n5 202, r520.240, P5 .001) and NE levelswithHierarchicDementiaScale scores (n5 142, r520.276,P5 .001).
3.4. Correlations between CSF levels of different aminoacids, NE, and different biogenic amine metabolites withbaseline behavioral data
In AD patients, CSF HVA/5HIAA ratios were positivelycorrelated with Behave-AD cluster anxieties/phobias(n5 202, P5 .002, r5 .222), whereas CSF levels of taurinewere negatively correlated with the Cornell Scale for Depres-sion and Behave-AD total scores (n 5 200, P , .0001,r 5 20.281; n 5 202, P 5 .001, r 5 20.227, respectively)(Tables 4 and 5). In the FTD patients, CSF levels of glutamatecorrelated negatively with CMAI cluster score verballyagitated behavior (n5 32,P5 .003, r520.504). InDLB pa-tients, CSF levels of HVA correlated negatively with Behave-AD cluster hallucinations (n 5 26, P 5 .003; r 5 20.554)(Tables 4 and 5).
In AD1CVD patients, an inverse correlation betweenMFS total scores and HVA levels did not remain significantafter total Bonferroni correction.
3.5. Correlations between CSF levels of differentneurochemical compounds
In AD and AD1CVD patients, DOPAC levels correlatedsignificantly with 5HIAA (AD: n 5 174, r 5 0.527,P , .001; AD1CVD: n 5 35, r 5 0.550, P 5 .001) and
NE (AD: n 5 161, r 5 0.334, P , .001; AD1CVD:n5 34, r5 0.433, P5 .011) levels. In the DLB patients, sig-nificant correlations were found between DOPAC and5HIAA levels (n 5 23, r 5 0.496, P 5 .016).
In the FTD patients, none of the correlations remainedstatistically significant after total Bonferroni correction.
3.6. Comparing neurocognitive, behavioral, andneurochemical data between patients receivinga psychotropic pharmacological treatment and untreatedpatients
Psychotropic pharmacological treatment consisted of an-tipsychotics, selective 5HTand NE reuptake inhibitors, ben-zodiazepines, cholinesterase inhibitors, levodopa (L-DOPA),monoamine oxidase inhibitors, valproate, carbamazepine,and phenobarbital. Of the 297 patients included, 45 receivedno psychotropic pharmacological treatment at baseline.
When comparing patients who did not receive a psycho-tropic pharmacological treatment (n 5 45) with patientsreceiving any psychotropic pharmacological treatment(n5 252), the untreated group had significantly less affectivedisturbances (Behave-AD cluster G) (P 5 .011), lower CSFDOPAC levels (P 5 .006), and lower CSF HVA/5HIAA ra-tios (P, .001). On the other hand, no significant differenceswere found between the treated and untreated group with re-gard to neurocognitive data (statistical data not shown). Fur-thermore, CSF HVA/5HIAA ratios were significantly lowerin untreated patients (n5 45) compared with patients takingcholinesterase inhibitors (n5 73), antipsychotics (n5 157),benzodiazepines (n5 76), or selective 5HTand NE reuptakeinhibitors (n5 116) (P, .001 for all). In addition, untreatedpatients (n 5 35) also had significantly lower CSF DOPAClevels compared with patients receiving antipsychotics(n5 144, P5 .010) or selective 5HTand NE reuptake inhib-itors (n 5 103, P 5 .017) as well as lower CSF HVA levels(n 5 45) compared with patients who received selective5HT and NE reuptake inhibitors (n 5 116; P 5 .032).
No significant differences in CSF levels of NE or bio-genic amine metabolites were found when comparing un-treated patients with patients receiving L-DOPA (n 5 18).
4. Discussion
4.1. Strengths and weaknesses
In 2000, a longitudinal, prospective research project onmarkers of behavioral disturbances in dementia was initiated[28]. The dementia patients in that large cohort were clini-cally and behaviorally well characterized, with inclusionof available clinical, behavioral, and neuropsychologicalfollow-up data every 3–6 months that contributed to diag-nostic certainty and by postmortem neuropathological con-firmation of the clinical diagnosis in 38 patients (AD: n 527; FTD: n 5 7; DLB: n 5 1; AD1CVD: n 5 3). About85% of the patients also underwent biomarker analyses forb-amyloid peptide1-42, total, and P-tauP181 levels, which

Table 2
Baseline behavioral data
ANOVA AD (n 5 202) AD1CVD (n 5 37) FTD (n 5 32) DLB (n 5 26)
MFS total score (/10) F 5 18.407, df 5 3, P , .001 3.8 6 1.8 (0–8) (n 5 202) 3.4 6 1.9 (0–7) (n 5 37) 6.2 6 1.4z (3–9) (n 5 32) 3.5 6 2.0 (0–7) (n 5 26)
Behave-AD cluster A: Delusions (/21) F 5 3.639, df 5 3, P 5 .013 1.5 6 2.4 (0–17) (n 5 202) 1.1 6 1.5 (0–5) (n 5 37) 0.6 6 1.5 (0–7) (n 5 32) 2.5 6 3.4 (0–11) (n 5 26)
Behave-AD cluster B: Hallucinations (/15) F 5 20.835, df 5 3, P , .001 0.4 6 0.9 (0–5) (n 5 202) 0.2 6 0.7 (0–3) (n 5 37) 0.3 6 1.1 (0–6) (n 5 32) 2.1 6 2.2z (0–9) (n 5 26)
Behave-AD cluster C: Activity disturbances (/9) F 5 4.243, df 5 3, P 5 .006 2.3 6 2.2 (0–9) (n 5 202) 1.6 6 1.9 (0–7) (n 5 37) 2.4 6 2.2 (0–7) (n 5 32) 0.9 6 1.4y (0–4) (n 5 26)
Behave-AD cluster D: Aggressiveness (/9) F 5 0.989, df 5 3, P 5 .398 2.7 6 2.8, (0–9) (n 5 202) 2.2 6 2.5 (0–9) (n 5 37) 2.2 6 2.5 (0–9) (n 5 32) 2.1 6 2.7 (0–9) (n 5 26)
Behave-AD cluster E: Diurnal rhythm disturbances (/3) F 5 0.931, df 5 3, P 5 .426 0.5 6 0.8 (0–3) (n 5 202) 0.4 6 0.7 (0–2) (n 5 37) 0.3 6 0.5 (0–1) (n 5 32) 0.4 6 0.8 (0–3) (n 5 26)
Behave-AD cluster F: Affective disturbances (/6) F 5 0.342, df 5 3, P 5 .795 0.9 6 1.3 (0–5) (n 5 202) 0.8 6 1.2 (0–4) (n 5 37) 0.6 6 1.1 (0–4), (n 5 32) 0.9 6 1.3 (0–4) (n 5 26)
Behave-AD cluster G: Anxieties/phobias (/12) F 5 1.938, df 5 3, P 5 .123 0.5 6 1.1 (0–6), (n 5 202) 0.4 6 1.0 (0–4) (n 5 37) 0.3 6 0.7 (0–3) (n 5 32) 1.0 6 1.5 (0–5) (n 5 26)
Behave-AD total score (/75) F 5 2.037, df 5 3, P 5 .109 8.7 6 6.8 (0–40) (n 5 202) 6.7 6 4.8 (0–17) (n 5 37) 6.7 6 5.1 (0–26) (n 5 32) 9.8 6 8.3 (0–29) (n 5 26)
Behave-AD global score (/3) F 5 0.519, df 5 3, P 5 .670 1.4 6 0.9 (0–3) (n 5 202) 1.4 6 0.8 (0–3) (n 5 37) 1.2 6 0.9 (0–3) (n 5 32) 1.4 6 0.9 (0–3) (n 5 26)
CMAI cluster 1: Aggressive behavior (/70) F 5 0.906, df 5 3, P 5 .438 12.4 6 6.2 (10–54) (n 5 200) 12.5 6 5.4 (10–31) (n 5 37) 11.0 6 2.7 (10–20) (n 5 32) 11.1 6 4.0 (10–30) (n 5 26)
CMAI cluster 2: physically non-aggressive behavior (/77) F 5 2.813, df 5 3, P 5 .040 18.4 6 7.3 (11–42) (n 5 200) 16.8 6 7.6 (11–46) (n 5 37) 19.3 6 8.0 (11–38) (n 5 32) 14.6 6 5.3* (11–27) (n 5 26)
CMAI cluster 3: verbally agitated behavior (/56) F 5 0.261, df 5 3, P 5 .854 12.9 6 6.3 (8–44) (n 5 200) 13.8 6 6.0 (8–30) (n 5 37) 12.9 6 7.2 (8–35) (n 5 32) 12.4 6 8.6 (8–47) (n 5 26)
CMAI total score (/203) F 5 0.972, df 5 3, P 5 .406 43.7 6 15.8 (29–127) (n 5 200) 43.2 6 16.1 (29–87) (n 5 37) 43.2 6 15.5 (29–91) (n 5 32) 38.1 6 15.2 (29–99) (n 5 26)
Cornell Scale for Depression (/38) F 5 0.730, df 5 3, P 5 .535 5.9 6 3.8 (0–21) (n 5 200) 6.3 6 4.1 (0–20) (n 5 37) 6.3 6 2.7 (1–11) (n 5 32) 6.9 6 4.3 (0–16) (n 5 26)
Data are given as mean 6 SD. Ranges are in parentheses.
Significant differences comparing each disease group versus the AD group are as follows: *P , .05; yP , .01; zP , .001 (one-way ANOVAwith post hoc Dunnett’s procedure).
Table 1
Baseline demographics and clinical data
ANOVA AD (n 5 202) AD1CVD (n 5 37) FTD (n 5 32) DLB (n 5 26)
Male/female NA 76/126 18/19 (c2 5 1.593, df 5 1) 16/16 (c2 5 1.773, df 5 1) 17/9y (c2 5 7.350, df 5 1)
Age at baseline (years) F 5 17.729, df 5 3, P , .001 80.4 6 6.7 (64–97) (n 5 202) 80.7 6 6.0 (68–94) (n 5 37) 70.1 6 10.0z (41–83) (n 5 32) 74.8 6 6.6* (62–89) (n 5 26)
Age at onset (years) F 5 16.260, df 5 3, P , .001 77.2 6 7.2 (57–96) (n 5 186) 77.3 6 6.0 (66–93) (n 5 33) 66.2 6 10.0z (40–79) (n 5 32) 70.2 6 7.1y (59–87) (n 5 23)
Disease duration (years) F 5 1.616, df 5 3, P 5 .186 3.2 6 2.3 (0–12) (n 5 186) 3.4 6 2.3 (0–11) (n 5 33) 3.9 6 4.3 (1–18) (n 5 32) 4.6 6 4.1 (0–14) (n 5 23)
Global Deterioration Scale (1–7) F 5 2.963, df 5 3, P 5 .032 5.3 6 0.8 (3–7) (n 5 202) 4.9 6 0.7 (4–6) (n 5 37) 4.7 6 0.9* (3–6) (n 5 32) 5.1 6 0.8 (4–6) (n 5 26)
MMSE score (/30) F 5 4.227, df 5 3, P 5 .006 15.1 6 5.1 (4–26) (n 5 197) 17.5 6 6.2 (7–29) (n 5 37) 19.4 6 5.0 (8–28) (n 5 29) 18.1 6 4.1* (12–27) (n 5 25)
Hierarchic Dementia Scale (/10) F 5 2.521, df 5 3, P 5 .059 7.3 6 1.2 (4–9) (n 5 157) 7.9 6 1.1 (6–10) (n 5 30) 7.7 6 1.2 (4–10) (n 5 22) 7.4 6 1.2 (5–9) (n 5 21)
Boston Naming Test (/60) F 5 13.244, df 5 3, P , .001 25.7 6 11.8 (0–51) (n 5 151) 29.9 6 13.4 (7–53) (n 5 32) 35.1 6 12.0z (8–57) (n 5 23) 39.4 6 9.0z (17–52) (n 5 24)
Data expressed as mean 6 SD. Ranges are in parentheses. c2 statistics were used for comparison of male:female ratios. For all other comparisons, one-way ANOVAwith post hoc Dunnett’s procedure was
applied. NA, not applicable.
Significant differences comparing each disease group versus the AD group are as follows: *P , .05; yP , .01; zP , .001.
Y.Verm
eirenet
al./Alzh
eimer’s
&Dem
entia
9(2013)488–498
492
Table
3
CSFconcentrationsofam
inoacids,NE,andbiogenic
aminemetabolites
ANOVA
AD(n
5202)
AD1CVD
(n5
37)
FTD
(n5
32)
DLB(n
526)
Glutamate(mmol/L)
F5
0.123,df5
3,P5
.947
1.6056
2.877(0.605–37.232)(n
5202)
1.3776
0.316(0.801–2.026)(n
537)
1.3526
0.323(0.619–2.259)(n
532)
1.4006
0.340(0.871–1.983)(n
526)
Aspartate
(mmol/L)
F5
0.342,df5
3,P5
.795
0.6706
0.335(0.102–2.944)(n
5200)
0.6686
0.342(0.094–1.781)(n
537)
0.6086
0.244(0.233–1.073)(n
532)
0.6146
0.191(0.233–1.075)(n
526)
Glutamine(mmol/L)
F5
2.326,df5
3,P5
.075
373.8
667.6
(192.4–707.0)(n
5202)
385.6
655.0
(286.0–536.3)(n
537)
394.4
675.1
(255.0–538.9)(n
532)
372.2
667.7
(259.6–506.9)(n
526)
Glycine(mmol/L)
F5
0.706,df5
3,P5
.549
4.3076
2.695(1.492–24.022)(n
5202)
4.2296
1.657(2.016–9.767)(n
537)
3.4066
1.038(1.571–5.694)(n
532)
4.2696
1.827(1.669–6.871)(n
526)
Proline(mmol/L)
F5
0.305,df5
3,P5
.822
0.5586
0.852(0.055–6.760)(n
5201)
0.4706
0.432(0.095–2.243)(n
537)
0.5836
0.945(0.064–5.101)(n
532)
0.5586
0.553(0.089–2.308)(n
526)
Taurine(mmol/L)
F5
0.614,df5
3,P5
.606
5.0446
2.033(0.960–15.286)(n
5202)
5.1856
1.764(1.328–8.241)(n
537)
4.6216
1.477(0.925–7.694)(n
532)
4.7016
1.613(1.959–8.066)(n
526)
NE(mmol/L)
F5
0.494,df5
3,P5
.687
0.00236
0.002(3
!102420.010)
(n5
183)
0.00246
0.002(1
!102420.013)
(n5
36)
0.00196
0.003(4
!102420.014)
(n5
30)
0.00206
0.001(5
!102420.006)
(n5
24)
DOPA
C(mmol/L)
F5
2.939,df5
3,P5
.034
0.00256
0.003(7
!102520.014)
(n5
174)
0.00296
0.003(2
!102420.012)
(n5
35)
0.00296
0.003(2
!1024–0.011)
(n5
30)
0.00526
0.007*(2
!1024–0.031)
(n5
23)
HVA(mmol/L)
F5
0.292,df5
3,P5
.831
0.3856
0.334(0.044–3.934)(n
5202)
0.3656
0.182(0.088–0.775)(n
537)
0.3186
0.118(0.116–0.513)(n
532)
0.4286
0.693(0.078–3.370)(n
526)
5HIA
A(mmol/L)
F5
1.627,df5
3,P5
.183
0.1326
0.133(0.011–1.199)(n
5202)
0.1696
0.157(0.020–0.722)(n
537)
0.1406
0.092(0.012–0.353)(n
532)
0.1006
0.078(0.015–0.259)(n
526)
HVA/5HIA
AF5
3.994,df5
3,P5
.008
4.7906
4.476,(0.255–20.274)(n
5202)
4.5946
5.102(0.350–20.942)(n
537)
3.5346
3.793(0.499–20.743)(n
532)
8.1176
10.530y(0.519–50.401)(n
526)
Dataarepresentedas
mean6
SD.Rangesarein
parentheses.
Significant
differencescomparingeach
disease
groupwiththeAD
groupareas
follow
s:*P,
.05;y P
,.01(one-way
ANOVAwithposthocDunnett’sprocedure).
Y. Vermeiren et al. / Alzheimer’s & Dementia 9 (2013) 488–498 493
simplified the differential diagnosis between AD and non-AD patients and between control subjects and dementia pa-tients with a specificity and sensitivity of approximately80% up to 90%, considering neuropathological diagnosisas the “gold standard” [29]. When the initially establishedclinical diagnoses during this follow-up period had to bechanged, patients were diagnostically recategorized so thatdata analyses remained unbiased. Behavioral assessmentand CSF sampling were performed in a time-linked fashion,which allowed us to perform this correlation study. More-over, the distribution pattern of the behavioral symptoms(Table 2) is in agreement with Engelborghs et al [28].
The limited number of pharmacologically untreated pa-tients might, however, be a limitation of this study as an ef-ficacious pharmacological treatment might diminish BPSD,thus weakening or evenmasking correlations between BPSDand CSF levels of the different neurochemical compounds.
Given the study design, a correlation study, inclusion ofa healthy control group was not considered obligatory for in-terpreting the results [6]. Furthermore, the concentrations ofour neurochemical compounds were of the same order ofmagnitude as in the study by Engelborghs et al [6] and thebroad ranges of neurochemical concentrations probably re-late to the heterogeneity of the different dementia subgroups.
Statistical significance was not maintained for several po-tentially relevant correlations between CSF neurochemicalcompounds and BPSD after total Bonferroni correction.Given the rather large number of behavioral assessment sub-scales (n 5 15; Table 2), a total Bonferroni’s correction forrepeated measures might, consequently, have introducedtype II errors. On the contrary, the relatively small numberof AD1CVD, FTD, and DLB patients could have hamperedstatistical validity, introducing a lack of statistical power, sothat one cannot rule out that the significant findings in thesepopulations are accidently due to some outliers (althougha total Bonferroni correction was applied to compensatefor this).
Finally, CSF contains a general and nonspecific amount ofall amino acids, biogenic amines, andmetabolites originatingfrom the entire brain, including brain regions that areperhaps less behaviorally and neurochemically relevant [30].
4.2. Higher DOPAC levels in DLB patients
First, DLB patients had significantly higher CSF DOPAClevels compared with AD patients. However, these resultsmust be interpreted cautiously as 14 of 26 DLB patientswere on L-DOPA treatment at the moment of CSF sampling.Indeed, in parkinsonian adult rats, Nowak et al [31] found el-evated DOPAC levels in striatal microdialysates after acuteL-DOPA administration and clearly indicated that acuteL-DOPA treatment causes extraneuronal DOPAC concentra-tions to rise rapidly. Moreover, Borah and Mohanakumar[32] stated that also long-term L-DOPA treatment acceler-ates DAmetabolism and gives rise to altered biogenic amineand metabolite levels, such as significantly increased DA,

Table 4
Significant correlations between CSF levels of the different amino acids with behavioral data
AD (n 5 202) FTD (n 5 32) DLB (n 5 26)
Glutamate � Behave-AD cluster E: Diurnal rhythm disturbances20.178* (n5 202) � CMAI cluster 3: Verbally agitated
behavior 20.504y (n 5 32)
� CMAI total score 20.464y
(n 5 32)
Aspartate � Behave-AD cluster B: Hallucinations 20.173* (n 5 200)
� Behave-AD cluster E: Diurnal rhythm disturbances20.161* (n5 200)
� Behave-AD total score 20.160* (n 5 200)
Glutamine � CMAI cluster 2: Physically
non-aggressive behavior 20.366*
(n 5 32)
� CMAI total score 20.358*
(n 5 32)
� MFS total score 0.432*
(n 5 26)
Taurine � Cornell Scale for Depression 20.281z (n 5 200)
� Behave-AD total score 20.227y (n 5 202)
� Behave-AD global score 20.186y (n 5 202)
� Behave-AD cluster B: Hallucinations 20.181* (n 5 202)
� Behave-AD cluster D: Aggressiveness 20.159* (n 5 202)
� Behave-AD cluster E: Diurnal rhythm disturbances20.150* (n5 202)
� Behave-AD cluster C: Activity disturbances 20.144* (n 5 202)
� Behave-AD global score
0.411* (n 5 26)
Correlation calculation was performed by using Spearman’s rank-order statistics. Correlation coefficients (r values) are given. Bold text indicates correlations
remaining statistically significant after total Bonferroni correction.
Significance of the different correlations is as follows: *P , .05; yP , .01; zP , .001.
Y. Vermeiren et al. / Alzheimer’s & Dementia 9 (2013) 488–498494
DOPAC, and HVA concentrations and decreased 5HT and5HIAA levels in different dopaminergic and serotonergicnuclei of adult male Sprague-Dawley rats. Similarly, ourstudy revealed increased DOPAC levels as well. To ruleout the possibility that L-DOPA treatment may have causedthese similar findings, statistical analysis between DLBpatients receiving (n 5 14) or not receiving (n 5 12)L-DOPA treatment was performed using a parametric un-paired Student’s t-test (because of normal distribution ofdata). However, no differences in DOPAC, HVA, 5HIAAlevels, or HVA/5HIAA ratios were found (data not shown).
Second, higher CSF HVA/5HIAA ratios in DLB patientswere observed compared with AD patients. This higher ratioprobably points to a different balance in the coupled seroto-nergic and dopaminergic neurotransmitter systems of DLBand AD patients.
In general, taking into account the significant P-values ofour findings noted earlier, we are the first to report that CFSDOPAC levels of DLB patients are elevated in comparisonwith AD patients.
4.3. Correlation between DOPAC and 5HIAA
Several studies provided evidence for a functional cou-pling between dopaminergic (HVA) and serotonergic(5HIAA) neurotransmitter systems in non-demented [33],depressive [34], and AD patients [6]. This assumption corre-sponds with our findings, as significant correlations werefound between CSF DOPAC and 5HIAA levels in not onlyAD but also AD1CVD and DLB patients. These resultspoint to a maintained coupling of both neurotransmitter sys-tems in AD, AD1CVD, and DLB. However, no correlationswere revealed in FTD patients, so the functional coupling
was not maintained in this diagnostic category. Apparently,the etiological properties of each of the different dementiasubtypes determine the metabolic outcome of both dopami-nergic and serotonergic neurotransmitter systems and thusthe coupling or uncoupling of these two normally coupledsystems. Although no correlations between HVA (notDOPAC) and 5HIAAwere observed in our study, DAmetab-olism in dementia patients most likely differs from normal[33] and depressive nondemented [34] control subjects; con-sequently, DOPAC instead of HVA correlated with 5HIAA.
Our results also showed significant correlations be-tween CSF DOPAC and NE levels in AD and AD1CVDpatients. Similarly, Engelborghs et al [6] found DOPAC–NE correlations in CSF of AD patients as well. Therefore,both findings suggest an interrelationship of dopaminergicand noradrenergic neurotransmitter systems in AD andAD1CVD.
4.4. Neurocognitive correlates of taurine in AD
In the AD patients, taurine correlated significantly withMMSE scores. Although several other correlations wereobserved as well, taurine emerges in the literature as beingthe most relevant amino acid of neurocognition in dementiaand senescence. Studies dealing with the neuromoleculareffects of taurine administration stressed that taurine exertsneuroprotective effects against b-amyloid peptide (Ab) for-mation [35,36], one of the hallmarks in AD etiology. Morespecifically, the neuroprotective effect of taurine issupposed to be mediated by GABAA-receptor activationafter which the neuronal vulnerability to the excitotoxicdamage caused by Ab significantly diminishes [35]. Tau-rine also correlated inversely with GDS scores of AD

Table 5
Significant correlations between CSF levels of NE and the different biogenic amine metabolites with behavioral data
AD (n 5 202) AD1CVD (n 5 37) FTD (n 5 32) DLB (n 5 26)
NE � Behave-AD cluster E: Diurnal
rhythm disturbances 0.184*
(n 5 183)
� Cornell Scale for Depression
0.166* (n 5 181)
� CMAI cluster 2: Physically
non-aggressive behavior 0.163*
(n 5 181)
� Behave-AD cluster C: Activity
disturbances 0.156* (n 5 183)
� CMAI total score 0.153* (n5 181)
� MFS total score 0.149* (n 5 183)
� Behave-AD cluster E: Diurnal
rhythm disturbances 0.457*
(n 5 30)
DOPAC � Behave-AD total score 20.194*
(n 5 174)
� Behave-AD cluster B: Hallucina-
tions 20.161* (n 5 174)
� Behave-AD cluster C: Activity
disturbances 20.156* (n 5 174)
� CMAI cluster 1: Aggressive
behavior 20.393* (n 5 30)
HVA � MFS total score
20.366* (n 5 37)
� Behave-AD cluster G:
Anxieties/phobias 0.470y
(n 5 32)
� Behave-AD cluster F:
Affective disturbances 0.417*
(n 5 32)
� Behave-AD cluster B:
Hallucinations20.554y (n5 26)
� Behave-AD total score 20.411*
(n 5 26)
� Behave-AD cluster F: Affective
disturbances 0.451* (n 5 26)
5HIAA � Behave-AD cluster G: Anxieties/
phobias 20.184y (n 5 202)
HVA/5HIAA � Behave-AD cluster G: Anxieties/
phobias 0.222y (n 5 202)
Correlation calculation was performed by means of Spearman’s rank-order statistics. Correlation coefficients (r values) are given. Bold text indicates cor-
relations remaining statistically significant after total Bonferroni correction.
Significance of the different correlations is as follows: *P , 0.05; yP , 0.01.
Y. Vermeiren et al. / Alzheimer’s & Dementia 9 (2013) 488–498 495
patients, which emphasizes the theory that taurineimproves or preserves cognitive functioning due to itsanti-Ab characteristics. Our assumption was supported byCsernansky et al [37], who found decreased CSF taurineconcentrations in AD patients with more advanced demen-tia symptoms and worsened neurocognitive function. Thisresult thus reflects that abundant taurine loss in moreadvanced AD stages may lead to increased global deterio-ration, including worsened cognitive deterioration.
4.5. Taurine and depression in AD
Taurine inversely and highly significantly correlated withCSDD scores of AD patients. Although ours is the firststudy to report altered CSF taurine levels in depressed ADpatients, animal studies already revealed several noteworthyfindings concerning taurine and depression. Li et al [38], forexample, examined significantly reduced taurine concentra-tions in prefrontal cortex of depression-like rat models. Inaddition, Murakami and Furuse [39] found that a taurine-supplemented diet had antidepressant-like effects in mice,whereas Whirley et al [40] concluded that taurine trials inmice demonstrated no antidepressant effect at all. In contrastto animal studies, taurine concentrations have also been an-alyzed in postmortem brain tissue and CSF of AD patients
[37,41,42]. Arai et al [41] found significantly decreasedtaurine concentrations in postmortem brains of AD patients,whereas Alom et al [42] and Csernansky et al [37] noteddecreased taurine in CSF. It was not investigated whetherthese patients suffered from depression. Nonetheless, thefrequently reoccurring importance of taurine in dementia-related and depression-related studies and the high signifi-cance (P , .0001) of this correlation implicate a potentiallyimportant role for taurine in the pathophysiology of depres-sion in AD. Confirmation of this finding in an independentstudy population is needed.
Except for depression scores, taurine also inversely cor-related with Behave-AD total scores in AD patients, indi-cating a broader role for taurine in BPSD. As describedearlier, taurine has important neuroprotective propertiesagainst b-amyloid peptide formation by activating GA-BAA-type receptors [35,36]. Similarly, psychotropicmedications, such as benzodiazepines, act on GABAA-type receptors [43] and are generally known to exert anxi-olytic and hypnotic/sedative effects. Therefore, taking intoaccount the behavioral outcome when GABAA-type recep-tor agonists are administered, taurine deficiency in AD pa-tients might possibly lead to a wide range of behavioralproblems due to a consequently inefficient GABAergicneurotransmission.

Y. Vermeiren et al. / Alzheimer’s & Dementia 9 (2013) 488–498496
4.6. Glutamate and verbally agitated behavior in FTD
Correlation statistics revealed a significantly inverse cor-relation between CSF levels of glutamate and verbally agi-tated behavior in FTD patients. Although ours is the firststudy to report on such a correlation in FTD, brain imagingstudies already presented an inverse association between an-terior cingulate cortex glutamate concentrations andsensation-seeking behavior in healthy individuals [44].The definition of sensation-seeking behavior, as describedby Gallinat et al [44], comprises “disinhibition” and “restlessreactions to a lack of stimulus variety,” two items that verywell resemble the individual items of CMAI cluster 3 (ver-bally agitated behavior) [23]. In contrast to the findings inFTD patients, Arai et al [38] also detected significantlylower glutamate concentrations in the temporal cortex ofpostmortem AD patients compared with histopathologicallyconfirmed controls. Unfortunately, they did not correlateglutamate levels with behavioral data as such. However,both earlier findings and our data suggest an importantrole for glutamate in general agitation and for glutamatergicdysfunction in neurodegenerative disorders such as AD andagitated FTD patients. The latter group was intensively ex-amined by Francis [15], who concluded that neurofibrillarytangle formation in glutamatergic pyramidal neurons offrontal and cingulate cortices leads to agitation and aggres-sion in neurodegenerative disorders.
4.7. HVA/5HIAA ratios and anxiety in AD
We suggested that the naturally occurring functional cou-pling between dopaminergic and serotonergic neurotrans-mitter systems in healthy humans [34] was maintainedin AD patients of our study population (reflected byDOPAC–5HIAA correlations). In addition, CSF HVA/5HIAA ratios correlated significantly with anxiety symp-toms in AD patients. Thus, as the effect of the serotonergicneurotransmitter system on dopaminergic neurotransmis-sion appears to be inhibitory [45], significantly increaseddopaminergic neurotransmitter activity as a result of ineffec-tive or decreased serotonergic inhibition may lead toanxiety-like behavior in AD. Studies supporting our findingsmainly examined behavior-modifying drugs, which provedto exert anxiolytic effects in AD patients by antagonizingdopaminergic (antipsychotics) [46] or stimulating serotoner-gic (antidepressants) [47] neurotransmission.
4.8. HVA and hallucinations in DLB
A significantly inverse correlation between CSF HVAlevels and hallucinations in DLB patients was found. Roselliet al [48] noted significant correlations between decreasedstriatal dopamine transporter (DAT) levels, indicatingdecreased DA reuptake followed by prolonged dopaminer-gic neurotransmitter activity between striatal neurons, andvisual hallucinations in DLB patients. Results were obtainedby means of in vivo single-photon emission CT dopamine
transporter (SPECT DAT) imaging with 123I-labeledligand N-d-(fluoropropyl)-2b-carbomethoxy-3b-(4-iodo-phenyl)-tropene, which reliably measured midbrain dopami-nergic dysfunction [49], in 18 DLB patients with a widerange of neuropsychiatric symptoms [48]. The same associ-ation between decreased DAT levels and hallucinations hasalso been reported in schizophrenic patients with a predomi-nantly positive syndrome type [50]. Moreover, Goldmanet al [51] demonstrated that therapeutic administration ofL-DOPA and other dopaminergic agonists increases therisk of psychosis to occur or even aggravate in DLB andParkinson patients. So, in general, combining our resultsshowing an inverse correlation between CSF HVA levelsand hallucinations in DLB patients with previous reportsof increased DA levels associated with aggravated psychosisin DLB or schizophrenic patients, a dysfunction of the en-zyme(s) that specifically regulate(s) the catabolic conversionof DA to DOPAC and/or from DA/DOPAC to HVA may beconsidered. Accordingly, Sweet et al [52] indicated thatgenetic variations of catechol-O-methyltransferase, whichconverts DOPAC into HVA or DA into 3-O-methyldop-amine, and consequently into HVA, can be associated withthe risk of psychosis in AD patients.
5. Conclusions
Our study has shown that not only biogenic amines andmetabolites but also amino acids are correlated with numer-ous behavioral symptoms in different types of dementia. Inparticular, taurine emerges as a significant amino acid thatmight be involved in depression in AD patients. Stronglysignificant findings may also suggest that reduced glutamatelevels could play an important role in verbally agitated FTDpatients and for imbalanced dopaminergic and serotonergicneurotransmitter systems to cause anxiety-like behavior inAD patients. Finally, reduced HVA levels were found to beinversely correlated with hallucinations in DLB patients.
Notably, we found that several neurotransmitter systemscan be linked to one specific behavioral syndrome. Further-more, it became clear that BPSD in dementia is as dependenton altered amino acid levels just as it is generally stated andknown to be dependent on deficits in dopaminergic, seroto-nergic, and noradrenergic neurotransmission. Althoughmost of our findings coincide indirectly with the literaturedata, this study is still the first to report on such correlationsin AD, FTD, and DLB patients.
Acknowledgments
This studywas supported by the Special Research Fund ofthe University of Antwerp, Stichting Alzheimer Onderzoek,the Thomas Riellaerts Research Fund, the Institute Born–Bunge, an agreement between the Institute Born–Bungeand the University of Antwerp, the central Biobank facilityof the Institute Born–Bunge/University of Antwerp, Neuro-search Antwerp, the Fund for Scientific Research—Flanders

Y. Vermeiren et al. / Alzheimer’s & Dementia 9 (2013) 488–498 497
(FWO-F), the Interuniversity Attraction Poles (IAP) Pro-gram P6/43 of the Belgian Federal Science Policy Office,and a Methusalem excellence grant from the FlemishGovernment, Belgium.
The authors have no conflicts of interest to disclose.
References
[1] Finkel SI, Costa e Silva J, Cohen G, Miller S, Sartorius N. Behavioral
and psychological signs and symptoms of dementia: a consensus state-
ment on current knowledge and implications for research and treat-
ment. Int Psychogeriatr 1996;8:497–500.
[2] Reisberg B, Borenstein J, Salob SP, Ferris SH, Franssen E,
Georgotas A. Behavioral symptoms in Alzheimer’s disease: Phenom-
enology and treatment. J Clin Psychiatry 1987;48:9–15.
[3] Weamer EA, Emanuel JE, Varon D, Miyahara S, Wilkosz PA,
Lopez OL, et al. The relationship of excess cognitive impairment in
MCI and early Alzheimer’s disease to the subsequent emergence of
psychosis. Int Psychogeriatr 2009;21:78–85.
[4] Finkel S. Introduction to behavioural and psychological symptoms of
dementia (BPSD). Int J Geriatr Psychiatry 2000;15:2–4.
[5] Beeri MS, Werner P, Davidson M, Noy S. The cost of behavioral and
psychological symptoms of dementia (BPSD) in community dwelling
Alzheimer’s disease patients. Int J Geriatr Psychiatry 2002;17:403–8.
[6] Engelborghs S, Vloeberghs E, Le Bastard N, Van Buggenhout M,
Mari€en P, Somers N, et al. The dopaminergic neurotransmitter system
is associated with aggression and agitation in frontotemporal demen-
tia. Neurochem Int 2008;52:1052–60.
[7] Herrmann N, Lanctot KL, Khan LR. The role of norepinephrine in the
behavioral and psychological symptoms of dementia. J Neuropsychi-
atry Clin Neurosci 2004;16:261–76.
[8] Matthews KL, Chen CP, Esiri MM, Keene J, Minger SL, Francis PT.
Noradrenergic changes, aggressive behavior, and cognition in patients
with dementia. Biol Psychiatry 2002;51:407–16.
[9] Lanari A, Amenta F, Silvestrelli G, Tomassoni D, Parnetti L. Neuro-
transmitter deficits in behavioural and psychological symptoms of
Alzheimer’s disease. Mech Ageing Dev 2006;127:158–65.
[10] Lanctot KL, Herrmann N, Mazzotta P. Role of serotonin in the behav-
ioral and psychological symptoms of dementia. J Neuropsychiatry
Clin Neurosci 2001;13:5–21.
[11] Garcia-Alloza M, Gil-Bea FJ, Diez-Ariza M, Chen CP, Francis PT,
Lasheras B, et al. Cholinergic–serotonergic imbalance contributes to
cognitive and behavioral symptoms in Alzheimer’s disease. Neuropsy-
chologia 2005;43:442–9.
[12] Engelborghs S, Marescau B, De Deyn PP. Amino acids and biogenic
amines in cerebrospinal fluid of patients with Parkinson’s disease.
Neurochem Res 2003;28:1145–50.
[13] Garcia-Alloza M, Tsang SW, Gil-Bea FJ, Francis PT, Lai MK,
Marcos B, et al. Involvement of the GABAergic system in depressive
symptoms of Alzheimer’s disease. Neurobiol Aging 2006;27:1110–7.
[14] Fekkes D, van der Cammen TJ, van Loon CP, Verschoor C, van
Harskamp F, de Koning I, et al. Abnormal amino acid metabolism in
patients with early stage Alzheimer dementia. J Neural Transm
1998;105:287–94.
[15] Francis PT. Altered glutamate neurotransmission and behaviour in de-
mentia: Evidence from studies of memantine. Curr Mol Pharmacol
2009;2:77–82.
[16] McKhann G, Drachman D, Folstein M, Katzman R, Price D,
Stadlan EM. Clinical diagnosis of Alzheimer’s disease: report of the
NINCDS-ADRDAWork Group under the auspices of Department of
Health and Human Services Task Force on Alzheimer’s Disease. Neu-
rology 1984;34:939–44.
[17] American Psychiatric Association. DSM-IV: Diagnostic and statistical
manual of mental disorders. Washington, DC: American Psychiatric
Association; 1994.
[18] Rom�an GC, Tatemichi TK, Erkinjuntti T, Cummings JL, Masdeu JC,
Garcia JH, et al. Vascular dementia: Diagnostic criteria for research
studies. Report of the NINDS-AIREN International Workshop. Neu-
rology 1993;43:250–60.
[19] Neary D, Snowden JS, Gustafson L, Passant U, Stuss D, Black S, et al.
Frontotemporal lobar degeneration: A consensus on clinical diagnostic
criteria. Neurology 1998;51:1546–54.
[20] McKeith IG, Galasko D, Kosaka K, Perry EK, Dickson DW,
Hansen LA, et al. Consensus guidelines for the clinical and patho-
logic diagnosis of dementia with Lewy bodies (DLB): Report of
the consortium on DLB international workshop. Neurology 1996;
47:1113–24.
[21] McKeith IG, Dickson DW, Lowe J, Emre M, O’Brien JT, Feldman H,
et al. Diagnosis and management of dementia with Lewy bodies: Third
report of the DLB Consortium. Neurology 2005;65:1863–72.
[22] De Deyn PP, Engelborghs S, Saerens J, Goeman J, Mari€en P,
Maertens K, et al. TheMiddelheim Frontality Score: A behavioural as-
sessment scale that discriminates frontotemporal dementia from Alz-
heimer’s disease. Int J Geriatr Psychiatry 2005;20:70–9.
[23] Cohen-Mansfield J, Marx MS, Rosenthal AS. A description of agita-
tion in a nursing home. J Gerontol 1989;44:77–84.
[24] Alexopoulos GS, Abrams RC, Young RC, Shamoian CA. Cornell
Scale for Depression in Dementia. Biol Psychiatry 1988;23:271–84.
[25] Reisberg B, Ferris SH, de LeonMJ, Crook T. The Global Deterioration
Scale for assessment of primary degenerative dementia. Am J Psychi-
atry 1982;139:1136–9.
[26] Cohen SA, Michaud DP. Synthesis of a fluorescent derivatizing re-
agent, 6-aminoquinolyl-N-hydroxysuccinimidyl carbamate, and its
application for the analysis of hydrolysate amino acids via high-
performance liquid chromatography. Anal Biochem 1993;
211:279–87.
[27] Yoshitake T, Kehr J, Yoshitake S, Fujino K, Nohta H, Yamaguchi M.
Determination of serotonin, noradrenaline, dopamine and their metab-
olites in rat brain extracts and microdialysis samples by column liquid
chromatography with fluorescence detection following derivatization
with benzylamine and 1,2-diphenylethylenediamine. J Chromatogr
B Anal Technol Biomed Life Sci 2004;807:177–83.
[28] Engelborghs S, Maertens K, Nagels G, Vloeberghs E, Mari€en P,
Symons A, et al. Neuropsychiatric symptoms of dementia: Cross-
sectional analysis from a prospective, longitudinal Belgian study. Int
J Geriatr Psychiatry 2005;20:1028–37.
[29] Engelborghs S, DeVreese K, Van de Casteele T, Vanderstichele H, Van
Everbroeck B, et al. Diagnostic performance of a CSF-biomarker
panel in autopsy-confirmed dementia. Neurobiol Aging 2008;
29:1143–59.
[30] Kandel ER, Schwartz JH, Jessell TM. Appendix C: Cerebrospinal
fluid: blood–brain barrier, brain edema, and hydrocephalus. In:
Rowland LP, Fink ME, Rubin L, eds. Principles of neural science.
3rd ed. East Norwalk, CT: Appleton & Lange; 1991. p. 1050–1.
[31] Nowak P, Kostrzewa RA, Skaba D, Kostrzewa RM. Acute L-DOPA ef-
fect on hydroxyl radical- and DOPAC-levels in striatal microdialysates
of parkinsonian rats. Neurotox Res 2010;17:299–304.
[32] Borah A, Mohanakumar KP. Long-term L-DOPA treatment causes in-
discriminate increase in dopamine levels at the cost of serotonin syn-
thesis in discrete brain regions of rats. Cell Mol Neurobiol 2007;
27:985–96.
[33] Geracioti TD Jr, Keck PE Jr, Ekhator NN, West SA, Baker DG,
Hill KK, et al. Continuous covariability of dopamine and serotonin
metabolites in human cerebrospinal fluid. Biol Psychiatry 1998;
44:228–33.
[34] Agren H, Mefford IN, Rudorfer MV, Linnoila M, Potter WZ. Interact-
ing neurotransmitter systems. A non-experimental approach to the
5HIAA–HVA correlation in human CSF. J Psychiatr Res 1986;
20:175–93.
[35] Louzada PR, Paula Lima AC, Mendonca-Silva DL, Noel F, De
Mello FG, Ferreira ST. Taurine prevents the neurotoxicity of beta-
amyloid and glutamate receptor agonists: activation of GABA

Y. Vermeiren et al. / Alzheimer’s & Dementia 9 (2013) 488–498498
receptors and possible implications for Alzheimer’s disease and other
neurological disorders. FASEB J 2004;18:511–8.
[36] Santa-Maria I, Hernandez F, Moreno FJ, Avila J. Taurine, an inducer
for tau polymerization and a weak inhibitor for amyloid-beta-
peptide aggregation. Neurosci Lett 2007;429:91–4.
[37] Csernansky JG, Bardgett ME, Sheline YI, Morris JC, Olney JW. CSF
excitatory amino acids and severity of illness in Alzheimer’s disease.
Neurology 1996;46:1715–20.
[38] Li CX, Wang Y, Gao H, Pan WJ, Xiang Y, Huang M, et al. Cerebral
metabolic changes in a depression-like rat model of chronic forced
swimming studied by ex vivo high resolution 1H magnetic resonance
spectroscopy. Neurochem Res 2008;33:2342–9.
[39] Murakami T, Furuse M. The impact of taurine- and beta-alanine-
supplemented diets on behavioral and neurochemical parameters in
mice: Antidepressant versus anxiolytic-like effects. Amino Acids
2010;39:427–34.
[40] Whirley BK, Einat H. Taurine trials in animal models offer no support
for anxiolytic, antidepressant or stimulant effects. Isr J Psychiatry Re-
lat Sci 2008;45:11–8.
[41] Arai H, Kobayashi K, Ichimiya Y, Kosaka K, Iizuka R. A preliminary
study of free amino acids in the postmortem temporal cortex from
Alzheimer-type dementia patients. Neurobiol Aging 1984;5:319–21.
[42] Alom J, Mahy JN, Brandi N, Tolosa E. Cerebrospinal fluid taurine in
Alzheimer’s disease. Ann Neurol 1991;30:735.
[43] Walters RJ, Hadley SH, Morris KD, Amin J. Benzodiazepines act on
GABAA receptors via two distinct and separable mechanisms. Nat
Neurosci 2000;3:1274–81.
[44] Gallinat J, Kunz D, Lang UE, Neu P, Kassim N, Kienast T, et al. As-
sociation between cerebral glutamate and human behaviour: The sen-
sation seeking personality trait. Neuroimage 2007;34:671–8.
[45] Kelland MD, Freeman AS, Chiodo LA. Serotonergic afferent regula-
tion of the basic physiology and pharmacological responsiveness of ni-
grostriatal dopamine neurons. J Pharmacol Exp Ther 1990;
253:803–11.
[46] Suh GH, Greenspan AJ, Choi SK. Comparative efficacy of risperidone
versus haloperidol on behavioural and psychological symptoms of de-
mentia. Int J Geriatr Psychiatry 2007;22:494–5.
[47] Nyth AL, Gottfries CG. The clinical efficacy of citalopram in treat-
ment of emotional disturbances in dementia disorders. ANordic multi-
centre study. Br J Psychiatry 1990;157:894–901.
[48] Roselli F, Pisciotta NM, Perneczky R, Pennelli M, Aniello MS, De
Caro MF, et al. Severity of neuropsychiatric symptoms and dopamine
transporter levels in dementia with Lewy bodies: A 123I-FP-CIT
SPECT study. Mov Disord 2009;24:2097–103.
[49] O’Brien JT, Colloby S, Fenwick J, Williams ED, Firbank M, Burn D,
et al. Dopamine transporter loss visualized with FP-CIT SPECT in the
differential diagnosis of dementia with Lewy bodies. Arch Neurol
2004;61:919–25.
[50] Schmitt GJ, Frodl T, Dresel S, la Foug�ere C, Bottlender R,
Koutsouleris N, et al. Striatal dopamine transporter availability is asso-
ciated with the productive psychotic state in first episode, drug-naive
schizophrenic patients. Eur Arch Psychiatry Clin Neurosci 2006;
256:115–21.
[51] Goldman JG, Goetz CG, BrandaburM, SanfilippoM, Stebbins GT. Ef-
fects of dopaminergic medications on psychosis and motor function in
dementia with Lewy bodies. Mov Disord 2008;23:2248–50.
[52] Sweet RA, Devlin B, Pollock BG, Sukonick DL, Kastango KB,
Bacanu SA, et al. Catechol-O-methyltransferase haplotypes are asso-
ciated with psychosis in Alzheimer disease. Mol Psychiatry 2005;
10:1026–36.


