Embed Size (px)
Citation preview
Refer to important disclosures at the end of this report
ed: TH/ sa: WMT, CW, CS
BUY (upgrade from HOLD)
Last Traded Price ( 6 Dec 2018): RM2.10 (KLCI : 1,683.34)
Price Target 12-mth: RM2.45 (17% upside) (Prev RM2.30) Analyst King Yoong CHEAH +60 32604 3908 [email protected] Abdul Azim Muhthar +60 32604 3967 [email protected]
What’s New Expecting to benefit from crackdown on illegal NFOs
Earnings risks from its Philippine operations being
addressed for now
Attractive dividend yield of >7%
Upgrade to BUY with a higher TP of RM2.45
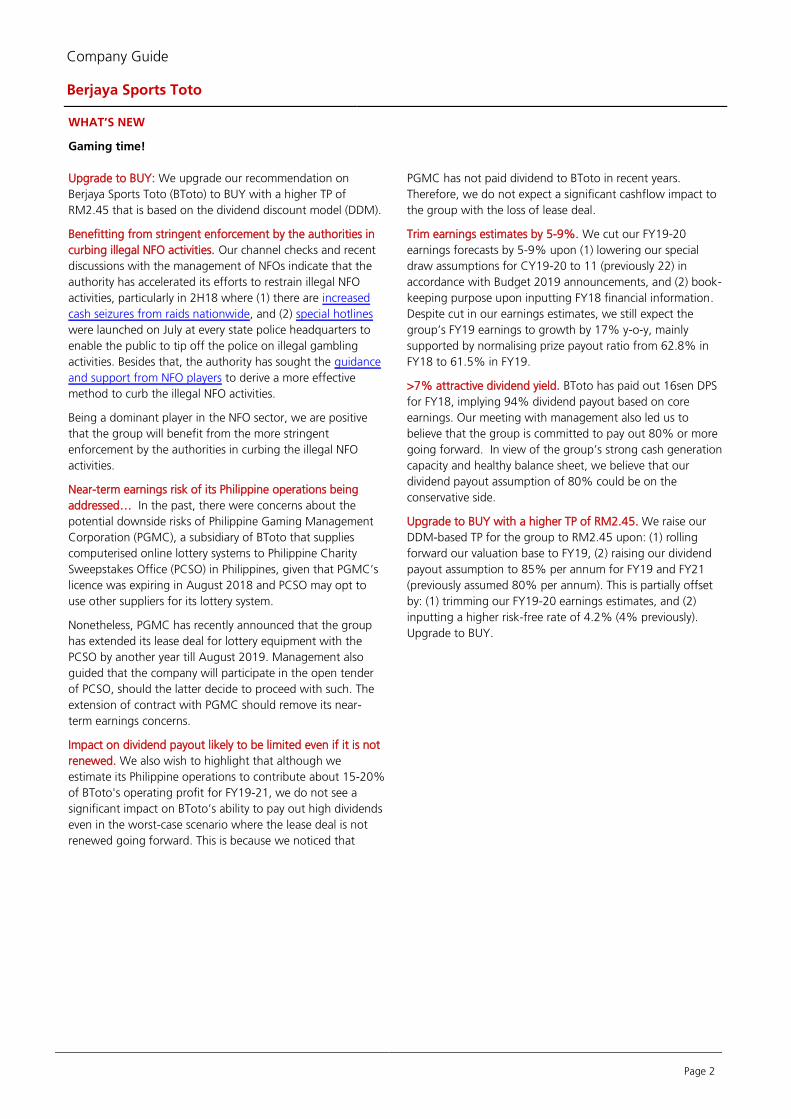
Price Relative
Forecasts and Valuation FY Apr (RMm) 2018A 2019F 2020F 2021F
Revenue 5,661 5,537 5,468 5,545 EBITDA 426 465 452 456 Pre-tax Profit 377 420 411 416 Net Profit 230 267 262 265 Net Pft (Pre Ex.) 228 267 262 265 Net Pft Gth (Pre-ex) (%) (7.9) 17.3 (2.0) 1.3 EPS (sen) 17.1 20.0 19.6 19.8 EPS Pre Ex. (sen) 17.0 20.0 19.6 19.8 EPS Gth Pre Ex (%) (8) 17 (2) 1 Diluted EPS (sen) 17.0 20.0 19.6 19.8 Net DPS (sen) 16.0 16.8 16.5 16.7 BV Per Share (sen) 54.6 57.8 60.8 64.0 PE (X) 12.2 10.5 10.7 10.6 PE Pre Ex. (X) 12.3 10.5 10.7 10.6 P/Cash Flow (X) 9.0 9.1 9.4 9.3 EV/EBITDA (X) 8.5 7.7 7.8 7.7 Net Div Yield (%) 7.6 8.0 7.8 7.9 P/Book Value (X) 3.8 3.6 3.5 3.3 Net Debt/Equity (X) 0.9 0.9 0.7 0.7 ROAE (%) 30.6 35.5 33.0 31.7 Earnings Rev (%): (5) (9) N/A Consensus EPS (sen): 21.3 21.1 21.4 Other Broker Recs: B: 2 S: 2 H: 6
Source of all data on this page: Company, AllianceDBS, Bloomberg Finance L.P
Time to chip in!
Turning positive. We upgrade our recommendation on Berjaya
Sports Toto (BToto) to BUY with a higher TP of RM2.45, which
is based on the dividend discount model (DDM). We are positive
that the group will benefit from the more stringent
enforcement by the authorities in curbing the activities of illegal
number forecast operators (NFOs). The extension of its lease
deal for lottery equipment with the Philippine Charity
Sweepstakes Office (PCSO) by another year should also address
its near-term earnings risks. We believe the stock’s attractive
dividend yield of >7% will continue to support its share price.
Where we differ: A more positive stance than consensus. Our
TP is higher than consensus as we have adopted a more
aggressive valuation basis. We believe that the market has
underappreciated the intensified efforts by the authority to curb
the illegal NFO activities. Furthermore, an attractive dividend
yield of >7% will continue to support its share price.
Potential catalysts. Higher-than-expected ticket sales. Higher-
than-expected ticket sales due to (1) intensified efforts by the
authority to curb the activities of illegal NFOs, (2) successful
launch of new game variants, and (3) stronger-than-expected
recovery in consumer sentiment. Valuation:
We upgrade our recommendation for the group to BUY with a
higher DDM-based TP of RM2.45.
Key Risks to Our View:
Steeper-than-expected decline in ticket sales on intensifying
competition from illegal NFOs and weaker consumer
sentiment. At A Glance Issued Capital (m shrs) 1,347
Mkt. Cap (RMm/US$m) 2,829 / 681
Major Shareholders (%)
Tan Sri Vincent Tan 49.2
Free Float (%)
3m Avg. Daily Val (US$m) 0.70
ICB Industry : Consumer Services / Travel & Leisure
AllianceDBS Research, Malaysia Equity
7 Dec 2018
Company Guide
Berjaya Sports Toto Version 8 | Bloomberg: BST MK | Reuters: BSTB.KL
Refer to important disclosures at the end of this report
50
70
90
110
130
150
170
190
210
1.8
2.3
2.8
3.3
3.8
Dec-14 Dec-15 Dec-16 Dec-17 Dec-18
Relative IndexRM
Berjaya Sports Toto (LHS) Relative KLCI (RHS)
Page 2
Company Guide
Berjaya Sports Toto
WHAT’S NEW
Gaming time!
Upgrade to BUY: We upgrade our recommendation on
Berjaya Sports Toto (BToto) to BUY with a higher TP of
RM2.45 that is based on the dividend discount model (DDM).
Benefitting from stringent enforcement by the authorities in
curbing illegal NFO activities. Our channel checks and recent
discussions with the management of NFOs indicate that the
authority has accelerated its efforts to restrain illegal NFO
activities, particularly in 2H18 where (1) there are increased
cash seizures from raids nationwide, and (2) special hotlines
were launched on July at every state police headquarters to
enable the public to tip off the police on illegal gambling
activities. Besides that, the authority has sought the guidance
and support from NFO players to derive a more effective
method to curb the illegal NFO activities.
Being a dominant player in the NFO sector, we are positive
that the group will benefit from the more stringent
enforcement by the authorities in curbing the illegal NFO
activities.
Near-term earnings risk of its Philippine operations being
addressed… In the past, there were concerns about the
potential downside risks of Philippine Gaming Management
Corporation (PGMC), a subsidiary of BToto that supplies
computerised online lottery systems to Philippine Charity
Sweepstakes Office (PCSO) in Philippines, given that PGMC’s
licence was expiring in August 2018 and PCSO may opt to
use other suppliers for its lottery system.
Nonetheless, PGMC has recently announced that the group
has extended its lease deal for lottery equipment with the
PCSO by another year till August 2019. Management also
guided that the company will participate in the open tender
of PCSO, should the latter decide to proceed with such. The
extension of contract with PGMC should remove its near-
term earnings concerns.
Impact on dividend payout likely to be limited even if it is not
renewed. We also wish to highlight that although we
estimate its Philippine operations to contribute about 15-20%
of BToto's operating profit for FY19-21, we do not see a
significant impact on BToto’s ability to pay out high dividends
even in the worst-case scenario where the lease deal is not
renewed going forward. This is because we noticed that
PGMC has not paid dividend to BToto in recent years.
Therefore, we do not expect a significant cashflow impact to
the group with the loss of lease deal.
Trim earnings estimates by 5-9%. We cut our FY19-20
earnings forecasts by 5-9% upon (1) lowering our special
draw assumptions for CY19-20 to 11 (previously 22) in
accordance with Budget 2019 announcements, and (2) book-
keeping purpose upon inputting FY18 financial information.
Despite cut in our earnings estimates, we still expect the
group’s FY19 earnings to growth by 17% y-o-y, mainly
supported by normalising prize payout ratio from 62.8% in
FY18 to 61.5% in FY19.
>7% attractive dividend yield. BToto has paid out 16sen DPS
for FY18, implying 94% dividend payout based on core
earnings. Our meeting with management also led us to
believe that the group is committed to pay out 80% or more
going forward. In view of the group’s strong cash generation
capacity and healthy balance sheet, we believe that our
dividend payout assumption of 80% could be on the
conservative side.
Upgrade to BUY with a higher TP of RM2.45. We raise our
DDM-based TP for the group to RM2.45 upon: (1) rolling
forward our valuation base to FY19, (2) raising our dividend
payout assumption to 85% per annum for FY19 and FY21
(previously assumed 80% per annum). This is partially offset
by: (1) trimming our FY19-20 earnings estimates, and (2)
inputting a higher risk-free rate of 4.2% (4% previously).
Upgrade to BUY.
Page 3
Company Guide
Berjaya Sports Toto
CRITICAL DATA POINTS TO WATCH
Critical Factors
Ticket sales and prize payout ratio. As one of only three legal
number forecast operators (NFOs) – the other two are Magnum
and Da Ma Cai in Malaysia – BToto’s earnings are largely
determined by its ticket sales and prize payout ratio.
Gaming revenue expected to decline this year. The earnings
prospects for the NFOs remain challenging, dragged by (1) slow
discretionary consumer spending, (2) intense competition from
illegal operators, and (3) regulatory risks.
Luck factor – prize payout ratio. The group’s earnings also move
along with the prize payout ratio. A substantial deviation from its
theoretical prize payout ratio of 61% will have a significant impact
on reported earnings and our earnings forecasts.
Contribution from car dealership remains relatively small. To
diversify its income base, the group increased its stake in HR Owen,
a franchise motor vehicle dealership in the UK, to 72% in 2013.
Nonetheless, profit contribution from HR Owen will remain
relatively small at <10% for FY18.
Earnings booster – new game variants. The group's ability to
introduce successful new game variants (such as Toto 4D Jackpot
and lotto games) will be a key earnings booster. But this is subject
to (1) authority approvals, and (2) popularity of the game variants.
Such game variants will help the group to expand its market share
in the legitimate market and induce punters to shift from illegal
operators to the legitimate NFOs.
Although there is no official estimate of the size of the illegal
market, we believe it to be 2- 3x that of the legal NFO market.
Nonetheless, the illegal market is highly fragmented (though larger
in size), which prevents them from introducing similar jackpot and
lotto games, which come with low betting fees and high prize
payouts.
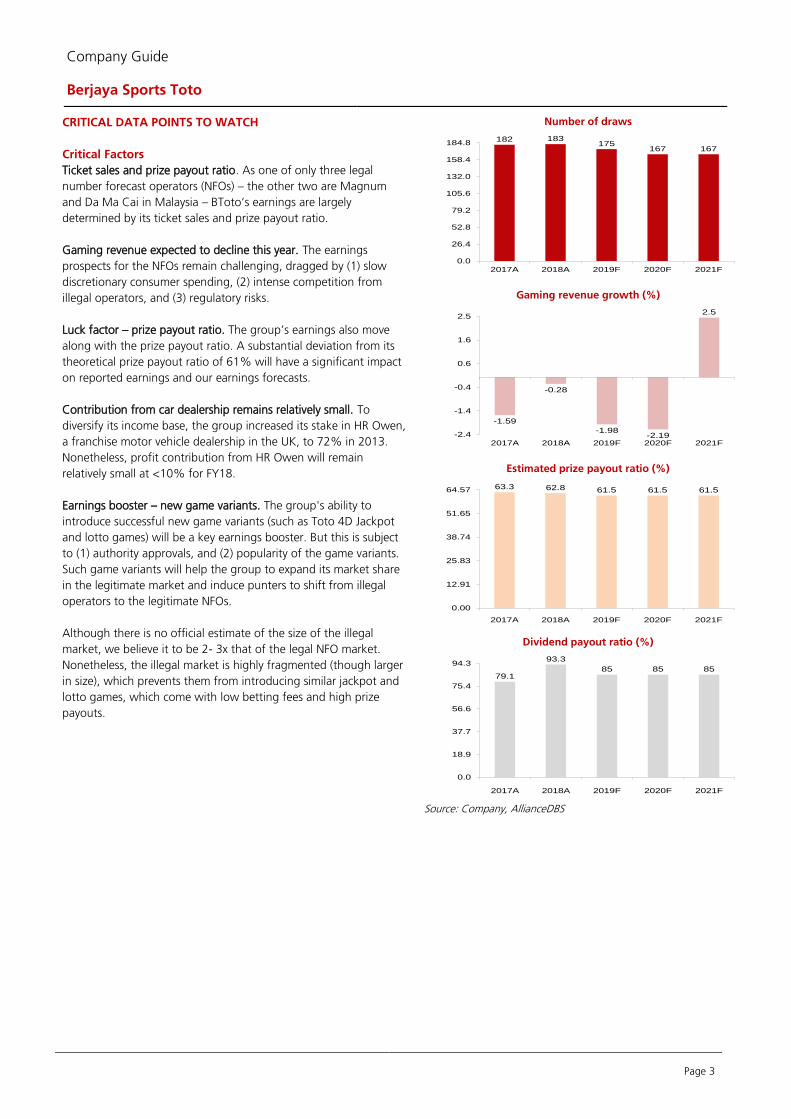
Number of draws
Gaming revenue growth (%)
Estimated prize payout ratio (%)
Dividend payout ratio (%)
Source: Company, AllianceDBS
182 183175
167 167
0.0
26.4
52.8
79.2
105.6
132.0
158.4
184.8
2017A 2018A 2019F 2020F 2021F
-1.59
-0.28
-1.98-2.19
2.5
-2.4
-1.4
-0.4
0.6
1.6
2.5
2017A 2018A 2019F 2020F 2021F
63.3 62.8 61.5 61.5 61.5
0.00
12.91
25.83
38.74
51.65
64.57
2017A 2018A 2019F 2020F 2021F
79.1
93.3
85 85 85
0.0
18.9
37.7
56.6
75.4
94.3
2017A 2018A 2019F 2020F 2021F
Page 4
Company Guide
Berjaya Sports Toto
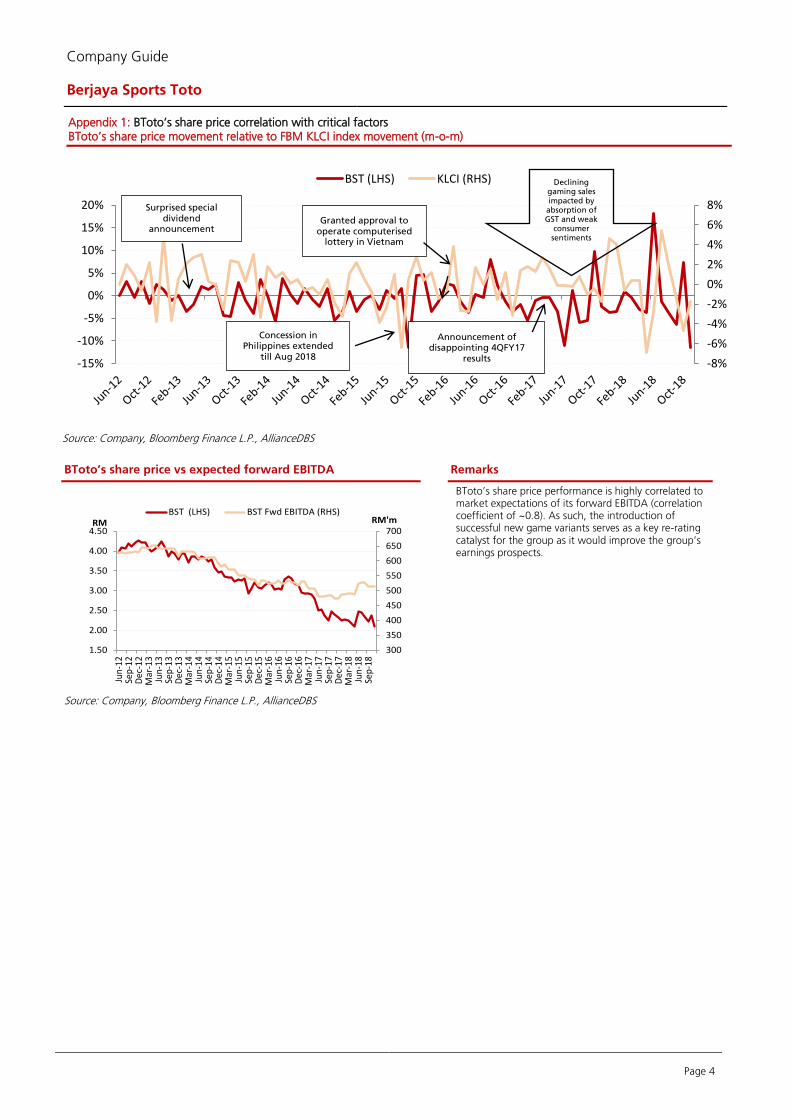
Appendix 1: BToto’s share price correlation with critical factors BToto’s share price movement relative to FBM KLCI index movement (m-o-m)
Source: Company, Bloomberg Finance L.P., AllianceDBS
BToto’s share price vs expected forward EBITDA Remarks
BToto’s share price performance is highly correlated to market expectations of its forward EBITDA (correlation coefficient of ~0.8). As such, the introduction of successful new game variants serves as a key re-rating catalyst for the group as it would improve the group’s earnings prospects.
Source: Company, Bloomberg Finance L.P., AllianceDBS
-8%
-6%
-4%
-2%
0%
2%
4%
6%
8%
-15%
-10%
-5%
0%
5%
10%
15%
20%
BST (LHS) KLCI (RHS)
300
350
400
450
500
550
600
650
700
1.50
2.00
2.50
3.00
3.50
4.00
4.50
Jun
-12
Sep
-12
Dec
-12
Mar
-13
Jun
-13
Sep
-13
Dec
-13
Mar
-14
Jun
-14
Sep
-14
Dec
-14
Mar
-15
Jun
-15
Sep
-15
Dec
-15
Mar
-16
Jun
-16
Sep
-16
Dec
-16
Mar
-17
Jun
-17
Sep
-17
Dec
-17
Mar
-18
Jun
-18
Sep
-18
RM'mRMBST (LHS) BST Fwd EBITDA (RHS)
Concession in Philippines extended
till Aug 2018
Surprised special dividend
announcement
Declining gaming sales impacted by
absorption of GST and weak
consumer sentiments
Announcement of disappointing 4QFY17
results
Granted approval to operate computerised
lottery in Vietnam
Page 5
Company Guide
Berjaya Sports Toto
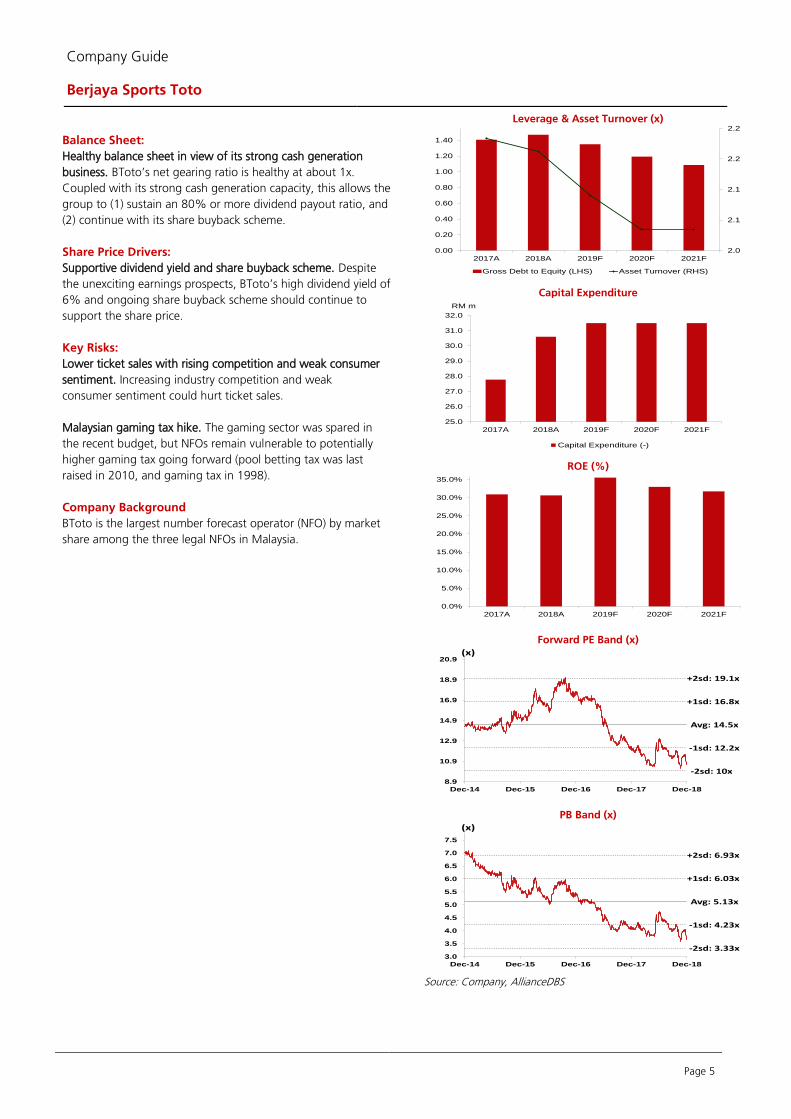
Balance Sheet:
Healthy balance sheet in view of its strong cash generation
business. BToto’s net gearing ratio is healthy at about 1x.
Coupled with its strong cash generation capacity, this allows the
group to (1) sustain an 80% or more dividend payout ratio, and
(2) continue with its share buyback scheme.
Share Price Drivers:
Supportive dividend yield and share buyback scheme. Despite
the unexciting earnings prospects, BToto’s high dividend yield of
6% and ongoing share buyback scheme should continue to
support the share price.
Key Risks:
Lower ticket sales with rising competition and weak consumer
sentiment. Increasing industry competition and weak
consumer sentiment could hurt ticket sales.
Malaysian gaming tax hike. The gaming sector was spared in
the recent budget, but NFOs remain vulnerable to potentially
higher gaming tax going forward (pool betting tax was last
raised in 2010, and gaming tax in 1998).
Company Background
BToto is the largest number forecast operator (NFO) by market
share among the three legal NFOs in Malaysia.
Leverage & Asset Turnover (x)
Capital Expenditure
ROE (%)
Forward PE Band (x)
PB Band (x)
Source: Company, AllianceDBS
2.0
2.1
2.1
2.2
2.2
0.00
0.20
0.40
0.60
0.80
1.00
1.20
1.40
2017A 2018A 2019F 2020F 2021F
Gross Debt to Equity (LHS) Asset Turnover (RHS)
25.0
26.0
27.0
28.0
29.0
30.0
31.0
32.0
2017A 2018A 2019F 2020F 2021F
Capital Expenditure (-)
RM m
0.0%
5.0%
10.0%
15.0%
20.0%
25.0%
30.0%
35.0%
2017A 2018A 2019F 2020F 2021F
Avg: 14.5x
+1sd: 16.8x
+2sd: 19.1x
-1sd: 12.2x
-2sd: 10x
8.9
10.9
12.9
14.9
16.9
18.9
20.9
Dec-14 Dec-15 Dec-16 Dec-17 Dec-18
(x)
Avg: 5.13x
+1sd: 6.03x
+2sd: 6.93x
-1sd: 4.23x
-2sd: 3.33x3.0
3.5
4.0
4.5
5.0
5.5
6.0
6.5
7.0
7.5
Dec-14 Dec-15 Dec-16 Dec-17 Dec-18
(x)
Page 6
Company Guide
Berjaya Sports Toto
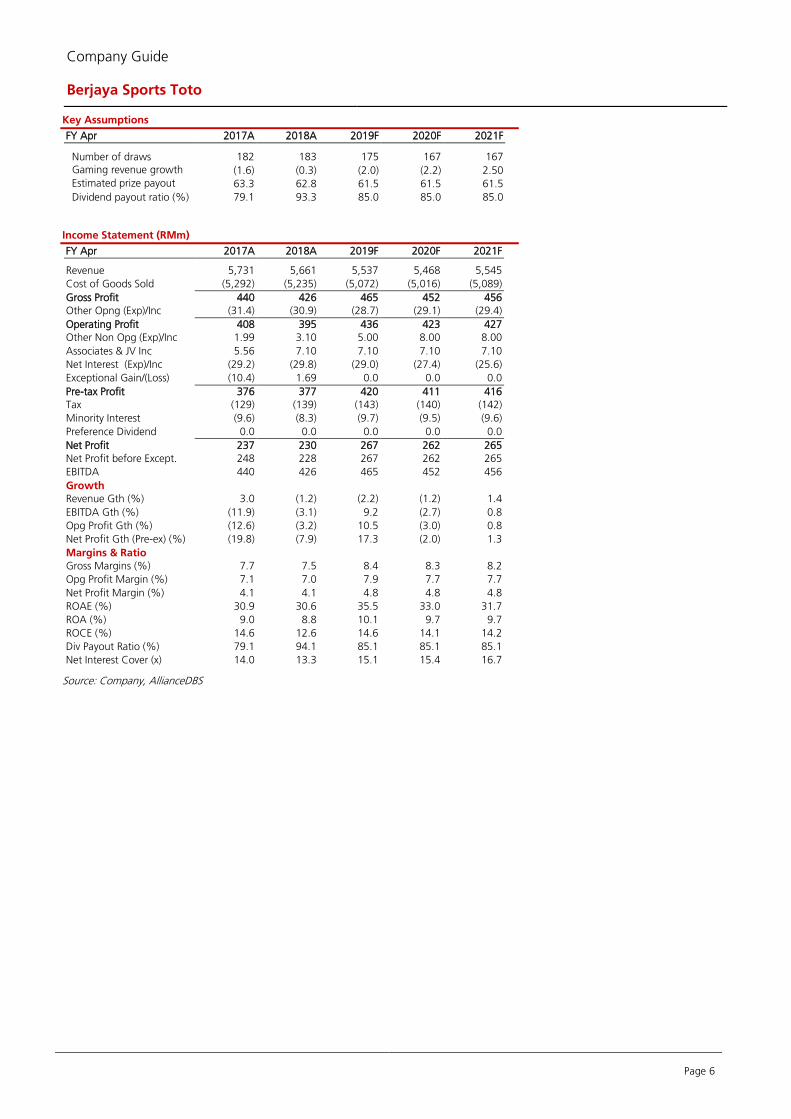
Key Assumptions
FY Apr 2017A 2018A 2019F 2020F 2021F
Number of draws 182 183 175 167 167
Gaming revenue growth (%)
(1.6) (0.3) (2.0) (2.2) 2.50 Estimated prize payout ratio (%)
63.3 62.8 61.5 61.5 61.5
Dividend payout ratio (%) 79.1 93.3 85.0 85.0 85.0
Income Statement (RMm)
FY Apr 2017A 2018A 2019F 2020F 2021F
Revenue 5,731 5,661 5,537 5,468 5,545
Cost of Goods Sold (5,292) (5,235) (5,072) (5,016) (5,089)
Gross Profit 440 426 465 452 456
Other Opng (Exp)/Inc (31.4) (30.9) (28.7) (29.1) (29.4)
Operating Profit 408 395 436 423 427
Other Non Opg (Exp)/Inc 1.99 3.10 5.00 8.00 8.00
Associates & JV Inc 5.56 7.10 7.10 7.10 7.10
Net Interest (Exp)/Inc (29.2) (29.8) (29.0) (27.4) (25.6)
Exceptional Gain/(Loss) (10.4) 1.69 0.0 0.0 0.0
Pre-tax Profit 376 377 420 411 416
Tax (129) (139) (143) (140) (142)
Minority Interest (9.6) (8.3) (9.7) (9.5) (9.6)
Preference Dividend 0.0 0.0 0.0 0.0 0.0
Net Profit 237 230 267 262 265
Net Profit before Except. 248 228 267 262 265
EBITDA 440 426 465 452 456
Growth
Revenue Gth (%) 3.0 (1.2) (2.2) (1.2) 1.4
EBITDA Gth (%) (11.9) (3.1) 9.2 (2.7) 0.8
Opg Profit Gth (%) (12.6) (3.2) 10.5 (3.0) 0.8
Net Profit Gth (Pre-ex) (%) (19.8) (7.9) 17.3 (2.0) 1.3
Margins & Ratio
Gross Margins (%) 7.7 7.5 8.4 8.3 8.2
Opg Profit Margin (%) 7.1 7.0 7.9 7.7 7.7
Net Profit Margin (%) 4.1 4.1 4.8 4.8 4.8
ROAE (%) 30.9 30.6 35.5 33.0 31.7
ROA (%) 9.0 8.8 10.1 9.7 9.7
ROCE (%) 14.6 12.6 14.6 14.1 14.2
Div Payout Ratio (%) 79.1 94.1 85.1 85.1 85.1
Net Interest Cover (x) 14.0 13.3 15.1 15.4 16.7
Source: Company, AllianceDBS
Page 7
Company Guide
Berjaya Sports Toto
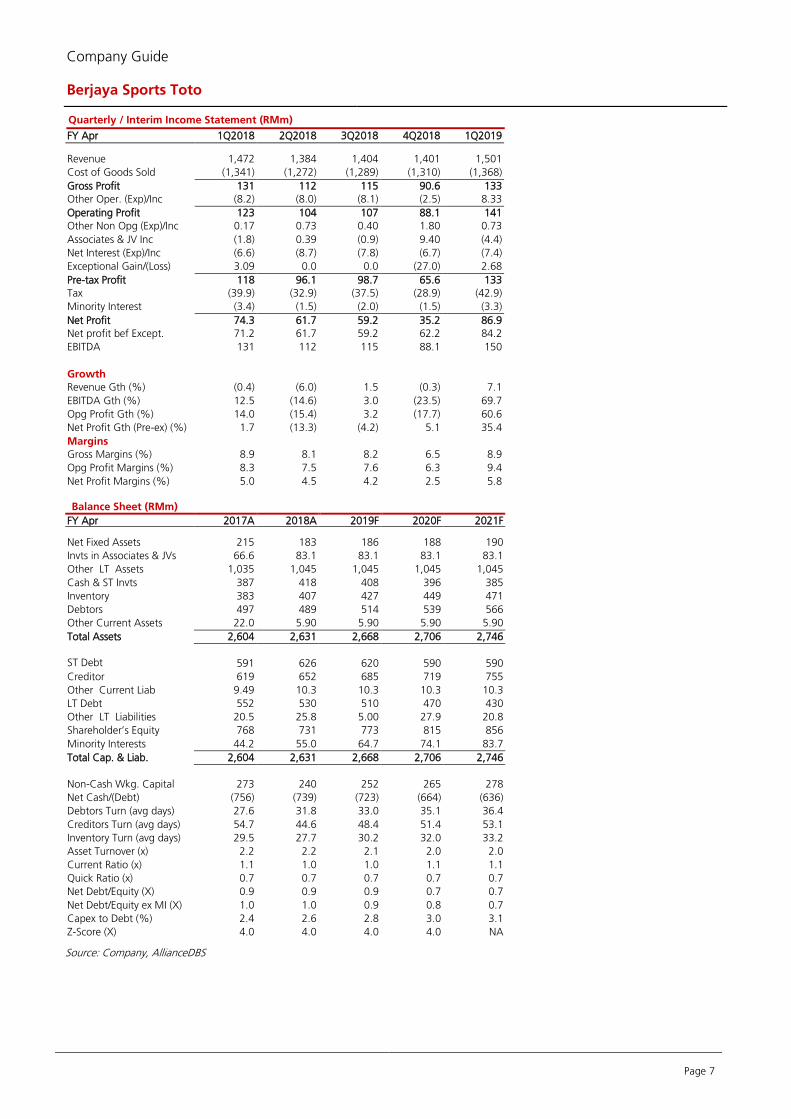
Quarterly / Interim Income Statement (RMm)
FY Apr 1Q2018 2Q2018 3Q2018 4Q2018 1Q2019
Revenue 1,472 1,384 1,404 1,401 1,501
Cost of Goods Sold (1,341) (1,272) (1,289) (1,310) (1,368)
Gross Profit 131 112 115 90.6 133
Other Oper. (Exp)/Inc (8.2) (8.0) (8.1) (2.5) 8.33
Operating Profit 123 104 107 88.1 141
Other Non Opg (Exp)/Inc 0.17 0.73 0.40 1.80 0.73
Associates & JV Inc (1.8) 0.39 (0.9) 9.40 (4.4)
Net Interest (Exp)/Inc (6.6) (8.7) (7.8) (6.7) (7.4)
Exceptional Gain/(Loss) 3.09 0.0 0.0 (27.0) 2.68
Pre-tax Profit 118 96.1 98.7 65.6 133
Tax (39.9) (32.9) (37.5) (28.9) (42.9)
Minority Interest (3.4) (1.5) (2.0) (1.5) (3.3)
Net Profit 74.3 61.7 59.2 35.2 86.9
Net profit bef Except. 71.2 61.7 59.2 62.2 84.2
EBITDA 131 112 115 88.1 150
Growth
Revenue Gth (%) (0.4) (6.0) 1.5 (0.3) 7.1
EBITDA Gth (%) 12.5 (14.6) 3.0 (23.5) 69.7
Opg Profit Gth (%) 14.0 (15.4) 3.2 (17.7) 60.6
Net Profit Gth (Pre-ex) (%) 1.7 (13.3) (4.2) 5.1 35.4
Margins
Gross Margins (%) 8.9 8.1 8.2 6.5 8.9
Opg Profit Margins (%) 8.3 7.5 7.6 6.3 9.4
Net Profit Margins (%) 5.0 4.5 4.2 2.5 5.8
Balance Sheet (RMm)
FY Apr 2017A 2018A 2019F 2020F 2021F Net Fixed Assets 215 183 186 188 190
Invts in Associates & JVs 66.6 83.1 83.1 83.1 83.1
Other LT Assets 1,035 1,045 1,045 1,045 1,045
Cash & ST Invts 387 418 408 396 385
Inventory 383 407 427 449 471
Debtors 497 489 514 539 566
Other Current Assets 22.0 5.90 5.90 5.90 5.90
Total Assets 2,604 2,631 2,668 2,706 2,746
ST Debt
591 626 620 590 590
Creditor 619 652 685 719 755
Other Current Liab 9.49 10.3 10.3 10.3 10.3
LT Debt 552 530 510 470 430
Other LT Liabilities 20.5 25.8 5.00 27.9 20.8
Shareholder’s Equity 768 731 773 815 856
Minority Interests 44.2 55.0 64.7 74.1 83.7
Total Cap. & Liab. 2,604 2,631 2,668 2,706 2,746
Non-Cash Wkg. Capital 273 240 252 265 278
Net Cash/(Debt) (756) (739) (723) (664) (636)
Debtors Turn (avg days) 27.6 31.8 33.0 35.1 36.4
Creditors Turn (avg days) 54.7 44.6 48.4 51.4 53.1
Inventory Turn (avg days) 29.5 27.7 30.2 32.0 33.2
Asset Turnover (x) 2.2 2.2 2.1 2.0 2.0
Current Ratio (x) 1.1 1.0 1.0 1.1 1.1
Quick Ratio (x) 0.7 0.7 0.7 0.7 0.7
Net Debt/Equity (X) 0.9 0.9 0.9 0.7 0.7
Net Debt/Equity ex MI (X) 1.0 1.0 0.9 0.8 0.7
Capex to Debt (%) 2.4 2.6 2.8 3.0 3.1
Z-Score (X) 4.0 4.0 4.0 4.0 NA
Source: Company, AllianceDBS
Page 8
Company Guide
Berjaya Sports Toto
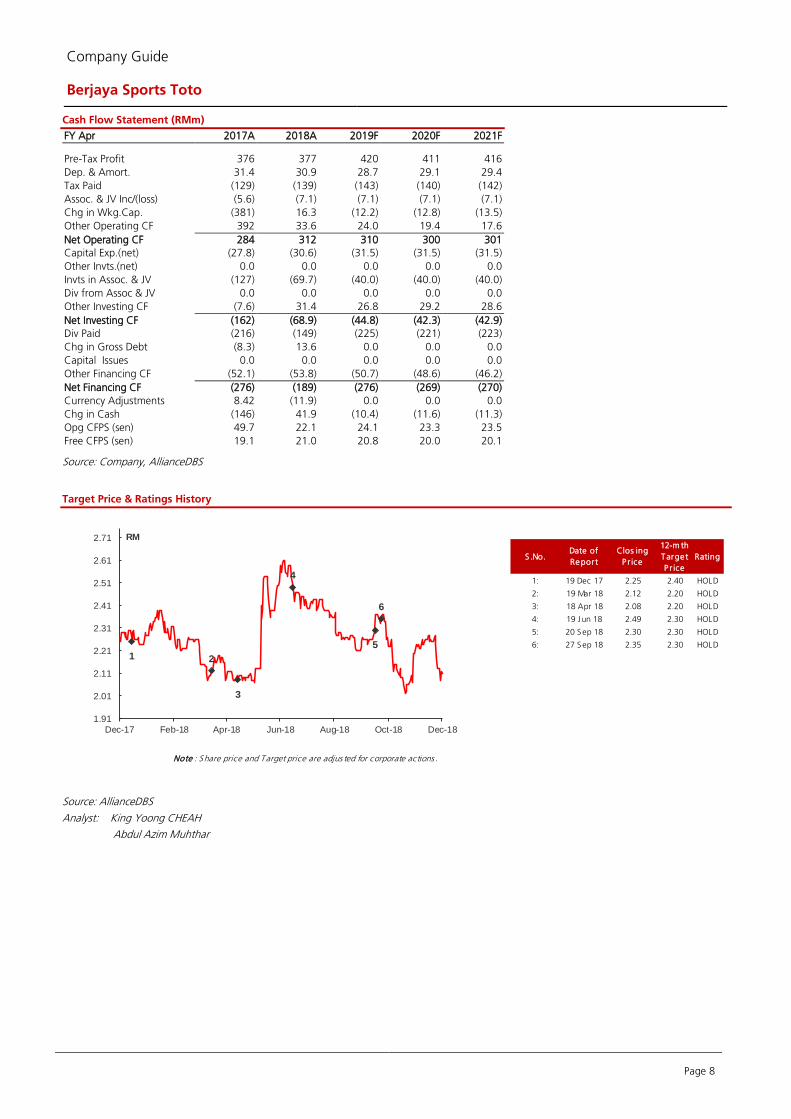
Cash Flow Statement (RMm)
FY Apr 2017A 2018A 2019F 2020F 2021F
Pre-Tax Profit 376 377 420 411 416
Dep. & Amort. 31.4 30.9 28.7 29.1 29.4
Tax Paid (129) (139) (143) (140) (142)
Assoc. & JV Inc/(loss) (5.6) (7.1) (7.1) (7.1) (7.1)
Chg in Wkg.Cap. (381) 16.3 (12.2) (12.8) (13.5)
Other Operating CF 392 33.6 24.0 19.4 17.6
Net Operating CF 284 312 310 300 301
Capital Exp.(net) (27.8) (30.6) (31.5) (31.5) (31.5)
Other Invts.(net) 0.0 0.0 0.0 0.0 0.0
Invts in Assoc. & JV (127) (69.7) (40.0) (40.0) (40.0)
Div from Assoc & JV 0.0 0.0 0.0 0.0 0.0
Other Investing CF (7.6) 31.4 26.8 29.2 28.6
Net Investing CF (162) (68.9) (44.8) (42.3) (42.9)
Div Paid (216) (149) (225) (221) (223)
Chg in Gross Debt (8.3) 13.6 0.0 0.0 0.0
Capital Issues 0.0 0.0 0.0 0.0 0.0
Other Financing CF (52.1) (53.8) (50.7) (48.6) (46.2)
Net Financing CF (276) (189) (276) (269) (270)
Currency Adjustments 8.42 (11.9) 0.0 0.0 0.0
Chg in Cash (146) 41.9 (10.4) (11.6) (11.3)
Opg CFPS (sen) 49.7 22.1 24.1 23.3 23.5
Free CFPS (sen) 19.1 21.0 20.8 20.0 20.1
Source: Company, AllianceDBS
Target Price & Ratings History
Source: AllianceDBS
Analyst: King Yoong CHEAH
Abdul Azim Muhthar
S .No.Date of
Repor t
Clos ing
P r ice
12-m th
Targe t
P r ice
Rating
1: 19 Dec 17 2.25 2.40 HOLD
2: 19 Mar 18 2.12 2.20 HOLD
3: 18 Apr 18 2.08 2.20 HOLD
4: 19 Jun 18 2.49 2.30 HOLD
5: 20 Sep 18 2.30 2.30 HOLD
6: 27 Sep 18 2.35 2.30 HOLD
Note : Share price and Target price are adjus ted for corporate actions .
1 2
3
4
5
6
1.91
2.01
2.11
2.21
2.31
2.41
2.51
2.61
2.71
Dec-17 Feb-18 Apr-18 Jun-18 Aug-18 Oct-18 Dec-18
RM
Page 9
Company Guide
Berjaya Sports Toto
DISCLOSURE
Stock rating definitions STRONG BUY - > 20% total return over the next 3 months, with identifiable share price catalysts within this time frame BUY - > 15% total return over the next 12 months for small caps, >10% for large caps HOLD - -10% to +15% total return over the next 12 months for small caps, -10% to +10% for large caps FULLY VALUED - negative total return > -10% over the next 12 months SELL - negative total return of > -20% over the next 3 months, with identifiable catalysts within this time frame Commonly used abbreviations Adex = advertising expenditure EPS = earnings per share PBT = profit before tax bn = billion EV = enterprise value P/B = price / book ratio BV = book value FCF = free cash flow P/E = price / earnings ratio CF = cash flow FV = fair value PEG = P/E ratio to growth ratio CAGR = compounded annual growth rate FY = financial year q-o-q = quarter-on-quarter Capex = capital expenditure m = million RM = Ringgit CY = calendar year M-o-m = month-on-month ROA = return on assets Div yld = dividend yield NAV = net assets value ROE = return on equity DCF = discounted cash flow NM = not meaningful TP = target price DDM = dividend discount model NTA = net tangible assets trn = trillion DPS = dividend per share NR = not rated WACC = weighted average cost of capital EBIT = earnings before interest & tax p.a. = per annum y-o-y = year-on-year EBITDA = EBIT before depreciation and amortisation PAT = profit after tax YTD = year-to-date
Page 10
Company Guide
Berjaya Sports Toto
DISCLAIMER
This report has been prepared for information purposes only by AllianceDBS Research Sdn Bhd (“ADBSR”), a subsidiary of Alliance Investment Bank Berhad (“AIBB”) and an associate of DBS Vickers Securities Holdings Pte Ltd (“DBSVH”). DBSVH is a wholly-owned subsidiary of DBS Bank Ltd. This report is strictly confidential and is meant for circulation to clients of ADBSR, AIBB and DBSVH only or such persons as may be deemed eligible to receive such research report, information or opinion contained herein. Receipt and review of this report indicate your agreement not to distribute, reproduce or disclose in any other form or medium (whether electronic or otherwise) the contents, views, information or opinions contained herein without the prior written consent of ADBSR. This report is based on data and information obtained from various sources believed to be reliable at the time of issuance of this report and any opinion expressed herein is subject to change without prior notice and may differ or be contrary to opinions expressed by ADBSR’s affiliates and/or related parties. ADBSR does not make any guarantee, representation or warranty (whether express or implied) as to the accuracy, completeness, reliability or fairness of the data and information obtained from such sources as may be contained in this report. As such, neither ADBSR nor its affiliates and/or related parties shall be held liable or responsible in any manner whatsoever arising out of or in connection with the reliance and usage of such data and information or third party references as may be made in this report (including, but not limited to any direct, indirect or consequential losses, loss of profits and damages). The views expressed in this report reflect the personal views of the analyst(s) about the subject securities or issuers and no part of the compensation of the analyst(s) was, is, or will be directly or indirectly related to the inclusion of specific recommendation(s) or view(s) in this report. ADBSR prohibits the analyst(s) who prepared this report from receiving any compensation, incentive or bonus based on specific investment banking transactions or providing a specific recommendation for, or view of, a particular company. This research report provides general information only and is not to be construed as an offer to sell or a solicitation to buy or sell any securities or other investments or any options, futures, derivatives or other instruments related to such securities or investments. In particular, it is highlighted that this report is not intended for nor does it have regard to the specific investment objectives, financial situation and particular needs of any specific person who may receive this report. Investors are therefore advised to make their own independent evaluation of the information contained in this report, consider their own individual investment objectives, financial situations and particular needs and consult their own professional advisers (including but not limited to financial, legal and tax advisers) regarding the appropriateness of investing in any securities or investments that may be featured in this report. ADBSR, AIBB, DBSVH and DBS Bank Ltd, their directors, representatives and employees or any of their affiliates or their related parties may, from time to time, have an interest in the securities mentioned in this report. AIBB, DBSVH and DBS Bank Ltd, their affiliates and/or their related persons may do and/or seek to do business with the company(ies) covered in this report and may from time to time act as market maker or have assumed an underwriting commitment in securities of such company(ies), may sell or buy such securities from customers on a principal basis and may also perform or seek to perform significant investment banking, advisory or underwriting services for or relating to such company(ies) as well as solicit such investment, advisory or other services from any entity mentioned in this report. AIBB, DBSVH, DBS Bank Ltd (which carries on, inter alia, corporate finance activities) and their activities are separate from ADBSR. AIBB, DBSVH and DBS Bank Ltd may have no input into company-specific coverage decisions (i.e. whether or not to initiate or terminate coverage of a particular company or securities in reports produced by ADBSR) and ADBSR does not take into account investment banking revenues or potential revenues when making company-specific coverage decisions. ADBSR, AIBB, DBSVH, DBS Bank Ltd and/or other affiliates of DBS Vickers Securities (USA) Inc (“DBSVUSA”), a U.S.-registered broker-dealer, may beneficially own a total of 1% or more of any class of common equity securities of the subject company mentioned in this report. ADBSR, AIBB, DBSVH, DBS Bank Ltd and/or other affiliates of DBSVUSA may, within the past 12 months, have received compensation and/or within the next 3 months seek to obtain compensation for investment banking services from the subject company. DBSVUSA does not have its own investment banking or research department, nor has it participated in any investment banking transaction as a manager or co-manager in the past twelve months. Any US persons wishing to obtain further information, including any clarification on disclosures in this disclaimer, or to effect a transaction in any security discussed in this report should contact DBSVUSA exclusively. DBS Vickers Securities (UK) Ltd is an authorised person in the meaning of the Financial Services and Markets Act and is regulated by The Financial Services Authority. Research distributed in the UK is intended only for institutional clients. In reviewing this report, an investor should be aware that any or all of the foregoing, among other things, may give rise to real or potential conflicts of interest. Additional information is, subject to the overriding issue of confidentiality, available upon request to enable an investor to make their own independent evaluation of the information contained herein.
Wong Ming Tek, Executive Director
Published by
AllianceDBS Research Sdn Bhd (128540 U)
19th Floor, Menara Multi-Purpose, Capital Square, 8 Jalan Munshi Abdullah, 50100 Kuala Lumpur, Malaysia.
Tel.: +603 2604 3333 Fax: +603 2604 3921 email : [email protected]