Embed Size (px)
Citation preview

SUMMARY
Europe no longer suffers from Eurosclerosis; unemployment, notably long-term
unemployment, had decreased substantially for more than a decade. Mobility
across labour market states increased in those countries where unemployment
has been falling the most. Institutional reforms – such as declining employment
protection for new entrants in the labour market and less generous unemploy-
ment benefits – account for this increase in mobility. Focusing on these reforms,
we rationalize why EU workers, including those with permanent contracts, are
increasingly unhappy about labour market conditions in spite of the disappear-
ance of mass unemployment in Europe. Due to these perceptions, policy reversals
cannot be ruled out. Governments wishing to minimize the risk of going back to
Eurosclerosis should move towards flexicurity configurations, compensating
workers for higher risks of job loss, and introduce tenure tracks to the labour
market, preventing the development of dual labour market structures. This
would avoid dissipating the employment gains of the last decade during this
recession.
— Tito Boeri and Pietro Garibaldi
Beyond
Eurosclero
sis
Economic Policy July 2009 Printed in Great Britain� CEPR, CES, MSH, 2009.

Beyond Eurosclerosis
Tito Boeri and Pietro Garibaldi
Universita Bocconi, Milan, IGIER and Fondazione Rodolfo Debenedetti (fRDB); Universitadi Torino, Collegio Carlo Alberto, and fRDB
1. INTRODUCTION
The labour market has become particularly worrying in Europe … slow employment
growth has always been a feature of the Efta and EC regions … there are indications that
employment has been unusually weak vis-a-vis output growth … In the EC employment
growth has been generally sluggish …. In inflexible Europe … the high incidence of long-
term unemployment is associated with low inflow rates into unemployment.
The quotes are from the Jobs Study, commissioned by the G7 and issued by the
OECD in 1994. The report was clearly pointing at Europe as the sick man in the
OECD area, and the sickness was ‘jobless growth’ with stagnant unemployment pools.
Since then there has been a sea change in labour market conditions in the EU.
Before entering the global recession, for 13 years several European countries experi-
enced a strong decline in unemployment in combination with protracted employ-
ment growth. The fall in unemployment was not due to a statistical artefact or to
compositional factors, such as the ageing of the European labour force or mass
immigration. And employment growth, in terms of both headcounts and hours,
occurred despite moderate output growth. The sickness of Europe is no longer job-
less growth. If anything, the symptoms are those typical of ‘growthless job creation’,
a much different pathology than Eurosclerosis.
BEYOND EUROSCLEROSIS 411
Economic Policy July 2009 pp. 409–461 Printed in Great Britain� CEPR, CES, MSH, 2009.
In this paper we document the disappearance of European structural unemploy-
ment, a fact which has been so far surprisingly overlooked. As unemployment may
fall because of smaller inflows or larger outflows, we also look at what happened to
mobility across Europe. In particular, using the European Labour Force Survey, we
measure unemployment mobility in terms of inflows and outflows, in terms of total
labour force mobility across the main labour market states (employment, unemploy-
ment and inactivity) and in terms of job-to-job flows. We find that, alongside the
change in unemployment, several countries, albeit not all of them, experienced an
increase in mobility. The relationship between declining unemployment and increas-
ing mobility appears to hold across different statistical measures. The increase in
mobility is thus the other side of the coin of the decrease in unemployment.
The large literature on Eurosclerosis has tried to find the institutional determi-
nants of European unemployment. In this paper we take a different route. We
focus on the determinants of mobility and document to which extent they are
related to institutional changes. This approach has the advantage of taking more
seriously economic theory which has clearcut implications as to the impact of
labour market reforms on flows rather than on stocks. We find that lower EPL and
lower unemployment benefits increased mobility, measured either in terms of un-
employment turnover, mobility indexes for transition matrices or job-to-job flows.
Labour taxes are also negatively correlated with mobility. These effects are present
also when we control for country fixed effects and we include time dummies.
We show that since the mid-1990s EU countries indeed carried out many
reforms of their labour markets, decreasing the overall degree of employment pro-
tection and reducing the generosity of non-employment benefits in terms of imple-
mentation procedures if not by introducing new regulations. These reforms have
been successful in taking Europe away from Eurosclerosis, but created dual labour
markets segregating many workers in jobs offering low incentives for human capital
investment and highly exposed to labour market risk.
Theories of dual labour markets suggest that temporary employment increases
mobility. Moreover, recent research shows that the introduction of dual labour
markets may also increase employment and decrease unemployment. As we argue
in the paper, the links between mobility, unemployment and dual labour markets
are thus consistent with this recent literature.
In light of the previous results we ask whether this sea change was associated with
an improvement of workers’ perceptions about underlying labour market conditions.
We find that employment satisfaction is unsurprisingly lower for temporary workers,
but also that perceptions deteriorated for workers with open-ended contracts.
Having reduced unemployment, the next challenge for policy-makers is to find
ways to improve workers’ perceptions and appreciation for the ongoing develop-
ments. This would also reduce the risk of policy reversals undoing the employment
412 TITO BOERI AND PIETRO GARIBALDI
enhancing reforms of the last decade. Our interpretation, coherent with our econo-
metric results and analysis of the institutional transformations that occurred in
Europe, is that a move aimed at exploiting the flexicurity trade-off could be the way.
In other words, reductions in employment protection should be compensated with a
higher coverage of unemployment benefits, and vice versa. Another way is to grease
the entry in the labour market preventing the creation of dual structures, for example
by introducing tenure tracks to stable jobs. This would also reduce the risk that the
current recession dissipates most of the employment gains of the previous decade.
The paper proceeds as follows. Section 2 establishes the key facts on unemploy-
ment decline, within and across EU countries and asks whether these developments
can be accounted for by statistical artifacts or by demographics (mass immigration
and population ageing). Section 3 evaluates the evolution of unemployment inflows
and outflows, as well as different measures of labour market mobility, and econo-
metrically estimates the effects of labour market institutions on these alternative
mobility indexes. Section 4 looks more closely at the characteristics of labour mar-
ket reforms in Europe, which have increased mobility. Finally, Section 5 analyses
the evolution of workers’ perceptions on labour market conditions, discussing poli-
cies which could reconcile higher mobility with greater satisfaction of European citi-
zens with respect to the operation of their labour markets.
2. WAS IT A TRUE DISAPPEARANCE?
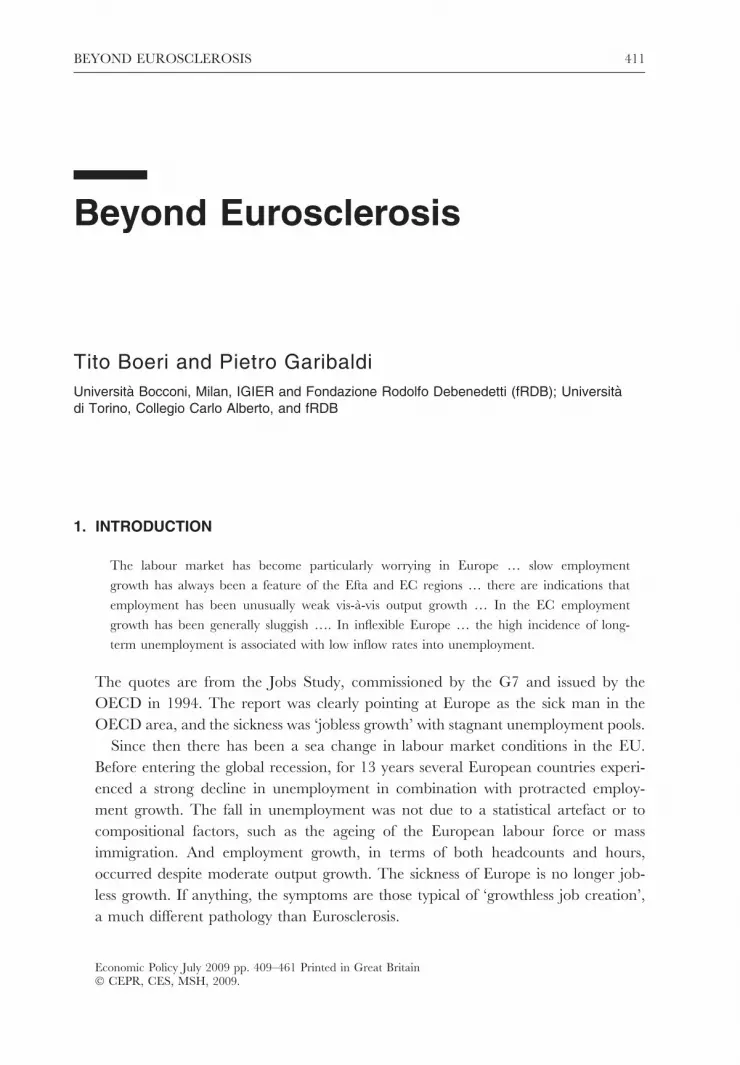
Before entering the 2008–09 recession, European unemployment had fallen to a
level not seen for over 25 years. If we look at the countries of the EU15, there were
almost 5 million less people unemployed than in 1996. Between 1995 and 2007 the
unemployment rate in the EU15 had fallen from almost 11% to some 8%, while it
remained stable around 6% in the United States (Figure 1a). Within the same time
span, long-term unemployment almost halved in the EU15 while it remained
remarkably low in the United States (Figure 1b). Overall, these changes suggest that
Europe is no longer a place where more than 50% of jobseekers have been on the
dole for more than 12 months, as was the case in the mid-1990s.
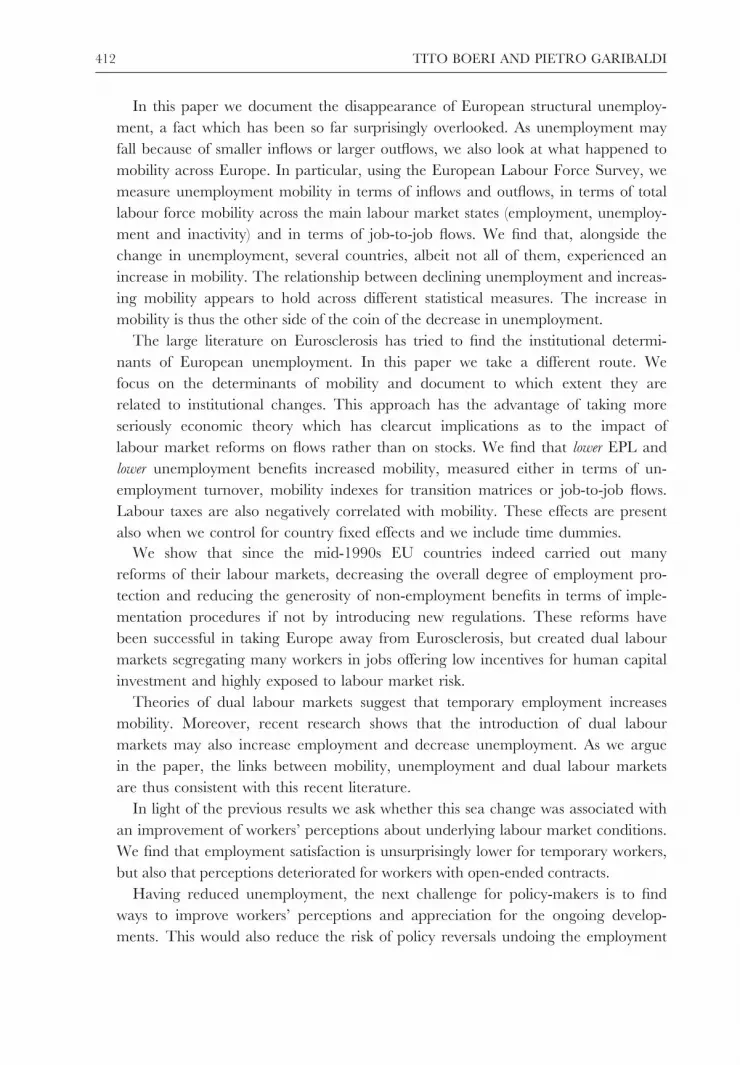
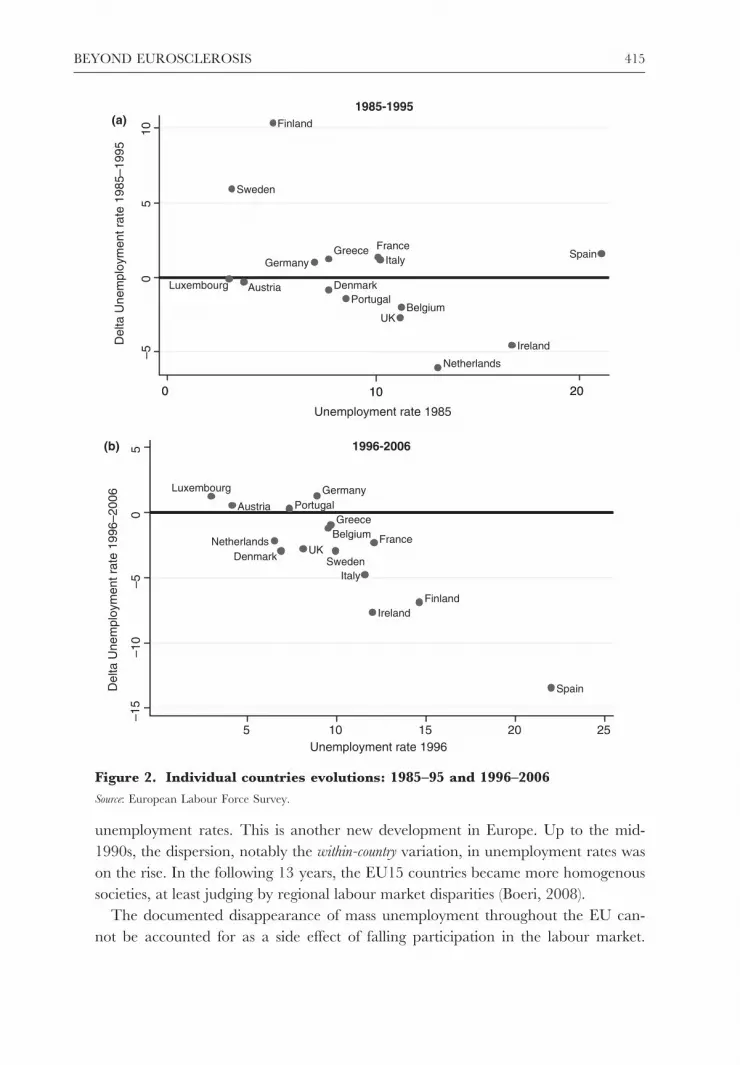
While the previous facts concern EU unemployment as a whole, we are very
much interested in the individual country experiences. Figures 2a and 2b show the
changes in unemployment in the individual countries of the EU in the two decades
1985–1995 and 1996–2006 respectively. In the first decade, unemployment for the
average country increased slightly, while in the latter decade it fell by more than 1
percentage point on average. Further, in the second decade unemployment fell in
11 out of 15 EU countries.
In the first decade, the high unemployment Club-Med countries (Italy, France,
Greece and Spain) were experiencing a further rise of their unemployment. Almost
BEYOND EUROSCLEROSIS 413
55% of EU unemployment was concentrated in these four countries at the end of
the period. This share could have been higher had Sweden and Finland, two ini-
tially low unemployment countries, not experienced a dramatic increase in unem-
ployment in the deep recession of the early 1990s. In the 1996–2006 period, the
countries that initially had the highest unemployment rates were the most successful
in reducing unemployment. By 2006 the share of unemployment in the Club-Med
had decreased to 45%. Overall, substantial progress was made not only in reducing
EU15 unemployment, but also its cross-country variation. These country dynamics
are also reported in Appendix A (Figure A1), where we plot the dynamics of the
unemployment rate in each European country.
The decline of mass unemployment in Europe was also associated with a reduc-
tion in the dispersion of unemployment rates within each country. In particular, the
cross-sectional standard deviation of unemployment rates across the regions of the
EU15 (defined according to the Nuts II classification) declined considerably after
1995, as a result of both less cross-country and less within-country variation in
Unemployment Rate
3
45
6
7
89
10
11
1994
1995
1996
1997
1998
1999
2000
2001
2002
2003
2004
2005
2006
2007
% o
f L
abo
ur
forc
eEU15 US
0
1
2
3
4
5
6
1994 1995 1996 1997 1998 1999 2000 2001 2002 2003 2004 2005 2006 2007
% o
f L
abo
ur
forc
e
Long Term unemployment
EU15 US
(a)
(b)
Figure 1. Evolution of unemployment and long-term unemployment in theEU15 and in the US (as a fraction of the labour force)
Source: Eurostat, http://epp.eurostat.ec.europa.eu
414 TITO BOERI AND PIETRO GARIBALDI
unemployment rates. This is another new development in Europe. Up to the mid-
1990s, the dispersion, notably the within-country variation, in unemployment rates was
on the rise. In the following 13 years, the EU15 countries became more homogenous
societies, at least judging by regional labour market disparities (Boeri, 2008).
The documented disappearance of mass unemployment throughout the EU can-
not be accounted for as a side effect of falling participation in the labour market.
Netherlands
Ireland
UKBelgium
PortugalDenmarkLuxembourg
SpainItalyFrance
GermanyGreece
Sweden
Finland
–50
510
0 20
Del
ta U
nem
ploy
men
t rat
e 19
85–1
995
1985-1995
10
Austria
0 20
Unemployment rate 1985
10
(a)
Netherlands
Ireland
UK
Belgium
Portugal
Denmark
Spain
France
Germany
Greece
Sweden
Finland
Austria
–15
–10
–50
5
5 10 15 20 25Unemployment rate 1996
Del
ta U
nem
ploy
men
t rat
e 19
96–2
006 Luxembourg
(b)
Italy
1996-2006
Figure 2. Individual countries evolutions: 1985–95 and 1996–2006
Source: European Labour Force Survey.
BEYOND EUROSCLEROSIS 415
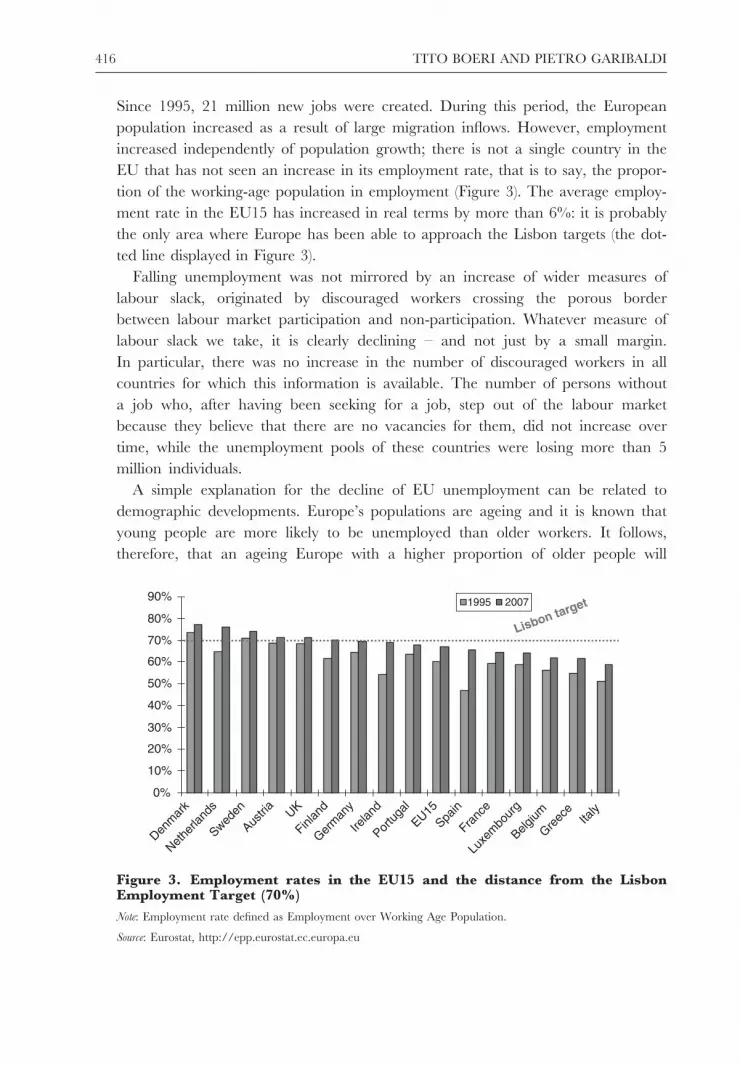
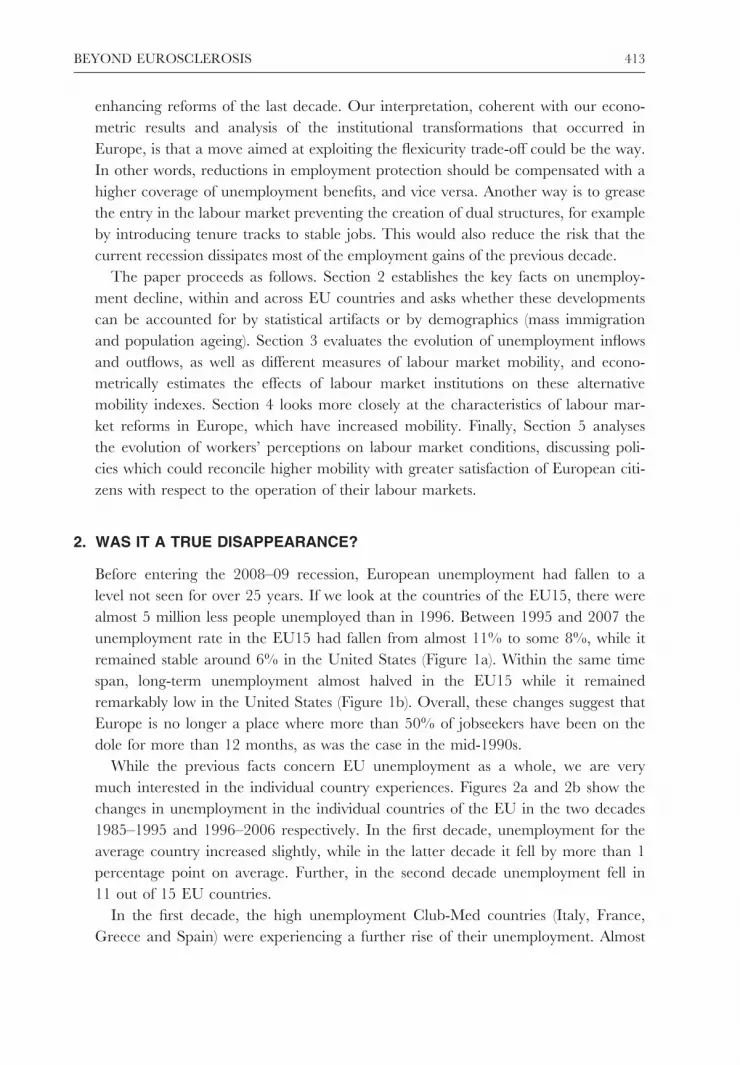
Since 1995, 21 million new jobs were created. During this period, the European
population increased as a result of large migration inflows. However, employment
increased independently of population growth; there is not a single country in the
EU that has not seen an increase in its employment rate, that is to say, the propor-
tion of the working-age population in employment (Figure 3). The average employ-
ment rate in the EU15 has increased in real terms by more than 6%: it is probably
the only area where Europe has been able to approach the Lisbon targets (the dot-
ted line displayed in Figure 3).
Falling unemployment was not mirrored by an increase of wider measures of
labour slack, originated by discouraged workers crossing the porous border
between labour market participation and non-participation. Whatever measure of
labour slack we take, it is clearly declining – and not just by a small margin.
In particular, there was no increase in the number of discouraged workers in all
countries for which this information is available. The number of persons without
a job who, after having been seeking for a job, step out of the labour market
because they believe that there are no vacancies for them, did not increase over
time, while the unemployment pools of these countries were losing more than 5
million individuals.
A simple explanation for the decline of EU unemployment can be related to
demographic developments. Europe’s populations are ageing and it is known that
young people are more likely to be unemployed than older workers. It follows,
therefore, that an ageing Europe with a higher proportion of older people will
0%
10%
20%
30%
40%
50%
60%
70%
80%
90%
Denm
ark
Nethe
rland
s
Sweden
Austri
aUK
Finlan
d
Germ
any
Irelan
d
Portu
gal
Spain
Franc
e
Luxe
mbo
urg
Belgium
Greec
eIta
ly
1995 2007
Lisbon target
EU15
1995 20071995 2007
Figure 3. Employment rates in the EU15 and the distance from the LisbonEmployment Target (70%)
Note: Employment rate defined as Employment over Working Age Population.
Source: Eurostat, http://epp.eurostat.ec.europa.eu
416 TITO BOERI AND PIETRO GARIBALDI
display lower unemployment simply as a reflection of an older workforce. To check
whether this composition effect does play a significant role in the decline of Euro-
pean unemployment we can perform a simple exercise in line with shift share anal-
ysis. Specifically, we compute the unemployment rate obtained by weighting the
age specific unemployment rate in 1995 with the 2007 shares of each age group in
the total population. The results are displayed in Table 1. The message is clear:
population ageing accounts for a modest fraction of the decline in unemployment,
at most one-fourth in the countries (like Austria and Belgium) where unemployment
to the working age population ratio hardly changed over the decade. Thus, the
dominant factor behind the decline in unemployment is a reduction in unemploy-
ment among all age groups.
An alternative demographic explanation for the decline of European unemploy-
ment could be related to the role of immigration. Large-scale immigration occurred
in the last decade, notably in countries such as Spain, where the decline in unem-
ployment was more marked. The third column of Table 1 performs a shift share
analysis for the immigration effect by applying the same shift share technique per-
formed when focusing on the age composition effects. The result is straightforward.
Large-scale immigration, the second most important demographic phenomenon
that has occurred in Europe over the last decade, cannot explain the disappearance
of European mass unemployment. If anything, more immigration should have
increased unemployment, as the incidence of unemployment is typically higher
among migrants than EU15 natives.
Table 1. Shift-share analysis of ageing and migration effects in unemploymentdynamics
DU as a percentage ofWAPa (1995–2007)
Ageingeffect (%)
Migrationeffect (%)
Austria 0.22 )20.2 25.5Belgium )0.79 )27.2 2.8Denmark )2.49 )6.1 8.0Finland )7.07 )6.3 0.6France )2.34 )12.8 )2.0Ireland )4.14 )2.7 21.7Italy )2.93 )19.8 n.a.Luxembourg 0.96 )5.0 8.9Netherlands )2.46 )12.2 )2.1Portugal 1.35 )8.5 2.3Spain )7.82 )7.0 3.4Sweden )2.06 )5.7 )1.0
Notes: Applying the 1995 group-specific unemployment rates to the 2007 shares in the working age population(WAP). Migration and ageing effects are expressed as a percentage of the (absolute value) change in un-employment (over working age population).aChange in unemployment measured as a proportion of the working age population.
Source: European Labour Force Survey.
BEYOND EUROSCLEROSIS 417
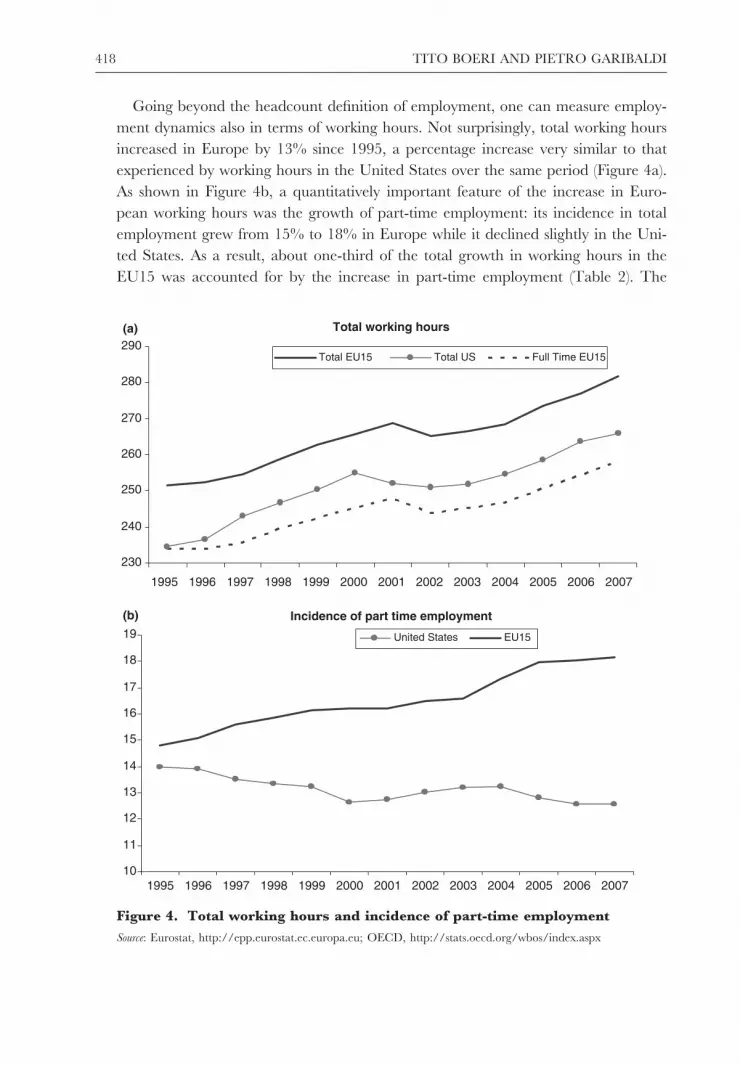
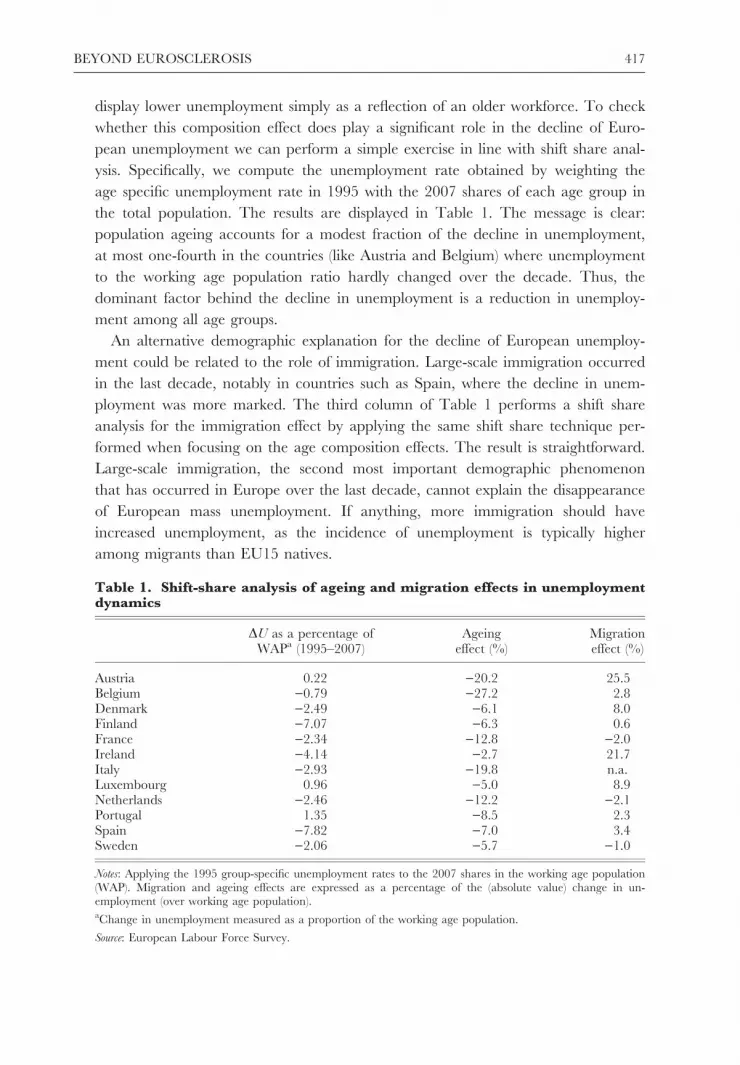
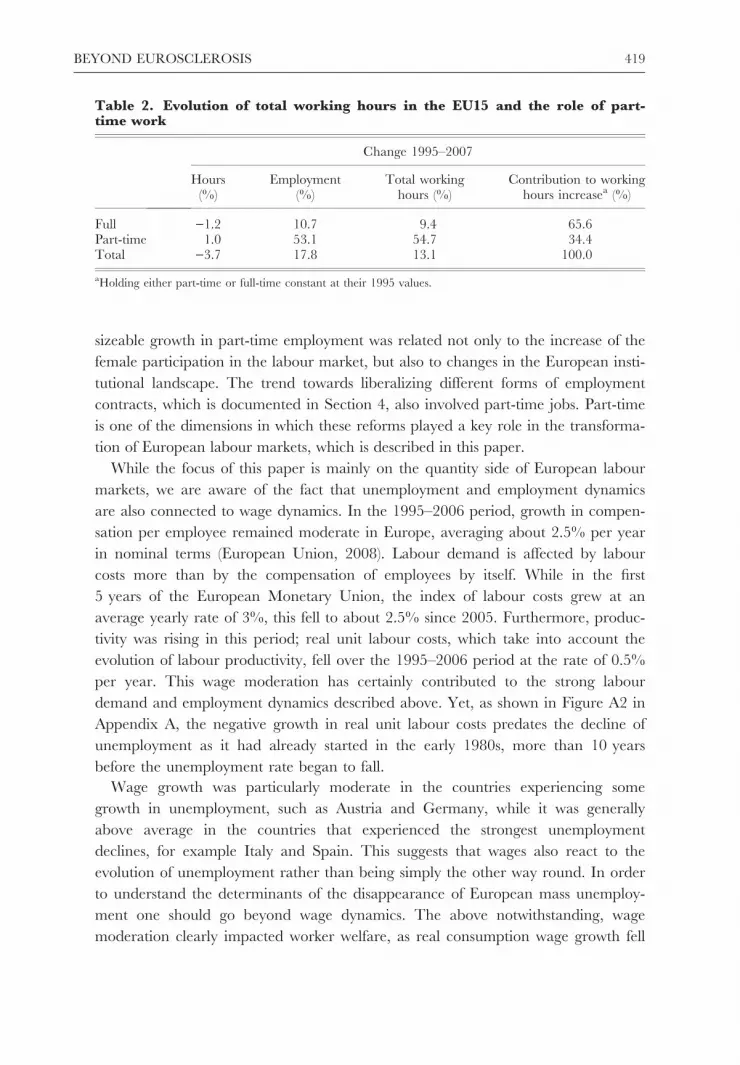
Going beyond the headcount definition of employment, one can measure employ-
ment dynamics also in terms of working hours. Not surprisingly, total working hours
increased in Europe by 13% since 1995, a percentage increase very similar to that
experienced by working hours in the United States over the same period (Figure 4a).
As shown in Figure 4b, a quantitatively important feature of the increase in Euro-
pean working hours was the growth of part-time employment: its incidence in total
employment grew from 15% to 18% in Europe while it declined slightly in the Uni-
ted States. As a result, about one-third of the total growth in working hours in the
EU15 was accounted for by the increase in part-time employment (Table 2). The
Total working hours
230
240
250
260
270
280
290Total EU15 Total US Full Time EU15
Incidence of part time employment
10
11
12
13
14
15
16
17
18
19
1995 1996 1997 1998 1999 2000 2001 2002 2003 2004 2005 2006 2007
1995 1996 1997 1998 1999 2000 2001 2002 2003 2004 2005 2006 2007
United States EU15
(b)
(a)
Figure 4. Total working hours and incidence of part-time employment
Source: Eurostat, http://epp.eurostat.ec.europa.eu; OECD, http://stats.oecd.org/wbos/index.aspx
418 TITO BOERI AND PIETRO GARIBALDI
sizeable growth in part-time employment was related not only to the increase of the
female participation in the labour market, but also to changes in the European insti-
tutional landscape. The trend towards liberalizing different forms of employment
contracts, which is documented in Section 4, also involved part-time jobs. Part-time
is one of the dimensions in which these reforms played a key role in the transforma-
tion of European labour markets, which is described in this paper.
While the focus of this paper is mainly on the quantity side of European labour
markets, we are aware of the fact that unemployment and employment dynamics
are also connected to wage dynamics. In the 1995–2006 period, growth in compen-
sation per employee remained moderate in Europe, averaging about 2.5% per year
in nominal terms (European Union, 2008). Labour demand is affected by labour
costs more than by the compensation of employees by itself. While in the first
5 years of the European Monetary Union, the index of labour costs grew at an
average yearly rate of 3%, this fell to about 2.5% since 2005. Furthermore, produc-
tivity was rising in this period; real unit labour costs, which take into account the
evolution of labour productivity, fell over the 1995–2006 period at the rate of 0.5%
per year. This wage moderation has certainly contributed to the strong labour
demand and employment dynamics described above. Yet, as shown in Figure A2 in
Appendix A, the negative growth in real unit labour costs predates the decline of
unemployment as it had already started in the early 1980s, more than 10 years
before the unemployment rate began to fall.
Wage growth was particularly moderate in the countries experiencing some
growth in unemployment, such as Austria and Germany, while it was generally
above average in the countries that experienced the strongest unemployment
declines, for example Italy and Spain. This suggests that wages also react to the
evolution of unemployment rather than being simply the other way round. In order
to understand the determinants of the disappearance of European mass unemploy-
ment one should go beyond wage dynamics. The above notwithstanding, wage
moderation clearly impacted worker welfare, as real consumption wage growth fell
Table 2. Evolution of total working hours in the EU15 and the role of part-time work
Change 1995–2007
Hours(%)
Employment(%)
Total workinghours (%)
Contribution to workinghours increasea (%)
Full )1.2 10.7 9.4 65.6Part-time 1.0 53.1 54.7 34.4Total )3.7 17.8 13.1 100.0
aHolding either part-time or full-time constant at their 1995 values.
BEYOND EUROSCLEROSIS 419
from 1.3% between 1992 and 1995 to a mere 0.4% between 2002 and 2007. Sec-
tion 5 takes a look at workers’ satisfaction.
3. MOBILITY AND INSTITUTIONS
If the first characteristic of Eurosclerosis was high unemployment, the second was
low mobility. The quotes from the OECD Jobs Study reproduced at the begin-
ning of this paper put the brunt of blame, after all, more on the turnover of the
unemployment pool than on the level of unemployment. In this section we ana-
lyse the evolution of alternative measures of labour market mobility in the last
decade. As it turns out that they are all increasing at a time when unemploy-
ment was declining, we also analyse the institutional determinants of these mobil-
ity patterns in some detail. Surprisingly enough, the empirical literature on
Eurosclerosis has mainly estimated aggregate employment and unemployment
stock equations devoting little, if any, attention to the empirical relationship
between aggregate measures of mobility and labour market institutions. A notable
exception is Messina and Vallanti (2007), but their work is limited to the analysis
of job flows measured in large firms and does not cover the most recent unem-
ployment decline, since the data set exploited in the work ranges between 1992
and 2001.
Unemployment declines when either inflows into unemployment fall or outflows
from unemployment increase. In the first case, unemployment declines in a context
of declining mobility across labour market states and lower unemployment turn-
over. In the second case, unemployment reductions are associated with larger
unemployment turnover and higher mobility. In order to evaluate the importance
played by inflows and outflows in the evolution of EU unemployment, we begin by
looking at inflows and outflows rates into unemployment and we try to quantita-
tively assess whether the fall in unemployment can be accounted for by changes in
outflows and/or in inflows.
In order to obtain long series of unemployment inflows and outflows for the
EU15 we used the OECD Unemployment Duration database. The latter provides
the distribution of unemployment by duration since 1978, drawing on the national
Labour Force Survey questionnaires. We proxied monthly unemployment inflows
by obtaining the number of people reporting to have been unemployed for less
than one month. Clearly, these proxy inflows do not capture within-month un-
employment turnover, notably persons becoming unemployed and leaving the un-
employment pool within a month. Unemployment outflows are obtained by the
distribution of unemployment durations at different thresholds. In particular, the
OECD duration database reports the share of unemployed at 1 month, 3 months,
6 months, 1 year and above 1 year. As the last interval is intrinsically an open
420 TITO BOERI AND PIETRO GARIBALDI
interval, we calibrate the average months in the last interval so as to match long-
term unemployment over a 10-year horizon.1
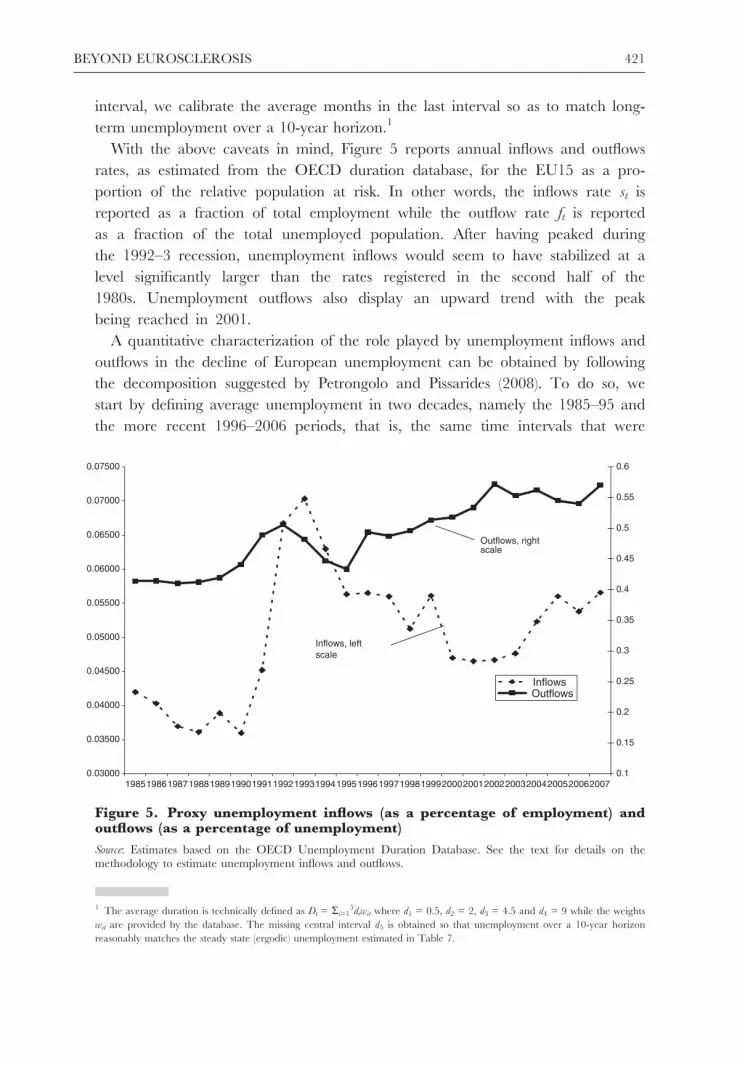
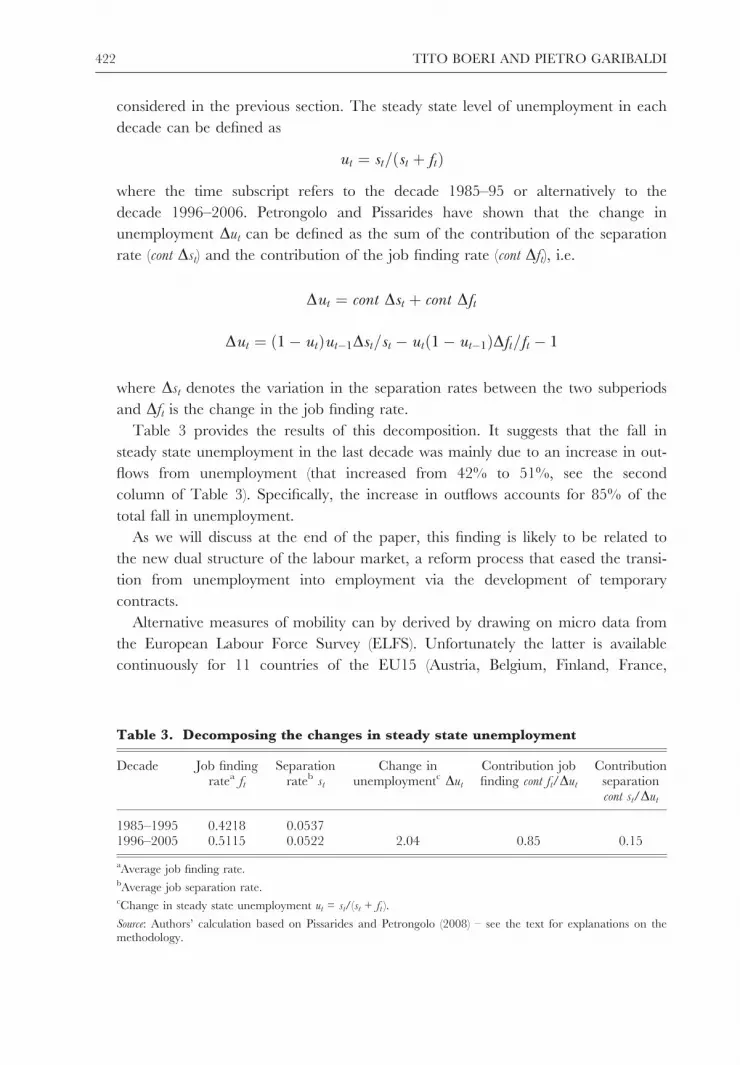
With the above caveats in mind, Figure 5 reports annual inflows and outflows
rates, as estimated from the OECD duration database, for the EU15 as a pro-
portion of the relative population at risk. In other words, the inflows rate st is
reported as a fraction of total employment while the outflow rate ft is reported
as a fraction of the total unemployed population. After having peaked during
the 1992–3 recession, unemployment inflows would seem to have stabilized at a
level significantly larger than the rates registered in the second half of the
1980s. Unemployment outflows also display an upward trend with the peak
being reached in 2001.
A quantitative characterization of the role played by unemployment inflows and
outflows in the decline of European unemployment can be obtained by following
the decomposition suggested by Petrongolo and Pissarides (2008). To do so, we
start by defining average unemployment in two decades, namely the 1985–95 and
the more recent 1996–2006 periods, that is, the same time intervals that were
1 The average duration is technically defined as Dt = Ri=15diwit where d1 = 0.5, d2 = 2, d3 = 4.5 and d4 = 9 while the weights
wit are provided by the database. The missing central interval d5 is obtained so that unemployment over a 10-year horizon
reasonably matches the steady state (ergodic) unemployment estimated in Table 7.
0.03000
0.03500
0.04000
0.04500
0.05000
0.05500
0.06000
0.06500
0.07000
0.07500
198519861987198819891990199119921993199419951996199719981999200020012002200320042005200620070.1
0.15
0.2
0.25
0.3
0.35
0.4
0.45
0.5
0.55
0.6
InflowsOutflows
Inflows, left scale
scaleOutflows, right
Figure 5. Proxy unemployment inflows (as a percentage of employment) andoutflows (as a percentage of unemployment)
Source: Estimates based on the OECD Unemployment Duration Database. See the text for details on themethodology to estimate unemployment inflows and outflows.
BEYOND EUROSCLEROSIS 421
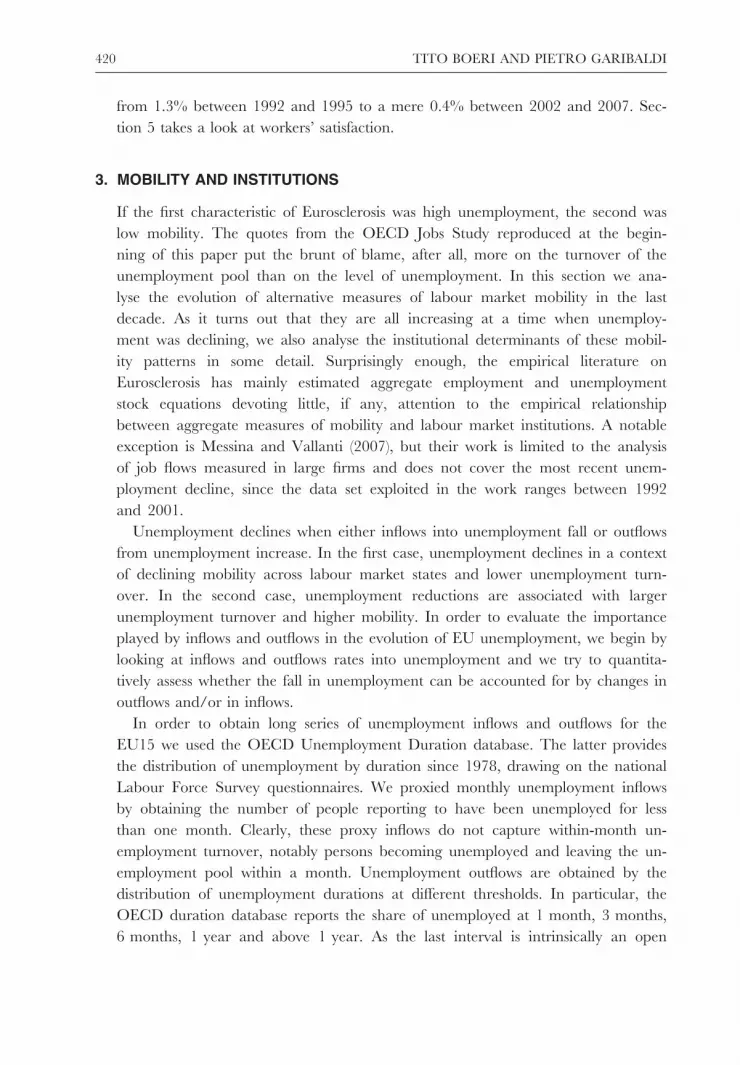
considered in the previous section. The steady state level of unemployment in each
decade can be defined as
ut ¼ st=ðst þ ftÞ
where the time subscript refers to the decade 1985–95 or alternatively to the
decade 1996–2006. Petrongolo and Pissarides have shown that the change in
unemployment Dut can be defined as the sum of the contribution of the separation
rate (cont Dst) and the contribution of the job finding rate (cont Dft), i.e.
Dut ¼ cont Dst þ cont Dft
Dut ¼ ð1� utÞut�1Dst=st � utð1� ut�1ÞDft=ft � 1
where Dst denotes the variation in the separation rates between the two subperiods
and Dft is the change in the job finding rate.
Table 3 provides the results of this decomposition. It suggests that the fall in
steady state unemployment in the last decade was mainly due to an increase in out-
flows from unemployment (that increased from 42% to 51%, see the second
column of Table 3). Specifically, the increase in outflows accounts for 85% of the
total fall in unemployment.
As we will discuss at the end of the paper, this finding is likely to be related to
the new dual structure of the labour market, a reform process that eased the transi-
tion from unemployment into employment via the development of temporary
contracts.
Alternative measures of mobility can by derived by drawing on micro data from
the European Labour Force Survey (ELFS). Unfortunately the latter is available
continuously for 11 countries of the EU15 (Austria, Belgium, Finland, France,
Table 3. Decomposing the changes in steady state unemployment
Decade Job findingratea ft
Separationrateb st
Change inunemploymentc Dut
Contribution jobfinding cont ft/Dut
Contributionseparationcont st/Dut
1985–1995 0.4218 0.05371996–2005 0.5115 0.0522 2.04 0.85 0.15
aAverage job finding rate.bAverage job separation rate.cChange in steady state unemployment ut = st/(st + ft ).
Source: Authors’ calculation based on Pissarides and Petrongolo (2008) – see the text for explanations on themethodology.
422 TITO BOERI AND PIETRO GARIBALDI

Ireland, Italy, Luxembourg, Netherlands, Portugal, Spain and Sweden) only since
1995. Moreover, ELFS data are not provided to researchers with individual identi-
fiers. Hence no matching of records across ELFS waves is possible. In order to
map transitions across labour market states we had therefore to use retrospective
information provided by the individuals. This means that the labour market status
in the initial period is the (subjective) status reported by the individual, rather than
the (objective) status obtained by applying the ILO-OECD definitions of employ-
ment and unemployment. As discussed below, the subjectivity of the initial status
may particularly affect measures of flows between inactivity and unemployment as
the latter (objective) definition is rather restrictive.
The flows estimated on the basis of the retrospective information provided in the
ELFS are the basis for our preferred unemployment turnover figures as well as for
summary measures of labour market mobility across labour market states. Unem-
ployment turnover figures can be obtained by adding up the number of persons
currently unemployed reporting to have been employed or inactive one year before
the interview and the persons reporting to have been unemployed one year earlier
who are currently either employed or out of the labour force, and normalizing this
sum by the beginning of period unemployment level. Clearly this measure does not
capture ‘roundtrip’ transitions occurring within each year, for example persons
moving from unemployment to employment and then back to unemployment
within a year. Thus, they represent lower bounds of actual unemployment turn-
over.
Mobility can be further analysed with the help of transition matrices across
labour market states. In particular, by drawing on the retrospective information
provided by the ELFS, we also estimated for each country the probability of mov-
ing across the three labour market states (employment, unemployment and inactiv-
ity) between year t and year t + 1. A transition matrix for country i between year t
and year t + 1 is a 3 · 3 matrix in which each element records the transition prob-
ability across the three labour force states.
In order to better compare mobility over time and across countries, it is useful to
obtain summary measures of labour market mobility. While the transition matrix
records 9 numbers, we can obtain for each matrix a scalar measure of mobility. An
index widely used in the literature on income mobility is the so-called Shorrocks
(1978) mobility index M it:
M it ¼ ðS � tr ðM i
t Þ=ðS � 1Þ
where S denotes the number of labour market states and tr(Mit) the trace of the
transition matrix mapping flows into and out of employment across the three
main labour market states (employment, unemployment and inactivity). The
index is bound below from zero, where there is no mobility, that is, the
BEYOND EUROSCLEROSIS 423
probability of leaving any state is zero, hence the trace is equal to the number
of states. The index is bound above from one when ‘stayer’ coefficients are not
larger than 1/S, a condition which is always satisfied in our estimated transition
matrices.
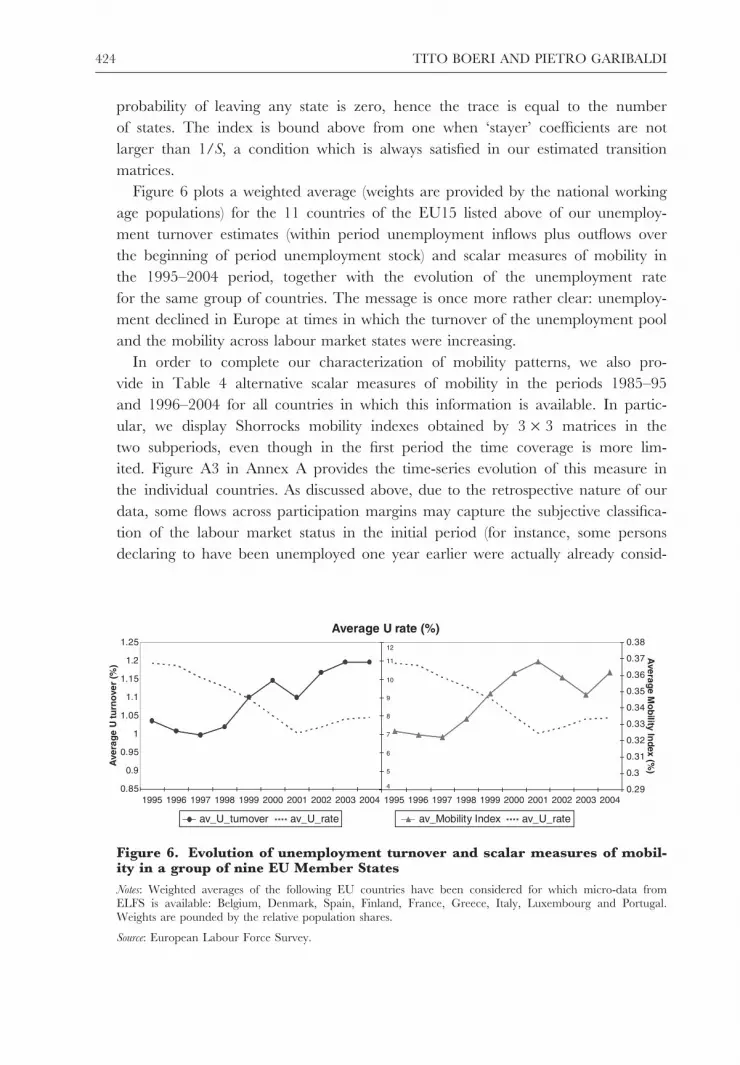
Figure 6 plots a weighted average (weights are provided by the national working
age populations) for the 11 countries of the EU15 listed above of our unemploy-
ment turnover estimates (within period unemployment inflows plus outflows over
the beginning of period unemployment stock) and scalar measures of mobility in
the 1995–2004 period, together with the evolution of the unemployment rate
for the same group of countries. The message is once more rather clear: unemploy-
ment declined in Europe at times in which the turnover of the unemployment pool
and the mobility across labour market states were increasing.
In order to complete our characterization of mobility patterns, we also pro-
vide in Table 4 alternative scalar measures of mobility in the periods 1985–95
and 1996–2004 for all countries in which this information is available. In partic-
ular, we display Shorrocks mobility indexes obtained by 3 · 3 matrices in the
two subperiods, even though in the first period the time coverage is more lim-
ited. Figure A3 in Annex A provides the time-series evolution of this measure in
the individual countries. As discussed above, due to the retrospective nature of our
data, some flows across participation margins may capture the subjective classifica-
tion of the labour market status in the initial period (for instance, some persons
declaring to have been unemployed one year earlier were actually already consid-
0.29
0.3
0.31
0.32
0.33
0.34
0.35
0.36
0.37
0.38
0.85
0.9
0.95
1
1.05
1.1
1.15
1.2
1.25
4
5
6
7
8
9
10
11
12
Average U rate (%)
Ave
rag
eU
tu
rno
ver
(%)
Averag
eM
ob
ilityIn
dex(%
)
av_U_turnover av_U_rate av_Mobility Index av_U_rate
1995 1996 1997 1998 1999 2000 2001 2002 2003 2004 1995 1996 1997 1998 1999 2000 2001 2002 2003 2004
Figure 6. Evolution of unemployment turnover and scalar measures of mobil-ity in a group of nine EU Member States
Notes: Weighted averages of the following EU countries have been considered for which micro-data fromELFS is available: Belgium, Denmark, Spain, Finland, France, Greece, Italy, Luxembourg and Portugal.Weights are pounded by the relative population shares.
Source: European Labour Force Survey.
424 TITO BOERI AND PIETRO GARIBALDI
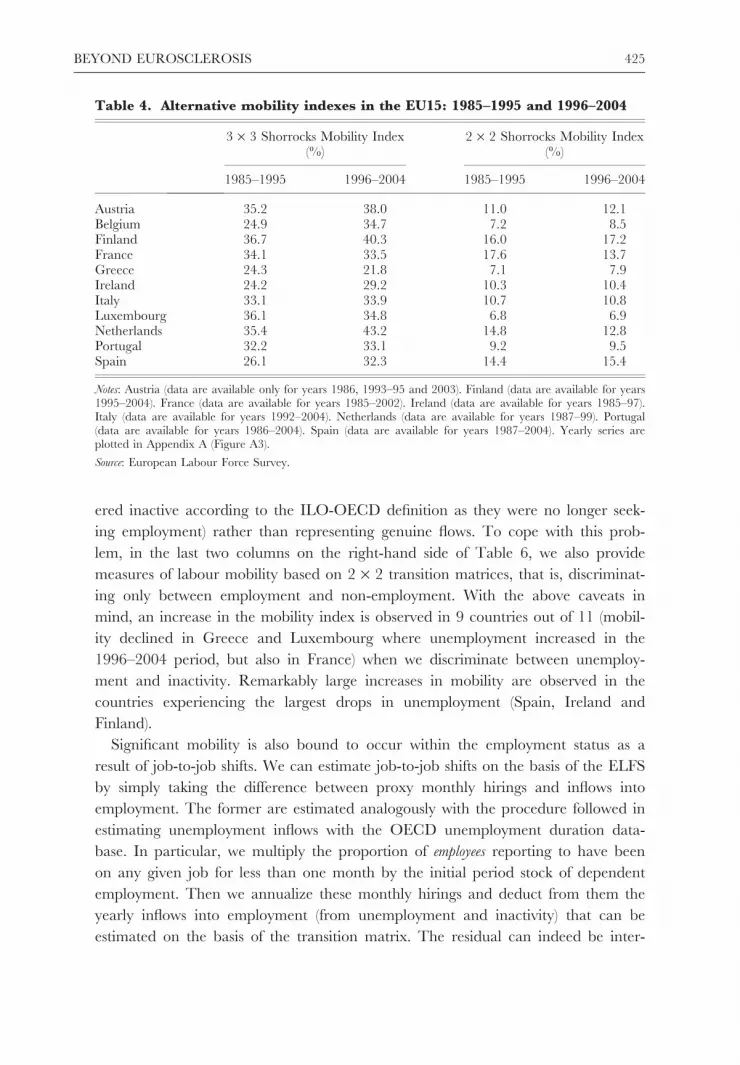
ered inactive according to the ILO-OECD definition as they were no longer seek-
ing employment) rather than representing genuine flows. To cope with this prob-
lem, in the last two columns on the right-hand side of Table 6, we also provide
measures of labour mobility based on 2 · 2 transition matrices, that is, discriminat-
ing only between employment and non-employment. With the above caveats in
mind, an increase in the mobility index is observed in 9 countries out of 11 (mobil-
ity declined in Greece and Luxembourg where unemployment increased in the
1996–2004 period, but also in France) when we discriminate between unemploy-
ment and inactivity. Remarkably large increases in mobility are observed in the
countries experiencing the largest drops in unemployment (Spain, Ireland and
Finland).
Significant mobility is also bound to occur within the employment status as a
result of job-to-job shifts. We can estimate job-to-job shifts on the basis of the ELFS
by simply taking the difference between proxy monthly hirings and inflows into
employment. The former are estimated analogously with the procedure followed in
estimating unemployment inflows with the OECD unemployment duration data-
base. In particular, we multiply the proportion of employees reporting to have been
on any given job for less than one month by the initial period stock of dependent
employment. Then we annualize these monthly hirings and deduct from them the
yearly inflows into employment (from unemployment and inactivity) that can be
estimated on the basis of the transition matrix. The residual can indeed be inter-
Table 4. Alternative mobility indexes in the EU15: 1985–1995 and 1996–2004
3 · 3 Shorrocks Mobility Index(%)
2 · 2 Shorrocks Mobility Index(%)
1985–1995 1996–2004 1985–1995 1996–2004
Austria 35.2 38.0 11.0 12.1Belgium 24.9 34.7 7.2 8.5Finland 36.7 40.3 16.0 17.2France 34.1 33.5 17.6 13.7Greece 24.3 21.8 7.1 7.9Ireland 24.2 29.2 10.3 10.4Italy 33.1 33.9 10.7 10.8Luxembourg 36.1 34.8 6.8 6.9Netherlands 35.4 43.2 14.8 12.8Portugal 32.2 33.1 9.2 9.5Spain 26.1 32.3 14.4 15.4
Notes: Austria (data are available only for years 1986, 1993–95 and 2003). Finland (data are available for years1995–2004). France (data are available for years 1985–2002). Ireland (data are available for years 1985–97).Italy (data are available for years 1992–2004). Netherlands (data are available for years 1987–99). Portugal(data are available for years 1986–2004). Spain (data are available for years 1987–2004). Yearly series areplotted in Appendix A (Figure A3).
Source: European Labour Force Survey.
BEYOND EUROSCLEROSIS 425
preted as hirings occurring without intervening unemployment or inactivity spells.
Clearly, the same caveats concerning unemployment turnover apply also to this
measure, which is likewise biased downwards because it neglects hirings resulting in
separations within the same month.
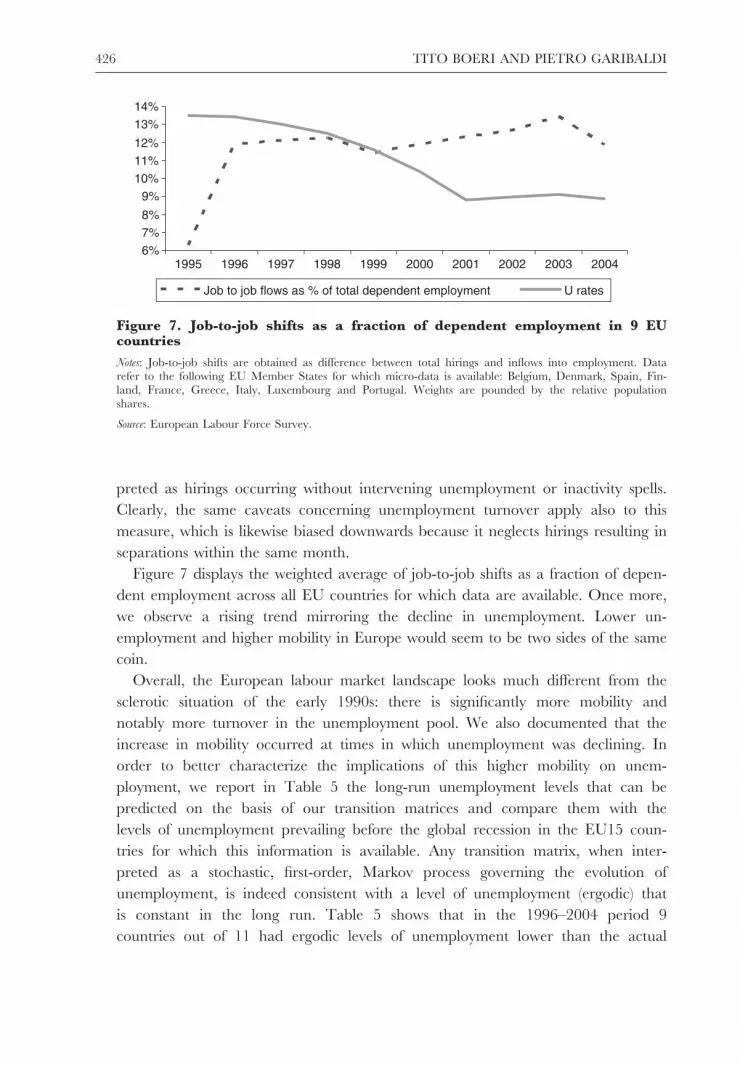
Figure 7 displays the weighted average of job-to-job shifts as a fraction of depen-
dent employment across all EU countries for which data are available. Once more,
we observe a rising trend mirroring the decline in unemployment. Lower un-
employment and higher mobility in Europe would seem to be two sides of the same
coin.
Overall, the European labour market landscape looks much different from the
sclerotic situation of the early 1990s: there is significantly more mobility and
notably more turnover in the unemployment pool. We also documented that the
increase in mobility occurred at times in which unemployment was declining. In
order to better characterize the implications of this higher mobility on unem-
ployment, we report in Table 5 the long-run unemployment levels that can be
predicted on the basis of our transition matrices and compare them with the
levels of unemployment prevailing before the global recession in the EU15 coun-
tries for which this information is available. Any transition matrix, when inter-
preted as a stochastic, first-order, Markov process governing the evolution of
unemployment, is indeed consistent with a level of unemployment (ergodic) that
is constant in the long run. Table 5 shows that in the 1996–2004 period 9
countries out of 11 had ergodic levels of unemployment lower than the actual
6%
7%
8%
9%
10%
11%
12%
13%
14%
1995 1996 1997 1998 1999 2000 2001 2002 2003 2004
Job to job flows as % of total dependent employment U rates
Figure 7. Job-to-job shifts as a fraction of dependent employment in 9 EUcountries
Notes: Job-to-job shifts are obtained as difference between total hirings and inflows into employment. Datarefer to the following EU Member States for which micro-data is available: Belgium, Denmark, Spain, Fin-land, France, Greece, Italy, Luxembourg and Portugal. Weights are pounded by the relative populationshares.
Source: European Labour Force Survey.
426 TITO BOERI AND PIETRO GARIBALDI
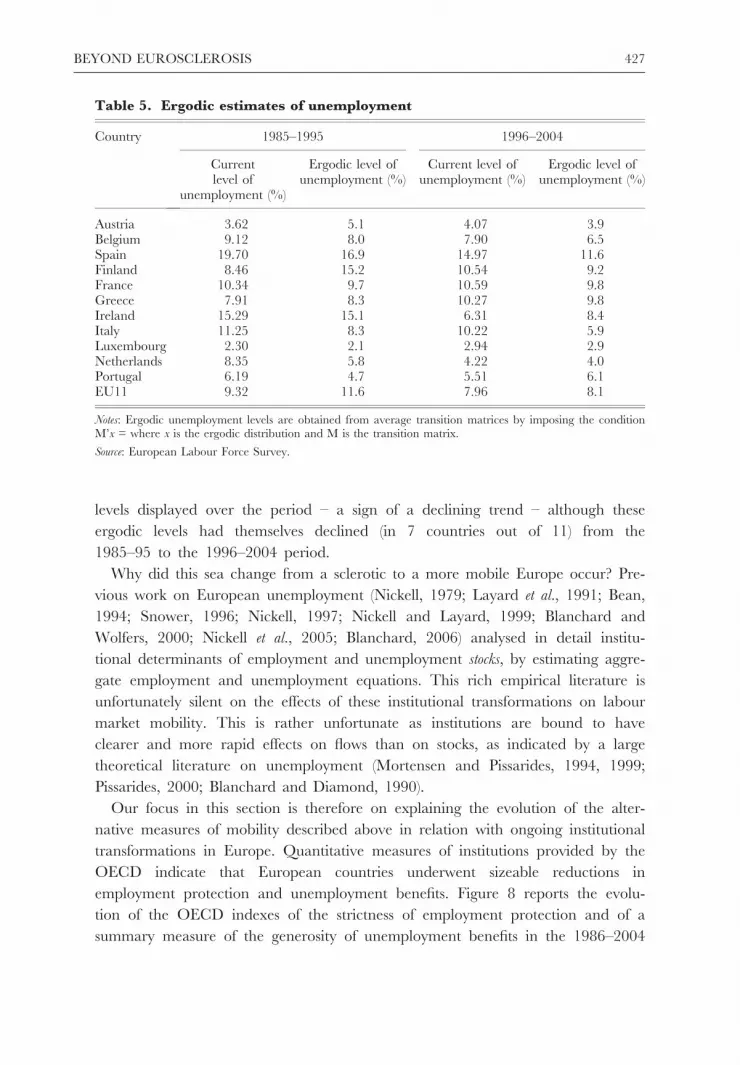
levels displayed over the period – a sign of a declining trend – although these
ergodic levels had themselves declined (in 7 countries out of 11) from the
1985–95 to the 1996–2004 period.
Why did this sea change from a sclerotic to a more mobile Europe occur? Pre-
vious work on European unemployment (Nickell, 1979; Layard et al., 1991; Bean,
1994; Snower, 1996; Nickell, 1997; Nickell and Layard, 1999; Blanchard and
Wolfers, 2000; Nickell et al., 2005; Blanchard, 2006) analysed in detail institu-
tional determinants of employment and unemployment stocks, by estimating aggre-
gate employment and unemployment equations. This rich empirical literature is
unfortunately silent on the effects of these institutional transformations on labour
market mobility. This is rather unfortunate as institutions are bound to have
clearer and more rapid effects on flows than on stocks, as indicated by a large
theoretical literature on unemployment (Mortensen and Pissarides, 1994, 1999;
Pissarides, 2000; Blanchard and Diamond, 1990).
Our focus in this section is therefore on explaining the evolution of the alter-
native measures of mobility described above in relation with ongoing institutional
transformations in Europe. Quantitative measures of institutions provided by the
OECD indicate that European countries underwent sizeable reductions in
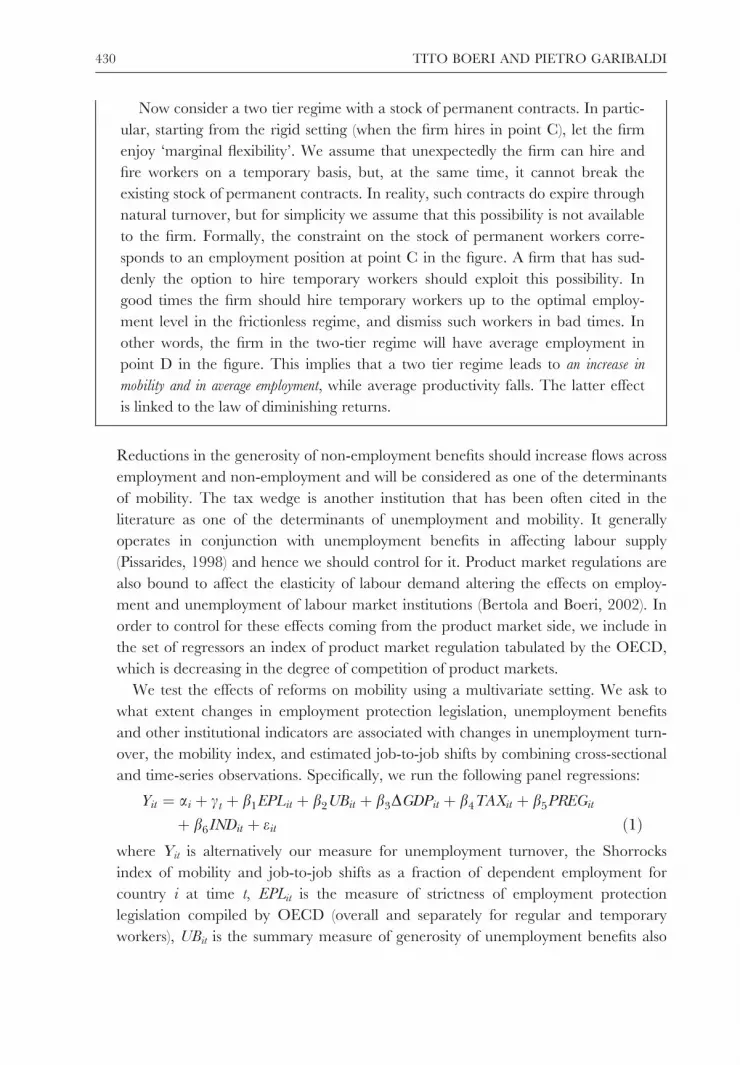
employment protection and unemployment benefits. Figure 8 reports the evolu-
tion of the OECD indexes of the strictness of employment protection and of a
summary measure of the generosity of unemployment benefits in the 1986–2004
Table 5. Ergodic estimates of unemployment
Country 1985–1995 1996–2004
Currentlevel of
unemployment (%)
Ergodic level ofunemployment (%)
Current level ofunemployment (%)
Ergodic level ofunemployment (%)
Austria 3.62 5.1 4.07 3.9Belgium 9.12 8.0 7.90 6.5Spain 19.70 16.9 14.97 11.6Finland 8.46 15.2 10.54 9.2France 10.34 9.7 10.59 9.8Greece 7.91 8.3 10.27 9.8Ireland 15.29 15.1 6.31 8.4Italy 11.25 8.3 10.22 5.9Luxembourg 2.30 2.1 2.94 2.9Netherlands 8.35 5.8 4.22 4.0Portugal 6.19 4.7 5.51 6.1EU11 9.32 11.6 7.96 8.1
Notes: Ergodic unemployment levels are obtained from average transition matrices by imposing the conditionM’x = where x is the ergodic distribution and M is the transition matrix.
Source: European Labour Force Survey.
BEYOND EUROSCLEROSIS 427
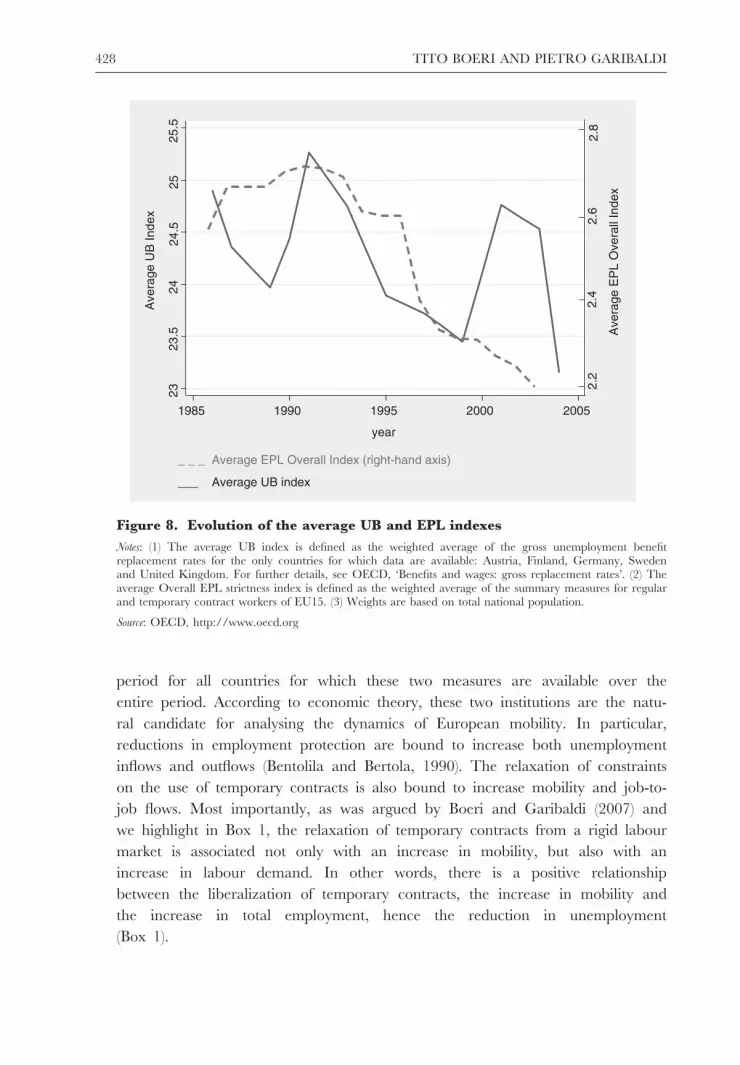
period for all countries for which these two measures are available over the
entire period. According to economic theory, these two institutions are the natu-
ral candidate for analysing the dynamics of European mobility. In particular,
reductions in employment protection are bound to increase both unemployment
inflows and outflows (Bentolila and Bertola, 1990). The relaxation of constraints
on the use of temporary contracts is also bound to increase mobility and job-to-
job flows. Most importantly, as was argued by Boeri and Garibaldi (2007) and
we highlight in Box 1, the relaxation of temporary contracts from a rigid labour
market is associated not only with an increase in mobility, but also with an
increase in labour demand. In other words, there is a positive relationship
between the liberalization of temporary contracts, the increase in mobility and
the increase in total employment, hence the reduction in unemployment
(Box 1).
2323
.524
24.5
2525
.5
Ave
rage
UB
Inde
x
1985 1990 1995 2000 2005
year
2.2
2.4
2.6
2.8
Ave
rage
EP
L O
vera
ll In
dex
_ _ _ Average EPL Overall Index (right-hand axis)
___ Average UB index
Figure 8. Evolution of the average UB and EPL indexes
Notes: (1) The average UB index is defined as the weighted average of the gross unemployment benefitreplacement rates for the only countries for which data are available: Austria, Finland, Germany, Swedenand United Kingdom. For further details, see OECD, ‘Benefits and wages: gross replacement rates’. (2) Theaverage Overall EPL strictness index is defined as the weighted average of the summary measures for regularand temporary contract workers of EU15. (3) Weights are based on total national population.
Source: OECD, http://www.oecd.org
428 TITO BOERI AND PIETRO GARIBALDI
Box 1. Employment protection legislation, mobility and average
employment
The relationship between average employment and EPL is well understood
in the literature since the pioneering work of Nickell (1986) and Bentolila
and Bertola (1990). In the basic model of labour demand under uncertainty
with adjustment costs, EPL has ambiguous effects on average employment,
but it clearly reduces market flows and mobility. While the result in terms of
mobility is fairly robust, the prediction on the effects of EPL on employment
slightly changes in the context of dual labour markets, when temporary con-
tracts are introduced alongside rigid open-ended contracts. Boeri and Gari-
baldi (2007) show that within a simple model of labour demand, the
introduction of temporary contracts within an otherwise rigid labour market
leads to an increase in both average employment and mobility. The point can be
illustrated more formally in what follows.
Labour is the only factor of production. There are decreasing returns to
scale and the production function of the representative firm reads
y ¼ Ai log l
where l is labour, y is output and Ai is the productivity level; there are business
fluctuations in the productivity of the firm and Ai assumes only two values Ah >
Al. Shocks to the productivity are i.i.d. In every period, there is a probability p
that productivity be equal to Ah and a probability 1 – p that productivity be
equal to Al. There is neither discounting nor natural turnover. The wage is
fixed and equal to w and the price that the firm charges for simplicity is set
equal to 1 and does not change between good and bad times. The key decision
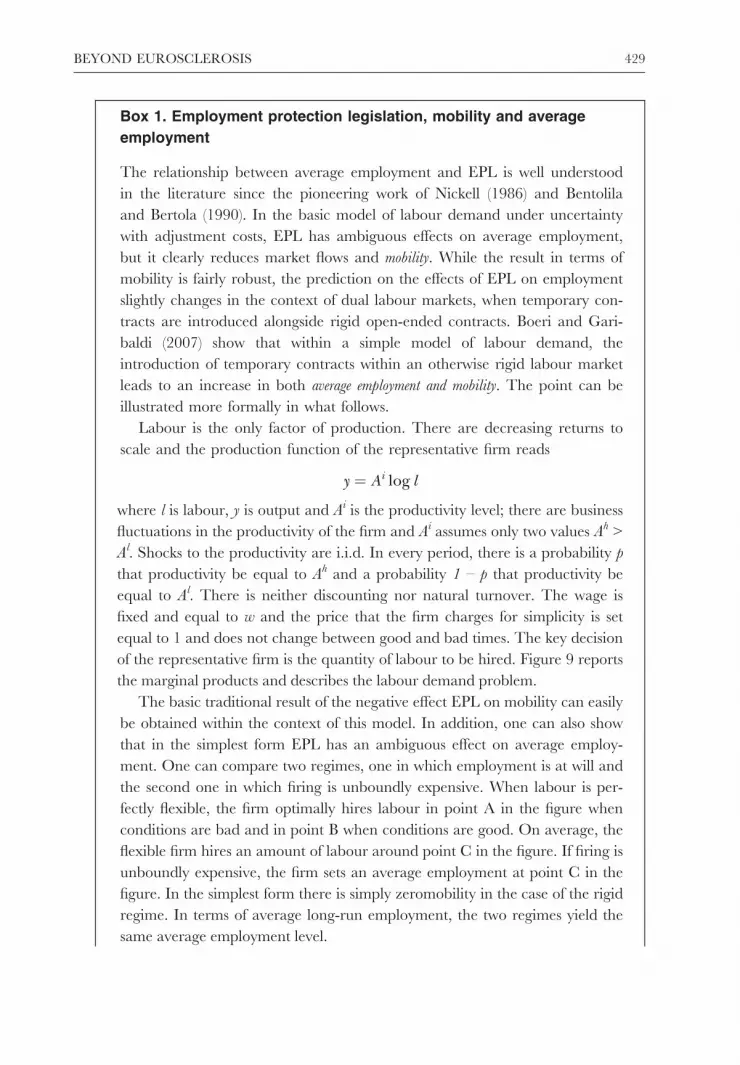
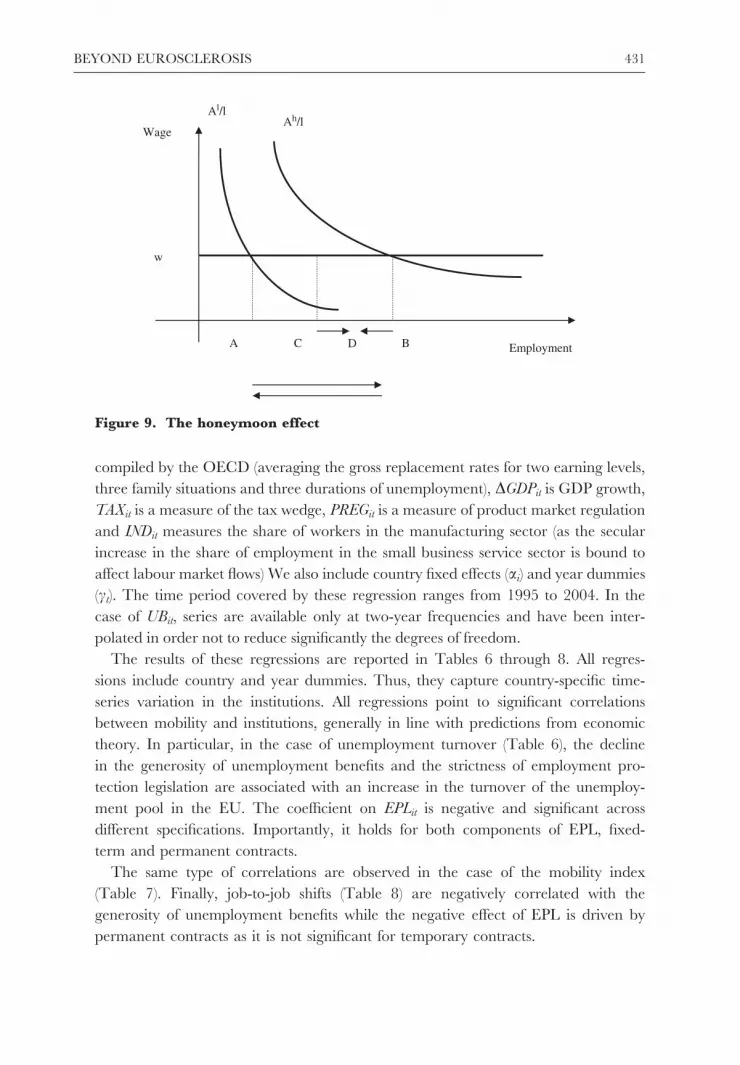
of the representative firm is the quantity of labour to be hired. Figure 9 reports
the marginal products and describes the labour demand problem.
The basic traditional result of the negative effect EPL on mobility can easily
be obtained within the context of this model. In addition, one can also show
that in the simplest form EPL has an ambiguous effect on average employ-
ment. One can compare two regimes, one in which employment is at will and
the second one in which firing is unboundly expensive. When labour is per-
fectly flexible, the firm optimally hires labour in point A in the figure when
conditions are bad and in point B when conditions are good. On average, the
flexible firm hires an amount of labour around point C in the figure. If firing is
unboundly expensive, the firm sets an average employment at point C in the
figure. In the simplest form there is simply zeromobility in the case of the rigid
regime. In terms of average long-run employment, the two regimes yield the
same average employment level.
BEYOND EUROSCLEROSIS 429
Now consider a two tier regime with a stock of permanent contracts. In partic-
ular, starting from the rigid setting (when the firm hires in point C), let the firm
enjoy ‘marginal flexibility’. We assume that unexpectedly the firm can hire and
fire workers on a temporary basis, but, at the same time, it cannot break the
existing stock of permanent contracts. In reality, such contracts do expire through
natural turnover, but for simplicity we assume that this possibility is not available
to the firm. Formally, the constraint on the stock of permanent workers corre-
sponds to an employment position at point C in the figure. A firm that has sud-
denly the option to hire temporary workers should exploit this possibility. In
good times the firm should hire temporary workers up to the optimal employ-
ment level in the frictionless regime, and dismiss such workers in bad times. In
other words, the firm in the two-tier regime will have average employment in
point D in the figure. This implies that a two tier regime leads to an increase in
mobility and in average employment, while average productivity falls. The latter effect
is linked to the law of diminishing returns.
Reductions in the generosity of non-employment benefits should increase flows across
employment and non-employment and will be considered as one of the determinants
of mobility. The tax wedge is another institution that has been often cited in the
literature as one of the determinants of unemployment and mobility. It generally
operates in conjunction with unemployment benefits in affecting labour supply
(Pissarides, 1998) and hence we should control for it. Product market regulations are
also bound to affect the elasticity of labour demand altering the effects on employ-
ment and unemployment of labour market institutions (Bertola and Boeri, 2002). In
order to control for these effects coming from the product market side, we include in
the set of regressors an index of product market regulation tabulated by the OECD,
which is decreasing in the degree of competition of product markets.
We test the effects of reforms on mobility using a multivariate setting. We ask to
what extent changes in employment protection legislation, unemployment benefits
and other institutional indicators are associated with changes in unemployment turn-
over, the mobility index, and estimated job-to-job shifts by combining cross-sectional
and time-series observations. Specifically, we run the following panel regressions:
Yit ¼ ai þ ct þ b1EPLit þ b2UBit þ b3DGDPit þ b4TAXit þ b5PREGit
þ b6INDit þ eit ð1Þwhere Yit is alternatively our measure for unemployment turnover, the Shorrocks
index of mobility and job-to-job shifts as a fraction of dependent employment for
country i at time t, EPLit is the measure of strictness of employment protection
legislation compiled by OECD (overall and separately for regular and temporary
workers), UBit is the summary measure of generosity of unemployment benefits also
430 TITO BOERI AND PIETRO GARIBALDI
compiled by the OECD (averaging the gross replacement rates for two earning levels,
three family situations and three durations of unemployment), DGDPit is GDP growth,
TAXit is a measure of the tax wedge, PREGit is a measure of product market regulation
and INDit measures the share of workers in the manufacturing sector (as the secular
increase in the share of employment in the small business service sector is bound to
affect labour market flows) We also include country fixed effects (ai) and year dummies
(ct). The time period covered by these regression ranges from 1995 to 2004. In the
case of UBit, series are available only at two-year frequencies and have been inter-
polated in order not to reduce significantly the degrees of freedom.
The results of these regressions are reported in Tables 6 through 8. All regres-
sions include country and year dummies. Thus, they capture country-specific time-
series variation in the institutions. All regressions point to significant correlations
between mobility and institutions, generally in line with predictions from economic
theory. In particular, in the case of unemployment turnover (Table 6), the decline
in the generosity of unemployment benefits and the strictness of employment pro-
tection legislation are associated with an increase in the turnover of the unemploy-
ment pool in the EU. The coefficient on EPLit is negative and significant across
different specifications. Importantly, it holds for both components of EPL, fixed-
term and permanent contracts.
The same type of correlations are observed in the case of the mobility index
(Table 7). Finally, job-to-job shifts (Table 8) are negatively correlated with the
generosity of unemployment benefits while the negative effect of EPL is driven by
permanent contracts as it is not significant for temporary contracts.
Employment
Ah/lAl/l
A B C D
w
Wage
Figure 9. The honeymoon effect
BEYOND EUROSCLEROSIS 431
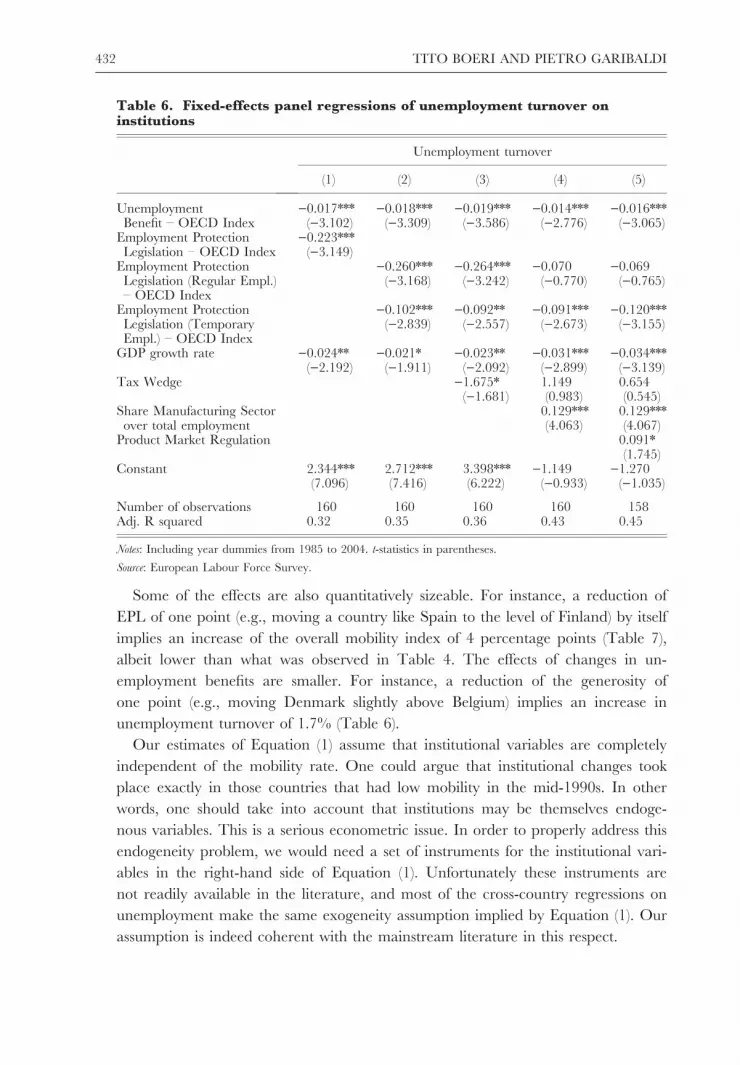
Some of the effects are also quantitatively sizeable. For instance, a reduction of
EPL of one point (e.g., moving a country like Spain to the level of Finland) by itself
implies an increase of the overall mobility index of 4 percentage points (Table 7),
albeit lower than what was observed in Table 4. The effects of changes in un-
employment benefits are smaller. For instance, a reduction of the generosity of
one point (e.g., moving Denmark slightly above Belgium) implies an increase in
unemployment turnover of 1.7% (Table 6).
Our estimates of Equation (1) assume that institutional variables are completely
independent of the mobility rate. One could argue that institutional changes took
place exactly in those countries that had low mobility in the mid-1990s. In other
words, one should take into account that institutions may be themselves endoge-
nous variables. This is a serious econometric issue. In order to properly address this
endogeneity problem, we would need a set of instruments for the institutional vari-
ables in the right-hand side of Equation (1). Unfortunately these instruments are
not readily available in the literature, and most of the cross-country regressions on
unemployment make the same exogeneity assumption implied by Equation (1). Our
assumption is indeed coherent with the mainstream literature in this respect.
Table 6. Fixed-effects panel regressions of unemployment turnover oninstitutions
Unemployment turnover
(1) (2) (3) (4) (5)
UnemploymentBenefit – OECD Index
)0.017***()3.102)
)0.018***()3.309)
)0.019***()3.586)
)0.014***()2.776)
)0.016***()3.065)
Employment ProtectionLegislation – OECD Index
)0.223***()3.149)
Employment ProtectionLegislation (Regular Empl.)– OECD Index
)0.260***()3.168)
)0.264***()3.242)
)0.070()0.770)
)0.069()0.765)
Employment ProtectionLegislation (TemporaryEmpl.) – OECD Index
)0.102***()2.839)
)0.092**()2.557)
)0.091***()2.673)
)0.120***()3.155)
GDP growth rate )0.024**()2.192)
)0.021*()1.911)
)0.023**()2.092)
)0.031***()2.899)
)0.034***()3.139)
Tax Wedge )1.675*()1.681)
1.149(0.983)
0.654(0.545)
Share Manufacturing Sectorover total employment
0.129***(4.063)
0.129***(4.067)
Product Market Regulation 0.091*(1.745)
Constant 2.344***(7.096)
2.712***(7.416)
3.398***(6.222)
)1.149()0.933)
)1.270()1.035)
Number of observations 160 160 160 160 158Adj. R squared 0.32 0.35 0.36 0.43 0.45
Notes: Including year dummies from 1985 to 2004. t-statistics in parentheses.
Source: European Labour Force Survey.
432 TITO BOERI AND PIETRO GARIBALDI
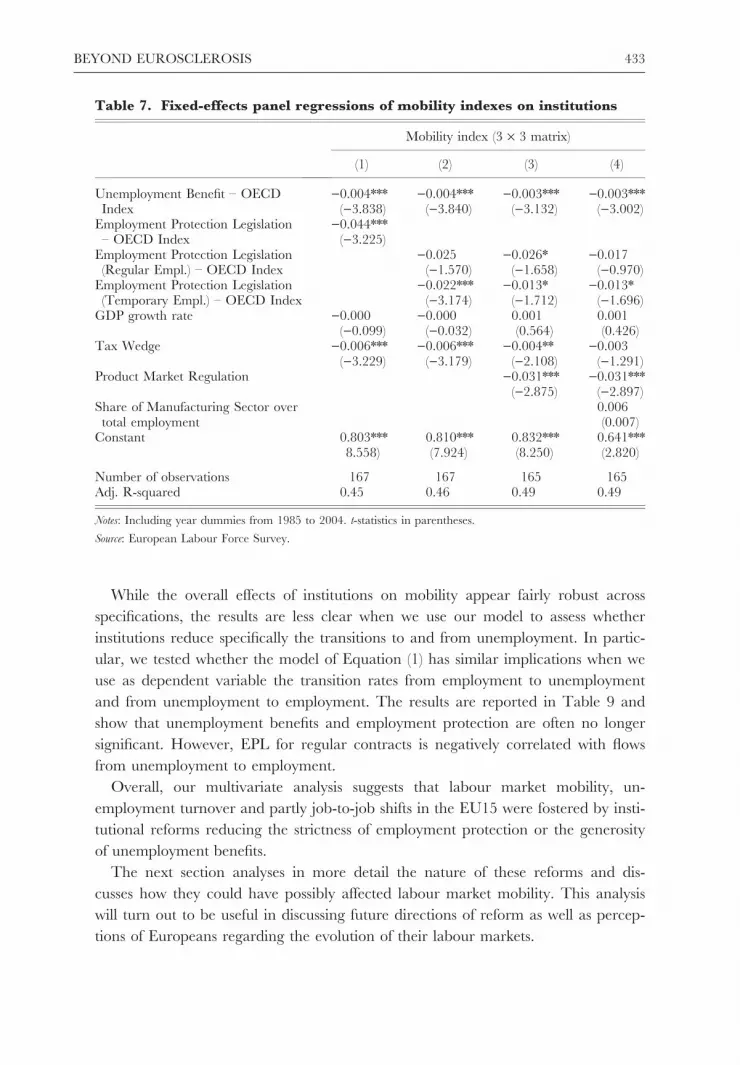
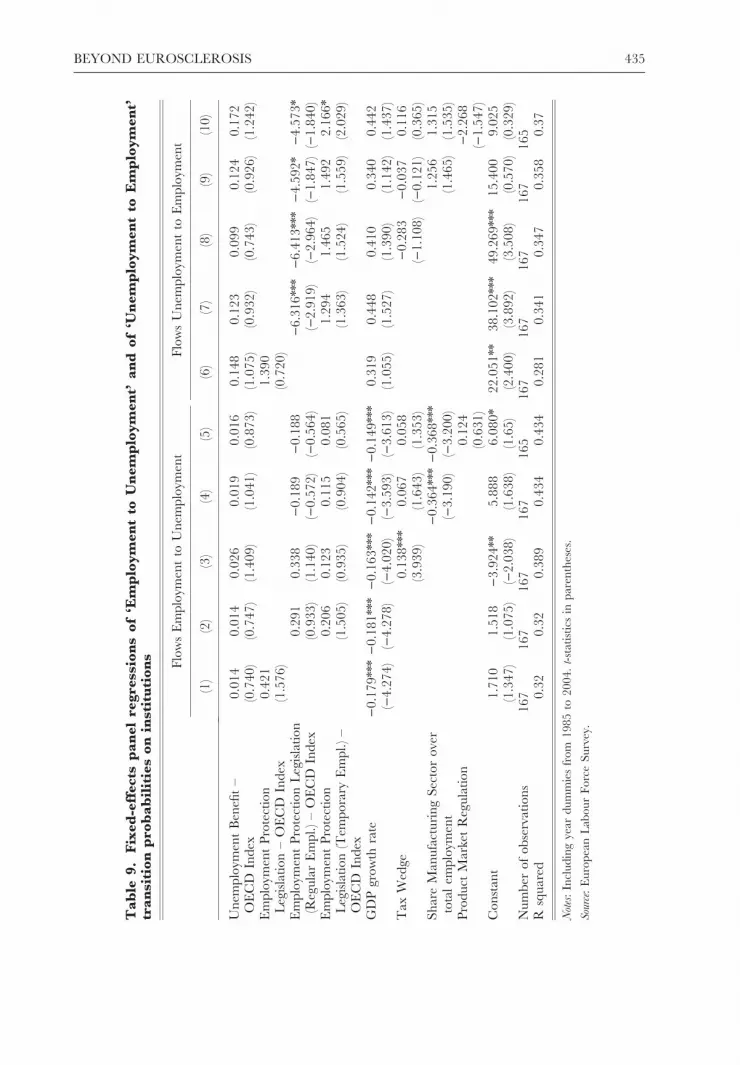
While the overall effects of institutions on mobility appear fairly robust across
specifications, the results are less clear when we use our model to assess whether
institutions reduce specifically the transitions to and from unemployment. In partic-
ular, we tested whether the model of Equation (1) has similar implications when we
use as dependent variable the transition rates from employment to unemployment
and from unemployment to employment. The results are reported in Table 9 and
show that unemployment benefits and employment protection are often no longer
significant. However, EPL for regular contracts is negatively correlated with flows
from unemployment to employment.
Overall, our multivariate analysis suggests that labour market mobility, un-
employment turnover and partly job-to-job shifts in the EU15 were fostered by insti-
tutional reforms reducing the strictness of employment protection or the generosity
of unemployment benefits.
The next section analyses in more detail the nature of these reforms and dis-
cusses how they could have possibly affected labour market mobility. This analysis
will turn out to be useful in discussing future directions of reform as well as percep-
tions of Europeans regarding the evolution of their labour markets.
Table 7. Fixed-effects panel regressions of mobility indexes on institutions
Mobility index (3 · 3 matrix)
(1) (2) (3) (4)
Unemployment Benefit – OECDIndex
)0.004***()3.838)
)0.004***()3.840)
)0.003***()3.132)
)0.003***()3.002)
Employment Protection Legislation– OECD Index
)0.044***()3.225)
Employment Protection Legislation(Regular Empl.) – OECD Index
)0.025()1.570)
)0.026*()1.658)
)0.017()0.970)
Employment Protection Legislation(Temporary Empl.) – OECD Index
)0.022***()3.174)
)0.013*()1.712)
)0.013*()1.696)
GDP growth rate )0.000()0.099)
)0.000()0.032)
0.001(0.564)
0.001(0.426)
Tax Wedge )0.006***()3.229)
)0.006***()3.179)
)0.004**()2.108)
)0.003()1.291)
Product Market Regulation )0.031***()2.875)
)0.031***()2.897)
Share of Manufacturing Sector overtotal employment
0.006(0.007)
Constant 0.803***8.558)
0.810***(7.924)
0.832***(8.250)
0.641***(2.820)
Number of observations 167 167 165 165Adj. R-squared 0.45 0.46 0.49 0.49
Notes: Including year dummies from 1985 to 2004. t-statistics in parentheses.
Source: European Labour Force Survey.
BEYOND EUROSCLEROSIS 433
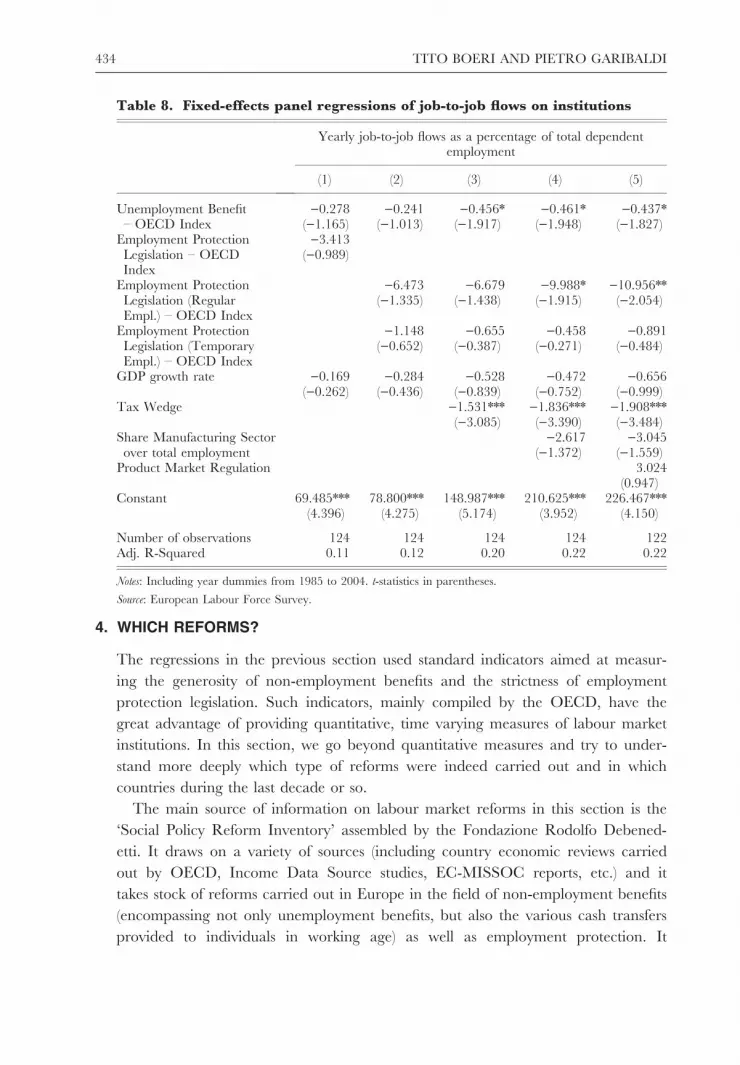
4. WHICH REFORMS?
The regressions in the previous section used standard indicators aimed at measur-
ing the generosity of non-employment benefits and the strictness of employment
protection legislation. Such indicators, mainly compiled by the OECD, have the
great advantage of providing quantitative, time varying measures of labour market
institutions. In this section, we go beyond quantitative measures and try to under-
stand more deeply which type of reforms were indeed carried out and in which
countries during the last decade or so.
The main source of information on labour market reforms in this section is the
‘Social Policy Reform Inventory’ assembled by the Fondazione Rodolfo Debened-
etti. It draws on a variety of sources (including country economic reviews carried
out by OECD, Income Data Source studies, EC-MISSOC reports, etc.) and it
takes stock of reforms carried out in Europe in the field of non-employment benefits
(encompassing not only unemployment benefits, but also the various cash transfers
provided to individuals in working age) as well as employment protection. It
Table 8. Fixed-effects panel regressions of job-to-job flows on institutions
Yearly job-to-job flows as a percentage of total dependentemployment
(1) (2) (3) (4) (5)
Unemployment Benefit– OECD Index
)0.278()1.165)
)0.241()1.013)
)0.456*()1.917)
)0.461*()1.948)
)0.437*()1.827)
Employment ProtectionLegislation – OECDIndex
)3.413()0.989)
Employment ProtectionLegislation (RegularEmpl.) – OECD Index
)6.473()1.335)
)6.679()1.438)
)9.988*()1.915)
)10.956**()2.054)
Employment ProtectionLegislation (TemporaryEmpl.) – OECD Index
)1.148()0.652)
)0.655()0.387)
)0.458()0.271)
)0.891()0.484)
GDP growth rate )0.169()0.262)
)0.284()0.436)
)0.528()0.839)
)0.472()0.752)
)0.656()0.999)
Tax Wedge )1.531***()3.085)
)1.836***()3.390)
)1.908***()3.484)
Share Manufacturing Sectorover total employment
)2.617()1.372)
)3.045()1.559)
Product Market Regulation 3.024(0.947)
Constant 69.485***(4.396)
78.800***(4.275)
148.987***(5.174)
210.625***(3.952)
226.467***(4.150)
Number of observations 124 124 124 124 122Adj. R-Squared 0.11 0.12 0.20 0.22 0.22
Notes: Including year dummies from 1985 to 2004. t-statistics in parentheses.
Source: European Labour Force Survey.
434 TITO BOERI AND PIETRO GARIBALDI
Table
9.
Fix
ed-e
ffects
panel
regressio
ns
of
‘Em
plo
ym
ent
toU
nem
plo
ym
ent’
and
of
‘Unem
plo
ym
ent
toE
mplo
ym
ent’
transit
ion
probabilit
ies
on
insti
tuti
ons
Flo
ws
Em
plo
ymen
tto
Unem
plo
ymen
tFlo
ws
Unem
plo
ymen
tto
Em
plo
ymen
t
(1)
(2)
(3)
(4)
(5)
(6)
(7)
(8)
(9)
(10)
Unem
plo
ymen
tBen
efit–
OEC
DIn
dex
0.0
14
0.0
14
0.0
26
0.0
19
0.0
16
0.1
48
0.1
23
0.0
99
0.1
24
0.1
72
(0.7
40)
(0.7
47)
(1.4
09)
(1.0
41)
(0.8
73)
(1.0
75)
(0.9
32)
(0.7
43)
(0.9
26)
(1.2
42)
Em
plo
ymen
tPro
tect
ion
Leg
isla
tion–
OEC
DIn
dex
0.4
21
1.3
90
(1.5
76)
(0.7
20)
Em
plo
ymen
tPro
tect
ion
Leg
isla
tion
(Reg
ula
rEm
pl.)–
OEC
DIn
dex
0.2
91
0.3
38
)0.1
89
)0.1
88
)6.3
16**
*)6.4
13**
*)4.5
92*
)4.5
73*
(0.9
33)
(1.1
40)
()0.5
72)
()0.5
64)
()2.9
19)
()2.9
64)
()1.8
47)
()1.8
40)
Em
plo
ymen
tPro
tect
ion
Leg
isla
tion
(Tem
pora
ryEm
pl.)–
OEC
DIn
dex
0.2
06
0.1
23
0.1
15
0.0
81
1.2
94
1.4
65
1.4
92
2.1
66*
(1.5
05)
(0.9
35)
(0.9
04)
(0.5
65)
(1.3
63)
(1.5
24)
(1.5
59)
(2.0
29)
GD
Pgro
wth
rate
)0.1
79**
*)0.1
81**
*)0.1
63**
*)0.1
42**
*)0.1
49**
*0.3
19
0.4
48
0.4
10
0.3
40
0.4
42
()4.2
74)
()4.2
78)
()4.0
20)
()3.5
93)
()3.6
13)
(1.0
55)
(1.5
27)
(1.3
90)
(1.1
42)
(1.4
37)
Tax
Wed
ge
0.1
38**
*0.0
67
0.0
58
)0.2
83
)0.0
37
0.1
16
(3.9
39)
(1.6
43)
(1.3
53)
()1.1
08)
()0.1
21)
(0.3
65)
Share
Manufa
cturing
Sec
tor
ove
rto
talem
plo
ymen
t)0.3
64**
*)0.3
68**
*1.2
56
1.3
15
()3.1
90)
()3.2
00)
(1.4
65)
(1.5
35)
Pro
duct
Mark
etR
egula
tion
0.1
24
)2.2
68
(0.6
31)
()1.5
47)
Constant
1.7
10
1.5
18
)3.9
24**
5.8
88
6.0
80*
22.0
51**
38.1
02**
*49.2
69**
*15.4
00
9.0
25
(1.3
47)
(1.0
75)
()2.0
38)
(1.6
38)
(1.6
5)
(2.4
00)
(3.8
92)
(3.5
08)
(0.5
70)
(0.3
29)
Num
ber
ofobse
rvations
167
167
167
167
165
167
167
167
167
165
Rsq
uare
d0.3
20.3
20.3
89
0.4
34
0.4
34
0.2
81
0.3
41
0.3
47
0.3
58
0.3
7
Notes:In
cludin
gye
ar
dum
mie
sfrom
1985
to2004.t-statistic
sin
pare
nth
eses
.
Sou
rce:
Euro
pea
nLabour
Forc
eSurv
ey.
BEYOND EUROSCLEROSIS 435
complements the information provided by the OECD indicators in that it offers
more insights on qualitative features of institutions. We may observe significant
reform activity even at times in which the regulatory indicator exhibits small
changes or no variation at all. This may point to unsuccessful attempts of govern-
ments to bypass political opposition to reforms.
Details on the inventory of social policy reforms and on each single regulatory
change are offered in the webpage of the Fondazione Rodolfo Debenedetti (http://
www.frdb.org). Hence, we can confine ourselves herein just to providing informa-
tion on the criteria followed in the classification of the reforms. The FRDB inven-
tory of reforms is organized along two main dimensions.
On the one hand, reforms are classified on the basis of their broad orientation,
that is, whether they tend to reduce or increase the generosity of non-employment
benefits and make employment protection more or less stringent. It should be
stressed that increasing rewards from labour market participation does not necessar-
ily mean phasing out existing cash transfers mechanism to non-employed individu-
als. It may simply involve the introduction of wage subsidies, employment
conditional incentives or just activation policies (including sanctions) for beneficiaries
of existing schemes. On the other hand, reforms are classified as piecemeal or
radical, on the basis of their design. Radical reforms operate in more than one
dimension, while piecemeal are narrow in scope. A key feature of this dataset is that
it provides country-specific institutional details that are always very important and
cannot be captured by simple quantitative indicators. The radical reforms carried
out in the EU15 in these domains in the period 1986–2005 are listed in Appendix B.
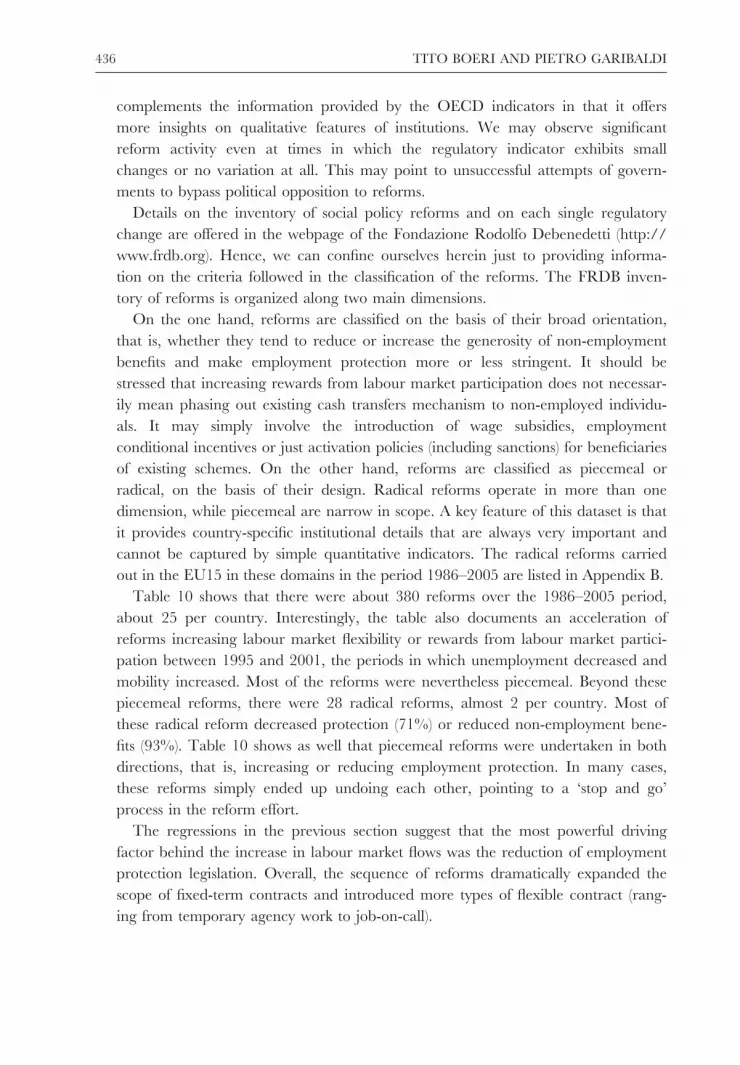
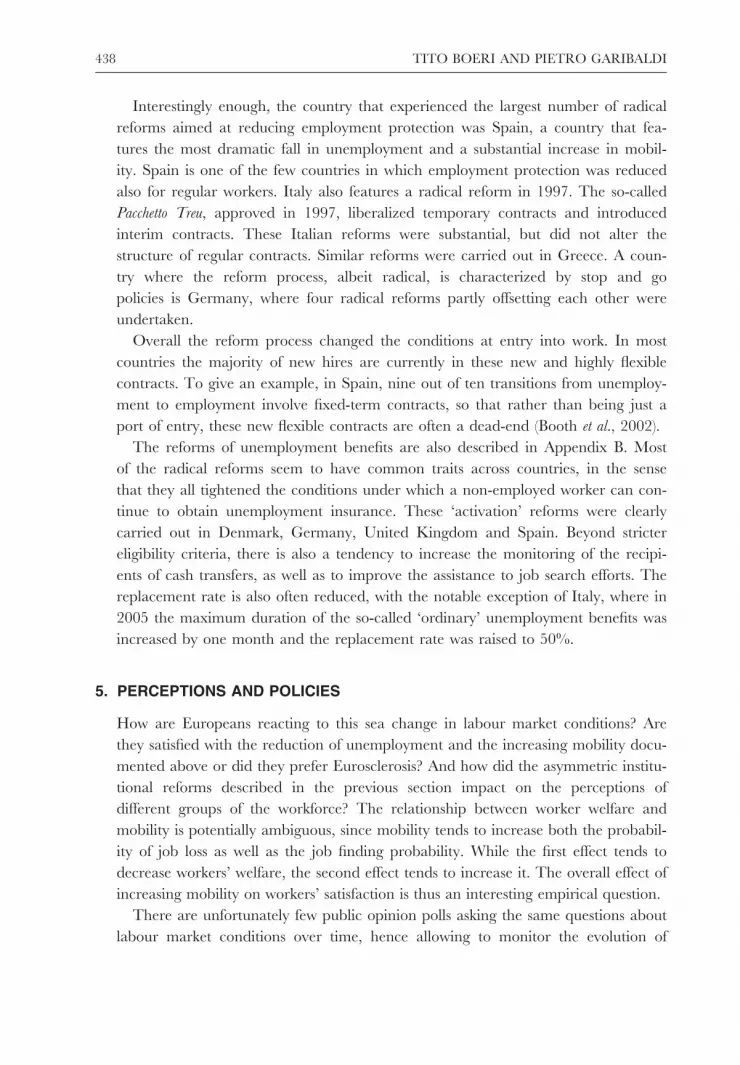
Table 10 shows that there were about 380 reforms over the 1986–2005 period,
about 25 per country. Interestingly, the table also documents an acceleration of
reforms increasing labour market flexibility or rewards from labour market partici-
pation between 1995 and 2001, the periods in which unemployment decreased and
mobility increased. Most of the reforms were nevertheless piecemeal. Beyond these
piecemeal reforms, there were 28 radical reforms, almost 2 per country. Most of
these radical reform decreased protection (71%) or reduced non-employment bene-
fits (93%). Table 10 shows as well that piecemeal reforms were undertaken in both
directions, that is, increasing or reducing employment protection. In many cases,
these reforms simply ended up undoing each other, pointing to a ‘stop and go’
process in the reform effort.
The regressions in the previous section suggest that the most powerful driving
factor behind the increase in labour market flows was the reduction of employment
protection legislation. Overall, the sequence of reforms dramatically expanded the
scope of fixed-term contracts and introduced more types of flexible contract (rang-
ing from temporary agency work to job-on-call).
436 TITO BOERI AND PIETRO GARIBALDI
Table
10.
Refo
rm
sof
em
plo
ym
ent
prote
cti
on
and
non-e
mplo
ym
ent
benefits
(1986–2005)
Dec
reasing
pro
tect
ion;in
crea
sing
rew
ard
sfrom
partic
ipation
Incr
easing
pro
tect
ion;dec
reasing
rew
ard
sfrom
partic
ipation
Tota
lper
row
Ofw
hic
hdec
reasing
(%)
1986–1990
1991–1995
1996–2000
2001–2005
1986–1990
1991–1995
1996–2000
2001–2005
EPL Pie
cem
eal
57
14
12
87
20
18
91
42
Radic
al
–4
42
21
114
71
NEB Pie
cem
eal
924
75
94
10
821
19
260
78
Radic
al
12
37
––
–1
14
93
Note:
Alist
ofth
era
dic
alre
form
sis
offer
edin
Appen
dix
B.
Sou
rce:
FR
DB
Ref
orm
Data
base
.
BEYOND EUROSCLEROSIS 437
Interestingly enough, the country that experienced the largest number of radical
reforms aimed at reducing employment protection was Spain, a country that fea-
tures the most dramatic fall in unemployment and a substantial increase in mobil-
ity. Spain is one of the few countries in which employment protection was reduced
also for regular workers. Italy also features a radical reform in 1997. The so-called
Pacchetto Treu, approved in 1997, liberalized temporary contracts and introduced
interim contracts. These Italian reforms were substantial, but did not alter the
structure of regular contracts. Similar reforms were carried out in Greece. A coun-
try where the reform process, albeit radical, is characterized by stop and go
policies is Germany, where four radical reforms partly offsetting each other were
undertaken.
Overall the reform process changed the conditions at entry into work. In most
countries the majority of new hires are currently in these new and highly flexible
contracts. To give an example, in Spain, nine out of ten transitions from unemploy-
ment to employment involve fixed-term contracts, so that rather than being just a
port of entry, these new flexible contracts are often a dead-end (Booth et al., 2002).
The reforms of unemployment benefits are also described in Appendix B. Most
of the radical reforms seem to have common traits across countries, in the sense
that they all tightened the conditions under which a non-employed worker can con-
tinue to obtain unemployment insurance. These ‘activation’ reforms were clearly
carried out in Denmark, Germany, United Kingdom and Spain. Beyond stricter
eligibility criteria, there is also a tendency to increase the monitoring of the recipi-
ents of cash transfers, as well as to improve the assistance to job search efforts. The
replacement rate is also often reduced, with the notable exception of Italy, where in
2005 the maximum duration of the so-called ‘ordinary’ unemployment benefits was
increased by one month and the replacement rate was raised to 50%.
5. PERCEPTIONS AND POLICIES
How are Europeans reacting to this sea change in labour market conditions? Are
they satisfied with the reduction of unemployment and the increasing mobility docu-
mented above or did they prefer Eurosclerosis? And how did the asymmetric institu-
tional reforms described in the previous section impact on the perceptions of
different groups of the workforce? The relationship between worker welfare and
mobility is potentially ambiguous, since mobility tends to increase both the probabil-
ity of job loss as well as the job finding probability. While the first effect tends to
decrease workers’ welfare, the second effect tends to increase it. The overall effect of
increasing mobility on workers’ satisfaction is thus an interesting empirical question.
There are unfortunately few public opinion polls asking the same questions about
labour market conditions over time, hence allowing to monitor the evolution of
438 TITO BOERI AND PIETRO GARIBALDI
perceptions throughout the institutional transformations documented in this paper.
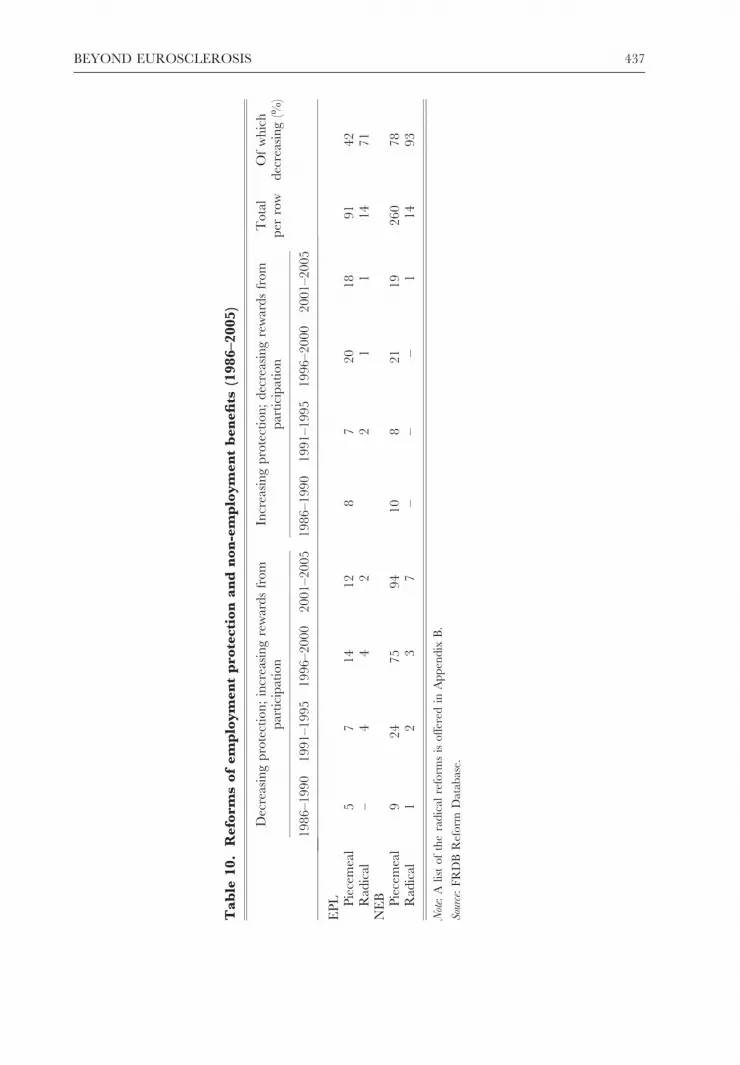
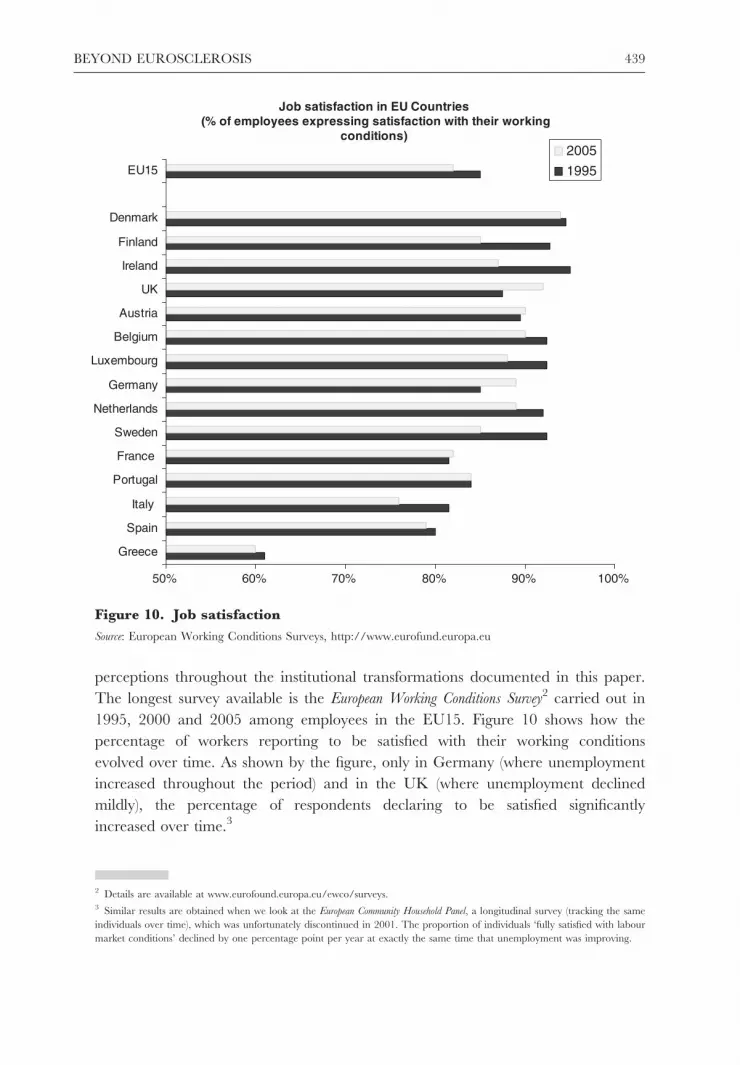
The longest survey available is the European Working Conditions Survey2 carried out in
1995, 2000 and 2005 among employees in the EU15. Figure 10 shows how the
percentage of workers reporting to be satisfied with their working conditions
evolved over time. As shown by the figure, only in Germany (where unemployment
increased throughout the period) and in the UK (where unemployment declined
mildly), the percentage of respondents declaring to be satisfied significantly
increased over time.3
Job satisfaction in EU Countries (% of employees expressing satisfaction with their working
conditions)
50% 60% 70% 80% 90% 100%
Greece
Spain
Italy
Portugal
France
Sweden
Netherlands
Germany
Luxembourg
Belgium
Austria
UK
Ireland
Finland
Denmark
EU15
2005
1995
Figure 10. Job satisfaction
Source: European Working Conditions Surveys, http://www.eurofund.europa.eu
2 Details are available at www.eurofound.europa.eu/ewco/surveys.3 Similar results are obtained when we look at the European Community Household Panel, a longitudinal survey (tracking the same
individuals over time), which was unfortunately discontinued in 2001. The proportion of individuals ‘fully satisfied with labour
market conditions’ declined by one percentage point per year at exactly the same time that unemployment was improving.
BEYOND EUROSCLEROSIS 439
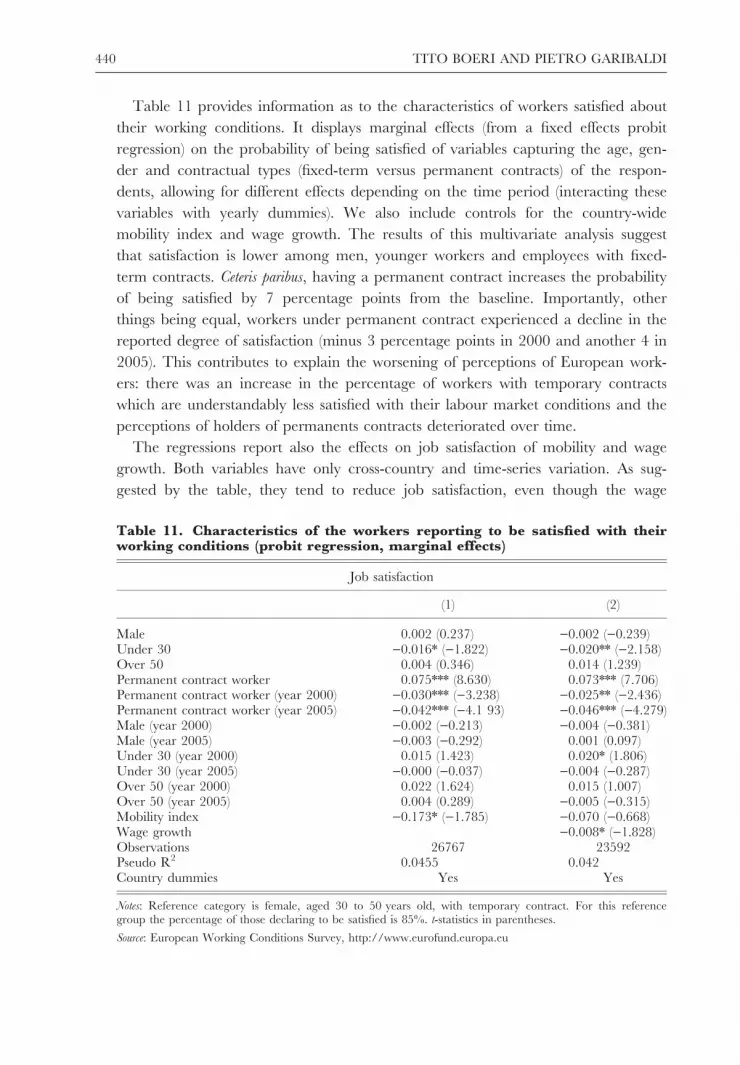
Table 11 provides information as to the characteristics of workers satisfied about
their working conditions. It displays marginal effects (from a fixed effects probit
regression) on the probability of being satisfied of variables capturing the age, gen-
der and contractual types (fixed-term versus permanent contracts) of the respon-
dents, allowing for different effects depending on the time period (interacting these
variables with yearly dummies). We also include controls for the country-wide
mobility index and wage growth. The results of this multivariate analysis suggest
that satisfaction is lower among men, younger workers and employees with fixed-
term contracts. Ceteris paribus, having a permanent contract increases the probability
of being satisfied by 7 percentage points from the baseline. Importantly, other
things being equal, workers under permanent contract experienced a decline in the
reported degree of satisfaction (minus 3 percentage points in 2000 and another 4 in
2005). This contributes to explain the worsening of perceptions of European work-
ers: there was an increase in the percentage of workers with temporary contracts
which are understandably less satisfied with their labour market conditions and the
perceptions of holders of permanents contracts deteriorated over time.
The regressions report also the effects on job satisfaction of mobility and wage
growth. Both variables have only cross-country and time-series variation. As sug-
gested by the table, they tend to reduce job satisfaction, even though the wage
Table 11. Characteristics of the workers reporting to be satisfied with theirworking conditions (probit regression, marginal effects)
Job satisfaction
(1) (2)
Male 0.002 (0.237) )0.002 ()0.239)Under 30 )0.016* ()1.822) )0.020** ()2.158)Over 50 0.004 (0.346) 0.014 (1.239)Permanent contract worker 0.075*** (8.630) 0.073*** (7.706)Permanent contract worker (year 2000) )0.030*** ()3.238) )0.025** ()2.436)Permanent contract worker (year 2005) )0.042*** ()4.1 93) )0.046*** ()4.279)Male (year 2000) )0.002 ()0.213) )0.004 ()0.381)Male (year 2005) )0.003 ()0.292) 0.001 (0.097)Under 30 (year 2000) 0.015 (1.423) 0.020* (1.806)Under 30 (year 2005) )0.000 ()0.037) )0.004 ()0.287)Over 50 (year 2000) 0.022 (1.624) 0.015 (1.007)Over 50 (year 2005) 0.004 (0.289) )0.005 ()0.315)Mobility index )0.173* ()1.785) )0.070 ()0.668)Wage growth )0.008* ()1.828)Observations 26767 23592Pseudo R2 0.0455 0.042Country dummies Yes Yes
Notes: Reference category is female, aged 30 to 50 years old, with temporary contract. For this referencegroup the percentage of those declaring to be satisfied is 85%. t-statistics in parentheses.
Source: European Working Conditions Survey, http://www.eurofund.europa.eu
440 TITO BOERI AND PIETRO GARIBALDI

growth effects appear more sizeable and quantitatively more robust. Unsurprisingly,
the low wage growth discussed in the first section contributes to reduce job satisfac-
tion.
While the documented difficulties in transforming fixed-term into permanent
contracts explain the dissatisfaction of workers with temporary contracts, it is less
evident why permanent workers reported increasing dissatisfaction with their work-
ing conditions even when we control for wage growth. A possible interpretation is
that higher risk of job loss was not compensated by an increase in the generosity of
unemployment benefits. In other words, rather than exploiting the flexicurity trade-off,
substituting less employment protection with more generous unemployment benefits
or ‘protection against the market’ with ‘protection in the market’ reforms forced
workers to move to a lower indifference curve, as discussed in Box 2 and depicted
in Figure 11.
Box 2. The flexicurity trade-off
Define the asset value of employment as W and let the worker face an invol-
untary separation with probability d. When a d shock hits the worker he or
she loses the job and becomes unemployed, yielding an asset value U, where
U < W. If the wage rate is w, the worker’s welfare or the value of employ-
ment W reads
ðr þ dÞW ¼ w þ dU
where U acts as worker’s outside option and r is the pure discount rate.
The value of a job to the firm is indicated with J. Let us assume that the
productivity of the firm is y and let us assume that conditional on a job
destruction shock d, the firm incurs a firing cost equal to –F. The firing cost
is wasted and it is not transferred outside the firm-worker relationship. If the
outside option to the firm is simply the wasteful firing cost, the value of the
job to a firm reads
ðr þ dÞJ ¼ y � w � dF :
Assume that the flow wage w is set by a standard Nash Bargaining problem.
In other words, the wage rate maximizes
w ¼ argmaxðW � U ÞbðJ þ F Þð1�bÞ
where b is the worker’s share of the surplus or the worker’s bargaining
power. The solution to the problems yields a value of the wage equal to
BEYOND EUROSCLEROSIS 441
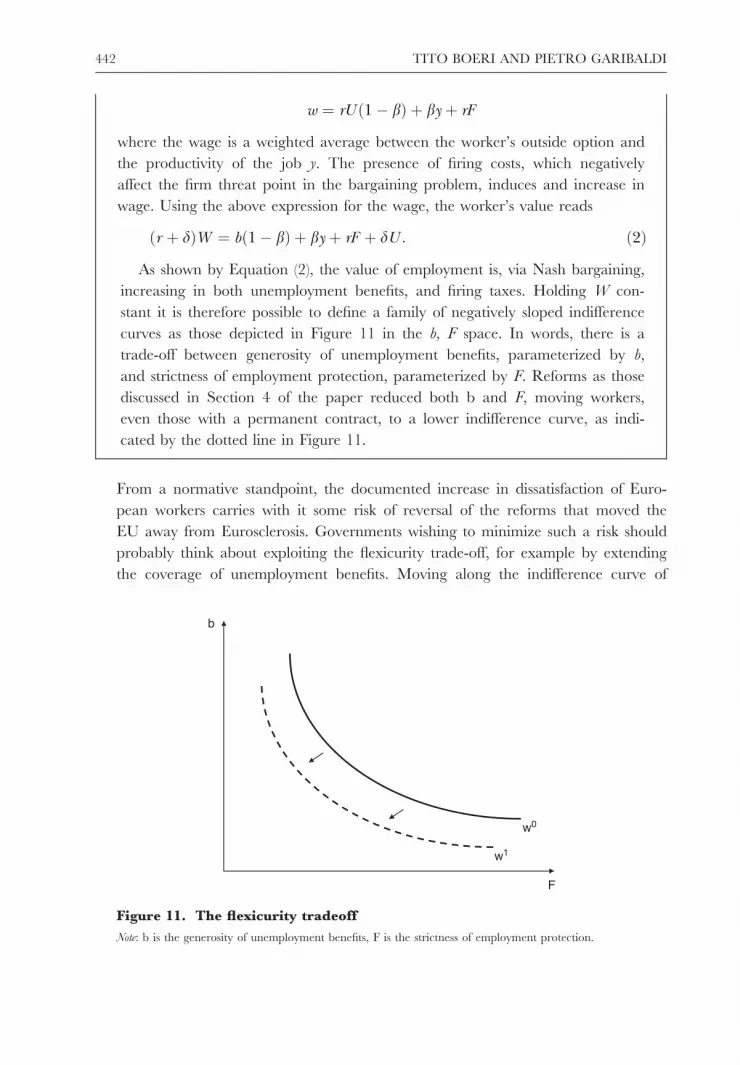
w ¼ rU ð1� bÞ þ by þ rF
where the wage is a weighted average between the worker’s outside option and
the productivity of the job y. The presence of firing costs, which negatively
affect the firm threat point in the bargaining problem, induces and increase in
wage. Using the above expression for the wage, the worker’s value reads
ðr þ dÞW ¼ bð1� bÞ þ by þ rF þ dU : ð2Þ
As shown by Equation (2), the value of employment is, via Nash bargaining,
increasing in both unemployment benefits, and firing taxes. Holding W con-
stant it is therefore possible to define a family of negatively sloped indifference
curves as those depicted in Figure 11 in the b, F space. In words, there is a
trade-off between generosity of unemployment benefits, parameterized by b,
and strictness of employment protection, parameterized by F. Reforms as those
discussed in Section 4 of the paper reduced both b and F, moving workers,
even those with a permanent contract, to a lower indifference curve, as indi-
cated by the dotted line in Figure 11.
From a normative standpoint, the documented increase in dissatisfaction of Euro-
pean workers carries with it some risk of reversal of the reforms that moved the
EU away from Eurosclerosis. Governments wishing to minimize such a risk should
probably think about exploiting the flexicurity trade-off, for example by extending
the coverage of unemployment benefits. Moving along the indifference curve of
b
F
w1
w0
Figure 11. The flexicurity tradeoff
Note: b is the generosity of unemployment benefits, F is the strictness of employment protection.
442 TITO BOERI AND PIETRO GARIBALDI
Figure 11, however, is non-neutral from the standpoint of public finance, as it
involves changes in the social security budget.
Another set of measures aimed at improving workers’ perceptions and neutral
from the standpoint of public finance tackle the increasing dualism between tempo-
rary and permanent jobs documented in Section 4. In particular, a ‘tenure track’
prospect to young workers could well complete reforms of employment protection
increasing at the same time their social acceptability. In particular, governments
could promote entrance into the permanent labour market in stages, introducing
graded employment protection and so avoiding the formation of a long-term dual
market. Job security provisions, in the form of mandated severance payments, could
increase steadily as workers acquire tenure without large discontinuities. Spain did
introduce a new type of regular contract in 1994 (see Appendix B), albeit not
exactly like the one we propose above, but it did not simultaneously restrict access
into temporary contracts. As a result, the dual structure of the labour market was
almost unaffected. In Italy and in France there is an ongoing policy discussion
about various possible schemes envisaging forms of contract with tenure tracks.
Arguably, the worsening of workers’ perceptions is also likely to be associated
with the poor growth performance of the European economy. As shown in Box 2,
productivity growth improves the flexicurity trade-off. Unfortunately, the way out
of Eurosclerosis occurred so far at the cost of negative or low growth of labour pro-
ductivity in many EU countries. This prevents workers being compensated for the
higher turnover risk they face. Wage moderation in Europe is also a byproduct of
centralized wage agreements which do not allow wages to be revised on the basis
of firm-specific productivity performance. A move towards decentralized wage set-
tings could increase productivity – via incentive and reallocation effects – as well as
wages. Centralized wage agreements also occur at relatively low frequencies. This
reduces wage adjustment to improved productivity conditions during upturns and
may increase the employment costs of the upcoming recession.
The increase in job-to-job mobility reported in Section 3 does not necessarily
come with a deterioration of workers’ perceptions. In fact, the effects of job-to-job
mobility on workers’ welfare depend mainly on whether wage setting institutions
impose a steep wage tenure profile, as the simple accounting model of Box 3 makes
clear. As we pointed out above, the increase in mobility has two opposite effects on
workers’ welfare. One the one hand, it increases the probability of job loss. On the
other hand, it increases the employability if a job destruction shock were to hit the
worker. As discussed in Box 3, the steeper is the wage tenure profile, the larger are
the costs relative to the benefits of increased mobility. In most European countries
wages are centralized and highly correlated with tenure. Decentralized, firm-level
wage setting could make it more responsive to productivity, while centralized wage
agreements tend to reward automatic adjustments of wages to tenure.
BEYOND EUROSCLEROSIS 443
Box 3. Dissatisfaction and wage tenure profile in a two-period
model
Consider an employed worker who faces a two-period job. The worker dis-
counts the future at a rate b < 1. In the first period the wage is given by
w1 = w(1 – c) while in the second period is given by w2 = w(1 + c). In other
words, c is a parameter that encodes the wage tenure profile of the job. At
the end of the first period, the worker faces an involuntary separation with
probability d. If a d shock hits the worker he or she loses the second period
wage. Conditional on a d shock, the worker faces a probability a of finding
another job. Obviously, if he or she finds a new job they will have access to
the first period wage w(1 – c). The outside option in the second period is
the unemployment benefit, b. If we indicate with W the present discounted
value of a job, its expression reads
W ¼ wð1� cÞ þ b½dawð1� cÞ þ dð1� aÞb þ ð1� dÞwð1þ cÞ�:
A viable labour market requires that w(1 – c) > b, so that the first period
wage is larger than the unemployed income. Let us assume that the worker
faces an increase in mobility, which can be recorded either by an increase
in d and/or an increase in a. Few steps of simple algebra show that an
increase in job destruction reduces the value of the job.
dW =dd ¼ �bð1� aÞ½wð1þ cÞ � b� < 0:
This is not surprising. The result we are mainly interested in is the effect
of the wage tenure parameter c on the worker welfare loss induced by
mobility. It is easy to show that
dW =ðdddcÞ ¼ bð1� aÞw < 0:
Result 1: The steeper is the wage tenure profile, the larger is the loss asso-
ciated to an increase in mobility.
An increase in mobility works also through an increase in the job finding rate.
dW =da ¼ bd½wð1� cÞ � b� > 0:
This simply suggests that an increase in the job finding rate increases work-
er’s welfare. Further, we have that
dW =ðdadcÞ ¼ �bdw < 0:
444 TITO BOERI AND PIETRO GARIBALDI

Result 2: The steeper the job finding profile, the lower the gain of the
increase in the job finding rate.
Overall, Europe is still stuck half way across the river of labour market reforms.
Pressures to go back to the old system are strong, but governments should resist this
pressure, as this would lead to a huge rise in unemployment. Moving along the
flexicurity trade-off can help reduce political opposition to reforms. An additional
reason to move towards flexicurity configurations and tenure tracks is that both
automatic stabilizers and protection against job loss do not operate efficiently when
there is a dualism in the labour market. The employment gains obtained in the last
decade can dissolve during the ongoing recession simply because employers do not
have to compensate workers in case of redundancies. There is just no time to waste
before completing the reforms.
Discussion
Clemens FuestOxford University
Economists have spent many years discussing the factors explaining the differences
in growth and employment performance between the US and Europe. Among
these factors, labour market institutions have always been considered as playing a
major role. Recently, many European countries have enacted reforms of their
labour market institutions, which have reduced employment protection, increased
pressures on the unemployed to find new jobs and given more room to fixed-term
employment and part-time jobs. The present paper suggests that these reforms have
led to a major change in European labour markets. The authors show that labour
market mobility as measured by flows into and out of employment increased and
that this also coincided with a decline in unemployment. Of course, we cannot
exclude the possibility that both increasing job mobility and institutional reforms
are driven by a third factor like, for example, structural changes in the economy
which lead to a more flexible organization of work. In any case, the findings in this
highly interesting paper do support the view that Eurosclerosis has been overcome
to a large extent.
The increase in employment which coincides with these reforms (and, as the
authors point out, with other factors like wage restraint, which may also be related
to the institutional changes), is a significant success. But the surge in employment
BEYOND EUROSCLEROSIS 445
did not lead to a similar increase in economic growth. One reason for this may be
that a significant part of the increase in employment is part-time employment and
fixed-term employment, which does not seem to be as productive as one might
have expected. Employees in these segments of the labour market also seem to find
it hard to switch to permanent contracts and potentially more productive and better
paid jobs. The hope that the newly introduced, more flexible forms of employment
would offer the unemployed an easier access to ‘good jobs’ with more stability and
higher income may therefore have been too optimistic. But integrating the un-
employed into the labour force is nevertheless an important success.
In a second step of their analysis, the authors point to the fact that, according to
surveys among employees, job satisfaction among European workers has declined
between 2000 and 2005. The authors argue that this may reflect the fact that more
labour market flexibility implies more risk for individual workers, and that workers
are unhappy about having to bear these risks. It is plausible that workers on fixed-
term contracts are less satisfied with their jobs than workers with permanent con-
tracts, and this is also clearly reflected in the survey results. But job satisfaction has
also declined among employees with permanent contracts. Tito Boeri and Pietro
Garibaldi argue that this decline in job satisfaction may create political pressures to
revert labour market reforms. Since this would jeopardize the achievements of
the reform policy in terms of generating employment, the authors argue that
governments should complement their reforms by offering better insurance to
workers – higher unemployment benefits and longer spells, for instance – in order
to compensate them for the greater risk they face.
This line of argument is intuitive and plausible, but it also raises some issues
which reflect the difficulties that arise when survey data about views and percep-
tions are used for economic analysis. Does the decline in job satisfaction really pro-
vide a basis for the recommendation to extend unemployment insurance? Several
issues arise here. First, job satisfaction is a slippery concept. For instance, standard
labour market theories such as efficiency wage models would suggest that workers
will be more satisfied with their jobs when unemployment is high compared to
times when it is low. Therefore the declining job satisfaction of employed workers
may be unrelated to issues of job mobility. Second, it remains unclear whether
labour market flexibility causes a decline in job satisfaction. Of course, investigating
this in detail is beyond the scope of this paper. Third, it is an open question
whether job satisfaction is related to voting behaviour or political decision making.
Fourth, moving along the flexicurity trade-off by offering higher unemployment
benefits is not without costs: It imposes a burden on the government budget,4 as
4 For analysis of labour market reforms with a government budget constraint see, e.g., Fath and Fuest (2005).
446 TITO BOERI AND PIETRO GARIBALDI
the authors mention, and it may also lead to higher wage demands and reduce
employment. One may also note that the widely celebrated flexicurity policy in
Denmark has not prevented job satisfaction from declining in this country.
In any case, the incoming recession suggests that things other than fine tuning
along the flexicurity trade-off will dominate the policy agenda. Clearly, the new,
flexible labour market institutions in Europe will be put to a severe test. It is likely
that the downturn will reveal one of the potential disadvantages of flexible labour
markets for employees, which is that firms may quickly dismiss a large part of their
workforce. But for the economy as a whole, this is not necessarily bad because
being able to adjust their labour force will make it easier for firms to survive the
economic downturn. If this is true, the labour market reforms highlighted in this
paper may have come just in time to help prepare the European economies for the
greatest challenge they had to face for decades.
Barbara PetrongoloLondon School of Economics
The rise in European unemployment in the 1970s and 1980s was followed by an
explosion of the European unemployment literature, with special emphasis on the
role of labour market institutions and their interactions with economic shocks. After
such a secular rise, European unemployment fell roughly monotonically from 11.5%
at the beginning of 1994 to 6.8% at the beginning of 2008. Despite going on for
almost 15 years, the literature is relatively thinner on the causes and the characteris-
tics of these later developments. The paper by Boeri and Garibaldi addresses this
gap in the literature. First, the paper clearly documents the fall in European un-
employment since the mid-1990s, with the associated convergence of unemployment
rates across Europe, and the overall increase in labour mobility, which is mostly
associated with an increase in job finding rates. Second, the rise in mobility is related
to institutional developments, mostly reductions in the generosity of unemployment
compensation and in firing costs. Finally, the paper suggests that the downside of
increased mobility could be to reduce worker satisfaction with working conditions.
This paper is a welcome addition to a large literature on European unemploy-
ment, and has a novel focus on the causes and consequences of increased mobility,
over and above developments in the unemployment stock. In particular, it illus-
trates that the fall in unemployment is at large driven by higher rates of job finding
for the unemployed, rather than reduced rates of job loss. Using a country-level
panel data set, changes in mobility are in turn related to changes in unemployment
insurance (UI), employment protection legislation (EPL), GDP growth and a few
other variables, delivering a significantly negative and sizeable effect of either
institutional variable on both unemployment turnover and the Shorrocks mobility
BEYOND EUROSCLEROSIS 447
index. This approach has the advantage of providing an overall cross-country per-
spective on mobility and institutions. However, it may have drawbacks related to
the often poor measurement of institutional variables across countries, the limited
number of degrees of freedom, and to the potential endogeneity of institutions
themselves, which makes it hard to establish causality. But the authors are well
aware of these limitations and throughout the paper do not make strong claims
about causal effects.
Given the effect of UI and EPL on unemployment turnover, one would expect
these effects to work through an increase in either unemployment flow, most likely
an increase in the outflow, given evidence on the contribution of higher unemploy-
ment outflow rates to the fall in unemployment. But separate regressions of un-
employment inflows and outflows on institutional variables deliver mixed results.
While – as expected – higher EPL is associated with lower transitions from un-
employment into jobs, higher UI is associated with both higher unemployment-to-
employment and higher employment-to-unemployment flows, although these effects
do not reach standard significance levels. This latter result is theoretically puzzling,
and also is at odds with the positive relationship between overall unemployment
turnover and UI. If the specifications estimated in Tables 8 and 11 are identical,
the associated results may be better understood by decomposing the unemployment
turnover rate, (IN+OUT)/U, as
IN þ OUT
U¼ IN
E
E
Uþ OUT
Uð2Þ
where IN, OUT, and U denote, respectively the unemployment inflow, outflow and
stock, and E denotes the employment stock. The left-hand side of Equation (2) is
found to fall with UI, while both the unemployment inflow rate (IN/E) and outflow
rate (OUT/U) are found to increase with UI. These two results can of course be
reconciled if the unemployment rate (�U/E) increases with UI. The resulting inter-
pretation is thus that a reduction in UI would indeed lower unemployment, but the
estimates of Table 11 imply that this does not take place via an increased un-
employment outflow. These estimates rather imply that this happens via a decrease
in the unemployment inflow.
A related suggestion regarding Tables 8–11 would be to allow for an interaction
between institutional variables and the business cycle indicator. As the labour mar-
ket ‘rigidities’ presumably bite differently on unemployment depending on the state
of the business cycle, the associated interactions may shed more light on the
impacts of interest.
The final part of the paper investigates how Europeans’ perceptions react to
the described developments in labour markets. The idea is that while lower
unemployment should improve subjective perceptions about the labour market,
448 TITO BOERI AND PIETRO GARIBALDI
higher mobility may come at the cost of more precarious or worse quality jobs. For
this purpose the authors provide a regression of subjective levels of satisfaction with
working conditions on individual characteristics, type of contract held, mobility and
wage growth. These regression results, however, are by definition conditional on
being employed, and refer to satisfaction with working conditions on the current
job. The estimates thus describe the impact of, say, higher labour mobility on satis-
faction with current working conditions, but may not be informative of opinions
about overall labour market developments. In other words, someone may be quite
happy about falling unemployment and rising job finding rates, but concerned with
lower job security on the current job or poor wage growth. Having said this, the
estimates of Table 11 illustrate that, while permanent workers are on average more
satisfied with their jobs than temporary workers, there has been a fall in satisfaction
for permanent workers over the sample period – although interpretation may be
more problematic than this because the regression does not seem to include the
main time effect and only its interactions with some characteristics. Mobility has a
negative impact on work satisfaction, but the fact that the negative trend in satisfac-
tion survives to the inclusion of the mobility index seems to imply that there are
other factors driving the fall in satisfaction. An obvious candidate is wage growth,
which is included in the next specification, but its negative impact on satisfaction is
the opposite of what one would expect. One way to potentially extract more infor-
mation from this kind of job satisfaction regression would be to allow the impact of
aggregate mobility indexes to vary with private or public employee status. I would
expect public employees to be less affected than private employees by the increase
in mobility, thus providing a sort of falsification test for the idea that reduced job
security is mostly responsible for the fall in work satisfaction.
Panel discussion
Daniel Leigh opened the panel discussion noticing that employment and unemploy-
ment clearly vary during the business cycle, an issue that is not addressed in the
paper; he also suggested including the NAIRU in the analysis. Francesco Caselli
and Georges de Menil noted that, besides employment protection legislation and
unemployment benefits, other institutions may be relevant for an analysis of job
mobility, such as the level of coordination in wage bargaining, but were not
included in the analysis. Paul Collier suggested decomposing changes in ergodic
unemployment to see how much it is due to GDP growth, institutions, and other
factors. Andrea Bassanini added that in the regressions estimated by the authors to
explain mobility it would be useful to account also for industry composition, as the
BEYOND EUROSCLEROSIS 449
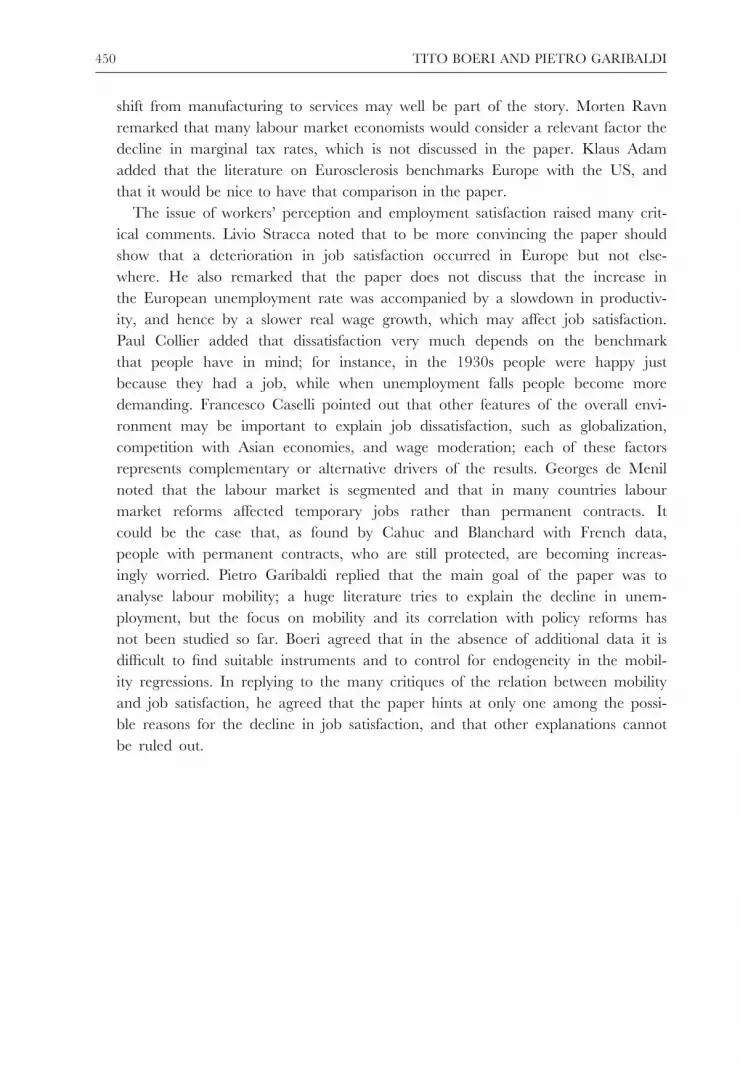
shift from manufacturing to services may well be part of the story. Morten Ravn
remarked that many labour market economists would consider a relevant factor the
decline in marginal tax rates, which is not discussed in the paper. Klaus Adam
added that the literature on Eurosclerosis benchmarks Europe with the US, and
that it would be nice to have that comparison in the paper.
The issue of workers’ perception and employment satisfaction raised many crit-
ical comments. Livio Stracca noted that to be more convincing the paper should
show that a deterioration in job satisfaction occurred in Europe but not else-
where. He also remarked that the paper does not discuss that the increase in
the European unemployment rate was accompanied by a slowdown in productiv-
ity, and hence by a slower real wage growth, which may affect job satisfaction.
Paul Collier added that dissatisfaction very much depends on the benchmark
that people have in mind; for instance, in the 1930s people were happy just
because they had a job, while when unemployment falls people become more
demanding. Francesco Caselli pointed out that other features of the overall envi-
ronment may be important to explain job dissatisfaction, such as globalization,
competition with Asian economies, and wage moderation; each of these factors
represents complementary or alternative drivers of the results. Georges de Menil
noted that the labour market is segmented and that in many countries labour
market reforms affected temporary jobs rather than permanent contracts. It
could be the case that, as found by Cahuc and Blanchard with French data,
people with permanent contracts, who are still protected, are becoming increas-
ingly worried. Pietro Garibaldi replied that the main goal of the paper was to
analyse labour mobility; a huge literature tries to explain the decline in unem-
ployment, but the focus on mobility and its correlation with policy reforms has
not been studied so far. Boeri agreed that in the absence of additional data it is
difficult to find suitable instruments and to control for endogeneity in the mobil-
ity regressions. In replying to the many critiques of the relation between mobility
and job satisfaction, he agreed that the paper hints at only one among the possi-
ble reasons for the decline in job satisfaction, and that other explanations cannot
be ruled out.
450 TITO BOERI AND PIETRO GARIBALDI
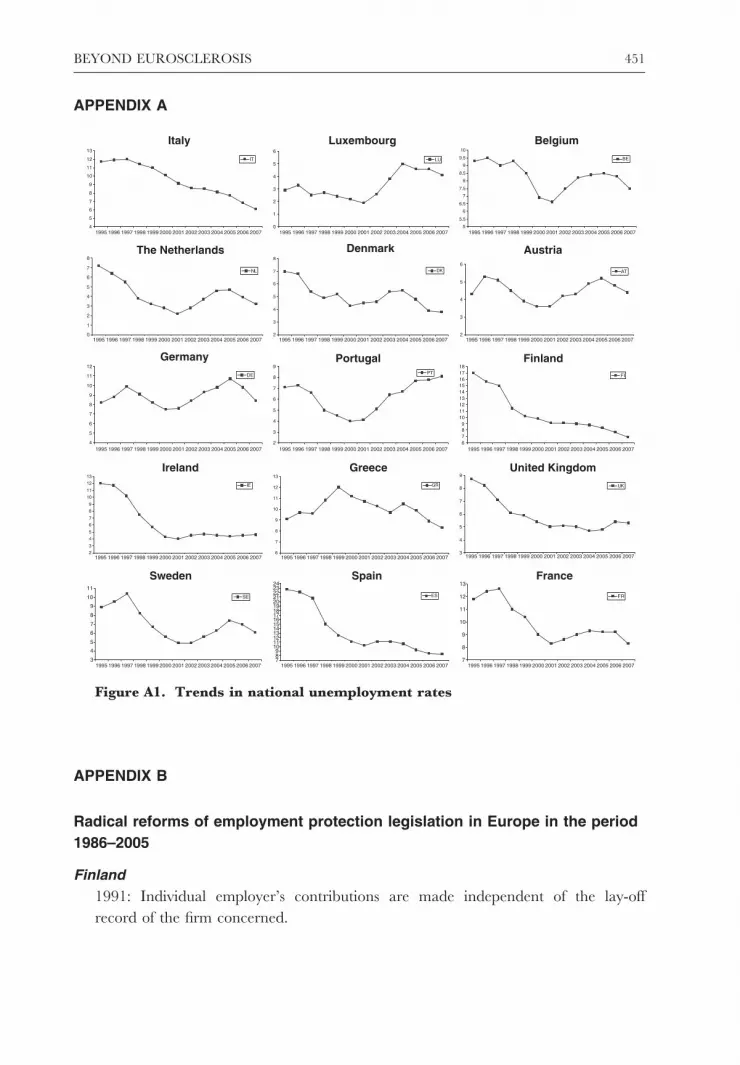
APPENDIX A
APPENDIX B
Radical reforms of employment protection legislation in Europe in the period
1986–2005
Finland
1991: Individual employer’s contributions are made independent of the lay-off
record of the firm concerned.
Ireland
2
3
4
5
6
7
8
9
10
11
12
13
IE
Greece
6
7
8
9
10
11
12
13
GR
United Kingdom
3
4
5
6
7
8
9
UK
Germany
4
5
6
7
8
9
10
11
12
DE
Portugal
2
3
4
5
6
7
8
9PT
Finland
6789
101112131415161718
FI
The Netherlands
0
1
2
3
4
5
6
7
8
NL
Denmark
2
3
4
5
6
7
8
DK
Austria
2
3
4
5
6
AT
Italy
4
5
6
7
8
9
10
11
12
13
IT
Luxembourg
0
1
2
3
4
5
6
LU
Belgium
5
5.5
6
6.5
7
7.5
8
8.5
9
9.5
10
BE
Sweden
3
4
5
6
7
8
9
10
11
SE
Spain
789
101112131415161718192021222324
ES
France
7
8
9
10
11
12
13
FR
1995 1996 1997 1998 1999 2000 2001 2002 2003 2004 2005 2006 2007 1995 1996 1997 1998 1999 2000 2001 2002 2003 2004 2005 2006 2007 1995 1996 1997 1998 1999 2000 2001 2002 2003 2004 2005 2006 2007
1995 1996 1997 1998 1999 2000 2001 2002 2003 2004 2005 2006 2007 1995 1996 1997 1998 1999 2000 2001 2002 2003 2004 2005 2006 2007 1995 1996 1997 1998 1999 2000 2001 2002 2003 2004 2005 2006 2007
1995 1996 1997 1998 1999 2000 2001 2002 2003 2004 2005 2006 2007 1995 1996 1997 1998 1999 2000 2001 2002 2003 2004 2005 2006 2007 1995 1996 1997 1998 1999 2000 2001 2002 2003 2004 2005 2006 2007
1995 1996 1997 1998 1999 2000 2001 2002 2003 2004 2005 2006 2007 1995 1996 1997 1998 1999 2000 2001 2002 2003 2004 2005 2006 2007 1995 1996 1997 1998 1999 2000 2001 2002 2003 2004 2005 2006 2007
1995 1996 1997 1998 1999 2000 2001 2002 2003 2004 2005 2006 2007 1995 1996 1997 1998 1999 2000 2001 2002 2003 2004 2005 2006 2007 1995 1996 1997 1998 1999 2000 2001 2002 2003 2004 2005 2006 2007
Figure A1. Trends in national unemployment rates
BEYOND EUROSCLEROSIS 451
France
1993: Statutory requirements are introduced concerning the contents of social
plans. If there is no social plan or the measures proposed are inadequate,
the redundancies will be considered invalid. Law 27/1/1993 nr.93-12. In 1995
the Court de Cassation will interpret the 1993 legislation restrictively.
2004: New rules concerning collective dismissals (Fillon Law):
1 firm-level agreements can now modify the procedure that must be followed in
case of collective dismissal;
2 modification of the threshold that triggers a collective dismissal procedure;
3 shortening of the collective dismissal procedure and shortening of the period
during which employees or unions can oppose the dismissal;
4 restrictions to the possibilities of employees’ reintegration when the judge deems
the efforts of the firm in terms of placement or training not large enough;
5 changes in the placement and training requirements for large and small firms.
Germany
1993: The notice period for blue-collar workers is extended and aligned with those
of white collar workers.
1996: A new law comes into force liberalizing employment conditions: The
employment threshold, at which EPLs applies, is increased from 5 to 10
Real unit labour costs EU15 (percentage change)
–3%
–2%
–1%
0%
1%
2%
3%
4%
5%
1971
1973
1975
1977
1979
1981
1983
1985
1987
1989
1991
1993
1995
1997
1999
2001
2003
2005
Figure A2. Trends in real unit labour costs in the EU15
Source: OECD Economic Outlook database no. 84.
452 TITO BOERI AND PIETRO GARIBALDI

employees (on a full basis) per firm. Legal conditions covering dismissals are
relaxed.
1999: The new government reintroduces full dismissal protection for all workers
who are hired in companies with more than five employees. The former government
had limited comprehensive dismissal protection to companies with more than 10
employees. In addition, the new government extends the so-called ‘social criteria’
(i.e. age, length of service or family situation) which must be taken into account by
employers in the event of redundancies. Redundancy payments will no longer be
used as subsidies for dismissals.
2003: New rules on dismissals, severance payments and the use of short-term con-
tracts come into force (Protection against Dismissal Act – Kundigungsschutzgesetz,
KSchG):
1 Simplification and reduction in the number of selection criteria to be consid-
ered by the enterprise in case of dismissals for operational reasons (now
Figure A3. Trends in the Shorrocks Mobility Index
BEYOND EUROSCLEROSIS 453
limited to disability of the employee, job tenure, age and presence of depen-
dants in the household). Employees with special skills and employees necessary
to maintain a well-balanced structure of the workforce can be excluded from
social criteria for dismissal.
2 Introduction of the possibility for employees facing dismissal for operational rea-
sons to choose between seeking legal action against the dismissal or accepting a
severance payment (equal to half a month’s earnings for each year employed).
3 The threshold number of employees above which dismissal protection legislation
is binding is raised from 5 to 10 employees with regard to new hirings (appren-
tices are not counted and part-time employees are only counted proportionally).
Employees in companies with more than 5 but not more than 10 employees will
keep their statutory protection if employed before 1 January 2004.
4 Liberalization of the use of short-term contracts (up to 4 years without giving
reasons, rather than maximum 2 years) for newly created enterprises during
the first 4 years after their start-up.
Greece
2004: Regulation of fixed-term contract job protection conditions for the private
sector workforce (Presidential Decree 180/2004). Under the new provisions:
1 workers may be employed on fixed-term contracts to meet standing, perma-
nent needs of the enterprise;
2 workers on fixed-term contracts must have completed 24 months of actual
employment or three successive renewals of their initial fixed-term contract in
order to be considered as having an open-ended contract;
3 for a fixed-term contract to be renewed, the time since expiry of the previous
contract may not exceed 3 months in public utilities and services and 45 days
in the rest of the private sector;
4 the exceptions that prevented certain categories of workers from converting
fixed-term contracts into open-end contracts have been abolished, except for
special conditions;
5 the previous precondition of objective reasons for renewal of fixed-term
employment contracts has been substantially restricted.
Italy
1997: ‘Treu Package’ is enacted: reduction of the drastic sanctions in case of viola-
tion of the fixed-term contracts’ discipline (conversion of fixed-term contract into
an open-ended one), which only applies to serious cases.
Legalization of temporary work agencies. The training contract can be extended
from 2 to 4 years in southern Italy, in case of a change into a permanent contract.
454 TITO BOERI AND PIETRO GARIBALDI
The term of the apprenticeship contract can vary across sectors. ‘Atypical’ labour
contracts are encouraged by reducing social security contributions and pension pro-
visions and by removing automatic transformations of fixed-term contracts into
open-ended ones. The package eases regulation of new apprenticeship (nuovo appren-
distato) and work-training contracts (contratto di formazione lavoro) and sets incentives
for on-the-job training (stages), temporary work via private agencies (lavoro interinale)
and intra regional labour mobility (assegni per la mobilita geografica).
The Netherlands
1995: The government decides to ease dismissal procedures. According to the new
rules, an employer can dismiss an employee at the same time or even before asking
permission to the director of the Public Employment Office.
Portugal
1991: Firing restrictions are eased, through a wider range of admissible lay-offs.
1996: Government, employers’ associations (AIP) and trade unions sign the Strate-
gic Social Pact. It includes: a wider use of atypical work contracts; in the public sec-
tor, fixed-term contracts can, under special circumstances, be extended beyond the
normal time limits, before being automatically transformed into a permanent con-
tract; incentives on using temporary employment agencies; stronger sanctions
against firms employing children or false self-employed workers.
Spain
1994: Individual dismissals are eased: zero days of notice is required when the length
of the contract is below 15 days for blue collar workers or below 1 month for white
collar workers. Moreover, in case of objective dismissal, the notice period is: one
month when the length of service is below one year, 2 months when the length of
service is between one and two years and 3 months for two or more years of service.
Collective redundancies: firms can start a collective dismissal procedure if the dis-
missal affects from 10 workers to 30% of the work force, depending on the firm’s
size. The legally acceptable reasons for collective dismissals have been extended to
include production and organizational changes. Law 19/5/1994 nr.11.
1997: The reform extends the reasons that may give rise to an individual dismissal.
It includes the possibility of staff adjustments with the aim of overcoming problems
related to a lack of competitiveness. Decree 17/5/1997 nr.8.
Introduction of a new kind of permanent contract with reduced severance pay-
ments: payment for unfair dismissal is reduced to 33 days per year of seniority for
new permanent employment contracts (intended for young and disadvantaged
workers), with a maximum of 24 months wages. Decree 17/5/1997 nr.8.
BEYOND EUROSCLEROSIS 455

Creation of a new contract with a training certificate. In order to give additional
incentives to the use of new permanent contracts, the government lowered the
employers’ share of contribution rate for workers under such contracts. The reduc-
tion only applies to the first 2 years of the contract and varies between 40% and
60% of the standard share. Certain types of fixed-term contracts are suppressed.
These contracts may have a higher contribution rate (1% higher) for unemploy-
ment coverage.
Radical reforms of non-employment benefits in Europe in the period
1986–2005
Belgium
2003: Reform of ‘service vouchers’ scheme (titre-services/dienstencheques), which sub-
sidizes the employment of people to carry out household tasks. The scheme: (1) will
be managed at federal level; (2) will be enlarged and made more flexible, with the
number of available vouchers significantly increased; (3) will be restricted to
employing people to perform cleaning, ironing, shopping and transport of people
with mobility difficulties; (4) a tax deduction will be introduced, while the cost of
the vouchers will not change. The cost of the service voucher to the user is €6.2
per hour, but taking into account a tax deduction of €4 net, the real cost is
€19.47.
Denmark
1994: ‘A comprehensive Labour Market Reform is approved by the Parliament:
The maximum duration of unemployment insurance benefits is limited to seven
years.’ The unemployment benefits period is split in two (four plus three years) with
full-time activation through job offers, training and education compulsory in the
second period. The possibility of renewing entitlements to unemployment benefits
by participation in active programmes is abolished. Policy implementation is decen-
tralized to regional labour market authorities.
1996: ‘Another Labour Market Reform is approved: Eligibility criteria for access to
Unemployment Benefits are tightened (compulsory activation of 13 weeks of unem-
ployment for youths below 25 years of age or 52 weeks for all above 25 years).’
The minimum age for accessing unemployment benefits is raised from 17 to 19.
The maximum duration of unemployment benefits is lowered to 5 years.
2004: Strengthening of the activities of PES and municipalities, concerning upgrad-
ing of skills and competence development for persons with little education and
ready to take up a job and creation of new placement units targeting weak groups,
including people in need of flexi-jobs and vocational rehabilitation.
456 TITO BOERI AND PIETRO GARIBALDI

France
2004: Provision of one million ‘employment starter contracts’ (contrats d’activite,
CDA), combined with systematic individual support, over a 5-year period, for peo-
ple who have been minimum integration income (RMI) and specific solidarity
allowance recipients for 6 months, and to people receiving single parent’s allow-
ance. This contract consists of 26–35 hours’ employment per week, split between
work and training, with working time being paid at the minimum wage (SMIC)
rate. The employer will receive a flat-rate state subsidy.
Setting-up of a clearer and better coordinated range of local services for the most
vulnerable. Creation of 300 local employment centres (maisons de l’emploi) by 2009,
that will: identify quantitative and qualitative job needs; provide a structure for
training; ensure the monitoring of unemployed people in difficult circumstances;
bring together in a single ‘public-interest partnership’ (groupement d’interet public, GIP)
all relevant parties (the National Employment Agency, ANPE, and the Associations
for Employment in Industry and Commerce, ASSEDIC) which are responsible for
paying out unemployment benefit at departmental level. A single file will now be
used for each job-seeker. ANPE’s monopoly over job placement is to be abolished,
and unemployed people will be monitored more effectively and checked up on
more frequently. The PES will be opened up to new private job placement opera-
tors, including temporary employment agencies.
New special scheme for youth employment (Youth-in-Business Contracts – Contrat
jeune en entreprise): each of the 800,000 young unqualified unemployed people aged
between 16 and 23 will be allocated an individual contact person and the 100,000
experiencing the greatest difficulty in finding employment will get extra assistance.
In the private sector, 350,000 young people will receive training in the form of
work experience alternating with study (under an apprenticeship or a ‘professionali-
zation’ contract), and there will be as many state-subsidized contracts. An ‘access
pathway’ to jobs in the local and regional government, hospital and central govern-
ment civil service (parcours d’acces a la fonction publique territoriale, hospitaliere et d’Etat,
PACTE) will enable 100,000 young people from disadvantaged neighbourhoods to
be recruited into the civil service, not through open competitions as usually hap-
pens, but via combined study and on-the-job training programmes.
Germany
2003: 12 months of unemployment insurance contributions requirement introduced
for eligibility to unemployment benefits, also for seasonal workers and self-employed
people or people caring for a relative at home. The latter have to pay contributions
on a voluntary basis in order to maintain or to reach their entitlements. Sanctions
are tightened and streamlined.
BEYOND EUROSCLEROSIS 457
2003: Reform of the Federal Employment Service (reorient the organizational
structures towards the provision of job placement service, simplification of benefit
entitlement rules) which will be renamed and restructured as the Federal Employ-
ment Agency. The relationship between the federal government and the federal
employment agency will be more modern and more effective than in the past:
an agreement will be reached on general policy guidelines and the federal
government will no longer seek to control the agency by means of regulatory
micromanagement.
2004: Merger of the unemployment assistance scheme and the social assistance
scheme into the Unemployment Benefit II Programme, leaving them both at
approximately the lower level of social assistance (up to €345 per month in the first
6 months of 2005 for singles or single parents in Western Germany and €331 in
Eastern Germany, plus cost of ‘adequate’ housing).
Cut in the duration of unemployment benefits. From 2005 on, reception of the
full unemployment pay (60–67% of previous salary: Arbeitslosengeld I ) is restricted
to 12 months in general and 18 months for over 55-year-olds. This is now fol-
lowed by (Arbeitslosengeld II) a usually much lower unemployment pay, if the claim-
ant fits the requirements (depending on savings, life insurance and household
income).
Tightening of job acceptance requirements for eligibility to unemployment bene-
fits. Recipients of the new benefits will be obliged to accept any legal job offer,
regardless of the level of pay. If they do not, unemployment benefits are reduced
for a limited time (30% less of the standard transfer payment for a period of
3 months) and the limited supplementary payment is withdrawn. If there are
repeated violations of any obligations, unemployment benefit II is eliminated
entirely. If individuals under 25 years of age reject a job, they receive no transfer
payment at all for 3 months.
Planned reform of the job agencies: special case managers will provide active
support, integrating all players of the local labour market and creating special inte-
gration services in order to create the prerequisites that will help find better jobs
more swiftly, in particular for the long-term unemployed.
Ireland
2004: Extension nationwide of the High Support Process programme, to assist
employment service officers in implementing a range of responses for clients who
are experiencing personal barriers in progressing from unemployment to work. This
support is tailor-made and arranged in consultation with other relevant depart-
ments, so that the specific needs of an individual can be addressed to facilitate entry
to the labour market.
458 TITO BOERI AND PIETRO GARIBALDI
Italy
2005: Total duration of ordinary unemployment benefit is raised from 6 to
7 months for workers aged under 50 years and from 9 to 10 months for workers
aged 50 or more. The level of ordinary unemployment benefits is raised from 40%
to 50% of reference salary for the first 6 months and is set at 40% during the sev-
enth month for workers aged under 50 years. The level is raised to 50% of refer-
ence wage (from 40%) for the first 6 months and is set at 40% for the following
3 months and 30% during the tenth month for workers aged 50 or more. Defini-
tion of the conditions for the immediate implementation of those measures (Art. 13)
of Law 276/2003 which provide for incentives to private employment agencies that
ensure the insertion or reinsertion in the labour market of difficult to employ per-
sons (so-called ‘presa in carico’). To this effect, the need for regions to legislate for
making such a measure effective has been dropped.
The Netherlands
1987: The two key parts of the previous Unemployment Benefits scheme (WW,
unemployment insurance and WWW, unemployment assistance) are combined and
eligibility requirements are tightened. The maximum duration of benefits is more
closely linked to age and length of the contribution period.
The Revision of the Social Security System Act is enacted to reduce the incen-
tive to obtain a disability pension rather than an unemployment benefit. Criteria
governing access to disability pensions are tightened. Claimants who are less than
80% disabled will receive a pro-rated disability pension supplemented by an un-
employment related component decreasing over time. The total benefit will decline
over time as the unemployment-related portion of the benefit falls, with a maxi-
mum benefit period of 5 years. Eligibility requirements for unemployment benefits
are tightened: the worker is obliged to accept an appropriate job even outside his
geographical region.
Spain
1992: A decree to redress fiscal slippage approved by the Government: the mini-
mum contribution period for eligibility is raised from 6 to 12 months.
The duration is reduced by about one-third. Lump-sum Unemployment Insurance
schemes offering lump-sum payments are phased out. The system of minimum unem-
ployment assistance allowances is reformed: it now provides those who have worked
for at least 3 months but are not eligible to unemployment insurance with 75% of the
minimum wage. The amount is reduced by over 10%. The unemployed people are
no longer allowed to take up the unemployment insurance payment in a single instal-
ment in order to start a new business as a self-employed worker.
BEYOND EUROSCLEROSIS 459
Sweden
1997: The Employment Bill was repealed before it entered into force and the
revised proposal forwarded in March:
1 The qualifying period is increased from 5 to 6 months (it had been proposed
9 months).
2 The proposal for an upper limit of the duration is dropped.
3 The underlying structure of the Unemployment Benefit is changed: the benefit
now consists of an earning-related part and a flat rate component.
4 The maximum Unemployment Insurance (earning-related component) benefit
is raised.
5 The possibility of re-qualifying for benefits through participation subsidized
jobs no longer available.
United Kingdom
1996: Unemployment benefit is replaced by the jobseekers allowance. The duration
of the jobseekers allowance is halved (from 12 to 6 months). The replacement rate
of the jobseekers allowance is lowered. The income support scheme is replaced by
the means-tested component of the JSA as a safety-net with a marginal withdrawal
rate of 100%.
REFERENCES
Bean, C. (1994). ‘European unemployment: A survey’, Journal of Economic Literature, 32(2),573–619.
Bentolila, S. and G. Bertola (1990). ‘Firing costs and labour demand: how bad is Eurosclero-sis?’ Review of Economic Studies, 57, 381–402.
Bertola, G. and T. Boeri (2002). ‘EMU labour markets two years on: microeconomics ten-sions and institutional evolution’, in M. Buti and A. Sapir (eds.), EMU and Economic Policyin Europe, Edward Elgar.
Blanchard, O. (2006). ‘European unemployment: the evolution of facts and ideas’, EconomicPolicy, 21(45), 5–59.
Blanchard, O. and P. Diamond (1990). ‘The flow approach to European unemployment’,Brooking Papers on Economic Activity.
Blanchard, O. and J. Wolfers (2000). ‘The role of shocks and institutions in the rise of Euro-pean unemployment: the aggregate evidence’, Economic Journal, 110, 1–33.
Boeri, T. (2008). ‘What happened to European mass unemployment?’, First DuisembergLecture, Amsterdam, 28 February 2008, http://www.nias.knaw.nl/en/new_3/duisen-berg_lectures/
Boeri, T. and P. Garibaldi (2007). ‘Two tier reforms of employment protection legislation: ahoneymoon effect?’ Economic Journal, June, F357–F385.
Booth, A., M. Francesconi and J. Frank (2002). ‘Temporary jobs: stepping stones or deadends?’ Economic Journal, Royal Economic Society, 112(480), 189–213.
European Union (2008). ‘Labour market and wage developments in 2007, with special focuson the impact of immigration’, European Economy, 5, Brussels.
Fath, J. and C. Fuest (2005). ‘Experience rating versus employment protection laws in amodel where firms monitor workers’, Scandinavian Journal of Economics, 107, 299–313.
460 TITO BOERI AND PIETRO GARIBALDI
Layard, R., S. Nickell and R. Jackman (1991). Unemployment, New York: Oxford UniversityPress.
Messina, J. and G. Vallanti (2007). ‘Job flow dynamics and firing restrictions evidence fromEurope’, Economic Journal, 117, 279–301.
Mortensen, D. and C. Pissarides (1994). ‘Job creation and job destruction in the theory ofequilibrium unemployment’, Review of Economic Studies, 61(3), 397–415.
—— (1999). ‘Unemployment responses to ‘‘skill-biased’’ technology shocks: the role oflabour market policy’, Economic Journal, 109(455), 242–65.
Nickell, S. (1979). ‘The effects of unemployment and related benefits on the duration ofunemployment’, Economic Journal, 89(353), 34–49.
—— (1986). ‘Dynamic models of labor demand’, in O. Ashenfelter and R. Layard (eds.),Handbook of Labor Economics, Vol. 1, Amsterdam: North Holland.
—— (1997). ‘Unemployment and labor market rigidities: Europe versus North America’,Journal of Economic Perspectives, 11(3), 55–74.
Nickell, S. and R. Layard (1999). ‘Labour market institutions and economic performance’,in O. Ashenfelter and D. Card (eds.), Handbook of Labour Economics, Vol. 3B, 3029–84,Amsterdam: North Holland.
Nickell, S., L. Nunziata and W. Ochel (2005). ‘Unemployment in the OECD since the1960s. What do we know?’ Economic Journal, 115, 1–27.
OECD (1994). The OECD Jobs Study: Evidence and Explanations, Paris: OECD.Petrongolo, B. and C. Pissarides (2008). ‘The ins and outs of European unemployment’,
CEPR Discussion Paper No. DP6681.Pissarides, C. (1998). ‘The impact of employment tax cuts on unemployment and wages: the
role of unemployment benefits and tax structure’, European Economic Review, 42, 155–83.—— (2000). Equilibrium Unemployment Theory. Cambridge, MA: MIT Press.Shorrocks, A. (1978). ‘Income inequality and income mobility’, Journal of Economic Theory,
19(2), 376–93.Snower, D. and G. de la Dehesa (eds.) (1996). Unemployment Policy, Cambridge: CEPR and
Cambridge University Press.
BEYOND EUROSCLEROSIS 461