Embed Size (px)
Citation preview
Bibliography and References
Acharya, V. V. & Pedersen, L. H. (2005) 'Asset Pricing with Liquidity Risk', Journal of Financial Economics, Vol. 77 No. 2, pp. 375-410.
Adamia, R., Goughb, O., Muradoglu, G. & Sivaprasadd, S. (2010) 'Returns and Leverage'. 2010 Oxford Business & Economics Conference Program. St. Hugh’s College, Oxford University, Oxford, UK [online] http://gcbe.us/2010_OBEC/data/ Roberta%20Adami,%20Orla%20Gough,%20Gulnur%20Muradoglu,%20Sheeja%20Sivaprasad.pdf (Accessed 31 January 2014).
Agrawal, M., Huang, J. & Boland, J. (2013a) 'Probabilistic Forecasting of Wind Farm Output'. 20th International Congress on Modelling and Simulation. Adelaide, Australia [online] http://www.mssanz.org.au/modsim2013/G1/agrawal.pdf (Accessed 2 Septembre 2016).
Agrawal, M. R., Boland, J. & Ridley, B. (2013b) 'Analysis of Wind Farm Output: Estimation of Volatility Using High-Frequency Data', Environmental Modeling & Assessment, Vol. 18 No. 4, pp. 481-492.
Agresti, A. & Kateri, M. (2011) Categorical Data Analysis, Springer, Berlin, Heidelberg, DE.
Agterbosch, S., Vermeulen, W. & Glasbergen, P. (2004) 'Implementation of Wind Energy in the Netherlands: the Importance of the Social–Institutional Setting', Energy Policy, Vol. 32 No. 18, pp. 2049-2066.
Aharoni, Y. (1966) 'The Foreign Investment Decision Process', Thunderbird International Business Review (The International Executive), Vol. 8 No. 4, pp. 13-14.
Akerlof, G. A. (1970) 'The Market for "Lemons": Quality Uncertainty and the Market Mechanism', Quarterly Journal of Economics, Vol. 84 No. 3, pp. 488-500.
Akintoye, A. S. & MacLeod, M. J. (1997) 'Risk Analysis and Management in Construction', International Journal of Project Management, Vol. 15 No. 1, pp. 31-38.
Al-Ali, J. & Arkwright, T. (2000) 'An Investigation of UK Companies Practices in the Determination, Interpretation and Usage of Cost of Capital', Journal of Interdisciplinary Economics, Vol. 11 No. 3-4, pp. 303-319.
Allen, I. E. & Seaman, C. A. (2007) 'Likert Scales and Data Analyses', Quality Progress, Vol. 40 No. 7, [online] (Accessed 10 November 2014).
Allianz (2015, November 24) Allianz is Phasing Out Coal, [Press release] https://www.allianz.com/en/press/news/financials/stakes_investments/151123_allianz-is-phasing-out-coal/ (Accessed 18 July 2018).
© Springer Fachmedien Wiesbaden GmbH, part of Springer Nature 2019C. Hürlimann, Valuation of Renewable Energy Investments, Sustainable Management, Wertschöpfung und Effizienz, https://doi.org/10.1007/978-3-658-27469-6
302 Bibliography and References Allianz Capital Partners (2016) Investing in Renewables, [online] http://www.
allianzcapitalpartners.com/our-business/renewables/ (Accessed 1 August 2018).
Alvesson, M. & Sköldberg, K. (2009) Reflexive Methodology: New Vistas for Qualitative Research, SAGE, Thousand Oaks, CA.
Ambler, S. W. & Kroll, P. (2007) Best Practices for Lean Development Governance, Part II: Processes and Measures, IBM, [online] http://www.ibm.com/developerworks/ rational/library/jul07/kroll_ambler/ (Accessed 13 March 2014).
Amihud, Y. & Mendelson, H. (1986) 'Asset Pricing and the Bid Ask Spread', Journal of Financial Economics, Vol. 17 No. 2, pp. 223-249.
Amihud, Y., Mendelson, H. & Pedersen, L. H. (2005) 'Liquidity and Asset Prices', Foundations & Trends in Finance, Vol. 1 No. 4, pp. 269-364.
Amram, M. & Kulatilaka, N. (1999) Real Options: Managing Strategic Investment in an Uncertain World, Harvard Business School Press, Boston, MA.
Andersen, T. J., Denrell, J. & Bettis, R. A. (2007) 'Strategic Responsiveness and Bowman's Risk–Return Paradox', Strategic Management Journal, Vol. 28 No. 4, pp. 407-429.
Ang, J. & Kohers, N. (2001) 'The Take Over Market for Privately Held Companies: the US Experience', Cambridge Journal of Economics, Vol. 25 No. 6, pp. 723-748.
Angelopoulos, D., Brückmann, R., Jirouš, F., Konstantinavičiūtė, I., Noothout, P., Psarras, J., Tesnière, L. & Breitschopf, B. (2016) 'Risks and Cost of Capital for Onshore Wind Energy Investments in EU Countries', Energy & Environment, Vol. 27 No. 1, [online] http://journals.sagepub.com/doi/pdf/10.1177/ 0958305X16638573 (Accessed 15 June 2017).
Angwin, D. (2001) 'Mergers and Acquisitions across European Borders: National Perspectives on Preacquisition Due Diligence and the Use of Professional Advisers', Journal of World Business, Vol. 36 No. 1, pp. 32-57.
Appadoo, S. S., Bhatt, S. K. & Bector, C. R. (2008) 'Application of Possibility Theory to Investment Decisions', Fuzzy Optimization and Decision Making, Vol. 7 No. 1, pp. 35-57.
Arago, V. & Salvador, E. (2012) 'The Risk-Return Trade-Off in Europe: is there a Pro-Cyclical Risk Aversion?', Economic Computation & Economic Cybernetics Studies & Research, Vol. 46 No. 3, pp. 183-194.
Archer, M. (1982) 'Morphogenesis versus Structuration: on Combining Structure and Action', The British Journal of Sociology, Vol. 33 No. 4, pp. 455-483.
Archer, M. (1995) Realist Social Theory: The Morphogenetic Approach, Cambridge University Press, Cambridge, UK.
Bibliography and References 303 Archer, M., Bhaskar, R., Collier, A., Lawson, T. & Norrie, A. (1998) Critical Realism:
Essential Readings, 1st ed. Routledge, London.
Archer, M., Decoteau, C., Gorski, P., Little, D., Porpora, D., Rutzou, T., Smith, C., Steinmetz, G. & Vandenberghe, F. (2016) What is Critical Realism?, [online] http://www.asatheory.org/current-newsletter-online/what-is-critical-realism (Accessed 25 July 2018).
Ariel, R. (1998) 'Risk Adjusted Discount Rates and the Present Value of Risky Costs', The Financial Review, Vol. 33 No. 1, pp. 17-30.
Arnold, G. (2008) Corporate Financial Management, 4th ed. Pearson Education, Harlow, UK.
Arnold, G. (2010) Financial Times Guide to Investing - The Definitive Companion to Investment and the Financial Markets, 2nd ed. FT Prentice Hall - Financial times, Harlow, UK.
Arnold, G. (2013) Corporate Financial Management, 5th ed. Pearson Education, Harlow, UK.
Arnold, G. C. & Hatzopoulos, P. D. (2000) 'The Theory Practice Gap in Capital Budgeting: Evidence from the United Kingdom', Journal of Business Finance & Accounting, Vol. 27 No. 5 6, pp. 603-626.
Audi, R. (ed.) (1999) The Cambridge Dictionary of Philosophy, New York: Cambridge University Press.
Aurora Energy Research (2018) 'Managing Merchant Risk in Renewables', [online] https://www.auroraer.com/wp-content/uploads/2018/03/Aurora-Energy-Research-Managing-Merchant-Risk-in-Renewables-March-2018-1.pdf (Accessed 3 August 2018).
Aven, T., Vinnem, J. E. & Wiencke, H. (2007) 'A Decision Framework for Risk Management, with Application to the Offshore Oil and Gas Industry', Reliability Engineering & System Safety, Vol. 92 No. 4, pp. 433-448.
Awerbuch, S. (2000) 'Investing in Photovoltaics: Risk, Accounting and the Value of New Technology', Energy Policy, Vol. 28 No. 14, pp. 1023-1035.
Awerbuch, S. (2003) 'Determining the Real Cost-Why Renewable Power is More Cost-Competitive than Previously Believed', Renewable Energy World, Vol. 6 No. 2, pp. 52-61.
Ayyub, B. M. (2014) Risk Analysis in Engineering and Economics, CRC Press, Boca Raton, FL.
Azar, J. (2016) 'Portfolio Diversification, Market Power, and the Theory of the Firm', Browser Download This Paper.
Badger, R. E. (1925) Valuation of Industrial Securities, Prentice-Hall, New York.
304 Bibliography and References Baird, I. S. & Thomas, H. (1985) 'Toward a Contingency Model of Strategic Risk Taking',
Academy of Management Review, Vol. 10 No. 2, pp. 230-243.
Baker, H. K., Dutta, S. & Saadi, S. (2009) 'Corporate Finance Practices in Canada: Where Do We Stand?', Multinational Finance Journal, Vol. 15 No. 3/4, pp. 157-192.
Baker, H. K. & Puttonen, V. (2017) Investment Traps Exposed: Navigating Investor Mistakes and Behavioral Biases, Emerald Publishing Limited, Bingley, UK.
Baker, H. K., Singleton, J. C. & Veit, E. T. (2010) Survey Research in Corporate Finance: Bridging The Gap Between Theory and Practice, Oxford University Press, Oxford.
Baker, S., Ponniah, D. & Smith, S. (1999) 'Risk Response Techniques Employed Currently for Major Projects', Construction Management & Economics, Vol. 17 No. 2, pp. 205-213.
Ballwieser, W. & Hachmeister, D. (2013) Unternehmensbewertung: Prozess, Methoden und Probleme, Schäffer-Poeschel Verlag für Wirtschaft Steuern Recht GmbH.
Bamberg, G., Dorfleitner, G. & Krapp, M. (2006) 'Unternehmensbewertung unter Unsicherheit: Zur entscheidungstheoretischen Fundierung der Risikoanalyse [Translation: "On the Evaluation of Risky Streams: Theoretical Underpinnings of the Risk Analysis"]', Zeitschrift für Betriebswirtschaft, Vol. 76 No. 3, pp. 287-307.
Banz, R. W. (1981) 'The Relationship between Return and Market Value of Common Stocks', Journal of Financial Economics, Vol. 9 No. 1, pp. 3-18.
Barnea, A., Haugen, R. A. & Senbet, L. W. (1980) 'A Rationale for Debt Maturity Structure and Call Provisions in the Agency Theoretic Framework', The Journal of Finance, Vol. 35 No. 5, pp. 1223-1234.
Barro, R. J. (2006) 'Rare Disasters and Asset Markets in the Twentieth Century', The Quarterly Journal of Economics, Vol. 121 No. 3, pp. 823-866.
Basu, S. (1983) 'The Relationship between Earnings' Yield, Market Value and Return for NYSE Common Stocks: Further Evidence', Journal of Financial Economics, Vol. 12 No. 1, pp. 129-156.
Baumann, D. D. & Sims, J. H. (1978) 'Flood Insurance: Some Determinants of Adoption', Economic Geography, Vol. 54 No. 3, pp. 189-196.
Bazeley, P. (2004) 'Issues in Mixing Qualitative and Quantitative Approaches to Research', Applying Qualitative Methods to Marketing Management Research, pp. 141-156.
Bazeley, P. (2010) 'Computer-Assisted Integration of Mixed Methods Data Sources and Analyses', In: Tashakkori, A. & Teddlie, C. (eds.) SAGE Handbook of Mixed Methods Research for the Social and Behavioral Sciences. pp. 431-467, SAGE, Thousand Oaks, CA.
Bibliography and References 305 Beaver, W., Kettler, P. & Scholes, M. (1970) 'The Association Between Market
Determined and Accounting Determined Risk Measures', Accounting Review, Vol. 45 No. 4, pp. 654-682.
Beedles, W. L. (1978) 'On the Use of Certainty Equivalent Factors as Risk Proxies', Journal of Financial Research, Vol. 1 No. 1, pp. 15-21.
Behrens, A. & Choobineh, F. (1992) 'Use of Intervals and Possibility Distributions in Economic Analysis', Journal of the Operational Research Society, Vol. 43 No. 9, pp. 907-918.
Bekaert, G., Erb, C. B., Harvey, C. R. & Viskanta, T. E. (1997) 'What Matters for Emerging Equity Market Investments', Emerging Markets Quarterly, Vol. 1 No. 2, pp. 17-46.
Benninga, S. & Protopapadakis, A. A. (1981) 'Real and Nominal Interest Rates Under Uncertainty: The Fisher Theorem and the Term Structure', Journal of Political Economy, Vol. 91 No. 5, pp. 856-867.
Bergek, A., Mignon, I. & Sundberg, G. (2013) 'Who Invests in Renewable Electricity Production? Empirical Evidence and Suggestions for Further Research', Energy Policy, Vol. 56, pp. 568-581.
Berger, P. G., Ofek, E. & Swary, I. (1996) 'Investor Valuation of the Abandonment Option', Journal of Financial Economics, Vol. 42 No. 2, pp. 257-287.
Beringer, S. (2010) Cash-Flow and Unternehmensbeurteilung [Translation: "Cash-Flow and Company Valuation"], Erich Schmidt, Berlin.
Berk, J. B. & DeMarzo, P. M. (2011) Grundlagen der Finanzwirtschaft: Analyse, Entscheidung und Umsetzung [Translation: "Fundamentals of Financial Management: Analysis, Decision-Making and Implementation"], Pearson Deutschland GmbH, München, D.
Bernhardt, K. J. (2000) Risk, Uncertainty, and Management Implications, National Program for Integrated Dairy Risk Management Education & Research, USDA Risk Management Agency, University of Wisconsin, Platteville, pp. 1-11.
Bernstein, P. L. (1996) 'The New Religion of Risk Management', Harvard Business Review, Vol. 74 No. 2, pp. 47-&.
Bettis, R. A. 'Risk Considerations in Modeling Corporate Strategy'. in Academy of Management Proceedings. Academy of Management, pp. 22-25.
Bhandari, L. C. (1988) 'Debt/Equity Ratio and Expected Common Stock Returns: Empirical Evidence', Journal of Finance, Vol. 43 No. 2, pp. 507-528.
Bhandari, N. C. (1981) 'Capital Expenditure Decisions under Risk and Uncertainty', Advanced Management Journal, Vol. 46 No. 4, pp. 52-61.
Bhaskar, R. (1975) A Realist Theory of Science, 1nd ed. Verso, London.
306 Bibliography and References Bhaskar, R. (1979) The Possibility of Naturalism: A Philosophical Critique of the
Contemporary Human Sciences, Humanities Press, Atlantic Highlands, NJ.
Bhaskar, R. (1989) Reclaiming Reality, Verso, London.
Bhaskar, R. (1998) 'General Introduction', In: Archer, M., Bhaskar, R., Collier, A., Lawson, T. & Norrie, A. (eds.) Critical Realism: Essential Readings. 1st ed, pp., Routledge, London.
Bhaskar, R. (2008) A Realist Theory of Science, 2nd ed. Routledge, London.
Bhaskar, R. (2010a) 'Contexts of Interdisciplinarity: Interdisciplinarity and Climate Change', In: Bhaskar, R., Frank, C., Hoyer, K. G. & Næss, P. (eds.) Interdisciplinarity and climate change. pp. 15-38, Routledge, London.
Bhaskar, R. (2010b) Reclaiming Reality: A Critical Introduction to Contemporary Philosophy, Taylor & Francis.
Bhaskar, R. (2014) The Possibility of Naturalism: A Philosophical Critique of the Contemporary Human Sciences, 4th ed. Routledge.
Bhaskar, R., Danermark, B. & Price, L. (2017) Interdisciplinarity and Wellbeing: A Critical Realist General Theory of Interdisciplinarity, Routledge.
Bhattacharya, A. & Kojima, S. (2012) 'Power Sector Investment Risk and Renewable Energy: A Japanese Case Study Using Portfolio Risk Optimization Method', Energy Policy, Vol. 40, pp. 69-80.
Bhattacharya, S. (1978) 'Project Valuation With Mean-Reverting Cash Flow Streams', The Journal of Finance, Vol. 33 No. 5, pp. 1317-1331.
Bierman, H. (1993) 'Capital Budgeting in 1992: A Survey', Financial Management, Vol. 22 No. 3, pp. 24-24.
Biesta, G. (2010) 'Pragmatism and the Philosophical Foundations of Mixed Methods Research', In: Tashakkori, A. & Teddlie, C. (eds.) SAGE Handbook of Mixed Methods in Social and Behavioral Research. pp. 95-117, SAGE, Thousand Oaks, CA.
Bitaraf, S. & Shahriari, M. (2015) 'Decision Making Under Uncertainty - A Case Study', International Journal of Risk Assessment and Management, Vol. 18 No. 1, pp. 21-37.
Black, F. (1972) 'Capital Market Equilibrium with Restricted Borrowing', Journal of Business, Vol. 45 No. 3, pp. 444-454.
Black, F. & Scholes, M. (1973) 'The Pricing of Options and Corporate Liabilities', Journal of Political Economy, Vol. 81 No. 3, pp. 637.
Blackburn, S. (2005) Truth: A Guide, Oxford University Press, Oxford, UK.
Blaikie, N. (2000) 'Designing Social Research', Polity, UK.
Bibliography and References 307 Blaikie, N. (2009) Designing Social Research, 2nd ed. Polity Press, Cambridge, UK.
Blaikie, N. W. (1991) 'A Critique of the Use of Triangulation in Social Research', Quality and Quantity, Vol. 25 No. 2, pp. 115-136.
Block, S. (2003) 'Divisional Cost of Capital: A Study of Its Use by Major US Firms', The Engineering Economist, Vol. 48 No. 4, pp. 345-362.
Block, S. (2005) 'Are There Differences in Capital Budgeting Procedures Between Industries? An Empirical Study', The Engineering Economist, Vol. 50 No. 1, pp. 55-67.
Bock, K. & Trück, S. (2011) 'Assessing Uncertainty and Risk in Public Sector Investment Projects', Technology and Investment, Vol. 2 No. 02, pp. 105.
Bodie, Z., Kane, A. & Marcus, A. (2014) Investments, McGraw-Hill Education, Berkshire.
Bodnar, G. M., Hayt, G. S. & Marston, R. C. (1998) 'Wharton Survey of Financial Risk Management by US Non-Financial Firms', Financial Management, [online] http://finance.wharton.upenn.edu/~bodnarg/courses/readings/survey98.pdf (Accessed 28 January 2014).
Bogdan, R. & Biklen, S. (2007) Qualitative Research for Education: An Introduction to Theory and Practice. Boston: Allyn and Bacon.
Boland, J. W., lgorzata Korolkiewicz, M., Agrawal, M. & Huang, J. 'Forecasting Solar Radiation on Short Time Scales Using a Coupled Autoregressive and Dynamical System (CARDS) Model'. in 50th Annual Conference Australian Solar Energy Society, Melbourne, Australia. AuSES-Australian Solar Energy Society, pp. 1-10.
Böttcher, J. (2009) Finanzierung von Erneuerbare-Energien-Vorhaben [Translation: "Financing of Renewable Energy Projects"], Oldenbourg, München.
Böttcher, J. & Blattner, P. (2010) Projektfinanzierung [Translation: "Project Financing"], Oldenbourg, München.
Botzen, W. J., Aerts, J. C. & van den Bergh, J. C. (2009) 'Willingness of Homeowners to Mitigate Climate Risk Through Insurance', Ecological Economics, Vol. 68 No. 8, pp. 2265-2277.
Bowman, E. H. (1980) 'A Risk/Return Paradox for Strategic Management', Sloan Management Review, Vol. 21 No. 3, pp. 17-31.
Boyd, R. (2002) Scientific Realism. In: Zalta, E. N. (ed.) The Stanford Encyclopedia of Philosophy. https://plato.stanford.edu/archives/sum2002/entries/scientific-realism/ (Accessed 18 August 2018).
Brach, M. A. (2003) Real Options in Practice, John Wiley & Sons.
Brandt, M. W. & Wang, K. Q. (2003) 'Time-varying risk aversion and unexpected inflatio', Journal of Monetary Economics, Vol. 50, pp. 1457–1498.
308 Bibliography and References Brealey, R. A., Myers, S. C. & Allen, F. (2011) Principles of corporate finance, 10th ed.
The McGraw-Hill Companies, Inc., New York.
Breeden, D. T. (1979) 'An intertemporal asset pricing model with stochastic consumption and investment opportunties', Journal of Financial Economics, Vol. 7 No. 3, pp. 265-296.
Brennan, M. (1971) 'A note on dividend irrelevance and the Gordon valuation model', The Journal of Finance, Vol. 26 No. 5, pp. 1115-1121.
Brennan, M. J. & Trigeorgis, L. (2000) Project flexibility, agency, and competition: new developments in the theory and application of real options, Oxford University Press, USA.
Brennan, M. J. & Xia, Y. (2003) 'Risk and valuation under an intertemporal capital asset pricing model', Social Science Research Network, Rodney L. White Center for Financial Research, [online] http://dx.doi.org/10.2139/ssrn.418922 (Accessed 15 March 2014).
Brewer, J. & Hunter, A. (1989) Multimethod research: A synthesis of styles, SAGE, Newbury Park, CA.
Brewer, M. B. & Crano, W. D. (2000) 'Research design and issues of validity', Handbook of research methods in social and personality psychology, pp. 3-16.
Brigham, E. F. (1975) 'Hurdle rates for screening capital expenditure proposals', Financial Management, Vol. 4 No. 3, pp. 17-26.
Brigham, E. F. & Ehrhardt, M. C. (2008) Financial Managment: Theory and Practice, Thomson Learning, Mason OH.
Brigham, E. F. & Houston, J. F. (2012) Fundamentals of financial management, Consice 7th ed. South-Western Cengage Learning, Mason, OH.
Brigham, E. F., Shome, D. K. & Vinson, S. R. (1985) 'The Risk Premium Approach to Measuring a Utility's Cost of Equity', Financial Management (1972), Vol. 14 No. 1, pp. 33-45.
Britzelmaier, B. (2013) Wertorientierte Unternehmensführung [Translation: "Value-Oriented Management"], 2nd ed. Kiehl, Herne, DE.
Britzelmaier, B., Kraus, P., Häberle, M., Mayer, B. & Beck, V. 'Value-Based Management in SMEs - A Critical Analysis of the Applicability and Determination of the Cost of Capital'. in 5th Annual EuroMed Conference of the EuroMed Academy of Business, Glion-Montreux, Switzerland. pp. 214-224.
Bröer, N. & Däumler, K. (1986) 'Investitionsrechnungsmethoden in der Praxis. Eine Umfrage [Translation: "Investment Accounting Methods in Practice. A Survey"', Buchführung, Bilanz, Kostenrechnung, H. 13, Fach 2, pp. 709-720.
Bibliography and References 309 Bromiley, P., McShane, M., Nair, A. & Rustambekov, E. (2015) 'Enterprise Risk
Management: Review, Critique, and Research Directions', Long Range Planning, Vol. 48 No. 4, pp. 265-276.
Brosius, F. (1998) SPSS 8 - Professionelle Statistik unter Windows [Translation: "SPSS 8 - Professional Statistics in Windows], MITP-Verlag GmbH, Bonn, DE.
Brounen, D., De Jong, A. & Koedijk, K. (2004) 'Corporate Finance in Europe Confronting Theory with Practice', EFA 2004 Maastricht Meetings Paper No. 2769, [online] http://ssrn.com/abstract=559415 (Accessed 24 February 2015).
Brounen, D., De Jong, A. & Koedijk, K. (2006) 'Capital Structure Policies in Europe: Survey Evidence', Journal of Banking & Finance, Vol. 30 No. 5, pp. 1409-1442.
Brown, R. & Brignall, S. (2007) 'Reflections on the Use of a Dual-Methodology Research Design to Evaluate Accounting and Management Practice in UK University Central Administrative Services', Management Accounting Research, Vol. 18 No. 1, pp. 32-48.
Bruck, M., Goudarzi, N. & Sandborn, P. 'A levelized Cost of Energy (LCOE) Model for Wind Farms that Includes Power Purchase Agreement (PPA) Energy Delivery Limits'. in ASME 2016 – Power Conference PowerEnergy2016, Charlotte, NC, USA. American Society of Mechanical Engineers, pp. V001T010A007-V001T010A007.
Bruner, R. F., Eades, K. M., Harris, R. S. & Higgins, R. C. (1998) 'Best Practices in Estimating the Cost of Capital: Survey and Synthesis', Financial Practice and Education, Vol. 8 No. 1, pp. 13-28.
Brunwasser, H. J. & McGowan, C. (1989) 'The Evaluation of International Capital Investment Decisions by United States Domiciled Multinationals: A Survey of Current Practice', American Business Review, Vol. 7 No. 1, pp. 23-29.
Bryman, A. (2006) 'Integrating Quantitative and Qualitative Research: How is it Done?', Qualitative research, Vol. 6 No. 1, pp. 97-113.
Bryman, A. (2007) 'Barriers to integrating quantitative and qualitative research', Journal of mixed methods research, Vol. 1 No. 1, pp. 8-22.
Bryman, A., Becker, S. & Sempik, J. (2008) 'Quality Criteria for Quantitative, +ualitative and Mixed Methods Research: A View from Social Policy', International Journal of Social Research Methodology, Vol. 11 No. 4, pp. 261-276.
Bryman, A. & Bell, E. (2011) Business Research Methods, 3rd ed. Oxford university press, Oxford, UK.
Buehler, K., Freeman, A. & Hulme, R. (2008) 'Owning the Right Risks', Harvard Business Review, Vol. 86 No. 9, pp. 102-110.
Bufka, J., Schiereck, D. & Zinn, K. (1999) 'Kapitalkostenbestimmung für diversifizierte Unternehmen: Ein empirischer Methodenvergleich [Translation: "Estimation of
310 Bibliography and References
Cost of Capital of Diversified Companies: a Comparison of Empirical Methods"]', Zeitschrift für Betriebswirtschaft, Vol. 69 No. 1, pp. 115-131.
Bullard, S. H., Gunter, J. E., Doolittle, M. L. & Arano, K. G. (2002) 'Discount Rates for Nonindustrial Private Forest Landowners in Mississippi: How High a Hurdle?', Southern Journal of Applied Forestry, Vol. 26 No. 1, pp. 26-31.
Bullen, P. (2013) Risk Management - Tools, Management Alternatives, [online] http://www.mapl.com.au/risk/risk4.htm (Accessed 26 July 2016).
Bürer, M. J. & Wüstenhagen, R. (2009) 'Which Renewable Energy Policy is a Venture Capitalist's Best Friend? Empirical Evidence from a Survey of International Cleantech Investors', Energy Policy, Vol. 37 No. 12, pp. 4997-5006.
Burns, R. M. & Walker, J. (1997) 'Capital Budgeting Techniques Among the Fortune 500: A Rationale Approach', Managerial Finance, Vol. 23 No. 9, pp. 3-15.
Burrell, G. & Morgan, G. (1979) Sociological Paradigms and Organisational Analysis, Heinemann, London.
Butler, J. & Schachter, B. (1989) 'The Investment Decision: Estimation Risk and Risk Adjusted Discount Rates', Financial Management, Vol. 18 No. 4, pp. 13-22.
BWE (2015) Akteursstruktur von Windenergieprojekten in Deutschland [Translation: "Stakeholder Structure of Wind Energy Projects in Germany], https://www.wind-energie.de/sites/default/files/download/publication/akteursstrukturen-von-windenergieprojekten-deutschland/20150218_studie_akteursvielfalt_final.pdf (Accessed 2 July 2017).
Cain, M. D., Denis, D. J. & Denis, D. K. (2011) 'Earnouts: A study of Financial Contracting in Acquisition Agreements', Journal of Accounting and Economics, Vol. 51 No. 1, pp. 151-170.
Câmara, A., Chung, S. L. & Wang, Y. H. (2009) 'Option Implied Cost of Equity and Its Properties', Journal of Futures Markets: Futures, Options, and Other Derivative Products, Vol. 29 No. 7, pp. 599-629.
Campbell, D. T. (1957) 'Factors Relevant to the Validity of Experiments in Social Settings', Psychological Bulletin, Vol. 54 No. 4, pp. 297-312.
Campbell, D. T. & Fiske, D. W. (1959) 'Convergent and Discriminant Validation by the Multitrait-Multimethod Matrix', Psychological Bulletin, Vol. 56 No. 2, pp. 81-105.
Campbell, J. Y. (1987) 'Stock Returns and the Term Structure', Journal of Financial Economics, Vol. 18 No. 2, pp. 373-399.
Campbell, J. Y. & Mei, J. (1993) 'Where Do Betas Come From? Asset Price Dynamics and the Sources of Systematic Risk', The Review of Financial Studies, Vol. 6 No. 3, pp. 567-592.
Bibliography and References 311 Campbell, J. Y. & Vuolteenaho, T. (2004) 'Bad Beta, Good Geta', American Economic
Review, Vol. 94 No. 5, pp. 1249-1275.
Capron, L. & Shen, J.-C. (2007) 'Acquisitions of Private vs. Public Firms: Private Information, Target Selection, and Acquirer Returns', Strategic Management Journal, Vol. 28 No. 9, pp. 892-911.
Carhart, M. M. (1997) 'On Persistence in Mutual Fund Performance', Journal of Finance, Vol. 52 No. 1, pp. 57-82.
Carifio, J. & Perla, R. J. (2007) 'Ten Common Misunderstandings, Misconceptions, Persistent Myths and Urban Legends about Likert Scales and Likert Response Formats and Their Antidotes', Journal of Social Sciences, Vol. 3 No. 3, pp. 106-116.
Carlson, A. (2002) 'On Cost Effective Technical Measures to Avoid Environmental Damages of Regional Energy Systems', International Journal of Energy Research, Vol. 26 No. 12, pp. 1103-1115.
Carmichael, D. G. (2011) 'An Alternative Approach to Capital Investment Appraisal', The Engineering Economist, Vol. 56 No. 2, pp. 123-139.
Carmichael, D. G. (2014) Infrastructure Investment: An Engineering Perspective, CRC Press, Boca Raton, FL.
Carmichael, D. G. (2016) 'Risk–a Commentary', Civil Engineering and Environmental Systems, Vol. 33 No. 3, pp. 177-198.
Carmichael, D. G. & Balatbat, M. C. (2008) 'Probabilistic DCF Analysis and Capital Budgeting and Investment - A Survey', The Engineering Economist, Vol. 53 No. 1, pp. 84-102.
Carter, S. M. & Little, M. (2007) 'Justifying Knowledge, Justifying Method, Taking Action: Epistemologies, Methodologies, and Methods in Qualitative Research', Qualitative Health Research, Vol. 17 No. 10, pp. 1316-1328.
Casey, C. (2004) 'Neue Aspekte des Roll Back-Verfahrens in der Unternehmensbewertung [Translation: "New Aspects of the Roll-Back Approach in Company Valuation"]', Zeitschrift fur Betriebswirtschaft, Vol. 74 No. 2, pp. 139-164.
Cassell, C. (2009) 'Interviews in Organizational Research', In: Bryman, A. & Buchanan, D. (eds.) The Sage Handbook of Organizational Research Methods. pp. 500-516, SAGE, London.
Chan, L. K., Hamao, Y. & Lakonishok, J. (1991) 'Fundamentals and Stock Returns in Japan', Journal of Finance, Vol. 46 No. 5, pp. 1739-1789.
Chang, B.-Y., Christoffersen, P., Jacobs, K. & Vainberg, G. (2011) 'Option-Implied Measures of Equity Risk', Review of Finance, [online] https://ssrn.com/ abstract=1416753 (Accessed 1 July 2017).
312 Bibliography and References Chapman, C. & Ward, S. (2003) Project Risk Management: Processes, Techniques and
Insights, 2nd ed. John Wiley & Sons Ltd, West Sussex, UK.
Chen, C. W. S., Gerlach, R. H. & Lin, A. M. H. (2011) 'Multi-Regime Nonlinear Capital Asset Pricing Models', Quantitative Finance, Vol. 11 No. 9, pp. 1421-1438.
Chen, H.-Y. (1967) 'Valuation under Uncertainty', Journal of Financial and Quantitative Analysis, Vol. 2 No. 03, pp. 313-325.
Chen, N.-f., Roll, R. & Ross, S. A. (1986) 'Economic Forces and the Stock Market', Journal of Business, Vol. 56 No. 3, pp. 383-403.
Cheng, E. W. L., Li, H. & Ho, D. C. K. (2002) 'Analytic Hierarchy Process (AHP): A Defective Tool When Used Improperly', Measuring Business Excellence, Vol. 6 No. 4, pp. 33-37.
Cheng, P., Lin, Z. & Liu, Y. (2013) 'Liquidity Risk of Private Assets: Evidence from Real Estate Markets', Financial Review, Vol. 48 No. 4, pp. 671-696.
Cheremushkin, S. V. (2009) 'Revisiting Modern Discounting of Risky Cash Flows: Imbedding Uncertainty Resolution Functions into Risk-Adjusted Discount Rates and Certainty Equivalent Factors (Revised)', [online] https://ssrn.com/ abstract=1526683 (Accessed 14 November 2016).
Chesla, C. A. (1989) 'Parents' Illness Models of Schizophrenia', Archives of Psychiatric Nursing, Vol. 3 No. 4, pp. 218-225.
Cholasuke, C., Bhardwa, R. & Antony, J. (2004) 'The Status of Maintenance Management in UK Manufacturing Organisations: Results from a Pilot Survey', Journal of Quality in Maintenance Engineering, Vol. 10 No. 1, pp. 5-15.
Chong, J., Jin, Y. & Phillips, M. (2013) 'The Entrepreneur's Cost of Capital: Incorporating Downside Risk in the Buildup Method (Working Paper, Posting Prohibited)', [online] http://www.macrorisk.com/wp-content/uploads/2013/04/MRA-WP-2013-e.pdf (Accessed 4 March 2014).
Christy, G. A. (1966) Capital Budgeting: Current Practices and Their Efficiency, Bureau of Business and Economic Research, University of Oregon, Eugene, OR.
Chua, J. H., Wu, Z. & Chang, P. C. (2006) 'The Full-Information Approach for Estimating Divisional Betas: Implementation Issues and Tests', Journal of Applied Finance, Vol. 16 No. 1, [online] http://ssrn.com/abstract=926173 (Accessed 5 April 2016).
Cleden, D. (2012) Managing Project Uncertainty, Routledge, London.
Cochrane, J. H. (1991) 'Production-Based Asset Pricing and the Link Between Stock Returns and Economic Fluctuations', Journal of Finance, Vol. 46 No. 1, pp. 209-237.
Cochrane, J. H. (2000) Asset Pricing, Princeton University Press, Princeton, NJ.
Bibliography and References 313 Cochrane, J. H. (2005) 'The Risk and Return of Venture Capital', Journal of Financial
Economics, Vol. 75 No. 1, pp. 3-52.
Coenenberg, A. G. & Schultze, W. (2002) 'Unternehmensbewertung: Konzeptionen und Perspektiven [Translation: "Company Valuation: Concepts and Perspectives"]', DBW, Vol. 62 No. 6, pp. 597-621.
Coenenberg, A. G. & Schultze, W. (2006) 'Methoden der Unternehmensbewertung [Translation: "Methods of Company Valuation"]', In: Wirth, B. W. (ed.) Handbuch Mergers & Acquisitions Management. pp. 471-500, Gabler, Wiesbaden.
Coghlan, D. & Brannick, T. (2014) Doing Action Research in Your Own Organization, SAGE, Thousand Oaks, CA.
Cohen, J. (1988) Statistical Power Analysis for the Behavior Science, 2nd ed. Lawrance Eribaum Association, Hillsdale, NJ.
Cohen, L., Manion, L. & Morrison, K. (2013) Research Methods in Education, Routledge, London.
Cohen, M. A. & Huchzermeier, A. (1999) 'Global Supply Chain Management: A Survey of Research and Applications', In: Tayur, S., Ganeshan, R. & Magazine, M. J. (eds.) Quantitative Models for Supply Chain Management. pp. 669-702, Kluwer Academic Publishers, Dordrecht.
Collan, M., Fullér, R. & Mezei, J. (2009) 'A Fuzzy Pay-Off Method for Real Option Valuation', Journal of Applied Mathematics & Decision Sciences, Vol. 2009 No. 13, pp. 1-14.
Collan, M., Haahtela, T. & Kyläheiko, K. (2016) 'On the Usability of Real Option Valuation Model Types under Different Types of Uncertainty', International Journal of Business Innovation and Research, Vol. 11 No. 1, pp. 18-37.
Collins, K. M. T., Onwuegbuzie, A. J. & Sutton, I. L. (2006) 'A Model Incorporating the Rationale and Purpose for Conducting Mixed Methods Research in Special Education and Beyond', Learning Disabilities: A Contemporary Journal, Vol. 4 No. 1, pp. 67-100.
Committee for Oversight and Assessment of U.S. Department of Energy Project Management - National Research Council (COA-DOE) (2005) The Owner's Role in Project Risk Management, The National Academies Press, Washington, D.C.
Connor, G. (1984) 'A Unified Beta Pricing Theory', Journal of Economic Theory, Vol. 34 No. 1, pp. 13-31.
Connor, G. & Korajczyk, R. A. (1989) 'An Intertemporal Equilibrium Beta Pricing Model', Review of Financial Studies, Vol. 2 No. 3, pp. 373-392.
Cook, T. D., Campbell, D. T. & Day, A. (1979) Quasiexperimentation: Design & Analysis Issues for Field Settings, Houghton Mifflin, Boston, MA.
314 Bibliography and References Cook, T. D. & Reichardt, C. S. (eds.) (1979) Qualitative and Quantitative Methods in
Evaluation Research, Vol. 1. Beverly Hills, CA: SAGE Publications.
Cooper, D. R. & Schindler, P. S. (2003) Business Research Methods, Vol. 9. McGraw-Hill, New York.
Copeland, T. & Antikarov, V. (2003) Real Options: A Practitioners Guide, Cengage Learning, New York.
Copeland, T. & Weiner, J. (1990) 'Proactive Management of Uncertainty', McKinsey Quarterly, Vol. 10 No. 4, pp. 133-152.
Copeland, T., Weston, J. F. & Shastri, K. (2005) Financial Theory and Corporate Policy, 4th ed. Addison-Wesely, Boston, MA.
Copeland, T. E., Koller, T. & Murrin, J. (2002) Unternehmenswert: Methoden und Strategien für eine wertorientierte Unternehmensführung [Translation: "Corporate Value: Methods and Strategies for Value-Based Corporate Governance"], 3nd ed. Campus Verlag, Frankfurt/New York.
Copur, Z. (2015) Handbook of Research on Behavioral Finance and Investment Strategies: Decision Making in the Financial Industry: Decision Making in the Financial Industry, IGI Global, Hershey, PA.
Cornelius, I. & Davies, M. (1997) Shareholder Value, Financial Times: Financial Publishing, London.
Cornell, B. (1999) 'Risk, duration, and capital budgeting: New evidence on some old questions', The Journal of Business, Vol. 72 No. 2, pp. 183-200.
Cornell, B. (2000) 'Equity Duration, Growth Options and Asset Pricing', The Journal of Portfolio Management, Vol. 26, pp. 183-200.
Cornell, B., Hirshleifer, J. I. & James, E. P. (1997) 'Estimating the Cost of Equity Capital', Contemporary Finance Digest, Vol. 1 No. 1, pp. 5-13.
Cotner, J. S. & Fletcher, H. D. (2000) 'Computing the Cost of Capital for Privately Held Firms', American Business Review, Vol. 18 No. 2, pp. 27-33.
Couture, T. & Gagnon, Y. (2010) 'An Analysis of Feed-in Tariff Remuneration Models: Implications for Renewable Energy Investment', Energy Policy, Vol. 38 No. 2, pp. 955-965.
Covaleski, M. A. & Dirsmith, M. W. (1990) 'Dialectic Tension, Double Reflexivity and the Everyday Accounting Researcher: on Using Qualitative Methods', Accounting, Organizations and Society, Vol. 15 No. 6, pp. 543-573.
Creswell, J. W. (1999) 'Mixed-Method Research: Introduction and Application', In: Cijek, T. (ed.) Handbook of Educational Policy. pp. 455-472, Academic Press, San Diego, CA.
Bibliography and References 315 Creswell, J. W. (2002) Educational Research: Planning, Conducting, and Evaluating
Quantitative, Prentice Hall, Upper Saddle River, NJ.
Creswell, J. W. (2011) 'Controversies in Mixed Methods Research', In: Denzin, N. K. & Lincoln, Y. S. (eds.) The SAGE Handbook of Qualitative Research. 4th ed, pp. 269-284, SAGE, Thousand Oaks, CA.
Creswell, J. W. (2013) Research Design: Qualitative, Quantitative, and Mixed Methods Approaches, SAGE, Thousand Oaks, CA.
Creswell, J. W. & Plano Clark, V. L. (2011a) 'Choosing a Mixed Methods Design', In: Creswell, J. W. & Plano Clark, V. L. (eds.) Designing and Conducting Mixed Methods Research. 2nd ed, pp. 53-106, SAGE, Thousand Oaks, CA.
Creswell, J. W. & Plano Clark, V. L. (2011b) Designing and Conducting Mixed Methods Research, 2nd ed. SAGE, Thousand Oaks, CA.
Creswell, J. W., Plano Clark, V. L., Gutmann, M. L. & Hanson, W. E. (2003) 'Advanced Mixed Methods Research Designs', In: Tashakkori, A. & Teddlie, C. (eds.) SAGE Handbook of Mixed Methods in Social and Behavioral Research. pp. 209-240, SAGE, Thousand Oaks, CA.
Cronbach, L. J. (1951) 'Coefficient Alpha and the Internal Structure of Tests', Psychometrika, Vol. 16 No. 3, pp. 297-334.
Csapi, V. (2013) 'Applying Real Options Theory in the Electrical Energy Sector', Public Finance Quarterly (0031-496X), Vol. 58 No. 4, pp. 469-483.
Cua, F. C. & Garret, T. C. (2009) 'Understanding Ontology and Epistemology in Information Systems
research', In: Cater-Steel, A. & Al-Hakim, L. (eds.) Information Systems Research Methods, Epistemology, and Applications., pp. 35–56, Information Science Reference, Hershey, PA.
Curry, L. & Nunez-Smith, M. (2015) Mixed Methods in Health Sciences Research: A Practical Primer, SAGE Publications, Thousand Oaks, CA.
Curtis, S., Gesler, W., Smith, G. & Washburn, S. (2000) 'Approaches to Sampling and Case Selection in Qualitative Research: Examples in the Geography of Health', Social Science & Medicine, Vol. 50 No. 7, pp. 1001-1014.
Cyert, R. & March, J. G. (1963) A Behavioral Theory of the Firm, Prentice-Hall, Englewood Cliffs, NJ.
da Silva Bastos, C. F. & Martins, A. M. F. (2007) 'O Cálculo do Custo do Capital nas Decisões de Investimento em Activos Reais em Portugal: Uma Análise Empírica'. in Conocimiento, Innovación y Emprendedores: Camino al Futuro, Lisboa. Logroño, ES: Universidad de La Rioja, pp. 857-870.
316 Bibliography and References Damodaran, A. (2001) Corporate Finance: Theory and Practice. , 2nd ed. John Wiley &
Sons, New York.
Damodaran, A. (2005a) 'Marketability and Value: Measuring the Illiquidity Discount', Social Science Research Network, [online] http://papers.ssrn.com/sol3/ papers.cfm?abstract_id=841484 (Accessed 10 November 2013).
Damodaran, A. (2005b) 'The Promise and Peril of Real Option', NYU, [online] http://people.stern.nyu.edu/adamodar/pdfiles/papers/realopt.pdf (Accessed 15 March 2014).
Damodaran, A. (2005c) 'Value and Risk: Beyond Betas', Financial Analysts Journal, Vol. 61 No. 2, pp. 38-43.
Damodaran, A. (2005d) 'The Value of Synergy', SSRN, [online] https://ssrn.com/ abstract=841486 or http://dx.doi.org/10.2139/ssrn.841486 (Accessed 13 May 2017).
Damodaran, A. (2008) 'What is the Riskfree Rate? A Search for the Basic Building Block', Social Science Research Network, [online] http://ssrn.com/abstract=1317436 (Accessed 5 January 2014).
Damodaran, A. (2010) 'Comatose Markets: What if Liquidity is Not the Norm?', Social Science Research Network, [online] http://ssrn.com/abstract=1729408 (Accessed 5 January 2014).
Damodaran, A. (2011a) Alternatives to the CAPM: Part 1: Relative Risk Measures, [online] http://aswathdamodaran.blogspot.ch/2011/04/alternatives-to-capm-part-1-relative.html (Accessed 13 January 2014).
Damodaran, A. (2011b) Alternatives to the CAPM: Part 2: Proxy Models, [online] http://aswathdamodaran.blogspot.ch/2011/04/alternatives-to-capm-part-2-proxy.html (Accessed 13 January 2014).
Damodaran, A. (2011c) Alternatives to the CAPM: Part 5: Risk Adjusting the cash flows, [online] http://aswathdamodaran.blogspot.ch/2011/04/alternatives-to-capm-5-risk-adjusting.html (Accessed 13 January 2014).
Damodaran, A. (2012) Investment Valuation: Tools and Techniques for Determining the Value of Any Asset, 3rd ed. John Wiley & Sons, Hoboken, NJ.
Damodaran, A. (2013) 'Equity Risk Premiums (ERP): Determinants, Estimation and Implications - The 2013 Edition', Social Science Research Network, [online] http://ssrn.com/abstract=2238064 (Accessed 20 September 2013).
Damodaran, A. (2017) 'Equity Risk Premiums (ERP): Determinants, Estimation and Implications - The 2017 Edition', Social Science Research Network, [online] http://ssrn.com/abstract=2238064 (Accessed 20 September 2013).
Bibliography and References 317 Damodaran, A. (n.d.) 'The Adjusted Present Value Approach', [online]
http://pages.stern.nyu.edu/~adamodar/New_Home_Page/valquestions/apv.htm (Accessed 6 July 2017).
Danermark, B., Ekstrom, M. & Jakobsen, L. (2005) Explaining Society: An Introduction to Critical Realism in the Social Sciences, Routledge, London.
Dash, S. R. & Mahakud, J. (2013) 'A Comparative Assessment of Unconditional Multifactor Asset-pricing Models', Journal of Management Research (09725814), Vol. 13 No. 1, pp. 35-54.
Datar, S., Frankel, R. & Wolfson, M. (2001) 'Earnouts: The Effects of Adverse Selection and Agency Costs on Acquisition Techniques', Journal of Law, Economics, and Organization, Vol. 17 No. 1, pp. 201-238.
Datta, L. (1994) 'Paradigm Wars: A Basis for Peaceful Coexistence and Beyond', In: Reichardt, C. S. & Rallis, S. F. (eds.) New Directions for Evaluation, No. 61. pp. 53-70, Jossey-Bass, San Francisco.
David, M. & Sutton, C. D. (2011) Social research: An introduction, 2nd ed. SAGE, London, UK.
Davidson, C. (2009) 'Transcription: Imperatives for Qualitative Research', International Journal of Qualitative Methods, Vol. 8 No. 2, pp. 35-52.
Davies, R., Goedhart, M. & Koller, T. (2012) 'Avoiding a Risk Premium that Unnecessarily Kills Your Project', McKinsey Quarterly, Vol. 2, [online] http://www.washburn.edu/faculty/rweigand/McKinsey/McKinsey-Avoiding-Risk-Premium-That-Kills-A-Project-2012.pdf (Accessed 30 June 2017).
De Vaus, D. A. (2002) Surveys in Social Research, Psychology Press, St. Leonards, AUS.
Dellinger, A. B. & Leech, N. L. (2007) 'Toward a Unified Validation Framework in Mixed Methods Research', Journal of Mixed Methods Research, Vol. 1 No. 4, pp. 309-332.
Deloitte (2014) Establishing the Investment Case Wind Power, Deloitte. [online] https://www2.deloitte.com/content/dam/Deloitte/global/Documents/Energy-and-Resources/gx-er-deloitte-establishing-the-wind-investment-case-2014.pdf (Accessed 15 May 2017).
Deloitte (2015) Establishing the Investment Case - Wind Power, Deloitte, Copenhagen, DK.
Delorme, R. 'Realism in Economics: Critical or Complex'. in Xlth Conference of The European Association for Evolutionary Political Economy Charles University of Prague, Prague. Citeseer, pp. 4-7.
Dhaliwal, D., Heitzman, S. & Zhen, O. (2006) 'Taxes, Leverage, and the Cost of Equity Capital', Journal of Accounting Research, Vol. 44 No. 4, pp. 691–723.
318 Bibliography and References Dierkes, S., Diedrich, R. & Gröger, H.-C. (2009) 'Unternehmensbewertung bei
wertabhängiger und autonomer Finanzierungspolitik unter Berücksichtigung einer Kursgewinnbesteuerung [Translation: "Company Valuation in the Case of Value-Dependent and Autonomous Financing Policies Taking into Account a Price Gain Tax"]', Zeitschrift für Betriebswirtschaft, Vol. 79 No. 3, pp. 275-301.
Dimitrov, V. & Jain, P. C. (2008) 'The Value-Relevance of Changes in Financial Leverage Beyond Growth in Assets and GAAP Earnings', Journal of Accounting, Auditing & Finance, Vol. 23 No. 2, pp. 191-222.
Dimson, E., Marsh, P. & Staunton, M. (2002a) 'Global Evidence on the Equity Risk Premium', Journal of Applied Corporate Finance, Vol. 15 No. 4, pp. 27-38.
Dimson, E., Marsh, P. & Staunton, M. (2002b) Triumph of the Optimists: 101 Years of Global Investment Returns, Princeton University Press, Princeton, NJ.
Dixit, A. K. & Pindyck, R. S. (1995) 'The Options Approach to Capital Investment', Harvard Business Review, Vol. 73 No. 3, pp. 105-115.
DNV GL (2018) 'Energy Transition Outlook 2018 - A Global and Regional Forecast to 2050', [online] https://eto.dnvgl.com/2018/download (Accessed 10 September 2018).
Dobson, P. (2002) 'Critical Realism and Information Systems Research: Why Bother with Philosophy?', [online] (Accessed 24 May 2014).
Downward, P., Finch, J. H. & Ramsay, J. (2002) 'Critical Realism, Empirical Methods and Inference: A Critical Discussion', Cambridge Journal of Economics, Vol. 26 No. 4, pp. 481-500.
Dressler, R. A. & Kreuz, R. J. (2000) 'Transcribing Oral Discourse: A Survey and a Model System', Discourse Processes, Vol. 29 No. 1, pp. 25-36.
Driessen, J., Lin, T.-C. & Phalippou, L. (2012) 'A New Method to Estimate Risk and Return of Nontraded Assets from Cash Flows: The Case of Private Equity Funds', Journal of Financial and Quantitative Analysis, Vol. 47 No. 3, pp. 511-535.
Drukarczyk, J. & Schüler, A. (2009) Unternehmensbewertung [Translation: "Company Valuation"], Verlag Franz Vahlen, München, DE.
Duffie, D. & Zame, W. (1989) 'The Consumption-Based Capital Asset Pricing Model', Econometrica, Vol. 57 No. 6, pp. 1279-1297.
Dunn, B., Kamath, H. & Tarascon, J.-M. (2011) 'Electrical Energy Storage for the Grid: A Battery of Choices', Science, Vol. 334 No. 6058, pp. 928-935.
Easterby-Smith, M., Thorpe, R. & Jackson, P. (2012) Management Research, SAGE Publications, Thousand Oaks, CA.
EEA (2017) Trends and Projections in Europe 2017 - Tracking Progress towards Europe’s Climate and Energy Targets (EEA Report No. 17/2017), Luxembourg.
Bibliography and References 319
https://www.eea.europa.eu/themes/climate/trends-and-projections-in-europe/ trends-and-projections-in-europe-2017/index (Accessed 10 January 2018).
Efron, B. & Tibshirani, R. J. (1993) An Introduction to the Bootstrap, Chapman & Hall, New York.
Ehrhardt, M. C. (2001) The Search for Value: Measuring the Company's Cost of Capital, Oxford University Press, Oxford, UK.
Ehrhardt, M. C. & Bhagwat, Y. N. (1991) 'A Full-Information Approach for Estimating Divisional Betas', The Journal of the Financial Management Association, Vol. 20 No. 2, pp. 60-69.
Ehrhardt, M. C. & Brigham, E. F. (2016) Corporate Finance: A Focused Approach, Cengage Learning, Boston, MA.
Eisenhardt, K. M. (1989) 'Building Theories from Case Study Research', Academy of Management Review, Vol. 14 No. 4, pp. 532-550.
Elton, E. J., Gruber, M. J., Brown, S. J. & Goetzmann, W. N. (2010) Modern Portfolio Theory and Investment Analysis, 8th ed. John Wiley & Sons, Inc., New York.
Energy Rev (2018) 'Merchant risk: When a PPA alone just isn’t enough', [online] https://energy-rev.com/2018/04/12/merchant-risk-when-a-ppa-alone-just-isnt-enough/ (Accessed 3 August 2018).
EnergyVortex.com (n.d.) Energy Dictionary - Independent Power Producer (IPP), Non-Utility Generator (NUG) [online] https://energyvortex.com/energydictionary/ independent_power_producer_(ipp)__non_utility_generator_(nug).html (Accessed 30 August 2017).
Ericsson, J. & Karlsson, S. (2004) 'Choosing Factors in a Multifactor Asset Pricing Model: A Bayesian Approach', SSE/EFI Working Paper Series in Economics and Finance, [online] http://swopec.hhs.se/hastef/papers/hastef0524.pdf (Accessed 20 January 2014).
Erzberger, C. (1998) Zahlen und Wörter: Die Verbindung quantitativer und qualitativer Daten und Methoden im Forschungsprozess [Translation: "Numbers and Words: The Combination of Quantitative and Qualitative Data and Methods in the Research Process"], Deutscher Studien Verlag, Weinheim, DE.
Erzberger, C. & Kelle, U. (2003) 'Making Inferences in Mixed Methods: The Rules of Integration', In: Tashakkori, A. & Teddlie, C. (eds.) SAGE Handbook of Mixed Methods in Social and Behavioral Research. pp. 457-488, SAGE, Thousand Oaks, CA.
Erzberger, C. & Prein, G. (1997) 'Triangulation: Validity and Empirically-Based Hypothesis Construction', Quality and Quantity, Vol. 31 No. 2, pp. 141-154.
320 Bibliography and References Espinoza, R. D. (2014) 'Separating Project Risk from the Time Value of Money: A Step
Toward Integration of Risk Management and Valuation of Infrastructure Investments', International Journal of Project Management, Vol. 32 No. 6, pp. 1056-1073.
Espinoza, R. D. (2015) 'The Cost of Risk: An alternative to Risk Adjusted Discount Rates', [online] https://www.researchgate.net/profile/David_Espinoza4/publication/304012087_THE_COST_OF_RISK_AN_ALTERNATIVE_TO_RISK_ADJUSTED_DISCOUNT_RATES/links/5762c08008ae0eda64311047.pdf (Accessed 3 October 2016).
Espinoza, R. D. & Morris, J. W. (2013) 'Decoupled NPV: A Simple, Improved Method to Value Infrastructure Investments', Construction Management and Economics, Vol. 31 No. 5, pp. 471-496.
Espinoza, R. D. & Rojo, J. (2015) 'Using DNPV for Valuing Investments in the Energy Sector: A Solar Project Case Study', Renewable Energy, Vol. 75, pp. 44-49.
Everett, J. E. & Schwab, B. (1979) 'On the Proper Adjustment for Risk Through Discount Rates in a Mean-Variance Framework', Financial Management, pp. 61-65.
EY (2010) Risk Appetite: The Strategic Balancing Act, http://www.ey.com/gl/en/ services/advisory/risk-appetite--the-strategic-balancing-act (Accessed 20 June 2017).
Fama, E. F. (1968) 'Risk, Return and Equilibrium: Some Clarifying Comments', Journal of Finance, Vol. 23 No. 1, pp. 29-40.
Fama, E. F. (1977) 'Risk-Adjusted Discount Rates and Capital Budgeting Under Uncertainty', Journal of Financial Economics, Vol. 5 No. 1, pp. 3-24.
Fama, E. F. (1996) 'Multifactor Portfolio Efficiency and Multifactor Asset Pricing', Journal of Financial & Quantitative Analysis, Vol. 31 No. 4, pp. 441-465.
Fama, E. F. & French, K. R. (1992) 'The Cross-Section of Expected Stock Returns', Journal of Finance, Vol. 47 No. 2, pp. 427-465.
Fama, E. F. & French, K. R. (1993) 'Common Risk Factors in the Returns on Stocks and Bonds', Journal of Financial Economics, Vol. 33 No. 1, pp. 3-56.
Fama, E. F. & French, K. R. (1995) 'Size and Book-to-Market Factors in Earnings and Returns', Journal of Finance, Vol. 50 No. 1, pp. 131-155.
Fama, E. F. & French, K. R. (1996) 'Multifactor Explanations of Asset-Pricing Anomalies', Journal of Finance, Vol. 51 No. 1, pp. 55-84.
Fama, E. F. & French, K. R. (1997) 'Industry Costs of Equity', Journal of Financial Economics, Vol. 43 No. 2, pp. 153-193.
Farlex Financial Dictionary (2009) Total Risk, [online] https://financial-dictionary. thefreedictionary.com/Total+risk (Accessed 15 January 2017).
Bibliography and References 321 Fernandez, P. (2007a) 'The Most Common Errors in Valuation (Working Paper No.
449)', University of Navarra. IESE Business School, [online] https://papers.ssrn. com/sol3/papers.cfm?abstract_id=1025424 (Accessed 10 February 2017).
Fernandez, P. (2007b) 'Valuing Companies by Cash Fow Dscounting: Ten Methods and Nine Theories', Managerial Finance, Vol. 11 No. 33, pp. 853–876.
Fernandez, P. (2015) 'Valuing Companies by Cash Flow Discounting: Ten Methods and Nine Theories', EFMA 2002 London Meetings, SSRN, [online] https://ssrn.com/ abstract=256987 (Accessed 7 July 2017).
Fernandez, P. (2016) 'Company Valuation Methods (Working Paper No. 714)', University of Navarra. IESE Business School, [online] https://papers.ssrn.com/ sol3/papers.cfm?abstract_id=274973 (Accessed 10 February 2017).
Ferson, W. E. & Harvey, C. R. (1991) 'The Variation of Economic Risk Premiums', Journal of Political Economy, Vol. 99 No. 2, pp. 385-415.
Field, A. (2013) Discovering Statistics Using IBM SPSS Statistics, 4th ed. SAGE, London.
Fielding, N. G. & Fielding, J. L. (1986) Linking Data: The Articulation of Qualitative and Quantitative Methods in Social Research, SAGE, Beverly Hills, CA.
Financial Glossary (2011) Total Risk, [online] https://financial-dictionary. thefreedictionary.com/Total+risk (Accessed 15 January 2017).
Finon, D. & Perez, Y. (2007) 'The Social Efficiency of Instruments of Promotion of Renewable Energies: A Transaction-Cost Perspective', Ecological Economics, Vol. 62 No. 1, pp. 77-92.
Fisher, I. (1930) The Theory of Interest, as Determined by Impatience to Spend Income and Opportunity to Invest It, Macmillan, New York.
Fleetwood, S. (1999) Critical Realism in Economics: Development and Debate, Routledge, London.
Flick, U. (2014) An Introduction to Qualitative Research, 5th ed. SAGE, Los Angeles, CA.
Fowler, F. (2009) Survey Research Methods, 4th ed. SAGE, Thousand Oaks, CA.
Franzoni, F., Nowak, E. & Phalippou, L. (2012) 'Private Equity Performance and Liquidity Risk', Journal of Finance, Vol. 67 No. 6, pp. 2341-2373.
Fremgen, J. M. (1973) 'Capital Budgeting Practices: A Survey', Management Accounting, Vol. 54 No. 11, pp. 19-25.
Fricke, W. & Totterdill, P. (2004) Action Research in Workplace Innovation and Regional Development, John Benjamins Publishing.
Friedman, M. (1962) Price Theory, A Provisional Text, Aldine, Chicago.
322 Bibliography and References Froot, K. A. & Stein, J. C. (1998) 'Risk Management, Capital Budgeting, and Capital
Structure Policy for Financial Institutions: An Integrated Approach', Journal of Financial Economics, Vol. 47 No. 1, pp. 55-82.
Fuller, R. J. & Kerr, H. S. (1981) 'Estimating the Divisional Cost of Capital: An Analysis of the Pure-Play Technique', Journal of Finance, Vol. 36 No. 5, pp. 997-1009.
Fusch, P. I. & Ness, L. R. (2015) 'Are We There Yet? Data Saturation in Qualitative Research', The Qualitative Report, Vol. 20 No. 9, pp. 1408-1416.
Gaweł, B., Rȩbiasz, B. & Skalna, I. 'Application of Probability and Possibility Theory in Investment Appraisal'. in International Conference on Information Systems Architecture and Technology. Springer, pp. 47-56.
Gigerenzer, G. & Brighton, H. (2009) 'Homo Heuristicus: Why Biased Minds Make Better Inferences', Topics in Cognitive Science, Vol. 1 No. 1, pp. 107-143.
Gilbert, E. (2004) 'Investment Basics XLIX. An Introduction to Real Options', Investment Analysts Journal, Vol. 33 No. 60, pp. 49-52.
Gilbert, E. & Reichert, A. (1995) 'The Practice of Financial Management Among Large United States Corporations', Financial Practice and Education, Vol. 5 No. 1, pp. 16-23.
Gitman, L. J. (1995) Foundations of Managerial Finance, 4th ed. HarperCollins, New York.
Gitman, L. J. & Forrester Jr, J. R. (1977) 'A Survey of Capital Budgeting Techniques Used by Major US Firms', Financial Management, Vol. 6 No. 3, pp. 66-71.
Gitman, L. J. & Maxwell, C. E. (1987) 'A Longitudinal Comparison of Capital Budgeting Techniques Used by Major US Firms: 1986 versus 1976', Journal of Applied Business Research (JABR), Vol. 3 No. 3, pp. 41-50.
Gitman, L. J. & Mercurio, V. A. (1982) 'Cost of Capital Techniques Used by Major US Firms: Survey and Analysis of Fortune's 1000', Financial Management, Vol. 14 No. 4, pp. 21-29.
Gitman, L. J. & Vandenberg, P. A. (2000) 'Cost of Capital Techniques Used by Major US Firms: 1997 vs. 1980', Financial Practice and Education, Vol. 10 No. 2, pp. 53-68.
Gläser, J. & Laudel, G. (2010) Experteninterviews und qualitative Inhaltsanalyse - als Instrument rekonstruierender Untersuchungen (Translation: "Expert Interviews and Qualitative Content Analysis - as an Instrument of Reconstructing Investigations"], 4th ed. Springer-Verlag, Wiesbaden, DE.
Glik, D. C., Parker, K., Muligande, G. & Hategikamana, B. (1986) 'Integrating Qualitative and Quantitative Survey Techniques', International Quarterly of Community Health Education, Vol. 7 No. 3, pp. 181-200.
Bibliography and References 323 Global Capital Finance (2014) The European Renewable Energy Investor Landscape,
[online] http://cleanenergypipeline.com/Resources/CE/ResearchReports/The% 20European%20Renewable%20Energy%20Investor%20Landscape.pdf (Accessed 30 July 2016).
Gordon, M. J. & Shapiro, E. (1956) 'Capital Equipment Analysis: The Required Rate of Profit', Management Science, Vol. 3 No. 1, pp. 102-110.
Gorski, P. S. (2013) What is Critical Realism? And Why Should You Care? Los Angeles, CA: SAGE Publications.
Gough, J. C. (1996) 'Environmental Decision Making for Groundwater Systems', [online] (Accessed 10 May 2017).
Grace-Martin, K. (2016) Can Likert Scale Data ever be Continuous?, [online] http://www.theanalysisfactor.com/can-likert-scale-data-ever-be-continuous/ (Accessed 20 August 2016).
Graham, J. R. & Harvey, C. R. (2001) 'The Theory and Practice of Corporate Finance: Evidence from the Field', Journal of Financial Economics, Vol. 60 No. 2, pp. 187-243.
Grande, T. L. (2014a) Calculating and Interpreting Cronbach's Alpha Using SPSS, [online] https://www.youtube.com/watch?v=Kz8OdR6lV44 (Accessed 2 August 2016).
Grande, T. L. (2014b) Factor Analysis Using SPSS, [online] https://www.youtube.com/ watch?v=pRA3Wapx7fY (Accessed 16 July 2018).
Grande, T. L. (2015a) Chi-Square Goodness of Fit Test in SPSS, [online] https://www. youtube.com/watch?v=kgbl3_E4Sus (Accessed 2 August 2016).
Grande, T. L. (2015b) Selecting a Post Hoc Test after ANOVA in SPSS [online] https://www.youtube.com/watch?v=J8lYgn0-3oA (Accessed 2 August 2016).
Greene, J. C. (2000) 'Understanding Social Programs through Evaluation', In: Denzin, N. K. & Lincoln, Y. S. (eds.) Handbook of Qualitative Research. pp. 981-999, SAGE, Thousand Oaks, CA.
Greene, J. C. (2007) Mixed Methods in Social Inquiry, Jossey-Bass, San Francisco, CA.
Greene, J. C. (2015) 'Preserving Distinctions within the Multimethod and Mixed Methods Research Merger', In: Hesse-Biber, S. & Johnson, R. B. (eds.) The Oxford Handbook of Multimethod and Mixed Methods Research Inquiry. pp.
Greene, J. C. & Caracelli, V. J. (1997) Advances in Mixed-Method Evaluation: The Challenges and Benefits of Integrating Diverse Paradigms, Jossey-Bass Publishers, San Francisco.
324 Bibliography and References Greene, J. C., Caracelli, V. J. & Graham, W. F. (1989) 'Toward a Conceptual Framework
for Mixed-Method Evaluation Designs', Educational Evaluation and Policy Analysis, Vol. 11 No. 3, pp. 255-274.
Greene, J. C. & Hall, J. N. (2010) 'Dialectics and Pragmatism: Being of Consequence', In: Tashakkori, A. & Teddlie, C. (eds.) SAGE Handbook of Mixed Methods in Social and Behavioral Research. pp. 119-143, SAGE, Thousand Oaks, CA.
Gregory, G. (1988) Decision Analysis, Plenum Press, New York.
Grix, J. (2002) 'Introducing students to the generic terminology of social research', Politics, Vol. 22 No. 3, pp. 175-186.
Groves, R. M., Fowler Jr, F. J., Couper, M. P., Lepkowski, J. M., Singer, E. & Tourangeau, R. (2011) Survey Methodology, John Wiley & Sons, Hoboken, NJ.
Guba, E. G. & Lincoln, Y. S. (1989) Fourth Generation Evaluation, SAGE, Thousand Oaks, CA.
Guerrero-Baena, M. D., Gómez-Limón, J. A. & Frut Cardozo, J. V. (2013) 'La Valoración de Inversiones Productivas: Una Aproximación Metodológica Basada en la Dreación de Valor Financiero e Intelectual [Translation: "The Capital Budgeting Process: A Methodological Approach Based on Financial and Intellectual Value Creation"]', Intangible Capital, Vol. 9 No. 4, pp. 1145-1169.
Guerron-Quintana, P. A. (2012) 'Risk and Uncertainty', Business Review, Federal Reserve Bank of Philadelphia No. Q1, [online] (Accessed 2 February 2014).
Guest, G. (2013) 'Describing Mixed Methods Research: An Alternative to Typologies', Journal of Mixed Methods Research, Vol. 7 No. 2, pp. 141-151.
Guest, G., Bunce, A. & Johnson, L. (2006) 'How Many Interviews Are Enough? An Experiment with Data Saturation and Variability', Field Methods, Vol. 18 No. 1, pp. 59-82.
Günther, T. (1997) Unternehmenswertorientiertes Controlling [Translation: "Enter-prise Value Oriented Controlling"], Vahlen, München, DE.
Gup, B. E. & Norwood III, S. W. (1982) 'Divisional Cost of Capital: a Practical Approach', Financial Management, Vol. 11 No. 1, pp. 20-24.
Hagenloch, T. (2007) Value Based Management und Discounted Cash Flow–Ansätze, Book on Demand, Norderstedt.
Hall, B. & Howard, K. (2008) 'A Synergistic Approach Conducting Mixed Methods Research with Typological and Systemic Design Considerations', Journal of Mixed Methods Research, Vol. 2 No. 3, pp. 248-269.
Hall, R. (2013) 'Mixed Methods: In Search of a Paradigm', In: Le, T. & Lê, Q. (eds.) Conducting Research in a Changing and Challenging World. pp. 71-78, Nova Science Publishers, New York.
Bibliography and References 325 Halliwell, L. J. 'A Critique of Risk-Adjusted Discounting'. in ASTIN Colloquium [online]
http://www.casact.org/coneduc/reinsure/astin/2000/halliwell1.doc (Accessed 14 November 2016).
Halliwell, L. J. 'The Conditional Validity of Risk-Adjusted Discounting'. in Casualty Actuarial Society E-Forum, Spring. pp. 1-20.
Hamada, R. S. (1969) 'Portfolio Analysis, Market Equilibrium and Corporation Finance', The Journal of Finance, Vol. 24 No. 1, pp. 13-31.
Hamada, R. S. (1972) 'The Effect of the Firm's Capital Structure on the Systematic Risk of Common Stock', Journal of Finance, Vol. 27 No. 2, pp. 435-452.
Hamada, R. S. (1977) 'Discussion on “Capital Budgeting and the Capital Asset Pricing Model: Good News and Bad News"', Journal of Finance, Vol. 32 No. 2, pp. 333-336.
Hanson, W. E., Creswell, J. W., Clark, V. L. P., Petska, K. S. & Creswell, J. D. (2005) 'Mixed Methods Research Designs in Counseling Psychology', Journal of Counseling Psychology, Vol. 52 No. 2, pp. 224.
Hansson, S. O. (2011) "Risk" – The Stanford Encyclopedia of Philosophy, University of Stanford [online] http://plato.stanford.edu/archives/win2012/entries/risk/ (Accessed 5 January 2014).
Harris, R. S. & Pringle, J. J. (1985) 'Risk-Adjusted Discount Rates - Extensions from the Average-Risk Case', Journal of Financial Research, Vol. 8 No. 3, pp. 237-244.
Hart, S. L. (1971) 'Axiology--Theory of Values', Philosophy and Phenomenological Research, pp. 29-41.
Hartmann, M. & Hassan, A. (2006) 'Application of Real Options Analysis for Pharmaceutical R&D Project Valuation—Empirical Results from a Survey', Research Policy, Vol. 35 No. 3, pp. 343-354.
Hassani, B. K. (2015) 'Risk Appetite in Practice: Vulgaris Mathematica', IUP Journal of Financial Risk Management, Vol. 12 No. 1, pp. 7-22.
Hastak, M. & Halpin, D. W. (2000) 'Assessment of Life-Cycle Benefit-Cost of Composites in Construction', Journal of Composites for Construction, Vol. 4 No. 3, pp. 103-111.
Hastak, M. & Shaked, A. (2000) 'ICRAM-1: Model for International Construction Risk Assessment', Journal of Management in Engineering, Vol. 16 No. 1, pp. 59-69.
Hastings, W. K. (1970) 'Monte Carlo Sampling Methods Using Markov Chains and Their Applications', Biometrika, Vol. 57 No. 1, pp. 97-109.
Hawawini, G. A. & Viallet, C. (2011) Finance For Executives, 4th ed. South-WesternCengage Learning, Mason, OH.
326 Bibliography and References Hay, C. (2006) 'Political Ontology', In: Goodin, R. E. & Tilly, C. (eds.) The Oxford
Handbook of Contextual Political Analysis. pp. 78-96, Oxford University Press, Oxford, UK.
Healey, M. J. & Rawlinson, M. B. (1994) Interviewing Techniques in Business and Management Research. London: Dartmouth Publishing.
Heise, D. R. (1970) 'The Semantic Differential and Attitude Research', Attitude Measurement, [online] http://www.indiana.edu/~socpsy/papers/AttMeasure/ attitude..htm (Accessed 10 November 2014).
Henkel, J. (2008) 'The Risk-Return Paradox for Strategic Management: Disentangling True and Spurious Effects', Social Science Research Network, [online] (Accessed 20 January 2014).
Henry, G. T. (1990) Practical Sampling, SAGE, Newbury Park, CA.
Hermes, N., Smid, P. & Yao, L. (2007) 'Capital Budgeting Practices: A Comparative Study of the Netherlands and China', International Business Review, Vol. 16 No. 5, pp. 630-654.
Heron, J. & Reason, P. (1997) 'A Participatory Inquiry Paradigm', Qualitative Inquiry, Vol. 3 No. 3, pp. 274-294.
Hillier, F. S. (1963) 'The Derivation of Probabilistic Information for the Evaluation of Risky Investments', Management Science, Vol. 9 No. 3, pp. 443-457.
Hillier, F. S. (1969) A Basic Approach to the Evaluation of Risky Interrelated Investments, Stanford, CA. DTIC Document, University of Stanford. [online] http://www.dtic. mil/dtic/tr/fulltext/u2/696999.pdf (Accessed 16 November 2016).
Hillson, D. & Murray-Webster, R. (2007) Understanding and Managing Risk Attitude, Gower Publishing Ltd, Hants, UK.
Hofstede, G. (1983) 'The Cultural Relativity of Organizational Practices and Theories', Journal of International Business Studies, Vol. 14 No. 2, pp. 75-89.
Holden, M. T. & Lynch, P. (2004) 'Choosing the Appropriate Methodology: Under-standing Research Philosophy', The Marketing Review, Vol. 4 No. 4, pp. 397-409.
Holstenkamp, L. & Kahla, F. (2016) 'What Are Community Energy Companies Trying to Accomplish? An Empirical Investigation of Investment Motives in the German Case', Energy Policy, Vol. 97, pp. 112-122.
Holton, G. A. (2004) 'Defining Risk', Financial Analysts Journal, Vol. 60 No. 6, pp. 19–25.
Hommel, M. & Dehmel, I. (2010) Unternehmensbewertung Case by Case [Translation: "Company Valuation Case by Case"], Verlag Recht und Wirtschaft, Frankfurt am Main, Germany.
Bibliography and References 327 Hommel, U. & Pritsch, G. (1998) 'Investitionsbewertung mit dem Realoptionsansatz
[Translations: "Investment Valuation with a Real Option Approach"]', WHU-Forschungspapier, No. 50, [online] https://opus4.kobv.de/opus4-whu/files/554/ WHU-FP_050.pdf (Accessed 30 July 2018).
Horrigan, P. (2007) Epistemology: An Introduction to the Philosophy of Knowledge, iUniverse, Lincoln, NE.
Hostettler, S. (2002) Economic Value Added (EVA), Paul Haupt, Berne, CH.
how2stats (2011a) Cronbach's Alpha – SPSS, [online] https://www.youtube.com/ watch?v=2gHvHm2SE5s (Accessed 3 August 2016).
how2stats (2011b) Levene's test – SPSS (Part 1 - 3), [online] https://www.youtube. com/watch?v=81Yi0cTuwzw (Accessed 3 August 2016).
how2stats (2012) Dealing with Unequal Variances and Sample Sizes – SPSS (Part 1 and 2) [online] https://www.youtube.com/watch?v=LMRYyB6ujTQ (Accessed 3 August 2016).
how2stats (2014) Do the t-test and ANOVA Really Assume Normality? (part 1 - 3), [online] https://www.youtube.com/watch?v=yNdlGRz-Z04 (Accessed 3 August 2016).
how2stats (2015) ANOVA - Unequal Variances Unequal Sample Sizes - Brown-Forsythe & Welch F tests, [online] https://www.youtube.com/watch?v=SNsDgNhRANA (Accessed 3 August 2016).
Howson, P. (2003) Due Diligence: The Critical Stage in Mergers and Acquisitions, Gower Publishing, Burlington, VT.
Hürlimann, C. & Bengoa, S. D. (2015) 'A Revised Theory to Estimate Returns in Renewable Energy Investments'. In: Vrontis, D., Weber, Y. & Tsoukatos, E., eds. in 8th Annual Conference of the EuroMed Academy of Business - Innovation, Entrepreneurship and Sustainable Value Chain in a Dynamic Environment, Verona, Italy. EuroMed Press, pp. 2056-2057.
Hürlimann, C. & Bengoa, S. D. (2016) 'Valuation Process in Renewable Energy Investments: A Survey among Investment Professionals'. In: Vrontis, D., Weber, Y. & Tsoukatos, E., eds. in 9th Annual Conference of the EuroMed Academy of Business - Innovation, Entrepreneurship and Digital Ecosystems, Warsaw, Poland. EuroMed Press, pp. 2008-2013.
Hürlimann, C. & Bengoa, S. D. (2017a) 'Corporate Finance in Renewable Energy Investments - A Review about Theory and Practice', Global Economics and Business Review, Vol. 19 No. 5, pp. 592-631.
Hürlimann, C. & Bengoa, S. D. (2016) 'Valuating Renewable Energy Investment within Transactions: A Comparative Review among Practitioners'. In: Vrontis, D., Weber, Y. & Tsoukatos, E., eds. in 10th Annual Conference of the EuroMed Academy of
328 Bibliography and References
Business - Global and National Business Theories and Practice: Bridging the Past with the Future, Rom, Italy. EuroMed Press, pp. 720-739.
Hürlimann, C., Bengoa, S. D. & Al-Ali, J. (in press) 'Theory and Practice of Valuation Approaches in Renewable Energy Investments: a Survey among Investment Professionals', World Review of Entrepreneurship, Management and Sustainable Development.
IEA (2015) Energy and Climate Change: World Energy Outlook Special Briefing for COP21, Paris. https://www.iea.org/media/news/WEO_INDC_Paper_Final_WEB. pdf (Accessed 30 June 2016).
Inselbag, I. & Kaufold, H. (1997) 'Two DCF Approaches for Valuing Companies under Alternative Financing Strategies (and How to Choose between Them)', Journal of Applied Corporate Finance, Vol. 10 No. 1, pp. 114-122.
International Electro-Technical Commission (IEC) (2008) IEC 31010:2009: Risk Management - Risk Assessment Techniques, [online] https://www.iso.org/obp/ ui/#iso:std:iec:31010:ed-1:v1:en (Accessed 23 November 2017).
International Organization for Standardization (ISO) (2009) 31000:2009 - Risk Management, International Organisation for Standardization [online] https://www.iso.org/iso-31000-risk-management.html (Accessed 16 June 2017).
Investopedia (n.d.-a) Financial Risk, [online] https://www.investopedia.com/terms/f/ financialrisk.asp (Accessed 11 July 2018).
Investopedia (n.d.-b) Free Cash Flow - FCF, [online] https://www.investopedia.com/ terms/f/freecashflow.asp (Accessed 20 August 2018).
Investopedia (n.d.-c) Internal Rate of Return, [online] https://www.investopedia.com/ walkthrough/corporate-finance/4/npv-irr/internal-rate-return.aspx (Accessed 20 August 2018).
Investopedia (n.d.-d) Net Present Value - NPV, [online] https://www.investopedia. com/terms/n/npv.asp (Accessed 20 August 2018).
Investopedia (n.d.-e) Non-Resource Finance, [online] https://www.investopedia.com/ terms/n/non-recoursefinance.asp (Accessed 15 September 2017).
IRENA (2012) 'Renewable Energy Technologies: Cost Analysis Series - Hydropower', [online] https://www.irena.org/documentdownloads/publications/re_ technologies_cost_analysis-hydropower.pdf (Accessed 18 August 2018).
Istvan, D. F. (1961) 'The Economic Evaluation of Capital Expenditures', The Journal of Business, Vol. 34 No. 1, pp. 45-51.
Ivankova, N. V. (2015) Mixed Methods Applications in Action Research: From Methods to Community Action, SAGE, Thousand Oaks, CA.
Bibliography and References 329 Ivankova, N. V., Creswell, J. W. & Stick, S. L. (2006) 'Using Mixed-Methods Sequential
Explanatory Design: From Theory to Practice', Field Methods, Vol. 18 No. 1, pp. 3-20.
Jagannathan, R. & Meier, I. (2002) Do We Need CAPM for Capital Budgeting?, Unpublished Working Paper, National Bureau of Economic Research, Northwestern University, Evanston, IL, [online] http://www.ucema.edu.ar/ u/jd/Inversiones/Articulos/Paper_Model_CAPM_in_practice.pdf (Accessed 30 June 2017).
Jägemann, C., Fürsch, M., Hagspiel, S. & Nagl, S. (2013) 'Decarbonizing Europe's Power Sector by 2050—Analyzing the Economic Implications of Alternative Decarbonization Pathways', Energy Economics, Vol. 40, pp. 622-636.
Jegadeesh, N. & Titman, S. (1993) 'Returns to Buying Winners and Selling Losers: Implications for Stock Market Efficiency', The Journal of Finance, Vol. 48 No. 1, pp. 65-91.
Jick, T. D. (1979) 'Mixing Qualitative and Quantitative Methods: Triangulation in Action', Administrative Science Quarterly, Vol. 24 No. 4, pp. 602-611.
Jin, Y. & Jorion, P. (2006) 'Firm Value And Hedging: Evidence from Oil and Gas Producers', The Journal of Finance, Vol. 61 No. 2, pp. 893-919.
Johnson, B. & Christensen, L. (2000) Educational Research: Quantitative and Qualitative Approaches, Allyn & Bacon, Boston, MA.
Johnson, B. & Turner, L. A. (2003) 'Data Collection Strategies in Mixed Methods Research', In: Tashakkori, A. & Teddlie, C. (eds.) SAGE Handbook of Mixed Methods in Social and Behavioral Research. pp. 297-319, SAGE, Thousand Oaks, CA.
Johnson, P. & Duberley, J. (2000) Understanding Management Research: An Introduction to Epistemology, SAGE, Thousand Oaks, CA.
Johnson, R. B. & Gray, R. (2010) 'A History of Philosophical and Theoretical Issues for Mixed Methods Research', In: Tashakkori, A. & Teddlie, C. (eds.) SAGE Handbook of Mixed Methods in Social and Behavioral Research. pp. 69-94, SAGE, Thousand Oaks, CA.
Johnson, R. B. & Onwuegbuzie, A. J. (2004) 'Mixed Methods Research: A Research Paradigm Whose Time Has Come', Educational Researcher, Vol. 33 No. 7, pp. 14-26.
Johnson, R. B., Onwuegbuzie, A. J. & Turner, L. A. (2007) 'Toward a Definition of Mixed Methods Research', Journal of Mixed Methods Research, Vol. 1 No. 2, pp. 112-133.
Kahneman, D. & Thaler, R. H. (2006) 'Anomalies: Utility Maximization and Experienced Utility', The Journal of Economic Perspectives, Vol. 20 No. 1, pp. 221-234.
330 Bibliography and References Kahneman, D. & Tversky, A. (1979) 'Prospect Theory: An Analysis of Decision under
Risk', Econometrica, Vol. 47 No. 2, pp. 263-291.
Kaliprasad, M. (2006) 'Proactive Risk Management', Cost Engineering Economist, Vol. 48 No. 12.
Kalkbrenner, B. J. & Roosen, J. (2016) 'Citizens’ Willingness to Participate in Local Renewable Energy Projects: The Role of Community and Trust in Germany', Energy Research & Social Science, Vol. 13 March, pp. 60-70.
Kane, M. & Trochim, W. M. (2007) Concept Mapping for Planning and Evaluation, SAGE, Thousand Oaks, CA.
Kanellis, P. & Papadopoulos, T. (2009) 'Conducting Research in Information Systems: an Epistemological Journey', In: Cater-Steel, A. & Al-Hakim, L. (eds.) Information Systems Research Methods, Epistemology, and Applications. pp. 1-34, Information Science Reference, Hershey, PA.
Kaplan, S. N. & Schoar, A. (2005) 'Private Equity Performance: Returns, Persistence, and Capital Flows', Journal of Finance, Vol. 60 No. 4, pp. 1791-1823.
Keim, D. B. & Stambaugh, R. F. (1986) 'Predicting Returns in the Stock and Bond Markets', Journal of Financial Economics, Vol. 17 No. 2, pp. 357-390.
Kelle, U. & Erzberger, C. (1999) 'Integration qualitativer und quantitativer Methoden. Methodologische Modelle und ihre Bedeutung für die Forschungspraxis [Translation: "The Integration of Qualitative and Quantitative Methods. Methodological Models and Their Significance for Practising Social Research"]', Kölner Zeitschrift für Soziologie und Sozialpsychologie, Vol. 51 No. 3, pp. 509-531.
Kemna, A. G. Z. (1993) 'Case Studies on Real Options', The Journal of the Financial Management Association, Vol. 22 No. 3, pp. 259-270.
Kemper, E. A., Stringfield, S. & Teddlie, C. (2003) 'Mixed Methods Sampling Strategies in Social Science Research', In: Tashakkori, A. & Teddlie, C. (eds.) SAGE Handbook of Mixed Methods in Social and Behavioral Research. pp. 273-296, SAGE, Thousand Oaks, CA.
Kester, G. W., Chang, R. P., Echanis, E. S., Haikal, S., Mansor, I. M., Skully, M. T., Tsui, K.-C. & Wang, C.-J. (1999) 'Capital Budgeting Practices in the Asia Pacific Region: Australia, Hong Kong, Indonesia, Malaysia, Philippines, and Singapore', Financial Practice and Education, Vol. 9 No. 1, pp. 25-33.
Kierulff, H. (2008) 'MIRR: A Better Measure', Business Horizons, Vol. 51 No. 4, pp. 321-329.
Kim, S. H., Crick, T. & Farragher, E. J. (1984) 'Foreign Capital Budgeting Practices Used by the US and Non-US Multinational Companies', The Engineering Economist, Vol. 29 No. 3, pp. 207-215.
Bibliography and References 331 King, N. (2004) 'Using Interviews in Qualitative Research', In: Cassell, C. & Symon, G.
(eds.) Essential Guide to Qualitative Methods in Organizational Research. pp. 11-22, SAGE, London.
Klammer, T. (1972) 'Empirical Evidence of the Adoption of Sophisticated Capital Budgeting Techniques', Journal of Business, Vol. 45 No. 3, pp. 387-397.
Klammer, T., Koch, B. & Wilner, N. (1991) 'Capital Budgeting Practices – A Survey of Corporate Use', Journal of Management Accounting Research, Vol. 3 No. 1, pp. 113-130.
Knight, F. H. (1921a) Risk, Uncertainty, and Profit, Boston, MA: Hart, Schaffner & Marx; Houghton Mifflin Co., [online] http://www.econlib.org/library/Knight/ knRUPCover.html.
Knight, F. H. (1921b) Risk, Uncertainty, and Profit, Houghton Mifflin Co., Boston and New York.
Kohers, N. & Ang, J. (2000) 'Earnouts in Mergers: Agreeing to Disagree and Agreeing to Stay', The Journal of Business, Vol. 73 No. 3, pp. 445-476.
Koller, T., Goedhart, M. & Wessels, D. (2010) Valuation: Measuring and Managing the Value of Companies, 5th ed. JohnWiley & Sons, Inc., Hoboken, NJ.
Koller, T., Goedhart, M. & Wessels, D. (2015) Valuation: Measuring and Managing the Value of Companies, 6th ed. JohnWiley & Sons, Inc., Hoboken, NJ.
Korteweg, A. (2010) 'The Net Benefits to Leverage', Journal of Finance, Vol. 65 No. 6, pp. 2137-2170.
Kost, C., Shammugam, S., Jülch, V., Nguyen, H.-T. & Schlegel, T. (2018) 'Levelized Cost of Electricity Renewable Energy Technologies', Fraunhofer Institute for Solar Energy Systems ISE, [online] https://www.ise.fraunhofer.de/content/dam/ise/ en/documents/publications/studies/EN2018_Fraunhofer-ISE_LCOE_Renewable _Energy_Technologies.pdf (Accessed 18 August 2018).
Krishnaswamy, K., Sivakumar, A. I. & Mathirajan, M. (2009) Management Research Methodology: Integration of Principles, Methods and Techniques, Pearson Education India, Delhi.
Kristensen, V., Aven, T. & Ford, D. (2006) 'A New Perspective on Renn and Klinke's Approach to Risk Evaluation and Management', Reliability Engineering & System Safety, Vol. 91 No. 4, pp. 421-432.
Krueger, P., Landier, A. & Thesmar, D. (2015) 'The WACC fallacy: The Real Effects of Using a Unique Discount Rate', The Journal of Finance, Vol. 70 No. 3, pp. 1253-1285.
Krueger, R. A. & Casey, M. A. (1994) Focus Groups: A Practical Guide for Applied Research, SAGE, Thousand Oaks, CA.
332 Bibliography and References Kruschwitz, L. & Löffler, A. (1999) 'Sichere und unsichere Steuervorteile bei der
Unternehmensbewertung I [Translation: "Safe and Uncertain Tax Advantages in the Company Assessment I"]', Arbeitspapier Freie Universität Berlin, Berlin, [online] https://www.econbiz.de/archiv/b/fub/bank/steuervorteile.pdf (Acces-sed 7 July 2017).
Kruschwitz, L. & Löffler, A. (2006) Discounted Cash Flow: A Theory of the Valuation of Firms, John Wiley & Sons, Chichester, UK.
Kruschwitz, L. & Lorenz, D. (2011) 'Eine Anmerkung zur Unternehmensbewertung bei autonomer und wertorientierter Verschuldung [Translation: "A Comment on the Company Valuation for Autonomous and Value-Oriented Debt]', Corporate Finance Biz, Vol. 2 No. 2, pp. 94-96.
Kuhner, C. & Maltry, H. (2006) Unternehmensbewertung [Translation: "Company Valuation"], Springer, Heidelberg, DE.
Kuppinger, B. & Wüst, K. (2011) 'Just a Game? How Continuous Time Modelling Can Ameliorate Corporate Strategy Games', World Review of Entrepreneurship, Management and Sustainable Development, Vol. 7 No. 4, pp. 422-439.
Küting, K. & Eidel, U. (1999) 'Marktwertansatz contra Ertragswert- und Discounted Cash Flow-Verfahren [Translation: "Fair Value Approach versus Net Asset Value and Discounted Cash Flow Approaches"]', Finanz Betrieb, Vol. 9 No. 1999, pp. 225-231.
Kuzel, A. J. (1992) 'Sampling in Qualitative Inquiry', In: Crabtree, B. & Miller, W. (eds.) Doing Qualitative Research. pp. 31–44, SAGE, Newbury Park, CA.
Laerd Statistics (2013) Cronbach's Alpha (α) using SPSS Statistics, [online] https://statistics.laerd.com/spss-tutorials/kruskal-wallis-h-test-using-spss-statistics.php (Accessed 21 August 2016).
Laitenberger, J. (2006) 'Rendite und Kapitalkosten [Translation: "Return and Capital Costs"]', Zeitschrift für Betriebswirtschaft, Vol. 76 No. 1, pp. 79-101.
Langlois, R. N. & Cosgel, M. M. (1993) 'Frank Knight on risk, Uncertainty, and the Firm: A New Interpretation', Economic Inquiry, Vol. 31 No. 3, pp. 456-465.
Langniss, O., Helby, P., Joosen, S., Lorenzoni, A., Mitchell, C. & Schlotterbeck, M. (1999) Financing Renewable Energy Systems, DLR, Stuttgart, DE.
Lankes, H.-P. & Venables, A. J. (1997) 'Foreign Direct Investment in Eastern Europe and the Former Soviet Union: Results from a Survey of Investors', In: Zecchini, S. (ed.) Lessons from the Economic Transition. pp. 555-565, Springer, NL.
Laux, H., Gillenkirch, R. M. & Schenk-Mathes, H. Y. (2014) 'Rationale Entscheidung bei Risiko: Das Bernoulli-Prinzip [Translation: "Rational Decision-Making at Risk: the Bernoulli Principle"]', In: Laux, H., Gillenkirch, R. M. & Schenk-Mathes, H. Y. (eds.)
Bibliography and References 333
Entscheidungstheorie [Translation: "Decision theory"]. pp. 113-153, Springer, Berlin / Heidelberg, Germany.
Lawson, T. (1989) 'Abstraction, Tendencies and Stylised Facts: A Realist Approach to Economic Analysis', Cambridge Journal of Economics, Vol. 13 No. 1, pp. 59-78.
Lawson, T. (1998) 'Transcendental Realism', In: Davis, J., Hands, D. W. & Ma"ki, U. (eds.) The Handbook of Economic Methodology. pp. 504-510, Edward Elgar, Cheltenham, UK.
Leech, N. L. & Onwuegbuzie, A. J. (2009) 'A Typology of Mixed Methods Research Designs', Quality & Quantity, Vol. 43 No. 2, pp. 265-275.
LeRoy, S. F. & Singell Jr, L. D. (1987) 'Knight on Risk and Uncertainty', Journal of Political Economy, Vol. 95 No. 2, pp. 394-406.
Leslie, K. J. & Michaels, M. P. (1997) 'The Real Power of Real Options', The McKinsey Quarterly, Vol. 1997 No. 3, pp. 4-22.
Lettau, M., Ludvigson, S. C. & Wachter, J. A. (2008) 'The Declining Equity Premium: What Role Does Macroeconomic Risk Play?', The Review of Financial Studies, Vol. 21 No. 4, pp. 1653-1687.
Lettau, M. & Wachter, J. A. (2007) 'Why is Long Horizon Equity Less Risky? A DurationBased Explanation of the Value Premium', The Journal of Finance, Vol. 62 No. 1, pp. 55-92.
Levy, H. (1990) 'Small Firm Effect: Are There Abnormal Returns in the Market?', Journal of Accounting, Auditing & Finance, Vol. 5 No. 2, pp. 235-270.
Lewins, A. & Silver, C. (2009) Choosing a Caqdas Package, 6th ed., [online] http:// eprints.ncrm.ac.uk/791/1/2009ChoosingaCAQDASPackage.pdf (Accessed 5 May 2017).
Lewis, T. G., Stelter, D. M., Casata, T. & Reiter, M. (1994) Steigerung des Unter-nehmenswertes: Total Value Management [Translation: "Increasing the Enterprise Value: Total Value Management"], Verlag Moderne Industrie, Landsberg/Lech, Germany.
Liebreich, M. (2005) 'Financing RE - Risk Management in Financing Renewable Energy Projects', Refocus, Vol. 6 No. 4, pp. 18-20.
Likert, R. (1932) 'A Technique for the Measurement of Attitudes', Archives of Psychology, Vol. 22 No. 140, pp. 1-55.
Lincoln, Y. & Guba, E. G. (1985) Naturalistic Inquiry, SAGE, Newbury Park, CA.
Lintner, J. (1965a) 'Security Prices, Risk, and Maximal Gains from Diversification', The Journal of Finance, Vol. 20 No. 4, pp. 587-615.
334 Bibliography and References Lintner, J. (1965b) 'The Valuation of Risk and the Selection of Risky Investments in Stock
Portfolios and Capital Budgets', Review of Economics & Statistics, Vol. 47 No. 1, pp. 13-37.
Lipp, J. (2007) 'Lessons for Effective Renewable Electricity Policy from Denmark, Germany and the United Kingdom', Energy Policy, Vol. 35 No. 11, pp. 5481-5495.
Ljungqvist, A. & Richardson, M. (2003) 'The Cash Flow, Return and Risk Characteristics of Private Equity', working paper, National Bureau of Economic Research, [online] http://www.nber.org/papers/w9454 (Accessed 10 January 2014).
Lo, A. W. & MacKinley, A. C. (1990) 'Data-Snooping Biases in Tests of Financial Asset Pricing Models', Review of Financial Studies, Vol. 3 No. 3, pp. 431-467.
Locarek-Junge, H. (1997) Finanzmathematik [Translation: "Financial Mathematics"], 3rd ed. Oldenbourg, München, Germany.
Locarek-Junge, H. & Loßagk, S. (2011) 'Die Fallstudie - Konstistente Unternehmensbewertung bei unterschiedlicher Finanzierungspolitik [Trans-lation: "The Case Study - Constistent Company Valuation with Different Financial Policies"]', Wirtschaftsstudium-WISU, Vol. 40 No. 3, pp. 364-366.
Loderer, C., Jörg, P., Pichler, K., Roth, L., Wälchli, U. & Zraggen, P. (2010) Handbuch der Bewertung - Band 1: Projekte [Translation: "Handbook of Valuation - Part 1: Projects"], Neue Zürcher Zeitung, Zurich, CH.
Lonergan, W. (2009) 'Pre and Post Tax Discount Rates and Cash Flows - A Technical Note', [online] https://www.researchonline.mq.edu.au/vital/access/services/ Download/mq:10341/DS01 (Accessed 11 July 2017).
Lopes, M. & Flavell, R. (1998) 'Project Appraisal - A Framework to Assess Non-Financial Aspects of Projects during the Project Life Cycle', International Journal of Project Management, Vol. 16 No. 4, pp. 223-233.
Lorterapong, P. & Moselhi, O. (1996) 'Project-Network Analysis Using Fuzzy Sets Theory', Journal of Construction Engineering and Management, Vol. 122 No. 4, pp. 308-318.
Loßagk, S. (2014) Die Bewertung nicht börsennotierter Unternehmen: Eine empirische Untersuchung zur Erklärung des systematischen Risikos mittels rechnungs-wesenbasierter Daten [Translation: "The Valuation of Non-Traded Companies: An Empirical Study to Explain the Systematic Risk by Means of Accounting Based Data"], Josef Eul, Lohmar, Germany.
Luborsky, M. R. & Rubinstein, R. L. (1995) 'Sampling in Qualitative Research: Rationale, Issues, and Methods', Research on Aging, Vol. 17 No. 1, pp. 89-113.
Lund_Research_Ltd (2013) Types of Variable, Lund Research Ltd, [online] https://statistics.laerd.com/statistical-guides/types-of-variable.php (Accessed 26 July 2016).
Bibliography and References 335 MacLean, L. M., Meyer, M. & Estable, A. (2004) 'Improving Accuracy of Transcripts in
Qualitative Research', Qualitative Health Research, Vol. 14 No. 1, pp. 113-123.
March, J. G. & Shapiro, Z. (1987) 'Managerial Perspectives on Risk and Risk Taking', Management Science, Vol. 33 No. 11, pp. 1404-1418.
Marks, N. (2011) 'Just What Is Risk Appetite and How Does It Differ from Risk Tolerance?', [online] (Accessed 16 June 2017).
Marshall, A. (1927) Principles of Economics: An Introductory Volume, Macmillan, London.
Mason, M. 'Sample Size and Saturation in PhD Studies Using Qualitative Interviews'. in Forum qualitative Sozialforschung/Forum: Qualitative Social Research.
Mathews, S., Datar, V. & Johnson, B. (2007) 'A Practical Method for Valuing Real Options: The Boeing Approach', Journal of Applied Corporate Finance, Vol. 19 No. 2, pp. 95-104.
Matzen, F. J. (2005) Unternehmensbewertung von Wohnungsbauunternehmen. Unter besonderer Berücksichtigung der Besteuerung und Finanzierung [Translation: "Company Valuation of Housing Construction Companies. Taking Particular Account of Taxation and Financing"], Phd, European Business School. Rudolf Müller Verlag, Köln.
Mauboussin, M. J. (2002a) 'Revisiting Market Efficiency: The Stock Market as a Complex Adaptive System', Journal of Applied Corporate Finance, Vol. 14 No. 4, pp. 47-55.
Mauboussin, M. J. (2002b) 'Valuation: An Epistemological View', Strategic Investor Relations, Vol. 2002 No. Spring, pp. 1-4.
Maxwell, J. A. (1992) 'Understanding and Validity in Qualitative Research', Harvard Educational Review, Vol. 62 No. 3, pp. 279-301.
Maxwell, J. A. (1996) Qualitative Research Design SAGE, Thousand Oaks, CA.
Maxwell, J. A. & Loomis, D. M. (2003) 'Mixed Methods Design: An Alternative Approach', In: Tashakkori, A. & Teddlie, C. (eds.) SAGE Handbook of Mixed Methods in Social and Behavioral Research. pp. 241-272, SAGE, Thousand Oaks, CA.
Maxwell, J. A. & Mittapalli, K. (2010) 'Realism as a Stance for Mixed Methods Research', In: Tashakkori, A. & Teddlie, C. (eds.) SAGE Handbook of Mixed Methods in Social and Behavioral Research. pp. 145-168, SAGE, Thousand Oaks, CA.
Maynard, D. (2013) SPSS - Post Hoc Tests for One-Way ANOVA, [online] https://www. youtube.com/watch?v=AE69FOLeFpA (Accessed 10 August 2016).
McEnally, R. W. & Upton, D. E. (1979) 'A Reexamination of the Ex Post Risk-Return Tradeoff on Common stocks', Journal of Financial & Quantitative Analysis, Vol. 14 No. 2, pp. 395-419.
336 Bibliography and References McEvoy, P. & Richards, D. (2006) 'A Critical Realist Rationale for Using a Combination
of Quantitative and Qualitative Methods', Journal of Research in Nursing, Vol. 11 No. 1, pp. 66-78.
McLafferty, I. (2004) 'Focus Group Interviews as a Data Collecting Strategy', Journal of Advanced Nursing, Vol. 48 No. 2, pp. 187-194.
McLaney, E., Pointon, J., Thomas, M. & Tucker, J. (2004) 'Practitioners’ Perspectives on the UK Cost of Capital', The European Journal of Finance, Vol. 10 No. 2, pp. 123-138.
McLellan, E., MacQueen, K. M. & Neidig, J. L. (2003) 'Beyond the Qualitative Interview: Data Preparation and Transcription', Field Methods, Vol. 15 No. 1, pp. 63-84.
McMahon, R. G. & Stanger, A. M. (1995) 'Understanding the Small Enterprise Financial Objective Function', Entrepreneurship: Theory and Practice, Vol. 19 No. 4, pp. 21-40.
McNulty, J. J., Yeh, T. D., Schulze, W. S. & Lubatkin, M. H. (2002) 'What’s Your Real Cost of Capital', Harvard Business Review, Vol. 80 No. 10, pp. 114-121.
Meder, B., Le Lec, F. & Osman, M. (2013) 'Decision Making in Uncertain Times: What Can Cognitive and Decision Sciences Say about or Learn from Economic Erises?', Trends in Cognitive Sciences, Vol. 17 No. 6, pp. 257-260.
Megginson, W. L. (1997) Corporate Finance Theory, Addison-Wesley, Reading, MA.
Meitner, M. & Streitferdt, F. (2012) 'Zum Unlevering und Relevering von Betafaktoren—Stellungnahme zu Kruschwitz/Löffler/Lorenz, WPg 2011, S. 672 [Translation: "About the Unlevering and Relevering of Betafaktor—Opinion on Kruschwitz / Löffler / Lorenz, WPg 2011, p. 672"]', Die Wirtschaftsprüfung, Vol. 65 No. 19, pp. 1037-1047.
Merton, R. C. (1973) 'An Intertemporal Capital Asset Pricing Model', Econometrica, Vol. 41 No. 5, pp. 867-887.
Meyer, N. I. & Koefoed, A. L. (2003) 'Danish Energy Reform: Policy Implications for Renewables', Energy Policy, Vol. 31 No. 7, pp. 597-607.
Michael, R. S. (2001) 'Crosstabulation & Chi Square', Indiana University, Bloomington, IN., [online] http://www.indiana.edu/~educy520/sec5982/week_12/chi_sq_ summary011020.pdf (Accessed 29 August 2016).
Michelez, J., Rossi, N., Blazquez, R., Martin, J., Mera, E., Christensen, D., Peineke, C., Graf, K., Lyon, D. & Stevens, G. (2011) Risk Quantification and Risk Management in Renewable Energy Projects, IEA. [online] http://iea-retd.org/wp-content/uploads/2011/11/RISK-IEA-RETD-2011-6.pdf (Accessed 24 April 2018).
Mielcarz, P. & Mlinarič, F. (2014) 'The superiority of FCFF over EVA and FCFE in Capital Budgeting', Economic Research, Vol. 27 No. 1, pp. 559–572.
Bibliography and References 337 Migilinskas, D. & Ustinovičius, L. 'Methodology of Risk and Uncertainty Management
in Construction’s Technological and Economical Problems'. In: Zavadskas, E., Kaklauskas, A. & Skibniewski, M. J., eds. in The 25th International Symposium on Automation and Robotics in Construction ISARC - 2008, Vilnius, Lithuania. pp. 789–795.
Miles, J. A. & Ezzell, J. R. (1985) 'Reformulating Tax Shield Valuation: A Note', The Journal of Finance, Vol. 40 No. 5, pp. 1485-1492.
Miles, M. B. & Huberman, A. M. (1994) Qualitative Data Analysis: An Expanded Sourcebook, 2nd ed. SAGE, Thousand Oaks, CA.
Miller, K. D. & Chen, W.-R. (2004) 'Variable Organizational Risk Preferences: Tests of the March-Shapira Model', Academy of Management Journal, Vol. 47 No. 1, pp. 105-115.
Miller, L. T. & Park, C. S. (2002) 'Decision Making Under Uncertainty—Real Options to the Rescue?', Engineering Economist, Vol. 47 No. 2, pp. 105-150.
Miller, P. J. & Cameron, R. (2011) 'Mixed Method Research Designs: A Case Study of Their Adoption in a Doctor of Business Administration Program', International Journal of Multiple Research Approaches, Vol. 5 No. 3, pp. 387-402.
Miller, S. (2003) 'Impact of Mixed Methods and Design on Inference Quality', In: Tashakkori, A. & Teddlie, C. (eds.) SAGE Handbook of Mixed Methods in Social and Behavioral Research. 1st ed, pp. 423-456, SAGE, Thousand Oaks, CA.
Milligan, M. R., Kirby, B., Gramlich, R. & Goggin, M. (2009) 'Impact of Electric Industry Structure on High Wind Penetration Potential', National Renewable Energy Laboratory, [online] https://www.nrel.gov/docs/fy09osti/46273.pdf (Accessed 23 July 2018).
Mingers, J. (2004) 'Realizing Information Systems: Critical Realism as an Underpinning Philosophy for Information Systems', Information and Organization, Vol. 14 No. 2, pp. 87-103.
Mitchell, C., Bauknecht, D. & Connor, P. M. (2006) 'Effectiveness Through Risk Reduction: A Comparison of the Renewable Obligation in England and Wales and the Feed-in System in Germany', Energy Policy, Vol. 34 No. 2, pp. 297-305.
Mitchell, V. (1996) 'Assessing the Reliability and Validity of Questionnaires: An Empirical Example', Journal of Applied Management Studies, Vol. 5 No. 2, pp. 199-208.
Modigliani, F. & Miller, M. H. (1958) 'The Cost of Capital, Corporation Finance and the Theory of Investment', American Economic Review, Vol. 48 No. 3, pp. 261.
Modigliani, F. & Miller, M. H. (1963) 'Corporate Income Taxes and the Cost of Capital: A Correction', The American Economic Review, Vol. 53 No. 3, pp. 433-443.
338 Bibliography and References Modigliani, F. & Pogue, G. A. (1974) 'An Introduction to Risk and Return', Financial
Analysts Journal, Vol. 30 No. 2, pp. 68-80.
Mohamed, S. & McCowan, A. K. (2001) 'Modelling Project Investment Decisions Under Uncertainty Using Possibility Theory', International Journal of Project Management, Vol. 19 No. 4, pp. 231-241.
Mohanty, S. K. & Nandha, M. (2011) 'Oil Shocks and Equity Returns:: An Empirical Analysis of the US Transportation Sector', Review of Pacific Basin Financial Markets & Policies, Vol. 14 No. 1, pp. 101-128.
Monette, D. R., Sullivan, T. J. & DeJong, C. R. (2013) Applied Social Research: A Tool for the Human Services, Cengage Learning, Boston, MA.
Monnin, P. 2015. Low Interest Rates: An Opportunity for Renewables. [online] https://www.cepweb.org/low-interest-rates-an-opportunity-for-renewables/ (accessed 27 February 2017).
Mooney, C. Z. (1997) Monte Carlo Simulation, SAGE Publications, Thousand Oaks, CA.
Moore, J. S. & Reichert, A. K. (1983) 'An Analysis of the Financial Management Techniques Currently Employed by Large US Corporations', Journal of Business Finance & Accounting, Vol. 10 No. 4, pp. 623-645.
Morgan, D. L. (1998) 'Practical Strategies for Combining Qualitative and Quantitative Methods: Applications to Health Research', Qualitative Health Research, Vol. 8 No. 3, pp. 362-376.
Morgan, D. L. (2014) Integrating Qualitative and Quantitative Methods: A Pragmatic Approach, SAGE, Los Angeles, CA.
Morrison, R. (2016) The Principles of Project Finance, Routledge, London, New York.
Morse, J. (1991) 'Approaches to Qualitative-Quantitative Methodological Triangu-lation', Nursing Research, Vol. 40 No. 2, pp. 120-123.
Morse, J. M. (2003) 'Principles of Mixed Methods and Multimethod Research Design', In: Tashakkori, A. & Teddlie, C. (eds.) SAGE Handbook of Mixed Methods in Social and Behavioral Research. pp. 189-208, SAGE, Thousand Oaks, CA.
Morse, J. M. & Niehaus, L. (2009) Principles and Procedures of Mixed Methods Design, Left Coast Press, Walnut Creek, CA.
Moschandreas, D. & Karuchit, S. (2005) 'Risk Uncertainty Matters: an Engineer's View', International Journal of Risk Assessment and Management, Vol. 5 No. 2-4, pp. 167-192.
Moskowitz, T. J. & Vissing-Jørgensen, A. (2002) 'The Returns to Entrepreneurial Investment: A Private Equity Premium Puzzle?', American Economic Review, Vol. 92 No. 4, pp. 745-778.
Bibliography and References 339 Mossin, J. (1966) 'Equilibrium in a Capital Asset Market', Econometrica, Vol. 34 No. 4,
pp. 768-783.
Mougeot, N. (2018) 'The Synthetic Cost of Liquidity', SSRN, [online] https://ssrn.com/ abstract=3189052 (Accessed 20 August 2018).
Moxter, A. (1983) Grundsätze ordnungsmäßiger Unternehmensbewertung [Trans-lation: "Principles of Proper Company Valuation"], Gabler, Wiesbaden, DE.
Mukherjee, T., Kiymaz, H. & Baker, H. (2004) 'Merger Motives and Target Valuation: A Survey of Evidence from CFOs', Journal of Applied Finance, Vol. 14 No. 2, pp. 7-24.
Myers, S. & Majd, S. (1990) 'Abandonment Value and Project Life', Advances in Futures and Options Research, Vol. 4, pp. 1-21.
Myers, S. C. (1974) 'Interactions of Corporate Financing and Investment Decisions-Implications for Capital Budgeting', The Journal of Finance, Vol. 29 No. 1, pp. 1-25.
Myers, S. C. (1977) 'Determinants of Corporate Borrowing', Journal of Financial Economics, Vol. 5 No. 2, pp. 147-175.
Myers, S. C. & Turnbull, S. M. (1977) 'Capital Budgeting and the Capital Asset Pricing Model: Good News and Bad News', The Journal of Finance, Vol. 32 No. 2, pp. 321-333.
Næss, P. (2010) 'The Dangerous Climate of Disciplinary Tunnel Vision', In: Bhaskar, R., Frank, C., Høyer, K. G., Naess, P. & Parker, J. (eds.) Interdisciplinarity and Climate Change - Transforming Knowledge and Practice for Our Global Future. pp. 68-98, Routledge, London.
Neth, H., Meder, B., Kothiyal, A. & Gigerenzer, G. (2014) 'Homo Heuristicus in the Financial World: From Risk Management to Managing Uncertainty', Journal of Risk Management in Financial Institutions, Vol. 7 No. 2, pp. 134-144.
Newman, I., Ridenour, C., Newman, C. & DeMarco, G. M. P., Jr. (2003) 'A Typology of Research Purposes and Its Relationship to Mixed Methods Research', In: Tashakkori, A. & Teddlie, C. (eds.) SAGE Handbook of Mixed Methods in Social and Behavioral Research. pp. 167-188, SAGE, Thousand Oaks, CA.
NGO Security (2010) Using the Likert Scale to Assess Risk Humanitarian and Non Governmental Organization Safety & Security, [online] http://ngosecurity. blogspot.ch/2010/02/using-likert-scale-to-assess-risk.html (Accessed 26 July 2016).
Nielsen, K. M. (2011) 'The Return to Direct Investment in Private Firms: New Evidence on the Private Equity Premium Puzzle', European Financial Management, Vol. 17 No. 3, pp. 436-463.
340 Bibliography and References Niglas, K. (2001) 'Paradigms and Methodology in Educational Research'. European
Conference on Educational Research on 5-8 Sept 2001. Lille, FR [online], http://www.leeds.ac.uk/educol/documents/00001840.htm (Accessed 18 Dezember 2017).
Niglas, K. (2010) 'The Multidimensional Model of Research Methodology. An Integrated Set of Continua', In: Tashakkori, A. & Teddlie, C. (eds.) SAGE Handbook of Mixed Methods in Social and Behavioral Research. pp. 215–236, SAGE, Thousand Oaks, CA.
Niglas, K. (2017) Katrin Niglas Uurimismetodoloogiast Ja -Paradigmadest [Translation: "Katrin Niglas Forschungsmethodik und Paradigmen"], [online] https://www.tlu. ee/opmat/ka/opiobjekt/Kasvatusfilosoofilised_paradigmad/katrin_niglas_uurimismetodoloogiast_ja_paradigmadest.html (Accessed 18 December 2017).
Niiniluoto, I. (1991) 'Realism, scientfic', In: Burkhardt, H. & Smith, B. (eds.) The Handbook of Metaphysics and Ontology. pp., Analytica/Philosophia Verlag, München, DE.
Nolan, D. P. (2015) Safety and Security Review for the Process Industries - Application of HAZOP, PHA, What-IF and SVA Reviews, 4th ed. Elsevier, Waltham, MA.
Noothout, P., de Jager, D., Tesnière, L., van Rooijen, S., Karypidis, N., Brückmann, R., Jirouš, F., Breitschopf, B., Angelopoulos, D. & Doukas, H. (2016) 'The Impact of Risks in Renewable Energy Investments and the Role of Smart Policies', DiaCore Report, [online] http://climateobserver.org/wp-content/uploads/2016/02/ diacore-2016-impact-of-risk-in-res-investments.pdf (Accessed 23 July 2018).
Norris, J. R. (1998) Markov Chains, Cambridge University Press, Cambridge, UK.
Nunnally, J. (1978) Psychometric Theory, 2nd ed. McGraw-Hill, New York.
O'Donoghue, T. & Punch, K. (2003) Qualitative Educational Research in Action: Doing and Reflecting, Routledge, London.
O'Sullivan, A. & Sheffrin, S. (2005) Economics: Economic Principle in Action, Pearson Prentice Hall, Upper Saddle River, NJ.
O’Cathain, A. (2010) 'Assessing the Quality of Mixed Methods Research: Toward a Comprehensive Framework', In: Tashakkori, A. & Teddlie, C. (eds.) SAGE Handbook of Mixed Methods in Social and Behavioral Research. pp. 531-555, SAGE, Thousand Oaks, CA.
Oblak, D. J. & Helm Jr, R. J. (1980) 'Survey and Analysis of Capital Budgeting Methods Used by Multinationals', Financial Management, Vol. 9 No. 4, pp. 37-41.
Olsen, W. 'Dialectical Triangulation and Empirical Research'. in 6th IACR Annual Conference, 16–18th August, University of Bradford.
Bibliography and References 341 Olsen, W. (2004) 'Methodological Triangulation and Realist Research: An Indian
Exemplar', In: Carter, B. & New, C. (eds.) Making Realism Work: Realist Social Theory and Empirical Research. pp. 135-150, Routledge, London.
Onwuegbuzie, A. J. & Johnson, R. B. (2006) 'The Validity Issue in Mixed Research', Research in the Schools, Vol. 13 No. 1, pp. 48-63.
Orsag, S. & McClure, K. G. (2013) 'Modified Net Present Value as a Useful Tool for Synergy Valuation in Business Combinations', UTMS Journal of Economics, Vol. 4 No. 2, [online] https://www.econstor.eu/bitstream/10419/105318/1/ 766682137.pdf (Accessed 2 December 2017).
Osborne, M. J. (2010) 'A Resolution to the NPV–IRR Debate?', The Quarterly Review of Economics and Finance, Vol. 50 No. 2, pp. 234-239.
Palliam, R. (2005a) 'Application of a Multi-Criteria Model for Determining Risk Premium', The Journal of Risk Finance, Vol. 6 No. 4, pp. 341-348.
Palliam, R. (2005b) 'Estimating the Cost of Capital: Considerations for Small Business', The Journal of Risk Finance, Vol. 6 No. 4, pp. 335-340.
Pastor, L., Sinha, M. & Swaminthan, B. (2008) 'Estimating the Intertemporal Risk-Return Tradeoff Using the Implied Cost of Capital', The Journal of Finance, Vol. 63 No. 6, [online] http://www.nber.org/papers/w11941.pdf?new_window=1 (Accessed 31 January 2014).
Pastor, L. & Veronesi, P. (2011) 'Uncertainty about Government Policy and Stock Prices', Chicago Booth Research Paper No. 10-25, Social Science Research Network, Fama-Miller Working Paper Series, [online] http://papers.ssrn.com/ sol3/papers.cfm?abstract_id=1625572 (Accessed 31 January 2014).
Patchett, E. & Horgan, J. (2011) 'A Contemporary View of Portfolio Risk and Diversification', Benefits Magazine, Vol. 48 No. 1, pp. 30-37.
Patton, M. Q. (1990) Qualitative Evaluation and Research Methods, 2nd ed. SAGE, Thousand Oaks, CA.
Patton, M. Q. (2002) Qualitative Research & Evaluation Methods, 3rd ed. SAGE, London, UK.
Pawelzik, K. U. (2012) 'Explizites und implizites Fremdkapital bei der Unternehmens-bewertung [Translation: "Explicit and Implicit Debt in the Company Valuation"]', Die Wirtschaftsprüfung, Vol. 65 No. 17, pp. 936-950.
Payne, J. D., Heath, W. C. & Gale, L. R. (1999) 'Comparative Financial Practice in the US and Canada: Capital Budgeting and Risk Assessment', Financial Practice and Education, Vol. 9 No. 10, pp. 16-24.
342 Bibliography and References Peemöller, V. H. (2005) 'Bewertung von Klein-und Mittelbetrieben [Translation:
"Valuation of Small and Medium Sized Companies"]', Betriebs-Berater, Vol. 60 No. 30, pp. 30-35.
Penman, S. H., Richardson, S. A. & Tuna, I. (2007) 'The Book-to-Price Effect in Stock Returns: Accounting for Leverage', Journal of Accounting Research, Vol. 45 No. 2, pp. 427-467.
Penn, I. (2018, July 24) The $3 Billion Plan to Turn Hoover Dam Into a Giant Battery, The New York Times, [online] https://www.nytimes.com/interactive/2018/07/ 24/business/energy-environment/hoover-dam-renewable-energy.html (Acces-sed 7 August 2018).
Penwarden, R. (2013) How to Write a Proper Survey Introduction, [online] https://fluidsurveys.com/university/how-to-write-a-proper-survey-introduction/ (Accessed 11 October 2015).
Pereira, L. M., de Oliveira Ribeiro, C. & Securato, J. R. (2012) 'Agricultural Commodities Pricing Model Applied to the Brazilian Sugar Market', Australian Journal of Agricultural & Resource Economics, Vol. 56 No. 4, pp. 542-557.
Pereiro, L. E. (2010) 'The Beta Dilemma in Emerging Markets', Journal of Applied Corporate Finance, Vol. 22 No. 4, pp. 110–122.
Perridon, L., Steiner, M. & Rathgeber, A. W. (2014) Finanzwirtschaft der Unternehmung [Translation: "Financial Management of the Company"], Vahlen, München, D.
Perry, J. S. & Herd, T. J. (2004) 'Reducing M&A Risk Through Improved Due Diligence', Strategy & Leadership, Vol. 32 No. 2, pp. 12-19.
Petersen, C., Plenborg, T. & Schøler, F. (2006) 'Issues in Valuation of Privately Held Firms', The Journal of Private Equity, Vol. 10 No. 1, pp. 33-48.
Petrolia, D. R., Landry, C. E. & Coble, K. H. (2013) 'Risk Preferences, Risk Perceptions, and Flood Insurance', Land Economics, Vol. 89 No. 2, pp. 227-245.
Petry, G. H. (1975) 'Effective Use of Capital Budgeting Tools', Business Horizons, Vol. 18 No. 5, pp. 57-65.
Petry, G. H. & Sprow, J. (1994) 'The Theory and Practice of Finance in the 1990s', The Quarterly Review of Economics and Finance, Vol. 33 No. 4, pp. 359-381.
Petty, W. J., Scott Jr, D. F. & Bird, M. M. (1975) 'The Capital Expenditure Decision-Making Process of Large Corporations', The Engineering Economist, Vol. 20 No. 3, pp. 159-172.
Pfister, C. (2003) Divisionale Kapitalkosten: Theorie und Anwendung [Translation: "Divisional Cost of Capital: Theory and Application"], Paul Haupt, Berne, CH.
Piel, J.-H., Humpert, F. J. & Breitner, M. H. (2018) 'Applying a Novel Investment Evaluation Method with Focus on Risk—A Wind Energy Case Study', In: Fink, A.,
Bibliography and References 343
Fügenschuh, A. & Geiger, M. J. (eds.) Operations Research Proceedings 2016. pp. 193-199, Springer, Heidelberg, D.
Pike, R. (1996) 'A Longitudinal Survey on Capital Budgeting Practices', Journal of Business Finance & Accounting, Vol. 23 No. 1, pp. 79-92.
Pike, R. H. (1983) 'A Review of Recent Trends in Formal Capital Budgeting Processes', Accounting and Business Research, Vol. 13 No. 51, pp. 201-208.
Pinches, G. E. & Vashist, M. (1996) Essentials of Financial Management, Addison-Wesley, Boston, MA.
Ping, C., Zhenguo, L. & Yingchun, L. (2013) 'Liquidity Risk of Private Assets: Evidence from Real Estate Markets', Financial Review, Vol. 48 No. 4, pp. 671-696.
Pitman, M. A. & Maxwell, J. A. (1992) 'Qualitative Approaches to Evaluation: Models and Methods', In: LeCompte, M. D., Millroy, W. L. & Preissle, J. (eds.) The Handbook of Qualitative Research in Education. pp. 770, Academic Press, San Diego, CA.
Plano Clark, V. L. & Ivankova, N. V. (2016) Mixed Methods Research: A Guide to the Field, SAGE, Los Angeles, London.
Polanyi, M. (1966) 'The Logic of Tacit Inference', Philosophy, Vol. 41 No. 155, pp. 1-18.
Popp, M. (2012) 'Vergangenheits- und Lageanalyse [Translation: "Past and Situation Analysis"]', In: Peemöller, V. H. (ed.) Praxishandbuch der Unternehmens-bewertung. 5th ed, pp. 173-218, nbw, Herne / Berlin, DE.
Poterba, J. M. & Summers, L. H. (1995) 'A CEO Survey of US Companies' Time Horizons and Hurdle Rates', Sloan Management Review, Vol. 37 No. 1, pp. 43-53.
Power, M. (2004) The Risk Management of Everything: Rethinking the Politics of Uncertainty, Demos, London.
Pratt, S. & Niculita, A. (2008) Valuing a Business, The Analysis and Appraisal of Closely Held Businesses, McGraw Hill, New York.
Pratt, S. P. & Grabowski, R. J. (2002) Cost of Capital, 2nd ed. John Wiley & Sons, Inc., Hoboken, NJ.
Pratt, S. P., Reilly, R. F. & Schweihs, R. P. (2000) Valuing a Business, McGraw-Hill Companies, New York.
Project Management Institute (PMI) (2009) Practice Standard for Project Risk Management, 4th ed. Project Management Institute, Newtown Square, PA.
Rabiee, F. (2004) 'Focus-Group Interview and Data Analysis', Proceedings of the Nutrition Society, Vol. 63 No. 04, pp. 655-660.
Rappaport, A. (1998) Creating Shareholder Value: The New Standard for Business Performance, The FreePress, New York.
344 Bibliography and References Raz, T. & Michael, E. (2001) 'Use and Benefits of Tools for Project Risk Management',
International Journal of Project Management, Vol. 19 No. 1, pp. 9-17.
Reason, P. & Bradbury, H. (2001) Handbook of Action Research: Participative Inquiry and Practice, SAGE, Thousand Oaks, CA.
Regan, C. M., Bryan, B. A., Connor, J. D., Meyer, W. S., Ostendorf, B., Zhu, Z. & Bao, C. (2015) 'Real Options Analysis for Land Use Management: Methods, Application, and Implications for Policy', Journal of Environmental Management, Vol. 161, pp. 144-152.
Reichardt, C. S. & Cook, T. D. (1979) 'Beyond Qualitative Versus Quantitative Methods.', In: Reichardt, C. S. & Cook, T. D. (eds.) Qualitative and Quantitative Methods in Evaluation Research. pp., SAGE, Beverly Hills, CA.
Reichardt, C. S. & Rallis, S. F. (1994) 'The Relationship Between the Qualitative and Quantitative Research Traditions', In: Reichardt, C. S. & Rallis, S. F. (eds.) New Directions for Evaluation. pp. 5-11, Jossey-Bass, San Francisco.
Reichert, A. K., Moore, J. S. & Byler, E. (1988) 'Financial Analysis Among Large US Corporations: Recent Trends and the Impact of the Personal Computer', Journal of Business Finance & Accounting, Vol. 15 No. 4, pp. 469-485.
Reichmuth, T. (ed.) (2013) Die Finanzierung der Energiewende in der Schweiz [Translation: "The Financing of the Energy Transition in Switzerland"], Zürich, CH: Verlag Neu Züricher Zeitung.
Reinganum, M. R. (1981) 'A New Empirical Perspective on the CAPM', Journal of Financial and Quantitative Analysis, Vol. 16 No. 4, pp. 439-462.
Remenyi, D., Williams, B., Money, A. & Swartz, E. (1998) Doing Research in Business and Management – An Introduction to Process and Method SAGE Publications, London.
Rentizelas, A., Tziralis, G. & Kirytopoulos, K. (2007) 'Incorporating Uncertainty in Optimal Investment Decisions', World Review of Entrepreneurship, Management and Sustainable Development, Vol. 3 No. 3-4, pp. 273-283.
Riahi-Belkaoui, A. (2016) Capital Budgeting and Leasing, https://www.researchgate. net/profile/Ahmed_Riahi-Belkaoui/publications, [online] (Accessed 30 March 2017).
Richter, F. (1998) 'Unternehmensbewertung bei variablem Verschuldungsgrad [Translation: "Company Valuation at Variable Debt"]', Zeitschrift für Bankrecht und Bankwirtschaft, Vol. 10 No. 6, pp. 379-389.
Richter, M. (2013) 'Business Model Innovation for Sustainable Energy: German Utilities and Renewable Energy', Energy Policy, Vol. 62, pp. 1226-1237.
Bibliography and References 345 Rietz, T. A. (1988) 'The Equity Risk Premium – A Solution', Journal of Monetary
Economics, Vol. 22 No. 1, pp. 117-131.
Rihoux, B., Ragin, C. C., Yamasaki, S. & Bol, D. (2009) 'Conclusions - The Way(s) Ahead', In: Rihoux, B. & Ragin, C. C. (eds.) Configurational Comparative Methods: Qualitative Comparative Analysis (QCA) and Related Techniques. pp. 167-178, SAGE, Los Angeles, CA.
RIMS (2012) RIMS Executive Report – The Risk Perspective: Exploring Risk Appetite and Risk Tolerance, https://www.rims.org/resources/ERM/Documents/RIMS_ Exploring_Risk_Appetite_Risk_Tolerance_0412.pdf (Accessed 15 June 2017).
Ritchie, J., Lewis, J., Nicholls, C. M. & Ormston, R. (2013) Qualitative Research Practice: A Auide for Social Science Students and Researchers, SAGE, Thousand Oaks, CA.
Robichek, A. A. & MacDonald, J. (1966) Financial Management in Transition, Long Range Planning Service, Report No. 268, Stanford Research Institute, Menlo Park, CA. [online].
Robichek, A. A. & Myers, S. C. (1966) 'Conceptual Problems in the Use of Risk Adjusted Discount Rates', Journal of Finance, Vol. 21 No. 4, pp. 727-730.
Robichek, A. A. & Myers, S. C. (1968) 'Valuation Under Uncertainty: Comment', Journal of Financial and Quantitative Analysis, Vol. 3 No. 4, pp. 479-483.
Robson, C. (2002) Real World Research, Blackwell, Oxford, UK.
Rodger, C. & Petch, J. (1999) 'Uncertainty & Risk Analysis – A Practical Guide from Business Dynamics', Business Dynamics, PricewaterhouseCoopers, Vol. 4, [online] http://www.michaelsamonas.gr/images/Mixalhs/resources/Uncertainty__Risk-Analysis.pdf (Accessed 15 June 2016).
Rodríguez, M. C. & Nickel, M. N. (2002) 'Is the Risk-Return Paradox Still Alive? (Working Paper)', Universidad Carlos III de Madrid, [online] http://e-archivo.uc3m. es/bitstream/id/66/wb024818.pdf/;jsessionid=2533587307B24B3E68B503F5D2AB70B5 (Accessed 19 January 2014).
Rogge, K. S., Pfluger, B. & Geels, F. W. (2018) 'Transformative Policy Mixes in Socio-Technical Scenarios: The Case of the Low-Carbon Transition of the German Electricity System (2010–2050)', Technological Forecasting and Social Change.
Rohrmann, B. (1998) 'The Risk Notion: Epistemological and Empirical Considerations', In: Stewart, M. G. & Melchers, R. E. (eds.) Integrated Risk Assessment: Applications and Regulations. pp. 39-46, Balkema, Rotterdam, NL.
Rohrmann, B. (2005) 'Risk Attitude Scales: Concepts, Questionnaires, Utilizations', Project report – University of Melbourne/Australia, Vol. 13, [online] http://www. rohrmannresearch.net/pdfs/rohrmann-racreport.pdf (Accessed 3 May 2016).
346 Bibliography and References Roland, H. E. & Moriarty, B. (1990) System Safety Engineering and Management, John
Wiley & Sons, Hoboken, NJ.
Roques, F., Hiroux, C. & Saguan, M. (2010) 'Optimal Wind Power Deployment in Europe – A Portfolio Approach', Energy Policy, Vol. 38 No. 7, pp. 3245-3256.
Rose, M. (2001) Risk versus Uncertainty, or Mr. Slate versus Great-Aunt Matilda, Library of Economics and Liberty, [online] http://www.econlib.org/library/Columns/ Teachers/riskuncertainty.html (Accessed 15 December 2013).
Rosenberg, B., Reid, K. & Lanstein, R. (1985) 'Persuasive Evidence of Market Inefficiency', Journal of Portfolio Management, Vol. 11 No. 3, pp. 9-17.
Ross, S. A. (1976) 'The Arbitrage Theory of Capital Asset Pricing', Journal of Economic Theory, Vol. 13 No. 3, pp. 341-360.
Ross, S. A., Westerfield, R. W. & Jaffe, J. F. (2008) Corporate Finance, 8th ed. McGraw-Hill Higher Education, New York.
Rossman, G. B. & Wilson, B. L. (1985) 'Numbers and Words: Combining Quantitative and Qualitative Methods in a Single Large-Scale Evaluation Study', Evaluation Review, Vol. 9 No. 5, pp. 627-643.
Rugman, A. M. (1976) 'Risk Reduction by International Diversification', Journal of International Business Studies, Vol. 7 No. 2, pp. 75-80.
Ryan, B., Scapens, R. W. & Theobald, M. (2002) Research Method and Methodology in Finance and Accounting, 2nd ed. Thomson, London.
Ryan, P. A. & Gallagher, T. J. (2006) 'Implied Risk Adjusted Discount Rates'. Paper presented at Academy of Business Education, Savannah, GA [online] https://docs.wixstatic.com/ugd/4ccb80_c318f274d56c4f9c8840610e28107922.pdf (Accessed 31 July 2017).
Ryan, P. A. & Ryan, G. P. (2002) 'Capital Budgeting Practices of the Fortune 1000: How Have Things Changed?', Journal of Business and Management, Vol. 8 No. 4, pp. 355.
Saaty, T. L. (1980) The Analytic Hierarchy Process: Planning, Priority Setting, Resources Allocation, McGraw-Hill, New York.
Saaty, T. L. (1990) 'How to Make a Decision: The Analytic Hierarchy Process', European Journal of Operational Research, Vol. 48 No. 1, pp. 9-26.
Sackmann, J. (2007) Risk vs. Uncertainty, [online] http://www.hardballtimes.com/ main/article/risk-vs-uncertainty/ (Accessed 5 May 2017).
Samson, S., Reneke, J. A. & Wiecek, M. M. (2009) 'A Review of Different Perspectives on Uncertainty and Risk and an Alternative Modeling Paradigm', Reliability Engineering & System Safety, Vol. 94 No. 2, pp. 558-567.
Bibliography and References 347 Sangster, A. (1993) 'Capital Investment Appraisal Techniques: A Survey of Current
Usage', Journal of Business Finance and Accounting, Vol. 20 No. 3, pp. 307-307.
Santiago, L. P. & Vakili, P. (2005) 'On the Value of Flexibility in R&D Projects', Management Science, Vol. 51 No. 8, pp. 1206-1218.
Sarin, R. K. & Weber, M. (1993) 'Risk-Value Models', European Journal of Operational Research, Vol. 70 No. 2, pp. 135-149.
Saunders, M., Lewis, P. & Thornhill, A. (2009) Research Methods for Business Students, Pearson Education Limited, Essex, UK.
Sayer, A. (2000) Realism and Social Science, SAGE, London.
Sayer, A. (2004) 'Foreword: Why Critical Realism?', In: Fleetwood, S. & Ackroyd, S. (eds.) Critical Realist Applications in Organisation and Management Studies. pp. 6, Routledge, London.
Schall, L. D., Sundem, G. L. & Geijsbeek, W. R. (1978) 'Survey and Analysis of Capital Budgeting Methods', Journal of Finance, Vol. 33 No. 1, pp. 281-287.
Schindler, R. M. (2011) Pricing Strategies: A Marketing Approach, SAGE, Thousand Oaks, CA.
Schlegel, D. (2015) Cost-of-Capital in Managerial Finance - An Examination of Practices in the German Real Economy Sector, Springer, Cham, CH.
Schleicher-Tappeser, R. (2012) 'How Renewables Will Change Electricity Markets in the Next Five Years', Energy Policy, Vol. 48, pp. 64-75.
Schmidt, T. S. (2014) 'Low-Carbon Investment Risks and De-Risking', Nature Climate Change, Vol. 4 No. 4, pp. 237.
Schoonenboom, J. & Johnson, R. B. (2017) 'How to Construct a Mixed Methods Research Design', KZfSS Kölner Zeitschrift für Soziologie und Sozialpsychologie, [online] https://link.springer.com/article/10.1007/s11577-017-0454-1 (Accessed 8 October 2017).
Schultze, W. (2003) Methoden der Unternehmensbewertung: Gemeinsamkeiten, Unterschiede, Perspektiven [Translation: "Methods of the Company Assessment: Similarities, Differences, Perspectives"], IDW-Verlag, Düsseldorf, D.
Schutz, A. (1970) Alfred Schutz on Phenomenology and Social Relations, University of Chicago Press, Chicago, IL.
Scott, D. L. (2003) Wall Street Words, 3rd ed. Houghton Mifflin, Boston, MA.
Shah, S. (2011) 'Spanish Government faces Lawsuits over Solar Feed in Tariff Cuts from ASIF'. Green World Investor, [Online]. 25 January. http://www. greenworldinvestor.com/2011/01/25/spanish-government-faces-lawsuits-over-solar-feed-in-tariff-cuts-from-asif/ (Accessed 10 January 2015).
348 Bibliography and References Shao, L. P. & Shao, A. T. (1996) 'Risk Analysis and Capital Budgeting Techniques of US
Multinational Enterprises', Managerial Finance, Vol. 22 No. 1, pp. 41-57.
Sharot, T. (2011) 'The Optimism Bias', Current Biology, Vol. 21 No. 23, pp. R941-R945.
Sharpe, W. F. (1964) 'Capital Asset Prices: A Theory of Market Equilibrium Under Conditions of Risk', Journal of Finance, Vol. 19 No. 3, pp. 425-442.
Shockley, R. L. (2007) An Applied Course in Real Options Valuation, Thomson Higher Education, Mason, OH.
Sick, G. A. (1986) 'A Certainty-Equivalent Approach to Capital Budgeting', Financial Management, Vol. 15 No. 4, pp. 23-32.
Sieben, G. (1995) 'Unternehmensbewertung: Discounted Cash Flow-Verfahren und Ertragswertverfahren – Zwei völlig unterschiedliche Ansätze [Translation: "Company Valuation: Discounted Cash Flow Procedures and Income Value Methods – Two Completely Different Approaches"]', 1995): Internationale Wirtschaftsprüfung, FS für Hans Havermann, Düsseldorf, DE.
Skea, J. (2015) 'The Clean Energy Imperative', In: Donovan, C. W. (ed.) Renewable Energy Finance: Powering the Future. pp. 17-46, Imperial College Press, London.
Smith, J. K. (1983) 'Quantitative versus Qualitative Research: An Attempt to Clarify the Issue', Educational Researcher, Vol. 12 No. 3, pp. 6-13.
Smithson, C. & Simkins, B. J. (2005) 'Does Risk Management Add Value? A Survey of the Evidence', Journal of Applied Corporate Finance, Vol. 17 No. 3, pp. 8-17.
Söderholm, P. & Pettersson, M. (2011) 'Offshore Wind Power Policy and Planning in Sweden', Energy Policy, Vol. 39 No. 2, pp. 518-525.
Solomon, E. 'Return on Investment: The Relation of Book-Yield to True Yield'. in Fall Meeting of the Society of Petroleum Engineers of AIME. Society of Petroleum Engineers.
Spremann, K. & Ernst, D. (2011) Unternehmensbewertung: Grundlagen und Praxis [Translation: "Company Valuation: Basics and Practice"], Oldenburger Wirtschaftsverlag, München, DE.
Stanley, M. T. & Block, S. B. (1984) 'A Survey of Multinational Capital Budgeting', Financial Review, Vol. 19 No. 1, pp. 36-54.
Steckler, A., McLeroy, K. R., Goodman, R. M., Bird, S. T. & McCormick, L. (1992) Toward Integrating Qualitative and Quantitative Methods: An Introduction, SAGE, Thousand Oaks, CA.
Steffen, B. (2018) 'The Importance of Project Finance for Renewable Energy Projects', Energy Economics, Vol. 69, pp. 280-294.
Bibliography and References 349 Steffen, B. & Schmidt, T. S. (2018) Current and Future Energy Performance of Power
Generation Technologies in Switzerland, Swiss Academy of Engineering Sciences (SATW). ETH Zurich. [online] https://www.satw.ch/fileadmin/user_upload/ documents/02_Themen/05_Energie/SATW-Energy-Performance-Switzerland-Report-EN.pdf#page=3&zoom=auto,-158,784 (Accessed 30 June 2018).
Steffen, B. & Weber, C. (2013) 'Efficient Storage Capacity in Power Systems with Thermal and Renewable Generation', Energy Economics, Vol. 36, pp. 556-567.
Steiner, M. & Wallmeier, M. (1999) 'Unternehmensbewertung mit Discounted Cash Flow-Methoden und dem Economic Value Added-Konzept [Translation: "Company Valuation Using Discounted Cash Flow Methods and the Economic Value Added Concept"]', Finanz Betrieb, Vol. 1 No. 5, pp. 1-10.
Stern, J. M., Stewart, G. B. & Chew, D. H. (1995) 'The EVA® Financial Management System', Journal of Applied Corporate Finance, Vol. 8 No. 2, pp. 32-46.
Stewart, J. J., Allison, P. N. & Johnson, R. S. (2001) 'Putting a Price on Biotechnology', Nature Biotechnology, Vol. 19 No. 9, pp. 813-817.
Stremersch, S., Wuyts, S. & Frambach, R. T. (2001) 'The Purchasing of Full-Service Contracts: An Exploratory Study within the Industrial Maintenance Market', Industrial Marketing Management, Vol. 30 No. 1, pp. 1-12.
STROM.info (n.d.) IPP (Independent Power Producer), STROM.info, [online] http://www.strom.info/ipp-independent-power-producer.html (Accessed 30 August 2017).
Sundberg, K.-H. & Engzell, T. (2007) 'AHP-modellen och kapitalkostnaden i onoterade bolag: En lösning på värderingsproblematiken i onoterade bolag? [Translation: "The AHP-Model and Cost of Capital in Unlisted Companies: A Solution to Valuation in Unlisted Companies?"]', Institutionen för ekonomisk och industriell utveckling, [online] http://www.diva-portal.org/smash/get/diva2:22998/ FULLTEXT01.pdf (Accessed 21 September 2014).
Sutton, I. (2014) Process Risk and Reliability Management, 2nd ed. Gulf Professional Publishing, Oxford, UK.
Taleb, N. N. (2010) The Black Swan: The Impact of the Highly Improbable, 2nd ed. Penguin, London.
Tashakkori, A. & Teddlie, C. (1998) Mixed Methodology: Combining Qualitative and Quantitative Approaches, SAGE, Thousand Oaks, CA.
Tashakkori, A. & Teddlie, C. (2003) 'The Past and the Future of Mixed Methods Research: from Data Triangulation to Mixed Model Designs', In: Tashakkori, A. & Teddlie, C. (eds.) SAGE Handbook of Mixed Methods in Social and Behavioural Research. pp. 671-701, SAGE, Thousand Oaks, CA.
350 Bibliography and References Tashakkori, A. & Teddlie, C. (2010) SAGE Handbook of Mixed Methods in Social and
Behavioural Research, SAGE, Thousand Oaks, CA.
Tattam, D. (2015) Risk Appetite: How Hungry Are You For risk?, Protecht Risk Manage-ment Insights, [online] http://blog.protecht.com.au/risk-appetite (Accessed 17 June 2017).
Tavakol, M. & Dennick, R. (2011) 'Making Sense of Cronbach's Alpha', International Journal of Medical Education, Vol. 2, pp. 53-55.
Taylor, J. J. (2014a) Statistical Soup: ANOVA, ANCOVA, MANOVA, & MANCOVA, [online] http://www.statsmakemecry.com/smmctheblog/stats-soup-anova-ancova-manova-mancova (Accessed 26 July 2016).
Taylor, L. (2014b) Practical Enterprise Risk Management: How to Optimize Business Strategies Through Managed Risk Taking, Kogan Page Publishers, London.
Teddlie, C. & Tashakkori, A. (2009) Foundations of Mixed Methods Research: Integrating Quantitative and Qualitative Approaches in the Social and Behavioral Sciences, SAGE, Thousand Oaks, CA.
Tellis, W. M. (1997) 'Application of a Case Study Methodology', The Qualitative Report, Vol. 3 No. 3, pp. 1-19.
Thakkar, R. (2015) Low Interest Rates and Technology Drive Renewable Energy, livemint, [online] http://www.livemint.com/Money/JHyIpkj4j0iT8zeFD8q1dO/ Low-interest-rates-and-technology-drive-renewable-energy.html (Accessed 27 February 2017).
TheRMUoHP Biostatistics Resource Channel (2012) How to Use SPSS:Chi Square Test for Independence or Crosstabulation (2x4) [online] https://www.youtube.com/ watch?v=S918nNTCTjA (Accessed 26 July 2016).
Tijdhof, L. (2007a) WACC: Practical Guide for Strategic Decision- Making – Part 1, Zanders - Treasury and Finance Solutions, [online] http://zanders.eu/nl/latest-insights/wacc-practical-guide-for-strategic-decision-making-part-1/ (Accessed 11 July 2017).
Tijdhof, L. (2007b) WACC: Practical Guide for Strategic Decision- Making – Part 5, Zanders - Treasury and Finance Solutions, [online] http://zanders.eu/nl/latest-insights/wacc-practical-guide-for-strategic-decision-making-part-5-2/ (Accessed 11 July 2017).
Tijdhof, L. (2007c) WACC: Practical Guide for Strategic Decision- Making – Part 8, Zanders - Treasury and Finance Solutions, [online] http://zanders.eu/nl/latest-insights/wacc-practical-guide-for-strategic-decision-making-part-8/ (Accessed 11 July 2017).
Bibliography and References 351 Tilley, S. A. & Powick, K. D. (2002) 'Distanced data: Transcribing other people's research
tapes', Canadian Journal of Education/Revue canadienne de l'education, Vol. 27 No. 2/3, pp. 291-310.
Titman, S. & Martin, J. D. (2008) Valuation: The Art and Science of Corporate Investment Decisions, Pearson, Addison-Wesley, Boston, MA.
trend:research (2013) Anteile einzelner Marktakteure an Erneuerbare Energien-Anlagen in Deutschland (Translation: "Shares of Individual Market Players to Renewable Energy Systems in Germany"), 2nd ed. trend:research GmbH, Bremen, DE.
Treynor, J. L. (1961) 'Market Value, Time, and Risk', Unpublished Manuscript.
Treynor, J. L. (1962) 'Toward a Theory of Market Value of Risky Assets', Unpublished Manuscript.
Trigeorgis, L. (1993) 'The Nature of Option Interactions and the Valuation of Investments with Multiple Real Options', Journal of Financial and Quantitative Analysis, Vol. 28 No. 1, pp. 1-20.
Trigeorgis, L. (1996) Real Options: Managerial Flexibility and Strategy in Resource Allocation, Asco Trade Typesetting Ltd., Hong Kong.
Truong, G., Partington, G. & Peat, M. (2008) 'Cost-of-Capital Estimation and Capital-Budgeting Practice in Australia', Australian Journal of Management, Vol. 33 No. 1, pp. 95-121.
Turner, G., Roots, S., Wiltshire, M., Trueb, J., Brown, S., Benz, G. & Hegelbach, M. (2013) 'Profiling the Risks in Solar and Wind: a Case for New Risk Management Approaches in the Renewable Energy Sector', Swiss Re and Bloomberg New Energy Finance, Vol. 23, [online] https://about.bnef.com/blog/profiling-the-risks-in-solar-and-wind/ (Accessed 30 June 2017).
Tweedale, H. (1993) 'Maximising the Usefulness of Risk Assessment', In: Melchers, R. E. & Stewart, M. G. (eds.) Probabilistic Risk and Hazard Assessment. pp. 1-11, Balkema, Rotterdam, NL.
Uher, T. E. & Toakley, A. R. (1999) 'Risk Management in the Conceptual Phase of a Project', International Journal of Project Management, Vol. 17 No. 3, pp. 161-169.
United Nations Framework Convention on Climate Change (UNFCCC) (n.d.) Background on the UNFCCC: The International Response to Climate Change, [online] http://unfccc.int/essential_background/items/6031.php (Accessed 30 June 2016).
University of Gloucestershire (2008) Research Ethics: A Handbook of Principles and Procedures, Cheltenham, UK, [online] http://www.glos.ac.uk/docs/download/ Research/handbook-of-principles-and-procedures.pdf (Accessed 30 November 2015).
352 Bibliography and References Unteutsch, M. & Lindenberger, D. (2016) 'Promotion of Electricity from Renewable
Energy in Europe post 2020—the Economic Benefits of Cooperation', In: von Weizsäcker, C. C., Lindenberger, D. & Höffler, F. (eds.) Interdisziplinäre Aspekte der Energiewirtschaft [Translation: "Interdisciplinary Aspects of the Energy Industry"]. pp. 61-78, Springer, Heidelberg, DE.
UZH (2016a) Methodenberatung - Einfaktorielle Varianzanalyse (ohne Mess-wiederholung) [Translation: "Methods Consulting - Univeriate Analysis of Variances (without Repeated Measurements)"], [online] http://www. methodenberatung.uzh.ch/datenanalyse/unterschiede/zentral/evarianz.html (Accessed 2 July 2016).
UZH (2016b) Methodenberatung – Korrelation nach Bravais-Pearson [Translation: "Methods Consulting – Correlation according to Bravais-Pearson"], [online] http://www.methodenberatung.uzh.ch/datenanalyse/zusammenhaenge/korrelation.html (Accessed 2 July 2016).
UZH (2016c) Methodenberatung – t-Test für unabhängige Stichproben [Translation: "Methods Consulting - t-Test for Independent samples"], [online] http://www. methodenberatung.uzh.ch/datenanalyse/unterschiede/zentral/ttestunabh.html (Accessed 2 July 2016).
UZH (2016d) Methodenberatung – Pearson Chi-Quadrat-Test (Kontingenzanalyse) [Translation: "Methods Consulting – Pearson Chi-Squared Test (Contingency Analysis)"], [online] http://www.methodenberatung.uzh.ch/datenanalyse/ unterschiede/proportionen/pearsonuntersch.html#80 (Accessed 2 July 2016).
Velez-Pareja, I. (2005) 'Cost of Capital for Non-Traded Firms', Social Science Research Network, [online] http://papers.ssrn.com/soL3/papers.cfm?abstract_id=366981 (Accessed 18 July 2014).
Viebig, J., Poddig, T. & Varmaz, A. (eds.) (2008) Equity Valuation – Models from Leading Investment Banks, Chichester, UK: John Wiley & Sons.
Villiger, R. & Bogdan, B. (2005) 'Valuing Pharma R&D: The Catch-22 of DCF', Journal of Applied Corporate Finance, Vol. 17 No. 2, pp. 113-116.
Vintila, N. (2007) 'Real Options in Capital Budgeting. Pricing the Option to Delay and the Option to Abandon a Project', Theoretical and Applied Economics, Vol. 7 No. 512, pp. 47-58.
Vogt, W. P. (1999) Dictionary of Statistics and Methodology, SAGE, Thousand Oaks, CA.
Wagle, B. (1967) 'A Statistical Analysis of Risk in Capital Investment Projects', Journal of the Operational Research Society, Vol. 18 No. 1, pp. 13-33.
Waldron, J. (1990) The Right to Private Property, Clarendon Paperbacks, Oxford, UK.
Wallace, R. O. & Mellor, C. (1988) 'Nonresponse Bias in Mail Accounting Surveys: A Pedagogical Note', The British Accounting Review, Vol. 20 No. 2, pp. 131-139.
Bibliography and References 353 Wallmeier, M. (1999) 'Kapitalkosten und Finanzierungsprämissen [Translation: "Capital
Costs and Financial Premises"]', Zeitschrift fur Betriebswirtschaft, Vol. 69 No. 12, pp. 1473-1490.
Warren, B. (2014) Chief Editor's Note, RECAI. [online]. EY, 40, February. [online] http://www.ey.com/Publication/vwLUAssets/RECAI_40_-_February_2014/ $FILE/EY_RECAI%2040_Feb%202014.pdf (Accessed 1 October 2015).
Warren, B. (2017) EY UK Energy Blog - RECAI at 50: The Next Phase of the Renewables Revolution, EY, 10 October, [online] https://www.ey.com/uk/en/services/ specialty-services/ey-energy-blog-ben-warren-10-2017 (Accessed 30 March 2018).
Wassmann, A., Martin, F. & Ebner, M. (2016) Market study - Investments in Renewables Survey of Institutional Investors 2015, KGAL. [online] http://www.kgal-group.com/uploads/tx_newsdownloads/KGAL_markets_study_infrastructure_2015_01.pdf (Accessed 5 January 2016).
Watts, C. (2011) Managing the Risk in Renewable Energy, Economist Intelligence Unit. [online]. The Economist, sponsored by Swiss Re. [online] http://www. economistinsights.com/sites/default/files/downloads/EIU-SwissRe_Managing RiskRenewableEnergy_Web_2.pdf (Accessed 30 March 2014).
Weber, E. U. (1997) 'The Utility of Measuring and Modeling Perceived Risk', In: Marley, A. A. J. (ed.) Choice, decision, and measurement: Essays in honor of R. Duncan Luce. pp. 45-56, Lawrence Erlbaum Associates Publishers, Mahwah, NJ.
Weber, E. U. (1998) 'Whos Afraid of a Little Risk? New Evidence for General Risk Aversion', In: J, S., Mellers, B. & Schum, D. (eds.) Decision science and technology: Reflections on the contributions of Ward Edwards. pp. 5364, Kluwer Academic Press, Norwell, MA.
Weber, E. U., Blais, A. R. & Betz, N. E. (2002) 'A Domain Specific Risk Attitude Scale: Measuring Risk Perceptions and Risk Behaviors', Journal of Behavioral Decision Making, Vol. 15 No. 4, pp. 263-290.
Weber, E. U. & Hsee, C. (1998) 'Cross-Cultural Differences in Risk Perception, but Cross-Cultural Similarities in Attitudes Towards Perceived Risk', Management Science, Vol. 44 No. 9, pp. 1205-1217.
Weitmayr, H. (2017) 'Die Schwäne sind gelandet [Translations: "The Swans Are Landed"]', Institutional Money, FONDS Professionell Multimedia GmbH, (1) [online] http://www.institutional-money.com/magazin/theorie-praxis/artikel/ die-schwaene-sind-gelandet-58793/ (Accessed 24 April 2018).
Welch, I. (2000) 'Views of Financial Economists on the Equity Premium and on Professional Controversies', Journal of Business, Vol. 73 No. 4, pp. 501-537.
354 Bibliography and References Welsh, J. A., White, J. F. & Dowell, P. (1982) 'A Small Business is not a Little Big Business
Harvard Business Review, Vol. 59, No. 4, July/August, 1981, pp. 18 (9 pages', International Small Business Journal, Vol. 1 No. 1, pp. 95-95.
Weston, J. F. (1954) 'The Profit Concept and Theory: A Restatement', Journal of Political Economy, Vol. 62 No. 2, pp. 152-170.
Weston, J. F. (1973) 'Investment Decisions Using the Capital Asset Pricing Model', Financial Management, Vol. 2 No. 2, pp. 25-33.
Whitehead, J. C., Groothuis, P. A. & Blomquist, G. C. (1993) 'Testing for Non-Response and Sample Selection Bias in Contingent Valuation: Analysis of a Combination Phone/Mail Survey', Economics Letters, Vol. 41 No. 2, pp. 215-220.
Wikgren, M. (2005) 'Critical Realism as a Philosophy and Social Theory in Information Science?', Journal of Documentation, Vol. 61 No. 1, pp. 11-22.
Wikipedia (2017) Risk Universe, [online] https://en.wiktionary.org/wiki/risk_universe (Accessed 23 November 2017).
Williams, J. B. (1938) The Theory of Investment Value., Harvard University Press, Cambridge.
Williams, J. T. (1991) 'Real Estate Development as an Option', The Journal of Real Estate Finance and Economics, Vol. 4 No. 2, pp. 191-208.
Willows, R., Reynard, N., Meadowcroft, I. & Connell, R. (2003) Climate Adaptation: Risk, Uncertainty and Decision-Making. UKCIP Technical Report, UK Climate Impacts Programme.
Wind:Research (2012) in Neue Energie (2014) Neue Energie, Vol. May.
Winkler, R. L. (2003) An Introduction to Bayesian Inference and Decision, 2nd ed. Probabilistic Publishing, Gainesville, US.
Wolffsen, P. (2012) 'Modification of Capital Budgeting Under Uncertainty', Taikomoji Ekonomika: Sisteminiai Tyrimai, Vol. 6 No. 2, pp. 143-159.
Womack, K., Zhang, Y., Borchert, A., Ensz, L., Knijn, J., Pope, G. & Smith, A. (2003) Understanding Risk and Return, the CAPM, and the Fama-French Three-Factor Model, Tuck School of Business. [online] http://ssrn.com/abstract=481881 (Accessed 15 February 2014).
Wong, K. & So, A. T. (1995) 'A Fuzzy Expert System for Contract Decision Making', Construction Management and Economics, Vol. 13 No. 2, pp. 95-103.
Wood, R. A., McInish, T. H. & Lawrence, K. D. (1992) 'Estimating Divisional Betas with Diversified Firm Data', Review of Quantitative Finance & Accounting, Vol. 2 No. 1, pp. 89-96.
Bibliography and References 355 Woolley, C. M. (2008) 'Meeting the Mixed Methods Challenge of Integration in a
Sociological Study of Structure and Agency', Journal of Mixed Methods Research, Vol. 3 No. 1, pp. 7-25.
Wuester, H., Jungmin Lee, J. & Lumijarvi, A. (2016) Unlocking Renewable Energy Investment: The Role of Risk Mitigation and Structured Finance, IRENA. [online] https://www.res4med.org/wp-content/uploads/2017/11/IRENA_Risk_ Mitigation_and_Structured_Finance_2016.pdf.
Wüstenhagen, R. & Menichetti, E. (2012) 'Strategic Choices for Renewable Energy Investment: Conceptual Framework and Opportunities for Further Research', Energy Policy, Vol. 40, pp. 1-10.
Yeh, T.-H. & Wang, L. (2008) 'A Study on Generator Capacity for Wind Turbines Under Various Tower Heights and Rated Wind Speeds Using Weibull Distribution', IEEE Transactions on Energy Conversion, Vol. 23 No. 2, pp. 592-602.
Yescombe, E. R. (2013) Principles of Project Finance, 2nd ed. Elsevier, New York.
Yin, R. K. (2011) Applications of Case Study Research, SAGE, Thousand Oaks, CA.
Yin, R. K. (2014) Case Study Research: Design and Methods, SAGE, Thousand Oaks, CA.
Zachariadis, M., Scott, S. V. & Barrett, M. I. (2010) 'Exploring Critical Realism as the Theoretical Foundation of Mixed-Method Research: Evidence from the Economies for IS Innovations', [online] https://www.jbs.cam.ac.uk/fileadmin/ user_upload/research/workingpapers/wp1003.pdf (Accessed 8 August 2018).
Zeckhauser, R. J. & Viscusi, W. K. (2008) 'Discounting Dilemmas: Editors’ Introduction', Journal of Risk and Uncertainty, Vol. 37 No. 2-3, pp. 95-106.
Zimmermann, H., Bilo, S., Christophers, H. & Degosciu, M. (2005) 'Risk, Returns, and Biases of Listed Private Equity Portfolios', working paper, WWZ/Department of Finance, [online] https://wwz.unibas.ch/uploads/tx_x4epublication/Risk-Returns.pdf (Accessed 21 February 2014).
Zink, D. W. (1973) The Political Risks for Multinational Enterprise in Developing Countries, Praeger Publishers, New York.
Zou, L. (2006) 'The Best-Beta CAPM', Applied Financial Economics Letters, Vol. 2 No. 2, pp. 131-137.
Appendices
Value creation methods One of the most popular valuation methods is the EVA, developed by Stern et al. (1995). A simplified EVA approach is given by the discounted EVA technique73. It is computed from the net operating profit after tax (NOPAT) which corresponds to the income surplus, reduced by the cost of capital (WACC) on the capital invested (CI) in the previous year as shown in the equation 12:
(12)
The EVA technique is applied for computing a NPV. The IRR method is not applicable when applying the EVA approach since the applied calculation of the surplus return over the cost of involved capital omits the initial expenditure when starting the valuation process (Mielcarz and Mlinarič, 2014). It is applied rather for project or company valuations with less data to plan with.
Alternative CoC models to CAPM
A2.1 Multi-Beta Models
In the late 1970ies, multi-beta models were introduced as alternatives and extensions to the simple one-factor CAPM using several risk premiums instead of only one. In general, multi-beta models try to explain returns of different assets by a set of common factors in a linear model (Ericsson and Karlsson, 2004). There are in principle two strands of multi-beta models in the empirical literature which can both be described by equation (13).
(13)
A2.1.1 The Arbitrage Pricing Model In the Arbitrage Pricing Model (APM)74 advocated by Ross (1976), betas are estimated against several individual unspecified market risk factors or macro economic factors (Dash and Mahakud, 2013). The focus is on unobservable or latent factors (Ericsson and Karlsson, 2004) which should not include more than five factors (Connor and Korajczyk, 1989). The expected return is a linear function of such variables based on the assumption that pricing of assets are about preventing arbitrage (Damodaran, 2011a, Dash and Mahakud, 2013). Within this theory, it is possible to produce exact statements of expected return as showed by Connor (1984) in his APM version. The
© Springer Fachmedien Wiesbaden GmbH, part of Springer Nature 2019C. Hürlimann, Valuation of Renewable Energy Investments, Sustainable Management, Wertschöpfung und Effizienz, https://doi.org/10.1007/978-3-658-27469-6
Alternative CoC models to CAPM 357 first step in the APM starts with identifying several possible macro economic factors which could affect expected returns (Brealey et al., 2011).
However, the APM comes also with certain drawbacks. It also assumes that the portfolio is completely diversified as we have already experienced for the CAPM (Fama, 1996). Moreover, there is a barrier in using it in practice since the model does not define which exact factors should be applied or to be looked for (Damodaran, 2011a). This lack is also probably one of the reasons why according to a survey performed by Gitman and Vandenberg (2000) the APM is seldom used, compared to the wide spread usage of the CAPM75.
A2.1.2 Multifactor Models The Multifactor models apply the same principle, but betas are estimated against specific, observable macro-economic variables in empirical studies, such as interest rates, GDP growth rate, slope of the yield curve, using historical data, sometimes up to 15 factors (Ericsson and Karlsson, 2004, Damodaran, 2011a). There are several subversions of this multifactor model.
The intertemporal CAPM (ICAPM) of Merton (1973) goes a step further than the standard CAPM in taking into account how investor participate in the market. Without having to assume a perfect portfolio diversification, the ICAPM predicts exact statement of expected return using a multifactor approach and utility maximization76. However, it comes with the cost of complexity since the used state variables cannot be easily identified which is key for doing empirical testing and for financial decision-making (Breeden, 1979). This model assumes that most investors participate in financial markets for multiple years and not only for one year. While over longer periods expectations of risk change, there might be a shift in investment opportunities. Hence investors might wish to react and hedge their portfolio against anticipated market changes (Brennan and Xia, 2003). Furthermore, the assumption that in the ICAPM, consumer expectations are assumed to be homogenous, meaning that it cannot take into account individual risk preferences have been criticised (Breeden, 1979, Cochrane, 2000).
Breeden (1979) extends the intertemporal model of Merton (1973) into a “multi-good, continuous-time model with uncertain consumption-goods prices and uncertain investment opportunities” (1979:265). This consumption-based CAPM (CCAPM) suggests that the expected return of stock is determined by the consumption beta or covariance of a securities return with the consumption growth risk instead of the market beta as argued by the CAPM (Breeden, 1979). The CCAPM includes the amount that an individual or firm wishes to consume in the future. In the simplest form of the
358 Appendices CCAPM, the model differs from the CAPM only by the beta for consumption which measures the covariance between the return from a market index and an investor's ability to consume goods and services from investments (Duffie and Zame, 1989, Cochrane, 2000).77
The APM and the Multifactor model have the advantage to do better than CAPM in explaining return differences across investment based on historical data (Womack et al., 2003, Damodaran, 2011a), but falls also short to bring along a forward-looking estimate of the expected return (Damodaran, 2011a). They are used less frequently by practitioners than the CAPM (Gitman and Vandenberg, 2000, Graham and Harvey, 2001, Damodaran, 2011a), probably due to its complexity.
A2.2 Proxy Models
In contrast to assumptions of the conventional risk-return models, such as CAPM and multi-beta models, that markets are perfect, there are no transaction costs and taxes, all investors have the same and costless information and behave rational (Fama, 1968), proxy models do not rely on those common theoretical concepts. They are essentially built up from scratch by trying to estimate returns on stock prices with observable variables (Damodaran, 2013). In general, proxy models applied to determine expected returns can be described with equation 14.
(14)
Proxy 1 and 2 are firm characteristics, such as market capitalization, price to book ratios or return momentum (Damodaran, 2013). Fama and French (1992), (1995) concluded in their widely noted research that there are evidences that firm size and book-to-market ratio are two relevant proxies in estimating expected returns which the CAPM does not consider at all (Fama and French, 1992, 1996). Newer research has been looking for alternative and better proxies, for example liquidity, in order to determine expected return of lower traded companies (Damodaran, 2005a). Comparing this model to CAPM, it seems to be rather complex. Moreover, it is solely applicable for PTC due to the necessary access to market data.
A2.3 Principle Models adjusted with Additional Determinants
While the use of pure proxy models by practitioners is seldom (Gitman and Vandenberg, 2000, Damodaran, 2011b), many analysts have however included the results or some of the characteristics in conventional models, for example, by adding
Alternative CoC models to CAPM 359 a small cap premium to the CAPM equation (Damodaran, 2011b), as shown in equation 15.78
(15)
Similarly, in order to overcome the problem of looking for not known factors to be applied in the APM (Brealey et al., 2011), the model has been adjusted with proxy model characteristics with the findings of Fama and French (1992, 1995) to come up with a model commonly known as Fama-French (FF) Three-Factor Model (Fama and French, 1993, 1997, Brealey et al., 2011) using three key factors: market factor, size factor and book-to-market factor79, as illustrated in equation 16.
(16)
This model has been supported by recent studies (Mohanty and Nandha, 2011). In addition, Carhart compared the FF-Three-Factor Model with the CAPM performance and found out that the first model is “more precise, but generally not economically different from the CAPM” (Carhart, 1997:61). He receives better estimates by adding a fourth factor, the momentum, to the FF-Three-Factor Model (Carhart, 1997). This momentum in a stock describes the inertia of the stock price, i.e. the stock price's tendency to continue rising, while increasing and to continue declining, while going down (Carhart, 1997).80 In the empirical financial literature, this FF-Carhard Model has become a popular and widely used asset pricing model (Mohanty and Nandha, 2011) while other authors critically discuss the relevance of its applied risk factors (Cochrane, 2000, Ericsson and Karlsson, 2004).
Table 33 gives an overview of all above discussed principle models which have been developed on the basis of traded companies, while summarizing the assumptions and limitations, giving pros and cons and suggesting its applicability.
A2.4 Market-derived Capital Asset Pricing Model (MCPM)
Based on the MCPM approach, the cost of capital is calculated based on three components: national confiscation risk, corporate default risk and equity return risk. The first components governmental bonds and for the second component corporate bonds are used as proxies. The last component is computed by considering the implied volatility derived from the market prices of stock options (McNulty et al., 2002).
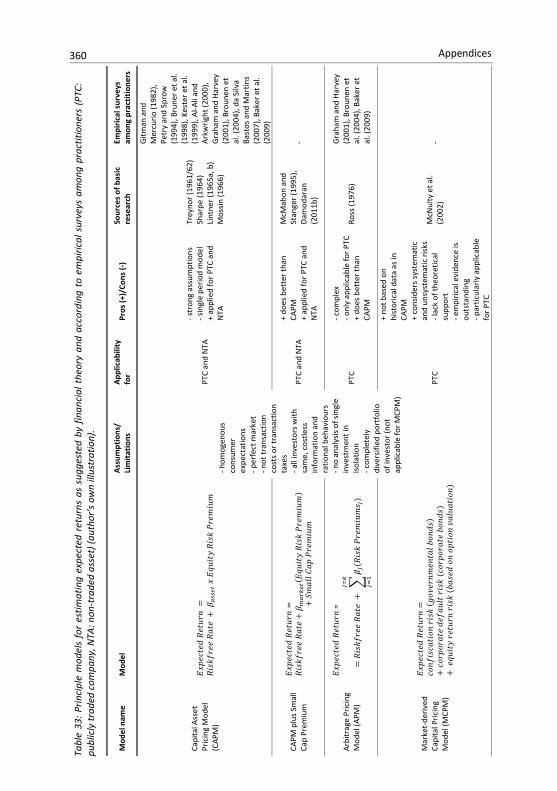
Tabl
e 33
: Prin
cipl
e m
odel
s fo
r es
timat
ing
expe
cted
ret
urns
as
sugg
este
d by
fin
anci
al t
heor
y an
d ac
cord
ing
to e
mpi
rical
sur
veys
am
ong
prac
titio
ners
(PT
C:
publ
icly
trad
ed c
ompa
ny, N
TA: n
on-t
rade
d as
set)
(aut
hor’s
ow
n ill
ustr
atio
n).
Mod
el n
ame
Mod
el
Assu
mpt
ions
/ Li
mita
tions
Ap
plic
abili
ty
for
Pros
(+)/
Cons
(-)
Sour
ces
of b
asic
re
sear
ch
Empi
rical
sur
veys
am
ong
prac
titio
ners
Capi
tal A
sset
Pr
icin
g M
odel
(C
APM
)
- hom
ogen
ous
cons
umer
ex
pect
atio
ns
- per
fect
mar
ket
- not
tran
sact
ion
cost
s or t
rans
actio
n ta
xes
- all
inve
stor
s with
sa
me,
cos
tless
in
form
atio
n an
d ra
tiona
l beh
avio
urs
- no
anal
ysis
of s
ingl
e in
vest
men
t in
isola
tion
- com
plet
ely
dive
rsifi
ed p
ortf
olio
of
inve
stor
(not
ap
plic
able
for M
CPM
)
PTC
and
NTA
- str
ong
assu
mpt
ions
- s
ingl
e pe
riod
mod
el
+ ap
plie
d fo
r PTC
and
N
TA
Trey
nor (
1961
/62)
Sh
arp e
(196
4)
Lint
ner (
1965
a, b
) M
ossi
n (1
966)
Gitm
an a
nd
Mer
curio
(198
2),
Petr
y an
d Sp
row
(1
994)
, Bru
ner e
t al.
(199
8), K
este
r et a
l. (1
999)
, Al-A
li an
d Ar
kwrig
ht (2
000)
, G
raha
m a
nd H
arve
y (2
001)
, Bro
unen
et
al. (
2004
), da
Silv
a Ba
stos
and
Mar
tins
(200
7), B
aker
et a
l. (2
009)
CAPM
plu
s Sm
all
Cap
Prem
ium
PTC
and
NTA
+ do
es b
ette
r tha
n CA
PM
+ ap
plie
d fo
r PTC
and
N
TA
McM
ahon
and
St
ange
r (19
95),
Dam
odar
an
(201
1b)
-
Arbi
trag
e Pr
icin
g M
odel
(APM
)
=
PT
C
- com
plex
- o
nly
appl
icab
le fo
r PTC
+
does
bet
ter t
han
CAPM
Ross
(197
6)
Gra
ham
and
Har
vey
(200
1), B
roun
en e
t al
. (20
04),
Bake
r et
al. (
2009
)
Mar
ket-
deriv
ed
Capi
tal P
ricin
g M
odel
(MCP
M)
PTC
+ no
t bas
ed o
n hi
stor
ical
dat
a as
in
CAPM
+
cons
ider
s sys
tem
atic
an
d un
syst
emat
ic ri
sks
- lac
k of
theo
retic
al
supp
ort
- em
piric
al e
vide
nce
is ou
tsta
ndin
g - p
artic
ular
ly a
pplic
able
fo
r PTC
McN
ulty
et a
l. (2
002)
-
360 Appendices
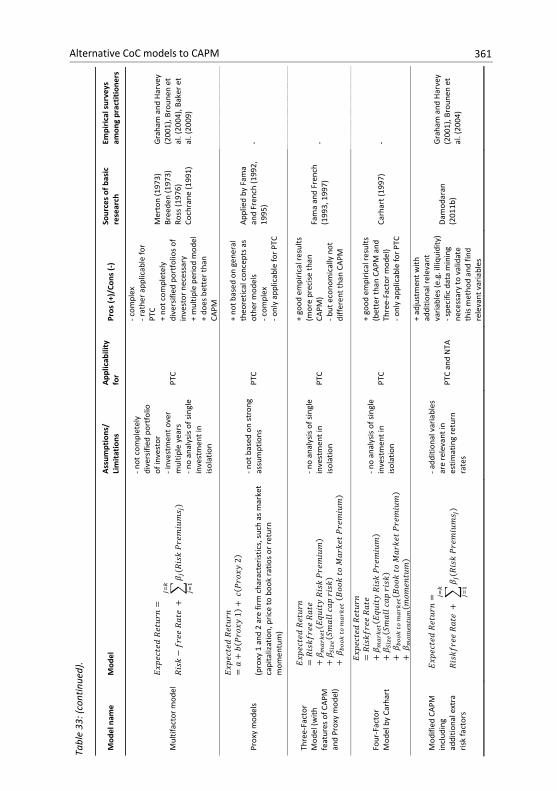
Tabl
e 33
: (co
ntin
ued)
.
Mod
el n
ame
Mod
el
Assu
mpt
ions
/ Li
mita
tions
Ap
plic
abili
ty
for
Pros
(+)/
Cons
(-)
Sour
ces
of b
asic
re
sear
ch
Empi
rical
sur
veys
am
ong
prac
titio
ners
Mul
tifac
tor m
odel
- not
com
plet
ely
dive
rsifi
ed p
ortf
olio
of
inve
stor
- i
nves
tmen
t ove
r m
ultip
le y
ears
- n
o an
alys
is o
f sin
gle
inve
stm
ent i
n is
olat
ion
PTC
- com
plex
- r
athe
r app
licab
le fo
r PT
C
+ no
t com
plet
ely
dive
rsifi
ed p
ortf
olio
s of
inve
stor
nec
essa
r y
+ m
ultip
le p
erio
d m
odel
+
does
bet
ter t
han
CAPM
Mer
ton
(197
3)
Bree
den
(197
3)
Ross
(197
6)
Coch
rane
(199
1)
Gra
ham
and
Har
vey
(200
1), B
roun
en e
t al
. (20
04),
Bake
r et
al. (
2009
)
Prox
y m
odel
s
(p
roxy
1 a
nd 2
are
firm
cha
ract
eris
tics,
suc
h as
mar
ket
capi
taliz
atio
n, p
rice
to b
ook
ratio
s or
retu
rn
mom
entu
m)
- not
bas
ed o
n st
rong
as
sum
ptio
ns
PTC
+ no
t bas
ed o
n ge
nera
l th
eore
tical
con
cept
s as
othe
r mod
els
- com
plex
- o
nly
appl
icab
le fo
r PTC
Appl
ied
by F
ama
and
Fren
ch (1
992,
19
95)
-
Thre
e-Fa
ctor
M
odel
(with
fe
atur
es o
f CAP
M
and
Prox
y m
odel
)
- no
anal
ysis
of s
ingl
e in
vest
men
t in
isol
atio
n PT
C
+ go
od e
mpi
rical
resu
lts
(mor
e pr
ecise
than
CA
PM)
- but
eco
nom
ical
ly n
ot
diffe
rent
than
CAP
M
Fam
a an
d Fr
ench
(1
993,
199
7)
-
Four
-Fac
tor
Mod
el b
y Ca
rhar
t
- no
anal
ysis
of s
ingl
e in
vest
men
t in
isol
atio
n PT
C
+ go
od e
mpi
rical
resu
lts
(bet
ter t
han
CAPM
and
Th
ree -
Fact
or m
odel
) - o
nly
appl
icab
le fo
r PTC
Carh
art (
1997
) -
Mod
ified
CAP
M
incl
udin
g ad
ditio
nal e
xtra
ris
k fa
ctor
s
- add
ition
al v
aria
bles
ar
e re
leva
nt in
es
timat
ing
retu
rn
rate
s
PTC
and
NTA
+ ad
just
men
t with
ad
ditio
nal r
e lev
ant
varia
bles
(e.g
. illi
quid
ity)
- spe
cific
dat
a m
inin
g ne
cess
ary
to v
alid
ate
this
met
hod
and
find
rele
vant
var
iabl
es
Dam
odar
an
(201
1b)
Gra
ham
and
Har
vey
(200
1), B
roun
en e
t al
. (20
04)
Alternative CoC models to CAPM 361
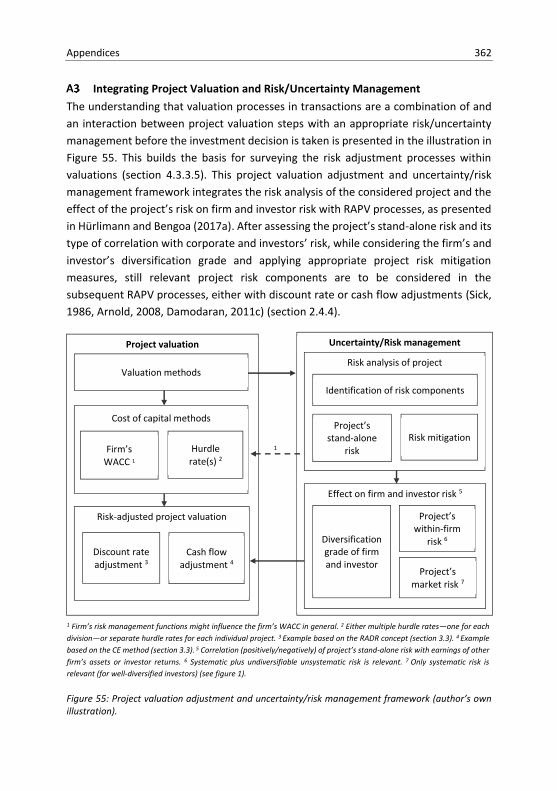
Appendices 362
Integrating Project Valuation and Risk/Uncertainty Management The understanding that valuation processes in transactions are a combination of and an interaction between project valuation steps with an appropriate risk/uncertainty management before the investment decision is taken is presented in the illustration in Figure 55. This builds the basis for surveying the risk adjustment processes within valuations (section 4.3.3.5). This project valuation adjustment and uncertainty/risk management framework integrates the risk analysis of the considered project and the effect of the project’s risk on firm and investor risk with RAPV processes, as presented in Hürlimann and Bengoa (2017a). After assessing the project’s stand-alone risk and its type of correlation with corporate and investors’ risk, while considering the firm’s and investor’s diversification grade and applying appropriate project risk mitigation measures, still relevant project risk components are to be considered in the subsequent RAPV processes, either with discount rate or cash flow adjustments (Sick, 1986, Arnold, 2008, Damodaran, 2011c) (section 2.4.4).
Figure 55: Project valuation adjustment and uncertainty/risk management framework (author’s own illustration).
Uncertainty/Risk management
Project valuation
Risk-adjusted project valuation
Valuation methods
1
Cash flow adjustment 4
Discount rate adjustment 3
Risk analysis of project
Project’s stand-alone
risk Risk mitigation
Effect on firm and investor risk 5
Project’s within-firm
risk 6 Diversification grade of firm and investor
Project’s market risk 7
Cost of capital methods
Hurdle rate(s) 2
Identification of risk components
Firm’s WACC 1
1 Firm’s risk management functions might influence the firm’s WACC in general. 2 Either multiple hurdle rates—one for each division—or separate hurdle rates for each individual project. 3 Example based on the RADR concept (section 3.3). 4 Example based on the CE method (section 3.3). 5 Correlation (positively/negatively) of project’s stand-alone risk with earnings of other firm’s assets or investor returns. 6 Systematic plus undiversifiable unsystematic risk is relevant. 7 Only systematic risk is relevant (for well-diversified investors) (see figure 1).
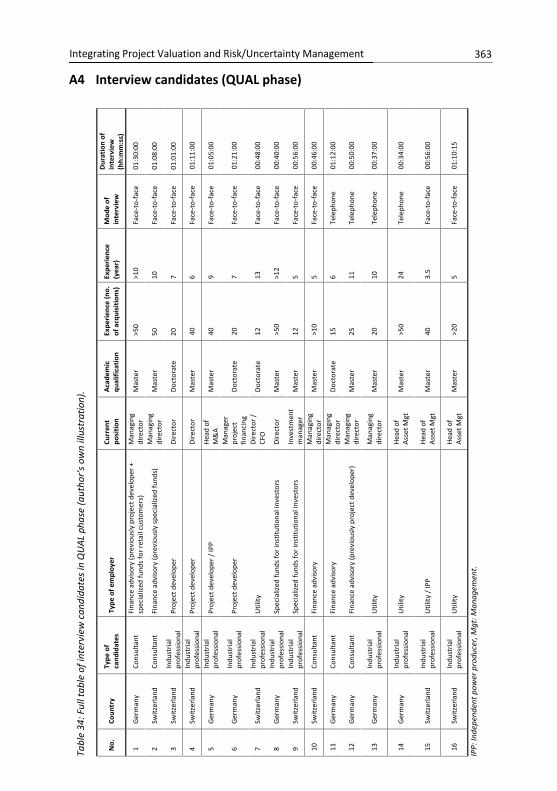
Tabl
e 34
: Ful
l tab
le o
f int
ervi
ew c
andi
date
s in
QU
AL p
hase
(aut
hor’s
ow
n ill
ustr
atio
n).
No.
Co
untr
y Ty
pe o
f ca
ndid
ates
Ty
pe o
f em
ploy
er
Curr
ent
posi
tion
Acad
emic
qu
alifi
catio
n Ex
perie
nce
(no.
of
acq
uisi
tions
) Ex
perie
nce
(yea
r)
Mod
e of
in
terv
iew
Dur
atio
n of
in
terv
iew
(h
h:m
m:s
s)
1 G
erm
any
Cons
ulta
nt
Fina
nce
advi
sory
(pre
viou
sly p
roje
ct d
evel
oper
+
spec
ializ
ed fu
nds
for r
etai
l cus
tom
ers)
M
anag
ing
dire
ctor
M
aste
r >5
0 >1
0 Fa
ce-t
o-fa
ce
01:3
0:00
2 Sw
itzer
land
Co
nsul
tant
Fi
nanc
e ad
viso
ry (p
revi
ously
spec
ializ
ed fu
nds)
M
anag
ing
dire
ctor
M
aste
r 50
10
Fa
ce-t
o-fa
ce
01:0
8:00
3 Sw
itzer
land
In
dust
rial
prof
essi
onal
Pr
ojec
t dev
elop
er
Dire
ctor
Do
ctor
ate
20
7 Fa
ce-t
o-fa
ce
01:0
1:00
4 Sw
itzer
land
In
dust
rial
prof
essi
onal
Pr
ojec
t dev
elop
er
Dire
ctor
M
aste
r 40
6
Face
-to-
face
01
:11:
00
5 G
erm
any
Indu
stria
l pr
ofes
sion
al
Proj
ect d
evel
oper
/ IP
P H
ead
of
M&
A M
aste
r 40
9
Face
-to-
face
01
:05:
00
6 G
erm
any
Indu
stria
l pr
ofes
sion
al
Proj
ect d
evel
oper
M
anag
er
proj
ect
finan
cing
Do
ctor
ate
20
7 Fa
ce-t
o-fa
ce
01:2
1:00
7 Sw
itzer
land
In
dust
rial
prof
essi
onal
U
tility
Di
rect
or /
CFO
Do
ctor
ate
12
13
Face
-to-
face
00
:48:
00
8 G
erm
any
Indu
stria
l pr
ofes
sion
al
Spec
ializ
ed fu
nds f
or in
stitu
tiona
l inv
esto
rs
Dire
ctor
M
aste
r >5
0 >1
2 Fa
ce-t
o-fa
ce
00:4
0:00
9 Sw
itzer
land
In
dust
rial
prof
essi
onal
Sp
ecia
lized
fund
s for
inst
itutio
nal i
nves
tors
In
vest
men
t m
anag
er
Mas
ter
12
5 Fa
ce-t
o-fa
ce
00:5
6:00
10
Switz
erla
nd
Cons
ulta
nt
Fina
nce
advi
sory
M
anag
ing
dire
ctor
M
aste
r >1
0 5
Face
-to-
face
00
:46:
00
11
Ger
man
y Co
nsul
tant
Fi
nanc
e ad
viso
ry
Man
agin
g di
rect
or
Doct
orat
e 15
6
Tele
phon
e 01
:12:
00
12
Ger
man
y Co
nsul
tant
Fi
nanc
e ad
viso
ry (p
revi
ously
pro
ject
dev
elop
er)
Man
agin
g di
rect
or
Mas
ter
25
11
Tele
phon
e 00
:50:
00
13
Ger
man
y In
dust
rial
prof
essi
onal
U
tility
M
anag
ing
dire
ctor
M
aste
r 20
10
Te
leph
one
00:3
7:00
14
Ger
man
y In
dust
rial
prof
essi
onal
U
tility
H
ead
of
Asse
t Mgt
M
aste
r >5
0 24
Te
leph
one
00:3
4:00
15
Switz
erla
nd
Indu
stria
l pr
ofes
sion
al
Util
ity /
IPP
Hea
d of
As
set M
gt
Mas
ter
40
3.5
Face
-to-
face
00
:56:
00
16
Switz
erla
nd
Indu
stria
l pr
ofes
sion
al
Util
ity
Hea
d of
As
set M
gt
Mas
ter
>20
5 Fa
ce-t
o-fa
ce
01:1
0:15
IPP:
Inde
pend
ent p
ower
pro
duce
r, M
gt: M
anag
emen
t.
A4 Interview candidates (QUAL phase)
Integrating Project Valuation and Risk/Uncertainty Management 363

364 Appendices
Questionnaire
Private equity investments in renewable energies
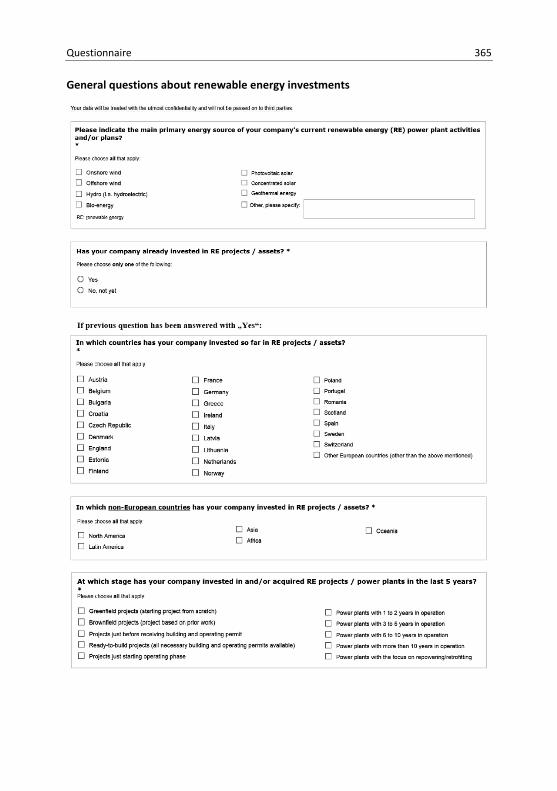
Questionnaire 365 General questions about renewable energy investments
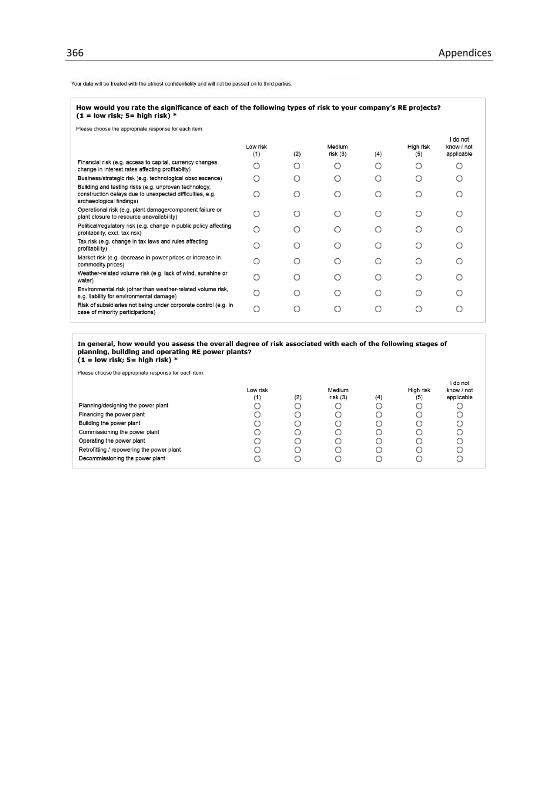
366 Appendices
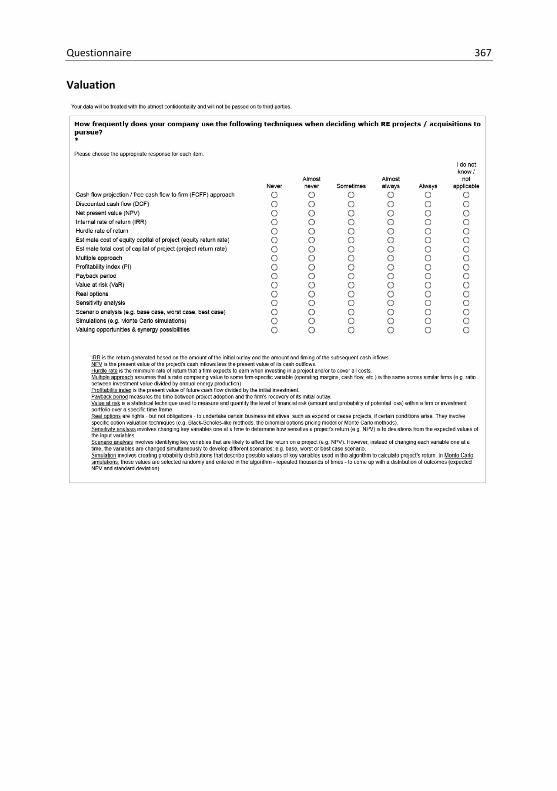
Questionnaire 367 Valuation
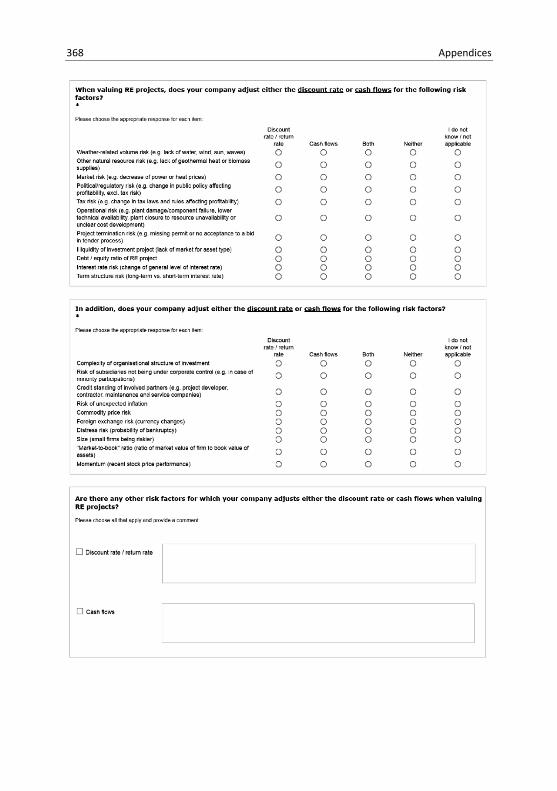
368 Appendices
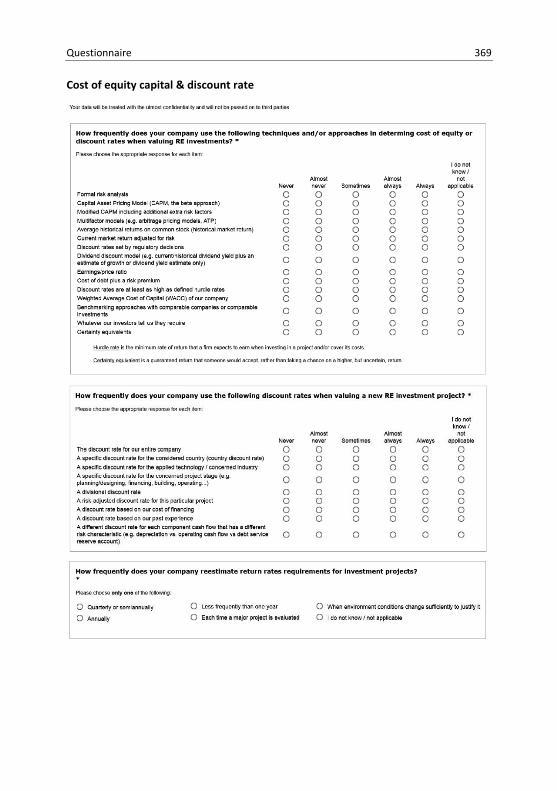
Questionnaire 369 Cost of equity capital & discount rate
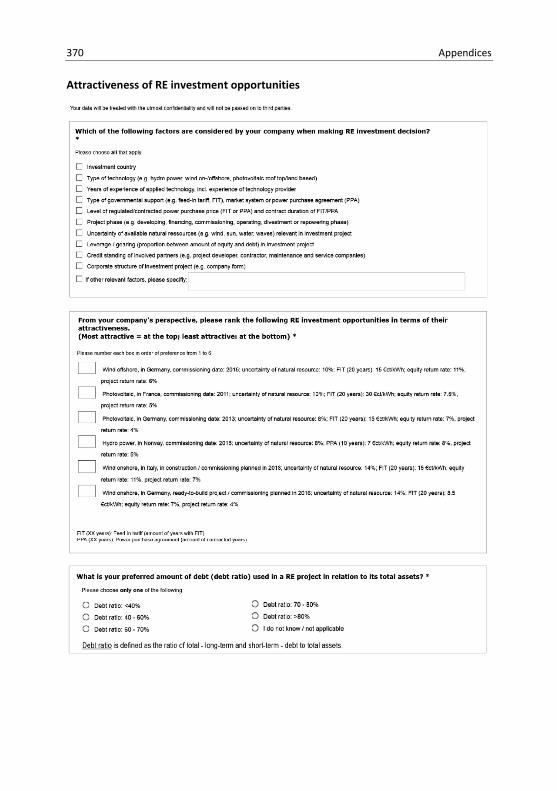
370 Appendices Attractiveness of RE investment opportunities
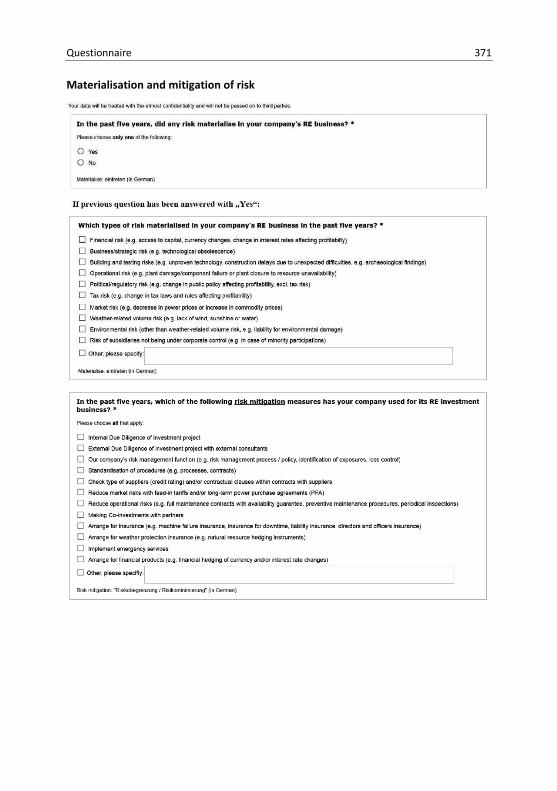
Questionnaire 371 Materialisation and mitigation of risk
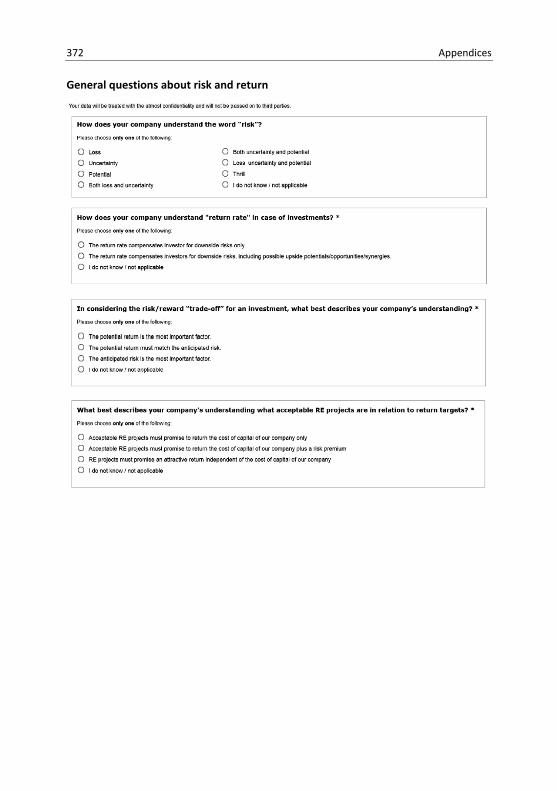
372 Appendices General questions about risk and return
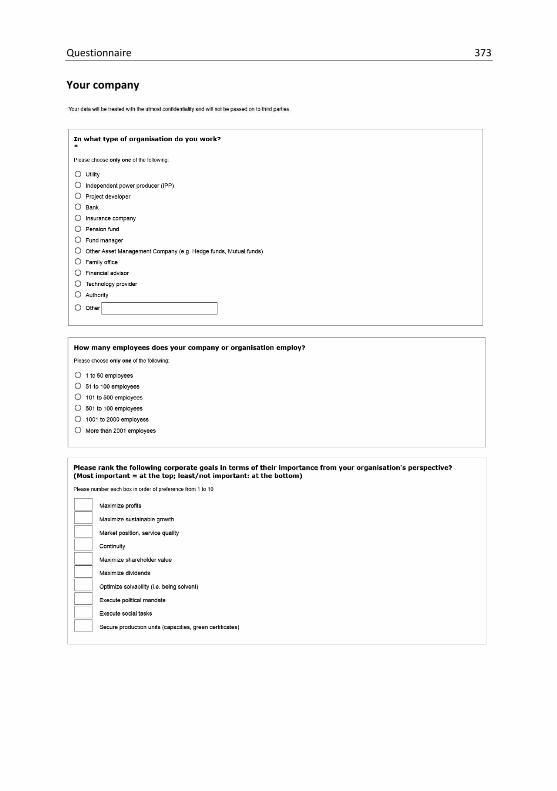
Questionnaire 373 Your company
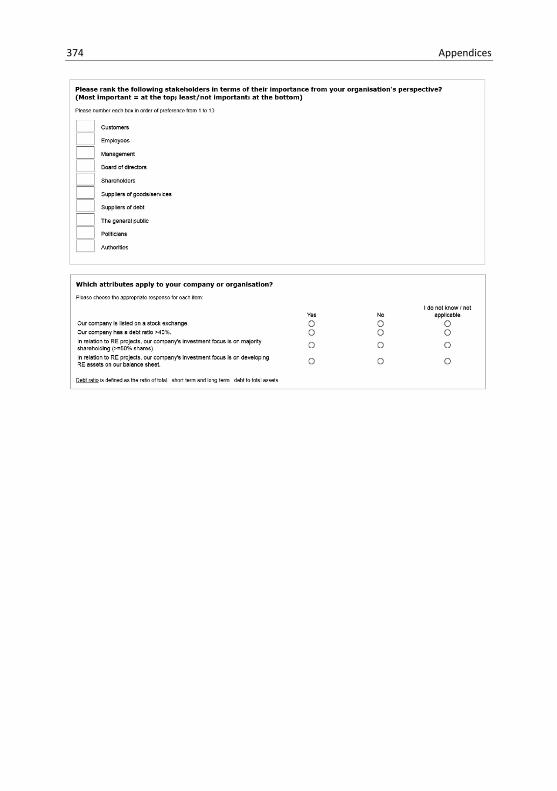
374 Appendices

Questionnaire 375 Your function and experience
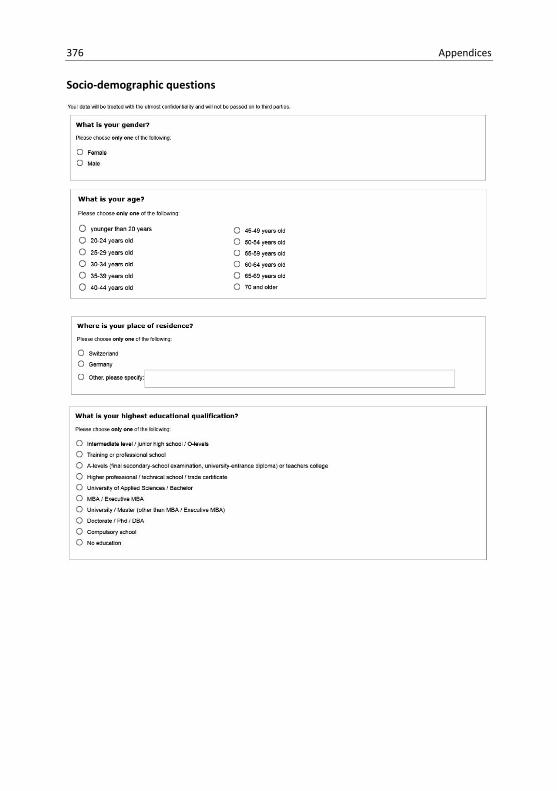
376 Appendices Socio-demographic questions

Questionnaire 377 Conclusion
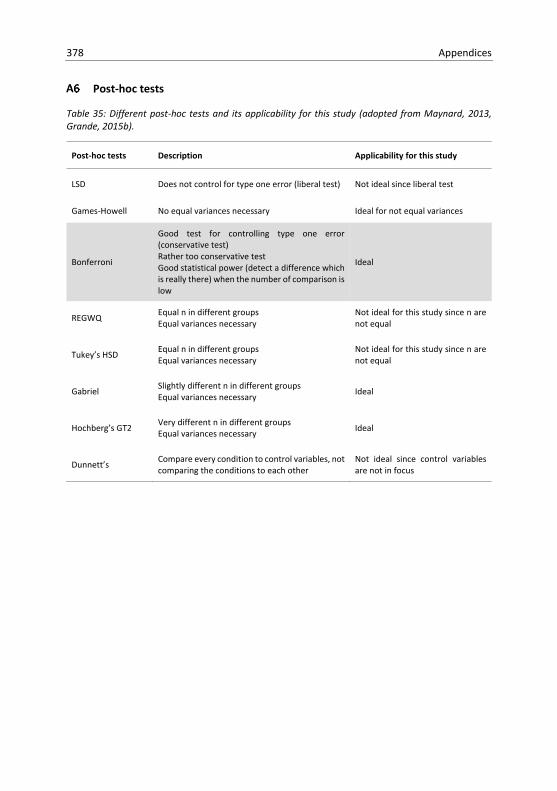
378 Appendices
Post-hoc tests
Table 35: Different post-hoc tests and its applicability for this study (adopted from Maynard, 2013, Grande, 2015b).
Post-hoc tests Description Applicability for this study
LSD Does not control for type one error (liberal test) Not ideal since liberal test
Games-Howell No equal variances necessary Ideal for not equal variances
Bonferroni
Good test for controlling type one error (conservative test) Rather too conservative test Good statistical power (detect a difference which is really there) when the number of comparison is low
Ideal
REGWQ Equal n in different groups Equal variances necessary
Not ideal for this study since n are not equal
Tukey’s HSD Equal n in different groups Equal variances necessary
Not ideal for this study since n are not equal
Gabriel Slightly different n in different groups Equal variances necessary Ideal
Hochberg’s GT2 Very different n in different groups Equal variances necessary Ideal
Dunnett’s Compare every condition to control variables, not comparing the conditions to each other
Not ideal since control variables are not in focus
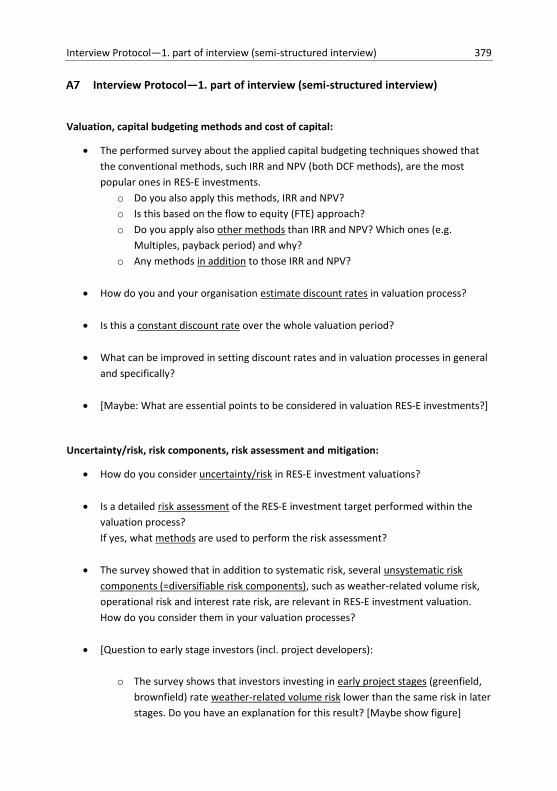
Interview Protocol—1. part of interview (semi-structured interview) 379
Interview Protocol—1. part of interview (semi-structured interview)
Valuation, capital budgeting methods and cost of capital:
The performed survey about the applied capital budgeting techniques showed that the conventional methods, such IRR and NPV (both DCF methods), are the most popular ones in RES-E investments.
o Do you also apply this methods, IRR and NPV? o Is this based on the flow to equity (FTE) approach? o Do you apply also other methods than IRR and NPV? Which ones (e.g.
Multiples, payback period) and why? o Any methods in addition to those IRR and NPV?
How do you and your organisation estimate discount rates in valuation process?
Is this a constant discount rate over the whole valuation period?
What can be improved in setting discount rates and in valuation processes in general
and specifically?
[Maybe: What are essential points to be considered in valuation RES-E investments?]
Uncertainty/risk, risk components, risk assessment and mitigation:
How do you consider uncertainty/risk in RES-E investment valuations?
Is a detailed risk assessment of the RES-E investment target performed within the valuation process? If yes, what methods are used to perform the risk assessment?
The survey showed that in addition to systematic risk, several unsystematic risk components (=diversifiable risk components), such as weather-related volume risk, operational risk and interest rate risk, are relevant in RES-E investment valuation. How do you consider them in your valuation processes?
[Question to early stage investors (incl. project developers):
o The survey shows that investors investing in early project stages (greenfield, brownfield) rate weather-related volume risk lower than the same risk in later stages. Do you have an explanation for this result? [Maybe show figure]
380 Appendices
o Or do you rate weather-related volume risk differently for greenfield or brownfield projects compared to investments at the later stage?]
Do you consider probabilities, i.e. distribution of input variables, in RES-E investment
valuations? If yes, how?
Do you consider the implemented or possible additional risk mitigation measures (mitigation = “Minderung/Entschärfung”, e.g. full maintenance contracts, insurances) in the valuation process? If yes, how?
Do you consider all risks and uncertainties in the project valuation?
How could latent uncertainties be found?
Additional influencing factors (apart from organisation type, size, leverage, stock exchange listing, project stages):
Do you consider opportunities within the RES-E investments (e.g. possibility to renegotiate contracts to decrease costs) within valuations?
Do you consider your existing RES-E portfolio or other ventures of your company when you perform valuations (“within-firm risk”)? If yes, how?
Or do you consider other possible synergies in RES-E valuations? If yes, which ones and how?
Do you consider shareholder’s risk-return preference in valuation instead of management’s risk-return preference (“market risk”)? If yes, how?
Do past experiences of the involved investment team members influence the valuation and investment decision process? If yes, how? Does this improve the investment decision? How?
Maybe: Are there any other important influencing factors in valuation process and decision-making of RES-E investments?
Does a known production site has influence on valuation? Makes it the cash flows more secure? Does this influence the discount rate?
What is the influence of leverage on the valuation?
Interview Protocol—1. part of interview (semi-structured interview) 381 Problems/Issues:
Have you ever encountered particular problems in valuation processes? If yes, which ones?
What would you improve in the valuation process?
In case of using DCF methods, do you discount free cash flows generated in the project itself or do you discount cash flows repatriated to the investing company ,e.g. to compute an Output IRR? What would be more appropriate?
There are critics propagating to decoupling time value of money and risk in valuation methods, e.g. as in the Certainty Equivalent method. Have you ever come across this problem? And have you ever considered such methods which address this issue?
Investment decisions:
What data and information have to be prepared and presented for the final investment decision?
Do you provide a final risk assessment as basis for the investment decision?
Are judgmental (“wertend/beurteilend/qualitative Beurteilung”) and/or non-mathematical components/determinants relevant in your decision-making process in case of RES-E investments? If yes, which ones and how?
Questions for the end of the interview:
Do you think that your organisation would consider additional methods in valuating RES-E investments if they are appropriate?
What is your personal opinion about this topic?
What do you think about this interview?
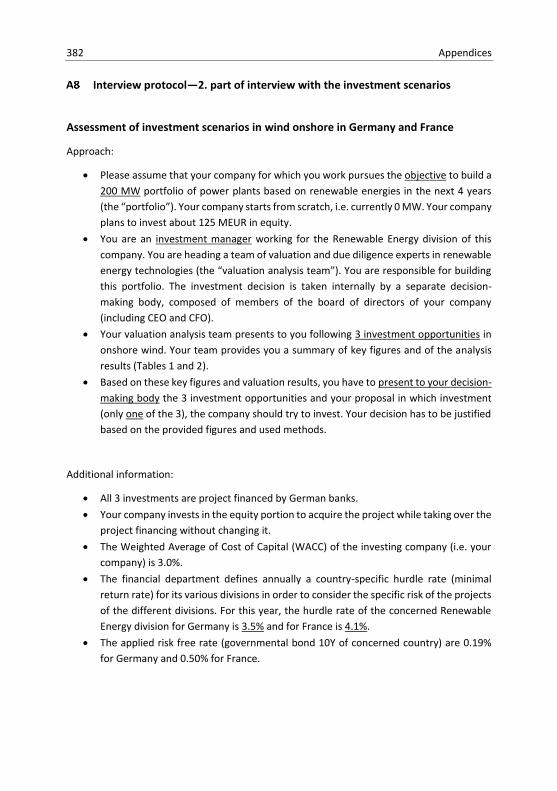
382 Appendices
Interview protocol—2. part of interview with the investment scenarios
Assessment of investment scenarios in wind onshore in Germany and France
Approach:
Please assume that your company for which you work pursues the objective to build a 200 MW portfolio of power plants based on renewable energies in the next 4 years (the “portfolio”). Your company starts from scratch, i.e. currently 0 MW. Your company plans to invest about 125 MEUR in equity.
You are an investment manager working for the Renewable Energy division of this company. You are heading a team of valuation and due diligence experts in renewable energy technologies (the “valuation analysis team”). You are responsible for building this portfolio. The investment decision is taken internally by a separate decision-making body, composed of members of the board of directors of your company (including CEO and CFO).
Your valuation analysis team presents to you following 3 investment opportunities in onshore wind. Your team provides you a summary of key figures and of the analysis results (Tables 1 and 2).
Based on these key figures and valuation results, you have to present to your decision-making body the 3 investment opportunities and your proposal in which investment (only one of the 3), the company should try to invest. Your decision has to be justified based on the provided figures and used methods.
Additional information:
All 3 investments are project financed by German banks. Your company invests in the equity portion to acquire the project while taking over the
project financing without changing it. The Weighted Average of Cost of Capital (WACC) of the investing company (i.e. your
company) is 3.0%. The financial department defines annually a country-specific hurdle rate (minimal
return rate) for its various divisions in order to consider the specific risk of the projects of the different divisions. For this year, the hurdle rate of the concerned Renewable Energy division for Germany is 3.5% and for France is 4.1%.
The applied risk free rate (governmental bond 10Y of concerned country) are 0.19% for Germany and 0.50% for France.
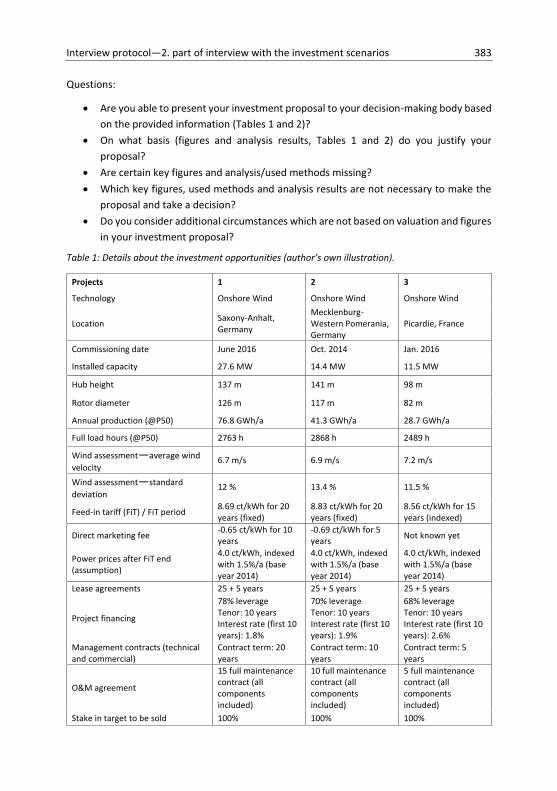
Interview protocol—2. part of interview with the investment scenarios 383 Questions:
Are you able to present your investment proposal to your decision-making body based on the provided information (Tables 1 and 2)?
On what basis (figures and analysis results, Tables 1 and 2) do you justify your proposal?
Are certain key figures and analysis/used methods missing? Which key figures, used methods and analysis results are not necessary to make the
proposal and take a decision? Do you consider additional circumstances which are not based on valuation and figures
in your investment proposal?
Table 1: Details about the investment opportunities (author’s own illustration).
Projects 1 2 3
Technology Onshore Wind Onshore Wind Onshore Wind
Location Saxony-Anhalt, Germany
Mecklenburg-Western Pomerania, Germany
Picardie, France
Commissioning date June 2016 Oct. 2014 Jan. 2016
Installed capacity 27.6 MW 14.4 MW 11.5 MW
Hub height 137 m 141 m 98 m
Rotor diameter 126 m 117 m 82 m
Annual production (@P50) 76.8 GWh/a 41.3 GWh/a 28.7 GWh/a
Full load hours (@P50) 2763 h 2868 h 2489 h
Wind assessment—average wind velocity
6.7 m/s 6.9 m/s 7.2 m/s
Wind assessment—standard deviation
12 % 13.4 % 11.5 %
Feed-in tariff (FiT) / FiT period 8.69 ct/kWh for 20 years (fixed)
8.83 ct/kWh for 20 years (fixed)
8.56 ct/kWh for 15 years (indexed)
Direct marketing fee -0.65 ct/kWh for 10 years
-0.69 ct/kWh for 5 years Not known yet
Power prices after FiT end (assumption)
4.0 ct/kWh, indexed with 1.5%/a (base year 2014)
4.0 ct/kWh, indexed with 1.5%/a (base year 2014)
4.0 ct/kWh, indexed with 1.5%/a (base year 2014)
Lease agreements 25 + 5 years 25 + 5 years 25 + 5 years
Project financing
78% leverage Tenor: 10 years Interest rate (first 10 years): 1.8%
70% leverage Tenor: 10 years Interest rate (first 10 years): 1.9%
68% leverage Tenor: 10 years Interest rate (first 10 years): 2.6%
Management contracts (technical and commercial)
Contract term: 20 years
Contract term: 10 years
Contract term: 5 years
O&M agreement
15 full maintenance contract (all components included)
10 full maintenance contract (all components included)
5 full maintenance contract (all components included)
Stake in target to be sold 100% 100% 100%
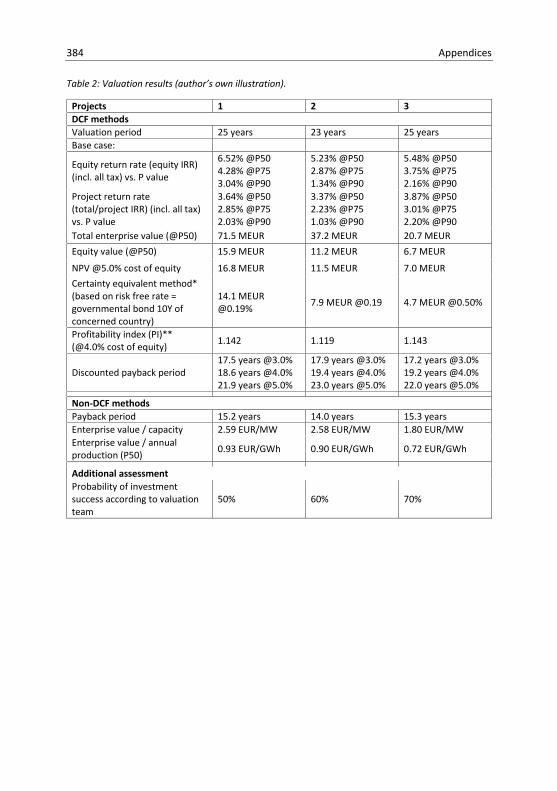
384 Appendices Table 2: Valuation results (author’s own illustration).
Projects 1 2 3 DCF methods Valuation period 25 years 23 years 25 years Base case:
Equity return rate (equity IRR) (incl. all tax) vs. P value
6.52% @P50 4.28% @P75 3.04% @P90
5.23% @P50 2.87% @P75 1.34% @P90
5.48% @P50 3.75% @P75 2.16% @P90
Project return rate (total/project IRR) (incl. all tax) vs. P value
3.64% @P50 2.85% @P75 2.03% @P90
3.37% @P50 2.23% @P75 1.03% @P90
3.87% @P50 3.01% @P75 2.20% @P90
Total enterprise value (@P50) 71.5 MEUR 37.2 MEUR 20.7 MEUR Equity value (@P50) 15.9 MEUR 11.2 MEUR 6.7 MEUR
NPV @5.0% cost of equity 16.8 MEUR 11.5 MEUR 7.0 MEUR Certainty equivalent method* (based on risk free rate = governmental bond 10Y of concerned country)
14.1 MEUR @0.19% 7.9 MEUR @0.19 4.7 MEUR @0.50%
Profitability index (PI)** (@4.0% cost of equity) 1.142 1.119 1.143
Discounted payback period 17.5 years @3.0% 18.6 years @4.0% 21.9 years @5.0%
17.9 years @3.0% 19.4 years @4.0% 23.0 years @5.0%
17.2 years @3.0% 19.2 years @4.0% 22.0 years @5.0%
Non-DCF methods Payback period 15.2 years 14.0 years 15.3 years Enterprise value / capacity 2.59 EUR/MW 2.58 EUR/MW 1.80 EUR/MW Enterprise value / annual production (P50) 0.93 EUR/GWh 0.90 EUR/GWh 0.72 EUR/GWh
Additional assessment Probability of investment success according to valuation team
50% 60% 70%
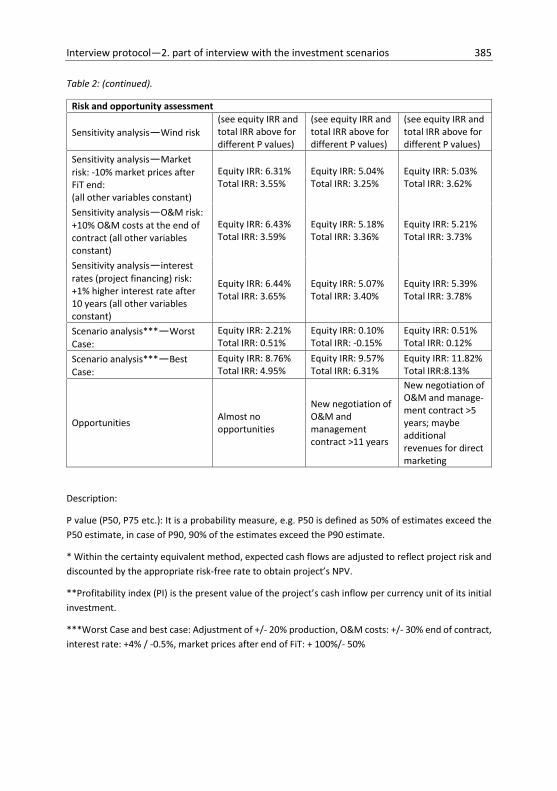
Interview protocol—2. part of interview with the investment scenarios 385 Table 2: (continued).
Risk and opportunity assessment
Sensitivity analysis—Wind risk (see equity IRR and total IRR above for different P values)
(see equity IRR and total IRR above for different P values)
(see equity IRR and total IRR above for different P values)
Sensitivity analysis—Market risk: -10% market prices after FiT end: (all other variables constant)
Equity IRR: 6.31% Total IRR: 3.55%
Equity IRR: 5.04% Total IRR: 3.25%
Equity IRR: 5.03% Total IRR: 3.62%
Sensitivity analysis—O&M risk: +10% O&M costs at the end of contract (all other variables constant)
Equity IRR: 6.43% Total IRR: 3.59%
Equity IRR: 5.18% Total IRR: 3.36%
Equity IRR: 5.21% Total IRR: 3.73%
Sensitivity analysis—interest rates (project financing) risk: +1% higher interest rate after 10 years (all other variables constant)
Equity IRR: 6.44% Total IRR: 3.65%
Equity IRR: 5.07% Total IRR: 3.40%
Equity IRR: 5.39% Total IRR: 3.78%
Scenario analysis***—Worst Case:
Equity IRR: 2.21% Total IRR: 0.51%
Equity IRR: 0.10% Total IRR: -0.15%
Equity IRR: 0.51% Total IRR: 0.12%
Scenario analysis***—Best Case:
Equity IRR: 8.76% Total IRR: 4.95%
Equity IRR: 9.57% Total IRR: 6.31%
Equity IRR: 11.82% Total IRR:8.13%
Opportunities Almost no opportunities
New negotiation of O&M and management contract >11 years
New negotiation of O&M and manage-ment contract >5 years; maybe additional revenues for direct marketing
Description:
P value (P50, P75 etc.): It is a probability measure, e.g. P50 is defined as 50% of estimates exceed the P50 estimate, in case of P90, 90% of the estimates exceed the P90 estimate.
* Within the certainty equivalent method, expected cash flows are adjusted to reflect project risk and discounted by the appropriate risk-free rate to obtain project’s NPV.
**Profitability index (PI) is the present value of the project’s cash inflow per currency unit of its initial investment.
***Worst Case and best case: Adjustment of +/- 20% production, O&M costs: +/- 30% end of contract, interest rate: +4% / -0.5%, market prices after end of FiT: + 100%/- 50%

386 Appendices
QUAN result tables
Figure 56: Organisation characteristics (author’s own illustration).
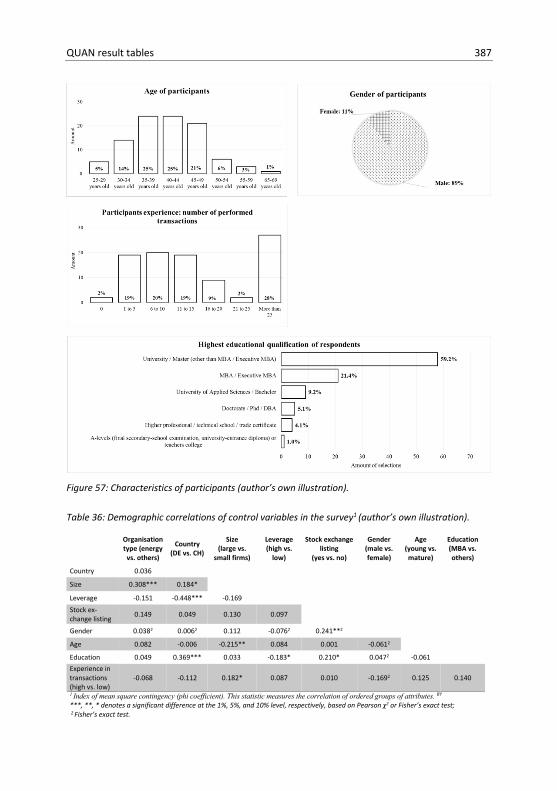
QUAN result tables 387
Figure 57: Characteristics of participants (author’s own illustration).
Table 36: Demographic correlations of control variables in the survey1 (author’s own illustration).
Organisation type (energy
vs. others)
Country (DE vs. CH)
Size (large vs.
small firms)
Leverage (high vs.
low)
Stock exchange listing
(yes vs. no)
Gender (male vs. female)
Age (young vs. mature)
Education (MBA vs. others)
Country 0.036
Size 0.308*** 0.184*
Leverage -0.151 -0.448*** -0.169 Stock ex-change listing 0.149 0.049 0.130 0.097
Gender 0.0382 0.0062 0.112 -0.0762 0.241**2
Age 0.082 -0.006 -0.215** 0.084 0.001 -0.0612
Education 0.049 0.369*** 0.033 -0.183* 0.210* 0.0472 -0.061 Experience in transactions (high vs. low)
-0.068 -0.112 0.182* 0.087 0.010 -0.1692 0.125 0.140
1 Index of mean square contingency (phi coefficient). This statistic measures the correlation of ordered groups of attributes. 81 ***, **, * denotes a significant difference at the 1%, 5%, and 10% level, respectively, based on Pearson χ2 or Fisher’s exact test; 2 Fisher’s exact test.
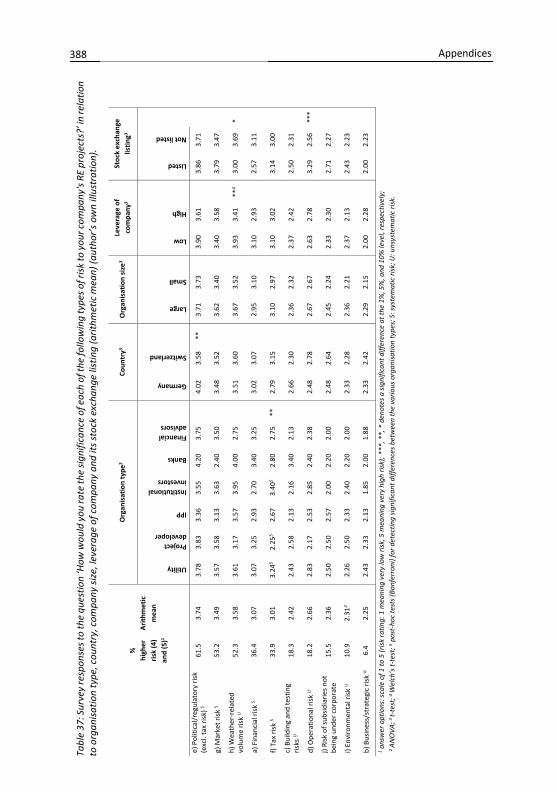
Tabl
e 37
: Sur
vey
resp
onse
s to
the
ques
tion
‘How
wou
ld y
ou ra
te th
e si
gnifi
canc
e of
eac
h of
the
follo
win
g ty
pes o
f risk
to y
our c
ompa
ny's
RE p
roje
cts?
’ in
rela
tion
to o
rgan
isat
ion
type
, cou
ntry
, com
pany
siz
e, le
vera
ge o
f com
pany
and
its
stoc
k ex
chan
ge li
stin
g (a
rithm
etic
mea
n) (a
utho
r’s o
wn
illus
trat
ion)
.
%
high
er
risk
(4)
and
(5)1
Arith
met
ic
mea
n
Org
anis
atio
n ty
pe2
Coun
try3
Org
anis
atio
n si
ze3
Leve
rage
of
com
pany
3 St
ock
exch
ange
lis
ting3
Utility
Project developer
IPP
Institutional investors
Banks
Financial advisors
Germany
Switzerland
Large
Small
Low
High
Listed
Not listed
e) P
oliti
cal/r
egul
ator
y ris
k (e
xcl.
tax
risk)
S 61
.5
3.74
3.78
3.
83
3.36
3.
55
4.20
3.
75
4.
02
3.58
**
3.
71
3.73
3.90
3.
61
3.
86
3.71
g) M
arke
t ris
k S
53.2
3.
49
3.
57
3.58
3.
13
3.63
2.
40
3.50
3.48
3.
52
3.
62
3.40
3.40
3.
58
3.
79
3.47
h) W
eath
er-r
elat
ed
volu
me
risk
U
52.3
3.
58
3.
61
3.17
3.
57
3.95
4.
00
2.75
3.51
3.
60
3.
67
3.52
3.93
3.
41
**4
3.00
3.
69
*
a) F
inan
cial
risk
S 36
.4
3.07
3.07
3.
25
2.93
2.
70
3.40
3.
25
3.
02
3.07
2.95
3.
10
3.
10
2.93
2.57
3.
11
f) Ta
x ris
k S
33.9
3.
01
3.
245
2.25
5 2.
67
3.40
5 2.
80
2.75
**
2.
79
3.15
3.10
2.
97
3.
10
3.02
3.14
3.
00
c) B
uild
ing
and
test
ing
risks
U
18.3
2.
42
2.
43
2.58
2.
13
2.16
3.
40
2.13
2.66
2.
30
2.
36
2.32
2.37
2.
42
2.
50
2.31
d) O
pera
tiona
l ris
k U
18.2
2.
66
2.
83
2.17
2.
53
2.85
2.
40
2.38
2.48
2.
78
2.
67
2.67
2.63
2.
78
3.
29
2.56
**
*
j) Ri
sk o
f sub
sidia
ries
not
bein
g un
der c
orpo
rate
15
.5
2.36
2.50
2.
50
2.57
2.
00
2.20
2.
00
2.
48
2.64
2.45
2.
24
2.
33
2.30
2.71
2.
27
i) En
viro
nmen
tal r
isk
U
10.9
2.
312
2.
26
2.50
2.
33
2.40
2.
20
2.00
2.33
2.
28
2.
36
2.21
2.37
2.
13
2.
43
2.23
b) B
usin
ess/
stra
tegi
c ris
k U
6.4
2.25
2.43
2.
33
2.13
1.
85
2.00
1.
88
2.
33
2.42
2.29
2.
15
2.
00
2.28
2.00
2.
23
1 ans
wer
opt
ions
: sca
le o
f 1 to
5 (r
isk
ratin
g: 1
mea
ning
ver
y lo
w ri
sk, 5
mea
ning
ver
y hi
gh ri
sk);
***,
**,
* d
enot
es a
sig
nific
ant d
iffer
ence
at t
he 1
%, 5
%, a
nd 1
0% le
vel,
resp
ectiv
ely;
2
ANO
VA; 3
t-te
st; 4
Wel
ch’s
t-te
st; 5 p
ost-
hoc
test
s (B
onfe
rron
i) fo
r det
ectin
g sig
nific
ant d
iffer
ence
s be
twee
n th
e va
rious
org
anis
atio
n ty
pes;
S: s
yste
mat
ic ri
sk; U
: uns
yste
mat
ic ri
sk.
388 Appendices
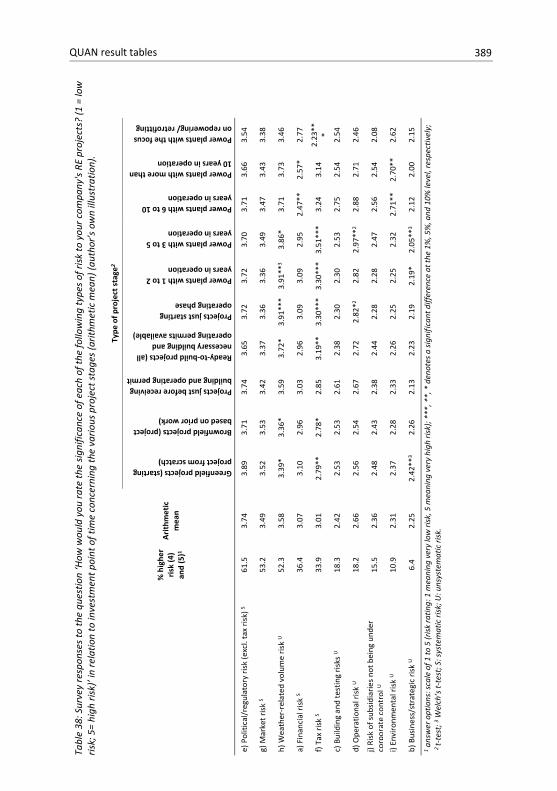
Tabl
e 38
: Sur
vey
resp
onse
s to
the
ques
tion
‘How
wou
ld y
ou ra
te th
e si
gnifi
canc
e of
eac
h of
the
follo
win
g ty
pes
of ri
sk to
you
r com
pany
's RE
pro
ject
s? (1
= lo
w
risk;
5=
high
risk
)’ in
rela
tion
to in
vest
men
t poi
nt o
f tim
e co
ncer
ning
the
vario
us p
roje
ct st
ages
(arit
hmet
ic m
ean)
(aut
hor’s
ow
n ill
ustr
atio
n).
%
hig
her
risk
(4)
and
(5)1
Arith
met
ic
mea
n
Type
of p
roje
ct s
tage
2
Greenfield projects (starting project from scratch)
Brownfield projects (project based on prior work)
Projects just before receiving building and operating permit
Ready-to-build projects (all necessary building and operating permits available)
Projects just starting operating phase
Power plants with 1 to 2 years in operation
Power plants with 3 to 5 years in operation
Power plants with 6 to 10 years in operation
Power plants with more than 10 years in operation
Power plants with the focus on repowering/ retrofitting
e) P
oliti
cal/
regu
lato
ry ri
sk (e
xcl.
tax
risk)
S 61
.5
3.74
3.89
3.
71
3.74
3.
65
3.72
3.
72
3.70
3.
71
3.66
3.
54
g) M
arke
t ris
k S
53.2
3.
49
3.
52
3.53
3.
42
3.37
3.
36
3.36
3.
49
3.47
3.
43
3.38
h) W
eath
er-r
elat
ed v
olum
e ris
k U
52.3
3.
58
3.
39*
3.36
* 3.
59
3.72
* 3.
91**
* 3.
91**
3 3.
86*
3.71
3.
73
3.46
a) F
inan
cial
risk
S 36
.4
3.07
3.10
2.
96
3.03
2.
96
3.09
3.
09
2.95
2.
47**
2.
57*
2.77
f) Ta
x ris
k S
33.9
3.
01
2.
79**
2.
78*
2.85
3.
19**
3.
30**
* 3.
30**
* 3.
51**
* 3.
24
3.14
2.
23**
* c)
Bui
ldin
g an
d te
stin
g ris
ks U
18
.3
2.42
2.53
2.
53
2.61
2.
38
2.30
2.
30
2.53
2.
75
2.54
2.
54
d) O
pera
tiona
l ris
k U
18.2
2.
66
2.
56
2.54
2.
67
2.72
2.
82*2
2.82
2.
97**
2 2.
88
2.71
2.
46
j) Ri
sk o
f sub
sidi
arie
s not
bei
ng u
nder
co
rpor
ate
cont
rol U
15
.5
2.36
2.48
2.
43
2.38
2.
44
2.28
2.
28
2.47
2.
56
2.54
2.
08
i) En
viro
nmen
tal r
isk
U
10.9
2.
31
2.
37
2.28
2.
33
2.26
2.
25
2.25
2.
32
2.71
**
2.70
**
2.62
b) B
usin
ess/
stra
tegi
c ris
k U
6.4
2.25
2.42
**3
2.26
2.
13
2.23
2.
19
2.19
* 2.
05**
3 2.
12
2.00
2.
15
1 ans
wer
opt
ions
: sca
le o
f 1 to
5 (r
isk
ratin
g: 1
mea
ning
ver
y lo
w ri
sk, 5
mea
ning
ver
y hi
gh ri
sk);
***,
**,
* d
enot
es a
sign
ifica
nt d
iffer
ence
at t
he 1
%, 5
%, a
nd 1
0% le
vel,
resp
ectiv
ely;
2
t-te
st; 3 W
elch
’s t-
test
; S: s
yste
mat
ic ri
sk; U
: uns
yste
mat
ic ri
sk.
QUAN result tables 389
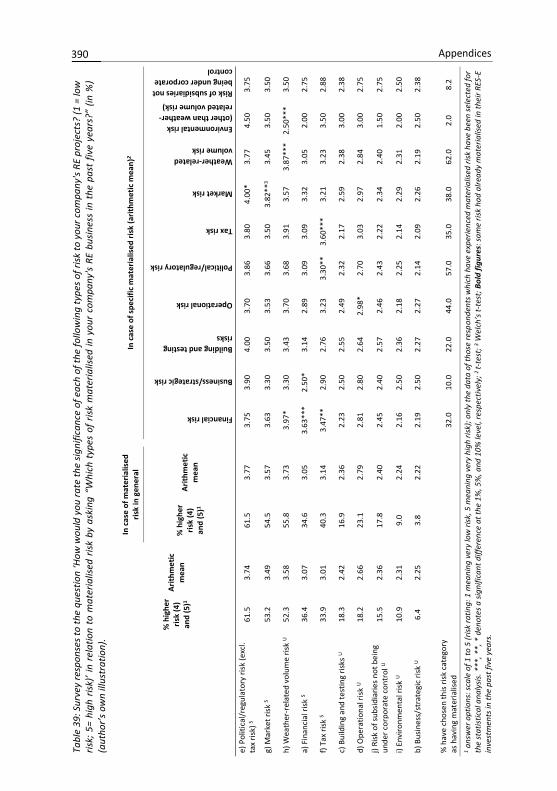
Tabl
e 39
: Sur
vey
resp
onse
s to
the
ques
tion
‘How
wou
ld y
ou ra
te th
e si
gnifi
canc
e of
eac
h of
the
follo
win
g ty
pes
of ri
sk to
you
r com
pany
's RE
pro
ject
s? (1
= lo
w
risk;
5=
high
risk
)’ in
rel
atio
n to
mat
eria
lised
risk
by
aski
ng “
Whi
ch t
ypes
of r
isk m
ater
ialis
ed in
you
r co
mpa
ny's
RE b
usin
ess
in t
he p
ast
five
year
s?”
(in %
) (a
utho
r’s o
wn
illus
trat
ion)
.
%
hig
her
risk
(4)
and
(5)1
Arith
met
ic
mea
n
In
cas
e of
mat
eria
lised
ris
k in
gen
eral
In c
ase
of s
peci
fic m
ater
ialis
ed ri
sk (a
rithm
etic
mea
n)2
% h
ighe
r ris
k (4
) an
d (5
)1
Arith
met
ic
mea
n
Financial risk
Business/strategic risk
Building and testing risks
Operational risk
Political/regulatory risk
Tax risk
Market risk
Weather-related volume risk
Environmental risk (other than weather-related volume risk)
Risk of subsidiaries not being under corporate control
e) P
oliti
cal/
regu
lato
ry ri
sk (e
xcl.
tax
risk)
S 61
.5
3.74
61.5
3.
77
3.
75
3.90
4.
00
3.70
3.
86
3.80
4.
00*
3.77
4.
50
3.75
g) M
arke
t ris
k S
53.2
3.
49
54
.5
3.57
3.63
3.
30
3.50
3.
53
3.66
3.
50
3.82
**3
3.45
3.
50
3.50
h) W
eath
er-r
elat
ed v
olum
e ris
k U
52.3
3.
58
55
.8
3.73
3.97
* 3.
30
3.43
3.
70
3.68
3.
91
3.57
3.
87**
* 2.
50**
* 3.
50
a) F
inan
cial
risk
S 36
.4
3.07
34.6
3.
05
3.
63**
* 2.
50*
3.14
2.
89
3.09
3.
09
3.32
3.
05
2.00
2.
75
f) Ta
x ris
k S
33.9
3.
01
40
.3
3.14
3.47
**
2.90
2.
76
3.23
3.
30**
3.
60**
* 3.
21
3.23
3.
50
2.88
c) B
uild
ing
and
test
ing
risks
U
18.3
2.
42
16
.9
2.36
2.23
2.
50
2.55
2.
49
2.32
2.
17
2.59
2.
38
3.00
2.
38
d) O
pera
tiona
l ris
k U
18.2
2.
66
23
.1
2.79
2.81
2.
80
2.64
2.
98*
2.70
3.
03
2.97
2.
84
3.00
2.
75
j) Ri
sk o
f sub
sidi
arie
s no
t bei
ng
unde
r cor
pora
te c
ontr
ol U
15
.5
2.36
17.8
2.
40
2.
45
2.40
2.
57
2.46
2.
43
2.22
2.
34
2.40
1.
50
2.75
i) En
viro
nmen
tal r
isk
U
10.9
2.
31
9.
0 2.
24
2.
16
2.50
2.
36
2.18
2.
25
2.14
2.
29
2.31
2.
00
2.50
b) B
usin
ess/
stra
tegi
c ris
k U
6.4
2.25
3.8
2.22
2.19
2.
50
2.27
2.
27
2.14
2.
09
2.26
2.
19
2.50
2.
38
%
hav
e ch
osen
this
risk
cat
egor
y as
hav
ing
mat
eria
lised
32
.0
10.0
22
.0
44.0
57
.0
35.0
38
.0
62.0
2.
0 8.
2
1 ans
wer
opt
ions
: sca
le o
f 1 to
5 (r
isk
ratin
g: 1
mea
ning
ver
y lo
w ri
sk, 5
mea
ning
ver
y hi
gh ri
sk);
only
the
data
of t
hose
resp
onde
nts w
hich
hav
e ex
perie
nced
mat
eria
lised
risk
hav
e be
en se
lect
ed fo
r th
e st
atis
tical
ana
lysi
s. *
**, *
*, *
den
otes
a si
gnifi
cant
diff
eren
ce a
t the
1%
, 5%
, and
10%
leve
l, re
spec
tivel
y; 2
t-te
st; 3 W
elch
’s t-
test
; Bol
d fig
ures
: sam
e ris
k ha
d al
read
y m
ater
ialis
ed in
thei
r RES
-E
inve
stm
ents
in th
e pa
st fi
ve y
ears
.
390 Appendices
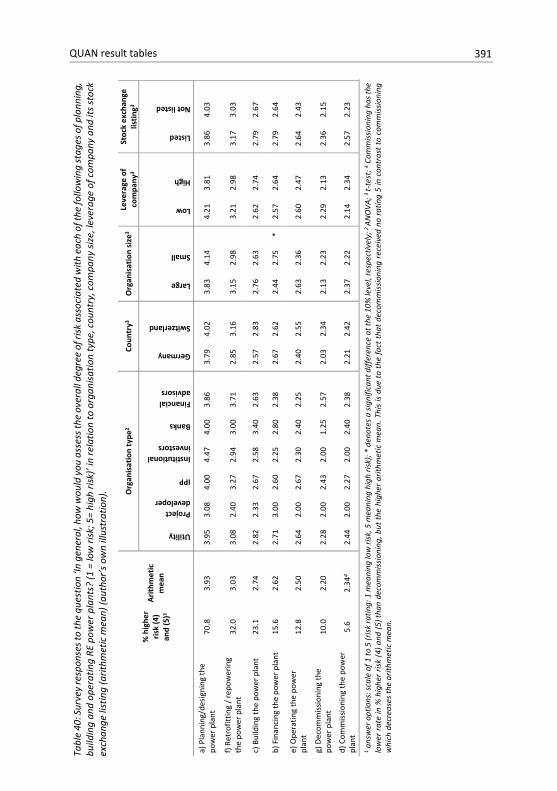
Tabl
e 40
: Sur
vey
resp
onse
s to
the
ques
tion
‘In g
ener
al, h
ow w
ould
you
ass
ess t
he o
vera
ll de
gree
of r
isk a
ssoc
iate
d w
ith e
ach
of th
e fo
llow
ing
stag
es o
f pla
nnin
g,
build
ing
and
oper
atin
g RE
pow
er p
lant
s? (1
= lo
w ri
sk; 5
= hi
gh ri
sk)’
in re
latio
n to
org
anis
atio
n ty
pe, c
ount
ry, c
ompa
ny s
ize,
leve
rage
of c
ompa
ny a
nd it
s sto
ck
exch
ange
list
ing
(arit
hmet
ic m
ean)
(aut
hor’s
ow
n ill
ustr
atio
n).
%
hig
her
risk
(4)
and
(5)1
Arith
met
ic
mea
n
Org
anis
atio
n ty
pe2
Coun
try3
Org
anis
atio
n si
ze3
Leve
rage
of
com
pany
3 St
ock
exch
ange
lis
ting3
Utility
Project developer
IPP
Institutional investors
Banks
Financial advisors
Germany
Switzerland
Large
Small
Low
High
Listed
Not listed
a) P
lann
ing/
desi
gnin
g th
e po
wer
pla
nt
70.8
3.
93
3.
95
3.08
4.
00
4.47
4.
00
3.86
3.79
4.
02
3.
83
4.14
4.21
3.
81
3.
86
4.03
f) Re
trof
ittin
g / r
epow
erin
g th
e po
wer
pla
nt
32.0
3.
03
3.
08
2.40
3.
27
2.94
3.
00
3.71
2.85
3.
16
3.
15
2.98
3.21
2.
98
3.
17
3.03
c) B
uild
ing
the
pow
er p
lant
23
.1
2.74
2.82
2.
33
2.67
2.
58
3.40
2.
63
2.
57
2.83
2.76
2.
63
2.
62
2.74
2.79
2.
67
b) F
inan
cing
the
pow
er p
lant
15
.6
2.62
2.71
3.
00
2.60
2.
25
2.80
2.
38
2.
67
2.62
2.44
2.
75
* 2.
57
2.64
2.79
2.
64
e) O
pera
ting
the
pow
er
plan
t 12
.8
2.50
2.64
2.
00
2.67
2.
30
2.40
2.
25
2.
40
2.55
2.63
2.
36
2.
60
2.47
2.64
2.
43
g) D
ecom
mis
sion
ing
the
pow
er p
lant
10
.0
2.20
2.28
2.
00
2.43
2.
00
1.25
2.
57
2.
03
2.34
2.13
2.
23
2.
29
2.13
2.36
2.
15
d) C
omm
issio
ning
the
pow
er
plan
t 5.
6 2.
344
2.
44
2.00
2.
27
2.00
2.
40
2.38
2.21
2.
42
2.
37
2.22
2.14
2.
34
2.
57
2.23
1 ans
wer
opt
ions
: sca
le o
f 1 to
5 (r
isk
ratin
g: 1
mea
ning
low
risk
, 5 m
eani
ng h
igh
risk)
; * d
enot
es a
sign
ifica
nt d
iffer
ence
at t
he 1
0% le
vel,
resp
ectiv
ely;
2 AN
OVA
; 3 t-
test
; 4 Com
miss
ioni
ng h
as th
e lo
wer
rat
e in
% h
ighe
r ris
k (4
) and
(5) th
an d
ecom
mis
sion
ing,
but
the
high
er a
rithm
etic
mea
n. T
his
is d
ue t
o th
e fa
ct t
hat d
ecom
mis
sioni
ng r
ecei
ved
no r
atin
g 5
in c
ontr
ast t
o co
mm
issi
onin
g w
hich
dec
reas
es th
e ar
ithm
etic
mea
n.
QUAN result tables 391
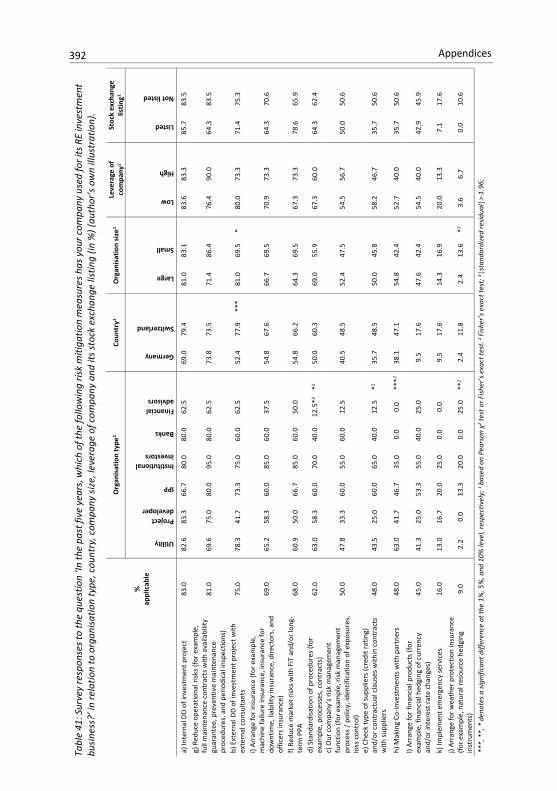
Tabl
e 41
: Sur
vey
resp
onse
s to
the
ques
tion
‘In th
e pa
st fi
ve y
ears
, whi
ch o
f the
follo
win
g ris
k m
itiga
tion
mea
sure
s has
you
r com
pany
use
d fo
r its
RE
inve
stm
ent
busi
ness
?’ in
rela
tion
to o
rgan
isat
ion
type
, cou
ntry
, com
pany
siz
e, le
vera
ge o
f com
pany
and
its
stoc
k ex
chan
ge li
stin
g (in
%) (
auth
or’s
ow
n ill
ustr
atio
n).
%
ap
plic
able
Org
anis
atio
n ty
pe1
Coun
try1
Org
anis
atio
n si
ze1
Leve
rage
of
com
pany
1 St
ock
exch
ange
lis
ting1
Utility
Project developer
IPP
Institutional investors
Banks
Financial advisors
Germany
Switzerland
Large
Small
Low
High
Listed
Not listed
a) In
tern
al D
D of
inve
stm
ent p
roje
ct
83.0
82.6
83
.3
66.7
80
.0
80.0
62
.5
69
.0
79.4
81.0
83
.1
83
.6
83.3
85.7
83
.5
g)
Red
uce
oper
atio
nal r
isks
(for e
xam
ple,
fu
ll m
aint
enan
ce c
ontr
acts
with
ava
ilabi
lity
guar
ante
e, p
reve
ntiv
e m
aint
enan
ce
proc
edur
es, a
nd p
erio
dica
l ins
pect
ions
)
81.0
69.6
75
.0
80.0
95
.0
80.0
62
.5
73
.8
73.5
71.4
86
.4
76
.4
90.0
64.3
83
.5
b) E
xter
nal D
D of
inve
stm
ent p
roje
ct w
ith
exte
rnal
con
sulta
nts
75.0
78.3
41
.7
73.3
75
.0
60.0
62
.5
52
.4
77.9
**
* 81
.0
69.5
*
80.0
73
.3
71
.4
75.3
i) Ar
rang
e fo
r ins
uran
ce (f
or e
xam
ple,
m
achi
ne fa
ilure
insu
ranc
e, in
sura
nce
for
dow
ntim
e, li
abili
ty in
sura
nce,
dire
ctor
s , a
nd
offic
ers i
nsur
ance
)
69.0
65.2
58
.3
60.0
85
.0
60.0
37
.5
54
.8
67.6
66.7
69
.5
70
.9
73.3
64.3
70
.6
f) Re
duce
mar
ket r
isks
with
FiT
and
/or l
ong-
term
PPA
68
.0
60
.9
50.0
66
.7
85.0
60
.0
50.0
54.8
66
.2
64
.3
69.5
67.3
73
.3
78
.6
65.9
d) S
tand
ardi
satio
n of
pro
cedu
res (
for
exam
ple,
pro
cess
es, c
ontr
acts
) 62
.0
63
.0
58.3
60
.0
70.0
40
.0
12.5
*3 *2
50.0
60
.3
69
.0
55.9
67.3
60
.0
64
.3
62.4
c) O
ur c
ompa
ny’s
risk
man
agem
ent
func
tion
(for e
xam
ple,
risk
man
agem
ent
proc
ess /
pol
icy,
iden
tific
atio
n of
exp
osur
es,
loss
con
trol
)
50.0
47.8
33
.3
60.0
55
.0
60.0
12
.5
40
.5
48.5
52.4
47
.5
54
.5
56.7
50.0
50
.6
e) C
heck
type
of s
uppl
iers
(cre
dit r
atin
g)
and/
or c
ontr
actu
al c
laus
es w
ithin
con
trac
ts
with
supp
liers
48
.0
43
.5
25.0
60
.0
65.0
40
.0
12.5
*2
35.7
48
.5
50
.0
45.8
58.2
46
.7
35
.7
50.6
h) M
akin
g Co
-inve
stm
ents
with
par
tner
s 48
.0
63
.0
41.7
46
.7
35.0
0.
0 0.
0 **
*2 38
.1
47.1
54.8
42
.4
52
.7
40.0
35.7
50
.6
l) Ar
rang
e fo
r fin
anci
al p
rodu
cts
(for
exam
ple,
fina
ncia
l hed
ging
of c
urre
ncy
and/
or in
tere
st ra
te c
hang
es)
45.0
41.3
25
.0
53.3
55
.0
40.0
25
.0
9.
5 17
.6
47
.6
42.4
54.5
40
.0
42
.9
45.9
k) Im
plem
ent e
mer
genc
y se
rvic
es
16.0
13.0
16
.7
20.0
25
.0
0.0
0.0
9.
5 17
.6
14
.3
16.9
20.0
13
.3
7.
1 17
.6
j)
Arra
nge
for w
eath
er p
rote
ctio
n in
sura
nce
(for e
xam
ple,
nat
ural
reso
urce
hed
ging
in
stru
men
ts)
9.0
2.
2 0.
0 13
.3
20.0
0.
0 25
.0
**2
2.4
11.8
2.4
13.6
*2
3.6
6.7
0.
0 10
.6
***,
**,
* d
enot
es a
sign
ifica
nt d
iffer
ence
at t
he 1
%, 5
%, a
nd 1
0% le
vel,
resp
ectiv
ely;
1 ba
sed
on P
ears
on χ
2 tes
t or F
isher
’s e
xact
test
. 2 Fi
sher
’s e
xact
test
; 3 │st
anda
rdiz
ed re
sidua
l│>
1.96
;
392 Appendices
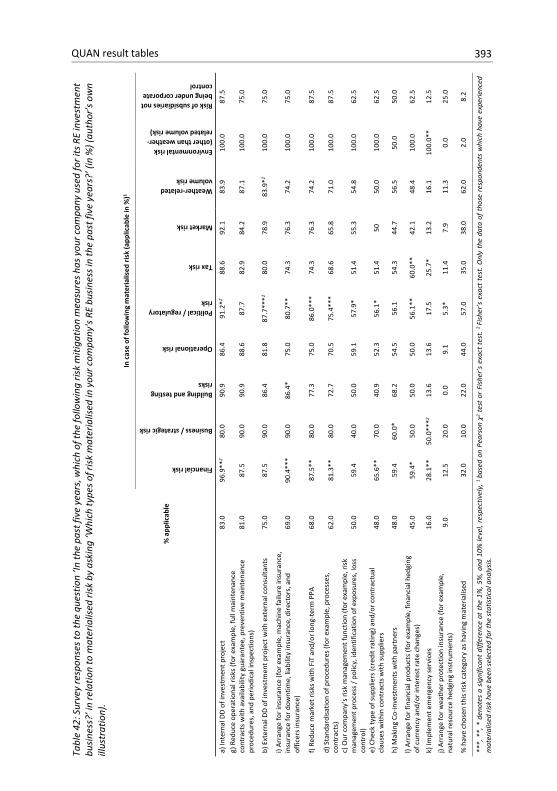
Tabl
e 42
: Sur
vey
resp
onse
s to
the
ques
tion
‘In th
e pa
st fi
ve y
ears
, whi
ch o
f the
follo
win
g ris
k m
itiga
tion
mea
sure
s has
you
r com
pany
use
d fo
r its
RE
inve
stm
ent
busi
ness
?’ in
rela
tion
to m
ater
ialis
ed ri
sk b
y as
king
‘Whi
ch ty
pes o
f ris
k m
ater
ialis
ed in
you
r com
pany
's RE
bus
ines
s in
the
past
five
yea
rs?’
(in
%) (
auth
or’s
ow
n ill
ustr
atio
n).
%
app
licab
le
In c
ase
of fo
llow
ing
mat
eria
lised
risk
(app
licab
le in
%)1
Financial risk
Business / strategic risk
Building and testing risks
Operational risk
Political / regulatory risk
Tax risk
Market risk
Weather-related volume risk
Environmental risk (other than weather-related volume risk)
Risk of subsidiaries not being under corporate control
a) In
tern
al D
D o
f inv
estm
ent p
roje
ct
83.0
96.9
**2
80.0
90
.9
86.4
91
.2*2
88.6
92
.1
83.9
10
0.0
87.5
g)
Red
uce
oper
atio
nal r
isks
(for
exa
mpl
e, fu
ll m
aint
enan
ce
cont
ract
s w
ith a
vaila
bilit
y gu
aran
tee,
pre
vent
ive
mai
nten
ance
pr
oced
ures
, and
per
iodi
cal i
nspe
ctio
ns)
81.0
87.5
90
.0
90.9
88
.6
87.7
82
.9
84.2
87
.1
100.
0 75
.0
b) E
xter
nal D
D o
f inv
estm
ent p
roje
ct w
ith e
xter
nal c
onsu
ltant
s 75
.0
87
.5
90.0
86
.4
81.8
87
.7**
*2 80
.0
78.9
83
.9*2
100.
0 75
.0
i) Ar
rang
e fo
r ins
uran
ce (f
or e
xam
ple,
mac
hine
failu
re in
sura
nce,
in
sura
nce
for d
ownt
ime,
liab
ility
insu
ranc
e, d
irect
ors,
and
of
ficer
s in
sura
nce)
69
.0
90
.4**
* 90
.0
86.4
* 75
.0
80.7
**
74.3
76
.3
74.2
10
0.0
75.0
f) Re
duce
mar
ket r
isks
with
FiT
and
/or l
ong-
term
PPA
68
.0
87
.5**
80
.0
77.3
75
.0
86.0
***
74.3
76
.3
74.2
10
0.0
87.5
d) S
tand
ardi
satio
n of
pro
cedu
res (
for e
xam
ple,
pro
cess
es,
cont
ract
s)
62.0
81.3
**
80.0
72
.7
70.5
75
.4**
* 68
.6
65.8
71
.0
100.
0 87
.5
c) O
ur c
ompa
ny’s
risk
man
agem
ent f
unct
ion
(for e
xam
ple,
risk
m
anag
emen
t pro
cess
/ p
olic
y, id
entif
icat
ion
of e
xpos
ures
, los
s co
ntro
l) 50
.0
59
.4
40.0
50
.0
59.1
57
.9*
51.4
55
.3
54.8
10
0.0
62.5
e) C
heck
type
of s
uppl
iers
(cre
dit r
atin
g) a
nd/o
r con
trac
tual
cl
ause
s with
in c
ontr
acts
with
sup
plie
rs
48.0
65.6
**
70.0
40
.9
52.3
56
.1*
51.4
50
50
.0
100.
0 62
.5
h) M
akin
g Co
-inve
stm
ents
with
par
tner
s 48
.0
59
.4
60.0
* 68
.2
54.5
56
.1
54.3
44
.7
56.5
50
.0
50.0
l) Ar
rang
e fo
r fin
anci
al p
rodu
cts
(for e
xam
ple,
fina
ncia
l hed
ging
of
cur
renc
y an
d/or
inte
rest
rate
cha
nges
) 45
.0
59
.4*
50.0
50
.0
50.0
56
.1**
60
.0**
42
.1
48.4
10
0.0
62.5
k) Im
plem
ent e
mer
genc
y se
rvic
es
16.0
28.1
**
50.0
***2
13.6
13
.6
17.5
25
.7*
13.2
16
.1
100.
0**
12.5
j) Ar
rang
e fo
r wea
ther
pro
tect
ion
insu
ranc
e (fo
r exa
mpl
e,
natu
ral r
esou
rce
hedg
ing
inst
rum
ents
) 9.
0
12.5
20
.0
0.0
9.1
5.3*
11
.4
7.9
11.3
0.
0 25
.0
% h
ave
chos
en th
is ri
sk c
ateg
ory
as h
avin
g m
ater
ialis
ed
32.0
10
.0
22.0
44
.0
57.0
35
.0
38.0
62
.0
2.0
8.2
***,
**,
* d
enot
es a
sig
nific
ant d
iffer
ence
at t
he 1
%, 5
%, a
nd 1
0% le
vel,
resp
ectiv
ely,
1 ba
sed
on P
ears
on χ
2 tes
t or
Fish
er’s
exa
ct te
st. 2
Fish
er’s
exa
ct te
st. O
nly
the
data
of t
hose
res
pond
ents
whi
ch h
ave
expe
rienc
ed
mat
eria
lised
risk
hav
e be
en s
elec
ted
for t
he s
tatis
tical
ana
lysi
s.
QUAN result tables 393
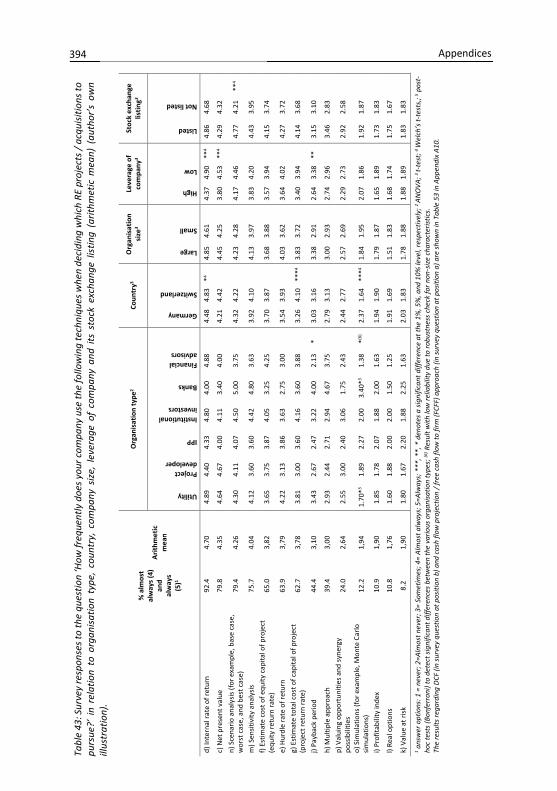
Tabl
e 43
: Sur
vey
resp
onse
s to
the
ques
tion
‘How
freq
uent
ly d
oes y
our c
ompa
ny u
se th
e fo
llow
ing
tech
niqu
es w
hen
deci
ding
whi
ch R
E pr
ojec
ts /
acqu
isiti
ons t
o pu
rsue
?’ i
n re
latio
n to
org
anis
atio
n ty
pe,
coun
try,
com
pany
siz
e, l
ever
age
of c
ompa
ny a
nd i
ts s
tock
exc
hang
e lis
ting
(arit
hmet
ic m
ean)
(au
thor
’s o
wn
illus
trat
ion)
.
% a
lmos
t al
way
s (4
) an
d al
way
s (5
)1
Arith
met
ic
mea
n
Org
anis
atio
n ty
pe2
Coun
try3
Org
anis
atio
n si
ze3
Leve
rage
of
com
pany
3 St
ock
exch
ange
lis
ting3
Utility
Project developer
IPP
Institutional investors
Banks
Financial advisors
Germany
Switzerland
Large
Small
High
Low
Listed
Not listed
d) In
tern
al ra
te o
f ret
urn
92.4
4.
70
4.
89
4.40
4.
33
4.80
4.
00
4.88
4.48
4.
83
*4 4.
85
4.61
4.37
4.
90
**4
4.86
4.
68
c) N
et p
rese
nt v
alue
79
.8
4.35
4.64
4.
67
4.00
4.
11
3.40
4.
00
4.
21
4.42
4.45
4.
25
3.
80
4.53
**
4 4.
29
4.32
n) S
cena
rio a
naly
sis (f
or e
xam
ple,
bas
e ca
se,
wor
st c
ase,
and
bes
t cas
e)
79.4
4.
26
4.
30
4.11
4.
07
4.50
5.
00
3.75
4.32
4.
22
4.
23
4.28
4.17
4.
46
4.
77
4.21
**
4
m) S
ensit
ivity
ana
lysis
75
.7
4.04
4.12
3.
60
3.60
4.
42
4.80
3.
63
3.
92
4.10
4.13
3.
97
3.
83
4.20
4.43
3.
95
f)
Estim
ate
cost
of e
quity
cap
ital o
f pro
ject
(e
quity
retu
rn ra
te)
65.0
3,
82
3.
65
3.75
3.
87
4.05
3.
25
4.25
3.70
3.
87
3.
68
3.88
3.57
3.
94
4.
15
3.74
e) H
urdl
e ra
te o
f ret
urn
63.9
3,
79
4.
22
3.13
3.
86
3.63
2.
75
3.00
3.54
3.
93
4.
03
3.62
3.64
4.
02
4.
27
3.72
g) E
stim
ate
tota
l cos
t of c
apita
l of p
roje
ct
(pro
ject
retu
rn ra
te)
62.7
3,
78
3.
81
3.00
3.
60
4.16
3.
60
3.88
3.26
4.
10
***4
3.83
3.
72
3.
40
3.94
4.14
3.
68
j) Pa
ybac
k pe
riod
44.4
3,
10
3.
43
2.67
2.
47
3.22
4.
00
2.13
*
3.03
3.
16
3.
38
2.91
2.64
3.
38
**
3.15
3.
10
h) M
ultip
le a
ppro
ach
39.4
3,
00
2.
93
2.44
2.
71
2.94
4.
67
3.75
2.79
3.
13
3.
00
2.93
2.74
2.
96
3.
46
2.83
p) V
alui
ng o
ppor
tuni
ties
and
syne
rgy
poss
ibili
ties
24.0
2,
64
2.
55
3.00
2.
40
3.06
1.
75
2.43
2.44
2.
77
2.
57
2.69
2.29
2.
73
2.
92
2.58
o) S
imul
atio
ns (f
or e
xam
ple,
Mon
te C
arlo
sim
ulat
ions
) 12
.2
1,94
1.70
*5 1.
89
2.27
2.
00
3.40
*5 1.
38
*(6)
2.37
1.
64
***4
1.84
1.
95
2.
07
1.86
1.92
1.
87
i) Pr
ofita
bilit
y in
dex
10.9
1,
90
1.
85
1.78
2.
07
1.88
2.
00
1.63
1.94
1.
90
1.
79
1.87
1.65
1.
89
1.
73
1.83
l) Re
al o
ptio
ns
10.8
1,
76
1.
60
1.88
2.
00
2.00
1.
50
1.25
1.91
1.
69
1.
51
1.83
1.68
1.
74
1.
75
1.67
k) V
alue
at r
isk
8.2
1,90
1.80
1.
67
2.20
1.
88
2.25
1.
63
2.
03
1.83
1.78
1.
88
1.
88
1.89
1.83
1.
83
1 ans
wer
opt
ions
: 1 =
nev
er; 2
=Alm
ost n
ever
; 3=
Som
etim
es; 4
= Al
mos
t alw
ays;
5=A
lway
s; *
**, *
*, *
den
otes
a s
igni
fican
t diff
eren
ce a
t the
1%
, 5%
, and
10%
leve
l, re
spec
tivel
y; 2
ANO
VA; 3
t-te
st; 4
Wel
ch’s
t-te
sts,
; 5 pos
t-ho
c te
sts
(Bon
ferr
oni)
to d
etec
t sig
nific
ant d
iffer
ence
s be
twee
n th
e va
rious
org
anisa
tion
type
s; (6
) Res
ult w
ith lo
w re
liabi
lity
due
to ro
bust
ness
che
ck fo
r non
-siz
e ch
arac
teris
tics.
Th
e re
sults
rega
rdin
g D
CF (i
n su
rvey
que
stio
n at
pos
ition
b) a
nd c
ash
flow
pro
ject
ion
/ fre
e ca
sh fl
ow to
firm
(FCF
F) a
ppro
ach
(in su
rvey
que
stio
n at
pos
ition
a) a
re s
how
n in
Tab
le 5
3 in
App
endi
x A1
0.
394 Appendices
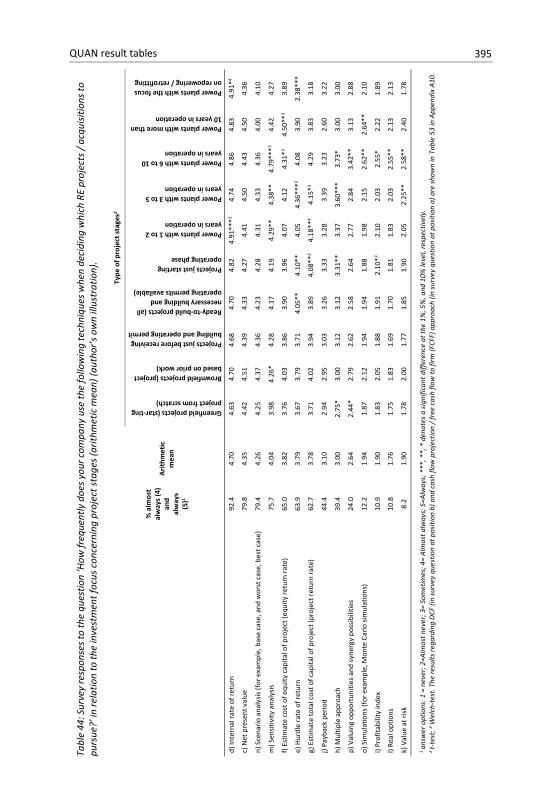
Tabl
e 44
: Sur
vey
resp
onse
s to
the
ques
tion
‘How
freq
uent
ly d
oes y
our c
ompa
ny u
se th
e fo
llow
ing
tech
niqu
es w
hen
deci
ding
whi
ch R
E pr
ojec
ts /
acqu
isiti
ons t
o pu
rsue
?’ in
rela
tion
to th
e in
vest
men
t foc
us c
once
rnin
g pr
ojec
t sta
ges (
arith
met
ic m
ean)
(aut
hor’s
ow
n ill
ustr
atio
n).
% a
lmos
t al
way
s (4
) an
d al
way
s (5
)1
Arith
met
ic
mea
n
Type
of p
roje
ct s
tage
s2
Greenfield projects (star-ting project from scratch)
Brownfield projects (project based on prior work)
Projects just before receiving building and operating permit
Ready-to-build projects (all necessary building and operating permits available)
Projects just starting operating phase
Power plants with 1 to 2 years in operation
Power plants with 3 to 5 years in operation
Power plants with 6 to 10 years in operation
Power plants with more than 10 years in operation
Power plants with the focus on repowering / retrofitting
d) In
tern
al ra
te o
f ret
urn
92.4
4.
70
4.
63
4.70
4.
68
4.70
4.
82
4.91
***3
4.74
4.
86
4.83
4.
91*4
c) N
et p
rese
nt v
alue
79
.8
4.35
4.42
4.
51
4.39
4.
33
4.27
4.
41
4.50
4.
43
4.50
4.
36
n) S
cena
rio a
naly
sis (f
or e
xam
ple,
bas
e ca
se, a
nd w
orst
cas
e, b
est c
ase)
79
.4
4.26
4.25
4.
37
4.36
4.
23
4.28
4.
31
4.33
4.
36
4.00
4.
10
m) S
ensit
ivity
ana
lysis
75
.7
4.04
3.98
4.
26*
4.28
4.
17
4.19
4.
29**
4.
38**
4.
79**
*3 4.
42
4.27
f) Es
timat
e co
st o
f equ
ity c
apita
l of p
roje
ct (e
quity
retu
rn ra
te)
65.0
3.
82
3.
76
4.03
3.
86
3.90
3.
96
4.07
4.
12
4.31
*3 4.
50**
3 3.
89
e) H
urdl
e ra
te o
f ret
urn
63.9
3.
79
3.
67
3.79
3.
71
4.05
**
4.10
**
4.05
4.
36**
*3 4.
08
3.90
2.
38**
*
g) E
stim
ate
tota
l cos
t of c
apita
l of p
roje
ct (p
roje
ct re
turn
rate
) 62
.7
3.78
3.71
4.
02
3.94
3.
89
4.08
**3
4.18
**4
4.15
*3 4.
29
3.83
3.
18
j) Pa
ybac
k pe
riod
44.4
3.
10
2.
94
2.95
3.
03
3.26
3.
33
3.28
3.
39
3.23
2.
60
3.22
h) M
ultip
le a
ppro
ach
39.4
3.
00
2.
75*
3.00
3.
12
3.12
3.
31**
3.
37
3.60
***
3.73
* 3.
00
3.00
p) V
alui
ng o
ppor
tuni
ties a
nd sy
nerg
y po
ssib
ilitie
s 24
.0
2.64
2.44
* 2.
79
2.62
2.
58
2.64
2.
77
2.84
3.
42**
3.
13
2.88
o) S
imul
atio
ns (f
or e
xam
ple,
Mon
te C
arlo
sim
ulat
ions
) 12
.2
1.94
1.87
2.
12
1.94
1.
94
1.88
1.
98
2.15
2.
62**
2.
64**
2.
10
i) Pr
ofita
bilit
y in
dex
10.9
1.
90
1.
83
2.05
1.
88
1.91
2.
10*3
2.10
2.
03
2.55
* 2.
22
1.89
l) Re
al o
ptio
ns
10.8
1.
76
1.
75
1.83
1.
69
1.70
1.
81
1.83
2.
03
2.55
**
2.13
2.
13
k) V
alue
at r
isk
8.2
1.90
1.78
2.
00
1.77
1.
85
1.90
2.
05
2.25
**
2.58
**
2.40
1.
78
1 an
swer
opt
ions
: 1 =
nev
er; 2
=Alm
ost n
ever
; 3=
Som
etim
es; 4
= Al
mos
t alw
ays;
5=A
lway
s; *
**, *
*, *
den
otes
a s
igni
fican
t diff
eren
ce a
t the
1%
, 5%
, and
10%
leve
l, re
spec
tivel
y.
2 t-
test
; 3 Wel
ch-t
est.
The
resu
lts re
gard
ing
DCF
(in
surv
ey q
uest
ion
at p
ositi
on b
) and
cas
h flo
w p
roje
ctio
n / f
ree
cash
flow
to fi
rm (F
CFF)
app
roac
h (in
sur
vey
ques
tion
at p
ositi
on a
) are
show
n in
Tab
le 5
3 in
App
endi
x A1
0.
QUAN result tables 395
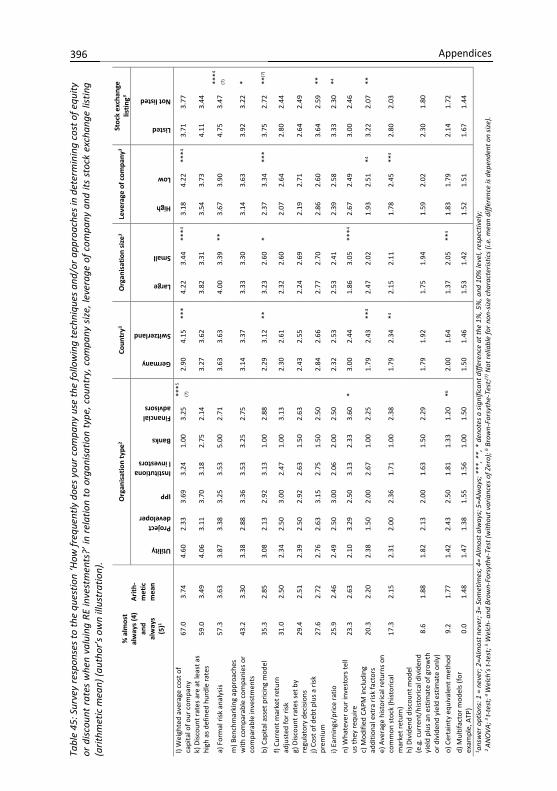
Tabl
e 45
: Sur
vey
resp
onse
s to
the
ques
tion
‘How
freq
uent
ly d
oes
your
com
pany
use
the
follo
win
g te
chni
ques
and
/or a
ppro
ache
s in
det
erm
inin
g co
st o
f equ
ity
or d
isco
unt r
ates
whe
n va
luin
g RE
inve
stm
ents
?’ in
rela
tion
to o
rgan
isat
ion
type
, cou
ntry
, com
pany
siz
e, le
vera
ge o
f com
pany
and
its
stoc
k ex
chan
ge li
stin
g (a
rithm
etic
mea
n) (a
utho
r’s o
wn
illus
trat
ion)
.
% a
lmos
t al
way
s (4
) an
d al
way
s (5
)1
Arith
-m
etic
m
ean
Org
anis
atio
n ty
pe2
Coun
try3
Org
anis
atio
n si
ze3
Leve
rage
of c
ompa
ny3
Stoc
k ex
chan
ge
listin
g3
Utility
Project developer
IPP
Institutional investors
Banks
Financial advisors
Germany
Switzerland
Large
Small
High
Low
Listed
Not listed
l) W
eigh
ted
aver
age
cost
of
capi
tal o
f our
com
pany
67
.0
3.74
4.60
2.
33
3.69
3.
24
1.00
3.
25
***5
(7)
2.90
4.
15
***
4.22
3.
44
***4
3.18
4.
22
***4
3.71
3.
77
k) D
isco
unt r
ates
are
at l
east
as
high
as
defin
ed h
urdl
e ra
tes
59.0
3.
49
4.
06
3.11
3.
70
3.18
2.
75
2.14
3.27
3.
62
3.
82
3.31
3.54
3.
73
4.
11
3.44
a) F
orm
al ri
sk a
naly
sis
57.3
3.
63
3.
87
3.38
3.
25
3.53
5.
00
2.71
3.63
3.
63
4.
00
3.39
**
3.
67
3.90
4.75
3.
47
***4
(7)
m) B
ench
mar
king
app
roac
hes
with
com
para
ble
com
pani
es o
r co
mpa
rabl
e in
vest
men
ts
43.2
3.
30
3.
38
2.88
3.
36
3.53
3.
25
2.75
3.14
3.
37
3.
33
3.30
3.14
3.
63
3.
92
3.22
*
b) C
apita
l ass
et p
ricin
g m
odel
35
.3
2.85
3.08
2.
13
2.92
3.
13
1.00
2.
88
2.
29
3.12
**
3.
23
2.60
*
2.37
3.
34
***
3.75
2.
72
**(7
)
f) Cu
rren
t mar
ket r
etur
n ad
just
ed fo
r ris
k 31
.0
2.50
2.34
2.
50
3.00
2.
47
1.00
3.
13
2.
30
2.61
2.32
2.
60
2.
07
2.64
2.80
2.
44
g) D
isco
unt r
ates
set
by
regu
lato
ry d
ecis
ions
29
.4
2.51
2.39
2.
50
2.92
2.
63
1.50
2.
63
2.
43
2.55
2.24
2.
69
2.
19
2.71
2.64
2.
49
j) Co
st o
f deb
t plu
s a ri
sk
prem
ium
27
.6
2.72
2.76
2.
63
3.15
2.
75
1.50
2.
50
2.
84
2.66
2.77
2.
70
2.
86
2.60
3.64
2.
59
**
i) Ea
rnin
gs/p
rice
ratio
25
.9
2.46
2.49
2.
50
3.00
2.
06
2.00
2.
50
2.
32
2.53
2.53
2.
41
2.
39
2.58
3.33
2.
30
*4 n)
Wha
teve
r our
inve
stor
s te
ll us
they
requ
ire
23.3
2.
63
2.
10
3.29
2.
50
3.13
2.
33
3.60
*
3.00
2.
44
1.
86
3.05
**
*4 2.
67
2.49
3.00
2.
46
c) M
odifi
ed C
APM
incl
udin
g ad
ditio
nal e
xtra
risk
fact
ors
20.3
2.
20
2.
38
1.50
2.
00
2.67
1.
00
2.25
1.79
2.
43
**4
2.47
2.
02
1.
93
2.51
*4
3.22
2.
07
**
e) A
vera
ge h
isto
rical
retu
rns o
n co
mm
on st
ock
(hist
oric
al
mar
ket r
etur
n)
17.3
2.
15
2.
31
2.00
2.
36
1.71
1.
00
2.38
1.79
2.
34
*4 2.
15
2.11
1.78
2.
45
**4
2.80
2.
03
h) D
ivid
end
disc
ount
mod
el
(e.g
. cur
rent
/his
toric
al d
ivid
end
yiel
d pl
us a
n es
timat
e of
gro
wth
or
div
iden
d yi
eld
estim
ate
only
)
8.6
1.88
1.82
2.
13
2.00
1.
63
1.50
2.
29
1.
79
1.92
1.75
1.
94
1.
59
2.02
2.30
1.
80
o) C
erta
inty
equ
ival
ent m
etho
d 9.
2 1.
77
1.
42
2.43
2.
50
1.81
1.
33
1.20
*6
2.00
1.
64
1.
37
2.05
**
4 1.
83
1.79
2.14
1.
72
d)
Mul
tifac
tor m
odel
s (fo
r ex
ampl
e, A
TP)
0.0
1.48
1.47
1.
38
1.55
1.
56
1.00
1.
50
1.
50
1.46
1.53
1.
42
1.
52
1.51
1.67
1.
44
1 ans
wer
opt
ions
: 1 =
nev
er; 2
=Alm
ost n
ever
; 3=
Som
etim
es; 4
= Al
mos
t alw
ays;
5=A
lway
s; *
**, *
*, *
den
otes
a s
igni
fican
t diff
eren
ce a
t the
1%
, 5%
, and
10%
leve
l, re
spec
tivel
y;
2 AN
OVA
; 3 t-
test
; 4 W
elch
’s t-
test
; 5 Wel
ch- a
nd B
row
n-Fo
rsyt
he-T
est (
with
out v
aria
nces
of Z
ero)
; 6 Bro
wn-
Fors
ythe
-Tes
t;(7) N
ot re
liabl
e fo
r non
-size
cha
ract
eris
tics
(i.e.
mea
n di
ffere
nce
is de
pend
ent o
n siz
e).
396 Appendices
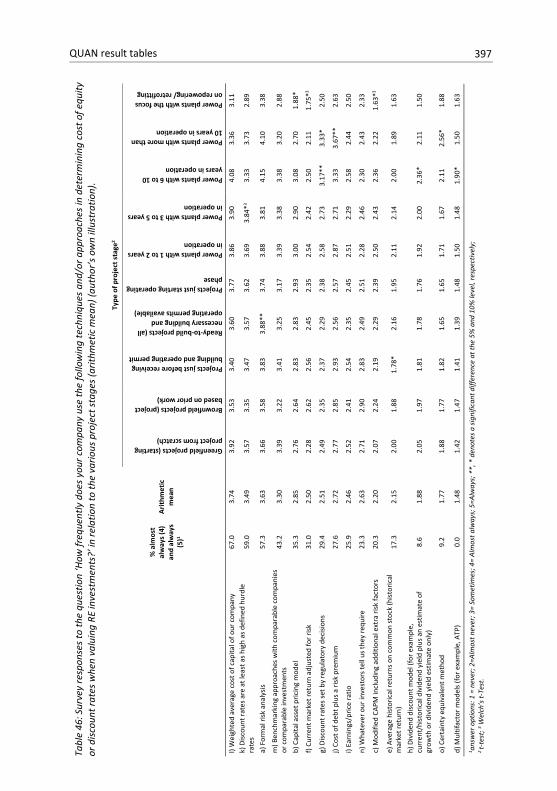
Tabl
e 46
: Sur
vey
resp
onse
s to
the
ques
tion
‘How
freq
uent
ly d
oes
your
com
pany
use
the
follo
win
g te
chni
ques
and
/or a
ppro
ache
s in
det
erm
inin
g co
st o
f equ
ity
or d
isco
unt r
ates
whe
n va
luin
g RE
inve
stm
ents
?’ in
rela
tion
to th
e va
rious
pro
ject
sta
ges (
arith
met
ic m
ean)
(aut
hor’s
ow
n ill
ustr
atio
n).
%
alm
ost
alw
ays
(4)
and
alw
ays
(5)1
Arith
met
ic
mea
n
Type
of p
roje
ct s
tage
2
Greenfield projects (starting project from scratch)
Brownfield projects (project based on prior work)
Projects just before receiving building and operating permit
Ready-to-build projects (all necessary building and operating permits available)
Projects just starting operating phase
Power plants with 1 to 2 years in operation
Power plants with 3 to 5 years in operation
Power plants with 6 to 10 years in operation
Power plants with more than 10 years in operation
Power plants with the focus on repowering/ retrofitting
l) W
eigh
ted
aver
age
cost
of c
apita
l of o
ur c
ompa
ny
67.0
3.
74
3.
92
3.53
3.
40
3.60
3.
77
3.86
3.
90
4.08
3.
36
3.11
k)
Dis
coun
t rat
es a
re a
t lea
st a
s hi
gh a
s de
fined
hur
dle
rate
s 59
.0
3.49
3.57
3.
35
3.47
3.
57
3.62
3.
69
3.84
*3 3.
33
3.73
2.
89
a) F
orm
al ri
sk a
naly
sis
57.3
3.
63
3.
66
3.58
3.
83
3.88
**
3.74
3.
88
3.81
4.
15
4.10
3.
38
m) B
ench
mar
king
app
roac
hes
with
com
para
ble
com
pani
es
or c
ompa
rabl
e in
vest
men
ts
43.2
3.
30
3.
39
3.22
3.
41
3.25
3.
17
3.39
3.
38
3.38
3.
20
2.88
b) C
apita
l ass
et p
ricin
g m
odel
35
.3
2.85
2.76
2.
64
2.83
2.
83
2.93
3.
00
2.90
3.
08
2.70
1.
88*
f) Cu
rren
t mar
ket r
etur
n ad
just
ed fo
r ris
k 31
.0
2.50
2.28
2.
62
2.56
2.
45
2.35
2.
54
2.42
2.
50
2.11
1.
75*3
g) D
isco
unt r
ates
set
by
regu
lato
ry d
ecisi
ons
29.4
2.
51
2.
49
2.35
2.
37
2.29
2.
38
2.58
2.
73
3.17
**
3.33
* 2.
50
j) Co
st o
f deb
t plu
s a ri
sk p
rem
ium
27
.6
2.72
2.77
2.
85
2.93
2.
56
2.57
2.
87
2.71
3.
33
3.67
**
2.63
i) Ea
rnin
gs/p
rice
ratio
25
.9
2.46
2.52
2.
41
2.54
2.
35
2.45
2.
51
2.29
2.
58
2.44
2.
50
n) W
hate
ver o
ur in
vest
ors t
ell u
s the
y re
quire
23
.3
2.63
2.71
2.
90
2.83
2.
49
2.51
2.
28
2.46
2.
30
2.43
2.
33
c) M
odifi
ed C
APM
incl
udin
g ad
ditio
nal e
xtra
risk
fact
ors
20.3
2.
20
2.
07
2.24
2.
19
2.29
2.
39
2.50
2.
43
2.36
2.
22
1.63
*3
e) A
vera
ge h
isto
rical
retu
rns o
n co
mm
on s
tock
(his
toric
al
mar
ket r
etur
n)
17.3
2.
15
2.
00
1.88
1.
78*
2.16
1.
95
2.11
2.
14
2.00
1.
89
1.63
h) D
ivid
end
disc
ount
mod
el (f
or e
xam
ple,
cu
rren
t/hi
stor
ical
div
iden
d yi
eld
plus
an
estim
ate
of
grow
th o
r div
iden
d yi
eld
estim
ate
only
) 8.
6 1.
88
2.
05
1.97
1.
81
1.78
1.
76
1.92
2.
00
2.36
* 2.
11
1.50
o) C
erta
inty
equ
ival
ent m
etho
d 9.
2 1.
77
1.
88
1.77
1.
82
1.65
1.
65
1.71
1.
67
2.11
2.
56*
1.88
d) M
ultif
acto
r mod
els
(for e
xam
ple,
ATP
) 0.
0 1.
48
1.
42
1.47
1.
41
1.39
1.
48
1.50
1.
48
1.90
* 1.
50
1.63
1 ans
wer
opt
ions
: 1 =
nev
er; 2
=Alm
ost n
ever
; 3=
Som
etim
es; 4
= Al
mos
t alw
ays;
5=A
lway
s; *
*, *
den
otes
a s
igni
fican
t diff
eren
ce a
t the
5%
and
10%
leve
l, re
spec
tivel
y;
2 t-
test
; 3 Wel
ch’s
t-Te
st.
QUAN result tables 397
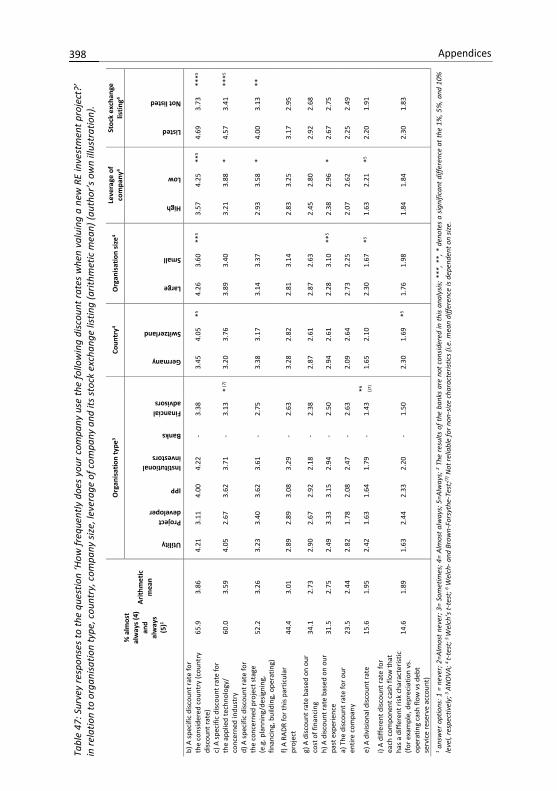
Tabl
e 47
: Sur
vey
resp
onse
s to
the
ques
tion
‘How
freq
uent
ly d
oes
your
com
pany
use
the
follo
win
g di
scou
nt ra
tes
whe
n va
luin
g a
new
RE
inve
stm
ent p
roje
ct?’
in
rela
tion
to o
rgan
isat
ion
type
, cou
ntry
, com
pany
siz
e, le
vera
ge o
f com
pany
and
its s
tock
exc
hang
e lis
ting
(arit
hmet
ic m
ean)
(aut
hor’s
ow
n ill
ustr
atio
n).
% a
lmos
t al
way
s (4
) an
d al
way
s (5
)1
Arith
met
ic
mea
n
Org
anis
atio
n ty
pe3
Coun
try4
Org
anis
atio
n si
ze4
Leve
rage
of
com
pany
4 St
ock
exch
ange
lis
ting4
Utility
Project developer
IPP
Institutional investors
Banks
Financial advisors
Germany
Switzerland
Large
Small
High
Low
Listed
Not listed
b) A
spec
ific
disc
ount
rate
for
the
cons
ider
ed c
ount
ry (c
ount
ry
disc
ount
rate
) 65
.9
3.86
4.21
3.
11
4.00
4.
22
- 3.
38
3.
45
4.05
*5
4.26
3.
60
**5
3.57
4.
25
**5
4.69
3.
73
***5
c) A
spec
ific
disc
ount
rate
for
the
appl
ied
tech
nolo
gy/
conc
erne
d in
dust
ry
60.0
3.
59
4.
05
2.67
3.
62
3.71
-
3.13
* (7
) 3.
20
3.76
3.89
3.
40
3.
21
3.88
*
4.57
3.
41
***5
d) A
spec
ific
disc
ount
rate
for
the
conc
erne
d pr
ojec
t sta
ge
(e.g
. pla
nnin
g/de
signi
ng,
finan
cing
, bui
ldin
g, o
pera
ting)
52.2
3.
26
3.
23
3.40
3.
62
3.61
-
2.75
3.38
3.
17
3.
14
3.37
2.93
3.
58
* 4.
00
3.13
**
f) A
RADR
for t
his p
artic
ular
pr
ojec
t 44
.4
3.01
2.89
2.
89
3.08
3.
29
- 2.
63
3.
28
2.82
2.81
3.
14
2.
83
3.25
3.17
2.
95
g) A
disc
ount
rate
bas
ed o
n ou
r co
st o
f fin
anci
ng
34.1
2.
73
2.
90
2.67
2.
92
2.18
-
2.38
2.87
2.
61
2.
87
2.63
2.45
2.
80
2.
92
2.68
h) A
disc
ount
rate
bas
ed o
n ou
r pa
st e
xper
ienc
e 31
.5
2.75
2.49
3.
33
3.15
2.
94
- 2.
50
2.
94
2.61
2.28
3.
10
**5
2.38
2.
96
* 2.
67
2.75
a) T
he d
iscou
nt ra
te fo
r our
en
tire
com
pany
23
.5
2.44
2.82
1.
78
2.08
2.
47
- 2.
63
2.
09
2.64
2.73
2.
25
2.
07
2.62
2.25
2.
49
e) A
div
ision
al d
iscou
nt ra
te
15.6
1.
95
2.
42
1.63
1.
64
1.79
-
1.43
*6
()7)
1.
65
2.10
2.30
1.
67
*5 1.
63
2.21
*5
2.20
1.
91
i) A
diffe
rent
disc
ount
rate
for
each
com
pone
nt c
ash
flow
that
ha
s a d
iffer
ent r
isk c
hara
cter
istic
(fo
r exa
mpl
e, d
epre
ciat
ion
vs.
oper
atin
g ca
sh fl
ow v
s deb
t se
rvic
e re
serv
e ac
coun
t)
14.6
1.
89
1.
63
2.44
2.
33
2.20
-
1.50
2.30
1.
69
*5 1.
76
1.98
1.84
1.
84
2.
30
1.83
1 ans
wer
opt
ions
: 1 =
nev
er; 2
=Alm
ost n
ever
; 3=
Som
etim
es; 4
= Al
mos
t alw
ays;
5=A
lway
s; 2 T
he re
sults
of t
he b
anks
are
not
con
side
red
in th
is an
alys
is; *
**, *
*, *
den
otes
a s
igni
fican
t diff
eren
ce a
t the
1%
, 5%
, and
10%
le
vel,
resp
ectiv
ely;
3 AN
OVA
; 4 t-
test
; 5 W
elch
’s t-
test
; 6 Wel
ch- a
nd B
row
n-Fo
rsyt
he-T
est;(7
) Not
relia
ble
for n
on-s
ize
char
acte
ristic
s (i.
e. m
ean
diffe
renc
e is
depe
nden
t on
size
.
398 Appendices
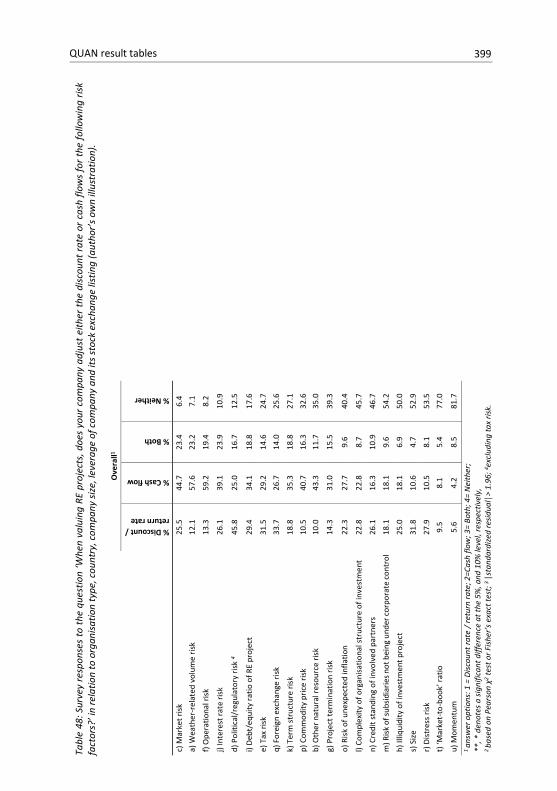
Tabl
e 48
: Sur
vey
resp
onse
s to
the
ques
tion
‘Whe
n va
luin
g RE
pro
ject
s, d
oes
your
com
pany
adj
ust e
ither
the
disc
ount
rate
or
cash
flow
s fo
r the
follo
win
g ris
k fa
ctor
s?’ i
n re
latio
n to
org
anis
atio
n ty
pe, c
ount
ry, c
ompa
ny s
ize,
leve
rage
of c
ompa
ny a
nd it
s st
ock
exch
ange
list
ing
(aut
hor’s
ow
n ill
ustr
atio
n).
Ove
rall1
% Discount / return rate
% Cash flow
% Both
% Neither
c) M
arke
t ris
k 25
.5
44.7
23
.4
6.4
a) W
eath
er-r
elat
ed v
olum
e ris
k 12
.1
57.6
23
.2
7.1
f) O
pera
tiona
l ris
k 13
.3
59.2
19
.4
8.2
j) In
tere
st ra
te ri
sk
26.1
39
.1
23.9
10
.9
d) P
oliti
cal/r
egul
ator
y ris
k 4
45.8
25
.0
16.7
12
.5
i) D
ebt/
equi
ty ra
tio o
f RE
proj
ect
29.4
34
.1
18.8
17
.6
e) T
ax ri
sk
31.5
29
.2
14.6
24
.7
q) F
orei
gn e
xcha
nge
risk
33
.7
26.7
14
.0
25.6
k) T
erm
stru
ctur
e ris
k 18
.8
35.3
18
.8
27.1
p)
Com
mod
ity p
rice
risk
10.5
40
.7
16.3
32
.6
b) O
ther
nat
ural
reso
urce
risk
10
.0
43.3
11
.7
35.0
g) P
roje
ct te
rmin
atio
n ris
k 14
.3
31.0
15
.5
39.3
o) R
isk
of u
nexp
ecte
d in
flatio
n 22
.3
27.7
9.
6 40
.4
l) Co
mpl
exity
of o
rgan
isat
iona
l str
uctu
re o
f inv
estm
ent
22.8
22
.8
8.7
45.7
n) C
redi
t sta
ndin
g of
invo
lved
par
tner
s 26
.1
16.3
10
.9
46.7
m) R
isk o
f sub
sidia
ries n
ot b
eing
und
er c
orpo
rate
con
trol
18
.1
18.1
9.
6 54
.2
h) Il
liqui
dity
of i
nves
tmen
t pro
ject
25
.0
18.1
6.
9 50
.0
s) S
ize
31.8
10
.6
4.7
52.9
r) D
istr
ess r
isk
27.9
10
.5
8.1
53.5
t)
‘Mar
ket-
to-b
ook’
ratio
9.
5 8.
1 5.
4 77
.0
u) M
omen
tum
5.
6 4.
2 8.
5 81
.7
1 an
swer
opt
ions
: 1 =
Dis
coun
t rat
e /
retu
rn ra
te; 2
=Cas
h flo
w; 3
= Bo
th; 4
= N
eith
er;
**, *
den
otes
a s
igni
fican
t diff
eren
ce a
t the
5%
, and
10%
leve
l, re
spec
tivel
y,
2 ba
sed
on P
ears
on χ
2 tes
t or F
ishe
r’s e
xact
test
; 3 │s
tand
ardi
zed
resid
ual│
> 1.
96; 4 e
xclu
ding
tax
risk.
QUAN result tables 399
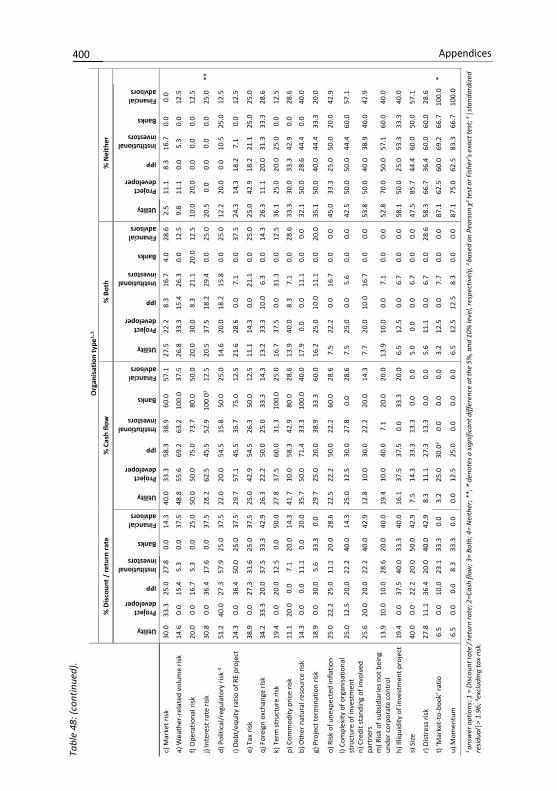
Tabl
e 48
: (co
ntin
ued)
.
Org
anis
atio
n ty
pe1,
2
% D
isco
unt /
retu
rn ra
te
% C
ash
flow
%
Bot
h %
Nei
ther
Utility
Project developer
IPP
Institutional investors
Banks
Financial advisors
Utility
Project developer
IPP
Institutional investors
Banks
Financial advisors
Utility
Project developer
IPP
Institutional investors
Banks
Financial advisors
Utility
Project developer
IPP
Institutional investors
Banks
Financial advisors
c) M
arke
t ris
k 30
.0
33.3
25
.0
27.8
0.
0 14
.3
40.0
33
.3
58.3
38
.9
60.0
57
.1
27.5
22
.2
8.3
16.7
4.
0 28
.6
2.5
11.1
8.
3 16
.7
0.0
0.0
a) W
eath
er-r
elat
ed v
olum
e ris
k 14
.6
0.0
15.4
5.
3 0.
0 37
.5
48.8
55
.6
69.2
63
.2
100.
0 37
.5
26.8
33
.3
15.4
26
.3
0.0
12.5
9.
8 11
.1
0.0
5.3
0.0
12.5
f) O
pera
tiona
l ris
k 20
.0
0.0
16.7
5.
3 0.
0 25
.0
50.0
50
.0
75.0
73
.7
80.0
50
.0
20.0
30
.0
8.3
21.1
20
.0
12.5
10
.0
20.0
0.
0 0.
0 0.
0 12
.5
j) In
tere
st ra
te ri
sk
30.8
0.
0 36
.4
17.6
0.
0 37
.5
28.2
62
.5
45.5
52
.9
100.
03 12
.5
20.5
37
.5
18.2
29
.4
0.0
25.0
20
.5
0.0
0.0
0.0
0.0
25.0
**
d) P
oliti
cal/
regu
lato
ry ri
sk 4
51.2
40
.0
27.3
57
.9
25.0
37
.5
22.0
20
.0
54.5
15
.8
50.0
25
.0
14.6
20
.0
18.2
15
.8
0.0
25.0
12
.2
20.0
0.
0 10
.5
25.0
12
.5
i) D
ebt/
equi
ty ra
tio o
f RE
proj
ect
24.3
0.
0 36
.4
50.0
25
.0
37.5
29
.7
57.1
45
.5
35.7
75
.0
12.5
21
.6
28.6
0.
0 7.
1 0.
0 37
.5
24.3
14
.3
18.2
7.
1 0.
0 12
.5
e) T
ax ri
sk
38.9
0.
0 27
.3
31.6
25
.0
37.5
25
.0
42.9
54
.5
26.3
50
.0
12.5
11
.1
14.3
0.
0 21
.1
0.0
25.0
25
.0
42.9
18
.2
21.1
25
.0
25.0
q) F
orei
gn e
xcha
nge
risk
34
.2
33.3
20
.0
37.5
33
.3
42.9
26
.3
22.2
50
.0
25.0
33
.3
14.3
13
.2
33.3
10
.0
6.3
0.0
14.3
26
.3
11.1
20
.0
31.3
33
.3
28.6
k) T
erm
str
uctu
re ri
sk
19.4
0.
0 20
.0
12.5
0.
0 50
.0
27.8
37
.5
60.0
31
.3
100.
0 25
.0
16.7
37
.5
0.0
31.3
0.
0 12
.5
36.1
25
.0
20.0
25
.0
0.0
12.5
p) C
omm
odity
pric
e ris
k 11
.1
20.0
0.
0 7.
1 20
.0
14.3
41
.7
10.0
58
.3
42.9
80
.0
28.6
13
.9
40.0
8.
3 7.
1 0.
0 28
.6
33.3
30
.0
33.3
42
.9
0.0
28.6
b) O
ther
nat
ural
reso
urce
risk
14
.3
0.0
0.0
11.1
0.
0 20
.0
35.7
50
.0
71.4
33
.3
100.
0 40
.0
17.9
0.
0 0.
0 11
.1
0.0
0.0
32.1
50
.0
28.6
44
.4
0.0
40.0
g) P
roje
ct te
rmin
atio
n ris
k 18
.9
0.0
30.0
5.
6 33
.3
0.0
29.7
25
.0
20.0
38
.9
33.3
60
.0
16.2
25
.0
10.0
11
.1
0.0
20.0
35
.1
50.0
40
.0
44.4
33
.3
20.0
o) R
isk
of u
nexp
ecte
d in
flatio
n 25
.0
22.2
25
.0
11.1
20
.0
28.6
22
.5
22.2
50
.0
22.2
60
.0
28.6
7.
5 22
.2
0.0
16.7
0.
0 0.
0 45
.0
33.3
25
.0
50.0
20
.0
42.9
l) Co
mpl
exity
of o
rgan
isat
iona
l st
ruct
ure
of in
vest
men
t 25
.0
12.5
20
.0
22.2
40
.0
14.3
25
.0
12.5
30
.0
27.8
0.
0 28
.6
7.5
25.0
0.
0 5.
6 0.
0 0.
0 42
.5
50.0
50
.0
44.4
60
.0
57.1
n) C
redi
t sta
ndin
g of
invo
lved
pa
rtne
rs
25.6
20
.0
20.0
22
.2
40.0
42
.9
12.8
10
.0
30.0
22
.2
20.0
14
.3
7.7
20.0
10
.0
16.7
0.
0 0.
0 53
.8
50.0
40
.0
38.9
40
.0
42.9
m) R
isk
of s
ubsi
diar
ies
not b
eing
un
der c
orpo
rate
con
trol
13
.9
10.0
10
.0
28.6
20
.0
40.0
19
.4
10.0
40
.0
7.1
20.0
20
.0
13.9
10
.0
0.0
7.1
0.0
0.0
52.8
70
.0
50.0
57
.1
60.0
40
.0
h) Il
liqui
dity
of i
nves
tmen
t pro
ject
19
.4
0.0
37.5
40
.0
33.3
40
.0
16.1
37
.5
37.5
0.
0 33
.3
20.0
6.
5 12
.5
0.0
6.7
0.0
0.0
58.1
50
.0
25.0
53
.3
33.3
40
.0
s) S
ize
40.0
0.
0 22
.2
20.0
50
.0
42.9
7.
5 14
.3
33.3
13
.3
0.0
0.0
5.0
0.0
0.0
6.7
0.0
0.0
47.5
85
.7
44.4
60
.0
50.0
57
.1
r) D
istr
ess
risk
27.8
11
.1
36.4
20
.0
40.0
42
.9
8.3
11.1
27
.3
13.3
0.
0 0.
0 5.
6 11
.1
0.0
6.7
0.0
28.6
58
.3
66.7
36
.4
60.0
60
.0
28.6
t) ‘M
arke
t-to
-boo
k’ ra
tio
6.5
0.0
10.0
23
.1
33.3
0.
0 3.
2 25
.0
30.0
2 0.
0 0.
0 0.
0 3.
2 12
.5
0.0
7.7
0.0
0.0
87.1
62
.5
60.0
69
.2
66.7
10
0.0
*
u) M
omen
tum
6.
5 0.
0 0.
0 8.
3 33
.3
0.0
0.0
12.5
25
.0
0.0
0.0
0.0
6.5
12.5
12
.5
8.3
0.0
0.0
87.1
75
.0
62.5
83
.3
66.7
10
0.0
1 an
swer
opt
ions
: 1 =
Dis
coun
t rat
e / r
etur
n ra
te; 2
=Cas
h flo
w; 3
= Bo
th; 4
= N
eith
er; *
*, *
den
otes
a si
gnifi
cant
diff
eren
ce a
t the
5%
, and
10%
leve
l, re
spec
tivel
y, 2
base
d on
Pea
rson
χ2 t
est o
r Fish
er’s
exa
ct te
st; 3
│sta
ndar
dize
d re
sidu
al│>
1.9
6; 4 e
xclu
ding
tax
risk.
400 Appendices
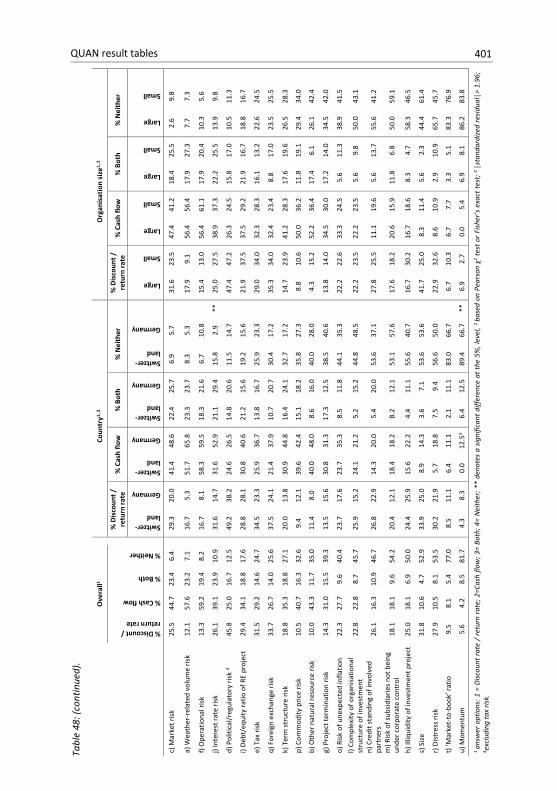
Tabl
e 48
: (co
ntin
ued)
.
Ove
rall1
Co
untr
y1, 2
O
rgan
isat
ion
size
1, 2
% Discount / return rate
% Cash flow
% Both
% Neither
%
Dis
coun
t /
retu
rn ra
te
% C
ash
flow
%
Bot
h %
Nei
ther
% D
isco
unt /
re
turn
rate
%
Cas
h flo
w
% B
oth
% N
eith
er
Switzer-land
Germany
Switzer-land
Germany
Switzer-land
Germany
Switzer-land
Germany
Large
Small
Large
Small
Large
Small
Large
Small
c) M
arke
t ris
k 25
.5
44.7
23
.4
6.4
29
.3
20.0
41
.4
48.6
22
.4
25.7
6.
9 5.
7
31.6
23
.5
47.4
41
.2
18.4
25
.5
2.6
9.8
a) W
eath
er-r
elat
ed v
olum
e ris
k 12
.1
57.6
23
.2
7.1
16
.7
5.3
51.7
65
.8
23.3
23
.7
8.3
5.3
17
.9
9.1
56.4
56
.4
17.9
27
.3
7.7
7.3
f) O
pera
tiona
l ris
k 13
.3
59.2
19
.4
8.2
16
.7
8.1
58.3
59
.5
18.3
21
.6
6.7
10.8
15.4
13
.0
56.4
61
.1
17.9
20
.4
10.3
5.
6
j) In
tere
st ra
te ri
sk
26.1
39
.1
23.9
10
.9
31
.6
14.7
31
.6
52.9
21
.1
29.4
15
.8
2.9
**
25.0
27
.5
38.9
37
.3
22.2
25
.5
13.9
9.
8
d) P
oliti
cal/r
egul
ator
y ris
k 4
45.8
25
.0
16.7
12
.5
49
.2
38.2
24
.6
26.5
14
.8
20.6
11
.5
14.7
47.4
47
.2
26.3
24
.5
15.8
17
.0
10.5
11
.3
i) De
bt/e
quity
ratio
of R
E pr
ojec
t 29
.4
34.1
18
.8
17.6
28.8
28
.1
30.8
40
.6
21.2
15
.6
19.2
15
.6
21
.9
37.5
37
.5
29.2
21
.9
16.7
18
.8
16.7
e) T
ax ri
sk
31.5
29
.2
14.6
24
.7
34
.5
23.3
25
.9
36.7
13
.8
16.7
25
.9
23.3
29.0
34
.0
32.3
28
.3
16.1
13
.2
22.6
24
.5
q) F
orei
gn e
xcha
nge
risk
33
.7
26.7
14
.0
25.6
37.5
24
.1
21.4
37
.9
10.7
20
.7
30.4
17
.2
35
.3
34.0
32
.4
23.4
8.
8 17
.0
23.5
25
.5
k) T
erm
str
uctu
re ri
sk
18.8
35
.3
18.8
27
.1
20
.0
13.8
30
.9
44.8
16
.4
24.1
32
.7
17.2
14.7
23
.9
41.2
28
.3
17.6
19
.6
26.5
28
.3
p) C
omm
odity
pric
e ris
k 10
.5
40.7
16
.3
32.6
9.4
12.1
39
.6
42.4
15
.1
18.2
35
.8
27.3
8.8
10.6
50
.0
36.2
11
.8
19.1
29
.4
34.0
b) O
ther
nat
ural
reso
urce
risk
10
.0
43.3
11
.7
35.0
11.4
8.
0 40
.0
48.0
8.
6 16
.0
40.0
28
.0
4.
3 15
.2
52.2
36
.4
17.4
6.
1 26
.1
42.4
g) P
roje
ct te
rmin
atio
n ris
k 14
.3
31.0
15
.5
39.3
13.5
15
.6
30.8
31
.3
17.3
12
.5
38.5
40
.6
13
.8
14.0
34
.5
30.0
17
.2
14.0
34
.5
42.0
o) R
isk
of u
nexp
ecte
d in
flatio
n 22
.3
27.7
9.
6 40
.4
23
.7
17.6
23
.7
35.3
8.
5 11
.8
44.1
35
.3
22
.2
22.6
33
.3
24.5
5.
6 11
.3
38.9
41
.5
l)
Com
plex
ity o
f org
anis
atio
nal
stru
ctur
e of
inve
stm
ent
22.8
22
.8
8.7
45.7
25.9
15
.2
24.1
21
.2
5.2
15.2
44
.8
48.5
22.2
23
.5
22.2
23
.5
5.6
9.8
50.0
43
.1
n) C
redi
t sta
ndin
g of
invo
lved
pa
rtne
rs
26.1
16
.3
10.9
46
.7
26
.8
22.9
14
.3
20.0
5.
4 20
.0
53.6
37
.1
27
.8
25.5
11
.1
19.6
5.
6 13
.7
55.6
41
.2
m) R
isk
of s
ubsi
diar
ies
not b
eing
un
der c
orpo
rate
con
trol
18
.1
18.1
9.
6 54
.2
20
.4
12.1
18
.4
18.2
8.
2 12
.1
53.1
57
.6
17
.6
18.2
20
.6
15.9
11
.8
6.8
50.0
59
.1
h) Il
liqui
dity
of i
nves
tmen
t pro
ject
25
.0
18.1
6.
9 50
.0
24
.4
25.9
15
.6
22.2
4.
4 11
.1
55.6
40
.7
16
.7
30.2
16
.7
18.6
8.
3 4.
7 58
.3
46.5
s) S
ize
31.8
10
.6
4.7
52.9
33.9
25
.0
8.9
14.3
3.
6 7.
1 53
.6
53.6
41.7
25
.0
8.3
11.4
5.
6 2.
3 44
.4
61.4
r) D
istr
ess r
isk
27.9
10
.5
8.1
53.5
30.2
21
.9
5.7
18.8
7.
5 9.
4 56
.6
50.0
22.9
32
.6
8.6
10.9
2.
9 10
.9
65.7
45
.7
t) ‘M
arke
t-to
-boo
k’ ra
tio
9.5
8.1
5.4
77.0
8.5
11.1
6.
4 11
.1
2.1
11.1
83
.0
66.7
6.7
10.3
6.
7 7.
7 3.
3 5.
1 83
.3
76.9
u) M
omen
tum
5.
6 4.
2 8.
5 81
.7
4.
3 8.
3 0.
0 12
.53
6.4
12.5
89
.4
66.7
**
6.
9 2.
7 0.
0 5.
4 6.
9 8.
1 86
.2
83.8
1 an
swer
opt
ions
: 1 =
Dis
coun
t rat
e /
retu
rn ra
te; 2
=Cas
h flo
w; 3
= Bo
th; 4
= N
eith
er; *
* de
note
s a
signi
fican
t diff
eren
ce a
t the
5%
, lev
el, 2
base
d on
Pea
rson
χ2 t
est o
r Fi
sher
’s e
xact
test
; 3 │s
tand
ardi
zed
resi
dual
│> 1
.96;
4 e
xclu
ding
tax
risk.
QUAN result tables 401
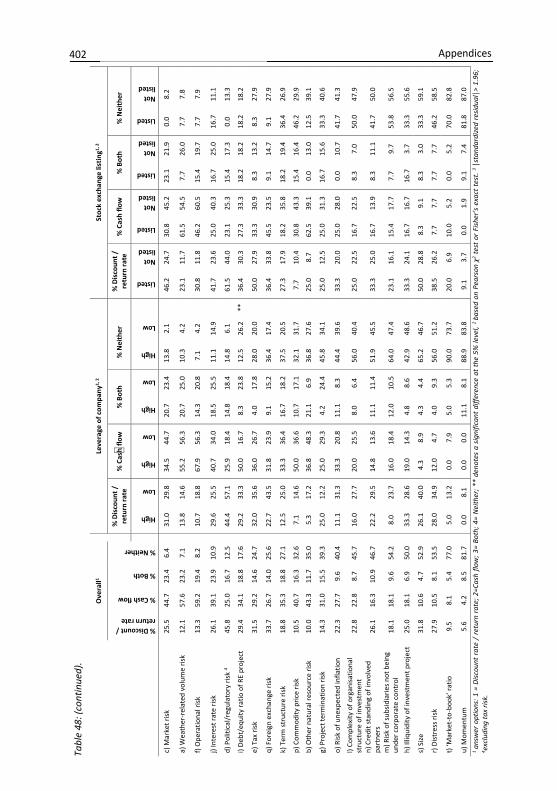
Tabl
e 48
: (co
ntin
ued)
.
Ove
rall1
Le
vera
ge o
f com
pany
1, 2
Stoc
k ex
chan
ge li
stin
g1, 2
% Discount / return rate
% Cash flow
% Both
% Neither
%
Dis
coun
t /
retu
rn ra
te
% C
ash
flow
%
Bot
h %
Nei
ther
% D
isco
unt /
re
turn
rate
%
Cas
h flo
w
% B
oth
% N
eith
er
High
Low
High
Low
High
Low
High
Low
Listed
Not listed
Listed
Not listed
Listed
Not listed
Listed
Not listed
c) M
arke
t ris
k 25
.5
44.7
23
.4
6.4
31
.0
29.8
34
.5
44.7
20
.7
23.4
13
.8
2.1
46
.2
24.7
30
.8
45.2
23
.1
21.9
0.
0 8.
2
a) W
eath
er-r
elat
ed v
olum
e ris
k 12
.1
57.6
23
.2
7.1
13
.8
14.6
55
.2
56.3
20
.7
25.0
10
.3
4.2
23
.1
11.7
61
.5
54.5
7.
7 26
.0
7.7
7.8
f) O
pera
tiona
l ris
k 13
.3
59.2
19
.4
8.2
10
.7
18.8
67
.9
56.3
14
.3
20.8
7.
1 4.
2
30.8
11
.8
46.2
60
.5
15.4
19
.7
7.7
7.9
j) In
tere
st ra
te ri
sk
26.1
39
.1
23.9
10
.9
29
.6
25.5
40
.7
34.0
18
.5
25.5
11
.1
14.9
41.7
23
.6
25.0
40
.3
16.7
25
.0
16.7
11
.1
d) P
oliti
cal/r
egul
ator
y ris
k 4
45.8
25
.0
16.7
12
.5
44
.4
57.1
25
.9
18.4
14
.8
18.4
14
.8
6.1
61
.5
44.0
23
.1
25.3
15
.4
17.3
0.
0 13
.3
i) De
bt/e
quity
ratio
of R
E pr
ojec
t 29
.4
34.1
18
.8
17.6
29.2
33
.3
50.0
16
.7
8.3
23.8
12
.5
26.2
**
36
.4
30.3
27
.3
33.3
18
.2
18.2
18
.2
18.2
e) T
ax ri
sk
31.5
29
.2
14.6
24
.7
32
.0
35.6
36
.0
26.7
4.
0 17
.8
28.0
20
.0
50
.0
27.9
33
.3
30.9
8.
3 13
.2
8.3
27.9
q) F
orei
gn e
xcha
nge
risk
33
.7
26.7
14
.0
25.6
22.7
43
.5
31.8
23
.9
9.1
15.2
36
.4
17.4
36.4
33
.8
45.5
23
.5
9.1
14.7
9.
1 27
.9
k) T
erm
str
uctu
re ri
sk
18.8
35
.3
18.8
27
.1
12
.5
25.0
33
.3
36.4
16
.7
18.2
37
.5
20.5
27.3
17
.9
18.2
35
.8
18.2
19
.4
36.4
26
.9
p) C
omm
odity
pric
e ris
k 10
.5
40.7
16
.3
32.6
7.1
14.6
50
.0
36.6
10
.7
17.1
32
.1
31.7
7.7
10.4
30
.8
43.3
15
.4
16.4
46
.2
29.9
b) O
ther
nat
ural
reso
urce
risk
10
.0
43.3
11
.7
35.0
5.3
17.2
36
.8
48.3
21
.1
6.9
36.8
27
.6
25
.0
8.7
62.5
39
.1
0.0
13.0
12
.5
39.1
g) P
roje
ct te
rmin
atio
n ris
k 14
.3
31.0
15
.5
39.3
25.0
12
.2
25.0
29
.3
4.2
24.4
45
.8
34.1
25.0
12
.5
25.0
31
.3
16.7
15
.6
33.3
40
.6
o) R
isk
of u
nexp
ecte
d in
flatio
n 22
.3
27.7
9.
6 40
.4
11
.1
31.3
33
.3
20.8
11
.1
8.3
44.4
39
.6
33
.3
20.0
25
.0
28.0
0.
0 10
.7
41.7
41
.3
l) Co
mpl
exity
of o
rgan
isat
iona
l st
ruct
ure
of in
vest
men
t 22
.8
22.8
8.
7 45
.7
16
.0
27.7
20
.0
25.5
8.
0 6.
4 56
.0
40.4
25.0
22
.5
16.7
22
.5
8.3
7.0
50.0
47
.9
n) C
redi
t sta
ndin
g of
invo
lved
pa
rtne
rs
26.1
16
.3
10.9
46
.7
22
.2
29.5
14
.8
13.6
11
.1
11.4
51
.9
45.5
33.3
25
.0
16.7
13
.9
8.3
11.1
41
.7
50.0
m) R
isk
of s
ubsi
diar
ies
not b
eing
un
der c
orpo
rate
con
trol
18
.1
18.1
9.
6 54
.2
8.
0 23
.7
16.0
18
.4
12.0
10
.5
64.0
47
.4
23
.1
16.1
15
.4
17.7
7.
7 9.
7 53
.8
56.5
h) Il
liqui
dity
of i
nves
tmen
t pro
ject
25
.0
18.1
6.
9 50
.0
33
.3
28.6
19
.0
14.3
4.
8 8.
6 42
.9
48.6
33.3
24
.1
16.7
16
.7
16.7
3.
7 33
.3
55.6
s) S
ize
31.8
10
.6
4.7
52.9
26.1
40
.0
4.3
8.9
4.3
4.4
65.2
46
.7
50
.0
28.8
8.
3 9.
1 8.
3 3.
0 33
.3
59.1
r) D
istr
ess r
isk
27.9
10
.5
8.1
53.5
28.0
34
.9
12.0
4.
7 4.
0 9.
3 56
.0
51.2
38.5
26
.2
7.7
7.7
7.7
7.7
46.2
58
.5
t) ‘M
arke
t-to
-boo
k’ ra
tio
9.5
8.1
5.4
77.0
5.0
13.2
0.
0 7.
9 5.
0 5.
3 90
.0
73.7
20.0
6.
9 10
.0
5.2
0.0
5.2
70.0
82
.8
u) M
omen
tum
5.
6 4.
2 8.
5 81
.7
0.
0 8.
1 0.
0 0.
0 11
.1
8.1
88.9
83
.8
9.
1 3.
7 0.
0 1.
9 9.
1 7.
4 81
.8
87.0
1 an
swer
opt
ions
: 1 =
Disc
ount
rat
e /
retu
rn r
ate;
2=C
ash
flow
; 3=
Both
; 4=
Nei
ther
; **
deno
tes
a si
gnifi
cant
diff
eren
ce a
t the
5%
leve
l, 2
base
d on
Pea
rson
χ2 t
est o
r Fi
sher
’s e
xact
test
. 3 │s
tand
ardi
zed
resid
ual│
> 1.
96;
4 exc
ludi
ng ta
x ris
k.
402 Appendices
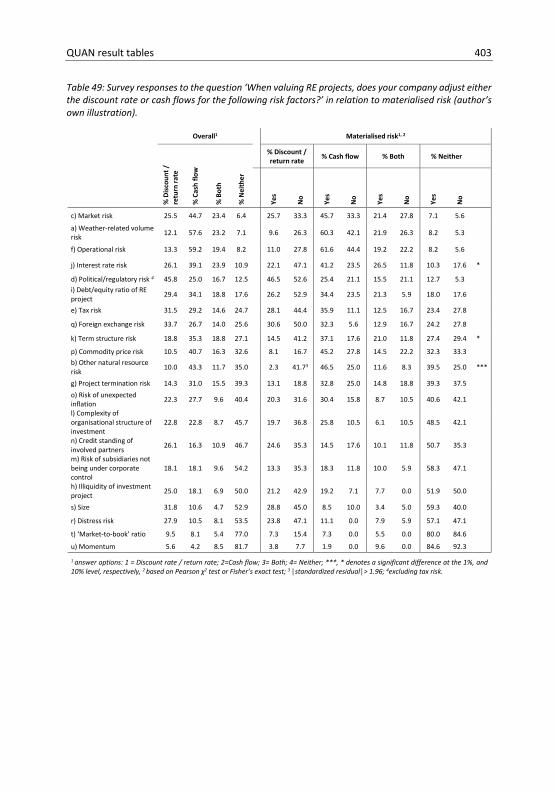
QUAN result tables 403
Table 49: Survey responses to the question ‘When valuing RE projects, does your company adjust either the discount rate or cash flows for the following risk factors?’ in relation to materialised risk (author’s own illustration).
Overall1 Materialised risk1, 2
% D
isco
unt /
re
turn
rate
% C
ash
flow
% B
oth
% N
eith
er
% Discount / return rate % Cash flow % Both % Neither
Yes
No
Yes
No
Yes
No
Yes
No
c) Market risk 25.5 44.7 23.4 6.4 25.7 33.3 45.7 33.3 21.4 27.8 7.1 5.6
a) Weather-related volume risk 12.1 57.6 23.2 7.1 9.6 26.3 60.3 42.1 21.9 26.3 8.2 5.3
f) Operational risk 13.3 59.2 19.4 8.2 11.0 27.8 61.6 44.4 19.2 22.2 8.2 5.6
j) Interest rate risk 26.1 39.1 23.9 10.9 22.1 47.1 41.2 23.5 26.5 11.8 10.3 17.6 *
d) Political/regulatory risk 4 45.8 25.0 16.7 12.5 46.5 52.6 25.4 21.1 15.5 21.1 12.7 5.3 i) Debt/equity ratio of RE project 29.4 34.1 18.8 17.6 26.2 52.9 34.4 23.5 21.3 5.9 18.0 17.6
e) Tax risk 31.5 29.2 14.6 24.7 28.1 44.4 35.9 11.1 12.5 16.7 23.4 27.8
q) Foreign exchange risk 33.7 26.7 14.0 25.6 30.6 50.0 32.3 5.6 12.9 16.7 24.2 27.8
k) Term structure risk 18.8 35.3 18.8 27.1 14.5 41.2 37.1 17.6 21.0 11.8 27.4 29.4 *
p) Commodity price risk 10.5 40.7 16.3 32.6 8.1 16.7 45.2 27.8 14.5 22.2 32.3 33.3 b) Other natural resource risk 10.0 43.3 11.7 35.0 2.3 41.73 46.5 25.0 11.6 8.3 39.5 25.0 ***
g) Project termination risk 14.3 31.0 15.5 39.3 13.1 18.8 32.8 25.0 14.8 18.8 39.3 37.5 o) Risk of unexpected inflation 22.3 27.7 9.6 40.4 20.3 31.6 30.4 15.8 8.7 10.5 40.6 42.1
l) Complexity of organisational structure of investment
22.8 22.8 8.7 45.7
19.7 36.8 25.8 10.5 6.1 10.5 48.5 42.1
n) Credit standing of involved partners 26.1 16.3 10.9 46.7 24.6 35.3 14.5 17.6 10.1 11.8 50.7 35.3
m) Risk of subsidiaries not being under corporate control
18.1 18.1 9.6 54.2
13.3 35.3 18.3 11.8 10.0 5.9 58.3 47.1
h) Illiquidity of investment project 25.0 18.1 6.9 50.0 21.2 42.9 19.2 7.1 7.7 0.0 51.9 50.0
s) Size 31.8 10.6 4.7 52.9 28.8 45.0 8.5 10.0 3.4 5.0 59.3 40.0
r) Distress risk 27.9 10.5 8.1 53.5 23.8 47.1 11.1 0.0 7.9 5.9 57.1 47.1
t) ‘Market-to-book’ ratio 9.5 8.1 5.4 77.0 7.3 15.4 7.3 0.0 5.5 0.0 80.0 84.6
u) Momentum 5.6 4.2 8.5 81.7 3.8 7.7 1.9 0.0 9.6 0.0 84.6 92.3
1 answer options: 1 = Discount rate / return rate; 2=Cash flow; 3= Both; 4= Neither; ***, * denotes a significant difference at the 1%, and 10% level, respectively, 2 based on Pearson χ2 test or Fisher’s exact test; 3 │standardized residual│> 1.96; 4excluding tax risk.
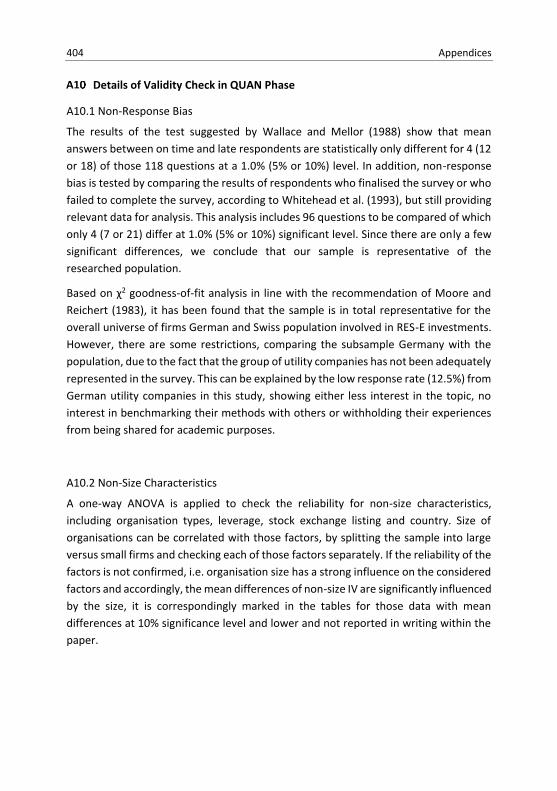
404 Appendices
Details of Validity Check in QUAN Phase
A10.1 Non-Response Bias
The results of the test suggested by Wallace and Mellor (1988) show that mean answers between on time and late respondents are statistically only different for 4 (12 or 18) of those 118 questions at a 1.0% (5% or 10%) level. In addition, non-response bias is tested by comparing the results of respondents who finalised the survey or who failed to complete the survey, according to Whitehead et al. (1993), but still providing relevant data for analysis. This analysis includes 96 questions to be compared of which only 4 (7 or 21) differ at 1.0% (5% or 10%) significant level. Since there are only a few significant differences, we conclude that our sample is representative of the researched population.
Based on χ2 goodness-of-fit analysis in line with the recommendation of Moore and Reichert (1983), it has been found that the sample is in total representative for the overall universe of firms German and Swiss population involved in RES-E investments. However, there are some restrictions, comparing the subsample Germany with the population, due to the fact that the group of utility companies has not been adequately represented in the survey. This can be explained by the low response rate (12.5%) from German utility companies in this study, showing either less interest in the topic, no interest in benchmarking their methods with others or withholding their experiences from being shared for academic purposes.
A10.2 Non-Size Characteristics
A one-way ANOVA is applied to check the reliability for non-size characteristics, including organisation types, leverage, stock exchange listing and country. Size of organisations can be correlated with those factors, by splitting the sample into large versus small firms and checking each of those factors separately. If the reliability of the factors is not confirmed, i.e. organisation size has a strong influence on the considered factors and accordingly, the mean differences of non-size IV are significantly influenced by the size, it is correspondingly marked in the tables for those data with mean differences at 10% significance level and lower and not reported in writing within the paper.
Details of Validity Check in QUAN Phase 405
A10.3 Robustness in Relation to Education and Experience
The robustness of the answers are checked in relation to the participants’ understanding of the topic and professional experience. This robustness check is passed if the methods suggested by finance theory are applied significantly more often by MBA-educated and/or high M&A-experienced participants.
In general, the results in Table 50 confirm the reliability of the capital budgeting technique results based on this performed robustness check. All, except a few methods (e.g. PB, PI and VaR), show a higher rate for participants with MBA degree and higher experience. However, only a few of them are significant. Scenario analysis shows a low significant dependency with a medium strength for the subgroups MBA based educations while the application of equity and project return rate present a low to medium significant strength in relation to experienced participants. These results confirm the robustness of the performed survey in respect to the participant’s understanding of the topic, i.e. the respondents understand the surveyed topic. Less experienced participants show a tendency to apply PB more frequently than more experienced participants, but not significantly. However, the method PI seems not be understood by low experienced participants since it is significantly more applied by this group within the sample. Similarly peculiar, VaR shows a significantly higher application rate by low experienced participants. These results cannot be explained and is regarded as less reliable, although their low application rate is probably valid.
The robustness check for general CoC methods (Table 51) shows only one significant results for CAPM, confirming that participants’ with a profound business admini-stration education apply more frequently this method, propagated by financial theory. The extensive us of CAPM by respondents who went through an MBA is also supported by the finds of Jagannathan and Meier (2002) who suspects that MBA graduates might be biased in favour of taught methods, such as CAPM, used in investment decisions. In contrast to this results, the method “whatever our investor tell us they require” as cost of capital is more often applied by non-MBA-educated and low experienced participants, although not significantly, still indicating the tendency of those two subgroups to rely on predefined return rates.
The robustness check for the application of discount rates (Table 52) can also be regarded as passed since the more appropriated methods according to theory, such as RADR concept, and country and technology specific discount, are applied more often by MBA-educated and more experienced participants, but not always significantly. On the other hand, the less appropriate methods according to theory, such as discount rate based on cost of finance or based on past experience are applied significantly more frequently by non-MBA-educated and less experienced participants. The latter
406 Appendices results is quite particular since less experienced participants apply discount rates only on few past experiences. Although not significant, the results for the application of “The discount rate for our entire company” in RES-E investment valuation show higher frequency for MBA-educated and M&A-experienced respondents are rather surprising.
In Table 53, the robustness for dependency between the DCF techniques in terms of understanding the topic is checked. Investing the results in section 5.2.2.3 in relation to the set educational criteria, the MBA-educated participants show a tendency to use DCF more often as underlying techniques (Table 2.1) while only DCF in relation to IRR and NPV shows higher application rates, significant however only for IRR (Table 2.4). This shows again the better understanding of MBA-educated participants for the surveyed topic, as anticipated and confirming the liability of the survey.
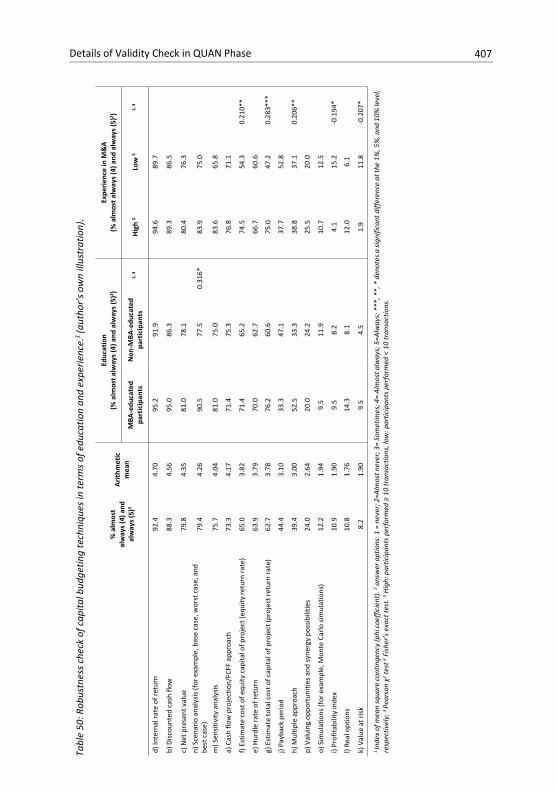
Tabl
e 50
: Rob
ustn
ess
chec
k of
cap
ital b
udge
ting
tech
niqu
es in
term
s of
edu
catio
n an
d ex
perie
nce.
1 (a
utho
r’s o
wn
illus
trat
ion)
.
%
alm
ost
alw
ays
(4) a
nd
alw
ays
(5)2
Arith
met
ic
mea
n
Educ
atio
n (%
alm
ost a
lway
s (4
) and
alw
ays
(5)2 )
Expe
rienc
e in
M&
A (%
alm
ost a
lway
s (4
) and
alw
ays
(5)2 )
MBA
-edu
cate
d pa
rtic
ipan
ts
Non
-MBA
-edu
cate
d pa
rtic
ipan
ts
1, 3
H
igh
5 Lo
w 5
1, 3
d) In
tern
al ra
te o
f ret
urn
92.4
4.
70
95.2
91
.9
94
.6
89.7
b) D
isco
unte
d ca
sh fl
ow
88.3
4.
56
95.0
86
.3
89
.3
86.5
c) N
et p
rese
nt v
alue
79
.8
4.35
81
.0
78.1
80.4
76
.3
n)
Sce
nario
ana
lysis
(for
exa
mpl
e, b
ase
case
, wor
st c
ase,
and
be
st c
ase)
79
.4
4.26
90
.5
77.5
0.
316*
83
.9
75.0
m) S
ensit
ivity
ana
lysis
75
.7
4.04
81
.0
75.0
83.6
65
.8
a) C
ash
flow
pro
ject
ion/
FCFF
app
roac
h 73
.3
4.17
71
.4
75.3
76.8
71
.1
f) Es
timat
e co
st o
f equ
ity c
apita
l of p
roje
ct (e
quity
retu
rn ra
te)
65.0
3.
82
71.4
65
.2
74
.5
54.3
0.
210*
*
e) H
urdl
e ra
te o
f ret
urn
63.9
3.
79
70.0
62
.7
66
.7
60.6
g) E
stim
ate
tota
l cos
t of c
apita
l of p
roje
ct (p
roje
ct re
turn
rate
) 62
.7
3.78
76
.2
60.6
75.0
47
.2
0.28
3***
j) Pa
ybac
k pe
riod
44.4
3.
10
33.3
47
.1
37
.7
52.8
h) M
ultip
le a
ppro
ach
39.4
3.
00
52.5
33
.3
38
.8
37.1
0.
206*
*
p) V
alui
ng o
ppor
tuni
ties
and
syne
rgy
poss
ibili
ties
24.0
2.
64
20.0
24
.2
25
.5
20.0
o) S
imul
atio
ns (f
or e
xam
ple,
Mon
te C
arlo
sim
ulat
ions
) 12
.2
1.94
9.
5 11
.9
10
.7
12.5
i) Pr
ofita
bilit
y in
dex
10.9
1.
90
9.5
8.2
4.
1 15
.2
-0.1
94*
l) Re
al o
ptio
ns
10.8
1.
76
14.3
8.
1
12.0
6.
1
k) V
alue
at r
isk
8.2
1.90
9.
5 4.
5
1.9
11.8
-0
.207
*
1 In
dex
of m
ean
squa
re c
ontin
genc
y (p
hi c
oeffi
cien
t). 2 a
nsw
er o
ptio
ns: 1
= n
ever
; 2=A
lmos
t nev
er; 3
= So
met
imes
; 4=
Alm
ost a
lway
s; 5
=Alw
ays;
***
, **,
* d
enot
es a
sign
ifica
nt d
iffer
ence
at t
he 1
%, 5
%, a
nd 1
0% le
vel,
resp
ectiv
ely;
3 Pe
arso
n χ2 t
est 4 F
isher
’s e
xact
test
. 5 Hig
h: p
artic
ipan
ts p
erfo
rmed
≥ 1
0 tr
ansa
ctio
ns, l
ow: p
artic
ipan
ts p
erfo
rmed
< 1
0 tr
ansa
ctio
ns.
Details of Validity Check in QUAN Phase 407
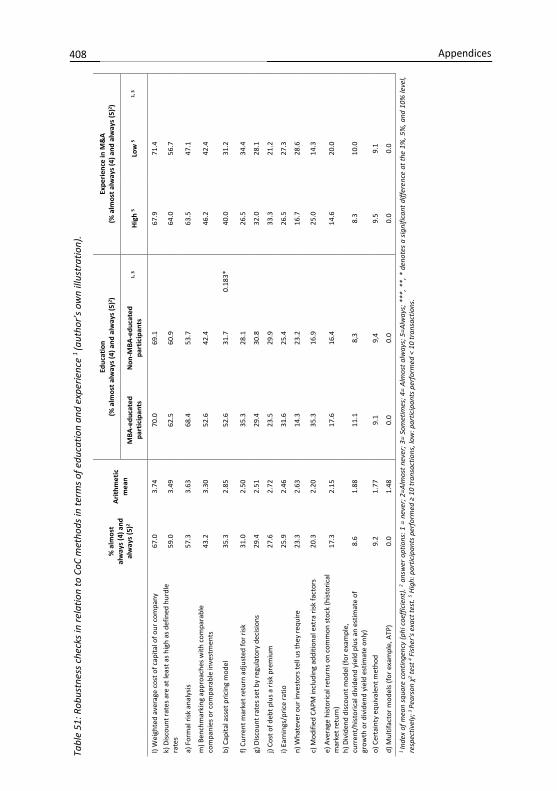
Tabl
e 51
: Rob
ustn
ess
chec
ks in
rela
tion
to C
oC m
etho
ds in
term
s of e
duca
tion
and
expe
rienc
e 1
(aut
hor’s
ow
n ill
ustr
atio
n).
%
alm
ost
alw
ays
(4) a
nd
alw
ays
(5)2
Arith
met
ic
mea
n
Educ
atio
n (%
alm
ost a
lway
s (4
) and
alw
ays
(5)2 )
Ex
perie
nce
in M
&A
(% a
lmos
t alw
ays
(4) a
nd a
lway
s (5
)2 )
MBA
-edu
cate
d pa
rtic
ipan
ts
Non
-MBA
-edu
cate
d pa
rtic
ipan
ts
1, 3
Hig
h 5
Low
5 1,
3
l) W
eigh
ted
aver
age
cost
of c
apita
l of o
ur c
ompa
ny
67.0
3.
74
70.0
69
.1
67
.9
71.4
k) D
isco
unt r
ates
are
at l
east
as
high
as
defin
ed h
urdl
e ra
tes
59.0
3.
49
62.5
60
.9
64
.0
56.7
a) F
orm
al ri
sk a
naly
sis
57.3
3.
63
68.4
53
.7
63
.5
47.1
m) B
ench
mar
king
app
roac
hes
with
com
para
ble
com
pani
es o
r com
para
ble
inve
stm
ents
43
.2
3.30
52
.6
42.4
46.2
42
.4
b) C
apita
l ass
et p
ricin
g m
odel
35
.3
2.85
52
.6
31.7
0.
183*
40
.0
31.2
f) Cu
rren
t mar
ket r
etur
n ad
just
ed fo
r ris
k 31
.0
2.50
35
.3
28.1
26.5
34
.4
g) D
isco
unt r
ates
set
by
regu
lato
ry d
ecis
ions
29
.4
2.51
29
.4
30.8
32.0
28
.1
j) Co
st o
f deb
t plu
s a ri
sk p
rem
ium
27
.6
2.72
23
.5
29.9
33.3
21
.2
i) Ea
rnin
gs/p
rice
ratio
25
.9
2.46
31
.6
25.4
26.5
27
.3
n) W
hate
ver o
ur in
vest
ors
tell
us th
ey re
quire
23
.3
2.63
14
.3
23.2
16.7
28
.6
c) M
odifi
ed C
APM
incl
udin
g ad
ditio
nal e
xtra
risk
fact
ors
20.3
2.
20
35.3
16
.9
25
.0
14.3
e) A
vera
ge h
isto
rical
retu
rns o
n co
mm
on s
tock
(his
toric
al
mar
ket r
etur
n)
17.3
2.
15
17.6
16
.4
14
.6
20.0
h) D
ivid
end
disc
ount
mod
el (f
or e
xam
ple,
cu
rren
t/hi
stor
ical
div
iden
d yi
eld
plus
an
estim
ate
of
grow
th o
r div
iden
d yi
eld
estim
ate
only
) 8.
6 1.
88
11.1
8,
3
8.3
10.0
o) C
erta
inty
equ
ival
ent m
etho
d 9.
2 1.
77
9.1
9,4
9.
5 9.
1
d) M
ultif
acto
r mod
els
(for e
xam
ple,
ATP
) 0.
0 1.
48
0.0
0.0
0.
0 0.
0
1 In
dex
of m
ean
squa
re c
ontin
genc
y (p
hi c
oeffi
cien
t). 2 a
nsw
er o
ptio
ns: 1
= n
ever
; 2=A
lmos
t nev
er; 3
= So
met
imes
; 4=
Alm
ost a
lway
s; 5
=Alw
ays;
***
, **,
* d
enot
es a
sig
nific
ant d
iffer
ence
at t
he 1
%, 5
%, a
nd 1
0% le
vel,
resp
ectiv
ely;
3 Pe
arso
n χ2 t
est 4 F
isher
’s e
xact
test
. 5 Hig
h: p
artic
ipan
ts p
erfo
rmed
≥ 1
0 tr
ansa
ctio
ns, l
ow: p
artic
ipan
ts p
erfo
rmed
< 1
0 tr
ansa
ctio
ns.
408 Appendices
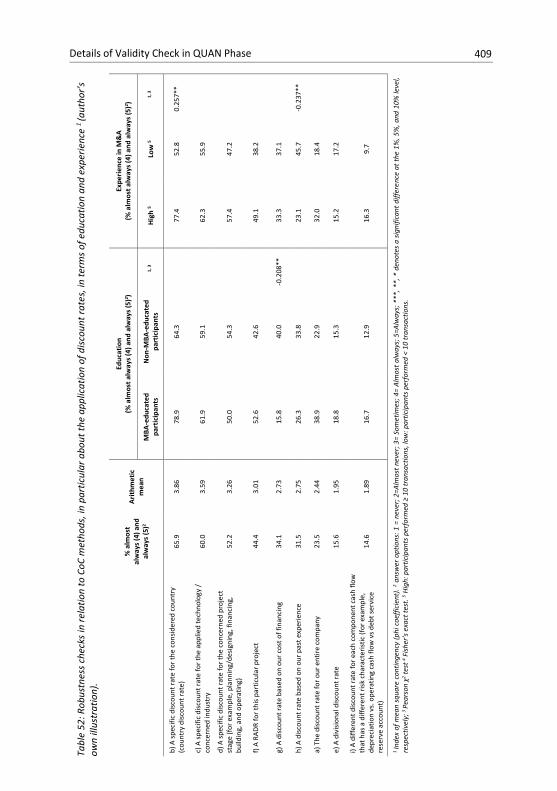
Tabl
e 52
: Rob
ustn
ess
chec
ks in
rela
tion
to C
oC m
etho
ds, i
n pa
rtic
ular
abo
ut th
e ap
plic
atio
n of
dis
coun
t rat
es, i
n te
rms
of e
duca
tion
and
expe
rienc
e 1
(aut
hor’s
ow
n ill
ustr
atio
n).
%
alm
ost
alw
ays
(4) a
nd
alw
ays
(5)2
Arith
met
ic
mea
n
Educ
atio
n (%
alm
ost a
lway
s (4
) and
alw
ays
(5)2 )
Expe
rienc
e in
M&
A (%
alm
ost a
lway
s (4
) and
alw
ays
(5)2 )
MBA
-edu
cate
d pa
rtic
ipan
ts
Non
-MBA
-edu
cate
d pa
rtic
ipan
ts
1, 3
H
igh
5 Lo
w 5
1, 3
b) A
spe
cific
disc
ount
rate
for t
he c
onsid
ered
cou
ntry
(c
ount
ry d
isco
unt r
ate)
65
.9
3.86
78
.9
64.3
77.4
52
.8
0.25
7**
c) A
spe
cific
disc
ount
rate
for t
he a
pplie
d te
chno
logy
/ co
ncer
ned
indu
stry
60
.0
3.59
61
.9
59.1
62.3
55
.9
d) A
spe
cific
disc
ount
rate
for t
he c
once
rned
pro
ject
st
age
(for e
xam
ple,
pla
nnin
g/de
signi
ng, f
inan
cing
, bu
ildin
g, a
nd o
pera
ting)
52
.2
3.26
50
.0
54.3
57.4
47
.2
f) A
RAD
R fo
r thi
s par
ticul
ar p
roje
ct
44.4
3.
01
52.6
42
.6
49
.1
38.2
g) A
dis
coun
t rat
e ba
sed
on o
ur c
ost o
f fin
anci
ng
34.1
2.
73
15.8
40
.0
-0.2
08**
33
.3
37.1
h) A
dis
coun
t rat
e ba
sed
on o
ur p
ast e
xper
ienc
e 31
.5
2.75
26
.3
33.8
23.1
45
.7
-0.2
37**
a) T
he d
isco
unt r
ate
for o
ur e
ntire
com
pany
23
.5
2.44
38
.9
22.9
32.0
18
.4
e) A
div
isio
nal d
isco
unt r
ate
15.6
1.
95
18.8
15
.3
15
.2
17.2
i) A
diffe
rent
dis
coun
t rat
e fo
r eac
h co
mpo
nent
cas
h flo
w
that
has
a d
iffer
ent r
isk
char
acte
ristic
( for
exa
mpl
e,
depr
ecia
tion
vs. o
pera
ting
cash
flow
vs d
ebt s
ervi
ce
rese
rve
acco
unt)
14.6
1.
89
16.7
12
.9
16
.3
9.7
1 In
dex
of m
ean
squa
re c
ontin
genc
y (p
hi c
oeffi
cien
t). 2 a
nsw
er o
ptio
ns: 1
= n
ever
; 2=A
lmos
t nev
er; 3
= So
met
imes
; 4=
Alm
ost a
lway
s; 5
=Alw
ays;
***
, **,
* d
enot
es a
sig
nific
ant d
iffer
ence
at t
he 1
%, 5
%, a
nd 1
0% le
vel,
resp
ectiv
ely;
3 Pe
arso
n χ2 t
est 4 F
isher
’s e
xact
test
. 5 Hig
h: p
artic
ipan
ts p
erfo
rmed
≥ 1
0 tr
ansa
ctio
ns, l
ow: p
artic
ipan
ts p
erfo
rmed
< 1
0 tr
ansa
ctio
ns.
Details of Validity Check in QUAN Phase 409
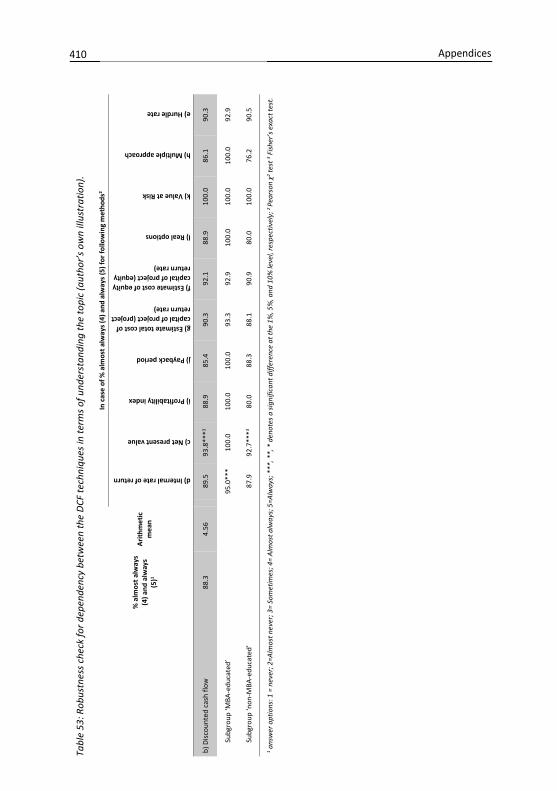
Tabl
e 53
: Rob
ustn
ess
chec
k fo
r dep
ende
ncy
betw
een
the
DCF
tech
niqu
es in
term
s of u
nder
stan
ding
the
topi
c (a
utho
r’s o
wn
illus
trat
ion)
.
%
alm
ost a
lway
s (4
) and
alw
ays
(5)1
Arith
met
ic
mea
n
In c
ase
of %
alm
ost a
lway
s (4)
and
alw
ays
(5) f
or fo
llow
ing
met
hods
2
d) Internal rate of return
c) Net present value
i) Profitability index
j) Payback period
g) Estimate total cost of capital of project (project return rate)
f) Estimate cost of equity capital of project (equity return rate)
l) Real options
k) Value at Risk
h) Multiple approach
e) Hurdle rate
b) D
isco
unte
d ca
sh fl
ow
88.3
4.
56
89
.5
93.8
***3
88.9
85
.4
90.3
92
.1
88.9
10
0.0
86.1
90
.3
Subg
roup
‘MBA
-edu
cate
d’
95
.0**
* 10
0.0
100.
0 10
0.0
93.3
92
.9
100.
0 10
0.0
100.
0 92
.9
Subg
roup
‘non
-MBA
-edu
cate
d’
87
.9
92.7
***3
80.0
88
.3
88.1
90
.9
80.0
10
0.0
76.2
90
.5
1 ans
wer
opt
ions
: 1 =
nev
er; 2
=Alm
ost n
ever
; 3=
Som
etim
es; 4
= Al
mos
t alw
ays;
5=A
lway
s; *
**, *
*, *
den
otes
a si
gnifi
cant
diff
eren
ce a
t the
1%
, 5%
, and
10%
leve
l, re
spec
tivel
y; 2
Pear
son
χ2 tes
t 3 Fis
her’s
exa
ct te
st.
410 Appendices
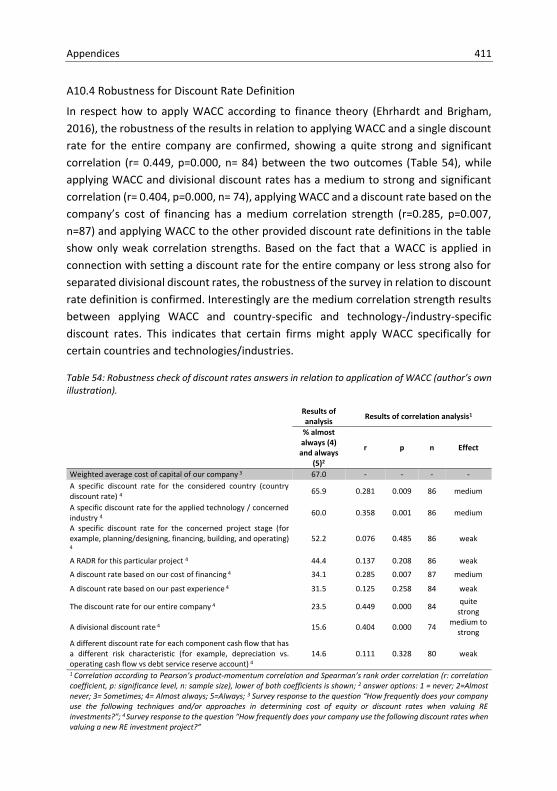
Appendices 411
A10.4 Robustness for Discount Rate Definition
In respect how to apply WACC according to finance theory (Ehrhardt and Brigham, 2016), the robustness of the results in relation to applying WACC and a single discount rate for the entire company are confirmed, showing a quite strong and significant correlation (r= 0.449, p=0.000, n= 84) between the two outcomes (Table 54), while applying WACC and divisional discount rates has a medium to strong and significant correlation (r= 0.404, p=0.000, n= 74), applying WACC and a discount rate based on the company’s cost of financing has a medium correlation strength (r=0.285, p=0.007, n=87) and applying WACC to the other provided discount rate definitions in the table show only weak correlation strengths. Based on the fact that a WACC is applied in connection with setting a discount rate for the entire company or less strong also for separated divisional discount rates, the robustness of the survey in relation to discount rate definition is confirmed. Interestingly are the medium correlation strength results between applying WACC and country-specific and technology-/industry-specific discount rates. This indicates that certain firms might apply WACC specifically for certain countries and technologies/industries.
Table 54: Robustness check of discount rates answers in relation to application of WACC (author’s own illustration).
Results of analysis Results of correlation analysis1
% almost always (4) and always
(5)2
r p n Effect
Weighted average cost of capital of our company 3 67.0 - - - - A specific discount rate for the considered country (country discount rate) 4 65.9 0.281 0.009 86 medium
A specific discount rate for the applied technology / concerned industry 4 60.0 0.358 0.001 86 medium
A specific discount rate for the concerned project stage (for example, planning/designing, financing, building, and operating)
4 52.2 0.076 0.485 86 weak
A RADR for this particular project 4 44.4 0.137 0.208 86 weak
A discount rate based on our cost of financing 4 34.1 0.285 0.007 87 medium
A discount rate based on our past experience 4 31.5 0.125 0.258 84 weak
The discount rate for our entire company 4 23.5 0.449 0.000 84 quite strong
A divisional discount rate 4 15.6 0.404 0.000 74 medium to strong
A different discount rate for each component cash flow that has a different risk characteristic (for example, depreciation vs. operating cash flow vs debt service reserve account) 4
14.6 0.111 0.328 80 weak
1 Correlation according to Pearson’s product-momentum correlation and Spearman’s rank order correlation (r: correlation coefficient, p: significance level, n: sample size), lower of both coefficients is shown; 2 answer options: 1 = never; 2=Almost never; 3= Sometimes; 4= Almost always; 5=Always; 3 Survey response to the question “How frequently does your company use the following techniques and/or approaches in determining cost of equity or discount rates when valuing RE investments?”; 4 Survey response to the question “How frequently does your company use the following discount rates when valuing a new RE investment project?”
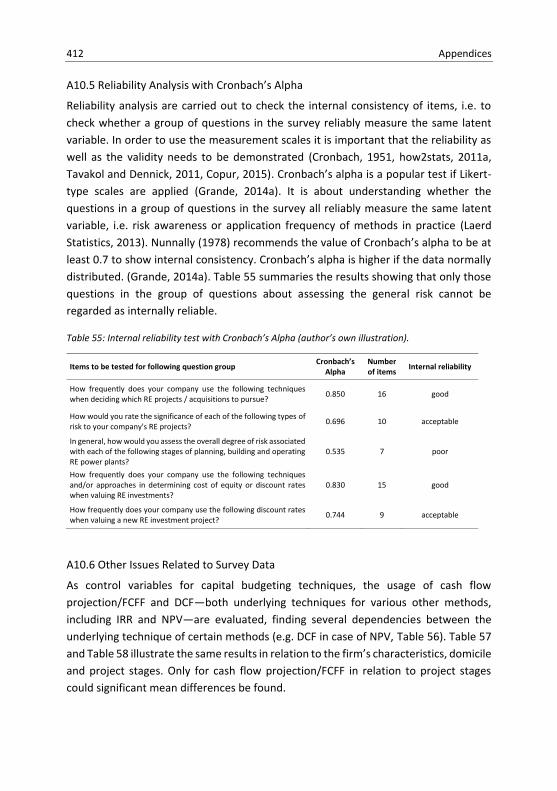
412 Appendices A10.5 Reliability Analysis with Cronbach’s Alpha
Reliability analysis are carried out to check the internal consistency of items, i.e. to check whether a group of questions in the survey reliably measure the same latent variable. In order to use the measurement scales it is important that the reliability as well as the validity needs to be demonstrated (Cronbach, 1951, how2stats, 2011a, Tavakol and Dennick, 2011, Copur, 2015). Cronbach’s alpha is a popular test if Likert-type scales are applied (Grande, 2014a). It is about understanding whether the questions in a group of questions in the survey all reliably measure the same latent variable, i.e. risk awareness or application frequency of methods in practice (Laerd Statistics, 2013). Nunnally (1978) recommends the value of Cronbach’s alpha to be at least 0.7 to show internal consistency. Cronbach’s alpha is higher if the data normally distributed. (Grande, 2014a). Table 55 summaries the results showing that only those questions in the group of questions about assessing the general risk cannot be regarded as internally reliable.
Table 55: Internal reliability test with Cronbach’s Alpha (author’s own illustration).
Items to be tested for following question group Cronbach’s Alpha
Number of items Internal reliability
How frequently does your company use the following techniques when deciding which RE projects / acquisitions to pursue? 0.850 16 good
How would you rate the significance of each of the following types of risk to your company's RE projects? 0.696 10 acceptable
In general, how would you assess the overall degree of risk associated with each of the following stages of planning, building and operating RE power plants?
0.535 7 poor
How frequently does your company use the following techniques and/or approaches in determining cost of equity or discount rates when valuing RE investments?
0.830 15 good
How frequently does your company use the following discount rates when valuing a new RE investment project? 0.744 9 acceptable
A10.6 Other Issues Related to Survey Data
As control variables for capital budgeting techniques, the usage of cash flow projection/FCFF and DCF—both underlying techniques for various other methods, including IRR and NPV—are evaluated, finding several dependencies between the underlying technique of certain methods (e.g. DCF in case of NPV, Table 56). Table 57 and Table 58 illustrate the same results in relation to the firm’s characteristics, domicile and project stages. Only for cash flow projection/FCFF in relation to project stages could significant mean differences be found.

Details of Validity Check in QUAN Phase 413 In addition, Table 59 puts applying past experience for defining discount rates in relation to the alternative approaches, applying the above introduced Pearson’s correlation.
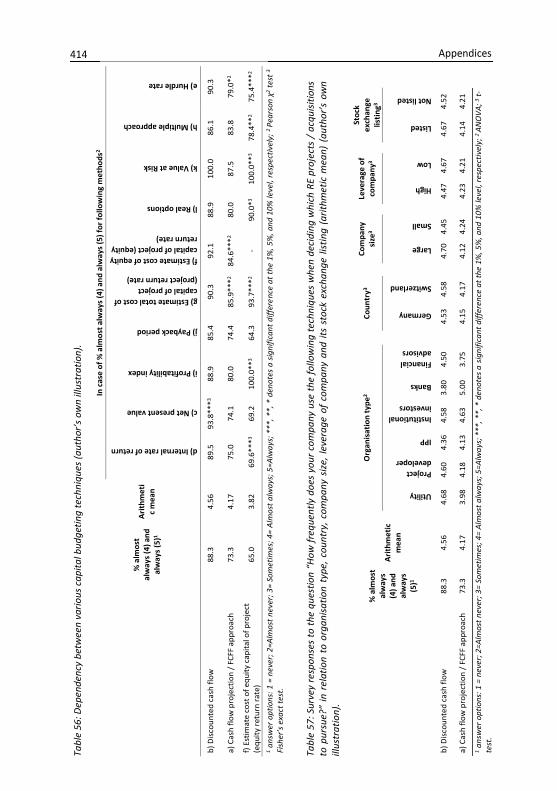
Tabl
e 56
: Dep
ende
ncy
betw
een
vario
us c
apita
l bud
getin
g te
chni
ques
(aut
hor’s
ow
n ill
ustr
atio
n).
%
alm
ost
alw
ays
(4) a
nd
alw
ays
(5)1
Arith
met
ic
mea
n
In c
ase
of %
alm
ost a
lway
s (4
) and
alw
ays
(5) f
or fo
llow
ing
met
hods
2
d) Internal rate of return
c) Net present value
i) Profitability index
j) Payback period
g) Estimate total cost of capital of project (project return rate)
f) Estimate cost of equity capital of project (equity return rate)
l) Real options
k) Value at Risk
h) Multiple approach
e) Hurdle rate
b) D
iscou
nted
cas
h flo
w
88.3
4.
56
89
.5
93.8
***3
88.9
85
.4
90.3
92
.1
88.9
10
0.0
86.1
90
.3
a) C
ash
flow
pro
ject
ion
/ FC
FF a
ppro
ach
73.3
4.
17
75
.0
74.1
80
.0
74.4
85
.9**
*2 84
.6**
*2 80
.0
87.5
83
.8
79.0
*2
f) Es
timat
e co
st o
f equ
ity c
apita
l of p
roje
ct
(equ
ity re
turn
rate
) 65
.0
3.82
69.6
***3
69.2
10
0.0*
*3 64
.3
93.7
***2
- 90
.0*3
100.
0**3
78.4
**2
75.4
***2
1 ans
wer
opt
ions
: 1 =
nev
er; 2
=Alm
ost n
ever
; 3=
Som
etim
es; 4
= Al
mos
t alw
ays;
5=A
lway
s; *
**, *
*, *
den
otes
a s
igni
fican
t diff
eren
ce a
t the
1%
, 5%
, and
10%
leve
l, re
spec
tivel
y; 2
Pear
son
χ2 tes
t 3 Fi
sher
’s e
xact
test
.
Tabl
e 57
: Sur
vey
resp
onse
s to
the
ques
tion
“How
freq
uent
ly d
oes
your
com
pany
use
the
follo
win
g te
chni
ques
whe
n de
cidi
ng w
hich
RE
proj
ects
/ a
cqui
sitio
ns
to p
ursu
e?”
in r
elat
ion
to o
rgan
isat
ion
type
, cou
ntry
, com
pany
siz
e, le
vera
ge o
f co
mpa
ny a
nd it
s st
ock
exch
ange
list
ing
(arit
hmet
ic m
ean)
(au
thor
’s o
wn
illus
trat
ion)
.
% a
lmos
t al
way
s (4
) and
al
way
s (5
)1
Arith
met
ic
mea
n
Org
anis
atio
n ty
pe2
Co
untr
y3
Com
pany
si
ze3
Le
vera
ge o
f co
mpa
ny3
St
ock
exch
ange
lis
ting3
Utility
Project developer
IPP
Institutional investors
Banks
Financial advisors
Germany
Switzerland
Large
Small
High
Low
Listed
Not listed
b) D
iscou
nted
cas
h flo
w
88.3
4.
56
4.
68
4.60
4.
36
4.58
3.
80
4.50
4.53
4.
58
4.
70
4.45
4.47
4.
67
4.
67
4.52
a) C
ash
flow
pro
ject
ion
/ FC
FF a
ppro
ach
73.3
4.
17
3.
98
4.18
4.
13
4.63
5.
00
3.75
4.15
4.
17
4.
12
4.24
4.23
4.
21
4.
14
4.21
1 ans
wer
opt
ions
: 1 =
nev
er; 2
=Alm
ost n
ever
; 3=
Som
etim
es; 4
= Al
mos
t alw
ays;
5=A
lway
s; *
**, *
*, *
den
otes
a s
igni
fican
t diff
eren
ce a
t the
1%
, 5%
, and
10%
leve
l, re
spec
tivel
y; 2
ANO
VA; 3 t
-te
st.
414 Appendices
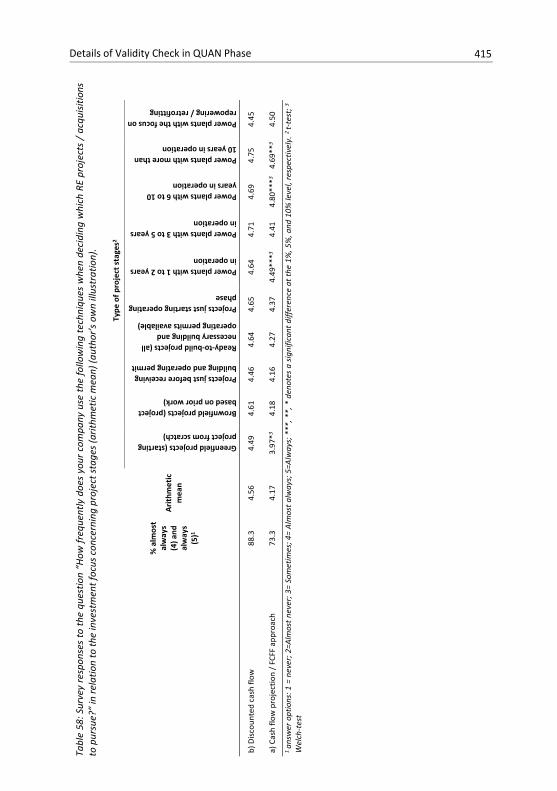
Tabl
e 58
: Sur
vey
resp
onse
s to
the
ques
tion
“How
freq
uent
ly d
oes
your
com
pany
use
the
follo
win
g te
chni
ques
whe
n de
cidi
ng w
hich
RE
proj
ects
/ a
cqui
sitio
ns
to p
ursu
e?”
in re
latio
n to
the
inve
stm
ent f
ocus
con
cern
ing
proj
ect s
tage
s (a
rithm
etic
mea
n) (a
utho
r’s o
wn
illus
trat
ion)
.
% a
lmos
t al
way
s (4
) and
al
way
s (5
)1
Arith
met
ic
mea
n
Type
of p
roje
ct s
tage
s2
Greenfield projects (starting project from scratch)
Brownfield projects (project based on prior work)
Projects just before receiving building and operating permit
Ready-to-build projects (all necessary building and operating permits available)
Projects just starting operating phase
Power plants with 1 to 2 years in operation
Power plants with 3 to 5 years in operation
Power plants with 6 to 10 years in operation
Power plants with more than 10 years in operation
Power plants with the focus on repowering / retrofitting
b) D
iscou
nted
cas
h flo
w
88.3
4.
56
4.
49
4.61
4.
46
4.64
4.
65
4.64
4.
71
4.69
4.
75
4.45
a) C
ash
flow
pro
ject
ion
/ FC
FF a
ppro
ach
73.3
4.
17
3.
97*3
4.18
4.
16
4.27
4.
37
4.49
***3
4.41
4.
80**
*3 4.
69**
3 4.
50
1 an
swer
opt
ions
: 1 =
nev
er; 2
=Alm
ost n
ever
; 3=
Som
etim
es; 4
= Al
mos
t alw
ays;
5=A
lway
s; *
**, *
*, *
den
otes
a s
igni
fican
t diff
eren
ce a
t the
1%
, 5%
, and
10%
leve
l, re
spec
tivel
y. 2
t-te
st; 3
Wel
ch-t
est
Details of Validity Check in QUAN Phase 415
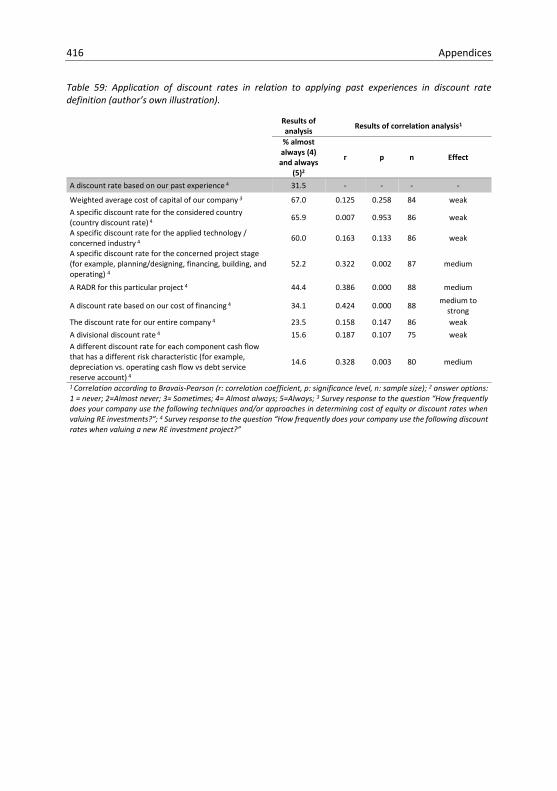
416 Appendices
Table 59: Application of discount rates in relation to applying past experiences in discount rate definition (author’s own illustration).
Results of analysis Results of correlation analysis1
% almost always (4) and always
(5)2
r p n Effect
A discount rate based on our past experience 4 31.5 - - - -
Weighted average cost of capital of our company 3 67.0 0.125 0.258 84 weak A specific discount rate for the considered country (country discount rate) 4 65.9 0.007 0.953 86 weak
A specific discount rate for the applied technology / concerned industry 4 60.0 0.163 0.133 86 weak
A specific discount rate for the concerned project stage (for example, planning/designing, financing, building, and operating) 4
52.2 0.322 0.002 87 medium
A RADR for this particular project 4 44.4 0.386 0.000 88 medium
A discount rate based on our cost of financing 4 34.1 0.424 0.000 88 medium to strong
The discount rate for our entire company 4 23.5 0.158 0.147 86 weak A divisional discount rate 4 15.6 0.187 0.107 75 weak A different discount rate for each component cash flow that has a different risk characteristic (for example, depreciation vs. operating cash flow vs debt service reserve account) 4
14.6 0.328 0.003 80 medium
1 Correlation according to Bravais-Pearson (r: correlation coefficient, p: significance level, n: sample size); 2 answer options: 1 = never; 2=Almost never; 3= Sometimes; 4= Almost always; 5=Always; 3 Survey response to the question “How frequently does your company use the following techniques and/or approaches in determining cost of equity or discount rates when valuing RE investments?”; 4 Survey response to the question “How frequently does your company use the following discount rates when valuing a new RE investment project?”
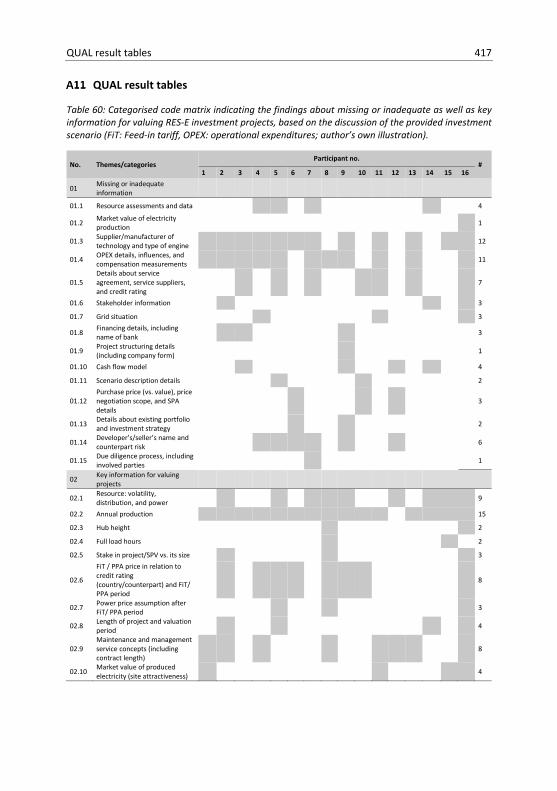
QUAL result tables 417
QUAL result tables
Table 60: Categorised code matrix indicating the findings about missing or inadequate as well as key information for valuing RES-E investment projects, based on the discussion of the provided investment scenario (FiT: Feed-in tariff, OPEX: operational expenditures; author’s own illustration).
No. Themes/categories Participant no.
# 1 2 3 4 5 6 7 8 9 10 11 12 13 14 15 16
01 Missing or inadequate information
01.1 Resource assessments and data 4
01.2 Market value of electricity production 1
01.3 Supplier/manufacturer of technology and type of engine 12
01.4 OPEX details, influences, and compensation measurements 11
01.5 Details about service agreement, service suppliers, and credit rating
7
01.6 Stakeholder information 3
01.7 Grid situation 3
01.8 Financing details, including name of bank 3
01.9 Project structuring details (including company form) 1
01.10 Cash flow model 4
01.11 Scenario description details 2
01.12 Purchase price (vs. value), price negotiation scope, and SPA details
3
01.13 Details about existing portfolio and investment strategy 2
01.14 Developer’s/seller’s name and counterpart risk 6
01.15 Due diligence process, including involved parties 1
02 Key information for valuing projects
02.1 Resource: volatility, distribution, and power 9
02.2 Annual production 15
02.3 Hub height 2
02.4 Full load hours 2
02.5 Stake in project/SPV vs. its size 3
02.6
FiT / PPA price in relation to credit rating (country/counterpart) and FiT/ PPA period
8
02.7 Power price assumption after FiT/ PPA period 3
02.8 Length of project and valuation period 4
02.9 Maintenance and management service concepts (including contract length)
8
02.10 Market value of produced electricity (site attractiveness) 4
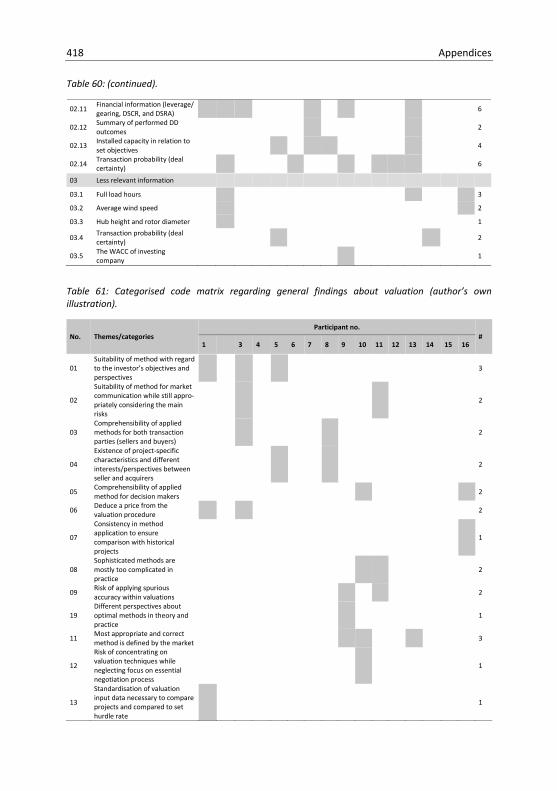
418 Appendices Table 60: (continued).
02.11 Financial information (leverage/ gearing, DSCR, and DSRA) 6
02.12 Summary of performed DD outcomes 2
02.13 Installed capacity in relation to set objectives 4
02.14 Transaction probability (deal certainty) 6
03 Less relevant information
03.1 Full load hours 3
03.2 Average wind speed 2
03.3 Hub height and rotor diameter 1
03.4 Transaction probability (deal certainty) 2
03.5 The WACC of investing company 1
Table 61: Categorised code matrix regarding general findings about valuation (author’s own illustration).
No. Themes/categories Participant no.
# 1 3 4 5 6 7 8 9 10 11 12 13 14 15 16
01 Suitability of method with regard to the investor’s objectives and perspectives
3
02
Suitability of method for market communication while still appro-priately considering the main risks
2
03 Comprehensibility of applied methods for both transaction parties (sellers and buyers)
2
04
Existence of project-specific characteristics and different interests/perspectives between seller and acquirers
2
05 Comprehensibility of applied method for decision makers 2
06 Deduce a price from the valuation procedure 2
07
Consistency in method application to ensure comparison with historical projects
1
08 Sophisticated methods are mostly too complicated in practice
2
09 Risk of applying spurious accuracy within valuations 2
19 Different perspectives about optimal methods in theory and practice
1
11 Most appropriate and correct method is defined by the market 3
12
Risk of concentrating on valuation techniques while neglecting focus on essential negotiation process
1
13
Standardisation of valuation input data necessary to compare projects and compared to set hurdle rate
1
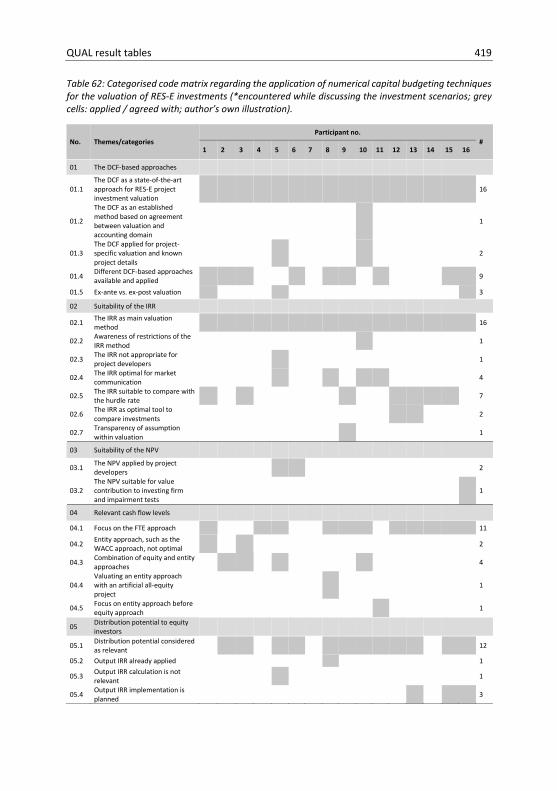
QUAL result tables 419
Table 62: Categorised code matrix regarding the application of numerical capital budgeting techniques for the valuation of RES-E investments (*encountered while discussing the investment scenarios; grey cells: applied / agreed with; author’s own illustration).
No. Themes/categories Participant no.
# 1 2 3 4 5 6 7 8 9 10 11 12 13 14 15 16
01 The DCF-based approaches
01.1 The DCF as a state-of-the-art approach for RES-E project investment valuation
16
01.2
The DCF as an established method based on agreement between valuation and accounting domain
1
01.3 The DCF applied for project-specific valuation and known project details
2
01.4 Different DCF-based approaches available and applied 9
01.5 Ex-ante vs. ex-post valuation 3
02 Suitability of the IRR
02.1 The IRR as main valuation method 16
02.2 Awareness of restrictions of the IRR method 1
02.3 The IRR not appropriate for project developers 1
02.4 The IRR optimal for market communication 4
02.5 The IRR suitable to compare with the hurdle rate 7
02.6 The IRR as optimal tool to compare investments 2
02.7 Transparency of assumption within valuation 1
03 Suitability of the NPV
03.1 The NPV applied by project developers 2
03.2 The NPV suitable for value contribution to investing firm and impairment tests
1
04 Relevant cash flow levels
04.1 Focus on the FTE approach 11
04.2 Entity approach, such as the WACC approach, not optimal 2
04.3 Combination of equity and entity approaches 4
04.4 Valuating an entity approach with an artificial all-equity project
1
04.5 Focus on entity approach before equity approach 1
05 Distribution potential to equity investors
05.1 Distribution potential considered as relevant 12
05.2 Output IRR already applied 1
05.3 Output IRR calculation is not relevant 1
05.4 Output IRR implementation is planned 3
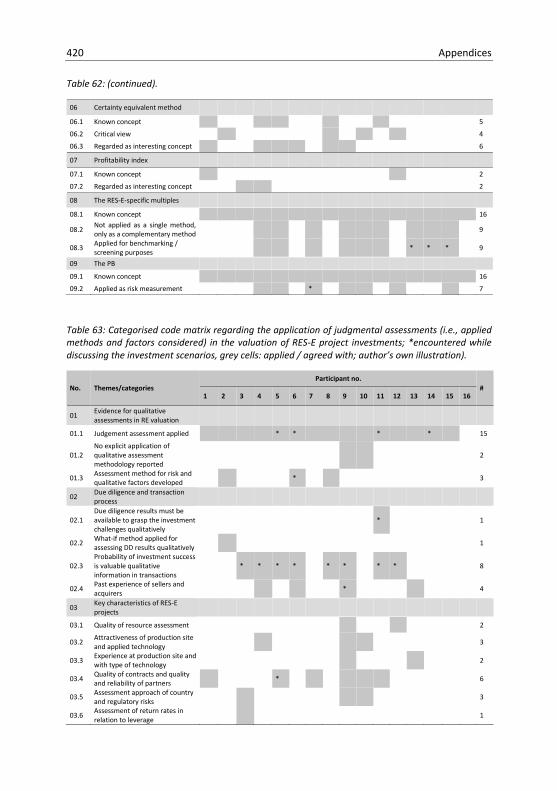
420 Appendices Table 62: (continued).
06 Certainty equivalent method
06.1 Known concept 5
06.2 Critical view 4
06.3 Regarded as interesting concept 6
07 Profitability index
07.1 Known concept 2
07.2 Regarded as interesting concept 2
08 The RES-E-specific multiples
08.1 Known concept 16
08.2 Not applied as a single method, only as a complementary method 9
08.3 Applied for benchmarking / screening purposes * * * 9
09 The PB
09.1 Known concept 16
09.2 Applied as risk measurement * 7
Table 63: Categorised code matrix regarding the application of judgmental assessments (i.e., applied methods and factors considered) in the valuation of RES-E project investments; *encountered while discussing the investment scenarios, grey cells: applied / agreed with; author’s own illustration).
No. Themes/categories Participant no.
# 1 2 3 4 5 6 7 8 9 10 11 12 13 14 15 16
01 Evidence for qualitative assessments in RE valuation
01.1 Judgement assessment applied * * * * 15
01.2 No explicit application of qualitative assessment methodology reported
2
01.3 Assessment method for risk and qualitative factors developed * 3
02 Due diligence and transaction process
02.1 Due diligence results must be available to grasp the investment challenges qualitatively
* 1
02.2 What-if method applied for assessing DD results qualitatively 1
02.3 Probability of investment success is valuable qualitative information in transactions
* * * * * * * * 8
02.4 Past experience of sellers and acquirers * 4
03 Key characteristics of RES-E projects
03.1 Quality of resource assessment 2
03.2 Attractiveness of production site and applied technology 3
03.3 Experience at production site and with type of technology 2
03.4 Quality of contracts and quality and reliability of partners * 6
03.5 Assessment approach of country and regulatory risks 3
03.6 Assessment of return rates in relation to leverage 1
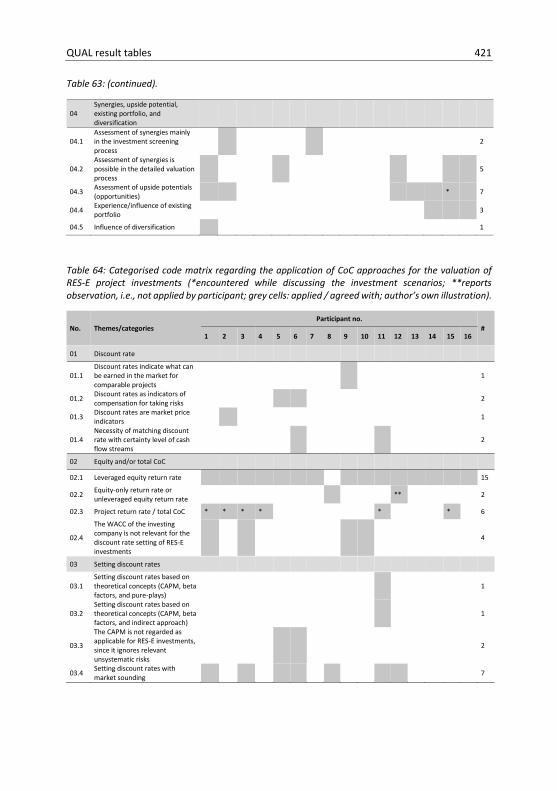
QUAL result tables 421
Table 63: (continued).
04 Synergies, upside potential, existing portfolio, and diversification
04.1 Assessment of synergies mainly in the investment screening process
2
04.2 Assessment of synergies is possible in the detailed valuation process
5
04.3 Assessment of upside potentials (opportunities) * 7
04.4 Experience/influence of existing portfolio 3
04.5 Influence of diversification 1
Table 64: Categorised code matrix regarding the application of CoC approaches for the valuation of RES-E project investments (*encountered while discussing the investment scenarios; **reports observation, i.e., not applied by participant; grey cells: applied / agreed with; author’s own illustration).
No. Themes/categories Participant no.
# 1 2 3 4 5 6 7 8 9 10 11 12 13 14 15 16
01 Discount rate
01.1 Discount rates indicate what can be earned in the market for comparable projects
1
01.2 Discount rates as indicators of compensation for taking risks 2
01.3 Discount rates are market price indicators 1
01.4 Necessity of matching discount rate with certainty level of cash flow streams
2
02 Equity and/or total CoC
02.1 Leveraged equity return rate 15
02.2 Equity-only return rate or unleveraged equity return rate ** 2
02.3 Project return rate / total CoC * * * * * * 6
02.4
The WACC of the investing company is not relevant for the discount rate setting of RES-E investments
4
03 Setting discount rates
03.1 Setting discount rates based on theoretical concepts (CAPM, beta factors, and pure-plays)
1
03.2 Setting discount rates based on theoretical concepts (CAPM, beta factors, and indirect approach)
1
03.3
The CAPM is not regarded as applicable for RES-E investments, since it ignores relevant unsystematic risks
2
03.4 Setting discount rates with market sounding 7
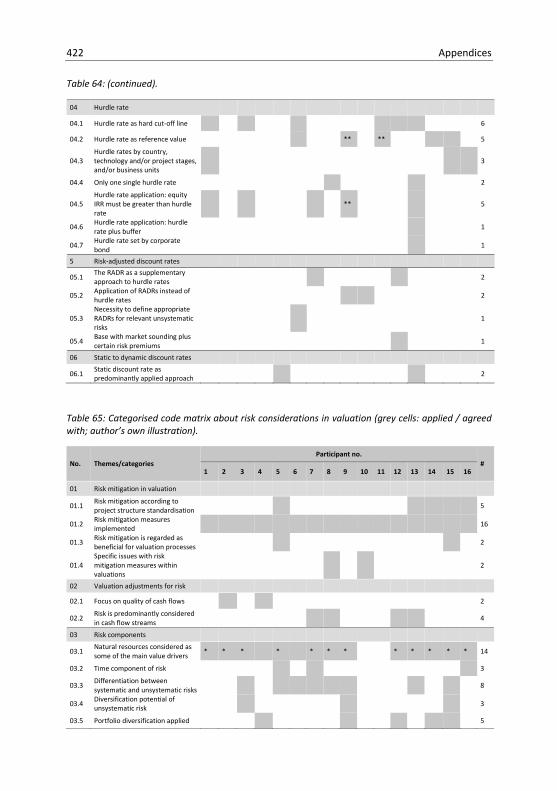
422 Appendices Table 64: (continued).
04 Hurdle rate
04.1 Hurdle rate as hard cut-off line 6
04.2 Hurdle rate as reference value ** ** 5
04.3 Hurdle rates by country, technology and/or project stages, and/or business units
3
04.4 Only one single hurdle rate 2
04.5 Hurdle rate application: equity IRR must be greater than hurdle rate
** 5
04.6 Hurdle rate application: hurdle rate plus buffer 1
04.7 Hurdle rate set by corporate bond 1
5 Risk-adjusted discount rates
05.1 The RADR as a supplementary approach to hurdle rates 2
05.2 Application of RADRs instead of hurdle rates 2
05.3 Necessity to define appropriate RADRs for relevant unsystematic risks
1
05.4 Base with market sounding plus certain risk premiums 1
06 Static to dynamic discount rates
06.1 Static discount rate as predominantly applied approach 2
Table 65: Categorised code matrix about risk considerations in valuation (grey cells: applied / agreed with; author’s own illustration).
No. Themes/categories Participant no.
# 1 2 3 4 5 6 7 8 9 10 11 12 13 14 15 16
01 Risk mitigation in valuation
01.1 Risk mitigation according to project structure standardisation 5
01.2 Risk mitigation measures implemented 16
01.3 Risk mitigation is regarded as beneficial for valuation processes 2
01.4 Specific issues with risk mitigation measures within valuations
2
02 Valuation adjustments for risk
02.1 Focus on quality of cash flows 2
02.2 Risk is predominantly considered in cash flow streams 4
03 Risk components
03.1 Natural resources considered as some of the main value drivers * * * * * * * * * * * * 14
03.2 Time component of risk 3
03.3 Differentiation between systematic and unsystematic risks 8
03.4 Diversification potential of unsystematic risk 3
03.5 Portfolio diversification applied 5
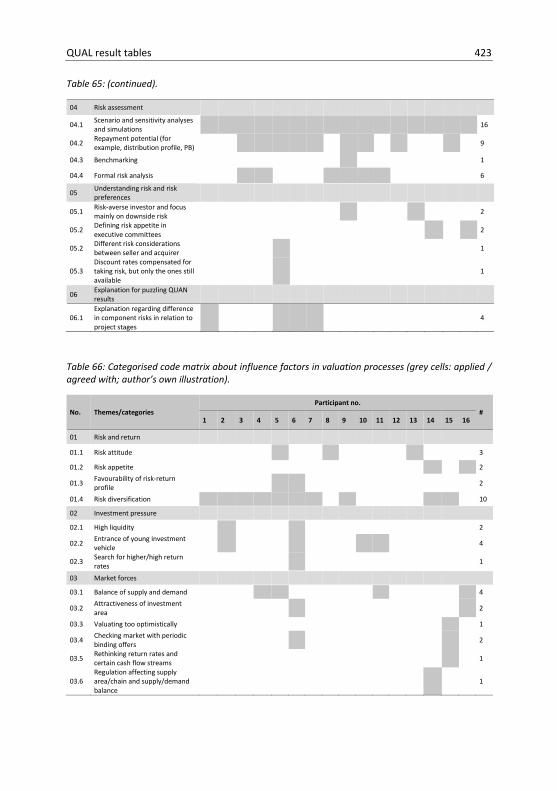
QUAL result tables 423
Table 65: (continued).
04 Risk assessment
04.1 Scenario and sensitivity analyses and simulations 16
04.2 Repayment potential (for example, distribution profile, PB) 9
04.3 Benchmarking 1
04.4 Formal risk analysis 6
05 Understanding risk and risk preferences
05.1 Risk-averse investor and focus mainly on downside risk 2
05.2 Defining risk appetite in executive committees 2
05.2 Different risk considerations between seller and acquirer 1
05.3 Discount rates compensated for taking risk, but only the ones still available
1
06 Explanation for puzzling QUAN results
06.1 Explanation regarding difference in component risks in relation to project stages
4
Table 66: Categorised code matrix about influence factors in valuation processes (grey cells: applied / agreed with; author’s own illustration).
No. Themes/categories Participant no.
# 1 2 3 4 5 6 7 8 9 10 11 12 13 14 15 16
01 Risk and return
01.1 Risk attitude 3
01.2 Risk appetite 2
01.3 Favourability of risk-return profile 2
01.4 Risk diversification 10
02 Investment pressure
02.1 High liquidity 2
02.2 Entrance of young investment vehicle 4
02.3 Search for higher/high return rates 1
03 Market forces
03.1 Balance of supply and demand 4
03.2 Attractiveness of investment area 2
03.3 Valuating too optimistically 1
03.4 Checking market with periodic binding offers 2
03.5 Rethinking return rates and certain cash flow streams 1
03.6 Regulation affecting supply area/chain and supply/demand balance
1
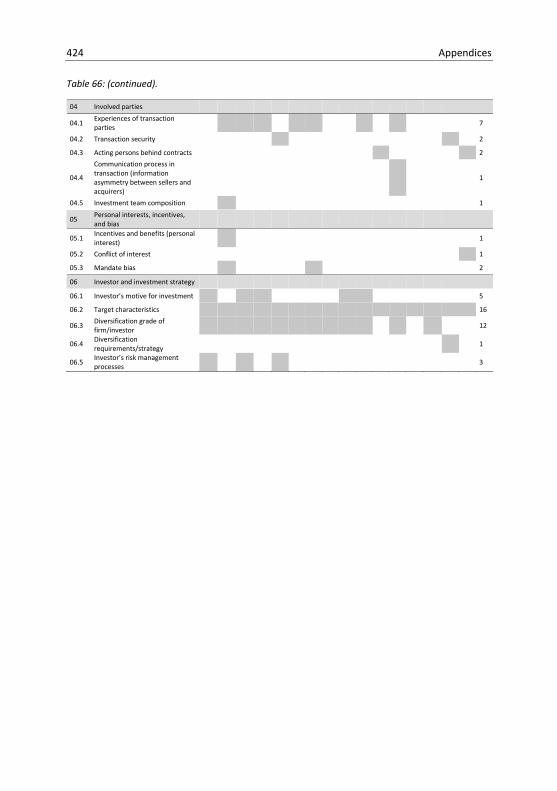
424 Appendices Table 66: (continued).
04 Involved parties
04.1 Experiences of transaction parties 7
04.2 Transaction security 2
04.3 Acting persons behind contracts 2
04.4
Communication process in transaction (information asymmetry between sellers and acquirers)
1
04.5 Investment team composition 1
05 Personal interests, incentives, and bias
05.1 Incentives and benefits (personal interest) 1
05.2 Conflict of interest 1
05.3 Mandate bias 2
06 Investor and investment strategy
06.1 Investor’s motive for investment 5
06.2 Target characteristics 16
06.3 Diversification grade of firm/investor 12
06.4 Diversification requirements/strategy 1
06.5 Investor’s risk management processes 3
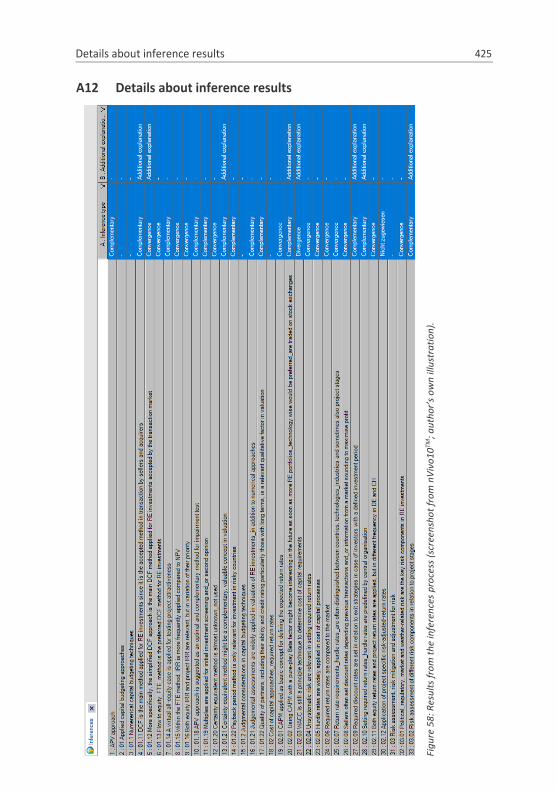
Figu
re 5
8: R
esul
ts fr
om th
e in
fere
nces
pro
cess
(scr
eens
hot f
rom
nVi
vo10
TM; a
utho
r’s o
wn
illus
trat
ion)
.
A12 Details about inference results
Details about inference results 425
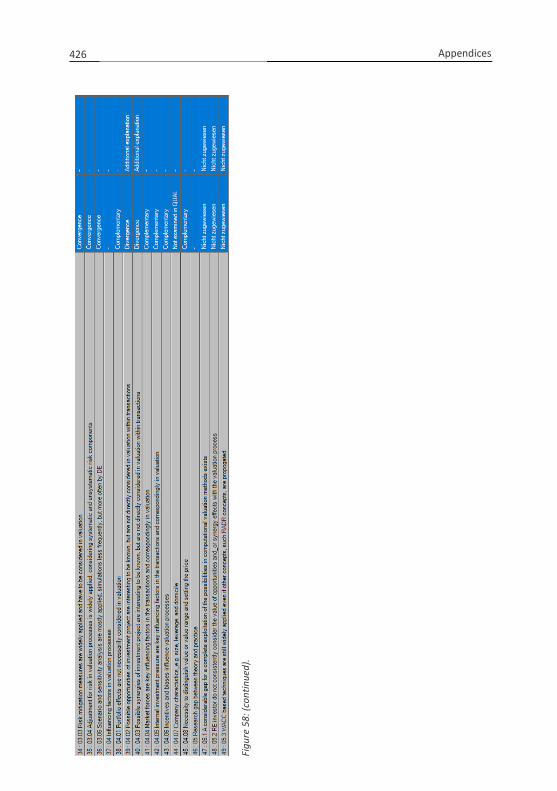
Figu
re 5
8: (c
ontin
ued)
.
426 Appendices
Endnotes: 1 During the course of the thesis, the abbreviation for renewable energy projects has been adjusted
and made more precise to be RES-E, instead of just RE for renewable energy or RES for renewable energy sources, emphasising the focus of the investigated objects on power plants producing electricity (E) from renewable energy sources. The abbreviation RE has been used in the questions of the questionnaire. Therefore, the QUAN results still refer to RE instead of RES-E in the titles of the corresponding table of results.
2 Subsidies can either be feed-in tariffs (FiTs, section 2.1.1) (Lipp, 2007, Bürer and Wüstenhagen,
2009, Couture, 2010), a fixed or semi-fixed revenue in currency per amount of production for a certain period of time, or production tax credits (mainly in the US) used by equity investors for their benefits in taxes (Liebreich, 2005).
3 The group of non-traded assets (or: non-marketable assets or perfectly non-liquid assets) consists
of assets that are not traded on the (public) market, such as human capital and private businesses (Bodie et al. 2014).
4 Private equity refers to an asset class that consists of equity securities and debt in an operating
company that is privately owned and hence not publicly traded on a stock exchange (Jegadeesh et al. 2009). These investments are considered to be illiquid and long term (Zimmermann et al. 2005, Sorensen, 2013, 2014). Market data for private equity are not directly accessible (Nielsen, 2011, Driessen et al., 2012), only if securities that are investing in private equity companies are publicly traded (Ljungqvist and Richardson, M, 2003). Such securities could be funds (Ljungqvist & Richardson, 2003) or specific companies (Zimmermann et al., 2005; Jegadeesh et al., 2009). Private equity can, for example, be categorised in private equity investment trusts, venture capital trusts, public to private, management buy-outs or management buy-ins, venture capital or business angels (Arnold 2010), or SPVs for operating specific projects.
5 i.e. the ‘conference best and highly commended student paper award’ for the best student paper
at the EuroMed Academy of Business (EMAB) conference 2017. 6 Valuation must always be considered in the context of its purpose. There is no one right value for a
company, a project, or an asset. There are different values that can each serve a different purpose (Moxter, 1983:4). In the past, various valuation concepts based on different methods have been in focus in practice. For example, in Germany, the substantial value method was used in the majority of cases until the 1960s, followed by the German income approach, which valued an asset based on the future streams of earnings or profits, before the discounted cash flow method became the main approach in practice in the mid 1980s (Drukarczyk and Schüler, 2009:9).
7 Renewable energy sources (RES) projects are enterprises that transform a replenishable primary
natural resource, such as biomass, hydro power, wind power, solar radiation, gravitation, isotope decay and residual heat in the earth's interior into secondary energy forms, such as electricity, heat or fuel (BMU 2006, cited in Peter and Fischedick, 2007). The abbreviation RES-E stands power plants producing electricity from renewable energy sources (Unteutsch, 2016); these could be hydro power plants, wind farms, photovoltaic plants or geothermal power plants. Newer RES-E technologies include wind farms, photovoltaic, concentrated solar, biomass or geothermal power plants. They are all characterized by long-term investments from 20 to 30 years for wind and
© Springer Fachmedien Wiesbaden GmbH, part of Springer Nature 2019C. Hürlimann, Valuation of Renewable Energy Investments, Sustainable Management, Wertschöpfung und Effizienz, https://doi.org/10.1007/978-3-658-27469-6
428 Endnotes
photovoltaic (Kost et al. 2018) and up to 80 years and more for hydro power plants (IRENA, 2012). They are typically private equity investments, either structured as completely private investments of a company on their own balance sheets or as special purpose vehicles (SPVs) with project financing (Steffen, 2018). An SPV is a business entity that is initialised by a firm for the purpose of conducting a clearly-specified activity (Gorton and Souleles, 2007; Böttcher, 2009, Chang, Wang, and Liao, 2009), such as developing, building and operating RES-E projects.
8 Possible improve options of RES-E are for instance: i) revenue improvements with the imple-
mentation of technological retrofit measurements and software upgrades in production control system and with the access to new markets, such as the ancillary market to stabilized the grid; and/or ii) decrease of costs be renegociating improved operating contracts, such as the operation and maintence contract, commercial and technological management contracts, merging of SPV to eliminate corporate specific cost components, such as accouting, performing financial statements, and auditor’s reports.
9 This limited scope for action in the operating phase has implication on the chosen valuation
method, as discussed in section for 2.4.2.4 about active decision making in projects with higher uncertainties.
10 Hanson summarised alternative risk definitions from a technical point of view: i) “the unwanted
event which may or may not occur [, ii)] the probability of an unwanted event which may or may not occur [, or iii)] the statistical expectation value of an unwanted event which may or may not occur” (2011:1). According to Hanson (2011), these definitions fall short of describing risk appropriately.
11 In addition to distinguishing risk from uncertainty, risk must be differentiated from the terms peril
and hazard. Peril is a probable cause, such as an earthquake, fire, or theft, that exposes a person or property to the risk of damage, injury, or loss. Perils can be covered with appropriate insurance policies. In contrast, hazard exists within a particular situation that poses a threat to human health and life, a threat to animals, and damage to property and the environment. In other words, a hazard is something that makes the occurrence of a peril more likely or more severe. It can be dormant/potential or active. In contrast to peril and hazard, the term risk only describes the chance of an adverse effect occurring (Sutton, 2014, Bitaraf and Shahriari, 2015).
12 The state of uncertainty describes situations that are also described in the literature as so-called
black swans or extreme tail events, which are highly improbable, unpredictable, or unforeseen events that, at an earlier stage, are not identified as potentially hazardous, but later emerge, often with extreme consequences (Taleb, 2010, Weitmayr, H. (2017).
13 t is common to use for the standard deviation, the square root of the variance, as a measurement
of the risk (Loderer et al., 2010). 14 This view on risk is defined as risk in the narrow sense. In the wide sense of the term, risk is
understood as peril that an actual, realised incident diverges from the expected incident in either a positive direction (also known as opportunity) or a negative direction (also known as risk in the narrow sense), based on the work of Hupe (1995, cited in Böttcher, 2009).
15 Or as Brealey et al. (2011) explain in their words, “Wise investors don’t take risks just for fun. They
are playing with real money. Therefore, they require a higher return from the market portfolio than from Treasury bills” (297).
Endnotes 429 16 Based on the given explanations, the terms expected return and risk premium as well as cost of
equity are used interchangeably within this thesis. 17 Kahneman and Tversky’s prospect theory (1979) describes a reference-depending nature of
individuals’ risk preferences, and it points out a risk aversion for decisions in a stage of gains and risk seeking for decisions in a stage of losses.
18 Unsystematic risk may also be called specific risk, firm-specific risk, residual risk, unique risk, idio-
syncratic risk, or diversified risk (Brealey et al., 2011, Damodaran, 2013, Espinoza, 2014). 19 Systematic risk may also be called market risk or undiversified risk (Brealey et al., 2011). 20 Here is the wider sense of financial risk meant. It includes credit risk, liquidity risk, currency risk,
foreign investment risk and equity risk. The narrower sense only includes risk of leverage (credit risk), see Table 4 (Investopedia, n.d.-a).
21 In further explanations, the term risk mitigation is used, although it means both risk and uncertainty
mitigation. 22 The risk premium approach can also be applied for a time-invariant risk premium for a multi-period
case based on equation 3. 23 The going concern principle is translated from the German expression ‘Fortführungsprinzip’,
adopted from §252 Abs. 1 Nr. 2 HGB (German ‘Handelsgesetzbuch’, English ‘commercial law’). 24 Project financing is defined as the financing of a project in which a lender first places the focus of
the credit check on the project's cash flows as the sole source of funds used to service the loans (Nevitt and Fabozzi, 2000, Yescombe, 2013, Morrison, 2016).
25 Compared to the EVA, DCF-based methods are more appropriate for handling projected cash flows
over the whole project period without applying a determination value (section 2.4.1.2) and for significant distributions to equity holders in later project years.
26 It is common praxis define net cash inflow (i.e. the difference between the present value of cash
inflows and the present value of cash outflows) as relevant cash flow for the NPV and IRR calculations (section 2.4.2.2) while the relevant cash flow for DCF-based methods (section 2.4.2.1) is usually expressed as free cash flow to equity or firm (i.e. the cash flow available to only equity or to all investors, respectively) (Investopedia, n.d. –b, -c, -d).
27 Those circulation issues in DCF-based valuation are also described as roll-back approach in literature
(Casey, 2004). 28 Expected net present value models are also called “risk-adjusted NPV models” (Villiger & Bogdan,
2005:113) or rNPV (Stewart et al., 2001). 29 Moxter (1983) proposed the term ‘valuing means comparing’ (in German: “bewerten heisst
vergleichen” [Moxter, 1983:123]) as basic concept for applying multiple approaches. 30 In case of leverage firms with corporate loans, Myers (1977) and Barnea et al. (1980) argue that
shareholders have a call option claim on assets and are incentivized to undertake riskier projects due to the increase of the call option value the riskier the project is (greater variance). As such, the call option is particularly attractive for high leveraged firms. Since in typically RES-E investments
430 Endnotes
however, the structure of the applied project financing does not provide incentives that a potential call option value on the equity is greater in case of greater variances of the assets.
31 The difference between real option and financial option is not discussed in this thesis. Brach (2003),
for instance, gives valuable details about real option valuation in practice, including an outline of the differences between the two option approaches.
32 The volatility as an input variable in ROV describes the uncertainty of the underlying asset over time
(Brealey et al., 2011). Derived from the discussion in chapter 2.2.1, the volatility and the corres-ponding probability distribution are its measurements of risk.
33 The use of the CoC and the WACC leads to confusion in some circumstances. For example, the WACC
described in this section should not be mistaken for the WACC of the targeted investment; the project-based WACC (see section 2.4.2.1), which is the total CoC of the investment project (Mielcarz & Mlinarič, 2014); and the DCF-based WACC approach (section 2.4.2.1).
34 There is a third WACC concept, called vanilla WACC. It takes into account the average of both post-
and pre-tax WACC Arnold, G. (2013) Corporate Financial Management, 5th ed. Pearson Education, Harlow, UK..
35 According to Ehrhardt and Birgham (2016), the divisional WACC is typically calculated using the
pure-play technique or the accounting beta method. 36 Empirical surveys among practitioners demonstrate that the WACC and a single company-wide
discount are predominantly applied in DCF analyses, although many practitioners also apply the hurdle rate and RADR concepts (e.g. Gitman and Mercurio, 1982, Bruner et al., 1998, Graham and Harvey, 2001).
37 The principle of the RADR concept illustration for an all-equity financed company can also be
applied and correspondingly adjusted for companies with different capital structures Arnold, G. (2013) Corporate Financial Management, 5th ed. Pearson Education, Harlow, UK.
38 Since the risk-free rate does not consider the tax advantage of debt, as within the WACC calculation,
it must be examined whether the potential advantages of a tax shield are appropriately considered in the CE cash flows or in the discount rates (Ehrhardt and Brigham, 2016). However, the cash flow projections for RES-E investments do typically correctly consider this benefit; therefore, cash flow adjustments on the CE level do correctly incorporate these circumstances.
39 In this study: CFO, asset managers, and other financial experts. 40 Similarly to private equity companies, estimating expected returns for investment projects is
challenging, since the cost of assets can normally not directly be monitored. Loderer et al. (2010) provide an approach to estimate the RADR for investment projects, using again the CAPM. This approach is based on the assumption that the operative risk of the project has the same risk as the whole company that is investing in this project, although each project has a different risk profile.
41 Professor Aswath Damodoran periodically publishes his industry beta calculations on the following
web page: http://pages.stern.nyu.edu/~adamodar/New_Home_Page/datafile/Betas.html 42 They are described elsewhere, for example, in Aharoni (1966) and Arnold (2013), p. 141ff.
Endnotes 431 43 These three fictive examples are realistic cases, applied in the qualitative interviews in section
4.4.1.2. Detailed figures are found in Appendix A8 (2. part of interview with the investment scenarios).
44 In the following course, the expressions research philosophy, philosophical stance, and paradigms
are used interchangeably. 45 The role of the researcher’s values is studied by axiology, which is a separate philosophical branch
about the theory of values (Hart, 1971). 46 These frictions are known as the paradigm war between quantitative and qualitative approaches
(Datta, 1994). 47 It is, however, not necessarily that the chosen paradigm within this research is always applied by
the author, for example, for other studies, since the selected paradigm must always match the performed research.
48 Social conditioning is explained and discussed in detail by Maki (1992): it is a sociological process of
training individuals in a society to respond in a manner generally approved by society and peer groups within society.
49 During an unstructured or in-depth interview, the interviewer does not have a list of themes and
questions to choose from, although he or she does have a clear focus on the area to be explored. It is a completely informal conversation in which the interviewee can talk freely to explore a certain area in depth (Saunders et al. 2009).
50 A selection of seminal MMR books: SAGA Handbook of Mixed Methods in Social & Behavioural
Research by Tashakkori and Teddlie (2010), The SAGE Handbook of Qualitative Research by Denzin and Lincoln (2011), Mixed Methods Research: A Guide to the Field by Plano Clark and Ivankova (2016), and Designing and Conducting Mixed Methods Research by Creswell and Plano Clark (2018).
51 This term ‘multiple approach’ with research methodologies should not confused with the same
term in valuation. Only the latter is abbreviated in this thesis with MA. 52 Independent power producers are defined as those companies with electricity generating units that
are not public utilities, do not have an own grid, and are therefore dependent on the grids of others (mainly utilities) (STROM.info, n.d., EnergyVortex.com, n.d.).They have often arisen from project developers of RES-E units.
53 The access to the group of industrial companies which also invest in RES-E projects is time-
consuming, difficult and therefore costly. It could be covered in a separate research project (section 6.5).
54 The questionnaire was composed of additional sections about the attractiveness of RES-E
investment opportunities, general questions about risk and return, and several additional detailed questions that were not evaluated within this research and in the subsequent QUAL phase due to resource and time restrictions.
55 The open source software survey tool, run on the server of the Kalaidos University of Applied
Sciences (see http://www.kalaidos-fh.ch/Forschung/Kalaidos-Befragungsserver), could be used.
432 Endnotes 56 Conferences on RES-E, such as the ‘New Energy Investor Summit’ in Switzerland, 2016, and the
‘Handelsblatt Tagung in Erneuerbare Energien’ in Berlin 2015. 57 Test re-tests to check the reliability of the questionnaire are planned within the additional interview
phases with the same and similar questions. 58 In the greenfield stage, power plant projects are only composed of a few rights (for example, land
rights), and almost no opportunities and synergies can be used due to the typically unique nature of the project. In this paper, the term brownfield relates to sites for potential development that have had previous development on them.
59 In general, having experienced weather-related volume risk to materialise does not increase the
need for more risk mitigation measures, except the need for more external DD (83.9% vs. 75.0%), probably in relation to wind assessment. This might be due to the fact that weather-related volume is considered anyhow as one of the most important risks (see section3.2) without having to materialise it in the first place. Likewise, materialised weather-related volume risk does not increase the demand for appropriate risk mitigation measures with weather protection insurances. This is probably because other risk mitigation is conducted, including portfolio diversification for sites in relation to the available natural resource conditions and for different energy transformation technologies, and because appropriate insurances are costly in relation to their benefits.
60 This indicates that, in the project stage of a power plant with six to 10 years in operation, the
possibility to adjust and improve certain essential contracts is considered, including renegotiating long-term operating and maintenance agreements, as well as refinancing loan agreements with interest rates, which are often fixed for up to 10 years in project financing agreements.
61 Measured as a percentage of the respondents who answered ‘cash flow adjustment’, ‘discount rate
adjustment’, and ‘both’. 62 Measured as a percentage of the respondents who answered ‘cash flow adjustment’ and ‘both’. 63 Measured as a percentage of the respondents who answered ‘discount rate’ and ‘both’. 64 Other natural resources means all natural resources, except weather-related volume risk. 65 Direct marketing in the power sector is a scheme to transform the rigid FiT system into a market-
oriented subsidy system in which an energy off-taker trades the power generation at the power exchange.
66 Market integration of RES-E, for instance, within a so-called direct market scheme. 67 The discussed topics during the interviews regarding the challenges and issues included the
following: The appropriateness and suitability of the IRR and NPV approaches (see section 5.3.3.2) The discount rate, typically incorporating both the time value of money and risk (see section
5.3.3.1) Methods to consider risk, either in the discount rate or the cash flows (see section 5.3.6.2) The selection of the appropriate cash flow streams for DCF-based valuation (see section
5.3.3.3) and matching them with the appropriate CoC approach (see section 5.3.5.1) The application of a constant or dynamic discount rate in relation to the involved financing
policy of the valuated project (see section 5.3.5.1)
Endnotes 433
The volatility of considered cash flow streams from period to period within the considered valuation period (see section 5.3.3.1)
Debate about ex-ante vs. ex-post valuations (see section 5.3.5.1) 68 Ex-post valuation means a retrospective valuation that considers certain later-known circum-
stances, in contrast to ex-ante valuation, which performs valuation without considering later circumstances that are not known at that point in time.
69 Definition of P value: it is a probability measure; for example, P50 is defined as 50% of estimates
exceeding the P50 estimate, and in the case of P90, it is 90% of the estimates exceeding the P90 estimate.
70 The DNPV method of Espinoza and Morris (2013) and Espinoza and Rojo (2015) provides possible
answers to the question of how to decrease the subjective assumptions for defining the certainty levels of the relevant input parameters (see section 2.4.4.4).
71 Earn-out is a provision written in the financial transaction document (for example, share purchase
agreement) whereby the seller of the business will receive additional payments after a defined earn-out period based on the future performance (for example, the actual production data, compared to forecasted production data) of the business sold. In a reverse earn-out provision, a certain amount is paid back to the acquirer.
72 Likewise, values (NPV versus DNPV) can be plotted (section 2.6.3) to reduce the inherit weakness
of IRR calculations, outlined in section 2.4.2.2. Despite the known weakness of the IRR, this measure has been chosen herein, since projects of different sizes (which is often the case in investment processes) can be better compared.
73 For clarity reasons, the simplified EVA calculation is presented here to omit the issue of corrections
to EBIT and CI calculations, proposed by Stern Stewart & Co. The majority of the corrections affect the EBIT calculation and CI symmetrically. Therefore, they should not have a significant impact on the final conclusions concerning the discussed issue as far as the same corrections would be applied in the process of FCF calculation (Mielcarz and Mlinarič, 2014
74 The APM is also known as the arbitrage pricing theory (APT) (Ross, 1976). 75 According to the study of Gitman and Vandenberg (2001), nearly 93% of the all survey participants
using the DCF apply the CAPM, compared to approximately 1% who apply the APM. 76 Utility maximisation is an economic concept that describes a consumer attempting to obtain the
greatest value possible from the expenditure of the least amount of money when making a purchase decision. The objective is to maximise the total value derived from the available money (Kahneman & Thaler, 2006).
77 Moreover, with the production-based CAPM, Cochrane (1991) developed an additional version of
this model. 78 There is a recent working paper (Chong, Jin, & Philipps, 2013) that discusses alternative CAPM
adjustments based on a build-up methodology. 79 The market factor is measured by the return on market index minus the risk-free interest rate; the
size factor is measured by the return on small-firm stocks less the return on large-firm stocks; and
434 Endnotes
the book-to-market factor is measured by the return on high book-to-market-ratio stock less the return on low book-to-market-ratio stocks (Brealey et al., 2011).
80 The momentum can be calculated by subtracting the equal weighted average of the highest
performing firms from the equal weighted average of the lowest performing firms, lagging by one month (Carhart, 1997).
81 Cross tabulations are conducted by organisation type (energy-related companies, i.e., firms with
energy as a core competence: utility, IPP, and project developers, versus others), country (DE: Germany, CH: Switzerland), size (large firms have more than 500 employees), leverage (firms with high leverage are defined as having a debt ratio of 40%, the ratio of total—short-term and long-term—debt to total assets), whether a firm is stock exchange listed (yes vs. no), gender (male vs. female), age (older than 40 vs. younger than 41), education (participants having an MBA vs. other qualifications), and experience (having performed more than 10 transactions is defined as having high experience). According to Cohen (1988), the phi coefficient (effect size) strength is small for a value of 0.1, moderate for 0.3, and large for 0.5.


