Embed Size (px)
Citation preview

Bioactive glass (type 45S5) nanoparticles: In vitro reactivity on nanoscale
and biocompatibility
M. Mačković1,2,¥ A. Hoppe1¥, R. Detsch1, D. Mohn3,4, W.J. Stark3, E. Spiecker1,2,* and A.R.
Boccaccini1,*
¥ These two authors share the first authorship
1Institute of Biomaterials, Department of Materials Science and Engineering, University of
Erlangen-Nürnberg, Cauerstr. 6, 91058 Erlangen, Germany
2Center for Nanoanalysis and Electron Microscopy (CENEM), Department of Materials
Science and Engineering, University of Erlangen- Nürnberg, Cauerstr. 6, 91058 Erlangen,
Germany
3Institute for Chemical and Bioengineering, ETH Zurich, Wolfgang-Pauli-Str. 10, 8093
Zurich, Switzerland
4Department of Preventive Dentistry, Periodontology, and Cardiology, University of Zurich
Center of Dental Medicine, Plattenstr. 11, 8032 Zurich, Switzerland
* Corresponding authors:
Aldo R. Boccaccini ([email protected]; Phone: +49-9131-85-28601;
Fax: +49-9131-85-28602) and
Erdmann Spiecker ([email protected]; Phone: +49-9131-85-28603;
Fax: +49-9131-85-28602)
Keywords: Nanoparticles, bioactive glass, TEM, hydroxyapatite, osteoblast

Abstract
Bioactive glasses represent important biomaterials being investigated for the repair and
reconstruction of diseased bone tissues, since they exhibit outstanding bonding properties to
human bone. In the present study bioactive glass (type 45S5) nanoparticles (nBG) with a
mean particle size in the range of 20-60 nm, synthesized by flame spray synthesis, are
investigated in relation to in vitro bioreactivity in simulated body fluid (SBF) and response to
osteoblast cells. The structure and kinetics of hydroxyapatite formation in SBF were
investigated using transmission electron microscopy (TEM), X-ray diffraction (XRD) and
Fourier-Transform Infrared Spectroscopy (FT-IR) revealing a very rapid transformation (after
1d) of nBG to nanocrystalline bone-like carbonated HAp. Additionally, calcite is formed after
1d of SBF immersion due to the high surface reactivity of the nBG particles. In the initial
state nBG particles were found to exhibit chain-like porous agglomerates of amorphous nature
which are transformed upon immersion in SBF into compact agglomerates covered by
hydroxyapatite with a reduced size of the primary nanoparticles. In vitro studies revealed high
cytocompatibility of nBG with human osteoblast cells, indicated through high
lactatedehydrogenase (LDH) and mitochondrial activity as well as alkaline phosphatase
activity. Hence, this study contributes to the understanding of the structure and bioactivity of
bioactive glass (type 45S5) nanoparticles, providing insights to the phenomena occurring at
the nanoscale after immersion in SBF. The results are relevant in relation to the understanding
of the nanoparticles’ bioreactivity required for applications in bone tissue engineering.

1. Introduction
Due to their attractive biological properties and appropriate mechanical performance bioactive
glasses, such as standard 45S5 Bioglass® (BG) is being widely considered in the fields of
bone tissue engineering (Hench et al. 2004), applied as bone graft materials for small bone
defects as bioactive coatings for orthopedic implants (Gabbi et al. 1995) and as filler particles
in biopolymer composites (Rezwan et al. 2006; Boccaccini et al. 2005). Bioactive materials
must possess controlled degradation behavior and kinetics that should synchronize with the
sequence of cellular changes occurring during new tissue formation (Hench et al. 2004; Gabbi
et al. 1995; Rezwan et al. 2006). In the field of bone engineering, bioactivity is defined as the
ability of the material to bond to bone tissue via the formation of a bone-like hydroxyapatite
(HAp) layer on its surface (Hench 1998; Kokubo et al. 1990). Kokubo (1991) proposed that
the essential requirement for an artificial material to bond to living bone is the formation of
bonelike apatite on its surface when it is implanted in the living body and that this in vivo
formation of HAp can be reproduced in a simulated body fluid (SBF) with ion concentrations
nearly equal to those of human blood plasma (Kokubo et al. 1990). Despite some critical
considerations on the validity of the SBF technique, this method continuous to be applied to
assess the bioactivity behavior of biomaterials (Bohner and Lemaitre 2009). Detailed analysis
of the surface apatite formed in SBF solution has been investigated by means of several
methods such as transmission electron microscopy (TEM), scanning electron microscopy
(SEM), thin-film X-ray diffraction (XRD) and Fourier-Transform Infrared Spectroscopy
(FTIR) and it has been shown that it is similar to bone material, both in its structure and in its
composition (Kokubo et al. 1990; Ohtsuki et al. 1995). The rate of HAp formation on
bioactive glass surfaces depends amongst other factors on the morphology and structure of the
material. The recently developed nanosized bioactive glass particles (Brunner et al. 2006)
represent an attractive alternative to glass particles in the micrometer range for hard tissue
regeneration, since their small particle size makes them ideal for injectable carrier for

effective introduction into bone defects. Furthermore, their larger surface area should lead to
increased interface effects, accelerate their interaction with tissue and improve mechanical
properties when used in compounds (Boccaccini et al. 2010) and, thus, contribute to an
improved bioactivity, compared to standard µm-sized particles (Brunner et al. 2006; Loher
2006) making nanoscaled bioactive glass particles very promising for biomedical
applications. For example, nanoscaled bioactive glass particles (n-BG) have been shown to
exhibit higher bioactivity, enhanced protein adsorption and to provide significant higher
stiffness effect when used as filler in P(3HB) matrices (Misra et al. 2008). Moreover,
nanoscaled sol-gel derived S70 bioactive glass particles containing nano-pores have been
shown to enhance the interaction with fibrinogen which depends on the nano-sized porosity
and the dissolution kinetics of the bioactive glass (Lin et al. 2011). Nanoscaled 45S5 bioactive
glass particles (same as used in this study) were also reported to exhibit antibacterial
properties (Waltimo et al. 2007) and to have potential for dentin remineralisation
(Vollenweider et al. 2007; Curtis et al. 2010) when applied to demineralised dentin matrix.
Despite these obvious advantages and great potential of nano and sub-micron sized bioactive
glass particles for tissue engineering applications, there are several concerns about bioactive
glass (and mixed inorganic nanoparticles in general) being applied in the human body, which
could potentially cause tissue damage or cytotoxicity. Especially for bioactive glasses, which
are dissolved in physiological medium creating even smaller particles being released in tissue
or cell surroundings, only little is known about the potential risks for biomedical applications
(Nel et al. 2009). Labbaf et al. (2011) investigated sub-micron bioactive glass particles
(SMBGs) of composition, 85 mol% SiO2 and 15 mol% CaO, synthesized by the sol-gel
process. They observed bioactivity by the formation of hydroxyapatite after immersion for 5
days in SBF solution and revealed that these particles did not cause any significant
cytotoxicity on hMSCs (Human mesenchymal stem cells) until 4 days of culture. It was
shown, however, that the particles caused significant reduction in cell viability after 7 days of

cell culture. The biological properties of nanosized inorganic bone substitute materials
cytocompatibility and osteoconductivity are being extensively investigated. It is well-known
that nanoscaled materials may exhibit very different physical, chemical and biological
properties compared to µ-sized materials of the same composition. However, the mechanisms
of nanosized particle-cell interactions are still not fully understood (Nel et al. 2009). The
plasma membrane of cells is a selectively permeable membrane for small and nonpolar
molecules such as O2 and CO2, which can diffuse across the lipid bilayer easily. Polar
molecules such as ions and larger particles (nanosized) are unable to pass the plasma
membrane on their own. In the case of particles, cells can uptake (Limbach et al. 2005) or
enclose them in membrane vesicles by the so called endocytosis process (Sahay et al. 2010).
However, in many cases, particles do not interact with cell membranes. Adsorption of
proteins on the nanosized particle surface can lead to agglomeration, which prevents its ability
to the endocytosis process. Furthermore, nonspecific interactions can also lead to bind
nanosized particles to the extracellular matrix (ECM). In addition, alterations of the ECM
caused by nanosized particles will also lead in a dramatic change of cell behavior. The
interaction of nanosized materials and cells is influenced by shape and size as well as
crystallinity and material composition of the nanoparticles (Nel et al. 2009). Therefore,
examining the cytotoxic potential of nanoparticles and its correlation with particle
characteristics is required for assessing the real applicability of the nanoparticles especially in
the field of bone regeneration. In a previous work it has been shown that bioactive glass
nanopowders produced by flame spray synthesis exhibit HAp formation after 5 days of
immersion in SBF as observed by means of Raman spectroscopy, SEM and XRD analysis
(Brunner et al. 2006). In the present study we provide a systematic and more comprehensive
investigation of the structure and bioreactivity kinetics occurring on the nanoscale during
immersion of the nanosized 45S5 bioactive glass particles in SBF for different time points.
Furthermore, cell culture tests are carried out in order to assess the cytocompatibility of these

glass particles. The overall aim of this paper is, thus, to provide the understanding of the
structure and bioactivity occurring on the nanoscale of bioactive glass (type 45S5)
nanoparticles and to assess the osteoblast cell response of these particles to their future
applications in bone tissue engineering, dentistry, wound healing and guided nerve
regeneration.
2. Experimental section
2.1. Materials
Nanoscaled bioactive glass particles (type 45S5), nBG, were synthesized by means of flame
spray synthesis, as described elsewhere (Brunner et al. 2006). Briefly, the synthesis occurred
by combining and mixing the corresponding liquid metal precursors and feeding the mixture
into a flame reactor. The nanopowder was collected on a filter mounted above the flame. The
specific surface area of the obtained nBG is 60 to 80 m2 g-1. As reference material melt-
derived 45S5 micron sized bioactive glass (µBG) with a mean particle size of D50= 10 µm
was used. For glass fabrication analytical grades of SiO2, Ca3PO4, NaCO3 and CaCO3 were
mixed and melted in platinum crucible at 1450 °C. The fritted glass was dried and milled
down to the required particle size (10 µm) using a planetary mill with zirconia jar and zirconia
milling beads. The properties of the glass powders used are given in Table 1. The chemical
composition (see Table 2) of the glass samples used was verified by laser ablation inductively
coupled plasma mass spectroscopy (LA-ICP-MS).
2.2 In vitro bioactivity testing in simulated body fluid (SBF)
The in vitro bioactivity of the samples (nBG and µBG) was tested by immersing the glass
powders in simulated body fluid (SBF). SBF solution was prepared according to Kokubo et
al. (2006). The pH value of SBF was adjusted to 7.4 at 37.0 °C, by using Tris(hydroxymethyl)
amino methane and hydrochloric acid. The ionic concentrations of the inorganic components
are given in Table 3. 75 mg of nBG powder were immersed in 50 ml SBF at 37 °C for 4h, 8h,

1d, 3d and 7d, respectively. The samples were stirred at 120 rpm using an orbital shaker (KS
4000i control, IKA, Staufen, Germany). After SBF soaking the nBG powder was filtered,
gently rinsed with distilled water and dehydrated with acetone. The samples were dried at 60
°C for 24h before characterization.
2.3 Cell culture tests
Cell culture and sample preparation
To evaluate the cell behaviour of nBG compared with µBG, MG-63 osteoblast-like cells
(Sigma-Aldrich, Germany) were used. This human osteosarcoma cell line was cultured at 37
°C in a humidified atmosphere of 95 % air and 5 % CO2, in DMEM (Dulbecco’s modified
Eagle’s medium, Gibco, Germany) containing 10 vol.% fetal bovine serum (FBS, Sigma-
Aldrich, Germany) and 1 vol.% penicillin/streptomycin (Sigma-Aldrich, Germany). Cells
were grown for 48 hours to confluence in 75 cm2 culture flasks (Nunc, Denmark), washed
with phosphate buffered saline (PBS) before harvested using Trypsin/EDTA (Sigma,
Germany), counted by a hemocytometer (Roth, Germany) and diluted to a final concentration
of 100.000 cells ml-1. Before cell seeding, the µBG and nBG particles were dispersed in 70%
ethanol and sonicated for 30-60 min. Then, bioactive glass (BG) containing ethanol
suspension was transferred into 48 well plates and ethanol was completely evaporated in a
drying chamber. MG-63 cells were exposed to varying concentrations (0.1, 1, 10, 100 and 200
µg ml-1) of BG particles present in final volume of 600 µl culture media for 48 hours. The in
vitro analysis of BG was compared to ZnO particles (Oxiznic Agalsa, Spain) with the same
concentrations as used for BG. ZnO is the positive control for cytotoxicity in this
investigation. Therefore, LC50 value (lethal concentration of the used particles where the
activity of the cells is reduced to 50%) was calculated. During cell incubation and after 48h of
incubation cell distribution and morphology in contact with BG and ZnO were evaluated
using phase contrast light microscopy (LM, Nikon Eclipse TE 2000-U, Japan).

LDH-activity
Lactate dehydrogenase (LDH-) activity gives a measurement of the amount of attached cells
on the BG. LDH reduces NAD+, which catalyses the conversion of tetrazolium to a coloured
formazan derivative. A commercially available LDH-activity quantification kit (TOX7,
Sigma-Aldrich) was used to quantify cell proliferation by enzyme activity in cell lysate. MG-
63 cells cultured in 48-well plates were washed with PBS and lysed with lysis buffer for 10
minutes (1 ml/well). The lysate solutions were centrifuged by 250 g and 100 µl from the
supernatant solutions were transferred to a 98-well plate. 30 µl of Master-mix were added to
each well containing equal amounts of: substrate solution, dye solution and cofactor solution
for LDH assay. The plates were left for 30 minutes in the dark and the reaction was stopped
with 40 µl HCl 1 N per well. The dye was measured using a spectrophotometer (SPECORD
40 BU, analytikjena, Germany) at 490 nm.
Mitochondrial activity
For assessing the influence of different BG and ZnO concentrations on the viability of MG-63
cells after 2 days of culture, a WST-8 assay (Sigma-Aldrich) was used. After a cultivation
period of 48 hours, the mitochondrial activity of MG-63cells was measured by the conversion
of tetrazolium (WST-8, Sigma) to formazan by mitochondrial enzymes. Culture media was
removed from the 48-well wells plates and the cells were washed with PBS. After addition of
100 µl of solution containing 99 µl culture medium and 1 µl WST-8 in each well, the plates
were incubated for 1 h. Afterwards the supernatant of all samples was transferred and
centrifuged by 250 g. Subsequently, the solution was given in a 98-well plates (50 µl in each
well) to measure the absorbance at 450 nm and 650 nm with an ELISA-Reader (Perkin Elmer,
Multilabel Reader Enspire 2300, Germany).
Vybrant™ cell-labeling
The samples were prepared for confocal scanning laser microscopy (CSLM, Leica TCS SP5
II, Germany) to analyse cell morphology and distribution. To analyse the adherent growth of
cells on the bioactive glass samples, Vybrant™ cell-labeling solution (Molecular Probes, The
Netherlands) was used. After 48 hours of incubation, cell culture medium was removed and
staining solution (5 µl dye labelling solution to 1 ml of growth medium) was added and
incubated for 15 min. Afterwards the solution was removed, the samples were washed with
PBS (phosphate buffered saline, Gibco) and cells on the BG samples were fixed by 3.7 vol.%
paraformaldehyde.
Specific Alkaline phosphatase (ALP) activity
ALP is a membrane-bound metalloenzyme which catalyzes the hydrolysis of
phosphomonoesters at an alkaline pH. For determining the osteoblastic activity of the MG-63,
ALP was analysed by measuring the specific enzyme activity after 48 hours of incubation
with BG. After lysing the cells with a cell lysis buffer containing 20 mM TRIS buffered
solution (Merck) with 0.1 wt% Triton X-100 (Sigma, Germany), containing 1 mM MgCl2
(Merck) and 0.1 mM ZnCl2 (Merck), the absorption was measured at 405 nm using a
spectrometer after 90 min of incubation. The specific activity was then calculated with respect
to the protein concentration of the cell lysates. Therefore, the protein content of the cell
lysates was determined using a commercial kit based on Bradford assay (Sigma).
Statistical analysis
Each experiment was repeated four times. The results are presented as average and standard
deviation of four replicates with the values. Samples with 0 µg ml-1 BG and ZnO were set as
100%. The differences in analysis parameters between the BG concentrations were evaluated
by one-way analysis of variance (ANOVA). The level of the statistical significance was
defined at p < 0.05 (Origin 8.1G, OriginLab Corporations, USA).
2.4 Characterisation techniques
Transmission electron microscopy (TEM) was carried out using a Phillips CM30
TWIN/STEM, equipped with an energy dispersive X-ray (EDX) spectroscopy detector for
analytical analyses. Further TEM investigations are performed using a Titan3 80-300

equipped with a field-emission gun, an image-side aberration corrector and also an EDX
detector. TEM images were acquired using charged coupled device (CCD) cameras, having
an image size of 1024 x 1024 pixels at the CM30 and 2048 x 2048 pixels at the Titan3,
respectively. Both microscopes were operated at 300 kV acceleration voltage. Furthermore,
all TEM analyses were performed using a Gatan Model 636-DH double tilt liquid nitrogen
(LN2) cooled specimen holder, which enables TEM investigations at -170°C specimen
temperature and prevents damage caused by the electron beam. For TEM investigations, all
samples were dispersed in a H2O/Ethanol solution and deposited on lacey carbon film coated
gold grids.
Fourier-Transform Infrared Spectroscopy (FT-IR) was used to identify the formation of
reaction phases during the immersion of the samples in SBF. FT-IR spectra of the glass
powders prior and after soaking in SBF solution were collected in transmission (Impact 420,
Nicolet Instr., Walthem, MA, US) in the frequency range 400-4000 cm-1 using the KBr
method. For KBr pellets a sample/KBr ratio of 1/300 was used. The spectra were collected
accumulating 64 scans with a resolution of 4 cm-1. The spectra were base-line corrected and
normalized to the main silicate glass peak at ~ 1050 cm-1 in order to compare the intensities of
the bands within one sample.
X-ray diffraction (XRD) analysis was used to investigate the structure and phase composition
present in the bioactive glass samples after immersion in SBF. The XRD data were collected
with a Bruker D8 Advance powder diffractometer with a graphite secondary monochromator
using Cu Kα radiation (λ = 0.15406 nm). The XRD patterns were acquired with a step width
of 0.014 and 1s time per step. The samples were measured over a 2θ range from 20° to 80°.
As reference, XRD spectra of the as-prepared powders were recorded.

3. Results
3.1 In vitro bioactivity
The kinetics of hydroxyapatite formation on nanoscaled glass particles were monitored by
FT-IR measurements and compared to micron sized 45S5 powder. The major bands appearing
in the IR-spectra are summarised in Table 4. Fig. 1 a) shows the FT-IR spectra of the micron-
sized glass (µBG) samples as-received and after immersion in SBF for 4h, 8h, 24h, 3d and 7d.
For the as-prepared sample without any treatment in SBF the bands at ~500 cm-1 and ~1030
cm-1 can be assigned to νsym(Si-O-Si) and νasym(Si-O-Si) bands of the SiO4 tetrahedra,
respectively (Cerruti et al. 2005). Due to the presence of Ca2+ and Na+ cations in the glass
network the νsym(Si-O-Si) band is shifted to 500 cm-1 compared to pure silica (νsym(Si-O-Si) at
450) (Bunker et al. 1998). The band at ~930 cm-1 can be attributed to the SiONBO (non-
bonding oxygen, NBO) which is formed through the presence of the glass network modifier,
creating Si-O groups (Bunker et al. 1998). At ~1450 cm-1 a broad peak is seen which can be
assigned to the ν3(CO32-) band of carbonates adsorbed on surfaces (Du et al. 2010). After the
initial stage of SBF immersion (4h) this single peak is split into two separate bands, but with
lower intensity at 1430 cm-1 and 1500 cm-1, respectively. With increasing immersion time in
SBF the intensity of the SiONBO band is decreasing becoming a weak shoulder after 4h of SBF
immersion which is due to the ion exchange in the glass network and leaching of Na+ and
Ca2+ ions. Also the νsym(Si-O-Si) band is shifted to 460 cm-1 as observed for pure silica
(Bunker et al. 1998). At ~ 600 cm-1 a broad peak is observed which can be attributed to
formation of an amorphous calcium phosphate (ACP) (Hench 1998; Cerruti et al. 2005).
After 3d of soaking in SBF the SiONBO intensity slightly increases again, whereby the overall
position of this peak is shifted from 930 cm-1 towards 960 cm-1. This shift is possibly related
to the higher frequency of SiO absorption as a result of lower content of the NBOs (Cerruti et
al. 2005). For all stages of the SBF immersion an additional band at ~1210 cm-1 is detected
which is assigned to ν(Si-O-Si) mode. After 3d immersion the δ(Si-O-Si) band appears at

~800 cm-1 which is related to the formation of highly disordered 3D silica structure (Cerruti et
al. 2005). After 3 d of immersion in SBF bending modes of ν4(P-O-P) bond from the PO43-
group at ~570 cm-1 and ~600 cm-1 are detected. The ν2(P-O-P) bending mode is also observed
at ~471 cm-1 which, however, is overlapped with the νsym(Si-O-Si) band of the glass network
(Koutsopoulos 2002). An additional band at 871 cm-1 appearing after 3d of SBF immersion
can be assigned to ν2(CO32). Moreover, the intensity of the ν2(CO3
2) bands at 1430 cm-1 and
1500 cm-1 increased along with increasing SBF immersion time. Fig. 1 b) shows the FT-IR
spectra for the nanoscaled bioactive glass particles prior and after 4h, 8h, 24h, 3d and 7d
immersion in SBF. Basically, the spectra exhibit similar characteristic bands as observed for
µBG. However, the relative intensity and time point of appearance of the absorption bands
can differ, as documented in Table 4. In the as-prepared state the nBG shows a significantly
higher intensity of the carbonate signal at 1450 cm-1. Additionally the carbonate band at 871
cm-1 appears also in the initial state of the sample. After 4h in SBF the intensity of ν2(CO32)
band drops, but is increasing again with increasing immersion time. Furthermore, the bands at
800 cm-1 and at ~600 cm-1 appear already after 4h compared to µBG. After 3d a weak
additional peak at 712 cm-1 is observed which can be attributed to calcite (Bosch et al. 2002).
For both glasses investigated adsorbed coordinated water molecules were detected on the
surface (at ~ 1630 cm1-).
Fig. 2 a) shows the XRD spectra of the as-prepared µBG and after immersion for 1, 3 and 7
days in SBF. The absence of reflections in the XRD pattern of the as-prepared sample
confirms the formation of the amorphous structure of the bioactive glass powder. After 1d no
formation of any crystalline phase is observed, whereas after 3d and 7d the formation of
carbonated hydroxyapatite, CHAp Ca10(PO4)6(CO3)0.5(OH), (ICDD PDF 2 01-089-4405) is
detected. The main characteristic peaks of CHA are at 2Θ=26° (002) and 2Θ=31.5° (112).
Fig. 2 b) shows the XRD spectra of the nBG after 1, 3 and 7 days in SBF. The amorphous
characteristics of the flame-synthesized nanoscaled bioactive glass was confirmed. After 1

day a weak signal is detected at 2Θ=31.5° suggesting the formation of CHA. After 3d and 7d
of immersion formation of CHAp can be clearly seen from the pronounced signals at 2Θ=26°
and 2Θ=31.5°. Aside from CHAp calcite (ICDD PDF2 01-0713695) is also formed after 3d
and 7d of immersion in SBF. Using the Scherrer equation the crystallite size Dhkl
perpendicular to (hkl) lattice planes can be calculated as follows (Danilchenko et al. 2002):
!!!" =!�
!"#$!!"!"#$ (1)
Here K, Θ, λ and FWHMhkl are the shape factor, diffraction angle, the wavelength of the x-
rays and the full width at half maximum of the (hkl) peak, respectively. For hydroxyapatite
and for calcite formed after 7 days in SBF a crystallite size of D112= 5.5 nm and D104=91.4 nm
were calculated, respectively.
Fig. 3 a) and b) show bright-field TEM images of the as-prepared nBG. The particles exhibit
chain-like agglomerates and are structurally amorphous, as confirmed by SAED (inset in Fig.
3 a)). TEM images show that the primary nanosized glass particles are fused together and
irregularly shaped, thus making it difficult to make precise conclusions about their size.
However, the particle size was estimated to be 20 - 60 nm in diameter. Fig. 3 c) – f) shows
bright- and dark-field TEM images and SAED pattern of nBG after immersion for 1 day in
SBF. Generally, formation of nanocrystalline HAp and co-precipitation of nanocrystalline and
coarse calcite is observed, as confirmed by the SAED (insets in Fig. 3 c), d) and e)). The HAp
found here has a hexagonal crystal structure with P63/m space group symmetry and lattice
parameters a = b = 0.94 nm, c = 0.69 nm (ICSD_150309). The observed calcite also has a
hexagonal crystal structure with P63/m space group symmetry and lattice parameters a = b =
0.49 nm, c = 1.71 nm (ICSD_15879). Unreacted nBG is still present after 1 day in SBF. This
is evident from the TEM images in Fig. 3 c) and d) showing a network of nanoparticles which
exhibit shapes being similar to the ones found in the as-prepared sample. Moreover, after
immersion for 1 day in SBF HAp is also found to precipitate completely separated, as shown

in Fig. 3 d) and inset in Fig. 3 d). Both DP (insets in Fig. 3 c) and d)) appear blurred, which
can be attributed to the signal coming from amorphous nBG still being present unreacted. At
last, after immersion for 1 day in SBF calcite crystals are also found to precipitate separately.
The DP (inset in Fig. 3 e)) was tilted into the [10-12] zone axis and indicates that this calcite
is single-crystalline. Dark-field imaging for the (-12-10) reflection (see Fig. 3 f)) reveals the
location of the calcite crystals. After immersion of nBG for 7 days in SBF formation of
calcite and HAp was observed. Fig. 4 a) shows a bright-field TEM image of calcite crystals
coexisting besides unreacted amorphous nBG. SAED (insets i) and ii) in Fig. 4 a)) confirms
the hexagonal crystal structure of calcite. On the one hand the SAED pattern (inset i) in Fig. 4
a)) indicates the presence of single-crystalline calcite (sharp diffraction dots in the pattern),
where the calcite crystals reach sizes of up to ~ 800 nm in diameter and exhibit irregular
morphologies. On the other hand, the same SAED pattern shows additional rings besides the
sharp dots, which indicates the presence of calcite nanocrystals. Thus, a mixture of calcite
nanocrystals and single crystals is present. Fig. 4 b) shows that the calcite nanocrystals
surround the bigger calcite crystals, which is evident from the diffraction-contrast of
crystalline particles being in Bragg-condition. In order to locate the calcite crystals, more
accurate dark-field TEM imaging was performed within the area marked with the bigger
dotted circle in Fig. 4 a). The corresponding dark-field images of the (113) and (104)
reflections are shown in Fig. 4 c) and d). It is worth to mention that during dark-field imaging
of these two reflections the sharp dots and the corresponding parts of the ring pattern are both
contributing to the dark-field images (due to the limiting size of the objective aperture), since
the sharp dots are located exactly on the corresponding reflections of the ring pattern.
However, these images additionally support that the coarse calcite crystals are surrounded by
calcite nanocrystals. At last, for the same sample after immersion for 7 days in SBF,
completely isolated more compact agglomerates (compared to the as-prepared nBG) are
observed, as shown exemplarily in Fig. 4 e) and f). The agglomerates contain a significant

amount of HAp, which is confirmed by SAED (inset in Fig. 4 e)). As shown in Fig. 4 f) the
agglomerates consist of irregularly shaped but also spherical and nearly-spherical particles,
which reach sizes of 5 - 25 nm in diameter. The transformation of the nBG into HAp and
calcite is also confirmed by TEM EDX spectroscopy analysis, as shown in the inset of Fig. 4
b). The EDX spectrum of the as-fabricated nBG shows the typical chemical composition of
this glass (see inset in Fig. 3 b)). The Ca/P ratio changes from 6.20 for the as-prepared nBG to
12.06 after immersion in SBF for 7 days. Moreover, a significant decrease of the sodium
concentration is observed.
3.2 Results of the in vitro investigation
Fig. 5 shows the LDH-activity of MG-63 cells cultured on µBG, nBG and ZnO in the range of
0-200 µg ml-1 over 48 h. ZnO particles induced a reduction in cell viability at higher
concentrations. Thus the calculated LC50 value for ZnO is approx. 31 µg ml-1. Both µBG and
nBG exhibit no reduced LDH-activity even at high concentration of 200 µg ml-1. At the
concentrations of 0.1-100 µg ml-1 significant higher amount of MG-63cells grew on nBG
compared to µBG.The cell viability of MG-63 cells cultured on µBG, nBG and ZnO in the
range of 0-200 µg ml-1 over 48 h measured by mitochondrial activity is shown in Fig. 6. In
case of ZnO there is an optimum concentration of 0.1 µg ml-1 for cell viability. The LC50
value was determined to be 41 µg ml-1. Again, for µBG and nBG, no reduction in cell
viability was found. Comparing the two BG samples, 10 and 100 µg ml-1 concentrations of
nBG induced a significant higher viability in MG-63 cells. MG-63 cells expressed mainly
elongated and polygonal phenotype and an almost dense cell layer in the cell culture dish after
48 h of cultivation. LM-images of the MG-63 cell morphology grown on ZnO, Fig. 7 a),
confirmed the LDH- and mitochondrial activity measurements. The cell layer at 0.1 µg ml-1 is
most dense and cells are most vital, which can be correlated with results in Fig. 6.
Furthermore, at the ZnO concentration 10 - 200 µg ml-1 reduction of cells can be seen and

changes in the morphology of MG-63 cells are observed, which become round. At the highest
concentration, 200 µg ml-1 agglomeration of ZnO particles and no cells could be detected.
Morphology analysis of MG-63 cells in contact with different µBG concentrations confirmed
also the LDH- and mitochondrial activity measurements. The LM-images in Fig. 7 b)
demonstrate no influence of µBG on MG-63 cell morphology. Compared to µBG, the analysis
of morphology on nBG showed similar results (Fig. 7 c)). No obvious effect could be detected
on cells during the cultivation with nanosized BG particles. However, at the highest
concentration of nBG (200 µg ml-1) agglomerates can be even detected by LM. Vybrant™
cell-labeling was used to display the cells at higher magnifications. In Fig. 8 CLSM-images of
MG-63 cultured with 200 µg ml-1 µBG and 200 µg ml-1 nBG and without contact to any BG
particles were shown. With or without BG particles cells form their typical elongated and
polygonal morphology, including cell-cell contacts. Even at this highest concentration of 200
µg ml-1 no influence of BG particles on MG-63 cells could be found. Osteoblastic activity was
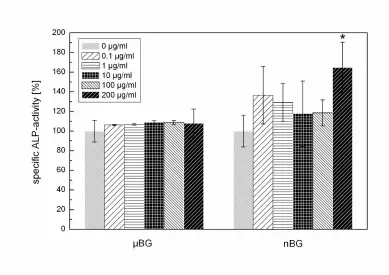
investigated by means of specific ALP activity (Fig. 9). Measured ALP activity was
comparable at all µBG concentrations, indicating a similar degree of osteoblastic activity. In
addition, the cultivation of MG-63 cells on nBG induced an increase of specific ALP-activity,
which was even significantly higher on concentration of 200 µg ml-1.
4. Discussion
4.1 As-prepared stage
The nBG synthesized by flame spray synthesis was investigated in terms of their in vitro
bioactivity and cell response. TEM and XRD analysis confirmed the amorphous structure of
the as-fabricated nBG since no evidence of a crystalline phase is detected, comparable to an
earlier study (Brunner et al. 2006). The nBG investigated in the present work exhibits chain-
like agglomerates.

4.2 In vitro reactivity in SBF
The reaction stages in the SBF monitored by FT-IR showed the presence of carbonate species
on the µBG as well as nBG particles. For the as-received materials these compounds detected
can be attributed to carbonate species adsorbed on the surface. The single peak at ~1460 cm-1
indicates the presence of purely ionic carbonate-like structures with high symmetry which are
likely adsorbed on the glass surface upon reaction with CO2 in air (Du et al. 2010; Cerruti and
Morterra 2004). Interestingly, the intensity of this band is higher in the nBG sample than in
the µBG and additionally the carbonate band at 871 cm-1 appears also in the initial state of the
nBG sample which is likely due to the higher specific surface of the nanoscaled glass powder
resulting in larger quantities of adsorbed species. After contact with liquid medium during the
first stage of reaction in SBF, i.e. after 4 h (see Fig. 1 a) and Fig. 1 b)) the single peak at 1460
cm-1 is split to a double peak related to asymmetric surface carbonate structures. Since it is
known that the BG surface is depleted in Na+ and enriched with Ca2+ ions, through migration
of the ionic species from the bulk glass to the surface, the change in CO32- symmetry is likely
due to formation of calcium coordinated carbonate structures (Ca2+⋅⋅⋅CO32-) (Cerruti and
Morterra 2004; Cerruti et al. 2005). However, the ν3(CO32-) modes represented as double peak
(1420 cm-1 and 1480 cm-1) can be also attributed to carbonate ions substituted in apatite lattice
(Koutsopoulos 2002). According to XRD analysis of the µBG, HAp formation takes place
after 3d immersion in SBF. At the same stage there is a sharp increase of the intensity of the
ν3(CO32-) modes and additionally the ν2(CO3
2-) mode appears, which is related to carbonate
ions incorporated in HAp. It is suggested that as soon as HAp forms on the glass particle
surface the detected carbonate species are dominated by carbonate ions replacing phosphate
groups in the HAp lattice. For the nBG samples it is difficult to distinguish between the
different carbonate species from the IR spectra since the ν2(CO32-) band is present for the as-
received sample and the reaction of the nanoscaled bioactive glass occurs rapidly making it
challenging to detect any changes in the IR bands related to carbonate species. However, we
assume that the mechanism for this transformation is valid as for µBG described above. In the
next step a silica gel layer is formed on the bioactive glass surfaces (both nBG and µBG) form
through condensation reaction of SiOH groups (Hench 1991):
2!"#$ !" − ! − !" + !!! (2)
Further, an amorphous calcium phosphate layer (ACP) as a precursor phase to hydroxyapatite
is formed (Hench 1998; Cerruti et al. 2005; Jones et al. 2001; Dey et al. 2010). For the nBG
the in vitro reactivity is enhanced compared to µBG since all stages of reaction in SBF
including the silica gel and ACP formations as well as HAp crystallisation occur faster (see
Table 4). It is well known that SBF and related physiological media are supersaturated in
respect to several calcium phosphate phases (Zhu et al. 2003; Müller and Müller 2006). The
thermodynamic driving force ΔG for crystallisation of a solid phase from aqueous solution
can be expressed using the supersaturation S according to following equation:
∆! = − !"!ln (!) (3)
Here R, T and n are the universal gas constant, temperature and number of ions present in the
solution, respectively. The supersaturation of a solution S can be calculated using equation (4)
with IP, Ksp and n being the ionic product activity, the solubility product and the number of
ions of the formula, respectively (Nielsen 1984):
! = !"!!"
! (4)
The supersaturation of a stoichiometric hydroxyapatite (HA, Ca10(PO4)6(OH)2), an A-type
carbonated hydroxyapatite (A-CHA, Ca10(PO4)6(CO3)0,5(OH)), a B-type (B-CHA,
Ca9(HPO4)6(PO4)5(CO3)0,5(OH)) carbonated apatite and calcite (CaCO3) were calculated
according to the equations 5-8 (Müller and Müller 2006):
!"!" = !"!! !" !"!!! ![!"!]!!!!!!!"!!! (5)
!"!!!"# = !"!! !" !"!!! !.! !"!!! ![!"!]!!!!!".!!!! (6)
!"!!!"# = !"!! !" !!"!!! !.! !"!!! !.! !"!!! ! !"! !!!!!".!!!! (7)

!"!"#$%&' = !"!! [!"!!!]!!! (8)
The activity coefficient yz of an ion with the valence z were calculated using a modified
Debey-Hückel equation as proposed by Davis and Shedlovsky (1964):
−!"#!! = 0.515!
hydroxyapatite formed in physiological media (Müller and Müller 2006; Pasteris et al. 2004).
TEM investigations revealed nanocrystalline HAp being present within compact agglomerates
after immersion for 1 and 7 days in SBF, also coexisting with unreacted nBG. Furthermore,
the reduction of the size of the primary bioactive glass nanoparticles is observed after
immersion in SBF solution, which indicates the dissolution of nBG and distortion of the
chain-like network of the nBG, as discussed above.
Labbaf et al. (2011) investigated submicron spherical bioactive glass particles with the
composition 85 mol% SiO2 and 15 mol% CaO by means of TEM. The particles were
produced by the sol-gel process with a mean particle diameter of 250 nm. They found
formation of HAp after 5 days immersion in SBF. Hereby, the authors also proposed
significant dissolution of the bioactive glass particles and formation of nanoscaled HAp.
However, it is difficult to directly compare our study with this work, due to the noted
differences in particle size and composition. For instance, in our case the formation of HAp is
already observed after 1 day of immersion in SBF by means of TEM, which supports the fact
that the reduced particle size of the present nBG compared to the particles investigated by
Labbaf et al. (2011) and thus the increased specific surface area significantly increases the
potential of the material to form HAp. The high reactivity of nanoparticles confirmed through
the very fast formation of CHAp might be also affected by the non uniform structure,
morphology and relatively high porosity of the as-prepared nBG, observed by TEM (see Fig.
3 a) and b)). Tilocca (2011) showed in molecular dynamic simulations of Bioglass®
nanoparticles that the Na+/Ca2+ ratio is increased for nanoparticles compared to bulk material
and that the network connectivity is reduced, indicated through higher Q1 and lower degree of
Q3 units. Moreover, the mobility of Na+ ions is increased in the nanoparticles. Since these
features are known to accelerate the dissolution behaviour of 45S5 bioactive glass via rapid
release of Na+ ions and exchange with H+ from the physiological environment they might also
explain the enhanced bioactivity of the nBG nanoparticles. An increased reactivity by

reduction of the particle size and thus an increase of the specific surface area has been
observed by several researchers for the 45S5-type bioactive glass. Sepulveda et al. (2002)
investigated the effect of powder type, particle size (50 – 20 µm (fine size); 90 – 300 µm
(medium size); 90 – 710 µm (coarse size)), and type of dissolution medium on the dissolution
behaviour of bioactive glasses by means of in vitro testing using melt-derived 45S5-type and
sol-gel derived 58S bioactive glass powders. The specific surface area of the fine-sized
particles was 2.7 m2g-1, 0.24 m2g-1 for the medium-sized particles, and 0.15 m2g-1 for the
coarse-sized particles, respectively. Amongst other observations, they found that the
dissolution and thus the reactivity of the melt-derived 45S5-type bioactive glass is
significantly increased for the finer particles ranging from 5 to 20 µm, compared to the more
coarse particles ranging from 90 to 710 µm. Although Sepulveda et al. (2002) did not
investigate nanometric particles their results support the here presented findings and the fact
that a clear trend of higher reactivity can be achieved by reducing the particle size (increasing
the specific surface area).
According to Table 5 SBF is undersaturated for calcite precluding the nucleation of calcite in
the SBF. Indeed, no calcite formation was found for the micron-sized bioactive glass particles
at any stages of reaction in SBF, as proved by FT-IR and XRD analyses. For the nanoscaled
bioactive glass particles, however, formation of nanosized and large calcite crystals (≥ 100
nm) was observed by TEM already after 1 day (and 7 days) in SBF, while large calcite
crystals are detected by XRD and FT-IR not until 3 days of immersion in SBF. Bioactivity
tests in SBF solution revealed the formation of two crystalline phases, calcite and HAp. The
high Ca/P peak intensity ratio of ~12, as observed by TEM EDX spectroscopy after
immersion for 7 days in SBF, is likely due to the large amounts of calcite precipitations. TEM
observations revealed the formation of HAp and calcite already after 1 day immersion in SBF,
while XRD and FTIR revealed the formation of HAp starting from day 3 in SBF. This
suggests that the amount of HAp and calcite precipitates is not strongly pronounced after

immersion for 1 day in SBF and thus HAp and calcite are not detectable by XRD and FTIR,
in those samples, Fig. 1 b) and Fig. 2 b). Moreover, it is worth mentioning that no calcite
formation was found on micron-sized glass particles, which might be attributed to the effect
of particle size. Jones et al. (2001) observed calcite formation for 45S5 bioactive glass powder
particles after 2h of immersion in SBF. It was found that calcite is forming at the expense of
HAp for high BG powder concentrations in the SBF solution, likely due to an excessive
amount of calcium ions released in the SBF resulting in a higher Ca/P ratio and a pH shift in
the SBF solution. This mechanism favoured the precipitation of calcite. Oyane et al. (2003)
investigated the formation and growth of CaCO3 clusters in different simulated body fluids.
They have shown that SBF solutions depleted in PO43- ions and thus high Ca/P ratio can
accelerate the precipitation of calcite by increasing the saturation of the solution in respect to
calcite. This early HAp formation agrees very well with our TEM results. Moreover, our
results indicate that the calcite formation on nBG is likely due to the large surface area of the
particles resulting in a high reactivity of the glass surface and enhanced diffusion of Ca ions
in the glass network. Mozafari et al. (2010) also observed co-precipitation of calcite beside of
hydroxyapatite on mesoporous sol gel derived bioactive glass after 1d of soaking in SBF
which was related to the high surface area (~140 m2 g-1) and nano-porosity of these particles.
They proposed that the high surface area allows the high release of calcium (Mozafari et al.
2010). According to the findings in the literature discussed above, the calcite precipitation
takes place parallel to the hydroxyapatite formation during the first stages of SBF reactions.
Even though the crystalline calcite phase was not detected by FT-IR and XRD until 3 days in
SBF, TEM clearly revealed calcite precipitates already formed after 1d in SBF. Thus, we
postulate that the calcite nucleation occurs as co-nucleation at very early stages of nBG
reaction in SBF. It has been shown previously that the precipitation of calcite is preceded by
formation of an amorphous carbonate cluster (ACC) as a precursor phase (Pichon et al. 2008)
which is obviously not seen in the XRD spectrum. Moreover, indicated through the large

crystalline size of calcite particle the diffusion driven crystal growth of the calcite phase
might need longer time not becoming detectable until 3d of reaction in SBF. Based on our
results and the findings in the literature, the following model can be suggested for the
reactions occurring at the surface of nBG when exposed to simulated body fluid, as shown in
Fig. 10:
• Stage 1 (4h-8h): Dissolution of nBG particles and release of ionic species (e.g. Ca2+,
Na+, PO43-). The network of primary particles is distorted and the particle size is
reduced. Silica layer is formed by condensation of Si-OH groups. Ca2+ and PO43- ions
diffuse through the silica layer forming an amorphous CaP layer (ACP) (Hench 1998).
Co-nucleation of an amorphous Calcium-carbonate as precursor phase for calcite
occurs.
• Stage 2 (1d): Forming of a 3D silica network and crystallisation of nanocrystalline (5-
20 nm) carbonated HAp (type B substitution) and co precipitation of calcite. Three
independent structural configurations are formed: i) unreacted nBG with
nanocrystalline HAp ii) unreacted nBG with nanocrystalline HA and calcite co-
precipitates and iii) unreacted nBG with single-crystalline calcite precipitates.
• Stage 3 (3-7d): Further co-precipitation and growth of larger calcite crystals (≥ 100
nm) at the expense of carbonated hydroxyapatite (CHA). Finally, separated
configurations of i) nBG and nanocrystalline HAp and ii) nBG and single-crystalline
calcite are present.
As in the present study, for the same nanosized 45S5 bioactive glass particles, Brunner et al.
(2006) observed HAp formation by means of Raman spectroscopy and scanning electron
microscopy after immersion of nBG pellets for 7 days in SBF. HAp nanocrystals covering the
rough surface of bioactive 45S5 glass pressed tablets were observed. However, the specific
effect of the nanosized particles was only partially investigated by pressing the glass powder

to dense bulk samples. Thus, the reactions kinetics of the nBG are different since, clearly, the
reactivity of single nanoscaled particles is expected to be higher due to the high surface area,
as shown in the present work. In the present study, however, HAp formation was investigated
by XRD, FTIR and TEM after immersion of the as-prepared nBG powder in SBF for different
time points ranging from 4 h to 7 d, monitoring in detail for the first time the reaction kinetics
in nBG. Moreover, a formation of calcite was detected, likely due to the high surface area of
the particles, which was not considered by Brunner et al. (2006) in the experiments with bulk
materials. Unlike bulk materials, the bioactivity of small particles strongly depends on their
size and specific surface area (Sepulveda et al. 2002), which is shown in the present work as a
fundamental and comparative study.
4.3 Cytocompatibility
In this study ZnO, µBG and nBG particles at the concentrations of 0.1 - 200 µg ml-1 were
incubated with MG-63 osteoblastic cells over 48 h. All materials were pre-treated in the same
way and incubated with the same amount of cells at the same cultivation period. Afterwards
cell amount, viability and morphology as well as spec. ALP-activity were analysed. Heng et
al. (2011) determined the cytotoxicity effect of ZnO particles and also of Zn2+ ions according
to cell type, seeding concentration and surface area of the culture well. They showed the
importance of the design of the in vitro experiments to measure the cytotoxicity of
nanoparticles. Therefore, ZnO particles with a particle size of 0.5-1.5 µm and a specific
surface of 6.5 m2 g-1 were used as a reference sample. The detected cytotoxicity of ZnO
particles analysed with 100.000 cells over 48 h of incubation ranged in the concentrations
between ~ 31 and 41 µg ml-1. These results correspond to the findings of Gann et al. (2010),
who showed cytotoxic effects of ZnO particles at concentrations of 31.5 - 62.5 µg ml-1.
Regarding both BG types, no cytotoxic effect was determined even by an increase of particle
concentration (see Fig. 6). Although the concentration of BG particles being kept constant, the
use of nanosized BG will increase the particle surface to cell area ratio dramatically

(compared to the constant MG-63 cell shape with an area of ~ 950 µm² and a volume 1.3 10³
µm³) which is expected to lead to a different cell response.
It should be also considered that the nanosized particles undergo sedimentation and
agglomeration before cell seeding. Despite this limitation, it is interesting that nBG induced
higher activities of MG-63 cells after 48 h of incubation compared to µBG. Even at a higher
concentration of 1000 µg ml-1 of nBG a remaining cell viability of 81 % was measured (data
not shown). In contrast to our results (with particle size of 20 - 40 nm and specific surface
area of ~70 m2 g-1), Labbaf et al. (2011) determined a reduction of hMSC viability to 85 %
after being in contact wirth sub-micron sized bioactive glass particles at a concentration of
200 µg ml-1. These sol-gel derived particles exhibit a size in the range of 175 - 250 nm and
with a specific surface area of 28 m2 g-1 (Labbaf et al. 2011). Other nanosized biomaterials
like TiO2 influenced also the cell viability. Gerhardt et al. (2007) measured a decrease of MG-
63 cell viability of 65 % by the use TiO2 particles (size 21 nm, specific surface area 50 m²g)
with a concentration of 250 µg ml-1 after 24 h. Beside the material composition, the size of the
particles clearly influences cell - biomaterial - interaction. The size effect was shown by Shi et
al. (2009), comparing hydroxyapatite particles in the range of 20, 80 and 500 nm. HAp
particles of 20 nm size were seen to support cell proliferation and inhibit apoptosis in MG-63
osteoblast-like cells. Our in vitro studies suggest also an increase of cell activity caused by the
use of nanosized BG compared to the microsized particles. One reason could be that bioactive
glass dissolution products have been shown to upregulate a number of genes in several cell
types and above all in osteoblasts (Jell and Stevens 2006). Especially, BG degradation
products like Si and P can influence ALP. Given the positive results of the present
investigation, future work will consider the long term influence of nBG and its dissolution
products on osteoblast-like cells and on the differentiation behaviour of precursor cells.

5. Conclusion Our study represents a novel detailed observation of physico-chemical reactions occurring on
nanoscaled bioactive 45S5 (nBG) particles in simulated body fluid (SBF). XRD, FT-IR and
TEM investigations revealed a very rapid formation of carbonated nanocrystalline
hydroxyapatite after 1d of immersion in SBF. The initial network of agglomerated primary
nanoscaled particles was shown to be distorted and the particle size is reduced upon the
dissolution process. Furthermore, nBG particles co-precipitation of nanocrystalline and large
calcite was observed by TEM after 1 day likely due to the higher surface area and, thus,
higher reactivity of the nBG particles in comparison to conventional (µBG) particles. These
findings bring new insight in the reactions kinetics of nanoscaled 45S5 bioactive glass
particles which are relevant for applications of nBG in tissue engineering and for
considerations for in vitro cells test carried out on this material. Furthermore, the in vitro
investigation with MG-63 osteoblast-like cells revealed a high cytocompatibility of the nBG
particles compared to µBG. It seems that particles size and material composition enhanced
cell growth and activity. Thus, the nanoscaled 45S5 bioactive glass particles can be
considered as well promising material for bone tissue engineering, providing very fast kinetics
for bone-like hydroxyapatite mineralisation without any toxic effects on osteoblast cells.
Acknowledgments
We thank Alexandra Grigore (Institute of Biomaterials, University of Erlangen-Nürnberg) for
supporting the cell culture experiments. Stefan Romeis, Claudia Eisermann and Nadine
Depner from Institute of Particle Technology (University of Erlangen-Nürnberg) are
gratefully acknowledged for discussions and experimental assistance. The German Research
Society (DFG) is gratefully acknowledged for the financial support. Prof. Ben Fabry is
acknowledged for allowing us to carry out experiments in his laboratory.

References
Hench LL, Xynos ID, Polak JM (2004) Bioactive glasses for in situ tissue regeneration. J Biomater Sci Polym Ed 15:543-562. Gabbi C, Cacchioli A, Locardi B, Guadagnino E (1995) Bioactive glass coating: physicochemical aspects and biological findings. Biomaterials 16(7):515-520. Rezwan K, Chen QZ, Blaker JJ, Boccaccini AR (2006) Biodegradable and bioactive porous polymer/inorganic composite scaffolds for bone tissue engineering Biomaterials 27(18):3413-3431. Boccaccini AR, Blaker JJ, Maquet V, Jerome R, Blacher S, Roether JA (2005) Biodegradable and bioactive polymer/Bioglass (R) composite foams for tissue engineering scaffolds. In: Uskokovic DP, Milonjic SK, Rakovic DI (editors) Mater Sci Forum, pp 499-506. Hench LL (1998) Bioceramics. J Am Ceram Soc 81(7):1705-1728. Kokubo T, Ito S, Huang ZT, Hayashi T, Sakka S, Kitsugi T, Yamamuro T (1990) Ca, P-rich layer formed on high-strength bioactive glass-ceramic A-W. J Biomed Mater Res 24(3):331-343. Kokubo T. Bioactive glass ceramics: properties and applications (1991) Biomaterials 12(2):155-163. Bohner M, Lemaitre J (2009) Can bioactivity be tested in vitro with SBF solution? Biomaterials 30(12):2175-2179. Kokubo T, Takadama H (2006) How useful is SBF in predicting in vivo bone bioactivity? Biomaterials 27(15):2907-2915. Ohtsuki C, Aoki Y, Kokubo T, Bando Y, Neo M, Nakamura T (1995) Transmission electron-microscopic observation of glass-ceramic A-W and apatite layer formed on its surface in a simulated body-fluid. J Ceram Soc Jpn 103(5):449-454. Brunner TJ, Grass RN, Stark WJ (2006) Glass and bioglass nanopowders by flame synthesis. Chem Commun 13:1384-1386. Boccaccini AR, Erol M, Stark WJ, Mohn D, Hong Z, Mano JF (2010) Polymer/bioactive glass nanocomposites for biomedical applications: A review. Composites Science and Technology 70(13):1764-1776. Loher S (2006) Improved degradation and bioactivity of amorphous aerosol derived tricalcium phosphate nanoparticles in poly(lactide-co-glycolide). Nanotechnology 17(8):2054. Misra SK, Mohn D, Brunner TJ et al (2008) Comparison of nanoscale and microscale bioactive glass on the properties of P(3HB)/Bioglass composites. Biomaterials 29(12):1750-1761. Lin S, Van den Bergh W, Baker S, Jones JR (2011) Protein interactions with nanoporous sol–gel derived bioactive glasses. Acta Biomater 7(10):3606-3615.

Waltimo T, Brunner TJ, Vollenweider M, Stark WJ, Zehnder M (2007) Antimicrobial effect of nanometric bioactive glass 45S5. J Dent Res 86(8):754-757. Vollenweider M, Brunner TJ, Knecht S, Grass RN, Zehnder M, Imfeld T, Stark WJ (2007) Remineralization of human dentin using ultrafine bioactive glass particles. Acta Biomater 3(6):936-943. Curtis AR, West NX, Su B (2010) Synthesis of nanobioglass and formation of apatite rods to occlude exposed dentine tubules and eliminate hypersensitivity. Acta Biomater 6(9):3740-3746. Nel AE, Madler L, Velegol D et al (2009) Understanding biophysicochemical interactions at the nano-bio interface. Nat Mater 8(7):543-557. Labbaf S, Tsigkou O, Müller KH, Stevens MM, Porter AE, Jones JR (2011) Spherical bioactive glass particles and their interaction with human mesenchymal stem cells in vitro. Biomaterials 32(4):1010-1018. Limbach LK, Li Y, Grass RN et al (2005) Oxide Nanoparticle Uptake in Human Lung Fibroblasts: Effects of Particle Size, Agglomeration, and Diffusion at Low Concentrations. Environ Sci Technol 39(23):9370-9376. Sahay G, Alakhova DY, Kabanov AV (2010) Endocytosis of nanomedicines. J Control Release 145(3):182-195. Cerruti M, Greenspan D, Powers K (2005) Effect of pH and ionic strength on the reactivity of Bioglass® 45S5. Biomaterials 26(14):1665-1674. Bunker BC, Tallant DR, Headley TJ et al (1998) Structure of leached sodium borosilicate glass. Phys Chem Glasses 29(3):106-120. Du H, Williams CT, Ebner AD, Ritter JA (2010) In Situ FTIR Spectroscopic Analysis of Carbonate Transformations during Adsorption and Desorption of CO2 in K-Promoted HTlc. Chem Mater 22(11):3519-3526. Koutsopoulos S (2002) Synthesis and characterization of hydroxyapatite crystals: A review study on the analytical methods. J Biomed Mater Res 62(4):600-612. Bosch RF, Adelantado JVG, Moya Moreno MCM (2002) FTIR quantitative analysis of calcium carbonate (calcite) and silica (quartz) mixtures using the constant ratio method. Application to geological samples. Talanta 58(4):811-821. Danilchenko SN, Kukharenko OG, Moseke C, Protsenko IY, Sukhodub LF, Sulkio-Cleff B (2002) Determination of the Bone Mineral Crystallite Size and Lattice Strain from Diffraction Line Broadening. Cryst Res Technol 37(11):1234-1240. Cerruti M, Morterra C (2004) Carbonate Formation on Bioactive Glasses. Langmuir 20(15):6382-6388.

Cerruti M, Bianchi CL, Bonino F, Damin A, Perardi A, Morterra C (2005) Surface Modifications of Bioglass Immersed in TRIS-Buffered Solution. A Multitechnical Spectroscopic Study. J Phys Chem B 109(30):14496-14505. Hench LL (1991) Bioceramics: From concept to clinic. J Am Ceram Soc 74(7):1487-1510. Jones JR, Sepulveda P, Hench LL (2001) Dose-dependent behavior of bioactive glass dissolution. J Biomed Mater Res 58(6):720-726. Dey A, Bomans PHH, Müller FA, Will J, Frederik PM, de With G, Sommerdijk NAJM (2010) The role of prenucleation clusters in surface-induced calcium phosphate crystallization. Nat Mater 9(12):1010-1014. Zhu PX, Masuda Y, Yonezawa T, Koumoto K (2003) Investigation of apatite deposition onto charged surfaces in aqueous solutions using a quartz-crystal microbalance. J Am Ceram Soc 86(5):782-790. Müller L, Müller FA (2006) Preparation of SBF with different content and its influence on the composition of biomimetic apatites. Acta Biomater 2(2):181-189. Nielsen AE (1984) Electrolyte crystal growth mechanisms. J Cryst Growth 67(2):289-310. Davies CW, Shedlovsky T (1964) Ion Association. J Electrochem Soc 111(3):85C-86C. Elliott JC (1994) Structure and Chemistry of the Apatites and Other Calcium Orthophosphates. Elsevier, Amsterdam. Antonakos A, Liarokapis E, Leventouri T (2007) Micro-Raman and FTIR studies of synthetic and natural apatites. Biomaterials 28(19):3043-3054. Pasteris JD, Wopenka B, Freeman JJ et al (2004) Lack of OH in nanocrystalline apatite as a function of degree of atomic order: implications for bone and biomaterials. Biomaterials 25(2):229-238. Tilocca A (2011) Molecular dynamics simulations of a bioactive glass nanoparticle. J Mater Chem 21(34):12660-12667. Oyane A, Onuma K, Ito A, Kim HM, Kokubo T, Nakamura T (2003) Formation and growth of clusters in conventional and new kinds of simulated body fluids. J Biomed Mater Res, Part A 64A(2):339-348. Mozafari M, Moztarzadeh F, Tahriri M (2010) Investigation of the physico-chemical reactivity of a mesoporous bioactive SiO(2)-CaO-P(2)O(5) glass in simulated body fluid. J Non-Cryst Solids 356(28-30):1470-1478. Pichon BP, Bomans PHH, Frederik PM, Sommerdijk NAJM (2008) A Quasi-Time-Resolved CryoTEM Study of the Nucleation of CaCO3 under Langmuir Monolayers. J Am Chem Soc 130(12):4034-4040. Sepulveda P, Jones JR, Hench LL (2002) In vitro dissolution of melt-derived 45S5 and sol-gel derived 58S bioactive glasses. J Biomed Mater Res 61(2):301-311.

Heng B, Zhao X, Xiong S, Ng K, Boey F, Loo J (2011) Cytotoxicity of zinc oxide (ZnO) nanoparticles is influenced by cell density and culture format. Arch Toxicol 85(6):695-704. Gann H, Glaspell G, Garrad R et al (2010) Interaction of MnO and ZnO Nanomaterials with Biomedically Important Proteins and Cells. J Biomed Nanotechnol 6(1):37-42. Gerhardt LC, Jell GMR, Boccaccini AR (2007) Titanium dioxide (TiO2) nanoparticles filled poly(D,L lactid acid) (PDLLA) matrix composites for bone tissue engineering. Journal of Materials Science-Materials in Medicine 18(7):1287-1298. Shi Z, Huang X, Cai Y, Tang R, Yang D (2009) Size effect of hydroxyapatite nanoparticles on proliferation and apoptosis of osteoblast-like cells. Acta Biomater 5(1):338-345. Jell G, Stevens M (2006) Gene activation by bioactive glasses. J Mater Sci: Mater Med 17(11):997-1002. Elliott JC, Mackie PE, Young RA (1973) Monoclinic Hydroxyapatite. Science 180(4090):1055-1057. Ito A, Maekawa K, Tsutsumi S, Ikazaki F, Tateishi T (1997) Solubility product of OH-carbonated hydroxyapatite. J Biomed Mater Res 36(4):522-528. Tang R, Henneman ZJ, Nancollas GH (2003) Constant composition kinetics study of carbonated apatite dissolution. J Cryst Growth 249(3-4):614-624. Berner RA (1976) The solubility of calcite and aragonite in seawater at atmospheric pressure and 34.5 0 / 00 salinity. Am J Sci 276(6):713-730.
Figure captions:
Table 1: Properties of the materials used in the study.
Table 2: Chemical composition of the melt-derived and flame synthesized bioactive 45S5
glass (in wt.%.).
Table 3: Ion concentrations of the simulated body fluid (SBF) and human blood plasma
(Boccaccini et al. 2010).

Table 4: Overview over the main peaks detected in the FT-IR spectra of nBG and µBG prior
and after soaking in SBF for different time points.
Table 5: Ionic product and degree of supersaturation calculated for hydroxyapatite and calcite.
Fig. 1: FTIR spectra of a) nanosized 45S5 bioactive glass particles (nBG) and b) micron-sized
45S5 bioactive (µBG) glass particles: as-prepared and after immersion in SBF for 4h, 8h, 24h,
3d and 7 d, respectively.
Fig. 2: XRD spectra of a) nanosized 45S5 bioactive glass (nBG) and b) micron-sized 45S5
bioactive glass (µBG) after immersion in SBF for 1d, 3d and 7d.
Fig. 3: TEM images and selected area electron diffraction (SAED) patterns of nBG particles:
a) and b) as-prepared, c) - f) after immersion for 1 day in SBF solution. After 1 day
immersion in SBF the formation of nanocrystalline and large calcite precipitates and
nanocrystalline HA is observed.
Fig. 4: TEM images and selected area electron diffraction (SAED) patterns of nBG after
immersion for 7 days in SBF: a) – d) nanocrystalline and large calcite precipitates, coexisting
with unreacted nBG; e) and f) compact agglomerates composed of HA and unreacted nBG.
Fig. 5: LDH-activity of MG-63 cell cultured on µBG, nBG and ZnO in the range of 0-200 µg
ml-1 over 48 h (normalized in each case to 0 µg ml-1 = 100 %, * p < 0.05).
Fig. 6: Mitochondrial activity MG-63 cell cultured on µBG, nBG and ZnO in the range of 0-
200 µg ml-1 over 48 h (normalized in each case to 0 µgml-1 = 100 %, * p < 0.05).

Fig. 7: LM-images of MG-63 cultured on a) ZnO particles b) on µBG particles and c) nBG
particles in the range of 0-200 µg ml-1 for 48 h.
Fig. 8: CLM-images of MG-63 cultured on 0 (left) 200 µg ml-1 µBG (centre) and 200 µg ml-1
nBG (right) particles in the range of 0-200 µg ml-1 for 48 h.
Fig. 9: Specific ALP-Activity of MG-63 cell cultured on µBG and nBG in the range of 0-200
µg ml-1 over 48 h (normalized in each case to 0 µg ml-1 = 100 %, * p < 0.05).
Fig. 10: Proposed model for HAp formation and co-precipitation of calcite on nanoscaled
bioactive glass powder during immersion in SBF.

Table 1
Material Sample code Particle size Specific surface (m2g-1) Melt-derived 45S5 glass µBG 10 µm 1-2 Flame-synthesized 45S5 glass nBG 20-60 nm 60-80 Zinc oxide ZnO 0.5-1.5 µm 6.5
Table 2
SiO2 CaO Na2O P2O5 nBG 47.8 25.1 22.6 4.6 µBG 44.97 24.55 24.55 5.99
Table 3
Ion Na+ K+ Mg2+ Ca2+ Cl- HCO3- HPO4
2- SO42-
Blood plasma 142 3,6-5,5 1 2,12 95-107 27 0,6-1,4 0.5 SBF 142 5,0 1,5 2,5 148,8 4,2 1,0 0.5

Table 4
Assignment Position (cm-1) and shape Time point of appearance* Remarks Reference nBG µBG
νsym(Si-O-Si) ~490-500 as-prepared state Shifted to 450 due to leaching of cations; νsym(Si-O-Si) at ~450 cm-
1is also observed for pure silica.
(Cerruti et al. 2005) (Bunker et al. 1998)
~450 all stages of reaction in SBF
P-O band Broad band at ~560-610 4h 1d Characteristic band for amorphous calcium phosphate.
(Cerruti et al. 2005)
ν4(P-O-P) Sharp double peak at ~570 and ~600
1d 3d Bending mode of P-O-P bond found in hydroxyapatite.
(Koutsopoulos 2002)
CO32- Small peak at ~712 3d not
visible Characteristic band for calcite. (Du et al. 2010)
δ(Si-O-Si) Peak at ~800
4h 3d 3D silica structures (Cerruti et al. 2005)
ν2(CO32) Sharp peak at ~871 permanent 3d Characteristic band for CO3
2-group in carbonated apatites. For nBG this band is related to both carbonates adsorbed on the surface and CO3
2- substituted in the apatite layer. See discussion.
(Koutsopoulos 2002)
SiONBO Shoulder at ~930 as-prepared state The SiONBO is decreasing in intensity due to cation leaching.
(Cerruti et al. 2005; Bunker et al. 1998)
νasym(Si-O-Si) Intense broad band at ~1020
as-prepared state The broad complex band at 900-1200 is difficult to analyse due to overlapping as both PO and SiO groups absorb in this region.
(Cerruti et al. 2005;Koutsopoulos 2002)
(Si-O-Si) bonds
Shoulder at ~1210 all stages of reaction in SBF Formation of new Si-O-Si bonds upon condensation of SiOH groups. Appearance of this band corresponds to the decrease of the SiONBO peak.
(Cerruti et al. 2005; Jones et al. 2001)
ν3(CO32-) Broad peak at ~1460 as-prepared state Observed for symmetrically
coordinated pure ionic carbonate ions adsorbed on surfaces. The intensity of the peak is higher for nBG compared to µBG.
(Du et al. 2010; Cerruti and Morterra 2004)
Double peak at ~1430 and ~1500
all stages of reaction in SBF These bands can be attributed either to Ca2+ coordinated CO3
2- adsorption [29-30] or carbonate ions substituted in carbonated apatites [26]. Please note: for µBG a sharp increase in intensity of this double peak after 3 d is attended by the appearance of the ν2(CO3
2) band at ~871 cm-1.
δ(H2O) Small peak at ~1630 all stages of reaction in SBF Coordinated water molecules adsorbed on the surface.
(Cerruti et al. 2005)
*related to immersion in SBF

Table 5
Phase Formula -log(IP) S Stoichiometric hydroxyapatite, sHA Ca10(PO4)6(OH)2) 97.6 1.1 Type-A carbonated hydroxyapatite, A-CHA Ca10(PO4)6(CO3)0,5(OH) 93.0 19.6 Type B carbonated hydroxyapatite, B-CHA Ca9(HPO4)6(PO4)5(CO3)0,5(OH) 90.8 19,8 Calcite CaCO3 22.8 8⋅10-8≅0 IP=Ionic activity; S=Saturation of the SBF in respect to corresponding phase. Ksp values for HA, A-CHA, B-CHA and calcite were taken from Elliot et al. (1973), Ito et al. (1997), Tang et al. (2003), and Berner 1976, respectively.