Embed Size (px)
Citation preview

Biomass production for sustainable aviation fuels: A regional casestudy in Queensland
Helen T. Murphy a,n, Deborah A. O’Connell b, R. John Raison b, Andrew C. Warden b,Trevor H. Booth b, Alexander Herr b, Andrew L. Braid c, Debbie F. Crawford b,Jennifer A. Hayward d, Tom Jovanovic b, John G. McIvor e, Michael H. O’Connor f,Michael L. Poole g, Di Prestwidge h, Nat Raisbeck-Brown f, Lucas Rye i
a CSIRO Land & Water Flagship, PO Box 780, Atherton, QLD 4883, Australiab CSIRO Land & Water Flagship, GPO Box 1700, Canberra, ACT 2601, Australiac RileM P/L, PO Box 6190, O'Connor, Canberra, ACT 2602, Australiad CSIRO Energy Flagship, PO Box 330, Newcastle, NSW 2300, Australiae CSIRO Agriculture Flagship, GPO Box 2583, Brisbane, QLD 4001, Australiaf CSIRO Land & Water Flagship, Private Bag 5, Wembley, WA 6913, Australiag CSIRO Agriculture Flagship, Private Bag 5, Wembley, WA 6913, Australiah CSIRO Land & Water Flagship, GPO Box 2583, Brisbane, QLD 4001, Australiai CSIRO Marine and Atmospheric Research, 107 - 121 Station Street, Aspendale, VIC 3195, Australia
a r t i c l e i n f o
Article history:Received 27 June 2013Received in revised form19 August 2014Accepted 4 January 2015
Keywords:Aviation biofuelsRegrowthShort rotation treesGrassEconomicsLignocellulose
a b s t r a c t
The aviation industry in Australia has aspirations to supply 5% of its domestic fuel use from biomass by2020. The majority of available sources of biomass in Australia are lignocellulosic, and novel productionsystems that integrate existing land uses with energy production systems could have many benefits togrowers and regions through enterprise diversification. This study assessed the operational andeconomic factors associated with lignocellulosic biomass supply for production of sustainable aviationfuel in a case study region in central Queensland, Australia. We examined the potential for biomasssupply from native grasses, naturally regenerating woody vegetation (regrowth), and newly establishedplantings of short rotation trees (SRT) from the Fitzroy Catchment (14.2 million hectares). We outline ahypothetical industry scale-up strategy that achieves a production target of 470 ML of aviation fuelwithin a 25 year timeframe. We assess the amount of biomass required to support the scale-up strategyand the associated costs of supply to meet production targets during the scale-up.
Approximately 5 million tonnes of biomass per year are required to support full production capacityafter 25 years; 1.1 millions of land is required to be managed to supply this quantum of biomass. Apreliminary assessment of the cost of supply for each feedstock indicates that grasses are most expensiveat �$142 t�1 due to relatively low biomass potentially available for harvest per hectare, and relativelyhigh costs of harvesting and transporting compared with woody biomass. Regrowth is the leastexpensive at �$56 t�1 due to low establishment and maintenance costs.
We conclude that the case study region has the potential to produce sufficient biomass to support thehypothetical industry scale-up and that a mixed feedstock base maximises the sustainability of biomasssupply. We discuss a range of sustainability issues associated with biomass production.
& 2015 Published by Elsevier Ltd.
Contents
1. Introduction . . . . . . . . . . . . . . . . . . . . . . . . . . . . . . . . . . . . . . . . . . . . . . . . . . . . . . . . . . . . . . . . . . . . . . . . . . . . . . . . . . . . . . . . . . . . . . . . . . . . . . . . 7391.1. Case study area in Queensland . . . . . . . . . . . . . . . . . . . . . . . . . . . . . . . . . . . . . . . . . . . . . . . . . . . . . . . . . . . . . . . . . . . . . . . . . . . . . . . . . . . 739
2. Industry development . . . . . . . . . . . . . . . . . . . . . . . . . . . . . . . . . . . . . . . . . . . . . . . . . . . . . . . . . . . . . . . . . . . . . . . . . . . . . . . . . . . . . . . . . . . . . . . . 7402.1. Conversion technology . . . . . . . . . . . . . . . . . . . . . . . . . . . . . . . . . . . . . . . . . . . . . . . . . . . . . . . . . . . . . . . . . . . . . . . . . . . . . . . . . . . . . . . . . 7412.2. Production scale-up strategy. . . . . . . . . . . . . . . . . . . . . . . . . . . . . . . . . . . . . . . . . . . . . . . . . . . . . . . . . . . . . . . . . . . . . . . . . . . . . . . . . . . . . 741
Contents lists available at ScienceDirect
journal homepage: www.elsevier.com/locate/rser
Renewable and Sustainable Energy Reviews
http://dx.doi.org/10.1016/j.rser.2015.01.0121364-0321/& 2015 Published by Elsevier Ltd.
n Corresponding author. Tel.: þ61 7 4091 8828; fax: þ61 7 4091 8888.E-mail address: [email protected] (H.T. Murphy).
Renewable and Sustainable Energy Reviews 44 (2015) 738–750
3. Lignocellulosic biomass production in the Fitzroy catchment . . . . . . . . . . . . . . . . . . . . . . . . . . . . . . . . . . . . . . . . . . . . . . . . . . . . . . . . . . . . . . . . . 7423.1. Grasses . . . . . . . . . . . . . . . . . . . . . . . . . . . . . . . . . . . . . . . . . . . . . . . . . . . . . . . . . . . . . . . . . . . . . . . . . . . . . . . . . . . . . . . . . . . . . . . . . . . . . . 7423.2. Short rotation trees (SRTs) . . . . . . . . . . . . . . . . . . . . . . . . . . . . . . . . . . . . . . . . . . . . . . . . . . . . . . . . . . . . . . . . . . . . . . . . . . . . . . . . . . . . . . 7443.3. Regrowth . . . . . . . . . . . . . . . . . . . . . . . . . . . . . . . . . . . . . . . . . . . . . . . . . . . . . . . . . . . . . . . . . . . . . . . . . . . . . . . . . . . . . . . . . . . . . . . . . . . . 744
4. Strategy for biomass supply . . . . . . . . . . . . . . . . . . . . . . . . . . . . . . . . . . . . . . . . . . . . . . . . . . . . . . . . . . . . . . . . . . . . . . . . . . . . . . . . . . . . . . . . . . . 7445. Biomass supply costs and assumptions . . . . . . . . . . . . . . . . . . . . . . . . . . . . . . . . . . . . . . . . . . . . . . . . . . . . . . . . . . . . . . . . . . . . . . . . . . . . . . . . . . 7466. Discussion . . . . . . . . . . . . . . . . . . . . . . . . . . . . . . . . . . . . . . . . . . . . . . . . . . . . . . . . . . . . . . . . . . . . . . . . . . . . . . . . . . . . . . . . . . . . . . . . . . . . . . . . . 746
6.1. Mixed biomass types for use as biofuel feedstock . . . . . . . . . . . . . . . . . . . . . . . . . . . . . . . . . . . . . . . . . . . . . . . . . . . . . . . . . . . . . . . . . . . . 7476.2. Securing biomass supply—Future supply chain arrangements . . . . . . . . . . . . . . . . . . . . . . . . . . . . . . . . . . . . . . . . . . . . . . . . . . . . . . . . . . 7476.3. Sustainability . . . . . . . . . . . . . . . . . . . . . . . . . . . . . . . . . . . . . . . . . . . . . . . . . . . . . . . . . . . . . . . . . . . . . . . . . . . . . . . . . . . . . . . . . . . . . . . . . 747
6.3.1. Food security . . . . . . . . . . . . . . . . . . . . . . . . . . . . . . . . . . . . . . . . . . . . . . . . . . . . . . . . . . . . . . . . . . . . . . . . . . . . . . . . . . . . . . . . . . 7486.3.2. Maintaining soil fertility to sustain rates of biomass production . . . . . . . . . . . . . . . . . . . . . . . . . . . . . . . . . . . . . . . . . . . . . . . . . 7486.3.3. Biodiversity . . . . . . . . . . . . . . . . . . . . . . . . . . . . . . . . . . . . . . . . . . . . . . . . . . . . . . . . . . . . . . . . . . . . . . . . . . . . . . . . . . . . . . . . . . . 748
7. Conclusions . . . . . . . . . . . . . . . . . . . . . . . . . . . . . . . . . . . . . . . . . . . . . . . . . . . . . . . . . . . . . . . . . . . . . . . . . . . . . . . . . . . . . . . . . . . . . . . . . . . . . . . . 749Acknowledgements . . . . . . . . . . . . . . . . . . . . . . . . . . . . . . . . . . . . . . . . . . . . . . . . . . . . . . . . . . . . . . . . . . . . . . . . . . . . . . . . . . . . . . . . . . . . . . . . . . . . . . 749References . . . . . . . . . . . . . . . . . . . . . . . . . . . . . . . . . . . . . . . . . . . . . . . . . . . . . . . . . . . . . . . . . . . . . . . . . . . . . . . . . . . . . . . . . . . . . . . . . . . . . . . . . . . . . 749
1. Introduction
Interest in using biomass for liquid fuels, electricity and otherproducts is increasing in Australia due to volatile and increasing oilprices, the pressing need to reduce greenhouse gas emissions, andthe recent introduction of a tax on carbon emissions. Currentproduction of biofuel in Australia makes only a very smallcontribution to fuel demand [1,2]. Aviation fuel accounts for 13%of total liquid fuel demand in Australia. However, over the nexttwo decades, global aviation is expected to grow at between 3 and5% per annum [3–5]. In Australia and New Zealand regionalgrowth is expected to be 4 to 5% per annum reflecting stronggrowth in trade and personal travel [4–7].
While the aviation sector contributed only 2% to total globalgreenhouse gas emissions in 2005, it has been strongly focussedon reducing emissions and limiting its exposure to carbon priceliability by improving fuel economy. Bio-derived jet fuels areanother essential part of the industry’s greenhouse gas reductionstrategy [8]. There is an opportunity for novel biomass productionsystems to be developed in Australia to meet the aspirations of theaviation industry to supply 5% of domestic aviation fuel frombiomass by 2020 and thus reduce greenhouse gas emissions [7,8].
The scope for potential production of advanced biofuels fromlignocellulosic biomass in Australia was demonstrated by Farineet al. [9]. Lignocellulose can be converted to bio-derived fuels viaseveral processes [10] and most of these processes can produceboth road and jet fuels. Currently, while there is promisingresearch on the distribution and production potential of individuallignocellulosic feedstocks in Australia (e.g. grasses [11,12] andcereal stubble [13]), there has been little assessment of thepotential for integrating energy production systems with existingproduction systems such as grazing and cropping. New biomassproduction systems could have many benefits at the ‘grower’ partof the value chain including enterprise diversification, reduction ofrisk, and reduction of GHG emissions. They could also benefitregional development, diversify employment and provide newmanufacturing opportunities. In addition, Hayward et al. [14] haveshown that the cost of biomass-based jet fuels may be competitivewith conventional fuel within the timeframe of the case studyoutlined here.
In this paper we consider the economic, operational andsustainability factors associated with lignocellulosic biomass sup-ply in a novel production system arrangement where biomass isregionally distributed and integrated with existing agriculturalproduction systems. We demonstrate a framework for assessingthe complex logistics of biomass scale-up and supply to meetindustry demands in order to provide investor confidence in thefeasibility of a biofuel industry in a new region. A case study
region, the Fitzroy Catchment of central Queensland (Fig. 1), waschosen to demonstrate the framework. The paper draws oninformation from studies of potential biomass production in theFitzroy Catchment for grasses [11] and woody biomass [15]. Weevaluate these potential biomass resources and demonstrate ascale-up strategy for production of 470 ML of aviation fuel over a25 year timeframe. A separate paper [14] examines the economicsof producing jet fuel based on this industry scale-up strategy inthe case study region.
1.1. Case study area in Queensland
The Fitzroy Catchment covers an area of 142,665 square kilo-metres (14.3 million hectares) and is the largest river catchmentflowing to the east coast of Australia. It adjoins the Burdekincatchment to the north and the Burnett River to the south. TheFitzroy catchment has a total resident population of nearly 70,000.Emerald is the largest town in the catchment (�13,500 residents),followed by Moranbah to the north (�8500) and Biloela to thesouth (�5800) [16]. The dominant land-use is grazing of naturalvegetation, accounting for nearly 90% of the catchment area; theconservation estate accounts for approximately 10% of the catch-ment (Fig. 1). Agricultural industries, particularly grazing and dryland grain cropping, have traditionally underpinned the economyof the area but mining is now the largest employer, followed byagriculture, together representing nearly 40% of the workforce.Unemployment in the region is significantly lower (2.3%) than theQueensland average (5.5%) [16]. The total value of agriculturalproduction in the region in 2005–2006 was $949.4 million, 10.9%of the total value of agricultural production in Queensland [16].
The dominant native plant communities are woodlands ofhighly water stress tolerant brigalow (Acacia harpophylla). Muchof the Brigalow Belt bioregion has been cleared for agriculture, and16 regional ecosystems within the Brigalow Belt are listed asthreatened (endangered) ecological communities under the Com-monwealth Environment Protection and Biodiversity ConservationAct 1999 (EPBC Act) [17].
Previous work has shown that a range of lignocellulosic feed-stocks are potentially available in the region in sufficient quantityto sustain a biofuel production industry [12,13]. Most of thecatchment area lies within the 600–900 mm yr�1 rainfall zone(Fig. 1) and the mean annual temperature range is 19–22 1C,providing suitable conditions for maintaining reasonable levelsof biomass production. The case study area mostly excludes thehigh rainfall (4800 mm) coastal zone where competition for landwith food production is highest, and where land prices are also
H.T. Murphy et al. / Renewable and Sustainable Energy Reviews 44 (2015) 738–750 739

high [18]. Transport infrastructure in the region is relatively welldeveloped with an extensive network of rail and roads supportingthe resources sector and with a deep water port nearby inGladstone. This is an important consideration given the largevolumes of biomass and crude bio-oil that would need to betransported.
2. Industry development
In the next sections we describe a hypothetical but plausibleproduction scale-up strategy to deliver up to 470 ML of jet fuelannually after 25 years from the Fitzroy catchment. Currently,national demand for aviation fuel is �6 GL annually; our strategy
Fig. 1. Location of Fitzroy catchment case study region in Queensland and showing (a) mean annual rainfall, and (b) landuse across the region.
H.T. Murphy et al. / Renewable and Sustainable Energy Reviews 44 (2015) 738–750740

delivers nearly 8% of current demand, and thus takes into accountthe predicted increased future demand over the 25 year timeframe of the strategy.
2.1. Conversion technology
There are many potential pathways for the production ofaviation fuel [7,19]. Here we consider a fast pyrolysis technologypathway that is implementable at the scale of the strategy, and issuited to the Australian context where biomass sources arespatially dispersed and occur at relatively low density [14,20].Pyrolysis involves the thermal decomposition of dry biomass intosolids, liquids and gases. Fast pyrolysis occurs under conditions ofhigh temperatures (up to 500 1C) and atmospheric pressure andproduces a crude bio-oil, an aqueous phase and char. The reactiontakes place in seconds. The ratio of the aqueous phase to the bio-oil depends on the pyrolysis conditions—a higher temperatureproduces a higher yield of bio-oil. The char can be sold as a by-product or can be fed back into the system to assist withmaintaining high temperatures during pyrolysis. The feedstockused in this process needs to be dry.
The crude bio-oil requires upgrading prior to use as a trans-portation fuel. Upgrade strategies vary between technology com-panies however a two stage upgrade process is common [20]. Thefirst hydro-reforming stage stabilises the oil, lowers its corrosive-ness and oxygen content, renders it miscible with hydrocarbonliquids and lowers its viscosity. This process requires the additionof hydrogen and the upgrade facility would most likely be locatedin a central location where hydrogen is available, rather than inour case study region. The second stage involves conventionalhydrotreatment over a commercial catalyst producing a range ofhydrocarbons including jet fuel. A schematic of average conversionefficiencies through this pathway is shown in Fig. 2. A morecomplete description of the conversion technology pathways andefficiencies is given in Hayward et al. [14].
We use this generic conversion technology and associatedaverage efficiencies to guide the amount of biomass needed tosupply our production scale-up strategy. Approximate conversionefficiencies are: 62% biomass to crude bio-oil, 31% biomass toupgraded crude bio-oil, 29% biomass to hydrocarbons and 9%biomass to jet fuel. Thus 1 t of lignocellulosic biomass producesapproximately 620 L of crude bio-oil, 290 L of hydro-carbons, and90 L of jet fuel (Fig. 2). However, conversion technologies andefficiencies vary significantly between companies and are likely toimprove over time as the technologies develop. The efficienciespresented here are indicative only, and are intended to drive thescale-up strategy at a regional scale. For the purpose of this casestudy we assume that only the first stage process, conversion ofbiomass to crude bio-oil, occurs in the case study region, followed
by transport to the upgrade facility and refinery outside the region.This model of decentralised conversion of biomass to bio-oilfollowed by centralised upgrading is being pursued by severalpyrolysis companies [20].
2.2. Production scale-up strategy
There are many potential approaches for industry scale-up. Wehave analysed one that begins conservatively, to reflect gradualgaining of experience, and then scales up exponentially. The 25year time frame of the strategy was chosen to allow a realistic,though ambitious, scale-up to the full production target of 470 MLof jet fuel. Our strategy results in 50 small-scale (�40 ML crudebio-oil per unit using �65 kt of biomass) and 10 midscale units(�124 ML crude bio-oil per unit using �200 kt of biomass) inoperation in the case study region at the end of the 25 yeartimeframe (Fig. 3) with associated progressive increase in biomassuse and production of jet fuel. Both large and small units may beimplemented as joined modules (e.g. five small-scale modulesjoined to produce �200 ML of crude bio-oil at the same facility) ordistributed throughout the case-study region. For the purpose ofthis case study we assume the upgrade facility is located in thenearest capital city, Brisbane, and that the crude bio-oil istransported by rail from the region to this facility. We do notattempt to optimise the trade-off between scale of facility and thedistribution of biomass potentially available for harvest in theregion; nor do we specify the location of facilities.
19 (GJ) 12 12 11 3
Fig. 2. Efficiencies of conversion of lignocellulose feedstocks to transport fuels using fast pyrolysis technology. Also shown is the approximate change in energy through thesystem from 1 t of lignocellulosic biomass to jet fuel.
Fig. 3. Hypothetical scale-up strategy for industry development over 25 years.White boxes represent a small-scale unit (�5.85 ML jet fuel), grey boxes representa large-scale unit (�18 ML jet fuel). Triangles connected by the dashed linerepresent the kt of biomass required to service the industry at each time step,and the production of jet fuel at that time.
H.T. Murphy et al. / Renewable and Sustainable Energy Reviews 44 (2015) 738–750 741

Our scale-up strategy has a 5 year planning and developmentphase that includes establishment of estates for the production ofbiomass, planning the logistical aspects of the supply chain, andthe building of one small-scale pilot unit which commencesoperation by the fifth year. The biomass estate continues to beacquired and/or planted throughout the entire 25 year time-frameof the strategy in order to meet the volume required for produc-tion. Construction of small-scale units continues throughout thestrategy and the first large-scale units come on-line in year 15. Byyear 25, at full production, �470 ML of jet fuel is produced fromthe case-study region (Fig. 3).
3. Lignocellulosic biomass production in the Fitzroycatchment
We have considered three potential lignocellulosic feedstocks,all of which have production potential in the case study region;grasses, short-rotation trees (SRTs) and regrowth [11,15]. In thefollowing sections we describe biomass production in the casestudy region for each of the three feedstocks. We identify desirablecharacteristics as well as potential challenges to their use asfeedstocks for biofuels. This information is summarised in Table 1.
3.1. Grasses
Grasses are of significant interest for biofuels because of theirhigh lignocellulose content and ease of mechanical harvesting[12]. Herr et al. [12] identified the potential for high yields(t ha�1 yr�1) in the north eastern tropical and subtropical regionof Australia centred on the Fitzroy catchment area. This areacomprises extensive agricultural lands with natural vegetationwhich are already under grazing production systems. Thus, whilegrass production for biofuel feedstock could be an alternative tolivestock production, it may also provide a diversification oppor-tunity for the current pastoral industries.
There are four major pasture communities in the Fitzroy–Burdekin catchments—black spear grass, Aristida–Bothriochloa,Queensland blue grass and pastures on cleared brigalow lands[21,22]. The productivity of these communities varies dependingon climate, soils, land management and degree of degradation ofthe plant communities. All communities are dominated by per-ennial C4 tussock grasses with only small proportions of annual
grasses, legumes and forbs. At present grass resources in theregion are managed for cattle production with managementsystems evolving over time to meet the needs of cattle breedingand fattening. Herr et al. [11] provides estimates of the net primaryproduction (NPP) for the study area.
Pasture growth rates are highest in summer when moisture ismost reliably available and temperatures are favourable for the C4
grasses. Growth rates then decline as water supply diminishes andtemperatures drop, reaching their lowest levels in August–Sep-tember. This growth pattern results in peak biomass occurring inMarch and then slowly declining as loss from detachment exceedsnew growth over winter. On a year-to-year basis grass growth inthe region varies with climate, especially by the amount andpattern of rainfall received; in lower rainfall years growth isgreatly restricted making sourcing of biomass difficult, and thereis strong competition for grass from the cattle industry [11].
Desirable factors encouraging the use of grass biomass includethe existence of a large and highly flexible supply, and thepotential co-benefits to grazing enterprises [11,12]. Althoughyields are high in an average year, the considerable year to yearvariability in supply and the narrow seasonal window for harvest-ing (a few months after the end of the wet season) means that arange of other sources of biomass are needed to ensure a reliablebiomass supply. Other impediments include challenges in harvest-ing due to tree cover, tree fall and other physical obstacles, unevenground and other unsuitable ground conditions.
A spatial layer of grass potentially available for harvest (PAfH)was generated using AussieGRASS [23] and is described in detail inHerr et al. [11]. In short, the model incorporates several constraintsincluding a simple harvest rule whereby harvest can only occur iftotal standing dry matter exceeds 2.5 t ha�1, thus allowing suffi-cient grass retention for soil protection. Further, the analysisexcludes areas that do not have 43 t ha�1 potentially availablefor harvesting based on the assumption that contractors will needto recover at least that much for the harvest to be economicallyworthwhile. This means only areas with a production of 5.5 t ha�1
or more are considered for grass harvest. Biomass amounts areonly calculated for areas in the region classified as being undergrazing and that have less than 12% tree basal area cover. Inaddition, areas with slopes steeper than 12 degrees (approxi-mately 20%) are generally excluded due to harvesting logistics.Slope in our case study region does not exceed this threshold atthe resolutions we have calculated it (5 km), but it is likely that
Table 1Comparison of the three biomass types considered as feedstock for producing jet fuel.
Grasses (managed naturalsystems)
Regrowth Short rotation trees
Existing resource-flexibility of use
Large, highly flexible (dependingon grazing strategy)
Large, existing resource, highly flexible No existing resource, ability to strategically locateresource
Complexity ofmanagement
High (if combined with grazing)—short window for harvest
Low to moderate Low, new harvesting equipment required
Harvesting technologyestablished
Variability ofsupply
High variability, possibility ofprolonged disruption
Low Low
Need for storage High (on farm) Moderate (at plant) Moderate (at plant)Lag toestablishment
o5 years o5 years 10 years from planting (progressive increase inharvestable amount)
Sustainingproduction
Nutrient input important Lower nutrient input likely Nutrient input required
Negative publicperception
Low to medium (food vs fuel) Medium, possible loss of biodiversity, but creation ofextensive permanent estate
Medium (food vs fuel), land use change
Environmentalimpacts
Low Low (not in sensitive areas) Low to positive
Co-benefits Diversification opportunity, riskmanagement
Diversification opportunity, increase herbage forcattle feed for several years after harvest
Diversification opportunity, risk management, potentialcarbon benefits, windbreaks, soil protection
H.T. Murphy et al. / Renewable and Sustainable Energy Reviews 44 (2015) 738–750742
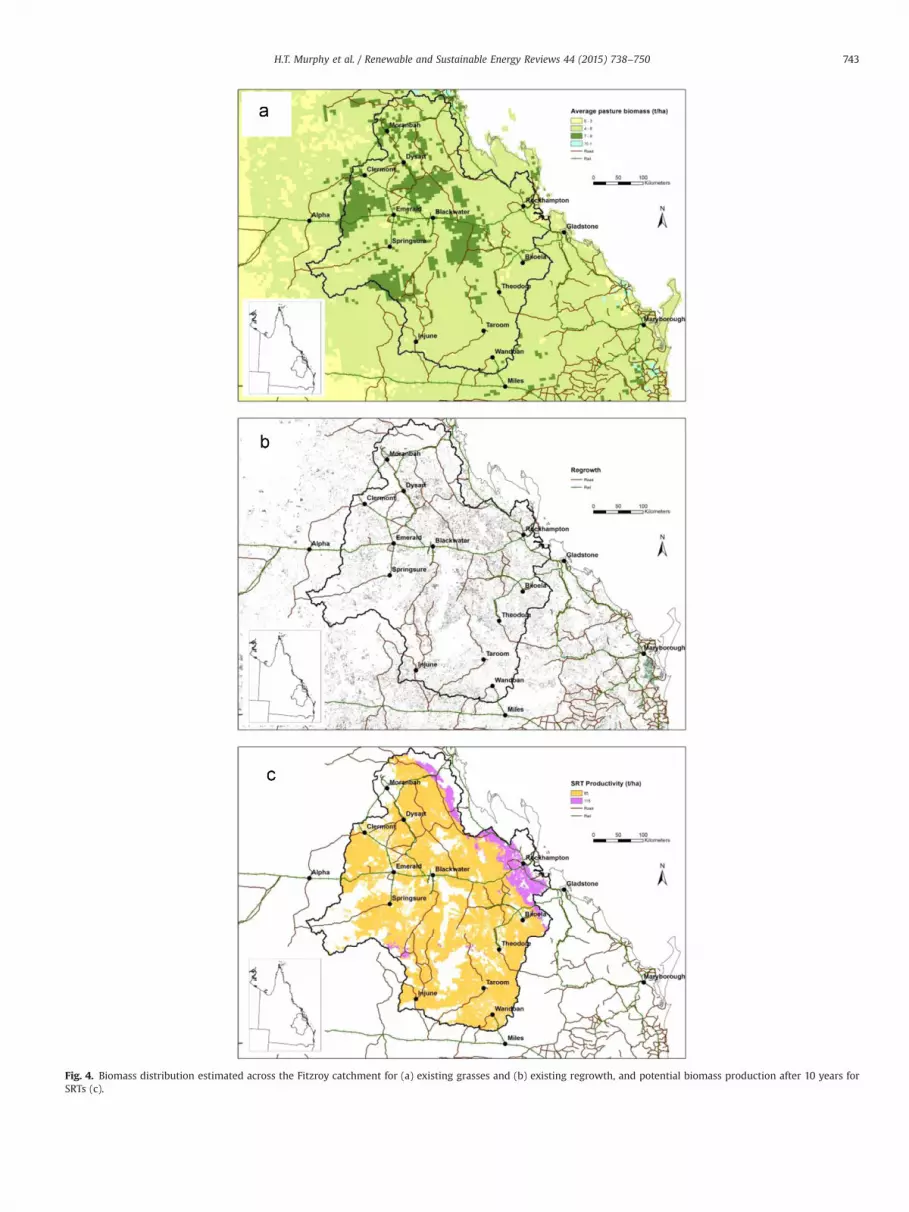
Fig. 4. Biomass distribution estimated across the Fitzroy catchment for (a) existing grasses and (b) existing regrowth, and potential biomass production after 10 years forSRTs (c).
H.T. Murphy et al. / Renewable and Sustainable Energy Reviews 44 (2015) 738–750 743

some areas do exceed this threshold over finer scales. The finallayer represents the distribution of grass biomass PAfH(t ha�1 yr�1 averaged over 30 years) across the case study region.Grass production is spatially variable tending to be higher in thecentre and centre-west of the region and lowest in the south(Fig. 4a). Across the Fitzroy catchment it averages 5 t ha�1 yr�1
(71.1 SD) over the 30 year time period, ranging from an averageof 1 to 8.2 t ha�1 yr�1.
3.2. Short rotation trees (SRTs)
Potential woody biomass production systems for biofuels mayspan along a continuum from largely unmanaged natural wood-lands through agroforestry systems such those using malleeeucalypts, where just part of the land is managed for forestry,through to intensively managed short rotation plantations [15]. Forthe purposes of this paper short rotation tree (SRT) systems aredefined as woody crop production systems including both mono-cultures and agroforestry systems that are harvested on rotationsof about 10 years or less. A ‘rotation’ is one complete cycle fromplanting or coppicing (i.e. regrowing trees from cut stumps) toharvest. Prospective production areas in Queensland includemainly the 600–900 mm rainfall zone for plantations. Promisingtaxa for SRT plantings in Queensland include several Eucalyptusand Corymbia species. Corymbia species, were until relativelyrecently included in the Eucalyptus genus. Promising species andhybrids for this zone include Eucalyptus dunnii, Eucalyptus cloezi-ana, Eucalyptus molocanna, Eucalyptus camaldulensis, Corymbiacitriodora subsp variegata, Eucalyptus longirostrata and Corymbiatorelliana � Corymbia variegata [15].
Desirable characteristics of SRTs as a feedstock include rapidearly growth and the ability to coppice (regrow from cut stumpswhich avoids having to replant). However, growth generally slowsafter several coppicing events, so the practice cannot be repeatedindefinitely, but it can continue several times over [15]. SRTsystems can be developed as agroforestry systems, where treesand agricultural (grazing or cropping) systems are integrated or asforest plantations on non-prime agricultural land. SRT plantationscan also be strategically located to supplement the biomassavailable from other sources such as woody regrowth. SRTsprovide a buffer against low availability of grass biomass in dryyears as they can be harvested during drought periods.
Other advantages of SRTs are that they are well adapted to awide range of environments and natural disturbances such as fire,and can contribute to increased carbon sequestration in thelandscape. Limitations include requirements for new mechanicalharvesting equipment, the relatively low energy density of theharvested biomass, and potential competing demands for the useof wood [15].
Booth et al. [15] analysed growth data from 26 C. citriodorasubsp variegata trial sites in or near the Fitzroy Basin. Theseindicate that biomass plantings could produce harvestable yieldof above-ground dry mass of approximately 85 t ha�1 over a 10-year rotation at relatively low rainfall (600–750 mm mean annualprecipitation) sites and about 115 t ha�1 at medium rainfall (750–900 mm) sites. These estimates are considered conservativebecause they are based on trials designed for sawlogs, whichrequire lower densities for planting and are grown to a particularform and size, rather than biomass production; therefore weassume, when managed for biomass production, an average of100 t ha�1 could be achieved across the case study region. Fig. 4bshows the distribution of land potentially suitable for establishingSRTs. Potentially suitable land includes that which is currentlyunder grazing and within the 600–900 mm annual precipitationzone. The layer excludes protected vegetation and conservationareas.
3.3. Regrowth
Large areas of Brigalow (A. harpophylla) regrowth occur in thecase study region, some of which is periodically re-cleared toprevent progressive suppression of pasture production [17]. Underthe Queensland Vegetation Management Act 1999, regrowth canlegally be cleared, subject to obtaining a permit, on leases issuedunder the Land Act 1994 for agriculture and grazing purposes.Regrowth can also be cleared without a permit on non-leasehold(freehold) lands, provided it is not high value regrowth (defined asnative vegetation that hasn’t been cleared since December 1989).A total of approximately 1.1 million hectares of regrowth forestwas cleared on freehold land in Queensland between 1995 and2007. Given the current legislation it seems unlikely that theannual rate of future tree clearing in Queensland would rise abovethe 2006–2007 figures of 66,400 ha on freehold land [24].
Using harvested regrowth as a feedstock for biofuel productionhas several advantages including a large amount of biomass beingpotentially available for harvest immediately, low variability ofsupply and relatively low complexity of management. In addition,it involves tree species naturally adapted to the region, its climate,pests and pathogens, and therefore should be relatively moreresilient to disturbance [25]. The costs of establishing new plant-ings to produce biomass are avoided and farmers would receive aneconomic return to off-set clearing costs. In addition, naturalsystems such as Brigalow contain primarily N-fixing species,minimising the need for N fertiliser inputs that are otherwiseneeded to maintain the productivity of intensively harvested SRTsystems. Harvesting regrowth for biomass will however requirecareful consideration of environmental impacts as well as manage-ment of public perception around those impacts. Our strategyconstrains biomass supply from regrowth so that it does notexceed current annual rates of clearing.
Brigalow persists by re-sprouting from root suckers. Afterclearing, stem densities may be very high (approximately25,000 ha�1) and this facilitates rapid early production of biomass.Scanlan [26] reported that annual rates of biomass production byBrigalow during the initial 10 years can be as high as4.6 t ha�1 yr�1. Booth et al. [15] presented a preliminary estimateof the location of regrowth PAfH in the Fitzroy region based on afoliage projected cover 4106 derived from the State Wide LandCover and Trees Study (SLATS) [24] (Fig. 4c). Foliage projectivecover (FPC) is the percentage of ground area occupied by thevertical projection of foliage, and values over 106 are roughlyequivalent to 20% canopy cover, which meets the definition offorest. This map excludes high value regrowth areas that are notavailable for harvest. The potential productivity of these areas wasestimated at 40 t ha�1 over a 10 year rotation, assuming the standswere managed to favour tree growth rather than grass regrowth.
4. Strategy for biomass supply
The above discussion highlights the high variability in supply,both intra- and inter-annually, associated particularly with bio-mass from grasses, and the relatively long lag-time (10 years)associated with establishing new estates of SRTs. A secure supply
Table 2Feedstock assumptions: biomass growth, yield and return times.
Feedstock Growth(t ha�1 yr�1)
Yield at harvest(t ha�1)
Return time
Grasses 3 3 2.5 (4 in 10 years)Regrowth 4 40 10 yearsSRTs 10 100 10 years
H.T. Murphy et al. / Renewable and Sustainable Energy Reviews 44 (2015) 738–750744
of feedstock must be underpinned by woody biomass (regrowthinitially, and then SRT and regrowth) to ensure biomass supply inyears when grasses are not available. The scale of the case studyarea means that temporal patterns in rainfall are likely to bestrongly spatially correlated, and therefore in a dry year, biomassfrom grasses may not be available across the entire region. In ourscale-up strategy we consider an ‘average’ year where all threebiomass types are PAfH, and a ‘dry’ year where grass is unavailablefor harvest. Table 2 outlines our assumptions about the supply ofthe three types of biomass.
A strategy for biomass supply to meet the requirements of thescale-up strategy described above is outlined in Table 3. Theproportion of supply sourced from each of the three biomasstypes was determined considering a balance of several factors:
� Maintaining diversity in the sources of biomass.� Amounts of biomass PAfH in the catchment and the likely cost
of supplying that biomass as feedstock for biofuel production.� Logistics of scaling-up the estate required to be managed to
provide a secure supply of feedstock over the timeframe of thestudy.
However, the proportions used here are one of many possiblecombinations of biomass types.
For grasses we assume an average annual supply of 3 t ha�1
with grass biomass available, on average, two years in five, basedon previous statistical average production rates with past climaticvariation [11] (Table 2). Biomass harvested from regrowth isassumed to average 40 t ha�1 with a return time of 10 years[15]. The 10-year return time is based on the minimum time forregrowth to regrow to economically harvestable levels. Similarly,SRTs are assumed to produce 100 t ha�1 with a return time of 10years [15].
Table 3 gives the harvest area required to meet the biomasssupply strategy based on assumptions about yield and returntimes given in Table 2. Thus, for example, for SRTs in year 20, tosource 1500 kt of biomass, a harvest area of 15,000 ha is required(at 100 t ha�1).
The ‘estate’ needed is based on the total area that would needto be secured in order to achieve the biomass harvest arearequirements over the time frame of our strategy. While we showhere only the production and biomass supply strategy up to year
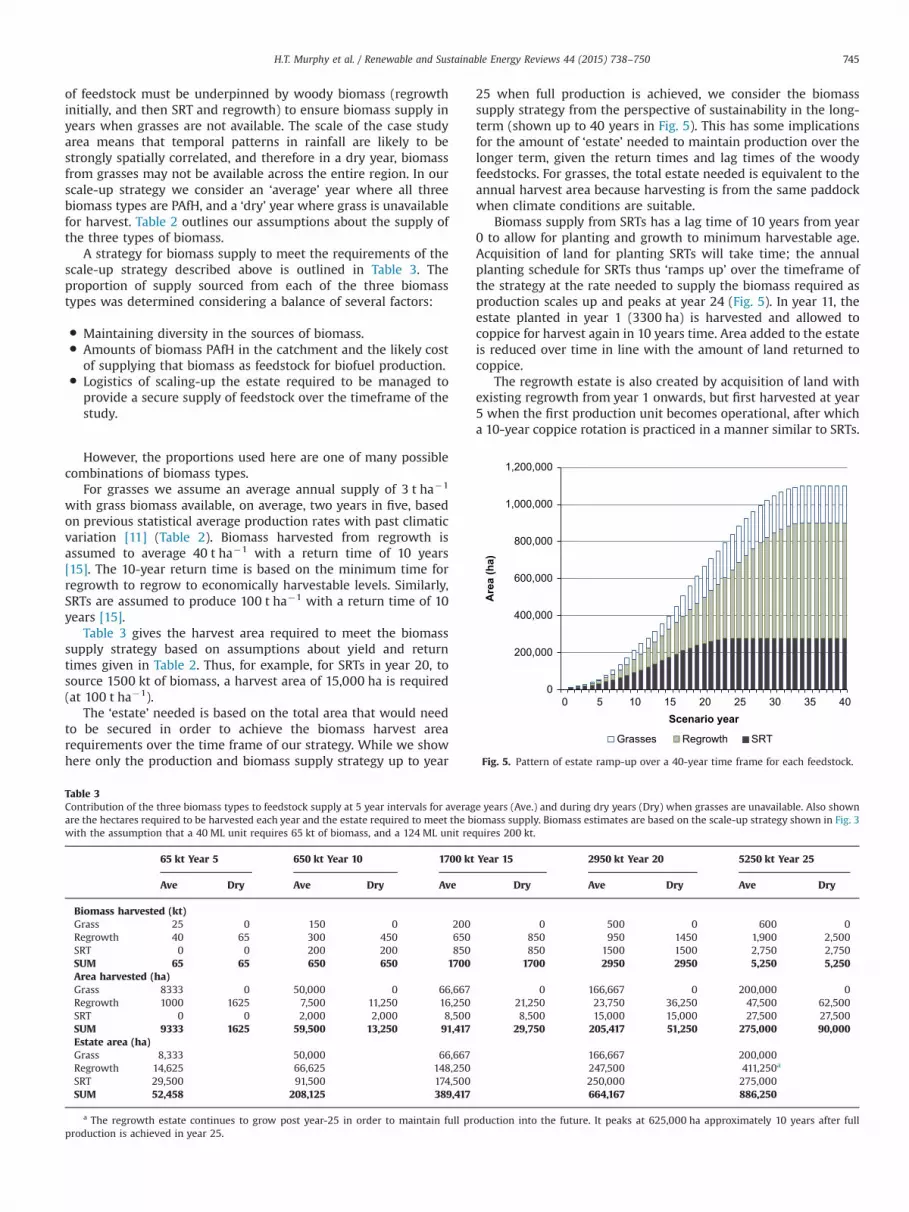
25 when full production is achieved, we consider the biomasssupply strategy from the perspective of sustainability in the long-term (shown up to 40 years in Fig. 5). This has some implicationsfor the amount of ‘estate’ needed to maintain production over thelonger term, given the return times and lag times of the woodyfeedstocks. For grasses, the total estate needed is equivalent to theannual harvest area because harvesting is from the same paddockwhen climate conditions are suitable.
Biomass supply from SRTs has a lag time of 10 years from year0 to allow for planting and growth to minimum harvestable age.Acquisition of land for planting SRTs will take time; the annualplanting schedule for SRTs thus ‘ramps up’ over the timeframe ofthe strategy at the rate needed to supply the biomass required asproduction scales up and peaks at year 24 (Fig. 5). In year 11, theestate planted in year 1 (3300 ha) is harvested and allowed tocoppice for harvest again in 10 years time. Area added to the estateis reduced over time in line with the amount of land returned tocoppice.
The regrowth estate is also created by acquisition of land withexisting regrowth from year 1 onwards, but first harvested at year5 when the first production unit becomes operational, after whicha 10-year coppice rotation is practiced in a manner similar to SRTs.
Table 3Contribution of the three biomass types to feedstock supply at 5 year intervals for average years (Ave.) and during dry years (Dry) when grasses are unavailable. Also shownare the hectares required to be harvested each year and the estate required to meet the biomass supply. Biomass estimates are based on the scale-up strategy shown in Fig. 3with the assumption that a 40 ML unit requires 65 kt of biomass, and a 124 ML unit requires 200 kt.
65 kt Year 5 650 kt Year 10 1700 kt Year 15 2950 kt Year 20 5250 kt Year 25
Ave Dry Ave Dry Ave Dry Ave Dry Ave Dry
Biomass harvested (kt)Grass 25 0 150 0 200 0 500 0 600 0Regrowth 40 65 300 450 650 850 950 1450 1,900 2,500SRT 0 0 200 200 850 850 1500 1500 2,750 2,750SUM 65 65 650 650 1700 1700 2950 2950 5,250 5,250Area harvested (ha)Grass 8333 0 50,000 0 66,667 0 166,667 0 200,000 0Regrowth 1000 1625 7,500 11,250 16,250 21,250 23,750 36,250 47,500 62,500SRT 0 0 2,000 2,000 8,500 8,500 15,000 15,000 27,500 27,500SUM 9333 1625 59,500 13,250 91,417 29,750 205,417 51,250 275,000 90,000Estate area (ha)Grass 8,333 50,000 66,667 166,667 200,000Regrowth 14,625 66,625 148,250 247,500 411,250a
SRT 29,500 91,500 174,500 250,000 275,000SUM 52,458 208,125 389,417 664,167 886,250
a The regrowth estate continues to grow post year-25 in order to maintain full production into the future. It peaks at 625,000 ha approximately 10 years after fullproduction is achieved in year 25.
0
200,000
400,000
600,000
800,000
1,000,000
1,200,000
0 5 10 15 20 25 30 35 40
Are
a (h
a)
Scenario year
Grasses Regrowth SRT
Fig. 5. Pattern of estate ramp-up over a 40-year time frame for each feedstock.
H.T. Murphy et al. / Renewable and Sustainable Energy Reviews 44 (2015) 738–750 745
We assume that regrowth areas enter the estate at 40 t ha�1.Interactions between the delay in first-cut at year 5, 10-yearharvest lag and the goal of maximum biomass production at year25 means that the regrowth estate does not peak until year 34 (at625,000 ha) (Fig. 5). The regrowth estate is required to besufficiently large as to be able to substitute for biomass providedby grasses in those dry years when grasses are not available. In anaverage year at full production in our strategy, only 1900 t yr�1
require to be harvested compared with 2500 t yr�1 in a dry year.We have constrained biomass supply from the regrowth estate sothat, at full production capacity, the area harvested annually doesnot exceed the approximate current annual rate of clearing ofregrowth on freehold land in Queensland.
Under our strategy, at the time of full production, 275,000 ha ofSRT estate are established, constituting nearly 2% of the studyregion, to sustain an annual harvest from 27,500 ha every year.This compares with over 11 million hectares of total land poten-tially suitable (biophysically) for establishment of SRTs across theFitzroy catchment. At the peak of production, the total regrowthestate is 625,000 ha, approximately 4.4% of the study region, inorder to maintain biomass supply of 2500 kt yr�1 from 62,500 ha.The total area of land under regrowth that is not currently exemptfrom harvesting in the catchment is 1.76 million hectares. Nearly1.5% of the catchment is managed for biomass supply for grasses atfull production. Total average yearly grass PAfH in the Fitzroycatchment is over 10 million tonnes.
5. Biomass supply costs and assumptions
We calculated the approximate costs of supply of each biomasstype to a crude bio-oil conversion facility located within theFitzroy Catchment (Table 4). The costs include establishment ofthe biomass, land rent, harvesting, and transport to the facility. Weestimated establishment, operations and maintenance, and har-vest costs based on figures provided by Polglase et al. [18] for anE. camaldulensis bioenergy plantation in Queensland, and/or GRO-Australia [27] fior hardwood plantations in south-east Queensland.Some costs were amended or rounded based on the author’sexpert knowledge of production systems in the Fitzroy region andto account for the current economy.
Initial establishment refers to costs associated with the first timethe land is used for biomass production. For SRTs, this is where theland is prepared, roads constructed and the seedlings planted. Inthe case of regrowth and grasses, the land already has establishedbiomass, but there is the need to establish roads and perhaps alsosome removal of debris to facilitate harvesting.
After harvest establishment costs are associated with coppicemanagement (e.g. thinning and pruning etc) for SRTs. Coppicingvigour can decline after several coppicing events and cannot be
repeated indefinitely, but it can continue several times over[15,28]. For the purpose of this study, coppicing is assumed tooccur for every SRT rotation after the first harvest. Grasses andregrowth have no costs associated with the establishment of eachrotation after the first harvest.
Operations and maintenance (O&M) costs which consists ofapplication of fertiliser, is only assumed to be applied to SRT andgrasses.
Harvest costs vary among the biomass types; the woody formsof biomass are chipped as part of the harvest operation andgrasses are baled and assembled for transport.
Land ‘rent’ is paid to the land owner every year the land isleased for production of biomass for biofuel. The rental cost hasbeen calculated using the percentage of market valuation methodas reported by Davies et al. [29], using a mid-range estimate forland values in the case study region ($1000 ha�1) and an agreedrental value of 5% of the value of the land. It is also consistent withan estimate based on a typical return on investment to land-owners for cattle grazing in the Fitzroy region. Thus, the return tothe land owner is approximately equivalent whether leasing theland for biomass production or grazing cattle.
Transport—for the purpose of this analysis it is assumed that theproduction units for conversion to crude bio-oil are located withina 50 km radius of the biomass, thus the biomass transportdistances are 100 km return. Transport costs by B-Double on awet basis, as calculated by Rodriguez et al. [30], were converted toa dry basis using an assumed 50% moisture content for woodchipsand 14% for baled grasses.
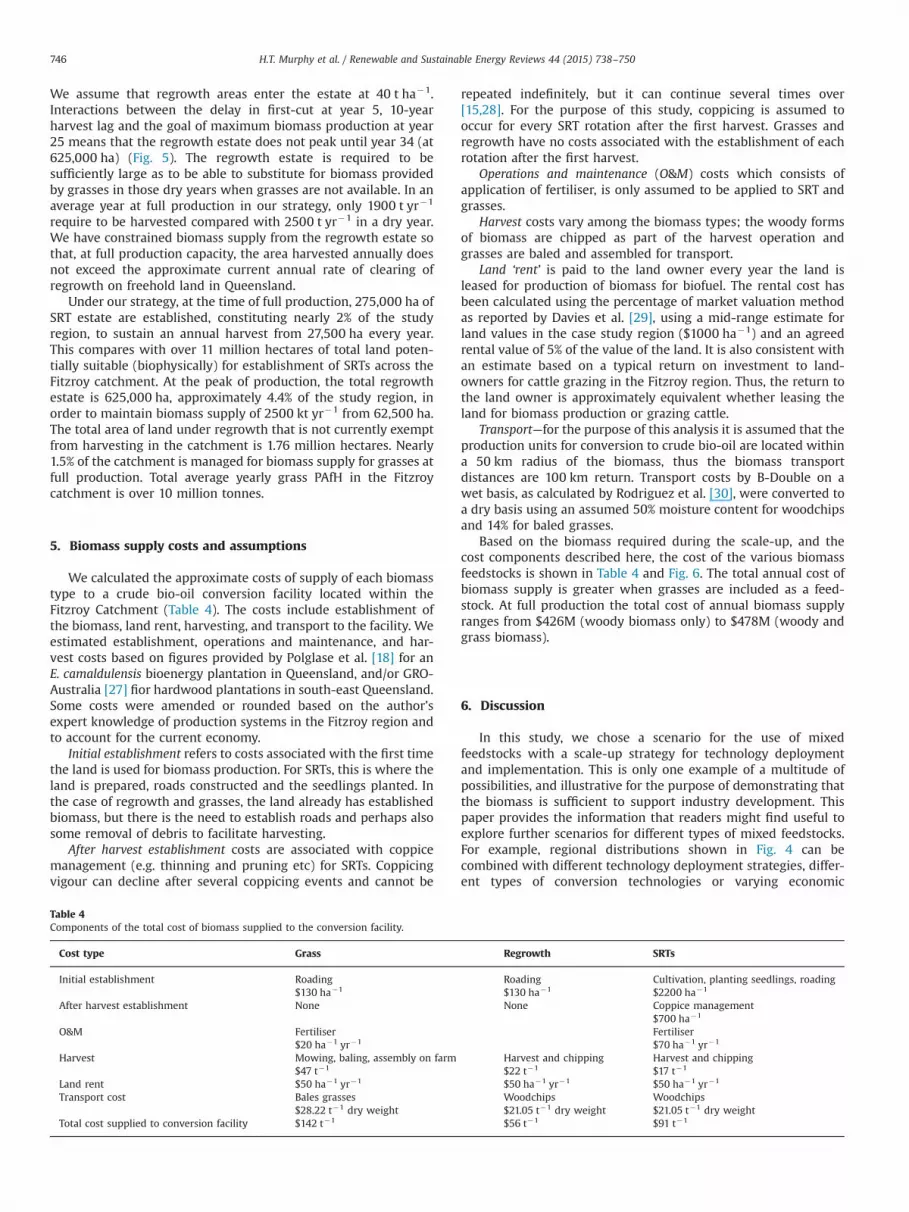
Based on the biomass required during the scale-up, and thecost components described here, the cost of the various biomassfeedstocks is shown in Table 4 and Fig. 6. The total annual cost ofbiomass supply is greater when grasses are included as a feed-stock. At full production the total cost of annual biomass supplyranges from $426M (woody biomass only) to $478M (woody andgrass biomass).
6. Discussion
In this study, we chose a scenario for the use of mixedfeedstocks with a scale-up strategy for technology deploymentand implementation. This is only one example of a multitude ofpossibilities, and illustrative for the purpose of demonstrating thatthe biomass is sufficient to support industry development. Thispaper provides the information that readers might find useful toexplore further scenarios for different types of mixed feedstocks.For example, regional distributions shown in Fig. 4 can becombined with different technology deployment strategies, differ-ent types of conversion technologies or varying economic
Table 4Components of the total cost of biomass supplied to the conversion facility.
Cost type Grass Regrowth SRTs
Initial establishment Roading Roading Cultivation, planting seedlings, roading$130 ha�1 $130 ha�1 $2200 ha�1
After harvest establishment None None Coppice management$700 ha�1
O&M Fertiliser Fertiliser$20 ha�1 yr�1 $70 ha�1 yr�1
Harvest Mowing, baling, assembly on farm Harvest and chipping Harvest and chipping$47 t�1 $22 t�1 $17 t�1
Land rent $50 ha�1 yr�1 $50 ha�1 yr�1 $50 ha�1 yr�1
Transport cost Bales grasses Woodchips Woodchips$28.22 t�1 dry weight $21.05 t�1 dry weight $21.05 t�1 dry weight
Total cost supplied to conversion facility $142 t�1 $56 t�1 $91 t�1
H.T. Murphy et al. / Renewable and Sustainable Energy Reviews 44 (2015) 738–750746

parameters to provide ‘first pass’ estimates of industry feasibilitywhich can then be explored in more detail.
Our assessment of biomass PAfH suggests that the Fitzroyregion has the potential to produce sufficient biomass to supportthe proposed industry scale-up. The Fitzroy region boundary neednot of course constrain biomass supply and in fact regionsadjacent, particularly the Wide-Bay Burnett region to the southfor woody biomass [15] and the Burdekin region to the north forgrass biomass [11], are also very prospective. Therefore, thepotential exists to produce biomass in a much more distributedfashion across Queensland. This will also provide the opportunityto accelerate the scale-up and distribute the investment and riskprofiles more widely.
6.1. Mixed biomass types for use as biofuel feedstock
The cost of supplying grass biomass ($142 t�1) for biofuels ishigh relative to woody biomass because of the low productivityper hectare and the relatively high harvesting and transport costs(see also [14]). Regrowth biomass is the cheapest option (at$56 t�1) and regrowth is already periodically cleared to preventprogressive suppression of pasture production in the region;farmers would also receive an economic return to off-set clearingcosts. However, use of regrowth as a feedstock for jet fuelproduction is a new and untested proposition and thus has manyuncertainties. There are several factors and complex interactionsthat could impact the sustainability, either positively or negatively,of biomass supply from regrowth, e.g., legislative change, climaticvariability affecting agricultural opportunities, the price on carbon,social acceptability, agricultural markets/prices and Internationalclimate change negotiations.
Short rotation trees, at an intermediate cost ($91 t�1), competewith grazing land and may be considered a higher risk diversifica-tion option, at least initially, due to the long lead-in time coupledwith the lack of a demonstrated industry demand. However, SRTsystems can either be developed as alley systems where trees andagriculture (grazing or cropping) are integrated, or as forestplantations on lower productivity agricultural land. SRTs as afeedstock are also potentially the most flexible in that land canbe acquired in a spatially strategic way.
The results of the economic analysis raise the question as to thevalue of inclusion of grasses in a biomass supply strategy. Thereare several issues to consider. First, access to a diversity of biomass
types minimises the risk to biomass supply. Risks associated withbiomass production in Queensland are linked to factors such asclimatic variability, extreme climatic events such as cyclones andfloods, bushfires, pests and diseases. Woody biomass in particularis susceptible to risks that may impact large areas of the region forprolonged periods of time, including cyclone damage and disease[15]. Many of these risks can be managed by ensuring a mixedbiomass base with contingencies to buffer the biomass supply inthe event that supply from any biomass type is interrupted.
Second, grazing natural vegetation is the dominant land use inthe Fitzroy region and supply of excess grass biomass representsthe lowest impact to existing production systems and has co-benefits in terms of diversifying the production enterprise, thuslowering the risk profile for growers and providing an additionalincome stream.
Hayward et al. [14] undertook an analysis of the cost ofproducing jet fuel from biomass feedstocks using fast pyrolysis,based on the same scale-up scenario presented here. Whereregrowth only is used the cost of jet fuel production may be aslow as �$1 L�1; with grasses and SRTs included the cost increasesby �$0.1 L�1. Operating and maintenance costs of the conversionfacilities themselves are the major contributor to the cost ofproduction of jet fuel. However, biomass costs are still significant(see Fig. 6).
6.2. Securing biomass supply—Future supply chain arrangements
Biomass supply chain arrangements globally vary enormouslydepending on social, cultural and economic perspectives in theparticular region of interest. Establishing processes for securinglong-term supply contracts with landowners will require consid-erable industry investment in research, and landholder andcommunity engagement. In this case study we have assumed along-term exclusive land rent arrangement for biomass supply,however, a diversity of arrangements are more likely to beimplemented depending on, for example, the existing land useand the productivity and profitability of individual properties,incentives provided, the individual aspirations of the landholders,and perceptions of risk.
The results of preliminary research in western New SouthWales on the types of incentives that could motivate landholdersto plant trees on their properties to supply a bioenergy industrysuggests that approximately 50% of landholders would be willinggiven sufficient economic incentives (Sandra Velarde pers comm.).However, some landholders would not be prepared to changeland-use practices, even if sufficient economic incentives wereprovided, for a number of reasons. These include; a lack of trust inindustry and/or government and past ‘bad’ experiences, an unwill-ingness to ‘lose control’ of land, negative perceptions about trees,and the need to see a real life example or market. Theseperspectives do not necessarily apply in the Fitzroy catchment;the predominantly grazing communities in the Fitzroy will likelyidentify a different set of considerations to determining appro-priate incentives. The research undertaken in western New SouthWales however, provides an indication of the methods that wouldneed to be employed to engage local landholders and identifybarriers to securing biomass supply. The development of culturallyand regionally specific supply arrangements will be crucial forestablishing sustainability of biomass supply.
6.3. Sustainability
Sustainability is a critical issue for the bioenergy industryinternationally and in Australia. Quantitative, robust and indepen-dently verified sustainability credentials are recognised as vital inorder for the bioenergy industry to expand globally. This
$0
$100
$200
$300
$400
$500
$600
0 5 10 15 20 25 30 35
Mill
ions
Scenario yearGrasses Regrowth SRT
Fig. 6. Total cost of biomass utilised for biofuel production for each year of thescale-up strategy.
H.T. Murphy et al. / Renewable and Sustainable Energy Reviews 44 (2015) 738–750 747

recognition is already translating to government policies in somecountries which will limit market access and government supportto only those biofuels which meet specified sustainability criteria[31].
The sustainability issues from bioenergy and biofuels have beenwell documented [32–35]. They arise at each stage of the valuechain, as well as across the whole value chain. Sustainability issuesarising directly from the bioenergy/biofuel value chain (calleddirect effects) are reasonably well-defined [31] although manyaspects require further R&D. Many sustainability frameworksunder development also identify the indirect effect of land usechange on GHG emissions, biodiversity and food as a verysignificant risk to sustainability.
In the international arena, there is active progress towardsassessment and verification of the sustainability of bioenergyproducts. The Round Table for Sustainable Biofuels (RSB), andthe International Standards Organisation (ISO) are two that are ofinterest to the aviation industry. The RSB is robust in terms ofensuring the principles of sustainable development are embeddedinto the production process, and is also reasonably well developedbut is yet to be widely applied. It has very stringent requirementsand it will be challenging and expensive for any new industry toattain certification. The ISO sustainability standard (TC 248) iscurrently under development, and is not yet implementable. All ofthe sustainability standards either do, or will, include criteria andindicators relating to the following sustainability aspects: socialissues such as human rights, labour rights, land use rights, foodsecurity, water security as well as environmental issues related togreenhouse gas emissions, water, soil, air, biodiversity etc. Wediscuss here several aspects which may be of particular relevancein the Fitzroy.
6.3.1. Food securityFood security is a critical issue globally, and any evaluation of
sustainability must address the impacts and tradeoffs involved. Inscaling up biomass production, some of the regional beef produc-tion herd will be displaced. At a maximum, based on (a) averagerates of cattle stocking in the Central Queensland region ofapproximately 5.5 ha per adult equivalent (AE) [11,36] and(b) total displacement of grazing from all areas used for biomassproduction (i.e. 1.1 million hectares) due to our assumed ‘exclusive'land rent arrangements, then overall, a cattle breeding herdequivalent to approximately 200,000 AE would be displaced inthe region over this period. In terms of cattle numbers, this wouldbe a reduction equivalent to 6.7% of the combined Fitzroy andMackay SD regions 2006 herd [37] or 1.7% of the Queensland2007–2008 herd [38]. When compared to the 2–7% year-to-yearfluctuations in Queensland’s cattle numbers [38], it would appearthat this reduction would have little effect on the availability orprice of beef at local, State or export levels. In addition, dependingon the contractual arrangements around securing estates forsupplying grass, regrowth or establishing SRTs, and the level towhich biomass production is integrated with existing productionsystems, this level of displacement may well be minimized. Thebenefits in land use, land conservation and animal productionthrough the integration of biomass production from SRT plantingswith livestock grazing have been described [39]. Development ofoptimised grazing regimes complementing biomass production inthe region is an area worthy of future research effort.
6.3.2. Maintaining soil fertility to sustain rates of biomass productionRepeated removal of the majority of above-ground biomass will
lead to significant exports of nutrients and may threaten thecapacity of soils to sustain high rates of biomass production inthe future. This is especially so for SRT systems where nutrient-
rich leaves and branches are harvested, and any adverse impactsare likely to increase over time with repeated harvests. Estimatingthe actual quantity of nutrients that need to be added to com-pensate for losses and to maintain production is complex because:
� In most soils some of the total nutrient capital can be convertedto plant available forms and thus contribute to the nutrientrequirements of the subsequent crop. Thus, while soil nutrientstocks are slowly declining, nutrient supply to plants may bemaintained. In fertile soils, the supply of cations and P may bemaintained for many decades.
� For some nutrients such as N and P, the amounts added infertilizer are not very effectively captured by plants because ofeither losses from the soil or because of rapid binding intoforms unavailable for plant uptake.
The objective in a biomass for bioenergy production system isto replace sufficient nutrients to sustain biomass production. Thiscould be either less or more than the amounts removed inharvested biomass. In practice, fertilizer trials are required toestablish the amounts for particular soils and production systems.In our analysis, in the absence of such information, we haveassumed that the amounts of nutrients exported need to bereplaced using fertilizer and that this can be achieved with 100%efficiency. Costs of nutrient replacement were based on fertilizercosts and the costs of application.
6.3.3. BiodiversityThe consequences for biodiversity of shifting land use to any
bioenergy feedstock will depend on the mix of current land use,the integration of the biomass feedstock with the existing landuse, the landscape context within which the land use shift occurs,and the magnitude of these shifts. Very little research has beenundertaken on the biodiversity outcomes of landscapes whichintegrate biomass supply for bioenergy with grazing productionsystems. Planting perennial crops like SRTs may improve habitatquality and connectivity on grazed lands for some species, how-ever market forces favourable for biofuels could make somemarginal and otherwise under-utilised land attractive for conver-sion to biofuel crops to the detriment of biodiversity overall[40,41].
Conversion of grazing land to SRTs involves the most dramaticland use shift in the strategy outlined here. Many studies indicatethat even single-species plantations have higher species diversitythan most other economically productive land, including nativepastures [42–45]. However, Felton et al. [46] note that this effectdepends strongly on the landscape context of both the plantationand pasture; notably, agricultural landscapes that support amosaic that includes native pasture and remnant native habitatmay provide higher biodiversity benefits than plantations. This isconsistent with much previous research which indicates thatspecies diversity increases with increasing landscape heterogene-ity [47]. Thus, careful consideration should be given to the spatialplacement of SRT plantations in the landscape, and the temporalharvesting regime.
The value of regrowth for biodiversity conservation in Queens-land’s extensively cleared Brigalow Belt has been consistentlyhighlighted [48,49], and clearing of mature regrowth is regulatedin Queensland. Recently, there has been interest in retainingregrowth for the value of the sequestered carbon (C), and forbiodiversity benefits in some areas [25]. If a significant marketdevelops for biomass from regrowth for biofuels this could have anumber of implications for biodiversity. Biodiversity outcomescould be improved in agricultural landscapes if regrowth thatwould otherwise be regularly cleared to prevent progressive
H.T. Murphy et al. / Renewable and Sustainable Energy Reviews 44 (2015) 738–750748

suppression of agricultural land is allowed to mature. On the otherhand, regrowth in relatively unproductive areas of grazing landmight be more likely to be cleared if there is sufficient demandand a profit to the grazier. Harvest of a portion of the regrowthresource for production of biofuels, together with retention of aportion for C sequestration and biodiversity, could constitute acomplementary approach to mitigation of GHG emissions.
7. Conclusions
In detailing how a new biomass production industry canfeasibly meet industry production targets over a 25 year time-frame, this paper fills a key research gap in understanding thecomplex logistics of woody biomass scale-up in a system thatinvolves a relatively long lag-time between establishment andsupply. We have also considered the economic and operationalfactors associated with sustainable biomass supply and industryscale-up in a new region using a novel production system. Thepaper thus provides a framework for assessing feasibility of similarcomplex production systems which is vital to provide some levelof confidence in investment into further industry development.
In our study area, further work will be required to focus on thesorts of arrangements to procure land for SRT establishment,negotiate contracts for biomass supply from graziers, quantifyand manage the investment and sustainability risks across variousagents in the value chain, establish infrastructure to accessbiomass, build the crude bio-oil units (estimated 2 year construc-tion phase), and establish labour and infrastructure to support theproduction units. There are many stakeholders with legitimateinterests in the development of individual bioenergy projects aswell as in the non-additive effects of major expansion of theindustry. Effective ways are needed to engage them in transparentand robust processes for achieving sustainability.
Acknowledgements
This work was financially supported by The Boeing Companyand the CSIRO Energy Transformed Flagship. We thank JohnMcGrath and Keryn Paul for their helpful comments on themanuscript.
References
[1] O’Connell D, Batten D, O’Connor M, May B, Raison J, Keating B, et al. Biofuels inAustralia—issues and prospects. Canberra, Australia: Rural Industries Researchand Development Corporation; 2007.
[2] Geoscience Australia and ABARE. Australian energy resource assessment.Canberra: Geoscience Australia and Australian Bureau of Agricultural andResource Economics; 2010.
[3] IEA. Transport, energy and CO2 moving towards sustainability. Paris: Interna-tional Energy Agency; 2009.
[4] Airbus. Global market forecast 2009–2028. Paris: Airbus; 2010.[5] Boeing. Current market outlook 2009–2028, Boeing, ⟨http://www.boeing.com/
commercial/cmo/index.html⟩; 2009.[6] Bureau of Infrastructure Transport and Regional Economics (BITRE). Aircraft
movements through capital city airports to 2029–30. Research report 117.Australian Government, ⟨http://www.btre.gov.au/Info.aspx?ResourceId=755&NodeId=15⟩; 2010.
[7] Graham PW, Reedman LJ, Rodriguez L, Raison J, Brain A, Haritos V, et al.Sustainable aviation fuels road map: data assumptions and modelling.Melbourne, Australia: CSIRO Publishing; 2011.
[8] CSIRO. Towards establishing a sustainable aviation fuels industry in Australiaand New Zealand—sustainable aviation fuel road map. Canberra: Common-wealth Scientific and Industrial Research Organisation (CSIRO) Australia; 2011.
[9] Farine DR, O’Connell DA, Raison JR, May BM, O’Connor MH, Crawford DF, et al.An assessment of biomass for bioelectricity and biofuel, and for greenhousegas emission reduction in Australia. GCB Bioenergy 2012;4:148–75.
[10] Xiu S, Shahbazi A. Bio-oil production and upgrading research: a review.Renewable Sustainable Energy Rev 2012;16:4406–14.
[11] Herr A, Braid A, Carter J, McIvor J, O’Connell D, Raisbeck-Brown N., et al. Cutyour grass and eat it too—is aviation biofuel production and grazing in theAustralian tropics possible? Renewable Sustainable Energy Rev, in review.
[12] Herr A, O’Connell D, Farine D, Dunlop M, Crimp S, Poole M. Watching grassgrow in Australia: is there sufficient production potential for a biofuelindustry? Biofuels Bioprod Biorefin 2012;6:257–68.
[13] Herr A, O’Connell D, Dunlop M, Unkovich M, Poulton P, Poole M. Secondharvest—is there sufficient stubble for biofuel production in Australia? GCBBioenergy 2012:654–60.
[14] Hayward JA, O’Connell DA, Raison J, Warden A, O’Connor M, Murphy HT, et al.The economics of producing sustainable aviation fuels: a regional case studyin Queensland, Australia. Global Change Biol Bioenergy http://dx.doi.org/10.1111/gcbb.12159.
[15] Booth TH, Raison RJ, Crawford DF, Javonovic T, O’Connor M, Raisbeck-Brown N,et al. Potential contribution of woody biomass for aviation fuel production inQueensland, Australia. Aust For 2014;77:1–8.
[16] Queensland Government. Queensland regional profiles: Fitzroy cathcment,⟨http://statistics.oesr.qld.gov.au/qld-regional-profiles⟩ (accessed March 2012);2012.
[17] DSEWPaC. Brigalow belt forests in Queensland, ⟨http://www.environment.gov.au/biodiversity/threatened/publications/brigalow⟩ (accessed March 2012);2012.
[18] Polglase P, Paul K, Hawkins C, Siggins A, Turner J, Booth TH, et al. Regionalopportunities for agroforestry systems in Australia. Canberra: Rural IndustriesResearch and Development Corporation; 2008.
[19] CSIRO. Sustainable aviation fuel roadmap. Flight path to sustainable aviation:towards a sustainable aviation fuels industry in Australia and New Zealand;2011.
[20] Butler E, Devlin G, Meier D, McDonnell K. A review of recent laboratoryresearch and commercial developments in fast pyrolysis and upgrading.Renewable Sustainable Energy Rev 2011;15:4171–86.
[21] Weston EJ. Native pastures in Queensland: the resources and their manage-ment Brisbane. In: Burrow WH, Scanlan JC, Rutherford MT, editors. Queens-land Department of Primary Industries Information series Q1870231988, 1988.
[22] Tothill JC, Gillies C. The pasture lands of northern Australia—their condition,productivity and sustainability. Brisbane: Tropical Grassland Society of Aus-tralia; 1992.
[23] Carter JO, Hall WB, Brook KD, McKeon GM, Day KA, Paull CJ. AussieGRASS:Australian grassland and rangeland assessment by spatial simulation. In:Hammer G, Nicholls N, Mitchell C, editors. Applications of seasonal climateforecasting in agricutural and natural ecosystems—the Australian experience.The Netherlands: Kluwer Academic Press; 2000. p. 329–49.
[24] Department of Natural Resources and Water. Land cover change in Queens-land 2006–2007: A Statewide Landcover and Trees Study (SLATS) report;2009.
[25] Fensham RJ, Guymer GP. Carbon accumulation through ecosystem recovery.Environ Sci Policy 2009;12:367–72.
[26] Scanlan JC. Woody overstorey and herbaceous understorey biomass in Acaciaharpophylla (brigalow) woodlands. Austral Ecol 1991;16:521–30.
[27] GRO-Australia. Silviculture, management and infrastructure requirements forhardwood plantations in South East Queensland. Main report, June 1999.Bureau of Rural Sciences, Canberra; 1999.
[28] Victorian Department of Environment and Primary Industries. Managingcoppice in Eucalypt plantations. Note no. AG0814. Available at: ⟨http://www.dpi.vic.gov.au/forestry/private-land-forestry/pruning-thinning-harvesting/managing-coppice-in-eucalypt-plantations⟩; 2000.
[29] Davies L, Mortensen K, Patton D. Leasing land—calculating a rental, Primefact,338, January. NSW DPI; 2007.
[30] Rodriguez LC, May B, Herr A, O’Connell D. Biomass assessment and small scalebiomass fired electricity generation in the Green Triangle, Australia. BiomassBioenergy 2011;35:2589–99.
[31] O’Connell D, Braid A, Raison J, Handberg K, Cowie A, Rodriguez L, et al.Sustainable bioenergy production: a review of global bioenergy sustainabilityframeworks and assessment systems. In: RIRDC Publication no 09/167; 2009.
[32] Fehrenbach H, Gierich, J., Reinhardt, G., Schmitz, J., Sayer, U., Gretz, M., et al.Criteria for a sustainable use of bioenergy on a global scale. In: FederalEnvironment Agency (Umweltbundesamt), editor. Dessau-Roblau; 2008.
[33] UN-E. Sustainable bioenergy: a framework for decision makers; 2007.[34] van Dam J, Junginger M, Faaij A, Jurgens I, Best G, Fritsche U. Overview of
recent developments in sustainable biomass certification. Biomass Bioenergy2008;32:749–80.
[35] Evans A, Strezov V, Evans TJ. Sustainability considerations for electricitygeneration from biomass. Renewable Sustainable Energy Rev 2010;14:1419–27.
[36] Bortolussi G, McIvor JG, Hodgkinson BB, Coffey SG, Holmes VR. The northernaustralian beef industry, a snapshot. 1. Regional enterprise activity andstructure. Aust J Exp Agric 2005;45:1057–73.
[37] Australian Bureau of Statistics. National regional profile: Fitzroy (statisticaldivision); 2008.
[38] DEEDI. The Queensland Beef Industry: current trends and future projections.(Updated August 2010). The State of Queensland, Department of Employment,Economic Development and Innovation; 2010.
[39] Braid AL. Land use in Australia for biofuels and bioenergy: opportunities andchallenges for livestock industries. In: Harinder PSM, editor. Biofuel co-products as livestock feed; opportunities and challenges. Rome: Food andAgriculture Organization of the United Nations; 2012.
H.T. Murphy et al. / Renewable and Sustainable Energy Reviews 44 (2015) 738–750 749

[40] Meehan TD, Hurlbert AH, Gratton C. Bird communities in future bioenergylandscapes of the Upper Midwest. Proc Natl Acad Sci 2010;107:18533–8.
[41] Stoms DM, Davis FW, Jenner MW, Nogeire TM, Kaffka SR. Modeling wildlifeand other trade-offs with biofuel crop production. GCB Bioenergy2012;4:330–41.
[42] Brockerhoff E, Jactel H, Parrotta J, Quine C, Sayer J. Plantation forests andbiodiversity: oxymoron or opportunity? Biodivers Conserv 2008;17:925–51.
[43] Lindenmayer DB, Hobbs RJ, Salt D. Plantation forests and biodiversityconservation. Aust For 2003;66:62–6.
[44] Pawson S, Brockerhoff E, Meenken E, Didham R. Non-native plantation forestsas alternative habitat for native forest beetles in a heavily modified landscape.Biodivers Conserv 2008;17:1127–48.
[45] Hobbs R, Catling PC, Wombey JC, Clayton M, Atkins L, Reid A. Faunal use ofbluegum (Eucalyptus globulus) plantations in southwestern Australia. AgroforSyst 2003;58:195–212.
[46] Felton A, Knight E, Wood J, Zammit C, Lindenmayer D. A meta-analysis offauna and flora species richness and abundance in plantations and pasturelands. Biol Conserv 2010;143:545–54.
[47] Benton TG, Vickery JA, Wilson JD. Farmland biodiversity: is habitat hetero-geneity the key? Trends Ecol Evol 2003;18:182–8.
[48] Bowen ME, McAlpine CA, Seabrook LM, House APN, Smith GC. The age andamount of regrowth forest in fragmented brigalow landscapes are bothimportant for woodland dependent birds. Biol Conserv 2009;142:3051–9.
[49] Dwyer JM, Fensham R, Buckley YM. Restoration thinning accelerates structuraldevelopment and carbon sequestration in an endangered Australian ecosys-tem. J Appl Ecol 2010;47:681–91.
H.T. Murphy et al. / Renewable and Sustainable Energy Reviews 44 (2015) 738–750750


