Embed Size (px)
Citation preview

¼ããÀ¦ã ‡ãŠñ ¼ããÀ¦ã ‡ãŠñ ¼ããÀ¦ã ‡ãŠñ ¼ããÀ¦ã ‡ãŠñ ½ãîÊã ½ãîÊã ½ãîÊã ½ãîÊã ¹ã§ã¶ã ¹ã§ã¶ã ¹ã§ã¶ã ¹ã§ã¶ã ‚ã‚ã‚ã‚ãããããââââ‡ãŠ‡ãŠ‡ãŠ‡ãŠÝñÝñÝñÝñ BASIC PORT STATISTICS OF INDIA 2012-13
¹ããäÀÌãֶ㠂ã¶ãìÔãâ£ãã¶ã ¹ãƼããØã TRANSPORT RESEARCH WING
¹ããñ¦ã ½ãâ¦ãÆãÊã¾ã MINISTRY OF SHIPPING
¼ããÀ¦ã ÔãÀ‡ãŠãÀ GOVERNMENT OF INDIA
¶ãƒÃ ãäªÊÊããè NEW DELHI

Officers associated with this publication
Mr. M.M. Hasija
Adviser (Statistics)
Ms. Anupam Bhatnagar
Director
Mr. Basant Kumar
Deputy Director
Mr. Jagdish Chand
Senior Statistical Officer
Ms. Savita Mittal
Economic Officer
Mr Gopal Yadav
Junior Statistical Officer

s1offif{+frDR. VISHWAPATI TRIVEDITel. : 23714938Fax : 23716656
ITT{E+d qFt+6{ {'Trcq
$ITG[ ITFI'RqR.{6:{ r:IEF[, 1, {-S( qfrf
r{ frd-tlooo1SECRETARY
MINISTRY OF SHIPPINGGOVERNMENT OF INDIA
Transport Bhawan, l, Parllament StreetNew Delhl-l10001
PREFACE
The Transport Research wing (TRW) of Ministry of RoadTransport & Highways brings out the 'Basic Port Statistics of lndia'(BPS) as an annual publication. This is a premier source of informationon the pofi performance in the country (covering both Major & Non-Major Ports) and provides consistent and comparable time series datain an analytical perspective.
2. The present issue, Basic Port Statistics of lndia 2012-13 is dividedinto three Sections. Section-l gives performance of the Indian PortSector in terms of cargo traffic & performance indicators in thebackdrop of lndia's broad macro performance and globaldevelopments. Section-ll contains key tables presented in Five Partsand; Section-lll contains the Appendices, which include a brief on theorganization of Major Ports and the definitions of terms used in the portsector.
3. We gratefully acknowledge the bo-operation of Major Ports, variousState Maritime Boards/State Governments and the Indian PortsAssociation for providing us with necessary information for inclusion inthe publication. The final form of publication owes to the combined andcommitted efforts put in by the officers and staff of Transport ResearchWing. n r
AI' il, rL,
-- ,,--
-a\ir,.il qq(
April, 2014 (Dr.Vishwapati Trivedi )

Sections/Tables
Subject Page No.
Port Sector At a Glance
Section I
MACRO ECONOMIC DEVELOPMENT & PERFORMANCE OF INDIAN PORTS - HIGHLIGHTS
A. Global Environment & Sea-borne Trade I B. An Overview of Performance of Indian Ports X C. Performance of Major Ports XIV D. Performance of Non-Major Ports
XXVIII
Section II
TABLES
1. VITAL PORT STATISTICS
1.1 Number of Major & Non-Major Ports in the Maritime States (As on 31.3.2013) 1 1.2 List of Non-Major Ports (As on 31.3.2013) 2 1.3 Topography of Major Ports (As on 31.3.2013) 3 1.4 Berths Available at Major Ports (As on 31.3.2013) 4 1.5 Storage Facilities Available at Major Ports (As on 31.3.2013) 11 1.6 Commodity-wise Capacity Available at Major Ports (As on 31
st March, 2007
to31.3.2013) 15
1.7 Number of Berths Available at Major Ports (As on 31st March, 2009 to 2013) 16
1.8 Cargo Handling Equipment Available at Major Ports (As on 31.3.2013) 17 1.9 Container Handling Facilities Available at Major Ports (As on 31.3.2013) 18 1.10 Berthing Facilities Available at Non-Major Ports (As on 31.3.2013) 19 1.11 Equipment Available at Various Non-Major Ports (As on 31.3.2013) 24 1.12 State-wise Navigational Aids Maintained by Department of Light-Houses &
Light-Ships (As on 31.3.2013) 26
2. CURRENT PORT STATISTICS
2.1 Major Ports
2.1.1 Traffic Handled at Major Ports in India - 2012-13 27 2.1.2. Traffic Handled at Major Ports by Selected Commodities – 2012-13 28 2.1.3 Traffic Handled – Port-wise and Principal Commodity-wise- 2010-11, 2011-12
& 2012-13 29
2.1.4 Percentage Share of Indian Flag Vessels in the Overseas Cargo Traffic Handled at Indian Ports – 2010-11, 2011-12, 2012-13
43
2.1.5 Container Traffic Handled at Major Ports – Type-wise – 2010-11, 2011-12 & 2012-13
44
2.1.6 Commodity-wise Break-up of Container and General Cargo and Level of Containerisation at Major Ports – 2011-12 & 2012-13
49

2.1.7
Commodity-wise Break-up of Container and General Cargo and Level of Containerization at Major Ports – Port-wise – 2011-12 & 2012-13
51
2.1.8 Overseas Cargo of Principal Commodities Unloaded by Country (Port-wise) – 2012-13
75
2.1.9 Overseas Cargo of Principal Commodities Loaded by Country (Port-wise) – 2012-13
84
2.1.10 Tare-weight of Containers Handled at Major Ports –2010-11, 2011-12 & 2012-13
89
2.1.11 Reefer Container Traffic at Major Ports – 2011-12 & 2012-13 90 2.1.12 Level of Containerization in General Cargo at Various Major Ports – 2011-12
& 2012-13 91
2.1.13 Inland Container Movement At Major Ports – 2011-12 & 2012-13 92 2.1.14 Inland Container Depot Movement of Containers at Major Ports –2011-12 &
2012-13 93
2.1.15 Selected Physical Performance Indicators - By Type of Vessels - 2011-12 & 2012-13
94
2.1.16 Selected Physical Performance Indicators – Major Port-Wise - 2011-12 & 2012-13
95
2.1.17 Number of Vessels Sailed by Type of Vessels – 2011-12& 2012-13 96 2.1.18 Average Pre-berthing Detention – By Type of Vessels- 2011-12 & 2012-13 97 2.1.19 Average Turn Round Time - By Type of Vessels - 2011-12 & 2012-13 98 2.1.20 Percentage of Idle Time at Berth to Time at Working Berth - By Type of
Vessels - 2011-12 & 2012-13 99
2.1.21 Out Put Per Ship Berth-day - By Type of Vessels - 2011-12 & 2012-13 100 2.1.22 Commodity-wise Average Pre-berthing Detention- 2011-12 & 2012-13 101 2.1.23 Commodity-wise Average Turn Round Time - 2011-12 & 2012-13 102 2.1.24 Commodity-wise Average Non-working Time at Berth- 2011-12 & 2012-13 103 2.1.25 Commodity-wise Output Per Ship Berth-day -2011-12 & 2012-13 104 2.1.26 Average Pre-berthing Detention on Port & Non Port Account - Major Port-wise
2011-12 & 2012-13 105
2.1.27 Reason-wise Major Port-wise Average Pre-berthing Detention – 2012-13 106 2.1.28 Average Berth Occupancy for Major Ports –2000-01 to 2012-13 110 2.1.29 Performance of Cargo Handling Equipments of Major Ports - 2009-10 ,2010-
11, 2011-12, 2011-12 & 2012-13 111
2.1.30 Availability and Utilisation of Container Handling Equipments – Major Ports – 2011-12 & 2012-13
112
2.1.31 Container Handling Rate – Major Ports – 2011-12 & 2012-13 116 2.1.32 Major Ports – Capacity & Utilisation – 2012-13 117 2.1.33 Employment at Major Ports – As on 31
st March, 2013 118
2.2.34 Employment at DLB’s of Major Ports – As on 31st March, 2013 118
2.1.35 Mandays Employed & Mandays Lost –Major Ports – 2009-2013(31st March) 119
2.1.36 Capital Employed at Major Ports –2012-13 120 2.1.37 Operating Expenditure under Various Heads - Major Ports 2011-12 &
2012-13 121
2.1.38 Operating Financial Parameters per Tonne of Cargo Handled at Major Ports - 2010-11, 2011-12 & 2012-13
122
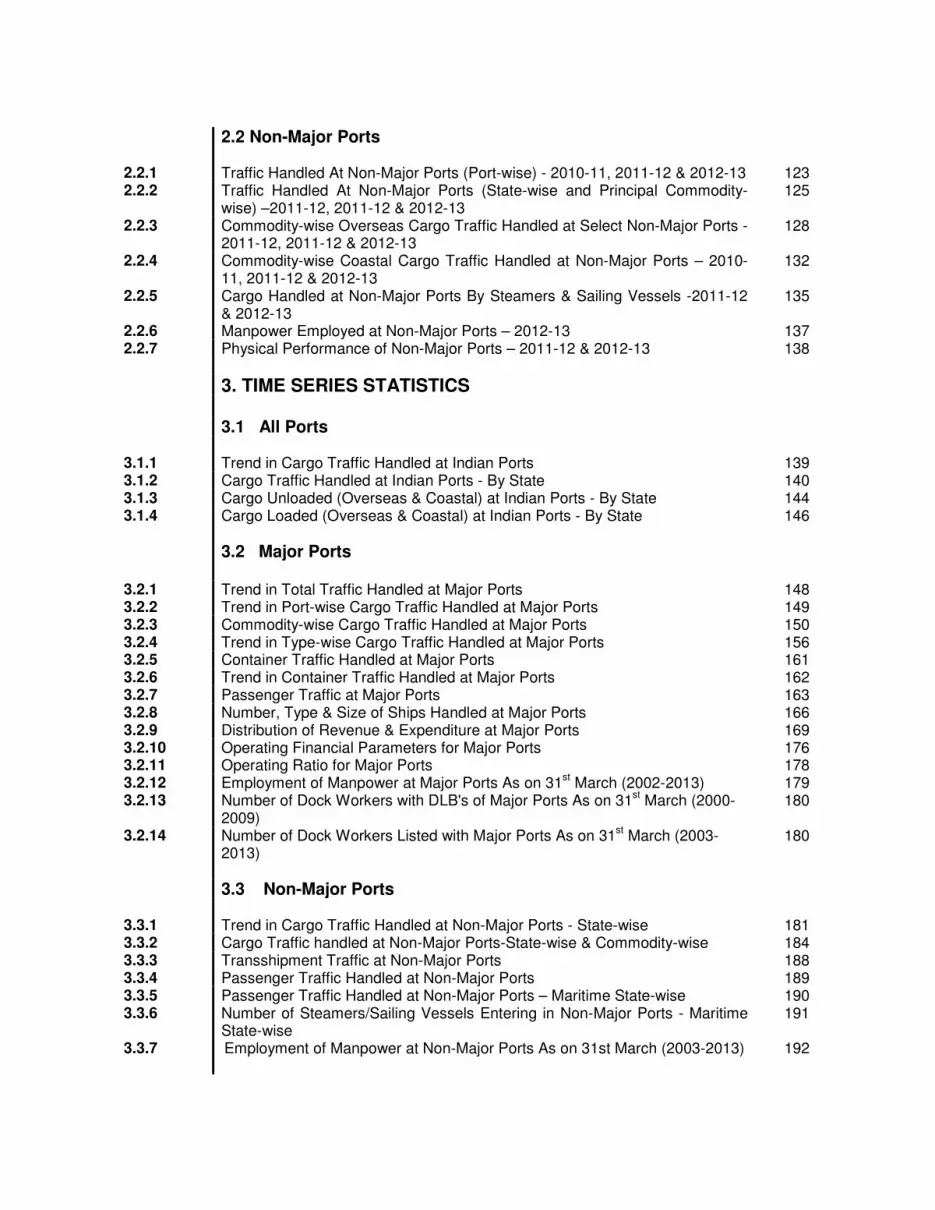
2.2 Non-Major Ports
2.2.1 Traffic Handled At Non-Major Ports (Port-wise) - 2010-11, 2011-12 & 2012-13 123 2.2.2 Traffic Handled At Non-Major Ports (State-wise and Principal Commodity-
wise) –2011-12, 2011-12 & 2012-13 125
2.2.3 Commodity-wise Overseas Cargo Traffic Handled at Select Non-Major Ports - 2011-12, 2011-12 & 2012-13
128
2.2.4 Commodity-wise Coastal Cargo Traffic Handled at Non-Major Ports – 2010-11, 2011-12 & 2012-13
132
2.2.5 Cargo Handled at Non-Major Ports By Steamers & Sailing Vessels -2011-12 & 2012-13
135
2.2.6 Manpower Employed at Non-Major Ports – 2012-13 137 2.2.7 Physical Performance of Non-Major Ports – 2011-12 & 2012-13 138
3. TIME SERIES STATISTICS
3.1 All Ports
3.1.1 Trend in Cargo Traffic Handled at Indian Ports 139 3.1.2 Cargo Traffic Handled at Indian Ports - By State 140 3.1.3 Cargo Unloaded (Overseas & Coastal) at Indian Ports - By State 144 3.1.4 Cargo Loaded (Overseas & Coastal) at Indian Ports - By State
146
3.2 Major Ports
3.2.1 Trend in Total Traffic Handled at Major Ports 148 3.2.2 Trend in Port-wise Cargo Traffic Handled at Major Ports 149 3.2.3 Commodity-wise Cargo Traffic Handled at Major Ports 150 3.2.4 Trend in Type-wise Cargo Traffic Handled at Major Ports 156 3.2.5 Container Traffic Handled at Major Ports 161 3.2.6 Trend in Container Traffic Handled at Major Ports 162 3.2.7 Passenger Traffic at Major Ports 163 3.2.8 Number, Type & Size of Ships Handled at Major Ports 166 3.2.9 Distribution of Revenue & Expenditure at Major Ports 169 3.2.10 Operating Financial Parameters for Major Ports 176 3.2.11 Operating Ratio for Major Ports 178 3.2.12 Employment of Manpower at Major Ports As on 31
st March (2002-2013) 179
3.2.13 Number of Dock Workers with DLB's of Major Ports As on 31st March (2000-
2009) 180
3.2.14 Number of Dock Workers Listed with Major Ports As on 31st March (2003-
2013)
180
3.3 Non-Major Ports
3.3.1 Trend in Cargo Traffic Handled at Non-Major Ports - State-wise 181 3.3.2 Cargo Traffic handled at Non-Major Ports-State-wise & Commodity-wise 184 3.3.3 Transshipment Traffic at Non-Major Ports 188 3.3.4 Passenger Traffic Handled at Non-Major Ports 189 3.3.5 Passenger Traffic Handled at Non-Major Ports – Maritime State-wise 190 3.3.6 Number of Steamers/Sailing Vessels Entering in Non-Major Ports - Maritime
State-wise 191
3.3.7 Employment of Manpower at Non-Major Ports As on 31st March (2003-2013) 192
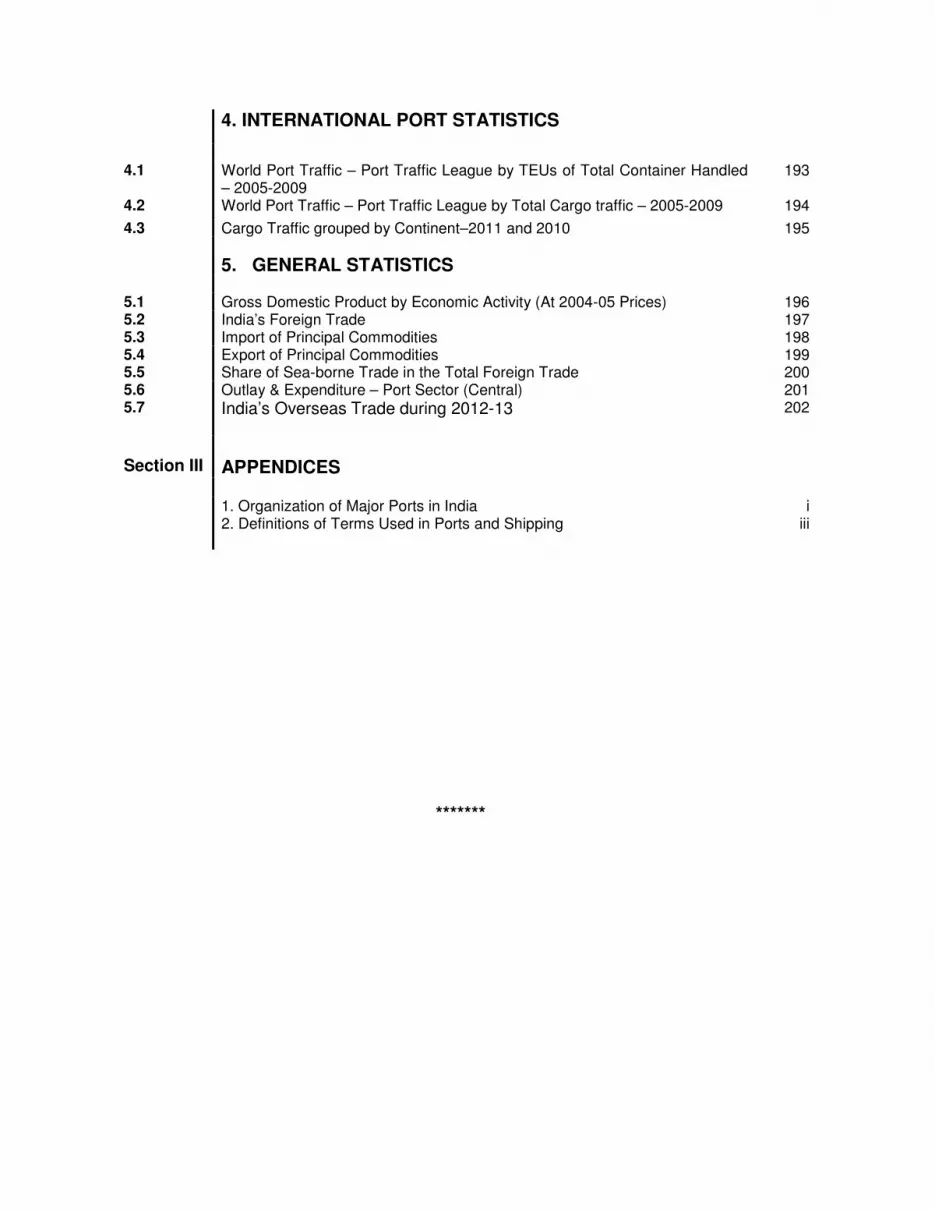
4. INTERNATIONAL PORT STATISTICS
4.1 World Port Traffic – Port Traffic League by TEUs of Total Container Handled
– 2005-2009 193
4.2 World Port Traffic – Port Traffic League by Total Cargo traffic – 2005-2009 194
4.3 Cargo Traffic grouped by Continent–2011 and 2010 195
5. GENERAL STATISTICS
5.1 Gross Domestic Product by Economic Activity (At 2004-05 Prices) 196 5.2 India’s Foreign Trade 197 5.3 Import of Principal Commodities 198 5.4 Export of Principal Commodities 199 5.5 Share of Sea-borne Trade in the Total Foreign Trade 200 5.6 Outlay & Expenditure – Port Sector (Central) 201 5.7 India’s Overseas Trade during 2012-13 202
Section III APPENDICES
1. Organization of Major Ports in India i 2. Definitions of Terms Used in Ports and Shipping iii
*******
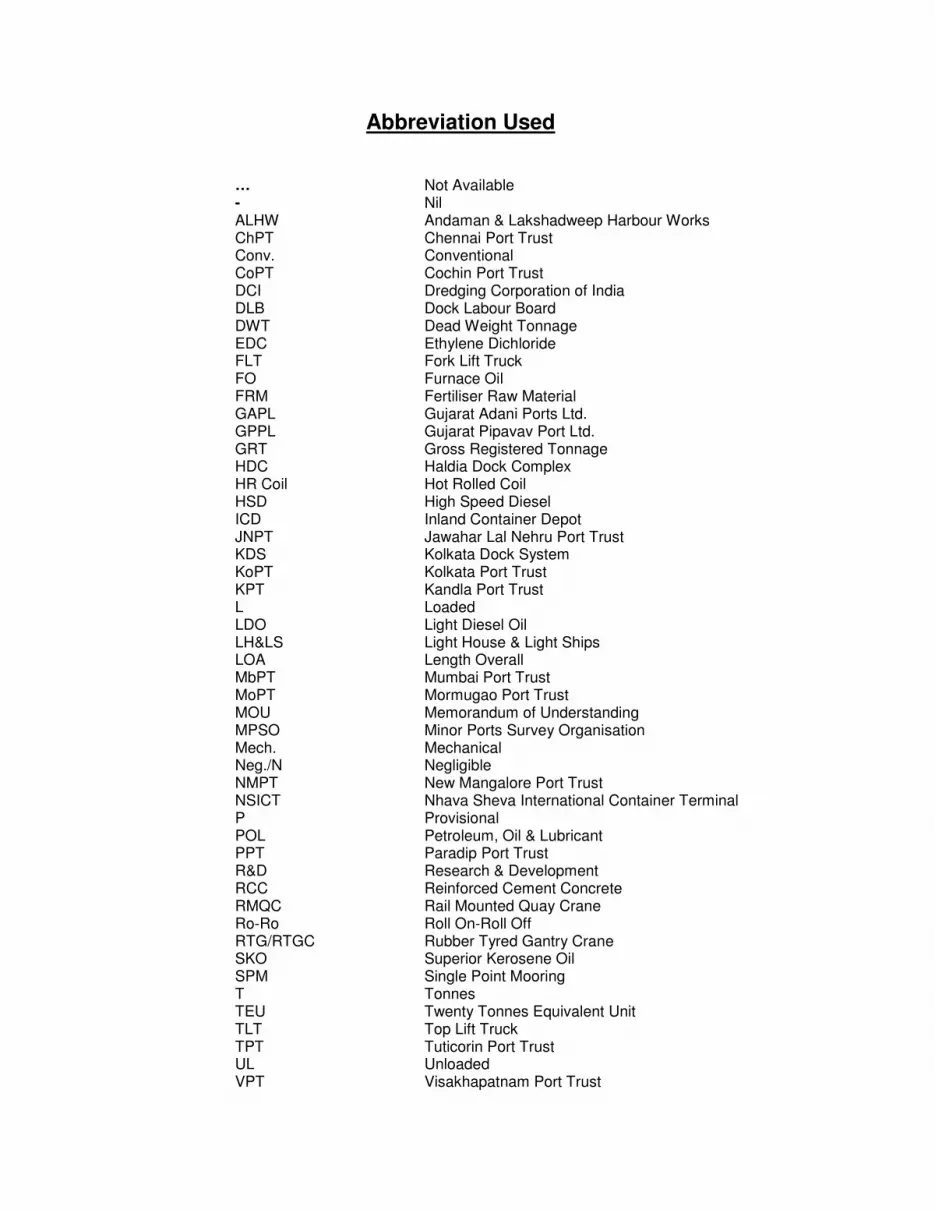
Abbreviation Used
… Not Available - Nil ALHW Andaman & Lakshadweep Harbour Works ChPT Chennai Port Trust Conv. Conventional CoPT Cochin Port Trust DCI Dredging Corporation of India DLB Dock Labour Board DWT Dead Weight Tonnage EDC Ethylene Dichloride FLT Fork Lift Truck FO Furnace Oil FRM Fertiliser Raw Material GAPL Gujarat Adani Ports Ltd. GPPL Gujarat Pipavav Port Ltd. GRT Gross Registered Tonnage HDC Haldia Dock Complex HR Coil Hot Rolled Coil HSD High Speed Diesel ICD Inland Container Depot JNPT Jawahar Lal Nehru Port Trust KDS Kolkata Dock System KoPT Kolkata Port Trust KPT Kandla Port Trust L Loaded LDO Light Diesel Oil LH&LS Light House & Light Ships LOA Length Overall MbPT Mumbai Port Trust MoPT Mormugao Port Trust MOU Memorandum of Understanding MPSO Minor Ports Survey Organisation Mech. Mechanical Neg./N Negligible NMPT New Mangalore Port Trust NSICT Nhava Sheva International Container Terminal P Provisional POL Petroleum, Oil & Lubricant PPT Paradip Port Trust R&D Research & Development RCC Reinforced Cement Concrete RMQC Rail Mounted Quay Crane Ro-Ro Roll On-Roll Off RTG/RTGC Rubber Tyred Gantry Crane SKO Superior Kerosene Oil SPM Single Point Mooring T Tonnes TEU Twenty Tonnes Equivalent Unit TLT Top Lift Truck TPT Tuticorin Port Trust UL Unloaded VPT Visakhapatnam Port Trust

Port Sector at a GlanceItem 2006-07 2007-08 2008-09 2009-10 2010-11 2011-12 2012-13
1 2 3 4 5 6 7 8
1. No. of Ports (Number)
Major Port 12 12 12 12 12 12 12
Non-Major Port 187 187 187 187 199 200 200
Total 199 199 199 199 211 212 212
2. Cargo Handled (Million Tonnes)
Major Port 463.78 519.31 530.80 561.09 570.09 560.19 545.83
Non-Major Port 184.92 206.38 213.22 288.94 315.36 353.74 387.92
Total 648.7 725.69 744.02 850.03 885.45 913.93 933.75
3. Containers
Major ('000 TEUs) 5537 6705 6578 6969 7561 7651 7714
('000 Tonnes) 73469 92247 93440 101287 114158 120276 119866
4. Passenger Traffic ('000 Nos.)
Major Port 431 483 330 460 344 465 408
Non-Major Port 15502 16108 17294 13523 13535 209744 216445
Total 15933 16591 17624 13983 13879 210209 216853
5. Employment ('000 Nos.)
Major Port 60 59 57 55 53 53 52
Non-Major Port 3 3 3 3 3 3 17
6. Financial Performance -
Major Ports (Rs. Million)
a) Total Revenue 68709 71893 75211 79767 80084 92672 90965
b) Total Expenditure 44221 46677 57315 65173 70431 83299 80397
7. Performance Indicators-
Major Ports
a) Total Cargo Vessels Sailed(Nos.) 20168 21529 21366 22047 22022 21163 19851
b) Av. Turn Round Time (Days) 3.65 3.98 4.20 4.63 5.29 4.56 4.29
c) Av. Pre-berthing Detention (Days) 1.20 1.55 1.63 2.16 2.32 2.05 1.79
On Port Account 0.39 0.46 0.39 0.49 0.5 0.45 0.50
On Non Port Account 0.81 1.09 1.24 1.67 1.82 1.60 1.29
d) Output per ship berth day (Tonnes) 10326 9440 9669 9215 9140 10575 11812
Container 19570 13776 15223 16272 17583 16968 19754
Break-Bulk 1839 1488 1647 1724 1922 1989 2384
Dry Bulk- Mechanical 22431 20057 18104 17044 13114 17740 19125
Conventional 6042 6394 6518 5985 6773 7712 7884
Liquid Bulk 17575 17034 17430 16445 16073 16533 18685

SECTION – I
MACRO ECONOMIC
DEVELOPMENT AND
PERFORMANCE OF INDIAN
PORTS - HIGHLIGHTS

I
1. International and Domestic Factors Related to Seaborne Trade.
1. The world economy slowed down in 2012 with GDP increasing by 2.2 per cent, down
from 2.8 per cent in 2011. Growth in GDP decelerated in all three country groupings,
namely to 1.2 per cent in developed countries, to 4.6 per cent in developing economies and
to 3.0 per cent in economies in transition. For comparison, equivalent growth rates in 2011
were 1.5 per cent, 5.9 per cent and 4.5 per cent, respectively. While still growing at a
reasonable rate, developing economies and the economies in transition are increasingly
being affected by the problems in Europe and the fragile recovery in the United States.
Spillover effects have filtered down through various channels, including through trade by
depressing the demand for the exports of developing countries and the economies in
transition. Countries such as the Russian Federation, Brazil and China are, in addition to
falling export volumes, facing internal problems and some structural challenges.
1.2 Economic growth in China slowed from 9.3 per cent in 2011 to 7.8 per cent in 2012,
the lowest rate in more than a decade. The deceleration is indicative of China’s efforts to
slow down the pace of its economic growth, mainly to reduce inflationary pressures. Growth
in India and growth in newly industrialized economies such as the Republic of Korea also
decelerated, owing to a large extent to a reduced European demand for these countries’
exports. Economies in transition continued to grow in 2012, albeit at a moderate pace of 3
per cent. Strong energy prices supported growth in the energy-exporting economies of
Kazakhstan and the Russian Federations. While the adverse effects of the crisis in Europe
hampered economic expansion in countries and regions such as the Republic of Moldova,
Ukraine and Eastern Europe. UNCTAD expects GDP growth to remain flat in 2013 with the
global economy still struggling to return to a strong and sustained growth path. A number of
factors are undermining a sustained global economic recovery, including the continued
impacts of the financial and economic crises that started in 2008, as well as of the
unsustainable financial processes and domestic and international imbalances that have led
to the crises. In several countries weaker growth may also be partly due to macroeconomic
policy choices.

II
1.3 Table 1 gives the growth of cargo at Indian ports and related parameters of Indian
and world trade.
Table 1: Growth in Cargo handled at Indian Ports and related parameters (in %)
Parameters 2009-10 2010-11 2011-12 2012-13
Trends in India’s Select : Macro Parameters I. Total Cargo 14.3 4.2 3.2 2.2 (a) Major Ports 5.8 1.6 -1.7 -2.6 (b) Non Major Ports 35.7 9.1 12.2 9.7 II.GDP overall 8.4 9.3 6.2 5.0 (a) Agriculture 1.0 7.9 3.6 1.9 (b) Industry 8.4 9.2 3.5 2.1 (c) Services 10.5 9.8 8.2 7.1 III. Foreign Trade (a) Export in $ value -3.5 40.5 21.8 -1.8 (b) Import in $ value -5.0 28.2 32.3 0.32
Trends in Select : Global Indicators IV. World Output -0.6 5.1 3.9 3.2 (a) Advanced Economies -3.5 3.0 1.7 1.5 (b) Developing Economies 2.7 7.4 6.2 4.9 V. World Economic Growth -2.2 4.1 2.8 2.2 (a) Advanced Economies -3.8 2.6 1.5 1.2 (b) Developing Economies 2.4 7.9 5.9 4.6 (c ) Transition Economies -6.6 4.5 4.5 3.0 VI. World Trade Volume (Goods) -11.7 14.1 6.5 2.5 VII. Export Volume growth (Goods)
(a) Advanced Economies -11.6 12.4 5.7 2.0 (b) Developing Economies -8.0 14.0 6.8 4.2 VIII. Import Volume (Goods) (a) Advanced Economies -12.1 11.7 4.7 1.0 (b) Developing Economies -8.3 14.7 8.8 5.5 IX. World Seaborne Trade* -5.0 7.4 4.3 4.4
(a) Goods Loaded -4.5 7.0 4.5 4.3 (b) Goods Unloaded -5.5 7.8 4.2 4.4 I. Based on data from Major Ports and Non Major Ports II. Based on gross domestic product (GDP) at Factor Cost (2004-05 Prices), Central Statistical Organization; III. Based on Department of Commerce, DGCI&S and RBI Bulletin IV,VI, VII & VIII Based on World Economic Outlook, October ,2013, IMF; V & IX. Based on Review of Maritime Transport, 2013, UNCTAD Note : MT: Million Tonnes; For item Nos IV, VI, VII &VIII year 2009-10 refers to calendar year 2009 and so on; * growth in total goods loaded plus unloaded;
III
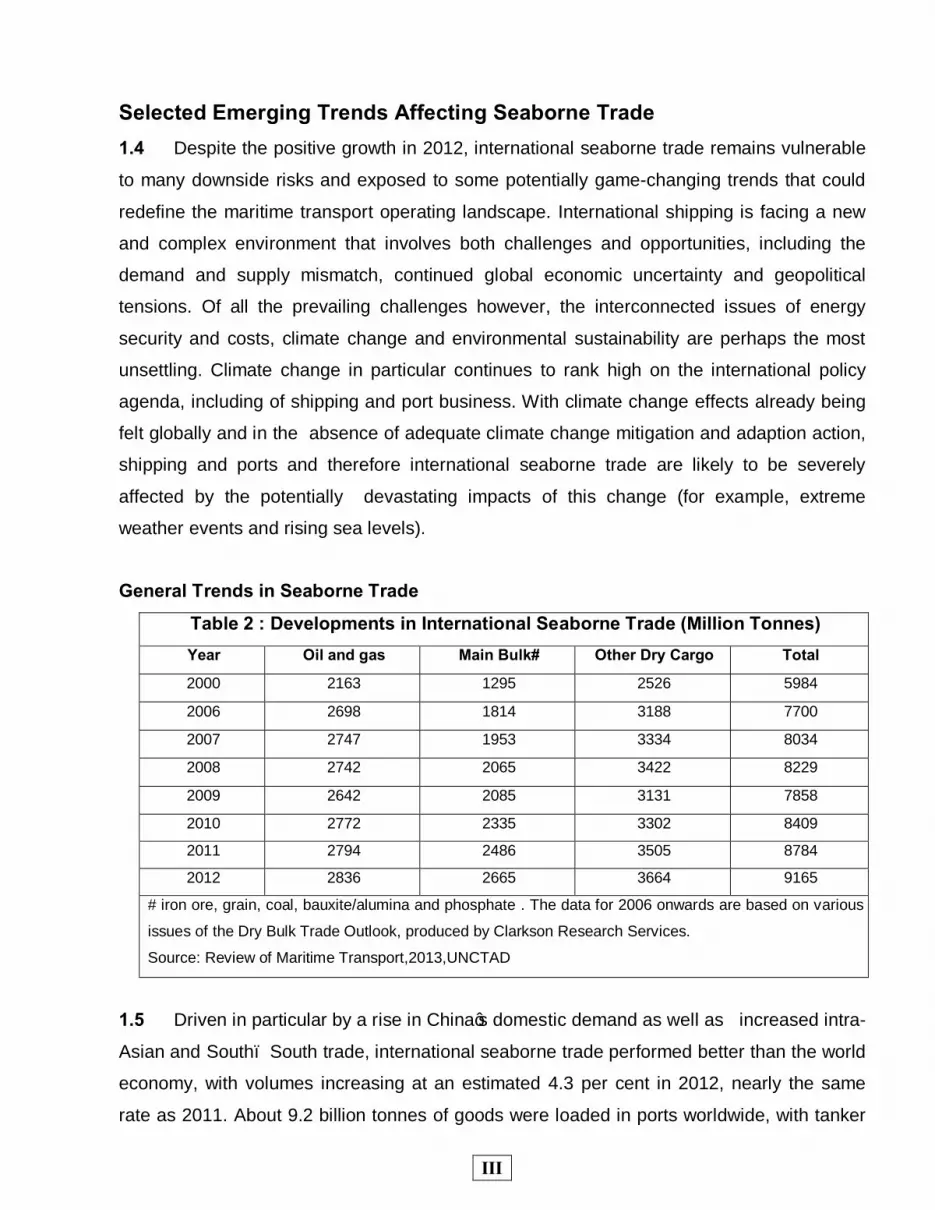
Selected Emerging Trends Affecting Seaborne Trade 1.4 Despite the positive growth in 2012, international seaborne trade remains vulnerable
to many downside risks and exposed to some potentially game-changing trends that could
redefine the maritime transport operating landscape. International shipping is facing a new
and complex environment that involves both challenges and opportunities, including the
demand and supply mismatch, continued global economic uncertainty and geopolitical
tensions. Of all the prevailing challenges however, the interconnected issues of energy
security and costs, climate change and environmental sustainability are perhaps the most
unsettling. Climate change in particular continues to rank high on the international policy
agenda, including of shipping and port business. With climate change effects already being
felt globally and in the absence of adequate climate change mitigation and adaption action,
shipping and ports and therefore international seaborne trade are likely to be severely
affected by the potentially devastating impacts of this change (for example, extreme
weather events and rising sea levels).
General Trends in Seaborne Trade
Table 2 : Developments in International Seaborne Trade (Million Tonnes) Year Oil and gas Main Bulk# Other Dry Cargo Total
2000 2163 1295 2526 5984
2006 2698 1814 3188 7700
2007 2747 1953 3334 8034
2008 2742 2065 3422 8229
2009 2642 2085 3131 7858
2010 2772 2335 3302 8409
2011 2794 2486 3505 8784
2012 2836 2665 3664 9165
# iron ore, grain, coal, bauxite/alumina and phosphate . The data for 2006 onwards are based on various
issues of the Dry Bulk Trade Outlook, produced by Clarkson Research Services.
Source: Review of Maritime Transport,2013,UNCTAD
1.5 Driven in particular by a rise in China’s domestic demand as well as increased intra-
Asian and South– South trade, international seaborne trade performed better than the world
economy, with volumes increasing at an estimated 4.3 per cent in 2012, nearly the same
rate as 2011. About 9.2 billion tonnes of goods were loaded in ports worldwide, with tanker

IV
trade (crude oil, petroleum products and gas) accounting for less than one third of the total
and dry cargo being responsible for the remaining lion’s share. Strong growth (5.7 per cent)
in dry-cargo shipments remained the mainstay of the expansion in 2012, driven in particular
by continued rapid growth in dry bulk volumes. Fuelled by growing Asian demand for iron
ore and coal and in line with the long-term trend, major dry-bulk shipments expanded at the
rate of 7.2 per cent. China, which has contributed significantly to the growth of seaborne
trade in recent years, continues to generate impressive import volumes. Although iron-ore
import growth has moderated compared with high previous levels, coal has stepped in to fill
the gap.
1.6 Reflecting to a large extent their increased participation in the world trading system,
developing countries continued to contribute larger shares to international seaborne trade.
In 2012, they accounted for 60 per cent of global goods loaded and 58 per cent of goods
unloaded in 2012. However, while the group’s share has been on the rise, contributions by
individual countries have been uneven, reflecting their respective varying levels of
integration into global trading networks and supply chains.
1.7 While, in line with previous trends, cargo volumes loaded in the ports of developing
countries exceeded the volumes of goods unloaded, their shares have nevertheless
evolved over the past four decades to reach near parity in 2012. Driven by the fast-growing
import demand in developing regions – fuelled by their industrialization process and rapidly
rising consumer demand – for the first time ever the share of goods unloaded in developing
countries is likely soon to surpass their share of goods loaded
Crude Oil and Petroleum products 1.8 Volumes of crude oil and refined petroleum products grew marginally at 1.5 per cent
in 2012. Though the economic slowdown, high oil price levels and new technologies have
dampened demand for crude oil, petroleum-product trade fared better in comparison.
1.9 Reflecting oil supply and demand dynamics, global crude-oil shipments grew by 1.3
per cent in 2012 with total volumes reaching 55.3 million bpd. Crude oil carried on board
tankers accounted for two thirds of this total and increased by an estimated 1.5 per cent
taking the total volume to 1.78 billion tonnes. Growth was particularly boosted by increased

V
global production and inventory-building ahead of the embargo involving oil trade with the
Islamic Republic of Iran.
1.10 In 2012, crude oil import volumes increased by 7.4 per cent in China and over 4.0
per cent in India (British Petroleum, 2013). As these countries continue to build local
refineries, their crude oil imports will also increase, including from sources in West Africa
and Latin America. This trend is likely to alter the direction of cargo flows, raise demand for
tankers and increase tonne–miles. However, a potentially offsetting pattern is that a growing
proportion of imports into China are likely to be delivered through pipelines from Kazakhstan,
the Russian Federation and Myanmar. New trading lanes both for refined petroleum
products and crude oil are emerging in tandem with changes in production, volume and
structure of demand as well as the location of global refineries.
Dry-cargo Bulks: 1.11 Despite the weakness of the global economy, dry cargo trade volumes continued to
grow at a healthy rate of 5.7 per cent in 2012, taking total volumes above the 6 billion
tonnes mark. The volume of dry-bulk cargo including the five major bulk commodities (iron
ore, coal, grain, bauxite/alumina and phosphate rock) and minor bulks( agri bulks, fertilizers,
metals, minerals, steel and forest products) increased by 6.7 per cent in 2012 (Clarkson
Research Services, 2013). A breakdown of this total indicates that much of the growth was
generated by the expansion in the five major bulk commodities (7.2 per cent) and to a
lesser extent by growth in the minor bulks (4.6 per cent), which in volume terms have added
nearly 500 million tonnes to world seaborne trade between 2002 and 2012 (Clarkson
Research Services, 2013). During the year the five major bulk commodities totalled about
2.7 billion Tonnes while the volume of minor dry bulks reached 1.4 billion tonnes. Together,
major and minor dry bulks accounted for nearly two thirds of global dry-cargo volumes. The
main caution, however, to growth in dry-bulk trade is the continued high dependence on the
Asian demand and on only two key commodities, namely iron ore and coal.
Coal 1.12 Coal is the fastest-growing fossil fuel, accounting for 30 per cent of global primary
energy consumption in 2012. Driven by non-OECD countries, global consumption expanded
by 2.5 per cent in 2012 while production increased by 2 per cent (British Petroleum, 2013).

VI
During the year, the total volume of coal shipments (thermal and coking) increased at an
annual rate of 12.3 per cent and surpassed the 1.06 billion tonnes mark for the first time.
Thermal-coal trade, which accounted for 78 per cent of the total, increased at a strong rate
of 14.2 per cent in 2012.
1.13 Coking-coal trade grew 5.4 per cent in 2012 driven by increases in import volumes of
43.7 per cent and 8 per cent in China and India, respectively. Elsewhere, imports into
Europe and the Republic of Korea were constrained by limited growth in steel production.
1.14 Coal trade is set to grow in tandem with growing import demand from China and as
Indian installations of coal-fired power stations expand. However, growing environmental
regulation, including in Europe, together with the upside potential of China given its large
domestic coal resources, may have an offsetting effect and result in a much moderated
growth.
1.15 In a separate development, it should be noted that new coal power plants are
expected to come on stream between 2012 and 2020 in Europe. These plants should reach
a capacity nearly double the existing capacity during the preceding eight-year period and
result in approximately 80 power plant units being newly built or replaced (Research and
Markets, 2012). These developments are likely to affect demand for coal and further shape
the flows and patterns of coal trade.
Iron ore shipments and steel production and consumption 1.16 As iron ore is a key ingredient used in steel production, its trade is largely determined
by developments in the steel sector. According to data from the World Steel Association,
global apparent steel use and steel production each increased by 1.2 per cent during 2012
(World Steel Association, 2013). China continued to increase its production with its market
share rising from 45.4 per cent in 2011 to 46.3 per cent in 2012. Against this background,
iron-ore trade expanded by 5.4 per cent in 2012, taking the total volumes to 1.11 billion
tonnes. Major iron-ore exporters were Australia, Brazil, Canada, India, South Africa and
Sweden. Together, Australia and Brazil account for 73.5 per cent of global exports.
Australia, the largest world exporter (44.5 per cent share), increased its shipments by 12.8
per cent. Similarly, other exporters such as Canada, South Africa and Sweden have also

VII
increased their shipments, while in India, mining bans and taxes on iron-ore exports have
significantly constrained the country’s export volumes (−52.8 per cent). As a result, India’s
market share declined and a structural shift unfolded, whereby India has moved from being
a major exporter to a net importer and its import demand is likely to increase over the next
few years.
Dry cargo: Minor bulks 1.17 In 2012, minor-bulks trade increased at a slower annual rate than in the previous
year, growing by 4.6 per cent and taking the total volumes to 1.4 billion tonnes. Metals and
minerals accounted for 45.6 per cent of this total followed by manufactures (33.0 per cent)
and agribulks (21.3 per cent). The largest growth was recorded in the metals and minerals
segment (for example, cement, nickel ore, anthracite) with volumes growing by 6.0 per cent
year-on-year. The next largest contributor to growth was the manufactures sector (for
example, steel and forest products) with 3.6 per cent annual growth. Recently, trade
patterns have been shifting in the manufactures sector owing to the surge in Chinese
exports with flows destined mainly for other Asian countries, Africa and developing America.
Ample supply of the more affordable Chinese steel, supported by a strong global demand,
has boosted trade in steel products. Finally, agribulks (soymeal, oilseed/meal and rice) also
expanded at 3.5 per cent, despite a drop in sugar and potash volume.
Other dry cargo: Containerized trade 1.18 For many decades, containerized trade has been the fastest-growing market
segment accounting for over 16 per cent of global seaborne trade by volume in 2012 and
more than half by value (in 2007). Containerized trade, which accounted for 65 per cent of
“other dry cargo” in 2012 (that is, nearly two thirds of the 2.28 billion tonnes of dry cargo that
remain after removing dry-bulk commodities), increased by 3.2 per cent in 2012, down from
13.1 per cent in 2010 and 7.1 per cent in 2011. The sharp deceleration resulted from the
depressed volumes on the main lane East–West trade, in particular, the Asia–Europe trade
route.

VIII
1.2 India: Seaborne Cargo Traffic 1.2.1 The growth in India’s GDP, Port traffic and growth in World output, export volume and seaborne trade (loadings and unloading) since 2007-08 is given in chart I.
Source: Growth rates for India’s GDP and Cargo Traffic are based on statistics released by Central Statistical Organization and data available with Transport Research Wing of M/o Shipping, Road Transport & Highways and pertain to fiscal year. Growth rates in the World Output, World Trade Volume and World Sea-borne Trade refer to calendar years (2007-08 refers to 2007 and so on) based on World Economic Outlook, April 2013, IMF and Review of Maritime Transport, 2013, UNCTAD. 2. India’s Maritime Trade 2.1 India’s maritime trade comprises of export-import trade in various bulk and non-bulk commodities. Over the last decade, since the launch of economic reforms, there has been a steady increase in handling of cargo traffic at Indian ports. Though India’s share in global exports is about 1%, export growth has shown vigour and vitality over the last few years. To sustain the momentum of exports and improve competitiveness the country would need adequate and efficient infrastructure in terms of ports and maritime services. Indian Shipping Share in the Total Overseas Cargo Carried 2.2 During 2012-13, the total overseas cargo handled at Indian ports was placed at 771.76 million tonnes. The share of Indian Flag vessels in carrying this total cargo is summarized in Table 2A.

IX
Table 2A : India’s Overseas Cargo Carried by Indian Flag Vessels during 2011-12 & 2012-13
(In Million Tonnes) Type of Cargo 2011-12 2012-13
Total Overseas Cargo
Share of Indian Lines
Total Overseas Cargo
Share of Indian Lines
Break Bulk 63.68 6.75(10.60) 71.47 4.64(6.49)
Container 140.64 2.89(2.05) 140.14 2.28(1.63)
Dry Bulk Cargo 272.58 24.41(8.95) 260.12 22.23(8.55)
Liquid Bulk Cargo 277.97 48.04(17.28) 300.03 41.08(13.69)
Total 754.87 82.09(10.87) 771.76 70.23(9.10)
Figures in parenthesis indicate the percentage share of Indian vessels in respective cargo categories. Source: Major & Non-Major Ports
2.3 It is observed that the share of overseas cargo carried by Indian flag vessels varies across different categories of cargo. At an aggregate level, Indian Flag Vessels carried 9.10% of the country’s overseas cargo during 2012-13 as against 10.87% in 2011-12.

X
3. PORT INFRASTRUCTURE
3.1 Ports are economic and service provision units of a remarkable importance since they
act as a place for the interchange of two transport modes, maritime and land, whether by
rail or road. Therefore, the essential aspect of ports lies in their intermodal nature. India has
a coast-line of around 7517 Kms with 12 major ports and 200 notified non-major ports along
the coast-line and sea-islands. 4. TOTAL TRAFFIC
4.1 The total cargo handled at Indian Ports (major and non-major) increased to 933.8 million
tonnes in 2012-13 from 913.9 million tonnes in 2011-12 reflecting small increase of 2.2%
during 2012-13. India’s major ports handled more than 58% of the cargo handled at Indian
ports. The growth profile of cargo throughput at India’s major and minor ports in terms of
their coastal and overseas trade during 2008-09 to 2012-13 is given in the Table: 3
Table 3 : Growth in Cargo Traffic at Indian Ports
Port 2008-09 2009-10 2010-11 2011-12 2012-13
OT CT TT OT CT TT OT CT TT OT CT TT OT CT TT
Major 2.0 2.9 2.2 6.21 3.6 5.7 2.46 -2.01 1.60 -2.28 0.58 -1.75 -3.46 1.40 -2.56
Non Major 3.5 2.1 3.3 32.7 53.1 35.5 9.70 6.19 9.14 12.51 10.26 12.17 10.77 3.38 9.66
All Ports 2.5 2.8 2.5 14.2 14.6
14.3 4.98 0.43 4.17 3.12 3.63 3.21 2.2 2.07 2.17
Note: OT - overseas cargo traffic; CT - Coastal cargo traffic; TT - Total cargo traffic

XI
4.2 The period 2000-01 to 2012-13 saw compound annual growth rate (CAGR) of 8.06% in
total cargo throughput at Indian ports. During this period, the annual growth of 28.67% in
Cargo handled at non-major ports was more than 3 times the growth in cargo traffic at major
ports of 7.85%. However, the growth in cargo handled by major and non-major port during
2012-2013 was (-) 2.56% and 9.66% respectively.
5. SHARE OF MARITIME STATES IN TOTAL SEABORNE CARGO TRAFFIC
5.1 The share of major maritime States of India in cargo handled is given in Table 4.
Table 4 : State-wise Cargo Traffic at Indian Ports during 2012-13 (Million Tonnes)
Name of the State Major Ports Non-Major Ports
Total
1. Gujarat 93.62 287.82 381.44 2. Maharashtra 122.53 24.2 146.73 3. Goa 17.74 3.39 21.13 4. Karnataka 37.04 0.61 37.65 5. Kerala 19.84 0.10 19.94 6. Tamil Nadu 99.55 0.93 100.48 7. Andhra Pradesh 59.04 51.81 110.85 8. Orissa 56.55 11.07 67.62 9. West Bengal 39.92 - 39.92 10. Others(a) 0.00 8.00 8.00 TOTAL 545.83 387.92 933.75

XII
5.2 Amongst the States, Gujarat has emerged as the premier maritime State in terms of
port traffic and accounted for 40.9% of the total cargo handled at Indian ports. It is also
noteworthy that more than 74% of the cargo handled by non-major ports pertains to the
State of Gujarat. In terms of total port traffic, Gujarat is followed by Maharashtra, Andhra
Pradesh and Tamil Nadu with their respective shares of 15.7%, 11.9% and 10.8%
respectively in India’s total seaborne traffic.
Composition of Cargo throughput at all Ports 5.3 Commodity-wise traffic handled, in respect of principal commodities, by all the ports
(major & non-major) in India during the last few years are presented in Table 5.
Table 5 : Commodity-wise Traffic Handled by All Ports (Million Tonnes)
Year
Commodity-wise Traffic
POL & products Iron Ore
Cement & clinker Coal
Fertiliser & FRM Others Total
2003-04 182.26 76.19 13.89 64.75 15.09 111.48 463.66
(10.17) (19.87) (14.04) (10.97) (-6.33) (10.99) (9.91)
2004-05 194.21 97.6 14.97 74.17 18.43 121.34 520.72 6.56 28.10 7.78 14.55 22.13 8.84 12.31
2005-06 211.81 108.06 14.47 82.4 22.91 134.04 573.69 9.06 10.72 (3.34) 11.10 24.31 10.47 10.17
2006-07 227.08 114.58 16.39 78.64 25.88 186.12 648.7 7.21 6.03 13.27 (4.56) 12.96 38.85 13.08
2007-08 257.93 123.05 17.99 83.58 25.01 218.13 725.69 13.59 7.39 9.76 6.28 (3.36) 17.20 11.87
2008-09 272.02 128.53 14.66 98.39 26.85 203.57 744.02 5.46 4.45 (18.51) 17.72 7.36 (6.67) 2.53
2009-10 312.58 149.71 14.69 113.06 27.23 232.76 850.03 14.91 16.48 0.20 14.91 1.42 14.34 14.25
2010-11 325.26 131.64 13.08 133.61 38.97 242.88 885.44 4.06 (12.07) (10.96) 18.18 43.11 4.35 4.17
2011-12 330.16 91.34 14.37 157.82 36.14 284.1 913.93 1.51 (30.61) 9.86 18.12 (7.26) 16.97 3.22
2012-13 349.3 49.15 11.95 196.06 27.35 299.95 933.75 5.80 (46.19) (16.84) 24.23 (24.32) 5.58 2.17
Note : Figures in brackets indicate the year-on-year growth rate; FRM : Fertilizer raw materials.

XIII
5.4 The commodity composition of the total traffic at Indian Ports has shown marginal
changes over the years. POL & its products continue to be the single largest commodity
handled by the ports, constituting 37.4% of the total seaborne traffic followed by Coal
(21.0%), Iron Ore (5.3%) and Fertilizer & Fertilizer Raw Material (2.9%) in 2012-13.
General cargo comprising of container cargo and break bulk constituted 23.6% of the cargo.

XIV
6. CARGO TRAFFIC HANDLED 6.1 The twelve major ports in India handled more than 58% of the maritime cargo traffic of
the country in 2012-13. Traffic handled at the major ports has been increasing over the
years in tandem with the economic activity and volume of trade turnover. The total traffic
handled by the major ports has recorded nearly threefold increase from 195.9 million tonnes
in 1994-95 to 545.83 million tonnes in 2012-13 (Chart 3).
6.2 Cargo handling capacity at major ports has also risen with traffic. The capacity which
was placed at 174.0 million tonnes at the end of 1994-95 has increased to a level of 744.91
million tonnes at the end of 2012-13.
6.3 The capacity addition and the productivity improvements achieved by the major ports
coupled with growing participation of Private Sector in cargo handling have had a
favourable impact on efficiency of cargo handling operations at India’s major ports. The
capacity utilization which was 112.6 % in 1994-95, remained above 100% thereafter till
1999-2000. The capacity utilization at Major ports from 1994-95 till 1999-2000 and
subsequent years till 2012-13 is present in Chart-3A.

XV
7. MAJOR PORTS: CARGO TRAFFIC IN TERMS OF OVERSEAS AND COASTAL TRAFFIC 7.1The overseas and coastal cargo handled during 2012-13 by major ports was of the order
of 438.83 million tonnes and 107.01 million tonnes respectively. The Overseas Cargo traffic
declined by -3.4% in 2012-13. The Coastal cargo traffic growth was 1.0% in 2012-13 over
2011-12.
7.2 The Cargo traffic in terms of coastal and overseas categories at Major Ports in 2012-13
is given in Table 6. Amongst the major ports, Kandla Port accounted for the highest share of
17.2% in the total cargo traffic at all major ports during 2012-13 followed by J. L. Nehru,
Vishakhapatnam, Mumbai Port, Paradip and Chennai. The cargo traffic at Mormugao Port
was overwhelmingly outward oriented with overseas cargo accounting for a share of 95.8 %
in the total cargo handled at the port.

XVI
Table 6 : Major Port wise-share of cargo handled (Million Tonnes)
Port
2011-12 2012-13
Overseas Coastal Total Overseas Coastal Total
Kolkata Dock System
11.33 0.90 12.23 10.73 1.11 11.84
(2.49) (0.85) (2.18) (2.45) (1.04) (2.17)
Haldia Dock Complex
24.51 6.51 31.02 22.93 5.16 28.09
5.39 6.15 5.54 5.23 4.82 5.15
Paradip
41.3 12.96 54.26 38.95 17.61 56.56 (9.09) (12.24) (9.69) (8.88) (16.46) (10.36)
Visakhapatnam
44.75 22.67 67.42 41.21 17.83 59.04
(9.85) (21.41) (12.04) (9.39) (16.66) (10.82)
Chennai
51.15 4.56 55.71 49.01 4.39 53.40 (11.26) (4.31) (9.94) (11.17) (4.10) (9.78)
Ennore
6.7 8.26 14.96 9.46 8.42 17.88 (1.47) (7.80) (2.67) (2.16) (7.87) (3.28)
Tuticorin
21.35 6.75 28.10 20.74 7.52 28.26 (4.70) (6.38) (5.02) (4.73) (7.03) (5.18)
Cochin
13.3 6.79 20.09 13.23 6.62 19.85 (2.93) (6.41) (3.59) (3.01) (6.19) (3.64)
New Mangalore
27.03 5.91 32.94 30.82 6.22 37.04 (5.95) (5.58) (5.88) (7.02) (5.81) (6.79)
Mormugao
37.91 1.13 39.04 16.98 0.75 17.73 (8.34) (1.07) (6.97) (3.87) (0.70) (3.25)
J. L. Nehru
60.7 5.03 65.73 61.03 3.46 64.49 (13.36) (4.75) (11.73) (13.91) (3.23) (11.81)
Mumbai
41.93 14.26 56.19 43.64 14.40 58.04 (9.23) (13.47) (10.03) (9.94) (13.46) (10.63)
Kandla
72.36 10.14 82.50 80.10 13.52 93.62 (15.93) (9.58) (14.73) (18.25) (12.63) (17.15)
Total
454.32 105.87 560.19 438.83 107.01 545.84
(100.00) (100.00) (100.00) (100.00) (100.00) (100.00)
The figures in parenthesis indicate percent share in total traffic in respective traffic categories at major ports
7.3 Port-wise analysis of the traffic growth indicates that Ennore Port recorded the highest
year on year growth of 19.5 % during 2012-13 followed by Kandla (13.5%), New Mangalore
(12.4%), Paradip (4.2%), Mumbai (3.3%) and Tuticorin (0.6%). Other major ports recorded
negative growth during 2012-13.
XVII
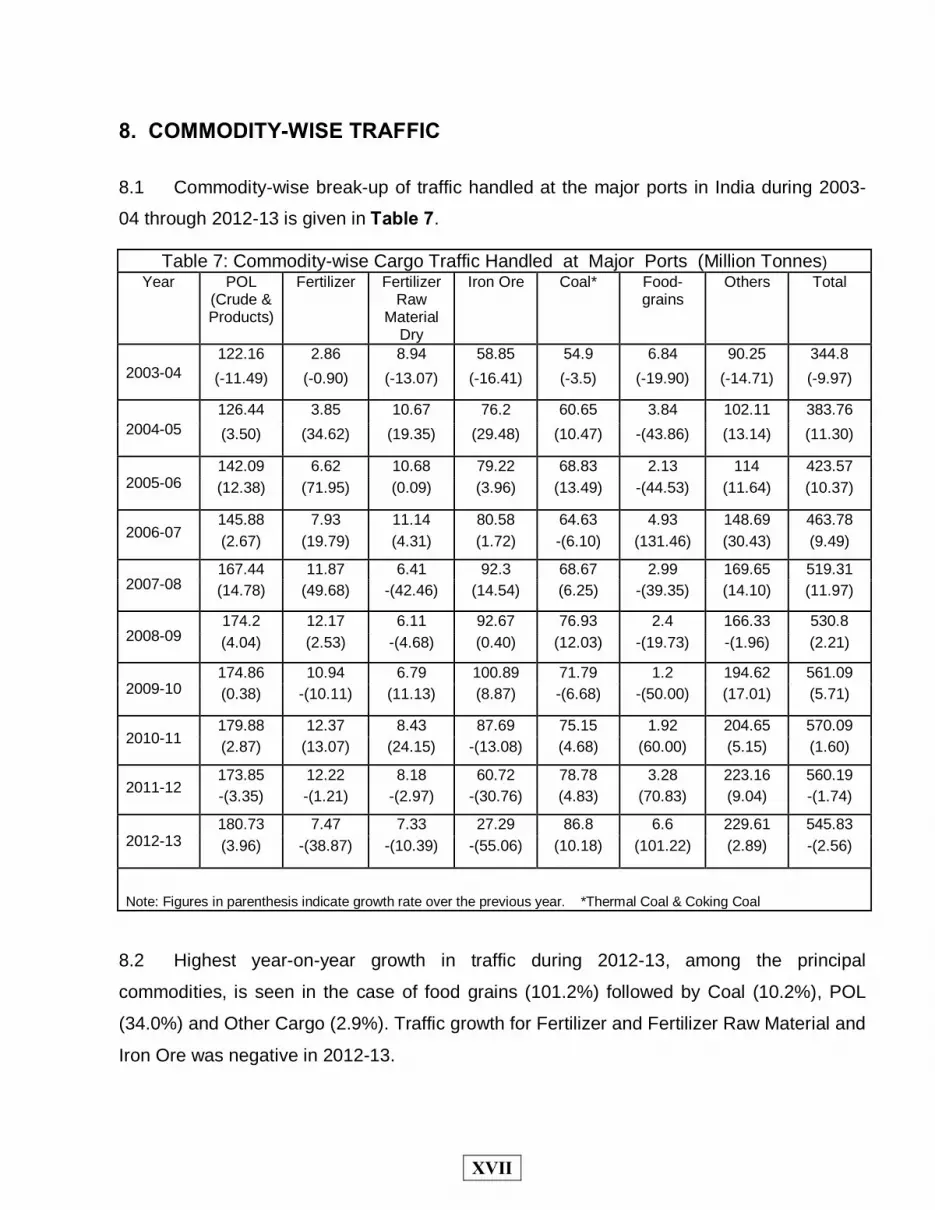
8. COMMODITY-WISE TRAFFIC
8.1 Commodity-wise break-up of traffic handled at the major ports in India during 2003-
04 through 2012-13 is given in Table 7.
Table 7: Commodity-wise Cargo Traffic Handled at Major Ports (Million Tonnes) Year POL
(Crude & Products)
Fertilizer Fertilizer Raw
Material Dry
Iron Ore Coal* Food-grains
Others Total
2003-04
122.16 2.86 8.94 58.85 54.9 6.84 90.25 344.8 (-11.49) (-0.90) (-13.07) (-16.41) (-3.5) (-19.90) (-14.71) (-9.97)
2004-05
126.44 3.85 10.67 76.2 60.65 3.84 102.11 383.76 (3.50) (34.62) (19.35) (29.48) (10.47) -(43.86) (13.14) (11.30)
2005-06
142.09 6.62 10.68 79.22 68.83 2.13 114 423.57 (12.38) (71.95) (0.09) (3.96) (13.49) -(44.53) (11.64) (10.37)
2006-07
145.88 7.93 11.14 80.58 64.63 4.93 148.69 463.78 (2.67) (19.79) (4.31) (1.72) -(6.10) (131.46) (30.43) (9.49)
2007-08
167.44 11.87 6.41 92.3 68.67 2.99 169.65 519.31 (14.78) (49.68) -(42.46) (14.54) (6.25) -(39.35) (14.10) (11.97)
2008-09
174.2 12.17 6.11 92.67 76.93 2.4 166.33 530.8 (4.04) (2.53) -(4.68) (0.40) (12.03) -(19.73) -(1.96) (2.21)
2009-10
174.86 10.94 6.79 100.89 71.79 1.2 194.62 561.09 (0.38) -(10.11) (11.13) (8.87) -(6.68) -(50.00) (17.01) (5.71)
2010-11
179.88 12.37 8.43 87.69 75.15 1.92 204.65 570.09 (2.87) (13.07) (24.15) -(13.08) (4.68) (60.00) (5.15) (1.60)
2011-12
173.85 12.22 8.18 60.72 78.78 3.28 223.16 560.19 -(3.35) -(1.21) -(2.97) -(30.76) (4.83) (70.83) (9.04) -(1.74)
2012-13
180.73 7.47 7.33 27.29 86.8 6.6 229.61 545.83 (3.96) -(38.87) -(10.39) -(55.06) (10.18) (101.22) (2.89) -(2.56)
Note: Figures in parenthesis indicate growth rate over the previous year. *Thermal Coal & Coking Coal
8.2 Highest year-on-year growth in traffic during 2012-13, among the principal
commodities, is seen in the case of food grains (101.2%) followed by Coal (10.2%), POL
(34.0%) and Other Cargo (2.9%). Traffic growth for Fertilizer and Fertilizer Raw Material and
Iron Ore was negative in 2012-13.

XVIII
8.3 In respect of the traffic at Major ports, it is also observed that around 91% of the
traffic handled during 2012-13 was accounted by three commodities viz. Other cargo
including Containers (42.1%), POL & Products (33.1%), and Coal (15.9%).
Chart 4: Commodity Composition of Traffic Handled – Major Ports
9. CONTAINER TRAFFIC 9.1 Containerization started in India in 1973 in a limited way with the creation of interim
container handling facilities at Mumbai and Cochin Ports. Since then, container traffic has
steadily increased over the years, in tune with the increasing use of containers in
international trade. Container traffic has experienced about seven fold increase from 1.05
million Twenty Feet Equivalent Units (TEUs) (13.08 million tonnes) in 1993-94 to 7.7 million
TEUs (119.87 million tonnes) in 2012-13. (Chart-5) Over the same period non-
containerized cargo grew from 166 million tonnes to 425.96 million tonnes i.e. about three
fold increases.

XIX
9.2 The growth in container traffic at the container handling ports of the country is given
in Table 8.
Table 8 : Major Port-wise Container Traffic Handled (in TEUs)
Name of the Port 2011-12 2012-13
000’ Tonnes TEUs 000’ Tonnes TEUs
Kolkata Dock System 6818 317 6960 463
Haldia Dock Complex 2619 115 2869 137 Paradip 109 8 171 13 Visakhapatnam 4213 234 4554 247
Chennai 30076 1555 29708 1539
Tuticorin 9227 477 9372 476 Cochin 4715 337 4607 335
New Mangalore 645 45 692 48
Mormugao 279 22 258 20 J. L. Nehru 58233 4317 57911 4259 Mumbai 551 56 829 58 Kandla 2791 168 1935 118
ALL PORTS 120276 7651 119866 7714
9.3 The share of JNPT during 2012-13 in total container traffic at 55.2% in (TEUs) and
48.3% (in tonnage) makes it the premier container port in India. Other important container
handling ports, in the order of their share in India’s total container traffic in terms of TEUs

XX
were Chennai (20.0%), Tuticorin (6.2%), Kolkata D S (6.0%), Cochin (4.3%) and
Vishakhapatnam (3.2%). The share of Mumbai Port in container traffic has seen a decline
from 38.7% in 1994-95 to less than one per cent in 2010-11 and 2011-12 due to diversion of
container traffic to JNPT. During 2012-13 also, the share of Mumbai Port in container traffic
was less than one per cent. Concomitantly, the share of JNPT has surged ahead from 19.4%
to 55.2 % during the same period (Chart 6).
Chart 6: Share of Major Ports in Container Traffic (TEUs)
KDS4.1%
HDC1.5%
PPT0.1%
VPT3.1%
ChPT20.3%
TPT6.2%CoPT
4.4%NMPT0.6%
MoPT0.3%
JNPT56.4%
MbPT0.7%
KPT2.2%
2011-12
KDS6.0% HDC
1.8%PPT0.2%
VPT3.2%
ChPT20.0%
TPT6.2%CoPT
4.3%NMPT0.6%
MoPT0.3%
JNPT55.2%
MbPT0.8%
KPT1.5%
2012-13
JNPT: Jawaharlal Nehru Port Trust MbPT: Mumbai Port Trust KPT: Kandla Port Trust PPT: Paradip Port Trust KDS: Kolkata Dock System HDC: Haldia Dock Complex VPT: Vishakapatnam Port Trust ChPT: Chennai Port Trust TPT: Tuticorin Port Trust CoPT: Cochin Port Trust NMPT: New Mangalore Port Trust MoPT: Mormugao Port Trust

XXI
PERFORMANCE INDICATORS
10. Capacity Utilization
10.1 Over the years, cargo handling capacity of major ports has steadily increased to
cater to the growing volume of internal and external trade. The capacity of the ports which
was 172.59 million tonnes at the end of 1993-94 increased to a level of 744.91million
tonnes at the end of 2012-13. The port-wise capacity and traffic for 2012-13 is brought out
in Table 9.
Table 9 : Major Port-wise Capacity Utilization During 2012-13 (Million Tonnes)
Name of the Port Capacity Traffic Capacity Utilisation(%)
Kolkata Dock System 17.14 11.84 69.08
Haldia Dock Complex 46.75 28.08 60.06
Paradip 102.3 56.55 55.28 Visakhapatnam 67.33 59.04 87.69
Ennore 31 17.89 57.71 Chennai 85.59 53.4 62.39 Tuticorin 33.34 28.26 84.76 Cochin 44.66 19.84 44.42 New Mangalore 76.77 37.04 48.25
Mormugao 36.4 17.74 48.74 J. L. Nehru 65.88 64.49 97.89 Mumbai 44.53 58.04 130.34 Kandla 93.22 93.62 100.43 ALL PORTS 744.91 545.83 73.27

XXII
EFFICIENCY INDICATORS OF MAJOR PORT OPERATIONS
11 Average Pre-berthing Detention 11.1 The average overall pre berthing detention time for all major ports has declined from
2.2 days in 1990-91 to 1.63 days in 2008-09. However, in 2009-10 and 2010-11, the
average PBDT edged up to 2.16 days and 2.32 days respectively. In contrast, average
PBDT on port account has seen a sharper decline from 2.10 days in 1990-91 to 0.50 day in
2010-11. Average PBDT on port account remained same at 0.50 days in 2011-12 and
2012-13. Port-wise PBD for select years is indicated in Table 10.
Table 10 : Average Pre-Berthing Detention(Days) Port 1990-91 2000-01 2008-09 2009-10 2010-11 2011-12 2012-13
1 2 3 4 5 6 7 8
Kolkata D.S 0.9 0.61 0.66 1.31 1.23 0.77 0.61
Haldia D.C 1.66 0.91 3.38 4.39 3.73 2.54 2.29
Paradip 1.59 1.41 2.32 6.30 5.04 3.69 1.65
Vishakhapatnam 1.83 0.75 1.28 1.90 2.81 2.84 2.50
Ennore 0.27 0.37 0.65 0.76 1.33
Chennai 2.1 2.45 1.39 1.35 1.61 1.16 0.80
Tuticorin 0.9 1.4 1.09 1.36 1.29 1.91 1.31
Cochin 0.83 0.74 0.70 0.85 1.03 1.05 1.09
New Mangalore 0.79 0.77 0.65 0.81 0.59 0.79 1.04
Mormugao* 2.51 1.32 1.77 3.46 4.07 2.94 1.62
J.L.Nehru 0.67 0.95 0.98 1.51 1.13 1.31
Mumbai 3.4 1.26 1.41 1.06 1.23 1.37 1.62
Kandla 4.4 1.51 2.62 2.60 3.32 3.74 3.58
All Ports 2.16 1.19 1.63 2.16 2.32 2.05 1.79
* Relate to dry bulk cargo for MOHP(Mech.) and Berth No. 10 &11 (Conv.)
Source: Major Ports/ Indian Ports Association(IPA)

XXIII
11.2 During 2012-13, ports at Kolkatta DS, Haldia DC, Paradip, Vishakhapatnam, Chennai,
Tuticorin, Mormugao and Kandla experienced drop in pre-berthing detention of vessels.
Data on PBD for different types of vessels indicate that in 2012-13, the PBD was the least
(0.71 days ) in the case of container vessels followed by liquid bulk vessels ( 1.93 days),
break bulk ( 2.30 days), dry bulk (Mechnical) ( 3.52 days) and dry bulk ( Conventional )
(4.12 days).
11.3 The trajectory of weighted average of pre berthing detention time at Major ports- total
and on port account during 1990-91, 1995-96, 2000-01, 2005-06 onwards is shown in
Chart 7 below.
12 Average Turn-Round Time (TRT) 12.1 This parameter has improved significantly during the past one and half decades for
all the major ports. Average TRT for all major ports improved from 8.10 days in 1990-91 to
3.63 days in 2005-06. Thereafter the TRT has increased steadily to 5.29 days in 2010-11.
In 2011-12, the average TRT declined to 4.56 days and further to 4.29 days in 2012-13.
The TRT varied in a range between 1.58 days at Cochin Port to 6.33 at Kandla. Amongst
the 12 major ports improvement in TRT during 2012-13 in comparison to 2011-12 is
reflected in all Major Ports except Ennore, HDC, New Mangalore, Mumbai and Jawahar Lal
Nehru Ports.
12.2 The data on TRT for different types of vessels indicate that in 2012-13, the average
TRT was least in case of container vessels ( 2.07 days) followed by liquid bulk ( 3.72 days),
dry bulk (Mech) (4.48 days), break bulk ( 6.14 days) and dry bulk ( Conv.) ( 7.02 days).

XXIV
Port-wise TRT for select years are given in Table 11.
Table 11: Average Turn Round Time (days) Port 1990-91 2000-01 2008-09 2009-10 2010-11 2011-12
2012-13
1 2 3 4 5 6 7 8 Kolkata D.S 11.90 5.50 5.10 6.80 6.21 5.45 4.72 Haldia D.C 6.47 3.97 4.21 5.01 4.45 3.62 3.95 Paradip 8.40 4.16 4.78 9.04 7.73 6.33 4.39 Vishakhapatnam 7.07 3.71 3.93 4.78 5.84 5.68 5.39 Ennore 2.35 2.11 2.78 2.17 2.95 Chennai 7.20 5.83 4.15 4.04 4.36 3.91 3.24 Tuticorin 4.70 4.10 3.64 3.90 4.00 4.94 4.31 Cochin 4.00 3.11 2.14 2.08 2.20 1.82 1.58 New Mangalore 4.96 2.89 3.00 3.06 2.70 2.95 3.29 Mormugao * 6.40 4.25 5.95 8.91 10.43 7.68 5.06 J.L.Nehru 2.21 1.90 2.01 2.64 1.94 2.48 Mumbai 10.80 5.20 4.95 4.61 4.96 5.22 5.58 Kandla 10.00 4.72 7.26 5.03 5.90 6.42 6.33 All Ports 8.10 4.24 4.20 4.63 5.29 4.56 4.29
* Relate to dry bulk cargo for MOHP(Mech.) and Berth No. 10 &11 (Conv.) Source: Major Ports / Indian Ports Association (IPA)
12.3 The path of turn round time at major ports for select years since 1990-91 to 2012-13
is presented in the Chart -8 below.
(Turn-Round Time - Total time spent by a ship since its entry till its departure).

XXV
12.4 The TRT is influenced by a number of factors like type of cargo, parcel size, PBD,
entrance channel, etc. During 2012-13, average parcel size has increased for all the
categories except for dry bulk (Mech.) where as average TRT has decreased for all types of
vessels except liquid bulk. Available data on type of vessels and average parcel size vis-à-
vis Average TRT is indicated in Table 12.
Table 12 : Average Parcel Size and Turn Round Time
Type of Vessel 2011-2012 2012-2013 Average Parcel Size (Tonnes)
(Cargo/vessels)
Average TRT (Days)
Average Parcel Size (Tonnes)
(Cargo/vessels)
Average TRT (Days)
Dry Bulk (Mech.) 52015 5.71 50814 4.48
Dry Bulk (Conv.) 31097 7.68 32805 7.02
Liquid Bulk 27085 3.23 29100 3.72
Break Bulk 7516 6.93 8032 6.14
Container 22187 2.17
23160 2.07
All Types 25654 4.56 26790 4.29
13 Average Output per Ship Berth-day
13.1 During the last 20 years this indicator has seen a tremendous improvement. Average
Output per Ship Berth-day has increased to almost four times from 3,372 tonnes in 1990-91
to 11812 tonnes in 2012-13 for major ports. However, average output per Ship Berth-day is
marked by substantial variation across major ports ranging from a high 27741 tonnes in
case of Ennore port to a low of 2762 tonnes at Kolkata Dock System during 2012-13. This
variation reflects the type of cargo being handled, level of mechanization and labour
practices. Amongst the 12 major ports improvement in average Output Per Ship Berth-day
during 2012-13 as compared to 2011-12 is visible in all the ports except Haldia DC and
Vishakhapatnam. Port-wise average output per Ship Berth-day for select years and latest
period are given in Table: 12.

XXVI
Table 12 : Average Output per Ship Berth-day (Tonnes) Port 1990-91 2000-01 2008-09 2009-10 2010-11 2011-12
2012-13
1 2 3 4 5 6 7 8
Kolkata D.S 560 2305 3027 1917 2253 2503 2762 Haldia D.C 5659 6384 7732 6243 6563 6728 6078 Paradip 4082 8503 12635 13853 14243 15995 16625 Visakhapatnam 5325 9799 11171 10484 10334 10704 10641 Ennore 28424 21665 17669 27505 27741 Chennai 3912 6977 10778 11428 10984 10352 12046 Tuticorin 2130 3983 5817 6934 7035 6733 7452 Cochin 3714 6138 10599 11089 11752 15784 15878 New Mangalore 4412 12192 13645 13896 14211 13957 15921 Mormugao 10429 12438 6290 5002 4409 10530 11484 J.L.Nehru 6383 20344 21563 20393 19227 23319 Mumbai 2310 4213 5717 6122 6042 6476 8709 Kandla 4417 8230 13107 13549 14137 14272 15728 All Ports 3372 6961 9669 9215 9140 10575 11812
Source: Major Ports /Indian Ports Association (IPA).
13.2 As compared to 2011-12, the increase in average output per Ship Berth-day (all major ports)
in 2012-13 was of the order of 17.13%. An important determinant of output per Ship Berth-day is the
composition of traffic at the port. The average out-put per Ship Berth-day by types of vessels in
2012-13 at major ports increased over the previous period for all types of vessels presented below
in Table-14.
Table 14 : Average Out Put Per Ship Berth-day by Vessel Type
Type of Vessel Average Out Put Per Ship Berth-day (Tonnes)
2011-12 2012-13 %change
Dry Bulk (Mech.) 17740 19125 7.81 Dry Bulk (Conv.) 7712 7884 2.23 Liquid Bulk 16533 18685 13.02 Break Bulk 1989 2384 19.86 Container 16968 19754 16.42 All Types 10575 11812 11.70

XXVII
13.3 The average out-put per Ship Berth-day for selected years since 1990-91 to 2012-13
is presented in the Chart -9 below.
3372 4047
6961
9371
9543
100169440 9669
9215 9140
10575
11812
0
2000
4000
6000
8000
10000
12000
14000
Tonn
esChart 9-Major Ports: Average Output per Ship Berh-Day
Output per Ship Berth-day – Total tonnage handled distributed over total number of berth days

XXVIII
14. CARGO TRAFFIC HANDLED 14.1 There are 200 non-major ports situated along the peninsula coast-line and sea-islands.
These ports are located in Gujarat (41), Maharashtra (48), Goa (5), Daman & Diu (2),
Karnataka (11), Kerala (17), Lakshdweep (10), Tamilnadu (15), Puducherry (2), Andhra
Pradesh (12), Orissa (13), West Bengal (1) and Andaman & Nicobar Island (23). Out of
these 200 Non-major ports, only some ports are well developed and provide all-weather
berthing facilities for cargo handling. In 2012-13, only 61 Non-major Ports were reported to
have handled cargo traffic.
14.2 The effectiveness of non-major ports in meeting the growing volume of cargo traffic
in the backdrop of saturation of existing capacities at the major ports cannot be overlooked.
Recognizing the importance of non-major ports, maritime states have launched initiatives
for their development, through the participation of private sector. This has led to significant
growth in the cargo traffic handled by the non-major ports in the past few years.
14.3 Non-major ports in India collectively handled 387.92 million tonnes of traffic during
the year 2012-13 as compared to 353.74 million tonnes of cargo handled in 2011-12
(Chart-9). The year-on-year growth in traffic in 2012-13 was 9.66% as compared to 12.17%
in 2011-12. At a disaggregated level, the overseas cargo traffic increased by 10.77 % in
2012-13 compared to an increase of 12.51% recorded in 2011-12. Coastal cargo traffic
increased by 3.38% in 2012-13 compared to an increase of 10.26 % in 2011-12.

XXIX
Commodity Composition of Non-Major Port Traffic 14.4 Commodity composition of traffic handled by non-major ports during the past few
years is given in Table 15. Table 15 : Commodity -wise Traffic Handled at Non-major Ports
Traffic Handled (Million Tonnes) Year POL & its
Products Iron Ore Building Coal Fertiliser &
FRM Others Total
Material 2003-04 60.1 17.34 13.4 9.85 3.29 14.88 118.86
(50.56) (14.59) (11.27) (08.29) (02.77) (12.52) (100.00) 2004-05 67.77 21.4 14.13 13.52 3.91 16.23 136.96
(49.48) (15.63) (10.32) (09.87) (02.85) (11.85) (100.00) 2005-06 69.72 28.84 13.39 13.57 5.61 18.99 150.12
(46.44) (19.21) (08.92) (09.04) (03.74) (12.65) (100.00) 2006-07 81.2 33.97 14.39 14.02 6.82 34.52 184.92
(43.91) (18.37) (07.78) (07.58) (03.69) (18.67) (100.00) 2007-08 91.04 34.22 16.26 15.45 7.11 42.3 206.38
(44.11) (16.58) (07.88) (07.49) (03.45) (20.50) (100.00) 2008-09 97.82 35.86 13.26 21.46 8.85 35.97 213.22
(45.88) (16.82) (06.22) (10.06) (04.15) (16.87) (100.00) 2009-10 137.72 48.81 13.14 41.28 9.5 38.49 288.94
(47.66) (16.89) (04.55) (14.29) (03.29) (13.32) (100.00) 2010-11 145.38 38.27 12.33 58.46 12.72 48.2 315.36
(46.10) (12.14) (03.91) (18.54) (04.03) (15.28) (100.00) 2011-12 156.32 30.62 12.87 79.04 15.74 59.16 353.74
(44.19) (08.66) (03.64) (22.34) (04.45) (16.72) (100.00) 2012-13 168.57 21.86 11.95 109.26 12.55 63.74 387.92
(43.45) (05.63) (03.08) (28.17) (03.23) (16.43) (100.00) (Note : Figures in parentheses indicate percentage share of cargo handled to total cargo handled-row-wise).

XXX
14.5 POL & its products (43.5%) was the single largest commodity handled at non major
ports in 2012-13 and its share has ranged between 44 to 48% (in 2005-06 to 2012-13). It is
observed that during the previous three years, the relative shares of commodities in the
cargo basket have not shown any pronounced shift. However, during 2012-13 the share of
Coal in the total traffic was 28.17% followed by Iron ore (5.63%) and Fertilizer & FRM
3.23%).
15 Maritime States – Non-Major Ports 15.1 Maritime State-wise traffic handled at non-major ports in the recent years is given in
Table 16:
Table 16 : Traffic Handled by Non-Major Ports – Maritime State-wise
Year Traffic Handled (Million Tonnes)
Gujarat Mahara-shtra
AP Goa Tamil Nadu
Karnataka Others Total
2003-04 87.33 10.33 10.02 8.44 0.69 1.17 0.88 118.86
-(07.07) -(19.70) (-2.15) -(51.53) -(15.00) -(74.63) (-14.56) -(09.75)
2004-05 96.14 12.14 15.07 8.2 0.85 3.51 1.05 136.96
(10.09) (17.52) (50.40) -(02.84) (23.19) (200.00) (19.32) (15.23)
2005-06 103.53 11.16 17.67 11.76 0.71 4.12 1.17 150.12
(07.69) -(08.07) (17.25) (43.41) -(16.47) (17.38) (11.43) (09.61)
2006-07 131.27 11.58 18.61 14.31 0.81 6.56 1.78 184.92
(26.79) (03.76) (05.32) (21.68) (14.08) (59.22) (52.14) (23.18)
2007-08 150.52 11.36 19.29 12.83 0.89 8.9 2.59 206.38
(14.66) -(01.90) (03.65) -(10.34) (09.88) (35.67) (45.51) (11.61)
2008-09 152.81 10.42 29.72 11.9 0.9 4.97 2.5 213.22
(01.52) -(08.27) (54.07) -(07.25) (01.12) -(44.16) -(03.47) (03.31)
2009-10 205.58 12.05 43.69 13.9 1.17 8.55 4 288.94
(34.53) (15.64) (47.01) (16.81) (30.00) (72.03) (60.00) (35.51)
2010-11 230.91 14.88 43.27 14.58 1.61 3.1 7.01 315.36 (12.32) (23.49) -(00.96) (04.89) (37.61) -(63.74) (75.25) (09.14)
2011-12 259.05 19.95 45.63 14.47 1.21 0.59 12.85 353.74
(12.19) (34.07) (05.45) -(00.75) -(24.84) -(80.97) (83.31) (12.17)
2012-13 287.82 24.20 51.81 3.39 0.93 0.61 19.17 387.92
(11.10) (21.29) (13.55) -(76.58) -(22.89) (03.39) (49.14) (09.66)
Note: (1) Figures in parentheses indicate the year-on-year percentage growth in each column. (2) ‘Others’ consists of non-major ports in all other maritime States/UTs

XXXI
The overall increase of 9.66% in cargo handled at non-major ports during 2012-13 was
mainly driven by traffic growth in Gujarat, Andhra Pradesh and Maharashtra, Though the
Cargo handled at the non major ports in Goa and Tamil Nadu have witnessed negative
growth of 76.58% and 22.89% respectively, the impact on the total traffic handled by Non-
Major Ports is not significant due to the share of these States in the total traffic handled
during the year being negligible. The share of traffic handled by non-major ports in the
maritime states is given in Table 17.
Table 17 : Share of Traffic Handled by Non-Major Ports to total traffic at non major ports – Maritime State-wise
Year Traffic Handled ( In Percentage)
Gujarat Maharashtra AP Goa Tamil Nadu
Karnataka Others Total
2003-04 73.5 8.7 8.4 7.1 0.6 1 0.7 100.0
2004-05 70.2 8.9 11 6 0.6 2.5 0.8 100.0
2005-06 69 7.4 11.8 7.8 0.5 2.7 0.8 100.0
2006-07 71 6.3 10.1 7.7 0.4 3.5 1 100.0
2007-08 72.9 5.5 9.3 6.2 0.5 4.3 1.3 100.0
2008-09 71.7 4.9 13.9 5.6 0.4 2.3 1.2 100.0
2009-10 71.2 4.2 15.1 4.8 0.4 2.9 1.4 100.0
2010-11 73.2 4.7 13.7 4.6 0.5 1 2.2 100.0
2011-12 73.2 5.6 13.0 4.1 0.3 0.2 3.6 100.0
2012-13 74.2 6.2 13.4 0.9 0.2 0.2 4.9 100.0
Note: (1) ‘Others’ consists of non-major ports in all other maritime States/UTs
15.2 Gujarat continues to be the leading maritime State, accounting for more than 74% of
the total non-major port cargo traffic in 2012-13. The other contributing States to the cargo
traffic at non-major ports during 2012-13 were: Andhra Pradesh (13.4%), Maharashtra
(6.2%) and Goa (0.9%). The remaining 5.3% of the cargo was handled by all the other
maritime States/Uts. This is brought out in the Chart 10 below:

XXXII
16. CARGO TRAFFIC HANDLED – STATE-WISE ANALYSIS
16.1 GUJARAT 16.1.1 Gujarat is a principal maritime State with a natural coastline of about 1215 kms.
(16% of India’s total coast line). The State has 41 non-major ports which are under the
jurisdiction of Gujarat Maritime Board (GMB) since April, 1982. Out of 41 non-major ports,
traffic is handled through 17 non-major ports. The remaining 24 non-major ports are used
for fishing activities and have traffic only of small volume.
16.1.2 Gujarat has the advantage of a vast hinterland covering the Northern and Central
Indian States and as a result, there is high demand for the services offered by the non-
major ports in Gujarat. The participation of the private sector has been a significant
contributing factor in the development of non-major ports in Gujarat,
16.1.3 The total cargo traffic handled at the non-major ports of Gujarat during 2012-13 was
of the order of 287.82 million tonnes as against 259.05 million tonnes in 2011-12, reflecting
an increase of 11.11%. Non-major ports of Gujarat account for more than 74% of the total
cargo handled by non-major ports in India. Overseas traffic in 2012-13 was 252.15 million
tonnes with the remaining 30.67 million tonnes being coastal traffic. The traffic handled at
important non-major ports of Gujarat during the past few years is brought out in the Table -18.

XXXIII
Table 18 : Gujarat : Traffic Achieved at Select Non-Major Ports
Year Traffic Handled (Million Tonnes) Sikka Magdalla Jafara-
bad Bedi Mul-
Dwarka GAPL Dahej Pipavav
(Inc. GPPL)
Others Total
2003-04 49.82 10.83 4.52 2.90 3.78 4.59 3.85 1.94 5.10 87.33
2004-05 51.51 11.64 4.60 3.24 3.93 6.04 6.52 2.07 6.59 96.14
2005-06 52.18 13.32 4.36 4.44 3.85 8.16 8.84 2.01 6.37 103.53
2006-07 60.25 14.27 5.50 4.16 4.08 19.72 10.09 3.66 9.54 131.27
2007-08 61.88 14.17 8.69 5.30 3.79 19.85 11.44 1.65 23.75 150.52
2008-09 65.28 14.05 4.81 2.60 3.43 35.62 11.00 3.71 12.31 152.81
2009-10 107.19 16.29 5.45 2.04 3.17 39.60 12.53 6.85 12.46 205.58
2010-11 115.41 18.52 4.46 2.12 3.85 51.91 14.31 7.82 12.51 230.91
2011-12 118.04 20.38 4.12 2.72 3.82 64.79 17.62 9.27 18.29 259.05
2012-13 124.52 22.67 3.41 6.70 3.45 76.94 22.26 8.06 19.81 287.82
16.1.4 Sikka Port handled the highest cargo tonnage of 124.52 million tonnes in 2012-13
up from 118.04 million tonnes handled in 2011-12. This port accounted for about 43% of the
total cargo handled by the non-major ports in Gujarat in 2012-13, and has witnessed
increase in the cargo traffic ever since the commissioning of Reliance Jamnagar maritime
terminal facility. More than 99% of the traffic handled at the port relates to POL & its
products.
16.1.5 Gujarat Adani Port Ltd. (GAPL) handled 76.94 million tonnes or 27% of the total
cargo in 2012-13. Main commodities handled by GAPL port are POL & its products and
Coal.
16.1.6 Magdalla accounted for 22.67 million tonnes or 8.0% of the cargo traffic in 2012-13.
Major commodities handled by the port are Iron Ore, POL & its product, and Building
Material.
16.1.7 Dahej Port handled 22.26 million tonnes of cargo in 2012-13 with a share of 8.0% in
total traffic. The other important port which showed increase in the cargo handled during
2012-13 was Bedi, Pipavav , Jafarabad and Mul Dwarka have shown decrease in cargo
traffic in 2012-13.

XXXIV
16.1.8 Commodity-wise analysis of the total cargo handled by the non-major ports in
Gujarat indicates that POL and other petroleum products continued to be the major
commodity handled. (Table 19).
Table 19 : Commodity-wise Traffic Handled at Gujarat Non-Major Ports
Year Traffic Handled (Million Tonnes)
POL & Products
Coal Building Material
Fertilizer & FRM
Iron Ore Others Total
2003-04 52.54 6.5 11.23 1.97 4.23 10.86 87.33 2004-05 56.48 9.93 11.51 2.34 4.05 11.83 96.14 2005-06 60.15 10.54 11 3.64 5.19 13.01 103.53 2006-07 71.16 11.31 11.23 4.21 5.71 27.65 131.27 2007-08 80.48 13.31 12.43 4.36 6..08 33.86 150.52 2008-09 87.38 16.46 9.59 5.09 5.9 28.39 152.81 2009-10 132.82 21.64 9.32 5.02 6.84 29.94 205.58 2010-11 140.87 29.73 8.8 6.09 7.16 38.26 230.91 2011-12 151.49 38.37 9.02 7.19 6.92 46.06 259.05 2012-13 165.14 54.34 8.41 6.42 7.64 45.89 287.82
POL & products accounted for 57.4% of the total cargo handled in 2012-13. This is followed
by Coal (18.9%), Building Material (2.9%), Iron Ore (2.7%) and Fertilizer & FRM (2.2%).
16.2 ANDHRA PRADESH
16.2.1 Andhra Pradesh is another important maritime State with a coast line of around 975
Kms. There are 12 non-major ports in Andhra Pradesh, of these, 5 ports normally handle
cargo traffic. The State has contributed 13.4% in the total traffic handled by all non-major
ports in the country during 2012-13.
16.2.2 Non-major ports in Andhra Pradesh collectively handled 51.81 million tonnes of
cargo during 2012-13 compared with 45.63 million tonnes in 2011-12 thus registering an
increase of 13.6% in traffic. The overseas traffic during 2012-13 was 46 million tonnes
(88.8% of the total cargo traffic in non major ports of Andhra Pradesh) and coastal traffic
was of the order of 5.81 million tonnes. The Table 20 gives the port wise details of the

XXXV
cargo handled at non-major ports in Andhra Pradesh during 2012-13 as well for the
previous years.
Table 20 : Traffic Achieved at Select Non-Major Ports – Andhra Pradesh
Year Traffic Handled (Million Tonnes) – Port Wise Rawa Kakinada
Anchorage Kakinada
Deep Water Port
Ganga- varam
Krishna- patnam
Total
2003-04 3.14 1.32 5.56 - - 10.02
2004-05 2.84 1.76 10.47 - - 15.07
2005-06 2.66 2.83 12.18 - - 17.67
2006-07* 2.65 3.78 12.18 - - 18.61
2007-08 2.63 4.02 12.64 - - 19.29
2008-09 2.18 2.19 14.51 2.63 8.21 29.72
2009-10 1.85 0.82 11.94 12.95 16.13 43.69
2010-11 1.56 1.15 10.81 13.84 15.91 43.27
2011-12 3.20 3.16 9.85 14.00 15.42 45.63 2012-13 1.37 3.95 12.32 13.05 21.12 51.81
* Includes others (0.34 million tonnes
16.2.3 Commodity-wise analysis of the total cargo handled by the non-major ports in
Andhra Pradesh indicates Coal (59.5%), Fertiliser & FRM (9.9%) and POL & its products
(3.4%) were the three principal items of cargo handled during ( 2012-13) by the Non-Major
Ports of Andhra Pradesh (Table 21).
Table 21 : Commodity-wise Traffic Handled at Andhra Pradesh Non-Major Ports
Year POL &
Products Iron ore Fertilizer &
FRM Coal Others Total
2003-04 6.49 0.04 1.12 0.02 2.35 10.02 2004-05 9.96 0.96 1.30 - 2.85 15.07 2005-06 8.51 3.88 1.84 0.14 3.30 17.67 2006-07 8.49 3.88 1.95 0.14 4.15 18.61 2007-08 9.21 3.59 1.98 0.05 4.46 19.29 2008-09 9.44 9.47 3.23 3.52 4.06 29.72 2009-10 3.67 15.26 4.17 15.24 5.35 43.69 2010-11 2.79 8.96 5.80 19.62 6.10 43.27 2011-12 3.51 2.97 7.04 23.51 8.60 45.63 2012-13 1.76 0.98 5.13 30.85 13.09 51.81

XXXVI
As seen from above Table 21, traffic in the Coa has mainly shown an increasing trend over
the consecutive years till 2012-13. However, due to ban on mining of iron ore in Karnataka,
the trend has reversed sharply for Iron ore in 2010-11.
16.3 MAHARASHTRA 16.3.1 Maharashtra has a coast line of around 653 Kms with 48 notified non-major ports.
Out of these only 12 ports handled cargo traffic during 2012-13.
16.3.2 The total cargo traffic handled at the non-major ports of Maharashtra during 2012-13
was 24.20 million tonnes compared with 19.95 million tonnes in 2011-12. This represents
an increase of 21.3%. Overseas traffic at 14.76 million tonnes has shown increase of 17%
from 12.62 million tonnes in 2011-12 whereas coastal traffic at 9.44 million tonnes has
increased by 28.8% from 7.33 million tonnes during the same period. The port-wise traffic
at non-major ports of Maharashtra is brought out in Table 22. Dharamtar is the leading non-
major port of Maharashtra with traffic of 9.72 million tonnes accounting for 40.2% of total
traffic at non major ports handled in the State. The other important non-major ports of
Maharashtra are Revdanda, Ulwa-Belapur and Ratnagiri.
Table 22 : Traffic Achieved at Select Non-Major Ports – Maharashtra
Year Traffic Handled (Million Tonnes) Dharamtar Revdanda Ulwa-Belapur Ratnagiri Others Total
2003-04 6.66 1.24 0.93 0.52 0.98 10.33 2004-05 7.73 1.27 1.01 0.62 1.51 12.14 2005-06 6.27 0.96 1.20 0.65 2.08 11.16 2006-07 6.80 1.02 1.28 0.66 1.82 11.58 2007-08 6.32 1.15 1.41 0.72 1.76 11.36 2008-09 5.09 1.03 1.56 0.73 2.01 10.42 2009-10 6.84 1.24 1.52 0.70 1.75 12.05 2010-11 7.08 1.67 1.62 0.96 3.55 14.88 2011-12 7.52 1.31 1.66 0.83 8.63 19.95 2012-13 9.72 1.35 1.43 0.86 10.84 24.20
16.3.3 Commodity-wise break-up of the cargo handled by the non-major ports of
Maharashtra indicates that Coal traffic of 10.4 million tonnes constituted (43%) of the total
cargo handled in 2012-13 followed by Iron ore (32.3%) and Building material (8.4%)
(Table 23)

XXXVII
Table 23 : Commodity-wise Traffic Achieved at Non-Major Ports – Maharashtra
Year Traffic Handled (Million Tonnes) Iron Ore Building
Material POL &
Products Coal Others Total
2003-04 4.57 1.33 0.19 2.91 1.33 10.33
2004-05 5.47 1.29 0.32 3.59 1.47 12.14
2005-06 4.95 1.49 0.23 2.55 1.94 11.16
2006-07 4.58 1.77 0.58 2.29 2.36 11.58
2007-08 3.74 2.25 0.40 2.00 2.97 11.36
2008-09 4.27 2.35 - 1.46 2.34 14.88
2009-10 5.06 2.20 - 2.88 1.91 12.05
2010-11 5.12 2.28 - 5.00 2.48 14.88
2011-12 6.36 2.49 - 7.59 3.51 19.95
2012-13 7.82 2.04 0.40 10.40 3.54 24.20
As seen from the above table, all commodities have shown increase in traffic in 2012-13 as
compared to 2011-12 except Building Material.
16.4 GOA 16.4.1 Goa has a coastline of around 118 Kms. There are 5 non–major ports in Goa. Of
this only one port, Panaji normally handles cargo traffic.
16.4.2 Panaji port handled cargo traffic of 3.39 million tonnes during 2012-13 compared with
14.47 million tonnes handled in the previous year, reflecting a sharp decrease of about
76.6%. The commodity composition of traffic is brought out in Table 24. Table 24 : Commodity-wise Traffic Handled at Non-Major Ports – GOA
Year Traffic Handled (Million Tonnes)
Iron Ore Coal Iron & Steel Others Total
2003-04 8.01 0.42 0.01 Neg. 8.44
2004-05 8.19 Neg. Neg. 0.01 8.20
2005-06 11.43 0.33 Neg. - 11.76
2006-07 14.03 0.28 - - 14.31
2007-08 12.74 0.09 - - 12.83
2008-09 11.90 - - - 11.90
2009-10 13.68 0.22 - - 13.90
2010-11 14.58 - - - 14.58
2011-12 14.31 0.16 - - 14.47
2012-13 3.28 0.11 - - 3.39
Iron Ore is the principal commodity handled at the port.

XXXVIII
16.5 KARNATAKA
16.5.1 Karnataka has a coastline of around 280 Kms. With 11 non-major ports. Out of
these 4 ports normally handle cargo traffic.
16.5.2 During 2012-13, non- major ports in the State handled 0.61 million tonnes of cargo
traffic as compared to 0.59 million tonnes in 2011-12 reflecting an increase of 3.4% over the
previous year. The port-wise traffic in Karnataka is given in Table 25.
Table 25 : Traffic Achieved at Select Non-Major Ports – Karnataka
Year Traffic Handled (Million Tonnes)
Karwar Old Mangalore
Malpe Belekri Others Total
2003-04 0.95 0.11 0.01 0.10 - 1.17
2004-05 2.61 0.08 0.01 0.81 - 3.51
2005-06 2.47 0.08 0.02 1.55 - 4.12
2006-07 2.38 0.09 0.01 4.08 - 6.56
2007-08 2.72 0.08 0.01 6.09 - 8.90
2008-09 2.96 0.09 0.01 1.91 - 4.97
2009-10 2.20 0.08 - 6.27 - 8.55
2010-11 1.13 0.14 - 1.83 - 3.10
2011-12 0.50 0.09 - - - 0.59
2012-13 0.44 0.16 - - 0.01 0.61
Belekri, the leading port of Karnataka which handled 1.83 million tonnes of cargo during
2010-11 did not handle any cargo during 2011-12 and 2012-13 due to ban on mining of Iron
Ore in Karnataka. The contribution of the Belekri to the total cargo handled by the non-
major ports of Karnataka was about 59% in 2010-11. Karwar the second leading port of
Karnataka which had handled 1.13 million tonnes of cargo during 2010-11( 36.4%) handled
the major portion of traffic ( 0.44 million tonnes) during 2012-13.
16.5.3 Commodity-wise breakup of the cargo traffic handled by the non-major ports of
Karnataka is given in Table 26.
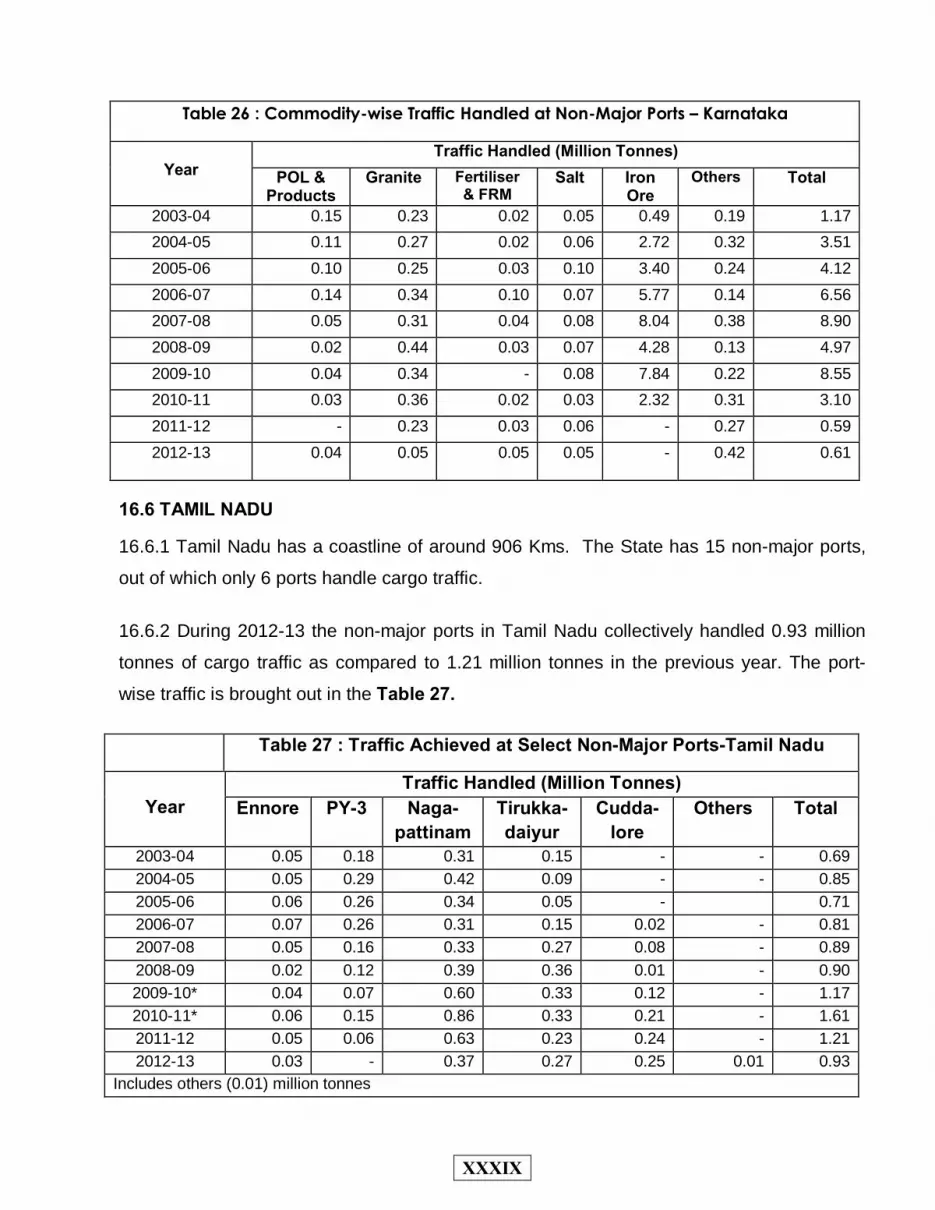
XXXIX
Table 26 : Commodity-wise Traffic Handled at Non-Major Ports – Karnataka
Year
Traffic Handled (Million Tonnes) POL &
Products Granite Fertiliser
& FRM Salt Iron
Ore Others Total
2003-04 0.15 0.23 0.02 0.05 0.49 0.19 1.17 2004-05 0.11 0.27 0.02 0.06 2.72 0.32 3.51 2005-06 0.10 0.25 0.03 0.10 3.40 0.24 4.12 2006-07 0.14 0.34 0.10 0.07 5.77 0.14 6.56 2007-08 0.05 0.31 0.04 0.08 8.04 0.38 8.90 2008-09 0.02 0.44 0.03 0.07 4.28 0.13 4.97 2009-10 0.04 0.34 - 0.08 7.84 0.22 8.55 2010-11 0.03 0.36 0.02 0.03 2.32 0.31 3.10 2011-12 - 0.23 0.03 0.06 - 0.27 0.59 2012-13 0.04 0.05 0.05 0.05 - 0.42 0.61
16.6 TAMIL NADU
16.6.1 Tamil Nadu has a coastline of around 906 Kms. The State has 15 non-major ports,
out of which only 6 ports handle cargo traffic.
16.6.2 During 2012-13 the non-major ports in Tamil Nadu collectively handled 0.93 million
tonnes of cargo traffic as compared to 1.21 million tonnes in the previous year. The port-
wise traffic is brought out in the Table 27.
Table 27 : Traffic Achieved at Select Non-Major Ports-Tamil Nadu
Year
Traffic Handled (Million Tonnes) Ennore PY-3 Naga-
pattinam Tirukka- daiyur
Cudda- lore
Others Total
2003-04 0.05 0.18 0.31 0.15 - - 0.69 2004-05 0.05 0.29 0.42 0.09 - - 0.85 2005-06 0.06 0.26 0.34 0.05 - 0.71 2006-07 0.07 0.26 0.31 0.15 0.02 - 0.81 2007-08 0.05 0.16 0.33 0.27 0.08 - 0.89 2008-09 0.02 0.12 0.39 0.36 0.01 - 0.90 2009-10* 0.04 0.07 0.60 0.33 0.12 - 1.17 2010-11* 0.06 0.15 0.86 0.33 0.21 - 1.61 2011-12 0.05 0.06 0.63 0.23 0.24 - 1.21 2012-13 0.03 - 0.37 0.27 0.25 0.01 0.93
Includes others (0.01) million tonnes

XL
Nagapattinam port handled the maximum traffic of 0.37 million tonnes during 2012-13
accounting for more than 39.8% of the total traffic handled by all the non major ports in the
State.
16.6.3 The commodity-wise breakup of traffic handled at non-major ports in Tamil Nadu
indicates that POL & products constitute the major item of cargo handled (67.7%) followed
by Fertiliser & FRM (26.9%) and Edible oil (2.2%) (Table 28).
Table 28 : Commodity-wise Traffic Handled at Non-Major Ports-Tamil Nadu
Year
Traffic Handled (Million Tonnes) POL &
Products Fertiliser &
FRM Edible Oil Others Total
2003-04 0.61 0.05 0.03 - 0.69
2004-05 0.75 0.05 0.02 0.03 0.85
2005-06 0.59 0.06 0.02 0.04 0.71
2006-07 0.67 0.07 0.03 0.04 0.81
2007-08 0.71 0.09 0.03 0.06 0.89
2008-09 0.80 0.02 0.05 0.03 0.90
2009-10 1.04 0.05 0.05 0.03 1.17 2010-11 1.50 0.06 0.04 0.01 1.61
2011-12 1.11 0.05 0.03 0.02 1.21
2012-13 0.63 0.25 0.02 0.03 0.93

SECTION – II
1. VITAL PORT
STATISTICS

1
Number of Major and Non-Major Ports in the Maritime States (As on 31.3.2013)
Number of Number of Non- Total Number
Major Ports Major Ports(a) of Ports
1 2 3 4
WEST COAST
Gujarat 1 41 42
Maharashtra 2 48 50
Goa 1 5 6
Daman & Diu - 2 2
Karnataka 1 11 12
Kerala 1 17 18
Lakshadweep Islands - 10 10
EAST COAST
Tamil Nadu 3 15 18
Pondicherry - 2 2
Andhra Pradesh 1 12 13
Orissa 1 13 14
West Bengal 1 1 2
Andaman & Nicobar Islands - 23 23
TOTAL 12 200 212
Note : (a)This includes working, non working and captive Ports.
For details see Table 1.2.
Source : M/O Shipping
State / U.T.
Table 1.1
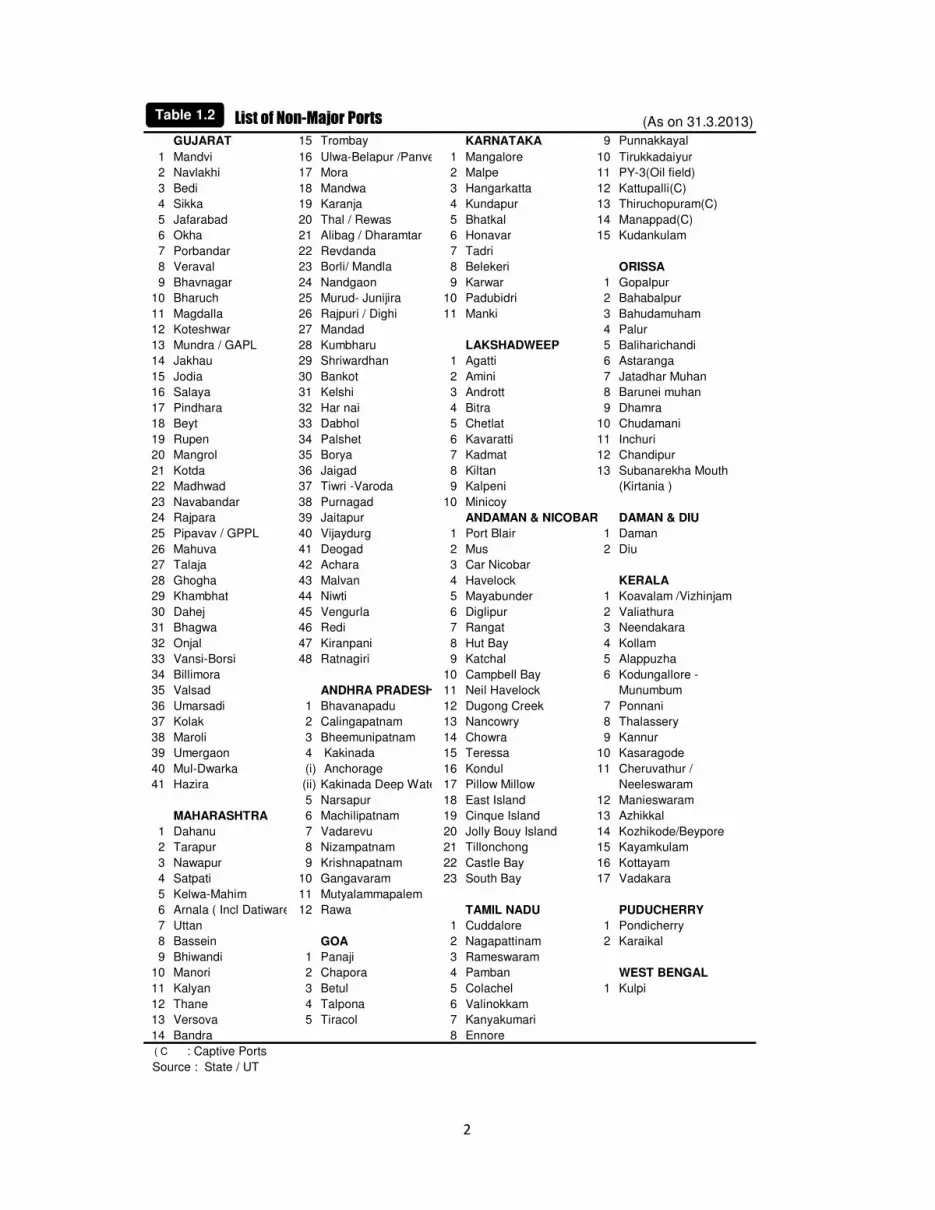
2
List of Non-Major Ports (As on 31.3.2013)
GUJARAT 15 Trombay KARNATAKA 9 Punnakkayal
1 Mandvi 16 Ulwa-Belapur /Panvel 1 Mangalore 10 Tirukkadaiyur
2 Navlakhi 17 Mora 2 Malpe 11 PY-3(Oil field)
3 Bedi 18 Mandwa 3 Hangarkatta 12 Kattupalli(C)
4 Sikka 19 Karanja 4 Kundapur 13 Thiruchopuram(C)
5 Jafarabad 20 Thal / Rewas 5 Bhatkal 14 Manappad(C)
6 Okha 21 Alibag / Dharamtar 6 Honavar 15 Kudankulam
7 Porbandar 22 Revdanda 7 Tadri
8 Veraval 23 Borli/ Mandla 8 Belekeri ORISSA
9 Bhavnagar 24 Nandgaon 9 Karwar 1 Gopalpur
10 Bharuch 25 Murud- Junijira 10 Padubidri 2 Bahabalpur
11 Magdalla 26 Rajpuri / Dighi 11 Manki 3 Bahudamuham
12 Koteshwar 27 Mandad 4 Palur
13 Mundra / GAPL 28 Kumbharu LAKSHADWEEP 5 Baliharichandi
14 Jakhau 29 Shriwardhan 1 Agatti 6 Astaranga
15 Jodia 30 Bankot 2 Amini 7 Jatadhar Muhan
16 Salaya 31 Kelshi 3 Andrott 8 Barunei muhan
17 Pindhara 32 Har nai 4 Bitra 9 Dhamra
18 Beyt 33 Dabhol 5 Chetlat 10 Chudamani
19 Rupen 34 Palshet 6 Kavaratti 11 Inchuri
20 Mangrol 35 Borya 7 Kadmat 12 Chandipur
21 Kotda 36 Jaigad 8 Kiltan 13 Subanarekha Mouth
22 Madhwad 37 Tiwri -Varoda 9 Kalpeni (Kirtania )
23 Navabandar 38 Purnagad 10 Minicoy
24 Rajpara 39 Jaitapur ANDAMAN & NICOBAR DAMAN & DIU
25 Pipavav / GPPL 40 Vijaydurg 1 Port Blair 1 Daman
26 Mahuva 41 Deogad 2 Mus 2 Diu
27 Talaja 42 Achara 3 Car Nicobar
28 Ghogha 43 Malvan 4 Havelock KERALA
29 Khambhat 44 Niwti 5 Mayabunder 1 Koavalam /Vizhinjam
30 Dahej 45 Vengurla 6 Diglipur 2 Valiathura
31 Bhagwa 46 Redi 7 Rangat 3 Neendakara
32 Onjal 47 Kiranpani 8 Hut Bay 4 Kollam
33 Vansi-Borsi 48 Ratnagiri 9 Katchal 5 Alappuzha
34 Billimora 10 Campbell Bay 6 Kodungallore -
35 Valsad ANDHRA PRADESH 11 Neil Havelock Munumbum
36 Umarsadi 1 Bhavanapadu 12 Dugong Creek 7 Ponnani
37 Kolak 2 Calingapatnam 13 Nancowry 8 Thalassery
38 Maroli 3 Bheemunipatnam 14 Chowra 9 Kannur
39 Umergaon 4 Kakinada 15 Teressa 10 Kasaragode
40 Mul-Dwarka (i) Anchorage 16 Kondul 11 Cheruvathur /
41 Hazira (ii) Kakinada Deep Water 17 Pillow Millow Neeleswaram
5 Narsapur 18 East Island 12 Manieswaram
MAHARASHTRA 6 Machilipatnam 19 Cinque Island 13 Azhikkal
1 Dahanu 7 Vadarevu 20 Jolly Bouy Island 14 Kozhikode/Beypore
2 Tarapur 8 Nizampatnam 21 Tillonchong 15 Kayamkulam
3 Nawapur 9 Krishnapatnam 22 Castle Bay 16 Kottayam
4 Satpati 10 Gangavaram 23 South Bay 17 Vadakara
5 Kelwa-Mahim 11 Mutyalammapalem
6 Arnala ( Incl Datiware) 12 Rawa TAMIL NADU PUDUCHERRY
7 Uttan 1 Cuddalore 1 Pondicherry
8 Bassein GOA 2 Nagapattinam 2 Karaikal
9 Bhiwandi 1 Panaji 3 Rameswaram
10 Manori 2 Chapora 4 Pamban WEST BENGAL
11 Kalyan 3 Betul 5 Colachel 1 Kulpi
12 Thane 4 Talpona 6 Valinokkam
13 Versova 5 Tiracol 7 Kanyakumari
14 Bandra 8 Ennore
( C ) : Captive Ports
Source : State / UT
Table 1.2

3
(As on 31.3.2013)
Distance of Minimum Minimum Diameter
Port Latitude Longitude anchor from Depth Width No. (In Mtrs.)
Harbour (In Mtrs.) (In Mtrs.)
entrance(In Km)
1 2 3 4 5 6 7 8 9
Kandla 230 01' N 700 13' E 25.0 7.0 180-200 - - Tidal Creek Port
Vadinar - - 8.0 23.5 1500 - - Single Buoy Mooring
(OOT) (Off -Shore Oil terminal)
Mumbai 180 54' N 720 49' E 9.6 10.9 366 1 366 Natural Harbour with
Impounded Wet docks.
J.L.Nehru 180 56' 43"N(a) 720 56' 24" E 10.0(#) 11.0 350 All Weather Tidal Port
Mormugao 150 25' N 730 48' E 4.6 14.4 250 2 480
New Mangalore 120 55' N 740 48' E 7.5 15.4 245 1 570 Artificial Lagoon port
Cochin 90 58' N 760 14' E 13.0 15.95 175 1 670 Dry Dock Natural Port
V.O. 80 45' N 780 13' E 4.0 10.4 162 1 488 Artificial Harbour
Chidambaranar
Chennai 130 06' N 800 18' E 6.7 IH 18.6 244 1 548 Artificial Harbour with
OH 19.2 Wet Docks.
Ennore 130 15' 30"N 800 21' E 3.775 16.0 250 1 600 Artificial Harbour
Visakhapatnam 170 41' N 830 17' E
Inner Harbour@ 2.0** 10.7 97.5 1 366 Natural Harbour
Outer Harbour@ 3.1** 20.0 200 1 610 Artificial Harbour
Paradip 200 15'-58".63N 860 40'-27".34E 2.2 17.1 240 1 520 Wet Dock
Kolkata Dock 220 33' N 880 18' E 232 2.8$ 45 2 KPD-190 Riverine with impounded
System NSD-228 Docks & River side Jetty.
Haldia Dock 220 02'N 880 06' E 115 6.7 467 1 549 --do --
Complex
(a) At GTI Berth South-West Corner ** Including both turning circles(#) Nautical Miles $ Draft variable Min-5.1, Max-8.5
@:IH= Inner Harbour upto Dolphins Nose Light House(incl. IHTB) OH: Outer Harbour beyond Dolphins Nose Light House(incl.OHTB)
Source : Major Ports/IPA Page No.2
Protected Open Natural
Harbour
All ships Turning off
berths
Topography of Major Ports
Type of Dock / Port
Location Entrance Channel Turning Circle
Table 1.3

4
Berths Available at Major Ports (As on 31.3.2013)
Port/ Draft Quay
Type of Berth (No.) (In Mtrs.) Length
(In Mtrs.) 2011-12 2012-13
1 2 3 4 5 6
KANDLA
I) Cargo Jetty
CJ-I - Multipurpose 9.8 182.87 45,000 92 93
CJ-II - Multipurpose 9.8 182.87 45,000 92 94
CJ-III - Multipurpose 9.8 182.87 45,000 91 95
J-IV - Multipurpose 9.8 182.87 45,000 88 93
CJ-V - Multipurpose 9.1 205.73 35,000 89 94
CJ-VI - Multipurpose 9.1 205.73 35,000 93 0
CJ-VII - Multipurpose 12.0 238.64 55,000 92 93
CJ-VIII - Multipurpose 12.0 213.04 55,000 94 81
CJ-IX - Multipurpose 12.0 182.87 55,000 91 89
CJ-X - Multipurpose 12.0 205.72 55,000 92 91
CJ-XI - Multipurpose & Container 12.5 281.00 65,000 52 48
CJ-XII - Multipurpose & Container 12.5 264.00 65,000 54 85
CJ- XIII- Multipurpose & Container 12.5 300.00 75,000 13
II) Oil Jetty
OJ-I - POL Products,Veg.Oil & other Liquids 10.4 213.4 40,000 78 83
OJ-II - POL Products, Veg.Oil & other Liquids 10.0 183.0 52,000 79 84
OJ-III - POL Products, Veg. Oil & other Liquids 10.7 213.4 40,000 81 81
OJ-IV - POL Products, Veg. Oil & other Liquids 10.7 216.0 56,000 80 81
OJ-V - Phos. Acid & Ammonia 10.7 216.0 45,000 66 65
OJ-VI - POL Products 10.1 216.0 45,000 20 20
III) At Vadinar
SBM-I - POL Crude 30.0 … 3,00,000 35 28
SBM-II - POL Crude 30.0 … 3,00,000 27 31
SBM-III - POL Crude 30.0 … 3,00,000 32 48
Product Jetty -I POL (Products) 14.0 … 1,00,000 48 73
Product Jetty -II POL (Products) 14.0 1,00,000 50 74
MUMBAI@
Indira Docks
1. Container 8.84 to 9.14 168 … 58 47
2. Container 8.84 to 9.14 175 … 60 50
3. Container 8.84 to 9.14 175 … 60 41
4. Container 8.84 to 9.14 175 … 40 54
9. Container 8.84 to 9.14 175 … 42 55
J/E Heavy lifts 8.84 to 9.14 160 … 40 22
10. Multipurpose 8.84 to 9.14 175 … 46 46
11. Multipurpose 8.84 to 9.14 175 … 42 32
12. Multipurpose 8.84 to 9.14 175 … 51 44
12 A. Multipurpose 8.84 to 9.14 175 … 51 35
12 B. Multipurpose 8.84 to 9.14 175 … 52 41
13 Multipurpose 8.84 to 9.14 175 … 35 32
13 A. Multipurpose 8.84 to 9.14 175 … 64 54
Maximum size of ships
that can be
accommodated (DWT)
Percentage
Occupancy during
Annual cargo handling capacity excluding 0.80 MMTs Transhipment capacity at vadinar and 1.50 MMTs at bunder area and 1.20 MMTs at TUNA.
Table 1.4

5
Berths Available at Major Ports Draft Quay
Type of Berth (No.) (In Mtrs.) Length
(In Mtrs.) 2011-12 2012-13
1 2 3 4 5 6
13 B.Cargo and Bulk Cargo 8.84 to 9.14 175 … 66 67
14. Fertilizers & Food Grains 8.84 to 9.14 175 … 23 50
15. Fertilizers & Food Grains 8.84 to 9.14 175 … 59 43
16. Multipurpose 8.84 to 9.14 175 … 40 54
18. Multipurpose 7.0 CD 186 … 58 63
19/20. Multipurpose 7.0 CD 160 … 63 76
21. Multipurpose 7.0 CD 160 … 60 84
22/23. Multipurpose 7.0 CD 160 … 38 65
Ballard Station
Pier- Container 10.0 CD 183 … 38 51
Ballard Extn.
Pier- Paassenger cum Cargo 10.0 CD 221 … 76 82
Victoria Dock *
1. Multipurpose Berth 6.7 140 …
2. Multipurpose Berth 6.7 140 …
3. Multipurpose Berth 6.7 140 … * *
4. Multipurpose Berth 6.0 140 … * *
5. Multipurpose Berth 6.7 140 … * *
6. Multipurpose Berth 6.7 140 … * *
7. Multipurpose Berth 6.7 140 … * *
8. Multipurpose Berth 6.7 140 … * *
9. Multipurpose Berth 6.7 140 … * *
10/11.Multipurpose Berth 6.7 140 … * *
12.Multipurpose Berth 6.7 140 … * *
14.Multipurpose Berth 6.7 140 … * *
Prince's Dock *
A. Multipurpose Berth 6.1 to 6.4 152 … ** **
B. Multipurpose Berth 6.1 to 6.4 152 … ** **
C. Multipurpose Berth 6.1 to 6.4 152 … ** **
D. Multipurpose Berth 6.1 to 6.4 152 … ** **
F. Multipurpose Berth 6.1 to 6.4 152 … ** **
G. Multipurpose Berth 6.1 to 6.4 152 … ** **
N/O. Multipurpose Berth 6.1 to 6.4 152 … ** **
P/Q. Multipurpose Berth 6.1 to 6.4 152 … ** **
Jawahar Dweep
1.JD - POL 11.58 226 70,000 65 57
2 JD - POL 10.97 226 48,000 46 47
3.JD - POL 11.58 226 70,000 60 57
4 JD - POL 14.30 300 1,25,000 67 71
Old Pir Pau Jetty - POL/Chem 7.50 171 35,000 40 51
New Pir Pau Jetty- POL/Chem 12.00 197 47,000 81 84
berthing small craffts.
Percentage
Occupancy during
Maximum size of
ships that can be
accommodated
(DWT)
Availability is less than 365 days at some berths due to deccommissioning of births for dredging, maintenance, repairs etc.Berth no. 5,6,7 and8
(As on 31.3.2013)
Indira Dock used as holding berths for Mb.P.T. crafts/supply vessels.17 ID was not used from October,2010 on wards due to beam restriction,
Table 1.4 Contd...
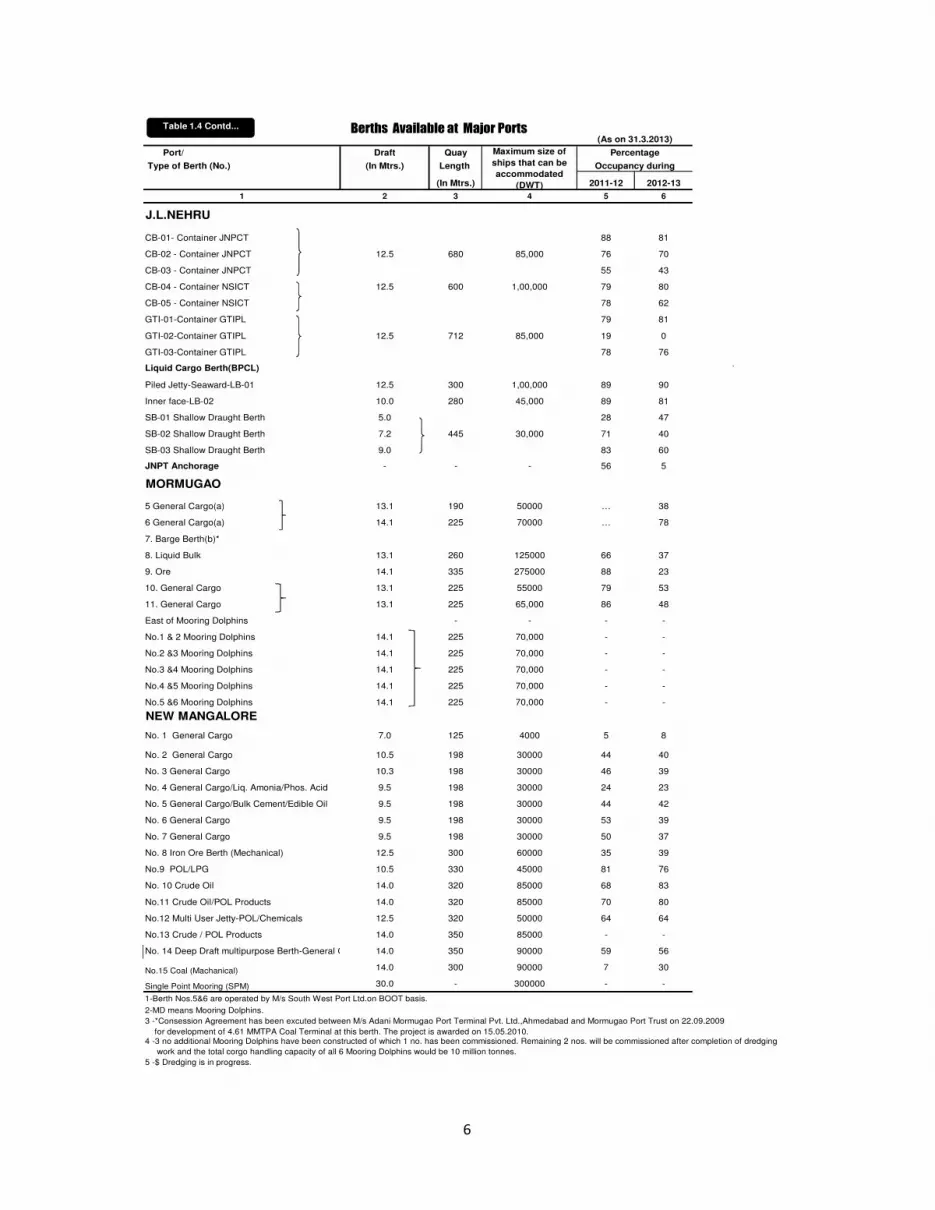
6
Port/ Draft Quay
Type of Berth (No.) (In Mtrs.) Length
(In Mtrs.) 2011-12 2012-13
1 2 3 4 5 6
J.L.NEHRU
CB-01- Container JNPCT 88 81
CB-02 - Container JNPCT 12.5 680 85,000 76 70
CB-03 - Container JNPCT 55 43
CB-04 - Container NSICT 12.5 600 1,00,000 79 80
CB-05 - Container NSICT 78 62
GTI-01-Container GTIPL 79 81
GTI-02-Container GTIPL 12.5 712 85,000 19 0
GTI-03-Container GTIPL 78 76
Liquid Cargo Berth(BPCL) `
Piled Jetty-Seaward-LB-01 12.5 300 1,00,000 89 90
Inner face-LB-02 10.0 280 45,000 89 81
SB-01 Shallow Draught Berth 5.0 28 47
SB-02 Shallow Draught Berth 7.2 445 30,000 71 40
SB-03 Shallow Draught Berth 9.0 83 60
JNPT Anchorage - - - 56 5
MORMUGAO
5 General Cargo(a) 13.1 190 50000 … 38
6 General Cargo(a) 14.1 225 70000 … 78
7. Barge Berth(b)*
8. Liquid Bulk 13.1 260 125000 66 37
9. Ore 14.1 335 275000 88 23
10. General Cargo 13.1 225 55000 79 53
11. General Cargo 13.1 225 65,000 86 48
East of Mooring Dolphins - - - -
No.1 & 2 Mooring Dolphins 14.1 225 70,000 - -
No.2 &3 Mooring Dolphins 14.1 225 70,000 - -
No.3 &4 Mooring Dolphins 14.1 225 70,000 - -
No.4 &5 Mooring Dolphins 14.1 225 70,000 - -
No.5 &6 Mooring Dolphins 14.1 225 70,000 - -
NEW MANGALORE
No. 1 General Cargo 7.0 125 4000 5 8
No. 2 General Cargo 10.5 198 30000 44 40
No. 3 General Cargo 10.3 198 30000 46 39
No. 4 General Cargo/Liq. Amonia/Phos. Acid 9.5 198 30000 24 23
No. 5 General Cargo/Bulk Cement/Edible Oil 9.5 198 30000 44 42
No. 6 General Cargo 9.5 198 30000 53 39
No. 7 General Cargo 9.5 198 30000 50 37
No. 8 Iron Ore Berth (Mechanical) 12.5 300 60000 35 39
No.9 POL/LPG 10.5 330 45000 81 76
No. 10 Crude Oil 14.0 320 85000 68 83
No.11 Crude Oil/POL Products 14.0 320 85000 70 80
No.12 Multi User Jetty-POL/Chemicals 12.5 320 50000 64 64
No.13 Crude / POL Products 14.0 350 85000 - -
No. 14 Deep Draft multipurpose Berth-General Cargo 14.0 350 90000 59 56
No.15 Coal (Machanical) 14.0 300 90000 7 30
Single Point Mooring (SPM) 30.0 - 300000 - -
1-Berth Nos.5&6 are operated by M/s South West Port Ltd.on BOOT basis.
2-MD means Mooring Dolphins.
3 -*Consession Agreement has been excuted between M/s Adani Mormugao Port Terminal Pvt. Ltd.,Ahmedabad and Mormugao Port Trust on 22.09.2009
for development of 4.61 MMTPA Coal Terminal at this berth. The project is awarded on 15.05.2010.4 -3 no additional Mooring Dolphins have been constructed of which 1 no. has been commissioned. Remaining 2 nos. will be commissioned after completion of dredging
work and the total corgo handling capacity of all 6 Mooring Dolphins would be 10 million tonnes.
5 -$ Dredging is in progress.
Percentage
Occupancy during
Maximum size of
ships that can be
accommodated
(DWT)
Berths Available at Major Ports (As on 31.3.2013)
Table 1.4 Contd...

7
Berths Available at Major Ports Port/ Draft Quay
Type of Berth (No.) (In Mtrs.) Length
(In Mtrs.) 2011-12 2012-13
1 2 3 4 5 6
COCHIN
Q1 - General Cargo 9.1 16000 100 36
Q2 - General Cargo 9.1 16000 28 100
Q3 - General Cargo 9.1 16000 100 100
Q4 - General Cargo/Liquid Bulk 9.1 16000 100 100
Q5 - General Cargo/Finished Fertiliser/CBFS 10.5 20000 98 100
Q6 - General Cargo/Container/CBFS 10.5 20000 42 84
Q7 - General Cargo 10.5 20000 20 100
Q8 - General Cargo 12.5 60000 55 65
Q9 - General Cargo 12.5 60000 82 100
Q10 - Fert. Raw Materials/Phos.Acid 10.7 278 60000 74 100
BTP - Passenger & Cargo/Liquid Bulk 10.2 35000 75 100
NCB - General Cargo/Liquid Amonia 9.1 35000 100 20
SCB - General Cargo/Liquid Amonia 9.1 192 12000 91 64
COT - POL /Crude 12.5 430 115000 78 62
NTB - POL Products 9.1 298 30000 46 49
STB - POL Products 9.1 266 18000 24 21
SPM - Crude Oil 22.5 370 300000 49 43
V1* Container - -
V2* Container 14.5 600 45000 42 70
V3* Container 14.5 45000 76 53
TUTICORIN
Alongside Berths
Berth No.1 - General Cargo 9.3 184 61755 92 85
Berth No.2 - General Cargo 9.3 191 57809 91 83
Berth No.3 - Bulk Cargo 10.7 230 71488 95 88
Berth No.4 - Bulk & Ph.Acid 10.7 230 71488 93 82
Berth No. 5 - Passenger & GC 8.6 201 55473 86 87
Berth No. 6 - General Cargo 9.3 201 58849 96 88
Berth No.7$ - Container 10.9 231 43401 94 92
Berth No.8 - General Cargo 12.8 190 58722 93 87
Berth No.9 - General Cargo 12.8 229 79224 89 90
Shallow Drought Berth
Berth No.1 - General Cargo 5.9 112 6266 40 25
Berth No.2 - Coast Guard 77 2800 - -
Oil Jetty
NCB I 82
Oil Jetty- POL, Ammonia 12.8 227 64220 57 39
Coal Jetties
Coal Jetty No.1 -Thermal Coal 12.8 196 58930 90 84
Coal Jetty No.2- Thermal Coal 12.8 224 73879 84 87
CHENNAI
Dr. Ambedkar Dock
1. North Quay - Passenger/ G.C./LB 8.5 198 … 64 55
2. West Quay I - G.C./Other Liquid Cargo 11.0 171 … 58 45
3. West Quay 2 - General Cargo/RO-RO/LB 12.0 171 … 54 44
4. Centre Quay - General Cargo/Food Grains 12.0 171 … 62 52
5. West Quay 3 - General Cargo/Food Grains 12.0 171 … 75 74
* Operated by Dubai Port World
$ Operated by M/s PSA SICAL Terminals Ltd.
… Maximum size of the ship that can be accommodated depends on length/Draft of berths and is not maintained in terms of DWT.
(As on 31.3.2013)
410
Maximum size of ships
that can be
accommodated (DWT)
Percentage
Occupancy during
670
503
414
Table 1.4 Contd...

8
Berths Available at Major Ports Port/ Draft Quay
Type of Berth (No.) (In Mtrs.) Length
(In Mtrs.) 2011-12 2012-13
1 2 3 4 5 6
6. West Quay 4 - Fert./General Cargo/Passenger 11.0 171 … 69 59
7. South Quay 1 - Fert./General Cargo/Dry Bulk 9.5 246 … 74 66
8. South Quay 2 - Fert./General Cargo/Dry Bulk/LB 9.5 179 … 75 62
Jawahar Docks
11. J.D.1 - Fertilizer/Dry Bulk 11.5 218 … 74 64
12 J.D.2 - Under BRS/Ferlizer/Dry Bulk 11.5 218 … 75 64
13. J.D.3 - Fertilizer/Dry Bulk 11.5 218 … 75 70
14. J.D.4 - Other Ores/Coal 11.0 218 … 47 58
15. J.D.5 -Fertilizer/Dry Bulk 11.5 218 … 61 51
16. J.D.6 - Other Ores/Coal 11.0 218 … 52 87
Bharathi Docks
17. B.D.1 - POL 14.6 356 … 82 82
18. B.D.2 - Iron Ore/Liquid 16.5 382 … 60 64
19. B.D.3 - POL 16.5 308 … 81 81
Container Terminal
20. CT-1 - Containers 13.4 200 … 19 10
21. CT-2 - Containers 13.4 200 … 56 37
22. CT-3 - Containers 13.4 200 … 70 53
23. CT-4 - Containers 13.4 285 … 73 57
24. SCB-I - Containers 12.0 287 …. 51 53
25. SCB-II - Containers 12.0 270 …. 48 53
26.SCB-III-Containers 12.0 275 …. 47 36
ENNORE
Coal Berth - 1 13.5 280(a) 77000 66 74
Coal Berth - 2 13.5 280(a) 77000 10 25
Marine Liquid Terminal-1-POL/Chemicals 13.5 360 150000 21 38
CICT- Coal 13.5 325 150000 38 49
GCB* Automobiles/Project Cargo 10.0 278 70000 27 15
VISAKHAPATNAM
Inner Harbour
Multipurpose Berths
East Quay - I@ 10.1 168 … 86 73
East Quay - 2@ 10.1 168 … 82 55
East Quay - 3 10.1 168 … 85 76
East Quay - 4 10.1 231 … 90 85
East Quay - 5 11.0 168 … 90 82
East Quay - 6@ 11.0 183 … 65 74
East Quay - 7 11.0 255 … 91 87
East Quay - 8 11.0 255 … 55 58
East Quay - 9 11.0 255 … 63 67
West Quay - 1 11.0 212 … 81 79
West Quay - 2 11.0 227 … 77 78
West Quay - 3 11.0 201 … 87 80
West Quay - 4 11.0 243 … 86 78
West Quay - 5 11.0 242 … 78 74
RE WQ-I -POL and small Jatties 8.0 170 46 39
Captive Berths
Oil Refinery Berth - 1-POL 10.1 183 … 73 66
@EQ1 berth was de-commissioned w.e.f. 17.6.2012.@WQ-2 berth was commissioned 24.6.2012
@ EQ-6 berth was de-commissioned w.e.f. 15.2.2013
GCB Berth was de-commissioned w.e.f. August, 2011
(As on 31.3.2013)
Maximum size of ships
that can be
accommodated (DWT)
Occupancy during
Percentage
Table 1.4Table 1.4 Contd...

9
Port/ Draft Quay
Type of Berth (No.) (In Mtrs.) Length
(In Mtrs.) 2011-12 2012-13
1 2 3 4 5 6
Oil Refinery Berth - 2-POL 9.8 183 … 72 65
Fertiliser Berth-Fert./Raw Material/Liquid Ammonia 10.1 173 … 46 28
Outer Harbour
1. GCB - General cum Bulk Cargo@-Multipurpose 14.5 356 … 83 -
Captive Berths
OB -1&OB-2 Iron Ore/Coking Coal/Steam coal 16.5 270 … 90 94
OSTT - Crude Oil 17.0 408 … 35 26
LPG -POL/LPG 14.0 371 … 69 74
VCT- Containers 14.5 451 75 71
PARADIP
Iron Ore Berth-Iron Ore 13.0 260 70,000 61 52
East Quay - I -General 11.0 260 60000 79 72
East Quay - II-General 11.5 260 60000 86 78
East Quay - III-General 12.0 260 70000 90 86
South Quay-General 12.5 260 60000 82 77
Central Quay - I-General 14.5 230 95000 86 88
Central Quay - II-General 12.8 230 95000 88 84
Central Quay - III-General 12.5 230 95000 73 68
Fertiliser Berth - I 12.5 252 65000 50 44
Fertiliser Berth - II 12.5 252 65000 77 63
Multipurpose Berth-General 12.5 190 60000 86 85
Coal Berth - I 14.0 260 80000 37 58
Coal Berth - II 14.0 260 80000 51 62
Oil Jetty 13.5 260 80000 39 43
SPM - Crude Oil 21.0 370 330000 34 37
RO-RO Jetty- P. Cargo 5.0 90 10000 - -
KOLKATA DOCK SYSTEM
Kidderpore Dock (KPD)
1 KPD- General 7.8 133 78 63
3 KPD -General 8.4 128 73 66
4 KPD-General 8.7 136 98 85
5/7 KPD- General 8.6 229 -do- 73 79
6 KPD-General 9.0 118 -do- 80 31
8 KPD- General 9.2 128 -do- 92 98
9 KPD- General 9.0 108 -do- 26 98
10 KPD- General 8.9 161 -do- 78 85
11 KPD (Passenger & Coastal) 8.7 151 -do- 83 52
12 KPD( Passenger & Coastal) 8.9 143 -do- 98 96
22 KPD-General 8.6 151 -do- 100 77
23 KPD-General 8.8 147 -do- 100 100
24 KPD-General 9.1 152 -do- 28 43
25 KPD-General 8.8 169 -do- 60 92
26 KPD-General 8.4 185 -do- 97 78
27 KPD-General 7.7 195 -do- 64 96
28 KPD-General 8.5 195 -do- 45 60
29 KPD-General 7.4 185 -do- 59 35
@GCB berth was de-commissioned w.e.f. August, 2011.
Berths Available at Major Ports
$ KPD berth drafts governed by Turning Basin Draft which is 8.5 mtr. At present. Normally KDS dock draftare governed by river drafts available.
# In additional, capacity of 2KPD (holding berth) is 0.099 mt, that of 19 KPD (Coal Berth) is 0.149 mt.and capacity available at Anchorage is 4.576 mt (approx)
Maximum size of ships
that can be
accommodated (DWT)Occupancy during
Percentage
Around 25000 depending
on parcel load#
+ Vessels with higher DWT/ Parcel load are handed at Anchorage.
* Pol Crude Tanker of much higher DWT can be handled at anchorages
(As on 31.3.2013)Table 1.4 Contd...

10
Berths Available at Major Ports Port/ Draft Quay
Type of Berth (No.) (In Mtrs.) Length
(In Mtrs.) 2011-12 2012-13
1 2 3 4 5 6
Netaji Subhash Dock (NSD)
1 NSD-General/Heavy Cargo 7.1 200 -do- 60 48
2 NSD-General Cargo 7.8. 187 -do- 40 55
3 NSD-General Cargo 9.0 183 -do- 48 59
4 NSD-Container 8.6 181 Around 21000 80 72
5 NSD-Container 8.2 182 -do- 63 62
7 NSD-Container 8.5 192 -do- 61 58
8 NSD-Container 8.0 225 78 79
12 NSD-Liquid Cargo 8.1 152 25 36
13 NSD-General Cargo 8.2 174 46 47
14 NSD-General Cargo 7.4 174 -do- 67 60
Buj Buj Jetties
1 BB-Liquid Cargo 11.5 189 Around 38000* 95 68
2 BB-Liquid Cargo 11.5 116 -do- 13 22
3 BB-Liquid Cargo 11.5 163 -do- 21 21
5 BB-Liquid Cargo 10.5 189 -do- 43 39
7 BB-Liquid Cargo 8.5 137 -do- 43 44
8 BB-Liquid Cargo 8.5 189 -do- 25 34
HALDIA DOCK COMPLEX
HOJ-I - POL, Amonia & Chemical 12.2 236 90000 79 79
HOJ-II - POL 12.2 277 150000 72 71
HOJ-III- POL Crude 12.5 275 150000 32 17
Berth No.2 - Multipurpose Berth handling Dry Bulk 12.2 238 75000 70 46
Berth No. -3- Multipurpose Berth handling POL, Iron Ore &
other bulk 12.2 239 75000 61 66
Berth No.- 4 -Thermal Coal (Mechanised) 12.2 239 90000 64 65
Berth No.- 4 A- Coking Coal (Mechanised) 12.2 230 75000 62 62
Berth No. - 4 B - Multipurpose-Dry Bulk & Break Bulk 12.2 180 75000 83 86
Berth No. 5 - Coking Coal & FRM (Dry)-Mechanised 12.2 183 75000 94 95
Berth No. 6 - Multipurpose-Dry Bulk, Break Bulk & Liquid Bulk 12.2 212 75000 82 79
Berth No. 7 - Multipurpose-Dry Bulk, Break Bulk & Liquid Bulk 12.2 212 75000 71 77
Berth No. 8 - Multipurpose-Dry Bulk, Break Bulk & Liquid Bulk 12.2 **220 75000 62 38
Berth No. 9 - Multiporpose-Dry Bulk, Break Bulk & Container 12.2 **210 75000 87 96
Berth No. 10 - Multipurpose-Dry Bulk, Break Bulk & Container 12.2 **210 75000 64 61
Berth No. 11 - Multipurpose-Dry Bulk, Break Bulk & Container 12.2 **210 75000 75 71
Berth No. 12 - Multiporpose-Dry Bulk & Break Bulk 12.2 **210 75000 66 71
Berth No. 13 - Multiporpose-Dry Bulk & Break Bulk 12.2 **210 75000 79 75
* POL Crude Tankers of much higher DWT can be handled at anchorages.
Note(1) vessels with maximume beam of 33 metres can enter the impounded dock system.There is no beam restruction of vessels at Oil Jetties
(2) There are two barge handling jetty for handling POL Products with a capacity of 0.50 million tonnes
** Multiple vessels within a total LOA of 1270 metres can be simultaneously accommodated from Berth No.8 to13
Source: Major Ports `
Maximum size of ships
that can be
accommodated (DWT)
Percentage
Occupancy during
Around 25000
depending on parcel
load
(As on31-03-2013)Table 1.4 Contd...

11
(As on 31.3.2013)
Port/Type Dry Storage Accomodation Liquid Storage Tanks
No.Area(Sq.mts)/
Capacity No. Location Capacity Type of Cargo
1 2 3 4 5 6 7
1. KANDLA
(a) Dry Cargo Storage accommodation
Covered area
i) Transit Sheds - Agencies 2188877 KLS
ii) Ware-Houses/Godowns 28 139279
iii) CFS Sheds 2 6480
iv) Bulk Storage for Fertilizers
i) Bulk Storage 1 7080
ii) Bagging plant 1 5510
v)Other Godowns in side dock area 1 2970
Open Area**
Kutcha Plots 74377
Pucca Plots 1282128
2. MUMBAI
(a) Covered area
i) Transit Sheds 19 89665 2 Jawahar Deep 5316 KLS Slop/dirty ballast
ii) Ware-Houses 27 155938 8 Jawahar Deep 182864KLS HSD/SKO/FO
iii) Container Freight Station 19 57227 4 Victoria Docks 29000 KLS Molasses/Vegitable Oil
(b) Open Area
i) Inside Docks 38 208685 3 Mallet Bunder 36000 T Vegitable Oil
6 Carnac Bunder 11500 T Vegitable Oil
ii) Outside Docks 17 220501 69 Hay Bunder 476000 T Vegitable Oil
(c) Container Yards
i) Inside Docks 3 622 Slots 2 Pir Pau 20000 T LPG
28 Pir Pau 90000 KL Chemicals
ii) Outside Docks 5 5579 17 Pir Pau 35000 KL Chemicals/Lub. Oil
3 62987
3. MORMUGAO
(a) Covered area
11 Port Area 22600 KL Molasses, Caustic
i) Transit Sheds/Overflow sheds. 1 8250 Soda, F. Oil, etc.
ii) Ware-Houses 6 18832 2 Port Area 8000 T Ammonia
iii)Ware-Houses- CWC & FCI 4 14480 31 Vasco City 204313 KL POL Products
(b) Open Area 3 Vasco City 12500 KL Phosphoric Acid
i) Container - 16000 4 Port Area 26000 T Liquid Products
ii) Others - 309389
** Open area excludes 27000 Sq.Mtrs of area at Tuna, Under Port
Storage Facilities Available at Major Ports Table 1.5

12
(As on 31.3.2013)
Dry Storage Accomodation Liquid Storage Tanks
No.
Area(Sq.mts)/
Capacity No. Location Capacity Type of Cargo
1 2 3 4 5 6 7
4. NEW MANGALORE
i) Transit/Overflow Sheds 4 16480 55 Wharf Area 230645 (KL) Chemicals/POL/Molasses
ii) Covered Ware-Houses 9 19984 /Edible Oil
iii) Open Stack Yard 6 115504 5 Wharf Area 33500(T) Phosphoric Acid/
Ammonia/Edible Oil.
iv) Container Stack Yard 2 43000 3 Wharf Area 15000( T) Cement Silos(3)
5. J. L. NEHRU
i) CFS- JNP 1 264166 124 Outside 671490 MT A,B,C class of chemicals,
ii) CFS-Private 29 2960602 Tank Farms POL Products, Edible
iii) Open Area-Inside Port 1518527 Oil & other liquids.
6. COCHIN
(a) Covered area
i) Transit Sheds 11 32360 90 W/Island 260117 Petroleum Products
ii) Ware-Houses 5 14780 19 W/Island 59091 KL Vegetable/Edible/Refined Oil
iii)Other Sheds 2 7000 2 W/Island 8600 MT Carbon Black Oil
iv) CFS 1 10000 1 W/Island 2400 MT Cashew
(b) Open Area 1 W/Island 10000 MT Ammonia
i) Open Space 1 125000
ii) Open at the Wharf 4 8850
iii) CFS Yard 1 20000
7. TUTICORIN 15540
(a) Covered area
i) Transit Sheds 2 22070 3 VOC Wharf Berth IV 15000 Cu.m Phosphoric Acid
ii) Ware - Houses 4 20550 3 Outside 41600 KL Naptha
iii) Other covered area 2 1472 3 -do- 25500 KL Furnace Oil
vi) Private Warehouses 16 459000 3 -do- 15540 KL LSHF/HSD
(b) Open Area 1 -do- 750 KL. LSFO
i) General cargo - 568700 3 -do- 78000 KL. Petrol
ii) Container - 54000TEUs 2 -do- 18030 KL. Kerosene
11 -do- 7000 Cu.m VCM
1 -do- 10000 T Ammonia
2 -do- 15000 T LPG
2 -do- 7790 KL EDC/DNS
8. CHENNAI
A. Port Owned
(a) Covered area
i) Transit / Overflow Sheds 7 37238 11 Area-I 33402 Molasses
ii) Ware-Houses 4 24329 9 Area-I 18000 Edible Oil /Molasses
iii) Container Freight station 1 6000 6 Area-IV 9966 Edible Oil & Palmolien Oil
(b) Open Area 663018 4 Area-IV 11796 Edible Oil
Port/Type
Storage Facilities Available at Major Ports Table 1.5 Contd.

13
(As on 31.3.2013)
Dry Storage Accomodation Liquid Storage Tanks
No.
Area(Sq.mts)/
Capacity No. Location Capacity Type of Cargo
1 2 3 4 5 6 7
B. Others (Area Allotted) 1 Area-IV 5834 Molasses
(a) Covered area 11 Area-IV 45700 Edible Oil & Palmolien Oil
i) Inside port 58422 3 Area-IV 18180 Phosphoric Acid
ii) Outside port 10697 4 Area-IV 11470 Molasses
(b) Open Area 4 Area-IV 12121 Molasses
i) Inside port 1167911
ii) Outside port 4068
9. VISAKHAPATNAM
A. Port Owned
(a) Covered area
i) Transit Sheds/Storage sheds 10 33888 93 HPCL 1193355 Crude & Products
ii) Ware- Houses 1 10482 29 IOC 121382(T) POL Products
(b) Open Area 15 BPCL 67770(T) POL
i) Bulk cargo … 1327765 11 CIL 67500 Mol.Sulphur, Phos. Acid, Sulphuric Acid & Liquid
ii) Iron ore … 369018
3 Nalco 30000 T Caustic Soda
B. Owned by Users 26 IMC/JRE/AVRS 72708 KLEdible Oil, Chemicals,
Sulphuric Acid, Bio-diesel, Molasses & Caustic Soda.(a) Covered area
i) Cargo 12 147570 3 EIPL 9000 T LPG
ii) Ware- Houses - 66230 21 EIPL 105690 KL POL & Ethonol
iii) Sylo 5 79300
1 South Asia LPG Co. 60000 T LPG
(b) Open Area
i) Cargo 25000
ii) Container
10. PARADIP
(a) Covered area
i) Transit Sheds/Over flow sheds 2 9700 36 Outside Port 243000 KL POL Products
ii) Ware - Houses 2 7700 32 Outside Port 289000 KL FRM (liquid)
iii) Container Freight Station 1 1000 TEUs 15 Outside Port 900000 KL POL (crude)
(b) Open Area 2150050
Port/Type
Storage Facilities Available at Major Ports Table 1.5 Contd.

14
Storage Facilities Available at Major Ports (As on 31.3.2013)
Dry Storage Accomodation Liquid Storage Tanks
No. Area(Sq.mts)/ Capacity No. Location Capacity Type of
Cargo
1 2 3 4 5 6 7
11. KOLKATA DOCK SYSTEM
A. Port Owned (inside port)
(a) Covered area
i) Transit Sheds 26 134722 3 Outside Port 4500 KL Vegitable Oil
ii) Ware-Houses 3 10794 42 Inside Port 82095 KL Vegitable Oil
iii) Container Freight Station 1 9000 118 Inside Port 380883 KL POL
144 TEUs Reefer 12 Outside Port 81114 KL POL
14 Inside Port 6070 KL Chemicals
(b) Open Area 133000
12000 TEUs Normal
B. Others (outside port)
(a) Covered area
i) Container Freight Station 4 …
12. HALDIA DOCK COMPLEX
(a) Covered area
i) Transit/Overflow Sheds 3 25040*
ii) Container Yard 1 5000
(b) Open Area 11 892840 **
13. ENNORE
Open Area
Harderne Area Dry Cargo - - 63 Port 249455 POL/Chemical
Car Parking Yard 1 166000
Coal/Iron Ore Stackyard 2 1014964
* Includes Transit sheds area leased to the Port users inside the dock.
** Includes storage area leased to port users inside the dock.Sorce -Major Ports
Port/Type
Table 1.5 Contd.

15
Commodity-Wise Capacity Available at Major Ports (In Million Tonnes)
Commodities KDS HDC PPT VPT EPL ChPT V.O.C. CoPT NMPT MoPT MbPT KPT JNPT Total1 2 3 4 5 6 7 8 9 10 11 12 13 14 15
POLAs on 31.3.08 3.96 17.00 6.00 17.65 - 11.80 2.30 18.70 22.00 1.50 32.00 46.00 5.50 184.41As on 31.3.09 3.96 17.00 21.00 17.65 3.00 11.80 2.30 18.70 22.00 1.50 32.00 55.24 5.50 211.65As on 31.3.10 3.96 17.00 21.00 17.65 3.00 11.80 2.30 18.70 22.00 1.50 32.00 62.83 5.50 219.24As on 31.3.11 4.11 17.00 21.00 17.65 3.00 11.80 2.30 18.70 23.37 1.50 32.00 62.83 5.50 220.76As on 31.3.12 4.50 17.00 21.00 17.65 3.00 15.27 2.30 19.01 23.37 1.50 32.00 66.60 5.50 228.70As on 31.3.13 4.50 17.00 43.00 17.65 3.00 17.67 2.30 19.01 49.17 1.50 32.00 66.60 5.50 278.90Iron Ore As on 31.3.08 - 6.00 4.50 12.50 - 8.00 - - 7.50 24.30 - - - 62.80As on 31.3.09 - 6.00 4.50 12.50 - 8.00 - - 7.50 24.30 - - - 62.80As on 31.3.10 - 6.00 4.50 12.50 - 8.00 - - 7.50 28.30 - - - 66.80As on 31.3.11 8.00 4.50 12.50 6.00^ 8.00 - - 7.50 33.00 - - - 79.50As on 31.3.12 - 8.00 4.50 12.50 6.00 8.00 - - 7.50 33.00 - - - 79.50As on 31.3.13 - 6.00 4.50 12.50 6.00 8.00 - - 7.50 27.50 - - - 72.00CoalAs on 31.3.08 - 7.00 20.00 - 13.00 - 6.25 - - - - - - 46.25As on 31.3.09 - 7.00 20.00 - 13.00 - 6.25 - - - - - - 46.25As on 31.3.10 - 7.00 20.00 - 13.00 - 6.25 - - - - - - 46.25As on 31.3.11 - 7.00 20.00 - 21.00 - 6.25 - - - - - - 54.25As on 31.3.12 - 7.00 20.00 - 21.00 - 12.55 - 5.40 - - - - 65.95As on 31.3.13 - 7.00 20.00 - 21.00 - 12.55 - 5.40 - - - - 65.95FertiliserAs on 31.3.08 - - 7.50 1.00 - - - 0.60 - - - - - 9.10As on 31.3.09 - - 7.50 1.00 - - - 0.60 - - - - - 9.10As on 31.3.10 - - 7.50 1.00 - - - 0.60 - - - - - 9.10As on 31.3.11 - - 7.50 1.00 - - - 0.80 - - - - - 9.30As on 31.3.12 - - 7.50 1.00 - - - 0.80 - - - - - 9.30As on 31.3.13 - - 7.50 1.00 - - - 0.80 - - - - - 9.30Break-Bulk CargoAs on 31.3.08 5.70 12.70 18.00 28.30 - 16.10 7.20 4.76 14.00 7.25 9.20 13.00 0.80 137.01As on 31.3.09 6.30 12.70 18.00 29.38 - 16.80 9.26 4.76 14.70 7.25 9.80 14.80 0.80 144.55As on 31.3.10 6.44 12.70 23.50 29.38 - 17.92 10.17 6.76 14.70 7.25 9.80 14.97 0.90 154.49As on 31.3.11 6.51 14.70 23.50 31.28 1.00 17.92 13.49 8.98 14.70 7.40 11.53 16.88 0.90 168.79As on 31.3.12 6.74 14.75 27.30 32.50 1.00 17.92 13.49 9.55 14.70 7.40 11.53 17.42 0.90 175.20As on 31.3.13 6.74 12.75 27.30 33.50 1.00 17.92 13.49 12.35 14.70 7.40 11.53 19.42 0.90 179.00
Container
As on 31.3.08 4.90 4.00 - 1.70 - 17.45 5.00 4.31 - - 3.50 3.60 48.04 92.50
As on 31.3.09 5.50 4.00 - 1.70 - 19.15 5.00 4.31 - - 1.90 7.20 51.66 100.42
As on 31.3.10 5.50 4.00 - 1.74 - 33.60 5.00 4.31 - - 1.90 7.20 57.60@ 120.85
As on 31.3.11 5.73 4.00 - 2.50 - 42.00# 5.00 12.50** - - 1.00* 7.20 57.60@ 137.53
As on 31.3.12 5.90 4.00 - 2.68 - 42.00 5.00 12.50 - - 1.00 7.20 57.60@ 137.88
As on 31.3.13 5.90 4.00 - 2.68 - 42.00 5.00 12.50 - - 1.00 7.20 59.48 @ 139.76
TOTAL `
As on 31.3.08 14.56 46.70 56.00 61.15 13.00 53.35 20.75 28.37 43.50 33.05 44.70 62.60 54.34 532.07
As on 31.3.09 15.76 46.70 71.00 62.23 16.00 55.75 22.81 28.37 44.20 33.05 43.70 77.24 57.96 574.77
As on 31.3.10 15.90 46.70 76.50 62.27 16.00 71.32 23.72 30.37 44.20 37.05 43.70 85.00 64.00 616.73
As on 31.3.11 16.35 50.70 76.50 64.93 31.00 79.72 27.04 40.98 45.57 41.90 44.53 86.91 64.00 670.13
As on 31.3.12 17.14 50.75 80.30 66.33 31.00 83.19 33.34 41.86 50.97 41.90 44.53 91.22 64.00 696.53
As on 31.3.13 17.14 46.75 102.30 67.33 31.00 85.59 33.34 44.66 76.77 36.40 44.53 93.22 65.88 744.91
Source : Development Wing - Department of Shipping.
Figure in the parenthesis indicate the number of berths. BJ Barge jetties, T-Transhippers, A-Anchorages, SBM-Single Buoy Mooring
@ : Capacity of JNP Container Termnal (3berths), NSICT (2berths), GTIPL (3berths) & 1 shallow water berth has been taken as 16.88 MT, 15.0 MT, 26.40 MT and 1.20 MT respectively.
Capacity of one shallow water berth at JNPT is .90 MT for dry bulk cargo.
Capacity of Iron Ore berth has been taken as 6.0MT at Ennore Poert. After full fledged commissioning, balance capacity of 6.0MT will be added.
Only BPS berth of Mumbai Port is considered as dedicated container berth. Assessed capacity of BPS (Dedicated) container berth of Mumbai Port is 1.0MT.
ID are used as holding berth for MbPT crafts & no capacity has been accounted.
Table 1.6

16
Number of Berths Available at Major Ports
KDS HDC PPT VPT EPL ChPT V.O.C. CoPT NMPT MoPT MbPT KPT JNPT
1 2 3 4 5 6 7 8 9 10 11 12 13 14 15
POL 31.3.09 7+A 3+2BJ 1+SBM 4 1 2 1 3+SPM 4 1 5 7+3SBM+A 2 41+5SBM+2BJ+A
31.3.10 7+A 3+2BJ 1+SBM 4 1 2 1 3+SPM 4 1 5 8+3SBM+A 2 42+3SBM+2BJ+2SPM
31.3.11 7+A 3+2BJ 1+SBM 4 1 2 1 3+SBM 4 1 5 8+3SBM+A 2 42+2BJ+A+55BM
31.3.12 7+A 3+2BJ 1+SPM 4 1 2 1 3+SPM 4 1 5 8+3SBM+A 2 42+SBM+2BJ
31.3.13 7+A 3+2BJ 1+3SPM 4 1 2 1 3+1SPM 5+1SPM 1 5 8+3SBM+A 2 43+8SBM+2BJ
IRON ORE 31.3.09 - 2 1 1 - 1 - - 1 1+TRANS - - - 7+TRANS
31.3.10 - 2 1 1 - 1 - - 1 1+TRANS - - - 7+TRANS
31.3.11 - 2 1 1 1 1 - - 1 1+TRANS - - - 8+TRANS
31.3.12 - 2 1 1 1 1 - - 1 1+TRANS - - - 8+TRANS
31.3.13 - 2 1 1 1 1 - - 1 1+3TRANS - - - 8+3TRANS
COAL 31.3.09 - 2 2 - 2 - 2 - - - - - - 8
31.3.10 - 2 2 - 2 - 2 - - - - - - 8
31.3.11 - 2 2 - 3 - 2 - - - - - - 9
31.3.12 - 2 2 - 3 - 3 - 1 - - - - 11
31.3.13 - 2 2 - 3 - 3 - 1 - - - - 11
FERTILISER 31.3.09 - - 2 1 - - - 1 - - - - - 4
31.3.10 - - 2 1 - - - 1 - - - - - 4
31.3.11 - - 2 1 - - - 1 - - - - - 4
31.3.12 - - 2 1 - - - 1 - - - - - 4
31.3.13 - - 2 1 - - - 1 - - - - - 4
BREAK BULK 31.3.09 22+A 8 8 15 - 14 10+ Bzone 8 8 4 24#+A 11 1 133+Bzone+A
31.3.10 22+A 8 9 15 - 14 10+BZone 9 8 4 24 11 1 135+Bzone+A
31.3.11 22+A 8 9 15 1 14 10+BZone 12 8 4 25 11 1 140+B Bzone
31.3.12 22+A 8 9 15 1 14 10 12 8 4 25+A 11 1 140+A
31.3.13 22+A 8 9 15 1 14 10 12 8 4 25+A 12 1 141+A
CONTAINER
31.3.09 4 2 - 1 - 4 1 3 - - 2 2 9 28
31.3.10 4 2 - 1 - 7 1 3 - - 2 2 9 31
31.3.11 4 2 - 1 - 7 1 3 - - 1 2 9 30
31.3.12 4 2 - 1 - 7 1 2 - - 1 2 9 29
31.3.13 4 2 - 1 - 7 1 2 - - 1 2 9 29
TOTAL 31.3.09 33+A 17+2BJ 14+SBM 22 3 21 14+BZone 15+SPM 13 6+TRANS 31+A 20+3SBM+A 12 221+5SBM+TRANS+
2BJ+Bzone+A
31.3.10 33+A* 17+2BJ 15+1SBM 22 3 24 14+BZone 16+SPM 13 6+TRANS 31+A 21+3SBM+A 12 227+5SBM+TRANS+
2BJ+B Zone+A
31.3.11 33+A* 17+2BJ 15+1SBM 22 6 24 14+BZone 19+1 SPM 13 6+TRANS 31+A 21+3SBM+A 12 233+2 BJs+A Zone+
TRANS+5SBM
31.3.12 33+A 17+2BJ 15+SPM 22 6 24 15 18+ SPM 14 6+TRANS 31+A 21+3SBM+A 13 234+5SBM+Trans+2BJ+A
31.3.13 33+A 17+2BJ 15+3SPM, 22 6 24 15 18+1SPM 15+1SPM 6+3TRANS 31+A 22+3SBM+A 12 236+8ABM+3TRANS+2BJ+A
BJ - Barge Jetty A - Anchorage SBM - Single Buoy Mooring TRANS - Transhipper B Zone : Small vessels handled at Zone B-Tuticorin.VJs= Virtual Jetties
*: In addition,lighterage operation of liquid cargo & dry cargo is carried out at Sandheads, Saugor Anchorage, Diamond Harbour, Kulpi, etc
Source : Development Wing, M/o Shipping.
P O R T SCommodities Total
Table 1.7

17
(In Nos.)
Fork Tractor Trailor Shovel Locomotive
Mobile Wharf Lift Dozer &Quay Yard Truck Pay Loader
1 2 3 4 5 6 7 8 9 10
Kolkata Dock System 10 1 - 4 16 $ 8 58 - 4
Haldia Dock Complex 2 - - 1 7 1 5 12 11
Paradip 5^ 2 - - - - - - 7
Visakhapatnam 2 19 - - - - - 6 13
Chennai 3 6 14* 40* 10+11* 2 12
V.O.Chidambaranar - 5 3* 8* 3 - - - 1
Cochin 1Port+2* - 4* 15* 21Port+9* - 30* - -
New Mangalore$$ 1 - - - 5 - - - -
Mormugao 1 - - - 10 - - - 2
Mumbai ## 5 11 2 3 35 @ 5 - - 5
J. L. Nehru 2 - 9+18* 23+64* 10+9* 4** -
Kandla - 16 - - 9 3 1 2 -
All Ports 34 60 50 158 134 26 55
**: 2 Pay Loaders, 1 Excavator, 1 JCB. #: Inclusive of 10 electric forklifts trucks for departmental use & 1 Floating Crane.
## In addition, Floating Crane-1. ^: 5 cranes are provided by Pvt. Operator.
$$ - Including 1 no. of 10 tonnes capacity, 2 nos.of 3 tonnes capicity of Forklift Truck and 2 nos. of Reach Stacker
Source:-Indian Ports Association.
@ Included of 10 electric forklifts trucks for departmental use and 1 floating Crane.
*: Under BOT Operators. ($) 13 FLTs, 3 RST
Port
512
Cargo Handling Equipment Available at Major Ports (As on 31.3.2013) Crane
Container
20+240*
95*
Table 1.8

18
Container Handling Facilities Available at Major Ports (As on 31.3.2013)
No. of Vessel Equipment
Port Berths Size Quay Side Yard Gantry Toplift
Trucks/Forklift Tractors Trailers
(IN DWT) Gantry Cranes Cranes Reach
Stackers1 2 3 4 5 6 8 7 9
KOLKATA 4 21,000 - 3x35.5 T RST:3X45T(*)Medium duty NILHippo 40T NIL 19X40T
DOCK SYSTEM 1x40 T TLT: Nil 6x20T
HALDIA 2 40,000 - 1x30 T 1X35T 7 1x10T 5
DOCK COMPLEX
VISAKHAPATNAM1(Under
BOT
Operator)
1,00,000 RMQC-2Nos. RTGC - 2 2x45T 1x5T - 16
2x35.6T (SWL) Nos. 2x10T
CHENNAI7 (Under
BOT
Operator)
95,000 14 40 1ECH -6 4 95
V.O.Chidambaranar1(Under
BOT
Operator)
47,000 3x40T 8x35T - - 12x50T 12x50T
(SWL) (SWL) (SWL) (SWL)
COCHIN #3(Under
BOT
Operator)
1,00,000 4 15 2/3 4 - 30
( Leased by
BOToperator)
J.N.P.T.- JNPCT4 + 1
Shallow
Berth
70,000 3x35.5 T RTGC- 12x40T 2x45T(**) 10(3 to 5T) 20 78
(Port's own) 2x 50 T -6x40T(Hired)
3x40T(Hired)RMGC- 1x35.5T
-2x40T(Hired)
NSICT 2 85,000 8x50 T RTGC- 29x40T 2x40T-TLT - 50 Owned# -
(BOT Operator) RMGC- 3x40T 3x40T - 100 Hired# -
GTIPL 2 85,000 8x61 T RTGC- 29x50/61T 4x40T 85##
(BOT Operator) RMGC- 3x61T
MUMBAI 1 42,000 2x35.5 T 3x35.5 T 2x42T(**) 47 27 -
(RTG) 2x45T(**)
KANDLA 2 50000 Wharf Cranes-16 2 9 3 1
*: In addition, 4 no. Reach Stackers of 45 T capacity each have been hired by Port. # In addition, 2 Mobile Harbour Cranes and 1Hydra Crane.
##: Tractor- trailers combined ** Reach Stackers
Source: Indian Ports Association
Table 1.9

19
Berthing Facilities Available at Non-Major Ports (As on 31.3.2013)
Name of the Intermediate/ Max.Depth Berth
Port Minor available at Type Below 2-4 4-6 6 meters Total
anchorage(mts) 2 meters meters meters above
1 2 3 4 5 6 7 8 9
GUJARAT
Dahej
Adani Petronet Port Private Ltd Minor 24.00 Soild cargo Berth 1 - - 2 3
Petronet LNG Ltd Minor 35.00 LNG Jetty - - - 1 1
Chemical Port Terminal Co. Ltd Minor 22.00 Motor Tanker Berth - - - 1 1
Harbour Infrastructure Ltd. Minor 20.00 Multi Purpose - - - 1 1
Reliance Marine Terminal Minor 12.00 Gas & Chemical Jetty - 1 - - 1Port facility
Hazira
Hazira Port Private Ltd Minor 25.00 LNH - - - 1 1
Adani Hazira Port Private Ltd Minor 25.00 Bulk Berth - - - 1 1
Larsen & Tubro Ltd Minor 12.00 - 1 2 - - 3
Reliance Industries Ltd Minor 25.00 Gas & Chemical Jetty - 3 - - 3
Essar Bulk Terminal Ltd Minor 20.00 Fixed Berth - 2 - - 2
Pipavav
Pipavav Port Ltd. 16.00 1 LPG - - - 5 51 Container3 Multipurpose
Ultratech Cement Ltd Minor 20.00 Captive Berth - - - 1 1
Mundre
Adani Ports and Special Minor 30.00 Pile Berths - - - 17 17Economic zone Ltd.
Sikka
Shree Digvijay Cement Co. Ltd. Minor 25.00 Shallow water - 1 - - 1
Tidal port/ Wharf
Bharat Oman refinery Ltd. Minor 32.00 SPM - - - 1 1
State Fertiliser Co.Ltd. Minor 25.00 Liquid cargo Berth - - - 1 1
Reliance Industries Ltd. Minor 37.00 SPM - - - 5 5
Jakhu
Sanghi Industries Ltd Minor 15.00 Pile Berth - - 3 - 3
Muldwarka
Ambuja Cement Ltd Minor 23.00 Pile & Breakwater jetty - - 2 2 4
No. of Berths by existing Draft
Table 1.10

20
Berthing Facilities Available at Non-Major Ports (As on 31.3.2013)
Name of the Intermediate/ Max.Depth Berth No. of Berths by existing DraftPort Minor available at Type Below 2-4 4-6 6 meters Total
anchorage 2 meters meters meters above1 2 3 4 5 6 7 8 9
GUJARAT(Contd…)
Okha Intermediate 12.80 Sayaji pier (East) - - - - -
D.C.B - - - 1 1Sheet piled wharf 1 - - - 1
Light Cargo 1 - - - 1Passenger Jetty 1 - - - 1
Bhavnagar Intermediate 12.00 1) Concrete Jetty - 1 - - 1RCC piles with slabwith docking
2) Akwada Wharf - 1 - - 1RCC wall3) North Quay RCC - 1 - - 1with Well foundation
Jafarabad Intermediate 14.00 Clinkers jetty - 1 - - 1T Shape jetty 1 - - - 1Captive jetty - 1 - 1
(a)Victor Minor 11.60 Along side wharf(east) 1 - - - 1Along side wharf (west) - - - - -LPG - - - 1 1
Navalakhi Intermediate 2.00 Jetty/wharf 2 2 - - 4
Magdalla Minor 15.00 RCC Jetty - 11 - - 11Wharf - 2 - - 2
Valsad Minor No Anchorage fixed RCC Jetty 1 - - - 1
Kolak Minor No Anchorage fixed RCC Fishing Jetty 1 - - - 1
Vansi Borsi Minor 11.00 RCC Fishing Jetty - - - - -
Onjal Minor 11.00 RCC Fishing Jetty 1 - - - 1
Umergaon Minor No Anchorage fixed RCC Jetty - 1 - - 1
Umarsadi Minor No Anchorage fixed Fishing Jetty 1 - - - 1Billimora Minor No Anchorage fixed Wooden jetty 3 - - - 3
RCC Jetty 1 - - - 1Porbandar Minor 12.00 Deep water Berth - - - 1 1
Bedi Intermediate 16.00 Block wharf - 2 1 - 3Mandvi Minor 10.00 Wharf - 2 - - 2GAPL Intermediate 28.00 T type fingure berth - - - 4 4
Barge Berth - - - 1 1
Veraval Intermediate 13-14 Direct berth for - 1 - - 1Fair Weather port small coaster with
Table 1.10 Table 1.10

21
Berthing Facilities Available at Non-Major Ports
(As on 31.3.2013)Name of the Intermediate/ Max.Depth Berth
Port Minor available at Type Below 2-4 4-6 6 meters Total
anchorage 2 meters meters meters above
1 2 3 4 5 6 7 8 9
MAHARASHTRA
Dahanu Minor Upto 12 Cargo jetty 1 - - - 1
Bassesin Minor 4.00 Sloping jetty - 2 - - 2
Kalyan Minor - Sloping jetty - 3 - - 3
Bhiwandi Minor 4.00 Sloping jetty - 3 - - 3
Thane Minor - Sloping jetty 1 - - - 1
Ulwa Belapur Minor 4.00 Captive Jetty - 4 - - 4
Mora Minor 2.00 Passenger Jetty - 3 - - 3
Karanja Minor 2.00 Sloping jetty 2 - - - 2
Rewas Minor 1.00 L Type Passenger Jetty - 3 - - 3
Mandwa Minor 7.00 L Type Passenger Jetty - 3 - - 3
Dharamtar Minor 3.00 T/ l/ Slopping Type - 3 - - 3
Trombay Minor 2.00 Jetty cum Wharf - - 6 - 6
Elephanta Minor 3.00 L Type Passenger Jetty - - 5 - 5
Revdanda Minor 14-24 Cargo jetty - - 6 - 6
Murud Minor 3.00 Passenger Jetty 2 - - - 2
Rajpuri Minor 2.00 Passenger Jetty - 2 - - 2
Dighi Minor 10-14 Cargo / Passenger - 3 - 8 11
Shirwardhan Minor 3.00 Passenger Jetty 2 - - - 2
Ratnagiri Minor 15-18 T&I Type jetty - - 1 - 1
Jaigad Minor 14.00 T Type Jetty - - 1 2 3
Borya Minor - I Type Jetty 1 - - - 1
Palshet Minor - L Type Jetty 1 - - - 1
Dabhol Minor 15.00 T Type Jetty - - 1 - 1
Harnai Minor - L Type Jetty 1 - - - 1
Kelsi Minor 15.00 T Type Jetty 1 - - - 1
Bankot Minor 3.00 T Type Jetty 1 - 1 - 2
Purnagad Minor - - 1 - - - 1
Jaitapur Minor 5.00 Steed Jetty 2 - - - 2
Vijaydurg Minor 8.00 T Type Jetty - - - 1 1
Deogad Minor 4-5 - - 1 - - 1
Achara Minor 4.00 - 3 1 - - 4
Malwan Minor - - 1 - - - 1
Niwati Minor - - 2 1 - - 3
Vengurla Minor 5-6 - 1 - - - 1
Redi Minor 10-12 - - 2 - - 2
Kiranpani Minor - - - 1 - - 1
No. of Berths by existing Draft
Table 1.10 (Contd...)

22
Berthing Facilities Available at Non-Major Ports (As on 31.3.2013)
Name of the Intermediate/ Max.Depth Berth
Port Minor available at Type Below 2-4 4-6 6 meters Total
anchorage 2 meters meters meters above
1 2 3 4 5 6 7 8 9
KARNATAKA
Karwar Intermediate 15.00 Along side berthing tanker - 1 - 1 2
and General cargo
Honavar Minor 10.00 RCC piled jetty - 1 - - 1
Bhatkal Minor 10.00 RCC piled jetty - 1 - - 1
Tadri Minor 10.00 RCC piled jetty - 1 - - 1
Kundapur Minor 8.00 RCC piled jetty - 1 - - 1
Belekeri Minor 13.00 Loading Chute - 1 - - 1
Malpe Minor 7.00 RCC piled jetty - 1 - - 1
Hangarkatta Minor 6.00 RCC piled jetty - 1 - - 1
Padubidri Minor 12.00 RCC piled jetty - - - - -
Mangalore Intermediate 12.00 RCC piled jetty - 1 - - 1
KERALA
1. Koavalam/ Minor 12.00 Dry Break Bulk - - 1 1 2
Vizhinjam
2. Neendakara Intermediate 13.00 Concrete wharf 1 - - - 1
3. Thalassery Minor 12.00 - - - - - -
3. Azhikkal Minor 3.00 RCC Wharf - 2 - - 2 4. Kozhikode/Beypore Intermediate 3.50 Cargo berth - 1 - - 1
5. Ponnani Minor 10.00 Laterite stone 1 - - - 1
6. Alappuzha Intermediate 12.00 - - - - - -
7.Kannur Minor 5.00 - - - 1 - 1
8.Kollam Minor 10'-15 Cargo berth - - - 1 1
9.Valtyathura Minor 5'-10 Open sea 1 - - - 1
10.Munambam Minor 6.00 - - - - - -
ODISHA
1. Dhamra Minor 20.00 Dry Bulk - - - 2 2
2. Gopalpur Minor No Limt Multi Purpose Berth - 4 - 1 5
No. of Berths by existing Draft
Table 1.10 (Contd...)

23
Berthing Facilities Available at Non-Major Ports (As on 31.3.2013)
Name of the Intermediate/ Max.Depth Berth
Port Minor available at Type Below 2-4 4-6 6 meters Total
anchorage 2 meters meters meters above
1 2 3 4 5 6 7 8 9
ANDHRA PRADESH
Kakinada
(a)Anchorage Intermediate - - - - - - -
(b)Deep water Intermediate 15.00 Diaphragm wall, 610 Mts - - - 3 3Piled jetty, 900 Mts - - - 3 3Piled jetty, 635 Mts - - - 3 3Piled jetty, 200 Mts - - - 1 1Piled jetty, 460 Mts - - - 6 6Piled jetty, 40 Mts - - - 1 1
Rawa Minor 30.00 S.B.M. Operation - - - 1 1
Krishnapattinam Minor 25.00 - - - - 9 9
Gangavaram Minor 50.00 Multipurpose - - - 5 5
TAMIL NADUCuddalore Intermediate 14.00 Open road stead Port - - - - -Cuddalore(Chemplast jetty) Intermediate 10.50 Island type Marine Terminal - - - 1 1
Nagapattinam Anchorage Berthig a wharf to a length Open road stead Port. - 1 - - 1 of 250 meters is available
Rameshwaram Minor 5.00 Open Road Stead - - - - -
Pamban Minor 7.00 - - - - - -
Colachel Minor 16.00 Rcc Jetty - 1 - - 1
Valinokkam Minor 12.00 - - - - - -
Kanyakumari Minor 165.00 L shape jetty 1 - - - 1
Ennore Minor 15.00 Four point mooring system - - - - -
Kattupalli Minor 19.00 Container Berths - - - 2 2
Tirukkadaiyur Minor 15.50 Singal Buoy Mooring - - - - -
Kuddnkulam Minor 11.00 Lo Lo & Ro Ro jetty - 2 - - 2
GOA
1. Panaji Minor 18.00 Anchorage - - - - -
2. Betul Minor 3.60 Anchorage - - - - -
3. Chapora Minor 2.40 Anchorage - - - - -
4. Talpona Minor 3.50 Anchorage - - - - -
5. Tiracol Minor 3.70 Anchorage - - - - -
DIUDiu Minor 18.00 Solid Wharf 1 - - - 1
Daman Minor 9.15 1. RCC jetty at - - 1 - 1 Nani Daman
PONDICHERRYPondicherry Minor 4.5 to 6.0 1) RCS pier - - 1 - 1
3.00 2) Cargo quay - 1 - - 1
Karaikal MTF Minor 8.50 Multi purpose - - - 1 1
Karaikal LTD Minor 14.00 Multi purpose - - - 5 5
Source : State / UT Maritime Boards
No. of Berths by existing Draft
Table 1.10 (Contd...)

24
Equipment Available at Various Non-Major Ports (As on 31.3.2013)(Nos.)
Dredgers Launches Tugs Pablos ForkUpto 5 6-10 Above Dumb Self- Water Liftstons tons 10 tons Propelled Barges
1 2 3 4 5 6 7 8 9 10 11 12GUJARAT2011-12 10 1 1 3 1 6 1 4 11 - -2012-13 10 - - 4 1 5 1 10 13 - -
MAHARASHTRA #2011-12 - - - - - - - - - - -2012-13 - - - - - - - - - - -
GOAPanaji 2011-12 1 - - - - 1 - 2 1 - -2012-13 1 1* * * * 1 * * 1 - -
ANDHRA PRADESH
2011-12 2 - - - 7 1 - 10 6 - -
2012-13 2 - - - 5 - - 1 2 - -
2011-12 - - - 10 - - - - 5 - -2012-13 - - - 10 - - - - 5 - -
2011-12 - - - 10 1 - - 2 4 - -2012-13 - 3 - 35 1 - - - 4 - -
2011-12 - - - 2 - - - 3 3 - -
2012-13 - - - 2 - - - 3 3 - -
TAMIL NADUNagapattinam2011-12 1 - - - - - - 1 - - -2012-13 1 - - - 2 - - 1 - - -Kanyakumari2011-12 1 - - - - - - 3 1 - -
2012-13 1 - - - - - - 3 1 - -
Kattupalli
2011-12 - - - 21 - - - 1 2 - -2012-13 - - - 21 - - - 1 2 - -
KERALANeendakara
2011-12 1 - - - - 4 - - 1 - -
2012-13 1 - - - - 4 - - 1 - -Kozhikode/Beypor2011-12 - 5 - 3 - - - - 3 - -2012-13 - 6 - 3 - - - - 3 - 1Kovalam-Vizhinjam2011-12 - 1 - - - - - - - - -2012-13 - 1 - - - - - - - - -* Out sourced by Private Companies at their end.# Data Not received
BargesCranesState/Port/ Year
Kakinada Anchorage Port
Kakinada Deep Water Port
Krishnapatnam
Gangavaram
Table 1.11

25
Equipment Available at Various Non-Major Ports (As on 31.3.2013) (Nos.)
Dredgers Launches Tugs Pablos Fork
Upto 5 6-10 Above Dumb Self- Water Lifts
tons tons 10 tons Propelled Barges
1 2 3 4 5 6 7 8 9 10 11 12
DIU
2011-12 - - - 2 - - - 2 - - -
2012-13 - - - 2 - - - 2 - - -
PUDUCHERRY
2011-12 2 - - - - - - 1 - - -
2012-13 4 - - 7 - - - 3 2 - -
GOA
Panaji
2011-12 1 - - - - 1 - 2 1 - -
2012-13 1 * * * * 1 * * 1 - -
ODISHA
Gopalpur
2011-12 1 - 4 - 4 8 - 3 - - -
2012-13 1 - 2 1 2 4 1 3 2 - -
Dhamra
2011-12 - - - - - - - - - - -
2012-13 - - - 2 - - - 3 3 - -
ANDAMAN &
NICOBAR ISLAND
2011-12# - - - - - - - - - - -
2012-13 - - 12 16 4 - 2 3 2 - -
: In Karnataka privatestevedores are have sufficient loading / unloading equipment like Cranes, Pay loaders, Fork Lifts, Excavators, Barges, ext.
No departmental Tug available.
* In Goa sr no 3,4,5,6,8,and 9 out sourced by Private Companies at their end.
# Not available
Source : State / UT Maritime Boards
State/Port/
Year
Cranes Barges
Table 1.11 (Contd...)

26
+ State-Wise Navigational Aids Maintained By DepartmentState-Wise Navigational Aids Maintained By DepartmentState-Wise Navigational Aids Maintained By DepartmentState-Wise Navigational Aids Maintained By Department
of Light-Houses and Light-Ships (As on 31.3.2013)of Light-Houses and Light-Ships (As on 31.3.2013)of Light-Houses and Light-Ships (As on 31.3.2013)of Light-Houses and Light-Ships (As on 31.3.2013) (Number)
General Light VHF/HF Light Light DGPS
Light buoy RT set. Racons Vessel House
house Tender
1 2 3 4 5 6 7 8 9
Gujarat 49 21 - 19 1 - 1 4
Maharashtra 19 - - 11 - - - 2
Goa, Daman & Diu 2 - - 1 - - - 1
Karnataka 8 - 2 - - - - 1
Kerala 15 - 2 5 - - 1 1
Tamilnadu 20 - 11 9 - - - 4
Puducherry 1 - 1 1 - - - 1
Andhra Pradesh 16 - 5 5 - - - 3
Orissa 6 - 4 2 - - - 1
West Bengal 2 - 3 1 - - - 1
Andaman & Nicobar
Islands31 - 1 5 - - 1 3
Lakshadweep 16 - 2 5 - - - 1
Total 185 21 31 64 1 - 3 23
Source : Directorate General of Light Houses & Light Ships.
Launc
hesMaritime States/Uts
Table 1.12
SECTION – II
2. CURRENT PORT
STATISTICS
2.1 MAJOR PORTS
2.2 NON-MAJOR PORTS

27
Traffic Handled At Major Ports in India -2012-13 (In '000 Tonnes)
Un-
LoadedLoaded
Transh-
ipmentTotal
Un-
LoadedLoaded
Transh-
ipmentTotal
Un-
LoadedLoaded
Transh-
ipmentTotal
1 2 3 4 5 6 7 8 9 10 11 12 13
Kandla 58851 21037 208 80096 4343 9180 0 13523 63194 30217 208 93619
Mumbai 29101 5156 9383 43640 1836 4798 7764 14398 30937 9954 17147 58038
J.L. Nehru 32272 28240 513 61025 1170 2293 0 3463 33442 30533 513 64488
Mormugao 8447 8537 0 16984 623 131 0 754 9070 8668 0 17738
New
Mangalore23301 7519 0 30820 4021 2195 0 6216 27322 9714 0 37036
Cochin 10749 2377 102 13228 5205 1396 16 6617 15954 3773 118 19845
Tuticorin 13236 7466 37 20739 6581 940 0 7521 19817 8406 37 28260
Chennai 30467 18547 0 49014 3907 483 0 4390 34374 19030 0 53404
Ennore 7724 1739 0 9463 8422 0 0 8422 16146 1739 0 17885
Visakha-
patnam29392 11203 616 41211 5118 11797 912 17827 34510 23000 1528 59038
Paradip 36846 2097 3 38946 2267 15337 2 17606 39113 17434 5 56552
Haldia Dock
Complex18663 4264 0 22927 1883 3274 0 5157 20546 7538 0 28084
Kolkata Dock
System5293 4707 733 10733 606 505 0 1111 5899 5212 733 11844
All Ports 304342 122889 11595 438826 45982 52329 8694 107005 350324 175218 20289 545831
Source : Major Ports
Port
Overseas Coastal Overseas & Coastal
Table 2.1.1
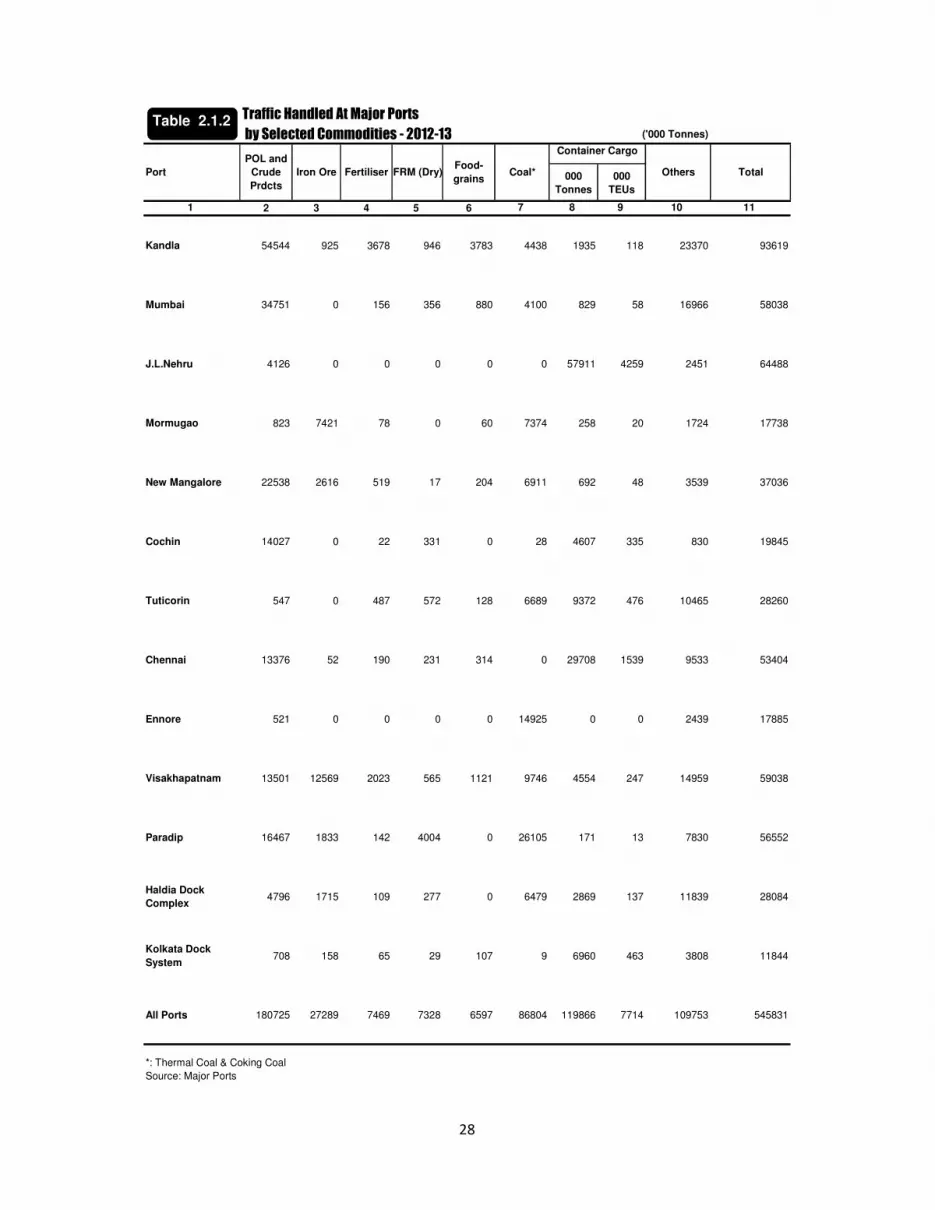
28
Traffic Handled At Major Ports
by Selected Commodities - 2012-13 ('000 Tonnes)
000
Tonnes
000
TEUs
1 2 3 4 5 6 7 8 9 10 11
Kandla 54544 925 3678 946 3783 4438 1935 118 23370 93619
Mumbai 34751 0 156 356 880 4100 829 58 16966 58038
J.L.Nehru 4126 0 0 0 0 0 57911 4259 2451 64488
Mormugao 823 7421 78 0 60 7374 258 20 1724 17738
New Mangalore 22538 2616 519 17 204 6911 692 48 3539 37036
Cochin 14027 0 22 331 0 28 4607 335 830 19845
Tuticorin 547 0 487 572 128 6689 9372 476 10465 28260
Chennai 13376 52 190 231 314 0 29708 1539 9533 53404
Ennore 521 0 0 0 0 14925 0 0 2439 17885
Visakhapatnam 13501 12569 2023 565 1121 9746 4554 247 14959 59038
Paradip 16467 1833 142 4004 0 26105 171 13 7830 56552
Haldia Dock
Complex4796 1715 109 277 0 6479 2869 137 11839 28084
Kolkata Dock
System708 158 65 29 107 9 6960 463 3808 11844
All Ports 180725 27289 7469 7328 6597 86804 119866 7714 109753 545831
*: Thermal Coal & Coking Coal
Source: Major Ports
Port
POL and
Crude
Prdcts
Iron Ore Fertiliser Others TotalFRM (Dry)Food-
grainsCoal*
Container Cargo
Table 2.1.2

29
Kolkata Dock System
CommodityUnloaded Loaded Total Unloaded Loaded Total Unloaded Loaded Total Unloaded Loaded Total Unloaded Loaded Total Unloaded Loaded Total
1 2 3 4 5 6 7 8 9 10 11 12 13 14 15 16 17 18 19
POL Crude 0 0 0 0 0 0 0 0 0 0 0 0 0 0 0 0 0 0
POL Products 79 98 177 619 82 701 42 76 118 524 40 564 39 9 48 523 137 660
Fertiliser 31 0 31 0 0 0 14 0 14 0 0 0 65 0 65 0 0 0
FRM - Dry 31 0 31 0 0 0 55 0 55 0 0 0 29 0 29 0 0 0
FRM - Liquid 0 0 0 0 0 0 0 0 0 0 0 0 0 0 0 0 0 0
Food Grains 11 0 11 0 0 0 0 0 0 0 0 0 17 90 107 0 0 0
Iron & Steel 88 18 106 6 0 6 67 21 88 0 0 0 57 17 74 1 15 16
Iron Scrap 0 0 0 0 0 0 0 0 0 0 0 0 0 0 0 0 0 0
Sugar 45 14 59 0 0 0 0 0 0 0 0 0 0 0 0 0 0 0
Veg. Oil 646 0 646 0 0 0 628 0 628 0 0 0 643 0 643 0 0 0
Salt 0 0 0 0 0 0 0 0 0 0 0 0 0 0 0 0 0 0
Coking Coal 97 0 97 0 0 0 8 0 8 0 0 0 9 0 9 0 0 0
Thermal Coal 0 0 0 0 0 0 0 0 0 0 0 0 0 0 0 0 0 0
Cement 0 0 0 0 0 0 0 0 0 0 0 0 0 0 0 0 0 0
Iron Ore/Pellets 0 827 827 0 0 0 0 450 450 0 0 0 0 158 158 0 0 0
Other Ore 162 0 162 0 0 0 30 0 30 0 0 0 68 0 68 0 0 0
Tea and Coffee 0 0 0 0 0 0 0 0 0 0 0 0 0 0 0 0 0 0
Chemicals 54 0 54 80 0 80 59 0 59 63 0 63 113 0 113 34 0 34
Others 5258 4049 9307 51 194 245 5466 4414 9880 47 229 276 4825 4594 9419 48 353 401
Total 6502 5006 11508 756 276 1032 6369 4961 11330 634 269 903 5865 4868 10733 606 505 1111
('000 Tonnes)
2012-13
Overseas Coastal
2011-12
Overseas CoastalOverseas Coastal
2010-11
Traffic Handled - Port-wise and Principal Commodity-wise -
2010-11, 2011-12 & 2012-13Table 2.1.3
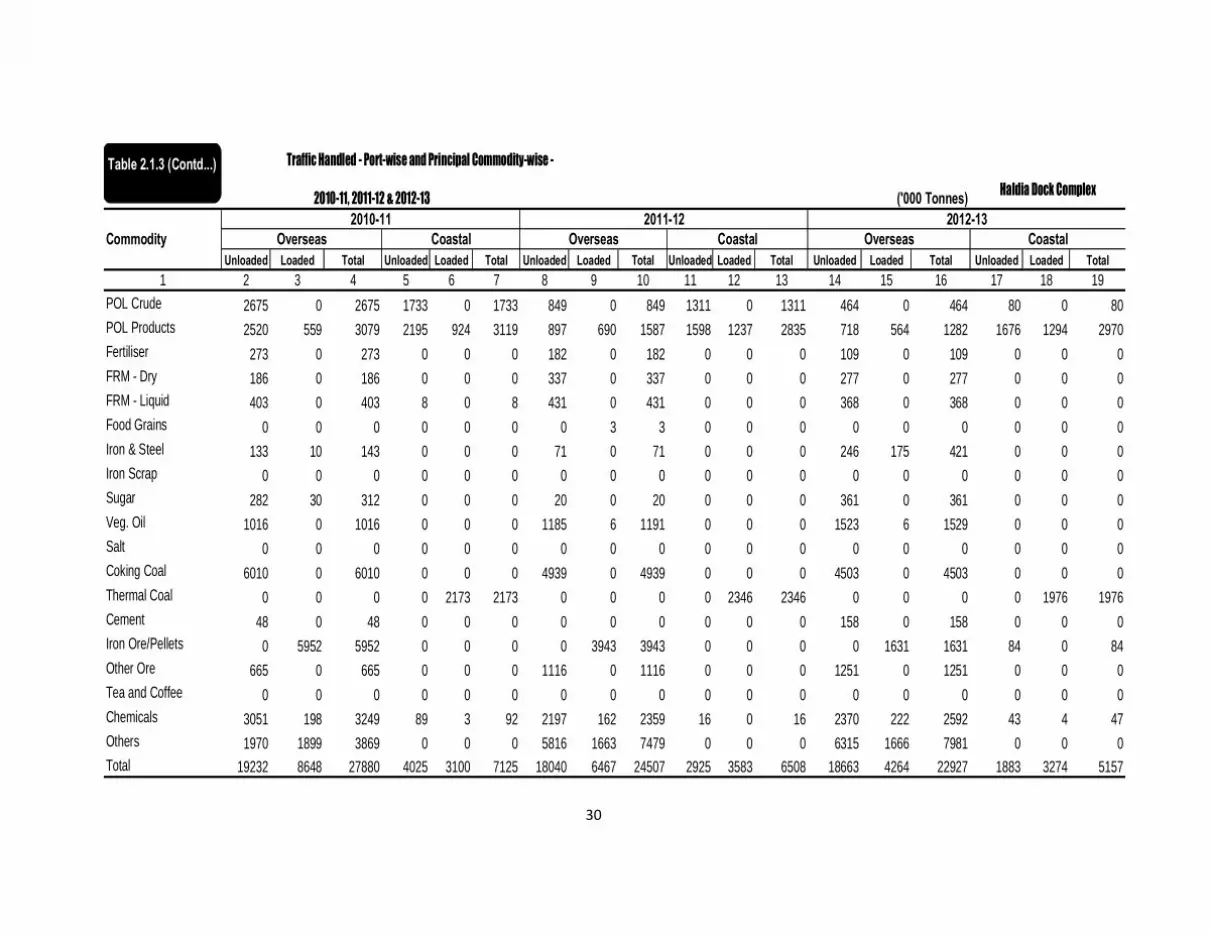
30
CommodityUnloaded Loaded Total Unloaded Loaded Total Unloaded Loaded Total Unloaded Loaded Total Unloaded Loaded Total Unloaded Loaded Total
1 2 3 4 5 6 7 8 9 10 11 12 13 14 15 16 17 18 19POL Crude 2675 0 2675 1733 0 1733 849 0 849 1311 0 1311 464 0 464 80 0 80POL Products 2520 559 3079 2195 924 3119 897 690 1587 1598 1237 2835 718 564 1282 1676 1294 2970Fertiliser 273 0 273 0 0 0 182 0 182 0 0 0 109 0 109 0 0 0FRM - Dry 186 0 186 0 0 0 337 0 337 0 0 0 277 0 277 0 0 0FRM - Liquid 403 0 403 8 0 8 431 0 431 0 0 0 368 0 368 0 0 0Food Grains 0 0 0 0 0 0 0 3 3 0 0 0 0 0 0 0 0 0Iron & Steel 133 10 143 0 0 0 71 0 71 0 0 0 246 175 421 0 0 0Iron Scrap 0 0 0 0 0 0 0 0 0 0 0 0 0 0 0 0 0 0Sugar 282 30 312 0 0 0 20 0 20 0 0 0 361 0 361 0 0 0Veg. Oil 1016 0 1016 0 0 0 1185 6 1191 0 0 0 1523 6 1529 0 0 0Salt 0 0 0 0 0 0 0 0 0 0 0 0 0 0 0 0 0 0Coking Coal 6010 0 6010 0 0 0 4939 0 4939 0 0 0 4503 0 4503 0 0 0Thermal Coal 0 0 0 0 2173 2173 0 0 0 0 2346 2346 0 0 0 0 1976 1976Cement 48 0 48 0 0 0 0 0 0 0 0 0 158 0 158 0 0 0Iron Ore/Pellets 0 5952 5952 0 0 0 0 3943 3943 0 0 0 0 1631 1631 84 0 84Other Ore 665 0 665 0 0 0 1116 0 1116 0 0 0 1251 0 1251 0 0 0Tea and Coffee 0 0 0 0 0 0 0 0 0 0 0 0 0 0 0 0 0 0Chemicals 3051 198 3249 89 3 92 2197 162 2359 16 0 16 2370 222 2592 43 4 47Others 1970 1899 3869 0 0 0 5816 1663 7479 0 0 0 6315 1666 7981 0 0 0Total 19232 8648 27880 4025 3100 7125 18040 6467 24507 2925 3583 6508 18663 4264 22927 1883 3274 5157
('000 Tonnes)2012-13
Overseas Coastal2011-12
Overseas CoastalOverseas Coastal
Traffic Handled - Port-wise and Principal Commodity-wise -
2010-11, 2011-12 & 2012-13 Haldia Dock Complex2010-11
Table 2.1.3 (Contd...)

31
b
Paradip
CommodityUnloaded Loaded Total Unloaded Loaded Total Unloaded Loaded Total Unloaded Loaded Total Unloaded Loaded Total Unloaded Loaded Total
1 2 3 4 5 6 7 8 9 10 11 12 13 14 15 16 17 18 19POL Crude 0 0 0 69 0 69 12718 0 12718 577 0 577 14533 0 14533 101 0 101POL Products 3140 0 3140 1119 599 1718 316 0 316 1245 235 1480 60 0 60 1519 254 1773Fertiliser 55 0 136 0 0 0 236 0 236 0 0 0 142 0 142 0 0 0FRM - Dry 588 0 588 0 0 0 4547 0 4547 0 0 0 4004 0 4004 0 0 0FRM - Liquid 786 0 786 228 144 372 1423 0 1423 155 195 350 1249 0 1249 334 0 334Food Grains 0 0 0 0 0 0 0 0 0 0 0 0 0 0 0 0 0 0Iron & Steel 0 0 0 148 0 148 223 3 226 13 0 13 142 6 148 0 0 0Iron Scrap 0 0 0 0 0 0 0 0 0 0 0 0 0 0 0 0 0 0Sugar 0 623 623 0 3 3 0 0 0 0 3 3 0 0 0 0 0 0Veg. Oil 12 0 12 0 0 0 59 0 59 7 0 7 70 0 70 0 0 0Salt 0 0 0 0 0 0 0 0 0 0 0 0 0 0 0 0 0 0Coking Coal 1799 0 1799 0 115 115 5101 0 5101 0 58 58 4526 0 4526 54 122 176Thermal Coal 11930 0 11930 0 8830 8830 6347 0 6347 0 10057 10057 7780 0 7780 0 13623 13623Cement 0 0 0 0 0 0 0 0 0 0 0 0 0 0 0 0 0 0Iron Ore/Pellets 2050 13795 15845 0 0 0 5 6551 6556 0 0 0 1 1609 1610 0 223 223Other Ore 0 488 488 0 0 0 140 473 613 0 12 12 78 318 396 0 0 0Tea and Coffee 0 0 0 0 0 0 0 0 0 0 0 0 0 0 0 0 0 0Chemicals 0 0 0 0 0 0 0 0 0 0 0 0 0 0 0 0 0 0Others 2136 89 2144 0 130 130 2675 480 3155 206 194 400 4263 165 4428 260 1116 1376Total 22496 14995 37491 1564 9821 11385 33790 7507 41297 2203 10754 12957 36848 2098 38946 2268 15338 17606
('000 Tonnes)2012-13
Overseas Coastal2011-12
Overseas CoastalCoastal2010-11
Traffic Handled - Port-wise and Principal Commodity-wise -
2010-11, 2011-12 & 2012-13
Overseas
Table 2.1.3 (Contd...)

32
Visakhapatnam
CommodityUnloaded Loaded Total Unloaded Loaded Total Unloaded Loaded Total Unloaded Loaded Total Unloaded Loaded Total Unloaded Loaded Total
1 2 3 4 5 6 7 8 9 10 11 12 13 14 15 16 17 18 19POL Crude 8091 0 8091 2270 2220 4490 8399 0 8399 1844 1518 3362 7227 0 7227 854 191 1045POL Products 1925 758 2683 2039 1939 3978 801 938 1739 2008 1920 3928 74 600 674 2825 1730 4555Fertiliser 3268 0 3268 0 0 0 3719 0 3719 0 0 0 2023 0 2023 0 0 0FRM - Dry 811 0 811 0 0 0 832 0 832 0 0 0 565 0 565 0 0 0FRM - Liquid 458 0 458 128 0 128 579 0 579 94 0 94 328 0 328 59 0 59Food Grains 119 51 170 0 33 33 126 353 479 0 38 38 0 1085 1085 0 36 36Iron & Steel 24 510 347 0 3 3 63 580 643 0 20 20 34 723 757 7 0 7Iron Scrap 0 0 0 0 0 0 32 0 32 0 0 0 42 0 42 0 0 0Sugar 7 12 19 0 5 5 0 0 0 0 4 4 0 0 0 0 3 3Veg. Oil 53 48 101 0 19 19 6 0 6 0 0 0 10 0 10 0 0 0Salt 0 0 0 89 0 89 0 0 0 160 0 160 0 0 0 45 0 45Coking Coal 7344 0 7344 0 582 582 6780 0 6780 0 94 94 6785 0 6785 0 10 10Thermal Coal 0 0 0 0 3538 3538 0 0 0 0 3189 3189 0 0 0 0 2951 2951Cement 0 0 0 0 0 0 0 0 0 0 1 1 0 0 0 0 1 1Iron Ore/Pellets 109 9954 10063 122 9162 9284 0 6324 6324 89 9830 9919 87 5109 5196 173 7200 7373Other Ore 784 144 928 417 0 417 740 116 856 852 39 891 1038 113 1151 0 0 0Tea and Coffee 0 0 0 0 0 0 0 0 0 0 0 0 0 0 0 0 0 0Chemicals 0 0 0 0 0 0 560 32 592 179 16 195 343 0 343 191 0 191Others 7771 2750 10521 299 185 484 10483 3290 13773 345 427 772 11452 3573 15025 1112 439 1551Total 30764 14227 44991 5364 17686 23050 33120 11633 44753 5571 17096 22667 30008 11203 41211 5266 12561 17827
('000 Tonnes)2012-13
Overseas CoastalCoastalOverseasCoastal
Traffic Handled - Port-wise and Principal Commodity-wise -
Overseas
2010-11 , 2011-12 & 2012-132010-11 2011-12
Table 2.1.3 (Contd...)

33
Ennore
CommodityUnloaded Loaded Total Unloaded Loaded Total Unloaded Loaded Total Unloaded Loaded Total Unloaded Loaded Total Unloaded Loaded Total
1 2 3 4 5 6 7 8 9 10 11 12 13 14 15 16 17 18 19POL Crude 0 0 0 0 0 0 0 0 0 0 0 0 0 0 0 0 0 0POL Products 325 0 325 184 0 184 322 0 322 180 0 180 294 0 294 227 0 227Fertiliser 0 0 0 0 0 0 0 0 0 0 0 0 0 0 0 0 0 0FRM - Dry 0 0 0 0 0 0 0 0 0 0 0 0 0 0 0 0 0 0FRM - Liquid 0 0 0 0 0 0 0 0 0 0 0 0 0 0 0 0 0 0Food Grains 0 0 0 0 0 0 0 0 0 0 0 0 0 0 0 0 0 0Iron & Steel 0 0 0 0 0 0 0 0 0 0 0 0 0 0 0 0 0 0Iron Scrap 0 0 0 0 0 0 0 0 0 0 0 0 0 0 0 0 0 0Sugar 0 0 0 0 0 0 0 0 0 0 0 0 0 0 0 0 0 0Veg. Oil 0 0 0 0 0 0 0 0 0 0 0 0 0 0 0 0 0 0Salt 0 0 0 0 0 0 0 0 0 0 0 0 0 0 0 0 0 0Coking Coal 103 0 103 0 0 0 465 0 465 0 0 0 685 0 685 0 0 0Thermal Coal 1540 0 1540 7725 0 7725 4571 0 4571 8075 0 8075 6046 0 6046 8194 0 8194Cement 0 0 0 0 0 0 0 0 0 0 0 0 0 0 0 0 0 0Iron Ore/Pellets 0 401 401 0 0 0 0 0 0 0 0 0 0 0 0 0 0 0Other Ore 0 0 0 0 0 0 0 0 0 0 0 0 0 0 0 0 0 0Tea and Coffee 0 0 0 0 0 0 0 0 0 0 0 0 0 0 0 0 0 0Chemicals 80 0 80 0 0 0 96 0 96 0 0 0 95 0 95 0 0 0Others 0 651 651 0 0 0 3 1244 1247 0 0 0 604 1739 2343 1 0 1Total 2048 1052 3100 7909 0 7909 5457 1244 6701 8255 0 8255 7724 1739 9463 8422 0 8422Note:- Port started its operation from June, 2001 onwards.
('000 Tonnes)2012-13
Overseas CoastalOverseas Coastal2010-11
Overseas2011-12
Coastal
Traffic Handled - Port-wise and Principal Commodity-wise - 2010-11, 2011-12 & 2012-13
Table 2.1.3 (Contd...)

34
Chennai
CommodityUnloaded Loaded Total Unloaded Loaded Total Unloaded Loaded Total Unloaded Loaded Total Unloaded Loaded Total Unloaded Loaded Total
1 2 3 4 5 6 7 8 9 10 11 12 13 14 15 16 17 18 19POL Crude 8967 0 8967 1064 0 1064 8337 0 8337 1478 0 1478 8072 0 8072 1150 0 1150POL Products 620 1168 1788 1374 798 2172 395 917 1312 1607 556 2163 232 984 1216 2544 394 2938Fertiliser 434 0 434 0 0 0 394 0 394 0 0 0 175 0 175 15 0 15FRM - Dry 337 0 337 0 0 0 249 0 249 0 0 0 231 0 231 0 0 0FRM - Liquid 8 0 8 0 0 0 37 0 37 0 0 0 31 0 31 0 0 0Food Grains 9 77 86 0 0 0 0 190 190 0 0 0 0 314 314 0 0 0Iron & Steel 825 13 838 42 0 42 963 0 963 43 1 44 858 230 1088 27 0 27Iron Scrap 187 116 303 0 0 0 178 162 340 0 0 0 410 159 569 0 0 0Sugar 272 61 333 0 0 0 0 112 112 0 0 0 33 140 173 0 0 0Veg. Oil 1069 0 1069 0 8 8 1122 0 1122 0 3 3 1051 0 1051 12 0 12Salt 0 0 0 0 0 0 0 0 0 0 0 0 0 0 0 0 0 0Coking Coal 606 0 606 0 0 0 351 0 351 0 0 0 0 0 0 0 0 0Thermal Coal 0 0 0 1417 0 1417 0 0 0 610 0 610 0 0 0 0 0 0Cement 0 0 0 0 0 0 0 0 0 0 0 0 0 0 0 0 4 4Iron Ore/Pellets 0 2114 2114 0 0 0 46 51 97 0 0 0 52 0 52 0 0 0Other Ore 2 582 584 0 0 0 0 563 563 0 0 0 0 882 882 0 0 0Tea and Coffee 0 0 0 0 0 0 0 0 0 0 0 0 0 0 0 0 0 0Chemicals 60 0 60 121 0 121 7 0 7 164 0 164 10 0 10 85 0 85Others 22891 16047 38938 20 151 171 20788 16286 37074 46 51 97 19312 15838 35150 74 85 159Total 36287 20178 56465 4038 957 4995 32867 18281 51148 3948 611 4559 30467 18547 49014 3907 483 4390
('000 Tonnes)2012-13
Overseas CoastalCoastal
Traffic Handled - Port-wise and Principal Commodity-wise -
2010-11, 2011-12 & 2012-132011-12
Coastal OverseasOverseas2010-11
Table 2.1.3 (Contd...)

35
Tuticorin
CommodityUnloaded Loaded Total Unloaded Loaded Total Unloaded Loaded Total Unloaded Loaded Total Unloaded Loaded Total Unloaded Loaded Total
1 2 3 4 5 6 7 8 9 10 11 12 13 14 15 16 17 18 19POL Crude 0 0 0 0 0 0 0 0 0 0 0 0 0 0 0 0 0POL Products 262 0 262 479 0 479 52 0 52 578 0 578 42 0 42 505 0 505Fertiliser 1159 12 1171 0 0 0 1111 23 1134 0 0 0 487 0 487 0 0 0FRM - Dry 730 0 730 0 0 0 891 0 891 0 0 0 564 8 572 0 0 0FRM - Liquid 81 40 121 0 167 167 123 26 149 0 94 94 87 89 176 0 38 38Food Grains 42 38 80 0 0 0 0 297 297 0 10 10 0 128 128 0 0 0Iron & Steel 0 4 4 182 0 182 0 6 6 274 0 274 0 4 4 199 0 199Iron Scrap 1 0 1 0 0 0 1 0 1 0 0 0 0 0 0 0 0 0Sugar 206 136 342 0 0 0 0 176 176 0 0 0 0 47 47 0 0 0Veg. Oil 241 0 241 0 0 0 245 4 249 0 0 0 250 0 250 0 0 0Salt 0 271 271 0 0 0 28 110 138 0 0 0 0 108 108 0 0 0Coking Coal 0 0 0 0 0 0 0 0 0 0 0 0 0 0 0 0 0 0Thermal Coal 1061 0 1061 4288 0 4288 1380 0 1380 4670 0 4670 1263 0 1263 5426 0 5426Cement 0 33 33 0 0 0 0 35 35 0 0 0 0 36 36 0 1 1Iron Ore/Pellets 0 64 64 0 0 0 0 33 33 0 0 0 0 0 0 0 0 0Other Ore 1322 371 1693 0 0 0 1167 260 1427 0 0 0 1302 300 1602 0 0 0Tea and Coffee 0 0 0 0 0 0 0 0 0 0 0 0 0 0 0 0 0 0Chemicals 87 332 419 0 0 0 86 54 140 0 292 292 78 225 303 0 348 348Others 7514 5284 12798 739 581 1320 8320 6924 15244 635 200 835 9200 6521 15721 451 553 1004Total 12706 6585 19291 5688 748 6436 13404 7948 21352 6157 596 6753 13273 7466 20739 6581 940 7521
('000 Tonnes)2012-13
Overseas Coastal2011-12
Overseas Coastal
Traffic Handled - Port-wise and Principal Commodity-wise - 2010-11 ,2011-12 & 2012-13
Overseas Coastal2010-11
Table 2.1.3 (Contd...)

36
Cochin
CommodityUnloaded Loaded Total Unloaded Loaded Total Unloaded Loaded Total Unloaded Loaded Total Unloaded Loaded Total Unloaded Loaded Total
1 2 3 4 5 6 7 8 9 10 11 12 13 14 15 16 17 18 19POL Crude 6708 0 6708 2053 102 2155 7570 0 7570 2230 227 2457 7995 0 7995 2068 123 2191POL Products 509 986 1495 1031 732 1763 465 1122 1587 1363 1107 2470 207 1007 1214 1502 1125 2627Fertiliser 76 0 76 0 0 0 115 0 115 0 0 0 22 0 22 0 0 0FRM - Dry 353 0 353 0 0 0 315 0 315 0 0 0 331 0 331 0 0 0FRM - Liquid 171 0 171 20 0 20 123 0 123 9 0 9 163 0 163 9 0 9Food Grains 0 0 0 0 0 0 0 0 0 0 0 0 0 0 0 0 0 0Iron & Steel 0 0 0 0 0 0 0 0 0 0 0 0 0 0 0 13 0 13Iron Scrap 181 0 181 0 0 0 27 0 27 0 0 0 29 0 29 0 0 0Sugar 0 0 0 0 0 0 0 0 0 0 0 0 0 0 0 0 0 0Veg. Oil 0 0 0 0 0 0 0 0 0 0 0 0 4 0 4 0 0 0Salt 0 0 0 0 0 0 0 0 0 0 0 0 0 0 0 0 0 0Coking Coal 0 0 0 0 0 0 0 0 0 0 0 0 0 0 0 0 0 0Thermal Coal 40 0 40 0 0 0 34 0 34 0 0 0 28 0 28 0 0 0Cement 0 0 0 259 0 259 0 0 0 350 0 350 0 0 0 311 0 311Iron Ore/Pellets 0 0 0 0 0 0 0 0 0 0 0 0 0 0 0 0 0 0Other Ore 0 0 0 0 0 0 0 0 0 0 0 0 0 0 0 0 0 0Tea and Coffee 12 196 208 0 0 0 0 115 115 0 0 0 8 175 183 0 0 0Chemicals 23 3 26 0 0 0 22 16 38 0 0 0 97 21 118 0 0 0Others 2153 1739 3892 371 155 526 1892 1484 3376 1260 244 1504 1915 1226 3141 1310 156 1466Total 10226 2924 13150 3734 989 4723 10563 2737 13300 5212 1578 6790 10799 2429 13228 5213 1404 6617
2012-13Overseas Coastal
('000 Tonnes)2010-11
2010-11 , 2011-12 & 2012-13
OverseasOverseas Coastal
Traffic Handled - Port-wise and Principal Commodity-wise -
Coastal2011-12
Table 2.1.3 (Contd...)

37
New Mangalore
CommodityUnloaded Loaded Total Unloaded Loaded Total Unloaded Loaded Total Unloaded Loaded Total Unloaded Loaded Total Unloaded Loaded Total
1 2 3 4 5 6 7 8 9 10 11 12 13 14 15 16 17 18 19
POL Crude 10462 0 10462 1931 0 1931 11467 0 11467 1614 0 1614 12332 0 12332 1886 0 1886
POL Products 1835 4845 6680 580 1898 2478 2285 5453 7738 236 1190 1426 198 6732 6930 296 1094 1390
Fertiliser 784 0 784 0 0 0 804 0 804 0 0 0 519 0 519 0 0 0
FRM - Dry 4 0 4 0 0 0 21 0 21 0 0 0 17 0 17 0 0 0
FRM - Liquid 225 0 225 8 0 8 186 0 186 4 0 4 150 0 150 14 0 14
Food Grains 0 116 116 0 0 0 0 58 58 0 0 0 0 204 204 0 0 0
Iron & Steel 0 0 0 0 0 0 0 0 0 0 0 0 0 0 0 0 0 0
Iron Scrap 0 0 0 0 0 0 0 0 0 0 0 0 0 0 0 0 0 0
Sugar 0 0 0 0 0 0 0 0 0 0 0 0 0 0 0 0 0 0
Veg. Oil 564 8 572 0 9 9 635 13 648 0 11 11 620 23 643 0 0 0
Salt 0 0 0 0 0 0 0 0 0 0 0 0 0 0 0 1 0 1
Coking Coal 2746 26 2772 84 0 84 4005 0 4005 17 0 17 4358 0 4358 0 0 0
Thermal Coal 0 0 0 0 0 0 0 0 0 0 0 0 2553 0 2553 0 0 0
Cement 0 0 0 243 0 243 0 0 0 254 0 254 0 0 0 262 0 262
Iron Ore/Pellets 0 1889 1889 629 1226 1855 0 649 649 1170 1217 2387 0 26 26 1496 1094 2590
Other Ore 85 0 85 0 0 0 188 0 188 0 0 0 153 0 153 0 0 0
Tea and Coffee 0 0 0 0 0 0 0 0 0 0 0 0 0 0 0 0 0 0
Chemicals 55 62 117 9 0 9 55 152 207 1 0 1 60 140 200 0 0 0
Others 755 359 1114 67 46 113 630 426 1056 112 88 200 2341 394 2735 66 7 73
Total 17515 7305 24820 3551 3179 6730 20276 6751 27027 3408 2506 5914 23301 7519 30820 4021 2195 6216
('000 Tonnes)
Overseas CoastalOverseas Coastal
2012-132011-12
Overseas
2010-11 , 2011-12 & 2012-13
2010-11
Traffic Handled - Port-wise and Principal Commodity-wise -
Coastal
Table 2.1.3 (Contd...)

38
Mormugao
CommodityUnloaded Loaded Total Unloaded Loaded Total Unloaded Loaded Total Unloaded Loaded Total Unloaded Loaded Total Unloaded Loaded Total
1 2 3 4 5 6 7 8 9 10 11 12 13 14 15 16 17 18 19POL Crude 0 0 0 0 0 0 0 0 0 0 0 0 0 0 0 0 0 0POL Products 286 0 286 653 0 653 227 0 227 696 0 696 222 0 222 601 0 601Fertiliser 232 0 232 0 0 0 93 0 93 0 0 0 78 0 78 0 0 0FRM - Dry 0 0 0 0 0 0 0 0 0 0 0 0 0 0 0 0 0 0FRM - Liquid 386 0 386 8 0 8 316 0 316 18 0 18 158 0 158 0 0 0Foodgrain 0 0 0 0 0 0 0 0 0 0 0 0 0 60 60 0 0 0Iron & Steel 0 20 20 0 46 46 0 105 105 3 14 17 0 0 0 0 13 13Iron Scrap 0 0 0 0 0 0 0 0 0 0 0 0 0 0 0 0 0 0Sugar 50 0 50 0 0 0 0 0 0 0 0 0 0 0 0 0 0 0Veg. Oil 0 0 0 0 0 0 0 0 0 0 0 0 0 0 0 0 0 0Salt 0 0 0 0 0 0 0 0 0 0 0 0 0 0 0 0 0 0Coking Coal 4923 0 4923 10 0 10 5639 0 5639 30 0 30 6606 0 6606 0 0 0Thermal Coal 1633 0 1633 0 0 0 1163 0 1163 0 0 0 768 0 768 0 0 0Cement 0 0 0 0 0 0 0 0 0 0 0 0 0 0 0 0 0 0Iron Ore/Pellets 55 40083 40138 221 266 487 99 28932 29031 62 277 339 0 7415 7415 0 6 6Other Ore 0 25 25 0 0 0 0 0 0 0 0 0 0 0 0 0 0 0Tea and Coffee 0 0 0 0 0 0 0 0 0 0 0 0 0 0 0 0 0 0Chemicals 0 0 0 0 0 0 0 0 0 0 0 0 0 0 0 0 0 0Others 728 419 1147 15 1 775 565 1340 11 24 35 615 1062 1677 22 112 134Total 8293 40547 48840 907 313 1220 8312 29602 37914 820 315 1135 8447 8537 16984 623 131 754
('000 Tonnes)2012-13
Overseas Coastal2011-12
Overseas
Traffic Handled - Port-wise and Principal Commodity-wise -
CoastalOverseas Coastal
2010-11, 2011-12 & 2012-132010-11
Table 2.1.3 (Contd...)

39
J. L. Nehru
CommodityUnloaded Loaded Total Unloaded Loaded Total Unloaded Loaded Total Unloaded Loaded Total Unloaded Loaded Total Unloaded Loaded Total
1 2 3 4 5 6 7 8 9 10 11 12 13 14 15 16 17 18 19POL Crude 0 0 0 0 0 0 0 0 0 0 0 0 0 0 0 0 0 0POL Products 299 663 962 1113 2968 4081 306 667 973 660 3212 3872 655 848 1503 464 2159 2623Fertiliser 627 0 627 0 0 0 0 4 4 0 0 0 0 0 0 0 0 0FRM - Dry 8 0 8 862 0 862 0 0 0 0 0 0 0 0 0 0 0 0FRM - Liquid 59 0 59 0 0 0 80 0 80 0 0 0 0 0 0 0 0 0Food Grains 0 0 0 0 0 0 19 0 19 0 0 0 0 0 0 0 0 0Iron & Steel 0 0 0 0 0 0 0 0 0 0 0 0 0 0 0 0 0 0Iron Scrap 0 0 0 0 0 0 0 0 0 0 0 0 0 0 0 0 0 0Sugar 0 0 0 0 0 0 0 0 0 0 0 0 0 0 0 0 0 0Veg. Oil 843 0 843 0 0 0 995 0 995 0 8 8 947 0 947 0 0 0Salt 0 0 0 0 0 0 0 0 0 0 0 0 0 0 0 0 0 0Coking Coal 0 0 0 0 0 0 0 0 0 0 0 0 0 0 0 0 0 0Thermal Coal 0 0 0 0 0 0 0 0 0 0 0 0 0 0 0 0 0 0Cement 9 0 9 0 0 0 9 0 9 685 0 685 0 0 0 594 0 594Iron Ore/Pellets 0 0 0 0 0 0 0 0 0 0 0 0 0 0 0 0 0 0Other Ore 0 0 0 0 0 0 0 0 0 0 0 0 0 0 0 0 0 0Tea and Coffee 0 0 0 0 0 0 0 0 0 0 0 0 0 0 0 0 0 0Chemicals 635 46 681 15 0 15 525 26 551 7 0 7 727 21 748 0 0 0Others 28600 26815 55415 344 411 755 29713 28352 58065 219 243 462 30193 27634 57827 112 134 246Total 31080 27524 58604 2334 3379 5713 31647 29049 60696 1571 3463 5034 32522 28503 61025 1170 2293 3463
('000 Tonnes)2012-13
Overseas CoastalOverseas Coastal
Traffic Handled - Port-wise and Principal Commodity-wise - 2010-11, 2011-12 & 2012-13
2011-12Coastal
2010-11Overseas
Table 2.1.3 (Contd...)

40
Mumbai
CommodityUnloaded Loaded Total Unloaded Loaded Total Unloaded Loaded Total Unloaded Loaded Total Unloaded Loaded Total Unloaded Loaded Total
1 2 3 4 5 6 7 8 9 10 11 12 13 14 15 16 17 18 19
POL Crude 12380 0 12380 6455 2977 9432 14492 0 14492 6073 2731 8804 15479 0 15479 5149 4552 9701
POL Products 3017 2893 5910 4796 472 5268 1390 1160 2550 4479 286 4765 1798 3472 5270 4055 246 4301
Fertiliser 155 0 155 0 0 0 230 0 230 0 0 0 156 0 156 0 0 0
FRM - Dry 300 0 300 0 0 0 174 0 174 0 0 0 356 0 356 0 0 0
FRM - Liquid 0 0 0 0 0 0 0 0 0 0 0 0 0 0 0 0 0 0
Food Grains 743 0 743 2 0 2 849 45 894 0 0 0 880 0 880 0 0 0
Iron & Steel 4042 364 4406 240 0 240 3359 572 3931 424 0 424 2830 741 3571 111 0 111
Iron Scrap 0 0 0 0 0 0 0 0 0 0 0 0 0 0 0 0 0 0
Sugar 12 12 24 0 0 0 0 162 162 0 0 0 0 162 162 0 0 0
Veg. Oil 191 0 191 0 0 0 192 7 199 0 0 0 239 15 254 0 0 0
Salt 0 0 0 0 0 0 0 0 0 0 0 0 0 0 0 0 0 0
Coking Coal 0 0 0 0 0 0 0 0 0 0 0 0 0 0 0 0 0 0
Thermal Coal 6368 0 6368 0 0 0 4622 0 4622 0 0 0 4100 0 4100 0 0 0
Cement 27 0 27 132 0 132 0 0 0 170 0 170 0 0 0 248 0 248
Iron Ore/Pellets 0 0 0 0 0 0 0 0 0 0 0 0 0 0 0 0 0 0
Other Ore 137 0 137 0 0 0 0 0 0 0 0 0 0 0 0 0 0 0
Tea and Coffee 0 0 0 0 0 0 0 0 0 0 0 0 0 0 0 0 0 0
Chemicals 51 7 58 0 0 0 0 0 0 0 0 0 0 0 0 0 0 0
Others 7302 1334 8627 186 0 186 11228 3447 14675 94 0 94 12386 1026 13412 37 0 37
Total 34716 4610 39326 11811 3449 15260 36536 5393 41929 11240 3017 14257 38224 5416 43640 9600 4798 14398
Note:- Coastal cargo unloaded includes transhipment of POL crude(9232 Th. Tonnes) and products(3502 Th. Tonnes) moved through pipiline and containers(658 Th. Tonnes) by road.
('000 Tonnes)
2012-13
Overseas Coastal
2011-12
Overseas CoastalOverseas
2010-11, 2011-12 & 2012-13
Coastal
Traffic Handled - Port-wise and Principal Commodity-wise -
2010-11
Table 2.1.3 (Contd...)

41
Kandla
CommodityUnloaded Loaded Total Unloaded Loaded Total Unloaded Loaded Total Unloaded Loaded Total Unloaded Loaded Total Unloaded Loaded Total
1 2 3 4 5 6 7 8 9 10 11 12 13 14 15 16 17 18 19POL Crude 34246 0 34246 2164 0 2164 33605 0 33605 2157 0 2157 36443 0 36443 3226 0 3226POL Products 1020 6145 7165 864 3987 4851 881 5636 6517 759 3900 4659 323 6098 6421 880 7574 8454Fertiliser 5807 0 5807 0 0 0 5297 0 5297 0 0 0 3678 0 3678 0 0 0FRM - Dry 583 0 583 0 0 0 761 0 761 0 0 0 946 0 946 0 0 0FRM - Liquid 1443 0 1443 136 0 136 1521 0 1521 157 0 157 1596 0 1596 0 0 0Food Grains 5 669 674 0 0 0 0 1291 1291 0 0 0 1 3782 3783 0 0 0Iron & Steel 1381 5 1386 52 40 92 840 28 868 26 136 162 1031 27 1058 115 63 178Iron Scrap 126 0 126 0 0 0 4 0 4 0 0 0 80 0 80 0 0 0Sugar 300 388 688 0 0 0 99 352 451 0 0 0 722 761 1483 0 0 0Veg. Oil 616 13 629 0 0 0 0 0 0 0 0 0 577 166 743 0 0 0Salt 0 0 0 0 152 152 0 0 0 0 0 0 0 4429 4429 0 66 66Coking Coal 410 0 410 0 0 0 156 0 156 5 0 5 374 0 374 0 0 0Thermal Coal 3082 0 3082 0 0 0 4049 0 4049 15 0 15 4064 0 4064 0 0 0Cement 0 0 0 0 0 0 0 0 0 0 0 0 0 0 0 0 0 0Iron Ore/Pellets 411 192 603 214 0 214 595 0 595 396 0 396 925 0 925 0 0 0Other Ore 10 258 268 0 6 6 38 232 270 0 271 271 50 310 360 0 583 583Tea and Coffee 0 0 0 0 0 0 0 0 0 0 0 0 0 0 0 0 0 0Chemicals 3900 298 4198 5 356 361 4288 250 4538 0 36 36 4938 218 5156 0 0 0Others 3945 7290 11235 521 840 1361 4240 8198 12438 523 1759 2282 3311 5246 8557 122 894 1016Total 57285 15258 72543 3956 5381 9337 56374 15987 72361 4038 6102 10140 59059 21037 80096 4343 9180 13523
('000 Tonnes)2012-13
Overseas Coastal
Traffic Handled - Port-wise and Principal Commodity-wise -
Overseas Coastal2011-12
2010-11, 2011-12 & 2012-13
CoastalOverseas2010-11
Table 2.1.3 (Contd...)

42
All Ports
CommodityUnloaded Loaded Total Unloaded Loaded Total Unloaded Loaded Total Unloaded Loaded Total Unloaded Loaded Total Unloaded Loaded Total
1 2 3 4 5 6 7 8 9 10 11 12 13 14 15 16 17 18 19POL Crude 83529 0 83529 17739 5299 23038 97437 0 97437 17284 4476 21760 102545 0 102545 14514 4866 19380POL Products 15837 18115 33952 17046 14399 31445 8379 16659 25038 15933 13683 29616 4862 20314 25176 17617 16007 33624Fertiliser 12901 12 12994 0 0 0 12195 27 12222 0 0 0 7454 0 7454 15 0 15FRM - Dry 3931 0 3931 862 0 862 8182 0 8182 0 0 0 7320 8 7328 0 0 0FRM - Liquid 4020 40 4060 536 311 847 4819 26 4845 437 289 726 4130 89 4219 416 38 454Food Grains 929 951 1880 2 33 35 994 2237 3231 0 48 48 898 5663 6561 0 36 36Iron & Steel 6493 944 7250 670 89 759 5586 1315 6901 783 171 954 5198 1923 7121 473 91 564Iron Scrap 495 116 611 0 0 0 242 162 404 0 0 0 561 159 720 0 0 0Sugar 1174 1276 2450 0 8 8 119 802 921 0 7 7 1116 1110 2226 0 3 3Veg. Oil 5251 69 5320 0 36 36 5067 30 5097 7 22 29 5934 210 6144 12 0 12Salt 0 271 271 89 152 241 28 110 138 160 0 160 0 4537 4537 46 66 112Coking Coal 24038 26 24064 94 697 791 27444 0 27444 52 152 204 27846 0 27846 54 132 186Thermal Coal 25654 0 25654 13430 14541 27971 22166 0 22166 13370 15592 28962 26602 0 26602 13620 18550 32170Cement 84 33 117 634 0 634 9 35 44 1459 1 1460 158 36 194 1415 6 1421Iron Ore/Pellets 2625 75271 77896 1186 10654 11840 745 46933 47678 1717 11324 13041 1065 15948 17013 1753 8523 10276Other Ore 3167 1868 5035 417 6 423 3419 1644 5063 852 322 1174 3940 1923 5863 0 583 583Tea and Coffee 12 196 208 0 0 0 0 115 115 0 0 0 8 175 183 0 0 0Chemicals 7996 946 8942 319 359 678 7895 692 8587 430 344 774 8831 847 9678 353 352 705Others 91023 68725 159658 2613 2694 5291 102029 76773 178802 3498 3459 6957 106732 70684 177416 3615 3849 7464Total 289150 168859 458009 55637 49278 104915 306755 147560 454315 55982 49890 105872 315200 123626 438826 53903 53102 107005Source: Major Ports.
Overseas Coastal2012-13
('000 Tonnes)
Overseas Coastal
Traffic Handled - Port-wise and Principal Commodity-wise -
2010-11 2011-12Coastal
2010-11, 2011-12 & 2012-13
Overseas
Table 2.1.3 (Contd...)

43
Unloaded Loaded Total Unloaded Loaded Total Unloaded Loaded Total
1 2 3 4 5 6 7 8 9 10
MAJOR PORTS 11.7 10.5 11.3 15.3 12.7 14.5 12.5 3.0 9.8
Kandla 10.6 3.4 9.1 17.0 4.7 14.3 13.2 4.5 10.9
Mumbai 20.7 3.6 18.7 23.1 2.4 20.4 26.8 2.3 23.8
J.N.P.T. 1.0 1.0 1.0 1.0 1.2 1.1 1.1 0.9 1.0
Mormugao 22.1 31.1 29.6 41.9 47.4 46.2 1.6 3.8 2.7
N.Mangalore 23.5 6.9 18.6 40.8 1.9 31.1 29.6 6.8 24.1
Cochin 6.5 1.4 5.4 13.0 24.3 15.3 10.5 13.2 11.0
Tuticorin 0.0 0.0 0.0 0.3 0.1 0.2 0.0 0.0 0.0
Chennai 8.7 2.2 6.4 12.8 1.7 8.8 10.1 1.8 7.0
Vizag 20.3 5.5 15.7 21.7 4.8 17.3 15.6 3.2 12.2
Paradip 4.1 4.7 4.3 4.5 2.4 4.1 7.6 9.4 7.7
Haldia Dock
Complex 17.7 3.3 13.2 11.2 3.8 9.2 8.2 3.0 7.2
Kolkata Dock
System6.4 26.5 15.2 6.6 26.7 15.4 4.3 3.6 4.0
Ennore 3.4 3.8 3.5 3.6 0.0 3.0 6.1 0.0 5.0
NON-MAJOR
PORTS1.8 2.9 2.2 4.8 3.1 5.4 9.6 4.0 8.2
All Ports 8.0 7.8 8.0 11.3 8.7 10.9 11.2 3.4 9.1
Port2012-13 (%)2011-12 (%)
Percentage Share Of Indian Flag In The Overseas
Cargo Trafiic Handled At Indian Ports
2010-11 (%)
Table 2.1.4
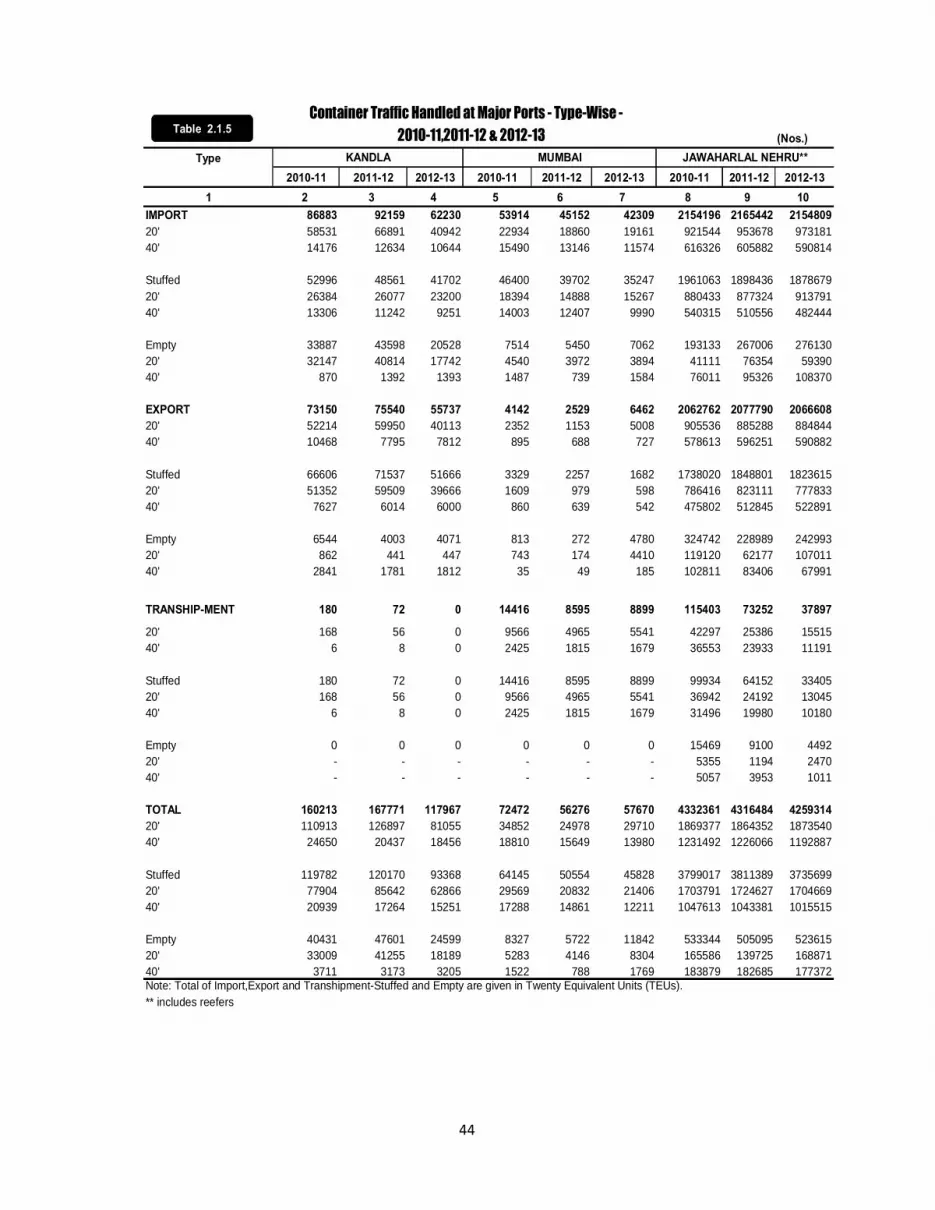
44
(Nos.)Type
2010-11 2011-12 2012-13 2010-11 2011-12 2012-13 2010-11 2011-12 2012-131 2 3 4 5 6 7 8 9 10
IMPORT 86883 92159 62230 53914 45152 42309 2154196 2165442 215480920' 58531 66891 40942 22934 18860 19161 921544 953678 97318140' 14176 12634 10644 15490 13146 11574 616326 605882 590814
Stuffed 52996 48561 41702 46400 39702 35247 1961063 1898436 187867920' 26384 26077 23200 18394 14888 15267 880433 877324 91379140' 13306 11242 9251 14003 12407 9990 540315 510556 482444
Empty 33887 43598 20528 7514 5450 7062 193133 267006 27613020' 32147 40814 17742 4540 3972 3894 41111 76354 5939040' 870 1392 1393 1487 739 1584 76011 95326 108370
EXPORT 73150 75540 55737 4142 2529 6462 2062762 2077790 206660820' 52214 59950 40113 2352 1153 5008 905536 885288 88484440' 10468 7795 7812 895 688 727 578613 596251 590882
Stuffed 66606 71537 51666 3329 2257 1682 1738020 1848801 182361520' 51352 59509 39666 1609 979 598 786416 823111 77783340' 7627 6014 6000 860 639 542 475802 512845 522891
Empty 6544 4003 4071 813 272 4780 324742 228989 24299320' 862 441 447 743 174 4410 119120 62177 10701140' 2841 1781 1812 35 49 185 102811 83406 67991
TRANSHIP-MENT 180 72 0 14416 8595 8899 115403 73252 37897
20' 168 56 0 9566 4965 5541 42297 25386 1551540' 6 8 0 2425 1815 1679 36553 23933 11191
Stuffed 180 72 0 14416 8595 8899 99934 64152 3340520' 168 56 0 9566 4965 5541 36942 24192 1304540' 6 8 0 2425 1815 1679 31496 19980 10180
Empty 0 0 0 0 0 0 15469 9100 449220' - - - - - - 5355 1194 247040' - - - - - - 5057 3953 1011
TOTAL 160213 167771 117967 72472 56276 57670 4332361 4316484 425931420' 110913 126897 81055 34852 24978 29710 1869377 1864352 187354040' 24650 20437 18456 18810 15649 13980 1231492 1226066 1192887
Stuffed 119782 120170 93368 64145 50554 45828 3799017 3811389 373569920' 77904 85642 62866 29569 20832 21406 1703791 1724627 170466940' 20939 17264 15251 17288 14861 12211 1047613 1043381 1015515
Empty 40431 47601 24599 8327 5722 11842 533344 505095 52361520' 33009 41255 18189 5283 4146 8304 165586 139725 16887140' 3711 3173 3205 1522 788 1769 183879 182685 177372Note: Total of Import,Export and Transhipment-Stuffed and Empty are given in Twenty Equivalent Units (TEUs). ** includes reefers
2010-11,2011-12 & 2012-13 Container Traffic Handled at Major Ports - Type-Wise -
KANDLA MUMBAI JAWAHARLAL NEHRU**
Table 2.1.5

45
(Nos.)Type
2010-11 2011-12 2012-13 2010-11 2011-12 2012-13 2010-11 2011-12 2012-131 2 3 4 5 6 7 8 9 10
IMPORT 9453 11213 10576 20157 22543 24141 145860 155307 16495720' 4281 5829 5236 14367 14795 16323 84228 90825 9406740' 2586 2692 2670 2895 3874 3909 30816 32241 35445
Stuffed 6411 8142 7096 10276 13592 15838 126805 134116 14118720' 4255 5768 5146 7714 9546 11334 81789 87438 9267940' 1078 1187 975 1281 2023 2252 22508 23339 24254
Empty 3042 3071 3480 9881 8951 8303 19055 21191 2377020' 26 61 90 6653 5249 4989 2439 3387 138840' 1508 1505 1695 1614 1851 1657 8308 8902 11191
EXPORT 8149 10794 9855 20001 22466 24268 141272 162635 16255720' 3611 5542 4887 14457 15314 16460 82688 92053 9132740' 2269 2626 2484 2772 3576 3904 29292 35291 35615
Stuffed 5447 6059 6048 15557 15944 16983 92706 107579 10597420' 1895 1933 2204 11433 11328 12757 37572 43643 4017840' 1776 2063 1922 2062 2308 2113 27567 31968 32898
Empty 2702 4735 3807 4444 6522 7285 48566 55056 5658320' 1716 3609 2683 3024 3986 3703 45116 48410 5114940' 493 563 562 710 1268 1791 1725 3323 2717
TRANSHIP-MENT - - - - - - 22576 18897 7411
20' - - - - - - 19350 15595 657340' - - - - - - 1613 1651 419 Stuffed - - - - - - 21828 18757 599720' - - - - - - 19350 15595 515940' - - - - - - 1239 1581 419 Empty - - - - - - 748 140 141420' - - - - - - 0 0 141440' - - - - - - 374 70 0
TOTAL 17602 22007 20431 40158 45009 48409 309708 336839 33492520' 7892 11371 10123 28824 30109 32783 186266 198473 19196740' 4855 5318 5154 5667 7450 7813 61721 69183 71479
Stuffed 11858 14201 13144 25833 29536 32821 241339 260452 25315820' 6150 7701 7350 19147 20874 24091 138711 146676 13801640' 2854 3250 2897 3343 4331 4365 51314 56888 57571
Empty 5744 7806 7287 14325 15473 15588 68369 76387 8176720' 1742 3670 2773 9677 9235 8692 47555 51797 5395140' 2001 2068 2257 2324 3119 3448 10407 12295 13908** includes reefers
Container Traffic Handled at Major Ports - Type-Wise - 2010-11,2011-12 & 2012-13
NEW MANGALORE** COCHIN**MORMUGAO**
Table 2.1.5 (Contd…)

46
Container Traffic Handled at Major Ports - Type-Wise - 2010-11, 2011-12 & 2012-13 (Nos.)
Type2010-11 2011-12 2012-13 2010-11 2011-12 2012-13 2010-11 2011-12 2012-13
1 2 3 4 5 6 7 8 9 10IMPORT 226230 231457 234098 761919 803694 782645 72937 82808 9588620' 95640 107281 104146 354089 360300 358189 48455 49902 6404640' 65295 62088 64976 203915 221697 212228 12241 16453 15920 Stuffed 153174 158565 178298 734934 783166 757951 63586 72909 7836620' 81690 87305 90924 340278 346968 342247 43126 47537 5542640' 35742 35630 43687 197328 218099 207852 10230 12686 11470 Empty 73056 72892 55800 26985 20528 24694 9351 9899 1752020' 13950 19976 13222 13811 13332 15942 5329 2365 862040' 29553 26458 21289 6587 3598 4376 2011 3767 4450
EXPORT 241522 245639 241501 723345 751327 756630 72437 76955 8713420' 101724 107791 105785 346907 344255 351312 48007 48273 5366640' 69899 68924 67858 188219 203536 202659 12215 14341 16734 Stuffed 226506 232680 226062 481913 524870 564058 58821 57788 6878920' 88838 96766 96072 246425 255916 268990 45203 44190 5057540' 68834 67957 64995 117744 134477 147534 6809 6799 9107 Empty 15016 12959 15439 241432 226457 192572 13616 19167 1834520' 12886 11025 9713 100482 88339 82322 2804 4083 309140' 1065 967 2863 70475 69059 55125 5406 7542 7627
TRANSHIP-MENT - - - - - - 0 74582 64291
20' - - - - - - 0 48788 4553940' - - - - - - - 12897 9376 Stuffed - - - - - - 0 72756 6331120' - - - - - - - 46962 4456140' - - - - - - - 12897 9375 Empty - - - - - - - 1826 98020' - - - - - - - 1826 97840' - - - - - - - - 1 TOTAL 467752 477096 475599 1485264 1555021 1539275 145374 234345 24731120' 197364 215072 209931 700996 704555 709501 96462 195751 20879040' 135194 131012 132834 392134 425233 414887 24456 56588 51406
Stuffed 379680 391245 404360 1216847 1308036 1322009 122407 203453 21046620' 170528 184071 186996 586703 602884 611237 88329 138689 15056240' 104576 103587 108682 315072 352576 355386 17039 32382 29952
Empty 88072 85851 71239 268417 246985 217266 22967 30892 3684520' 26836 31001 22935 114293 101671 98264 8133 8274 1268940' 30618 27425 24152 77062 72657 59501 7417 11309 12078** includes reefers
TUTICORIN** CHENNAI** VISAKHAPATNAM**
Table 2.1.5 (Contd…)

47
Container Traffic Handled at Major Ports - Type-Wise - 2010-11,2011-12 & 2012-13 (Nos.)
Type2010-11 2011-12 2012-13 2010-11 2011-12 2012-13 2010-11 2011-12 2012-13
1 2 3 4 5 6 7 8 9 10IMPORT 1084 3795 6263 70995 54008 67796 192075 162802 23240620' 1084 3795 6263 39613 41272 47036 111043 116254 13562440' - - 0 15691 6368 10380 40516 23274 48391 Stuffed - - 147 70558 53299 67009 183051 154930 21733020' - - 147 39440 40573 46267 107485 110666 12540840' - - - 15559 6363 10371 37783 22132 45961
Empty 1084 3795 6116 437 709 787 9024 7872 1507620' 1084 3795 6116 173 699 769 3558 5588 1021640' - - - 132 5 9 2733 1142 2430
EXPORT 2443 4058 6809 68408 61262 69418 185060 154133 23080620' 2443 4058 6809 50144 49450 52244 96216 105525 13010040' - - - 9132 5906 8587 44422 24304 50353 Stuffed 2443 4058 6717 47496 47496 46885 139783 124918 17995420' 2443 4058 6717 43470 43470 41619 80165 92840 11476640' - - - 2013 2013 2633 29809 16039 32594 Empty - - 92 20912 13766 22533 45277 29215 5085220' - - 92 6674 5980 10625 16051 12685 1533440' - - - 7119 3893 5954 14613 8265 17759
TRANSHIP-MENT - - - - - - - - -
20' - - - - - - - - -40' - - - - - - - - -
Stuffed - - - - - - - - -20' - - - - - - - - -40' - - - - - - - - -
Empty - - - - - - - - -20' - - - - - - - - -40' - - - - - - - - - TOTAL 3527 7853 13072 139403 115270 137214 377135 316935 46321220' 3527 7853 13072 89757 90722 99280 207259 221779 26572440' - - - 24823 12274 18967 84938 47578 98744
Stuffed 2443 4058 6864 118054 100795 113894 322834 279848 39728420' 2443 4058 6864 82910 84043 87886 187650 203506 24017440' - - - 17572 8376 13004 67592 38171 78555
Empty 1084 3795 6208 21349 14475 23320 54301 37087 6592820' 1084 3795 6208 6847 6679 11394 19609 18273 2555040' - - - 7251 3898 5963 17346 9407 201891. Containers of size 40,/ more than 40, converted into TEUs by taking 1 container =2 TEUs.
PARADIP HALDIA KOLKATA
Table 2.1.5 (Contd…)

48
Container Traffic Handled at Major Ports - Type-Wise - 2010-11 , 2011-12 &2012-13 (Nos.)
Type
1 2 3 4
IMPORT 3795703 3251801 387811620' 1755809 1563167 186421440' 1019947 844317 1006951 Stuffed 3409254 2676427 341885020' 1630988 1295169 172183640' 889133 690629 848507
Empty 386449 575374 45926620' 124821 267998 14237840' 130814 153688 158444
EXPORT 3612627 3107798 371778520' 1714003 1507546 174255540' 949312 800126 987615 Stuffed 2888563 2671808 309843320' 1404525 1360798 145197540' 742019 655505 823229 Empty 724064 435990 61935220' 309478 146748 29058040' 207293 144621 164386
TRANSHIP-MENT 152575 218662 11849820' 71381 90634 7316840' 40597 64014 22665
Stuffed 136358 159211 11161220' 66026 76093 6830640' 35166 41559 21653
Empty 16217 59451 688620' 5355 14541 486240' 5431 22455 1012 TOTAL 7560905 7650908 771439920' 3541193 3161347 367993740' 2009856 1708457 2017231 Stuffed 6434175 5507446 662889520' 3101539 2732060 324211740' 1666318 1387693 1693389 Empty 1126730 1070815 108550420' 439654 429287 43782040' 343538 320764 323842
Source: Major Ports and IPA
ALL PORTS2010-11 2011-12 2012-13
Table 2.1.5 (Contd…)

49
2011-12 2012-13 2011-12 2012-13 2011-12 2012-13 2011-12 2012-13 2011-12 2012-13
1 2 3 4 5 6 7 8 9 10 11
ALL PORTS
LOADED
1. Textiles(Cotton,Silk,Synthetic)Yarn
etc.33 26 33 26 0.06 0.04 0.05 0.04 100.00 100.00
2. Metal & Metal products 398 448 766 832 0.67 0.76 1.12 1.16 51.96 53.85
3. Tea & Coffee 487 254 487 254 0.81 0.43 0.71 0.35 100.00 100.00
4. Foodgrain (Cereals and Pulses) 139 460 517 763 0.23 0.78 0.75 1.06 26.89 60.29
5. Marine products 255 259 255 259 0.43 0.44 0.37 0.36 100.00 100.00
6. Fodder 39 45 39 45 0.07 0.08 0.06 0.06 100.00 100.00
7. Fruits & Vegetables. 0 0 4 1 0.00 0.00 0.01 0.00 0.00 0.00
8. Spices 88 88 88 88 0.15 0.15 0.13 0.12 100.00 100.00
9. Hossiery, Harberdasherry and
Millinary.14 0 14 0 0.02 0.00 0.02 0.00 100.00 0.00
10. Machinery,Instruments Transport
equipments.73 43 175 161 0.12 0.07 0.26 0.22 41.71 26.71
11.Drugs and Medicines. 21 0 22 1 0.04 0.00 0.03 0.00 95.45 0.00
12.Dyes and Colours. 0 0 0 0 0.00 0.00 0.00 0.00 0.00 0.00
13.Oil seeds,fats etc. 19 17 19 17 0.03 0.03 0.03 0.02 100.00 100.00
14.Chemicals 37 50 226 399 0.06 0.08 0.33 0.55 16.37 12.53
15.Dry Fruits 9 11 9 11 0.02 0.02 0.01 0.02 100.00 100.00
16.Jute & its Products 299 235 299 235 0.50 0.40 0.44 0.33 100.00 100.00
17.Leather & its Products 33 29 33 29 0.06 0.05 0.05 0.04 100.00 100.00
18.Others 49483 26681 56530 38662 82.74 45.14 82.45 53.69 87.53 69.01
20.All Commodities 51427 28676 59516 29671 85.99 48.51 86.80 41.20 86.41 96.65
21.Tare Weight(a) 7907 5956 8578 6131 13.22 10.08 12.51 8.51 92.18 97.15
22.Transhipment incl. Tare Wt.(b) 472 2030 472 4238 0.79 3.43 0.69 5.89 100.00 47.90
Grand Total 59806 59113 68566 72011 100.00 100.00 100.00 100.00 87.22 82.09
(2) In case of KDS, transhipment is included in respective commodity traffic.
Commodities
General Cargo (000T)
% Share of
Commodities in
Total Container
Cargo
% Share of
Commodities in
Total General
Cargo
Container Total General
Cargo Cargo
Level of
Containerisation %
of
Containerisation
to General Cargo
Commodity-Wise Break-Up of Container and General Cargo and Level
of Containerisation at Major Ports -Port-wise 2011-12 & 2012-13
Note : (1) For Visakhapatnam, Tuticorin and J.L.Nehru ports Commodity-wise break up of Container Cargo is not available foryears 2011-12 & 2012-13. In case of
Chennai port, commodity-wise break up of Container Cargo and General Cargo for 2011-12 & 201
Table 2.1.6

50
Commodity-Wise Break-Up of Container and General Cargo and Level of Containerisation at Major Ports - Port-wise - 2011-12 & 2012-13
2011-12 2012-13 2011-12 2012-13 2011-12 2012-13 2011-12 2012-13 2011-12 2012-131 2 3 4 5 6 7 8 9 10 11
ALL PORTS
UNLOADED
1. Iron & Steel 345 95 2946 3475 0.57 0.16 3.47 4.12 11.71 2.73
2. Metal & Metal Products. 346 287 1884 514 0.57 0.47 2.22 0.61 18.37 55.84
3. Chemicals 173 110 399 853 0.29 0.18 0.47 1.01 43.36 12.90
4. Paper, Newsprints etc. 262 181 263 181 0.43 0.30 0.31 0.21 99.62 100.00
5. Plastic & its products 149 41 149 42 0.25 0.07 0.18 0.05 100.00 97.62
6. Machinery/Instrument and Transport equipments. 170 43 1031 499 0.28 0.07 1.21 0.59 16.49 8.62
7. Textiles(Cotton,Silk, Synthetic)Yarn etc. 9 2 13 2 0.01 0.00 0.02 0.00 69.23 100.00
8. Hair and wool 9 3 9 3 0.01 0.00 0.01 0.00 100.00 100.00
9. Rubber and its products. 105 90 105 91 0.17 0.15 0.12 0.11 100.00 98.90
10.Oil, fats etc. 74 21 592 1218 0.12 0.03 0.70 1.44 12.50 1.72
11.Woodpulp. 2 1 95 105 0.00 0.00 0.11 0.12 2.11 0.95
4. Foodgrain (Cereals and Pulses) 27 11 1850 1324 0.04 0.02 2.18 1.57 1.46 0.83
13.Fertiliser & FRM 5 2 2849 1739 0.01 0.00 3.36 2.06 0.18 0.12
14.Industrial Alcohol & Spirits (Non-potable) 0 0 0 0 0.00 0.00 0.00 0.00 - -
15.Drugs & Medicines 1 0 1 0 0.00 0.00 0.00 0.00 100.00 -
16.Timber & Log 59 51 1964 1952 0.10 0.08 2.31 2.31 3.00 2.61
17.Others 29842 32131 61150 42239 49.53 52.89 72.04 50.09 48.80 76.07
19.All Commodities 27129 28322 75300 29546 45.03 46.62 88.71 35.03 36.03 95.86
20.Tare Weight (a) 6017 6238 8487 12319 9.99 10.27 10.00 14.61 70.90 50.64
21.Transhipment incl.Tare Wt.(b) 6208 6583 1101 16860 10.30 10.84 1.30 19.99 563.85 39.05
Grand Total 60253 60753 84888 84334 100.00 100.00 100.00 100.00 70.98 72.04
(2) In case of KDS, transhipment is included in respective commodity traffic.
Source: Major Ports
Level of Containerisation
% of Containerisation to General Cargo
Commodities
General Cargo (000T)
% Share of Commodities in Total Container
Cargo
% Share of Commodities in
Total General Cargo
Container Total GeneralCargo Cargo
Note : (1) For Visakhapatnam, Tuticorin and J.L.Nehru ports commodity-wise break up of Container Cargo is not available for years 2010-11 & 2011-12. In case of Chennai port, commodity-wise break up of Container Cargo and General Cargo for 2010-11 & 201
Table 2.1.6

51
Commodity-Wise Break-Up of Container and General Cargo and Level
of Containerisation at Major Ports -Port-wise 2011-12&2012-13
2011-12 2012-13 2011-12 2012-13 2011-12 2012-13 2011-12 2012-13 2011-12 2012-13
1 2 3 4 5 6 7 8 9 10 11
PORT: KOLKATA DOCK SYSTEM
LOADED `
1. Textiles(Cotton,Silk, Synthetic)Yarn
etc.28 18 28 18 0.86 0.51 0.66 0.39 100.00 100.00
2. Metal & Metal products 68 81 68 81 2.09 2.31 1.60 1.73 100.00 100.00
3. Tea & Coffee 141 122 141 122 4.33 3.48 3.31 2.61 100.00 100.00
4. Foodgrain (Cereals and Pulses) 82 410 107 506 2.52 11.69 2.52 10.84 76.64 81.03
5. Marine products 0 0 0 0 0.00 0.00 0.00 0.00 - -
6. Fodder 0 0 0 0 0.00 0.00 0.00 0.00 - -
7. Fruits & Vegetables. 0 0 0 0 0.00 0.00 0.00 0.00 - -
8. Spices 0 0 0 0 0.00 0.00 0.00 0.00 - -
9. Hossiery, Harberdasherry and
Millinary.14 0 14 0 0.43 0.00 0.33 0.00 100.00 -
10. Machinery,Instruments Transport
equipments.44 35 50 38 1.35 1.00 1.18 0.81 88.00 92.11
11.Drugs and Medicines. 21 0 21 0 0.65 0.00 0.49 0.00 100.00 -
12.Dyes and Colours. 0 0 0 0 0.00 0.00 0.00 0.00 - -
13.Oil seeds,fats etc. 6 0 6 0 0.18 0.00 0.14 0.00 100.00 -
14.Chemicals 14 17 14 17 0.43 0.48 0.33 0.36 100.00 100.00
15.Dry Fruits 0 0 0 0 0.00 0.00 0.00 0.00 - -
16.Jute & its Products 289 227 289 227 8.88 6.47 6.79 4.86 100.00 100.00
17.Leather & its Products 31 28 31 28 0.95 0.80 0.73 0.60 100.00 100.00
18.Others 2092 2079 3060 3143 64.27 59.30 71.93 67.32 68.37 66.15
a).Iron & Steel 442 488 463 505 13.58 13.92 10.88 10.82 95.46 96.63
b).Cast Iron Goods 216 197 216 197 6.64 5.62 5.08 4.22 100.00 100.00
c). Miscelleneous 1434 1394 2381 2441 44.06 39.76 55.97 52.28 60.23 57.11
19. All Commodities 2830 3017 3829 4180 86.94 86.05 90.01 89.53 73.91 72.18
20. Tare Weight 425 489 425 489 13.06 13.95 9.99 10.47 100.00 100.00
21 . Transhipment incl.tare wt. (a) (a) (a) (a) - - - - - -
3255 3506 4254 4669 100.00 100.00 100.00 100.00 76.52 75.09
(a): Cargo weights included in respective commodity weights. Tare weight is included in S.N.20.
Commodities
General Cargo (000T)Container
CargoTotal General
Cargo
% Share of
Commodities in
Total Container
Cargo
% Share of
Commodities in
Total General Cargo
Level of
Containerisation %
of Containerisation
to General Cargo
Table 2.1.7
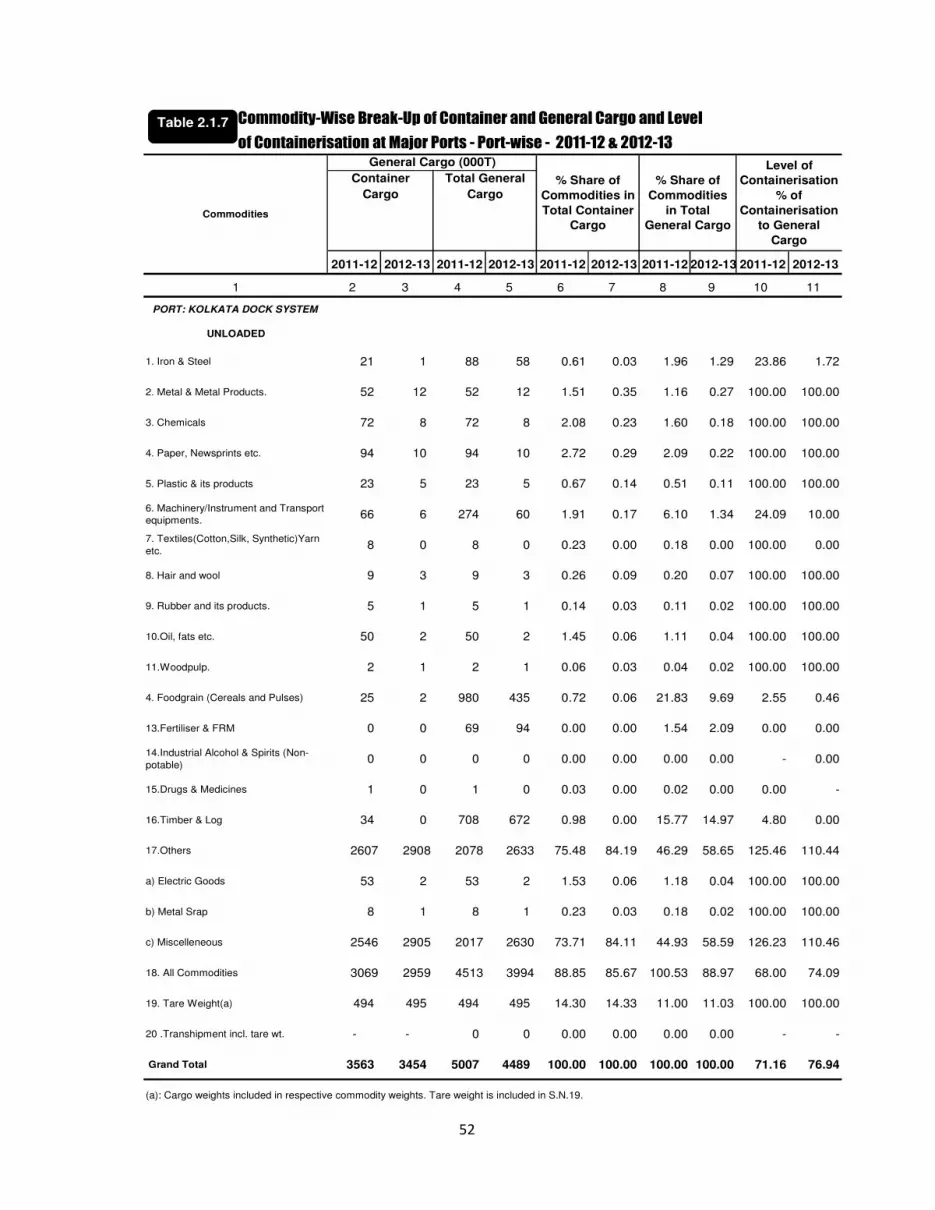
52
Commodity-Wise Break-Up of Container and General Cargo and Level
of Containerisation at Major Ports - Port-wise - 2011-12 & 2012-13
2011-12 2012-13 2011-12 2012-13 2011-12 2012-13 2011-12 2012-13 2011-12 2012-13
1 2 3 4 5 6 7 8 9 10 11
PORT: KOLKATA DOCK SYSTEM
UNLOADED
1. Iron & Steel 21 1 88 58 0.61 0.03 1.96 1.29 23.86 1.72
2. Metal & Metal Products. 52 12 52 12 1.51 0.35 1.16 0.27 100.00 100.00
3. Chemicals 72 8 72 8 2.08 0.23 1.60 0.18 100.00 100.00
4. Paper, Newsprints etc. 94 10 94 10 2.72 0.29 2.09 0.22 100.00 100.00
5. Plastic & its products 23 5 23 5 0.67 0.14 0.51 0.11 100.00 100.00
6. Machinery/Instrument and Transport equipments.
66 6 274 60 1.91 0.17 6.10 1.34 24.09 10.00
7. Textiles(Cotton,Silk, Synthetic)Yarn
etc.8 0 8 0 0.23 0.00 0.18 0.00 100.00 0.00
8. Hair and wool 9 3 9 3 0.26 0.09 0.20 0.07 100.00 100.00
9. Rubber and its products. 5 1 5 1 0.14 0.03 0.11 0.02 100.00 100.00
10.Oil, fats etc. 50 2 50 2 1.45 0.06 1.11 0.04 100.00 100.00
11.Woodpulp. 2 1 2 1 0.06 0.03 0.04 0.02 100.00 100.00
4. Foodgrain (Cereals and Pulses) 25 2 980 435 0.72 0.06 21.83 9.69 2.55 0.46
13.Fertiliser & FRM 0 0 69 94 0.00 0.00 1.54 2.09 0.00 0.00
14.Industrial Alcohol & Spirits (Non-
potable)0 0 0 0 0.00 0.00 0.00 0.00 - 0.00
15.Drugs & Medicines 1 0 1 0 0.03 0.00 0.02 0.00 0.00 -
16.Timber & Log 34 0 708 672 0.98 0.00 15.77 14.97 4.80 0.00
17.Others 2607 2908 2078 2633 75.48 84.19 46.29 58.65 125.46 110.44
a) Electric Goods 53 2 53 2 1.53 0.06 1.18 0.04 100.00 100.00
b) Metal Srap 8 1 8 1 0.23 0.03 0.18 0.02 100.00 100.00
c) Miscelleneous 2546 2905 2017 2630 73.71 84.11 44.93 58.59 126.23 110.46
18. All Commodities 3069 2959 4513 3994 88.85 85.67 100.53 88.97 68.00 74.09
19. Tare Weight(a) 494 495 494 495 14.30 14.33 11.00 11.03 100.00 100.00
20 .Transhipment incl. tare wt. - - 0 0 0.00 0.00 0.00 0.00 - -
Grand Total 3563 3454 5007 4489 100.00 100.00 100.00 100.00 71.16 76.94
(a): Cargo weights included in respective commodity weights. Tare weight is included in S.N.19.
% Share of
Commodities in
Total Container
Cargo
% Share of
Commodities
in Total
General Cargo
Level of
Containerisation
% of
Containerisation
to General
Cargo
Cargo Cargo
Commodities
General Cargo (000T)
Container Total General
Table 2.1.7

53
Commodity-Wise Break-Up of Container and General Cargo and Level
of Containerisation at Major Ports -Port-wise 2011-12 & 2012-13
2011-12 2012-13 2011-12 2012-13 2011-12 2012-13 2011-12 2012-13 2011-12 2012-13
1 2 3 4 5 6 7 8 9 10 11
PORT:HALDIA DOCK COMPLEX
LOADED `1. Textiles(Cotton,Silk, Synthetic)Yarn
etc.1 0 1 0 0.08 0.00 0.07 0.00 100.00 -
2. Metal & Metal products 324 307 324 307 26.73 25.33 23.36 22.13 - 100.00
3. Tea & Coffee 2 0 2 0 0.17 0.00 0.14 0.00 100.00 -
4. Foodgrain (Cereals and Pulses) 54 50 54 50 4.46 4.13 3.89 3.60 100.00 100.00
5. Marine products 0 0 0 0 0.00 0.00 0.00 0.00 - -
6. Fodder 0 0 0 0 0.00 0.00 0.00 0.00 - -
7. Fruits & Vegetables. 0 0 0 0 0.00 0.00 0.00 0.00 - -
8. Spices 0 0 0 0 0.00 0.00 0.00 0.00 - -
9. Hossiery, Harberdasherry and
Millinary.0 0 0 0 0.00 0.00 0.00 0.00 - -
10. Machinery,Instruments Transport
equipments.2 2 3 2 0.17 0.17 0.22 0.14 - 100.00
11.Drugs and Medicines. 0 0 0 0 0.00 0.00 0.00 0.00 - -
12.Dyes and Colours. 0 0 0 0 0.00 0.00 0.00 0.00 - -
13.Oil seeds,fats etc. 0 0 0 0 0.00 0.00 0.00 0.00 - -
14.Chemicals 3 2 3 2 0.25 0.17 0.22 0.14 100.00 100.00
15.Dry Fruits 0 0 0 0 0.00 0.00 0.00 0.00 - -
16.Jute & its Products 4 1 4 1 0.33 0.08 0.29 0.07 100.00 100.00
17.Leather & its Products 1 1 1 1 0.08 0.08 0.07 0.07 100.00 100.00
18.Others 729 692 729 867 60.15 57.10 52.56 62.51 100.00 79.82
a) Iron Goods 0 0 0 0 0.00 0.00 0.00 0.00 - -
b) Iron & Steel 323 288 323 463 26.65 23.76 23.29 33.38 100.00 62.20
c). Miscelleneous 406 404 406 404 33.50 33.33 29.27 29.13 100.00 100.00
19. All Commodities 1120 1055 1121 1230 92.41 87.05 80.82 88.68 99.91 85.77
20. Tare Weight 159 157 159 157 13.12 12.95 11.46 11.32 100.00 100.00
21. Transhipment incl. tare wt. 0 0 0 0 0.00 0.00 0.00 0.00 - -
Grand Total 1279 1212 1280 1387 100.00 100.00 100.00 100.00 99.92 87.38
Cargo Cargo
Commodities
General Cargo (000T)Container Total General % Share of
Commodities in
Total Container
Cargo
% Share of
Commodities in
Total General Cargo
Level of
Containerisation %
of Containerisation
to General Cargo
Table 2.1.7(Contd…)

54
Commodity-Wise Break-Up of Container and General Cargo and Level of Containerisation at Major Ports - Port-wise - 2011-12 & 2012-13
2011-12 2012-13 2011-12 2012-13 2011-12 2012-13 2011-12 2012-13 2011-12 2012-13
1 2 3 4 5 6 7 8 9 10 11PORT:HALDIA DOCK COMPLEX
UNLOADED
1. Iron & Steel 264 61 335 307 15.93 3.68 15.73 14.41 78.81 19.87
2. Metal & Metal Products. 250 263 250 263 15.09 15.87 11.74 12.35 - 100.00
3. Chemicals 64 9 64 9 3.86 0.54 3.00 0.42 100.00 100.00
4. Paper, Newsprints etc. 122 42 122 42 7.36 2.53 5.73 1.97 100.00 100.00
5. Plastic & its products 118 30 118 30 7.12 1.81 5.54 1.41 100.00 100.00
6. Machinery/Instrument and Transport equipments. 62 20 287 192 3.74 1.21 13.47 9.01 21.60 10.42
7. Textiles(Cotton,Silk, Synthetic)Yarn etc. 0 0 0 0 0.00 0.00 0.00 0.00 - -
8. Hair and wool 0 0 0 0 0.00 0.00 0.00 0.00 - -
9. Rubber and its products. 33 20 33 20 1.99 1.21 1.55 0.94 100.00 100.00
10.Oil, fats etc. 11 18 11 18 0.66 1.09 0.52 0.85 100.00 100.00
11.Woodpulp. 0 0 0 0 0.00 0.00 0.00 0.00 - -
4. Foodgrain (Cereals and Pulses) 2 2 2 2 0.12 0.12 0.09 0.09 100.00 100.00
13.Fertiliser & FRM 0 0 0 109 0.00 0.00 0.00 5.12 - -
14.Industrial Alcohol & Spirits (Non-potable) 0 0 0 0 0.00 0.00 0.00 0.00 - -
15.Drugs & Medicines 0 0 0 0 0.00 0.00 0.00 0.00 - -
16.Timber & Log 0 15 0 15 0.00 0.91 0.00 0.70 - -
17.Others 272 1028 272 974 16.42 62.04 12.77 45.73 100.00 105.54
a) Soda Ash 0 0 0 0 0.00 0.00 0.00 0.00 - -
b) Waste Paper 0 0 0 0 0.00 0.00 0.00 0.00 - -
c) Miscelleneous 272 1028 272 974 16.42 62.04 12.77 45.73 100.00 105.54
18. All Commodities 1198 1508 1494 1981 72.30 91.01 70.14 93.00 80.19 76.12
19. Tare Weight 142 149 142 149 8.57 8.99 6.67 7.00 100.00 100.00
20. Transhipment incl tare wt. 0 0 0 0 0.00 0.00 0.00 0.00 - -
Grand Total 1340 1657 1636 2130 100.00 100.00 100.00 100.00 81.91 77.79
Level of Containerisation
% of Containerisation to General Cargo
% Share of Commodities in Total Container
Cargo
% Share of Commodities in Total General
CargoCommodities
General Cargo (000T)Container Total General
Cargo Cargo
Table 2.1.7(Contd…)

55
Commodity-Wise Break-Up of Container and General Cargo and Level
of Containerisation at Major Ports -Port-wise 2011-12 & 2012-13
2011-12 2012-13 2011-12 2012-13 2011-12 2012-13 2011-12 2012-13 2011-12 2012-13
1 2 3 4 5 6 7 8 9 10 11
PORT : PARADIP
LOADED
1. Textiles(Cotton,Silk, Synthetic)Yarn
etc.0 0 0 0 0.00 0.00 0.00 0.00 - -
2. Metal & Metal products 0 0 0 0 0.00 0.00 0.00 0.00 - -
3. Tea & Coffee 0 0 0 0 0.00 0.00 0.00 0.00 - -
4. Foodgrain (Cereals and Pulses) 0 0 0 0 0.00 0.00 0.00 0.00 - -
5. Marine products 0 0 0 0 0.00 0.00 0.00 0.00 - -
6. Fodder 0 0 0 0 0.00 0.00 0.00 0.00 - -
7. Fruits & Vegetables. 0 0 0 0 0.00 0.00 0.00 0.00 - -
8. Spices 0 0 0 0 0.00 0.00 0.00 0.00 - -
9. Hossiery, Harberdasherry and
Millinary.0 0 0 0 0.00 0.00 0.00 0.00 - -
10. Machinery,Instruments Transport
equipments.0 0 0 0 0.00 0.00 0.00 0.00 - -
11.Drugs and Medicines. 0 0 0 0 0.00 0.00 0.00 0.00 - -
12.Dyes and Colours. 0 0 0 0 0.00 0.00 0.00 0.00 - -
13.Oil seeds,fats etc. 0 0 0 0 0.00 0.00 0.00 0.00 - -
14.Chemicals 0 0 0 0 0.00 0.00 0.00 0.00 - -
15.Dry Fruits 0 0 0 0 0.00 0.00 0.00 0.00 - -
16.Jute & its Products 0 0 0 0 0.00 0.00 0.00 0.00 - -
17.Leather & its Products 1 0 1 0 0.64 0.00 0.61 0.00 100.00 -
18.Others 90 138 92 145 57.69 88.46 56.44 88.96 97.83 95.17
a).Iron & Steel 0 6 1 6 0.00 3.85 0.61 3.68 0.00 100.00
b).Al.Ingot 0 0 0 0 0.00 0.00 0.00 0.00 - -
c). Miscelleneous 90 132 91 139 57.69 84.62 55.83 85.28 98.90 94.96
19. All Commodities 91 138 93 145 58.33 88.46 57.06 88.96 97.85 95.17
20. Tare Weight 9 18 9 18 5.77 11.54 5.52 11.04 100.00 100.00
21. Transhipment incl tare wt. 0 0 0 0 0.00 0.00 0.00 0.00 - -
Grand Total 100 156 102 163 100.00 100.00 100.00 100.00 98.04 95.71
Commodities
General Cargo (000T)Container Total General
Cargo Cargo% Share of
Commodities in
Total Container
Cargo
% Share of
Commodities in
Total General Cargo
Level of
Containerisation %
of Containerisation
to General Cargo
Table 2.1.7(Contd…)

56
Commodity-Wise Break-Up of Container and General Cargo and Level of Containerisation at Major Ports - Port-wise - 2011-12 & 2012-2013
2011-12 2012-13 2011-12 2012-13 2011-12 2012-13 2011-12 2012-13 2011-12 2012-13
1 2 3 4 5 6 7 8 9 10 11PORT : PARADIP
UNLOADED `
1. Iron & Steel 0 0 223 145 - - 135.98 88.41 0.00 0.00
2. Metal & Metal Products. 0 0 0 0 - - 0.00 0.00 - -
3. Chemicals 0 0 0 0 - - 0.00 0.00 - -
4. Paper, Newsprints etc. 0 0 0 0 - - 0.00 0.00 - -
5. Plastic & its products 0 0 0 0 - - 0.00 0.00 - -
6. Machinery/Instrument and Transport equipments. 0 0 0 0 - - 0.00 0.00 - -
7. Textiles(Cotton,Silk, Synthetic)Yarn etc. 0 0 0 0 - - 0.00 0.00 - -
8. Hair and wool 0 0 0 0 - - 0.00 0.00 - -
9. Rubber and its products. 0 0 0 0 - - 0.00 0.00 - -
10.Oil, fats etc. 0 0 0 0 - - 0.00 0.00 - -
11.Woodpulp. 0 0 0 0 - - 0.00 0.00 - -
4. Foodgrain (Cereals and Pulses) 0 0 0 0 - - 0.00 0.00 - -
13.Fertiliser & FRM 0 0 0 0 - - 0.00 0.00 - -
14.Industrial Alcohol & Spirits (Non-potable) 0 0 0 0 - - 0.00 0.00 - -
15.Drugs & Medicines 0 0 0 0 - - 0.00 0.00 - -
16.Timber & Log 0 0 0 0 - - 0.00 0.00 - -
17.Others 1 1 33 5 - 0.06 20.12 3.05 3.03 20.00
a)Care Cargo 0 0 0 0 - 0.00 0.00 0.00 - -
b) Edible Oil 0 0 0 0 - 0.00 0.00 0.00 - -
c) Miscelleneous 1 1 33 5 - 0.06 20.12 3.05 3.03 20.00
18. All Commodities 1 1 256 150 - 0.06 156.10 91.46 0.39 0.67
19. Tare Weight 8 14 8 14 - 0.84 4.88 8.54 - -
20. Transhipment incl.tare wt. 0 0 0 0 - 0.00 0.00 0.00 - -
Grand Total 9 15 264 164 - 0.91 100.00 100.00 3.41 9.15
Level of Containerisation
% of Containerisation to General Cargo
% Share of Commodities in Total Container
Cargo
% Share of Commodities in
Total General Cargo
Commodities
General Cargo (000T)Container Total General
Cargo Cargo
Table 2.1.7
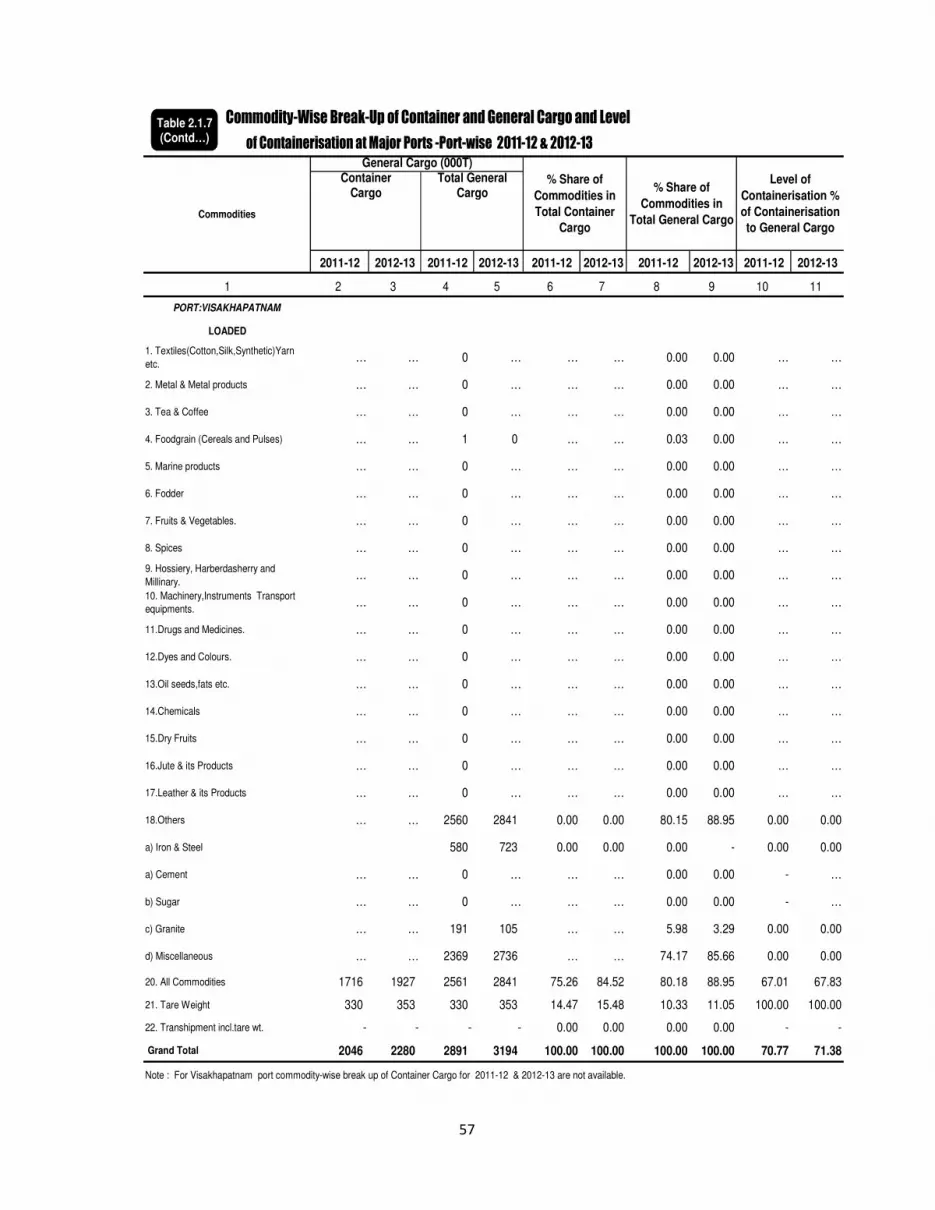
57
Commodity-Wise Break-Up of Container and General Cargo and Level
of Containerisation at Major Ports -Port-wise 2011-12 & 2012-13
2011-12 2012-13 2011-12 2012-13 2011-12 2012-13 2011-12 2012-13 2011-12 2012-13
1 2 3 4 5 6 7 8 9 10 11
PORT:VISAKHAPATNAM
LOADED
1. Textiles(Cotton,Silk,Synthetic)Yarn
etc.… … 0 … … … 0.00 0.00 … …
2. Metal & Metal products … … 0 … … … 0.00 0.00 … …
3. Tea & Coffee … … 0 … … … 0.00 0.00 … …
4. Foodgrain (Cereals and Pulses) … … 1 0 … … 0.03 0.00 … …
5. Marine products … … 0 … … … 0.00 0.00 … …
6. Fodder … … 0 … … … 0.00 0.00 … …
7. Fruits & Vegetables. … … 0 … … … 0.00 0.00 … …
8. Spices … … 0 … … … 0.00 0.00 … …
9. Hossiery, Harberdasherry and
Millinary.… … 0 … … … 0.00 0.00 … …
10. Machinery,Instruments Transport
equipments.… … 0 … … … 0.00 0.00 … …
11.Drugs and Medicines. … … 0 … … … 0.00 0.00 … …
12.Dyes and Colours. … … 0 … … … 0.00 0.00 … …
13.Oil seeds,fats etc. … … 0 … … … 0.00 0.00 … …
14.Chemicals … … 0 … … … 0.00 0.00 … …
15.Dry Fruits … … 0 … … … 0.00 0.00 … …
16.Jute & its Products … … 0 … … … 0.00 0.00 … …
17.Leather & its Products … … 0 … … … 0.00 0.00 … …
18.Others … … 2560 2841 0.00 0.00 80.15 88.95 0.00 0.00
a) Iron & Steel 580 723 0.00 0.00 0.00 - 0.00 0.00
a) Cement … … 0 … … … 0.00 0.00 - …
b) Sugar … … 0 … … … 0.00 0.00 - …
c) Granite … … 191 105 … … 5.98 3.29 0.00 0.00
d) Miscellaneous … … 2369 2736 … … 74.17 85.66 0.00 0.00
20. All Commodities 1716 1927 2561 2841 75.26 84.52 80.18 88.95 67.01 67.83
21. Tare Weight 330 353 330 353 14.47 15.48 10.33 11.05 100.00 100.00
22. Transhipment incl.tare wt. - - - - 0.00 0.00 0.00 0.00 - -
Grand Total 2046 2280 2891 3194 100.00 100.00 100.00 100.00 70.77 71.38
Note : For Visakhapatnam port commodity-wise break up of Container Cargo for 2011-12 & 2012-13 are not available.
Commodities
General Cargo (000T)Container Total General
Cargo Cargo% Share of
Commodities in
Total Container
Cargo
% Share of
Commodities in
Total General Cargo
Level of
Containerisation %
of Containerisation
to General Cargo
Table 2.1.7(Contd…)

58
Commodity-Wise Break-Up of Container and General Cargo and Level of Containerisation at Major Ports - Port-wise - 2011-12 & 2012-13
2011-12 2012-13 2011-12 2012-13 2011-12 2012-13 2011-12 2012-13 2011-12 2012-131 2 3 4 5 6 7 8 9 10 11
PORT : VISAKHAPATNAM
UNLOADED
1. Iron & Steel … … 63 34 0 0 2.37 1.28 0.00 0.00
2. Metal & Metal Products. … … 0 0 … … 0.00 0.00 … …
3. Chemicals … … 0 0 … … 0.00 0.00 … …
4. Paper, Newsprints etc. … … 0 0 … … 0.00 0.00 … …
5. Plastic & its products … … 0 0 … … 0.00 0.00 … …
6. Machinery/Instrument and Transport equipments. … … 0 0 … … 0.00 0.00 … …
7. Textiles(Cotton,Silk, Synthetic)Yarn etc. … … 0 0 … … 0.00 0.00 … …
8. Hair and wool … … 0 0 … … 0.00 0.00 … …
9. Rubber and its products. … … 0 0 … … 0.00 0.00 … …
10.Oil, fats etc. … … 0 0 … … 0.00 0.00 … …
11.Woodpulp. … … 0 0 … … 0.00 0.00 … …
4. Foodgrain (Cereals and Pulses) … … 0 0 … … 0.00 0.00 … …
13.Fertiliser & FRM … … 2 0 … … 0.08 0.00 0.00 0.00
14.Industrial Alcohol & Spirits (Non-potable) … … 0 0 … … 0.00 0.00 … …
15.Drugs & Medicines … … 0 … … … 0.00 0.00 … 0.00
16.Timber & Log … … 184 157 … … 6.92 5.90 0.00 0.00
17.Others … … 2044 2110 … … 76.84 79.32 … …
a) Carbon Materials … … 0 0 … … 0.00 0.00 … …
b) Miscelleneous … … 2044 2110 0.00 0.00 76.84 79.32 … …
19. All Commodities 1816 1915 2291 2301 79.86 84.21 86.13 86.50 79.27 83.22
20. Tare Weight 351 359 351 359 15.44 15.79 13.20 13.50 100.00 100.00
21. Transhipment incl. tare wt. - - 0 0 0.00 0.00 0.00 0.00 - -
Grand Total 2167 2274 2642 2660 100.00 100.00 100.00 100.00 82.02 85.49Note : For Visakhapatnam port commodity-wise break up of Container Cargo for 2011-12 & 2012-13 are not available.
Level of Containerisation
% of Containerisation to General Cargo
% Share of Commodities in Total Container
Cargo
% Share of Commodities in
Total General Cargo
Commodities
General Cargo (000T)Container Total General
Cargo Cargo
Table 2.1.7(Contd…)

59
Commodity-Wise Break-Up of Container and General Cargo and Level
of Containerisation at Major Ports -Port-wise 2011-12 & 2012-13
2011-12 2012-13 2011-12 2012-13 2011-12 2012-13 2011-12 2012-13 2011-12 2012-13
1 2 3 4 5 6 7 8 9 10 11
PORT : CHENNAI
LOADED
1. Textiles(Cotton,Silk, Synthetic)Yarn
etc.… … … … … … ` … … …
2. Metal & Metal products … … … … … … … … … …
3. Tea & Coffee … … … … … … … … … …
4. Foodgrain (Cereals and Pulses) … … … … … … … … … …
5. Marine products … … … … … … … … … …
6. Fodder … … … … … … … … … …
7. Fruits & Vegetables. … … … … … … … … … …
8. Spices … … … … … … … … … …
9. Hossiery, Harberdasherry and
Millinary.… … … … … … … … … …
10. Machinery,Instruments Transport
equipments.… … … … … … … … … …
11.Drugs and Medicines. … … … … … … … … … …
12.Dyes and Colours. … … … … … … … … … …
13.Oil seeds,fats etc. … … … … … … … … … …
14.Chemicals … … … … … … … … … …
15.Dry Fruits … … … … … … … … … …
16.Jute & its Products … … … … … … … … … …
17.Leather & its Products … … … … … … … … … …
18.Others … … … … … … … … … …
a). Minerals … … … … … … … … … …
b).Granite … … … … … … … … … …
c).Iron & Steel … … … … … … … … … …
d).Miscelleneous … … … … … … … … … …
20. All Commodities 14536 14604 16254 16088 99.53 100.00 101.03 100.00 0.62 0.62
21. Tare Weight 1605 2276 1605 2276 10.99 15.58 9.98 14.15 0.07 0.10
22. Transhipment incl. tare wt. … … … … 0.00 0.00 0.00 0.00 0.00 0.00
Grand Total 14536 14604 16254 16088 100.00 100.00 100.00 100.00 89.43 90.78
Note: For Chennai port commodity-wise break up of Container and General Cargo for 2011-12 & 2012-13 are not available.
Commodities
General Cargo (000T)
Container Total General
Cargo Cargo% Share of
Commodities in
Total Container
Cargo
% Share of
Commodities in
Total General
Cargo
Level of
Containerisation %
of
Containerisation
to General Cargo
Table 2.1.7

60
Commodity-Wise Break-Up of Container and General Cargo and Level of Containerisation at Major Ports - Port-wise - 2011-12 & 2012-13
2011-12 2012-13 2011-12 2012-13 2011-12 2012-13 2011-12 2012-13 2011-12 2012-13
1 2 3 4 5 6 7 8 9 10 11PORT : CHENNAI
UNLOADED
1. Iron & Steel … … … … … … … ` … …
2. Metal & Metal Products. … … … … … … … … … …
3. Chemicals … … … … … … … … … …
4. Paper, Newsprints etc. … … … … … … … … … …
5. Plastic & its products … … … … … … … … … …6. Machinery/Instrument and Transport equipments. … … … … … … … … … …7. Textiles(Cotton,Silk, Synthetic)Yarn etc. … … … … … … … … … …
8. Hair and wool … … … … … … … … … …
9. Rubber and its products. … … … … … … … … … …
10.Oil, fats etc. … … … … … … … … … …
11.Woodpulp. … … … … … … … … … …
4. Foodgrain (Cereals and Pulses) … … … … … … … … … …
13.Fertiliser & FRM … … … … … … … … … …14.Industrial Alcohol & Spirits (Non-potable) … … … … … … … … … …
15.Drugs & Medicines … … … … … … … … … …
16.Timber & Log … … … … … … … … … …
17.Others … … … … … … … … … …
a) Non ferrous Metals … … … … … … … … … …
b). Waste Paper … … … … … … … … … …
c) Hides & Shines … … … … … … … … … …
d) Miscelleneous … … … … … … … … … …
19. All Commodities 13832 12747 15204 14017 91.58 84.39 92.85 85.61 90.98 90.94
20. Tare Weight 1708 2357 1708 2357 11.31 15.61 10.43 14.39 100.00 100.00
21. Transhipment incl. tare wt. … … … … 0.00 0.00 0.00 0.00 0.00 0.00
Grand Total 15540 15104 16912 16374 100.00 100.00 100.00 100.00 91.89 92.24
Note: For Chennai port commodity-wise break up of Container and General Cargo for 2011-12 & 2012-13 are not available.
Level of Containerisation
% of Containerisation to General Cargo
% Share of Commodities in Total Container
Cargo
% Share of Commodities in Total General
CargoCommodities
General Cargo (000T)Container Total General
Cargo Cargo
Table 2.1.7(Contd…)

61
Commodity-Wise Break-Up of Container and General Cargo and Level
of Containerisation at Major Ports -Port-wise 2011-12 & 2012-13
2011-12 2012-13 2011-12 2012-13 2011-12 2012-13 2011-12 2012-13 2011-12 2012-13
1 2 3 4 5 6 7 8 9 10 11
PORT : TUTICORIN
LOADED
1. Textiles(Cotton,Silk, Synthetic)Yarn
etc.… … 0 0 … … 0.00 0.00 … `
2. Metal & Metal products … … 0 0 … … 0.00 0.00 … …
3. Tea & Coffee … … 0 0 … … 0.00 0.00 … …
4. Foodgrain (Cereals and Pulses) … … 293 128 0.00 0.00 4.31 1.88 0.00 0.00
5. Marine products … … 0 0 0.00 0.00 0.00 0.00 0.00 0.00
6. Fodder … … 0 0 0.00 0.00 0.00 0.00 0.00 0.00
7. Fruits & Vegetables. … … 0 0 0.00 0.00 0.00 0.00 0.00 0.00
8. Spices … … 0 0 0.00 0.00 0.00 0.00 0.00 0.00
9. Hossiery, Harberdasherry and
Millinary.… … 0 0 0.00 0.00 0.00 0.00 0.00 0.00
10. Machinery,Instruments Transport
equipments.… … 21 2 0.00 0.00 0.31 0.03 0.00 0.00
11.Drugs and Medicines. … … 0 0 0.00 0.00 0.00 0.00 0.00 0.00
12.Dyes and Colours. … … 0 0 0.00 0.00 0.00 0.00 0.00 0.00
13.Oil seeds,fats etc. … … 0 0 0.00 0.00 0.00 0.00 0.00 0.00
14.Chemicals … … 175 315 0.00 0.00 2.58 4.64 0.00 0.00
15.Dry Fruits … … 0 0 0.00 0.00 0.00 0.00 0.00 0.00
16.Jute & its Products … … 0 0 0.00 0.00 0.00 0.00 0.00 0.00
17.Leather & its Products … … 0 0 0.00 0.00 0.00 0.00 0.00 0.00
18.Others … … 6484 5881 0.00 0.00 95.41 86.54 0.00 0.00
a) Iron & Steel 6 4 0.00 0.00 0.09 0.06 0.00 0.00
b) Sugar 65 47 0.00 0.00 0.96 0.69 0.00 0.00
c) Granite 195 84 0.00 0.00 2.87 1.24 0.00 0.00
20. All Commodities 5651 5417 6973 6326 95.99 92.02 102.60 93.08 81.04 85.63
21. Tare Weight 478 470 478 470 8.12 7.98 7.03 6.92 100.00 100.00
22. Transhipment incl. tare wt. 0.00 0.00 0.00 0.00 0.00 0.00 0.00 0.00 0.00 0.00
Grand Total 6129 5887 7451 6796 100.00 100.00 100.00 100.00 82.26 86.62
Note : For Tuticorin port commodity-wise break up of Container Cargo for 2011-12 & 2012-13 are not available.
Commodities
General Cargo (000T)
Container Total General
Cargo Cargo% Share of
Commodities in
Total Container
Cargo
% Share of
Commodities in
Total General
Cargo
Level of
Containerisation %
of
Containerisation
to General Cargo
Table 2.1.7(Contd…)

62
Commodity-Wise Break-Up of Container and General Cargo and Level of Containerisation at Major Ports - Port-wise - 2011-12 & 2012-13
2011-12 2012-13 2011-12 2012-13 2011-12 2012-13 2011-12 2012-13 2011-12 2012-13
1 2 3 4 5 6 7 8 9 10 11
PORT : TUTICORIN
UNLOADED
1. Iron & Steel … … 0 0 … … 0.00 0.00 … …
2. Metal & Metal Products. … … 0 0 … … 0.00 0.00 … …
3. Chemicals … … 209 78 … … 4.48 1.67 0.00 0.00
4. Paper, Newsprints etc. … … 0 0 … … 0.00 0.00 … …
5. Plastic & its products … … 0 0 … … 0.00 0.00 … …
6. Machinery/Instrument and Transport equipments. … … 77 16 … … 1.65 0.34 … …
7. Textiles(Cotton,Silk,Synthetic)Yarn etc. … … 0 0 … … 0.00 0.00 … …
8. Hair and wool … … 0 0 … … 0.00 0.00 … …
9. Rubber and its products. … … 0 0 … … 0.00 0.00 … …
10.Oil, fats etc. … … 245 250 … … 5.25 5.36 0.00 0.00
11.Woodpulp. … … 0 0 … … 0.00 0.00 … …
12. Foodgrain (Cereals and Pulses) … … 0 0 … … 0.00 0.00 0.00 0.00
13.Fertiliser & FRM … … 2002 1051 … … 42.91 22.52 0.00 0.00
14.Industrial Alcohol & Spirits (Non-potable) … … 0 0 … … 0.00 0.00 … …
15.Drugs & Medicines … … 0 0 … … 0.00 0.00 0.00 0.00
16.Timber & Log … … 664 699 … … 14.23 14.98 0.00 0.00
17.Others … … 0 0 … … 0.00 0.00 … …
19. All Commodities 2644 3028 4708 4209 75.87 86.89 100.90 90.21 56.16 71.94
20. Tare Weight 454 457 454 457 13.03 13.11 9.73 9.79 100.00 100.00
21. Transhipment incl. tare wt. 0 0 0 0 0.00 0.00 0.00 0.00 … …
Grand Total 3098 3485 5162 4666 100.00 100.00 100.00 100.00 60.02 74.69
Level of Containerisation
% of Containerisation to General Cargo
% Share of Commodities in Total Container
Cargo
% Share of Commodities in
Total General Cargo
Commodities
General Cargo (000T)Container Total General
Cargo Cargo
Note : For Tuticorin port commodity-wise break up of Container Cargo for 2011-12 & 2012-13 are not available.
Table 2.1.7(Contd…)

63
Commodity-Wise Break-Up of Container and General Cargo and Level
of Containerisation at Major Ports -Port-wise 2011-12 & 2012-13
2011-12 2012-13 2011-12 2012-13 2011-12 2012-13 2011-12 2012-13 2011-12 2012-13
1 2 3 4 5 6 7 8 9 10 11
PORT : COCHIN
LOADED
1. Textiles(Cotton,Silk,Synthetic)Yarn
etc.4 8 4 8 0.24 0.47 0.24 0.47 - 100.00
2. Metal & Metal products 0 18 0 18 0.00 1.07 0.00 1.07 - -
3. Tea & Coffee 226 1 226 1 13.39 0.06 13.38 0.06 100.00 100.00
4. Foodgrain (Cereals and Pulses) 0 0 0 0 0.00 0.00 0.00 0.00 - -
5. Marine products 207 211 207 211 12.26 12.50 12.26 12.49 100.00 100.00
6. Fodder 0 0 0 0 0.00 0.00 0.00 0.00 - -
7. Fruits & Vegetables. 0 0 0 0 0.00 0.00 0.00 0.00 - -
8. Spices 87 88 87 88 5.15 5.21 5.15 5.21 100.00 100.00
9. Hossiery, Harberdasherry and
Millinary.0 0 0 0 0.00 0.00 0.00 0.00 - -
10. Machinery,Instruments Transport
equipments.25 0 25 0 1.48 0.00 1.48 0.00 100.00 -
11.Drugs and Medicines. 0 0 0 0 0.00 0.00 0.00 0.00 - -
12.Dyes and Colours. 0 0 0 0 0.00 0.00 0.00 0.00 - -
13.Oil seeds,fats etc. 0 0 0 0 0.00 0.00 0.00 0.00 - -
14.Chemicals 16 25 16 25 0.95 1.48 0.95 1.48 100.00 100.00
15.Dry Fruits 0 0 0 0 0.00 0.00 0.00 0.00 - -
16.Jute & its Products 6 7 6 7 0.36 0.41 0.36 0.41 - 100.00
17.Leather & its Products 0 0 0 0 0.00 0.00 0.00 0.00 - -
18.Others 607 919 608 920 35.96 54.44 36.00 54.47 99.84 99.89
a) Rubber 79 105 79 105 4.68 6.22 4.68 6.22 100.00 100.00
b). Coir Products 0 0 0 0 0.00 0.00 0.00 0.00 - -
c). Iron & Steel 2 0 2 0 0.12 0.00 0.12 0.00 100.00 -
d). Mineral Sand 0 0 0 0 0.00 0.00 0.00 0.00 - -
e). Miscelleneous 526 814 527 815 31.16 48.22 31.20 48.25 99.81 99.88
f) Granite 18 12 18 12 1.07 0.71 1.07 0.71 100.00 100.00
19. All Commodities 1178 1277 1179 1278 69.79 75.65 69.80 75.67 99.92 99.92
20. Tare Weight 502 360 502 360 29.74 21.33 29.72 21.31 100.00 100.00
21 Transhipment Incl .Tare Wt. 174 51 174 51 10.31 3.02 10.30 3.02 100.00 100.00
Grand Total 1854 1688 1855 1689 100.00 100.00 100.00 100.00 99.95 99.94
Commodities
General Cargo (000T)
Container Total General
Cargo Cargo% Share of
Commodities in
Total Container
Cargo
% Share of
Commodities in
Total General
Cargo
Level of
Containerisation %
of
Containerisation
to General Cargo
Table 2.1.7(contd…)

64
Commodity-Wise Break-Up of Container and General Cargo and Level of Containerisation at Major Ports - Port-wise - 2011-12 & 2012-13
2011-12 2012-13 2011-12 2012-13 2011-12 2012-13 2011-12 2012-13 2011-12 2012-131 2 3 4 5 6 7 8 9 10 11
PORT : COCHIN
UNLOADED
1. Iron & Steel 5 0 47 13 0.17 0.00 1.54 0.43 10.64 0.00
2. Metal & Metal Products. 0 8 0 8 0.00 0.27 0.00 0.26 - -
3. Chemicals 23 77 23 77 0.79 2.64 0.76 2.53 100.00 100.00
4. Paper, Newsprints etc. 40 124 40 124 1.37 4.25 1.31 4.07 100.00 100.00
5. Plastic & its products 1 0 1 0 0.03 0.00 0.03 0.00 - -6. Machinery/Instrument and Transport equipments. 6 0 7 0 0.21 0.00 0.23 0.00 85.71 -7. Textiles(Cotton,Silk, Synthetic)Yarn etc. 0 0 4 0 0.00 0.00 0.13 0.00 0.00 -
8. Hair and wool 0 0 0 0 0.00 0.00 0.00 0.00 - -
9. Rubber and its products. 65 69 65 69 2.23 2.36 2.13 2.27 100.00 100.00
10.Oil, fats etc. 0 0 0 0 0.00 0.00 0.00 0.00 - -
11.Woodpulp. 0 0 0 0 0.00 0.00 0.00 0.00 - -
12. Foodgrain (Cereals and Pulses) 0 7 0 7 0.00 0.24 0.00 0.23 - -
13.Fertiliser & FRM 0 0 431 353 0.00 0.00 14.15 11.59 - 0.0014.Industrial Alcohol & Spirits (Non-potable) 0 0 0 0 0.00 0.00 0.00 0.00 - -
15.Drugs & Medicines 0 0 0 0 0.00 0.00 0.00 0.00 - -
16.Timber & Log 0 0 64 95 0.00 0.00 2.10 3.12 0.00 0.00
17.Others 2067 2208 1631 1873 70.81 75.64 53.56 61.51 126.73 117.89
a) Cement 0 0 0 0 0.00 0.00 0.00 0.00 - -
b) Cashew 253 250 253 250 8.67 8.56 8.31 8.21 100.00 100.00
c). Cement Clinker 0 0 0 0 0.00 0.00 0.00 0.00 - -
d) Miscelleneous 1814 1958 1378 1623 62.14 67.08 45.25 53.30 131.64 120.64
18. All Commodities 2207 2493 2313 2619 75.61 85.41 75.96 86.01 95.42 95.19
19. Tare Weight 480 367 480 367 16.44 12.57 15.76 12.05 100.00 100.00
20 Transhipment incl. Tare Wt. 174 59 174 59 5.96 2.02 5.71 1.94 100.00 100.00
Grand Total 2861 2919 2967 3045 100.00 100.00 100.00 100.00 96.43 95.86
Level of Containerisation
% of Containerisation to General Cargo
% Share of Commodities in Total Container
Cargo
% Share of Commodities in
Total General Cargo
Commodities
General Cargo (000T)Container Total General
Cargo Cargo
Table 2.1.7(Contd…)

65
Commodity-Wise Break-Up of Container and General Cargo and Level
of Containerisation at Major Ports -Port-wise 2011-12 & 2012-13
2011-12 2012-13 2011-12 2012-13 2011-12 2012-13 2011-12 2012-13 2011-12 2012-13
1 2 3 4 5 6 7 8 9 10 11
PORT : NEW MANGALORE
LOADED
1. Textiles(Cotton,Silk,Synthetic)Yarn
etc.0 0 0 0 0.00 0.00 0.00 0.00 - -
2. Metal & Metal products 4 4 4 4 1.10 1.10 1.00 1.00 100.00 100.00
3. Tea & Coffee 118 131 118 131 32.60 36.19 29.43 32.67 100.00 100.00
4. Foodgrain (Cereals and Pulses) 3 0 61 20 0.83 0.00 15.21 4.99 - 0.00
5. Marine products 48 48 48 48 13.26 13.26 11.97 11.97 100.00 100.00
6. Fodder 39 45 39 45 10.77 12.43 9.73 11.22 100.00 100.00
7. Fruits & Vegetables. 0 0 0 0 0.00 0.00 0.00 0.00 - -
8. Spices 0 0 0 0 0.00 0.00 0.00 0.00 - -
9. Hossiery, Harberdasherry and
Millinary.0 0 0 0 0.00 0.00 0.00 0.00 - -
10. Machinery,Instruments Transport
equipments.2 5 13 36 0.55 1.38 3.24 8.98 15.38 13.89
11.Drugs and Medicines. 0 0 0 0 0.00 0.00 0.00 0.00 - -
12.Dyes and Colours. 0 0 0 0 0.00 0.00 0.00 0.00 - -
13.Oil seeds,fats etc. 13 17 13 17 3.59 4.70 3.24 4.24 100.00 100.00
14.Chemicals 4 6 4 6 1.10 1.66 1.00 1.50 100.00 100.00
15.Dry Fruits 9 11 9 11 2.49 3.04 2.24 2.74 100.00 100.00
16.Jute & its Products 0 0 0 0 0.00 0.00 0.00 0.00 - -
17.Leather & its Products 0 0 0 0 0.00 0.00 0.00 0.00 - -
18.Others 66 41 146 29 18.23 11.33 36.41 7.23 45.21 141.38
a) Granite Stones 4 8 102 16 1.10 2.21 25.44 3.99 - 50.00
b) Sugar 0 0 0 0 0.00 0.00 0.00 0.00 - -
c). Miscelleneous 62 33 44 13 17.13 9.12 10.97 3.24 140.91 253.85
19. All Commodities 306 308 455 347 84.53 85.08 113.47 86.53 67.25 88.76
20. Tare Weight 50 54 50 54 13.81 14.92 12.47 13.47 100.00 100.00
21 Transhipment Incl tare Wt. 0 0 0 0 0.00 0.00 0.00 0.00 - -
Grand Total 356 362 505 401 100.00 100.00 100.00 100.00 70.50 90.27
Commodities
General Cargo (000T)
Container Total General
Cargo Cargo% Share of
Commodities in
Total Container
Cargo
% Share of
Commodities in
Total General
Cargo
Level of
Containerisation %
of
Containerisation
to General Cargo
Table 2.1.7(Contd…)

66
Commodity-Wise Break-Up of Container and General Cargo and Level of Containerisation at Major Ports - Port-wise - 2011-12 & 2012-13
2011-12 2012-13 2011-12 2012-13 2011-12 2012-13 2011-12 2012-13 2011-12 2012-13
1 2 3 4 5 6 7 8 9 10 11PORT : NEW MANGALORE
UNLOADED
1. Iron & Steel 0 0 0 0 0.00 0.00 0.00 0.00 - -
2. Metal & Metal Products. 0 0 0 0 0.00 0.00 0.00 0.00 - -
3. Chemicals 13 16 13 16 1.28 4.85 1.53 1.89 100.00 100.00
4. Paper, Newsprints etc. 4 3 4 3 0.00 0.91 0.47 0.35 - 100.00
5. Plastic & its products 0 0 0 0 0.00 0.00 0.00 0.00 - -6. Machinery/Instrument and Transport equipments. 16 11 36 14 1.71 3.33 4.25 1.65 44.44 78.57
7. Textiles(Cotton,Silk, Synthetic)Yarn etc. 0 0 0 0 0.00 0.00 0.00 0.00 - -
8. Hair and wool 0 0 0 0 0.00 0.00 0.00 0.00 - -
9. Rubber and its products. 0 0 0 0 0.00 0.00 0.00 0.00 - -
10.Oil, fats etc. 13 1 13 1 0.00 0.30 1.53 0.12 - 100.00
11.Woodpulp. 0 0 0 0 0.00 0.00 0.00 0.00 - -
12. Foodgrain (Cereals and Pulses) 0 0 0 0 1.28 0.00 0.00 0.00 - -
13.Fertiliser & FRM 5 2 83 54 0.00 0.61 9.80 6.38 6.02 3.70
14.Industrial Alcohol & Spirits (Non-potable) 0 0 0 0 0.00 0.00 0.00 0.00 - -
15.Drugs & Medicines 0 0 0 0 0.00 0.00 0.00 0.00 - -
16.Timber & Log 25 36 322 283 5.98 10.91 38.02 33.41 7.76 12.72
17.Others 164 208 389 423 74.79 63.03 45.93 49.94 42.16 49.17
a) Cashew 124 147 124 147 55.56 44.55 14.64 17.36 100.00 100.00
b) Cement 0 0 0 0 0.00 0.00 0.00 0.00 - -
c) Miscelleneous 40 61 265 276 19.23 18.48 31.29 32.59 15.09 22.10
18. All Commodities 240 277 860 794 85.04 83.94 101.53 93.74 27.91 34.89
19. Tare Weight 49 53 49 53 14.96 16.06 5.79 6.26 100.00 100.00
20 . Transhipment incl. tare wt. 0 0 0 0 0.00 0.00 0.00 0.00 - -
Grand Total 289 330 909 847 100.00 100.00 100.00 100.00 31.79 38.96
Level of Containerisation
% of Containerisation to General Cargo
% Share of Commodities in Total Container
Cargo
% Share of Commodities in Total General
CargoCommodities
General Cargo (000T)Container Total General
Cargo Cargo
Table 2.1.7(Contd…)

67
Commodity-Wise Break-Up of Container and General Cargo and Level
of Containerisation at Major Ports -Port-wise 2011-12 & 2012-13
2011-12 2012-13 2011-12 2012-13 2011-12 2012-13 2011-12 2012-13 2011-12 2012-13
1 2 3 4 5 6 7 8 9 10 11
PORT : MORMUGAO
LOADED
1. Textiles(Cotton,Silk, Synthetic)Yarn
etc.0 0 0 0 0.00 0.00 0.00 0.00 - -
2. Metal & Metal products 0 0 0 0 0.00 0.00 0.00 0.00 - -
3. Tea & Coffee 0 0 0 0 0.00 0.00 0.00 0.00 - -
4. Foodgrain (Cereals and Pulses) 0 0 0 59 0.00 0.00 0.00 5.28 0.00 0.00
5. Marine products 0 0 0 0 0.00 0.00 0.00 0.00 - -
6. Fodder 0 0 0 0 0.00 0.00 0.00 0.00 - -
7. Fruits & Vegetables. 0 0 0 0 0.00 0.00 0.00 0.00 - -
8. Spices 0 0 0 0 0.00 0.00 0.00 0.00 - -
9. Hossiery, Harberdasherry and
Millinary.0 0 0 0 0.00 0.00 0.00 0.00 - -
10. Machinery,Instruments Transport
equipments.0 0 0 0 0.00 0.00 0.00 0.00 - -
11.Drugs and Medicines. 0 0 0 0 0.00 0.00 0.00 0.00 - -
12.Dyes and Colours. 0 0 0 0 0.00 0.00 0.00 0.00 - -
13.Oil seeds,fats etc. 0 0 0 0 0.00 0.00 0.00 0.00 - -
14.Chemicals 0 0 0 0 0.00 0.00 0.00 0.00 - -
15.Dry Fruits 0 0 0 0 0.00 0.00 0.00 0.00 - -
16.Jute & its Products 0 0 0 0 0.00 0.00 0.00 0.00 - -
17.Leather & its Products 0 0 0 0 0.00 0.00 0.00 0.00 - -
18.Others 87 89 660 1036 78.38 80.18 59.09 92.75 13.18 8.59
a) Frozen Fish 43 43 43 43 38.74 38.74 3.85 3.85 - 100.00
b) Alumina 0 0 0 0 0.00 0.00 0.00 0.00 - -
c) H. R. Coils 0 0 381 677 0.00 0.00 34.11 60.61 0.00 0.00
d). Miscelleneous 44 46 236 316 39.64 41.44 21.13 28.29 18.64 14.56
e) Iron & Steel 0 0 105 0
19. All Commodities 87 89 660 1095 78.38 80.18 59.09 98.03 13.18 8.13
20. Tare Weight 24 22 24 22 21.62 19.82 2.15 1.97 100.00 100.00
21. Transhipment incl. tare wt. 0 0 0 0 0.00 0.00 0.00 0.00 - -
Grand Total 111 111 684 1117 100.00 100.00 100.00 100.00 16.23 9.94
Commodities
General Cargo (000T)
Container Total General
Cargo Cargo% Share of
Commodities in
Total Container
Cargo
% Share of
Commodities in
Total General
Cargo
Level of
Containerisation %
of
Containerisation
to General Cargo
Table 2.1.7(Contd…)
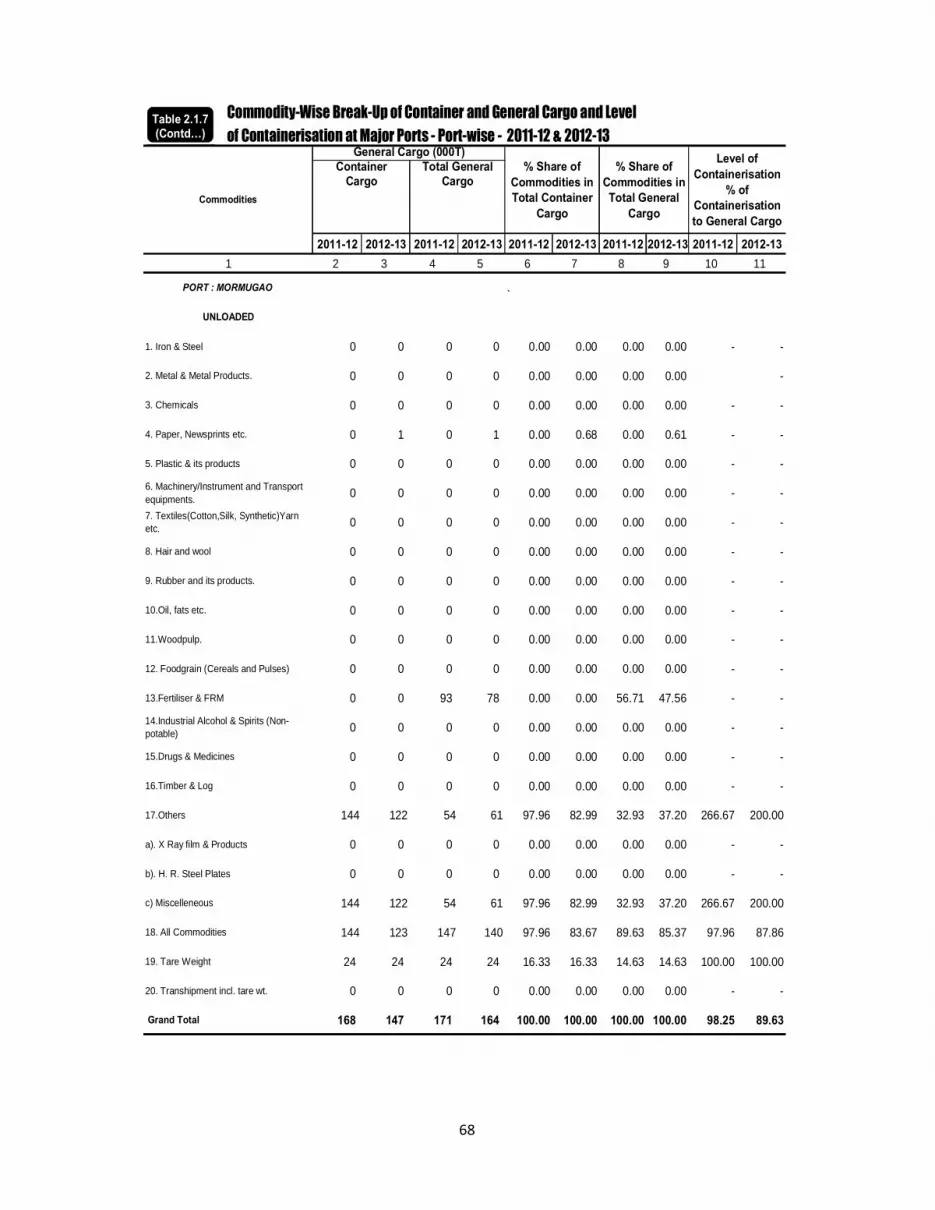
68
Commodity-Wise Break-Up of Container and General Cargo and Level of Containerisation at Major Ports - Port-wise - 2011-12 & 2012-13
2011-12 2012-13 2011-12 2012-13 2011-12 2012-13 2011-12 2012-13 2011-12 2012-131 2 3 4 5 6 7 8 9 10 11
PORT : MORMUGAO `
UNLOADED
1. Iron & Steel 0 0 0 0 0.00 0.00 0.00 0.00 - -
2. Metal & Metal Products. 0 0 0 0 0.00 0.00 0.00 0.00 -
3. Chemicals 0 0 0 0 0.00 0.00 0.00 0.00 - -
4. Paper, Newsprints etc. 0 1 0 1 0.00 0.68 0.00 0.61 - -
5. Plastic & its products 0 0 0 0 0.00 0.00 0.00 0.00 - -
6. Machinery/Instrument and Transport equipments. 0 0 0 0 0.00 0.00 0.00 0.00 - -
7. Textiles(Cotton,Silk, Synthetic)Yarn etc. 0 0 0 0 0.00 0.00 0.00 0.00 - -
8. Hair and wool 0 0 0 0 0.00 0.00 0.00 0.00 - -
9. Rubber and its products. 0 0 0 0 0.00 0.00 0.00 0.00 - -
10.Oil, fats etc. 0 0 0 0 0.00 0.00 0.00 0.00 - -
11.Woodpulp. 0 0 0 0 0.00 0.00 0.00 0.00 - -
12. Foodgrain (Cereals and Pulses) 0 0 0 0 0.00 0.00 0.00 0.00 - -
13.Fertiliser & FRM 0 0 93 78 0.00 0.00 56.71 47.56 - -
14.Industrial Alcohol & Spirits (Non-potable) 0 0 0 0 0.00 0.00 0.00 0.00 - -
15.Drugs & Medicines 0 0 0 0 0.00 0.00 0.00 0.00 - -
16.Timber & Log 0 0 0 0 0.00 0.00 0.00 0.00 - -
17.Others 144 122 54 61 97.96 82.99 32.93 37.20 266.67 200.00
a). X Ray film & Products 0 0 0 0 0.00 0.00 0.00 0.00 - -
b). H. R. Steel Plates 0 0 0 0 0.00 0.00 0.00 0.00 - -
c) Miscelleneous 144 122 54 61 97.96 82.99 32.93 37.20 266.67 200.00
18. All Commodities 144 123 147 140 97.96 83.67 89.63 85.37 97.96 87.86
19. Tare Weight 24 24 24 24 16.33 16.33 14.63 14.63 100.00 100.00
20. Transhipment incl. tare wt. 0 0 0 0 0.00 0.00 0.00 0.00 - -
Grand Total 168 147 171 164 100.00 100.00 100.00 100.00 98.25 89.63
Level of Containerisation
% of Containerisation to General Cargo
% Share of Commodities in Total Container
Cargo
% Share of Commodities in Total General
CargoCommodities
General Cargo (000T)Container Total General
Cargo Cargo
Table 2.1.7(Contd…)

69
Commodity-Wise Break-Up of Container and General Cargo and Level
of Containerisation at Major Ports -Port-wise 2011-12 & 2012-13
2011-12 2012-13 2011-12 2012-13 2011-12 2012-13 2011-12 2012-13 2011-12 2012-13
1 2 3 4 5 6 7 8 9 10 11
PORT : J. L. NEHRU
LOADED
1. Textiles(Cotton,Silk, Synthetic)Yarn
etc.… … … … … … … … … …
2. Metal & Metal products … … … … … … … … … …
3. Tea & Coffee … … … … … … … … … …
4. Foodgrain (Cereals and Pulses) … … … … … … … … … …
5. Marine products … … … … … … … … … …
6. Fodder … … … … … … … … … …
7. Fruits & Vegetables. … … … … … … … … … …
8. Spices … … … … … … … … … …
9. Hossiery, Harberdasherry and Millinary.
… … … … … … … … … …
10. Machinery,Instruments Transport
equipments.… … … … … … … … … …
11.Drugs and Medicines. … … … … … … … … … …
12.Dyes and Colours. … … … … … … … … … …
13.Oil seeds,fats etc. … … … … … … … … … …
14.Chemicals … … … 21 0 0 0 0.0759 0 0
15.Dry Fruits … … … … … … … … … …
16.Jute & its Products … … … … … … … … … …
17.Leather & its Products … … … … … … … … … …
18. Others 23876 22609 23890 22649 86.35 81.77 86.21 81.73 0.31 0.30
20. All Commodities 23876 22609 23890 22670 86.35 81.77 86.21 81.81 99.94 99.73
21. Tare Weight 4318 5001 4318 5001 15.62 18.09 15.58 18.05 100.00 100.00
22. Transhipment incl. tare wt. 298 40 298 40 1.08 0.14 1.08 0.14 100.00 100.00
Grand Total 28492 27650 28506 27711 100.00 100.00 100.00 100.00 99.95 99.78
Note: For J.L.Nehru port commodity-wise break up of Container Cargo for 2011-12 & 2012-13 are not available..
Commodities
General Cargo (000T)
Container Total General
Cargo Cargo% Share of
Commodities in
Total Container
Cargo
% Share of
Commodities in
Total General
Cargo
Level of
Containerisation %
of
Containerisation
to General Cargo
Table 2.1.7(Contd….)

70
Commodity-Wise Break-Up of Container and General Cargo and Level of Containerisation at Major Ports - Port-wise - 2011-12 & 2012-13
2011-12 2012-13 2011-12 2012-13 2011-12 2012-13 2011-12 2012-13 2011-12 2012-131 2 3 4 5 6 7 8 9 10 11
PORT : J. L. NEHRU
UNLOADED
1. Iron & Steel … … … … 0.00 0.00 … … ` …
2. Metal & Metal Products. … … … … 0.00 0.00 … … … …
3. Chemicals … … … 654 0.00 0.00 0.00 2.16 0.00 0.00
4. Paper, Newsprints etc. … … … … 0.00 0.00 … … … …
5. Plastic & its products … … … … 0.00 0.00 … … … …
6. Machinery/Instrument and Transport equipments. … … … … 0.00 0.00 … … … …
7. Textiles(Cotton,Silk, Synthetic)Yarn etc. … … … … 0.00 0.00 … … … …
8. Hair and wool … … … … 0.00 0.00 … … … …
9. Rubber and its products. … … … … 0.00 0.00 … … … …
10.Oil, fats etc. … … … 947 0.00 0.00 0.00 3.13 0.00 0.00
11.Woodpulp. … … … … 0.00 0.00 … … … …
4. Foodgrain (Cereals and Pulses) … … 19 0 0.00 0.00 … … … …
13.Fertiliser & FRM … … … … 0.00 0.00 … … … …
14.Industrial Alcohol & Spirits (Non-potable) … … … … 0.00 0.00 … … … …
15.Drugs & Medicines … … … … 0.00 0.00 … … … …
16.Timber & Log … … … … 0.00 0.00 … … … …
17. Others 24308 25145 24426 23586 80.33 83.09 80.61 77.83 99.52 106.61
19. All Commodities 24308 25145 24426 25187 80.33 83.09 80.61 83.12 99.52 99.83
20. Tare Weight 4506 5076 4506 5076 14.89 16.77 14.87 16.75 100.00 100.00
21. Transhipment incl tare wt. 927 40 927 40 3.06 0.13 3.06 0.13 100.00 100.00
Grand Total 29741 30261 29859 30303 100.00 100.00 100.00 100.00 99.60 99.86
Note: For J.L.Nehru port commodity-wise break up of Container Cargo for 2011-12 & 2012-13 are not available.
Level of Containerisation
% of Containerisation to General Cargo
% Share of Commodities in Total Container
Cargo
% Share of Commodities in
Total General Cargo
Commodities
General Cargo (000T)Container Total General
Cargo Cargo
Table 2.1.7(Contd…)

71
Commodity-Wise Break-Up of Container and General Cargo and Level
of Containerisation at Major Ports -Port-wise 2011-12 &2012-13
2011-12 2012-13 2011-12 2012-13 2011-12 2012-13 2011-12 2012-13 2011-12 2012-13
1 2 3 4 5 6 7 8 9 10 11
PORT : KANDLA
LOADED `
1. Textiles(Cotton,Silk, Synthetic)Yarn
etc.… … … … 0.00 0.00 0.00 0.00 … …
2. Metal & Metal products … … … … 0.00 0.00 0.00 0.00 … …
3. Tea & Coffee … … … … 0.00 0.00 0.00 0.00 … …
4. Foodgrain (Cereals and Pulses) … … … … 0.00 0.00 0.00 0.00 … …
5. Marine products … … … … 0.00 0.00 0.00 0.00 … …
6. Fodder … … … … 0.00 0.00 0.00 0.00 … …
7. Fruits & Vegetables. … … … … 0.00 0.00 0.00 0.00 … …
8. Spices … … … … 0.00 0.00 0.00 0.00 … …
9. Hossiery, Harberdasherry and
Millinary.… … … … 0.00 0.00 0.00 0.00 … …
10. Machinery,Instruments Transport
equipments.… … … … 0.00 0.00 0.00 0.00 … …
11.Drugs and Medicines. … … … … 0.00 0.00 0.00 0.00 … …
12.Dyes and Colours. … … … … 0.00 0.00 0.00 0.00 … …
13.Oil seeds,fats etc. … … … … 0.00 0.00 0.00 0.00 … …
14.Chemicals … … … … 0.00 0.00 0.00 0.00 … …
15.Dry Fruits … … … … 0.00 0.00 0.00 0.00 … …
16.Jute & its Products … … … … 0.00 0.00 0.00 0.00 … …
17.Leather & its Products … … … … 0.00 0.00 0.00 0.00 … …
18.Others … … … … 0.00 0.00 0.00 0.00 … …
a) Ores … … … … 0.00 0.00 0.00 0.00 … …
b) Salt … … … … 0.00 0.00 0.00 0.00 … …
c). Iron & Steel … … … … 0.00 0.00 0.00 0.00 … …
d). Miscelleneous 0 0 0 0 0.00 0.00 0.00 0.00 … …
19. All Commodities 1593 1481 2963 7102 107.56 100.00 41.72 100.00 53.76 20.85
20. Tare Weight 2 0 2 0 0.14 0.00 0.03 0.00 100.00 -
21. Transhipment incl. tare wt. 0 0 0 0 0.00 0.00 0.00 0.00 - -
Grand Total 1595 1481 2965 7102 100.00 100.00 100.00 100.00 53.79 20.85
Note: For Kandla port commodity-wise break up of Container Cargo for 2011-12 & 2012-13 are not available..
% Share of
Commodities in
Total Container
Cargo
% Share of
Commodities in
Total General
Cargo
Level of
Containerisation %
of
Containerisation
to General Cargo
Commodities
General Cargo (000T)
Container Total General
Cargo Cargo
Table 2.1.7(Contd…)

72
Commodity-Wise Break-Up of Container and General Cargo and Level of Containerisation at Major Ports - Port-wise - 2011-12 & 2012-13
2011-12 2012-13 2011-12 2012-13 2011-12 2012-13 2011-12 2012-13 2011-12 2012-131 2 3 4 5 6 7 8 9 10 11
PORT : KANDLA
UNLOADED
1. Iron & Steel … … … … 0.00 0.00 0.00 0.00 … …
2. Metal & Metal Products. … … … … 0.00 0.00 0.00 0.00 … …
3. Chemicals … … … … 0.00 0.00 0.00 0.00 … …
4. Paper, Newsprints etc. … … … … 0.00 0.00 0.00 0.00 … …
5. Plastic & its products … … … … 0.00 0.00 0.00 0.00 … …
6. Machinery/Instrument and Transport equipments. … … … … 0.00 0.00 0.00 0.00 … …
7. Textiles(Cotton,Silk, Synthetic)Yarn etc. … … … … 0.00 0.00 0.00 0.00 … …
8. Hair and wool … … … … 0.00 0.00 0.00 0.00 … …
9. Rubber and its products. … … … … 0.00 0.00 0.00 0.00 … …
10.Oil, fats etc. … … … … 0.00 0.00 0.00 0.00 … …
11.Woodpulp. … … … … 0.00 0.00 0.00 0.00 … …
4. Foodgrain (Cereals and Pulses) … … … … 0.00 0.00 0.00 0.00 … …
13.Fertiliser & FRM … … … … 0.00 0.00 0.00 0.00 … …
14.Industrial Alcohol & Spirits (Non-potable) … … … … 0.00 0.00 0.00 0.00 … …
15.Drugs & Medicines … … … … 0.00 0.00 0.00 0.00 … …
16.Timber & Log … … … … 0.00 0.00 0.00 0.00 … …
17.Others … … … … 0.00 0.00 0.00 0.00 … …
a). Mislleneous … … … … 0.00 0.00 0.00 0.00 … …
18. All Commodities 795 454 4697 4425 175.11 100.00 106.15 100.00 3.96 2.26
19. Tare Weight 184 0 184 0 40.53 0.00 4.16 0.00 0.92 0.00
20. Transhipment incl.tare wt. 0 0 0 0 0.00 0.00 0.00 0.00 … …
Grand Total 979 454 4881 4425 100.00 100.00 100.00 100.00 20.06 10.26
Note: For Kandla port commodity-wise break up of Container Cargo for 2011-12 & 2012-13 are not available.
Commodities
General Cargo (000T)Container Total General
Cargo Cargo% Share of
Commodities in Total General
Cargo
Level of Containerisation
% of Containerisation to General Cargo
% Share of Commodities in Total Container
Cargo
Table 2.1.7(Contd…)

73
Commodity-Wise Break-Up of Container and General Cargo and Level
of Containerisation at Major Ports -Port-wise 2011-12 & 2012-13
2011-12 2012-13 2011-12 2012-13 2011-12 2012-13 2011-12 2012-13 2011-12 2012-13
1 2 3 4 5 6 7 8 9 10 11
PORT : MUMBAI
LOADED` `
1. Textiles(Cotton,Silk, Synthetic)Yarn etc.
0 0 0 0 0.00 0.00 0.00 0.00 - -
2. Metal & Metal products 2 38 370 422 1.14 21.59 21.84 24.91 0.54 9.00
3. Tea & Coffee 0 0 0 0 0.00 0.00 0.00 0.00 - -
4. Foodgrain (Cereals and Pulses) 0 0 1 0 0.00 0.00 0.06 0.00 - -
5. Marine products 0 0 0 0 0.00 0.00 0.00 0.00 - -
6. Fodder 0 0 0 0 0.00 0.00 0.00 0.00 - -
7. Fruits & Vegetables. 0 0 4 1 0.00 0.00 0.24 0.06 0.00 0.00
8. Spices 1 0 1 0 0.57 0.00 0.06 0.00 - -
9. Hossiery, Harberdasherry and
Millinary.0 0 0 0 0.00 0.00 0.00 0.00 - -
10. Machinery,Instruments Transport
equipments.0 1 63 83 0.00 0.57 3.72 4.90 0.00 1.20
11.Drugs and Medicines. 0 0 1 1 0.00 0.00 0.06 0.06 - -
12.Dyes and Colours. 0 0 0 0 0.00 0.00 0.00 0.00 - -
13.Oil seeds,fats etc. 0 0 0 0 0.00 0.00 0.00 0.00 - -
14.Chemicals 0 0 14 13 0.00 0.00 0.83 0.77 0.00 0.00
15.Dry Fruits 0 0 0 0 0.00 0.00 0.00 0.00 - -
16.Jute & its Products 0 0 0 0 0.00 0.00 0.00 0.00 - -
17.Leather & its Products 0 0 0 0 0.00 0.00 0.00 0.00 - -
18.Others 45 114 1360 1151 25.57 64.77 80.28 67.95 3.31 9.90
a) Instrument 0 0 0 0 0.00 0.00 0.00 0.00 - -
b) Paint etc. 0 0 0 0 0.00 0.00 0.00 0.00 - -
c) Iron & Steel 0 27 572 419 0.00 15.34 33.77 24.73 0.00 6.44
d) Sugar 0 0 139 175 0.00 0.00 8.21 10.33 - 0.00
e) Miscellaneous 45 87 649 557 25.57 49.43 38.31 32.88 6.93 15.62
19. All Commodities 48 153 1814 1671 27.27 86.93 107.08 98.64 2.65 9.16
20. Tare Weight 5 14 5 14 2.84 7.95 0.30 0.83 100.00 100.00
21. Transhipment incl.tare wt. 0 9 0 9 0.00 5.11 0.00 0.53 - -
Grand Total 53 176 1819 1694 100.00 100.00 100.00 100.00 2.91 10.39
Commodities
General Cargo (000T)
Container Total General
Cargo Cargo% Share of
Commodities in
Total Container
Cargo
% Share of
Commodities in
Total General
Cargo
Level of
Containerisation %
of
Containerisation
to General Cargo
Table 2.1.7(Contd…)

74
Commodity-Wise Break-Up of Container and General Cargo and Level of Containerisation at Major Ports - Port-wise - 2011-12 & 2012-13
2011-12 2012-13 2011-12 2012-13 2011-12 2012-13 2011-12 2012-13 2011-12 2012-131 2 3 4 5 6 7 8 9 10 11
PORT : MUMBAI
UNLOADED
1. Iron & Steel 55 33 2190 2918 8.42 5.05 14.54 19.37 2.51 1.13
2. Metal & Metal Products. 44 4 1582 231 6.74 0.61 10.50 1.53 2.78 1.73
3. Chemicals 1 0 18 11 0.15 0.00 0.12 0.07 5.56 0.00
4. Paper, Newsprints etc. 2 1 3 1 0.31 0.15 0.02 0.01 66.67 100.00
5. Plastic & its products 7 6 7 7 1.07 0.92 0.05 0.05 100.00 85.71
6. Machinery/Instrument and Transport equipments. 20 6 350 217 3.06 0.92 2.32 1.44 5.71 2.76
7. Textiles(Cotton,Silk, Synthetic)Yarn etc. 1 2 1 2 0.15 0.31 0.01 0.01 100.00 100.00
8. Hair and wool 0 0 0 0 0.00 0.00 0.00 0.00 - -
9. Rubber and its products. 2 0 2 1 0.31 0.00 0.01 0.01 100.00 0.00
10.Oil, fats etc. 0 0 273 0 0.00 0.00 1.81 0.00 0.00 0.00
11.Woodpulp. 0 0 93 104 0.00 0.00 0.62 0.69 0.00 0.00
4. Foodgrain (Cereals and Pulses) 0 0 849 880 0.00 0.00 5.63 5.84 0.00 0.00
13.Fertiliser & FRM 0 0 169 0 0.00 0.00 1.12 0.00 - -
14.Industrial Alcohol & Spirits (Non-potable) 0 0 0 0 0.00 0.00 0.00 0.00 - -
15.Drugs & Medicines 0 0 0 0 0.00 0.00 0.00 0.00 - -
16.Timber & Log 0 0 22 31 0.00 0.00 0.15 0.21 0.00 0.00
17.Others 279 511 8832 10574 42.73 78.25 58.62 70.18 3.16 4.83
a) Fruits 0 0 11 1 0.00 0.00 0.07 0.01 0.00 0.00
b) Synthetic Resin 1 0 1 0 0.15 0.00 0.01 0.00 - 0.00
c) Miscellaneous 278 511 8820 10573 42.57 78.25 58.54 70.17 3.15 4.83
18. All Commodities 411 563 14391 14977 62.94 86.22 95.51 99.40 2.86 3.76
19. Tare Weight 87 81 87 81 13.32 12.40 0.58 0.54 100.00 100.00
20.Transhipment incl.tare wt. 0 9 0 9 0.00 1.38 0.00 0.06 - 100.00
Grand Total 498 653 14478 15067 100.00 100.00 100.00 100.00 3.44 4.33
Source: Major Ports
Level of Containerisation
% of Containerisation to General Cargo
% Share of Commodities in Total General
Cargo
% Share of Commodities in Total Container
CargoCommodities
General Cargo (000T)Container Total General
Cargo Cargo
Table 2.1.7(Contd…)

75
Country of
Origin/Commodities KDS HDC PPT VPT EPL ChPT TPT CoPT NMPT MoPT JNPT MbPT KPT ALL PORTS
1 2 3 4 5 6 7 8 9 10 11 12 13 14 15
POL-CRUDE
Angola 1540 1011 94 2645
Algeria 261 251 512
Argentina 0
Australia 0
Benin 0
Brunei 471 471
CIS (Ex Russia) 0
Denmark 0
Egypt 498 556 1054
Indonesia 0
Iran 1735 4532 4339 10606
Iraq 3602 52 2268 314 1426 8255 15917
Ivory Cost 0
Kuwait 919 1343 1357 8692 12311
Liberia 248 248
Libya 167 404 571
Malaysia 380 511 576 82 1549
Mauritius 135 135
Netherland 90 90
Nigeria 55 2039 605 128 1848 161 4584 9420
Oman 161 161
Pakistan 0
Qatar 1094 1094
Russia 0
Saudi Arabia 0 1214 632 2184 2764 4712 548 12054
Singapore 4313 4313
South Korea 0
Sudan 0
Syria 29 29
Tunisia 0
Turkey 225 423 249 897
U.A.E. 0 408 2813 1180 2251 903 7555
Ukraine 264 264
Venezuela 0
Yemen 0
Other Countries 435 328 5011 426 7471 6978 20649Total 0 464 14533 7227 0 8072 0 7995 12332 0 0 15479 36443 102545
In '000 Tonnes
Overseas Cargo of Principal Commodities Unloaded by Country - 2012-13Overseas Cargo of Principal Commodities Unloaded by Country - 2012-13Overseas Cargo of Principal Commodities Unloaded by Country - 2012-13Overseas Cargo of Principal Commodities Unloaded by Country - 2012-13Table 2.1.8

76
Table 2.1.8
Country of
Origin/Commodities KDS HDC PPT VPT EPL ChPT TPT CoPT NMPT MoPT JNPT MbPT KPT ALL PORTS
1 2 3 4 5 6 7 8 9 10 11 12 13 14 15
POL-PRODUCT
Bahrain 71 25 96
Belgium 4 4
Bangladesh 39 39
Canada 0
China 2 3 5
France 4 4
Hong Kong 4 4
Indonesia 3 8 1 121 133
Iran 0
Iraq 0
Japan 52 52
North Korea 0
South Korea 3 16 524 543
Kuwait 219 9 55 283
Malaysia 4 4 17 12 3 9 8 17 74
Maldives 39 39
Netherland 32 32
Norway 0
Oman 72 47 11 130
Pakistan 2 13 15
Qatar 42 42
Russia 0
Saudi Arabia 2 15 89 396 80 582
Singapore 79 56 23 26 164 30 83 40 0 501
Taiwan 4 24 28
Thailand 0
Turkey 11 11
Tunisia 0
U.A.E. 186 47 174 214 112 376 175 1284
USA 213 56 104 373
Other Countries 39 51 8 109 381 0 588
Total 39 718 60 74 294 232 42 207 198 222 655 1798 323 4862
Overseas Cargo of Principal Commodities Unloaded by Country - 2012-13Overseas Cargo of Principal Commodities Unloaded by Country - 2012-13Overseas Cargo of Principal Commodities Unloaded by Country - 2012-13Overseas Cargo of Principal Commodities Unloaded by Country - 2012-13Table 2.1.8

77
Country of
Origin/Commodities KDS HDC PPT VPT EPL ChPT TPT CoPT NMPT MoPT JNPT MbPT KPT ALL PORTS
1 2 3 4 5 6 7 8 9 10 11 12 13 14 15
FERTILIZER
Albania 0
Australia 44 44
Baharain 0
Belarus 0 0
Brazil 0
Canada 56 108 32 196
China 65 53 112 899 22 504 1655
CIS (Ex. Russia) 31 31
Egypt 0
Estonia 204 204
Ethopia 0
Germany 71 28 99
Indonesia 30 54 84
Iran 25 335 360
Israel 47 47 272 366
Jordan 22 72 31 214 339
Kuwait 0 0
Latvia 29 0 29
Lithuania 108 66 57 231
Malaysia 0
Mexico 0
Morocco 467 467
Netherland 0
Oman 240 229 238 319 1026
Qatar 55 0 55
Romania 0
Russia 117 68 114 139 438
Saudi Arabia 128 446 574
Singapore 80 16 96
South Korea 33 36 69
Soviet Union 0
Sri Lanka 0
Thailand 0
Tunisia 0
Turkey 0
U.A.E. 31 33 64
Ukraine 148 27 207 382
United Kingdom 32 32
USA 28 248 276
Other Countries 40 34 156 107 337
Total 65 109 142 2023 0 175 487 22 519 78 0 156 3678 7454
Overseas Cargo of Principal Commodities Unloaded by Country - 2012-13Overseas Cargo of Principal Commodities Unloaded by Country - 2012-13Overseas Cargo of Principal Commodities Unloaded by Country - 2012-13Overseas Cargo of Principal Commodities Unloaded by Country - 2012-13Table 2.1.8

78
Country of Origin/Commodities KDS HDC PPT VPT EPL ChPT TPT CoPT NMPT MoPT JNPT MbPT KPT ALL PORTS
1 2 3 4 5 6 7 8 9 10 11 12 13 14 15FRM-DRYAlgeria 61 61Antigua 0Australia 123 123Bahrain 98 21 0 119Brunoi 38 38Belgium 0Chile 42 42China 55 55Denmark 8 83 91Egypt 31 194 94 81 13 9 722 1144Iran 88 88Israel 34 35 69Italy 0Japan 29 29Jordan 201 1795 79 181 130 2386Kuwait 18 29 30 82 159Libya 17 17Morocco 540 174 128 842Nauru 31 31Qatar 161 27 0 188Russia 27 27Saudi Arabia 10 183 8 24 0 225Senegal 33 33South Africa 175 175Sri Lanka 0Sudan 24 24Syria 0Togo 196 45 241Tunisia 0U.A.E. 0 212 70 48 15 0 345USA 0Ukraine 0Vietnam 0Yemen 0Other Countries 29 0 307 0 207 16 146 63 768Total 29 277 4004 565 0 231 564 331 17 0 0 356 946 7320
Overseas Cargo of Principal Commodities Unloaded by Country - 2012-13Table 2.1.8

79
Country of Origin/Commodities KDS HDC PPT VPT EPL ChPT TPT CoPT NMPT MoPT JNPT MbPT KPT ALL PORTS
1 2 3 4 5 6 7 8 9 10 11 12 13 14 15FRM-LIQUIDAustralia 39 39Bahrain 0Bangladesh 15 15Belgium 0Egypt 6 21 27Germany 0Indonesia 7 12 19Iran 103 31 15 149Israel 9 9Japan 343 31 374Jordan 30 30Kuwait 7 7 6 8 3 23 54Malaysia 11 73 84Mauritius 0Morocco 291 161 129 98 158 150 987Oman 14 105 119Qatar 31 84 48 73 21 39 296Russia 0Saudi Arabia 53 38 6 68 165Senegal 720 720Singapore 23 23South Africa 3 10 13South Korea 138 19 157Tunisia 40 40USA 10 459 469U.A.E. 92 106 198U.K 0Ukraine 28 35 63Other Countries 0 49 31 80Total 0 368 1249 328 0 31 87 163 150 158 0 0 1596 4130
Overseas Cargo of Principal Commodities Unloaded by Country - 2012-13Table 2.1.8

80
Country of
Origin/Commodities KDS HDC PPT VPT EPL ChPT TPT CoPT NMPT MoPT JNPT MbPT KPT ALL PORTS
1 2 3 4 5 6 7 8 9 10 11 12 13 14 15
FOOD GRAIN
Australia 84 84
Canada 6 664 670
China 0
Dubai 0
Indonesia 0
Japan 11 11
Jordan 0
Myanmar 27 27
Russia 0
Taiwan 0
Vietnam 0
Others 105 1 106
Total 17 0 0 0 0 0 0 0 0 0 0 880 1 898
IRON & STEEL
Australia 0 0
Bangladesh 0
Brazil 51 39 90
Belgium 1 23 24
China 13 102 115 13 167 1170 49 1629
CIS(Ex. Russia) 10 10
Egypt 9 9
France 21 21
Germany 20 20
Indonesia 3 5 8
Iran 3 10 13
Italy 1 1 2
Japan 22 91 11 182 486 792
North Korea 0
South Africa 5 5
South Korea 12 5 893 281 1191
Malaysia 8 8
Myanmar 1 3 4
Netherland 0
Panama 0
Romania 3 3
Russia 266 53 319
Singapore 13 68 81
Saudi Arabia 2 2
Spain 0
Sri Lanka 2 4 6
Swedon 0
Taiwan 5 5
Thailand 6 6
Turkey 0
U.A.E. 10 57 67Ukraine 9 345 22 376UK 0 0USA 0Vietnam 22 22
Other Countries 20 3 325 105 32 485
Total 57 246 142 34 0 858 0 0 0 0 0 2830 1031 5198
Overseas Cargo of Principal Commodities Unloaded by Country - 2012-13Overseas Cargo of Principal Commodities Unloaded by Country - 2012-13Overseas Cargo of Principal Commodities Unloaded by Country - 2012-13Overseas Cargo of Principal Commodities Unloaded by Country - 2012-13Table 2.1.8 (Contd...)
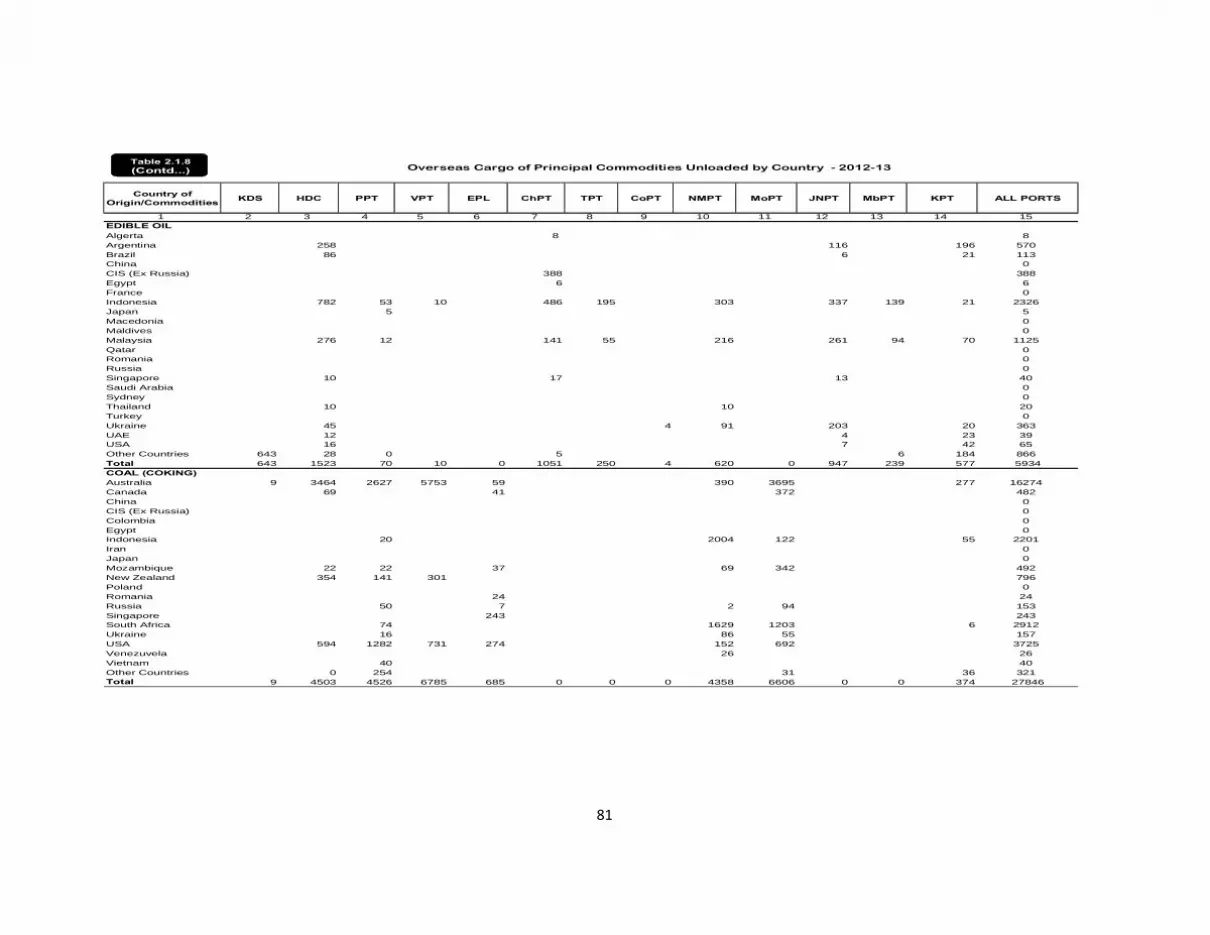
81
Country of Origin/Commodities KDS HDC PPT VPT EPL ChPT TPT CoPT NMPT MoPT JNPT MbPT KPT ALL PORTS
1 2 3 4 5 6 7 8 9 10 11 12 13 14 15EDIBLE OILAlgerta 8 8Argentina 258 116 196 570Brazil 86 6 21 113China 0CIS (Ex Russia) 388 388Egypt 6 6France 0Indonesia 782 53 10 486 195 303 337 139 21 2326Japan 5 5Macedonia 0Maldives 0Malaysia 276 12 141 55 216 261 94 70 1125Qatar 0Romania 0Russia 0Singapore 10 17 13 40Saudi Arabia 0Sydney 0Thailand 10 10 20Turkey 0Ukraine 45 4 91 203 20 363UAE 12 4 23 39USA 16 7 42 65Other Countries 643 28 0 5 6 184 866Total 643 1523 70 10 0 1051 250 4 620 0 947 239 577 5934COAL (COKING)Australia 9 3464 2627 5753 59 390 3695 277 16274Canada 69 41 372 482China 0CIS (Ex Russia) 0Colombia 0Egypt 0Indonesia 20 2004 122 55 2201Iran 0Japan 0Mozambique 22 22 37 69 342 492New Zealand 354 141 301 796Poland 0Romania 24 24Russia 50 7 2 94 153Singapore 243 243South Africa 74 1629 1203 6 2912Ukraine 16 86 55 157USA 594 1282 731 274 152 692 3725Venezuvela 26 26Vietnam 40 40Other Countries 0 254 31 36 321Total 9 4503 4526 6785 685 0 0 0 4358 6606 0 0 374 27846
Overseas Cargo of Principal Commodities Unloaded by Country - 2012-13Table 2.1.8(Contd...)

82
Country of Origin/Commodities KDS HDC PPT VPT EPL ChPT TPT CoPT NMPT MoPT JNPT MbPT KPT ALL PORTS
1 2 3 4 5 6 7 8 9 10 11 12 13 14 15COAL (THERMAL)Australia 204 108 33 345China 0Colombia 89 89Indonesia 5487 5670 1171 28 2177 474 2067 3338 20412Malaysia 92 92Phillipines 0Russia 0Singapore 20 20South Africa 287 376 166 1865 438 3132Spain 0Thailand 0USA 90 90UAE 0Ukaraine 0Other Countries 2089 168 165 2422Total 0 0 7780 0 6046 0 1263 28 2553 768 0 4100 4064 26602IRON ORE / PELLETSAustralia 156 156Bahrain 161 161Brazil 52 52China 1 1Finland 53 53Oman 87 55 142Qatar 0Russia 0Senegal 83 83South Africa 72 72Ukrain 292 292Vietnam 0Other Countries 52 1 53Total 0 0 1 87 0 52 0 0 0 0 0 0 925 1065
Overseas Cargo of Principal Commodities Unloaded by Country - 2012-13Table 2.1.8(Contd...)

83
Country of KDS HDC PPT VPT EPL ChPT TPT CoPT NMPT MoPT JNPT MbPT KPT ALL PORTS
1 2 3 4 5 6 7 8 9 10 11 12 13 14 15
OTHER ORES
Australia 362 481 272 30 1145
Argentina 17 11 28
Brazil 33 33
Canada 8 8
Chile 678 678
China 114 25 139
Egypt 0
Gabon 94 133 227
Ghana 13 15 28
Indonesia 117 48 165
Iran 0
Japan 8 71 79
Malaysia 8 8
Maxico 10 10
Mozambique 65 65
Oman 105 105
Peru 10 10
Phillipines 8 8
Saudi Arabia 6 6
South Africa 580 401 0 981
Thailand 42 42
Turkey 25 25
UAE 12 12
USA 0Other Countries 60 0 78 0 138
Total 68 1251 78 1038 0 0 1302 0 153 0 0 0 50 3940
Overseas Cargo of Principal Commodities Unloaded by Country - 2012-13Overseas Cargo of Principal Commodities Unloaded by Country - 2012-13Overseas Cargo of Principal Commodities Unloaded by Country - 2012-13Overseas Cargo of Principal Commodities Unloaded by Country - 2012-13Table 2.1.8
(Contd...)

84
`
Country of Origin/Commodities KDS HDC PPT VPT EPL ChPT TPT CoPT NMPT MoPT JNPT MbPT KPT ALL PORTS
1 2 3 4 5 6 7 8 9 10 11 12 13 14 15POL-PRODUCTAustralia 35 35Argentina 1 1Bangladesh 10 10Belgium 0China 19 130 149Egypt 169 169France 38 38Guyan 0Hongkong 117 117Indonesia 2 270 272Japan 34 549 184 142 909Jakarta 35 35Jordan 290 290Kenya 38 62 100North Korea 0South Korea 29 70 225 93 101 518Liberia 31 31Malaysia 59 32 35 88 30 183 427Maldives 0Malta 0Mauritius 1238 1238Namibia 216 32 248Netherland 751 1 752Oman 21 48 41 110Pakistan 33 33Qutar 1 1Saudi Arabia 80 29 701 810Singapore 426 431 914 33 1898 121 392 1953 6168Sri Lanka 14 93 42 25 174Slovenia 161 161Switzerland 11 11Taiwan 62 301 287 145 136 931Tanzania 0U.A.E. 43 21 530 153 1424 2171Ukarine 266 22 288USA 1 313 314Vietnam 5 5Yemen 32 440 472Yugoslavia 38 38Other Countries 9 35 28 2833 383 3288Total 9 564 0 600 0 984 0 1007 6732 0 848 3472 6098 20314
Overseas Cargo of Principal Commodities Loaded by Country ( Port-wise) - 2012-13(In '000 Tonnes)
Table 2.1.9

85
Country of Origin/Commodities KDS HDC PPT VPT EPL ChPT TPT CoPT NMPT MoPT JNPT MbPT KPT ALL PORTS
1 2 3 4 5 6 7 8 9 10 11 12 13 14 15
FOOD GRAIN
Australia 0
Bangladesh 86 32 110 228
Canada 0
China 6 6
Ethopia 32 32
France 0
Indonesia 626 94 46 156 28 88 1038
Iran 10 315 325
Italy 0
Japan 0
Kuwait 117 117
Malaysia 12 17 9 21 10 69
Maldives 12 12
Mozambique 20 20
Oman 147 147
Saudi Arabia 195 195
Singapore 10 10
Somalia 40 40
Sudan 48 48
Taiwan 0
Thailand 0
U.A.E. 21 307 328
Vietnam 405 27 62 494
Other Countries 4 83 34 2433 2554
Total 90 0 0 1085 0 314 128 0 204 60 0 0 3782 5663
Overseas Cargo of Principal Commodities Loaded by Country ( Port-wise) - 2012-13(In '000 Tonnes)
Table 2.1.9 (Contd.)

86
Country of
Origin/Commodities KDS HDC PPT VPT EPL ChPT TPT CoPT NMPT MoPT JNPT MbPT KPT ALL PORTS
1 2 3 4 5 6 7 8 9 10 11 12 13 14 15
IRON & STEEL
Algeria 0
Bangladesh 2 27 43 41 113
Belgium 8 103 111
Brazil 0
China 12 15 27
CIS 11 11
Indonesia 1 1
Iran 2 2
Italy 7 37 44
Japan 0
Kenya 1 1
Kuwait 3 3
Malaysia 63 63
Maldives 4 4
Myanmar 0
Oman 9 23 32
Philipines 0
Qatar 0
Saudi Arabia 2 163 22 187
South Korea 20 116 136
Singapore 2 52 2 56
Spain 10 10
Sri Lanka 2 3 15 4 24
Sudan 0
Taiwan 80 80
Tanzania 34 34
Thailand 78 7 123 208
U.A.E. 21 69 90
United Kingdom 11 11
USA 111 111
Vietnam 32 20 52
Other Countries 15 1 47 449 512
Total 17 175 6 723 0 230 4 0 0 0 0 741 27 1923
Overseas Cargo of Principal Commodities Loaded by Country ( Port-wise) - 2012-13(In '000 Tonnes)
Table 2.1.9 Contd.

87
Country of
Origin/Commodities KDS HDC PPT VPT EPL ChPT TPT CoPT NMPT MoPT JNPT MbPT KPT ALL PORTS
1 2 3 4 5 6 7 8 9 10 11 12 13 14 15
IRON ORE
Bangladesh 0
China 158 1631 1609 3507 26 6945 13876
Itlay 55 55
Japan 1464 415 1879
Kuwait 0
Malaysia 0
South Korea 138 138
Netherlands 0
Pakistan 0
Phillipines 0
Romania 0
Saudi Arabia 0
U.A.E. 0
United Kingdom 0
Vietnam 0
Other Countries 0
Total 158 1631 1609 5109 0 0 0 0 26 7415 0 0 0 15948
(In '000 Tonnes)Overseas Cargo of Principal Commodities Loaded by Country ( Port-wise) - 2012-13Table 2.1.9 Contd.

88
Country of
Origin/Commodities KDS HDC PPT VPT EPL ChPT TPT CoPT NMPT MoPT JNPT MbPT KPT ALL PORTS
1 2 3 4 5 6 7 8 9 10 11 12 13 14 15
OTHER ORES
Banagladesh 17 17
Balgaria 7 7
Belgium 3 3
Brazil 62 62
China 190 84 50 83 407
France 0
Indonesia 60 60
Iran 7 7
Iraq 4 4
Italy 14 14
Japan 111 36 147
Kuwait 0
Poland 16 16
Singapore 29 29
Spain 0
South Korea 0
Maldives 0
Malaysia 29 19 100 148
Mexico 0
Netherlands 169 21 190
Nigeria 4 4
Qatar 12 12
Saudi Arabia 0
South Africa 0
Tanzania 7 7
Thailand 6 6
USA 238 26 264
Other Countries 503 16 519
Total 0 0 318 113 0 882 300 0 0 0 0 0 310 1923
Overseas Cargo of Principal Commodities Loaded by Country ( Port-wise) - 2012-13(In '000 Tonnes)
Table 2.1.9 (Contd.)

89
Tare Weight of Containers handled At Major Ports (000'Tonnes)
2010-11 2011-12 2012-13 2010-11 2011-12 2012-13 2010-11 2011-12 2012-13
1 2 3 4 5 6 7 8 9 10
Kandla 2258 2457 1935 328 335 0 2432 2792 1935
Mumbai* 510 442 716 143 109 113 607 551 829
J.L.Nehru* 47617 49262 47754 8809 8971 10157 53096 58233 57911
Mormugao 182 231 213 38 48 45 229 279 258
N.Mangalore 480 546 585 88 99 107 475 645 692
Cochin 3737 3733 3879 682 982 728 3929 4715 4607
Tuticorin 7261 8295 8445 908 932 927 6599 9227 9372
Chennai** 26148 26751 25060 3273 3325 4648 23477 30076 29708
Visakhapatnam 2245 3532 3841 327 681 713 1678 4213 4554
Paradip 61 92 140 8 17 31 52 109 171
Haldia Dock Complex 2505 2318 2563 330 301 306 2068 2619 2869
Kolkata Dock System* 5405 5899 5976 815 919 984 6645 6818 6960
Total 98409 103558 101107 15749 16719 18759 101287 120277 119866** includes 83 container cargo and 15 Tare Weight on account of shifting * Tare weight includes transhipmentSource: Major Ports
Tare Weight Container TrafficPort
Container Cargo
Table 2.1.10

90
Reefer Container Traffic at Major Ports - 2011-12 & 2012-13
Port YearTEUs Tonnes TEUs Tonnes TEUs Tonnes TEUs Tonnes
1 2 3 4 5 6 7 8 9 10Kolkata Dock System 2011-12 952 12576 2327 65439 877 8247 2243 17762
2012-13 845 8703 4754 56733 901 8875 4500 19922
Haldia Dock Complex 2011-12 - - - - - - 1 29
2012-13 - - - - - - - -
Paradip 2011-12 - - - - - - - -
2012-13 - - - - - - - -
Visakhapatnam 2011-12 586 17784 6838 93326 511 2460 3206 8411
2012-13 582 18241 4583 144743 465 1959 4145 15610
Chennai 2011-12 1213 … 13122 … 1440 … 14048 …
2012-13 1318 … 18112 … 1745 … 18932 …
Tuticorin 2011-12 649 16224 6114 154124 640 8572 4642 55531
2012-13 850 20724 5384 130944 324 4821 4210 55757
Cochin 2011-12 1326 13223 14849 199953 1705 4995 12708 39600
2012-13 720 10485 13902 199270 672 1592 13416 49165
New Mangalore 2011-12 31 676 3266 55972 36 108 3526 7662
2012-13 47 987 3112 53945 44 141 3242 7052
Mormugao 2011-12 15 55 3410 49730 10 151 3220 10395
2012-13 5 34 3178 49453 5 53 3104 8964
J.L.Nehru 2011-12 3466 46915 139232 1978212 2640 36577 39666 309606
2012-13 3997 45140 164832 2421519 3117 42668 67436 375757
Mumbai 2011-12 - - - - 2 34 - -
2012-13 - - - - 1 16 2 32
Kandla 2011-12 26 392 - - 15 245 20 226
2012-13 - - - - - - - -
2011-12 8264 107845 189158 2596756 7876 61389 83280 449222
2012-13 8364 104314 217857 3056607 7274 60125 118987 532259
Note: There is no container traffic at Ennore.Source: Major Ports
Total
Export Import20 ft Containers 40 ft Containers 20 ft Containers 40 ft Containers
Table 2.1.11

91
Level of Containerisation in General Cargo at various Major Ports - 2011-12 & 2012-13
Loaded Unloaded Total Loaded Unloaded Total Loaded Unloaded Total
1 2 3 4 5 6 7 8 9 10
KANDLA
2011-12 1813 979 2792 4401 4881 9282 41.2 20.1 30.1
2012-13 1481 454 1935 7102 4425 11527 20.9 10.3 16.8
MUMBAI `
2011-12 53 498 551 1819 14478 16297 2.9 3.4 3.4
2012-13 176 653 829 1694 15067 16761 10.4 4.3 4.9
J. L. NEHRU2011-12 28492 29741 58233 28506 29859 58365 100.0 99.6 99.8
2012-13 27650 30261 57911 27711 30303 58014 99.8 99.9 99.8
MORMUGAO2011-12 111 168 279 684 171 855 16.2 98.2 32.6
2012-13 111 147 258 1117 164 1281 9.9 89.6 20.1
NEW MANGALORE
2011-12 356 289 645 505 909 1414 70.5 31.8 45.6
2012-13 362 330 692 401 847 1248 90.3 39.0 55.4
COCHIN2011-12 1854 2861 4715 1855 2967 4822 99.9 96.4 97.8
2012-13 1688 2919 4607 1689 3045 4734 99.9 95.9 97.3
TUTICORIN2011-12 6129 3098 9227 7451 5162 12613 82.3 60.0 73.2
2012-13 5887 3485 9372 6796 4666 11462 86.6 74.7 81.8
CHENNAI `
2011-11 14536 15540 30076 16254 16912 33166 89.4 91.9 90.7
2012-13 14604 15104 29708 16088 16374 32462 90.8 92.2 91.5
VISAKHAPATNAM
2011-12 2046 2167 4213 2891 2642 5533 70.8 82.0 76.1
2012-13 2280 2274 4554 3194 2660 5854 71.4 85.5 77.8
PARADIP2011-12 100 9 109 102 264 366 98.0 3.4 29.8
2012-13 156 15 171 163 164 327 95.7 9.1 52.3
KOLKATA DOCK SYSTEM `
2011-12 3255 3563 6818 4254 5007 9261 76.5 71.2 73.6
2012-13 3506 3454 6960 4669 4489 9158 75.1 76.9 76.0
HALDIA DOCK COMPLEX2011-12 1279 1340 2619 1280 1636 2916 99.9 81.9 89.8
2012-13 1212 1657 2869 1387 2130 3517 87.4 77.8 81.6
TOTAL2011-11 60024 60253 120277 70002 84888 154890 85.7 71.0 77.7
2012-13 59113 60753 119866 72011 84334 156345 82.1 72.0 76.7
Note: Containers were not handled at Ennore Port. * Includes tare weight also
Source: Major Ports
Container Cargo*
(000 tonnes)Port/Year
Percentage of Container
Cargo to General Cargo
General Cargo(Break Bulk
+ Container) (000 tonnes)
Table 2.1.12

92
Inland Container Movement At Major Ports - 2011-12 & 2012-13
Port YearTEUs Tonnes TEUs Tonnes TEUs Tonnes TEUs Tonnes TEUs Tonnes
1 2 3 4 5 6 7 8 9 10 11 12
Kolkata Dock System 2011-12 3202 … 5617 … 17961 … 3633 … 30413 …
2012-13 3651 … 6441 … 19855 … 4179 … 34126 …
Haldia Dock Complex 2011-12 12194 170079 72563 1112949 12048 102001 65811 1161117 162616 2546146
2012-13 14768 222554 69177 1040199 14336 170090 68179 1323320 166460 2756163
Paradip 2011-12 … … … … … … … … … -
2012-13 … … … … … … … … … -
Visakhapatnam 2011-12 197 452 127156 2028181 1161 22006 119169 2145061 247683 4195700
2012-13 … … 91144 1652337 … … 91876 1623692 183020 3276029
Chennai 2011-12 - … 473410 … 27584 … 527328 … 1028322 -
2012-13 31142 … 607508 … 40116 … 728911 … 1407677 -
Tuticorin 2011-12 - - 245639 6128807 - - 231457 3098352 477096 9227159
2012-13 1400 2473 240101 5885467 222 488 233876 3484017 475599 9372445
New Mangalore 2011-12 70 166 22396 355390 - - 22543 289749 45009 645305
2012-13 - - 24268 362185 30 75 24111 329854 48409 692114
Cochin 2011-12 7348 115500 7629 86839 1092 17681 2 29 16071 220049
2012-13 1916 35374 6462 69547 1286 6192 0 0 9664 111113
Mormugao 2011-12 - - 9358 73367 - - 9888 109542 19246 182909
2012-13 - - 7466 73132 - - 8406 100262 15872 173394
J.L.Nehru(a) 2011-12 185178 3486662 811498 14446013 251022 5242028 852286 14928161 2099984 38102864
2012-13 202220 3876999 889121 15489364 283992 6007218 940742 17085197 2316075 42458778
Mumbai 2011-12 - - 1721 8850 - - 26326 198617 28047 207467
2012-13 - - 7097 108854 - - 26899 396759 33996 505613
Kandla 2011-12 - - 73988 1771640 - - 91544 954770 165532 2726410
2012-13 - - - - - - - - - -
Total 2011-12 208189 3772859 1850975 26012036 310868 5383716 1949987 22885398 4320019 58054009
2012-13 255097 4137400 1948785 24681085 359837 6184063 2127179 24343101 4690898 59345649Note:-Containers are not handled at Ennore Port.Source: Major Ports
Incoming To Port Outgoing from Port TotalBy Rail By Road By Rail By Road
Table 2.1.13

93
2011-12 & 2012-13
Total Total
Moved Moved Total Container Moved Moved Total Container
in out Traffic in out Traffic
1 2 3 4 5 6 7 8 9
Kolkata Dock System
8823 21594 30417 316935 10092 24034 34126 463212
Haldia Dock Complex
0 0 0 115270 70 0 70 137214
Paradip - - 0 7853 - - 0 13072
Visakhapatnam 197 1161 1358 234345 - - 0 247311
Chennai 38125 45434 83559 1555021 48675 53131 101806 1539275
Tuticorin 19196 6406 25602 477096 9529 1381 10910 475599
Cochin 14977 1094 16071 336839 8378 1286 9664 334925
New Mangalore 0 0 0 45009 0 30 30 48409
Mormugao 0 0 0 22007 0 0 0 20431
J.L.Nehru 185178 251022 436200 4316486 202220 283992 486212 4259314
Mumbai 94 0 94 56276 108 0 108 57670
Kandla 0 0 0 167771 0 0 0 117967
All Ports 266590 326711 593301 7650908 279072 363854 642926 7714399
(a) ICD movement figures shown are for JNPCT and NSICTonly.
Source: Major Ports
Inland Container Depot Movement at Major Ports -
2012-13
ICD MovementPORT
2011-12
ICD Movement
Table 2.1.14

94
Selected Physical Performance Indicators - By Type of Vessels - 2011-12&2012-13
Item/Year Dry-Bulk Dry-Bulk Liquid Break- Container All(Mech.) (Conv.) Bulk Bulk vessels Types
1 2 3 4 5 6 7
1. No. of vessels sailed
2011-12 1557 4157 7035 3035 5390 21163
2012-13 1453 3577 6828 2855 5138 19851
2. Av. pre-berthing waiting time(days)
2011-12 3.52 4.12 1.74 2.66 0.77 2.05
2012-13 3.52 4.12 1.93 2.30 0.71 1.79
3. Av. turn round time (days)
2011-12 5.71 7.68 3.23 6.93 2.17 4.56
2012-13 4.48 7.02 3.72 6.14 2.07 4.29
4. Percentage of idle time at berth to time at working berth
2011-12 23.8 21.5 23.1 28.9 18.5 23.3
2012-13 22.0 18.9 21.7 28.0 13.6 21.1
5. Av. Output per ship berth day (tonnes)
2011-12 17740 7712 16533 1989 16968 10575
2012-13 19125 7884 18685 2384 19754 11812Note :- Item 1 (No. of vessels sailed) pertain to ships which left after cargo operation.
Source: Major Ports
Category of Vessels
* : Total may not tally with breakups since some vessels are double counted . Details of double counting are given in table 2.1.17.
Table 2.1.15

95
Selected Physical Performance Indicators - Major Port-wise -2011-12 & 2012-13
Item
1 2 3 4 5 6 7 8 9 10 11 12 13 14 15
1. No. of vessels sailed
2011-12 1203 1982 1328 2432 385 2043 1376 833 1136 785 2929 2017 2714 21163
2012-13 1216 1943 1274 2041 475 1928 1292 875 1072 475 2588 1908 2764 19851
2. Av. pre-berthing waiting time(days)
2011-12 0.77 2.54 3.69 2.84 0.76 1.16 1.91 1.05 0.79 2.94 1.13 1.37 3.74 2.05
2012-13 0.61 2.29 1.65 2.50 1.33 0.80 1.31 1.09 1.04 1.62 1.31 1.62 3.58 1.79
3. Av. turn round time (days)
2011-12 5.45 3.62 6.33 5.68 2.17 3.91 4.94 1.82 2.95 7.68 1.94 5.22 6.42 4.56
2012-13 4.72 3.95 4.39 5.39 2.95 3.24 4.31 1.58 3.29 5.06 2.48 5.58 6.33 4.29
4. Percentage of Idle time at berth to time at working berth
2011-12 35.0 37.0 24.1 24.2 7.4 22.3 26.4 22.0 15.8 20.2 23.7 16.9 15.9 23.3
2012-13 32.9 28.7 19.4 24.7 13.2 21.1 25.7 25.9 15.9 18.4 11.8 15.9 15.7 21.1
`
5. Av. Output per ship berth day (tonnes)
2011-12 2503 6728 15995 10704 27505 10352 6733 15784 13957 10530 19227 6476 14272 10575
2012-13 2762 6078 16625 10641 27741 12046 7452 15878 15921 11484 23319 8709 15728 11812
/_1: Excludes Lighterage Operation. /_2: Excludes Stream Vessels except for TRT & No. of Vessels. /_3: Includes stream Vessels
/_4: Performance relates to Coal Handling except for No. of vessels.
Source: Major Ports
Kolkata
Dock/_1
System
Haldia
Dock
Comple
x
ParadipVisakha-
patnam
Ennore
/_4Chennai
J.L.
Nehru
Mumbai
/_3All PortsKandla
Tuti-
CorinCochin
New Man-
galore
Mormu-
gao /_2
Table 2.1.16
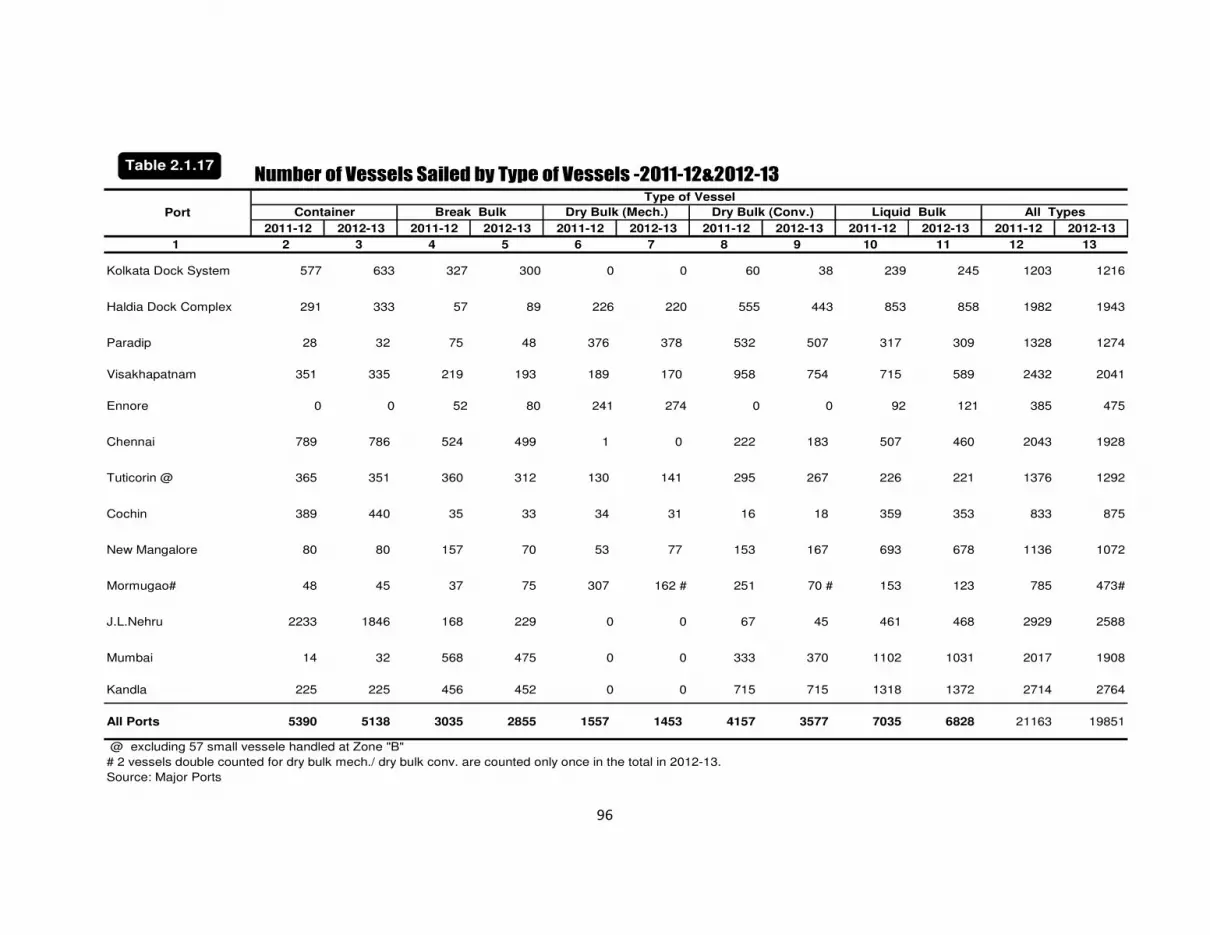
96
Number of Vessels Sailed by Type of Vessels -2011-12&2012-13
2011-12 2012-13 2011-12 2012-13 2011-12 2012-13 2011-12 2012-13 2011-12 2012-13 2011-12 2012-13
1 2 3 4 5 6 7 8 9 10 11 12 13
Kolkata Dock System 577 633 327 300 0 0 60 38 239 245 1203 1216
Haldia Dock Complex 291 333 57 89 226 220 555 443 853 858 1982 1943
Paradip 28 32 75 48 376 378 532 507 317 309 1328 1274
Visakhapatnam 351 335 219 193 189 170 958 754 715 589 2432 2041
Ennore 0 0 52 80 241 274 0 0 92 121 385 475
Chennai 789 786 524 499 1 0 222 183 507 460 2043 1928
Tuticorin @ 365 351 360 312 130 141 295 267 226 221 1376 1292
Cochin 389 440 35 33 34 31 16 18 359 353 833 875
New Mangalore 80 80 157 70 53 77 153 167 693 678 1136 1072
Mormugao# 48 45 37 75 307 162 # 251 70 # 153 123 785 473#
J.L.Nehru 2233 1846 168 229 0 0 67 45 461 468 2929 2588
Mumbai 14 32 568 475 0 0 333 370 1102 1031 2017 1908
Kandla 225 225 456 452 0 0 715 715 1318 1372 2714 2764
All Ports 5390 5138 3035 2855 1557 1453 4157 3577 7035 6828 21163 19851
Source: Major Ports
# 2 vessels double counted for dry bulk mech./ dry bulk conv. are counted only once in the total in 2012-13.
Port
Type of Vessel
Container Break Bulk Dry Bulk (Mech.) Dry Bulk (Conv.) Liquid Bulk All Types
@ excluding 57 small vessele handled at Zone "B"
Table 2.1.17

97
( In Days )
2011-12 2012-13 2011-12 2012-13 2011-12 2012-13 2011-12 2012-13 2011-12 2012-13 2011-12 2012-13
1 2 3 4 5 6 7 8 9 10 11 12 13
Kolkata Dock System 0.61 0.44 0.77 0.69 - - 1.41 0.57 0.99 0.98 0.77 0.61
Haldia Dock Complex 0.70 0.69 4.55 3.51 1.60 1.20 3.08 2.85 2.94 2.78 2.54 2.29
Paradip 1.12 1.51 6.35 2.16 2.39 1.00 5.81 2.48 1.28 1.00 3.69 1.65
Visakhapatnam 0.81 0.54 3.94 2.85 4.84 3.57 3.48 3.10 2.11 2.42 2.84 2.50
Ennore - - 1.21 0.96 0.91 1.17 - - 0.11 1.95 0.76 1.33
Chennai 0.68 0.35 0.87 0.50 0.76 0.00 1.00 0.68 2.28 1.93 1.16 0.80
Tuticorin 0.43 0.54 2.76 1.66 2.41 2.36 3.05 1.73 1.14 0.91 1.91 1.31
Cochin 0.98 1.03 0.34 0.50 2.54 4.28 0.53 0.15 1.07 0.98 1.05 1.09
New Mangalore 0.05 0.06 0.48 0.69 0.44 0.59 0.53 0.48 1.03 1.38 0.79 1.04
Mormugao 0.05 0.04 0.81 0.69 4.77 3.08 2.88 2.09 0.80 0.54 2.94 1.62
J.L.Nehru 0.83 0.96 1.03 0.32 - - 1.94 0.62 2.55 3.23 1.13 1.31
Mumbai 1.25 0.47 1.64 1.89 - - 0.47 0.52 1.50 1.92 1.37 1.62
Kandla 1.38 0.89 7.76 7.81 - - 5.82 4.87 1.62 1.94 3.74 3.58
All Ports 0.77 0.71 2.66 2.30 3.52 3.52 4.12 4.12 1.74 1.93 2.05 1.79
Source: Major Ports
Average Pre-berthing Detention By Type of Vessels - 2011-12 & 2012-13
Dry Bulk (conv.) Liquid Bulk All TypesPort
Container Break Bulk Dry Bulk (Mech.)
Table 2.1.18

98
Average Turn Round Time - By Type Of Vessels - 2011-12 & 2012-13(In Days)
2011-12 2012-13 2011-12 2012-13 2011-12 2012-13 2011-12 2012-13 2011-12 2012-13 2011-12 2012-13
1 2 3 4 5 6 7 8 9 10 11 12 13
Kolkata Dock System 4.21 3.93 8.68 7.26 - - 6.47 6.00 3.77 3.47 5.45 4.72
Haldia Dock Complex 2.43 2.20 7.28 7.44 4.06 3.79 5.14 5.88 2.67 3.30 3.62 3.95
Paradip 2.59 3.64 10.41 6.06 4.49 3.10 9.36 6.34 2.80 2.58 6.33 4.39
Visakhapatnam 1.95 1.51 7.95 6.77 7.55 5.96 7.43 7.46 3.96 4.34 5.68 5.39
Ennore 0.00 0.00 1.60 1.70 2.71 3.23 0.00 0.00 1.06 3.15 2.17 2.95
Chennai 2.46 1.83 4.33 3.38 2.90 0.00 6.39 5.74 4.64 4.49 3.91 3.24
Tuticorin 1.54 1.68 6.70 5.24 6.64 6.86 7.60 6.28 3.21 3.38 4.94 4.31
Cochin 0.96 0.73 3.74 5.09 5.90 6.02 6.16 4.10 1.98 1.80 1.82 1.58
New Mangalore 1.62 1.54 3.43 3.95 2.52 3.24 4.04 4.11 2.78 3.24 2.95 3.29
Mormugao 1.95 1.42 5.33 4.47 9.78 7.39 9.93 8.28 2.13 1.85 7.68 5.06
J.L.Nehru 1.77 2.02 1.61 1.34 0.00 0.00 4.16 4.59 2.59 4.68 1.94 2.48
Mumbai 4.72 2.57 6.19 5.89 0.00 0.00 8.95 8.70 3.61 4.40 5.22 5.58
Kandla 3.00 2.02 12.72 12.70 0.00 0.00 9.00 8.32 3.42 3.91 6.42 6.33
All Ports 2.17 2.07 6.93 6.14 5.71 4.48 7.68 7.02 3.23 3.72 4.56 4.29
Source: Major Ports
Dry Bulk (conv.) Liquid Bulk All TypesPort
Container Break Bulk Dry Bulk (Mech.)
Table 2.1.19

99
Percentage Of Idle Time At Working Berth To Time At Working Berth - By Type Of Vessels - 2011-12 & 2012-13
2011-12 2012-13 2011-12 2012-13 2011-12 2012-13 2011-12 2012-13 2011-12 2012-13 2011-12 2012-13
1 2 3 4 5 6 7 8 9 10 11 12 13
Kolkata Dock System 22.1 22.6 39.5 36.5 - - 45.1 50.3 41.1 41.6 35.0 32.9
Haldia Dock Complex
28.7 29.0 23.6 23.1 39.1 32.2 43.6 26.2 33.4 32.2 37.0 28.7
Paradip 22.2 33.1 58.5 24.7 31.8 28.8 21.3 19.4 - - 24.1 19.4
Visakhapatnam 17.3 15.6 22.6 26.6 41.5 38.4 21.0 22.1 30.1 28.7 24.2 24.7
Ennore - - - - 9.6 15.8 - - - - 7.4 11.7
Chennai - - 38.6 37.7 42.9 - 27.9 26.0 18.6 17.7 22.3 21.1
Tuticorin 1.1 - 36.4 38.3 14.5 13.1 29.0 30.8 24.6 22.0 26.4 25.7
Cochin 27.5 36.3 22.5 26.8 8.0 9.7 39.2 29.2 21.6 25.7 22.0 25.9
New Mangalore 15.9 14.3 19.7 18.3 18.9 12.9 14.3 16.5 14.6 15.7 15.8 15.9
Mormugao 7.1 10.8 14.3 19.4 18.3 13.1 21.6 21.2 32.5 35.7 20.2 18.4
J.L.Nehru 26.6 8.1 13.7 18.5 - - 7.3 7.0 19.8 21.2 23.7 11.8
Mumbai 25.9 27.2 25.7 30.4 - - 5.2 6.2 23.5 18.2 16.9 15.9
Kandla 25.0 28.0 9.0 9.4 - - 13.0 12.5 22.1 21.0 15.9 15.7
All Ports 18.5 13.6 28.9 28.0 23.8 21.6 21.5 18.9 23.1 21.7 23.3 21.0
Source: Major Ports
Dry Bulk (conv.) Liquid Bulk All TypesPort
Container Break Bulk Dry Bulk (Mech.)
Table 2.1.20

100
( Tonnes )
2011-12 2012-13 2011-12 2012-13 2011-12 2012-13 2011-12 2012-13 2011-12 2012-13 2011-12 2012-13
1 2 3 4 5 6 7 8 9 10 11 12 13
Kolkata Dock System
5768 5490 1833 1702 0 0 1892 1680 2817 2907 2503 2762
Haldia Dock Complex
5369 5932 816 1447 8242 9355 6484 5459 8608 7118 6728 6078
Paradip 2717 2774 848 890 22956 24314 10503 10012 37757 39445 15995 16625
Visakhapatnam 11511 15143 1635 1741 26087 28079 8956 8520 16098 15317 10704 10641
Ennore 0 0 25398 32614 31395 32861 0 7768 8889 27505 27741
Chennai 22077 27160 1783 2023 13717 0 6888 6960 12840 13589 10352 12046
Tuticorin 24004 24275 1781 24275 10754 10547 6064 7071 3934 3660 6733 7452
Cochin 19988 17936 870 775 3458 3538 4018 3840 22762 24621 15784 15878
New Mangalore 5359 6085 1133 1311 19097 19985 12172 11629 20259 21010 13957 15921
Mormugao 2659 3647 3469 3734 16916 19029 6394 7069 7265 6971 10530 11484
J.L.Nehru 23763 32841 742 494 0 0 3832 3417 10994 9517 19227 23319
Mumbai 3645 3539 2385 2764 0 0 4626 4705 14115 41611 6476 8709
Kandla 8407 8653 3713 4294 0 0 11831 13783 25309 25186 14272 15728
All Ports 16968 19754 1989 2384 17740 19125 7712 7884 16533 18685 10575 11812
Source: Major Ports
Average Output Per Ship Berthday - By Type Of Vessels - 2011-12 & 2012-13
Dry Bulk (conv.) Liquid Bulk All TypesPort
Container Break Bulk Dry Bulk (Mech.)
Table 2.1.21

101
Commodity-wise Average Pre-Berthing Detention - 2011-12 & 2012-13(In Days)
Port Mumbai
Commodity
1 2 3 4 5 6 7 8 9 10 11 12 13 14 15
POL(Crude) 2012-13 - 1.25 1.76 2.10 - 4.30 - 0.82 1.33 - 3.31 2.90 1.31
2011-12 - 0.93 1.98 0.89 - 3.60 - 1.21 1.21 - 1.93 2.34 1.56
POL(Product) 2012-13 0.65 2.84 0.62 1.68 - 2.07 0.61 1.07 1.40 0.42 - 1.43 1.76
2011-12 0.81 3.32 0.84 1.47 - 2.89 1.27 1.21 1.04 0.87 - 1.12 1.75
LPG 2012-13 - 5.09 - 12.57 - - 1.16 - 1.75 - - - 6.89
2011-12 - 5.96 - 11.85 - - 0.67 - 1.20 - - - 4.20
Iron Ore 2012-13 - 3.79 1.89 3.24 - 0.00 - - 0.41 2.83 - - 2.91
2011-12 - 5.30 8.77 5.10 - 0.80 2.11 - 0.27 4.67 - - 2.32
Coking Coal 2012-13 - 1.40 2.17 2.54 0.00 - - 0.54 2.83 - - 3.38
2011-12 - 0.77 3.25 3.16 0.66 - - 0.49 2.54 - - 2.54
Thermal Coal 2012-13 - 0.81 0.53 0.63 1.17 0.00 2.37 0.14 0.34 2.38 - - 1.95
2011-12 - 0.82 0.28 0.93 0.91 0.77 2.43 1.90 - 1.69 - - 3.77
Fertilisers 2012-13 0.43 10.88 1.21 6.81 - 0.42 1.35 0.21 0.68 0.53 - 1.48 2.34
2011-12 3.49 1.27 0.37 4.19 - 0.91 2.09 0.29 0.90 - - 3.14 2.01
FRM (Dry) 2012-13 - 3.59 2.18 2.63 - 0.59 2.14 3.23 1.11 - - 0.40 8.63
2011-12 - 3.95 3.01 2.69 - 0.81 2.09 2.02 0.27 - - 0.00 9.08
Other Dry Bulk 2012-13 0.22 2.66 2.62 3.46 - 0.58 1.69 3.56 0.64 2.77 0.62 2.34 5.74
2011-12 - 2.81 5.91 3.36 - 1.01 3.36 2.05 0.77 0.58 1.94 1.89 7.51
Other Lqd. Bulk 2012-13 1.14 2.36 0.92 0.71 1.95 0.61 1.01 0.41 0.64 0.91 3.12 1.73 2.15
2011-12 1.10 2.25 1.31 1.47 0.11 0.67 1.21 0.38 0.65 0.69 3.14 1.44 1.44
General Cargo 2012-13 0.59 2.90 2.16 2.85 0.96 0.50 1.68 0.50 0.69 0.69 0.32 1.89 7.81
2011-12 0.58 4.55 6.35 3.94 1.21 0.87 2.48 0.34 0.48 0.81 1.03 1.64 7.76
Containers 2012-13 0.44 0.69 1.51 0.54 - 0.35 0.54 1.03 0.06 0.04 0.96 0.47 1.03
2011-12 0.61 0.70 1.12 0.81 - 0.68 0.61 0.98 0.05 0.05 0.83 1.25 1.38
2012-13 0.59 2.29 1.65 2.50 1.33 0.80 1.26 1.09 1.04 1.61 1.30 1.62 3.58
2011-12 0.77 2.54 3.69 2.84 0.76 1.16 1.91 1.05 0.79 2.94 1.13 1.37 3.74
(a) Included in POL Products $ Excludes vessels engaged in lighterage operations of dry cargo at anchorages. `
Source: Major Ports
Tuticorin Cochin KandlaYear Visakhak
hapatna
m
New
Manglore
Mormuga
o
J L NehruChennaiEnnoreParadipKolkata
Dock
System$
Haldia
Dock
Comple
x
Total
Table 2.1.22

102
Commodity-wise Average Turn Round Time 2011-12 & 2012-13(In Days)
Port --->
Commodity
1 2 3 4 5 6 7 8 9 10 11 12 13 14 15
POL (Crude) 2012-13 - 1.39 3.71 3.88 - 6.64 - 1.47 3.17 - 4.95 4.71 3.12
2011-12 - 1.49 4.02 2.64 - 5.64 - 1.75 2.67 - 2.22 4.56 3.48
POL(Product) 2012-13 2.86 3.19 1.93 3.71 - 4.81 2.05 2.14 3.26 1.80 - 5.28 3.84
2011-12 3.43 2.27 2.01 3.46 - 5.21 2.95 2.37 2.73 2.27 - 3.56 3.84
LPG 2012-13 - 2.61 - 15.49 - - 3.00 - 4.68 - - - 10.85
2011-12 - 2.25 - 14.40 - - 2.15 - 3.93 - - - 7.41
Iron Ore 2012-13 - 5.71 5.23 5.60 - 0.00 - - 3.08 9.84 - 5.54 6.35
2011-12 - 6.08 11.85 7.84 - 3.65 4.82 - 2.40 11.62 - 4.12 4.75
Coking Coal 2012-13 - 4.03 5.92 7.00 - 0.00 - - 3.27 9.00 - 8.04 6.44
2011-12 - 3.36 7.29 7.20 - 4.73 - - 3.21 6.08 - 6.00 4.73
Thermal Coal 2012-13 - 3.33 2.20 2.54 3.23 0.00 6.87 5.84 3.58 5.43 - 8.16 6.40
2011-12 - 2.96 1.74 2.84 2.71 5.10 6.71 4.43 - 4.30 - 9.66 8.30
Fertilisers 2012-13 11.03 14.70 8.71 12.98 - 8.50 9.36 5.64 6.50 5.98 - 26.05 6.96
2011-12 16.86 6.06 6.61 9.49 - 9.93 8.26 9.62 7.32 4.68 - 30.05 6.66
FRM (Dry) 2012-13 - 7.43 5.23 8.67 - 5.16 7.01 11.06 3.36 - - 11.74 11.73
2011-12 - 8.16 5.98 9.72 - 5.67 6.50 10.72 2.38 - - 13.07 12.90
Other Dry Bulk 2012-13 6.76 5.75 6.53 8.19 - 5.21 6.02 3.65 5.25 7.09 4.59 12.02 8.80
2011-12 6.38 5.56 9.30 7.59 - 5.30 7.61 4.06 4.54 4.06 5.95 11.42 10.38
Other Lqd. Bulk 2012-13 3.77 3.53 2.55 2.12 3.15 3.06 4.27 1.00 1.92 1.99 4.42 3.38 4.05
2011-12 3.95 3.33 2.89 2.95 1.06 3.31 3.64 1.04 1.79 1.86 2.94 3.14 2.97
General Cargo 2012-13 6.72 6.88 6.06 6.78 1.70 3.38 5.24 5.09 3.95 4.48 1.34 5.89 12.69
2011-12 7.26 7.35 10.41 7.95 1.60 4.33 6.01 3.74 3.43 5.33 1.61 6.19 12.72
Containers 2012-13 3.93 2.20 3.64 1.51 - 1.83 1.68 0.73 1.54 1.42 2.02 2.57 2.34
2011-12 4.21 2.43 2.59 1.95 - 2.46 1.99 0.96 1.62 1.95 1.77 4.72 3.00
2012-13 4.49 3.95 4.39 5.39 2.95 3.24 4.17 1.58 3.29 5.06 2.48 5.58 6.33
2011-12 5.45 3.62 6.33 5.68 2.17 3.91 4.94 1.82 2.95 7.68 1.94 5.22 6.42
$ Excludes vessels engaged in lighterage operations of dry cargo at anchorages. Source: Major Ports ` ` `
New
Manglore
Total
Kolkata
Dock
System$
Haldia Dock
Complex
Tuticorin Mormugao J.L.Nehru Mumbai KandlaParadipYear CochinEnnoreVisakhak
hapatnam
Chennai
Table 2.1.23

103
Commodity-wise Average Non-Working Time at Berth - 2011-12 & 2012-13 (In Days)
Port --->
Commodity
1 2 3 4 5 6 7 8 9 10 11 12 13 14 15
POL(Crude) 2012-13 - 0.32 … 0.43 - 0.29 - 0.42 0.25 - 0.32 0.36 0.19
2011-12 - 0.42 … 0.57 - 0.34 - 0.29 0.22 - 0.17 0.37 0.17
POL(Product) 2012-13 0.74 0.50 … 0.58 - 0.43 0.46 0.43 0.33 0.45 - 0.39 0.52
2011-12 0.82 0.43 … 0.58 - 0.42 0.55 0.47 0.29 0.42 - 0.44 0.44
LPG 2012-13 - 0.52 - 0.63 - - 0.43 … 0.28 - - - 0.48
2011-12 - 0.42 - 0.56 - - 0.43 … 0.25 - - - 0.50
Iron Ore 2012-13 - 1.21 1.36 0.72 … 0.00 - - 0.47 1.34 - - 0.29
2011-12 - 1.84 1.20 0.78 … 1.05 0.13 - 0.41 1.46 - - 0.32
Coking Coal 2012-13 - 0.60 0.59 0.99 0.00 - - 0.31 0.27 - - 0.32
2011-12 - 0.93 0.68 0.83 1.18 - - 0.32 0.53 - - 0.26
Thermal Coal 2012-13 - 0.95 0.66 0.50 0.31 0.00 0.58 1.10 0.42 0.55 - 0.16
2011-12 - 0.81 0.63 0.50 0.17 1.12 0.63 0.94 - 0.38 - 0.25
Fertilisers 2012-13 2.27 2.35 1.57 1.27 - 1.77 2.16 1.20 1.18 0.88 - 6.57 0.31
2011-12 5.97 1.06 1.48 0.92 - 2.59 1.47 3.24 0.84 0.52 - 4.04 0.33
FRM (Dry) 2012-13 - 1.61 - 1.50 - 1.10 1.47 0.56 0.63 - - 0.48 0.30
2011-12 - 2.18 - 1.66 - 1.41 1.28 0.29 0.50 - - 0.66 0.27
Other Dry Bulk 2012-13 1.56 0.97 0.76 0.95 - 1.09 1.31 0.83 0.78 0.66 0.27 1.88 0.31
2011-12 1.78 1.37 0.69 0.75 - 1.04 1.25 0.99 0.63 0.43 0.24 1.51 0.31
Other Lqd. Bulk 2012-13 0.70 0.46 - 0.38 - 0.46 0.62 0.36 0.24 0.34 0.24 0.35 0.35
2011-12 0.73 0.54 - 0.36 - 0.47 0.47 0.19 0.18 0.34 0.36 0.36 0.35
General Cargo 2012-13 1.75 1.08 0.94 1.00 - 1.03 1.33 1.33 0.59 0.70 0.17 1.07 0.33
2011-12 1.99 1.46 2.33 0.87 - 1.28 1.23 0.81 0.57 0.63 0.15 0.99 0.32
Containers 2012-13 0.44 0.42 0.64 0.14 - * 0.00 0.21 0.20 0.14 0.08 0.35 0.32
2011-12 0.44 0.48 0.31 0.18 - * 0.10 0.17 0.24 0.13 0.30 0.71 0.37
2012-13 0.80 0.66 0.52 0.67 0.18 0.82 0.71 0.37 0.34 0.62 0.12 0.57 0.34
2011-12 1.16 0.84 0.62 0.63 0.10 0.96 0.77 0.33 0.33 0.95 0.29 0.57 0.34
Source: Major Ports $ Excludes vessels engaged in lighterage operations of dry cargo at anchorages.
* Excludes container vessels Excludes FRM and oil vessels handled mechanically in Paradip total
Tuticorin Cochin
Total
Kolkata
Dock
System
Haldia
Dock
Complex
New
Mangalore
Mormuga
oJ.L.Nehru Mumbai Kandla
Year
ParadipVisakhakh
apatnamEnnore Chennai
Table 2.1.24

104
Commodity-wise Output per Ship Berth Day - 2011-12 & 2012-13 (In Tonnes)
Port
Commodity
1 2 3 4 5 6 7 8 9 10 11 12 13 14 15
POL(Crude) 2012-13 - 34297 109806 59509 - 48558 - 71109 59618 - 13503 52390 100478
2011-12 - 31493 107296 50142 - 41677 - 64802 61007 - 16033 51456 110184
POL(Product) 2012-13 3534 10056 61628 9426 - 8172 6594 9273 20983 6899 - 5082 2900
2011-12 3484 11078 13413 8788 - 7394 6015 9107 21629 7303 - 7545 15872
LPG 2012-13 - 10064 - 8214 - - 3621 … 4445 - - - 2578
2011-12 - 9653 - 8016 - - 4207 … 4811 - - - 4854
Iron Ore 2012-13 - 6086 11709 25342 - 0 - - 18390 11560 - 8353 23744
2011-12 - 4703 13636 19858 - 9237 6254 - 22826 10490 - 10326 17757
Coking Coal 2012-13 - 10129 10872 12350 - 0 - - 17504 24117 - 4161 23944
2011-12 - 10859 11112 12267 - 7263 - - 18258 18393 - 5413 18328
Thermal Coal 2012-13 - 8250 27502 17896 27662 0 10595 5000 25080 12568 - 5635 30894
2011-12 - 9504 33903 17130 31395 10148 10542 6897 - 16480 - 5002 22015
Fertilisers 2012-13 710 1597 6352 5511 - 3933 4793 4074 5315 3627 - 1082 13225
2011-12 592 3832 4520 5727 - 2989 4881 3053 5073 5112 - 952 12221
FRM (Dry) 2012-13 - 2660 15652 4246 - 3646 6893 2961 3834 - - 1771 9723
2011-12 - 2397 16317 4596 - 3482 6819 2740 5084 - - 1626 8742
Other Dry Bulk 2012-13 1180 5121 9877 7016 - 8345 7193 4632 3621 8636 3417 2177 11708
2011-12 1229 6777 10036 7627 - 8746 5570 4511 4977 8570 3832 2435 9459
Other Liquid Bulk 2012-13 2650 4340 9557 6500 8889 3454 2985 6283 5822 7442 5567 4379 15974
2011-12 2489 4295 9425 6279 7768 3089 1543 5536 6088 7308 5750 3450 8916
General Cargo 2012-13 630 1513 890 1740 32614 2023 1779 775 1311 3734 503 2764 4294
2011-12 610 816 848 1633 25398 1783 2792 870 1133 3469 742 2385 3713
Containers 2012-13 5477 5932 2774 15169 - 27160 24294 17936 6085 3647 32824 3539 8653
2011-12 5762 5369 2717 11511 - 22077 24004 19988 5359 2659 23763 3667 8407
2012-13 2985 6078 16927 10646 24497 12046 7621 15878 15921 11484 23287 6912 15728
2011-12 2787 6728 15995 10704 27505 10352 6733 15784 13957 10533 19227 6476 14272
$ Excludes vessels engaged in lighterage operations of dry cargo at anchorages.
(a) Includes Pellets (b) Includes NSICT also ` (c) Includes NSICT & GTIPL also `
Source: Major Ports `
Total
New
Mangalore
Ennore TuticorinParadip Visakhap
atnam
Chennai Cochin Mormuga
o
J.L.Nehru KandlaYear MumbaiKolkata
Dock
System$
Haldia
Dock
Complex
Table 2.1.25

105
Average Pre-berthing Detention on Port & Non Port
Account -Major Port-wise -2011-12 & 2012-13 (In Days)
Total Port A/c Non-Port A/c Total Port A/c Non-Port A/c
1 2 3 4 5 6 7
Kolkata Dock System 0.77 0.04 0.73 0.61 0.00 0.61
Haldia Dock Complex 2.54 0.54 2.00 2.29 0.84 1.45
Paradip 3.69 0.05 3.64 1.65 0.05 1.60
Visakhapatnam 2.84 0.09 2.75 2.50 0.06 2.44
Ennore 0.76 0.00 0.76 1.33 0.00 1.33
Chennai 1.16 0.04 1.12 0.80 0.04 0.76
Tuticorin 1.91 0.80 1.11 1.31 0.35 0.96
Cochin 1.05 0.15 0.90 1.09 0.06 1.03
New Mangalore 0.79 0.04 0.75 1.04 0.05 0.99
Mormugao 2.94 0.60 2.35 1.61 0.69 0.92
J.L.Nehru 1.13 0.35 0.78 1.31 0.37 0.93
Mumbai 1.37 0.25 1.12 1.62 0.25 1.36
Kandla 3.74 1.78 1.96 3.58 2.03 1.55
All Ports 2.05 0.45 1.60 1.79 0.50 1.29
Source: Major Ports
Port
2011-12 2012-13
Table 2.1.26

106
Reason-wise, Major Port-wise Average Pre-berthing Detention - 2012 - 13
Sl. No. Category Of Ships No. Of Non-avail. Non-avail. Non-avail. Navigation Draft Shippers/ Lack Others Total
Ships of Berth of Tug/Craft Of Pilot Restriction Restric- Ships/ of
tion Agents cargo
Option
1 2 3 4 5 6 7 8 9 10 11 12
Kolkata Dock System
1. Container 633 - - - - - 0.11 - 7.90 8.00
2. Break Bulk 300 - - 0.08 0.17 - 2.40 - 9.68 12.33
3. Dry Bulk(C) 38 - - - - - - - 0.42 0.42
4. Liquid Bulk 245 - - - - - 3.85 - 19.68 23.52
Total 1216 - - 0.02 - - 2.69 - 10.52 13.23
Haldia Dock Complex
1. Container 333 4.40 - - - 6.05 - 6.01 16.46
2. Break Bulk 89 21.46 - - - - 53.09 - 9.69 84.24
3. Dry Bulk(M) 220 7.34 - - - - 11.78 - 9.74 28.86
4. Dry Bulk(C) 443 22.64 - - - - 36.52 - 9.24 68.41
5. Liquid Bulk 858 28.01 - - - - 27.81 - 10.97 66.79
Total 1943 20.10 - - - 25.41 - 9.53 55.04
Paradip
1. Container 32 0.31 - - - - 35.28 - 0.56 36.16
2. Break Bulk 48 0.54 - - - - 49.71 - 1.52 51.77
3. Dry Bulk(M) 378 0.10 - - - - 22.24 - 1.60 23.93 *
4. Dry Bulk (C) 507 0.36 - - - - 57.64 - 1.57 59.56
5. Liquid Bulk 309 0.00 - - - - 23.53 - 0.50 24.04
Total 1274 0.20 - - - - 38.00 - 1.29 39.49
(M) Mechanised. (C) Conventional.
Reason-wise average pre-berthing delay (in hrs.)
Table 2.1.27

107
Reason-wise, Major Port-wise Average Pre-berthing Detention - 2012 - 13
Sl. No. Category Of Ships No. Of Non-avail. Non-avail. Non-avail. Navigation Draft Shippers/ Lack Of Others TotalShips of Berth of Tug/Craft Of Pilot Restriction Restric- Ships/ Cargo
tion AgentsOption
1 2 3 4 5 6 7 8 9 10 11 12
Visakhapatnam1. Container 335 0.40 - - - 7.55 - 4.94 12.892. Break Bulk 193 0.96 - - - 39.96 - 27.51 68.433. Dry Bulk(M) 170 1.69 - - - 29.82 - 54.33 85.844. Dry Bulk(C) 754 1.23 - - - 37.62 - 35.62 74.475. Liquid Bulk 589 0.49 - - - 17.77 19.23 20.53 58.02
Total 2041 0.89 - - - 26.53 5.55 27.02 59.99Ennore*
1. Container - - - - - - - - - -
2. Break Bulk - - - - - - - - - -
3. Dry Bulk(M) 274 - 0.07 - - 27.97 - - 28.044. Dry Bulk(C) - - - - - - - - - -5. Liquid Bulk 121 - - 0.01 - - 46.78 - - 46.796. Other 80 - - 0.02 23.02 23.04
Total 475 - - 0.05 - - 31.93 - - 31.98
Chennai1. Container 786 - - - 0.73 - 7.70 - - 8.442. Break Bulk 499 - - - 0.85 - 11.13 - - 11.983. Dry Bulk(M) 0 - - - - - - - - -4. Dry Bulk(C) 183 - - - 1.38 - 14.87 - - 16.255. Liquid Bulk 460 - - - 1.02 - 45.22 - - 46.24
Total 1928 - - - 0.89 - 18.22 - - 19.12
(M) Mechanised. (C) Conventional.
Reason-wise average pre-berthing delay (in hrs.)
* - Data pertains to dry Bulk (mechanical) ships only
Table 2.1.27(Contd...)

108
Reason-wise, Major Port-wise Average Pre-berthing Detention - 2012-13
Sl. No. Category Of Ships No. Of Non-avail. Non-avail. Non-avail. Draft Shippers/ Lack Of Others TotalShips of Berth of Tug/Craft Of Pilot Navigation Restric- Ships/ Cargo
Restriction tion AgentsOption
1 2 3 4 5 6 7 8 9 10 11 12
Tuticorin1. Container 351 0.05 - - - - 10.75 - 2.11 12.912. Break Bulk 312 11.63 - - - - 17.96 - 4.91 34.503. Dry Bulk(M) 141 0.57 - - - - 25.60 - 30.39 56.564. Dry Bulk(C) 267 19.61 - - - - 15.35 - 6.53 41.49 *5. Liquid Bulk 221 6.18 - - - - 13.76 - 1.94 21.88
Total 1292 7.99 - - - - 15.58 - 6.75 30.33
Cochin1. Container 440 1.01 - - - - 17.53 - 6.18 24.722. Break Bulk 33 - - - - - 3.88 - 8.13 12.013. Dry Bulk(M) 31 0.62 - - - - 84.66 - 17.50 102.784. Dry Bulk(C) 18 - - - - - 2.14 - 1.50 3.645. Liquid Bulk 353 2.30 - - - - 17.20 - 4.03 23.53
Total 875 1.46 - - - - 18.94 - 5.69 26.09
New Mangalore1. Container 80 - - - - - 1.04 - 0.31 1.352. Break Bulk 70 - - - - - 13.39 - 3.13 16.51 *3. Dry Bulk(M) 77 - - - - - 12.83 0.77 0.45 14.054. Dry Bulk(C) 167 0.24 - - - - 10.75 - 0.62 11.605. Liquid Bulk 678 1.76 - - - - 31.01 - 0.40 33.17
Total 1072 1.15 - - - - 23.16 0.06 0.61 24.97 Mormugao#
1. Container 45 - - - 0.87 - - - 0.11 0.982. Break Bulk 75 10.96 - - 0.41 - 3.83 - 0.96 16.163. Dry Bulk(M) 162 33.53 - - 0.19 - 20.08 3.38 0.98 58.164. Dry Bulk(C) 70 7.59 - - 0.13 - - 4.33 18.30 30.345. Liquid Bulk 123 5.95 - - 1.00 - 3.65 2.20 0.06 12.85
Total 475 15.83 - - 0.49 - 8.40 2.36 3.21 30.28 (M) Mechanised. (C) Conventional.
Reason-wise average pre-berthing delay (in hrs.)
# 2 vessels double counted for dry bulk mech./dry bulk conv. are counted only once in the total
Table 2.1.27(Contd...)

109
Reason-wise, Major Port-wise Average Pre-berthing Detention - 2012-13
Sl. No. Category Of Ships No. Of Non-avail. Non-avail. Non-avail. Navigation Draft Shippers/ Lack Of Others TotalShips of Berth of Tug/Craft Of Pilot Restriction Restric- Ships/ Cargo
tion AgentsOption
1 2 3 4 5 6 7 8 9 10 11 12
J.L.Nehru1. Container 1846 0.05 - 0.04 0.02 0.38 0.80 - 21.69 22.982. Break Bulk 229 - - 0.03 0.05 0.42 0.18 - 7.02 7.683. Dry Bulk(C) 45 - - 0.01 0.34 2.41 0.28 - 11.83 14.884. Liquid Bulk 468 - - 0.03 0.01 0.86 0.13 - 76.49 77.52
Total 2588 0.04 - 0.03 0.02 0.51 0.62 - 30.13 31.35
Mumbai 1. Container 32 0.91 - - - - 9.45 - 1.00 11.362. Break Bulk 475 0.88 - - - - 43.47 - 0.98 45.333 Dry Bulk(C) 370 0.12 - - - 12.31 - 0.15 12.584 Liquid Bulk 1031 10.79 - - - - 34.43 - 0.91 46.13
Total 1908 6.09 - - - - 31.97 - 0.78 38.84
Kandla 1. Container 225 3.10 - - - - 14.08 - 4.22 21.402. Break Bulk 452 109.83 - - - - 74.54 - 3.09 187.463. Dry Bulk(C) 715 82.61 - - - - 31.03 - 3.35 116.994. Liquid Bulk 1372 18.22 - - - - 26.68 - 1.76 46.66
Total 2764 48.63 - - - - 34.60 - 2.59 85.82 P- Provisional (C) Conventional. Source: Major Ports
Reason-wise average pre-berthing delay (in hrs.)
Table 2.1.27(Contd...)

110
Port 2001-02 2002-03 2003-04 2004-05 2005-06 2006-07 2007-08 2008-09 2009-10 2010-11 2011-12 2012-13
1 2 3 4 5 6 7 8 9 10 11 12 13
KANDLA 72.3 70.5 69.8 69.1 73.5 71.0 71.0 66.9 72.0 69.7 70.5 73.6
MUMBAI 58.4 57.0 57.5 60.6 61.1 64.4 65.4 65.5 50.6 63.9 57.2 50.8
J.L. NEHRU 61.0 53.1 53.2 60.1 66.7 64.3 66.4 67.7 66.2 73.5 71.4 58.3
MORMUGAO 81.1 69.3 65.5 82.2 78.7 81.0 73.8 70.2 79.2 79.2 79.2 46.7
NEW MANGALORE
35.1 29.1 33.3 49.7 52.3 47.0 56.0 54.0 52.0 46.5 48.6 49.1
COCHIN 61.4 56.7 63.3 71.9 65.7 67.3 66.0 63.5 63.7 70.3 74.9 71.9
TUTICORIN 68.8 61.3 54.8 53.7 59.3 67.6 72.9 70.2 66.9 70.5 84.5 83.0
CHENNAI 71.9 60.1 57.1 58.0 57.7 63.3 74.0 67.3 63.8 63.6 62.5 57.4
ENNORE 43.7 43.4 39.3 31.2 34.2 34.4 35.5 47.0 41.2 42.5 33.1 40.0
VISAKHAPAT-NAM
63.3 62.0 65.1 61.8 58.2 59.5 73.6 65.9 76.3 73.2 73.6 68.7
PARADIP 55.6 47.6 52.6 59.9 59.7 65.0 76.6 70.9 77.6 73.6 63.6 66.4
HALDIA DOCK COMPLEX
74.1 71.6 60.8 75.3 85.6 85.9 81.1 83.6 81.2 78.6 70.6 68.0
KOLKATA DOCK SYSTEM
38.0 44.6 41.8 42.3 41.8 45.5 59.2 57.3 70.8 68.3 64.2 64.8
Average Berth Occupancy For Major-Ports-2001-02 to 2012-13Table 2.1.28

111
Performance of Cargo Handling Equipments of Major Ports -
2010-11,2011-12 & 2012-13( In Percent)
Sl. Name Of The 2010-11
No. Port Equipment % Avail- % Utili- % Avail- % Utili- % Avail- % Utili-
ability sation ability sation ability sation
1 2 3 4 5 6 7 8 9
1. Kandla Wharf Crane 84 59 94 66 89 66
Mobile Crane - - - - 93 54
Forklift Truck 96 70 88 63 92 55
2. Mumbai Wharf Crane 83 11 84 18 94 27
Mobile Crane 91 12 91 11 86 22
Forklift Truck 97 15 97 16 95 15
3. Mormugao Wharf Crane - - - - - -
Mobile Crane 50 - # # - -
Forklift Truck 98 4 97 1 - -
4. N.Mangalore Wharf Crane - - - - - -
Mobile Crane 94 1 97 2 90 1
Forklift Truck 73 13 63 14 74 12
5. Cochin Wharf Crane 47 1 # # - -
Mobile Crane - - - - 91 12
Forklift Truck 78 14 73 13 83 16
6. Tuticorin Wharf Crane 94 48 97 38 85 32
Mobile Crane - - - - - -
Forklift Truck - - - - - -
7. Chennai Wharf Crane 92 9 89 4 97 3
Mobile Crane 99 30 99 30 99 32
Forklift Truck 72 13 62 8 64 7
8. VisakhapatanamWharf Crane 98 37 99 34 97 23
Mobile Crane - - - - - -
Forklift Truck - - - - - -
9. Paradip Wharf Crane 95 21 83 22 90 15
Mobile Crane - - - - - -
Forklift Truck - - - - - -
10. Kolkata Wharf Crane 96 25 88 28 100 35
Dock System Mobile Crane 85 38 86 42 92 42
Forklift Truck 94 41 91 46 97 41
11 Haldia Wharf Crane - - - - - -
Dock Complex Mobile Crane - - - - - -
Forklift Truck 0 0 - - - -
Average Norms for :1. Wharf Crane : Availability 85 % to 90 % Utilisation 35 % and above2. Mobile Crane : Availability 82 % to 85 % Utilisation 30 % and above3. Forklift Truck : Availability 75 % to 80 % Utilisation 35 % and aboveSource : Indian Ports Association.
2012-132011-12
# Decommissioned
Table 2.1.29

112
Availability And Utilisation Of Container Handling Equipments - Major Ports - 2011-12 & 2012-13
PORT Year % availa- % Availa-
No. bility Available Possible No. bility Available Possible
Hrs. Hrs. Hrs. Hrs.
1 2 3 4 5 6 7 8 9 10
Kolkata Dock System 2011-12 - - - - 3 67.8 53.0 35.9
2012-13 - - - - 3 67.4 40.6 27.3
Haldia Dock Complex 2011-12 - - - - 4 82.3 … …
2012-13 - - - - 4 82.3 … …
Paradip 2011-12 - - - - - - - -
2012-13 - - - - - - - -
Visakhapatnam 2011-12 2 98.3 48.3 47.5 6 99.5 15.1 15.0
2012-13 4 93.3 25.7 24.0 6 96.5 44.3 42.7
Chennai 2011-12 7 94.4 71.2 67.2 22 95.1 87.9 83.5
2012-13 7 92.0 8.0 8.0 22 91.0 8.0 8.0
Tuticorin 2011-12 3 91.0 58.0 53.0 8 93.0 92.0 86.0
2012-13 3 88.0 - - 8 92.0 - -
Cochin 2011-12 4 89.3 31.2 27.8 15 92.7 47.0 43.5
2012-13 4 100.0 29.0 29.0 15 100.0 47.0 47.0
New Mangalore 2011-12 - - - - - - - -
2012-13 - - - - - - - -
Mormugao 2011-12 ` - - - - - - -
2012-13 - - - - - - - -
J.L.Nehru(a) 2011-12 10 97.8 51.5 50.4 40 96.4 66.5 64.1
2012-13 9 87.3 56.6 49.4 18 90.5 78.6 71.1
Mumbai 2011-12 - - - - - - - -
2012-13 - - - - - - - -
Kandla 2011-12 4 95.6 25.8 25.8 4 98.2 25.1 25.1
2012-13 - - - - - - - -
Note : Possible hours: are the maximum hours for which the equipment is available.(No. of equipments x no of days x 24)
Available hours=Possival Hours - (hours lost due to maintenance + hours lost due to breakdown + hours lost due to recess)
% Availability = (Total Available Hours/Total Possible Hours) x 100
%Utilisation = (No. of Hours equipment utilised/No. of available hours/possible hours)x100 `
(a) Relates to JNPCTonly.
Quay Side Gantry Crane R.T. Gantry Crane
% Utilisation of % Utilisation of
Table 2.1.30

113
Availability And Utilisation Of Container Handling Equipments - Major Ports - 2011-12 & 2012-13
PORT Year % availa- % Availa-No. bility Available Possible No. bility Available Possible
Hrs. Hrs. Hrs. Hrs.1 2 3 4 5 6 7 8 9 10
Kolkata Dock System 2011-12 0 0.0 0.0 0.0 0 0.0 0.0 0.0
2012-13 0 0.0 0.0 0.0 0 0.0 0.0 0.0
Haldia Dock Complex 2011-12 - - - - 1 0.0 0.0 0.0
2012-13 - - - - 1 0.0 0.0 0.0Paradip 2011-12 - - - - - - - -
2012-13 - - - - - - - -Visakhapatnam 2011-12 - - - - 1 99.3 0.6 0.6
2012-13 - - - - 1 100 .0 0.0 0.0Chennai 2011-12 - - - - - - - -
2012-13 - - - - - - - -Tuticorin 2011-12 12 94.0 71.0 67.0 - - - -
2012-13 12 90.0 - - - - - -Cochin 2011-12 - - - - 2 97 35 34
2012-13 - - - - 2 100 42 42New Mangalore 2011-12 - - - - - - - -
2012-13 - - - - - - - -Mormugao 2011-12 - - - - - - - -
2012-13 - - - - - - - -J.L.Nehru(a) 2011-12 - - - - - - - -
2012-13 20.0 89.4 100.0 89.4 3.0 94.2 90.2 85.0Mumbai 2011-12 - - - - - - - -
2012-13 - - - - - ` - -Kandla 2011-12 12 99.1 2 .0 2. 0 - - - -
2012-13 - - - - - - - -(a) :Relates to JNPT only.
Tractor Top Lift Trucks% Utilisation of % Utilisation of
Table 2.1.30(Contd.)

114
Table 2.1.30(Contd.) Availability And Utilisation Of Container Handling Equipments - Major Ports - 2011-12 & 2012-13
PORT Year % availa- % Availa-No. bility Available Possible No. bility Available Possible
Hrs. Hrs. Hrs. Hrs.
1 2 3 4 5 6 7 8 9 10
Kolkata Dock System 2011-12 - - - - - - - -
2012-13 - - - - - - - -
Haldia Dock Complex 2011-12 1 80.9 58.8 47.5 - - - -
2012-13 1 62.3 63.2 39.4 - - - -
Paradip 2011-12 - - - - - - - -
2012-13 - - - - - - - -
Visakhapatnam 2011-12 - - - - - - - -
2012-13 - - - - - - - -
Chennai 2011-12 - - - - - - - -
2012-13 - - - - - - - -
Tuticorin 2011-12 - - - - - - - -
2012-13 - - - - - - - -
Cochin 2011-12 2 99 1 1 - - - -
2012-13 2 100 5 5 - - - -
New Mangalore 2011-12 - - - - - - - -
2012-13 - - - - - - - -
Mormugao 2011-12 - - - - - - - -
2012-13 - - - - - - - -
J.L.Nehru(a) 2011-12 3 98.9 53.4 52.8 - - - -
2012-13 6 84.6 53.7 45.4 2.0 53.9 90.2 85.0
Mumbai 2011-12 - - - - - - - -
2012-13 - - - - - - - -
Kandla 2011-12 - - - - - - - -
2012-13 - - - - - - - -
(a) :Relates to JNPCT.
Rail Mounted G.Crane Tata P&H Crane/Mobile Crane% Utilisation of % Utilisation of
Table 2.1.30(Contd.)

115
Availability And Utilisation Of Container Handling Equipments - Major Ports - 2011-12 & 2012-13
PORT Year % availa- % Availa-
No. bility Available Possible No. bility Available Possible
Hrs. Hrs. Hrs. Hrs.
1 2 3 4 5 6 7 8 9 10
Kolkata Dock System 2011-12 - - - - 0 - - -
2012-13 - - - - 0 - - -
Haldia Dock Complex 2011-12 1 0.0 0.0 0.0 - - - -
2012-13 - - - - - - - -
Paradip 2011-12 - - - - - - - -
2012-13 - - - - - - - -
Visakhapatnam 2011-12 - - - - 6 99.7 8.0 8.0
2012-13 - - - - 6 97.6 8.9 8.7
Chennai 2011-12 - - - - - - - -
2012-13 - - - - - - - -
Tuticorin 2011-12 - - - - - - - -
2012-13 - - - - - - - -
Cochin 2011-12 - - - - 3 92.0 16.0 15.0
2012-13 - - - - 3 100.0 8.0 8.0
New Mangalore 2011-12 1 96.7 21.0 20.3 2 93.9 65.8 61.7
2012-13 1 55.8 24.5 13.6 3 86.2 58.3 50.2
Mormugao 2011-12 - - - - - - - -
2012-13 - - - - - - - -
J.L.Nehru(a) 2011-12 - - - - - - - -
2012-13 4 82.3 88.8 73.0 - - - -
Mumbai 2011-12 - - - - - - - -
2012-13 - - - - - - - -
Kandla 2011-12 7.0 87.7 68.3 59.9 4 93.3 32.5 32.5
2012-13 - - - - - - - -
(a) Relates to JNPCT.
Source: Major Ports
FLT/FEL Reach Truck/Steaker
% Utilisation of % Utilisation of
Table 2.1.30(Contd.)

116
Container Handling Rate - Major Ports -2011-12 & 2012-13
PortYear %age of %age of %age of
Idle Time Actual Idle Time Actual Idle Time Actual
Worked Hr. Worked Hr. Worked Hr.
1 2 3 4 5 6 7 8 9 10 11
Kolkata Dock 2011-12 - - - - - - 47.0 3.2 6.6
System 2012-13 - - - - - - 47.3 3.4 6.4
Haldia Dock 2011-12 - - - 41.2 1.6 2.8 ... ... ...
Complex 2012-13 34.3 8.5 12.9 36.8 1.5 2.4 ... ... ...
Paradip 2011-12 - - - - - - - - -
2012-13 - - - - - - - - -
Vishakhapat-nam 2011-12 4.6 23.0 24.1 - - - 3.1 19.4 20.0
2012-13 21.7 19.0 24.3 - - - 7.6 19.1 20.7
Chennai( CCTL) 2011-12 7.1 22.2 23.9 - ` - 47.3 11.1 21.0
2012-13 17.8 23.0 28.0 - ` - 8.7 8.0 8.0
Tuticorin 2011-12 4.5 27.0 28.0 ... ... ... 7.0 13.0 14.0
2012-13 4.2 23.0 24.0 ... ... ... 7.5 13.0 14.0
Cochin 2011-12 - 34.4 34.4 - - - - 12.1 12.1
2012-13 19.9 32.7 40.8 - - - - 10.5 10.5
New Mangalore 2011-12 - - - - - - - - -
2012-13 - ` - ` - - - - -
Mormugao 2011-12 - - - - - - - - -
2012-13 - - - - - - - - -
J.L.Nehru(a) 2011-12 28.6 15.4 21.5 18.6 7.2 8.8 26.3 5.1 6.9
2012-13 29.5 16.1 22.8 25.9 7.6 10.2 28.2 6.0 8.4
Mumbai 2011-12 - - - - - - - -
2012-13 - ` - - - - - - -
Kandla 2011-12 4.2 16.3 5.1 … … … 2.0 11.4 10.9
2012-13 4.2 16.3 5.1 … … … 2.0 11.4 10.9
Note: Number of Container per worked hour = Total Containers Handled/Total no. of equipment hours worked
Number of container per actual worked hour = Total container Handled/Total No. of equipment hours actually worked (Total No. of equipment hrs. worked-idle time)
(a): Relates to JNPCT.
Cochin not received from BOT Operator M/s IGTPL
Source: Major Ports
Worked Hr. Worked Hr. Worked Hr.
Quay Side Gantry Crane Rail Mounted Gantry Crane RTG
No of container
handled per
No of container
handled per
No of container
handled per
Table 2.1.31

117
Major Ports-Capacity and Utilisation - 2012-13(In Million Tonnes/Percentage)
Port Total
1 2 3 4 5 6 7 8 9
KDS Cap. 4.50 - - - 6.74 5.90 17.14
Util. 15.73 - - - 58.09 117.97 69.10
HDC Cap. 17.00 6.00 7.00 - 12.75 4.00 46.75
Util. 28.21 28.58 92.56 - 92.85 71.73 60.07
PPT Cap. 43.00 4.50 20.00 7.50 27.30 - 102.30
Util. 38.30 40.73 130.53 55.28 28.68 - 55.28
VPT Cap. 17.65 12.50 - 1.00 33.50 2.68 67.33
Util. 76.49 100.55 - 258.80 48.00 169.93 87.68
EPL(a) Cap. 3.00 6.00 21.00 - 1.00 - 31.00
Util. 17.37 0.00 71.07 - 15.17 - 57.69
ChPT Cap. 17.67 8.00 - - 17.92 42.00 85.59
Util. 75.70 0.65 - - 54.94 70.74 62.40
TPT Cap. 2.30 - 12.55 - 13.49 5.00 33.34
Util. 23.78 - 53.30 - 78.52 187.44 84.76
CoPT Cap. 19.01 - - 0.80 12.35 12.50 44.66
Util. 73.79 - - 44.13 6.72 36.86 44.44
NMPT Cap. 49.17 7.50 5.40 - 14.70 - 76.77
Util. 45.84 34.88 - - 25.46 - 48.24
MoPT Cap. 1.50 27.50 - - 7.40 - 36.40
Util. 54.87 26.99 - - 24.11 - 48.73
JNPT Cap. 5.50 - - - 0.90 59.48@ 65.88
Util. 75.02 - - - 272.33 101.10 97.89
MbPT Cap. 32.00 - - - 11.53 1.00 44.53
Util. 108.60 - - - 154.78 82.90 130.33
KPT Cap. 66.60 - - - 19.42 7.20 93.22
Util. 81.90 - - - 139.82 26.88 100.43
Cap. 278.90 72.00 65.95 9.30 179.00 139.76 744.91
Util. 64.80 37.90 131.62 159.11 65.00 85.77 73.27
Source : Development wing D/o Shipping & Major Ports.
Fertiliser &
FRM
Other Cargo Container
ALL PORTS
Capacity/Uti
lisation
POL (Crude
&
Products)
Iron Ore Thermal
Coal
capacity of 6.0 MT will be added.
Only BPS berth of Mumbai Port is cosidered as dedicated container berth. Assessed capacity of BPS (Dedicated)
container berth of Mumbai Port is 1.0MT. Berth No.6, 7/8 ID are used as holding berths for MbPT crafts and capacity has been
accounted.
Figure in the parenthesis indicate the number of berths.BJ Barge jetties, T-Transhippers, A-Anchorages,
SBM- Single Buoy Mooring.
@ Capcity of JNP container terminal (3berths), NSICT(2berths), GTIL(3 BERTHS) and shallow water berth (1no)
has been taken as 15.0 MT, 15.00 MT ,26.40 MT and 1.20MT respectively .Capcity of one shallow water berth at
JNPT is 0.90 MT for dry bulk cargo.
Capcity of Iron Ore berth has been taken as 6.0MT at Ennore Port. After full fledged commissioning, balance
Table 2.1.32

118
` Employment At Major Ports
(As on 31st March, 2013) (In Numbers)
Port
Class I Class II Class III Class IV Others Class III Class IV
1 2 3 4 5 6 7 8 9 10 11
KPT 84 60 383 1077 962 70 601 286 698 4221
MbPT 364 22 4269 4003 0 889 81 2327 0 11955
JNPT 182 51 349 107 113 904 0 0 0 1706
MoPT(a) 133 78 1192 641 0 363 131 0 0 2538
NMPT (b) 73 86 571 122 0 260 323 0 0 1435
CoPT 128 136 525 452 1107 319 50 49 0 2766
TPT 84 59 602 214 0 276 578 0 0 1813
ChPT 273 140 2721 958 267 1297 430 496 0 6582
EPL 33 21 35 11 0 0 0 0 0 100
VPT 165 117 607 883 544 1414 365 0 0 4095
PPT 114 62 681 1256 0 0 0 0 121* 2234
KDS 449 122 2421 1170 0 168 35 282 0 4647
HDC 171 107 153 295 260 965 936 0 0 2887
Total 2253 1061 14509 11189 3253 6925 3530 3440 698 46979
(b) The cargo handling workers of Port are under "New Mangalore Port
Cargo handling workers(Regulation of Employment) Scheme,1990".
Source: Major Port
Employment At Dock Labour Boards of Major Ports
(As on 31st March, 2013) (In Numbers)
Port
Class I Class II Class III Class IV Total Regis-
tered
Listed Others Total
1 2 3 4 5 6 7 8 9 10 11
VPT 11 2 62 43 118 728 - - 728 846
KDS 15 7 63 12 97 84 0 0 84 181
MbPT 14 1 975 101 1091 2205 0 107 2312 3403
All DLBs 40 10 1100 156 1306 3017 0 107 3124 4430
Source: Major Port
*Supernumerary staff
Number
of casual
workers
Total
Number of DLB Employees Number of Dock Workers Grand
Total
Number of
Officers
Number of non-cargo
handling workers
Number of cargo
handling workers
other than Shore
workers
Number of
cargo
handling
shore
workers
(a) Includes CHL, erstwhile MDLB
Table 2.1.33
Table 2.1.34

119
Mandays Employed and Mandays Lost at Major Ports : 2010-2013 (31st March)
2010 2011
Port Mandays Mandays
Employed(a) Lost(b) Employed(
a)
Lost(b) Employed(a) Lost(b) Employed(a) Lost(b)
1 2 3 4 5 6 7 8 9
KPT 1463 - 1962 - 1370 - 1541 0.0
MbPT 5132 3.2 6295 0.0 4645 0.0 5606 3.7
MoPT 1055 7.0 1028 0.0 973 0.0 926 0.0
NMPT 627 5.6 356 0.0 564 0.0 524 4.1
CoPT 1441 - 1368 - 1097 - 1010 4.1
TPT 800 - 759 - 713 - 662 1.1
EPL 31 - 32 - 34 - 37 0.0
ChPT 2927 0.9 2838 - 0 - 2402 0.0
VPT 2205 0.6 2036 0.6 1848 0.1 1803 2.5
PPT 1008 - 961 - 889 0.8 815 0.3
KDS 2186 - 2052 - 1928 - 1762 0.0
HDC 1277 0.8 1206 2.6 1136 0.2 1054 0.5
JNPT 635 - 631 - 627 - 623 3.3
TOTAL 20786 0.6 21524 0.6 21524 0.6 18764 1.9
Note: (a) Mandays calculation includes Port Employees as well as Dock Employees.
(b): Mandays lost per 1000 Mandays employed
Source: Major Port
2013
MandaysMandays
2012
Table 2.1.35

120
(Rs. Crore)
1 2 31 KANDLA 1172.35
2 MUMBAI 863.74
3 J. L. NEHRU 5316.00
4 MORMUGAO 440.39
5 NEW MANGALORE 896.03
6 COCHIN 154.75
7 TUTICORIN 799.32
8 CHENNAI 664.27
9 ENNORE 848.92
10 VISAKHAPATNAM 1047.97
11 PARADIP 1730.41
12 HALDIA DOCK COMPLEX 765.53
13 KOLKATA DOCK SYSTEM 798.0815497.76
Source: Major Ports
Port Capital Employed
Capital Employed at Major Ports - during 2012-13
S.No.
Table 2.1.36

121
Operating Expenditure Under Various Heads - Major Ports - 2011-12 & 2012-13 (Rs. Crore)
Operation &
Port Maintenance2011-12 2012-13 2011-12 2012-13 2011-12 2012-13 2011-12 2012-13 2011-12 2012-13 2011-12 2012-13 2011-12 2012-13
1 2 3 4 5 6 7 8 9 10 11 12 13 14 15
Kolkata 213.22 217.67 1.28 1.43 73.24 78.63 12.71 12.92 82.74 101.75 215.53 267.14 598.72 679.54
(35.61) (32.03) (.21) (.21) (12.23) (11.57) (2.12) (1.9) (13.82) (14.97) (36.) (39.31) (100) (100)
HDC 173.18 179.97 12.26 10.55 40.88 47.01 25.68 25.22 118.79 119.06 585.45 639.07 956.24 1020.88
(18.11) (17.63) (1.28) (1.03) (4.28) (4.6) (2.69) (2.47) (12.42) (11.66) (61.22) (62.6) (100) (100)
Paradip 110.27 128.93 21.69 15.65 35.41 38.59 55.59 57.51 177.59 190.07 17.11 10.36 417.66 441.11
(26.4) (29.23) (5.19) (3.55) (8.48) (8.75) (13.31) (13.04) (42.52) (43.09) (4.1) (2.35) (100) (100)
Visakhapatnam 216.49 240.68 54.92 45.12 34.39 40.97 34.54 39.51 27.36 36.18 68.66 86.96 436.36 489.42
(49.61) (49.18) (12.59) (9.22) (7.88) (8.37) (7.92) (8.07) (6.27) (7.39) (15.73) (17.77) (100.) (100.)
Chennai 357.19 375.85 12.32 13.10 50.42 43.06 29.79 31.00 48.68 40.69 66.40 83.04 564.80 586.74
(63.24) (64.06) (2.18) (2.23) (8.93) (7.34) (5.27) (5.28) (8.62) (6.93) (11.76) (14.15) (100) (100)
Tuticorin 101.91 114.32 7.77 10.87 32.65 31.05 16.78 18.26 35.56 36.51 0.00 0.00 194.67 211.01
(52.35) (54.18) (3.99) (5.15) (16.77) (14.71) (8.62) (8.65) (18.27) (17.3) (0.00) (0.00) (100) (100)
Cochin 130.32 127.15 13.81 15.71 30.76 41.12 19.50 31.22 87.85 152.19 0.00 0.00 282.24 367.39
(46.17) (34.61) (4.89) (4.28) (10.9) (11.19) (6.91) (8.5) (31.13) (41.42) (0.00) (0.00) (100) (100)
New Mangalore 75.73 80.23 10.25 9.36 25.48 26.72 21.91 22.79 21.61 21.52 110.88 119.19 265.86 279.81
(28.48) (28.67) (3.86) (3.35) (9.58) (9.55) (8.24) (8.14) (8.13) (7.69) (41.71) (42.6) (100) (100)
Mormugao 119.04 127.24 14.23 11.76 26.85 26.92 18.07 17.39 79.07 74.97 1.63 1.48 258.89 259.76
(45.98) (48.98) (5.5) (4.53) (10.37) (10.36) (6.98) (6.69) (30.54) (28.86) (.63) (.57) (100) (100)
Mumbai (1) 730.85 878.19 3.19 2.49 80.55 89.73 58.57 58.26 110.85 116.76 10.67 10.16 994.68 1155.59(73.48) (75.99) (.32) (.22) (8.1) (7.76) (5.89) (5.04) (11.14) (10.1) (1.07) (.88) (100) (100)
J. L. Nehru 141.81 182.09 9.53 10.80 81.64 116.68 40.35 45.07 226.30 254.06 54.74 156.39 554.37 765.09(25.58) (23.8) (1.72) (1.41) (14.73) (15.25) (7.28) (5.89) (40.82) (33.21) (9.87) (20.44) (100) (100)
Kandla 211.72 228.17 8.53 6.17 29.08 33.24 47.46 47.89 206.91 196.61 2.28 2.89 505.98 514.97
(41.84) (44.31) (1.69) (1.2) (5.75) (6.45) (9.38) (9.3) (40.89) (38.18) (.45) (.56) (100.) (100.)
Ennore 7.54 8.65 0.00 0.00 9.79 12.81 13.25 13.76 27.45 23.50 96.04 93.61 154.07 152.33
(4.89) (5.68) (0.00) (0.00) (6.35) (8.41) (8.6) (9.03) (17.82) (15.43) (62.34) (61.45) (100) (100)
Total 2589.27 2889.14 169.78 153.01 551.14 626.53 394.20 420.80 1250.76 1363.87 1229.39 1470.29 6184.54 6923.64
(41.87) (41.73) (2.75) (2.21) (8.91) (9.05) (6.37) (6.08) (20.22) (19.7) (19.88) (21.24) (100) (100)
Note : Figures in paranthesis are the percentage of respective heads of Account to the total.
Source : Major Ports
Salaries & Wages Stores Office & Administrative Depreciation Other Exp Total
Security & Medical
Table 2.1.37

122
Operating Financial Parameters Per Tonne Of Cargo
Handled at Major Ports : , 2010-11, 2011-12 & 2012-13
Port
2010-11 2011-12 2012-13 2010-11 2011-12 2012-13 2010-11 2011-12 2012-13
1 2 3 4 5 6 7 8 9 10
KPT 60.08 75.60 83.36 46.67 61.33 55.01 13.40 14.27 28.35
MbPT 174.95 182.08 198.91 141.98 146.21 162.84 32.98 35.88 36.07
JNPT 174.55 177.57 170.24 69.10 76.01 94.39 105.44 101.55 75.85
MoPT 74.34 91.99 125.08 48.32 66.30 146.44 26.02 25.69 -21.36
NMPT 97.59 113.01 90.35 59.46 59.68 54.83 38.14 53.33 35.52
CoPT 154.47 152.86 157.02 153.58 140.44 185.13 0.89 12.42 -28.11
TPT 101.47 135.10 128.81 46.52 69.27 74.67 54.95 65.83 54.14
ChPT 111.28 112.57 118.13 94.33 101.39 109.87 16.95 11.19 8.26
EPL 151.95 167.33 182.11 29.39 29.57 25.14 122.56 137.76 156.98
VPT 108.56 107.75 119.06 59.92 64.72 82.90 48.64 43.02 36.16
PPT 125.89 117.85 120.90 69.81 76.98 78.00 56.08 40.87 42.90
HDS 295.76 316.81 262.84 190.04 221.92 256.45 105.72 94.89 6.39
KDS 366.71 462.73 425.61 320.96 344.36 381.44 45.75 118.38 44.17
All Major
Ports132.92 143.24 143.82 86.02 95.18 107.07 46.89 48.06 36.75
Source: Major Ports
(Rs.)
Surplus/Deficit
per tonneOperating Income Operating Expenditure
Table 2.1.38

123
Traffic Handled at Non-Major Ports ( State-wise & Port-wise) - 2010-11, 2011-12 & 2012-13 , ('000 Tonnes)
Unloaded Loaded Total Unloaded Loaded Total Unloaded Loaded Total Unloaded Loaded Total Unloaded Loaded Total Unloaded Loaded Total
1 2 3 4 5 6 7 8 9 10 11 12 13 14 15 16 17 18 19
GUJARAT
Bedi 1297 651 1948 2 171 173 1472 846 2318 42 363 405 4151 2387 6538 - 158 158
Bhavnagar 303 22 325 - - 0 908 - 908 - - - 1071 55 1126 - - -
Dahej 11679 1505 13184 857 271 1128 15127 1455 16582 783 251 1034 21092 1149 22241 18 - 18
GAPL 35038 11378 46416 4881 608 5489 45901 13234 59135 5049 611 5660 57018 13762 70780 5764 400 6164
GPPL 5568 2172 7740 79 2 81 6354 2764 9118 145 9 154 5372 2631 8003 44 11 55
Jafrabad 389 1905 2294 - 2169 2169 - 1880 1880 - 2238 2238 - 1333 1333 - 2072 2072
Magdalla 6094 1335 7429 10480 614 11094 5886 1974 7860 11596 928 12524 8603 2337 10940 10986 740 11726
Mul-Dwarka 925 453 1378 - 2468 2468 783 300 1083 - 2738 2738 625 157 782 - 2669 2669
Navalakhi 4282 205 4487 33 - 33 5491 183 5674 68 - 68 6272 149 6421 - - -
Okha 1103 48 1151 - - 0 1506 31 1537 - 88 88 1706 5 1711 - 33 33
Porbandar 185 483 668 232 - 232 616 341 957 - 190 190 693 1567 2260 - 110 110
Sikka 65280 38750 104030 330 11046 11376 66660 39190 105850 66 12129 12195 71574 40638 112212 817 11492 12309
Veraval 0 - - - 74 74 8 3 11 - 28 28 - - 0 - 25 25
Mundra (Old) 24 39 63 - - 0 11 112 123 - - - 5 34 39 1 - 1
Jakhau 387 738 1125 - 82 82 534 907 1441 - 332 332 467 620 1087 117 215 332
Others 4052 216 4268 2 0 2 6485 352 6837 0 82 82 6672 0 6672 0 0 0
TOTAL 136606 59900 196506 16896 17505 34401 157742 63572 221314 17749 19987 37736 185321 66824 252145 17747 17925 35672
MAHARASHTRA
Dabhol 1 - 1 12 5 17 3 - 3 36 1 37 397 - 397 2 - 2
Dahanu - - - 674 - 674 - - - 691 - 691 - - 0 531 - 531
Dharamtar 2569 651 3220 3857 4 3861 3638 191 3829 3693 - 3693 3887 172 4059 5663 - 5663
Ratnagiri 514 - 514 391 50 441 448 - 448 377 - 377 540 3 543 317 - 317
Revdanda 809 129 938 717 18 735 511 159 670 634 6 640 1017 102 1119 234 - 234
Ulwa-Belapur - 1 1 1623 - 1623 1 - 1 1657 - 1657 - - 0 1429 - 1429
Jaigad 633 422 1055 244 44 288 4536 467 5003 3 60 63 5738 621 6359 552 678 1230
Redi - 709 709 - - - - 1954 1954 - - - - 1494 1494 - - -
Dighi (Rajpuri) - 212 212 20 64 84 56 239 295 11 161 172 51 164 215 30 - 30
Kelshi 203 286 489 - 10 10 - 361 361 - - - - 505 505 - - -
Others 1 1 2 1 0 1 3 50 53 0 0 0 0 70 70 1 0 1
TOTAL 4730 2411 7141 7539 195 7734 9196 3421 12617 7102 228 7330 11630 3131 14761 8759 678 9437
GOA
Panaji 96 14468 14564 17 - 17 165 14305 14470 - - - 113 3276 3389 - - -
TOTAL 96 14468 14564 17 0 17 165 14305 14470 0 0 0 113 3276 3389 0 0 0
Note : The cargo data of GAPL & GPPL for 2009-10, 2010-11, 2011-12 & 2012-13 include containers.
States/U.T.
2011-12 2012-13
Overseas Coastal Overseas Coastal Overseas Coastal
2010-11
Table 2.2.1
Table 2.2.1(Contd…)Table

124
Traffic Handled at Non-Major Ports ( State-wise & Port-wise) - 2010-11 , 2011-12 & 2012-13 , ('000 Tonnes)
Unloaded Loaded Total Unloaded Loaded Total Unloaded Loaded Total Unloaded Loaded Total Unloaded Loaded Total Unloaded Loaded Total1 2 3 4 5 6 7 8 9 10 11 12 13 14 15 16 17 18 19
ANDHRA PRADESHKakinada Anchorage Port 358 746 1104 13 29 42 16 3098 3114 - 50 50 - 3929 3929 - 18 18 Deep Water Port 7000 2337 9337 1314 154 1468 5969 1835 7804 1791 255 2046 6272 2823 9095 2764 464 3228Rawa - - - - 1561 1561 - - - - 3198 3198 - - 0 - 1369 1369Krishnapatnam 10049 5856 15905 10 - 10 13633 1369 15002 417 - 417 17772 2154 19926 1196 - 1196Gangavaram 11256 2584 13840 - - - 11746 2256 14002 - - - 12599 451 13050 - - -TOTAL 28663 11523 40186 1337 1744 3081 31364 8558 39922 2208 3503 5711 36643 9357 46000 3960 1851 5811
KARNATAKAKarwar 85 947 1032 84 11 95 78 352 430 67 - 67 216 225 441 - - -Old Mangalore - - - 15 121 136 - - 0 16 72 88 - - 0 77 85 162Malpe 1 - 1 - - - - - 0 2 - 3 - - 0 1 2 3Hangarkatta - - - - - - 4 - 4 - - - - - 0 - 2 2Belkeri - 1831 1831 - - - - - 0 - - - - - 0 2 - 2Others 0 0 0 0 0 0 0 1 1 0 0 0 0 0 0 0 0 0TOTAL 86 2778 2864 99 132 231 82 353 435 85 72 158 216 225 441 80 89 169
KERALAKozikode/Beypore - - - 30 77 107 - - - 17 79 96 - - 0 15 70 85Kovalam/Vizhinjam - 7 7 2 - 2 - 6 6 - - - - 8 8 - 2 2Others 1 1 2 5 1 6 0 0 0 0 2 2 0 0 0 1 0 1TOTAL 1 8 9 37 78 115 0 6 6 17 81 98 0 8 8 16 72 88
TAMIL NADUEnnore 58 - 58 - - - 46 - 46 - - - 29 - 29 - - -PY-3 - - - - 152 152 - - - - 59 59 - - 0 - - -Nagapattinam 36 7 43 484 334 818 25 - 25 309 296 605 15 - 15 15 342 357Thrukkadaiyur - - - 327 - 327 - - - 235 - 235 - - 0 274 - 274Cuddalore 210 - 210 - 1 1 227 1 228 - 2 2 237 8 245 - 2 2Others 2 0 2 0 0 0 9 0 9 0 1 1 4 0 4 0 7 7TOTAL 306 7 313 811 487 1298 307 1 308 544 358 902 285 8 293 289 351 640
PUDUCHERRYKaraikal 4627 101 4728 - - - 6240 168 6408 - 13 13 6436 431 6867 - 42 42TOTAL 4627 101 4728 0 0 0 6240 168 6408 0 13 13 6436 431 6867 0 42 42
ODISHADhamra 174 291 465 - - - 5064 - 5064 - 20 20 8733 288 9021 - 2047 2047TOTAL 174 291 465 0 0 0 5064 0 5064 0 20 20 8733 288 9021 0 2047 2047
SEA ISLANDSAndaman Nicobar 342 - 342 985 352 1337 10 - 10 950 248 1198 7 - 7 854 205 1059Lakshadweep - - - 26 - 26 - - - 26 - 26 - - 0 26 - 26TOTAL 342 0 342 1011 352 1363 10 0 10 976 248 1224 7 0 7 880 205 1085All States TOTAL 175631 91487 267118 27747 20493 48240 210170 90384 300554 28681 24510 53192 249384 83548 332932 31731 23260 54991Source : State / UT Maritime Boards
States/U.T.2010-11 2011-12 2012-13
Overseas Coastal Overseas Coastal Overseas Coastal
Table 2.2.1(Contd…)

125
Traffic Handled at Non-Major Ports (State-wise & Principal Commodity-wise) - 2010-11, 2011-12 & 2012-13 ('000 Tonnes)
Unloaded Loaded Total Unloaded Loaded Total Unloaded Loaded Total Unloaded Loaded Total Unloaded Loaded Total Unloaded Loaded Total
1 2 3 4 5 6 7 8 9 10 11 12 13 14 15 16 17 18 19
GUJARATPOL & other Products 82317 38695 121012 8958 10905 19863 89646 40896 130542 8632 12312 20944 102368 42831 145199 8222 11716 19938Coal 28302 1132 29434 22 275 297 36656 1017 37673 151 548 699 51406 1013 52419 1681 236 1917Building Material 153 2614 2767 1294 4737 6031 0 2171 2171 1511 5340 6851 263 1459 1722 1647 5038 6685Fertiliser & FRM 5876 209 6085 0 0 0 6885 301 7186 0 0 0 6396 21 6417 0 0 0Chemicals 406 1078 1484 37 309 346 137 367 504 305 281 586 20 30 50 14 21 35Iron Ore 797 50 847 6309 0 6309 97 148 245 6674 0 6674 1411 43 1454 6160 22 6182Iron & Steel 1638 1205 2843 2 580 582 5482 2008 7490 5 741 746 1418 2075 3493 0 563 563Other Ore 1286 198 1484 51 191 242 1225 482 1707 0 354 354 539 2540 3079 0 22 22Foodgrains 0 693 693 20 5 25 1 821 822 0 0 0 272 991 1263 1 8 9Salt 0 898 898 0 60 60 0 999 999 0 150 150 0 779 779 0 95 95Oil Cake 0 381 381 0 1 1 0 500 500 0 0 0 0 410 410 0 0 0Edible Oil 673 1348 2021 0 42 42 613 3 616 0 0 0 662 0 662 0 0 0Others 15158 11399 26557 203 400 603 17000 13859 30859 471 261 732 20566 14632 35198 22 204 226Total 136606 59900 196506 16896 17505 34401 157742 63572 221314 17749 19987 37736 185321 66824 252145 17747 17925 35672
MAHARASHTRAIron Ore 1186 850 2036 3078 6 3084 738 2218 2956 3406 0 3406 1851 1747 3598 3606 614 4220Iron & Steel 45 27 72 20 15 35 33 0 33 194 6 200 157 32 189 268 0 268POL & other Products 0 0 0 0 0 0 0 0 0 0 0 0 397 0 397 0 0 0Building Material 150 1 151 2076 50 2126 48 0 48 2442 0 2442 56 0 56 1986 0 1986Coal 2381 499 2880 2115 2 2117 6535 0 6535 1054 0 1054 7866 0 7866 2530 0 2530Fertiliser & FRM 145 44 189 40 0 40 230 0 230 0 0 0 59 1 60 24 0 24Chemicals 164 0 164 59 0 59 160 0 160 0 0 0 199 0 199 0 0 0Others 659 990 1649 151 122 273 1452 1203 2655 6 222 228 1045 1351 2396 345 64 409Total 4730 2411 7141 7539 195 7734 9196 3421 12617 7102 228 7330 11630 3131 14761 8759 678 9437
GOAIron Ore 96 14468 14564 17 0 17 0 14305 14305 0 0 0 0 3276 3276 0 0 0Coal 0 0 0 0 0 0 165 0 165 0 0 0 113 0 113 0 0 0Others 0 0 0 0 0 0 0 0 0 0 0 0 0 0 0 0 0 0Total 96 14468 14564 17 0 17 165 14305 14470 0 0 0 113 3276 3389 0 0 0
Coastal2010-11 2011-12 2012-13
Overseas Coastal Overseas OverseasCoastal
Table 2.2.2

126
Traffic Handled at Non-Major Ports (State-wise & Principal Commodity-wise) - 2010-11, 2011-12 & 2012-13 ('000 Tonnes)
CommodityUnloaded Loaded Total Unloaded Loaded Total Unloaded Loaded Total Unloaded Loaded Total Unloaded Loaded Total Unloaded Loaded Total
1 2 3 4 5 6 7 8 9 10 11 12 13 14 15 16 17 18 19TAMIL NADUPOL & other Products 210 0 210 811 482 1293 220 0 220 544 350 894 0 0 0 289 343 632Edible Oil 36 0 36 0 0 0 25 0 25 0 0 0 15 0 15 0 0 0Fertiliser & FRM 58 0 58 0 0 0 46 0 46 0 0 0 252 0 252 0 0 0Bldg. Material 0 7 0 0 0 0 7 0 7 0 0 0 6 0 6 0 0 0Others 2 0 9 0 5 5 9 1 10 0 8 8 12 8 20 0 8 8Total 306 7 313 811 487 1298 307 1 308 544 358 902 285 8 293 289 351 640
KERALABldg. Material 0 0 0 2 9 11 0 0 0 14 73 87 0 0 0 0 30 30POL & other Products 0 0 0 17 0 17 0 0 0 0 4 4 0 0 0 0 7 7Others 1 8 9 18 69 87 0 6 6 3 4 7 0 8 8 16 35 51Total 1 8 9 37 78 115 0 6 6 17 81 98 0 8 8 16 72 88
PUDUCHERRYPOL & Other Prdct 0 0 0 0 0 0 45 0 45 0 0 0 411 0 411 0 0 0Bldg. Material 0 2 2 0 0 0 0 52 52 0 0 0 0 78 78 0 0 0Coal 3974 0 3974 0 0 0 4838 0 4838 0 0 0 4666 0 4666 0 0 0Fertiliser & FRM 465 35 500 0 0 0 1182 31 1213 0 0 0 607 1 608 0 0 0Iron Ore 0 0 0 0 0 0 0 0 0 0 0 0 495 0 495 0 0 0Others 188 64 252 0 0 0 175 85 260 0 13 13 752 352 1104 0 42 42Total 4627 101 4728 0 0 0 6240 168 6408 0 13 13 6436 431 6867 0 42 42
A & N ISLANDSPOL & other Products 6 0 6 146 16 162 7 0 7 141 16 157 7 0 7 163 12 175Bldg. Material 5 0 5 460 206 666 3 0 3 268 59 327 0 0 0 255 24 279Foodgrains 6 0 6 63 17 80 0 0 0 64 12 76 0 0 0 50 6 56Ferliliser & FRM 0 0 0 4 2 6 0 0 0 3 1 4 0 0 0 0 0 0Others 325 0 325 312 111 423 0 0 0 474 160 634 0 0 0 386 163 549Total 342 0 342 985 352 1337 10 0 10 950 248 1198 7 0 7 854 205 1059
LAKSHADWEEPOthers 0 0 0 26 0 26 0 0 0 26 0 26 0 0 0 26 0 26Total 0 0 0 26 0 26 0 0 0 26 0 26 0 0 0 26 0 26
ANDHRA PRADESHPOL & other Products 964 0 964 258 1564 1822 108 7 115 175 3218 3393 226 5 231 145 1386 1531Fertilisre & FRM 5728 0 5728 70 1 71 6815 163 6978 57 0 57 5064 0 5064 51 20 71Edible Oil 1222 9 1231 0 0 0 1451 5 1456 0 0 0 1999 30 2029 0 0 0Coal 18622 0 18622 996 0 996 21536 0 21536 1976 0 1976 27157 0 27157 3697 0 3697Bldg. Material 0 456 456 0 28 28 74 744 818 0 41 41 109 984 1093 0 18 18Chemicals 0 0 0 0 0 0 48 0 48 0 0 0 34 0 34 0 0 0Iron ore 0 8957 8957 0 0 0 0 2740 2740 0 234 234 148 408 556 0 421 421Others 2127 2101 4228 13 151 164 1332 4899 6231 0 10 10 1906 7930 9836 67 6 73Total 28663 11523 40186 1337 1744 3081 31364 8558 39922 2208 3503 5711 36643 9357 46000 3960 1851 5811
2010-11 2011-12 2012-13Overseas Coastal Overseas Coastal Overseas Coastal
Table 2.2.2 (Contd…)

127
Traffic Handled at Non-Major Ports (State-wise & Principal Commodity-wise) - 2010-11, 2011-12 & 2012-13 ('000 Tonnes)
CommodityUnloaded Loaded Total Unloaded Loaded Total Unloaded Loaded Total Unloaded Loaded Total Unloaded Loaded Total Unloaded Loaded Total
1 2 3 4 5 6 7 8 9 10 11 12 13 14 15 16 17 18 19
KARNATAKAOther Minerals 0 360 360 0 0 0 0 202 202 0 23 23 0 54 54 0 0 0
Fertiliser & FRM 17 0 17 0 0 0 29 0 29 0 0 0 52 0 52 0 0 0Salt 0 0 0 32 0 32 0 0 0 64 0 64 51 0 51 0 0 0Coal 0 0 0 0 0 0 0 0 0 0 0 0 5 0 5 0 0 0POL & other Products 3 0 3 28 0 28 0 0 0 0 0 0 38 0 38 0 0 0Bldg. Material 0 0 0 0 77 77 0 0 0 2 17 19 0 0 0 0 0 0Iron ore 0 2322 2322 0 0 0 0 0 0 0 0 0 0 0 0 0 0 0Others 66 96 162 39 55 94 53 151 204 19 32 51 70 171 241 80 89 169Total 86 2778 2864 99 132 231 82 353 435 85 72 157 216 225 441 80 89 169
ODISHAFertiliser & FRM 32 0 32 0 0 0 0 0 0 0 0 0 0 0 0 0 0 0
Iron ore 0 130 130 0 0 0 56 0 56 0 0 0 0 288 288 0 1365 1365
Coal 142 0 142 0 0 0 4543 0 4543 0 20 20 8211 0 8211 0 682 682
Others 0 161 161 0 0 0 465 0 465 0 0 0 522 0 522 0 0 0Total 174 291 465 0 0 0 5064 0 5064 0 20 20 8733 288 9021 0 2047 2047
ALL STATESPOL & other Pdcts 83500 38695 122195 10218 12967 23185 90026 40903 130929 9492 15900 25392 103447 42836 146283 8819 13464 22283Coal 53421 1631 55052 3133 277 3410 74273 1017 75290 3181 568 3749 99424 1013 100437 7908 918 8826Building Material 308 3080 3381 3832 5107 8939 132 2967 3099 4237 5530 9767 434 2521 2955 3888 5110 8998Fertiliser & FRM 12321 288 12609 114 3 117 15187 495 15682 60 1 61 12430 23 12453 75 20 95Chemicals 570 1078 1648 96 309 405 345 367 712 305 281 586 253 30 283 14 21 35Iron Ore 2079 26777 28856 9404 6 9410 891 19411 20302 10080 234 10314 3905 5762 9667 9766 2422 12188Iron & Steel 1683 1232 2915 22 595 617 5515 2008 7523 199 747 946 1575 2107 3682 268 563 831Other Ore 1286 198 1484 51 191 242 1225 482 1707 0 354 354 539 2540 3079 0 22 22Salt 0 898 898 32 60 92 0 999 999 64 150 214 51 779 830 0 95 95
Oil Cake 0 381 381 0 1 1 0 500 500 0 0 0 0 410 410 0 0 0
Edible Oil 1931 1357 3288 0 42 42 2089 8 2097 0 0 0 2676 30 2706 0 0 0Foodgrains 6 693 699 83 22 105 1 821 822 64 12 76 272 991 1263 51 14 65Other Minerals 0 360 360 0 0 0 0 202 202 0 23 23 0 54 54 0 0 0Others 18526 14819 33352 762 913 1675 20486 20204 40690 999 710 1709 24873 24452 49325 942 611 1553Total 175631 91487 267118 27747 20493 48240 210170 90384 300554 28681 24510 53191 249384 83548 332932 31731 23260 54991Source : States/UT Maritime Boards
2010-11 2011-12 2012-13Overseas Coastal Overseas Coastal Overseas Coastal
Table 2.2.2
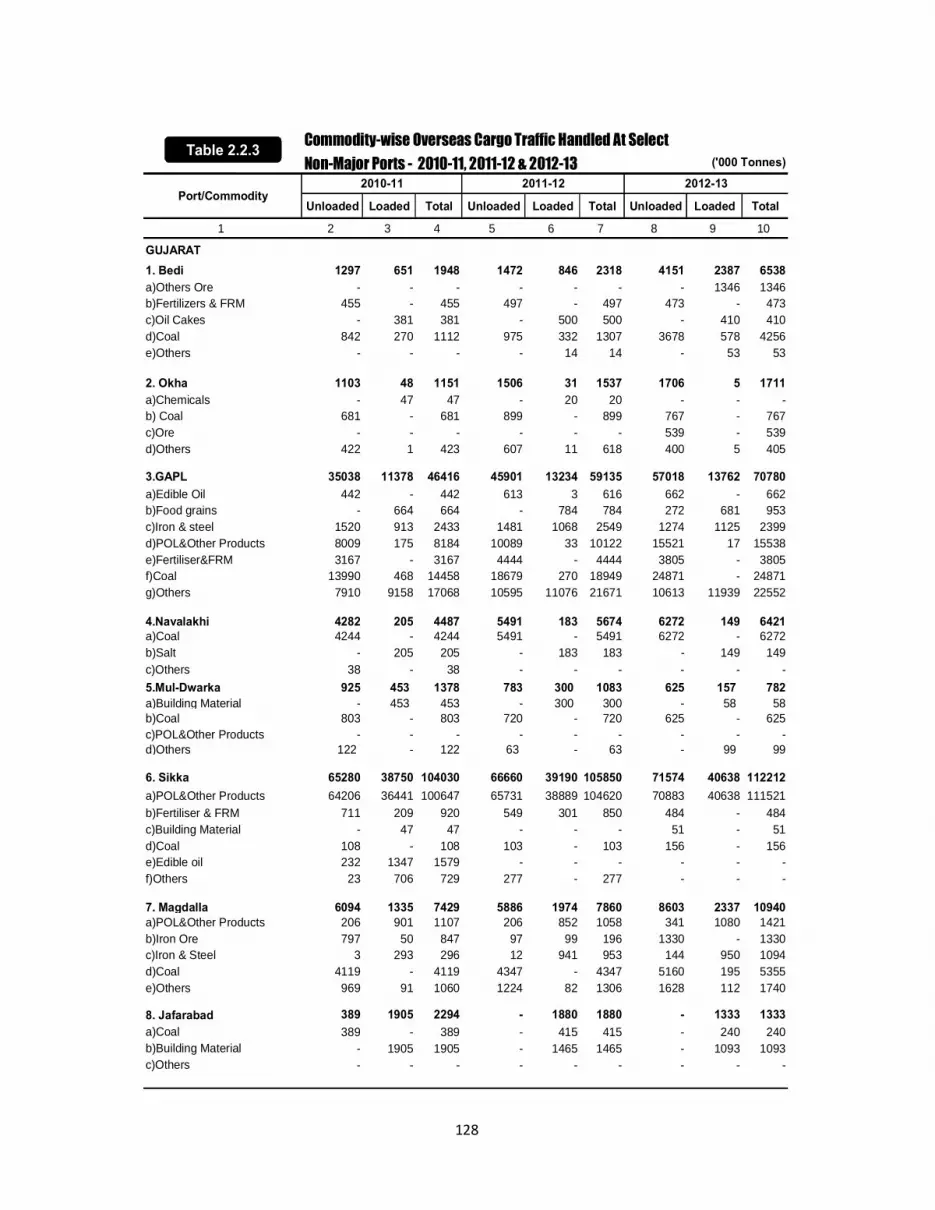
128
Commodity-wise Overseas Cargo Traffic Handled At Select Non-Major Ports - 2010-11, 2011-12 & 2012-13 ('000 Tonnes)
Unloaded Loaded Total Unloaded Loaded Total Unloaded Loaded Total
1 2 3 4 5 6 7 8 9 10
GUJARAT1. Bedi 1297 651 1948 1472 846 2318 4151 2387 6538a)Others Ore - - - - - - - 1346 1346b)Fertilizers & FRM 455 - 455 497 - 497 473 - 473c)Oil Cakes - 381 381 - 500 500 - 410 410d)Coal 842 270 1112 975 332 1307 3678 578 4256e)Others - - - - 14 14 - 53 53
2. Okha 1103 48 1151 1506 31 1537 1706 5 1711a)Chemicals - 47 47 - 20 20 - - -b) Coal 681 - 681 899 - 899 767 - 767c)Ore - - - - - - 539 - 539d)Others 422 1 423 607 11 618 400 5 405
3.GAPL 35038 11378 46416 45901 13234 59135 57018 13762 70780a)Edible Oil 442 - 442 613 3 616 662 - 662b)Food grains - 664 664 - 784 784 272 681 953c)Iron & steel 1520 913 2433 1481 1068 2549 1274 1125 2399d)POL&Other Products 8009 175 8184 10089 33 10122 15521 17 15538e)Fertiliser&FRM 3167 - 3167 4444 - 4444 3805 - 3805f)Coal 13990 468 14458 18679 270 18949 24871 - 24871g)Others 7910 9158 17068 10595 11076 21671 10613 11939 22552
4.Navalakhi 4282 205 4487 5491 183 5674 6272 149 6421a)Coal 4244 - 4244 5491 - 5491 6272 - 6272b)Salt - 205 205 - 183 183 - 149 149c)Others 38 - 38 - - - - - -5.Mul-Dwarka 925 453 1378 783 300 1083 625 157 782a)Building Material - 453 453 - 300 300 - 58 58b)Coal 803 - 803 720 - 720 625 - 625c)POL&Other Products - - - - - - - - -d)Others 122 - 122 63 - 63 - 99 99
6. Sikka 65280 38750 104030 66660 39190 105850 71574 40638 112212a)POL&Other Products 64206 36441 100647 65731 38889 104620 70883 40638 111521b)Fertiliser & FRM 711 209 920 549 301 850 484 - 484c)Building Material - 47 47 - - - 51 - 51d)Coal 108 - 108 103 - 103 156 - 156e)Edible oil 232 1347 1579 - - - - - -f)Others 23 706 729 277 - 277 - - -
7. Magdalla 6094 1335 7429 5886 1974 7860 8603 2337 10940a)POL&Other Products 206 901 1107 206 852 1058 341 1080 1421b)Iron Ore 797 50 847 97 99 196 1330 - 1330c)Iron & Steel 3 293 296 12 941 953 144 950 1094d)Coal 4119 - 4119 4347 - 4347 5160 195 5355e)Others 969 91 1060 1224 82 1306 1628 112 1740
8. Jafarabad 389 1905 2294 - 1880 1880 - 1333 1333a)Coal 389 - 389 - 415 415 - 240 240b)Building Material - 1905 1905 - 1465 1465 - 1093 1093c)Others - - - - - - - - -
Port/Commodity2010-11 2012-132011-12
Table 2.2.3
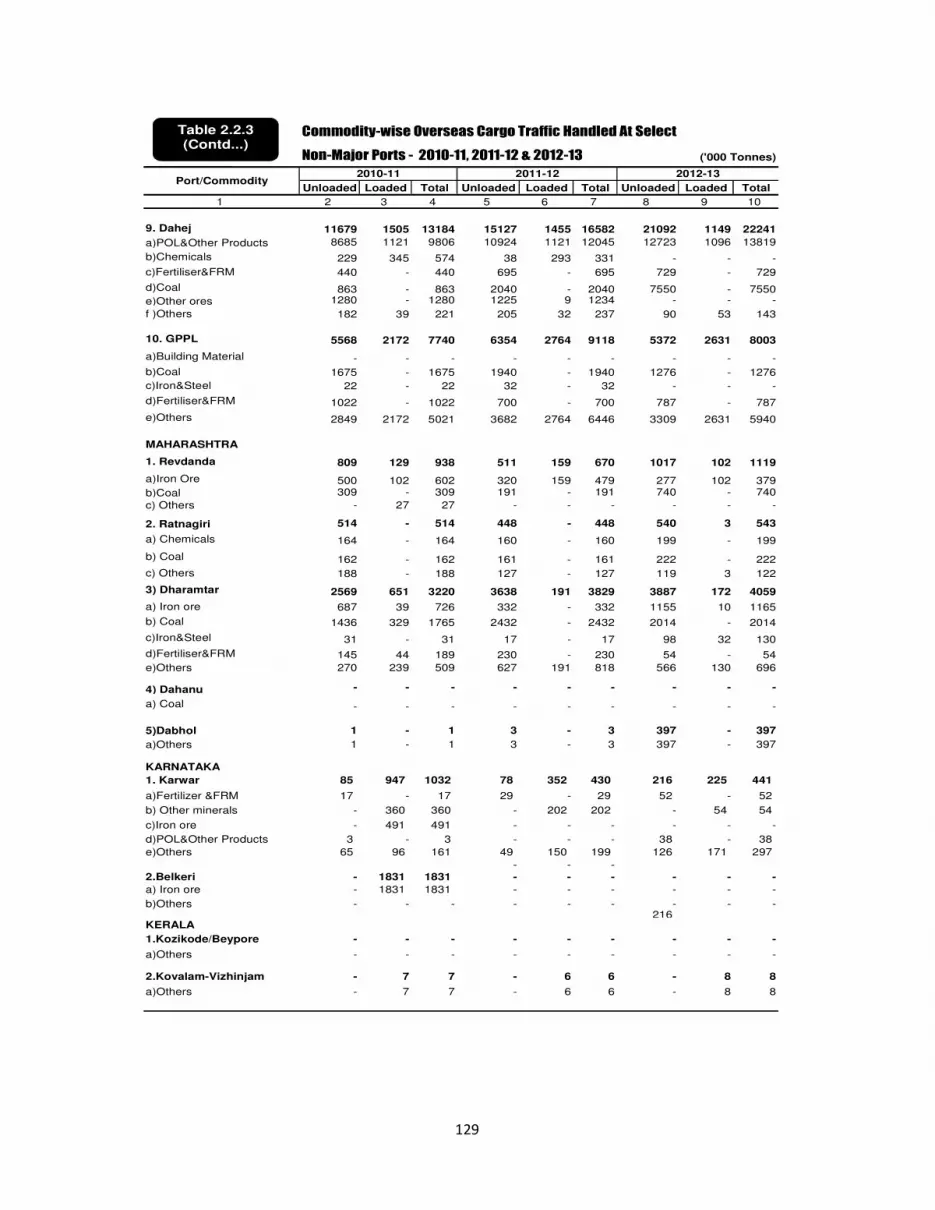
129
Commodity-wise Overseas Cargo Traffic Handled At Select
Non-Major Ports - 2010-11, 2011-12 & 2012-13 ('000 Tonnes)
Unloaded Loaded Total Unloaded Loaded Total Unloaded Loaded Total
1 2 3 4 5 6 7 8 9 10
9. Dahej 11679 1505 13184 15127 1455 16582 21092 1149 22241
a)POL&Other Products 8685 1121 9806 10924 1121 12045 12723 1096 13819
b)Chemicals 229 345 574 38 293 331 - - -
c)Fertiliser&FRM 440 - 440 695 - 695 729 - 729
d)Coal 863 - 863 2040 - 2040 7550 - 7550e)Other ores 1280 - 1280 1225 9 1234 - - -
f )Others 182 39 221 205 32 237 90 53 143
10. GPPL 5568 2172 7740 6354 2764 9118 5372 2631 8003
a)Building Material - - - - - - - - -
b)Coal 1675 - 1675 1940 - 1940 1276 - 1276
c)Iron&Steel 22 - 22 32 - 32 - - -
d)Fertiliser&FRM 1022 - 1022 700 - 700 787 - 787
e)Others 2849 2172 5021 3682 2764 6446 3309 2631 5940
MAHARASHTRA
1. Revdanda 809 129 938 511 159 670 1017 102 1119
a)Iron Ore 500 102 602 320 159 479 277 102 379b)Coal 309 - 309 191 - 191 740 - 740
c) Others - 27 27 - - - - - -
2. Ratnagiri 514 - 514 448 - 448 540 3 543
a) Chemicals 164 - 164 160 - 160 199 - 199
b) Coal 162 - 162 161 - 161 222 - 222
c) Others 188 - 188 127 - 127 119 3 122
3) Dharamtar 2569 651 3220 3638 191 3829 3887 172 4059
a) Iron ore 687 39 726 332 - 332 1155 10 1165
b) Coal 1436 329 1765 2432 - 2432 2014 - 2014
c)Iron&Steel 31 - 31 17 - 17 98 32 130
d)Fertiliser&FRM 145 44 189 230 - 230 54 - 54
e)Others 270 239 509 627 191 818 566 130 696
4) Dahanu - - - - - - - - -
a) Coal - - - - - - - - -
5)Dabhol 1 - 1 3 - 3 397 - 397
a)Others 1 - 1 3 - 3 397 - 397
KARNATAKA
1. Karwar 85 947 1032 78 352 430 216 225 441
a)Fertilizer &FRM 17 - 17 29 - 29 52 - 52
b) Other minerals - 360 360 - 202 202 - 54 54
c)Iron ore - 491 491 - - - - - -
d)POL&Other Products 3 - 3 - - - 38 - 38
e)Others 65 96 161 49 150 199 126 171 297
- - -2.Belkeri - 1831 1831 - - - - - -
a) Iron ore - 1831 1831 - - - - - -
b)Others - - - - - - - - -216
KERALA
1.Kozikode/Beypore - - - - - - - - -
a)Others - - - - - - - - -
2.Kovalam-Vizhinjam - 7 7 - 6 6 - 8 8
a)Others - 7 7 - 6 6 - 8 8
Port/Commodity2011-12 2012-132010-11
Table 2.2.3 (Contd...)

130
Commodity-wise Overseas Cargo Traffic Handled At Select
Non-Major Ports - 2010-11, 2011-12 & 2012-13 ('000 Tonnes)
Port/Commodity
Unloaded Loaded Total Unloaded Loaded Total Unloaded Loaded Total
1 2 3 4 5 6 7 8 9 10
TAMILNADU
1. Ennore 58 - 58 46 - 46 29 - 29
a)Fertiliser&FRM 58 - 58 46 - 46 29 - 29
b)Others - - - - - - - - -
2, Nagapattinam 36 7 43 25 - 25 15 - 15
a)Edible Oil 36 - 36 25 - 25 15 - 15
b)Others - 7 7 - - - - - -
3. Cuddalore 210 - 210 227 1 228 237 8 245
a)POL&Other Products 210 - 210 220 - 220 - - -
b)Fertiliser&FRM 223 - 223
c)Others - - - 7 1 8 14 8 22
GOA
Panaji 96 14468 14564 165 14305 14470 113 3276 3389
a) Iron ore 96 14468 14564 - 14305 14305 - 3276 3276
b) Coal - - - 165 - 165 113 - 113
ANDHRA PRADESH
1. Kakinada Anchorage Port 358 746 1104 16 3098 3114 - 3929 3929
a)Foodgrain - 746 746 - 2020 2020 - 2815 2815
b)Fertiliser &FRM 123 - 123 10 - 10 - - -
c) Coal 147 - 147 - - - - - -
d)Others 88 - 88 6 1078 1084 - 1114 1114
2. Kakinada Deep Water Port 7000 2337 9337 5969 1835 7804 6272 2823 9095
a)Fertiliser &FRM 3125 - 3125 3785 163 3948 2349 - 2349
b)Edible Oil 855 9 864 851 - 851 987 7 994
c)POL&Other Products 964 - 964 108 7 115 226 5 231
d)Iron ore - 1018 1018 - 509 509 - 136 136
e)Coal 1500 - 1500 948 - 948 2313 - 2313
e)Others 556 1310 1866 277 1156 1433 397 2675 3072
3.Krishnapatinam 10049 5856 15905 13633 1370 15003 17772 2154 19926
a)Fertiliser &FRM 2115 - 2115 2197 - 2197 1553 - 1553
b) Iron ore - 5355 5355 - 90 90 148 - 148
c) Coal 7389 - 7389 10629 - 10629 14979 - 14979
d)Building Material - 456 456 - 744 744 - 984 984
e)Others 545 45 590 807 536 1343 1092 1170 2262
4. Gangavaram 11256 2584 13840 11746 2256 14002 12599 451 13050
a)Fertiliser &FRM 365 - 365 823 - 823 1162 - 1162
b) Iron ore - 2584 2584 - 2141 2141 - 272 272
c) Coal 9587 - 9587 9959 - 9959 9865 - 9865
d)Others 1304 - 1304 964 115 1079 1572 179 1751
PUDUCHERRY
Karaikal 4627 101 4728 6240 168 6408 6436 431 6867
a))Building Material - 2 2 - 52 52 - 78 78
b)Coal 3974 - 3974 4839 - 4839 4666 - 4666
c)Fertiliser &FRM 465 35 500 1182 31 1213 607 - 607
d)POL&Other Products 411 - 411
e)Salt 88 - 88 69 - 69 - - -
f)Others 100 64 164 150 85 235 752 353 1105
2011-12 2012-132010-11
Table 2.2.3 (Contd...)
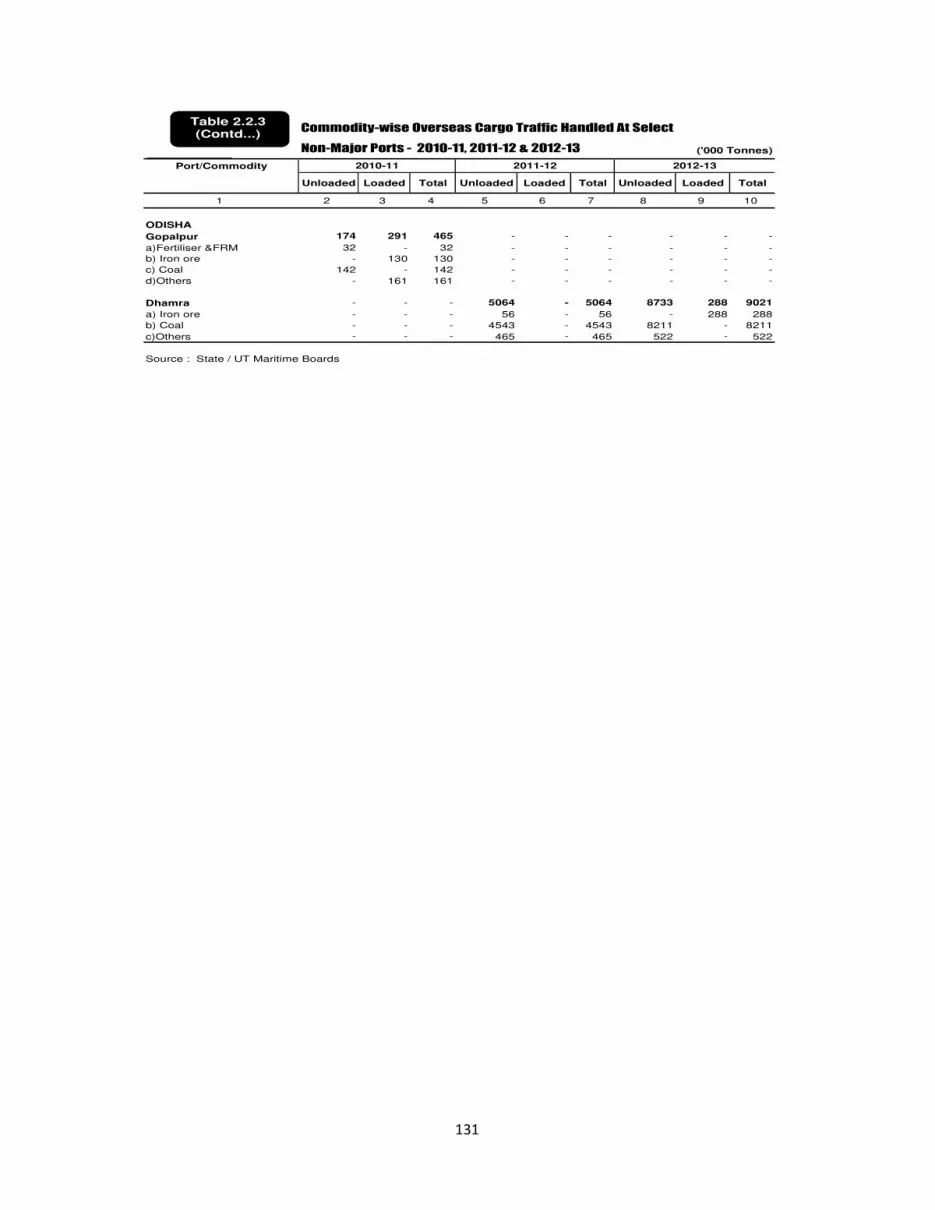
131
Commodity-wise Overseas Cargo Traffic Handled At Select
Non-Major Ports - 2010-11, 2011-12 & 2012-13 ('000 Tonnes)
Port/Commodity
Unloaded Loaded Total Unloaded Loaded Total Unloaded Loaded Total
1 2 3 4 5 6 7 8 9 10
ODISHA
Gopalpur 174 291 465 - - - - - -
a)Fertiliser &FRM 32 - 32 - - - - - -
b) Iron ore - 130 130 - - - - - -
c) Coal 142 - 142 - - - - - -
d)Others - 161 161 - - - - - -
Dhamra - - - 5064 - 5064 8733 288 9021
a) Iron ore - - - 56 - 56 - 288 288
b) Coal - - - 4543 - 4543 8211 - 8211
c)Others - - - 465 - 465 522 - 522
Source : State / UT Maritime Boards
2010-11 2011-12 2012-13
Table 2.2.3 (Contd...)

132
Commodity-wise Coastal Cargo Traffic Handled At Select Non-Major Ports - 2010-11 , 2011-12 & 2012-13 ('000 Tonnes)
2010-11Unloaded Loaded Total Unloaded Loaded Total Unloaded Loaded Total
1 2 3 4 5 6 7 8 9 10GUJARAT1.Bedi 2 171 173 42 363 405 - 158 158a)Coal - 171 171 42 363 405 - 151 151b)Building Material 2 - 2 - - - - - -c)Others - - - - - - - 7 7
2.Okha - - - - 88 88 - 33 33a) Other Ores - - - - 69 69 - 15 15b)Coal - - - - 13 13 - 9 9b) Others - - - - 6 6 - 9 9
3.GAPL 4881 608 5489 5049 611 5660 5764 400 6164a)POL&Other Products 4880 235 5115 5000 247 5247 4037 275 4312b)Coal - 104 104 48 104 152 1675 - 1675c) Iron Ore - - - - - - 52 - 52d)Others 1 269 270 1 260 261 0 125 125
4.Navlakhi 33 - 33 68 - 68 - - -a)Building Material 33 - 33 68 - 68 - - -
5.Mul-Dwarka - 2468 2468 - 2738 2738 - 2669 2669a)Building Material - 2468 2468 - 2738 2738 - 2669 2669
6.Sikka 330 11046 11376 65 12129 12194 817 11492 12309a) POL&Other Products 330 10669 10999 65 12065 12130 817 11441 12258b) Edible oil - 42 42 - - - - - -c) Salt - 32 32 - 64 64 - 51 51d) Others - 303 303 - - - - - -
7.Magdalla 10480 614 11094 11596 928 12524 10986 740 11726a) POL&Other Products 3091 - 3091 3404 - 3404 3368 - 3368b)Building Material 1050 - 1050 1443 - 1443 1530 - 1530c) Iron Ore 6283 - 6283 6643 - 6643 6068 22 6090d) Iron & Steel - 521 521 5 683 688 - 500 500e) Others 56 93 149 101 245 346 20 218 238
8.Jafarabad - 2169 2169 - 2238 2238 - 2072 2072a)Building Material - 2169 2169 - 2238 2238 - 2072 2072
9.Dahej 857 271 1128 783 251 1034 18 - 18a) POL&Other Products 657 - 657 163 - 163 - - -b)Chemicals 5 271 276 274 247 521 - - -c)Others 195 - 195 346 4 350 18 - 18
10.GPPL 79 2 81 145 9 154 44 11 55a)Building Material - - - - - - - - -b) Iron & Steel - - - - - - - - -c)Iron Ore 27 - 27 31 - 31 40 - 40d)Others 52 - 52 114 9 123 4 11 15
GOA1. Panaji 17 - 17 - - - - - -a) Iron ore 17 - 17 - - - - - -b) Others - - - - - - - - -
2012-13Port/Commodity 2011-12
Table 2.2.4

133
Commodity-wise Coastal Cargo Traffic Handled At Select Non-Major Ports - 2010-11 , 2011-12 & 2012-13 ('000 Tonnes)
Unloaded Loaded Total Unloaded Loaded Total Unloaded Loaded Total1 2 3 4 5 6 7 8 9 10
MAHARASHTRA1.Ratnagiri 391 50 441 377 - 377 317 - 317a)Building Material 232 50 282 377 - 377 317 - 317b) Others 159 - 159 - - - - - -
2.Dharamtar 3857 4 3861 3693 - 3693 5663 - 5663a) Iron Ore 2386 - 2386 2772 - 2772 3292 - 3292b)Building Material 221 - 221 408 - 408 240 - 240c)Coal 1118 2 1120 363 - 363 1578 - 1578d) Others 132 2 134 150 - 150 553 - 553
3. Revdanda 717 18 735 634 6 640 234 - 234a) Iron Ore 692 6 698 634 - 634 234 - 234b) Iron & Steel - 12 12 - 6 6 - - -c) Others 25 - 25 - - - - - -
4. Ulwa-Belapur 1623 - 1623 1657 - 1657 1429 - 1429a)Building Material 1623 - 1623 1657 - 1657 1429 - 1429b) Others - - - - - - - - -
5.Dabhol 12 5 17 36 1 37 2 - 2a) Iron & Steel 1 - 1 32 - 32 - - -b) Others 11 5 16 4 1 5 2 - 2
6.Dahanu 674 - 674 691 - 691 531 - 531a)Coal 674 - 674 691 - 691 531 - 531
ODISHA1. Dhamra 17 - 17 - 20 20 - 2047 2047a) Coal 17 - 17 - 20 20 - 682 682b) Iron Ore - - - - - - - 1365 1365
KERALA1.Kozikoda/ Beypore 30 77 107 17 79 96 15 70 85a)Builiding material - 9 9 14 71 85 - 30 30b)Foodgrains 4 - 4 3 4 7 9 3 12c)Others 26 68 94 - 4 4 6 37 43
2)Neendakara - - - - - - - - -
3)Kovlam-Vizanjam 2 - 2 - - - - 2 2a)Others 2 - 2 - - - - 2 2
ANDHRA PRADESH1.Rawa Port - 1561 1561 - 3198 3198 - 1369 1369a)Crude Oil - 1561 1561 - 3198 3198 - 1369 1369
2.Kakinada Anchorage Port 13 29 42 - 50 50 - 18 18a)Salt - - - - - - - - -b)Builiding material - 28 28 - 41 41 - 18 18c)Others 13 1 14 - 9 9 - - -3.Kakinada Deep Water 1314 154 1468 1791 255 2046 2764 464 3228a)POL&other Products 258 2 260 175 21 196 145 17 162b)Chemical - - - - - 0 - - -c)Coal 986 - 986 1559 - 1559 2501 - 2501d)Iron Ore - - - - 234 234 - 421 421d)Other 70 152 222 57 - 57 118 26 144
4.Gangavaram - - - - - - - - -a)Iron & steel - - - - - - - - -b)Other - - - - - - - - -
Port/Commodity2010-11 2012-132011-12
Table 2.2.4

134
Commodity-wise Coastal Cargo Traffic Handled At Select Non-Major Ports - 2010-11 , 2011-12 & 2012-13 ('000 Tonnes)
Unloaded Loaded Total Unloaded Loaded Total Unloaded Loaded Total1 2 3 4 5 6 7 8 9 10
TAMIL NADU1.py-03 - 152 152 - 59 59 - - -a)POL&other Products - 152 152 - 59 59 - - -
2.Nagapattinam 484 334 818 309 296 605 15 342 357a)POL&other Products 484 330 814 309 291 600 15 342 357b)Others - 4 4 - 5 5 - - -
3.Thirukkadaiyur 327 - 327 235 - 235 274 - 274a)POL&other Products 327 - 327 235 - 235 274 - 274b)Others - - - - - - - - -
KARNATAKA1.Karwar 84 11 95 67 - 67 - - -a)Salt 32 - 32 64 - 64 - - -b)Others 52 11 63 3 - 3 - - -
2.Mangalore 15 121 136 16 72 88 77 85 162a)Other Minerals - - - - 23 23 - - -b)Building Material - 77 77 - 16 16 - - -c)Others 15 44 59 16 33 49 77 85 162
PUDUCHERRY1)Karaikal - - - - 13 13 - 42 42a)Others - - - - 13 13 - 42 42
ANDAMAN & NICOBAR 985 352 1337 950 248 1198 854 205 1059a)Building Material 460 206 666 268 59 327 255 24 279b)POL&Other Products 146 16 162 141 16 157 163 12 175c)Foodgrains 63 17 80 64 12 76 50 6 56d)Others 316 113 429 477 161 638 386 163 549Source : State / UT Maritime Boards
Port/Commodity2010-11 2011-12 2012-13
Table 2.2.4

135
.
Cargo Handled at Non-Major Ports ( By Steamers & Sailing vessels) State Wise - 2011-12 &2012-13 (000'Tonnes) Total
State/Port Loaded2011-12 2012-13 2011-12 2012-13 2011-12 2012-13 2011-12 2012-13 2011-12 2012-13
1 2 3 4 5 6 7 8 9 10 11
Gujarat 157742 185321 63572 66824 17749 17747 19987 17925 259050 287817
Steamers 157742 185321 63572 66824 17749 17747 19987 17925 259050 287817S.V. - - - - - - - - - -
Maharastra 9196 11630 3421 3131 7102 8759 228 678 19947 24198
Steamers 9196 11630 3421 3131 7102 8759 228 678 19947 24198S.V. - - - - - - - - - -
Goa 165 113 14305 3276 - - - - 14470 3389
Steamers 165 113 14305 3276 - - - - 14470 3389S.V. - - - - - - - - - -
Karnataka 82 216 353 225 85 80 72 89 592 610
Steamers 82 216 353 225 85 80 72 89 592 610S.V. - - - - - - - - - -
Tamilnadu 307 285 1 8 544 289 358 351 1210 933
Steamers 307 285 1 8 544 289 358 351 1210 933S.V. - - - - - - - - - -
Andhra Pradesh 31364 36643 8558 9357 2208 3960 3503 1851 45633 51811
Steamers 31364 36643 8558 9357 2208 3960 3503 1851 45633 51811S.V. - - - - - - - - - -
Overseas & CoastalCoastal
LoadedOverseas
UnloadedUnloaded
Table 2.2.5

136
Cargo Handled at Non-Major Ports ( By Steamers & Sailing vessels) State Wise - 2011-12 & 2012-13 (000'Tonnes) Total
State/Port Loaded2011-12 2012-13 2011-12 2012-13 2011-12 2012-13 2011-12 2012-13 2011-12 2012-13
1 2 3 4 5 6 7 8 9 10 11Kerala - - 6 8 17 16 81 72 104 96
Steamers - - 6 8 17 16 81 72 104 96S.V. - - - - - - - - - -
Puducherry 6240 6436 168 431 - - 13 42 6421 6909
Steamers 6240 6436 168 431 - - 13 42 6421 6909S.V. - - - - - - - - - -
Odisha 5064 8733 - 288 - - 20 2047 5084 11068
Steamers 5064 8733 - 288 - - 20 2047 5084 11068S.V. - - - - - - - -
Sea Islands 10 7 - - 976 880 248 205 1234 1092
Steamers 10 7 - - 976 880 248 205 1234 1092S.V. - - - - - - - - - -
- -All States 210170 249384 90384 83548 28681 31731 24510 23260 353745 387923
Steamers 210170 249384 90384 83548 28681 31731 24510 23260 353745 387923S.V. - - - - - - - - -
Source : State / UT Maritime Boards
Overseas & CoastalOverseas Coastal
Unloaded Unloaded Loaded
Table 2.2.5

137
Manpower Employment At Non-Major
Ports - 2012-13 (In No.)
Casual
Sanctioned Actual Sanctioned Actual Workers
1 2 3 4 5 6
Gujarat 281 161 2469 1653 416
Maharashtra 44 24 469 337 25
Goa 13 7 173 148 0
Diu 1 1 9 9 2
Karnataka* 124 0 0 0 0
Kerala 43 32 106 101 1
Tamil Nadu 12 8 61 20 1
Puducherry 76 72 453 413 1047
Andhra Pradesh** 0 0 1195 1195 5734
Andaman & Nicobar Islands
78 62 448 363 16
Odisha 70 70 298 297 4776
Total 742 437 5681 4536 12018
* In Karnataka , No Departmental dock labour in Minor Ports.
All the labour activities are done by Private laboures appointed by Stevedores.
** Since Kakinada Anchorage Port is function under State Government.
Source : State / UT Maritime Boards
Officers Regular WorkersStates/UTs
Table 2.2.6
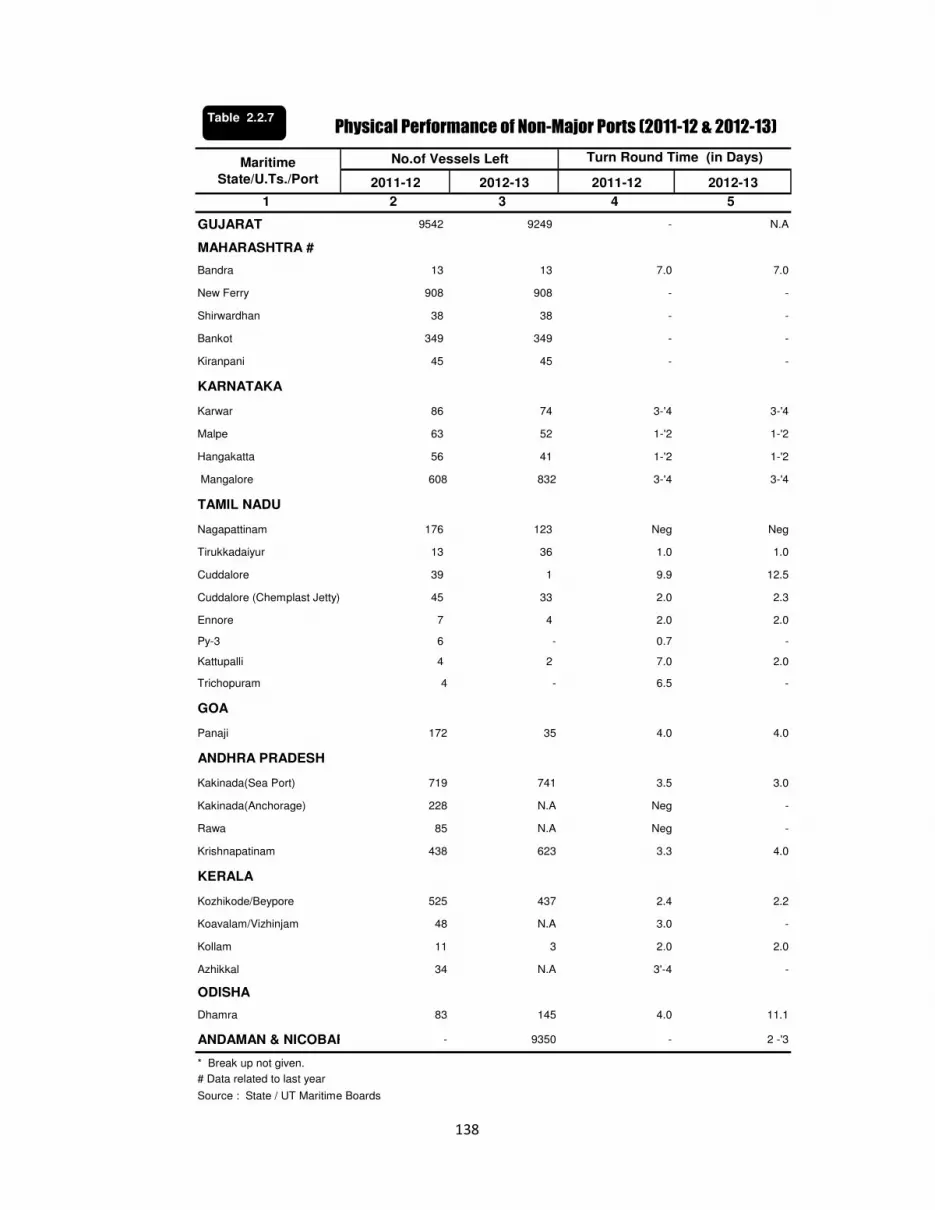
138
Physical Performance of Non-Major Ports (2011-12 & 2012-13)
2011-12 2012-13 2011-12 2012-13
1 2 3 4 5
GUJARAT 9542 9249 - N.A
MAHARASHTRA #
Bandra 13 13 7.0 7.0
New Ferry 908 908 - -
Shirwardhan 38 38 - -
Bankot 349 349 - -
Kiranpani 45 45 - -
KARNATAKA
Karwar 86 74 3-'4 3-'4
Malpe 63 52 1-'2 1-'2
Hangakatta 56 41 1-'2 1-'2
Mangalore 608 832 3-'4 3-'4
TAMIL NADU
Nagapattinam 176 123 Neg Neg
Tirukkadaiyur 13 36 1.0 1.0
Cuddalore 39 1 9.9 12.5
Cuddalore (Chemplast Jetty) 45 33 2.0 2.3
Ennore 7 4 2.0 2.0
Py-3 6 - 0.7 -
Kattupalli 4 2 7.0 2.0
Trichopuram 4 - 6.5 -
GOA
Panaji 172 35 4.0 4.0
ANDHRA PRADESH
Kakinada(Sea Port) 719 741 3.5 3.0
Kakinada(Anchorage) 228 N.A Neg -
Rawa 85 N.A Neg -
Krishnapatinam 438 623 3.3 4.0
KERALA
Kozhikode/Beypore 525 437 2.4 2.2
Koavalam/Vizhinjam 48 N.A 3.0 -
Kollam 11 3 2.0 2.0
Azhikkal 34 N.A 3'-4 -
ODISHA
Dhamra 83 145 4.0 11.1
ANDAMAN & NICOBAR - 9350 - 2 -'3
* Break up not given.
# Data related to last year
Source : State / UT Maritime Boards
No.of Vessels Left Turn Round Time (in Days) Maritime
State/U.Ts./Port
Table 2.2.7
SECTION – II
3. TIME SERIES STATISTICS
3.1 ALL PORTS
3.2 MAJOR PORTS
3.3 NON-MAJOR PORTS

139
(In Million Tonnes)
Ports/Years Unloaded Loaded Total Unloaded Loaded Total Unloaded Loaded Total
1 2 3 4 5 6 7 8 9 10
MAJOR PORTS
1997-98 117.43 62.25 179.68 38.55 33.43 71.98 155.98 95.68 251.66
1998-99 124.99 55.03 180.02 39.54 32.18 71.72 164.53 87.21 251.74
1999-00 133.80 56.63 190.43 49.92 31.62 81.54 183.72 88.25 271.97
2000-01 127.20 66.20 193.40 51.55 36.18 87.73 178.75 102.38 281.13
2001-02 130.12 76.77 206.89 47.03 33.66 80.69 177.15 110.43 287.58
2002-03 133.83 93.52 227.35 48.21 37.99 86.20 182.04 131.51 313.55
2003-04 148.13 110.66 258.79 48.53 37.48 86.01 196.66 148.14 344.80
2004-05 169.42 126.20 295.62 47.02 41.12 88.14 216.44 167.32 383.76
2005-06 199.48 133.64 333.12 44.22 46.23 90.45 243.70 179.87 423.57
2006-07 225.55 143.26 368.81 52.57 42.40 94.97 278.12 185.66 463.78
2007-08 253.16 165.76 418.92 57.50 42.89 100.39 310.66 208.65 519.31
2008-09 260.97 166.49 427.46 57.70 45.65 103.34 318.67 212.14 530.80
2009-10 286.50 167.52 454.02 58.93 48.14 107.07 345.43 215.66 561.09
2010-11 296.31 168.86 465.17 55.64 49.29 104.92 351.95 218.15 570.09
2011-12 306.76 147.56 454.56 55.98 49.89 105.53 362.74 197.45 560.19
2012-13 315.20 123.63 438.83 53.90 53.10 107.01 369.10 176.73 545.83
NON-MAJOR PORTS
1997-98 18.75 10.42 29.17 5.22 4.22 9.44 23.97 14.64 38.61
1998-99 15.93 8.42 24.35 6.34 5.62 11.96 22.27 14.04 36.31
1999-00 31.13 8.18 39.31 10.20 13.87 24.07 41.33 22.05 63.38
2000-01 43.73 17.59 61.32 10.86 15.19 26.05 54.59 32.78 87.37
2001-02 49.18 19.76 68.94 10.45 16.13 26.58 59.63 35.89 95.52
2002-03 50.85 27.16 78.01 14.06 16.23 30.29 64.91 43.39 108.30
2003-04 56.38 31.15 87.53 14.18 17.15 31.33 70.56 48.30 118.86
2004-05 65.47 39.50 104.97 15.52 16.47 31.99 80.99 55.97 136.96
2005-06 69.58 48.69 118.27 16.47 15.38 31.85 86.05 64.07 150.12
2006-07 90.76 49.34 140.11 17.50 27.32 44.82 108.26 76.66 184.92
2007-08 107.04 70.27 177.31 16.87 12.20 29.07 123.91 82.47 206.38
2008-09 117.76 65.78 183.54 18.51 11.17 29.68 136.27 76.95 213.22
2009-10 159.89 83.62 243.51 24.71 20.72 45.43 184.60 104.34 288.94
2010-11 175.63 91.49 267.12 27.75 20.49 48.24 203.38 111.98 315.36
2011-12 210.17 90.38 300.55 28.68 24.51 53.19 238.85 114.89 353.75
2012-13 249.38 83.55 332.93 31.73 23.26 54.99 281.12 106.81 387.92
ALL PORTS
1997-98 136.18 72.67 208.85 4.77 37.65 81.42 179.95 110.32 290.27
1998-99 140.92 63.45 204.37 45.88 37.80 83.68 186.80 101.25 288.05
1999-00 164.93 64.81 229.74 60.12 45.49 105.61 225.05 110.30 335.35
2000-01 170.93 83.79 254.72 62.41 51.37 113.78 233.34 135.16 368.50
2001-02 179.30 96.53 275.83 57.48 49.79 107.27 236.78 146.32 383.10
2002-03 184.68 120.68 305.36 62.27 54.22 116.49 246.95 174.90 421.85
2003-04 204.51 141.81 346.32 62.71 54.63 117.34 267.22 196.44 463.66
2004-05 234.89 165.70 400.59 62.54 57.59 120.13 297.43 223.29 520.72
2005-06 269.06 182.33 451.39 60.69 61.61 122.30 297.43 223.29 573.69
2006-07 316.31 192.60 508.91 70.07 69.72 139.79 386.38 262.32 648.70
2007-08 360.20 236.03 596.23 74.37 55.09 129.46 434.57 291.12 725.69
2008-09 378.73 232.27 611.00 76.21 56.82 133.02 454.94 289.09 744.02
2009-10 446.39 251.14 697.53 83.64 68.86 152.50 530.03 320.00 850.03
2010-11 471.94 260.35 732.29 83.39 69.78 153.16 555.33 330.13 885.45
2011-12 516.93 237.94 755.11 84.66 74.40 158.72 601.59 312.34 913.93
2012-13 564.58 207.17 771.76 85.63 76.36 162.00 650.22 283.54 933.75
Overseas Coastal Overseas & CoastalTrend in Cargo Traffic Handled At Indian PortsTable 3.1.1Table 3.1.1

140
Port/State/Type 2001-02 2002-03 2003-04 2004-05 2005-06 2006-07 2007-08 2008-09 2009-10 2010-11 2011-12 2012-13of Traffic
1 2 3 4 5 6 7 8 9 10 11 12 13
GUJARAT 117263 122194 128855 137692 149434 184247 215441 225035 285083 312787 341551 381436
Kandla 37728 40633 41523 41551 45907 52982 64920 72224 79500 81880 82501 93619
Other Ports 79535 81561 87332 96141 103527 131265 150521 152811 205583 230907 259050 287817
Overseas 95314 97572 103247 111691 123660 146295 192185 199107 242187 269049 293675 332241
Coastal 21949 24622 25608 26001 25774 37952 23256 25928 42896 43738 47876 49195
Loaded 36153 40600 43694 46379 47821 56420 64601 60201 78063 98045 105648 114966
Unloaded 81110 81594 85161 91313 101613 127827 150840 164834 207020 214742 235903 266470
MAHARASHTRA 53911 62265 71517 80138 93182 108759 124239 119588 127350 133778 141863 146724
Mumbai 26433 26796 29995 35187 44190 52364 57038 51876 54541 54586 56186 58038
J.L.Nehru 22521 26844 31190 32808 37836 44815 55838 57296 60763 64317 65730 64488
Other Ports 4957 8625 10332 12143 11156 11580 11363 10416 12046 14875 19947 24198
Overseas 39555 46044 54689 60476 70003 83450 95041 90191 97925 105071 115242 119426
Coastal 14356 16221 16828 19662 23179 25309 29198 29397 29425 28707 26621 27298
Loaded 19196 25156 28370 29911 37379 36029 40739 40801 37079 41536 44571 44819
Unloaded 34715 37109 43147 50227 55803 72730 83509 78787 90271 92242 97292 101905
GOA 25786 24223 36310 38860 43450 48547 47953 53582 62744 64641 53519 21127
Mormugao 22928 23649 27874 30659 31688 34241 35128 41681 48847 50060 39049 17738
Other Ports 2858 5574 8436 8201 11762 14306 12825 11901 13897 14581 14470 3389
Overseas 23857 27818 34969 37711 42452 47685 46832 52550 61196 63404 52384 20373
Coastal 1929 1405 1341 1149 998 862 1121 1032 1548 1237 1135 754
Loaded 20654 24449 31424 32978 37043 41218 40679 46570 54634 55328 44222 11944
Unloaded 5132 4774 4886 5882 6407 7329 7274 7012 8110 9313 9297 9183
Cargo Traffic Handled At Indian Ports - By State Cargo Traffic At Indian Port- (In'000 Tonns)Table 3.1.2
Table 3.1.2

141
Cargo Traffic Handled At Indian Ports - By State Port/State/Type 2001-02 2002-03 2003-04 2004-05 2005-06 2006-07 2007-08 2008-09 2009-10 2010-11 2011-12 2012-13of Traffic
1 2 3 4 5 6 7 8 9 10 11 12 13DAMAN & DIU - - - - - - - - -
Other Ports - - - - - - - - -
Overseas - - - - - - - - -Coastal - - - - - - - - -
Loaded - - - - - - - - -Unloaded - - - - - - - - -
KARNATAKA 18247 22102 27841 37397 38568 38603 44918 41659 44075 34645 33533 37646
New Mangalore 17501 21430 26673 33891 34451 32042 36019 36691 35528 31550 32941 37036Other Ports 746 672 1168 3506 4117 6561 8899 4968 8547 3095 592 610
Overseas 13517 17740 22387 28823 30673 30640 38627 35482 36790 27684 27462 31261Coastal 4730 4362 5454 8574 7895 7963 6291 6177 7285 6991 6071 6385
Loaded 9195 11238 14446 21440 21700 20326 25095 21613 22215 13094 9682 10028Unloaded 9052 10864 13395 15957 16868 18277 19823 20046 21860 21251 23851 27618
KERALA 12186 13113 13630 14184 14023 15429 15914 15625 17548 17997 20194 19941
Cochin 12059 13024 13572 14103 13888 15257 15810 15494 17429 17873 20090 19845Other Ports 127 89 58 81 135 172 104 131 119 124 104 96
Overseas 7032 8347 9830 10365 9842 10862 10670 11111 11898 13159 13306 13236Coastal 5154 4766 3800 3819 4181 4567 5244 4514 5650 4838 6888 6705
Loaded 2000 2158 2572 3188 2971 3533 3708 2794 3680 3999 4400 3913Unloaded 10186 10955 11058 10996 11052 11896 12206 12831 13868 13998 15794 16028
TAMILNADU 53068 56068 60355 69951 74266 82934 91084 91900 96721 99807 99978 100482
Tuticorin 13017 13294 13678 15811 17139 18001 21480 22011 23787 25727 28105 28260Chennai 36115 33687 36710 43806 47248 53414 57154 57491 61057 61460 55707 53404Ennore 3401 8485 9277 9480 9168 10714 11563 11500 10703 11009 14956 17885Other Ports 535 602 690 854 711 805 887 898 1174 1611 1210 933
Overseas 31978 32835 36929 46655 53198 62038 70809 71367 75856 79169 79509 79509Coastal 21090 23233 23426 23296 21068 20896 20275 20533 20865 20638 20469 20973
Loaded 16445 18010 20080 23639 24602 29156 32759 29896 29349 30014 29039 29534Unloaded 36623 38058 40275 46312 49664 53778 58325 62004 67372 69793 70939 70948
Cargo Traffic At Indian Port- (In'000 Tonns)Table 3.1.2 ( Contd...)

142
Cargo Traffic Handled At Indian Ports - By State
Port/State/Type 2001-02 2002-03 2003-04 2004-05 2005-06 2006-07 2007-08 2008-09 2009-10 2010-11 2011-12 2012-13of Traffic
1 2 3 4 5 6 7 8 9 10 11 12 13PONDICHERRY 95 19 108 59 96 34 10 47 1316 4728 6421 6909
Other Ports 95 19 108 59 96 34 10 47 1316 4728 6421 6909
Overseas 95 19 108 59 85 34 10 47 1316 4728 6408 6867Coastal - - - - 11 - - - - - 13 42
Loaded - 8 71 26 56 18 - - 38 101 181 473Unloaded 95 11 37 33 40 16 10 47 1278 4627 6240 6436
ANDHRA PRADESH 49998 56242 57757 65215 73475 74994 83887 93628 109191 111308 113053 110849
Visakhapatnam 44344 46006 47736 50148 55801 56385 64597 63908 65501 68041 67420 59038Other Ports 5654 10236 10021 15067 17674 18609 19290 29720 43690 43267 45633 51811
Overseas 29868 35943 38300 48133 54394 53676 60938 69929 85364 85177 84675 87211Coastal 20130 20299 19457 17082 19081 21318 22949 23699 23827 26131 28378 23638
Loaded 20409 26835 25921 30818 34006 33486 38779 42381 49727 45180 40790 34972Unloaded 29589 29407 31836 34397 39469 41508 45108 51247 59464 66128 72263 75877
ORISSA 21149 23901 25311 30104 33109 38517 42732 46707 57476 56503 59338 67620
Paradip 21131 23901 25311 30104 33109 38517 42437 46412 57011 56038 54254 56552Other Ports 18 - - - - 295 295 465 465 5084 11068
Overseas 10175 11700 13150 18580 23051 26777 30191 33958 45180 45118 46361 47967Coastal 10974 12201 12161 11524 10058 11740 12541 12749 12296 11385 12977 19653
Loaded 14483 16910 18606 21666 21685 24855 25672 26615 28127 25107 18281 19771Unloaded 6666 6991 6705 8438 11424 13662 17060 20092 29349 31396 41057 47849
WEST BENGAL 30403 35804 41260 46207 53143 55050 57329 54220 46423 47545 43248 39928
KDS 5374 7201 8693 9945 10806 12596 13741 12428 13045 12540 12233 11844HDC 25029 28603 32567 36262 42337 42454 43588 41792 33378 35005 31015 28084Other Ports - - - - - - - - - - - -
Overseas 24437 27341 32714 38086 44025 47447 50912 47187 39334 39388 35837 33660Coastal 5966 8463 8546 8121 9118 7603 6417 7033 7089 8157 7411 6268
Loaded 7431 9344 11024 13001 16405 16735 18288 17547 16572 17030 15280 12911Unloaded 22972 26460 30236 33206 36738 38315 39041 36673 29851 30515 27968 27017
Cargo Traffic At Indian Port- (In'000 Tonns)Table 3.1.2(Contd...)
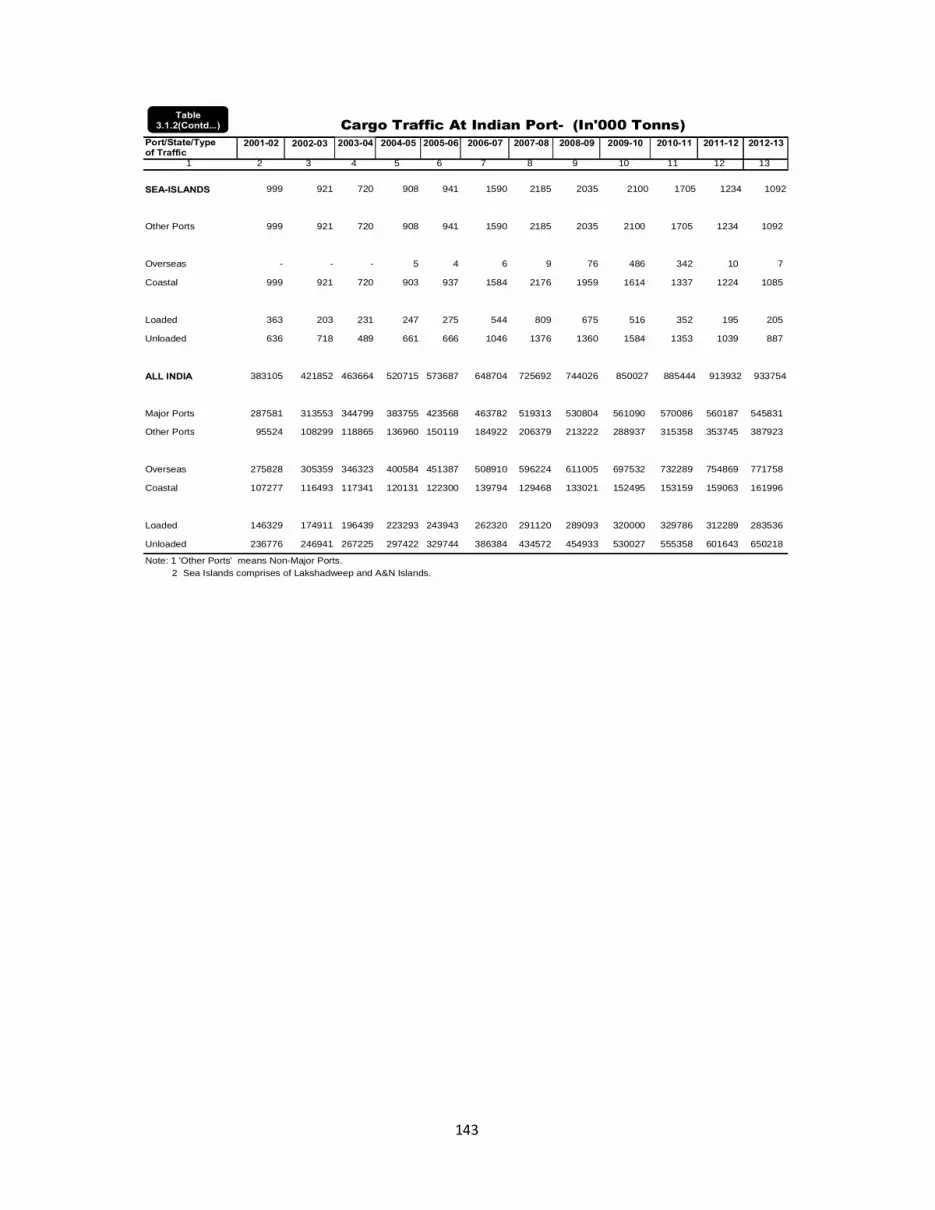
143
Cargo Traffic Handled At Indian Ports - By State
Port/State/Type 2001-02 2002-03 2003-04 2004-05 2005-06 2006-07 2007-08 2008-09 2009-10 2010-11 2011-12 2012-13of Traffic
1 2 3 4 5 6 7 8 9 10 11 12 13
SEA-ISLANDS 999 921 720 908 941 1590 2185 2035 2100 1705 1234 1092
Other Ports 999 921 720 908 941 1590 2185 2035 2100 1705 1234 1092
Overseas - - - 5 4 6 9 76 486 342 10 7
Coastal 999 921 720 903 937 1584 2176 1959 1614 1337 1224 1085
Loaded 363 203 231 247 275 544 809 675 516 352 195 205
Unloaded 636 718 489 661 666 1046 1376 1360 1584 1353 1039 887
ALL INDIA 383105 421852 463664 520715 573687 648704 725692 744026 850027 885444 913932 933754
Major Ports 287581 313553 344799 383755 423568 463782 519313 530804 561090 570086 560187 545831
Other Ports 95524 108299 118865 136960 150119 184922 206379 213222 288937 315358 353745 387923
Overseas 275828 305359 346323 400584 451387 508910 596224 611005 697532 732289 754869 771758
Coastal 107277 116493 117341 120131 122300 139794 129468 133021 152495 153159 159063 161996
Loaded 146329 174911 196439 223293 243943 262320 291120 289093 320000 329786 312289 283536
Unloaded 236776 246941 267225 297422 329744 386384 434572 454933 530027 555358 601643 650218
Note: 1 'Other Ports' means Non-Major Ports. 2 Sea Islands comprises of Lakshadweep and A&N Islands.
Cargo Traffic At Indian Port- (In'000 Tonns)Table
3.1.2(Contd...)

144
Port/State/Type 2001-02 2002-03 2003-04 2004-05 2005-06 2006-07 2007-08 2008-09 2009-10 2010-11 2011-12 2012-13
of Traffic
1 2 3 4 5 6 7 8 9 10 11 12 13
GUJARAT
Kandla 30024 30259 31214 32006 35731 41246 48404 54200 61893 61241 60412 63402
Other Ports 51086 51335 53947 59307 65882 86581 102436 110634 145127 153502 175491 203068
Total 81110 81594 85161 91313 101613 127827 150840 164834 207020 214743 235903 266470
Overseas 71757 70310 73215 78664 87723 114032 137352 150376 187390 193891 214117 244380
Coastal 9353 11284 11946 12649 13890 13795 13488 14458 19630 20852 21786 22090
MAHARASHTRA
Mumbai 17310 16409 19052 23061 26867 39067 44540 42915 46826 46527 47776 47824
J. L. Nehru 12920 12668 14794 16633 19516 23270 29434 28166 32382 33414 33218 33692
Other Ports 4485 8032 9301 10533 9420 10393 9526 7706 11063 12269 16298 20389
Total 34715 37109 43147 50227 55803 72730 83500 78787 90271 92210 97292 101905
Overseas 27014 29025 35481 39558 47210 55846 62069 56983 68231 70526 77379 82376
Coastal 7701 8084 7666 10669 8593 16884 21439 21804 22040 21684 19913 19529
GOA
Mormugao 4619 4380 4468 5631 6074 7050 7185 7012 7892 9200 9132 9070
Other Ports 513 394 418 251 333 279 89 0 218 113 165 113
Total 5132 4774 4886 5882 6407 7329 7274 7012 8110 9313 9297 9183
Overseas 3761 3731 3659 5035 5852 6705 6636 6395 7088 8389 8477 8560
Coastal 1371 1043 1227 847 555 624 638 617 1022 924 820 623
KARNATAKA
New Mangalore 8757 10592 13047 15512 16519 17922 19625 19964 21569 21066 23684 27322
Other Ports 295 272 348 445 349 355 198 82 291 185 167 296
Total 9052 10864 13395 15957 16868 18277 19823 20046 21860 21251 23851 27618
Overseas 7496 9601 10657 11641 12758 13528 16759 16815 18096 17601 20358 23517
Coastal 1556 1263 2738 4316 4110 4749 3064 3231 3764 3650 3493 4101
KERALA
Cochin 10094 10899 11018 10950 10968 11785 12189 12783 13834 13960 15775 16012
Other Ports 92 56 40 46 84 111 17 48 34 38 17 16
Total 10186 10955 11058 10996 11052 11896 12206 12831 13868 13998 15792 16028
Overseas 5816 7239 8174 8331 8044 8959 8529 9343 9570 10227 10563 10799
Coastal 4370 3716 2884 2665 3008 2937 3677 3488 4298 3771 5229 5229
TAMIL NADU
Tuticorin 9811 9564 10184 12060 13375 13502 15472 16370 18652 18394 19561 19854
Chennai 23140 19606 20302 24745 27203 30759 32859 34645 38114 40325 36815 34374
Ennore 3401 8485 9277 8960 8631 8990 9373 10389 9767 9957 13712 16146
Other Port 271 403 512 547 455 527 621 600 839 1117 851 574
Total 36623 38058 40275 46312 49664 53778 58325 62004 67372 69793 70939 70948
Overseas 16879 16028 18170 25179 30941 34659 39721 43203 48276 51041 52035 51749
Coastal 19744 22030 22105 21133 18723 19119 18604 18801 19096 17635 18904 19199
('000 Tonnes) Cargo Unloaded (Overseas & Coastal) At Indian Ports - By StateTable 3.1.3

145
Port/State/Type 2001-02 2002-03 2003-04 2004-05 2005-06 2006-07 2007-08 2008-09 2009-10 2010-11 2011-12 2012-13of Traffic
1 3 4 5 6 7 8 9 10 11 12 13 13
PONDICHERRY
Other Ports 95 11 37 33 40 16 10 47 1278 4627 6240 6436
Total 95 11 37 33 40 16 10 47 1278 4627 6240 6436
Overseas 95 11 37 33 40 16 10 47 1278 4627 6240 6436
Coastal - - - - - - - - - - - -
ANDHRA PRADESH
Visakhapatnam 27436 25724 26367 25232 30651 32555 35675 35660 35477 36128 38691 35274
Other Ports 2153 3683 5469 9165 8818 8953 9433 15587 23987 30000 33572 40603
Total 29589 29407 31836 34397 39469 41508 45108 51247 59464 66128 72263 75877
Overseas 20031 20727 23641 29206 33185 35140 38045 43889 52727 59427 64484 66651
Coastal 9558 8680 8195 5191 6284 6368 7063 7358 6737 6701 7779 9226
ORISSA
Paradip 6662 6991 6705 8438 11424 13662 16854 19891 29175 31222 35993 39116
Other Ports 4 - - - - - 206 201 174 174 5064 8733
Total 6666 6991 6705 8438 11424 13362 17060 20092 29349 31396 41057 47849
Overseas 5746 5914 5896 7931 10950 12826 15309 18683 27683 29832 38854 45581
Coastal 920 1077 809 507 474 836 1751 1409 1666 1564 2203 2268
WEST BENGAL
KDS 4505 6337 7559 8201 8628 9780 10362 8800 8269 7258 7003 6471
HDC 18467 20123 22677 25005 28110 28535 28679 27873 21582 23257 20965 20546
Other Ports - - - - - - - - - - 0 0
Total 22972 26460 30236 33206 36738 38315 39041 36673 29851 30515 27968 27017
Overseas 20697 22089 25580 29298 32346 34594 35761 32920 25577 25734 24409 24528
Coastal 2275 4371 4656 3908 4392 3721 3280 3753 4274 4781 3559 2489
SEA-ISLAND
Other Ports 636 718 489 661 666 1046 1376 1360 1584 1353 986 887
Total 636 718 489 661 666 1046 1376 1360 1584 1353 986 887
Overseas - - - 5 4 6 9 76 476 342 10 7
Coastal 636 718 489 656 662 1040 1367 1284 1108 1011 976 880
ALL INDIA
MAJOR PORTS 177146 182037 196664 216434 243697 278123 310651 318668 345432 351949 362737 369103
Other Ports 59630 64904 70561 80988 86047 108261 123912 136265 184595 203378 238851 281115
Total 236776 246941 267225 297422 329744 386384 434572 454933 530027 555327 601588 650218
Overseas 179292 184675 204510 234881 269053 316311 329218 378730 446392 471943 516926 564584
Coastal 57484 62266 62715 62541 60691 70073 67308 76203 83635 83384 84662 85634
Note: 1 'Other Ports' means Non-Major Ports
2 Sea Islands comprises of Lakshadweep & A & N Islands.
('000 Tonnes) Cargo Unloaded (Overseas & Coastal) At Indian Ports - By State
Table 3.1.3( Contd…)

146
Cargo Loaded (Overseas & Coastal ) At Indian Ports - By State
Port / State 2001-02 2002-03 2003-04 2004-05 2005-06 2006-07 2007-08 2008-09 2009-10 2010-11 2011-12 2012-13
1 2 3 4 5 6 7 8 9 10 11 12 13
GUJARATKandla 7704 10374 10309 9545 10176 11736 16516 18024 17607 20639 22089 30217Other Ports 28449 30226 33385 36834 37645 44684 48085 42177 60456 77405 83559 84749Total 36153 40600 43694 46379 47821 56420 64601 60201 78063 98044 105648 114966
Overseas 23557 27262 30032 33027 35937 32263 54833 48731 54797 75158 79559 87861Coastal 12596 13338 13662 13352 11884 24157 9768 11470 23266 22886 26089 27105
MAHARASHTRAMumbai 9123 10387 10943 12126 17323 13297 12489 8961 7715 8059 8410 10214J. L. Nehru 9601 14176 16396 16175 18320 21545 26404 29130 28381 30903 32512 30796Other Ports 472 593 1031 1610 1736 1187 1837 2710 983 2606 3649 3809Total 19196 25156 28370 29911 37379 36029 40730 40801 37079 41568 44571 44819
Overseas 12541 17019 19208 20918 22793 27604 32972 33208 29694 34545 37863 37050Coastal 6655 8137 9162 8993 14586 8425 7759 7593 7385 7023 6708 7769
GOAMormugao 18309 19269 23406 25028 25614 27191 27943 34669 40955 40860 29917 8668Other Ports 2345 5180 8018 7950 11429 14027 12736 11901 13679 14468 14305 3276Total 20654 24449 81424 32978 37043 41218 40679 46570 54634 55328 44222 11944
Overseas 20096 24087 31310 32676 36600 40980 40196 46155 54108 55015 43907 11813Coastal 558 362 114 302 443 238 483 415 526 313 315 131
KARNATAKANew Mangalore 8744 10838 13626 18379 17932 14120 16394 16727 13959 10484 9257 9714Other Ports 451 400 820 3061 3768 6206 8701 4886 8256 2910 425 314Total 9195 11238 14446 21440 21700 20326 25095 21613 22215 13394 9682 10028
Overseas 6021 8139 11730 17182 17915 17112 21868 18667 18694 10083 7104 7744Coastal 3174 3099 2716 4258 3785 3214 3227 2946 3521 3311 2578 2284
KERALACochin 1965 2125 2554 3153 2920 3472 3621 2711 3595 3913 4315 3833Other Ports 35 33 18 35 51 61 87 83 85 86 87 80Total 2000 2158 2572 3188 2971 3533 3708 2794 3680 3999 4402 3913
Overseas 1216 1108 1656 2034 1798 1903 2141 1768 2328 2932 2743 2437Coastal 784 1050 916 1154 1173 1630 1567 1026 1352 1067 1659 1476
TAMIL NADUTuticorin 3206 3730 3494 3751 3764 4499 6008 5641 5135 7333 8544 8406Chennai 12975 14081 16408 19061 20045 22655 24295 22846 22943 21135 18892 19030Ennore - - - 520 537 1724 2190 1111 936 1052 1244 1739Other Ports 264 199 178 307 256 278 266 298 335 494 359 359Total 16445 18010 20080 23639 24602 29156 32759 29896 29349 30014 29039 29534
Overseas 15099 16807 18759 21476 22257 27379 31088 28164 27580 33069 27474 27760Coastal 1346 1203 1321 2163 2345 1777 1671 1732 1769 2192 1565 1774
('000 Tonnes)Table 3.1.4

147
Cargo Loaded (Overseas & Coastal ) At Indian Ports - By State('000 Tonnes)
2001-02 2002-03 2003-04 2004-05 2005-06 2006-07 2007-08 2008-09
2009-10 2010-11
1 2 3 4 5 6 7 8 9 10 11 12 13
PONDICHERRYOther Ports - 8 71 26 56 18 - - 38 101 181 473Total - 8 71 26 56 18 - - 38 101 181 473Overseas - 8 71 26 45 18 - - 38 101 168 431Coastal - - - - 11 - - - - - 13 42
ANDHRA PRADESHVisakhapatnam 16908 20282 21369 24916 25150 23830 28922 28248 30024 31913 28729 23764Other Ports 3501 6553 4552 5902 8856 9656 9857 14133 19703 13267 12061 11208Total 20409 26835 25921 30818 34006 33486 38779 42381 49727 45180 40790 34972
Overseas 9837 15216 14659 18927 21209 18536 22893 26040 32637 25750 20191 20560Coastal 10572 11619 11262 11891 12797 14950 15886 16341 17090 19430 20599 14412
ORISSAParadip 14469 16910 18606 21666 21685 24855 25583 26521 27836 24810 18261 17436Other Ports 14 - - - - - 89 94 291 291 20 2335Total 14483 16910 18606 21666 21685 24855 25672 26615 28127 25101 18281 19771
Overseas 4429 5786 7254 10649 12101 13951 14882 15275 17497 15286 7507 2386Coastal 10054 11124 11352 11017 9584 10904 10790 13340 10630 9821 10774 17385
WEST BENGALKDS 869 864 1134 1744 2178 2816 3379 3628 4776 5282 10050 5373HDC 6562 8480 9890 11257 14227 13919 14909 13919 11796 11748 5230 7538Other Ports - - - - - - - - - -Total 7431 9344 11024 13001 16405 16735 18288 17547 16572 17030 15280 12911
Overseas 3740 5252 7134 8788 11679 12853 15151 14267 13757 13654 11428 9132Coastal 3691 4092 3890 4213 4726 3882 3137 3280 2815 3376 3852 3779
SEA-ISLANDSOther Ports 363 203 231 247 275 544 809 675 516 352 248 205Total 363 203 231 247 275 544 809 675 516 352 248 205
Overseas - - - - - - - - 10 - - -Coastal 363 203 231 247 275 544 809 675 506 352 248 205
ALL INDIAMajor Ports 110435 131516 148135 167321 179871 185659 208653 212136 215658 218137 197450 176728Other Ports 35894 43395 48304 55972 64072 76661 82467 76957 104342 111980 114894 106808Total 146329 174911 196439 223293 243943 262320 291120 289093 320000 330117 312344 283536
Overseas 96536 120684 141813 165703 182334 192599 236024 232275 251140 260346 238183 207174Coastal 49793 54227 54626 57590 61609 69721 55097 56818 68860 69771 74161 76362
Note: 1) 'Other Ports' means Non-Major Ports 2) Sea Islands comprises of Lakshadweep & A & N Islands.
2012-132011-12Port / State
Table 3.1.4( Contd…)

148
Trend in Total Traffic Handled at Major Ports (Million Tonnes)
Unloaded Loaded Total Unloaded Loaded Total Unloaded Loaded Total
1 2 3 4 5 6 7 8 9 10
1980-81 39.09 28.50 67.59 7.73 4.95 12.68 46.82 33.45 80.27
1981-82 39.78 32.23 72.01 8.61 7.36 15.97 48.39 39.59 87.98
1982-83 41.08 29.16 70.24 10.57 12.89 23.46 51.65 42.05 93.70
1983-84 38.80 29.07 67.87 13.41 15.10 28.51 52.21 44.17 96.38
1984-85 39.62 33.97 73.59 15.71 16.52 32.23 55.33 50.49 105.82
1985-86 45.82 36.73 82.55 22.16 14.91 37.07 67.98 51.64 119.62
1986-87 43.58 39.79 83.37 23.36 17.64 41.00 66.94 57.43 124.37
1987-88 49.95 40.15 90.10 23.39 21.11 44.50 73.34 61.26 134.60
1988-89 55.40 43.79 99.19 25.91 21.96 47.87 81.31 65.75 147.06
1989-90 54.13 45.26 99.39 26.72 21.46 48.18 80.85 66.72 147.57
1990-91 59.02 43.63 102.65 26.07 22.95 49.02 85.09 66.58 151.67
1991-92 59.91 44.89 104.80 26.66 25.18 51.84 86.57 70.07 156.64
1992-93 74.09 43.28 117.37 24.35 24.78 49.13 98.44 68.06 166.50
1993-94 76.02 53.48 129.50 24.81 24.71 49.52 100.83 78.19 179.02
1994-95 83.60 52.18 135.78 29.60 30.51 60.11 113.20 82.69 195.89
1995-96 94.86 57.24 152.10 31.79 31.32 63.11 126.65 88.56 215.21
1996-97 102.84 57.77 160.61 36.37 30.28 66.65 139.21 88.05 227.26
1997-98 117.43 62.25 179.68 38.55 33.43 71.98 155.98 95.68 251.66
1998-99 124.99 55.03 180.02 39.54 32.18 71.72 164.53 87.21 251.74
1999-00 133.80 56.63 190.43 49.92 31.62 81.54 183.72 88.25 271.97
2000-01 127.20 66.20 193.40 51.55 36.18 87.73 178.75 102.38 281.13
2001-02 130.12 76.77 206.89 47.03 33.66 80.69 177.15 110.43 287.58
2002-03 133.83 93.52 227.35 48.21 37.99 86.20 182.04 131.51 313.55
2003-04 148.13 110.66 258.79 48.53 37.48 86.01 196.66 148.14 344.80
2004-05 169.42 126.20 295.62 47.02 41.12 88.14 216.44 167.32 383.76
2005-06 199.48 133.64 333.12 44.22 46.23 90.45 243.70 179.87 423.57
2006-07 225.55 143.26 368.81 52.57 42.40 94.97 278.12 185.66 463.78
2007-08 253.16 165.76 418.92 57.49 42.90 100.39 310.65 208.66 519.31
2008-09 260.97 166.49 427.46 57.70 45.65 103.34 318.67 212.14 530.80
2009-10 286.50 167.52 454.02 58.93 48.14 107.07 345.43 215.66 561.09
2010-11 296.31 168.86 465.17 55.64 49.28 104.92 351.95 218.14 570.09
2011-12 306.76 147.80 454.56 55.98 49.65 105.63 362.74 197.45 560.19
2012-13 315.20 123.63 438.83 53.90 53.10 107.01 369.10 176.73 545.83
Year
Overseas Coastal Overseas & Coastal
Table 3.2.1
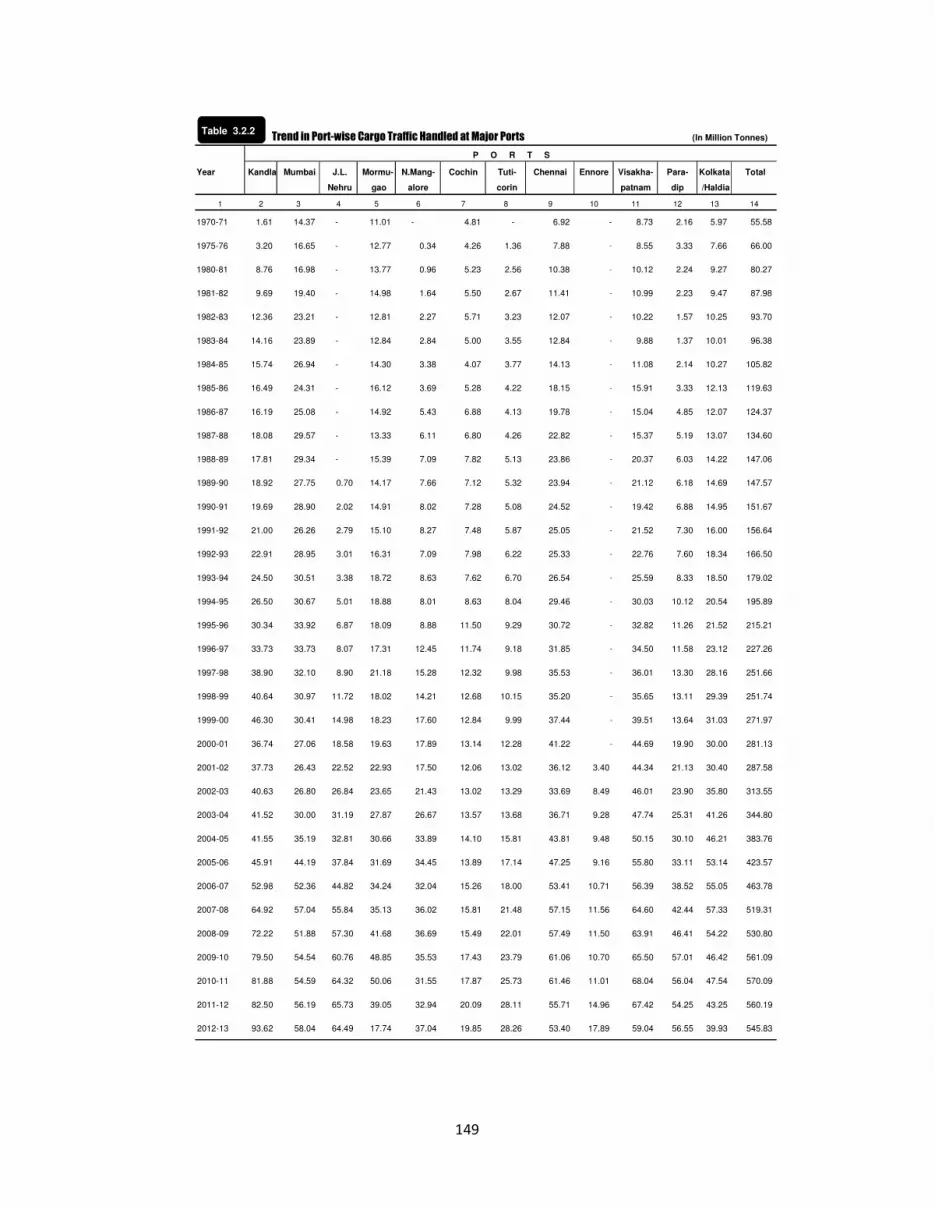
149
Trend in Port-wise Cargo Traffic Handled at Major Ports (In Million Tonnes)
Year Kandla Mumbai J.L. Mormu- N.Mang- Cochin Tuti- Chennai Ennore Visakha- Para- Kolkata Total
Nehru gao alore corin patnam dip /Haldia
1 2 3 4 5 6 7 8 9 10 11 12 13 14
1970-71 1.61 14.37 - 11.01 - 4.81 - 6.92 - 8.73 2.16 5.97 55.58
1975-76 3.20 16.65 - 12.77 0.34 4.26 1.36 7.88 - 8.55 3.33 7.66 66.00
1980-81 8.76 16.98 - 13.77 0.96 5.23 2.56 10.38 - 10.12 2.24 9.27 80.27
1981-82 9.69 19.40 - 14.98 1.64 5.50 2.67 11.41 - 10.99 2.23 9.47 87.98
1982-83 12.36 23.21 - 12.81 2.27 5.71 3.23 12.07 - 10.22 1.57 10.25 93.70
1983-84 14.16 23.89 - 12.84 2.84 5.00 3.55 12.84 - 9.88 1.37 10.01 96.38
1984-85 15.74 26.94 - 14.30 3.38 4.07 3.77 14.13 - 11.08 2.14 10.27 105.82
1985-86 16.49 24.31 - 16.12 3.69 5.28 4.22 18.15 - 15.91 3.33 12.13 119.63
1986-87 16.19 25.08 - 14.92 5.43 6.88 4.13 19.78 - 15.04 4.85 12.07 124.37
1987-88 18.08 29.57 - 13.33 6.11 6.80 4.26 22.82 - 15.37 5.19 13.07 134.60
1988-89 17.81 29.34 - 15.39 7.09 7.82 5.13 23.86 - 20.37 6.03 14.22 147.06
1989-90 18.92 27.75 0.70 14.17 7.66 7.12 5.32 23.94 - 21.12 6.18 14.69 147.57
1990-91 19.69 28.90 2.02 14.91 8.02 7.28 5.08 24.52 - 19.42 6.88 14.95 151.67
1991-92 21.00 26.26 2.79 15.10 8.27 7.48 5.87 25.05 - 21.52 7.30 16.00 156.64
1992-93 22.91 28.95 3.01 16.31 7.09 7.98 6.22 25.33 - 22.76 7.60 18.34 166.50
1993-94 24.50 30.51 3.38 18.72 8.63 7.62 6.70 26.54 - 25.59 8.33 18.50 179.02
1994-95 26.50 30.67 5.01 18.88 8.01 8.63 8.04 29.46 - 30.03 10.12 20.54 195.89
1995-96 30.34 33.92 6.87 18.09 8.88 11.50 9.29 30.72 - 32.82 11.26 21.52 215.21
1996-97 33.73 33.73 8.07 17.31 12.45 11.74 9.18 31.85 - 34.50 11.58 23.12 227.26
1997-98 38.90 32.10 8.90 21.18 15.28 12.32 9.98 35.53 - 36.01 13.30 28.16 251.66
1998-99 40.64 30.97 11.72 18.02 14.21 12.68 10.15 35.20 - 35.65 13.11 29.39 251.74
1999-00 46.30 30.41 14.98 18.23 17.60 12.84 9.99 37.44 - 39.51 13.64 31.03 271.97
2000-01 36.74 27.06 18.58 19.63 17.89 13.14 12.28 41.22 - 44.69 19.90 30.00 281.13
2001-02 37.73 26.43 22.52 22.93 17.50 12.06 13.02 36.12 3.40 44.34 21.13 30.40 287.58
2002-03 40.63 26.80 26.84 23.65 21.43 13.02 13.29 33.69 8.49 46.01 23.90 35.80 313.55
2003-04 41.52 30.00 31.19 27.87 26.67 13.57 13.68 36.71 9.28 47.74 25.31 41.26 344.80
2004-05 41.55 35.19 32.81 30.66 33.89 14.10 15.81 43.81 9.48 50.15 30.10 46.21 383.76
2005-06 45.91 44.19 37.84 31.69 34.45 13.89 17.14 47.25 9.16 55.80 33.11 53.14 423.57
2006-07 52.98 52.36 44.82 34.24 32.04 15.26 18.00 53.41 10.71 56.39 38.52 55.05 463.78
2007-08 64.92 57.04 55.84 35.13 36.02 15.81 21.48 57.15 11.56 64.60 42.44 57.33 519.31
2008-09 72.22 51.88 57.30 41.68 36.69 15.49 22.01 57.49 11.50 63.91 46.41 54.22 530.80
2009-10 79.50 54.54 60.76 48.85 35.53 17.43 23.79 61.06 10.70 65.50 57.01 46.42 561.09
2010-11 81.88 54.59 64.32 50.06 31.55 17.87 25.73 61.46 11.01 68.04 56.04 47.54 570.09
2011-12 82.50 56.19 65.73 39.05 32.94 20.09 28.11 55.71 14.96 67.42 54.25 43.25 560.19
2012-13 93.62 58.04 64.49 17.74 37.04 19.85 28.26 53.40 17.89 59.04 56.55 39.93 545.83
P O R T S
Table 3.2.2

150
Commodity-wise Cargo Traffic Handled at Major Ports ('000 Tonnes)
YearPOL
(Crude & Products)
Fertiliser Fertiliser Raw Material Iron Ore Coal Food-grains Others Total
1 2 3 4 5 6 7 8 9ALL PORTS1986-87 53070 2387 4075 30609 8551 1402 24272 1243661987-88 58917 1417 4165 28748 12788 1672 26895 1346021988-89 63166 1648 4738 32738 15468 3388 25915 1470611989-90 61968 2921 5193 33186 17616 1493 25198 1475751990-91 64004 2879 6064 31904 19659 1528 25627 1516651991-92 67625 3153 6767 32101 22403 1539 23056 1566441992-93 73959 3595 6318 29827 24488 2795 25515 1664971993-94 77265 4183 5291 34096 26806 1964 29414 1790191994-95 80753 4334 6667 34354 30798 1343 37641 1958901995-96 90923 5727 6628 34562 33790 3852 39726 2152081996-97 97854 3298 6633 33260 37530 3269 45413 2272571997-98 104393 4797 7614 39611 42295 2904 50044 2516581998-99 107574 4717 7837 34547 43605 3653 49805 2517381999-00 117674 5641 8207 36382 43193 3003 57867 2719672000-01 108382 3029 10305 40458 54524 1978 62455 2811312001-02 103278 3492 10480 45764 51253 3914 69400 2875812002-03 109570 2881 10285 50556 53040 8538 78683 3135532003-04 122161 2855 8941 58853 54896 6839 90254 3447992004-05 126441 3846 10670 76201 60647 3838 102112 3837552005-06 142094 6624 10676 79217 68827 2133 113997 4235682006-07 145878 7929 11139 80584 64634 4930 148688 4637822007-08 167435 11874 6405 92298 68665 2990 169646 5193132008-09 174203 12171 6106 92669 76925 2401 166329 5308042009-10 174861 10941 6790 100892 71786 1757 194063 5610902010-11 179882 12367 8431 87686 75146 1915 204659 5700862011-12 173851 12218 8186 60719 78776 3279 223158 5601872012-13 180725 7469 7328 27289 86804 6597 229619 545831KANDLA1986-87 11928 270 127 … … 454 3415 161941987-88 13395 207 191 … … 812 3478 180831988-89 13238 235 204 … … 580 3550 178071989-90 14354 302 730 … … 436 3103 189251990-91 15062 308 737 … … 585 2993 196851991-92 16503 365 936 … … 940 2258 210021992-93 17951 448 945 … … 600 2966 229101993-94 18157 824 1043 … … 629 3847 245001994-95 18898 705 1174 … … 689 5036 265021995-96 21126 676 1102 … … 2038 5397 303391996-97 25061 366 1335 … … 1951 5017 337301997-98 29036 732 1550 … … 1386 6197 389011998-99 30468 588 1629 … 736 1697 5519 406371999-00 34612 1020 1746 … 829 1050 7046 463032000-01 25094 471 1694 … 624 1273 7585 367412001-02 22709 611 2129 … 381 2584 9314 377282002-03 23014 516 2429 … 255 5445 8974 406332003-04 23625 502 2169 … 244 4804 10179 415232004-05 22120 678 2441 … 229 2535 13548 415512005-06 24297 1678 2459 2 434 1379 15658 459072006-07 29711 2049 1944 234 704 2024 16316 529822007-08 38225 3916 160 419 1179 1373 19648 649202008-09 45538 5195 298 129 1874 1029 18161 722242009-10 46970 4912 788 661 3225 632 22312 795002010-11 48426 5807 583 817 3492 674 22081 818802011-12 46938 5297 761 991 4225 1291 22998 825012012-13 54544 3678 946 925 4438 3783 25305 93619
Table 3.2.3

151
Commodity-wise Cargo Traffic Handled at Major Ports('000 Tonnes)
YearPOL
(Crude & Products)
Fertiliser Fertiliser Raw Material Iron Ore Coal Food-grains Others Total
1 2 3 4 5 6 7 8 9MUMBAI (a)1986-87 16313 236 985 … - 497 7043 250741987-88 19384 174 992 … - 572 8446 295681988-89 19063 162 1266 … - 860 7991 293421989-90 18210 141 1082 … - 432 7881 277461990-91 19670 46 621 … - 625 7937 288991991-92 19512 37 457 … - 340 5915 262611992-93 20303 39 928 … - 544 7232 289461993-94 20820 57 845 … - 763 8021 305061994-95 18833 70 892 … - 616 10262 306731995-96 21138 105 735 … - 1209 10729 339161996-97 18712 50 673 … - 114 14178 337271997-98 16732 60 818 … - 24 14463 320971998-99 16671 96 806 … - 30 13367 309701999-00 16785 140 749 … - 141 12597 304122000-01 15641 139 561 … - 186 10536 270632001-02 15710 108 552 … - 123 9940 264332002-03 16039 125 339 … - 163 10130 267962003-04 18576 113 406 … - 129 10771 299952004-05 19396 161 413 … - 224 14993 351872005-06 27781 171 424 … 1844 98 13872 441902006-07 24281 136 337 … 2533 857 24220 523642007-08 37074 102 231 … 2872 532 16227 570382008-09 34571 136 210 … 3676 479 12804 518762009-10 34538 201 241 … 3815 578 15168 545412010-11 32990 155 300 … 6368 745 14028 545862011-12 30611 230 174 … 4622 894 19655 561862012-13 34751 156 356 … 4100 880 17795 58038J.L.NEHRU1990-91 - 516 850 - … - 656 20221991-92 - 623 820 - … - 1351 27941992-93 - 588 114 - … 577 1728 30071993-94 - 855 23 - … 275 2234 33871994-95 - 1187 125 - … - 3696 50081995-96 139 1716 179 648 … 68 4123 68731996-97 252 984 363 686 … 380 5404 80691997-98 681 881 75 657 … 355 6246 88951998-99 1271 796 93 531 … 418 8614 117231999-00 1413 627 164 48 … 555 12169 149762000-01 1811 246 148 - … - 16370 185752001-02 1747 265 68 - - 30 20411 225212002-03 1888 95 209 - - - 24652 268442003-04 1939 95 115 - - - 29041 311902004-05 2460 - 37 - - - 30311 328082005-06 2545 - 33 - - - 35258 378362006-07 2625 - 2 - - - 42188 448152007-08 2188 - - - - - 53650 558382008-09 4551 - - - - - 52745 572962009-10 4916 - - - - - 55847 607632010-11 5043 - 870 - - - 58404 643172011-12 4845 - 4 - - 19 60862 657302012-13 4126 - - - - - 60362 64488(a):Figures from 1996-97 onwards are based on actual physical traffic handled.
Table 3.2.3 (Contd...)

152
Commodity-wise Cargo Traffic Handled at Major Ports ('000 Tonnes)
YearPOL
(Crude & Products)
Fertiliser Fertiliser Raw Material Iron Ore Coal Food-grains Others Total
1 2 3 4 5 6 7 8 9MORMUGAO 1986-87 784 229 226 13472 - - 208 149191987-88 1132 54 178 11697 - - 271 133321988-89 1321 127 221 13373 - 70 277 153891989-90 1043 245 146 12413 15 12 294 141681990-91 1369 166 148 12986 34 - 208 149111991-92 1865 127 251 12517 31 - 308 150991992-93 1784 244 204 13601 107 4 370 163141993-94 2098 141 135 15748 109 11 475 187171994-95 1938 70 191 15693 413 - 576 188811995-96 1911 56 174 14923 565 - 466 180951996-97 1218 39 214 14635 386 - 820 173121997-98 1134 43 225 18701 487 - 592 211821998-99 1047 86 155 15101 674 - 957 180201999-00 1143 112 154 14831 1219 - 767 182262000-01 1089 124 138 15663 1927 - 687 196282001-02 1153 159 274 17966 2725 - 651 229282002-03 1128 156 341 18666 2517 - 841 236492003-04 1321 129 389 22943 2397 - 695 278742004-05 1010 172 407 24717 3711 - 642 306592005-06 833 228 377 25314 4125 - 811 316882006-07 786 226 394 26741 5091 - 1003 342412007-08 874 192 - 27329 4244 - 2489 351282008-09 1038 182 33809 4556 - 2096 416812009-10 964 125 - 40574 4741 - 2443 488472010-11 939 232 - 40625 6566 - 1698 500602011-12 923 93 - 29370 6832 - 1831 390492012-13 823 78 - 7421 7374 60 1982 17738NEW MANGALORE1986-87 533 165 - 3873 - - 860 54311987-88 461 93 - 4357 - - 1197 61081988-89 571 46 - 5011 - 62 1394 70841989-90 577 115 77 5877 - - 1015 76611990-91 612 83 99 6125 - - 1103 80221991-92 622 141 175 6493 - - 843 82741992-93 630 241 115 5082 - 258 762 70881993-94 646 106 130 7060 - 19 669 86301994-95 742 87 162 6080 - - 934 80051995-96 957 205 115 6639 41 - 927 88841996-97 5069 222 163 5945 19 106 929 124531997-98 6963 242 203 6536 99 325 914 152821998-99 7188 175 215 5334 61 368 865 142061999-00 9161 172 217 6387 117 315 1232 176012000-01 10918 198 252 5111 220 - 1192 178912001-02 9897 248 198 5783 233 - 1142 175012002-03 13450 249 152 6139 236 - 1204 214302003-04 17954 238 111 5414 93 15 2848 266732004-05 21434 354 215 10275 315 10 1288 338912005-06 22392 662 227 9307 513 7 1343 344512006-07 21868 972 286 6248 1047 88 1533 320422007-08 21782 831 9 9264 1691 57 2385 360192008-09 21328 905 13 9774 1929 111 2631 366912009-10 21339 820 13 7062 2810 161 3323 355282010-11 21551 784 4 3744 2856 116 2495 315502011-12 22245 804 21 3036 4022 58 2755 329412012-13 22538 519 17 2616 6911 204 4231 37036
Table 3.2.3 (Contd...)

153
Commodity-wise Cargo Traffic Handled at Major Ports('000 Tonnes)
Year
POL
(Crude &
Products)
FertiliserFertiliser Raw
MaterialIron Ore Coal Food-grains Others Total
1 2 3 4 5 6 7 8 9COCHIN1986-87 5432 139 734 … - 15 563 6883
1987-88 5366 110 757 … - 23 546 6802
1988-89 6268 139 549 … - 175 693 7824
1989-90 5589 209 680 … - 45 601 7124
1990-91 5804 181 684 … - 40 566 7275
1991-92 5881 148 821 … - 19 612 7481
1992-93 6222 136 800 … - 90 730 7978
1993-94 6101 39 704 … - - 776 7620
1994-95 6635 95 816 … - - 1085 8631
1995-96 9416 194 803 … - 9 1081 11503
1996-97 9218 194 786 … 119 32 1393 11742
1997-98 9613 160 688 … 141 164 1557 12323
1998-99 9665 72 683 … 157 289 1815 12681
1999-00 9885 53 616 … 156 98 2033 12841
2000-01 9681 28 594 … 176 12 2653 13144
2001-02 8588 107 539 … 92 11 2722 12059
2002-03 9368 97 534 … 187 18 2820 13024
2003-04 9960 101 403 … 142 - 2966 13572
2004-05 10277 71 495 … 210 - 3050 14103
2005-06 9641 81 646 … 199 - 3321 13888
2006-07 10475 79 560 … 219 184 3740 15257
2007-08 11300 83 271 27 246 6 3877 15810
2008-09 10492 193 265 … 259 - 4285 15494
2009-10 11938 135 211 … 148 - 4997 17429
2010-11 12121 76 353 … 40 - 5283 17873
2011-12 14084 115 315 … 34 - 5542 20090
2012-13 14027 22 331 … 28 - 5437 19845
TUTICORIN1986-87 327 132 478 … 2802 - 391 4130
1987-88 364 106 320 … 2904 70 497 4261
1988-89 468 145 532 … 2981 408 591 5125
1989-90 476 434 231 … 2926 159 1098 5324
1990-91 470 288 327 … 2635 110 1245 5075
1991-92 496 302 442 … 3116 75 1437 5868
1992-93 510 378 431 … 3162 189 1545 6215
1993-94 463 205 209 … 3937 29 1857 6700
1994-95 417 221 463 … 4495 - 2445 8041
1995-96 434 412 376 … 5620 16 2428 9286
1996-97 466 259 364 … 5493 131 2461 9174
1997-98 459 512 711 … 5578 146 2568 9974
1998-99 441 413 849 … 5204 194 3049 10150
1999-00 532 423 791 … 4163 196 3888 9993
2000-01 460 332 884 … 6293 149 4166 12284
2001-02 430 284 776 8 5997 405 5117 13017
2002-03 492 147 880 - 5539 704 5532 13294
2003-04 558 177 853 - 5789 337 5964 13678
2004-05 743 297 944 42 6601 130 7054 15811
2005-06 774 484 1167 - 7240 61 7413 171392006-07 626 678 792 - 5608 54 10243 180012007-08 464 1098 632 - 6112 443 12731 214802008-09 503 1147 677 6047 195 13442 220112009-10 514 1221 860 41 5603 150 15398 237872010-11 741 1171 730 64 5349 80 17592 257272011-12 630 1134 891 33 6050 307 19060 281052012-13 547 487 572 0 6689 128 19837 28260
Table 3.2.3 (Contd...)

154
Commodity-wise Cargo Traffic Handled at Major Ports('000 Tonnes)
YearPOL
(Crude & Products)
Fertiliser Fertilser Raw Material Iron Ore Coal Food-grains Others Total
1 2 3 4 5 6 7 8 9CHENNAI1986-87 6724 620 259 5304 781 98 5989 197751987-88 7337 373 317 5400 1866 45 7481 228191988-89 8769 410 326 5746 2616 471 5225 238631989-90 8455 422 311 6046 3643 137 4926 239401990-91 8162 501 343 5549 4353 65 5545 245181991-92 8649 544 288 5406 5051 77 5031 250461992-93 8632 582 271 4838 5588 242 5178 253311993-94 9143 858 288 4540 5857 89 5766 265411994-95 11942 834 403 5149 6448 10 4678 294641995-96 11419 963 374 4951 7530 32 5452 307211996-97 11762 520 343 4665 8796 107 5655 318481997-98 11585 946 428 6232 10463 162 5715 355311998-99 10565 712 441 5445 11944 151 5944 352021999-00 10173 731 479 6259 12522 327 6952 374432000-01 8896 459 714 7049 14996 164 8942 412202001-02 8473 459 533 7482 9656 3 9509 361152002-03 8946 420 422 7945 5818 5 10131 336872003-04 9200 412 470 8359 5631 20 12618 367102004-05 11422 572 459 9615 7511 30 14197 438062004-05 13113 701 414 9527 7078 1 16414 472482006-07 12987 654 380 10531 3345 661 24856 534142007-08 12713 585 266 10781 9698 84 23027 571542008-09 13132 516 267 6846 9848 22 26860 574912009-10 13321 357 254 8027 3059 - 36039 610572010-11 13991 434 337 2114 2023 86 42475 614602011-12 13290 394 249 97 961 190 40526 557072012-13 13376 190 231 52 0 314 39241 53404ENNORE2001-02 - - - - 3401 - - 34012002-03 - - - - 8485 - - 84852003-04 - - - - 9277 - - 92772004-05 104 - - 520 8856 - - 94802005-06 244 - - 537 8387 - - 91682006-07 188 - - 1724 8802 - - 107142007-08 319 - - 2190 9051 - 3 115632008-09 366 1111 9708 - 315 115002009-10 395 - - 936 9279 - 93 107032010-11 509 - - 401 9368 - 731 110092011-12 502 - - - 13111 - 1343 149562012-13 521 - - - 14925 - 2439 17885VISAKHAPATNAM1986-87 5307 164 540 5881 976 263 1904 150351987-88 5566 108 642 5585 2516 34 920 153711988-89 6999 145 701 6930 3810 265 1522 203721989-90 6828 410 1115 6791 4221 113 1639 211171990-91 5598 459 1290 5496 4889 - 1689 194211991-92 6384 504 1325 6161 5648 27 1473 215221992-93 7592 484 1336 4960 6021 171 2201 227651993-94 7498 682 1092 5230 6624 46 4423 255951994-95 11237 790 1337 5551 7771 3 3340 300291995-96 12575 1104 1235 5710 8203 353 3637 328171996-97 13422 489 1134 5948 9057 405 4043 344981997-98 12116 1039 1214 6050 9934 300 5361 360141998-99 12503 1634 1251 7339 9180 361 3386 356541999-00 15288 2172 1163 7825 9534 261 3267 395102000-01 18336 829 907 9269 12185 173 2986 446852001-02 18583 986 1033 9199 10677 703 3163 443442002-03 16854 716 902 10433 9958 2196 4947 460062003-04 17427 838 941 12378 9392 1453 5307 477362004-05 14628 1367 1074 16587 10097 825 5570 501482005-06 16941 2295 1329 16170 12167 543 6356 558012006-07 18178 2618 1298 14718 11401 980 7192 563852007-08 18523 4572 716 18948 10367 486 10985 645972008-09 19758 3408 726 17519 11020 527 10950 639082009-10 18291 2909 775 18944 11722 226 12634 655012010-11 19242 3268 811 19347 11464 203 13706 680412011-12 17428 3719 832 16243 10063 517 18618 674202012-13 13501 2023 565 12569 9746 1121 19513 59038
Table 3.2.3 (Contd...)

155
Commodity-wise Cargo Traffic Handled at Major Ports('000 Tonnes)
YearPOL
(Crude & Products)
Fertiliser Fertiliser Raw Material Iron Ore Coal Food-grains Others Total
1 2 3 4 5 6 7 8 9PARADIP1986-87 - 61 494 2079 1511 - 708 48531987-88 - 9 470 1709 2305 - 694 51871988-89 - - 648 1678 2394 50 1262 60321989-90 - 157 301 2059 2709 6 952 61841990-91 - 100 508 1748 3614 11 903 68841991-92 23 87 773 1524 3954 1 935 72971992-93 195 142 647 1346 4542 3 731 76061993-94 345 192 534 1518 4845 Neg. 893 83271994-95 380 125 691 1881 5830 - 1214 101211995-96 1066 134 956 1691 5909 20 1483 112591996-97 1693 102 699 1381 6513 26 1166 115801997-98 1737 116 1066 1435 7852 - 1096 133021998-99 2007 26 1127 797 8198 12 941 131081999-00 2219 55 1374 1025 7755 - 1208 136362000-01 2219 - 3370 2992 10097 - 1222 199002001-02 1993 - 3421 3546 10722 - 1449 211312002-03 1923 - 3055 4679 11722 - 2522 239012003-04 1365 - 2218 5934 14037 - 1757 253112004-05 839 - 3418 9051 14209 - 2587 301042005-06 910 - 2496 10273 16287 - 3143 331092006-07 1376 89 4173 11880 17130 - 3869 385172007-08 1765 136 3742 12960 15932 - 7902 424372008-09 3240 173 3397 14272 20162 - 5168 464122009-10 11647 81 3486 16159 19820 - 5818 570112010-11 12845 136 4226 13795 19340 - 5696 560382011-12 15091 236 4547 6556 21563 - 6261 542542012-13 16467 142 4004 1833 26105 - 8001 56552KOLKATA/HALDIA1986-87 5722 371 232 - 2481 75 3191 120721987-88 5912 183 298 - 3132 116 3430 130711988-89 6469 239 291 - 3605 447 3172 142231989-90 6436 384 388 - 4178 193 3110 146891990-91 7257 231 457 - 4134 92 2782 149531991-92 7690 275 479 - 4603 60 2893 160001992-93 8940 313 527 - 5068 117 3372 183371993-94 8696 224 288 - 5434 103 3751 184961994-95 9731 150 413 - 5841 25 4375 205351995-96 10742 162 579 - 5922 107 4003 215151996-97 10981 73 559 - 7147 17 4347 231241997-98 14337 66 636 - 7741 42 5335 281571998-99 15748 119 588 - 7451 133 5348 293871999-00 16463 136 754 - 6898 60 6715 310262000-01 14237 203 1043 374 8006 21 6116 300002001-02 13995 265 957 1780 7369 55 5982 304032002-03 16468 360 1022 2694 8323 7 6930 358042003-04 20236 250 866 3825 7894 81 8108 412602004-05 22008 174 767 5394 8908 84 8872 462072005-06 22623 324 1104 8087 10553 44 10408 531432006-07 22777 428 973 8509 8754 82 13527 550502007-08 22208 359 378 10380 7273 9 16722 573292008-09 19686 316 253 9209 7846 38 16872 542202009-10 10028 180 162 8488 7564 10 19991 464232010-11 11484 304 217 6779 8280 11 20470 475452011-12 7264 196 392 4393 7293 3 23707 432482012-13 5504 174 306 1873 6488 107 25476 39928Source : Major Ports
Table 3.2.3 (Cont)

156
Trend in Type-wise Cargo Traffic Handled at Major Ports ('000 tonnes)
Un- Un- Un-
Loaded Loaded Loaded
1 2 3 4 5 6 7 8 9 10
KANDLA
1995-96 21626 4356 25982 4247 110 4357 25873 4466 30339
1996-97 24360 4331 28691 4907 132 5039 29267 4463 33730
1997-98 29755 3702 33457 5266 178 5444 35021 3880 38901
1998-99 31626 4023 35649 4831 157 4988 36457 4180 40637
1999-00 34700 3402 38102 7935 266 8201 42635 3668 46303
2000-01 26704 4400 31104 5250 387 5637 31954 4787 36741
2001-02 26434 6855 33289 3590 849 4439 30024 7704 37728
2002-03 26865 9377 36242 3394 997 4391 30259 10374 40633
2003-04 27906 9207 37113 3308 1102 4410 31214 10309 41523
2004-05 28328 8655 36983 3678 890 4568 32006 9545 41551
2005-06 31516 9457 40973 4215 719 4934 35731 10176 45907
2006-07 36601 10684 47285 4645 1052 5697 41246 11736 52982
2007-08 43591 14623 58214 4813 1893 6706 48404 16516 64920
2008-09 50663 14014 64677 3537 4010 7547 54200 18024 72224
2009-10 57505 11830 69335 4388 5777 10165 61893 17607 79500
2010-11 57285 15258 72543 3956 5381 9337 61241 20639 81880
2011-12 56374 15987 72361 4038 6102 10140 60412 22089 82501
2012-13 59059 21037 80096 4343 9180 13523 63402 30217 93619
MUMBAI
1995-96 16990 5722 22712 330 10874 11204 17320 16596 33916
1996-97 18054 6596 24650 316 8761 9077 18370 15357 33727
1997-98 17684 5824 23508 1623 6966 8589 19307 12790 32097
1998-99 17548 5070 22618 1618 6734 8352 19166 11804 30970
1999-00 17512 3922 21434 2879 6099 8978 20391 10021 30412
2000-01 14799 3593 18392 2160 6511 8671 16959 10104 27063
2001-02 14558 3373 17931 2752 5750 8502 17310 9123 26433
2002-03 14588 3464 18052 1821 6923 8744 16409 10387 26796
2003-04 17496 3519 21015 1556 7424 8980 19052 10943 29995
2004-05 19185 4313 23498 3876 7813 11689 23061 12126 35187
2005-06 25249 4222 29471 1618 13101 14719 26867 17323 44190
2006-07 30411 5792 36203 8656 7505 16161 39067 13297 52364
2007-08 31503 5436 36939 13037 7062 20099 44540 12498 57038
2008-09 28210 4591 32801 14705 4370 19075 42915 8961 51876
2009-10 33191 3971 37162 13635 3744 17379 46826 7715 54541
2010-11 34716 4610 39326 11811 3449 15260 46527 8059 54586
2011-12 36536 5393 41929 11240 3017 14257 47776 8410 56186
2012-13 38224 5416 43640 9600 4798 14398 47824 10214 58038
J.L.NEHRU
1995-96 4314 2559 6873 - - - 4314 2559 6873
1996-97 4185 3261 7446 623 - 623 4808 3261 8069
1997-98 5052 3418 8470 321 104 425 5373 3522 8895
1998-99 6553 4257 10810 865 48 913 7418 4305 11723
1999-00 8193 5831 14024 880 72 952 9073 5903 14976
2000-01 9120 7644 16764 1491 320 1811 10611 7964 18575
2001-02 11174 9168 20342 1746 433 2179 12920 9601 22521
2002-03 11237 13415 24652 1431 761 2192 12668 14176 26844
2003-04 12964 15487 28451 1830 909 2739 14794 16396 31190
2004-05 14591 15437 30028 2042 738 2780 16633 16175 32808
2005-06 17442 17485 34927 2074 835 2909 19516 18320 37836
2006-07 20994 21047 42041 2276 498 2774 23270 21545 44815
2007-08 26727 26015 52742 2707 389 3096 29434 26404 55838
2008-09 25880 26241 52121 2286 2889 5175 28166 29130 57296
2009-10 30069 25077 55146 2313 3304 5617 32382 28381 60763
2010-11 31080 27524 58604 2334 3379 5713 33414 30903 64317
2011-12 31647 29049 60696 1571 3463 5034 33218 32512 65730
2012-13 32522 28503 61025 1170 2293 3463 33692 30796 64488
PORT/YEAR
Overseas Coastal Overseas & Coastal
Loaded Total Loaded Total Loaded Total
Table 3.2.4

157
Trend in Type-wise Cargo Traffic Handled at Major Ports ('000 tonnes)
Un- Un- Un-
Loaded Loaded Loaded
1 2 3 4 5 6 7 8 9 10
1995-96 2336 15146 17482 483 130 613 2819 15276 18095
1996-97 1156 15260 16416 795 101 896 1951 15361 17312
1997-98 1122 19114 20236 856 90 946 1978 19204 21182
1998-99 1779 15335 17114 781 125 906 2560 15460 18020
1999-00 2278 14784 17062 1019 145 1164 3297 14929 18226
2000-01 2558 15813 18371 1132 125 1257 3690 15938 19628
2001-02 3564 18153 21717 1055 156 1211 4619 18309 22928
2002-03 3379 19076 22455 1001 193 1194 4380 19269 23649
2003-04 3241 23326 26567 1227 80 1307 4468 23406 27874
2004-05 4784 24741 29525 847 287 1134 5631 25028 30659
2005-06 5519 25255 30774 555 359 914 6074 25614 31688
2006-07 6426 26988 33414 624 203 827 7050 27191 34241
2007-08 6547 27539 34086 638 404 1042 7185 27943 35128
2008-09 6395 34255 40650 617 414 1031 7012 34669 41681
2009-10 6870 40429 47299 1022 526 1548 7892 40955 48847
2010-11 8293 40547 48840 907 313 1220 9200 40860 50060
2011-12 8312 29602 37914 820 315 1135 9132 29917 39049
2012-13 8447 8537 16984 623 131 754 9070 8668 17738
NEW MANGALORE1995-96 1077 6528 7605 806 473 1279 1883 7001 8884
1996-97 4202 5895 10097 277 2079 2356 4479 7974 12453
1997-98 5823 6441 12264 275 2743 3018 6098 9184 15282
1998-99 6581 5120 11701 348 2157 2505 6929 7277 14206
1999-00 7977 5911 13888 476 3237 3713 8453 9148 17601
2000-01 8227 5349 13576 963 3352 4315 9190 8701 17891
2001-02 7324 5720 13044 1433 3024 4457 8757 8744 17501
2002-03 9426 7843 17269 1166 2995 4161 10592 10838 21430
2003-04 10393 11026 21419 2654 2600 5254 13047 13626 26673
2004-05 11277 14207 25484 4235 4172 8407 15512 18379 33891
2005-06 12570 14330 26900 3949 3602 7551 16519 17932 34451
2006-07 13367 11022 24389 4555 3098 7653 17922 14120 32042
2007-08 16693 13255 29948 2932 3139 6071 19625 16394 36019
2008-09 16760 13871 30631 3204 2856 6060 19964 16727 36691
2009-10 17976 10508 28484 3593 3451 7044 21569 13959 35528
2010-11 17515 7305 24820 3551 3179 6730 21066 10484 31550
2011-12 20276 6751 27027 3408 2506 5914 23684 9257 32941
2012-13 23301 7519 30820 4021 2195 6216 27322 9714 37036
COCHIN
1995-96 3522 1184 4706 5603 1194 6797 9125 2378 11503
1996-97 4497 1190 5687 4990 1065 6055 9487 2255 11742
1997-98 5447 1038 6485 4334 1504 5838 9781 2542 12323
1998-99 6168 952 7120 4083 1478 5561 10251 2430 12681
1999-00 3490 893 4383 7146 1312 8458 10636 2205 12841
2000-01 6278 1072 7350 4783 1011 5794 11061 2083 13144
2001-02 5815 1214 7029 4279 751 5030 10094 1965 12059
2002-03 7230 1108 8338 3669 1017 4686 10899 2125 13024
2003-04 8174 1656 9830 2844 898 3742 11018 2554 13572
2004-05 8324 2027 10351 2626 1126 3752 10950 3153 14103
2005-06 8007 1785 9792 2961 1135 4096 10968 2920 13888
2006-07 8913 1903 10816 2872 1569 4441 11785 3472 15257
2007-08 8529 2130 10659 3660 1491 5151 12189 3621 15810
2008-09 9343 1747 11090 3440 964 4404 12783 2711 15494
2009-10 9570 2314 11884 4264 1281 5545 13834 3595 17429
2010-11 10226 2924 13150 3734 989 4723 13960 3913 17873
2011-12 10563 2737 13300 5212 1578 6790 15775 4315 20090
2012-13 10799 2429 13228 5213 1404 6617 16012 3833 19845
PORT/YEAR
Overseas Coastal Overseas & Coastal
Loaded Total Loaded Total Loaded Total
MORMUGAO
Table 3.2.4 (Contd...)

158
Trend in Type-wise Cargo Traffic Handled at Major Ports ('000 tonnes)
Un- Un- Un-
Loaded Loaded Loaded
1 2 3 4 5 6 7 8 9 10
1995-96 2788 1312 4100 5167 19 5186 7955 1331 9286
1996-97 1734 1545 3279 5877 18 5895 7611 1563 9174
1997-98 2791 1542 4333 5623 18 5641 8414 1560 9974
1998-99 3341 1629 4970 5144 36 5180 8485 1665 10150
1999-00 3732 2029 5761 4202 30 4232 7934 2059 9993
2000-01 3654 2396 6050 6185 49 6234 9839 2445 12284
2001-02 4094 3147 7241 5717 59 5776 9811 3206 13017
2002-03 3950 3690 7640 5614 40 5654 9564 3730 13294
2003-04 4281 3410 7691 5903 84 5987 10184 3494 13678
2004-05 6024 3665 9689 6036 86 6122 12060 3751 15811
2005-06 6509 3656 10165 6866 108 6974 13375 3764 17139
2006-07 7695 4302 11997 5807 197 6004 13502 4499 18001
2007-08 9824 5515 15339 5648 493 6141 15472 6008 21480
2008-09 11242 5070 16312 5128 571 5699 16370 5641 22011
2009-10 12870 4414 17284 5782 721 6503 18652 5135 23787
2010-11 12706 6585 19291 5688 748 6436 18394 7333 25727
2011-12 13404 7948 21352 6157 596 6753 19561 8544 28105
2012-13 13273 7466 20739 6581 940 7521 19854 8406 28260
CHENNAI1995-96 11693 9259 20952 8740 1029 9769 20433 10288 30721
1996-97 11603 8728 20331 10330 1187 11517 21933 9915 31848
1997-98 12730 10455 23185 11299 1047 12346 24029 11502 35531
1998-99 12431 9217 21648 12660 894 13554 25091 10111 35202
1999-00 12950 9826 22776 13488 1179 14667 26438 11005 37443
2000-01 13187 11567 24754 15733 733 16466 28920 12300 41220
2001-02 12682 11952 24634 10458 1023 11481 23140 12975 36115
2002-03 12003 13117 25120 7603 964 8567 19606 14081 33687
2003-04 13807 15349 29156 6495 1059 7554 20302 16408 36710
2004-05 18952 17273 36225 5793 1788 7581 24745 19061 43806
2005-06 23247 18064 41311 3956 1981 5937 27203 20045 47248
2006-07 26195 21337 47532 4564 1318 5882 30759 22655 53414
2007-08 28526 23369 51895 4333 926 5259 32859 24295 57154
2008-09 30028 21983 52011 4617 863 5480 34645 22846 57491
2009-10 33875 22219 56094 4239 724 4963 38114 22943 61057
2010-11 36287 20178 56465 4038 957 4995 40325 21135 61460
2011-12 32867 18281 51148 3948 611 4559 36815 18892 55707
2012-13 30467 18547 49014 3907 483 4390 34374 19030 53404
ENNORE
2001-02 - - - 3401 - 3401 3401 - 3401
2002-03 - - - 8485 - 8485 8485 - 8485
2003-04 - - - 9277 - 9277 9277 - 9277
2004-05 122 520 642 8838 - 8838 8960 520 9480
2005-06 1066 537 1603 7565 - 7565 8631 537 9168
2006-07 653 1724 2377 8337 - 8337 8990 1724 10714
2007-08 1212 2190 3402 8161 - 8161 9373 2190 11563
2008-09 1848 1111 2959 8541 - 8541 10389 1111 11500
2009-10 1313 936 2249 8454 - 8454 9767 936 10703
2010-11 2048 1052 3100 7909 - 7909 9957 1052 11009
2011-12 5457 1244 6701 8255 - 8255 13712 1244 14956
2012-13 7724 1739 9463 8422 - 8422 16146 1739 17885
VISAKHAPATNAM
1995-96 14094 7155 21249 3517 8051 11568 17611 15206 32817
1996-97 15807 7243 23050 5407 6041 11448 21214 13284 34498
1997-98 15885 6797 22682 5941 7391 13332 21826 14188 36014
1998-99 16033 6379 22412 6070 7172 13242 22103 13551 35654
1999-00 16379 6299 22678 8772 8060 16832 25151 14359 39510
Overseas & Coastal
Loaded Total Loaded Total LoadedPORT/YEAR
Overseas Coastal
Total
TUTICORIN
Table 3.2.4 (Contd...)

159
Trend in Type-wise Cargo Traffic Handled at Major Ports ('000 tonnes)
Un- Un- Un-
Loaded Loaded Loaded
1 2 3 4 5 6 7 8 9 10
2000-01 16407 8170 24577 10092 10016 20108 26499 18186 44685
2001-02 18033 9037 27070 9403 7871 17274 27436 16908 44344
2002-03 17148 11394 28542 8576 8888 17464 25724 20282 46006
2003-04 18392 13290 31682 7975 8079 16054 26367 21369 47736
2004-05 20602 15924 36526 4630 8992 13622 25232 24916 50148
2005-06 25055 15075 40130 5596 10075 15671 30651 25150 55801
2006-07 26873 11654 38527 5682 12176 17858 32555 23830 56385
2007-08 29145 15742 44887 6530 13180 19710 35675 28922 64597
2008-09 29200 14158 43358 6460 14090 20550 35660 28248 63908
2009-10 30181 14856 45037 5296 15168 20464 35477 30024 65501
2010-11 30764 14227 44991 5364 17686 23050 36128 31913 68041
2011-12 33120 11633 44753 5571 17096 22667 38691 28729 67420
2012-13 30008 11203 41211 5266 12561 17827 35274 23764 59038
PARADIP
1995-96 4135 2200 6335 65 4859 4924 4200 7059 11259
1996-97 3733 1818 5551 126 5903 6029 3859 7721 11580
1997-98 4379 1676 6055 109 7138 7247 4488 8814 13302
1998-99 3939 1343 5282 568 7258 7826 4507 8601 13108
1999-00 4237 1933 6170 539 6927 7466 4776 8860 13636
2000-01 6015 3793 9808 833 9259 10092 6848 13052 19900
2001-02 5742 4415 10157 920 10054 10974 6662 14469 21131
2002-03 5914 5786 11700 1077 11124 12201 6991 16910 23901
2003-04 5896 7254 13150 809 11352 12161 6705 18606 25311
2004-05 7931 10649 18580 507 11017 11524 8438 21666 30104
2005-06 10950 12101 23051 474 9584 10058 11424 21685 33109
2006-07 12826 13951 26777 836 10904 11740 13662 24855 38517
2007-08 15103 14793 29896 1751 10790 12541 16854 25583 42437
2008-09 18482 15181 33663 1409 11340 12749 19891 26521 46412
2009-10 27509 17206 44715 1666 10630 12296 29175 27836 57011
2010-11 29658 14995 44653 1564 9821 11385 31222 24816 56038
2011-12 33790 7507 41297 2203 10754 12957 35993 18261 54254
2012-13 36848 2098 38946 2268 15338 17606 39116 17436 56552
KOLKATA/HALDIA
1995-96 12283 1822 14105 2832 4578 7410 15115 6400 21515
1996-97 13505 1906 15411 2723 4990 7713 16228 6896 23124
1997-98 16757 2247 19004 2902 6251 9153 19659 8498 28157
1998-99 18987 1707 20694 2576 6117 8693 21563 7824 29387
1999-00 22350 1803 24153 2586 4287 6873 24936 6090 31026
2000-01 20254 2405 22659 2925 4416 7341 23179 6821 30000
2001-02 20697 3740 24437 2275 3691 5966 22972 7431 30403
2002-03 22089 5252 27341 4371 4092 8463 26460 9344 35804
2003-04 25580 7134 32714 4656 3890 8546 30236 11024 41260
2004-05 29298 8788 38086 3908 4213 8121 33206 13001 46207
2005-06 32346 11679 44025 4392 4726 9118 36738 16405 53143
2006-07 34594 12853 47447 3721 3882 7603 38315 16735 55050
2007-08 35761 15151 50912 3280 3137 6417 39041 18288 57329
2008-09 32920 14267 47187 3753 3280 7033 36673 17547 54220
2009-10 25577 13757 39334 4274 2815 7089 29851 16572 46423
2010-11 25734 13654 39388 4781 3376 8157 30515 17030 47545
2011-12 24409 11428 35837 3559 3852 7411 27968 15280 43248
2012-13 24528 9132 33660 2489 3779 6268 27017 12911 39928
Loaded TotalPORT/YEAR
Overseas Coastal Overseas & Coastal
Loaded Total Loaded Total
Table 3.2.4 (Contd...)

160
Trend in Type-wise Cargo Traffic Handled at Major Ports
('000 tonnes)
PORT/YEAR
Overseas Coastal Overseas & Coastal
Un- Loaded Total Un- Loaded Total Un- Loaded Total
Loaded Loaded Loaded
1 2 3 4 5 6 7 8 9 10
ALL PORTS1995-96 94858 57243 152101 31790 31317 63107 126648 88560 215208
1996-97 102836 57773 160609 36371 30277 66648 139207 88050 227257
1997-98 117425 62254 179679 38549 33430 71979 155974 95684 251658
1998-99 124986 55032 180018 39544 32176 71720 164530 87208 251738
1999-00 133798 56633 190431 49922 31614 81536 183720 88247 271967
2000-01 127203 66202 193405 51547 36179 87726 178750 102381 281131
2001-02 130117 76774 206891 47029 33661 80690 177146 110435 287581
2002-03 133829 93522 227351 48208 37994 86202 182037 131516 313553
2003-04 148130 110658 258788 48534 37477 86011 196664 148135 344799
2004-05 169418 126199 295617 47016 41122 88138 216434 167321 383755
2005-06 199476 133646 333122 44221 46225 90446 243697 179871 423568
2006-07 225548 143257 368805 52575 42402 94977 278123 185659 463782
2007-08 253161 165758 418919 57490 42904 100394 310651 208662 519313
2008-09 260971 166489 427460 57697 45647 103344 318668 212136 530804
2009-10 286506 167517 454023 58926 48141 107067 345432 215658 561090
2010-11 296312 168859 465171 55637 49278 104915 351949 218137 570086
2011-12 306755 147560 454315 55982 49890 105872 362737 197450 560187
2012-13 315200 123626 438826 53903 53102 107005 369103 176728 545831
Table 3.2.4 (Contd...)Table 3.2.4 (Contd...)

161
Container Traffic Handled at Major Ports (In Million Tonnes)
Item 2000-01 2001-02 2002-03 2003-04 2004-05 2005-06 2006-07 2007-08 2008-092009-102010-11 2011-12 2012-13
1 2 3 4 5 6 7 8 9 10 11 12 13 14
1. LOADED
i) Indian Lines 1.71 1.99 2.45 2.81 2.91 3.19 2.73 2.03 2.46 3.94 2.23 3.33 2.72
ii) Foreign Lines 14.96 17.32 21.28 24.45 25.31 27.74 35.42 44.16 44.42 43.67 54.06 56.69 56.39
iii)Total 16.67 19.31 23.73 27.26 28.22 30.93 38.15 46.19 46.88 47.61 56.29 60.02 59.11
2. UNLOADED
i) Indian Lines 1.58 1.81 2.01 2.39 2.67 3.12 1.56 2.23 1.16 3.61 1.65 3.11 2.55
ii) Foreign Lines 14.09 16.13 17.95 21.39 23.90 27.96 33.76 43.83 45.33 64.48 56.23 57.14 58.20
iii)Total 15.67 17.94 19.96 23.78 26.57 31.08 35.32 46.06 46.49 68.09 57.88 60.25 60.75
3. Total
i) Indian Lines 3.29 3.80 4.46 5.20 5.58 6.31 4.29 4.26 3.62 7.55 3.88 6.44 5.27
ii) Foreign Lines 29.05 33.45 39.23 45.84 49.21 55.70 69.18 87.99 89.75 108.15 110.29 113.84 114.59
iii)Total 32.34 37.25 43.69 51.04 54.79 62.01 73.47 92.25 93.37 115.70 114.17 120.28 119.87
4.General Cargo 46.37 52.92 64.47 69.77 72.50 82.85 97.40 123.79 120.01 132.59 146.47 156.14 158.09
(Break Bulk & Container)
% Of Container Cargo
to general cargo 69.80 70.40 67.80 73.10 75.60 74.80 75.43 74.52 77.80 87.26 77.95 77.03 75.82
Table 3.2.5

162
Trend in Container Traffic Handled at Major Ports
Kandla Mumbai J. L. Mormu N.Manga- Cochin Tuti- Chennai Visakha- Paradip Kolkata DockHaldia Dock Total
Nehru -gao lore corin patnam System Complex
1 2 3 4 5 6 7 8 9 10 11 12 13 14
LOADED
1997-98 805 3922 3389 22 - 754 742 1651 95 - 1116 293 127891998-99 521 3146 4234 23 - 799 785 1471 84 1 812 376 122521999-00 703 2602 5674 24 - 865 925 1958 132 - 845 366 140942000-01 806 1766 7547 31 18 1042 940 2880 168 - 817 658 166732001-02 1164 1188 9954 44 34 1217 1280 2757 178 4 512 975 193072002-03 1537 811 13282 70 58 1074 1375 3536 191 25 574 1199 237322003-04 1605 713 15616 77 61 1166 1585 4106 197 58 636 1436 272562004-05 1477 568 15399 72 71 1264 1961 4718 370 31 1070 1220 282212005-06 1340 614 17317 67 81 1100 2035 5664 365 48 1252 1044 309272006-07 1733 631 21582 79 158 1457 2444 6809 512 34 1610 1105 381542007-08 1546 866 27179 84 166 1553 2877 8679 678 57 1903 1383 469712008-09 1233 720 25931 87 186 1383 2807 9964 737 34 2307 1319 467082009-10 1437 58 24609 89 241 1960 3396 11410 884 52 2534 963 476332010-11 1595 87 26966 95 344 2177 4931 14381 1330 66 2799 1512 562832011-12 1813 53 28492 111 356 1854 6129 14536 2046 100 3255 1279 600242012-13 1481 176 27650 111 362 1688 5887 14604 2280 156 3506 1212 59113UNLOADED 1997-98 494 4175 2661 16 - 302 374 1351 51 - 1006 88 105181998-99 395 3923 3795 23 - 531 428 1471 88 - 1159 51 118641999-00 431 3528 5006 41 - 571 708 2018 130 - 1272 68 137732000-01 481 2598 6731 26 6 630 629 3109 110 8 1194 148 156702001-02 588 2496 8530 26 11 682 919 3100 143 3 899 548 179452002-03 688 2332 9582 40 26 997 926 3683 105 8 924 651 199622003-04 801 2103 12169 56 35 959 1102 4522 80 3 1110 839 237792004-05 1277 2003 13348 67 65 1059 1244 5146 265 - 1287 809 265702005-06 971 1531 16460 63 68 1388 1393 6093 266 1 1982 866 310822006-07 1045 949 19229 76 107 1492 1567 7357 287 0 2393 813 353152007-08 1070 766 24744 82 153 1630 2753 9371 455 1 3236 1014 452752008-09 903 571 24671 91 218 2139 2675 10617 624 0 3169 1054 467322009-10 995 549 28487 140 234 1969 3203 12067 794 0 4111 1105 536542010-11 991 566 29460 125 224 2242 3238 15040 1242 3 3421 1323 578752011-12 979 498 29741 168 289 2861 3098 15540 2167 9 3563 1340 602532012-13 454 653 30261 147 330 2919 3485 15104 2274 15 3454 1657 60753TOTAL 1997-98 1299 8097 6050 38 - 1056 1116 3002 146 - 2122 381 233071998-99 916 7069 8029 46 - 1330 1213 2942 172 1 1971 427 241161999-00 1134 6130 10680 65 - 1436 1633 3976 262 - 2117 434 278672000-01 1287 4364 14278 57 24 1672 1569 5989 278 8 2011 806 323432001-02 1752 3684 18484 70 45 1899 2199 5857 321 7 1411 1523 372522002-03 2225 3143 22864 110 84 2071 2301 7219 296 33 1498 1850 436942003-04 2406 2816 27785 133 96 2125 2687 8628 277 61 1746 2275 510352004-05 2754 2571 28747 139 136 2323 3205 9864 635 31 2357 2029 547912005-06 2311 2145 33777 130 149 2488 3428 11757 631 49 3234 1910 62009
2006-07 2778 1580 40811 155 265 2949 4011 14166 799 34 4003 1918 73469
2007-08 2616 1632 51923 166 319 3183 5630 18050 1133 58 5139 2397 92246
2008-09 2136 1291 50602 178 404 3522 5482 20581 1361 34 5476 2373 93440
2009-10 2432 607 53096 229 475 3929 6599 23477 1678 52 6645 2068 1012872010-11 2586 653 56426 220 568 4419 8169 29421 2572 69 6220 2835 1141582011-12 2792 551 58233 279 645 4715 9227 30076 4213 109 6818 2619 120277
2012-13 1935 829 57911 258 692 4607 9372 29708 4554 171 6960 2869 119866
Item
(In '000 Tonnes)
Table 3.2.6

163
Passenger Traffic at Major Ports (In '000) Overseas Coastal Total
EmbarkedDis-
embarked Total EmbarkedDis-
embarked Total EmbarkedDis-
embarked Total1 2 3 4 5 6 7 8 9 10
MUMBAI1993-94 7.2 8.6 15.8 - - - - - -1994-95 7.0 12.9 19.9 31.3 26.3 57.6 38.3 39.2 77.51995-96 9.0 12.9 21.9 31.4 34.4 65.8 40.4 47.3 87.71996-97 3.2 8.4 11.6 25.2 34.0 59.2 28.4 42.4 70.81997-98 4.8 12.5 17.3 22.9 28.4 51.3 27.7 40.9 68.61998-99 4.6 2.6 7.2 5.3 7.8 13.1 9.9 10.4 20.31999-00 3.4 1.5 4.9 1.3 3.5 4.8 4.7 5.0 9.72000-01 4.8 7.7 12.5 3.3 5.0 8.3 8.1 12.7 20.82001-02 3.2 4.8 8.0 0.3 - 0.3 3.5 4.8 8.32002-03 3.6 2.6 6.2 - - - 3.6 2.6 6.22003-04 1.7 1.9 3.6 - - - 1.7 1.9 3.62004-05 0.7 0.5 1.2 0.8 0.8 1.6 1.5 1.3 2.82005-06 0.3 0.9 1.2 42.0 41.5 83.5 42.3 42.4 84.72006-07 1.3 0.5 1.8 81.7 78.8 160.5 83.0 79.3 162.32007-08 1.3 0.5 1.8 81.8 78.8 160.6 83.1 79.3 162.42008-09 1.6 0.8 2.4 12.9 13.3 26.2 14.5 14.1 28.62009-10 0.9 1.5 2.4 31.0 31.0 62.0 31.9 32.5 64.42010-11 1.8 2.1 3.9 6.1 5.9 12.0 8.0 8.0 16.02011-12 2.9 1.8 4.7 0.0 0.0 0.0 2.9 1.8 4.72012-13 3.2 2.5 5.6 0.0 0.0 0.0 3.2 2.5 5.6COCHIN1993-94 1.2 1.3 2.5 28.3 31.3 59.6 29.5 32.6 62.11994-95 1.7 1.8 3.5 26.5 30.7 57.2 28.2 32.5 60.71995-96 8.6 8.6 17.2 24.9 34.2 59.1 33.5 42.8 76.31996-97 4.6 4.7 9.3 23.5 32.8 56.3 28.1 37.5 65.61997-98 7.1 7.0 14.1 28.3 30.7 59.0 35.4 37.7 73.11998-99 4.9 4.8 9.7 33.2 34.3 67.5 38.1 39.1 77.21999-00 9.1 9.3 18.4 28.5 29.1 57.6 37.6 38.4 76.02000-01 11.7 10.5 22.2 30.7 31.3 62.0 42.4 41.8 84.22001-02 8.9 6.2 15.1 36.8 16.1 52.9 45.7 22.3 68.02002-03 2.9 2.9 5.8 45.8 48.7 94.5 48.7 51.6 100.32003-04 8.9 8.8 17.7 51.7 48.9 100.6 60.6 57.7 118.32004-05 9.6 9.5 19.1 51.3 49.3 100.6 60.9 58.8 119.72005-06 10.5 10.6 21.1 50.2 49.9 100.1 60.7 60.5 121.22006-07 14.1 14.0 28.1 49.0 54.0 103.0 63.1 68.0 131.12007-08 14.0 14.0 28.0 47.9 52.6 100.5 61.9 66.6 128.52008-09 19.3 19.2 38.5 40.6 43.7 84.3 59.9 62.9 122.82009-10 38.0 38.0 76.0 64.0 72.0 136.0 102.0 110.0 212.02010-11 24.1 24.1 48.2 69.1 77.0 146.1 71.5 79.5 151.02011-12 25.5 25.5 51.0 120.4 92.2 212.6 145.9 117.7 263.62012-13 37.2 36.8 74.0 91.6 84.5 176.1 128.8 121.3 250.0CHENNAI1993-94 6.9 - 6.9 41.2 37.3 78.5 48.1 37.3 85.41994-95 10.1 - 10.1 38.2 32.4 70.6 48.3 32.4 80.71995-96 3.3 ... 3.3 42.6 39.9 82.5 45.9 39.9 85.81996-97 3.9 ... 3.9 40.1 38.1 78.2 44.0 38.1 82.11997-98 (a) (a) (a) 37.3 38.9 76.2 37.3 38.9 76.21998-99 (a) (a) (a) 47.6 44.6 92.2 47.6 44.6 92.21999-00 0.1 - 0.1 45.6 40.7 86.3 45.7 40.7 86.42000-01 0.2 0.1 0.3 51.6 43.8 95.4 51.8 43.9 95.72001-02 0.5 0.4 0.9 53.2 45.9 99.1 53.7 46.3 100.02002-03 Neg. Neg. Neg. 52.9 44.7 97.6 52.9 44.7 97.6
Port/Year
Table 3.2.7

164
Passenger Traffic at Major Ports (In '000) Overseas Coastal Total
EmbarkedDis-
embarked Total EmbarkedDis-
embarked Total EmbarkedDis-
embarked Total1 2 3 4 5 6 7 8 9 10
2003-04 Neg. Neg. Neg. 55.9 49.5 105.4 55.9 49.5 105.42004-05 0.6 0.6 1.2 51.2 48.4 99.6 51.8 49.0 100.82005-06 0.9 0.2 1.1 49.4 45.8 95.2 50.3 46.0 96.32006-07 0.2 0.3 0.5 39.3 30.8 70.1 39.5 31.1 70.62007-08 0.1 0.2 0.3 43.1 38.4 81.5 43.2 38.6 81.82008-09 0.3 0.2 0.5 44.0 40.7 84.7 44.3 40.9 85.22009-10 0.2 0.0 0.2 39.4 36.6 76.0 39.6 36.6 76.22010-11 0.3 0.4 0.7 39.3 35.8 75.1 39.6 36.2 75.82011-12 0.2 0.2 0.4 42.2 36.1 78.3 42.3 36.4 78.72012-13 0.5 0.7 1.2 29.2 27.3 56.5 29.7 28.1 57.8PARADIP2009-10 - - - - - - - - -2010-11 - - - - - - - - -2011-12 - - - - - - - - -2012-13 - - - - - - - - -TUTICORIN2010-11 - - - - - - - - -2011-12 7.6 4.6 12.2 - - - 7.6 4.6 12.22012-13 - - - - - - - - -VISAKHAPATNAM1993-94 - - - 4.6 7.4 12.0 4.6 7.4 12.01994-95 - - - 3.6 4.8 8.4 3.6 4.8 8.41995-96 - - - 3.7 4.0 7.7 3.7 4.0 7.71996-97 - - - 6.0 6.9 12.9 6.0 6.9 12.91997-98 - - - 6.1 5.6 11.7 6.1 5.6 11.71998-99 - - - 8.8 5.0 13.8 8.8 5.0 13.81999-00 - - - 5.7 7.5 13.2 5.7 7.5 13.22000-01 - - - 9.8 7.1 16.9 9.8 7.1 16.92001-02 - - - 8.6 8.6 17.2 8.6 8.6 17.22002-03 - - - 11.3 11.7 23.0 11.3 11.7 23.02003-04 - - - 8.6 9.0 17.6 8.6 9.0 17.62004-05 - - - 10.1 12.0 22.1 10.1 12.0 22.12005-06 - - - 8.4 7.8 16.2 8.4 7.8 16.22006-07 - - - 8.4 8.4 16.8 8.4 8.4 16.82007-08 - - - 12.2 10.3 22.5 12.2 10.3 22.52008-09 - - - 11.2 12.8 24.0 11.2 12.8 24.02009-10 - - - 10.0 11.0 21.0 10.0 11.0 21.02010-11 - - - 11.4 11.2 22.6 11.4 11.2 22.62011-12 - - - 13.2 13.3 26.5 13.2 13.3 26.52012-13 - - - 12.8 13.3 26.2 12.8 13.3 26.2KOLKATA/HALDIA1993-94 - - - 22.8 17.5 40.3 22.8 17.5 40.31994-95 - - - 20.5 18.4 38.9 20.5 18.4 38.91995-96 - - - 21.7 16.7 38.4 21.7 16.7 38.41996-97 - - - 24.0 21.8 45.8 24.0 21.8 45.81997-98 - - - 19.9 15.1 35.0 19.9 15.1 35.01998-99 - - - 28.0 24.3 52.3 28.0 24.3 52.31999-00 - - - 26.4 22.6 49.0 26.4 22.6 49.02000-01 0.2 0.2 0.4 29.6 27.1 56.7 29.8 27.3 57.12001-02 - - - 30.0 28.4 58.4 30.0 28.4 58.42002-03 - - - 25.3 27.4 52.7 25.3 27.4 52.72003-04 - - - 25.5 30.6 56.1 25.5 30.6 56.12004-05 - - - 31.7 30.8 62.5 31.7 30.8 62.52005-06 - - - 34.3 26.0 60.3 34.3 26.0 60.32006-07 - - - 29.2 21.4 50.6 29.2 21.4 50.62007-08 - - - 43.5 31.6 75.1 43.5 31.6 75.12008-09 - - - 30.9 27.2 58.1 30.9 27.2 58.12009-10 - - - 34.8 32.9 67.7 34.8 32.9 67.72010-11 - - - 31.2 32.3 63.5 31.2 32.3 63.52011-12 - - - 27.0 25.3 52.2 27.0 25.3 52.22012-13 - - - 20.3 20.0 40.3 20.3 20.0 40.3
Port/Year
Table 3.2.7(Contd.)

165
Passenger Traffic at Major Ports (In '000) Overseas Coastal Total
EmbarkedDis-
embarked Total EmbarkedDis-
embarked Total EmbarkedDis-
embarked Total1 2 3 4 5 6 7 8 9 10
MORMUGAO2005-06 … … 2.6 … … 26.7 … … 29.32006-07 … … 11.9 … … 30.4 … … 42.32007-08 … … 13.0 - - - … … 13.02008-09 … … 10.9 - - - … … 10.92009-10 … … 18.7 … … … … … 18.72010-11 … … 9.4 … … … 0.0 0.2 9.42011-12 … … 19.7 … … … 0.2 0.2 19.72012-13 … … … … … … 0.1 0.2 18.1NEW MANGALORE2008-09 - 0.9 0.9 - - - - 0.9 0.92009-10 - 1.9 1.9 - - - - 1.9 1.92010-11 - 5.9 5.9 - - - - 5.9 5.92011-12 - 7.8 7.8 - - - - 7.8 7.82012-13 - 10.2 10.2 - - - - 10.2 10.2ALL MAJOR PORTS1993-94 21.0 14.3 35.3 85.8 81.6 167.4 106.8 95.9 202.71994-95 15.3 9.9 25.2 102.9 87.5 190.4 118.2 97.4 215.61995-96 18.8 14.7 33.5 120.1 112.6 232.7 138.9 127.3 266.21996-97 20.9 21.5 42.4 124.3 129.2 253.5 145.2 150.7 295.91997-98 11.7 13.1 24.8 118.8 133.6 252.4 130.5 146.7 277.21998-99 12.6 20.2 32.8 114.5 118.7 233.2 127.1 138.9 266.01999-00 9.5 7.4 16.9 122.9 116.0 238.9 132.4 123.4 255.82000-01 12.6 10.8 23.4 107.5 103.4 210.9 120.1 114.2 234.32001-02 16.9 18.5 35.4 125.0 114.3 239.3 141.9 132.8 274.72002-03 12.6 11.4 24.0 128.9 99.0 227.9 141.5 110.4 251.92003-04 6.5 5.5 12.0 135.3 132.5 267.8 141.8 138.0 279.82004-05 10.6 10.7 24.1 141.7 138.0 279.7 152.3 148.7 303.82005-06 10.9 10.6 24.6 145.1 141.3 286.4 156.0 151.9 311.02006-07 11.7 11.7 26.0 184.3 171.0 382.0 196.0 182.7 408.02007-08 15.4 14.5 29.9 207.6 193.4 401.0 223.0 207.9 430.92008-09 15.4 14.7 43.1 228.5 211.7 440.2 243.9 226.4 483.32009-10 21.3 20.3 52.5 139.6 137.7 277.3 160.9 158.0 329.82010-11 26.2 26.6 62.2 157.1 162.2 319.3 161.7 167.4 338.32011-12 36.2 39.9 95.8 202.6 167.0 369.6 239.1 207.0 465.42012-13 40.8 50.2 91.0 153.9 145.1 299.1 194.9 195.6 408.2(a) : Included in coastal.Note : There was no Passenger Traffic at Kandla, J. L. Nehru, Ennore and Tuticorin Ports for the period 1992-93 to 2009-102010-11
Port/Year
*At New Mangalor Port, no passenger traffic handled. Howevre 10196 tourists of 15 cruise vessels were visited the port and opted for gound tour and visited tourist destination of Karnatka during the year 2012-13
Table 3.2.7(Cont

166
(GRT in '000)
No. GRT No. GRT No. GRT No. GRT No. GRT No. GRT No. GRT
1 2 3 4 5 6 7 8 9 10 11 12 13 14 15 16
Kandla 2000-01 194 1365 269 2935 253 3473 736 18963 - - - - 1452 26736
2001-02 263 1918 370 4075 311 4591 728 18249 - - - - 1672 28833
2002-03 289 2751 460 5570 288 4512 776 19479 - - - - 1813 32312
2003-04 295 2872 364 4212 375 5454 789 20495 - - - - 1823 33033
2004-05 276 2813 439 4541 403 5772 822 20767 - - - - 1940 33893
2005-06 252 2578 505 5568 461 7292 906 22884 - - - - 2124 38322
2006-07 264 2565 595 6181 449 7316 1010 27845 - - - - 2318 43907
2007-08 235 2747 557 5843 598 9373 1208 34386 - - - - 2598 52349
2008-09 221 2625 448 5319 636 10683 1212 37981 2517 56608
2009-10 255 3095 437 5872 663 11910 1421 42561 2776 63438
2010-11 226 2699 431 6017 684 13082 1351 43127 2692 64925
2011-12 225 2798 456 6407 715 14600 1318 42101 2714 65906
2012-13 195 2596 452 7069 715 16861 1372 47669 2734 74195
Mumbai 2000-01 472 5950 457 5030 134 1910 847 15730 11 310 (c) (c) 1921 28930
2001-02 388 4190 466 5200 143 2260 790 16070 9 260 (c) (c) 1796 27980
2002-03 316 4310 459 5350 131 2440 721 16080 2 70 (c) (c) 1629 28250
2003-04 298 4270 532 5540 128 2650 840 18080 2 80 (c) (c) 1800 30620
2004-05 249 3650 581 8300 216 4670 834 19910 3 110 (c) (c) 1883 36640
2005-06 220 2960 665 10790 235 4940 933 22300 - - (c) (c) 2053 40990
2006-07 133 2120 749 11920 234 5640 970 24070 1 40 - - 2087 43790
2007-08 12 190 765 12250 234 6050 1055 25050 - - - - 2066 43540
2008-09 12 320 672 11380 233 6030 1014 23000 1931 40730
2009-10 10 300 732 14600 283 7400 1021 24930 2046 47230
2010-11 14 330 715 15400 336 9090 1027 26250 2092 51070
2011-12 14 460 568 13900 333 9190 1102 27810 2017 51360
2012-13 32 320 475 12870 370 10670 1031 28180 1908 52040
J.L. Nehru 2000-01 1247 21461 - - 88 1071 269 3484 - - 102(d) 2489 1706 28505
2001-02 1498 30347 - - 68 879 260 3533 - - 243(d) 2506 2069 37265
2002-03 1544 35654 - - 55 698 284 3471 - - 299(d) 2780 2182 42603
2003-04 1678 41780 57 118 36 419 298 4064 - - 1848(d) 5365 3917 51746
2004-05 1600 39120 28 108 32 344 356 4988 - - 308(d) 2325 2324 46885
2005-06 1754 40657 64 1015 - - 305 4920 - - 1932(d) 2699 4055 49291
2006-07 2070 55113 13 106 46 513 321 5305 - - 324(d) 662 2775 61699
2007-08 2339 65258 9 89 48 542 333 5516 - - 390(d) 875 5140 72280
2008-09 2221 68407 7 78 57 647 428 7266 11 440 2724 76838
2009-10 2470 76079 10 113 66 724 524 9002 2 80 3072 85998
2010-11 2490 79106 60 528 71 791 507 3939 2644 4455 5772 88819
2011-12 2233 77374 67 669 168 554 461 8859 2646 4593 5575 92049
2012-13 1846 73400 229 565 45 522 468 9920 2800 4558 5388 88965
Mormugao 2000-01 50 824 14 212 350 11279 174 2491 - - - - 588 14806
2001-02 54 773 11 124 349 13157 183 2682 - - - - 597 16736
2002-03 80 427 23 371 365 12940 158 2643 - - - - 626 16381
2003-04 62 388 15 165 416 15983 184 3110 - - - - 677 19646
2004-05 37 196 7 110 290 9591 172 2926 - - - - 506 12823
2005-06 38 227 7 72 443 16398 162 3053 - - - - 650 19750
2006-07 39 274 21 366 482 17020 161 3111 - - - - 699 20771
2007-08 37 302 15 219 525 17525 175 3507 - - - - 748 21553
2008-09 36 301 8 81 600 21616 170 3323 805* 24733
2009-10 38 387 8 114 675 25378 184 3679 905 29558
2010-11 27 298 7 107 669 20740 160 3238 863 24383
2011-12 48 624 37 698 558 22735 153 3224 796 27281
2012-13 45 602 75 1208 232 10045 123 2728 475 14583
New 2000-01 30 272 111 1219 161 3887 432 9891 - - - - 734 15269
Mangalore 2001-02 63 349 97 1228 180 4595 423 9209 - - - - 763 15381
2002-03 58 274 88 1198 181 4605 505 10589 - - - - 832 16666
2003-04 49 276 82 1084 198 5051 547 14394 - - - - 876 20805
2004-05 36 224 67 882 318 7752 636 17009 - - - - 1057 25867
2005-06 39 233 63 869 311 7538 667 18456 - - - - 1080 27096
2006-07 48 357 51 638 276 6118 640 18819 - - - - 1015 25932
2007-08 64 512 38 433 403 8962 639 18691 - - - - 1144 28598
2008-09 69 663 72 792 404 9526 639 17853 1184 28834
2009-10 77 853 74 773 353 8524 682 18004 1186 28154
2010-11 80 983 89 817 228 6011 700 19265 1097 27076
2011-12 80 1068 157 1207 206 6068 693 20627 1136 28970
2012-13 80 1208 70 872 244 7721 678 22574 1072 32375Mormugao-2 vessels double counted for dry bulk mech.iron ore/conv. Other are counted only once in the Total A
Number, Type And Size Of Ships Handled at Major Ports
Port YearContainer Break Bulk Dry Bulk Liquid Bulk Lash Ro-Ro Total
Table 3.2.8
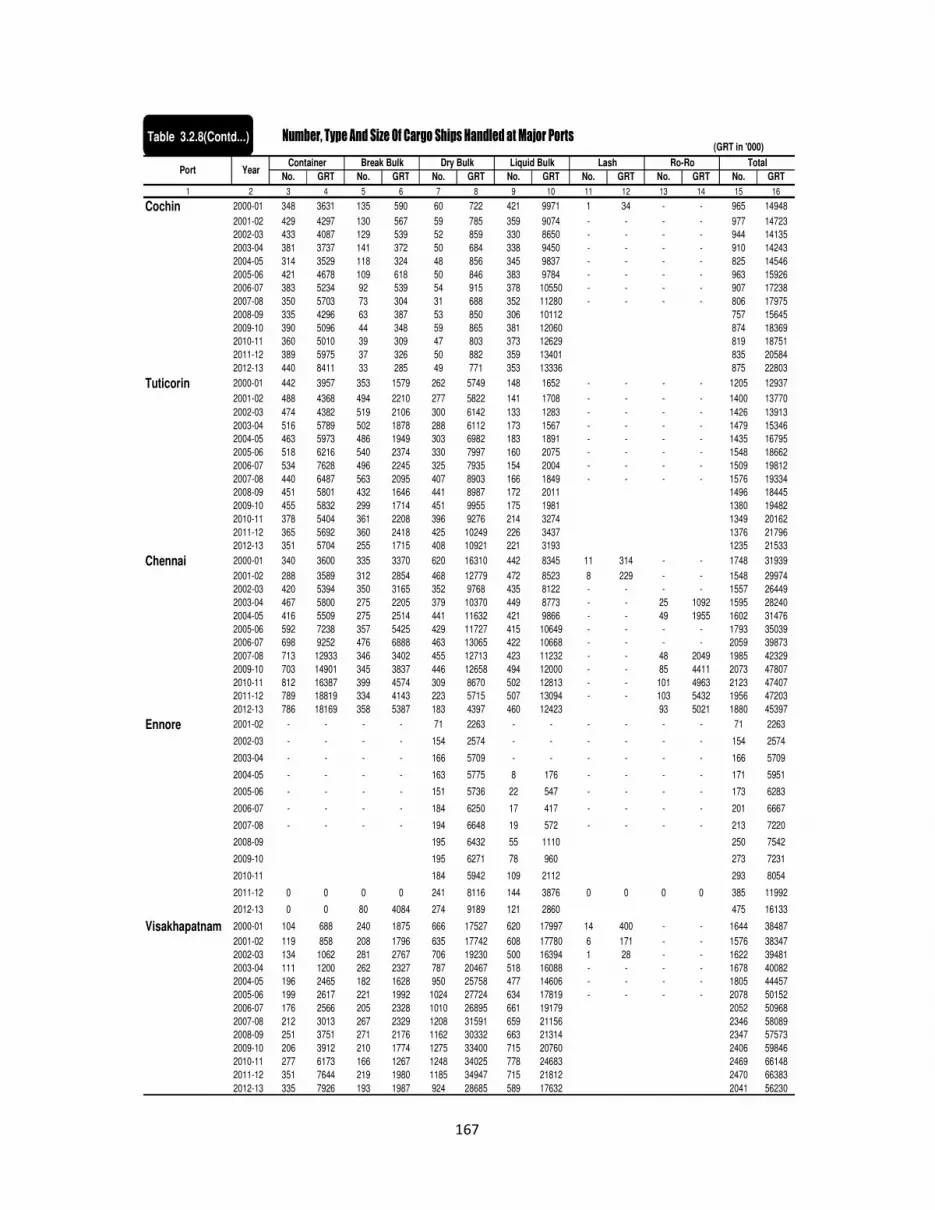
167
(GRT in '000)
No. GRT No. GRT No. GRT No. GRT No. GRT No. GRT No. GRT
1 2 3 4 5 6 7 8 9 10 11 12 13 14 15 16
Cochin 2000-01 348 3631 135 590 60 722 421 9971 1 34 - - 965 14948
2001-02 429 4297 130 567 59 785 359 9074 - - - - 977 14723
2002-03 433 4087 129 539 52 859 330 8650 - - - - 944 14135
2003-04 381 3737 141 372 50 684 338 9450 - - - - 910 14243
2004-05 314 3529 118 324 48 856 345 9837 - - - - 825 14546
2005-06 421 4678 109 618 50 846 383 9784 - - - - 963 15926
2006-07 383 5234 92 539 54 915 378 10550 - - - - 907 17238
2007-08 350 5703 73 304 31 688 352 11280 - - - - 806 17975
2008-09 335 4296 63 387 53 850 306 10112 757 15645
2009-10 390 5096 44 348 59 865 381 12060 874 18369
2010-11 360 5010 39 309 47 803 373 12629 819 18751
2011-12 389 5975 37 326 50 882 359 13401 835 20584
2012-13 440 8411 33 285 49 771 353 13336 875 22803
Tuticorin 2000-01 442 3957 353 1579 262 5749 148 1652 - - - - 1205 12937
2001-02 488 4368 494 2210 277 5822 141 1708 - - - - 1400 13770
2002-03 474 4382 519 2106 300 6142 133 1283 - - - - 1426 13913
2003-04 516 5789 502 1878 288 6112 173 1567 - - - - 1479 15346
2004-05 463 5973 486 1949 303 6982 183 1891 - - - - 1435 16795
2005-06 518 6216 540 2374 330 7997 160 2075 - - - - 1548 18662
2006-07 534 7628 496 2245 325 7935 154 2004 - - - - 1509 19812
2007-08 440 6487 563 2095 407 8903 166 1849 - - - - 1576 19334
2008-09 451 5801 432 1646 441 8987 172 2011 1496 18445
2009-10 455 5832 299 1714 451 9955 175 1981 1380 19482
2010-11 378 5404 361 2208 396 9276 214 3274 1349 20162
2011-12 365 5692 360 2418 425 10249 226 3437 1376 21796
2012-13 351 5704 255 1715 408 10921 221 3193 1235 21533
Chennai 2000-01 340 3600 335 3370 620 16310 442 8345 11 314 - - 1748 31939
2001-02 288 3589 312 2854 468 12779 472 8523 8 229 - - 1548 29974
2002-03 420 5394 350 3165 352 9768 435 8122 - - - - 1557 26449
2003-04 467 5800 275 2205 379 10370 449 8773 - - 25 1092 1595 28240
2004-05 416 5509 275 2514 441 11632 421 9866 - - 49 1955 1602 31476
2005-06 592 7238 357 5425 429 11727 415 10649 - - - - 1793 35039
2006-07 698 9252 476 6888 463 13065 422 10668 - - - - 2059 39873
2007-08 713 12933 346 3402 455 12713 423 11232 - - 48 2049 1985 42329
2009-10 703 14901 345 3837 446 12658 494 12000 - - 85 4411 2073 47807
2010-11 812 16387 399 4574 309 8670 502 12813 - - 101 4963 2123 47407
2011-12 789 18819 334 4143 223 5715 507 13094 - - 103 5432 1956 47203
2012-13 786 18169 358 5387 183 4397 460 12423 93 5021 1880 45397
Ennore 2001-02 - - - - 71 2263 - - - - - - 71 2263
2002-03 - - - - 154 2574 - - - - - - 154 2574
2003-04 - - - - 166 5709 - - - - - - 166 5709
2004-05 - - - - 163 5775 8 176 - - - - 171 5951
2005-06 - - - - 151 5736 22 547 - - - - 173 6283
2006-07 - - - - 184 6250 17 417 - - - - 201 6667
2007-08 - - - - 194 6648 19 572 - - - - 213 7220
2008-09 195 6432 55 1110 250 7542
2009-10 195 6271 78 960 273 7231
2010-11 184 5942 109 2112 293 8054
2011-12 0 0 0 0 241 8116 144 3876 0 0 0 0 385 11992
2012-13 0 0 80 4084 274 9189 121 2860 475 16133
Visakhapatnam 2000-01 104 688 240 1875 666 17527 620 17997 14 400 - - 1644 38487
2001-02 119 858 208 1796 635 17742 608 17780 6 171 - - 1576 38347
2002-03 134 1062 281 2767 706 19230 500 16394 1 28 - - 1622 39481
2003-04 111 1200 262 2327 787 20467 518 16088 - - - - 1678 40082
2004-05 196 2465 182 1628 950 25758 477 14606 - - - - 1805 44457
2005-06 199 2617 221 1992 1024 27724 634 17819 - - - - 2078 50152
2006-07 176 2566 205 2328 1010 26895 661 19179 2052 50968
2007-08 212 3013 267 2329 1208 31591 659 21156 2346 58089
2008-09 251 3751 271 2176 1162 30332 663 21314 2347 57573
2009-10 206 3912 210 1774 1275 33400 715 20760 2406 59846
2010-11 277 6173 166 1267 1248 34025 778 24683 2469 66148
2011-12 351 7644 219 1980 1185 34947 715 21812 2470 66383
2012-13 335 7926 193 1987 924 28685 589 17632 2041 56230
Number, Type And Size Of Cargo Ships Handled at Major Ports
Port YearContainer Break Bulk Dry Bulk Liquid Bulk Lash Ro-Ro Total
Table 3.2.8(Contd...)
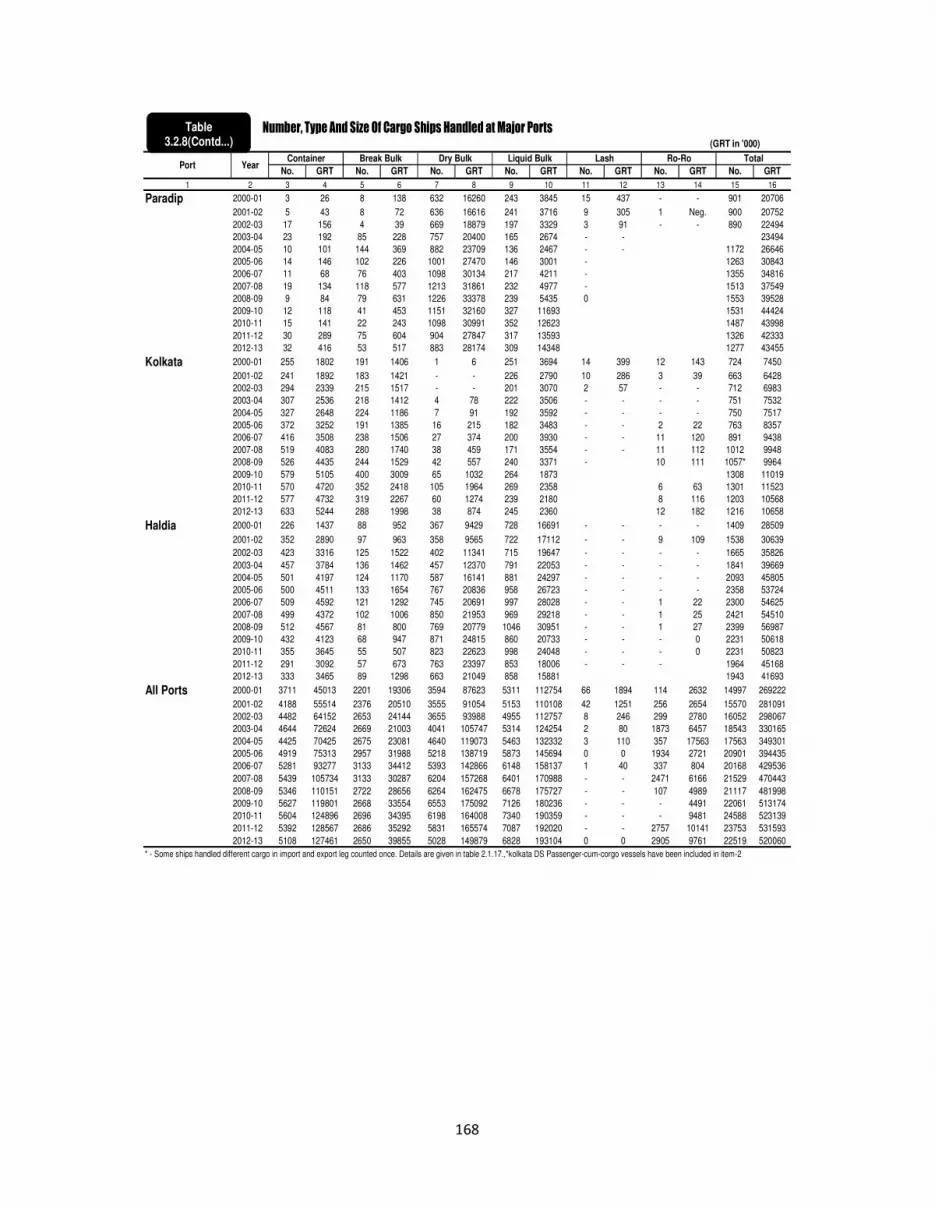
168
(GRT in '000)
No. GRT No. GRT No. GRT No. GRT No. GRT No. GRT No. GRT
1 2 3 4 5 6 7 8 9 10 11 12 13 14 15 16
Paradip 2000-01 3 26 8 138 632 16260 243 3845 15 437 - - 901 20706
2001-02 5 43 8 72 636 16616 241 3716 9 305 1 Neg. 900 20752
2002-03 17 156 4 39 669 18879 197 3329 3 91 - - 890 22494
2003-04 23 192 85 228 757 20400 165 2674 - - 23494
2004-05 10 101 144 369 882 23709 136 2467 - - 1172 26646
2005-06 14 146 102 226 1001 27470 146 3001 - 1263 30843
2006-07 11 68 76 403 1098 30134 217 4211 - 1355 34816
2007-08 19 134 118 577 1213 31861 232 4977 - 1513 37549
2008-09 9 84 79 631 1226 33378 239 5435 0 1553 39528
2009-10 12 118 41 453 1151 32160 327 11693 1531 44424
2010-11 15 141 22 243 1098 30991 352 12623 1487 43998
2011-12 30 289 75 604 904 27847 317 13593 1326 42333
2012-13 32 416 53 517 883 28174 309 14348 1277 43455
Kolkata 2000-01 255 1802 191 1406 1 6 251 3694 14 399 12 143 724 7450
2001-02 241 1892 183 1421 - - 226 2790 10 286 3 39 663 6428
2002-03 294 2339 215 1517 - - 201 3070 2 57 - - 712 6983
2003-04 307 2536 218 1412 4 78 222 3506 - - - - 751 7532
2004-05 327 2648 224 1186 7 91 192 3592 - - - - 750 7517
2005-06 372 3252 191 1385 16 215 182 3483 - - 2 22 763 8357
2006-07 416 3508 238 1506 27 374 200 3930 - - 11 120 891 9438
2007-08 519 4083 280 1740 38 459 171 3554 - - 11 112 1012 9948
2008-09 526 4435 244 1529 42 557 240 3371 - 10 111 1057* 9964
2009-10 579 5105 400 3009 65 1032 264 1873 1308 11019
2010-11 570 4720 352 2418 105 1964 269 2358 6 63 1301 11523
2011-12 577 4732 319 2267 60 1274 239 2180 8 116 1203 10568
2012-13 633 5244 288 1998 38 874 245 2360 12 182 1216 10658
Haldia 2000-01 226 1437 88 952 367 9429 728 16691 - - - - 1409 28509
2001-02 352 2890 97 963 358 9565 722 17112 - - 9 109 1538 30639
2002-03 423 3316 125 1522 402 11341 715 19647 - - - - 1665 35826
2003-04 457 3784 136 1462 457 12370 791 22053 - - - - 1841 39669
2004-05 501 4197 124 1170 587 16141 881 24297 - - - - 2093 45805
2005-06 500 4511 133 1654 767 20836 958 26723 - - - - 2358 53724
2006-07 509 4592 121 1292 745 20691 997 28028 - - 1 22 2300 54625
2007-08 499 4372 102 1006 850 21953 969 29218 - - 1 25 2421 54510
2008-09 512 4567 81 800 769 20779 1046 30951 - - 1 27 2399 56987
2009-10 432 4123 68 947 871 24815 860 20733 - - - 0 2231 50618
2010-11 355 3645 55 507 823 22623 998 24048 - - - 0 2231 50823
2011-12 291 3092 57 673 763 23397 853 18006 - - - 1964 45168
2012-13 333 3465 89 1298 663 21049 858 15881 1943 41693
All Ports 2000-01 3711 45013 2201 19306 3594 87623 5311 112754 66 1894 114 2632 14997 269222
2001-02 4188 55514 2376 20510 3555 91054 5153 110108 42 1251 256 2654 15570 281091
2002-03 4482 64152 2653 24144 3655 93988 4955 112757 8 246 299 2780 16052 298067
2003-04 4644 72624 2669 21003 4041 105747 5314 124254 2 80 1873 6457 18543 330165
2004-05 4425 70425 2675 23081 4640 119073 5463 132332 3 110 357 17563 17563 349301
2005-06 4919 75313 2957 31988 5218 138719 5873 145694 0 0 1934 2721 20901 394435
2006-07 5281 93277 3133 34412 5393 142866 6148 158137 1 40 337 804 20168 429536
2007-08 5439 105734 3133 30287 6204 157268 6401 170988 - - 2471 6166 21529 470443
2008-09 5346 110151 2722 28656 6264 162475 6678 175727 - - 107 4989 21117 481998
2009-10 5627 119801 2668 33554 6553 175092 7126 180236 - - - 4491 22061 513174
2010-11 5604 124896 2696 34395 6198 164008 7340 190359 - - - 9481 24588 523139
2011-12 5392 128567 2686 35292 5831 165574 7087 192020 - - 2757 10141 23753 531593
2012-13 5108 127461 2650 39855 5028 149879 6828 193104 0 0 2905 9761 22519 520060
* - Some ships handled different cargo in import and export leg counted once. Details are given in table 2.1.17.,*kolkata DS Passenger-cum-corgo vessels have been included in item-2
Number, Type And Size Of Cargo Ships Handled at Major Ports
Port YearContainer Break Bulk Dry Bulk Liquid Bulk Lash Ro-Ro Total
Table 3.2.8(Contd...)

169
Distribution of Revenue And Expenditure at Major Ports (Rs. in Lakh)
Management &
General
Administration
Revenue Exp. Revenue Exp. Revenue Exp. Revenue Exp. Revenue Exp. Exp.1 2 3 4 5 6 7 8 9 10 11 12 13 14
KANDLA1995-96 20099 7491 5424 3428 7548 1443 - 18 856 508 6271 846 1248
1996-97 25496 9217 6126 4253 8646 1606 - 132 1244 611 9480 1278 1337
1997-98 28813 9793 7497 4858 10178 1788 - 31 1389 653 9749 824 1639
1998-99 34492 13382 10564 4029 11339 1853 - 18 1324 872 11265 4757 1853
1999-00 36985 15493 9839 6823 11304 2301 - 4 1377 1054 14465 2851 2460
2000-01 32660 15595 8413 5098 8087 2317 - 4 1598 1054 14562 4055 3067
2001-02 33724 14484 8565 3704 7975 2432 - 5 1425 1078 15759 3991 3274
2002-03 37440 20233 10399 6753 9040 2671 - 7 1758 1037 16243 6262 3503
2003-04 38783 29721 10124 8151 9444 3013 - 4 1523 1282 17692 13163 4108
2004-05 38601 19258 10630 8354 10489 3402 - 5 2507 1330 14975 1980 4187
2005-06 38612 18611 10702 7937 12867 3609 - 10 1850 1549 13193 1323 4183
2006-07 46644 25019 13431 8609 16629 6330 - 274 3066 1492 13518 3834 4480
2007-08 50577 25868 14310 11098 18142 6892 - 93 1706 1774 16419 1071 4940
2008-09 59171 36840 18917 15497 19814 8297 - 30 2145 2677 18295 4176 6163
2009-10 63406 43239 20692 16497 22509 9335 - 224 1718 2832 18487 7190 7161
2010-11 67664 51516 20168 15751 24378 11856 - 30 4645 2923 18473 13300 7656
2011-12 82238 59486 29075 25583 29332 16303 110 55 3854 2888 19867 8889 8468
2012-13 98293 59327 39531 24627 30044 13289 104 272 8362 3552 20252 7830 9757
MUMBAI1995-96 68243 42809 13620 5954 42318 14427 610 1669 1640 2766 10055 11450 6543
1996-97 68852 49660 13362 9973 43570 15598 491 1826 1835 3229 9594 12217 6817
1997-98 68520 51160 16311 9898 40237 16553 496 1801 3594 3608 7882 11637 7663
1998-99 68632 57868 16680 11068 39245 18056 771 1890 4035 3735 7901 14428 8691
1999-00 63379 55038 16276 10751 32683 17642 625 1748 3683 3523 10112 12760 8614
2000-01 56331 93066 15860 13620 27101 20969 312 1784 3146 3876 9912 42984 9833
2001-02 55604 71554 15065 10826 25002 17868 308 1375 3437 3808 11792 29458 8219
2002-03 91344 59958 17007 10122 24315 18305 291 1434 4279 4945 45452 16859 8293
2003-04 49269 65523 15426 10091 26208 18256 299 1540 4106 3608 3230 23265 8763
2004-05 84252 79576 21997 12777 30211 19376 412 1455 4476 3570 27156 33656 8742
2005-06 100233 72119 24198 11555 35369 19665 647 1780 5810 3898 34209 26078 9143
2006-07 115573 97806 26733 12472 40423 21371 1069 2009 7596 4225 39752 47543 10186
2007-08 131262 104956 26032 13573 44466 24090 1109 2124 10208 4852 49447 48231 12086
2008-09 129787 120080 27899 17475 44621 24566 1036 2185 7319 5834 48912 57091 12929
2009-10 131502 129388 34131 17052 44523 29628 731 2670 10129 6599 41988 57366 16073
2010-11 143686 147982 35667 17322 55402 45705 948 2795 10788 6324 40881 54200 21636
2011-12 158156 168092 37778 17884 58417 48392 1468 3024 11965 6686 48528 68624 23482
2012-13 167959 195725 47741 19670 62694 57516 1181 3332 11118 7471 45225 80166 27570
Finance and Misc.Port and Dock Charges
including Pilotage
Cargo handling and ware-
housing
On account of
Railways
Land and building
Port/ YearTotal
Revenue
Total Expen-
diture
Table 3.2.9

170
Distribution of Revenue And Expenditure at Major Ports (Rs. in Lakh)
Management & General
Administration Revenue Exp. Revenue Exp. Revenue Exp. Revenue Exp. Revenue Exp. Exp.
1 2 3 4 5 6 7 8 9 10 11 12 13 14JAWAHARLAL NEHRU1995-96 27883 15341 3579 1201 18390 7925 - 102 1398 728 4516 3777 16081996-97 31749 17497 4252 1779 18519 9234 - 119 1836 969 7142 3514 18821997-98 41731 21256 5618 2517 23466 11413 - 124 2919 1047 9728 4286 18691998-99 48231 24685 7492 3034 27586 12007 - 124 3231 1212 9922 5998 23101999-00 47529 34224 9225 5604 23413 12737 - 124 4115 1290 10776 11489 29802000-01 44317 34196 10192 4007 17643 13154 - 121 4786 930 11696 13084 29002001-02 50377 39079 13364 4135 20860 13760 - 121 4443 1048 11710 16895 31202002-03 55322 37388 16089 3584 23527 13548 - 121 4509 1029 11197 16157 29492003-04 64779 38573 17662 4136 31512 14225 - 121 4757 1298 10848 15167 36262004-05 71050 37439 15447 4588 33094 16128 - 122 4754 1602 17755 11494 35052005-06 65025 32226 14477 4782 35747 13173 - 121 4679 3000 10122 6837 43132006-07 91047 34132 15837 5568 35045 14041 - 121 5272 2231 34893 7596 45752007-08 63075 31758 11921 6213 32203 12594 - 121 5674 2768 13277 3274 67882008-09 68488 40549 14114 7613 28024 13415 - 121 6612 2986 19738 7528 88862009-10 62107 37341 16017 8436 21984 14426 - 121 6413 3280 17693 2576 85022010-11 65408 44997 16231 8741 25957 15448 - 121 6583 4329 16637 5753 106052011-12 147169 85466 16673 8284 28648 18557 - 121 7725 4195 30454 7911 125312012-13 149582 99088 18264 8726 32546 24416 - 121 814 7098 90632 45186 13541MORMUGAO1995-96 9867 7931 2198 2476 5454 1967 - 116 358 67 1857 1557 17481996-97 11055 8912 2263 2055 6287 2616 - 112 485 94 2020 2060 19751997-98 13317 10297 2522 2303 8188 3525 4 139 345 235 2258 1954 21411998-99 14849 12575 2884 2748 8460 4297 181 136 567 280 2757 2529 25851999-00 16046 13702 3100 3022 8993 3977 389 222 966 272 2598 3286 29232000-01 21474 19254 3789 3474 10914 5761 533 337 957 311 5281 5091 42802001-02 19696 18923 4633 3752 12060 4784 839 401 1225 366 939 5650 39702002-03 19483 17147 4803 3628 12217 4378 806 321 933 515 724 4315 39902003-04 21516 18779 5372 3780 14055 4940 661 264 681 522 747 5306 39672004-05 22072 19807 5402 3567 14317 5230 893 394 953 459 507 5869 42882005-06 22925 18190 5500 3649 14352 5509 1001 420 1253 369 819 3960 42892006-07 27187 23141 6346 3583 16204 6394 1712 473 1532 381 1393 7118 51922007-08 26802 22817 6280 4626 15531 6887 2015 477 925 538 2051 4355 59342008-09 29696 28562 7401 5574 17245 7614 2089 567 815 602 2146 6585 76202009-10 34610 32303 9063 6288 20556 9869 2233 610 831 544 1927 8779 62132010-11 38586 33088 10055 6007 22829 10870 3095 661 1207 772 1400 8916 58622011-12 37773 35337 10311 6823 20569 11330 3882 784 1159 798 1852 9447 61552012-13 24610 35365 6534 7287 9775 10470 4512 961 1367 855 2422 9388 6404Finance and Misc. Includes BOT contracts and Income Tax in JNPT
Total Revenue
Total Expen-diturePort/ Year Finance and Misc.Port and Dock Charges
including PilotageCargo handling and ware-
housingOn account of
Railways Land and building
Table 3.2.9

171
Distribution of Revenue And Expenditure at Major Ports (Rs. in Lakh)
Management & General
Administration Revenue Exp. Revenue Exp. Revenue Exp. Revenue Exp. Revenue Exp. Exp.
1 2 3 4 5 6 7 8 9 10 11 12 13 14NEW MANGALORE1995-96 6672 4615 1398 2204 3291 637 13 13 759 112 1211 592 10571996-97 13422 9275 2355 2819 8831 1443 12 35 649 119 1575 3469 13901997-98 17852 10938 3085 3789 11264 1597 25 36 1122 138 2356 3744 16341998-99 16924 13009 3603 4390 10950 1801 22 23 917 180 1432 4758 18571999-00 18600 13028 3742 4880 12315 2053 13 28 1040 198 1490 3568 23012000-01 19173 14884 3415 5759 12961 2312 13 29 1145 213 1639 3904 26672001-02 20714 15745 3593 5685 14472 2425 27 32 1341 219 1281 4944 24402002-03 21505 15981 4652 4338 14272 2680 15 32 1302 198 1264 6378 23552003-04 23803 17863 5550 5171 15490 2968 16 30 1360 208 1387 7052 24342004-05 28835 21037 6547 4271 18491 3791 40 48 1693 271 2064 10223 24332005-06 28217 13849 6657 5167 16782 3931 87 43 1946 276 2745 1838 25942006-07 27987 17071 6136 5313 17156 4426 159 55 2148 312 2388 4135 28302007-08 30877 18181 6374 5337 18098 4983 354 125 2284 403 3767 4194 31392008-09 35398 20598 7045 5149 19906 5922 463 111 2685 391 5299 5403 36222009-10 36317 23452 6844 6933 21374 6040 536 94 3090 505 4473 5126 47542010-11 35317 24490 6258 7845 20595 5280 316 110 3621 568 4527 5731 49562011-12 43242 26586 7192 7864 24657 5522 303 116 5073 681 6017 6928 54752012-13 43108 27982 8872 7697 20530 6008 413 93 4647 709 8645 7674 5802COCHIN1995-96 12493 13058 2934 3470 7132 1984 - 29 643 334 1784 4894 23471996-97 15866 13601 3456 4107 9456 2059 - 29 864 321 2090 4143 29421997-98 17748 13241 4034 4903 10490 2193 - 22 1021 427 2203 2115 35811998-99 19560 16435 4386 5778 10735 2710 - 25 1169 592 3270 3486 38441999-00 20355 20084 5324 6144 11354 3628 - 31 1363 476 2314 5358 44472000-01 20597 23972 5367 5262 11295 4530 - 40 1698 490 2237 8626 50242001-02 20144 23646 5989 6141 10810 4411 - 18 1907 456 1438 8073 48472002-03 21597 19657 5947 5618 11991 3806 - 14 2130 427 1529 4936 48562003-04 21746 19612 5702 4971 12316 3868 - - 2128 453 1600 5424 48962004-05 22060 21696 5668 5117 12817 3903 - - 2263 456 1312 7071 51492005-06 21684 18724 5988 4976 10193 2764 - - 3714 616 1789 5220 51482006-07 23335 20670 6299 6107 10515 2761 - - 4393 618 2128 5913 52712007-08 24756 24307 6933 8391 10821 3172 - - 4240 750 2762 6186 58082008-09 22979 24454 8010 9281 7795 2904 - - 5036 716 2138 4907 66462009-10 25130 34057 9061 10634 8825 3808 - - 5321 796 1923 10762 80572010-11 31177 39783 11521 13542 9228 4110 - - 6859 979 3569 12335 88172011-12 34220 42612 12786 11990 11544 4987 - - 6380 1245 3510 14398 99922012-13 44604 51119 12426 18370 11918 5422 - - 6818 1905 13442 14380 11042
Port/ Year Total Revenue
Total Expen-diture
Port and Dock Charges including Pilotage
Cargo handling and ware-housing
On account of Railways Land and building Finance and Misc.
Table 3.2.9

172
Distribution of Revenue And Expenditure at Major Ports (Rs. in Lakh)
Management & General
Administration Revenue Exp. Revenue Exp. Revenue Exp. Revenue Exp. Revenue Exp. Exp.
1 2 3 4 5 6 7 8 9 10 11 12 13 14TUTICORIN1995-96 5979 3634 1613 875 3542 737 9 50 241 231 574 816 9251996-97 6709 4063 1885 931 3710 790 57 58 232 247 825 939 10981997-98 8649 5025 2271 1193 4676 915 93 129 479 259 1130 1314 12151998-99 9594 5957 2710 1308 5194 999 119 205 520 402 1051 1493 15501999-00 10217 6528 2920 1560 4981 1156 136 137 977 460 1203 1303 19122000-01 13128 9390 4637 1952 5796 1195 154 165 870 594 1671 3378 21062001-02 13538 9489 4983 1980 5647 1089 189 163 886 666 1833 3680 19112002-03 14474 9418 5500 2240 5641 1102 265 158 1053 675 2015 3319 19242003-04 14994 9428 2325 2668 6136 1113 189 165 812 613 2532 2950 19192004-05 16335 9416 5942 2581 7043 1065 181 208 613 208 2556 2979 23752005-06 18158 9119 6692 2437 8474 1092 190 195 548 209 2254 2962 22242006-07 21173 9828 7769 2900 9689 1082 276 190 567 198 2872 2932 25272007-08 22504 10944 7006 3011 11648 1245 277 331 604 225 2969 3468 26642008-09 25821 13476 7358 4351 13474 1579 349 270 792 172 3848 3628 34762009-10 28298 15381 8010 4522 14586 1799 356 533 818 386 4528 3520 46212010-11 31273 16377 7917 4407 16846 2057 202 348 1140 390 5168 4408 47672011-12 33561 18859 9818 5323 19916 2429 197 394 1136 636 2794 4565 52122012-13 40921 28002 10101 6256 25066 8207 139 445 1096 464 4519 6899 5731CHENNAI1995-96 33879 20365 6826 2850 16313 6173 1987 1138 387 170 8366 5175 48591996-97 38378 20933 7194 3113 17582 6816 2292 1081 328 187 10982 4452 52841997-98 41676 24860 7913 3994 18954 7723 2887 1526 381 232 11541 4912 64731998-99 43928 26834 8829 4284 19232 8453 3016 1701 337 276 12514 4898 72221999-00 45966 31440 8558 6071 21146 9915 3886 1725 314 235 12062 4712 87822000-01 47473 43713 7506 6807 24738 12302 4283 2408 522 289 10424 11228 106792001-02 62497 41143 6951 6431 22852 10610 3823 1888 353 253 28518 13052 89092002-03 44604 31936 8106 5067 20508 10965 4551 2256 381 304 11058 4911 84332003-04 41358 33939 10365 4791 23046 10043 3172 1989 273 252 4502 7800 90642004-05 47496 35901 11353 5920 25392 10352 3272 1938 347 345 7132 7254 100922005-06 52026 36190 11975 5553 26342 11202 3492 2409 1360 434 8857 4895 116972006-07 67370 41092 14326 5591 33203 12388 4766 2349 1202 461 13873 6284 140192007-08 89040 45914 14696 6396 40568 13699 5074 2716 2471 524 26231 5829 167502008-09 85344 58678 16951 6973 43501 16303 4835 2781 1863 564 18194 13127 189302009-10 90315 69199 19597 7946 46298 18320 4272 3778 1668 736 18480 15915 225042010-11 87577 80770 19111 9384 44532 19458 2868 4099 1881 844 19185 22797 241882011-12 84036 81823 17519 9735 41260 17527 2220 3969 1712 786 21325 25343 244632012-13 88368 86542 19067 11174 40684 16945 1742 3453 1591 900 25284 27867 26203ENNORE2001-02 3094 6690 18 - 3059 148 - - - - 17 4959 15832002-03 7805 7149 @ @ 7687 1829 - - @ @ 118 4889 4312003-04 8732 9311 @ @ 8564 3185 - - @ @ 168 5535 5912004-05 9327 8326 @ @ 9200 3468 - - @ @ 127 4153 7052005-06 9780 8848 @ @ 9232 3290 - - @ @ 548 4897 6612006-07 11050 7588 @ @ 10105 3337 - - @ @ 946 3481 7702007-08 14372 3787 @ @ 12802 2995 - - @ @ 1570 6641* 7922009-10 14553 9685 @ @ 14206 9685 - - @ @ 347 … …2010-11 16810 11252 @ @ 16728 11252 - - @ @ 82 … …2011-12 25025 15353 - - 24864 15353 - - - - 161 … …2012-13 32020 15230 - - 32021 15233 - - - - 549 … …
Port/ Year Total Revenue
Total Expen-diture
Land and building Finance and Misc.Port and Dock Charges including Pilotage
Cargo handling and ware-housing
On account of Railways
Table 3.2.9
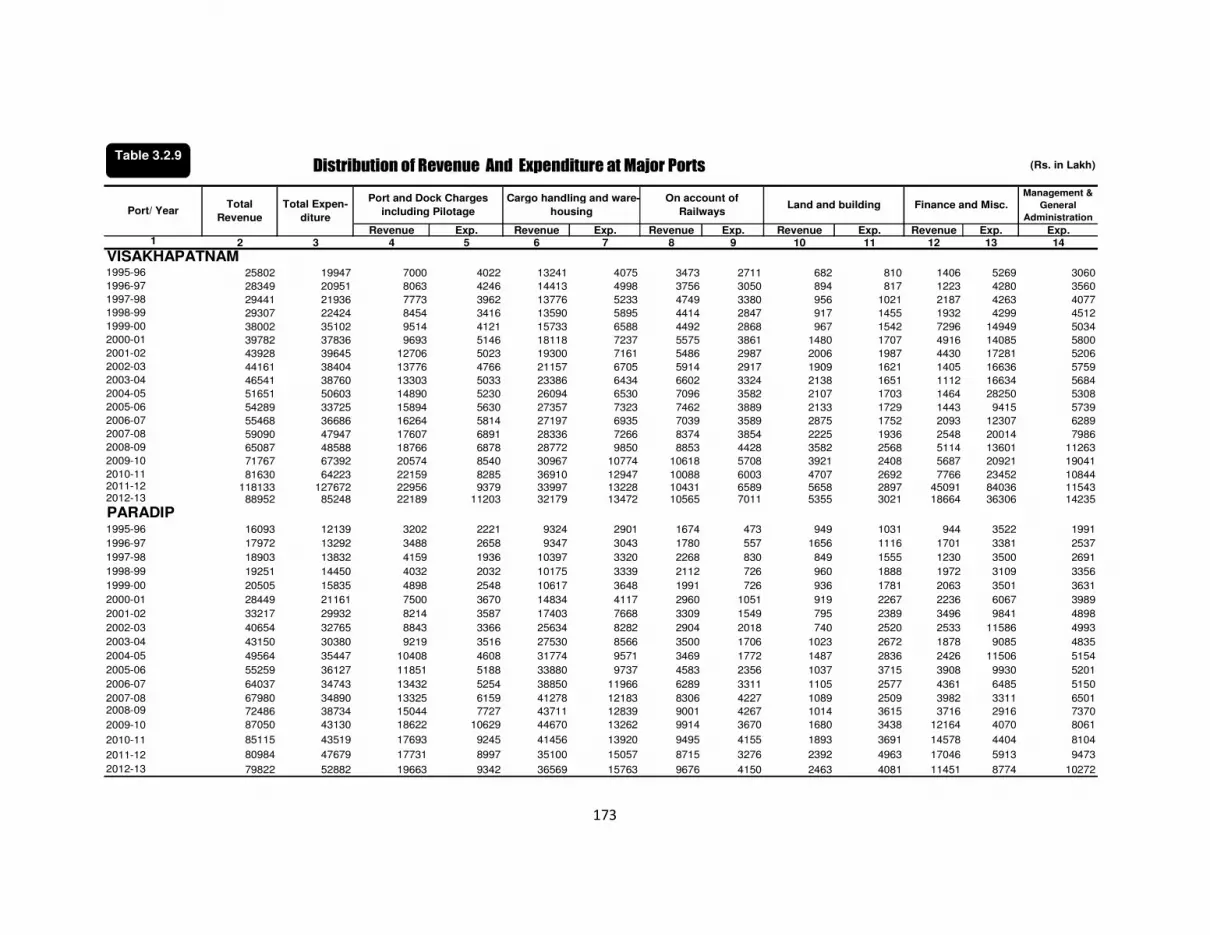
173
Distribution of Revenue And Expenditure at Major Ports (Rs. in Lakh)
Management &
General
Administration
Revenue Exp. Revenue Exp. Revenue Exp. Revenue Exp. Revenue Exp. Exp.1 2 3 4 5 6 7 8 9 10 11 12 13 14
VISAKHAPATNAM1995-96 25802 19947 7000 4022 13241 4075 3473 2711 682 810 1406 5269 3060
1996-97 28349 20951 8063 4246 14413 4998 3756 3050 894 817 1223 4280 3560
1997-98 29441 21936 7773 3962 13776 5233 4749 3380 956 1021 2187 4263 40771998-99 29307 22424 8454 3416 13590 5895 4414 2847 917 1455 1932 4299 4512
1999-00 38002 35102 9514 4121 15733 6588 4492 2868 967 1542 7296 14949 50342000-01 39782 37836 9693 5146 18118 7237 5575 3861 1480 1707 4916 14085 5800
2001-02 43928 39645 12706 5023 19300 7161 5486 2987 2006 1987 4430 17281 5206
2002-03 44161 38404 13776 4766 21157 6705 5914 2917 1909 1621 1405 16636 57592003-04 46541 38760 13303 5033 23386 6434 6602 3324 2138 1651 1112 16634 5684
2004-05 51651 50603 14890 5230 26094 6530 7096 3582 2107 1703 1464 28250 5308
2005-06 54289 33725 15894 5630 27357 7323 7462 3889 2133 1729 1443 9415 5739
2006-07 55468 36686 16264 5814 27197 6935 7039 3589 2875 1752 2093 12307 6289
2007-08 59090 47947 17607 6891 28336 7266 8374 3854 2225 1936 2548 20014 79862008-09 65087 48588 18766 6878 28772 9850 8853 4428 3582 2568 5114 13601 11263
2009-10 71767 67392 20574 8540 30967 10774 10618 5708 3921 2408 5687 20921 19041
2010-11 81630 64223 22159 8285 36910 12947 10088 6003 4707 2692 7766 23452 108442011-12 118133 127672 22956 9379 33997 13228 10431 6589 5658 2897 45091 84036 115432012-13 88952 85248 22189 11203 32179 13472 10565 7011 5355 3021 18664 36306 14235
PARADIP1995-96 16093 12139 3202 2221 9324 2901 1674 473 949 1031 944 3522 1991
1996-97 17972 13292 3488 2658 9347 3043 1780 557 1656 1116 1701 3381 2537
1997-98 18903 13832 4159 1936 10397 3320 2268 830 849 1555 1230 3500 2691
1998-99 19251 14450 4032 2032 10175 3339 2112 726 960 1888 1972 3109 3356
1999-00 20505 15835 4898 2548 10617 3648 1991 726 936 1781 2063 3501 3631
2000-01 28449 21161 7500 3670 14834 4117 2960 1051 919 2267 2236 6067 3989
2001-02 33217 29932 8214 3587 17403 7668 3309 1549 795 2389 3496 9841 4898
2002-03 40654 32765 8843 3366 25634 8282 2904 2018 740 2520 2533 11586 4993
2003-04 43150 30380 9219 3516 27530 8566 3500 1706 1023 2672 1878 9085 4835
2004-05 49564 35447 10408 4608 31774 9571 3469 1772 1487 2836 2426 11506 5154
2005-06 55259 36127 11851 5188 33880 9737 4583 2356 1037 3715 3908 9930 5201
2006-07 64037 34743 13432 5254 38850 11966 6289 3311 1105 2577 4361 6485 5150
2007-08 67980 34890 13325 6159 41278 12183 8306 4227 1089 2509 3982 3311 65012008-09 72486 38734 15044 7727 43711 12839 9001 4267 1014 3615 3716 2916 7370
2009-10 87050 43130 18622 10629 44670 13262 9914 3670 1680 3438 12164 4070 8061
2010-11 85115 43519 17693 9245 41456 13920 9495 4155 1893 3691 14578 4404 8104
2011-12 80984 47679 17731 8997 35100 15057 8715 3276 2392 4963 17046 5913 9473
2012-13 79822 52882 19663 9342 36569 15763 9676 4150 2463 4081 11451 8774 10272
Finance and Misc.Port and Dock Charges
including Pilotage
Cargo handling and ware-
housingLand and building
On account of
RailwaysPort/ YearTotal
Revenue
Total Expen-
diture
Table 3.2.9
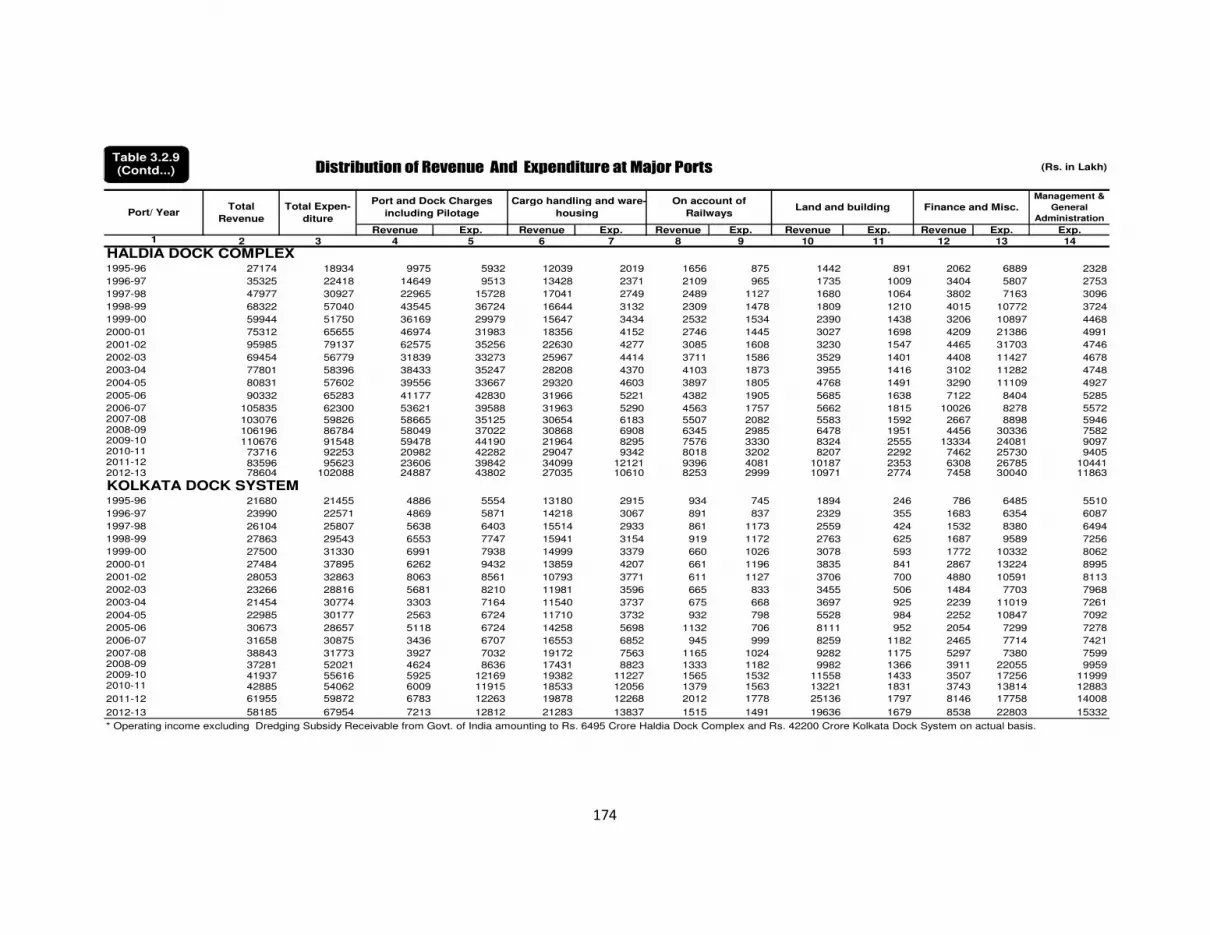
174
Distribution of Revenue And Expenditure at Major Ports (Rs. in Lakh)
Management &
General
Administration
Revenue Exp. Revenue Exp. Revenue Exp. Revenue Exp. Revenue Exp. Exp.1 2 3 4 5 6 7 8 9 10 11 12 13 14
HALDIA DOCK COMPLEX1995-96 27174 18934 9975 5932 12039 2019 1656 875 1442 891 2062 6889 2328
1996-97 35325 22418 14649 9513 13428 2371 2109 965 1735 1009 3404 5807 2753
1997-98 47977 30927 22965 15728 17041 2749 2489 1127 1680 1064 3802 7163 3096
1998-99 68322 57040 43545 36724 16644 3132 2309 1478 1809 1210 4015 10772 3724
1999-00 59944 51750 36169 29979 15647 3434 2532 1534 2390 1438 3206 10897 4468
2000-01 75312 65655 46974 31983 18356 4152 2746 1445 3027 1698 4209 21386 4991
2001-02 95985 79137 62575 35256 22630 4277 3085 1608 3230 1547 4465 31703 4746
2002-03 69454 56779 31839 33273 25967 4414 3711 1586 3529 1401 4408 11427 4678
2003-04 77801 58396 38433 35247 28208 4370 4103 1873 3955 1416 3102 11282 4748
2004-05 80831 57602 39556 33667 29320 4603 3897 1805 4768 1491 3290 11109 4927
2005-06 90332 65283 41177 42830 31966 5221 4382 1905 5685 1638 7122 8404 5285
2006-07 105835 62300 53621 39588 31963 5290 4563 1757 5662 1815 10026 8278 55722007-08 103076 59826 58665 35125 30654 6183 5507 2082 5583 1592 2667 8898 59462008-09 106196 86784 58049 37022 30868 6908 6345 2985 6478 1951 4456 30336 75822009-10 110676 91548 59478 44190 21964 8295 7576 3330 8324 2555 13334 24081 90972010-11 73716 92253 20982 42282 29047 9342 8018 3202 8207 2292 7462 25730 94052011-12 83596 95623 23606 39842 34099 12121 9396 4081 10187 2353 6308 26785 104412012-13 78604 102088 24887 43802 27035 10610 8253 2999 10971 2774 7458 30040 11863
KOLKATA DOCK SYSTEM1995-96 21680 21455 4886 5554 13180 2915 934 745 1894 246 786 6485 5510
1996-97 23990 22571 4869 5871 14218 3067 891 837 2329 355 1683 6354 6087
1997-98 26104 25807 5638 6403 15514 2933 861 1173 2559 424 1532 8380 6494
1998-99 27863 29543 6553 7747 15941 3154 919 1172 2763 625 1687 9589 7256
1999-00 27500 31330 6991 7938 14999 3379 660 1026 3078 593 1772 10332 8062
2000-01 27484 37895 6262 9432 13859 4207 661 1196 3835 841 2867 13224 8995
2001-02 28053 32863 8063 8561 10793 3771 611 1127 3706 700 4880 10591 8113
2002-03 23266 28816 5681 8210 11981 3596 665 833 3455 506 1484 7703 7968
2003-04 21454 30774 3303 7164 11540 3737 675 668 3697 925 2239 11019 7261
2004-05 22985 30177 2563 6724 11710 3732 932 798 5528 984 2252 10847 7092
2005-06 30673 28657 5118 6724 14258 5698 1132 706 8111 952 2054 7299 7278
2006-07 31658 30875 3436 6707 16553 6852 945 999 8259 1182 2465 7714 7421
2007-08 38843 31773 3927 7032 19172 7563 1165 1024 9282 1175 5297 7380 75992008-09 37281 52021 4624 8636 17431 8823 1333 1182 9982 1366 3911 22055 99592009-10 41937 55616 5925 12169 19382 11227 1565 1532 11558 1433 3507 17256 119992010-11 42885 54062 6009 11915 18533 12056 1379 1563 13221 1831 3743 13814 12883
2011-12 61955 59872 6783 12263 19878 12268 2012 1778 25136 1797 8146 17758 14008
2012-13 58185 67954 7213 12812 21283 13837 1515 1491 19636 1679 8538 22803 15332
Finance and Misc.Land and buildingPort/ Year
Total
Revenue
Total Expen-
diture
* Operating income excluding Dredging Subsidy Receivable from Govt. of India amounting to Rs. 6495 Crore Haldia Dock Complex and Rs. 42200 Crore Kolkata Dock System on actual basis.
Port and Dock Charges
including Pilotage
Cargo handling and ware-
housing
On account of
Railways
Table 3.2.9 (Contd...)

175
Distribution of Revenue And Expenditure at Major Ports (Rs. in Lakh)
Management & General
Administration Revenue Exp. Revenue Exp. Revenue Exp. Revenue Exp. Revenue Exp. Exp.
1 2 3 4 5 6 7 8 9 10 11 12 13 14
ALL PORTS
1995-96 275864 187719 62655 40187 151772 47203 10356 7939 11249 7894 39832 51272 33224
1996-97 317163 212390 71962 51318 168007 53641 11388 8801 14087 9074 51719 51894 37662
1997-98 360731 239072 89786 61484 184181 59942 13872 10318 17294 10663 55598 54092 42573
1998-99 400952 294202 119732 86558 189091 65696 13863 10345 18549 12727 59717 70116 48760
1999-00 405028 323554 116556 89441 183185 70458 14724 10173 21206 12862 69357 85006 55614
2000-01 426180 416617 129608 96210 183702 82258 17237 12441 23983 14270 71650 147112 64331
2001-02 480571 422331 154719 95081 192863 80104 17677 11274 24754 14517 90558 160118 61237
2002-03 491109 375631 132642 90965 213937 82281 19122 11697 25978 15178 99430 115378 60132
2003-04 474001 407542 139784 94719 237435 84718 19217 11684 26453 14900 51112 139625 61896
2004-05 545293 435546 160116 98640 259953 91151 20192 12127 31496 15255 73536 154416 63957
2005-06 598130 393691 172358 108072 276819 92208 22976 13834 38126 18385 87851 93437 67755
2006-07 686641 441689 183630 107506 302627 103304 26818 15127 43677 17244 129889 124292 74217
2007-08 717662 468029 187076 113852 320149 110047 32181 17174 46291 19046 131965 121108 86802
2008-09 748785 573615 204178 132176 325267 119020 34304 18927 48323 23442 136713 174834 105216
2009-10 797668 651731 228014 153836 331844 146468 37801 22270 55471 25512 144538 177562 126083
2010-11 800844 704312 193771 154726 362441 174301 36409 23087 64752 27635 143471 194840 129723
2011-12 926719 832993 212228 163967 382281 193074 38734 24187 82377 29925 211099 280597 141243
2012-13 909647 803968 211601 137164 355309 200578 29847 21329 63267 31735 249623 267273 145889
Source : Major Ports
Port/ Year Total Revenue
Total Expen-diture
Port and Dock Charges including Pilotage
Cargo handling and ware-housing
On account of Railways Land and building Finance and Misc.
Table 3.2.9 (Contd...)

176
Operating Financial Parameters for Major Ports (Rs. In Lakh)
Item/Year Ennore
1 2 3 4 5 6 7 8 9 10 11 12 13 14 15
Operating Income1995-96 13828 58188 23367 8010 5461 10709 5405 25513 - 24396 15149 25112 20894 236032
1996-97 16016 59258 24607 9035 11847 13776 5884 27396 - 27126 16271 31921 22307 265444
1997-98 19064 60638 32003 11059 15496 15545 7519 30135 - 27254 17673 44175 24572 305133
1998-99 23227 60731 38309 12092 15492 16290 8543 31414 - 27375 17279 64307 26176 341235
1999-00 22520 53267 36753 13448 17110 18041 9014 33904 - 30706 18442 56738 25728 335671
2000-01 18098 46419 32621 16193 17534 18360 11457 37049 - 34866 26213 71103 24617 354530
2001-02 17965 43812 38667 18757 19433 18706 11705 33979 3077 39498 29721 91520 23173 390013
2002-03 21197 45892 44125 18759 20241 20068 12459 33546 7687 42756 38121 65046 21782 391679
2003-04 21091 46039 53931 20769 22416 20146 12462 36856 8564 45429 41272 74699 19215 422889
2004-05 23626 57096 63009 21565 26771 20748 13779 40364 9200 50187 47138 77541 20733 471757
2005-06 25419 66024 67032 22106 25472 19895 15904 43169 9232 52846 51351 83210 28619 510279
2006-07 33126 75791 80279 25794 25598 21208 18301 53497 10104 53375 59676 95809 31386 583944
2007-08 34157 81815 89082 24751 27109 22009 19535 62809 12802 56542 63998 100409 36213 631231
2008-09 40876 80875 96506 27549 30099 20840 21973 67149 13776 59973 69671 101739 36477 667503
2009-10 44919 89514 104206 32683 31845 23208 24040 71835 14266 66080 74887 97342 45078 719903
2010-11 49191 95500 112263 37186 30791 27608 26106 68391 16731 73864 70538 103530 45985 757684
2011-12 62371 102305 116715 35920 37226 30710 37970 62711 25026 72642 63939 98259 56606 802400
2012-13 78041 115444 109787 22187 33462 31161 36402 63084 32571 70288 68373 73815 50409 785024
Operating Expenditure1995-96 6645 31359 11564 6374 4023 8164 2818 15190 - 14678 8617 12045 14970 136447
1996-97 7939 37443 13983 6852 5806 9458 3124 16481 - 16671 9911 16611 16217 160496
1997-98 8969 39523 16970 8343 7194 11126 3711 19948 - 17673 10332 23764 17427 184980
1998-99 8625 43440 18687 10046 8251 12949 4464 21936 - 18125 11341 46268 19954 224086
1999-00 12642 42278 22735 10416 9460 14726 5225 26728 - 20153 12334 40853 20998 238548
2000-01 11540 50082 21112 14163 10980 15346 6012 32485 - 23751 15094 44269 24671 269505
2001-02 10493 42096 22185 13273 10801 15573 5809 28091 1731 22364 20091 47434 22272 262213
2002-03 13971 43099 21231 12832 9603 14721 6099 27025 2260 21768 21179 45352 21113 260253
2003-04 16558 42258 23406 13473 10811 14188 6478 26139 3776 22126 21295 47654 19755 267917
2004-05 17278 45920 27181 13938 10814 14625 6437 28647 4173 22353 23941 46493 19330 281130
2005-06 17288 46041 27033 14230 12011 13504 6157 31295 3951 24310 26197 56879 21358 300254
2006-07 21186 50263 28795 16022 12936 14757 6897 34808 4107 24379 28260 54022 23161 319593
2007-08 24797 56725 31379 18463 13987 18120 7476 40085 3788 27933 25078 50929 24392 343152
2008-09 32646 62989 37537 21978 15194 19546 9847 45551 3533 34987 35817 56448 29966 406039
2009-10 36048 72022 39370 23525 18326 23295 11861 53284 3084 46471 39060 67437 38360 472143
2010-11 38216 77500 44445 24172 18759 27449 11969 57973 3263 40771 39115 66523 40248 490403
2011-12 50598 82147 49963 25889 19658 28214 19469 56480 4423 43636 41766 68828 42125 5331962012-13 51497 94509 60870 25976 20308 36739 21102 58675 4496 48942 44111 72021 45178 584424
N.Manga-
lore
Cochin Tuticorin Chennai ParadipKandla Mumbai J.L.
Nehru
Mormugao Visakha-
patnam
Haldia
Dock
Complex
Kolkata
Dock
System
All Ports
Table 3.2.10

177
Operating Financial Parameters for Major Ports (Rs. In Lakh)
Item/Year Ennore
1 2 3 4 5 6 7 8 9 10 11 12 13 14 15
Operating Surplus1995-96 7183 26829 11803 1636 1438 2545 2587 10323 - 9718 6532 13067 5924 99585
1996-97 8077 21815 10624 2183 6041 4318 2760 10915 - 10455 6360 15310 6090 104948
1997-98 10095 21115 15033 2716 8302 4419 3808 10187 - 9581 7341 20411 7145 120153
1998-99 14602 17291 19622 2046 7241 3341 4079 9478 - 9250 5938 18039 6222 117149
1999-00 9878 10989 14018 3032 7650 3315 3789 7176 - 10553 6108 15885 4730 97123
2000-01 6558 (-)3663 11509 2030 6554 3014 5445 4564 - 11115 11119 26834 (-)54 85025
2001-02 7472 1716 16482 5484 8632 3133 5896 5888 1346 17134 9630 44086 901 127800
2002-03 7226 2793 22894 5927 10638 5347 6360 6521 5427 20988 16942 19694 669 131426
2003-04 4533 3781 30525 7296 11605 5958 5984 10717 4788 23303 19977 27045 (-)540 154972
2004-05 6348 11176 35828 7627 15957 6123 7342 11717 5027 27834 23197 31048 1403 190627
2005-06 8131 19983 39999 7876 13461 6391 9747 11874 5281 28536 25154 26331 7261 210025
2006-07 11940 25528 51484 9772 12662 6450 11404 18689 7103 28996 31416 41787 8225 265456
2007-08 9360 25090 57703 6288 13122 3889 12059 22724 9014 28609 38920 49480 11821 288079
2008-09 8230 17886 58969 5571 14905 1294 12126 21598 10243 24986 33854 45291 6511 261464
2009-10 8871 17492 64836 9158 13519 -87 12179 18551 11182 19609 35827 29905 6718 247760
2010-11 10975 18000 67818 13014 12032 159 14137 10418 13468 33093 31423 37007 5737 267281
2011-12 11773 20158 66752 10031 17568 2496 18501 6231 20603 29006 22173 29431 14481 269204
2012-13 26544 20935 48917 -3789 13154 -5578 15300 4409 28075 21346 24262 1794 5231 200600
Net Surplus (before tax)1995-96 12608 25434 12542 1936 2057 (-)565 2345 13514 - 5855 3954 8240 225 88145
1996-97 16279 19192 14252 2143 4147 2265 2646 17445 - 7398 4680 12907 1419 104773
1997-98 19020 17360 20475 3020 6914 4507 3624 16816 - 7505 5071 17050 297 121659
1998-99 21110 10764 23545 2274 3915 3125 3637 17094 - 6883 4801 11282 (-)1680 106750
1999-00 21492 8341 13305 2344 5572 271 3689 14526 - 2900 4670 8194 (-)3830 81474
2000-01 17065 (-)36735 10121 2220 4289 (-)3375 3738 3760 - 1946 7288 9657 (-)10411 9563
2001-02 19240 (-)15950 11297 773 4969 (-)3502 4049 21354 (-)3596 4283 3285 16848 (-)4810 58240
2002-03 17207 31386 17935 2336 5524 1940 5056 12668 656 5757 7889 12675 (-)5550 115478
2003-04 9062 (-)16254 26206 2737 5940 2134 5566 7419 (-)579 7781 12770 18865 (-)9320 66459
2004-05 19343 4676 33613 2265 7798 364 6919 11595 1001 1048 14117 23229 (-)7192 109747
2005-06 20001 28320 43716 4735 14368 2960 9039 15836 932 20564 19132 25049 2016 204439
2006-07 21624 18698 56915 4047 10916 2666 11345 26279 3462 18782 29292 43535 2976 250537
2007-08 24709 26796 67759 3985 12696 449 11560 43126 3943 11144 33090 43250 9737 292244
2008-09 22349 10749 71230 1133 14801 (-)1475 12346 26666 5224 16499 34654 19411 (-)13761 235062
2009-10 20168 2999 78337 2306 12866 (-)8926 13187 21115 5893 4375 43922 19158 (-)7030 224326
2010-11 16148 13995 78667 5499 10826 (-)8608 14897 6806 6986 17408 41595 18740 (-)4335 231567
2011-12 22751 7666 89295 2436 16657 (-)8391 14798 2213 12078 -9939 33306 8944 4880 205085
2012-13 38966 -4283 73075 (-) 10755 15126 (-)6515 12920 1827 21674 3704 26939 (-) 20788 (-) 9034 189948
Source : Major Ports
All PortsTuticorin Chennai Visakha-
patnam
Paradip Haldia
Dock
Complex
Kolkata
Dock
System
Kandla Mumbai J.L.
Nehru
Mormu-gao N.Manga-
lore
Cochin
Table 3.2.10 (Contd...)

178
Operating Ratio for Major Ports (In Percentage)
1 2 3 4 5 6 7 8 9 10 11 12 13 14 15
1994-95 46.32 63.27 56.88 71.34 63.17 75.87 72.07 57.31 - 62.35 56.20 56.12 74.98 61.79
1995-96 48.05 53.89 49.49 79.58 73.67 76.23 52.14 59.54 - 60.16 56.88 47.96 71.65 57.81
1996-97 49.57 63.19 56.82 75.84 49.00 68.65 53.09 60.16 - 61.46 60.91 52.04 72.70 60.46
1997-98 47.05 65.18 53.03 75.44 46.42 71.57 49.35 66.20 - 64.84 58.46 53.80 70.92 60.62
1998-99 37.13 71.53 48.78 83.08 53.26 79.49 52.25 69.83 - 66.21 65.63 71.95 76.23 65.67
1999-00 56.14 79.37 61.86 77.45 55.29 81.63 57.97 78.83 - 65.63 66.88 72.00 81.61 71.07
2000-01 63.76 107.89 64.72 87.46 62.62 83.58 52.47 87.68 - 68.12 57.58 62.26 100.22 76.02
2001-02 58.41 96.08 57.37 70.76 55.58 83.25 49.63 82.67 56.26 56.62 67.60 51.83 96.11 67.23
2002-03 65.91 93.91 48.12 68.40 47.44 73.35 48.95 80.56 29.40 50.91 55.56 69.72 96.93 66.45
2003-04 78.50 91.79 43.38 64.87 48.23 70.42 51.98 70.92 44.09 48.70 51.60 63.75 102.81 63.35
2004-05 73.13 80.43 43.14 64.63 40.39 70.49 46.72 70.97 45.36 44.54 50.79 59.96 93.23 59.59
2005-06 68.01 69.73 40.33 64.37 47.15 67.88 38.71 72.49 42.80 46.00 51.02 68.36 74.63 58.84
2006-07 63.95 66.33 35.87 62.11 50.53 69.59 37.68 65.07 29.71 45.67 47.36 56.38 73.79 54.38
2007-08 72.60 56.27 35.22 57.49 51.60 61.36 31.52 63.82 30.86 49.40 49.34 56.65 58.98 47.57
2008-09 79.87 77.88 38.90 79.77 50.48 93.79 44.81 67.84 25.65 58.34 51.41 55.48 82.15 60.83
2009-10 80.25 80.46 37.78 71.98 57.55 100.37 49.34 74.18 21.62 70.33 52.16 69.28 85.10 65.58
2010-11 77.69 81.21 39.59 65.00 60.92 99.42 45.85 84.77 19.50 55.20 55.45 59.93 87.52 65.75
2011-12 81.12 80.30 42.81 72.07 52.81 91.87 46.48 90.06 17.67 60.07 65.32 70.06 74.4 66.40
2012-13 65.99 81.87 55.14 117.08 58.93 117.9 57.97 93.01 13.8 69.63 64.62 97.57 89.62 74.36
Item/Year Kandla MumbaiJ.L.
Nehru
Mormu-
gao
N.Mang
a-lore
Haldia
Dock
Comple
x
Kolkata
Dock
System
All PortsCochinTuticori
nChennai Ennore
Visakha-
patnamParadip
Table 3.2.11

179
(In Numbers)
2004 2005 2006 2007 2008 2009 2010 2011 2012 2013
1 2 3 4 5 6 7 8 9 10 11
KPT 3788 3574 3506 3414 4237 4149 4008 3774 4500 4221
MbPT(a) 21480 19388 19682 14935 14481 14296 14059 13391 16379 15358
JNPT 1810 1791 1778 1766 1763 1746 1739 1730 1718 1706
MoPT 3385(a) 3243(a) 3135(a) 3082 3018 2967 2891 2817 2665 2538
NMPT(c) 2124 1985 1908 1832 1770 1819 1719 1636 1544 1435
CoPT(a) 4353 3959 3849 4823 4306 4103 3948 3749 3005 2766
TPT(b) 2788 2589 2574 2407 2259 2224 2191 2079 1954 1813
ChPT 10329(a) 8842(a) 8582(a) 9755 9065 8117 8020 7774 7511 6582
EPL 17 21 20 45 59 65 86 88 94 100
VPT 5889 5550 5216 5208 5069 5052 4877 4584 4189 4941
PPT 3407 3306 3158 3013 2910 2851 2761 2634 2437 2234
KDS 7551 6995 6530 6138 5925 5869 5675 5374 5068 4828
HDC 4285 4104 3964 3793 3694 3620 3498 3304 3111 2887
ALL MAJOR
PORTS71206 65347 63903 60211 58556 56878 55472 52934 54175 51409
(a) DLB merged with Port.
(b) Includes workers of cargo handling Labour Pool(TPTCHLP)..
(c) Includes workers of New Mangalore Port Cargo Handling workers (Regulation of Emloyment) Scheme,1990.
PORTYear
Employment of Manpower at Major Ports as on 31st March (2004-2013)Table 3.2.12

180
Number of Dock Workers Registered With
DLB'S of Major Ports (As on 31st March, 2004-2013) (In Numbers)
2004 2005 2006 2007 2008 2009 2010 2011 2012 2013
1 2 3 4 5 6 7 8 9 10 11
KPT 770 746 708 646 (a) (a) (a) 789 (a) (a)
MbPT (a) (a) (a) (a) (a) (a) (a) 2586 (a) (a)
MoPT (a) (a) (a) (a) (a) (a) (a) (a) (a) (a)
CoPT (a) (a) (a) (a) (a) (a) (a) (a) (a) (a)
ChPT (a) (a) (a) (a) (a) (a) (a) (a) (a) (a)
VPT 1113 1082 996 966 925 - 978 859 874 846
KDS 967 692 431 290 195 177 140 100 215 181
TOTAL 2850 2520 2135 1902 1120 177 1118 4334 1089 1027
(a) Dock Labour Board merged with Port Trust.
Number of Dock Workers Listed with
Major Ports (As On31st March, 2004-2013) (In Numbers)
2004 2005 2006 2007 2008 2009 2010 2011 2012 2013
1 2 3 4 5 6 7 8 9 10 11
ChPT (a) (a) (a) (a) (a) (a) (a) (a) (a) (a)
VPT 115 102 152 159 139 - - - - -
TOTAL 115 102 152 159 139 - - - - -
(a) DLB merged with Port.
PORT
PORT
Table 3.2.13
Table 3.2.14

181
Trend in Cargo Traffic Handled At Non-Major Ports
State-Wise (In'000 Tonnes)
States/
U.T. Unloaded Loaded Total Unloaded Loaded Total Unloaded Loaded Total
1 2 3 4 5 6 7 8 9 10
GUJARAT
2002-03 43445 17885 61330 7890 12341 20231 51335 30226 81561
2003-04 45309 20825 66134 8638 12560 21198 53947 33385 87332
2004-05 50336 24372 74708 8971 12462 21433 59307 36834 96141
2005-06 56207 26480 82687 9675 11165 20840 65882 37645 103527
2006-07 77431 21579 99010 9150 23105 32255 86581 44684 131265
2007-08 93761 40210 133971 8675 7875 16550 102436 48085 150521
2008-09 99713 34717 134430 10921 7460 18381 110634 42177 152811
2009-10* 129885 42967 172852 15242 17489 32731 145127 60456 205583
2010-11# 136606 59900 196506 16896 17505 34401 153502 77405 230907
2011-12& 157742 63572 221314 17749 19987 37736 175491 83559 259050
2012-13$ 185321 66824 252145 17747 17925 35672 203068 84749 287817
MAHARASHTRA
2002-03 3200 140 3340 4832 453 5285 8032 593 8625
2003-04 5021 202 5223 4280 829 5109 9301 1031 10332
2004-05 5782 1168 6950 4751 442 5193 10533 1610 12143
2005-06 4519 1086 5605 4901 650 5551 9420 1736 11156
2006-07 4441 765 5206 5952 422 6374 10393 1187 11580
2007-08 3840 1520 5360 5686 317 6003 9526 1837 11363
2008-09 2893 2376 5269 4813 334 5147 7706 2710 10416
2009-10 4971 646 5617 6092 337 6429 11063 983 12046
2010-11 4730 2411 7141 7539 195 7734 12269 2606 14875
2011-12 9196 3421 12617 7102 228 7330 16298 3649 19947
2012-13 11630 3131 14761 8759 678 9437 20389 3809 24198
GOA
2002-03 352 5011 5363 42 169 211 394 5180 5574
2003-04 418 7984 8402 - 34 34 418 8018 8436
2004-05 251 7935 8186 - 15 15 251 7950 8201
2005-06 333 11345 11678 - 84 84 333 11429 11762
2006-07 279 13992 14271 - 35 35 279 14027 14306
2007-08 89 12657 12746 - 79 79 89 12736 12825
2008-09 - 11900 11900 - 1 1 0 11901 11901
2009-10 218 13679 13897 - - - 218 13679 13897
2010-11 96 14468 14564 17 - 17 113 14468 14581
2011-12 165 14305 14470 - - - 165 14305 14470
2012-13 113 3276 3389 - - - 113 3276 3389
ANDHRA PRADESH
2002-03 3579 3822 7401 104 2731 2835 3683 6553 10236
2003-04 5249 1369 6618 220 3183 3403 5469 4552 10021
2004-05 8604 3003 11607 561 2899 3460 9165 5902 15067
2005-06 8130 6134 14264 688 2722 3410 8818 8856 17674
2006-07 8267 6882 15149 686 2774 3460 8953 9656 18609
2007-08 8900 7151 16051 533 2706 3239 9433 9857 19290
2008-09 14689 11882 26571 898 2251 3149 15587 14133 29720
2009-10 22546 17781 40327 1441 1922 3363 23987 19703 43690
2010-11 28663 11523 40186 1337 1744 3081 30000 13267 43267
2011-12 31364 8558 39922 2208 3503 5711 33572 12061 45633
2012-13 36643 9357 46000 3960 1851 5811 40603 11208 51811* : Container cargo is included in Overseas"Unloaded" (144.15 Lakh tonnes)
# : Container cargo is included in Overseas ( Unloaded 94.28 Lakh tonnes & Loaded 104.38 Lakh tonnes )
& : Container cargo is included in Overseas ( Unloaded 120.90 Lakh tonnes & Loaded 129.79 Lakh tonnes )
$ : Container cargo is included in Overseas ( Unloaded 116.54 Lakh tonnes & Loaded 129.64 Lakh tonnes )
Overseas Coastal Overseas & Coastal
Table 3.3.1
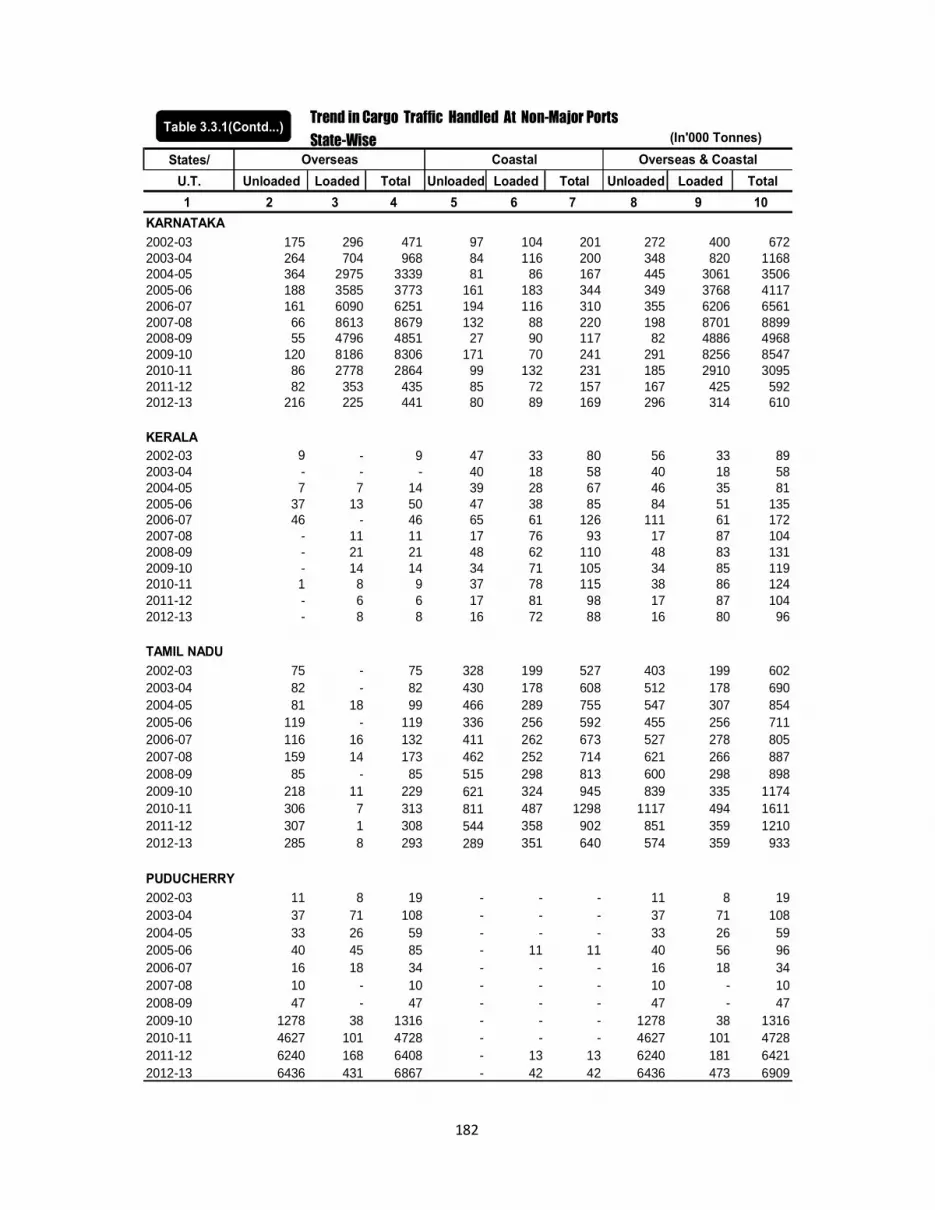
182
Trend in Cargo Traffic Handled At Non-Major PortsState-Wise (In'000 Tonnes)
States/U.T. Unloaded Loaded Total Unloaded Loaded Total Unloaded Loaded Total1 2 3 4 5 6 7 8 9 10
2002-03 175 296 471 97 104 201 272 400 6722003-04 264 704 968 84 116 200 348 820 11682004-05 364 2975 3339 81 86 167 445 3061 35062005-06 188 3585 3773 161 183 344 349 3768 41172006-07 161 6090 6251 194 116 310 355 6206 65612007-08 66 8613 8679 132 88 220 198 8701 88992008-09 55 4796 4851 27 90 117 82 4886 49682009-10 120 8186 8306 171 70 241 291 8256 85472010-11 86 2778 2864 99 132 231 185 2910 30952011-12 82 353 435 85 72 157 167 425 5922012-13 216 225 441 80 89 169 296 314 610
KERALA2002-03 9 - 9 47 33 80 56 33 892003-04 - - - 40 18 58 40 18 582004-05 7 7 14 39 28 67 46 35 812005-06 37 13 50 47 38 85 84 51 1352006-07 46 - 46 65 61 126 111 61 1722007-08 - 11 11 17 76 93 17 87 1042008-09 - 21 21 48 62 110 48 83 1312009-10 - 14 14 34 71 105 34 85 1192010-11 1 8 9 37 78 115 38 86 1242011-12 - 6 6 17 81 98 17 87 1042012-13 - 8 8 16 72 88 16 80 96
TAMIL NADU2002-03 75 - 75 328 199 527 403 199 6022003-04 82 - 82 430 178 608 512 178 6902004-05 81 18 99 466 289 755 547 307 8542005-06 119 - 119 336 256 592 455 256 7112006-07 116 16 132 411 262 673 527 278 8052007-08 159 14 173 462 252 714 621 266 8872008-09 85 - 85 515 298 813 600 298 8982009-10 218 11 229 621 324 945 839 335 11742010-11 306 7 313 811 487 1298 1117 494 16112011-12 307 1 308 544 358 902 851 359 12102012-13 285 8 293 289 351 640 574 359 933
PUDUCHERRY2002-03 11 8 19 - - - 11 8 192003-04 37 71 108 - - - 37 71 1082004-05 33 26 59 - - - 33 26 592005-06 40 45 85 - 11 11 40 56 962006-07 16 18 34 - - - 16 18 342007-08 10 - 10 - - - 10 - 102008-09 47 - 47 - - - 47 - 472009-10 1278 38 1316 - - - 1278 38 13162010-11 4627 101 4728 - - - 4627 101 47282011-12 6240 168 6408 - 13 13 6240 181 64212012-13 6436 431 6867 - 42 42 6436 473 6909
KARNATAKA
Overseas Coastal Overseas & Coastal
Table 3.3.1(Contd...)

183
Trend in Cargo Traffic Handled At Non-Major Ports
- State-Wise (In'000 Tonnes)
States/U.T. Unloaded Loaded Total Unloaded Loaded Total Unloaded Loaded Total1 2 3 4 5 6 7 8 9 10
ODISHA
2002-03 - - - - - - - - -2003-04 - - - - - - - - -2004-05 - - - - - - - - -2005-06 - - - - - - - - -2006-07 - - - - - - - - -2007-08 206 89 295 - - - 206 89 2952008-09 201 94 295 - - - 201 94 2952009-10 174 291 465 - - - 174 291 4652010-11 174 291 465 - - - 174 291 4652011-12 5064 - 5064 - 20 20 5064 20 50842012-13 8733 288 9021 - 2047 2047 8733 2335 11068
ANDAMAN NICOBAR ISLANDS
2002-03 - - - 538 203 741 538 203 741
2003-04 - - - 463 231 694 463 231 694
2004-05 5 - 5 630 247 877 635 247 882
2005-06 4 - 4 636 275 911 640 275 915
2006-07 6 - 6 1014 544 1558 1020 544 1564
2007-08 9 - 9 1341 809 2150 1350 809 2159
2008-09 76 - 76 1258 675 1933 1334 675 2009
2009-10$ 476 10 486 1082 506 1588 1558 516 2074
2010-11* 342 - 342 985 352 1337 1327 352 1679
2011-12# 10 - 10 950 248 1198 960 248 1208
2012-13 a 7 - 7 854 205 1059 861 205 1066
LAKSHADWEEP
2002-03 - - - 180 - 180 180 - 180
2003-04 - - - 26 - 26 26 - 26
2004-05 - - - 26 - 26 26 - 26
2005-06 - - - 26 - 26 26 - 26
2006-07 - - - 26 5 26 26 - 26
2007-08 - - - 26 - 26 26 - 26
2008-09 - - - 26 - 26 26 - 26
2009-10 - - - 26 - 26 26 - 26
2010-11 - - - 26 - 26 26 - 26
2011-12 - - - 26 - 26 26 - 26
2012-13 - - - 26 - 26 26 - 26
TOTAL
2002-03 50846 27162 78008 14058 16233 30291 64904 43395 108299
2003-04 56380 31155 87535 14181 17149 31330 70561 48304 118865
2004-05 65463 39504 104967 15525 16468 31993 80988 55972 136960
2005-06 69577 48688 118265 16470 15384 31854 86047 64072 150119
2006-07 90763 49342 140105 17498 27324 44817 108261 76661 184922
2007-08 107040 70265 177305 16872 12202 29074 123912 82467 206379
2008-09 117759 65786 183545 18506 11171 29677 136265 76957 213222
2009-10 159886 83623 243509 24709 20719 45428 184595 104342 288937
2010-11 175631 91487 267118 27747 20493 48240 203378 111980 315358
2011-12 210170 90384 300554 28681 24510 53191 238851 114894 353745
2012-13 249384 83548 332932 31731 23260 54991 281115 106808 387923* : Container cargo is included in Overseas"Unloaded" (3.25 Lakh tonnes)
# : Container cargo is included in Coastal"Unloaded" ( 2.84 Lakh tonnes)
a : Container cargo is included in Coastal"Unloaded" ( 2.40 Lakh tonnes) & Loaded ( .51 Lakh tonnes)
Overseas Coastal Overseas & Coastal
Table 3.3.1(Contd...)

184
Cargo Traffic Handled At Non-Major Ports
State-Wise & Commodity Wise. (In'000 Tonnes)
States POL & Iron ore Building Coal Fertiliser Others Total
Products Material & FRM
1 2 3 4 5 6 7 8
GUJARAT
1998-99 3740 2828 5077 4357 1846 5074 229221999-00 23738 3363 5808 6034 2420 5334 466972000-01 42736 2313 7930 8788 1910 7582 712592001-02 48496 3046 7987 7826 1988 10192 795352002-03 48852 3439 9691 8762 1894 8923 815612003-04 52538 4232 11226 6500 1969 10867 873322004-05 56479 4052 11512 9926 2342 11830 961412005-06 60149 5191 11000 10541 3636 13010 1035272006-07 71159 5713 11231 11306 4208 27648 1312652007-08 80484 6076 12430 13313 4361 33857 1505212008-09 87382 5900 9585 16464 5092 28388 1528112009-10* 132817 6845 9321 21636 5021 29943 2055832010-11a 140874 7156 8798 29731 6085 38263 2309072011-12 b 151487 6919 9022 38372 7185 46065 2590502012-13$ 165137 7636 8408 54337 6418 45881 287817
MAHARASHTRA
1998-99 209 2653 1446 529 0 358 51951999-00 751 3022 1284 475 0 514 60462000-01 495 3466 1279 395 0 410 60452001-02 98 2077 1354 826 0 602 49572002-03 92 4384 1249 1969 0 931 86252003-04 185 4573 1334 2911 117 1212 103322004-05 320 5471 3286 3592 194 1280 121432005-06 230 4947 1495 2550 38 1896 111562006-07 576 4582 1772 2290 473 1887 115802007-08 396 3735 2251 1992 442 2547 113632008-09 0 4273 2352 1460 277 2054 104162009-10 0 5055 2199 2880 221 1691 120462010-11 0 5120 2277 4997 228 2253 148752011-12 0 6362 2490 7589 230 3276 199472012-13 397 7818 2042 10396 84 3461 24198
GOA
1998-99 0 2065 0 104 0 5 21741999-00 0 2366 0 98 0 22 24862000-01 0 2738 0 410 0 40 31882001-02 0 2532 0 248 0 78 28582002-03 0 5176 0 358 0 40 55742003-04 0 8007 0 418 0 11 84362004-05 0 8193 0 0 0 8 82012005-06 0 11428 0 333 0 1 117622006-07 0 14027 0 279 0 0 143062007-08 0 12736 0 89 0 0 128252008-09 0 11901 0 0 0 0 119012009-10 0 13679 0 218 0 0 138972010-11 0 14581 0 0 0 0 145812011-12 0 14305 0 165 0 0 14470
2012-13 0 3276 0 113 0 0 3389
* a, b,$ : Containers cargo is included.
Table 3.3.2
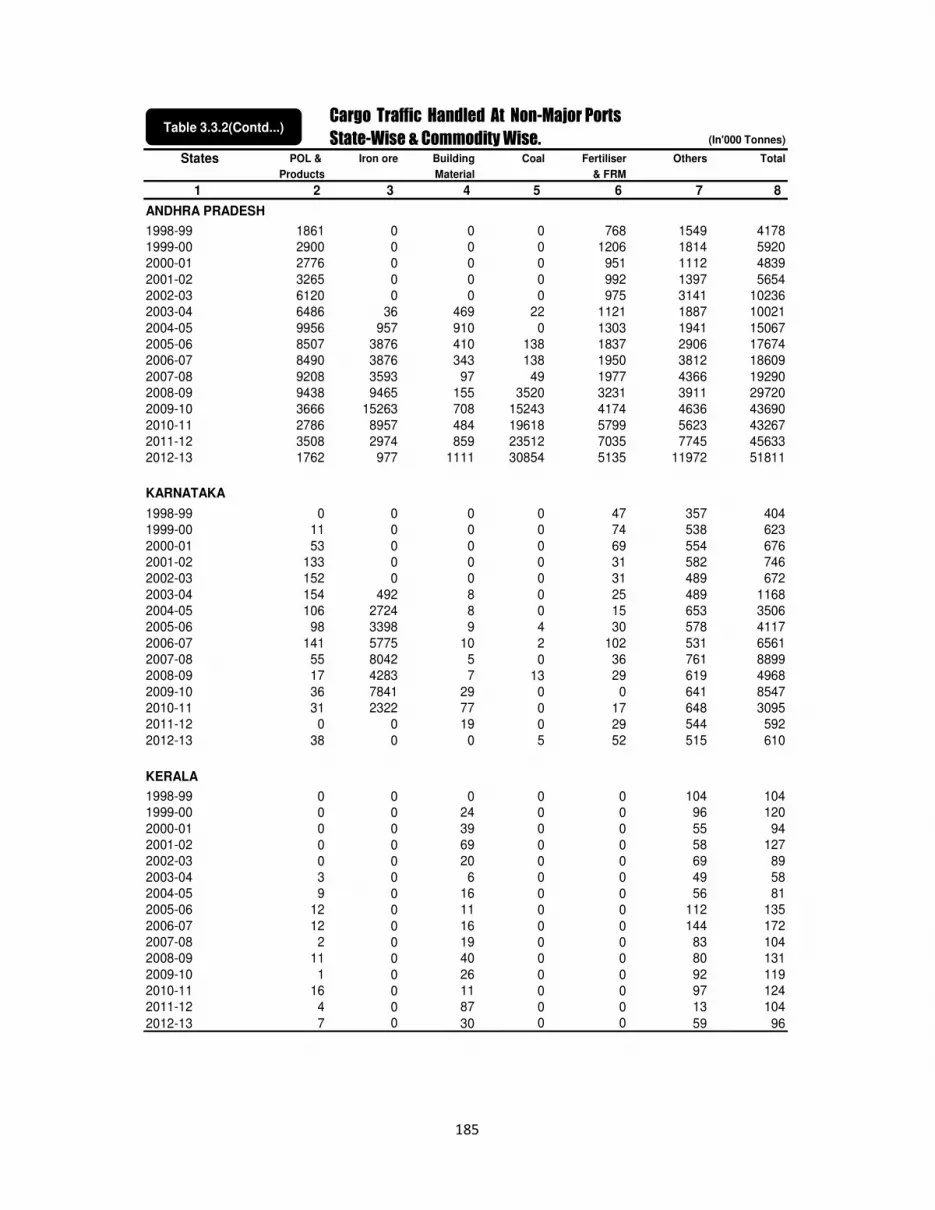
185
Cargo Traffic Handled At Non-Major Ports
State-Wise & Commodity Wise. (In'000 Tonnes)
States POL & Iron ore Building Coal Fertiliser Others Total
Products Material & FRM
1 2 3 4 5 6 7 8
ANDHRA PRADESH
1998-99 1861 0 0 0 768 1549 41781999-00 2900 0 0 0 1206 1814 59202000-01 2776 0 0 0 951 1112 48392001-02 3265 0 0 0 992 1397 56542002-03 6120 0 0 0 975 3141 102362003-04 6486 36 469 22 1121 1887 100212004-05 9956 957 910 0 1303 1941 150672005-06 8507 3876 410 138 1837 2906 176742006-07 8490 3876 343 138 1950 3812 186092007-08 9208 3593 97 49 1977 4366 192902008-09 9438 9465 155 3520 3231 3911 297202009-10 3666 15263 708 15243 4174 4636 436902010-11 2786 8957 484 19618 5799 5623 432672011-12 3508 2974 859 23512 7035 7745 456332012-13 1762 977 1111 30854 5135 11972 51811
1998-99 0 0 0 0 47 357 4041999-00 11 0 0 0 74 538 6232000-01 53 0 0 0 69 554 6762001-02 133 0 0 0 31 582 7462002-03 152 0 0 0 31 489 6722003-04 154 492 8 0 25 489 11682004-05 106 2724 8 0 15 653 35062005-06 98 3398 9 4 30 578 41172006-07 141 5775 10 2 102 531 65612007-08 55 8042 5 0 36 761 88992008-09 17 4283 7 13 29 619 49682009-10 36 7841 29 0 0 641 85472010-11 31 2322 77 0 17 648 30952011-12 0 0 19 0 29 544 5922012-13 38 0 0 5 52 515 610
KERALA
1998-99 0 0 0 0 0 104 1041999-00 0 0 24 0 0 96 1202000-01 0 0 39 0 0 55 942001-02 0 0 69 0 0 58 1272002-03 0 0 20 0 0 69 892003-04 3 0 6 0 0 49 582004-05 9 0 16 0 0 56 812005-06 12 0 11 0 0 112 1352006-07 12 0 16 0 0 144 1722007-08 2 0 19 0 0 83 1042008-09 11 0 40 0 0 80 1312009-10 1 0 26 0 0 92 1192010-11 16 0 11 0 0 97 1242011-12 4 0 87 0 0 13 104
2012-13 7 0 30 0 0 59 96
KARNATAKA
Table 3.3.2(Contd...)

186
Cargo Traffic Handled At Non-Major Ports
State-Wise & Commodity Wise. (In'000 Tonnes)
States POL & Iron ore Building Coal Fertiliser Others Total
Products Material & FRM
1 2 3 4 5 6 7 8
TAMIL NADU
1998-99 394 0 0 0 51 25 4701999-00 304 0 0 0 44 66 4142000-01 206 0 0 0 55 73 3342001-02 429 0 0 0 50 56 5352002-03 527 0 0 0 50 25 6022003-04 608 0 2 0 54 26 6902004-05 755 0 18 0 53 28 8542005-06 592 0 0 0 56 63 7112006-07 667 0 8 0 69 61 8052007-08 713 0 5 0 93 76 8872008-09 803 0 0 0 21 74 8982009-10 1035 0 0 0 45 94 11742010-11 1503 0 7 0 58 43 16112011-12 1114 0 7 0 46 43 12102012-13 631 0 6 0 252 44 933
PUDUCHERRY
1998-99 0 0 0 0 0 23 231999-00 0 0 0 0 0 0 02000-01 0 0 0 0 0 76 762001-02 0 0 0 0 0 95 952002-03 0 0 0 0 0 19 192003-04 0 0 67 0 0 41 1082004-05 0 0 24 0 0 35 592005-06 0 0 57 0 0 39 962006-07 0 0 17 0 0 17 342007-08 0 0 0 0 0 10 102008-09 0 0 0 0 0 47 472009-10 0 0 22 1157 0 137 13162010-11 0 0 2 3974 500 252 47282011-12 45 0 52 4839 1213 272 64212012-13 411 495 78 4666 607 652 6909
ODISHA
1998-99 0 0 0 0 0 120 1201999-00 0 0 0 0 0 154 1542000-01 0 0 0 0 0 140 1402001-02 0 0 0 0 0 18 182002-03 0 0 0 0 0 0 02003-04 0 0 0 0 0 0 02004-05 0 0 0 0 0 0 02005-06 0 0 0 0 0 0 02006-07 0 0 0 0 0 0 02007-08 0 41 0 0 201 53 2952008-09 0 41 0 0 201 53 2952009-10 0 130 0 142 32 161 4652010-11# 0 130 0 142 32 161 4652011-12 0 56 0 4563 0 465 5084
2012-13 0 1653 0 8893 0 522 11068# Data related to last year
Table 3.3.2(Contd...)

187
Cargo Traffic Handled At Non-Major Ports
State-Wise & Commodity Wise. (In'000 Tonnes)
States POL & Iron ore Building Coal Fertiliser Others Total
Products Material & FRM
1 2 3 4 5 6 7 8
ANDAMAN NICOBAR ISLANDS
1998-99 94 0 109 0 0 490 6931999-00 94 0 106 0 0 541 7412000-01 119 0 124 0 0 322 5652001-02 122 0 176 0 0 520 8182002-03 118 0 216 0 0 407 7412003-04 127 0 219 0 0 348 6942004-05 141 0 358 0 2 381 8822005-06 136 0 412 0 17 350 9152006-07 155 0 994 0 16 399 15642007-08 177 0 1457 0 2 523 21592008-09 165 0 1120 0 4 720 20092009-10 165 0 837 0 8 1064 20742010-11 168 0 671 0 6 834 16792011-12 164 0 330 0 4 710 12082012-13 182 0 278 0 0 606 1066
LAKSHADWEEP
1998-99 0 0 0 0 0 23 231999-00 0 0 0 0 0 182 1822000-01 0 0 0 0 0 150 1502001-02 0 0 0 0 0 181 1812002-03 0 0 0 0 0 180 1802003-04 0 0 0 0 0 26 262004-05 0 0 0 0 0 26 262005-06 0 0 0 0 0 26 262006-07 0 0 0 0 0 26 262007-08 0 0 0 0 0 26 262008-09 0 0 0 0 0 26 262009-10 0 0 0 0 0 26 262010-11 0 0 0 0 0 26 262011-12 0 0 0 0 0 26 262012-13 0 0 0 0 0 26 26
TOTAL
1998-99 6298 7546 6632 4990 2712 8128 363061999-00 27798 8751 7222 6607 3744 9261 633832000-01 46385 8517 9372 9593 2985 10514 873662001-02 52543 7655 9586 8900 3061 13779 955242002-03 55861 12999 11176 11089 2950 14224 1082992003-04 60101 17340 13331 9851 3286 14956 1188652004-05 67766 21397 16132 13518 3909 16238 1369602005-06 69724 28840 13394 13566 5614 18981 1501192006-07 81200 33973 14391 14015 6818 34525 1849222007-08 91035 34223 16264 15443 7112 42302 2063792008-09 97816 35863 13259 21457 8855 35972 2132222009-10 137720 48813 13142 41276 9501 38485 2889372010-11 145378 38266 12327 58462 12725 48200 3153582011-12 156322 30616 12866 79040 15742 59159 353745
2012-13 168565 21855 11953 109264 12548 63738 387923
Table 3.3.2(Contd...)

188
Transhipment Traffic at Non-Major Ports (In '000 Tonnes)
State/Port Commodity 2006-07 2007-08 2008-09 2009-10 2010-11 2011-12 2012-13
1 2 3 4 5 6 7 8 9
GUJARAT
Sikka Crude Oil - - - - - - -
Propylene - - - - - - -
Bedi Iron Ore - - - - - - -
Bhavnagar Iron Ore - - - - - - -
Clinker - - - - - - -
Iron&steel - - - - - - -
Lime stone - - - - - - -
Magdalla EDC - - - - - - -
Paraxylene - - - - - - -
Copper - - - - - - -
GAPL … - - - - - - -
Pipavav Salt - - - 2 - - -
MAHARASHTRA
Dharamtar 6437 5840 4850 6531 6531* N.A N.A
ANDHRA PRADESH - - - - - -
Kakinada - - - - - - -
Deep water Crude oil 5 - 6724 1509 901 108 226
- - - - - -
TAMIL NADU - - - - - -
Cuddalore - - - - - - -
Kerala - - - - - -
Kozhikode/Beypore - - 36 37 - - -
Total Transhipment
6442 5840 11610 8093 7432 108 226
* Data related to last year
Table 3.3.3

189
Passenger Traffic Handled At Non-Major Ports ('00 Nos.)
EmbarkedDis-
embarked EmbarkedDis-
embarked EmbarkedDis-
embarked
1 2 3 4 5 6 7
2003-04 - - 73204 56641 73204 56641
2004-05 2 2 75502 71871 75504 71873
2005-06 - - 132199 70477 132199 70477
2006-07 21 21 80632 74349 80653 74370
2007-08 16 133 83581 77346 83597 77479
2008-09 23 23 91981 80984 92004 81007
2009-10 7 7 73322 61894 73329 61901
2010-11 3 3 73412 61935 73415 61938
2011-12 32 32 110696 98984 110728 99016
2012-13 36 37 113729 102643 113765 102680
Overseas Coastal Total
Year
Table 3.3.4

190
Passenger Traffic Handled at Non-Major Port -Maritime State-wise (In '00 Nos.)
State/UT/Port 2003-04 2004-05 2005-06 2006-07 2007-08 2008-09 2009-10 2010-11 2011-12 2012-13
1 2 3 4 5 6 7 8 9 10 11
GUJARAT
Embarked - - - - - - 1 - - -
Disembarked - - - - - - 1 - - -
MAHARASHTRA 109713 130577 181380 130880 133172 142114 105648 105648 179264 184152
Embarked 63174 67057 121638 68492 69607 76718 58598 58598 95486 97582
Disembarked 46539 63520 59742 62388 63565 65396 47050 47050 83778 86570
KERALA 87 76 76 115 123 153 151 211 11 182
Embarked 52 39 39 56 63 73 72 101 5 92
Disembarked 35 37 37 59 60 80 79 110 6 90
TAMILNADU 15356 11458 10317 14920 16752 18580 19330 19250 20380 20698
Embarked 7678 5729 5158 7460 8376 9290 9665 9625 10190 10349
Disembarked 7678 5729 5159 7460 8376 9290 9665 9625 10190 10349
KARNATAKA 19 11 23 19 7 30 12 46 2 16
Embarked 8 6 11 11 4 15 8 23 1 8
Disembarked 11 5 12 8 3 15 4 23 1 8
ANDAMAN GROUP 4689 5255 10880 9089 11022 12061 10087 10198 10087 11397
Embarked 2300 2673 5353 4634 5547 5835 4985 5068 5046 5734
Disembarked 2389 2582 5527 4455 5475 6226 5102 5130 5041 5663
ALL MINOR/
INTERMEDIATE
PORTS
129864 147377 202676 155023 161076 172938 135230 135353 209744 216445
Embarked 73212 75504 132199 80653 83597 91931 73329 73415 110728 113765
Disembarked 56652 71873 70477 74370 77479 81007 61901 61938 99016 102680
* Data related to previous year
Table 3.3.5

191
Number Of Steamers/Sailing Vessels Entering Non-Major Ports in Various Maritime States-Wise (In Number)
Type of Gujarat Mahara- Goa Karna- Kerala Tamil Pudu- Andhra Odisha Seavessels/year shtra$ taka Nadu cherry Pradesh (a) Island #
1 2 3 4 5 6 7 8 9 10 11STEAMERS2006-07 5224 714 - 198 168 89 19 343 - 75492007-08 6136 865 - 171* 187 45 3 383 - 81872008-09 6741 867 - 110 211 120 12 1213 - 78042009-10 6808 796 - 242 235 259 51 1213 - 80412010-11 6730 796 - 217 209 80 137 1213 - 66162011-12 9125 401 - 137 151 126 206 719 - 62362012-13 9045 401 - 127 172 98 184 741 - 6647
SAILING VESSELS 2006-07 5590 13133 273 756 296 67 - 350 - 23802007-08 5522 11270 267 64* 364 260 - 688 16 23342008-09 5805 11630 192 757 390 338 - 1234 16 24502009-10 2477 17285 193 662 370 301 - 1234 20 20892010-11 2504 17285 191 644 340 413 - 1234 20 16982011-12 417 2429 172 677 467 234 - 1392 83 24382012-13 204 2429 35 705 334 293 148 1347 145 2827
TOTAL2006-07 10814 13847 273 954 464 156 19 693 - 99292007-08 11658 12135 267 235* 551 305 3 1071 16 105212008-09 12546 12497 192 867 601 458 12 2447 16 102542009-10 9285 18081 193 904 605 560 51 2447 20 101302010-11 9234 18081 191 861 549 493 137 2447 20 83142011-12 9542 2830 172 814 618 360 206 2111 83 86742012-13 9249 2830 35 832 506 391 332 2088 145 9474 # Data relates to Andaman & Nicobar Islands* Data related to Karwar & Malpe port only.$ Data related to previous year
Table 3.3.6

192
Employment of Manpower At Non Major Ports As On 31st March (In numbers)
2003 2004 2005 2006 2007 2008 2009 2010 2011 2012 20131 2 3 4 5 6 7 8 9 10 11 12
GUJARAT 2662 2048 1816 1265 1743 1718 1650 1590 981 1886 1814
MAHARASHTRA 173 165 154 154 154 153 130 84 84 158 361
GOA 166 139 139 134 133 146 140 140 141 148 155
DAMAN & DIU 22 22 22 22 22 22 22 22 22 13 10
KARNATAKA 99 76 105 109 103 55 146 145 145 -* -*
KERALA 316 257 121 121 185 191 175 175 195 136 133
TAMIL NADU 110 73 89 68 68 62 60 60 51 56 28
PUDUCHERRY 79 79 75 75 42 33 59 59 66 60 485
ANDHRA PRADESH 109 62 66 57 57 69 269 269 269 1153 1195
ANDAMAN & NICOBAR
Island 477 470 468 452 447 452 454 454 448 422 425
Orissa N.A N.A N.A N.A N.A 118 118 118 118 - 367
TOTAL 4213 3391 3055 2457 2954 3019 3223 3116 2520 4032 4973* In Karnataka , No Departmental dock labour in Minor Ports. All the labour activities are done by Private laboures appointed by Stevedores.
PORTYear
Table 3.3.7

SECTION – II
4. INTERNATIONAL
PORT STATISTICS

193
Table 4.1 Table 4.1
S.No. Port 2010 2011 2012
1 Ningbo & Zhoushan (PRC)1) 627 691 744
2 Shanghai (PRC) 2) 653 727.6 736
3 Singapore 503.3 531.2 538
4 Tianjin (PRC) 408 451 476
5 Rotterdam (Netherlands) 430.2 434.6 441.5
6 Guangzhou (PRC) 400 429 434
7 Qingdao (PRC) 350.1 375 402
8 Dalian(PRC) 300.8 338 373
9 Tangshan (PRC) 250.6 308 364.6
10 Yingkou(PRC) 225 261 301.1
11 Busan (South Korea)3 241.1 269.9 298.7
12 Rizhao (PRC) 221 252.6 281
13 Qinhuangdao (PRC) 257 287 271.5
14 Hong Kong 4) 267.8 277.4 269.3
15 Port Hedland (Australia) 177.5 197.7 260.1
16 Shenzen (PRC) 221 223 228.1
17 Port Klang( Maleisie) 171 194.2 197.9
18 Los Angles (USA) 204.8 203.9 193.1
19 Antwerp (Belgium) 178.2 187.2 184.1
20 Xiamen(China) 139.3 156.5 172
Total of Top 20 Ports 6226.7 6795.8 7166
Source: Port Statistics, Port of Rotterdam Authority;
PRC: Peoples Republic of China;
: 1) Port combined in 2006, 2) Including domestic trade and river trade: 3) Converted from freight ton to
metric ton; I, 4) Including river trade; China ports figures for 2012 are provisional
Top 20 World Major Ports (in Million Tonnes)Table 4.1

194
S.No. Port 2010 2011 2012
1 Shanghai (PRC)1) 29.07 31.74 32.53
2 Singapore 28.43 29.94 31.65
3 Hong Kong (PRC)2) 23.7 24.22 23.12
4 Shenzhen (PRC) 22.51 22.57 22.94
5 Busan (Republic Korea) 14.19 16.19 17.04
6 Zhoushan/Ningbo 3)(PRC) 13.14 14.69 16.83
7 Guangzhou(PRC) 12.55 14.4 14.74
8 Qingdao(PRC) 12.01 13.02 14.5
9 Dubai Ports (UAE) 11.6 13 13.28
11 Tianjin(PRC) 10.08 11.5 12.3
10 Rotterdam (Netherlands) 11.15 11.89 11.87
13 Port Klang (Malaysia) 8.87 9.6 10
12 Kaohsiung (Taiwan Province of
PRC)
9.18 9.64 9.78
14 Hamburg (Germany) 7.9 9.01 8.86
15 Antwerpen (Belgium) 8.47 8.66 8.64
16 Los Angles (USA) 7.83 7.94 8.08
17 Dalian(PRC) 5.24 6.4 8.06
18 Tanjung Pelepas (Malaysia) 6.53 7.5 7.7
19 Bremerhaven(Germany) 4.89 5.92 6.12
20 Long Beach (USA) 6.26 6.06 6.05
Total of Top 20 Ports 253.6 273.89 284.09
1) Including domestic trade: 2) including river trade: 3) Ports Combined in 2006
Top 20 World Container Ports (in Million TEUs)
Source: Port Statistics, Port of Rotterdam Authority;
PRC: Peoples Republic of China;
Table 4.2

195
S.No. Continent
2011 2010 2011 2010 2011 2010
1 Europe 1,40,875 1,42,732 62,211 68,171 2,03,086 2,10,903
2 Africa 31,225 32,011 7,004 7,016 38,229 39,027
3 America 73,452 70,959 15,422 13,739 88,874 84,698
4 Asia 55,891 53,143 40,771 35,239 96,662 88,382
5 Oceania 7,322 6,732 366 383 7,688 7,115
6 Not specified 0 0 13 33 13 33
Total 3,08,765 3,05,577 1,25,787 1,24,581 4,34,552 4,30,158
Source: Port of Rotterdam
Incoming Outgoing Total
Incoming and outgoing goods, grouped by continent, 2011 and 2010
Unit : Gross weight x 1,000 metric tonnes
Table 4.3

SECTION – II
5. GENERAL
STATISTICS

196
Gross Domestic Product by Economic Activity ( at 2004-05 prices)
(Rs. in Crore)
Industry2004-05 2005-06 2006-07 2007-08 2008-09 2009-10 2010-11^ 2011-12 @ 2012-13* 2009-10 2010-11^ 2011-12 @ 2012-13*
1 2 3 4 5 6 7 8 9 10 11 12 13 14
1. Agriculture, forestry&
fishing565426 594487 619190 655080 655689 660987 717814 753832 764510 0.8 8.6 5.0 1.4
1.1Agriculture 476643 502996 523745 556956 555442 557715 610905 643543 649424 0.4 9.5 5.3 0.9
1.2 Farestery & Logging 61640 62742 64795 65697 66932 68877 70509 71816 73864 2.9 2.4 1.9 2.9
1.3 Fishing 27152 28749 30650 32427 33315 34395 36400 38473 41222 3.2 5.8 5.7 7.1
2. Mining & quarrying 85028 86141 92578 95997 98055 103830 110617 110725 108328 5.9 6.5 0.1 -2.2
3. Manufacturing 453225 499020 570458 629073 656302 730435 795152 854098 863876 11.3 8.9 7.4 1.1
3.1 Registered 292344 327739 379374 417528 442055 506679 555240 607589 614569 14.6 9.6 9.4 1.1
3.2 Unregistered 160881 171281 191084 211545 214247 223756 239912 246509 249307 4.4 7.2 2.7 1.1
4. Elect.gas & water supply 62675 67123 73362 79430 83050 88218 92862 100646 102922 6.2 5.3 8.4 2.3
5. Construction 228855 258129 284806 315495 332329 354436 374708 415188 419795 6.7 5.7 10.8 1.1
6. Trade, hotels & restaurant 477303 535397 594918 655013 692224 747019 836352 846630 884308 7.9 12.0 1.2 4.5
6.1Trade 433967 484521 536693 589242 628627 682207 764018 771572 808908 8.5 12.0 1.0 4.8
6.2 Hotel&Restaurents 43336 50876 58225 65771 63597 64812 72334 75058 75400 1.9 11.6 3.8 0.5
7. Transport, storage &
communication250417 280010 315166 354507 392901 450872 507672 555631 589045 14.8 12.6 9.4 6.0
7.1.Railaway 29162 31339 34832 38235 41161 44763 47404 50963 51112 8.8 5.9 7.5 0.3
7.2.Transports by other means 169995 185741 202367 219969 231564 248380 268669 291886 311173 7.3 8.2 8.6 6.6
7.3Storege 1980 2073 2298 2375 2711 3233 3353 3450 3748 19.3 3.7 2.9 8.6
7.4.Communication 49280 60857 75669 93928 117465 154496 188246 209332 223012 31.5 21.8 11.2 6.5
8. Financing, insurance, real
estate & business services437174 492340 561063 628124 703629 771905 849189 945534 1048748 9.7 10.0 11.3 10.9
8.1. Banking & Insurance 171098 198158 238899 278776 317826 353983 406609 459142 513519 11.4 14.9 12.9 11.8
8.2.Real Estate,Ownership of
dwelling&Business Service266076 294182 322164 349348 385803 417922 442580 486392 535229 8.3 5.9 9.9 10.0
9. Community, social &
personal services411361 440426 452823 483917 544497 608369 634167 665246 700579 11.7 4.2 4.9 5.3
9.1.Public Admistration &
Defence174638 182212 185639 199773 239349 281365 280268 292138 302149 17.6 -0.4 4.2 3.4
9.2. Other Service 236723 258214 267184 284144 305148 327004 353899 373108 398430 7.2 8.2 5.4 6.8
10. GDP at factor cost (Total) 2971464 3253073 3564364 3896636 4158676 4516071 4918533 5247530 5482111 8.6 8.9 6.7 4.5
(9.5) (9.6) (9.3) (6.7) (8.6) (8.9) (6.7) (4.5)
Source: Central Statistical Organisation, Govt. of India.^- Third revised estimtes
@ : Second revised estimates , *First revised estimates # revisions have been made in Manufacuturing data for 2009-10 due to receipt of fresh data
% age change over previous year
Note: Figures in parentheses represent percentage change.
Table 5.1

197
Oil Non-oil Total Oil Non-oil Total Oil Non-oil Total
1 2 3 4 5 6 7 8 9 10
(US $ Million)
1990-91 522.70 17622.50 18145.20 6028.10 18044.40 24072.50 -5505.40 -421.90 -5927.30
1991-92 414.70 17450.70 17865.40 5324.80 14085.70 19410.50 -4910.10 3365.00 -1545.10
1992-93 476.20 18061.00 18537.20 6100.00 15781.60 21881.60 -5623.80 2279.40 -3344.40
1993-94 397.80 21840.50 22238.30 5753.50 17552.70 23306.20 -5355.70 4287.80 -1067.90
1994-95 416.90 25913.60 26330.50 5927.80 22726.50 28654.30 -5510.90 3187.10 -2323.80
1995-96 453.70 31341.20 31794.90 7525.80 29149.50 36675.30 -7072.10 2191.70 -4880.40
1996-97 481.80 32987.90 33469.70 10036.20 29096.20 39132.40 -9554.40 3891.70 -5662.70
1997-98 352.80 34653.70 35006.50 8164.00 33320.50 41484.50 -7811.20 1333.20 -6478.00
1998-99 89.40 33129.30 33218.70 6398.60 35990.10 42388.70 -6309.20 -2860.80 -9170.00
1999-00 38.90 36783.30 36822.20 12611.40 37059.30 49670.70 -12572.50 -276.00 -12848.50
2000-01 1869.70 42690.60 44560.30 15650.10 34886.40 50536.50 -13780.40 7804.20 -5976.20
2001-02 2119.10 41707.60 43826.70 14000.30 37413.00 51413.30 -11881.20 4294.60 -7586.60
2002-03 2576.50 50142.90 52719.40 17639.50 43772.60 61412.10 -15063.00 6370.30 -8692.70
2003-04 3568.40 60274.20 63842.60 20569.50 57579.60 78149.10 -17001.10 2694.60 -14306.50
2004-05 6989.30 76546.60 83535.90 29844.10 81673.30 111517.40 -22854.80 -5126.70 -27981.50
2005-06 11639.60 91450.90 103090.50 43963.10 105202.60 149165.70 -32323.50 -13751.70 -46075.20
2006-07 18634.60 107779.50 126414.10 56945.30 128790.00 185735.30 -38310.70 -21010.50 -59321.20
2007-08 28363.10 134541.10 162904.20 79644.50 171794.60 251439.10 -51281.40 -37253.50 -88534.90
2008-09 27547.00 157748.00 185295.00 93671.70 210024.60 303696.30 -66124.70 -52276.60 -118401.30
2009-10 28192.00 150559.00 178751.00 87136.00 201237.00 288373.00 -58944.00 -50678.00 -109622.00
2010-11 41480.00 209656.20 251136.20 105964.40 263804.70 369769.10 -64484.40 -54148.50 -118632.90
2011-12 56038.50 249925.30 305963.80 154967.60 334351.90 489319.50 -98929.10 -84426.60 -183355.70
2012-13 60290.70 240279.80 300570.50 169319.30 322167.90 491487.20 -109028.60 -81888.10 -190916.70
(Rupees Crore)
1990-91 937.80 31619.83 32557.63 10816.11 32376.75 43192.86 -9878.31 -756.92 -10635.23
1991-92 1022.27 43019.54 44041.81 13126.72 34724.12 47850.84 -12104.45 8295.42 -3809.03
1992-93 1379.25 52309.00 53688.25 17141.70 46232.62 63374.32 -15762.45 6076.38 -9686.07
1993-94 1247.79 68503.60 69751.39 18046.19 55054.82 73101.01 -16798.40 13448.78 -3349.62
1994-95 1308.98 81365.13 82674.11 18612.55 71358.11 89970.66 -17303.57 10007.02 -7296.55
1995-96 1517.75 104835.59 106353.34 25173.60 97504.54 122678.14 -23655.85 7331.05 -16324.80
1996-97 1710.35 117106.73 118817.08 35628.52 103291.16 138919.68 -33918.17 13815.57 -20102.60
1997-98 1310.99 128789.65 130100.64 30341.19 123835.11 154176.30 -29030.20 4954.54 -24075.66
1998-99 376.22 139376.92 139753.14 26919.28 151412.57 178331.85 -26543.06 -12035.65 -38578.71
1999-00 168.45 159392.94 159561.39 54648.60 160587.87 215236.47 -54480.15 -1194.93 -55675.08
2000-01 8541.67 195029.34 203571.01 71496.52 159376.24 230872.76 -62954.85 35653.10 -27301.75
2001-02 10106.58 19894.39 209017.97 66769.86 178429.86 245199.72 -56663.28 20481.53 -36181.75
2002-03 12469.22 242668.06 255137.28 85367.00 211838.87 297205.87 -72897.78 30829.19 -42068.59
2003-04 16397.44 276969.31 293366.75 94520.00 264587.66 359107.66 -78122.56 12381.65 -65740.91
2004-05 31404.20 343935.40 375339.60 134094.00 366970.50 501064.50 -102689.80 -23035.10 -125724.90
2005-06 51532.80 404885.10 456417.90 194640.00 465768.90 660408.90 -143107.20 -60883.80 -203991.00
2006-07 84520.20 487259.10 571779.30 258571.80 581934.60 840506.40 -174051.60 -94675.50 -268727.10
2007-08 114191.70 541671.80 655863.50 320654.50 691657.20 1012311.70 -206462.80 -149985.40 -356448.20
2008-09 123397.90 717357.20 840755.10 419967.60 954468.00 1374435.60 -296569.70 -237110.80 -533680.50
2009-10 132900.00 712630.00 845530.00 411650.00 952090.00 1363740.00 -278750.00 -239460.00 -518210.00
2010-11 188779.00 954143.00 1142922.00 482282.00 1201185.00 1683467.00 -293503.00 -247042.00 -540545.00
2011-12 267915.00 1198045.00 1465960.00 743075.00 1602388.00 2345463.00 -475160.00 -404343.00 -879503.00
2012-13 327679.00 1307582.00 1635261.00 920456.00 1752657.00 2673113.00 -592777.00 -445075.00 -1037852.00
Source: Directorate General of Commercial Intelligence and Statistics & RBI
Exports Imports Trade BalanceYear
India's Foreign TradeTable 5.2

198
Commodity
2007-08 2008-09 2009-10 2010-11 2011-12 2012-13(P) 2007-08 2008-09 2009-10 2010-11 2011-12(P) 2012-13(P)
1 2 3 4 5 6 7 8 9 10 11 12 13
I Bulk Imports 112744.8 138791.1 125315.1 151167.3 214933.2 229572.7 453918.0 627486.4 592784.6 688237.3 1030446.0 1248294.0
A. Petroleum, Crude and Products 79644.6 93671.7 87135.9 105964.4 154967.6 169319.3 320654.5 419967.6 411649.1 482281.7 743075.0 920456.0
B. Bulk Consumption Goods 4600.3 4975.3 9012.7 8854.9 11654.8 14219.8 18521.0 22883.3 42759.3 40344.9 55852.0 77370.0
1. Cereals and Cereal Preparations 705.2 47.0 104.7 119.7 73.6 83.2 2839.1 216.2 496.8 545.3 352.0 453.0
2. Edible Oils 2558.6 3443.4 5582.1 6553.7 9652.0 11230.8 10301.1 15837.5 26483.3 29860.4 46255.0 61106.0
3. Pulses 1335.0 1358.1 2068.4 1569.2 1863.7 2341.2 5374.9 6246.4 9813.4 7149.6 8931.0 12739.0
4. Sugar 1.5 126.8 1257.5 612.3 65.5 564.6 5.9 583.2 5965.8 2789.6 314.0 3072.0
C. Other Bulk Items 28499.9 40144.1 29166.5 36348.0 48310.8 46033.6 114742.5 184635.5 138376.2 165610.7 231519.0 250468.0
1. Fertilizers 5405.9 13626.5 6836.9 7162.1 11601.2 9085.3 21764.9 62672.7 32437.2 32632.1 55597.0 49433.0
a) Crude 467.3 1062.6 701.1 715.7 1749.0 1348.1 1881.6 4887.4 3326.2 3260.9 8382.0 7335.0
b) Sulpher and Unroasted Iron Pyrities 362.0 651.2 143.7 241.3 476.9 319.6 1457.5 2994.8 682.0 1099.3 2286.0 1739.0
c) Manufactured 4576.6 11912.7 5992.1 6205.1 9375.3 7417.6 18425.8 54790.5 28429.0 28271.9 44929.0 40359.0
2. Non Ferrous Metals 3505.2 5699.3 3006.5 4080.2 4888.7 5123.8 14112.3 26213.0 14264.0 18590.2 23428.0 27878.0
3. Paper, Paperboards, Mgfs. Incl. News Prints 1424.8 1770.3 1504.1 2110.0 2567.7 2379.1 5736.2 8142.0 7136.1 9614.0 12305.0 12945.0
4. Crude Rubber,incl. Synthetic and Reclaimed 785.7 860.8 1014.6 1772.1 2501.9 2234.3 3163.3 3959.0 4813.4 8074.0 11990.0 12157.0
5. Pulp and Waste Paper. 778.0 805.6 880.7 1143.1 1361.5 1284.3 3132.1 3705.0 4178.1 5208.4 6524.0 6988.0
6. Metalliferrous Ores, Metal Scrap, etc. 7911.7 7906.3 7682.8 9704.6 13380.5 14982.2 31852.9 36363.6 36449.9 44216.6 64123.0 81518.0
7. Iron and Steel 8688.6 9475.3 8240.9 10375.9 12009.3 10944.6 34980.8 43580.2 39097.5 47275.4 57552.0 59549.0
II. Non-Bulk Imports 138694.5 164905.2 163057.9 218602.4 274386.5 261914.7 558393.8 746949.3 770951.5 995230.2 1315017.0 1424819.0
A.Capital Goods 70110.4 71833.0 65865.1 78546.2 99223.2 91449.8 282269.3 330384.3 312485.5 357876.4 475508.0 497576.0
1. Manufactures of Metals 2662.7 3254.9 2402.1 3328.9 4261.6 4288.4 10720.2 14970.5 11396.3 15167.3 20423.0 23333.0
2. Machine Tools 2208.0 2259.8 1655.7 2255.3 2986.2 2761.5 8889.6 10393.6 7855.3 10275.5 14311.0 15025.0
3. Machinery except Electrical and Electronic 19860.4 21601.0 19683.1 23846.8 30110.8 27642.8 79959.4 99350.3 93383.3 108652.1 144300.0 150404.0
4. Electrical Machinery except Electronic 2870.5 3685.5 3113.4 3843.0 4778.2 4454.2 11556.9 16951.0 14770.8 17509.6 22899.0 24235.0
5. Electronic Goods 20209.9 23333.8 20955.2 26560.6 32657.4 31457.4 81366.3 107319.8 99418.6 121017.2 156504.0 171159.0
6. Computer Goods 893.8 1274.6 1680.5 1129.7 1539.2 574.6 3598.3 5862.5 7972.8 5147.1 7376.0 3126.0
7. Transport Equipment 20111.6 13230.3 11692.3 11437.5 14079.6 13713.3 80970.7 60850.7 55471.9 52112.2 67474.0 74614.0
8. Project Goods 1293.5 3193.1 4682.8 6144.4 8810.2 6557.6 5207.9 14685.9 22216.5 27995.6 42221.0 35680.0
B.Mainly Exported Related Items 20768.2 31930.8 31270.1 53608.3 51895.2 46844.9 83614.6 146860.0 148355.2 244253.4 248697.0 254882.0
1. Perals, Precious and Semi-Precious Stones 7971.6 16581.3 16162.1 34588.9 28017.2 22619.2 32094.3 76263.0 76678.3 157596.1 134266.0 123071.0
2. Organic and Inorganic Chemicals 9896.6 12203.0 11903.2 15220.8 18841.8 19256.7 39844.5 56125.4 56472.7 69349.8 90296.0 104775.0
3. Textile Yarn, Fabrics, Made-ups, etc, 2474.1 2565.4 2562.4 3217.1 3922.2 3989.2 9961.0 11799.2 12156.7 14658.0 18796.0 21705.0
4. Cashew Nuts 425.9 581.1 642.4 581.5 1114.0 979.8 1714.8 2672.4 3047.5 2649.6 5339.0 5331.0
C.Others 47815.9 61141.4 65922.7 86447.9 123268.1 123620.0 192509.8 269705.0 310110.9 393100.4 590812.0 672361.0
1.Gold and Silver 17866.9 22783.0 29601.7 42482.7 61401.8 55674.1 71933.5 104786.4 140440.4 193562.0 294255.0 302922.0
a). Gold 16723.6 20725.6 28640.00 40546.9 56319.8 53694.1 67330.4 95323.8 135877.9 184742.00 269901.00 292149.0
b). Silver 1143.3 2057.4 961.70 1935.8 5082.0 1980.0 4603.1 9462.6 4562.5 8820.00 24354.00 10773.0
2. Articificial Resins and Plastic Materials, etc. 3685.2 3939.1 4990.1 6870.5 7540.0 8623.9 14836.6 18117.3 23674.7 31303.6 36134.0 46923.0
3. Professional, Scientific Controlling Instruments,
Photographic Optical Goods 3899.6 4420.3 3616.3 4214.0 5247.2 5367.7 15700.0 20330.4 17157.0 19200.0 25146.0 29206.0
4. Coal, Coke and Briquittes, etc. 6423.7 9990.2 8960.4 9804.1 17443.9 15438.1 25862.2 45948.0 42511.1 44669.9 83596.0 83999.0
5. Medical and Phamacuitical Products 1671.7 1886.1 2099.1 2439.3 2981.4 3118.0 6730.4 8674.8 9959.0 11113.9 14288.0 16965.0
6. Chemical Materials and Products. 1625.3 2092.8 2292.1 2914.3 3462.9 3631.0 6543.6 9625.6 10874.3 13278.1 16595.0 19756.0
7. Non-Metallic Mineral Manufactures 1046.6 1171.4 1080.8 1523.2 2064.5 2068.3 4213.7 5387.7 5127.7 6939.9 9894.0 11253.0
8. Others 11596.9 14858.5 13282.2 16199.8 23126.4 29698.9 46689.8 56834.8 60366.7 73033.0 110904.0 161337.0
Toal Imports 251439.3 303696.3 288373.0 369769.7 489319.7 491487.4 1012311.8 1374435.7 1363736.1 1683467.5 2345463.0 2673113.0
P: Provisional
Source: Directorate General of Commercial Intelligence and Statistics.
(Rupees crore)
Import of Principal Commodities
(US$ Million)
Table 5.3

199
Export of Principal Commodities
2006-07 2007-08 2008-09 2009-10 20010-11 2011-12 2012-13 2007-08 2008-09 2009-10 2010-11 2011-12 2012-13
1 2 3 4 5 6 7 8 9 10 11 12 13 14
1. Primary Products 19685.8 27551.9 25335.4 26396.6 32844.2 45923.6 46200.3 110925.8 116526.6 125233.9 149648.4 220080.1 251373.0
A. Agriculture and Allied Products12683.3 18432.1 17534.9 17734.2 24207.6 37473.3 40641.7 74208.9 80649.6 84136.3 110295.8 179583.1 221130.0
1. Tea 435.3 505.3 584.6 620.4 736.2 851.1 859.6 2034.2 2688.9 2943.5 3354.3 4079.0 4677.0
2. Coffee 435.1 465.0 490.4 428.3 660.6 946.2 866.1 1872.3 2255.8 2032.1 3009.9 4535.0 4713.0
3. Rice 1554.9 2919.6 2427.4 2372.3 2542.9 5030.7 6213.6 11754.6 11164.4 11254.9 11586.1 24109.0 33808.0
4. Wheat 7.8 0.1 0.3 0.2 0.2 213.5 1927.7 0.0 2.0 0.0 1.0 1023.8 10488.0
5.Cotton raw including waste 1349.8 2202.0 623.1 2010.2 2888.4 4512.3 3641.4 8865.4 2865.9 9537.1 13160.5 21624.0 19813.0
6. Tobacco 372.4 479.8 752.5 915.7 874.7 836.0 925.6 1931.9 3461.1 4344.4 3985.4 4006.1 5036.0
7. Cashew incl. Cashew Nut Shell Liquid553.9 555.1 637.2 596.3 626.2 928.6 753.0 2234.8 2930.7 2829.2 2853.2 4450.2 4097.0
8. Spices 697.9 1071.7 1378.1 1297.8 1765.4 2758.6 2815.5 4314.9 6338.4 6157.3 8043.5 13220.0 15319.0
9. Oil Meals 1216.4 2022.0 2232.8 1650.8 2429.5 2461.6 2907.9 8140.5 10269.2 7831.8 11069.6 11796.0 15822.0
10. Fruits and Vegitables 26.9 761.6 982.6 1128.9 1076.5 1200.4 1238.1 3066.4 4519.4 5355.9 4905.0 5752.0 6736.0
11. Processed Fruits, Juices, misc. 405.8 530.5 690.7 686.0 805.4 1145.3 1273.5 2135.8 3176.6 3254.6 3669.0 5489.0 6929.0
Processed items
12. Marine Products 1768.2 1720.5 1536.4 2086.7 2615.6 3460.7 3461.3 6926.7 7066.4 9900.0 11917.1 16585.0 18833.0
13. Sugar and Mollases 720.6 1406.5 985.2 27.4 1236.4 1872.0 1617.7 5662.8 4531.4 130.0 5633.3 8971.0 8802.0
14. Meat and Meat preparations 732.4 931.3 1167.9 1325.0 1966.5 2944.5 3290.3 3749.5 5371.4 6286.1 8960.1 14111.0 17902.0
15. Others 2405.9 2861.1 3045.7 2588.2 3983.1 8311.8 8850.4 11519.1 14008.0 12279.4 18148.0 39832.0 48155.0
B. Ores and Minerals 7002.5 9119.8 7800.5 8662.4 8636.6 8450.3 5558.6 36716.9 35877.0 41097.6 39352.7 40497.0 30243.0
1. Iron Ore 3902.0 5812.0 4723.6 5978.9 4700.3 4629.1 1600.3 23399.7 21725.2 28366.1 21415.6 22184.0 8707.0
2. Mica 16.8 21.8 29.6 27.8 41.5 49.6 50.6 87.5 136.2 132.0 189.2 238.0 275.0
3. Others 3083.7 3286.0 3047.3 2655.7 3894.8 3771.6 3907.7 13229.7 14015.6 12599.5 17747.9 18075.0 21261.0
II. Manufactured Goods 84920.4 102978.8 123148.9 115180.7 157994.5 185422.7 183718.8 414599.3 566402.4 546455.7 719862.4 888597.8 999614.0
A. Leather and Manufactures 3016.7 3502.5 3556.0 3361.1 3910.6 4793.6 4870.2 14101.3 16355.1 15946.4 17817.8 22972.0 26499.0
B. Chemicals and Related Products17335.4 21193.8 22708.2 22908.8 28871.1 37104.6 39929.7 85327.7 104442.1 108686.7 131544.0 177816.0 217257.0
1. Basic Chemicals,pharmaceuticals10958.8 13952.4 15628.4 15767.5 19305.0 24528.5 27043.4 56173.4 71880.0 74806.2 87958.5 117548.0 147143.0
&cosmetics
2. Plastic and Linoleum Products3252.6 3418.6 3004.2 3354.1 4674.2 6241.5 6311.1 13763.4 13817.3 15912.8 21296.8 29911.0 34339.0
3. Rubber, Glass, Paints, Enamels and 2372.8 2886.3 2992.2 2752.5 3595.9 4727.9 5075.0 11620.5 13762.0 13058.9 16384.0 22658.0 27613.0
Products
4 Residual Chemicals &allied products751.2 936.5 1083.4 1034.7 1296.0 1606.7 1500.2 3770.5 4982.8 4908.8 5904.7 7700.0 8163.0
C. Engineering goods 29567.1 37365.1 47285.5 38271.2 58137.9 67832.3 65288.6 150434.8 217482.0 181571.7 264891.0 325072.0 355236.0
1. Iron & Steel 5238.6 5446.5 5822.7 3622.2 5113.3 6587.9 6225.9 21928.1 26780.6 17185.1 23297.4 31571.0 33875.0
2. Manufacture of metals 5081.2 7051.3 7548.2 5523.0 8456.0 9581.9 10034.3 28389.0 34716.7 26203.0 38527.6 45919.0 54597.0
3. Machinery & instruments 6722.8 9128.1 10945.5 9539.0 11839.0 14310.8 15215.6 36750.3 50341.9 45256.3 53941.8 68582.0 82788.0
4. Transport equipment 4949.9 7024.7 11153.3 9824.3 16048.5 21140.5 18409.3 28282.1 51297.8 46609.8 73121.3 101311.0 100165.0
5. Electronic goods 2854.0 3361.1 6805.6 5458.2 8203.7 8851.5 8065.2 13532.2 31301.4 25895.4 37378.0 42419.0 43883.0
6. Others 4720.6 5353.4 5010.2 4304.5 8477.4 7359.7 7338.3 21553.1 23043.6 20422.1 38625.0 35270.0 39928.0
D. Textile &textile products 17373.2 19425.8 20016.4 19853.1 24225.0 28026.6 27343.0 78209.3 92061.9 94189.3 110374.6 134309.8 148774.0
1.Cotton yarn,fabrics ,made-ups etc 4218.7 4653.3 4115.7 3684.2 5785.6 6805.1 7516.6 18734.4 18929.5 17479.1 26360.8 32611.8 40898.0
2. Natural silk yarn ,fabrics, made-ups etc.441.9 385.8 363.1 302.7 374.2 208.5 167.7 1553.1 1670.0 1436.0 1705.0 999.0 912.0
including silk waste
3. Man made yarn, fabrics, made-ups etc.2204.4 2897.0 3026.3 3602.7 4277.7 5069.5 4535.2 11663.3 13918.8 17092.5 19490.0 24294.0 24676.0
4. Manmade staple fibre 196.4 278.6 254.8 356.4 421.4 574.4 507.2 1121.7 1172.0 1690.7 1920.0 2753.0 2760.0
5. Woolen yarn, fabrics , made-ups etc.85.2 92.8 99.3 89.6 110.0 151.3 121.1 373.6 456.5 424.9 501.0 725.0 659.0
6. Readymade garments 8892.3 9687.1 10935.0 10705.6 11601.8 13691.2 12925.6 39001.0 50293.5 50791.0 52860.9 65612.0 70328.0
7. Jute & jute manufactures 260.4 327.7 299.1 217.8 459.2 464.5 387.2 1319.4 1375.8 1033.1 2092.1 2226.0 2107.0
8. Coir & coir manufactures 145.9 160.2 148.0 160.1 159.5 212.5 197.0 644.9 680.7 759.7 726.5 1018.0 1072.0
9. Carpets 928.0 943.3 775.1 734.0 1035.6 849.6 985.4 3797.9 3565.1 3482.3 4718.3 4071.0 5362.0
(a) Carpet handmade 898.7 925.4 762.4 725.4 1033.0 845.4 981.6 3725.8 3506.4 3441.7 4706.7 4051.0 5341.0
(b) Carpet millmade 0.0 0.0 0.0 0.0 0.0 0.0 0.0 0.0 0.0 0.0 0.0
(c) Silk carpet 29.3 17.9 12.8 8.6 2.6 4.2 3.8 72.1 58.7 40.6 11.7 20.0 21.0
E. Gems & Jewellery 15977.0 19678.7 27955.2 28996.3 40476.1 44840.5 43457.4 79227.7 128575.2 137568.0 184419.5 214889.0 236451.0
F. Handicrafts(excluding carpets)438.0 508.2 301.0 224.8 256.9 277.9 200.2 2046.2 1384.2 1066.6 1170.5 1332.0 1089.0
G. Other manufactured goods. 1213.0 1304.6 1326.7 1565.5 2116.9 2547.2 2629.7 5252.3 6101.9 7427.0 9645.0 12207.0 14308.0
III. Petroleum Products 18634.6 28363.1 27547.0 28192.0 41480.0 56038.5 60290.7 114191.7 123397.9 132899.0 188779.0 267915.0 327679.0
IV. Others 3173.2 4010.5 9263.7 8982.2 18817.7 18579.1 10361.0 16146.6 34428.9 40945.0 84633.0 89366.0 56597.0
Total Exports 126414.1 162904.3 185295.0 178751.5 251136.3 305963.9 300570.8 655863.4 840755.8 845533.6 1142922.8 1465958.9 1635263.0
P: Provisional
Source: Directorate General of Commercial Intelligence and Statistics.
Commodity(US$ Million) (Ruppees Crore)
Table 5.4

200
Share of Sea-borne Trade in the Total Foreign Trade(Value In Rs. Crore)
Total Share of Sea Total Share of Sea Share Of Sea
Exports Borne in Imports Borne in Borne Trade
Year Including Exports(In Imports(In To Total
Re-exports Percentage) Percentage) Foreign Trade
(In Percentage)
1 2 3 4 5 6
1982-83 8803 79.0 14293 86.5 83.7
1983-84 9771 74.4 15831 85.4 81.2
1984-85 11744 77.3 17134 87.7 83.6
1985-86 10895 71.7 19658 87.9 82.2
1986-87 12569 65.8 20201 82.7 76.1
1987-88 15674 62.1 22244 77.2 71.0
1988-89 20232 59.7 28235 72.9 67.4
1989-90 27681 59.5 35416 69.6 65.2
1990-91 32553 67.3 43193 81.1 75.1
1991-92 44042 66.6 47851 80.8 74.0
1992-93 53688 64.9 63375 78.0 72.0
1993-94 69751 66.1 73101 96.0 81.4
1994-95 82673 64.3 89971 79.8 72.4
1995-96 106353 63.7 122678 80.7 72.8
1996-97 118817 67.4 138920 82.4 75.5
1997-98 130101 64.4 154176 74.7 70.0
1998-99 139752 62.2 178332 67.9 65.4
1999-00 159095 58.4 215528 68.8 64.4
2000-01 129940 64.5 156166 68.4 66.6
2001-02 209018 64.6 245200 68.2 66.5
2002-03 255137 65.1 297206 61.5 63.2
2003-04 293367 64.8 359108 65.1 65.0
2004-05 375340 66.2 501065 65.8 65.9
2005-06 456418 69.1 660409 70.3 69.8
2006-07 571779 64.2 840506 66.6 65.6
2007-08 655864 66.0 1012312 67.1 66.6
2008-09 840755 ... 1374436 ... ...
2009-10 845534 ... 1363736 ... ...
2010-11 1142922 ... 1683467 ... ...
2011-12 1465959 ... 2345463 ... ...
2012-13 1635263 ... 2673113 ... ...
Source : DGCI & S, Ministry Of Commerce
Table 5.5

201
Outlay And Expenditure - Port Sector (Central)
Actual Actual Actual Actual Actual Actual Actual
Exp. Exp. Exp. Exp. Exp. Exp.Exp.(Upto
Feb,14.)
1 2 3 4 5 6 7 8 9 10 11 12 13 14 15
Kolkata (a) 37.37 63.05 44.97 53.64 58.00 48.85 50.88 49.76 63.73 21.29 28.45 17.34 38.03 11.62
Mumbai 50.36 26.10 150.00 23.50 192.00 146.09 179.58 116.76 176.57 142.05 279.79 149.30 427.60 99.69
JNPT 188.18 70.28 175.17 48.77 324.00 177.94 89.61 38.24 153.69 140.52 341.18 240.21 1559.10 850.23
Chennai 47.81 44.41 72.95 48.98 34.00 58.37 243.00 184.46 136.00 4.44 145.00 81.75 107.00 18.92
Cochin 158.52 139.07 255.65 246.33 191.97 190.93 259.35 160.86 115.08 92.21 93.45 78.47 123.05 20.88
Visakhapatnam 83.00 36.61 39.97 31.44 65.01 75.74 151.00 121.19 190.00 113.45 102.71 57.92 182.34 131.58
Kandla 89.49 38.25 140.87 58.07 115.00 62.64 45.66 52.70 92.27 52.82 166.89 138.44 145.45 103.23
Mormugao 10.10 11.18 22.07 17.52 71.00 31.01 66.29 71.52 108.93 69.17 71.36 46.95 110.00 58.69
Paradip 100.00 42.05 288.00 101.47 276.51 128.19 166.21 81.26 70.00 74.80 127.31 73.73 96.91 69.39
New Mangalore 36.00 25.81 30.00 30.11 34.00 32.48 31.00 24.56 36.00 38.45 36.00 45.50 75.00 29.59
Tuticorin 79.46 63.16 96.87 65.12 220.50 39.03 90.94 172.08 291.97 369.65 201.42 42.63 547.82 9.76
Ennore Port Ltd. 61.00 34.53 70.00 102.43 95.01 50.52 95.00 70.12 60.00 61.92 73.50 80.03 600.00 538.25
Sethusamudram
Ship Canal Project664.22 119.47 1581.07 152.24 161.10 20.98 10.00 6.02 10.01 8.51 4.00 2.12* 6.00 2.58*
WEB Based EDI
Port Community
System
7.50 0.04 6.00 1.00 3.00 3.33 4.88 4.46 2.38 2.01 2.00 2.00 1.00 0.83
Others (b) 477.26 170.67 598.38 88.50 564.90 161.68 362.86 223.31 673.09 518.08 901.87 579.43 635.00 824.27
Survey Vessels 19.00 0.00 79.00 5.00 10.00 0.00 15.00 15.00 15.00 15.00 0.00 0.00 0.00 0.00
Total 2109.27 884.68 3650.97 1143.10 2416.00 1227.8 1861.26 1392.30 2194.72 1724.37 2574.93 1633.70 4654.30 2766.93
(a) Includes Haldia and RR Schemes.
(b) Includes DCI, ALHW, R&D Studies, Post Tusnami Works, Minor Ports Studies,IT for D/Shipping, Web based PCS Dev of Non-Major Ports etc.
* The amount is received as equity from Govt. of India and other stakeholders.
App.Outlay: Approved OutlaySource : Annual Plan - Port Sector ( Deptt. of Shipping)/IPA
(Rs. In crore)
App.
Outlay
App.
Outlay
App.
Outlay
Annual Plan
(2013-14)
App.
Outlay
Annual Plan
(2010-11)
Annual Plan
(2011-12)
Annual Plan
(2012-13)
App.
Outlay
App.
Outlay
App.
Outlay
Port
Annual Plan
(2007-2008)
Annual Plan
(2008-2009)
Annual Plan
(2009-2010)
Table 5.6

202
Port : All Ports India's Overseas Trade during 2012-13 (In '000 Tonnes)
Type of Cargo Indian Lines Foreign Lines TotalGeneral Cargo
Loaded 1582 5.11 29353 94.89 30935Unloaded 3053 7.53 37482 92.47 40535Total 4635 6.49 66835 93.51 71470
ContainerLoaded 1313 1.88 68689 98.12 70002Unloaded 966 1.38 69170 98.62 70136Total 2279 1.63 137859 98.37 140138
Dry BulkLoaded 1423 3.42 40227 96.58 41650Unloaded 20807 9.52 197667 90.48 218474Total 22230 8.55 237894 91.45 260124
POL/Product & Other LiquidsLoaded 2775 4.30 61812 95.70 64587Unloaded 38308 16.27 197131 83.73 235439Total 41083 13.69 258943 86.31 300026
Grand TotalLoaded 7093 3.42 200081 96.58 207174Unloaded 63134 11.18 501450 88.82 564584Total 70227 9.10 701531 90.90 771758Source: Major Ports and State Maritime Boards
Table 5.7

SECTION - III
APPENDICES

i
Appendix - 1
PORT ORGANISATION IN INDIA
Ports are meant to provide sea-borne vessels some basic services such as dock, harbour or berth facilities and landing facilities for the passengers and cargo. Apart from this, Ports provide the basic services in the form of cranes, warehouses and labour for cargo handling. 2. There are 12 Major Ports viz. Kandla, Mumbai, J.L.Nehru, Mormugao, New Mangalore, Cochin, Tuticorin, Chennai, Ennore, Visakhapatnam, Paradip and Kolkata and 185 minor/intermediate ports situated along the coast line of about 6,000 Kms. and at sea islands. Four of the major Ports viz. Mumbai, Calcutta, Chennai and Mormugao are more than 100 years old. Cochin and Visakhapatnam Ports have celebrated their Golden Jubilee. The Ports of Kandla, Tuticorin, New Mangalore and Paradip were developed in the post independent period and are, thus, relatively new. J. L. Nehru Port at Nhava Sheva became operational in 1989. Ennore Port Ltd. which was dedicated to the Nation in February, 2001, is the first corporatised port registered under Companies Act, 1956. 3. Major Ports other than Ennore governed by the Major Port Trusts Act, 1963 and the Indian Ports Act, 1908 and the rules and regulations framed thereunder. 4. Each Major Port has a Board of Trustees representing various interests connected with the port operations and the shipping industry. The Chairman of each Major Port is appointed by Central Government. Besides Chairman, the Port Trust Board comprises Deputy Chairman, representatives of Customs, Railways, Defence, State Govt., Shipowners, Shippers, etc. All members of the Board, other than the Chairman and the Deputy Chairman are part time members. 5. Modernisation and development of Major Ports is a plan scheme. The Major Ports are empowered to receive loans from Government, raise loans in the open market and levy rates and fees for the services rendered. They are required to receive the prior approval of Central Govt. for the scale of rates, annual budgets and submit Annual Administration Reports. Their annual accounts are subject to audit by the Comptroller and Auditor General of India. 6. Ports mainly derive their revenue from cargo handled charges on the ships visiting them, and other related charges. The main sources of revenue from cargo traffic are (I) Wharfage/landing fees, cargo related charges, (ii) Crane hire charges, (iii) Rentals from warehouses, (iv) Demurrage charges, (v) Charges for providing rail and other transport for the cargo movement and providing water facilities for the visiting ships. Similarly the main sources of revenue from ship traffic are (I) Port dues, (ii) Pilotage, (iii) Berth-hire, (iv) Survey and measuring fees, (v) Ship repairs in dock areas.
7. The main activities of the Ports relate to (I) Maintenance of Port approaches, navigable channels and along side berths, dredging, conservancy, hydrographic surveys, (ii) Light houses and light vessels under the Port, (iii) Pilotage, towage, berthing and unberthing of visiting ships, (iv) Handling warehousing and transportation of goods in Port area, (v) Civil,

ii
mechanical and electrical engineering and maintenance of harbour crafts and plants, (vi) Fire-fighting and fumigation, (vii) Storage, (viii) Medical, welfare & housing services, (ix) Management of port properties and estates. 8. For its various activities, each Port engages different types of labour. The workers employed by the Port authorities are generally known as ‘Port Workers’ and they work on shore and for work on board the ship, workers registered with Dock Labour Board known as ‘Dock Labour’ are engaged. 9. Major Development in port sector a) Privatisation of port facilities : The Government has laid down guidelines for private
sector participation in the port sector. Following areas have been identified. i) Leasing out assets of the port. ii) Construction and operation of container terminals, multipurpose cargo berths
and specialised cargo berths, warehousing, storage facilities, tank farms, container freight stations, setting up of captive power plants etc.
iii) Leasing of equipment for cargo handling and leasing of floating crafts from the private sector.
iv) Pilotage. v) Captive facilities for port based industries.
b) Government have also issued guidelines on joint venture formation in Major Ports
which have come into force with effect from 1.9.2000. In order to attract private sector investment, model bid documents have been finalised for private sector projects laying down transparent bidding procedure, qualifications and selection criteria, bid evaluation procedure, termination payment, dispute resolution process etc. and detailed terms and conditions of the License Agreement, inter-alia, aiming at bankability, uniformity and reduction in time taken to select private parties.
c) The powers of the port trust Boards have been increased to Rs. 50 crores in respect of
additions/modifications/new investments and to Rs. 100 crores in case of replacement/renewal of assets.
d) Maritime States Development Council (MSDC) : With a view to have an integrated
approach for the development of both Major and Minor Ports, a maritime States Development Council was constituted under the Chairmanship of the Honourable Minister of Shipping. The Ministers in-charge of Ports in all Maritime States, UT of Pondicherry and A&N Administration, Daman & Diu and Lakshadweep are its members.
e) Tariff Authority for Major Ports (TAMP) : The Major Port Trust Act, 1963 was
amended by Port Laws (Amendment) Act, 1997 (15 of 1997) to provide for an independent Tariff Authority for Major Ports for fixing and revising the port tariff. An independent authority for the above purpose has been set up on 10.4.1997. The Major Port Trust Act, 1963 was further amended in the year 2000 for allowing major ports to form joint ventures with minor/foreign ports as well as companies

iii
Appendix - 2
DEFINITIONS OF TERMS USED
1. Load Line The Outer line on the body of a ship upto which she submerges in
water with safety. It varies according to the seasons and waters in which she plies.
2. Draft The depth necessary to submerge a ship to their load line.
3. Dead Weight Tonnage(DWT)
It is the number of tons of (2240 pounds) stores, fuel and cargo that a ship can transport. This presents the actual carrying capacity of a ship.
4. Gross Registered Tonnage (GRT)
It applies to the vessels and not to cargo. It is the weight of the volume occupied by the closed-in-spaces of a ship taking 100 cubic feet of such closed-in-spaces as equivalent to one vessels ton. It thus refers to the cubic capacity of the vessels.
5. Net Registered Tonnage (NRT)
It refers to the earning space capacity of a ship available for the storage of cargo and accommodation of passengers. It is obtained by deducting from GRT the cubic capacity space (taking 100 cubic feet = 1 ton) occupied by stores, fuel, machinery, crew etc. which does not represent the earning capacity of the ship.
6. Ore/Oil and Bulk Carrier
A bulk cargo ship designed to carry ore and oil enabling there by to be loaded in both directions.
7. Tankers Cargo ships constructed or adopted for the carriage in bulk of liquid cargoes of an inflammable nature.
8. Sailing Vessel Any description of vessel provided with sufficient sail area for navigation under sails along whether or not fitted with mechanical means of propulsion and includes a rowing boat or crane but does not include a pleasure craft.
9. Roll-on/Roll-off Vessel
It is frequently called a vehicle ferry. It is designed for the conveyance of road vehicles and private cars. At each terminal port, a tramp of link span is provided enabling the vehicles to drive on or off the vessels, thereby eliminating cranage and cargo handling (and also pilferage) and permitting a quick turn round of the ships.
10. Berth-Day A day of occupation of a berth (quay or mooring) by a ship.
11. Ship-Day A day spent in harbour by a ship.

iv
12. Turn-Round Time Total time spent by a ship since its entry till its departure.
13. Port Dues A levy of port authority on a ship.
14. Pilotage A port charge for guiding a ship in or out of a harbour through channels, passages or other waters by an authorised pilot.
15. Output per Berth Day Total tonnage handled distributed over the total number of berth days.
16. Idle Time Non-working time of a ship (without loading or unloading of cargo) at berth.
17. Pre-berthing Detention The time for which a ship waits before getting entry into a berth.
18. Berth Occupancy The time for which a berth is occupied (by ships).
19. Export Loaded overseas traffic.
20. Import Unloaded overseas traffic.
21. Traffic A scalar with only magnitude but no direction such as the total of exports and imports or loaded and unloaded cargo.
22. Traffic flows A vector with magnitude and direction such as passengers embarked/disembarked or cargo exports/imports.
23. Gang Gang is a group of workers formed as one unit for the purpose of handling cargo in the act of discharging from or loading on to the ship inside the ship inside the hatch-hold of the vessel or in the deck as per necessity.
24. Gang shift Refers to a gang (irrespective of number of persons in the gang) working in one shift.
25. Gang hours Number of hours per shift multiplied by number of gang shift.
26. Cranage The hire charges for providing a port crane for cargo handling.
27. Wharfage A port charge on the ships for all cargo conveyed on over or through a wharf/berth.


