Embed Size (px)
Citation preview
HOUNDÉ GOLD PROJECT – BURKINA FASO
FEASIBILITY STUDY NI 43-101 TECHNICAL REPORT1813.20-STY-001
1813.20\25.01\1813.20-STY-001_B October 2013LLycopodium Minerals Pty Ltd
NI43-101 TECHNICAL REPORT AND ECONOMIC ASSESSMENT OF THE HOUNDÉ GOLD PROJECT, BURKINA FASO, WEST
AFRICA
Endeavour Mining CorporationRegatta Office ParkWindward 3,Suite 240, PO Box 1793West Bay Road, Grand CaymanKY1-1109, Cayman IslandsTel: +1 345 946 7603W: www.endeavourmining.com
Lycopodium Minerals Pty Ltd1 Adelaide TerraceEAST PERTH WA 6004Tel: +61 8 6210 5222W: www.lycopodium.com.au
Project No: S1813.20Effective Date: 31 October 2013Authorised By:
Mark Zammit BSc(Hons) GradCertGeostats GradDipBus MAIGPrincipal Consultant GeologistCUBE CONSULTING ™ W: www.cubeconsulting.com
Michael Warren BSc, MSc Eng, MIEAust, CPEng (ret) Study Manager, Lycopodium Minerals Pty LtdW: www.lycopodium.com.au
Ross Malcolm Cheyne, BE (FAusIMM)Director/Principal ConsultantORELOGY Group Pty LtdW: www.orelogy.com
David Morgan BSc, MSc, CPEng, AUSIMMManaging Director, Knight Piésold Pty LtdW: www.knightpiesold.com
Peter O’Bryan, BE, MEngSc, (CPAUSIMM)Principal, Peter O’Bryan & AssociatesW: www.wbg.com.au
HOUNDÉ GOLD PROJECT – BURKINA FASO
FEASIBILITY STUDY NI 43-101 TECHNICAL REPORT1813.20-STY-001
TTable of ContentsPage
1813.20\25.01\1813.20-STY-001_B October 2013Lycopodium Minerals Pty Ltd
EXECUTIVE SUMMARY 1
1.0 SUMMARY 1.1 1.1 Introduction 1.1
1.1.1 Contributors 1.1 1.1.2 Units and Currency 1.2
1.2 Property, Access and History 1.2 1.3 Licence Status 1.3 1.4 Geology and Mineralization 1.4 1.5 Exploration and Drilling 1.5 1.6 Mineral Resource 1.5 1.7 Mineral Reserve 1.7 1.8 Mining 1.9 1.9 Metallurgical 1.10
1.9.1 Testwork 1.10 1.9.2 Plant Design 1.11
1.10 Infrastructure 1.11 1.10.1 Roads 1.11 1.10.2 Water Supply 1.12 1.10.3 Surface Water Management 1.12 1.10.4 Tailings Disposal (Tailings Storage Facility) 1.12 1.10.5 Dumps 1.13 1.10.6 Power Supply and Distribution 1.13 1.10.7 Accommodation Camp 1.13 1.10.8 Buildings and Support Facilities 1.13
1.11 Capital and Operating Costs 1.14 1.12 Project Execution 1.18 1.13 Environmental 1.18
1.13.1 Baseline Conditions 1.18 1.13.2 Permitting Requirements 1.19 1.13.3 Social and Community Impact 1.19 1.13.4 Land Acquisition 1.20 1.13.5 Closure Costs 1.20
1.14 Economic Analysis 1.20 1.15 Recommendations and Conclusions 1.23
1.15.1 Conclusions 1.23 1.15.2 Recommendation 1.24
2.0 INTRODUCTION 2.1 2.1 Terms of Reference 2.1 2.2 Sources of Information 2.1
2.2.1 Site Visits 2.1 2.3 Technical Report Preparation 2.2
2.3.1 Contributors 2.2 2.3.2 Units and Currency 2.3
3.0 RELIANCE ON OTHER EXPERTS 3.1 3.1 General Statement 3.1 3.2 Sources of Information 3.1
HOUNDÉ GOLD PROJECT – BURKINA FASO
FEASIBILITY STUDY NI 43-101 TECHNICAL REPORT1813.20-STY-001
TTable of ContentsPage
1813.20\25.01\1813.20-STY-001_B October 2013Lycopodium Minerals Pty Ltd
4.0 PROPERTY DESCRIPTION AND LOCATION 4.1 4.1 License Location 4.1 4.2 License Status 4.2 4.3 Mineral Tenure 4.4
5.0 ACCESSIBILITY, CLIMATE, LOCAL RESOURCES,INFRASTRUCTURE AND PHYSIOGRAPHY 5.1 5.1 Accessibility 5.1 5.2 Climate 5.1 5.3 Local Resources and Infrastructure 5.2 5.4 Physiography, Topography, Elevation and Vegetation 5.3 5.5 Water 5.4 5.6 Waste Disposal Sites 5.5
5.6.1 Waste Rock 5.5 5.6.2 Tailings 5.5
5.7 Process Plant Site 5.7 5.8 Flora and Fauna 5.7
6.0 HISTORY 6.1 6.1 Ownership History 6.1 6.2 Exploration History 6.3 6.3 Resource History 6.5
6.3.1 2010 Resource Estimate 6.5 6.3.2 2011 Resource Estimate 6.6 6.3.3 2012 Resource Estimate 6.7
6.4 Production History 6.8
7.0 GEOLOGICAL SETTING, MINERALIZATION AND ALTERATION 7.1 7.1 Regional Geology 7.1 7.2 Local Geology 7.4 7.3 Deposit Scale Geology 7.5 7.4 Structure 7.10 7.5 Mineralization and Alteration 7.10 7.6 Veining 7.14
8.0 DEPOSIT TYPES 8.1 8.1 Introduction 8.1
9.0 EXPLORATION 9.1 9.1 Introduction 9.1 9.2 Auger Drilling Program 9.1 9.3 Induced Polarization Sterilization Survey 9.4 9.4 Exploration Targets 9.8
9.4.1 Vindaloo Trend 9.8 9.4.2 Madras Zone 9.12 9.4.3 Koho 9.15 9.4.4 Induced Polarization Survey Anomalies 9.18
HOUNDÉ GOLD PROJECT – BURKINA FASO
FEASIBILITY STUDY NI 43-101 TECHNICAL REPORT1813.20-STY-001
TTable of ContentsPage
1813.20\25.01\1813.20-STY-001_B October 2013Lycopodium Minerals Pty Ltd
10.0 DRILLING 10.1 10.1 Introduction 10.1 10.2 In-Fill Drill Program 10.2 10.3 RC Drill Sterilization Program 10.13
10.3.2 RC Sterilization Drill Results 10.15
11.0 SAMPLE PREPARATION, ANALYSES AND SECURITY 11.1 11.1 Historical Sampling (Goldbelt Resources, Avocet) 11.1 11.2 Sample Submission 11.1 11.3 Sample Preparation and Analysis 11.1
11.3.1 RC Drilling Samples 11.1 11.3.2 Diamond Drilling Samples 11.2
11.4 Quality Assurance and Quality Control Programmes 11.2 11.4.1 Standards 11.3 11.4.2 Blanks 11.8 11.4.3 Duplicate Samples 11.8 11.4.4 Recommendations 11.10
11.5 ICP Analysis 11.11 11.6 Density Analysis 11.11 11.7 Sample Security 11.12 11.8 Author’s Comments 11.12
12.0 DATA VERIFICATION 12.1 12.1 Project Drill Hole Database 12.1 12.2 QAQC Analysis 12.3 12.3 Independent Verification Samples 12.3 12.4 Author’s Statement 12.5
13.0 MINERAL PROCESSING AND METALLURGICAL TESTING 13.1 13.1 Introduction 13.1 13.2 Metallurgical Summary 13.1 13.3 Metallurgical Sampling 13.2 13.4 Metallurgical Testing 13.5
13.4.1 Head Analysis 13.5 13.4.2 Comminution Testwork 13.7 13.4.3 Variability Testwork 13.7 13.4.4 Gravity / Intensive Leach Testwork 13.11 13.4.5 Direct Cyanidation and Gravity / Cyanidation Testwork 13.12 13.4.6 Grind / Extraction Testwork 13.13 13.4.7 Grind Optimisation and Residence Time Analysis 13.15 13.4.8 Gravity Concentrate Retreatment 13.16 13.4.9 Preg-Robbing Test 13.21 13.4.10 Bulk Leach Testwork 13.21 13.4.11 Ancillary Testwork 13.21 13.4.12 Metallurgical Recoveries and Reagent Consumptions 13.23 13.4.13 Technical Risks and Opportunities 13.26
HOUNDÉ GOLD PROJECT – BURKINA FASO
FEASIBILITY STUDY NI 43-101 TECHNICAL REPORT1813.20-STY-001
TTable of ContentsPage
1813.20\25.01\1813.20-STY-001_B October 2013Lycopodium Minerals Pty Ltd
14.0 MINERAL RESOURCE ESTIMATE 14.1 14.1 Introduction 14.1 14.2 Previous Resource Estimate 14.1 14.3 Data Supplied 14.1 14.4 Geological Interpretation and Modelling 14.2
14.4.1 Lithology 14.2 14.4.2 Weathering Domains 14.2 14.4.3 Mineralisation Domains 14.3 14.4.4 Bulk Density 14.6
14.5 Compositing 14.7 14.6 Statistical Analysis and Variography 14.8 14.7 Evaluation of Outliers 14.15 14.8 Block Model Set Up 14.18 14.9 Block Model Grade Estimation 14.20
14.9.1 Treatment for Un-estimated Blocks 14.21 14.10 Model Validation 14.23 14.11 Mineral Resource Classification 14.27 14.12 Mineral Resource Statement 14.27
15.0 MINERAL RESERVE ESTIMATES 15.1 15.1 Mining and Mineral Reserves Estimation Approach 15.1 15.2 Pit Optimisation Key Assumptions / Basis of Estimate 15.2
15.2.1 Resource Model 15.2 15.2.2 Geotechnical Considerations 15.3 15.2.3 Ore Loss and Dilution 15.4 15.2.4 Optimisation Mining Costs 15.5 15.2.5 Processing Costs and Recoveries 15.12 15.2.6 Gold Price 15.13
15.3 Pit Optimization Results 15.13 15.3.1 Whittle Results and Shell Selection 15.13 15.3.2 Optimisation Sensitivity 15.16 15.3.3 Risk Management 15.18
15.4 Mine Design Process 15.19 15.5 Pit Design 15.19
15.5.1 Design Criteria 15.19 15.5.2 Vindaloo Main Ultimate Pit Designs 15.20 15.5.3 Vindaloo 1 Design 15.26 15.5.4 Vindaloo 2 Design 15.28 15.5.5 Madras Design 15.30
15.6 Houndé Mineral Reserves Calculation 15.32 15.7 Stage Designs 15.34 15.8 Waste Storage Facility Designs 15.41
16.0 MINING METHODS 16.1 16.1 Mining Method 16.1
16.1.1 General Description Mining Methods 16.1 16.1.2 Mining Equipment 16.1 16.1.3 Blasting 16.2 16.1.4 Mine Dewatering 16.3 16.1.5 Dust Suppression 16.3
HOUNDÉ GOLD PROJECT – BURKINA FASO
FEASIBILITY STUDY NI 43-101 TECHNICAL REPORT1813.20-STY-001
TTable of ContentsPage
1813.20\25.01\1813.20-STY-001_B October 2013Lycopodium Minerals Pty Ltd
16.1.6 Grade Control 16.3 16.1.7 Mining Schedule 16.4
16.2 Hydrogeology 16.10 16.2.1 Groundwater Levels 16.10 16.2.2 Permeability Values 16.10 16.2.3 Predicted Groundwater Inflows 16.11 16.2.4 Baseline Water Chemistry 16.11
16.3 Fleet Size and Personnel Numbers 16.11 16.4 Mining CAPEX / OPEX 16.14 16.5 Technical Risks and Opportunities 16.14
16.5.1 Open Pit Optimisation 16.14 16.5.2 Mine Design 16.14 16.5.3 Mine Scheduling 16.15 16.5.4 Cost Estimation 16.15
17.0 RECOVERY METHODS 17.1 17.1 Process Selection 17.1
17.1.1 Selected Process Flowsheet 17.1 17.1.2 Key Process Design Criteria 17.2
17.2 Process and Plant Description 17.4 17.3 Control Philosophy 17.9
18.0 PROJECT INFRASTRUCTURE 18.1 18.1 Overall Site Development 18.1 18.2 Roads 18.3
18.2.1 Road Types 18.3 18.2.2 Access to Site 18.3 18.2.3 Project Site Roads 18.3
18.3 Rail Connections 18.4 18.4 Port Facilities 18.5 18.5 Water Supply 18.5
18.5.1 Water Demand 18.5 18.5.2 Decant From Tailings Storage Facility 18.5 18.5.3 Groundwater Investigation 18.5 18.5.4 Surface Water 18.6
18.6 Tailings Storage Facility (TSF) 18.7 18.6.1 Capacity and Location 18.7 18.6.2 Design Considerations 18.7 18.6.3 Geotechnical 18.8 18.6.4 Operation 18.9
18.7 Surface Water Management 18.12 18.7.1 Design Objectives 18.12 18.7.2 Diversion Structures 18.12 18.7.3 Collection and Control Structures 18.13
18.8 Power Supply 18.13 18.9 Power Distribution 18.14
18.9.1 Total Installed Load and Maximum Demand 18.15 18.9.2 Electrical Substation Buildings 18.15 18.9.3 11 kV Switchboard 18.15 18.9.4 Power Factor Correction Capacitor 18.15 18.9.5 Internet Fibre Optic Line 18.15
HOUNDÉ GOLD PROJECT – BURKINA FASO
FEASIBILITY STUDY NI 43-101 TECHNICAL REPORT1813.20-STY-001
TTable of ContentsPage
1813.20\25.01\1813.20-STY-001_B October 2013Lycopodium Minerals Pty Ltd
18.10 Pipelines 18.15 18.10.1 Tailings and Decant Return Pipelines 18.15 18.10.2 Water Supply Pipelines 18.16
18.11 Fuel Supply 18.16 18.12 General Site Development 18.16
18.12.1 Site Topography and Ground Conditions 18.16 18.13 Sewage and Solid Waste Management 18.16
18.13.1 Sewage Treatment 18.16 18.13.2 Solid Wastes 18.17
18.14 Explosive Storage and Handling 18.17 18.15 Accommodation Camp 18.17 18.16 Process Plant Facilities 18.17
18.16.1 General 18.17 18.16.2 Mine Services Area Facilities 18.19 18.16.3 Plant Area 18.19 18.16.4 Other Support Facilities 18.20
19.0 MARKET STUDIES AND CONTRACTS 19.1 19.1 Market Studies 19.1 19.2 Pricing 19.1 19.3 Contracts 19.1
20.0 REQUIRED PERMITS AND ENVIRONMENTAL CONSIDERATIONS 20.1 20.1 Environmental Studies and Permitting 20.1 20.2 Anticipated Environmental Costs – Operations 20.1 20.3 Social and Community Impact 20.2 20.4 Anticipated Land Acquisition and Relocation Costs 20.4 20.5 Anticipated Cost – Closure 20.5
21.0 CAPITAL AND OPERATING COSTS 21.1 21.1 Mining Cost Estimates 21.1
21.1.1 Estimate Basis and Qualifications 21.1 21.2 Process Plant and Administration 21.4
21.2.1 Summary 21.4 21.2.2 Power 21.6 21.2.3 Operating Consumables 21.7 21.2.4 Labour (Processing / Maintenance and Administration) 21.7 21.2.5 General and Administration Cost (excluding G&A labour) 21.8 21.2.6 Maintenance 21.9
21.3 Capital Cost Estimate 21.9 21.3.1 Summary 21.9 21.3.2 Estimating Methodology 21.12 21.3.3 Field Indirect Costs 21.14 21.3.4 EPCM Services 21.15 21.3.5 Owner’s Costs 21.15 21.3.6 Contingency 21.16 21.3.7 Deferred Capital 21.17 21.3.8 Qualifications and Assumptions 21.17 21.3.9 Exclusions 21.19
HOUNDÉ GOLD PROJECT – BURKINA FASO
FEASIBILITY STUDY NI 43-101 TECHNICAL REPORT1813.20-STY-001
TTable of ContentsPage
1813.20\25.01\1813.20-STY-001_B October 2013Lycopodium Minerals Pty Ltd
21.4 Project Implementation 21.19 21.4.1 Implementation Strategy 21.19 21.4.2 Implementation Schedule 21.19 21.4.3 HSEC Management 21.24 21.4.4 Logistics 21.24 21.4.5 Training 21.24
22.0 ECONOMIC ANALYSIS 22.1 22.1 Introduction 22.1 22.2 Summary 22.2 22.3 Principal Assumptions 22.4 22.4 Processing Costs and Production Schedules 22.5
22.4.1 Mine Production Schedule 22.5 22.4.2 Operating Cost 22.7 Capital Cost 22.7
22.5 Outcomes 22.10 22.5.1 Base Case 22.10
22.6 Sensitivity Analysis 22.12
23.0 ADJACENT PROPERTIES 23.1 23.1 Overall Location 23.1 23.2 Yaramoko – Roxgold Inc. 23.2 23.3 Houndé South – Savory Capital Corp. 23.2 23.4 MM Prospect – Sarama Resources Ltd. 23.2 23.5 Bondigui – Orezone Gold Corporation 23.3 23.6 Dossi – ACC Resources 23.3 23.7 Mana Mine – Semafo SARL 23.4
24.0 OTHER RELEVANT DATA AND INFORMATION 24.1 24.1 Risks and Opportunities 24.1 24.2 Other Relevant Data 24.1
25.0 CONCLUSIONS 25.1 25.1 Conclusions 25.1
26.0 RECOMMENDATIONS 26.1
27.0 SELECTED REFERENCES 27.1 27.1 Supporting Documents 27.1
27.1.1 Orelogy Mining Reports 27.1 27.1.2 Knight Piésold Reports 27.1 27.1.3 Peter O’Bryan and Associates Pit Geotechnical Report 27.1 27.1.4 Lycopodium Design Documents and Reports 27.1
27.2 References 27.3
28.0 QP CERTIFICATES 28.1
HOUNDÉ GOLD PROJECT – BURKINA FASO
FEASIBILITY STUDY NI 43-101 TECHNICAL REPORT1813.20-STY-001
TTable of ContentsPage
1813.20\25.01\1813.20-STY-001_B October 2013Lycopodium Minerals Pty Ltd
TABLESTable 1 FS Parameters 2 Table 2 Summary of the Vindaloo Optimised In-Pit Mineral Resources1
Table 3 Summary of Mineral Reserves 3 3
Table 1.1.1 Report Contributors 1.1 Table 1.1.2 Exchange Rates 1.2 Table 1.3.1 Houndé Permits 1.4 Table 1.6.1 Mineral Resource, Houndé Gold Project 1.6 Table 1.7.1 Gold Price and Royalties Assumptions 1.8 Table 1.7.2 Shell 30 Optimisation Result 1.8 Table 1.7.3 Houndé Mineral Reserves by Reserve Category 1.9 Table 1.8.1 Mill Throughput with Varying Ore Materials 1.9 Table 1.9.1 Houndé Mining Cost Summary 1.14 Table 1.9.2 Houndé Process Plant LOM Blend Operating Cost Summary 1.14 Table 1.9.3 Capital Cost Summary, 3Q13, ± 15% 1.16 Table 1.9.4 Deferred Capital Cost Summary, 3Q13, ± 15% 1.17 Table 1.14.1 Project Cash Flow Summary 1.21 Table 1.14.2 Project Financial Measures Summary 1.21 Table 2.3.1 Report Contributors 2.2 Table 3.2.1 Report Authors 3.2 Table 4.2.1 Kari North (250 km2
Table 4.2.2 Kari South (230.35 km) with the UTM (Adindan, zone N 30) coordinates 4.3
2
Table 4.2.3 Karba (192.40 km) 4.3
2
Table 4.2.4 Bouhaoun (130.60 km) 4.3
2
Table 4.2.5 Kopoi (138.00 km) 4.3
2
Table 4.2.6 Wakui (64.30 km) 4.4
2
Table 4.3.1 Houndé Permits 4.5 ) 4.4
Table 5.2.1 Synthetic Annual Rainfall and Evaporation Data 5.2 Table 5.2.2 Extreme Annual Design Precipitation 5.2 Table 6.3.1 Houndé Resource Estimate (effective October 31, 2012) 6.7 Table 9.2.1 Auger Drilling Summary 9.2 Table 9.3.1 Statistics of the IP Surveyed Grid Measured Parameters 9.4 Table 9.4.1 Significant Results Vindaloo Far South Target 9.9 Table 9.4.2 Significant Results Madras Zone 9.13 Table 9.4.3 Significant Results Koho Zone 9.15 Table 10.1.1 Drilling Summary, Q4, 2012 and 2013, Endeavour Drill program 10.1 Table 10.2.1 Highlight In-Fill Drill Intercepts With Intercepts Greater Than 20 g.m/t
Au* 10.5 Table 10.3.1 RC Drill Collar Coordinates – Sterilization Program 10.14 Table 10.3.2 Significant Results from RC Sterilization Drill Program 10.15 Table 11.4.1 Certified Reference Material List 11.4 Table 11.4.2 Certified Reference Material – Summary of Results for SGS
Ouagadougou 11.6 Table 11.4.3 Certified Reference Material – Summary of Results for SGS Morila 11.6 Table 11.4.4 Summary of Results for Lab Inserted Standards 11.7 Table 11.4.5 Assay Blank Material – Summary of Results 11.8 Table 11.4.6 Assay Blank Material – Summary of Results 11.9 Table 12.1.1 Drill hole Database Structure (Houndé Update_20130507.mdb) 12.2 Table 12.3.1 Independent Verification Samples Summary 12.4 Table 13.3.1 Houndé Metallurgical Testwork Samples 13.4
HOUNDÉ GOLD PROJECT – BURKINA FASO
FEASIBILITY STUDY NI 43-101 TECHNICAL REPORT1813.20-STY-001
TTable of ContentsPage
1813.20\25.01\1813.20-STY-001_B October 2013Lycopodium Minerals Pty Ltd
Table 13.3.2 Houndé Primary Metallurgical Composites 13.5 Table 13.4.1 Primary Composites Head Analyses 13.5 Table 13.4.2 Individual Metallurgical Sample Head Analyses 13.6 Table 13.4.3 Comminution Testwork Results Summary 13.7 Table 13.4.4 Variability Testwork Summary 13.9 Table 13.4.5 Vindaloo 2 Primary Samples Diagnostic Leach Summary 13.11 Table 13.4.6 Gravity / Concentrate Intensive Leach Testwork on Individual Samples
Summary 13.12 Table 13.4.7 Grind Sensitivity Testwork on Primary Composites 13.14 Table 13.4.8 Gravity Gold Extraction – Primary Composites 13.15 Table 13.4.9 Gravity Concentrate Regrind / Leach Testwork Summary - Primary
Composites 13.19 Table 13.4.10 Gravity Concentrate Regrind / Leach Testwork Reagents Summary -
Primary Composites 13.20 Table 13.4.11 Air / SO2Table 13.4.12 Summary of Testwork Leach Gold Extractions and Reagent
Requirements by Weathering and Deposit Area 13.24
Cyanide Destruction Testwork – Vindaloo Main Primary 13.22
Table 13.4.13 Calculation of Houndé Plant Gold Recoveries 13.25 Table 13.4.14 Summary of Houndé Plant Gold Recoveries and Reagent
Consumptions 13.25 Table 14.2.1 Summary of March 2013 Mineral Resource Estimate 14.1 Table 14.4.1 Lithological Interpretation Solids and Assignment 14.2 Table 14.4.2 Weathering Interpretation Surfaces and Assignment 14.3 Table 14.4.3 Mineralisation Sub-Domains 14.5 Table 14.4.4 Insitu Bulk Density Data Summary 14.7 Table 14.4.5 Insitu Bulk Density Data Assignment 14.7 Table 14.6.1 Basic Statistics – Vindaloo Main (Au) 14.8 Table 14.6.2 Basic Statistics – Vindaloo North-West (Au) 14.9 Table 14.6.3 Basic Statistics – Madras North-West (Au) 14.9 Table 14.6.4 Absolute Variogram Parameters – Domain 2 14.13 Table 14.6.5 Relative Variogram Parameters – Domain 2 14.13 Table 14.7.1 Basic Statistics – Vindaloo Main (Cut Au) 14.15 Table 14.7.2 Basic Statistics – Vindaloo North-East (Cut Au) 14.16 Table 14.7.3 Basic Statistics – Madras North-West (Cut Au) 14.16 Table 14.8.1 Block Model Definition for Grade Estimation 14.19 Table 14.8.2 Block Model Definition for Final Model - hounde_june2013.mdl 14.19 Table 14.8.3 Block Model Attributes - hounde_june2013.mdl 14.19 Table 14.9.1 Grade Estimation Parameters 14.22 Table 14.10.1 Block Model Estimate Compared to Composite Mean 14.23 Table 14.10.2 Block Model Estimation Method Comparison 14.26 Table 14.12.1 Processing Recovery Summary 14.28 Table 14.12.2 Processing Cost Summary 14.29 Table 14.12.3 Pit Slope Summary 14.29 Table 14.12.4 Summary of the Vindaloo Optimised In-Pit Mineral Resources 14.30 Table 14.12.5 Vindaloo Measured and Indicated Optimised In-Pit Mineral Resources
- Grade Tonnage 14.30 Table 14.12.6 Vindaloo Inferred In-Pit Mineral Resources - Grade Tonnage 14.31 Table 14.12.7 Vindaloo Combined In-Pit and Out-of-Pit Measured and Indicated
Mineral Resources - Grade Tonnage 14.32 Table 14.12.8 Vindaloo Combined In-Pit and Out-of-Pit Inferred Mineral Resources -
Grade Tonnage 14.32
HOUNDÉ GOLD PROJECT – BURKINA FASO
FEASIBILITY STUDY NI 43-101 TECHNICAL REPORT1813.20-STY-001
TTable of ContentsPage
1813.20\25.01\1813.20-STY-001_B October 2013Lycopodium Minerals Pty Ltd
Table 15.2.1 Slope Design Criteria 15.3 Table 15.2.2 Final Optimisation – Overall Slope Angles 15.3 Table 15.2.3 Material Properties 15.5 Table 15.2.4 Shovel Productivity by Material Type 15.6 Table 15.2.5 Key Drill and Blast Parameters 15.8 Table 15.2.6 Drill and Blast Unit Costs per Tonne 15.8 Table 15.2.7 Clearing, Stripping and Rehabilitation Rates 15.9 Table 15.2.8 WSF Clearing Rate 15.9 Table 15.2.9 Ore Grade Control Costs 15.9 Table 15.2.10 Ore Rehandle Costs 15.10 Table 15.2.11 Annual Fixed Costs and Overheads 15.10 Table 15.2.12 Processing Costs 15.12 Table 15.2.13 Processing Recoveries 15.12 Table 15.2.14 Gold Price and Royalties Assumptions 15.13 Table 15.3.1 Optimisation Results 15.14 Table 15.3.2 Shell 30 Optimisation Result 15.16 Table 15.5.1 Ramp Design Criteria 15.20 Table 15.6.1 Houndé Cut-off Grades 15.33 Table 15.6.2 Houndé Mineral Reserves by Reserve Category 15.33 Table 15.6.3 Houndé Mineral Reserves by Material Type 15.34 Table 15.7.1 Vindaloo Stages for Scheduling 15.40 Table 16.1.1 Mining Fleet – Heavy Equipment 16.1 Table 16.1.2 Mining Fleet - Light Vehicles and Ancillary Equipment 16.2 Table 16.1.3 Mill Throughput with Varying Ore Materials 16.5 Table 16.1.4 Mining Schedule 16.9 Table 16.1.5 Vertical Advance Rate 16.10 Table 16.3.1 Loading Productivity and Truck Payload 16.12 Table 16.3.2 Mine Production Fleet Size and Purchase Schedule – Annual LoM 16.13 Table 16.3.3 Mine Department Personnel Costs by Position 16.13 Table 16.3.4 Mine Department Personnel Numbers (Annual Maximum) 16.14 Table 17.1.1 Summary of Key Process Design Criteria 17.2 Table 20.5.1 TSF Rehabilitation Details (excl Contingency) 20.6 Table 21.1.1 Annual Mining Cost Summary, $M 21.2 Table 21.1.2 Production Drill and Blast Costs, ($/dmt) 21.3 Table 21.1.3 Grade Control Costs 21.3 Table 21.1.4 Mining Personnel Costs 21.4 Table 21.1.5 Fixed Costs and Overheads 21.4 Table 21.2.1 Houndé Process Plant LOM Blend Operating Cost Summary 21.5 Table 21.2.2 Houndé Process Plant Operating Cost Summary by Oxidation Level 21.5 Table 21.2.3 Houndé Process Plant Power Cost by Plant Area 21.7 Table 21.2.4 Houndé Process Plant Consumables Cost by Plant Area 21.7 Table 21.2.5 Houndé Plant Processing and Administration Manning Levels 21.8 Table 21.2.6 Labour Roster and Manpower Requirements 21.8 Table 21.2.7 Houndé Plant General and Administration Summary 21.8 Table 21.2.8 Houndé Plant Total Plant Maintenance Cost by Plant Area 21.9 Table 21.3.1 Exchange Rates 21.10 Table 21.3.2 Capital Cost Summary, 3Q13, ± 15% 21.11 Table 21.3.3 Derivation of Quantities 21.12 Table 21.3.4 Sources of Pricing 21.13 Table 21.3.5 Standard Direct Labour Gang Rates 21.14 Table 21.3.6 Contingency Percentage Summary 21.16
HOUNDÉ GOLD PROJECT – BURKINA FASO
FEASIBILITY STUDY NI 43-101 TECHNICAL REPORT1813.20-STY-001
TTable of ContentsPage
1813.20\25.01\1813.20-STY-001_B October 2013Lycopodium Minerals Pty Ltd
Table 21.3.7 Deferred Capital Cost Summary, 3Q13, ± 15% 21.17 Table 22.1.1 Project Production Summary 22.2 Table 22.2.1 Project Cash Flow Summary 22.3 Table 22.2.2 Project Financial Measures Summary 22.3 Table 22.4.1 Summarised Annual Capital Cost Schedule 22.9 Table 22.5.1 Annual Cash Flow Statement 22.11
FIGURESFigure 1.2.1 Houndé Project Location 1.3 Figure 1.7.1 Houndé Gold Project – Site Layout 1.7 Figure 1.8.1 Processing Plant Feed Schedule 1.10 Figure 1.14.1 Sensitivity of IRR to variations in project inputs 1.22 Figure 1.14.2 Sensitivity of NPV (5% discount) to variations in project inputs 1.22 Figure 4.1.1 Houndé Project Location 4.1 Figure 4.2.1 Houndé Project Concessions 4.2 Figure 4.3.1 New Concession Applications 4.6 Figure 5.4.1 Typical View of Project Area Landscape 5.3 Figure 5.4.2 Cotton Field in Project Area 5.4 Figure 5.5.1 Houndé Community Barrage 5.5 Figure 5.6.1 Potential Tailings Dam Site – View 1 5.6 Figure 5.6.2 Potential Tailings Dam Site – View 2 5.6 Figure 6.1.1 Houndé Property 6.2 Figure 7.1.1 Regional Geology of West Africa 7.3 Figure 7.2.1 Burkina Faso Greenstone Belts 7.4 Figure 7.3.1 Deposit Area Geology 7.6 Figure 7.3.2 Intermediate volcanic polymicitc fragmental with weak sericite
alteration in the upper part of the image and hematitic alteration in the base of the photo 7.7
Figure 7.3.3 Contorted Argillite, Siltstone and Greywacke 7.7 Figure 7.3.4 Propylitically Altered Gabbro 7.8 Figure 7.3.5 Typical Geology Section 7.9 Figure 7.5.1 Sericite-, Epidote-, Carbonate-, Fuschite-Altered Intermediate
Fragmental 7.11 Figure 7.5.2 Silicified (grey areas) Sericite and Ankerite Altered Gold Mineralized
Gabbro 7.11 Figure 7.5.3 Pyrite Crystal with Fine Gold Grain Inclusion (Kjarsgaard, 2013) 7.12 Figure 7.5.4 Alteration Mineralogy Paragenesis Edited from Lester (2010) 7.13 Figure 7.6.1 Dominant Vein Direction (030- 045°) 7.14 Figure 7.6.2 Secondary Vein Direction (060- 070°) 7.15 Figure 7.6.3 Tertiary Vein Direction (130- 140°) 7.15 Figure 7.6.4 Rose Diagram Quartz Vein Orientations at Vindaloo West Zone 7.16 Figure 9.2.1 Summary of Auger Drilling Sampling Results 9.2 Figure 9.2.2 Interpreted Anomalous Trends on Colour-Contoured Au ppb from
Auger Drilling for Mine and Waste Pile Site Areas 9.3 Figure 9.3.1 Sterilization IP Survey Grid Locations 9.5 Figure 9.3.2 Interpreted Anomalous Mineralization Trends on Compiled Color
Contoured IP Resistivity for Mine Site and Waste Pile Areas 9.6 Figure 9.3.3 IP Colour-Contoured IP Resistivity Over Dam Site 9.7 Figure 9.3.4 IP Colour-Contoured IP Resistivity Over Tailings Pond Site 9.7 Figure 9.4.1 Vindaloo Far South Drilling 9.10
HOUNDÉ GOLD PROJECT – BURKINA FASO
FEASIBILITY STUDY NI 43-101 TECHNICAL REPORT1813.20-STY-001
TTable of ContentsPage
1813.20\25.01\1813.20-STY-001_B October 2013Lycopodium Minerals Pty Ltd
Figure 9.4.2 Soukou Artisanal Mining Location 9.11 Figure 9.4.3 Madras Zone Drilling 9.14 Figure 9.4.4 Koho Zone Drilling 9.17 Figure 9.4.5 Colour Contoured IP Resistivity Data and Au Occurrences 9.18 Figure 10.2.1 Location In-fill Drill Hole Locations 10.3 Figure 10.2.2 Location Drill Hole Section Sets 10.4 Figure 10.2.3 Vindaloo Trend – Mineralized Zones 10.7 Figure 10.2.4 Vindaloo South – Typical Section 10.8 Figure 10.2.5 Vindaloo Main – Typical Section 10.9 Figure 10.2.6 Vindaloo NE – Typical Section 10.10 Figure 10.2.7 Vindaloo 2 – Typical Section 10.11 Figure 10.2.8 Madras NW – Typical Section 10.12 Figure 10.3.1 Location Sterilization RC Holes 10.13 Figure 10.3.2 Significant RC Sterilization Results 10.16 Figure 12.3.1 Plot of Independent Verification Samples 12.5 Figure 13.3.1 Metallurgical Sample Drill Hole Locations 13.3 Figure 13.4.1 Variability Testwork on Vindaloo Primary Samples 13.10 Figure 13.4.2 Variability Testwork on other Houndé Primary Samples 13.10 Figure 13.4.3 Variability Testwork on Saprolite and Transition Samples 13.11 Figure 13.4.4 Effect of Gravity Stage on Gold Extraction 13.13 Figure 13.4.5 Effect of Grind on Total Gold Extraction – Vindaloo Main Primary 13.15 Figure 13.4.6 Gravity Concentrate Mass / Contained Gold Relationship – Vindaloo
Main Primary Composite 13.17 Figure 13.4.7 Effect of Concentrate Regrind on Overall Gold Extraction – Primary
Composites 13.21 Figure 14.4.1 Boundary Analysis – Domain 2 14.4 Figure 14.4.2 Boundary Analysis – Domain 17 14.4 Figure 14.4.3 Vindaloo Mineralization Domains with Drilling – Plan View 14.6 Figure 14.6.1 Vindaloo Main (No. 1 m Composites >100) - Log Probability Plot 14.10 Figure 14.6.2 Vindaloo Main (No. 1 m Composites <100) - Log Probability Plot 14.10 Figure 14.6.3 Vindaloo North-East (No. 1 m Composites >100) - Log Probability Plot 14.11 Figure 14.6.4 Vindaloo North-East (No. 1 m Composites <100) - Log Probability Plot 14.11 Figure 14.6.5 Madras North-West (No. 1 m Composites >100) - Log Probability Plot 14.12 Figure 14.6.6 Madras North-West (No. 1 m Composites <100) - Log Probability Plot 14.12 Figure 14.6.7 Domain 2 Variogram - Gaussian transformed 1 metre composite data 14.14 Figure 14.6.8 Domain 2 Variogram - Back transformed 1 metre composite data 14.14 Figure 14.7.1 All Combined 1 m Composites - Log Probability Plot 14.17 Figure 14.7.2 All Combined 1 m Composites - Log Histogram Plot 14.17 Figure 14.7.3 1 m Composites by Weathering Domains - Log Probability Plot 14.18 Figure 14.10.1 Block Model Validation by Northing for Domain 2 14.24 Figure 14.10.2 Block Model Validation between 1261150N and 12611850N by RL for
Domain 2 14.25 Figure 14.12.1 Pit Slope Zone Summary 14.29 Figure 15.1.1 Houndé Gold Project – Site Layout 15.1 Figure 15.2.1 Optimisation Slope Zones 15.4 Figure 15.2.2 Locations of Five Mining Areas for Mining Cost Allocation 15.7 Figure 15.2.3 Waste Mining Unit Costs – All Pits 15.11 Figure 15.2.4 Ore Mining Unit Costs – All Pits 15.11 Figure 15.3.1 Optimisation Results 15.15 Figure 15.3.2 Optimisation Sensitivity Analysis – Best Case Ore Tonnage 15.17 Figure 15.3.3 Optimisation Sensitivity Analysis – Best Case Discounted Cashflow 15.17
HOUNDÉ GOLD PROJECT – BURKINA FASO
FEASIBILITY STUDY NI 43-101 TECHNICAL REPORT1813.20-STY-001
TTable of ContentsPage
1813.20\25.01\1813.20-STY-001_B October 2013Lycopodium Minerals Pty Ltd
Figure 15.5.1 Vindaloo Main South Pit Design 15.21 Figure 15.5.2 Vindaloo Main North Pit Design 15.22 Figure 15.5.3 Vindaloo Main Section A 15.23 Figure 15.5.4 Vindaloo Main Section B 15.23 Figure 15.5.5 Vindaloo Main Section C 15.24 Figure 15.5.6 Vindaloo Main Section D 15.24 Figure 15.5.7 Vindaloo Main Section E 15.25 Figure 15.5.8 Vindaloo Main Section F 15.25 Figure 15.5.9 Vindaloo 1 Pit Design 15.26 Figure 15.5.10 Vindaloo 1 Section G 15.27 Figure 15.5.11 Vindaloo 2 Pit Design 15.28 Figure 15.5.12 Vindaloo 2 Section H 15.29 Figure 15.5.13 Madras Pit Designs 15.30 Figure 15.5.14 Madras Section I 15.31 Figure 15.5.15 Madras Section J 15.32 Figure 15.7.1 Vindaloo Main Stages 15.35 Figure 15.3.1 Vindaloo Main Stage 11 15.36 Figure 15.7.3 Vindaloo Main Stage 12 15.37 Figure 15.7.4 Vindaloo Main Stage 13 15.38 Figure 15.7.5 Vindaloo Main Stage 15 15.39 Figure 15.8.1 WSF Standoff Distance from Pit Crest 15.41 Figure 15.8.2 WSF Profile - Construction and Final Landform 15.42 Figure 16.1.1 Ore and Waste Mining Schedule 16.6 Figure 16.1.2 Ore Mining Schedule by Rock Type 16.7 Figure 16.1.3 End of Year Stockpile by Rock Type 16.7 Figure 16.1.4 Processing Plant Feed Schedule 16.8 Figure 16.1.5 Recovered Metal Schedule 16.8 Figure 17.1.1 Houndé Preliminary Simplified Flowsheet 17.3 Figure 18.1.1 Overall Site Layout – Drawing 110-G-001 18.2 Figure 18.5.1 TSF Final Stage General Arrangement 18.10 Figure 18.5.2 TSF Monitoring Bores Locations 18.11 Figure 18.16.1 Process Plant 18.18 Figure 19.2.1 Historical gold prices 19.1 Figure 20.1.1 Permit Schedule 20.3 Figure 21.2.1 Processing Cost Summary by LOM and Ore Types 21.6 Figure 21.4.1 Project Implementation Schedule 21.21 Figure 21.4.2 Project Schedule Critical Path 21.23 Figure 22.4.1 Ore and Waste Mining Schedule 22.6 Figure 22.4.2 Processing Plant Feed Schedule 22.6 Figure 22.4.3 Operating Cost Contribution (US$/oz Recovered & %) 22.7 Figure 22.6.1 Sensitivity of IRR to variations in project inputs 22.12 Figure 22.6.2 Sensitivity of NPV (5% discount) to variations in project inputs 22.13 Figure 22.6.3 Sensitivity of payback period to variations in project inputs 22.13 Figure 23.1.1 Location Map – Adjacent Properties 23.1
HOUNDÉ GOLD PROJECT – BURKINA FASO
FEASIBILITY STUDY NI 43-101 TECHNICAL REPORT1813.20-STY-001
TTable of ContentsPage
1813.20\25.01\1813.20-STY-001_B October 2013Lycopodium Minerals Pty Ltd
APPENDICESAppendix 10.1 Drill Hole Collar Table Appendix 10.2 In-fill Drill Program Significant Drill Results Appendix 11.1 Selected Standard Plots Appendix 11.2 Selected Blank Plots Appendix 11.3 Selected Duplicate Plots Appendix 11.4 Data Issues Appendix 14.1 Interpolator Output Files Appendix 14.2 Swath Plots Appendix 14.3 Grade Tonnage Curves Appendix 22.1 Cash Flow Model Appendix 24.1 Project Risk Register
HOUNDÉ GOLD PROJECT – BURKINA FASOFEASIBILITY STUDY NI 43-101 TECHNICAL REPORT
1813.20\25.01\1813.20-STY-001_B October 2013LLycopodium Minerals Pty Ltd
DISCLAIMER
This report has been prepared for ENDEAVOUR MINING (Endeavour) by Lycopodium MineralsPty Ltd (Lycopodium) as an independent consultant and is based in part on information furnished by Endeavour and in part on information not within the control of either Endeavour or Lycopodium. While it is believed that the information, conclusions and recommendations will be reliable under the conditions and subject to the limitations set forward herein, Lycopodium does not guarantee their accuracy. The use of this report and the information contained herein shall be at the user’s sole risk, regardless of any fault or negligence of Lycopodium.
HOUNDÉ GOLD PROJECT, BURKINA FASO
FEASIBILITY STUDY NI 43-101 TECHNICAL REPORT
1813.20-STY-001
Table of Contents Page
EXECUTIVE SUMMARY 1�
TABLESTable 1� FS Parameters 2�Table 2� Summary of the Vindaloo Optimised In-Pit Mineral Resources1 3�Table 3� Summary of Mineral Reserves 3�
1813\25.01\1813-STY-000]_B October 2013 Lycopodium Minerals Pty Ltd
HOUNDÉ GOLD PROJECT, BURKINA FASO FEASIBILITY STUDY NI 43-101 TECHNICAL REPORT
1813.20\25.01\1813.20-STY-001_B S
Page 1
October 2013 Lycopodium Minerals Pty Ltd
EXECUTIVE SUMMARY
Endeavour Mining Corporation, through its 100% owned subsidiary Avion Gold (Burkina Faso) SARL, has a 100% interest in the approximately 1,000 square kilometre Houndé Gold Project, situated in the South-western region of Burkina Faso. Ownership upon achieving production will be 90% by Endeavour and 10% by the government of Burkina Faso.
The Houndé Project feasibility study (FS) focuses on the Vindaloo group of deposits that are located approximately 250 km Southwest of Ouagadougou, the capital city of Burkina Faso. The deposits are approximately 2.7 km from a paved highway and as close as 200 metres from a 225 kV power line that extends from Cote d’Ivoire through to Ouagadougou. The nearby town of Houndé has a population of approximately 22,000. A rail line that extends to the port of Abidjan, Cote d’Ivoire lies approximately 25 km west of the deposit area.
Lycopodium Minerals Pty Ltd. was the FS study lead consultant with a focus on study coordination, metallurgy, infrastructure design and process plant design. Cube Consulting completed an updated mineral resource estimate. Knight Piésold Pty. Ltd. carried out pit and site geotechnical reviews, completed a water balance study and designed the tailings storage facility, water harvest dam and the water storage dam along with mine site drainage control elements. Orelogy completed the mine plan and mineral Reserve.
Mine environmental and social studies were completed under the lead of Genivar Inc. with SOCREGE and INGRID collecting social and environmental data, respectively. INGRID also completed an additional environmental and social study on the project’s water supply. Knight Piésold provided high level oversight over all of these studies.
Copies of the studies were presented to the government of Burkina Faso on November 7, 2013.
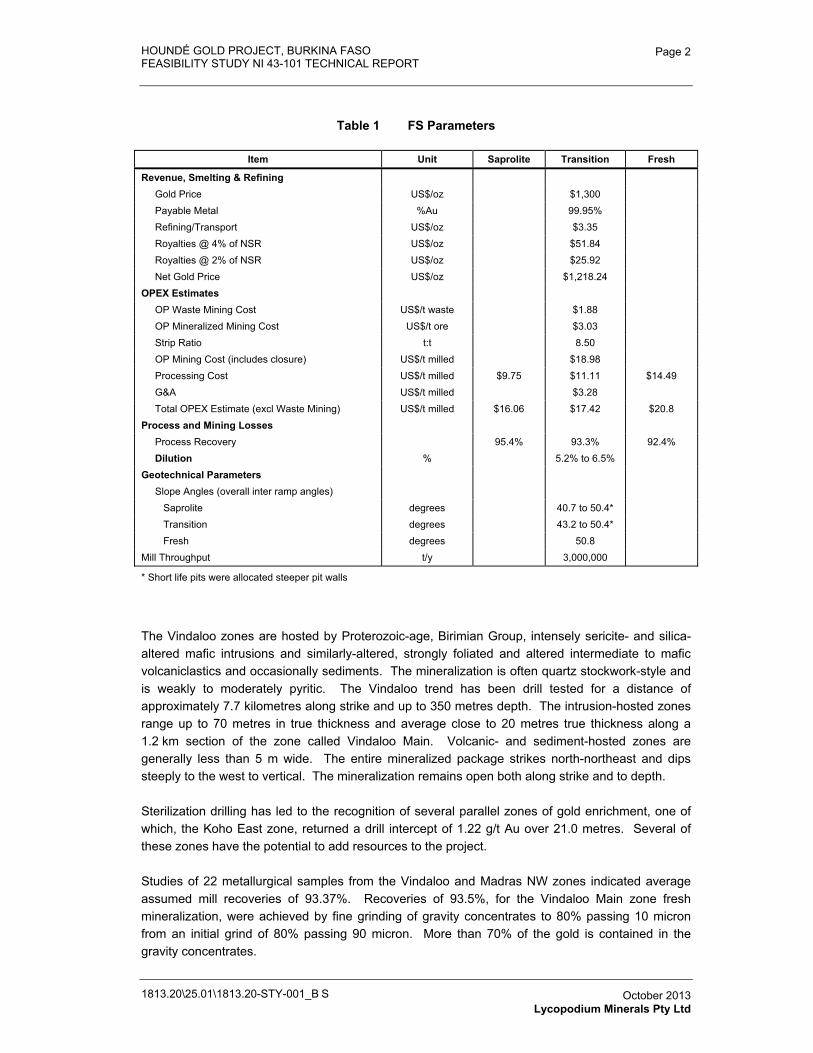
The following table presents the parameters used in the study.
HOUNDÉ GOLD PROJECT, BURKINA FASO FEASIBILITY STUDY NI 43-101 TECHNICAL REPORT
1813.20\25.01\1813.20-STY-001_B S
Page 2
October 2013 Lycopodium Minerals Pty Ltd
Table 1 FS Parameters
Item Unit Saprolite Transition Fresh
Revenue, Smelting & Refining Gold Price US$/oz $1,300 Payable Metal %Au 99.95% Refining/Transport US$/oz $3.35 Royalties @ 4% of NSR US$/oz $51.84 Royalties @ 2% of NSR US$/oz $25.92 Net Gold Price US$/oz $1,218.24
OPEX Estimates OP Waste Mining Cost US$/t waste $1.88 OP Mineralized Mining Cost US$/t ore $3.03 Strip Ratio t:t 8.50OP Mining Cost (includes closure) US$/t milled $18.98 Processing Cost US$/t milled $9.75 $11.11 $14.49 G&A US$/t milled $3.28 Total OPEX Estimate (excl Waste Mining) US$/t milled $16.06 $17.42 $20.8
Process and Mining Losses Process Recovery 95.4% 93.3% 92.4% Dilution % 5.2% to 6.5%
Geotechnical Parameters Slope Angles (overall inter ramp angles) Saprolite degrees 40.7 to 50.4* Transition degrees 43.2 to 50.4* Fresh degrees 50.8
Mill Throughput t/y 3,000,000
* Short life pits were allocated steeper pit walls
The Vindaloo zones are hosted by Proterozoic-age, Birimian Group, intensely sericite- and silica-altered mafic intrusions and similarly-altered, strongly foliated and altered intermediate to mafic volcaniclastics and occasionally sediments. The mineralization is often quartz stockwork-style and is weakly to moderately pyritic. The Vindaloo trend has been drill tested for a distance of approximately 7.7 kilometres along strike and up to 350 metres depth. The intrusion-hosted zones range up to 70 metres in true thickness and average close to 20 metres true thickness along a 1.2 km section of the zone called Vindaloo Main. Volcanic- and sediment-hosted zones are generally less than 5 m wide. The entire mineralized package strikes north-northeast and dips steeply to the west to vertical. The mineralization remains open both along strike and to depth.
Sterilization drilling has led to the recognition of several parallel zones of gold enrichment, one of which, the Koho East zone, returned a drill intercept of 1.22 g/t Au over 21.0 metres. Several of these zones have the potential to add resources to the project.
Studies of 22 metallurgical samples from the Vindaloo and Madras NW zones indicated average assumed mill recoveries of 93.37%. Recoveries of 93.5%, for the Vindaloo Main zone fresh mineralization, were achieved by fine grinding of gravity concentrates to 80% passing 10 micron from an initial grind of 80% passing 90 micron. More than 70% of the gold is contained in the gravity concentrates.
HOUNDÉ GOLD PROJECT, BURKINA FASO FEASIBILITY STUDY NI 43-101 TECHNICAL REPORT
1813.20\25.01\1813.20-STY-001_B S
Page 3
October 2013 Lycopodium Minerals Pty Ltd
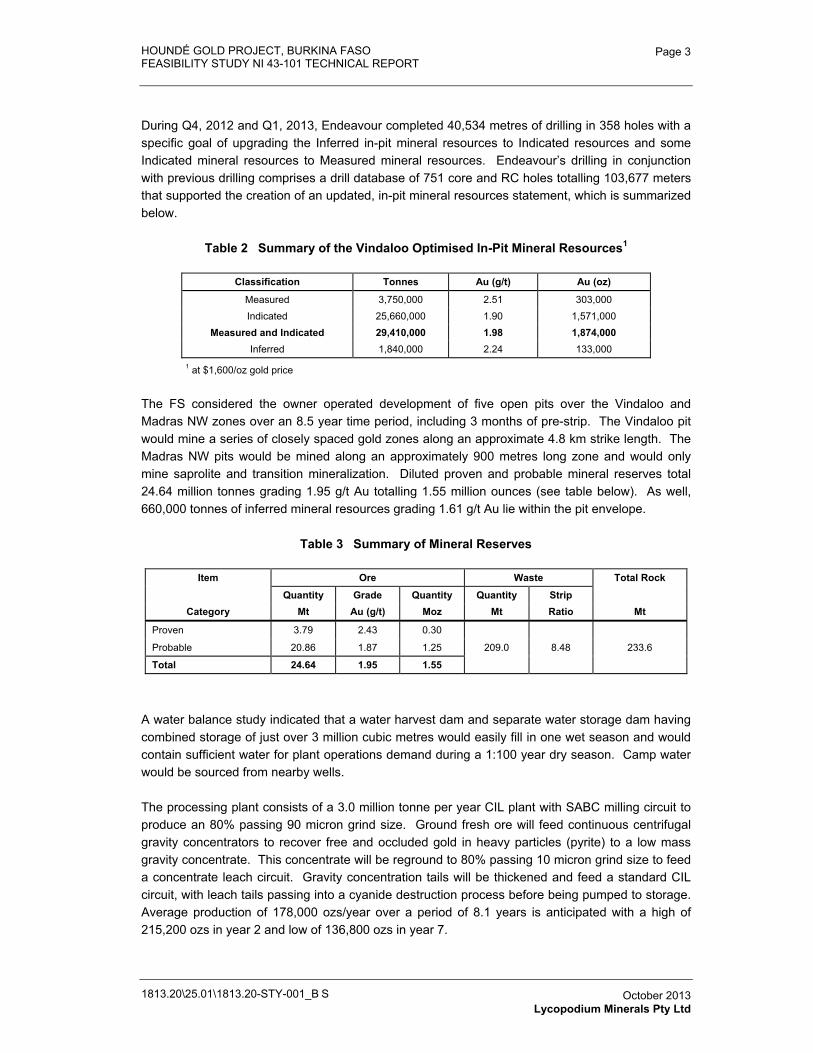
During Q4, 2012 and Q1, 2013, Endeavour completed 40,534 metres of drilling in 358 holes with a specific goal of upgrading the Inferred in-pit mineral resources to Indicated resources and some Indicated mineral resources to Measured mineral resources. Endeavour’s drilling in conjunction with previous drilling comprises a drill database of 751 core and RC holes totalling 103,677 meters that supported the creation of an updated, in-pit mineral resources statement, which is summarized below.
Table 2 Summary of the Vindaloo Optimised In-Pit Mineral Resources1
Classification Tonnes Au (g/t) Au (oz)
Measured 3,750,000 2.51 303,000 Indicated 25,660,000 1.90 1,571,000
Measured and Indicated 29,410,000 1.98 1,874,000 Inferred 1,840,000 2.24 133,000
1 at $1,600/oz gold price
The FS considered the owner operated development of five open pits over the Vindaloo and Madras NW zones over an 8.5 year time period, including 3 months of pre-strip. The Vindaloo pit would mine a series of closely spaced gold zones along an approximate 4.8 km strike length. The Madras NW pits would be mined along an approximately 900 metres long zone and would only mine saprolite and transition mineralization. Diluted proven and probable mineral reserves total 24.64 million tonnes grading 1.95 g/t Au totalling 1.55 million ounces (see table below). As well, 660,000 tonnes of inferred mineral resources grading 1.61 g/t Au lie within the pit envelope.
Table 3 Summary of Mineral Reserves
Item Ore Waste Total Rock
Quantity Grade Quantity Quantity Strip Category Mt Au (g/t) Moz Mt Ratio Mt
Proven 3.79 2.43 0.30
209.0 8.48 233.6 Probable 20.86 1.87 1.25
Total 24.64 1.95 1.55
A water balance study indicated that a water harvest dam and separate water storage dam having combined storage of just over 3 million cubic metres would easily fill in one wet season and would contain sufficient water for plant operations demand during a 1:100 year dry season. Camp water would be sourced from nearby wells.
The processing plant consists of a 3.0 million tonne per year CIL plant with SABC milling circuit to produce an 80% passing 90 micron grind size. Ground fresh ore will feed continuous centrifugal gravity concentrators to recover free and occluded gold in heavy particles (pyrite) to a low mass gravity concentrate. This concentrate will be reground to 80% passing 10 micron grind size to feed a concentrate leach circuit. Gravity concentration tails will be thickened and feed a standard CIL circuit, with leach tails passing into a cyanide destruction process before being pumped to storage. Average production of 178,000 ozs/year over a period of 8.1 years is anticipated with a high of 215,200 ozs in year 2 and low of 136,800 ozs in year 7.
HOUNDÉ GOLD PROJECT, BURKINA FASO FEASIBILITY STUDY NI 43-101 TECHNICAL REPORT
1813.20\25.01\1813.20-STY-001_B S
Page 4
October 2013 Lycopodium Minerals Pty Ltd
The tailings storage facility is located 4 km west of the plant in a natural valley. Studies indicate that the tailings storage does not need to be lined as the near-surface, clay-rich substrate would limit migration of tailings fluids away from the site. Decant fluids, though, are not suitable for release to the environment and will be pumped back to the plant. An impact assessment, including a dam break scenario, indicates a high consequence in the event of a wall failure and the tailings embankments were designed to reduce this risk. Closure will require covering the surface with 0.5 metres of broken rock. The facility has the potential to hold up to 100% more than is currently designed.
Power for the processing plant will come from the adjacent 225 kV power line that extends from Cote d’Ivoire to Ouagadougou. Sonabel, the state power entity, have agreed, in principle, to sell power to the project; however, the terms and conditions of this sale have not been defined.
Project staff will include approximately 470 people, not including catering and cleaning staff and miscellaneous contractors with 41 international and African expats and 430 Burkinabe employees. A camp to house 130 senior staff will be installed with the remaining employees living in the nearby communities.
An environmental and social impact and mitigation study, with a goal to be IFC complaint, was completed. The study outlines Endeavour’s responsibilities to the well being of the people and the environment during the development, operation and closure of the Houndé gold project. The project will require the acquisition of 2,096 ha of land. Several major land owners own the bulk of the land, however, numerous subsistence farmers rent portions of the land from the land owners. Compensation mechanisms for the land, buildings, trees and crops are part of the ongoing permitting process. Typical concerns, as a result of the project development include changes to quality of life, loss of livelihood, environmental degradation, potential for jobs, potential health issues, increase in traffic etc. Permitting is expected to take approximately a year to complete.
Houndé Capital Cost Estimate
The total estimated cost to bring the Houndé Gold Project into production is approximately $314.8 million, inclusive of contingency and working capital and an allowance for VAT and import duties. Additional deferred capital including closure costs, totals 87.6 million.
HOUNDÉ GOLD PROJECT, BURKINA FASO FEASIBILITY STUDY NI 43-101 TECHNICAL REPORT
1813.20\25.01\1813.20-STY-001_B S
Page 5
October 2013 Lycopodium Minerals Pty Ltd
Houndé PEA Financial Summary
The Houndé Project generates the following financial results:
� At $1,300/oz gold price (Base Case) Post-Tax
- NPV at 5% discount rate totals $230.2 million
- IRR = 22.45%
- Payback 2.84 years from commencement of production
- Cash cost per ounce produced - $635.69/oz (excluding royalties)
- Cash cost per ounce produced - $713.65/oz (including royalties).
Conclusions and Recommendations
Independent studies of the mineral resources, metallurgy, mine plan, processing plant, capital costs, construction costs, environmental and social impact and relocation expenses have been carried out for the Houndé Project. These studies and subsequent cash flow model concluded that the project had an acceptable rate of return, even at current depressed gold prices and that Endeavour should proceed with project development. Should the project be developed, it is estimated that approximately 55% of the project’s net revenues would go to the state with a cash benefit of US$330 million over the project life.
HOUNDÉ GOLD PROJECT, BURKINA FASO
FEASIBILITY STUDY NI 43-101 TECHNICAL REPORT
1813.20-STY-001
Table of Contents Page
1.0� SUMMARY 1.1�1.1� Introduction 1.1�
1.1.1� Contributors 1.1�1.1.2� Units and Currency 1.2�
1.2� Property, Access and History 1.2�1.3� Licence Status 1.3�1.4� Geology and Mineralization 1.4�1.5� Exploration and Drilling 1.5�1.6� Mineral Resource 1.5�1.7� Mineral Reserve 1.7�1.8� Mining 1.9�1.9� Metallurgical 1.10�
1.9.1� Testwork 1.10�1.9.2� Plant Design 1.11�
1.10� Infrastructure 1.11�1.10.1� Roads 1.11�1.10.2� Water Supply 1.12�1.10.3� Surface Water Management 1.12�1.10.4� Tailings Disposal (Tailings Storage Facility) 1.12�1.10.5� Dumps 1.13�1.10.6� Power Supply and Distribution 1.13�1.10.7� Accommodation Camp 1.13�1.10.8� Buildings and Support Facilities 1.13�
1.11� Capital and Operating Costs 1.14�1.12� Project Execution 1.18�1.13� Environmental 1.18�
1.13.1� Baseline Conditions 1.18�1.13.2� Permitting Requirements 1.19�1.13.3� Social and Community Impact 1.19�1.13.4� Land Acquisition 1.20�1.13.5� Closure Costs 1.20�
1.14� Economic Analysis 1.20�1.15� Recommendations and Conclusions 1.23�
1.15.1� Conclusions 1.23�1.15.2� Recommendation 1.24�
TABLESTable 1.1.1� Report Contributors 1.1�Table 1.1.2� Exchange Rates 1.2�Table 1.3.1� Houndé Permits 1.4�Table 1.6.1� Mineral Resource, Houndé Gold Project 1.6�Table 1.7.1� Gold Price and Royalties Assumptions 1.8�Table 1.7.2� Shell 30 Optimisation Result 1.8�Table 1.7.3� Houndé Mineral Reserves by Reserve Category 1.9�Table 1.8.1� Mill Throughput with Varying Ore Materials 1.9�Table 1.9.1� Houndé Mining Cost Summary 1.14�Table 1.9.2� Houndé Process Plant LOM Blend Operating Cost Summary 1.14�Table 1.9.3� Capital Cost Summary, 3Q13, ± 15% 1.16�Table 1.9.4� Deferred Capital Cost Summary, 3Q13, ± 15% 1.17�
1813\25.01\1813.20-STY-001_B S1 October 2013 Lycopodium Minerals Pty Ltd
HOUNDÉ GOLD PROJECT, BURKINA FASO
FEASIBILITY STUDY NI 43-101 TECHNICAL REPORT
1813.20-STY-001
Table of Contents (Continued) Page
1813.20\25.01\1813.20-STY-001_B S1 October 2013 Lycopodium Minerals Pty Ltd
Table 1.14.1� Project Cash Flow Summary 1.21�Table 1.14.2� Project Financial Measures Summary 1.21�
FIGURESFigure 1.2.1� Houndé Project Location 1.3�Figure 1.7.1� Houndé Gold Project – Site Layout 1.7�Figure 1.8.1� Processing Plant Feed Schedule 1.10�Figure 1.14.1� Sensitivity of IRR to variations in project inputs 1.22�Figure 1.14.2� Sensitivity of NPV (5% discount) to variations in project inputs 1.22�
HOUNDÉ GOLD PROJECT, BURKINA FASO FEASIBILITY STUDY NI 43-101 TECHNICAL REPORT
1813.20\25.01\1813.20-STY-001_B S1
Page 1.1
October 2013 Lycopodium Minerals Pty Ltd
1.0 SUMMARY
1.1 Introduction
This report was prepared to provide a NI 43-101-compliant Technical Report on the Feasibility Study carried out for the Houndé gold project in Burkina Faso. The project is owned 100% by Avion Gold (Burkina Faso) SARL, a wholly owned subsidiary of Endeavour Mining Corporation (Endeavour), prior to a 10% carried interest to the government of Burkina Faso, which is granted once a mining permit is approved. This Report was prepared at the request of Endeavour and has been prepared in conformance with the standards required by NI 43-101 and Form 43-101(F). The Report is intended to be used to demonstrate the results of the Feasibility Study.
In compliance with the requirements for preparation of a 43-101 Report, key competent persons visited the project site to gather first-hand information. In addition, Lycopodium and other contributors have studied and constructed numerous projects in the region and are familiar with local conditions.
1.1.1 Contributors
The contributions to this Report have been provided by the organisations listed in Table 1.1.1:
Table 1.1.1 Report Contributors
Organisation Contribution
Lycopodium Minerals Pty Ltd (Lycopodium), Perth, Western Australia
� Accessibility climate and local resources � Review and supervision of metallurgy and
associated testwork, carried out by SGS Laboratories, Perth, Western Australia
� Process plant design � Infrastructure design (power supply, roads,
buildings) � Market studies � Project implementation � Project capital cost estimating � Processing cost estimating � Risk assessment � Project cashflow modelling � Overall Report compilation
Cube Consulting (Cube), Perth, Western Australia � Property description and location � History, geological setting, mineralization and
deposit types � Exploration, drilling � Sampling and verification � Geological modelling � Resource statement � Adjacent properties and other information
HOUNDÉ GOLD PROJECT, BURKINA FASO FEASIBILITY STUDY NI 43-101 TECHNICAL REPORT
1813.20\25.01\1813.20-STY-001_B S1
Page 1.2
October 2013 Lycopodium Minerals Pty Ltd
Orelogy, Perth, Western Australia � Pit optimisation � Mine design and scheduling � Mining costs estimating
Knight Piésold Pty Ltd, (Knight Piésold) Perth, Western Australia
� Geotechnical and hydrogeotechnical investigations and analysis
� Water supply and overall water balance � Tailings storage � Overview of environmental and social impact
assessment
Genivar / Ingrid � Environmental baseline studies, including social and community
Genivar / Socrege � Environmental baseline studies, including social and community
Orway Mineral Consultants Pty Ltd (OMC) � Comminution modelling
1.1.2 Units and Currency
Unless stated otherwise Le Système international d'unités (SI) units have been used throughout the reports and currencies used in the report are US Dollars, unless noted otherwise. Exchange rates used are listed in Table 1.1.2:
Table 1.1.2 Exchange Rates
Currency� Rate used �
CAD� 1.00�
JPY� 100�
AUD� 0.90�
EUR� 1.30�
CFA� 0.002�
ZAR� 0.10�
THB� 0.030�
GBP� 1.55�
1.2 Property, Access and History
Endeavour’s Houndé license area is situated in the southwestern region of Burkina Faso, West Africa (Figure 1.2.1). Administratively it is in the provinces of Tuy and Mouhoun.
The Houndé project Feasibility Study focuses on the Vindaloo and Madras NW group of deposits that are located approximately 250 km southwest of Ouagadougou, the capital city of Burkina Faso. The deposits are approximately 2.7 km from a paved highway and as close as 200 metres from a 225 kV power line that extends from Cote d’Ivoire through to Ouagadougou. The nearby city of Houndé contains approximately 22,000 people. A rail line that extends to the port of Abijan, Cote d’Ivoire lies approximately 25 km West of the deposit area with a rail siding at the community of Béréba.
HOUNDÉ GOLD PROJECT, BURKINA FASO FEASIBILITY STUDY NI 43-101 TECHNICAL REPORT
1813.20\25.01\1813.20-STY-001_B S1
Page 1.3
October 2013 Lycopodium Minerals Pty Ltd
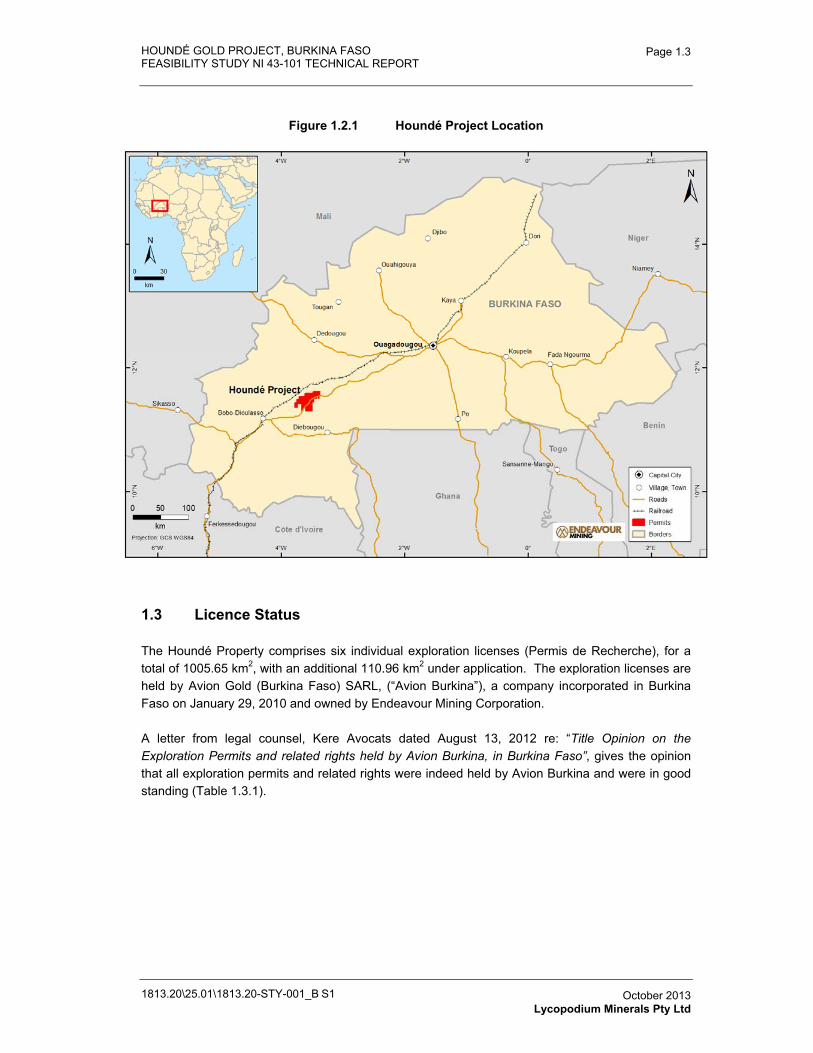
Figure 1.2.1 Houndé Project Location
1.3 Licence Status
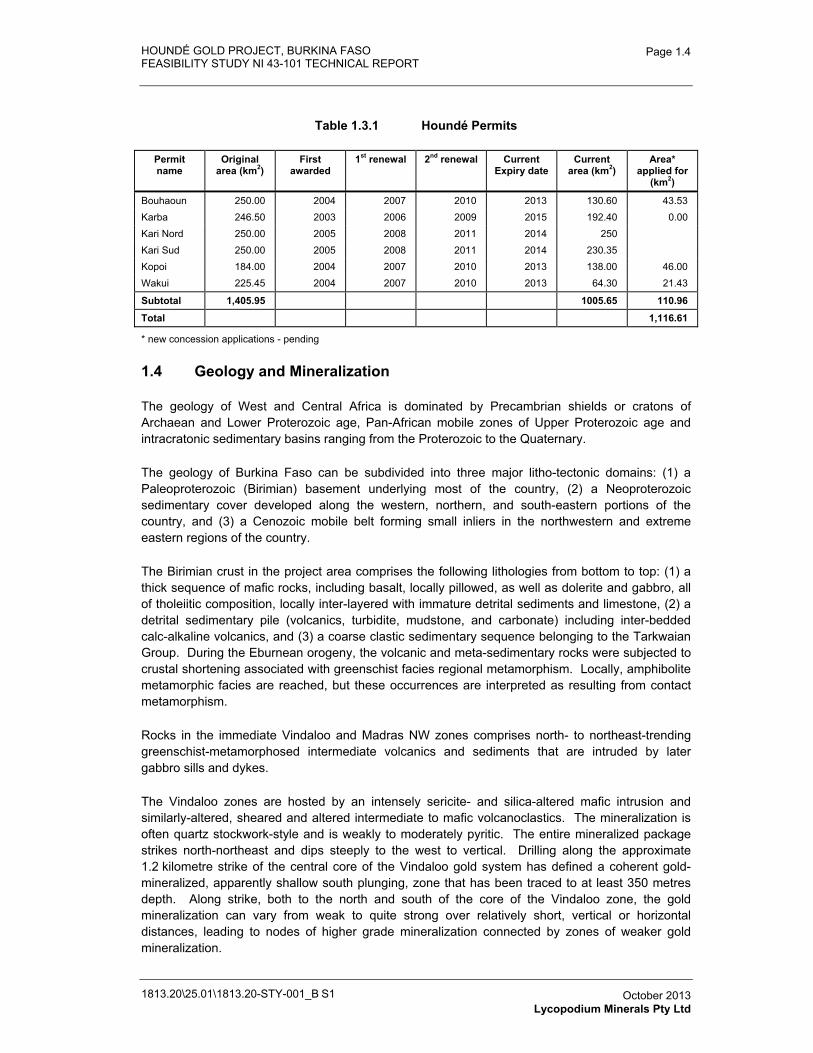
The Houndé Property comprises six individual exploration licenses (Permis de Recherche), for a total of 1005.65 km2, with an additional 110.96 km2 under application. The exploration licenses are held by Avion Gold (Burkina Faso) SARL, (“Avion Burkina”), a company incorporated in Burkina Faso on January 29, 2010 and owned by Endeavour Mining Corporation.
A letter from legal counsel, Kere Avocats dated August 13, 2012 re: “Title Opinion on the Exploration Permits and related rights held by Avion Burkina, in Burkina Faso”, gives the opinion that all exploration permits and related rights were indeed held by Avion Burkina and were in good standing (Table 1.3.1).
HOUNDÉ GOLD PROJECT, BURKINA FASO FEASIBILITY STUDY NI 43-101 TECHNICAL REPORT
1813.20\25.01\1813.20-STY-001_B S1
Page 1.4
October 2013 Lycopodium Minerals Pty Ltd
Table 1.3.1 Houndé Permits
Permitname
Original area (km2)
Firstawarded
1st renewal 2nd renewal Current Expiry date
Currentarea (km2)
Area* applied for
(km2)
Bouhaoun 250.00 2004 2007 2010 2013 130.60 43.53 Karba 246.50 2003 2006 2009 2015 192.40 0.00 Kari Nord 250.00 2005 2008 2011 2014 250 Kari Sud 250.00 2005 2008 2011 2014 230.35 Kopoi 184.00 2004 2007 2010 2013 138.00 46.00 Wakui 225.45 2004 2007 2010 2013 64.30 21.43
Subtotal 1,405.95 1005.65 110.96
Total 1,116.61
* new concession applications - pending
1.4 Geology and Mineralization
The geology of West and Central Africa is dominated by Precambrian shields or cratons of Archaean and Lower Proterozoic age, Pan-African mobile zones of Upper Proterozoic age and intracratonic sedimentary basins ranging from the Proterozoic to the Quaternary.
The geology of Burkina Faso can be subdivided into three major litho-tectonic domains: (1) a Paleoproterozoic (Birimian) basement underlying most of the country, (2) a Neoproterozoic sedimentary cover developed along the western, northern, and south-eastern portions of the country, and (3) a Cenozoic mobile belt forming small inliers in the northwestern and extreme eastern regions of the country.
The Birimian crust in the project area comprises the following lithologies from bottom to top: (1) a thick sequence of mafic rocks, including basalt, locally pillowed, as well as dolerite and gabbro, all of tholeiitic composition, locally inter-layered with immature detrital sediments and limestone, (2) a detrital sedimentary pile (volcanics, turbidite, mudstone, and carbonate) including inter-bedded calc-alkaline volcanics, and (3) a coarse clastic sedimentary sequence belonging to the Tarkwaian Group. During the Eburnean orogeny, the volcanic and meta-sedimentary rocks were subjected to crustal shortening associated with greenschist facies regional metamorphism. Locally, amphibolite metamorphic facies are reached, but these occurrences are interpreted as resulting from contact metamorphism.
Rocks in the immediate Vindaloo and Madras NW zones comprises north- to northeast-trending greenschist-metamorphosed intermediate volcanics and sediments that are intruded by later gabbro sills and dykes.
The Vindaloo zones are hosted by an intensely sericite- and silica-altered mafic intrusion and similarly-altered, sheared and altered intermediate to mafic volcanoclastics. The mineralization is often quartz stockwork-style and is weakly to moderately pyritic. The entire mineralized package strikes north-northeast and dips steeply to the west to vertical. Drilling along the approximate 1.2 kilometre strike of the central core of the Vindaloo gold system has defined a coherent gold-mineralized, apparently shallow south plunging, zone that has been traced to at least 350 metres depth. Along strike, both to the north and south of the core of the Vindaloo zone, the gold mineralization can vary from weak to quite strong over relatively short, vertical or horizontal distances, leading to nodes of higher grade mineralization connected by zones of weaker gold mineralization.
HOUNDÉ GOLD PROJECT, BURKINA FASO FEASIBILITY STUDY NI 43-101 TECHNICAL REPORT
1813.20\25.01\1813.20-STY-001_B S1
Page 1.5
October 2013 Lycopodium Minerals Pty Ltd
The Vindaloo trend has been drill tested for a distance of approximately 7.7 kilometres along strike. The Vindaloo deposit open pit resources comprise a group of closely-spaced gold-mineralized structures that currently represent an approximate 4.8 km section of the Vindaloo Zone and a 0.9 km long section of the Madras NW zone. Modelling work has outlined 39 separate, semi-parallel lenses of mineralization, that are up to approximately 70 metres wide, that comprise the Vindaloo and Madras NW zones, of which 6 of the lenses contain the bulk of the mineral resources.
The Vindaloo zone mineralization is open along strike and to depth. Within and adjacent to the modelled area, there are indications of additional hanging wall parallel gold zones and gold-mineralized cross-structures. These areas are under-explored and need follow-up. There is a reasonable likelihood that additional drilling will result in additional mineral resources.
1.5 Exploration and Drilling
Mineral exploration in the Houndé area began in the 1939 by the Bureau de Recherches Géologiques et Minières (BRGM) and Bureau de Mines et de la Géologie du Burkina Faso (BUMIGEB) and continued to 1982. Exploration resumed in the 90’s with a group of companies that initially carried out regional geochemical surveys that were followed up by mode detailed geochemistry, prospecting, mapping and RAB to RC drilling as follow-up. Several gold zones were identified during this work, most of which still require follow-up today.
Endeavour initiated an in-fill drill program over the Vindaloo and Madras NW zones in late October 2012, with a goal to convert Inferred mineral resources to Indicated Mineral Resources and some of the Indicated mineral resources to Measured Mineral Resources. This program consisted of 358 holes totalling 40,534 metres. Including this drill program, during the period from 2007 to 2013, Endeavour, Avion Gold, Goldbelt and African Barrick completed 751 core and RC holes totalling 103,677 meters along the trend of the Vindaloo and Madras NW zones. All of this data has been digitized, incorporated into section sets, interpreted and used as the basis for this study. The data from these exploration programs is used in the current Mineral Resource estimate.
1.6 Mineral Resource
The updated Mineral Resource estimate for the Vindaloo deposits was completed by Cube in June 2013. This estimate represents an update of the Mineral Resources previously reported in the March 2013 PEA. All estimation work was carried out using SURPAC mining software and Isatis geostatistical software. Grade interpolation for gold has used Ordinary Block Kriging (OK) of downhole composite drill data.
The Vindaloo mineral resource is reported inside an optimized pit shell. The results from the optimized pit shell are used solely for the purpose of reporting mineral resources that have reasonable prospects for economic extraction, and the optimization was based on the following economic parameters:
� US$1,600/oz Au price,
� 94.7% to 97.7% saprolite recovery depending on zone,
HOUNDÉ GOLD PROJECT, BURKINA FASO FEASIBILITY STUDY NI 43-101 TECHNICAL REPORT
1813.20\25.01\1813.20-STY-001_B S1
Page 1.6
October 2013 Lycopodium Minerals Pty Ltd
� 88.1% to 94.1% transition zone recovery depending on zone,
� 79% to 94% fresh zone recovery depending on zone,
� $11.58 /t saprolite zone processing cost, including G&A of $0.99/t,
� $12.94 /t transition zone processing cost, including G&A of $0.99/t,
� $16.32 /t fresh zone processing cost, including G&A of $0.99/t,
� $2.11/t average mining cost,
� 31.6 to 54.0 degree pit slopes with the shallowest slopes generally in saprolite zones.
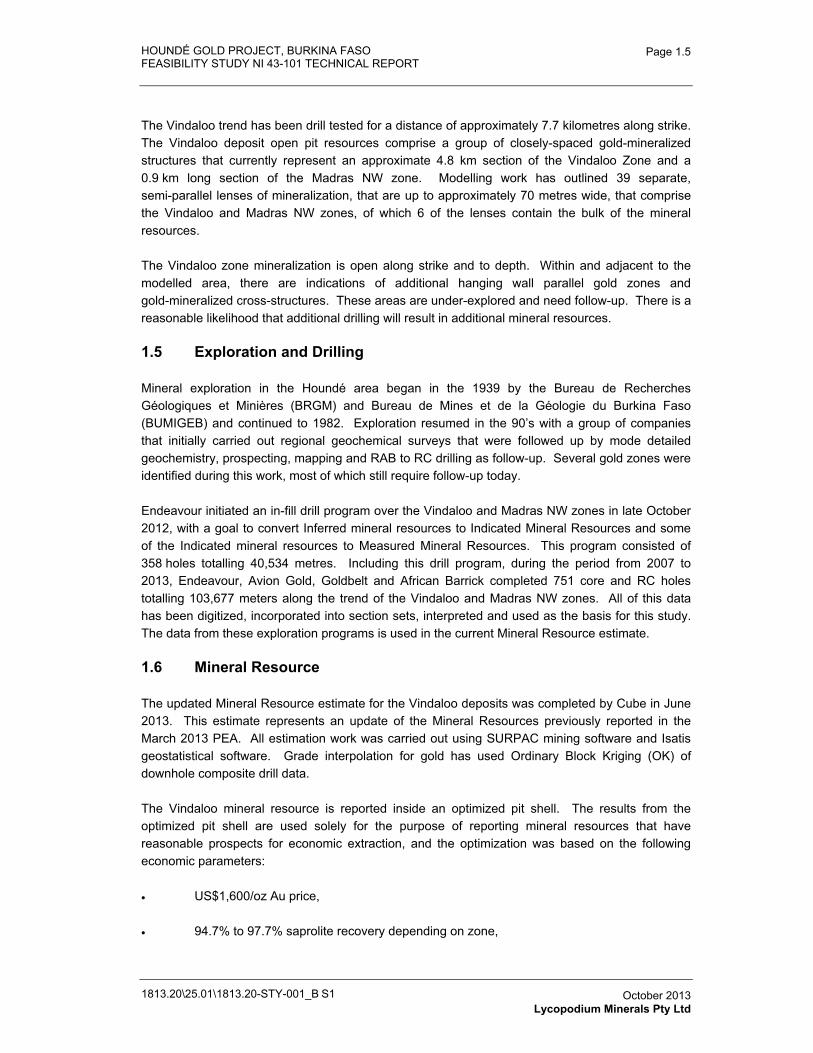
The Mineral Resource estimate was carried out using CIM guidelines (CIM 2005) by Cube Consulting and is reported at a cut-off grade of 0.35 g/t Au (Table 1.6.1), with an effective date of July 18, 2012.
Table 1.6.1 Mineral Resource, Houndé Gold Project
Classification Weathering Tonnes Au (g/t) Au (oz)
Measured
Saprolite 450,000 2.08 30,000
Transitional 1,560,000 2.64 133,000
Fresh 1,740,000 2.51 140,000
Total 3,750,000 2.51 303,000
Indicated
Saprolite 1,640,000 1.45 77,000
Transitional 1,400,000 1.93 87,000
Fresh 22,620,000 1.94 1,407,000
Total 25,660,000 1.90 1,571,000
Measured & Indicated
Saprolite 2,090,000 1.59 107,000
Transitional 2,960,000 2.31 220,000
Fresh 24,360,000 1.98 1,547,000
Total 29,410,000 1.98 1,874,000
Inferred
Saprolite 280,000 1.40 13,000
Transitional 290,000 1.60 15,000
Fresh 1,270,000 2.57 105,000
Total 1,840,000 2.24 133,000
HOUNDÉ GOLD PROJECT, BURKINA FASO FEASIBILITY STUDY NI 43-101 TECHNICAL REPORT
1813.20\25.01\1813.20-STY-001_B S1
Page 1.7
October 2013 Lycopodium Minerals Pty Ltd
1.7 Mineral Reserve
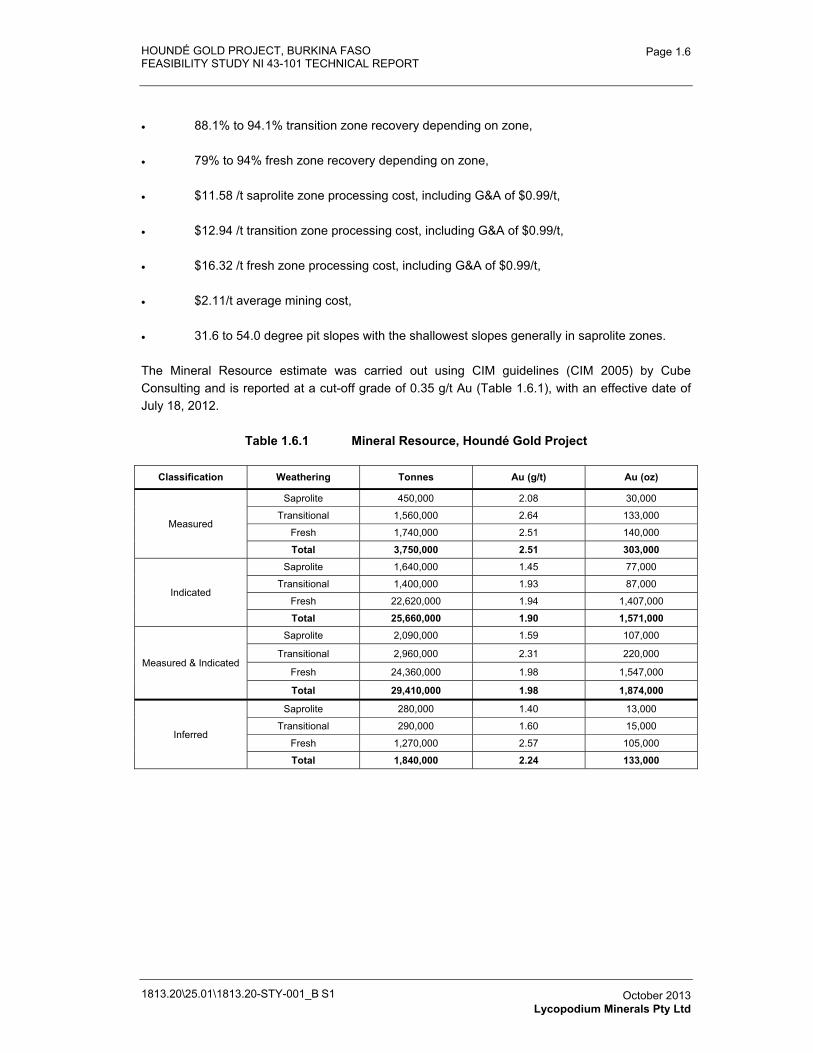
A general site layout is presented in Figure 1.7.1.
Figure 1.7.1 Houndé Gold Project – Site Layout
Overall wall slopes were derived from the inter-ramp angles recommended by Peter O’Bryan and Associates, independent geotechnical consultants commissioned by Knight Piésold. ORELOGY utilised these parameters to develop the overall slopes for the optimisation, with the final wall slopes developed for five areas of the deposit.
Deposit characteristics and mining practices to be adopted led ORELOGY to estimate that the amount of mixing at ore / waste boundaries should be limited to a 1 m wide zone only, resulting in average values for dilution and ore loss within the Measured / Indicated orebody of 6.5% and 5.2% respectively.
HOUNDÉ GOLD PROJECT, BURKINA FASO FEASIBILITY STUDY NI 43-101 TECHNICAL REPORT
1813.20\25.01\1813.20-STY-001_B S1
Page 1.8
October 2013 Lycopodium Minerals Pty Ltd
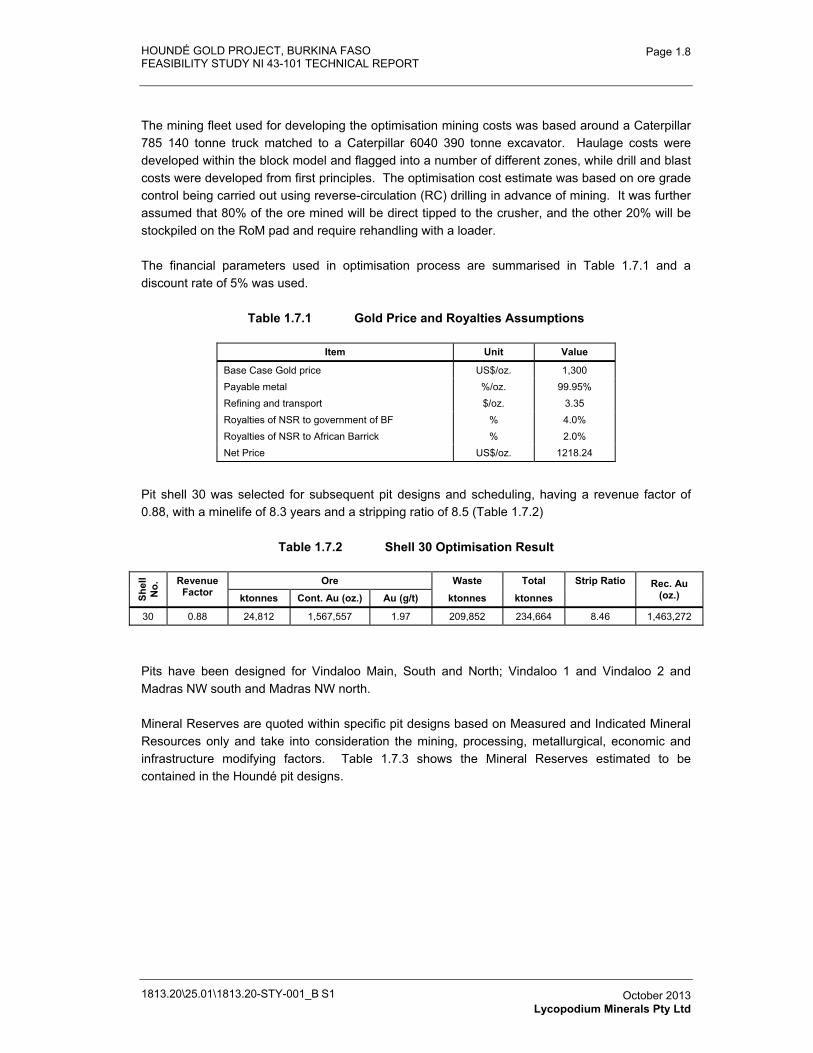
The mining fleet used for developing the optimisation mining costs was based around a Caterpillar 785 140 tonne truck matched to a Caterpillar 6040 390 tonne excavator. Haulage costs were developed within the block model and flagged into a number of different zones, while drill and blast costs were developed from first principles. The optimisation cost estimate was based on ore grade control being carried out using reverse-circulation (RC) drilling in advance of mining. It was further assumed that 80% of the ore mined will be direct tipped to the crusher, and the other 20% will be stockpiled on the RoM pad and require rehandling with a loader.
The financial parameters used in optimisation process are summarised in Table 1.7.1 and a discount rate of 5% was used.
Table 1.7.1 Gold Price and Royalties Assumptions
Item Unit Value
Base Case Gold price US$/oz. 1,300 Payable metal %/oz. 99.95% Refining and transport $/oz. 3.35Royalties of NSR to government of BF % 4.0% Royalties of NSR to African Barrick % 2.0% Net Price US$/oz. 1218.24
Pit shell 30 was selected for subsequent pit designs and scheduling, having a revenue factor of 0.88, with a minelife of 8.3 years and a stripping ratio of 8.5 (Table 1.7.2)
Table 1.7.2 Shell 30 Optimisation Result
Shel
lN
o. Revenue
Factor Ore Waste Total Strip Ratio Rec. Au
(oz.) ktonnes Cont. Au (oz.) Au (g/t) ktonnes ktonnes
30 0.88 24,812 1,567,557 1.97 209,852 234,664 8.46 1,463,272
Pits have been designed for Vindaloo Main, South and North; Vindaloo 1 and Vindaloo 2 and Madras NW south and Madras NW north.
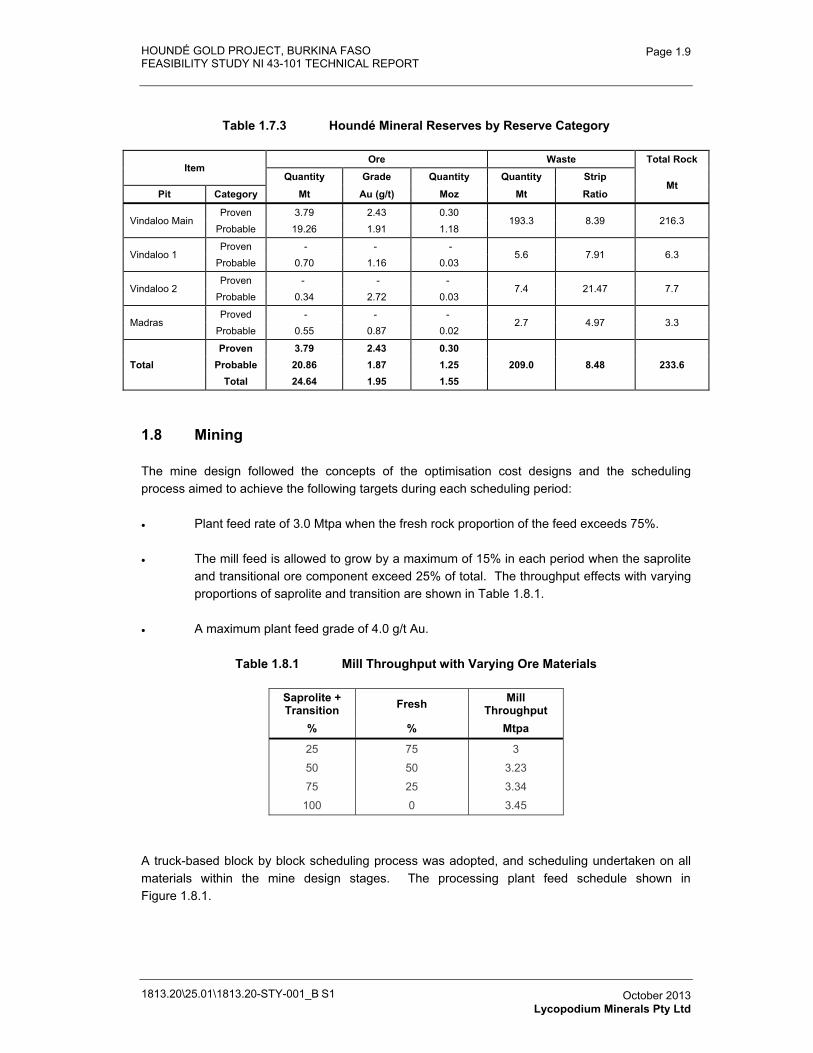
Mineral Reserves are quoted within specific pit designs based on Measured and Indicated Mineral Resources only and take into consideration the mining, processing, metallurgical, economic and infrastructure modifying factors. Table 1.7.3 shows the Mineral Reserves estimated to be contained in the Houndé pit designs.
HOUNDÉ GOLD PROJECT, BURKINA FASO FEASIBILITY STUDY NI 43-101 TECHNICAL REPORT
1813.20\25.01\1813.20-STY-001_B S1
Page 1.9
October 2013 Lycopodium Minerals Pty Ltd
Table 1.7.3 Houndé Mineral Reserves by Reserve Category
Item Ore Waste Total Rock
Quantity Grade Quantity Quantity Strip Mt
Pit Category Mt Au (g/t) Moz Mt Ratio
Vindaloo Main Proven 3.79 2.43 0.30
193.3 8.39 216.3 Probable 19.26 1.91 1.18
Vindaloo 1 Proven - - -
5.6 7.91 6.3 Probable 0.70 1.16 0.03
Vindaloo 2 Proven - - -
7.4 21.47 7.7 Probable 0.34 2.72 0.03
MadrasProved - - -
2.7 4.97 3.3 Probable 0.55 0.87 0.02
Total Proven 3.79 2.43 0.30
209.0 8.48 233.6 Probable 20.86 1.87 1.25 Total 24.64 1.95 1.55
1.8 Mining
The mine design followed the concepts of the optimisation cost designs and the scheduling process aimed to achieve the following targets during each scheduling period:
� Plant feed rate of 3.0 Mtpa when the fresh rock proportion of the feed exceeds 75%.
� The mill feed is allowed to grow by a maximum of 15% in each period when the saprolite and transitional ore component exceed 25% of total. The throughput effects with varying proportions of saprolite and transition are shown in Table 1.8.1.
� A maximum plant feed grade of 4.0 g/t Au.
Table 1.8.1 Mill Throughput with Varying Ore Materials
Saprolite + Transition Fresh Mill
Throughput % % Mtpa
25 75 3
50 50 3.23
75 25 3.34
100 0 3.45
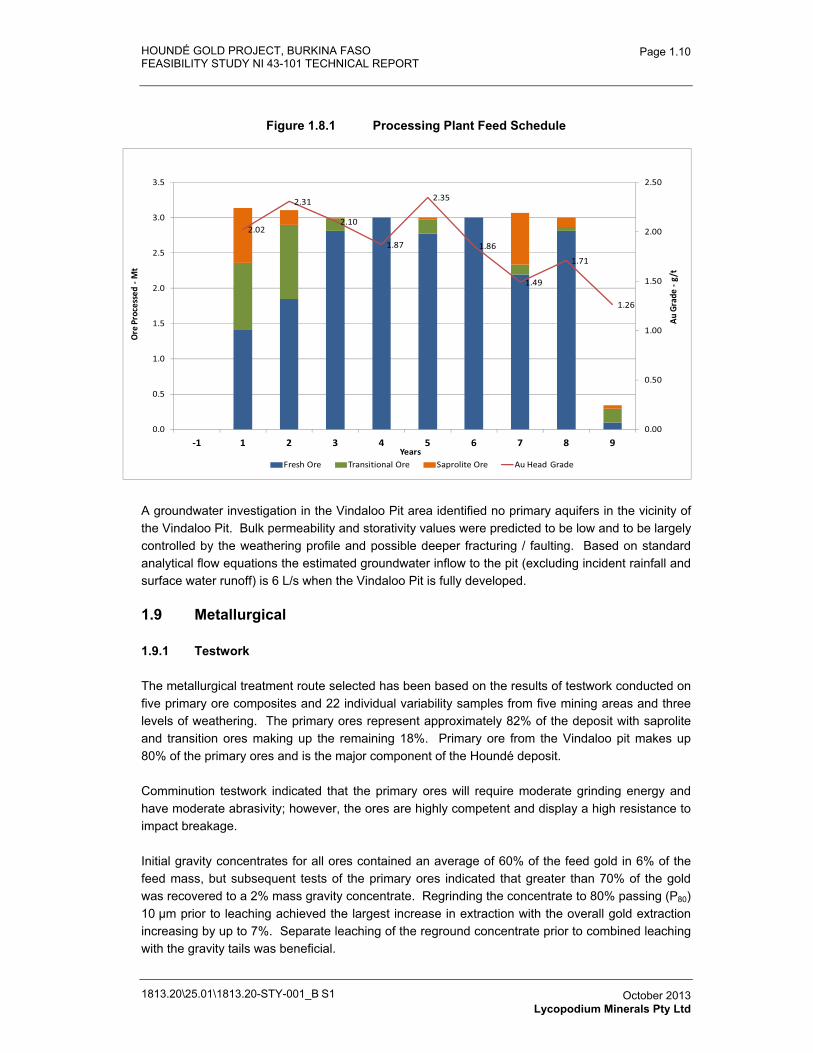
A truck-based block by block scheduling process was adopted, and scheduling undertaken on all materials within the mine design stages. The processing plant feed schedule shown in Figure 1.8.1.
HOUNDÉ GOLD PROJECT, BURKINA FASO FEASIBILITY STUDY NI 43-101 TECHNICAL REPORT
1813.20\25.01\1813.20-STY-001_B S1
Page 1.10
October 2013 Lycopodium Minerals Pty Ltd
Figure 1.8.1 Processing Plant Feed Schedule
A groundwater investigation in the Vindaloo Pit area identified no primary aquifers in the vicinity of the Vindaloo Pit. Bulk permeability and storativity values were predicted to be low and to be largely controlled by the weathering profile and possible deeper fracturing / faulting. Based on standard analytical flow equations the estimated groundwater inflow to the pit (excluding incident rainfall and surface water runoff) is 6 L/s when the Vindaloo Pit is fully developed.
1.9 Metallurgical
1.9.1 Testwork
The metallurgical treatment route selected has been based on the results of testwork conducted on five primary ore composites and 22 individual variability samples from five mining areas and three levels of weathering. The primary ores represent approximately 82% of the deposit with saprolite and transition ores making up the remaining 18%. Primary ore from the Vindaloo pit makes up 80% of the primary ores and is the major component of the Houndé deposit.
Comminution testwork indicated that the primary ores will require moderate grinding energy and have moderate abrasivity; however, the ores are highly competent and display a high resistance to impact breakage.
Initial gravity concentrates for all ores contained an average of 60% of the feed gold in 6% of the feed mass, but subsequent tests of the primary ores indicated that greater than 70% of the gold was recovered to a 2% mass gravity concentrate. Regrinding the concentrate to 80% passing (P80)10 μm prior to leaching achieved the largest increase in extraction with the overall gold extraction increasing by up to 7%. Separate leaching of the reground concentrate prior to combined leaching with the gravity tails was beneficial.
2.02
2.31
2.10
1.87
2.35
1.86
1.49
1.71
1.26
0.00
0.50
1.00
1.50
2.00
2.50
0.0
0.5
1.0
1.5
2.0
2.5
3.0
3.5
�1 1 2 3 4 5 6 7 8 9
Au�
Gra
de��
g/t
Ore
�Pro
cess
ed��
Mt
Years
Source:�0262_Pit_Dump_131004�� 0262_LOM_Update_newWSF_5x10x5_as_Fnal_131016��20131016002127�� Schedule�01_Final_Schedule_Selected_newWSF_131016
Fresh�Ore Transitional�Ore Saprolite�Ore Au�Head�Grade
HOUNDÉ GOLD PROJECT, BURKINA FASO FEASIBILITY STUDY NI 43-101 TECHNICAL REPORT
1813.20\25.01\1813.20-STY-001_B S1
Page 1.11
October 2013 Lycopodium Minerals Pty Ltd
Grind sensitivity testwork on the primary composites indicated that lower residue grades, faster leaching rates and higher gold extractions are achieved with increasing fineness of grind. Evaluating these benefits against the increased costs led to selection of an optimum residence time of 24 hours with a conservative grind size of P80 90 μm.
1.9.2 Plant Design
The process plant will be designed for a nominal 3 Mt/y (9,000 t/d) throughput on the life of mine blend ore (88% primary and 12% saprolite + transition ores), although the mine will deliver predominantly saprolite and transition ores for the first 18 months of operation. The design will allow the nominal throughput to be achieved in 8,000 operating hours per year.
The flowsheet comprises a primary jaw crusher feeding a live stockpile and then to a SABC comminution circuit with 6 MW SAG and ball mills and recycle pebble crusher, producing a target P80 90 μm grind size. With fresh ore in the feed, the cyclone product will pass through a gravity concentration circuit that will extract 2.5% of the feed as concentrate to be reground to P80 of 10 μm before intensive leaching. Saprolite ore and the gravity tails will be thickened and combined with the leached gravity concentrate as feed for a standard CIL leach circuit. A split AARL 6.5 t elution circuit will recover the gold for electrowinning and the leach tails will pass to a cyanide destruction circuit using the SO2 / air technology to ensure plant tailings comply with the Cyanide Management Code. The leach feed thickener overflow will provide cyanide free water for use in the milling circuit, while decant return from the tailings dam will supply process water.
A moderate level of automation and remote control will be provided, to ensure safe operation of the plant and to control process conditions for optimum recovery, while still requiring manual inspection of equipment before starting. Operators will also monitor the plant to ensure that spillage is detected and cleaned up quickly and that good housekeeping practices are followed in compliance with safe working practices and country regulations.
1.10 Infrastructure
1.10.1 Roads
A new intersection will be constructed on the N1 highway for the 1.5 km long sealed main access road to the plant site. The 1 km long unsealed camp access road will branch off the main road. Service roads within the plant will be laterite surface designed for the truck and crane access needed for maintenance and delivery of consumables and reagents.
Access to more remote dams (10 km) and the tailings facility (4.5 km) will be on upgraded existing laterite tracks, but the tailings dam access road will be constructed alongside the pipeline corridor to provide maintenance access to the pipeline if needed. Within the plant area, unsealed roads will provide access around the processing facilities.
HOUNDÉ GOLD PROJECT, BURKINA FASO FEASIBILITY STUDY NI 43-101 TECHNICAL REPORT
1813.20\25.01\1813.20-STY-001_B S1
Page 1.12
October 2013 Lycopodium Minerals Pty Ltd
1.10.2 Water Supply
A water balance model estimated the demand for raw water at 3.3 Mm3 per year. The annual water demand for the process plant amounts to 2.85 Mm3, with an additional 0.54 Mm3 for dust suppression. The demand will be met from TSF decant, pit dewatering (including precipitation on the pit area) and runoff from the ROM pad and stockpiles with the shortfall to be supplied from a water storage dam which will be fed from a water harvesting dam. Groundwater resources were considered but are expected to be very small; however, they will be sufficient for potable water use.
1.10.3 Surface Water Management
Wherever possible, run-off from undisturbed areas will be diverted around the mining and processing operations. Clean run-off that has contacted disturbed areas or dumps will be collected in sediment control structures and then discharged, while run-off that has contacted process areas or ore piles will be collected and returned to the process plant for use there.
1.10.4 Tailings Disposal (Tailings Storage Facility)
The TSF will have a capacity of approximately 25 Mt and it is estimated that the tailings surface at full capacity will cover approximately 200 ha. The selected site has the potential to provide storage for up to 50 Mt of tailings by increasing the embankment height and, if required, adding a saddle embankment to the south of the facility. It is expected that the tailings will settle to a density of approximately 1.4 t/m3 initially, increasing to 1.6 t/m3 to give an overall final density of 1.55 t/m3.
The tailings acid base accounting indicated that the tailings would be acid consuming and assay results showed that the tailings solids had a low number of elemental enrichments, with arsenic, selenium and antimony significantly enriched and chromium slightly enriched. A comparison with soil intervention guidelines indicated that a number of element concentrations will exceed the guidelines, thus requiring a cover system designed to isolate the tailings facility from the environment on closure to prevent migration of tailings.
Arsenic and antimony were present in the supernatant liquor at levels which would require dilution before releasing into aquatic systems as surface flows. It will therefore be required to store up to a 1 in 100 year wet event on the TSF without release to the environment and a suitable seepage reduction system will be required to reduce the risk of tailings supernatant affecting the groundwater. Seepage analysis site indicated that the in-situ saprolite will provide a suitably low permeability layer.
A dam break analysis of the TSF embankments resulted in the classification of the facility as a “High” consequence rating. As a result Embankment 2, which has the largest potential impact in the event of a failure, was designed to mitigate this risk by using the downstream construction method, while Embankment 1 and Embankment 3, which are lower risk, will be built downstream for Stage 1 and centreline for subsequent stages.
At closure, the embankments will be rehabilitated and revegetated and the TSF surface will be covered with a layer of waste rock and a soil layer and shaped to be free draining towards the closure spillway.
HOUNDÉ GOLD PROJECT, BURKINA FASO FEASIBILITY STUDY NI 43-101 TECHNICAL REPORT
1813.20\25.01\1813.20-STY-001_B S1
Page 1.13
October 2013 Lycopodium Minerals Pty Ltd
1.10.5 Dumps
Waste Storage Facility (WSF) shells have been designed with the standoff distance between the pits and the waste storage facilities determined in accordance with safety bund requirements by the Department of Industry and Resources of Western Australia.
In order to realise cost savings now, rather than a potential cost saving at some point in the future it, was decided to allow the eastern WSF to be constructed on the Koho zone. No consideration was given to stand off distances between WSFs and villages or heritage sites as none were apparent in the vicinity of the mining area.
WSFs are constructed in 20 m high lifts with 37 degree face angles and are later reworked into their final landform during the WSF rehabilitation process.
1.10.6 Power Supply and Distribution
A major 225 kV power line supplying power to Burkina Faso from Cote d’Ivoire is located adjacent to the plant site. Sonabel, the national power company, has agreed in principle to sell the project power. However, the means and final cost details have not been negotiated yet. The preferred option is to erect a sub-station on this line to provide power to the mine and processing operations at 11 kV.
The mine and processing plant installed load is estimated to be 26 MW, with an average demand of 15.5 MW, which will be supplied to the plant HV switchroom near the mills. The large loads (mill motors and elution heater) will be supplied at 11 kV, with power distributed to the remaining drives at 415 V from local switchrooms and motor control centres.
Remote loads (the camp, tailings decant pumps, water dam transfer pumps and street lighting at the highway intersection) will be supplied by 11 kV overhead lines, with pole-top transformers reducing the voltage to 415 V.
1.10.7 Accommodation Camp
It is anticipated that a significant proportion of the workforce will be recruited from Burkina Faso, with a preference to those from the Houndé area, and reside in Houndé town; however, permanent accommodation to house 130 senior operations and mining workforce personnel will be provided approximately one kilometre to the north of the process plant for expatriates and personnel from outside the local district. Blockwork construction on concrete slabs and steel trussed roofs will be used for the kitchen, dining and common facilities, as well as for the larger rooms reserved for management, whilst converted sea containers will be used for the junior staff rooms.
1.10.8 Buildings and Support Facilities
The process plant support facilities will generally be constructed of a concrete slab on ground with structural steel frame and metal cladding. Office and amenity areas associated with the main structures will generally be of blockwork construction, but other facilities such as ablutions, control room, switchrooms, etc., will be prefabricated.
HOUNDÉ GOLD PROJECT, BURKINA FASO FEASIBILITY STUDY NI 43-101 TECHNICAL REPORT
1813.20\25.01\1813.20-STY-001_B S1
Page 1.14
October 2013 Lycopodium Minerals Pty Ltd
The mine services facilities allowed include a heavy vehicle washdown bay with water recycle, a workshop and warehouse and an administration building with shift change facilities, including toilets and showers.
Sewage from the accommodation camp, process plant and mining services facilities will be collected and treated in two separate package treatment facilities. Treated effluent from the accommodation camp will be discharged to a leach field or a surface spray field, while the treated effluent from the plant site and mining services area will be discharged into the tails hopper.
General solid wastes will be deposited into a landfill, but dangerous materials such as cyanide packaging, will be incinerated on site to prevent unauthorised use.
1.11 Capital and Operating Costs
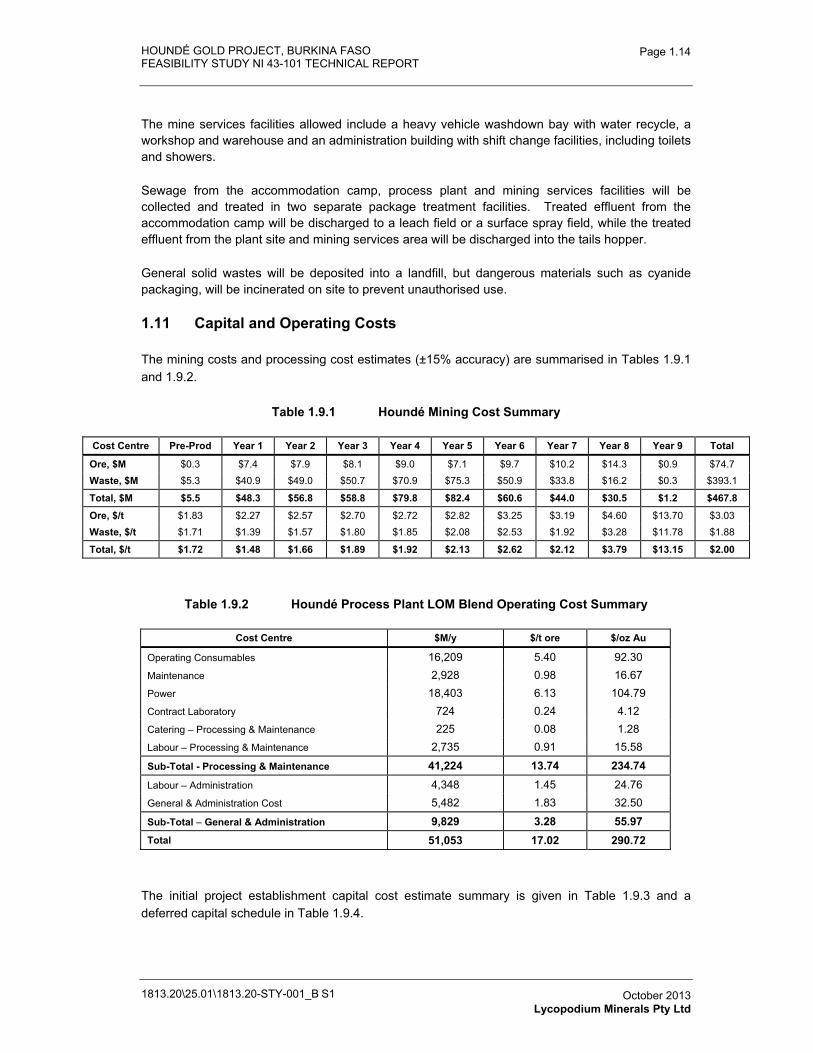
The mining costs and processing cost estimates (±15% accuracy) are summarised in Tables 1.9.1 and 1.9.2.
Table 1.9.1 Houndé Mining Cost Summary
Cost Centre Pre-Prod Year 1 Year 2 Year 3 Year 4 Year 5 Year 6 Year 7 Year 8 Year 9 Total
Ore, $M $0.3 $7.4 $7.9 $8.1 $9.0 $7.1 $9.7 $10.2 $14.3 $0.9 $74.7 Waste, $M $5.3 $40.9 $49.0 $50.7 $70.9 $75.3 $50.9 $33.8 $16.2 $0.3 $393.1
Total, $M $5.5 $48.3 $56.8 $58.8 $79.8 $82.4 $60.6 $44.0 $30.5 $1.2 $467.8
Ore, $/t $1.83 $2.27 $2.57 $2.70 $2.72 $2.82 $3.25 $3.19 $4.60 $13.70 $3.03 Waste, $/t $1.71 $1.39 $1.57 $1.80 $1.85 $2.08 $2.53 $1.92 $3.28 $11.78 $1.88
Total, $/t $1.72 $1.48 $1.66 $1.89 $1.92 $2.13 $2.62 $2.12 $3.79 $13.15 $2.00
Table 1.9.2 Houndé Process Plant LOM Blend Operating Cost Summary
Cost Centre $M/y $/t ore $/oz Au
Operating Consumables 16,209 5.40 92.30Maintenance 2,928 0.98 16.67Power 18,403 6.13 104.79Contract Laboratory 724 0.24 4.12Catering – Processing & Maintenance 225 0.08 1.28 Labour – Processing & Maintenance 2,735 0.91 15.58
Sub-Total - Processing & Maintenance 41,224 13.74 234.74Labour – Administration 4,348 1.45 24.76General & Administration Cost 5,482 1.83 32.50
Sub-Total – General & Administration 9,829 3.28 55.97Total 51,053 17.02 290.72
The initial project establishment capital cost estimate summary is given in Table 1.9.3 and a deferred capital schedule in Table 1.9.4.
HOUNDÉ GOLD PROJECT, BURKINA FASO FEASIBILITY STUDY NI 43-101 TECHNICAL REPORT
1813.20\25.01\1813.20-STY-001_B S1
Page 1.15
October 2013 Lycopodium Minerals Pty Ltd
The estimates have been prepared from first principles, but do not make any allowance for escalation from the date of the estimate or any variation in exchange rates. The schedule allows for $30 million of losses carried forward at the start of the operation. An allowance for Import Duties has also been made in the operating cost schedule of 7.5% on 50% of the operating costs for mining, processing and G&A. Allowance has been made in the capital costs for Import Duties at the rate of 2.5% on an amount of $180 million, representing an approximate value of the goods and services to be imported.

HO
UN
DÉ
GO
LD P
RO
JEC
T, B
UR
KIN
A F
AS
O
FEA
SIB
ILIT
Y S
TUD
Y N
I 43-
101
TEC
HN
ICA
L R
EP
OR
T
1813
.20\
25.0
1\18
13.2
0-S
TY-0
01_B
S1
Pag
e 1.
16
Oct
ober
201
3 Ly
copo
dium
Min
eral
s Pt
y Lt
d
Tabl
e 1.
9.3
Cap
ital C
ost S
umm
ary,
3Q
13, ±
15%
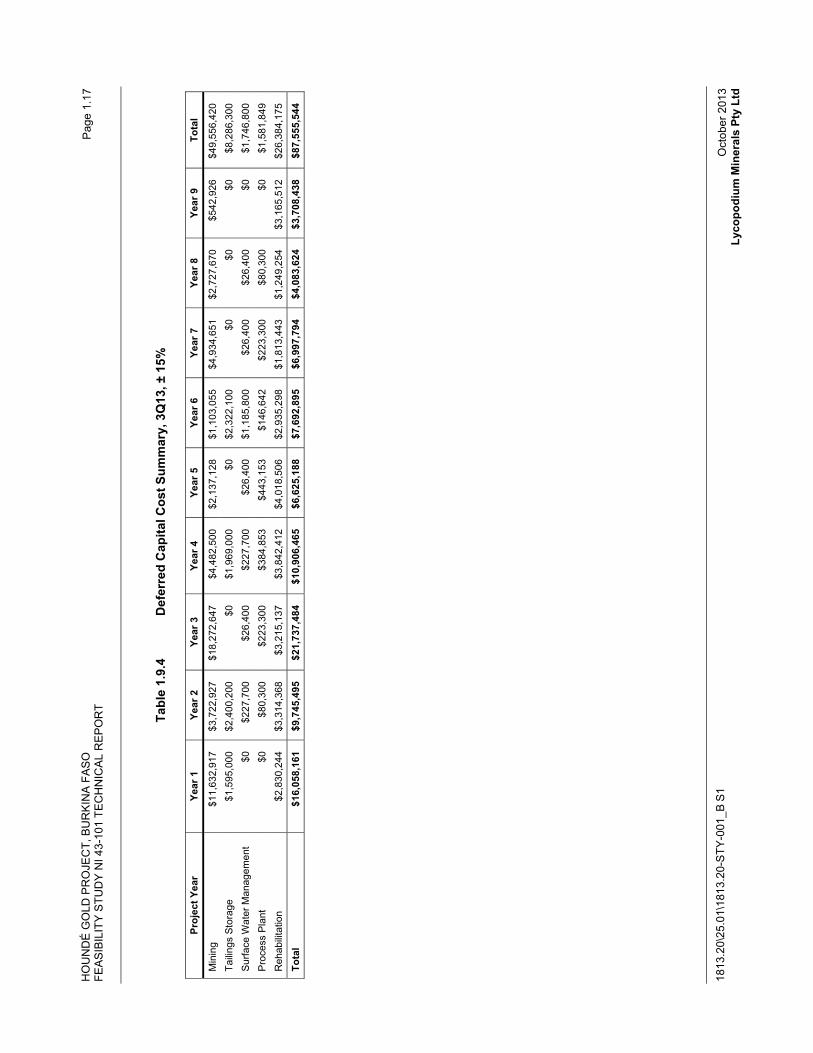
HO
UN
DÉ
GO
LD P
RO
JEC
T, B
UR
KIN
A F
AS
O
FEA
SIB
ILIT
Y S
TUD
Y N
I 43-
101
TEC
HN
ICA
L R
EP
OR
T
1813
.20\
25.0
1\18
13.2
0-S
TY-0
01_B
S1
Pag
e 1.
17
Oct
ober
201
3 Ly
copo
dium
Min
eral
s Pt
y Lt
d
Tabl
e 1.
9.4
Def
erre
d C
apita
l Cos
t Sum
mar
y, 3
Q13
, ± 1
5%
Proj
ect Y
ear
Year
1
Year
2
Year
3
Year
4
Year
5
Year
6
Year
7
Year
8
Year
9
Tota
l
Min
ing
$11,
632,
917
$3,7
22,9
27
$18,
272,
647
$4,4
82,5
00
$2,1
37,1
28
$1,1
03,0
55
$4,9
34,6
51
$2,7
27,6
70
$542
,926
$4
9,55
6,42
0 Ta
iling
s S
tora
ge
$1,5
95,0
00
$2,4
00,2
00
$0
$1,9
69,0
00
$0
$2,3
22,1
00
$0
$0
$0
$8,2
86,3
00
Sur
face
Wat
er M
anag
emen
t $0
$2
27,7
00
$26,
400
$227
,700
$2
6,40
0 $1
,185
,800
$2
6,40
0 $2
6,40
0 $0
$1
,746
,800
P
roce
ss P
lant
$0
$8
0,30
0 $2
23,3
00
$384
,853
$4
43,1
53
$146
,642
$2
23,3
00
$80,
300
$0
$1,5
81,8
49
Reh
abili
tatio
n$2
,830
,244
$3
,314
,368
$3
,215
,137
$3
,842
,412
$4
,018
,506
$2
,935
,298
$1
,813
,443
$1
,249
,254
$3
,165
,512
$2
6,38
4,17
5
Tota
l $1
6,05
8,16
1 $9
,745
,495
$2
1,73
7,48
4 $1
0,90
6,46
5 $6
,625
,188
$7
,692
,895
$6
,997
,794
$4
,083
,624
$3
,708
,438
$8
7,55
5,54
4
HOUNDÉ GOLD PROJECT, BURKINA FASO FEASIBILITY STUDY NI 43-101 TECHNICAL REPORT
1813.20\25.01\1813.20-STY-001_B S1
Page 1.18
October 2013 Lycopodium Minerals Pty Ltd
1.12 Project Execution
The cost estimates have been complied on the basis that Endeavour will adopt an EPCM approach, with engineering commencing after the Board has given approval to the Project, and the necessary permits are in place.
The overall duration of the project from Board Approval to first gold is estimated to be 21 months. The critical path runs from the award of the EPCM contract through the process and detailed design to mill building structural steel supply, erection of the milling building and installation of the equipment before final completion of the piping and electrical activities to allow commissioning to proceed. The schedule is based on purchase orders for the SAG ball and UFG mills being placed immediately the project is approved.
1.13 Environmental
1.13.1 Baseline Conditions
As part of this study, two ESIA studies and a RAP (Resettlement Action Plan) study were carried out by Genivar Inc., INGRID and SOCREGE under Endeavour’s supervision. Baseline studies carried out over a period of nine months showed:
� The biological environment lacked flora and fauna diversity.
� The human environment was dominated by traditional community structures and a low level of development based on a cash crop and subsistence economy.
� The ambient air quality contained high background levels of dust and the noise environment close to the highway had noise levels close to existing IFC limits.
� Water sampling showed on average the water quality is slightly acidic and pH of water at individual sites may be lower than the low limit in the WHO standards. Many of the surface water and well sites exceeded turbidity limits and a few sites had iron, chromium and manganese levels in excess of the WHO standard.
Key environmental issues identified include:
� Water supply for the mine;
� TSF location and post-closure land use;
� Transport and management of hazardous materials;
� Proximity of infrastructure (road, power line and optic fibre cable);
� Potential for in-migration and its effect on level of service in public infrastructure;
� Allowance for traditional grazing patterns; and
� Resettlement and reallocation of land.
HOUNDÉ GOLD PROJECT, BURKINA FASO FEASIBILITY STUDY NI 43-101 TECHNICAL REPORT
1813.20\25.01\1813.20-STY-001_B S1
Page 1.19
October 2013 Lycopodium Minerals Pty Ltd
1.13.2 Permitting Requirements
The key environmental permit required by the project is the environmental certificates from the Ministry of Environment and Sustainable Development (MEED) which will follow submission of the EIA and RAP. A number of secondary approvals may also be needed in relation to specific elements of the project, such as licences for dams, transport and storage of dangerous goods, highway intersection works, etc. These activities are likely to take 12 to 14 months:
Submission of the ESIA reports (Phase 2), public hearings and updates: complete by end April 2014.
Industrial Operating Permit application: estimated reception by end August 2014.
Operations Approval, signed Mining Permit: estimated reception 1 December 2014.
1.13.3 Social and Community Impact
Endeavour, through its subsidiary Avion Gold, has put in place a mechanism for gathering information and consulting the communities throughout this process, including a Stakeholder Engagement Plan (PEPP) and development of various information tools. Items of concern raised during community contacts related mainly to:
� Employment opportunities and possible influx from outside the area.
� Resettlement actions and future standard of living.
� Effect of the project on water and other local infrastructure.
� Possible health impacts and negative impacts on local moral standards and security.
� Impact of the project on current artisanal gold mining activities.
The project will also have positive impacts,
� Wages and salaries paid and spent in the region and services procured from local businesses.
� Training and skills development.
� Compensation payments for land.
� Taxes, Royalties and levies paid to the state of Burkina Faso of approximately $330 million over the project’s life.
HOUNDÉ GOLD PROJECT, BURKINA FASO FEASIBILITY STUDY NI 43-101 TECHNICAL REPORT
1813.20\25.01\1813.20-STY-001_B S1
Page 1.20
October 2013 Lycopodium Minerals Pty Ltd
1.13.4 Land Acquisition
The mine will need to acquire 2.096 ha for the open pit, processing plant, waste piles, TSF, water harvest dam and water storage dam, as well as the necessary roads. As well, a 250 metre wide health perimeter has been delineated around the existing infrastructure for optional compensation and relocation. A further compensation perimeter, designated as a mitigated 50 dB(A) nighttime sound perimeter has also been delineated to provide a mechanism for those impacted by the mine noise the option of being compensated and moved to another location further from the mine.
Fair baseline compensation was determined from a detailed local study by SOCREGE under the supervision of Genivar and Endeavour. The process of determining the appropriate level of compensation is still proceeding with estimates ranging from $6.2 million to $15.8 million. For the purpose of this study, an overall compensation level of $12.0 million was allowed.
1.13.5 Closure Costs
The estimate cost of closure is US$26,384,000. This cost is based on a combination of resale, reuse, recovery and rehabilitation options for the facilities. The biggest single cost will be the cost of closure of the tailings storage facilities which require covering with a layer of fresh waste rock before adding a low permeability layer and topsoil for revegetation. Mine waste dumps will be battered down and covered with topsoil. Infrastructure items of use such as dams, roads, office buildings, accommodation camp, etc, will be donated to the community, while the process plant will be demolished and the area rehabilitated.
The closure costs will be covered by a rehabilitation fund which is required to be set up upon opening of the mine. Contributions to the fund will match total material movement in the mine with $0.10 /tonne mined added to the fund annually, giving a closing balance will be $23.3 million, which will be topped up to $26.4 million (including contingency) at closure. This cost does not include provision for ongoing monitoring that may be required after closure and rehabilitation works have been completed. It is expected these could require ongoing monitoring of US$175,000/y, if required by the regulatory authorities prior to acceptance of relinquishment.
1.14 Economic Analysis
A simple cash flow model was prepared, based on the mine schedule and cost estimates. The results of the model are summarised in Table 1.14.1 and Table 1.14.2. At a gold price of $1,300 per ounce and full equity funding, the Project is estimated to have an after-tax IRR of 22.4% and a pay-back period of 2.88 years. At a discount rate of 5.0%, the after-tax NPV of this scenario is estimated at $230 million.
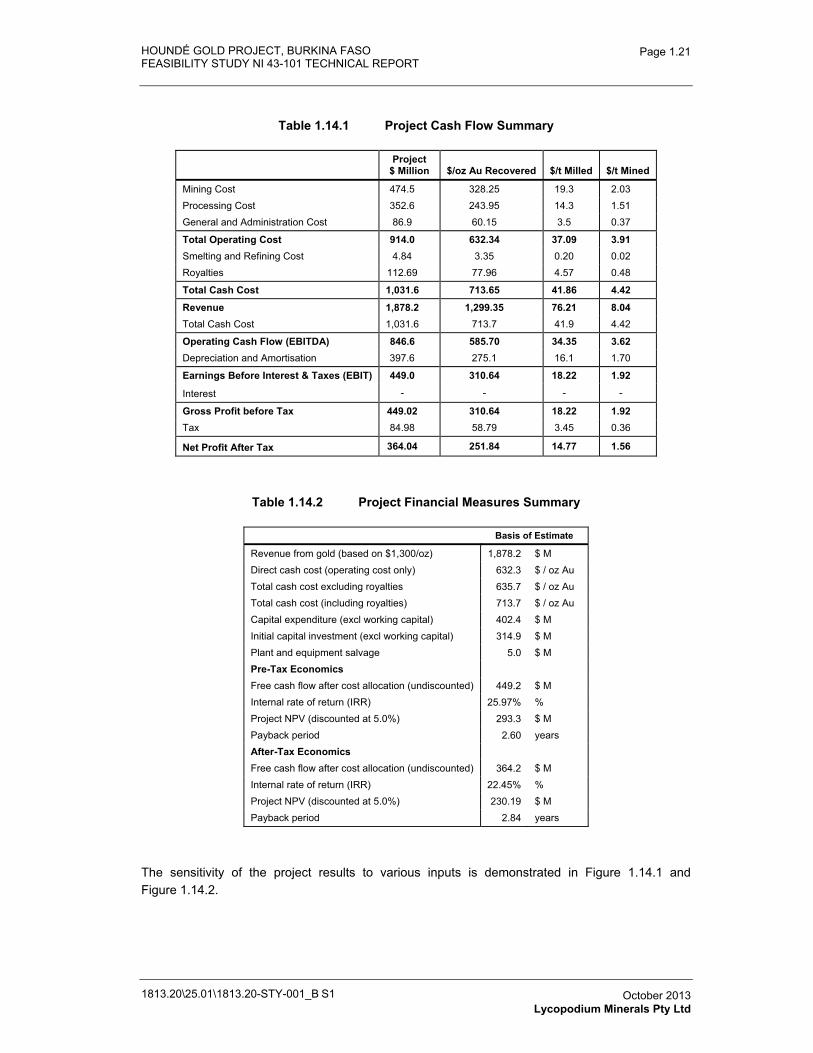
HOUNDÉ GOLD PROJECT, BURKINA FASO FEASIBILITY STUDY NI 43-101 TECHNICAL REPORT
1813.20\25.01\1813.20-STY-001_B S1
Page 1.21
October 2013 Lycopodium Minerals Pty Ltd
Table 1.14.1 Project Cash Flow Summary
Project $ Million $/oz Au Recovered $/t Milled $/t Mined
Mining Cost 474.5 328.25 19.3 2.03 Processing Cost 352.6 243.95 14.3 1.51 General and Administration Cost 86.9 60.15 3.5 0.37
Total Operating Cost 914.0 632.34 37.09 3.91 Smelting and Refining Cost 4.84 3.35 0.20 0.02 Royalties 112.69 77.96 4.57 0.48
Total Cash Cost 1,031.6 713.65 41.86 4.42
Revenue 1,878.2 1,299.35 76.21 8.04Total Cash Cost 1,031.6 713.7 41.9 4.42
Operating Cash Flow (EBITDA) 846.6 585.70 34.35 3.62 Depreciation and Amortisation 397.6 275.1 16.1 1.70
Earnings Before Interest & Taxes (EBIT) 449.0 310.64 18.22 1.92
Interest - - - -
Gross Profit before Tax 449.02 310.64 18.22 1.92 Tax 84.98 58.79 3.45 0.36
Net Profit After Tax 364.04 251.84 14.77 1.56
Table 1.14.2 Project Financial Measures Summary
Basis of Estimate
Revenue from gold (based on $1,300/oz) 1,878.2 $ M Direct cash cost (operating cost only) 632.3 $ / oz Au Total cash cost excluding royalties 635.7 $ / oz Au Total cash cost (including royalties) 713.7 $ / oz Au Capital expenditure (excl working capital) 402.4 $ M Initial capital investment (excl working capital) 314.9 $ M Plant and equipment salvage 5.0 $ M Pre-Tax Economics Free cash flow after cost allocation (undiscounted) 449.2 $ M Internal rate of return (IRR) 25.97% %Project NPV (discounted at 5.0%) 293.3 $ M Payback period 2.60 years After-Tax Economics Free cash flow after cost allocation (undiscounted) 364.2 $ M Internal rate of return (IRR) 22.45% %Project NPV (discounted at 5.0%) 230.19 $ M Payback period 2.84 years
The sensitivity of the project results to various inputs is demonstrated in Figure 1.14.1 and Figure 1.14.2.
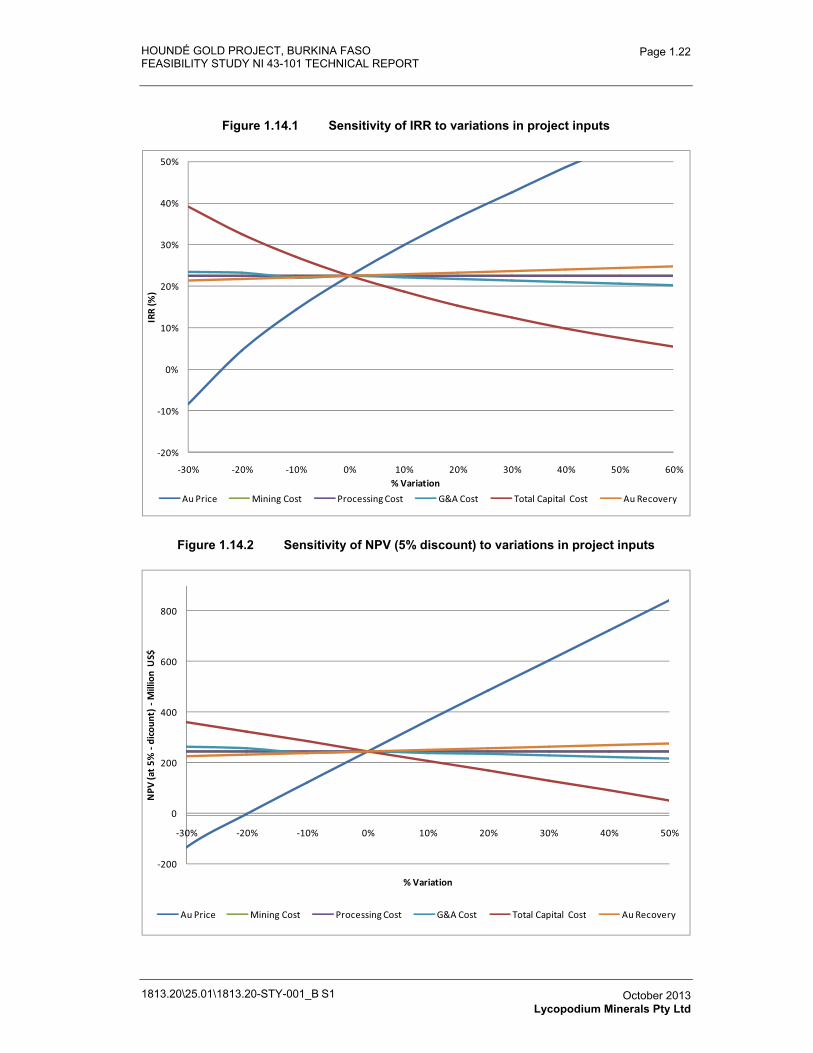
HOUNDÉ GOLD PROJECT, BURKINA FASO FEASIBILITY STUDY NI 43-101 TECHNICAL REPORT
1813.20\25.01\1813.20-STY-001_B S1
Page 1.22
October 2013 Lycopodium Minerals Pty Ltd
Figure 1.14.1 Sensitivity of IRR to variations in project inputs
�
�20%
�10%
0%
10%
20%
30%
40%
50%
�30% �20% �10% 0% 10% 20% 30% 40% 50% 60%
IRR�
(%)�
%�Variation
Au�Price Mining�Cost Processing�Cost G&A�Cost Total�Capital� Cost Au�Recovery
Figure 1.14.2 Sensitivity of NPV (5% discount) to variations in project inputs
�200
0
200
400
600
800
�30% �20% �10% 0% 10% 20% 30% 40% 50%
NPV
�(at�
5%��
dico
unt)
��M
illio
n�U
S$
%�Variation
Au�Price Mining�Cost Processing�Cost G&A�Cost Total�Capital� Cost Au�Recovery
HOUNDÉ GOLD PROJECT, BURKINA FASO FEASIBILITY STUDY NI 43-101 TECHNICAL REPORT
1813.20\25.01\1813.20-STY-001_B S1
Page 1.23
October 2013 Lycopodium Minerals Pty Ltd
1.15 Recommendations and Conclusions
1.15.1 Conclusions
� Exploration drilling in the immediate Vindaloo and Madras NW pit areas indicates that there is both in-pit and near pit mineralized zones that merit follow-up in the short term, as their delineation could have a positive impact on the current mine and waste pile models.
� Exploration targets, located around the periphery of the Vindaloo and Madras NW pits, have the potential to add additional mineable resources.
� The Vindaloo mineralisation is sufficiently drilled and modelled to allow classification into a Resource Model that has been developed using generally accepted industry techniques and practices and conforms to CIM guidelines (CIM 2005). The mineral resource estimate is reported at a cut-off grade of 0.35 g/t Au with an effective date of July 18, 2012. The mine design and scheduling activities have resulted in a Reserve statement produced in accordance with Canadian National Instrument 43-101, ‘Standards of Disclosure for Mineral Projects’ of June 2011 (the Instrument) and the Definition Standards adopted by CIM Council in November 2010.
� The metallurgical testwork conducted on samples representing the bulk of the deposit to be mined has resulted in the development of a robust process flowsheet which is expected to recover in excess of 93% of the gold in the mill feed. Additional testwork on gravity concentration would improve the confidence of the design details and recovery estimates for this part of the process, and further testwork to optimise cyanide consumption may lead to reductions in overall operating costs.
� The preliminary design of the supporting infrastructure for the project has been carried out in sufficient detail to arrive at cost estimates of appropriate accuracy for study of this nature. One item still under negotiation is the connection to the HV power grid; while SONABEL has agreed in principle to supply power to the project, the details of the connection have not yet been agreed.
� Environmental studies have established the baseline conditions in the local project area and the efforts to mitigate the environmental impact of developing, operating and closure of a mine.
� A social impact assessment study has identified a number of areas of concern raised by the local community and identified appropriate mitigating actions. Overall, this study has demonstrated the economic and social benefits of the project for the area and the Country. A compensation and relocation plan has been developed for those that will be impacted by the Project.
� Based on the current reserves, production schedule, the metallurgical performance of the ore, the cost estimates, and other relevant criteria and parameters, the cash flow model indicates a robust project with an acceptable rate of return, even at current depressed gold prices.
HOUNDÉ GOLD PROJECT, BURKINA FASO FEASIBILITY STUDY NI 43-101 TECHNICAL REPORT
1813.20\25.01\1813.20-STY-001_B S1
Page 1.24
October 2013 Lycopodium Minerals Pty Ltd
1.15.2 Recommendation
Given the favourable economics of the project, it is recommended that Endeavour proceed with development of the project.
An exploration plan should be developed that matches the mine development schedule to ensure that any mineralized zones, that could positively impact the mine plan, are delineated in sufficient time to allow for the development of an updated mine plans.
HOUNDÉ GOLD PROJECT, BURKINA FASO
FEASIBILITY STUDY NI 43-101 TECHNICAL REPORT
1813.20-STY-001
Table of Contents Page
2.0� INTRODUCTION 2.1�2.1� Terms of Reference 2.1�2.2� Sources of Information 2.1�
2.2.1� Site Visits 2.1�2.3� Technical Report Preparation 2.2�
2.3.1� Contributors 2.2�2.3.2� Units and Currency 2.3�
TABLESTable 2.3.1� Report Contributors 2.2�
1813.20\25.01\1813.20-STY-001_B S2 October 2013 Lycopodium Minerals Pty Ltd
HOUNDÉ GOLD PROJECT, BURKINA FASO FEASIBILITY STUDY NI 43-101 TECHNICAL REPORT
1813.20\25.01\1813.20-STY-001_B S2
Page 2.1
October 2013 Lycopodium Minerals Pty Ltd
2.0 INTRODUCTION
2.1 Terms of Reference
This report was prepared to provide a NI 43-101-compliant Technical Report on the Feasibility Study carried out for the Houndé gold project in Burkina Faso. The project comprises the Vindaloo and Madras NW zones of the mineralization, the project being owned 100% by Avion Gold (Burkina Faso) SARL, a wholly owned subsidiary of Endeavour Mining Corporation (Endeavour), prior to a 10% carried interest to the government of Burkina Faso, which is granted once a mining permit is approved. Endeavour is listed on the TSX (symbol EDV) and ASX (symbol EVR), and trades on the QTCQX (Symbol EDVMF). The address of the corporate office is:
Regatta Office Park Windward 3, Suite 240 PO Box 1793 West Bay Road, Grand Cayman KY1-1109
Main Line: +1 345 946 7603 Fax: +1 (345) 769-7256.
This Report was prepared at the request of Endeavour and has been prepared in conformance with the standards required by NI 43-101 and Form 43-101(F). The Report is intended to be used to demonstrate the results of the Feasibility Study.
2.2 Sources of Information
The sources of the information used in the preparation of the Study are predominantly the reports and deliverables produced from the site-based investigation work and the calculations and engineering work carried out as part of the Study. Where appropriate, the information is attached to this report as appendices, or is available from Endeavour’s or the relevant consultant’s office on request. References to sources of information are included either as descriptions in the text, or as footnotes.
2.2.1 Site Visits
In compliance with the requirements for preparation of a 43-101 Report, key competent persons visited the project site to gather first-hand information. In addition, Lycopodium and other contributors have studied and constructed numerous projects in the region and are familiar with local conditions.
The following site inspections were carried out:
� Mark Zammitt, Principal Consulting Geologist, Cube Consulting, visited the site and review material aspects of the exploration drilling program from 9 to 13 February 2013.
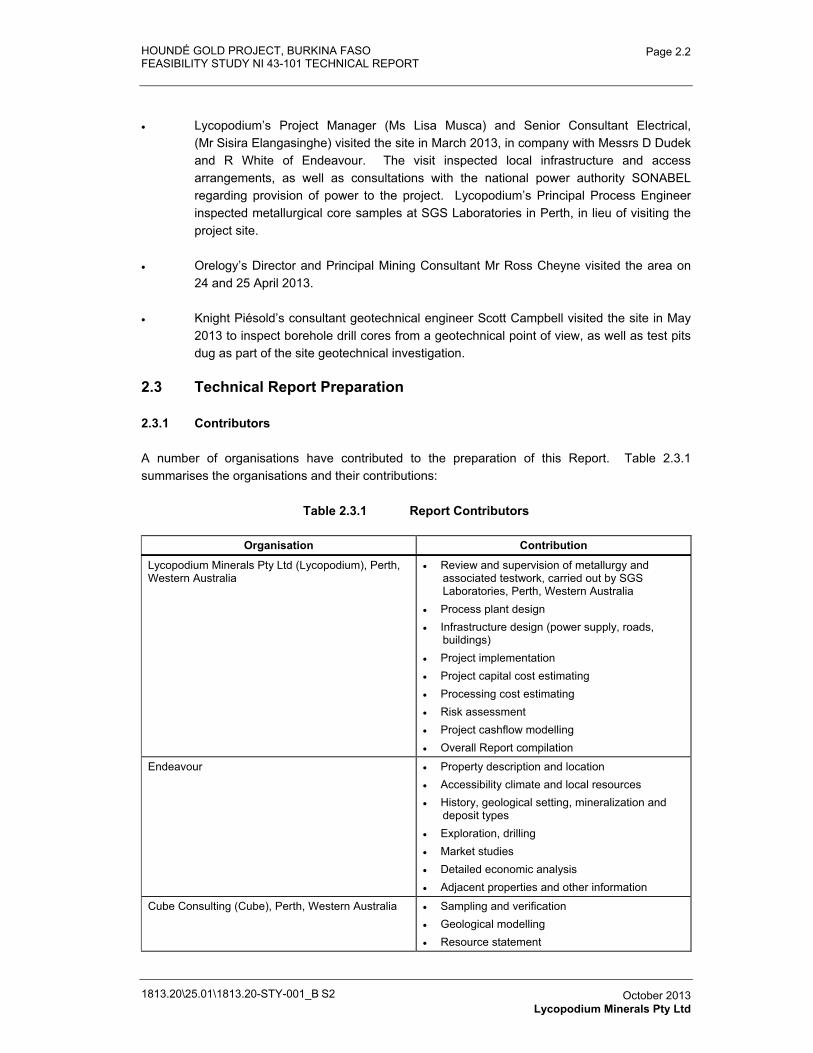
HOUNDÉ GOLD PROJECT, BURKINA FASO FEASIBILITY STUDY NI 43-101 TECHNICAL REPORT
1813.20\25.01\1813.20-STY-001_B S2
Page 2.2
October 2013 Lycopodium Minerals Pty Ltd
� Lycopodium’s Project Manager (Ms Lisa Musca) and Senior Consultant Electrical, (Mr Sisira Elangasinghe) visited the site in March 2013, in company with Messrs D Dudek and R White of Endeavour. The visit inspected local infrastructure and access arrangements, as well as consultations with the national power authority SONABEL regarding provision of power to the project. Lycopodium’s Principal Process Engineer inspected metallurgical core samples at SGS Laboratories in Perth, in lieu of visiting the project site.
� Orelogy’s Director and Principal Mining Consultant Mr Ross Cheyne visited the area on 24 and 25 April 2013.
� Knight Piésold’s consultant geotechnical engineer Scott Campbell visited the site in May 2013 to inspect borehole drill cores from a geotechnical point of view, as well as test pits dug as part of the site geotechnical investigation.
2.3 Technical Report Preparation
2.3.1 Contributors
A number of organisations have contributed to the preparation of this Report. Table 2.3.1 summarises the organisations and their contributions:
Table 2.3.1 Report Contributors
Organisation Contribution
Lycopodium Minerals Pty Ltd (Lycopodium), Perth, Western Australia
� Review and supervision of metallurgy and associated testwork, carried out by SGS Laboratories, Perth, Western Australia
� Process plant design � Infrastructure design (power supply, roads,
buildings) � Project implementation � Project capital cost estimating � Processing cost estimating � Risk assessment � Project cashflow modelling � Overall Report compilation
Endeavour � Property description and location � Accessibility climate and local resources � History, geological setting, mineralization and
deposit types � Exploration, drilling � Market studies � Detailed economic analysis � Adjacent properties and other information
Cube Consulting (Cube), Perth, Western Australia � Sampling and verification � Geological modelling � Resource statement
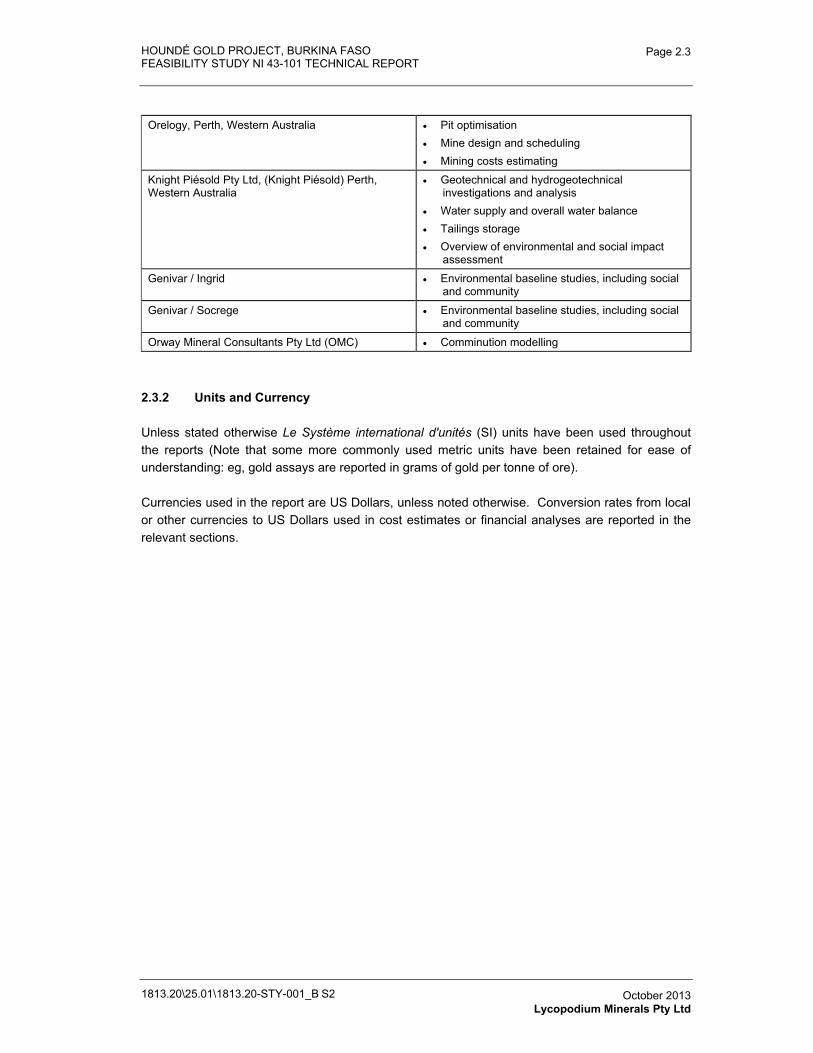
HOUNDÉ GOLD PROJECT, BURKINA FASO FEASIBILITY STUDY NI 43-101 TECHNICAL REPORT
1813.20\25.01\1813.20-STY-001_B S2
Page 2.3
October 2013 Lycopodium Minerals Pty Ltd
Orelogy, Perth, Western Australia � Pit optimisation � Mine design and scheduling � Mining costs estimating
Knight Piésold Pty Ltd, (Knight Piésold) Perth, Western Australia
� Geotechnical and hydrogeotechnical investigations and analysis
� Water supply and overall water balance � Tailings storage � Overview of environmental and social impact
assessment
Genivar / Ingrid � Environmental baseline studies, including social and community
Genivar / Socrege � Environmental baseline studies, including social and community
Orway Mineral Consultants Pty Ltd (OMC) � Comminution modelling
2.3.2 Units and Currency
Unless stated otherwise Le Système international d'unités (SI) units have been used throughout the reports (Note that some more commonly used metric units have been retained for ease of understanding: eg, gold assays are reported in grams of gold per tonne of ore).
Currencies used in the report are US Dollars, unless noted otherwise. Conversion rates from local or other currencies to US Dollars used in cost estimates or financial analyses are reported in the relevant sections.
HOUNDÉ GOLD PROJECT, BURKINA FASO
FEASIBILITY STUDY NI 43-101 TECHNICAL REPORT
1813.20-STY-001
Table of Contents Page
3.0� RELIANCE ON OTHER EXPERTS 3.1�3.1� General Statement 3.1�3.2� Sources of Information 3.1�
TABLESTable 3.2.1� Report Authors 3.2�
1813.20\25.01\1813.20-STY-001_B S3 October 2013 Lycopodium Minerals Pty Ltd
HOUNDÉ GOLD PROJECT, BURKINA FASO FEASIBILITY STUDY NI 43-101 TECHNICAL REPORT
1813.20\25.01\1813.20-STY-001_B S3
Page 3.1
October 2013 Lycopodium Minerals Pty Ltd
3.0 RELIANCE ON OTHER EXPERTS
3.1 General Statement
Lycopodium has assumed and relied on the fact that all the information and existing technical documents listed in the References section of this Report are accurate and complete in all material aspects. While all the available information was carefully reviewed, Lycopodium cannot guarantee its accuracy and completeness. Lycopodium reserves the right, but will not be obligated, to revise the Report and conclusions if additional information becomes known to us subsequent to the date of this Report.
Although copies of the tenure documents, operating licenses, permits, and work contracts were reviewed, an independent verification of land title and tenure was not performed. Lycopodium has not verified the legality of any underlying agreement(s) that may exist concerning the licenses or other agreement(s) between third parties but has relied on the client’s solicitor to have conducted the proper legal due diligence. Information on tenure and permits was obtained from Endeavour.
A copy of this Report has been reviewed for factual errors by Endeavour, and Lycopodium has relied on Endeavour’s historical and current knowledge of the Property in this regard. Any statements and opinions expressed in this document are given in good faith and in the belief that such statements and opinions are not false and misleading at the date of this Report.
3.2 Sources of Information
The following Table 3.2.1 identifies the authors for each section of the Report. The References and Supporting Documentation listed in Section 27 provide further details.
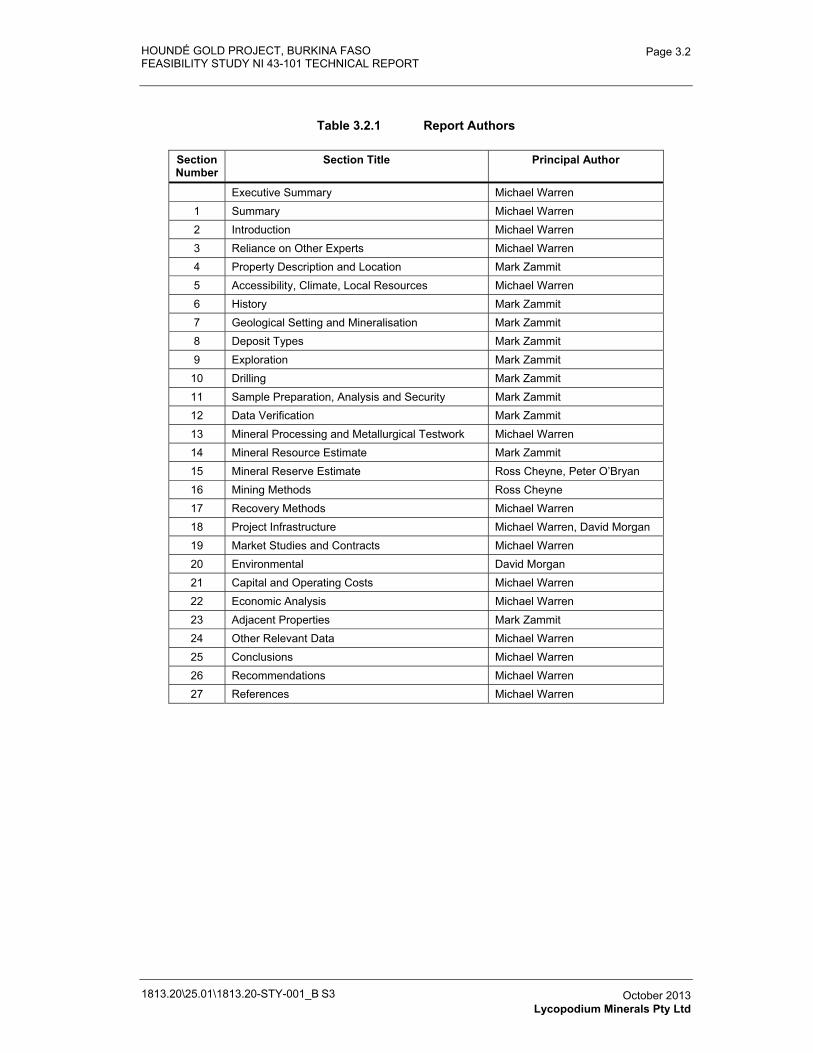
HOUNDÉ GOLD PROJECT, BURKINA FASO FEASIBILITY STUDY NI 43-101 TECHNICAL REPORT
1813.20\25.01\1813.20-STY-001_B S3
Page 3.2
October 2013 Lycopodium Minerals Pty Ltd
Table 3.2.1 Report Authors
Section Number
Section Title Principal Author
Executive Summary Michael Warren 1 Summary Michael Warren 2 Introduction Michael Warren 3 Reliance on Other Experts Michael Warren 4 Property Description and Location Mark Zammit 5 Accessibility, Climate, Local Resources Michael Warren 6 History Mark Zammit 7 Geological Setting and Mineralisation Mark Zammit 8 Deposit Types Mark Zammit 9 Exploration Mark Zammit
10 Drilling Mark Zammit 11 Sample Preparation, Analysis and Security Mark Zammit 12 Data Verification Mark Zammit13 Mineral Processing and Metallurgical Testwork Michael Warren 14 Mineral Resource Estimate Mark Zammit 15 Mineral Reserve Estimate Ross Cheyne, Peter O’Bryan 16 Mining Methods Ross Cheyne 17 Recovery Methods Michael Warren 18 Project Infrastructure Michael Warren, David Morgan 19 Market Studies and Contracts Michael Warren 20 Environmental David Morgan 21 Capital and Operating Costs Michael Warren 22 Economic Analysis Michael Warren 23 Adjacent Properties Mark Zammit 24 Other Relevant Data Michael Warren 25 Conclusions Michael Warren 26 Recommendations Michael Warren 27 References Michael Warren
HOUNDÉ GOLD PROJECT, BURKINA FASO
FEASIBILITY STUDY NI 43-101 TECHNICAL REPORT
1813.20-STY-001
Table of Contents Page
4.0� PROPERTY DESCRIPTION AND LOCATION 4.1�4.1� License Location 4.1�4.2� License Status 4.2�4.3� Mineral Tenure 4.4�
TABLESTable 4.2.1� Kari North (250 km2) with the UTM (Adindan, zone N 30) coordinates 4.3�Table 4.2.2� Kari South (230.35 km2) 4.3�Table 4.2.3� Karba (192.40 km2) 4.3�Table 4.2.4� Bouhaoun (130.60 km2) 4.3�Table 4.2.5� Kopoi (138.00 km2) 4.4�Table 4.2.6� Wakui (64.30 km2) 4.4�Table 4.3.1� Houndé Permits 4.5�
FIGURESFigure 4.1.1� Houndé Project Location 4.1�Figure 4.2.1� Houndé Project Concessions 4.2�Figure 4.3.1� New Concession Applications 4.6�
1813.20\25.01\1813.20-STY-001_B S4 October 2013 Cube Consulting Pty Ltd
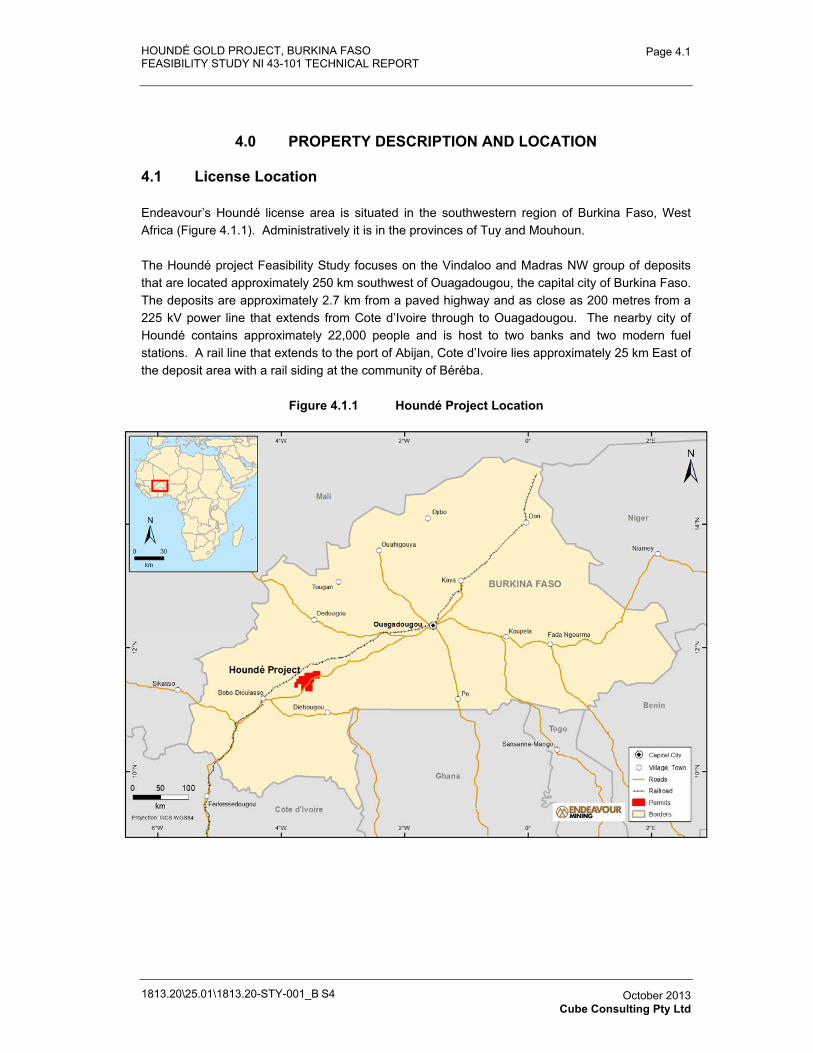
HOUNDÉ GOLD PROJECT, BURKINA FASO FEASIBILITY STUDY NI 43-101 TECHNICAL REPORT
1813.20\25.01\1813.20-STY-001_B S4
Page 4.1
October 2013 Cube Consulting Pty Ltd
4.0 PROPERTY DESCRIPTION AND LOCATION
4.1 License Location
Endeavour’s Houndé license area is situated in the southwestern region of Burkina Faso, West Africa (Figure 4.1.1). Administratively it is in the provinces of Tuy and Mouhoun.
The Houndé project Feasibility Study focuses on the Vindaloo and Madras NW group of deposits that are located approximately 250 km southwest of Ouagadougou, the capital city of Burkina Faso. The deposits are approximately 2.7 km from a paved highway and as close as 200 metres from a 225 kV power line that extends from Cote d’Ivoire through to Ouagadougou. The nearby city of Houndé contains approximately 22,000 people and is host to two banks and two modern fuel stations. A rail line that extends to the port of Abijan, Cote d’Ivoire lies approximately 25 km East of the deposit area with a rail siding at the community of Béréba.
Figure 4.1.1 Houndé Project Location
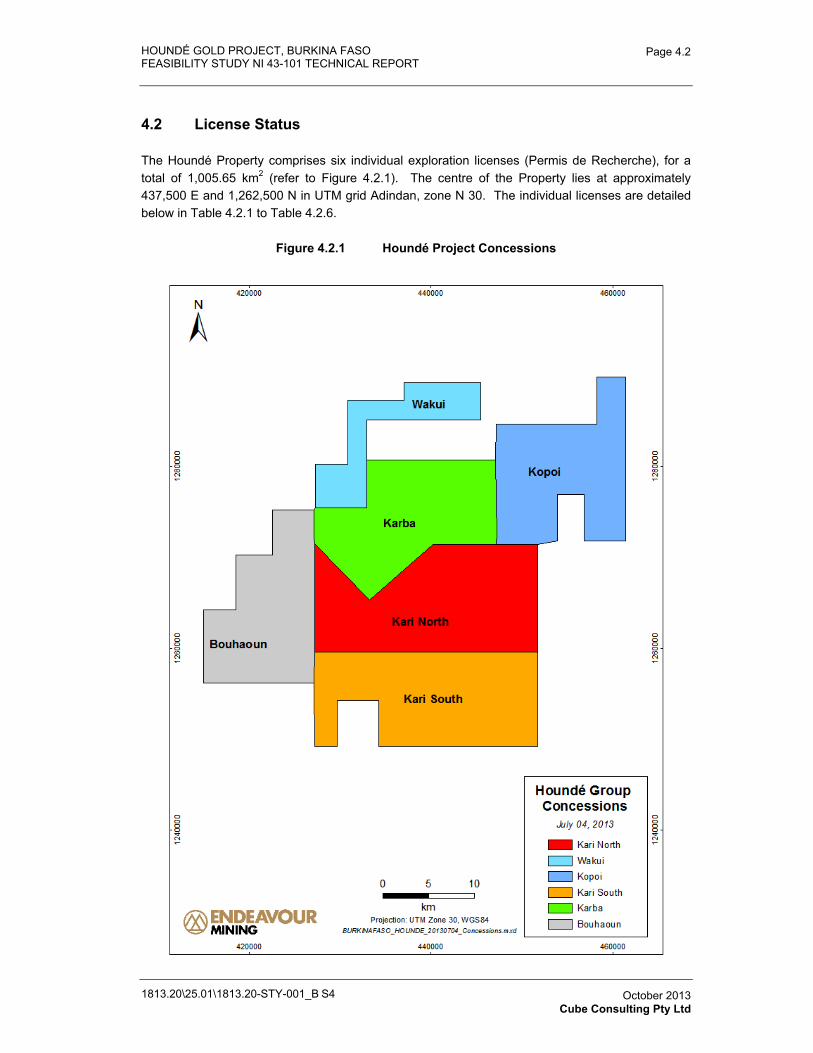
HOUNDÉ GOLD PROJECT, BURKINA FASO FEASIBILITY STUDY NI 43-101 TECHNICAL REPORT
1813.20\25.01\1813.20-STY-001_B S4
Page 4.2
October 2013 Cube Consulting Pty Ltd
4.2 License Status
The Houndé Property comprises six individual exploration licenses (Permis de Recherche), for a total of 1,005.65 km2 (refer to Figure 4.2.1). The centre of the Property lies at approximately 437,500 E and 1,262,500 N in UTM grid Adindan, zone N 30. The individual licenses are detailed below in Table 4.2.1 to Table 4.2.6.
Figure 4.2.1 Houndé Project Concessions
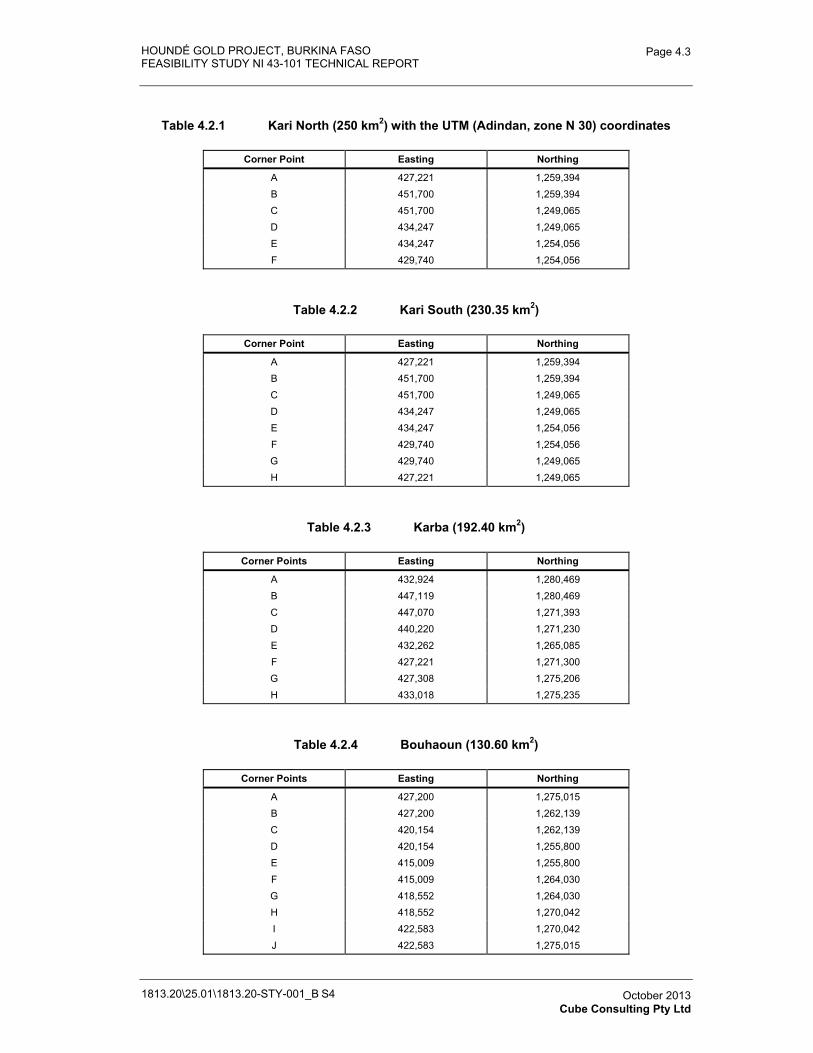
HOUNDÉ GOLD PROJECT, BURKINA FASO FEASIBILITY STUDY NI 43-101 TECHNICAL REPORT
1813.20\25.01\1813.20-STY-001_B S4
Page 4.3
October 2013 Cube Consulting Pty Ltd
Table 4.2.1 Kari North (250 km2) with the UTM (Adindan, zone N 30) coordinates
Corner Point Easting Northing
A 427,221 1,259,394 B 451,700 1,259,394 C 451,700 1,249,065 D 434,247 1,249,065 E 434,247 1,254,056 F 429,740 1,254,056
Table 4.2.2 Kari South (230.35 km2)
Corner Point Easting Northing
A 427,221 1,259,394 B 451,700 1,259,394 C 451,700 1,249,065 D 434,247 1,249,065 E 434,247 1,254,056 F 429,740 1,254,056 G 429,740 1,249,065 H 427,221 1,249,065
Table 4.2.3 Karba (192.40 km2)
Corner Points Easting Northing
A 432,924 1,280,469 B 447,119 1,280,469 C 447,070 1,271,393 D 440,220 1,271,230 E 432,262 1,265,085 F 427,221 1,271,300 G 427,308 1,275,206 H 433,018 1,275,235
Table 4.2.4 Bouhaoun (130.60 km2)
Corner Points Easting Northing
A 427,200 1,275,015 B 427,200 1,262,139 C 420,154 1,262,139 D 420,154 1,255,800 E 415,009 1,255,800 F 415,009 1,264,030 G 418,552 1,264,030 H 418,552 1,270,042 I 422,583 1,270,042 J 422,583 1,275,015
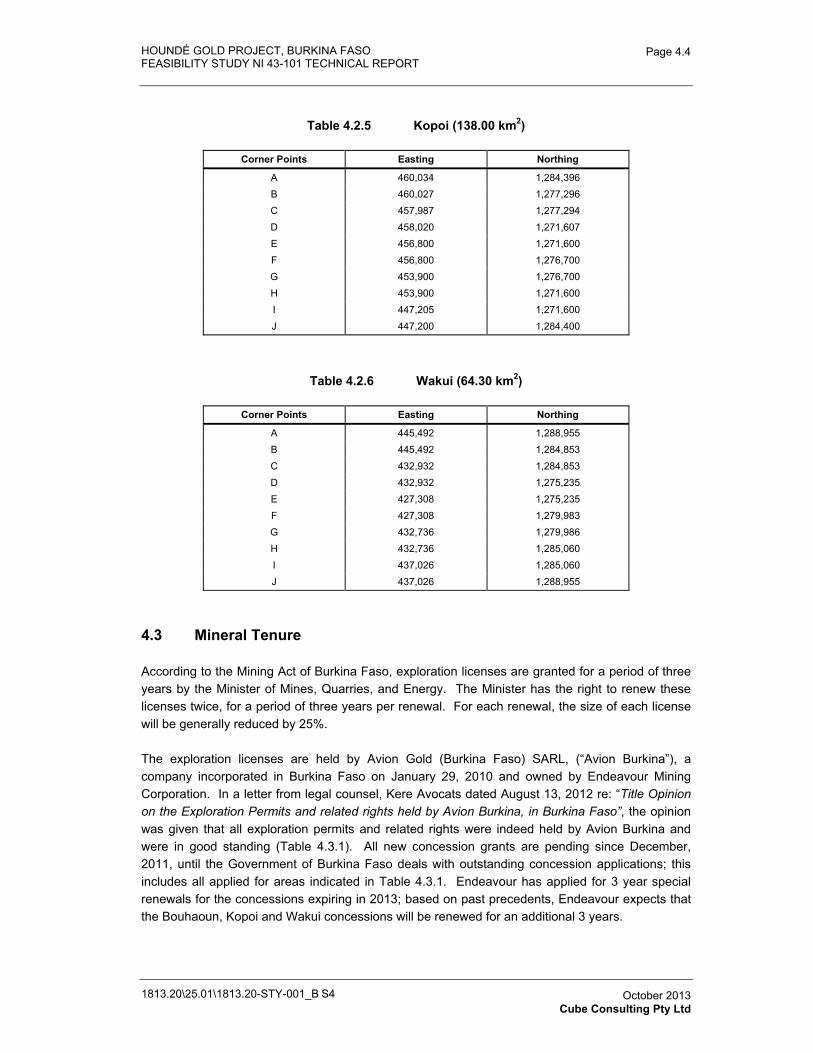
HOUNDÉ GOLD PROJECT, BURKINA FASO FEASIBILITY STUDY NI 43-101 TECHNICAL REPORT
1813.20\25.01\1813.20-STY-001_B S4
Page 4.4
October 2013 Cube Consulting Pty Ltd
Table 4.2.5 Kopoi (138.00 km2)
Corner Points Easting Northing
A 460,034 1,284,396 B 460,027 1,277,296 C 457,987 1,277,294 D 458,020 1,271,607 E 456,800 1,271,600 F 456,800 1,276,700 G 453,900 1,276,700 H 453,900 1,271,600 I 447,205 1,271,600 J 447,200 1,284,400
Table 4.2.6 Wakui (64.30 km2)
Corner Points Easting Northing
A 445,492 1,288,955 B 445,492 1,284,853 C 432,932 1,284,853 D 432,932 1,275,235 E 427,308 1,275,235 F 427,308 1,279,983 G 432,736 1,279,986 H 432,736 1,285,060 I 437,026 1,285,060 J 437,026 1,288,955
4.3 Mineral Tenure
According to the Mining Act of Burkina Faso, exploration licenses are granted for a period of three years by the Minister of Mines, Quarries, and Energy. The Minister has the right to renew these licenses twice, for a period of three years per renewal. For each renewal, the size of each license will be generally reduced by 25%.
The exploration licenses are held by Avion Gold (Burkina Faso) SARL, (“Avion Burkina”), a company incorporated in Burkina Faso on January 29, 2010 and owned by Endeavour Mining Corporation. In a letter from legal counsel, Kere Avocats dated August 13, 2012 re: “Title Opinion on the Exploration Permits and related rights held by Avion Burkina, in Burkina Faso”, the opinion was given that all exploration permits and related rights were indeed held by Avion Burkina and were in good standing (Table 4.3.1). All new concession grants are pending since December, 2011, until the Government of Burkina Faso deals with outstanding concession applications; this includes all applied for areas indicated in Table 4.3.1. Endeavour has applied for 3 year special renewals for the concessions expiring in 2013; based on past precedents, Endeavour expects that the Bouhaoun, Kopoi and Wakui concessions will be renewed for an additional 3 years.
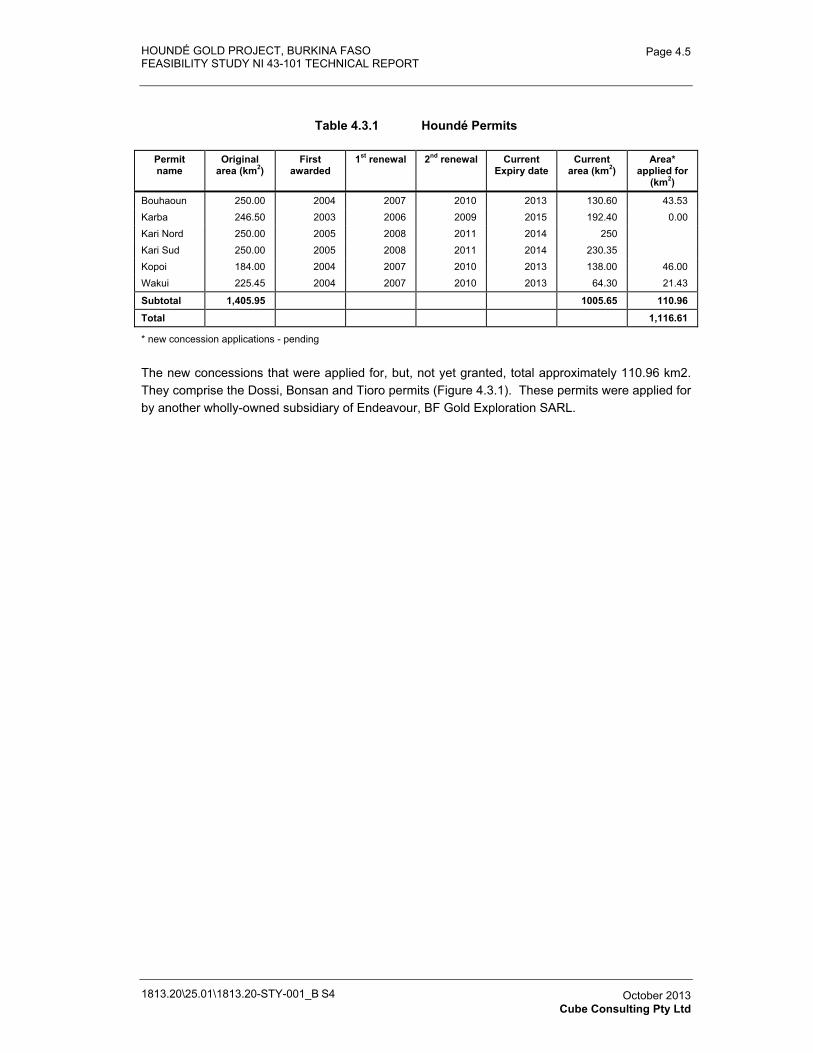
HOUNDÉ GOLD PROJECT, BURKINA FASO FEASIBILITY STUDY NI 43-101 TECHNICAL REPORT
1813.20\25.01\1813.20-STY-001_B S4
Page 4.5
October 2013 Cube Consulting Pty Ltd
Table 4.3.1 Houndé Permits
Permitname
Original area (km2)
Firstawarded
1st renewal 2nd renewal Current Expiry date
Currentarea (km2)
Area* applied for
(km2)
Bouhaoun 250.00 2004 2007 2010 2013 130.60 43.53 Karba 246.50 2003 2006 2009 2015 192.40 0.00 Kari Nord 250.00 2005 2008 2011 2014 250 Kari Sud 250.00 2005 2008 2011 2014 230.35 Kopoi 184.00 2004 2007 2010 2013 138.00 46.00 Wakui 225.45 2004 2007 2010 2013 64.30 21.43
Subtotal 1,405.95 1005.65 110.96
Total 1,116.61
* new concession applications - pending
The new concessions that were applied for, but, not yet granted, total approximately 110.96 km2. They comprise the Dossi, Bonsan and Tioro permits (Figure 4.3.1). These permits were applied for by another wholly-owned subsidiary of Endeavour, BF Gold Exploration SARL.
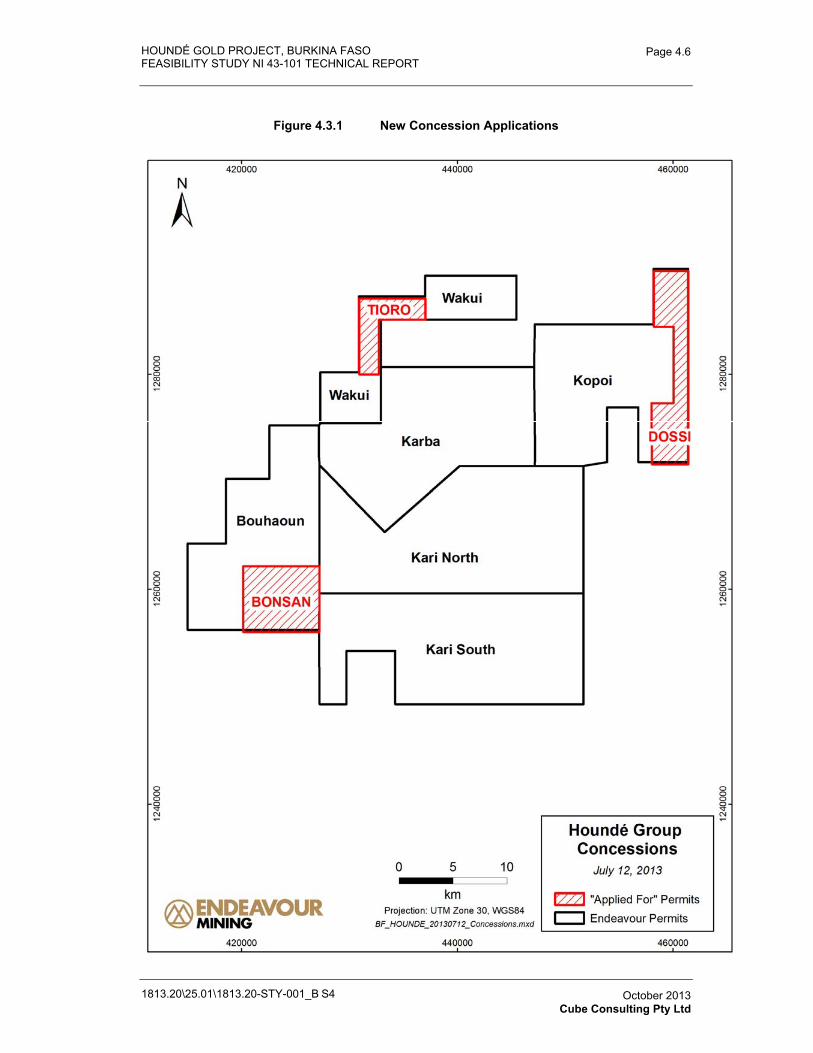
HOUNDÉ GOLD PROJECT, BURKINA FASO FEASIBILITY STUDY NI 43-101 TECHNICAL REPORT
1813.20\25.01\1813.20-STY-001_B S4
Page 4.6
October 2013 Cube Consulting Pty Ltd
Figure 4.3.1 New Concession Applications
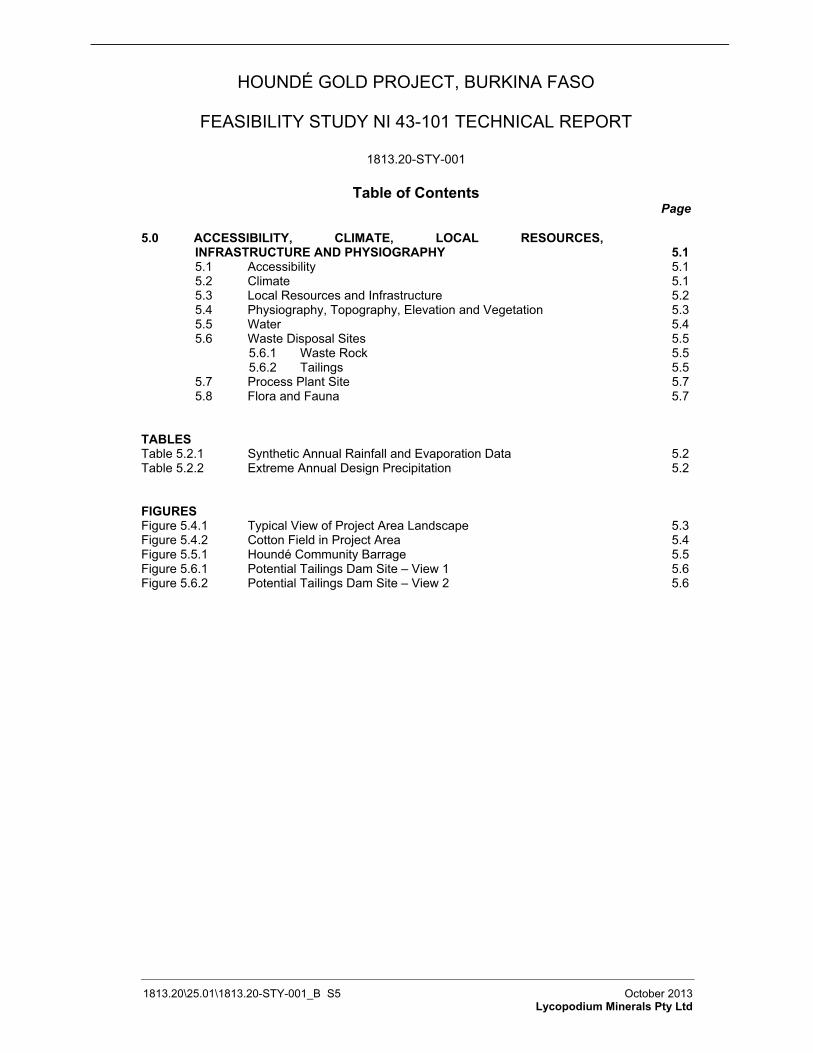
HOUNDÉ GOLD PROJECT, BURKINA FASO
FEASIBILITY STUDY NI 43-101 TECHNICAL REPORT
1813.20-STY-001
Table of Contents Page
5.0� ACCESSIBILITY, CLIMATE, LOCAL RESOURCES, INFRASTRUCTURE AND PHYSIOGRAPHY 5.1�5.1� Accessibility 5.1�5.2� Climate 5.1�5.3� Local Resources and Infrastructure 5.2�5.4� Physiography, Topography, Elevation and Vegetation 5.3�5.5� Water 5.4�5.6� Waste Disposal Sites 5.5�
5.6.1� Waste Rock 5.5�5.6.2� Tailings 5.5�
5.7� Process Plant Site 5.7�5.8� Flora and Fauna 5.7�
TABLESTable 5.2.1� Synthetic Annual Rainfall and Evaporation Data 5.2�Table 5.2.2� Extreme Annual Design Precipitation 5.2�
FIGURESFigure 5.4.1� Typical View of Project Area Landscape 5.3�Figure 5.4.2� Cotton Field in Project Area 5.4�Figure 5.5.1� Houndé Community Barrage 5.5�Figure 5.6.1� Potential Tailings Dam Site – View 1 5.6�Figure 5.6.2� Potential Tailings Dam Site – View 2 5.6�
1813.20\25.01\1813.20-STY-001_B S5 October 2013 Lycopodium Minerals Pty Ltd
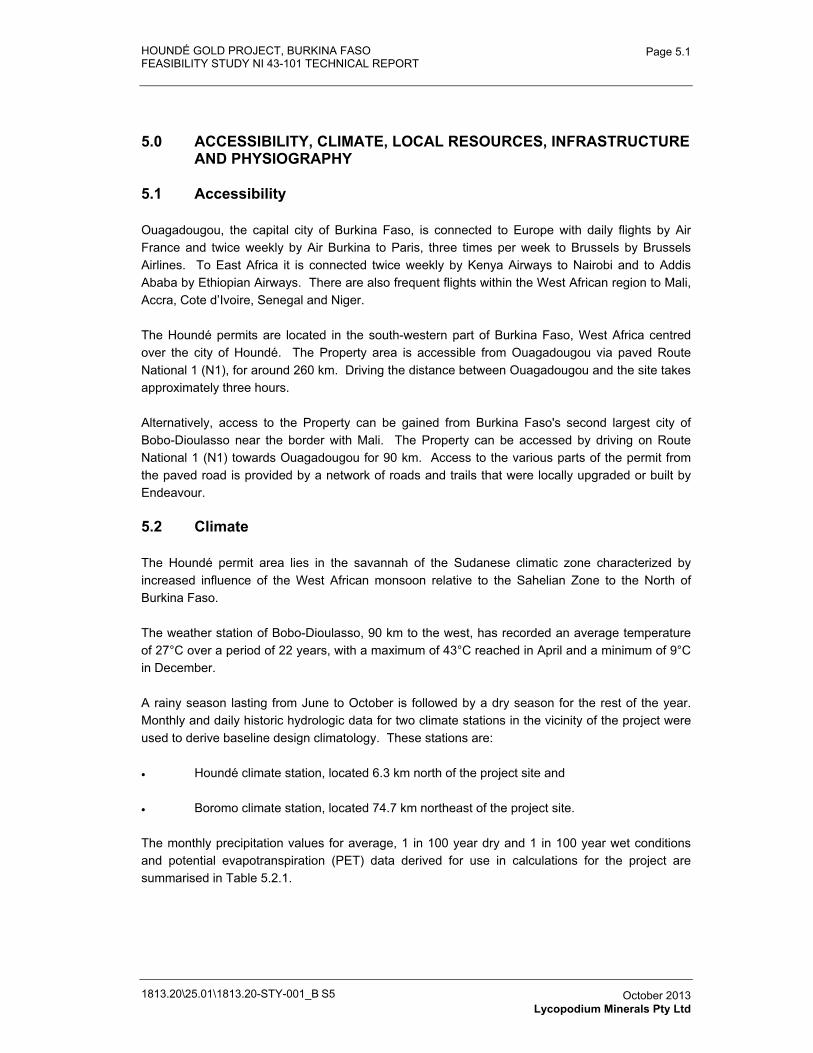
HOUNDÉ GOLD PROJECT, BURKINA FASO FEASIBILITY STUDY NI 43-101 TECHNICAL REPORT
1813.20\25.01\1813.20-STY-001_B S5
Page 5.1
October 2013 Lycopodium Minerals Pty Ltd
5.0 ACCESSIBILITY, CLIMATE, LOCAL RESOURCES, INFRASTRUCTURE AND PHYSIOGRAPHY
5.1 Accessibility
Ouagadougou, the capital city of Burkina Faso, is connected to Europe with daily flights by Air France and twice weekly by Air Burkina to Paris, three times per week to Brussels by Brussels Airlines. To East Africa it is connected twice weekly by Kenya Airways to Nairobi and to Addis Ababa by Ethiopian Airways. There are also frequent flights within the West African region to Mali, Accra, Cote d’Ivoire, Senegal and Niger.
The Houndé permits are located in the south-western part of Burkina Faso, West Africa centred over the city of Houndé. The Property area is accessible from Ouagadougou via paved Route National 1 (N1), for around 260 km. Driving the distance between Ouagadougou and the site takes approximately three hours.
Alternatively, access to the Property can be gained from Burkina Faso's second largest city of Bobo-Dioulasso near the border with Mali. The Property can be accessed by driving on Route National 1 (N1) towards Ouagadougou for 90 km. Access to the various parts of the permit from the paved road is provided by a network of roads and trails that were locally upgraded or built by Endeavour.
5.2 Climate
The Houndé permit area lies in the savannah of the Sudanese climatic zone characterized by increased influence of the West African monsoon relative to the Sahelian Zone to the North of Burkina Faso.
The weather station of Bobo-Dioulasso, 90 km to the west, has recorded an average temperature of 27°C over a period of 22 years, with a maximum of 43°C reached in April and a minimum of 9°C in December.
A rainy season lasting from June to October is followed by a dry season for the rest of the year. Monthly and daily historic hydrologic data for two climate stations in the vicinity of the project were used to derive baseline design climatology. These stations are:
� Houndé climate station, located 6.3 km north of the project site and
� Boromo climate station, located 74.7 km northeast of the project site.
The monthly precipitation values for average, 1 in 100 year dry and 1 in 100 year wet conditions and potential evapotranspiration (PET) data derived for use in calculations for the project are summarised in Table 5.2.1.
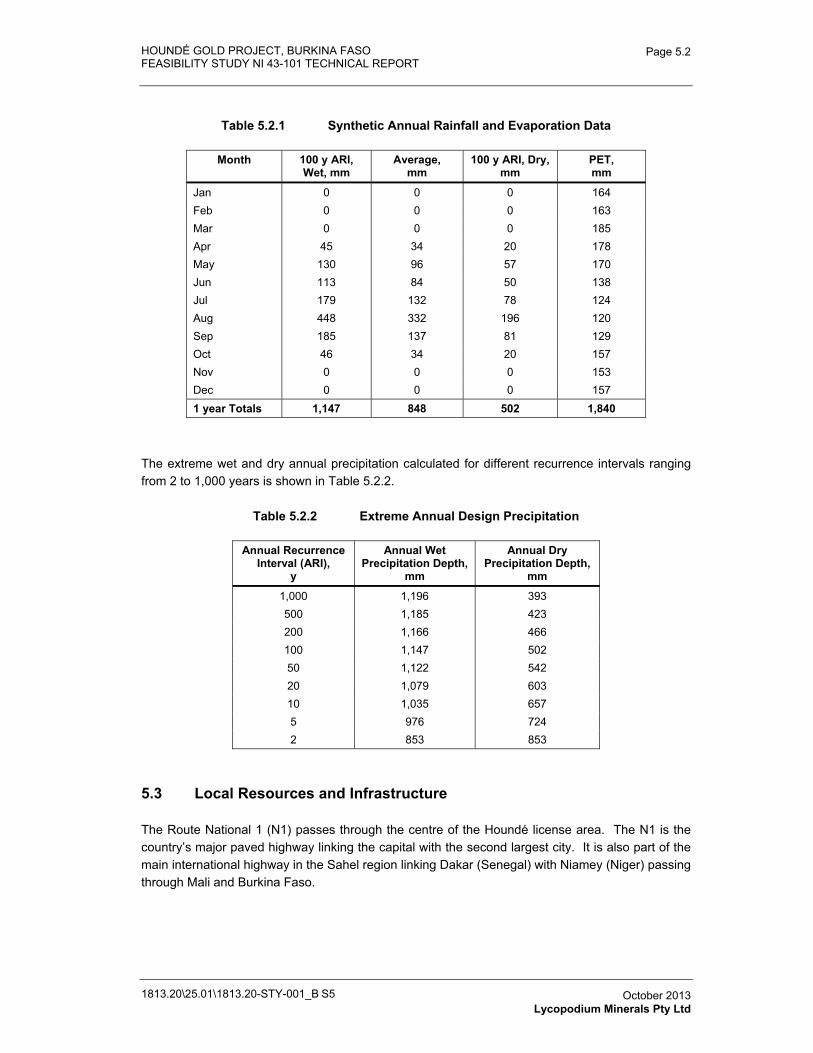
HOUNDÉ GOLD PROJECT, BURKINA FASO FEASIBILITY STUDY NI 43-101 TECHNICAL REPORT
1813.20\25.01\1813.20-STY-001_B S5
Page 5.2
October 2013 Lycopodium Minerals Pty Ltd
Table 5.2.1 Synthetic Annual Rainfall and Evaporation Data
Month 100 y ARI, Wet, mm
Average, mm
100 y ARI, Dry, mm
PET,mm
Jan 0 0 0 164 Feb 0 0 0 163 Mar 0 0 0 185 Apr 45 34 20 178 May 130 96 57 170 Jun 113 84 50 138 Jul 179 132 78 124 Aug 448 332 196 120 Sep 185 137 81 129 Oct 46 34 20 157 Nov 0 0 0 153 Dec 0 0 0 157 1 year Totals 1,147 848 502 1,840
The extreme wet and dry annual precipitation calculated for different recurrence intervals ranging from 2 to 1,000 years is shown in Table 5.2.2.
Table 5.2.2 Extreme Annual Design Precipitation
Annual Recurrence Interval (ARI),
y
Annual Wet Precipitation Depth,
mm
Annual Dry Precipitation Depth,
mm
1,000 1,196 393 500 1,185 423 200 1,166 466 100 1,147 502 50 1,122 542 20 1,079 603 10 1,035 657 5 976 724 2 853 853
5.3 Local Resources and Infrastructure
The Route National 1 (N1) passes through the centre of the Houndé license area. The N1 is the country’s major paved highway linking the capital with the second largest city. It is also part of the main international highway in the Sahel region linking Dakar (Senegal) with Niamey (Niger) passing through Mali and Burkina Faso.
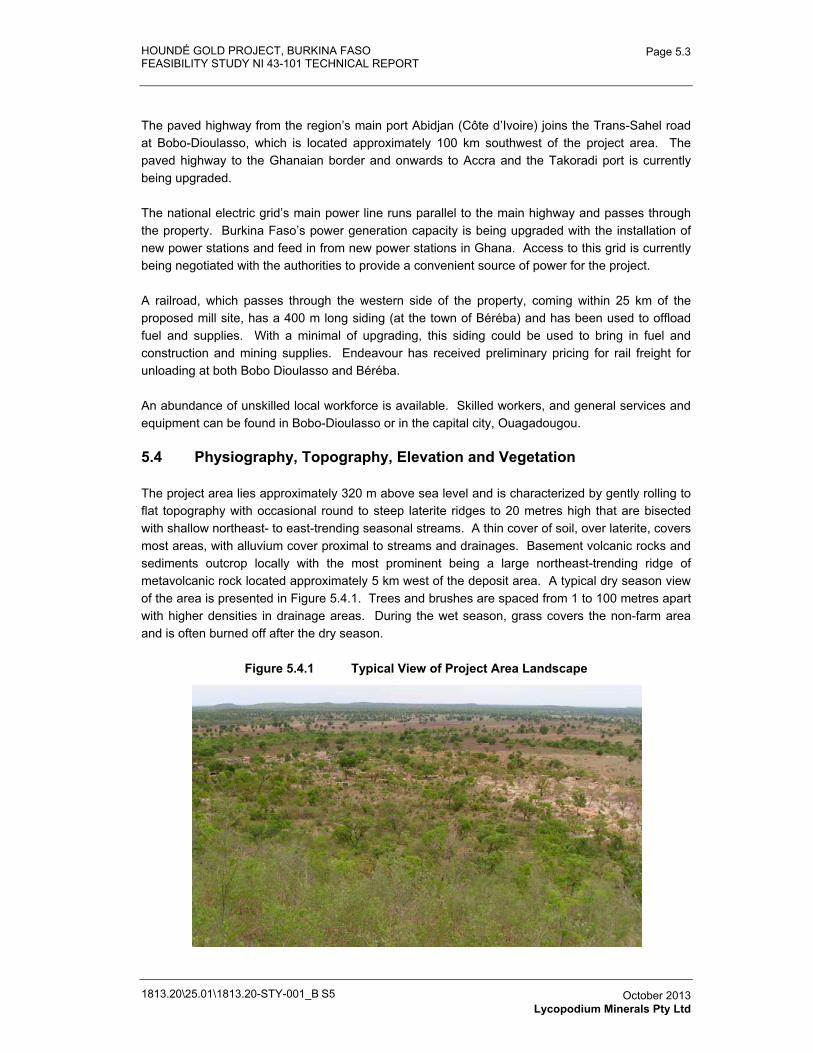
HOUNDÉ GOLD PROJECT, BURKINA FASO FEASIBILITY STUDY NI 43-101 TECHNICAL REPORT
1813.20\25.01\1813.20-STY-001_B S5
Page 5.3
October 2013 Lycopodium Minerals Pty Ltd
The paved highway from the region’s main port Abidjan (Côte d’Ivoire) joins the Trans-Sahel road at Bobo-Dioulasso, which is located approximately 100 km southwest of the project area. The paved highway to the Ghanaian border and onwards to Accra and the Takoradi port is currently being upgraded.
The national electric grid’s main power line runs parallel to the main highway and passes through the property. Burkina Faso’s power generation capacity is being upgraded with the installation of new power stations and feed in from new power stations in Ghana. Access to this grid is currently being negotiated with the authorities to provide a convenient source of power for the project.
A railroad, which passes through the western side of the property, coming within 25 km of the proposed mill site, has a 400 m long siding (at the town of Béréba) and has been used to offload fuel and supplies. With a minimal of upgrading, this siding could be used to bring in fuel and construction and mining supplies. Endeavour has received preliminary pricing for rail freight for unloading at both Bobo Dioulasso and Béréba.
An abundance of unskilled local workforce is available. Skilled workers, and general services and equipment can be found in Bobo-Dioulasso or in the capital city, Ouagadougou.
5.4 Physiography, Topography, Elevation and Vegetation
The project area lies approximately 320 m above sea level and is characterized by gently rolling to flat topography with occasional round to steep laterite ridges to 20 metres high that are bisected with shallow northeast- to east-trending seasonal streams. A thin cover of soil, over laterite, covers most areas, with alluvium cover proximal to streams and drainages. Basement volcanic rocks and sediments outcrop locally with the most prominent being a large northeast-trending ridge of metavolcanic rock located approximately 5 km west of the deposit area. A typical dry season view of the area is presented in Figure 5.4.1. Trees and brushes are spaced from 1 to 100 metres apart with higher densities in drainage areas. During the wet season, grass covers the non-farm area and is often burned off after the dry season.
Figure 5.4.1 Typical View of Project Area Landscape
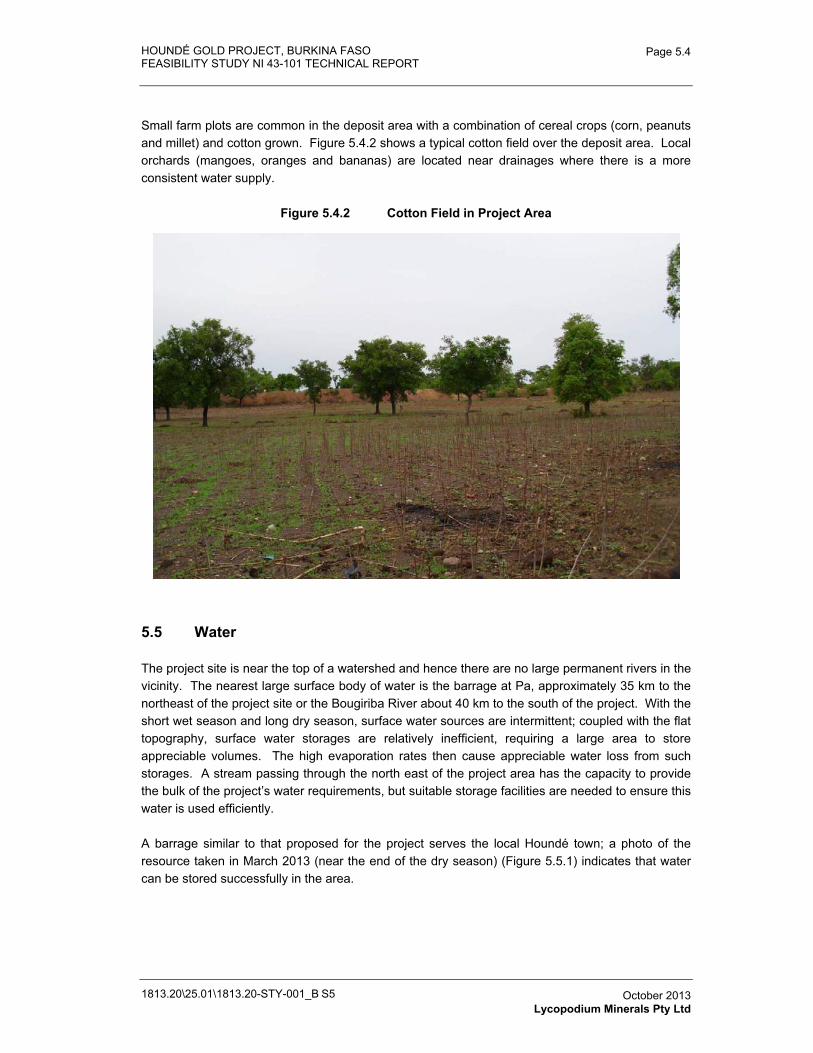
HOUNDÉ GOLD PROJECT, BURKINA FASO FEASIBILITY STUDY NI 43-101 TECHNICAL REPORT
1813.20\25.01\1813.20-STY-001_B S5
Page 5.4
October 2013 Lycopodium Minerals Pty Ltd
Small farm plots are common in the deposit area with a combination of cereal crops (corn, peanuts and millet) and cotton grown. Figure 5.4.2 shows a typical cotton field over the deposit area. Local orchards (mangoes, oranges and bananas) are located near drainages where there is a more consistent water supply.
Figure 5.4.2 Cotton Field in Project Area
5.5 Water
The project site is near the top of a watershed and hence there are no large permanent rivers in the vicinity. The nearest large surface body of water is the barrage at Pa, approximately 35 km to the northeast of the project site or the Bougiriba River about 40 km to the south of the project. With the short wet season and long dry season, surface water sources are intermittent; coupled with the flat topography, surface water storages are relatively inefficient, requiring a large area to store appreciable volumes. The high evaporation rates then cause appreciable water loss from such storages. A stream passing through the north east of the project area has the capacity to provide the bulk of the project’s water requirements, but suitable storage facilities are needed to ensure this water is used efficiently.
A barrage similar to that proposed for the project serves the local Houndé town; a photo of the resource taken in March 2013 (near the end of the dry season) (Figure 5.5.1) indicates that water can be stored successfully in the area.
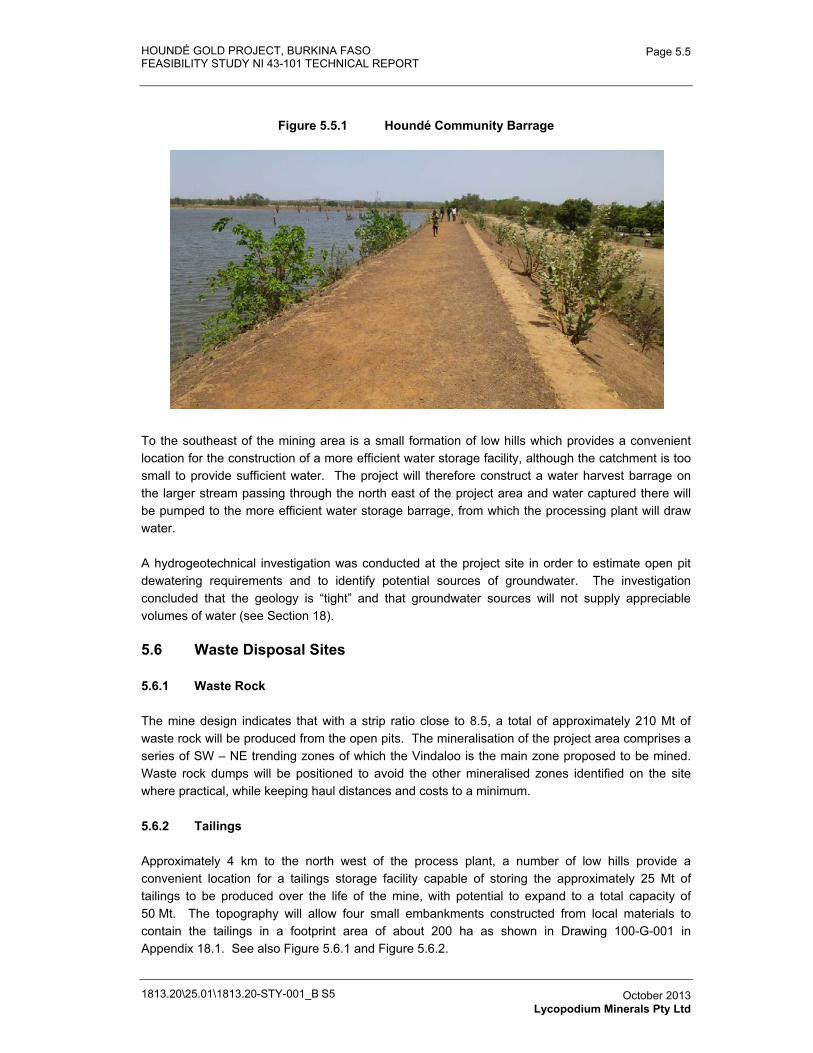
HOUNDÉ GOLD PROJECT, BURKINA FASO FEASIBILITY STUDY NI 43-101 TECHNICAL REPORT
1813.20\25.01\1813.20-STY-001_B S5
Page 5.5
October 2013 Lycopodium Minerals Pty Ltd
Figure 5.5.1 Houndé Community Barrage
To the southeast of the mining area is a small formation of low hills which provides a convenient location for the construction of a more efficient water storage facility, although the catchment is too small to provide sufficient water. The project will therefore construct a water harvest barrage on the larger stream passing through the north east of the project area and water captured there will be pumped to the more efficient water storage barrage, from which the processing plant will draw water.
A hydrogeotechnical investigation was conducted at the project site in order to estimate open pit dewatering requirements and to identify potential sources of groundwater. The investigation concluded that the geology is “tight” and that groundwater sources will not supply appreciable volumes of water (see Section 18).
5.6 Waste Disposal Sites
5.6.1 Waste Rock
The mine design indicates that with a strip ratio close to 8.5, a total of approximately 210 Mt of waste rock will be produced from the open pits. The mineralisation of the project area comprises a series of SW – NE trending zones of which the Vindaloo is the main zone proposed to be mined. Waste rock dumps will be positioned to avoid the other mineralised zones identified on the site where practical, while keeping haul distances and costs to a minimum.
5.6.2 Tailings
Approximately 4 km to the north west of the process plant, a number of low hills provide a convenient location for a tailings storage facility capable of storing the approximately 25 Mt of tailings to be produced over the life of the mine, with potential to expand to a total capacity of 50 Mt. The topography will allow four small embankments constructed from local materials to contain the tailings in a footprint area of about 200 ha as shown in Drawing 100-G-001 in Appendix 18.1. See also Figure 5.6.1 and Figure 5.6.2.
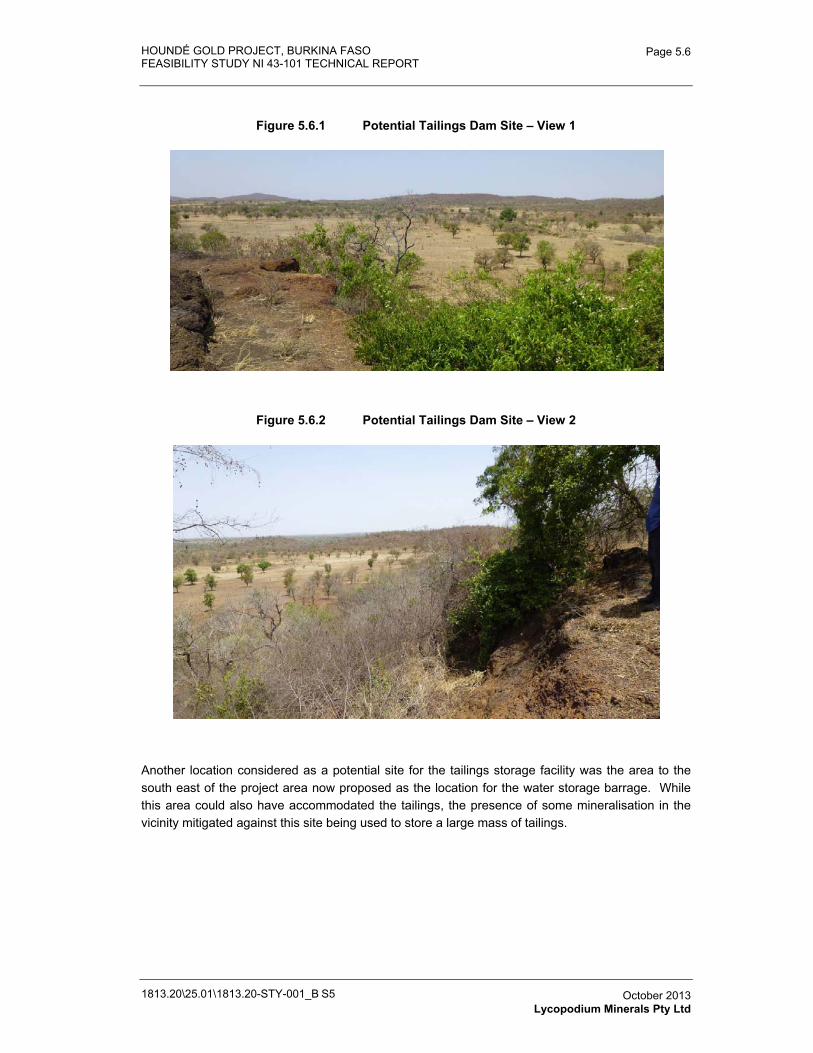
HOUNDÉ GOLD PROJECT, BURKINA FASO FEASIBILITY STUDY NI 43-101 TECHNICAL REPORT
1813.20\25.01\1813.20-STY-001_B S5
Page 5.6
October 2013 Lycopodium Minerals Pty Ltd
Figure 5.6.1 Potential Tailings Dam Site – View 1
Figure 5.6.2 Potential Tailings Dam Site – View 2
Another location considered as a potential site for the tailings storage facility was the area to the south east of the project area now proposed as the location for the water storage barrage. While this area could also have accommodated the tailings, the presence of some mineralisation in the vicinity mitigated against this site being used to store a large mass of tailings.
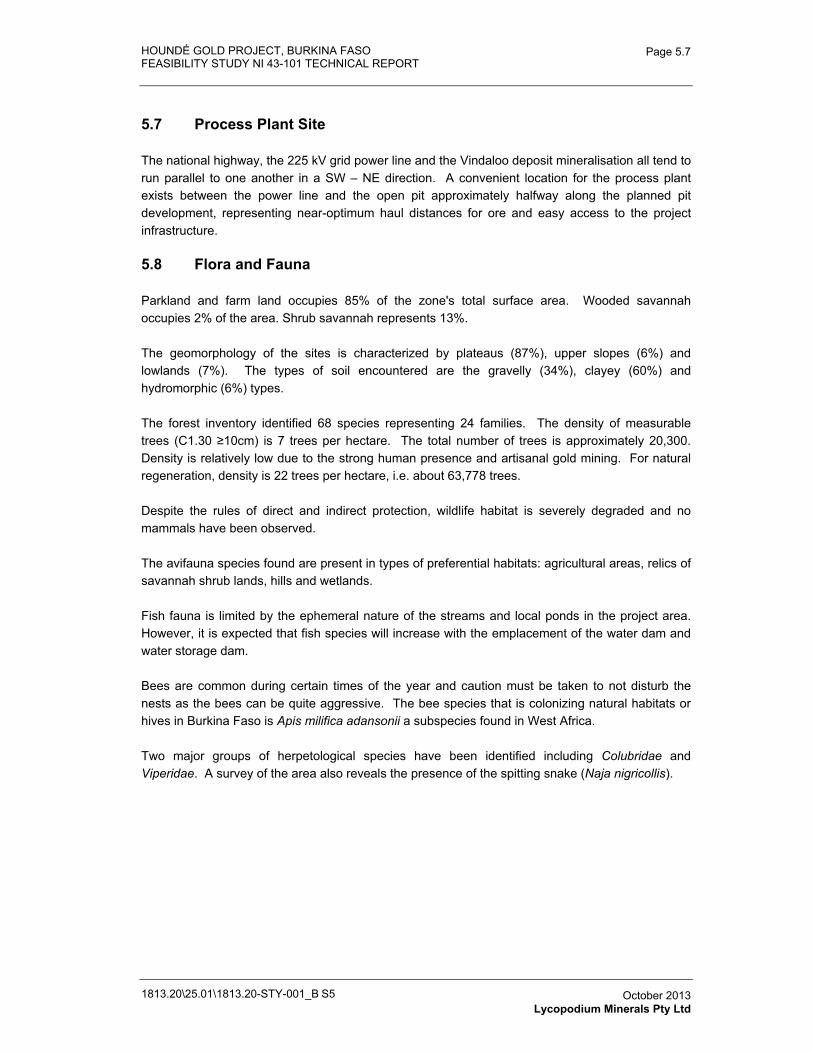
HOUNDÉ GOLD PROJECT, BURKINA FASO FEASIBILITY STUDY NI 43-101 TECHNICAL REPORT
1813.20\25.01\1813.20-STY-001_B S5
Page 5.7
October 2013 Lycopodium Minerals Pty Ltd
5.7 Process Plant Site
The national highway, the 225 kV grid power line and the Vindaloo deposit mineralisation all tend to run parallel to one another in a SW – NE direction. A convenient location for the process plant exists between the power line and the open pit approximately halfway along the planned pit development, representing near-optimum haul distances for ore and easy access to the project infrastructure.
5.8 Flora and Fauna
Parkland and farm land occupies 85% of the zone's total surface area. Wooded savannah occupies 2% of the area. Shrub savannah represents 13%.
The geomorphology of the sites is characterized by plateaus (87%), upper slopes (6%) and lowlands (7%). The types of soil encountered are the gravelly (34%), clayey (60%) and hydromorphic (6%) types.
The forest inventory identified 68 species representing 24 families. The density of measurable trees (C1.30 �10cm) is 7 trees per hectare. The total number of trees is approximately 20,300. Density is relatively low due to the strong human presence and artisanal gold mining. For natural regeneration, density is 22 trees per hectare, i.e. about 63,778 trees.
Despite the rules of direct and indirect protection, wildlife habitat is severely degraded and no mammals have been observed.
The avifauna species found are present in types of preferential habitats: agricultural areas, relics of savannah shrub lands, hills and wetlands.
Fish fauna is limited by the ephemeral nature of the streams and local ponds in the project area. However, it is expected that fish species will increase with the emplacement of the water dam and water storage dam.
Bees are common during certain times of the year and caution must be taken to not disturb the nests as the bees can be quite aggressive. The bee species that is colonizing natural habitats or hives in Burkina Faso is Apis milifica adansonii a subspecies found in West Africa.
Two major groups of herpetological species have been identified including Colubridae and Viperidae. A survey of the area also reveals the presence of the spitting snake (Naja nigricollis).
HOUNDÉ GOLD PROJECT, BURKINA FASO
FEASIBILITY STUDY NI 43-101 TECHNICAL REPORT
1813.20-STY-001
Table of Contents Page
6.0� HISTORY 6.1�6.1� Ownership History 6.1�6.2� Exploration History 6.3�6.3� Resource History 6.5�
6.3.1� 2010 Resource Estimate 6.5�6.3.2� 2011 Resource Estimate 6.6�6.3.3� 2012 Resource Estimate 6.7�
6.4� Production History 6.8�
TABLESTable 6.3.1� Houndé Resource Estimate (effective October 31, 2012) 6.7�
FIGURESFigure 6.1.1� Houndé Property 6.2�
1813.20\25.01\1813.20-STY-001_B S6 October 2013 Cube Consulting Pty Ltd
HOUNDÉ GOLD PROJECT, BURKINA FASO FEASIBILITY STUDY NI 43-101 TECHNICAL REPORT
1813.20\25.01\1813.20-STY-001_B S6
Page 6.1
October 2013 Cube Consulting Pty Ltd
6.0 HISTORY
Mineral exploration in the Houndé area began in the 1990’s. Previously, the Bureau de Recherches Géologiques et Minières (BRGM) and Bureau de Mines et de la Géologie du Burkina Faso (BUMIGEB) worked in the area intermittently from 1939 to 1982.
6.1 Ownership History
Following positive results from the UNDP regional geochemical surveys, Oxford Resources Inc. optioned the Kari Nord permit in 1998 and began an exploration program which, from 1998 to 2000, gained financial support from Avgold Ltd. of South Africa. Their program consisted of regional soil sampling (1,000 m by 250 m) and geophysical interpretation. Apparently, the soil survey indicated low gold values in the Vindaloo and Kari areas. A lack of funds stopped work in 2000.
The Kari Nord and Kari Sud permits were granted to Pyramide-M in 2004. Barrick Africa Exploration Ltd. Burkina (Barrick) acquired them in 2005. Then the permits passed into the hands of Goldbelt Resources West Africa SARL (Goldbelt) at the end of 2007. The Karba permit was initially held by Resolute West Africa (Resolute) from 2003 to 2006. In 2006, Goldbelt acquired the permit.
Wakui, Kopoi and Bouhaoun permits were initially held by Resolute in 2004, then by Goldbelt in 2006.
In late 2007 Goldbelt was purchased by Wega Mining (Wega), which was in turn purchased by Avocet Mining (Avocet) in June 2009. In October 2010, Avion Gold Corporation acquired Avion Gold (Burkina Faso) SARL, the subsidiary that was created to hold the Houndé permits (Kari Nord, Kari Sud, Karba, Wakui, Kopoi and Bouhaoun), from Avocet Mining. In October 2012, Endeavour Mining Corporation acquired Avion Gold Corporation and now owns a 100% interest in the Houndé Property (see Figure 6.1.1) through its 100% ownership of Avion Gold (Burkina Faso) SARL. Note that the original size of the permits has changed over time to reflect the permit renewal process and that the current map displays the current permit outlines.
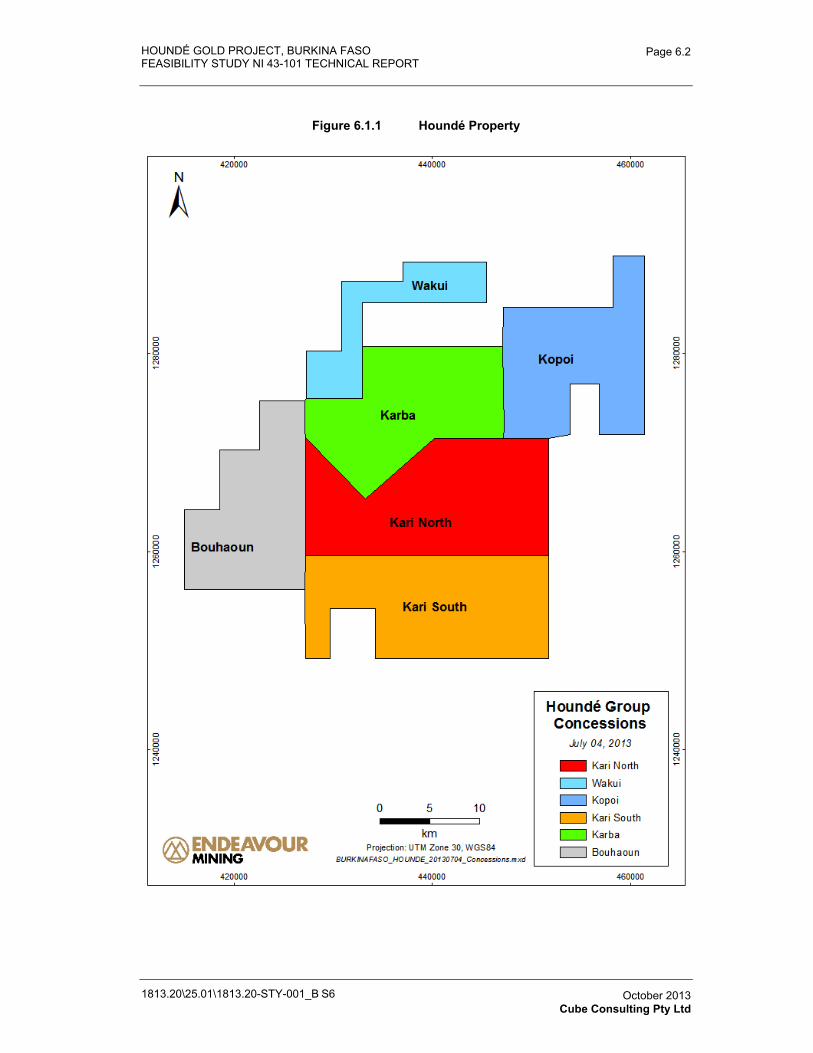
HOUNDÉ GOLD PROJECT, BURKINA FASO FEASIBILITY STUDY NI 43-101 TECHNICAL REPORT
1813.20\25.01\1813.20-STY-001_B S6
Page 6.2
October 2013 Cube Consulting Pty Ltd
Figure 6.1.1 Houndé Property
HOUNDÉ GOLD PROJECT, BURKINA FASO FEASIBILITY STUDY NI 43-101 TECHNICAL REPORT
1813.20\25.01\1813.20-STY-001_B S6
Page 6.3
October 2013 Cube Consulting Pty Ltd
6.2 Exploration History
Some of the first recorded work on the permits was a 1980’s regional scale UNDP soil survey where 28,300 samples were collected from a grid with spacings of 500 metres to 1,000 metres by 300 metres. These samples indicated several areas of gold enrichment in soil on the Houndé property. Regional magnetic surveys were also carried out over the same area by UNDP at the same time. Since the magnetic data indicated that the regional geology appeared to follow the trend of the artisanal workings the UNDP decided to carry out additional exploration in the Kari Nord permit area and specifically in the Kari Zone. Their initial follow-up work consisted of a soil grid with lines every 100 to 200 metres with samples collected every 50 metre along with lithogeochemical and geophysical surveys (magnetic and Max-min electromagnetic) and geological mapping. From this first pass, in 1997 the UNDP decided to drill 23 reverse circulation holes followed by twelve diamond drill holes in the Kari area. Five of these holes were reported to contain significant amounts of gold both visually and by assay.
From 2005 - 2007, Barrick conducted regional soil surveys (collecting a total of 912 samples), carried out geological mapping, completed 8,263 m of CBI drilling (cover-bedrock interface) in 544 holes, 9,264 m of RAB drilling in 279 holes, 70 m of RC drilling in one hole and 4 hole core holes totalling 625 metres on the Kari Nord permit. The core holes tested the centre of the Vindaloo Main zone with one of the holes returning 4.45 g/t Au over 34.0 m. After optioning the property from Barrick, Goldbelt in 2007 - 2009, conducted a detailed soil survey collecting 4,476 samples, carried out 1,344 m of RAB drilling in 92 holes, 9,483 m of RC drilling in 98 holes and 885 m of core drilling in 6 holes. In addition, they conducted a gradient IP survey at Vindaloo and Kari Pump for a total of 13.4 km². The best hole from this program returned 8.90 g/t Au over 29.0 m on section 49650N from the Vindaloo zone. Note that all Barrick and Goldbelt holes in the Vindaloo and Madras areas are part of the drill hole database that was evaluated and incorporated into the current Mineral Resource estimate.
From 2005 - 2007, Barrick conducted a regional soil survey collecting 949 samples, performed geological mapping, carried out 2,108 m of CBI drilling (cover-bedrock interface) in 153 holes and 4,656 m of RC drilling in 129 holes on the Kari Sud permit. Following up on this work, in 2007 - 2009, Goldbelt conducted detailed soil surveys collecting 382 samples and carried out 4,700 m of RAB drilling in 94 holes. The best hole from these two programs returned 3.47 g/t Au over 18.0 m from an area referred to as Vindaloo SE located approximately 4.4 km southeast of the Vindaloo Main zone. An evaluation of this area is still required.
The Karba permit was held by Resolute from 2003 – 2006. Resolute carried out 6,047 m of RC drilling in 130 holes. Interesting intercepts were returned from the Grand Espoir Zone: 2.65 g/t Au over 12.0 metres and the east end of the Kari area, 31.92 g/t Au over 3.0 metres. Goldbelt acquired the permit in 2006 and from 2006 to 2009, conducted regional and semi-detailed soil surveys collecting a total of 10,904 samples.
HOUNDÉ GOLD PROJECT, BURKINA FASO FEASIBILITY STUDY NI 43-101 TECHNICAL REPORT
1813.20\25.01\1813.20-STY-001_B S6
Page 6.4
October 2013 Cube Consulting Pty Ltd
The Wakui permit was initially held by Resolute who conducted a regional soil survey collecting 3,718 samples in 2004 to 2005. From 2006 to 2007, Goldbelt conducted regional and semi-detailed soil surveys collecting a total of 2,996 samples. Subsequently they carried out 8,875 m of rotary airblast (RAB) drilling in 264 holes. Several holes drilled near the southern boundary of the concession in the Grand Espoir showing area returned anomalous results with hole WKRA009 returning the best intercepts of 2.26 g/t Au over 12.0 metres and 2.22 g/t Au over 8.0 metres. More work is required in this area.
Resolute conducted regional soil surveys on the Kopoi permit, collecting 3,599 samples during the period from 2004 to 2006. Kopoi was next held by Goldbelt from 2006 to 2007. During this period they conducted a regional soil survey collecting a total of 2,658 samples and carried out 3,850 m of RAB drilling in 77 holes.
The Bouhaoun permit was initially held by Resolute, who collected 3,270 regional scale soil samples, from 2004 to 2005. From 2006 – 2007, Goldbelt conducted regional and semi-detailed soil surveys collecting a total of 2,956 samples and carried out 4,988 m of RAB drilling in 215 holes.
After Avocet acquired the Houndé property in 2009, through its purchase of Wega, it completed 24 RC drill holes totaling 2,395 metres, carried out surface mapping and collected 243 rock samples and 49 soil samples. Avocet’s work focused on the western and northern parts of the property where assessment work was required. Drilling at the Douhoun occurrence returned a best intercept of 5.69 g/t Au over 14.0 metres core length at a vertical depth of 63.0 metres. This drill program also resulted in the discovery of the Kopoi occurrence where drilling return 3.43 g/t Au over 4.0 metres.
Avion commenced work over the Houndé property in early 2010, prior to the completion of the deal to acquire the Property. Initial work comprised a detailed airborne magnetic and radiometric survey, prospect review, soil sampling (2,808 samples collected on the Bouhaoun permit), chip and core re-logging and the completion of 34 drill holes totalling 5,515 metres mainly over the Vindaloo, Bouéré and Dohoun prospects. Upon completion of the drilling, Avion announced the first Mineral Resource estimate for the Vindaloo zone in late October 2010.
In 2011, Avion continued with the exploration program with 584 line km of IP gradient surveys over the Grand Espoir, Bouéré, Kari and Vindaloo areas, the collection of 324 soil samples over the Bouere and Vindaloo areas and the completion of 182 holes totalling 35,033 metres over the Vindaloo, Kari and Bouéré areas. Upon completion of this program, an updated Mineral Resource estimate was completed for the Vindaloo area. Anomalous drill results were returned from the Grand Espoir, Bouéré and Kari areas with holes returning best intercepts of 0.55 g/t Au over 34.0 metres, 24.18 g/t Au over 17.8 metres and 7.80 over 3.4 metres, respectively, at these zones; additional work is warranted over these areas.
In the first half of 2012, Avion continued the drill and geophysical program over the Vindaloo area completing 151 holes totalling 23,707 metres, 211 km of IP gradient surveys and initiated baseline environmental studies. As well, Avion commissioned an updated Mineral Resource estimate and a Preliminary Economic Assessment study (PEA), both of which were completed in early 2013.
HOUNDÉ GOLD PROJECT, BURKINA FASO FEASIBILITY STUDY NI 43-101 TECHNICAL REPORT
1813.20\25.01\1813.20-STY-001_B S6
Page 6.5
October 2013 Cube Consulting Pty Ltd
Immediately upon Endeavour acquiring Avion in late October 2012, drilling resumed over the Vindaloo zone with a goal to convert Inferred Mineral Resources to Indicated Mineral Resources and some of the Indicated Mineral Resources to Measured Mineral Resources. This program consisted of 369 holes totalling 41,365 metres. In conjunction with this drill program base line environmental monitoring commenced and additional community consultations were carried out. Once the results of the PEA indicated a positive financial return, 22 composite core samples were collected for metallurgical studies with SGS Laboratories in Perth, a thin section report was prepared and feasibility level engineering studies were contracted. ESIA and RAP (Resettlement Action Plan) studies commenced in April, 2013 with the selection of consulting firms, and delivery of the Terms of Reference (TOR) to the government.
6.3 Resource History
Three previous resource estimates were calculated for the Vindaloo zone on the Houndé Property reflecting drill programs in each of 2010, 2011 and 2012. In each case, the overall resources increased each year.
6.3.1 2010 Resource Estimate
P&E Mining Consultants Inc. (P&E) completed the initial resource estimate carried out on the Houndé Property. Highlights of the Vindaloo initial resource estimate, at a 1.0 g/t Au cut-off grade, defined within an optimized pit shell as a constraint, are as follows:
� 883,000 tonnes Indicated Mineral Resources at 2.23 g/t Au totaling 63,000 Ounces 1, 2, 3, 4,
5, 6, 7
� 5,725,000 tonnes Inferred Mineral Resources at 2.97 g/t Au totaling 547,000 Ounces 1, 2, 3,
4, 5, 6, 7
1. Mineral Resources which are not Mineral Reserves do not have demonstrated economic viability. The estimate of Mineral Resources may be materially affected by environmental, permitting, legal, title, taxation, sociopolitical, marketing, or other relevant issues and are subject to the findings of a feasibility study.
2. The quantity and grade of reported inferred resources in this estimation are uncertain in nature and there has been insufficient exploration to define these inferred resources as an Indicated or Measured Mineral Resource and it is uncertain if further exploration will result in upgrading them to an indicated or measured Mineral Resource category.
3. The Vindaloo Zone Resource Estimates were prepared by Eugene Puritch, P. Eng. and Antoine Yassa, P. Geo. from P&E Mining Consultants Inc., Qualified Persons under NI 43-101 who are independent of the Company.
4. The Mineral Resources were estimated using the CIM Definition Standards - For Mineral Resources and Mineral Reserves, Prepared by the CIM Standing Committee on Reserve Definitions, Adopted by CIM Council on November 27, 2010.
5. The gold price used in this estimate was the June 30, 2010 two year trailing average of US$1,027/oz. Au recovery was 92% and mining costs were US$2.75/tonne of ore and US$1.50/tonne of waste. Processing and G&A costs combined were US$30/tonne. Pit optimization slopes were 50 degrees.
6. Effective date of June 30, 2010.
7. This resource is no longer current as it has been superseded by the resource estimate used in this feasibility study.
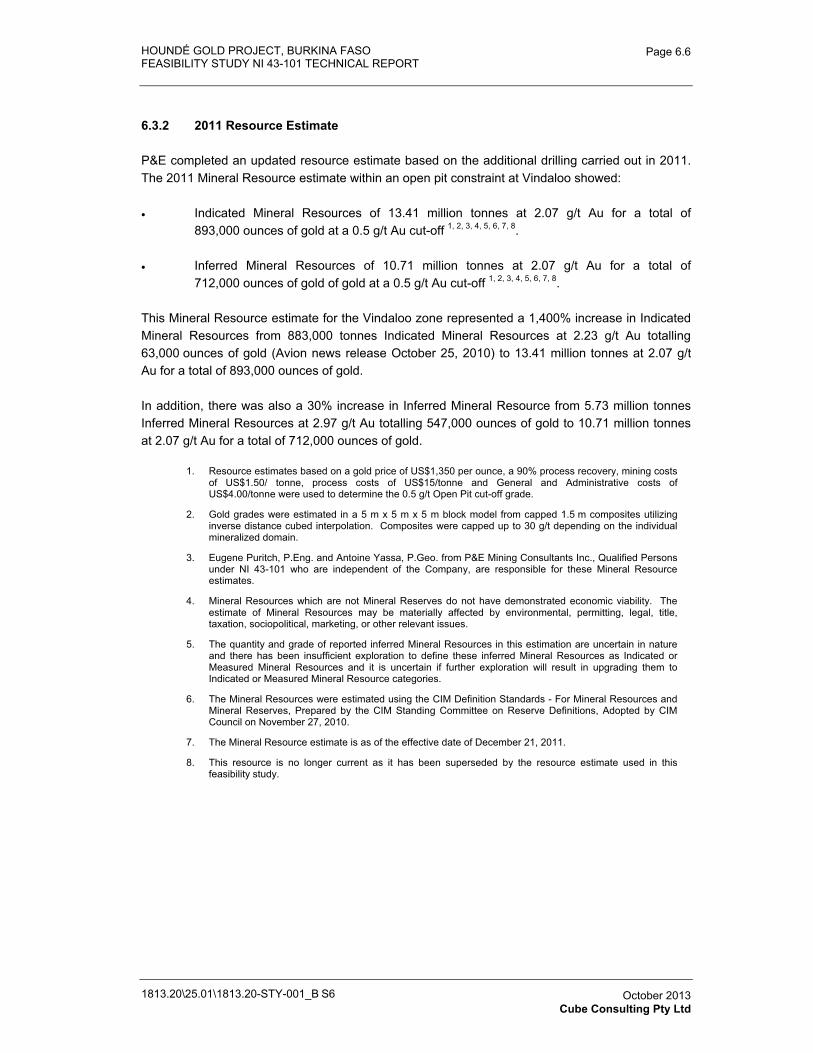
HOUNDÉ GOLD PROJECT, BURKINA FASO FEASIBILITY STUDY NI 43-101 TECHNICAL REPORT
1813.20\25.01\1813.20-STY-001_B S6
Page 6.6
October 2013 Cube Consulting Pty Ltd
6.3.2 2011 Resource Estimate
P&E completed an updated resource estimate based on the additional drilling carried out in 2011. The 2011 Mineral Resource estimate within an open pit constraint at Vindaloo showed:
� Indicated Mineral Resources of 13.41 million tonnes at 2.07 g/t Au for a total of 893,000 ounces of gold at a 0.5 g/t Au cut-off 1, 2, 3, 4, 5, 6, 7, 8.
� Inferred Mineral Resources of 10.71 million tonnes at 2.07 g/t Au for a total of 712,000 ounces of gold of gold at a 0.5 g/t Au cut-off 1, 2, 3, 4, 5, 6, 7, 8.
This Mineral Resource estimate for the Vindaloo zone represented a 1,400% increase in Indicated Mineral Resources from 883,000 tonnes Indicated Mineral Resources at 2.23 g/t Au totalling 63,000 ounces of gold (Avion news release October 25, 2010) to 13.41 million tonnes at 2.07 g/t Au for a total of 893,000 ounces of gold.
In addition, there was also a 30% increase in Inferred Mineral Resource from 5.73 million tonnes Inferred Mineral Resources at 2.97 g/t Au totalling 547,000 ounces of gold to 10.71 million tonnes at 2.07 g/t Au for a total of 712,000 ounces of gold.
1. Resource estimates based on a gold price of US$1,350 per ounce, a 90% process recovery, mining costs of US$1.50/ tonne, process costs of US$15/tonne and General and Administrative costs of US$4.00/tonne were used to determine the 0.5 g/t Open Pit cut-off grade.
2. Gold grades were estimated in a 5 m x 5 m x 5 m block model from capped 1.5 m composites utilizing inverse distance cubed interpolation. Composites were capped up to 30 g/t depending on the individual mineralized domain.
3. Eugene Puritch, P.Eng. and Antoine Yassa, P.Geo. from P&E Mining Consultants Inc., Qualified Persons under NI 43-101 who are independent of the Company, are responsible for these Mineral Resource estimates.
4. Mineral Resources which are not Mineral Reserves do not have demonstrated economic viability. The estimate of Mineral Resources may be materially affected by environmental, permitting, legal, title, taxation, sociopolitical, marketing, or other relevant issues.
5. The quantity and grade of reported inferred Mineral Resources in this estimation are uncertain in nature and there has been insufficient exploration to define these inferred Mineral Resources as Indicated or Measured Mineral Resources and it is uncertain if further exploration will result in upgrading them to Indicated or Measured Mineral Resource categories.
6. The Mineral Resources were estimated using the CIM Definition Standards - For Mineral Resources and Mineral Reserves, Prepared by the CIM Standing Committee on Reserve Definitions, Adopted by CIM Council on November 27, 2010.
7. The Mineral Resource estimate is as of the effective date of December 21, 2011.
8. This resource is no longer current as it has been superseded by the resource estimate used in this feasibility study.
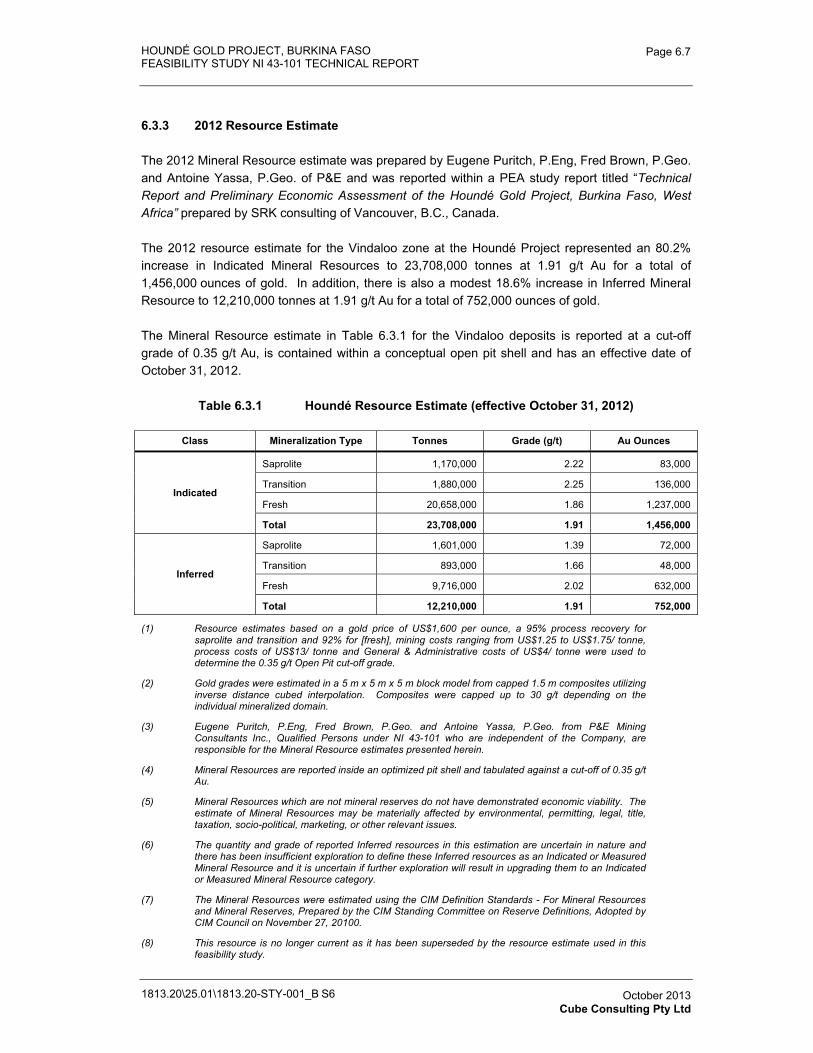
HOUNDÉ GOLD PROJECT, BURKINA FASO FEASIBILITY STUDY NI 43-101 TECHNICAL REPORT
1813.20\25.01\1813.20-STY-001_B S6
Page 6.7
October 2013 Cube Consulting Pty Ltd
6.3.3 2012 Resource Estimate
The 2012 Mineral Resource estimate was prepared by Eugene Puritch, P.Eng, Fred Brown, P.Geo. and Antoine Yassa, P.Geo. of P&E and was reported within a PEA study report titled “Technical Report and Preliminary Economic Assessment of the Houndé Gold Project, Burkina Faso, West Africa” prepared by SRK consulting of Vancouver, B.C., Canada.
The 2012 resource estimate for the Vindaloo zone at the Houndé Project represented an 80.2% increase in Indicated Mineral Resources to 23,708,000 tonnes at 1.91 g/t Au for a total of 1,456,000 ounces of gold. In addition, there is also a modest 18.6% increase in Inferred Mineral Resource to 12,210,000 tonnes at 1.91 g/t Au for a total of 752,000 ounces of gold.
The Mineral Resource estimate in Table 6.3.1 for the Vindaloo deposits is reported at a cut-off grade of 0.35 g/t Au, is contained within a conceptual open pit shell and has an effective date of October 31, 2012.
Table 6.3.1 Houndé Resource Estimate (effective October 31, 2012)
Class Mineralization Type Tonnes Grade (g/t) Au Ounces
Indicated
Saprolite 1,170,000 2.22 83,000
Transition 1,880,000 2.25 136,000
Fresh 20,658,000 1.86 1,237,000
Total 23,708,000 1.91 1,456,000
Inferred
Saprolite 1,601,000 1.39 72,000
Transition 893,000 1.66 48,000
Fresh 9,716,000 2.02 632,000
Total 12,210,000 1.91 752,000
(1) Resource estimates based on a gold price of US$1,600 per ounce, a 95% process recovery for saprolite and transition and 92% for [fresh], mining costs ranging from US$1.25 to US$1.75/ tonne, process costs of US$13/ tonne and General & Administrative costs of US$4/ tonne were used to determine the 0.35 g/t Open Pit cut-off grade.
(2) Gold grades were estimated in a 5 m x 5 m x 5 m block model from capped 1.5 m composites utilizing inverse distance cubed interpolation. Composites were capped up to 30 g/t depending on the individual mineralized domain.
(3) Eugene Puritch, P.Eng, Fred Brown, P.Geo. and Antoine Yassa, P.Geo. from P&E Mining Consultants Inc., Qualified Persons under NI 43-101 who are independent of the Company, are responsible for the Mineral Resource estimates presented herein.
(4) Mineral Resources are reported inside an optimized pit shell and tabulated against a cut-off of 0.35 g/t Au.
(5) Mineral Resources which are not mineral reserves do not have demonstrated economic viability. The estimate of Mineral Resources may be materially affected by environmental, permitting, legal, title, taxation, socio-political, marketing, or other relevant issues.
(6) The quantity and grade of reported Inferred resources in this estimation are uncertain in nature and there has been insufficient exploration to define these Inferred resources as an Indicated or Measured Mineral Resource and it is uncertain if further exploration will result in upgrading them to an Indicated or Measured Mineral Resource category.
(7) The Mineral Resources were estimated using the CIM Definition Standards - For Mineral Resources and Mineral Reserves, Prepared by the CIM Standing Committee on Reserve Definitions, Adopted by CIM Council on November 27, 20100.
(8) This resource is no longer current as it has been superseded by the resource estimate used in this feasibility study.
HOUNDÉ GOLD PROJECT, BURKINA FASO FEASIBILITY STUDY NI 43-101 TECHNICAL REPORT
1813.20\25.01\1813.20-STY-001_B S6
Page 6.8
October 2013 Cube Consulting Pty Ltd
6.4 Production History
Other than widespread, small scale artisanal mining, there is no recorded production from the property.
HOUNDÉ GOLD PROJECT, BURKINA FASO
FEASIBILITY STUDY NI 43-101 TECHNICAL REPORT
1813.20-STY-001
Table of Contents Page
7.0� GEOLOGICAL SETTING, MINERALIZATION AND ALTERATION 7.1�7.1� Regional Geology 7.1�7.2� Local Geology 7.4�7.3� Deposit Scale Geology 7.5�7.4� Structure 7.10�7.5� Mineralization and Alteration 7.10�7.6� Veining 7.14�
FIGURESFigure 7.1.1� Regional Geology of West Africa 7.3�Figure 7.2.1� Burkina Faso Greenstone Belts 7.4�Figure 7.3.1� Deposit Area Geology 7.6�Figure 7.3.2� Intermediate volcanic polymicitc fragmental with weak sericite
alteration in the upper part of the image and hematitic alteration in the base of the photo 7.7�
Figure 7.3.3� Contorted Argillite, Siltstone and Greywacke 7.7�Figure 7.3.4� Propylitically Altered Gabbro 7.8�Figure 7.3.5� Typical Geology Section 7.9�Figure 7.5.1� Sericite-, Epidote-, Carbonate-, Fuschite-Altered Intermediate
Fragmental 7.11�Figure 7.5.2� Silicified (grey areas) Sericite and Ankerite Altered Gold Mineralized
Gabbro 7.11�Figure 7.5.3� Pyrite Crystal with Fine Gold Grain Inclusion (Kjarsgaard, 2013) 7.12�Figure 7.5.4� Alteration Mineralogy Paragenesis Edited from Lester (2010) 7.13�Figure 7.6.1� Dominant Vein Direction (030- 045°) 7.14�Figure 7.6.2� Secondary Vein Direction (060- 070°) 7.15�Figure 7.6.3� Tertiary Vein Direction (130- 140°) 7.15�Figure 7.6.4� Rose Diagram Quartz Vein Orientations at Vindaloo West Zone 7.16�
1813\25.01\1813.20-STY-001_B S7 October 2013 Cube Consulting Pty Ltd
HOUNDÉ GOLD PROJECT, BURKINA FASO FEASIBILITY STUDY NI 43-101 TECHNICAL REPORT
1813.20\25.01\1813.20-STY-001_B S7
Page 7.1
October 2013 Cube Consulting Pty Ltd
7.0 GEOLOGICAL SETTING, MINERALIZATION AND ALTERATION
7.1 Regional Geology
The geology of West and Central Africa is dominated by Precambrian shields or cratons of Archaean and Lower Proterozoic age, Pan-African mobile zones of Upper Proterozoic age and intracratonic sedimentary basins ranging from the Proterozoic to the Quaternary (Figure 7.1.1).
The Precambrian history of this part of Africa is commonly described as a process of progressive accretion of a series of successively younger mobile or orogenic zones or belts to the old crustal nuclei of early Archaean age. Occasionally, subsequent orogenic belts develop inside existing cratons, but more commonly they add to the size of older cratons by the addition of new crustal material along their margins.
Most of the cratonic nuclei in the area under discussion stabilized during the Archaean after the accretion of Archaean mobile zones subsequent to earlier orogenic events. The North Gabon Archaean nucleus for example, stabilized around 2.7 Ga. An exception is the West African craton, which stabilized much later at about 1.99 Ga after the accretion of vast areas of Lower Proterozoic (or Birimian) formations at the end of the Eburnean orogenic event. This fact has led to much confusion as to the use of the word craton in regard to West Africa in recent years.
The Man Craton is considered to be a remnant of a much larger craton that included the present day Guyana Craton of South America. This former craton was split by continental breakup in the Jurassic and the two segments have since drifted apart.
The Lower Archaean-Proterozoic shields consist essentially of granitic-gneissic terrains and of isoclinally folded volcano-sedimentary and sedimentary greenstone belts, which can be of either Lower Archaean or Proterozoic age. Both ages of greenstone belts are host to significant precious metal, base metal, and bulk mineral deposits in Africa and worldwide. Archaean greenstone belts exist within the Man Craton and host banded iron formation (BIF) deposits, Archaean mafic cumulate deposits and Mesozoic supergene nickel deposits and so are compositionally different from their later equivalents.
The Proterozoic greenstone belts of West Africa are also known as Birimian greenstone belts, named after the Birim River Valley in Ghana, where both gold and diamonds occur. They encompass a vast area of approximately 350,000 km² covering parts of Niger, Burkina Faso, Benin, Togo, Ghana, Ivory Coast, Mali, Guinea, Liberia, and Sénégal. In general the Birimian rocks lie outside of the cratonic Archaean areas and are sometimes thought of as mobile belts. Birimian rocks are locally unconformably overlain by Lower Proterozoic-age Tarkwaian Group conglomerates and volcanic. Tarkwaian rocks have been identified in Ghana and Burkina Faso and likely occur in Cote d’Ivoire as well.
The Proterozoic Birimian greenstone rocks have undergone orogeny in Eburnean times, which dates roughly from 1.99–2.19 Ga. The last orogenic event in West and Central Africa was the Pan-African of Upper Proterozoic to Lower Paleozoic age (600–450 Ma). This event completed the addition of new crustal material to the older shield areas composed of Archaean cratons and Proterozoic mobile belts.
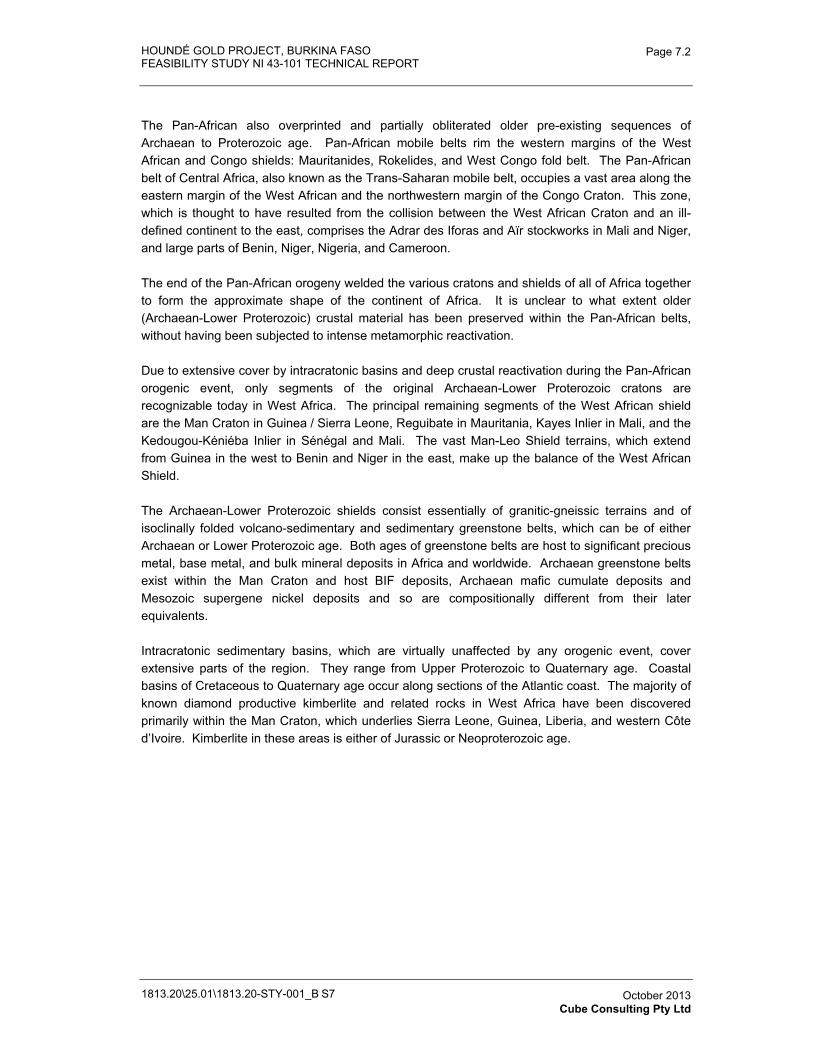
HOUNDÉ GOLD PROJECT, BURKINA FASO FEASIBILITY STUDY NI 43-101 TECHNICAL REPORT
1813.20\25.01\1813.20-STY-001_B S7
Page 7.2
October 2013 Cube Consulting Pty Ltd
The Pan-African also overprinted and partially obliterated older pre-existing sequences of Archaean to Proterozoic age. Pan-African mobile belts rim the western margins of the West African and Congo shields: Mauritanides, Rokelides, and West Congo fold belt. The Pan-African belt of Central Africa, also known as the Trans-Saharan mobile belt, occupies a vast area along the eastern margin of the West African and the northwestern margin of the Congo Craton. This zone, which is thought to have resulted from the collision between the West African Craton and an ill-defined continent to the east, comprises the Adrar des Iforas and Aïr stockworks in Mali and Niger, and large parts of Benin, Niger, Nigeria, and Cameroon.
The end of the Pan-African orogeny welded the various cratons and shields of all of Africa together to form the approximate shape of the continent of Africa. It is unclear to what extent older (Archaean-Lower Proterozoic) crustal material has been preserved within the Pan-African belts, without having been subjected to intense metamorphic reactivation.
Due to extensive cover by intracratonic basins and deep crustal reactivation during the Pan-African orogenic event, only segments of the original Archaean-Lower Proterozoic cratons are recognizable today in West Africa. The principal remaining segments of the West African shield are the Man Craton in Guinea / Sierra Leone, Reguibate in Mauritania, Kayes Inlier in Mali, and the Kedougou-Kéniéba Inlier in Sénégal and Mali. The vast Man-Leo Shield terrains, which extend from Guinea in the west to Benin and Niger in the east, make up the balance of the West African Shield.
The Archaean-Lower Proterozoic shields consist essentially of granitic-gneissic terrains and of isoclinally folded volcano-sedimentary and sedimentary greenstone belts, which can be of either Archaean or Lower Proterozoic age. Both ages of greenstone belts are host to significant precious metal, base metal, and bulk mineral deposits in Africa and worldwide. Archaean greenstone belts exist within the Man Craton and host BIF deposits, Archaean mafic cumulate deposits and Mesozoic supergene nickel deposits and so are compositionally different from their later equivalents.
Intracratonic sedimentary basins, which are virtually unaffected by any orogenic event, cover extensive parts of the region. They range from Upper Proterozoic to Quaternary age. Coastal basins of Cretaceous to Quaternary age occur along sections of the Atlantic coast. The majority of known diamond productive kimberlite and related rocks in West Africa have been discovered primarily within the Man Craton, which underlies Sierra Leone, Guinea, Liberia, and western Côte d’Ivoire. Kimberlite in these areas is either of Jurassic or Neoproterozoic age.
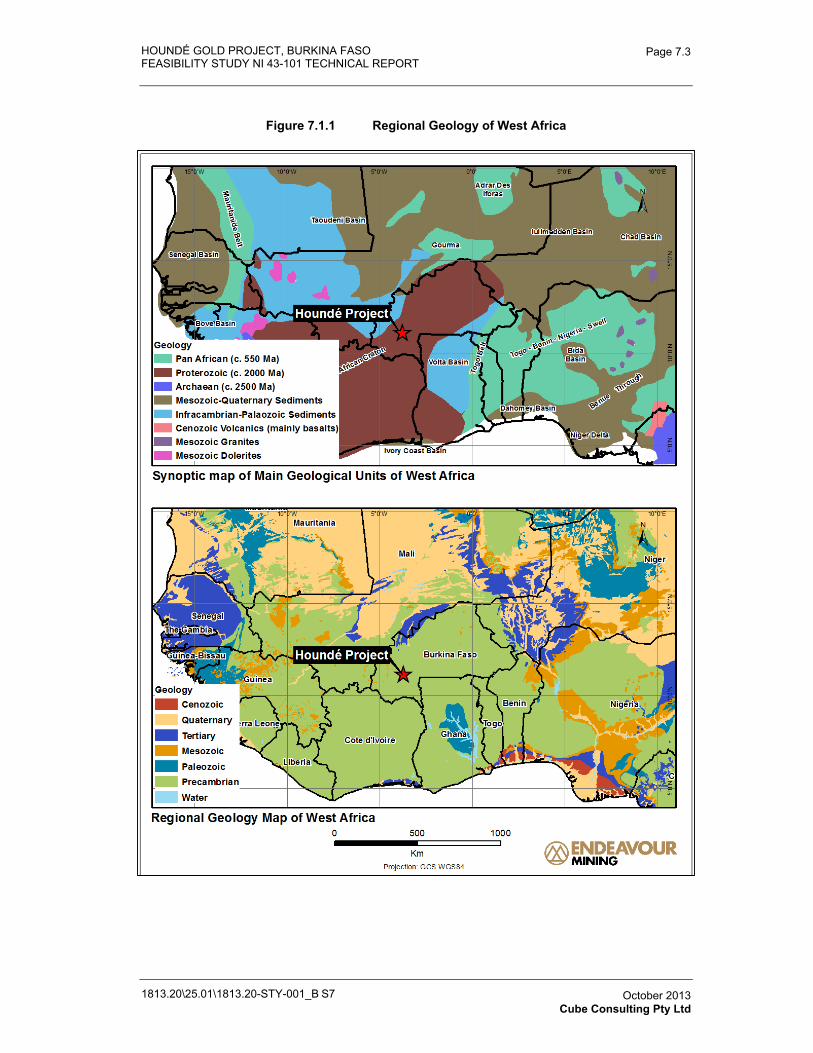
HOUNDÉ GOLD PROJECT, BURKINA FASO FEASIBILITY STUDY NI 43-101 TECHNICAL REPORT
1813.20\25.01\1813.20-STY-001_B S7
Page 7.3
October 2013 Cube Consulting Pty Ltd
Figure 7.1.1 Regional Geology of West Africa
HOUNDÉ GOLD PROJECT, BURKINA FASO FEASIBILITY STUDY NI 43-101 TECHNICAL REPORT
1813.20\25.01\1813.20-STY-001_B S7
Page 7.4
October 2013 Cube Consulting Pty Ltd
7.2 Local Geology
The geology of Burkina Faso can be subdivided into three major litho-tectonic domains: (1) a Paleoproterozoic (Birimian) basement underlying most of the country, (2) a Neoproterozoic sedimentary cover developed along the western, northern, and south-eastern portions of the country, and (3) a Cenozoic mobile belt forming small inliers in the northwestern and extreme eastern regions of the country (Figure 7.2.1).
The Birimian crust comprises the following lithologies from bottom to top: (1) a thick sequence of mafic rocks, including basalt, locally pillowed, as well as dolerite and gabbro, all of tholeiitic composition, locally inter layered with immature detrital sediments and limestone, (2) a detrital sedimentary pile (volcanics, turbidite, mudstone, and carbonate) including inter bedded calc-alkaline volcanics, and (3) a coarse clastic sedimentary sequence belonging to the Tarkwaian Group. During the Eburnean orogeny, the volcanic and meta-sedimentary rocks were subjected to crustal shortening associated with greenschist facies regional metamorphism. Locally, amphibolite metamorphic facies are reached, but these occurrences are interpreted as resulting from contact metamorphism.
Figure 7.2.1 Burkina Faso Greenstone Belts
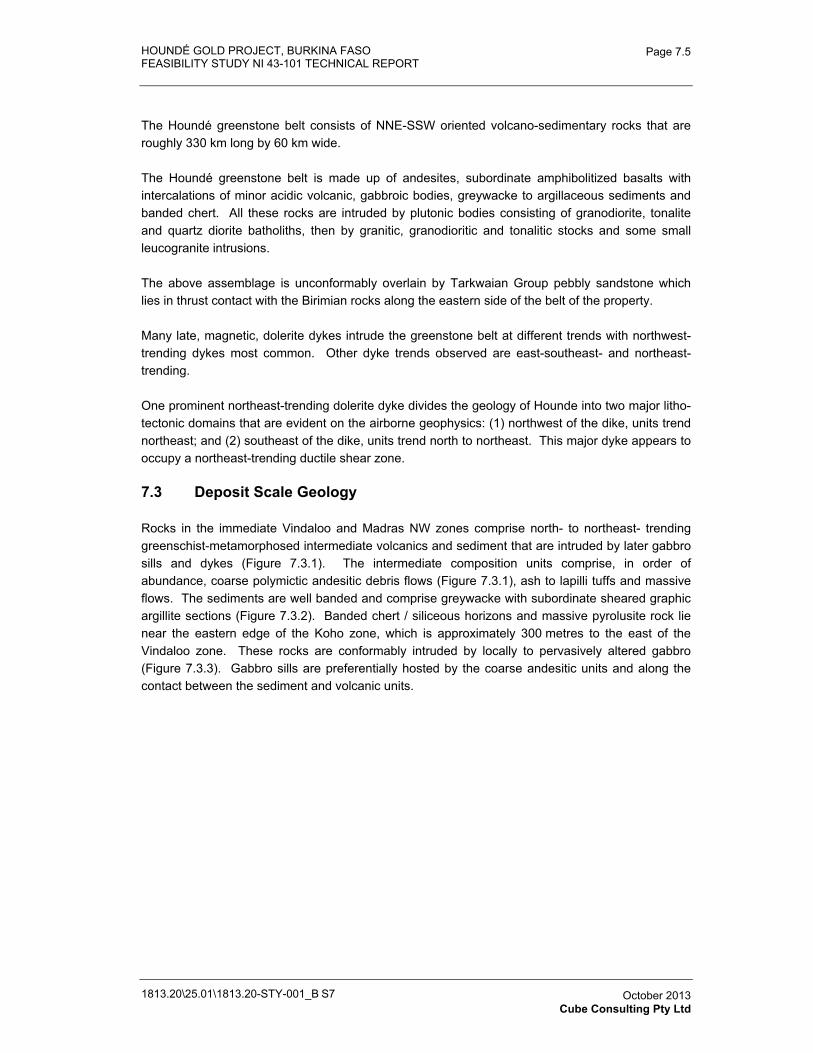
HOUNDÉ GOLD PROJECT, BURKINA FASO FEASIBILITY STUDY NI 43-101 TECHNICAL REPORT
1813.20\25.01\1813.20-STY-001_B S7
Page 7.5
October 2013 Cube Consulting Pty Ltd
The Houndé greenstone belt consists of NNE-SSW oriented volcano-sedimentary rocks that are roughly 330 km long by 60 km wide.
The Houndé greenstone belt is made up of andesites, subordinate amphibolitized basalts with intercalations of minor acidic volcanic, gabbroic bodies, greywacke to argillaceous sediments and banded chert. All these rocks are intruded by plutonic bodies consisting of granodiorite, tonalite and quartz diorite batholiths, then by granitic, granodioritic and tonalitic stocks and some small leucogranite intrusions.
The above assemblage is unconformably overlain by Tarkwaian Group pebbly sandstone which lies in thrust contact with the Birimian rocks along the eastern side of the belt of the property.
Many late, magnetic, dolerite dykes intrude the greenstone belt at different trends with northwest-trending dykes most common. Other dyke trends observed are east-southeast- and northeast-trending.
One prominent northeast-trending dolerite dyke divides the geology of Hounde into two major litho-tectonic domains that are evident on the airborne geophysics: (1) northwest of the dike, units trend northeast; and (2) southeast of the dike, units trend north to northeast. This major dyke appears to occupy a northeast-trending ductile shear zone.
7.3 Deposit Scale Geology
Rocks in the immediate Vindaloo and Madras NW zones comprise north- to northeast- trending greenschist-metamorphosed intermediate volcanics and sediment that are intruded by later gabbro sills and dykes (Figure 7.3.1). The intermediate composition units comprise, in order of abundance, coarse polymictic andesitic debris flows (Figure 7.3.1), ash to lapilli tuffs and massive flows. The sediments are well banded and comprise greywacke with subordinate sheared graphic argillite sections (Figure 7.3.2). Banded chert / siliceous horizons and massive pyrolusite rock lie near the eastern edge of the Koho zone, which is approximately 300 metres to the east of the Vindaloo zone. These rocks are conformably intruded by locally to pervasively altered gabbro (Figure 7.3.3). Gabbro sills are preferentially hosted by the coarse andesitic units and along the contact between the sediment and volcanic units.
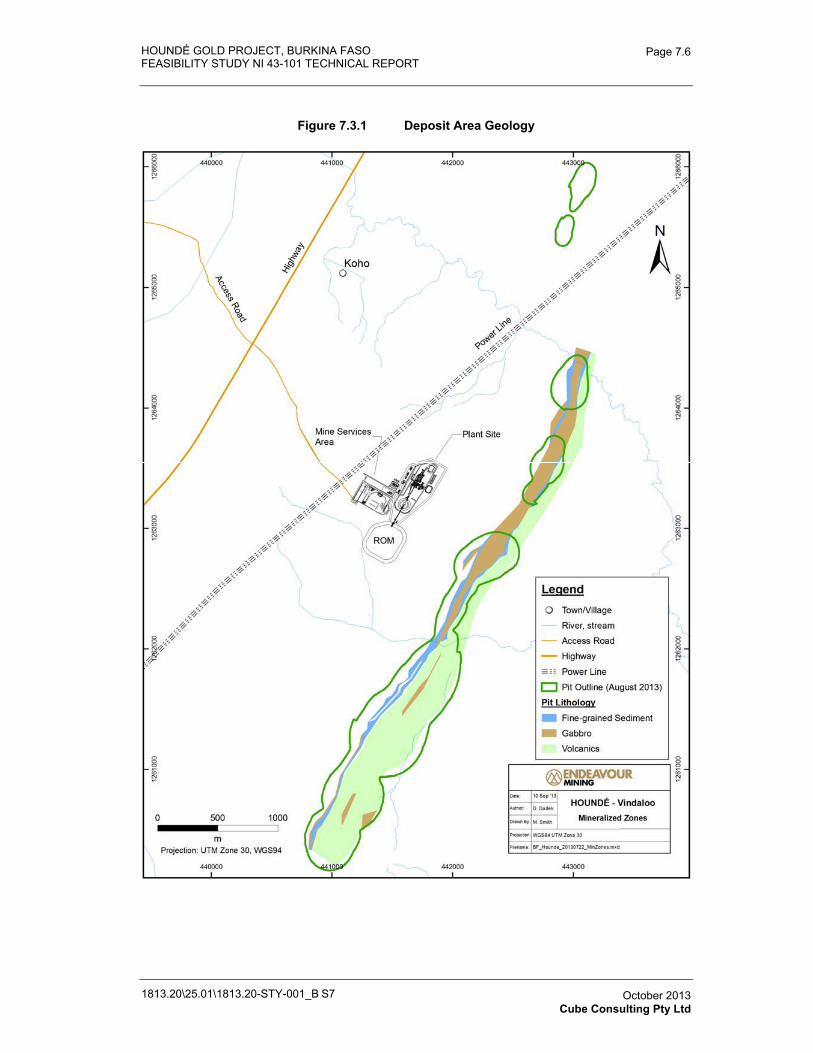
HOUNDÉ GOLD PROJECT, BURKINA FASO FEASIBILITY STUDY NI 43-101 TECHNICAL REPORT
1813.20\25.01\1813.20-STY-001_B S7
Page 7.6
October 2013 Cube Consulting Pty Ltd
Figure 7.3.1 Deposit Area Geology
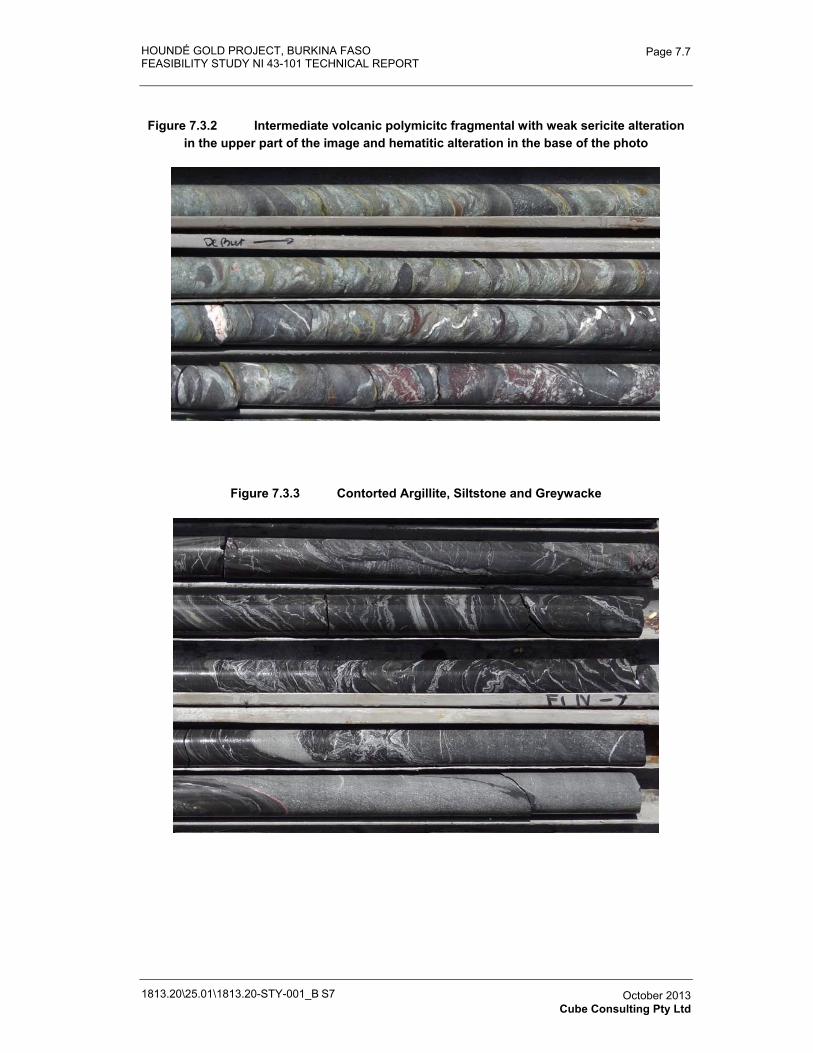
HOUNDÉ GOLD PROJECT, BURKINA FASO FEASIBILITY STUDY NI 43-101 TECHNICAL REPORT
1813.20\25.01\1813.20-STY-001_B S7
Page 7.7
October 2013 Cube Consulting Pty Ltd
Figure 7.3.2 Intermediate volcanic polymicitc fragmental with weak sericite alteration in the upper part of the image and hematitic alteration in the base of the photo
Figure 7.3.3 Contorted Argillite, Siltstone and Greywacke
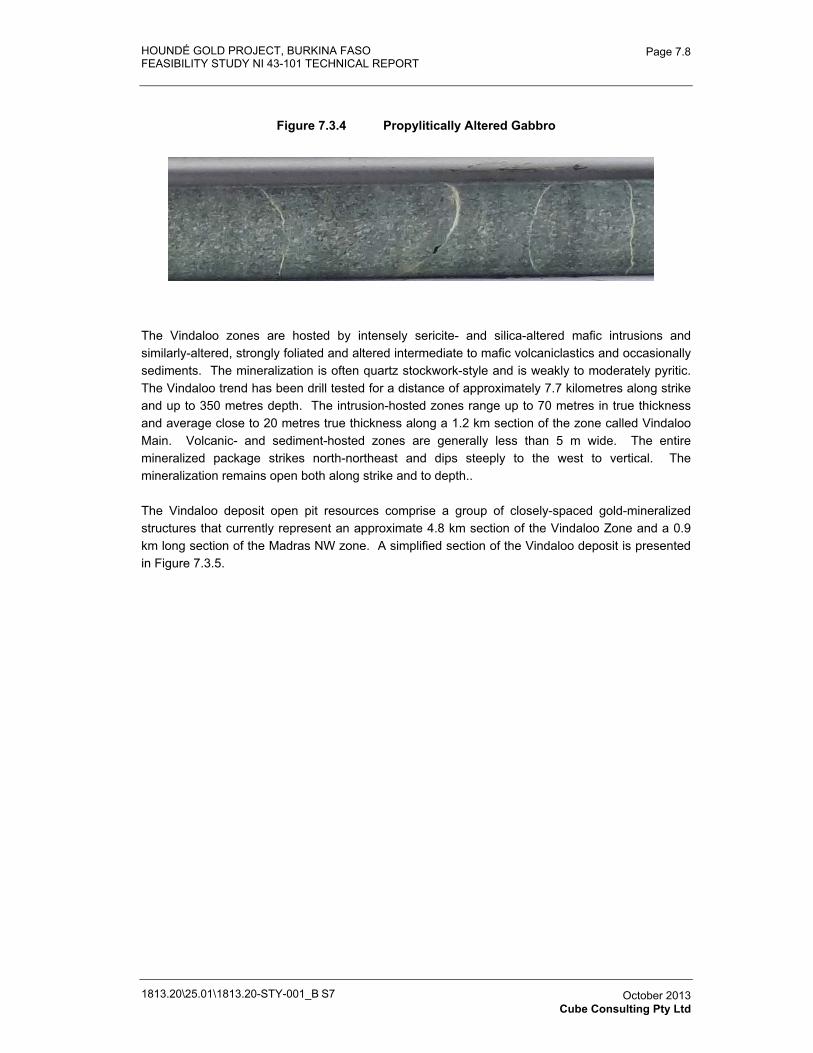
HOUNDÉ GOLD PROJECT, BURKINA FASO FEASIBILITY STUDY NI 43-101 TECHNICAL REPORT
1813.20\25.01\1813.20-STY-001_B S7
Page 7.8
October 2013 Cube Consulting Pty Ltd
Figure 7.3.4 Propylitically Altered Gabbro
The Vindaloo zones are hosted by intensely sericite- and silica-altered mafic intrusions and similarly-altered, strongly foliated and altered intermediate to mafic volcaniclastics and occasionally sediments. The mineralization is often quartz stockwork-style and is weakly to moderately pyritic. The Vindaloo trend has been drill tested for a distance of approximately 7.7 kilometres along strike and up to 350 metres depth. The intrusion-hosted zones range up to 70 metres in true thickness and average close to 20 metres true thickness along a 1.2 km section of the zone called Vindaloo Main. Volcanic- and sediment-hosted zones are generally less than 5 m wide. The entire mineralized package strikes north-northeast and dips steeply to the west to vertical. The mineralization remains open both along strike and to depth..
The Vindaloo deposit open pit resources comprise a group of closely-spaced gold-mineralized structures that currently represent an approximate 4.8 km section of the Vindaloo Zone and a 0.9 km long section of the Madras NW zone. A simplified section of the Vindaloo deposit is presented in Figure 7.3.5.
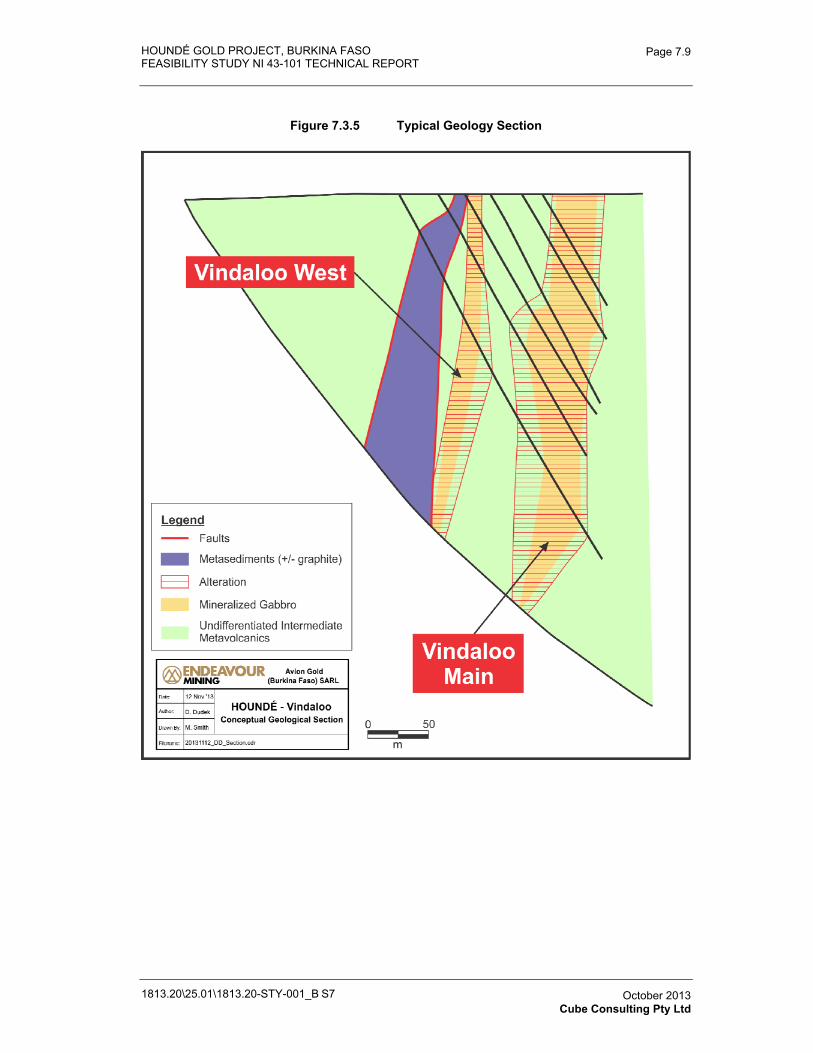
HOUNDÉ GOLD PROJECT, BURKINA FASO FEASIBILITY STUDY NI 43-101 TECHNICAL REPORT
1813.20\25.01\1813.20-STY-001_B S7
Page 7.9
October 2013 Cube Consulting Pty Ltd
Figure 7.3.5 Typical Geology Section
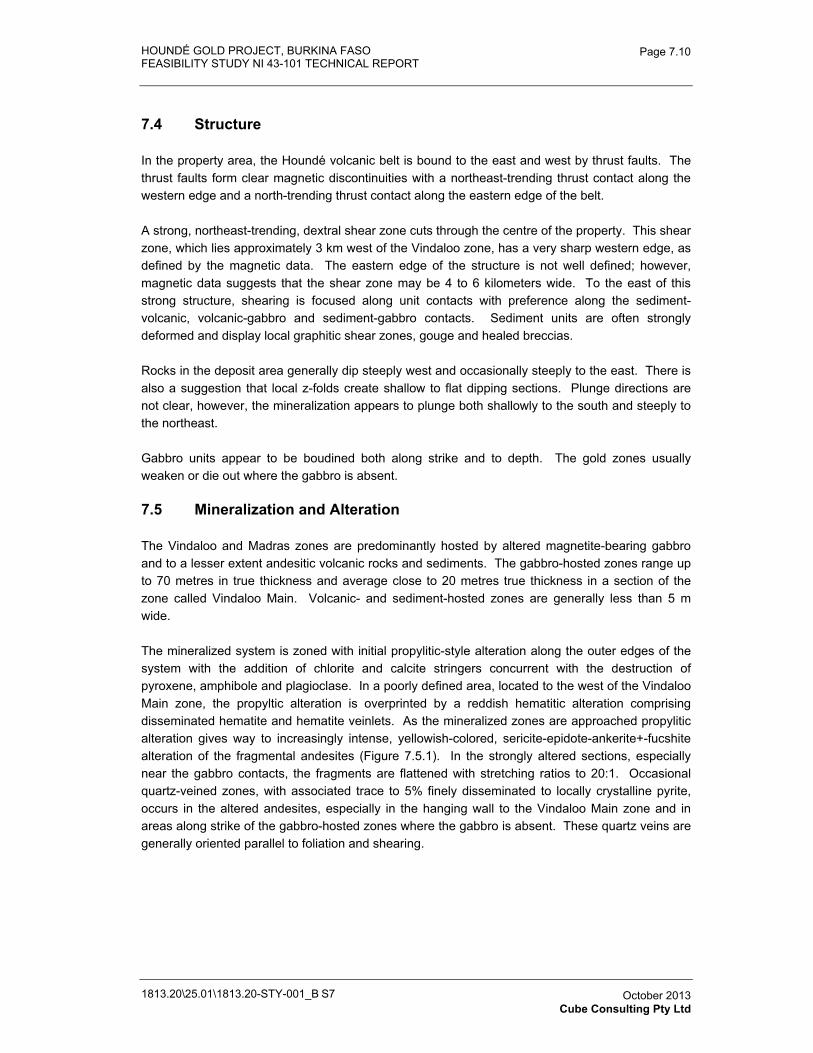
HOUNDÉ GOLD PROJECT, BURKINA FASO FEASIBILITY STUDY NI 43-101 TECHNICAL REPORT
1813.20\25.01\1813.20-STY-001_B S7
Page 7.10
October 2013 Cube Consulting Pty Ltd
7.4 Structure
In the property area, the Houndé volcanic belt is bound to the east and west by thrust faults. The thrust faults form clear magnetic discontinuities with a northeast-trending thrust contact along the western edge and a north-trending thrust contact along the eastern edge of the belt.
A strong, northeast-trending, dextral shear zone cuts through the centre of the property. This shear zone, which lies approximately 3 km west of the Vindaloo zone, has a very sharp western edge, as defined by the magnetic data. The eastern edge of the structure is not well defined; however, magnetic data suggests that the shear zone may be 4 to 6 kilometers wide. To the east of this strong structure, shearing is focused along unit contacts with preference along the sediment-volcanic, volcanic-gabbro and sediment-gabbro contacts. Sediment units are often strongly deformed and display local graphitic shear zones, gouge and healed breccias.
Rocks in the deposit area generally dip steeply west and occasionally steeply to the east. There is also a suggestion that local z-folds create shallow to flat dipping sections. Plunge directions are not clear, however, the mineralization appears to plunge both shallowly to the south and steeply to the northeast.
Gabbro units appear to be boudined both along strike and to depth. The gold zones usually weaken or die out where the gabbro is absent.
7.5 Mineralization and Alteration
The Vindaloo and Madras zones are predominantly hosted by altered magnetite-bearing gabbro and to a lesser extent andesitic volcanic rocks and sediments. The gabbro-hosted zones range up to 70 metres in true thickness and average close to 20 metres true thickness in a section of the zone called Vindaloo Main. Volcanic- and sediment-hosted zones are generally less than 5 m wide.
The mineralized system is zoned with initial propylitic-style alteration along the outer edges of the system with the addition of chlorite and calcite stringers concurrent with the destruction of pyroxene, amphibole and plagioclase. In a poorly defined area, located to the west of the Vindaloo Main zone, the propyltic alteration is overprinted by a reddish hematitic alteration comprising disseminated hematite and hematite veinlets. As the mineralized zones are approached propylitic alteration gives way to increasingly intense, yellowish-colored, sericite-epidote-ankerite+-fucshite alteration of the fragmental andesites (Figure 7.5.1). In the strongly altered sections, especially near the gabbro contacts, the fragments are flattened with stretching ratios to 20:1. Occasional quartz-veined zones, with associated trace to 5% finely disseminated to locally crystalline pyrite, occurs in the altered andesites, especially in the hanging wall to the Vindaloo Main zone and in areas along strike of the gabbro-hosted zones where the gabbro is absent. These quartz veins are generally oriented parallel to foliation and shearing.
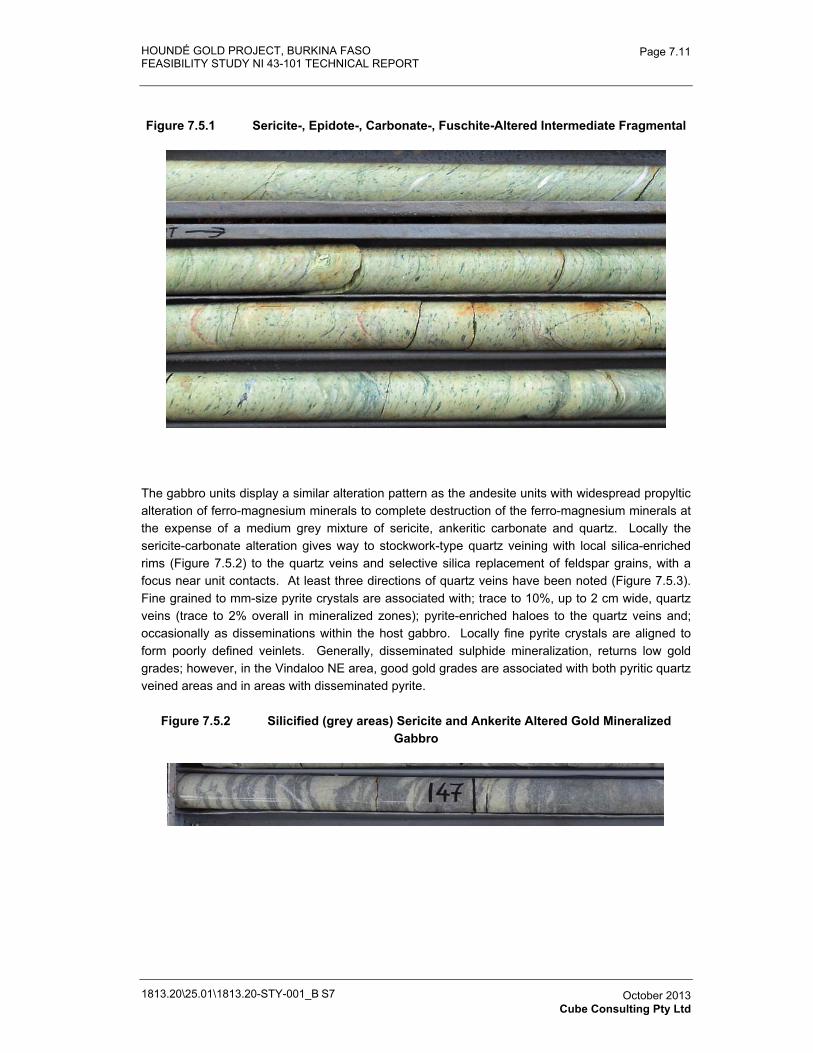
HOUNDÉ GOLD PROJECT, BURKINA FASO FEASIBILITY STUDY NI 43-101 TECHNICAL REPORT
1813.20\25.01\1813.20-STY-001_B S7
Page 7.11
October 2013 Cube Consulting Pty Ltd
Figure 7.5.1 Sericite-, Epidote-, Carbonate-, Fuschite-Altered Intermediate Fragmental
The gabbro units display a similar alteration pattern as the andesite units with widespread propyltic alteration of ferro-magnesium minerals to complete destruction of the ferro-magnesium minerals at the expense of a medium grey mixture of sericite, ankeritic carbonate and quartz. Locally the sericite-carbonate alteration gives way to stockwork-type quartz veining with local silica-enriched rims (Figure 7.5.2) to the quartz veins and selective silica replacement of feldspar grains, with a focus near unit contacts. At least three directions of quartz veins have been noted (Figure 7.5.3). Fine grained to mm-size pyrite crystals are associated with; trace to 10%, up to 2 cm wide, quartz veins (trace to 2% overall in mineralized zones); pyrite-enriched haloes to the quartz veins and; occasionally as disseminations within the host gabbro. Locally fine pyrite crystals are aligned to form poorly defined veinlets. Generally, disseminated sulphide mineralization, returns low gold grades; however, in the Vindaloo NE area, good gold grades are associated with both pyritic quartz veined areas and in areas with disseminated pyrite.
Figure 7.5.2 Silicified (grey areas) Sericite and Ankerite Altered Gold Mineralized Gabbro
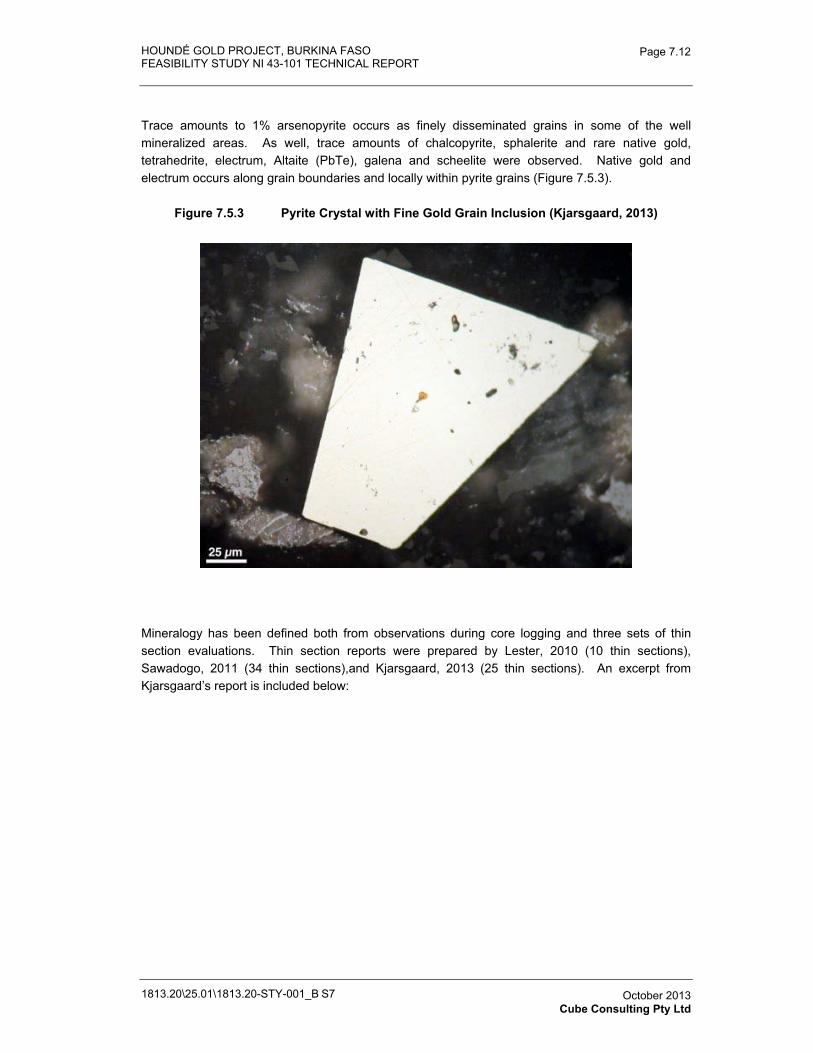
HOUNDÉ GOLD PROJECT, BURKINA FASO FEASIBILITY STUDY NI 43-101 TECHNICAL REPORT
1813.20\25.01\1813.20-STY-001_B S7
Page 7.12
October 2013 Cube Consulting Pty Ltd
Trace amounts to 1% arsenopyrite occurs as finely disseminated grains in some of the well mineralized areas. As well, trace amounts of chalcopyrite, sphalerite and rare native gold, tetrahedrite, electrum, Altaite (PbTe), galena and scheelite were observed. Native gold and electrum occurs along grain boundaries and locally within pyrite grains (Figure 7.5.3).
Figure 7.5.3 Pyrite Crystal with Fine Gold Grain Inclusion (Kjarsgaard, 2013)
Mineralogy has been defined both from observations during core logging and three sets of thin section evaluations. Thin section reports were prepared by Lester, 2010 (10 thin sections), Sawadogo, 2011 (34 thin sections),and Kjarsgaard, 2013 (25 thin sections). An excerpt from Kjarsgaard’s report is included below:
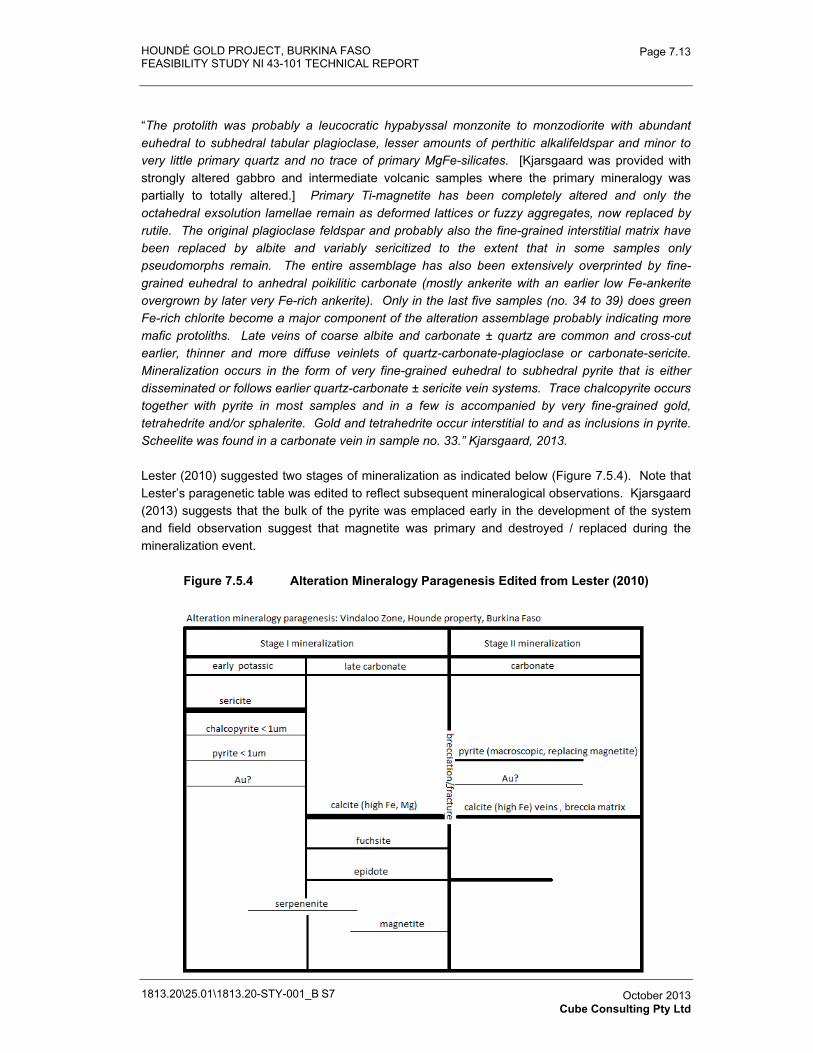
HOUNDÉ GOLD PROJECT, BURKINA FASO FEASIBILITY STUDY NI 43-101 TECHNICAL REPORT
1813.20\25.01\1813.20-STY-001_B S7
Page 7.13
October 2013 Cube Consulting Pty Ltd
“The protolith was probably a leucocratic hypabyssal monzonite to monzodiorite with abundant euhedral to subhedral tabular plagioclase, lesser amounts of perthitic alkalifeldspar and minor to very little primary quartz and no trace of primary MgFe-silicates. [Kjarsgaard was provided with strongly altered gabbro and intermediate volcanic samples where the primary mineralogy was partially to totally altered.] Primary Ti-magnetite has been completely altered and only the octahedral exsolution lamellae remain as deformed lattices or fuzzy aggregates, now replaced by rutile. The original plagioclase feldspar and probably also the fine-grained interstitial matrix have been replaced by albite and variably sericitized to the extent that in some samples only pseudomorphs remain. The entire assemblage has also been extensively overprinted by fine-grained euhedral to anhedral poikilitic carbonate (mostly ankerite with an earlier low Fe-ankerite overgrown by later very Fe-rich ankerite). Only in the last five samples (no. 34 to 39) does green Fe-rich chlorite become a major component of the alteration assemblage probably indicating more mafic protoliths. Late veins of coarse albite and carbonate ± quartz are common and cross-cut earlier, thinner and more diffuse veinlets of quartz-carbonate-plagioclase or carbonate-sericite. Mineralization occurs in the form of very fine-grained euhedral to subhedral pyrite that is either disseminated or follows earlier quartz-carbonate ± sericite vein systems. Trace chalcopyrite occurs together with pyrite in most samples and in a few is accompanied by very fine-grained gold, tetrahedrite and/or sphalerite. Gold and tetrahedrite occur interstitial to and as inclusions in pyrite. Scheelite was found in a carbonate vein in sample no. 33.” Kjarsgaard, 2013.
Lester (2010) suggested two stages of mineralization as indicated below (Figure 7.5.4). Note that Lester’s paragenetic table was edited to reflect subsequent mineralogical observations. Kjarsgaard (2013) suggests that the bulk of the pyrite was emplaced early in the development of the system and field observation suggest that magnetite was primary and destroyed / replaced during the mineralization event.
Figure 7.5.4 Alteration Mineralogy Paragenesis Edited from Lester (2010)
Pyrite replacing
Carbonate – albite veins
Fe-enriched ankerite Ankerite
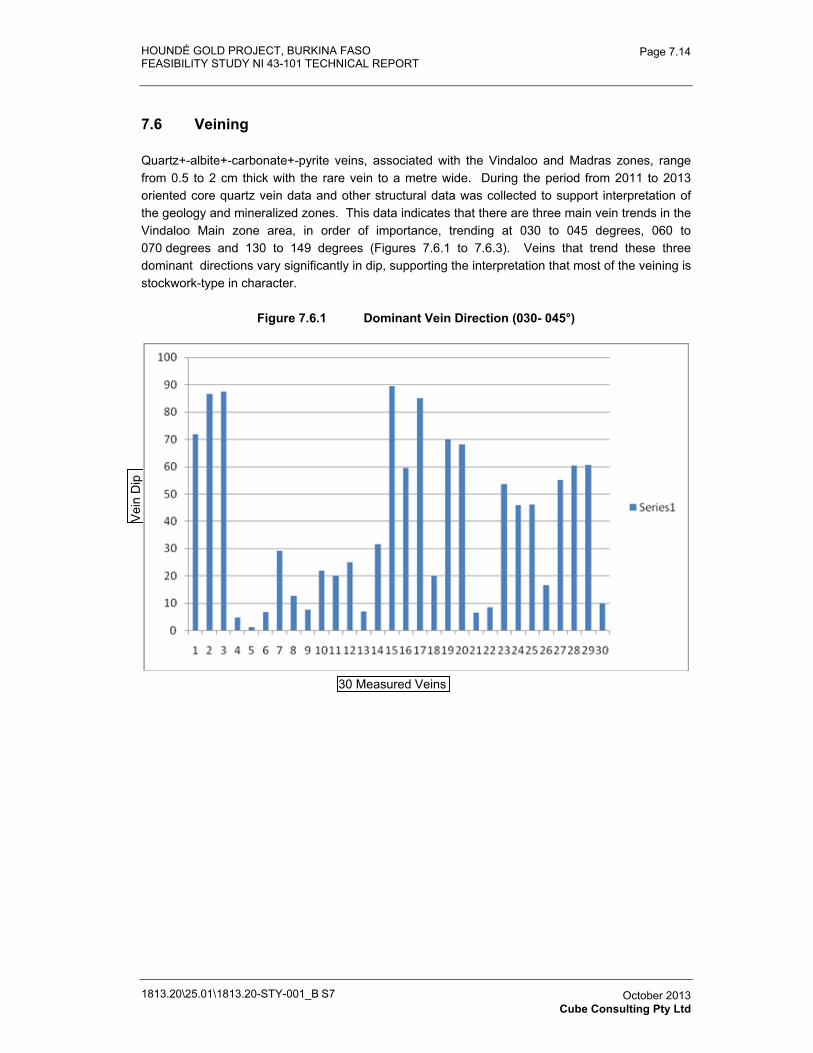
HOUNDÉ GOLD PROJECT, BURKINA FASO FEASIBILITY STUDY NI 43-101 TECHNICAL REPORT
1813.20\25.01\1813.20-STY-001_B S7
Page 7.14
October 2013 Cube Consulting Pty Ltd
7.6 Veining
Quartz+-albite+-carbonate+-pyrite veins, associated with the Vindaloo and Madras zones, range from 0.5 to 2 cm thick with the rare vein to a metre wide. During the period from 2011 to 2013 oriented core quartz vein data and other structural data was collected to support interpretation of the geology and mineralized zones. This data indicates that there are three main vein trends in the Vindaloo Main zone area, in order of importance, trending at 030 to 045 degrees, 060 to 070 degrees and 130 to 149 degrees (Figures 7.6.1 to 7.6.3). Veins that trend these three dominant directions vary significantly in dip, supporting the interpretation that most of the veining is stockwork-type in character.
Figure 7.6.1 Dominant Vein Direction (030- 045°)
30 Measured Veins
Vei
n D
ip
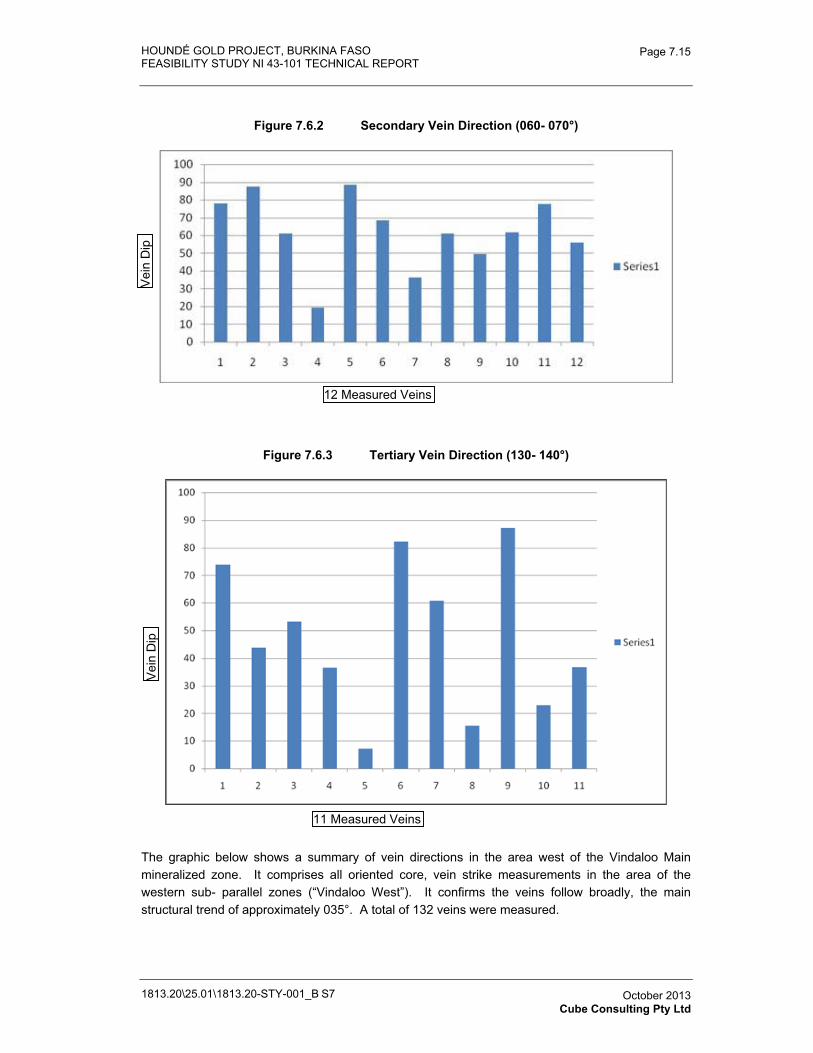
HOUNDÉ GOLD PROJECT, BURKINA FASO FEASIBILITY STUDY NI 43-101 TECHNICAL REPORT
1813.20\25.01\1813.20-STY-001_B S7
Page 7.15
October 2013 Cube Consulting Pty Ltd
Figure 7.6.2 Secondary Vein Direction (060- 070°)
Figure 7.6.3 Tertiary Vein Direction (130- 140°)
�
The graphic below shows a summary of vein directions in the area west of the Vindaloo Main mineralized zone. It comprises all oriented core, vein strike measurements in the area of the western sub- parallel zones (“Vindaloo West”). It confirms the veins follow broadly, the main structural trend of approximately 035°. A total of 132 veins were measured.
12 Measured Veins
11 Measured Veins
Vei
n D
ip
Vei
n D
ip
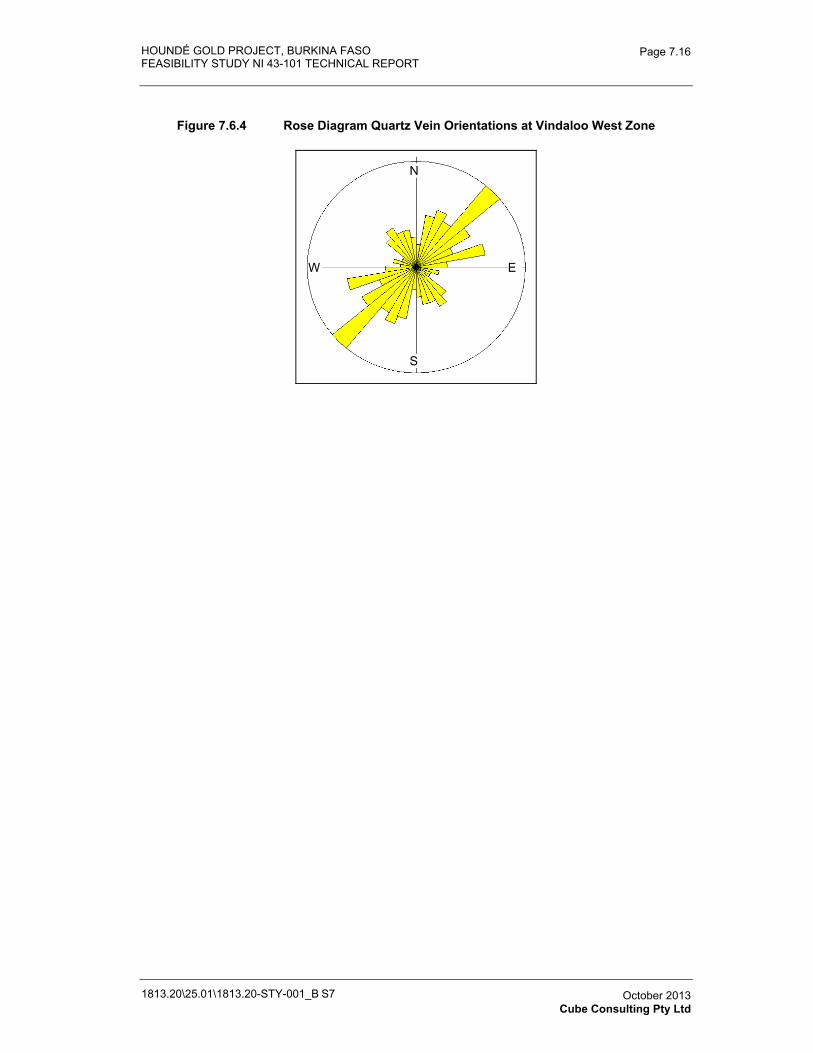
HOUNDÉ GOLD PROJECT, BURKINA FASO FEASIBILITY STUDY NI 43-101 TECHNICAL REPORT
1813.20\25.01\1813.20-STY-001_B S7
Page 7.16
October 2013 Cube Consulting Pty Ltd
Figure 7.6.4 Rose Diagram Quartz Vein Orientations at Vindaloo West Zone
�
N
E
S
W
HOUNDÉ GOLD PROJECT, BURKINA FASO
FEASIBILITY STUDY NI 43-101 TECHNICAL REPORT
1813.20-STY-001
Table of Contents Page
8.0� DEPOSIT TYPES 8.1�8.1� Introduction 8.1�
1813.20\25.01\1813.20-STY-001_B S8 October 2013 Cube Consulting Pty Ltd
HOUNDÉ GOLD PROJECT, BURKINA FASO FEASIBILITY STUDY NI 43-101 TECHNICAL REPORT
1813.20\25.01\1813.20-STY-001_B S8
Page 8.1
October 2013 Cube Consulting Pty Ltd
8.0 DEPOSIT TYPES
8.1 Introduction
The West African Lower Proterozoic greenstone belts have produced world-class gold deposits, such as the Obuasi mines of Anglo-Ashanti Corp. in Ghana that have been in continuous production since 1897.
The gold deposits in West Africa have been classified into the following types:
1. Structurally-controlled, epigenetic lode or stockwork mineralization related to major shear zones with native gold (Poura, Burkina Faso; Kalana, Mali),
2. Structurally-controlled, epigenetic lode or stockwork mineralization related to major shear zones and characterized by the inclusion of gold in the crystal structure of the sulphides, often locked in arsenopyrite (Ashanti type: Obuasi, Ghana),
3. Stratiform deposits hosted in tourmalinized turbidites (Gara Deposit Loulo, Mali),
4. Disseminated sulphides hosted in volcanic or plutonic rocks (Syama, Mali; Yaouré, Ivory Coast; granitoid-hosted, Ayanfuri, Ghana),
5. Paleo-placer deposits: auriferous quartz-pebble conglomerates (Tarkwa, Ghana); modern placers (eluvial, alluvial).
The classic structurally-controlled or shear-hosted quartz, sericite schist gold mineralization model with alteration halo (Type 1) matches that of the Vindaloo and Madras NW deposits.
HOUNDÉ GOLD PROJECT, BURKINA FASO
FEASIBILITY STUDY NI 43-101 TECHNICAL REPORT
1813.20-STY-001
Table of Contents Page
9.0� EXPLORATION 9.1�9.1� Introduction 9.1�9.2� Auger Drilling Program 9.1�9.3� Induced Polarization Sterilization Survey 9.4�9.4� Exploration Targets 9.8�
9.4.1� Vindaloo Trend 9.8�9.4.2� Madras Zone 9.12�9.4.3� Koho 9.15�9.4.4� Induced Polarization Survey Anomalies 9.18�
TABLESTable 9.2.1� Auger Drilling Summary 9.2�Table 9.3.1� Statistics of the IP Surveyed Grid Measured Parameters 9.4�Table 9.4.1� Significant Results Vindaloo Far South Target 9.9�Table 9.4.2� Significant Results Madras Zone 9.13�Table 9.4.3� Significant Results Koho Zone 9.15�
FIGURESFigure 9.2.1� Summary of Auger Drilling Sampling Results 9.2�Figure 9.2.2� Interpreted Anomalous Trends on Colour-Contoured Au ppb from
Auger Drilling for Mine and Waste Pile Site Areas 9.3�Figure 9.3.1� Sterilization IP Survey Grid Locations 9.5�Figure 9.3.2� Interpreted Anomalous Mineralization Trends on Compiled Color
Contoured IP Resistivity for Mine Site and Waste Pile Areas 9.6�Figure 9.3.3� IP Colour-Contoured IP Resistivity Over Dam Site 9.7�Figure 9.3.4� IP Colour-Contoured IP Resistivity Over Tailings Pond Site 9.7�Figure 9.4.1� Vindaloo Far South Drilling 9.10�Figure 9.4.2� Soukou Artisanal Mining Location 9.11�Figure 9.4.3� Madras Zone Drilling 9.14�Figure 9.4.4� Koho Zone Drilling 9.17�Figure 9.4.5� Colour Contoured IP Resistivity Data and Au Occurrences 9.18�
1813.20\25.01\1813.20-STY-001_B S9 October 2013 Cube Consulting Pty Ltd
HOUNDÉ GOLD PROJECT, BURKINA FASO FEASIBILITY STUDY NI 43-101 TECHNICAL REPORT
1813.20\25.01\1813.20-STY-001_B S9
Page 9.1
October 2013 Cube Consulting Pty Ltd
9.0 EXPLORATION
9.1 Introduction
Endeavour acquired Avion Gold Corporation in late October 2012, which included the wholly owned subsidiary, Avion Gold (Burkina Faso) SARL, which owns the rights to the Houndé Exploration Permits. Exploration that was carried out prior to the acquisition by Endeavour, has been presented in previous reports and most recently in the Preliminary Economic Assessment (PEA) report by Rykaart, et. al, 2013. Immediately after Endeavour acquired the right to the property, drilling resumed with a goal to convert Inferred Mineral Resources to Indicated Mineral Resources and to convert some of the near-surface Indicated Mineral Resources to Measured Mineral Resources. This drilling and a summary of the historic drill programs carried out over the Vindaloo zone, will be presented in Section 10, Drilling.
Upon reception of the PEA, which indicated a potential economically viable project, a 1 metre contour map was created, developed from a satellite image collected in January 2013, additional metallurgical samples were collected and sent to SGS Perth for processing, additional thin section work was contracted, an auger drilling program as part of a sterilization program, was completed, additional IP surveys were carried out, a sterilization drilling program was carried out, and feasibility, ESIA and Resettlement Action Plan (RAP) studies were initiated. With the exception of the auger drilling program, IP survey and a summary of near-by exploration opportunities, the rest of the exploration and technical study results will be presented in other sections of this report.
9.2 Auger Drilling Program
An auger drilling program was initiated over those areas likely to be impacted by mine infrastructure including the potential tailings pond sites, mine and camp sites, waste dump sites and water dam site (Figure 9.2.1). Auger holes were designed to drill through the overlying laterite and alluvium so that the upper metre or so, of saprolite could be sampled and sent to the laboratory for analysis. Auger holes were drilled 25 metres apart on lines spaced every 200 metres. In total 1,977 auger holes totalling 13,760 metres of drilling, were completed as summarized below in Table 9.2.1.
Samples, representing one metre of drilling, were collected in rice bags under the supervision of a geologist. Prior to splitting (to reduce sample size), the contents of the rice sack were stirred to produce a uniform mixture. The sample was then reduced to 2 kg using a coning and quartering procedure with the sample transferred into a numbered plastic sample bag with a corresponding sample tag, sealed and dispatched twice a day to the Houndé exploration camp. Note that all sample equipment (sample bowls and scoops) were bristle brush cleaned before collecting the assay sample and that the drill rods were metal brushed to remove any material sticking to the rods.
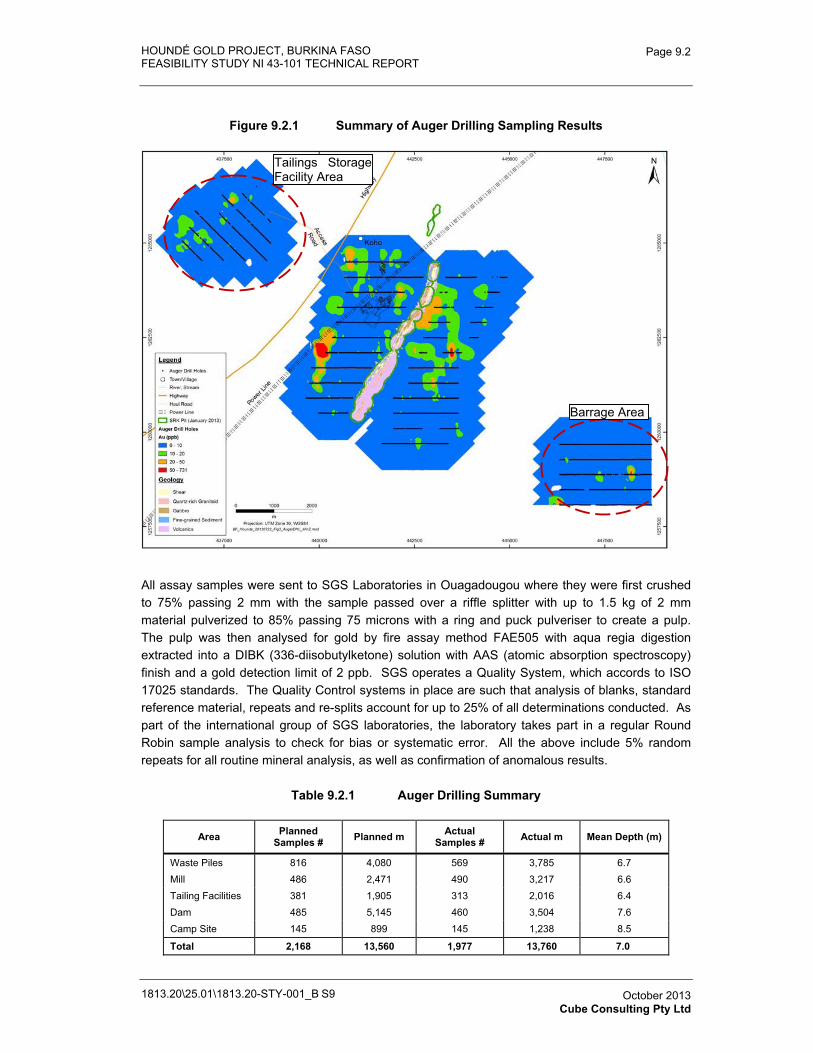
HOUNDÉ GOLD PROJECT, BURKINA FASO FEASIBILITY STUDY NI 43-101 TECHNICAL REPORT
1813.20\25.01\1813.20-STY-001_B S9
Page 9.2
October 2013 Cube Consulting Pty Ltd
Figure 9.2.1 Summary of Auger Drilling Sampling Results
All assay samples were sent to SGS Laboratories in Ouagadougou where they were first crushed to 75% passing 2 mm with the sample passed over a riffle splitter with up to 1.5 kg of 2 mm material pulverized to 85% passing 75 microns with a ring and puck pulveriser to create a pulp. The pulp was then analysed for gold by fire assay method FAE505 with aqua regia digestion extracted into a DIBK (336-diisobutylketone) solution with AAS (atomic absorption spectroscopy) finish and a gold detection limit of 2 ppb. SGS operates a Quality System, which accords to ISO 17025 standards. The Quality Control systems in place are such that analysis of blanks, standard reference material, repeats and re-splits account for up to 25% of all determinations conducted. As part of the international group of SGS laboratories, the laboratory takes part in a regular Round Robin sample analysis to check for bias or systematic error. All the above include 5% random repeats for all routine mineral analysis, as well as confirmation of anomalous results.
Table 9.2.1 Auger Drilling Summary
Area Planned Samples # Planned m Actual
Samples # Actual m Mean Depth (m)
Waste Piles 816 4,080 569 3,785 6.7 Mill 486 2,471 490 3,217 6.6 Tailing Facilities 381 1,905 313 2,016 6.4 Dam 485 5,145 460 3,504 7.6 Camp Site 145 899 145 1,238 8.5
Total 2,168 13,560 1,977 13,760 7.0
Tailings StorageFacility Area
Barrage Area
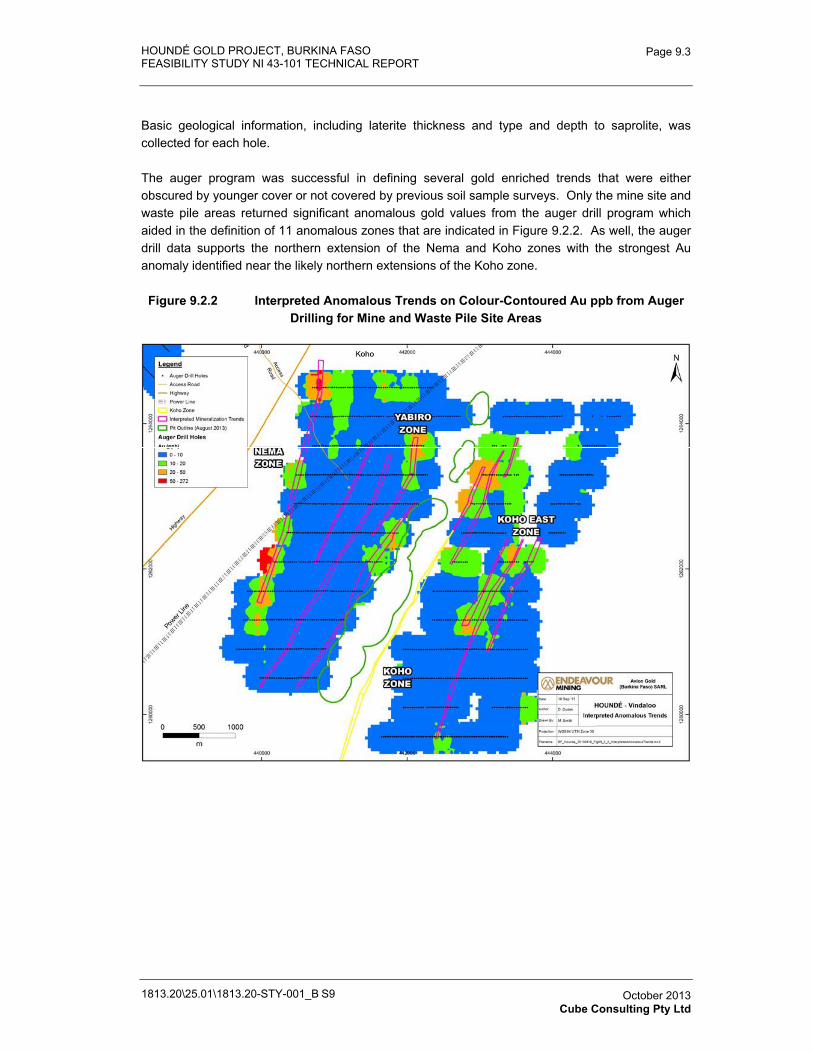
HOUNDÉ GOLD PROJECT, BURKINA FASO FEASIBILITY STUDY NI 43-101 TECHNICAL REPORT
1813.20\25.01\1813.20-STY-001_B S9
Page 9.3
October 2013 Cube Consulting Pty Ltd
Basic geological information, including laterite thickness and type and depth to saprolite, was collected for each hole.
The auger program was successful in defining several gold enriched trends that were either obscured by younger cover or not covered by previous soil sample surveys. Only the mine site and waste pile areas returned significant anomalous gold values from the auger drill program which aided in the definition of 11 anomalous zones that are indicated in Figure 9.2.2. As well, the auger drill data supports the northern extension of the Nema and Koho zones with the strongest Au anomaly identified near the likely northern extensions of the Koho zone.
Figure 9.2.2 Interpreted Anomalous Trends on Colour-Contoured Au ppb from Auger Drilling for Mine and Waste Pile Site Areas
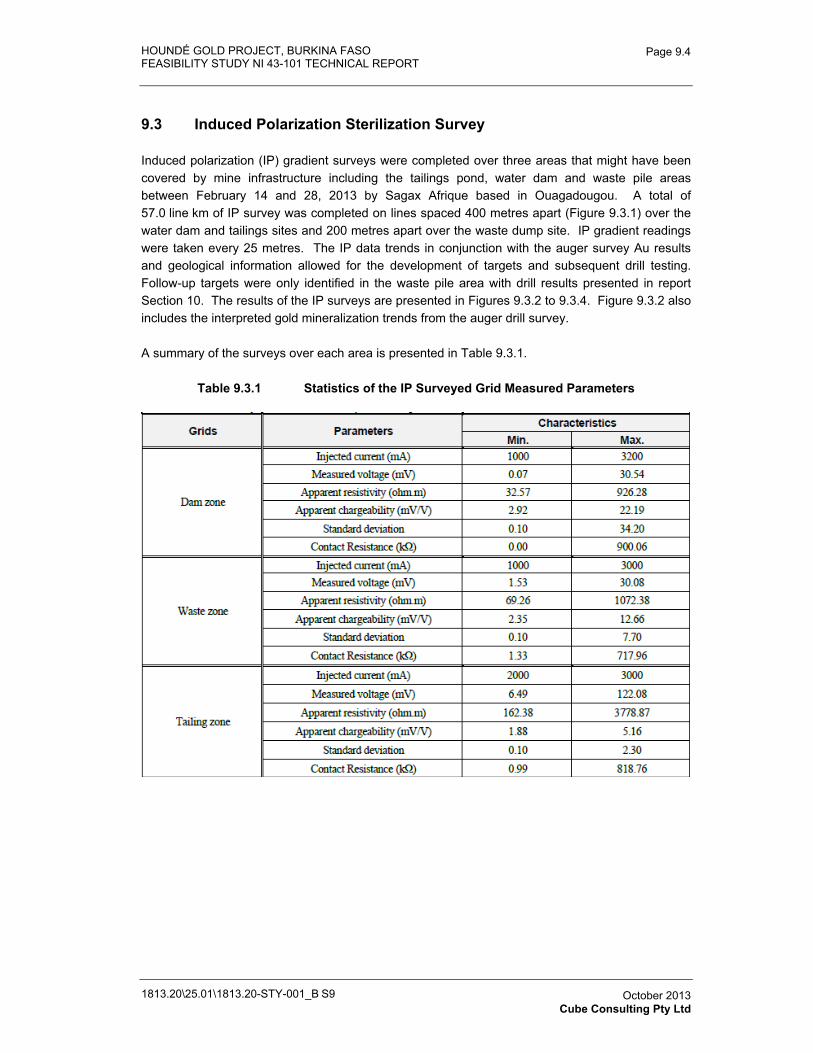
HOUNDÉ GOLD PROJECT, BURKINA FASO FEASIBILITY STUDY NI 43-101 TECHNICAL REPORT
1813.20\25.01\1813.20-STY-001_B S9
Page 9.4
October 2013 Cube Consulting Pty Ltd
9.3 Induced Polarization Sterilization Survey
Induced polarization (IP) gradient surveys were completed over three areas that might have been covered by mine infrastructure including the tailings pond, water dam and waste pile areas between February 14 and 28, 2013 by Sagax Afrique based in Ouagadougou. A total of 57.0 line km of IP survey was completed on lines spaced 400 metres apart (Figure 9.3.1) over the water dam and tailings sites and 200 metres apart over the waste dump site. IP gradient readings were taken every 25 metres. The IP data trends in conjunction with the auger survey Au results and geological information allowed for the development of targets and subsequent drill testing. Follow-up targets were only identified in the waste pile area with drill results presented in report Section 10. The results of the IP surveys are presented in Figures 9.3.2 to 9.3.4. Figure 9.3.2 also includes the interpreted gold mineralization trends from the auger drill survey.
A summary of the surveys over each area is presented in Table 9.3.1.
Table 9.3.1 Statistics of the IP Surveyed Grid Measured Parameters
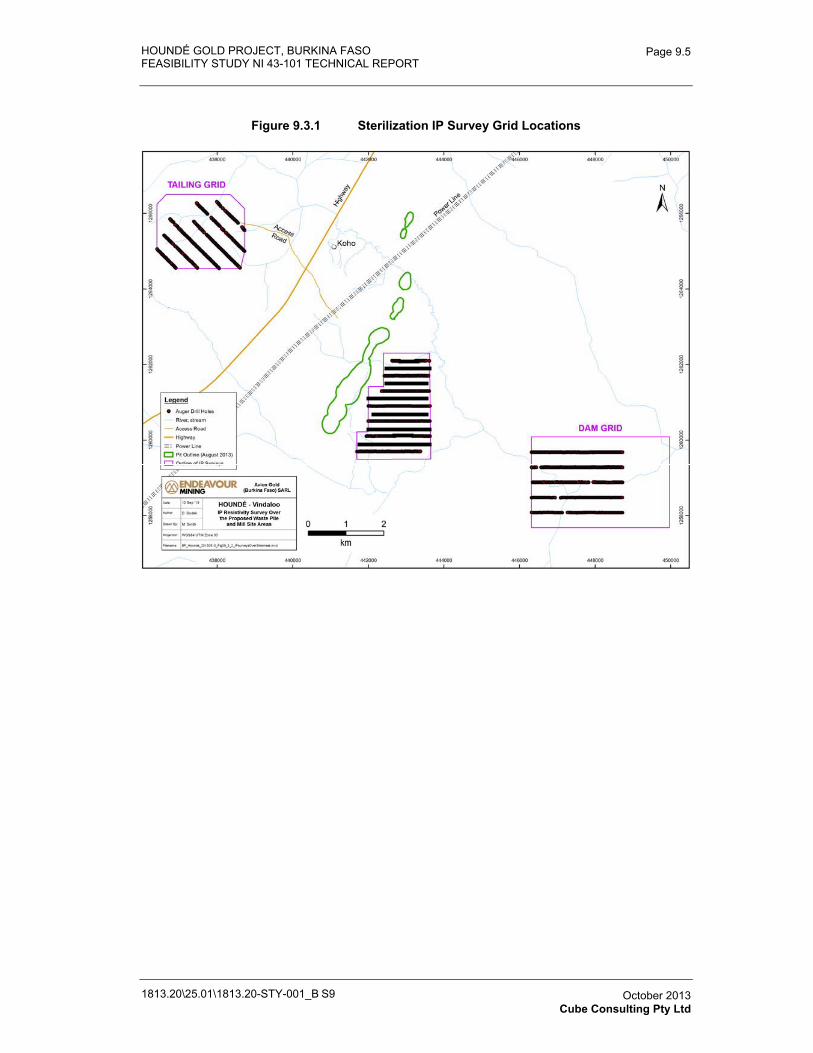
HOUNDÉ GOLD PROJECT, BURKINA FASO FEASIBILITY STUDY NI 43-101 TECHNICAL REPORT
1813.20\25.01\1813.20-STY-001_B S9
Page 9.5
October 2013 Cube Consulting Pty Ltd
Figure 9.3.1 Sterilization IP Survey Grid Locations
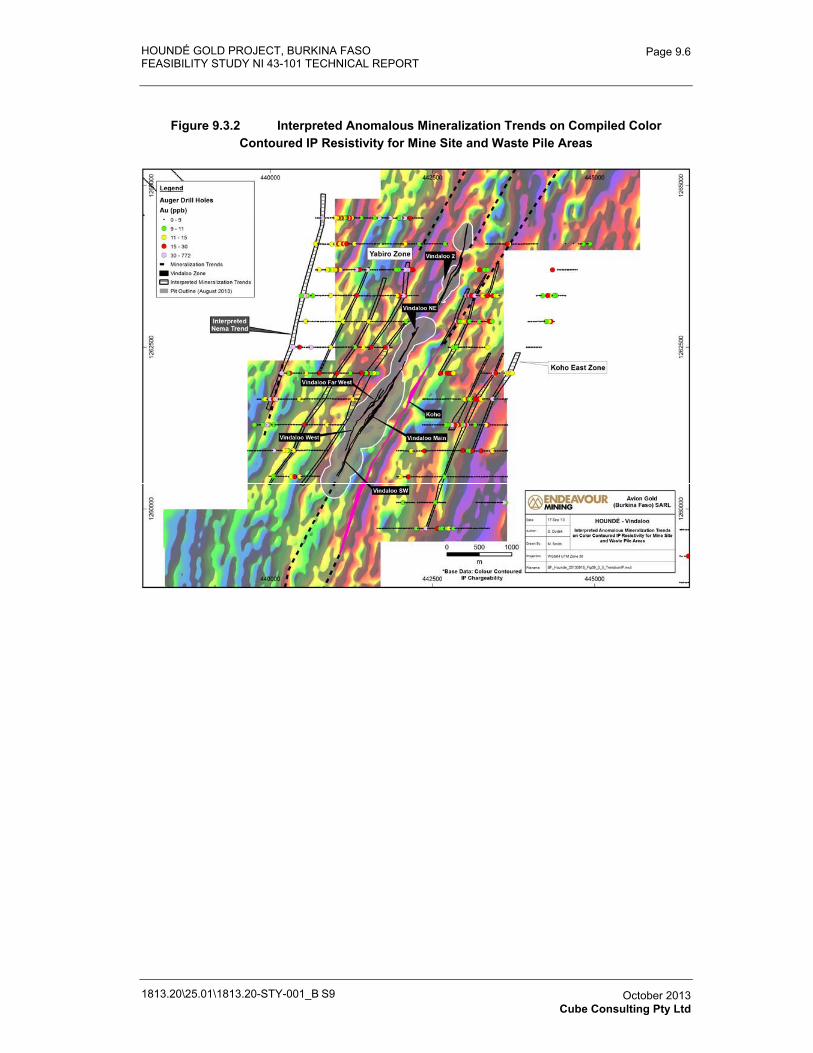
HOUNDÉ GOLD PROJECT, BURKINA FASO FEASIBILITY STUDY NI 43-101 TECHNICAL REPORT
1813.20\25.01\1813.20-STY-001_B S9
Page 9.6
October 2013 Cube Consulting Pty Ltd
Figure 9.3.2 Interpreted Anomalous Mineralization Trends on Compiled Color Contoured IP Resistivity for Mine Site and Waste Pile Areas
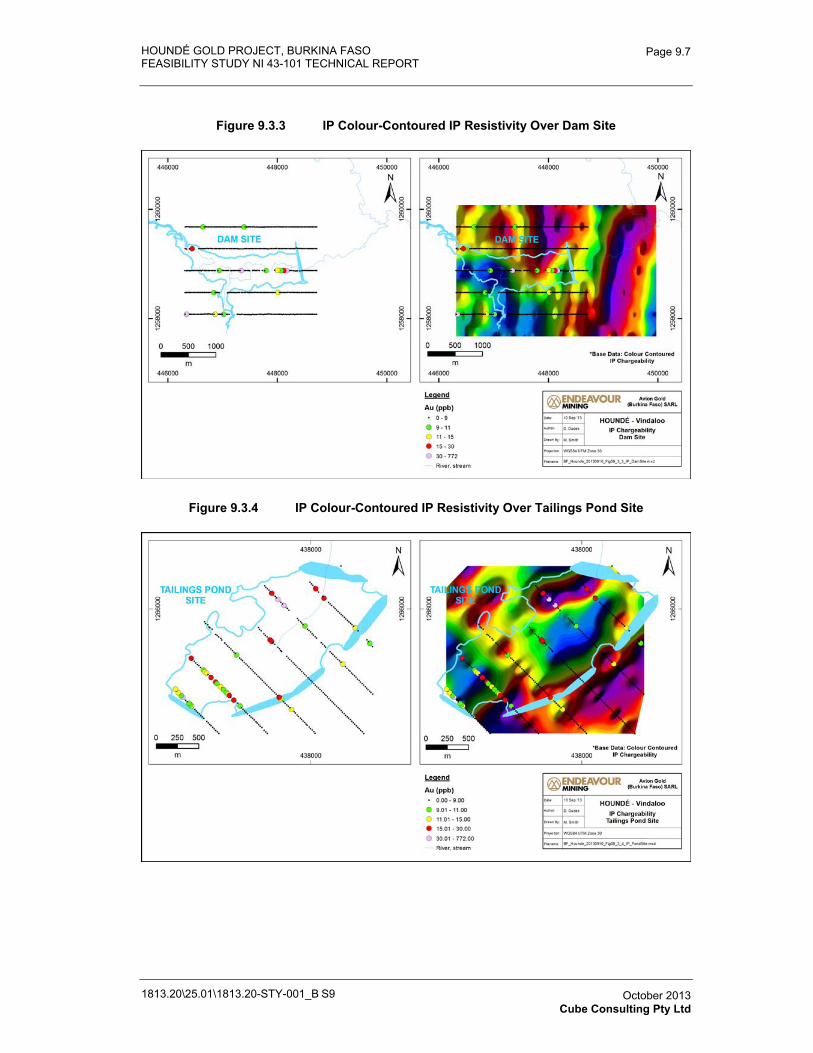
HOUNDÉ GOLD PROJECT, BURKINA FASO FEASIBILITY STUDY NI 43-101 TECHNICAL REPORT
1813.20\25.01\1813.20-STY-001_B S9
Page 9.7
October 2013 Cube Consulting Pty Ltd
Figure 9.3.3 IP Colour-Contoured IP Resistivity Over Dam Site
Figure 9.3.4 IP Colour-Contoured IP Resistivity Over Tailings Pond Site
HOUNDÉ GOLD PROJECT, BURKINA FASO FEASIBILITY STUDY NI 43-101 TECHNICAL REPORT
1813.20\25.01\1813.20-STY-001_B S9
Page 9.8
October 2013 Cube Consulting Pty Ltd
9.4 Exploration Targets
This section will present exploration targets proximal to the Vindaloo zone that were identified during the drill programs carried out over the Houndé property by Avion Burkina from 2010 to the end of the current in-fill and sterilization drilling program. In summary six mineralization trends, Vindaloo, Madras, Madras NW, Koho East, Nema and Yabiro, were identified. The Koho East, Nema and Yabiro trends will be discussed in section 10 with recent drilling. Each of the remaining areas will be presented separately below. Section references are based on detailed drill section sets (Figure 10.2.2), which will not be part of this report and can be accessed, with permission, from Endeavour.
9.4.1 Vindaloo Trend
Drilling along, and proximal to, the Vindaloo trend has intersected both mineralized zones and sericite-carbonate-epidote altered zones, without mineralization. As a general statement, the Vindaloo zones are open both along strike and to depth. The general location of most of the various target areas can be discerned from Figure 10.2.1.
Vindaloo South Target Area
Significant opportunities to extend the zone both to depth and along strike have been identified at the southern end of the deposit where the deepest holes along a 500 metres strike length showed either the best intercept on that section, below the 200 metre elevation or a significant increase in the width of the altered gabbro host for the mineralization. A section by section description, where there is drill information, follows:
� On section 48350N, the deepest hole, HE-12-01 returned 2.47 g/t Au over 5.7 metres and intersected a 25 metre wide alteration zone compared to hole HA-12-92, located 25 metres above which intersected 10 metres of altered gabbro.
� On section 48375N the alteration zone in hole HE-12-07, the deepest hole, is approximately 100 metres wide compared to hole HE-12-03, located 50 metres above, which has two, approximately 15 metre wide alteration zones. As well, hole HE-12-07 returned three high grade intercepts, located up to 75 metres below the pit floor which included 16.00 g/t Au over 8.1 metres, 9.57 g/t Au over 7.2 metres and 28.25 g/t Au over 6.8 metres. These intercepts are open to the north.
� The next set of holes to the north lie on section 48450N. The alteration zone on this section is approximately 100 metres wide and the deepest hole on the section, HA-12-41 returned intercepts of 1.38 g/t Au over 48.1 metres including 1.86 g/t Au over 10.1 metres located 10 to 50 metres below the pit floor.
� Another 50 metres to the north, on section 48500N, the deepest hole returned 6.27 g/t Au over 43.2 metres that lies within the pit envelope and an intercept of 3.07 g/t Au over 9.5 metres, below the pit floor.
� On section 48550N, hole H-11-18 intersected 2.84 g/t Au over 4.1 metres, at about 85 metres below the surface, which appears to be close to the upper extension of the high grade zone in this area. It is likely that there is better mineralization to depth.
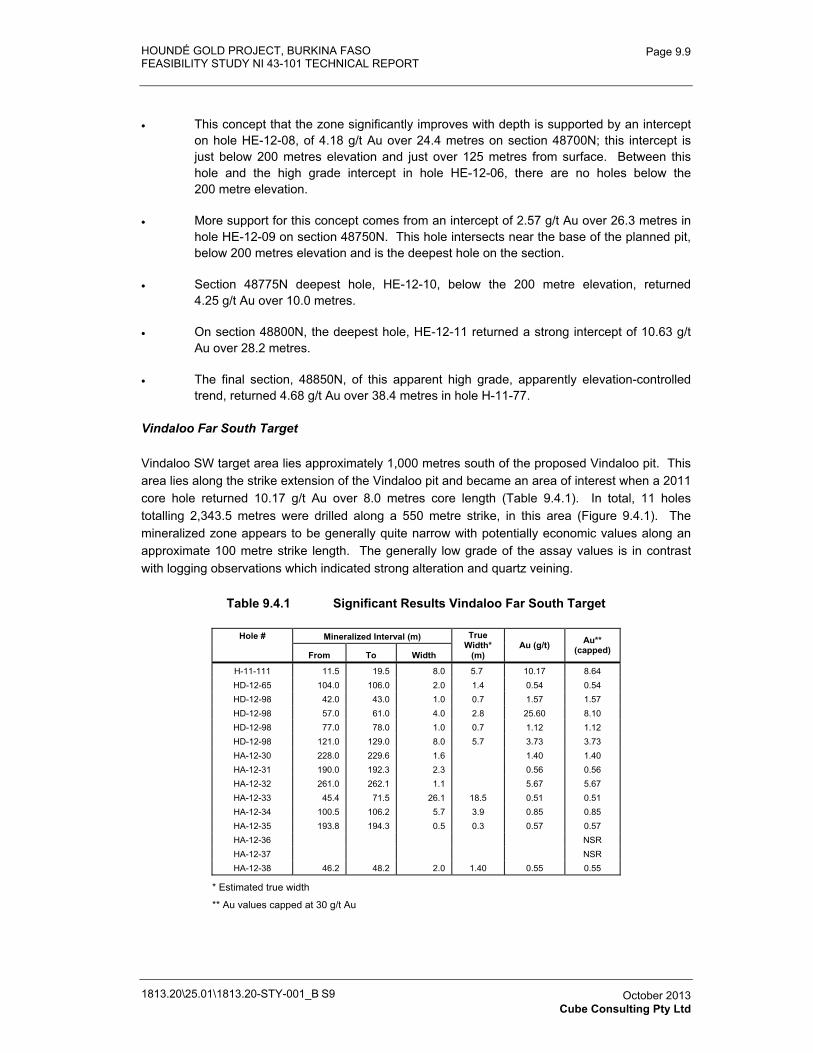
HOUNDÉ GOLD PROJECT, BURKINA FASO FEASIBILITY STUDY NI 43-101 TECHNICAL REPORT
1813.20\25.01\1813.20-STY-001_B S9
Page 9.9
October 2013 Cube Consulting Pty Ltd
� This concept that the zone significantly improves with depth is supported by an intercept on hole HE-12-08, of 4.18 g/t Au over 24.4 metres on section 48700N; this intercept is just below 200 metres elevation and just over 125 metres from surface. Between this hole and the high grade intercept in hole HE-12-06, there are no holes below the 200 metre elevation.
� More support for this concept comes from an intercept of 2.57 g/t Au over 26.3 metres in hole HE-12-09 on section 48750N. This hole intersects near the base of the planned pit, below 200 metres elevation and is the deepest hole on the section.
� Section 48775N deepest hole, HE-12-10, below the 200 metre elevation, returned 4.25 g/t Au over 10.0 metres.
� On section 48800N, the deepest hole, HE-12-11 returned a strong intercept of 10.63 g/t Au over 28.2 metres.
� The final section, 48850N, of this apparent high grade, apparently elevation-controlled trend, returned 4.68 g/t Au over 38.4 metres in hole H-11-77.
Vindaloo Far South Target
Vindaloo SW target area lies approximately 1,000 metres south of the proposed Vindaloo pit. This area lies along the strike extension of the Vindaloo pit and became an area of interest when a 2011 core hole returned 10.17 g/t Au over 8.0 metres core length (Table 9.4.1). In total, 11 holes totalling 2,343.5 metres were drilled along a 550 metre strike, in this area (Figure 9.4.1). The mineralized zone appears to be generally quite narrow with potentially economic values along an approximate 100 metre strike length. The generally low grade of the assay values is in contrast with logging observations which indicated strong alteration and quartz veining.
Table 9.4.1 Significant Results Vindaloo Far South Target
Hole # Mineralized Interval (m) True Width*
(m) Au (g/t) Au**
(capped)From To Width
H-11-111 11.5 19.5 8.0 5.7 10.17 8.64 HD-12-65 104.0 106.0 2.0 1.4 0.54 0.54 HD-12-98 42.0 43.0 1.0 0.7 1.57 1.57 HD-12-98 57.0 61.0 4.0 2.8 25.60 8.10 HD-12-98 77.0 78.0 1.0 0.7 1.12 1.12 HD-12-98 121.0 129.0 8.0 5.7 3.73 3.73 HA-12-30 228.0 229.6 1.6 1.40 1.40 HA-12-31 190.0 192.3 2.3 0.56 0.56 HA-12-32 261.0 262.1 1.1 5.67 5.67 HA-12-33 45.4 71.5 26.1 18.5 0.51 0.51 HA-12-34 100.5 106.2 5.7 3.9 0.85 0.85 HA-12-35 193.8 194.3 0.5 0.3 0.57 0.57 HA-12-36 NSRHA-12-37 NSRHA-12-38 46.2 48.2 2.0 1.40 0.55 0.55
* Estimated true width
** Au values capped at 30 g/t Au
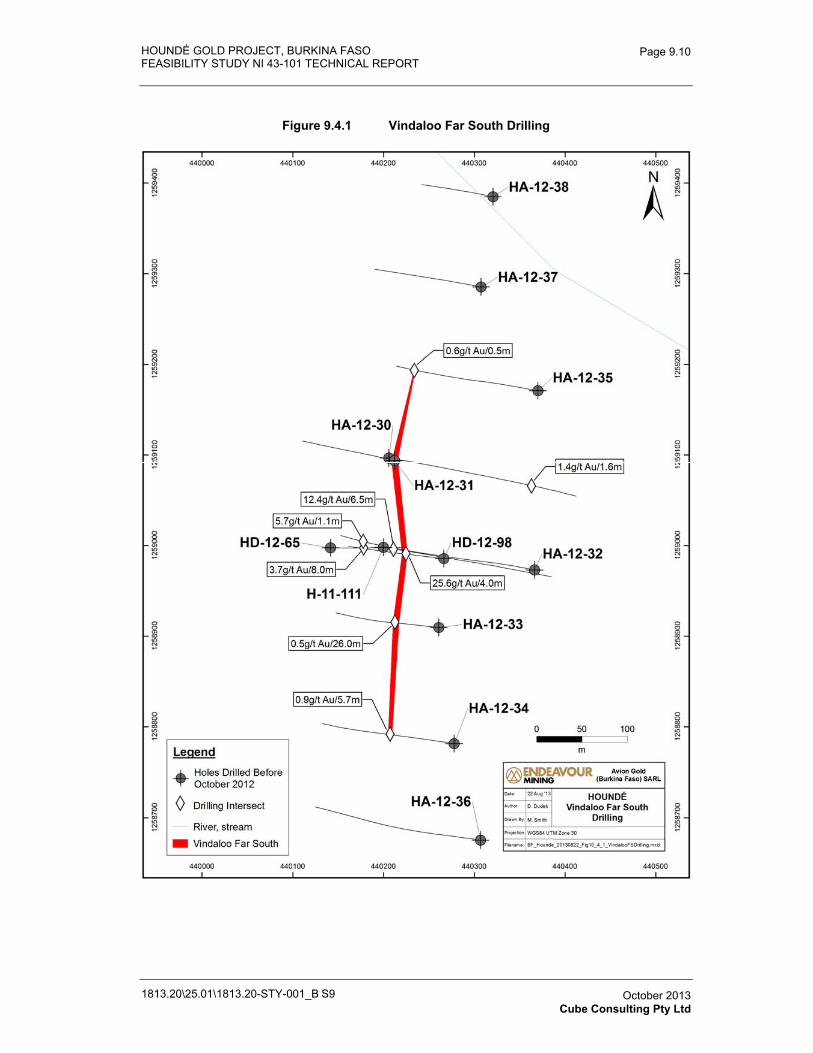
HOUNDÉ GOLD PROJECT, BURKINA FASO FEASIBILITY STUDY NI 43-101 TECHNICAL REPORT
1813.20\25.01\1813.20-STY-001_B S9
Page 9.10
October 2013 Cube Consulting Pty Ltd
Figure 9.4.1 Vindaloo Far South Drilling
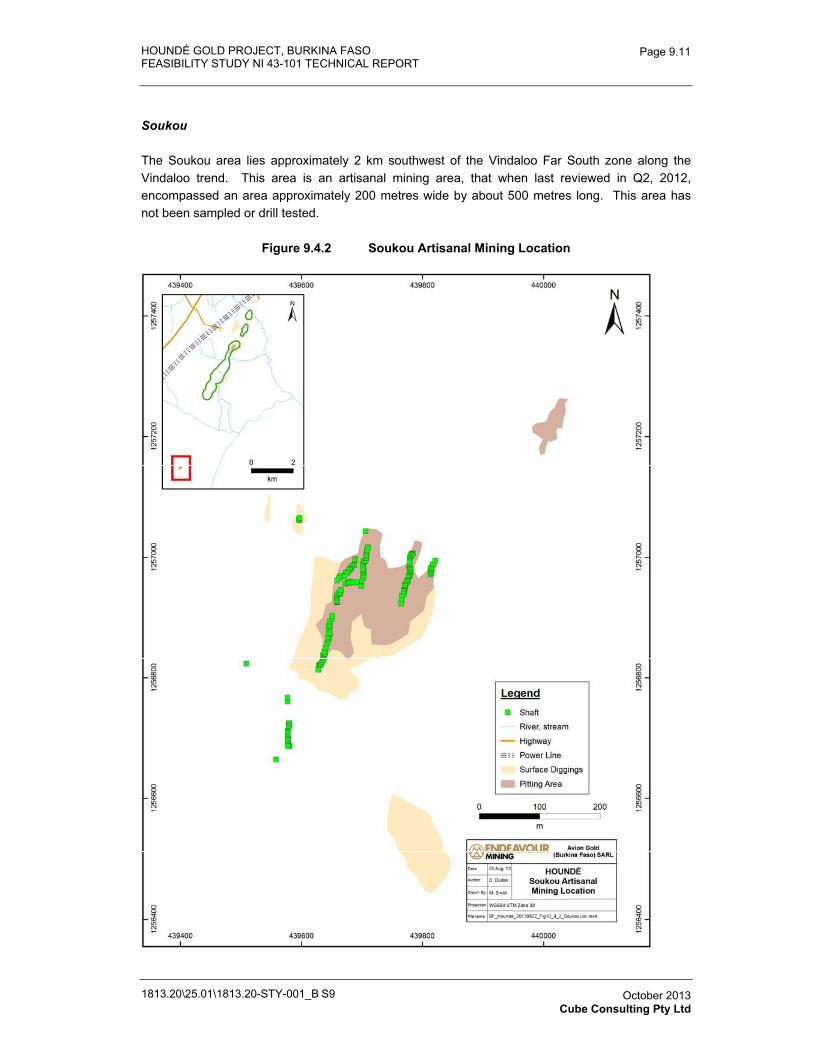
HOUNDÉ GOLD PROJECT, BURKINA FASO FEASIBILITY STUDY NI 43-101 TECHNICAL REPORT
1813.20\25.01\1813.20-STY-001_B S9
Page 9.11
October 2013 Cube Consulting Pty Ltd
Soukou
The Soukou area lies approximately 2 km southwest of the Vindaloo Far South zone along the Vindaloo trend. This area is an artisanal mining area, that when last reviewed in Q2, 2012, encompassed an area approximately 200 metres wide by about 500 metres long. This area has not been sampled or drill tested.
Figure 9.4.2 Soukou Artisanal Mining Location
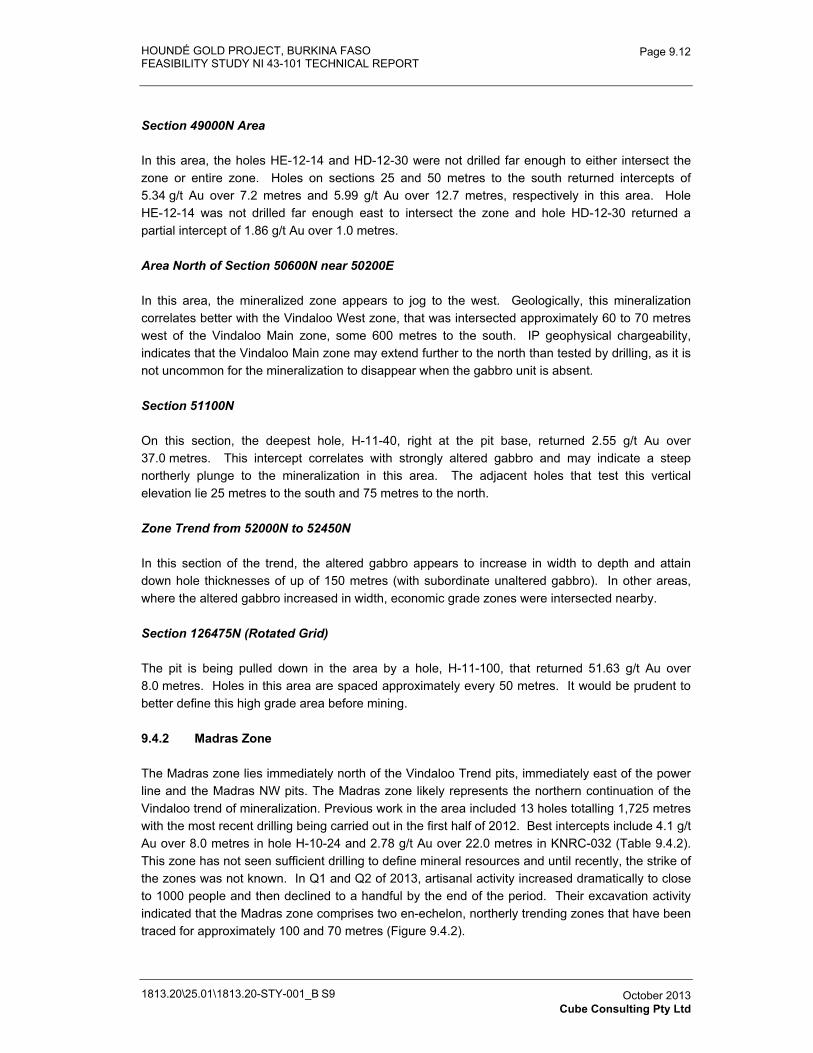
HOUNDÉ GOLD PROJECT, BURKINA FASO FEASIBILITY STUDY NI 43-101 TECHNICAL REPORT
1813.20\25.01\1813.20-STY-001_B S9
Page 9.12
October 2013 Cube Consulting Pty Ltd
Section 49000N Area
In this area, the holes HE-12-14 and HD-12-30 were not drilled far enough to either intersect the zone or entire zone. Holes on sections 25 and 50 metres to the south returned intercepts of 5.34 g/t Au over 7.2 metres and 5.99 g/t Au over 12.7 metres, respectively in this area. Hole HE-12-14 was not drilled far enough east to intersect the zone and hole HD-12-30 returned a partial intercept of 1.86 g/t Au over 1.0 metres.
Area North of Section 50600N near 50200E
In this area, the mineralized zone appears to jog to the west. Geologically, this mineralization correlates better with the Vindaloo West zone, that was intersected approximately 60 to 70 metres west of the Vindaloo Main zone, some 600 metres to the south. IP geophysical chargeability, indicates that the Vindaloo Main zone may extend further to the north than tested by drilling, as it is not uncommon for the mineralization to disappear when the gabbro unit is absent.
Section 51100N
On this section, the deepest hole, H-11-40, right at the pit base, returned 2.55 g/t Au over 37.0 metres. This intercept correlates with strongly altered gabbro and may indicate a steep northerly plunge to the mineralization in this area. The adjacent holes that test this vertical elevation lie 25 metres to the south and 75 metres to the north.
Zone Trend from 52000N to 52450N
In this section of the trend, the altered gabbro appears to increase in width to depth and attain down hole thicknesses of up of 150 metres (with subordinate unaltered gabbro). In other areas, where the altered gabbro increased in width, economic grade zones were intersected nearby.
Section 126475N (Rotated Grid)
The pit is being pulled down in the area by a hole, H-11-100, that returned 51.63 g/t Au over 8.0 metres. Holes in this area are spaced approximately every 50 metres. It would be prudent to better define this high grade area before mining.
9.4.2 Madras Zone
The Madras zone lies immediately north of the Vindaloo Trend pits, immediately east of the power line and the Madras NW pits. The Madras zone likely represents the northern continuation of the Vindaloo trend of mineralization. Previous work in the area included 13 holes totalling 1,725 metres with the most recent drilling being carried out in the first half of 2012. Best intercepts include 4.1 g/t Au over 8.0 metres in hole H-10-24 and 2.78 g/t Au over 22.0 metres in KNRC-032 (Table 9.4.2). This zone has not seen sufficient drilling to define mineral resources and until recently, the strike of the zones was not known. In Q1 and Q2 of 2013, artisanal activity increased dramatically to close to 1000 people and then declined to a handful by the end of the period. Their excavation activity indicated that the Madras zone comprises two en-echelon, northerly trending zones that have been traced for approximately 100 and 70 metres (Figure 9.4.2).
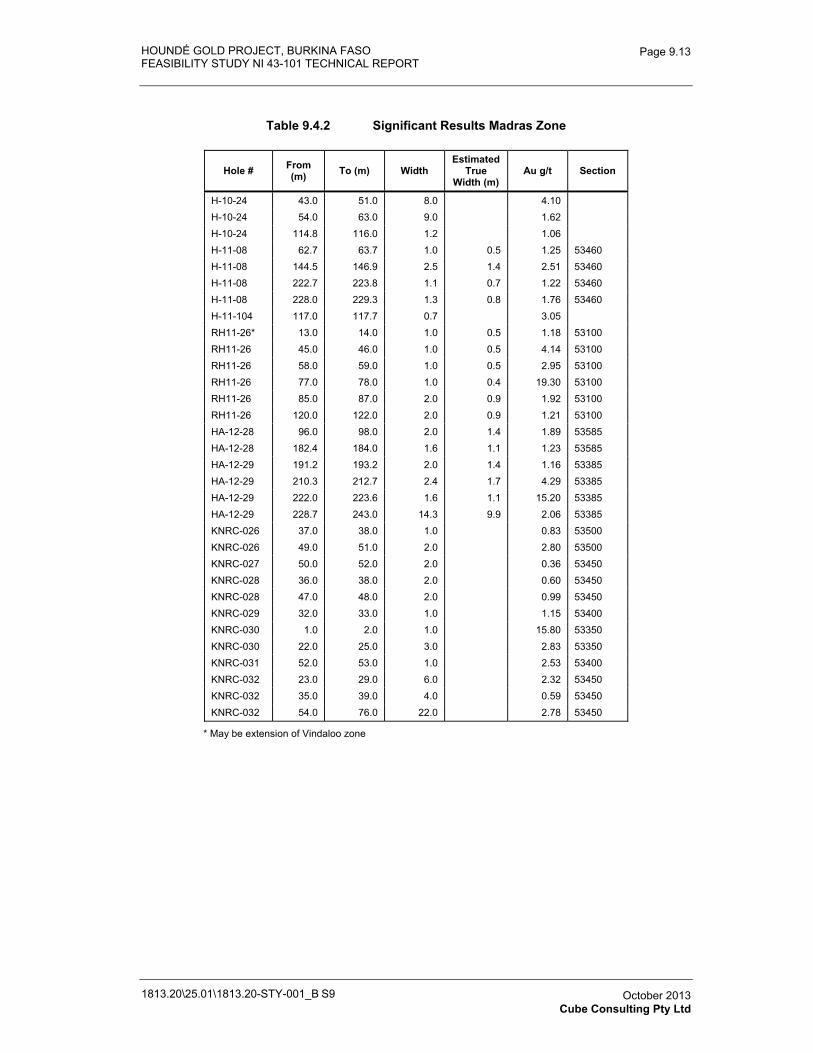
HOUNDÉ GOLD PROJECT, BURKINA FASO FEASIBILITY STUDY NI 43-101 TECHNICAL REPORT
1813.20\25.01\1813.20-STY-001_B S9
Page 9.13
October 2013 Cube Consulting Pty Ltd
Table 9.4.2 Significant Results Madras Zone
Hole # From(m) To (m) Width
EstimatedTrue
Width (m) Au g/t Section
H-10-24 43.0 51.0 8.0 4.10 H-10-24 54.0 63.0 9.0 1.62 H-10-24 114.8 116.0 1.2 1.06 H-11-08 62.7 63.7 1.0 0.5 1.25 53460 H-11-08 144.5 146.9 2.5 1.4 2.51 53460 H-11-08 222.7 223.8 1.1 0.7 1.22 53460 H-11-08 228.0 229.3 1.3 0.8 1.76 53460 H-11-104 117.0 117.7 0.7 3.05 RH11-26* 13.0 14.0 1.0 0.5 1.18 53100 RH11-26 45.0 46.0 1.0 0.5 4.14 53100 RH11-26 58.0 59.0 1.0 0.5 2.95 53100 RH11-26 77.0 78.0 1.0 0.4 19.30 53100 RH11-26 85.0 87.0 2.0 0.9 1.92 53100 RH11-26 120.0 122.0 2.0 0.9 1.21 53100 HA-12-28 96.0 98.0 2.0 1.4 1.89 53585 HA-12-28 182.4 184.0 1.6 1.1 1.23 53585 HA-12-29 191.2 193.2 2.0 1.4 1.16 53385 HA-12-29 210.3 212.7 2.4 1.7 4.29 53385 HA-12-29 222.0 223.6 1.6 1.1 15.20 53385 HA-12-29 228.7 243.0 14.3 9.9 2.06 53385 KNRC-026 37.0 38.0 1.0 0.83 53500 KNRC-026 49.0 51.0 2.0 2.80 53500 KNRC-027 50.0 52.0 2.0 0.36 53450 KNRC-028 36.0 38.0 2.0 0.60 53450 KNRC-028 47.0 48.0 2.0 0.99 53450 KNRC-029 32.0 33.0 1.0 1.15 53400 KNRC-030 1.0 2.0 1.0 15.80 53350 KNRC-030 22.0 25.0 3.0 2.83 53350 KNRC-031 52.0 53.0 1.0 2.53 53400 KNRC-032 23.0 29.0 6.0 2.32 53450 KNRC-032 35.0 39.0 4.0 0.59 53450 KNRC-032 54.0 76.0 22.0 2.78 53450
* May be extension of Vindaloo zone
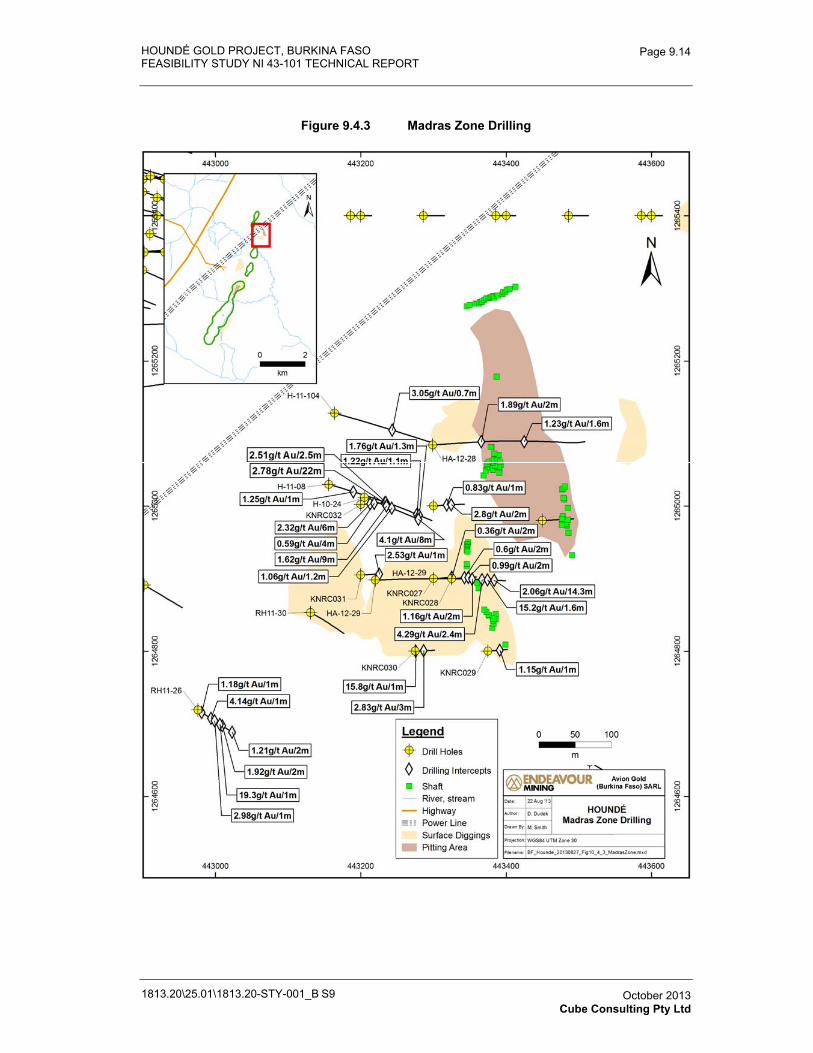
HOUNDÉ GOLD PROJECT, BURKINA FASO FEASIBILITY STUDY NI 43-101 TECHNICAL REPORT
1813.20\25.01\1813.20-STY-001_B S9
Page 9.14
October 2013 Cube Consulting Pty Ltd
Figure 9.4.3 Madras Zone Drilling
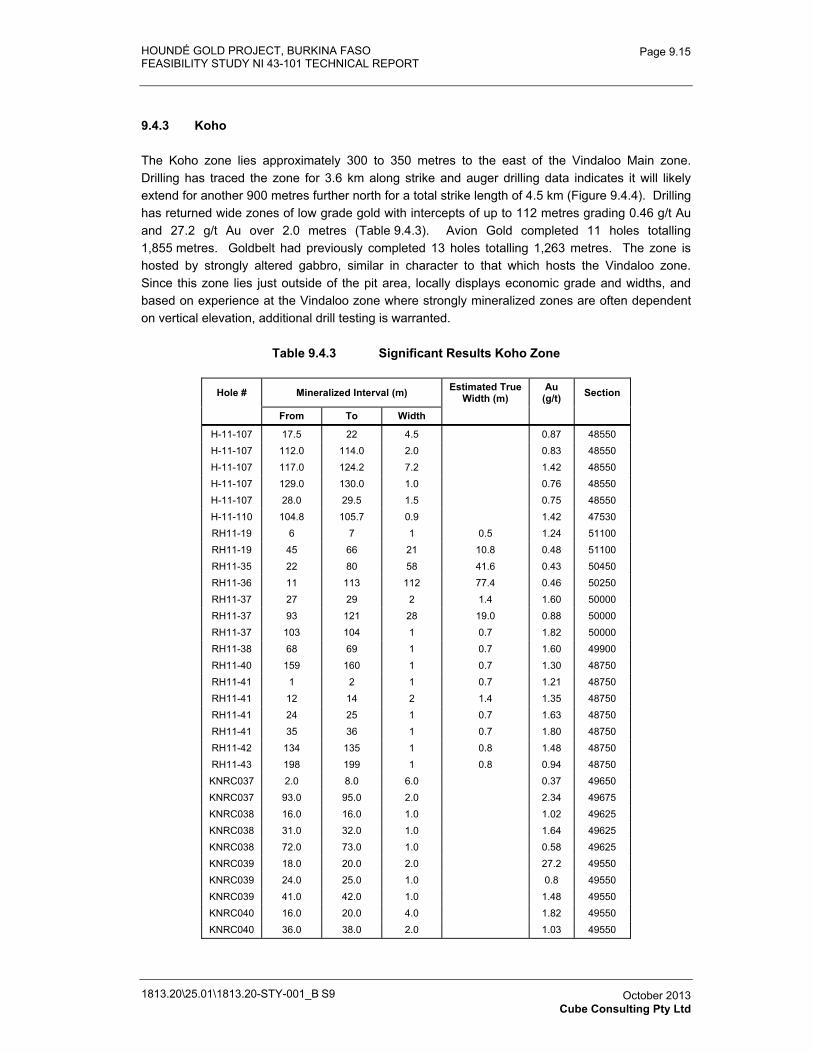
HOUNDÉ GOLD PROJECT, BURKINA FASO FEASIBILITY STUDY NI 43-101 TECHNICAL REPORT
1813.20\25.01\1813.20-STY-001_B S9
Page 9.15
October 2013 Cube Consulting Pty Ltd
9.4.3 Koho
The Koho zone lies approximately 300 to 350 metres to the east of the Vindaloo Main zone. Drilling has traced the zone for 3.6 km along strike and auger drilling data indicates it will likely extend for another 900 metres further north for a total strike length of 4.5 km (Figure 9.4.4). Drilling has returned wide zones of low grade gold with intercepts of up to 112 metres grading 0.46 g/t Au and 27.2 g/t Au over 2.0 metres (Table 9.4.3). Avion Gold completed 11 holes totalling 1,855 metres. Goldbelt had previously completed 13 holes totalling 1,263 metres. The zone is hosted by strongly altered gabbro, similar in character to that which hosts the Vindaloo zone. Since this zone lies just outside of the pit area, locally displays economic grade and widths, and based on experience at the Vindaloo zone where strongly mineralized zones are often dependent on vertical elevation, additional drill testing is warranted.
Table 9.4.3 Significant Results Koho Zone
Hole # Mineralized Interval (m) Estimated True Width (m)
Au (g/t) Section
From To Width
H-11-107 17.5 22 4.5 0.87 48550 H-11-107 112.0 114.0 2.0 0.83 48550 H-11-107 117.0 124.2 7.2 1.42 48550 H-11-107 129.0 130.0 1.0 0.76 48550 H-11-107 28.0 29.5 1.5 0.75 48550 H-11-110 104.8 105.7 0.9 1.42 47530 RH11-19 6 7 1 0.5 1.24 51100 RH11-19 45 66 21 10.8 0.48 51100 RH11-35 22 80 58 41.6 0.43 50450 RH11-36 11 113 112 77.4 0.46 50250 RH11-37 27 29 2 1.4 1.60 50000 RH11-37 93 121 28 19.0 0.88 50000 RH11-37 103 104 1 0.7 1.82 50000 RH11-38 68 69 1 0.7 1.60 49900 RH11-40 159 160 1 0.7 1.30 48750 RH11-41 1 2 1 0.7 1.21 48750 RH11-41 12 14 2 1.4 1.35 48750 RH11-41 24 25 1 0.7 1.63 48750 RH11-41 35 36 1 0.7 1.80 48750 RH11-42 134 135 1 0.8 1.48 48750 RH11-43 198 199 1 0.8 0.94 48750 KNRC037 2.0 8.0 6.0 0.37 49650 KNRC037 93.0 95.0 2.0 2.34 49675 KNRC038 16.0 16.0 1.0 1.02 49625 KNRC038 31.0 32.0 1.0 1.64 49625 KNRC038 72.0 73.0 1.0 0.58 49625 KNRC039 18.0 20.0 2.0 27.2 49550 KNRC039 24.0 25.0 1.0 0.8 49550 KNRC039 41.0 42.0 1.0 1.48 49550 KNRC040 16.0 20.0 4.0 1.82 49550 KNRC040 36.0 38.0 2.0 1.03 49550
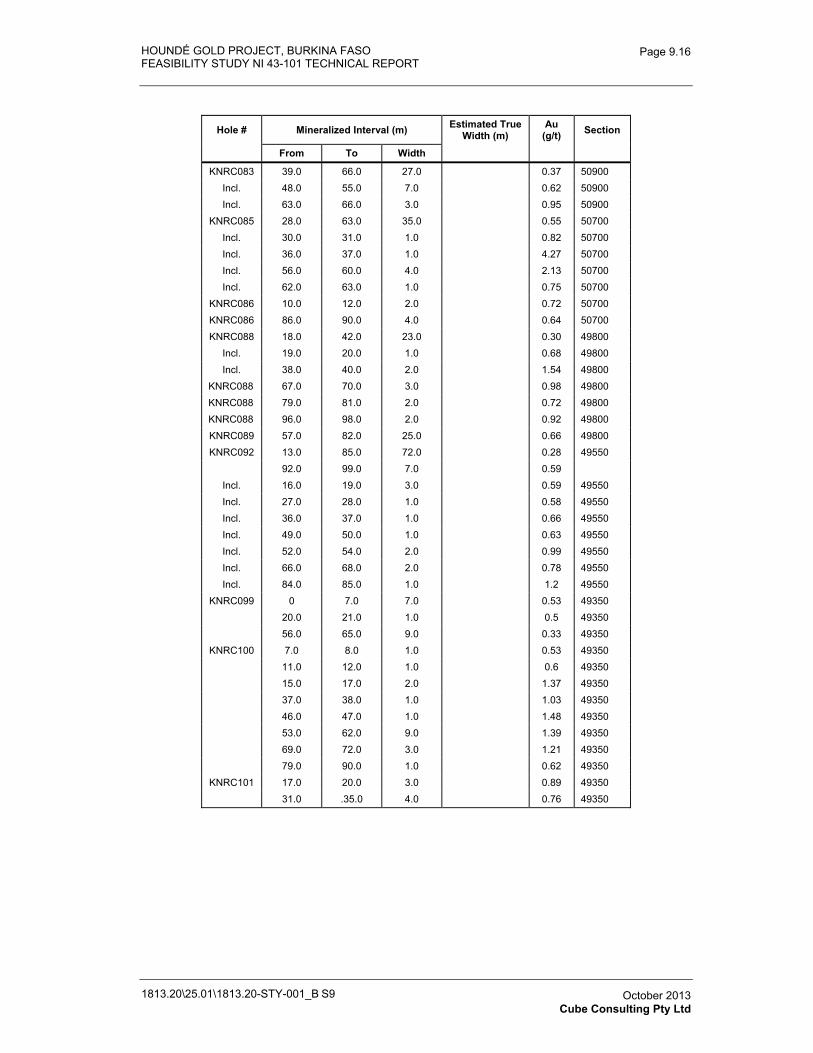
HOUNDÉ GOLD PROJECT, BURKINA FASO FEASIBILITY STUDY NI 43-101 TECHNICAL REPORT
1813.20\25.01\1813.20-STY-001_B S9
Page 9.16
October 2013 Cube Consulting Pty Ltd
Hole # Mineralized Interval (m) Estimated True Width (m)
Au (g/t) Section
From To Width
KNRC083 39.0 66.0 27.0 0.37 50900 Incl. 48.0 55.0 7.0 0.62 50900 Incl. 63.0 66.0 3.0 0.95 50900
KNRC085 28.0 63.0 35.0 0.55 50700 Incl. 30.0 31.0 1.0 0.82 50700 Incl. 36.0 37.0 1.0 4.27 50700 Incl. 56.0 60.0 4.0 2.13 50700 Incl. 62.0 63.0 1.0 0.75 50700
KNRC086 10.0 12.0 2.0 0.72 50700 KNRC086 86.0 90.0 4.0 0.64 50700 KNRC088 18.0 42.0 23.0 0.30 49800
Incl. 19.0 20.0 1.0 0.68 49800 Incl. 38.0 40.0 2.0 1.54 49800
KNRC088 67.0 70.0 3.0 0.98 49800 KNRC088 79.0 81.0 2.0 0.72 49800 KNRC088 96.0 98.0 2.0 0.92 49800 KNRC089 57.0 82.0 25.0 0.66 49800 KNRC092 13.0 85.0 72.0 0.28 49550
92.0 99.0 7.0 0.59Incl. 16.0 19.0 3.0 0.59 49550 Incl. 27.0 28.0 1.0 0.58 49550 Incl. 36.0 37.0 1.0 0.66 49550 Incl. 49.0 50.0 1.0 0.63 49550 Incl. 52.0 54.0 2.0 0.99 49550 Incl. 66.0 68.0 2.0 0.78 49550 Incl. 84.0 85.0 1.0 1.2 49550
KNRC099 0 7.0 7.0 0.53 49350 20.0 21.0 1.0 0.5 49350 56.0 65.0 9.0 0.33 49350
KNRC100 7.0 8.0 1.0 0.53 49350 11.0 12.0 1.0 0.6 49350 15.0 17.0 2.0 1.37 49350 37.0 38.0 1.0 1.03 49350 46.0 47.0 1.0 1.48 49350 53.0 62.0 9.0 1.39 49350 69.0 72.0 3.0 1.21 49350 79.0 90.0 1.0 0.62 49350
KNRC101 17.0 20.0 3.0 0.89 49350 31.0 .35.0 4.0 0.76 49350
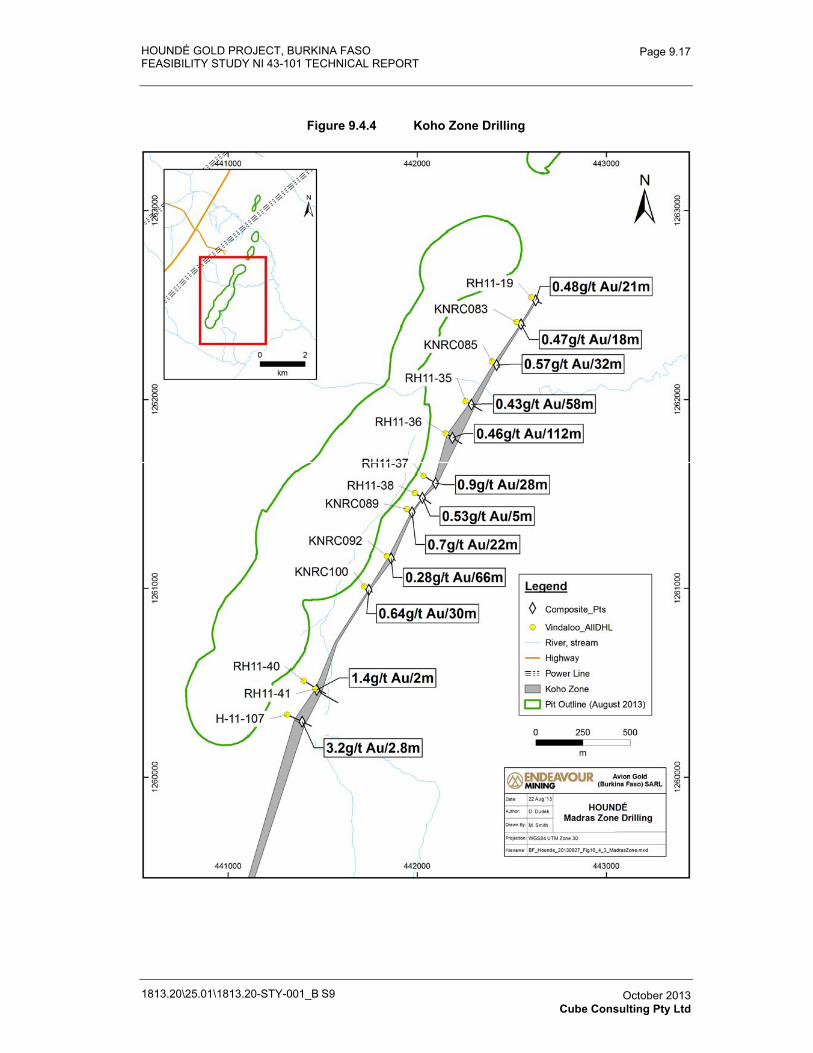
HOUNDÉ GOLD PROJECT, BURKINA FASO FEASIBILITY STUDY NI 43-101 TECHNICAL REPORT
1813.20\25.01\1813.20-STY-001_B S9
Page 9.17
October 2013 Cube Consulting Pty Ltd
Figure 9.4.4 Koho Zone Drilling
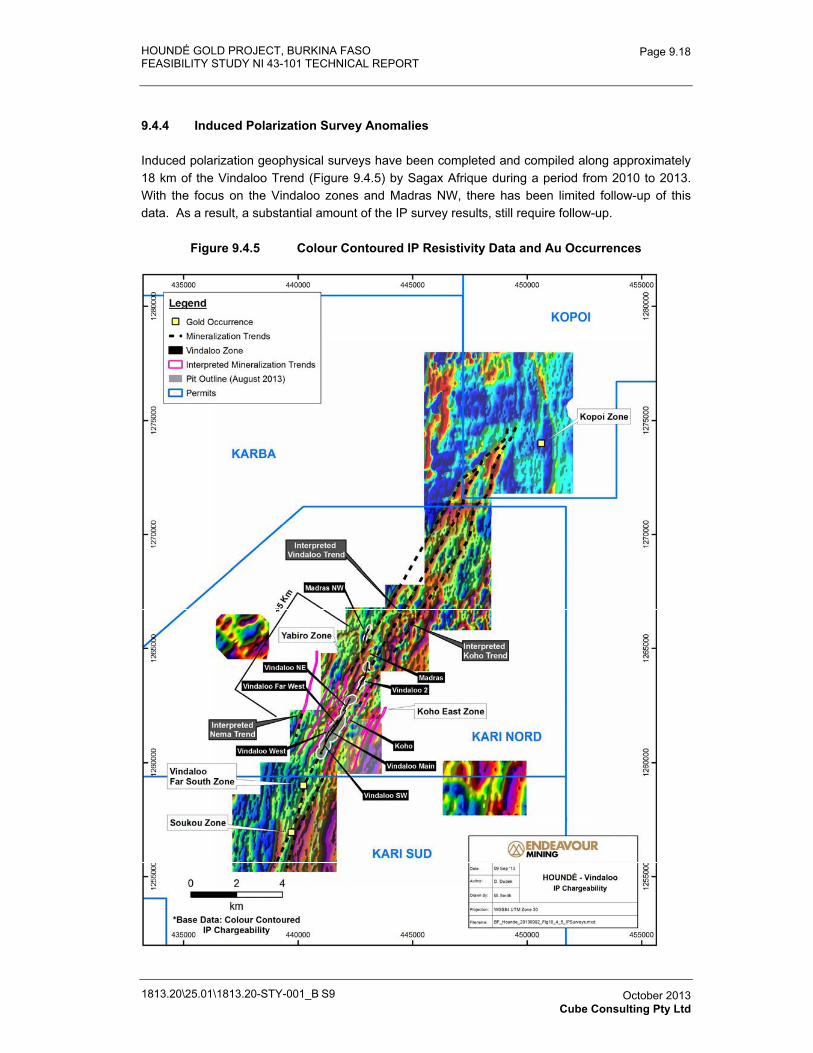
HOUNDÉ GOLD PROJECT, BURKINA FASO FEASIBILITY STUDY NI 43-101 TECHNICAL REPORT
1813.20\25.01\1813.20-STY-001_B S9
Page 9.18
October 2013 Cube Consulting Pty Ltd
9.4.4 Induced Polarization Survey Anomalies
Induced polarization geophysical surveys have been completed and compiled along approximately 18 km of the Vindaloo Trend (Figure 9.4.5) by Sagax Afrique during a period from 2010 to 2013. With the focus on the Vindaloo zones and Madras NW, there has been limited follow-up of this data. As a result, a substantial amount of the IP survey results, still require follow-up.
Figure 9.4.5 Colour Contoured IP Resistivity Data and Au Occurrences
HOUNDÉ GOLD PROJECT, BURKINA FASO
FEASIBILITY STUDY NI 43-101 TECHNICAL REPORT
1813.20-STY-001
Table of Contents Page
10.0� DRILLING 10.1�10.1� Introduction 10.1�10.2� In-Fill Drill Program 10.2�10.3� RC Drill Sterilization Program 10.13�
10.3.2� RC Sterilization Drill Results 10.15�
TABLESTable 10.1.1� Drilling Summary, Q4, 2012 and 2013, Endeavour Drill program 10.1�Table 10.2.1� Highlight In-Fill Drill Intercepts With Intercepts Greater Than 20 g.m/t
Au* 10.5�Table 10.3.1� RC Drill Collar Coordinates – Sterilization Program 10.14�Table 10.3.2� Significant Results from RC Sterilization Drill Program 10.15�
FIGURESFigure 10.2.1� Location In-fill Drill Hole Locations 10.3�Figure 10.2.2� Location Drill Hole Section Sets 10.4�Figure 10.2.3� Vindaloo Trend – Mineralized Zones 10.7�Figure 10.2.4� Vindaloo South – Typical Section 10.8�Figure 10.2.5� Vindaloo Main – Typical Section 10.9�Figure 10.2.6� Vindaloo NE – Typical Section 10.10�Figure 10.2.7� Vindaloo 2 – Typical Section 10.11�Figure 10.2.8� Madras NW – Typical Section 10.12�Figure 10.3.1� Location Sterilization RC Holes 10.13�Figure 10.3.2� Significant RC Sterilization Results 10.16�
APPENDICES Appendix 10.1� Drill Hole Collar Table�Appendix 10.2� In-fill Drill Program Significant Drill Results�
1813.20\24.02\1813.20-STY-001_B S10 October 2013 Cube Consulting Pty Ltd
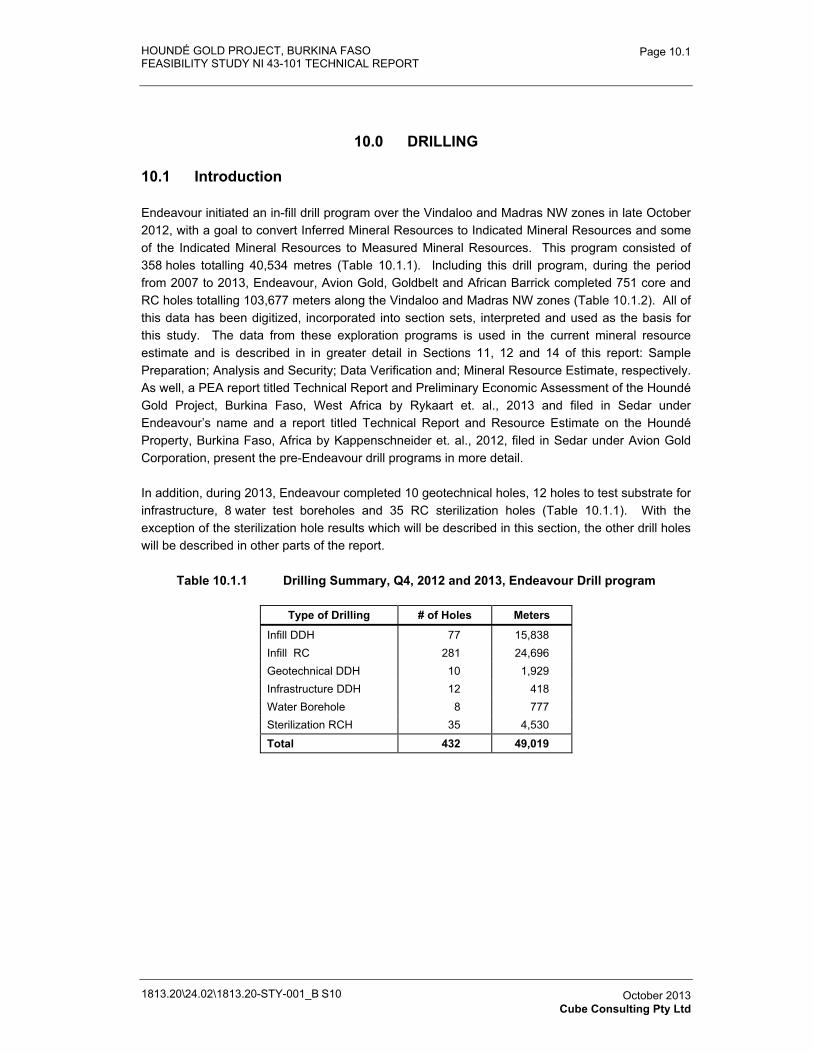
HOUNDÉ GOLD PROJECT, BURKINA FASO FEASIBILITY STUDY NI 43-101 TECHNICAL REPORT
1813.20\24.02\1813.20-STY-001_B S10
Page 10.1
October 2013 Cube Consulting Pty Ltd
10.0 DRILLING
10.1 Introduction
Endeavour initiated an in-fill drill program over the Vindaloo and Madras NW zones in late October 2012, with a goal to convert Inferred Mineral Resources to Indicated Mineral Resources and some of the Indicated Mineral Resources to Measured Mineral Resources. This program consisted of 358 holes totalling 40,534 metres (Table 10.1.1). Including this drill program, during the period from 2007 to 2013, Endeavour, Avion Gold, Goldbelt and African Barrick completed 751 core and RC holes totalling 103,677 meters along the Vindaloo and Madras NW zones (Table 10.1.2). All of this data has been digitized, incorporated into section sets, interpreted and used as the basis for this study. The data from these exploration programs is used in the current mineral resource estimate and is described in in greater detail in Sections 11, 12 and 14 of this report: Sample Preparation; Analysis and Security; Data Verification and; Mineral Resource Estimate, respectively. As well, a PEA report titled Technical Report and Preliminary Economic Assessment of the Houndé Gold Project, Burkina Faso, West Africa by Rykaart et. al., 2013 and filed in Sedar under Endeavour’s name and a report titled Technical Report and Resource Estimate on the Houndé Property, Burkina Faso, Africa by Kappenschneider et. al., 2012, filed in Sedar under Avion Gold Corporation, present the pre-Endeavour drill programs in more detail.
In addition, during 2013, Endeavour completed 10 geotechnical holes, 12 holes to test substrate for infrastructure, 8 water test boreholes and 35 RC sterilization holes (Table 10.1.1). With the exception of the sterilization hole results which will be described in this section, the other drill holes will be described in other parts of the report.
Table 10.1.1 Drilling Summary, Q4, 2012 and 2013, Endeavour Drill program
Type of Drilling # of Holes Meters
Infill DDH 77 15,838 Infill RC 281 24,696 Geotechnical DDH 10 1,929 Infrastructure DDH 12 418Water Borehole 8 777 Sterilization RCH 35 4,530
Total 432 49,019
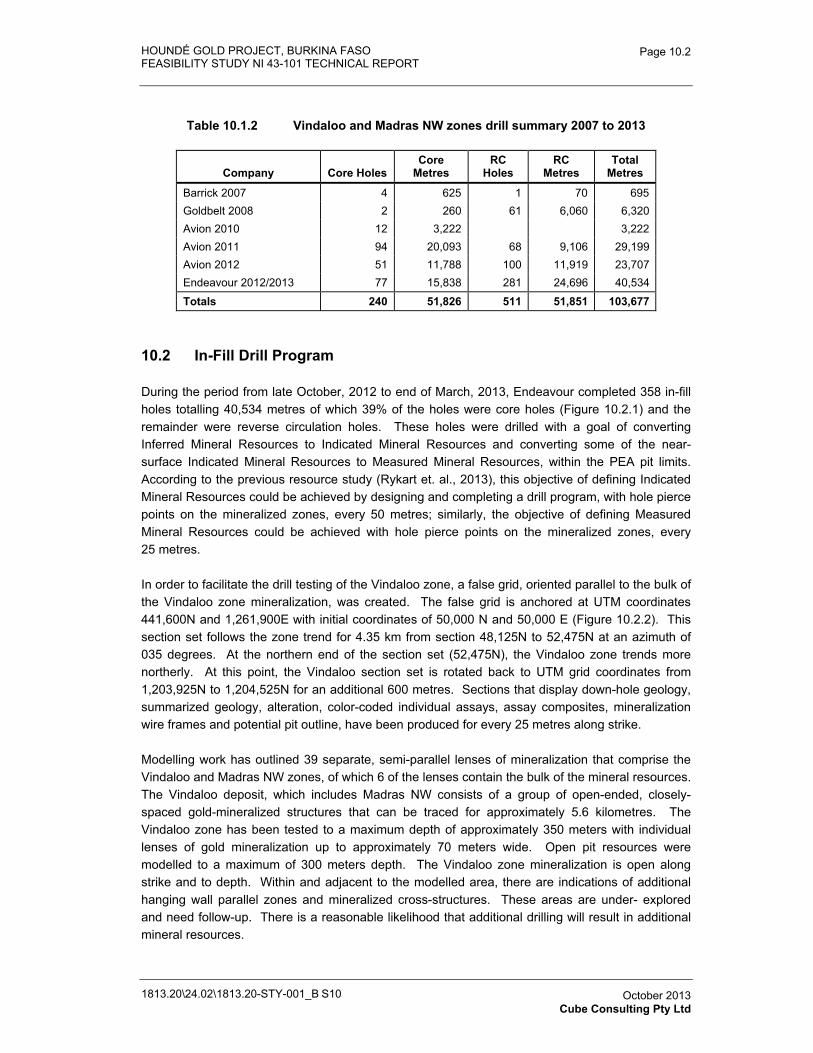
HOUNDÉ GOLD PROJECT, BURKINA FASO FEASIBILITY STUDY NI 43-101 TECHNICAL REPORT
1813.20\24.02\1813.20-STY-001_B S10
Page 10.2
October 2013 Cube Consulting Pty Ltd
Table 10.1.2 Vindaloo and Madras NW zones drill summary 2007 to 2013
Company Core Holes Core
MetresRC
Holes RC
MetresTotal
Metres
Barrick 2007 4 625 1 70 695 Goldbelt 2008 2 260 61 6,060 6,320 Avion 2010 12 3,222 3,222 Avion 2011 94 20,093 68 9,106 29,199 Avion 2012 51 11,788 100 11,919 23,707 Endeavour 2012/2013 77 15,838 281 24,696 40,534
Totals 240 51,826 511 51,851 103,677
10.2 In-Fill Drill Program
During the period from late October, 2012 to end of March, 2013, Endeavour completed 358 in-fill holes totalling 40,534 metres of which 39% of the holes were core holes (Figure 10.2.1) and the remainder were reverse circulation holes. These holes were drilled with a goal of converting Inferred Mineral Resources to Indicated Mineral Resources and converting some of the near-surface Indicated Mineral Resources to Measured Mineral Resources, within the PEA pit limits. According to the previous resource study (Rykart et. al., 2013), this objective of defining Indicated Mineral Resources could be achieved by designing and completing a drill program, with hole pierce points on the mineralized zones, every 50 metres; similarly, the objective of defining Measured Mineral Resources could be achieved with hole pierce points on the mineralized zones, every 25 metres.
In order to facilitate the drill testing of the Vindaloo zone, a false grid, oriented parallel to the bulk of the Vindaloo zone mineralization, was created. The false grid is anchored at UTM coordinates 441,600N and 1,261,900E with initial coordinates of 50,000 N and 50,000 E (Figure 10.2.2). This section set follows the zone trend for 4.35 km from section 48,125N to 52,475N at an azimuth of 035 degrees. At the northern end of the section set (52,475N), the Vindaloo zone trends more northerly. At this point, the Vindaloo section set is rotated back to UTM grid coordinates from 1,203,925N to 1,204,525N for an additional 600 metres. Sections that display down-hole geology, summarized geology, alteration, color-coded individual assays, assay composites, mineralization wire frames and potential pit outline, have been produced for every 25 metres along strike.
Modelling work has outlined 39 separate, semi-parallel lenses of mineralization that comprise the Vindaloo and Madras NW zones, of which 6 of the lenses contain the bulk of the mineral resources. The Vindaloo deposit, which includes Madras NW consists of a group of open-ended, closely-spaced gold-mineralized structures that can be traced for approximately 5.6 kilometres. The Vindaloo zone has been tested to a maximum depth of approximately 350 meters with individual lenses of gold mineralization up to approximately 70 meters wide. Open pit resources were modelled to a maximum of 300 meters depth. The Vindaloo zone mineralization is open along strike and to depth. Within and adjacent to the modelled area, there are indications of additional hanging wall parallel zones and mineralized cross-structures. These areas are under- explored and need follow-up. There is a reasonable likelihood that additional drilling will result in additional mineral resources.
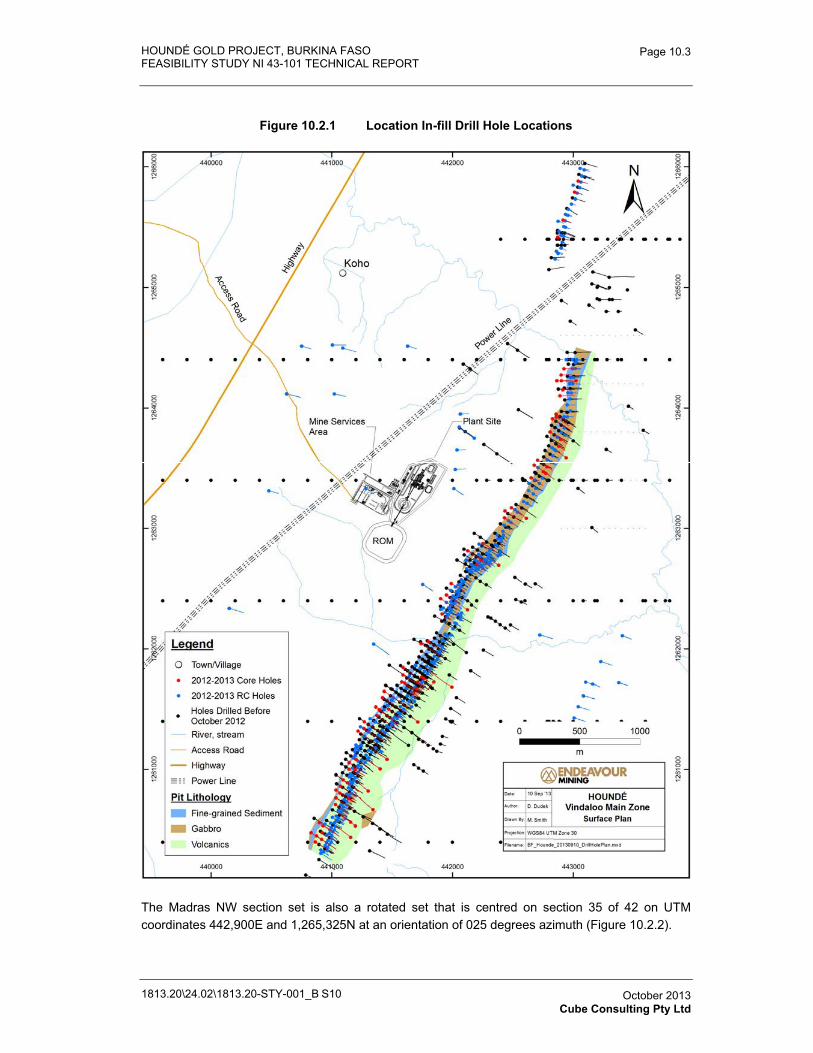
HOUNDÉ GOLD PROJECT, BURKINA FASO FEASIBILITY STUDY NI 43-101 TECHNICAL REPORT
1813.20\24.02\1813.20-STY-001_B S10
Page 10.3
October 2013 Cube Consulting Pty Ltd
Figure 10.2.1 Location In-fill Drill Hole Locations
The Madras NW section set is also a rotated set that is centred on section 35 of 42 on UTM coordinates 442,900E and 1,265,325N at an orientation of 025 degrees azimuth (Figure 10.2.2).
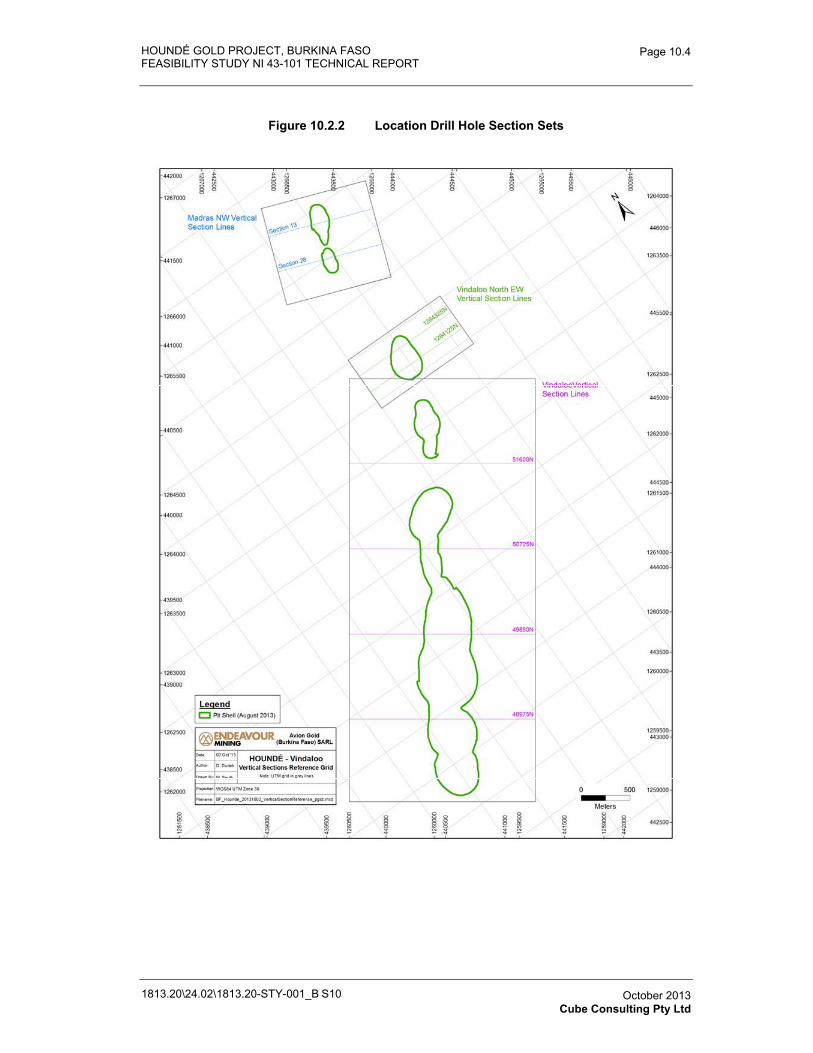
HOUNDÉ GOLD PROJECT, BURKINA FASO FEASIBILITY STUDY NI 43-101 TECHNICAL REPORT
1813.20\24.02\1813.20-STY-001_B S10
Page 10.4
October 2013 Cube Consulting Pty Ltd
Figure 10.2.2 Location Drill Hole Section Sets
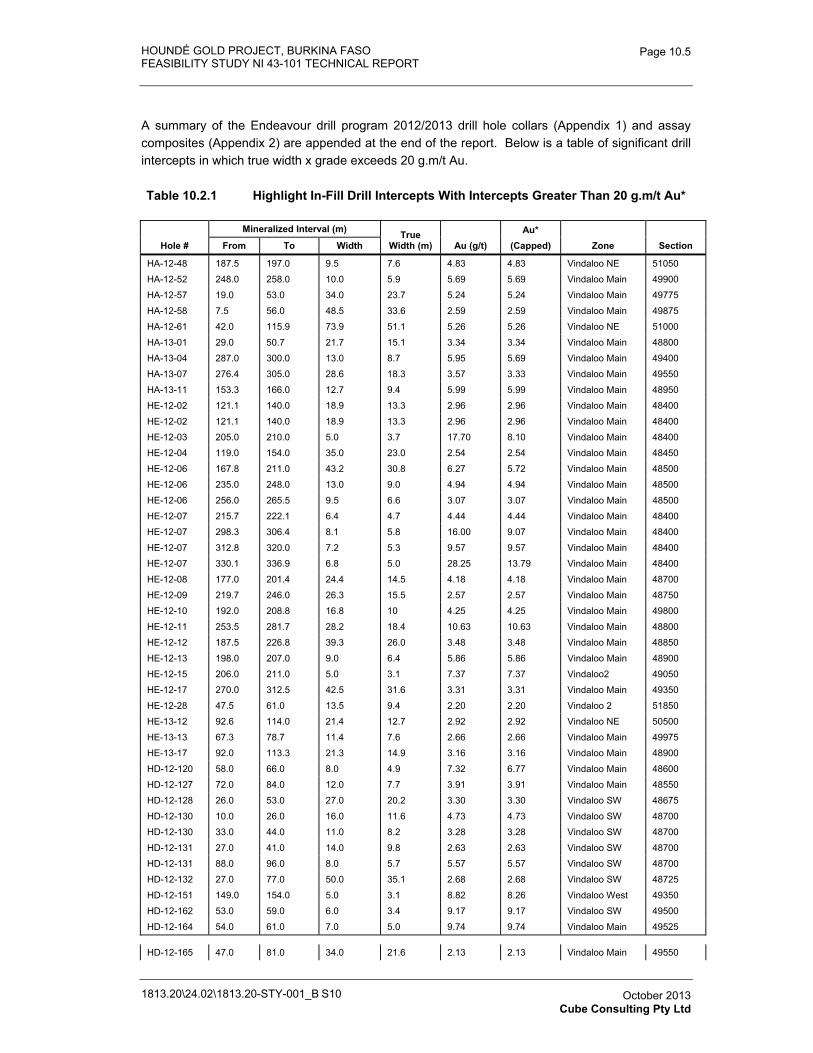
HOUNDÉ GOLD PROJECT, BURKINA FASO FEASIBILITY STUDY NI 43-101 TECHNICAL REPORT
1813.20\24.02\1813.20-STY-001_B S10
Page 10.5
October 2013 Cube Consulting Pty Ltd
A summary of the Endeavour drill program 2012/2013 drill hole collars (Appendix 1) and assay composites (Appendix 2) are appended at the end of the report. Below is a table of significant drill intercepts in which true width x grade exceeds 20 g.m/t Au.
Table 10.2.1 Highlight In-Fill Drill Intercepts With Intercepts Greater Than 20 g.m/t Au*
Hole #
Mineralized Interval (m) True Width (m) Au (g/t)
Au* (Capped) Zone Section From To Width
HA-12-48 187.5 197.0 9.5 7.6 4.83 4.83 Vindaloo NE 51050
HA-12-52 248.0 258.0 10.0 5.9 5.69 5.69 Vindaloo Main 49900
HA-12-57 19.0 53.0 34.0 23.7 5.24 5.24 Vindaloo Main 49775
HA-12-58 7.5 56.0 48.5 33.6 2.59 2.59 Vindaloo Main 49875
HA-12-61 42.0 115.9 73.9 51.1 5.26 5.26 Vindaloo NE 51000
HA-13-01 29.0 50.7 21.7 15.1 3.34 3.34 Vindaloo Main 48800
HA-13-04 287.0 300.0 13.0 8.7 5.95 5.69 Vindaloo Main 49400
HA-13-07 276.4 305.0 28.6 18.3 3.57 3.33 Vindaloo Main 49550
HA-13-11 153.3 166.0 12.7 9.4 5.99 5.99 Vindaloo Main 48950
HE-12-02 121.1 140.0 18.9 13.3 2.96 2.96 Vindaloo Main 48400
HE-12-02 121.1 140.0 18.9 13.3 2.96 2.96 Vindaloo Main 48400
HE-12-03 205.0 210.0 5.0 3.7 17.70 8.10 Vindaloo Main 48400
HE-12-04 119.0 154.0 35.0 23.0 2.54 2.54 Vindaloo Main 48450
HE-12-06 167.8 211.0 43.2 30.8 6.27 5.72 Vindaloo Main 48500
HE-12-06 235.0 248.0 13.0 9.0 4.94 4.94 Vindaloo Main 48500
HE-12-06 256.0 265.5 9.5 6.6 3.07 3.07 Vindaloo Main 48500
HE-12-07 215.7 222.1 6.4 4.7 4.44 4.44 Vindaloo Main 48400
HE-12-07 298.3 306.4 8.1 5.8 16.00 9.07 Vindaloo Main 48400
HE-12-07 312.8 320.0 7.2 5.3 9.57 9.57 Vindaloo Main 48400
HE-12-07 330.1 336.9 6.8 5.0 28.25 13.79 Vindaloo Main 48400
HE-12-08 177.0 201.4 24.4 14.5 4.18 4.18 Vindaloo Main 48700
HE-12-09 219.7 246.0 26.3 15.5 2.57 2.57 Vindaloo Main 48750
HE-12-10 192.0 208.8 16.8 10 4.25 4.25 Vindaloo Main 49800
HE-12-11 253.5 281.7 28.2 18.4 10.63 10.63 Vindaloo Main 48800
HE-12-12 187.5 226.8 39.3 26.0 3.48 3.48 Vindaloo Main 48850
HE-12-13 198.0 207.0 9.0 6.4 5.86 5.86 Vindaloo Main 48900
HE-12-15 206.0 211.0 5.0 3.1 7.37 7.37 Vindaloo2 49050
HE-12-17 270.0 312.5 42.5 31.6 3.31 3.31 Vindaloo Main 49350
HE-12-28 47.5 61.0 13.5 9.4 2.20 2.20 Vindaloo 2 51850
HE-13-12 92.6 114.0 21.4 12.7 2.92 2.92 Vindaloo NE 50500
HE-13-13 67.3 78.7 11.4 7.6 2.66 2.66 Vindaloo Main 49975
HE-13-17 92.0 113.3 21.3 14.9 3.16 3.16 Vindaloo Main 48900
HD-12-120 58.0 66.0 8.0 4.9 7.32 6.77 Vindaloo Main 48600
HD-12-127 72.0 84.0 12.0 7.7 3.91 3.91 Vindaloo Main 48550
HD-12-128 26.0 53.0 27.0 20.2 3.30 3.30 Vindaloo SW 48675
HD-12-130 10.0 26.0 16.0 11.6 4.73 4.73 Vindaloo SW 48700
HD-12-130 33.0 44.0 11.0 8.2 3.28 3.28 Vindaloo SW 48700
HD-12-131 27.0 41.0 14.0 9.8 2.63 2.63 Vindaloo SW 48700
HD-12-131 88.0 96.0 8.0 5.7 5.57 5.57 Vindaloo SW 48700
HD-12-132 27.0 77.0 50.0 35.1 2.68 2.68 Vindaloo SW 48725
HD-12-151 149.0 154.0 5.0 3.1 8.82 8.26 Vindaloo West 49350
HD-12-162 53.0 59.0 6.0 3.4 9.17 9.17 Vindaloo SW 49500
HD-12-164 54.0 61.0 7.0 5.0 9.74 9.74 Vindaloo Main 49525
HD-12-165 47.0 81.0 34.0 21.6 2.13 2.13 Vindaloo Main 49550
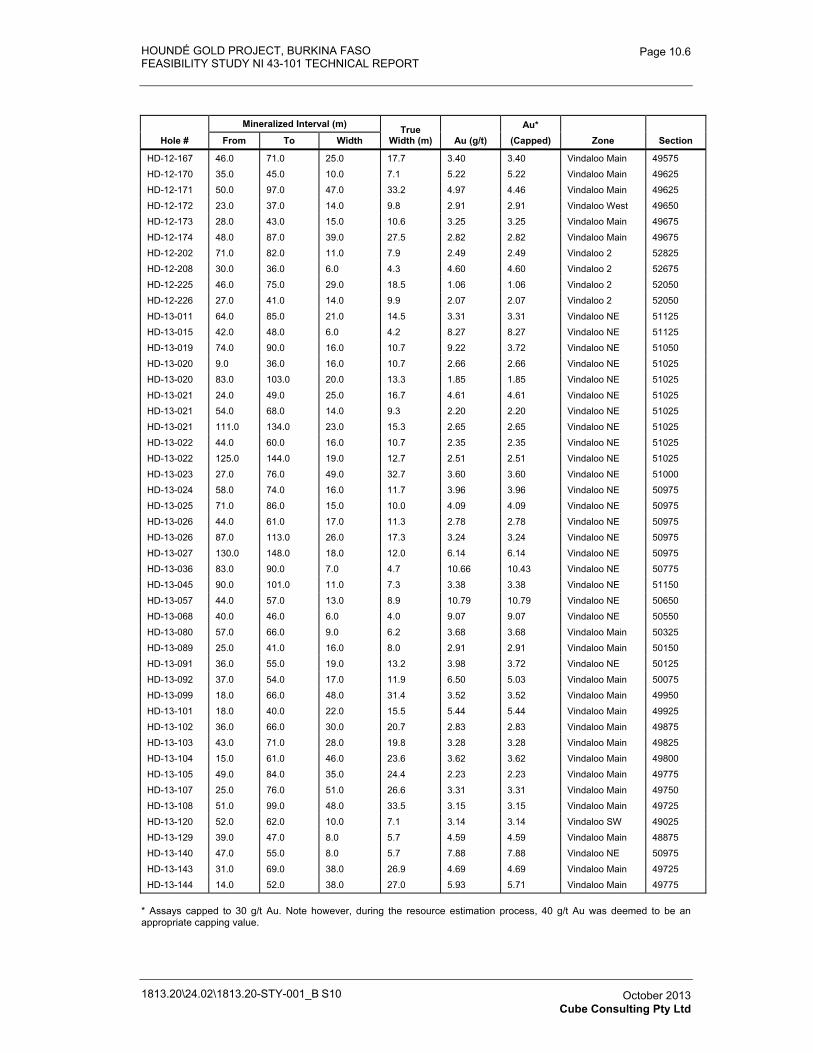
HOUNDÉ GOLD PROJECT, BURKINA FASO FEASIBILITY STUDY NI 43-101 TECHNICAL REPORT
1813.20\24.02\1813.20-STY-001_B S10
Page 10.6
October 2013 Cube Consulting Pty Ltd
Hole #
Mineralized Interval (m) True Width (m) Au (g/t)
Au* (Capped) Zone Section From To Width
HD-12-167 46.0 71.0 25.0 17.7 3.40 3.40 Vindaloo Main 49575
HD-12-170 35.0 45.0 10.0 7.1 5.22 5.22 Vindaloo Main 49625
HD-12-171 50.0 97.0 47.0 33.2 4.97 4.46 Vindaloo Main 49625
HD-12-172 23.0 37.0 14.0 9.8 2.91 2.91 Vindaloo West 49650
HD-12-173 28.0 43.0 15.0 10.6 3.25 3.25 Vindaloo Main 49675
HD-12-174 48.0 87.0 39.0 27.5 2.82 2.82 Vindaloo Main 49675
HD-12-202 71.0 82.0 11.0 7.9 2.49 2.49 Vindaloo 2 52825
HD-12-208 30.0 36.0 6.0 4.3 4.60 4.60 Vindaloo 2 52675
HD-12-225 46.0 75.0 29.0 18.5 1.06 1.06 Vindaloo 2 52050
HD-12-226 27.0 41.0 14.0 9.9 2.07 2.07 Vindaloo 2 52050
HD-13-011 64.0 85.0 21.0 14.5 3.31 3.31 Vindaloo NE 51125
HD-13-015 42.0 48.0 6.0 4.2 8.27 8.27 Vindaloo NE 51125
HD-13-019 74.0 90.0 16.0 10.7 9.22 3.72 Vindaloo NE 51050
HD-13-020 9.0 36.0 16.0 10.7 2.66 2.66 Vindaloo NE 51025
HD-13-020 83.0 103.0 20.0 13.3 1.85 1.85 Vindaloo NE 51025
HD-13-021 24.0 49.0 25.0 16.7 4.61 4.61 Vindaloo NE 51025
HD-13-021 54.0 68.0 14.0 9.3 2.20 2.20 Vindaloo NE 51025
HD-13-021 111.0 134.0 23.0 15.3 2.65 2.65 Vindaloo NE 51025
HD-13-022 44.0 60.0 16.0 10.7 2.35 2.35 Vindaloo NE 51025
HD-13-022 125.0 144.0 19.0 12.7 2.51 2.51 Vindaloo NE 51025
HD-13-023 27.0 76.0 49.0 32.7 3.60 3.60 Vindaloo NE 51000
HD-13-024 58.0 74.0 16.0 11.7 3.96 3.96 Vindaloo NE 50975
HD-13-025 71.0 86.0 15.0 10.0 4.09 4.09 Vindaloo NE 50975
HD-13-026 44.0 61.0 17.0 11.3 2.78 2.78 Vindaloo NE 50975
HD-13-026 87.0 113.0 26.0 17.3 3.24 3.24 Vindaloo NE 50975
HD-13-027 130.0 148.0 18.0 12.0 6.14 6.14 Vindaloo NE 50975
HD-13-036 83.0 90.0 7.0 4.7 10.66 10.43 Vindaloo NE 50775
HD-13-045 90.0 101.0 11.0 7.3 3.38 3.38 Vindaloo NE 51150
HD-13-057 44.0 57.0 13.0 8.9 10.79 10.79 Vindaloo NE 50650
HD-13-068 40.0 46.0 6.0 4.0 9.07 9.07 Vindaloo NE 50550
HD-13-080 57.0 66.0 9.0 6.2 3.68 3.68 Vindaloo Main 50325
HD-13-089 25.0 41.0 16.0 8.0 2.91 2.91 Vindaloo Main 50150
HD-13-091 36.0 55.0 19.0 13.2 3.98 3.72 Vindaloo NE 50125
HD-13-092 37.0 54.0 17.0 11.9 6.50 5.03 Vindaloo Main 50075
HD-13-099 18.0 66.0 48.0 31.4 3.52 3.52 Vindaloo Main 49950
HD-13-101 18.0 40.0 22.0 15.5 5.44 5.44 Vindaloo Main 49925
HD-13-102 36.0 66.0 30.0 20.7 2.83 2.83 Vindaloo Main 49875
HD-13-103 43.0 71.0 28.0 19.8 3.28 3.28 Vindaloo Main 49825
HD-13-104 15.0 61.0 46.0 23.6 3.62 3.62 Vindaloo Main 49800
HD-13-105 49.0 84.0 35.0 24.4 2.23 2.23 Vindaloo Main 49775
HD-13-107 25.0 76.0 51.0 26.6 3.31 3.31 Vindaloo Main 49750
HD-13-108 51.0 99.0 48.0 33.5 3.15 3.15 Vindaloo Main 49725
HD-13-120 52.0 62.0 10.0 7.1 3.14 3.14 Vindaloo SW 49025
HD-13-129 39.0 47.0 8.0 5.7 4.59 4.59 Vindaloo Main 48875
HD-13-140 47.0 55.0 8.0 5.7 7.88 7.88 Vindaloo NE 50975
HD-13-143 31.0 69.0 38.0 26.9 4.69 4.69 Vindaloo Main 49725
HD-13-144 14.0 52.0 38.0 27.0 5.93 5.71 Vindaloo Main 49775
* Assays capped to 30 g/t Au. Note however, during the resource estimation process, 40 g/t Au was deemed to be an appropriate capping value.
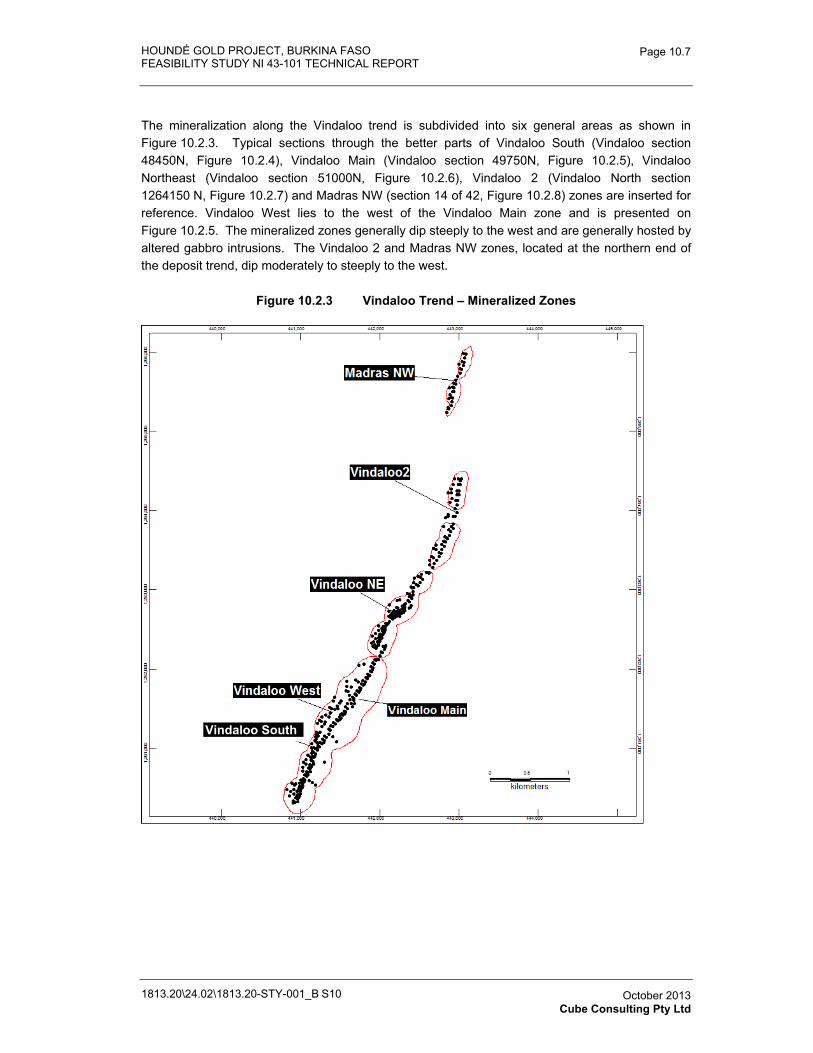
HOUNDÉ GOLD PROJECT, BURKINA FASO FEASIBILITY STUDY NI 43-101 TECHNICAL REPORT
1813.20\24.02\1813.20-STY-001_B S10
Page 10.7
October 2013 Cube Consulting Pty Ltd
The mineralization along the Vindaloo trend is subdivided into six general areas as shown in Figure 10.2.3. Typical sections through the better parts of Vindaloo South (Vindaloo section 48450N, Figure 10.2.4), Vindaloo Main (Vindaloo section 49750N, Figure 10.2.5), Vindaloo Northeast (Vindaloo section 51000N, Figure 10.2.6), Vindaloo 2 (Vindaloo North section 1264150 N, Figure 10.2.7) and Madras NW (section 14 of 42, Figure 10.2.8) zones are inserted for reference. Vindaloo West lies to the west of the Vindaloo Main zone and is presented on Figure 10.2.5. The mineralized zones generally dip steeply to the west and are generally hosted by altered gabbro intrusions. The Vindaloo 2 and Madras NW zones, located at the northern end of the deposit trend, dip moderately to steeply to the west.
Figure 10.2.3 Vindaloo Trend – Mineralized Zones
Vindaloo South
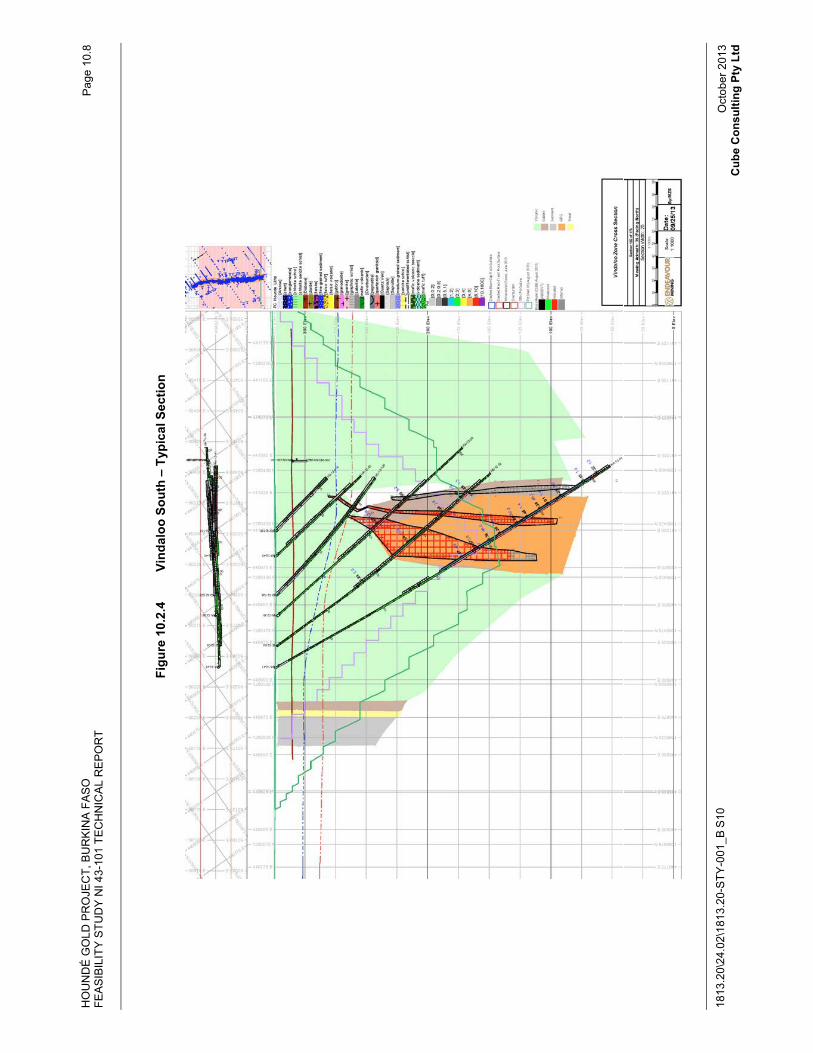
HO
UN
DÉ
GO
LD P
RO
JEC
T, B
UR
KIN
A F
AS
O
FEA
SIB
ILIT
Y S
TUD
Y N
I 43-
101
TEC
HN
ICA
L R
EP
OR
T
1813
.20\
24.0
2\18
13.2
0-S
TY-0
01_B
S10
Pag
e 10
.8
Oct
ober
201
3 C
ube
Con
sulti
ng P
ty L
td
Figu
re 1
0.2.
4 Vi
ndal
oo S
outh
– T
ypic
al S
ectio
n
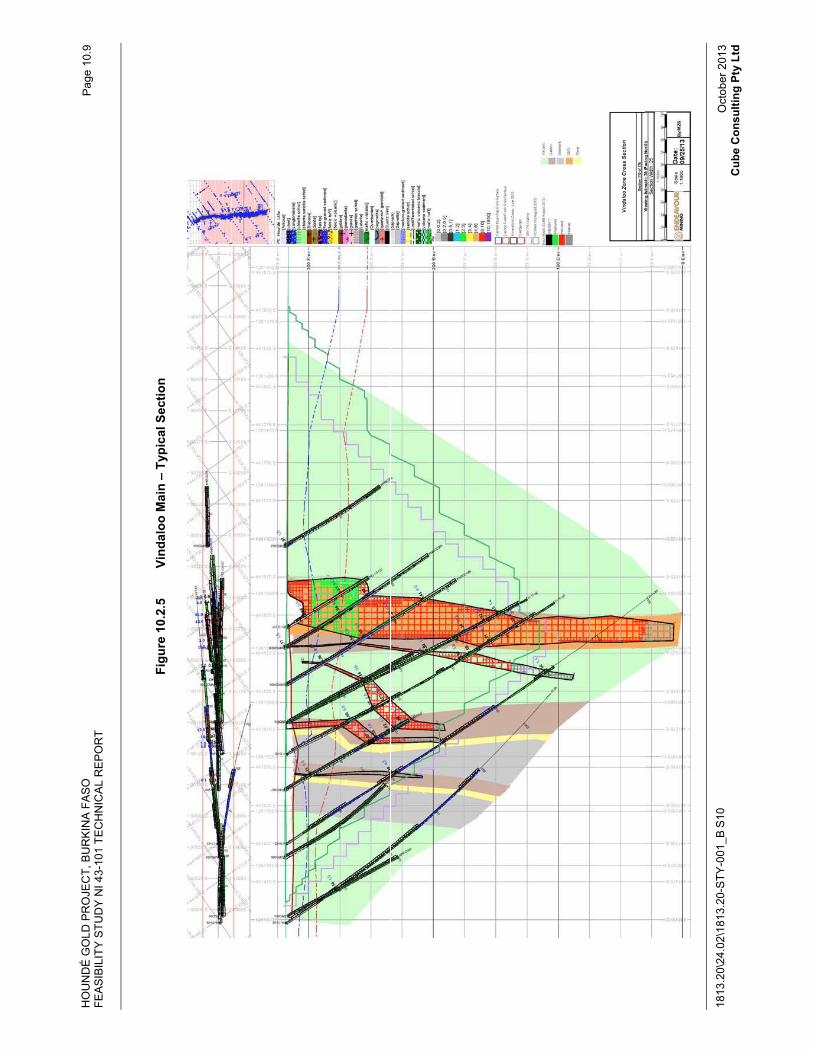
HO
UN
DÉ
GO
LD P
RO
JEC
T, B
UR
KIN
A F
AS
O
FEA
SIB
ILIT
Y S
TUD
Y N
I 43-
101
TEC
HN
ICA
L R
EP
OR
T
1813
.20\
24.0
2\18
13.2
0-S
TY-0
01_B
S10
Pag
e 10
.9
Oct
ober
201
3 C
ube
Con
sulti
ng P
ty L
td
Figu
re 1
0.2.
5 Vi
ndal
oo M
ain
– Ty
pica
l Sec
tion
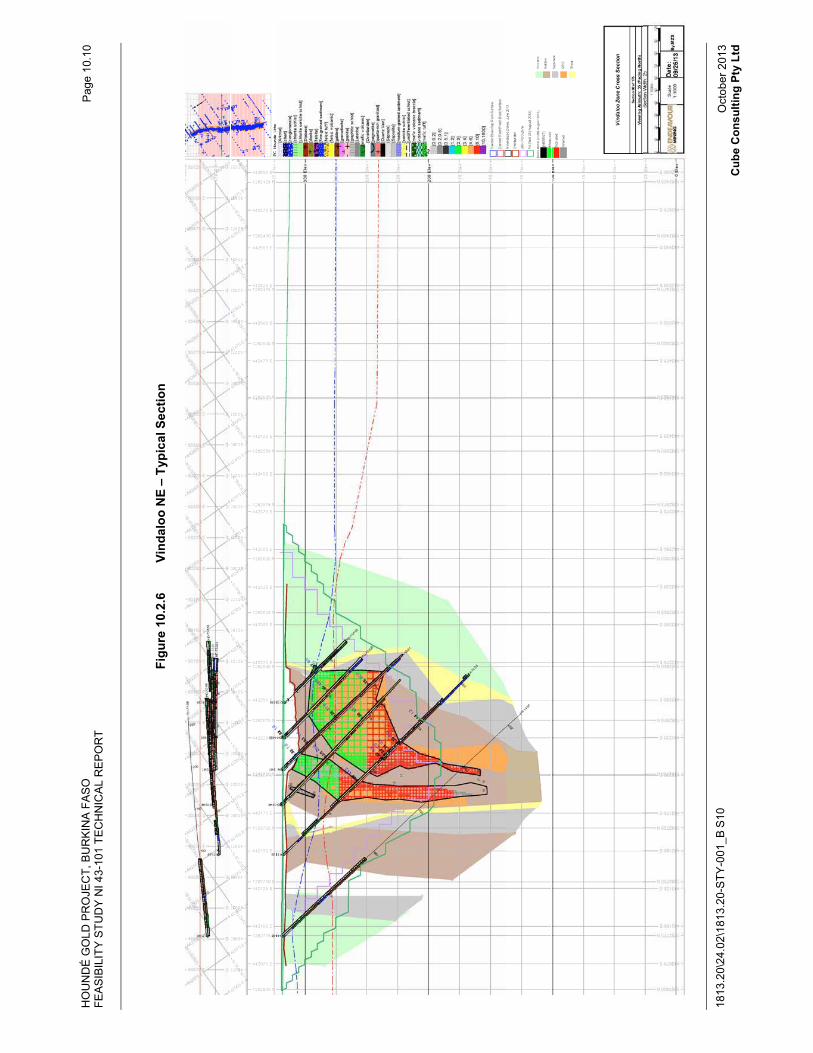
HO
UN
DÉ
GO
LD P
RO
JEC
T, B
UR
KIN
A F
AS
O
FEA
SIB
ILIT
Y S
TUD
Y N
I 43-
101
TEC
HN
ICA
L R
EP
OR
T
1813
.20\
24.0
2\18
13.2
0-S
TY-0
01_B
S10
Pag
e 10
.10
Oct
ober
201
3 C
ube
Con
sulti
ng P
ty L
td
Figu
re 1
0.2.
6 Vi
ndal
oo N
E –
Typi
cal S
ectio
n
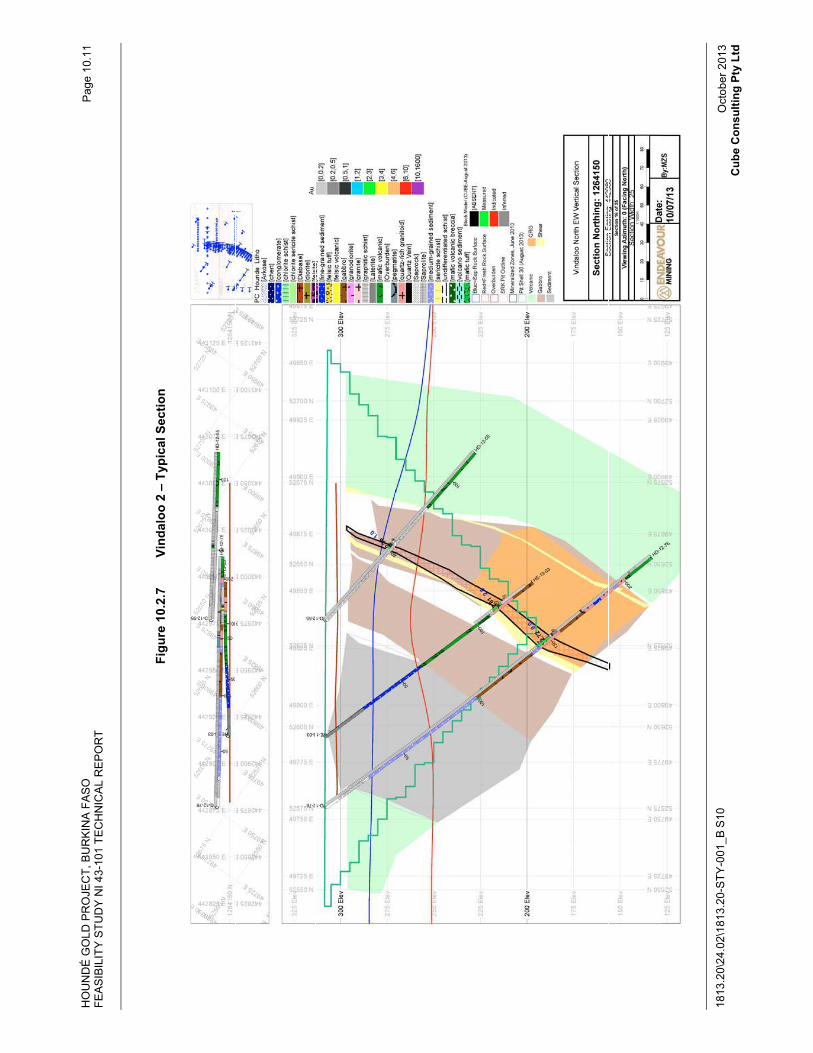
HO
UN
DÉ
GO
LD P
RO
JEC
T, B
UR
KIN
A F
AS
O
FEA
SIB
ILIT
Y S
TUD
Y N
I 43-
101
TEC
HN
ICA
L R
EP
OR
T
1813
.20\
24.0
2\18
13.2
0-S
TY-0
01_B
S10
Pag
e 10
.11
Oct
ober
201
3 C
ube
Con
sulti
ng P
ty L
td
Figu
re 1
0.2.
7 Vi
ndal
oo 2
– T
ypic
al S
ectio
n
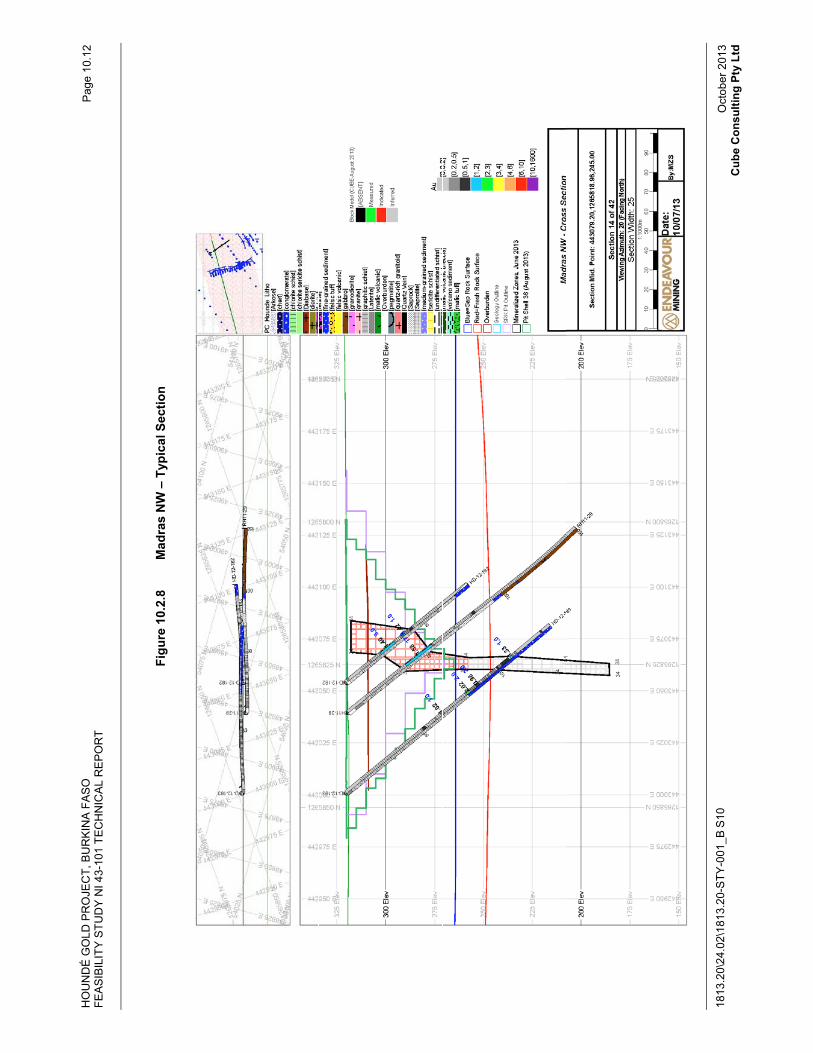
HO
UN
DÉ
GO
LD P
RO
JEC
T, B
UR
KIN
A F
AS
O
FEA
SIB
ILIT
Y S
TUD
Y N
I 43-
101
TEC
HN
ICA
L R
EP
OR
T
1813
.20\
24.0
2\18
13.2
0-S
TY-0
01_B
S10
Pag
e 10
.12
Oct
ober
201
3 C
ube
Con
sulti
ng P
ty L
td
Figu
re 1
0.2.
8 M
adra
s N
W –
Typ
ical
Sec
tion
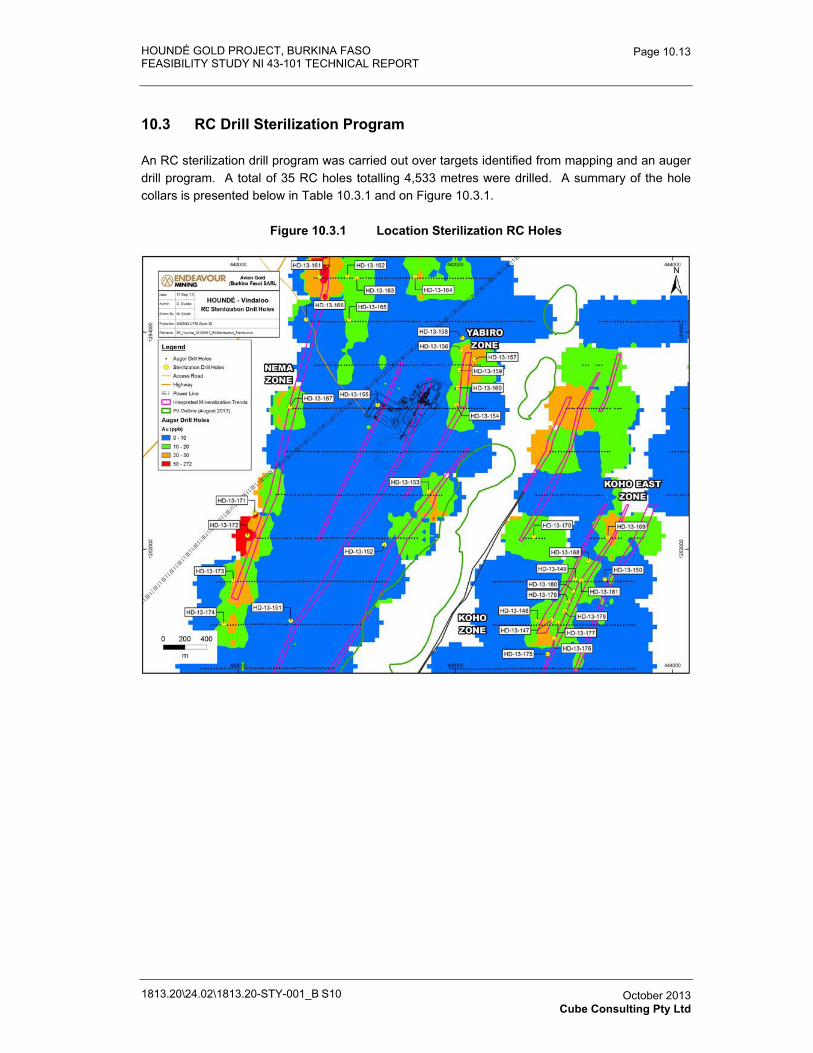
HOUNDÉ GOLD PROJECT, BURKINA FASO FEASIBILITY STUDY NI 43-101 TECHNICAL REPORT
1813.20\24.02\1813.20-STY-001_B S10
Page 10.13
October 2013 Cube Consulting Pty Ltd
10.3 RC Drill Sterilization Program
An RC sterilization drill program was carried out over targets identified from mapping and an auger drill program. A total of 35 RC holes totalling 4,533 metres were drilled. A summary of the hole collars is presented below in Table 10.3.1 and on Figure 10.3.1.
Figure 10.3.1 Location Sterilization RC Holes
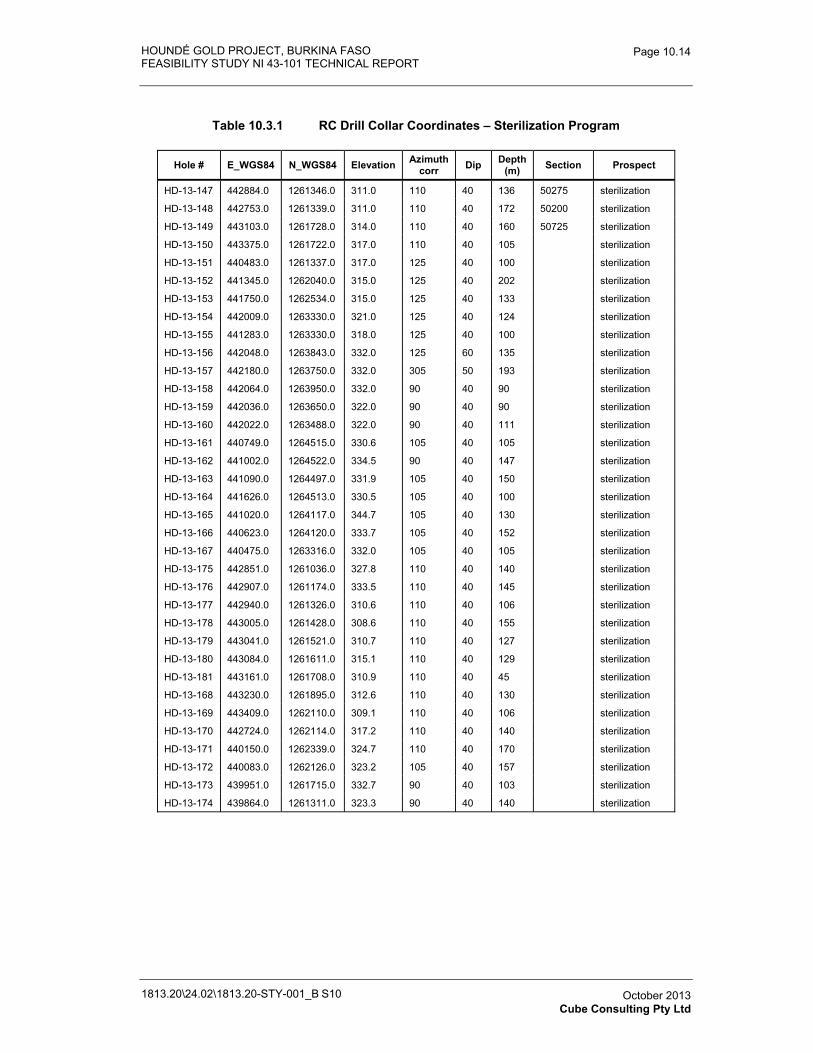
HOUNDÉ GOLD PROJECT, BURKINA FASO FEASIBILITY STUDY NI 43-101 TECHNICAL REPORT
1813.20\24.02\1813.20-STY-001_B S10
Page 10.14
October 2013 Cube Consulting Pty Ltd
Table 10.3.1 RC Drill Collar Coordinates – Sterilization Program
Hole # E_WGS84 N_WGS84 Elevation Azimuth corr Dip Depth
(m) Section Prospect
HD-13-147 442884.0 1261346.0 311.0 110 40 136 50275 sterilization
HD-13-148 442753.0 1261339.0 311.0 110 40 172 50200 sterilization
HD-13-149 443103.0 1261728.0 314.0 110 40 160 50725 sterilization
HD-13-150 443375.0 1261722.0 317.0 110 40 105 sterilization
HD-13-151 440483.0 1261337.0 317.0 125 40 100 sterilization
HD-13-152 441345.0 1262040.0 315.0 125 40 202 sterilization
HD-13-153 441750.0 1262534.0 315.0 125 40 133 sterilization
HD-13-154 442009.0 1263330.0 321.0 125 40 124 sterilization
HD-13-155 441283.0 1263330.0 318.0 125 40 100 sterilization
HD-13-156 442048.0 1263843.0 332.0 125 60 135 sterilization
HD-13-157 442180.0 1263750.0 332.0 305 50 193 sterilization
HD-13-158 442064.0 1263950.0 332.0 90 40 90 sterilization
HD-13-159 442036.0 1263650.0 322.0 90 40 90 sterilization
HD-13-160 442022.0 1263488.0 322.0 90 40 111 sterilization
HD-13-161 440749.0 1264515.0 330.6 105 40 105 sterilization
HD-13-162 441002.0 1264522.0 334.5 90 40 147 sterilization
HD-13-163 441090.0 1264497.0 331.9 105 40 150 sterilization
HD-13-164 441626.0 1264513.0 330.5 105 40 100 sterilization
HD-13-165 441020.0 1264117.0 344.7 105 40 130 sterilization
HD-13-166 440623.0 1264120.0 333.7 105 40 152 sterilization
HD-13-167 440475.0 1263316.0 332.0 105 40 105 sterilization
HD-13-175 442851.0 1261036.0 327.8 110 40 140 sterilization
HD-13-176 442907.0 1261174.0 333.5 110 40 145 sterilization
HD-13-177 442940.0 1261326.0 310.6 110 40 106 sterilization
HD-13-178 443005.0 1261428.0 308.6 110 40 155 sterilization
HD-13-179 443041.0 1261521.0 310.7 110 40 127 sterilization
HD-13-180 443084.0 1261611.0 315.1 110 40 129 sterilization
HD-13-181 443161.0 1261708.0 310.9 110 40 45 sterilization
HD-13-168 443230.0 1261895.0 312.6 110 40 130 sterilization
HD-13-169 443409.0 1262110.0 309.1 110 40 106 sterilization
HD-13-170 442724.0 1262114.0 317.2 110 40 140 sterilization
HD-13-171 440150.0 1262339.0 324.7 110 40 170 sterilization
HD-13-172 440083.0 1262126.0 323.2 105 40 157 sterilization
HD-13-173 439951.0 1261715.0 332.7 90 40 103 sterilization
HD-13-174 439864.0 1261311.0 323.3 90 40 140 sterilization
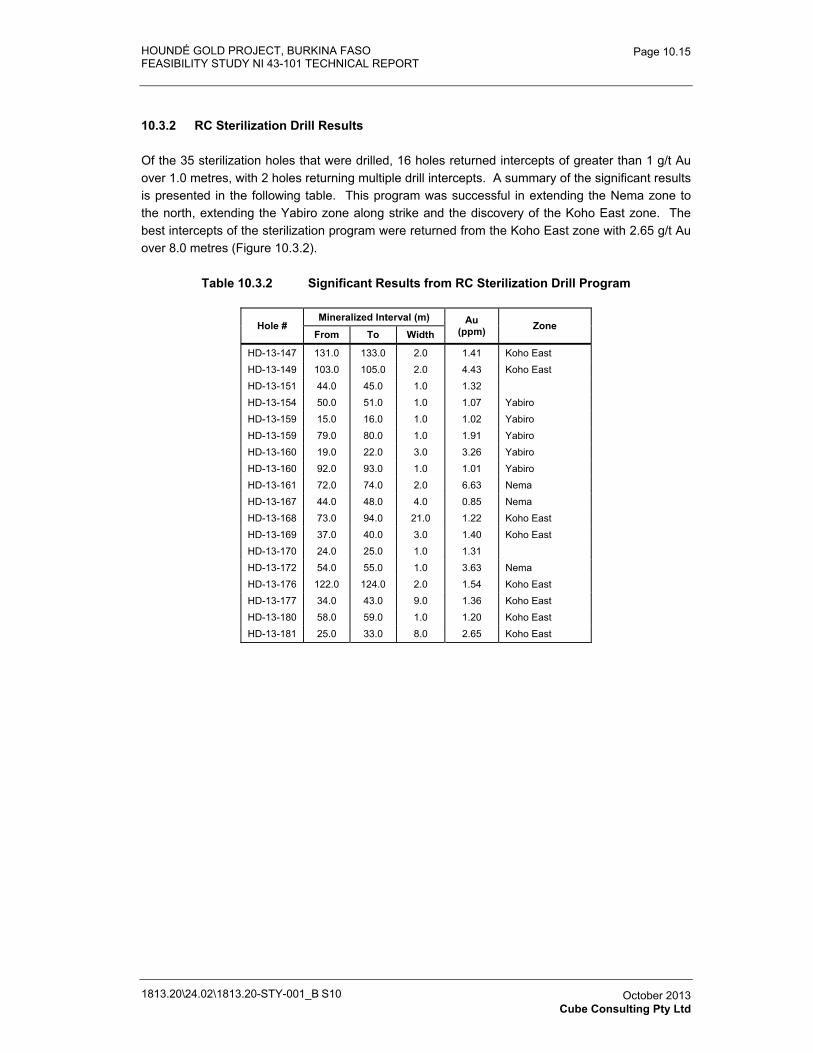
HOUNDÉ GOLD PROJECT, BURKINA FASO FEASIBILITY STUDY NI 43-101 TECHNICAL REPORT
1813.20\24.02\1813.20-STY-001_B S10
Page 10.15
October 2013 Cube Consulting Pty Ltd
10.3.2 RC Sterilization Drill Results
Of the 35 sterilization holes that were drilled, 16 holes returned intercepts of greater than 1 g/t Au over 1.0 metres, with 2 holes returning multiple drill intercepts. A summary of the significant results is presented in the following table. This program was successful in extending the Nema zone to the north, extending the Yabiro zone along strike and the discovery of the Koho East zone. The best intercepts of the sterilization program were returned from the Koho East zone with 2.65 g/t Au over 8.0 metres (Figure 10.3.2).
Table 10.3.2 Significant Results from RC Sterilization Drill Program
Hole # Mineralized Interval (m) Au
(ppm) Zone From To Width
HD-13-147 131.0 133.0 2.0 1.41 Koho East HD-13-149 103.0 105.0 2.0 4.43 Koho East HD-13-151 44.0 45.0 1.0 1.32 HD-13-154 50.0 51.0 1.0 1.07 Yabiro HD-13-159 15.0 16.0 1.0 1.02 Yabiro HD-13-159 79.0 80.0 1.0 1.91 Yabiro HD-13-160 19.0 22.0 3.0 3.26 Yabiro HD-13-160 92.0 93.0 1.0 1.01 Yabiro HD-13-161 72.0 74.0 2.0 6.63 Nema HD-13-167 44.0 48.0 4.0 0.85 Nema HD-13-168 73.0 94.0 21.0 1.22 Koho East HD-13-169 37.0 40.0 3.0 1.40 Koho East HD-13-170 24.0 25.0 1.0 1.31 HD-13-172 54.0 55.0 1.0 3.63 Nema HD-13-176 122.0 124.0 2.0 1.54 Koho East HD-13-177 34.0 43.0 9.0 1.36 Koho East HD-13-180 58.0 59.0 1.0 1.20 Koho East HD-13-181 25.0 33.0 8.0 2.65 Koho East
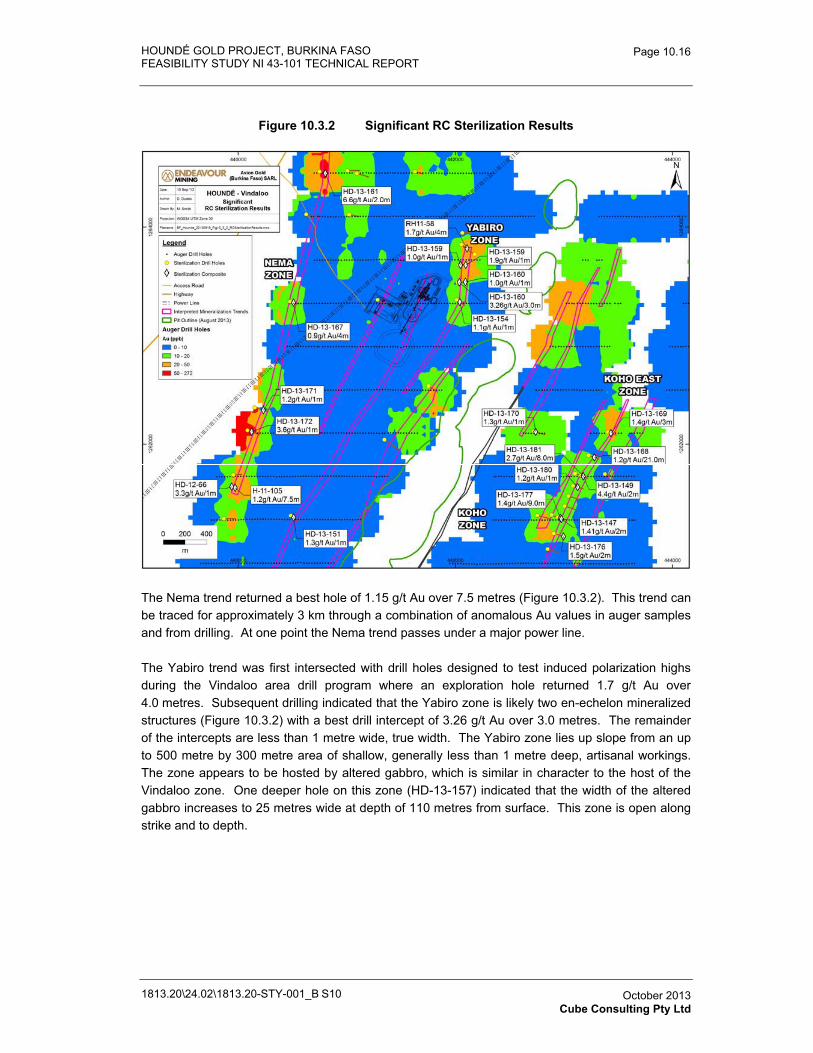
HOUNDÉ GOLD PROJECT, BURKINA FASO FEASIBILITY STUDY NI 43-101 TECHNICAL REPORT
1813.20\24.02\1813.20-STY-001_B S10
Page 10.16
October 2013 Cube Consulting Pty Ltd
Figure 10.3.2 Significant RC Sterilization Results
The Nema trend returned a best hole of 1.15 g/t Au over 7.5 metres (Figure 10.3.2). This trend can be traced for approximately 3 km through a combination of anomalous Au values in auger samples and from drilling. At one point the Nema trend passes under a major power line.
The Yabiro trend was first intersected with drill holes designed to test induced polarization highs during the Vindaloo area drill program where an exploration hole returned 1.7 g/t Au over 4.0 metres. Subsequent drilling indicated that the Yabiro zone is likely two en-echelon mineralized structures (Figure 10.3.2) with a best drill intercept of 3.26 g/t Au over 3.0 metres. The remainder of the intercepts are less than 1 metre wide, true width. The Yabiro zone lies up slope from an up to 500 metre by 300 metre area of shallow, generally less than 1 metre deep, artisanal workings. The zone appears to be hosted by altered gabbro, which is similar in character to the host of the Vindaloo zone. One deeper hole on this zone (HD-13-157) indicated that the width of the altered gabbro increases to 25 metres wide at depth of 110 metres from surface. This zone is open along strike and to depth.
HOUNDÉ GOLD PROJECT, BURKINA FASO FEASIBILITY STUDY NI 43-101 TECHNICAL REPORT
1813.20\24.02\1813.20-STY-001_B S10
Page 10.17
October 2013 Cube Consulting Pty Ltd
The Koho East zone discovery seems to be the most interesting zone that resulted from the RC sterilization program with intercepts to 2.65 g/t Au over 8.0 metres (Figure 10.3.2). This zone is hosted by quartz-veined and pyritic iron carbonatized massive mafic volcanic rocks. The quartz veins appear to be oriented as left stepping, en-echelon veins, trending N045, within a N025-trending corridor based on the small occurrence located 320 m south of HD-13-147. Visible gold in quartz veining was discovered during a site visit at the occurrence. The Koho East Zone pinches and swells, with the assay results demonstrating that there is gold enrichment (>100 ppb) over 3 to 23 metres even though, locally, the grades are not economic. From drilling and auger drilling results, the zone can be traced for approximately 1,000 metres. The northern part of Koho East Zone appears potentially economic over a strike length of 470 metres. It is open to the north along one of the intermittent creeks, and at depth. The southern part, however, appears limited both along strike and to depth, although the zone might pass to the west of holes HD-13-175 and HD-13-176 as there are no auger samples south of these two holes.
HOUNDÉ GOLD PROJECT, BURKINA FASO
FEASIBILITY STUDY NI 43-101 TECHNICAL REPORT
1813.20-STY-001
Table of Contents Page
11.0� SAMPLE PREPARATION, ANALYSES AND SECURITY 11.1�11.1� Historical Sampling (Goldbelt Resources, Avocet) 11.1�11.2� Sample Submission 11.1�11.3� Sample Preparation and Analysis 11.1�
11.3.1� RC Drilling Samples 11.1�11.3.2� Diamond Drilling Samples 11.2�
11.4� Quality Assurance and Quality Control Programmes 11.2�11.4.1� Standards 11.3�11.4.2� Blanks 11.8�11.4.3� Duplicate Samples 11.8�11.4.4� Recommendations 11.10�
11.5� ICP Analysis 11.11�11.6� Density Analysis 11.11�11.7� Sample Security 11.12�11.8� Author’s Comments 11.12�
TABLESTable 11.4.1� Certified Reference Material List 11.4�Table 11.4.2� Certified Reference Material – Summary of Results for SGS
Ouagadougou 11.6�Table 11.4.3� Certified Reference Material – Summary of Results for SGS Morila 11.6�Table 11.4.4� Summary of Results for Lab Inserted Standards 11.7�Table 11.4.5� Assay Blank Material – Summary of Results 11.8�Table 11.4.6� Assay Blank Material – Summary of Results 11.9�
APPENDICES Appendix 11.1� Selected Standard Plots�Appendix 11.2� Selected Blank Plots�Appendix 11.3� Selected Duplicate Plots�Appendix 11.4� Data Issues�
1813.20\25.01\1813.20-STY-001_B S11 October 2013 Lycopodium Minerals Pty Ltd
HOUNDÉ GOLD PROJECT, BURKINA FASO FEASIBILITY STUDY NI 43-101 TECHNICAL REPORT
1813.20\25.01\1813.20-STY-001_B S11
Page 11.1
October 2013 Lycopodium Minerals Pty Ltd
11.0 SAMPLE PREPARATION, ANALYSES AND SECURITY
From 2010 to June 2013 sample preparation, analysis and security have been under the supervision of at least two and up to six contract geologists employed on site at any given time. All samples collected by Endeavour, or by third parties contracted by Endeavour, were subject to quality control procedures that ensured that industry best practice was utilised for the handling, sampling, transport, analysis, storage and documentation of sample material and analytical results.
For sample preparation and analysis, Endeavour has used the services of SGS Bureau de Liaison (“SGS”) laboratories at Ouagadougou, Burkina Faso and Morila, Mali. SGS is also a global independent provider of assaying and analytical testing services for the mining and mineral exploration industry with consistent quality standards implemented across all regions. Whilst they are not formally accredited, the SGS laboratories at Ouagadougou and Morila operate to ISO 17025 standards. As part of the international group of SGS laboratories, all laboratories take part in regular Round Robin sample analysis to check for bias or systematic error.
11.1 Historical Sampling (Goldbelt Resources, Avocet)
Endeavour / Avion carried out drilling and sampling campaigns during 2010 to 2013. Prior to this, Rotary Air Blast (RAB), Reverse Circulation (RC) and diamond (core) drilling was carried out by Barrick, Goldbelt Resources and Avocet Mining.
The samples were analyzed by Abilabs (Mali) and SGS Ouagadougou. Blanks, standards and duplicates were used to test the accuracy of the respective labs. Generally, every 10th sample was a control sample for QA/QC purposes. Blanks, standards and duplicates were used in equal numbers.
11.2 Sample Submission
A sample submission form detailing the sample number sequences and laboratory instructions accompanied every sample dispatch. On arrival at the laboratory, the samples are checked by SGS against the submission to ensure all samples were received. At completion of assaying and once results have been delivered by SGS, Endeavour geological staff confirms that all the submitted samples were analyzed by the methods requested by the client.
11.3 Sample Preparation and Analysis
11.3.1 RC Drilling Samples
RC samples were collected as 1 m sample lengths in bags directly from the cyclone discharge at the drill rig. The sample was then riffle split into a numbered sample bag with the corresponding sample tag to produce a sample of approximately 2 kg in size. The riffle splitters, plates, tubs and working areas were cleaned with compressed air after each sample was processed. The remaining reject sample was returned to the bulk plastic bag and remained at the drill site. Representative drill chips are collected from each 1 m sample reject and glued to a sample board for future reference.
HOUNDÉ GOLD PROJECT, BURKINA FASO FEASIBILITY STUDY NI 43-101 TECHNICAL REPORT
1813.20\25.01\1813.20-STY-001_B S11
Page 11.2
October 2013 Lycopodium Minerals Pty Ltd
Approximately 30 assay samples were placed in large polyweave bags and transported to the Endeavour exploration camp at Houndé. The samples were then transported to the laboratory by Endeavour personal or collected by SGS. All RC samples were sent to the SGS laboratory in Ouagadougou where they were logged into the laboratory information management system (“LIMS”), weighed and dried. The submitted samples were crushed and pulverised to 85% passing 75 micron using an LM2 pulveriser. The pulveriser was flushed with barren material after each sample. A nominal 50 g pulp aliquot was analysed for gold by lead collection fire assay with AAS instrumentation.
11.3.2 Diamond Drilling Samples
Diamond core was placed in steel core boxes holding either four metres of HQ size or five metres of NQ size core. Core trays were marked with the drill hole number and downhole distance for the start and finish of the core in the tray. Core orientation was undertaken in competent fresh rock and completed at the drill site. The core trays are transported from the drilling site to the Endeavour exploration camp at Houndé where the core is laid out for geological logging, photographing and other data collection.
Specific intervals for sampling based on lithology were identified during the logging process and the core was cut in half along its longitudinal axis with a purpose-built diamond-blade core saw. After the core was cut, the right hand side of the cut core (looking down hole) was placed in plastic sample bags and sealed with the remaining core left in the core box. The sample bags were then picked up by a representative of SGS when a sufficient number of samples were collected and transported to either SGS Ouagadougou, Burkina Faso or Morila, Mali.
On arrival at the laboratory, the samples were logged into LIMS, weighed, dried and finely crushed. Samples were crushed to a nominal 2 mm diameter using a jaw crusher, with a sub-sample of <1.5 kg taken using a Jones-type riffle splitter. Reject material was retained in the original bag and stored. The sub-sample was pulverised to 85% passing 75 micron using an LM2 pulveriser. Approximately 200 g was taken for assay and the remainder placed in a plastic bag. The pulveriser was flushed with barren material after each sample. A nominal 50 g pulp aliquot was analysed for gold by lead collection fire assay with AAS instrumentation.
11.4 Quality Assurance and Quality Control Programmes
A program of quality control (QC) and quality assurance (QA) has been undertaken by Endeavour to check for contamination, accuracy and precision within the drill sampling and assaying process. The types of check samples that have been introduced into the sample stream include blank samples (“blanks”), certified reference materials (“standards”), and field duplicate samples.
A total of 5,326 records for client introduced blanks, standards, and field duplicates with Au values were in the database of 77,054 Au records. This equates to a total insertion rate of control samples of approximately 7%. A more detailed breakdown is 2,071 standard samples (2.6%); 2,152 blank samples (2.8%) and 1,103 field duplicates (1.4%). In addition, 3,196 internal laboratory standard results (4.1%); 2,899 internal laboratory blank samples (3.8%) and 169 pulp duplicates were also produced and analysed during the time period.
HOUNDÉ GOLD PROJECT, BURKINA FASO FEASIBILITY STUDY NI 43-101 TECHNICAL REPORT
1813.20\25.01\1813.20-STY-001_B S11
Page 11.3
October 2013 Lycopodium Minerals Pty Ltd
In addition, the SGS laboratories have their own internal quality performance processes which follow best practice guidelines required for qualification under International Organisation for Standardisation (“ISO”) standards. The standard QA/QC protocols for the laboratories include the insertion of CRMs, blanks, duplicates and repeat assaying to monitor the quality of the preparation and analytical processes of the laboratory.
Overall, the QAQC samples have performed satisfactorily and indicate the sample data is suitable for mineral resource estimation.
11.4.1 Standards
A number of standards were used to verify the ability of the laboratory to accurately determine the gold values. For DDH and RC drill samples, one certified reference standard was typically inserted into the sample stream for each group of 20 samples (5.0%).
Fifty three different standards were utilised as control samples and are detailed in Table 11.4.1 below and Appendix 11.1. The G* series of standards used by Endeavour were obtained from Geostats Pty Ltd based in Australia. All others were internal lab standards from various sources. AMIS series was obtained from AMIS in South Africa. The AU* series was obtained from Data Analysis Australia, OX* and S* series from Rocklabs New Zealand, and ST* series being internal SGS standards.
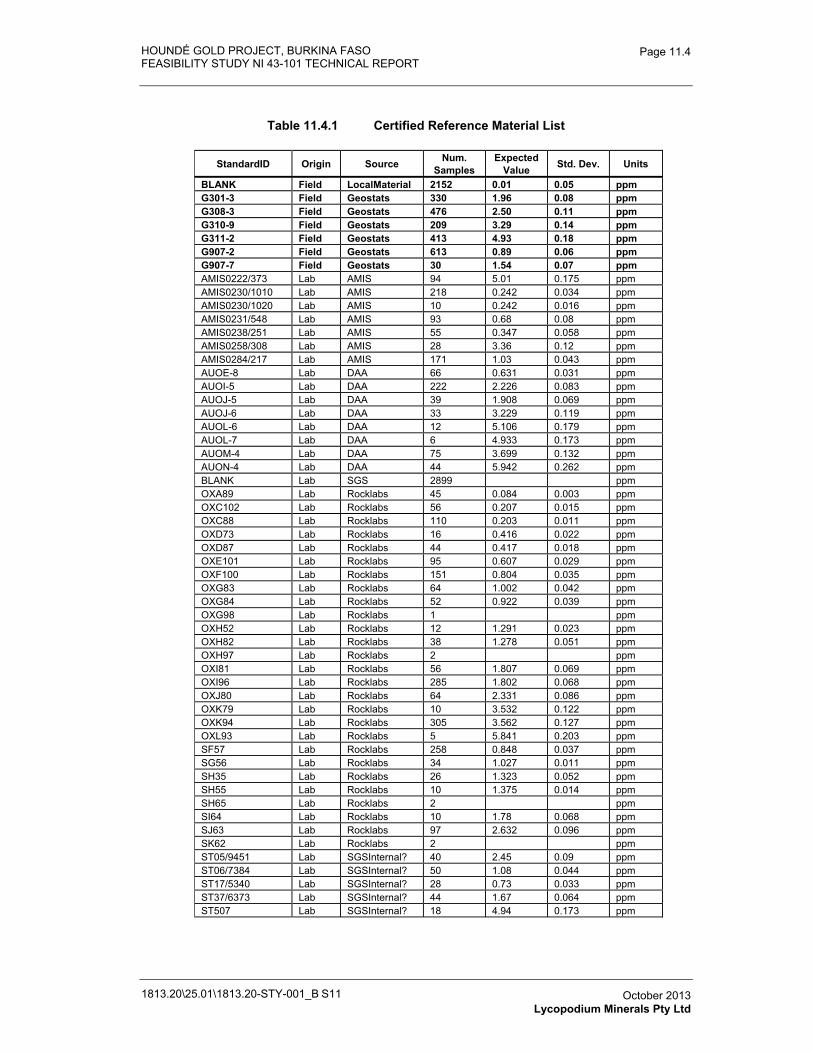
HOUNDÉ GOLD PROJECT, BURKINA FASO FEASIBILITY STUDY NI 43-101 TECHNICAL REPORT
1813.20\25.01\1813.20-STY-001_B S11
Page 11.4
October 2013 Lycopodium Minerals Pty Ltd
Table 11.4.1 Certified Reference Material List
StandardID Origin Source Num.Samples
Expected Value Std. Dev. Units
BLANK Field LocalMaterial 2152 0.01 0.05 ppm G301-3 Field Geostats 330 1.96 0.08 ppm G308-3 Field Geostats 476 2.50 0.11 ppm G310-9 Field Geostats 209 3.29 0.14 ppm G311-2 Field Geostats 413 4.93 0.18 ppm G907-2 Field Geostats 613 0.89 0.06 ppm G907-7 Field Geostats 30 1.54 0.07 ppm AMIS0222/373 Lab AMIS 94 5.01 0.175 ppm AMIS0230/1010 Lab AMIS 218 0.242 0.034 ppm AMIS0230/1020 Lab AMIS 10 0.242 0.016 ppm AMIS0231/548 Lab AMIS 93 0.68 0.08 ppm AMIS0238/251 Lab AMIS 55 0.347 0.058 ppm AMIS0258/308 Lab AMIS 28 3.36 0.12 ppm AMIS0284/217 Lab AMIS 171 1.03 0.043 ppm AUOE-8 Lab DAA 66 0.631 0.031 ppm AUOI-5 Lab DAA 222 2.226 0.083 ppm AUOJ-5 Lab DAA 39 1.908 0.069 ppm AUOJ-6 Lab DAA 33 3.229 0.119 ppm AUOL-6 Lab DAA 12 5.106 0.179 ppm AUOL-7 Lab DAA 6 4.933 0.173 ppm AUOM-4 Lab DAA 75 3.699 0.132 ppm AUON-4 Lab DAA 44 5.942 0.262 ppm BLANK Lab SGS 2899 ppm OXA89 Lab Rocklabs 45 0.084 0.003 ppm OXC102 Lab Rocklabs 56 0.207 0.015 ppm OXC88 Lab Rocklabs 110 0.203 0.011 ppm OXD73 Lab Rocklabs 16 0.416 0.022 ppm OXD87 Lab Rocklabs 44 0.417 0.018 ppm OXE101 Lab Rocklabs 95 0.607 0.029 ppm OXF100 Lab Rocklabs 151 0.804 0.035 ppm OXG83 Lab Rocklabs 64 1.002 0.042 ppm OXG84 Lab Rocklabs 52 0.922 0.039 ppm OXG98 Lab Rocklabs 1 ppm OXH52 Lab Rocklabs 12 1.291 0.023 ppm OXH82 Lab Rocklabs 38 1.278 0.051 ppm OXH97 Lab Rocklabs 2 ppm OXI81 Lab Rocklabs 56 1.807 0.069 ppm OXI96 Lab Rocklabs 285 1.802 0.068 ppm OXJ80 Lab Rocklabs 64 2.331 0.086 ppm OXK79 Lab Rocklabs 10 3.532 0.122 ppm OXK94 Lab Rocklabs 305 3.562 0.127 ppm OXL93 Lab Rocklabs 5 5.841 0.203 ppm SF57 Lab Rocklabs 258 0.848 0.037 ppm SG56 Lab Rocklabs 34 1.027 0.011 ppm SH35 Lab Rocklabs 26 1.323 0.052 ppm SH55 Lab Rocklabs 10 1.375 0.014 ppm SH65 Lab Rocklabs 2 ppm SI64 Lab Rocklabs 10 1.78 0.068 ppm SJ63 Lab Rocklabs 97 2.632 0.096 ppm SK62 Lab Rocklabs 2 ppm ST05/9451 Lab SGSInternal? 40 2.45 0.09 ppm ST06/7384 Lab SGSInternal? 50 1.08 0.044 ppm ST17/5340 Lab SGSInternal? 28 0.73 0.033 ppm ST37/6373 Lab SGSInternal? 44 1.67 0.064 ppm ST507 Lab SGSInternal? 18 4.94 0.173 ppm
HOUNDÉ GOLD PROJECT, BURKINA FASO FEASIBILITY STUDY NI 43-101 TECHNICAL REPORT
1813.20\25.01\1813.20-STY-001_B S11
Page 11.5
October 2013 Lycopodium Minerals Pty Ltd
Ninety five samples representing about 4.5% of the 2,071 client field inserted standard samples included in the database exceeded two standard deviations (SD) from the expected value for gold (Table 11.4.2 and Table 11.4.3). Two SD is considered to be the acceptable variance limit above which follow up of the associated sample assay batch is recommended. Additionally there were 50 samples representing 1.5% of the 3,196 internal laboratory inserted standards which exceeded two standard deviations.
The Houndé site technical department advised that 1,169 samples were re-assayed when a review of the sample results indicated that the standards returned assay values greater than 3 SD off the accepted data value. In addition, standards that returned assays values greater than 2 SD from the norm, in mineralized sections, were also re-run.
Some of the large deviations from the certified standard value can be attributed to sample handling errors, involving accidental switching of standards in the sample stream. The identified cases of sample switching and mislabelling of the standards represent about 1% of the data and were not accounted for among the failed samples in the final statistics. See Appendix 11.4 for further details regarding these samples.
There are 7 internal laboratory inserted standards which could not be analysed as there were not enough samples (4 or less).
There are biases both positive and negative, observed in most of the results from the field inserted standard. These biases were observed throughout the period being analysed affecting the SGS_MORILA laboratory, even though this laboratory analysed samples only during the 2012 period. The main standards involved were G907-7; at SGS_OUA and G301-3; G907-7 and G907-2; at SGS_MORILA.
There are 4 samples that could not be associated with a known standard. Their values could not be associated with any expected value as a possible misclassified standard ID. This may indicate possible sample swaps and should be investigated. See Appendix 11.4 for further details on these samples.
Although most of the assay biases are small (�5%) and can be attributed to expected instrument drift within the laboratories, some of the laboratory inserted standards also show positive and negative biases. The main standards affected are: AUOJ-6; SG56; SH55. A possible recalibration of OXK94 between December 2012 and January 2013 can be observed.
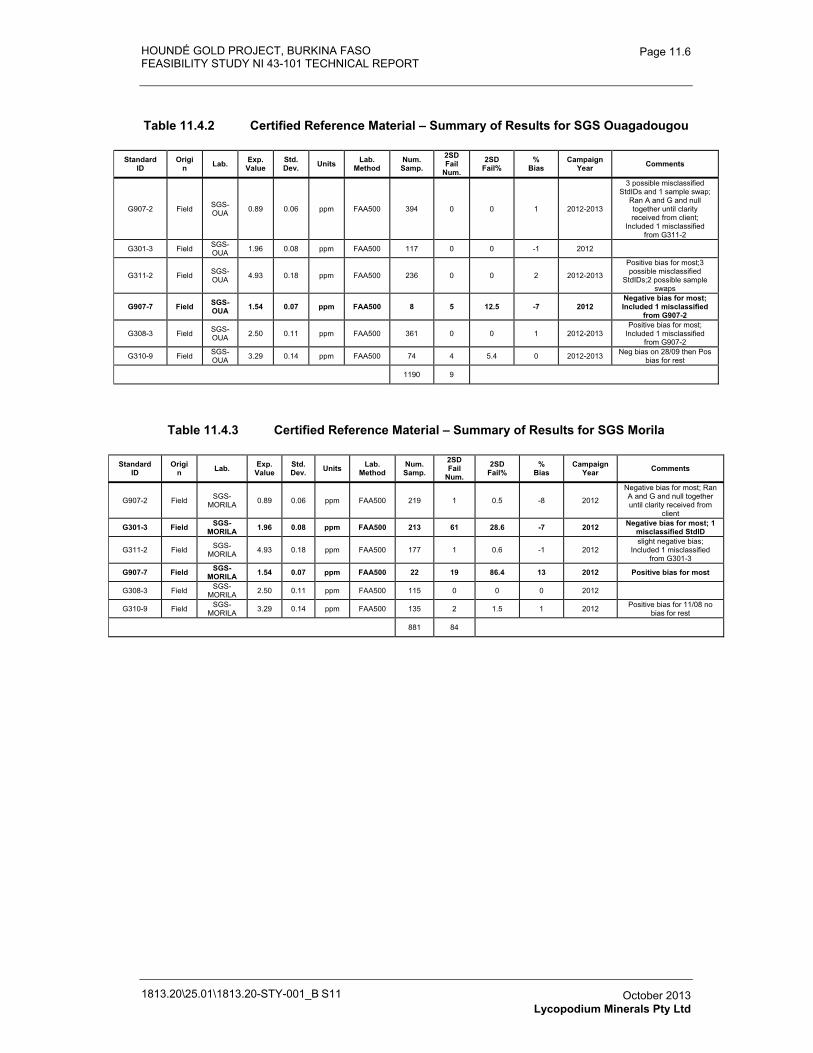
HOUNDÉ GOLD PROJECT, BURKINA FASO FEASIBILITY STUDY NI 43-101 TECHNICAL REPORT
1813.20\25.01\1813.20-STY-001_B S11
Page 11.6
October 2013 Lycopodium Minerals Pty Ltd
Table 11.4.2 Certified Reference Material – Summary of Results for SGS Ouagadougou
Standard ID
Origin Lab. Exp.
Value Std. Dev. Units Lab.
MethodNum.Samp.
2SDFail
Num.2SD
Fail% %
Bias Campaign
Year Comments
G907-2 Field SGS-OUA 0.89 0.06 ppm FAA500 394 0 0 1 2012-2013
3 possible misclassified StdIDs and 1 sample swap;
Ran A and G and null together until clarity received from client;
Included 1 misclassified from G311-2
G301-3 Field SGS-OUA 1.96 0.08 ppm FAA500 117 0 0 -1 2012
G311-2 Field SGS-OUA 4.93 0.18 ppm FAA500 236 0 0 2 2012-2013
Positive bias for most;3 possible misclassified
StdIDs;2 possible sample swaps
G907-7 Field SGS-OUA 1.54 0.07 ppm FAA500 8 5 12.5 -7 2012
Negative bias for most;Included 1 misclassified
from G907-2
G308-3 Field SGS-OUA 2.50 0.11 ppm FAA500 361 0 0 1 2012-2013
Positive bias for most; Included 1 misclassified
from G907-2
G310-9 Field SGS-OUA 3.29 0.14 ppm FAA500 74 4 5.4 0 2012-2013 Neg bias on 28/09 then Pos
bias for rest
1190 9
Table 11.4.3 Certified Reference Material – Summary of Results for SGS Morila
Standard ID
Origin Lab. Exp.
Value Std. Dev. Units Lab.
MethodNum.Samp.
2SDFail
Num.2SD
Fail% %
Bias Campaign
Year Comments
G907-2 Field SGS-MORILA 0.89 0.06 ppm FAA500 219 1 0.5 -8 2012
Negative bias for most; Ran A and G and null together until clarity received from
client
G301-3 Field SGS-MORILA 1.96 0.08 ppm FAA500 213 61 28.6 -7 2012 Negative bias for most; 1
misclassified StdID
G311-2 Field SGS-MORILA 4.93 0.18 ppm FAA500 177 1 0.6 -1 2012
slight negative bias; Included 1 misclassified
from G301-3
G907-7 Field SGS-MORILA 1.54 0.07 ppm FAA500 22 19 86.4 13 2012 Positive bias for most
G308-3 Field SGS-MORILA 2.50 0.11 ppm FAA500 115 0 0 0 2012
G310-9 Field SGS-MORILA 3.29 0.14 ppm FAA500 135 2 1.5 1 2012 Positive bias for 11/08 no
bias for rest
881 84
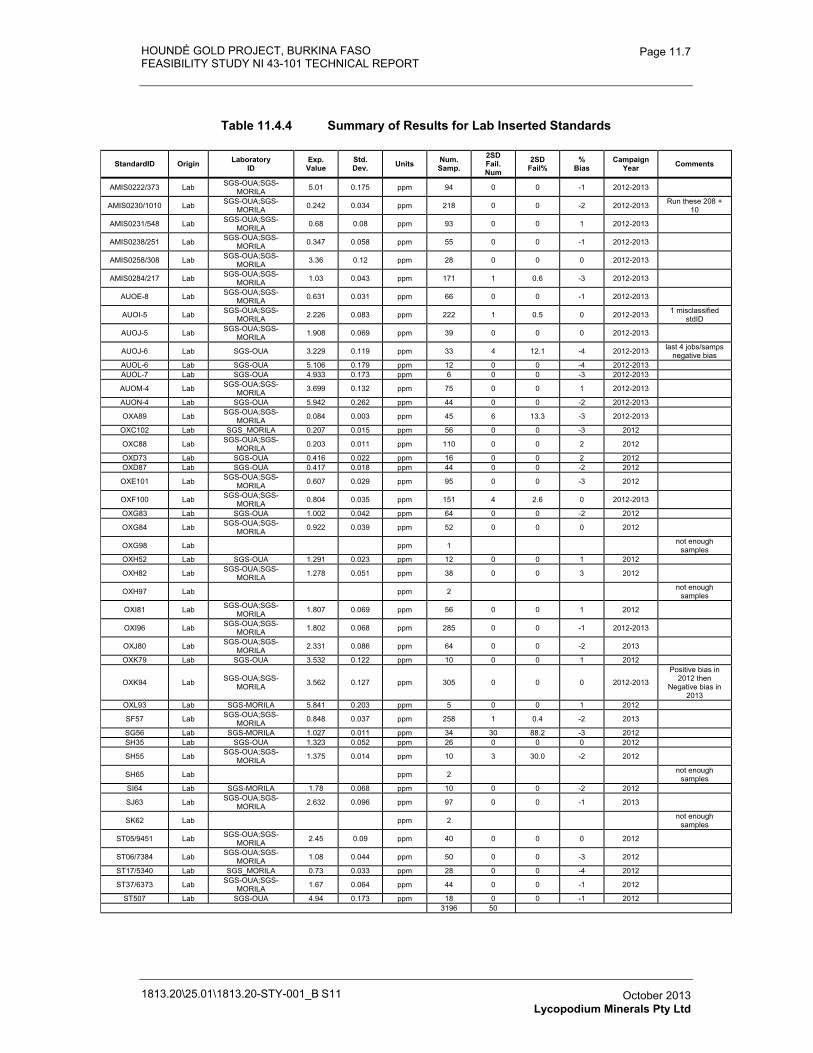
HOUNDÉ GOLD PROJECT, BURKINA FASO FEASIBILITY STUDY NI 43-101 TECHNICAL REPORT
1813.20\25.01\1813.20-STY-001_B S11
Page 11.7
October 2013 Lycopodium Minerals Pty Ltd
Table 11.4.4 Summary of Results for Lab Inserted Standards
StandardID Origin Laboratory ID
Exp.Value
Std. Dev. Units Num.
Samp. 2SDFail.Num
2SD Fail%
%Bias
Campaign Year Comments
AMIS0222/373 Lab SGS-OUA;SGS-MORILA 5.01 0.175 ppm 94 0 0 -1 2012-2013
AMIS0230/1010 Lab SGS-OUA;SGS-MORILA 0.242 0.034 ppm 218 0 0 -2 2012-2013 Run these 208 +
10
AMIS0231/548 Lab SGS-OUA;SGS-MORILA 0.68 0.08 ppm 93 0 0 1 2012-2013
AMIS0238/251 Lab SGS-OUA;SGS-MORILA 0.347 0.058 ppm 55 0 0 -1 2012-2013
AMIS0258/308 Lab SGS-OUA;SGS-MORILA 3.36 0.12 ppm 28 0 0 0 2012-2013
AMIS0284/217 Lab SGS-OUA;SGS-MORILA 1.03 0.043 ppm 171 1 0.6 -3 2012-2013
AUOE-8 Lab SGS-OUA;SGS-MORILA 0.631 0.031 ppm 66 0 0 -1 2012-2013
AUOI-5 Lab SGS-OUA;SGS-MORILA 2.226 0.083 ppm 222 1 0.5 0 2012-2013 1 misclassified
stdID
AUOJ-5 Lab SGS-OUA;SGS-MORILA 1.908 0.069 ppm 39 0 0 0 2012-2013
AUOJ-6 Lab SGS-OUA 3.229 0.119 ppm 33 4 12.1 -4 2012-2013 last 4 jobs/samps negative bias
AUOL-6 Lab SGS-OUA 5.106 0.179 ppm 12 0 0 -4 2012-2013 AUOL-7 Lab SGS-OUA 4.933 0.173 ppm 6 0 0 -3 2012-2013
AUOM-4 Lab SGS-OUA;SGS-MORILA 3.699 0.132 ppm 75 0 0 1 2012-2013
AUON-4 Lab SGS-OUA 5.942 0.262 ppm 44 0 0 -2 2012-2013
OXA89 Lab SGS-OUA;SGS-MORILA 0.084 0.003 ppm 45 6 13.3 -3 2012-2013
OXC102 Lab SGS_MORILA 0.207 0.015 ppm 56 0 0 -3 2012
OXC88 Lab SGS-OUA;SGS-MORILA 0.203 0.011 ppm 110 0 0 2 2012
OXD73 Lab SGS-OUA 0.416 0.022 ppm 16 0 0 2 2012 OXD87 Lab SGS-OUA 0.417 0.018 ppm 44 0 0 -2 2012
OXE101 Lab SGS-OUA;SGS-MORILA 0.607 0.029 ppm 95 0 0 -3 2012
OXF100 Lab SGS-OUA;SGS-MORILA 0.804 0.035 ppm 151 4 2.6 0 2012-2013
OXG83 Lab SGS-OUA 1.002 0.042 ppm 64 0 0 -2 2012
OXG84 Lab SGS-OUA;SGS-MORILA 0.922 0.039 ppm 52 0 0 0 2012
OXG98 Lab ppm 1 not enough samples
OXH52 Lab SGS-OUA 1.291 0.023 ppm 12 0 0 1 2012
OXH82 Lab SGS-OUA;SGS-MORILA 1.278 0.051 ppm 38 0 0 3 2012
OXH97 Lab ppm 2 not enough samples
OXI81 Lab SGS-OUA;SGS-MORILA 1.807 0.069 ppm 56 0 0 1 2012
OXI96 Lab SGS-OUA;SGS-MORILA 1.802 0.068 ppm 285 0 0 -1 2012-2013
OXJ80 Lab SGS-OUA;SGS-MORILA 2.331 0.086 ppm 64 0 0 -2 2013
OXK79 Lab SGS-OUA 3.532 0.122 ppm 10 0 0 1 2012
OXK94 Lab SGS-OUA;SGS-MORILA 3.562 0.127 ppm 305 0 0 0 2012-2013
Positive bias in 2012 then
Negative bias in 2013
OXL93 Lab SGS-MORILA 5.841 0.203 ppm 5 0 0 1 2012
SF57 Lab SGS-OUA;SGS-MORILA 0.848 0.037 ppm 258 1 0.4 -2 2013
SG56 Lab SGS-MORILA 1.027 0.011 ppm 34 30 88.2 -3 2012 SH35 Lab SGS-OUA 1.323 0.052 ppm 26 0 0 0 2012
SH55 Lab SGS-OUA;SGS-MORILA 1.375 0.014 ppm 10 3 30.0 -2 2012
SH65 Lab ppm 2 not enough samples
SI64 Lab SGS-MORILA 1.78 0.068 ppm 10 0 0 -2 2012
SJ63 Lab SGS-OUA;SGS-MORILA 2.632 0.096 ppm 97 0 0 -1 2013
SK62 Lab ppm 2 not enough samples
ST05/9451 Lab SGS-OUA;SGS-MORILA 2.45 0.09 ppm 40 0 0 0 2012
ST06/7384 Lab SGS-OUA;SGS-MORILA 1.08 0.044 ppm 50 0 0 -3 2012
ST17/5340 Lab SGS_MORILA 0.73 0.033 ppm 28 0 0 -4 2012
ST37/6373 Lab SGS-OUA;SGS-MORILA 1.67 0.064 ppm 44 0 0 -1 2012
ST507 Lab SGS-OUA 4.94 0.173 ppm 18 0 0 -1 2012 3196 50
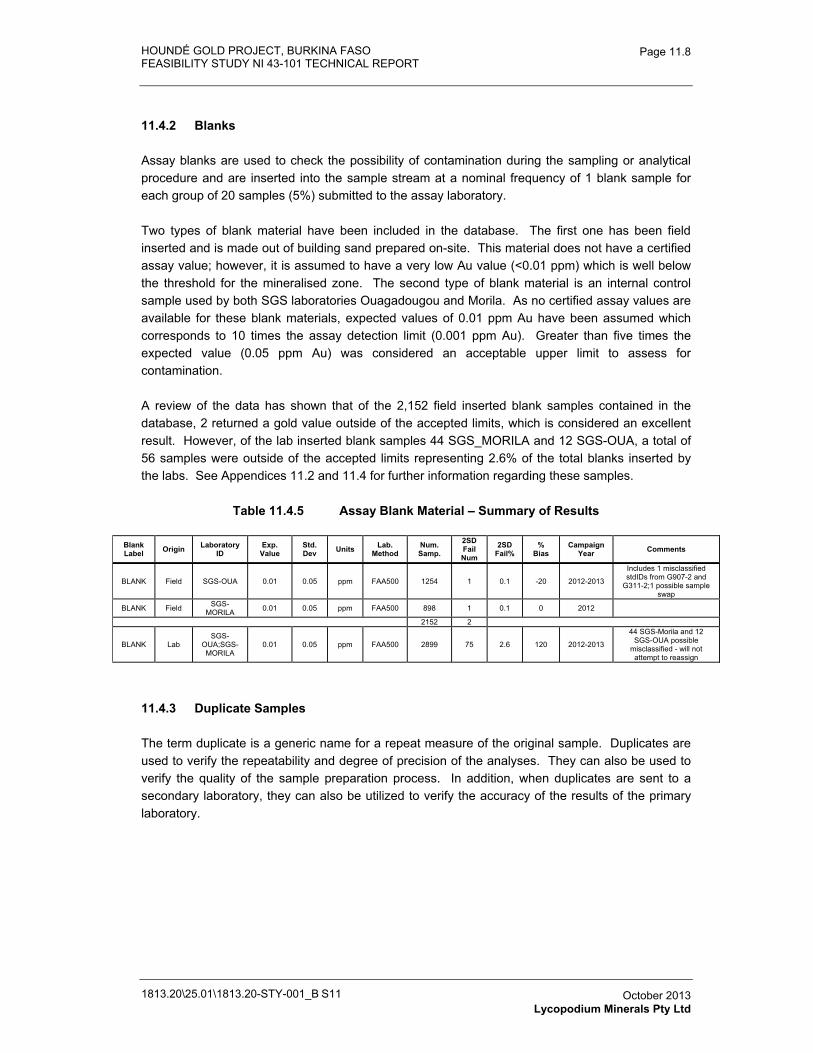
HOUNDÉ GOLD PROJECT, BURKINA FASO FEASIBILITY STUDY NI 43-101 TECHNICAL REPORT
1813.20\25.01\1813.20-STY-001_B S11
Page 11.8
October 2013 Lycopodium Minerals Pty Ltd
11.4.2 Blanks
Assay blanks are used to check the possibility of contamination during the sampling or analytical procedure and are inserted into the sample stream at a nominal frequency of 1 blank sample for each group of 20 samples (5%) submitted to the assay laboratory.
Two types of blank material have been included in the database. The first one has been field inserted and is made out of building sand prepared on-site. This material does not have a certified assay value; however, it is assumed to have a very low Au value (<0.01 ppm) which is well below the threshold for the mineralised zone. The second type of blank material is an internal control sample used by both SGS laboratories Ouagadougou and Morila. As no certified assay values are available for these blank materials, expected values of 0.01 ppm Au have been assumed which corresponds to 10 times the assay detection limit (0.001 ppm Au). Greater than five times the expected value (0.05 ppm Au) was considered an acceptable upper limit to assess for contamination.
A review of the data has shown that of the 2,152 field inserted blank samples contained in the database, 2 returned a gold value outside of the accepted limits, which is considered an excellent result. However, of the lab inserted blank samples 44 SGS_MORILA and 12 SGS-OUA, a total of 56 samples were outside of the accepted limits representing 2.6% of the total blanks inserted by the labs. See Appendices 11.2 and 11.4 for further information regarding these samples.
Table 11.4.5 Assay Blank Material – Summary of Results
Blank Label Origin Laboratory
IDExp.
Value Std. Dev Units Lab.
MethodNum.Samp.
2SDFail Num
2SD Fail%
%Bias
Campaign Year Comments
BLANK Field SGS-OUA 0.01 0.05 ppm FAA500 1254 1 0.1 -20 2012-2013
Includes 1 misclassified stdIDs from G907-2 and
G311-2;1 possible sample swap
BLANK Field SGS-MORILA 0.01 0.05 ppm FAA500 898 1 0.1 0 2012
2152 2
BLANK Lab SGS-
OUA;SGS-MORILA
0.01 0.05 ppm FAA500 2899 75 2.6 120 2012-2013
44 SGS-Morila and 12 SGS-OUA possible
misclassified - will not attempt to reassign
11.4.3 Duplicate Samples
The term duplicate is a generic name for a repeat measure of the original sample. Duplicates are used to verify the repeatability and degree of precision of the analyses. They can also be used to verify the quality of the sample preparation process. In addition, when duplicates are sent to a secondary laboratory, they can also be utilized to verify the accuracy of the results of the primary laboratory.
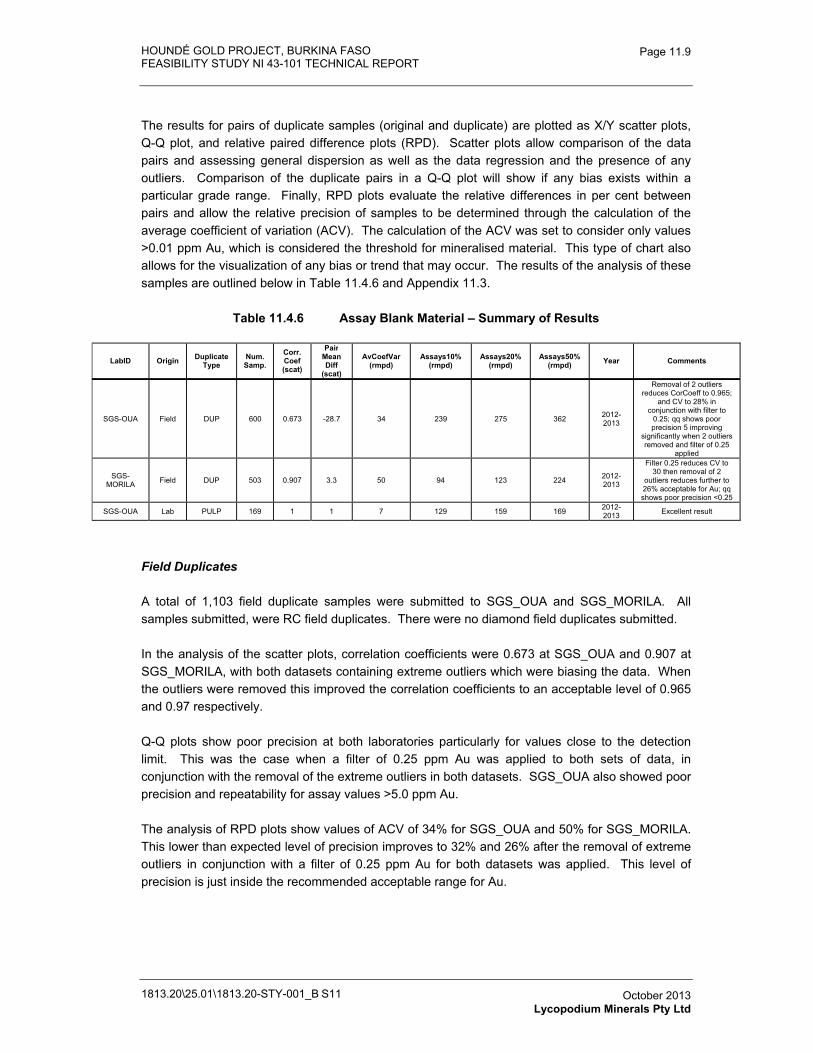
HOUNDÉ GOLD PROJECT, BURKINA FASO FEASIBILITY STUDY NI 43-101 TECHNICAL REPORT
1813.20\25.01\1813.20-STY-001_B S11
Page 11.9
October 2013 Lycopodium Minerals Pty Ltd
The results for pairs of duplicate samples (original and duplicate) are plotted as X/Y scatter plots, Q-Q plot, and relative paired difference plots (RPD). Scatter plots allow comparison of the data pairs and assessing general dispersion as well as the data regression and the presence of any outliers. Comparison of the duplicate pairs in a Q-Q plot will show if any bias exists within a particular grade range. Finally, RPD plots evaluate the relative differences in per cent between pairs and allow the relative precision of samples to be determined through the calculation of the average coefficient of variation (ACV). The calculation of the ACV was set to consider only values >0.01 ppm Au, which is considered the threshold for mineralised material. This type of chart also allows for the visualization of any bias or trend that may occur. The results of the analysis of these samples are outlined below in Table 11.4.6 and Appendix 11.3.
Table 11.4.6 Assay Blank Material – Summary of Results
LabID Origin Duplicate Type
Num.Samp.
Corr.Coef (scat)
PairMean Diff
(scat)
AvCoefVar (rmpd)
Assays10% (rmpd)
Assays20% (rmpd)
Assays50% (rmpd) Year Comments
SGS-OUA Field DUP 600 0.673 -28.7 34 239 275 362 2012-2013
Removal of 2 outliers reduces CorCoeff to 0.965;
and CV to 28% in conjunction with filter to
0.25; qq shows poor precision 5 improving
significantly when 2 outliers removed and filter of 0.25
applied
SGS-MORILA Field DUP 503 0.907 3.3 50 94 123 224 2012-
2013
Filter 0.25 reduces CV to 30 then removal of 2
outliers reduces further to 26% acceptable for Au; qq shows poor precision <0.25
SGS-OUA Lab PULP 169 1 1 7 129 159 169 2012-2013 Excellent result
Field Duplicates
A total of 1,103 field duplicate samples were submitted to SGS_OUA and SGS_MORILA. All samples submitted, were RC field duplicates. There were no diamond field duplicates submitted.
In the analysis of the scatter plots, correlation coefficients were 0.673 at SGS_OUA and 0.907 at SGS_MORILA, with both datasets containing extreme outliers which were biasing the data. When the outliers were removed this improved the correlation coefficients to an acceptable level of 0.965 and 0.97 respectively.
Q-Q plots show poor precision at both laboratories particularly for values close to the detection limit. This was the case when a filter of 0.25 ppm Au was applied to both sets of data, in conjunction with the removal of the extreme outliers in both datasets. SGS_OUA also showed poor precision and repeatability for assay values >5.0 ppm Au.
The analysis of RPD plots show values of ACV of 34% for SGS_OUA and 50% for SGS_MORILA. This lower than expected level of precision improves to 32% and 26% after the removal of extreme outliers in conjunction with a filter of 0.25 ppm Au for both datasets was applied. This level of precision is just inside the recommended acceptable range for Au.
HOUNDÉ GOLD PROJECT, BURKINA FASO FEASIBILITY STUDY NI 43-101 TECHNICAL REPORT
1813.20\25.01\1813.20-STY-001_B S11
Page 11.10
October 2013 Lycopodium Minerals Pty Ltd
The field duplicate assays show acceptable precision at both laboratories after removal of outliers, however, it is recommended that the presence of these outliers be investigated as it could indicate:
� Sampling procedure / issues associated with low homogeneity of the pulp samples; and
� Poor precision of the assay laboratory.
Coarse Duplicates (Rejects)
There were no coarse duplicates available for analysis for this project.
Pulp Duplicates
There were no client initiated pulp duplicates available for analysis for this project.
A total of 169 internal laboratory pulp duplicate samples were analysed by SGS_OUA on approximately 1:20 samples per batch from 2012 onwards.
The scatter plot shows a correlation coefficient of 1.0 and an ACV of 7% which is an excellent result.
Umpire Duplicates
There were no umpire duplicate samples available for analysis for this project.
11.4.4 Recommendations
It is recommended for future drilling campaigns, that a smaller selection of certified standards be used, in order to have a more meaningful number of results for analysis.
Although the performance of the blank assay samples is very good, the natural variability in the assays for the BLANK (internal material) makes the determination of possible contamination issues difficult. A certified blank assay sample should be sourced to ensure a more homogenous and predictable assay result.
The levels of precision observed in field duplicates are considered acceptable. However, the presence of outliers creating bias in the datasets at both laboratories should be investigated as it may indicate underlying issues with laboratory procedures.
For diamond drill samples, the recommended standard practise is that one field duplicate is nominally inserted into the sample stream for each 30 samples (3.3%). The duplicate is generally a quarter cut core sample obtained from the remaining half core assay sample. When RC drilling, the supervising geologist should select one or two “mineralised” metre samples to be re-split and submitted as field duplicates.
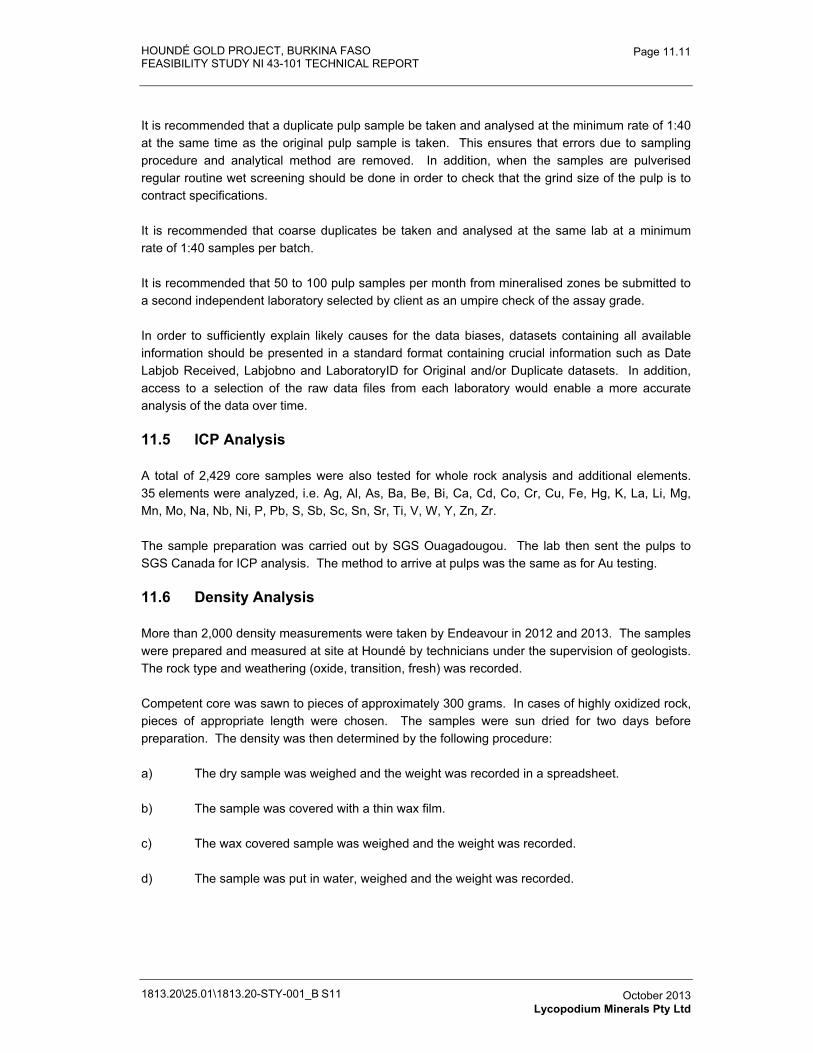
HOUNDÉ GOLD PROJECT, BURKINA FASO FEASIBILITY STUDY NI 43-101 TECHNICAL REPORT
1813.20\25.01\1813.20-STY-001_B S11
Page 11.11
October 2013 Lycopodium Minerals Pty Ltd
It is recommended that a duplicate pulp sample be taken and analysed at the minimum rate of 1:40 at the same time as the original pulp sample is taken. This ensures that errors due to sampling procedure and analytical method are removed. In addition, when the samples are pulverised regular routine wet screening should be done in order to check that the grind size of the pulp is to contract specifications.
It is recommended that coarse duplicates be taken and analysed at the same lab at a minimum rate of 1:40 samples per batch.
It is recommended that 50 to 100 pulp samples per month from mineralised zones be submitted to a second independent laboratory selected by client as an umpire check of the assay grade.
In order to sufficiently explain likely causes for the data biases, datasets containing all available information should be presented in a standard format containing crucial information such as Date Labjob Received, Labjobno and LaboratoryID for Original and/or Duplicate datasets. In addition, access to a selection of the raw data files from each laboratory would enable a more accurate analysis of the data over time.
11.5 ICP Analysis
A total of 2,429 core samples were also tested for whole rock analysis and additional elements. 35 elements were analyzed, i.e. Ag, Al, As, Ba, Be, Bi, Ca, Cd, Co, Cr, Cu, Fe, Hg, K, La, Li, Mg, Mn, Mo, Na, Nb, Ni, P, Pb, S, Sb, Sc, Sn, Sr, Ti, V, W, Y, Zn, Zr.
The sample preparation was carried out by SGS Ouagadougou. The lab then sent the pulps to SGS Canada for ICP analysis. The method to arrive at pulps was the same as for Au testing.
11.6 Density Analysis
More than 2,000 density measurements were taken by Endeavour in 2012 and 2013. The samples were prepared and measured at site at Houndé by technicians under the supervision of geologists. The rock type and weathering (oxide, transition, fresh) was recorded.
Competent core was sawn to pieces of approximately 300 grams. In cases of highly oxidized rock, pieces of appropriate length were chosen. The samples were sun dried for two days before preparation. The density was then determined by the following procedure:
a) The dry sample was weighed and the weight was recorded in a spreadsheet.
b) The sample was covered with a thin wax film.
c) The wax covered sample was weighed and the weight was recorded.
d) The sample was put in water, weighed and the weight was recorded.
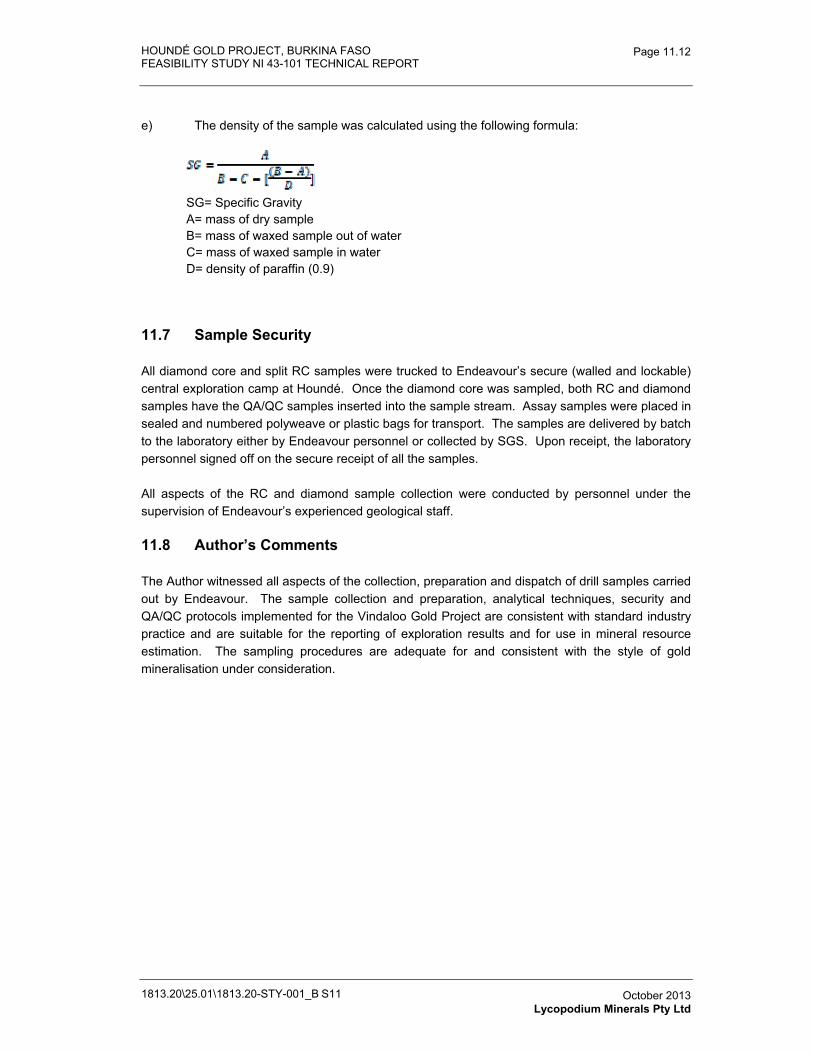
HOUNDÉ GOLD PROJECT, BURKINA FASO FEASIBILITY STUDY NI 43-101 TECHNICAL REPORT
1813.20\25.01\1813.20-STY-001_B S11
Page 11.12
October 2013 Lycopodium Minerals Pty Ltd
e) The density of the sample was calculated using the following formula:
SG= Specific Gravity A= mass of dry sample B= mass of waxed sample out of water C= mass of waxed sample in water D= density of paraffin (0.9)
11.7 Sample Security
All diamond core and split RC samples were trucked to Endeavour’s secure (walled and lockable) central exploration camp at Houndé. Once the diamond core was sampled, both RC and diamond samples have the QA/QC samples inserted into the sample stream. Assay samples were placed in sealed and numbered polyweave or plastic bags for transport. The samples are delivered by batch to the laboratory either by Endeavour personnel or collected by SGS. Upon receipt, the laboratory personnel signed off on the secure receipt of all the samples.
All aspects of the RC and diamond sample collection were conducted by personnel under the supervision of Endeavour’s experienced geological staff.
11.8 Author’s Comments
The Author witnessed all aspects of the collection, preparation and dispatch of drill samples carried out by Endeavour. The sample collection and preparation, analytical techniques, security and QA/QC protocols implemented for the Vindaloo Gold Project are consistent with standard industry practice and are suitable for the reporting of exploration results and for use in mineral resource estimation. The sampling procedures are adequate for and consistent with the style of gold mineralisation under consideration.
HOUNDÉ GOLD PROJECT, BURKINA FASO
FEASIBILITY STUDY NI 43-101 TECHNICAL REPORT
1813.20-STY-001
Table of Contents Page
12.0� DATA VERIFICATION 12.1�12.1� Project Drill Hole Database 12.1�12.2� QAQC Analysis 12.3�12.3� Independent Verification Samples 12.3�12.4� Author’s Statement 12.5�
TABLESTable 12.1.1� Drill hole Database Structure (Houndé Update_20130507.mdb) 12.2�Table 12.3.1� Independent Verification Samples Summary 12.4�
FIGURESFigure 12.3.1� Plot of Independent Verification Samples 12.5�
1813.20\25.01\1813.20-STY-001_B S12 October 2013 Cube Consulting Pty Ltd
HOUNDÉ GOLD PROJECT, BURKINA FASO FEASIBILITY STUDY NI 43-101 TECHNICAL REPORT
1813.20\25.01\1813.20-STY-001_B S12
Page 12.1
October 2013 Cube Consulting Pty Ltd
12.0 DATA VERIFICATION
In accordance with National Instrument 43-101 guidelines, the Author visited the Vindaloo Project between 9 February and 13 February 2013.
The site visit involved comprehensive data verification, inspections and reviews of the following:
� geology and exploration history of the permit area;
� current drilling and sampling procedures;
� ground checking of main Project area;
� geochemistry and drilling data;
� QA/QC procedures and control data;
� data and database management systems;
� SGS analytical laboratory in Ouagadougou;
� sample handling and storage facility in Houndé; and
� independent verification sampling of mineralised gold intercepts from the active drilling program.
12.1 Project Drill Hole Database
The drill hole database is managed on site by Endeavour geological staff. Cube was provided with the final database dated 7 May 2013 and an updated database that corrected some minor previous errors on 30 July 2013. For the purposes of this report, the May database was used.
Cube completed validation checks prior to final interpretation and compositing for grade estimation. The validation checks included:
� graphically check collar location with respect to topography;
� graphically check downhole survey;
� check discrepancies in maximum depths between collar, assay, survey and geology records;
� check for overlapping and duplicate assay and geology records; and
� Comparison of database assay records against original digital laboratory certificates.
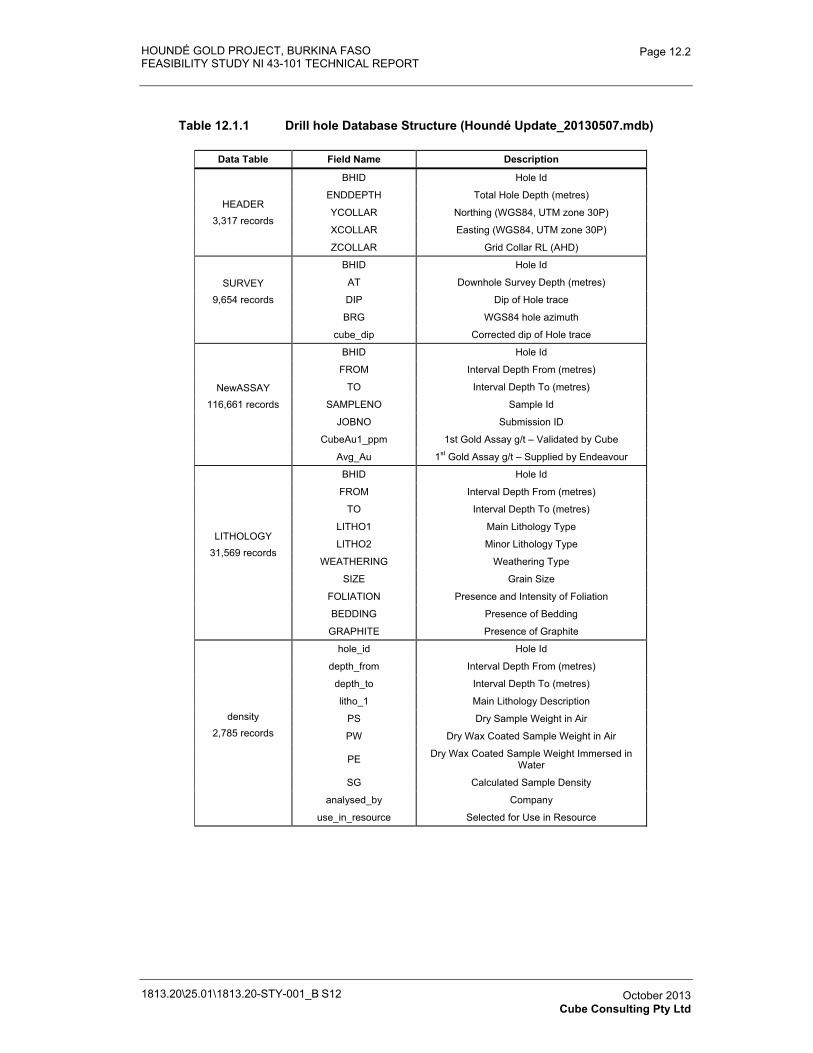
HOUNDÉ GOLD PROJECT, BURKINA FASO FEASIBILITY STUDY NI 43-101 TECHNICAL REPORT
1813.20\25.01\1813.20-STY-001_B S12
Page 12.2
October 2013 Cube Consulting Pty Ltd
Table 12.1.1 Drill hole Database Structure (Houndé Update_20130507.mdb)
Data Table Field Name Description
HEADER3,317 records
BHID Hole Id
ENDDEPTH Total Hole Depth (metres)
YCOLLAR Northing (WGS84, UTM zone 30P)
XCOLLAR Easting (WGS84, UTM zone 30P)
ZCOLLAR Grid Collar RL (AHD)
SURVEY 9,654 records
BHID Hole Id
AT Downhole Survey Depth (metres)
DIP Dip of Hole trace
BRG WGS84 hole azimuth
cube_dip Corrected dip of Hole trace
NewASSAY 116,661 records
BHID Hole Id
FROM Interval Depth From (metres)
TO Interval Depth To (metres)
SAMPLENO Sample Id
JOBNO Submission ID
CubeAu1_ppm 1st Gold Assay g/t – Validated by Cube
Avg_Au 1st Gold Assay g/t – Supplied by Endeavour
LITHOLOGY 31,569 records
BHID Hole Id
FROM Interval Depth From (metres)
TO Interval Depth To (metres)
LITHO1 Main Lithology Type
LITHO2 Minor Lithology Type
WEATHERING Weathering Type
SIZE Grain Size
FOLIATION Presence and Intensity of Foliation
BEDDING Presence of Bedding
GRAPHITE Presence of Graphite
density2,785 records
hole_id Hole Id
depth_from Interval Depth From (metres)
depth_to Interval Depth To (metres)
litho_1 Main Lithology Description
PS Dry Sample Weight in Air
PW Dry Wax Coated Sample Weight in Air
PE Dry Wax Coated Sample Weight Immersed in Water
SG Calculated Sample Density
analysed_by Company
use_in_resource Selected for Use in Resource
HOUNDÉ GOLD PROJECT, BURKINA FASO FEASIBILITY STUDY NI 43-101 TECHNICAL REPORT
1813.20\25.01\1813.20-STY-001_B S12
Page 12.3
October 2013 Cube Consulting Pty Ltd
Table 12.1.1 summarises the main tables and fields in the database used for the Mineral Resource estimation. Three fields were introduced into the database as part of the audit completed by Cube. “Cube_dip” was included in the “SURVEY” table to remove inconsistencies with the recording of the down hole survey declination. “Use_in_resource” was included in the “density” table to identify the measurements considered by Cube as acceptable for use in the resource estimation. “CubeAu1_ppm” was included in the NewASSAY table and represents the validated Au field used for grade estimation.
Electronic laboratory certificate files supplied by SGS allowed 43% of the entire Au assay data to be validated. The 43% of records verified represent 65% of the assays used directly for the compositing and estimation process.
Subsequent to the completion of the Mineral Resource estimate, an additional drill hole database was supplied to Cube on the 31st July 2013. This database included corrections made to the azimuth of some drill holes which were not adjusted for the magnetic declination (-3.6 degrees). This error only materially affects holes with intersections below 300 m drill length. At this depth the error begins to exceed 10 metres and is present in approximately 5 drill holes. Given the error only effects the drill hole azimuth and the resulting correction is along strike of the mineralisation, the net effect is not considered material.
12.2 QAQC Analysis
A program of quality control (QC) and quality assurance (QA) has been undertaken by Endeavour to check for contamination, accuracy and precision within the drill sampling and assaying process. The types of check samples that have been introduced into the sample stream include blank samples (“blanks”), certified reference materials (“standards”), and field duplicate samples.
Overall, the QAQC samples have performed satisfactorily and indicate the sample data is suitable for mineral resource estimation.
12.3 Independent Verification Samples
During the author’s site visit, a total of 31 independent samples from 2 RC holes were collected. The holes were selected at random and the sample intervals were chosen to include a range of gold grades. The samples were split from the remaining coarse reject sample bag. For the sample submission, 2 standards and 1 blank sample were included in the sample sequence. The author personally transported the samples to the SGS laboratory in Ouagadougou. The sample submission requested analysis for gold using 50 g Fire Assay with AAS finish as this was the same technique employed for all resource sampling. The results were emailed electronically from the laboratory to the author. The results are tabulated in Table 12.3.1 and also presented graphically in Figure 12.3.1.
There is generally a good correlation between the original and independently taken samples and the results are considered by the author to be acceptable.
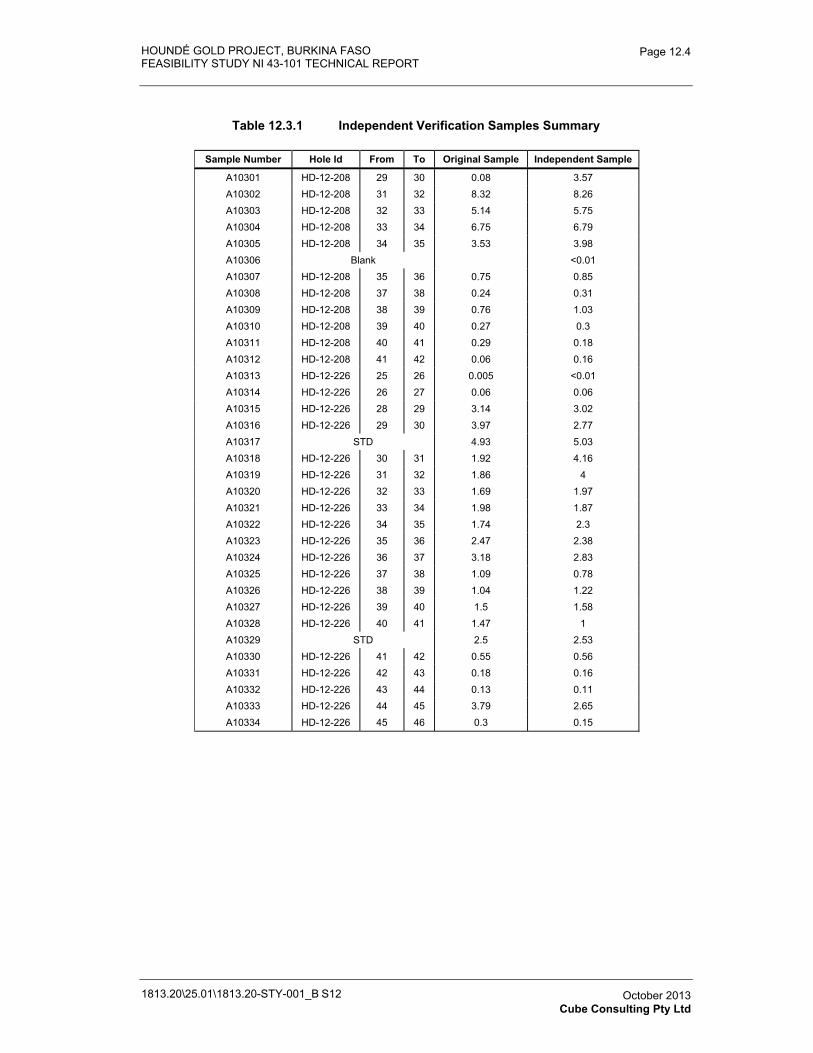
HOUNDÉ GOLD PROJECT, BURKINA FASO FEASIBILITY STUDY NI 43-101 TECHNICAL REPORT
1813.20\25.01\1813.20-STY-001_B S12
Page 12.4
October 2013 Cube Consulting Pty Ltd
Table 12.3.1 Independent Verification Samples Summary
Sample Number Hole Id From To Original Sample Independent Sample
A10301 HD-12-208 29 30 0.08 3.57 A10302 HD-12-208 31 32 8.32 8.26 A10303 HD-12-208 32 33 5.14 5.75 A10304 HD-12-208 33 34 6.75 6.79 A10305 HD-12-208 34 35 3.53 3.98 A10306 Blank <0.01 A10307 HD-12-208 35 36 0.75 0.85 A10308 HD-12-208 37 38 0.24 0.31 A10309 HD-12-208 38 39 0.76 1.03 A10310 HD-12-208 39 40 0.27 0.3 A10311 HD-12-208 40 41 0.29 0.18 A10312 HD-12-208 41 42 0.06 0.16 A10313 HD-12-226 25 26 0.005 <0.01 A10314 HD-12-226 26 27 0.06 0.06 A10315 HD-12-226 28 29 3.14 3.02 A10316 HD-12-226 29 30 3.97 2.77 A10317 STD 4.93 5.03 A10318 HD-12-226 30 31 1.92 4.16 A10319 HD-12-226 31 32 1.86 4 A10320 HD-12-226 32 33 1.69 1.97 A10321 HD-12-226 33 34 1.98 1.87 A10322 HD-12-226 34 35 1.74 2.3 A10323 HD-12-226 35 36 2.47 2.38 A10324 HD-12-226 36 37 3.18 2.83 A10325 HD-12-226 37 38 1.09 0.78 A10326 HD-12-226 38 39 1.04 1.22 A10327 HD-12-226 39 40 1.5 1.58 A10328 HD-12-226 40 41 1.47 1 A10329 STD 2.5 2.53 A10330 HD-12-226 41 42 0.55 0.56 A10331 HD-12-226 42 43 0.18 0.16 A10332 HD-12-226 43 44 0.13 0.11 A10333 HD-12-226 44 45 3.79 2.65 A10334 HD-12-226 45 46 0.3 0.15
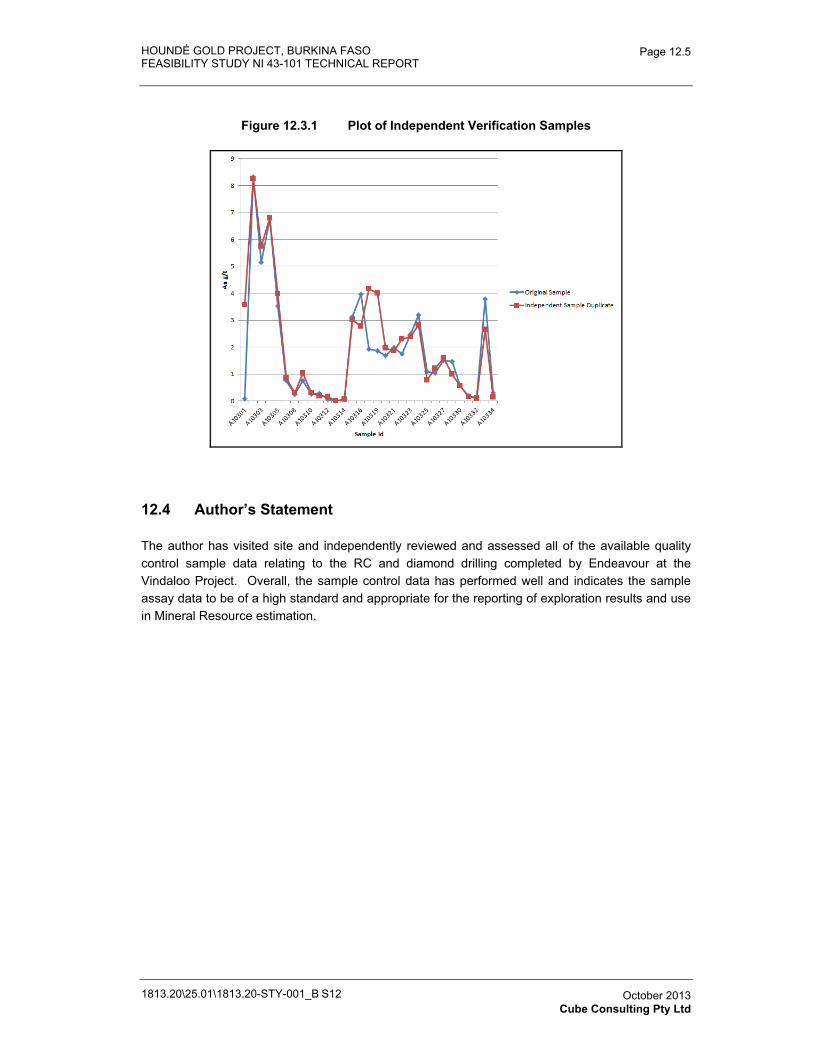
HOUNDÉ GOLD PROJECT, BURKINA FASO FEASIBILITY STUDY NI 43-101 TECHNICAL REPORT
1813.20\25.01\1813.20-STY-001_B S12
Page 12.5
October 2013 Cube Consulting Pty Ltd
Figure 12.3.1 Plot of Independent Verification Samples
12.4 Author’s Statement
The author has visited site and independently reviewed and assessed all of the available quality control sample data relating to the RC and diamond drilling completed by Endeavour at the Vindaloo Project. Overall, the sample control data has performed well and indicates the sample assay data to be of a high standard and appropriate for the reporting of exploration results and use in Mineral Resource estimation.
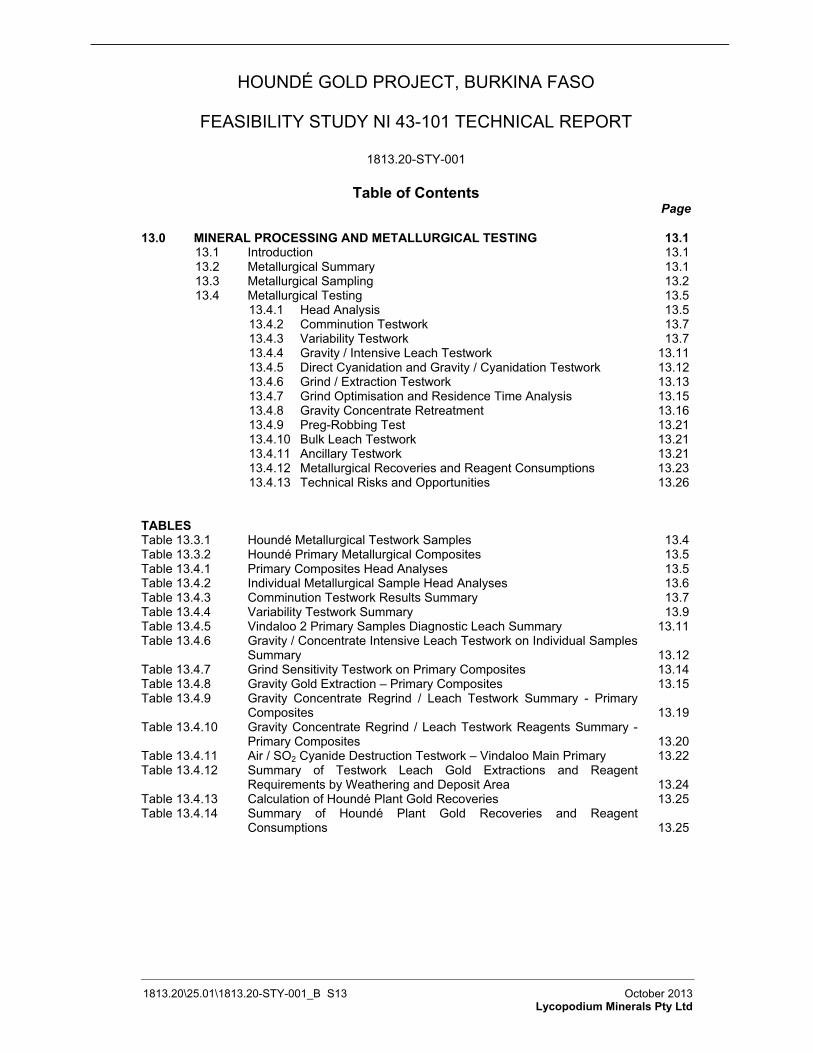
HOUNDÉ GOLD PROJECT, BURKINA FASO
FEASIBILITY STUDY NI 43-101 TECHNICAL REPORT
1813.20-STY-001
Table of Contents Page
13.0� MINERAL PROCESSING AND METALLURGICAL TESTING 13.1�13.1� Introduction 13.1�13.2� Metallurgical Summary 13.1�13.3� Metallurgical Sampling 13.2�13.4� Metallurgical Testing 13.5�
13.4.1� Head Analysis 13.5�13.4.2� Comminution Testwork 13.7�13.4.3� Variability Testwork 13.7�13.4.4� Gravity / Intensive Leach Testwork 13.11�13.4.5� Direct Cyanidation and Gravity / Cyanidation Testwork 13.12�13.4.6� Grind / Extraction Testwork 13.13�13.4.7� Grind Optimisation and Residence Time Analysis 13.15�13.4.8� Gravity Concentrate Retreatment 13.16�13.4.9� Preg-Robbing Test 13.21�13.4.10� Bulk Leach Testwork 13.21�13.4.11� Ancillary Testwork 13.21�13.4.12� Metallurgical Recoveries and Reagent Consumptions 13.23�13.4.13� Technical Risks and Opportunities 13.26�
TABLESTable 13.3.1� Houndé Metallurgical Testwork Samples 13.4�Table 13.3.2� Houndé Primary Metallurgical Composites 13.5�Table 13.4.1� Primary Composites Head Analyses 13.5�Table 13.4.2� Individual Metallurgical Sample Head Analyses 13.6�Table 13.4.3� Comminution Testwork Results Summary 13.7�Table 13.4.4� Variability Testwork Summary 13.9�Table 13.4.5� Vindaloo 2 Primary Samples Diagnostic Leach Summary 13.11�Table 13.4.6� Gravity / Concentrate Intensive Leach Testwork on Individual Samples
Summary 13.12�Table 13.4.7� Grind Sensitivity Testwork on Primary Composites 13.14�Table 13.4.8� Gravity Gold Extraction – Primary Composites 13.15�Table 13.4.9� Gravity Concentrate Regrind / Leach Testwork Summary - Primary
Composites 13.19�Table 13.4.10� Gravity Concentrate Regrind / Leach Testwork Reagents Summary -
Primary Composites 13.20�Table 13.4.11� Air / SO2 Cyanide Destruction Testwork – Vindaloo Main Primary 13.22�Table 13.4.12� Summary of Testwork Leach Gold Extractions and Reagent
Requirements by Weathering and Deposit Area 13.24�Table 13.4.13� Calculation of Houndé Plant Gold Recoveries 13.25�Table 13.4.14� Summary of Houndé Plant Gold Recoveries and Reagent
Consumptions 13.25�
1813.20\25.01\1813.20-STY-001_B S13 October 2013 Lycopodium Minerals Pty Ltd
HOUNDÉ GOLD PROJECT, BURKINA FASO
FEASIBILITY STUDY NI 43-101 TECHNICAL REPORT
1813.20-STY-001
Table of Contents (Continued) Page
1813.20\25.01\1813.20-STY-001_B S13 October 2013 Lycopodium Minerals Pty Ltd
FIGURESFigure 13.3.1� Metallurgical Sample Drill Hole Locations 13.3�Figure 13.4.1� Variability Testwork on Vindaloo Primary Samples 13.10�Figure 13.4.2� Variability Testwork on other Houndé Primary Samples 13.10�Figure 13.4.3� Variability Testwork on Saprolite and Transition Samples 13.11�Figure 13.4.4� Effect of Gravity Stage on Gold Extraction 13.13�Figure 13.4.5� Effect of Grind on Total Gold Extraction – Vindaloo Main Primary 13.15�Figure 13.4.6� Gravity Concentrate Mass / Contained Gold Relationship – Vindaloo
Main Primary Composite 13.17�Figure 13.4.7� Effect of Concentrate Regrind on Overall Gold Extraction – Primary
Composites 13.21�
HOUNDÉ GOLD PROJECT, BURKINA FASO FEASIBILITY STUDY NI 43-101 TECHNICAL REPORT
1813.20\25.01\1813.20-STY-001_B S13
Page 13.1
October 2013 Lycopodium Minerals Pty Ltd
13.0 MINERAL PROCESSING AND METALLURGICAL TESTING
13.1 Introduction
Several comminution and metallurgical extraction testwork programmes have been performed on ore samples from the Houndé deposit. Two preliminary testwork programmes were completed on samples from the Houndé deposit under the supervision of Endeavour. The first programme was completed in 2010 at SGS Laboratory, Burkina Faso and the second programme was completed in 2011 at the Endeavour Mining Tabakoto Plant metallurgical laboratory, Mali. These programmes showed that the Houndé ores contain a significant amount of gravity gold and that high gold extraction by conventional cyanidation is achievable. Review of this testwork is not included in this section.
A third Houndé metallurgical testwork programme has been completed during 2013 at SGS Lakefield laboratory in Perth, Western Australia. This detailed testwork programme was developed and supervised by Endeavour with results interpreted by Lycopodium for use in the feasibility study. The results of the detailed programme are presented in this section of the report.
13.2 Metallurgical Summary
The metallurgical treatment route selected has been based on the results of the current testwork programme. Full testwork details and testwork results of the SGS testwork programme, conducted on the 5 primary ore composites and the 22 individual variability samples, are included in the SGS report available on request from Endeavour.
The Houndé project consists of 5 mining areas; Vindaloo, Vindaloo West, Vindaloo NE, Vindaloo 2 and Madras, and three levels of weathering; primary, transition and saprolite. The primary ores represent approximately 88% of the ore body with saprolite and transition ores making up the remaining 12%. Primary ore from the Vindaloo pit makes up 80% of the primary ores and is the major component of the Houndé deposit.
Comminution testwork indicated that the primary ores will require moderate grinding energy and have moderate abrasivity; however, the ores are highly competent and display a high resistance to impact breakage.
Gravity concentrates for all ores contained an average of 60% of the feed gold in 6% of the feed mass. Inclusion of a gravity concentration stage in the testwork procedure increased the leaching rate but had no impact on final overall gold extraction. A gravity stage was included in the testwork and in the plant design.
Grind sensitivity testwork on the primary composites indicated that lower residue grades, faster leaching rates and higher gold extractions are achieved with increasing fineness of grind. Whilst gold leaching continued to occur through to 48 hours, an optimum residence time of 24 hours was selected for the design and further testwork. The grind optimisation analysis indicated that similar net revenues at grinds of P80 106 and 75 μm were achieved. Evaluating the benefits against the increased costs led to selection of a conservative grind size of P80 90 μm for the design and for further testwork.
HOUNDÉ GOLD PROJECT, BURKINA FASO FEASIBILITY STUDY NI 43-101 TECHNICAL REPORT
1813.20\25.01\1813.20-STY-001_B S13
Page 13.2
October 2013 Lycopodium Minerals Pty Ltd
Gold extractions after 24 hours using gravity concentration and conventional cyanidation averaged 89% for the primary (excluding the low tonnage Vindaloo 2 ore), 93% for the transition and 95% for the saprolite ores.
Testwork to investigate regrinding of the gravity concentrate was conducted on all primary composites. The Vindaloo Main primary composite contained 46% free gold and 35% occluded gold in the 7% mass gravity concentrate. The relationship between mass pull to gravity concentrate and contained gold was investigated and showed that greater than 70% of the gold was recovered to a 2% mass gravity concentrate. Concentrate regrind and leaching testwork was completed at P80 25 μm, 15 μm and 10 μm with regrind improving gold extraction through liberation of occluded gold in the gravity concentrate. The finest concentrate regrind of P80 10 μm prior to leaching achieved the largest increase in extraction with the overall gold extraction increased by up to 7%. Separate leaching of the reground concentrate prior to combined leaching with the gravity tails is beneficial. Cyanide levels of 0.2 % w/v in the concentrate leach and 0.035% w/v in the combined leach were utilised.
High graphitic material from the western resource boundary that has potential for ore dilution was also tested. This graphitic material appears to have no preg-robbing characteristics and can be treated by conventional cyanidation.
Endeavour provided variability samples representative of the gold grades, lithologies and spatial distribution of the Houndé ore body. Variability testwork on the individual samples was completed to determine the level of variability within the Houndé ores and included a gravity concentration step but excluded the concentrate regrind step. While there is considerable variation in gold extraction throughout the ores, the variation for the same oxidation level within the same mining area is minor.
Ancillary testwork for plant design was conducted and indicates that the slurry rheology will not impact on processing, conventional aeration in the CIL is suitable and typical carbon loadings are achievable. Thickening testwork indicated that the primary ores will thicken with acceptable underflow densities. Cyanide destruction testwork showed that the air / SO2 process can be successfully employed to treat the CIL tailings stream to achieve CNWAD concentrations of less than 5 mg/L if required.
13.3 Metallurgical Sampling
The Houndé project consists of 4 deposit areas; Vindaloo, Vindaloo NE, Vindaloo 2 and Madras. Houndé ore mineralisation has been classified into three main types based on rock alteration and degree of weathering:
� Saprolite for strongly oxidised material found near the topographic surface
� Transition for weakly oxidised material, and
� Primary for unoxidised material located beneath the zone of weathering.
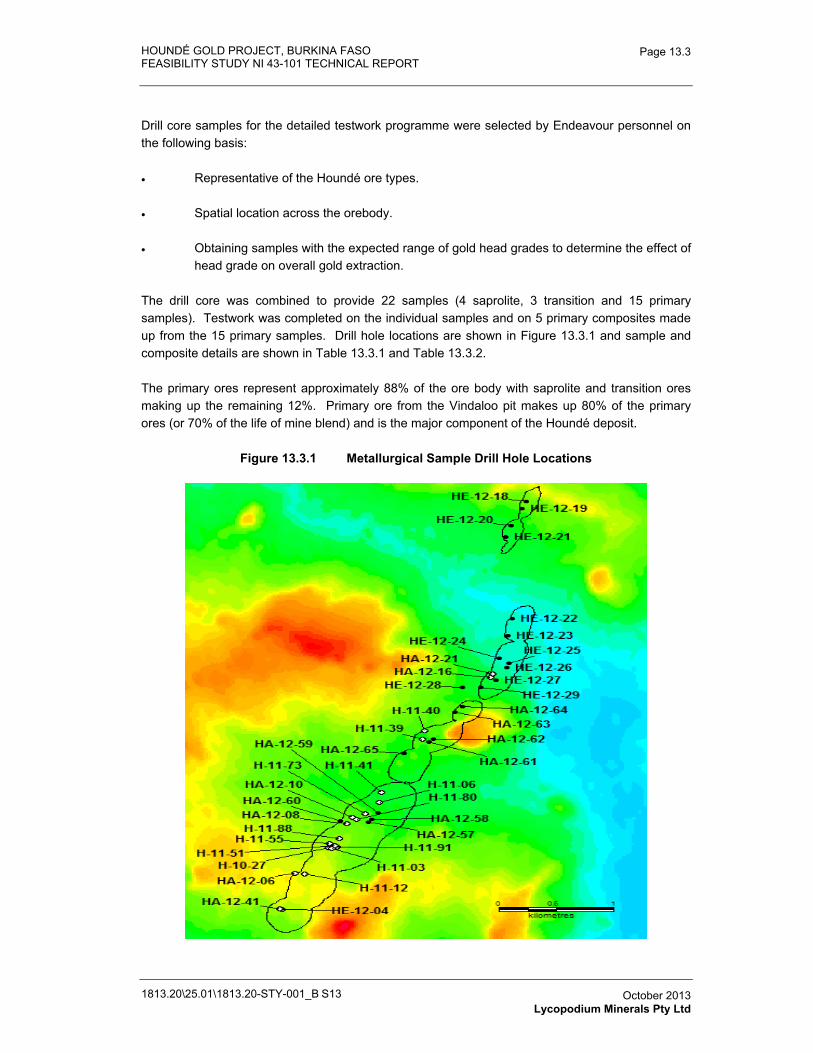
HOUNDÉ GOLD PROJECT, BURKINA FASO FEASIBILITY STUDY NI 43-101 TECHNICAL REPORT
1813.20\25.01\1813.20-STY-001_B S13
Page 13.3
October 2013 Lycopodium Minerals Pty Ltd
Drill core samples for the detailed testwork programme were selected by Endeavour personnel on the following basis:
� Representative of the Houndé ore types.
� Spatial location across the orebody.
� Obtaining samples with the expected range of gold head grades to determine the effect of head grade on overall gold extraction.
The drill core was combined to provide 22 samples (4 saprolite, 3 transition and 15 primary samples). Testwork was completed on the individual samples and on 5 primary composites made up from the 15 primary samples. Drill hole locations are shown in Figure 13.3.1 and sample and composite details are shown in Table 13.3.1 and Table 13.3.2.
The primary ores represent approximately 88% of the ore body with saprolite and transition ores making up the remaining 12%. Primary ore from the Vindaloo pit makes up 80% of the primary ores (or 70% of the life of mine blend) and is the major component of the Houndé deposit.
Figure 13.3.1 Metallurgical Sample Drill Hole Locations
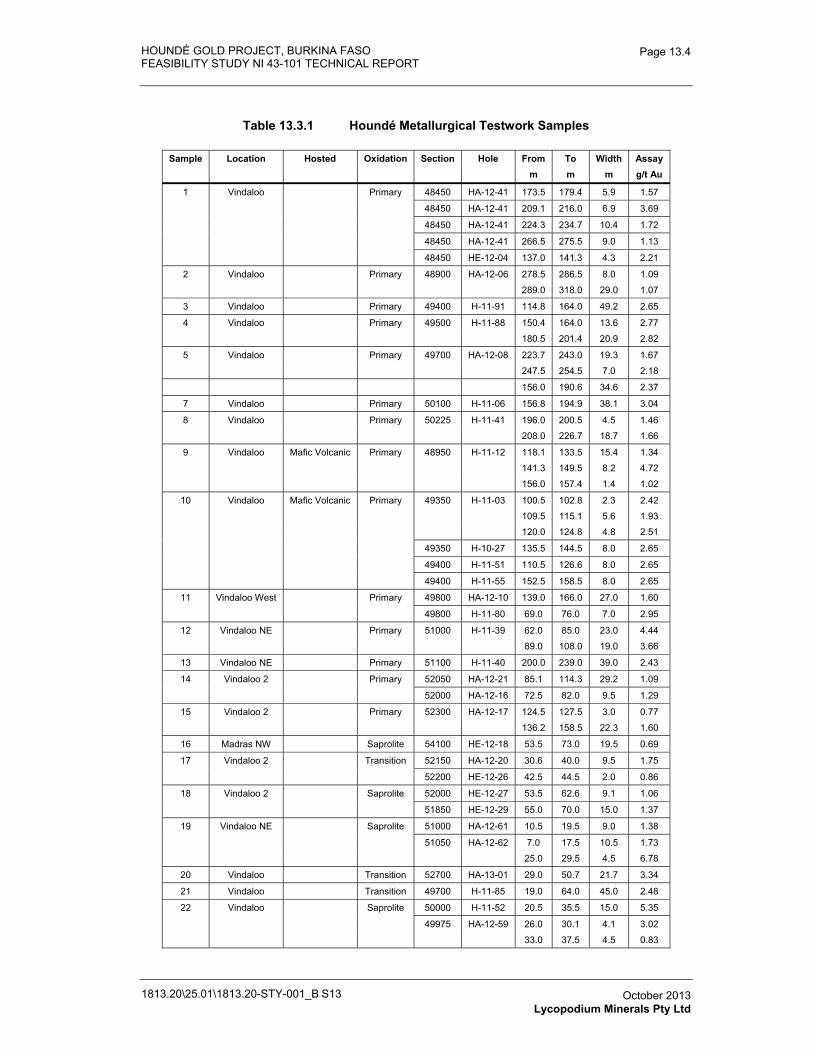
HOUNDÉ GOLD PROJECT, BURKINA FASO FEASIBILITY STUDY NI 43-101 TECHNICAL REPORT
1813.20\25.01\1813.20-STY-001_B S13
Page 13.4
October 2013 Lycopodium Minerals Pty Ltd
Table 13.3.1 Houndé Metallurgical Testwork Samples
Sample Location Hosted Oxidation Section Hole From To Width Assay m m m g/t Au
1 Vindaloo Primary 48450 HA-12-41 173.5 179.4 5.9 1.57
48450 HA-12-41 209.1 216.0 6.9 3.69
48450 HA-12-41 224.3 234.7 10.4 1.72
48450 HA-12-41 266.5 275.5 9.0 1.13
48450 HE-12-04 137.0 141.3 4.3 2.21
2 Vindaloo Primary 48900 HA-12-06 278.5 286.5 8.0 1.09
289.0 318.0 29.0 1.07
3 Vindaloo Primary 49400 H-11-91 114.8 164.0 49.2 2.65
4 Vindaloo Primary 49500 H-11-88 150.4 164.0 13.6 2.77
180.5 201.4 20.9 2.82
5 Vindaloo Primary 49700 HA-12-08 223.7 243.0 19.3 1.67
247.5 254.5 7.0 2.18
156.0 190.6 34.6 2.37
7 Vindaloo Primary 50100 H-11-06 156.8 194.9 38.1 3.04
8 Vindaloo Primary 50225 H-11-41 196.0 200.5 4.5 1.46
208.0 226.7 18.7 1.66
9 Vindaloo Mafic Volcanic Primary 48950 H-11-12 118.1 133.5 15.4 1.34
141.3 149.5 8.2 4.72
156.0 157.4 1.4 1.02
10 Vindaloo Mafic Volcanic Primary 49350 H-11-03 100.5 102.8 2.3 2.42
109.5 115.1 5.6 1.93
120.0 124.8 4.8 2.51
49350 H-10-27 135.5 144.5 8.0 2.65
49400 H-11-51 110.5 126.6 8.0 2.65
49400 H-11-55 152.5 158.5 8.0 2.65
11 Vindaloo West Primary 49800 HA-12-10 139.0 166.0 27.0 1.60
49800 H-11-80 69.0 76.0 7.0 2.95
12 Vindaloo NE Primary 51000 H-11-39 62.0 85.0 23.0 4.44
89.0 108.0 19.0 3.66
13 Vindaloo NE Primary 51100 H-11-40 200.0 239.0 39.0 2.43
14 Vindaloo 2 Primary 52050 HA-12-21 85.1 114.3 29.2 1.09
52000 HA-12-16 72.5 82.0 9.5 1.29
15 Vindaloo 2 Primary 52300 HA-12-17 124.5 127.5 3.0 0.77
136.2 158.5 22.3 1.60
16 Madras NW Saprolite 54100 HE-12-18 53.5 73.0 19.5 0.69
17 Vindaloo 2 Transition 52150 HA-12-20 30.6 40.0 9.5 1.75
52200 HE-12-26 42.5 44.5 2.0 0.86
18 Vindaloo 2 Saprolite 52000 HE-12-27 53.5 62.6 9.1 1.06
51850 HE-12-29 55.0 70.0 15.0 1.37
19 Vindaloo NE Saprolite 51000 HA-12-61 10.5 19.5 9.0 1.38
51050 HA-12-62 7.0 17.5 10.5 1.73
25.0 29.5 4.5 6.78
20 Vindaloo Transition 52700 HA-13-01 29.0 50.7 21.7 3.34
21 Vindaloo Transition 49700 H-11-85 19.0 64.0 45.0 2.48
22 Vindaloo Saprolite 50000 H-11-52 20.5 35.5 15.0 5.35
49975 HA-12-59 26.0 30.1 4.1 3.02
33.0 37.5 4.5 0.83
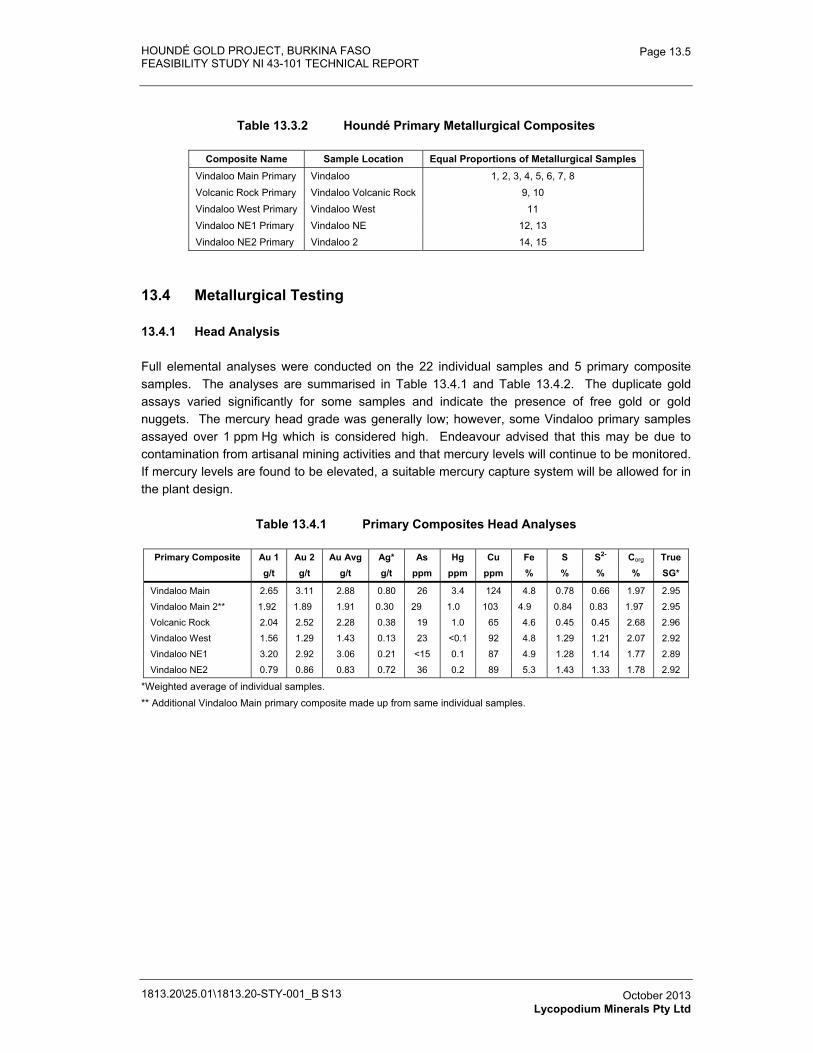
HOUNDÉ GOLD PROJECT, BURKINA FASO FEASIBILITY STUDY NI 43-101 TECHNICAL REPORT
1813.20\25.01\1813.20-STY-001_B S13
Page 13.5
October 2013 Lycopodium Minerals Pty Ltd
Table 13.3.2 Houndé Primary Metallurgical Composites
Composite Name Sample Location Equal Proportions of Metallurgical Samples Vindaloo Main Primary Vindaloo 1, 2, 3, 4, 5, 6, 7, 8 Volcanic Rock Primary Vindaloo Volcanic Rock 9, 10 Vindaloo West Primary Vindaloo West 11Vindaloo NE1 Primary Vindaloo NE 12, 13 Vindaloo NE2 Primary Vindaloo 2 14, 15
13.4 Metallurgical Testing
13.4.1 Head Analysis
Full elemental analyses were conducted on the 22 individual samples and 5 primary composite samples. The analyses are summarised in Table 13.4.1 and Table 13.4.2. The duplicate gold assays varied significantly for some samples and indicate the presence of free gold or gold nuggets. The mercury head grade was generally low; however, some Vindaloo primary samples assayed over 1 ppm Hg which is considered high. Endeavour advised that this may be due to contamination from artisanal mining activities and that mercury levels will continue to be monitored. If mercury levels are found to be elevated, a suitable mercury capture system will be allowed for in the plant design.
Table 13.4.1 Primary Composites Head Analyses
Primary Composite Au 1 Au 2 Au Avg Ag* As Hg Cu Fe S S2- Corg True g/t g/t g/t g/t ppm ppm ppm % % % % SG*
Vindaloo Main 2.65 3.11 2.88 0.80 26 3.4 124 4.8 0.78 0.66 1.97 2.95
Vindaloo Main 2** 1.92 1.89 1.91 0.30 29 1.0 103 4.9 0.84 0.83 1.97 2.95
Volcanic Rock 2.04 2.52 2.28 0.38 19 1.0 65 4.6 0.45 0.45 2.68 2.96
Vindaloo West 1.56 1.29 1.43 0.13 23 <0.1 92 4.8 1.29 1.21 2.07 2.92
Vindaloo NE1 3.20 2.92 3.06 0.21 <15 0.1 87 4.9 1.28 1.14 1.77 2.89
Vindaloo NE2 0.79 0.86 0.83 0.72 36 0.2 89 5.3 1.43 1.33 1.78 2.92
*Weighted average of individual samples. ** Additional Vindaloo Main primary composite made up from same individual samples.
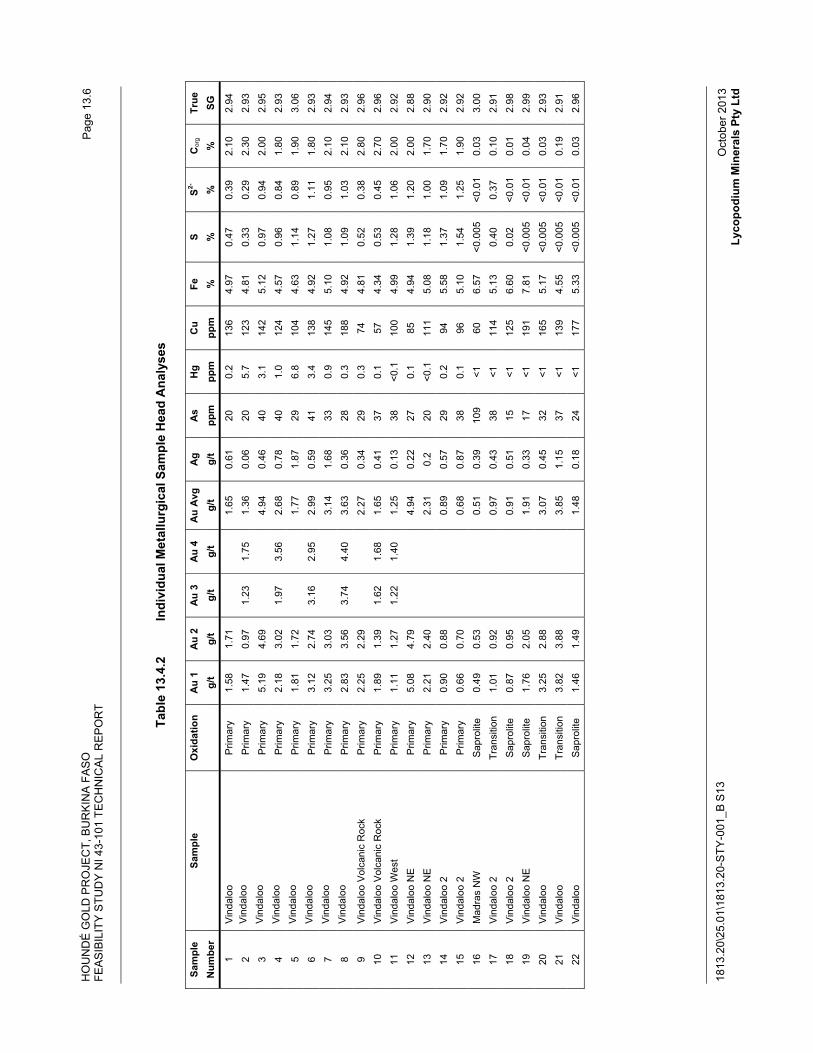
HO
UN
DÉ
GO
LD P
RO
JEC
T, B
UR
KIN
A F
AS
O
FEA
SIB
ILIT
Y S
TUD
Y N
I 43-
101
TEC
HN
ICA
L R
EP
OR
T
1813
.20\
25.0
1\18
13.2
0-S
TY-0
01_B
S13
Pag
e 13
.6
Oct
ober
201
3 Ly
copo
dium
Min
eral
s Pt
y Lt
d
Tabl
e 13
.4.2
In
divi
dual
Met
allu
rgic
al S
ampl
e H
ead
Ana
lyse
s
Sam
ple
Sam
ple
Oxi
datio
n A
u 1
Au
2 A
u 3
Au
4 A
u A
vg
Ag
As
Hg
Cu
Fe
S S2-
C
org
True
N
umbe
r
g/t
g/t
g/t
g/t
g/t
g/t
ppm
pp
m
ppm
%
%
%
%
SG
1 V
inda
loo
P
rimar
y 1.
58
1.71
1.
65
0.61
20
0.
2 13
6 4.
97
0.47
0.
39
2.10
2.
94
2V
inda
loo
Prim
ary
1.47
0.
97
1.23
1.
75
1.36
0.
06
20
5.7
123
4.81
0.
33
0.29
2.
30
2.93
3
Vin
dalo
oP
rimar
y 5.
19
4.69
4.
94
0.46
40
3.
1 14
2 5.
12
0.97
0.
94
2.00
2.
95
4V
inda
loo
Prim
ary
2.18
3.
02
1.97
3.
56
2.68
0.
78
40
1.0
124
4.57
0.
96
0.84
1.
80
2.93
5
Vin
dalo
oP
rimar
y 1.
81
1.72
1.
77
1.87
29
6.
8 10
4 4.
63
1.14
0.
89
1.90
3.
06
6V
inda
loo
Prim
ary
3.12
2.
74
3.16
2.
95
2.99
0.
59
41
3.4
138
4.92
1.
27
1.11
1.
80
2.93
7
Vin
dalo
oP
rimar
y 3.
25
3.03
3.
14
1.68
33
0.
9 14
5 5.
10
1.08
0.
95
2.10
2.
94
8V
inda
loo
Prim
ary
2.83
3.
56
3.74
4.
40
3.63
0.
36
28
0.3
188
4.92
1.
09
1.03
2.
10
2.93
9
Vin
dalo
o V
olca
nic
Roc
k P
rimar
y 2.
25
2.29
2.
27
0.34
29
0.
3 74
4.
81
0.52
0.
38
2.80
2.
96
10
Vin
dalo
o V
olca
nic
Roc
k P
rimar
y 1.
89
1.39
1.
62
1.68
1.
65
0.41
37
0.
1 57
4.
34
0.53
0.
45
2.70
2.
96
11
Vin
dalo
o W
est
Prim
ary
1.11
1.
27
1.22
1.
40
1.25
0.
13
38
<0.1
10
0 4.
99
1.28
1.
06
2.00
2.
92
12
Vin
dalo
o N
E
Prim
ary
5.08
4.
79
4.94
0.
22
27
0.1
85
4.94
1.
39
1.20
2.
00
2.88
13
V
inda
loo
NE
P
rimar
y 2.
21
2.40
2.
31
0.2
20
<0.1
11
1 5.
08
1.18
1.
00
1.70
2.
90
14
Vin
dalo
o 2
Prim
ary
0.90
0.
88
0.89
0.
57
29
0.2
94
5.58
1.
37
1.09
1.
70
2.92
15
V
inda
loo
2 P
rimar
y 0.
66
0.70
0.
68
0.87
38
0.
1 96
5.
10
1.54
1.
25
1.90
2.
92
16
Mad
ras
NW
S
apro
lite
0.49
0.
53
0.51
0.
39
109
<1
60
6.57
<0
.005
<0
.01
0.03
3.
00
17
Vin
dalo
o 2
Tran
sitio
n 1.
01
0.92
0.
97
0.43
38
<1
11
4 5.
13
0.40
0.
37
0.10
2.
91
18
Vin
dalo
o 2
Sap
rolit
e 0.
87
0.95
0.
91
0.51
15
<1
12
5 6.
60
0.02
<0
.01
0.01
2.
98
19
Vin
dalo
o N
E
Sap
rolit
e 1.
76
2.05
1.
91
0.33
17
<1
19
1 7.
81
<0.0
05
<0.0
1 0.
04
2.99
20
V
inda
loo
Tr
ansi
tion
3.25
2.
88
3.07
0.
45
32
<1
165
5.17
<0
.005
<0
.01
0.03
2.
93
21
Vin
dalo
o
Tran
sitio
n 3.
82
3.88
3.
85
1.15
37
<1
13
9 4.
55
<0.0
05
<0.0
1 0.
19
2.91
22
V
inda
loo
S
apro
lite
1.46
1.
49
1.48
0.
18
24
<1
177
5.33
<0
.005
<0
.01
0.03
2.
96
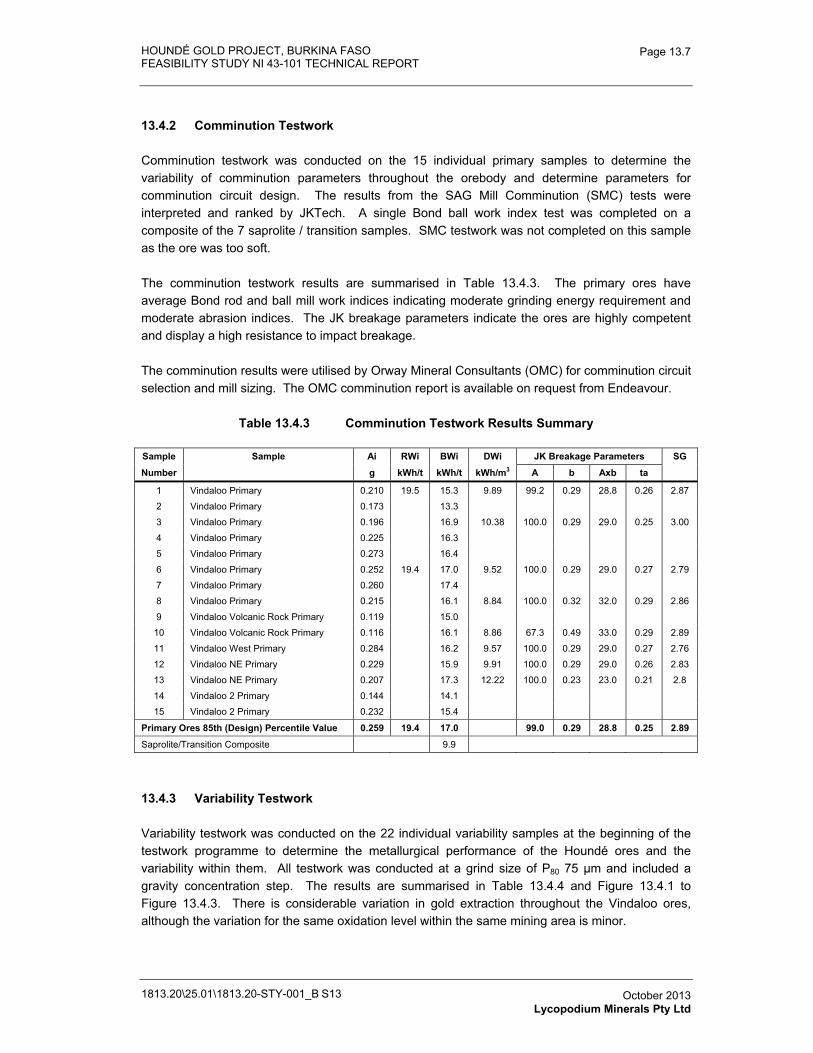
HOUNDÉ GOLD PROJECT, BURKINA FASO FEASIBILITY STUDY NI 43-101 TECHNICAL REPORT
1813.20\25.01\1813.20-STY-001_B S13
Page 13.7
October 2013 Lycopodium Minerals Pty Ltd
13.4.2 Comminution Testwork
Comminution testwork was conducted on the 15 individual primary samples to determine the variability of comminution parameters throughout the orebody and determine parameters for comminution circuit design. The results from the SAG Mill Comminution (SMC) tests were interpreted and ranked by JKTech. A single Bond ball work index test was completed on a composite of the 7 saprolite / transition samples. SMC testwork was not completed on this sample as the ore was too soft.
The comminution testwork results are summarised in Table 13.4.3. The primary ores have average Bond rod and ball mill work indices indicating moderate grinding energy requirement and moderate abrasion indices. The JK breakage parameters indicate the ores are highly competent and display a high resistance to impact breakage.
The comminution results were utilised by Orway Mineral Consultants (OMC) for comminution circuit selection and mill sizing. The OMC comminution report is available on request from Endeavour.
Table 13.4.3 Comminution Testwork Results Summary
Sample Sample Ai RWi BWi DWi JK Breakage Parameters SG
Number g kWh/t kWh/t kWh/m3 A b Axb ta
1 Vindaloo Primary 0.210 19.5 15.3 9.89 99.2 0.29 28.8 0.26 2.87
2 Vindaloo Primary 0.173 13.3
3 Vindaloo Primary 0.196 16.9 10.38 100.0 0.29 29.0 0.25 3.00
4 Vindaloo Primary 0.225 16.3
5 Vindaloo Primary 0.273 16.4
6 Vindaloo Primary 0.252 19.4 17.0 9.52 100.0 0.29 29.0 0.27 2.79
7 Vindaloo Primary 0.260 17.4
8 Vindaloo Primary 0.215 16.1 8.84 100.0 0.32 32.0 0.29 2.86
9 Vindaloo Volcanic Rock Primary 0.119 15.0
10 Vindaloo Volcanic Rock Primary 0.116 16.1 8.86 67.3 0.49 33.0 0.29 2.89
11 Vindaloo West Primary 0.284 16.2 9.57 100.0 0.29 29.0 0.27 2.76
12 Vindaloo NE Primary 0.229 15.9 9.91 100.0 0.29 29.0 0.26 2.83
13 Vindaloo NE Primary 0.207 17.3 12.22 100.0 0.23 23.0 0.21 2.8
14 Vindaloo 2 Primary 0.144 14.1
15 Vindaloo 2 Primary 0.232 15.4
Primary Ores 85th (Design) Percentile Value 0.259 19.4 17.0 99.0 0.29 28.8 0.25 2.89
Saprolite/Transition Composite 9.9
13.4.3 Variability Testwork
Variability testwork was conducted on the 22 individual variability samples at the beginning of the testwork programme to determine the metallurgical performance of the Houndé ores and the variability within them. All testwork was conducted at a grind size of P80 75 μm and included a gravity concentration step. The results are summarised in Table 13.4.4 and Figure 13.4.1 to Figure 13.4.3. There is considerable variation in gold extraction throughout the Vindaloo ores, although the variation for the same oxidation level within the same mining area is minor.
HOUNDÉ GOLD PROJECT, BURKINA FASO FEASIBILITY STUDY NI 43-101 TECHNICAL REPORT
1813.20\25.01\1813.20-STY-001_B S13
Page 13.8
October 2013 Lycopodium Minerals Pty Ltd
Overall 24 hour primary ore gold extractions varied between 57% and 92% with an average of 85%. The average gold extraction for Vindaloo 2 primary ores was significantly lower at 57% while the other primary ore were less variable (average 89%, range 83% to 95%). The gold extraction for the 8 Vindaloo primary samples varied between 85% and 92% and averaged 89%.
Overall 24 hour gold extraction for the saprolite ores averaged 95% with a range of 92% to 97%. The 4 saprolite samples showed minor variation in gold extraction despite originating from 4 separate mining areas.
Overall 24 hour gold extractions for the transition ores averaged 93% with a range of 89% to 95%. The 3 transition samples represented 2 mining areas with the 2 Vindaloo transition samples showing no variation in gold extraction.
Diagnostic leach testwork was completed on the 2 Vindaloo 2 primary samples which achieved the lowest gold extractions. The results are summarised in Table 13.4.5 and show that the samples had 22% to 35% of the gold occluded in sulphides and silicates and not readily amenable to cyanidation.
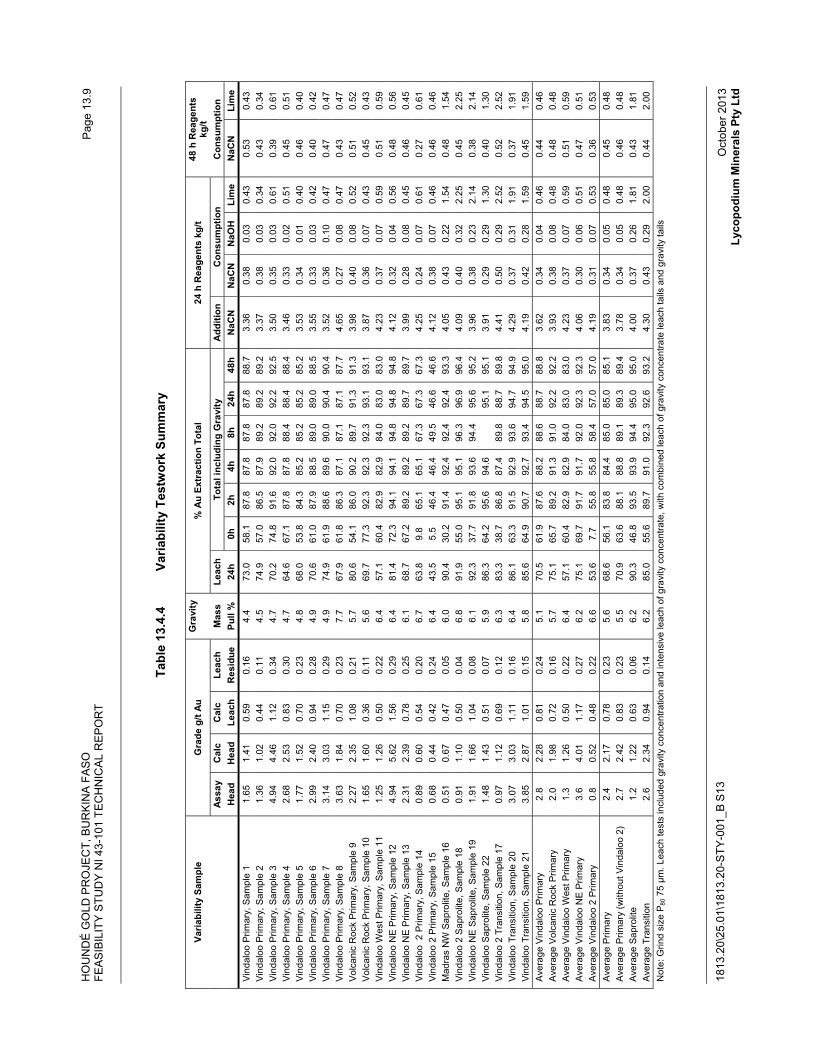
HO
UN
DÉ
GO
LD P
RO
JEC
T, B
UR
KIN
A F
AS
O
FEA
SIB
ILIT
Y S
TUD
Y N
I 43-
101
TEC
HN
ICA
L R
EP
OR
T
1813
.20\
25.0
1\18
13.2
0-S
TY-0
01_B
S13
Pag
e 13
.9
Oct
ober
201
3 Ly
copo
dium
Min
eral
s Pt
y Lt
d
Tabl
e 13
.4.4
Va
riabi
lity
Test
wor
k Su
mm
ary
Varia
bilit
y Sa
mpl
e G
rade
g/t
Au
Gra
vity
%
Au
Extr
actio
n To
tal
24 h
Rea
gent
s kg
/t 48
h R
eage
nts
kg/t
Assa
y C
alc
Cal
c Le
ach
Mas
s Le
ach
Tota
l inc
ludi
ng G
ravi
ty
Add
ition
C
onsu
mpt
ion
Con
sum
ptio
n H
ead
Hea
d Le
ach
Res
idue
Pu
ll %
24
h 0h
2h
4h
8h
24
h 48
h N
aCN
N
aCN
N
aOH
Li
me
NaC
N
Lim
e Vi
ndal
oo P
rimar
y, S
ampl
e 1
1.65
1.
41
0.59
0.
16
4.4
73.0
58
.1
87.8
87
.8
87.8
87
.8
88.7
3.
36
0.38
0.
03
0.43
0.
53
0.43
Vi
ndal
oo P
rimar
y, S
ampl
e 2
1.36
1.
02
0.44
0.
11
4.5
74.9
57
.0
86.5
87
.9
89.2
89
.2
89.2
3.
37
0.38
0.
03
0.34
0.
43
0.34
Vi
ndal
oo P
rimar
y, S
ampl
e 3
4.94
4.
46
1.12
0.
34
4.7
70.2
74
.8
91.6
92
.0
92.0
92
.2
92.5
3.
50
0.35
0.
03
0.61
0.
39
0.61
Vi
ndal
oo P
rimar
y, S
ampl
e 4
2.68
2.
53
0.83
0.
30
4.7
64.6
67
.1
87.8
87
.8
88.4
88
.4
88.4
3.
46
0.33
0.
02
0.51
0.
45
0.51
Vi
ndal
oo P
rimar
y, S
ampl
e 5
1.77
1.
52
0.70
0.
23
4.8
68.0
53
.8
84.3
85
.2
85.2
85
.2
85.2
3.
53
0.34
0.
01
0.40
0.
46
0.40
Vi
ndal
oo P
rimar
y, S
ampl
e 6
2.99
2.
40
0.94
0.
28
4.9
70.6
61
.0
87.9
88
.5
89.0
89
.0
88.5
3.
55
0.33
0.
03
0.42
0.
40
0.42
Vi
ndal
oo P
rimar
y, S
ampl
e 7
3.14
3.
03
1.15
0.
29
4.9
74.9
61
.9
88.6
89
.6
90.0
90
.4
90.4
3.
52
0.36
0.
10
0.47
0.
47
0.47
Vi
ndal
oo P
rimar
y, S
ampl
e 8
3.63
1.
84
0.70
0.
23
7.7
67.9
61
.8
86.3
87
.1
87.1
87
.1
87.7
4.
65
0.27
0.
08
0.47
0.
43
0.47
Vo
lcan
ic R
ock
Prim
ary,
Sam
ple
9 2.
27
2.35
1.
08
0.21
5.
7 80
.6
54.1
86
.0
90.2
89
.7
91.3
91
.3
3.98
0.
40
0.08
0.
52
0.51
0.
52
Volc
anic
Roc
k Pr
imar
y, S
ampl
e 10
1.
65
1.60
0.
36
0.11
5.
6 69
.7
77.3
92
.3
92.3
92
.3
93.1
93
.1
3.87
0.
36
0.07
0.
43
0.45
0.
43
Vind
aloo
Wes
t Prim
ary,
Sam
ple
11
1.25
1.
26
0.50
0.
22
6.4
57.1
60
.4
82.9
82
.9
84.0
83
.0
83.0
4.
23
0.37
0.
07
0.59
0.
51
0.59
Vi
ndal
oo N
E Pr
imar
y, S
ampl
e 12
4.
94
5.62
1.
56
0.29
6.
4 81
.4
72.3
94
.1
94.1
94
.8
94.8
94
.8
4.12
0.
32
0.04
0.
56
0.48
0.
56
Vind
aloo
NE
Prim
ary,
Sam
ple
13
2.31
2.
39
0.78
0.
25
6.1
68.7
67
.2
89.2
89
.2
89.2
89
.7
89.7
3.
99
0.28
0.
08
0.45
0.
46
0.45
Vi
ndal
oo 2
Prim
ary,
Sam
ple
14
0.89
0.
60
0.54
0.
20
6.7
63.8
9.
8 65
.1
65.1
67
.3
67.3
67
.3
4.25
0.
24
0.07
0.
61
0.27
0.
61
Vind
aloo
2 P
rimar
y, S
ampl
e 15
0.
68
0.44
0.
42
0.24
6.
4 43
.5
5.5
46.4
46
.4
49.5
46
.6
46.6
4.
12
0.38
0.
07
0.46
0.
46
0.46
M
adra
s N
W S
apro
lite,
Sam
ple
16
0.51
0.
67
0.47
0.
05
6.0
90.4
30
.2
91.4
92
.4
92.4
92
.4
93.3
4.
05
0.43
0.
22
1.54
0.
48
1.54
Vi
ndal
oo 2
Sap
rolit
e, S
ampl
e 18
0.
91
1.10
0.
50
0.04
6.
8 91
.9
55.0
95
.1
95.1
96
.3
96.9
96
.4
4.09
0.
40
0.32
2.
25
0.45
2.
25
Vind
aloo
NE
Sapr
olite
, Sam
ple
19
1.91
1.
66
1.04
0.
08
6.1
92.3
37
.7
91.8
93
.6
94.4
95
.6
95.2
3.
96
0.38
0.
23
2.14
0.
38
2.14
Vi
ndal
oo S
apro
lite,
Sam
ple
22
1.48
1.
43
0.51
0.
07
5.9
86.3
64
.2
95.6
94
.6
95.1
95
.1
3.91
0.
29
0.29
1.
30
0.40
1.
30
Vind
aloo
2 T
rans
ition
, Sam
ple
17
0.97
1.
12
0.69
0.
12
6.3
83.3
38
.7
86.8
87
.4
89.8
88
.7
89.8
4.
41
0.50
0.
29
2.52
0.
52
2.52
Vi
ndal
oo T
rans
ition
, Sam
ple
20
3.07
3.
03
1.11
0.
16
6.4
86.1
63
.3
91.5
92
.9
93.6
94
.7
94.9
4.
29
0.37
0.
31
1.91
0.
37
1.91
Vi
ndal
oo T
rans
ition
, Sam
ple
21
3.85
2.
87
1.01
0.
15
5.8
85.6
64
.9
90.7
92
.7
93.4
94
.5
95.0
4.
19
0.42
0.
28
1.59
0.
45
1.59
A
vera
ge V
inda
loo
Prim
ary
2.8
2.28
0.
81
0.24
5.
1 70
.5
61.9
87
.6
88.2
88
.6
88.7
88
.8
3.62
0.
34
0.04
0.
46
0.44
0.
46
Ave
rage
Vol
cani
c R
ock
Prim
ary
2.0
1.98
0.
72
0.16
5.
7 75
.1
65.7
89
.2
91.3
91
.0
92.2
92
.2
3.93
0.
38
0.08
0.
48
0.48
0.
48
Ave
rage
Vin
dalo
o W
est P
rimar
y 1.
3 1.
26
0.50
0.
22
6.4
57.1
60
.4
82.9
82
.9
84.0
83
.0
83.0
4.
23
0.37
0.
07
0.59
0.
51
0.59
A
vera
ge V
inda
loo
NE
Prim
ary
3.6
4.01
1.
17
0.27
6.
2 75
.1
69.7
91
.7
91.7
92
.0
92.3
92
.3
4.06
0.
30
0.06
0.
51
0.47
0.
51
Ave
rage
Vin
dalo
o 2
Prim
ary
0.8
0.52
0.
48
0.22
6.
6 53
.6
7.7
55.8
55
.8
58.4
57
.0
57.0
4.
19
0.31
0.
07
0.53
0.
36
0.53
A
vera
ge P
rimar
y 2.
4 2.
17
0.78
0.
23
5.6
68.6
56
.1
83.8
84
.4
85.0
85
.0
85.1
3.
83
0.34
0.
05
0.48
0.
45
0.48
A
vera
ge P
rimar
y (w
ithou
t Vin
dalo
o 2)
2.
7 2.
42
0.83
0.
23
5.5
70.9
63
.6
88.1
88
.8
89.1
89
.3
89.4
3.
78
0.34
0.
05
0.48
0.
46
0.48
A
vera
ge S
apro
lite
1.2
1.22
0.
63
0.06
6.
2 90
.3
46.8
93
.5
93.9
94
.4
95.0
95
.0
4.00
0.
37
0.26
1.
81
0.43
1.
81
Ave
rage
Tra
nsiti
on
2.6
2.34
0.
94
0.14
6.
2 85
.0
55.6
89
.7
91.0
92
.3
92.6
93
.2
4.30
0.
43
0.29
2.
00
0.44
2.
00
Not
e: G
rind
size
P80
75
μm. L
each
test
s in
clud
ed g
ravi
ty c
once
ntra
tion
and
inte
nsiv
e le
ach
of g
ravi
ty c
once
ntra
te, w
ith c
ombi
ned
leac
h of
gra
vity
con
cent
rate
leac
h ta
ils a
nd g
ravi
ty ta
ils
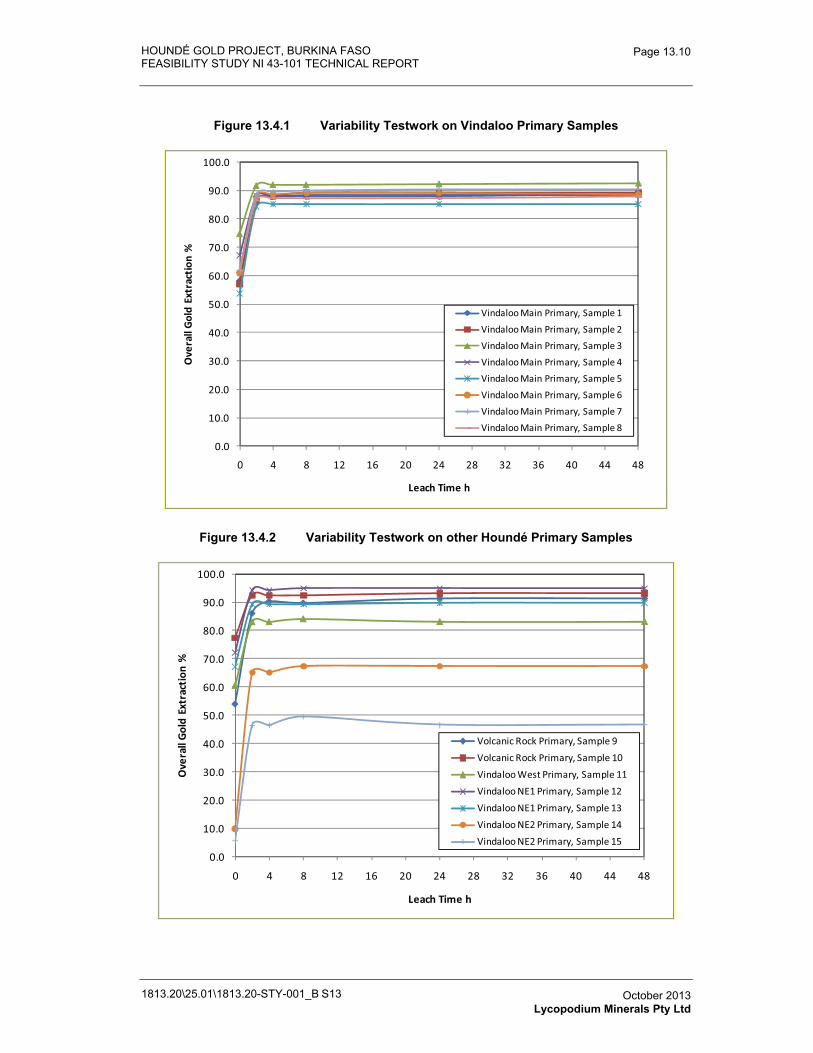
HOUNDÉ GOLD PROJECT, BURKINA FASO FEASIBILITY STUDY NI 43-101 TECHNICAL REPORT
1813.20\25.01\1813.20-STY-001_B S13
Page 13.10
October 2013 Lycopodium Minerals Pty Ltd
Figure 13.4.1 Variability Testwork on Vindaloo Primary Samples
0.0
10.0
20.0
30.0
40.0
50.0
60.0
70.0
80.0
90.0
100.0
0 4 8 12 16 20 24 28 32 36 40 44 48
Ove
rall�
Gol
d�Ex
trac
tion
�%
Leach�Time�h
Vindaloo�Main�Primary,�Sample�1
Vindaloo�Main�Primary,�Sample�2Vindaloo�Main�Primary,�Sample�3
Vindaloo�Main�Primary,�Sample�4Vindaloo�Main�Primary,�Sample�5
Vindaloo�Main�Primary,�Sample�6
Vindaloo�Main�Primary,�Sample�7Vindaloo�Main�Primary,�Sample�8
Figure 13.4.2 Variability Testwork on other Houndé Primary Samples
0.0
10.0
20.0
30.0
40.0
50.0
60.0
70.0
80.0
90.0
100.0
0 4 8 12 16 20 24 28 32 36 40 44 48
Ove
rall�
Gol
d�Ex
trac
tion
�%
Leach�Time�h
Volcanic�Rock�Primary,�Sample�9Volcanic�Rock�Primary,�Sample�10Vindaloo�West�Primary,�Sample�11Vindaloo�NE1�Primary,�Sample�12Vindaloo�NE1�Primary,�Sample�13Vindaloo�NE2�Primary,�Sample�14Vindaloo�NE2�Primary,�Sample�15
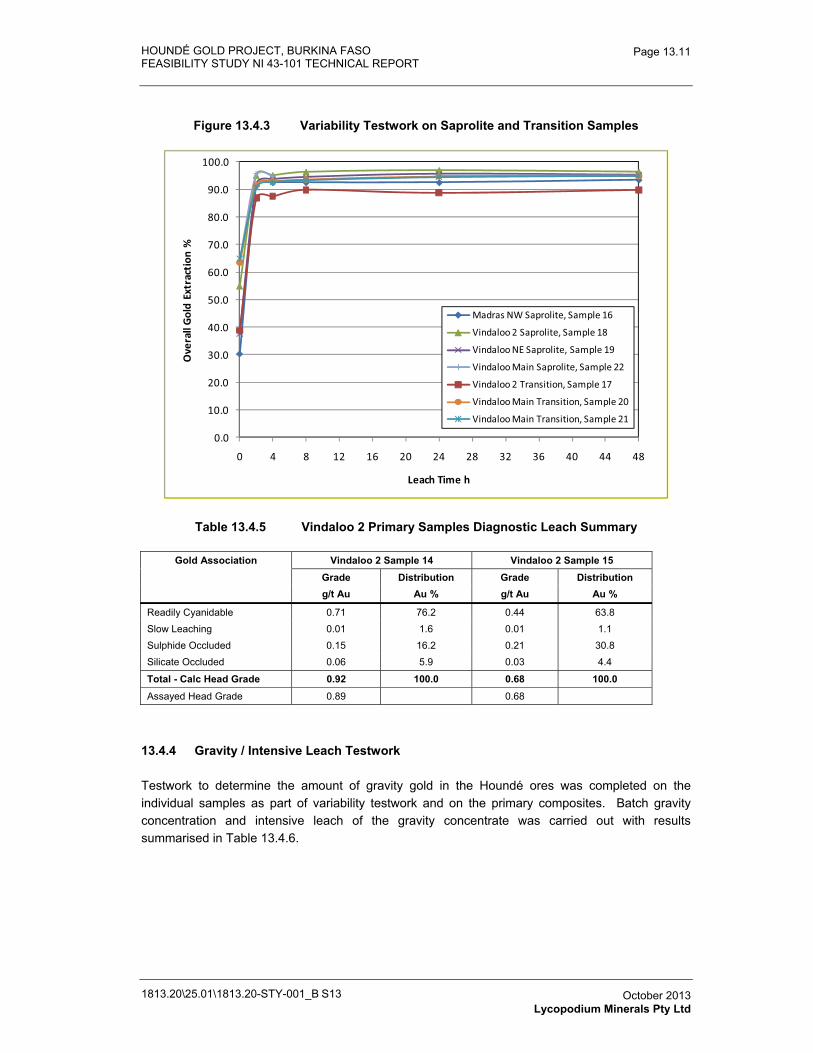
HOUNDÉ GOLD PROJECT, BURKINA FASO FEASIBILITY STUDY NI 43-101 TECHNICAL REPORT
1813.20\25.01\1813.20-STY-001_B S13
Page 13.11
October 2013 Lycopodium Minerals Pty Ltd
Figure 13.4.3 Variability Testwork on Saprolite and Transition Samples
0.0
10.0
20.0
30.0
40.0
50.0
60.0
70.0
80.0
90.0
100.0
0 4 8 12 16 20 24 28 32 36 40 44 48
Ove
rall�
Gol
d�Ex
trac
tion
�%
Leach�Time�h
Madras�NW�Saprolite,�Sample�16
Vindaloo�2�Saprolite,�Sample�18
Vindaloo�NE�Saprolite,�Sample�19
Vindaloo�Main�Saprolite,�Sample�22
Vindaloo�2�Transition,�Sample�17
Vindaloo�Main�Transition,�Sample�20
Vindaloo�Main�Transition,�Sample�21
Table 13.4.5 Vindaloo 2 Primary Samples Diagnostic Leach Summary
Gold Association Vindaloo 2 Sample 14 Vindaloo 2 Sample 15 Grade Distribution Grade Distribution g/t Au Au % g/t Au Au %
Readily Cyanidable 0.71 76.2 0.44 63.8Slow Leaching 0.01 1.6 0.01 1.1Sulphide Occluded 0.15 16.2 0.21 30.8Silicate Occluded 0.06 5.9 0.03 4.4
Total - Calc Head Grade 0.92 100.0 0.68 100.0 Assayed Head Grade 0.89 0.68
13.4.4 Gravity / Intensive Leach Testwork
Testwork to determine the amount of gravity gold in the Houndé ores was completed on the individual samples as part of variability testwork and on the primary composites. Batch gravity concentration and intensive leach of the gravity concentrate was carried out with results summarised in Table 13.4.6.
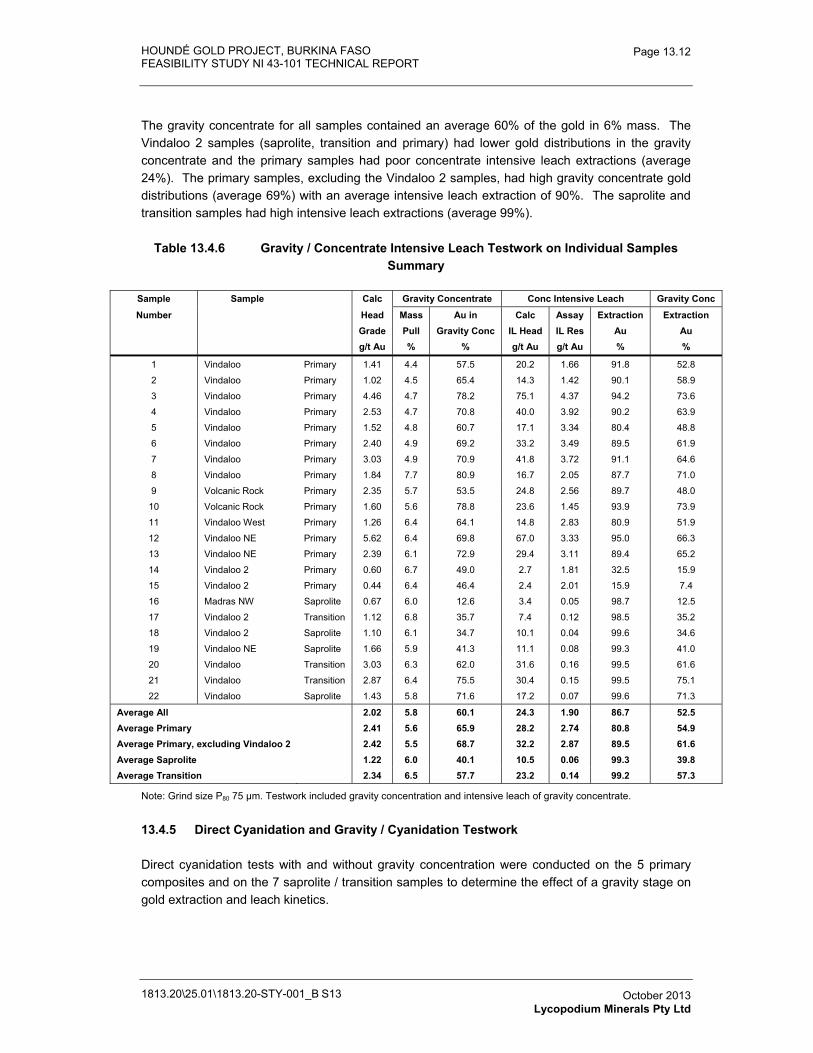
HOUNDÉ GOLD PROJECT, BURKINA FASO FEASIBILITY STUDY NI 43-101 TECHNICAL REPORT
1813.20\25.01\1813.20-STY-001_B S13
Page 13.12
October 2013 Lycopodium Minerals Pty Ltd
The gravity concentrate for all samples contained an average 60% of the gold in 6% mass. The Vindaloo 2 samples (saprolite, transition and primary) had lower gold distributions in the gravity concentrate and the primary samples had poor concentrate intensive leach extractions (average 24%). The primary samples, excluding the Vindaloo 2 samples, had high gravity concentrate gold distributions (average 69%) with an average intensive leach extraction of 90%. The saprolite and transition samples had high intensive leach extractions (average 99%).
Table 13.4.6 Gravity / Concentrate Intensive Leach Testwork on Individual Samples Summary
Sample Sample Calc Gravity Concentrate Conc Intensive Leach Gravity Conc
Number Head Mass Au in Calc Assay Extraction Extraction Grade Pull Gravity Conc IL Head IL Res Au Au g/t Au % % g/t Au g/t Au % %
1 Vindaloo Primary 1.41 4.4 57.5 20.2 1.66 91.8 52.8
2 Vindaloo Primary 1.02 4.5 65.4 14.3 1.42 90.1 58.9
3 Vindaloo Primary 4.46 4.7 78.2 75.1 4.37 94.2 73.6
4 Vindaloo Primary 2.53 4.7 70.8 40.0 3.92 90.2 63.9
5 Vindaloo Primary 1.52 4.8 60.7 17.1 3.34 80.4 48.8
6 Vindaloo Primary 2.40 4.9 69.2 33.2 3.49 89.5 61.9
7 Vindaloo Primary 3.03 4.9 70.9 41.8 3.72 91.1 64.6
8 Vindaloo Primary 1.84 7.7 80.9 16.7 2.05 87.7 71.0
9 Volcanic Rock Primary 2.35 5.7 53.5 24.8 2.56 89.7 48.0
10 Volcanic Rock Primary 1.60 5.6 78.8 23.6 1.45 93.9 73.9
11 Vindaloo West Primary 1.26 6.4 64.1 14.8 2.83 80.9 51.9
12 Vindaloo NE Primary 5.62 6.4 69.8 67.0 3.33 95.0 66.3
13 Vindaloo NE Primary 2.39 6.1 72.9 29.4 3.11 89.4 65.2
14 Vindaloo 2 Primary 0.60 6.7 49.0 2.7 1.81 32.5 15.9
15 Vindaloo 2 Primary 0.44 6.4 46.4 2.4 2.01 15.9 7.4
16 Madras NW Saprolite 0.67 6.0 12.6 3.4 0.05 98.7 12.5
17 Vindaloo 2 Transition 1.12 6.8 35.7 7.4 0.12 98.5 35.2
18 Vindaloo 2 Saprolite 1.10 6.1 34.7 10.1 0.04 99.6 34.6
19 Vindaloo NE Saprolite 1.66 5.9 41.3 11.1 0.08 99.3 41.0
20 Vindaloo Transition 3.03 6.3 62.0 31.6 0.16 99.5 61.6
21 Vindaloo Transition 2.87 6.4 75.5 30.4 0.15 99.5 75.1
22 Vindaloo Saprolite 1.43 5.8 71.6 17.2 0.07 99.6 71.3
Average All 2.02 5.8 60.1 24.3 1.90 86.7 52.5 Average Primary 2.41 5.6 65.9 28.2 2.74 80.8 54.9 Average Primary, excluding Vindaloo 2 2.42 5.5 68.7 32.2 2.87 89.5 61.6 Average Saprolite 1.22 6.0 40.1 10.5 0.06 99.3 39.8 Average Transition 2.34 6.5 57.7 23.2 0.14 99.2 57.3
Note: Grind size P80 75 μm. Testwork included gravity concentration and intensive leach of gravity concentrate.
13.4.5 Direct Cyanidation and Gravity / Cyanidation Testwork
Direct cyanidation tests with and without gravity concentration were conducted on the 5 primary composites and on the 7 saprolite / transition samples to determine the effect of a gravity stage on gold extraction and leach kinetics.
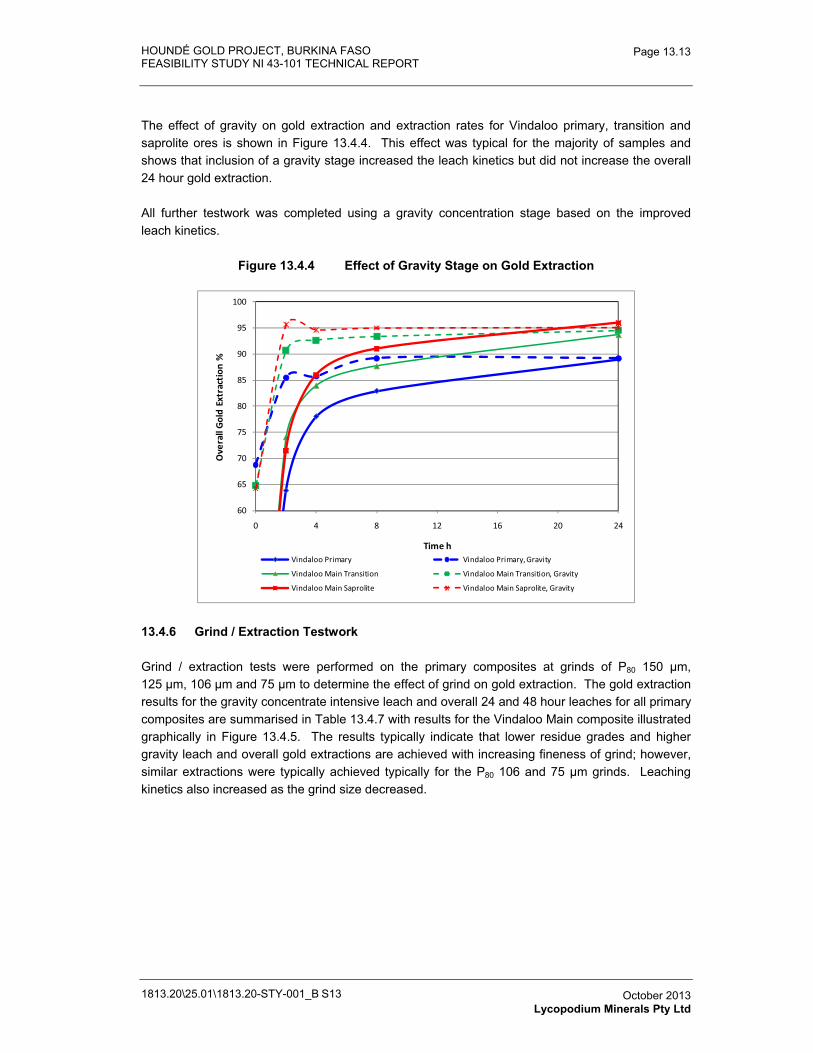
HOUNDÉ GOLD PROJECT, BURKINA FASO FEASIBILITY STUDY NI 43-101 TECHNICAL REPORT
1813.20\25.01\1813.20-STY-001_B S13
Page 13.13
October 2013 Lycopodium Minerals Pty Ltd
The effect of gravity on gold extraction and extraction rates for Vindaloo primary, transition and saprolite ores is shown in Figure 13.4.4. This effect was typical for the majority of samples and shows that inclusion of a gravity stage increased the leach kinetics but did not increase the overall 24 hour gold extraction.
All further testwork was completed using a gravity concentration stage based on the improved leach kinetics.
Figure 13.4.4 Effect of Gravity Stage on Gold Extraction
60
65
70
75
80
85
90
95
100
0 4 8 12 16 20 24
Ove
rall�
Gol
d�Ex
trac
tion
�%
Time�hVindaloo�Primary Vindaloo�Primary,�Gravity
Vindaloo�Main�Transition Vindaloo�Main�Transition,�Gravity
Vindaloo�Main�Saprolite Vindaloo�Main�Saprolite,�Gravity
13.4.6 Grind / Extraction Testwork
Grind / extraction tests were performed on the primary composites at grinds of P80 150 μm, 125 μm, 106 μm and 75 μm to determine the effect of grind on gold extraction. The gold extraction results for the gravity concentrate intensive leach and overall 24 and 48 hour leaches for all primary composites are summarised in Table 13.4.7 with results for the Vindaloo Main composite illustrated graphically in Figure 13.4.5. The results typically indicate that lower residue grades and higher gravity leach and overall gold extractions are achieved with increasing fineness of grind; however, similar extractions were typically achieved typically for the P80 106 and 75 μm grinds. Leaching kinetics also increased as the grind size decreased.
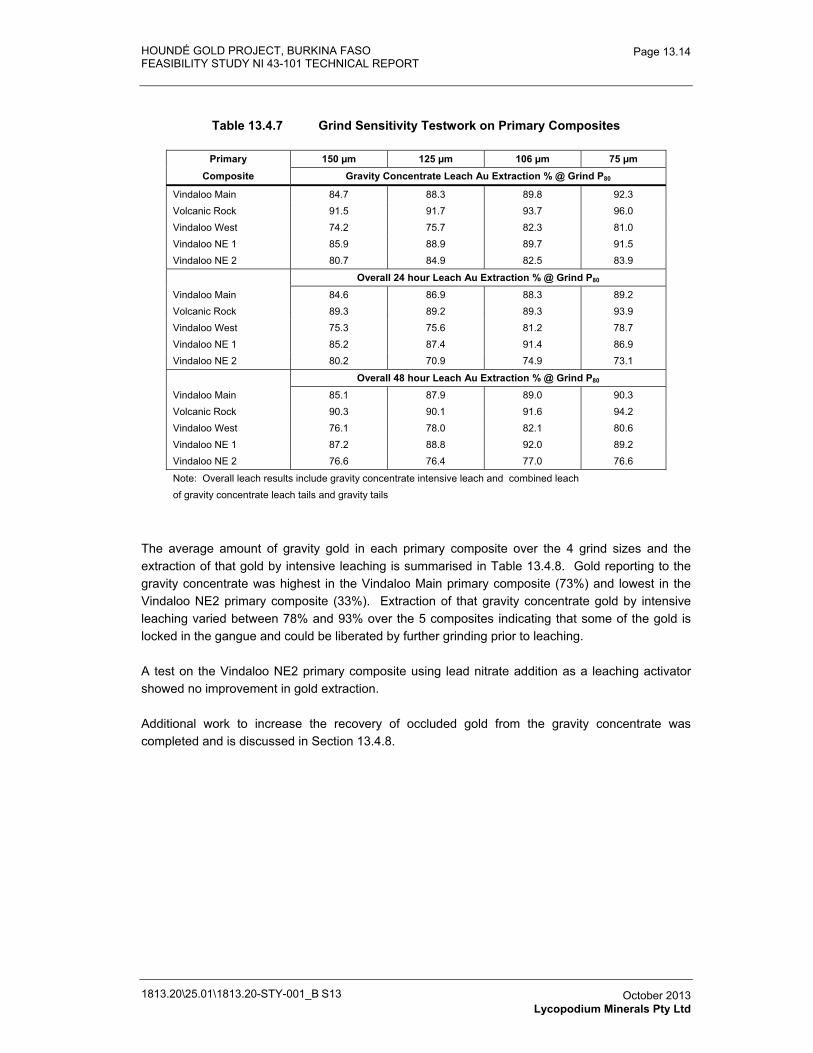
HOUNDÉ GOLD PROJECT, BURKINA FASO FEASIBILITY STUDY NI 43-101 TECHNICAL REPORT
1813.20\25.01\1813.20-STY-001_B S13
Page 13.14
October 2013 Lycopodium Minerals Pty Ltd
Table 13.4.7 Grind Sensitivity Testwork on Primary Composites
Primary 150 μm 125 μm 106 μm 75 μm Composite Gravity Concentrate Leach Au Extraction % @ Grind P80
Vindaloo Main 84.7 88.3 89.8 92.3 Volcanic Rock 91.5 91.7 93.7 96.0 Vindaloo West 74.2 75.7 82.3 81.0 Vindaloo NE 1 85.9 88.9 89.7 91.5Vindaloo NE 2 80.7 84.9 82.5 83.9
Overall 24 hour Leach Au Extraction % @ Grind P80
Vindaloo Main 84.6 86.9 88.3 89.2 Volcanic Rock 89.3 89.2 89.3 93.9 Vindaloo West 75.3 75.6 81.2 78.7 Vindaloo NE 1 85.2 87.4 91.4 86.9Vindaloo NE 2 80.2 70.9 74.9 73.1
Overall 48 hour Leach Au Extraction % @ Grind P80
Vindaloo Main 85.1 87.9 89.0 90.3 Volcanic Rock 90.3 90.1 91.6 94.2 Vindaloo West 76.1 78.0 82.1 80.6 Vindaloo NE 1 87.2 88.8 92.0 89.2Vindaloo NE 2 76.6 76.4 77.0 76.6
Note: Overall leach results include gravity concentrate intensive leach and combined leachof gravity concentrate leach tails and gravity tails
The average amount of gravity gold in each primary composite over the 4 grind sizes and the extraction of that gold by intensive leaching is summarised in Table 13.4.8. Gold reporting to the gravity concentrate was highest in the Vindaloo Main primary composite (73%) and lowest in the Vindaloo NE2 primary composite (33%). Extraction of that gravity concentrate gold by intensive leaching varied between 78% and 93% over the 5 composites indicating that some of the gold is locked in the gangue and could be liberated by further grinding prior to leaching.
A test on the Vindaloo NE2 primary composite using lead nitrate addition as a leaching activator showed no improvement in gold extraction.
Additional work to increase the recovery of occluded gold from the gravity concentrate was completed and is discussed in Section 13.4.8.
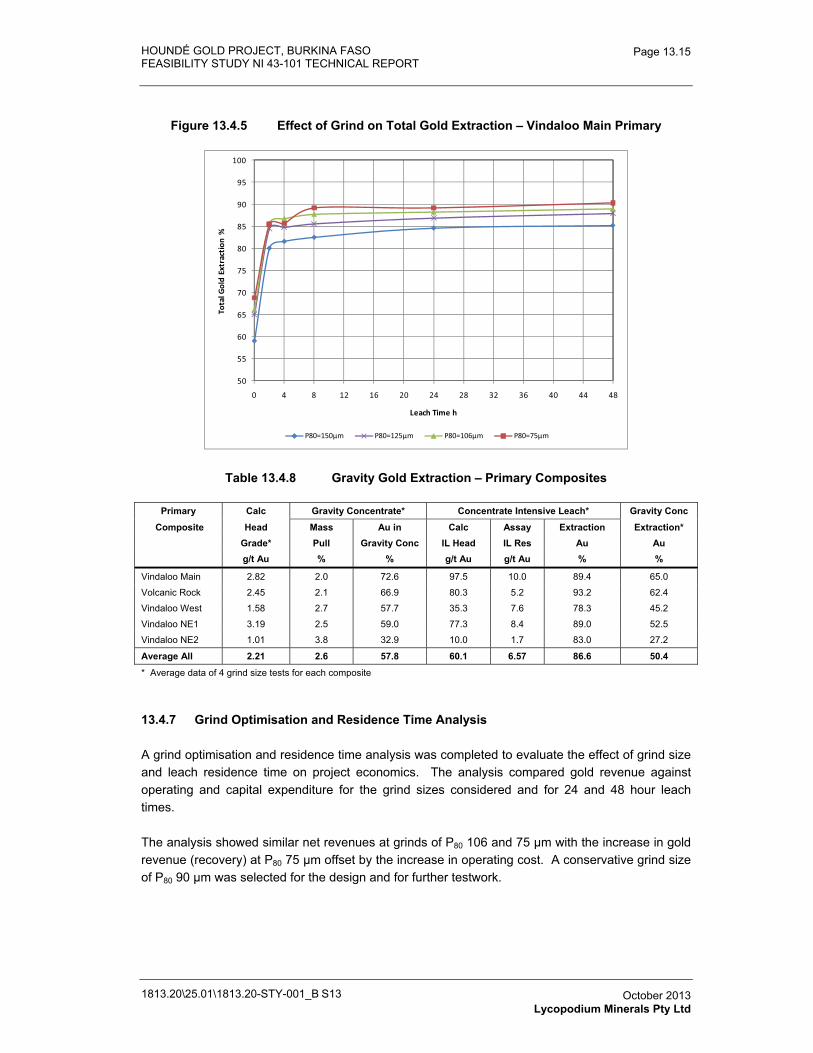
HOUNDÉ GOLD PROJECT, BURKINA FASO FEASIBILITY STUDY NI 43-101 TECHNICAL REPORT
1813.20\25.01\1813.20-STY-001_B S13
Page 13.15
October 2013 Lycopodium Minerals Pty Ltd
Figure 13.4.5 Effect of Grind on Total Gold Extraction – Vindaloo Main Primary
50
55
60
65
70
75
80
85
90
95
100
0 4 8 12 16 20 24 28 32 36 40 44 48
Tota
l�Gol
d�Ex
trac
tion
�%
Leach�Time�h
P80=150μm P80=125μm P80=106μm P80=75μm
Table 13.4.8 Gravity Gold Extraction – Primary Composites
Primary Calc Gravity Concentrate* Concentrate Intensive Leach* Gravity Conc
Composite Head Mass Au in Calc Assay Extraction Extraction* Grade* Pull Gravity Conc IL Head IL Res Au Au
g/t Au % % g/t Au g/t Au % %
Vindaloo Main 2.82 2.0 72.6 97.5 10.0 89.4 65.0
Volcanic Rock 2.45 2.1 66.9 80.3 5.2 93.2 62.4
Vindaloo West 1.58 2.7 57.7 35.3 7.6 78.3 45.2
Vindaloo NE1 3.19 2.5 59.0 77.3 8.4 89.0 52.5
Vindaloo NE2 1.01 3.8 32.9 10.0 1.7 83.0 27.2
Average All 2.21 2.6 57.8 60.1 6.57 86.6 50.4
* Average data of 4 grind size tests for each composite
13.4.7 Grind Optimisation and Residence Time Analysis
A grind optimisation and residence time analysis was completed to evaluate the effect of grind size and leach residence time on project economics. The analysis compared gold revenue against operating and capital expenditure for the grind sizes considered and for 24 and 48 hour leach times.
The analysis showed similar net revenues at grinds of P80 106 and 75 μm with the increase in gold revenue (recovery) at P80 75 μm offset by the increase in operating cost. A conservative grind size of P80 90 μm was selected for the design and for further testwork.
HOUNDÉ GOLD PROJECT, BURKINA FASO FEASIBILITY STUDY NI 43-101 TECHNICAL REPORT
1813.20\25.01\1813.20-STY-001_B S13
Page 13.16
October 2013 Lycopodium Minerals Pty Ltd
Although gold leaching continued to occur through to 48 hours, the increased costs (leach reagents and CIL power and tankage) associated with the longer residence time were similar to the increased gold revenue. A residence time of 24 hours was selected for the design and further testwork.
13.4.8 Gravity Concentrate Retreatment
The gravity concentrate intensive leach gold extractions for the primary samples and composites ranged from 16% to 96% with an average extraction of 85%. Further testwork was conducted on the five primary composites to investigate the effect on gold extraction of regrinding the 7% mass gravity concentrate prior to leaching. Gravity concentrate regrind sizes of P80 25 μm and 10 μm were tested with concentrate gold extractions increasing as the regrind size decreased. The results are summarised in Table 13.4.9.
Additional optimisation testwork was completed on a second Vindaloo Main primary composite (representing 70% of the Houndé ore) to investigate gravity concentrate treatment:
The amount of free gold in the gravity concentrate was determined using mercury amalgamation. The gravity concentrate contained 46% free gold and 35% locked gold with the remaining 19% of gold in the gravity tails.
The relationship between mass pull to gravity concentrate and contained gold was investigated with results presented in Figure 13.4.6. For the Vindaloo Main primary composite, greater than 70% of the gold was recovered to a 2% mass gravity concentrate. A target mass pull of 2.5% to gravity concentrate was selected for the plant design based on the results of this testwork.
Gravity concentrate regrind testwork was conducted at regrind sizes of P80 15 μm and 10 μm to confirm previous results and to determine whether a coarser regrind size was suitable. This repeat testwork was completed at a lower gravity concentrate mass of 3.4% in line with the mass pull selected for the plant design.
The primary composites showed a range of 24 hour overall gold extraction increases of 2% to 6% with a P80 10 μm regrind of the gravity concentrate prior to leaching (1% to 4% at a P80 25 μm regrind), based on a gravity concentrate mass pull of 6% to 7%. This increase is due to the liberation of the finer gold particles locked within the coarser sulphide and silicate particles that are reporting to the gravity concentrate. The repeat testwork on the Vindaloo Main primary composite confirmed the previous results (7% gold extraction increase to 95% overall gold extraction at P80 10 μm) at a lower 3.4% mass pull to gravity concentrate. The P80 15 μm regrind achieved a lower 4% gold extraction increase.
The additional testwork on the Vindaloo Main primary composite also investigated the effect of leaching cyanide levels, combined leaching of the reground gravity concentrate and the gravity tails (in comparison to the standard test of separate leaching of the reground gravity concentrate prior to a combined leach of the concentrate leach tails and the gravity tails) and oxygen sparging.
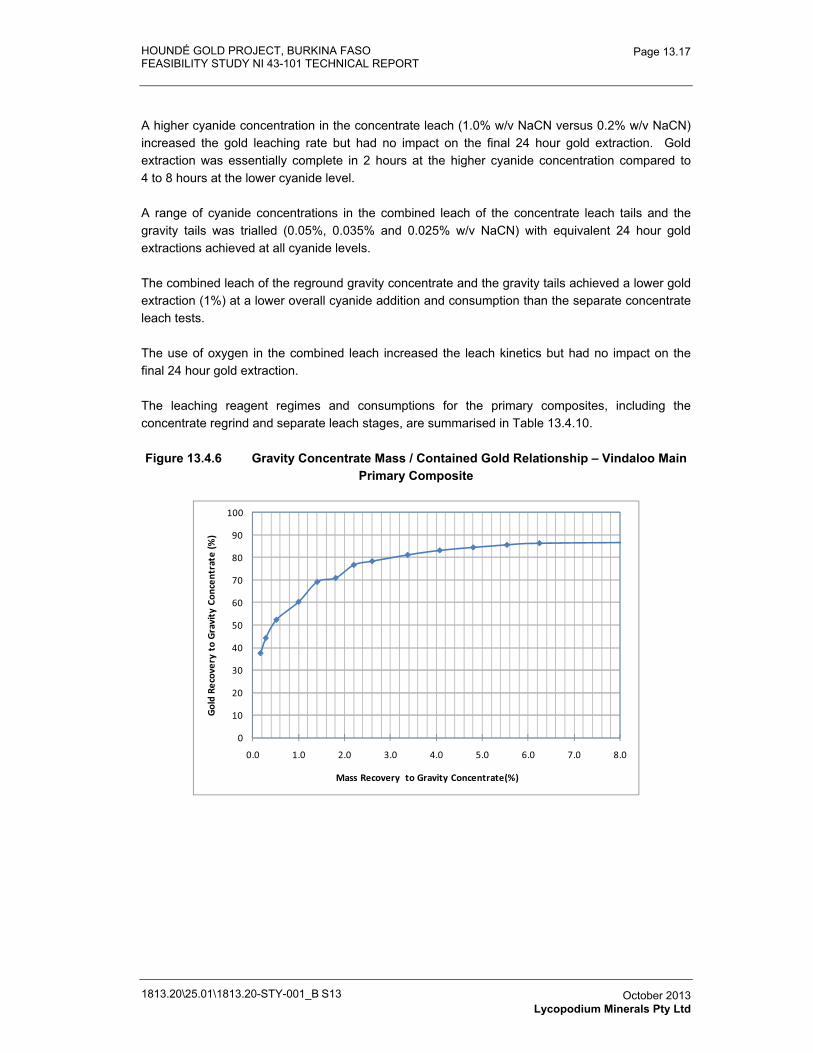
HOUNDÉ GOLD PROJECT, BURKINA FASO FEASIBILITY STUDY NI 43-101 TECHNICAL REPORT
1813.20\25.01\1813.20-STY-001_B S13
Page 13.17
October 2013 Lycopodium Minerals Pty Ltd
A higher cyanide concentration in the concentrate leach (1.0% w/v NaCN versus 0.2% w/v NaCN) increased the gold leaching rate but had no impact on the final 24 hour gold extraction. Gold extraction was essentially complete in 2 hours at the higher cyanide concentration compared to 4 to 8 hours at the lower cyanide level.
A range of cyanide concentrations in the combined leach of the concentrate leach tails and the gravity tails was trialled (0.05%, 0.035% and 0.025% w/v NaCN) with equivalent 24 hour gold extractions achieved at all cyanide levels.
The combined leach of the reground gravity concentrate and the gravity tails achieved a lower gold extraction (1%) at a lower overall cyanide addition and consumption than the separate concentrate leach tests.
The use of oxygen in the combined leach increased the leach kinetics but had no impact on the final 24 hour gold extraction.
The leaching reagent regimes and consumptions for the primary composites, including the concentrate regrind and separate leach stages, are summarised in Table 13.4.10.
Figure 13.4.6 Gravity Concentrate Mass / Contained Gold Relationship – Vindaloo Main Primary Composite
0
10
20
30
40
50
60
70
80
90
100
0.0 1.0 2.0 3.0 4.0 5.0 6.0 7.0 8.0
Gol
d�Re
cove
ry�t
o�G
ravi
ty�C
once
ntra
te�(%
)
Mass�Recovery��to�Gravity�Concentrate(%)
HOUNDÉ GOLD PROJECT, BURKINA FASO FEASIBILITY STUDY NI 43-101 TECHNICAL REPORT
1813.20\25.01\1813.20-STY-001_B S13
Page 13.18
October 2013 Lycopodium Minerals Pty Ltd
The optimised conditions for the Vindaloo primary ores, based in the gravity concentrate treatment testwork are:
� Primary grind of P80 90 μm.
� Recovery of a 2.5% mass gravity concentrate.
� Regrind of the gravity concentrate to P80 10 μm to liberate occluded gold.
� Separate leach of the reground gravity concentrate at 0.2% w/v NaCN.
� Combined leach of the gravity tails and the gravity concentrate leach tails at 0.035% w/v NaCN.
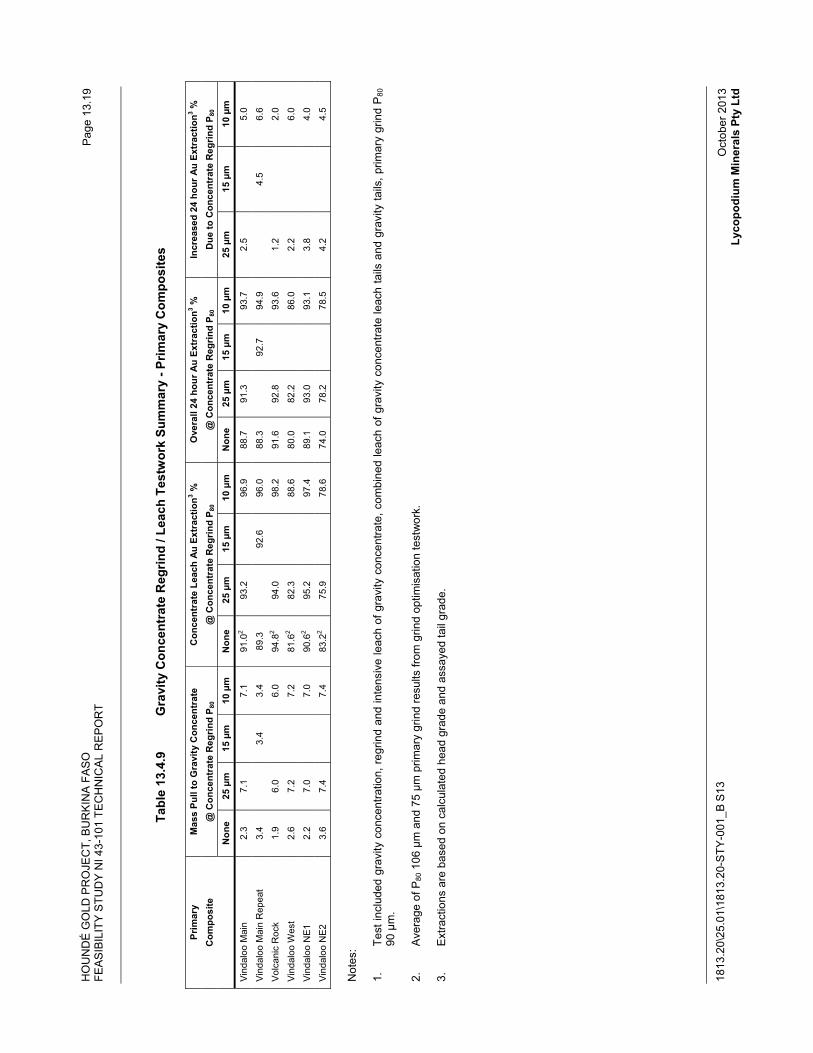
HO
UN
DÉ
GO
LD P
RO
JEC
T, B
UR
KIN
A F
AS
O
FEA
SIB
ILIT
Y S
TUD
Y N
I 43-
101
TEC
HN
ICA
L R
EP
OR
T
1813
.20\
25.0
1\18
13.2
0-S
TY-0
01_B
S13
Pag
e 13
.19
Oct
ober
201
3 Ly
copo
dium
Min
eral
s Pt
y Lt
d
Tabl
e 13
.4.9
G
ravi
ty C
once
ntra
te R
egrin
d / L
each
Tes
twor
k Su
mm
ary
- Prim
ary
Com
posi
tes
Prim
ary
Mas
s Pu
ll to
Gra
vity
Con
cent
rate
C
once
ntra
te L
each
Au
Extr
actio
n3 %
Ove
rall
24 h
our A
u Ex
trac
tion3 %
In
crea
sed
24 h
our A
u Ex
trac
tion3 %
C
ompo
site
@
Con
cent
rate
Reg
rind
P 80
@ C
once
ntra
te R
egrin
d P 8
0@
Con
cent
rate
Reg
rind
P 80
Due
to C
once
ntra
te R
egrin
d P 8
0
Non
e 25
μm
15
μm
10
μm
N
one
25 μ
m
15 μ
m
10 μ
m
Non
e 25
μm
15
μm
10
μm
25
μm
15
μm
10
μm
Vind
aloo
Mai
n 2.
3 7.
1
7.1
91.0
2 93
.2
96.9
88
.7
91.3
93
.7
2.5
5.
0
Vind
aloo
Mai
n R
epea
t 3.
4
3.4
3.4
89.3
92
.6
96.0
88
.3
92.7
94
.9
4.
5 6.
6
Volc
anic
Roc
k 1.
9 6.
0
6.0
94.8
2 94
.0
98.2
91
.6
92.8
93
.6
1.2
2.
0
Vind
aloo
Wes
t 2.
6 7.
2
7.2
81.6
2 82
.3
88.6
80
.0
82.2
86
.0
2.2
6.
0
Vind
aloo
NE1
2.
2 7.
0
7.0
90.6
2 95
.2
97.4
89
.1
93.0
93
.1
3.8
4.
0
Vind
aloo
NE2
3.
6 7.
4
7.4
83.2
2 75
.9
78.6
74
.0
78.2
78
.5
4.2
4.
5
Not
es:
1.
Test
incl
uded
gra
vity
con
cent
ratio
n, re
grin
d an
d in
tens
ive
leac
h of
gra
vity
con
cent
rate
, com
bine
d le
ach
of g
ravi
ty c
once
ntra
te le
ach
tails
and
gra
vity
tails
, prim
ary
grin
d P
8090
μm
.
2.
Ave
rage
of P
80 1
06 μ
m a
nd 7
5 μm
prim
ary
grin
d re
sults
from
grin
d op
timis
atio
n te
stw
ork.
3.
Ext
ract
ions
are
bas
ed o
n ca
lcul
ated
hea
d gr
ade
and
assa
yed
tail
grad
e.
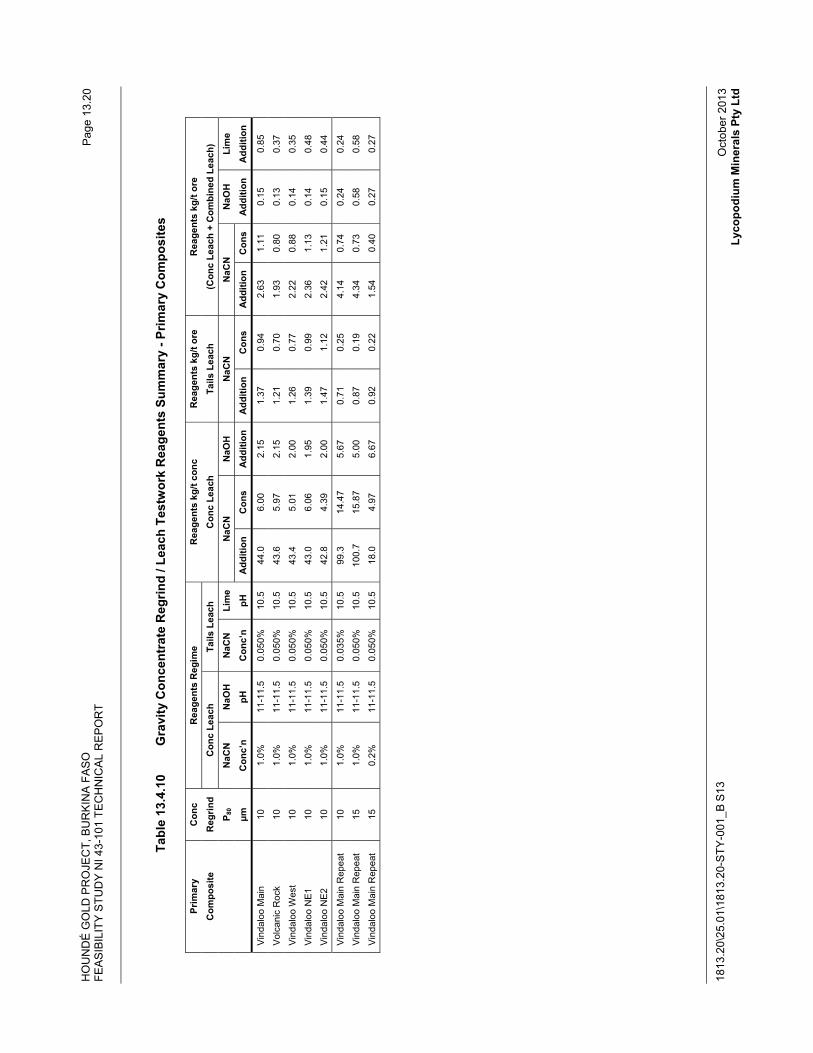
HO
UN
DÉ
GO
LD P
RO
JEC
T, B
UR
KIN
A F
AS
O
FEA
SIB
ILIT
Y S
TUD
Y N
I 43-
101
TEC
HN
ICA
L R
EP
OR
T
1813
.20\
25.0
1\18
13.2
0-S
TY-0
01_B
S13
Pag
e 13
.20
Oct
ober
201
3 Ly
copo
dium
Min
eral
s Pt
y Lt
d
Tabl
e 13
.4.1
0 G
ravi
ty C
once
ntra
te R
egrin
d / L
each
Tes
twor
k R
eage
nts
Sum
mar
y - P
rimar
y C
ompo
site
s
Prim
ary
Con
c R
eage
nts
Reg
ime
Rea
gent
s kg
/t co
nc
Rea
gent
s kg
/t or
e R
eage
nts
kg/t
ore
Com
posi
te
Reg
rind
Con
c Le
ach
Tails
Lea
ch
Con
c Le
ach
Tails
Lea
ch
(Con
c Le
ach
+ C
ombi
ned
Leac
h)
P 80
NaC
N
NaO
H
NaC
N
Lim
e N
aCN
N
aOH
N
aCN
N
aCN
N
aOH
Li
me
μm
Con
c’n
pH
Con
c’n
pH
Add
ition
C
ons
Add
ition
A
dditi
on
Con
s A
dditi
on
Con
s A
dditi
on
Add
ition
Vind
aloo
Mai
n 10
1.
0%
11-1
1.5
0.05
0%
10.5
44
.0
6.00
2.
15
1.37
0.
94
2.63
1.
11
0.15
0.
85
Volc
anic
Roc
k 10
1.
0%
11-1
1.5
0.05
0%
10.5
43
.6
5.97
2.
15
1.21
0.
70
1.93
0.
80
0.13
0.
37
Vind
aloo
Wes
t 10
1.
0%
11-1
1.5
0.05
0%
10.5
43
.4
5.01
2.
00
1.26
0.
77
2.22
0.
88
0.14
0.
35
Vind
aloo
NE1
10
1.
0%
11-1
1.5
0.05
0%
10.5
43
.0
6.06
1.
95
1.39
0.
99
2.36
1.
13
0.14
0.
48
Vind
aloo
NE2
10
1.
0%
11-1
1.5
0.05
0%
10.5
42
.8
4.39
2.
00
1.47
1.
12
2.42
1.
21
0.15
0.
44
Vind
aloo
Mai
n R
epea
t 10
1.
0%
11-1
1.5
0.03
5%
10.5
99
.3
14.4
7 5.
67
0.71
0.
25
4.14
0.
74
0.24
0.
24
Vind
aloo
Mai
n R
epea
t 15
1.
0%
11-1
1.5
0.05
0%
10.5
10
0.7
15.8
7 5.
00
0.87
0.
19
4.34
0.
73
0.58
0.
58
Vind
aloo
Mai
n R
epea
t 15
0.
2%
11-1
1.5
0.05
0%
10.5
18
.0
4.97
6.
67
0.92
0.
22
1.54
0.
40
0.27
0.
27
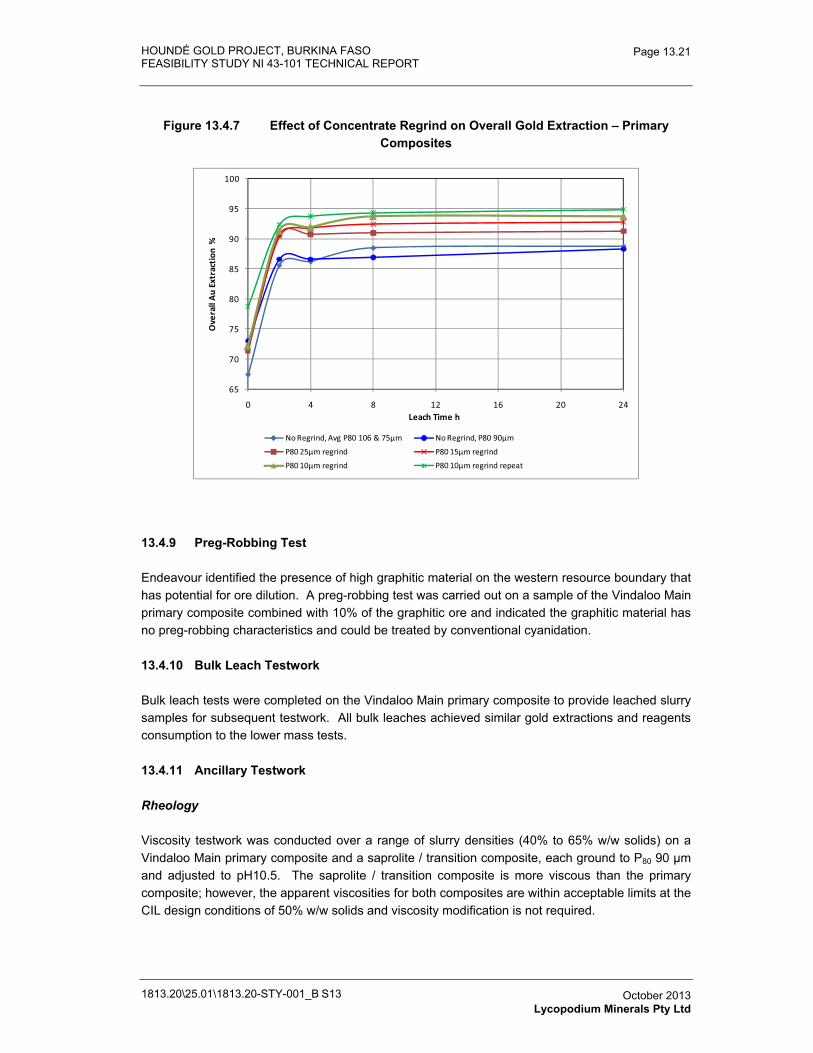
HOUNDÉ GOLD PROJECT, BURKINA FASO FEASIBILITY STUDY NI 43-101 TECHNICAL REPORT
1813.20\25.01\1813.20-STY-001_B S13
Page 13.21
October 2013 Lycopodium Minerals Pty Ltd
Figure 13.4.7 Effect of Concentrate Regrind on Overall Gold Extraction – Primary Composites
65
70
75
80
85
90
95
100
0 4 8 12 16 20 24
Ove
rall�
Au�
Extr
acti
on�%
Leach�Time�h
No�Regrind,�Avg�P80�106�&�75μm No�Regrind,�P80�90μm
P80�25μm�regrind P80�15μm�regrind
P80�10μm�regrind P80�10μm�regrind�repeat
13.4.9 Preg-Robbing Test
Endeavour identified the presence of high graphitic material on the western resource boundary that has potential for ore dilution. A preg-robbing test was carried out on a sample of the Vindaloo Main primary composite combined with 10% of the graphitic ore and indicated the graphitic material has no preg-robbing characteristics and could be treated by conventional cyanidation.
13.4.10 Bulk Leach Testwork
Bulk leach tests were completed on the Vindaloo Main primary composite to provide leached slurry samples for subsequent testwork. All bulk leaches achieved similar gold extractions and reagents consumption to the lower mass tests.
13.4.11 Ancillary Testwork
Rheology
Viscosity testwork was conducted over a range of slurry densities (40% to 65% w/w solids) on a Vindaloo Main primary composite and a saprolite / transition composite, each ground to P80 90 μm and adjusted to pH10.5. The saprolite / transition composite is more viscous than the primary composite; however, the apparent viscosities for both composites are within acceptable limits at the CIL design conditions of 50% w/w solids and viscosity modification is not required.
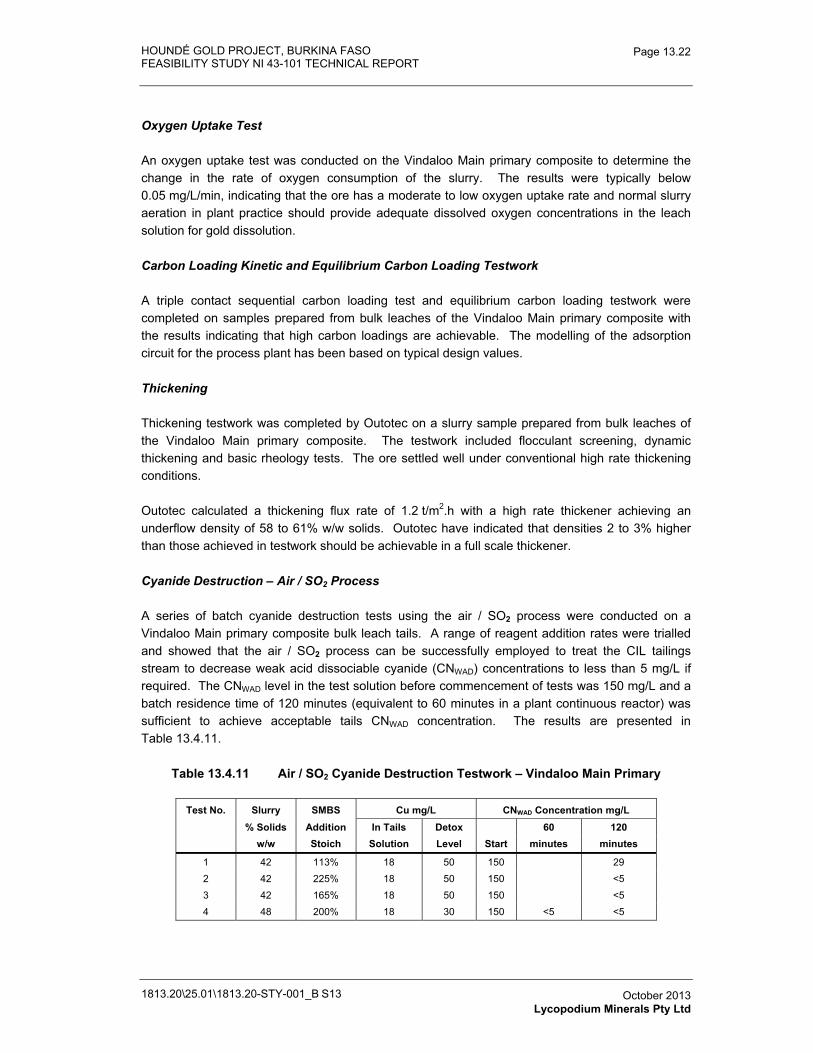
HOUNDÉ GOLD PROJECT, BURKINA FASO FEASIBILITY STUDY NI 43-101 TECHNICAL REPORT
1813.20\25.01\1813.20-STY-001_B S13
Page 13.22
October 2013 Lycopodium Minerals Pty Ltd
Oxygen Uptake Test
An oxygen uptake test was conducted on the Vindaloo Main primary composite to determine the change in the rate of oxygen consumption of the slurry. The results were typically below 0.05 mg/L/min, indicating that the ore has a moderate to low oxygen uptake rate and normal slurry aeration in plant practice should provide adequate dissolved oxygen concentrations in the leach solution for gold dissolution.
Carbon Loading Kinetic and Equilibrium Carbon Loading Testwork
A triple contact sequential carbon loading test and equilibrium carbon loading testwork were completed on samples prepared from bulk leaches of the Vindaloo Main primary composite with the results indicating that high carbon loadings are achievable. The modelling of the adsorption circuit for the process plant has been based on typical design values.
Thickening
Thickening testwork was completed by Outotec on a slurry sample prepared from bulk leaches of the Vindaloo Main primary composite. The testwork included flocculant screening, dynamic thickening and basic rheology tests. The ore settled well under conventional high rate thickening conditions.
Outotec calculated a thickening flux rate of 1.2 t/m2.h with a high rate thickener achieving an underflow density of 58 to 61% w/w solids. Outotec have indicated that densities 2 to 3% higher than those achieved in testwork should be achievable in a full scale thickener.
Cyanide Destruction – Air / SO2 Process
A series of batch cyanide destruction tests using the air / SO2 process were conducted on a Vindaloo Main primary composite bulk leach tails. A range of reagent addition rates were trialled and showed that the air / SO2 process can be successfully employed to treat the CIL tailings stream to decrease weak acid dissociable cyanide (CNWAD) concentrations to less than 5 mg/L if required. The CNWAD level in the test solution before commencement of tests was 150 mg/L and a batch residence time of 120 minutes (equivalent to 60 minutes in a plant continuous reactor) was sufficient to achieve acceptable tails CNWAD concentration. The results are presented in Table 13.4.11.
Table 13.4.11 Air / SO2 Cyanide Destruction Testwork – Vindaloo Main Primary
Test No. Slurry SMBS Cu mg/L CNWAD Concentration mg/L % Solids Addition In Tails Detox 60 120
w/w Stoich Solution Level Start minutes minutes
1 42 113% 18 50 150 292 42 225% 18 50 150 <53 42 165% 18 50 150 <54 48 200% 18 30 150 <5 <5
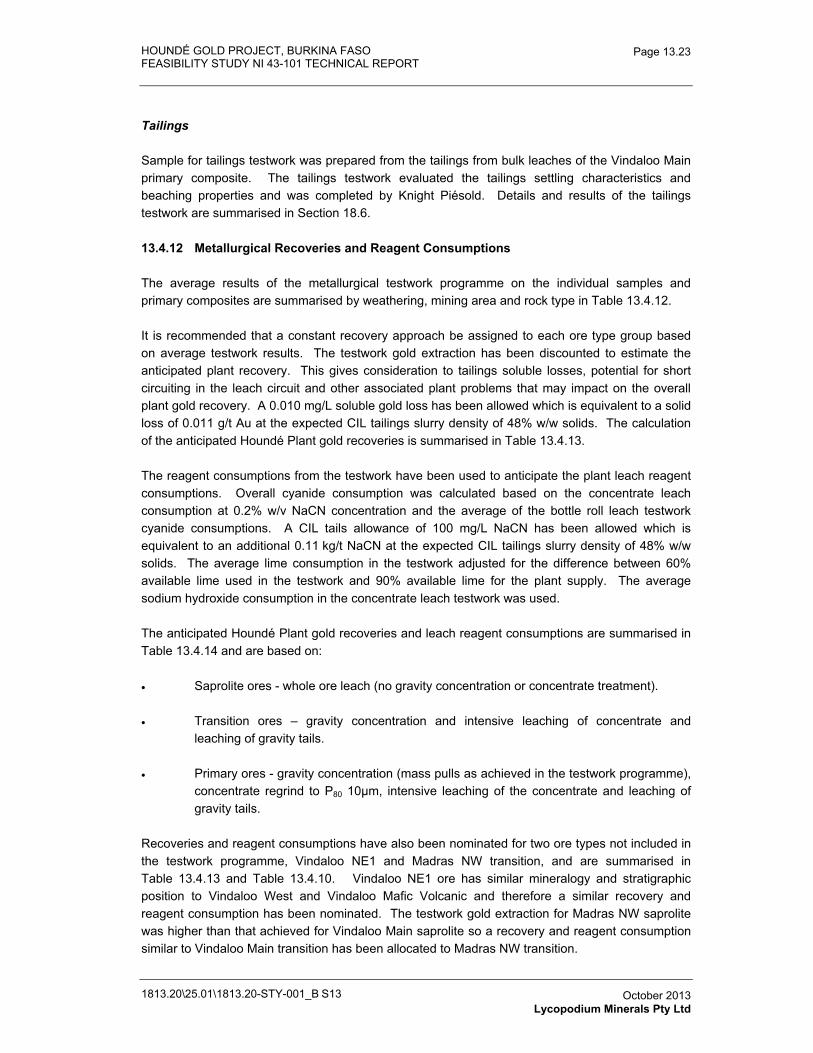
HOUNDÉ GOLD PROJECT, BURKINA FASO FEASIBILITY STUDY NI 43-101 TECHNICAL REPORT
1813.20\25.01\1813.20-STY-001_B S13
Page 13.23
October 2013 Lycopodium Minerals Pty Ltd
Tailings
Sample for tailings testwork was prepared from the tailings from bulk leaches of the Vindaloo Main primary composite. The tailings testwork evaluated the tailings settling characteristics and beaching properties and was completed by Knight Piésold. Details and results of the tailings testwork are summarised in Section 18.6.
13.4.12 Metallurgical Recoveries and Reagent Consumptions
The average results of the metallurgical testwork programme on the individual samples and primary composites are summarised by weathering, mining area and rock type in Table 13.4.12.
It is recommended that a constant recovery approach be assigned to each ore type group based on average testwork results. The testwork gold extraction has been discounted to estimate the anticipated plant recovery. This gives consideration to tailings soluble losses, potential for short circuiting in the leach circuit and other associated plant problems that may impact on the overall plant gold recovery. A 0.010 mg/L soluble gold loss has been allowed which is equivalent to a solid loss of 0.011 g/t Au at the expected CIL tailings slurry density of 48% w/w solids. The calculation of the anticipated Houndé Plant gold recoveries is summarised in Table 13.4.13.
The reagent consumptions from the testwork have been used to anticipate the plant leach reagent consumptions. Overall cyanide consumption was calculated based on the concentrate leach consumption at 0.2% w/v NaCN concentration and the average of the bottle roll leach testwork cyanide consumptions. A CIL tails allowance of 100 mg/L NaCN has been allowed which is equivalent to an additional 0.11 kg/t NaCN at the expected CIL tailings slurry density of 48% w/w solids. The average lime consumption in the testwork adjusted for the difference between 60% available lime used in the testwork and 90% available lime for the plant supply. The average sodium hydroxide consumption in the concentrate leach testwork was used.
The anticipated Houndé Plant gold recoveries and leach reagent consumptions are summarised in Table 13.4.14 and are based on:
� Saprolite ores - whole ore leach (no gravity concentration or concentrate treatment).
� Transition ores – gravity concentration and intensive leaching of concentrate and leaching of gravity tails.
� Primary ores - gravity concentration (mass pulls as achieved in the testwork programme), concentrate regrind to P80 10μm, intensive leaching of the concentrate and leaching of gravity tails.
Recoveries and reagent consumptions have also been nominated for two ore types not included in the testwork programme, Vindaloo NE1 and Madras NW transition, and are summarised in Table 13.4.13 and Table 13.4.10. Vindaloo NE1 ore has similar mineralogy and stratigraphic position to Vindaloo West and Vindaloo Mafic Volcanic and therefore a similar recovery and reagent consumption has been nominated. The testwork gold extraction for Madras NW saprolite was higher than that achieved for Vindaloo Main saprolite so a recovery and reagent consumption similar to Vindaloo Main transition has been allocated to Madras NW transition.
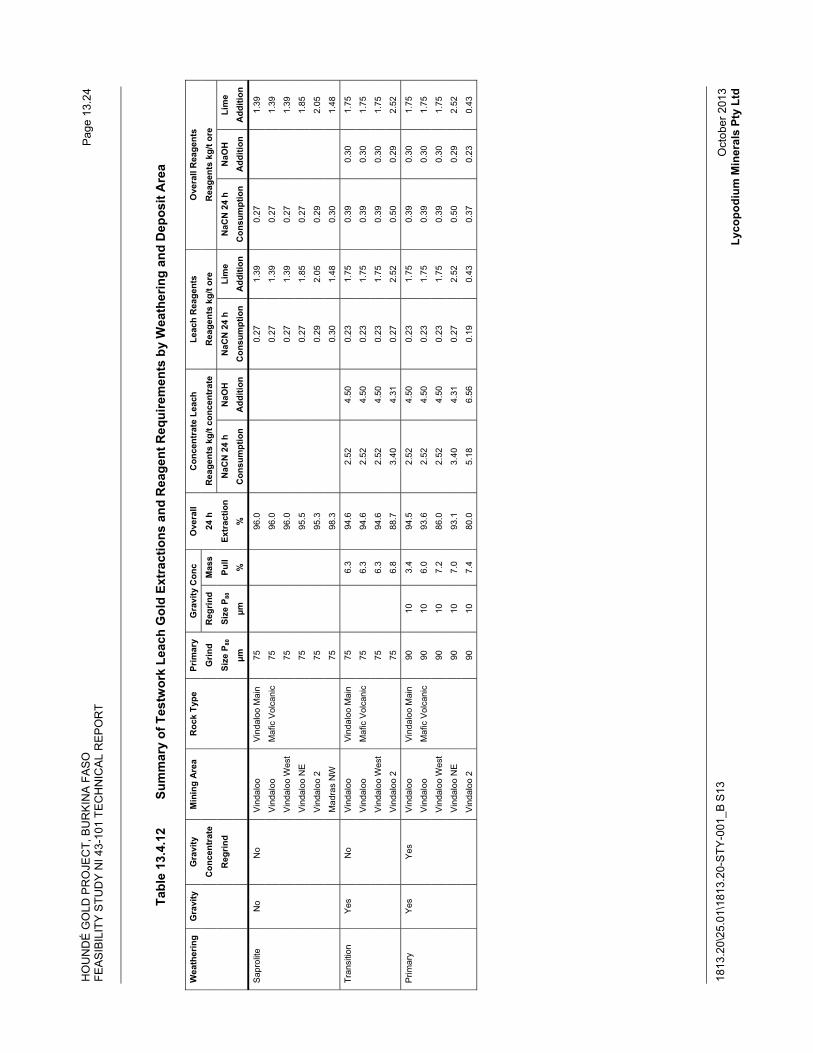
HO
UN
DÉ
GO
LD P
RO
JEC
T, B
UR
KIN
A F
AS
O
FEA
SIB
ILIT
Y S
TUD
Y N
I 43-
101
TEC
HN
ICA
L R
EP
OR
T
1813
.20\
25.0
1\18
13.2
0-S
TY-0
01_B
S13
Pag
e 13
.24
Oct
ober
201
3 Ly
copo
dium
Min
eral
s Pt
y Lt
d
Tabl
e 13
.4.1
2 Su
mm
ary
of T
estw
ork
Leac
h G
old
Extr
actio
ns a
nd R
eage
nt R
equi
rem
ents
by
Wea
ther
ing
and
Dep
osit
Are
a
Wea
ther
ing
Gra
vity
G
ravi
ty
Min
ing
Area
R
ock
Type
Pr
imar
y G
ravi
ty C
onc
Ove
rall
Con
cent
rate
Lea
ch
Leac
h R
eage
nts
Ove
rall
Rea
gent
s
C
once
ntra
te
Grin
d R
egrin
d M
ass
24 h
R
eage
nts
kg/t
conc
entr
ate
Rea
gent
s kg
/t or
e R
eage
nts
kg/t
ore
R
egrin
d
Size
P80
Si
ze P
80
Pull
Extr
actio
n N
aCN
24
h N
aOH
N
aCN
24
h Li
me
NaC
N 2
4 h
NaO
H
Lim
e
μm
μm
%
%
Con
sum
ptio
n A
dditi
on
Con
sum
ptio
n A
dditi
on
Con
sum
ptio
n A
dditi
on
Add
ition
Sap
rolit
e N
o N
o
Vin
dalo
o V
inda
loo
Mai
n 75
96
.0
0.27
1.
39
0.27
1.39
V
inda
loo
Maf
ic V
olca
nic
75
96.0
0.
27
1.39
0.
27
1.
39
Vi
ndal
oo W
est
75
96
.0
0.27
1.
39
0.27
1.39
V
inda
loo
NE
75
95.5
0.
27
1.85
0.
27
1.
85
V
inda
loo
2
75
95.3
0.
29
2.05
0.
29
2.
05
M
adra
s N
W
75
98
.3
0.30
1.
48
0.30
1.48
Tran
sitio
n Ye
s N
o
Vin
dalo
o V
inda
loo
Mai
n 75
6.3
94.6
2.
52
4.50
0.
23
1.75
0.
39
0.30
1.
75
V
inda
loo
Maf
ic V
olca
nic
75
6.
3 94
.6
2.52
4.
50
0.23
1.
75
0.39
0.
30
1.75
V
inda
loo
Wes
t
75
6.
3 94
.6
2.52
4.
50
0.23
1.
75
0.39
0.
30
1.75
V
inda
loo
2
75
6.
8 88
.7
3.40
4.
31
0.27
2.
52
0.50
0.
29
2.52
Prim
ary
Yes
Yes
Vin
dalo
o V
inda
loo
Mai
n 90
10
3.
4 94
.5
2.52
4.
50
0.23
1.
75
0.39
0.
30
1.75
V
inda
loo
Maf
ic V
olca
nic
90
10
6.0
93.6
2.
52
4.50
0.
23
1.75
0.
39
0.30
1.
75
V
inda
loo
Wes
t
90
10
7.2
86.0
2.
52
4.50
0.
23
1.75
0.
39
0.30
1.
75
V
inda
loo
NE
90
10
7.0
93.1
3.
40
4.31
0.
27
2.52
0.
50
0.29
2.
52
V
inda
loo
2
90
10
7.4
80.0
5.
18
6.56
0.
19
0.43
0.
37
0.23
0.
43
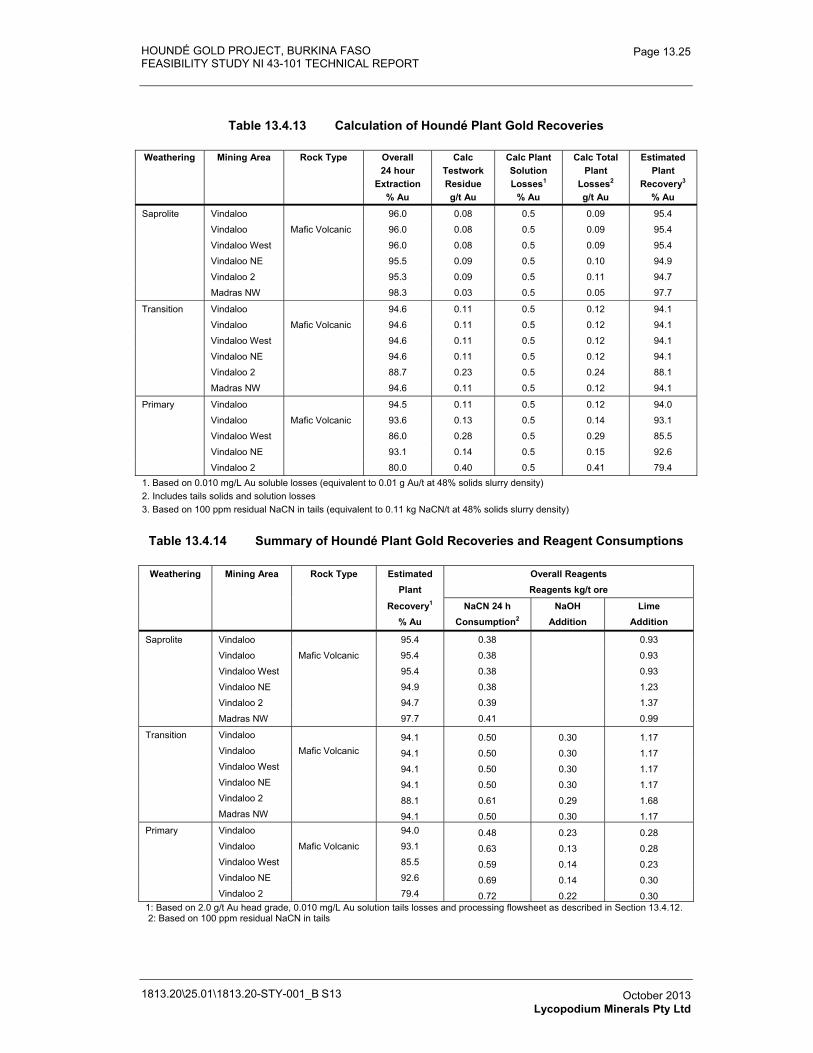
HOUNDÉ GOLD PROJECT, BURKINA FASO FEASIBILITY STUDY NI 43-101 TECHNICAL REPORT
1813.20\25.01\1813.20-STY-001_B S13
Page 13.25
October 2013 Lycopodium Minerals Pty Ltd
Table 13.4.13 Calculation of Houndé Plant Gold Recoveries
Weathering Mining Area Rock Type Overall Calc Calc Plant Calc Total Estimated 24 hour Testwork Solution Plant Plant
Extraction Residue Losses1 Losses2 Recovery3
% Au g/t Au % Au g/t Au % Au
Saprolite Vindaloo 96.0 0.08 0.5 0.09 95.4
Vindaloo Mafic Volcanic 96.0 0.08 0.5 0.09 95.4
Vindaloo West 96.0 0.08 0.5 0.09 95.4
Vindaloo NE 95.5 0.09 0.5 0.10 94.9
Vindaloo 2 95.3 0.09 0.5 0.11 94.7
Madras NW 98.3 0.03 0.5 0.05 97.7
Transition Vindaloo 94.6 0.11 0.5 0.12 94.1
Vindaloo Mafic Volcanic 94.6 0.11 0.5 0.12 94.1
Vindaloo West 94.6 0.11 0.5 0.12 94.1
Vindaloo NE 94.6 0.11 0.5 0.12 94.1
Vindaloo 2 88.7 0.23 0.5 0.24 88.1
Madras NW 94.6 0.11 0.5 0.12 94.1
Primary Vindaloo 94.5 0.11 0.5 0.12 94.0
Vindaloo Mafic Volcanic 93.6 0.13 0.5 0.14 93.1
Vindaloo West 86.0 0.28 0.5 0.29 85.5
Vindaloo NE 93.1 0.14 0.5 0.15 92.6
Vindaloo 2 80.0 0.40 0.5 0.41 79.4 1. Based on 0.010 mg/L Au soluble losses (equivalent to 0.01 g Au/t at 48% solids slurry density) 2. Includes tails solids and solution losses 3. Based on 100 ppm residual NaCN in tails (equivalent to 0.11 kg NaCN/t at 48% solids slurry density)
Table 13.4.14 Summary of Houndé Plant Gold Recoveries and Reagent Consumptions
Weathering Mining Area Rock Type Estimated Overall Reagents Plant Reagents kg/t ore
Recovery1 NaCN 24 h NaOH Lime % Au Consumption2 Addition Addition
Saprolite Vindaloo 95.4 0.38 0.93
Vindaloo Mafic Volcanic 95.4 0.38 0.93
Vindaloo West 95.4 0.38 0.93
Vindaloo NE 94.9 0.38 1.23
Vindaloo 2 94.7 0.39 1.37
Madras NW 97.7 0.41 0.99
Transition Vindaloo 94.1 0.50 0.30 1.17 Vindaloo Mafic Volcanic 94.1 0.50 0.30 1.17 Vindaloo West 94.1 0.50 0.30 1.17 Vindaloo NE 94.1 0.50 0.30 1.17 Vindaloo 2 88.1 0.61 0.29 1.68 Madras NW 94.1 0.50 0.30 1.17
Primary Vindaloo 94.0 0.48 0.23 0.28 Vindaloo Mafic Volcanic 93.1 0.63 0.13 0.28 Vindaloo West 85.5 0.59 0.14 0.23 Vindaloo NE 92.6 0.69 0.14 0.30 Vindaloo 2 79.4 0.72 0.22 0.30
1: Based on 2.0 g/t Au head grade, 0.010 mg/L Au solution tails losses and processing flowsheet as described in Section 13.4.12. 2: Based on 100 ppm residual NaCN in tails
HOUNDÉ GOLD PROJECT, BURKINA FASO FEASIBILITY STUDY NI 43-101 TECHNICAL REPORT
1813.20\25.01\1813.20-STY-001_B S13
Page 13.26
October 2013 Lycopodium Minerals Pty Ltd
13.4.13 Technical Risks and Opportunities
A number of technical risk and opportunity areas have been identified during the testwork programme and subsequent process design.
Gravity Concentration
Two continuous centrifugal gravity concentrators have been selected in the plant design to recover a 2 to 3% mass gravity concentrate from the cyclone overflow stream. A grade recovery relationship was established in the current test programme using a multiple pass approach on a batch basis. The relationship was very clear and indicates a mass pull of 2.5% would result in a gold recovery of approximately 75%. A conservative approach has been taken in sizing the gravity concentrators and subsequent fine grinding equipment. Additional testwork will provide an opportunity to further optimise these selections. In particular this may result in the inclusion of a small secondary concentrator operating in a cleaner mode, while reducing the fine grinding requirements with a smaller, higher grade concentrate.
Gravity Concentrate Comminution
Testwork to determine the gravity concentrate milling specific energy has not been completed due to time and sample limitations. A conservative milling specific energy has been assumed for the purposes of the design. If the specific energy requirement is less than the conservative estimate, there is opportunity to reduce the project capital and operating cost. Alternatively a larger gravity concentrate mass could be collected with an opportunity for increased plant gold recoveries for some ores. Fine grinding mill vendor testwork on a gravity concentrate sample to provide this data is likely to improve project economics.
Plant Recoveries
Plant recoveries for the transition ores do not include fine grinding of the gravity concentrate prior to leaching as this flowsheet was not trialled on the transition ores due to the typically high recoveries achieved without further grinding. There is an opportunity that the plant recovery for the moderately oxidised transition ores will increase when processed with the selected flowsheet.
The plant recoveries estimated for the minority Houndé primary ores (i.e. other than Vindaloo) have been based on higher mass pull gravity concentrates. There is a risk that the recoveries may be reduced at the lower plant design gravity mass pulls, although this risk is minimised by the minor proportion that these ores constitute and the possibility that a higher concentrate mass pull may be able to be treated as a conservative concentrate milling specific energy has been selected.
The plant recoveries have been estimated based on the leaching testwork 24 hour extractions. The plant CIL design allows for 36 hours leaching residence time and there is opportunity for higher plant gold recoveries than nominated.
HOUNDÉ GOLD PROJECT, BURKINA FASO FEASIBILITY STUDY NI 43-101 TECHNICAL REPORT
1813.20\25.01\1813.20-STY-001_B S13
Page 13.27
October 2013 Lycopodium Minerals Pty Ltd
Reagent Optimisation
The concentrate leach cyanide consumption was based on a high leaching concentration of 0.2% NaCN w/w (2000 ppm). There is an opportunity to optimise the plant concentrate leach cyanide concentration, thereby reducing the overall cyanide consumption and operating cost.
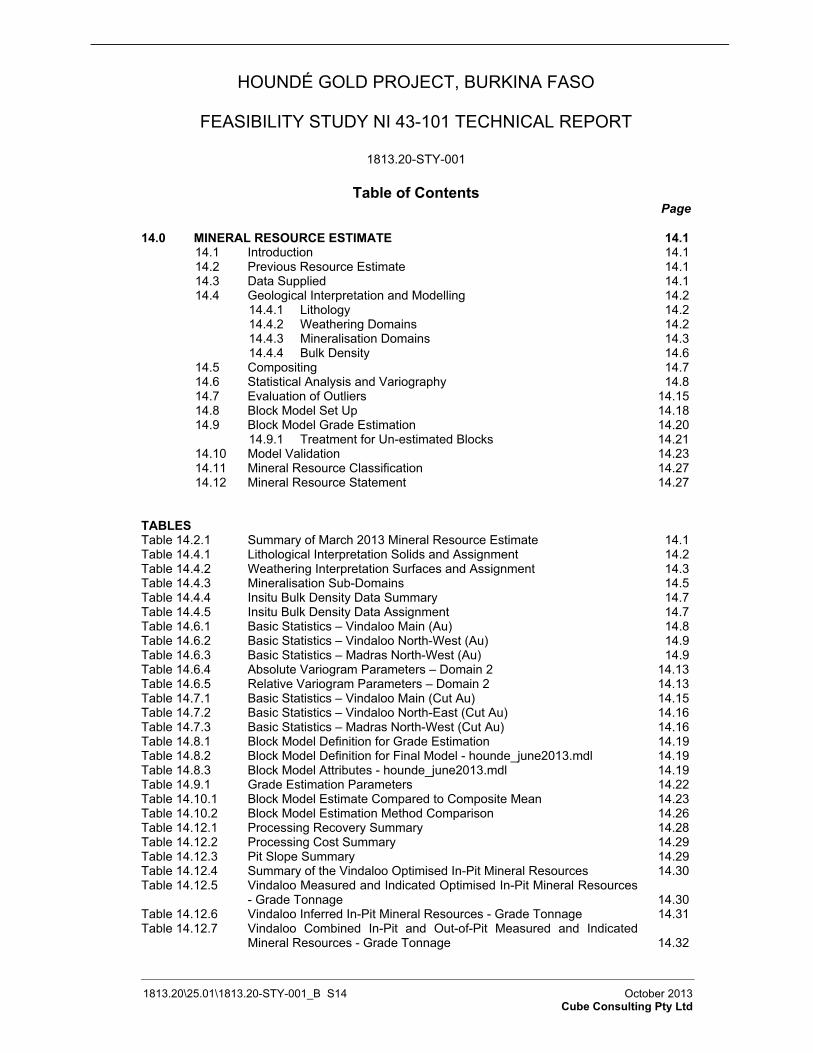
HOUNDÉ GOLD PROJECT, BURKINA FASO
FEASIBILITY STUDY NI 43-101 TECHNICAL REPORT
1813.20-STY-001
Table of Contents Page
14.0� MINERAL RESOURCE ESTIMATE 14.1�14.1� Introduction 14.1�14.2� Previous Resource Estimate 14.1�14.3� Data Supplied 14.1�14.4� Geological Interpretation and Modelling 14.2�
14.4.1� Lithology 14.2�14.4.2� Weathering Domains 14.2�14.4.3� Mineralisation Domains 14.3�14.4.4� Bulk Density 14.6�
14.5� Compositing 14.7�14.6� Statistical Analysis and Variography 14.8�14.7� Evaluation of Outliers 14.15�14.8� Block Model Set Up 14.18�14.9� Block Model Grade Estimation 14.20�
14.9.1� Treatment for Un-estimated Blocks 14.21�14.10� Model Validation 14.23�14.11� Mineral Resource Classification 14.27�14.12� Mineral Resource Statement 14.27�
TABLESTable 14.2.1� Summary of March 2013 Mineral Resource Estimate 14.1�Table 14.4.1� Lithological Interpretation Solids and Assignment 14.2�Table 14.4.2� Weathering Interpretation Surfaces and Assignment 14.3�Table 14.4.3� Mineralisation Sub-Domains 14.5�Table 14.4.4� Insitu Bulk Density Data Summary 14.7�Table 14.4.5� Insitu Bulk Density Data Assignment 14.7�Table 14.6.1� Basic Statistics – Vindaloo Main (Au) 14.8�Table 14.6.2� Basic Statistics – Vindaloo North-West (Au) 14.9�Table 14.6.3� Basic Statistics – Madras North-West (Au) 14.9�Table 14.6.4� Absolute Variogram Parameters – Domain 2 14.13�Table 14.6.5� Relative Variogram Parameters – Domain 2 14.13�Table 14.7.1� Basic Statistics – Vindaloo Main (Cut Au) 14.15�Table 14.7.2� Basic Statistics – Vindaloo North-East (Cut Au) 14.16�Table 14.7.3� Basic Statistics – Madras North-West (Cut Au) 14.16�Table 14.8.1� Block Model Definition for Grade Estimation 14.19�Table 14.8.2� Block Model Definition for Final Model - hounde_june2013.mdl 14.19�Table 14.8.3� Block Model Attributes - hounde_june2013.mdl 14.19�Table 14.9.1� Grade Estimation Parameters 14.22�Table 14.10.1� Block Model Estimate Compared to Composite Mean 14.23�Table 14.10.2� Block Model Estimation Method Comparison 14.26�Table 14.12.1� Processing Recovery Summary 14.28�Table 14.12.2� Processing Cost Summary 14.29�Table 14.12.3� Pit Slope Summary 14.29�Table 14.12.4� Summary of the Vindaloo Optimised In-Pit Mineral Resources 14.30�Table 14.12.5� Vindaloo Measured and Indicated Optimised In-Pit Mineral Resources
- Grade Tonnage 14.30�Table 14.12.6� Vindaloo Inferred In-Pit Mineral Resources - Grade Tonnage 14.31�Table 14.12.7� Vindaloo Combined In-Pit and Out-of-Pit Measured and Indicated
Mineral Resources - Grade Tonnage 14.32�
1813.20\25.01\1813.20-STY-001_B S14 October 2013 Cube Consulting Pty Ltd
HOUNDÉ GOLD PROJECT, BURKINA FASO
FEASIBILITY STUDY NI 43-101 TECHNICAL REPORT
1813.20-STY-001
Table of Contents (Continued) Page
1813.20\25.01\1813.20-STY-001_B S14 October 2013 Cube Consulting Pty Ltd
Table 14.12.8� Vindaloo Combined In-Pit and Out-of-Pit Inferred Mineral Resources - Grade Tonnage 14.32�
FIGURESFigure 14.4.1� Boundary Analysis – Domain 2 14.4�Figure 14.4.2� Boundary Analysis – Domain 17 14.4�Figure 14.4.3� Vindaloo Mineralization Domains with Drilling – Plan View 14.6�Figure 14.6.1� Vindaloo Main (No. 1 m Composites >100) - Log Probability Plot 14.10�Figure 14.6.2� Vindaloo Main (No. 1 m Composites <100) - Log Probability Plot 14.10�Figure 14.6.3� Vindaloo North-East (No. 1 m Composites >100) - Log Probability Plot 14.11�Figure 14.6.4� Vindaloo North-East (No. 1 m Composites <100) - Log Probability Plot 14.11�Figure 14.6.5� Madras North-West (No. 1 m Composites >100) - Log Probability Plot 14.12�Figure 14.6.6� Madras North-West (No. 1 m Composites <100) - Log Probability Plot 14.12�Figure 14.6.7� Domain 2 Variogram - Gaussian transformed 1 metre composite data 14.14�Figure 14.6.8� Domain 2 Variogram - Back transformed 1 metre composite data 14.14�Figure 14.7.1� All Combined 1 m Composites - Log Probability Plot 14.17�Figure 14.7.2� All Combined 1 m Composites - Log Histogram Plot 14.17�Figure 14.7.3� 1 m Composites by Weathering Domains - Log Probability Plot 14.18�Figure 14.10.1� Block Model Validation by Northing for Domain 2 14.24�Figure 14.10.2� Block Model Validation between 1261150N and 12611850N by RL for
Domain 2 14.25�Figure 14.12.1� Pit Slope Zone Summary 14.29�
APPENDICES Appendix 14.1� Interpolator Output Files�Appendix 14.2� Swath Plots�Appendix 14.3� Grade Tonnage Curves�
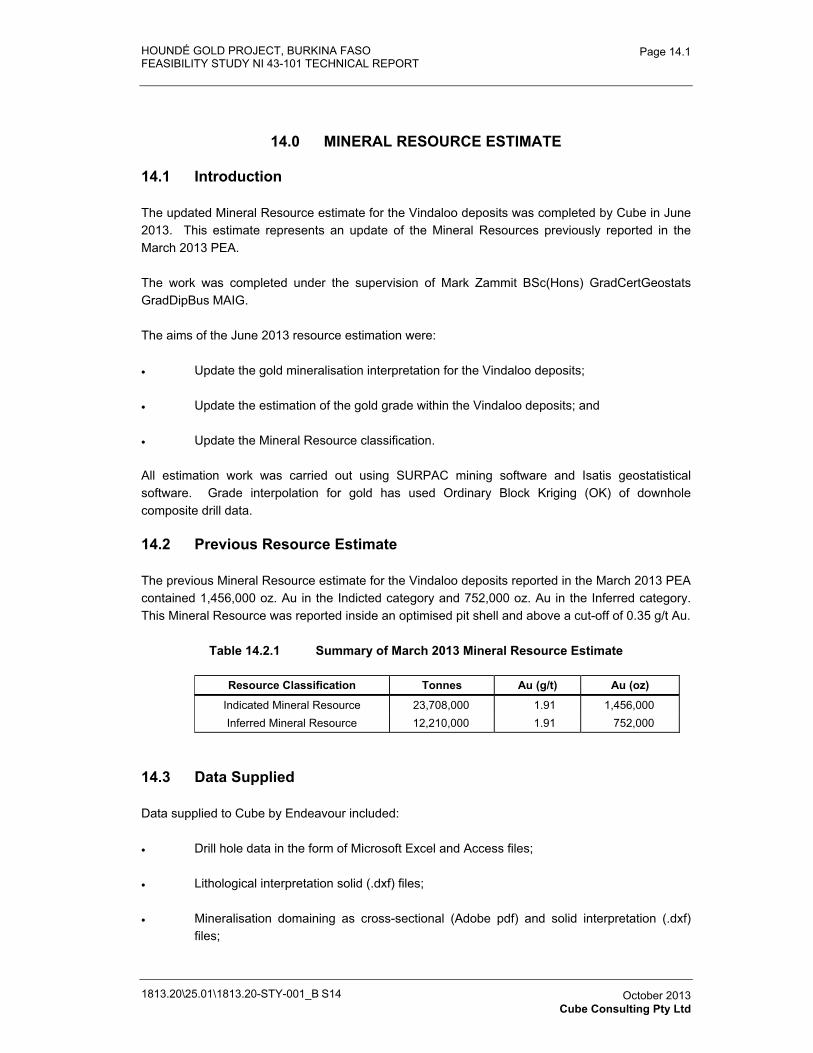
HOUNDÉ GOLD PROJECT, BURKINA FASO FEASIBILITY STUDY NI 43-101 TECHNICAL REPORT
1813.20\25.01\1813.20-STY-001_B S14
Page 14.1
October 2013 Cube Consulting Pty Ltd
14.0 MINERAL RESOURCE ESTIMATE
14.1 Introduction
The updated Mineral Resource estimate for the Vindaloo deposits was completed by Cube in June 2013. This estimate represents an update of the Mineral Resources previously reported in the March 2013 PEA.
The work was completed under the supervision of Mark Zammit BSc(Hons) GradCertGeostats GradDipBus MAIG.
The aims of the June 2013 resource estimation were:
� Update the gold mineralisation interpretation for the Vindaloo deposits;
� Update the estimation of the gold grade within the Vindaloo deposits; and
� Update the Mineral Resource classification.
All estimation work was carried out using SURPAC mining software and Isatis geostatistical software. Grade interpolation for gold has used Ordinary Block Kriging (OK) of downhole composite drill data.
14.2 Previous Resource Estimate
The previous Mineral Resource estimate for the Vindaloo deposits reported in the March 2013 PEA contained 1,456,000 oz. Au in the Indicted category and 752,000 oz. Au in the Inferred category. This Mineral Resource was reported inside an optimised pit shell and above a cut-off of 0.35 g/t Au.
Table 14.2.1 Summary of March 2013 Mineral Resource Estimate
Resource Classification Tonnes Au (g/t) Au (oz)
Indicated Mineral Resource 23,708,000 1.91 1,456,000 Inferred Mineral Resource 12,210,000 1.91 752,000
14.3 Data Supplied
Data supplied to Cube by Endeavour included:
� Drill hole data in the form of Microsoft Excel and Access files;
� Lithological interpretation solid (.dxf) files;
� Mineralisation domaining as cross-sectional (Adobe pdf) and solid interpretation (.dxf) files;
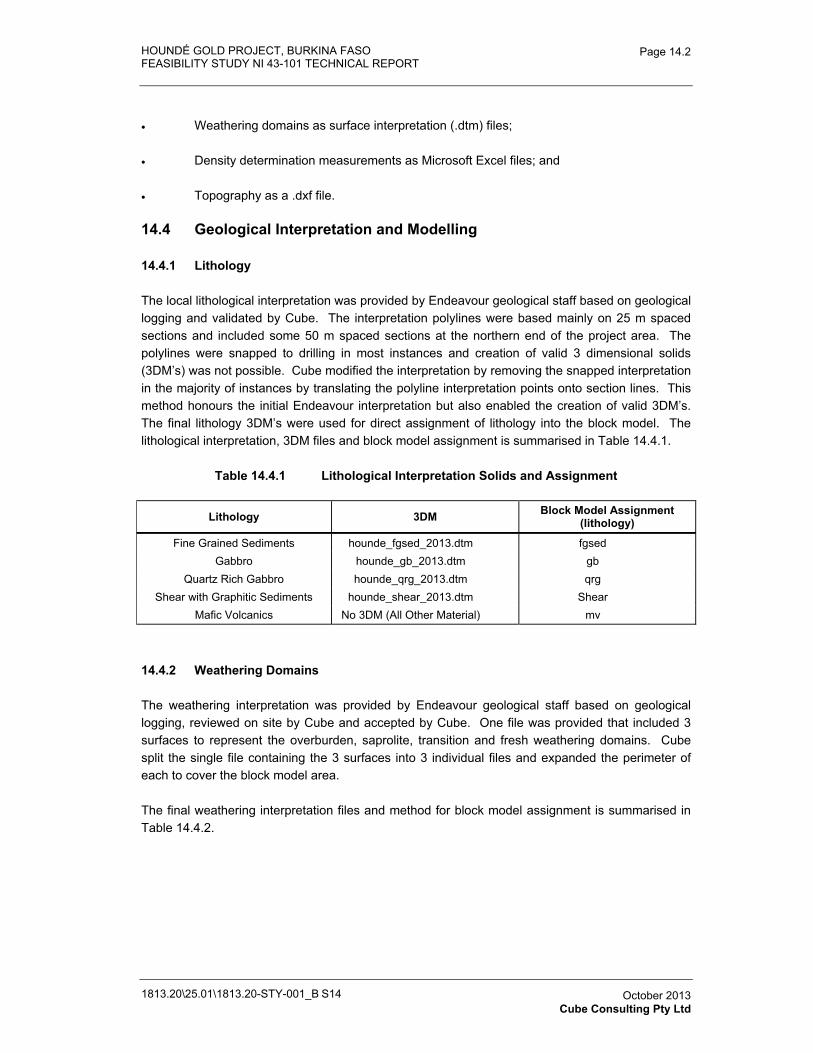
HOUNDÉ GOLD PROJECT, BURKINA FASO FEASIBILITY STUDY NI 43-101 TECHNICAL REPORT
1813.20\25.01\1813.20-STY-001_B S14
Page 14.2
October 2013 Cube Consulting Pty Ltd
� Weathering domains as surface interpretation (.dtm) files;
� Density determination measurements as Microsoft Excel files; and
� Topography as a .dxf file.
14.4 Geological Interpretation and Modelling
14.4.1 Lithology
The local lithological interpretation was provided by Endeavour geological staff based on geological logging and validated by Cube. The interpretation polylines were based mainly on 25 m spaced sections and included some 50 m spaced sections at the northern end of the project area. The polylines were snapped to drilling in most instances and creation of valid 3 dimensional solids (3DM’s) was not possible. Cube modified the interpretation by removing the snapped interpretation in the majority of instances by translating the polyline interpretation points onto section lines. This method honours the initial Endeavour interpretation but also enabled the creation of valid 3DM’s. The final lithology 3DM’s were used for direct assignment of lithology into the block model. The lithological interpretation, 3DM files and block model assignment is summarised in Table 14.4.1.
Table 14.4.1 Lithological Interpretation Solids and Assignment
Lithology 3DM Block Model Assignment (lithology)
Fine Grained Sediments hounde_fgsed_2013.dtm fgsed Gabbro hounde_gb_2013.dtm gb
Quartz Rich Gabbro hounde_qrg_2013.dtm qrg Shear with Graphitic Sediments hounde_shear_2013.dtm Shear
Mafic Volcanics No 3DM (All Other Material) mv
14.4.2 Weathering Domains
The weathering interpretation was provided by Endeavour geological staff based on geological logging, reviewed on site by Cube and accepted by Cube. One file was provided that included 3 surfaces to represent the overburden, saprolite, transition and fresh weathering domains. Cube split the single file containing the 3 surfaces into 3 individual files and expanded the perimeter of each to cover the block model area.
The final weathering interpretation files and method for block model assignment is summarised in Table 14.4.2.
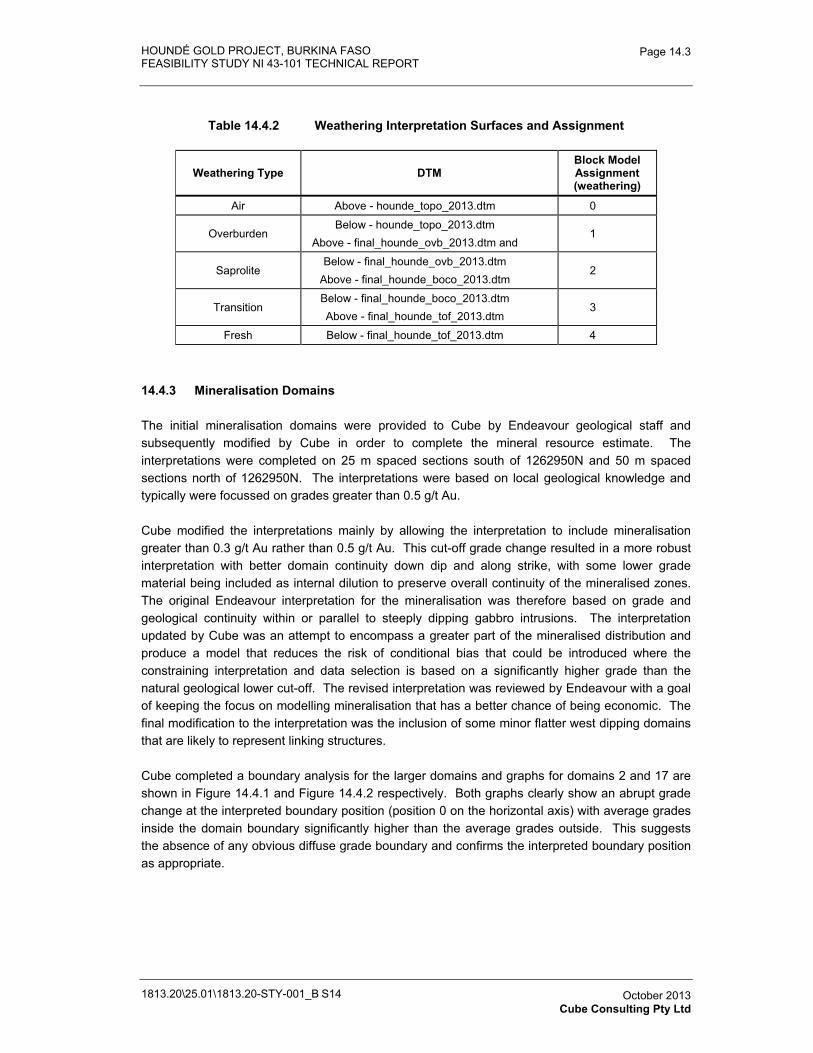
HOUNDÉ GOLD PROJECT, BURKINA FASO FEASIBILITY STUDY NI 43-101 TECHNICAL REPORT
1813.20\25.01\1813.20-STY-001_B S14
Page 14.3
October 2013 Cube Consulting Pty Ltd
Table 14.4.2 Weathering Interpretation Surfaces and Assignment
Weathering Type DTMBlock Model Assignment (weathering)
Air Above - hounde_topo_2013.dtm 0
Overburden Below - hounde_topo_2013.dtm
Above - final_hounde_ovb_2013.dtm and 1
Saprolite Below - final_hounde_ovb_2013.dtm
Above - final_hounde_boco_2013.dtm 2
Transition Below - final_hounde_boco_2013.dtm Above - final_hounde_tof_2013.dtm
3
Fresh Below - final_hounde_tof_2013.dtm 4
14.4.3 Mineralisation Domains
The initial mineralisation domains were provided to Cube by Endeavour geological staff and subsequently modified by Cube in order to complete the mineral resource estimate. The interpretations were completed on 25 m spaced sections south of 1262950N and 50 m spaced sections north of 1262950N. The interpretations were based on local geological knowledge and typically were focussed on grades greater than 0.5 g/t Au.
Cube modified the interpretations mainly by allowing the interpretation to include mineralisation greater than 0.3 g/t Au rather than 0.5 g/t Au. This cut-off grade change resulted in a more robust interpretation with better domain continuity down dip and along strike, with some lower grade material being included as internal dilution to preserve overall continuity of the mineralised zones. The original Endeavour interpretation for the mineralisation was therefore based on grade and geological continuity within or parallel to steeply dipping gabbro intrusions. The interpretation updated by Cube was an attempt to encompass a greater part of the mineralised distribution and produce a model that reduces the risk of conditional bias that could be introduced where the constraining interpretation and data selection is based on a significantly higher grade than the natural geological lower cut-off. The revised interpretation was reviewed by Endeavour with a goal of keeping the focus on modelling mineralisation that has a better chance of being economic. The final modification to the interpretation was the inclusion of some minor flatter west dipping domains that are likely to represent linking structures.
Cube completed a boundary analysis for the larger domains and graphs for domains 2 and 17 are shown in Figure 14.4.1 and Figure 14.4.2 respectively. Both graphs clearly show an abrupt grade change at the interpreted boundary position (position 0 on the horizontal axis) with average grades inside the domain boundary significantly higher than the average grades outside. This suggests the absence of any obvious diffuse grade boundary and confirms the interpreted boundary position as appropriate.
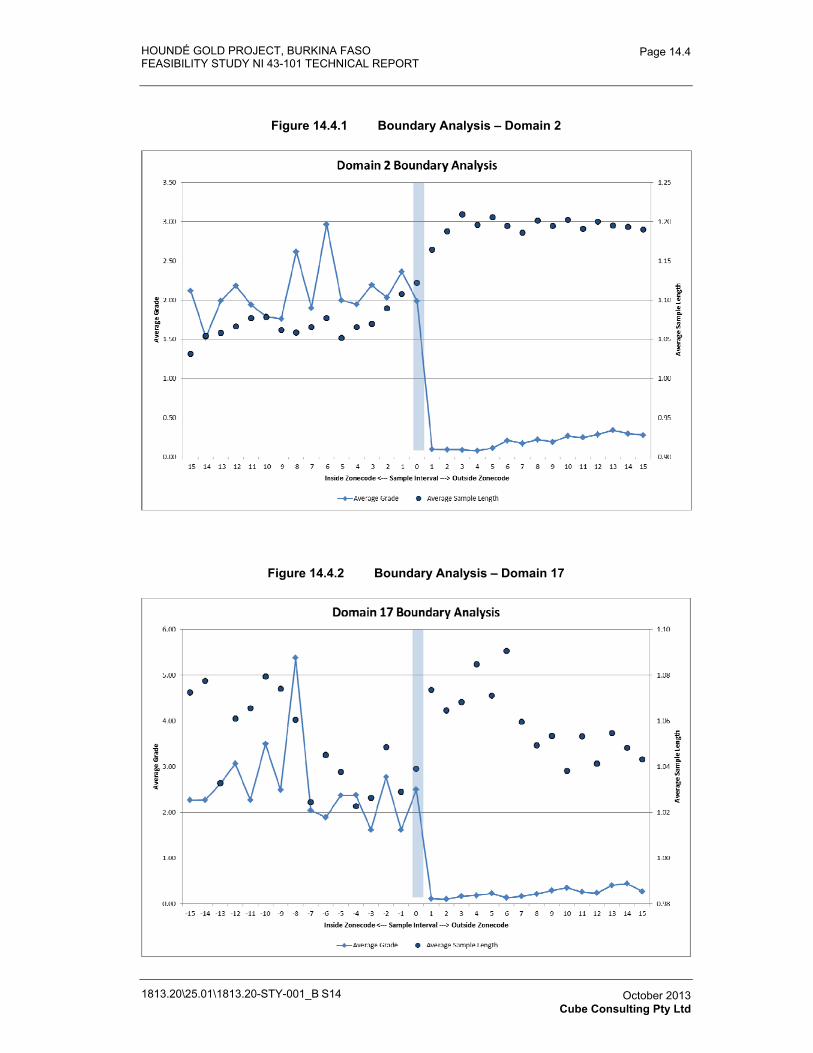
HOUNDÉ GOLD PROJECT, BURKINA FASO FEASIBILITY STUDY NI 43-101 TECHNICAL REPORT
1813.20\25.01\1813.20-STY-001_B S14
Page 14.4
October 2013 Cube Consulting Pty Ltd
Figure 14.4.1 Boundary Analysis – Domain 2
Figure 14.4.2 Boundary Analysis – Domain 17
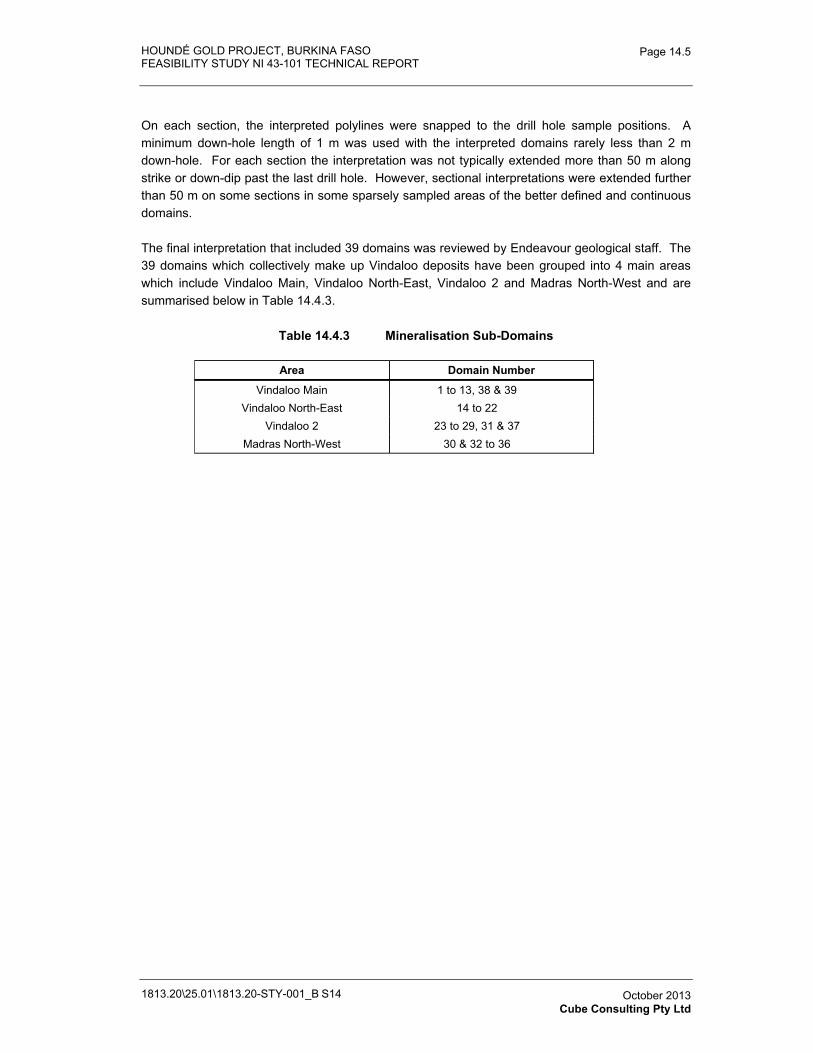
HOUNDÉ GOLD PROJECT, BURKINA FASO FEASIBILITY STUDY NI 43-101 TECHNICAL REPORT
1813.20\25.01\1813.20-STY-001_B S14
Page 14.5
October 2013 Cube Consulting Pty Ltd
On each section, the interpreted polylines were snapped to the drill hole sample positions. A minimum down-hole length of 1 m was used with the interpreted domains rarely less than 2 m down-hole. For each section the interpretation was not typically extended more than 50 m along strike or down-dip past the last drill hole. However, sectional interpretations were extended further than 50 m on some sections in some sparsely sampled areas of the better defined and continuous domains.
The final interpretation that included 39 domains was reviewed by Endeavour geological staff. The 39 domains which collectively make up Vindaloo deposits have been grouped into 4 main areas which include Vindaloo Main, Vindaloo North-East, Vindaloo 2 and Madras North-West and are summarised below in Table 14.4.3.
Table 14.4.3 Mineralisation Sub-Domains
Area Domain Number
Vindaloo Main 1 to 13, 38 & 39 Vindaloo North-East 14 to 22
Vindaloo 2 23 to 29, 31 & 37 Madras North-West 30 & 32 to 36
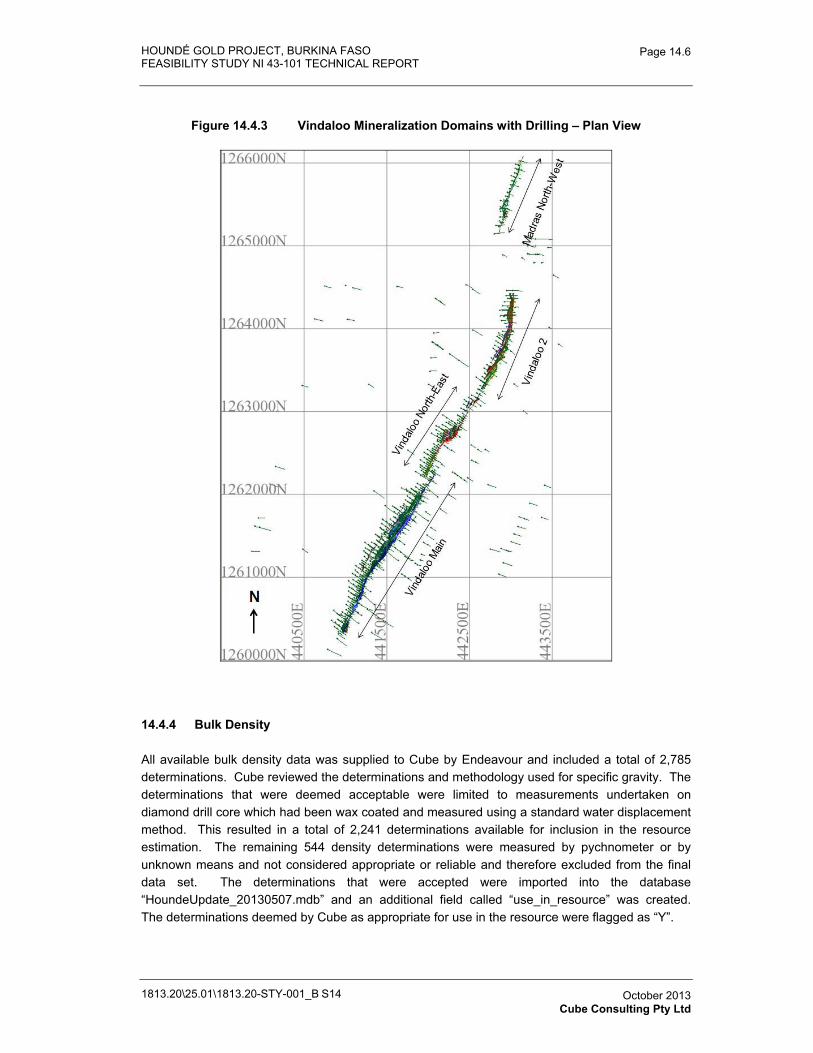
HOUNDÉ GOLD PROJECT, BURKINA FASO FEASIBILITY STUDY NI 43-101 TECHNICAL REPORT
1813.20\25.01\1813.20-STY-001_B S14
Page 14.6
October 2013 Cube Consulting Pty Ltd
Figure 14.4.3 Vindaloo Mineralization Domains with Drilling – Plan View
14.4.4 Bulk Density
All available bulk density data was supplied to Cube by Endeavour and included a total of 2,785 determinations. Cube reviewed the determinations and methodology used for specific gravity. The determinations that were deemed acceptable were limited to measurements undertaken on diamond drill core which had been wax coated and measured using a standard water displacement method. This resulted in a total of 2,241 determinations available for inclusion in the resource estimation. The remaining 544 density determinations were measured by pychnometer or by unknown means and not considered appropriate or reliable and therefore excluded from the final data set. The determinations that were accepted were imported into the database “HoundeUpdate_20130507.mdb” and an additional field called “use_in_resource” was created. The determinations deemed by Cube as appropriate for use in the resource were flagged as “Y”.
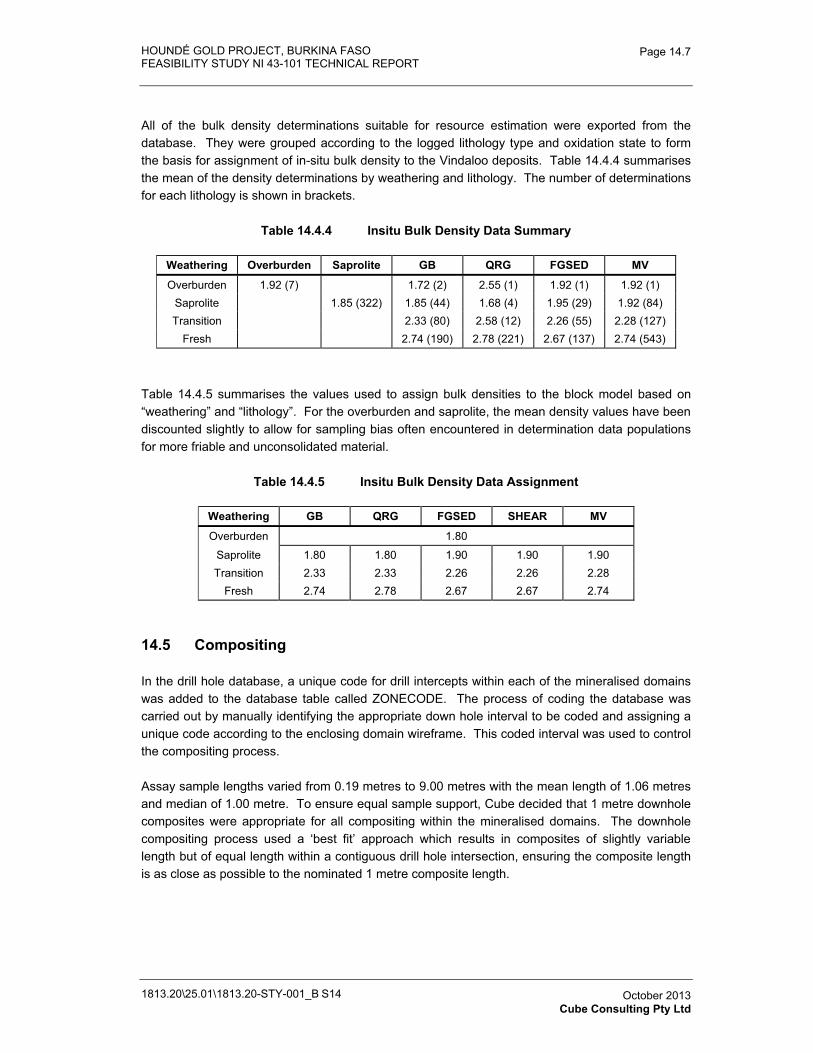
HOUNDÉ GOLD PROJECT, BURKINA FASO FEASIBILITY STUDY NI 43-101 TECHNICAL REPORT
1813.20\25.01\1813.20-STY-001_B S14
Page 14.7
October 2013 Cube Consulting Pty Ltd
All of the bulk density determinations suitable for resource estimation were exported from the database. They were grouped according to the logged lithology type and oxidation state to form the basis for assignment of in-situ bulk density to the Vindaloo deposits. Table 14.4.4 summarises the mean of the density determinations by weathering and lithology. The number of determinations for each lithology is shown in brackets.
Table 14.4.4 Insitu Bulk Density Data Summary
Weathering Overburden Saprolite GB QRG FGSED MV
Overburden 1.92 (7) 1.72 (2) 2.55 (1) 1.92 (1) 1.92 (1) Saprolite 1.85 (322) 1.85 (44) 1.68 (4) 1.95 (29) 1.92 (84) Transition 2.33 (80) 2.58 (12) 2.26 (55) 2.28 (127)
Fresh 2.74 (190) 2.78 (221) 2.67 (137) 2.74 (543)
Table 14.4.5 summarises the values used to assign bulk densities to the block model based on “weathering” and “lithology”. For the overburden and saprolite, the mean density values have been discounted slightly to allow for sampling bias often encountered in determination data populations for more friable and unconsolidated material.
Table 14.4.5 Insitu Bulk Density Data Assignment
Weathering GB QRG FGSED SHEAR MV
Overburden 1.80
Saprolite 1.80 1.80 1.90 1.90 1.90 Transition 2.33 2.33 2.26 2.26 2.28
Fresh 2.74 2.78 2.67 2.67 2.74
14.5 Compositing
In the drill hole database, a unique code for drill intercepts within each of the mineralised domains was added to the database table called ZONECODE. The process of coding the database was carried out by manually identifying the appropriate down hole interval to be coded and assigning a unique code according to the enclosing domain wireframe. This coded interval was used to control the compositing process.
Assay sample lengths varied from 0.19 metres to 9.00 metres with the mean length of 1.06 metres and median of 1.00 metre. To ensure equal sample support, Cube decided that 1 metre downhole composites were appropriate for all compositing within the mineralised domains. The downhole compositing process used a ‘best fit’ approach which results in composites of slightly variable length but of equal length within a contiguous drill hole intersection, ensuring the composite length is as close as possible to the nominated 1 metre composite length.
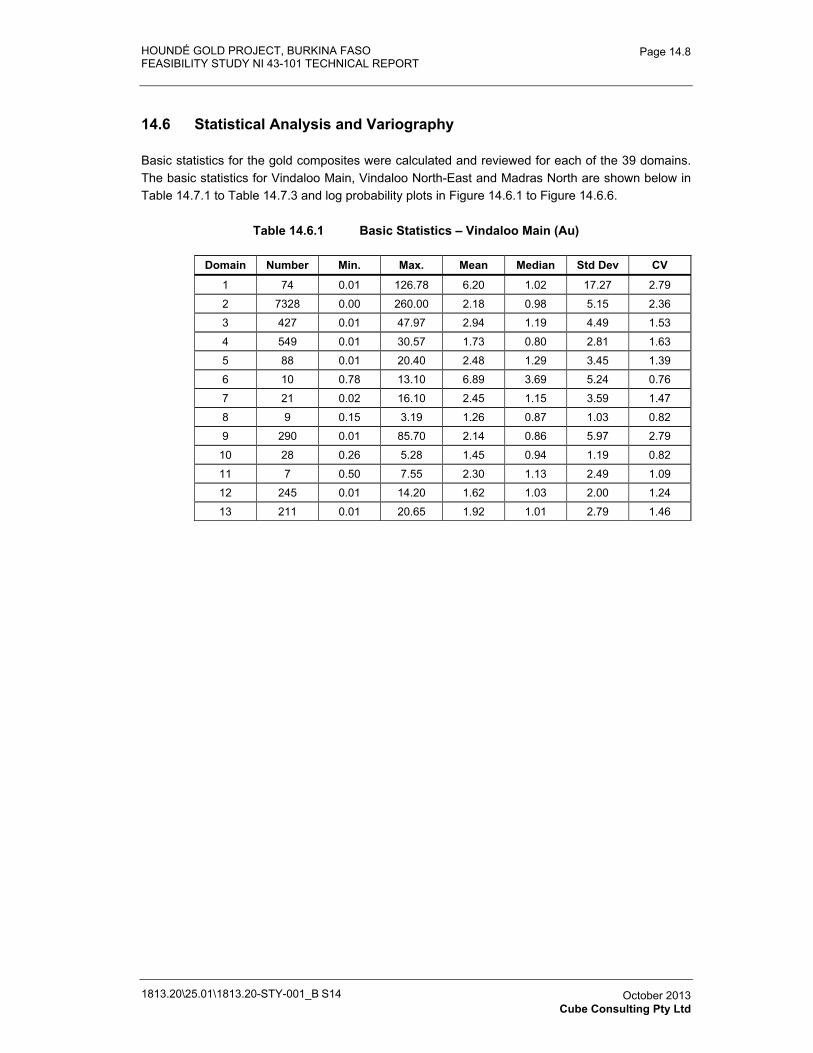
HOUNDÉ GOLD PROJECT, BURKINA FASO FEASIBILITY STUDY NI 43-101 TECHNICAL REPORT
1813.20\25.01\1813.20-STY-001_B S14
Page 14.8
October 2013 Cube Consulting Pty Ltd
14.6 Statistical Analysis and Variography
Basic statistics for the gold composites were calculated and reviewed for each of the 39 domains. The basic statistics for Vindaloo Main, Vindaloo North-East and Madras North are shown below in Table 14.7.1 to Table 14.7.3 and log probability plots in Figure 14.6.1 to Figure 14.6.6.
Table 14.6.1 Basic Statistics – Vindaloo Main (Au)
Domain Number Min. Max. Mean Median Std Dev CV
1 74 0.01 126.78 6.20 1.02 17.27 2.79
2 7328 0.00 260.00 2.18 0.98 5.15 2.36
3 427 0.01 47.97 2.94 1.19 4.49 1.53
4 549 0.01 30.57 1.73 0.80 2.81 1.63
5 88 0.01 20.40 2.48 1.29 3.45 1.39
6 10 0.78 13.10 6.89 3.69 5.24 0.76
7 21 0.02 16.10 2.45 1.15 3.59 1.47
8 9 0.15 3.19 1.26 0.87 1.03 0.82
9 290 0.01 85.70 2.14 0.86 5.97 2.79
10 28 0.26 5.28 1.45 0.94 1.19 0.82
11 7 0.50 7.55 2.30 1.13 2.49 1.09
12 245 0.01 14.20 1.62 1.03 2.00 1.24
13 211 0.01 20.65 1.92 1.01 2.79 1.46
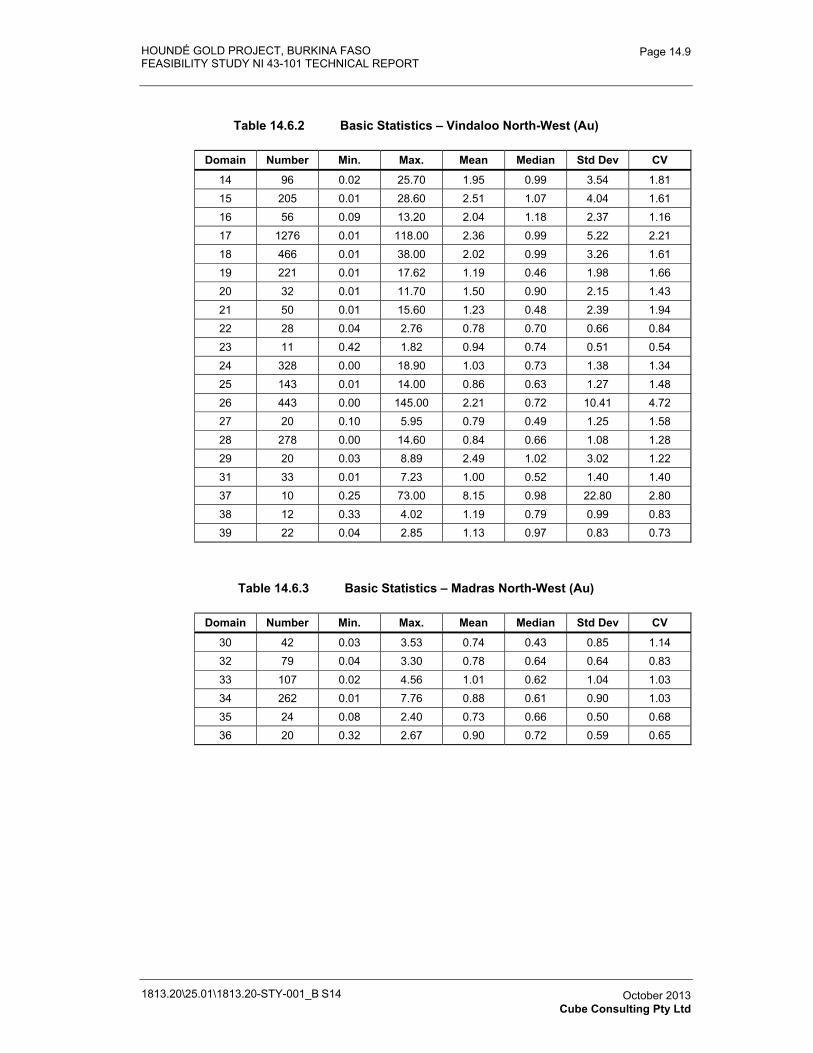
HOUNDÉ GOLD PROJECT, BURKINA FASO FEASIBILITY STUDY NI 43-101 TECHNICAL REPORT
1813.20\25.01\1813.20-STY-001_B S14
Page 14.9
October 2013 Cube Consulting Pty Ltd
Table 14.6.2 Basic Statistics – Vindaloo North-West (Au)
Domain Number Min. Max. Mean Median Std Dev CV
14 96 0.02 25.70 1.95 0.99 3.54 1.81 15 205 0.01 28.60 2.51 1.07 4.04 1.61 16 56 0.09 13.20 2.04 1.18 2.37 1.16 17 1276 0.01 118.00 2.36 0.99 5.22 2.21 18 466 0.01 38.00 2.02 0.99 3.26 1.61 19 221 0.01 17.62 1.19 0.46 1.98 1.66 20 32 0.01 11.70 1.50 0.90 2.15 1.43 21 50 0.01 15.60 1.23 0.48 2.39 1.94 22 28 0.04 2.76 0.78 0.70 0.66 0.84 23 11 0.42 1.82 0.94 0.74 0.51 0.54 24 328 0.00 18.90 1.03 0.73 1.38 1.34 25 143 0.01 14.00 0.86 0.63 1.27 1.48 26 443 0.00 145.00 2.21 0.72 10.41 4.72 27 20 0.10 5.95 0.79 0.49 1.25 1.58 28 278 0.00 14.60 0.84 0.66 1.08 1.28 29 20 0.03 8.89 2.49 1.02 3.02 1.22 31 33 0.01 7.23 1.00 0.52 1.40 1.40 37 10 0.25 73.00 8.15 0.98 22.80 2.80 38 12 0.33 4.02 1.19 0.79 0.99 0.83 39 22 0.04 2.85 1.13 0.97 0.83 0.73
Table 14.6.3 Basic Statistics – Madras North-West (Au)
Domain Number Min. Max. Mean Median Std Dev CV
30 42 0.03 3.53 0.74 0.43 0.85 1.14 32 79 0.04 3.30 0.78 0.64 0.64 0.83 33 107 0.02 4.56 1.01 0.62 1.04 1.03 34 262 0.01 7.76 0.88 0.61 0.90 1.03 35 24 0.08 2.40 0.73 0.66 0.50 0.68 36 20 0.32 2.67 0.90 0.72 0.59 0.65
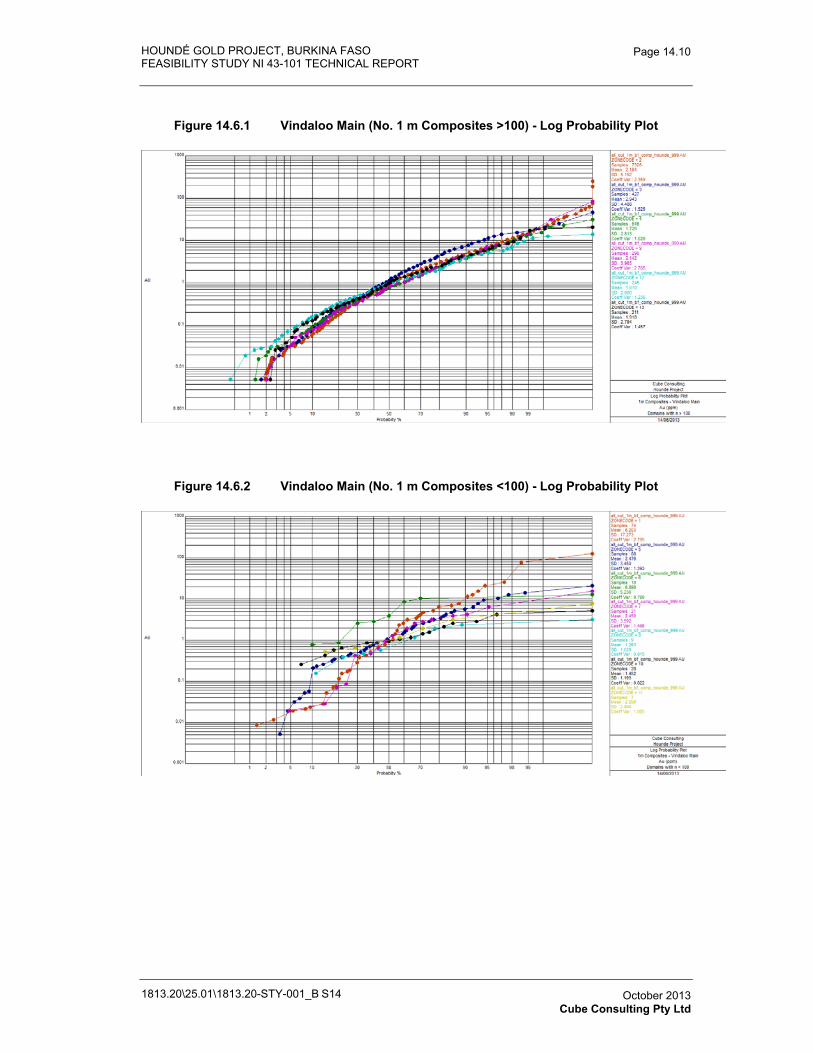
HOUNDÉ GOLD PROJECT, BURKINA FASO FEASIBILITY STUDY NI 43-101 TECHNICAL REPORT
1813.20\25.01\1813.20-STY-001_B S14
Page 14.10
October 2013 Cube Consulting Pty Ltd
Figure 14.6.1 Vindaloo Main (No. 1 m Composites >100) - Log Probability Plot
Figure 14.6.2 Vindaloo Main (No. 1 m Composites <100) - Log Probability Plot
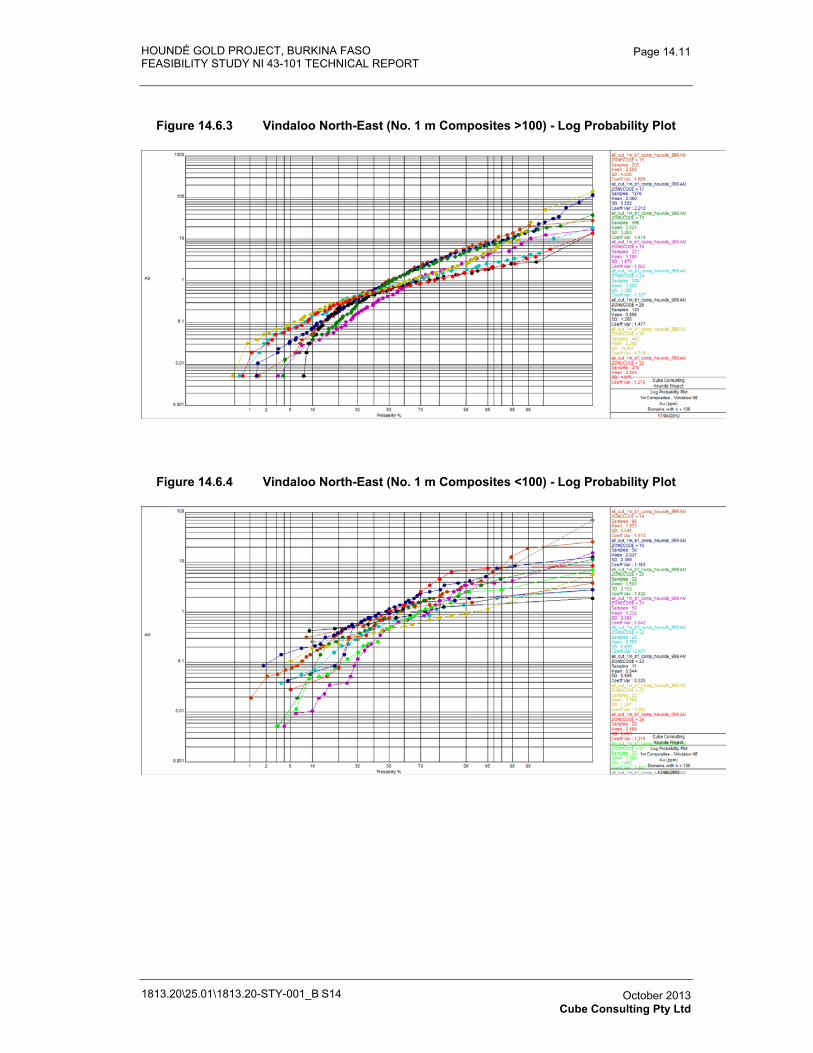
HOUNDÉ GOLD PROJECT, BURKINA FASO FEASIBILITY STUDY NI 43-101 TECHNICAL REPORT
1813.20\25.01\1813.20-STY-001_B S14
Page 14.11
October 2013 Cube Consulting Pty Ltd
Figure 14.6.3 Vindaloo North-East (No. 1 m Composites >100) - Log Probability Plot
Figure 14.6.4 Vindaloo North-East (No. 1 m Composites <100) - Log Probability Plot
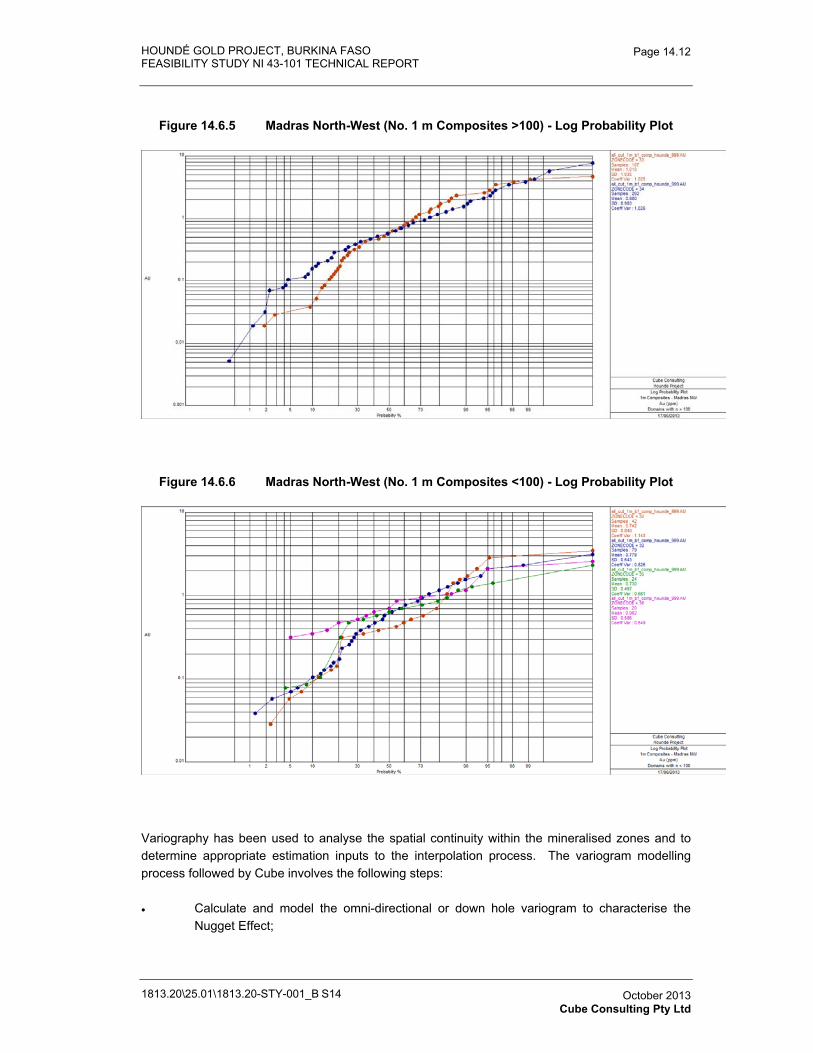
HOUNDÉ GOLD PROJECT, BURKINA FASO FEASIBILITY STUDY NI 43-101 TECHNICAL REPORT
1813.20\25.01\1813.20-STY-001_B S14
Page 14.12
October 2013 Cube Consulting Pty Ltd
Figure 14.6.5 Madras North-West (No. 1 m Composites >100) - Log Probability Plot
Figure 14.6.6 Madras North-West (No. 1 m Composites <100) - Log Probability Plot
Variography has been used to analyse the spatial continuity within the mineralised zones and to determine appropriate estimation inputs to the interpolation process. The variogram modelling process followed by Cube involves the following steps:
� Calculate and model the omni-directional or down hole variogram to characterise the Nugget Effect;
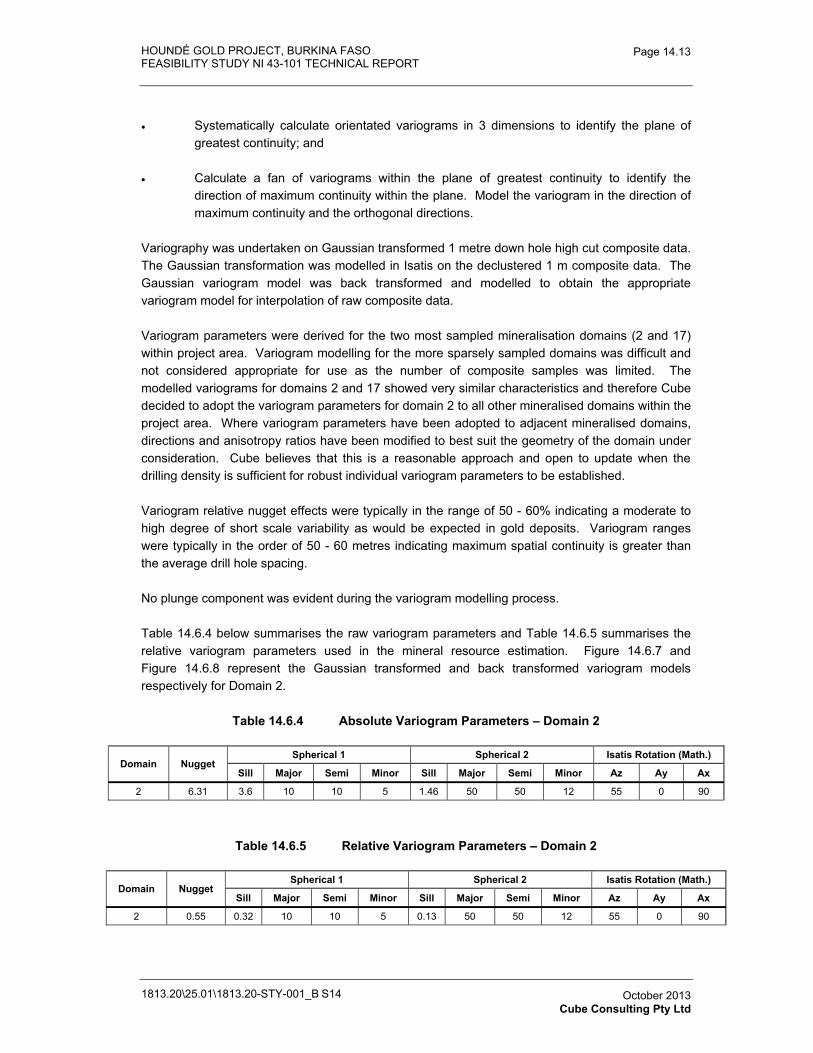
HOUNDÉ GOLD PROJECT, BURKINA FASO FEASIBILITY STUDY NI 43-101 TECHNICAL REPORT
1813.20\25.01\1813.20-STY-001_B S14
Page 14.13
October 2013 Cube Consulting Pty Ltd
� Systematically calculate orientated variograms in 3 dimensions to identify the plane of greatest continuity; and
� Calculate a fan of variograms within the plane of greatest continuity to identify the direction of maximum continuity within the plane. Model the variogram in the direction of maximum continuity and the orthogonal directions.
Variography was undertaken on Gaussian transformed 1 metre down hole high cut composite data. The Gaussian transformation was modelled in Isatis on the declustered 1 m composite data. The Gaussian variogram model was back transformed and modelled to obtain the appropriate variogram model for interpolation of raw composite data.
Variogram parameters were derived for the two most sampled mineralisation domains (2 and 17) within project area. Variogram modelling for the more sparsely sampled domains was difficult and not considered appropriate for use as the number of composite samples was limited. The modelled variograms for domains 2 and 17 showed very similar characteristics and therefore Cube decided to adopt the variogram parameters for domain 2 to all other mineralised domains within the project area. Where variogram parameters have been adopted to adjacent mineralised domains, directions and anisotropy ratios have been modified to best suit the geometry of the domain under consideration. Cube believes that this is a reasonable approach and open to update when the drilling density is sufficient for robust individual variogram parameters to be established.
Variogram relative nugget effects were typically in the range of 50 - 60% indicating a moderate to high degree of short scale variability as would be expected in gold deposits. Variogram ranges were typically in the order of 50 - 60 metres indicating maximum spatial continuity is greater than the average drill hole spacing.
No plunge component was evident during the variogram modelling process.
Table 14.6.4 below summarises the raw variogram parameters and Table 14.6.5 summarises the relative variogram parameters used in the mineral resource estimation. Figure 14.6.7 and Figure 14.6.8 represent the Gaussian transformed and back transformed variogram models respectively for Domain 2.
Table 14.6.4 Absolute Variogram Parameters – Domain 2
Domain Nugget Spherical 1 Spherical 2 Isatis Rotation (Math.)
Sill Major Semi Minor Sill Major Semi Minor Az Ay Ax
2 6.31 3.6 10 10 5 1.46 50 50 12 55 0 90
Table 14.6.5 Relative Variogram Parameters – Domain 2
Domain Nugget Spherical 1 Spherical 2 Isatis Rotation (Math.)
Sill Major Semi Minor Sill Major Semi Minor Az Ay Ax
2 0.55 0.32 10 10 5 0.13 50 50 12 55 0 90
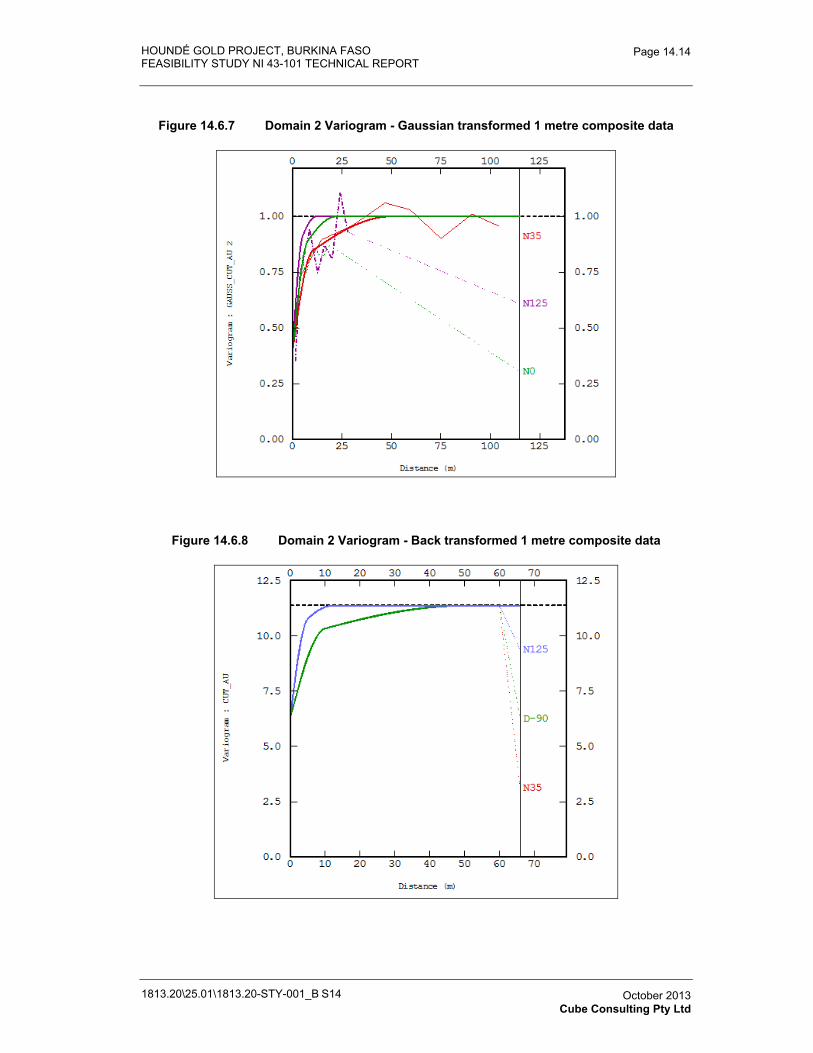
HOUNDÉ GOLD PROJECT, BURKINA FASO FEASIBILITY STUDY NI 43-101 TECHNICAL REPORT
1813.20\25.01\1813.20-STY-001_B S14
Page 14.14
October 2013 Cube Consulting Pty Ltd
Figure 14.6.7 Domain 2 Variogram - Gaussian transformed 1 metre composite data
Figure 14.6.8 Domain 2 Variogram - Back transformed 1 metre composite data
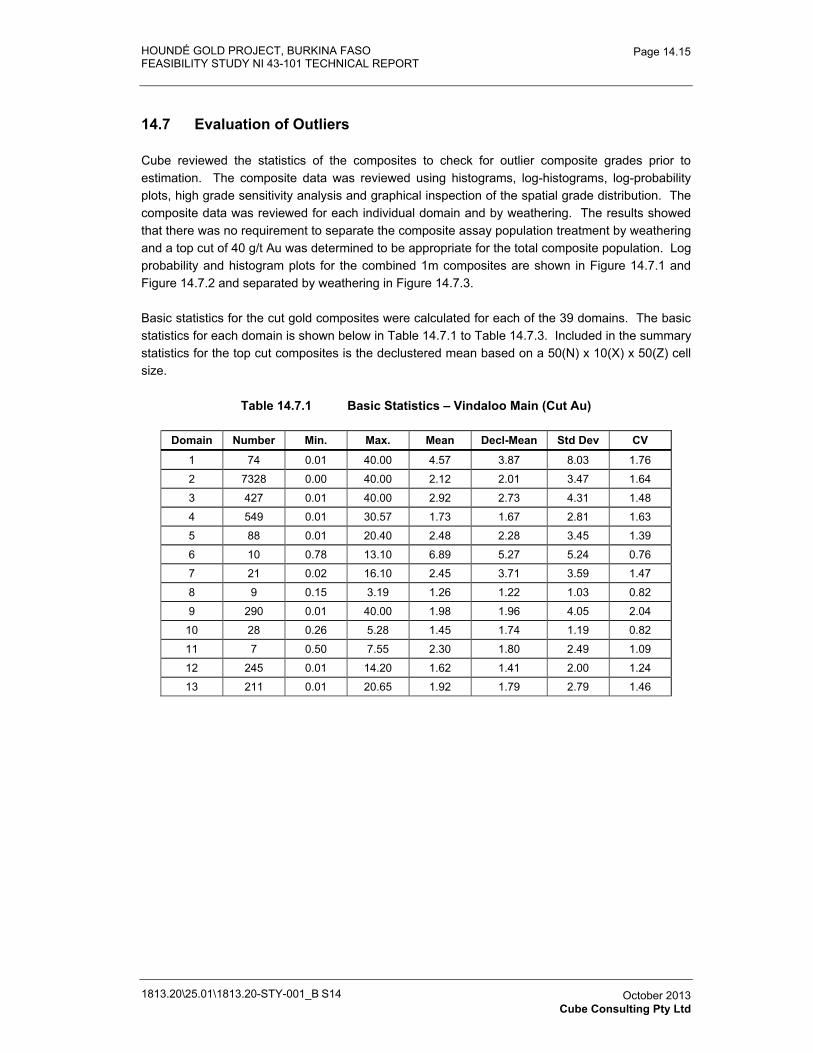
HOUNDÉ GOLD PROJECT, BURKINA FASO FEASIBILITY STUDY NI 43-101 TECHNICAL REPORT
1813.20\25.01\1813.20-STY-001_B S14
Page 14.15
October 2013 Cube Consulting Pty Ltd
14.7 Evaluation of Outliers
Cube reviewed the statistics of the composites to check for outlier composite grades prior to estimation. The composite data was reviewed using histograms, log-histograms, log-probability plots, high grade sensitivity analysis and graphical inspection of the spatial grade distribution. The composite data was reviewed for each individual domain and by weathering. The results showed that there was no requirement to separate the composite assay population treatment by weathering and a top cut of 40 g/t Au was determined to be appropriate for the total composite population. Log probability and histogram plots for the combined 1m composites are shown in Figure 14.7.1 and Figure 14.7.2 and separated by weathering in Figure 14.7.3.
Basic statistics for the cut gold composites were calculated for each of the 39 domains. The basic statistics for each domain is shown below in Table 14.7.1 to Table 14.7.3. Included in the summary statistics for the top cut composites is the declustered mean based on a 50(N) x 10(X) x 50(Z) cell size.
Table 14.7.1 Basic Statistics – Vindaloo Main (Cut Au)
Domain Number Min. Max. Mean Decl-Mean Std Dev CV
1 74 0.01 40.00 4.57 3.87 8.03 1.76
2 7328 0.00 40.00 2.12 2.01 3.47 1.64
3 427 0.01 40.00 2.92 2.73 4.31 1.48
4 549 0.01 30.57 1.73 1.67 2.81 1.63
5 88 0.01 20.40 2.48 2.28 3.45 1.39
6 10 0.78 13.10 6.89 5.27 5.24 0.76
7 21 0.02 16.10 2.45 3.71 3.59 1.47
8 9 0.15 3.19 1.26 1.22 1.03 0.82
9 290 0.01 40.00 1.98 1.96 4.05 2.04
10 28 0.26 5.28 1.45 1.74 1.19 0.82
11 7 0.50 7.55 2.30 1.80 2.49 1.09
12 245 0.01 14.20 1.62 1.41 2.00 1.24
13 211 0.01 20.65 1.92 1.79 2.79 1.46
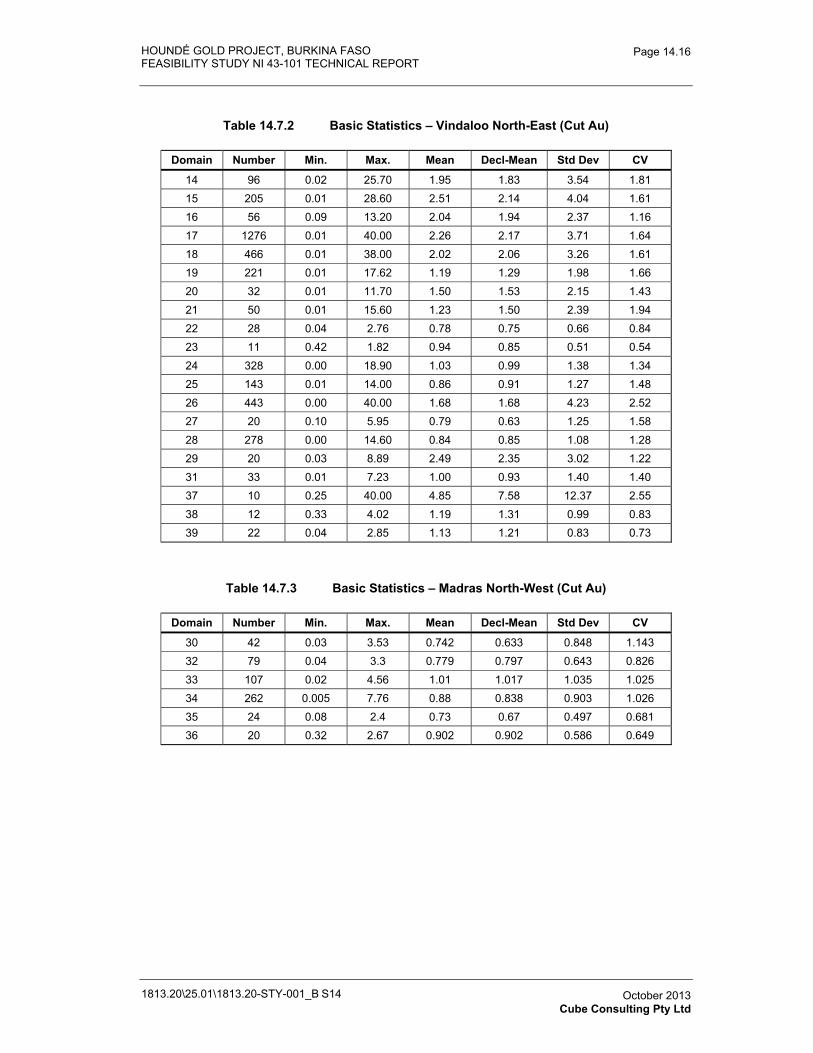
HOUNDÉ GOLD PROJECT, BURKINA FASO FEASIBILITY STUDY NI 43-101 TECHNICAL REPORT
1813.20\25.01\1813.20-STY-001_B S14
Page 14.16
October 2013 Cube Consulting Pty Ltd
Table 14.7.2 Basic Statistics – Vindaloo North-East (Cut Au)
Domain Number Min. Max. Mean Decl-Mean Std Dev CV
14 96 0.02 25.70 1.95 1.83 3.54 1.81 15 205 0.01 28.60 2.51 2.14 4.04 1.61 16 56 0.09 13.20 2.04 1.94 2.37 1.16 17 1276 0.01 40.00 2.26 2.17 3.71 1.64 18 466 0.01 38.00 2.02 2.06 3.26 1.61 19 221 0.01 17.62 1.19 1.29 1.98 1.66 20 32 0.01 11.70 1.50 1.53 2.15 1.43 21 50 0.01 15.60 1.23 1.50 2.39 1.94 22 28 0.04 2.76 0.78 0.75 0.66 0.84 23 11 0.42 1.82 0.94 0.85 0.51 0.54 24 328 0.00 18.90 1.03 0.99 1.38 1.34 25 143 0.01 14.00 0.86 0.91 1.27 1.48 26 443 0.00 40.00 1.68 1.68 4.23 2.52 27 20 0.10 5.95 0.79 0.63 1.25 1.58 28 278 0.00 14.60 0.84 0.85 1.08 1.28 29 20 0.03 8.89 2.49 2.35 3.02 1.22 31 33 0.01 7.23 1.00 0.93 1.40 1.40 37 10 0.25 40.00 4.85 7.58 12.37 2.55 38 12 0.33 4.02 1.19 1.31 0.99 0.83 39 22 0.04 2.85 1.13 1.21 0.83 0.73
Table 14.7.3 Basic Statistics – Madras North-West (Cut Au)
Domain Number Min. Max. Mean Decl-Mean Std Dev CV
30 42 0.03 3.53 0.742 0.633 0.848 1.143 32 79 0.04 3.3 0.779 0.797 0.643 0.826 33 107 0.02 4.56 1.01 1.017 1.035 1.025 34 262 0.005 7.76 0.88 0.838 0.903 1.026 35 24 0.08 2.4 0.73 0.67 0.497 0.681 36 20 0.32 2.67 0.902 0.902 0.586 0.649
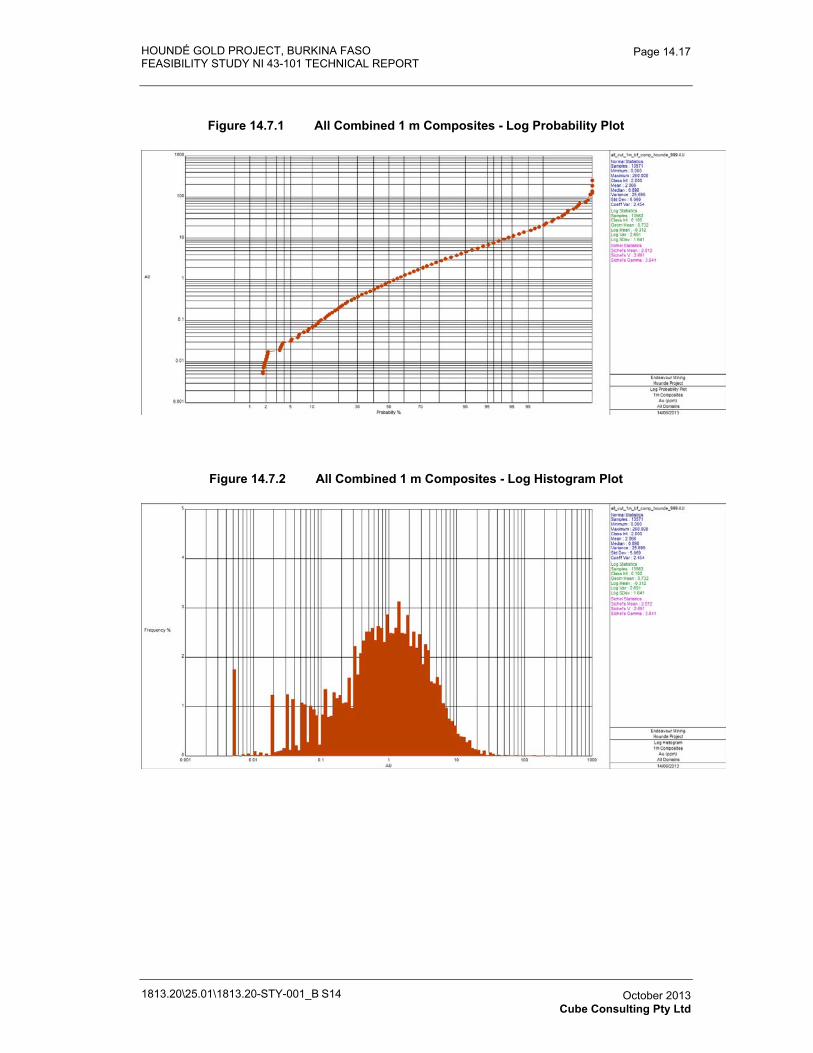
HOUNDÉ GOLD PROJECT, BURKINA FASO FEASIBILITY STUDY NI 43-101 TECHNICAL REPORT
1813.20\25.01\1813.20-STY-001_B S14
Page 14.17
October 2013 Cube Consulting Pty Ltd
Figure 14.7.1 All Combined 1 m Composites - Log Probability Plot
Figure 14.7.2 All Combined 1 m Composites - Log Histogram Plot
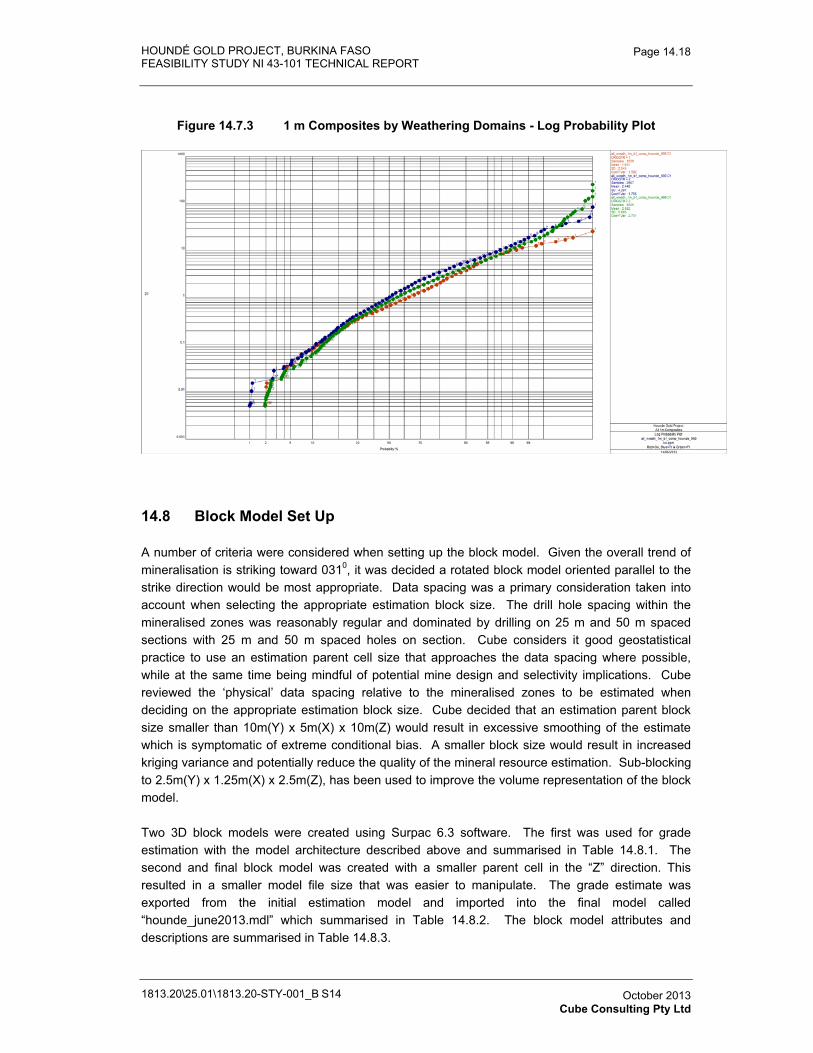
HOUNDÉ GOLD PROJECT, BURKINA FASO FEASIBILITY STUDY NI 43-101 TECHNICAL REPORT
1813.20\25.01\1813.20-STY-001_B S14
Page 14.18
October 2013 Cube Consulting Pty Ltd
Figure 14.7.3 1 m Composites by Weathering Domains - Log Probability Plot
14.8 Block Model Set Up
A number of criteria were considered when setting up the block model. Given the overall trend of mineralisation is striking toward 0310, it was decided a rotated block model oriented parallel to the strike direction would be most appropriate. Data spacing was a primary consideration taken into account when selecting the appropriate estimation block size. The drill hole spacing within the mineralised zones was reasonably regular and dominated by drilling on 25 m and 50 m spaced sections with 25 m and 50 m spaced holes on section. Cube considers it good geostatistical practice to use an estimation parent cell size that approaches the data spacing where possible, while at the same time being mindful of potential mine design and selectivity implications. Cube reviewed the ‘physical’ data spacing relative to the mineralised zones to be estimated when deciding on the appropriate estimation block size. Cube decided that an estimation parent block size smaller than 10m(Y) x 5m(X) x 10m(Z) would result in excessive smoothing of the estimate which is symptomatic of extreme conditional bias. A smaller block size would result in increased kriging variance and potentially reduce the quality of the mineral resource estimation. Sub-blocking to 2.5m(Y) x 1.25m(X) x 2.5m(Z), has been used to improve the volume representation of the block model.
Two 3D block models were created using Surpac 6.3 software. The first was used for grade estimation with the model architecture described above and summarised in Table 14.8.1. The second and final block model was created with a smaller parent cell in the “Z” direction. This resulted in a smaller model file size that was easier to manipulate. The grade estimate was exported from the initial estimation model and imported into the final model called “hounde_june2013.mdl” which summarised in Table 14.8.2. The block model attributes and descriptions are summarised in Table 14.8.3.
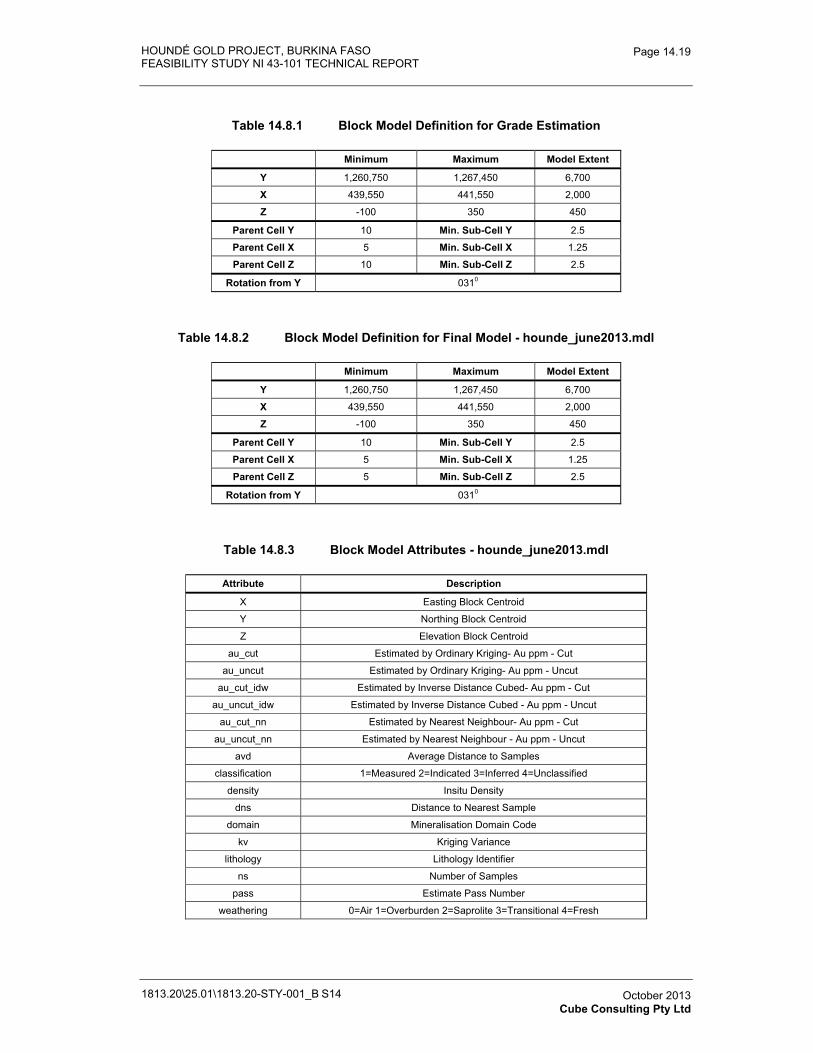
HOUNDÉ GOLD PROJECT, BURKINA FASO FEASIBILITY STUDY NI 43-101 TECHNICAL REPORT
1813.20\25.01\1813.20-STY-001_B S14
Page 14.19
October 2013 Cube Consulting Pty Ltd
Table 14.8.1 Block Model Definition for Grade Estimation
Minimum Maximum Model Extent
Y 1,260,750 1,267,450 6,700
X 439,550 441,550 2,000
Z -100 350 450
Parent Cell Y 10 Min. Sub-Cell Y 2.5
Parent Cell X 5 Min. Sub-Cell X 1.25
Parent Cell Z 10 Min. Sub-Cell Z 2.5
Rotation from Y 0310
Table 14.8.2 Block Model Definition for Final Model - hounde_june2013.mdl
Minimum Maximum Model Extent
Y 1,260,750 1,267,450 6,700
X 439,550 441,550 2,000
Z -100 350 450
Parent Cell Y 10 Min. Sub-Cell Y 2.5
Parent Cell X 5 Min. Sub-Cell X 1.25
Parent Cell Z 5 Min. Sub-Cell Z 2.5
Rotation from Y 0310
Table 14.8.3 Block Model Attributes - hounde_june2013.mdl
Attribute Description
X Easting Block Centroid
Y Northing Block Centroid
Z Elevation Block Centroid
au_cut Estimated by Ordinary Kriging- Au ppm - Cut
au_uncut Estimated by Ordinary Kriging- Au ppm - Uncut
au_cut_idw Estimated by Inverse Distance Cubed- Au ppm - Cut
au_uncut_idw Estimated by Inverse Distance Cubed - Au ppm - Uncut
au_cut_nn Estimated by Nearest Neighbour- Au ppm - Cut
au_uncut_nn Estimated by Nearest Neighbour - Au ppm - Uncut
avd Average Distance to Samples
classification 1=Measured 2=Indicated 3=Inferred 4=Unclassified
density Insitu Density
dns Distance to Nearest Sample
domain Mineralisation Domain Code
kv Kriging Variance
lithology Lithology Identifier
ns Number of Samples
pass Estimate Pass Number
weathering 0=Air 1=Overburden 2=Saprolite 3=Transitional 4=Fresh
HOUNDÉ GOLD PROJECT, BURKINA FASO FEASIBILITY STUDY NI 43-101 TECHNICAL REPORT
1813.20\25.01\1813.20-STY-001_B S14
Page 14.20
October 2013 Cube Consulting Pty Ltd
14.9 Block Model Grade Estimation
Grade interpolation was carried out using Ordinary Kriging (OK) for each mineralised domain using the uniquely coded 1 metre down hole composite data specific to that domain. All block estimates were based on grade interpolation into parent cells of 10m(Y) x 5m(X) x 10m(Z). Block discretisation points were set to 4(Y) x 2(X) x 2(Z).
Cube has attempted to characterise the spatial relationship of the data using variography and has sought to implement search strategies aimed at producing a robust block estimate whilst at the same time minimising estimation error and conditional biases. Cube routinely tests several search iterations before determining the most appropriate search strategy. Fundamental to the search strategy is the determination of appropriate minimum and maximum numbers of composites for estimation. The minimum number of composites has been considered by Cube as a key component of the criteria applied in determining the appropriate resource classification.
Cube initially bases search distances for the first search iteration on the analysis of the theoretical kriging weight charts. An examination of these kriging weight charts provides a good starting point for testing a search strategy as they provide a guide as to the distribution of kriging weights for a given variogram with respect to distance along the major axis of the search volume. Of particular interest is the approximate distance that kriging weights tend towards zero. Cube believes that it good estimation practice to use a search distance that ensures that kriging weights allocated to composites tend toward zero or slightly negative on the periphery of the search.
Cube generally extends the search where there are large positive weights at the periphery and reduces the search where there are a large proportion of negative kriging weights involved. A limitation of these charts is that they are based on an assumption that each block is directly informed by a composite at the block centroid and they will, therefore generally understate the required search with respect to actual data spacing to achieve a robust block estimate.
A Quantitative Kriging Neighbourhood Analysis (QKNA) was undertaken to assist in optimising the search parameters.
The procedure for search optimisation adopted by Cube involves selecting several individual blocks representing data configurations ranging from poorly to well informed. The aim of these tests is to optimise the kriging search neighbourhood and maximise the quality of the kriging when dealing with a non-exhaustive data set. A number of key criteria were captured for each selected block as follows:
� Block coordinates and dimensions;
� Estimated grade;
� Kriging variance;
� Block Dispersion variance;
� Slope of Regression of estimated blocks z*(v) and theoretical true blocks z(v);
HOUNDÉ GOLD PROJECT, BURKINA FASO FEASIBILITY STUDY NI 43-101 TECHNICAL REPORT
1813.20\25.01\1813.20-STY-001_B S14
Page 14.21
October 2013 Cube Consulting Pty Ltd
� A listing of the actual informing composites within the search volume of the block including coordinates, grades, distance from block and kriging weight; and
� Statistics of the informing composites including number of composites, minimum, maximum, mean, standard deviation, variance and coefficient of variation.
An important feature of Ordinary Kriging is its inherent property to minimise estimation error. The estimation error will increase substantially as the amount of informing data decreases.
Based on the QKNA and visual analysis of the samples selected under OK, appropriate search parameters were chosen and are detailed below in Table 14.9.1. Search ellipse orientations for each domain interpolation were orientated to follow the direction of the mineralised domain. A two pass search strategy was used for grade estimation. The first pass search used a search radius of 75 m and this was doubled for the second search pass to 150 m. The same minimum (6) and maximum (40) number of samples were used for both search passes. Appendix 14.1 tabulates the complete estimation parameters used for each domain.
14.9.1 Treatment for Un-estimated Blocks
A small proportion of blocks for Domain 18 only did not satisfy the minimum criteria for grade estimation. The volume of these blocks represented 3.3% of that domain and less than 0.1% of the total volume. These blocks remained un-estimated and not included with the Mineral Resource.
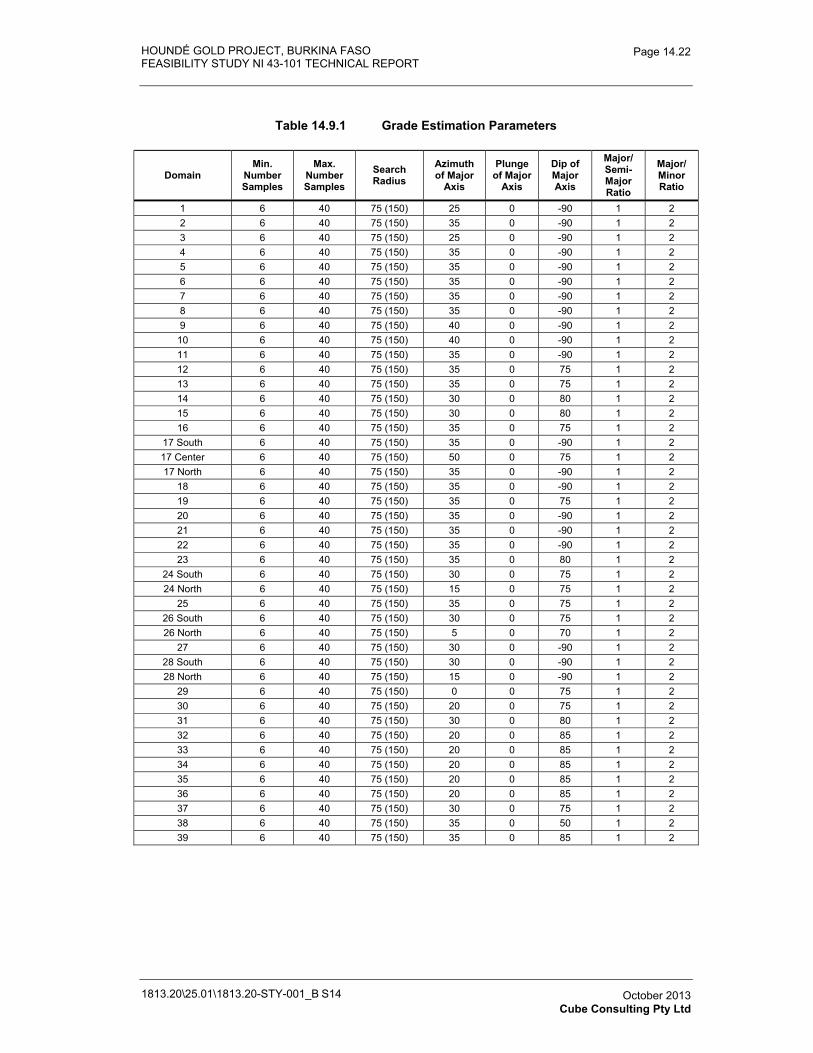
HOUNDÉ GOLD PROJECT, BURKINA FASO FEASIBILITY STUDY NI 43-101 TECHNICAL REPORT
1813.20\25.01\1813.20-STY-001_B S14
Page 14.22
October 2013 Cube Consulting Pty Ltd
Table 14.9.1 Grade Estimation Parameters
Domain Min.
Number Samples
Max.Number Samples
SearchRadius
Azimuth of Major
Axis
Plungeof Major
Axis
Dip of MajorAxis
Major/Semi-MajorRatio
Major/MinorRatio
1 6 40 75 (150) 25 0 -90 1 2 2 6 40 75 (150) 35 0 -90 1 2 3 6 40 75 (150) 25 0 -90 1 2 4 6 40 75 (150) 35 0 -90 1 2 5 6 40 75 (150) 35 0 -90 1 2 6 6 40 75 (150) 35 0 -90 1 2 7 6 40 75 (150) 35 0 -90 1 2 8 6 40 75 (150) 35 0 -90 1 2 9 6 40 75 (150) 40 0 -90 1 2
10 6 40 75 (150) 40 0 -90 1 2 11 6 40 75 (150) 35 0 -90 1 2 12 6 40 75 (150) 35 0 75 1 2 13 6 40 75 (150) 35 0 75 1 2 14 6 40 75 (150) 30 0 80 1 2 15 6 40 75 (150) 30 0 80 1 2 16 6 40 75 (150) 35 0 75 1 2
17 South 6 40 75 (150) 35 0 -90 1 2 17 Center 6 40 75 (150) 50 0 75 1 2 17 North 6 40 75 (150) 35 0 -90 1 2
18 6 40 75 (150) 35 0 -90 1 2 19 6 40 75 (150) 35 0 75 1 2 20 6 40 75 (150) 35 0 -90 1 2 21 6 40 75 (150) 35 0 -90 1 2 22 6 40 75 (150) 35 0 -90 1 2 23 6 40 75 (150) 35 0 80 1 2
24 South 6 40 75 (150) 30 0 75 1 2 24 North 6 40 75 (150) 15 0 75 1 2
25 6 40 75 (150) 35 0 75 1 2 26 South 6 40 75 (150) 30 0 75 1 2 26 North 6 40 75 (150) 5 0 70 1 2
27 6 40 75 (150) 30 0 -90 1 2 28 South 6 40 75 (150) 30 0 -90 1 2 28 North 6 40 75 (150) 15 0 -90 1 2
29 6 40 75 (150) 0 0 75 1 2 30 6 40 75 (150) 20 0 75 1 2 31 6 40 75 (150) 30 0 80 1 2 32 6 40 75 (150) 20 0 85 1 2 33 6 40 75 (150) 20 0 85 1 2 34 6 40 75 (150) 20 0 85 1 2 35 6 40 75 (150) 20 0 85 1 2 36 6 40 75 (150) 20 0 85 1 2 37 6 40 75 (150) 30 0 75 1 2 38 6 40 75 (150) 35 0 50 1 2 39 6 40 75 (150) 35 0 85 1 2
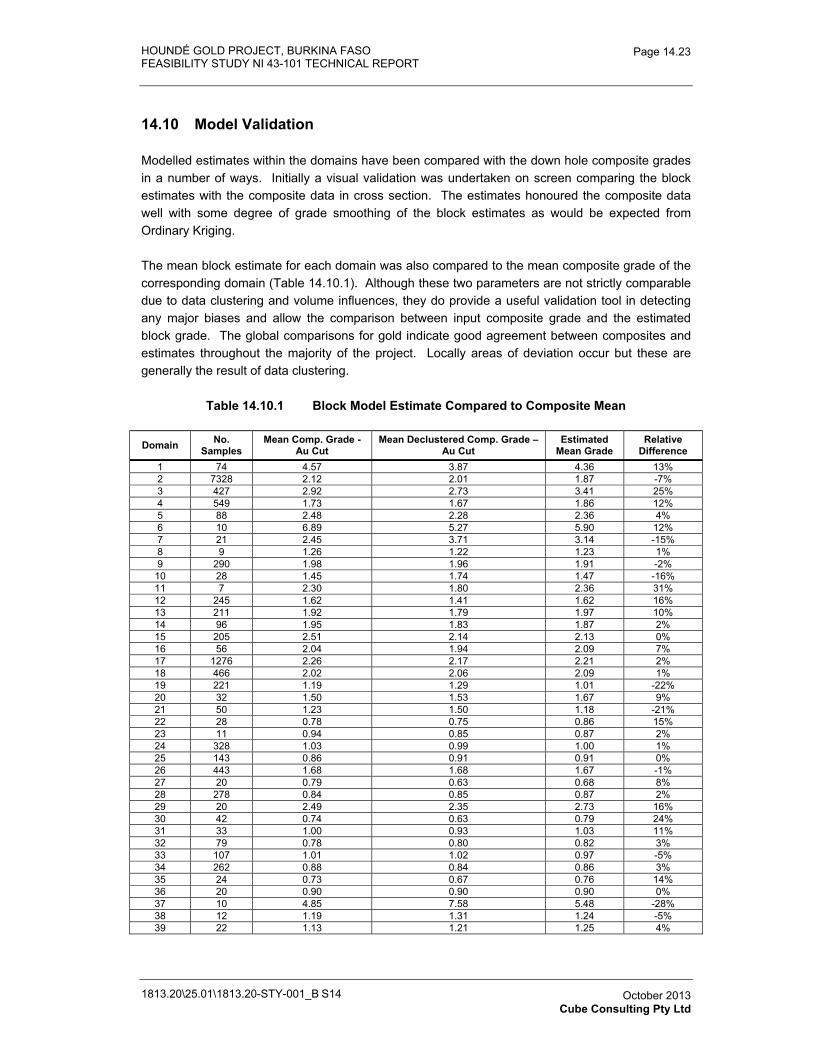
HOUNDÉ GOLD PROJECT, BURKINA FASO FEASIBILITY STUDY NI 43-101 TECHNICAL REPORT
1813.20\25.01\1813.20-STY-001_B S14
Page 14.23
October 2013 Cube Consulting Pty Ltd
14.10 Model Validation
Modelled estimates within the domains have been compared with the down hole composite grades in a number of ways. Initially a visual validation was undertaken on screen comparing the block estimates with the composite data in cross section. The estimates honoured the composite data well with some degree of grade smoothing of the block estimates as would be expected from Ordinary Kriging.
The mean block estimate for each domain was also compared to the mean composite grade of the corresponding domain (Table 14.10.1). Although these two parameters are not strictly comparable due to data clustering and volume influences, they do provide a useful validation tool in detecting any major biases and allow the comparison between input composite grade and the estimated block grade. The global comparisons for gold indicate good agreement between composites and estimates throughout the majority of the project. Locally areas of deviation occur but these are generally the result of data clustering.
Table 14.10.1 Block Model Estimate Compared to Composite Mean
Domain No.Samples
Mean Comp. Grade - Au Cut
Mean Declustered Comp. Grade – Au Cut
Estimated Mean Grade
Relative Difference
1 74 4.57 3.87 4.36 13% 2 7328 2.12 2.01 1.87 -7% 3 427 2.92 2.73 3.41 25% 4 549 1.73 1.67 1.86 12% 5 88 2.48 2.28 2.36 4% 6 10 6.89 5.27 5.90 12% 7 21 2.45 3.71 3.14 -15% 8 9 1.26 1.22 1.23 1% 9 290 1.98 1.96 1.91 -2%
10 28 1.45 1.74 1.47 -16% 11 7 2.30 1.80 2.36 31% 12 245 1.62 1.41 1.62 16% 13 211 1.92 1.79 1.97 10% 14 96 1.95 1.83 1.87 2% 15 205 2.51 2.14 2.13 0% 16 56 2.04 1.94 2.09 7% 17 1276 2.26 2.17 2.21 2% 18 466 2.02 2.06 2.09 1% 19 221 1.19 1.29 1.01 -22% 20 32 1.50 1.53 1.67 9% 21 50 1.23 1.50 1.18 -21% 22 28 0.78 0.75 0.86 15% 23 11 0.94 0.85 0.87 2% 24 328 1.03 0.99 1.00 1% 25 143 0.86 0.91 0.91 0% 26 443 1.68 1.68 1.67 -1% 27 20 0.79 0.63 0.68 8% 28 278 0.84 0.85 0.87 2% 29 20 2.49 2.35 2.73 16% 30 42 0.74 0.63 0.79 24% 31 33 1.00 0.93 1.03 11% 32 79 0.78 0.80 0.82 3% 33 107 1.01 1.02 0.97 -5% 34 262 0.88 0.84 0.86 3% 35 24 0.73 0.67 0.76 14% 36 20 0.90 0.90 0.90 0% 37 10 4.85 7.58 5.48 -28% 38 12 1.19 1.31 1.24 -5% 39 22 1.13 1.21 1.25 4%
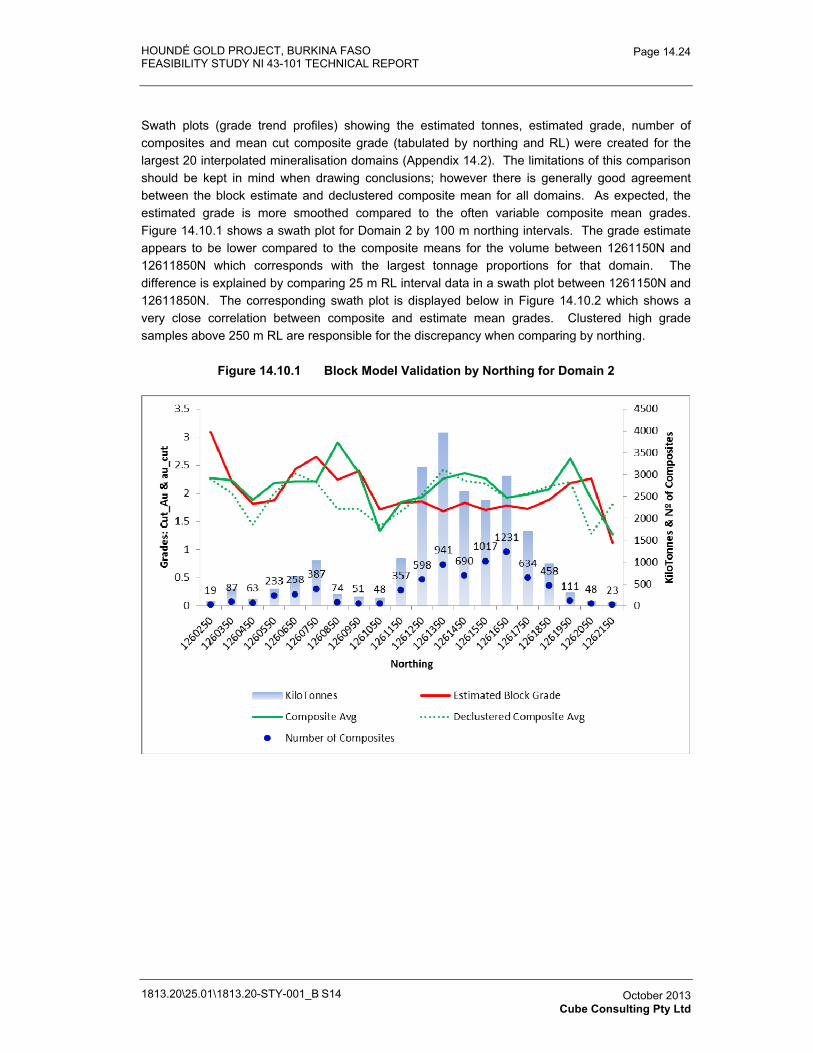
HOUNDÉ GOLD PROJECT, BURKINA FASO FEASIBILITY STUDY NI 43-101 TECHNICAL REPORT
1813.20\25.01\1813.20-STY-001_B S14
Page 14.24
October 2013 Cube Consulting Pty Ltd
Swath plots (grade trend profiles) showing the estimated tonnes, estimated grade, number of composites and mean cut composite grade (tabulated by northing and RL) were created for the largest 20 interpolated mineralisation domains (Appendix 14.2). The limitations of this comparison should be kept in mind when drawing conclusions; however there is generally good agreement between the block estimate and declustered composite mean for all domains. As expected, the estimated grade is more smoothed compared to the often variable composite mean grades. Figure 14.10.1 shows a swath plot for Domain 2 by 100 m northing intervals. The grade estimate appears to be lower compared to the composite means for the volume between 1261150N and 12611850N which corresponds with the largest tonnage proportions for that domain. The difference is explained by comparing 25 m RL interval data in a swath plot between 1261150N and 12611850N. The corresponding swath plot is displayed below in Figure 14.10.2 which shows a very close correlation between composite and estimate mean grades. Clustered high grade samples above 250 m RL are responsible for the discrepancy when comparing by northing.
Figure 14.10.1 Block Model Validation by Northing for Domain 2
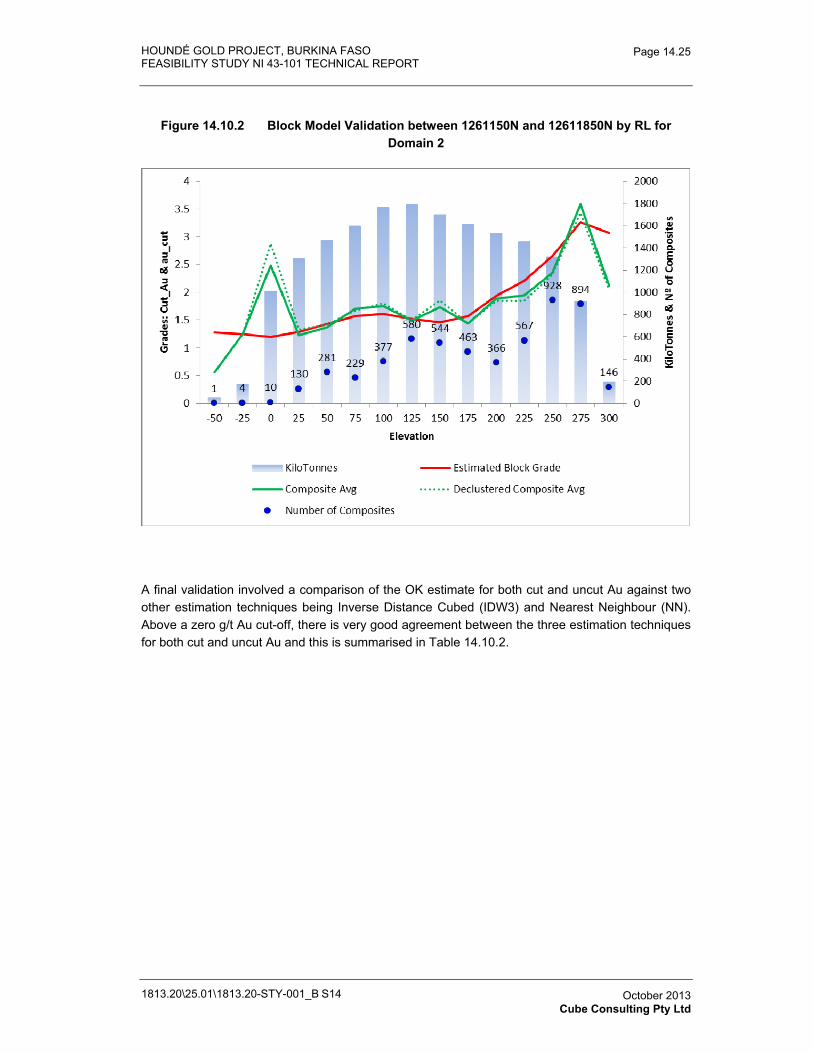
HOUNDÉ GOLD PROJECT, BURKINA FASO FEASIBILITY STUDY NI 43-101 TECHNICAL REPORT
1813.20\25.01\1813.20-STY-001_B S14
Page 14.25
October 2013 Cube Consulting Pty Ltd
Figure 14.10.2 Block Model Validation between 1261150N and 12611850N by RL for Domain 2
A final validation involved a comparison of the OK estimate for both cut and uncut Au against two other estimation techniques being Inverse Distance Cubed (IDW3) and Nearest Neighbour (NN). Above a zero g/t Au cut-off, there is very good agreement between the three estimation techniques for both cut and uncut Au and this is summarised in Table 14.10.2.
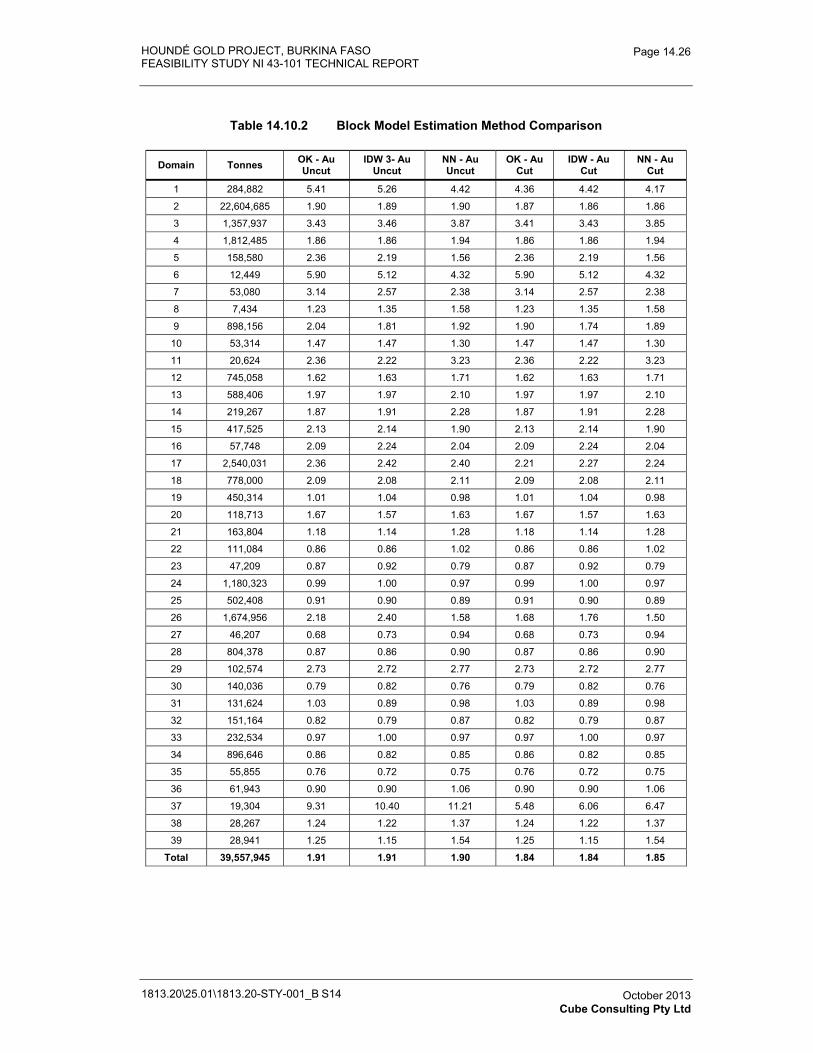
HOUNDÉ GOLD PROJECT, BURKINA FASO FEASIBILITY STUDY NI 43-101 TECHNICAL REPORT
1813.20\25.01\1813.20-STY-001_B S14
Page 14.26
October 2013 Cube Consulting Pty Ltd
Table 14.10.2 Block Model Estimation Method Comparison
Domain Tonnes OK - Au Uncut
IDW 3- Au Uncut
NN - Au Uncut
OK - Au Cut
IDW - Au Cut
NN - Au Cut
1 284,882 5.41 5.26 4.42 4.36 4.42 4.17
2 22,604,685 1.90 1.89 1.90 1.87 1.86 1.86
3 1,357,937 3.43 3.46 3.87 3.41 3.43 3.85
4 1,812,485 1.86 1.86 1.94 1.86 1.86 1.94
5 158,580 2.36 2.19 1.56 2.36 2.19 1.56
6 12,449 5.90 5.12 4.32 5.90 5.12 4.32
7 53,080 3.14 2.57 2.38 3.14 2.57 2.38
8 7,434 1.23 1.35 1.58 1.23 1.35 1.58
9 898,156 2.04 1.81 1.92 1.90 1.74 1.89
10 53,314 1.47 1.47 1.30 1.47 1.47 1.30
11 20,624 2.36 2.22 3.23 2.36 2.22 3.23
12 745,058 1.62 1.63 1.71 1.62 1.63 1.71
13 588,406 1.97 1.97 2.10 1.97 1.97 2.10
14 219,267 1.87 1.91 2.28 1.87 1.91 2.28
15 417,525 2.13 2.14 1.90 2.13 2.14 1.90
16 57,748 2.09 2.24 2.04 2.09 2.24 2.04
17 2,540,031 2.36 2.42 2.40 2.21 2.27 2.24
18 778,000 2.09 2.08 2.11 2.09 2.08 2.11
19 450,314 1.01 1.04 0.98 1.01 1.04 0.98
20 118,713 1.67 1.57 1.63 1.67 1.57 1.63
21 163,804 1.18 1.14 1.28 1.18 1.14 1.28
22 111,084 0.86 0.86 1.02 0.86 0.86 1.02
23 47,209 0.87 0.92 0.79 0.87 0.92 0.79
24 1,180,323 0.99 1.00 0.97 0.99 1.00 0.97
25 502,408 0.91 0.90 0.89 0.91 0.90 0.89
26 1,674,956 2.18 2.40 1.58 1.68 1.76 1.50
27 46,207 0.68 0.73 0.94 0.68 0.73 0.94
28 804,378 0.87 0.86 0.90 0.87 0.86 0.90
29 102,574 2.73 2.72 2.77 2.73 2.72 2.77
30 140,036 0.79 0.82 0.76 0.79 0.82 0.76
31 131,624 1.03 0.89 0.98 1.03 0.89 0.98
32 151,164 0.82 0.79 0.87 0.82 0.79 0.87
33 232,534 0.97 1.00 0.97 0.97 1.00 0.97
34 896,646 0.86 0.82 0.85 0.86 0.82 0.85
35 55,855 0.76 0.72 0.75 0.76 0.72 0.75
36 61,943 0.90 0.90 1.06 0.90 0.90 1.06
37 19,304 9.31 10.40 11.21 5.48 6.06 6.47
38 28,267 1.24 1.22 1.37 1.24 1.22 1.37
39 28,941 1.25 1.15 1.54 1.25 1.15 1.54
Total 39,557,945 1.91 1.91 1.90 1.84 1.84 1.85
HOUNDÉ GOLD PROJECT, BURKINA FASO FEASIBILITY STUDY NI 43-101 TECHNICAL REPORT
1813.20\25.01\1813.20-STY-001_B S14
Page 14.27
October 2013 Cube Consulting Pty Ltd
14.11 Mineral Resource Classification
It is Cube’s opinion that the Vindaloo mineralisation is sufficiently drilled to allow classification in accordance with the CIM guidelines (CIM 2005). As with any non-rigidly defined classification there will always be some blocks within categories that depart from defined criteria. It is Cube’s view that the final outcome must reflect a practical combination of geological knowledge and estimation quality parameters that may be more numerical in nature. This approach to classification aims to avoid creating a complex numerically based ‘mosaic’. Cube has considered all criteria and has classified the resource accordingly. The classification supports the recommendations made in the PEA March 2013 which states “nominal 50 m x 50 m drill spacing for Indicated Mineral Resources and approximately 25 m x 25 m spacing for Measured Mineral Resource”.
The primary criterion for Measured Mineral Resources is defined by a drill spacing of at least 25 m x 25 m. In addition, Measured Mineral Resources were confined to the largest interpreted mineralisation domains that had the least amount of risk associated with geological interpretation and continuity. The only domains to include Measured Mineral Resources are 2, 3, 15, 17, 18 and 19.
A basic Conditional Simulation study was undertaken to provide supporting evidence for classification of the Measured Mineral Resources. Domain 2 was chosen for the study as it represents the largest and most continuous mineralised domain at Vindaloo. The results suggested that on a mining production quarterly basis the grade variance was within ±10% at a 90% confidence limit.
Indicated Mineral Resources are defined as areas outside the Measured Mineral Resource and defined by 50 m x 50 m drill spacing. As mentioned in Section 14.9, a 2 pass search strategy was used for grade estimation and the Indicated Mineral Resource is confined to blocks estimated within the first pass search.
Inferred Mineral Resources include all remaining estimated mineralisation defined either by a drill spacing greater than 50 m x 50 m or estimated within the second pass search .
14.12 Mineral Resource Statement
For the purpose of public reporting, the Vindaloo Mineral Resource is reported inside an optimised pit shell. Reporting within an optimised pit shell satisfies the requirement for the Mineral Resource to have reasonable prospects for future economic extraction. The pit optimisation was undertaken by Orelogy and assumed a US$1,600/oz Au price and an average mining cost of US$2.107/tonne; note that Orelogy estimated a higher mining cost per tonne than estimated in the PEA, resulting in the development of a shallower optimized open pit than was envisioned in the PEA. Table 14.12.1 to Table 14.12.3 summarise the economic parameters used.
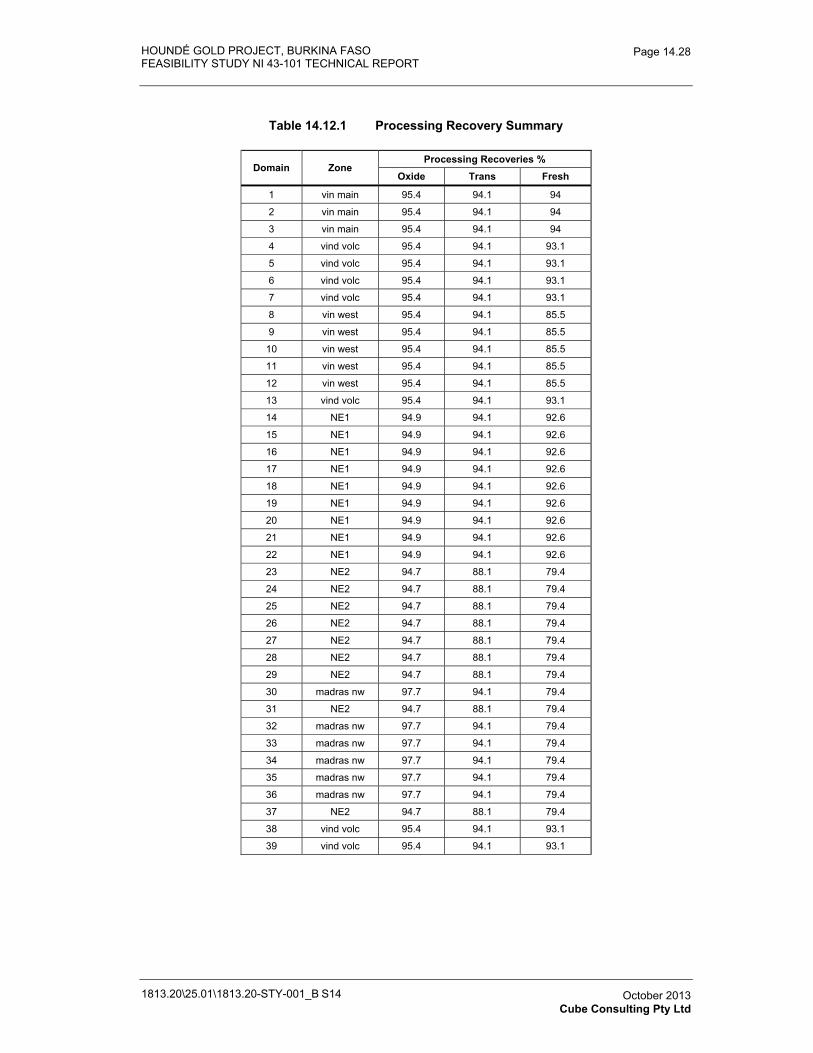
HOUNDÉ GOLD PROJECT, BURKINA FASO FEASIBILITY STUDY NI 43-101 TECHNICAL REPORT
1813.20\25.01\1813.20-STY-001_B S14
Page 14.28
October 2013 Cube Consulting Pty Ltd
Table 14.12.1 Processing Recovery Summary
Domain Zone Processing Recoveries %
Oxide Trans Fresh
1 vin main 95.4 94.1 94
2 vin main 95.4 94.1 94
3 vin main 95.4 94.1 94
4 vind volc 95.4 94.1 93.1
5 vind volc 95.4 94.1 93.1
6 vind volc 95.4 94.1 93.1
7 vind volc 95.4 94.1 93.1
8 vin west 95.4 94.1 85.5
9 vin west 95.4 94.1 85.5
10 vin west 95.4 94.1 85.5
11 vin west 95.4 94.1 85.5
12 vin west 95.4 94.1 85.5
13 vind volc 95.4 94.1 93.1
14 NE1 94.9 94.1 92.6
15 NE1 94.9 94.1 92.6
16 NE1 94.9 94.1 92.6
17 NE1 94.9 94.1 92.6
18 NE1 94.9 94.1 92.6
19 NE1 94.9 94.1 92.6
20 NE1 94.9 94.1 92.6
21 NE1 94.9 94.1 92.6
22 NE1 94.9 94.1 92.6
23 NE2 94.7 88.1 79.4
24 NE2 94.7 88.1 79.4
25 NE2 94.7 88.1 79.4
26 NE2 94.7 88.1 79.4
27 NE2 94.7 88.1 79.4
28 NE2 94.7 88.1 79.4
29 NE2 94.7 88.1 79.4
30 madras nw 97.7 94.1 79.4
31 NE2 94.7 88.1 79.4
32 madras nw 97.7 94.1 79.4
33 madras nw 97.7 94.1 79.4
34 madras nw 97.7 94.1 79.4
35 madras nw 97.7 94.1 79.4
36 madras nw 97.7 94.1 79.4
37 NE2 94.7 88.1 79.4
38 vind volc 95.4 94.1 93.1
39 vind volc 95.4 94.1 93.1
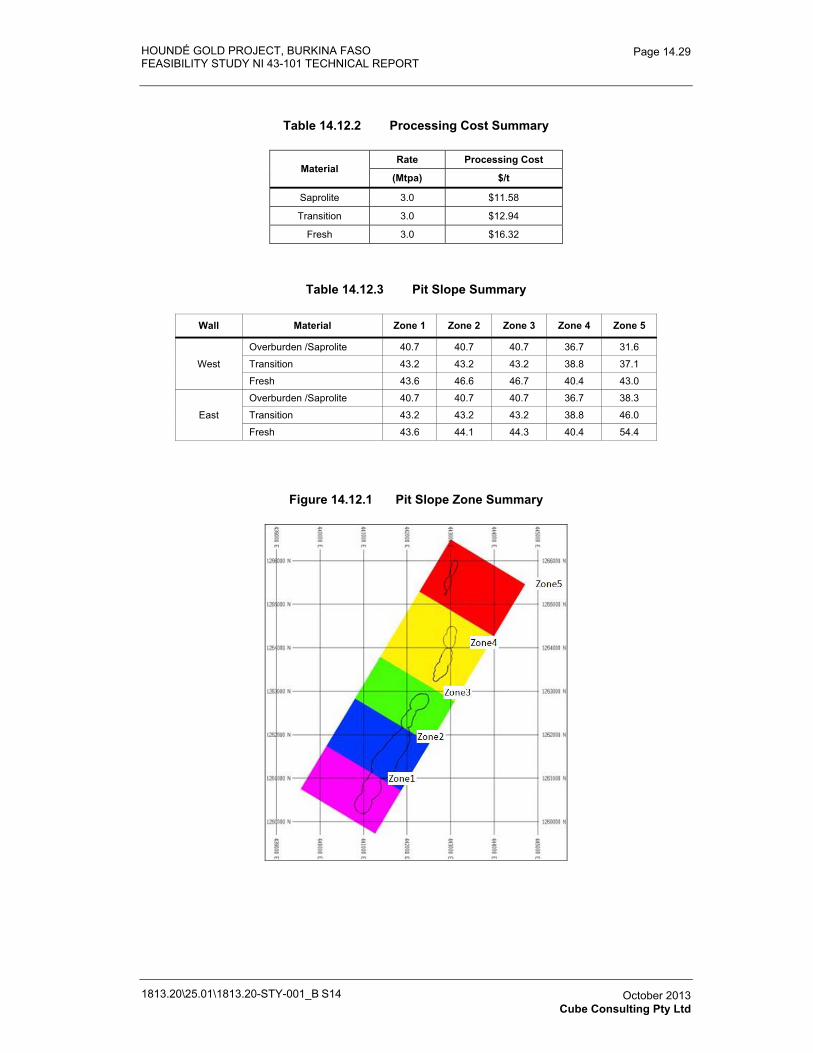
HOUNDÉ GOLD PROJECT, BURKINA FASO FEASIBILITY STUDY NI 43-101 TECHNICAL REPORT
1813.20\25.01\1813.20-STY-001_B S14
Page 14.29
October 2013 Cube Consulting Pty Ltd
Table 14.12.2 Processing Cost Summary
Material Rate Processing Cost
(Mtpa) $/t
Saprolite 3.0 $11.58
Transition 3.0 $12.94
Fresh 3.0 $16.32
Table 14.12.3 Pit Slope Summary
Figure 14.12.1 Pit Slope Zone Summary
Wall Material Zone 1 Zone 2 Zone 3 Zone 4 Zone 5
West
Overburden /Saprolite 40.7 40.7 40.7 36.7 31.6
Transition 43.2 43.2 43.2 38.8 37.1
Fresh 43.6 46.6 46.7 40.4 43.0
East
Overburden /Saprolite 40.7 40.7 40.7 36.7 38.3
Transition 43.2 43.2 43.2 38.8 46.0
Fresh 43.6 44.1 44.3 40.4 54.4
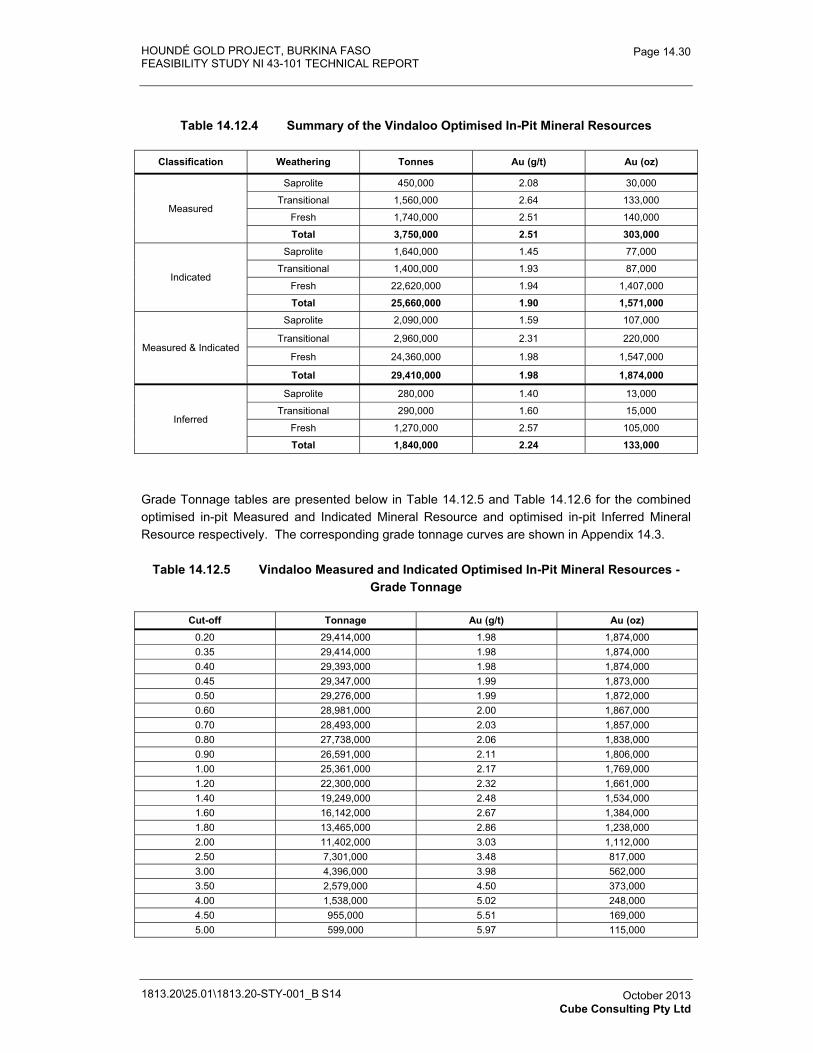
HOUNDÉ GOLD PROJECT, BURKINA FASO FEASIBILITY STUDY NI 43-101 TECHNICAL REPORT
1813.20\25.01\1813.20-STY-001_B S14
Page 14.30
October 2013 Cube Consulting Pty Ltd
Table 14.12.4 Summary of the Vindaloo Optimised In-Pit Mineral Resources
Classification Weathering Tonnes Au (g/t) Au (oz)
Measured
Saprolite 450,000 2.08 30,000
Transitional 1,560,000 2.64 133,000
Fresh 1,740,000 2.51 140,000
Total 3,750,000 2.51 303,000
Indicated
Saprolite 1,640,000 1.45 77,000
Transitional 1,400,000 1.93 87,000
Fresh 22,620,000 1.94 1,407,000
Total 25,660,000 1.90 1,571,000
Measured & Indicated
Saprolite 2,090,000 1.59 107,000
Transitional 2,960,000 2.31 220,000
Fresh 24,360,000 1.98 1,547,000
Total 29,410,000 1.98 1,874,000
Inferred
Saprolite 280,000 1.40 13,000
Transitional 290,000 1.60 15,000
Fresh 1,270,000 2.57 105,000
Total 1,840,000 2.24 133,000
Grade Tonnage tables are presented below in Table 14.12.5 and Table 14.12.6 for the combined optimised in-pit Measured and Indicated Mineral Resource and optimised in-pit Inferred Mineral Resource respectively. The corresponding grade tonnage curves are shown in Appendix 14.3.
Table 14.12.5 Vindaloo Measured and Indicated Optimised In-Pit Mineral Resources - Grade Tonnage
Cut-off Tonnage Au (g/t) Au (oz) 0.20 29,414,000 1.98 1,874,000 0.35 29,414,000 1.98 1,874,000 0.40 29,393,000 1.98 1,874,000 0.45 29,347,000 1.99 1,873,000 0.50 29,276,000 1.99 1,872,000 0.60 28,981,000 2.00 1,867,000 0.70 28,493,000 2.03 1,857,000 0.80 27,738,000 2.06 1,838,000 0.90 26,591,000 2.11 1,806,000 1.00 25,361,000 2.17 1,769,000 1.20 22,300,000 2.32 1,661,000 1.40 19,249,000 2.48 1,534,000 1.60 16,142,000 2.67 1,384,000 1.80 13,465,000 2.86 1,238,000 2.00 11,402,000 3.03 1,112,000 2.50 7,301,000 3.48 817,000 3.00 4,396,000 3.98 562,000 3.50 2,579,000 4.50 373,000 4.00 1,538,000 5.02 248,000 4.50 955,000 5.51 169,000 5.00 599,000 5.97 115,000
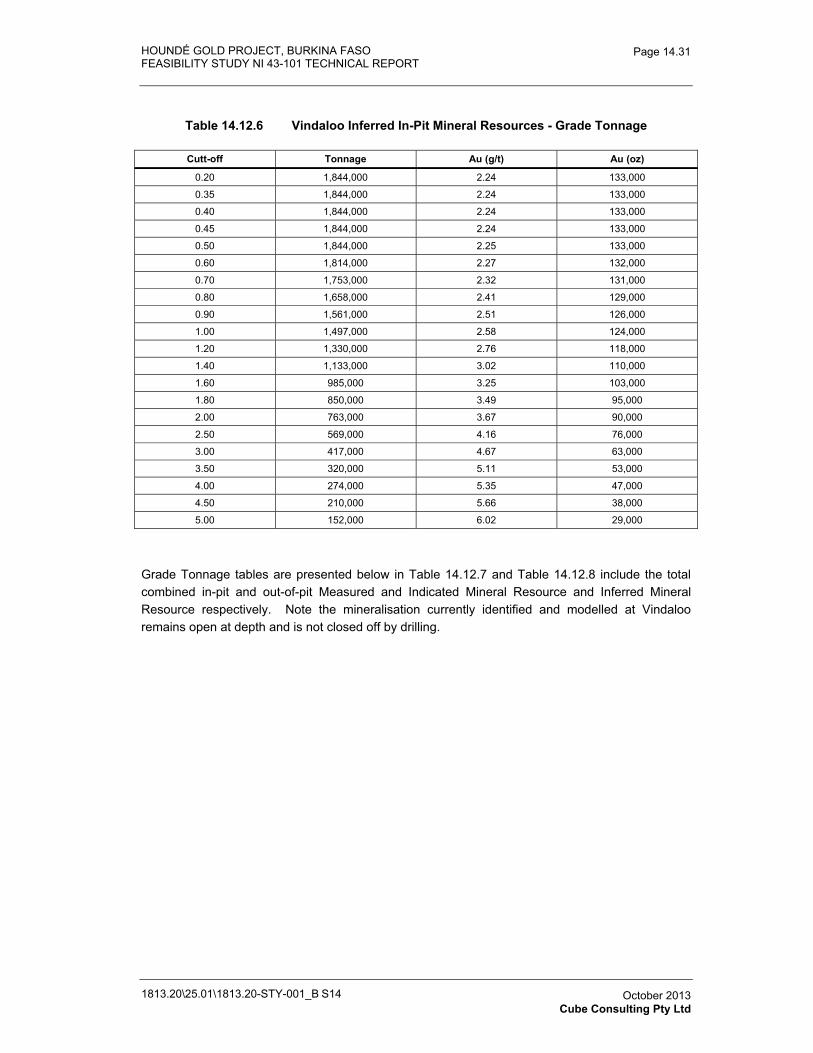
HOUNDÉ GOLD PROJECT, BURKINA FASO FEASIBILITY STUDY NI 43-101 TECHNICAL REPORT
1813.20\25.01\1813.20-STY-001_B S14
Page 14.31
October 2013 Cube Consulting Pty Ltd
Table 14.12.6 Vindaloo Inferred In-Pit Mineral Resources - Grade Tonnage
Cutt-off Tonnage Au (g/t) Au (oz)
0.20 1,844,000 2.24 133,000
0.35 1,844,000 2.24 133,000
0.40 1,844,000 2.24 133,000
0.45 1,844,000 2.24 133,000
0.50 1,844,000 2.25 133,000
0.60 1,814,000 2.27 132,000
0.70 1,753,000 2.32 131,000
0.80 1,658,000 2.41 129,000
0.90 1,561,000 2.51 126,000
1.00 1,497,000 2.58 124,000
1.20 1,330,000 2.76 118,000
1.40 1,133,000 3.02 110,000
1.60 985,000 3.25 103,000
1.80 850,000 3.49 95,000
2.00 763,000 3.67 90,000
2.50 569,000 4.16 76,000
3.00 417,000 4.67 63,000
3.50 320,000 5.11 53,000
4.00 274,000 5.35 47,000
4.50 210,000 5.66 38,000
5.00 152,000 6.02 29,000
Grade Tonnage tables are presented below in Table 14.12.7 and Table 14.12.8 include the total combined in-pit and out-of-pit Measured and Indicated Mineral Resource and Inferred Mineral Resource respectively. Note the mineralisation currently identified and modelled at Vindaloo remains open at depth and is not closed off by drilling.
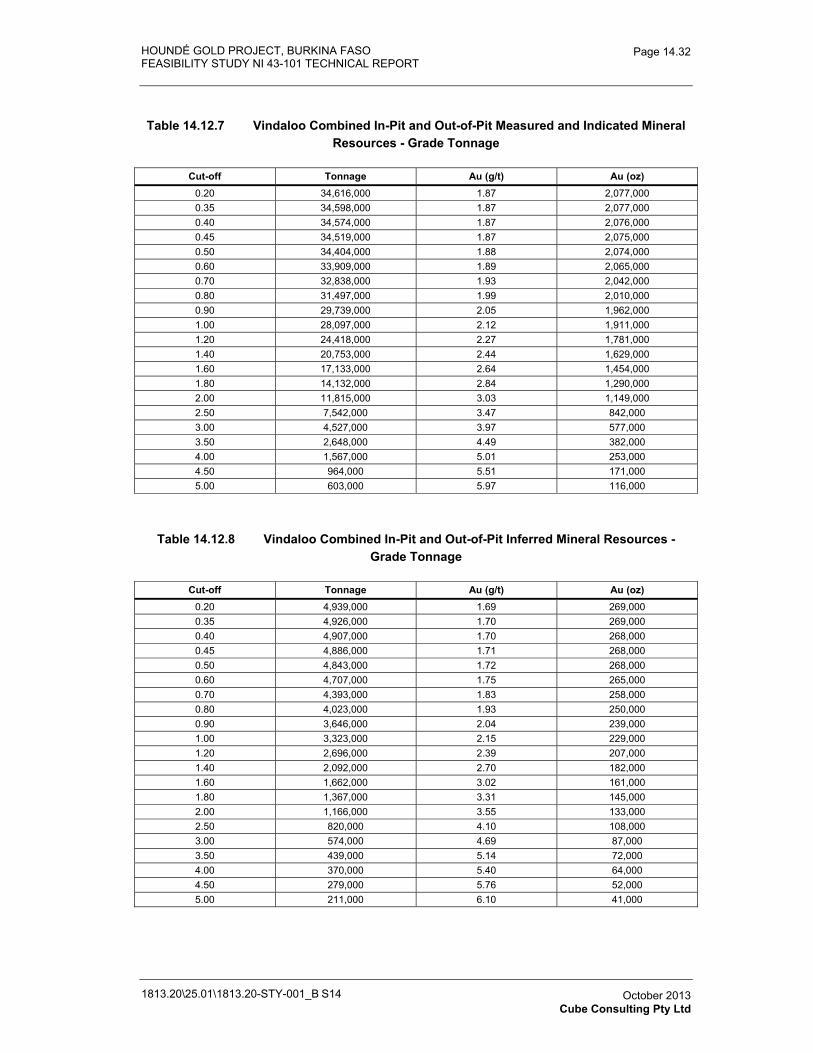
HOUNDÉ GOLD PROJECT, BURKINA FASO FEASIBILITY STUDY NI 43-101 TECHNICAL REPORT
1813.20\25.01\1813.20-STY-001_B S14
Page 14.32
October 2013 Cube Consulting Pty Ltd
Table 14.12.7 Vindaloo Combined In-Pit and Out-of-Pit Measured and Indicated Mineral Resources - Grade Tonnage
Cut-off Tonnage Au (g/t) Au (oz) 0.20 34,616,000 1.87 2,077,000 0.35 34,598,000 1.87 2,077,000 0.40 34,574,000 1.87 2,076,000 0.45 34,519,000 1.87 2,075,000 0.50 34,404,000 1.88 2,074,000 0.60 33,909,000 1.89 2,065,000 0.70 32,838,000 1.93 2,042,000 0.80 31,497,000 1.99 2,010,000 0.90 29,739,000 2.05 1,962,000 1.00 28,097,000 2.12 1,911,000 1.20 24,418,000 2.27 1,781,000 1.40 20,753,000 2.44 1,629,000 1.60 17,133,000 2.64 1,454,000 1.80 14,132,000 2.84 1,290,000 2.00 11,815,000 3.03 1,149,000 2.50 7,542,000 3.47 842,000 3.00 4,527,000 3.97 577,000 3.50 2,648,000 4.49 382,000 4.00 1,567,000 5.01 253,000 4.50 964,000 5.51 171,000 5.00 603,000 5.97 116,000
Table 14.12.8 Vindaloo Combined In-Pit and Out-of-Pit Inferred Mineral Resources - Grade Tonnage
Cut-off Tonnage Au (g/t) Au (oz) 0.20 4,939,000 1.69 269,000 0.35 4,926,000 1.70 269,000 0.40 4,907,000 1.70 268,000 0.45 4,886,000 1.71 268,000 0.50 4,843,000 1.72 268,000 0.60 4,707,000 1.75 265,000 0.70 4,393,000 1.83 258,000 0.80 4,023,000 1.93 250,000 0.90 3,646,000 2.04 239,000 1.00 3,323,000 2.15 229,000 1.20 2,696,000 2.39 207,000 1.40 2,092,000 2.70 182,000 1.60 1,662,000 3.02 161,000 1.80 1,367,000 3.31 145,000 2.00 1,166,000 3.55 133,000 2.50 820,000 4.10 108,000 3.00 574,000 4.69 87,000 3.50 439,000 5.14 72,000 4.00 370,000 5.40 64,000 4.50 279,000 5.76 52,000 5.00 211,000 6.10 41,000
HOUNDÉ GOLD PROJECT, BURKINA FASO
FEASIBILITY STUDY NI 43-101 TECHNICAL REPORT
1813.20-STY-001
Table of Contents Page
15.0� MINERAL RESERVE ESTIMATES 15.1�15.1� Mining and Mineral Reserves Estimation Approach 15.1�15.2� Pit Optimisation Key Assumptions / Basis of Estimate 15.2�
15.2.1� Resource Model 15.2�15.2.2� Geotechnical Considerations 15.3�15.2.3� Ore Loss and Dilution 15.4�15.2.4� Optimisation Mining Costs 15.5�15.2.5� Processing Costs and Recoveries 15.12�15.2.6� Gold Price 15.13�
15.3� Pit Optimization Results 15.13�15.3.1� Whittle Results and Shell Selection 15.13�15.3.2� Optimisation Sensitivity 15.16�15.3.3� Risk Management 15.18�
15.4� Mine Design Process 15.19�15.5� Pit Design 15.19�
15.5.1� Design Criteria 15.19�15.5.2� Vindaloo Main Ultimate Pit Designs 15.20�15.5.3� Vindaloo 1 Design 15.26�15.5.4� Vindaloo 2 Design 15.28�15.5.5� Madras Design 15.30�
15.6� Houndé Mineral Reserves Calculation 15.32�15.7� Stage Designs 15.34�15.8� Waste Storage Facility Designs 15.41�
TABLESTable 15.2.1� Slope Design Criteria 15.3�Table 15.2.2� Final Optimisation – Overall Slope Angles 15.3�Table 15.2.3� Material Properties 15.5�Table 15.2.4� Shovel Productivity by Material Type 15.6�Table 15.2.5� Key Drill and Blast Parameters 15.8�Table 15.2.6� Drill and Blast Unit Costs per Tonne 15.8�Table 15.2.7� Clearing, Stripping and Rehabilitation Rates 15.9�Table 15.2.8� WSF Clearing Rate 15.9�Table 15.2.9� Ore Grade Control Costs 15.9�Table 15.2.10� Ore Rehandle Costs 15.10�Table 15.2.11� Annual Fixed Costs and Overheads 15.10�Table 15.2.12� Processing Costs 15.12�Table 15.2.13� Processing Recoveries 15.12�Table 15.2.14� Gold Price and Royalties Assumptions 15.13�Table 15.3.1� Optimisation Results 15.14�Table 15.3.2� Shell 30 Optimisation Result 15.16�Table 15.5.1� Ramp Design Criteria 15.20�Table 15.6.1� Houndé Cut-off Grades 15.33�Table 15.6.2� Houndé Mineral Reserves by Reserve Category 15.33�Table 15.6.3� Houndé Mineral Reserves by Material Type 15.34�Table 15.7.1� Vindaloo Stages for Scheduling 15.40�
1813.20\25.01\1813.20-STY-001_B S15 October 2013 Orelogy Pty Ltd
HOUNDÉ GOLD PROJECT, BURKINA FASO
FEASIBILITY STUDY NI 43-101 TECHNICAL REPORT
1813.20-STY-001
Table of Contents (Continued) Page
1813.20\25.01\1813.20-STY-001_B S15
October 2013 Orelogy Pty Ltd
FIGURESFigure 15.1.1� Houndé Gold Project – Site Layout 15.1�Figure 15.2.1� Optimisation Slope Zones 15.4�Figure 15.2.2� Locations of Five Mining Areas for Mining Cost Allocation 15.7�Figure 15.2.3� Waste Mining Unit Costs – All Pits 15.11�Figure 15.2.4� Ore Mining Unit Costs – All Pits 15.11�Figure 15.3.1� Optimisation Results 15.15�Figure 15.3.2� Optimisation Sensitivity Analysis – Best Case Ore Tonnage 15.17�Figure 15.3.3� Optimisation Sensitivity Analysis – Best Case Discounted Cashflow 15.17�Figure 15.5.1� Vindaloo Main South Pit Design 15.21�Figure 15.5.2� Vindaloo Main North Pit Design 15.22�Figure 15.5.3� Vindaloo Main Section A 15.23�Figure 15.5.4� Vindaloo Main Section B 15.23�Figure 15.5.5� Vindaloo Main Section C 15.24�Figure 15.5.6� Vindaloo Main Section D 15.24�Figure 15.5.7� Vindaloo Main Section E 15.25�Figure 15.5.8� Vindaloo Main Section F 15.25�Figure 15.5.9� Vindaloo 1 Pit Design 15.26�Figure 15.5.10� Vindaloo 1 Section G 15.27�Figure 15.5.11� Vindaloo 2 Pit Design 15.28�Figure 15.5.12� Vindaloo 2 Section H 15.29�Figure 15.5.13� Madras Pit Designs 15.30�Figure 15.5.14� Madras Section I 15.31�Figure 15.5.15� Madras Section J 15.32�Figure 15.7.1� Vindaloo Main Stages 15.35�Figure 15.3.1� Vindaloo Main Stage 11 15.36�Figure 15.7.3� Vindaloo Main Stage 12 15.37�Figure 15.7.4� Vindaloo Main Stage 13 15.38�Figure 15.7.5� Vindaloo Main Stage 15 15.39�Figure 15.8.1� WSF Standoff Distance from Pit Crest 15.41�Figure 15.8.2� WSF Profile - Construction and Final Landform 15.42�
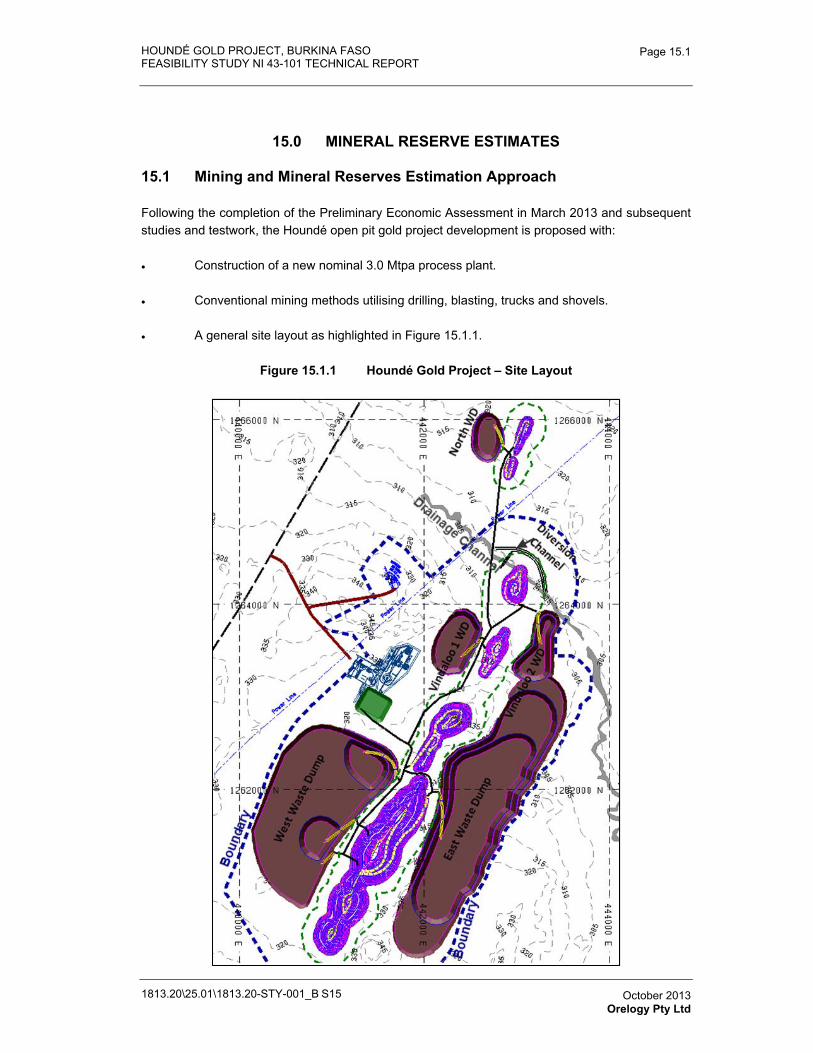
HOUNDÉ GOLD PROJECT, BURKINA FASO FEASIBILITY STUDY NI 43-101 TECHNICAL REPORT
1813.20\25.01\1813.20-STY-001_B S15
Page 15.1
October 2013 Orelogy Pty Ltd
15.0 MINERAL RESERVE ESTIMATES
15.1 Mining and Mineral Reserves Estimation Approach
Following the completion of the Preliminary Economic Assessment in March 2013 and subsequent studies and testwork, the Houndé open pit gold project development is proposed with:
� Construction of a new nominal 3.0 Mtpa process plant.
� Conventional mining methods utilising drilling, blasting, trucks and shovels.
� A general site layout as highlighted in Figure 15.1.1.
Figure 15.1.1 Houndé Gold Project – Site Layout
HOUNDÉ GOLD PROJECT, BURKINA FASO FEASIBILITY STUDY NI 43-101 TECHNICAL REPORT
1813.20\25.01\1813.20-STY-001_B S15
Page 15.2
October 2013 Orelogy Pty Ltd
This section of the report includes discussion on the open pit optimization and practical pit design. The mineral reserves and the results of the mine design process are presented. Other items such as the scheduling process and equipment considerations are presented in the following section “Mining Methods” (Section 16) and mining cost estimates are included in the “Capital and Operating Costs” (Section 21).
The mine planning process for the reserve estimation comprised the following components:
� Whittle-4X pit optimisation software was used to identify the optimum pit shell in terms of value and tonnage using the parameters outlined below in this section.
� MineSight general mine planning software was used to develop practical stage designs to access the orebody.
� EVORELUTION scheduling software was used to develop strategic level schedules to determine a practical starting sequence that maximised net present value (NPV). This was then used as a guide to the subsequent detailed life-of-mine (LOM) schedule.
� Mining costs for the project, to be incorporated in the project financial cash flow model, were estimated based on the final design and associated LOM schedule.
The mining components of the study are based on the geological Mineral Resource block model generated by Cube Consulting Pty Ltd which encompasses the Vindaloo and Madras deposits. Mineral Reserves have been modified from Mineral Resources by taking into account geological, geotechnical, mining, processing, economic parameters and permitting requirements and therefore are classified in accordance with the Joint Ore Reserve Committee (JORC) 2012 standards and/or CIM Definition Standards for Mineral Resources and Mineral Reserves.
15.2 Pit Optimisation Key Assumptions / Basis of Estimate
Mineral Reserves for Vindaloo and Madras are supported by a LOM plan, which was developed using the following information and key parameters in the pit optimisation process.
15.2.1 Resource Model
The resource model is an Ordinary Kriged (OK) model developed by Cube Consulting and has a total of 39.6 Mt at 1.91 g/t Au at a 0 g/t Au cut-off grade. Over 87% of the resource is classified as Measured or Indicated with the remaining 13% classified as Inferred. Earlier sections of this report provide more background and detail on this resource estimate.
Throughout the mine planning process, only Measured and Indicated Mineral Resources are eligible to qualify as ore, all other mineralization, including Inferred Mineral Resources, have been classified as waste.
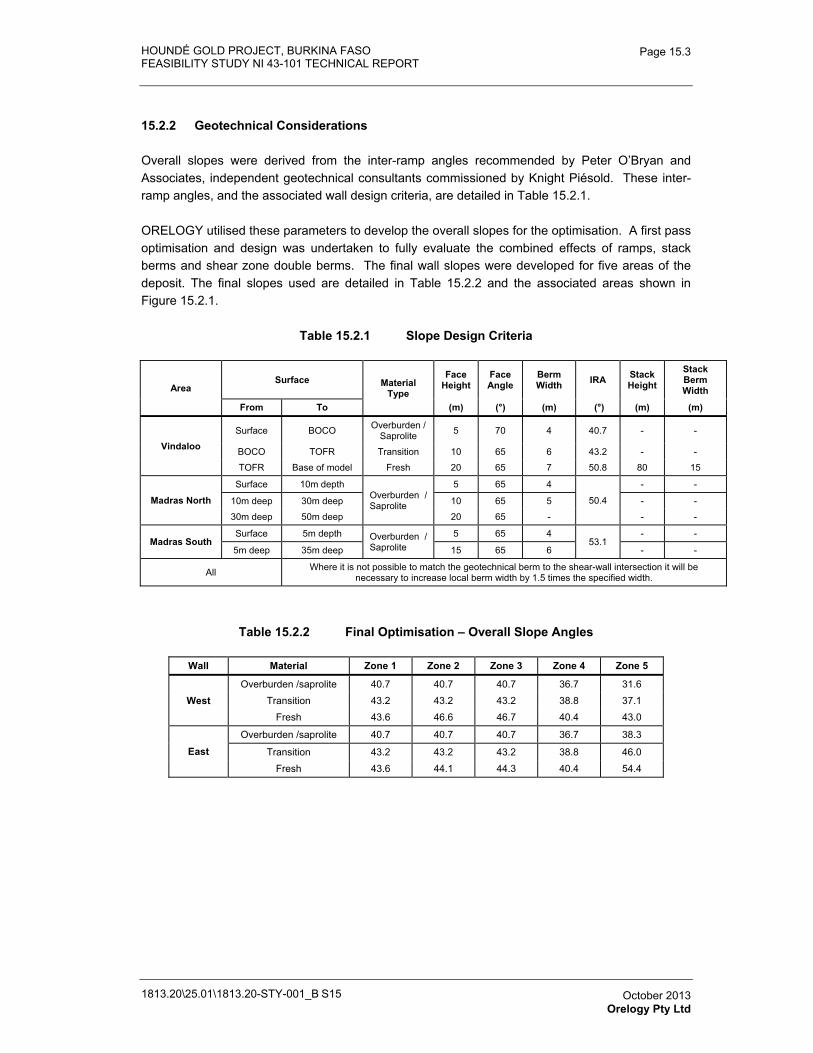
HOUNDÉ GOLD PROJECT, BURKINA FASO FEASIBILITY STUDY NI 43-101 TECHNICAL REPORT
1813.20\25.01\1813.20-STY-001_B S15
Page 15.3
October 2013 Orelogy Pty Ltd
15.2.2 Geotechnical Considerations
Overall slopes were derived from the inter-ramp angles recommended by Peter O’Bryan and Associates, independent geotechnical consultants commissioned by Knight Piésold. These inter-ramp angles, and the associated wall design criteria, are detailed in Table 15.2.1.
ORELOGY utilised these parameters to develop the overall slopes for the optimisation. A first pass optimisation and design was undertaken to fully evaluate the combined effects of ramps, stack berms and shear zone double berms. The final wall slopes were developed for five areas of the deposit. The final slopes used are detailed in Table 15.2.2 and the associated areas shown in Figure 15.2.1.
Table 15.2.1 Slope Design Criteria
Area Surface Material
Type
Face Height
Face Angle
Berm Width IRA Stack
Height Stack Berm Width
From To (m) (°) (m) (°) (m) (m)
Vindaloo Surface BOCO Overburden /
Saprolite 5 70 4 40.7 - -
BOCO TOFR Transition 10 65 6 43.2 - -
TOFR Base of model Fresh 20 65 7 50.8 80 15
Madras North Surface 10m depth
Overburden / Saprolite
5 65 4
50.4
- -
10m deep 30m deep 10 65 5 - -
30m deep 50m deep 20 65 - - -
Madras South Surface 5m depth Overburden /
Saprolite 5 65 4
53.1 - -
5m deep 35m deep 15 65 6 - -
All Where it is not possible to match the geotechnical berm to the shear-wall intersection it will be necessary to increase local berm width by 1.5 times the specified width.
Table 15.2.2 Final Optimisation – Overall Slope Angles
Wall Material Zone 1 Zone 2 Zone 3 Zone 4 Zone 5
West Overburden /saprolite 40.7 40.7 40.7 36.7 31.6
Transition 43.2 43.2 43.2 38.8 37.1 Fresh 43.6 46.6 46.7 40.4 43.0
East Overburden /saprolite 40.7 40.7 40.7 36.7 38.3
Transition 43.2 43.2 43.2 38.8 46.0 Fresh 43.6 44.1 44.3 40.4 54.4
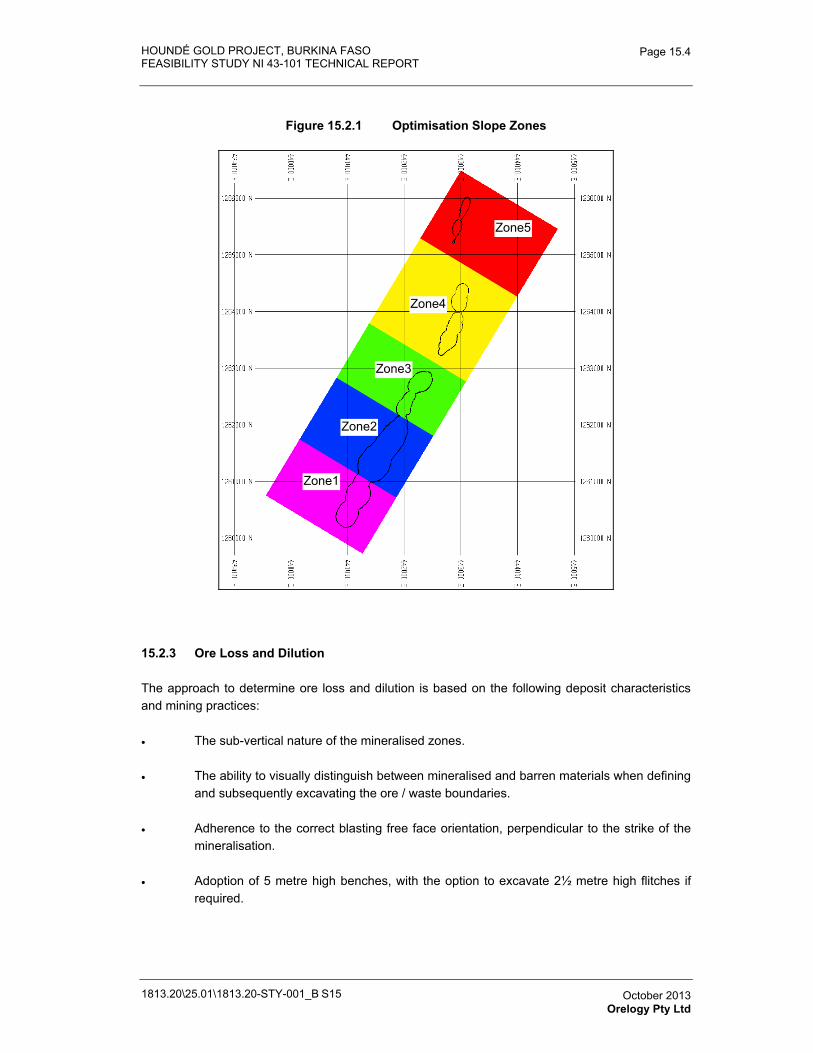
HOUNDÉ GOLD PROJECT, BURKINA FASO FEASIBILITY STUDY NI 43-101 TECHNICAL REPORT
1813.20\25.01\1813.20-STY-001_B S15
Page 15.4
October 2013 Orelogy Pty Ltd
Figure 15.2.1 Optimisation Slope Zones
15.2.3 Ore Loss and Dilution
The approach to determine ore loss and dilution is based on the following deposit characteristics and mining practices:
� The sub-vertical nature of the mineralised zones.
� The ability to visually distinguish between mineralised and barren materials when defining and subsequently excavating the ore / waste boundaries.
� Adherence to the correct blasting free face orientation, perpendicular to the strike of the mineralisation.
� Adoption of 5 metre high benches, with the option to excavate 2½ metre high flitches if required.
Zone2
Zone1
Zone3
Zone4
Zone5
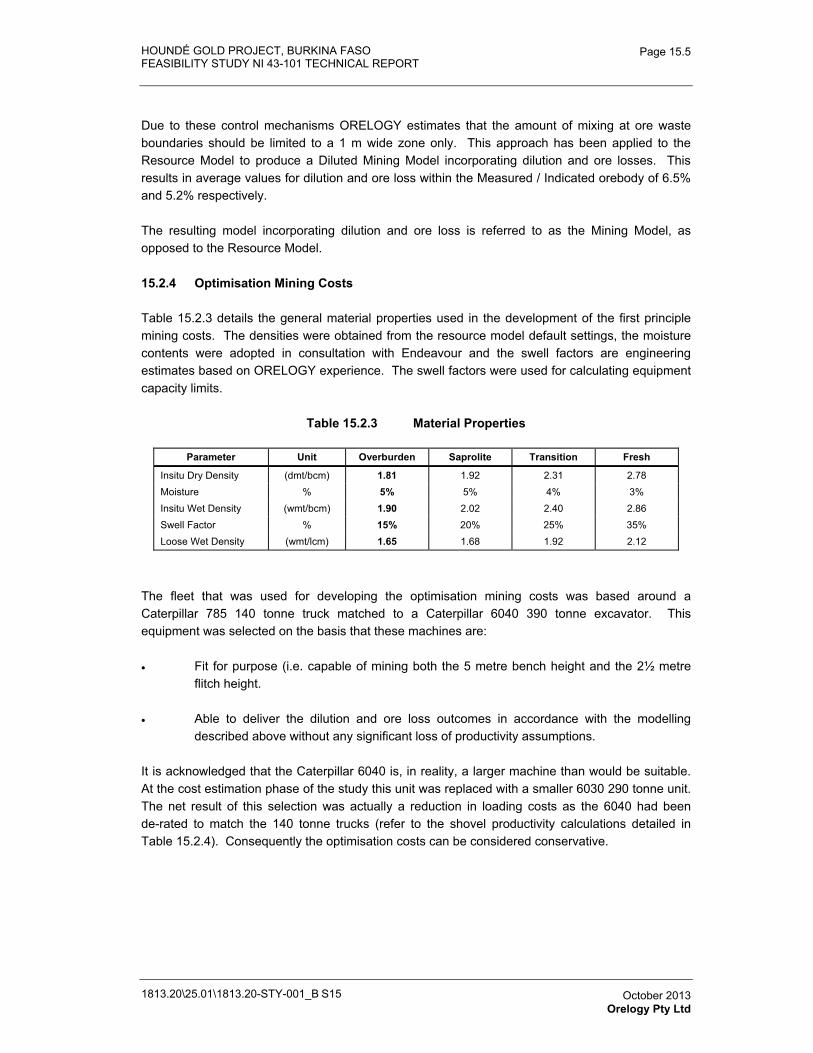
HOUNDÉ GOLD PROJECT, BURKINA FASO FEASIBILITY STUDY NI 43-101 TECHNICAL REPORT
1813.20\25.01\1813.20-STY-001_B S15
Page 15.5
October 2013 Orelogy Pty Ltd
Due to these control mechanisms ORELOGY estimates that the amount of mixing at ore waste boundaries should be limited to a 1 m wide zone only. This approach has been applied to the Resource Model to produce a Diluted Mining Model incorporating dilution and ore losses. This results in average values for dilution and ore loss within the Measured / Indicated orebody of 6.5% and 5.2% respectively.
The resulting model incorporating dilution and ore loss is referred to as the Mining Model, as opposed to the Resource Model.
15.2.4 Optimisation Mining Costs
Table 15.2.3 details the general material properties used in the development of the first principle mining costs. The densities were obtained from the resource model default settings, the moisture contents were adopted in consultation with Endeavour and the swell factors are engineering estimates based on ORELOGY experience. The swell factors were used for calculating equipment capacity limits.
Table 15.2.3 Material Properties
Parameter Unit Overburden Saprolite Transition Fresh
Insitu Dry Density (dmt/bcm) 1.81 1.92 2.31 2.78 Moisture % 5% 5% 4% 3% Insitu Wet Density (wmt/bcm) 1.90 2.02 2.40 2.86 Swell Factor % 15% 20% 25% 35% Loose Wet Density (wmt/lcm) 1.65 1.68 1.92 2.12
The fleet that was used for developing the optimisation mining costs was based around a Caterpillar 785 140 tonne truck matched to a Caterpillar 6040 390 tonne excavator. This equipment was selected on the basis that these machines are:
� Fit for purpose (i.e. capable of mining both the 5 metre bench height and the 2½ metre flitch height.
� Able to deliver the dilution and ore loss outcomes in accordance with the modelling described above without any significant loss of productivity assumptions.
It is acknowledged that the Caterpillar 6040 is, in reality, a larger machine than would be suitable. At the cost estimation phase of the study this unit was replaced with a smaller 6030 290 tonne unit. The net result of this selection was actually a reduction in loading costs as the 6040 had been de-rated to match the 140 tonne trucks (refer to the shovel productivity calculations detailed in Table 15.2.4). Consequently the optimisation costs can be considered conservative.
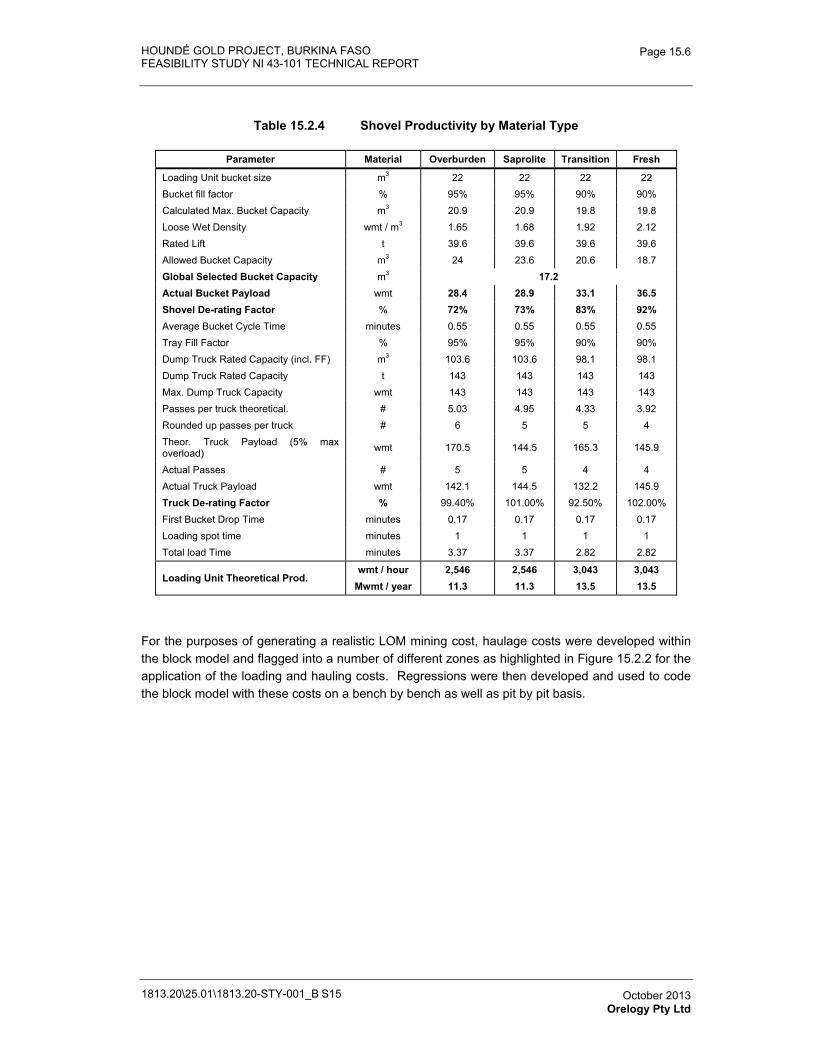
HOUNDÉ GOLD PROJECT, BURKINA FASO FEASIBILITY STUDY NI 43-101 TECHNICAL REPORT
1813.20\25.01\1813.20-STY-001_B S15
Page 15.6
October 2013 Orelogy Pty Ltd
Table 15.2.4 Shovel Productivity by Material Type
Parameter Material Overburden Saprolite Transition Fresh
Loading Unit bucket size m3 22 22 22 22 Bucket fill factor % 95% 95% 90% 90% Calculated Max. Bucket Capacity m3 20.9 20.9 19.8 19.8 Loose Wet Density wmt / m3 1.65 1.68 1.92 2.12 Rated Lift t 39.6 39.6 39.6 39.6 Allowed Bucket Capacity m3 24 23.6 20.6 18.7 Global Selected Bucket Capacity m3 17.2Actual Bucket Payload wmt 28.4 28.9 33.1 36.5 Shovel De-rating Factor % 72% 73% 83% 92% Average Bucket Cycle Time minutes 0.55 0.55 0.55 0.55 Tray Fill Factor % 95% 95% 90% 90% Dump Truck Rated Capacity (incl. FF) m3 103.6 103.6 98.1 98.1 Dump Truck Rated Capacity t 143 143 143 143 Max. Dump Truck Capacity wmt 143 143 143 143 Passes per truck theoretical. # 5.03 4.95 4.33 3.92 Rounded up passes per truck # 6 5 5 4 Theor. Truck Payload (5% max overload) wmt 170.5 144.5 165.3 145.9
Actual Passes # 5 5 4 4 Actual Truck Payload wmt 142.1 144.5 132.2 145.9 Truck De-rating Factor % 99.40% 101.00% 92.50% 102.00% First Bucket Drop Time minutes 0.17 0.17 0.17 0.17 Loading spot time minutes 1 1 1 1 Total load Time minutes 3.37 3.37 2.82 2.82
Loading Unit Theoretical Prod. wmt / hour 2,546 2,546 3,043 3,043
Mwmt / year 11.3 11.3 13.5 13.5
For the purposes of generating a realistic LOM mining cost, haulage costs were developed within the block model and flagged into a number of different zones as highlighted in Figure 15.2.2 for the application of the loading and hauling costs. Regressions were then developed and used to code the block model with these costs on a bench by bench as well as pit by pit basis.
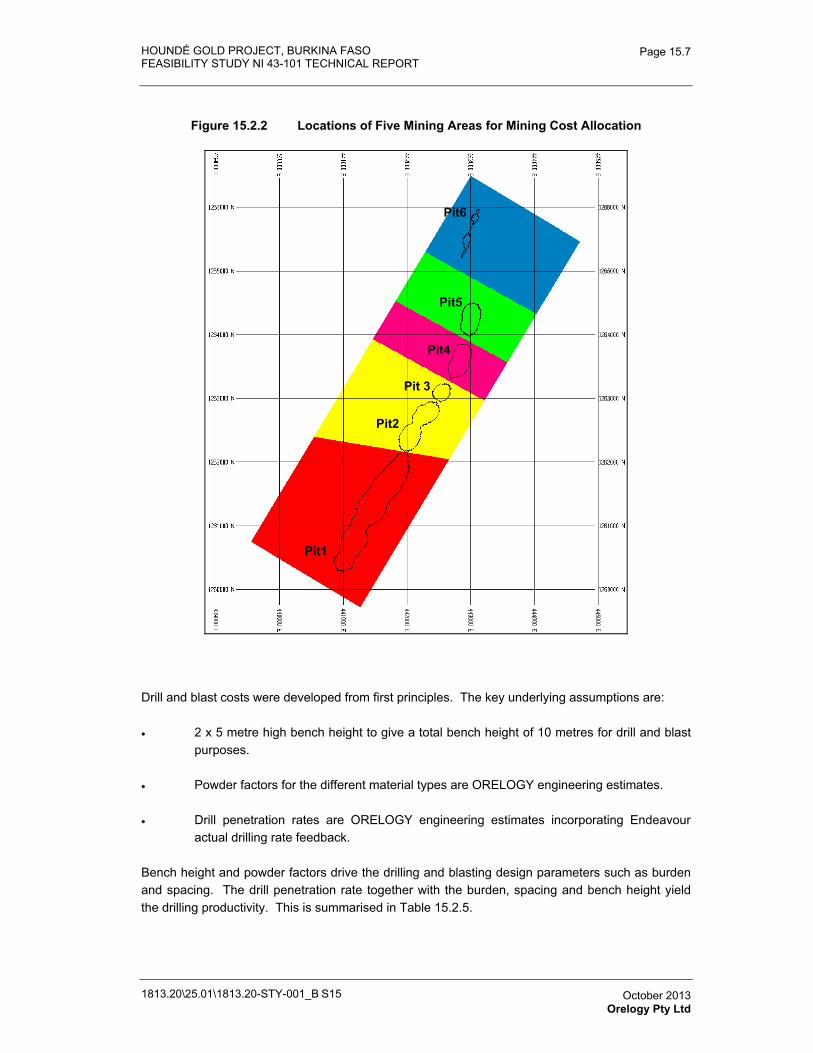
HOUNDÉ GOLD PROJECT, BURKINA FASO FEASIBILITY STUDY NI 43-101 TECHNICAL REPORT
1813.20\25.01\1813.20-STY-001_B S15
Page 15.7
October 2013 Orelogy Pty Ltd
Figure 15.2.2 Locations of Five Mining Areas for Mining Cost Allocation
Drill and blast costs were developed from first principles. The key underlying assumptions are:
� 2 x 5 metre high bench height to give a total bench height of 10 metres for drill and blast purposes.
� Powder factors for the different material types are ORELOGY engineering estimates.
� Drill penetration rates are ORELOGY engineering estimates incorporating Endeavour actual drilling rate feedback.
Bench height and powder factors drive the drilling and blasting design parameters such as burden and spacing. The drill penetration rate together with the burden, spacing and bench height yield the drilling productivity. This is summarised in Table 15.2.5.
Pit1
Pit2
Pit4
Pit5
Pit6
Pit 3
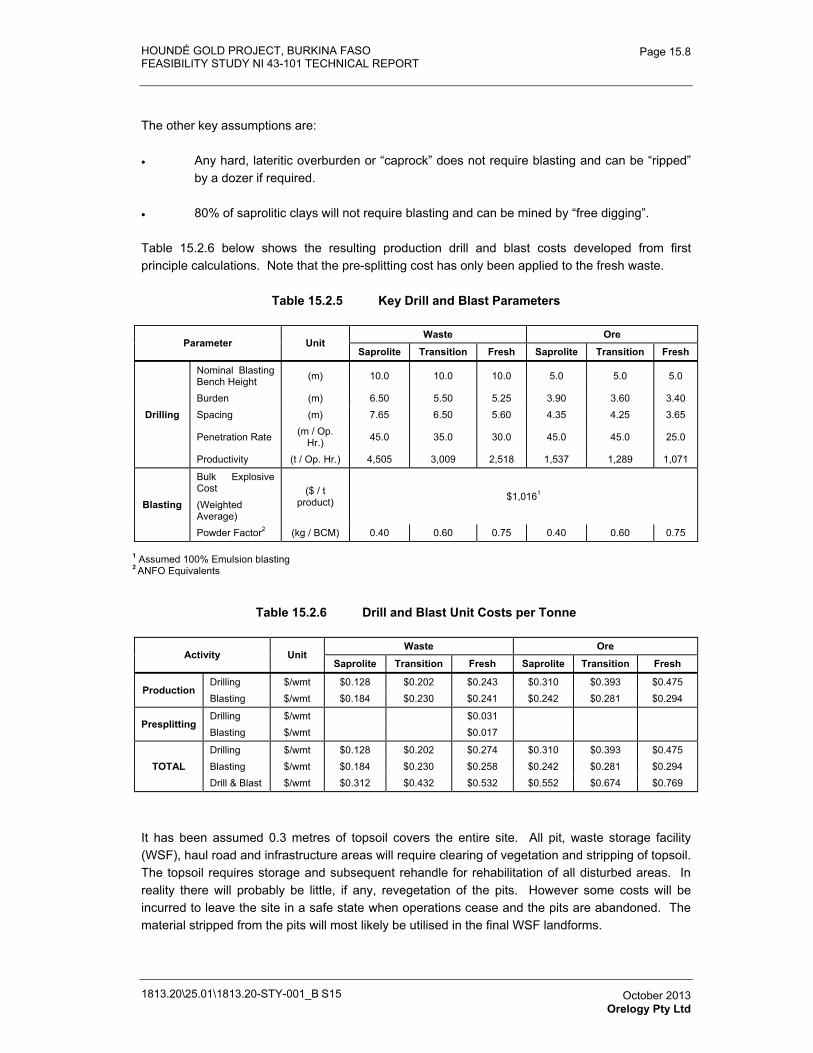
HOUNDÉ GOLD PROJECT, BURKINA FASO FEASIBILITY STUDY NI 43-101 TECHNICAL REPORT
1813.20\25.01\1813.20-STY-001_B S15
Page 15.8
October 2013 Orelogy Pty Ltd
The other key assumptions are:
� Any hard, lateritic overburden or “caprock” does not require blasting and can be “ripped” by a dozer if required.
� 80% of saprolitic clays will not require blasting and can be mined by “free digging”.
Table 15.2.6 below shows the resulting production drill and blast costs developed from first principle calculations. Note that the pre-splitting cost has only been applied to the fresh waste.
Table 15.2.5 Key Drill and Blast Parameters
Parameter Unit Waste Ore
Saprolite Transition Fresh Saprolite Transition Fresh
Drilling
Nominal Blasting Bench Height (m) 10.0 10.0 10.0 5.0 5.0 5.0
Burden (m) 6.50 5.50 5.25 3.90 3.60 3.40 Spacing (m) 7.65 6.50 5.60 4.35 4.25 3.65
Penetration Rate (m / Op. Hr.) 45.0 35.0 30.0 45.0 45.0 25.0
Productivity (t / Op. Hr.) 4,505 3,009 2,518 1,537 1,289 1,071
Blasting
Bulk Explosive Cost (Weighted Average)
($ / t product) $1,0161
Powder Factor2 (kg / BCM) 0.40 0.60 0.75 0.40 0.60 0.75
1 Assumed 100% Emulsion blasting 2 ANFO Equivalents
Table 15.2.6 Drill and Blast Unit Costs per Tonne
Activity Unit Waste Ore
Saprolite Transition Fresh Saprolite Transition Fresh
Production Drilling $/wmt $0.128 $0.202 $0.243 $0.310 $0.393 $0.475 Blasting $/wmt $0.184 $0.230 $0.241 $0.242 $0.281 $0.294
Presplitting Drilling $/wmt $0.031 Blasting $/wmt $0.017
TOTAL Drilling $/wmt $0.128 $0.202 $0.274 $0.310 $0.393 $0.475 Blasting $/wmt $0.184 $0.230 $0.258 $0.242 $0.281 $0.294 Drill & Blast $/wmt $0.312 $0.432 $0.532 $0.552 $0.674 $0.769
It has been assumed 0.3 metres of topsoil covers the entire site. All pit, waste storage facility (WSF), haul road and infrastructure areas will require clearing of vegetation and stripping of topsoil. The topsoil requires storage and subsequent rehandle for rehabilitation of all disturbed areas. In reality there will probably be little, if any, revegetation of the pits. However some costs will be incurred to leave the site in a safe state when operations cease and the pits are abandoned. The material stripped from the pits will most likely be utilised in the final WSF landforms.
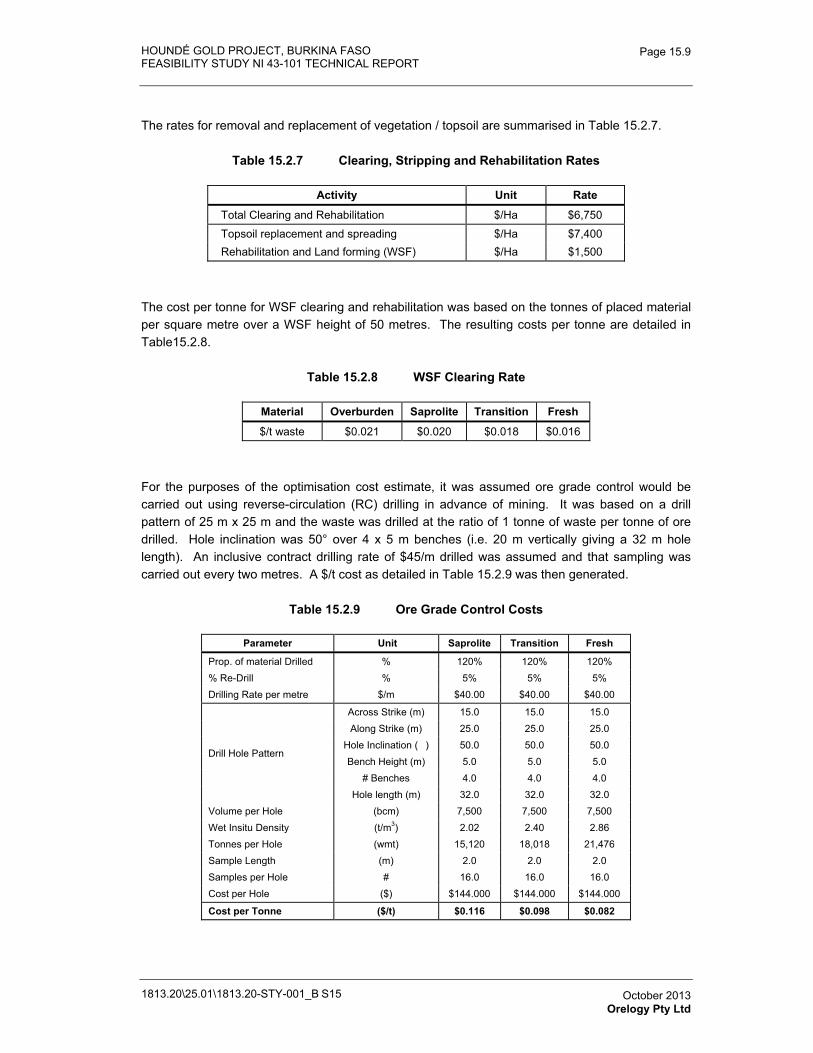
HOUNDÉ GOLD PROJECT, BURKINA FASO FEASIBILITY STUDY NI 43-101 TECHNICAL REPORT
1813.20\25.01\1813.20-STY-001_B S15
Page 15.9
October 2013 Orelogy Pty Ltd
The rates for removal and replacement of vegetation / topsoil are summarised in Table 15.2.7.
Table 15.2.7 Clearing, Stripping and Rehabilitation Rates
Activity Unit Rate
Total Clearing and Rehabilitation $/Ha $6,750
Topsoil replacement and spreading $/Ha $7,400 Rehabilitation and Land forming (WSF) $/Ha $1,500
The cost per tonne for WSF clearing and rehabilitation was based on the tonnes of placed material per square metre over a WSF height of 50 metres. The resulting costs per tonne are detailed in Table15.2.8.
Table 15.2.8 WSF Clearing Rate
Material Overburden Saprolite Transition Fresh
$/t waste $0.021 $0.020 $0.018 $0.016
For the purposes of the optimisation cost estimate, it was assumed ore grade control would be carried out using reverse-circulation (RC) drilling in advance of mining. It was based on a drill pattern of 25 m x 25 m and the waste was drilled at the ratio of 1 tonne of waste per tonne of ore drilled. Hole inclination was 50° over 4 x 5 m benches (i.e. 20 m vertically giving a 32 m hole length). An inclusive contract drilling rate of $45/m drilled was assumed and that sampling was carried out every two metres. A $/t cost as detailed in Table 15.2.9 was then generated.
Table 15.2.9 Ore Grade Control Costs
Parameter Unit Saprolite Transition Fresh
Prop. of material Drilled % 120% 120% 120% % Re-Drill % 5% 5% 5% Drilling Rate per metre $/m $40.00 $40.00 $40.00
Drill Hole Pattern
Across Strike (m) 15.0 15.0 15.0 Along Strike (m) 25.0 25.0 25.0
Hole Inclination ( ) 50.0 50.0 50.0 Bench Height (m) 5.0 5.0 5.0
# Benches 4.0 4.0 4.0 Hole length (m) 32.0 32.0 32.0
Volume per Hole (bcm) 7,500 7,500 7,500 Wet Insitu Density (t/m3) 2.02 2.40 2.86 Tonnes per Hole (wmt) 15,120 18,018 21,476 Sample Length (m) 2.0 2.0 2.0 Samples per Hole # 16.0 16.0 16.0 Cost per Hole ($) $144.000 $144.000 $144.000
Cost per Tonne ($/t) $0.116 $0.098 $0.082
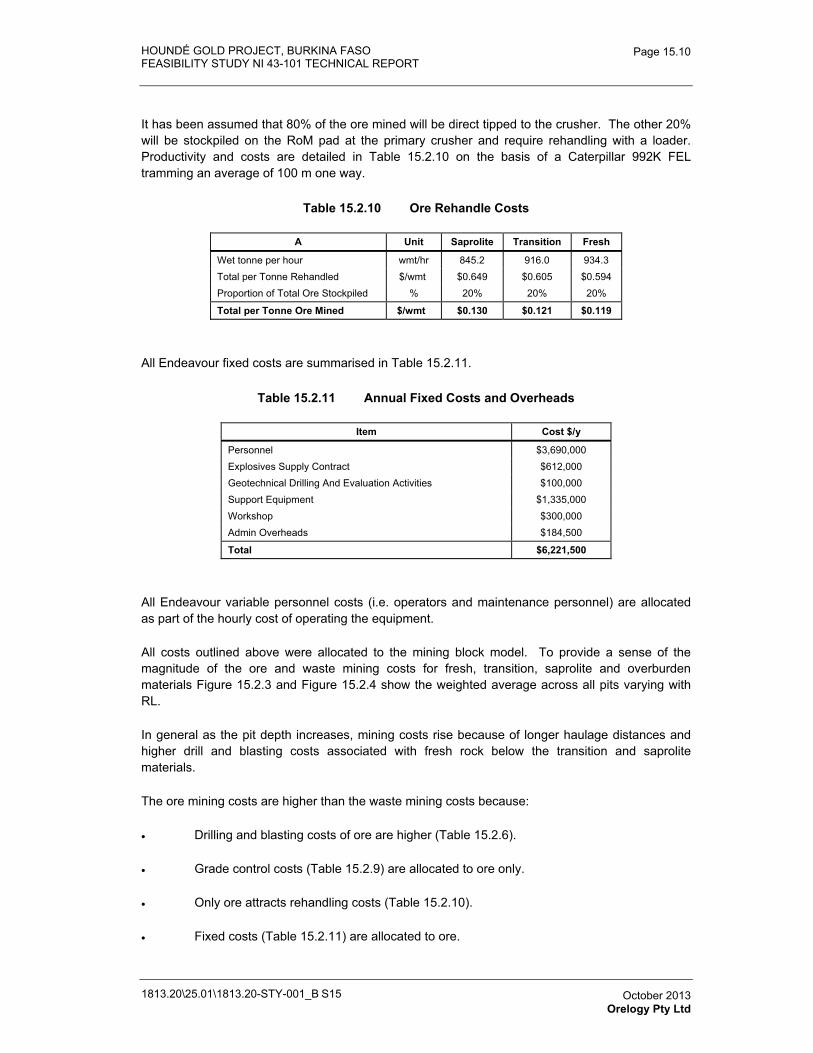
HOUNDÉ GOLD PROJECT, BURKINA FASO FEASIBILITY STUDY NI 43-101 TECHNICAL REPORT
1813.20\25.01\1813.20-STY-001_B S15
Page 15.10
October 2013 Orelogy Pty Ltd
It has been assumed that 80% of the ore mined will be direct tipped to the crusher. The other 20% will be stockpiled on the RoM pad at the primary crusher and require rehandling with a loader. Productivity and costs are detailed in Table 15.2.10 on the basis of a Caterpillar 992K FEL tramming an average of 100 m one way.
Table 15.2.10 Ore Rehandle Costs
A Unit Saprolite Transition Fresh
Wet tonne per hour wmt/hr 845.2 916.0 934.3 Total per Tonne Rehandled $/wmt $0.649 $0.605 $0.594 Proportion of Total Ore Stockpiled % 20% 20% 20%
Total per Tonne Ore Mined $/wmt $0.130 $0.121 $0.119
All Endeavour fixed costs are summarised in Table 15.2.11.
Table 15.2.11 Annual Fixed Costs and Overheads
Item Cost $/y
Personnel $3,690,000 Explosives Supply Contract $612,000 Geotechnical Drilling And Evaluation Activities $100,000 Support Equipment $1,335,000 Workshop $300,000 Admin Overheads $184,500
Total $6,221,500
All Endeavour variable personnel costs (i.e. operators and maintenance personnel) are allocated as part of the hourly cost of operating the equipment.
All costs outlined above were allocated to the mining block model. To provide a sense of the magnitude of the ore and waste mining costs for fresh, transition, saprolite and overburden materials Figure 15.2.3 and Figure 15.2.4 show the weighted average across all pits varying with RL.
In general as the pit depth increases, mining costs rise because of longer haulage distances and higher drill and blasting costs associated with fresh rock below the transition and saprolite materials.
The ore mining costs are higher than the waste mining costs because:
� Drilling and blasting costs of ore are higher (Table 15.2.6).
� Grade control costs (Table 15.2.9) are allocated to ore only.
� Only ore attracts rehandling costs (Table 15.2.10).
� Fixed costs (Table 15.2.11) are allocated to ore.
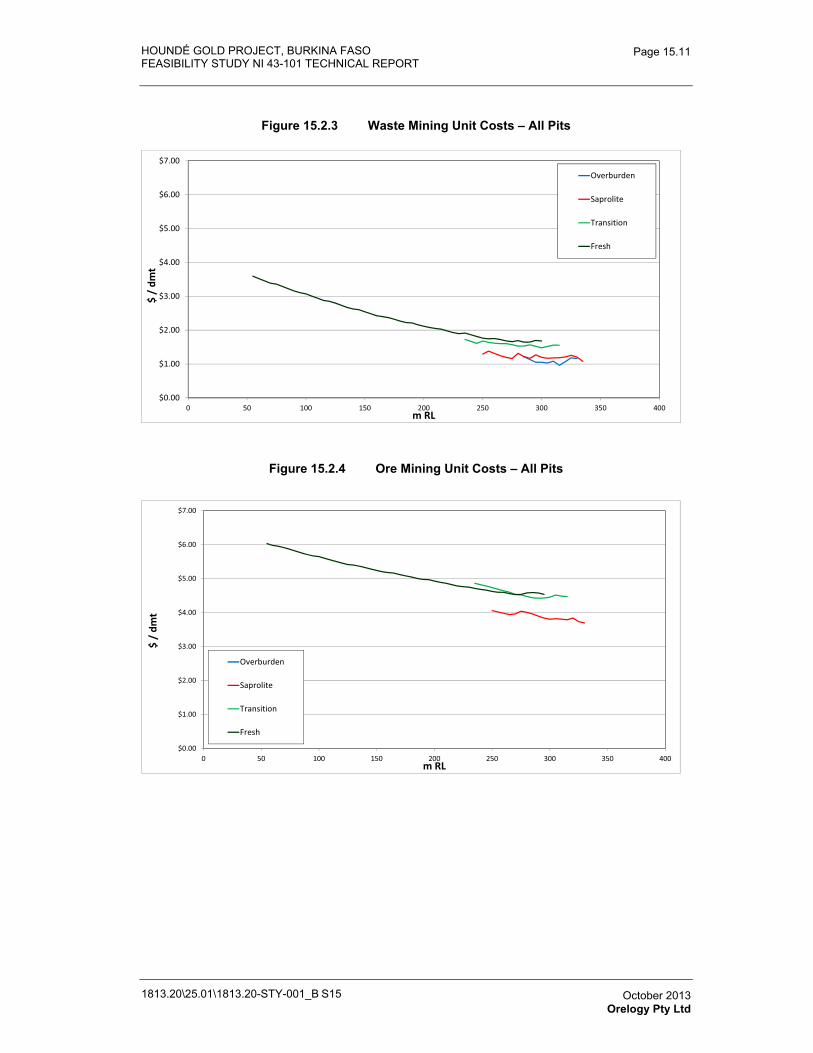
HOUNDÉ GOLD PROJECT, BURKINA FASO FEASIBILITY STUDY NI 43-101 TECHNICAL REPORT
1813.20\25.01\1813.20-STY-001_B S15
Page 15.11
October 2013 Orelogy Pty Ltd
Figure 15.2.3 Waste Mining Unit Costs – All Pits
$0.00
$1.00
$2.00
$3.00
$4.00
$5.00
$6.00
$7.00
0 50 100 150 200 250 300 350 400
$�/�
dmt
m�RL
Overburden
Saprolite
Transition
Fresh
Figure 15.2.4 Ore Mining Unit Costs – All Pits
$0.00
$1.00
$2.00
$3.00
$4.00
$5.00
$6.00
$7.00
0 50 100 150 200 250 300 350 400
$�/�
dmt
m�RL
Overburden
Saprolite
Transition
Fresh
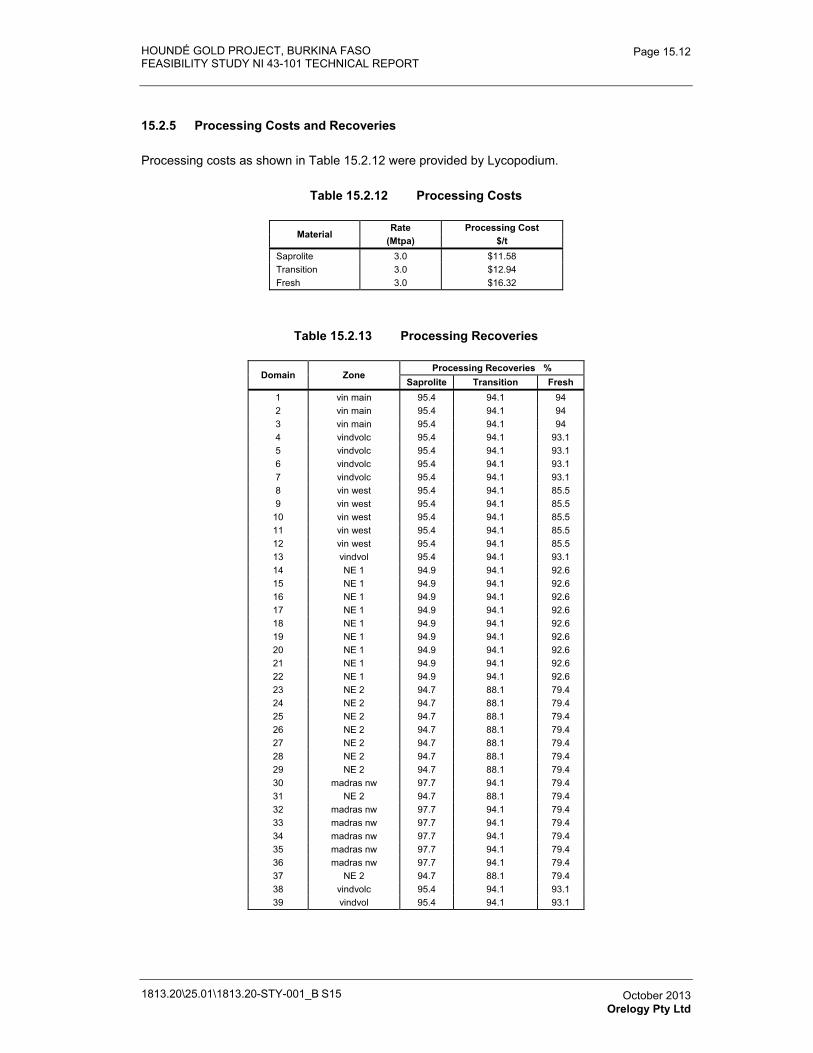
HOUNDÉ GOLD PROJECT, BURKINA FASO FEASIBILITY STUDY NI 43-101 TECHNICAL REPORT
1813.20\25.01\1813.20-STY-001_B S15
Page 15.12
October 2013 Orelogy Pty Ltd
15.2.5 Processing Costs and Recoveries
Processing costs as shown in Table 15.2.12 were provided by Lycopodium.
Table 15.2.12 Processing Costs
MaterialRate Processing Cost
(Mtpa) $/t Saprolite 3.0 $11.58 Transition 3.0 $12.94 Fresh 3.0 $16.32
Table 15.2.13 Processing Recoveries
Domain Zone Processing Recoveries %
Saprolite Transition Fresh 1 vin main 95.4 94.1 94 2 vin main 95.4 94.1 94 3 vin main 95.4 94.1 94 4 vindvolc 95.4 94.1 93.1 5 vindvolc 95.4 94.1 93.1 6 vindvolc 95.4 94.1 93.1 7 vindvolc 95.4 94.1 93.1 8 vin west 95.4 94.1 85.5 9 vin west 95.4 94.1 85.5
10 vin west 95.4 94.1 85.5 11 vin west 95.4 94.1 85.5 12 vin west 95.4 94.1 85.5 13 vindvol 95.4 94.1 93.1 14 NE 1 94.9 94.1 92.6 15 NE 1 94.9 94.1 92.6 16 NE 1 94.9 94.1 92.6 17 NE 1 94.9 94.1 92.6 18 NE 1 94.9 94.1 92.6 19 NE 1 94.9 94.1 92.6 20 NE 1 94.9 94.1 92.6 21 NE 1 94.9 94.1 92.6 22 NE 1 94.9 94.1 92.6 23 NE 2 94.7 88.1 79.4 24 NE 2 94.7 88.1 79.4 25 NE 2 94.7 88.1 79.4 26 NE 2 94.7 88.1 79.4 27 NE 2 94.7 88.1 79.4 28 NE 2 94.7 88.1 79.4 29 NE 2 94.7 88.1 79.4 30 madras nw 97.7 94.1 79.4 31 NE 2 94.7 88.1 79.4 32 madras nw 97.7 94.1 79.4 33 madras nw 97.7 94.1 79.4 34 madras nw 97.7 94.1 79.4 35 madras nw 97.7 94.1 79.4 36 madras nw 97.7 94.1 79.4 37 NE 2 94.7 88.1 79.4 38 vindvolc 95.4 94.1 93.1 39 vindvol 95.4 94.1 93.1
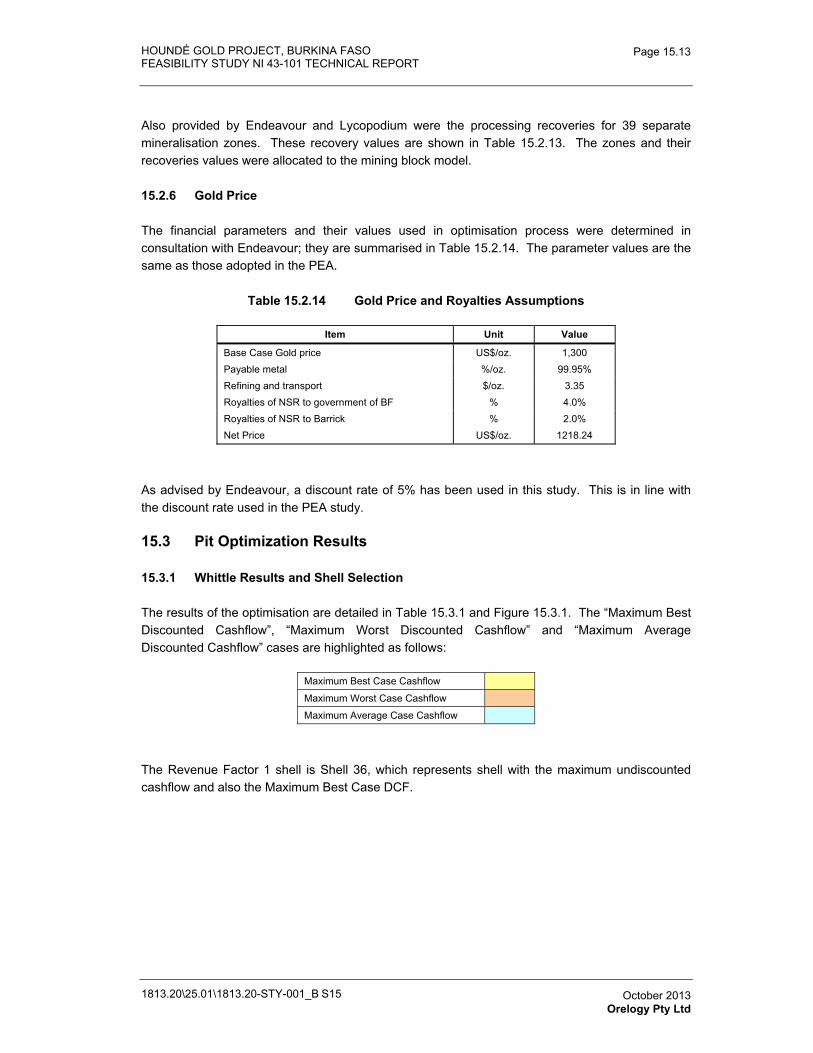
HOUNDÉ GOLD PROJECT, BURKINA FASO FEASIBILITY STUDY NI 43-101 TECHNICAL REPORT
1813.20\25.01\1813.20-STY-001_B S15
Page 15.13
October 2013 Orelogy Pty Ltd
Also provided by Endeavour and Lycopodium were the processing recoveries for 39 separate mineralisation zones. These recovery values are shown in Table 15.2.13. The zones and their recoveries values were allocated to the mining block model.
15.2.6 Gold Price
The financial parameters and their values used in optimisation process were determined in consultation with Endeavour; they are summarised in Table 15.2.14. The parameter values are the same as those adopted in the PEA.
Table 15.2.14 Gold Price and Royalties Assumptions
Item Unit Value
Base Case Gold price US$/oz. 1,300 Payable metal %/oz. 99.95% Refining and transport $/oz. 3.35 Royalties of NSR to government of BF % 4.0% Royalties of NSR to Barrick % 2.0% Net Price US$/oz. 1218.24
As advised by Endeavour, a discount rate of 5% has been used in this study. This is in line with the discount rate used in the PEA study.
15.3 Pit Optimization Results
15.3.1 Whittle Results and Shell Selection
The results of the optimisation are detailed in Table 15.3.1 and Figure 15.3.1. The “Maximum Best Discounted Cashflow”, “Maximum Worst Discounted Cashflow” and “Maximum Average Discounted Cashflow” cases are highlighted as follows:
Maximum Best Case Cashflow
Maximum Worst Case Cashflow
Maximum Average Case Cashflow
The Revenue Factor 1 shell is Shell 36, which represents shell with the maximum undiscounted cashflow and also the Maximum Best Case DCF.
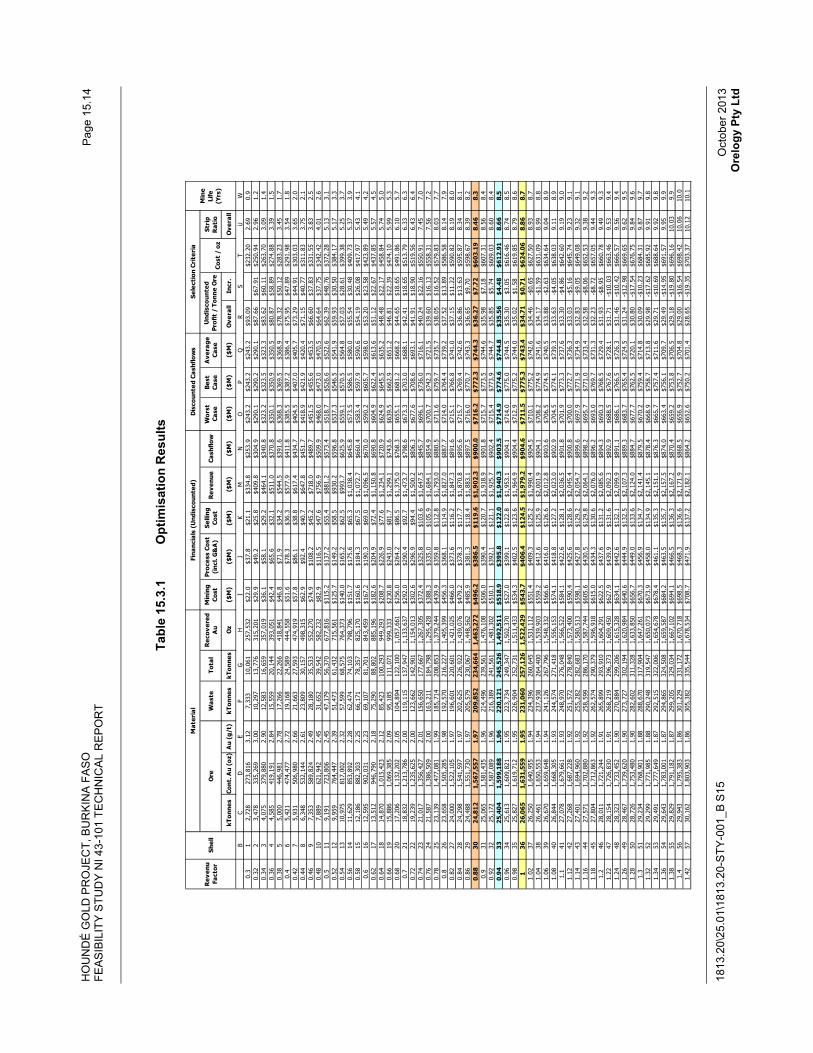
HO
UN
DÉ
GO
LD P
RO
JEC
T, B
UR
KIN
A F
AS
O
FEA
SIB
ILIT
Y S
TUD
Y N
I 43-
101
TEC
HN
ICA
L R
EP
OR
T
1813
.20\
25.0
1\18
13.2
0-S
TY-0
01_B
S15
Pag
e 15
.14
Oct
ober
201
3 O
relo
gy P
ty L
td
Tabl
e 15
.3.1
O
ptim
isat
ion
Res
ults
Mat
eria
lFi
nan
cial
s (U
ndis
cou
nted
)D
isco
unte
d C
ashf
low
sSe
lect
ion
Crit
eri
a
Rev
enu
Fact
or
Shel
lO
reW
aste
Tota
lR
ecov
ered
A
uM
inin
g Co
stPr
oces
s Co
st
(inc
l. G
&A
)Se
llin
g C
ost
Re
venu
e Ca
shfl
owW
ors
t Ca
seBe
st
Case
Ave
rage
Ca
seSt
rip
Rat
io
kTo
nnes
Con
t. A
u (
oz)
Au
(g/t
)kT
onne
skT
onn
esO
z($
M)
($M
)($
M)
($M
)($
M)
($M
)($
M)
($M
)O
vera
llIn
cr.
Ove
rall
BC
DE
FG
HI
JK
MN
OP
QR
ST
UW
0.3
12,728
273,816
3.12
7,333
10,061
257,532
$22.0
$37.8
$21.1
$334.8
$253.9
$243.2
$243.2
$243.2
$93.09
$232.20
2.69
0.9
0.32
23,478
335,269
3.00
10,297
13,776
315,201
$29.9
$49.2
$25.8
$409.8
$304.9
$290.1
$290.2
$290.1
$87.66
$67.91
$250.94
2.96
1.2
0.34
34,075
379,880
2.90
12,583
16,659
357,019
$36.1
$58.1
$29.2
$464.1
$340.8
$323.2
$323.5
$323.3
$83.62
$60.11
$263.70
3.09
1.4
0.36
44,585
419,191
2.84
15,559
20,144
393,051
$42.4
$65.6
$32.1
$511.0
$370.8
$350.1
$350.9
$350.5
$80.87
$58.89
$274.88
3.39
1.5
0.38
55,000
446,981
2.78
17,266
22,266
418,841
$46.8
$71.9
$34.2
$544.5
$391.6
$368.3
$369.5
$368.9
$78.32
$50.12
$283.23
3.45
1.7
0.4
65,421
474,477
2.72
19,168
24,589
444,558
$51.6
$78.3
$36.3
$577.9
$411.8
$385.5
$387.2
$386.4
$75.95
$47.89
$291.98
3.54
1.8
0.42
75,931
506,980
2.66
21,663
27,593
474,919
$57.8
$86.1
$38.8
$617.4
$434.7
$404.5
$407.0
$405.7
$73.29
$44.91
$303.03
3.65
2.0
0.44
86,348
532,144
2.61
23,809
30,157
498,315
$62.9
$92.4
$40.7
$647.8
$451.7
$418.9
$421.9
$420.4
$71.15
$40.77
$311.83
3.75
2.1
0.46
97,353
589,824
2.49
28,180
35,533
552,270
$74.9
$108.2
$45.2
$718.0
$489.7
$451.5
$455.6
$453.5
$66.60
$37.83
$331.55
3.83
2.5
0.48
107,889
621,942
2.45
31,652
39,542
582,232
$82.9
$116.5
$47.6
$756.9
$509.9
$468.0
$473.0
$470.5
$64.64
$37.75
$342.42
4.01
2.6
0.5
119,191
723,806
2.45
47,179
56,370
677,816
$115.2
$137.2
$55.4
$881.2
$573.4
$518.7
$526.6
$522.6
$62.39
$48.76
$372.28
5.13
3.1
0.52
129,959
764,447
2.39
51,473
61,432
715,561
$125.7
$149.2
$58.5
$930.2
$596.8
$537.3
$546.5
$541.9
$59.93
$30.50
$384.17
5.17
3.3
0.54
1310,975
817,002
2.32
57,599
68,575
764,373
$140.0
$165.2
$62.5
$993.7
$625.9
$559.1
$570.5
$564.8
$57.03
$28.61
$399.38
5.25
3.7
0.56
1411,629
853,892
2.28
62,474
74,103
798,796
$151.7
$175.6
$65.3
$1,038.4
$645.8
$573.5
$586.5
$580.0
$55.54
$30.48
$409.73
5.37
3.9
0.58
1512,186
882,303
2.25
66,171
78,357
825,170
$160.6
$184.3
$67.5
$1,072.7
$660.4
$583.4
$597.9
$590.6
$54.19
$26.08
$417.97
5.43
4.1
0.6
1612,595
902,031
2.23
69,107
81,701
843,459
$167.2
$190.3
$69.0
$1,096.5
$670.0
$590.2
$605.7
$598.0
$53.20
$23.58
$423.89
5.49
4.2
0.62
1713,512
946,790
2.18
75,290
88,802
885,196
$182.6
$204.9
$72.4
$1,150.8
$690.8
$604.9
$622.4
$613.6
$51.12
$22.67
$437.85
5.57
4.5
0.64
1814,870
1,015,423
2.12
85,423
100,293
949,293
$208.7
$226.9
$77.6
$1,234.1
$720.9
$624.9
$645.5
$635.2
$48.48
$22.17
$458.84
5.74
5.0
0.66
1915,886
1,069,385
2.09
95,185
111,071
999,333
$230.8
$243.0
$81.7
$1,299.1
$743.6
$639.5
$662.9
$651.2
$46.81
$22.39
$474.10
5.99
5.3
0.68
2017,206
1,132,202
2.05
104,894
122,100
1,057,661
$256.0
$264.2
$86.5
$1,375.0
$768.3
$655.1
$681.2
$668.2
$44.65
$18.65
$491.86
6.10
5.7
0.7
2118,832
1,213,786
2.00
119,115
137,947
1,133,637
$292.0
$290.4
$92.7
$1,473.7
$798.6
$673.3
$703.0
$688.1
$42.41
$18.65
$513.79
6.33
6.3
0.72
2219,239
1,235,625
2.00
123,662
142,901
1,154,013
$302.6
$296.9
$94.4
$1,500.2
$806.3
$677.6
$708.6
$693.1
$41.91
$18.90
$519.56
6.43
6.4
0.74
2321,017
1,356,427
2.01
156,650
177,667
1,267,305
$372.4
$325.8
$103.6
$1,647.5
$845.7
$696.1
$736.0
$716.1
$40.24
$22.16
$550.91
7.45
7.0
0.76
2421,587
1,386,509
2.00
163,211
184,798
1,295,428
$388.3
$335.0
$105.9
$1,684.1
$854.9
$700.7
$742.3
$721.5
$39.60
$16.13
$558.31
7.56
7.2
0.78
2523,139
1,477,081
1.99
185,714
208,853
1,379,244
$439.9
$359.8
$112.8
$1,793.0
$880.5
$711.6
$759.7
$735.7
$38.05
$16.52
$579.83
8.03
7.7
0.8
2623,658
1,505,285
1.98
192,570
216,227
1,405,399
$456.3
$368.1
$114.9
$1,827.0
$887.7
$714.0
$764.4
$739.2
$37.52
$13.89
$586.58
8.14
7.9
0.82
2724,000
1,522,105
1.97
196,601
220,601
1,421,025
$466.0
$373.6
$116.2
$1,847.3
$891.6
$715.1
$766.8
$741.0
$37.15
$11.22
$590.82
8.19
8.0
0.84
2824,298
1,541,597
1.97
202,625
226,922
1,439,076
$479.2
$378.3
$117.7
$1,870.8
$895.6
$715.7
$769.4
$742.6
$36.86
$13.63
$595.87
8.34
8.1
0.86
2924,488
1,551,730
1.97
205,579
230,067
1,448,562
$485.9
$381.3
$118.4
$1,883.1
$897.5
$716.0
$770.7
$743.3
$36.65
$9.70
$598.67
8.39
8.2
0.88
302
4,81
21,
567,
557
1.97
209,
852
234
,664
1,4
63,2
72$4
96.2
$386
.5$1
19.6
$1,9
02.3
$900
.0$
716.
2$7
72.
3$7
44.3
$36.
27$
7.7
2$6
03.1
98.
46
8.3
0.9
3125,065
1,581,435
1.96
214,496
239,561
1,476,108
$506.0
$390.4
$120.7
$1,918.9
$901.8
$715.7
$773.5
$744.6
$35.98
$7.18
$607.31
8.56
8.4
0.92
3225,172
1,587,089
1.96
216,389
241,561
1,481,302
$510.1
$392.1
$121.1
$1,925.7
$902.4
$715.4
$773.9
$744.7
$35.85
$5.74
$609.03
8.60
8.4
0.94
332
5,40
41,
599,
188
1.96
220,
121
245
,526
1,4
92,5
11$5
18.9
$395
.8$1
22.0
$1,9
40.3
$903
.5$
714.
9$7
74.
6$7
44.8
$35.
56$
4.4
8$6
12.9
18.
66
8.5
0.96
3425,613
1,609,821
1.95
223,734
249,347
1,502,370
$527.0
$399.1
$122.8
$1,953.1
$904.1
$714.0
$775.0
$744.5
$35.30
$3.05
$616.46
8.74
8.5
0.98
3525,827
1,619,712
1.95
226,904
252,731
1,511,433
$534.3
$402.5
$123.6
$1,964.9
$904.4
$712.9
$775.2
$744.0
$35.02
$1.58
$619.85
8.79
8.6
136
26,
065
1,63
1,55
91.
9523
1,06
025
7,1
261,
522
,429
$543
.7$4
06.4
$124
.5$1
,979
.2$9
04.6
$71
1.5
$77
5.3
$743
.4$3
4.71
$0.
71
$624
.06
8.8
68.
71.02
3726,250
1,640,955
1.94
234,396
260,645
1,531,112
$551.4
$409.3
$125.2
$1,990.4
$904.5
$710.1
$775.2
$742.6
$34.46
-$0.65
$627.50
8.93
8.7
1.04
3826,461
1,650,553
1.94
237,938
264,400
1,539,903
$559.2
$412.6
$125.9
$2,001.9
$904.1
$708.2
$774.9
$741.6
$34.17
-$1.59
$631.09
8.99
8.8
1.06
3926,670
1,659,648
1.94
241,126
267,796
1,548,332
$566.6
$416.0
$126.6
$2,012.8
$903.6
$706.5
$774.5
$740.5
$33.88
-$2.63
$634.64
9.04
8.9
1.08
4026,844
1,668,305
1.93
244,574
271,418
1,556,153
$574.1
$418.8
$127.2
$2,023.0
$902.9
$704.5
$774.1
$739.3
$33.63
-$4.05
$638.03
9.11
8.9
1.1
4127,078
1,679,661
1.93
248,970
276,048
1,566,522
$584.1
$422.6
$128.1
$2,036.5
$901.8
$701.9
$773.3
$737.6
$33.30
-$4.86
$642.60
9.19
9.0
1.12
4227,268
1,687,228
1.92
251,572
278,840
1,573,400
$590.4
$425.6
$128.6
$2,045.4
$900.8
$700.0
$772.7
$736.3
$33.03
-$5.16
$645.74
9.23
9.1
1.14
4327,401
1,694,960
1.92
255,282
282,683
1,580,513
$598.1
$427.8
$129.2
$2,054.7
$899.6
$697.9
$771.9
$734.9
$32.83
-$9.05
$649.08
9.32
9.1
1.16
4427,571
1,702,880
1.92
258,599
286,170
1,587,744
$605.6
$430.5
$129.8
$2,064.1
$898.2
$695.7
$771.0
$733.4
$32.58
-$8.06
$652.53
9.38
9.2
1.18
4527,804
1,712,863
1.92
262,574
290,379
1,596,918
$615.0
$434.3
$130.6
$2,076.0
$896.2
$693.0
$769.7
$731.3
$32.23
-$8.72
$657.05
9.44
9.3
1.2
4628,011
1,721,244
1.91
265,899
293,910
1,604,291
$622.5
$437.6
$131.2
$2,085.6
$894.3
$690.3
$768.5
$729.4
$31.93
-$8.95
$660.78
9.49
9.3
1.22
4728,154
1,726,830
1.91
268,219
296,373
1,609,450
$627.9
$439.9
$131.6
$2,092.3
$892.9
$688.5
$767.6
$728.1
$31.71
-$10.03$663.46
9.53
9.4
1.24
4828,323
1,733,452
1.90
270,884
299,206
1,615,328
$634.1
$442.6
$132.1
$2,099.9
$891.1
$686.1
$766.5
$726.3
$31.46
-$10.42$666.57
9.56
9.4
1.26
4928,467
1,739,620
1.90
273,727
302,194
1,620,984
$640.6
$444.9
$132.5
$2,107.3
$889.3
$683.7
$765.4
$724.5
$31.24
-$12.98$669.65
9.62
9.5
1.28
5028,726
1,753,480
1.90
282,602
311,328
1,633,850
$656.7
$449.0
$133.6
$2,124.0
$884.7
$677.7
$762.5
$720.1
$30.80
-$17.54$676.75
9.84
9.6
1.3
5129,234
1,768,901
1.88
288,670
317,904
1,647,261
$670.3
$456.9
$134.7
$2,141.4
$879.5
$670.2
$759.4
$714.8
$30.09
-$10.23$684.31
9.87
9.7
1.32
5229,299
1,771,985
1.88
290,248
319,547
1,650,073
$673.9
$458.0
$134.9
$2,145.1
$878.4
$668.9
$758.7
$713.8
$29.98
-$17.62$685.92
9.91
9.8
1.34
5329,491
1,777,649
1.87
292,515
322,006
1,654,678
$678.4
$461.1
$135.3
$2,151.1
$876.3
$665.7
$757.4
$711.6
$29.71
-$10.69$688.64
9.92
9.8
1.36
5429,643
1,783,001
1.87
294,865
324,508
1,659,587
$684.2
$463.5
$135.7
$2,157.5
$874.0
$663.4
$756.1
$709.7
$29.49
-$14.95$691.57
9.95
9.9
1.38
5529,829
1,791,182
1.87
299,205
329,034
1,667,102
$694.1
$466.5
$136.3
$2,167.2
$870.4
$659.2
$753.8
$706.5
$29.18
-$19.80$696.16
10.03
9.9
1.4
5629,943
1,795,383
1.86
301,229
331,172
1,670,718
$698.5
$468.3
$136.6
$2,171.9
$868.5
$656.9
$752.7
$704.8
$29.00
-$16.54$698.42
10.06
10.0
1.42
5730,162
1,803,903
1.86
305,382
335,544
1,678,534
$708.7
$471.9
$137.2
$2,182.1
$864.2
$652.6
$750.2
$701.4
$28.65
-$19.35$703.37
10.12
10.1
Min
e Li
fe
(Yrs
)
Und
isco
unte
d Pr
ofit
/ T
onn
e O
reCo
st /
oz
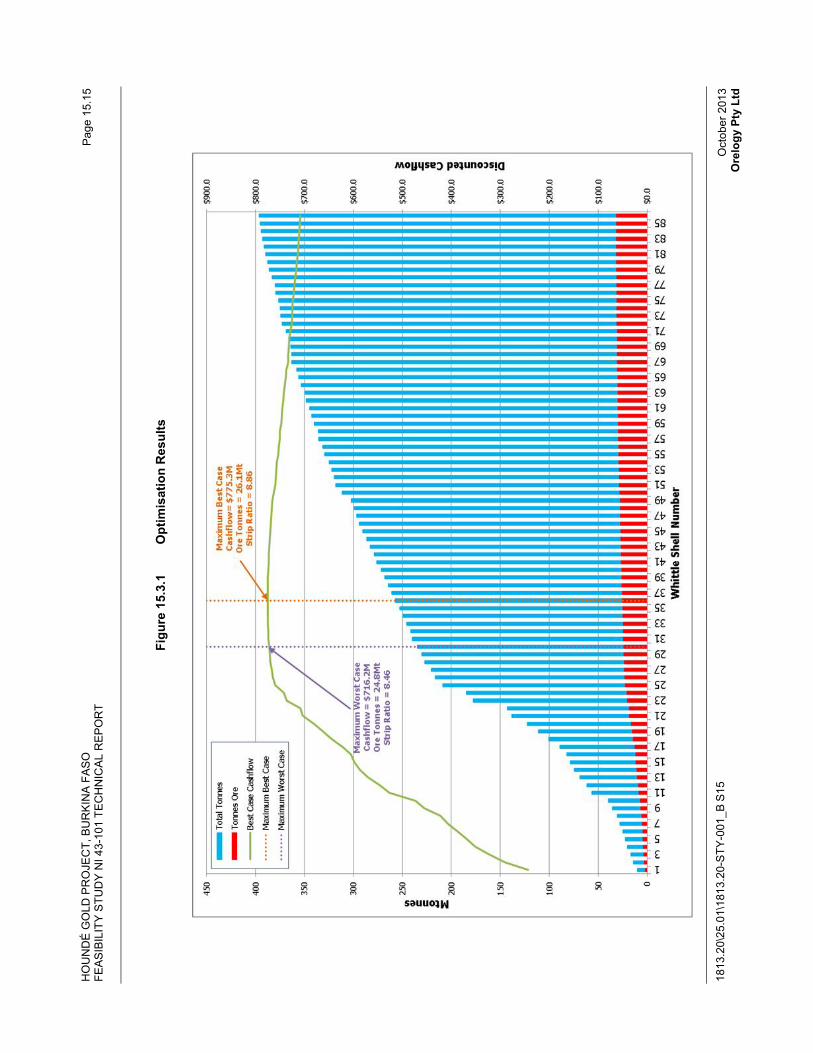
HO
UN
DÉ
GO
LD P
RO
JEC
T, B
UR
KIN
A F
AS
O
FEA
SIB
ILIT
Y S
TUD
Y N
I 43-
101
TEC
HN
ICA
L R
EP
OR
T
1813
.20\
25.0
1\18
13.2
0-S
TY-0
01_B
S15
Pag
e 15
.15
Oct
ober
201
3 O
relo
gy P
ty L
td
Figu
re 1
5.3.
1 O
ptim
isat
ion
Res
ults
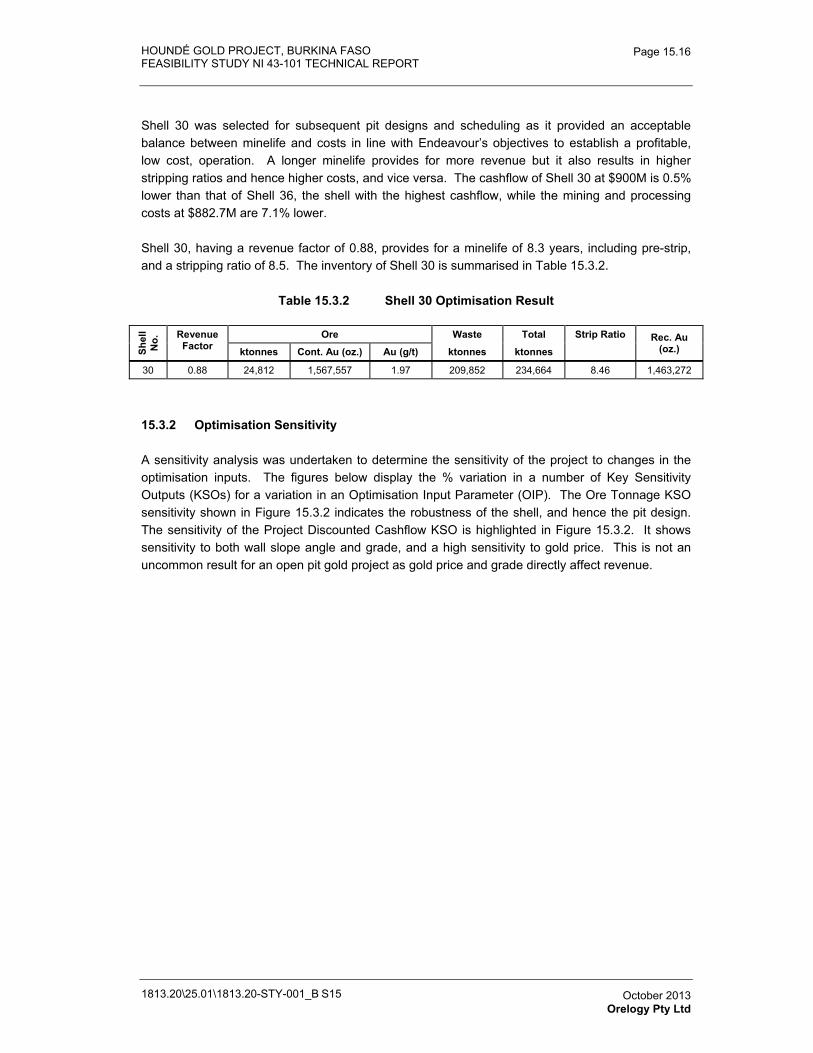
HOUNDÉ GOLD PROJECT, BURKINA FASO FEASIBILITY STUDY NI 43-101 TECHNICAL REPORT
1813.20\25.01\1813.20-STY-001_B S15
Page 15.16
October 2013 Orelogy Pty Ltd
Shell 30 was selected for subsequent pit designs and scheduling as it provided an acceptable balance between minelife and costs in line with Endeavour’s objectives to establish a profitable, low cost, operation. A longer minelife provides for more revenue but it also results in higher stripping ratios and hence higher costs, and vice versa. The cashflow of Shell 30 at $900M is 0.5% lower than that of Shell 36, the shell with the highest cashflow, while the mining and processing costs at $882.7M are 7.1% lower.
Shell 30, having a revenue factor of 0.88, provides for a minelife of 8.3 years, including pre-strip, and a stripping ratio of 8.5. The inventory of Shell 30 is summarised in Table 15.3.2.
Table 15.3.2 Shell 30 Optimisation Result
Shel
lN
o. Revenue
Factor Ore Waste Total Strip Ratio Rec. Au
(oz.) ktonnes Cont. Au (oz.) Au (g/t) ktonnes ktonnes
30 0.88 24,812 1,567,557 1.97 209,852 234,664 8.46 1,463,272
15.3.2 Optimisation Sensitivity
A sensitivity analysis was undertaken to determine the sensitivity of the project to changes in the optimisation inputs. The figures below display the % variation in a number of Key Sensitivity Outputs (KSOs) for a variation in an Optimisation Input Parameter (OIP). The Ore Tonnage KSO sensitivity shown in Figure 15.3.2 indicates the robustness of the shell, and hence the pit design. The sensitivity of the Project Discounted Cashflow KSO is highlighted in Figure 15.3.2. It shows sensitivity to both wall slope angle and grade, and a high sensitivity to gold price. This is not an uncommon result for an open pit gold project as gold price and grade directly affect revenue.
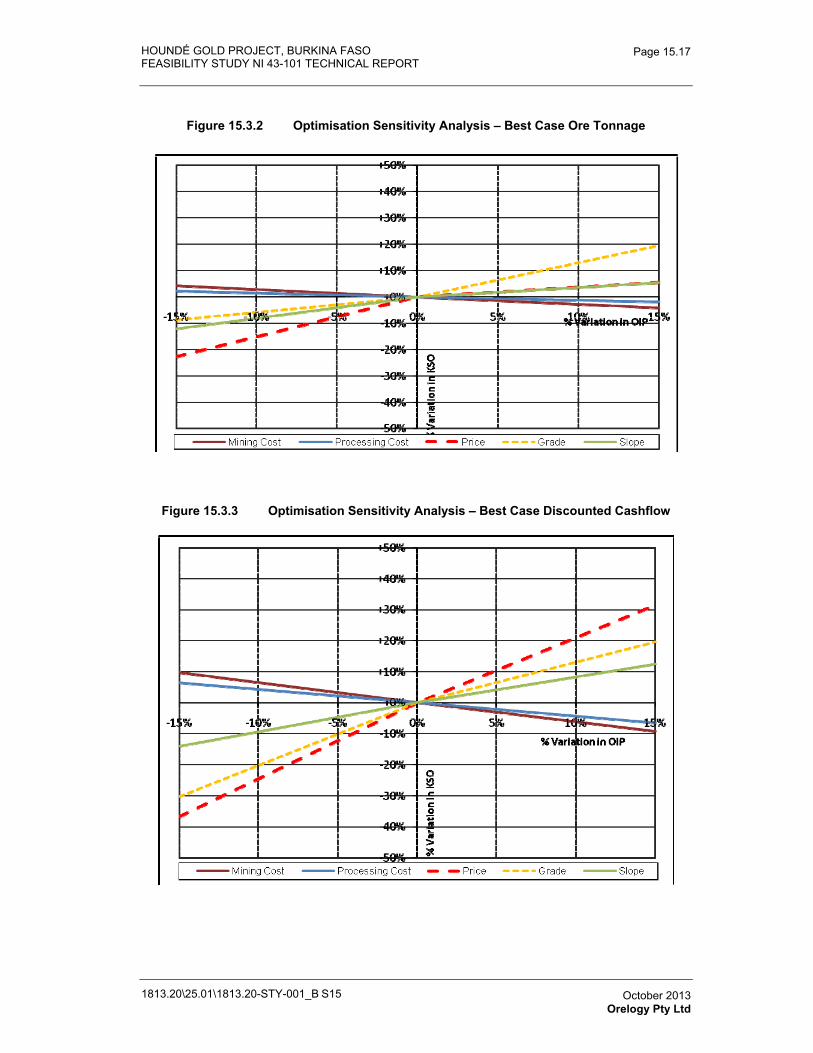
HOUNDÉ GOLD PROJECT, BURKINA FASO FEASIBILITY STUDY NI 43-101 TECHNICAL REPORT
1813.20\25.01\1813.20-STY-001_B S15
Page 15.17
October 2013 Orelogy Pty Ltd
Figure 15.3.2 Optimisation Sensitivity Analysis – Best Case Ore Tonnage
Figure 15.3.3 Optimisation Sensitivity Analysis – Best Case Discounted Cashflow
HOUNDÉ GOLD PROJECT, BURKINA FASO FEASIBILITY STUDY NI 43-101 TECHNICAL REPORT
1813.20\25.01\1813.20-STY-001_B S15
Page 15.18
October 2013 Orelogy Pty Ltd
Ore tonnes sensitivity:
� The project is highly sensitive to a reduction in price but only slightly sensitive to an increase in price. This indicates that the pit shell and therefore associated pit design will not increase significantly should price increase and that the ultimate pit extent will be relatively robust.
� Variations in grade and process recovery are effectively equivalent. As with price, the shell is more sensitive to reductions in grade / recovery than increases.
� The shell is insensitive to variations in processing cost, slightly sensitive to variations in mining cost, and sensitive to variations in the combined costs.
� It is sensitive to variations in slope angles.
� A sensitivity analysis was also run on applying a global 15% dilution and 0% ore loss. As expected, this indicated that ore tonnes were sensitive to this parameter combination, and therefore dilution should be accepted in order to minimise ore loss.
Cashflow sensitivity:
� The project value is highly sensitive to parameters that directly affect revenue (i.e. price / grade / recovery).
� Project value shows the same sensitivity to the other parameters as the ore tonnes displays.
� The 15% dilution / 0% ore loss sensitivity has a marginal positive impact on DCF.
� Overall this indicates the Houndé Project is sensitive to optimisation parameters, with price / grade / recovery being the main major sensitivities.
15.3.3 Risk Management
As with most gold projects, the Houndé Project is most sensitive to those parameters that directly affect revenue, in particular, the gold price, processing recovery and the grade of the ore. Therefore any practices that can result in fixing these parameters at a feasible level (e.g. gold hedging) should be investigated to determine if, where necessary, project risk can be reduced.
There will be a degree of flexibility built into both the pit designs and schedules based around Shell 30 to mitigate against any future variations in economic parameters. For example:
� The main Vindaloo pit will be developed as smaller, interim stage designs that focus on the high value ends of the pits. This will defer the establishment of the more sensitive areas of final pit wall so that economic parameters can be re-assessed and the final wall adjusted if necessary.
HOUNDÉ GOLD PROJECT, BURKINA FASO FEASIBILITY STUDY NI 43-101 TECHNICAL REPORT
1813.20\25.01\1813.20-STY-001_B S15
Page 15.19
October 2013 Orelogy Pty Ltd
� The small northern pits are relatively marginal and generate little significant value. Therefore they will be scheduled late in the mine life such that they can be “dropped off” should conditions deteriorate or more attractive deposits be identified.
The sensitivity study results also indicate that while there are the usual cashflow benefits associated with decreasing costs, the project is more susceptible to the adverse effects of increasing costs than any benefit of equivalent cost reductions. Therefore robust cost estimation and rigorous operating practices are required in order to maintain an on-going cost regime driving low cost outcomes.
15.4 Mine Design Process
Pits were designed using MineSight mine planning software, and utilised the MiningModel, the pit optimisation results (Shell 30) and application of the pit design criteria outlined in Sections 15.5.1 as guides. The results of the pit design process were then exported to EVORELUTION, the ORELOGY proprietary mine scheduling software, for scheduling and reporting of the mineral reserves.
Global “waste storage shells” were developed in MineSight at the waste storage facility locations shown in Figure 15.1 1. A waste storage shell is a space to which waste may be allocated in the mine scheduling process, and is designed in accordance with waste storage facility design criteria provided in Section 15.7. These shells were then also exported to EVORELUTION where they are used to develop a waste storage facility model. Determination of the waste haulage is calculated on the basis of minimising haulage costs as each block is mined from the pit and then “placed” within the waste storage model. Hence the final waste storage facility geometry is optimised by the EVORELUTION scheduling software, while remaining faithful to the dump design guidelines.
The results of this process are provided below.
15.5 Pit Design
15.5.1 Design Criteria
Slope design criteria, as summarised in Table 15.2.2 Final Optimisation – Overall Slope Angles were supplied by Peter O’Bryan and Associates.
The ramp design criteria, summarised in Table 15.5.1, are based on the 143 tonne payload Caterpillar 785D dump truck. The 785D has a total operating width of 7.1 metres and has a machine clearance turning diameter of approximately 33 metres.
It is common industry practice to design the width of the main ramps at 3.5 times truck width and adopting a 10% gradient. This allows for safe passing of trucks inclusive of wall side drainage and pit side bunding. The two-way ramp width used for the designs in Vindaloo Main was 25 metres, which equates to 3.5 times the 785D operating width. 15 metre wide single lane ramps (approximately 2 times the truck width) were used in Vindaloo 1, Vindaloo 2 and the Madras pits from the surface all the way to the bottom of the pit in order to minimise waste mining and hence costs.
HOUNDÉ GOLD PROJECT, BURKINA FASO FEASIBILITY STUDY NI 43-101 TECHNICAL REPORT
1813.20\25.01\1813.20-STY-001_B S15
Page 15.20
October 2013 Orelogy Pty Ltd
For the benches at the pit base (i.e. the bottom 30 – 40 vertical metres), a single lane ramp width of 15 m with a maximum gradient of 12.5% was allowed. This reflects the lower traffic intensity on this section of the ramp and allows waste development to be minimised.
Table 15.5.1 Ramp Design Criteria
Pit Lanes Width (m)
Maximum Grade (%)
Vindaloo Main Dual 25 10 Vindaloo 1 & 2 and Madras Single 15 10 All pits – Bottom Section Single 15 12.5
Switchbacks are to be located on flat sections of ramp. The switchback centreline turning diameter equals 39 metres which equates to 1.5 times the truck centreline turning diameter.
Pit designs, whether they are final or interim stage designs, need to provide sufficient space to undertake mining activities in an efficient and safe manner. This applies to the bottom of each stage / ultimate pit design and also to pushbacks. Providing sufficient space is achieved by adopting a minimum mining width in the design criteria.
A minimum mining width of 55 m has been adopted. This distance is based on loading machine clearance turning diameter of 20 m, plus 15 m clearance on both sides plus a 5 m windrow. This will allow a truck to turn around on the bench with ease, provide sufficient space at the truck loading areas, space for jump up access for drilling and blasting activities and space for bunding and drainage.
A narrower width of 14 m has been allowed for the final “goodbye” drop cut at the very base of the pits. Goodbye cuts, targeting ore material only, are mined from a pit floor with permanent ramp access and a minimum mining width of approximately 20 m to 25 m. Goodbye cuts are excavated with a backhoe and there is no access to the bottom of these cuts.
The location of the pit exits is important to minimise the ore and waste haulage costs. The overall stripping ratio from the pit optimisation process equals 8.5, this means the waste volume is much larger than the ore volume and hence the pit exits need to be located such that the waste haulage is minimised.
The design of the Vindaloo and Madras pits are shown in Figure 15.5.1 to Figure 15.5.15. Also shown in these figures are the diluted ore grades of the measured and indicated materials, the optimisation shell, surface topography, bottom of the oxidation (BOCO), top of fresh rock (TOFR) and locations of the shear zone.
15.5.2 Vindaloo Main Ultimate Pit Designs
Due to the presence of a shear in the western wall of the Vindaloo Main South pit and because the relative long period of time over which this pit is being mined, the ramp was located in the eastern wall to avoid any pit access interruptions.
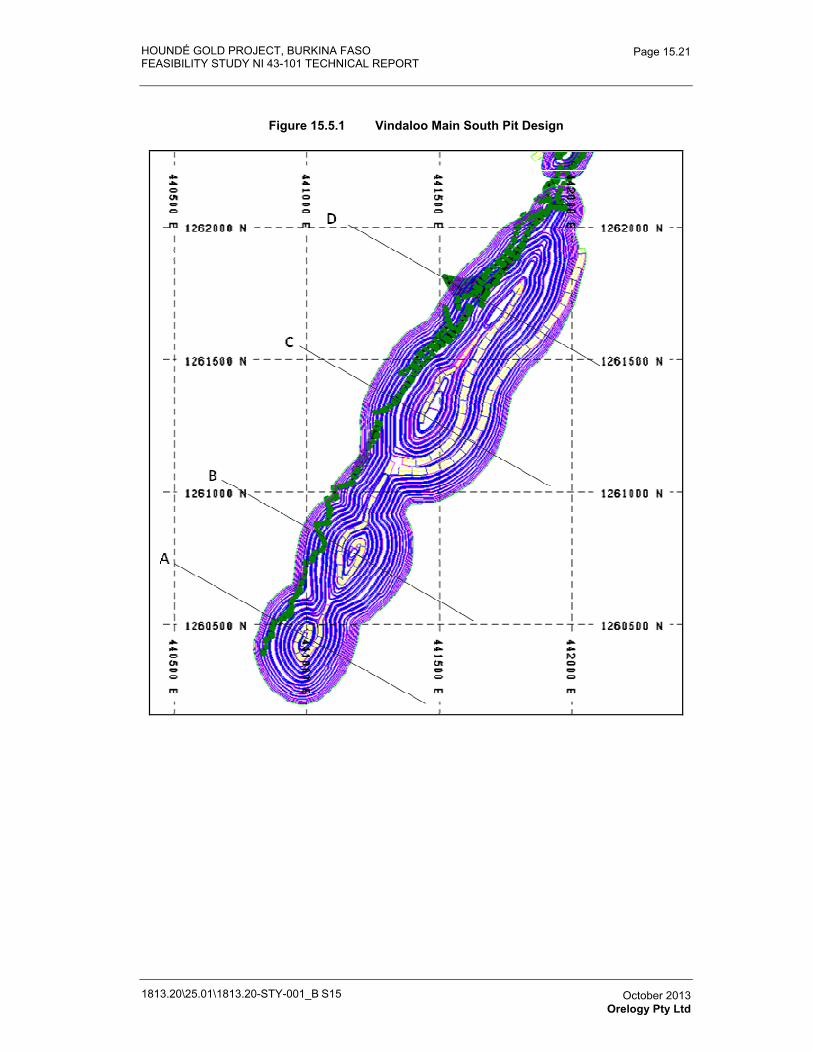
HOUNDÉ GOLD PROJECT, BURKINA FASO FEASIBILITY STUDY NI 43-101 TECHNICAL REPORT
1813.20\25.01\1813.20-STY-001_B S15
Page 15.21
October 2013 Orelogy Pty Ltd
Figure 15.5.1 Vindaloo Main South Pit Design
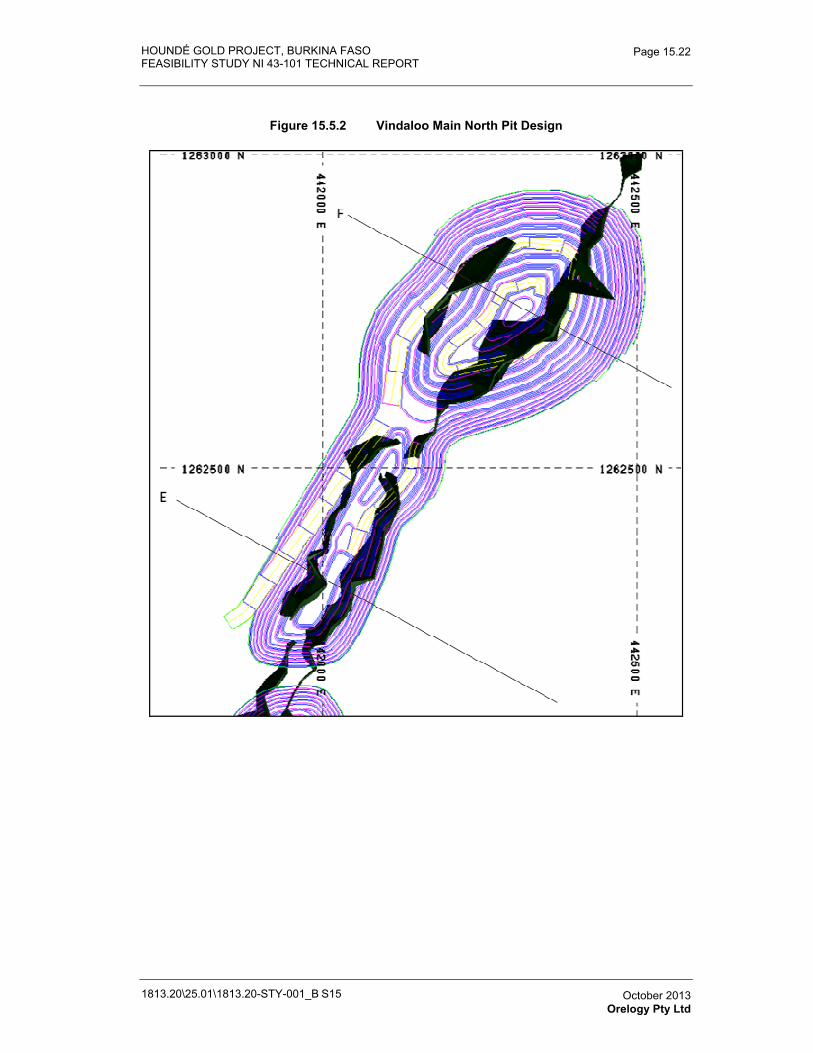
HOUNDÉ GOLD PROJECT, BURKINA FASO FEASIBILITY STUDY NI 43-101 TECHNICAL REPORT
1813.20\25.01\1813.20-STY-001_B S15
Page 15.22
October 2013 Orelogy Pty Ltd
Figure 15.5.2 Vindaloo Main North Pit Design
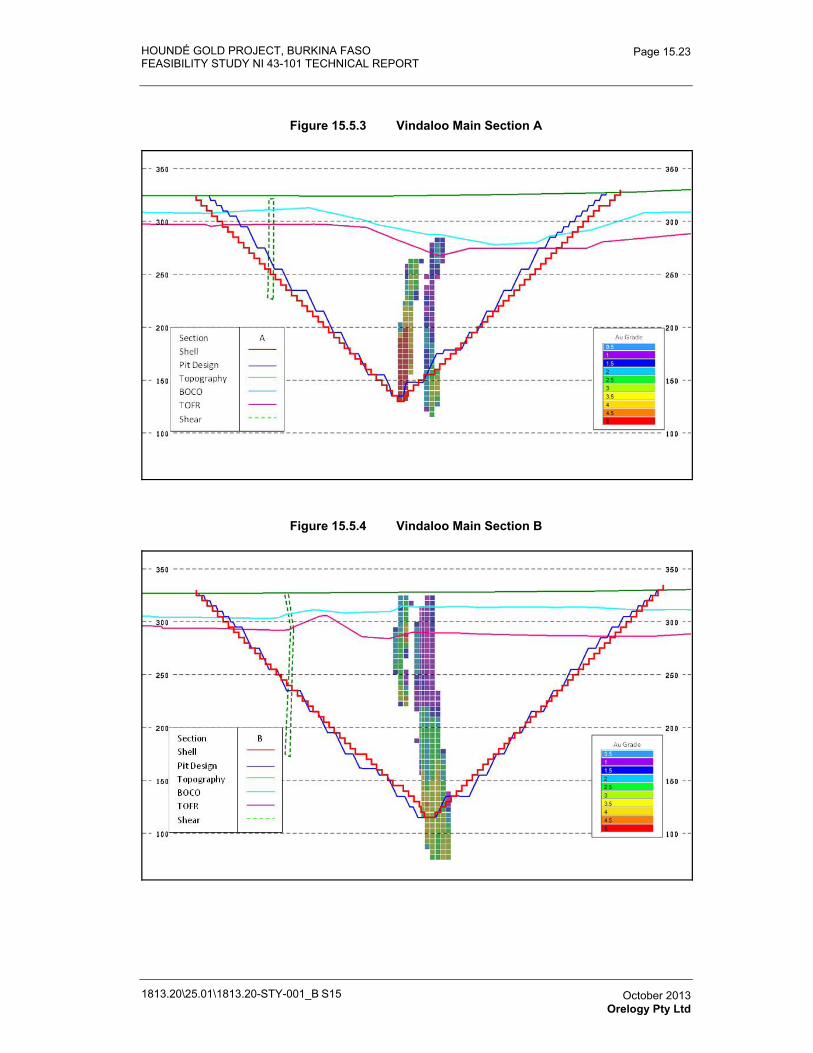
HOUNDÉ GOLD PROJECT, BURKINA FASO FEASIBILITY STUDY NI 43-101 TECHNICAL REPORT
1813.20\25.01\1813.20-STY-001_B S15
Page 15.23
October 2013 Orelogy Pty Ltd
Figure 15.5.3 Vindaloo Main Section A
Figure 15.5.4 Vindaloo Main Section B
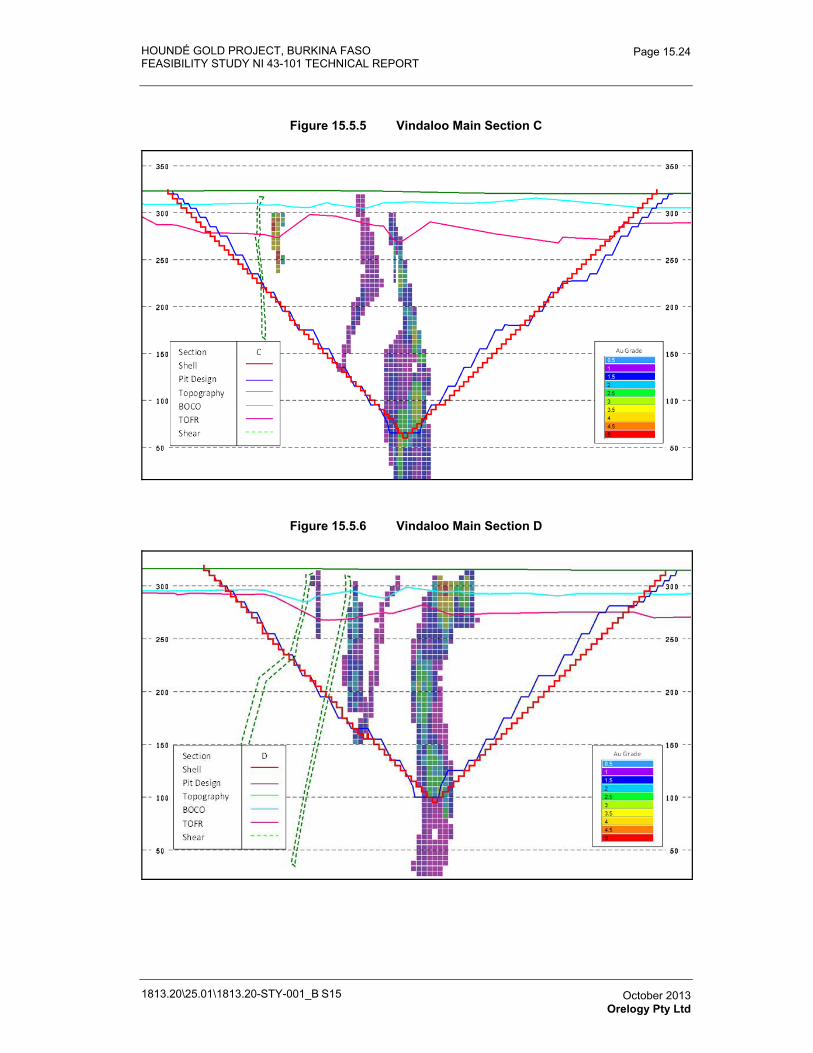
HOUNDÉ GOLD PROJECT, BURKINA FASO FEASIBILITY STUDY NI 43-101 TECHNICAL REPORT
1813.20\25.01\1813.20-STY-001_B S15
Page 15.24
October 2013 Orelogy Pty Ltd
Figure 15.5.5 Vindaloo Main Section C
Figure 15.5.6 Vindaloo Main Section D
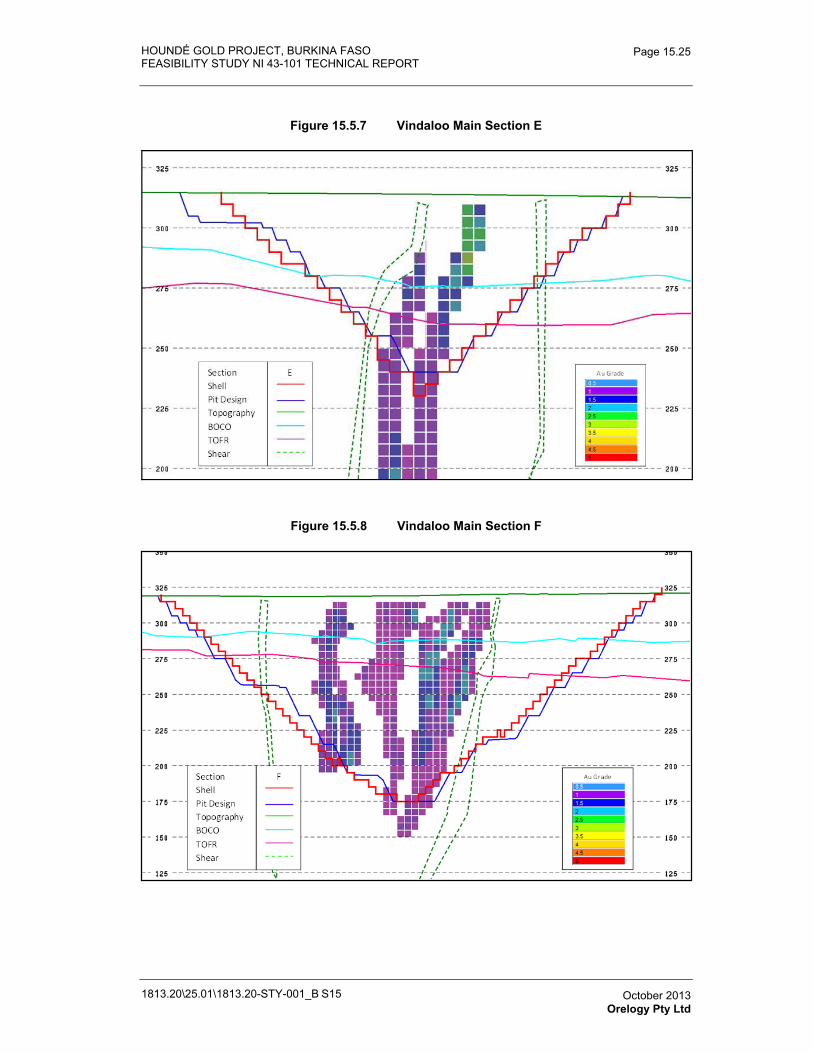
HOUNDÉ GOLD PROJECT, BURKINA FASO FEASIBILITY STUDY NI 43-101 TECHNICAL REPORT
1813.20\25.01\1813.20-STY-001_B S15
Page 15.25
October 2013 Orelogy Pty Ltd
Figure 15.5.7 Vindaloo Main Section E
Figure 15.5.8 Vindaloo Main Section F
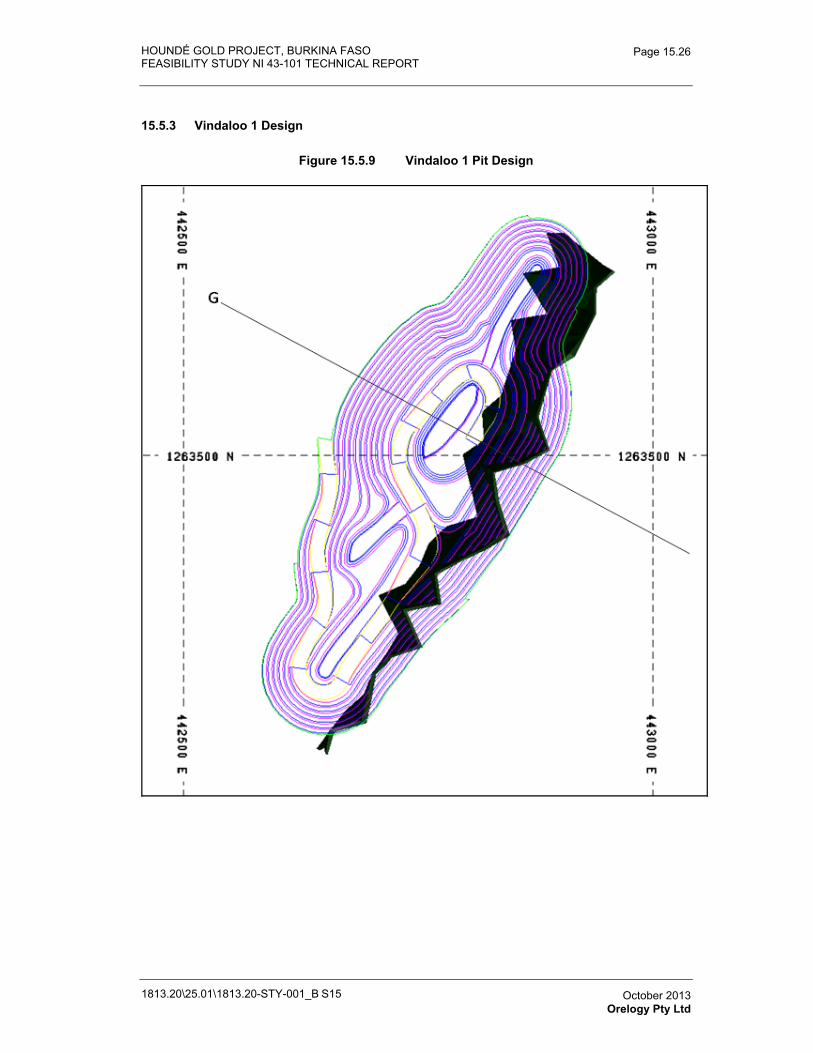
HOUNDÉ GOLD PROJECT, BURKINA FASO FEASIBILITY STUDY NI 43-101 TECHNICAL REPORT
1813.20\25.01\1813.20-STY-001_B S15
Page 15.26
October 2013 Orelogy Pty Ltd
15.5.3 Vindaloo 1 Design
Figure 15.5.9 Vindaloo 1 Pit Design
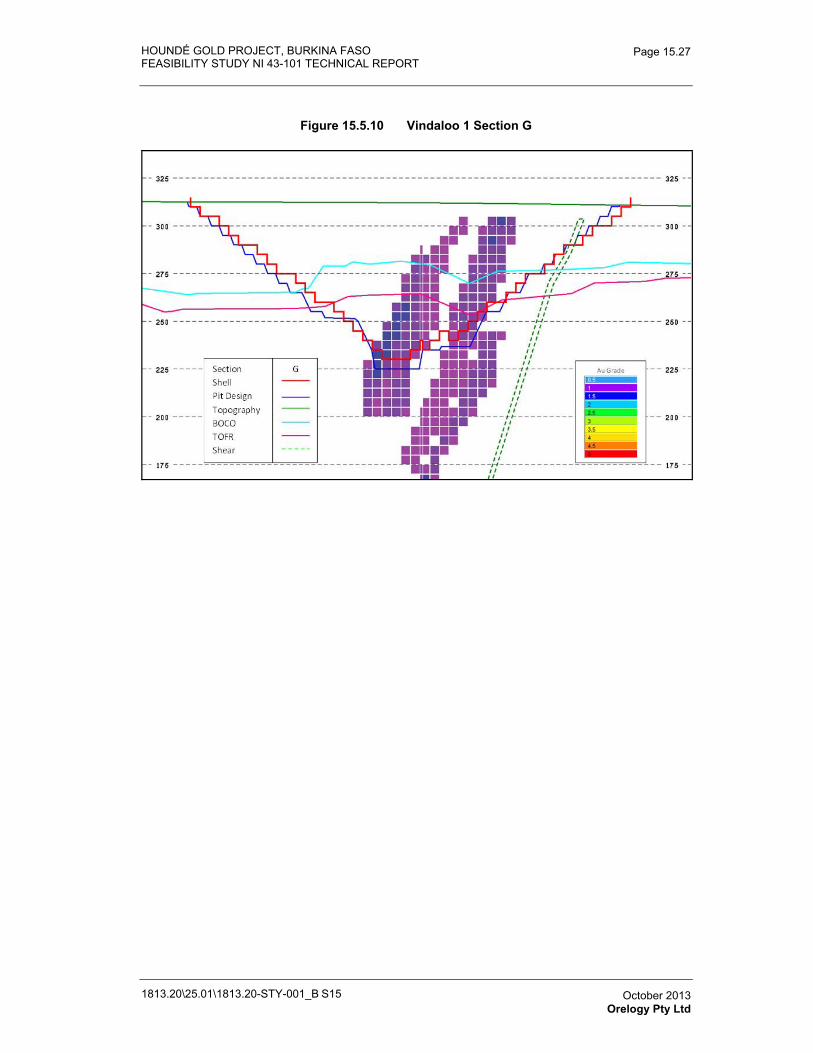
HOUNDÉ GOLD PROJECT, BURKINA FASO FEASIBILITY STUDY NI 43-101 TECHNICAL REPORT
1813.20\25.01\1813.20-STY-001_B S15
Page 15.27
October 2013 Orelogy Pty Ltd
Figure 15.5.10 Vindaloo 1 Section G
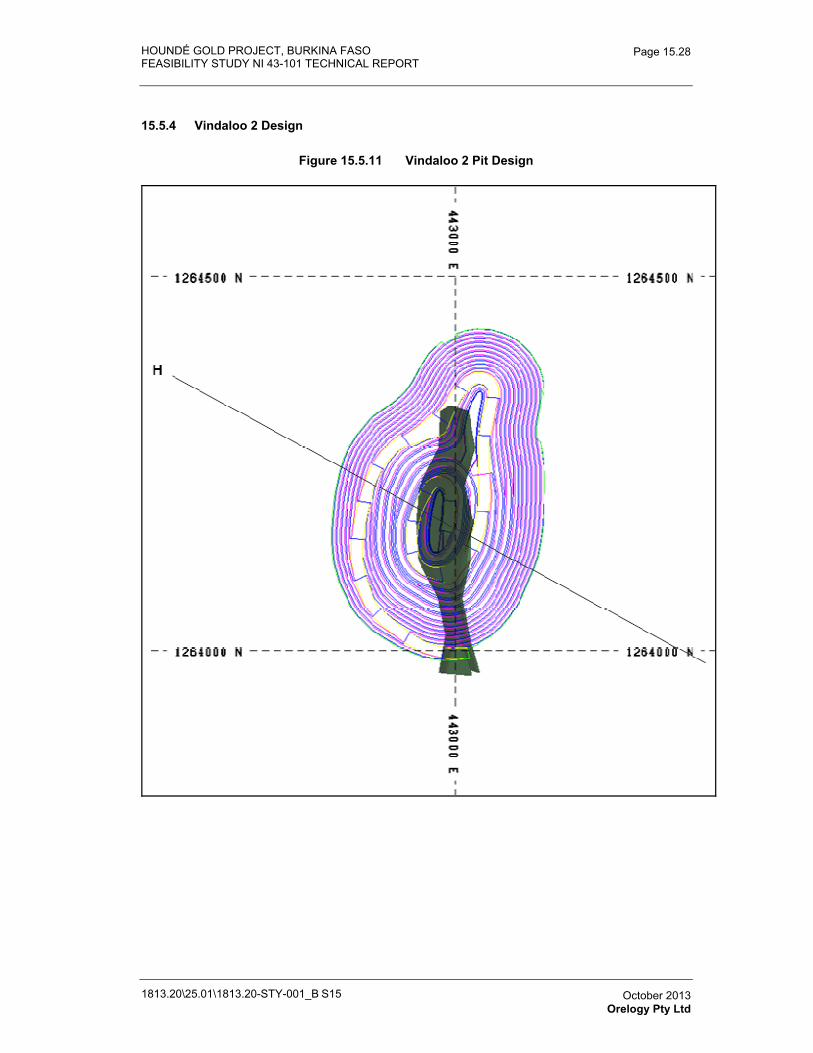
HOUNDÉ GOLD PROJECT, BURKINA FASO FEASIBILITY STUDY NI 43-101 TECHNICAL REPORT
1813.20\25.01\1813.20-STY-001_B S15
Page 15.28
October 2013 Orelogy Pty Ltd
15.5.4 Vindaloo 2 Design
Figure 15.5.11 Vindaloo 2 Pit Design
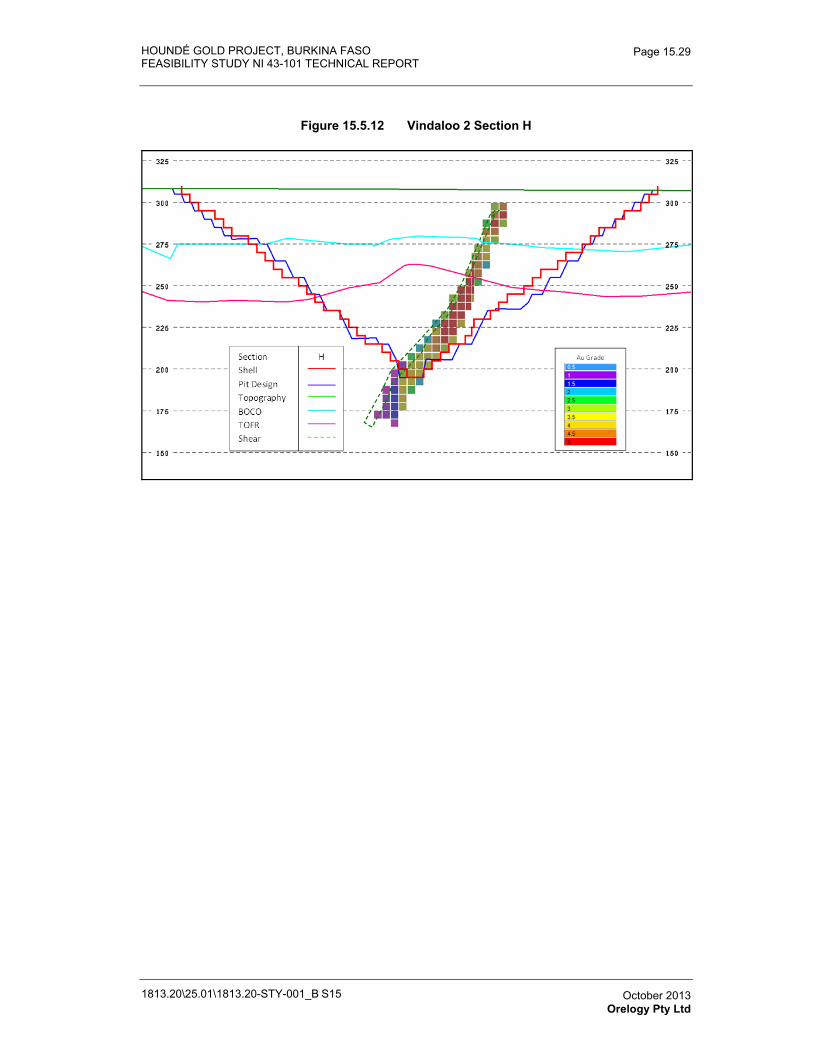
HOUNDÉ GOLD PROJECT, BURKINA FASO FEASIBILITY STUDY NI 43-101 TECHNICAL REPORT
1813.20\25.01\1813.20-STY-001_B S15
Page 15.29
October 2013 Orelogy Pty Ltd
Figure 15.5.12 Vindaloo 2 Section H
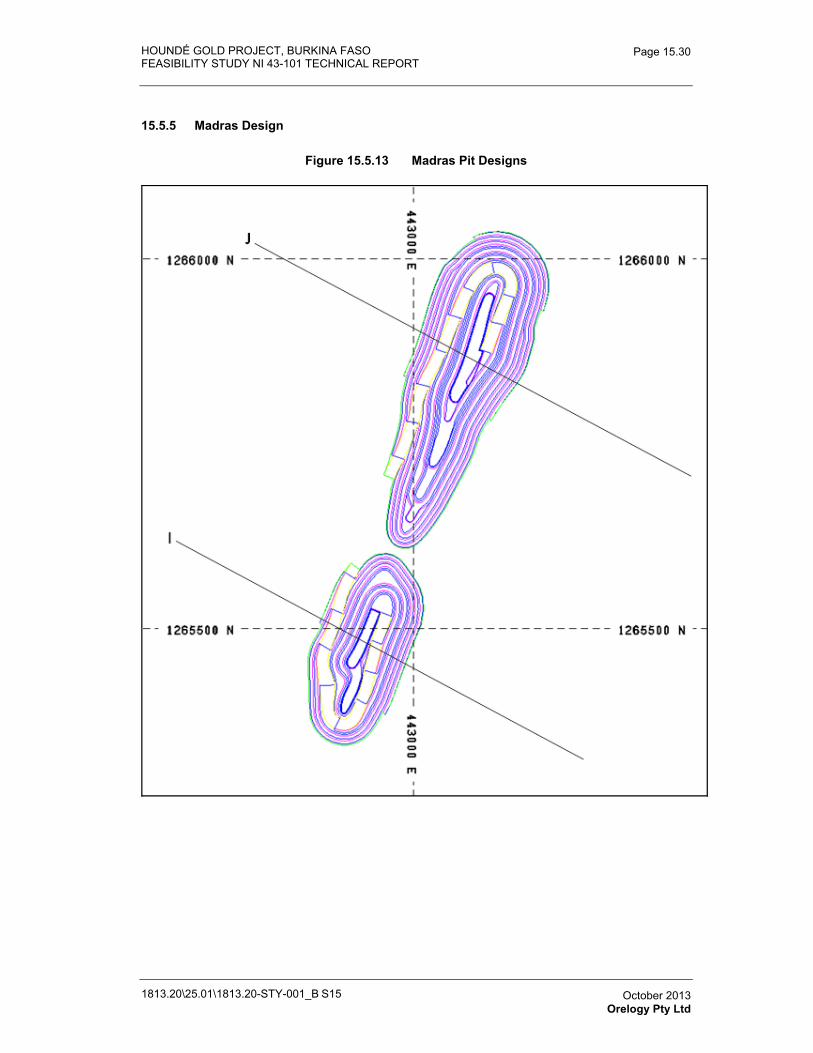
HOUNDÉ GOLD PROJECT, BURKINA FASO FEASIBILITY STUDY NI 43-101 TECHNICAL REPORT
1813.20\25.01\1813.20-STY-001_B S15
Page 15.30
October 2013 Orelogy Pty Ltd
15.5.5 Madras Design
Figure 15.5.13 Madras Pit Designs
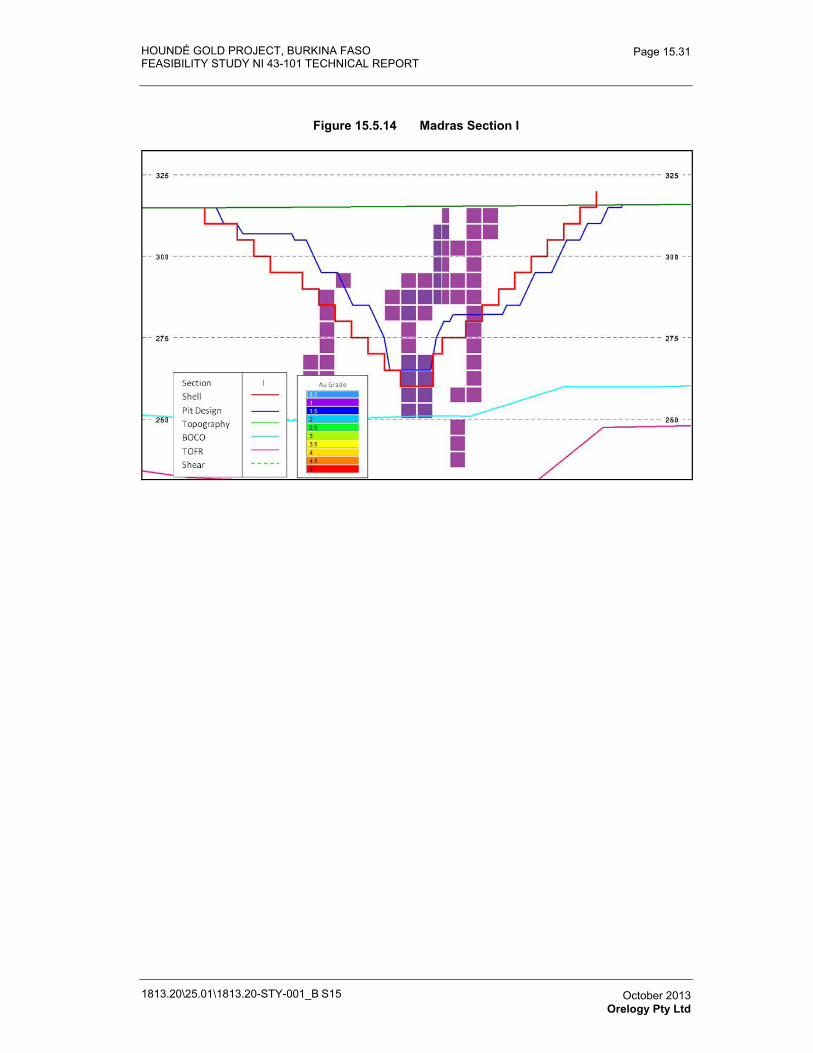
HOUNDÉ GOLD PROJECT, BURKINA FASO FEASIBILITY STUDY NI 43-101 TECHNICAL REPORT
1813.20\25.01\1813.20-STY-001_B S15
Page 15.31
October 2013 Orelogy Pty Ltd
Figure 15.5.14 Madras Section I
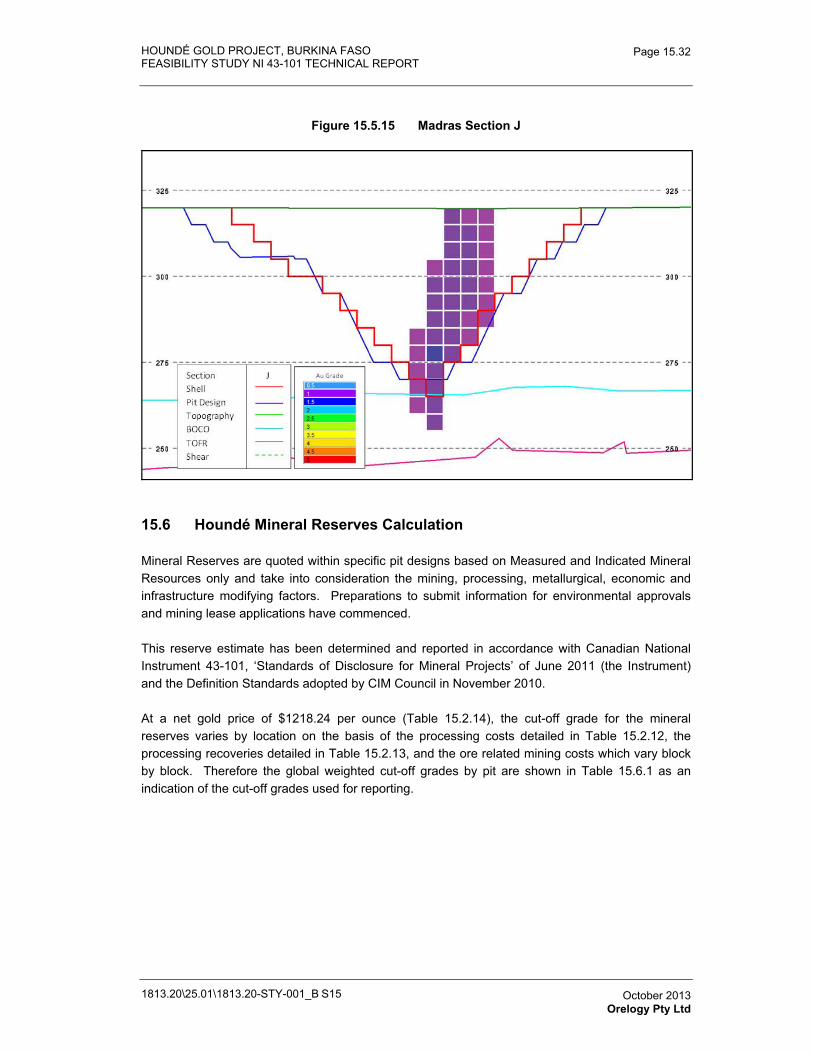
HOUNDÉ GOLD PROJECT, BURKINA FASO FEASIBILITY STUDY NI 43-101 TECHNICAL REPORT
1813.20\25.01\1813.20-STY-001_B S15
Page 15.32
October 2013 Orelogy Pty Ltd
Figure 15.5.15 Madras Section J
15.6 Houndé Mineral Reserves Calculation
Mineral Reserves are quoted within specific pit designs based on Measured and Indicated Mineral Resources only and take into consideration the mining, processing, metallurgical, economic and infrastructure modifying factors. Preparations to submit information for environmental approvals and mining lease applications have commenced.
This reserve estimate has been determined and reported in accordance with Canadian National Instrument 43-101, ‘Standards of Disclosure for Mineral Projects’ of June 2011 (the Instrument) and the Definition Standards adopted by CIM Council in November 2010.
At a net gold price of $1218.24 per ounce (Table 15.2.14), the cut-off grade for the mineral reserves varies by location on the basis of the processing costs detailed in Table 15.2.12, the processing recoveries detailed in Table 15.2.13, and the ore related mining costs which vary block by block. Therefore the global weighted cut-off grades by pit are shown in Table 15.6.1 as an indication of the cut-off grades used for reporting.
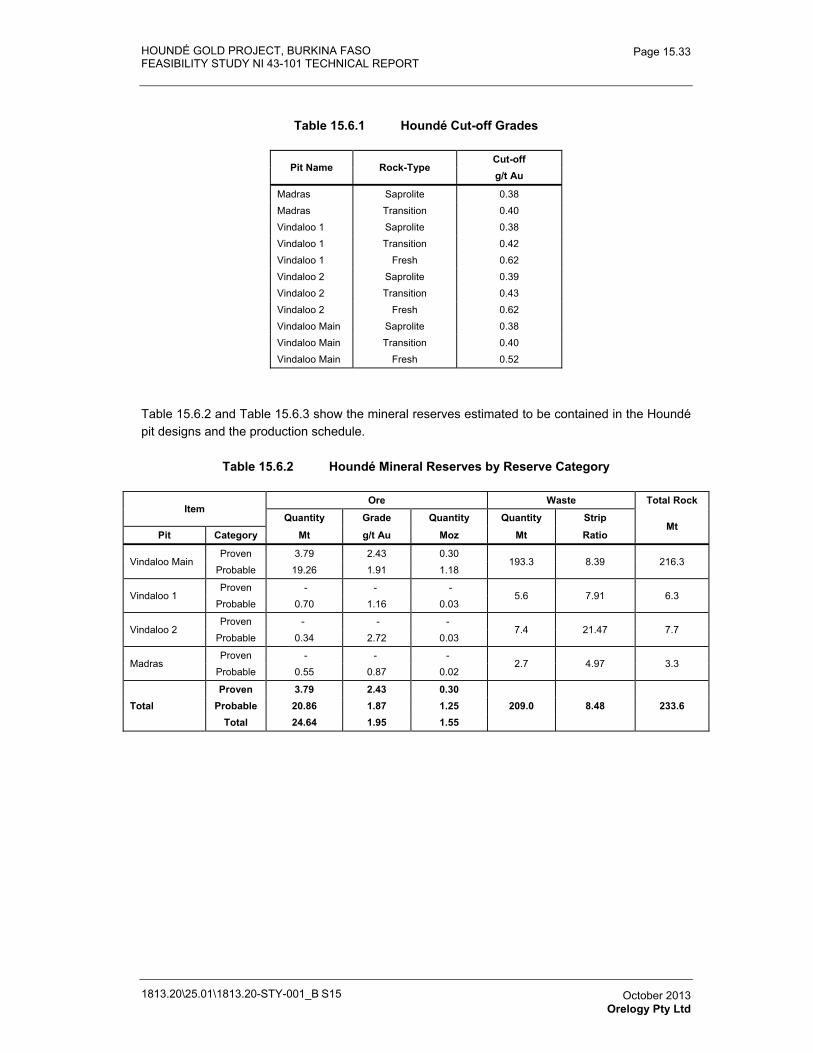
HOUNDÉ GOLD PROJECT, BURKINA FASO FEASIBILITY STUDY NI 43-101 TECHNICAL REPORT
1813.20\25.01\1813.20-STY-001_B S15
Page 15.33
October 2013 Orelogy Pty Ltd
Table 15.6.1 Houndé Cut-off Grades
Pit Name Rock-Type Cut-off g/t Au
Madras Saprolite 0.38 Madras Transition 0.40 Vindaloo 1 Saprolite 0.38 Vindaloo 1 Transition 0.42 Vindaloo 1 Fresh 0.62 Vindaloo 2 Saprolite 0.39 Vindaloo 2 Transition 0.43 Vindaloo 2 Fresh 0.62 Vindaloo Main Saprolite 0.38 Vindaloo Main Transition 0.40 Vindaloo Main Fresh 0.52
Table 15.6.2 and Table 15.6.3 show the mineral reserves estimated to be contained in the Houndé pit designs and the production schedule.
Table 15.6.2 Houndé Mineral Reserves by Reserve Category
Item Ore Waste Total Rock
Quantity Grade Quantity Quantity Strip Mt
Pit Category Mt g/t Au Moz Mt Ratio
Vindaloo Main Proven 3.79 2.43 0.30
193.3 8.39 216.3 Probable 19.26 1.91 1.18
Vindaloo 1 Proven - - -
5.6 7.91 6.3 Probable 0.70 1.16 0.03
Vindaloo 2 Proven - - -
7.4 21.47 7.7 Probable 0.34 2.72 0.03
Madras Proven - - -
2.7 4.97 3.3 Probable 0.55 0.87 0.02
Total Proven 3.79 2.43 0.30
209.0 8.48 233.6 Probable 20.86 1.87 1.25 Total 24.64 1.95 1.55
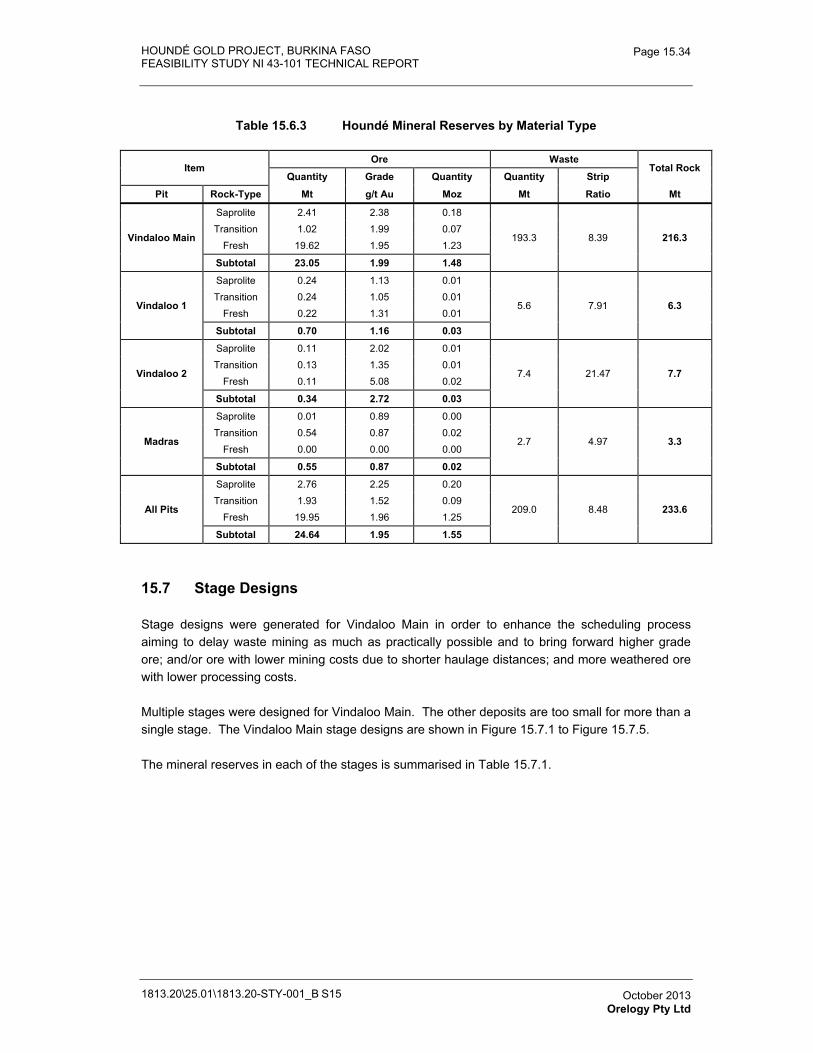
HOUNDÉ GOLD PROJECT, BURKINA FASO FEASIBILITY STUDY NI 43-101 TECHNICAL REPORT
1813.20\25.01\1813.20-STY-001_B S15
Page 15.34
October 2013 Orelogy Pty Ltd
Table 15.6.3 Houndé Mineral Reserves by Material Type
Item Ore Waste
Total Rock Quantity Grade Quantity Quantity Strip
Pit Rock-Type Mt g/t Au Moz Mt Ratio Mt
Vindaloo Main
Saprolite 2.41 2.38 0.18
193.3 8.39 216.3 Transition 1.02 1.99 0.07
Fresh 19.62 1.95 1.23
Subtotal 23.05 1.99 1.48
Vindaloo 1
Saprolite 0.24 1.13 0.01
5.6 7.91 6.3Transition 0.24 1.05 0.01
Fresh 0.22 1.31 0.01
Subtotal 0.70 1.16 0.03
Vindaloo 2
Saprolite 0.11 2.02 0.01
7.4 21.47 7.7Transition 0.13 1.35 0.01
Fresh 0.11 5.08 0.02
Subtotal 0.34 2.72 0.03
Madras
Saprolite 0.01 0.89 0.00
2.7 4.97 3.3Transition 0.54 0.87 0.02
Fresh 0.00 0.00 0.00
Subtotal 0.55 0.87 0.02
All Pits
Saprolite 2.76 2.25 0.20
209.0 8.48 233.6 Transition 1.93 1.52 0.09
Fresh 19.95 1.96 1.25
Subtotal 24.64 1.95 1.55
15.7 Stage Designs
Stage designs were generated for Vindaloo Main in order to enhance the scheduling process aiming to delay waste mining as much as practically possible and to bring forward higher grade ore; and/or ore with lower mining costs due to shorter haulage distances; and more weathered ore with lower processing costs.
Multiple stages were designed for Vindaloo Main. The other deposits are too small for more than a single stage. The Vindaloo Main stage designs are shown in Figure 15.7.1 to Figure 15.7.5.
The mineral reserves in each of the stages is summarised in Table 15.7.1.
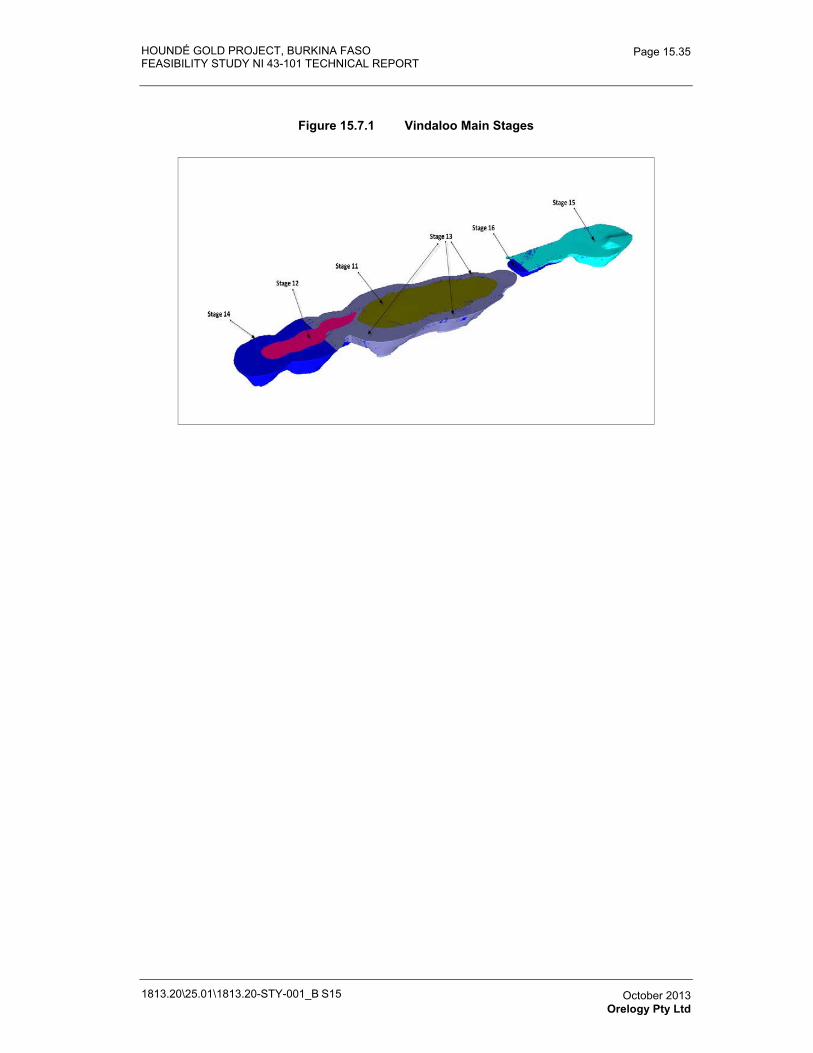
HOUNDÉ GOLD PROJECT, BURKINA FASO FEASIBILITY STUDY NI 43-101 TECHNICAL REPORT
1813.20\25.01\1813.20-STY-001_B S15
Page 15.35
October 2013 Orelogy Pty Ltd
Figure 15.7.1 Vindaloo Main Stages
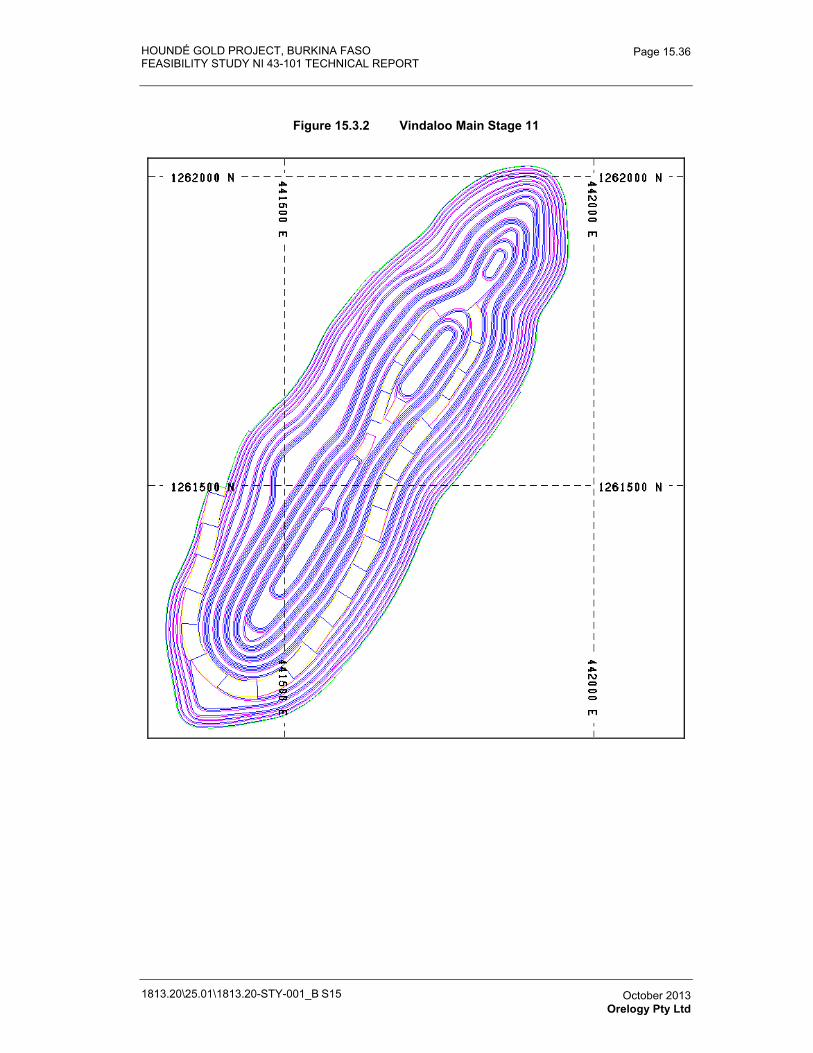
HOUNDÉ GOLD PROJECT, BURKINA FASO FEASIBILITY STUDY NI 43-101 TECHNICAL REPORT
1813.20\25.01\1813.20-STY-001_B S15
Page 15.36
October 2013 Orelogy Pty Ltd
Figure 15.3.2 Vindaloo Main Stage 11
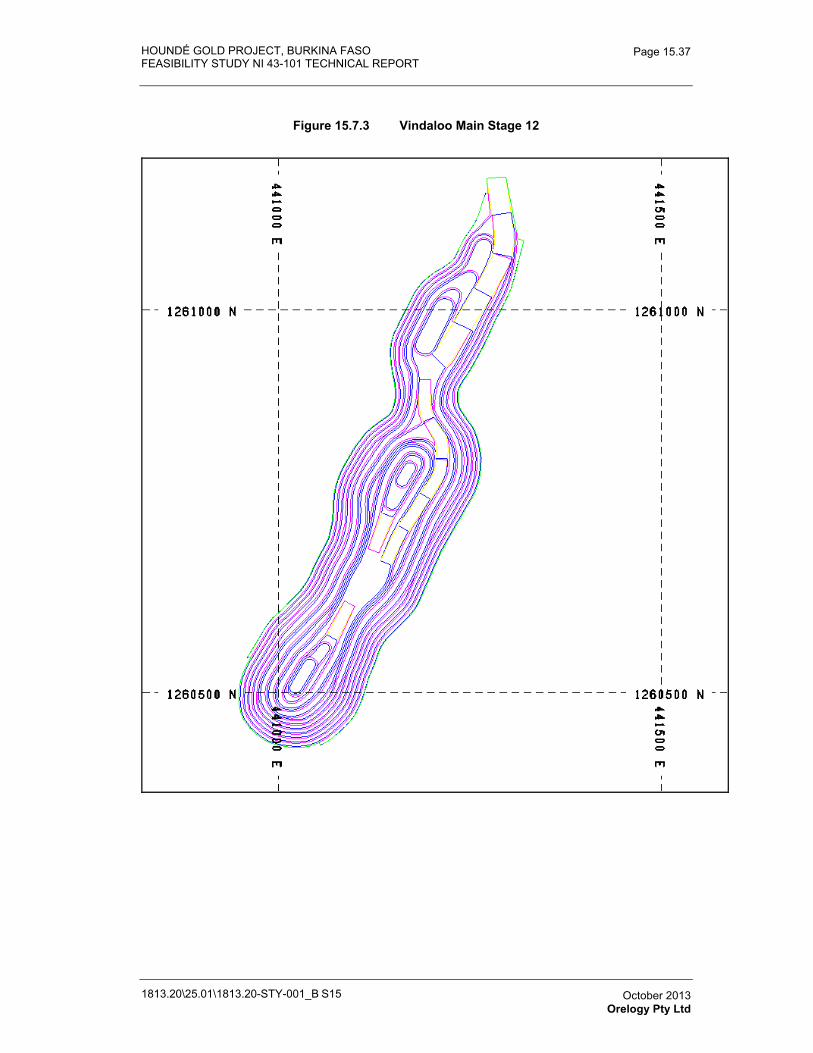
HOUNDÉ GOLD PROJECT, BURKINA FASO FEASIBILITY STUDY NI 43-101 TECHNICAL REPORT
1813.20\25.01\1813.20-STY-001_B S15
Page 15.37
October 2013 Orelogy Pty Ltd
Figure 15.7.3 Vindaloo Main Stage 12
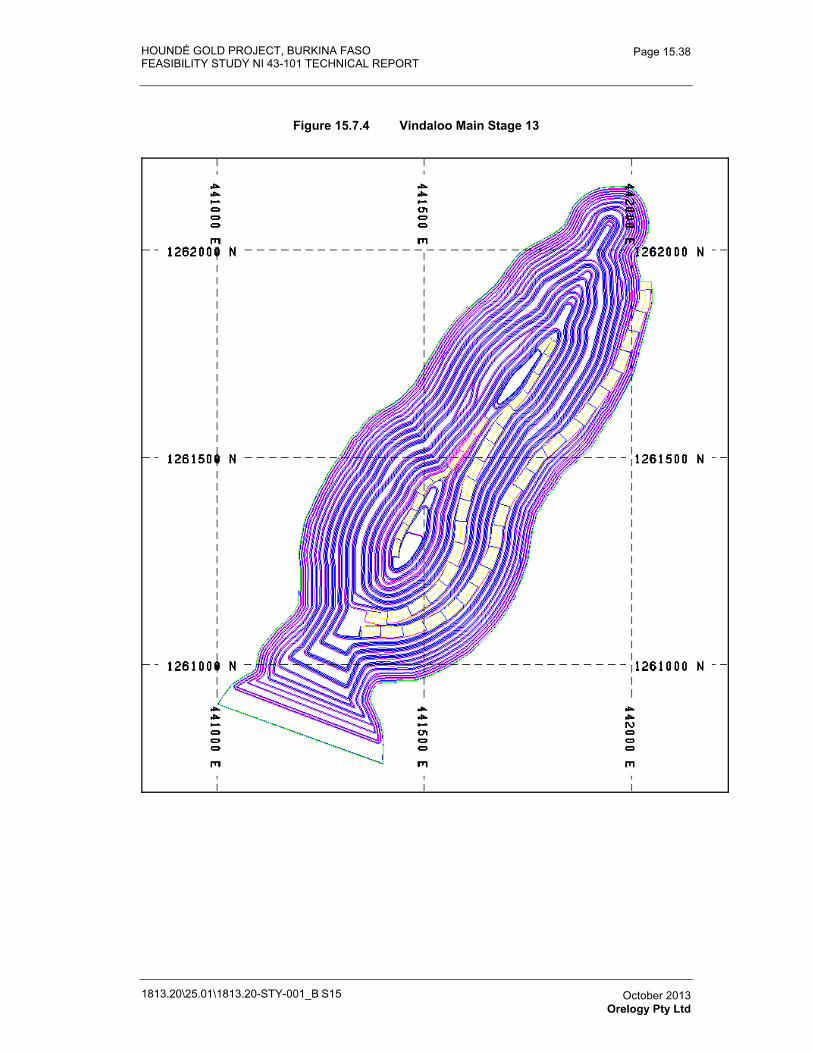
HOUNDÉ GOLD PROJECT, BURKINA FASO FEASIBILITY STUDY NI 43-101 TECHNICAL REPORT
1813.20\25.01\1813.20-STY-001_B S15
Page 15.38
October 2013 Orelogy Pty Ltd
Figure 15.7.4 Vindaloo Main Stage 13
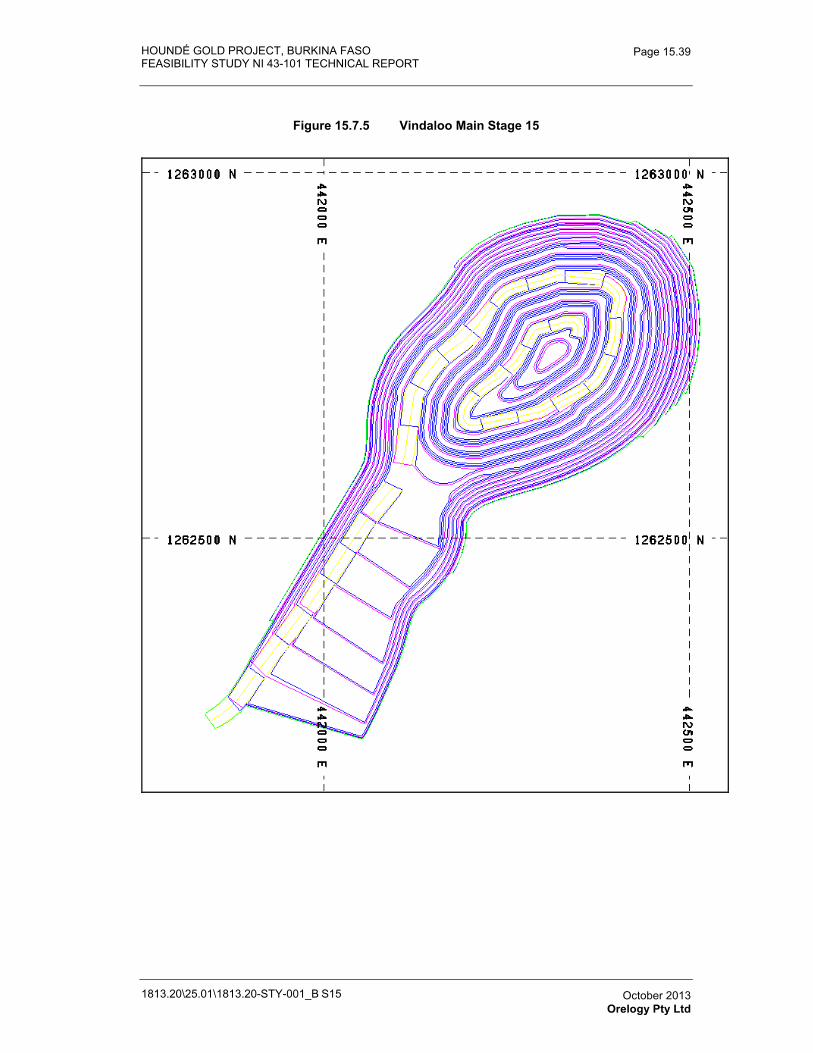
HOUNDÉ GOLD PROJECT, BURKINA FASO FEASIBILITY STUDY NI 43-101 TECHNICAL REPORT
1813.20\25.01\1813.20-STY-001_B S15
Page 15.39
October 2013 Orelogy Pty Ltd
Figure 15.7.5 Vindaloo Main Stage 15
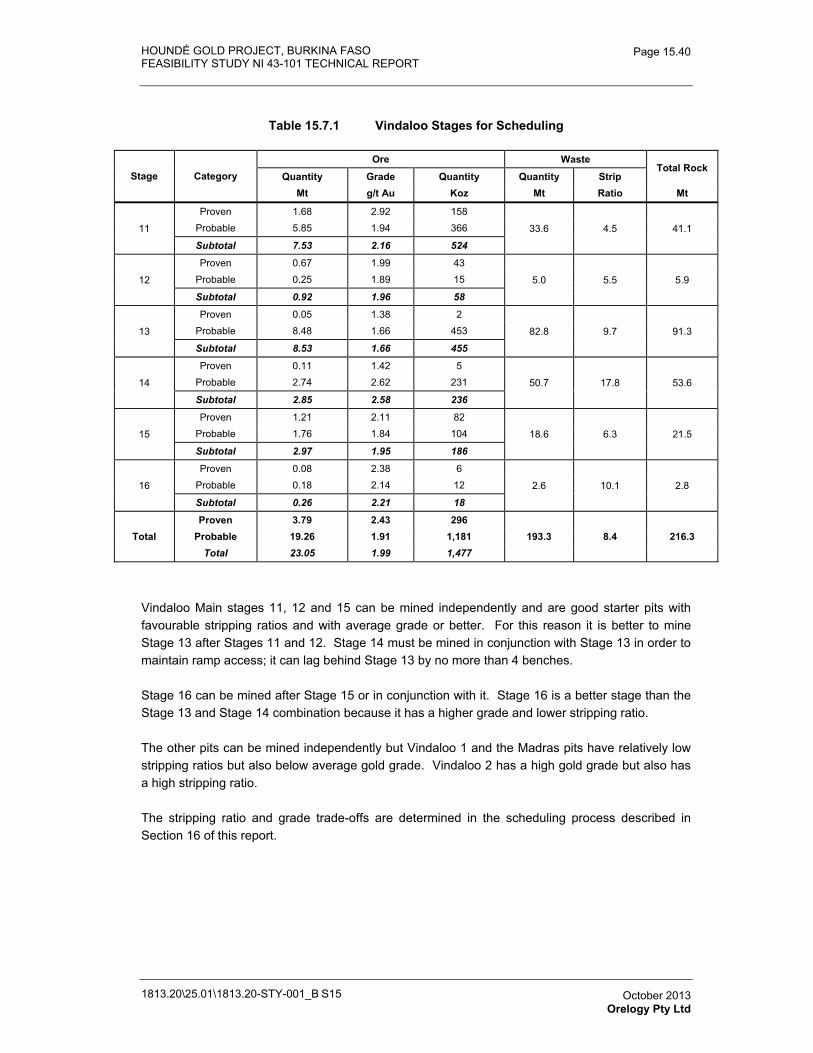
HOUNDÉ GOLD PROJECT, BURKINA FASO FEASIBILITY STUDY NI 43-101 TECHNICAL REPORT
1813.20\25.01\1813.20-STY-001_B S15
Page 15.40
October 2013 Orelogy Pty Ltd
Table 15.7.1 Vindaloo Stages for Scheduling
Stage Category Ore Waste
Total Rock Quantity Grade Quantity Quantity Strip
Mt g/t Au Koz Mt Ratio Mt
11
Proven 1.68 2.92 158
33.6 4.5 41.1 Probable 5.85 1.94 366
Subtotal 7.53 2.16 524
12
Proven 0.67 1.99 43
5.0 5.5 5.9 Probable 0.25 1.89 15
Subtotal 0.92 1.96 58
13
Proven 0.05 1.38 2
82.8 9.7 91.3 Probable 8.48 1.66 453
Subtotal 8.53 1.66 455
14
Proven 0.11 1.42 5
50.7 17.8 53.6 Probable 2.74 2.62 231
Subtotal 2.85 2.58 236
15
Proven 1.21 2.11 82
18.6 6.3 21.5 Probable 1.76 1.84 104
Subtotal 2.97 1.95 186
16
Proven 0.08 2.38 6
2.6 10.1 2.8 Probable 0.18 2.14 12
Subtotal 0.26 2.21 18
Total Proven 3.79 2.43 296
193.3 8.4 216.3 Probable 19.26 1.91 1,181 Total 23.05 1.99 1,477
Vindaloo Main stages 11, 12 and 15 can be mined independently and are good starter pits with favourable stripping ratios and with average grade or better. For this reason it is better to mine Stage 13 after Stages 11 and 12. Stage 14 must be mined in conjunction with Stage 13 in order to maintain ramp access; it can lag behind Stage 13 by no more than 4 benches.
Stage 16 can be mined after Stage 15 or in conjunction with it. Stage 16 is a better stage than the Stage 13 and Stage 14 combination because it has a higher grade and lower stripping ratio.
The other pits can be mined independently but Vindaloo 1 and the Madras pits have relatively low stripping ratios but also below average gold grade. Vindaloo 2 has a high gold grade but also has a high stripping ratio.
The stripping ratio and grade trade-offs are determined in the scheduling process described in Section 16 of this report.
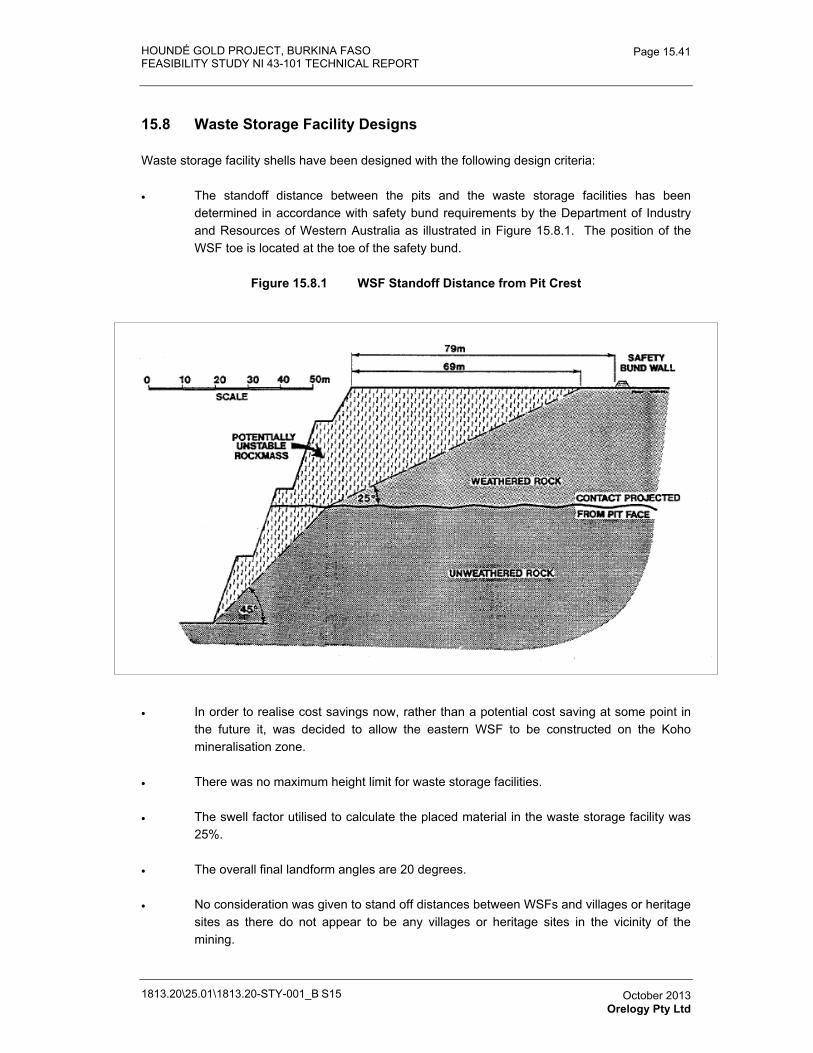
HOUNDÉ GOLD PROJECT, BURKINA FASO FEASIBILITY STUDY NI 43-101 TECHNICAL REPORT
1813.20\25.01\1813.20-STY-001_B S15
Page 15.41
October 2013 Orelogy Pty Ltd
15.8 Waste Storage Facility Designs
Waste storage facility shells have been designed with the following design criteria:
� The standoff distance between the pits and the waste storage facilities has been determined in accordance with safety bund requirements by the Department of Industry and Resources of Western Australia as illustrated in Figure 15.8.1. The position of the WSF toe is located at the toe of the safety bund.
Figure 15.8.1 WSF Standoff Distance from Pit Crest
� In order to realise cost savings now, rather than a potential cost saving at some point in the future it, was decided to allow the eastern WSF to be constructed on the Koho mineralisation zone.
� There was no maximum height limit for waste storage facilities.
� The swell factor utilised to calculate the placed material in the waste storage facility was 25%.
� The overall final landform angles are 20 degrees.
� No consideration was given to stand off distances between WSFs and villages or heritage sites as there do not appear to be any villages or heritage sites in the vicinity of the mining.
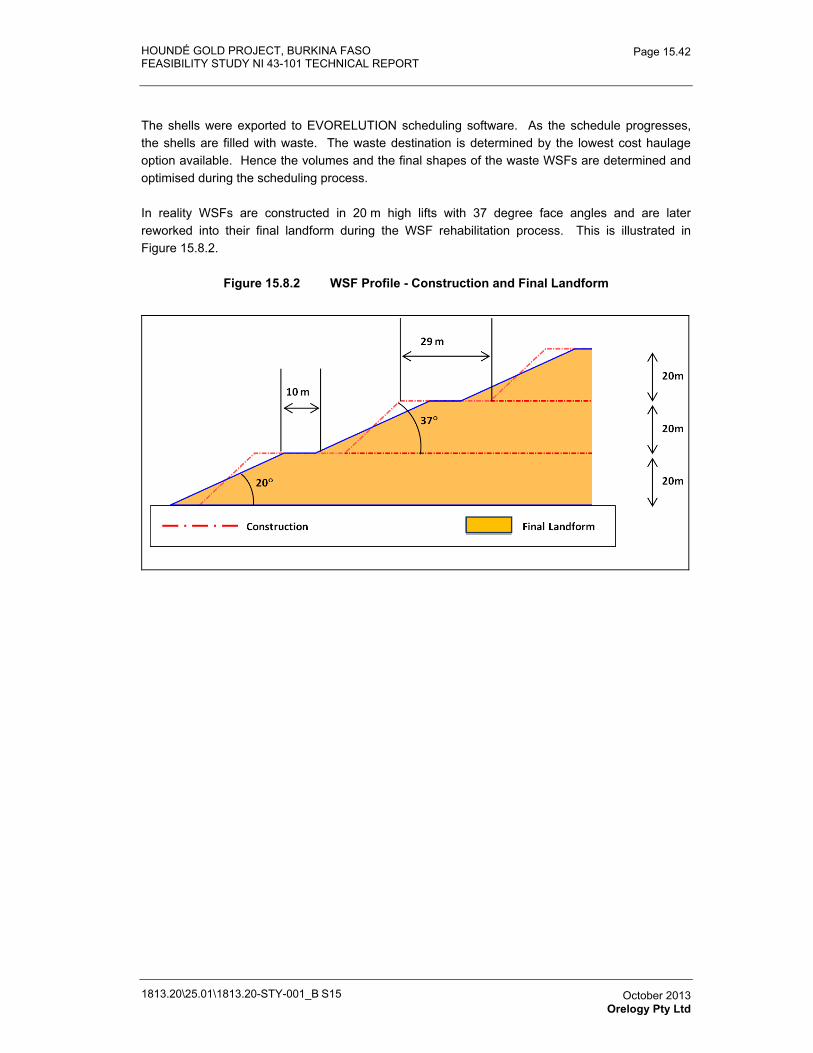
HOUNDÉ GOLD PROJECT, BURKINA FASO FEASIBILITY STUDY NI 43-101 TECHNICAL REPORT
1813.20\25.01\1813.20-STY-001_B S15
Page 15.42
October 2013 Orelogy Pty Ltd
The shells were exported to EVORELUTION scheduling software. As the schedule progresses, the shells are filled with waste. The waste destination is determined by the lowest cost haulage option available. Hence the volumes and the final shapes of the waste WSFs are determined and optimised during the scheduling process.
In reality WSFs are constructed in 20 m high lifts with 37 degree face angles and are later reworked into their final landform during the WSF rehabilitation process. This is illustrated in Figure 15.8.2.
Figure 15.8.2 WSF Profile - Construction and Final Landform
HOUNDÉ GOLD PROJECT, BURKINA FASO
FEASIBILITY STUDY NI 43-101 TECHNICAL REPORT
1813.20-STY-001
Table of Contents Page
16.0� MINING METHODS 16.1�16.1� Mining Method 16.1�
16.1.1� General Description Mining Methods 16.1�16.1.2� Mining Equipment 16.1�16.1.3� Blasting 16.2�16.1.4� Mine Dewatering 16.3�16.1.5� Dust Suppression 16.3�16.1.6� Grade Control 16.3�16.1.7� Mining Schedule 16.4�
16.2� Hydrogeology 16.10�16.2.1� Groundwater Levels 16.10�16.2.2� Permeability Values 16.10�16.2.3� Predicted Groundwater Inflows 16.11�16.2.4� Baseline Water Chemistry 16.11�
16.3� Fleet Size and Personnel Numbers 16.11�16.4� Mining CAPEX / OPEX 16.14�16.5� Technical Risks and Opportunities 16.14�
16.5.1� Open Pit Optimisation 16.14�16.5.2� Mine Design 16.14�16.5.3� Mine Scheduling 16.15�16.5.4� Cost Estimation 16.15�
TABLESTable 16.1.1� Mining Fleet – Heavy Equipment 16.1�Table 16.1.2� Mining Fleet - Light Vehicles and Ancillary Equipment 16.2�Table 16.1.3� Mill Throughput with Varying Ore Materials 16.5�Table 16.1.4� Mining Schedule 16.9�Table 16.1.5� Vertical Advance Rate 16.10�Table 16.3.1� Loading Productivity and Truck Payload 16.12�Table 16.3.2� Mine Production Fleet Size and Purchase Schedule – Annual LoM 16.13�Table 16.3.3� Mine Department Personnel Costs by Position 16.13�Table 16.3.4� Mine Department Personnel Numbers (Annual Maximum) 16.14�
FIGURESFigure 16.1.1� Ore and Waste Mining Schedule 16.6�Figure 16.1.2� Ore Mining Schedule by Rock Type 16.7�Figure 16.1.3� End of Year Stockpile by Rock Type 16.7�Figure 16.1.4� Processing Plant Feed Schedule 16.8�Figure 16.1.5� Recovered Metal Schedule 16.8�
1813.20\25.01\1813.20-STY-001_B S16 October 2013 Orelogy Pty Ltd
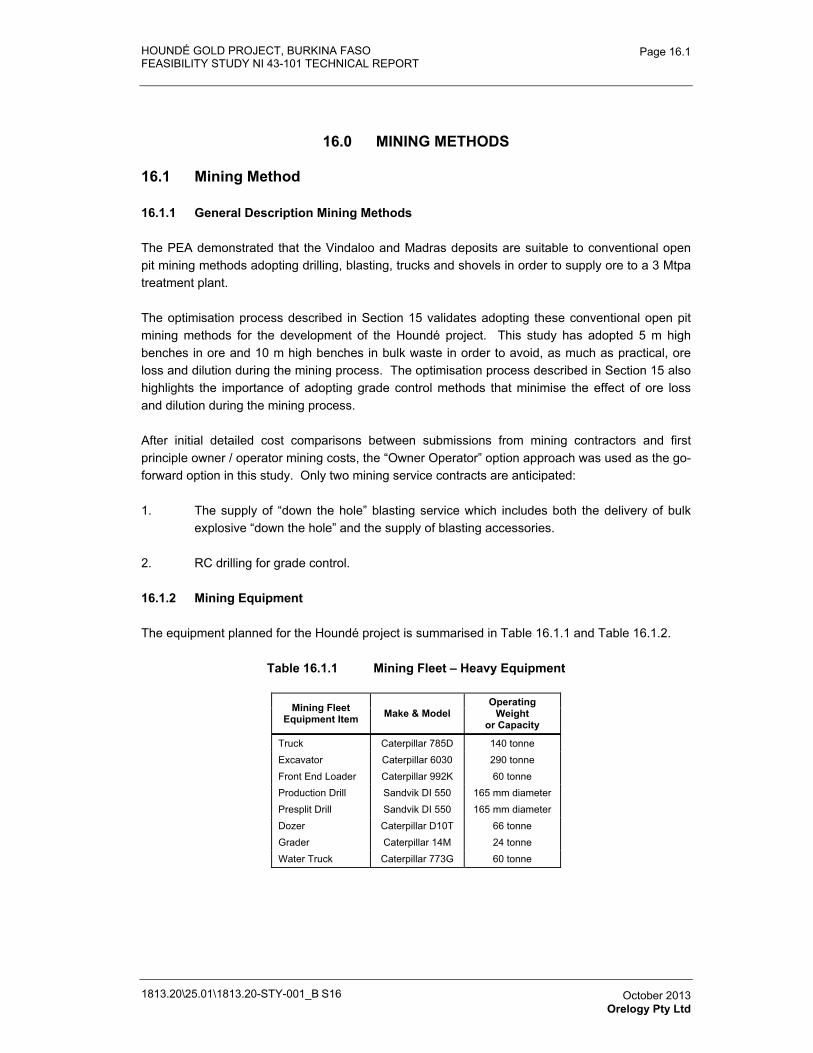
HOUNDÉ GOLD PROJECT, BURKINA FASO FEASIBILITY STUDY NI 43-101 TECHNICAL REPORT
1813.20\25.01\1813.20-STY-001_B S16
Page 16.1
October 2013 Orelogy Pty Ltd
16.0 MINING METHODS
16.1 Mining Method
16.1.1 General Description Mining Methods
The PEA demonstrated that the Vindaloo and Madras deposits are suitable to conventional open pit mining methods adopting drilling, blasting, trucks and shovels in order to supply ore to a 3 Mtpa treatment plant.
The optimisation process described in Section 15 validates adopting these conventional open pit mining methods for the development of the Houndé project. This study has adopted 5 m high benches in ore and 10 m high benches in bulk waste in order to avoid, as much as practical, ore loss and dilution during the mining process. The optimisation process described in Section 15 also highlights the importance of adopting grade control methods that minimise the effect of ore loss and dilution during the mining process.
After initial detailed cost comparisons between submissions from mining contractors and first principle owner / operator mining costs, the “Owner Operator” option approach was used as the go-forward option in this study. Only two mining service contracts are anticipated:
1. The supply of “down the hole” blasting service which includes both the delivery of bulk explosive “down the hole” and the supply of blasting accessories.
2. RC drilling for grade control.
16.1.2 Mining Equipment
The equipment planned for the Houndé project is summarised in Table 16.1.1 and Table 16.1.2.
Table 16.1.1 Mining Fleet – Heavy Equipment
Mining Fleet Equipment Item Make & Model
Operating Weight
or Capacity
Truck Caterpillar 785D 140 tonne Excavator Caterpillar 6030 290 tonne Front End Loader Caterpillar 992K 60 tonne Production Drill Sandvik DI 550 165 mm diameter Presplit Drill Sandvik DI 550 165 mm diameter Dozer Caterpillar D10T 66 tonne Grader Caterpillar 14M 24 tonne Water Truck Caterpillar 773G 60 tonne
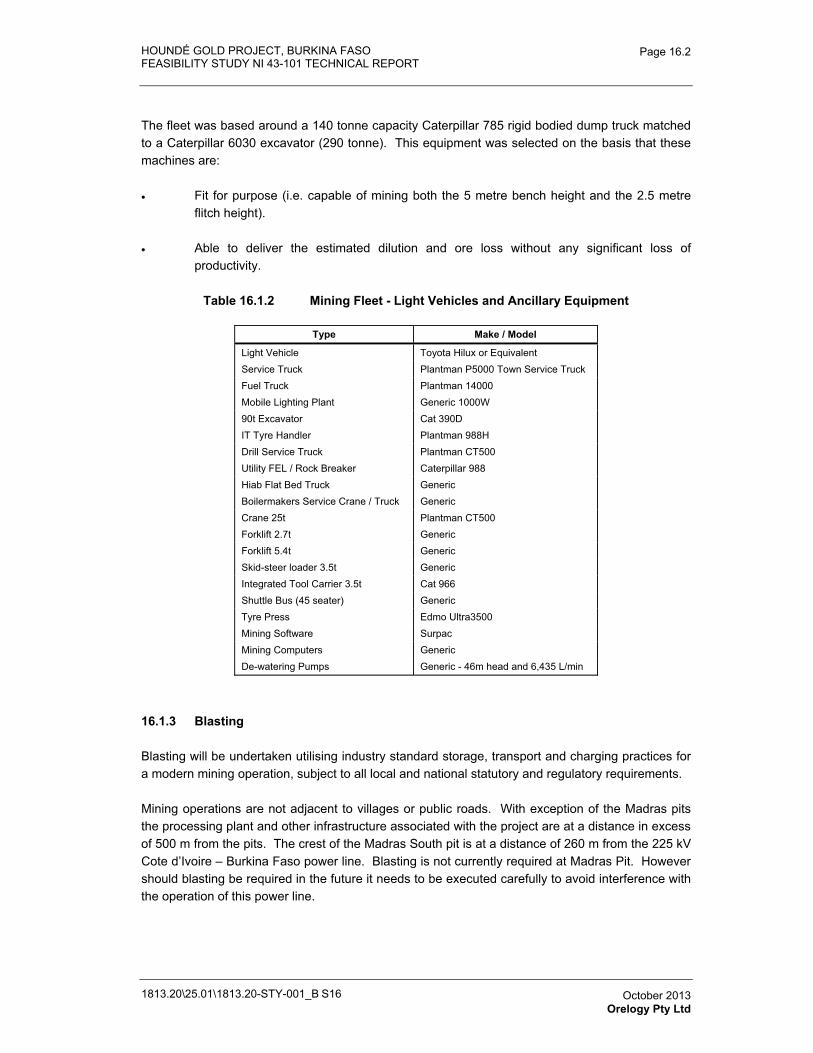
HOUNDÉ GOLD PROJECT, BURKINA FASO FEASIBILITY STUDY NI 43-101 TECHNICAL REPORT
1813.20\25.01\1813.20-STY-001_B S16
Page 16.2
October 2013 Orelogy Pty Ltd
The fleet was based around a 140 tonne capacity Caterpillar 785 rigid bodied dump truck matched to a Caterpillar 6030 excavator (290 tonne). This equipment was selected on the basis that these machines are:
� Fit for purpose (i.e. capable of mining both the 5 metre bench height and the 2.5 metre flitch height).
� Able to deliver the estimated dilution and ore loss without any significant loss of productivity.
Table 16.1.2 Mining Fleet - Light Vehicles and Ancillary Equipment
Type Make / Model
Light Vehicle Toyota Hilux or Equivalent Service Truck Plantman P5000 Town Service Truck Fuel Truck Plantman 14000 Mobile Lighting Plant Generic 1000W 90t Excavator Cat 390D IT Tyre Handler Plantman 988H Drill Service Truck Plantman CT500 Utility FEL / Rock Breaker Caterpillar 988 Hiab Flat Bed Truck Generic Boilermakers Service Crane / Truck Generic Crane 25t Plantman CT500 Forklift 2.7t Generic Forklift 5.4t Generic Skid-steer loader 3.5t Generic Integrated Tool Carrier 3.5t Cat 966 Shuttle Bus (45 seater) Generic Tyre Press Edmo Ultra3500 Mining Software SurpacMining Computers Generic De-watering Pumps Generic - 46m head and 6,435 L/min
16.1.3 Blasting
Blasting will be undertaken utilising industry standard storage, transport and charging practices for a modern mining operation, subject to all local and national statutory and regulatory requirements.
Mining operations are not adjacent to villages or public roads. With exception of the Madras pits the processing plant and other infrastructure associated with the project are at a distance in excess of 500 m from the pits. The crest of the Madras South pit is at a distance of 260 m from the 225 kV Cote d’Ivoire – Burkina Faso power line. Blasting is not currently required at Madras Pit. However should blasting be required in the future it needs to be executed carefully to avoid interference with the operation of this power line.
HOUNDÉ GOLD PROJECT, BURKINA FASO FEASIBILITY STUDY NI 43-101 TECHNICAL REPORT
1813.20\25.01\1813.20-STY-001_B S16
Page 16.3
October 2013 Orelogy Pty Ltd
At the start of blasting operations it is planned to measure the blasting induced vibration levels at the power line to confirm that these levels are negligible and will not interfere with the operation of this line.
16.1.4 Mine Dewatering
Water inflows resulting from rainfall and from ground water into the pits will be collected in pit sumps. Sump pumps will transfer this water into water carts being used for dust suppression or into the “Turkeys Nest” pond on the surface if there is more water than needed for dust suppression. The Turkeys Nest is connected to the water management system of the processing plant and excess mine water will be absorbed by this system.
The general drainage in the project area is towards the south east. It has been indicated that the catchment areas are relatively small and the average rainfall is also relatively low at 226 mm for August, the wettest month.
None of the pits are immune to the surface water inflow without the protection of a small cut-off bund around the pit crest. These bunds are also needed to prevent people inadvertently gaining access to the pit crest with vehicles. Construction of bunds with waste material is addressed during the mining phase without incurring extra costs (i.e. instead of this material being dumped on the waste storage facility it is placed around the pit edge at no additional cost).
The Vindaloo 2 pit intersects one of the natural drainage channels running north of this pit and an engineered diversion has been generated to avoid flooding of this pit. This civil engineering solution is not part of the mining scope and this work was undertaken by Knight Piésold.
16.1.5 Dust Suppression
Dust suppression will be undertaken by water carts fitted with spray bars. Water for dust suppression will be available from sumps in the pits in first instance and from the Turkeys Nest on the surface if the pit sumps run dry.
16.1.6 Grade Control
The grade control approach during optimisation was based on blast holes. However, this has changed as it is intended to adopt RC drilling techniques as the basis for grade control in order to provide better coverage of the ore zones. Samples are planned to be taken every 2 metres over a 32 metre deep inclined (50°) hole. The grade control pattern across the ore is factored by 100% to account for the drilling of the surrounding waste (i.e. a ratio of 1 waste tonne for every ore tonne drilled). A pattern size of 25 metres along strike and 15 metres across strike is planned. It is intended to undertake this activity using contract drilling.
The samples will be collected by geology personnel and delivered to the site lab. Assay results will be used for grade control modelling and reconciliation, eventually feeding back into the resource modelling and mine planning.
HOUNDÉ GOLD PROJECT, BURKINA FASO FEASIBILITY STUDY NI 43-101 TECHNICAL REPORT
1813.20\25.01\1813.20-STY-001_B S16
Page 16.4
October 2013 Orelogy Pty Ltd
16.1.7 Mining Schedule
Aim of the Schedule
The aim was to generate a practical, realistically achievable schedule which maximises value within the constraints.
A practical, realistically achievable schedule is one that:
� Meets mill feed requirements.
� Includes ramp-up considerations for mine operations as well as the processing plant.
� Avoids vertical advance rates of >100 m per annum.
� Is centred around a stable fleet size that does not vary too much between periods and is sufficient to undertake the work without unnecessary excess capacity.
� Avoids congestion on benches and ramps.
Maximum value is achieved by:
� Bringing forward higher grade, lower cost ore as much as possible.
� Delaying waste mining as much as possible. This includes keeping the pre-stripping period as short as possible.
� Avoiding rehandling and avoiding stockpiles larger than necessary.
In order to obtain sufficient resolution of material movement and hence mill feed during the early years of the operation, and to raise the confidence in the achievability of the schedule, the first 4 years (including the pre-stripping period) of the Life of Mine (LOM) schedule were undertaken in monthly periods with quarterly increments thereafter.
Scheduling Targets and Constraints
The processing plant feed schedule aims to meet the following criteria during each scheduling period:
� Plant feed rate of 3.0 Mtpa when the fresh rock proportion of the feed is greater than 75%.
� The mill feed rate is allowed to grow by a maximum of 15% in each period when the saprolite and transitional ore component exceeds 25% of total. The throughput effects with varying proportions of saprolite and transition are shown in Table 16.1.3.
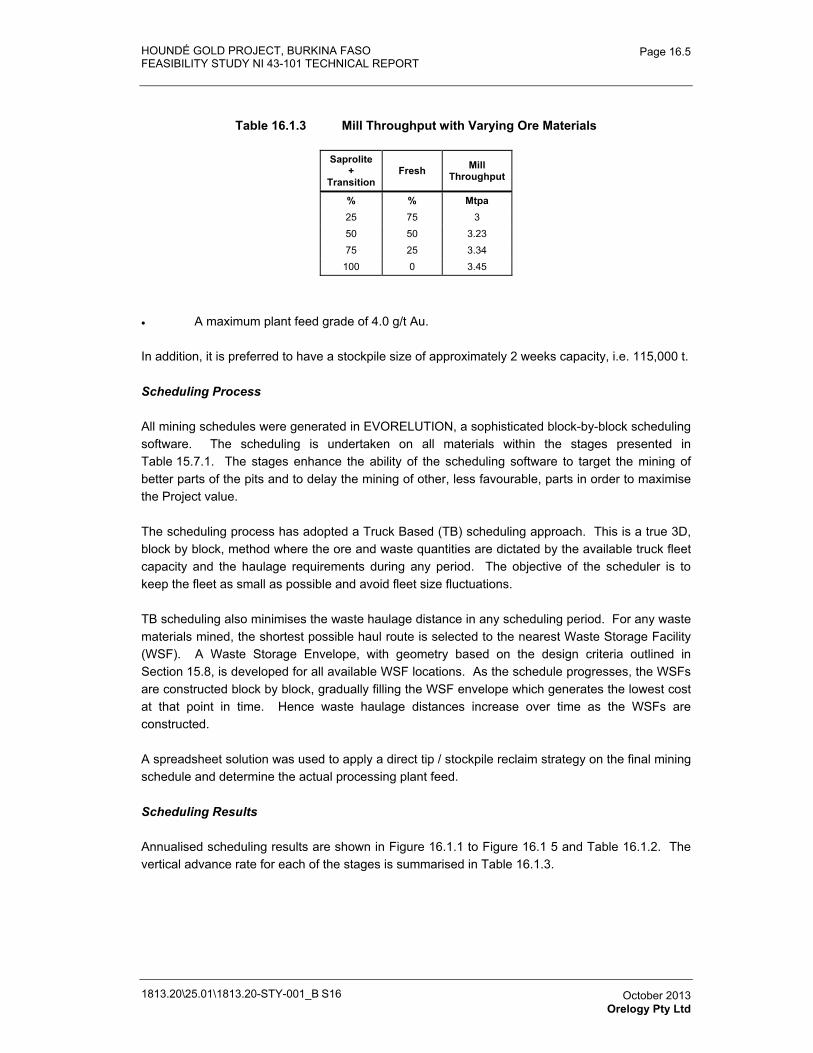
HOUNDÉ GOLD PROJECT, BURKINA FASO FEASIBILITY STUDY NI 43-101 TECHNICAL REPORT
1813.20\25.01\1813.20-STY-001_B S16
Page 16.5
October 2013 Orelogy Pty Ltd
Table 16.1.3 Mill Throughput with Varying Ore Materials
Saprolite +
Transition Fresh Mill
Throughput
% % Mtpa 25 75 3 50 50 3.23 75 25 3.34
100 0 3.45
� A maximum plant feed grade of 4.0 g/t Au.
In addition, it is preferred to have a stockpile size of approximately 2 weeks capacity, i.e. 115,000 t.
Scheduling Process
All mining schedules were generated in EVORELUTION, a sophisticated block-by-block scheduling software. The scheduling is undertaken on all materials within the stages presented in Table 15.7.1. The stages enhance the ability of the scheduling software to target the mining of better parts of the pits and to delay the mining of other, less favourable, parts in order to maximise the Project value.
The scheduling process has adopted a Truck Based (TB) scheduling approach. This is a true 3D, block by block, method where the ore and waste quantities are dictated by the available truck fleet capacity and the haulage requirements during any period. The objective of the scheduler is to keep the fleet as small as possible and avoid fleet size fluctuations.
TB scheduling also minimises the waste haulage distance in any scheduling period. For any waste materials mined, the shortest possible haul route is selected to the nearest Waste Storage Facility (WSF). A Waste Storage Envelope, with geometry based on the design criteria outlined in Section 15.8, is developed for all available WSF locations. As the schedule progresses, the WSFs are constructed block by block, gradually filling the WSF envelope which generates the lowest cost at that point in time. Hence waste haulage distances increase over time as the WSFs are constructed.
A spreadsheet solution was used to apply a direct tip / stockpile reclaim strategy on the final mining schedule and determine the actual processing plant feed.
Scheduling Results
Annualised scheduling results are shown in Figure 16.1.1 to Figure 16.1 5 and Table 16.1.2. The vertical advance rate for each of the stages is summarised in Table 16.1.3.
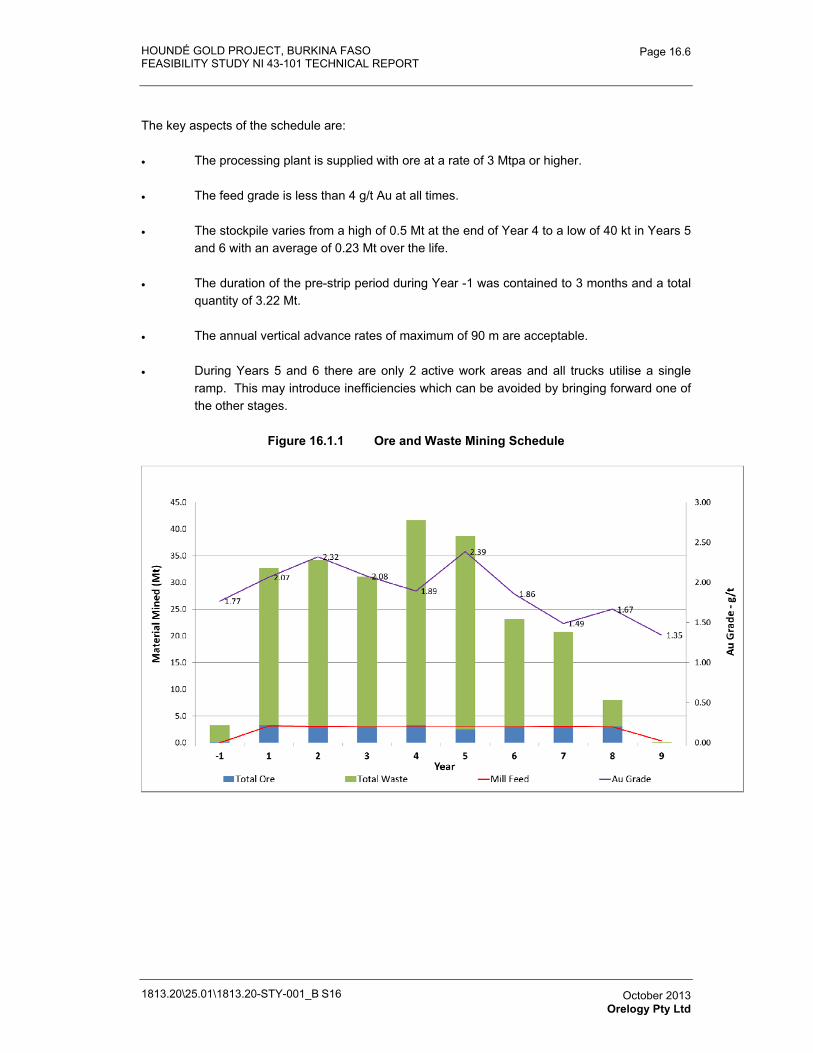
HOUNDÉ GOLD PROJECT, BURKINA FASO FEASIBILITY STUDY NI 43-101 TECHNICAL REPORT
1813.20\25.01\1813.20-STY-001_B S16
Page 16.6
October 2013 Orelogy Pty Ltd
The key aspects of the schedule are:
� The processing plant is supplied with ore at a rate of 3 Mtpa or higher.
� The feed grade is less than 4 g/t Au at all times.
� The stockpile varies from a high of 0.5 Mt at the end of Year 4 to a low of 40 kt in Years 5 and 6 with an average of 0.23 Mt over the life.
� The duration of the pre-strip period during Year -1 was contained to 3 months and a total quantity of 3.22 Mt.
� The annual vertical advance rates of maximum of 90 m are acceptable.
� During Years 5 and 6 there are only 2 active work areas and all trucks utilise a single ramp. This may introduce inefficiencies which can be avoided by bringing forward one of the other stages.
Figure 16.1.1 Ore and Waste Mining Schedule
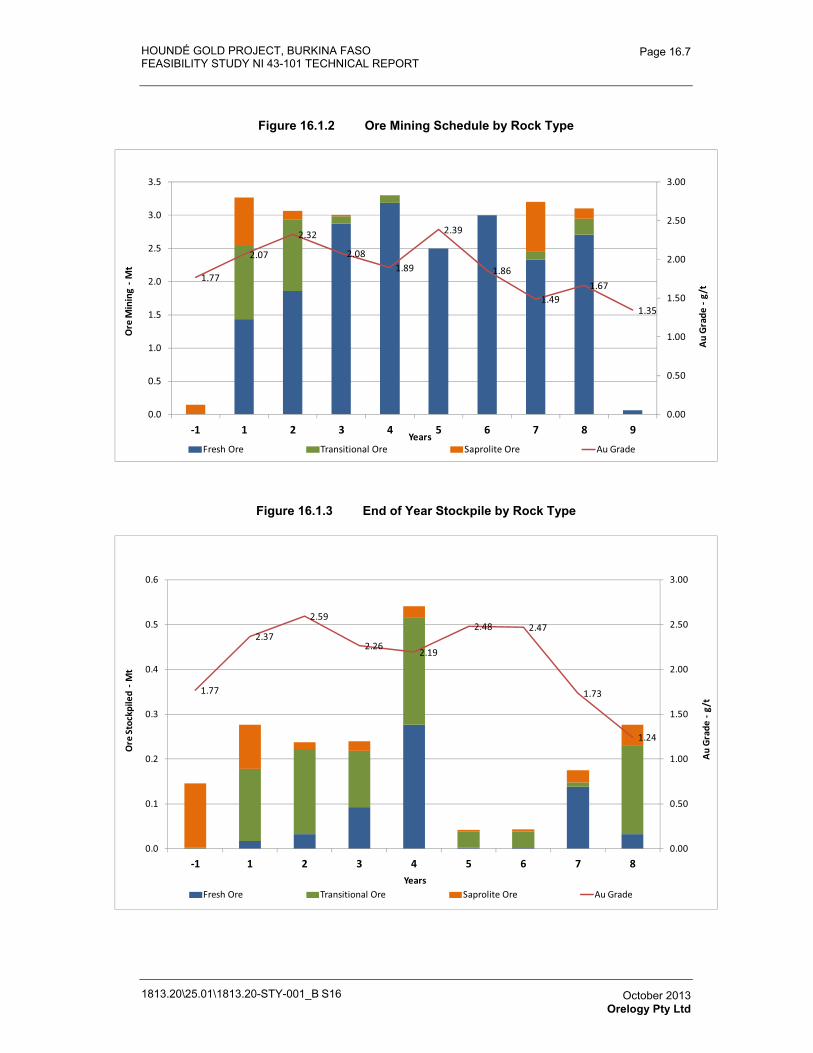
HOUNDÉ GOLD PROJECT, BURKINA FASO FEASIBILITY STUDY NI 43-101 TECHNICAL REPORT
1813.20\25.01\1813.20-STY-001_B S16
Page 16.7
October 2013 Orelogy Pty Ltd
Figure 16.1.2 Ore Mining Schedule by Rock Type
Figure 16.1.3 End of Year Stockpile by Rock Type
1.77
2.07
2.32
2.081.89
2.39
1.86
1.491.67
1.35
0.00
0.50
1.00
1.50
2.00
2.50
3.00
0.0
0.5
1.0
1.5
2.0
2.5
3.0
3.5
�1 1 2 3 4 5 6 7 8 9
Au�
Gra
de��
g/t
Ore
�Min
ing�
�Mt
Years
Source:�0262_Pit_Dump_131004� � 0262_LOM_Update_newWSF_5x10x5_as_Fnal_131016� �20131016002127��Schedule�01_Final_Schedule_Selected_newWSF_131016
Fresh�Ore Transitional�Ore Saprolite�Ore Au�Grade
1.77
2.37
2.59
2.262.19
2.48 2.47
1.73
1.24
0.00
0.50
1.00
1.50
2.00
2.50
3.00
0.0
0.1
0.2
0.3
0.4
0.5
0.6
�1 1 2 3 4 5 6 7 8
Au�
Gra
de��
g/t
Ore
�Sto
ckpi
led�
�Mt
Years
Source:�0262_Pit_Dump_131004�� 0262_LOM_Update_newWSF_5x10x5_as_Fnal_131016��20131016002127�� Schedule�01_Final_Schedule_Selected_newWSF_131016
Fresh�Ore Transitional�Ore Saprolite�Ore Au�Grade
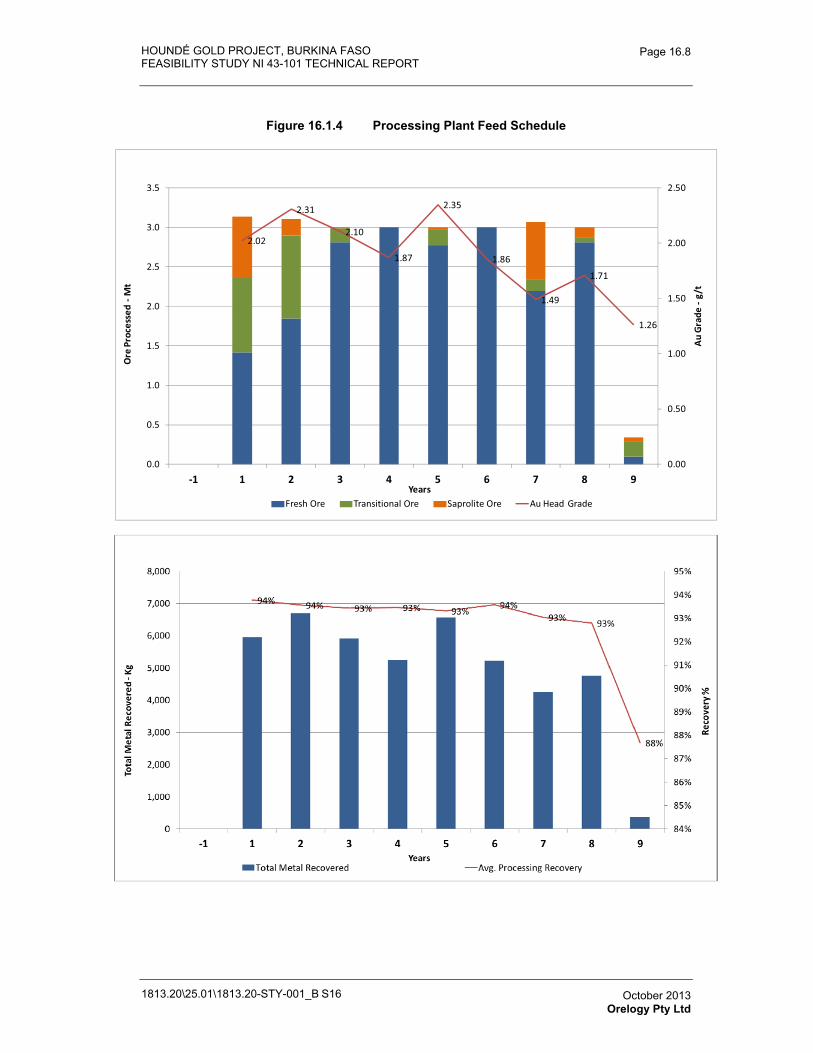
HOUNDÉ GOLD PROJECT, BURKINA FASO FEASIBILITY STUDY NI 43-101 TECHNICAL REPORT
1813.20\25.01\1813.20-STY-001_B S16
Page 16.8
October 2013 Orelogy Pty Ltd
Figure 16.1.4 Processing Plant Feed Schedule
Figure 16.1.5 Recovered Metal Schedule
2.02
2.31
2.10
1.87
2.35
1.86
1.49
1.71
1.26
0.00
0.50
1.00
1.50
2.00
2.50
0.0
0.5
1.0
1.5
2.0
2.5
3.0
3.5
�1 1 2 3 4 5 6 7 8 9
Au�
Gra
de��
g/t
Ore
�Pro
cess
ed��
Mt
Years
Source:�0262_Pit_Dump_131004�� 0262_LOM_Update_newWSF_5x10x5_as_Fnal_131016��20131016002127�� Schedule�01_Final_Schedule_Selected_newWSF_131016
Fresh�Ore Transitional�Ore Saprolite�Ore Au�Head�Grade
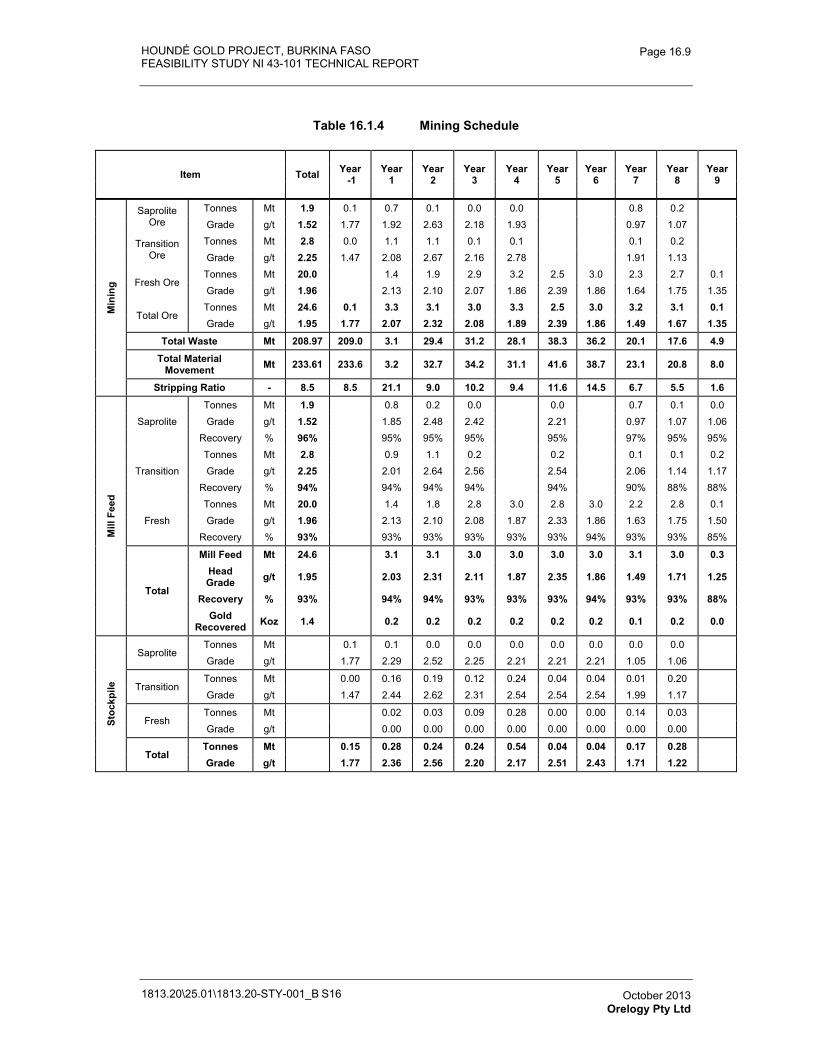
HOUNDÉ GOLD PROJECT, BURKINA FASO FEASIBILITY STUDY NI 43-101 TECHNICAL REPORT
1813.20\25.01\1813.20-STY-001_B S16
Page 16.9
October 2013 Orelogy Pty Ltd
Table 16.1.4 Mining Schedule
Item Total Year -1
Year1
Year2
Year3
Year4
Year5
Year6
Year7
Year8
Year9
Min
ing
SaproliteOre
Tonnes Mt 1.9 0.1 0.7 0.1 0.0 0.0 0.8 0.2 Grade g/t 1.52 1.77 1.92 2.63 2.18 1.93 0.97 1.07
TransitionOre
Tonnes Mt 2.8 0.0 1.1 1.1 0.1 0.1 0.1 0.2 Grade g/t 2.25 1.47 2.08 2.67 2.16 2.78 1.91 1.13
Fresh Ore Tonnes Mt 20.0 1.4 1.9 2.9 3.2 2.5 3.0 2.3 2.7 0.1 Grade g/t 1.96 2.13 2.10 2.07 1.86 2.39 1.86 1.64 1.75 1.35
Total Ore Tonnes Mt 24.6 0.1 3.3 3.1 3.0 3.3 2.5 3.0 3.2 3.1 0.1 Grade g/t 1.95 1.77 2.07 2.32 2.08 1.89 2.39 1.86 1.49 1.67 1.35
Total Waste Mt 208.97 209.0 3.1 29.4 31.2 28.1 38.3 36.2 20.1 17.6 4.9
Total Material Movement Mt 233.61 233.6 3.2 32.7 34.2 31.1 41.6 38.7 23.1 20.8 8.0
Stripping Ratio - 8.5 8.5 21.1 9.0 10.2 9.4 11.6 14.5 6.7 5.5 1.6
Mill
Fee
d
SaproliteTonnes Mt 1.9 0.8 0.2 0.0 0.0 0.7 0.1 0.0 Grade g/t 1.52 1.85 2.48 2.42 2.21 0.97 1.07 1.06
Recovery % 96% 95% 95% 95% 95% 97% 95% 95%
TransitionTonnes Mt 2.8 0.9 1.1 0.2 0.2 0.1 0.1 0.2 Grade g/t 2.25 2.01 2.64 2.56 2.54 2.06 1.14 1.17
Recovery % 94% 94% 94% 94% 94% 90% 88% 88%
Fresh Tonnes Mt 20.0 1.4 1.8 2.8 3.0 2.8 3.0 2.2 2.8 0.1 Grade g/t 1.96 2.13 2.10 2.08 1.87 2.33 1.86 1.63 1.75 1.50
Recovery % 93% 93% 93% 93% 93% 93% 94% 93% 93% 85%
Total
Mill Feed Mt 24.6 3.1 3.1 3.0 3.0 3.0 3.0 3.1 3.0 0.3 HeadGrade g/t 1.95 2.03 2.31 2.11 1.87 2.35 1.86 1.49 1.71 1.25
Recovery % 93% 94% 94% 93% 93% 93% 94% 93% 93% 88% Gold
Recovered Koz 1.4 0.2 0.2 0.2 0.2 0.2 0.2 0.1 0.2 0.0
Stoc
kpile
SaproliteTonnes Mt 0.1 0.1 0.0 0.0 0.0 0.0 0.0 0.0 0.0 Grade g/t 1.77 2.29 2.52 2.25 2.21 2.21 2.21 1.05 1.06
TransitionTonnes Mt 0.00 0.16 0.19 0.12 0.24 0.04 0.04 0.01 0.20 Grade g/t 1.47 2.44 2.62 2.31 2.54 2.54 2.54 1.99 1.17
Fresh Tonnes Mt 0.02 0.03 0.09 0.28 0.00 0.00 0.14 0.03 Grade g/t 0.00 0.00 0.00 0.00 0.00 0.00 0.00 0.00
Total Tonnes Mt 0.15 0.28 0.24 0.24 0.54 0.04 0.04 0.17 0.28 Grade g/t 1.77 2.36 2.56 2.20 2.17 2.51 2.43 1.71 1.22
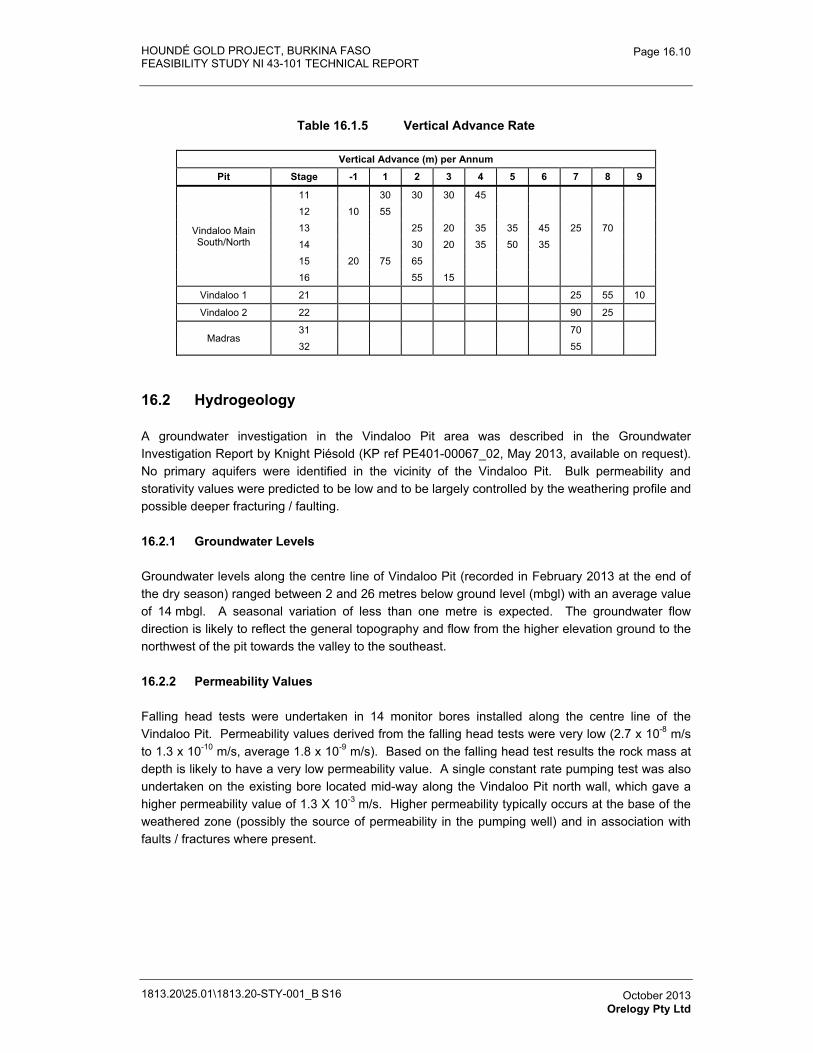
HOUNDÉ GOLD PROJECT, BURKINA FASO FEASIBILITY STUDY NI 43-101 TECHNICAL REPORT
1813.20\25.01\1813.20-STY-001_B S16
Page 16.10
October 2013 Orelogy Pty Ltd
Table 16.1.5 Vertical Advance Rate
Vertical Advance (m) per Annum
Pit Stage -1 1 2 3 4 5 6 7 8 9
Vindaloo Main South/North
11 30 30 30 45 12 10 55 13 25 20 35 35 45 25 70 14 30 20 35 50 35 15 20 75 65 16 55 15
Vindaloo 1 21 25 55 10
Vindaloo 2 22 90 25
Madras 31 70 32 55
16.2 Hydrogeology
A groundwater investigation in the Vindaloo Pit area was described in the Groundwater Investigation Report by Knight Piésold (KP ref PE401-00067_02, May 2013, available on request). No primary aquifers were identified in the vicinity of the Vindaloo Pit. Bulk permeability and storativity values were predicted to be low and to be largely controlled by the weathering profile and possible deeper fracturing / faulting.
16.2.1 Groundwater Levels
Groundwater levels along the centre line of Vindaloo Pit (recorded in February 2013 at the end of the dry season) ranged between 2 and 26 metres below ground level (mbgl) with an average value of 14 mbgl. A seasonal variation of less than one metre is expected. The groundwater flow direction is likely to reflect the general topography and flow from the higher elevation ground to the northwest of the pit towards the valley to the southeast.
16.2.2 Permeability Values
Falling head tests were undertaken in 14 monitor bores installed along the centre line of the Vindaloo Pit. Permeability values derived from the falling head tests were very low (2.7 x 10⁻⁸ m/s to 1.3 x 10⁻¹⁰ m/s, average 1.8 x 10⁻⁹ m/s). Based on the falling head test results the rock mass at depth is likely to have a very low permeability value. A single constant rate pumping test was also undertaken on the existing bore located mid-way along the Vindaloo Pit north wall, which gave a higher permeability value of 1.3 X 10⁻³ m/s. Higher permeability typically occurs at the base of the weathered zone (possibly the source of permeability in the pumping well) and in association with faults / fractures where present.
HOUNDÉ GOLD PROJECT, BURKINA FASO FEASIBILITY STUDY NI 43-101 TECHNICAL REPORT
1813.20\25.01\1813.20-STY-001_B S16
Page 16.11
October 2013 Orelogy Pty Ltd
16.2.3 Predicted Groundwater Inflows
Groundwater inflow to the pit is expected to be low based on the geology and the predominantly low permeability values encountered. Based on standard analytical flow equations the estimated groundwater inflow to the pit (excluding incident rainfall and surface water runoff) is 6 L/s when the Vindaloo Pit is fully developed. It is anticipated that groundwater seepages may take place at the base of the weathered zone and possibly in association with deeper fracturing / faulting that will be controlled by in-pit sumps. Abstraction from the existing bore located mid-way along the Vindaloo Pit north wall will also assist with pit dewatering as well as provide a water supply for construction and dust suppression purposes. It is noted that the presence of water bearing structures such as faults / fractures or shear zones cannot be ruled out.
16.2.4 Baseline Water Chemistry
Water samples collected from dams, surface water, drill holes and wells in the vicinity of the Houndé project (50 samples) were very fresh (total dissolved solids (TDS) 14 to 451 mg/L, average TDS 114 mg/L), slightly acidic (pH 5 to 7.9, average pH 6.3), and bicarbonate dominated water typical of rainwater or recently recharged groundwater. Chromium (in three samples) and arsenic (one sample) occurs above the 2011 WHO Drinking Water Quality Guideline Values.
16.3 Fleet Size and Personnel Numbers
Fleet productivity was developed on the basis of a Caterpillar 6030 290 tonne excavator matched to a Caterpillar 785D 140 tonne dump truck. The shovel productivity and truck payload were calculated as shown in Table 16.3.1.
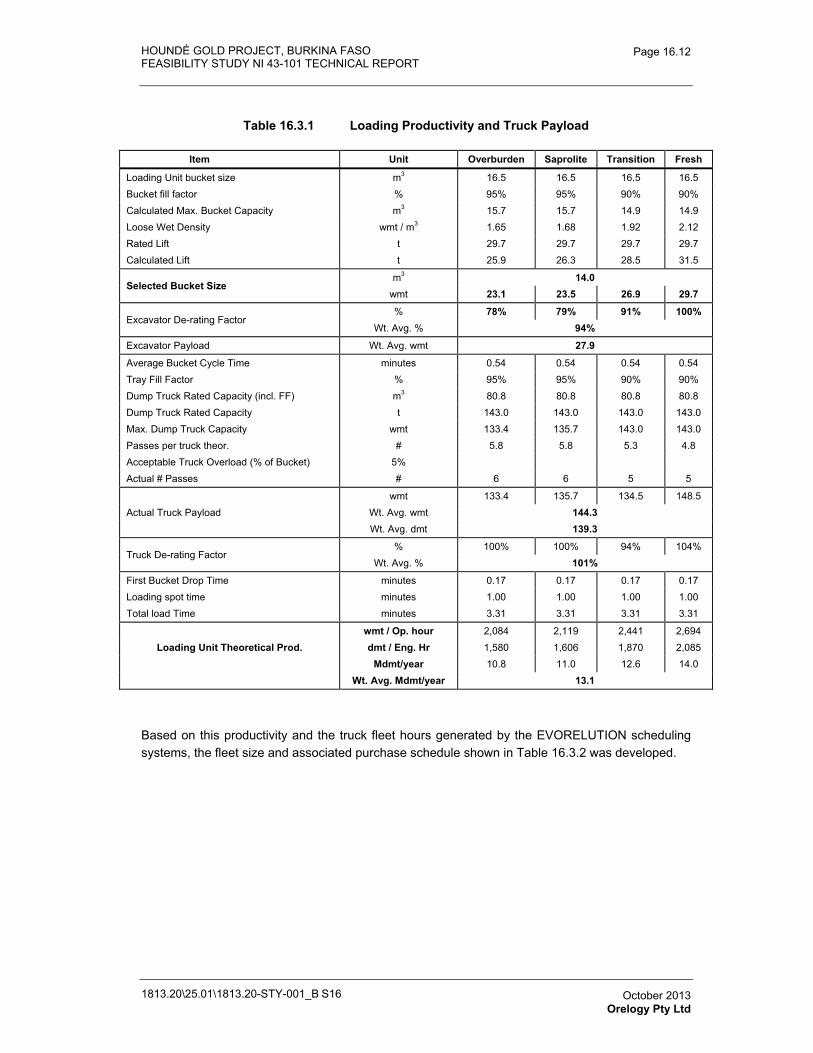
HOUNDÉ GOLD PROJECT, BURKINA FASO FEASIBILITY STUDY NI 43-101 TECHNICAL REPORT
1813.20\25.01\1813.20-STY-001_B S16
Page 16.12
October 2013 Orelogy Pty Ltd
Table 16.3.1 Loading Productivity and Truck Payload
Item Unit Overburden Saprolite Transition Fresh
Loading Unit bucket size m3 16.5 16.5 16.5 16.5 Bucket fill factor % 95% 95% 90% 90% Calculated Max. Bucket Capacity m3 15.7 15.7 14.9 14.9 Loose Wet Density wmt / m3 1.65 1.68 1.92 2.12 Rated Lift t 29.7 29.7 29.7 29.7 Calculated Lift t 25.9 26.3 28.5 31.5
Selected Bucket Size m3 14.0
wmt 23.1 23.5 26.9 29.7
Excavator De-rating Factor % 78% 79% 91% 100%
Wt. Avg. % 94%
Excavator Payload Wt. Avg. wmt 27.9
Average Bucket Cycle Time minutes 0.54 0.54 0.54 0.54 Tray Fill Factor % 95% 95% 90% 90% Dump Truck Rated Capacity (incl. FF) m3 80.8 80.8 80.8 80.8 Dump Truck Rated Capacity t 143.0 143.0 143.0 143.0 Max. Dump Truck Capacity wmt 133.4 135.7 143.0 143.0 Passes per truck theor. # 5.8 5.8 5.3 4.8 Acceptable Truck Overload (% of Bucket) 5% Actual # Passes # 6 6 5 5
Actual Truck Payload wmt 133.4 135.7 134.5 148.5
Wt. Avg. wmt 144.3Wt. Avg. dmt 139.3
Truck De-rating Factor % 100% 100% 94% 104%
Wt. Avg. % 101%
First Bucket Drop Time minutes 0.17 0.17 0.17 0.17 Loading spot time minutes 1.00 1.00 1.00 1.00 Total load Time minutes 3.31 3.31 3.31 3.31
Loading Unit Theoretical Prod. wmt / Op. hour 2,084 2,119 2,441 2,694 dmt / Eng. Hr 1,580 1,606 1,870 2,085
Mdmt/year 10.8 11.0 12.6 14.0 Wt. Avg. Mdmt/year 13.1
Based on this productivity and the truck fleet hours generated by the EVORELUTION scheduling systems, the fleet size and associated purchase schedule shown in Table 16.3.2 was developed.
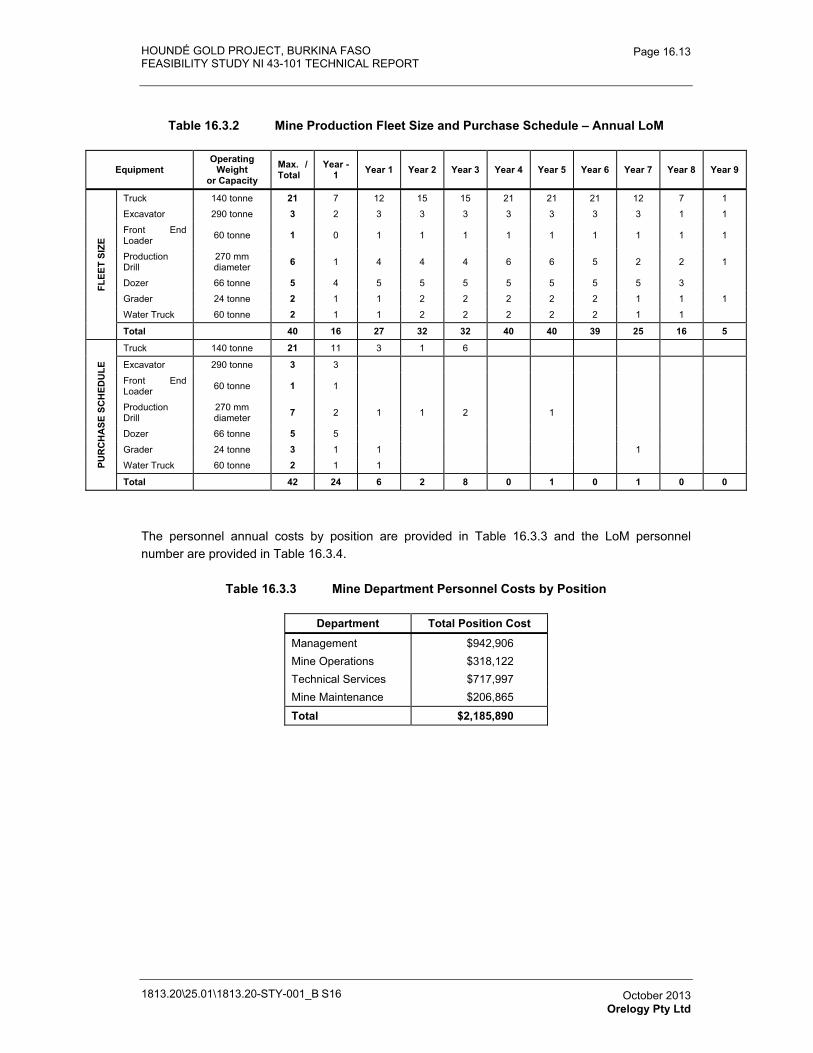
HOUNDÉ GOLD PROJECT, BURKINA FASO FEASIBILITY STUDY NI 43-101 TECHNICAL REPORT
1813.20\25.01\1813.20-STY-001_B S16
Page 16.13
October 2013 Orelogy Pty Ltd
Table 16.3.2 Mine Production Fleet Size and Purchase Schedule – Annual LoM
Equipment Operating
Weight or Capacity
Max. / Total
Year -1 Year 1 Year 2 Year 3 Year 4 Year 5 Year 6 Year 7 Year 8 Year 9
FLEE
T SI
ZE
Truck 140 tonne 21 7 12 15 15 21 21 21 12 7 1
Excavator 290 tonne 3 2 3 3 3 3 3 3 3 1 1
Front End Loader 60 tonne 1 0 1 1 1 1 1 1 1 1 1
Production Drill
270 mm diameter 6 1 4 4 4 6 6 5 2 2 1
Dozer 66 tonne 5 4 5 5 5 5 5 5 5 3
Grader 24 tonne 2 1 1 2 2 2 2 2 1 1 1
Water Truck 60 tonne 2 1 1 2 2 2 2 2 1 1
Total 40 16 27 32 32 40 40 39 25 16 5
PUR
CH
ASE
SC
HED
ULE
Truck 140 tonne 21 11 3 1 6
Excavator 290 tonne 3 3
Front End Loader 60 tonne 1 1
Production Drill
270 mm diameter 7 2 1 1 2 1
Dozer 66 tonne 5 5
Grader 24 tonne 3 1 1 1
Water Truck 60 tonne 2 1 1
Total 42 24 6 2 8 0 1 0 1 0 0
The personnel annual costs by position are provided in Table 16.3.3 and the LoM personnel number are provided in Table 16.3.4.
Table 16.3.3 Mine Department Personnel Costs by Position
Department Total Position Cost
Management $942,906 Mine Operations $318,122 Technical Services $717,997 Mine Maintenance $206,865
Total $2,185,890
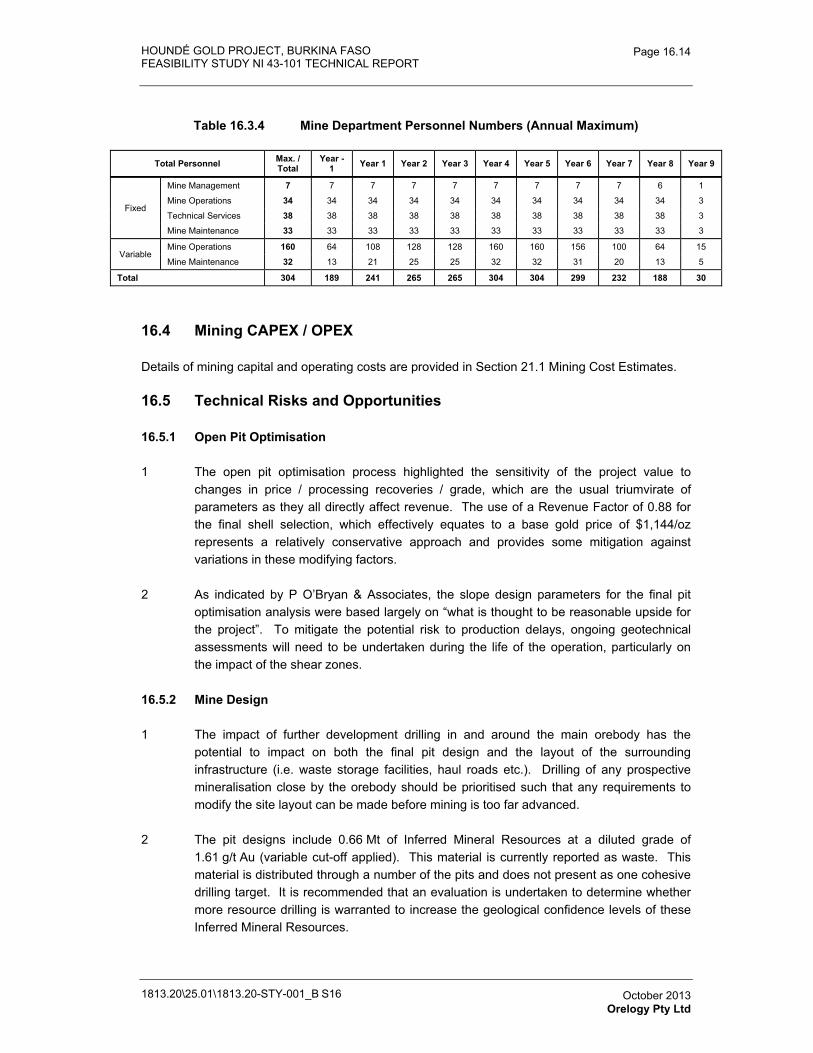
HOUNDÉ GOLD PROJECT, BURKINA FASO FEASIBILITY STUDY NI 43-101 TECHNICAL REPORT
1813.20\25.01\1813.20-STY-001_B S16
Page 16.14
October 2013 Orelogy Pty Ltd
Table 16.3.4 Mine Department Personnel Numbers (Annual Maximum)
Total Personnel Max. / Total
Year -1 Year 1 Year 2 Year 3 Year 4 Year 5 Year 6 Year 7 Year 8 Year 9
Fixed
Mine Management 7 7 7 7 7 7 7 7 7 6 1
Mine Operations 34 34 34 34 34 34 34 34 34 34 3
Technical Services 38 38 38 38 38 38 38 38 38 38 3
Mine Maintenance 33 33 33 33 33 33 33 33 33 33 3
Variable Mine Operations 160 64 108 128 128 160 160 156 100 64 15
Mine Maintenance 32 13 21 25 25 32 32 31 20 13 5
Total 304 189 241 265 265 304 304 299 232 188 30
16.4 Mining CAPEX / OPEX
Details of mining capital and operating costs are provided in Section 21.1 Mining Cost Estimates.
16.5 Technical Risks and Opportunities
16.5.1 Open Pit Optimisation
1 The open pit optimisation process highlighted the sensitivity of the project value to changes in price / processing recoveries / grade, which are the usual triumvirate of parameters as they all directly affect revenue. The use of a Revenue Factor of 0.88 for the final shell selection, which effectively equates to a base gold price of $1,144/oz represents a relatively conservative approach and provides some mitigation against variations in these modifying factors.
2 As indicated by P O’Bryan & Associates, the slope design parameters for the final pit optimisation analysis were based largely on “what is thought to be reasonable upside for the project”. To mitigate the potential risk to production delays, ongoing geotechnical assessments will need to be undertaken during the life of the operation, particularly on the impact of the shear zones.
16.5.2 Mine Design
1 The impact of further development drilling in and around the main orebody has the potential to impact on both the final pit design and the layout of the surrounding infrastructure (i.e. waste storage facilities, haul roads etc.). Drilling of any prospective mineralisation close by the orebody should be prioritised such that any requirements to modify the site layout can be made before mining is too far advanced.
2 The pit designs include 0.66 Mt of Inferred Mineral Resources at a diluted grade of 1.61 g/t Au (variable cut-off applied). This material is currently reported as waste. This material is distributed through a number of the pits and does not present as one cohesive drilling target. It is recommended that an evaluation is undertaken to determine whether more resource drilling is warranted to increase the geological confidence levels of these Inferred Mineral Resources.
HOUNDÉ GOLD PROJECT, BURKINA FASO FEASIBILITY STUDY NI 43-101 TECHNICAL REPORT
1813.20\25.01\1813.20-STY-001_B S16
Page 16.15
October 2013 Orelogy Pty Ltd
16.5.3 Mine Scheduling
1 Re-optimise the waste development sequence to align with the mine lease boundaries.
2 Conduct sterilisation drilling of the Koho mineralisation on the east side of Vindaloo Main before the 2nd quarter of Year 2; prior to commencing waste dump construction of the Vindaloo Main East WSF.
3 Bring a minimal amount of waste forward in Years 1 to 3 in order to:
a. Reduce the vertical advance rate in Year 7 in the Vindaloo 2 pit.
b. Reduce the TMM to within the capacity of the primary loading fleet over the Year 4 to Year 5 period when the 992 FEL is required to undertake some primary loading of pit waste.
4 Conduct evaluation into the effect of the single lane ramps on traffic congestion.
16.5.4 Cost Estimation
1 More detailed due diligence of competitive mining equipment should be undertaken and more detailed budget estimates obtained before a final OEM is selected. The decision should not be based on cost alone but should include assessment of:
a. In-country track record and support personnel / facilities.
b. Number of units in operation in Burkina Faso, Africa and world-wide.
c. Performance guarantees and availability of spares.
2 The potential to purchase second-hand equipment, particularly for the trucks that are required mid-life, should be investigated.
3 A 51 minute working hour has been selected for cost estimation purposes. This is on the basis that Endeavour will be able to source and train a competent and skilled workforce from start-up. Additional funds were specifically allocated to training to improve mine team safety and efficiencies.
4 As owner / operator, securing a long term supply for fuel and tires is of critical importance.
5 Personnel costs currently constitute an extremely low proportion of the overall mining costs (<9%). Should the mining industry in Burkina Faso expand over the next few years, as is predicted, then the associated competiveness for skilled staff may well increase this cost.
HOUNDÉ GOLD PROJECT, BURKINA FASO
FEASIBILITY STUDY NI 43-101 TECHNICAL REPORT
1813.20-STY-001
Table of Contents Page
17.0� RECOVERY METHODS 17.1�17.1� Process Selection 17.1�
17.1.1� Selected Process Flowsheet 17.1�17.1.2� Key Process Design Criteria 17.2�
17.2� Process and Plant Description 17.4�17.3� Control Philosophy 17.9�
TABLESTable 17.1.1� Summary of Key Process Design Criteria 17.2�
FIGURESFigure 17.1.1� Houndé Preliminary Simplified Flowsheet 17.3�
1813.20\25.01\1813.20-STY-001_B S17 October 2013 Lycopodium Minerals Pty Ltd
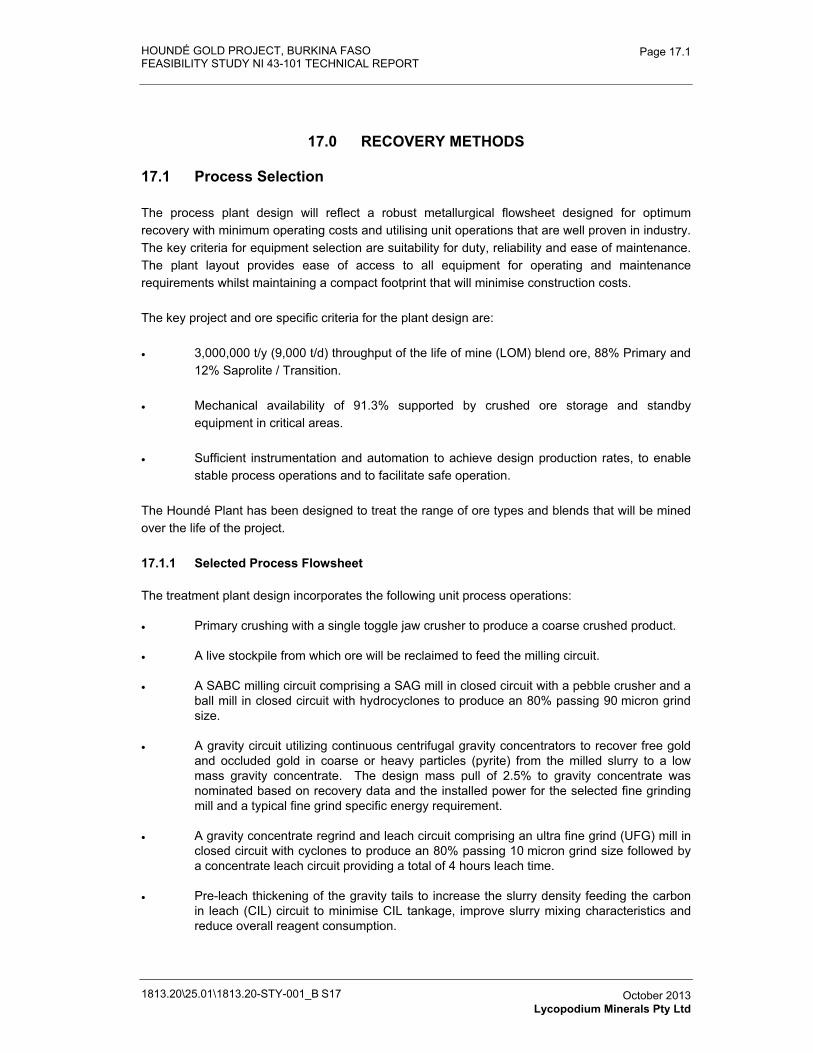
HOUNDÉ GOLD PROJECT, BURKINA FASO FEASIBILITY STUDY NI 43-101 TECHNICAL REPORT
1813.20\25.01\1813.20-STY-001_B S17
Page 17.1
October 2013 Lycopodium Minerals Pty Ltd
17.0 RECOVERY METHODS
17.1 Process Selection
The process plant design will reflect a robust metallurgical flowsheet designed for optimum recovery with minimum operating costs and utilising unit operations that are well proven in industry. The key criteria for equipment selection are suitability for duty, reliability and ease of maintenance. The plant layout provides ease of access to all equipment for operating and maintenance requirements whilst maintaining a compact footprint that will minimise construction costs.
The key project and ore specific criteria for the plant design are:
� 3,000,000 t/y (9,000 t/d) throughput of the life of mine (LOM) blend ore, 88% Primary and 12% Saprolite / Transition.
� Mechanical availability of 91.3% supported by crushed ore storage and standby equipment in critical areas.
� Sufficient instrumentation and automation to achieve design production rates, to enable stable process operations and to facilitate safe operation.
The Houndé Plant has been designed to treat the range of ore types and blends that will be mined over the life of the project.
17.1.1 Selected Process Flowsheet
The treatment plant design incorporates the following unit process operations:
� Primary crushing with a single toggle jaw crusher to produce a coarse crushed product.
� A live stockpile from which ore will be reclaimed to feed the milling circuit.
� A SABC milling circuit comprising a SAG mill in closed circuit with a pebble crusher and a ball mill in closed circuit with hydrocyclones to produce an 80% passing 90 micron grind size.
� A gravity circuit utilizing continuous centrifugal gravity concentrators to recover free gold and occluded gold in coarse or heavy particles (pyrite) from the milled slurry to a low mass gravity concentrate. The design mass pull of 2.5% to gravity concentrate was nominated based on recovery data and the installed power for the selected fine grinding mill and a typical fine grind specific energy requirement.
� A gravity concentrate regrind and leach circuit comprising an ultra fine grind (UFG) mill in closed circuit with cyclones to produce an 80% passing 10 micron grind size followed by a concentrate leach circuit providing a total of 4 hours leach time.
� Pre-leach thickening of the gravity tails to increase the slurry density feeding the carbon in leach (CIL) circuit to minimise CIL tankage, improve slurry mixing characteristics and reduce overall reagent consumption.
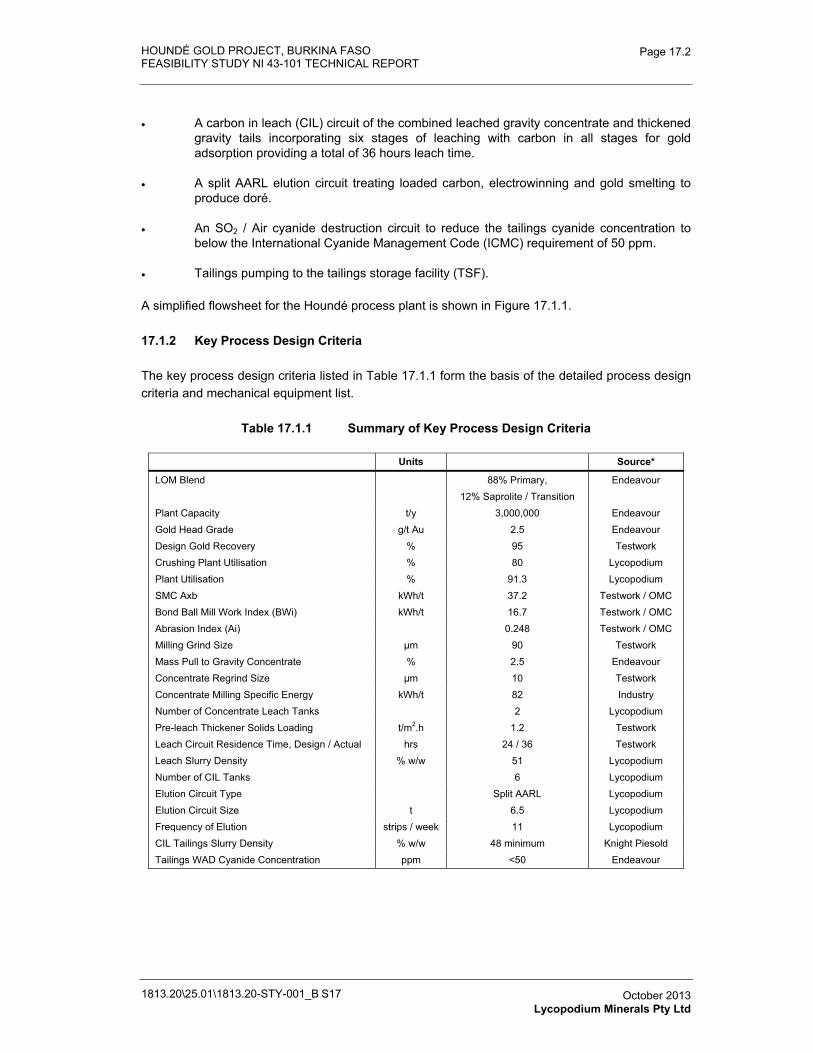
HOUNDÉ GOLD PROJECT, BURKINA FASO FEASIBILITY STUDY NI 43-101 TECHNICAL REPORT
1813.20\25.01\1813.20-STY-001_B S17
Page 17.2
October 2013 Lycopodium Minerals Pty Ltd
� A carbon in leach (CIL) circuit of the combined leached gravity concentrate and thickened gravity tails incorporating six stages of leaching with carbon in all stages for gold adsorption providing a total of 36 hours leach time.
� A split AARL elution circuit treating loaded carbon, electrowinning and gold smelting to produce doré.
� An SO2 / Air cyanide destruction circuit to reduce the tailings cyanide concentration to below the International Cyanide Management Code (ICMC) requirement of 50 ppm.
� Tailings pumping to the tailings storage facility (TSF).
A simplified flowsheet for the Houndé process plant is shown in Figure 17.1.1.
17.1.2 Key Process Design Criteria
The key process design criteria listed in Table 17.1.1 form the basis of the detailed process design criteria and mechanical equipment list.
Table 17.1.1 Summary of Key Process Design Criteria
Units Source*
LOM Blend 88% Primary, 12% Saprolite / Transition
Endeavour
Plant Capacity t/y 3,000,000 Endeavour Gold Head Grade g/t Au 2.5 Endeavour Design Gold Recovery % 95 Testwork Crushing Plant Utilisation % 80 Lycopodium Plant Utilisation % 91.3 Lycopodium SMC Axb kWh/t 37.2 Testwork / OMC Bond Ball Mill Work Index (BWi) kWh/t 16.7 Testwork / OMC Abrasion Index (Ai) 0.248 Testwork / OMC Milling Grind Size μm 90 Testwork Mass Pull to Gravity Concentrate % 2.5 Endeavour Concentrate Regrind Size μm 10 Testwork Concentrate Milling Specific Energy kWh/t 82 Industry Number of Concentrate Leach Tanks 2 Lycopodium Pre-leach Thickener Solids Loading t/m2.h 1.2 Testwork Leach Circuit Residence Time, Design / Actual hrs 24 / 36 Testwork Leach Slurry Density % w/w 51 Lycopodium Number of CIL Tanks 6 Lycopodium Elution Circuit Type Split AARL Lycopodium Elution Circuit Size t 6.5 Lycopodium Frequency of Elution strips / week 11 Lycopodium CIL Tailings Slurry Density % w/w 48 minimum Knight Piesold Tailings WAD Cyanide Concentration ppm <50 Endeavour
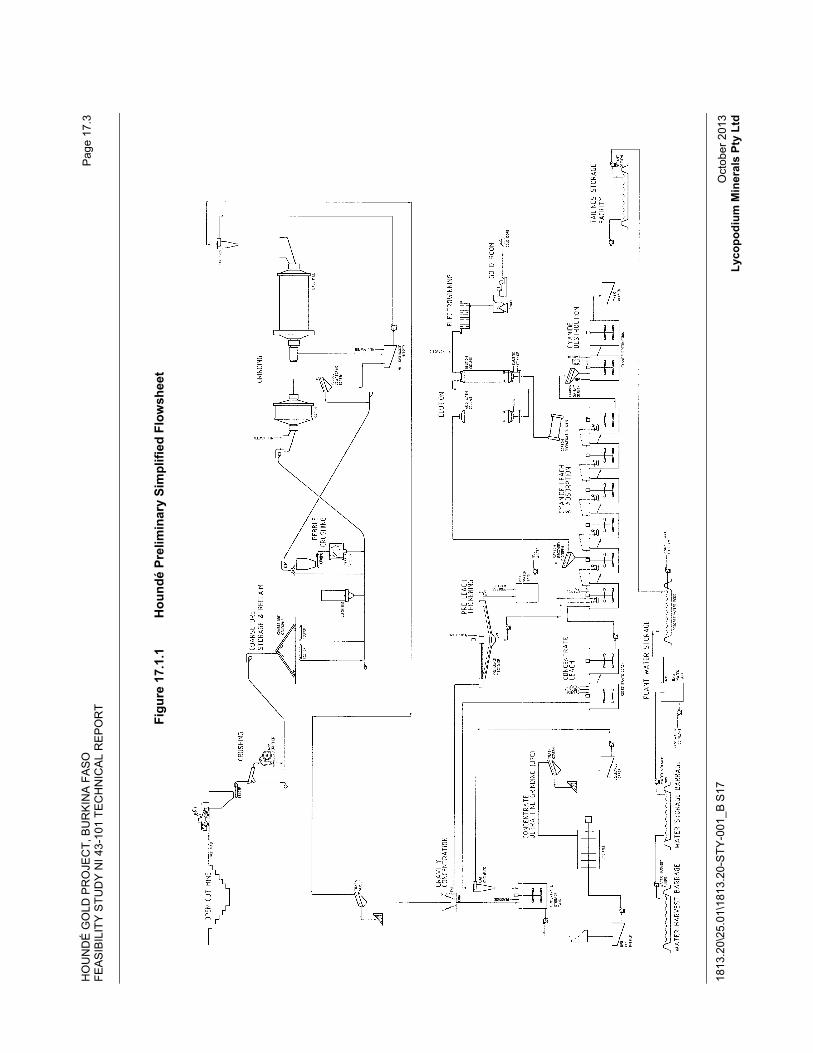
HO
UN
DÉ
GO
LD P
RO
JEC
T, B
UR
KIN
A F
AS
O
FEA
SIB
ILIT
Y S
TUD
Y N
I 43-
101
TEC
HN
ICA
L R
EP
OR
T
1813
.20\
25.0
1\18
13.2
0-S
TY-0
01_B
S17
Pag
e 17
.3
Oct
ober
201
3 Ly
copo
dium
Min
eral
s Pt
y Lt
d
Figu
re 1
7.1.
1 H
ound
é Pr
elim
inar
y Si
mpl
ified
Flo
wsh
eet
HOUNDÉ GOLD PROJECT, BURKINA FASO FEASIBILITY STUDY NI 43-101 TECHNICAL REPORT
1813.20\25.01\1813.20-STY-001_B S17
Page 17.4
October 2013 Lycopodium Minerals Pty Ltd
17.2 Process and Plant Description
17.2.1 ROM Pad
The Run of Mine (ROM) pad will be used to provide a buffer between the mine and the plant. The ROM stockpile will allow blending of ore feed stocks, and will ensure a consistent feed type and feed rate to the plant. ROM ore will be loaded into the crushing circuit feed bin (ROM bin) by direct tipping from the mining haul trucks or by front end loader (FEL).
17.2.2 Crushing and Grinding Circuit
ROM ore will be drawn from the ROM bin at a controlled rate by an apron feeder and discharged onto a vibrating grizzly. The grizzly oversize will report to the jaw crusher for primary crushing. The jaw crusher product together with grizzly undersize will report to the primary crusher discharge conveyor feeding directly to the crushed ore stockpile.
Ore will be withdrawn from the coarse ore stockpile and fed via the mill feed conveyor to the SAG mill. Lime and SAG mill grinding media will be added to the mill feed conveyor as required.
The grinding circuit will consist of a SAG mill in open circuit, a pebble crusher and a ball mill in closed circuit with hydrocyclones.
The SAG mill will discharge via a pebble dewatering screen, and oversize consisting of pebbles and worn steel grinding media, will discharge onto the pebble transfer conveyor. Worn media will be removed by a magnet and pebbles will be crushed in the pebble crusher and will report back to the SAG mill conveyor. The screen undersize will gravitate to the mill discharge hopper and will be pumped to the hydrocyclone cluster for size classification.
The cyclone underflow (coarse material) will report to the ball mill feed chute for further grinding. The cyclone overflow (product size material) will gravitate to the trash screens prior to gravity concentration and leaching.
17.2.3 Trash Screening
Cyclone overflow will gravitate to two trash screen located in the CIL area for removal of trash material and coarse particles. The underflow of the trash screens will gravitate to the gravity circuit for gravity concentration.
17.2.4 Gravity Circuit
Milled and screened slurry will report to the gravity circuit where it will be treated by centrifugal gravity concentrators to recover the free coarse gold and gold associated with coarse sulphide and silicate particles. The low mass gravity concentrate (2 to 3% of feed tonnage) will report to the concentrate UFG circuit and the gravity tails will report to pre-leach thickening.
HOUNDÉ GOLD PROJECT, BURKINA FASO FEASIBILITY STUDY NI 43-101 TECHNICAL REPORT
1813.20\25.01\1813.20-STY-001_B S17
Page 17.5
October 2013 Lycopodium Minerals Pty Ltd
17.2.5 Gravity Concentrate Treatment
The gravity concentrate treatment circuit will consist of a UFG mill in closed circuit with hydrocyclones and a concentrate leach circuit.
The gravity concentrate will gravitate to the concentrate storage tank which will provide a buffer for the UFG circuit. Provision will be made to add peroxide solution to the concentrate storage tank. UFG feed slurry will be pumped to the UFG mill for fine grinding. The ground slurry will be diluted and pumped to the UFG cyclones for classification. The UFG cyclone underflow (material requiring further grinding) will report to the concentrate storage tank for further grinding. The UFG cyclone overflow (reground concentrate size material) will gravitate to the concentrate leach tanks.
The concentrate leach circuit will consist of two leach tanks providing 4 hours residence time. Caustic and peroxide solutions will be added to ensure that the slurry pH (caustic) and dissolved oxygen level (peroxide) is suitable for cyanidation. Sodium cyanide solution will be metered into the leach circuit and air from dedicated blowers will be sparged down the shafts of the leach agitators to provide oxygen to the leach slurry.
Leached concentrate will be pumped to the CIL circuit for gold adsorption as well as using any residual sodium cyanide in the concentrate slurry.
17.2.6 Pre-leach Thickening
Tails from the gravity circuit will be thickened in a high rate thickener prior to CIL. The thickener feed slurry will be mixed with flocculant and will report to the pre-leach thickener.
The thickened slurry (thickener underflow) will be pumped to CIL and the thickener overflow will gravitate to the adjacent mill water tank and will be distributed as dilution water to the milling and UFG circuits. Process water from the process water pond will be added to the mill water tank to balance mill water requirements.
17.2.7 Leach and Adsorption Circuit
The adsorption circuit will consist of six CIL adsorption tanks providing 36 hours residence time (the minimum 24 hours required by the testwork can still be achieved if the thickener is by-passed). The tanks will be interconnected with launders and slurry will flow by gravity through the tank train.
Pre-leach thickener underflow and leached concentrate will be combined as CIL feed. Quicklime added to the mill feed conveyor will ensure that the slurry pH is suitable for cyanidation and sodium cyanide solution will be metered into the CIL circuit. Air from dedicated blowers will be sparged down the shafts of the CIL agitators to provide oxygen to the leach slurry.
Barren activated carbon will be added to the last tank and advanced counter current to the slurry flow. The leached gold will adsorb onto the carbon and be removed from the CIL slurry. Carbon loaded with gold (loaded carbon) will be recovered from the CIL slurry via the loaded carbon recovery screen and will report to the elution circuit.
HOUNDÉ GOLD PROJECT, BURKINA FASO FEASIBILITY STUDY NI 43-101 TECHNICAL REPORT
1813.20\25.01\1813.20-STY-001_B S17
Page 17.6
October 2013 Lycopodium Minerals Pty Ltd
Slurry from the last CIL tank (CIL tails) will gravitate via the carbon safety screen to the cyanide destruction circuit.
17.2.8 Elution and Gold Recovery
The following operations will be carried out in the elution and goldroom areas:
� Acid washing of loaded carbon.
� Stripping (elution) of gold from loaded carbon using the split AARL method.
� Electrowinning of gold from pregnant solution.
� Smelting of electrowinning products.
� Regeneration of barren carbon.
Loaded carbon will be washed with a dilute acid solution to remove contaminants prior to being rinsed with water. The loaded carbon will be eluted with a hot dilute cyanide / caustic solution which will recover the gold from the carbon into the solution. The gold solution (pregnant solution) will be pumped through electrowinning cells and the gold will be recovered onto the cell cathodes. The gold will be removed from the cathodes by high pressure water jets with the gold sludge being filtered and dried prior to smelting with fluxes in a furnace to produce doré bars.
Eluted carbon (barren carbon) will be transferred to the carbon regeneration kiln for reactivation prior to re-use in the CIL circuit.
17.2.9 Cyanide Destruction
Endeavour Mining Corporation is committed to meeting or exceeding the ICMC requirements. An SO2 / air cyanide destruction circuit will be utilised to meet this requirement. The SO2 / air destruction circuit will reduce the weak acid dissociable cyanide (CNWAD) in the slurry discharged from the CIL circuit to less than 50 mg/L prior to pumping to the TSF.
The cyanide destruction circuit will consist of two tanks providing one hour residence time. The tanks will be interconnected with launders to allow the circuit to be run in parallel or series.
Underflow from the CIL circuit carbon safety screen will gravitate to the cyanide destruction circuit. Copper sulphate and sodium metabisulphite (SMBS) solutions will be added to provide the required copper and sulphur dioxide for the cyanide destruction process. Air from dedicated blowers will be sparged down the shafts of the cyanide destruction agitators to provide oxygen to the slurry. Provision will be made for caustic solution to be added to maintain a slurry pH 8.0 to 9.0.
Treated tailings will gravitate to the tailings tank and will be pumped to the TSF.
HOUNDÉ GOLD PROJECT, BURKINA FASO FEASIBILITY STUDY NI 43-101 TECHNICAL REPORT
1813.20\25.01\1813.20-STY-001_B S17
Page 17.7
October 2013 Lycopodium Minerals Pty Ltd
17.2.10 Tails Disposal
Tailings will be deposited into the TSF using established discharge and decant methods. The supernatant water will be directed to a pond and will be pumped to the process plant for re-use.
17.2.11 Reagents
Reagents will be stored on site to ensure that supply interruptions do not restrict production. The following reagents will be used in the process:
Quicklime – Quicklime powder will be delivered in bulk bags and unloaded into the lime silo. Quicklime will be metered onto the mill feed conveyor for CIL circuit pH control.
Cyanide - Cyanide will be delivered as dry briquettes in bulk bags. The cyanide will be dissolved by mixing with process water and transferred to a storage tank. Cyanide solution will be metered to the concentrate leach and CIL circuit for gold leaching and to the elution circuit for stripping gold from the loaded carbon.
Caustic Soda - Caustic soda (sodium hydroxide) will be delivered as dry 'pearl' pellets in bulk bags. The caustic will be dissolved by mixing with filtered raw water and caustic solution will be metered into the elution circuit for stripping gold from the loaded carbon and to the concentrate leach and cyanide destruction circuits for pH control.
Hydrochloric Acid - Concentrated hydrochloric acid will be delivered in drums. The acid will be diluted with filtered raw water and metered into the elution circuit for acid washing of the loaded carbon.
Activated Carbon - Activated carbon will be delivered in bulk bags and will be added to the carbon quench tank for barren carbon make-up to the CIL circuit.
Grinding Media – SAG and ball mill steel grinding balls will be delivered in drums. UFG mill ceramic media will be delivered in bulk bags. Media for the SAG mill will be loaded onto the mill feed conveyor via the plant cleanup hopper. Ball mill grinding media will be loaded into ball loading kibbles and lifted to the ball mill feed chute. UFG media will be educted into the UFG mill via the media hopper.
Flocculant - Flocculant powder will be delivered in bulk bags and will be mixed with process water and transferred to a storage tank. Flocculant solution will be metered to the pre-leach thickener as required.
Hydrogen Peroxide – Hydrogen peroxide solution will be delivered in isotainers and will be metered to the gravity concentrate treatment circuit by dosing pumps as required.
Sodium Metabisulphite – SMBS powder will be delivered in bulk bags and will be mixed with filtered raw water and transferred to a storage tank. SMBS solution will be metered to the cyanide destruction circuit by dosing pumps as required to meet ICMC requirements.
HOUNDÉ GOLD PROJECT, BURKINA FASO FEASIBILITY STUDY NI 43-101 TECHNICAL REPORT
1813.20\25.01\1813.20-STY-001_B S17
Page 17.8
October 2013 Lycopodium Minerals Pty Ltd
Copper Sulphate – Copper sulphate will be delivered in 25 kg bags and will be mixed with filtered raw water. Copper sulphate solution will be metered to the cyanide destruction circuit by dosing pumps as required to meet ICMC requirements.
Fluxes – Sodium borate (borax), silica flour, sodium nitrate (nitre) and sodium carbonate (soda ash) are used as fluxes for gold smelting. The fluxes are delivered in 25 kg bags and mixed in small quantities with the gold sludge prior to smelting.
17.2.12 Services
The following plant services will be provided:
Raw Water - Raw water from the water harvest dam and /or the water storage dam will be pumped to the plant raw water tank. Raw water will be pumped to the plant as required. The pit dewatering “Turkeys Nest” pond will also be connected to the plant raw water system, either to receive excess water or provide water for dust suppression.
Process Water - Process water will consist of the pre-leach thickener overflow, TSF decant return water with raw water make-up as required. Pre-leach thickener overflow will gravitate to the mill water tank and will be recycled to the milling circuit. TSF decant return water with raw water make-up will be stored in the plant process water tank and will be pumped as required as make up water to the mill water tank and for use in the plant.
Filtered Water - Raw water from the raw water tank will be treated in the filtered water treatment plant and report to the filtered water storage tank for use in the process plant.
Gland Water - Filtered raw water from the filtered water storage tank will be used as gland service water.
Fire Water - Fire water for the process plant will be sourced from the raw water tank. The fire water suction from the raw water tank will be at a lower level than the raw water supply suction to ensure a fire water reserve always remains in the tank. A backup diesel driven fire water pump will be provided in addition to the electric fire water pump.
Potable Water - Raw water will be treated in the potable water treatment plant (filtration, chlorination and ultraviolet sterilisation) and will be stored in the potable water tank. Potable water will be distributed to the plant for use in the site ablutions, safety showers and other potable water outlets.
Cooling Water - Filtered water will be pumped to the milling lubrication system heat exchangers. Single pass open circuit cooling will be used to remove heat from the lubrication system with discharge of the cooling water to the raw water tank.
CIL Air Supply - CIL air will be supplied by dedicated air blowers and will be reticulated to the concentrate leach tanks and the CIL tanks.
Cyanide Destruction Air Supply – Oxygen for the cyanide destruction process will be supplied by dedicated air blowers and will be reticulated to the cyanide destruction tanks.
HOUNDÉ GOLD PROJECT, BURKINA FASO FEASIBILITY STUDY NI 43-101 TECHNICAL REPORT
1813.20\25.01\1813.20-STY-001_B S17
Page 17.9
October 2013 Lycopodium Minerals Pty Ltd
Plant and Instrument Air Supply - Plant and instrument air will be supplied from air compressors and will be filtered and dried before distribution with separate plant and instrument air receivers.
17.3 Control Philosophy
The general control philosophy for the plant is to provide a moderate level of automation and remote control facilities. Instrumentation will be provided within the plant to measure and control key process parameters, while still requiring manual inspection of equipment before starting.
The main control room will house two PC based operator interface terminals (OIT). Both of the OITs will act as the control system supervisory control and data acquisition (SCADA) servers as well as configuration / operator stations. The control room is intended to provide a central area from where the plant is operated and monitored and from which the regulatory control loops can be monitored and adjusted. All key process and maintenance parameters will be available for trending and alarming on the process control system (PCS).
The process control system that will be used for the plant will be a programmable logic controller (PLC) based SCADA system. The PCS will control the process interlocks and PID control loops for non-packaged equipment. Control loop set-point changes for non-packaged equipment will be made at the OIT.
In general, the plant process drives will report their ready, run and start pushbutton status to the PCS and will be displayed on the OIT. Local control stations will be located in the field in proximity to the relevant drives. These will, as a minimum, contain start and latch-off-stop (LOS) push-buttons which will be hard-wired to the drive starter. Plant drives will predominantly be started by an operator in the field after inspecting the local equipment.
The OITs will allow drives to be selected to Local or Remote or Maintenance modes via the drive control popup. Statutory interlocks such as emergency stops and thermal protection will be hardwired and will apply in all three modes of operation. All PLC generated process interlocks will apply in Local and Remote modes. Process interlocks will be disabled or bypassed in Maintenance mode with the exception of critical interlocks such as lubrication systems on the mill.
Local selection will allow each drive to be operated by the operator in the field via the local start pushbutton which is connected to a PLC input. Remote selection will allow the equipment to be started from the control room via the drive control popup. Maintenance selection will allow each drive to be operated by maintenance personnel in the field via the local start push-button which is connected to a PLC input. A PLC output will be wired to each drive starter circuit for starting and stopping drives. Status indication of process interlocks as well as the selected mode of operation will be displayed on the OIT.
Vendor supplied packages will use vendor standard control systems throughout the project. Vendor packages will generally be operated locally with limited control or set-point changes from the PCS system. General equipment fault alarms from each vendor package will be monitored by the PCS system and displayed on the OIT. Fault diagnostics and troubleshooting of vendor packages will be performed locally.
HOUNDÉ GOLD PROJECT, BURKINA FASO
FEASIBILITY STUDY NI 43-101 TECHNICAL REPORT
1813.20-STY-001
Table of Contents Page
18.0� PROJECT INFRASTRUCTURE 18.1�18.1� Overall Site Development 18.1�18.2� Roads 18.3�
18.2.1� Road Types 18.3�18.2.2� Access to Site 18.3�18.2.3� Project Site Roads 18.3�
18.3� Rail Connections 18.4�18.4� Port Facilities 18.5�18.5� Water Supply 18.5�
18.5.1� Water Demand 18.5�18.5.2� Decant From Tailings Storage Facility 18.5�18.5.3� Groundwater Investigation 18.5�18.5.4� Surface Water 18.6�
18.6� Tailings Storage Facility (TSF) 18.7�18.6.1� Capacity and Location 18.7�18.6.2� Design Considerations 18.7�18.6.3� Geotechnical 18.8�18.6.4� Operation 18.9�
18.7� Surface Water Management 18.12�18.7.1� Design Objectives 18.12�18.7.2� Diversion Structures 18.12�18.7.3� Collection and Control Structures 18.13�
18.8� Power Supply 18.13�18.9� Power Distribution 18.14�
18.9.1� Total Installed Load and Maximum Demand 18.15�18.9.2� Electrical Substation Buildings 18.15�18.9.3� 11 kV Switchboard 18.15�18.9.4� Power Factor Correction Capacitor 18.15�18.9.5� Internet Fibre Optic Line 18.15�
18.10� Pipelines 18.15�18.10.1� Tailings and Decant Return Pipelines 18.15�18.10.2� Water Supply Pipelines 18.16�
18.11� Fuel Supply 18.16�18.12� General Site Development 18.16�
18.12.1� Site Topography and Ground Conditions 18.16�18.13� Sewage and Solid Waste Management 18.16�
18.13.1� Sewage Treatment 18.16�18.13.2� Solid Wastes 18.17�
18.14� Explosive Storage and Handling 18.17�18.15� Accommodation Camp 18.17�18.16� Process Plant Facilities 18.17�
18.16.1� General 18.17�18.16.2� Mine Services Area Facilities 18.19�18.16.3� Plant Area 18.19�18.16.4� Other Support Facilities 18.20�
1813.20\25.01\1813.20-STY-001_B S18 October 2013 Lycopodium Minerals Pty Ltd
HOUNDÉ GOLD PROJECT, BURKINA FASO
FEASIBILITY STUDY NI 43-101 TECHNICAL REPORT
1813.20-STY-001
Table of Contents (Continued) Page
1813.20\25.01\1813.20-STY-001_B S18 October 2013 Lycopodium Minerals Pty Ltd
FIGURESFigure 18.1.1� Overall Site Layout – Drawing 110-G-001 18.2�Figure 18.5.1� TSF Final Stage General Arrangement 18.10�Figure 18.5.2� TSF Monitoring Bores Locations 18.11�Figure 18.16.1� Process Plant 18.18�
HOUNDÉ GOLD PROJECT, BURKINA FASO FEASIBILITY STUDY NI 43-101 TECHNICAL REPORT
1813.20\25.01\1813.20-STY-001_B S18
Page 18.1
October 2013 Lycopodium Minerals Pty Ltd
18.0 PROJECT INFRASTRUCTURE
18.1 Overall Site Development
The Houndé Project site development plan is shown in Drawing 110-G-001, included overleaf as Figure 18.1.1. The drawing shows the major features of the project and its infrastructure, including roads, power lines, tailings storage facilities, water dams, accommodation camp, mine and waste dump footprints and the process plant.
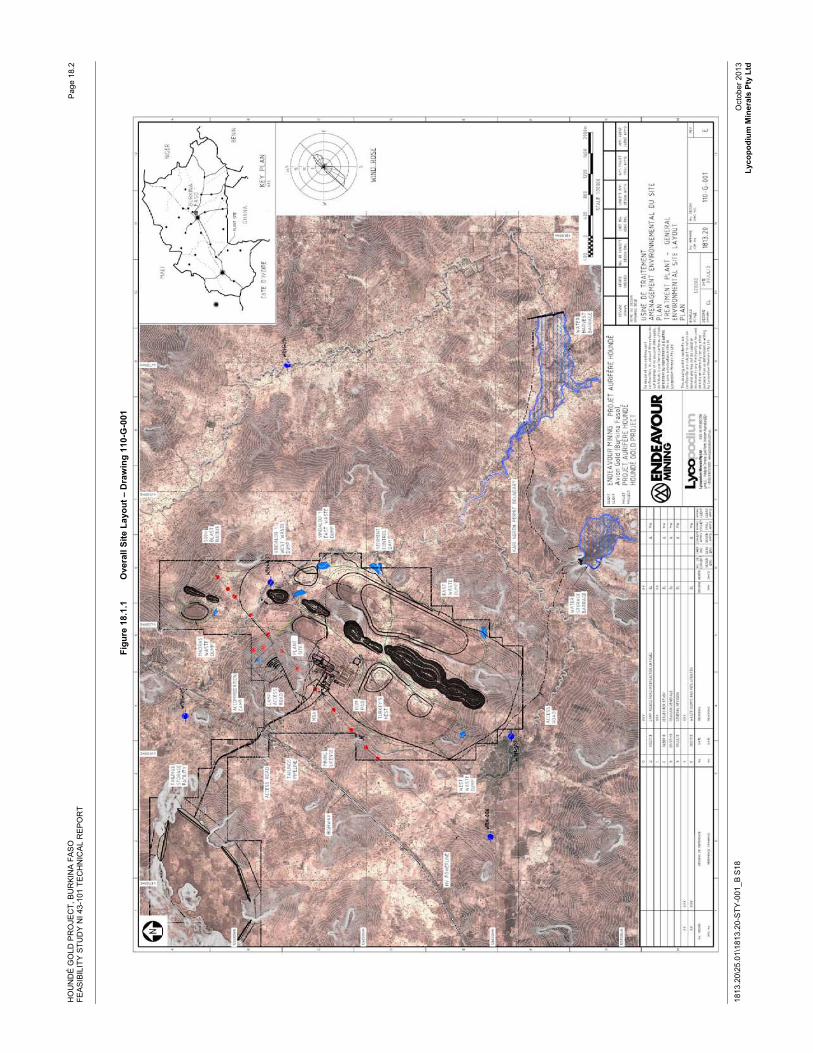
HO
UN
DÉ
GO
LD P
RO
JEC
T, B
UR
KIN
A F
AS
O
FEA
SIB
ILIT
Y S
TUD
Y N
I 43-
101
TEC
HN
ICA
L R
EP
OR
T
1813
.20\
25.0
1\18
13.2
0-S
TY-0
01_B
S18
Pag
e 18
.2
Oct
ober
201
3 Ly
copo
dium
Min
eral
s Pt
y Lt
d
Figu
re 1
8.1.
1 O
vera
ll Si
te L
ayou
t – D
raw
ing
110-
G-0
01
HOUNDÉ GOLD PROJECT, BURKINA FASO FEASIBILITY STUDY NI 43-101 TECHNICAL REPORT
1813.20\25.01\1813.20-STY-001_B S18
Page 18.3
October 2013 Lycopodium Minerals Pty Ltd
18.2 Roads
18.2.1 Road Types
A range of road types will be required to and within the Project site to meet a wide range of duties. The hierarchy of road types includes dedicated mine haul roads, main access roads, general access roads and minor use roads and tracks. Some of the roads will border service corridors, e.g. raw water supply pipe lines, or tailing pump line access. Hence, road alignments also need to consider service routes in addition to transport requirements.
The road widths and construction details have been selected to match the required duties. The respective details are described below. The total lengths of the main road types are:
� Mine haul roads Approximately 8.5 km.
� Main access roads Approximately 3.0 km.
� Plant roads Approximately 2.7 km.
� Access tracks Approximately 19 km.
Roads will generally follow existing tracks or contours where no direct route can be achieved with the aim to minimise disruption to local villages and crop fields.
Interpretation of the geotechnical test results and ground conditions suggests that the local soils are typically clayey / gravely silt with low plasticity and less than ideal for road pavement construction.
Laterite gravel material, to form the base course for minor roads and the sub-base for heavy use roads, will be sourced from borrow pits along the main roads within the purchased property area or within the open pit mine footprint. Suitable gravel borrow areas will be identified during the next phase of the Project.
18.2.2 Access to Site
Current road access to the plant site from the N1 Highway is on an unsealed track for 1.5 km – this will be upgraded, to a sealed, 9 m wide road. The proposed camp will be approximately 1 km from the main access road and will be a 7 m wide unsealed road.
18.2.3 Project Site Roads
Mine Haul Roads
Mine haul roads will be designed and constructed by the mining department to access the pits, waste dumps and ROM pad. The mining services facilities will be designed and built by the EPCM contractor.
HOUNDÉ GOLD PROJECT, BURKINA FASO FEASIBILITY STUDY NI 43-101 TECHNICAL REPORT
1813.20\25.01\1813.20-STY-001_B S18
Page 18.4
October 2013 Lycopodium Minerals Pty Ltd
Main Access Road
The 1.5 km section of access track will be reconstructed, widened, and sealed to form the main access road. The road will have a width of 9 m with two 3.5 m wide sealed lanes and 1 m shoulders. The road will follow the natural grade of the ground and designated crossing points for farm machinery, herding or walking will be provided near where current, well used trails exist.
The proposed road alignment passes under the 225 kV power line near to a cable tower in order to provide a clearance envelope of 10 to 12 m under the minimum 5.5 m clearance to the lowest power cable. A berm of waste rock will be placed to protect the tower base.
The intersection of the main access road with the N1 Highway, has been designed for a speed limit of 60 km/h, and will include a centre island with dedicated turning lanes for vehicles entering the main access road. Street lighting will be installed at the junction approaches to improve visibility and safety during night time.
Camp Access Road
The camp access road will be 7 m wide and will be constructed as an unsealed all-weather road with appropriate drainage provisions where necessary.
Plant Roads
Plant site internal roads will be 7 m wide and will be constructed flush with the bulk earthworks pad to ensure that storm water sheet flow is achieved across the site, avoiding the need for deep surface drains and culvert crossings within this area.
Access Tracks
A number of tracks will be constructed to access infrastructure such as the water storage facility, bore pumps and tailings dam which are remote from the plant site. These access tracks will generally follow the alignment of existing tracks and will be cleared and graded natural earth tracks. Pipeline routes will generally follow the access tracks.
18.3 Rail Connections
The main railway line between Abidjan, the chief port in Cote d’Ivoire, and Ouagadougou passes approximately 28 km to the north of the project site along the D40 main road heading north west from Houndé town. The station at Béréba services the local cotton producers, and with minor modifications would be suitable as a terminal to receive construction materials and equipment and ongoing operational supplies, especially those that can be containerized for security of shipment and ease of handling.
HOUNDÉ GOLD PROJECT, BURKINA FASO FEASIBILITY STUDY NI 43-101 TECHNICAL REPORT
1813.20\25.01\1813.20-STY-001_B S18
Page 18.5
October 2013 Lycopodium Minerals Pty Ltd
18.4 Port Facilities
The main ports serving project are Abidjan, in Cote d’Ivoire and Tema in Ghana. Both ports are connected to Burkina Faso by main roads and provide the prime entry point for importation of equipment and fabrications. Both ports are able to handle all types of cargo required for the project.
18.5 Water Supply
18.5.1 Water Demand
A water balance model was prepared to estimate the demand for raw water on site, considering the process water demand, losses and gains from the tailings storage facility, pit dewatering and dust suppression and runoff from the ROM pad and plant site. Utilization of ground water resources from boreholes was incorporated into the model. Any potential shortfall was modeled to be supplied from a water storage dam which will be fed from a water harvesting dam.
The total water demand for the site was estimated at 3.3 Mm3 per year. The water demand for the process plant amounts to 2.85 Mm3, which includes the minimum raw water requirement of 0.49 Mm3 but excludes water in ore. Other water demands include a provision of 0.54 Mm3 for dust suppression. The demand will be met from TSF decant, pit dewatering (including precipitation on the pit area), runoff from the ROM pad and sub-ore stockpiles.
Potable water demand for the project has been estimated from the number of persons expected to be working and living on site, and the per capita daily demand estimated from similar projects in the region.
18.5.2 Decant From Tailings Storage Facility
The water balance modelling indicated that for tailings pumped to the TSF at 50% solids, the pond on the TSF would increase during the wet season and reduce to the minimum pre-set level during the following dry season. Recovery from the TSF decant would gradually increase to supply up to 79% of the process water demand, or up to 2.3 Mm3 per year, in the later years of operation. The water balance modelling is described in the Site Water Management Report prepared by Knight Piésold (Report PE401-00067_05, July 2013, available on request).
18.5.3 Groundwater Investigation
Knight Piésold carried out an investigation into groundwater sources in the project area with the aims of estimating the likely volumes of water arising from open pit mine dewatering and the availability of water to meet the project demand. Details of the investigation are available on request in Knight Piésold’s Groundwater Investigation Report PE401-00067_02 Rev B, May 2013. The report concludes that the contribution from pit dewatering, including external groundwater sources of 8 L/s and precipitation on the pit surface is estimated to be up to 1.5 Mm3 per year, depending on the extent of the pit development.
HOUNDÉ GOLD PROJECT, BURKINA FASO FEASIBILITY STUDY NI 43-101 TECHNICAL REPORT
1813.20\25.01\1813.20-STY-001_B S18
Page 18.6
October 2013 Lycopodium Minerals Pty Ltd
18.5.4 Surface Water
The water balance model assumes that any water demand which could not be met from the tailings storage facility, pit dewatering or groundwater sources, will be met from surface water sources. The models were run on a monthly basis for the life of mine for average climatic conditions and tested for a 1 in 100 year dry event and 1 in 100 year wet event occurring when each would have the greatest impact on operations. Under average climatic conditions, the water demand from surface water sources decreases as the tailings beach in the tailings storage facility increases, resulting in higher recovery of precipitation on the tailings storage facility. The recovery from pit dewatering also increases as the pit surface increases.
The demand from surface water sources is highest in the year when the process plant is commissioned, when under average climatic conditions 1.75 Mm3 is required from the water storage dam. The demand for surface water decreases to 1.2 Mm3 in the 9th year of operation.
Water Harvest Dam
A water harvest dam will be constructed east of the pit. The mean annual runoff at the dam site is estimated to be 4.8 Mm3 from a catchment area of 21,850 Ha. The required earth fill embankment will be 8 m high and 760 m long to create a storage capacity of 1.8 Mm3. The surface area of the dam at full supply will be 120 Ha. A spillway will be provided to safely pass a 1 in 100 year peak flood. The embankment will be constructed from material excavated from the basin. The embankment will consist of several zones, including a low permeability core, a chimney drain, a structural layer and, on the upstream face, a layer of non-dispersive material covered by an erosion protection layer. The embankment slopes will be 2.5H:1V on both upstream and downstream faces.
Due to the flat topography at the dam site, the proposed water harvesting facility on its own would not meet the project water demand on a sustainable basis; therefore a supplementary water storage dam was identified.
Water Storage Dam
A more favourable storage site was identified approximately 5 km west of the water harvest dam site. This storage dam would have a catchment area of only 400 Ha and so could not replace the harvest dam, but due to its more efficient storage characteristics and relatively small embankment, it was selected as a storage facility to be supplied from the harvest dam during the wet season. The water storage dam will have a capacity of 1.5 Mm3 and will have a surface area of 58 Ha at full capacity. The required earth fill embankment will be 10 m high and 130 m long. The embankment construction will be similar to that described for the water harvest dam.
HOUNDÉ GOLD PROJECT, BURKINA FASO FEASIBILITY STUDY NI 43-101 TECHNICAL REPORT
1813.20\25.01\1813.20-STY-001_B S18
Page 18.7
October 2013 Lycopodium Minerals Pty Ltd
Water will be pumped from a decant structure in the water harvest dam to the water storage dam at a rate of 600 m3/h to build up storage capacity for use during the dry season, when the water harvest dam could be empty. The demand from the water harvest dam is highest in the first year of operation, when the process plant will have to be supplied and storage built up in the storage dam. The peak annual demand for surface water was projected to be 2.4 Mm3 (Note: The mean annual runoff at the harvest dam site is >4.8 Mm3. Therefore, if water is pumped at a high enough rate, water could be harvested and pumped to the storage facility during the rainy season when the dam will mostly be at full capacity or spilling).
18.6 Tailings Storage Facility (TSF)
18.6.1 Capacity and Location
A tailings storage facility (TSF) with a capacity of approximately 25 Mt will be required to store the tailings generated by the process plant over a period of about 8 to 9 years, at a rate of 3 Mtpa. The TSF was designed to international standards to provide a facility to safely contain the tailings and reduce the potential effect thereof on the environment in the form of dusting, seepage or runoff from the tailings surface during operation and post closure. The design complies with the guidelines proposed by the International Committee on Large Dams (ICOLD) and Guidelines on Tailings Dams: Planning, Design, Construction, Operation and Closure (ANCOLD 2012). Provision was made for the effects of seismic events and probable maximum precipitation events during operation and post closure. To support the design and improve the safety of the facility, a dam break analysis, seepage analysis and stability analysis were performed on the embankments. A water balance model was prepared to determine the impact of extreme rainfall events on the TSF pond. If built and operated in accordance with the principles and design concepts outlined in this document, this facility would contain the tailings generated from the project and the effects on the environment would be within acceptable limits as defined by international standards.
Seven locations were evaluated as potential sites for the TSF. The selected site, a valley storage facility approximately 5 km to the west of the proposed process plant site will require a main embankment 668 m long and 23 m high and three smaller saddle embankments respectively 130 m long and 10 m high, 755 m long and 15.5 m high, 1,116 m long and 7 m high. It is estimated that the tailings surface at full capacity will cover approximately 200 ha. It is noted that the selected site has the potential to provide storage in excess of the required 25 Mt of tailings by increasing the embankment height and, if required, adding a saddle embankment to the south of the facility. Initial estimates indicate that by increasing the embankment height by 9 m, the storage capacity of the TSF could potentially double.
18.6.2 Design Considerations
Tailings will be pumped to the TSF as a slurry at 48% to 50% solids and will be deposited sub-aerially to facilitate drying and consolidation of the tailings mass. It is expected that in the TSF a density of approximately 1.4 t/m3 will be achieved initially, increasing to 1.6 t/m3 to give an overall final density of 1.55 t/m3.
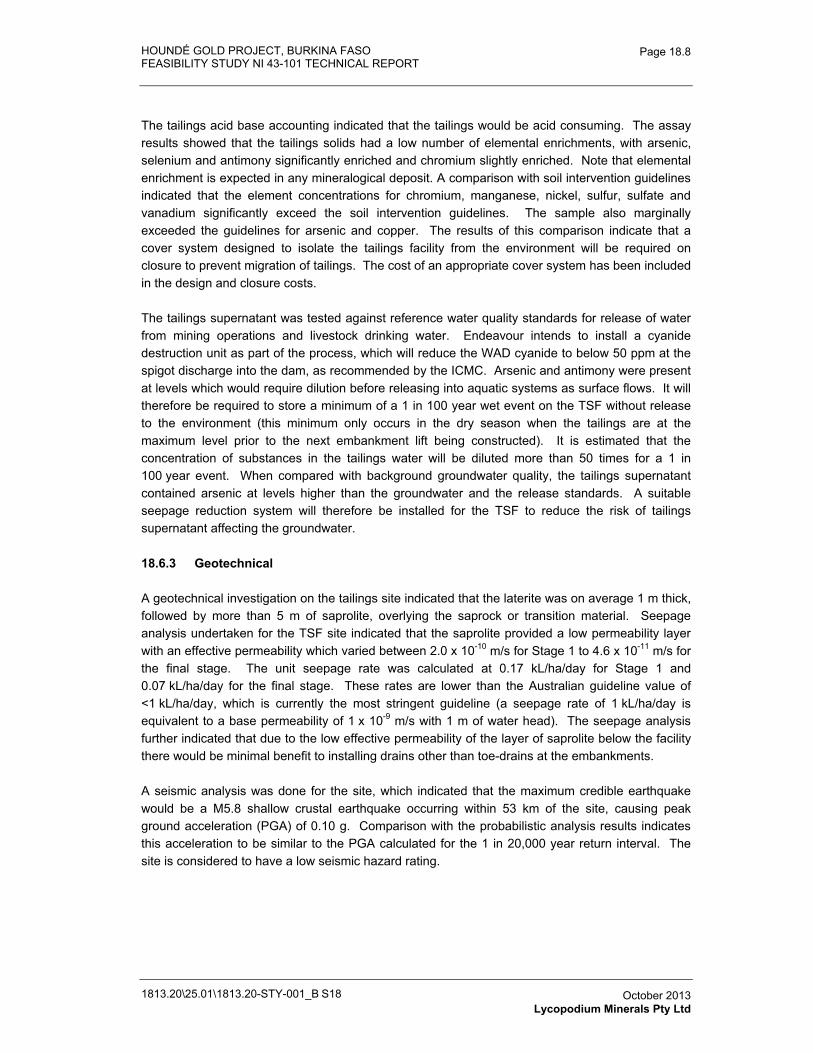
HOUNDÉ GOLD PROJECT, BURKINA FASO FEASIBILITY STUDY NI 43-101 TECHNICAL REPORT
1813.20\25.01\1813.20-STY-001_B S18
Page 18.8
October 2013 Lycopodium Minerals Pty Ltd
The tailings acid base accounting indicated that the tailings would be acid consuming. The assay results showed that the tailings solids had a low number of elemental enrichments, with arsenic, selenium and antimony significantly enriched and chromium slightly enriched. Note that elemental enrichment is expected in any mineralogical deposit. A comparison with soil intervention guidelines indicated that the element concentrations for chromium, manganese, nickel, sulfur, sulfate and vanadium significantly exceed the soil intervention guidelines. The sample also marginally exceeded the guidelines for arsenic and copper. The results of this comparison indicate that a cover system designed to isolate the tailings facility from the environment will be required on closure to prevent migration of tailings. The cost of an appropriate cover system has been included in the design and closure costs.
The tailings supernatant was tested against reference water quality standards for release of water from mining operations and livestock drinking water. Endeavour intends to install a cyanide destruction unit as part of the process, which will reduce the WAD cyanide to below 50 ppm at the spigot discharge into the dam, as recommended by the ICMC. Arsenic and antimony were present at levels which would require dilution before releasing into aquatic systems as surface flows. It will therefore be required to store a minimum of a 1 in 100 year wet event on the TSF without release to the environment (this minimum only occurs in the dry season when the tailings are at the maximum level prior to the next embankment lift being constructed). It is estimated that the concentration of substances in the tailings water will be diluted more than 50 times for a 1 in 100 year event. When compared with background groundwater quality, the tailings supernatant contained arsenic at levels higher than the groundwater and the release standards. A suitable seepage reduction system will therefore be installed for the TSF to reduce the risk of tailings supernatant affecting the groundwater.
18.6.3 Geotechnical
A geotechnical investigation on the tailings site indicated that the laterite was on average 1 m thick, followed by more than 5 m of saprolite, overlying the saprock or transition material. Seepage analysis undertaken for the TSF site indicated that the saprolite provided a low permeability layer with an effective permeability which varied between 2.0 x 10⁻¹⁰ m/s for Stage 1 to 4.6 x 10⁻¹¹ m/s for the final stage. The unit seepage rate was calculated at 0.17 kL/ha/day for Stage 1 and 0.07 kL/ha/day for the final stage. These rates are lower than the Australian guideline value of <1 kL/ha/day, which is currently the most stringent guideline (a seepage rate of 1 kL/ha/day is equivalent to a base permeability of 1 x 10⁻⁹ m/s with 1 m of water head). The seepage analysis further indicated that due to the low effective permeability of the layer of saprolite below the facility there would be minimal benefit to installing drains other than toe-drains at the embankments.
A seismic analysis was done for the site, which indicated that the maximum credible earthquake would be a M5.8 shallow crustal earthquake occurring within 53 km of the site, causing peak ground acceleration (PGA) of 0.10 g. Comparison with the probabilistic analysis results indicates this acceleration to be similar to the PGA calculated for the 1 in 20,000 year return interval. The site is considered to have a low seismic hazard rating.
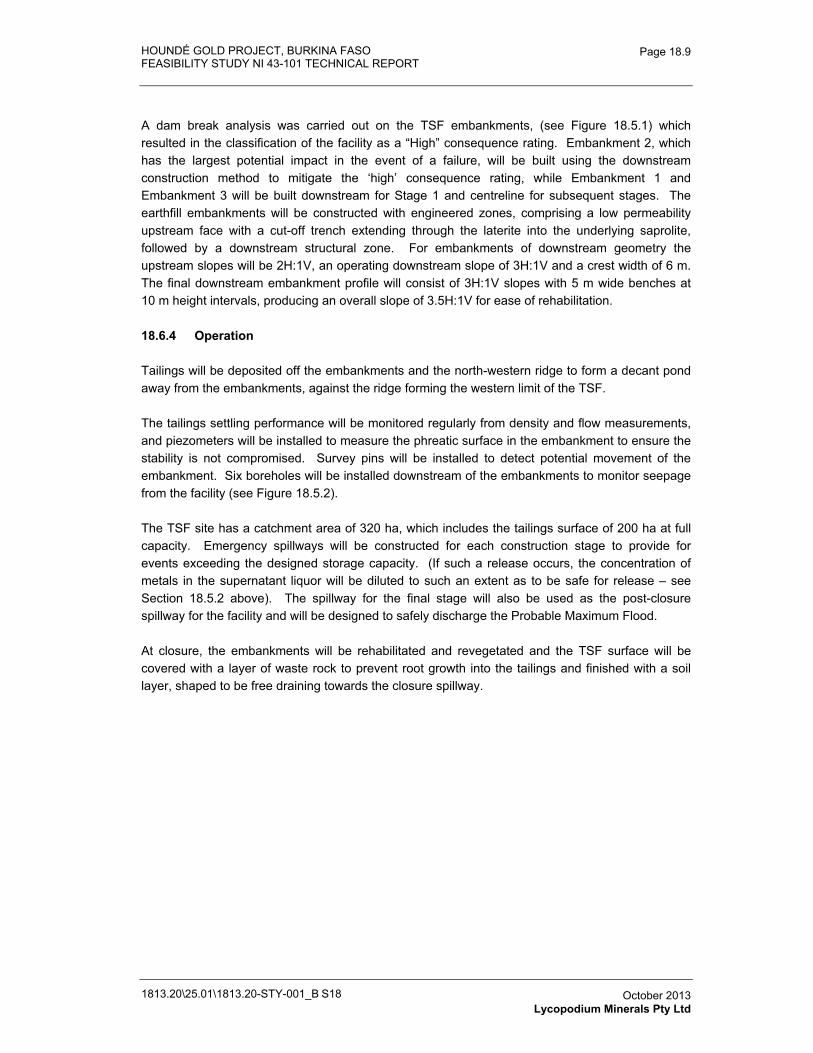
HOUNDÉ GOLD PROJECT, BURKINA FASO FEASIBILITY STUDY NI 43-101 TECHNICAL REPORT
1813.20\25.01\1813.20-STY-001_B S18
Page 18.9
October 2013 Lycopodium Minerals Pty Ltd
A dam break analysis was carried out on the TSF embankments, (see Figure 18.5.1) which resulted in the classification of the facility as a “High” consequence rating. Embankment 2, which has the largest potential impact in the event of a failure, will be built using the downstream construction method to mitigate the ‘high’ consequence rating, while Embankment 1 and Embankment 3 will be built downstream for Stage 1 and centreline for subsequent stages. The earthfill embankments will be constructed with engineered zones, comprising a low permeability upstream face with a cut-off trench extending through the laterite into the underlying saprolite, followed by a downstream structural zone. For embankments of downstream geometry the upstream slopes will be 2H:1V, an operating downstream slope of 3H:1V and a crest width of 6 m. The final downstream embankment profile will consist of 3H:1V slopes with 5 m wide benches at 10 m height intervals, producing an overall slope of 3.5H:1V for ease of rehabilitation.
18.6.4 Operation
Tailings will be deposited off the embankments and the north-western ridge to form a decant pond away from the embankments, against the ridge forming the western limit of the TSF.
The tailings settling performance will be monitored regularly from density and flow measurements, and piezometers will be installed to measure the phreatic surface in the embankment to ensure the stability is not compromised. Survey pins will be installed to detect potential movement of the embankment. Six boreholes will be installed downstream of the embankments to monitor seepage from the facility (see Figure 18.5.2).
The TSF site has a catchment area of 320 ha, which includes the tailings surface of 200 ha at full capacity. Emergency spillways will be constructed for each construction stage to provide for events exceeding the designed storage capacity. (If such a release occurs, the concentration of metals in the supernatant liquor will be diluted to such an extent as to be safe for release – see Section 18.5.2 above). The spillway for the final stage will also be used as the post-closure spillway for the facility and will be designed to safely discharge the Probable Maximum Flood.
At closure, the embankments will be rehabilitated and revegetated and the TSF surface will be covered with a layer of waste rock to prevent root growth into the tailings and finished with a soil layer, shaped to be free draining towards the closure spillway.
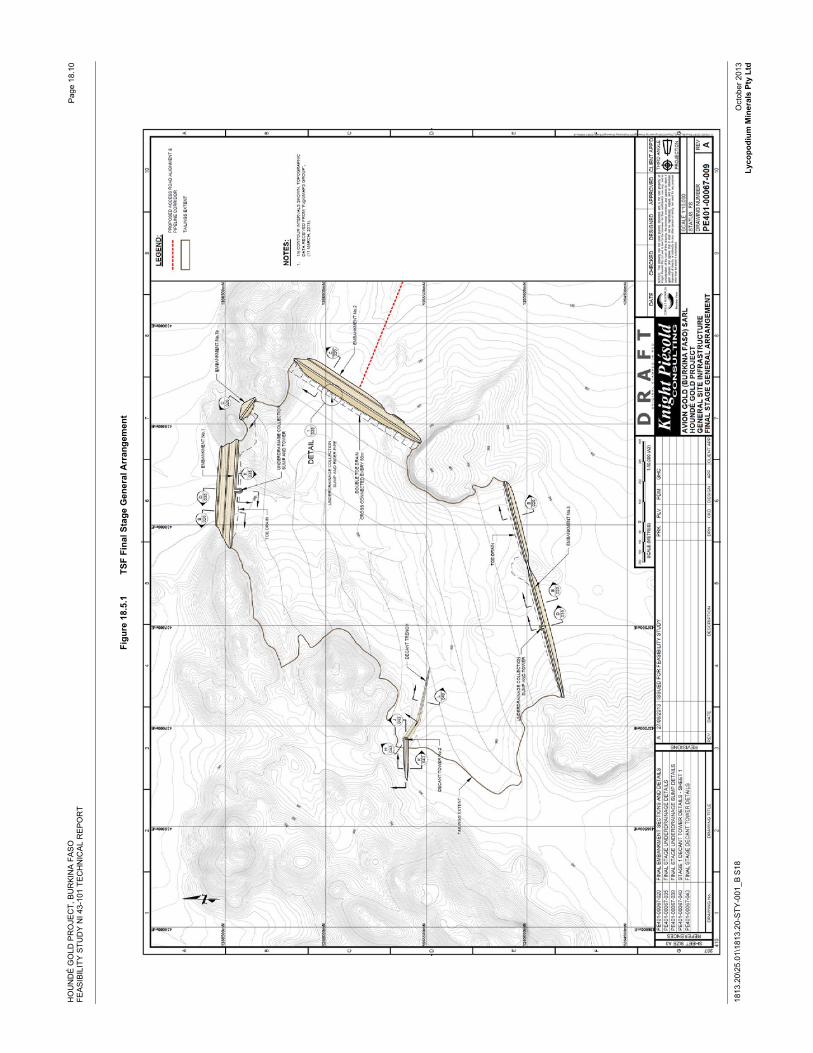
HO
UN
DÉ
GO
LD P
RO
JEC
T, B
UR
KIN
A F
AS
O
FEA
SIB
ILIT
Y S
TUD
Y N
I 43-
101
TEC
HN
ICA
L R
EP
OR
T
1813
.20\
25.0
1\18
13.2
0-S
TY-0
01_B
S18
Pag
e 18
.10
Oct
ober
201
3 Ly
copo
dium
Min
eral
s Pt
y Lt
d
Figu
re 1
8.5.
1 TS
F Fi
nal S
tage
Gen
eral
Arr
ange
men
t
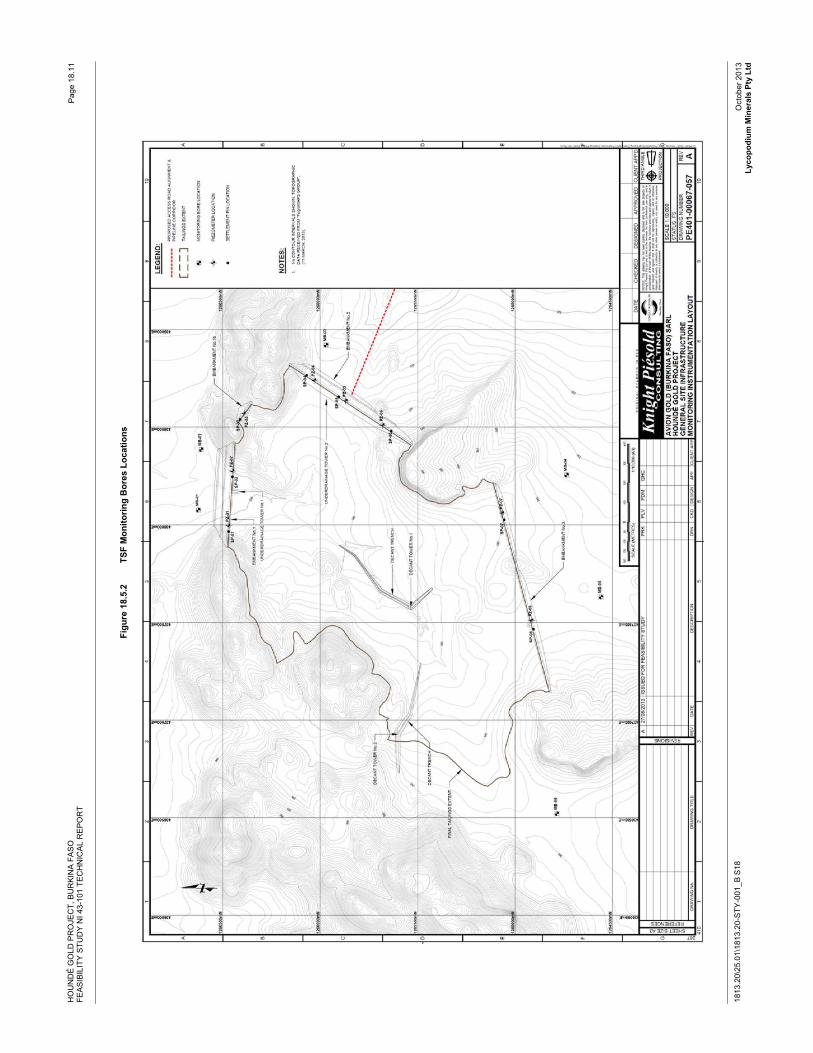
HO
UN
DÉ
GO
LD P
RO
JEC
T, B
UR
KIN
A F
AS
O
FEA
SIB
ILIT
Y S
TUD
Y N
I 43-
101
TEC
HN
ICA
L R
EP
OR
T
1813
.20\
25.0
1\18
13.2
0-S
TY-0
01_B
S18
Pag
e 18
.11
Oct
ober
201
3 Ly
copo
dium
Min
eral
s Pt
y Lt
d
Figu
re 1
8.5.
2 TS
F M
onito
ring
Bor
es L
ocat
ions
HOUNDÉ GOLD PROJECT, BURKINA FASO FEASIBILITY STUDY NI 43-101 TECHNICAL REPORT
1813.20\25.01\1813.20-STY-001_B S18
Page 18.12
October 2013 Lycopodium Minerals Pty Ltd
18.7 Surface Water Management
18.7.1 Design Objectives
The surface water management at the site will incorporate control measures in order to reduce impacts to downstream environments for all aspects of the Project, from initial development through to completion of rehabilitation.
The main objectives of the management of surface water on the site are summarised as follows:
� Maximising the internal recycle of contact and process waters in ore processing and thereby minimising the use of external water sources.
� Minimise the impact of the proposed mining activities on the quality and quantity of surface water. This is achieved by routing clean surface water runoff around disturbed areas and minimising sediment discharge from the site to the environment by entrapping and retaining eroded sediment as close as possible to disturbed areas.
� Protect internal infrastructure and personnel from the uncontrolled effects of surface water runoff during storm events, thereby enhancing the safety of project personnel and reducing maintenance costs.
� Provide long-term post-mining erosion and sediment control measures, including where practical the establishment of fully stabilised and protected final reclaimed surfaces that require minimal maintenance.
The following four categories of water were identified on the site:
� Undisturbed water (U) Runoff from undisturbed catchments.
� Contact clean water (CC) Runoff from disturbed catchment areas with some sediment pickup.
� Contact dirty water (CD) Runoff from disturbed catchment areas with potential for contamination; sources include runoff from sub-ore stockpiles, ROM pad and plant site.
� Process water (P) Water that has passed through the process or come into contact with process water.
Based on the above classifications, the following main components are required:
18.7.2 Diversion Structures
It will be necessary to alter the current flow path of surface water flows to reduce the potential for harm to people or infrastructure or to minimise the potential for mixing clean water with runoff from disturbed sites. The following structures are envisaged.
HOUNDÉ GOLD PROJECT, BURKINA FASO FEASIBILITY STUDY NI 43-101 TECHNICAL REPORT
1813.20\25.01\1813.20-STY-001_B S18
Page 18.13
October 2013 Lycopodium Minerals Pty Ltd
Stream Diversions
The Vindaloo North pit will extend across one of the drainage channels feeding the water harvest dam. A stream diversion will be installed to divert the flow of Undisturbed water around the northern tip of the pit to reduce the risk of flooding of the pit when runoff occurs. The diversion has been designed to safely pass a 1 in 100 year storm event.
Diversion Berms / Channels
A series of diversion berms and/or channels will need to be constructed over the life of the mine, as development progresses, to separate Undisturbed water from other water categories at the plant site, ROM pad, sub-ore stockpiles, pit and waste rock dumps.
18.7.3 Collection and Control Structures
Runoff from areas designated as Contact Clean (CC) water and Contact Dirty (CD) water will be directed to Sediment Control Structures and Collection Structures, respectively. The sediment control structures will provide adequate retention to allow settling of medium sized silt, but will have spillways to pass flows larger than 1 in 10 year recurrence interval.
Collection Structures
Runoff from the ROM pad and sub-ore stockpiles will be directed to a Collection Structure downstream of the stockpiles. The quality of the water collected from these areas will be tested and the water either released to the environment after providing time for solids to settle, or pumped to the process plant as process water.
Sediment Control Structures
Runoff from CC disturbed areas such as the waste rock dumps will be collected and directed to one of eight proposed Sediment Control Structures to provide retention time for sediment to settle, before water is released to the environment.
It is noted that the water harvest dam is situated downstream of the site in such a position that it will capture sediment not settled in other structures upstream thereof. The dimensions of the water harvest dam are such that it would provide adequate retention time for medium sized silt (>20 μm) to settle.
The position of the surface water management structures at Houndé in relation to the mining areas is described in the Site Water Management Report prepared by Knight Piésold (Report PE401-00067_05, July 2013), available on request.
18.8 Power Supply
The National Electricity Company of Burkina Faso (SONABEL) has confirmed that the Houndé Gold Project demand can be met by the existing power generation and transmission network and SONABEL has agreed in principle to sell the project power. However, negotiation of the means and final cost details has not been completed yet.
HOUNDÉ GOLD PROJECT, BURKINA FASO FEASIBILITY STUDY NI 43-101 TECHNICAL REPORT
1813.20\25.01\1813.20-STY-001_B S18
Page 18.14
October 2013 Lycopodium Minerals Pty Ltd
The preferred option for the high voltage supply for the Houndé Project will be a tap off from the existing 225 kV line interconnecting between the Kodeni and Pa substations. Two tension towers will be erected at close proximity to the 225 kV line tap off point, allowing 225 kV supply to be fed to the Houndé switchyard. This switchyard will be located about 70 m from the process plant HV switchroom. Refer to the high voltage supply option drawing 330-E-301. (Note that while the preferred option of the above 225 kV connection has been used as the basis for the study, negotiations are continuing with SONABEL to confirm this power supply arrangement, rather than installing a 90 kV feeder line from the Pa substation back to the Houndé project. Should the lower voltage supply from Pa be stipulated by SONABEL, then a Static VAR Compensation facility will be required to ensure that the mill motors can be started without adversely affecting system voltages.) The grid network stability analysis revealed the 225 kV supply will provide more stable operation for the mill drives, with only infrequent to rare power outages likely to be experienced.
18.9 Power Distribution
The main distribution voltages are 11 kV and 415 V for the process plant. Refer to the power distribution overall plant single line drawings 330-E-302 and 330-E-303.
The 225 kV supply will be stepped down to 11 kV via a single 225 / 11 kV, 25 / 35 MVA, ONAF main transformer, feeding the plant 11 kV main switchboard. A standby transformer will be installed in the switchyard and put on ‘soak’ via the 11 kV supply. In case of a failure of the duty unit, the standby unit will be relocated to the duty position to replace the defective unit during a relatively short outage for the transformer replacement work to be carried out. The 11 kV supply will be distributed to various process plant load centres, support facilities, remote facilities and accommodation camp.
A 415 V, 2.5 MVA diesel emergency generator supply with a step-up transformer has been allowed for the essential loads of the process plant during grid power outages. The change over from the grid to the emergency power supply will be effected manually.
The process plant load includes a SAG mill of 6 MW, a ball mill of 6 MW and an 800 kW UFG mill. These mills will be fed at 11 kV. The mill drives include:
� WRIM (Wound Rotor Induction Motors).
� LRS (Liquid Resistor Starters) for starting.
� Heat exchanger for speed control, in the range of 65% - 75% mill critical speed for the SAG mill only.
The 415 V supply to the plant MCCs, plant buildings and remote MCCs will be fed from the plant 11 kV main switchboard via separate 11 kV / 433 V distribution or “transformer kiosks” (HV / LV outdoor prefabricated substations).
HOUNDÉ GOLD PROJECT, BURKINA FASO FEASIBILITY STUDY NI 43-101 TECHNICAL REPORT
1813.20\25.01\1813.20-STY-001_B S18
Page 18.15
October 2013 Lycopodium Minerals Pty Ltd
The supply to the remote electrical loads such as the water harvest barrage, water storage barrage, accommodation camp site, boreholes and tailings dam will be taken from the mining services kiosk transformer via 11 kV overhead power lines constructed using steel or concrete poles, steel cross arms and earth shield wire, acceptable to the Local Power Authority’s requirements / standards. No overhead power lines will be installed within the plant perimeter area, and insulated cables will be installed on above ground cable ladders.
18.9.1 Total Installed Load and Maximum Demand
The estimated maximum power demand of the process plant is approximately 18.3 MW with a total connected load of 26.5 MW. Refer to the Electrical Load List (1813.20-LST-002) for details.
18.9.2 Electrical Substation Buildings
The three plant electrical substation buildings will be prefabricated flat pack type construction on concrete columns for bottom entry cables. The buildings will be insulated, furnished with air-conditioners, fire detection and alarm systems, lighting and small power.
The remote MCCs / control panels at the water storage barrage, water harvest barrage, boreholes and tailings dam will be installed in outdoor substations with roof covers.
18.9.3 11 kV Switchboard
The plant main switchboard will be metal-clad type with fully withdrawable circuit breakers complete with protection, metering and earthing facilities. Protection will be provided by microprocessor based protection relays.
18.9.4 Power Factor Correction Capacitor
One unit of 11 kV power factor correction capacitor bank will be installed at the plant 11 kV main switchboard to correct the power factor to 0.9 or better as required by the power supply authority.
18.9.5 Internet Fibre Optic Line
The Project will connect to the internet via a fibre optic line from a local carrier. The same fibre optic cable will be used for telephone connections, using Voice Over Internet Protocol (VOIP) for fixed telephone connections. Mobile telephone services are also available in the area.
18.10 Pipelines
18.10.1 Tailings and Decant Return Pipelines
The tailings pipeline will be above ground and follow the alignment of the access road to the TSF in a bunded zone towards the tailings storage facility to the north. This will act as a barrier to movement of stormwater so there will be a need for culvert crossings under the pipeline and road.
The pipelines will pass under the N1 Highway through dedicated culverts.
HOUNDÉ GOLD PROJECT, BURKINA FASO FEASIBILITY STUDY NI 43-101 TECHNICAL REPORT
1813.20\25.01\1813.20-STY-001_B S18
Page 18.16
October 2013 Lycopodium Minerals Pty Ltd
18.10.2 Water Supply Pipelines
The HDPE pipelines from the water dams to the process plant will be laid on surface, running alongside the access track. Where necessary, crossings will be provided for pedestrian, light vehicle traffic and livestock.
18.11 Fuel Supply
The largest user by far of diesel fuel will be the mining fleet, which will consume approximately 1.5 ML/ month in the early years, rising to 1.8 ML/ month later in the mine life. A contract will be entered into with a local fuel supply company for them to supply diesel fuel on a consignment basis and establish their own, 1 million litre storage tank on site.
18.12 General Site Development
18.12.1 Site Topography and Ground Conditions
Geotechnical investigations to determine ground conditions and material properties for the various components of the proposed infrastructure were carried out by Knight Piésold. The investigation results and geotechnical design parameters for use in design and construction of the foundations and earthworks are provided in the Knight Piésold Site Infrastructure Report PE13-00463 available on request. The report concluded that at the tailings dam site, the ground conditions encountered typically comprised a shallow depth of laterite (gravel or silt) overlying saprolite (silt). The materials are initially considered suitable for the construction of embankments if the design incorporates measures to mitigate against the dispersive nature of the soils. Sand for drainage layers will need to be trucked in from local quarries or screened.
The report also considered that the strength and stiffness characteristics of the ground are sufficient for the majority of the plant site’s structures to be founded on shallow spread foundations.
The topography at the Project site is generally open and undulating with the main process plant and mine services facilities located on ground with a gradual natural slope towards the south. The plant will be inset into a cut surface with a 3 metre high western wall; this will help to reduce ground level noise from the plant to the community located 1 km west of the plant area.
There are no major watercourses in the vicinity of the proposed plant site area and the surface water drains naturally toward the valley south east of the site.
18.13 Sewage and Solid Waste Management
18.13.1 Sewage Treatment
Sewage from the accommodation camp, process plant and mining services areas will be collected and treated in two package sewage treatment plants. Sludge will be suitable for direct landfill burial in unlined pits. Treated effluent from the accommodation camp will be discharged to a leach field or a surface spray field at a location to be agreed, while the treated effluent from the plant site and mining services area will be discharged into the tails hopper.
HOUNDÉ GOLD PROJECT, BURKINA FASO FEASIBILITY STUDY NI 43-101 TECHNICAL REPORT
1813.20\25.01\1813.20-STY-001_B S18
Page 18.17
October 2013 Lycopodium Minerals Pty Ltd
18.13.2 Solid Wastes
General solid wastes will be deposited into a landfill, in accordance with local regulations, but dangerous materials such as cyanide packaging, will be incinerated on site to prevent unauthorised use. Other materials unsuited to landfill will be stored on site for later disposal.
18.14 Explosive Storage and Handling
A contract will be entered into with a recognised supplier of mining explosives, to establish his own facilities in the southern end of the eastern waste dump, well away from the local population and mine activities, and to supply emulsion as needed.
18.15 Accommodation Camp
It is anticipated that a significant proportion of the workforce will be recruited from and continue to reside in Houndé town; however, permanent accommodation to house 130 senior operations and mining workforce personnel will be provided approximately one kilometre to the north of the process plant for expatriates and personnel from outside the local district. The camp will be accessed from a new road that links to the mine access road.
The village will have a mix of building types with blockwork construction on concrete slabs and steel trussed roofs for the larger rooms reserved for management, whilst converted sea containers will be used for the junior staff rooms. All buildings will be single storey.
For fit-out and finishes within buildings, preference will be given to locally available equipment and materials subject to availability and quality constraints.
18.16 Process Plant Facilities
18.16.1 General
The process plant support facilities will generally be industrial type structures constructed of a concrete slab on ground with structural steel frame and metal cladding. Office and amenity areas associated with the main structures will generally be of blockwork construction.
The process plant and its support facilities are shown in Figure 18.16.1.
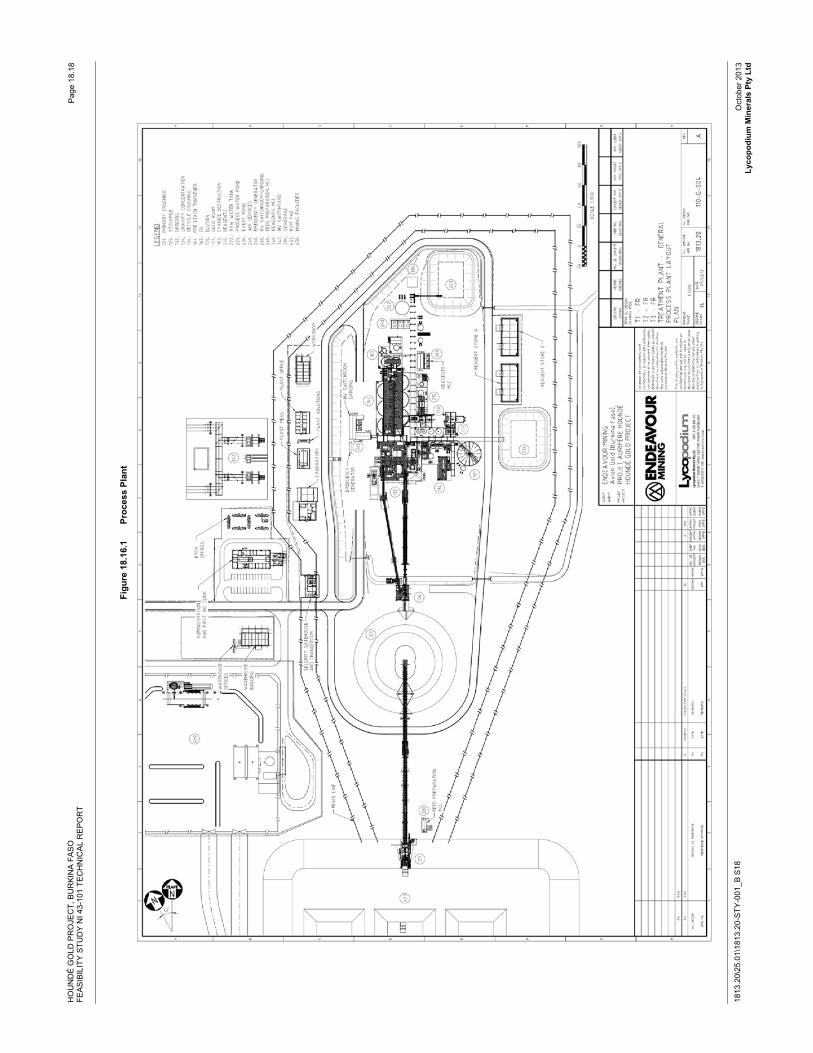
HO
UN
DÉ
GO
LD P
RO
JEC
T, B
UR
KIN
A F
AS
O
FEA
SIB
ILIT
Y S
TUD
Y N
I 43-
101
TEC
HN
ICA
L R
EP
OR
T
1813
.20\
25.0
1\18
13.2
0-S
TY-0
01_B
S18
Pag
e 18
.18
Oct
ober
201
3 Ly
copo
dium
Min
eral
s Pt
y Lt
d
Figu
re 1
8.16
.1
Proc
ess
Plan
t
HOUNDÉ GOLD PROJECT, BURKINA FASO FEASIBILITY STUDY NI 43-101 TECHNICAL REPORT
1813.20\25.01\1813.20-STY-001_B S18
Page 18.19
October 2013 Lycopodium Minerals Pty Ltd
18.16.2 Mine Services Area Facilities
The mine services facilities allowed are summarised below, with further details available on request. The facilities provided will include:
� Heavy vehicle workshop (5 bays).
� Washdown bay, with water recycle.
� Mining services administration building.
� Shift change house, complete with showers and ablutions.
� Warehouse.
18.16.3 Plant Area
The process plant support facilities will generally be industrial type structures. Most will be constructed of a concrete slab on ground with structural steel frame and metal cladding. Office and amenity areas associated with the main structures will generally be of pre-fabricated construction. The facilities allowed are summarised below, with further details available on request. The facilities provided will include:
� Main administration building, with annexe for first aid clinic and emergency services.
� Laboratory, including sample preparation area, wet and dry areas and environmental section.
� Plant offices, mess and ablutions.
� Electrical switchrooms (three), prefabricated construction, mounted on plinths for bottom cable entry.
� Gatehouse for entry boom gate control.
� Security building and change room, for all access control functions, and will include washrooms and laundry.
� Plant control / titration room (prefabricated structure) located above the CIL tanks.
� Reagent stores (two).
� Plant workshop, with appropriate tools.
� Plant warehouse and stores, with secure storage for smaller items and outdoor yard for larger items.
HOUNDÉ GOLD PROJECT, BURKINA FASO FEASIBILITY STUDY NI 43-101 TECHNICAL REPORT
1813.20\25.01\1813.20-STY-001_B S18
Page 18.20
October 2013 Lycopodium Minerals Pty Ltd
18.16.4 Other Support Facilities
Water Services
Raw water will be pumped to the plant site from the water harvest and storage dams and will discharge into the raw water tank for distribution around the plant.
Fire water for the process plant will be drawn from the raw water tank. Suctions for other water services fed from the raw water tank will be at an elevated level to ensure a fire water reserve always remains in the raw water tank.
Fire hydrants and hose reels will be placed throughout the process plant, fuel storage and plant offices at intervals that ensure complete coverage in areas where flammable materials are present.
Raw water directly from bores, will be supplied to the plant potable water treatment plant for filtration, ultra-violet sterilisation and chlorination. Potable water will be reticulated to the plant buildings, site ablutions, safety showers and other potable water outlets. Additional ultra-violet sterilisation units will be installed on outgoing potable water distribution headers.
HOUNDÉ GOLD PROJECT, BURKINA FASO
FEASIBILITY STUDY NI 43-101 TECHNICAL REPORT
1813.20-STY-001
Table of Contents Page
19.0� MARKET STUDIES AND CONTRACTS 19.1�19.1� Market Studies 19.1�19.2� Pricing 19.1�19.3� Contracts 19.1�
FIGURESFigure 19.2.1� Historical gold prices 19.1�
1813.20\25.01\1813.20-STY-001_B S19 October 2013 Lycopodium Minerals Pty Ltd
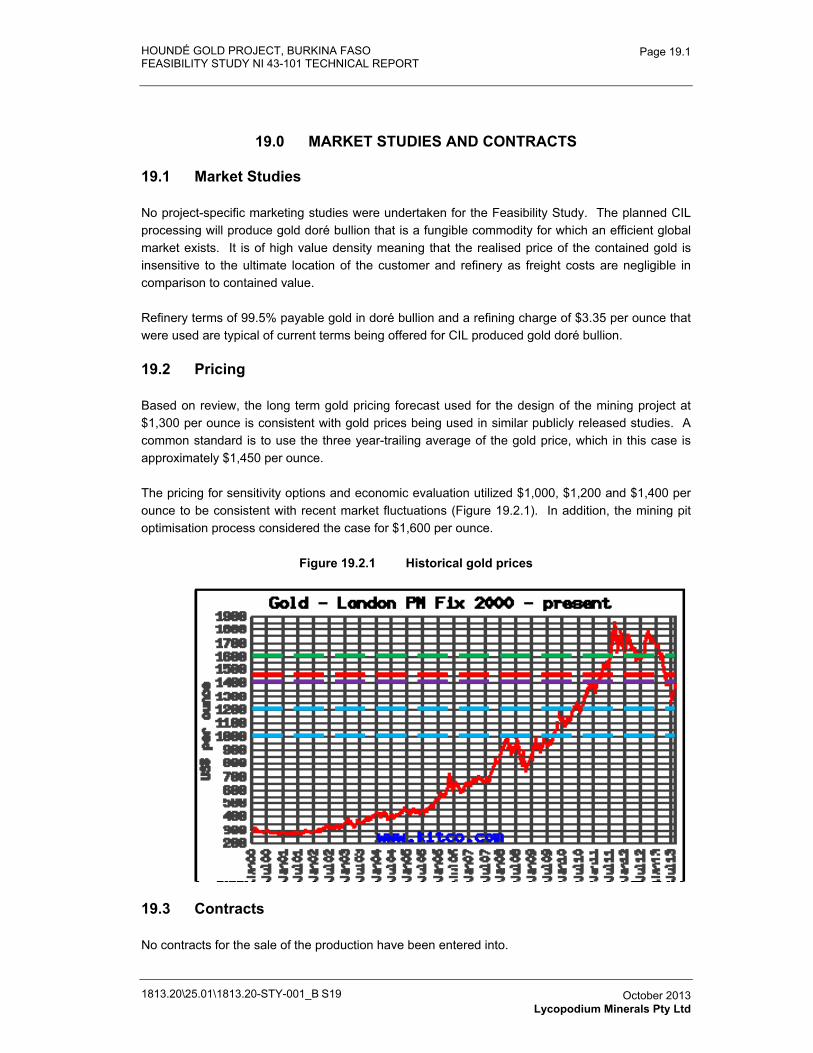
HOUNDÉ GOLD PROJECT, BURKINA FASO FEASIBILITY STUDY NI 43-101 TECHNICAL REPORT
1813.20\25.01\1813.20-STY-001_B S19
Page 19.1
October 2013 Lycopodium Minerals Pty Ltd
19.0 MARKET STUDIES AND CONTRACTS
19.1 Market Studies
No project-specific marketing studies were undertaken for the Feasibility Study. The planned CIL processing will produce gold doré bullion that is a fungible commodity for which an efficient global market exists. It is of high value density meaning that the realised price of the contained gold is insensitive to the ultimate location of the customer and refinery as freight costs are negligible in comparison to contained value.
Refinery terms of 99.5% payable gold in doré bullion and a refining charge of $3.35 per ounce that were used are typical of current terms being offered for CIL produced gold doré bullion.
19.2 Pricing
Based on review, the long term gold pricing forecast used for the design of the mining project at $1,300 per ounce is consistent with gold prices being used in similar publicly released studies. A common standard is to use the three year-trailing average of the gold price, which in this case is approximately $1,450 per ounce.
The pricing for sensitivity options and economic evaluation utilized $1,000, $1,200 and $1,400 per ounce to be consistent with recent market fluctuations (Figure 19.2.1). In addition, the mining pit optimisation process considered the case for $1,600 per ounce.
Figure 19.2.1 Historical gold prices
19.3 Contracts
No contracts for the sale of the production have been entered into.
HOUNDÉ GOLD PROJECT, BURKINA FASO
FEASIBILITY STUDY NI 43-101 TECHNICAL REPORT
1813.20-STY-001
Table of Contents Page
20.0� REQUIRED PERMITS AND ENVIRONMENTAL CONSIDERATIONS 20.1�20.1� Environmental Studies and Permitting 20.1�20.2� Anticipated Environmental Costs – Operations 20.1�20.3� Social and Community Impact 20.2�20.4� Anticipated Land Acquisition and Relocation Costs 20.4�20.5� Anticipated Cost – Closure 20.5�
TABLESTable 20.5.1� TSF Rehabilitation Details (excl Contingency) 20.6�
FIGURESFigure 20.1.1� Permit Schedule 20.3�
1813.20\25.01\1813.20-STY-001_B S20 October 2013 Knight Piésold Pty Ltd
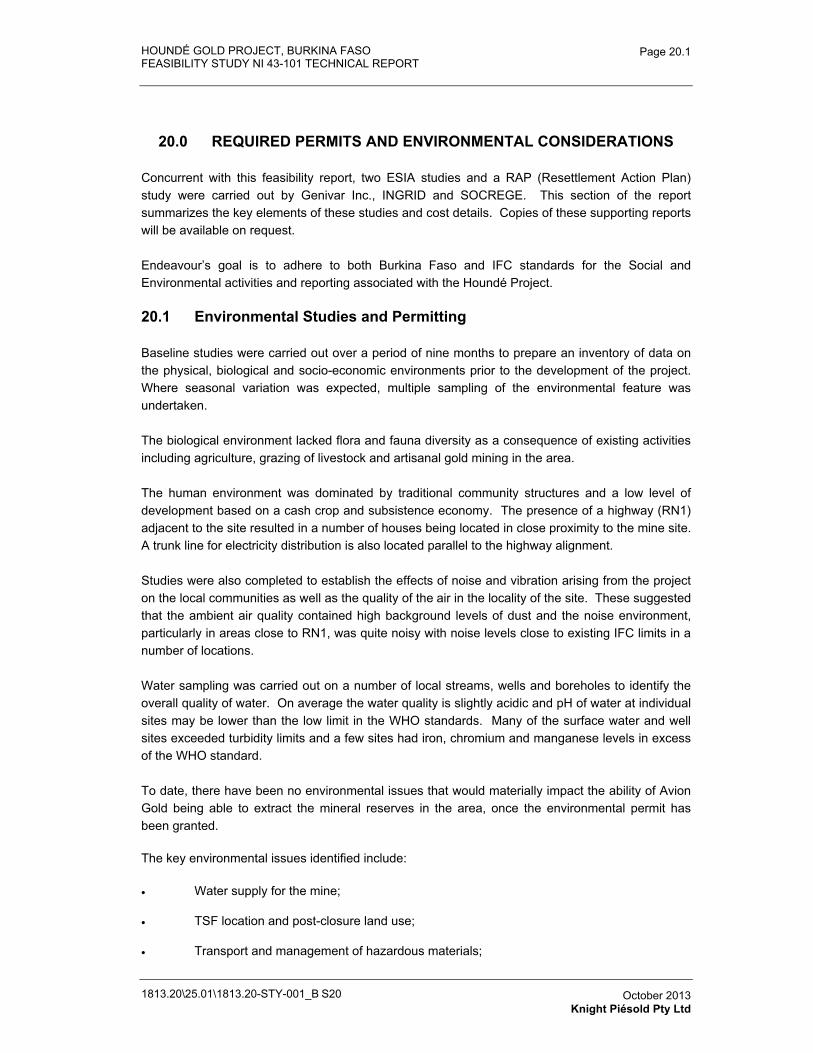
HOUNDÉ GOLD PROJECT, BURKINA FASO FEASIBILITY STUDY NI 43-101 TECHNICAL REPORT
1813.20\25.01\1813.20-STY-001_B S20
Page 20.1
October 2013 Knight Piésold Pty Ltd
20.0 REQUIRED PERMITS AND ENVIRONMENTAL CONSIDERATIONS
Concurrent with this feasibility report, two ESIA studies and a RAP (Resettlement Action Plan) study were carried out by Genivar Inc., INGRID and SOCREGE. This section of the report summarizes the key elements of these studies and cost details. Copies of these supporting reports will be available on request.
Endeavour’s goal is to adhere to both Burkina Faso and IFC standards for the Social and Environmental activities and reporting associated with the Houndé Project.
20.1 Environmental Studies and Permitting
Baseline studies were carried out over a period of nine months to prepare an inventory of data on the physical, biological and socio-economic environments prior to the development of the project. Where seasonal variation was expected, multiple sampling of the environmental feature was undertaken.
The biological environment lacked flora and fauna diversity as a consequence of existing activities including agriculture, grazing of livestock and artisanal gold mining in the area.
The human environment was dominated by traditional community structures and a low level of development based on a cash crop and subsistence economy. The presence of a highway (RN1) adjacent to the site resulted in a number of houses being located in close proximity to the mine site. A trunk line for electricity distribution is also located parallel to the highway alignment.
Studies were also completed to establish the effects of noise and vibration arising from the project on the local communities as well as the quality of the air in the locality of the site. These suggested that the ambient air quality contained high background levels of dust and the noise environment, particularly in areas close to RN1, was quite noisy with noise levels close to existing IFC limits in a number of locations.
Water sampling was carried out on a number of local streams, wells and boreholes to identify the overall quality of water. On average the water quality is slightly acidic and pH of water at individual sites may be lower than the low limit in the WHO standards. Many of the surface water and well sites exceeded turbidity limits and a few sites had iron, chromium and manganese levels in excess of the WHO standard.
To date, there have been no environmental issues that would materially impact the ability of Avion Gold being able to extract the mineral reserves in the area, once the environmental permit has been granted.
The key environmental issues identified include:
� Water supply for the mine;
� TSF location and post-closure land use;
� Transport and management of hazardous materials;
HOUNDÉ GOLD PROJECT, BURKINA FASO FEASIBILITY STUDY NI 43-101 TECHNICAL REPORT
1813.20\25.01\1813.20-STY-001_B S20
Page 20.2
October 2013 Knight Piésold Pty Ltd
� Proximity of infrastructure (road, power line and optic fibre cable);
� Potential for in-migration and its effect on level of service in public infrastructure;
� Allowance for traditional grazing patterns; and
� Resettlement and reallocation of land.
The key environmental permit required by the project is the environmental certificates from the Ministry of Environment and Sustainable Development (MEED) which will follow submission of the EIA and RAP.
Following receipt of the environmental certificate it is expected that a number of secondary approvals may need to be sought in relation to specific elements of the project:
� Dam licences for the operation of the water dams as described in Decree No. 2005-193/PRES/PM/MAHRH/MFB of 4 April 2005 and the tailings storage facility;
� Licences to store hazardous materials as described in Decree No. 98-322/PRES/PM/MEE/MCIA/MEM/MS/MATS/METSS/MEF of 28 July 1998 including:
- Fuel
- Explosives
- Cyanide and
- Lime.
� Licences for importation of cyanide and ammonium nitrate;
� Licence or approval to remove materials from stream beds as described in Decree No. 2006-588 / PRES / PM / MAHRH / MECV / MPAD / MFB / MS of 6 December 2006;
� Approval of land use and water management plans as described in Decree No. 2005-192/PRES/PM/MAHRH/MFB of 4 April 2005;
� Approval for widening of the RN1 and development of the rural roads from the Ministry of Infrastructure Road Development and Transport;
� Approval to operate the mine under the Mining Code and Decree No. 2007-853/PRES/PM/MCE/MECV/MATD of 26 December 2007; and
� Approval to discharge any effluent as described in Decree No. 2001-185/PRES/PM/MEE of 7 May 2001.
The schedule in Figure 20.1.1 for permitting is the current estimate to enable all approvals to be obtained.
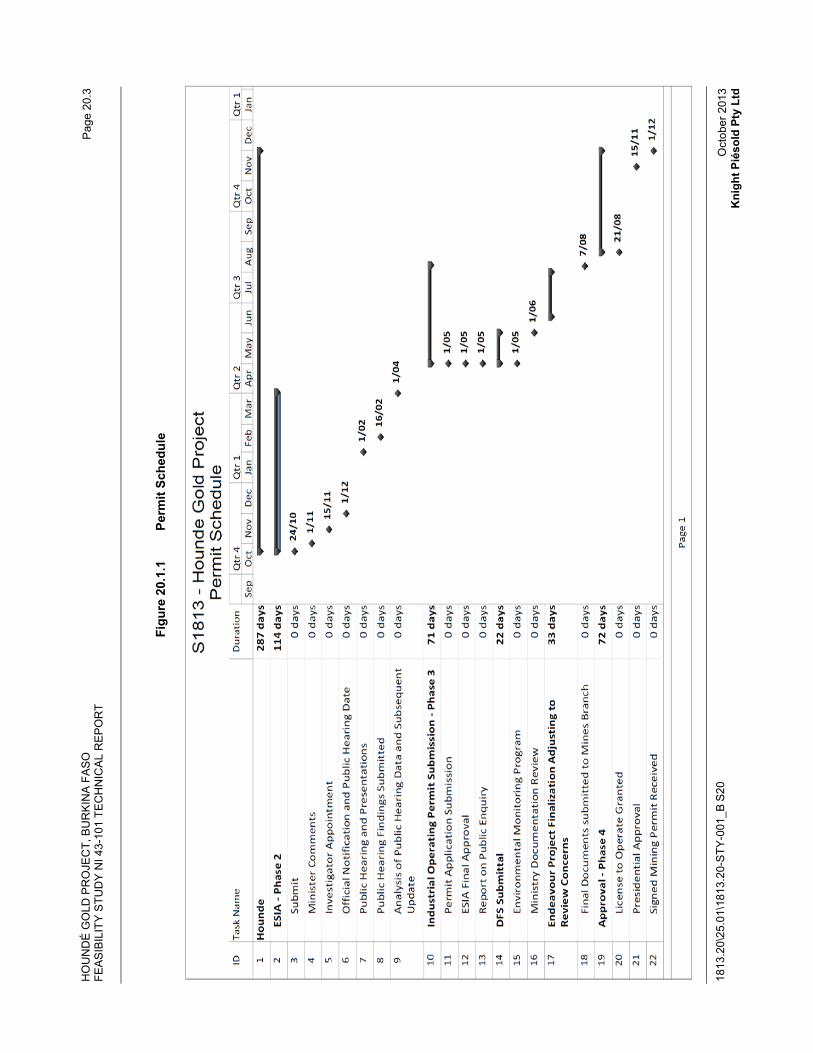
HO
UN
DÉ
GO
LD P
RO
JEC
T, B
UR
KIN
A F
AS
O
FEA
SIB
ILIT
Y S
TUD
Y N
I 43-
101
TEC
HN
ICA
L R
EP
OR
T
1813
.20\
25.0
1\18
13.2
0-S
TY-0
01_B
S20
Pag
e 20
.3
Oct
ober
201
3 K
nigh
t Pié
sold
Pty
Ltd
Figu
re 2
0.1.
1 Pe
rmit
Sche
dule
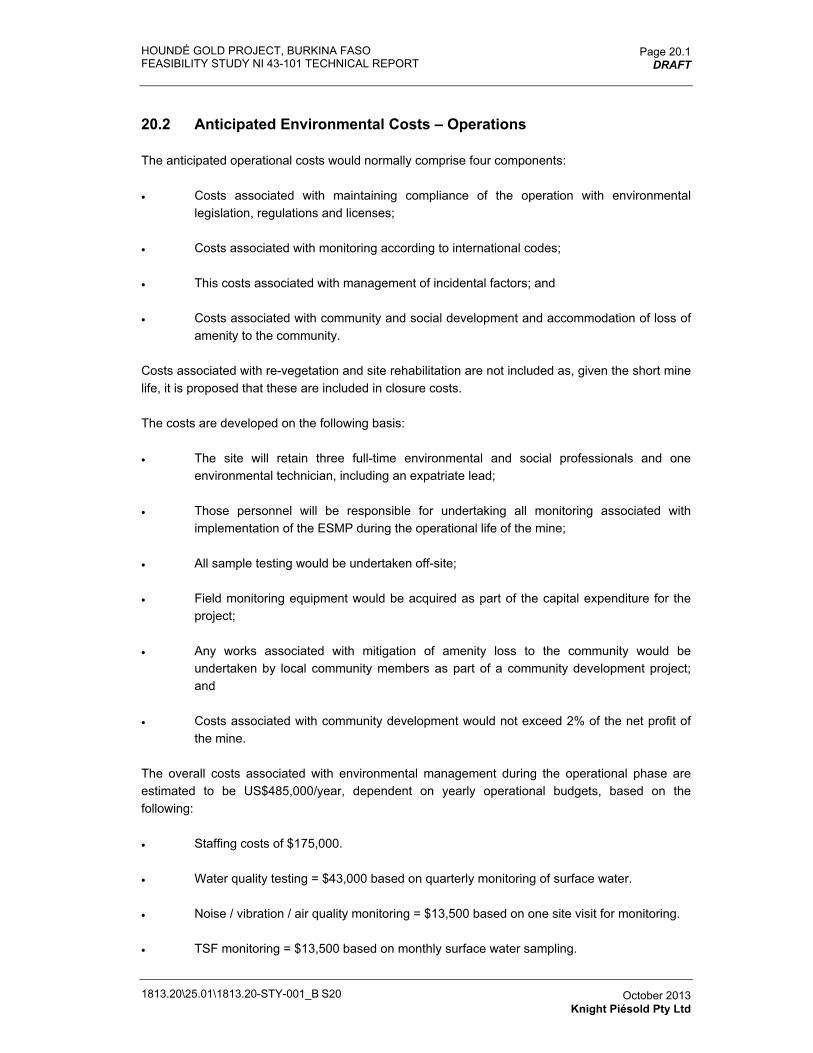
HOUNDÉ GOLD PROJECT, BURKINA FASO FEASIBILITY STUDY NI 43-101 TECHNICAL REPORT
1813.20\25.01\1813.20-STY-001_B S20
Page 20.1 DRAFT
October 2013 Knight Piésold Pty Ltd
20.2 Anticipated Environmental Costs – Operations
The anticipated operational costs would normally comprise four components:
� Costs associated with maintaining compliance of the operation with environmental legislation, regulations and licenses;
� Costs associated with monitoring according to international codes;
� This costs associated with management of incidental factors; and
� Costs associated with community and social development and accommodation of loss of amenity to the community.
Costs associated with re-vegetation and site rehabilitation are not included as, given the short mine life, it is proposed that these are included in closure costs.
The costs are developed on the following basis:
� The site will retain three full-time environmental and social professionals and one environmental technician, including an expatriate lead;
� Those personnel will be responsible for undertaking all monitoring associated with implementation of the ESMP during the operational life of the mine;
� All sample testing would be undertaken off-site;
� Field monitoring equipment would be acquired as part of the capital expenditure for the project;
� Any works associated with mitigation of amenity loss to the community would be undertaken by local community members as part of a community development project; and
� Costs associated with community development would not exceed 2% of the net profit of the mine.
The overall costs associated with environmental management during the operational phase are estimated to be US$485,000/year, dependent on yearly operational budgets, based on the following:
� Staffing costs of $175,000.
� Water quality testing = $43,000 based on quarterly monitoring of surface water.
� Noise / vibration / air quality monitoring = $13,500 based on one site visit for monitoring.
� TSF monitoring = $13,500 based on monthly surface water sampling.
HOUNDÉ GOLD PROJECT, BURKINA FASO FEASIBILITY STUDY NI 43-101 TECHNICAL REPORT
1813.20\25.01\1813.20-STY-001_B S20
Page 20.2 DRAFT
October 2013 Knight Piésold Pty Ltd
� Biological monitoring = $36,000 per year for 2 seasonal surveys.
� Social monitoring = $54,000 based on one annual survey to monitor social change and impact of community development expenditure.
� Community development = $150,000 for community donations with money spent where a local committee of consisting of an Endeavour representative, community leaders and regional government representatives decide.
Of these costs, the Community Development and Staffing costs (total $325,000) have been included in the General and Administration charges as described in Section 21, while the remaining monitoring costs (total $160,000) have been allowed in the cash flow model in Section 22.
Trialling and monitoring of closure and rehabilitation methods to ensure the efficacy of the methods prior to implementation of closure works, will be carried on over the life of the mine.
20.3 Social and Community Impact
The information and stakeholder consultation process was an integral part of the EIA process. In this regard, since the start of the study, Avion Gold has put in place a mechanism for gathering information and consulting the communities, throughout this process. The information gathered was used to better identify and target issues, to minimize the negative impacts and enhance the positive. A Stakeholder Engagement Plan (PEPP) and various information tools have also been developed for this purpose. A list of stakeholders was also developed and updated throughout the information and consultation process. Information about the project was disseminated through radio and a bilingual information leaflet (French and Dioula) has been given to administrative, technical services and representatives of the affected villages.
As part of this information and consultation process, numerous meetings were held with stakeholders. The main concerns raised during the information and consultation activities were as follows:
� Youth employment at the mine;
� The process of resettlement of affected populations so that they regain their previous standard of living;
� Security issues related to mining operations;
� The water supply of the mine (and its potential impact on watersheds and water supply to nearby villages);
� The rehabilitation of the site following the eventual closure of the mine;
� The Project's impacts on infrastructure and administrative buildings;
� Concerns about the presence of the 225 kV high voltage power line between Kadéni and Pa which is located near the site, in addition to the RN1 and a fibre optic line;
HOUNDÉ GOLD PROJECT, BURKINA FASO FEASIBILITY STUDY NI 43-101 TECHNICAL REPORT
1813.20\25.01\1813.20-STY-001_B S20
Page 20.3 DRAFT
October 2013 Knight Piésold Pty Ltd
� The impact of the Project on the classified area Houndé forests;
� The impact of mining activities on the health of workers and local communities;
� The impact of mining activities on the artisanal gold mining activities;
� The occurrence of certain health problems; and
� The disturbance / degradation of morals.
Social and community impacts will arise in a number of key areas including:
� Loss of land;
� Loss of access to grazing;
� Inability to work on the mine site due to demographic, social and cultural restrictions;
� In-migration of skilled labour; and
� Development of local enterprises servicing the mine.
The most significant impact is likely to be the increased levels of income that arise from sources such as:
� Wages and salaries earned;
� Compensation received from loss of land; and
� Payments for services from local small businesses.
The increased levels of income will advantage those in receipt of the payments but adversely affect those who have not had the advantage, directly or indirectly of those increases in income.
The key offsets available will be those arising from training of people who cannot immediately seek or gain employment on the mine to give them skills required to gain benefit from the mine indirectly, through service supply.
The community development programme will also contribute to reduction of the social impact.
HOUNDÉ GOLD PROJECT, BURKINA FASO FEASIBILITY STUDY NI 43-101 TECHNICAL REPORT
1813.20\25.01\1813.20-STY-001_B S20
Page 20.4 DRAFT
October 2013 Knight Piésold Pty Ltd
20.4 Anticipated Land Acquisition and Relocation Costs
The mine will need to acquire 2,096 ha to provide space for the open pit, processing plant, waste piles, TSF, water harvest dam and water storage dam, as well as the necessary roads. However, most access roads will use existing pathways and upgrade them as necessary. As well, a 250 metre wide health perimeter around the existing infrastructure has been delineated to ensure that those that may be impacted by the mine the most (dust, noise etc.), have the option of receiving compensation and moving to another area. A further compensation perimeter, designated as a mitigated 50 dB(A) night time sound perimeter has also been delineated to provide a mechanism for those impacted by the mine noise the option of being compensated and moved to another location further from the mine.
In order to evaluate what fair compensation entails, a detailed study of the local inhabitants, cultural property, land use, land productivity, trees, replacement land, local businesses and replacement structures was carried out by SOCREGE under the supervision of Genivar. In conjunction with this study, Endeavour also reviewed land productivity, crop selection, yearly crop prices and crop selection. This work then provided a range of compensation options dependent on the individual compensation circumstances. For this study, fair baseline compensation was determined for the following major items:
� For farm land
- a combination of cash and crop compensation that totals up to 5 years crop value at Houndé regional productivity for a particular farm plot
- access to replacement land if desired.
� For habitations and out buildings
- replacement with same or better homes in an area of their choosing with a study bias toward the nearby community of Houndé
- cash or in-kind compensation for out buildings that would not be used any more.
� Cultural property (graves, ceremonial sites, archaeological sites and household fetishes)
- mixture of ceremony fees and direct cash compensation.
� Re-establishment costs.
� Cash compensation or re-planting for crop trees and other trees.
� Cash compensation for small businesses in the impact zone.
The process of determining the appropriate level of compensation is still proceeding with total compensation levels ranging from $6.2 million to $15.8 million. For the purpose of this study, an overall compensation level of $12.0 million was chosen. Details for the various compensatory items are contained in the Resettlement Action Plan study.
HOUNDÉ GOLD PROJECT, BURKINA FASO FEASIBILITY STUDY NI 43-101 TECHNICAL REPORT
1813.20\25.01\1813.20-STY-001_B S20
Page 20.5 DRAFT
October 2013 Knight Piésold Pty Ltd
20.5 Anticipated Cost – Closure
The estimate cost of closure is US$26,384,000 (see Table 21.3.7, including Contingency). This cost is based on a combination of resale, reuse, recovery and rehabilitation options for the facilities as described in earlier Sections. The biggest single cost will be the cost of closure of the tailings storage facilities. This cost does not include provision for ongoing monitoring that may be required after closure and rehabilitation works have been completed. It is expected these could require ongoing monitoring of US$175,000/y, if required by the regulatory authorities prior to acceptance of relinquishment.
The objective of the mine closure will be to provide landforms that can be utilized by the community without liability to the community to generate an ecologically sustainable landscape post-mining. The present dependence of the community on cash crops and subsistence farming suggests that the closed mine should provide landforms which are capable of being grazed by animals or supporting annual or perennial crops. Given the sensitivity to water availability in the area, any water dams should be retained for use by the community and any water management structures that can increase water storage capacity for the community would be seriously considered.
Any saleable items will be recovered from the site. Buildings and infrastructure will be offered to the community for use and any materials suitable for recycling will be sold.
All contaminated land will be remediated either by placement of a soil / rock cover system over the area (such as with the TSF) or through removal of the contaminated material to a designated landfill area and replacement of the soil with rock waste and a topsoil cover.
Provision has been made to batter down waste rock dumps and cover their surfaces with topsoil collected during the construction and operations phase. Waste dumps will then be reseeded with local plant species to provide both a vegetated cover to control wind and water erosion and support any beneficial uses identified by the local community.
The pit voids will be left open but surrounded by a protective bund, outside the zone of instability, to ensure entry by vehicles will be hindered.
A rehabilitation fund is required to be set up upon opening of the mine. The funding for the rehabilitation fund will be set up to match total material movement in the mine with $0.10 /tonne mined added to the fund annually. Using this methodology, the closing balance will be $23.3 million, which will be topped up to $26.4 million (includes contingency) at closure. The details of the rehabilitation costs are as follows:
� Tailings - $ 14,505,000 (see table 20.5.1).
� Water pipeline removal - $60,300.
� Mining Services – wash bay demolition = $13,440.
� Process Plant demolition - $4,953,000
- demolish and sell steelwork structure
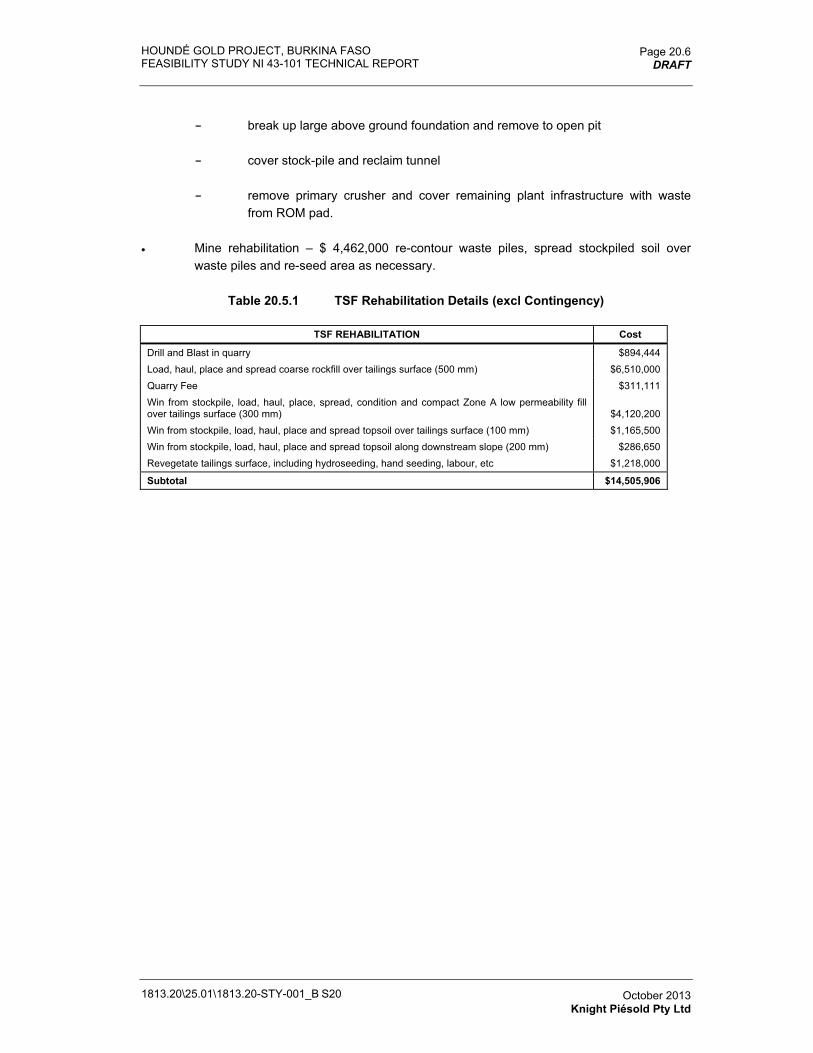
HOUNDÉ GOLD PROJECT, BURKINA FASO FEASIBILITY STUDY NI 43-101 TECHNICAL REPORT
1813.20\25.01\1813.20-STY-001_B S20
Page 20.6 DRAFT
October 2013 Knight Piésold Pty Ltd
- break up large above ground foundation and remove to open pit
- cover stock-pile and reclaim tunnel
- remove primary crusher and cover remaining plant infrastructure with waste from ROM pad.
� Mine rehabilitation – $ 4,462,000 re-contour waste piles, spread stockpiled soil over waste piles and re-seed area as necessary.
Table 20.5.1 TSF Rehabilitation Details (excl Contingency)
TSF REHABILITATION Cost
Drill and Blast in quarry $894,444 Load, haul, place and spread coarse rockfill over tailings surface (500 mm) $6,510,000 Quarry Fee $311,111 Win from stockpile, load, haul, place, spread, condition and compact Zone A low permeability fill over tailings surface (300 mm) $4,120,200 Win from stockpile, load, haul, place and spread topsoil over tailings surface (100 mm) $1,165,500 Win from stockpile, load, haul, place and spread topsoil along downstream slope (200 mm) $286,650 Revegetate tailings surface, including hydroseeding, hand seeding, labour, etc $1,218,000
Subtotal $14,505,906
HOUNDÉ GOLD PROJECT, BURKINA FASO
FEASIBILITY STUDY NI 43-101 TECHNICAL REPORT
1813.20-STY-001
Table of Contents Page
21.0� CAPITAL AND OPERATING COSTS 21.1�21.1� Mining Cost Estimates 21.1�
21.1.1� Estimate Basis and Qualifications 21.1�21.2� Process Plant and Administration 21.4�
21.2.1� Summary 21.4�21.2.2� Power 21.6�21.2.3� Operating Consumables 21.7�21.2.4� Labour (Processing / Maintenance and Administration) 21.7�21.2.5� General and Administration Cost (excluding G&A labour) 21.8�21.2.6� Maintenance 21.9�
21.3� Capital Cost Estimate 21.9�21.3.1� Summary 21.9�21.3.2� Estimating Methodology 21.12�21.3.3� Field Indirect Costs 21.14�21.3.4� EPCM Services 21.15�21.3.5� Owner’s Costs 21.15�21.3.6� Contingency 21.16�21.3.7� Deferred Capital 21.17�21.3.8� Qualifications and Assumptions 21.17�21.3.9� Exclusions 21.19�
21.4� Project Implementation 21.19�21.4.1� Implementation Strategy 21.19�21.4.2� Implementation Schedule 21.19�21.4.3� HSEC Management 21.24�21.4.4� Logistics 21.24�21.4.5� Training 21.24�
TABLESTable 21.1.1� Annual Mining Cost Summary, $M 21.2�Table 21.1.2� Production Drill and Blast Costs, ($/dmt) 21.3�Table 21.1.3� Grade Control Costs 21.3�Table 21.1.4� Mining Personnel Costs 21.4�Table 21.1.5� Fixed Costs and Overheads 21.4�Table 21.2.1� Houndé Process Plant LOM Blend Operating Cost Summary 21.5�Table 21.2.2� Houndé Process Plant Operating Cost Summary by Oxidation Level 21.5�Table 21.2.3� Houndé Process Plant Power Cost by Plant Area 21.7�Table 21.2.4� Houndé Process Plant Consumables Cost by Plant Area 21.7�Table 21.2.5� Houndé Plant Processing and Administration Manning Levels 21.8�Table 21.2.6� Labour Roster and Manpower Requirements 21.8�Table 21.2.7� Houndé Plant General and Administration Summary 21.8�Table 21.2.8� Houndé Plant Total Plant Maintenance Cost by Plant Area 21.9�Table 21.3.1� Exchange Rates 21.10�Table 21.3.2� Capital Cost Summary, 3Q13, ± 15% 21.11�Table 21.3.3� Derivation of Quantities 21.12�Table 21.3.4� Sources of Pricing 21.13�Table 21.3.5� Standard Direct Labour Gang Rates 21.14�Table 21.3.6� Contingency Percentage Summary 21.16�Table 21.3.7� Deferred Capital Cost Summary, 3Q13, ± 15% 21.17�
1813.20\25.01\1813.20-STY-001_B S21 October 2013 Lycopodium Minerals Pty Ltd
HOUNDÉ GOLD PROJECT, BURKINA FASO
FEASIBILITY STUDY NI 43-101 TECHNICAL REPORT
1813.20-STY-001
Table of Contents (Continued) Page
1813.20\25.01\1813.20-STY-001_B S21 October 2013 Lycopodium Minerals Pty Ltd
FIGURESFigure 21.2.1� Processing Cost Summary by LOM and Ore Types 21.6�Figure 21.4.1� Project Implementation Schedule 21.21�Figure 21.4.2� Project Schedule Critical Path 21.23�
HOUNDÉ GOLD PROJECT, BURKINA FASO FEASIBILITY STUDY NI 43-101 TECHNICAL REPORT
1813.20\25.01\1813.20-STY-001_B S21
Page 21.1
October 2013 Lycopodium Minerals Pty Ltd
21.0 CAPITAL AND OPERATING COSTS
21.1 Mining Cost Estimates
Orelogy has estimated mining costs for the project on an Owner operated basis as summarised in Table 21.1.1.
Costs were built up from first principles in a detailed cost model utilising:
1. Heavy equipment capital and operating costs sourced from the relevant Original Equipment Supplier (OEM) during 3rd quarter 2013.
2. Productivity and equipment hours generated by EVORELUTION mine scheduling and haulage optimisation software, based on reasonable working productivity assumptions.
3. Personnel, fuel and power costs in line with those utilised by Lycopodium for the processing cost estimation.
21.1.1 Estimate Basis and Qualifications
The various cost items were then applied to the physicals of the LoM schedule to develop a mining cashflow schedule over the life of the operation. Mine scheduling work has been based on 300 tonne excavators loading 140 tonne trucks supported by a medium sized ancillary fleet.
The capital cost provided by the OEM is inclusive of sea freight and delivery to the Houndé site. Additional allowances for the following have been included:
� Additional equipment (e.g. water tanks for water truck).
� First fill spares component at 1% of F.O.B cost.
� Initial truck tires are included in the capital expenditure, and the costs of subsequent tires are allocated to the operating cost.
A fuel price of $1.312/L was used for pre-production and this was increased to $1.40/L for LoM.
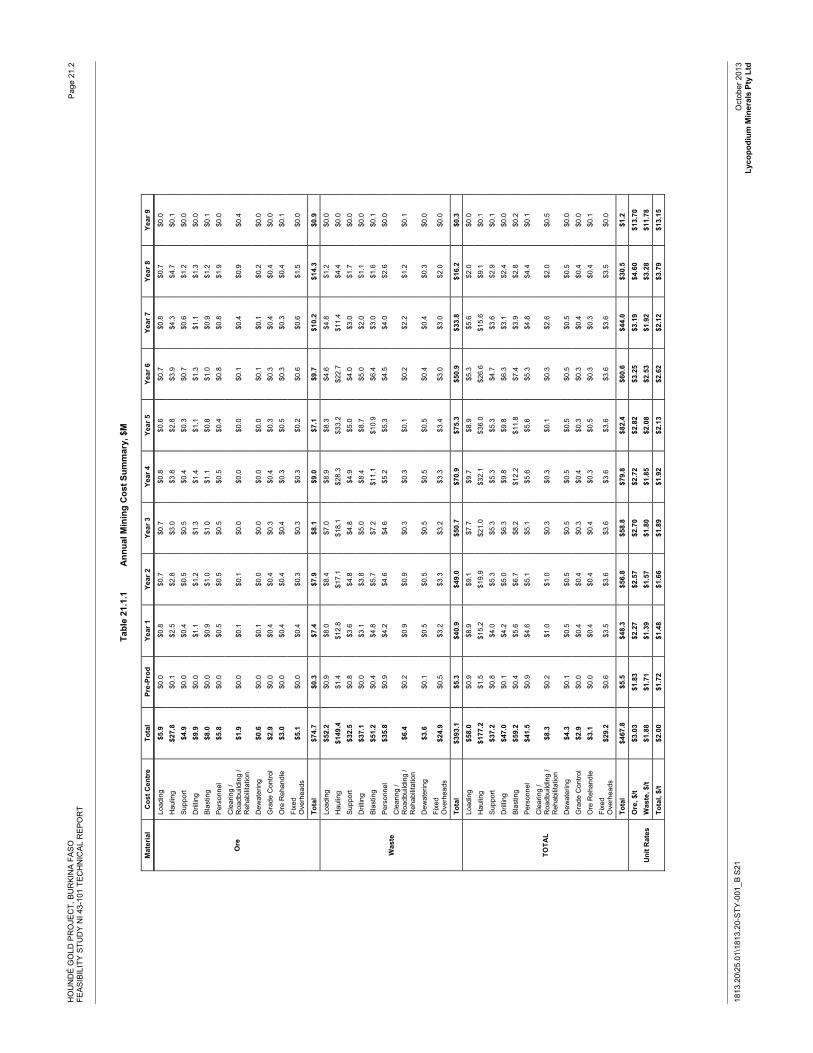
HO
UN
DÉ
GO
LD P
RO
JEC
T, B
UR
KIN
A F
AS
O
FEA
SIB
ILIT
Y S
TUD
Y N
I 43-
101
TEC
HN
ICA
L R
EP
OR
T
1813
.20\
25.0
1\18
13.2
0-S
TY-0
01_B
S21
Pag
e 21
.2
Oct
ober
201
3 Ly
copo
dium
Min
eral
s Pt
y Lt
d
Tabl
e 21
.1.1
A
nnua
l Min
ing
Cos
t Sum
mar
y, $
M
Mat
eria
l C
ost C
entr
e To
tal
Pre-
Prod
Ye
ar 1
Ye
ar 2
Ye
ar 3
Ye
ar 4
Ye
ar 5
Ye
ar 6
Ye
ar 7
Ye
ar 8
Ye
ar 9
Ore
Load
ing
$5.9
$0.0
$0
.8
$0.7
$0
.7
$0.8
$0
.6
$0.7
$0
.8
$0.7
$0
.0
Hau
ling
$27.
8 $0
.1
$2.5
$2
.8
$3.0
$3
.8
$2.8
$3
.9
$4.3
$4
.7
$0.1
S
uppo
rt $4
.9$0
.0
$0.4
$0
.5
$0.5
$0
.4
$0.3
$0
.7
$0.6
$1
.2
$0.0
D
rillin
g $9
.9$0
.0
$1.1
$1
.2
$1.3
$1
.4
$1.1
$1
.3
$1.1
$1
.3
$0.0
B
last
ing
$8.0
$0.0
$0
.9
$1.0
$1
.0
$1.1
$0
.8
$1.0
$0
.9
$1.2
$0
.1
Per
sonn
el$5
.8$0
.0
$0.5
$0
.5
$0.5
$0
.5
$0.4
$0
.8
$0.8
$1
.9
$0.0
C
lear
ing
/ R
oadb
uild
ing
/ R
ehab
ilita
tion
$1.9
$0.0
$0
.1
$0.1
$0
.0
$0.0
$0
.0
$0.1
$0
.4
$0.9
$0
.4
Dew
ater
ing
$0.6
$0.0
$0
.1
$0.0
$0
.0
$0.0
$0
.0
$0.1
$0
.1
$0.2
$0
.0
Gra
de C
ontro
l $2
.9$0
.0
$0.4
$0
.4
$0.3
$0
.4
$0.3
$0
.3
$0.4
$0
.4
$0.0
O
re R
ehan
dle
$3.0
$0.0
$0
.4
$0.4
$0
.4
$0.3
$0
.5
$0.3
$0
.3
$0.4
$0
.1
Fixe
dO
verh
eads
$5
.1$0
.0
$0.4
$0
.3
$0.3
$0
.3
$0.2
$0
.6
$0.6
$1
.5
$0.0
Tota
l $7
4.7
$0.3
$7
.4
$7.9
$8
.1
$9.0
$7
.1
$9.7
$1
0.2
$14.
3 $0
.9
Was
te
Load
ing
$52.
2 $0
.9
$8.0
$8
.4
$7.0
$8
.9
$8.3
$4
.6
$4.8
$1
.2
$0.0
H
aulin
g$1
49.4
$1
.4
$12.
8 $1
7.1
$18.
1 $2
8.3
$33.
2 $2
2.7
$11.
4 $4
.4
$0.0
S
uppo
rt $3
2.5
$0.8
$3
.6
$4.8
$4
.8
$4.9
$5
.0
$4.0
$3
.0
$1.7
$0
.0
Dril
ling
$37.
1 $0
.0
$3.1
$3
.8
$5.0
$8
.4
$8.7
$5
.0
$2.0
$1
.1
$0.0
B
last
ing
$51.
2 $0
.4
$4.8
$5
.7
$7.2
$1
1.1
$10.
9 $6
.4
$3.0
$1
.6
$0.1
P
erso
nnel
$35.
8 $0
.9
$4.2
$4
.6
$4.6
$5
.2
$5.3
$4
.5
$4.0
$2
.6
$0.0
C
lear
ing
/ R
oadb
uild
ing
/ R
ehab
ilita
tion
$6.4
$0.2
$0
.9
$0.9
$0
.3
$0.3
$0
.1
$0.2
$2
.2
$1.2
$0
.1
Dew
ater
ing
$3.6
$0.1
$0
.5
$0.5
$0
.5
$0.5
$0
.5
$0.4
$0
.4
$0.3
$0
.0
Fixe
dO
verh
eads
$2
4.9
$0.5
$3
.2
$3.3
$3
.2
$3.3
$3
.4
$3.0
$3
.0
$2.0
$0
.0
Tota
l $3
93.1
$5
.3
$40.
9 $4
9.0
$50.
7 $7
0.9
$75.
3 $5
0.9
$33.
8 $1
6.2
$0.3
TOTA
L
Load
ing
$58.
0 $0
.9
$8.9
$9
.1
$7.7
$9
.7
$8.9
$5
.3
$5.6
$2
.0
$0.0
H
aulin
g$1
77.2
$1
.5
$15.
2 $1
9.9
$21.
0 $3
2.1
$36.
0 $2
6.6
$15.
6 $9
.1
$0.1
S
uppo
rt $3
7.2
$0.8
$4
.0
$5.3
$5
.3
$5.3
$5
.3
$4.7
$3
.6
$2.9
$0
.1
Dril
ling
$47.
0 $0
.1
$4.2
$5
.0
$6.3
$9
.8
$9.8
$6
.3
$3.1
$2
.4
$0.0
B
last
ing
$59.
2 $0
.4
$5.6
$6
.7
$8.2
$1
2.2
$11.
8 $7
.4
$3.9
$2
.8
$0.2
P
erso
nnel
$41.
5 $0
.9
$4.6
$5
.1
$5.1
$5
.6
$5.6
$5
.3
$4.8
$4
.4
$0.1
C
lear
ing
/ R
oadb
uild
ing
/ R
ehab
ilita
tion
$8.3
$0.2
$1
.0
$1.0
$0
.3
$0.3
$0
.1
$0.3
$2
.6
$2.0
$0
.5
Dew
ater
ing
$4.3
$0.1
$0
.5
$0.5
$0
.5
$0.5
$0
.5
$0.5
$0
.5
$0.5
$0
.0
Gra
de C
ontro
l $2
.9$0
.0
$0.4
$0
.4
$0.3
$0
.4
$0.3
$0
.3
$0.4
$0
.4
$0.0
O
re R
ehan
dle
$3.1
$0.0
$0
.4
$0.4
$0
.4
$0.3
$0
.5
$0.3
$0
.3
$0.4
$0
.1
Fixe
dO
verh
eads
$2
9.2
$0.6
$3
.5
$3.6
$3
.6
$3.6
$3
.6
$3.6
$3
.6
$3.5
$0
.0
Tota
l $4
67.8
$5
.5
$48.
3 $5
6.8
$58.
8 $7
9.8
$82.
4 $6
0.6
$44.
0 $3
0.5
$1.2
Uni
t Rat
es
Ore
, $/t
$3.0
3 $1
.83
$2.2
7 $2
.57
$2.7
0 $2
.72
$2.8
2 $3
.25
$3.1
9 $4
.60
$13.
70
Was
te, $
/t $1
.88
$1.7
1 $1
.39
$1.5
7 $1
.80
$1.8
5 $2
.08
$2.5
3 $1
.92
$3.2
8 $1
1.78
Tota
l, $/
t $2
.00
$1.7
2 $1
.48
$1.6
6 $1
.89
$1.9
2 $2
.13
$2.6
2 $2
.12
$3.7
9 $1
3.15
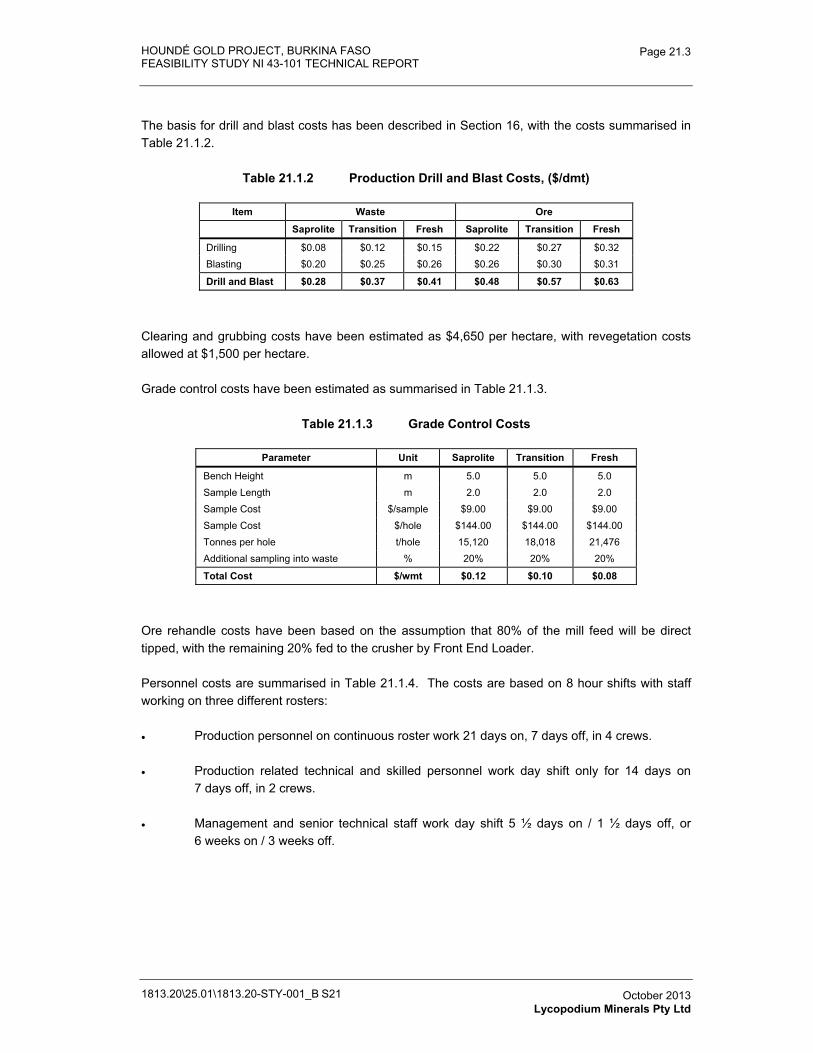
HOUNDÉ GOLD PROJECT, BURKINA FASO FEASIBILITY STUDY NI 43-101 TECHNICAL REPORT
1813.20\25.01\1813.20-STY-001_B S21
Page 21.3
October 2013 Lycopodium Minerals Pty Ltd
The basis for drill and blast costs has been described in Section 16, with the costs summarised in Table 21.1.2.
Table 21.1.2 Production Drill and Blast Costs, ($/dmt)
Item Waste Ore
Saprolite Transition Fresh Saprolite Transition Fresh
Drilling $0.08 $0.12 $0.15 $0.22 $0.27 $0.32 Blasting $0.20 $0.25 $0.26 $0.26 $0.30 $0.31
Drill and Blast $0.28 $0.37 $0.41 $0.48 $0.57 $0.63
Clearing and grubbing costs have been estimated as $4,650 per hectare, with revegetation costs allowed at $1,500 per hectare.
Grade control costs have been estimated as summarised in Table 21.1.3.
Table 21.1.3 Grade Control Costs
Parameter Unit Saprolite Transition Fresh
Bench Height m 5.0 5.0 5.0 Sample Length m 2.0 2.0 2.0 Sample Cost $/sample $9.00 $9.00 $9.00 Sample Cost $/hole $144.00 $144.00 $144.00 Tonnes per hole t/hole 15,120 18,018 21,476 Additional sampling into waste % 20% 20% 20%
Total Cost $/wmt $0.12 $0.10 $0.08
Ore rehandle costs have been based on the assumption that 80% of the mill feed will be direct tipped, with the remaining 20% fed to the crusher by Front End Loader.
Personnel costs are summarised in Table 21.1.4. The costs are based on 8 hour shifts with staff working on three different rosters:
� Production personnel on continuous roster work 21 days on, 7 days off, in 4 crews.
� Production related technical and skilled personnel work day shift only for 14 days on 7 days off, in 2 crews.
� Management and senior technical staff work day shift 5 ½ days on / 1 ½ days off, or 6 weeks on / 3 weeks off.
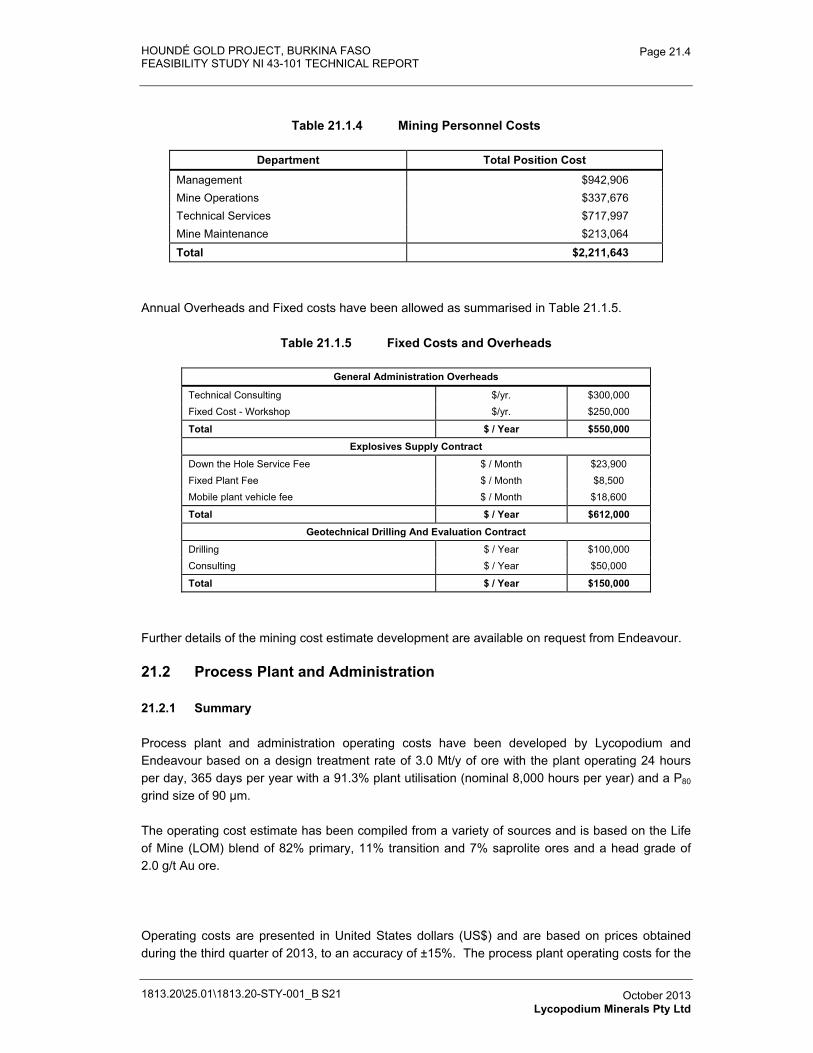
HOUNDÉ GOLD PROJECT, BURKINA FASO FEASIBILITY STUDY NI 43-101 TECHNICAL REPORT
1813.20\25.01\1813.20-STY-001_B S21
Page 21.4
October 2013 Lycopodium Minerals Pty Ltd
Table 21.1.4 Mining Personnel Costs
Department Total Position Cost
Management $942,906 Mine Operations $337,676 Technical Services $717,997 Mine Maintenance $213,064
Total $2,211,643
Annual Overheads and Fixed costs have been allowed as summarised in Table 21.1.5.
Table 21.1.5 Fixed Costs and Overheads
General Administration Overheads
Technical Consulting $/yr. $300,000 Fixed Cost - Workshop $/yr. $250,000
Total $ / Year $550,000
Explosives Supply Contract
Down the Hole Service Fee $ / Month $23,900 Fixed Plant Fee $ / Month $8,500 Mobile plant vehicle fee $ / Month $18,600
Total $ / Year $612,000
Geotechnical Drilling And Evaluation Contract
Drilling $ / Year $100,000 Consulting $ / Year $50,000
Total $ / Year $150,000
Further details of the mining cost estimate development are available on request from Endeavour.
21.2 Process Plant and Administration
21.2.1 Summary
Process plant and administration operating costs have been developed by Lycopodium and Endeavour based on a design treatment rate of 3.0 Mt/y of ore with the plant operating 24 hours per day, 365 days per year with a 91.3% plant utilisation (nominal 8,000 hours per year) and a P80
grind size of 90 μm.
The operating cost estimate has been compiled from a variety of sources and is based on the Life of Mine (LOM) blend of 82% primary, 11% transition and 7% saprolite ores and a head grade of 2.0 g/t Au ore.
Operating costs are presented in United States dollars (US$) and are based on prices obtained during the third quarter of 2013, to an accuracy of ±15%. The process plant operating costs for the
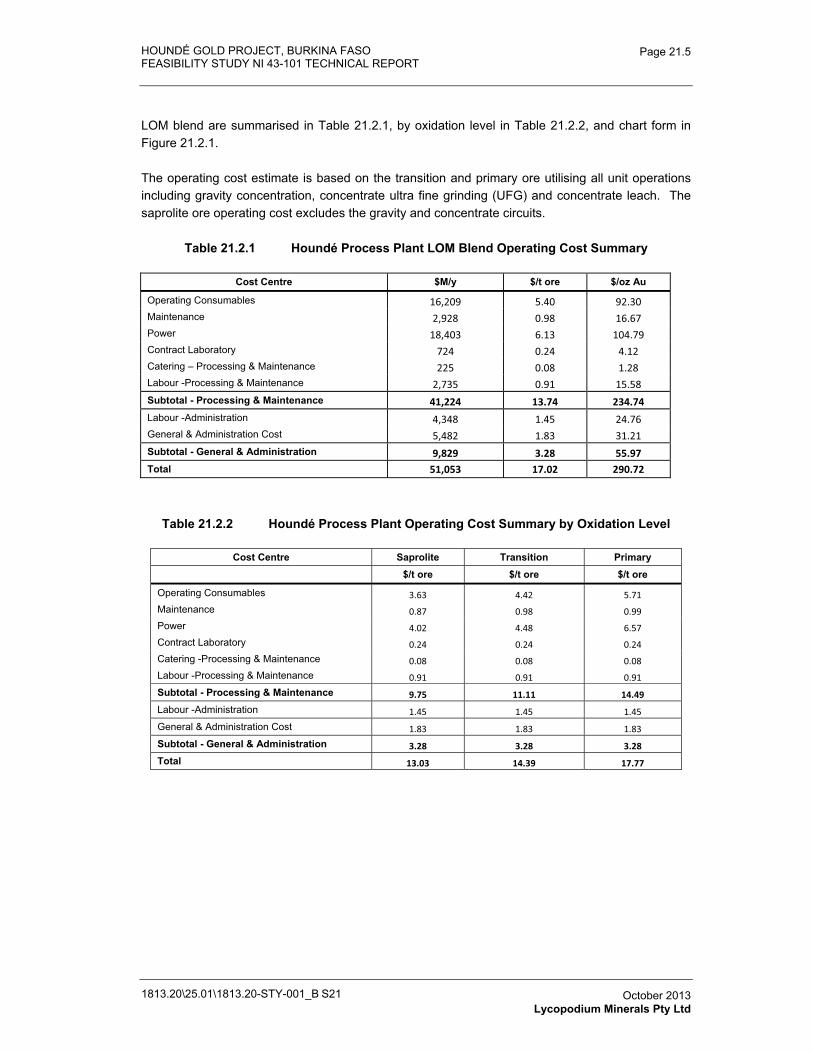
HOUNDÉ GOLD PROJECT, BURKINA FASO FEASIBILITY STUDY NI 43-101 TECHNICAL REPORT
1813.20\25.01\1813.20-STY-001_B S21
Page 21.5
October 2013 Lycopodium Minerals Pty Ltd
LOM blend are summarised in Table 21.2.1, by oxidation level in Table 21.2.2, and chart form in Figure 21.2.1.
The operating cost estimate is based on the transition and primary ore utilising all unit operations including gravity concentration, concentrate ultra fine grinding (UFG) and concentrate leach. The saprolite ore operating cost excludes the gravity and concentrate circuits.
Table 21.2.1 Houndé Process Plant LOM Blend Operating Cost Summary
Cost Centre $M/y $/t ore $/oz Au
Operating Consumables 16,209� 5.40� 92.30�Maintenance 2,928� 0.98� 16.67�Power 18,403� 6.13� 104.79�Contract Laboratory 724� 0.24� 4.12�Catering – Processing & Maintenance 225� 0.08� 1.28�Labour -Processing & Maintenance 2,735� 0.91� 15.58�Subtotal - Processing & Maintenance 41,224� 13.74� 234.74�Labour -Administration 4,348� 1.45� 24.76�General & Administration Cost 5,482� 1.83� 31.21�Subtotal - General & Administration 9,829� 3.28� 55.97�Total 51,053� 17.02� 290.72�
Table 21.2.2 Houndé Process Plant Operating Cost Summary by Oxidation Level
Cost Centre Saprolite Transition Primary $/t ore $/t ore $/t ore
Operating Consumables 3.63� 4.42� 5.71�Maintenance 0.87� 0.98� 0.99�Power 4.02� 4.48� 6.57�Contract Laboratory 0.24� 0.24� 0.24�Catering -Processing & Maintenance 0.08� 0.08� 0.08�Labour -Processing & Maintenance 0.91� 0.91� 0.91�Subtotal - Processing & Maintenance 9.75� 11.11� 14.49�
Labour -Administration 1.45� 1.45� 1.45�General & Administration Cost 1.83� 1.83� 1.83�Subtotal - General & Administration 3.28� 3.28� 3.28�
Total 13.03� 14.39� 17.77�
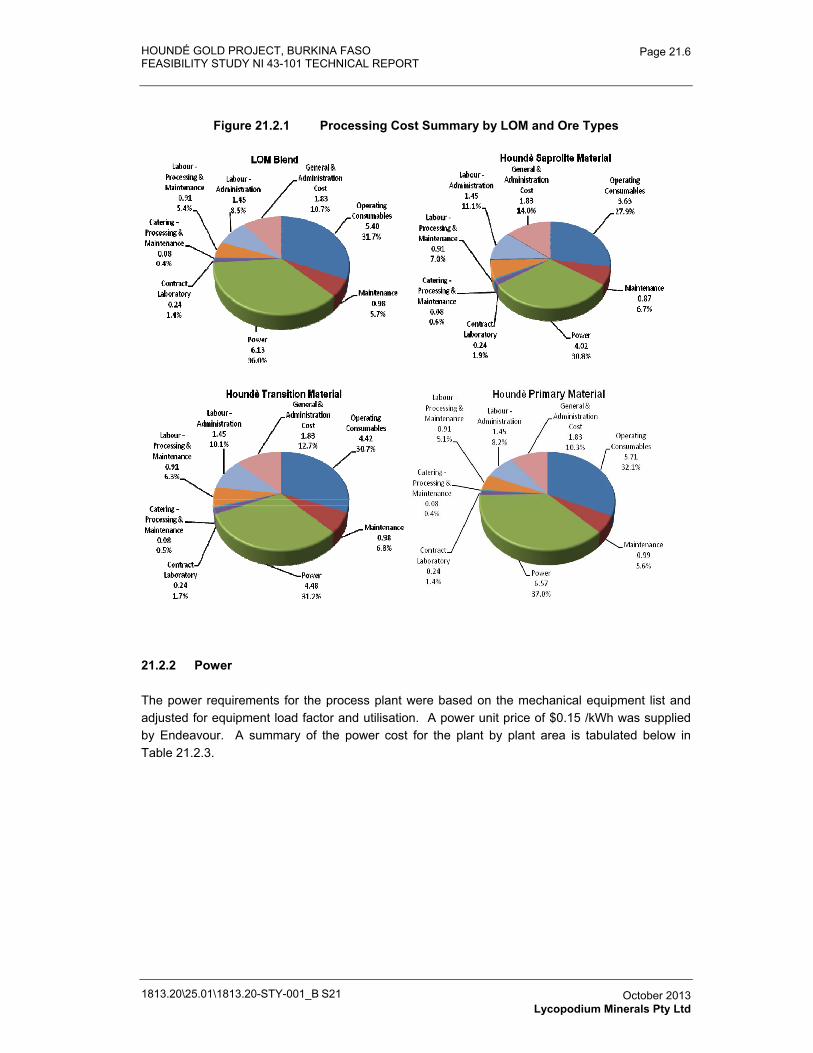
HOUNDÉ GOLD PROJECT, BURKINA FASO FEASIBILITY STUDY NI 43-101 TECHNICAL REPORT
1813.20\25.01\1813.20-STY-001_B S21
Page 21.6
October 2013 Lycopodium Minerals Pty Ltd
Figure 21.2.1 Processing Cost Summary by LOM and Ore Types
21.2.2 Power
The power requirements for the process plant were based on the mechanical equipment list and adjusted for equipment load factor and utilisation. A power unit price of $0.15 /kWh was supplied by Endeavour. A summary of the power cost for the plant by plant area is tabulated below in Table 21.2.3.
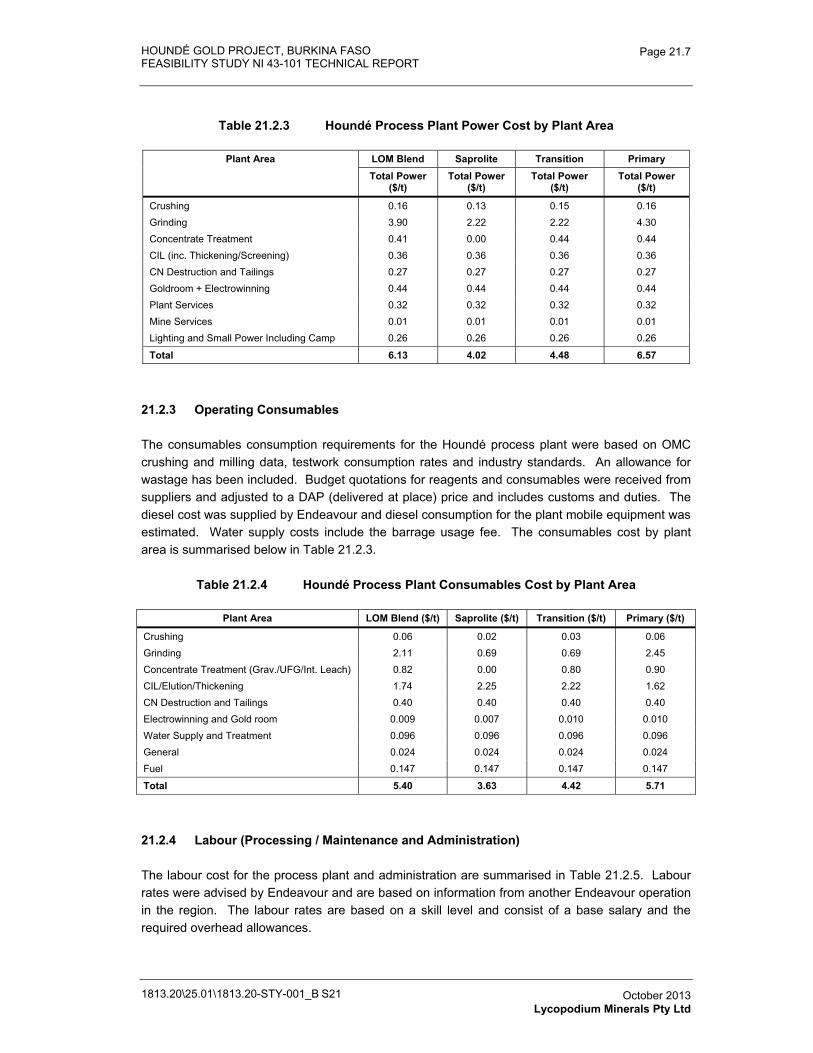
HOUNDÉ GOLD PROJECT, BURKINA FASO FEASIBILITY STUDY NI 43-101 TECHNICAL REPORT
1813.20\25.01\1813.20-STY-001_B S21
Page 21.7
October 2013 Lycopodium Minerals Pty Ltd
Table 21.2.3 Houndé Process Plant Power Cost by Plant Area
Plant Area LOM Blend Saprolite Transition Primary Total Power
($/t) Total Power
($/t) Total Power
($/t) Total Power
($/t)
Crushing 0.16 0.13 0.15 0.16Grinding 3.90 2.22 2.22 4.30Concentrate Treatment 0.41 0.00 0.44 0.44CIL (inc. Thickening/Screening) 0.36 0.36 0.36 0.36 CN Destruction and Tailings 0.27 0.27 0.27 0.27Goldroom + Electrowinning 0.44 0.44 0.44 0.44Plant Services 0.32 0.32 0.32 0.32Mine Services 0.01 0.01 0.01 0.01Lighting and Small Power Including Camp 0.26 0.26 0.26 0.26
Total 6.13 4.02 4.48 6.57
21.2.3 Operating Consumables
The consumables consumption requirements for the Houndé process plant were based on OMC crushing and milling data, testwork consumption rates and industry standards. An allowance for wastage has been included. Budget quotations for reagents and consumables were received from suppliers and adjusted to a DAP (delivered at place) price and includes customs and duties. The diesel cost was supplied by Endeavour and diesel consumption for the plant mobile equipment was estimated. Water supply costs include the barrage usage fee. The consumables cost by plant area is summarised below in Table 21.2.3.
Table 21.2.4 Houndé Process Plant Consumables Cost by Plant Area
Plant Area LOM Blend ($/t) Saprolite ($/t) Transition ($/t) Primary ($/t)
Crushing 0.06 0.02 0.03 0.06Grinding 2.11 0.69 0.69 2.45Concentrate Treatment (Grav./UFG/Int. Leach) 0.82 0.00 0.80 0.90CIL/Elution/Thickening 1.74 2.25 2.22 1.62CN Destruction and Tailings 0.40 0.40 0.40 0.40Electrowinning and Gold room 0.009 0.007 0.010 0.010 Water Supply and Treatment 0.096 0.096 0.096 0.096 General 0.024 0.024 0.024 0.024 Fuel 0.147 0.147 0.147 0.147
Total 5.40 3.63 4.42 5.71
21.2.4 Labour (Processing / Maintenance and Administration)
The labour cost for the process plant and administration are summarised in Table 21.2.5. Labour rates were advised by Endeavour and are based on information from another Endeavour operation in the region. The labour rates are based on a skill level and consist of a base salary and the required overhead allowances.
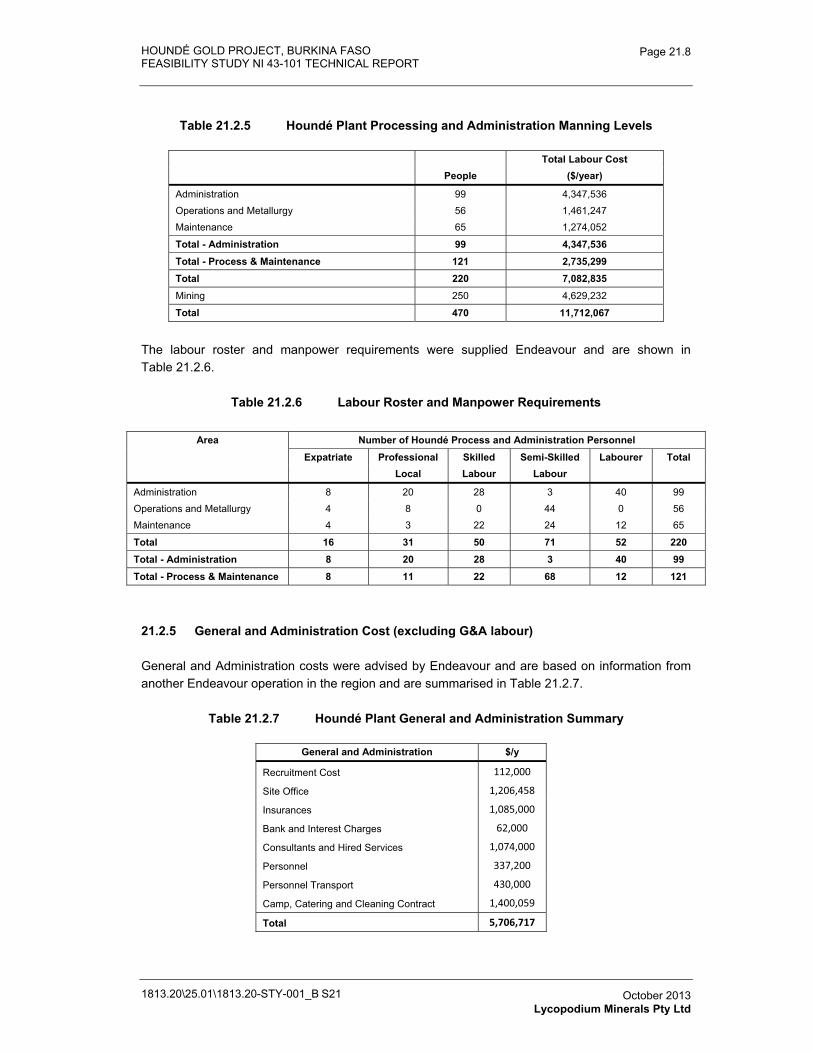
HOUNDÉ GOLD PROJECT, BURKINA FASO FEASIBILITY STUDY NI 43-101 TECHNICAL REPORT
1813.20\25.01\1813.20-STY-001_B S21
Page 21.8
October 2013 Lycopodium Minerals Pty Ltd
Table 21.2.5 Houndé Plant Processing and Administration Manning Levels
The labour roster and manpower requirements were supplied Endeavour and are shown in Table 21.2.6.
Table 21.2.6 Labour Roster and Manpower Requirements
21.2.5 General and Administration Cost (excluding G&A labour)
General and Administration costs were advised by Endeavour and are based on information from another Endeavour operation in the region and are summarised in Table 21.2.7.
Table 21.2.7 Houndé Plant General and Administration Summary
General and Administration $/y
Recruitment Cost 112,000
Site Office 1,206,458
Insurances 1,085,000
Bank and Interest Charges 62,000
Consultants and Hired Services 1,074,000
Personnel 337,200
Personnel Transport 430,000
Camp, Catering and Cleaning Contract 1,400,059
Total 5,706,717
Total Labour Cost People ($/year)
Administration 99 4,347,536 Operations and Metallurgy 56 1,461,247 Maintenance 65 1,274,052
Total - Administration 99 4,347,536 Total - Process & Maintenance 121 2,735,299 Total 220 7,082,835 Mining 250 4,629,232
Total 470 11,712,067
Area Number of Houndé Process and Administration Personnel Expatriate Professional Skilled Semi-Skilled Labourer Total
Local Labour Labour
Administration 8 20 28 3 40 99Operations and Metallurgy 4 8 0 44 0 56 Maintenance 4 3 22 24 12 65
Total 16 31 50 71 52 220Total - Administration 8 20 28 3 40 99 Total - Process & Maintenance 8 11 22 68 12 121
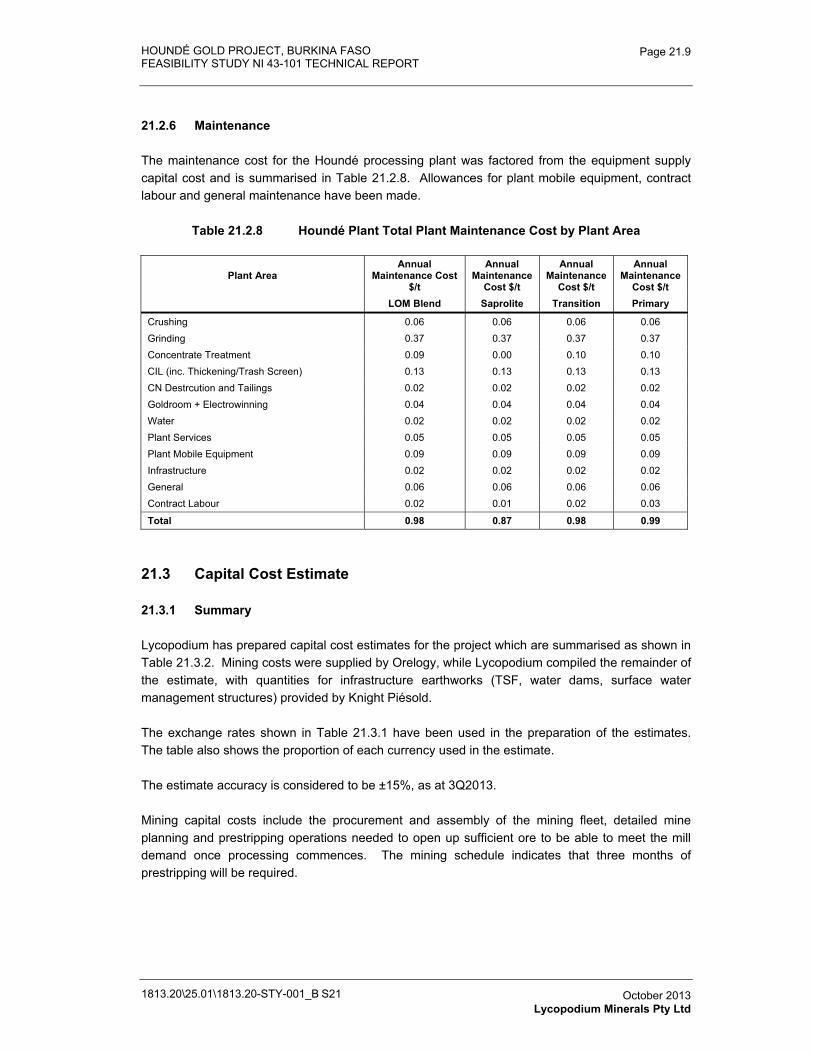
HOUNDÉ GOLD PROJECT, BURKINA FASO FEASIBILITY STUDY NI 43-101 TECHNICAL REPORT
1813.20\25.01\1813.20-STY-001_B S21
Page 21.9
October 2013 Lycopodium Minerals Pty Ltd
21.2.6 Maintenance
The maintenance cost for the Houndé processing plant was factored from the equipment supply capital cost and is summarised in Table 21.2.8. Allowances for plant mobile equipment, contract labour and general maintenance have been made.
Table 21.2.8 Houndé Plant Total Plant Maintenance Cost by Plant Area
Plant Area Annual
Maintenance Cost $/t
Annual Maintenance
Cost $/t
Annual Maintenance
Cost $/t
Annual Maintenance
Cost $/t LOM Blend Saprolite Transition Primary
Crushing 0.06 0.06 0.06 0.06Grinding 0.37 0.37 0.37 0.37Concentrate Treatment 0.09 0.00 0.10 0.10CIL (inc. Thickening/Trash Screen) 0.13 0.13 0.13 0.13 CN Destrcution and Tailings 0.02 0.02 0.02 0.02Goldroom + Electrowinning 0.04 0.04 0.04 0.04Water 0.02 0.02 0.02 0.02Plant Services 0.05 0.05 0.05 0.05Plant Mobile Equipment 0.09 0.09 0.09 0.09Infrastructure 0.02 0.02 0.02 0.02General 0.06 0.06 0.06 0.06Contract Labour 0.02 0.01 0.02 0.03
Total 0.98 0.87 0.98 0.99
21.3 Capital Cost Estimate
21.3.1 Summary
Lycopodium has prepared capital cost estimates for the project which are summarised as shown in Table 21.3.2. Mining costs were supplied by Orelogy, while Lycopodium compiled the remainder of the estimate, with quantities for infrastructure earthworks (TSF, water dams, surface water management structures) provided by Knight Piésold.
The exchange rates shown in Table 21.3.1 have been used in the preparation of the estimates. The table also shows the proportion of each currency used in the estimate.
The estimate accuracy is considered to be ±15%, as at 3Q2013.
Mining capital costs include the procurement and assembly of the mining fleet, detailed mine planning and prestripping operations needed to open up sufficient ore to be able to meet the mill demand once processing commences. The mining schedule indicates that three months of prestripping will be required.
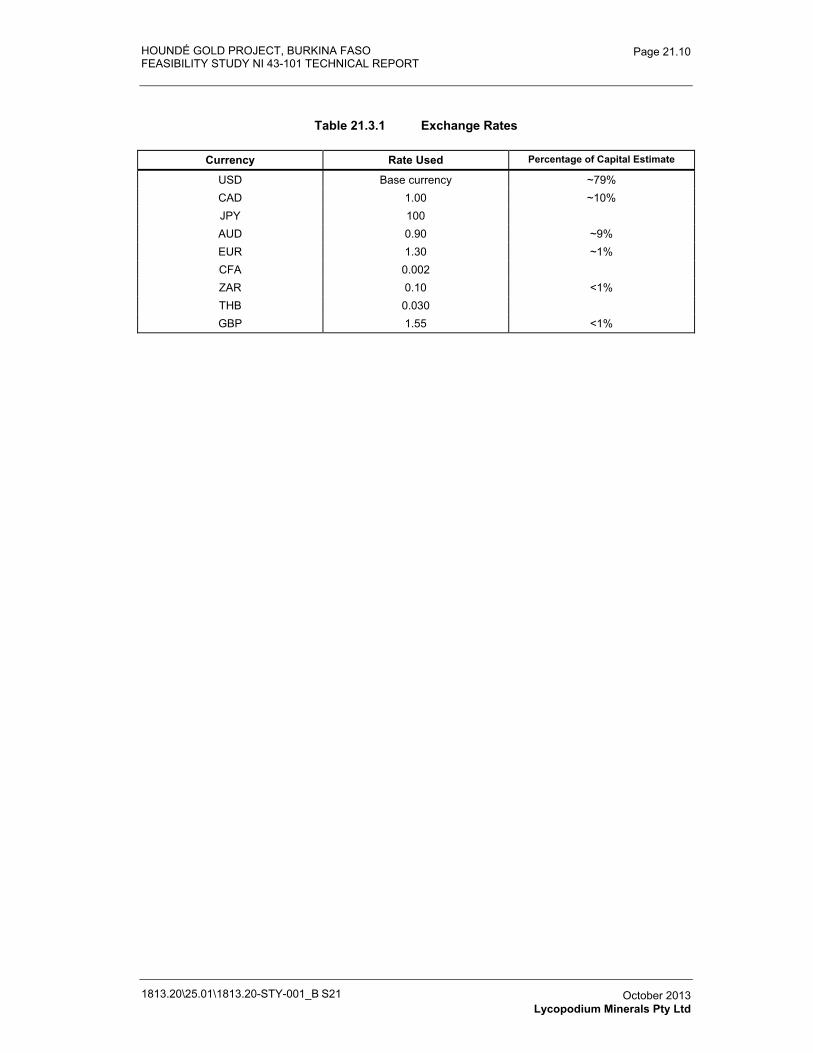
HOUNDÉ GOLD PROJECT, BURKINA FASO FEASIBILITY STUDY NI 43-101 TECHNICAL REPORT
1813.20\25.01\1813.20-STY-001_B S21
Page 21.10
October 2013 Lycopodium Minerals Pty Ltd
Table 21.3.1 Exchange Rates
Currency Rate Used Percentage of Capital Estimate
USD Base currency ~79% CAD 1.00 ~10% JPY 100 AUD 0.90 ~9% EUR 1.30 ~1% CFA 0.002 ZAR 0.10 <1% THB 0.030 GBP 1.55 <1%
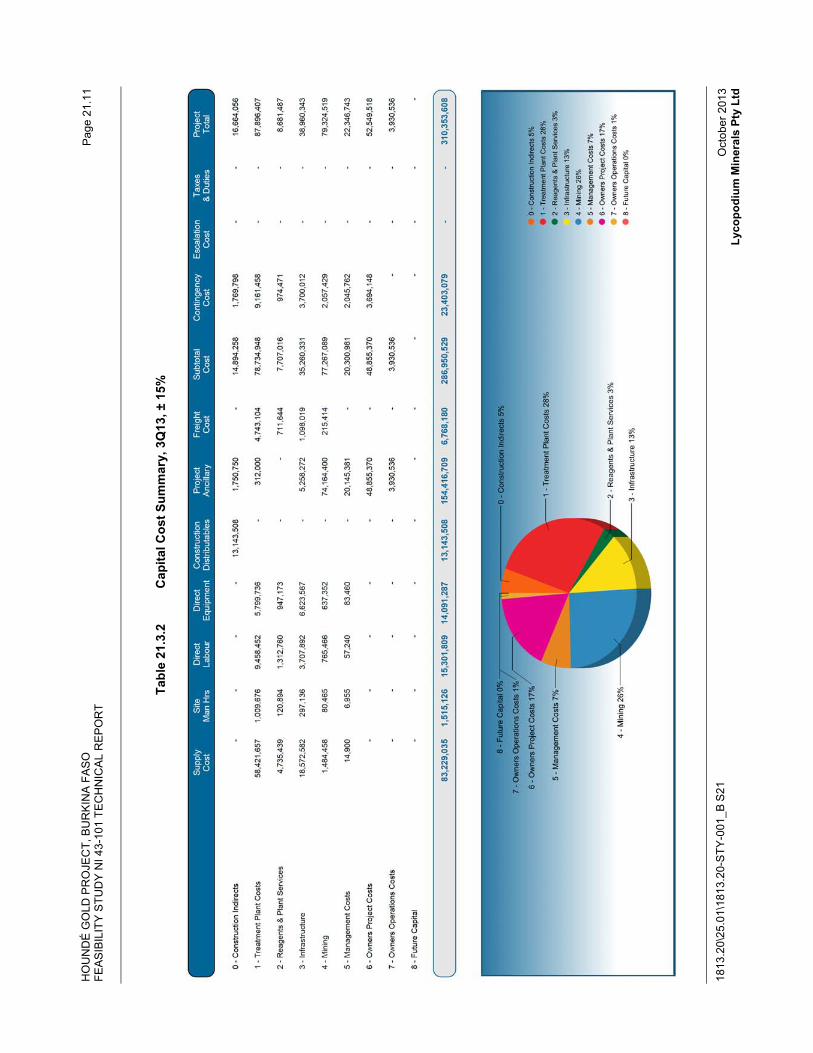
HO
UN
DÉ
GO
LD P
RO
JEC
T, B
UR
KIN
A F
AS
O
FEA
SIB
ILIT
Y S
TUD
Y N
I 43-
101
TEC
HN
ICA
L R
EP
OR
T
1813
.20\
25.0
1\18
13.2
0-S
TY-0
01_B
S21
Pag
e 21
.11
Oct
ober
201
3 Ly
copo
dium
Min
eral
s Pt
y Lt
d
Tabl
e 21
.3.2
C
apita
l Cos
t Sum
mar
y, 3
Q13
, ± 1
5%
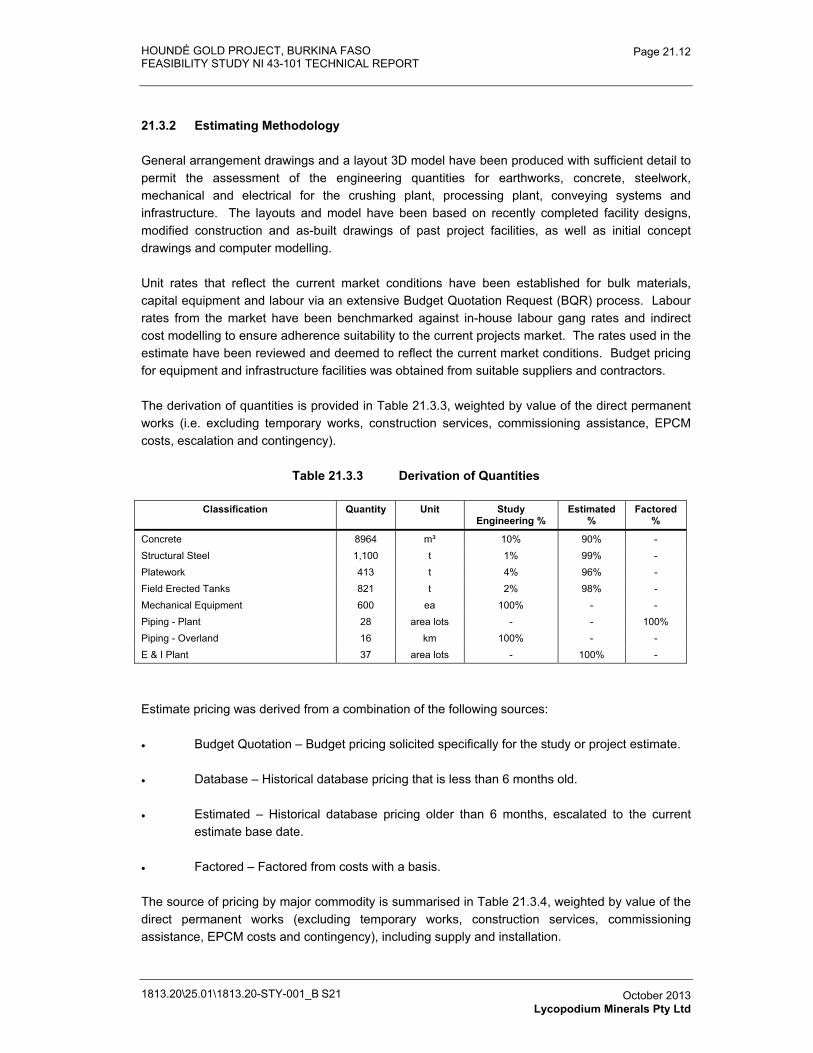
HOUNDÉ GOLD PROJECT, BURKINA FASO FEASIBILITY STUDY NI 43-101 TECHNICAL REPORT
1813.20\25.01\1813.20-STY-001_B S21
Page 21.12
October 2013 Lycopodium Minerals Pty Ltd
21.3.2 Estimating Methodology
General arrangement drawings and a layout 3D model have been produced with sufficient detail to permit the assessment of the engineering quantities for earthworks, concrete, steelwork, mechanical and electrical for the crushing plant, processing plant, conveying systems and infrastructure. The layouts and model have been based on recently completed facility designs, modified construction and as-built drawings of past project facilities, as well as initial concept drawings and computer modelling.
Unit rates that reflect the current market conditions have been established for bulk materials, capital equipment and labour via an extensive Budget Quotation Request (BQR) process. Labour rates from the market have been benchmarked against in-house labour gang rates and indirect cost modelling to ensure adherence suitability to the current projects market. The rates used in the estimate have been reviewed and deemed to reflect the current market conditions. Budget pricing for equipment and infrastructure facilities was obtained from suitable suppliers and contractors.
The derivation of quantities is provided in Table 21.3.3, weighted by value of the direct permanent works (i.e. excluding temporary works, construction services, commissioning assistance, EPCM costs, escalation and contingency).
Table 21.3.3 Derivation of Quantities
Classification Quantity Unit Study Engineering %
Estimated %
Factored %
Concrete 8964 m³ 10% 90% -Structural Steel 1,100 t 1% 99% - Platework 413 t 4% 96% -Field Erected Tanks 821 t 2% 98% - Mechanical Equipment 600 ea 100% - -Piping - Plant 28 area lots - - 100% Piping - Overland 16 km 100% - -E & I Plant 37 area lots - 100% -
Estimate pricing was derived from a combination of the following sources:
� Budget Quotation – Budget pricing solicited specifically for the study or project estimate.
� Database – Historical database pricing that is less than 6 months old.
� Estimated – Historical database pricing older than 6 months, escalated to the current estimate base date.
� Factored – Factored from costs with a basis.
The source of pricing by major commodity is summarised in Table 21.3.4, weighted by value of the direct permanent works (excluding temporary works, construction services, commissioning assistance, EPCM costs and contingency), including supply and installation.
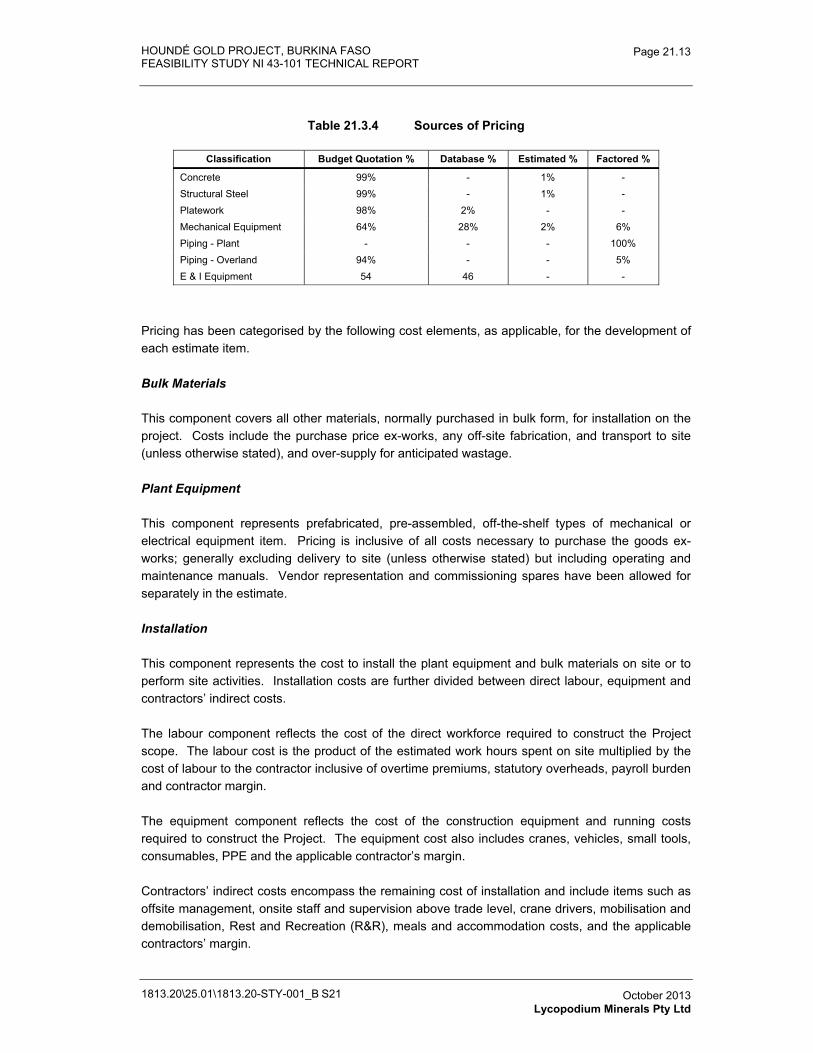
HOUNDÉ GOLD PROJECT, BURKINA FASO FEASIBILITY STUDY NI 43-101 TECHNICAL REPORT
1813.20\25.01\1813.20-STY-001_B S21
Page 21.13
October 2013 Lycopodium Minerals Pty Ltd
Table 21.3.4 Sources of Pricing
Classification Budget Quotation % Database % Estimated % Factored %
Concrete 99% - 1% -Structural Steel 99% - 1% -Platework 98% 2% - -Mechanical Equipment 64% 28% 2% 6% Piping - Plant - - - 100% Piping - Overland 94% - - 5% E & I Equipment 54 46 - -
Pricing has been categorised by the following cost elements, as applicable, for the development of each estimate item.
Bulk Materials
This component covers all other materials, normally purchased in bulk form, for installation on the project. Costs include the purchase price ex-works, any off-site fabrication, and transport to site (unless otherwise stated), and over-supply for anticipated wastage.
Plant Equipment
This component represents prefabricated, pre-assembled, off-the-shelf types of mechanical or electrical equipment item. Pricing is inclusive of all costs necessary to purchase the goods ex-works; generally excluding delivery to site (unless otherwise stated) but including operating and maintenance manuals. Vendor representation and commissioning spares have been allowed for separately in the estimate.
Installation
This component represents the cost to install the plant equipment and bulk materials on site or to perform site activities. Installation costs are further divided between direct labour, equipment and contractors’ indirect costs.
The labour component reflects the cost of the direct workforce required to construct the Project scope. The labour cost is the product of the estimated work hours spent on site multiplied by the cost of labour to the contractor inclusive of overtime premiums, statutory overheads, payroll burden and contractor margin.
The equipment component reflects the cost of the construction equipment and running costs required to construct the Project. The equipment cost also includes cranes, vehicles, small tools, consumables, PPE and the applicable contractor’s margin.
Contractors’ indirect costs encompass the remaining cost of installation and include items such as offsite management, onsite staff and supervision above trade level, crane drivers, mobilisation and demobilisation, Rest and Recreation (R&R), meals and accommodation costs, and the applicable contractors’ margin.
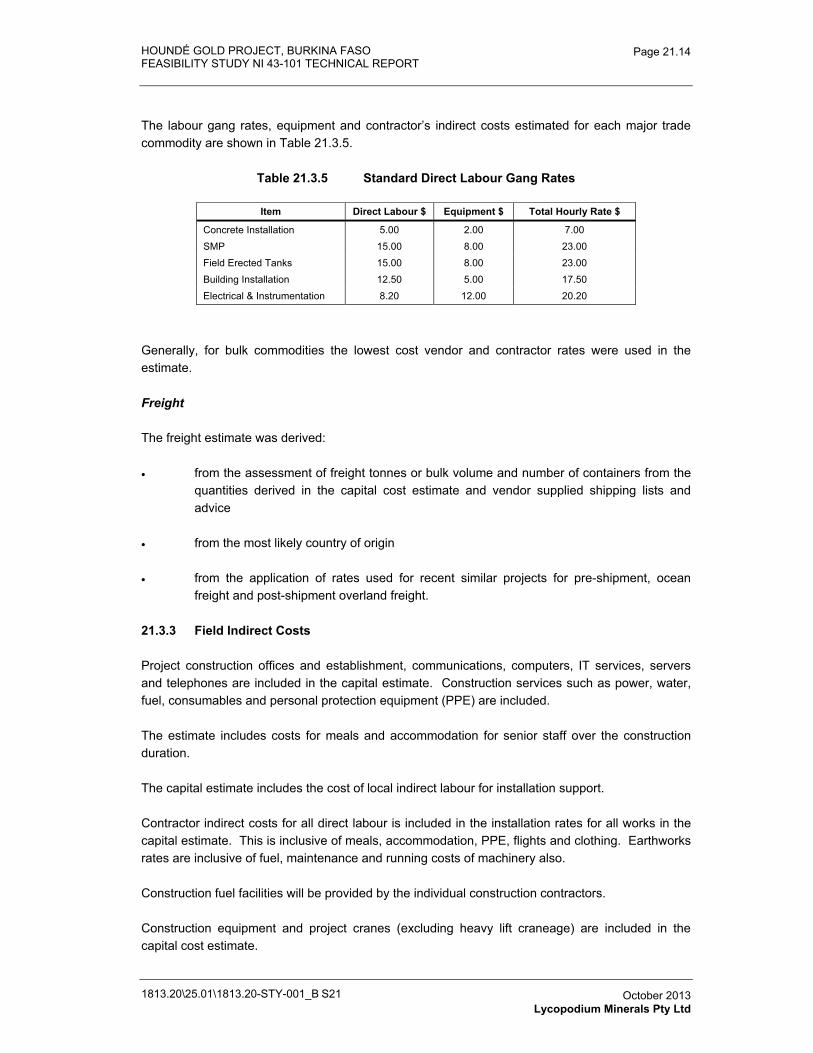
HOUNDÉ GOLD PROJECT, BURKINA FASO FEASIBILITY STUDY NI 43-101 TECHNICAL REPORT
1813.20\25.01\1813.20-STY-001_B S21
Page 21.14
October 2013 Lycopodium Minerals Pty Ltd
The labour gang rates, equipment and contractor’s indirect costs estimated for each major trade commodity are shown in Table 21.3.5.
Table 21.3.5 Standard Direct Labour Gang Rates
Item Direct Labour $ Equipment $ Total Hourly Rate $
Concrete Installation 5.00 2.00 7.00SMP 15.00 8.00 23.00 Field Erected Tanks 15.00 8.00 23.00 Building Installation 12.50 5.00 17.50 Electrical & Instrumentation 8.20 12.00 20.20
Generally, for bulk commodities the lowest cost vendor and contractor rates were used in the estimate.
Freight
The freight estimate was derived:
� from the assessment of freight tonnes or bulk volume and number of containers from the quantities derived in the capital cost estimate and vendor supplied shipping lists and advice
� from the most likely country of origin
� from the application of rates used for recent similar projects for pre-shipment, ocean freight and post-shipment overland freight.
21.3.3 Field Indirect Costs
Project construction offices and establishment, communications, computers, IT services, servers and telephones are included in the capital estimate. Construction services such as power, water, fuel, consumables and personal protection equipment (PPE) are included.
The estimate includes costs for meals and accommodation for senior staff over the construction duration.
The capital estimate includes the cost of local indirect labour for installation support.
Contractor indirect costs for all direct labour is included in the installation rates for all works in the capital estimate. This is inclusive of meals, accommodation, PPE, flights and clothing. Earthworks rates are inclusive of fuel, maintenance and running costs of machinery also.
Construction fuel facilities will be provided by the individual construction contractors.
Construction equipment and project cranes (excluding heavy lift craneage) are included in the capital cost estimate.
HOUNDÉ GOLD PROJECT, BURKINA FASO FEASIBILITY STUDY NI 43-101 TECHNICAL REPORT
1813.20\25.01\1813.20-STY-001_B S21
Page 21.15
October 2013 Lycopodium Minerals Pty Ltd
21.3.4 EPCM Services
The estimate for Engineering Procurement and Construction Management (EPCM) services costs has been based on a preliminary manning schedule for the anticipated project deliverables and project schedule. The resulting EPCM cost estimate is consistent with other projects of this nature in terms of the percentage of the direct costs.
The engineering design component of the EPCM estimate for the home office is based on a calculation of required manning levels to complete the Project and benchmarked against previous Lycopodium experience on similar projects.
21.3.5 Owner’s Costs
As part of the construction, Endeavour will provide a Project management team.
The Owner’s construction team will interact closely with operations management personnel recruited during the construction phase of the Project.
Endeavour has successfully developed several projects in the West African region and has elected to procure the mills and free-issue these to the EPCM contractor, as well as supervising much of the earthworks and infrastructure works to the EPCM contractor’s design. Because of this approach, the Owners’ cost allowances in the above estimates are relatively high compared with a “pure” EPCM approach.
In addition to the above, the following allowances have been made in the estimate.
� Owners project expenses.
� Pre-production costs.
� First fills (grinding media, lubricants, fuel, and reagents).
� Opening stocks.
� Plant mobile equipment.
� Project spares.
� Vendor representative and training costs for the process plant.
� Asset management system implementation, training and software.
� Crop compensation and resettlement costs for the first year of construction.
� Connection to the power grid and associated engineering costs.
� Environmental cost allowance.
� Working capital.
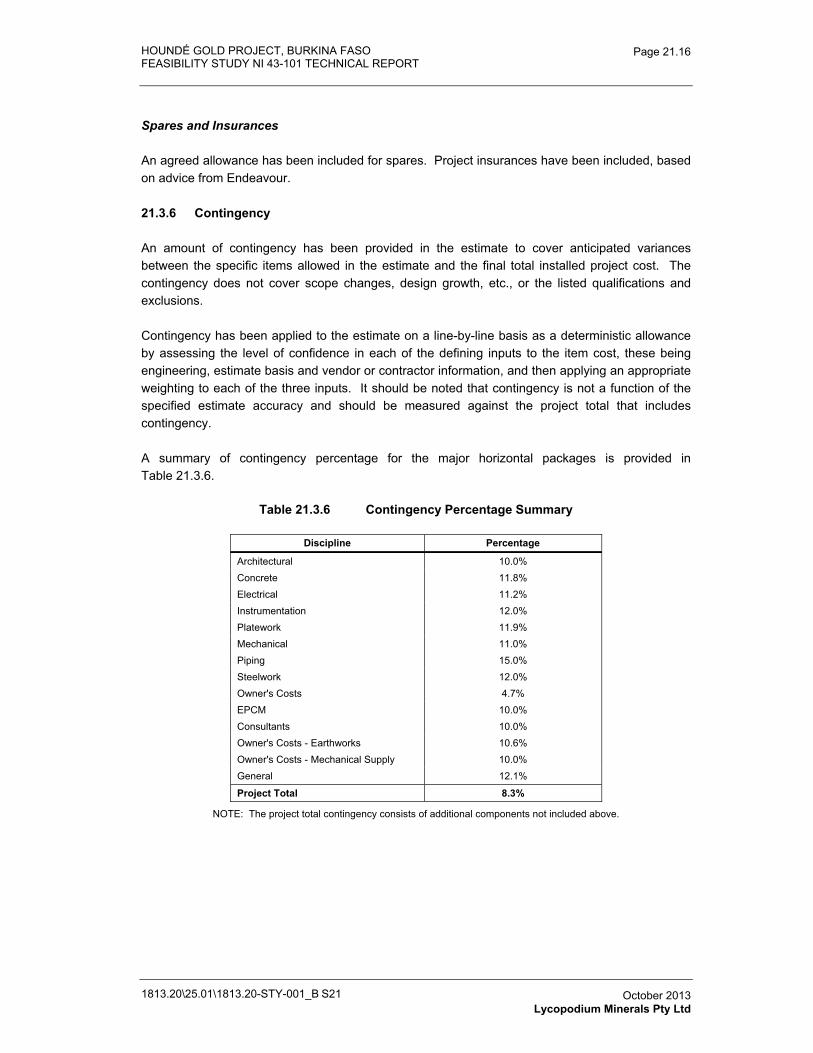
HOUNDÉ GOLD PROJECT, BURKINA FASO FEASIBILITY STUDY NI 43-101 TECHNICAL REPORT
1813.20\25.01\1813.20-STY-001_B S21
Page 21.16
October 2013 Lycopodium Minerals Pty Ltd
Spares and Insurances
An agreed allowance has been included for spares. Project insurances have been included, based on advice from Endeavour.
21.3.6 Contingency
An amount of contingency has been provided in the estimate to cover anticipated variances between the specific items allowed in the estimate and the final total installed project cost. The contingency does not cover scope changes, design growth, etc., or the listed qualifications and exclusions.
Contingency has been applied to the estimate on a line-by-line basis as a deterministic allowance by assessing the level of confidence in each of the defining inputs to the item cost, these being engineering, estimate basis and vendor or contractor information, and then applying an appropriate weighting to each of the three inputs. It should be noted that contingency is not a function of the specified estimate accuracy and should be measured against the project total that includes contingency.
A summary of contingency percentage for the major horizontal packages is provided in Table 21.3.6.
Table 21.3.6 Contingency Percentage Summary
Discipline Percentage
Architectural 10.0% Concrete 11.8% Electrical 11.2% Instrumentation 12.0% Platework 11.9% Mechanical 11.0% Piping 15.0% Steelwork 12.0% Owner's Costs 4.7% EPCM 10.0% Consultants 10.0% Owner's Costs - Earthworks 10.6%Owner's Costs - Mechanical Supply 10.0% General 12.1%
Project Total 8.3%
NOTE: The project total contingency consists of additional components not included above.
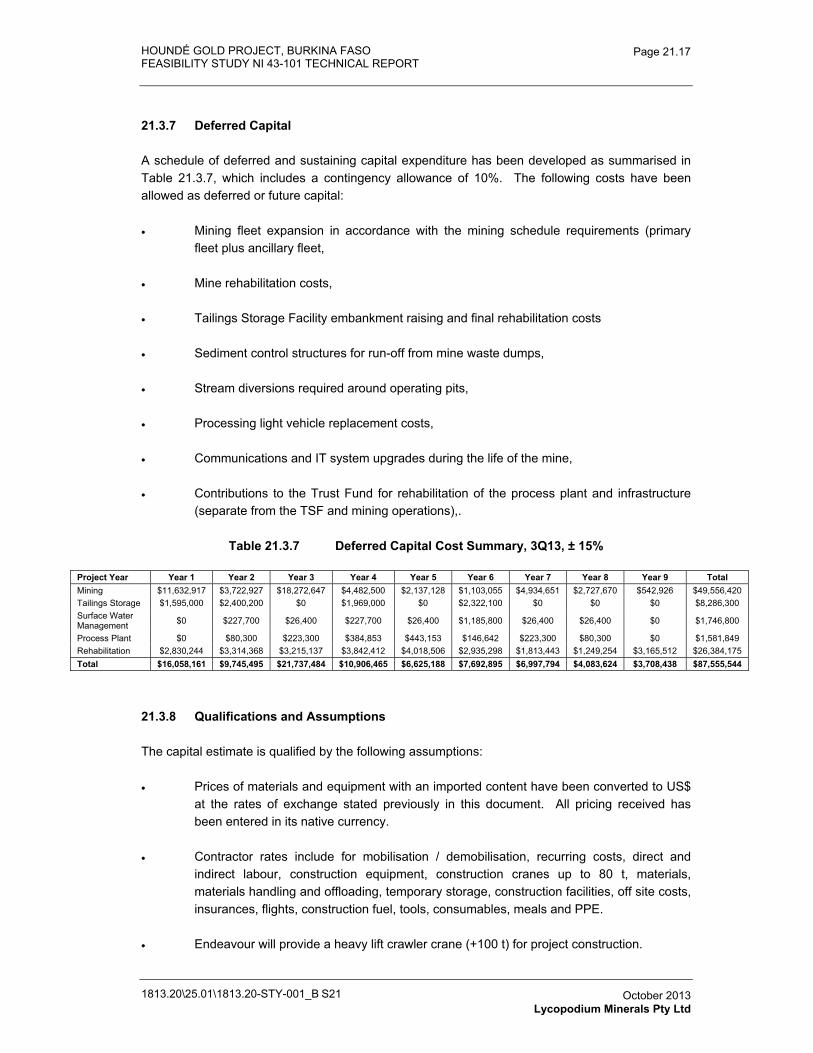
HOUNDÉ GOLD PROJECT, BURKINA FASO FEASIBILITY STUDY NI 43-101 TECHNICAL REPORT
1813.20\25.01\1813.20-STY-001_B S21
Page 21.17
October 2013 Lycopodium Minerals Pty Ltd
21.3.7 Deferred Capital
A schedule of deferred and sustaining capital expenditure has been developed as summarised in Table 21.3.7, which includes a contingency allowance of 10%. The following costs have been allowed as deferred or future capital:
� Mining fleet expansion in accordance with the mining schedule requirements (primary fleet plus ancillary fleet,
� Mine rehabilitation costs,
� Tailings Storage Facility embankment raising and final rehabilitation costs
� Sediment control structures for run-off from mine waste dumps,
� Stream diversions required around operating pits,
� Processing light vehicle replacement costs,
� Communications and IT system upgrades during the life of the mine,
� Contributions to the Trust Fund for rehabilitation of the process plant and infrastructure (separate from the TSF and mining operations),.
Table 21.3.7 Deferred Capital Cost Summary, 3Q13, ± 15%
Project Year Year 1 Year 2 Year 3 Year 4 Year 5 Year 6 Year 7 Year 8 Year 9 Total Mining $11,632,917 $3,722,927 $18,272,647 $4,482,500 $2,137,128 $1,103,055 $4,934,651 $2,727,670 $542,926 $49,556,420 Tailings Storage $1,595,000 $2,400,200 $0 $1,969,000 $0 $2,322,100 $0 $0 $0 $8,286,300 Surface Water Management $0 $227,700 $26,400 $227,700 $26,400 $1,185,800 $26,400 $26,400 $0 $1,746,800
Process Plant $0 $80,300 $223,300 $384,853 $443,153 $146,642 $223,300 $80,300 $0 $1,581,849 Rehabilitation $2,830,244 $3,314,368 $3,215,137 $3,842,412 $4,018,506 $2,935,298 $1,813,443 $1,249,254 $3,165,512 $26,384,175 Total $16,058,161 $9,745,495 $21,737,484 $10,906,465 $6,625,188 $7,692,895 $6,997,794 $4,083,624 $3,708,438 $87,555,544
21.3.8 Qualifications and Assumptions
The capital estimate is qualified by the following assumptions:
� Prices of materials and equipment with an imported content have been converted to US$ at the rates of exchange stated previously in this document. All pricing received has been entered in its native currency.
� Contractor rates include for mobilisation / demobilisation, recurring costs, direct and indirect labour, construction equipment, construction cranes up to 80 t, materials, materials handling and offloading, temporary storage, construction facilities, off site costs, insurances, flights, construction fuel, tools, consumables, meals and PPE.
� Endeavour will provide a heavy lift crawler crane (+100 t) for project construction.
HOUNDÉ GOLD PROJECT, BURKINA FASO FEASIBILITY STUDY NI 43-101 TECHNICAL REPORT
1813.20\25.01\1813.20-STY-001_B S21
Page 21.18
October 2013 Lycopodium Minerals Pty Ltd
� The bulk commodity rates that include for imported material are based on the assumption that suitable construction / fill materials will be available from borrow pits within 2,000 m of the work fronts.
� The estimate includes for the placement and compaction of fill material to the crushing chamber wall to a horizontal distance of 3 metres only. ROM pad earthworks construction costs have been allowed in the mining cost estimate.
� The estimate allows for all reinforced bar and mesh for construction to be provided by the concrete contractor. Free issue of materials would be a project capital opportunity and has not been allowed at this time.
� There is no allowance for unforeseen blasting in the bulk earthworks cost estimates, given the results of the site geotechnical investigation. There is an allowance for part of the bulk earthworks balance to be imported fill in the unforeseen event that the in-place material is unsuitable.
� Mobilisation / demobilisation of a roadworks contractor has not been allowed as it is assumed the plant earthworks contractor can complete the works. Duration costs have been included.
� The estimate allows for supply of structural steel and minor platework from South East Asia. The rates for structural steel supply are based on recent project costs.
� The estimate allows for one piece tanks and large platework items to be fabricated in country as the freight cost for these items from South East Asia makes this option uneconomical.
� Supply and installation of field erected tanks will be by a suitable in-country contractor. There is no allowance for free issue of strakes and materials to the installation contractor. This is a project capital opportunity and has not been included at this time.
� Supply of construction and potable water prior to completion of the water harvest dam will be from the existing site supply. The capital includes for the mechanical costs and installation of one additional bore pump at the location of the permanent village; however, there is no allowance to drill and case a bore in the estimate. The locations of the additional bores have not been defined at this time and the cost of establishing further water sources is not included.
� The supply of the SAG and Ball mills has been included in Owner’s costs.
� The estimate excludes for a construction camp. The permanent camp will be constructed as early as practical and until such time as it is available for use, construction personnel will be accommodated in Houndé town.
� Owner’s mobile equipment for construction and operations is included.
HOUNDÉ GOLD PROJECT, BURKINA FASO FEASIBILITY STUDY NI 43-101 TECHNICAL REPORT
1813.20\25.01\1813.20-STY-001_B S21
Page 21.19
October 2013 Lycopodium Minerals Pty Ltd
� Asset management software for operations is allowed for in the capital estimate. Software implementation and training costs are included.
� There is an allowance for surveying to be performed by the Owner’s team.
� Mining contractor facilities are included in the capital costs.
21.3.9 Exclusions
The following items are specifically excluded from the capital cost estimate:
� Permits and licences (except as listed).
� Project sunk costs (these are addressed in the financial model.
� Government and import taxes and duties (these are addressed in the financial model).
� Exchange rate variations.
� Escalation.
21.4 Project Implementation
21.4.1 Implementation Strategy
The cost estimates have been complied on the basis that Endeavour will adopt an EPCM approach, in which a small Owner’s team will manage several specialist engineers and consultants, who will carry out the detailed engineering, procure the equipment and fabricated items and manage the installation contracts. The EPCM engineer will be appointed on a schedule of rates basis, this arrangement permitting Endeavour to have maximum input to the quality of engineering and equipment procured for the project with a minimum Owner’s team and securing the services of specialist designers and project management expertise.
21.4.2 Implementation Schedule
The project implementation schedule has been developed on the basis that no early procurement works will be conducted – i.e., that engineering will only commence after full project approval has been secured from the Board. A high level schedule has been prepared on this basis and is shown in Figure 21.4.1. The overall duration of the project from Board Approval to first gold is estimated to be 21 months.
HOUNDÉ GOLD PROJECT, BURKINA FASO FEASIBILITY STUDY NI 43-101 TECHNICAL REPORT
1813.20\25.01\1813.20-STY-001_B S21
Page 21.20
October 2013 Lycopodium Minerals Pty Ltd
The project critical path shown in Figure 21.4.2 runs from the award of the EPCM contract through the process and detailed design to mill building structural steel supply, erection of the milling building and installation of the equipment before final completion of the piping and electrical activities to allow commissioning to proceed. The schedule is based on purchase orders for the SAG, ball and UFG mills being placed immediately the project is approved; if these orders are delayed, the critical path then shifts to the mills procurement and delivery. The mining fleet and HV power equipment also require engineering and procurement activities to commence immediately on project approval in order to meet the overall schedule of 21 months.
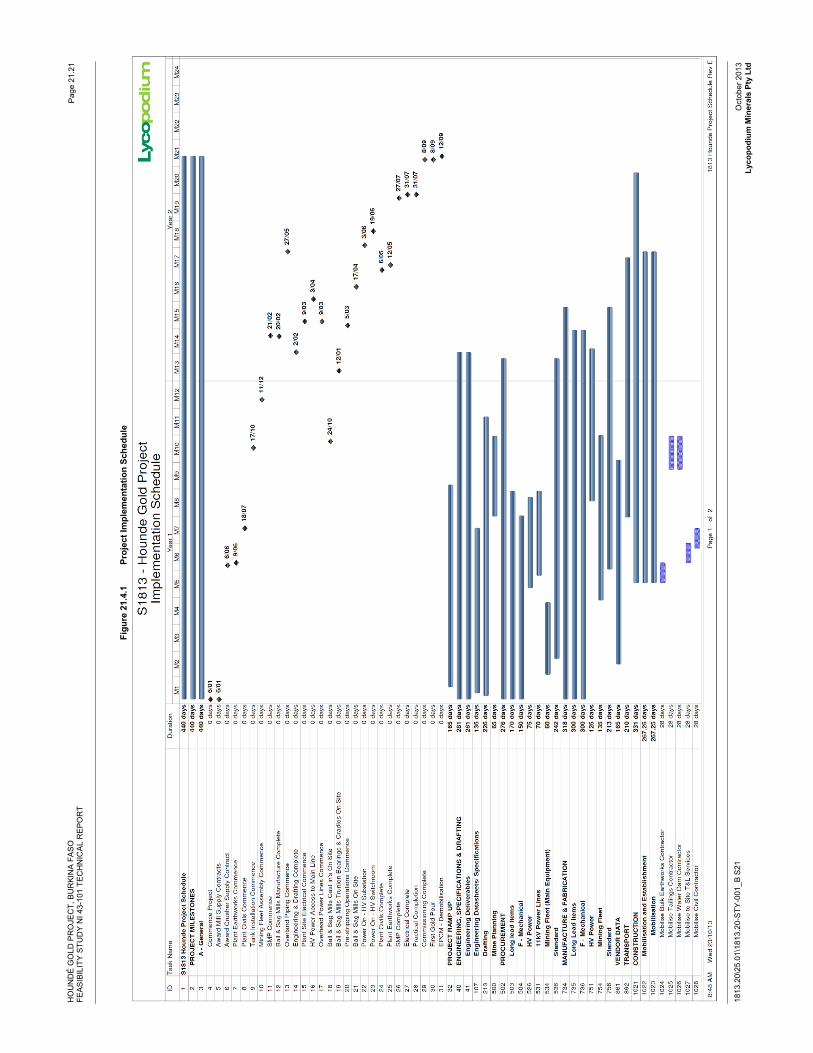
HO
UN
DÉ
GO
LD P
RO
JEC
T, B
UR
KIN
A F
AS
O
FEA
SIB
ILIT
Y S
TUD
Y N
I 43-
101
TEC
HN
ICA
L R
EP
OR
T
1813
.20\
25.0
1\18
13.2
0-S
TY-0
01_B
S21
Pag
e 21
.21
Oct
ober
201
3 Ly
copo
dium
Min
eral
s Pt
y Lt
d
Figu
re 2
1.4.
1 Pr
ojec
t Im
plem
enta
tion
Sche
dule
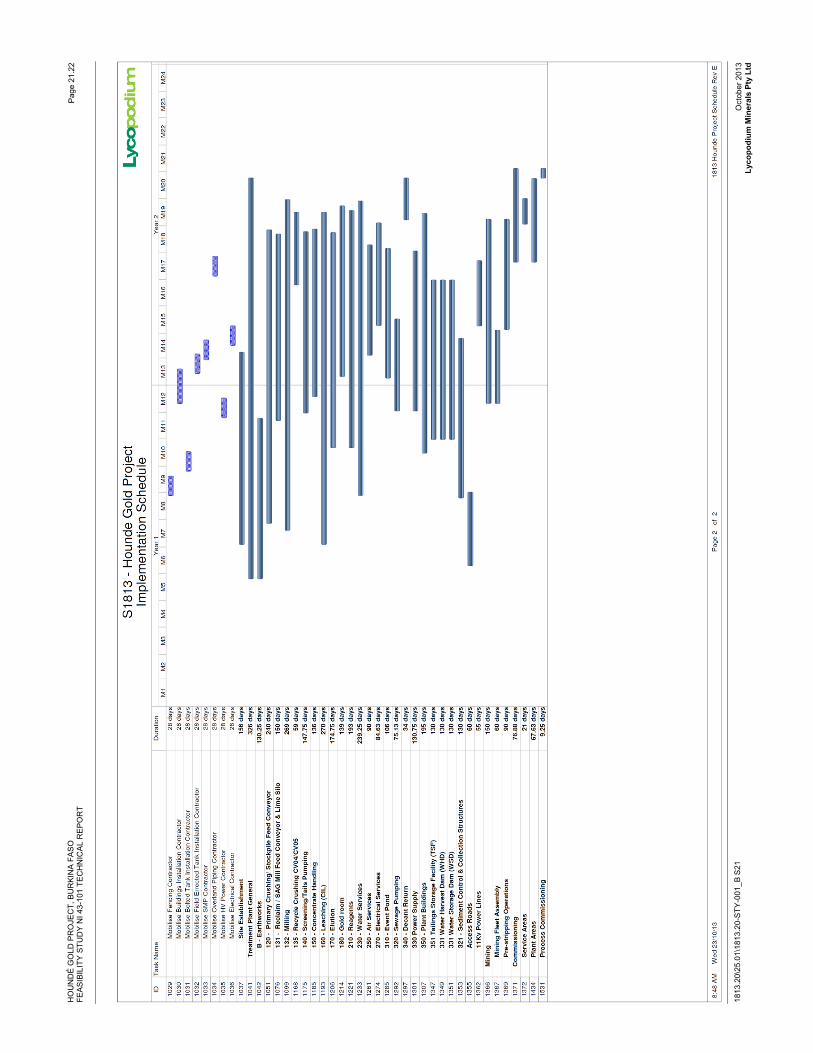
HO
UN
DÉ
GO
LD P
RO
JEC
T, B
UR
KIN
A F
AS
O
FEA
SIB
ILIT
Y S
TUD
Y N
I 43-
101
TEC
HN
ICA
L R
EP
OR
T
1813
.20\
25.0
1\18
13.2
0-S
TY-0
01_B
S21
Pag
e 21
.22
Oct
ober
201
3 Ly
copo
dium
Min
eral
s Pt
y Lt
d
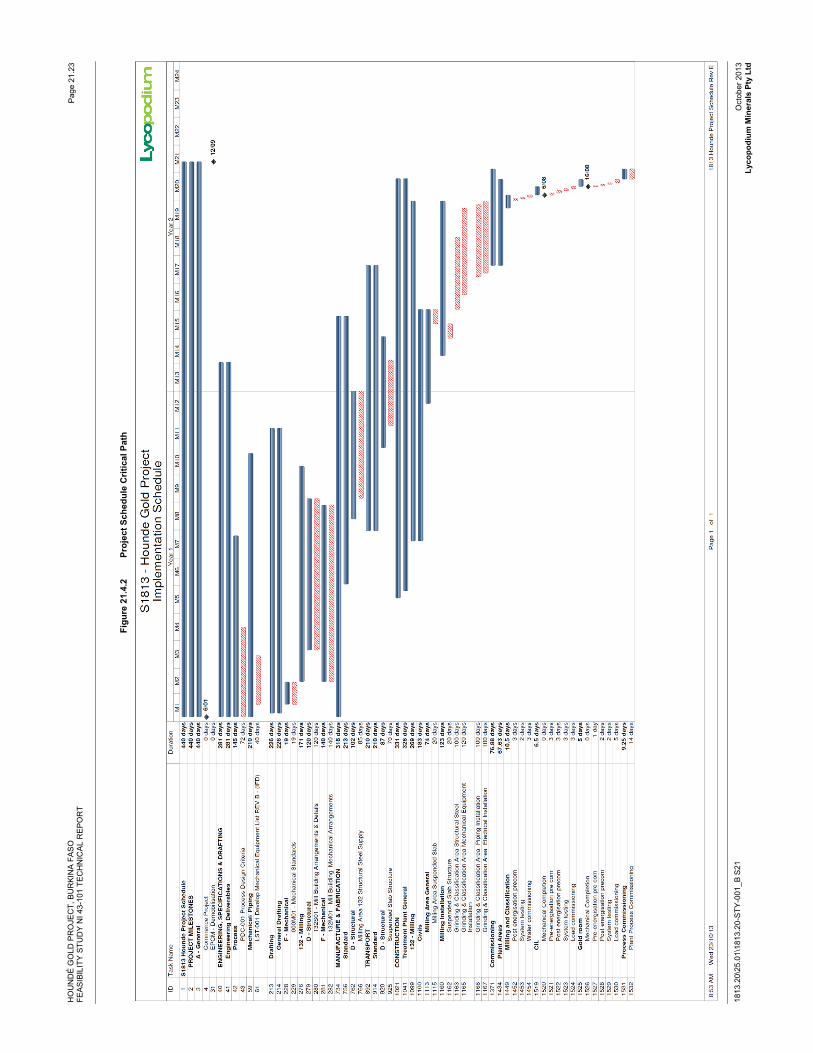
HO
UN
DÉ
GO
LD P
RO
JEC
T, B
UR
KIN
A F
AS
O
FEA
SIB
ILIT
Y S
TUD
Y N
I 43-
101
TEC
HN
ICA
L R
EP
OR
T
1813
.20\
25.0
1\18
13.2
0-S
TY-0
01_B
S21
Pag
e 21
.23
Oct
ober
201
3 Ly
copo
dium
Min
eral
s Pt
y Lt
d
Figu
re 2
1.4.
2 Pr
ojec
t Sch
edul
e C
ritic
al P
ath
HOUNDÉ GOLD PROJECT, BURKINA FASO FEASIBILITY STUDY NI 43-101 TECHNICAL REPORT
1813.20\25.01\1813.20-STY-001_B S21
Page 21.24 DRAFT
October 2013 Lycopodium Minerals Pty Ltd
21.4.3 HSEC Management
The management of health and safety as well as the environment and local community (HSEC) are critical for any successful project development. The EPCM Engineer will develop a project management plan to address these issues, based on their standard procedures, project construction experience and the risks and hazards identified during the feasibility and design stages, all through the project construction to commissioning and hand-over.
21.4.4 Logistics
Equipment will be sourced from vendors on the basis of price and delivery; such vendors typically fabricate components in many different countries. Fabricated steelwork and platework will be sourced from Africa or SE Asia, again on the basis of price, delivery and quality. The EPCM engineer will engage a logistics and transport coordinator to consolidate freight items where possible and facilitate clearance through customs and transport to site. Where practical, containerised items will be transported by rail, with the remainder transported to site by truck. Oversize loads will receive special attention and escorts as applicable.
21.4.5 Training
Endeavour is an operating company with well-established training procedures. The EPCM engineer will assist Endeavour to train its operations staff during the commissioning period and thereafter as needed, to ensure a smooth transition from construction to operations.
HOUNDÉ GOLD PROJECT, BURKINA FASO
FEASIBILITY STUDY NI 43-101 TECHNICAL REPORT
1813.20-STY-001
Table of Contents Page
22.0� ECONOMIC ANALYSIS 22.1�22.1� Introduction 22.1�22.2� Summary 22.2�22.3� Principal Assumptions 22.4�22.4� Processing Costs and Production Schedules 22.5�
22.4.1� Mine Production Schedule 22.5�22.4.2� Operating Cost 22.7�Capital Cost 22.7�
22.5� Outcomes 22.10�22.5.1� Base Case 22.10�
22.6� Sensitivity Analysis 22.12�
TABLESTable 22.1.1� Project Production Summary 22.2�Table 22.2.1� Project Cash Flow Summary 22.3�Table 22.2.2� Project Financial Measures Summary 22.3�Table 22.4.1� Summarised Annual Capital Cost Schedule 22.9�Table 22.5.1� Annual Cash Flow Statement 22.11�
FIGURESFigure 22.4.1� Ore and Waste Mining Schedule 22.6�Figure 22.4.2� Processing Plant Feed Schedule 22.6�Figure 22.4.3� Operating Cost Contribution (US$/oz Recovered & %) 22.7�Figure 22.6.1� Sensitivity of IRR to variations in project inputs 22.12�Figure 22.6.2� Sensitivity of NPV (5% discount) to variations in project inputs 22.13�Figure 22.6.3� Sensitivity of payback period to variations in project inputs 22.13�
APPENDICES Appendix 22.1� Cash Flow Model�
1813.20\25.01\1813.20-STY-001_B S22 October 2013 Lycopodium Minerals Pty Ltd
HOUNDÉ GOLD PROJECT, BURKINA FASO FEASIBILITY STUDY NI 43-101 TECHNICAL REPORT
1813.20\25.01\1813.20-STY-001_B S22
Page 22.1
October 2013 Lycopodium Minerals Pty Ltd
22.0 ECONOMIC ANALYSIS
An economic analysis of the Houndé Gold Project has been conducted using a simple cash flow model prepared by Lycopodium. The model was structured using an Excel workbook with the basis and assumptions as stated in the following discussion.
Disclaimer
Lycopodium has used all reasonable care and skill in compiling the content of these materials, however Lycopodium makes no warranty as to the accuracy or completeness of any information or data contained therein. The information in this document is subject to any changes arising after the date of publication. This report is meant to be read as a whole and no section or part of it should be relied upon out of context. Lycopodium does not purport to give financial advice. The information contained in these materials (including the financial model) does not incorporate lending requirements of financial institutions, or the effects of inflation, escalation or other financial inputs and such information needs to be verified by suitably qualified financial advisors. Any use, reliance or publication of these materials by any person or entity or any part thereof is entirely at their own risk. Lycopodium shall not be liable for any damages, liability or losses (including, without limitation, damages for loss of business or loss of profits) arising directly or indirectly from the use of this information or from any action or decision taken as a result of using this information.
22.1 Introduction
The economic evaluation of the Houndé Gold Project was based upon:
� Capital cost estimates prepared by Lycopodium and Orelogy.
� Mine schedule and mining operating cost estimates based on an owner-operated mining fleet, prepared by Orelogy.
� Process operating and general and administration (G&A) cost estimates prepared by Lycopodium.
� Metallurgical performance characterised by testwork conducted on composite samples from the Houndé deposits.
� Sustaining capital cost estimates for the mining operation prepared by Orelogy and for infrastructure and process plant by Lycopodium and Endeavour.
� Owners capital cost estimates prepared by Lycopodium and Endeavour.
� Royalty, tax, discount rates and other model inputs provided by Endeavour. The cash flow analysis excludes any effects due to inflation and all dollars are expressed as real.
� A gold price of $1,300/oz.
� The economic assessment has been undertaken in US dollars.
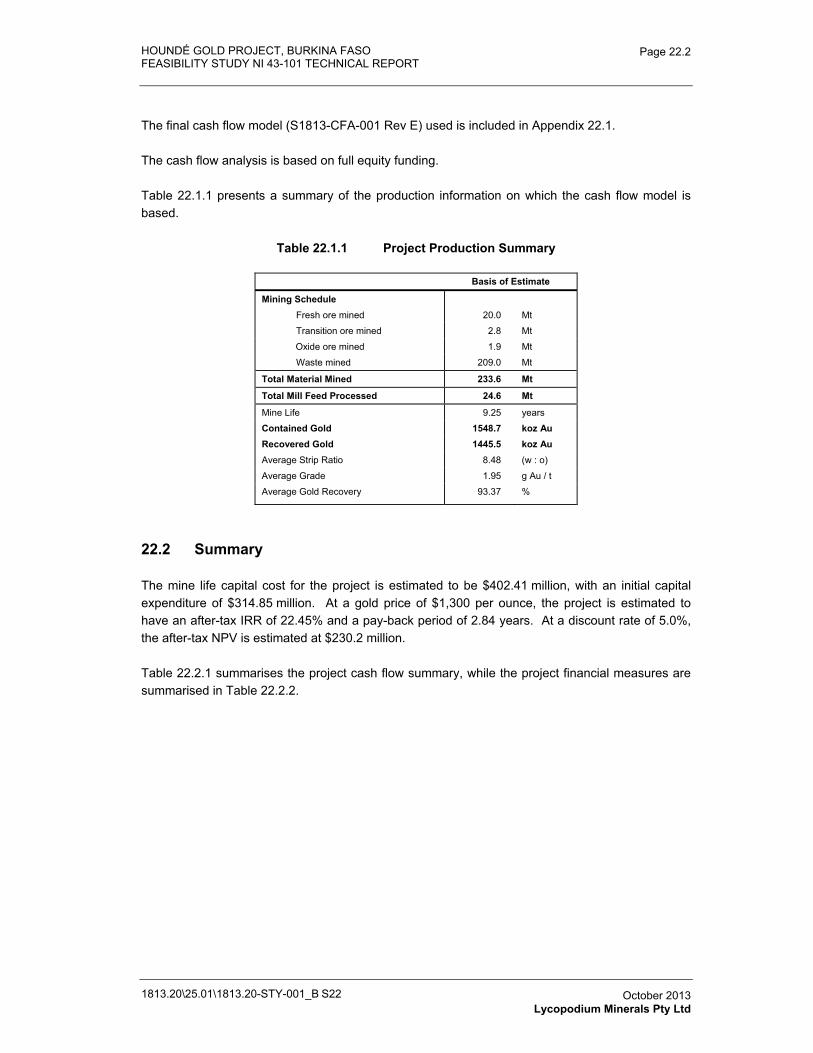
HOUNDÉ GOLD PROJECT, BURKINA FASO FEASIBILITY STUDY NI 43-101 TECHNICAL REPORT
1813.20\25.01\1813.20-STY-001_B S22
Page 22.2
October 2013 Lycopodium Minerals Pty Ltd
The final cash flow model (S1813-CFA-001 Rev E) used is included in Appendix 22.1.
The cash flow analysis is based on full equity funding.
Table 22.1.1 presents a summary of the production information on which the cash flow model is based.
Table 22.1.1 Project Production Summary
Basis of Estimate
Mining Schedule Fresh ore mined 20.0 Mt
Transition ore mined 2.8 Mt
Oxide ore mined 1.9 Mt
Waste mined 209.0 Mt
Total Material Mined 233.6 Mt
Total Mill Feed Processed 24.6 Mt
Mine Life 9.25 years
Contained Gold 1548.7 koz Au Recovered Gold 1445.5 koz Au Average Strip Ratio 8.48 (w : o)
Average Grade 1.95 g Au / t
Average Gold Recovery 93.37 %
22.2 Summary
The mine life capital cost for the project is estimated to be $402.41 million, with an initial capital expenditure of $314.85 million. At a gold price of $1,300 per ounce, the project is estimated to have an after-tax IRR of 22.45% and a pay-back period of 2.84 years. At a discount rate of 5.0%, the after-tax NPV is estimated at $230.2 million.
Table 22.2.1 summarises the project cash flow summary, while the project financial measures are summarised in Table 22.2.2.
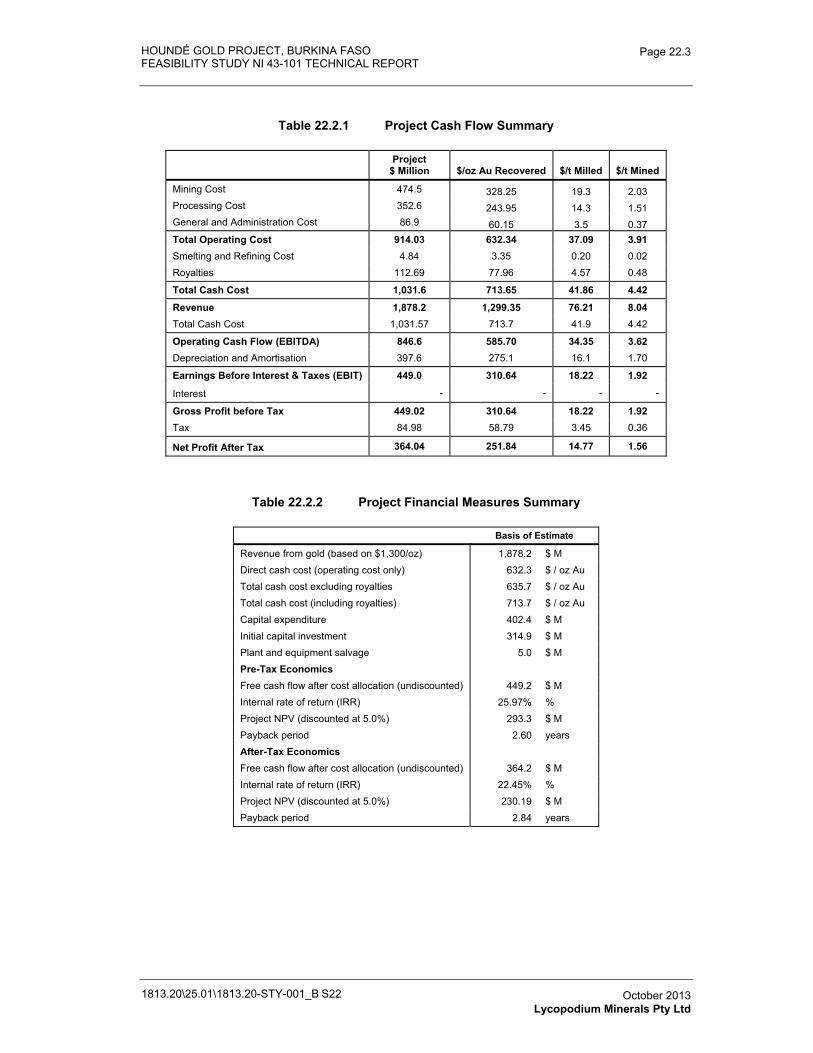
HOUNDÉ GOLD PROJECT, BURKINA FASO FEASIBILITY STUDY NI 43-101 TECHNICAL REPORT
1813.20\25.01\1813.20-STY-001_B S22
Page 22.3
October 2013 Lycopodium Minerals Pty Ltd
Table 22.2.1 Project Cash Flow Summary
Project $ Million $/oz Au Recovered $/t Milled $/t Mined
Mining Cost 474.5 328.25 19.3 2.03 Processing Cost 352.6 243.95 14.3 1.51 General and Administration Cost 86.9 60.15 3.5 0.37 Total Operating Cost 914.03 632.34 37.09 3.91 Smelting and Refining Cost 4.84 3.35 0.20 0.02 Royalties 112.69 77.96 4.57 0.48
Total Cash Cost 1,031.6 713.65 41.86 4.42
Revenue 1,878.2 1,299.35 76.21 8.04Total Cash Cost 1,031.57 713.7 41.9 4.42
Operating Cash Flow (EBITDA) 846.6 585.70 34.35 3.62 Depreciation and Amortisation 397.6 275.1 16.1 1.70
Earnings Before Interest & Taxes (EBIT) 449.0 310.64 18.22 1.92
Interest - - - -
Gross Profit before Tax 449.02 310.64 18.22 1.92 Tax 84.98 58.79 3.45 0.36
Net Profit After Tax 364.04 251.84 14.77 1.56
Table 22.2.2 Project Financial Measures Summary
Basis of Estimate
Revenue from gold (based on $1,300/oz) 1,878.2 $ M Direct cash cost (operating cost only) 632.3 $ / oz Au Total cash cost excluding royalties 635.7 $ / oz Au Total cash cost (including royalties) 713.7 $ / oz Au Capital expenditure 402.4 $ M Initial capital investment 314.9 $ M Plant and equipment salvage 5.0 $ M Pre-Tax Economics Free cash flow after cost allocation (undiscounted) 449.2 $ M Internal rate of return (IRR) 25.97% %Project NPV (discounted at 5.0%) 293.3 $ M Payback period 2.60 years After-Tax Economics Free cash flow after cost allocation (undiscounted) 364.2 $ M Internal rate of return (IRR) 22.45% %Project NPV (discounted at 5.0%) 230.19 $ M Payback period 2.84 years
HOUNDÉ GOLD PROJECT, BURKINA FASO FEASIBILITY STUDY NI 43-101 TECHNICAL REPORT
1813.20\25.01\1813.20-STY-001_B S22
Page 22.4
October 2013 Lycopodium Minerals Pty Ltd
22.3 Principal Assumptions
The cash flow analysis is based on the following:
Basis of Estimate
� Annual tonnage, strip ratio and head grade have been based on the mining schedule as discussed in Section 16.
� The mining, processing and administration costs are based on the operating cost estimate discussed in Section 21.
� The overall recovery figures are based on testwork. Metallurgical recovery is discussed in Section 17.
� The capital cost estimate used as basis for the cash flow model is discussed in Section 21.
� The treatment of depreciation and company taxes are based on the understanding of current Burkinian tax law.
Depreciation
� Provision has been made for depreciation using a straight line method for a period of 4 years.
� The schedule allows for $30 million of losses carried forward at the start of the operation.
� In the final year of operation, the residual capital allowance outstanding is depreciated against the salvage value of the plant.
Company Tax
� Provision has been made for company tax at 17.5% of gross profit. This is the rate of corporate tax in Burkina Faso.
� Tax losses that can be carried forward have been ignored
Gold Price
� A gold price of $1,300 per ounce is assumed based on advice from Endeavour.
� A refinery gold payable rate of 99.95% is assumed.
� The refining charge of $3.35 per ounce of gold was advised by Endeavour to include the cost of transport and insurance of the gold from site to the refinery.
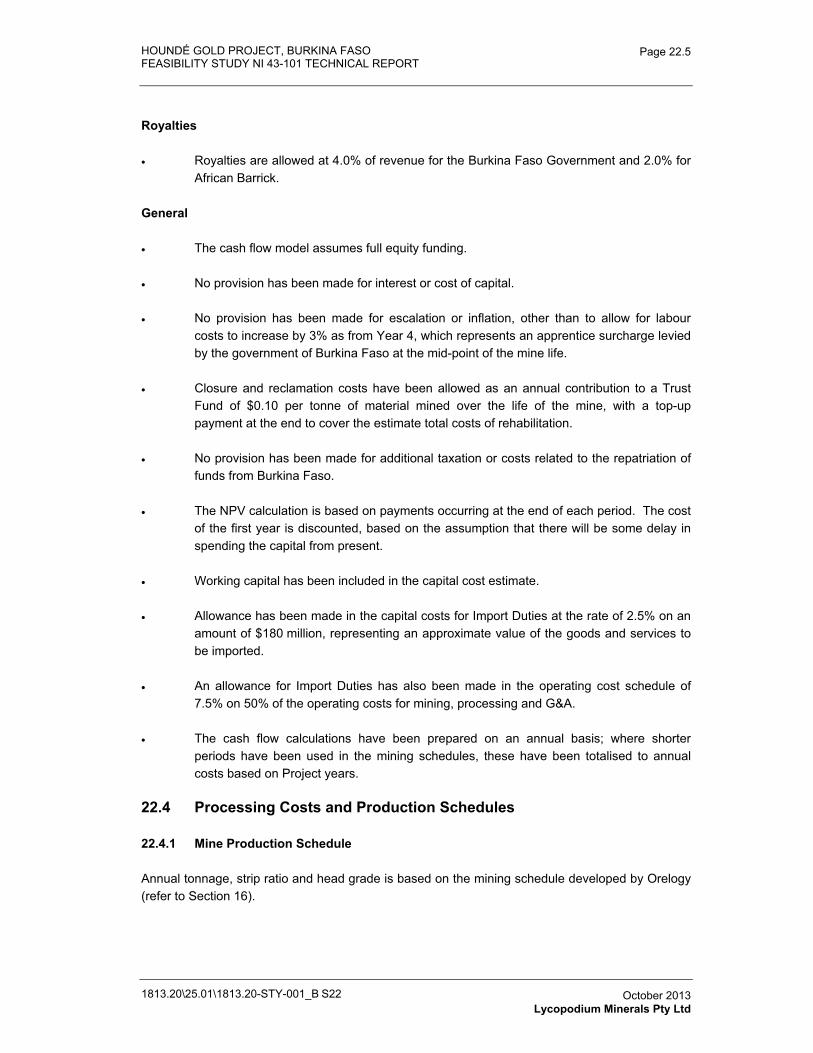
HOUNDÉ GOLD PROJECT, BURKINA FASO FEASIBILITY STUDY NI 43-101 TECHNICAL REPORT
1813.20\25.01\1813.20-STY-001_B S22
Page 22.5
October 2013 Lycopodium Minerals Pty Ltd
Royalties
� Royalties are allowed at 4.0% of revenue for the Burkina Faso Government and 2.0% for African Barrick.
General
� The cash flow model assumes full equity funding.
� No provision has been made for interest or cost of capital.
� No provision has been made for escalation or inflation, other than to allow for labour costs to increase by 3% as from Year 4, which represents an apprentice surcharge levied by the government of Burkina Faso at the mid-point of the mine life.
� Closure and reclamation costs have been allowed as an annual contribution to a Trust Fund of $0.10 per tonne of material mined over the life of the mine, with a top-up payment at the end to cover the estimate total costs of rehabilitation.
� No provision has been made for additional taxation or costs related to the repatriation of funds from Burkina Faso.
� The NPV calculation is based on payments occurring at the end of each period. The cost of the first year is discounted, based on the assumption that there will be some delay in spending the capital from present.
� Working capital has been included in the capital cost estimate.
� Allowance has been made in the capital costs for Import Duties at the rate of 2.5% on an amount of $180 million, representing an approximate value of the goods and services to be imported.
� An allowance for Import Duties has also been made in the operating cost schedule of 7.5% on 50% of the operating costs for mining, processing and G&A.
� The cash flow calculations have been prepared on an annual basis; where shorter periods have been used in the mining schedules, these have been totalised to annual costs based on Project years.
22.4 Processing Costs and Production Schedules
22.4.1 Mine Production Schedule
Annual tonnage, strip ratio and head grade is based on the mining schedule developed by Orelogy (refer to Section 16).
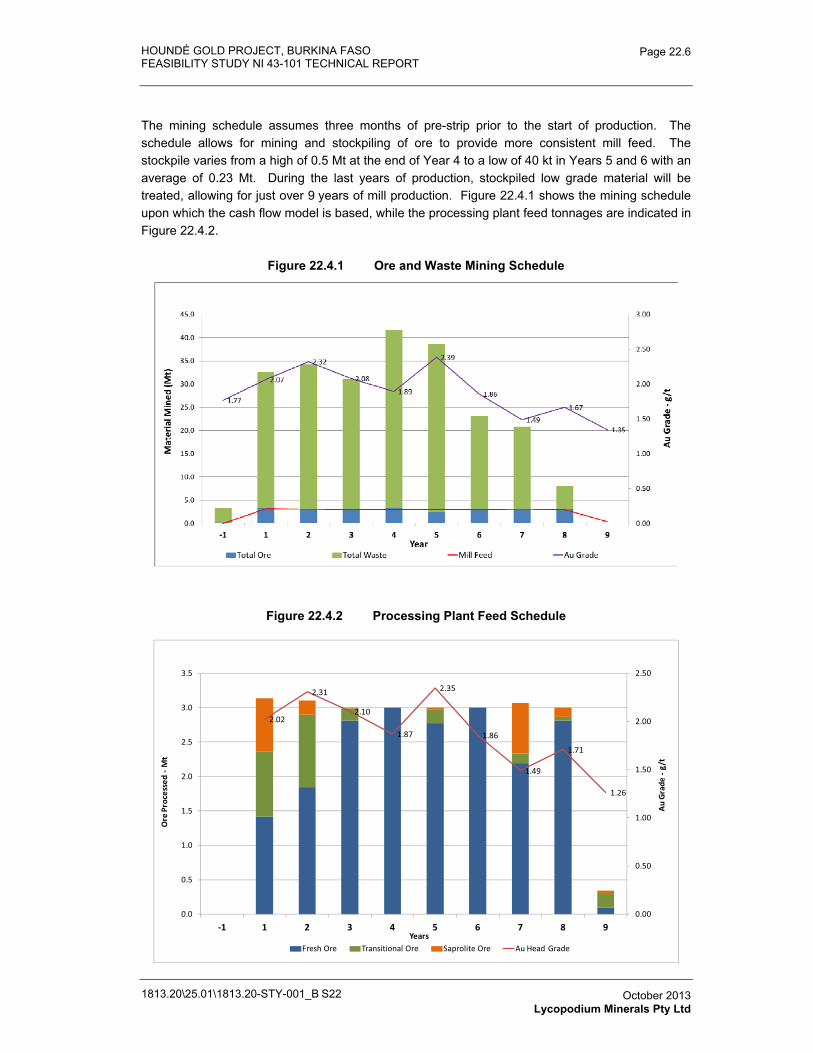
HOUNDÉ GOLD PROJECT, BURKINA FASO FEASIBILITY STUDY NI 43-101 TECHNICAL REPORT
1813.20\25.01\1813.20-STY-001_B S22
Page 22.6
October 2013 Lycopodium Minerals Pty Ltd
The mining schedule assumes three months of pre-strip prior to the start of production. The schedule allows for mining and stockpiling of ore to provide more consistent mill feed. The stockpile varies from a high of 0.5 Mt at the end of Year 4 to a low of 40 kt in Years 5 and 6 with an average of 0.23 Mt. During the last years of production, stockpiled low grade material will be treated, allowing for just over 9 years of mill production. Figure 22.4.1 shows the mining schedule upon which the cash flow model is based, while the processing plant feed tonnages are indicated in Figure 22.4.2.
Figure 22.4.1 Ore and Waste Mining Schedule
Figure 22.4.2 Processing Plant Feed Schedule
2.02
2.31
2.10
1.87
2.35
1.86
1.49
1.71
1.26
0.00
0.50
1.00
1.50
2.00
2.50
0.0
0.5
1.0
1.5
2.0
2.5
3.0
3.5
�1 1 2 3 4 5 6 7 8 9
Au�
Gra
de��
g/t
Ore
�Pro
cess
ed��
Mt
Years
Source:�0262_Pit_Dump_131004�� 0262_LOM_Update_newWSF_5x10x5_as_Fnal_131016��20131016002127�� Schedule�01_Final_Schedule_Selected_newWSF_131016
Fresh�Ore Transitional�Ore Saprolite�Ore Au�Head�Grade
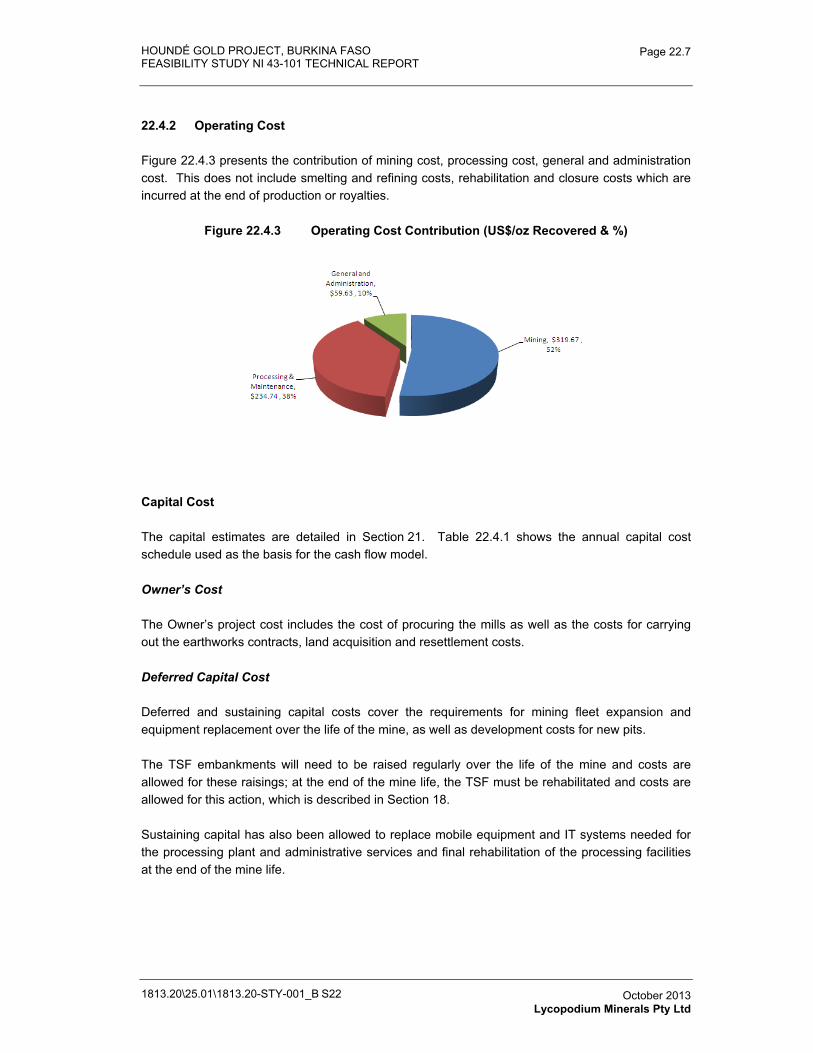
HOUNDÉ GOLD PROJECT, BURKINA FASO FEASIBILITY STUDY NI 43-101 TECHNICAL REPORT
1813.20\25.01\1813.20-STY-001_B S22
Page 22.7
October 2013 Lycopodium Minerals Pty Ltd
22.4.2 Operating Cost
Figure 22.4.3 presents the contribution of mining cost, processing cost, general and administration cost. This does not include smelting and refining costs, rehabilitation and closure costs which are incurred at the end of production or royalties.
Figure 22.4.3 Operating Cost Contribution (US$/oz Recovered & %)
Capital Cost
The capital estimates are detailed in Section 21. Table 22.4.1 shows the annual capital cost schedule used as the basis for the cash flow model.
Owner’s Cost
The Owner’s project cost includes the cost of procuring the mills as well as the costs for carrying out the earthworks contracts, land acquisition and resettlement costs.
Deferred Capital Cost
Deferred and sustaining capital costs cover the requirements for mining fleet expansion and equipment replacement over the life of the mine, as well as development costs for new pits.
The TSF embankments will need to be raised regularly over the life of the mine and costs are allowed for these raisings; at the end of the mine life, the TSF must be rehabilitated and costs are allowed for this action, which is described in Section 18.
Sustaining capital has also been allowed to replace mobile equipment and IT systems needed for the processing plant and administrative services and final rehabilitation of the processing facilities at the end of the mine life.
HOUNDÉ GOLD PROJECT, BURKINA FASO FEASIBILITY STUDY NI 43-101 TECHNICAL REPORT
1813.20\25.01\1813.20-STY-001_B S22
Page 22.8
October 2013 Lycopodium Minerals Pty Ltd
Working Capital
The Owner’s Operations Costs cover the working capital requirements for four weeks until revenue is received from the first bullion shipment. No allowance has been made to recover the working capital at the end of the mine life.
Plant Salvage
An allowance has been made for salvage of the mining equipment and process plant, for a nominal value of $5 million.
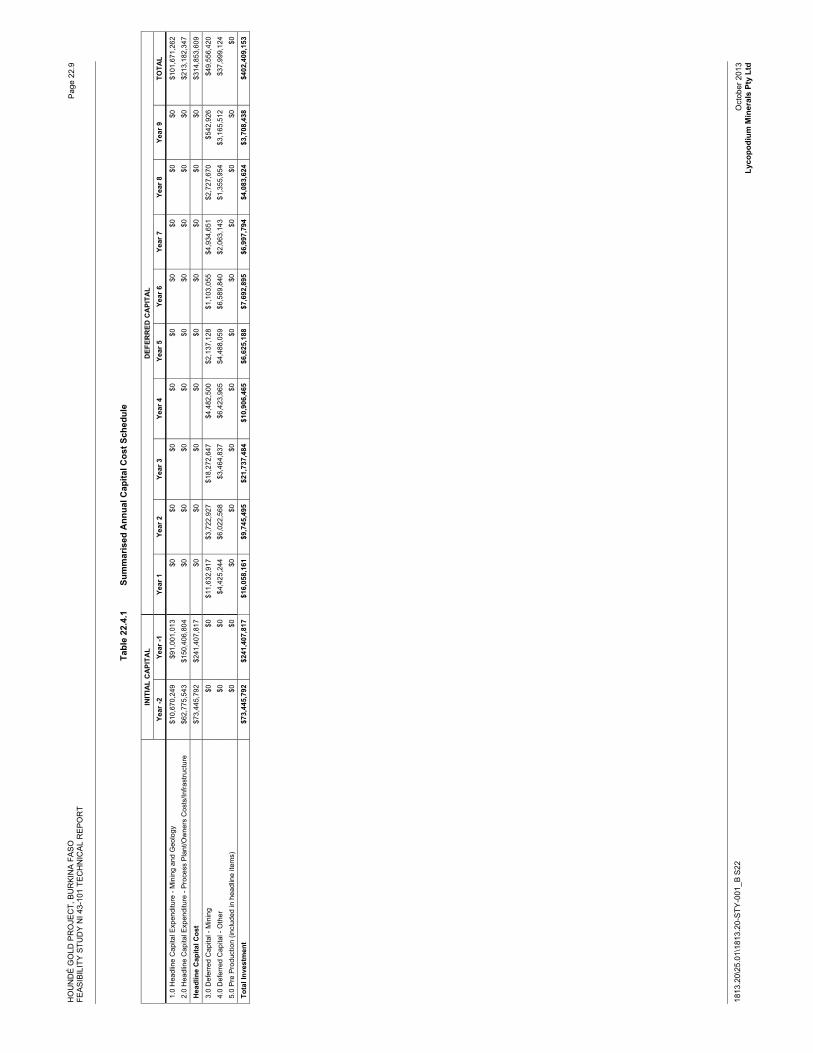
HO
UN
DÉ
GO
LD P
RO
JEC
T, B
UR
KIN
A F
AS
O
FEA
SIB
ILIT
Y S
TUD
Y N
I 43-
101
TEC
HN
ICA
L R
EP
OR
T
1813
.20\
25.0
1\18
13.2
0-S
TY-0
01_B
S22
Pag
e 22
.9
Oct
ober
201
3 Ly
copo
dium
Min
eral
s Pt
y Lt
d
Tabl
e 22
.4.1
Su
mm
aris
ed A
nnua
l Cap
ital C
ost S
ched
ule
INIT
IAL
CA
PITA
L D
EFER
RED
CA
PITA
L Ye
ar -2
Ye
ar -1
Ye
ar 1
Ye
ar 2
Ye
ar 3
Ye
ar4
Year
5
Year
6
Year
7
Year
8
Year
9
TOTA
L
1.0
Hea
dlin
e C
apita
l Exp
endi
ture
- M
inin
g an
d G
eolo
gy
$10,
670,
249
$91,
001,
013
$0$0
$0$0
$0$0
$0$0
$0
$101
,671
,262
2.
0 H
eadl
ine
Cap
ital E
xpen
ditu
re -
Pro
cess
Pla
nt/O
wne
rs C
osts
/Infra
stru
ctur
e $6
2,77
5,54
3 $1
50,4
06,8
04
$0
$0
$0
$0
$0
$0
$0
$0
$0
$213
,182
,347
Hea
dlin
e C
apita
l Cos
t $7
3,44
5,79
2 $2
41,4
07,8
17
$0
$0
$0
$0
$0
$0
$0
$0
$0
$314
,853
,609
3.0
Def
erre
d C
apita
l - M
inin
g $0
$0
$11,
632,
917
$3,7
22,9
27
$18,
272,
647
$4,4
82,5
00
$2,1
37,1
28
$1,1
03,0
55
$4,9
34,6
51
$2,7
27,6
70
$542
,926
$4
9,55
6,42
0 4.
0 D
efer
red
Cap
ital -
Oth
er
$0$0
$4
,425
,244
$6
,022
,568
$3
,464
,837
$6
,423
,965
$4
,488
,059
$6
,589
,840
$2
,063
,143
$1
,355
,954
$3
,165
,512
$3
7,99
9,12
4 5.
0 P
re P
rodu
ctio
n (in
clud
ed in
hea
dlin
e ite
ms)
$0
$0$0
$0$0
$0$0
$0$0
$0$0
$0
Tota
l Inv
estm
ent
$73,
445,
792
$241
,407
,817
$1
6,05
8,16
1 $9
,745
,495
$2
1,73
7,48
4 $1
0,90
6,46
5 $6
,625
,188
$7
,692
,895
$6
,997
,794
$4
,083
,624
$3
,708
,438
$4
02,4
09,1
53
HOUNDÉ GOLD PROJECT, BURKINA FASO FEASIBILITY STUDY NI 43-101 TECHNICAL REPORT
1813.20\25.01\1813.20-STY-001_B S22
Page 22.10
October 2013 Lycopodium Minerals Pty Ltd
22.5 Outcomes
22.5.1 Base Case
At a gold price of $1,300 per ounce and full equity funding, the Project is estimated to have an after-tax IRR of 22.45% and a pay-back period of 2.84 years. At a discount rate of 5.0%, the after-tax NPV of this scenario is estimated at $230.2 million.
Cash Flow Analysis
The undiscounted annual cash flow is summarised in Table 22.5.1. This shows that the project is expected to be cash flow positive from the first year of operation, while project payback is achieved at the end of year 2. The undiscounted net present value of the project (after tax) is $364.2 million.
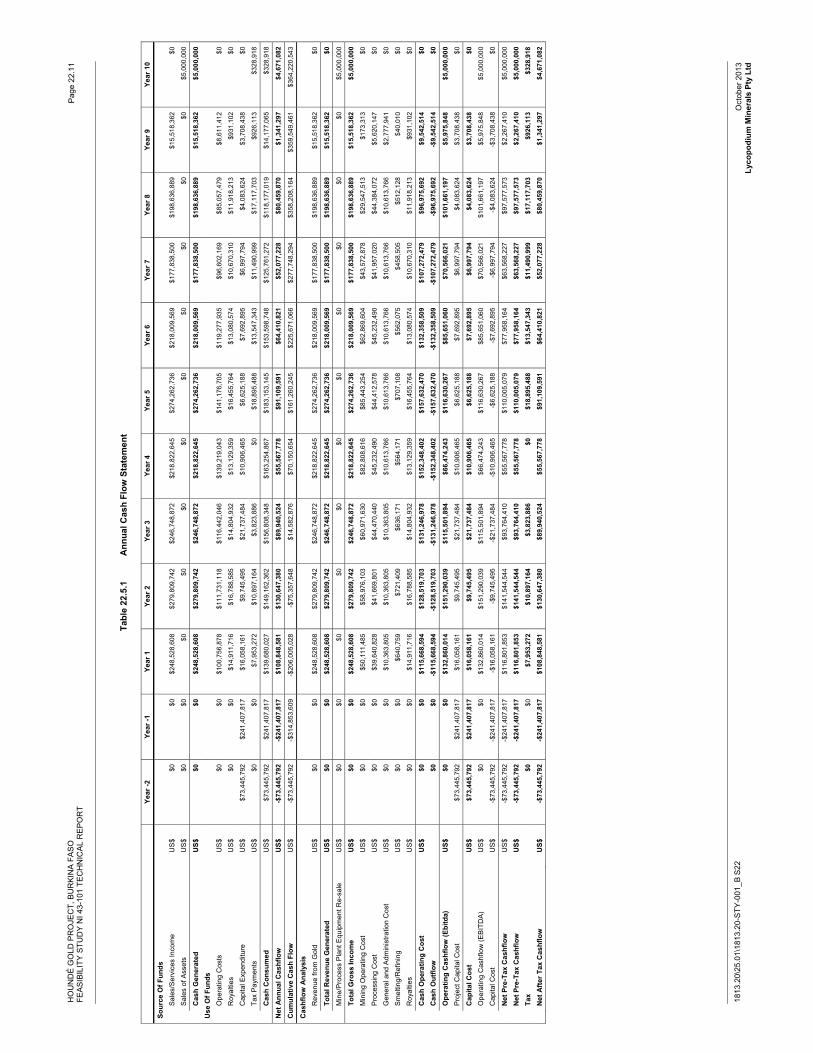
HO
UN
DÉ
GO
LD P
RO
JEC
T, B
UR
KIN
A F
AS
O
FEA
SIB
ILIT
Y S
TUD
Y N
I 43-
101
TEC
HN
ICA
L R
EP
OR
T
1813
.20\
25.0
1\18
13.2
0-S
TY-0
01_B
S22
Pag
e 22
.11
Oct
ober
201
3 Ly
copo
dium
Min
eral
s Pt
y Lt
d
Tabl
e 22
.5.1
A
nnua
l Cas
h Fl
ow S
tate
men
t
Year
-2
Year
-1
Year
1
Year
2
Year
3
Year
4
Year
5
Year
6
Year
7
Year
8
Year
9
Year
10
Sour
ce O
f Fun
ds
S
ales
/Ser
vice
s In
com
e U
S$
$0
$0
$248
,528
,608
$2
79,8
09,7
42
$246
,748
,872
$2
18,8
22,6
45
$274
,262
,736
$2
18,0
09,5
69
$177
,838
,500
$1
98,6
36,8
89
$15,
518,
362
$0
S
ales
of A
sset
s U
S$
$0
$0
$0
$0
$0
$0
$0
$0
$0
$0
$0
$5,0
00,0
00
Cas
h G
ener
ated
U
S$$0
$0
$2
48,5
28,6
08
$279
,809
,742
$2
46,7
48,8
72
$218
,822
,645
$2
74,2
62,7
36
$218
,009
,569
$1
77,8
38,5
00
$198
,636
,889
$1
5,51
8,36
2 $5
,000
,000
Use
Of F
unds
Ope
ratin
g C
osts
U
S$
$0
$0
$100
,756
,878
$1
11,7
31,1
18
$116
,442
,046
$1
39,2
19,0
43
$141
,176
,705
$1
19,2
77,9
35
$96,
602,
169
$85,
057,
479
$8,6
11,4
12
$0
R
oyal
ties
US
$$0
$0
$1
4,91
1,71
6 $1
6,78
8,58
5 $1
4,80
4,93
2 $1
3,12
9,35
9 $1
6,45
5,76
4 $1
3,08
0,57
4 $1
0,67
0,31
0 $1
1,91
8,21
3 $9
31,1
02
$0
C
apita
l Exp
endi
ture
U
S$
$73,
445,
792
$241
,407
,817
$1
6,05
8,16
1 $9
,745
,495
$2
1,73
7,48
4 $1
0,90
6,46
5 $6
,625
,188
$7
,692
,895
$6
,997
,794
$4
,083
,624
$3
,708
,438
$0
Ta
x P
aym
ents
U
S$
$0
$0
$7,9
53,2
72
$10,
897,
164
$3,8
23,8
86
$0
$18,
895,
488
$13,
547,
343
$11,
490,
999
$17,
117,
703
$926
,113
$3
28,9
18
Cas
h C
onsu
med
U
S$
$73,
445,
792
$241
,407
,817
$1
39,6
80,0
27
$149
,162
,362
$1
56,8
08,3
48
$163
,254
,867
$1
83,1
53,1
45
$153
,598
,748
$1
25,7
61,2
72
$118
,177
,019
$1
4,17
7,06
5 $3
28,9
18
Net
Ann
ual C
ashf
low
U
S$-$
73,4
45,7
92
-$24
1,40
7,81
7 $1
08,8
48,5
81
$130
,647
,380
$8
9,94
0,52
4 $5
5,56
7,77
8 $9
1,10
9,59
1 $6
4,41
0,82
1 $5
2,07
7,22
8 $8
0,45
9,87
0 $1
,341
,297
$4
,671
,082
Cum
ulat
ive
Cas
h Fl
ow
US
$-$
73,4
45,7
92
-$31
4,85
3,60
9 -$
206,
005,
028
-$75
,357
,648
$1
4,58
2,87
6 $7
0,15
0,65
4 $1
61,2
60,2
45
$225
,671
,066
$2
77,7
48,2
94
$358
,208
,164
$3
59,5
49,4
61
$364
,220
,543
Cas
hflo
w A
naly
sis
R
even
ue fr
om G
old
US
$$0
$0
$2
48,5
28,6
08
$279
,809
,742
$2
46,7
48,8
72
$218
,822
,645
$2
74,2
62,7
36
$218
,009
,569
$1
77,8
38,5
00
$198
,636
,889
$1
5,51
8,36
2 $0
Tota
l Rev
enue
Gen
erat
ed
US$
$0
$0
$248
,528
,608
$2
79,8
09,7
42
$246
,748
,872
$2
18,8
22,6
45
$274
,262
,736
$2
18,0
09,5
69
$177
,838
,500
$1
98,6
36,8
89
$15,
518,
362
$0
M
ine/
Pro
cess
Pla
nt E
quip
men
t Re-
sale
U
S$
$0
$0
$0
$0
$0
$0
$0
$0
$0
$0
$0
$5,0
00,0
00
To
tal G
ross
Inco
me
US$
$0
$0
$248
,528
,608
$2
79,8
09,7
42
$246
,748
,872
$2
18,8
22,6
45
$274
,262
,736
$2
18,0
09,5
69
$177
,838
,500
$1
98,6
36,8
89
$15,
518,
362
$5,0
00,0
00
M
inin
g O
pera
ting
Cos
t U
S$
$0
$0
$50,
111,
485
$58,
976,
103
$60,
971,
630
$82,
808,
616
$85,
443,
254
$62,
869,
604
$43,
572,
878
$29,
547,
513
$173
,313
$0
P
roce
ssin
g C
ost
US
$$0
$0
$3
9,64
0,82
8 $4
1,66
9,80
1 $4
4,47
0,44
0 $4
5,23
2,49
0 $4
4,41
2,57
8 $4
5,23
2,49
0 $4
1,95
7,02
0 $4
4,38
4,07
2 $5
,620
,147
$0
G
ener
al a
nd A
dmin
istra
tion
Cos
t U
S$
$0
$0
$10,
363,
805
$10,
363,
805
$10,
363,
805
$10,
613,
766
$10,
613,
766
$10,
613,
766
$10,
613,
766
$10,
613,
766
$2,7
77,9
41
$0
S
mel
ting/
Ref
inin
g U
S$
$0
$0
$640
,759
$7
21,4
09
$636
,171
$5
64,1
71
$707
,108
$5
62,0
75
$458
,505
$5
12,1
28
$40,
010
$0
R
oyal
ties
US
$$0
$0
$1
4,91
1,71
6 $1
6,78
8,58
5 $1
4,80
4,93
2 $1
3,12
9,35
9 $1
6,45
5,76
4 $1
3,08
0,57
4 $1
0,67
0,31
0 $1
1,91
8,21
3 $9
31,1
02
$0
C
ash
Ope
ratin
g C
ost
US$
$0
$0
$115
,668
,594
$1
28,5
19,7
03
$131
,246
,978
$1
52,3
48,4
02
$157
,632
,470
$1
32,3
58,5
09
$107
,272
,479
$9
6,97
5,69
2 $9
,542
,514
$0
C
ash
Out
flow
$0
$0
-$
115,
668,
594
-$12
8,51
9,70
3 -$
131,
246,
978
-$15
2,34
8,40
2 -$
157,
632,
470
-$13
2,35
8,50
9 -$
107,
272,
479
-$96
,975
,692
-$
9,54
2,51
4 $0
O
pera
ting
Cas
hflo
w (E
bitd
a)
US$
$0
$0
$132
,860
,014
$1
51,2
90,0
39
$115
,501
,894
$6
6,47
4,24
3 $1
16,6
30,2
67
$85,
651,
060
$70,
566,
021
$101
,661
,197
$5
,975
,848
$5
,000
,000
P
roje
ct C
apita
l Cos
t $7
3,44
5,79
2 $2
41,4
07,8
17
$16,
058,
161
$9,7
45,4
95
$21,
737,
484
$10,
906,
465
$6,6
25,1
88
$7,6
92,8
95
$6,9
97,7
94
$4,0
83,6
24
$3,7
08,4
38
$0
C
apita
l Cos
t U
S$$7
3,44
5,79
2 $2
41,4
07,8
17
$16,
058,
161
$9,7
45,4
95
$21,
737,
484
$10,
906,
465
$6,6
25,1
88
$7,6
92,8
95
$6,9
97,7
94
$4,0
83,6
24
$3,7
08,4
38
$0
O
pera
ting
Cas
hflo
w (E
BIT
DA
) U
S$
$0
$0
$132
,860
,014
$1
51,2
90,0
39
$115
,501
,894
$6
6,47
4,24
3 $1
16,6
30,2
67
$85,
651,
060
$70,
566,
021
$101
,661
,197
$5
,975
,848
$5
,000
,000
C
apita
l Cos
t U
S$
-$73
,445
,792
-$
241,
407,
817
-$16
,058
,161
-$
9,74
5,49
5 -$
21,7
37,4
84
-$10
,906
,465
-$
6,62
5,18
8 -$
7,69
2,89
5 -$
6,99
7,79
4 -$
4,08
3,62
4 -$
3,70
8,43
8 $0
Net
Pre
-Tax
Cas
hflo
w
US
$-$
73,4
45,7
92
-$24
1,40
7,81
7 $1
16,8
01,8
53
$141
,544
,544
$9
3,76
4,41
0 $5
5,56
7,77
8 $1
10,0
05,0
79
$77,
958,
164
$63,
568,
227
$97,
577,
573
$2,2
67,4
10
$5,0
00,0
00
N
et P
re-T
ax C
ashf
low
U
S$-$
73,4
45,7
92
-$24
1,40
7,81
7 $1
16,8
01,8
53
$141
,544
,544
$9
3,76
4,41
0 $5
5,56
7,77
8 $1
10,0
05,0
79
$77,
958,
164
$63,
568,
227
$97,
577,
573
$2,2
67,4
10
$5,0
00,0
00
Tax
$0
$0
$7,9
53,2
72
$10,
897,
164
$3,8
23,8
86
$0
$18,
895,
488
$13,
547,
343
$11,
490,
999
$17,
117,
703
$926
,113
$3
28,9
18
Net
Afte
r Tax
Cas
hflo
w
US$
-$73
,445
,792
-$
241,
407,
817
$108
,848
,581
$1
30,6
47,3
80
$89,
940,
524
$55,
567,
778
$91,
109,
591
$64,
410,
821
$52,
077,
228
$80,
459,
870
$1,3
41,2
97
$4,6
71,0
82
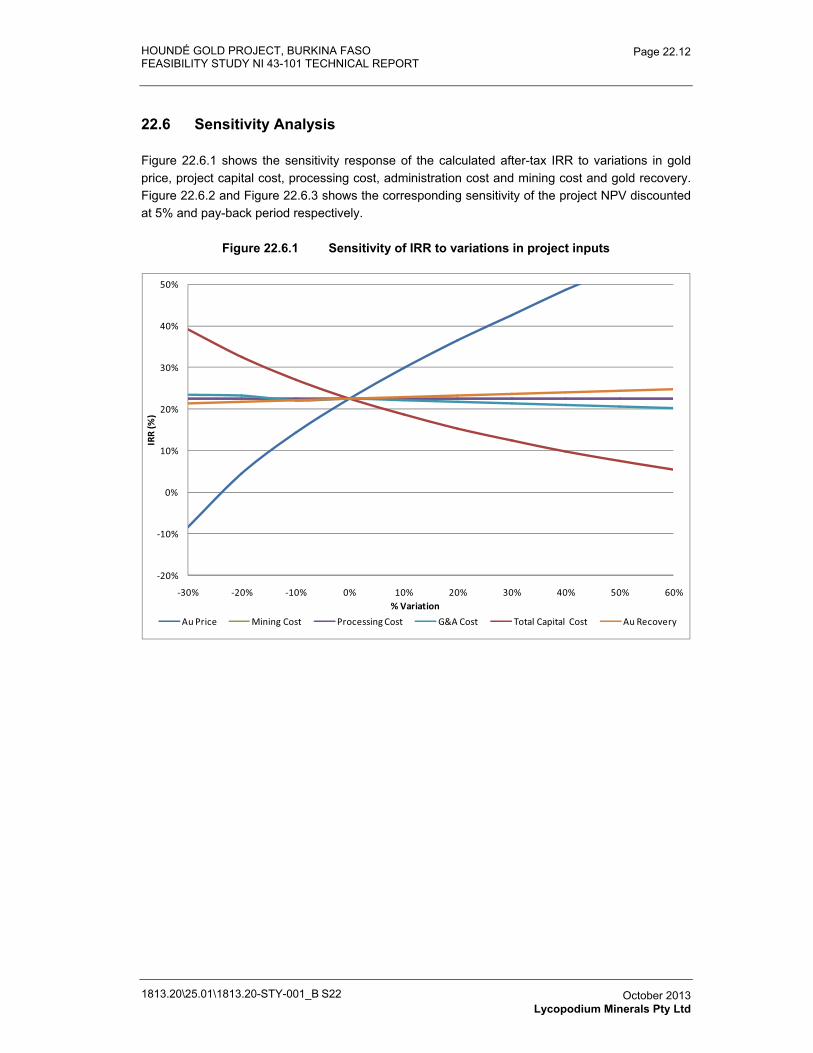
HOUNDÉ GOLD PROJECT, BURKINA FASO FEASIBILITY STUDY NI 43-101 TECHNICAL REPORT
1813.20\25.01\1813.20-STY-001_B S22
Page 22.12
October 2013 Lycopodium Minerals Pty Ltd
22.6 Sensitivity Analysis
Figure 22.6.1 shows the sensitivity response of the calculated after-tax IRR to variations in gold price, project capital cost, processing cost, administration cost and mining cost and gold recovery. Figure 22.6.2 and Figure 22.6.3 shows the corresponding sensitivity of the project NPV discounted at 5% and pay-back period respectively.
Figure 22.6.1 Sensitivity of IRR to variations in project inputs
�20%
�10%
0%
10%
20%
30%
40%
50%
�30% �20% �10% 0% 10% 20% 30% 40% 50% 60%
IRR�
(%)�
%�Variation
Au�Price Mining�Cost Processing�Cost G&A�Cost Total�Capital� Cost Au�Recovery
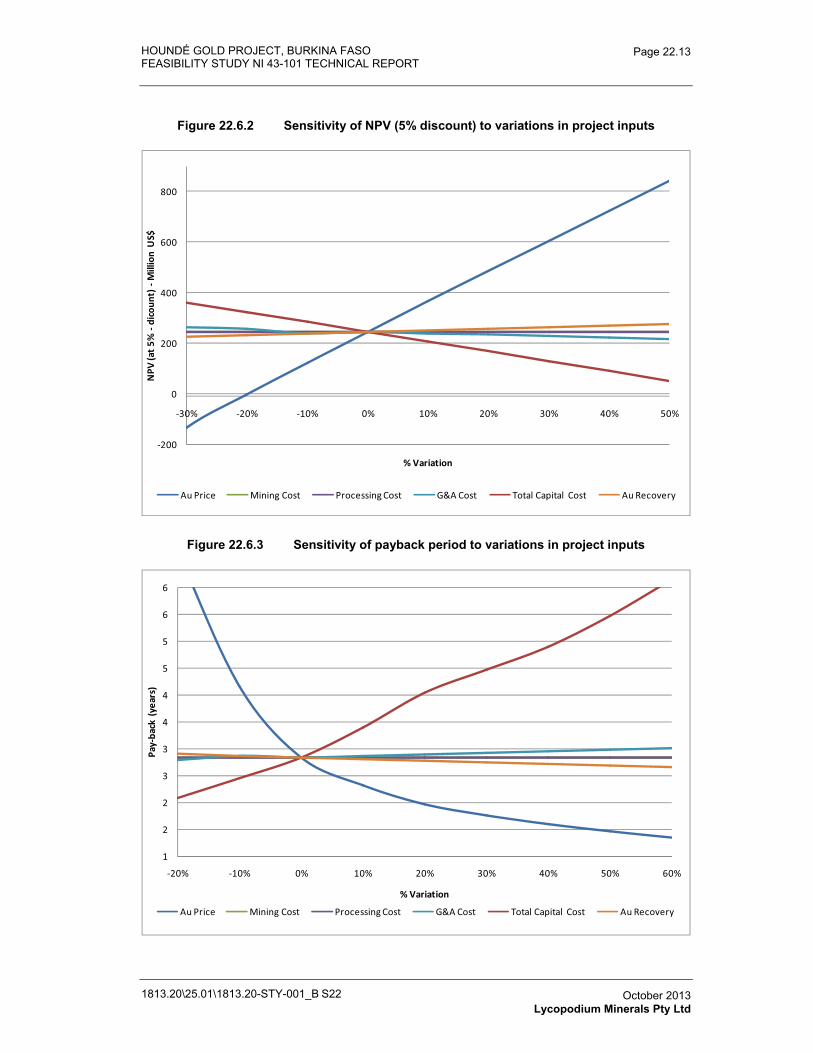
HOUNDÉ GOLD PROJECT, BURKINA FASO FEASIBILITY STUDY NI 43-101 TECHNICAL REPORT
1813.20\25.01\1813.20-STY-001_B S22
Page 22.13
October 2013 Lycopodium Minerals Pty Ltd
Figure 22.6.2 Sensitivity of NPV (5% discount) to variations in project inputs
�200
0
200
400
600
800
�30% �20% �10% 0% 10% 20% 30% 40% 50%
NPV
�(at�
5%��
dico
unt)
��M
illio
n�U
S$
%�Variation
Au�Price Mining�Cost Processing�Cost G&A�Cost Total�Capital� Cost Au�Recovery
Figure 22.6.3 Sensitivity of payback period to variations in project inputs
1
2
2
3
3
4
4
5
5
6
6
�20% �10% 0% 10% 20% 30% 40% 50% 60%
Pay�
back
�(ye
ars)
%�Variation
Au�Price Mining�Cost Processing�Cost G&A�Cost Total�Capital� Cost Au�Recovery
HOUNDÉ GOLD PROJECT, BURKINA FASO
FEASIBILITY STUDY NI 43-101 TECHNICAL REPORT
1813.20-STY-001
Table of Contents Page
23.0� ADJACENT PROPERTIES 23.1�23.1� Overall Location 23.1�23.2� Yaramoko – Roxgold Inc. 23.2�23.3� Houndé South – Savory Capital Corp. 23.2�23.4� MM Prospect – Sarama Resources Ltd. 23.2�23.5� Bondigui – Orezone Gold Corporation 23.3�23.6� Dossi – ACC Resources 23.3�23.7� Mana Mine – Semafo SARL 23.4�
FIGURESFigure 23.1.1� Location Map – Adjacent Properties 23.1�
1813.20\25.01\1813.20-STY-001_B S23 October 2013 Cube Consulting Pty Ltd
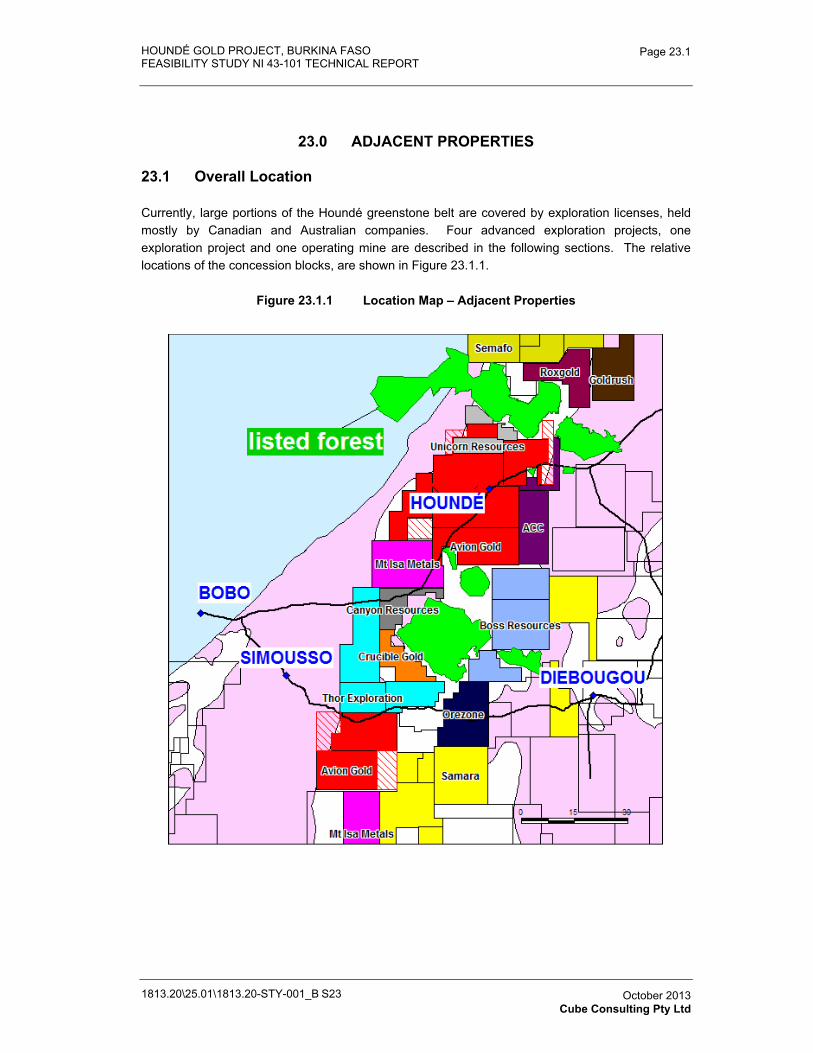
HOUNDÉ GOLD PROJECT, BURKINA FASO FEASIBILITY STUDY NI 43-101 TECHNICAL REPORT
1813.20\25.01\1813.20-STY-001_B S23
Page 23.1
October 2013 Cube Consulting Pty Ltd
23.0 ADJACENT PROPERTIES
23.1 Overall Location
Currently, large portions of the Houndé greenstone belt are covered by exploration licenses, held mostly by Canadian and Australian companies. Four advanced exploration projects, one exploration project and one operating mine are described in the following sections. The relative locations of the concession blocks, are shown in Figure 23.1.1.
Figure 23.1.1 Location Map – Adjacent Properties
HOUNDÉ GOLD PROJECT, BURKINA FASO FEASIBILITY STUDY NI 43-101 TECHNICAL REPORT
1813.20\25.01\1813.20-STY-001_B S23
Page 23.2
October 2013 Cube Consulting Pty Ltd
23.2 Yaramoko – Roxgold Inc.
The Yaramoko property is controlled by Canadian listed Roxgold Inc. The property lies approximately 40 km northeast of the Vindaloo zone, along the eastern edge of the Houndé volcanic belt. The deposit is structurally controlled and hosted by a mixture of granite and volcanic rock. According to a presentation from April, 2013 the property hosts 639,951 ounces Indicated Mineral Resources at 19.3 g/t Au and 183,894 ounces Inferred Mineral Resources at 11.5 g/t Au at a 5 g/t Au cut-off. This Mineral Resource estimate is based on 216 holes to a depth of 800 metres. A PEA is due in Q3, 2013.
23.3 Houndé South – Savory Capital Corp.
The Houndé South property is controlled by Canadian-listed Savory Capital Corp. (Savory). This property is optioned from Endeavour Mining. In order to earn a 100% interest in the property, Savory needs to spend $3 million on exploration by mid May, 2014 and give Endeavour shares totalling up to an interest of 19.9% of the company. The property is located approximately 45 km southwest of Endeavour’s Houndé property.
‘The Houndé South concessions are underlain by a northerly-trending package of mafic to intermediate composition volcanics and sediments that are intruded by a mix of early to late felsic to mafic intrusions. These rocks have been deformed and subjected to local shearing and faulting. Property-scale airborne magnetic data indicate strong, north-trending lineaments that are interpreted to represent shear zones or large fault zones, lie to the east and west of the known zones of gold mineralization. Less well defined magnetic lineament correlate well with the gold occurrences and gold-in-soil anomalies.’ excerpt from Savory’s 43-101 report, Armstrong et. al., 2012.
Savory has carried out two drill programs since acquiring the property option. The drilling has confirmed the existence of some of the historic gold mineralization and resulted in the discovery of two new zones, one of which returned an intercept of 11.16 g/t Au over 9.0 metres (news release May 9, 2013).
23.4 MM Prospect – Sarama Resources Ltd.
The MM prospect, which is located on the Tankoro property, is owned by Canadian-listed Sarama Resources Ltd. The property is located approximately 60 km south of Endeavour’s Houndé property.
During 2012, Sarama completed 80,000 metres of RC, diamond and RAB / air core drilling and outlined a 30 km long mineralized structural corridor. Within this corridor, two 2 km long mineralized zones were discovered in the MM and Phantom zone areas. Gold mineralization in these areas is mainly associated with strongly altered feldspar porphyry dykes. Significant results include 10.2 metres at 14.85 g/t Au, 15.50 metres at 6.61 g/t Au, 11.8 metres at 8.06 g/t Au, 13.9 metres at 14.47 g/t Au, 18.3 metres at 7.09 g/t Au and 13.9 metres at 5.90 g/t Au. A maiden Mineral Resource estimate is expected in Q3, 2013.
HOUNDÉ GOLD PROJECT, BURKINA FASO FEASIBILITY STUDY NI 43-101 TECHNICAL REPORT
1813.20\25.01\1813.20-STY-001_B S23
Page 23.3
October 2013 Cube Consulting Pty Ltd
23.5 Bondigui – Orezone Gold Corporation
The Bondigui Property is owned by Orezone Gold Corporation. It is located approximately 30 km due south of Endeavour’s Houndé property within the Houndé greenstone belt.
The gold mineralization at Bondigui is chiefly associated with a north to north-northeast striking, sub-vertical shear zone array, accompanied with discrete shears splaying off along 330/60°E, 000/90°, and 035/80°E. The system has been interpreted as a dextral shear zone with second and third-order shears. The individual shear corridors are 5 to 50 m wide.
The mineralization lies in a shear zone cutting across the eastern contact of the Tarkwa sedimentary trough within the eastern volcanic domain and is in close spatial association with mafic and intrusive bodies.
Mineralization is characterized by alteration that manifests itself by silicification, sericite, carbonate (ankerite), and hematite, with occurrences of finely disseminated pyrite. The sulphide abundance amounts to 1 to 2% (locally 5 to 10%) and is dominantly represented by pyrite, with subordinate arsenopyrite and chalcopyrite.
Veins and veinlets ranging from 0.1 – 1.0 m found with the alteration in the shear zone form mineralized bodies up to 24 m wide.
A NI 43-101 compliant report titled ‘Technical Report on the Mineral Resource of the Bondigui Gold Project’ was published in February 2009 on SEDAR. The deposits hosts Measured and Indicated Mineral Resources totalling 4,140,000 t at 2.12 g/t Au (282,000 oz Au), whereas the Inferred Mineral Resources were 2,536,000 t at 1.84 g/t Au (149,700 oz Au).
23.6 Dossi – ACC Resources
The Dossi property is owned by ACC Resources. It is situated immediately east of Endeavour’s Houndé licenses (Figure 23.1) within the Houndé greenstone belt. ACC carried out several exploration campaigns, including the following:
� 227 RC drill holes (27,827 m),
� 31 Core holes (4,676 m) in Zone 1,
� 800 RAB drill holes (20,910 m),
� 2,827 soil geochemistry samples,
� Four ground geophysical programs (IP), and
� High resolution aeromag and radiometry (Fugro Airborne Surveys, MIDAS) completed in November 2010.
The company has not publically reported a mineral resource estimate.
HOUNDÉ GOLD PROJECT, BURKINA FASO FEASIBILITY STUDY NI 43-101 TECHNICAL REPORT
1813.20\25.01\1813.20-STY-001_B S23
Page 23.4
October 2013 Cube Consulting Pty Ltd
23.7 Mana Mine – Semafo SARL
The Mana mine is operated by SEMAFO SARL. It is situated approximately 40 km North of Endeavour’s Houndé licenses.
The Mana property is mostly covered by Houndé greenstone belt sedimentary, volcano-sedimentary, and volcanic rocks of Birimian age.
SEMAFO has discovered seven areas of gold mineralization within 20 km of the mill including Wona, Nyafe, Filion 67, Fofina, Yaho, Fobiri and the newest, Siou. Six of these zones have reported mineral resources.
The Wona deposit is hosted in a series of highly deformed sedimentary (black pelites), volcano-sedimentary, and meta-volcanic rocks. The gold mineralization developed along a major northeast-trending sub-vertical fault zone of regional extent. The zone is up to 200 metres wide in the Wona pit sector. The original stratigraphic sequence is a succession of pelitic sediments with graphitic horizons and volcaniclastics. The rocks have been affected by a pervasive S1 schistosity, which would be associated to vertical movements along the fault (i.e., the east block rising with respect to the west one) as well as sinistral lateral movements. These foliated rocks are cut by mafic to intermediate dikes, themselves foliated (i.e., S2 schistosity parallel to S1).
The mineralization itself would be associated to a posterior lateral movement along the fault with hydrothermal fluid circulation and intense silicification.
The Nyafé deposit is hosted in a purely volcanic sequence with basalt and mafic to intermediate tuffs and flows. Pillows display a dark ferrous chloritic border suggesting some hydrothermal alteration of volcanogenic origin. Several sub-vertical decametric dikes cross the volcanic sequence, in particular a N-S felsic quartz porphyritic dike and two mafic dikes on both sides of the pit parallel to the mineralization.
The Filon 67 deposit, next to Nyafé is comprised of greenschist-hosted quartz veins that are associated with shear zones with dextral movement. These composite veins demonstrate multiple episodes of crack and fill textures.
As is the case for outcropping mineral deposits in tropical climate zones, in western Africa in particular, the rock package hosting both Wona and Nyafé deposits has been subjected to intense meteoritic alteration with the development of a saprolitic zone near the surface.
The Wona deposit has been traced over a distance of 4.7 km along an azimuth of 46°. The Nyafé deposit extends for 2.4 km along a N-S direction.
The Filon 67 or F67 ore body lies almost parallel to the Nyafé ore body, about 300 m to the east. It strikes almost NS over a length of about 500 m.
Siou is hosted by a shear zone that lies along the contact between granodiorite and sediments.
HOUNDÉ GOLD PROJECT, BURKINA FASO FEASIBILITY STUDY NI 43-101 TECHNICAL REPORT
1813.20\25.01\1813.20-STY-001_B S23
Page 23.5
October 2013 Cube Consulting Pty Ltd
As of January, 2013 SEMAFO’s Mana project hosted reserves of 25.68 million tonnes grading 2.40 g/t Au totalling 1.98 million ounces of gold and Measured and Indicated Mineral Resources of 51.40 million tonnes grading 1.69 g/t Au totalling 2.79 million ounces of gold (SEMAFO presentation January, 2013). On February 21, 2013, SEMAFO announced additional in-pit Inferred Mineral Resources for the Sioux sector of 6.73 million tonnes grading 4.62 g/t Au totalling 999,200 ounces of gold.
HOUNDÉ GOLD PROJECT, BURKINA FASO
FEASIBILITY STUDY NI 43-101 TECHNICAL REPORT
1813.20-STY-001
Table of Contents Page
24.0� OTHER RELEVANT DATA AND INFORMATION 24.1�24.1� Risks and Opportunities 24.1�24.2� Other Relevant Data 24.1�
APPENDICES Appendix 24.1� Project Risk Register�
1813.20\25.01\1813-STY-000]_B S24 October 2013 Lycopodium Minerals Pty Ltd
HOUNDÉ GOLD PROJECT, BURKINA FASO FEASIBILITY STUDY NI 43-101 TECHNICAL REPORT
1813.20\25.01\1813.20-STY-001_B S24
Page 24.1
October 2013 Lycopodium Minerals Pty Ltd
24.0 OTHER RELEVANT DATA AND INFORMATION
24.1 Risks and Opportunities
In addition to the risks and opportunities outlined in the sections above, a workshop was conducted to identify high level sources of uncertainty that could influence the Project outcome. The workshop was attended by representatives of the organisations contributing to the Report and was facilitated by an experienced person independent of the study teams. The workshop identified both risks and opportunities, evaluated likely scenarios and rated these in terms of likelihood of occurrence and severity of consequences. The resulting level of risk for each item was then evaluated and a decision made to accept the risk or implement additional mitigating measures. The Risk Register arising from the workshop is attached in Appendix 24.1.
24.2 Other Relevant Data
There is no other data relevant to the Houndé Project that has not already been discussed in this report.

HOUNDÉ GOLD PROJECT, BURKINA FASO
FEASIBILITY STUDY NI 43-101 TECHNICAL REPORT
1813.20-STY-001
Table of Contents Page
25.0� CONCLUSIONS 25.1�25.1� Conclusions 25.1�
1813.20\25.01\1813.20-STY-001_B S25 October 2013 Lycopodium Minerals Pty Ltd
HOUNDÉ GOLD PROJECT, BURKINA FASO FEASIBILITY STUDY NI 43-101 TECHNICAL REPORT
1813.20\25.01\1813.20-STY-001_B S25
Page 25.1
October 2013 Lycopodium Minerals Pty Ltd
25.0 CONCLUSIONS
Detailed conclusions arising out of the performance of this Study have been utilised in the development of the relevant sections of this report. This section considers more general aspects of the study.
25.1 Conclusions
� Exploration drilling in the immediate Vindaloo and Madras NW pit areas indicates that there are both in-pit and near pit mineralized zones that merit follow-up in the short term, as their delineation could have a positive impact on the current mine and waste pile models.
� Exploration targets, located around the periphery of the Vindaloo and Madras NW pits, have the potential to add additional reserves.
� The Vindaloo mineralisation is sufficiently drilled and modelled to allow classification into a Resource Model that has been developed using generally accepted industry techniques and practices and conforms to CIM guidelines (CIM 2005). The Mineral Resource estimate is reported at a cut-off grade of 0.35 g/t Au with an effective date of July 18, 2012.
� The metallurgical testwork conducted on samples representing the bulk of the deposit to be mined has resulted in the development of a robust process flowsheet which is expected to recover in excess of 93% of the gold in the mill feed. Additional testwork on gravity concentration would improve the confidence of the design details and recovery estimates for this part of the process, and further testwork to optimise cyanide consumption may lead to reductions in overall operating costs.
� The mine design and scheduling activities have resulted in a Reserve statement produced in accordance with Canadian National Instrument 43-101, ‘Standards of Disclosure for Mineral Projects’ of June 2011 (the Instrument) and the Definition Standards adopted by CIM Council in November 2010.
� The preliminary design of the supporting infrastructure for the project has been carried out in sufficient detail to arrive at cost estimates of appropriate accuracy for study of this nature. One item still under negotiation is the connection to the HV power grid; while SONABEL has agreed in principle to supply power to the project, the details of the connection have not yet been agreed.
� Environmental studies have established the baseline conditions in the local project area and the efforts to mitigate the environmental impact of developing, operating and closure of a mine. The ESIA Reports have been completed and the Resettlement Action Plan is nearing completion to support the application for permits.
HOUNDÉ GOLD PROJECT, BURKINA FASO FEASIBILITY STUDY NI 43-101 TECHNICAL REPORT
1813.20\25.01\1813.20-STY-001_B S25
Page 25.2
October 2013 Lycopodium Minerals Pty Ltd
� A social impact assessment study has identified a number of areas of concern raised by the local community and identified appropriate mitigating actions. Overall, this study has demonstrated the economic and social benefits of the project for the area and the Country, A compensation and relocation plan has been developed for those that will be impacted by the Project.
� Based on the current reserves, production schedule, the metallurgical performance of the ore, the cost estimates, and other relevant criteria and parameters, the cash flow model indicates a robust project with an acceptable rate of return, even at current depressed gold prices.

HOUNDÉ GOLD PROJECT, BURKINA FASO
FEASIBILITY STUDY NI 43-101 TECHNICAL REPORT
1813.20-STY-001
Table of Contents Page
26.0� RECOMMENDATIONS 26.1�
1813.20\25.01\1813.20-STY-001_B S26 October 2013 Lycopodium Minerals Pty Ltd
HOUNDÉ GOLD PROJECT, BURKINA FASO FEASIBILITY STUDY NI 43-101 TECHNICAL REPORT
1813.20\25.01\1813.20-STY-001_B S26
Page 26.1
October 2013 Lycopodium Minerals Pty Ltd
26.0 RECOMMENDATIONS
Specific recommendations arising out of the performance of this Feasibility Study have been identified and recorded in the relevant sections of this report. This section considers more general aspects of the study.
Given the favourable economics of the project, it is recommended that Endeavour proceed with development of the project.
An exploration plan should be developed that matches the mine development schedule to ensure that any mineralized zones that could positively impact the mine plan, are delineated in sufficient time to allow for the development of an updated mine plan.
HOUNDÉ GOLD PROJECT, BURKINA FASO
FEASIBILITY STUDY NI 43-101 TECHNICAL REPORT
1813.20-STY-001
Table of Contents Page
27.0� SELECTED REFERENCES 27.1�27.1� Supporting Documents 27.1�
27.1.1� Orelogy Mining Reports 27.1�27.1.2� Knight Piésold Reports 27.1�27.1.3� Peter O’Bryan and Associates Pit Geotechnical Report 27.1�27.1.4� Lycopodium Design Documents and Reports 27.1�
27.2� References 27.3�
1813.20\25.01\1813-STY-000]_B S27 October 2013 Lycopodium Minerals Pty Ltd
HOUNDÉ GOLD PROJECT, BURKINA FASO FEASIBILITY STUDY NI 43-101 TECHNICAL REPORT
1813.20\25.01\1813.20-STY-001_B S27
Page 27.1
October 2013 Lycopodium Minerals Pty Ltd
27.0 SELECTED REFERENCES
27.1 Supporting Documents
The following documents have been developed during the course of the Feasibility Study and support the designs and schedules included in this report. They are available on request from Endeavour.
27.1.1 Orelogy Mining Reports
0262_EDV_HoundeFS_PitOptimisation_Oct2013_FINAL_131031
0262_EDV_HoundeFS_MineDesign_Oct2013_FINAL_131031
0262_EDV_HoundeFS_MineScheduling_Oct2013_FINAL_131031
0262_EDV_HoundeFS_MineCostEstimate_Oct2013_FINAL_131031
0262_EDV_HoundeFS_Addendum_Oct13_FINAL_131028
27.1.2 Knight Piésold Reports
Houndé Climatology PE13-00460
PE401-00067_02 Houndé Gold Project Groundwater Study Rev 0
PE401-00067_03 Houndé Gold Project Geotechnical Report Rev 0
PE401-00067_04 Houndé Tailings Testing Report Rev 1
PE401-00067_05 Houndé Gold Project Water Management Report Rev 1
PE401-00067_07 Houndé TSF Design Report Rev 0
27.1.3 Peter O’Bryan and Associates Pit Geotechnical Report
Houndé Vindaloo and Madras FS Geotechnical Assessment Report 13005
27.1.4 Lycopodium Design Documents and Reports
Design Documents
1813.20-PDC-001_D - Process Design
1813.20-LST-001_E - Mechanical Equipment
1813.20-LST-002_E - Electrical Load
1813.20-LST-003_B - Instruments
HOUNDÉ GOLD PROJECT, BURKINA FASO FEASIBILITY STUDY NI 43-101 TECHNICAL REPORT
1813.20\25.01\1813.20-STY-001_B S27
Page 27.2
October 2013 Lycopodium Minerals Pty Ltd
Drawings
Process Flowsheets:
1813.20-000-F-001 through 1813.20-000-F-026 (all Rev D)
1813.20-000-F-100_D
Plant Visualisations:
1813.20-121-W-301
1813.20-131-W-301
1813.20-132-W-301
1813.20-134-W-301
1813.20-136-W-301
1813.20-161-W-301
1813.20-162-W-301
1813.20-170-W-301
1813.20-177-W-301
1813.20-183-W-301
1813.20-210-W-301
1813.20-220-W-301
Electrical:
1813.20-330-E-302_F
1813.20-330-E-303_C
1813.20_330-E-301_D
Cost Estimate Report
02 Summary x Main Area
03 Summary x Discipline
HOUNDÉ GOLD PROJECT, BURKINA FASO FEASIBILITY STUDY NI 43-101 TECHNICAL REPORT
1813.20\25.01\1813.20-STY-001_B S27
Page 27.3
October 2013 Lycopodium Minerals Pty Ltd
04 Summary x Plant Area
05 Summary x Facility
06 Summary x Plant Area & Disc
07 Commodity Rate Report
08 Estimate Detailed Print
09 Mechanical Equip x Plant Area
27.2 References
Dr. Sawadogo, S., 2011. “Description Petrographique de Lames Minces”.
GENIVAR, Octobre, 2013. “Étude d’impact environnemental. Projet minier Houndé, Burkina Faso. Rapport préliminaire.” Rapport réalisé pour Avion Gold Burkina SARL, filiale d’Endeavour Mining. Pagination multiple.
INGRID S/C GROUPE SAPIENS INTERNATIONAL, November 2013. “Étude d’Impact Environnemental et Social (EIES) du projet de barrage minier de Houndé”.
Kappenschneider, Klaus, Dudek, Don., Armstrong, Tracy, Puritch, Eugene, and Yassa, Antoine, 2011. “Technical report and resource estimate on the Houndé Property, Burkina Faso, Africa.” Technical report prepared by P&E Mining Consultants Inc. dated Sept 19, 2011.
Kjarsgaard, I, 2013. ”Petrographic Description of Twenty-five Polished Thin Sections from Burkina Faso”.
Lester, G., 2010. ”Petrographic description and interpretation of ten thin and polished sections from the Vindaloo zone of the Hounde property, Burkina Faso”.
Rykaart, M., Pilotto, D., Royle. M., Duncan, J., Liskowich, M., Dance, A., Yakasovitch, J., Murphy, B., Puritch, G., Brown, F., Armstrong, T., Yassa, A. and Dudek, D., March, 2013. ”Technical Report and Preliminary Economic Assessment of the Houndé Gold Project, Burkina Faso, West Africa” with an effective date of December 31, 2012.
HOUNDÉ GOLD PROJECT, BURKINA FASO
FEASIBILITY STUDY NI 43-101 TECHNICAL REPORT
1813.20-STY-001
Table of Contents Page
28.0� QP CERTIFICATES 28.1�
1813.20\25.01\1813.20-STY-001_B S28 October 2013 Lycopodium Minerals Pty Ltd
HOUNDÉ GOLD PROJECT, BURKINA FASO FEASIBILITY STUDY NI 43-101 TECHNICAL REPORT
1813.20\25.01\1813.20-STY-001_B S28
Page 28.1
October 2013 Lycopodium Minerals Pty Ltd
28.0 QP CERTIFICATES
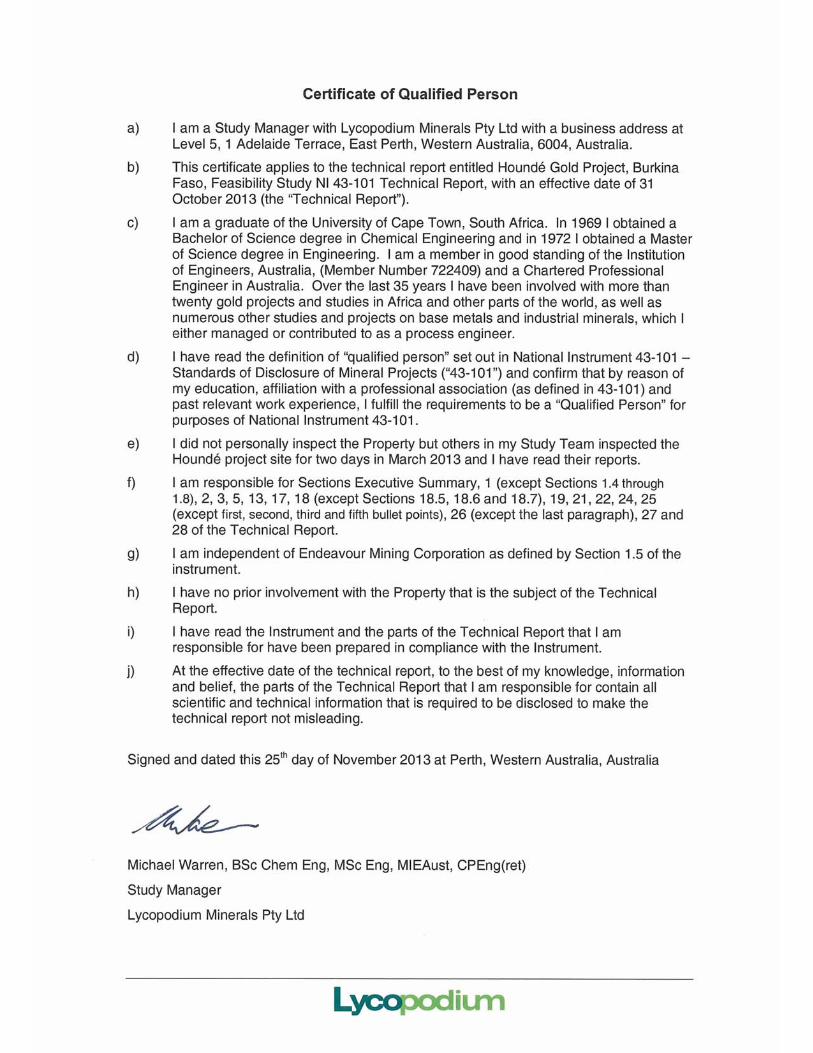
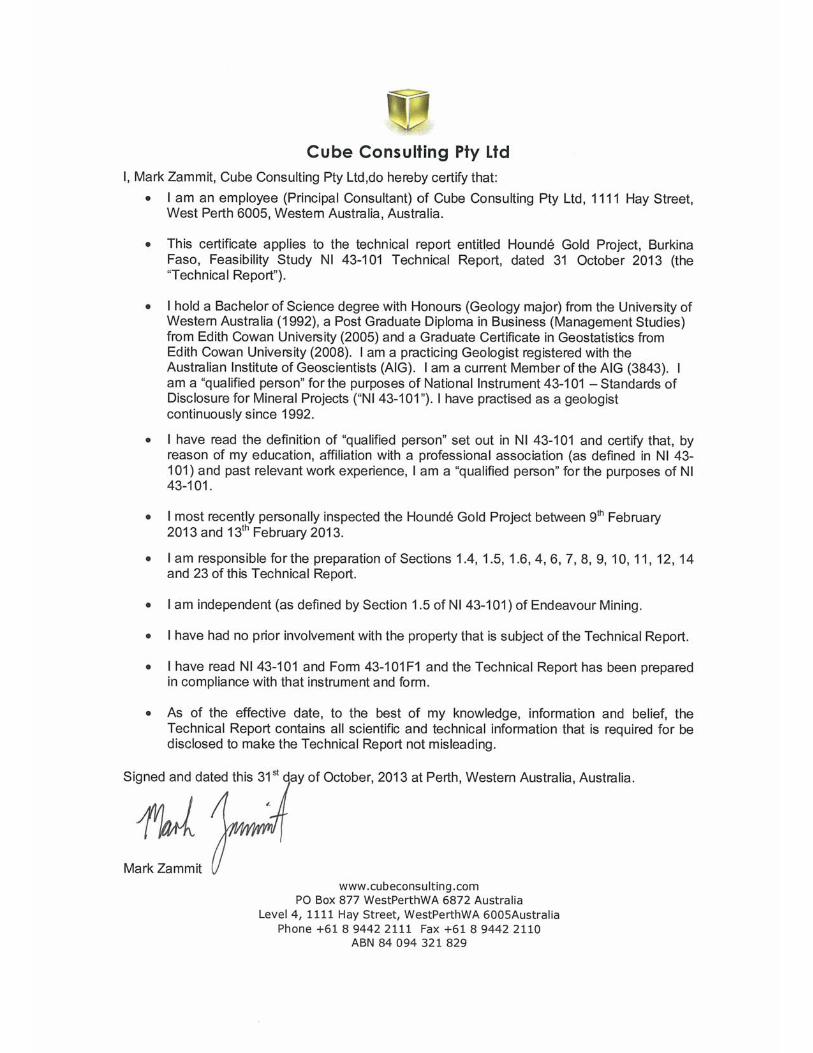


HOUNDÉ GOLD PROJECT, BURKINA FASO FEASIBILITY STUDY NI 43-101 TECHNICAL REPORT
1813.20\24.02\1813.20-STY-001_B S10 October 2013 Cube Consulting Pty Ltd
APPENDIX 10.1
DRILL HOLE COLLAR TABLE
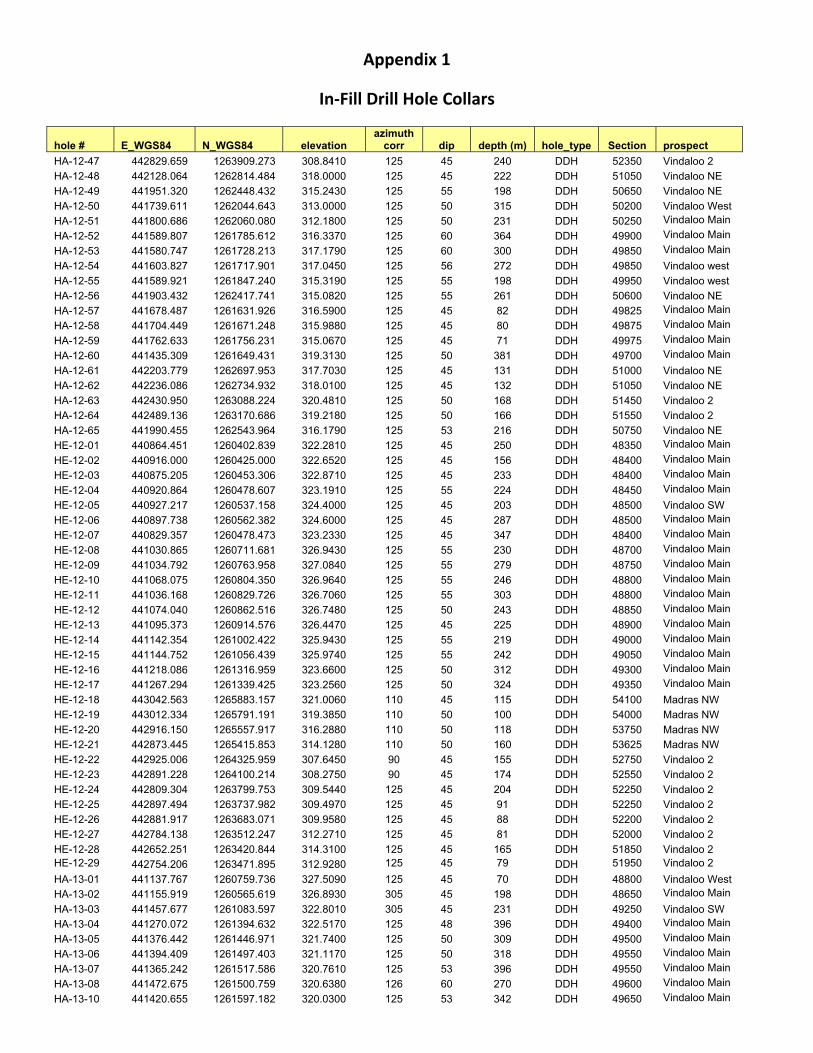
Appendix�1�
In�Fill�Drill�Hole�Collars�
hole # E_WGS84 N_WGS84 elevation azimuth
corr dip depth (m) hole_type Section prospect HA-12-47 442829.659 1263909.273 308.8410 125 45 240 DDH 52350 Vindaloo 2 HA-12-48 442128.064 1262814.484 318.0000 125 45 222 DDH 51050 Vindaloo NE HA-12-49 441951.320 1262448.432 315.2430 125 55 198 DDH 50650 Vindaloo NE HA-12-50 441739.611 1262044.643 313.0000 125 50 315 DDH 50200 Vindaloo West HA-12-51 441800.686 1262060.080 312.1800 125 50 231 DDH 50250 Vindaloo Main HA-12-52 441589.807 1261785.612 316.3370 125 60 364 DDH 49900 Vindaloo Main HA-12-53 441580.747 1261728.213 317.1790 125 60 300 DDH 49850 Vindaloo Main HA-12-54 441603.827 1261717.901 317.0450 125 56 272 DDH 49850 Vindaloo west HA-12-55 441589.921 1261847.240 315.3190 125 55 198 DDH 49950 Vindaloo west HA-12-56 441903.432 1262417.741 315.0820 125 55 261 DDH 50600 Vindaloo NE HA-12-57 441678.487 1261631.926 316.5900 125 45 82 DDH 49825 Vindaloo Main HA-12-58 441704.449 1261671.248 315.9880 125 45 80 DDH 49875 Vindaloo Main HA-12-59 441762.633 1261756.231 315.0670 125 45 71 DDH 49975 Vindaloo Main HA-12-60 441435.309 1261649.431 319.3130 125 50 381 DDH 49700 Vindaloo Main HA-12-61 442203.779 1262697.953 317.7030 125 45 131 DDH 51000 Vindaloo NE HA-12-62 442236.086 1262734.932 318.0100 125 45 132 DDH 51050 Vindaloo NE HA-12-63 442430.950 1263088.224 320.4810 125 50 168 DDH 51450 Vindaloo 2 HA-12-64 442489.136 1263170.686 319.2180 125 50 166 DDH 51550 Vindaloo 2 HA-12-65 441990.455 1262543.964 316.1790 125 53 216 DDH 50750 Vindaloo NE HE-12-01 440864.451 1260402.839 322.2810 125 45 250 DDH 48350 Vindaloo Main HE-12-02 440916.000 1260425.000 322.6520 125 45 156 DDH 48400 Vindaloo Main HE-12-03 440875.205 1260453.306 322.8710 125 45 233 DDH 48400 Vindaloo Main HE-12-04 440920.864 1260478.607 323.1910 125 55 224 DDH 48450 Vindaloo Main HE-12-05 440927.217 1260537.158 324.4000 125 45 203 DDH 48500 Vindaloo SW HE-12-06 440897.738 1260562.382 324.6000 125 45 287 DDH 48500 Vindaloo Main HE-12-07 440829.357 1260478.473 323.2330 125 45 347 DDH 48400 Vindaloo Main HE-12-08 441030.865 1260711.681 326.9430 125 55 230 DDH 48700 Vindaloo Main HE-12-09 441034.792 1260763.958 327.0840 125 55 279 DDH 48750 Vindaloo Main HE-12-10 441068.075 1260804.350 326.9640 125 55 246 DDH 48800 Vindaloo Main HE-12-11 441036.168 1260829.726 326.7060 125 55 303 DDH 48800 Vindaloo Main HE-12-12 441074.040 1260862.516 326.7480 125 50 243 DDH 48850 Vindaloo Main HE-12-13 441095.373 1260914.576 326.4470 125 45 225 DDH 48900 Vindaloo Main HE-12-14 441142.354 1261002.422 325.9430 125 55 219 DDH 49000 Vindaloo Main HE-12-15 441144.752 1261056.439 325.9740 125 55 242 DDH 49050 Vindaloo Main HE-12-16 441218.086 1261316.959 323.6600 125 50 312 DDH 49300 Vindaloo Main HE-12-17 441267.294 1261339.425 323.2560 125 50 324 DDH 49350 Vindaloo Main HE-12-18 443042.563 1265883.157 321.0060 110 45 115 DDH 54100 Madras NW HE-12-19 443012.334 1265791.191 319.3850 110 50 100 DDH 54000 Madras NW HE-12-20 442916.150 1265557.917 316.2880 110 50 118 DDH 53750 Madras NW HE-12-21 442873.445 1265415.853 314.1280 110 50 160 DDH 53625 Madras NW HE-12-22 442925.006 1264325.959 307.6450 90 45 155 DDH 52750 Vindaloo 2 HE-12-23 442891.228 1264100.214 308.2750 90 45 174 DDH 52550 Vindaloo 2 HE-12-24 442809.304 1263799.753 309.5440 125 45 204 DDH 52250 Vindaloo 2 HE-12-25 442897.494 1263737.982 309.4970 125 45 91 DDH 52250 Vindaloo 2 HE-12-26 442881.917 1263683.071 309.9580 125 45 88 DDH 52200 Vindaloo 2 HE-12-27 442784.138 1263512.247 312.2710 125 45 81 DDH 52000 Vindaloo 2 HE-12-28 442652.251 1263420.844 314.3100 125 45 165 DDH 51850 Vindaloo 2 HE-12-29 442754.206 1263471.895 312.9280 125 45 79 DDH 51950 Vindaloo 2 HA-13-01 441137.767 1260759.736 327.5090 125 45 70 DDH 48800 Vindaloo West HA-13-02 441155.919 1260565.619 326.8930 305 45 198 DDH 48650 Vindaloo Main HA-13-03 441457.677 1261083.597 322.8010 305 45 231 DDH 49250 Vindaloo SW HA-13-04 441270.072 1261394.632 322.5170 125 48 396 DDH 49400 Vindaloo Main HA-13-05 441376.442 1261446.971 321.7400 125 50 309 DDH 49500 Vindaloo Main HA-13-06 441394.409 1261497.403 321.1170 125 50 318 DDH 49550 Vindaloo Main HA-13-07 441365.242 1261517.586 320.7610 125 53 396 DDH 49550 Vindaloo Main HA-13-08 441472.675 1261500.759 320.6380 126 60 270 DDH 49600 Vindaloo Main HA-13-10 441420.655 1261597.182 320.0300 125 53 342 DDH 49650 Vindaloo Main
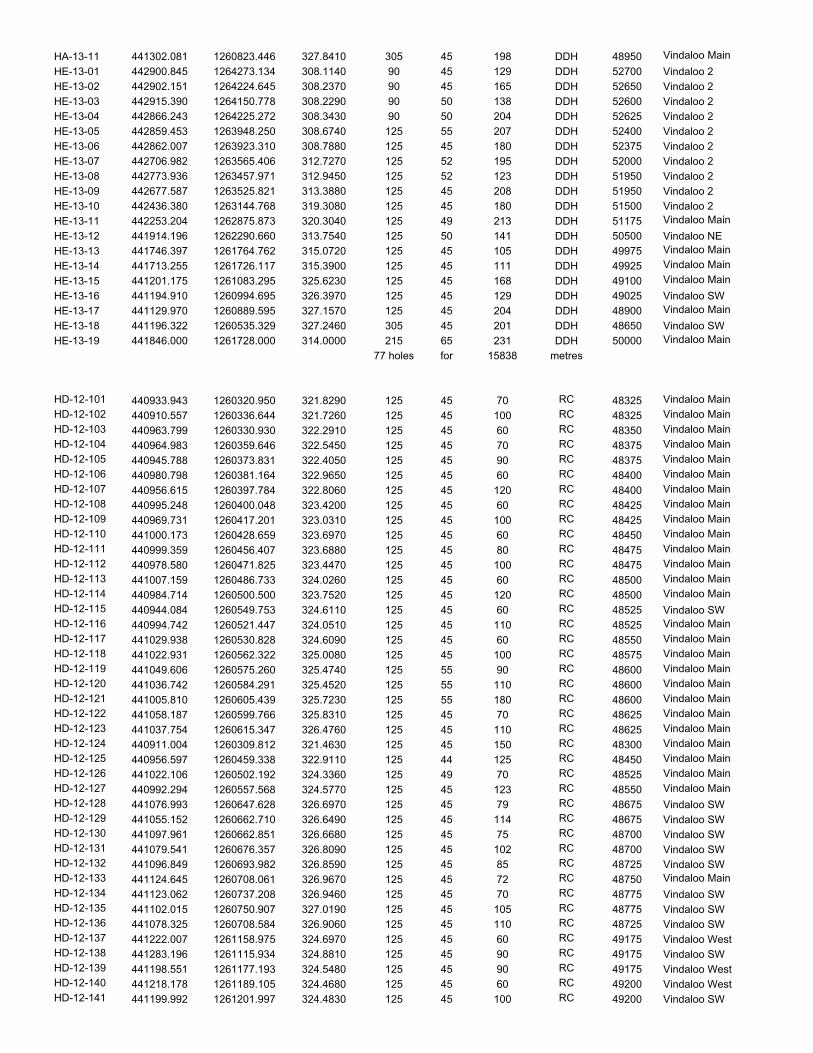
HA-13-11 441302.081 1260823.446 327.8410 305 45 198 DDH 48950 Vindaloo Main HE-13-01 442900.845 1264273.134 308.1140 90 45 129 DDH 52700 Vindaloo 2 HE-13-02 442902.151 1264224.645 308.2370 90 45 165 DDH 52650 Vindaloo 2 HE-13-03 442915.390 1264150.778 308.2290 90 50 138 DDH 52600 Vindaloo 2 HE-13-04 442866.243 1264225.272 308.3430 90 50 204 DDH 52625 Vindaloo 2 HE-13-05 442859.453 1263948.250 308.6740 125 55 207 DDH 52400 Vindaloo 2 HE-13-06 442862.007 1263923.310 308.7880 125 45 180 DDH 52375 Vindaloo 2 HE-13-07 442706.982 1263565.406 312.7270 125 52 195 DDH 52000 Vindaloo 2 HE-13-08 442773.936 1263457.971 312.9450 125 52 123 DDH 51950 Vindaloo 2 HE-13-09 442677.587 1263525.821 313.3880 125 45 208 DDH 51950 Vindaloo 2 HE-13-10 442436.380 1263144.768 319.3080 125 45 180 DDH 51500 Vindaloo 2 HE-13-11 442253.204 1262875.873 320.3040 125 49 213 DDH 51175 Vindaloo Main HE-13-12 441914.196 1262290.660 313.7540 125 50 141 DDH 50500 Vindaloo NE HE-13-13 441746.397 1261764.762 315.0720 125 45 105 DDH 49975 Vindaloo Main HE-13-14 441713.255 1261726.117 315.3900 125 45 111 DDH 49925 Vindaloo Main HE-13-15 441201.175 1261083.295 325.6230 125 45 168 DDH 49100 Vindaloo Main HE-13-16 441194.910 1260994.695 326.3970 125 45 129 DDH 49025 Vindaloo SW HE-13-17 441129.970 1260889.595 327.1570 125 45 204 DDH 48900 Vindaloo Main HE-13-18 441196.322 1260535.329 327.2460 305 45 201 DDH 48650 Vindaloo SW HE-13-19 441846.000 1261728.000 314.0000 215 65 231 DDH 50000 Vindaloo Main
77 holes for 15838 metres
HD-12-101 440933.943 1260320.950 321.8290 125 45 70 RC 48325 Vindaloo Main HD-12-102 440910.557 1260336.644 321.7260 125 45 100 RC 48325 Vindaloo Main HD-12-103 440963.799 1260330.930 322.2910 125 45 60 RC 48350 Vindaloo Main HD-12-104 440964.983 1260359.646 322.5450 125 45 70 RC 48375 Vindaloo Main HD-12-105 440945.788 1260373.831 322.4050 125 45 90 RC 48375 Vindaloo Main HD-12-106 440980.798 1260381.164 322.9650 125 45 60 RC 48400 Vindaloo Main HD-12-107 440956.615 1260397.784 322.8060 125 45 120 RC 48400 Vindaloo Main HD-12-108 440995.248 1260400.048 323.4200 125 45 60 RC 48425 Vindaloo Main HD-12-109 440969.731 1260417.201 323.0310 125 45 100 RC 48425 Vindaloo Main HD-12-110 441000.173 1260428.659 323.6970 125 45 60 RC 48450 Vindaloo Main HD-12-111 440999.359 1260456.407 323.6880 125 45 80 RC 48475 Vindaloo Main HD-12-112 440978.580 1260471.825 323.4470 125 45 100 RC 48475 Vindaloo Main HD-12-113 441007.159 1260486.733 324.0260 125 45 60 RC 48500 Vindaloo Main HD-12-114 440984.714 1260500.500 323.7520 125 45 120 RC 48500 Vindaloo Main HD-12-115 440944.084 1260549.753 324.6110 125 45 60 RC 48525 Vindaloo SW HD-12-116 440994.742 1260521.447 324.0510 125 45 110 RC 48525 Vindaloo Main HD-12-117 441029.938 1260530.828 324.6090 125 45 60 RC 48550 Vindaloo Main HD-12-118 441022.931 1260562.322 325.0080 125 45 100 RC 48575 Vindaloo Main HD-12-119 441049.606 1260575.260 325.4740 125 55 90 RC 48600 Vindaloo Main HD-12-120 441036.742 1260584.291 325.4520 125 55 110 RC 48600 Vindaloo Main HD-12-121 441005.810 1260605.439 325.7230 125 55 180 RC 48600 Vindaloo Main HD-12-122 441058.187 1260599.766 325.8310 125 45 70 RC 48625 Vindaloo Main HD-12-123 441037.754 1260615.347 326.4760 125 45 110 RC 48625 Vindaloo Main HD-12-124 440911.004 1260309.812 321.4630 125 45 150 RC 48300 Vindaloo Main HD-12-125 440956.597 1260459.338 322.9110 125 44 125 RC 48450 Vindaloo Main HD-12-126 441022.106 1260502.192 324.3360 125 49 70 RC 48525 Vindaloo Main HD-12-127 440992.294 1260557.568 324.5770 125 45 123 RC 48550 Vindaloo Main HD-12-128 441076.993 1260647.628 326.6970 125 45 79 RC 48675 Vindaloo SW HD-12-129 441055.152 1260662.710 326.6490 125 45 114 RC 48675 Vindaloo SW HD-12-130 441097.961 1260662.851 326.6680 125 45 75 RC 48700 Vindaloo SW HD-12-131 441079.541 1260676.357 326.8090 125 45 102 RC 48700 Vindaloo SW HD-12-132 441096.849 1260693.982 326.8590 125 45 85 RC 48725 Vindaloo SW HD-12-133 441124.645 1260708.061 326.9670 125 45 72 RC 48750 Vindaloo Main HD-12-134 441123.062 1260737.208 326.9460 125 45 70 RC 48775 Vindaloo SW HD-12-135 441102.015 1260750.907 327.0190 125 45 105 RC 48775 Vindaloo SW HD-12-136 441078.325 1260708.584 326.9060 125 45 110 RC 48725 Vindaloo SW HD-12-137 441222.007 1261158.975 324.6970 125 45 60 RC 49175 Vindaloo West HD-12-138 441283.196 1261115.934 324.8810 125 45 90 RC 49175 Vindaloo SW HD-12-139 441198.551 1261177.193 324.5480 125 45 90 RC 49175 Vindaloo West HD-12-140 441218.178 1261189.105 324.4680 125 45 60 RC 49200 Vindaloo West HD-12-141 441199.992 1261201.997 324.4830 125 45 100 RC 49200 Vindaloo SW
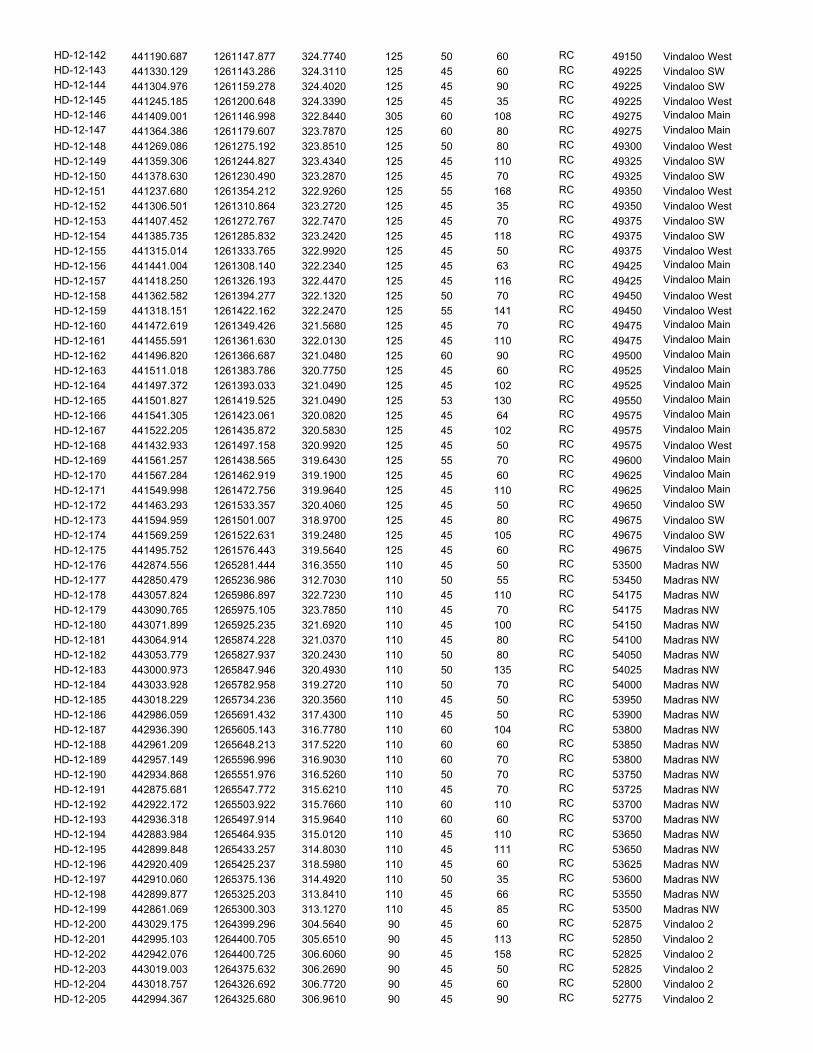
HD-12-142 441190.687 1261147.877 324.7740 125 50 60 RC 49150 Vindaloo West HD-12-143 441330.129 1261143.286 324.3110 125 45 60 RC 49225 Vindaloo SW HD-12-144 441304.976 1261159.278 324.4020 125 45 90 RC 49225 Vindaloo SW HD-12-145 441245.185 1261200.648 324.3390 125 45 35 RC 49225 Vindaloo West HD-12-146 441409.001 1261146.998 322.8440 305 60 108 RC 49275 Vindaloo Main HD-12-147 441364.386 1261179.607 323.7870 125 60 80 RC 49275 Vindaloo Main HD-12-148 441269.086 1261275.192 323.8510 125 50 80 RC 49300 Vindaloo West HD-12-149 441359.306 1261244.827 323.4340 125 45 110 RC 49325 Vindaloo SW HD-12-150 441378.630 1261230.490 323.2870 125 45 70 RC 49325 Vindaloo SW HD-12-151 441237.680 1261354.212 322.9260 125 55 168 RC 49350 Vindaloo West HD-12-152 441306.501 1261310.864 323.2720 125 45 35 RC 49350 Vindaloo West HD-12-153 441407.452 1261272.767 322.7470 125 45 70 RC 49375 Vindaloo SW HD-12-154 441385.735 1261285.832 323.2420 125 45 118 RC 49375 Vindaloo SW HD-12-155 441315.014 1261333.765 322.9920 125 45 50 RC 49375 Vindaloo West HD-12-156 441441.004 1261308.140 322.2340 125 45 63 RC 49425 Vindaloo Main HD-12-157 441418.250 1261326.193 322.4470 125 45 116 RC 49425 Vindaloo Main HD-12-158 441362.582 1261394.277 322.1320 125 50 70 RC 49450 Vindaloo West HD-12-159 441318.151 1261422.162 322.2470 125 55 141 RC 49450 Vindaloo West HD-12-160 441472.619 1261349.426 321.5680 125 45 70 RC 49475 Vindaloo Main HD-12-161 441455.591 1261361.630 322.0130 125 45 110 RC 49475 Vindaloo Main HD-12-162 441496.820 1261366.687 321.0480 125 60 90 RC 49500 Vindaloo Main HD-12-163 441511.018 1261383.786 320.7750 125 45 60 RC 49525 Vindaloo Main HD-12-164 441497.372 1261393.033 321.0490 125 45 102 RC 49525 Vindaloo Main HD-12-165 441501.827 1261419.525 321.0490 125 53 130 RC 49550 Vindaloo Main HD-12-166 441541.305 1261423.061 320.0820 125 45 64 RC 49575 Vindaloo Main HD-12-167 441522.205 1261435.872 320.5830 125 45 102 RC 49575 Vindaloo Main HD-12-168 441432.933 1261497.158 320.9920 125 45 50 RC 49575 Vindaloo West HD-12-169 441561.257 1261438.565 319.6430 125 55 70 RC 49600 Vindaloo Main HD-12-170 441567.284 1261462.919 319.1900 125 45 60 RC 49625 Vindaloo Main HD-12-171 441549.998 1261472.756 319.9640 125 45 110 RC 49625 Vindaloo Main HD-12-172 441463.293 1261533.357 320.4060 125 45 50 RC 49650 Vindaloo SW HD-12-173 441594.959 1261501.007 318.9700 125 45 80 RC 49675 Vindaloo SW HD-12-174 441569.259 1261522.631 319.2480 125 45 105 RC 49675 Vindaloo SW HD-12-175 441495.752 1261576.443 319.5640 125 45 60 RC 49675 Vindaloo SW HD-12-176 442874.556 1265281.444 316.3550 110 45 50 RC 53500 Madras NW HD-12-177 442850.479 1265236.986 312.7030 110 50 55 RC 53450 Madras NW HD-12-178 443057.824 1265986.897 322.7230 110 45 110 RC 54175 Madras NW HD-12-179 443090.765 1265975.105 323.7850 110 45 70 RC 54175 Madras NW HD-12-180 443071.899 1265925.235 321.6920 110 45 100 RC 54150 Madras NW HD-12-181 443064.914 1265874.228 321.0370 110 45 80 RC 54100 Madras NW HD-12-182 443053.779 1265827.937 320.2430 110 50 80 RC 54050 Madras NW HD-12-183 443000.973 1265847.946 320.4930 110 50 135 RC 54025 Madras NW HD-12-184 443033.928 1265782.958 319.2720 110 50 70 RC 54000 Madras NW HD-12-185 443018.229 1265734.236 320.3560 110 45 50 RC 53950 Madras NW HD-12-186 442986.059 1265691.432 317.4300 110 45 50 RC 53900 Madras NW HD-12-187 442936.390 1265605.143 316.7780 110 60 104 RC 53800 Madras NW HD-12-188 442961.209 1265648.213 317.5220 110 60 60 RC 53850 Madras NW HD-12-189 442957.149 1265596.996 316.9030 110 60 70 RC 53800 Madras NW HD-12-190 442934.868 1265551.976 316.5260 110 50 70 RC 53750 Madras NW HD-12-191 442875.681 1265547.772 315.6210 110 45 70 RC 53725 Madras NW HD-12-192 442922.172 1265503.922 315.7660 110 60 110 RC 53700 Madras NW HD-12-193 442936.318 1265497.914 315.9640 110 60 60 RC 53700 Madras NW HD-12-194 442883.984 1265464.935 315.0120 110 45 110 RC 53650 Madras NW HD-12-195 442899.848 1265433.257 314.8030 110 45 111 RC 53650 Madras NW HD-12-196 442920.409 1265425.237 318.5980 110 45 60 RC 53625 Madras NW HD-12-197 442910.060 1265375.136 314.4920 110 50 35 RC 53600 Madras NW HD-12-198 442899.877 1265325.203 313.8410 110 45 66 RC 53550 Madras NW HD-12-199 442861.069 1265300.303 313.1270 110 45 85 RC 53500 Madras NW HD-12-200 443029.175 1264399.296 304.5640 90 45 60 RC 52875 Vindaloo 2 HD-12-201 442995.103 1264400.705 305.6510 90 45 113 RC 52850 Vindaloo 2 HD-12-202 442942.076 1264400.725 306.6060 90 45 158 RC 52825 Vindaloo 2 HD-12-203 443019.003 1264375.632 306.2690 90 45 50 RC 52825 Vindaloo 2 HD-12-204 443018.757 1264326.692 306.7720 90 45 60 RC 52800 Vindaloo 2 HD-12-205 442994.367 1264325.680 306.9610 90 45 90 RC 52775 Vindaloo 2
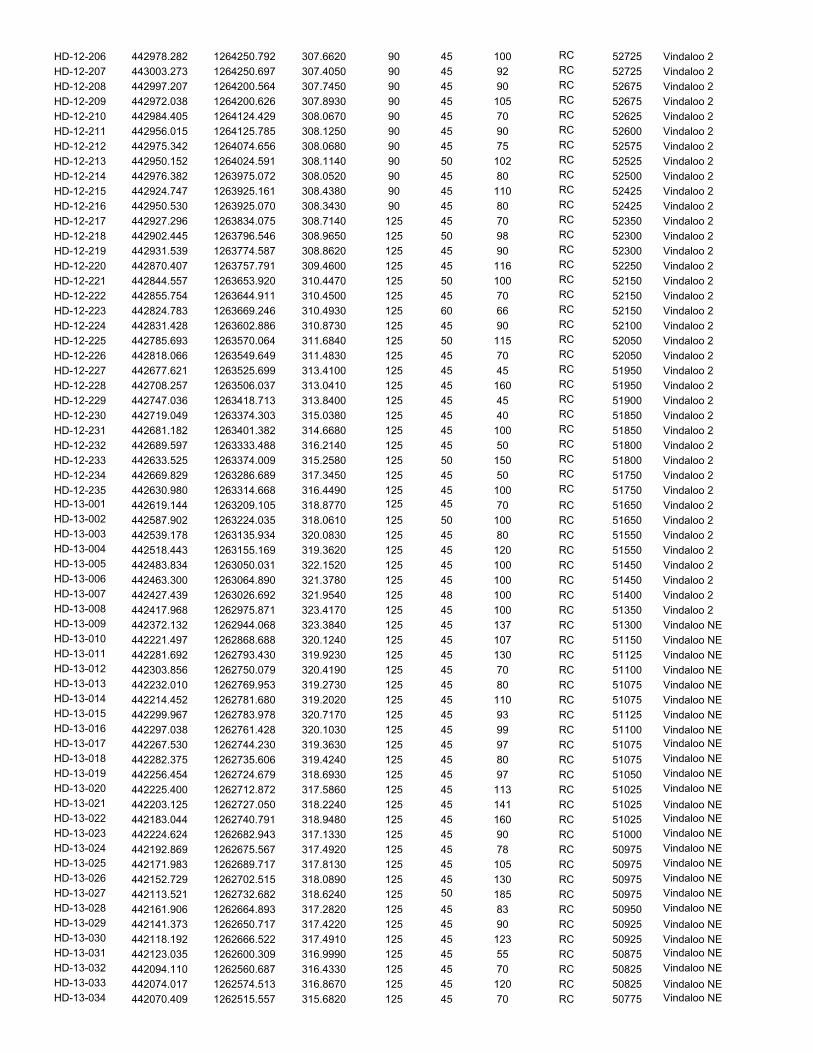
HD-12-206 442978.282 1264250.792 307.6620 90 45 100 RC 52725 Vindaloo 2 HD-12-207 443003.273 1264250.697 307.4050 90 45 92 RC 52725 Vindaloo 2 HD-12-208 442997.207 1264200.564 307.7450 90 45 90 RC 52675 Vindaloo 2 HD-12-209 442972.038 1264200.626 307.8930 90 45 105 RC 52675 Vindaloo 2 HD-12-210 442984.405 1264124.429 308.0670 90 45 70 RC 52625 Vindaloo 2 HD-12-211 442956.015 1264125.785 308.1250 90 45 90 RC 52600 Vindaloo 2 HD-12-212 442975.342 1264074.656 308.0680 90 45 75 RC 52575 Vindaloo 2 HD-12-213 442950.152 1264024.591 308.1140 90 50 102 RC 52525 Vindaloo 2 HD-12-214 442976.382 1263975.072 308.0520 90 45 80 RC 52500 Vindaloo 2 HD-12-215 442924.747 1263925.161 308.4380 90 45 110 RC 52425 Vindaloo 2 HD-12-216 442950.530 1263925.070 308.3430 90 45 80 RC 52425 Vindaloo 2 HD-12-217 442927.296 1263834.075 308.7140 125 45 70 RC 52350 Vindaloo 2 HD-12-218 442902.445 1263796.546 308.9650 125 50 98 RC 52300 Vindaloo 2 HD-12-219 442931.539 1263774.587 308.8620 125 45 90 RC 52300 Vindaloo 2 HD-12-220 442870.407 1263757.791 309.4600 125 45 116 RC 52250 Vindaloo 2 HD-12-221 442844.557 1263653.920 310.4470 125 50 100 RC 52150 Vindaloo 2 HD-12-222 442855.754 1263644.911 310.4500 125 45 70 RC 52150 Vindaloo 2 HD-12-223 442824.783 1263669.246 310.4930 125 60 66 RC 52150 Vindaloo 2 HD-12-224 442831.428 1263602.886 310.8730 125 45 90 RC 52100 Vindaloo 2 HD-12-225 442785.693 1263570.064 311.6840 125 50 115 RC 52050 Vindaloo 2 HD-12-226 442818.066 1263549.649 311.4830 125 45 70 RC 52050 Vindaloo 2 HD-12-227 442677.621 1263525.699 313.4100 125 45 45 RC 51950 Vindaloo 2 HD-12-228 442708.257 1263506.037 313.0410 125 45 160 RC 51950 Vindaloo 2 HD-12-229 442747.036 1263418.713 313.8400 125 45 45 RC 51900 Vindaloo 2 HD-12-230 442719.049 1263374.303 315.0380 125 45 40 RC 51850 Vindaloo 2 HD-12-231 442681.182 1263401.382 314.6680 125 45 100 RC 51850 Vindaloo 2 HD-12-232 442689.597 1263333.488 316.2140 125 45 50 RC 51800 Vindaloo 2 HD-12-233 442633.525 1263374.009 315.2580 125 50 150 RC 51800 Vindaloo 2 HD-12-234 442669.829 1263286.689 317.3450 125 45 50 RC 51750 Vindaloo 2 HD-12-235 442630.980 1263314.668 316.4490 125 45 100 RC 51750 Vindaloo 2 HD-13-001 442619.144 1263209.105 318.8770 125 45 70 RC 51650 Vindaloo 2 HD-13-002 442587.902 1263224.035 318.0610 125 50 100 RC 51650 Vindaloo 2 HD-13-003 442539.178 1263135.934 320.0830 125 45 80 RC 51550 Vindaloo 2 HD-13-004 442518.443 1263155.169 319.3620 125 45 120 RC 51550 Vindaloo 2 HD-13-005 442483.834 1263050.031 322.1520 125 45 100 RC 51450 Vindaloo 2 HD-13-006 442463.300 1263064.890 321.3780 125 45 100 RC 51450 Vindaloo 2 HD-13-007 442427.439 1263026.692 321.9540 125 48 100 RC 51400 Vindaloo 2 HD-13-008 442417.968 1262975.871 323.4170 125 45 100 RC 51350 Vindaloo 2 HD-13-009 442372.132 1262944.068 323.3840 125 45 137 RC 51300 Vindaloo NE HD-13-010 442221.497 1262868.688 320.1240 125 45 107 RC 51150 Vindaloo NE HD-13-011 442281.692 1262793.430 319.9230 125 45 130 RC 51125 Vindaloo NE HD-13-012 442303.856 1262750.079 320.4190 125 45 70 RC 51100 Vindaloo NE HD-13-013 442232.010 1262769.953 319.2730 125 45 80 RC 51075 Vindaloo NE HD-13-014 442214.452 1262781.680 319.2020 125 45 110 RC 51075 Vindaloo NE HD-13-015 442299.967 1262783.978 320.7170 125 45 93 RC 51125 Vindaloo NE HD-13-016 442297.038 1262761.428 320.1030 125 45 99 RC 51100 Vindaloo NE HD-13-017 442267.530 1262744.230 319.3630 125 45 97 RC 51075 Vindaloo NE HD-13-018 442282.375 1262735.606 319.4240 125 45 80 RC 51075 Vindaloo NE HD-13-019 442256.454 1262724.679 318.6930 125 45 97 RC 51050 Vindaloo NE HD-13-020 442225.400 1262712.872 317.5860 125 45 113 RC 51025 Vindaloo NE HD-13-021 442203.125 1262727.050 318.2240 125 45 141 RC 51025 Vindaloo NE HD-13-022 442183.044 1262740.791 318.9480 125 45 160 RC 51025 Vindaloo NE HD-13-023 442224.624 1262682.943 317.1330 125 45 90 RC 51000 Vindaloo NE HD-13-024 442192.869 1262675.567 317.4920 125 45 78 RC 50975 Vindaloo NE HD-13-025 442171.983 1262689.717 317.8130 125 45 105 RC 50975 Vindaloo NE HD-13-026 442152.729 1262702.515 318.0890 125 45 130 RC 50975 Vindaloo NE HD-13-027 442113.521 1262732.682 318.6240 125 50 185 RC 50975 Vindaloo NE HD-13-028 442161.906 1262664.893 317.2820 125 45 83 RC 50950 Vindaloo NE HD-13-029 442141.373 1262650.717 317.4220 125 45 90 RC 50925 Vindaloo NE HD-13-030 442118.192 1262666.522 317.4910 125 45 123 RC 50925 Vindaloo NE HD-13-031 442123.035 1262600.309 316.9990 125 45 55 RC 50875 Vindaloo NE HD-13-032 442094.110 1262560.687 316.4330 125 45 70 RC 50825 Vindaloo NE HD-13-033 442074.017 1262574.513 316.8670 125 45 120 RC 50825 Vindaloo NE HD-13-034 442070.409 1262515.557 315.6820 125 45 70 RC 50775 Vindaloo NE
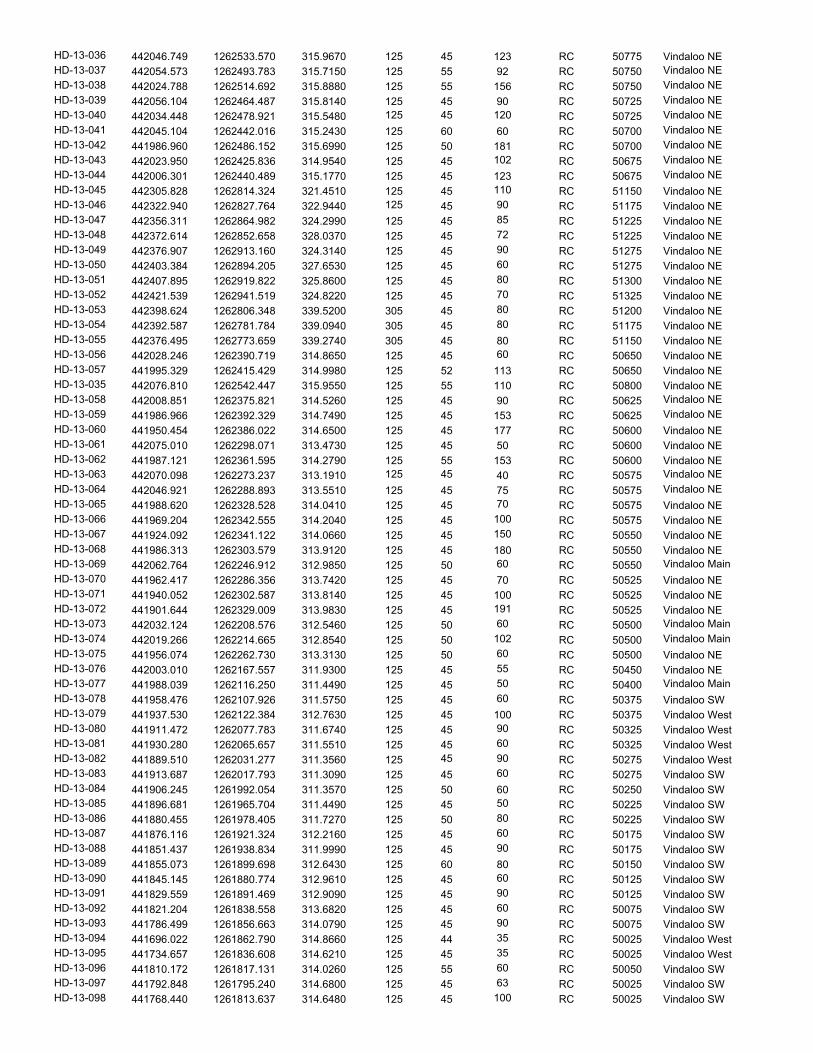
HD-13-036 442046.749 1262533.570 315.9670 125 45 123 RC 50775 Vindaloo NE HD-13-037 442054.573 1262493.783 315.7150 125 55 92 RC 50750 Vindaloo NE HD-13-038 442024.788 1262514.692 315.8880 125 55 156 RC 50750 Vindaloo NE HD-13-039 442056.104 1262464.487 315.8140 125 45 90 RC 50725 Vindaloo NE HD-13-040 442034.448 1262478.921 315.5480 125 45 120 RC 50725 Vindaloo NE HD-13-041 442045.104 1262442.016 315.2430 125 60 60 RC 50700 Vindaloo NE HD-13-042 441986.960 1262486.152 315.6990 125 50 181 RC 50700 Vindaloo NE HD-13-043 442023.950 1262425.836 314.9540 125 45 102 RC 50675 Vindaloo NE HD-13-044 442006.301 1262440.489 315.1770 125 45 123 RC 50675 Vindaloo NE HD-13-045 442305.828 1262814.324 321.4510 125 45 110 RC 51150 Vindaloo NE HD-13-046 442322.940 1262827.764 322.9440 125 45 90 RC 51175 Vindaloo NE HD-13-047 442356.311 1262864.982 324.2990 125 45 85 RC 51225 Vindaloo NE HD-13-048 442372.614 1262852.658 328.0370 125 45 72 RC 51225 Vindaloo NE HD-13-049 442376.907 1262913.160 324.3140 125 45 90 RC 51275 Vindaloo NE HD-13-050 442403.384 1262894.205 327.6530 125 45 60 RC 51275 Vindaloo NE HD-13-051 442407.895 1262919.822 325.8600 125 45 80 RC 51300 Vindaloo NE HD-13-052 442421.539 1262941.519 324.8220 125 45 70 RC 51325 Vindaloo NE HD-13-053 442398.624 1262806.348 339.5200 305 45 80 RC 51200 Vindaloo NE HD-13-054 442392.587 1262781.784 339.0940 305 45 80 RC 51175 Vindaloo NE HD-13-055 442376.495 1262773.659 339.2740 305 45 80 RC 51150 Vindaloo NE HD-13-056 442028.246 1262390.719 314.8650 125 45 60 RC 50650 Vindaloo NE HD-13-057 441995.329 1262415.429 314.9980 125 52 113 RC 50650 Vindaloo NE HD-13-035 442076.810 1262542.447 315.9550 125 55 110 RC 50800 Vindaloo NE HD-13-058 442008.851 1262375.821 314.5260 125 45 90 RC 50625 Vindaloo NE HD-13-059 441986.966 1262392.329 314.7490 125 45 153 RC 50625 Vindaloo NE HD-13-060 441950.454 1262386.022 314.6500 125 45 177 RC 50600 Vindaloo NE HD-13-061 442075.010 1262298.071 313.4730 125 45 50 RC 50600 Vindaloo NE HD-13-062 441987.121 1262361.595 314.2790 125 55 153 RC 50600 Vindaloo NE HD-13-063 442070.098 1262273.237 313.1910 125 45 40 RC 50575 Vindaloo NE HD-13-064 442046.921 1262288.893 313.5510 125 45 75 RC 50575 Vindaloo NE HD-13-065 441988.620 1262328.528 314.0410 125 45 70 RC 50575 Vindaloo NE HD-13-066 441969.204 1262342.555 314.2040 125 45 100 RC 50575 Vindaloo NE HD-13-067 441924.092 1262341.122 314.0660 125 45 150 RC 50550 Vindaloo NE HD-13-068 441986.313 1262303.579 313.9120 125 45 180 RC 50550 Vindaloo NE HD-13-069 442062.764 1262246.912 312.9850 125 50 60 RC 50550 Vindaloo Main HD-13-070 441962.417 1262286.356 313.7420 125 45 70 RC 50525 Vindaloo NE HD-13-071 441940.052 1262302.587 313.8140 125 45 100 RC 50525 Vindaloo NE HD-13-072 441901.644 1262329.009 313.9830 125 45 191 RC 50525 Vindaloo NE HD-13-073 442032.124 1262208.576 312.5460 125 50 60 RC 50500 Vindaloo Main HD-13-074 442019.266 1262214.665 312.8540 125 50 102 RC 50500 Vindaloo Main HD-13-075 441956.074 1262262.730 313.3130 125 50 60 RC 50500 Vindaloo NE HD-13-076 442003.010 1262167.557 311.9300 125 45 55 RC 50450 Vindaloo NE HD-13-077 441988.039 1262116.250 311.4490 125 45 50 RC 50400 Vindaloo Main HD-13-078 441958.476 1262107.926 311.5750 125 45 60 RC 50375 Vindaloo SW HD-13-079 441937.530 1262122.384 312.7630 125 45 100 RC 50375 Vindaloo West HD-13-080 441911.472 1262077.783 311.6740 125 45 90 RC 50325 Vindaloo West HD-13-081 441930.280 1262065.657 311.5510 125 45 60 RC 50325 Vindaloo West HD-13-082 441889.510 1262031.277 311.3560 125 45 90 RC 50275 Vindaloo West HD-13-083 441913.687 1262017.793 311.3090 125 45 60 RC 50275 Vindaloo SW HD-13-084 441906.245 1261992.054 311.3570 125 50 60 RC 50250 Vindaloo SW HD-13-085 441896.681 1261965.704 311.4490 125 45 50 RC 50225 Vindaloo SW HD-13-086 441880.455 1261978.405 311.7270 125 50 80 RC 50225 Vindaloo SW HD-13-087 441876.116 1261921.324 312.2160 125 45 60 RC 50175 Vindaloo SW HD-13-088 441851.437 1261938.834 311.9990 125 45 90 RC 50175 Vindaloo SW HD-13-089 441855.073 1261899.698 312.6430 125 60 80 RC 50150 Vindaloo SW HD-13-090 441845.145 1261880.774 312.9610 125 45 60 RC 50125 Vindaloo SW HD-13-091 441829.559 1261891.469 312.9090 125 45 90 RC 50125 Vindaloo SW HD-13-092 441821.204 1261838.558 313.6820 125 45 60 RC 50075 Vindaloo SW HD-13-093 441786.499 1261856.663 314.0790 125 45 90 RC 50075 Vindaloo SW HD-13-094 441696.022 1261862.790 314.8660 125 44 35 RC 50025 Vindaloo West HD-13-095 441734.657 1261836.608 314.6210 125 45 35 RC 50025 Vindaloo West HD-13-096 441810.172 1261817.131 314.0260 125 55 60 RC 50050 Vindaloo SW HD-13-097 441792.848 1261795.240 314.6800 125 45 63 RC 50025 Vindaloo SW HD-13-098 441768.440 1261813.637 314.6480 125 45 100 RC 50025 Vindaloo SW
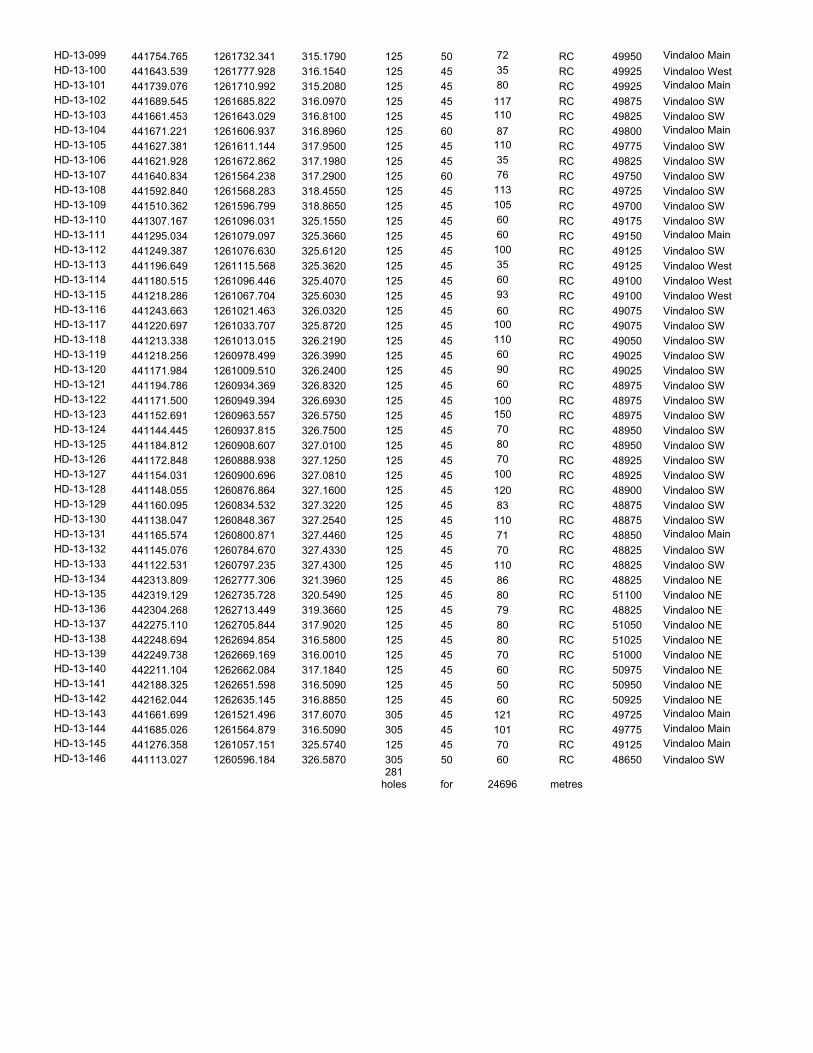
HD-13-099 441754.765 1261732.341 315.1790 125 50 72 RC 49950 Vindaloo Main HD-13-100 441643.539 1261777.928 316.1540 125 45 35 RC 49925 Vindaloo West HD-13-101 441739.076 1261710.992 315.2080 125 45 80 RC 49925 Vindaloo Main HD-13-102 441689.545 1261685.822 316.0970 125 45 117 RC 49875 Vindaloo SW HD-13-103 441661.453 1261643.029 316.8100 125 45 110 RC 49825 Vindaloo SW HD-13-104 441671.221 1261606.937 316.8960 125 60 87 RC 49800 Vindaloo Main HD-13-105 441627.381 1261611.144 317.9500 125 45 110 RC 49775 Vindaloo SW HD-13-106 441621.928 1261672.862 317.1980 125 45 35 RC 49825 Vindaloo SW HD-13-107 441640.834 1261564.238 317.2900 125 60 76 RC 49750 Vindaloo SW HD-13-108 441592.840 1261568.283 318.4550 125 45 113 RC 49725 Vindaloo SW HD-13-109 441510.362 1261596.799 318.8650 125 45 105 RC 49700 Vindaloo SW HD-13-110 441307.167 1261096.031 325.1550 125 45 60 RC 49175 Vindaloo SW HD-13-111 441295.034 1261079.097 325.3660 125 45 60 RC 49150 Vindaloo Main HD-13-112 441249.387 1261076.630 325.6120 125 45 100 RC 49125 Vindaloo SW HD-13-113 441196.649 1261115.568 325.3620 125 45 35 RC 49125 Vindaloo West HD-13-114 441180.515 1261096.446 325.4070 125 45 60 RC 49100 Vindaloo West HD-13-115 441218.286 1261067.704 325.6030 125 45 93 RC 49100 Vindaloo West HD-13-116 441243.663 1261021.463 326.0320 125 45 60 RC 49075 Vindaloo SW HD-13-117 441220.697 1261033.707 325.8720 125 45 100 RC 49075 Vindaloo SW HD-13-118 441213.338 1261013.015 326.2190 125 45 110 RC 49050 Vindaloo SW HD-13-119 441218.256 1260978.499 326.3990 125 45 60 RC 49025 Vindaloo SW HD-13-120 441171.984 1261009.510 326.2400 125 45 90 RC 49025 Vindaloo SW HD-13-121 441194.786 1260934.369 326.8320 125 45 60 RC 48975 Vindaloo SW HD-13-122 441171.500 1260949.394 326.6930 125 45 100 RC 48975 Vindaloo SW HD-13-123 441152.691 1260963.557 326.5750 125 45 150 RC 48975 Vindaloo SW HD-13-124 441144.445 1260937.815 326.7500 125 45 70 RC 48950 Vindaloo SW HD-13-125 441184.812 1260908.607 327.0100 125 45 80 RC 48950 Vindaloo SW HD-13-126 441172.848 1260888.938 327.1250 125 45 70 RC 48925 Vindaloo SW HD-13-127 441154.031 1260900.696 327.0810 125 45 100 RC 48925 Vindaloo SW HD-13-128 441148.055 1260876.864 327.1600 125 45 120 RC 48900 Vindaloo SW HD-13-129 441160.095 1260834.532 327.3220 125 45 83 RC 48875 Vindaloo SW HD-13-130 441138.047 1260848.367 327.2540 125 45 110 RC 48875 Vindaloo SW HD-13-131 441165.574 1260800.871 327.4460 125 45 71 RC 48850 Vindaloo Main HD-13-132 441145.076 1260784.670 327.4330 125 45 70 RC 48825 Vindaloo SW HD-13-133 441122.531 1260797.235 327.4300 125 45 110 RC 48825 Vindaloo SW HD-13-134 442313.809 1262777.306 321.3960 125 45 86 RC 48825 Vindaloo NE HD-13-135 442319.129 1262735.728 320.5490 125 45 80 RC 51100 Vindaloo NE HD-13-136 442304.268 1262713.449 319.3660 125 45 79 RC 48825 Vindaloo NE HD-13-137 442275.110 1262705.844 317.9020 125 45 80 RC 51050 Vindaloo NE HD-13-138 442248.694 1262694.854 316.5800 125 45 80 RC 51025 Vindaloo NE HD-13-139 442249.738 1262669.169 316.0010 125 45 70 RC 51000 Vindaloo NE HD-13-140 442211.104 1262662.084 317.1840 125 45 60 RC 50975 Vindaloo NE HD-13-141 442188.325 1262651.598 316.5090 125 45 50 RC 50950 Vindaloo NE HD-13-142 442162.044 1262635.145 316.8850 125 45 60 RC 50925 Vindaloo NE HD-13-143 441661.699 1261521.496 317.6070 305 45 121 RC 49725 Vindaloo Main HD-13-144 441685.026 1261564.879 316.5090 305 45 101 RC 49775 Vindaloo Main HD-13-145 441276.358 1261057.151 325.5740 125 45 70 RC 49125 Vindaloo Main HD-13-146 441113.027 1260596.184 326.5870 305 50 60 RC 48650 Vindaloo SW
281holes for 24696 metres
�
HOUNDÉ GOLD PROJECT, BURKINA FASO FEASIBILITY STUDY NI 43-101 TECHNICAL REPORT
1813.20\24.02\1813.20-STY-001_B S10 October 2013 Cube Consulting Pty Ltd
APPENDIX 10.2
IN-FILL DRILL PROGRAM SIGNIFICANT DRILL RESULTS
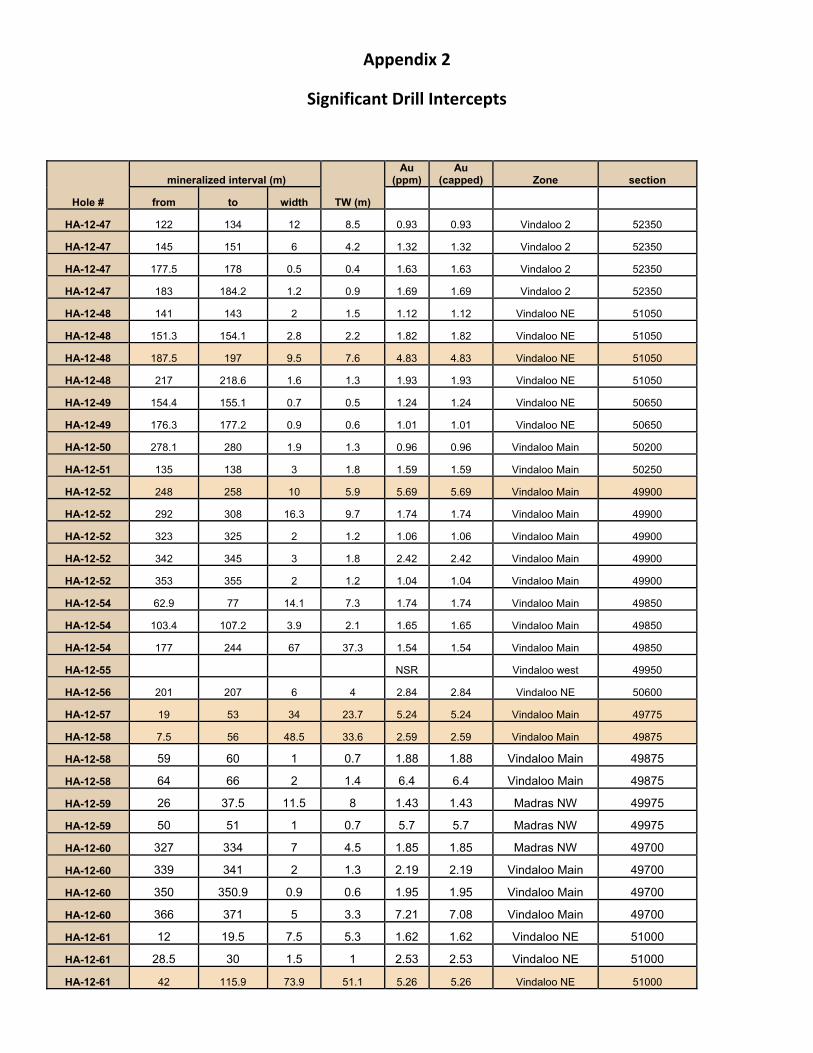
Appendix�2�
Significant�Drill�Intercepts�
�
Hole #
mineralized interval (m)
TW (m)
Au (ppm)
Au (capped) Zone section
from to width
HA-12-47 122 134 12 8.5 0.93 0.93 Vindaloo 2 52350
HA-12-47 145 151 6 4.2 1.32 1.32 Vindaloo 2 52350
HA-12-47 177.5 178 0.5 0.4 1.63 1.63 Vindaloo 2 52350
HA-12-47 183 184.2 1.2 0.9 1.69 1.69 Vindaloo 2 52350
HA-12-48 141 143 2 1.5 1.12 1.12 Vindaloo NE 51050
HA-12-48 151.3 154.1 2.8 2.2 1.82 1.82 Vindaloo NE 51050
HA-12-48 187.5 197 9.5 7.6 4.83 4.83 Vindaloo NE 51050
HA-12-48 217 218.6 1.6 1.3 1.93 1.93 Vindaloo NE 51050
HA-12-49 154.4 155.1 0.7 0.5 1.24 1.24 Vindaloo NE 50650
HA-12-49 176.3 177.2 0.9 0.6 1.01 1.01 Vindaloo NE 50650
HA-12-50 278.1 280 1.9 1.3 0.96 0.96 Vindaloo Main 50200
HA-12-51 135 138 3 1.8 1.59 1.59 Vindaloo Main 50250
HA-12-52 248 258 10 5.9 5.69 5.69 Vindaloo Main 49900
HA-12-52 292 308 16.3 9.7 1.74 1.74 Vindaloo Main 49900
HA-12-52 323 325 2 1.2 1.06 1.06 Vindaloo Main 49900
HA-12-52 342 345 3 1.8 2.42 2.42 Vindaloo Main 49900
HA-12-52 353 355 2 1.2 1.04 1.04 Vindaloo Main 49900
HA-12-54 62.9 77 14.1 7.3 1.74 1.74 Vindaloo Main 49850
HA-12-54 103.4 107.2 3.9 2.1 1.65 1.65 Vindaloo Main 49850
HA-12-54 177 244 67 37.3 1.54 1.54 Vindaloo Main 49850
HA-12-55 NSR Vindaloo west 49950
HA-12-56 201 207 6 4 2.84 2.84 Vindaloo NE 50600
HA-12-57 19 53 34 23.7 5.24 5.24 Vindaloo Main 49775
HA-12-58 7.5 56 48.5 33.6 2.59 2.59 Vindaloo Main 49875
HA-12-58 59 60 1 0.7 1.88 1.88 Vindaloo Main 49875
HA-12-58 64 66 2 1.4 6.4 6.4 Vindaloo Main 49875
HA-12-59 26 37.5 11.5 8 1.43 1.43 Madras NW 49975
HA-12-59 50 51 1 0.7 5.7 5.7 Madras NW 49975
HA-12-60 327 334 7 4.5 1.85 1.85 Madras NW 49700
HA-12-60 339 341 2 1.3 2.19 2.19 Vindaloo Main 49700
HA-12-60 350 350.9 0.9 0.6 1.95 1.95 Vindaloo Main 49700
HA-12-60 366 371 5 3.3 7.21 7.08 Vindaloo Main 49700
HA-12-61 12 19.5 7.5 5.3 1.62 1.62 Vindaloo NE 51000
HA-12-61 28.5 30 1.5 1 2.53 2.53 Vindaloo NE 51000
HA-12-61 42 115.9 73.9 51.1 5.26 5.26 Vindaloo NE 51000
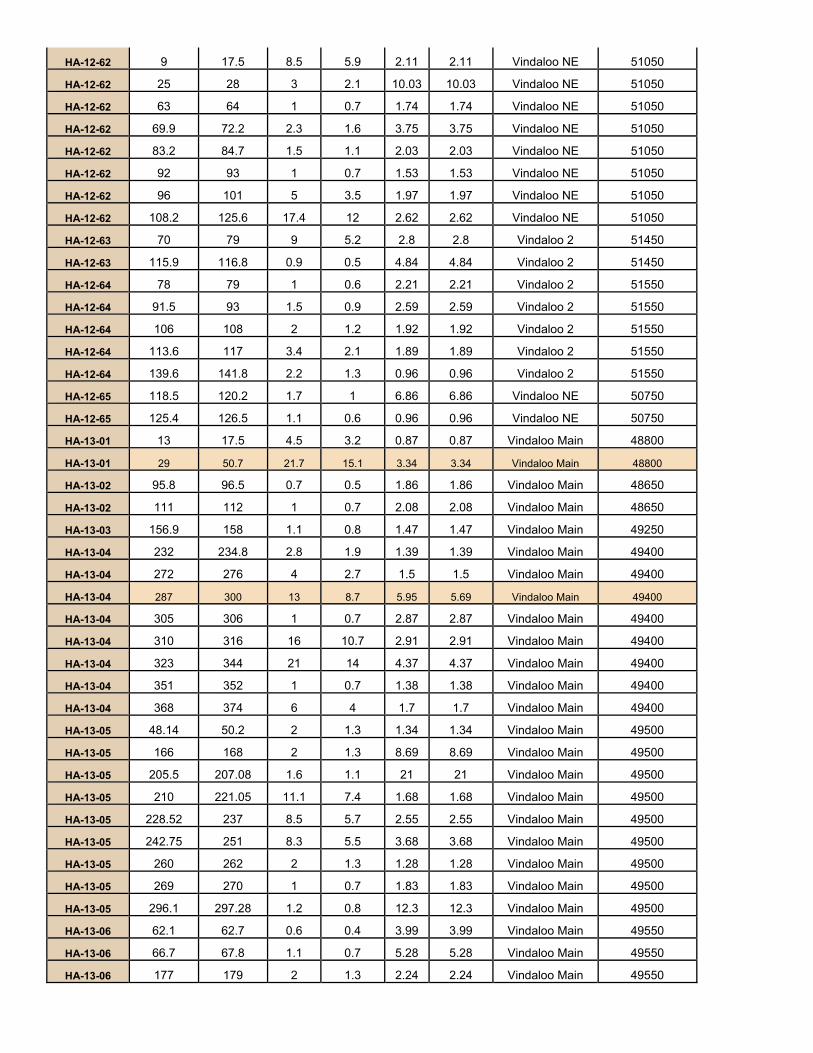
HA-12-62 9 17.5 8.5 5.9 2.11 2.11 Vindaloo NE 51050
HA-12-62 25 28 3 2.1 10.03 10.03 Vindaloo NE 51050
HA-12-62 63 64 1 0.7 1.74 1.74 Vindaloo NE 51050
HA-12-62 69.9 72.2 2.3 1.6 3.75 3.75 Vindaloo NE 51050
HA-12-62 83.2 84.7 1.5 1.1 2.03 2.03 Vindaloo NE 51050
HA-12-62 92 93 1 0.7 1.53 1.53 Vindaloo NE 51050
HA-12-62 96 101 5 3.5 1.97 1.97 Vindaloo NE 51050
HA-12-62 108.2 125.6 17.4 12 2.62 2.62 Vindaloo NE 51050
HA-12-63 70 79 9 5.2 2.8 2.8 Vindaloo 2 51450
HA-12-63 115.9 116.8 0.9 0.5 4.84 4.84 Vindaloo 2 51450
HA-12-64 78 79 1 0.6 2.21 2.21 Vindaloo 2 51550
HA-12-64 91.5 93 1.5 0.9 2.59 2.59 Vindaloo 2 51550
HA-12-64 106 108 2 1.2 1.92 1.92 Vindaloo 2 51550
HA-12-64 113.6 117 3.4 2.1 1.89 1.89 Vindaloo 2 51550
HA-12-64 139.6 141.8 2.2 1.3 0.96 0.96 Vindaloo 2 51550
HA-12-65 118.5 120.2 1.7 1 6.86 6.86 Vindaloo NE 50750
HA-12-65 125.4 126.5 1.1 0.6 0.96 0.96 Vindaloo NE 50750
HA-13-01 13 17.5 4.5 3.2 0.87 0.87 Vindaloo Main 48800
HA-13-01 29 50.7 21.7 15.1 3.34 3.34 Vindaloo Main 48800
HA-13-02 95.8 96.5 0.7 0.5 1.86 1.86 Vindaloo Main 48650
HA-13-02 111 112 1 0.7 2.08 2.08 Vindaloo Main 48650
HA-13-03 156.9 158 1.1 0.8 1.47 1.47 Vindaloo Main 49250
HA-13-04 232 234.8 2.8 1.9 1.39 1.39 Vindaloo Main 49400
HA-13-04 272 276 4 2.7 1.5 1.5 Vindaloo Main 49400
HA-13-04 287 300 13 8.7 5.95 5.69 Vindaloo Main 49400
HA-13-04 305 306 1 0.7 2.87 2.87 Vindaloo Main 49400
HA-13-04 310 316 16 10.7 2.91 2.91 Vindaloo Main 49400
HA-13-04 323 344 21 14 4.37 4.37 Vindaloo Main 49400
HA-13-04 351 352 1 0.7 1.38 1.38 Vindaloo Main 49400
HA-13-04 368 374 6 4 1.7 1.7 Vindaloo Main 49400
HA-13-05 48.14 50.2 2 1.3 1.34 1.34 Vindaloo Main 49500
HA-13-05 166 168 2 1.3 8.69 8.69 Vindaloo Main 49500
HA-13-05 205.5 207.08 1.6 1.1 21 21 Vindaloo Main 49500
HA-13-05 210 221.05 11.1 7.4 1.68 1.68 Vindaloo Main 49500
HA-13-05 228.52 237 8.5 5.7 2.55 2.55 Vindaloo Main 49500
HA-13-05 242.75 251 8.3 5.5 3.68 3.68 Vindaloo Main 49500
HA-13-05 260 262 2 1.3 1.28 1.28 Vindaloo Main 49500
HA-13-05 269 270 1 0.7 1.83 1.83 Vindaloo Main 49500
HA-13-05 296.1 297.28 1.2 0.8 12.3 12.3 Vindaloo Main 49500
HA-13-06 62.1 62.7 0.6 0.4 3.99 3.99 Vindaloo Main 49550
HA-13-06 66.7 67.8 1.1 0.7 5.28 5.28 Vindaloo Main 49550
HA-13-06 177 179 2 1.3 2.24 2.24 Vindaloo Main 49550
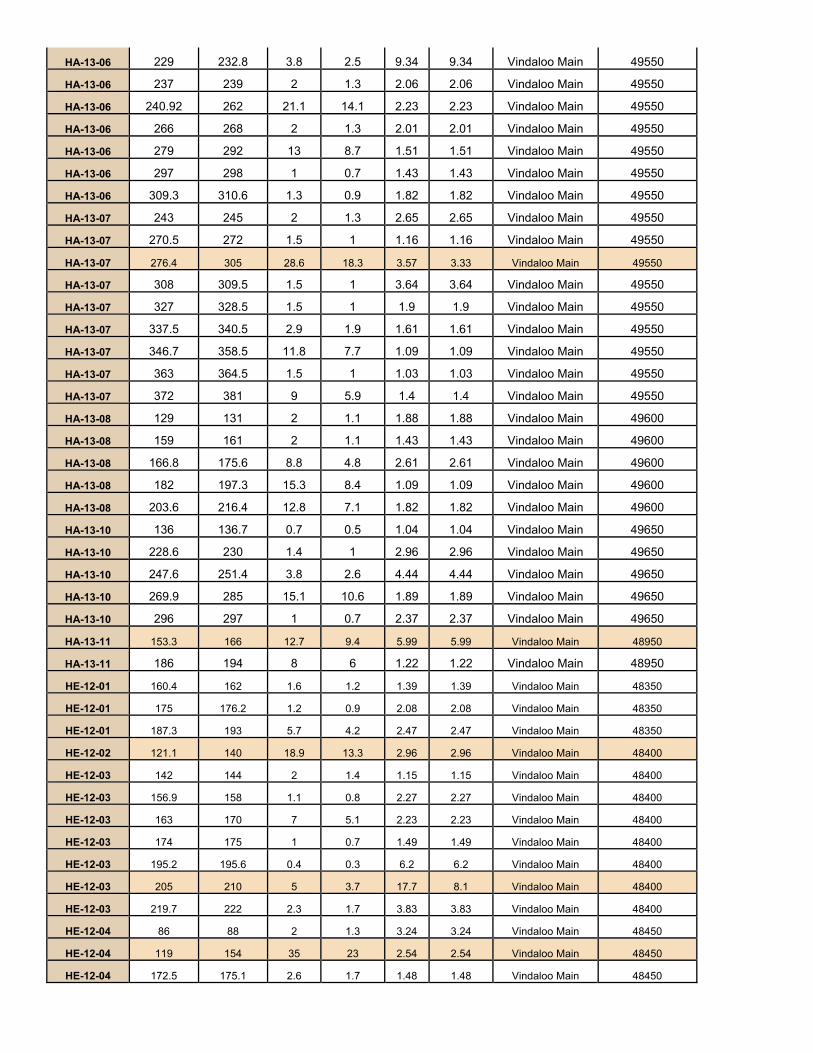
HA-13-06 229 232.8 3.8 2.5 9.34 9.34 Vindaloo Main 49550
HA-13-06 237 239 2 1.3 2.06 2.06 Vindaloo Main 49550
HA-13-06 240.92 262 21.1 14.1 2.23 2.23 Vindaloo Main 49550
HA-13-06 266 268 2 1.3 2.01 2.01 Vindaloo Main 49550
HA-13-06 279 292 13 8.7 1.51 1.51 Vindaloo Main 49550
HA-13-06 297 298 1 0.7 1.43 1.43 Vindaloo Main 49550
HA-13-06 309.3 310.6 1.3 0.9 1.82 1.82 Vindaloo Main 49550
HA-13-07 243 245 2 1.3 2.65 2.65 Vindaloo Main 49550
HA-13-07 270.5 272 1.5 1 1.16 1.16 Vindaloo Main 49550
HA-13-07 276.4 305 28.6 18.3 3.57 3.33 Vindaloo Main 49550
HA-13-07 308 309.5 1.5 1 3.64 3.64 Vindaloo Main 49550
HA-13-07 327 328.5 1.5 1 1.9 1.9 Vindaloo Main 49550
HA-13-07 337.5 340.5 2.9 1.9 1.61 1.61 Vindaloo Main 49550
HA-13-07 346.7 358.5 11.8 7.7 1.09 1.09 Vindaloo Main 49550
HA-13-07 363 364.5 1.5 1 1.03 1.03 Vindaloo Main 49550
HA-13-07 372 381 9 5.9 1.4 1.4 Vindaloo Main 49550
HA-13-08 129 131 2 1.1 1.88 1.88 Vindaloo Main 49600
HA-13-08 159 161 2 1.1 1.43 1.43 Vindaloo Main 49600
HA-13-08 166.8 175.6 8.8 4.8 2.61 2.61 Vindaloo Main 49600
HA-13-08 182 197.3 15.3 8.4 1.09 1.09 Vindaloo Main 49600
HA-13-08 203.6 216.4 12.8 7.1 1.82 1.82 Vindaloo Main 49600
HA-13-10 136 136.7 0.7 0.5 1.04 1.04 Vindaloo Main 49650
HA-13-10 228.6 230 1.4 1 2.96 2.96 Vindaloo Main 49650
HA-13-10 247.6 251.4 3.8 2.6 4.44 4.44 Vindaloo Main 49650
HA-13-10 269.9 285 15.1 10.6 1.89 1.89 Vindaloo Main 49650
HA-13-10 296 297 1 0.7 2.37 2.37 Vindaloo Main 49650
HA-13-11 153.3 166 12.7 9.4 5.99 5.99 Vindaloo Main 48950
HA-13-11 186 194 8 6 1.22 1.22 Vindaloo Main 48950
HE-12-01 160.4 162 1.6 1.2 1.39 1.39 Vindaloo Main 48350
HE-12-01 175 176.2 1.2 0.9 2.08 2.08 Vindaloo Main 48350
HE-12-01 187.3 193 5.7 4.2 2.47 2.47 Vindaloo Main 48350
HE-12-02 121.1 140 18.9 13.3 2.96 2.96 Vindaloo Main 48400
HE-12-03 142 144 2 1.4 1.15 1.15 Vindaloo Main 48400
HE-12-03 156.9 158 1.1 0.8 2.27 2.27 Vindaloo Main 48400
HE-12-03 163 170 7 5.1 2.23 2.23 Vindaloo Main 48400
HE-12-03 174 175 1 0.7 1.49 1.49 Vindaloo Main 48400
HE-12-03 195.2 195.6 0.4 0.3 6.2 6.2 Vindaloo Main 48400
HE-12-03 205 210 5 3.7 17.7 8.1 Vindaloo Main 48400
HE-12-03 219.7 222 2.3 1.7 3.83 3.83 Vindaloo Main 48400
HE-12-04 86 88 2 1.3 3.24 3.24 Vindaloo Main 48450
HE-12-04 119 154 35 23 2.54 2.54 Vindaloo Main 48450
HE-12-04 172.5 175.1 2.6 1.7 1.48 1.48 Vindaloo Main 48450
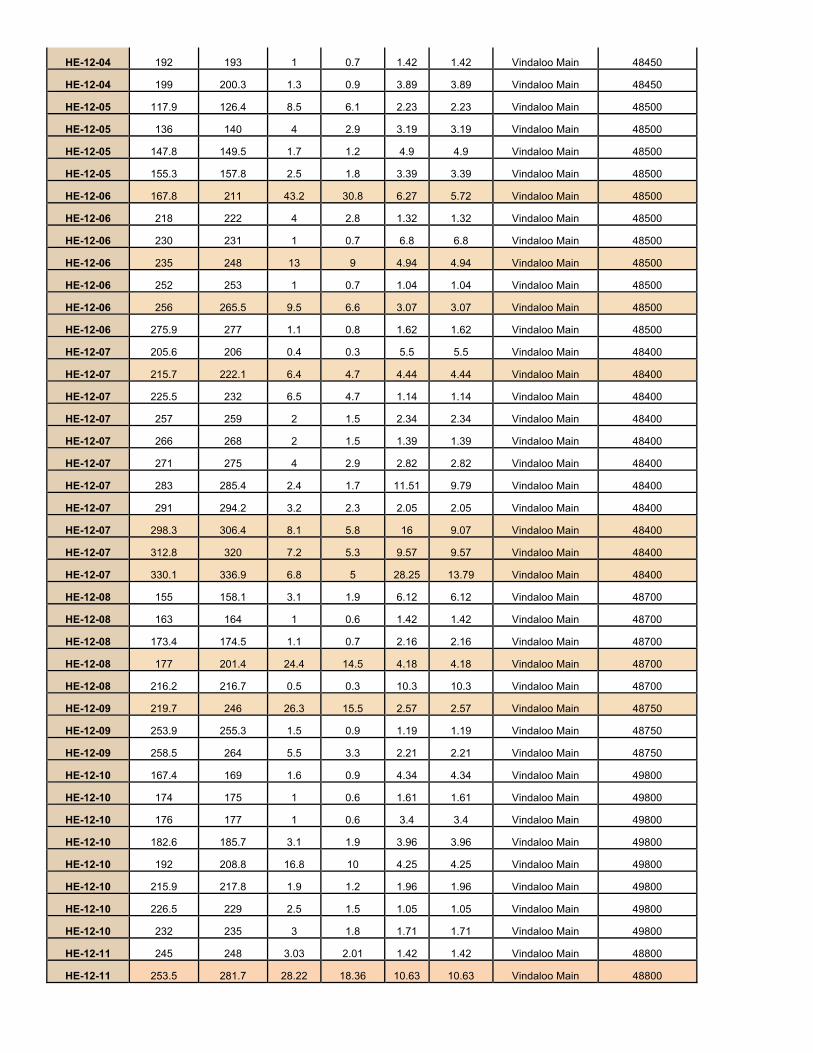
HE-12-04 192 193 1 0.7 1.42 1.42 Vindaloo Main 48450
HE-12-04 199 200.3 1.3 0.9 3.89 3.89 Vindaloo Main 48450
HE-12-05 117.9 126.4 8.5 6.1 2.23 2.23 Vindaloo Main 48500
HE-12-05 136 140 4 2.9 3.19 3.19 Vindaloo Main 48500
HE-12-05 147.8 149.5 1.7 1.2 4.9 4.9 Vindaloo Main 48500
HE-12-05 155.3 157.8 2.5 1.8 3.39 3.39 Vindaloo Main 48500
HE-12-06 167.8 211 43.2 30.8 6.27 5.72 Vindaloo Main 48500
HE-12-06 218 222 4 2.8 1.32 1.32 Vindaloo Main 48500
HE-12-06 230 231 1 0.7 6.8 6.8 Vindaloo Main 48500
HE-12-06 235 248 13 9 4.94 4.94 Vindaloo Main 48500
HE-12-06 252 253 1 0.7 1.04 1.04 Vindaloo Main 48500
HE-12-06 256 265.5 9.5 6.6 3.07 3.07 Vindaloo Main 48500
HE-12-06 275.9 277 1.1 0.8 1.62 1.62 Vindaloo Main 48500
HE-12-07 205.6 206 0.4 0.3 5.5 5.5 Vindaloo Main 48400
HE-12-07 215.7 222.1 6.4 4.7 4.44 4.44 Vindaloo Main 48400
HE-12-07 225.5 232 6.5 4.7 1.14 1.14 Vindaloo Main 48400
HE-12-07 257 259 2 1.5 2.34 2.34 Vindaloo Main 48400
HE-12-07 266 268 2 1.5 1.39 1.39 Vindaloo Main 48400
HE-12-07 271 275 4 2.9 2.82 2.82 Vindaloo Main 48400
HE-12-07 283 285.4 2.4 1.7 11.51 9.79 Vindaloo Main 48400
HE-12-07 291 294.2 3.2 2.3 2.05 2.05 Vindaloo Main 48400
HE-12-07 298.3 306.4 8.1 5.8 16 9.07 Vindaloo Main 48400
HE-12-07 312.8 320 7.2 5.3 9.57 9.57 Vindaloo Main 48400
HE-12-07 330.1 336.9 6.8 5 28.25 13.79 Vindaloo Main 48400
HE-12-08 155 158.1 3.1 1.9 6.12 6.12 Vindaloo Main 48700
HE-12-08 163 164 1 0.6 1.42 1.42 Vindaloo Main 48700
HE-12-08 173.4 174.5 1.1 0.7 2.16 2.16 Vindaloo Main 48700
HE-12-08 177 201.4 24.4 14.5 4.18 4.18 Vindaloo Main 48700
HE-12-08 216.2 216.7 0.5 0.3 10.3 10.3 Vindaloo Main 48700
HE-12-09 219.7 246 26.3 15.5 2.57 2.57 Vindaloo Main 48750
HE-12-09 253.9 255.3 1.5 0.9 1.19 1.19 Vindaloo Main 48750
HE-12-09 258.5 264 5.5 3.3 2.21 2.21 Vindaloo Main 48750
HE-12-10 167.4 169 1.6 0.9 4.34 4.34 Vindaloo Main 49800
HE-12-10 174 175 1 0.6 1.61 1.61 Vindaloo Main 49800
HE-12-10 176 177 1 0.6 3.4 3.4 Vindaloo Main 49800
HE-12-10 182.6 185.7 3.1 1.9 3.96 3.96 Vindaloo Main 49800
HE-12-10 192 208.8 16.8 10 4.25 4.25 Vindaloo Main 49800
HE-12-10 215.9 217.8 1.9 1.2 1.96 1.96 Vindaloo Main 49800
HE-12-10 226.5 229 2.5 1.5 1.05 1.05 Vindaloo Main 49800
HE-12-10 232 235 3 1.8 1.71 1.71 Vindaloo Main 49800
HE-12-11 245 248 3.03 2.01 1.42 1.42 Vindaloo Main 48800
HE-12-11 253.5 281.7 28.22 18.36 10.63 10.63 Vindaloo Main 48800
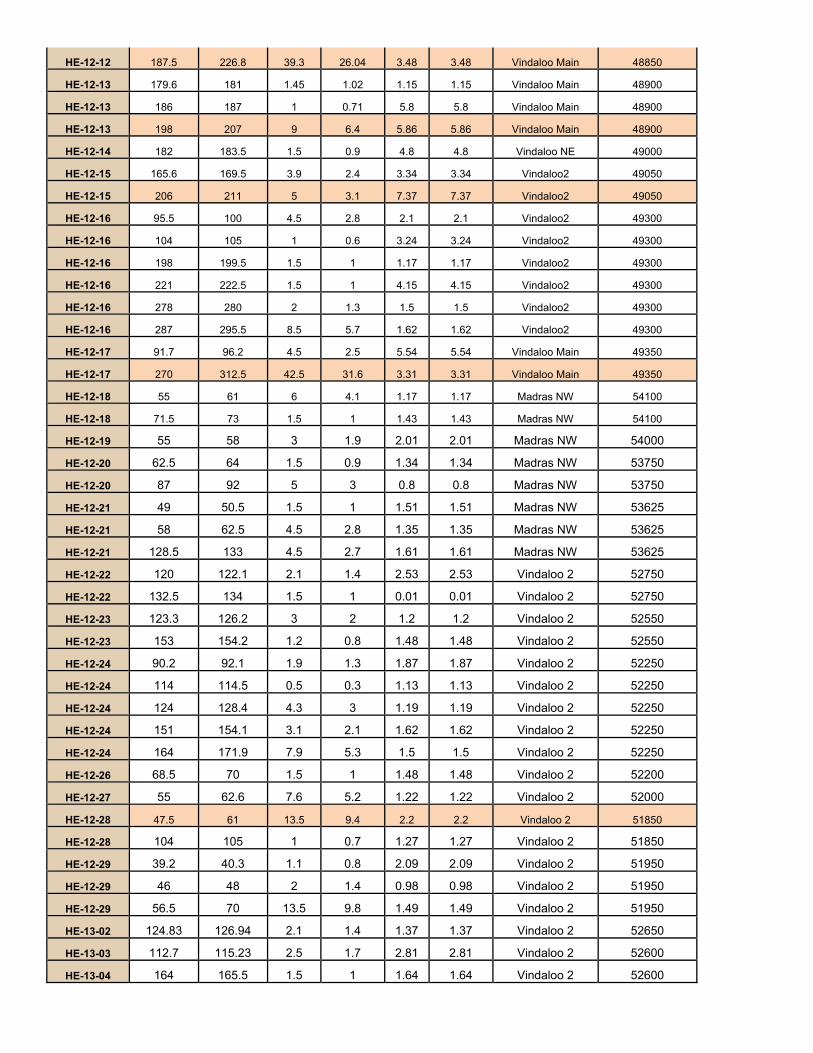
HE-12-12 187.5 226.8 39.3 26.04 3.48 3.48 Vindaloo Main 48850
HE-12-13 179.6 181 1.45 1.02 1.15 1.15 Vindaloo Main 48900
HE-12-13 186 187 1 0.71 5.8 5.8 Vindaloo Main 48900
HE-12-13 198 207 9 6.4 5.86 5.86 Vindaloo Main 48900
HE-12-14 182 183.5 1.5 0.9 4.8 4.8 Vindaloo NE 49000
HE-12-15 165.6 169.5 3.9 2.4 3.34 3.34 Vindaloo2 49050
HE-12-15 206 211 5 3.1 7.37 7.37 Vindaloo2 49050
HE-12-16 95.5 100 4.5 2.8 2.1 2.1 Vindaloo2 49300
HE-12-16 104 105 1 0.6 3.24 3.24 Vindaloo2 49300
HE-12-16 198 199.5 1.5 1 1.17 1.17 Vindaloo2 49300
HE-12-16 221 222.5 1.5 1 4.15 4.15 Vindaloo2 49300
HE-12-16 278 280 2 1.3 1.5 1.5 Vindaloo2 49300
HE-12-16 287 295.5 8.5 5.7 1.62 1.62 Vindaloo2 49300
HE-12-17 91.7 96.2 4.5 2.5 5.54 5.54 Vindaloo Main 49350
HE-12-17 270 312.5 42.5 31.6 3.31 3.31 Vindaloo Main 49350
HE-12-18 55 61 6 4.1 1.17 1.17 Madras NW 54100
HE-12-18 71.5 73 1.5 1 1.43 1.43 Madras NW 54100
HE-12-19 55 58 3 1.9 2.01 2.01 Madras NW 54000
HE-12-20 62.5 64 1.5 0.9 1.34 1.34 Madras NW 53750
HE-12-20 87 92 5 3 0.8 0.8 Madras NW 53750
HE-12-21 49 50.5 1.5 1 1.51 1.51 Madras NW 53625
HE-12-21 58 62.5 4.5 2.8 1.35 1.35 Madras NW 53625
HE-12-21 128.5 133 4.5 2.7 1.61 1.61 Madras NW 53625
HE-12-22 120 122.1 2.1 1.4 2.53 2.53 Vindaloo 2 52750
HE-12-22 132.5 134 1.5 1 0.01 0.01 Vindaloo 2 52750
HE-12-23 123.3 126.2 3 2 1.2 1.2 Vindaloo 2 52550
HE-12-23 153 154.2 1.2 0.8 1.48 1.48 Vindaloo 2 52550
HE-12-24 90.2 92.1 1.9 1.3 1.87 1.87 Vindaloo 2 52250
HE-12-24 114 114.5 0.5 0.3 1.13 1.13 Vindaloo 2 52250
HE-12-24 124 128.4 4.3 3 1.19 1.19 Vindaloo 2 52250
HE-12-24 151 154.1 3.1 2.1 1.62 1.62 Vindaloo 2 52250
HE-12-24 164 171.9 7.9 5.3 1.5 1.5 Vindaloo 2 52250
HE-12-26 68.5 70 1.5 1 1.48 1.48 Vindaloo 2 52200
HE-12-27 55 62.6 7.6 5.2 1.22 1.22 Vindaloo 2 52000
HE-12-28 47.5 61 13.5 9.4 2.2 2.2 Vindaloo 2 51850
HE-12-28 104 105 1 0.7 1.27 1.27 Vindaloo 2 51850
HE-12-29 39.2 40.3 1.1 0.8 2.09 2.09 Vindaloo 2 51950
HE-12-29 46 48 2 1.4 0.98 0.98 Vindaloo 2 51950
HE-12-29 56.5 70 13.5 9.8 1.49 1.49 Vindaloo 2 51950
HE-13-02 124.83 126.94 2.1 1.4 1.37 1.37 Vindaloo 2 52650
HE-13-03 112.7 115.23 2.5 1.7 2.81 2.81 Vindaloo 2 52600
HE-13-04 164 165.5 1.5 1 1.64 1.64 Vindaloo 2 52600
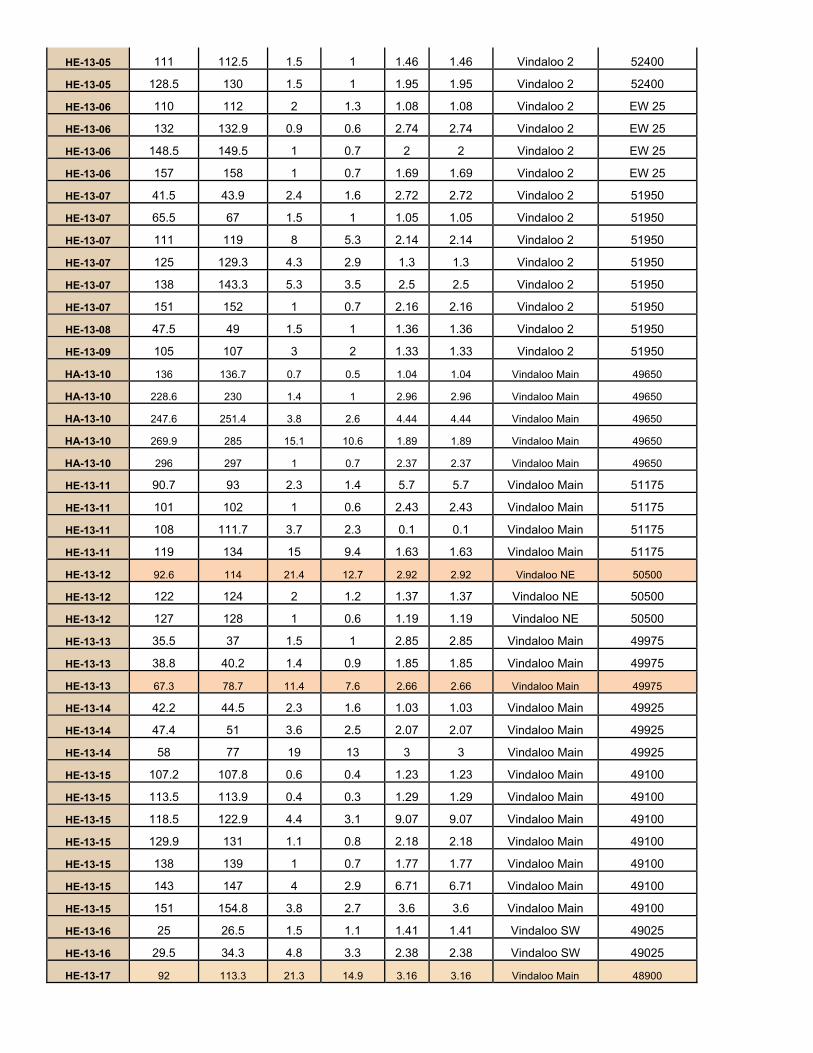
HE-13-05 111 112.5 1.5 1 1.46 1.46 Vindaloo 2 52400
HE-13-05 128.5 130 1.5 1 1.95 1.95 Vindaloo 2 52400
HE-13-06 110 112 2 1.3 1.08 1.08 Vindaloo 2 EW 25
HE-13-06 132 132.9 0.9 0.6 2.74 2.74 Vindaloo 2 EW 25
HE-13-06 148.5 149.5 1 0.7 2 2 Vindaloo 2 EW 25
HE-13-06 157 158 1 0.7 1.69 1.69 Vindaloo 2 EW 25
HE-13-07 41.5 43.9 2.4 1.6 2.72 2.72 Vindaloo 2 51950
HE-13-07 65.5 67 1.5 1 1.05 1.05 Vindaloo 2 51950
HE-13-07 111 119 8 5.3 2.14 2.14 Vindaloo 2 51950
HE-13-07 125 129.3 4.3 2.9 1.3 1.3 Vindaloo 2 51950
HE-13-07 138 143.3 5.3 3.5 2.5 2.5 Vindaloo 2 51950
HE-13-07 151 152 1 0.7 2.16 2.16 Vindaloo 2 51950
HE-13-08 47.5 49 1.5 1 1.36 1.36 Vindaloo 2 51950
HE-13-09 105 107 3 2 1.33 1.33 Vindaloo 2 51950
HA-13-10 136 136.7 0.7 0.5 1.04 1.04 Vindaloo Main 49650
HA-13-10 228.6 230 1.4 1 2.96 2.96 Vindaloo Main 49650
HA-13-10 247.6 251.4 3.8 2.6 4.44 4.44 Vindaloo Main 49650
HA-13-10 269.9 285 15.1 10.6 1.89 1.89 Vindaloo Main 49650
HA-13-10 296 297 1 0.7 2.37 2.37 Vindaloo Main 49650
HE-13-11 90.7 93 2.3 1.4 5.7 5.7 Vindaloo Main 51175
HE-13-11 101 102 1 0.6 2.43 2.43 Vindaloo Main 51175
HE-13-11 108 111.7 3.7 2.3 0.1 0.1 Vindaloo Main 51175
HE-13-11 119 134 15 9.4 1.63 1.63 Vindaloo Main 51175
HE-13-12 92.6 114 21.4 12.7 2.92 2.92 Vindaloo NE 50500
HE-13-12 122 124 2 1.2 1.37 1.37 Vindaloo NE 50500
HE-13-12 127 128 1 0.6 1.19 1.19 Vindaloo NE 50500
HE-13-13 35.5 37 1.5 1 2.85 2.85 Vindaloo Main 49975
HE-13-13 38.8 40.2 1.4 0.9 1.85 1.85 Vindaloo Main 49975
HE-13-13 67.3 78.7 11.4 7.6 2.66 2.66 Vindaloo Main 49975
HE-13-14 42.2 44.5 2.3 1.6 1.03 1.03 Vindaloo Main 49925
HE-13-14 47.4 51 3.6 2.5 2.07 2.07 Vindaloo Main 49925
HE-13-14 58 77 19 13 3 3 Vindaloo Main 49925
HE-13-15 107.2 107.8 0.6 0.4 1.23 1.23 Vindaloo Main 49100
HE-13-15 113.5 113.9 0.4 0.3 1.29 1.29 Vindaloo Main 49100
HE-13-15 118.5 122.9 4.4 3.1 9.07 9.07 Vindaloo Main 49100
HE-13-15 129.9 131 1.1 0.8 2.18 2.18 Vindaloo Main 49100
HE-13-15 138 139 1 0.7 1.77 1.77 Vindaloo Main 49100
HE-13-15 143 147 4 2.9 6.71 6.71 Vindaloo Main 49100
HE-13-15 151 154.8 3.8 2.7 3.6 3.6 Vindaloo Main 49100
HE-13-16 25 26.5 1.5 1.1 1.41 1.41 Vindaloo SW 49025
HE-13-16 29.5 34.3 4.8 3.3 2.38 2.38 Vindaloo SW 49025
HE-13-17 92 113.3 21.3 14.9 3.16 3.16 Vindaloo Main 48900
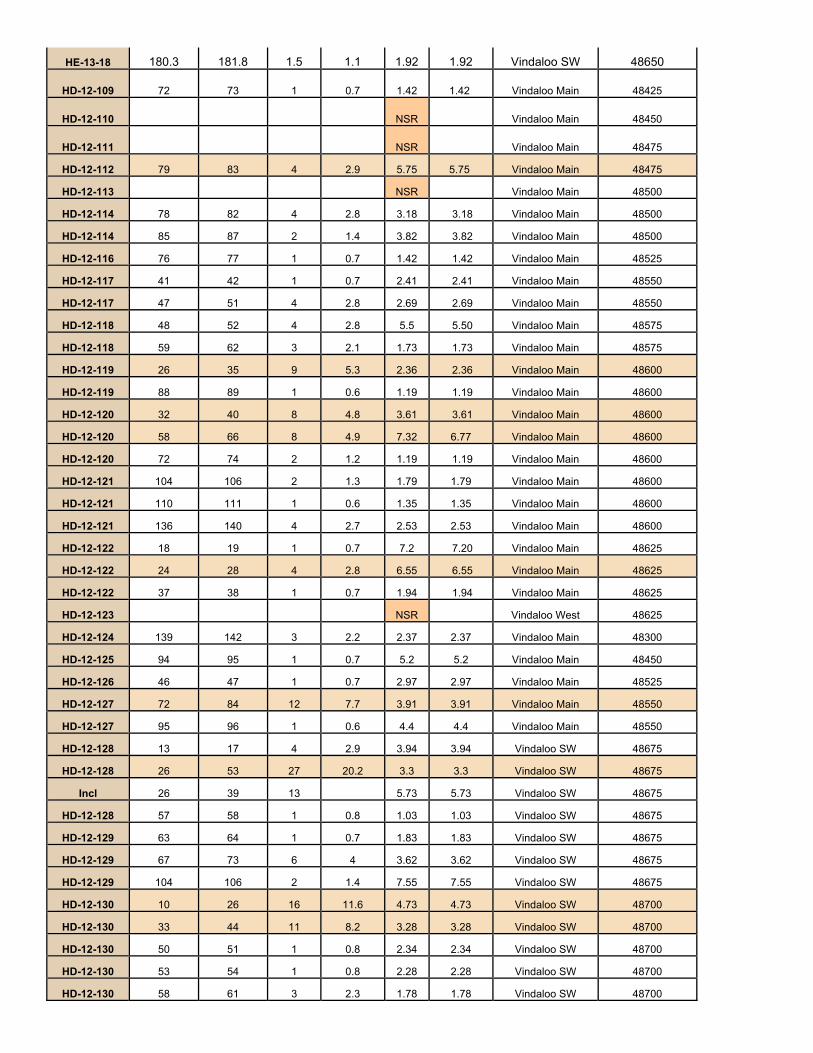
HE-13-18 180.3 181.8 1.5 1.1 1.92 1.92 Vindaloo SW 48650
HD-12-109 72 73 1 0.7 1.42 1.42 Vindaloo Main 48425
HD-12-110 NSR Vindaloo Main 48450
HD-12-111 NSR Vindaloo Main 48475
HD-12-112 79 83 4 2.9 5.75 5.75 Vindaloo Main 48475
HD-12-113 NSR Vindaloo Main 48500
HD-12-114 78 82 4 2.8 3.18 3.18 Vindaloo Main 48500
HD-12-114 85 87 2 1.4 3.82 3.82 Vindaloo Main 48500
HD-12-116 76 77 1 0.7 1.42 1.42 Vindaloo Main 48525
HD-12-117 41 42 1 0.7 2.41 2.41 Vindaloo Main 48550
HD-12-117 47 51 4 2.8 2.69 2.69 Vindaloo Main 48550
HD-12-118 48 52 4 2.8 5.5 5.50 Vindaloo Main 48575
HD-12-118 59 62 3 2.1 1.73 1.73 Vindaloo Main 48575
HD-12-119 26 35 9 5.3 2.36 2.36 Vindaloo Main 48600
HD-12-119 88 89 1 0.6 1.19 1.19 Vindaloo Main 48600
HD-12-120 32 40 8 4.8 3.61 3.61 Vindaloo Main 48600
HD-12-120 58 66 8 4.9 7.32 6.77 Vindaloo Main 48600
HD-12-120 72 74 2 1.2 1.19 1.19 Vindaloo Main 48600
HD-12-121 104 106 2 1.3 1.79 1.79 Vindaloo Main 48600
HD-12-121 110 111 1 0.6 1.35 1.35 Vindaloo Main 48600
HD-12-121 136 140 4 2.7 2.53 2.53 Vindaloo Main 48600
HD-12-122 18 19 1 0.7 7.2 7.20 Vindaloo Main 48625
HD-12-122 24 28 4 2.8 6.55 6.55 Vindaloo Main 48625
HD-12-122 37 38 1 0.7 1.94 1.94 Vindaloo Main 48625
HD-12-123 NSR Vindaloo West 48625
HD-12-124 139 142 3 2.2 2.37 2.37 Vindaloo Main 48300
HD-12-125 94 95 1 0.7 5.2 5.2 Vindaloo Main 48450
HD-12-126 46 47 1 0.7 2.97 2.97 Vindaloo Main 48525
HD-12-127 72 84 12 7.7 3.91 3.91 Vindaloo Main 48550
HD-12-127 95 96 1 0.6 4.4 4.4 Vindaloo Main 48550
HD-12-128 13 17 4 2.9 3.94 3.94 Vindaloo SW 48675
HD-12-128 26 53 27 20.2 3.3 3.3 Vindaloo SW 48675
Incl 26 39 13 5.73 5.73 Vindaloo SW 48675
HD-12-128 57 58 1 0.8 1.03 1.03 Vindaloo SW 48675
HD-12-129 63 64 1 0.7 1.83 1.83 Vindaloo SW 48675
HD-12-129 67 73 6 4 3.62 3.62 Vindaloo SW 48675
HD-12-129 104 106 2 1.4 7.55 7.55 Vindaloo SW 48675
HD-12-130 10 26 16 11.6 4.73 4.73 Vindaloo SW 48700
HD-12-130 33 44 11 8.2 3.28 3.28 Vindaloo SW 48700
HD-12-130 50 51 1 0.8 2.34 2.34 Vindaloo SW 48700
HD-12-130 53 54 1 0.8 2.28 2.28 Vindaloo SW 48700
HD-12-130 58 61 3 2.3 1.78 1.78 Vindaloo SW 48700
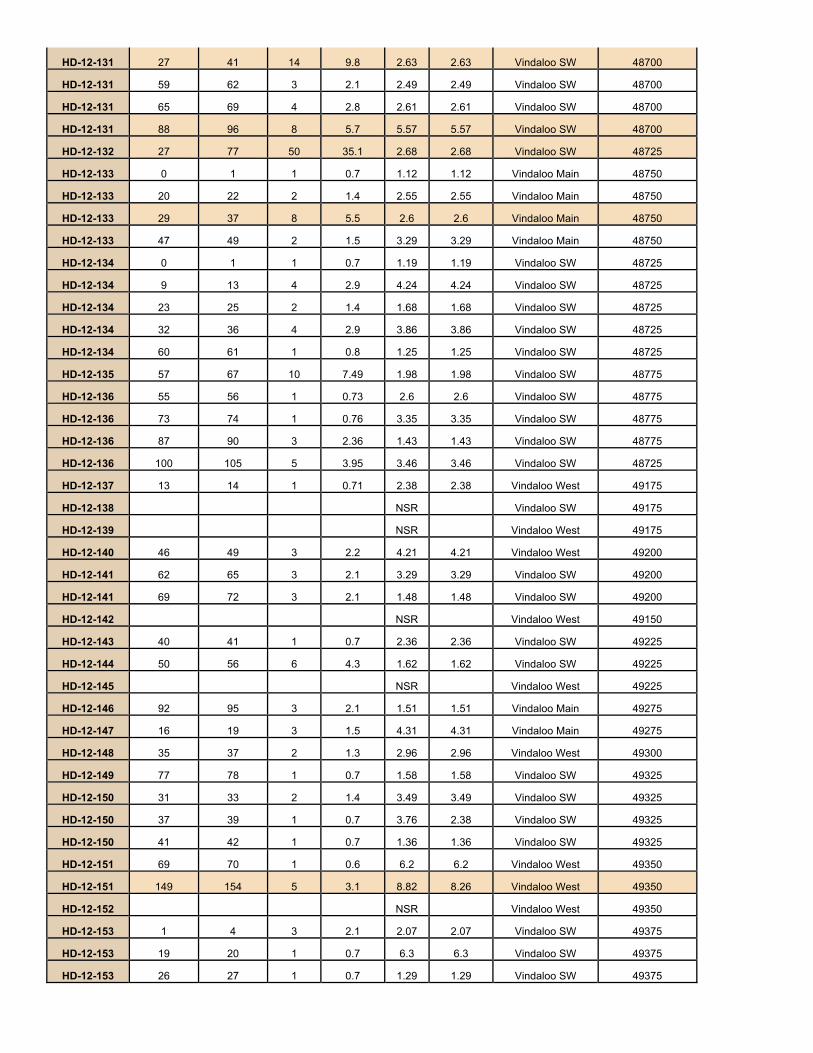
HD-12-131 27 41 14 9.8 2.63 2.63 Vindaloo SW 48700
HD-12-131 59 62 3 2.1 2.49 2.49 Vindaloo SW 48700
HD-12-131 65 69 4 2.8 2.61 2.61 Vindaloo SW 48700
HD-12-131 88 96 8 5.7 5.57 5.57 Vindaloo SW 48700
HD-12-132 27 77 50 35.1 2.68 2.68 Vindaloo SW 48725
HD-12-133 0 1 1 0.7 1.12 1.12 Vindaloo Main 48750
HD-12-133 20 22 2 1.4 2.55 2.55 Vindaloo Main 48750
HD-12-133 29 37 8 5.5 2.6 2.6 Vindaloo Main 48750
HD-12-133 47 49 2 1.5 3.29 3.29 Vindaloo Main 48750
HD-12-134 0 1 1 0.7 1.19 1.19 Vindaloo SW 48725
HD-12-134 9 13 4 2.9 4.24 4.24 Vindaloo SW 48725
HD-12-134 23 25 2 1.4 1.68 1.68 Vindaloo SW 48725
HD-12-134 32 36 4 2.9 3.86 3.86 Vindaloo SW 48725
HD-12-134 60 61 1 0.8 1.25 1.25 Vindaloo SW 48725
HD-12-135 57 67 10 7.49 1.98 1.98 Vindaloo SW 48775
HD-12-136 55 56 1 0.73 2.6 2.6 Vindaloo SW 48775
HD-12-136 73 74 1 0.76 3.35 3.35 Vindaloo SW 48775
HD-12-136 87 90 3 2.36 1.43 1.43 Vindaloo SW 48775
HD-12-136 100 105 5 3.95 3.46 3.46 Vindaloo SW 48725
HD-12-137 13 14 1 0.71 2.38 2.38 Vindaloo West 49175
HD-12-138 NSR Vindaloo SW 49175
HD-12-139 NSR Vindaloo West 49175
HD-12-140 46 49 3 2.2 4.21 4.21 Vindaloo West 49200
HD-12-141 62 65 3 2.1 3.29 3.29 Vindaloo SW 49200
HD-12-141 69 72 3 2.1 1.48 1.48 Vindaloo SW 49200
HD-12-142 NSR Vindaloo West 49150
HD-12-143 40 41 1 0.7 2.36 2.36 Vindaloo SW 49225
HD-12-144 50 56 6 4.3 1.62 1.62 Vindaloo SW 49225
HD-12-145 NSR Vindaloo West 49225
HD-12-146 92 95 3 2.1 1.51 1.51 Vindaloo Main 49275
HD-12-147 16 19 3 1.5 4.31 4.31 Vindaloo Main 49275
HD-12-148 35 37 2 1.3 2.96 2.96 Vindaloo West 49300
HD-12-149 77 78 1 0.7 1.58 1.58 Vindaloo SW 49325
HD-12-150 31 33 2 1.4 3.49 3.49 Vindaloo SW 49325
HD-12-150 37 39 1 0.7 3.76 2.38 Vindaloo SW 49325
HD-12-150 41 42 1 0.7 1.36 1.36 Vindaloo SW 49325
HD-12-151 69 70 1 0.6 6.2 6.2 Vindaloo West 49350
HD-12-151 149 154 5 3.1 8.82 8.26 Vindaloo West 49350
HD-12-152 NSR Vindaloo West 49350
HD-12-153 1 4 3 2.1 2.07 2.07 Vindaloo SW 49375
HD-12-153 19 20 1 0.7 6.3 6.3 Vindaloo SW 49375
HD-12-153 26 27 1 0.7 1.29 1.29 Vindaloo SW 49375
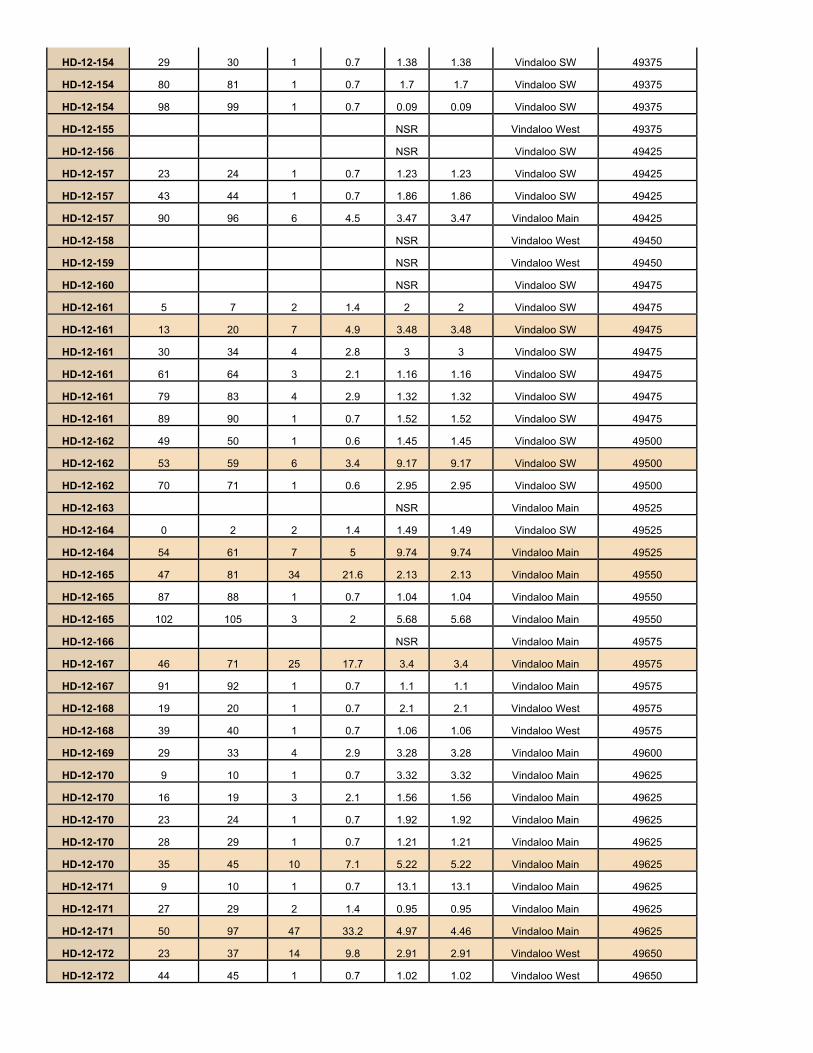
HD-12-154 29 30 1 0.7 1.38 1.38 Vindaloo SW 49375
HD-12-154 80 81 1 0.7 1.7 1.7 Vindaloo SW 49375
HD-12-154 98 99 1 0.7 0.09 0.09 Vindaloo SW 49375
HD-12-155 NSR Vindaloo West 49375
HD-12-156 NSR Vindaloo SW 49425
HD-12-157 23 24 1 0.7 1.23 1.23 Vindaloo SW 49425
HD-12-157 43 44 1 0.7 1.86 1.86 Vindaloo SW 49425
HD-12-157 90 96 6 4.5 3.47 3.47 Vindaloo Main 49425
HD-12-158 NSR Vindaloo West 49450
HD-12-159 NSR Vindaloo West 49450
HD-12-160 NSR Vindaloo SW 49475
HD-12-161 5 7 2 1.4 2 2 Vindaloo SW 49475
HD-12-161 13 20 7 4.9 3.48 3.48 Vindaloo SW 49475
HD-12-161 30 34 4 2.8 3 3 Vindaloo SW 49475
HD-12-161 61 64 3 2.1 1.16 1.16 Vindaloo SW 49475
HD-12-161 79 83 4 2.9 1.32 1.32 Vindaloo SW 49475
HD-12-161 89 90 1 0.7 1.52 1.52 Vindaloo SW 49475
HD-12-162 49 50 1 0.6 1.45 1.45 Vindaloo SW 49500
HD-12-162 53 59 6 3.4 9.17 9.17 Vindaloo SW 49500
HD-12-162 70 71 1 0.6 2.95 2.95 Vindaloo SW 49500
HD-12-163 NSR Vindaloo Main 49525
HD-12-164 0 2 2 1.4 1.49 1.49 Vindaloo SW 49525
HD-12-164 54 61 7 5 9.74 9.74 Vindaloo Main 49525
HD-12-165 47 81 34 21.6 2.13 2.13 Vindaloo Main 49550
HD-12-165 87 88 1 0.7 1.04 1.04 Vindaloo Main 49550
HD-12-165 102 105 3 2 5.68 5.68 Vindaloo Main 49550
HD-12-166 NSR Vindaloo Main 49575
HD-12-167 46 71 25 17.7 3.4 3.4 Vindaloo Main 49575
HD-12-167 91 92 1 0.7 1.1 1.1 Vindaloo Main 49575
HD-12-168 19 20 1 0.7 2.1 2.1 Vindaloo West 49575
HD-12-168 39 40 1 0.7 1.06 1.06 Vindaloo West 49575
HD-12-169 29 33 4 2.9 3.28 3.28 Vindaloo Main 49600
HD-12-170 9 10 1 0.7 3.32 3.32 Vindaloo Main 49625
HD-12-170 16 19 3 2.1 1.56 1.56 Vindaloo Main 49625
HD-12-170 23 24 1 0.7 1.92 1.92 Vindaloo Main 49625
HD-12-170 28 29 1 0.7 1.21 1.21 Vindaloo Main 49625
HD-12-170 35 45 10 7.1 5.22 5.22 Vindaloo Main 49625
HD-12-171 9 10 1 0.7 13.1 13.1 Vindaloo Main 49625
HD-12-171 27 29 2 1.4 0.95 0.95 Vindaloo Main 49625
HD-12-171 50 97 47 33.2 4.97 4.46 Vindaloo Main 49625
HD-12-172 23 37 14 9.8 2.91 2.91 Vindaloo West 49650
HD-12-172 44 45 1 0.7 1.02 1.02 Vindaloo West 49650
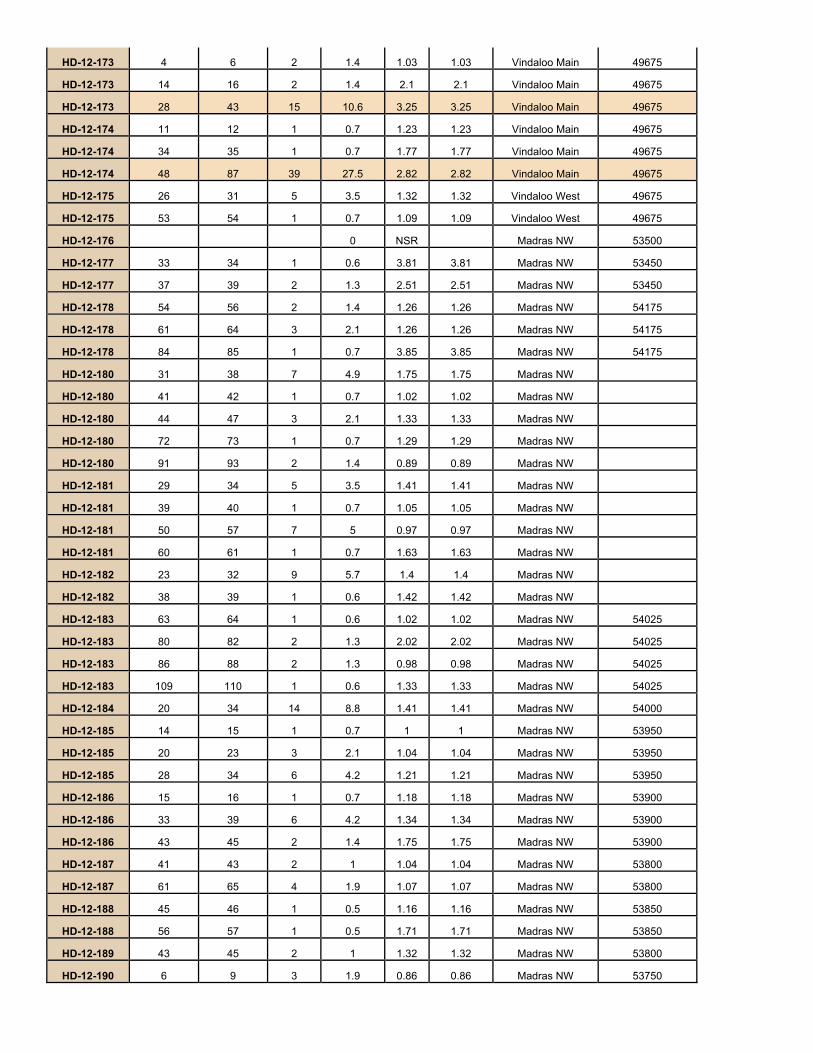
HD-12-173 4 6 2 1.4 1.03 1.03 Vindaloo Main 49675
HD-12-173 14 16 2 1.4 2.1 2.1 Vindaloo Main 49675
HD-12-173 28 43 15 10.6 3.25 3.25 Vindaloo Main 49675
HD-12-174 11 12 1 0.7 1.23 1.23 Vindaloo Main 49675
HD-12-174 34 35 1 0.7 1.77 1.77 Vindaloo Main 49675
HD-12-174 48 87 39 27.5 2.82 2.82 Vindaloo Main 49675
HD-12-175 26 31 5 3.5 1.32 1.32 Vindaloo West 49675
HD-12-175 53 54 1 0.7 1.09 1.09 Vindaloo West 49675
HD-12-176 0 NSR Madras NW 53500
HD-12-177 33 34 1 0.6 3.81 3.81 Madras NW 53450
HD-12-177 37 39 2 1.3 2.51 2.51 Madras NW 53450
HD-12-178 54 56 2 1.4 1.26 1.26 Madras NW 54175
HD-12-178 61 64 3 2.1 1.26 1.26 Madras NW 54175
HD-12-178 84 85 1 0.7 3.85 3.85 Madras NW 54175
HD-12-180 31 38 7 4.9 1.75 1.75 Madras NW
HD-12-180 41 42 1 0.7 1.02 1.02 Madras NW
HD-12-180 44 47 3 2.1 1.33 1.33 Madras NW
HD-12-180 72 73 1 0.7 1.29 1.29 Madras NW
HD-12-180 91 93 2 1.4 0.89 0.89 Madras NW
HD-12-181 29 34 5 3.5 1.41 1.41 Madras NW
HD-12-181 39 40 1 0.7 1.05 1.05 Madras NW
HD-12-181 50 57 7 5 0.97 0.97 Madras NW
HD-12-181 60 61 1 0.7 1.63 1.63 Madras NW
HD-12-182 23 32 9 5.7 1.4 1.4 Madras NW
HD-12-182 38 39 1 0.6 1.42 1.42 Madras NW
HD-12-183 63 64 1 0.6 1.02 1.02 Madras NW 54025
HD-12-183 80 82 2 1.3 2.02 2.02 Madras NW 54025
HD-12-183 86 88 2 1.3 0.98 0.98 Madras NW 54025
HD-12-183 109 110 1 0.6 1.33 1.33 Madras NW 54025
HD-12-184 20 34 14 8.8 1.41 1.41 Madras NW 54000
HD-12-185 14 15 1 0.7 1 1 Madras NW 53950
HD-12-185 20 23 3 2.1 1.04 1.04 Madras NW 53950
HD-12-185 28 34 6 4.2 1.21 1.21 Madras NW 53950
HD-12-186 15 16 1 0.7 1.18 1.18 Madras NW 53900
HD-12-186 33 39 6 4.2 1.34 1.34 Madras NW 53900
HD-12-186 43 45 2 1.4 1.75 1.75 Madras NW 53900
HD-12-187 41 43 2 1 1.04 1.04 Madras NW 53800
HD-12-187 61 65 4 1.9 1.07 1.07 Madras NW 53800
HD-12-188 45 46 1 0.5 1.16 1.16 Madras NW 53850
HD-12-188 56 57 1 0.5 1.71 1.71 Madras NW 53850
HD-12-189 43 45 2 1 1.32 1.32 Madras NW 53800
HD-12-190 6 9 3 1.9 0.86 0.86 Madras NW 53750
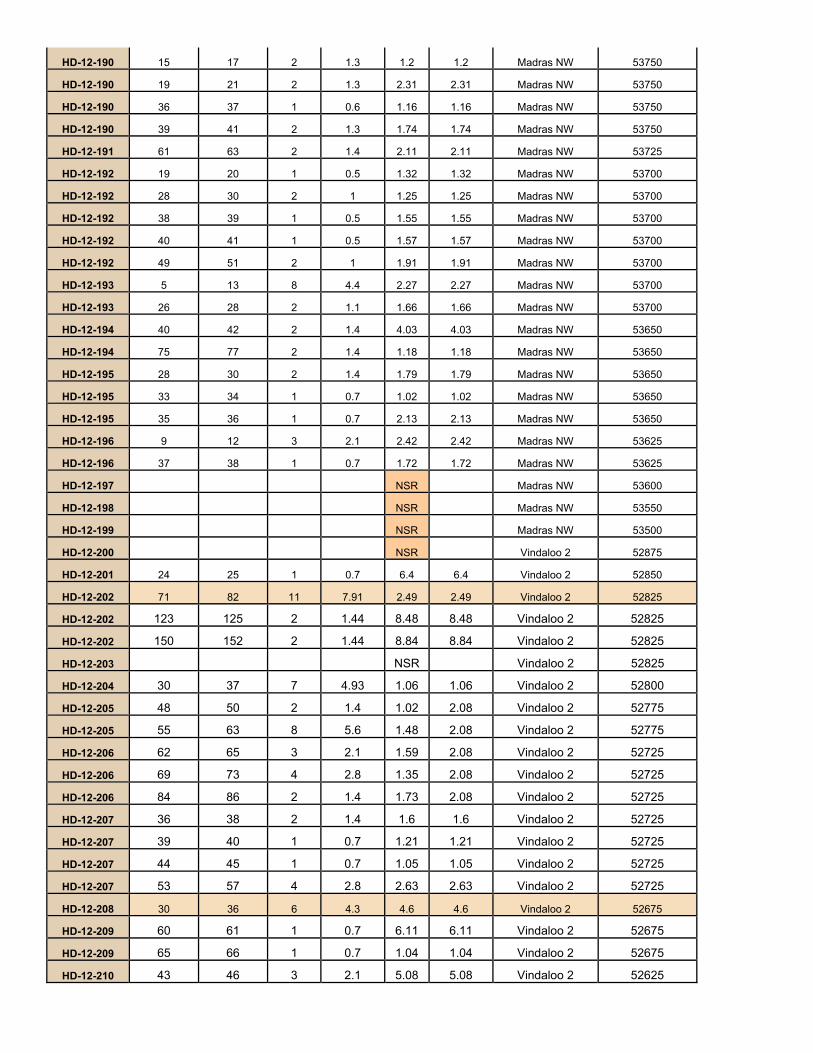
HD-12-190 15 17 2 1.3 1.2 1.2 Madras NW 53750
HD-12-190 19 21 2 1.3 2.31 2.31 Madras NW 53750
HD-12-190 36 37 1 0.6 1.16 1.16 Madras NW 53750
HD-12-190 39 41 2 1.3 1.74 1.74 Madras NW 53750
HD-12-191 61 63 2 1.4 2.11 2.11 Madras NW 53725
HD-12-192 19 20 1 0.5 1.32 1.32 Madras NW 53700
HD-12-192 28 30 2 1 1.25 1.25 Madras NW 53700
HD-12-192 38 39 1 0.5 1.55 1.55 Madras NW 53700
HD-12-192 40 41 1 0.5 1.57 1.57 Madras NW 53700
HD-12-192 49 51 2 1 1.91 1.91 Madras NW 53700
HD-12-193 5 13 8 4.4 2.27 2.27 Madras NW 53700
HD-12-193 26 28 2 1.1 1.66 1.66 Madras NW 53700
HD-12-194 40 42 2 1.4 4.03 4.03 Madras NW 53650
HD-12-194 75 77 2 1.4 1.18 1.18 Madras NW 53650
HD-12-195 28 30 2 1.4 1.79 1.79 Madras NW 53650
HD-12-195 33 34 1 0.7 1.02 1.02 Madras NW 53650
HD-12-195 35 36 1 0.7 2.13 2.13 Madras NW 53650
HD-12-196 9 12 3 2.1 2.42 2.42 Madras NW 53625
HD-12-196 37 38 1 0.7 1.72 1.72 Madras NW 53625
HD-12-197 NSR Madras NW 53600
HD-12-198 NSR Madras NW 53550
HD-12-199 NSR Madras NW 53500
HD-12-200 NSR Vindaloo 2 52875
HD-12-201 24 25 1 0.7 6.4 6.4 Vindaloo 2 52850
HD-12-202 71 82 11 7.91 2.49 2.49 Vindaloo 2 52825
HD-12-202 123 125 2 1.44 8.48 8.48 Vindaloo 2 52825
HD-12-202 150 152 2 1.44 8.84 8.84 Vindaloo 2 52825
HD-12-203 NSR Vindaloo 2 52825
HD-12-204 30 37 7 4.93 1.06 1.06 Vindaloo 2 52800
HD-12-205 48 50 2 1.4 1.02 2.08 Vindaloo 2 52775
HD-12-205 55 63 8 5.6 1.48 2.08 Vindaloo 2 52775
HD-12-206 62 65 3 2.1 1.59 2.08 Vindaloo 2 52725
HD-12-206 69 73 4 2.8 1.35 2.08 Vindaloo 2 52725
HD-12-206 84 86 2 1.4 1.73 2.08 Vindaloo 2 52725
HD-12-207 36 38 2 1.4 1.6 1.6 Vindaloo 2 52725
HD-12-207 39 40 1 0.7 1.21 1.21 Vindaloo 2 52725
HD-12-207 44 45 1 0.7 1.05 1.05 Vindaloo 2 52725
HD-12-207 53 57 4 2.8 2.63 2.63 Vindaloo 2 52725
HD-12-208 30 36 6 4.3 4.6 4.6 Vindaloo 2 52675
HD-12-209 60 61 1 0.7 6.11 6.11 Vindaloo 2 52675
HD-12-209 65 66 1 0.7 1.04 1.04 Vindaloo 2 52675
HD-12-210 43 46 3 2.1 5.08 5.08 Vindaloo 2 52625
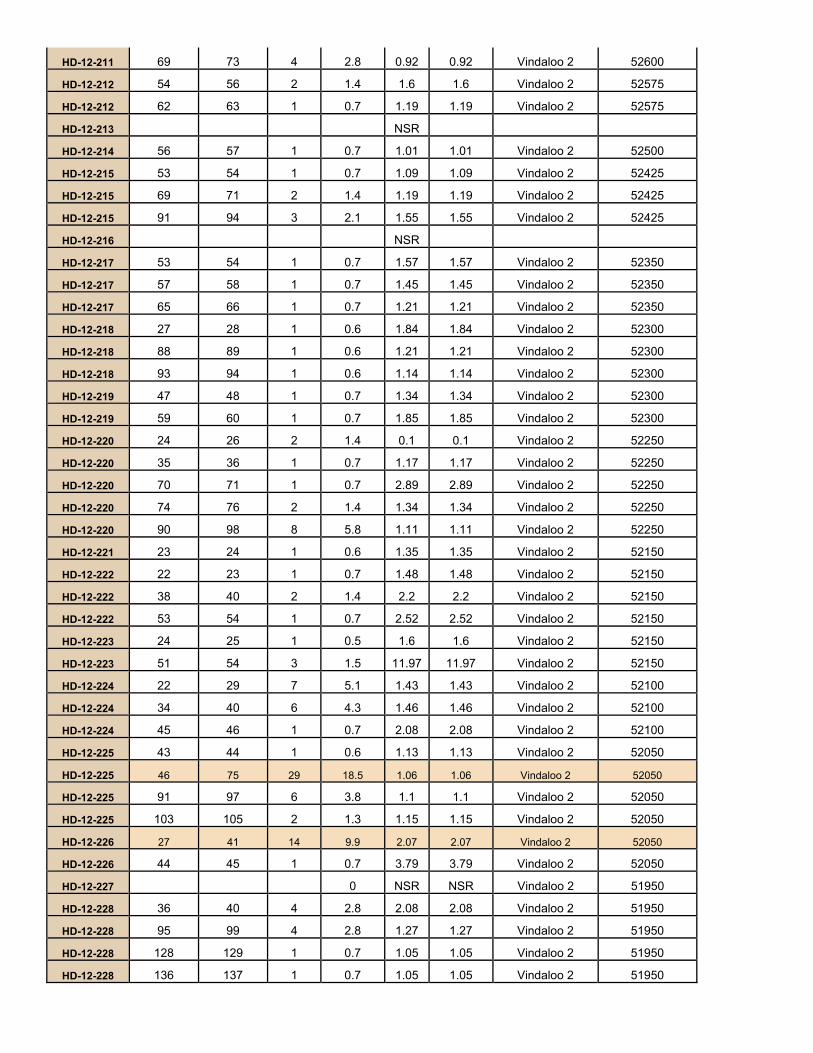
HD-12-211 69 73 4 2.8 0.92 0.92 Vindaloo 2 52600
HD-12-212 54 56 2 1.4 1.6 1.6 Vindaloo 2 52575
HD-12-212 62 63 1 0.7 1.19 1.19 Vindaloo 2 52575
HD-12-213 NSR
HD-12-214 56 57 1 0.7 1.01 1.01 Vindaloo 2 52500
HD-12-215 53 54 1 0.7 1.09 1.09 Vindaloo 2 52425
HD-12-215 69 71 2 1.4 1.19 1.19 Vindaloo 2 52425
HD-12-215 91 94 3 2.1 1.55 1.55 Vindaloo 2 52425
HD-12-216 NSR
HD-12-217 53 54 1 0.7 1.57 1.57 Vindaloo 2 52350
HD-12-217 57 58 1 0.7 1.45 1.45 Vindaloo 2 52350
HD-12-217 65 66 1 0.7 1.21 1.21 Vindaloo 2 52350
HD-12-218 27 28 1 0.6 1.84 1.84 Vindaloo 2 52300
HD-12-218 88 89 1 0.6 1.21 1.21 Vindaloo 2 52300
HD-12-218 93 94 1 0.6 1.14 1.14 Vindaloo 2 52300
HD-12-219 47 48 1 0.7 1.34 1.34 Vindaloo 2 52300
HD-12-219 59 60 1 0.7 1.85 1.85 Vindaloo 2 52300
HD-12-220 24 26 2 1.4 0.1 0.1 Vindaloo 2 52250
HD-12-220 35 36 1 0.7 1.17 1.17 Vindaloo 2 52250
HD-12-220 70 71 1 0.7 2.89 2.89 Vindaloo 2 52250
HD-12-220 74 76 2 1.4 1.34 1.34 Vindaloo 2 52250
HD-12-220 90 98 8 5.8 1.11 1.11 Vindaloo 2 52250
HD-12-221 23 24 1 0.6 1.35 1.35 Vindaloo 2 52150
HD-12-222 22 23 1 0.7 1.48 1.48 Vindaloo 2 52150
HD-12-222 38 40 2 1.4 2.2 2.2 Vindaloo 2 52150
HD-12-222 53 54 1 0.7 2.52 2.52 Vindaloo 2 52150
HD-12-223 24 25 1 0.5 1.6 1.6 Vindaloo 2 52150
HD-12-223 51 54 3 1.5 11.97 11.97 Vindaloo 2 52150
HD-12-224 22 29 7 5.1 1.43 1.43 Vindaloo 2 52100
HD-12-224 34 40 6 4.3 1.46 1.46 Vindaloo 2 52100
HD-12-224 45 46 1 0.7 2.08 2.08 Vindaloo 2 52100
HD-12-225 43 44 1 0.6 1.13 1.13 Vindaloo 2 52050
HD-12-225 46 75 29 18.5 1.06 1.06 Vindaloo 2 52050
HD-12-225 91 97 6 3.8 1.1 1.1 Vindaloo 2 52050
HD-12-225 103 105 2 1.3 1.15 1.15 Vindaloo 2 52050
HD-12-226 27 41 14 9.9 2.07 2.07 Vindaloo 2 52050
HD-12-226 44 45 1 0.7 3.79 3.79 Vindaloo 2 52050
HD-12-227 0 NSR NSR Vindaloo 2 51950
HD-12-228 36 40 4 2.8 2.08 2.08 Vindaloo 2 51950
HD-12-228 95 99 4 2.8 1.27 1.27 Vindaloo 2 51950
HD-12-228 128 129 1 0.7 1.05 1.05 Vindaloo 2 51950
HD-12-228 136 137 1 0.7 1.05 1.05 Vindaloo 2 51950
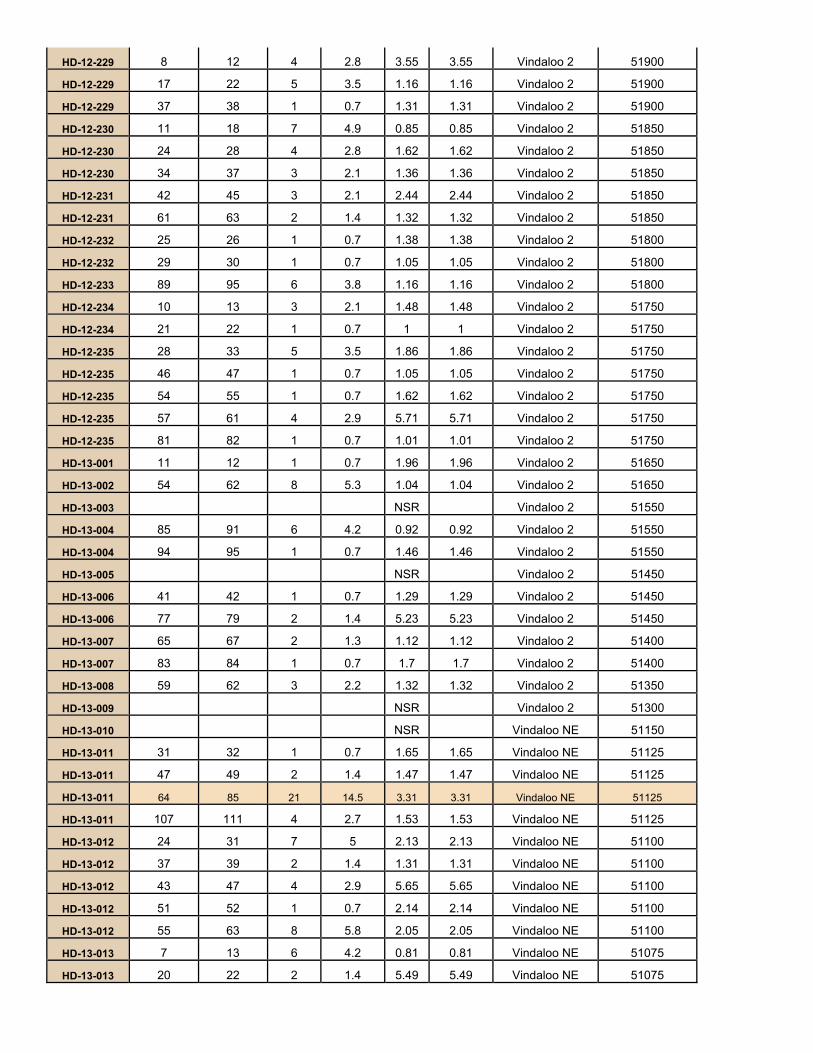
HD-12-229 8 12 4 2.8 3.55 3.55 Vindaloo 2 51900
HD-12-229 17 22 5 3.5 1.16 1.16 Vindaloo 2 51900
HD-12-229 37 38 1 0.7 1.31 1.31 Vindaloo 2 51900
HD-12-230 11 18 7 4.9 0.85 0.85 Vindaloo 2 51850
HD-12-230 24 28 4 2.8 1.62 1.62 Vindaloo 2 51850
HD-12-230 34 37 3 2.1 1.36 1.36 Vindaloo 2 51850
HD-12-231 42 45 3 2.1 2.44 2.44 Vindaloo 2 51850
HD-12-231 61 63 2 1.4 1.32 1.32 Vindaloo 2 51850
HD-12-232 25 26 1 0.7 1.38 1.38 Vindaloo 2 51800
HD-12-232 29 30 1 0.7 1.05 1.05 Vindaloo 2 51800
HD-12-233 89 95 6 3.8 1.16 1.16 Vindaloo 2 51800
HD-12-234 10 13 3 2.1 1.48 1.48 Vindaloo 2 51750
HD-12-234 21 22 1 0.7 1 1 Vindaloo 2 51750
HD-12-235 28 33 5 3.5 1.86 1.86 Vindaloo 2 51750
HD-12-235 46 47 1 0.7 1.05 1.05 Vindaloo 2 51750
HD-12-235 54 55 1 0.7 1.62 1.62 Vindaloo 2 51750
HD-12-235 57 61 4 2.9 5.71 5.71 Vindaloo 2 51750
HD-12-235 81 82 1 0.7 1.01 1.01 Vindaloo 2 51750
HD-13-001 11 12 1 0.7 1.96 1.96 Vindaloo 2 51650
HD-13-002 54 62 8 5.3 1.04 1.04 Vindaloo 2 51650
HD-13-003 NSR Vindaloo 2 51550
HD-13-004 85 91 6 4.2 0.92 0.92 Vindaloo 2 51550
HD-13-004 94 95 1 0.7 1.46 1.46 Vindaloo 2 51550
HD-13-005 NSR Vindaloo 2 51450
HD-13-006 41 42 1 0.7 1.29 1.29 Vindaloo 2 51450
HD-13-006 77 79 2 1.4 5.23 5.23 Vindaloo 2 51450
HD-13-007 65 67 2 1.3 1.12 1.12 Vindaloo 2 51400
HD-13-007 83 84 1 0.7 1.7 1.7 Vindaloo 2 51400
HD-13-008 59 62 3 2.2 1.32 1.32 Vindaloo 2 51350
HD-13-009 NSR Vindaloo 2 51300
HD-13-010 NSR Vindaloo NE 51150
HD-13-011 31 32 1 0.7 1.65 1.65 Vindaloo NE 51125
HD-13-011 47 49 2 1.4 1.47 1.47 Vindaloo NE 51125
HD-13-011 64 85 21 14.5 3.31 3.31 Vindaloo NE 51125
HD-13-011 107 111 4 2.7 1.53 1.53 Vindaloo NE 51125
HD-13-012 24 31 7 5 2.13 2.13 Vindaloo NE 51100
HD-13-012 37 39 2 1.4 1.31 1.31 Vindaloo NE 51100
HD-13-012 43 47 4 2.9 5.65 5.65 Vindaloo NE 51100
HD-13-012 51 52 1 0.7 2.14 2.14 Vindaloo NE 51100
HD-13-012 55 63 8 5.8 2.05 2.05 Vindaloo NE 51100
HD-13-013 7 13 6 4.2 0.81 0.81 Vindaloo NE 51075
HD-13-013 20 22 2 1.4 5.49 5.49 Vindaloo NE 51075
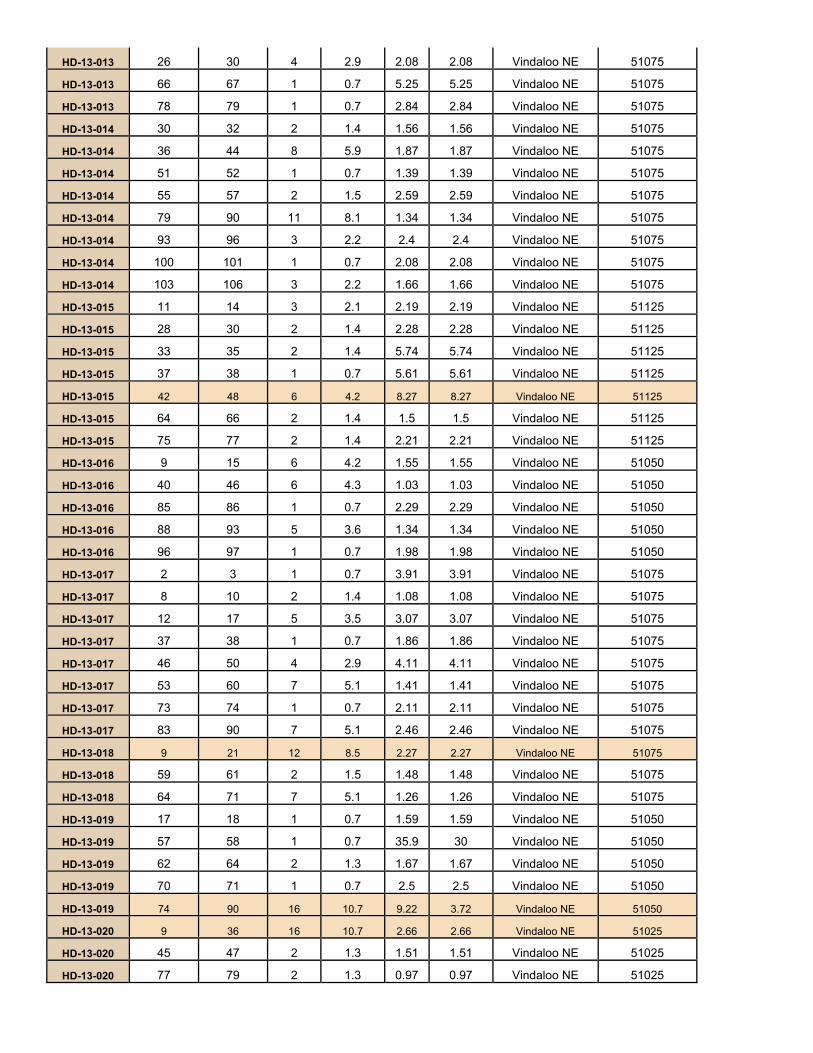
HD-13-013 26 30 4 2.9 2.08 2.08 Vindaloo NE 51075
HD-13-013 66 67 1 0.7 5.25 5.25 Vindaloo NE 51075
HD-13-013 78 79 1 0.7 2.84 2.84 Vindaloo NE 51075
HD-13-014 30 32 2 1.4 1.56 1.56 Vindaloo NE 51075
HD-13-014 36 44 8 5.9 1.87 1.87 Vindaloo NE 51075
HD-13-014 51 52 1 0.7 1.39 1.39 Vindaloo NE 51075
HD-13-014 55 57 2 1.5 2.59 2.59 Vindaloo NE 51075
HD-13-014 79 90 11 8.1 1.34 1.34 Vindaloo NE 51075
HD-13-014 93 96 3 2.2 2.4 2.4 Vindaloo NE 51075
HD-13-014 100 101 1 0.7 2.08 2.08 Vindaloo NE 51075
HD-13-014 103 106 3 2.2 1.66 1.66 Vindaloo NE 51075
HD-13-015 11 14 3 2.1 2.19 2.19 Vindaloo NE 51125
HD-13-015 28 30 2 1.4 2.28 2.28 Vindaloo NE 51125
HD-13-015 33 35 2 1.4 5.74 5.74 Vindaloo NE 51125
HD-13-015 37 38 1 0.7 5.61 5.61 Vindaloo NE 51125
HD-13-015 42 48 6 4.2 8.27 8.27 Vindaloo NE 51125
HD-13-015 64 66 2 1.4 1.5 1.5 Vindaloo NE 51125
HD-13-015 75 77 2 1.4 2.21 2.21 Vindaloo NE 51125
HD-13-016 9 15 6 4.2 1.55 1.55 Vindaloo NE 51050
HD-13-016 40 46 6 4.3 1.03 1.03 Vindaloo NE 51050
HD-13-016 85 86 1 0.7 2.29 2.29 Vindaloo NE 51050
HD-13-016 88 93 5 3.6 1.34 1.34 Vindaloo NE 51050
HD-13-016 96 97 1 0.7 1.98 1.98 Vindaloo NE 51050
HD-13-017 2 3 1 0.7 3.91 3.91 Vindaloo NE 51075
HD-13-017 8 10 2 1.4 1.08 1.08 Vindaloo NE 51075
HD-13-017 12 17 5 3.5 3.07 3.07 Vindaloo NE 51075
HD-13-017 37 38 1 0.7 1.86 1.86 Vindaloo NE 51075
HD-13-017 46 50 4 2.9 4.11 4.11 Vindaloo NE 51075
HD-13-017 53 60 7 5.1 1.41 1.41 Vindaloo NE 51075
HD-13-017 73 74 1 0.7 2.11 2.11 Vindaloo NE 51075
HD-13-017 83 90 7 5.1 2.46 2.46 Vindaloo NE 51075
HD-13-018 9 21 12 8.5 2.27 2.27 Vindaloo NE 51075
HD-13-018 59 61 2 1.5 1.48 1.48 Vindaloo NE 51075
HD-13-018 64 71 7 5.1 1.26 1.26 Vindaloo NE 51075
HD-13-019 17 18 1 0.7 1.59 1.59 Vindaloo NE 51050
HD-13-019 57 58 1 0.7 35.9 30 Vindaloo NE 51050
HD-13-019 62 64 2 1.3 1.67 1.67 Vindaloo NE 51050
HD-13-019 70 71 1 0.7 2.5 2.5 Vindaloo NE 51050
HD-13-019 74 90 16 10.7 9.22 3.72 Vindaloo NE 51050
HD-13-020 9 36 16 10.7 2.66 2.66 Vindaloo NE 51025
HD-13-020 45 47 2 1.3 1.51 1.51 Vindaloo NE 51025
HD-13-020 77 79 2 1.3 0.97 0.97 Vindaloo NE 51025
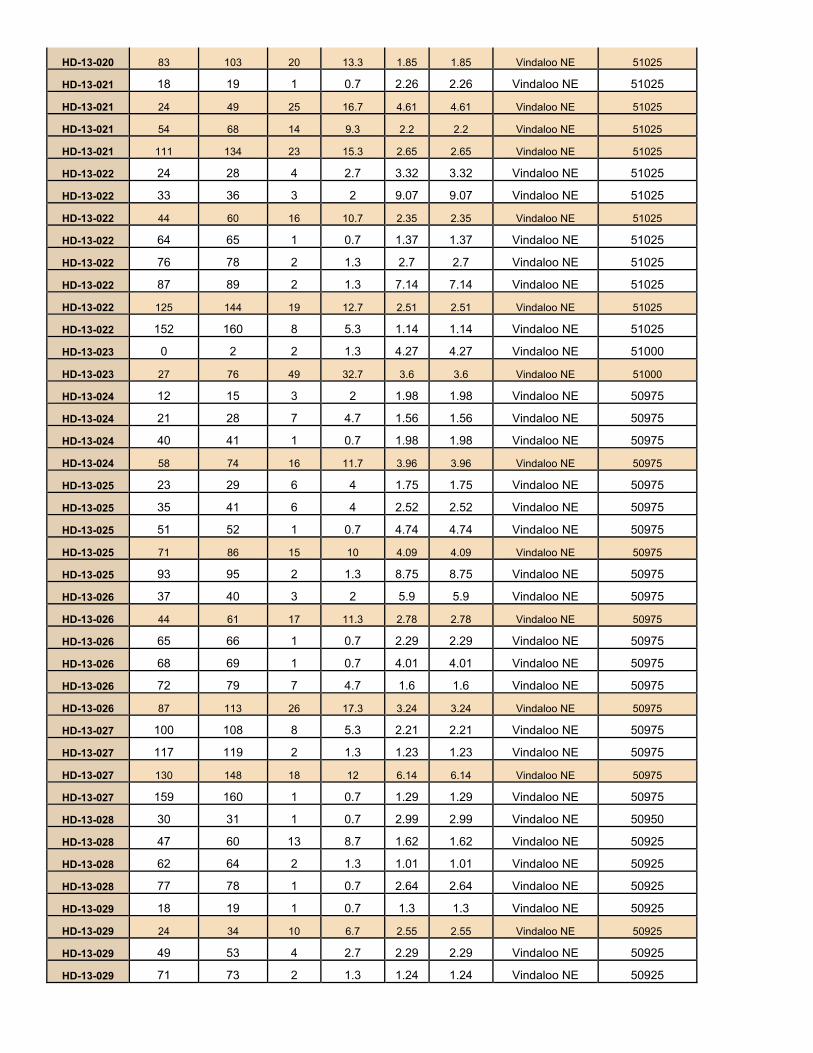
HD-13-020 83 103 20 13.3 1.85 1.85 Vindaloo NE 51025
HD-13-021 18 19 1 0.7 2.26 2.26 Vindaloo NE 51025
HD-13-021 24 49 25 16.7 4.61 4.61 Vindaloo NE 51025
HD-13-021 54 68 14 9.3 2.2 2.2 Vindaloo NE 51025
HD-13-021 111 134 23 15.3 2.65 2.65 Vindaloo NE 51025
HD-13-022 24 28 4 2.7 3.32 3.32 Vindaloo NE 51025
HD-13-022 33 36 3 2 9.07 9.07 Vindaloo NE 51025
HD-13-022 44 60 16 10.7 2.35 2.35 Vindaloo NE 51025
HD-13-022 64 65 1 0.7 1.37 1.37 Vindaloo NE 51025
HD-13-022 76 78 2 1.3 2.7 2.7 Vindaloo NE 51025
HD-13-022 87 89 2 1.3 7.14 7.14 Vindaloo NE 51025
HD-13-022 125 144 19 12.7 2.51 2.51 Vindaloo NE 51025
HD-13-022 152 160 8 5.3 1.14 1.14 Vindaloo NE 51025
HD-13-023 0 2 2 1.3 4.27 4.27 Vindaloo NE 51000
HD-13-023 27 76 49 32.7 3.6 3.6 Vindaloo NE 51000
HD-13-024 12 15 3 2 1.98 1.98 Vindaloo NE 50975
HD-13-024 21 28 7 4.7 1.56 1.56 Vindaloo NE 50975
HD-13-024 40 41 1 0.7 1.98 1.98 Vindaloo NE 50975
HD-13-024 58 74 16 11.7 3.96 3.96 Vindaloo NE 50975
HD-13-025 23 29 6 4 1.75 1.75 Vindaloo NE 50975
HD-13-025 35 41 6 4 2.52 2.52 Vindaloo NE 50975
HD-13-025 51 52 1 0.7 4.74 4.74 Vindaloo NE 50975
HD-13-025 71 86 15 10 4.09 4.09 Vindaloo NE 50975
HD-13-025 93 95 2 1.3 8.75 8.75 Vindaloo NE 50975
HD-13-026 37 40 3 2 5.9 5.9 Vindaloo NE 50975
HD-13-026 44 61 17 11.3 2.78 2.78 Vindaloo NE 50975
HD-13-026 65 66 1 0.7 2.29 2.29 Vindaloo NE 50975
HD-13-026 68 69 1 0.7 4.01 4.01 Vindaloo NE 50975
HD-13-026 72 79 7 4.7 1.6 1.6 Vindaloo NE 50975
HD-13-026 87 113 26 17.3 3.24 3.24 Vindaloo NE 50975
HD-13-027 100 108 8 5.3 2.21 2.21 Vindaloo NE 50975
HD-13-027 117 119 2 1.3 1.23 1.23 Vindaloo NE 50975
HD-13-027 130 148 18 12 6.14 6.14 Vindaloo NE 50975
HD-13-027 159 160 1 0.7 1.29 1.29 Vindaloo NE 50975
HD-13-028 30 31 1 0.7 2.99 2.99 Vindaloo NE 50950
HD-13-028 47 60 13 8.7 1.62 1.62 Vindaloo NE 50925
HD-13-028 62 64 2 1.3 1.01 1.01 Vindaloo NE 50925
HD-13-028 77 78 1 0.7 2.64 2.64 Vindaloo NE 50925
HD-13-029 18 19 1 0.7 1.3 1.3 Vindaloo NE 50925
HD-13-029 24 34 10 6.7 2.55 2.55 Vindaloo NE 50925
HD-13-029 49 53 4 2.7 2.29 2.29 Vindaloo NE 50925
HD-13-029 71 73 2 1.3 1.24 1.24 Vindaloo NE 50925
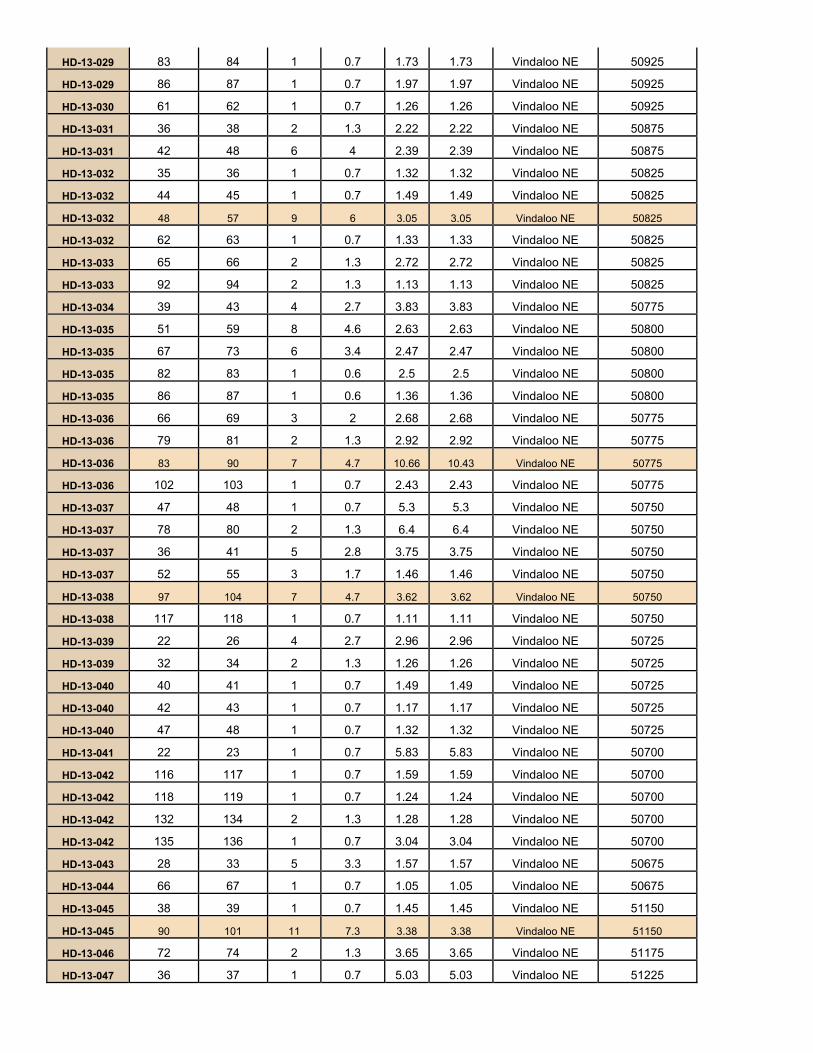
HD-13-029 83 84 1 0.7 1.73 1.73 Vindaloo NE 50925
HD-13-029 86 87 1 0.7 1.97 1.97 Vindaloo NE 50925
HD-13-030 61 62 1 0.7 1.26 1.26 Vindaloo NE 50925
HD-13-031 36 38 2 1.3 2.22 2.22 Vindaloo NE 50875
HD-13-031 42 48 6 4 2.39 2.39 Vindaloo NE 50875
HD-13-032 35 36 1 0.7 1.32 1.32 Vindaloo NE 50825
HD-13-032 44 45 1 0.7 1.49 1.49 Vindaloo NE 50825
HD-13-032 48 57 9 6 3.05 3.05 Vindaloo NE 50825
HD-13-032 62 63 1 0.7 1.33 1.33 Vindaloo NE 50825
HD-13-033 65 66 2 1.3 2.72 2.72 Vindaloo NE 50825
HD-13-033 92 94 2 1.3 1.13 1.13 Vindaloo NE 50825
HD-13-034 39 43 4 2.7 3.83 3.83 Vindaloo NE 50775
HD-13-035 51 59 8 4.6 2.63 2.63 Vindaloo NE 50800
HD-13-035 67 73 6 3.4 2.47 2.47 Vindaloo NE 50800
HD-13-035 82 83 1 0.6 2.5 2.5 Vindaloo NE 50800
HD-13-035 86 87 1 0.6 1.36 1.36 Vindaloo NE 50800
HD-13-036 66 69 3 2 2.68 2.68 Vindaloo NE 50775
HD-13-036 79 81 2 1.3 2.92 2.92 Vindaloo NE 50775
HD-13-036 83 90 7 4.7 10.66 10.43 Vindaloo NE 50775
HD-13-036 102 103 1 0.7 2.43 2.43 Vindaloo NE 50775
HD-13-037 47 48 1 0.7 5.3 5.3 Vindaloo NE 50750
HD-13-037 78 80 2 1.3 6.4 6.4 Vindaloo NE 50750
HD-13-037 36 41 5 2.8 3.75 3.75 Vindaloo NE 50750
HD-13-037 52 55 3 1.7 1.46 1.46 Vindaloo NE 50750
HD-13-038 97 104 7 4.7 3.62 3.62 Vindaloo NE 50750
HD-13-038 117 118 1 0.7 1.11 1.11 Vindaloo NE 50750
HD-13-039 22 26 4 2.7 2.96 2.96 Vindaloo NE 50725
HD-13-039 32 34 2 1.3 1.26 1.26 Vindaloo NE 50725
HD-13-040 40 41 1 0.7 1.49 1.49 Vindaloo NE 50725
HD-13-040 42 43 1 0.7 1.17 1.17 Vindaloo NE 50725
HD-13-040 47 48 1 0.7 1.32 1.32 Vindaloo NE 50725
HD-13-041 22 23 1 0.7 5.83 5.83 Vindaloo NE 50700
HD-13-042 116 117 1 0.7 1.59 1.59 Vindaloo NE 50700
HD-13-042 118 119 1 0.7 1.24 1.24 Vindaloo NE 50700
HD-13-042 132 134 2 1.3 1.28 1.28 Vindaloo NE 50700
HD-13-042 135 136 1 0.7 3.04 3.04 Vindaloo NE 50700
HD-13-043 28 33 5 3.3 1.57 1.57 Vindaloo NE 50675
HD-13-044 66 67 1 0.7 1.05 1.05 Vindaloo NE 50675
HD-13-045 38 39 1 0.7 1.45 1.45 Vindaloo NE 51150
HD-13-045 90 101 11 7.3 3.38 3.38 Vindaloo NE 51150
HD-13-046 72 74 2 1.3 3.65 3.65 Vindaloo NE 51175
HD-13-047 36 37 1 0.7 5.03 5.03 Vindaloo NE 51225
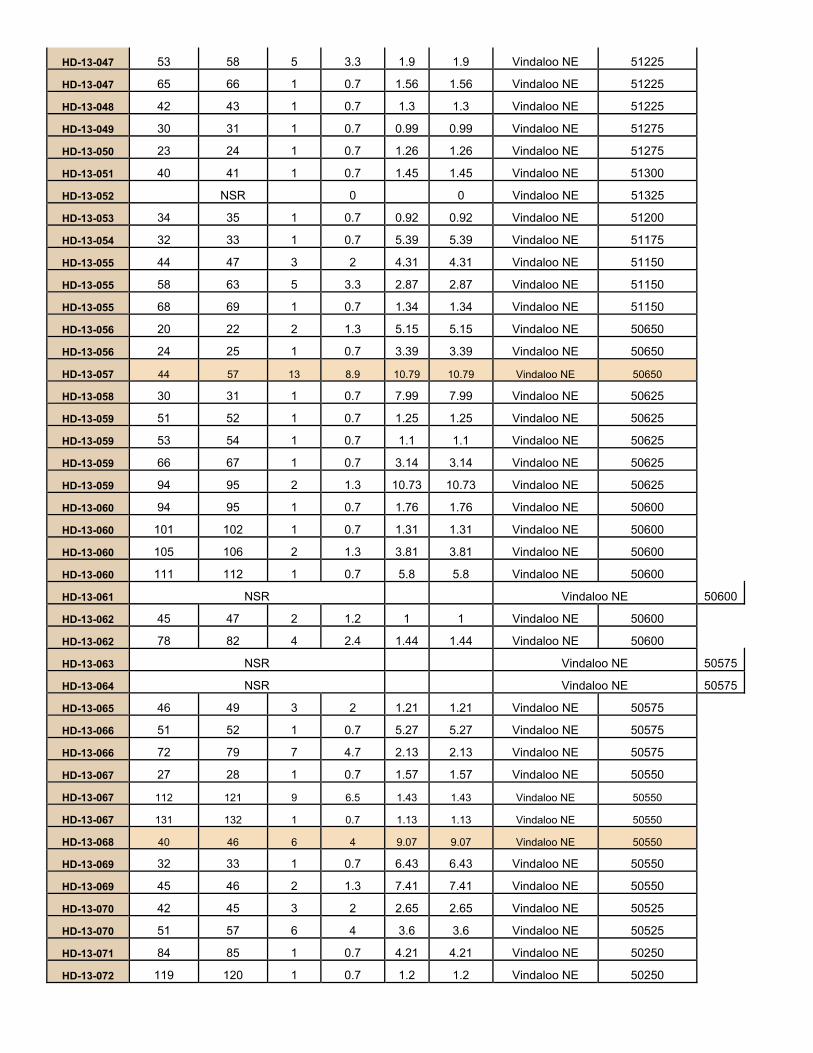
HD-13-047 53 58 5 3.3 1.9 1.9 Vindaloo NE 51225
HD-13-047 65 66 1 0.7 1.56 1.56 Vindaloo NE 51225
HD-13-048 42 43 1 0.7 1.3 1.3 Vindaloo NE 51225
HD-13-049 30 31 1 0.7 0.99 0.99 Vindaloo NE 51275
HD-13-050 23 24 1 0.7 1.26 1.26 Vindaloo NE 51275
HD-13-051 40 41 1 0.7 1.45 1.45 Vindaloo NE 51300
HD-13-052 NSR 0 0 Vindaloo NE 51325
HD-13-053 34 35 1 0.7 0.92 0.92 Vindaloo NE 51200
HD-13-054 32 33 1 0.7 5.39 5.39 Vindaloo NE 51175
HD-13-055 44 47 3 2 4.31 4.31 Vindaloo NE 51150
HD-13-055 58 63 5 3.3 2.87 2.87 Vindaloo NE 51150
HD-13-055 68 69 1 0.7 1.34 1.34 Vindaloo NE 51150
HD-13-056 20 22 2 1.3 5.15 5.15 Vindaloo NE 50650
HD-13-056 24 25 1 0.7 3.39 3.39 Vindaloo NE 50650
HD-13-057 44 57 13 8.9 10.79 10.79 Vindaloo NE 50650
HD-13-058 30 31 1 0.7 7.99 7.99 Vindaloo NE 50625
HD-13-059 51 52 1 0.7 1.25 1.25 Vindaloo NE 50625
HD-13-059 53 54 1 0.7 1.1 1.1 Vindaloo NE 50625
HD-13-059 66 67 1 0.7 3.14 3.14 Vindaloo NE 50625
HD-13-059 94 95 2 1.3 10.73 10.73 Vindaloo NE 50625
HD-13-060 94 95 1 0.7 1.76 1.76 Vindaloo NE 50600
HD-13-060 101 102 1 0.7 1.31 1.31 Vindaloo NE 50600
HD-13-060 105 106 2 1.3 3.81 3.81 Vindaloo NE 50600
HD-13-060 111 112 1 0.7 5.8 5.8 Vindaloo NE 50600
HD-13-061 NSR Vindaloo NE 50600
HD-13-062 45 47 2 1.2 1 1 Vindaloo NE 50600
HD-13-062 78 82 4 2.4 1.44 1.44 Vindaloo NE 50600
HD-13-063 NSR Vindaloo NE 50575
HD-13-064 NSR Vindaloo NE 50575
HD-13-065 46 49 3 2 1.21 1.21 Vindaloo NE 50575
HD-13-066 51 52 1 0.7 5.27 5.27 Vindaloo NE 50575
HD-13-066 72 79 7 4.7 2.13 2.13 Vindaloo NE 50575
HD-13-067 27 28 1 0.7 1.57 1.57 Vindaloo NE 50550
HD-13-067 112 121 9 6.5 1.43 1.43 Vindaloo NE 50550
HD-13-067 131 132 1 0.7 1.13 1.13 Vindaloo NE 50550
HD-13-068 40 46 6 4 9.07 9.07 Vindaloo NE 50550
HD-13-069 32 33 1 0.7 6.43 6.43 Vindaloo NE 50550
HD-13-069 45 46 2 1.3 7.41 7.41 Vindaloo NE 50550
HD-13-070 42 45 3 2 2.65 2.65 Vindaloo NE 50525
HD-13-070 51 57 6 4 3.6 3.6 Vindaloo NE 50525
HD-13-071 84 85 1 0.7 4.21 4.21 Vindaloo NE 50250
HD-13-072 119 120 1 0.7 1.2 1.2 Vindaloo NE 50250
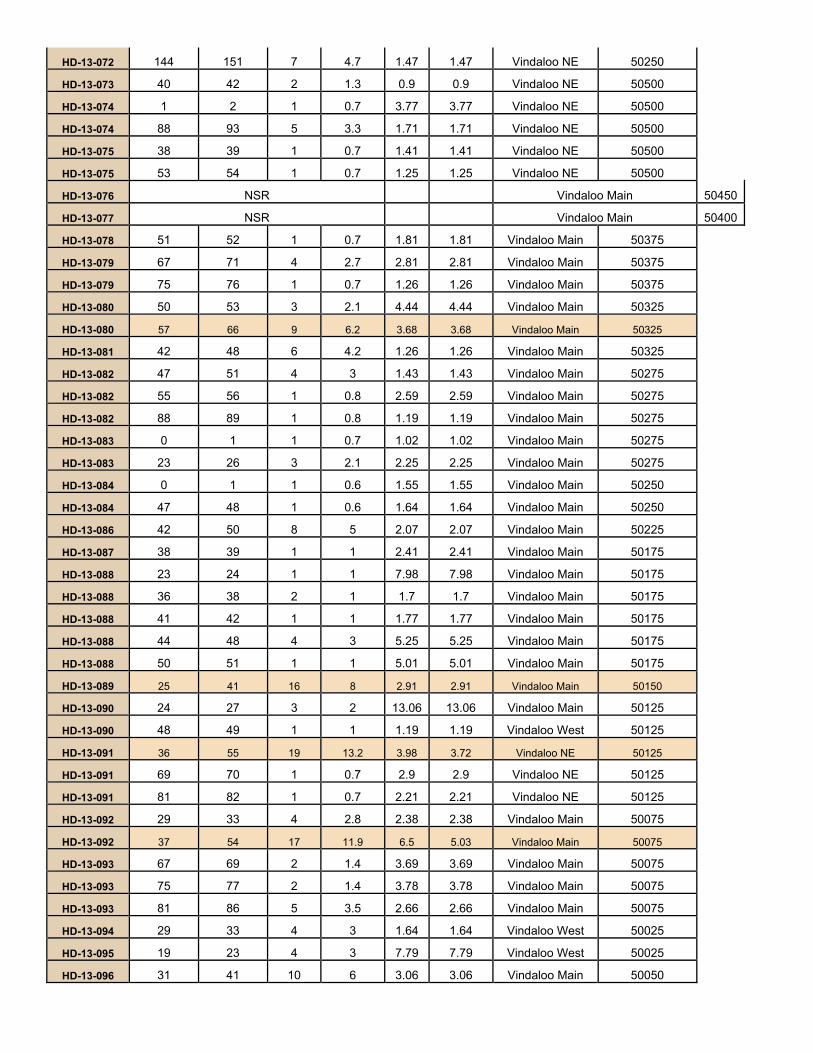
HD-13-072 144 151 7 4.7 1.47 1.47 Vindaloo NE 50250
HD-13-073 40 42 2 1.3 0.9 0.9 Vindaloo NE 50500
HD-13-074 1 2 1 0.7 3.77 3.77 Vindaloo NE 50500
HD-13-074 88 93 5 3.3 1.71 1.71 Vindaloo NE 50500
HD-13-075 38 39 1 0.7 1.41 1.41 Vindaloo NE 50500
HD-13-075 53 54 1 0.7 1.25 1.25 Vindaloo NE 50500
HD-13-076 NSR Vindaloo Main 50450
HD-13-077 NSR Vindaloo Main 50400
HD-13-078 51 52 1 0.7 1.81 1.81 Vindaloo Main 50375
HD-13-079 67 71 4 2.7 2.81 2.81 Vindaloo Main 50375
HD-13-079 75 76 1 0.7 1.26 1.26 Vindaloo Main 50375
HD-13-080 50 53 3 2.1 4.44 4.44 Vindaloo Main 50325
HD-13-080 57 66 9 6.2 3.68 3.68 Vindaloo Main 50325
HD-13-081 42 48 6 4.2 1.26 1.26 Vindaloo Main 50325
HD-13-082 47 51 4 3 1.43 1.43 Vindaloo Main 50275
HD-13-082 55 56 1 0.8 2.59 2.59 Vindaloo Main 50275
HD-13-082 88 89 1 0.8 1.19 1.19 Vindaloo Main 50275
HD-13-083 0 1 1 0.7 1.02 1.02 Vindaloo Main 50275
HD-13-083 23 26 3 2.1 2.25 2.25 Vindaloo Main 50275
HD-13-084 0 1 1 0.6 1.55 1.55 Vindaloo Main 50250
HD-13-084 47 48 1 0.6 1.64 1.64 Vindaloo Main 50250
HD-13-086 42 50 8 5 2.07 2.07 Vindaloo Main 50225
HD-13-087 38 39 1 1 2.41 2.41 Vindaloo Main 50175
HD-13-088 23 24 1 1 7.98 7.98 Vindaloo Main 50175
HD-13-088 36 38 2 1 1.7 1.7 Vindaloo Main 50175
HD-13-088 41 42 1 1 1.77 1.77 Vindaloo Main 50175
HD-13-088 44 48 4 3 5.25 5.25 Vindaloo Main 50175
HD-13-088 50 51 1 1 5.01 5.01 Vindaloo Main 50175
HD-13-089 25 41 16 8 2.91 2.91 Vindaloo Main 50150
HD-13-090 24 27 3 2 13.06 13.06 Vindaloo Main 50125
HD-13-090 48 49 1 1 1.19 1.19 Vindaloo West 50125
HD-13-091 36 55 19 13.2 3.98 3.72 Vindaloo NE 50125
HD-13-091 69 70 1 0.7 2.9 2.9 Vindaloo NE 50125
HD-13-091 81 82 1 0.7 2.21 2.21 Vindaloo NE 50125
HD-13-092 29 33 4 2.8 2.38 2.38 Vindaloo Main 50075
HD-13-092 37 54 17 11.9 6.5 5.03 Vindaloo Main 50075
HD-13-093 67 69 2 1.4 3.69 3.69 Vindaloo Main 50075
HD-13-093 75 77 2 1.4 3.78 3.78 Vindaloo Main 50075
HD-13-093 81 86 5 3.5 2.66 2.66 Vindaloo Main 50075
HD-13-094 29 33 4 3 1.64 1.64 Vindaloo West 50025
HD-13-095 19 23 4 3 7.79 7.79 Vindaloo West 50025
HD-13-096 31 41 10 6 3.06 3.06 Vindaloo Main 50050
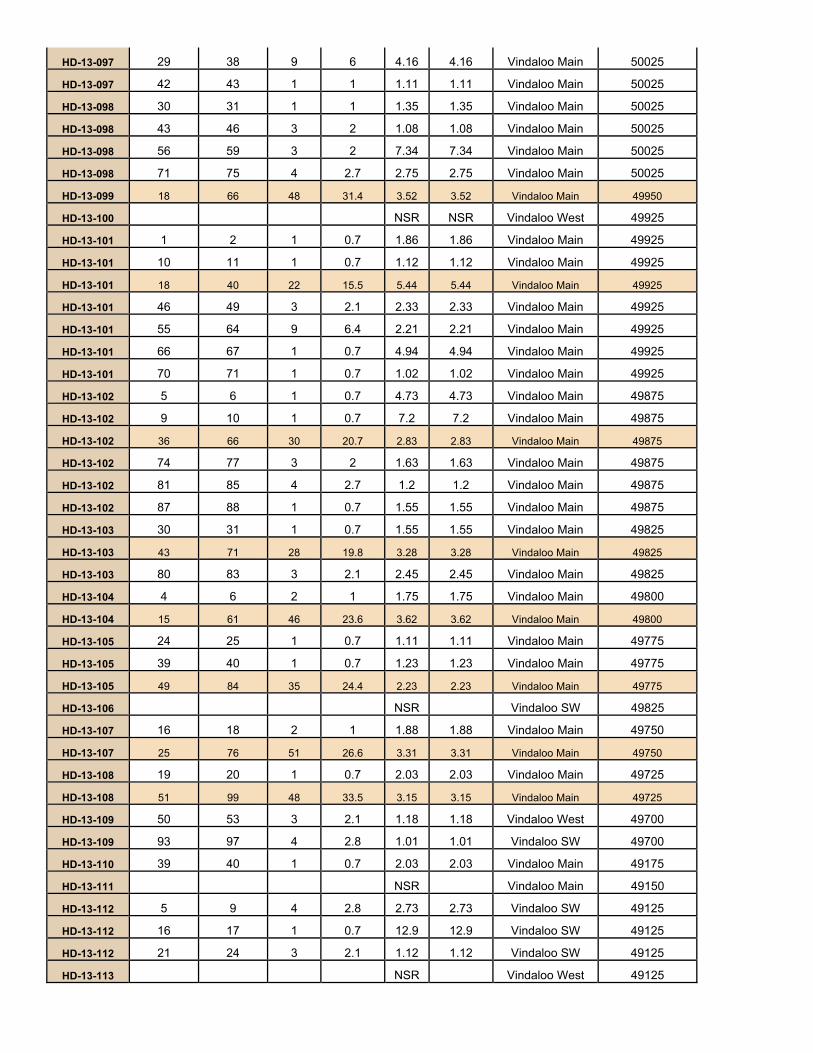
HD-13-097 29 38 9 6 4.16 4.16 Vindaloo Main 50025
HD-13-097 42 43 1 1 1.11 1.11 Vindaloo Main 50025
HD-13-098 30 31 1 1 1.35 1.35 Vindaloo Main 50025
HD-13-098 43 46 3 2 1.08 1.08 Vindaloo Main 50025
HD-13-098 56 59 3 2 7.34 7.34 Vindaloo Main 50025
HD-13-098 71 75 4 2.7 2.75 2.75 Vindaloo Main 50025
HD-13-099 18 66 48 31.4 3.52 3.52 Vindaloo Main 49950
HD-13-100 NSR NSR Vindaloo West 49925
HD-13-101 1 2 1 0.7 1.86 1.86 Vindaloo Main 49925
HD-13-101 10 11 1 0.7 1.12 1.12 Vindaloo Main 49925
HD-13-101 18 40 22 15.5 5.44 5.44 Vindaloo Main 49925
HD-13-101 46 49 3 2.1 2.33 2.33 Vindaloo Main 49925
HD-13-101 55 64 9 6.4 2.21 2.21 Vindaloo Main 49925
HD-13-101 66 67 1 0.7 4.94 4.94 Vindaloo Main 49925
HD-13-101 70 71 1 0.7 1.02 1.02 Vindaloo Main 49925
HD-13-102 5 6 1 0.7 4.73 4.73 Vindaloo Main 49875
HD-13-102 9 10 1 0.7 7.2 7.2 Vindaloo Main 49875
HD-13-102 36 66 30 20.7 2.83 2.83 Vindaloo Main 49875
HD-13-102 74 77 3 2 1.63 1.63 Vindaloo Main 49875
HD-13-102 81 85 4 2.7 1.2 1.2 Vindaloo Main 49875
HD-13-102 87 88 1 0.7 1.55 1.55 Vindaloo Main 49875
HD-13-103 30 31 1 0.7 1.55 1.55 Vindaloo Main 49825
HD-13-103 43 71 28 19.8 3.28 3.28 Vindaloo Main 49825
HD-13-103 80 83 3 2.1 2.45 2.45 Vindaloo Main 49825
HD-13-104 4 6 2 1 1.75 1.75 Vindaloo Main 49800
HD-13-104 15 61 46 23.6 3.62 3.62 Vindaloo Main 49800
HD-13-105 24 25 1 0.7 1.11 1.11 Vindaloo Main 49775
HD-13-105 39 40 1 0.7 1.23 1.23 Vindaloo Main 49775
HD-13-105 49 84 35 24.4 2.23 2.23 Vindaloo Main 49775
HD-13-106 NSR Vindaloo SW 49825
HD-13-107 16 18 2 1 1.88 1.88 Vindaloo Main 49750
HD-13-107 25 76 51 26.6 3.31 3.31 Vindaloo Main 49750
HD-13-108 19 20 1 0.7 2.03 2.03 Vindaloo Main 49725
HD-13-108 51 99 48 33.5 3.15 3.15 Vindaloo Main 49725
HD-13-109 50 53 3 2.1 1.18 1.18 Vindaloo West 49700
HD-13-109 93 97 4 2.8 1.01 1.01 Vindaloo SW 49700
HD-13-110 39 40 1 0.7 2.03 2.03 Vindaloo Main 49175
HD-13-111 NSR Vindaloo Main 49150
HD-13-112 5 9 4 2.8 2.73 2.73 Vindaloo SW 49125
HD-13-112 16 17 1 0.7 12.9 12.9 Vindaloo SW 49125
HD-13-112 21 24 3 2.1 1.12 1.12 Vindaloo SW 49125
HD-13-113 NSR Vindaloo West 49125
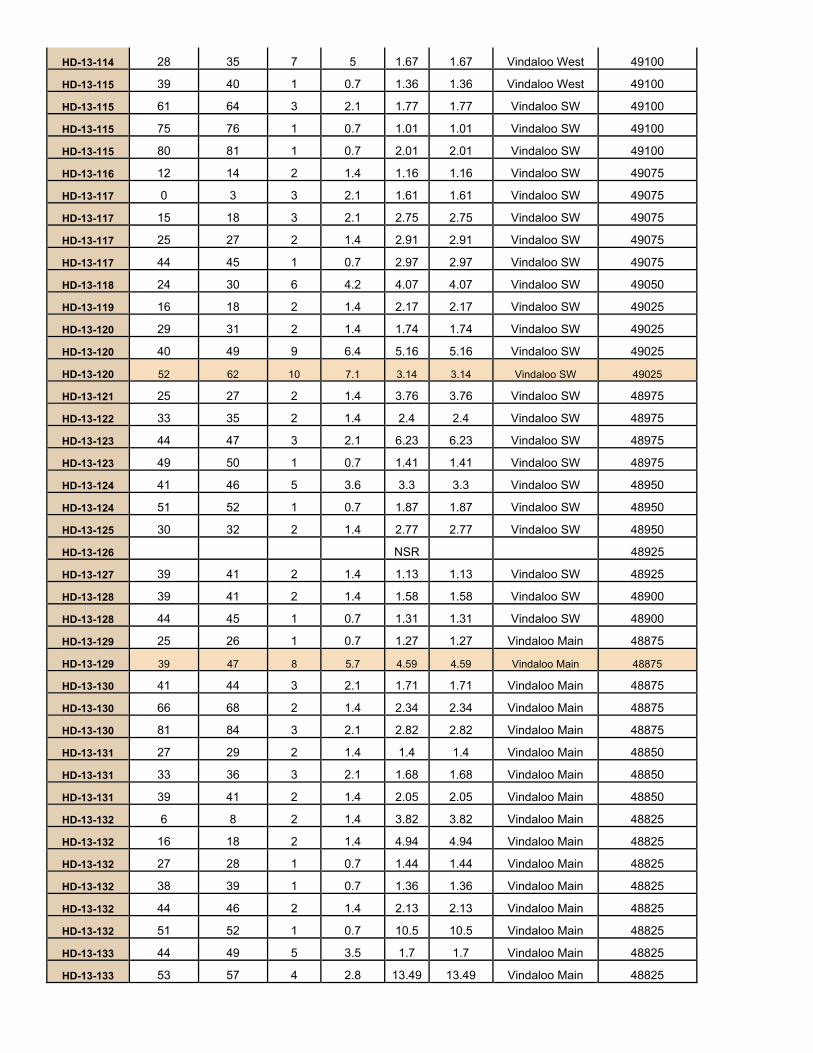
HD-13-114 28 35 7 5 1.67 1.67 Vindaloo West 49100
HD-13-115 39 40 1 0.7 1.36 1.36 Vindaloo West 49100
HD-13-115 61 64 3 2.1 1.77 1.77 Vindaloo SW 49100
HD-13-115 75 76 1 0.7 1.01 1.01 Vindaloo SW 49100
HD-13-115 80 81 1 0.7 2.01 2.01 Vindaloo SW 49100
HD-13-116 12 14 2 1.4 1.16 1.16 Vindaloo SW 49075
HD-13-117 0 3 3 2.1 1.61 1.61 Vindaloo SW 49075
HD-13-117 15 18 3 2.1 2.75 2.75 Vindaloo SW 49075
HD-13-117 25 27 2 1.4 2.91 2.91 Vindaloo SW 49075
HD-13-117 44 45 1 0.7 2.97 2.97 Vindaloo SW 49075
HD-13-118 24 30 6 4.2 4.07 4.07 Vindaloo SW 49050
HD-13-119 16 18 2 1.4 2.17 2.17 Vindaloo SW 49025
HD-13-120 29 31 2 1.4 1.74 1.74 Vindaloo SW 49025
HD-13-120 40 49 9 6.4 5.16 5.16 Vindaloo SW 49025
HD-13-120 52 62 10 7.1 3.14 3.14 Vindaloo SW 49025
HD-13-121 25 27 2 1.4 3.76 3.76 Vindaloo SW 48975
HD-13-122 33 35 2 1.4 2.4 2.4 Vindaloo SW 48975
HD-13-123 44 47 3 2.1 6.23 6.23 Vindaloo SW 48975
HD-13-123 49 50 1 0.7 1.41 1.41 Vindaloo SW 48975
HD-13-124 41 46 5 3.6 3.3 3.3 Vindaloo SW 48950
HD-13-124 51 52 1 0.7 1.87 1.87 Vindaloo SW 48950
HD-13-125 30 32 2 1.4 2.77 2.77 Vindaloo SW 48950
HD-13-126 NSR 48925
HD-13-127 39 41 2 1.4 1.13 1.13 Vindaloo SW 48925
HD-13-128 39 41 2 1.4 1.58 1.58 Vindaloo SW 48900
HD-13-128 44 45 1 0.7 1.31 1.31 Vindaloo SW 48900
HD-13-129 25 26 1 0.7 1.27 1.27 Vindaloo Main 48875
HD-13-129 39 47 8 5.7 4.59 4.59 Vindaloo Main 48875
HD-13-130 41 44 3 2.1 1.71 1.71 Vindaloo Main 48875
HD-13-130 66 68 2 1.4 2.34 2.34 Vindaloo Main 48875
HD-13-130 81 84 3 2.1 2.82 2.82 Vindaloo Main 48875
HD-13-131 27 29 2 1.4 1.4 1.4 Vindaloo Main 48850
HD-13-131 33 36 3 2.1 1.68 1.68 Vindaloo Main 48850
HD-13-131 39 41 2 1.4 2.05 2.05 Vindaloo Main 48850
HD-13-132 6 8 2 1.4 3.82 3.82 Vindaloo Main 48825
HD-13-132 16 18 2 1.4 4.94 4.94 Vindaloo Main 48825
HD-13-132 27 28 1 0.7 1.44 1.44 Vindaloo Main 48825
HD-13-132 38 39 1 0.7 1.36 1.36 Vindaloo Main 48825
HD-13-132 44 46 2 1.4 2.13 2.13 Vindaloo Main 48825
HD-13-132 51 52 1 0.7 10.5 10.5 Vindaloo Main 48825
HD-13-133 44 49 5 3.5 1.7 1.7 Vindaloo Main 48825
HD-13-133 53 57 4 2.8 13.49 13.49 Vindaloo Main 48825
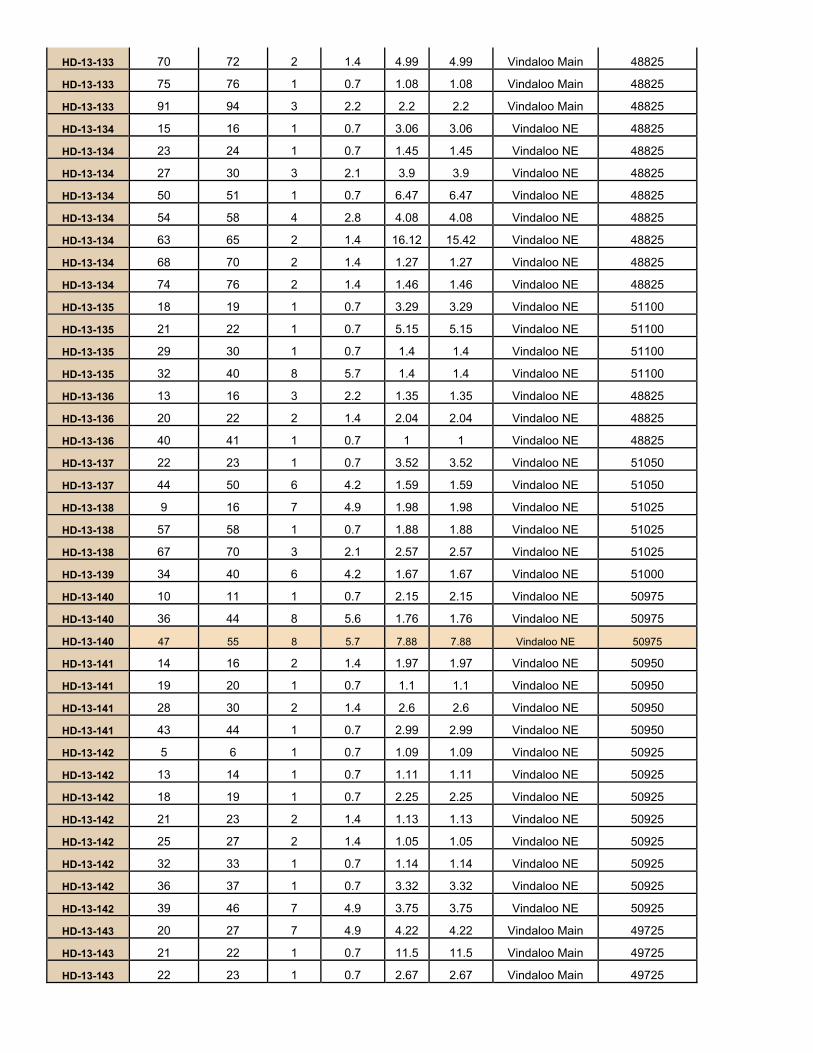
HD-13-133 70 72 2 1.4 4.99 4.99 Vindaloo Main 48825
HD-13-133 75 76 1 0.7 1.08 1.08 Vindaloo Main 48825
HD-13-133 91 94 3 2.2 2.2 2.2 Vindaloo Main 48825
HD-13-134 15 16 1 0.7 3.06 3.06 Vindaloo NE 48825
HD-13-134 23 24 1 0.7 1.45 1.45 Vindaloo NE 48825
HD-13-134 27 30 3 2.1 3.9 3.9 Vindaloo NE 48825
HD-13-134 50 51 1 0.7 6.47 6.47 Vindaloo NE 48825
HD-13-134 54 58 4 2.8 4.08 4.08 Vindaloo NE 48825
HD-13-134 63 65 2 1.4 16.12 15.42 Vindaloo NE 48825
HD-13-134 68 70 2 1.4 1.27 1.27 Vindaloo NE 48825
HD-13-134 74 76 2 1.4 1.46 1.46 Vindaloo NE 48825
HD-13-135 18 19 1 0.7 3.29 3.29 Vindaloo NE 51100
HD-13-135 21 22 1 0.7 5.15 5.15 Vindaloo NE 51100
HD-13-135 29 30 1 0.7 1.4 1.4 Vindaloo NE 51100
HD-13-135 32 40 8 5.7 1.4 1.4 Vindaloo NE 51100
HD-13-136 13 16 3 2.2 1.35 1.35 Vindaloo NE 48825
HD-13-136 20 22 2 1.4 2.04 2.04 Vindaloo NE 48825
HD-13-136 40 41 1 0.7 1 1 Vindaloo NE 48825
HD-13-137 22 23 1 0.7 3.52 3.52 Vindaloo NE 51050
HD-13-137 44 50 6 4.2 1.59 1.59 Vindaloo NE 51050
HD-13-138 9 16 7 4.9 1.98 1.98 Vindaloo NE 51025
HD-13-138 57 58 1 0.7 1.88 1.88 Vindaloo NE 51025
HD-13-138 67 70 3 2.1 2.57 2.57 Vindaloo NE 51025
HD-13-139 34 40 6 4.2 1.67 1.67 Vindaloo NE 51000
HD-13-140 10 11 1 0.7 2.15 2.15 Vindaloo NE 50975
HD-13-140 36 44 8 5.6 1.76 1.76 Vindaloo NE 50975
HD-13-140 47 55 8 5.7 7.88 7.88 Vindaloo NE 50975
HD-13-141 14 16 2 1.4 1.97 1.97 Vindaloo NE 50950
HD-13-141 19 20 1 0.7 1.1 1.1 Vindaloo NE 50950
HD-13-141 28 30 2 1.4 2.6 2.6 Vindaloo NE 50950
HD-13-141 43 44 1 0.7 2.99 2.99 Vindaloo NE 50950
HD-13-142 5 6 1 0.7 1.09 1.09 Vindaloo NE 50925
HD-13-142 13 14 1 0.7 1.11 1.11 Vindaloo NE 50925
HD-13-142 18 19 1 0.7 2.25 2.25 Vindaloo NE 50925
HD-13-142 21 23 2 1.4 1.13 1.13 Vindaloo NE 50925
HD-13-142 25 27 2 1.4 1.05 1.05 Vindaloo NE 50925
HD-13-142 32 33 1 0.7 1.14 1.14 Vindaloo NE 50925
HD-13-142 36 37 1 0.7 3.32 3.32 Vindaloo NE 50925
HD-13-142 39 46 7 4.9 3.75 3.75 Vindaloo NE 50925
HD-13-143 20 27 7 4.9 4.22 4.22 Vindaloo Main 49725
HD-13-143 21 22 1 0.7 11.5 11.5 Vindaloo Main 49725
HD-13-143 22 23 1 0.7 2.67 2.67 Vindaloo Main 49725
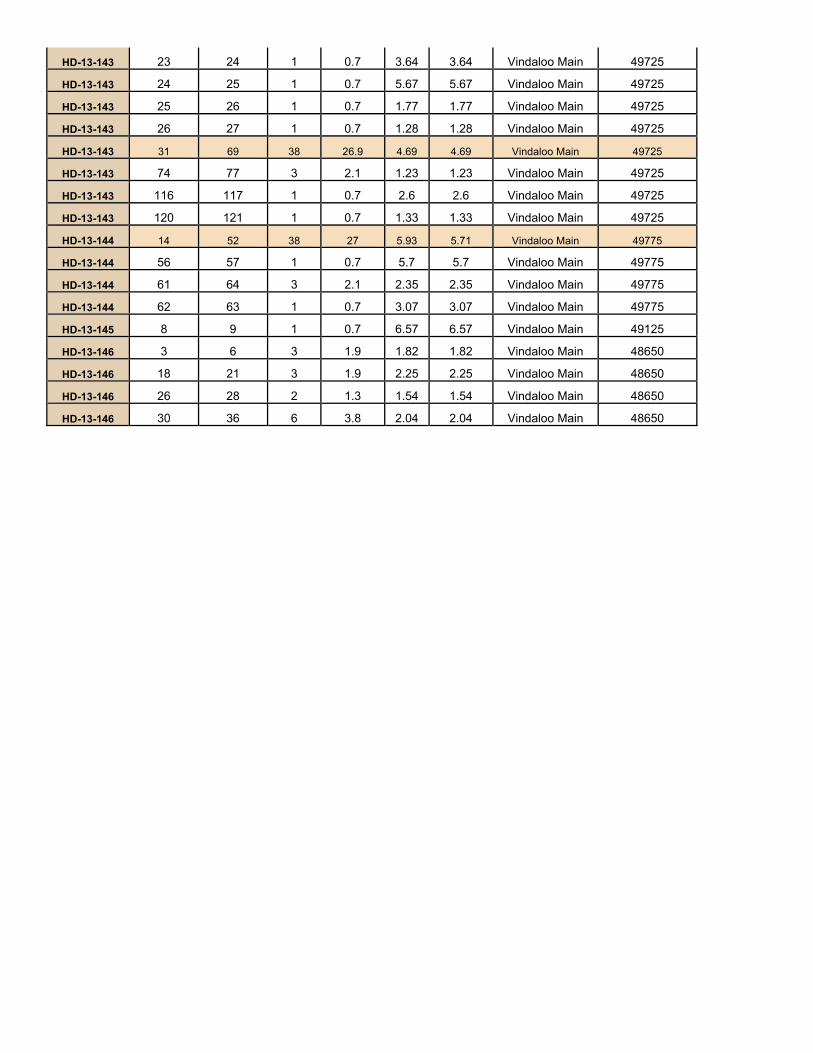
HD-13-143 23 24 1 0.7 3.64 3.64 Vindaloo Main 49725
HD-13-143 24 25 1 0.7 5.67 5.67 Vindaloo Main 49725
HD-13-143 25 26 1 0.7 1.77 1.77 Vindaloo Main 49725
HD-13-143 26 27 1 0.7 1.28 1.28 Vindaloo Main 49725
HD-13-143 31 69 38 26.9 4.69 4.69 Vindaloo Main 49725
HD-13-143 74 77 3 2.1 1.23 1.23 Vindaloo Main 49725
HD-13-143 116 117 1 0.7 2.6 2.6 Vindaloo Main 49725
HD-13-143 120 121 1 0.7 1.33 1.33 Vindaloo Main 49725
HD-13-144 14 52 38 27 5.93 5.71 Vindaloo Main 49775
HD-13-144 56 57 1 0.7 5.7 5.7 Vindaloo Main 49775
HD-13-144 61 64 3 2.1 2.35 2.35 Vindaloo Main 49775
HD-13-144 62 63 1 0.7 3.07 3.07 Vindaloo Main 49775
HD-13-145 8 9 1 0.7 6.57 6.57 Vindaloo Main 49125
HD-13-146 3 6 3 1.9 1.82 1.82 Vindaloo Main 48650
HD-13-146 18 21 3 1.9 2.25 2.25 Vindaloo Main 48650
HD-13-146 26 28 2 1.3 1.54 1.54 Vindaloo Main 48650
HD-13-146 30 36 6 3.8 2.04 2.04 Vindaloo Main 48650 �
HOUNDÉ GOLD PROJECT, BURKINA FASO FEASIBILITY STUDY NI 43-101 TECHNICAL REPORT
1813.20\25.02\1813.20-STY-001_B S11 October 2013 Lycopodium Minerals Pty Ltd
APPENDIX 11.1SELECTED STANDARD PLOTS
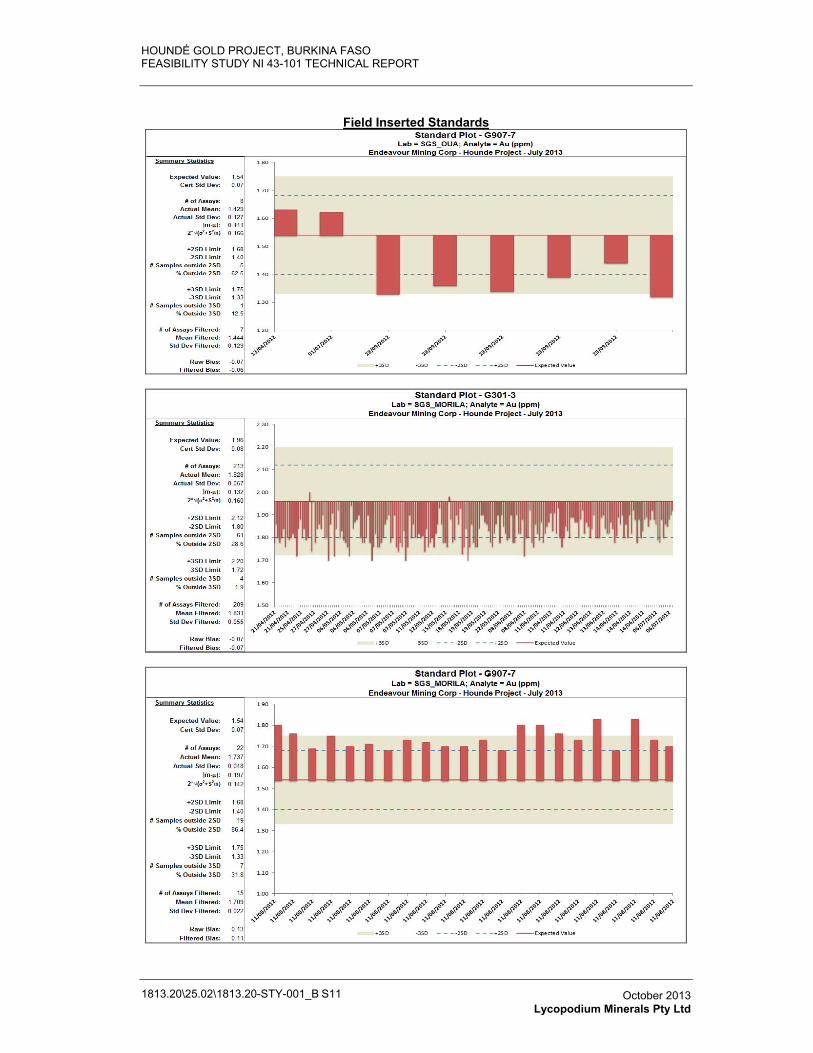
HOUNDÉ GOLD PROJECT, BURKINA FASO FEASIBILITY STUDY NI 43-101 TECHNICAL REPORT
1813.20\25.02\1813.20-STY-001_B S11 October 2013 Lycopodium Minerals Pty Ltd
Field Inserted Standards
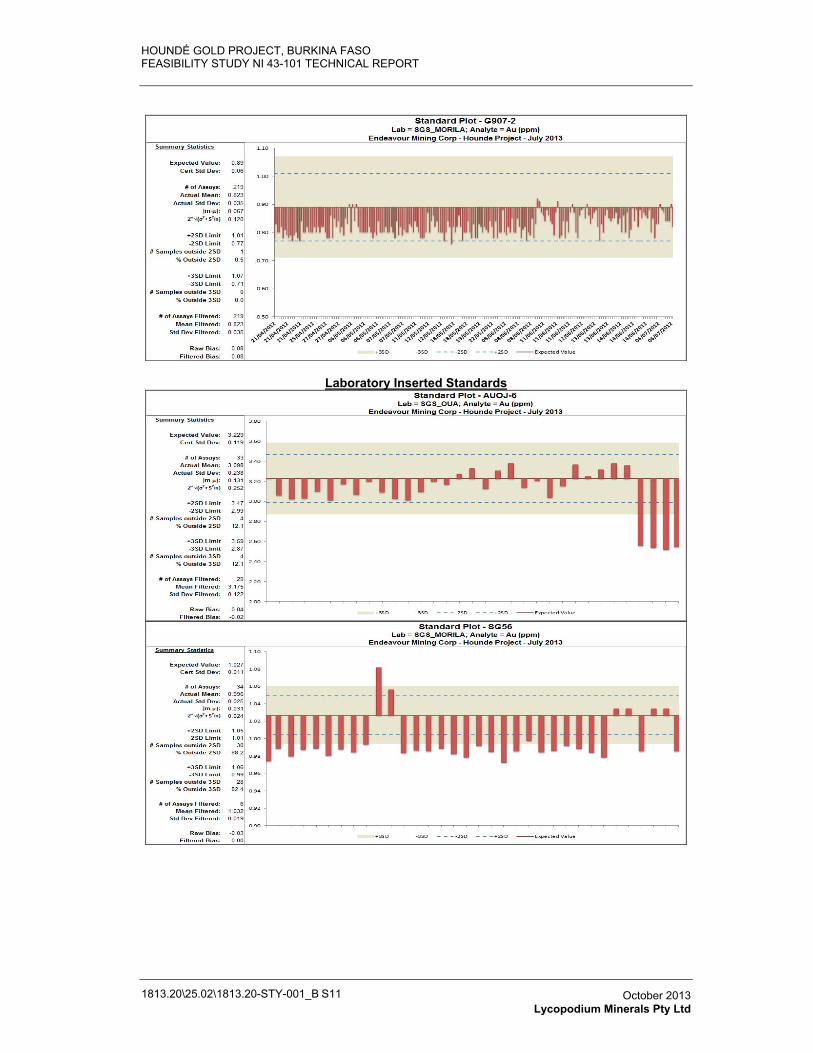
HOUNDÉ GOLD PROJECT, BURKINA FASO FEASIBILITY STUDY NI 43-101 TECHNICAL REPORT
1813.20\25.02\1813.20-STY-001_B S11 October 2013 Lycopodium Minerals Pty Ltd
Laboratory Inserted Standards
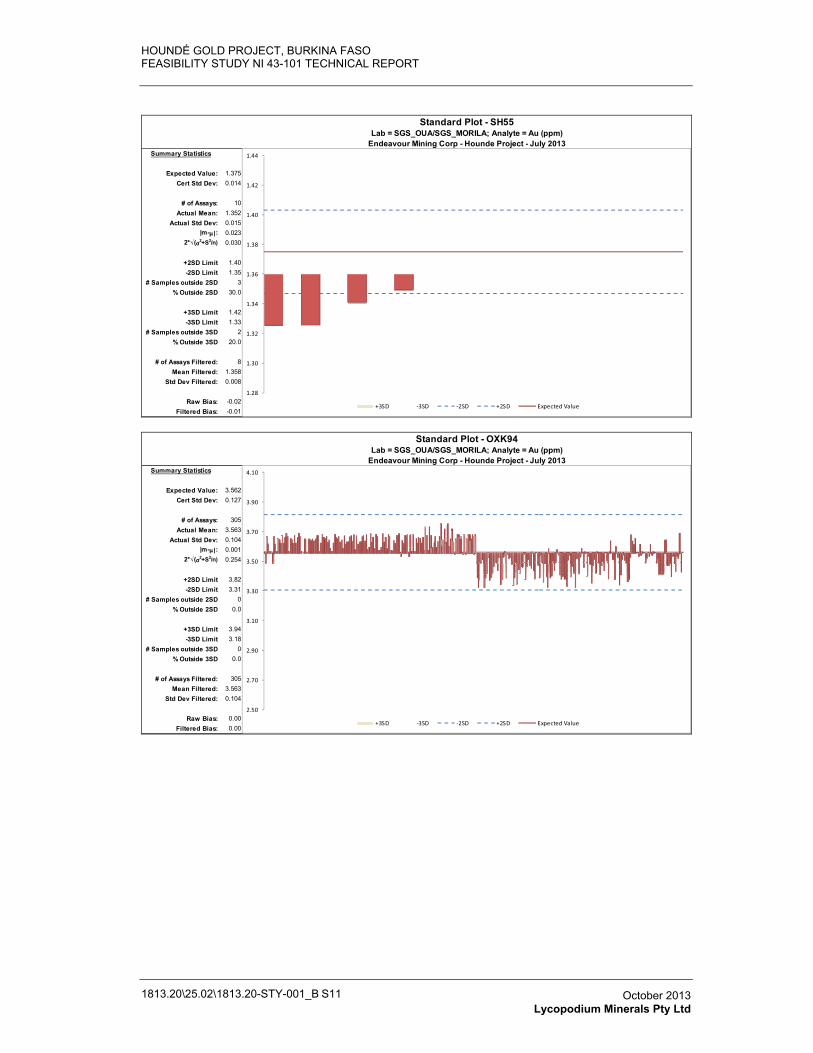
HOUNDÉ GOLD PROJECT, BURKINA FASO FEASIBILITY STUDY NI 43-101 TECHNICAL REPORT
1813.20\25.02\1813.20-STY-001_B S11 October 2013 Lycopodium Minerals Pty Ltd
Summary Statistics
Expected Value: 1.375Cert Std Dev: 0.014
# of Assays: 10Actual Mean: 1.352
Actual Std Dev: 0.015|m-μ|: 0.023
2*�(�2+S2/n) 0.030
+2SD Limit 1.40-2SD Limit 1.35
# Samples outside 2SD 3% Outside 2SD 30.0
+3SD Limit 1.42-3SD Limit 1.33
# Samples outside 3SD 2% Outside 3SD 20.0
# of Assays Filtered: 8 Mean Filtered: 1.358
Std Dev Filtered: 0.008
Raw Bias: -0.02Filtered Bias: -0.01
Standard Plot - SH55Lab = SGS_OUA/SGS_MORILA; Analyte = Au (ppm)
Endeavour Mining Corp - Hounde Project - July 2013
1.28
1.30
1.32
1.34
1.36
1.38
1.40
1.42
1.44
+3SD �3SD �2SD +2SD Expected�Value
Summary Statistics
Expected Value: 3.562Cert Std Dev: 0.127
# of Assays: 305Actual Mean: 3.563
Actual Std Dev: 0.104|m-μ|: 0.001
2*�(�2+S2/n) 0.254
+2SD Limit 3.82-2SD Limit 3.31
# Samples outside 2SD 0% Outside 2SD 0.0
+3SD Limit 3.94-3SD Limit 3.18
# Samples outside 3SD 0% Outside 3SD 0.0
# of Assays Filtered: 305 Mean Filtered: 3.563
Std Dev Filtered: 0.104
Raw Bias: 0.00Filtered Bias: 0.00
Standard Plot - OXK94Lab = SGS_OUA/SGS_MORILA; Analyte = Au (ppm)
Endeavour Mining Corp - Hounde Project - July 2013
2.50
2.70
2.90
3.10
3.30
3.50
3.70
3.90
4.10
+3SD �3SD �2SD +2SD Expected�Value
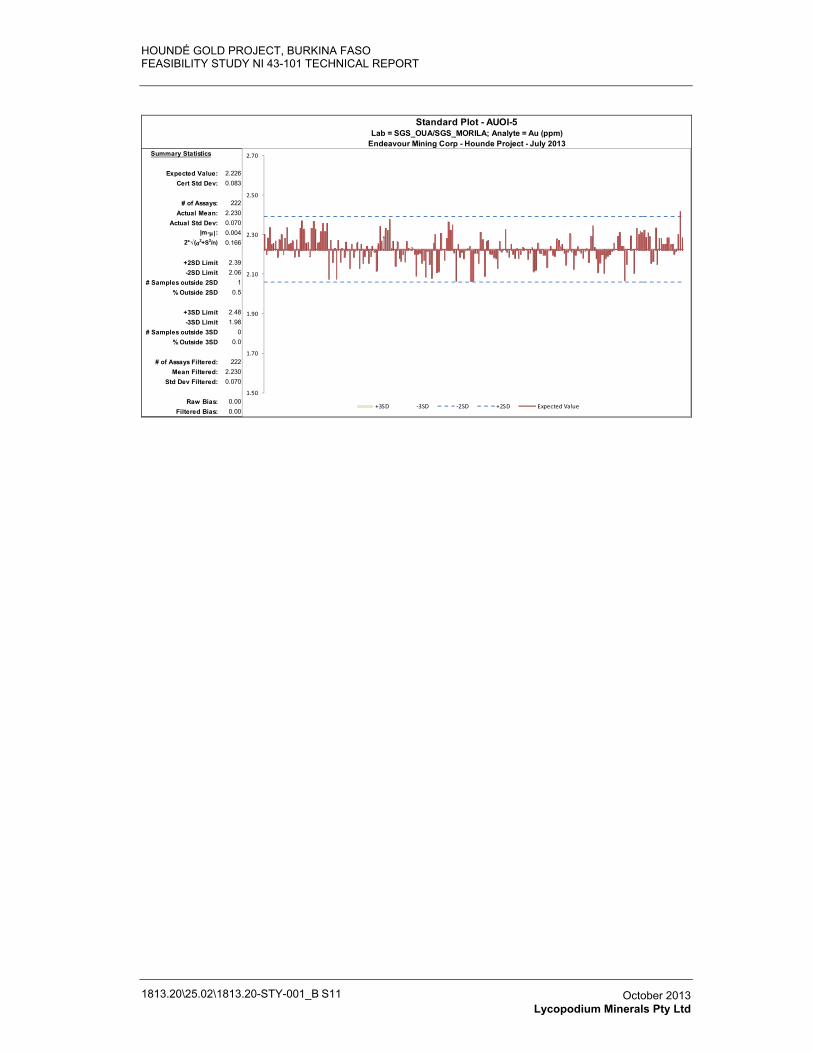
HOUNDÉ GOLD PROJECT, BURKINA FASO FEASIBILITY STUDY NI 43-101 TECHNICAL REPORT
1813.20\25.02\1813.20-STY-001_B S11 October 2013 Lycopodium Minerals Pty Ltd
Summary Statistics
Expected Value: 2.226Cert Std Dev: 0.083
# of Assays: 222Actual Mean: 2.230
Actual Std Dev: 0.070|m-μ|: 0.004
2*�(�2+S2/n) 0.166
+2SD Limit 2.39-2SD Limit 2.06
# Samples outside 2SD 1% Outside 2SD 0.5
+3SD Limit 2.48-3SD Limit 1.98
# Samples outside 3SD 0% Outside 3SD 0.0
# of Assays Filtered: 222 Mean Filtered: 2.230
Std Dev Filtered: 0.070
Raw Bias: 0.00Filtered Bias: 0.00
Standard Plot - AUOI-5Lab = SGS_OUA/SGS_MORILA; Analyte = Au (ppm)
Endeavour Mining Corp - Hounde Project - July 2013
1.50
1.70
1.90
2.10
2.30
2.50
2.70
+3SD �3SD �2SD +2SD Expected�Value
HOUNDÉ GOLD PROJECT, BURKINA FASO FEASIBILITY STUDY NI 43-101 TECHNICAL REPORT
1813.20\25.02\1813.20-STY-001_B S11 October 2013 Lycopodium Minerals Pty Ltd
APPENDIX 11.2SELECTED BLANK PLOTS
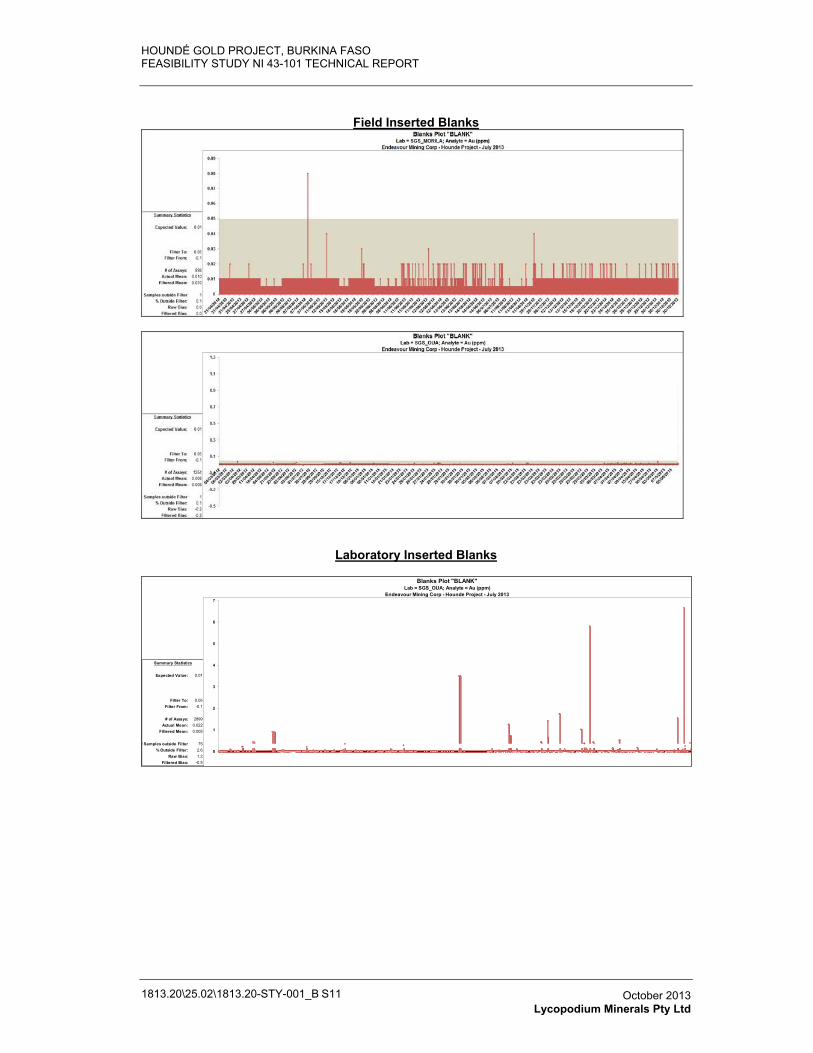
HOUNDÉ GOLD PROJECT, BURKINA FASO FEASIBILITY STUDY NI 43-101 TECHNICAL REPORT
1813.20\25.02\1813.20-STY-001_B S11 October 2013 Lycopodium Minerals Pty Ltd
Field Inserted Blanks
Laboratory Inserted Blanks
Expected Value: 0.01
Filter To: 0.05Filter From: -0.1
# of Assays: 2899 Actual Mean: 0.022
Filtered Mean: 0.005
# Samples outside Filter 75% Outside Filter: 2.6
Raw Bias: 1.2Filtered Bias: -0.5
Summary Statistics
Blanks Plot "BLANK"Lab = SGS_OUA; Analyte = Au (ppm)
Endeavour Mining Corp - Hounde Project - July 2013
0
1
2
3
4
5
6
7
HOUNDÉ GOLD PROJECT, BURKINA FASO FEASIBILITY STUDY NI 43-101 TECHNICAL REPORT
1813.20\25.02\1813.20-STY-001_B S11 October 2013 Lycopodium Minerals Pty Ltd
APPENDIX 11.3SELECTED DUPLICATE PLOTS
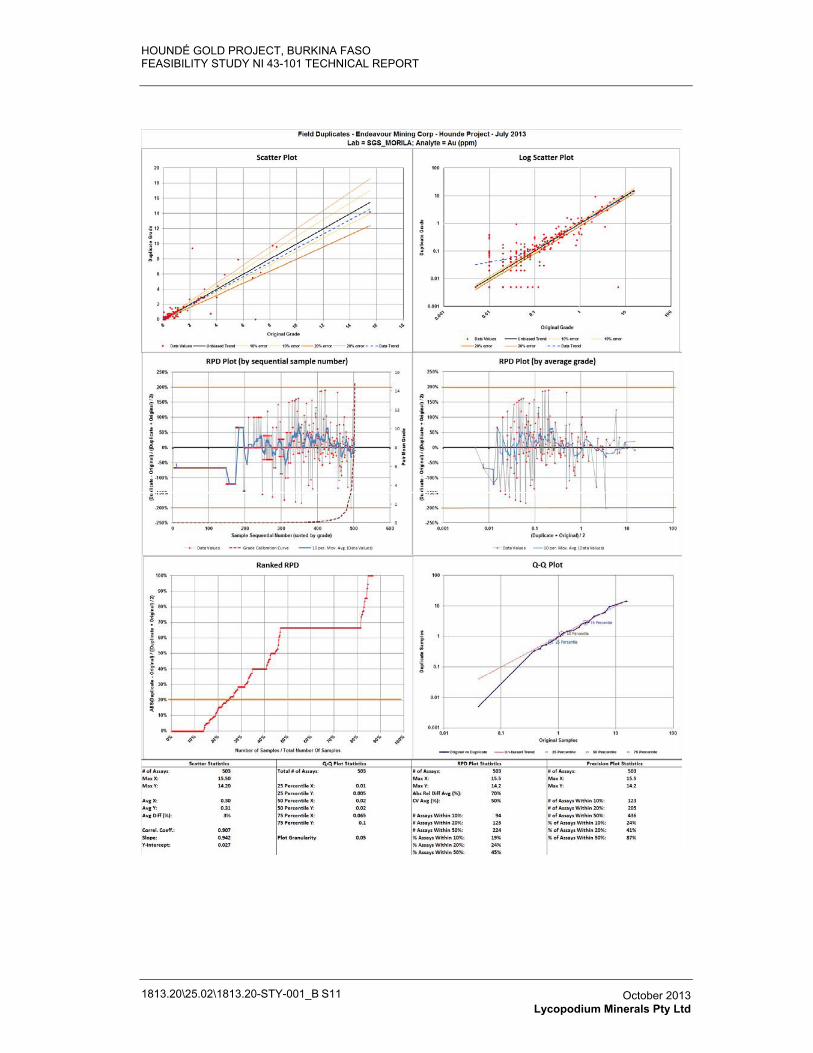
HOUNDÉ GOLD PROJECT, BURKINA FASO FEASIBILITY STUDY NI 43-101 TECHNICAL REPORT
1813.20\25.02\1813.20-STY-001_B S11 October 2013 Lycopodium Minerals Pty Ltd
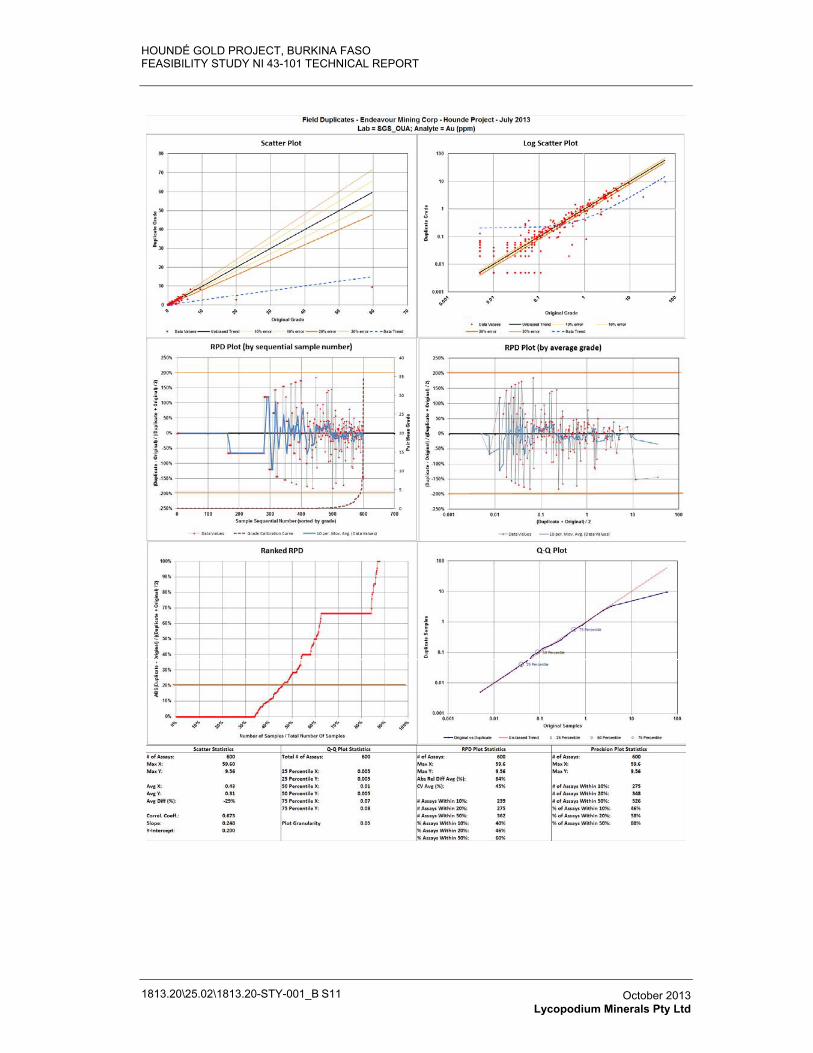
HOUNDÉ GOLD PROJECT, BURKINA FASO FEASIBILITY STUDY NI 43-101 TECHNICAL REPORT
1813.20\25.02\1813.20-STY-001_B S11 October 2013 Lycopodium Minerals Pty Ltd
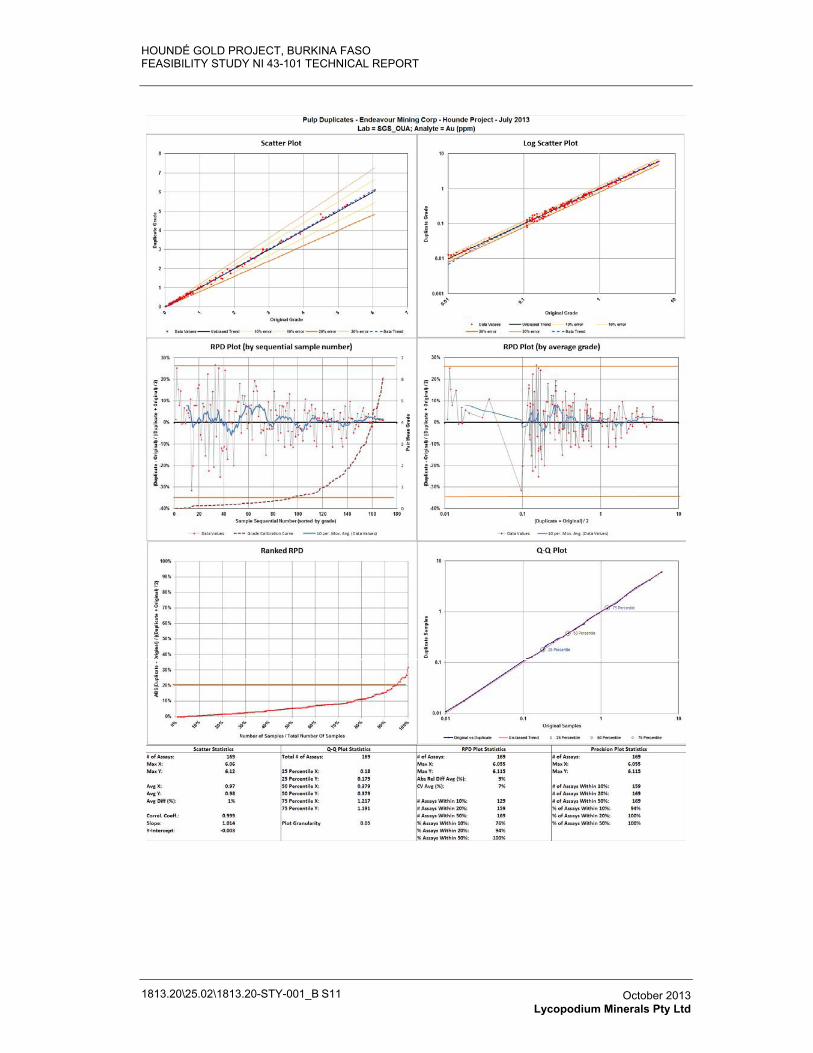
HOUNDÉ GOLD PROJECT, BURKINA FASO FEASIBILITY STUDY NI 43-101 TECHNICAL REPORT
1813.20\25.02\1813.20-STY-001_B S11 October 2013 Lycopodium Minerals Pty Ltd
HOUNDÉ GOLD PROJECT, BURKINA FASO FEASIBILITY STUDY NI 43-101 TECHNICAL REPORT
1813.20\25.02\1813.20-STY-001_B S11 October 2013 Lycopodium Minerals Pty Ltd
APPENDIX 11.4DATA ISSUES
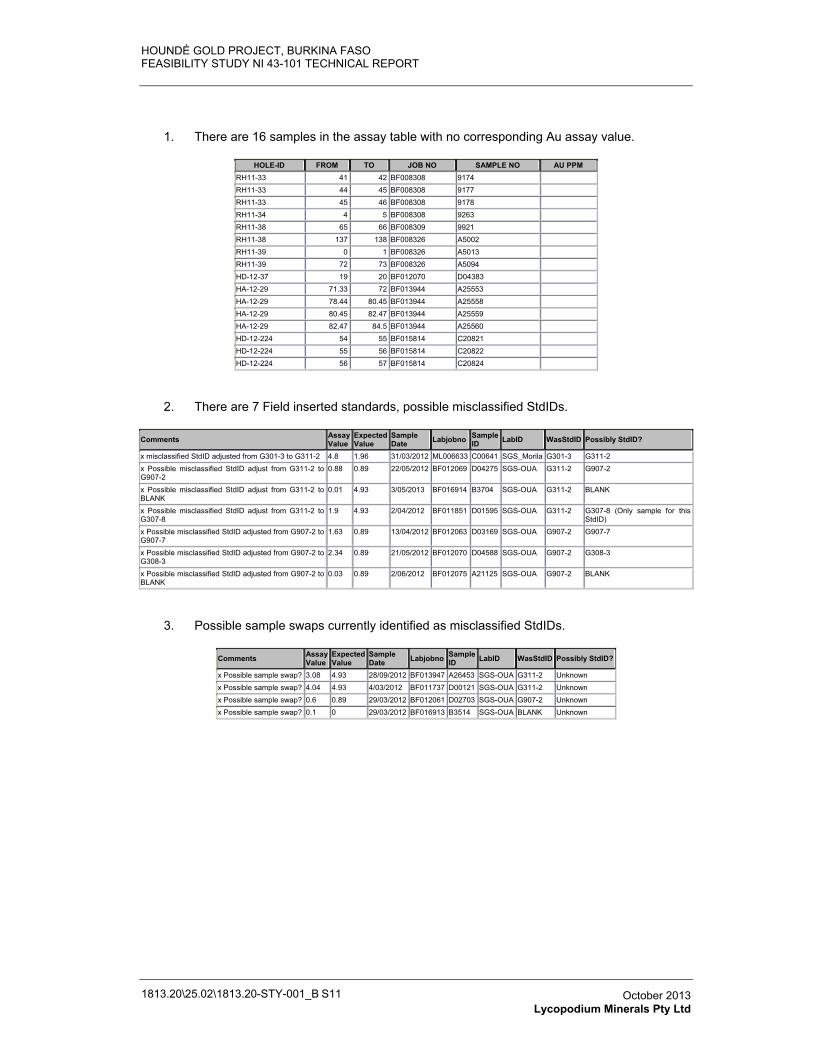
HOUNDÉ GOLD PROJECT, BURKINA FASO FEASIBILITY STUDY NI 43-101 TECHNICAL REPORT
1813.20\25.02\1813.20-STY-001_B S11 October 2013 Lycopodium Minerals Pty Ltd
1. There are 16 samples in the assay table with no corresponding Au assay value.
HOLE-ID FROM TO JOB NO SAMPLE NO AU PPM RH11-33 41 42 BF008308 9174 RH11-33 44 45 BF008308 9177 RH11-33 45 46 BF008308 9178 RH11-34 4 5 BF008308 9263 RH11-38 65 66 BF008309 9921 RH11-38 137 138 BF008326 A5002 RH11-39 0 1 BF008326 A5013 RH11-39 72 73 BF008326 A5094 HD-12-37 19 20 BF012070 D04383 HA-12-29 71.33 72 BF013944 A25553 HA-12-29 78.44 80.45 BF013944 A25558 HA-12-29 80.45 82.47 BF013944 A25559 HA-12-29 82.47 84.5 BF013944 A25560 HD-12-224 54 55 BF015814 C20821 HD-12-224 55 56 BF015814 C20822 HD-12-224 56 57 BF015814 C20824
2. There are 7 Field inserted standards, possible misclassified StdIDs.
Comments AssayValue
ExpectedValue
SampleDate Labjobno Sample
ID LabID WasStdID Possibly StdID?
x misclassified StdID adjusted from G301-3 to G311-2 4.8 1.96 31/03/2012 ML006633 C00641 SGS_Morila G301-3 G311-2 x Possible misclassified StdID adjust from G311-2 to G907-2
0.88 0.89 22/05/2012 BF012069 D04275 SGS-OUA G311-2 G907-2
x Possible misclassified StdID adjust from G311-2 to BLANK
0.01 4.93 3/05/2013 BF016914 B3704 SGS-OUA G311-2 BLANK
x Possible misclassified StdID adjust from G311-2 to G307-8
1.9 4.93 2/04/2012 BF011851 D01595 SGS-OUA G311-2 G307-8 (Only sample for this StdID)
x Possible misclassified StdID adjusted from G907-2 to G907-7
1.63 0.89 13/04/2012 BF012063 D03169 SGS-OUA G907-2 G907-7
x Possible misclassified StdID adjusted from G907-2 to G308-3
2.34 0.89 21/05/2012 BF012070 D04588 SGS-OUA G907-2 G308-3
x Possible misclassified StdID adjusted from G907-2 to BLANK
0.03 0.89 2/06/2012 BF012075 A21125 SGS-OUA G907-2 BLANK
3. Possible sample swaps currently identified as misclassified StdIDs.
Comments Assay Value
ExpectedValue
SampleDate Labjobno Sample
ID LabID WasStdID Possibly StdID?
x Possible sample swap? 3.08 4.93 28/09/2012 BF013947 A26453 SGS-OUA G311-2 Unknown x Possible sample swap? 4.04 4.93 4/03/2012 BF011737 D00121 SGS-OUA G311-2 Unknown x Possible sample swap? 0.6 0.89 29/03/2012 BF012061 D02703 SGS-OUA G907-2 Unknown x Possible sample swap? 0.1 0 29/03/2012 BF016913 B3514 SGS-OUA BLANK Unknown
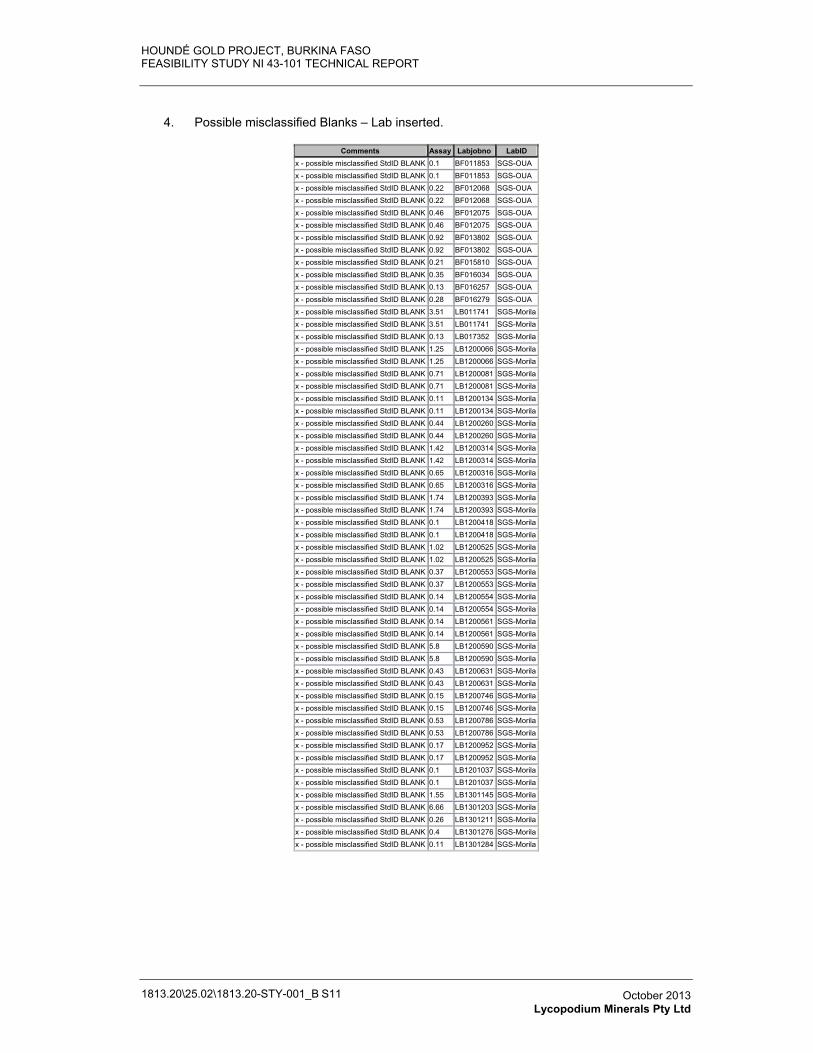
HOUNDÉ GOLD PROJECT, BURKINA FASO FEASIBILITY STUDY NI 43-101 TECHNICAL REPORT
1813.20\25.02\1813.20-STY-001_B S11 October 2013 Lycopodium Minerals Pty Ltd
4. Possible misclassified Blanks – Lab inserted.
Comments Assay Labjobno LabIDx - possible misclassified StdID BLANK 0.1 BF011853 SGS-OUA x - possible misclassified StdID BLANK 0.1 BF011853 SGS-OUA x - possible misclassified StdID BLANK 0.22 BF012068 SGS-OUA x - possible misclassified StdID BLANK 0.22 BF012068 SGS-OUA x - possible misclassified StdID BLANK 0.46 BF012075 SGS-OUA x - possible misclassified StdID BLANK 0.46 BF012075 SGS-OUA x - possible misclassified StdID BLANK 0.92 BF013802 SGS-OUA x - possible misclassified StdID BLANK 0.92 BF013802 SGS-OUA x - possible misclassified StdID BLANK 0.21 BF015810 SGS-OUA x - possible misclassified StdID BLANK 0.35 BF016034 SGS-OUA x - possible misclassified StdID BLANK 0.13 BF016257 SGS-OUA x - possible misclassified StdID BLANK 0.28 BF016279 SGS-OUA x - possible misclassified StdID BLANK 3.51 LB011741 SGS-Morilax - possible misclassified StdID BLANK 3.51 LB011741 SGS-Morilax - possible misclassified StdID BLANK 0.13 LB017352 SGS-Morilax - possible misclassified StdID BLANK 1.25 LB1200066 SGS-Morilax - possible misclassified StdID BLANK 1.25 LB1200066 SGS-Morilax - possible misclassified StdID BLANK 0.71 LB1200081 SGS-Morilax - possible misclassified StdID BLANK 0.71 LB1200081 SGS-Morilax - possible misclassified StdID BLANK 0.11 LB1200134 SGS-Morilax - possible misclassified StdID BLANK 0.11 LB1200134 SGS-Morilax - possible misclassified StdID BLANK 0.44 LB1200260 SGS-Morilax - possible misclassified StdID BLANK 0.44 LB1200260 SGS-Morilax - possible misclassified StdID BLANK 1.42 LB1200314 SGS-Morilax - possible misclassified StdID BLANK 1.42 LB1200314 SGS-Morilax - possible misclassified StdID BLANK 0.65 LB1200316 SGS-Morilax - possible misclassified StdID BLANK 0.65 LB1200316 SGS-Morilax - possible misclassified StdID BLANK 1.74 LB1200393 SGS-Morilax - possible misclassified StdID BLANK 1.74 LB1200393 SGS-Morilax - possible misclassified StdID BLANK 0.1 LB1200418 SGS-Morilax - possible misclassified StdID BLANK 0.1 LB1200418 SGS-Morilax - possible misclassified StdID BLANK 1.02 LB1200525 SGS-Morilax - possible misclassified StdID BLANK 1.02 LB1200525 SGS-Morilax - possible misclassified StdID BLANK 0.37 LB1200553 SGS-Morilax - possible misclassified StdID BLANK 0.37 LB1200553 SGS-Morilax - possible misclassified StdID BLANK 0.14 LB1200554 SGS-Morilax - possible misclassified StdID BLANK 0.14 LB1200554 SGS-Morilax - possible misclassified StdID BLANK 0.14 LB1200561 SGS-Morilax - possible misclassified StdID BLANK 0.14 LB1200561 SGS-Morilax - possible misclassified StdID BLANK 5.8 LB1200590 SGS-Morilax - possible misclassified StdID BLANK 5.8 LB1200590 SGS-Morilax - possible misclassified StdID BLANK 0.43 LB1200631 SGS-Morilax - possible misclassified StdID BLANK 0.43 LB1200631 SGS-Morilax - possible misclassified StdID BLANK 0.15 LB1200746 SGS-Morilax - possible misclassified StdID BLANK 0.15 LB1200746 SGS-Morilax - possible misclassified StdID BLANK 0.53 LB1200786 SGS-Morilax - possible misclassified StdID BLANK 0.53 LB1200786 SGS-Morilax - possible misclassified StdID BLANK 0.17 LB1200952 SGS-Morilax - possible misclassified StdID BLANK 0.17 LB1200952 SGS-Morilax - possible misclassified StdID BLANK 0.1 LB1201037 SGS-Morilax - possible misclassified StdID BLANK 0.1 LB1201037 SGS-Morilax - possible misclassified StdID BLANK 1.55 LB1301145 SGS-Morilax - possible misclassified StdID BLANK 6.66 LB1301203 SGS-Morilax - possible misclassified StdID BLANK 0.26 LB1301211 SGS-Morilax - possible misclassified StdID BLANK 0.4 LB1301276 SGS-Morilax - possible misclassified StdID BLANK 0.11 LB1301284 SGS-Morila
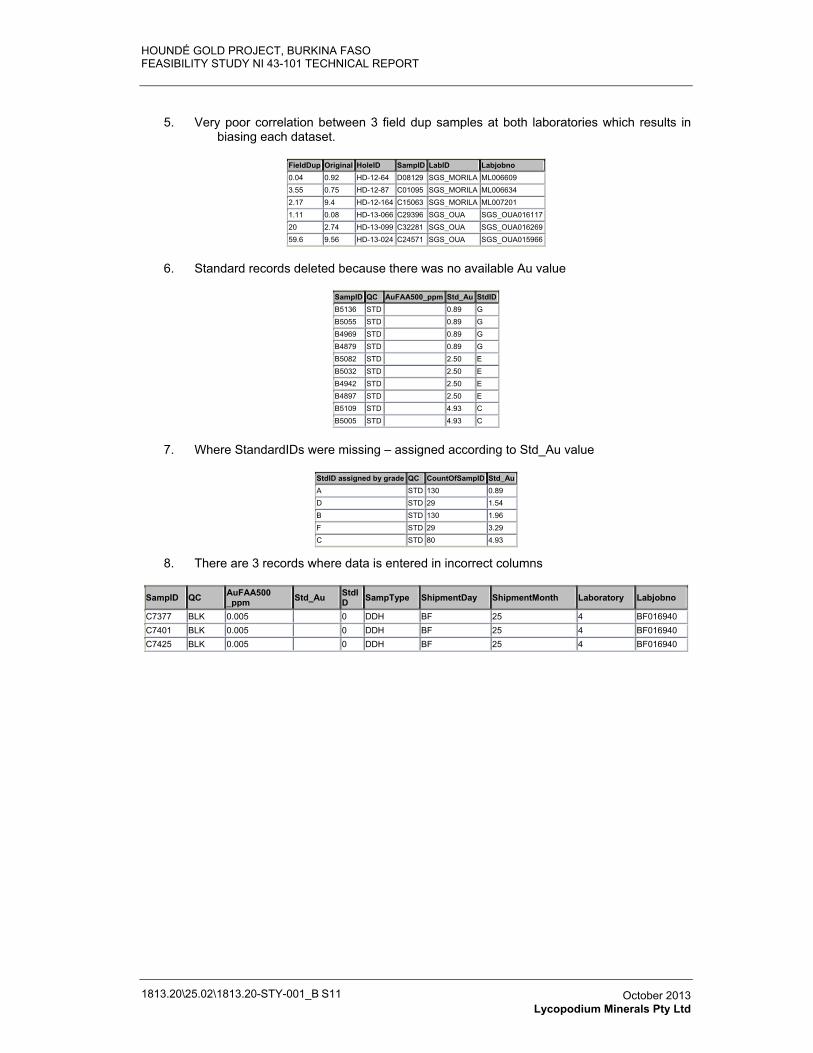
HOUNDÉ GOLD PROJECT, BURKINA FASO FEASIBILITY STUDY NI 43-101 TECHNICAL REPORT
1813.20\25.02\1813.20-STY-001_B S11 October 2013 Lycopodium Minerals Pty Ltd
5. Very poor correlation between 3 field dup samples at both laboratories which results in biasing each dataset.
FieldDup Original HoleID SampID LabID Labjobno0.04 0.92 HD-12-64 D08129 SGS_MORILA ML006609 3.55 0.75 HD-12-87 C01095 SGS_MORILA ML006634 2.17 9.4 HD-12-164 C15063 SGS_MORILA ML007201 1.11 0.08 HD-13-066 C29396 SGS_OUA SGS_OUA01611720 2.74 HD-13-099 C32281 SGS_OUA SGS_OUA01626959.6 9.56 HD-13-024 C24571 SGS_OUA SGS_OUA015966
6. Standard records deleted because there was no available Au value
SampID QC AuFAA500_ppm Std_Au StdIDB5136 STD 0.89 GB5055 STD 0.89 GB4969 STD 0.89 GB4879 STD 0.89 GB5082 STD 2.50 EB5032 STD 2.50 EB4942 STD 2.50 EB4897 STD 2.50 EB5109 STD 4.93 CB5005 STD 4.93 C
7. Where StandardIDs were missing – assigned according to Std_Au value
StdID assigned by grade QC CountOfSampID Std_AuA STD 130 0.89 D STD 29 1.54 B STD 130 1.96 F STD 29 3.29 C STD 80 4.93
8. There are 3 records where data is entered in incorrect columns
SampID QC AuFAA500 _ppm Std_Au StdI
D SampType ShipmentDay ShipmentMonth Laboratory Labjobno
C7377 BLK 0.005 0 DDH BF 25 4 BF016940 C7401 BLK 0.005 0 DDH BF 25 4 BF016940 C7425 BLK 0.005 0 DDH BF 25 4 BF016940
HOUNDÉ GOLD PROJECT, BURKINA FASO FEASIBILITY STUDY NI 43-101 TECHNICAL REPORT
1813.20\25.02\1813.20-STY-001_B A14.1.1 October 2013 Cube Consulting Pty Ltd
APPENDIX 14.1INTERPOLATOR OUTPUT FILES

HOUNDÉ GOLD PROJECT, BURKINA FASO FEASIBILITY STUDY NI 43-101 TECHNICAL REPORT
1813.20\25.02\1813.20-STY-001_B A14.1.1 October 2013 Cube Consulting Pty Ltd
Interpolation Date Tuesday - 18 June - 2013 - at 22:26:38Interpolation Run Number 1Interpolarion ipar file hounde_estimation_2013_0_20.iparWorking Directory d:/endeavour/2013_012_hounde/blockmodel_10_5_10
Input Assay File DetailsAssay File Location ../composites/cut_1m_ con_panel_hounde_june20Assay File Id 1 au_cutAssay String Numbers 1,99Assay Description Field 11
Assay File Constraint DetailsConstrain Assays N YAssay Constraint File domain_1Save Constrained Assays N domain_1_cutOutput Constrained Assay File LocationOutput Constrained Assay File Id
Interpolation Search DetailsOctant or Ellipsoid EllipsoidMax No of Adjacent Empty OctantsMinimum Number of Samples 6Maximum Number of Samples 40Limit Samples by Hole Id NHole Id FieldMaximum Number of Samples per HoleMaximum Search Distance for Major Axis 75Maximum Vertical Search Distance 1000Bearing of Major Axis 25Plunge of Major Axis 0Dip of Semi-Major Axis -90Major / Semi-Major Ratio 1Major / Minor Ratio 4
Pass Details Pass 1 Pass 2 Pass 3Pass Field pass passPass Field Value 1 2Pass Ratio 2Pass Minimum Samples 6 4Pass Maximum Samples 40 40
Interpolation Method DetailsInverse Distance or Ordinary Krigging Ordinary KrigingInverse Distance PowerNo of X Descretisation Points 2No of Y Descretisation Points 4No of Z Descretisation Points 2
Variogram Parameters if OK is chosenNumber of Structures 2Nugget 0.55Relative Nugget 55% Major/Semi Major/
Sill Range Azimuth Plunge Dip Major Ratio Minor RatioStructure 1 0.32 10 25 0 -90 1 2Structure 2 0.13 50 25 0 -90 1 4Structure 3 0 0 0 0 0 1 1Structure 4 0 0 0 0 0 1 1Structure 5 0 0 0 0 0 1 1
Interpolation Output FieldsDistance to Nearest Sample Field dnsAverage Distance Field avdNumber of Samples Field nsKriging Variance Field kv
Output Report File Name *.XLS au_cut_dom_1
Domain Name
Block Model DetailsBlock ModelBlock Model Field
Interpolator Output Report
Block Model Constraint DetailsConstrain EstimationEstimation Constraints File

HOUNDÉ GOLD PROJECT, BURKINA FASO FEASIBILITY STUDY NI 43-101 TECHNICAL REPORT
1813.20\25.02\1813.20-STY-001_B A14.1.1 October 2013 Cube Consulting Pty Ltd
Interpolation Date Tuesday - 18 June - 2013 - at 22:27:14Interpolation Run Number 3Interpolarion ipar file hounde_estimation_2013_0_20.iparWorking Directory d:/endeavour/2013_012_hounde/blockmodel_10_5_10
Input Assay File DetailsAssay File Location ../composites/cut_1m_ con_panel_hounde_june20Assay File Id 2 au_cutAssay String Numbers 1,99Assay Description Field 11
Assay File Constraint DetailsConstrain Assays N YAssay Constraint File domain_2Save Constrained Assays N domain_2_cutOutput Constrained Assay File LocationOutput Constrained Assay File Id
Interpolation Search DetailsOctant or Ellipsoid EllipsoidMax No of Adjacent Empty OctantsMinimum Number of Samples 6Maximum Number of Samples 40Limit Samples by Hole Id NHole Id FieldMaximum Number of Samples per HoleMaximum Search Distance for Major Axis 75Maximum Vertical Search Distance 1000Bearing of Major Axis 35Plunge of Major Axis 0Dip of Semi-Major Axis -90Major / Semi-Major Ratio 1Major / Minor Ratio 4
Pass Details Pass 1 Pass 2 Pass 3Pass Field pass passPass Field Value 1 2Pass Ratio 2Pass Minimum Samples 6 4Pass Maximum Samples 40 40
Interpolation Method DetailsInverse Distance or Ordinary Krigging Ordinary KrigingInverse Distance PowerNo of X Descretisation Points 2No of Y Descretisation Points 4No of Z Descretisation Points 2
Variogram Parameters if OK is chosenNumber of Structures 2Nugget 0.55Relative Nugget 55% Major/Semi Major/
Sill Range Azimuth Plunge Dip Major Ratio Minor RatioStructure 1 0.32 10 35 0 -90 1 2Structure 2 0.13 50 35 0 -90 1 4Structure 3 0 0 0 0 0 1 1Structure 4 0 0 0 0 0 1 1Structure 5 0 0 0 0 0 1 1
Interpolation Output FieldsDistance to Nearest Sample Field dnsAverage Distance Field avdNumber of Samples Field nsKriging Variance Field kv
Output Report File Name *.XLS au_cut_dom_2
Domain Name
Block Model DetailsBlock ModelBlock Model Field
Interpolator Output Report
Block Model Constraint DetailsConstrain EstimationEstimation Constraints File

HOUNDÉ GOLD PROJECT, BURKINA FASO FEASIBILITY STUDY NI 43-101 TECHNICAL REPORT
1813.20\25.02\1813.20-STY-001_B A14.1.1 October 2013 Cube Consulting Pty Ltd
Interpolation Date Tuesday - 18 June - 2013 - at 22:30:21Interpolation Run Number 5Interpolarion ipar file hounde_estimation_2013_0_20.iparWorking Directory d:/endeavour/2013_012_hounde/blockmodel_10_5_10
Input Assay File DetailsAssay File Location ../composites/cut_1m_ con_panel_hounde_june20Assay File Id 3 au_cutAssay String Numbers 1,99Assay Description Field 11
Assay File Constraint DetailsConstrain Assays N YAssay Constraint File domain_3Save Constrained Assays N domain_3_cutOutput Constrained Assay File LocationOutput Constrained Assay File Id
Interpolation Search DetailsOctant or Ellipsoid EllipsoidMax No of Adjacent Empty OctantsMinimum Number of Samples 6Maximum Number of Samples 40Limit Samples by Hole Id NHole Id FieldMaximum Number of Samples per HoleMaximum Search Distance for Major Axis 75Maximum Vertical Search Distance 1000Bearing of Major Axis 25Plunge of Major Axis 0Dip of Semi-Major Axis -90Major / Semi-Major Ratio 1Major / Minor Ratio 4
Pass Details Pass 1 Pass 2 Pass 3Pass Field pass passPass Field Value 1 2Pass Ratio 2Pass Minimum Samples 6 4Pass Maximum Samples 40 40
Interpolation Method DetailsInverse Distance or Ordinary Krigging Ordinary KrigingInverse Distance PowerNo of X Descretisation Points 2No of Y Descretisation Points 4No of Z Descretisation Points 2
Variogram Parameters if OK is chosenNumber of Structures 2Nugget 0.55Relative Nugget 55% Major/Semi Major/
Sill Range Azimuth Plunge Dip Major Ratio Minor RatioStructure 1 0.32 10 25 0 -90 1 2Structure 2 0.13 50 25 0 -90 1 4Structure 3 0 0 0 0 0 1 1Structure 4 0 0 0 0 0 1 1Structure 5 0 0 0 0 0 1 1
Interpolation Output FieldsDistance to Nearest Sample Field dnsAverage Distance Field avdNumber of Samples Field nsKriging Variance Field kv
Output Report File Name *.XLS au_cut_dom_3
Domain Name
Block Model DetailsBlock ModelBlock Model Field
Interpolator Output Report
Block Model Constraint DetailsConstrain EstimationEstimation Constraints File

HOUNDÉ GOLD PROJECT, BURKINA FASO FEASIBILITY STUDY NI 43-101 TECHNICAL REPORT
1813.20\25.02\1813.20-STY-001_B A14.1.1 October 2013 Cube Consulting Pty Ltd
Interpolation Date Tuesday - 18 June - 2013 - at 22:32:02Interpolation Run Number 9Interpolarion ipar file hounde_estimation_2013_0_20.iparWorking Directory d:/endeavour/2013_012_hounde/blockmodel_10_5_10
Input Assay File DetailsAssay File Location ../composites/cut_1m_ con_panel_hounde_june20Assay File Id 5 au_cutAssay String Numbers 1,99Assay Description Field 11
Assay File Constraint DetailsConstrain Assays N YAssay Constraint File domain_5Save Constrained Assays N domain_5_cutOutput Constrained Assay File LocationOutput Constrained Assay File Id
Interpolation Search DetailsOctant or Ellipsoid EllipsoidMax No of Adjacent Empty OctantsMinimum Number of Samples 6Maximum Number of Samples 40Limit Samples by Hole Id NHole Id FieldMaximum Number of Samples per HoleMaximum Search Distance for Major Axis 75Maximum Vertical Search Distance 1000Bearing of Major Axis 35Plunge of Major Axis 0Dip of Semi-Major Axis -90Major / Semi-Major Ratio 1Major / Minor Ratio 4
Pass Details Pass 1 Pass 2 Pass 3Pass Field pass passPass Field Value 1 2Pass Ratio 2Pass Minimum Samples 6 4Pass Maximum Samples 40 40
Interpolation Method DetailsInverse Distance or Ordinary Krigging Ordinary KrigingInverse Distance PowerNo of X Descretisation Points 2No of Y Descretisation Points 4No of Z Descretisation Points 2
Variogram Parameters if OK is chosenNumber of Structures 2Nugget 0.55Relative Nugget 55% Major/Semi Major/
Sill Range Azimuth Plunge Dip Major Ratio Minor RatioStructure 1 0.32 10 35 0 -90 1 2Structure 2 0.13 50 35 0 -90 1 4Structure 3 0 0 0 0 0 1 1Structure 4 0 0 0 0 0 1 1Structure 5 0 0 0 0 0 1 1
Interpolation Output FieldsDistance to Nearest Sample Field dnsAverage Distance Field avdNumber of Samples Field nsKriging Variance Field kv
Output Report File Name *.XLS au_cut_dom_5
Domain Name
Block Model DetailsBlock ModelBlock Model Field
Interpolator Output Report
Block Model Constraint DetailsConstrain EstimationEstimation Constraints File

HOUNDÉ GOLD PROJECT, BURKINA FASO FEASIBILITY STUDY NI 43-101 TECHNICAL REPORT
1813.20\25.02\1813.20-STY-001_B A14.1.1 October 2013 Cube Consulting Pty Ltd
Interpolation Date Tuesday - 18 June - 2013 - at 22:32:44Interpolation Run Number 11Interpolarion ipar file hounde_estimation_2013_0_20.iparWorking Directory d:/endeavour/2013_012_hounde/blockmodel_10_5_10
Input Assay File DetailsAssay File Location ../composites/cut_1m_ con_panel_hounde_june20Assay File Id 6 au_cutAssay String Numbers 1,99Assay Description Field 11
Assay File Constraint DetailsConstrain Assays N YAssay Constraint File domain_6Save Constrained Assays N domain_6_cutOutput Constrained Assay File LocationOutput Constrained Assay File Id
Interpolation Search DetailsOctant or Ellipsoid EllipsoidMax No of Adjacent Empty OctantsMinimum Number of Samples 6Maximum Number of Samples 40Limit Samples by Hole Id NHole Id FieldMaximum Number of Samples per HoleMaximum Search Distance for Major Axis 75Maximum Vertical Search Distance 1000Bearing of Major Axis 35Plunge of Major Axis 0Dip of Semi-Major Axis -90Major / Semi-Major Ratio 1Major / Minor Ratio 4
Pass Details Pass 1 Pass 2 Pass 3Pass Field pass passPass Field Value 1 2Pass Ratio 2Pass Minimum Samples 6 4Pass Maximum Samples 40 40
Interpolation Method DetailsInverse Distance or Ordinary Krigging Ordinary KrigingInverse Distance PowerNo of X Descretisation Points 2No of Y Descretisation Points 4No of Z Descretisation Points 2
Variogram Parameters if OK is chosenNumber of Structures 2Nugget 0.55Relative Nugget 55% Major/Semi Major/
Sill Range Azimuth Plunge Dip Major Ratio Minor RatioStructure 1 0.32 10 35 0 -90 1 2Structure 2 0.13 50 35 0 -90 1 4Structure 3 0 0 0 0 0 1 1Structure 4 0 0 0 0 0 1 1Structure 5 0 0 0 0 0 1 1
Interpolation Output FieldsDistance to Nearest Sample Field dnsAverage Distance Field avdNumber of Samples Field nsKriging Variance Field kv
Output Report File Name *.XLS au_cut_dom_6
Domain Name
Block Model DetailsBlock ModelBlock Model Field
Interpolator Output Report
Block Model Constraint DetailsConstrain EstimationEstimation Constraints File

HOUNDÉ GOLD PROJECT, BURKINA FASO FEASIBILITY STUDY NI 43-101 TECHNICAL REPORT
1813.20\25.02\1813.20-STY-001_B A14.1.1 October 2013 Cube Consulting Pty Ltd
Interpolation Date Tuesday - 18 June - 2013 - at 22:33:31Interpolation Run Number 13Interpolarion ipar file hounde_estimation_2013_0_20.iparWorking Directory d:/endeavour/2013_012_hounde/blockmodel_10_5_10
Input Assay File DetailsAssay File Location ../composites/cut_1m_ con_panel_hounde_june20Assay File Id 7 au_cutAssay String Numbers 1,99Assay Description Field 11
Assay File Constraint DetailsConstrain Assays N YAssay Constraint File domain_7Save Constrained Assays N domain_7_cutOutput Constrained Assay File LocationOutput Constrained Assay File Id
Interpolation Search DetailsOctant or Ellipsoid EllipsoidMax No of Adjacent Empty OctantsMinimum Number of Samples 6Maximum Number of Samples 40Limit Samples by Hole Id NHole Id FieldMaximum Number of Samples per HoleMaximum Search Distance for Major Axis 75Maximum Vertical Search Distance 1000Bearing of Major Axis 35Plunge of Major Axis 0Dip of Semi-Major Axis -90Major / Semi-Major Ratio 1Major / Minor Ratio 4
Pass Details Pass 1 Pass 2 Pass 3Pass Field pass passPass Field Value 1 2Pass Ratio 2Pass Minimum Samples 6 4Pass Maximum Samples 40 40
Interpolation Method DetailsInverse Distance or Ordinary Krigging Ordinary KrigingInverse Distance PowerNo of X Descretisation Points 2No of Y Descretisation Points 4No of Z Descretisation Points 2
Variogram Parameters if OK is chosenNumber of Structures 2Nugget 0.55Relative Nugget 55% Major/Semi Major/
Sill Range Azimuth Plunge Dip Major Ratio Minor RatioStructure 1 0.32 10 35 0 -90 1 2Structure 2 0.13 50 35 0 -90 1 4Structure 3 0 0 0 0 0 1 1Structure 4 0 0 0 0 0 1 1Structure 5 0 0 0 0 0 1 1
Interpolation Output FieldsDistance to Nearest Sample Field dnsAverage Distance Field avdNumber of Samples Field nsKriging Variance Field kv
Output Report File Name *.XLS au_cut_dom_7
Domain Name
Block Model DetailsBlock ModelBlock Model Field
Interpolator Output Report
Block Model Constraint DetailsConstrain EstimationEstimation Constraints File

HOUNDÉ GOLD PROJECT, BURKINA FASO FEASIBILITY STUDY NI 43-101 TECHNICAL REPORT
1813.20\25.02\1813.20-STY-001_B A14.1.1 October 2013 Cube Consulting Pty Ltd
Interpolation Date Tuesday - 18 June - 2013 - at 22:34:15Interpolation Run Number 15Interpolarion ipar file hounde_estimation_2013_0_20.iparWorking Directory d:/endeavour/2013_012_hounde/blockmodel_10_5_10
Input Assay File DetailsAssay File Location ../composites/cut_1m_ con_panel_hounde_june20Assay File Id 8 au_cutAssay String Numbers 1,99Assay Description Field 11
Assay File Constraint DetailsConstrain Assays N YAssay Constraint File domain_8Save Constrained Assays N domain_8_cutOutput Constrained Assay File LocationOutput Constrained Assay File Id
Interpolation Search DetailsOctant or Ellipsoid EllipsoidMax No of Adjacent Empty OctantsMinimum Number of Samples 6Maximum Number of Samples 40Limit Samples by Hole Id NHole Id FieldMaximum Number of Samples per HoleMaximum Search Distance for Major Axis 75Maximum Vertical Search Distance 1000Bearing of Major Axis 35Plunge of Major Axis 0Dip of Semi-Major Axis -90Major / Semi-Major Ratio 1Major / Minor Ratio 4
Pass Details Pass 1 Pass 2 Pass 3Pass Field pass passPass Field Value 1 2Pass Ratio 2Pass Minimum Samples 6 4Pass Maximum Samples 40 40
Interpolation Method DetailsInverse Distance or Ordinary Krigging Ordinary KrigingInverse Distance PowerNo of X Descretisation Points 2No of Y Descretisation Points 4No of Z Descretisation Points 2
Variogram Parameters if OK is chosenNumber of Structures 2Nugget 0.55Relative Nugget 55% Major/Semi Major/
Sill Range Azimuth Plunge Dip Major Ratio Minor RatioStructure 1 0.32 10 35 0 -90 1 2Structure 2 0.13 50 35 0 -90 1 4Structure 3 0 0 0 0 0 1 1Structure 4 0 0 0 0 0 1 1Structure 5 0 0 0 0 0 1 1
Interpolation Output FieldsDistance to Nearest Sample Field dnsAverage Distance Field avdNumber of Samples Field nsKriging Variance Field kv
Output Report File Name *.XLS au_cut_dom_8
Domain Name
Block Model DetailsBlock ModelBlock Model Field
Interpolator Output Report
Block Model Constraint DetailsConstrain EstimationEstimation Constraints File

HOUNDÉ GOLD PROJECT, BURKINA FASO FEASIBILITY STUDY NI 43-101 TECHNICAL REPORT
1813.20\25.02\1813.20-STY-001_B A14.1.1 October 2013 Cube Consulting Pty Ltd
Interpolation Date Tuesday - 18 June - 2013 - at 22:34:56Interpolation Run Number 17Interpolarion ipar file hounde_estimation_2013_0_20.iparWorking Directory d:/endeavour/2013_012_hounde/blockmodel_10_5_10
Input Assay File DetailsAssay File Location ../composites/cut_1m_ con_panel_hounde_june20Assay File Id 9 au_cutAssay String Numbers 1,99Assay Description Field 11
Assay File Constraint DetailsConstrain Assays N YAssay Constraint File domain_9Save Constrained Assays N domain_9_cutOutput Constrained Assay File LocationOutput Constrained Assay File Id
Interpolation Search DetailsOctant or Ellipsoid EllipsoidMax No of Adjacent Empty OctantsMinimum Number of Samples 6Maximum Number of Samples 40Limit Samples by Hole Id NHole Id FieldMaximum Number of Samples per HoleMaximum Search Distance for Major Axis 75Maximum Vertical Search Distance 1000Bearing of Major Axis 40Plunge of Major Axis 0Dip of Semi-Major Axis -90Major / Semi-Major Ratio 1Major / Minor Ratio 4
Pass Details Pass 1 Pass 2 Pass 3Pass Field pass passPass Field Value 1 2Pass Ratio 2Pass Minimum Samples 6 4Pass Maximum Samples 40 40
Interpolation Method DetailsInverse Distance or Ordinary Krigging Ordinary KrigingInverse Distance PowerNo of X Descretisation Points 2No of Y Descretisation Points 4No of Z Descretisation Points 2
Variogram Parameters if OK is chosenNumber of Structures 2Nugget 0.55Relative Nugget 55% Major/Semi Major/
Sill Range Azimuth Plunge Dip Major Ratio Minor RatioStructure 1 0.32 10 40 0 -90 1 2Structure 2 0.13 50 40 0 -90 1 4Structure 3 0 0 0 0 0 1 1Structure 4 0 0 0 0 0 1 1Structure 5 0 0 0 0 0 1 1
Interpolation Output FieldsDistance to Nearest Sample Field dnsAverage Distance Field avdNumber of Samples Field nsKriging Variance Field kv
Output Report File Name *.XLS au_cut_dom_9
Domain Name
Block Model DetailsBlock ModelBlock Model Field
Interpolator Output Report
Block Model Constraint DetailsConstrain EstimationEstimation Constraints File

HOUNDÉ GOLD PROJECT, BURKINA FASO FEASIBILITY STUDY NI 43-101 TECHNICAL REPORT
1813.20\25.02\1813.20-STY-001_B A14.1.1 October 2013 Cube Consulting Pty Ltd
Interpolation Date Tuesday - 18 June - 2013 - at 22:35:44Interpolation Run Number 19Interpolarion ipar file hounde_estimation_2013_0_20.iparWorking Directory d:/endeavour/2013_012_hounde/blockmodel_10_5_10
Input Assay File DetailsAssay File Location ../composites/cut_1m_ con_panel_hounde_june20Assay File Id 10 au_cutAssay String Numbers 1,99Assay Description Field 11
Assay File Constraint DetailsConstrain Assays N YAssay Constraint File domain_10Save Constrained Assays N domain_10_cutOutput Constrained Assay File LocationOutput Constrained Assay File Id
Interpolation Search DetailsOctant or Ellipsoid EllipsoidMax No of Adjacent Empty OctantsMinimum Number of Samples 6Maximum Number of Samples 40Limit Samples by Hole Id NHole Id FieldMaximum Number of Samples per HoleMaximum Search Distance for Major Axis 75Maximum Vertical Search Distance 1000Bearing of Major Axis 40Plunge of Major Axis 0Dip of Semi-Major Axis -90Major / Semi-Major Ratio 1Major / Minor Ratio 4
Pass Details Pass 1 Pass 2 Pass 3Pass Field pass passPass Field Value 1 2Pass Ratio 2Pass Minimum Samples 6 4Pass Maximum Samples 40 40
Interpolation Method DetailsInverse Distance or Ordinary Krigging Ordinary KrigingInverse Distance PowerNo of X Descretisation Points 2No of Y Descretisation Points 4No of Z Descretisation Points 2
Variogram Parameters if OK is chosenNumber of Structures 2Nugget 0.55Relative Nugget 55% Major/Semi Major/
Sill Range Azimuth Plunge Dip Major Ratio Minor RatioStructure 1 0.32 10 40 0 -90 1 2Structure 2 0.13 50 40 0 -90 1 4Structure 3 0 0 0 0 0 1 1Structure 4 0 0 0 0 0 1 1Structure 5 0 0 0 0 0 1 1
Interpolation Output FieldsDistance to Nearest Sample Field dnsAverage Distance Field avdNumber of Samples Field nsKriging Variance Field kv
Output Report File Name *.XLS au_cut_dom_10
Domain Name
Block Model DetailsBlock ModelBlock Model Field
Interpolator Output Report
Block Model Constraint DetailsConstrain EstimationEstimation Constraints File

HOUNDÉ GOLD PROJECT, BURKINA FASO FEASIBILITY STUDY NI 43-101 TECHNICAL REPORT
1813.20\25.02\1813.20-STY-001_B A14.1.1 October 2013 Cube Consulting Pty Ltd
Interpolation Date Tuesday - 18 June - 2013 - at 22:36:27Interpolation Run Number 21Interpolarion ipar file hounde_estimation_2013_0_20.iparWorking Directory d:/endeavour/2013_012_hounde/blockmodel_10_5_10
Input Assay File DetailsAssay File Location ../composites/cut_1m_ con_panel_hounde_june20Assay File Id 11 au_cutAssay String Numbers 1,99Assay Description Field 11
Assay File Constraint DetailsConstrain Assays N YAssay Constraint File domain_11Save Constrained Assays N domain_11_cutOutput Constrained Assay File LocationOutput Constrained Assay File Id
Interpolation Search DetailsOctant or Ellipsoid EllipsoidMax No of Adjacent Empty OctantsMinimum Number of Samples 6Maximum Number of Samples 40Limit Samples by Hole Id NHole Id FieldMaximum Number of Samples per HoleMaximum Search Distance for Major Axis 75Maximum Vertical Search Distance 1000Bearing of Major Axis 35Plunge of Major Axis 0Dip of Semi-Major Axis -90Major / Semi-Major Ratio 1Major / Minor Ratio 4
Pass Details Pass 1 Pass 2 Pass 3Pass Field pass passPass Field Value 1 2Pass Ratio 2Pass Minimum Samples 6 4Pass Maximum Samples 40 40
Interpolation Method DetailsInverse Distance or Ordinary Krigging Ordinary KrigingInverse Distance PowerNo of X Descretisation Points 2No of Y Descretisation Points 4No of Z Descretisation Points 2
Variogram Parameters if OK is chosenNumber of Structures 2Nugget 0.55Relative Nugget 55% Major/Semi Major/
Sill Range Azimuth Plunge Dip Major Ratio Minor RatioStructure 1 0.32 10 35 0 -90 1 2Structure 2 0.13 50 35 0 -90 1 4Structure 3 0 0 0 0 0 1 1Structure 4 0 0 0 0 0 1 1Structure 5 0 0 0 0 0 1 1
Interpolation Output FieldsDistance to Nearest Sample Field dnsAverage Distance Field avdNumber of Samples Field nsKriging Variance Field kv
Output Report File Name *.XLS au_cut_dom_11
Domain Name
Block Model DetailsBlock ModelBlock Model Field
Interpolator Output Report
Block Model Constraint DetailsConstrain EstimationEstimation Constraints File
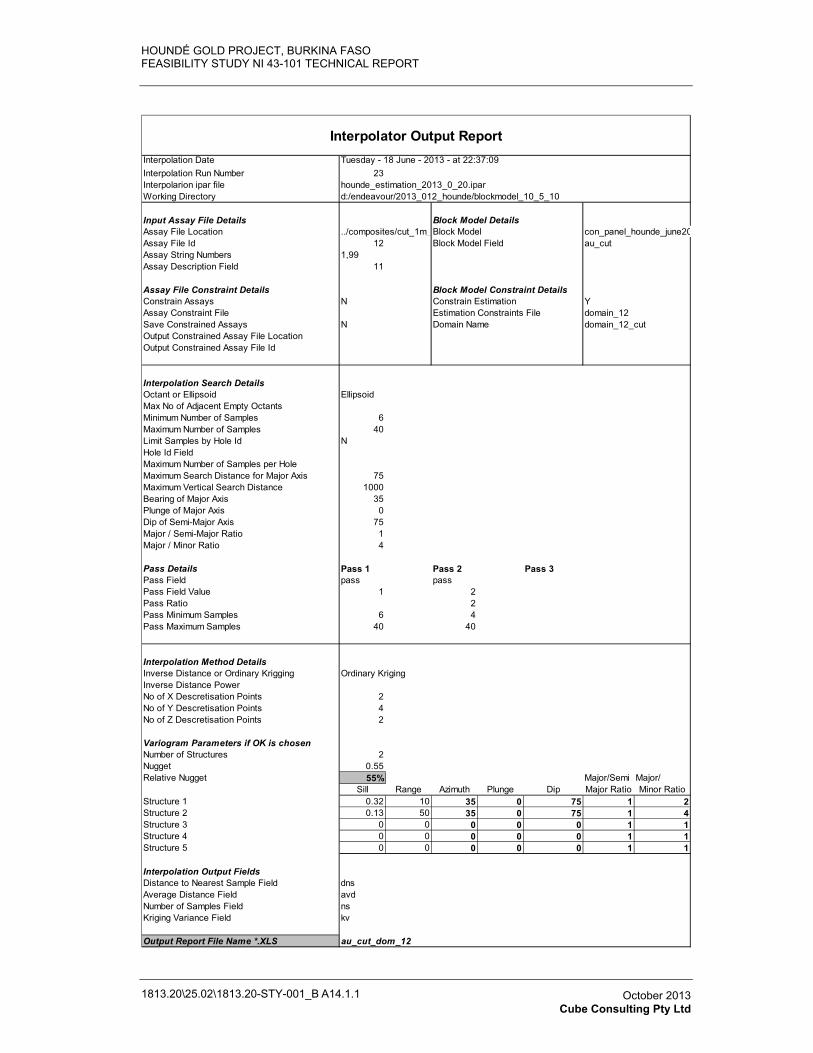
HOUNDÉ GOLD PROJECT, BURKINA FASO FEASIBILITY STUDY NI 43-101 TECHNICAL REPORT
1813.20\25.02\1813.20-STY-001_B A14.1.1 October 2013 Cube Consulting Pty Ltd
Interpolation Date Tuesday - 18 June - 2013 - at 22:37:09Interpolation Run Number 23Interpolarion ipar file hounde_estimation_2013_0_20.iparWorking Directory d:/endeavour/2013_012_hounde/blockmodel_10_5_10
Input Assay File DetailsAssay File Location ../composites/cut_1m_ con_panel_hounde_june20Assay File Id 12 au_cutAssay String Numbers 1,99Assay Description Field 11
Assay File Constraint DetailsConstrain Assays N YAssay Constraint File domain_12Save Constrained Assays N domain_12_cutOutput Constrained Assay File LocationOutput Constrained Assay File Id
Interpolation Search DetailsOctant or Ellipsoid EllipsoidMax No of Adjacent Empty OctantsMinimum Number of Samples 6Maximum Number of Samples 40Limit Samples by Hole Id NHole Id FieldMaximum Number of Samples per HoleMaximum Search Distance for Major Axis 75Maximum Vertical Search Distance 1000Bearing of Major Axis 35Plunge of Major Axis 0Dip of Semi-Major Axis 75Major / Semi-Major Ratio 1Major / Minor Ratio 4
Pass Details Pass 1 Pass 2 Pass 3Pass Field pass passPass Field Value 1 2Pass Ratio 2Pass Minimum Samples 6 4Pass Maximum Samples 40 40
Interpolation Method DetailsInverse Distance or Ordinary Krigging Ordinary KrigingInverse Distance PowerNo of X Descretisation Points 2No of Y Descretisation Points 4No of Z Descretisation Points 2
Variogram Parameters if OK is chosenNumber of Structures 2Nugget 0.55Relative Nugget 55% Major/Semi Major/
Sill Range Azimuth Plunge Dip Major Ratio Minor RatioStructure 1 0.32 10 35 0 75 1 2Structure 2 0.13 50 35 0 75 1 4Structure 3 0 0 0 0 0 1 1Structure 4 0 0 0 0 0 1 1Structure 5 0 0 0 0 0 1 1
Interpolation Output FieldsDistance to Nearest Sample Field dnsAverage Distance Field avdNumber of Samples Field nsKriging Variance Field kv
Output Report File Name *.XLS au_cut_dom_12
Domain Name
Block Model DetailsBlock ModelBlock Model Field
Interpolator Output Report
Block Model Constraint DetailsConstrain EstimationEstimation Constraints File

HOUNDÉ GOLD PROJECT, BURKINA FASO FEASIBILITY STUDY NI 43-101 TECHNICAL REPORT
1813.20\25.02\1813.20-STY-001_B A14.1.1 October 2013 Cube Consulting Pty Ltd
Interpolation Date Tuesday - 18 June - 2013 - at 22:38:00Interpolation Run Number 25Interpolarion ipar file hounde_estimation_2013_0_20.iparWorking Directory d:/endeavour/2013_012_hounde/blockmodel_10_5_10
Input Assay File DetailsAssay File Location ../composites/cut_1m_ con_panel_hounde_june20Assay File Id 13 au_cutAssay String Numbers 1,99Assay Description Field 11
Assay File Constraint DetailsConstrain Assays N YAssay Constraint File domain_13Save Constrained Assays N domain_13_cutOutput Constrained Assay File LocationOutput Constrained Assay File Id
Interpolation Search DetailsOctant or Ellipsoid EllipsoidMax No of Adjacent Empty OctantsMinimum Number of Samples 6Maximum Number of Samples 40Limit Samples by Hole Id NHole Id FieldMaximum Number of Samples per HoleMaximum Search Distance for Major Axis 75Maximum Vertical Search Distance 1000Bearing of Major Axis 35Plunge of Major Axis 0Dip of Semi-Major Axis 75Major / Semi-Major Ratio 1Major / Minor Ratio 4
Pass Details Pass 1 Pass 2 Pass 3Pass Field pass passPass Field Value 1 2Pass Ratio 2Pass Minimum Samples 6 4Pass Maximum Samples 40 40
Interpolation Method DetailsInverse Distance or Ordinary Krigging Ordinary KrigingInverse Distance PowerNo of X Descretisation Points 2No of Y Descretisation Points 4No of Z Descretisation Points 2
Variogram Parameters if OK is chosenNumber of Structures 2Nugget 0.55Relative Nugget 55% Major/Semi Major/
Sill Range Azimuth Plunge Dip Major Ratio Minor RatioStructure 1 0.32 10 35 0 75 1 2Structure 2 0.13 50 35 0 75 1 4Structure 3 0 0 0 0 0 1 1Structure 4 0 0 0 0 0 1 1Structure 5 0 0 0 0 0 1 1
Interpolation Output FieldsDistance to Nearest Sample Field dnsAverage Distance Field avdNumber of Samples Field nsKriging Variance Field kv
Output Report File Name *.XLS au_cut_dom_13
Domain Name
Block Model DetailsBlock ModelBlock Model Field
Interpolator Output Report
Block Model Constraint DetailsConstrain EstimationEstimation Constraints File

HOUNDÉ GOLD PROJECT, BURKINA FASO FEASIBILITY STUDY NI 43-101 TECHNICAL REPORT
1813.20\25.02\1813.20-STY-001_B A14.1.1 October 2013 Cube Consulting Pty Ltd
Interpolation Date Tuesday - 18 June - 2013 - at 22:38:51Interpolation Run Number 27Interpolarion ipar file hounde_estimation_2013_0_20.iparWorking Directory d:/endeavour/2013_012_hounde/blockmodel_10_5_10
Input Assay File DetailsAssay File Location ../composites/cut_1m_ con_panel_hounde_june20Assay File Id 14 au_cutAssay String Numbers 1,99Assay Description Field 11
Assay File Constraint DetailsConstrain Assays N YAssay Constraint File domain_14Save Constrained Assays N domain_14_cutOutput Constrained Assay File LocationOutput Constrained Assay File Id
Interpolation Search DetailsOctant or Ellipsoid EllipsoidMax No of Adjacent Empty OctantsMinimum Number of Samples 6Maximum Number of Samples 40Limit Samples by Hole Id NHole Id FieldMaximum Number of Samples per HoleMaximum Search Distance for Major Axis 75Maximum Vertical Search Distance 1000Bearing of Major Axis 30Plunge of Major Axis 0Dip of Semi-Major Axis 80Major / Semi-Major Ratio 1Major / Minor Ratio 4
Pass Details Pass 1 Pass 2 Pass 3Pass Field pass passPass Field Value 1 2Pass Ratio 2Pass Minimum Samples 6 4Pass Maximum Samples 40 40
Interpolation Method DetailsInverse Distance or Ordinary Krigging Ordinary KrigingInverse Distance PowerNo of X Descretisation Points 2No of Y Descretisation Points 4No of Z Descretisation Points 2
Variogram Parameters if OK is chosenNumber of Structures 2Nugget 0.55Relative Nugget 55% Major/Semi Major/
Sill Range Azimuth Plunge Dip Major Ratio Minor RatioStructure 1 0.32 10 30 0 80 1 2Structure 2 0.13 50 30 0 80 1 4Structure 3 0 0 0 0 0 1 1Structure 4 0 0 0 0 0 1 1Structure 5 0 0 0 0 0 1 1
Interpolation Output FieldsDistance to Nearest Sample Field dnsAverage Distance Field avdNumber of Samples Field nsKriging Variance Field kv
Output Report File Name *.XLS au_cut_dom_14
Domain Name
Block Model DetailsBlock ModelBlock Model Field
Interpolator Output Report
Block Model Constraint DetailsConstrain EstimationEstimation Constraints File

HOUNDÉ GOLD PROJECT, BURKINA FASO FEASIBILITY STUDY NI 43-101 TECHNICAL REPORT
1813.20\25.02\1813.20-STY-001_B A14.1.1 October 2013 Cube Consulting Pty Ltd
Interpolation Date Tuesday - 18 June - 2013 - at 22:39:39Interpolation Run Number 29Interpolarion ipar file hounde_estimation_2013_0_20.iparWorking Directory d:/endeavour/2013_012_hounde/blockmodel_10_5_10
Input Assay File DetailsAssay File Location ../composites/cut_1m_ con_panel_hounde_june20Assay File Id 15 au_cutAssay String Numbers 1,99Assay Description Field 11
Assay File Constraint DetailsConstrain Assays N YAssay Constraint File domain_15Save Constrained Assays N domain_15_cutOutput Constrained Assay File LocationOutput Constrained Assay File Id
Interpolation Search DetailsOctant or Ellipsoid EllipsoidMax No of Adjacent Empty OctantsMinimum Number of Samples 6Maximum Number of Samples 40Limit Samples by Hole Id NHole Id FieldMaximum Number of Samples per HoleMaximum Search Distance for Major Axis 75Maximum Vertical Search Distance 1000Bearing of Major Axis 30Plunge of Major Axis 0Dip of Semi-Major Axis 80Major / Semi-Major Ratio 1Major / Minor Ratio 4
Pass Details Pass 1 Pass 2 Pass 3Pass Field pass passPass Field Value 1 2Pass Ratio 2Pass Minimum Samples 6 4Pass Maximum Samples 40 40
Interpolation Method DetailsInverse Distance or Ordinary Krigging Ordinary KrigingInverse Distance PowerNo of X Descretisation Points 2No of Y Descretisation Points 4No of Z Descretisation Points 2
Variogram Parameters if OK is chosenNumber of Structures 2Nugget 0.55Relative Nugget 55% Major/Semi Major/
Sill Range Azimuth Plunge Dip Major Ratio Minor RatioStructure 1 0.32 10 30 0 80 1 2Structure 2 0.13 50 30 0 80 1 4Structure 3 0 0 0 0 0 1 1Structure 4 0 0 0 0 0 1 1Structure 5 0 0 0 0 0 1 1
Interpolation Output FieldsDistance to Nearest Sample Field dnsAverage Distance Field avdNumber of Samples Field nsKriging Variance Field kv
Output Report File Name *.XLS au_cut_dom_15
Domain Name
Block Model DetailsBlock ModelBlock Model Field
Interpolator Output Report
Block Model Constraint DetailsConstrain EstimationEstimation Constraints File

HOUNDÉ GOLD PROJECT, BURKINA FASO FEASIBILITY STUDY NI 43-101 TECHNICAL REPORT
1813.20\25.02\1813.20-STY-001_B A14.1.1 October 2013 Cube Consulting Pty Ltd
Interpolation Date Tuesday - 18 June - 2013 - at 22:40:29Interpolation Run Number 31Interpolarion ipar file hounde_estimation_2013_0_20.iparWorking Directory d:/endeavour/2013_012_hounde/blockmodel_10_5_10
Input Assay File DetailsAssay File Location ../composites/cut_1m_ con_panel_hounde_june20Assay File Id 16 au_cutAssay String Numbers 1,99Assay Description Field 11
Assay File Constraint DetailsConstrain Assays N YAssay Constraint File domain_16Save Constrained Assays N domain_16_cutOutput Constrained Assay File LocationOutput Constrained Assay File Id
Interpolation Search DetailsOctant or Ellipsoid EllipsoidMax No of Adjacent Empty OctantsMinimum Number of Samples 6Maximum Number of Samples 40Limit Samples by Hole Id NHole Id FieldMaximum Number of Samples per HoleMaximum Search Distance for Major Axis 75Maximum Vertical Search Distance 1000Bearing of Major Axis 35Plunge of Major Axis 0Dip of Semi-Major Axis 75Major / Semi-Major Ratio 1Major / Minor Ratio 4
Pass Details Pass 1 Pass 2 Pass 3Pass Field pass passPass Field Value 1 2Pass Ratio 2Pass Minimum Samples 6 4Pass Maximum Samples 40 40
Interpolation Method DetailsInverse Distance or Ordinary Krigging Ordinary KrigingInverse Distance PowerNo of X Descretisation Points 2No of Y Descretisation Points 4No of Z Descretisation Points 2
Variogram Parameters if OK is chosenNumber of Structures 2Nugget 0.55Relative Nugget 55% Major/Semi Major/
Sill Range Azimuth Plunge Dip Major Ratio Minor RatioStructure 1 0.32 10 35 0 75 1 2Structure 2 0.13 50 35 0 75 1 4Structure 3 0 0 0 0 0 1 1Structure 4 0 0 0 0 0 1 1Structure 5 0 0 0 0 0 1 1
Interpolation Output FieldsDistance to Nearest Sample Field dnsAverage Distance Field avdNumber of Samples Field nsKriging Variance Field kv
Output Report File Name *.XLS au_cut_dom_16
Domain Name
Block Model DetailsBlock ModelBlock Model Field
Interpolator Output Report
Block Model Constraint DetailsConstrain EstimationEstimation Constraints File

HOUNDÉ GOLD PROJECT, BURKINA FASO FEASIBILITY STUDY NI 43-101 TECHNICAL REPORT
1813.20\25.02\1813.20-STY-001_B A14.1.1 October 2013 Cube Consulting Pty Ltd
Interpolation Date Tuesday - 18 June - 2013 - at 22:42:13Interpolation Run Number 35Interpolarion ipar file hounde_estimation_2013_0_20.iparWorking Directory d:/endeavour/2013_012_hounde/blockmodel_10_5_10
Input Assay File DetailsAssay File Location ../composites/cut_1m_ con_panel_hounde_june20Assay File Id 17 au_cutAssay String Numbers 1,99Assay Description Field 11
Assay File Constraint DetailsConstrain Assays N YAssay Constraint File domain_center_17Save Constrained Assays N domain_17_center_cutOutput Constrained Assay File LocationOutput Constrained Assay File Id
Interpolation Search DetailsOctant or Ellipsoid EllipsoidMax No of Adjacent Empty OctantsMinimum Number of Samples 6Maximum Number of Samples 40Limit Samples by Hole Id NHole Id FieldMaximum Number of Samples per HoleMaximum Search Distance for Major Axis 75Maximum Vertical Search Distance 1000Bearing of Major Axis 50Plunge of Major Axis 0Dip of Semi-Major Axis 75Major / Semi-Major Ratio 1Major / Minor Ratio 4
Pass Details Pass 1 Pass 2 Pass 3Pass Field pass passPass Field Value 1 2Pass Ratio 2Pass Minimum Samples 6 4Pass Maximum Samples 40 40
Interpolation Method DetailsInverse Distance or Ordinary Krigging Ordinary KrigingInverse Distance PowerNo of X Descretisation Points 2No of Y Descretisation Points 4No of Z Descretisation Points 2
Variogram Parameters if OK is chosenNumber of Structures 2Nugget 0.55Relative Nugget 55% Major/Semi Major/
Sill Range Azimuth Plunge Dip Major Ratio Minor RatioStructure 1 0.32 10 50 0 75 1 2Structure 2 0.13 50 50 0 75 1 4Structure 3 0 0 0 0 0 1 1Structure 4 0 0 0 0 0 1 1Structure 5 0 0 0 0 0 1 1
Interpolation Output FieldsDistance to Nearest Sample Field dnsAverage Distance Field avdNumber of Samples Field nsKriging Variance Field kv
Output Report File Name *.XLS au_cut_dom_center_17
Domain Name
Block Model DetailsBlock ModelBlock Model Field
Interpolator Output Report
Block Model Constraint DetailsConstrain EstimationEstimation Constraints File
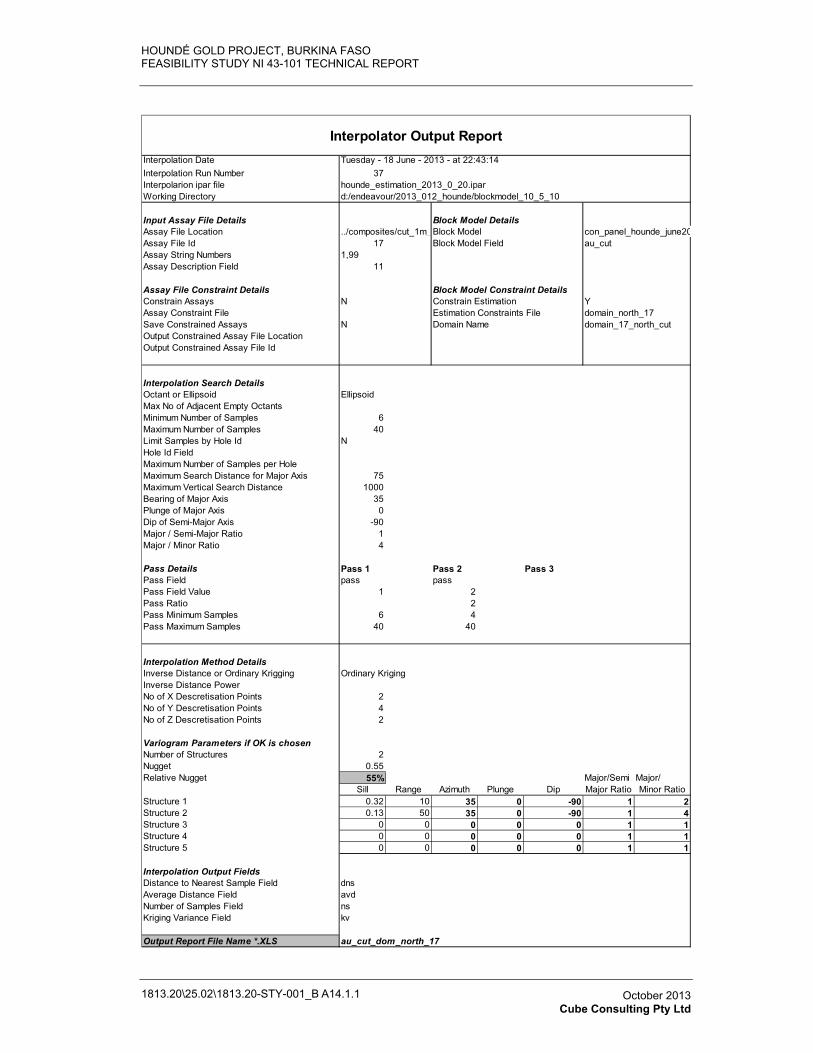
HOUNDÉ GOLD PROJECT, BURKINA FASO FEASIBILITY STUDY NI 43-101 TECHNICAL REPORT
1813.20\25.02\1813.20-STY-001_B A14.1.1 October 2013 Cube Consulting Pty Ltd
Interpolation Date Tuesday - 18 June - 2013 - at 22:43:14Interpolation Run Number 37Interpolarion ipar file hounde_estimation_2013_0_20.iparWorking Directory d:/endeavour/2013_012_hounde/blockmodel_10_5_10
Input Assay File DetailsAssay File Location ../composites/cut_1m_ con_panel_hounde_june20Assay File Id 17 au_cutAssay String Numbers 1,99Assay Description Field 11
Assay File Constraint DetailsConstrain Assays N YAssay Constraint File domain_north_17Save Constrained Assays N domain_17_north_cutOutput Constrained Assay File LocationOutput Constrained Assay File Id
Interpolation Search DetailsOctant or Ellipsoid EllipsoidMax No of Adjacent Empty OctantsMinimum Number of Samples 6Maximum Number of Samples 40Limit Samples by Hole Id NHole Id FieldMaximum Number of Samples per HoleMaximum Search Distance for Major Axis 75Maximum Vertical Search Distance 1000Bearing of Major Axis 35Plunge of Major Axis 0Dip of Semi-Major Axis -90Major / Semi-Major Ratio 1Major / Minor Ratio 4
Pass Details Pass 1 Pass 2 Pass 3Pass Field pass passPass Field Value 1 2Pass Ratio 2Pass Minimum Samples 6 4Pass Maximum Samples 40 40
Interpolation Method DetailsInverse Distance or Ordinary Krigging Ordinary KrigingInverse Distance PowerNo of X Descretisation Points 2No of Y Descretisation Points 4No of Z Descretisation Points 2
Variogram Parameters if OK is chosenNumber of Structures 2Nugget 0.55Relative Nugget 55% Major/Semi Major/
Sill Range Azimuth Plunge Dip Major Ratio Minor RatioStructure 1 0.32 10 35 0 -90 1 2Structure 2 0.13 50 35 0 -90 1 4Structure 3 0 0 0 0 0 1 1Structure 4 0 0 0 0 0 1 1Structure 5 0 0 0 0 0 1 1
Interpolation Output FieldsDistance to Nearest Sample Field dnsAverage Distance Field avdNumber of Samples Field nsKriging Variance Field kv
Output Report File Name *.XLS au_cut_dom_north_17
Domain Name
Block Model DetailsBlock ModelBlock Model Field
Interpolator Output Report
Block Model Constraint DetailsConstrain EstimationEstimation Constraints File

HOUNDÉ GOLD PROJECT, BURKINA FASO FEASIBILITY STUDY NI 43-101 TECHNICAL REPORT
1813.20\25.02\1813.20-STY-001_B A14.1.1 October 2013 Cube Consulting Pty Ltd
Interpolation Date Tuesday - 18 June - 2013 - at 22:44:03Interpolation Run Number 39Interpolarion ipar file hounde_estimation_2013_0_20.iparWorking Directory d:/endeavour/2013_012_hounde/blockmodel_10_5_10
Input Assay File DetailsAssay File Location ../composites/cut_1m_ con_panel_hounde_june20Assay File Id 18 au_cutAssay String Numbers 1,99Assay Description Field 11
Assay File Constraint DetailsConstrain Assays N YAssay Constraint File domain_18Save Constrained Assays N domain_18_cutOutput Constrained Assay File LocationOutput Constrained Assay File Id
Interpolation Search DetailsOctant or Ellipsoid EllipsoidMax No of Adjacent Empty OctantsMinimum Number of Samples 6Maximum Number of Samples 40Limit Samples by Hole Id NHole Id FieldMaximum Number of Samples per HoleMaximum Search Distance for Major Axis 75Maximum Vertical Search Distance 1000Bearing of Major Axis 35Plunge of Major Axis 0Dip of Semi-Major Axis -90Major / Semi-Major Ratio 1Major / Minor Ratio 3
Pass Details Pass 1 Pass 2 Pass 3Pass Field pass passPass Field Value 1 2Pass Ratio 2Pass Minimum Samples 6 4Pass Maximum Samples 40 40
Interpolation Method DetailsInverse Distance or Ordinary Krigging Ordinary KrigingInverse Distance PowerNo of X Descretisation Points 2No of Y Descretisation Points 4No of Z Descretisation Points 2
Variogram Parameters if OK is chosenNumber of Structures 2Nugget 0.55Relative Nugget 55% Major/Semi Major/
Sill Range Azimuth Plunge Dip Major Ratio Minor RatioStructure 1 0.32 10 35 0 -90 1 2Structure 2 0.13 50 35 0 -90 1 4Structure 3 0 0 0 0 0 1 1Structure 4 0 0 0 0 0 1 1Structure 5 0 0 0 0 0 1 1
Interpolation Output FieldsDistance to Nearest Sample Field dnsAverage Distance Field avdNumber of Samples Field nsKriging Variance Field kv
Output Report File Name *.XLS au_cut_dom_18
Domain Name
Block Model DetailsBlock ModelBlock Model Field
Interpolator Output Report
Block Model Constraint DetailsConstrain EstimationEstimation Constraints File

HOUNDÉ GOLD PROJECT, BURKINA FASO FEASIBILITY STUDY NI 43-101 TECHNICAL REPORT
1813.20\25.02\1813.20-STY-001_B A14.1.1 October 2013 Cube Consulting Pty Ltd
Interpolation Date Tuesday - 18 June - 2013 - at 22:45:00Interpolation Run Number 41Interpolarion ipar file hounde_estimation_2013_0_20.iparWorking Directory d:/endeavour/2013_012_hounde/blockmodel_10_5_10
Input Assay File DetailsAssay File Location ../composites/cut_1m_ con_panel_hounde_june20Assay File Id 19 au_cutAssay String Numbers 1,99Assay Description Field 11
Assay File Constraint DetailsConstrain Assays N YAssay Constraint File domain_19Save Constrained Assays N domain_19_cutOutput Constrained Assay File LocationOutput Constrained Assay File Id
Interpolation Search DetailsOctant or Ellipsoid EllipsoidMax No of Adjacent Empty OctantsMinimum Number of Samples 6Maximum Number of Samples 40Limit Samples by Hole Id NHole Id FieldMaximum Number of Samples per HoleMaximum Search Distance for Major Axis 75Maximum Vertical Search Distance 1000Bearing of Major Axis 35Plunge of Major Axis 0Dip of Semi-Major Axis 75Major / Semi-Major Ratio 1Major / Minor Ratio 4
Pass Details Pass 1 Pass 2 Pass 3Pass Field pass passPass Field Value 1 2Pass Ratio 2Pass Minimum Samples 6 4Pass Maximum Samples 40 40
Interpolation Method DetailsInverse Distance or Ordinary Krigging Ordinary KrigingInverse Distance PowerNo of X Descretisation Points 2No of Y Descretisation Points 4No of Z Descretisation Points 2
Variogram Parameters if OK is chosenNumber of Structures 2Nugget 0.55Relative Nugget 55% Major/Semi Major/
Sill Range Azimuth Plunge Dip Major Ratio Minor RatioStructure 1 0.32 10 35 0 75 1 2Structure 2 0.13 50 35 0 75 1 4Structure 3 0 0 0 0 0 1 1Structure 4 0 0 0 0 0 1 1Structure 5 0 0 0 0 0 1 1
Interpolation Output FieldsDistance to Nearest Sample Field dnsAverage Distance Field avdNumber of Samples Field nsKriging Variance Field kv
Output Report File Name *.XLS au_cut_dom_19
Domain Name
Block Model DetailsBlock ModelBlock Model Field
Interpolator Output Report
Block Model Constraint DetailsConstrain EstimationEstimation Constraints File

HOUNDÉ GOLD PROJECT, BURKINA FASO FEASIBILITY STUDY NI 43-101 TECHNICAL REPORT
1813.20\25.02\1813.20-STY-001_B A14.1.1 October 2013 Cube Consulting Pty Ltd
Interpolation Date Tuesday - 18 June - 2013 - at 22:45:50Interpolation Run Number 43Interpolarion ipar file hounde_estimation_2013_0_20.iparWorking Directory d:/endeavour/2013_012_hounde/blockmodel_10_5_10
Input Assay File DetailsAssay File Location ../composites/cut_1m_ con_panel_hounde_june20Assay File Id 20 au_cutAssay String Numbers 1,99Assay Description Field 11
Assay File Constraint DetailsConstrain Assays N YAssay Constraint File domain_20Save Constrained Assays N domain_20_cutOutput Constrained Assay File LocationOutput Constrained Assay File Id
Interpolation Search DetailsOctant or Ellipsoid EllipsoidMax No of Adjacent Empty OctantsMinimum Number of Samples 6Maximum Number of Samples 40Limit Samples by Hole Id NHole Id FieldMaximum Number of Samples per HoleMaximum Search Distance for Major Axis 75Maximum Vertical Search Distance 1000Bearing of Major Axis 35Plunge of Major Axis 0Dip of Semi-Major Axis -90Major / Semi-Major Ratio 1Major / Minor Ratio 4
Pass Details Pass 1 Pass 2 Pass 3Pass Field pass passPass Field Value 1 2Pass Ratio 2Pass Minimum Samples 6 4Pass Maximum Samples 40 40
Interpolation Method DetailsInverse Distance or Ordinary Krigging Ordinary KrigingInverse Distance PowerNo of X Descretisation Points 2No of Y Descretisation Points 4No of Z Descretisation Points 2
Variogram Parameters if OK is chosenNumber of Structures 2Nugget 0.55Relative Nugget 55% Major/Semi Major/
Sill Range Azimuth Plunge Dip Major Ratio Minor RatioStructure 1 0.32 10 35 0 -90 1 2Structure 2 0.13 50 35 0 -90 1 4Structure 3 0 0 0 0 0 1 1Structure 4 0 0 0 0 0 1 1Structure 5 0 0 0 0 0 1 1
Interpolation Output FieldsDistance to Nearest Sample Field dnsAverage Distance Field avdNumber of Samples Field nsKriging Variance Field kv
Output Report File Name *.XLS au_cut_dom_20
Domain Name
Block Model DetailsBlock ModelBlock Model Field
Interpolator Output Report
Block Model Constraint DetailsConstrain EstimationEstimation Constraints File

HOUNDÉ GOLD PROJECT, BURKINA FASO FEASIBILITY STUDY NI 43-101 TECHNICAL REPORT
1813.20\25.02\1813.20-STY-001_B A14.1.1 October 2013 Cube Consulting Pty Ltd
Interpolation Date Wednesday - 19 June - 2013 - at 06:02:14Interpolation Run Number 1Interpolarion ipar file hounde_estimation_2013_21_39.iparWorking Directory d:/endeavour/2013_012_hounde/blockmodel_10_5_10
Input Assay File DetailsAssay File Location ../composites/cut_1m_ con_panel_hounde_june20Assay File Id 21 au_cutAssay String Numbers 1,99Assay Description Field 11
Assay File Constraint DetailsConstrain Assays N YAssay Constraint File domain_21Save Constrained Assays N domain_21_cutOutput Constrained Assay File LocationOutput Constrained Assay File Id
Interpolation Search DetailsOctant or Ellipsoid EllipsoidMax No of Adjacent Empty OctantsMinimum Number of Samples 6Maximum Number of Samples 40Limit Samples by Hole Id NHole Id FieldMaximum Number of Samples per HoleMaximum Search Distance for Major Axis 75Maximum Vertical Search Distance 1000Bearing of Major Axis 35Plunge of Major Axis 0Dip of Semi-Major Axis -90Major / Semi-Major Ratio 1Major / Minor Ratio 4
Pass Details Pass 1 Pass 2 Pass 3Pass Field pass passPass Field Value 1 2Pass Ratio 2Pass Minimum Samples 6 4Pass Maximum Samples 40 40
Interpolation Method DetailsInverse Distance or Ordinary Krigging Ordinary KrigingInverse Distance PowerNo of X Descretisation Points 2No of Y Descretisation Points 4No of Z Descretisation Points 2
Variogram Parameters if OK is chosenNumber of Structures 2Nugget 0.55Relative Nugget 55% Major/Semi Major/
Sill Range Azimuth Plunge Dip Major Ratio Minor RatioStructure 1 0.32 10 35 0 -90 1 2Structure 2 0.13 50 25 0 -90 1 4Structure 3 0 0 0 0 0 1 1Structure 4 0 0 0 0 0 1 1Structure 5 0 0 0 0 0 1 1
Interpolation Output FieldsDistance to Nearest Sample Field dnsAverage Distance Field avdNumber of Samples Field nsKriging Variance Field kv
Output Report File Name *.XLS au_cut_dom_21
Domain Name
Block Model DetailsBlock ModelBlock Model Field
Interpolator Output Report
Block Model Constraint DetailsConstrain EstimationEstimation Constraints File

HOUNDÉ GOLD PROJECT, BURKINA FASO FEASIBILITY STUDY NI 43-101 TECHNICAL REPORT
1813.20\25.02\1813.20-STY-001_B A14.1.1 October 2013 Cube Consulting Pty Ltd
Interpolation Date Wednesday - 19 June - 2013 - at 06:03:08Interpolation Run Number 3Interpolarion ipar file hounde_estimation_2013_21_39.iparWorking Directory d:/endeavour/2013_012_hounde/blockmodel_10_5_10
Input Assay File DetailsAssay File Location ../composites/cut_1m_ con_panel_hounde_june20Assay File Id 22 au_cutAssay String Numbers 1,99Assay Description Field 11
Assay File Constraint DetailsConstrain Assays N YAssay Constraint File domain_22Save Constrained Assays N domain_22_cutOutput Constrained Assay File LocationOutput Constrained Assay File Id
Interpolation Search DetailsOctant or Ellipsoid EllipsoidMax No of Adjacent Empty OctantsMinimum Number of Samples 6Maximum Number of Samples 40Limit Samples by Hole Id NHole Id FieldMaximum Number of Samples per HoleMaximum Search Distance for Major Axis 75Maximum Vertical Search Distance 1000Bearing of Major Axis 35Plunge of Major Axis 0Dip of Semi-Major Axis -90Major / Semi-Major Ratio 1Major / Minor Ratio 4
Pass Details Pass 1 Pass 2 Pass 3Pass Field pass passPass Field Value 1 2Pass Ratio 2Pass Minimum Samples 6 4Pass Maximum Samples 40 40
Interpolation Method DetailsInverse Distance or Ordinary Krigging Ordinary KrigingInverse Distance PowerNo of X Descretisation Points 2No of Y Descretisation Points 4No of Z Descretisation Points 2
Variogram Parameters if OK is chosenNumber of Structures 2Nugget 0.55Relative Nugget 55% Major/Semi Major/
Sill Range Azimuth Plunge Dip Major Ratio Minor RatioStructure 1 0.32 10 35 0 -90 1 2Structure 2 0.13 50 35 0 -90 1 4Structure 3 0 0 0 0 0 1 1Structure 4 0 0 0 0 0 1 1Structure 5 0 0 0 0 0 1 1
Interpolation Output FieldsDistance to Nearest Sample Field dnsAverage Distance Field avdNumber of Samples Field nsKriging Variance Field kv
Output Report File Name *.XLS au_cut_dom_22
Domain Name
Block Model DetailsBlock ModelBlock Model Field
Interpolator Output Report
Block Model Constraint DetailsConstrain EstimationEstimation Constraints File

HOUNDÉ GOLD PROJECT, BURKINA FASO FEASIBILITY STUDY NI 43-101 TECHNICAL REPORT
1813.20\25.02\1813.20-STY-001_B A14.1.1 October 2013 Cube Consulting Pty Ltd
Interpolation Date Wednesday - 19 June - 2013 - at 06:03:59Interpolation Run Number 5Interpolarion ipar file hounde_estimation_2013_21_39.iparWorking Directory d:/endeavour/2013_012_hounde/blockmodel_10_5_10
Input Assay File DetailsAssay File Location ../composites/cut_1m_ con_panel_hounde_june20Assay File Id 23 au_cutAssay String Numbers 1,99Assay Description Field 11
Assay File Constraint DetailsConstrain Assays N YAssay Constraint File domain_23Save Constrained Assays N domain_23_cutOutput Constrained Assay File LocationOutput Constrained Assay File Id
Interpolation Search DetailsOctant or Ellipsoid EllipsoidMax No of Adjacent Empty OctantsMinimum Number of Samples 6Maximum Number of Samples 40Limit Samples by Hole Id NHole Id FieldMaximum Number of Samples per HoleMaximum Search Distance for Major Axis 75Maximum Vertical Search Distance 1000Bearing of Major Axis 35Plunge of Major Axis 0Dip of Semi-Major Axis 80Major / Semi-Major Ratio 1Major / Minor Ratio 4
Pass Details Pass 1 Pass 2 Pass 3Pass Field pass passPass Field Value 1 2Pass Ratio 2Pass Minimum Samples 6 4Pass Maximum Samples 40 40
Interpolation Method DetailsInverse Distance or Ordinary Krigging Ordinary KrigingInverse Distance PowerNo of X Descretisation Points 2No of Y Descretisation Points 4No of Z Descretisation Points 2
Variogram Parameters if OK is chosenNumber of Structures 2Nugget 0.55Relative Nugget 55% Major/Semi Major/
Sill Range Azimuth Plunge Dip Major Ratio Minor RatioStructure 1 0.32 10 35 0 80 1 2Structure 2 0.13 50 35 0 80 1 4Structure 3 0 0 0 0 0 1 1Structure 4 0 0 0 0 0 1 1Structure 5 0 0 0 0 0 1 1
Interpolation Output FieldsDistance to Nearest Sample Field dnsAverage Distance Field avdNumber of Samples Field nsKriging Variance Field kv
Output Report File Name *.XLS au_cut_dom_23
Domain Name
Block Model DetailsBlock ModelBlock Model Field
Interpolator Output Report
Block Model Constraint DetailsConstrain EstimationEstimation Constraints File
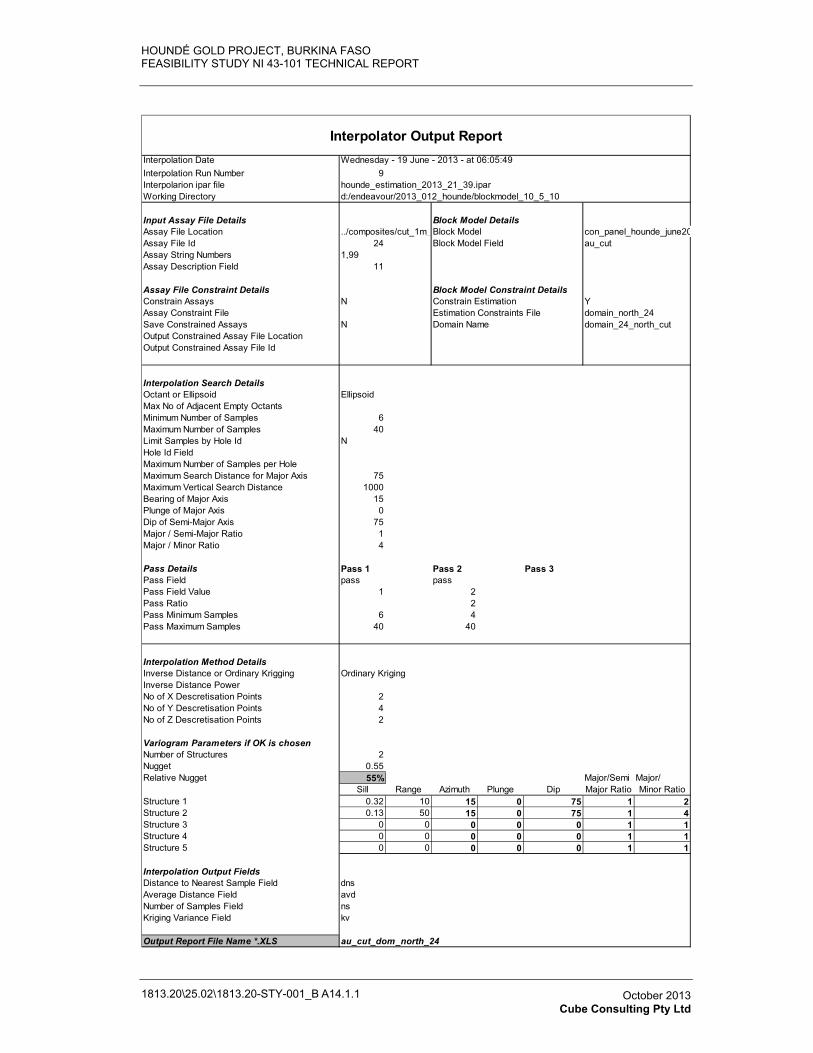
HOUNDÉ GOLD PROJECT, BURKINA FASO FEASIBILITY STUDY NI 43-101 TECHNICAL REPORT
1813.20\25.02\1813.20-STY-001_B A14.1.1 October 2013 Cube Consulting Pty Ltd
Interpolation Date Wednesday - 19 June - 2013 - at 06:05:49Interpolation Run Number 9Interpolarion ipar file hounde_estimation_2013_21_39.iparWorking Directory d:/endeavour/2013_012_hounde/blockmodel_10_5_10
Input Assay File DetailsAssay File Location ../composites/cut_1m_ con_panel_hounde_june20Assay File Id 24 au_cutAssay String Numbers 1,99Assay Description Field 11
Assay File Constraint DetailsConstrain Assays N YAssay Constraint File domain_north_24Save Constrained Assays N domain_24_north_cutOutput Constrained Assay File LocationOutput Constrained Assay File Id
Interpolation Search DetailsOctant or Ellipsoid EllipsoidMax No of Adjacent Empty OctantsMinimum Number of Samples 6Maximum Number of Samples 40Limit Samples by Hole Id NHole Id FieldMaximum Number of Samples per HoleMaximum Search Distance for Major Axis 75Maximum Vertical Search Distance 1000Bearing of Major Axis 15Plunge of Major Axis 0Dip of Semi-Major Axis 75Major / Semi-Major Ratio 1Major / Minor Ratio 4
Pass Details Pass 1 Pass 2 Pass 3Pass Field pass passPass Field Value 1 2Pass Ratio 2Pass Minimum Samples 6 4Pass Maximum Samples 40 40
Interpolation Method DetailsInverse Distance or Ordinary Krigging Ordinary KrigingInverse Distance PowerNo of X Descretisation Points 2No of Y Descretisation Points 4No of Z Descretisation Points 2
Variogram Parameters if OK is chosenNumber of Structures 2Nugget 0.55Relative Nugget 55% Major/Semi Major/
Sill Range Azimuth Plunge Dip Major Ratio Minor RatioStructure 1 0.32 10 15 0 75 1 2Structure 2 0.13 50 15 0 75 1 4Structure 3 0 0 0 0 0 1 1Structure 4 0 0 0 0 0 1 1Structure 5 0 0 0 0 0 1 1
Interpolation Output FieldsDistance to Nearest Sample Field dnsAverage Distance Field avdNumber of Samples Field nsKriging Variance Field kv
Output Report File Name *.XLS au_cut_dom_north_24
Domain Name
Block Model DetailsBlock ModelBlock Model Field
Interpolator Output Report
Block Model Constraint DetailsConstrain EstimationEstimation Constraints File

HOUNDÉ GOLD PROJECT, BURKINA FASO FEASIBILITY STUDY NI 43-101 TECHNICAL REPORT
1813.20\25.02\1813.20-STY-001_B A14.1.1 October 2013 Cube Consulting Pty Ltd
Interpolation Date Wednesday - 19 June - 2013 - at 06:04:49Interpolation Run Number 7Interpolarion ipar file hounde_estimation_2013_21_39.iparWorking Directory d:/endeavour/2013_012_hounde/blockmodel_10_5_10
Input Assay File DetailsAssay File Location ../composites/cut_1m_ con_panel_hounde_june20Assay File Id 24 au_cutAssay String Numbers 1,99Assay Description Field 11
Assay File Constraint DetailsConstrain Assays N YAssay Constraint File domain_south_24Save Constrained Assays N domain_24_south_cutOutput Constrained Assay File LocationOutput Constrained Assay File Id
Interpolation Search DetailsOctant or Ellipsoid EllipsoidMax No of Adjacent Empty OctantsMinimum Number of Samples 6Maximum Number of Samples 40Limit Samples by Hole Id NHole Id FieldMaximum Number of Samples per HoleMaximum Search Distance for Major Axis 75Maximum Vertical Search Distance 1000Bearing of Major Axis 30Plunge of Major Axis 0Dip of Semi-Major Axis 75Major / Semi-Major Ratio 1Major / Minor Ratio 4
Pass Details Pass 1 Pass 2 Pass 3Pass Field pass passPass Field Value 1 2Pass Ratio 2Pass Minimum Samples 6 4Pass Maximum Samples 40 40
Interpolation Method DetailsInverse Distance or Ordinary Krigging Ordinary KrigingInverse Distance PowerNo of X Descretisation Points 2No of Y Descretisation Points 4No of Z Descretisation Points 2
Variogram Parameters if OK is chosenNumber of Structures 2Nugget 0.55Relative Nugget 55% Major/Semi Major/
Sill Range Azimuth Plunge Dip Major Ratio Minor RatioStructure 1 0.32 10 30 0 75 1 2Structure 2 0.13 50 30 0 75 1 4Structure 3 0 0 0 0 0 1 1Structure 4 0 0 0 0 0 1 1Structure 5 0 0 0 0 0 1 1
Interpolation Output FieldsDistance to Nearest Sample Field dnsAverage Distance Field avdNumber of Samples Field nsKriging Variance Field kv
Output Report File Name *.XLS au_cut_dom_south_24
Domain Name
Block Model DetailsBlock ModelBlock Model Field
Interpolator Output Report
Block Model Constraint DetailsConstrain EstimationEstimation Constraints File

HOUNDÉ GOLD PROJECT, BURKINA FASO FEASIBILITY STUDY NI 43-101 TECHNICAL REPORT
1813.20\25.02\1813.20-STY-001_B A14.1.1 October 2013 Cube Consulting Pty Ltd
Interpolation Date Wednesday - 19 June - 2013 - at 06:06:41Interpolation Run Number 11Interpolarion ipar file hounde_estimation_2013_21_39.iparWorking Directory d:/endeavour/2013_012_hounde/blockmodel_10_5_10
Input Assay File DetailsAssay File Location ../composites/cut_1m_ con_panel_hounde_june20Assay File Id 25 au_cutAssay String Numbers 1,99Assay Description Field 11
Assay File Constraint DetailsConstrain Assays N YAssay Constraint File domain_25Save Constrained Assays N domain_25_cutOutput Constrained Assay File LocationOutput Constrained Assay File Id
Interpolation Search DetailsOctant or Ellipsoid EllipsoidMax No of Adjacent Empty OctantsMinimum Number of Samples 6Maximum Number of Samples 40Limit Samples by Hole Id NHole Id FieldMaximum Number of Samples per HoleMaximum Search Distance for Major Axis 75Maximum Vertical Search Distance 1000Bearing of Major Axis 35Plunge of Major Axis 0Dip of Semi-Major Axis 75Major / Semi-Major Ratio 1Major / Minor Ratio 4
Pass Details Pass 1 Pass 2 Pass 3Pass Field pass passPass Field Value 1 2Pass Ratio 2Pass Minimum Samples 6 4Pass Maximum Samples 40 40
Interpolation Method DetailsInverse Distance or Ordinary Krigging Ordinary KrigingInverse Distance PowerNo of X Descretisation Points 2No of Y Descretisation Points 4No of Z Descretisation Points 2
Variogram Parameters if OK is chosenNumber of Structures 2Nugget 0.55Relative Nugget 55% Major/Semi Major/
Sill Range Azimuth Plunge Dip Major Ratio Minor RatioStructure 1 0.32 10 35 0 75 1 2Structure 2 0.13 50 35 0 75 1 4Structure 3 0 0 0 0 0 1 1Structure 4 0 0 0 0 0 1 1Structure 5 0 0 0 0 0 1 1
Interpolation Output FieldsDistance to Nearest Sample Field dnsAverage Distance Field avdNumber of Samples Field nsKriging Variance Field kv
Output Report File Name *.XLS au_cut_dom_25
Domain Name
Block Model DetailsBlock ModelBlock Model Field
Interpolator Output Report
Block Model Constraint DetailsConstrain EstimationEstimation Constraints File

HOUNDÉ GOLD PROJECT, BURKINA FASO FEASIBILITY STUDY NI 43-101 TECHNICAL REPORT
1813.20\25.02\1813.20-STY-001_B A14.1.1 October 2013 Cube Consulting Pty Ltd
Interpolation Date Wednesday - 19 June - 2013 - at 06:08:34Interpolation Run Number 15Interpolarion ipar file hounde_estimation_2013_21_39.iparWorking Directory d:/endeavour/2013_012_hounde/blockmodel_10_5_10
Input Assay File DetailsAssay File Location ../composites/cut_1m_ con_panel_hounde_june20Assay File Id 26 au_cutAssay String Numbers 1,99Assay Description Field 11
Assay File Constraint DetailsConstrain Assays N YAssay Constraint File domain_north_26Save Constrained Assays N domain_26_north_cutOutput Constrained Assay File LocationOutput Constrained Assay File Id
Interpolation Search DetailsOctant or Ellipsoid EllipsoidMax No of Adjacent Empty OctantsMinimum Number of Samples 6Maximum Number of Samples 40Limit Samples by Hole Id NHole Id FieldMaximum Number of Samples per HoleMaximum Search Distance for Major Axis 75Maximum Vertical Search Distance 1000Bearing of Major Axis 5Plunge of Major Axis 0Dip of Semi-Major Axis 70Major / Semi-Major Ratio 1Major / Minor Ratio 4
Pass Details Pass 1 Pass 2 Pass 3Pass Field pass passPass Field Value 1 2Pass Ratio 2Pass Minimum Samples 6 4Pass Maximum Samples 40 40
Interpolation Method DetailsInverse Distance or Ordinary Krigging Ordinary KrigingInverse Distance PowerNo of X Descretisation Points 2No of Y Descretisation Points 4No of Z Descretisation Points 2
Variogram Parameters if OK is chosenNumber of Structures 2Nugget 0.55Relative Nugget 55% Major/Semi Major/
Sill Range Azimuth Plunge Dip Major Ratio Minor RatioStructure 1 0.32 10 5 0 70 1 2Structure 2 0.13 50 5 0 70 1 4Structure 3 0 0 0 0 0 1 1Structure 4 0 0 0 0 0 1 1Structure 5 0 0 0 0 0 1 1
Interpolation Output FieldsDistance to Nearest Sample Field dnsAverage Distance Field avdNumber of Samples Field nsKriging Variance Field kv
Output Report File Name *.XLS au_cut_dom_north_26
Domain Name
Block Model DetailsBlock ModelBlock Model Field
Interpolator Output Report
Block Model Constraint DetailsConstrain EstimationEstimation Constraints File
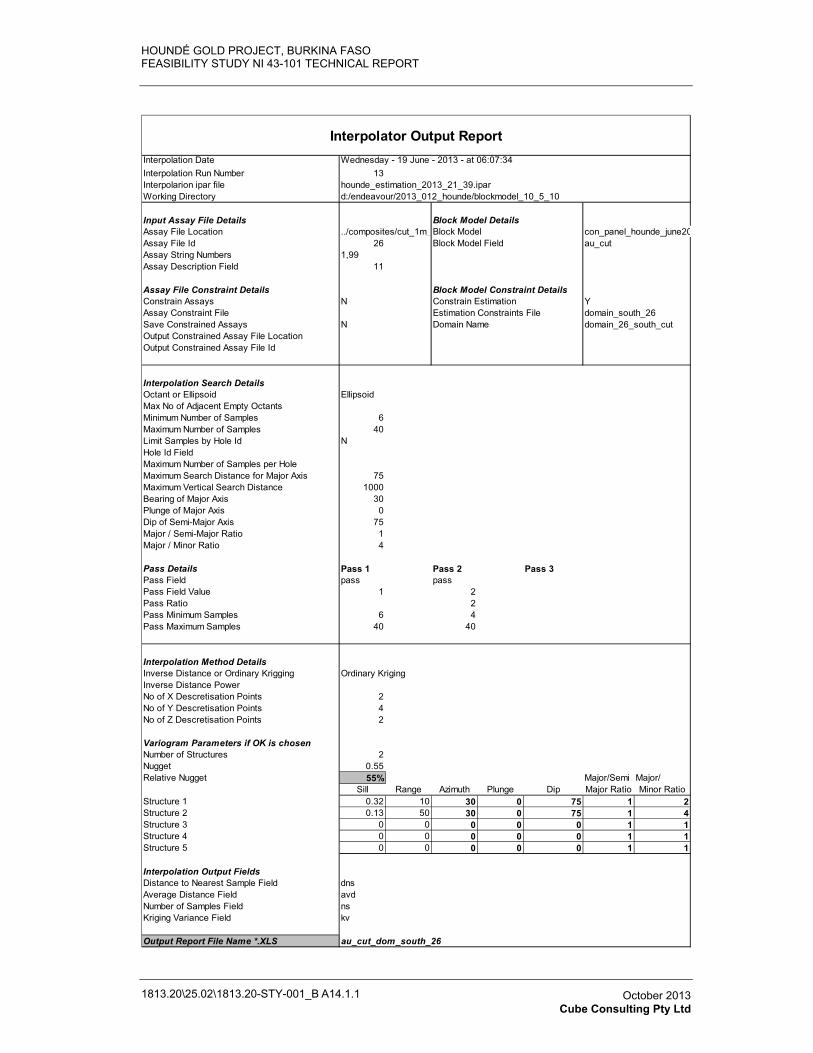
HOUNDÉ GOLD PROJECT, BURKINA FASO FEASIBILITY STUDY NI 43-101 TECHNICAL REPORT
1813.20\25.02\1813.20-STY-001_B A14.1.1 October 2013 Cube Consulting Pty Ltd
Interpolation Date Wednesday - 19 June - 2013 - at 06:07:34Interpolation Run Number 13Interpolarion ipar file hounde_estimation_2013_21_39.iparWorking Directory d:/endeavour/2013_012_hounde/blockmodel_10_5_10
Input Assay File DetailsAssay File Location ../composites/cut_1m_ con_panel_hounde_june20Assay File Id 26 au_cutAssay String Numbers 1,99Assay Description Field 11
Assay File Constraint DetailsConstrain Assays N YAssay Constraint File domain_south_26Save Constrained Assays N domain_26_south_cutOutput Constrained Assay File LocationOutput Constrained Assay File Id
Interpolation Search DetailsOctant or Ellipsoid EllipsoidMax No of Adjacent Empty OctantsMinimum Number of Samples 6Maximum Number of Samples 40Limit Samples by Hole Id NHole Id FieldMaximum Number of Samples per HoleMaximum Search Distance for Major Axis 75Maximum Vertical Search Distance 1000Bearing of Major Axis 30Plunge of Major Axis 0Dip of Semi-Major Axis 75Major / Semi-Major Ratio 1Major / Minor Ratio 4
Pass Details Pass 1 Pass 2 Pass 3Pass Field pass passPass Field Value 1 2Pass Ratio 2Pass Minimum Samples 6 4Pass Maximum Samples 40 40
Interpolation Method DetailsInverse Distance or Ordinary Krigging Ordinary KrigingInverse Distance PowerNo of X Descretisation Points 2No of Y Descretisation Points 4No of Z Descretisation Points 2
Variogram Parameters if OK is chosenNumber of Structures 2Nugget 0.55Relative Nugget 55% Major/Semi Major/
Sill Range Azimuth Plunge Dip Major Ratio Minor RatioStructure 1 0.32 10 30 0 75 1 2Structure 2 0.13 50 30 0 75 1 4Structure 3 0 0 0 0 0 1 1Structure 4 0 0 0 0 0 1 1Structure 5 0 0 0 0 0 1 1
Interpolation Output FieldsDistance to Nearest Sample Field dnsAverage Distance Field avdNumber of Samples Field nsKriging Variance Field kv
Output Report File Name *.XLS au_cut_dom_south_26
Domain Name
Block Model DetailsBlock ModelBlock Model Field
Interpolator Output Report
Block Model Constraint DetailsConstrain EstimationEstimation Constraints File

HOUNDÉ GOLD PROJECT, BURKINA FASO FEASIBILITY STUDY NI 43-101 TECHNICAL REPORT
1813.20\25.02\1813.20-STY-001_B A14.1.1 October 2013 Cube Consulting Pty Ltd
Interpolation Date Wednesday - 19 June - 2013 - at 06:09:31Interpolation Run Number 17Interpolarion ipar file hounde_estimation_2013_21_39.iparWorking Directory d:/endeavour/2013_012_hounde/blockmodel_10_5_10
Input Assay File DetailsAssay File Location ../composites/cut_1m_ con_panel_hounde_june20Assay File Id 27 au_cutAssay String Numbers 1,99Assay Description Field 11
Assay File Constraint DetailsConstrain Assays N YAssay Constraint File domain_27Save Constrained Assays N domain_27_cutOutput Constrained Assay File LocationOutput Constrained Assay File Id
Interpolation Search DetailsOctant or Ellipsoid EllipsoidMax No of Adjacent Empty OctantsMinimum Number of Samples 6Maximum Number of Samples 40Limit Samples by Hole Id NHole Id FieldMaximum Number of Samples per HoleMaximum Search Distance for Major Axis 75Maximum Vertical Search Distance 1000Bearing of Major Axis 30Plunge of Major Axis 0Dip of Semi-Major Axis 75Major / Semi-Major Ratio 1Major / Minor Ratio 4
Pass Details Pass 1 Pass 2 Pass 3Pass Field pass passPass Field Value 1 2Pass Ratio 2Pass Minimum Samples 6 4Pass Maximum Samples 40 40
Interpolation Method DetailsInverse Distance or Ordinary Krigging Ordinary KrigingInverse Distance PowerNo of X Descretisation Points 2No of Y Descretisation Points 4No of Z Descretisation Points 2
Variogram Parameters if OK is chosenNumber of Structures 2Nugget 0.55Relative Nugget 55% Major/Semi Major/
Sill Range Azimuth Plunge Dip Major Ratio Minor RatioStructure 1 0.32 10 30 0 -90 1 2Structure 2 0.13 50 40 0 -90 1 4Structure 3 0 0 0 0 0 1 1Structure 4 0 0 0 0 0 1 1Structure 5 0 0 0 0 0 1 1
Interpolation Output FieldsDistance to Nearest Sample Field dnsAverage Distance Field avdNumber of Samples Field nsKriging Variance Field kv
Output Report File Name *.XLS au_cut_dom_27
Domain Name
Block Model DetailsBlock ModelBlock Model Field
Interpolator Output Report
Block Model Constraint DetailsConstrain EstimationEstimation Constraints File

HOUNDÉ GOLD PROJECT, BURKINA FASO FEASIBILITY STUDY NI 43-101 TECHNICAL REPORT
1813.20\25.02\1813.20-STY-001_B A14.1.1 October 2013 Cube Consulting Pty Ltd
Interpolation Date Wednesday - 19 June - 2013 - at 06:11:22Interpolation Run Number 21Interpolarion ipar file hounde_estimation_2013_21_39.iparWorking Directory d:/endeavour/2013_012_hounde/blockmodel_10_5_10
Input Assay File DetailsAssay File Location ../composites/cut_1m_ con_panel_hounde_june20Assay File Id 28 au_cutAssay String Numbers 1,99Assay Description Field 11
Assay File Constraint DetailsConstrain Assays N YAssay Constraint File domain_north_28Save Constrained Assays N domain_28_north_cutOutput Constrained Assay File LocationOutput Constrained Assay File Id
Interpolation Search DetailsOctant or Ellipsoid EllipsoidMax No of Adjacent Empty OctantsMinimum Number of Samples 6Maximum Number of Samples 40Limit Samples by Hole Id NHole Id FieldMaximum Number of Samples per HoleMaximum Search Distance for Major Axis 75Maximum Vertical Search Distance 1000Bearing of Major Axis 15Plunge of Major Axis 0Dip of Semi-Major Axis 75Major / Semi-Major Ratio 1Major / Minor Ratio 4
Pass Details Pass 1 Pass 2 Pass 3Pass Field pass passPass Field Value 1 2Pass Ratio 2Pass Minimum Samples 6 4Pass Maximum Samples 40 40
Interpolation Method DetailsInverse Distance or Ordinary Krigging Ordinary KrigingInverse Distance PowerNo of X Descretisation Points 2No of Y Descretisation Points 4No of Z Descretisation Points 2
Variogram Parameters if OK is chosenNumber of Structures 2Nugget 0.55Relative Nugget 55% Major/Semi Major/
Sill Range Azimuth Plunge Dip Major Ratio Minor RatioStructure 1 0.32 10 15 0 -90 1 2Structure 2 0.13 50 35 0 -90 1 4Structure 3 0 0 0 0 0 1 1Structure 4 0 0 0 0 0 1 1Structure 5 0 0 0 0 0 1 1
Interpolation Output FieldsDistance to Nearest Sample Field dnsAverage Distance Field avdNumber of Samples Field nsKriging Variance Field kv
Output Report File Name *.XLS au_cut_dom_north_28
Domain Name
Block Model DetailsBlock ModelBlock Model Field
Interpolator Output Report
Block Model Constraint DetailsConstrain EstimationEstimation Constraints File

HOUNDÉ GOLD PROJECT, BURKINA FASO FEASIBILITY STUDY NI 43-101 TECHNICAL REPORT
1813.20\25.02\1813.20-STY-001_B A14.1.1 October 2013 Cube Consulting Pty Ltd
Interpolation Date Wednesday - 19 June - 2013 - at 06:10:21Interpolation Run Number 19Interpolarion ipar file hounde_estimation_2013_21_39.iparWorking Directory d:/endeavour/2013_012_hounde/blockmodel_10_5_10
Input Assay File DetailsAssay File Location ../composites/cut_1m_ con_panel_hounde_june20Assay File Id 28 au_cutAssay String Numbers 1,99Assay Description Field 11
Assay File Constraint DetailsConstrain Assays N YAssay Constraint File domain_south_28Save Constrained Assays N domain_28_south_cutOutput Constrained Assay File LocationOutput Constrained Assay File Id
Interpolation Search DetailsOctant or Ellipsoid EllipsoidMax No of Adjacent Empty OctantsMinimum Number of Samples 6Maximum Number of Samples 40Limit Samples by Hole Id NHole Id FieldMaximum Number of Samples per HoleMaximum Search Distance for Major Axis 75Maximum Vertical Search Distance 1000Bearing of Major Axis 30Plunge of Major Axis 0Dip of Semi-Major Axis 75Major / Semi-Major Ratio 1Major / Minor Ratio 4
Pass Details Pass 1 Pass 2 Pass 3Pass Field pass passPass Field Value 1 2Pass Ratio 2Pass Minimum Samples 6 4Pass Maximum Samples 40 40
Interpolation Method DetailsInverse Distance or Ordinary Krigging Ordinary KrigingInverse Distance PowerNo of X Descretisation Points 2No of Y Descretisation Points 4No of Z Descretisation Points 2
Variogram Parameters if OK is chosenNumber of Structures 2Nugget 0.55Relative Nugget 55% Major/Semi Major/
Sill Range Azimuth Plunge Dip Major Ratio Minor RatioStructure 1 0.32 10 30 0 -90 1 2Structure 2 0.13 50 40 0 -90 1 4Structure 3 0 0 0 0 0 1 1Structure 4 0 0 0 0 0 1 1Structure 5 0 0 0 0 0 1 1
Interpolation Output FieldsDistance to Nearest Sample Field dnsAverage Distance Field avdNumber of Samples Field nsKriging Variance Field kv
Output Report File Name *.XLS au_cut_dom_south_28
Domain Name
Block Model DetailsBlock ModelBlock Model Field
Interpolator Output Report
Block Model Constraint DetailsConstrain EstimationEstimation Constraints File

HOUNDÉ GOLD PROJECT, BURKINA FASO FEASIBILITY STUDY NI 43-101 TECHNICAL REPORT
1813.20\25.02\1813.20-STY-001_B A14.1.1 October 2013 Cube Consulting Pty Ltd
Interpolation Date Wednesday - 19 June - 2013 - at 06:12:29Interpolation Run Number 23Interpolarion ipar file hounde_estimation_2013_21_39.iparWorking Directory d:/endeavour/2013_012_hounde/blockmodel_10_5_10
Input Assay File DetailsAssay File Location ../composites/cut_1m_ con_panel_hounde_june20Assay File Id 29 au_cutAssay String Numbers 1,99Assay Description Field 11
Assay File Constraint DetailsConstrain Assays N YAssay Constraint File domain_29Save Constrained Assays N domain_29_cutOutput Constrained Assay File LocationOutput Constrained Assay File Id
Interpolation Search DetailsOctant or Ellipsoid EllipsoidMax No of Adjacent Empty OctantsMinimum Number of Samples 6Maximum Number of Samples 40Limit Samples by Hole Id NHole Id FieldMaximum Number of Samples per HoleMaximum Search Distance for Major Axis 75Maximum Vertical Search Distance 1000Bearing of Major Axis 0Plunge of Major Axis 0Dip of Semi-Major Axis 70Major / Semi-Major Ratio 1Major / Minor Ratio 4
Pass Details Pass 1 Pass 2 Pass 3Pass Field pass passPass Field Value 1 2Pass Ratio 2Pass Minimum Samples 6 4Pass Maximum Samples 40 40
Interpolation Method DetailsInverse Distance or Ordinary Krigging Ordinary KrigingInverse Distance PowerNo of X Descretisation Points 2No of Y Descretisation Points 4No of Z Descretisation Points 2
Variogram Parameters if OK is chosenNumber of Structures 2Nugget 0.55Relative Nugget 55% Major/Semi Major/
Sill Range Azimuth Plunge Dip Major Ratio Minor RatioStructure 1 0.32 10 0 0 75 1 2Structure 2 0.13 50 35 0 75 1 4Structure 3 0 0 0 0 0 1 1Structure 4 0 0 0 0 0 1 1Structure 5 0 0 0 0 0 1 1
Interpolation Output FieldsDistance to Nearest Sample Field dnsAverage Distance Field avdNumber of Samples Field nsKriging Variance Field kv
Output Report File Name *.XLS au_cut_dom_29
Domain Name
Block Model DetailsBlock ModelBlock Model Field
Interpolator Output Report
Block Model Constraint DetailsConstrain EstimationEstimation Constraints File

HOUNDÉ GOLD PROJECT, BURKINA FASO FEASIBILITY STUDY NI 43-101 TECHNICAL REPORT
1813.20\25.02\1813.20-STY-001_B A14.1.1 October 2013 Cube Consulting Pty Ltd
Interpolation Date Wednesday - 19 June - 2013 - at 06:13:20Interpolation Run Number 25Interpolarion ipar file hounde_estimation_2013_21_39.iparWorking Directory d:/endeavour/2013_012_hounde/blockmodel_10_5_10
Input Assay File DetailsAssay File Location ../composites/cut_1m_ con_panel_hounde_june20Assay File Id 30 au_cutAssay String Numbers 1,99Assay Description Field 11
Assay File Constraint DetailsConstrain Assays N YAssay Constraint File domain_30Save Constrained Assays N domain_30_cutOutput Constrained Assay File LocationOutput Constrained Assay File Id
Interpolation Search DetailsOctant or Ellipsoid EllipsoidMax No of Adjacent Empty OctantsMinimum Number of Samples 6Maximum Number of Samples 40Limit Samples by Hole Id NHole Id FieldMaximum Number of Samples per HoleMaximum Search Distance for Major Axis 75Maximum Vertical Search Distance 1000Bearing of Major Axis 20Plunge of Major Axis 0Dip of Semi-Major Axis 85Major / Semi-Major Ratio 1Major / Minor Ratio 4
Pass Details Pass 1 Pass 2 Pass 3Pass Field pass passPass Field Value 1 2Pass Ratio 2Pass Minimum Samples 6 4Pass Maximum Samples 40 40
Interpolation Method DetailsInverse Distance or Ordinary Krigging Ordinary KrigingInverse Distance PowerNo of X Descretisation Points 2No of Y Descretisation Points 4No of Z Descretisation Points 2
Variogram Parameters if OK is chosenNumber of Structures 2Nugget 0.55Relative Nugget 55% Major/Semi Major/
Sill Range Azimuth Plunge Dip Major Ratio Minor RatioStructure 1 0.32 10 20 0 75 1 2Structure 2 0.13 50 35 0 75 1 4Structure 3 0 0 0 0 0 1 1Structure 4 0 0 0 0 0 1 1Structure 5 0 0 0 0 0 1 1
Interpolation Output FieldsDistance to Nearest Sample Field dnsAverage Distance Field avdNumber of Samples Field nsKriging Variance Field kv
Output Report File Name *.XLS au_cut_dom_30
Domain Name
Block Model DetailsBlock ModelBlock Model Field
Interpolator Output Report
Block Model Constraint DetailsConstrain EstimationEstimation Constraints File

HOUNDÉ GOLD PROJECT, BURKINA FASO FEASIBILITY STUDY NI 43-101 TECHNICAL REPORT
1813.20\25.02\1813.20-STY-001_B A14.1.1 October 2013 Cube Consulting Pty Ltd
Interpolation Date Wednesday - 19 June - 2013 - at 06:14:12Interpolation Run Number 27Interpolarion ipar file hounde_estimation_2013_21_39.iparWorking Directory d:/endeavour/2013_012_hounde/blockmodel_10_5_10
Input Assay File DetailsAssay File Location ../composites/cut_1m_ con_panel_hounde_june20Assay File Id 31 au_cutAssay String Numbers 1,99Assay Description Field 11
Assay File Constraint DetailsConstrain Assays N YAssay Constraint File domain_31Save Constrained Assays N domain_31_cutOutput Constrained Assay File LocationOutput Constrained Assay File Id
Interpolation Search DetailsOctant or Ellipsoid EllipsoidMax No of Adjacent Empty OctantsMinimum Number of Samples 6Maximum Number of Samples 40Limit Samples by Hole Id NHole Id FieldMaximum Number of Samples per HoleMaximum Search Distance for Major Axis 75Maximum Vertical Search Distance 1000Bearing of Major Axis 30Plunge of Major Axis 0Dip of Semi-Major Axis 80Major / Semi-Major Ratio 1Major / Minor Ratio 4
Pass Details Pass 1 Pass 2 Pass 3Pass Field pass passPass Field Value 1 2Pass Ratio 2Pass Minimum Samples 6 4Pass Maximum Samples 40 40
Interpolation Method DetailsInverse Distance or Ordinary Krigging Ordinary KrigingInverse Distance PowerNo of X Descretisation Points 2No of Y Descretisation Points 4No of Z Descretisation Points 2
Variogram Parameters if OK is chosenNumber of Structures 2Nugget 0.55Relative Nugget 55% Major/Semi Major/
Sill Range Azimuth Plunge Dip Major Ratio Minor RatioStructure 1 0.32 10 30 0 80 1 2Structure 2 0.13 50 30 0 80 1 4Structure 3 0 0 0 0 0 1 1Structure 4 0 0 0 0 0 1 1Structure 5 0 0 0 0 0 1 1
Interpolation Output FieldsDistance to Nearest Sample Field dnsAverage Distance Field avdNumber of Samples Field nsKriging Variance Field kv
Output Report File Name *.XLS au_cut_dom_31
Domain Name
Block Model DetailsBlock ModelBlock Model Field
Interpolator Output Report
Block Model Constraint DetailsConstrain EstimationEstimation Constraints File

HOUNDÉ GOLD PROJECT, BURKINA FASO FEASIBILITY STUDY NI 43-101 TECHNICAL REPORT
1813.20\25.02\1813.20-STY-001_B A14.1.1 October 2013 Cube Consulting Pty Ltd
Interpolation Date Wednesday - 19 June - 2013 - at 06:15:02Interpolation Run Number 29Interpolarion ipar file hounde_estimation_2013_21_39.iparWorking Directory d:/endeavour/2013_012_hounde/blockmodel_10_5_10
Input Assay File DetailsAssay File Location ../composites/cut_1m_ con_panel_hounde_june20Assay File Id 32 au_cutAssay String Numbers 1,99Assay Description Field 11
Assay File Constraint DetailsConstrain Assays N YAssay Constraint File domain_32Save Constrained Assays N domain_32_cutOutput Constrained Assay File LocationOutput Constrained Assay File Id
Interpolation Search DetailsOctant or Ellipsoid EllipsoidMax No of Adjacent Empty OctantsMinimum Number of Samples 6Maximum Number of Samples 40Limit Samples by Hole Id NHole Id FieldMaximum Number of Samples per HoleMaximum Search Distance for Major Axis 75Maximum Vertical Search Distance 1000Bearing of Major Axis 20Plunge of Major Axis 0Dip of Semi-Major Axis 85Major / Semi-Major Ratio 1Major / Minor Ratio 4
Pass Details Pass 1 Pass 2 Pass 3Pass Field pass passPass Field Value 1 2Pass Ratio 2Pass Minimum Samples 6 4Pass Maximum Samples 40 40
Interpolation Method DetailsInverse Distance or Ordinary Krigging Ordinary KrigingInverse Distance PowerNo of X Descretisation Points 2No of Y Descretisation Points 4No of Z Descretisation Points 2
Variogram Parameters if OK is chosenNumber of Structures 2Nugget 0.55Relative Nugget 55% Major/Semi Major/
Sill Range Azimuth Plunge Dip Major Ratio Minor RatioStructure 1 0.32 10 20 0 85 1 2Structure 2 0.13 50 20 0 80 1 4Structure 3 0 0 0 0 0 1 1Structure 4 0 0 0 0 0 1 1Structure 5 0 0 0 0 0 1 1
Interpolation Output FieldsDistance to Nearest Sample Field dnsAverage Distance Field avdNumber of Samples Field nsKriging Variance Field kv
Output Report File Name *.XLS au_cut_dom_32
Domain Name
Block Model DetailsBlock ModelBlock Model Field
Interpolator Output Report
Block Model Constraint DetailsConstrain EstimationEstimation Constraints File

HOUNDÉ GOLD PROJECT, BURKINA FASO FEASIBILITY STUDY NI 43-101 TECHNICAL REPORT
1813.20\25.02\1813.20-STY-001_B A14.1.1 October 2013 Cube Consulting Pty Ltd
Interpolation Date Wednesday - 19 June - 2013 - at 06:15:53Interpolation Run Number 31Interpolarion ipar file hounde_estimation_2013_21_39.iparWorking Directory d:/endeavour/2013_012_hounde/blockmodel_10_5_10
Input Assay File DetailsAssay File Location ../composites/cut_1m_ con_panel_hounde_june20Assay File Id 33 au_cutAssay String Numbers 1,99Assay Description Field 11
Assay File Constraint DetailsConstrain Assays N YAssay Constraint File domain_33Save Constrained Assays N domain_33_cutOutput Constrained Assay File LocationOutput Constrained Assay File Id
Interpolation Search DetailsOctant or Ellipsoid EllipsoidMax No of Adjacent Empty OctantsMinimum Number of Samples 6Maximum Number of Samples 40Limit Samples by Hole Id NHole Id FieldMaximum Number of Samples per HoleMaximum Search Distance for Major Axis 75Maximum Vertical Search Distance 1000Bearing of Major Axis 20Plunge of Major Axis 0Dip of Semi-Major Axis 85Major / Semi-Major Ratio 1Major / Minor Ratio 4
Pass Details Pass 1 Pass 2 Pass 3Pass Field pass passPass Field Value 1 2Pass Ratio 2Pass Minimum Samples 6 4Pass Maximum Samples 40 40
Interpolation Method DetailsInverse Distance or Ordinary Krigging Ordinary KrigingInverse Distance PowerNo of X Descretisation Points 2No of Y Descretisation Points 4No of Z Descretisation Points 2
Variogram Parameters if OK is chosenNumber of Structures 2Nugget 0.55Relative Nugget 55% Major/Semi Major/
Sill Range Azimuth Plunge Dip Major Ratio Minor RatioStructure 1 0.32 10 20 0 85 1 2Structure 2 0.13 50 20 0 85 1 4Structure 3 0 0 0 0 0 1 1Structure 4 0 0 0 0 0 1 1Structure 5 0 0 0 0 0 1 1
Interpolation Output FieldsDistance to Nearest Sample Field dnsAverage Distance Field avdNumber of Samples Field nsKriging Variance Field kv
Output Report File Name *.XLS au_cut_dom_33
Domain Name
Block Model DetailsBlock ModelBlock Model Field
Interpolator Output Report
Block Model Constraint DetailsConstrain EstimationEstimation Constraints File

HOUNDÉ GOLD PROJECT, BURKINA FASO FEASIBILITY STUDY NI 43-101 TECHNICAL REPORT
1813.20\25.02\1813.20-STY-001_B A14.1.1 October 2013 Cube Consulting Pty Ltd
Interpolation Date Wednesday - 19 June - 2013 - at 06:16:52Interpolation Run Number 33Interpolarion ipar file hounde_estimation_2013_21_39.iparWorking Directory d:/endeavour/2013_012_hounde/blockmodel_10_5_10
Input Assay File DetailsAssay File Location ../composites/cut_1m_ con_panel_hounde_june20Assay File Id 34 au_cutAssay String Numbers 1,99Assay Description Field 11
Assay File Constraint DetailsConstrain Assays N YAssay Constraint File domain_34Save Constrained Assays N domain_34_cutOutput Constrained Assay File LocationOutput Constrained Assay File Id
Interpolation Search DetailsOctant or Ellipsoid EllipsoidMax No of Adjacent Empty OctantsMinimum Number of Samples 6Maximum Number of Samples 40Limit Samples by Hole Id NHole Id FieldMaximum Number of Samples per HoleMaximum Search Distance for Major Axis 75Maximum Vertical Search Distance 1000Bearing of Major Axis 20Plunge of Major Axis 0Dip of Semi-Major Axis 85Major / Semi-Major Ratio 1Major / Minor Ratio 4
Pass Details Pass 1 Pass 2 Pass 3Pass Field pass passPass Field Value 1 2Pass Ratio 2Pass Minimum Samples 6 4Pass Maximum Samples 40 40
Interpolation Method DetailsInverse Distance or Ordinary Krigging Ordinary KrigingInverse Distance PowerNo of X Descretisation Points 2No of Y Descretisation Points 4No of Z Descretisation Points 2
Variogram Parameters if OK is chosenNumber of Structures 2Nugget 0.55Relative Nugget 55% Major/Semi Major/
Sill Range Azimuth Plunge Dip Major Ratio Minor RatioStructure 1 0.32 10 20 0 85 1 2Structure 2 0.13 50 20 0 85 1 4Structure 3 0 0 0 0 0 1 1Structure 4 0 0 0 0 0 1 1Structure 5 0 0 0 0 0 1 1
Interpolation Output FieldsDistance to Nearest Sample Field dnsAverage Distance Field avdNumber of Samples Field nsKriging Variance Field kv
Output Report File Name *.XLS au_cut_dom_34
Domain Name
Block Model DetailsBlock ModelBlock Model Field
Interpolator Output Report
Block Model Constraint DetailsConstrain EstimationEstimation Constraints File

HOUNDÉ GOLD PROJECT, BURKINA FASO FEASIBILITY STUDY NI 43-101 TECHNICAL REPORT
1813.20\25.02\1813.20-STY-001_B A14.1.1 October 2013 Cube Consulting Pty Ltd
Interpolation Date Wednesday - 19 June - 2013 - at 06:17:53Interpolation Run Number 35Interpolarion ipar file hounde_estimation_2013_21_39.iparWorking Directory d:/endeavour/2013_012_hounde/blockmodel_10_5_10
Input Assay File DetailsAssay File Location ../composites/cut_1m_ con_panel_hounde_june20Assay File Id 35 au_cutAssay String Numbers 1,99Assay Description Field 11
Assay File Constraint DetailsConstrain Assays N YAssay Constraint File domain_35Save Constrained Assays N domain_35_cutOutput Constrained Assay File LocationOutput Constrained Assay File Id
Interpolation Search DetailsOctant or Ellipsoid EllipsoidMax No of Adjacent Empty OctantsMinimum Number of Samples 6Maximum Number of Samples 40Limit Samples by Hole Id NHole Id FieldMaximum Number of Samples per HoleMaximum Search Distance for Major Axis 75Maximum Vertical Search Distance 1000Bearing of Major Axis 20Plunge of Major Axis 0Dip of Semi-Major Axis 85Major / Semi-Major Ratio 1Major / Minor Ratio 4
Pass Details Pass 1 Pass 2 Pass 3Pass Field pass passPass Field Value 1 2Pass Ratio 2Pass Minimum Samples 6 4Pass Maximum Samples 40 40
Interpolation Method DetailsInverse Distance or Ordinary Krigging Ordinary KrigingInverse Distance PowerNo of X Descretisation Points 2No of Y Descretisation Points 4No of Z Descretisation Points 2
Variogram Parameters if OK is chosenNumber of Structures 2Nugget 0.55Relative Nugget 55% Major/Semi Major/
Sill Range Azimuth Plunge Dip Major Ratio Minor RatioStructure 1 0.32 10 20 0 85 1 2Structure 2 0.13 50 20 0 85 1 4Structure 3 0 0 0 0 0 1 1Structure 4 0 0 0 0 0 1 1Structure 5 0 0 0 0 0 1 1
Interpolation Output FieldsDistance to Nearest Sample Field dnsAverage Distance Field avdNumber of Samples Field nsKriging Variance Field kv
Output Report File Name *.XLS au_cut_dom_35
Domain Name
Block Model DetailsBlock ModelBlock Model Field
Interpolator Output Report
Block Model Constraint DetailsConstrain EstimationEstimation Constraints File

HOUNDÉ GOLD PROJECT, BURKINA FASO FEASIBILITY STUDY NI 43-101 TECHNICAL REPORT
1813.20\25.02\1813.20-STY-001_B A14.1.1 October 2013 Cube Consulting Pty Ltd
Interpolation Date Wednesday - 19 June - 2013 - at 06:18:44Interpolation Run Number 37Interpolarion ipar file hounde_estimation_2013_21_39.iparWorking Directory d:/endeavour/2013_012_hounde/blockmodel_10_5_10
Input Assay File DetailsAssay File Location ../composites/cut_1m_ con_panel_hounde_june20Assay File Id 36 au_cutAssay String Numbers 1,99Assay Description Field 11
Assay File Constraint DetailsConstrain Assays N YAssay Constraint File domain_36Save Constrained Assays N domain_36_cutOutput Constrained Assay File LocationOutput Constrained Assay File Id
Interpolation Search DetailsOctant or Ellipsoid EllipsoidMax No of Adjacent Empty OctantsMinimum Number of Samples 6Maximum Number of Samples 40Limit Samples by Hole Id NHole Id FieldMaximum Number of Samples per HoleMaximum Search Distance for Major Axis 75Maximum Vertical Search Distance 1000Bearing of Major Axis 20Plunge of Major Axis 0Dip of Semi-Major Axis 85Major / Semi-Major Ratio 1Major / Minor Ratio 4
Pass Details Pass 1 Pass 2 Pass 3Pass Field pass passPass Field Value 1 2Pass Ratio 2Pass Minimum Samples 6 4Pass Maximum Samples 40 40
Interpolation Method DetailsInverse Distance or Ordinary Krigging Ordinary KrigingInverse Distance PowerNo of X Descretisation Points 2No of Y Descretisation Points 4No of Z Descretisation Points 2
Variogram Parameters if OK is chosenNumber of Structures 2Nugget 0.55Relative Nugget 55% Major/Semi Major/
Sill Range Azimuth Plunge Dip Major Ratio Minor RatioStructure 1 0.32 10 20 0 85 1 2Structure 2 0.13 50 20 0 85 1 4Structure 3 0 0 0 0 0 1 1Structure 4 0 0 0 0 0 1 1Structure 5 0 0 0 0 0 1 1
Interpolation Output FieldsDistance to Nearest Sample Field dnsAverage Distance Field avdNumber of Samples Field nsKriging Variance Field kv
Output Report File Name *.XLS au_cut_dom_36
Domain Name
Block Model DetailsBlock ModelBlock Model Field
Interpolator Output Report
Block Model Constraint DetailsConstrain EstimationEstimation Constraints File

HOUNDÉ GOLD PROJECT, BURKINA FASO FEASIBILITY STUDY NI 43-101 TECHNICAL REPORT
1813.20\25.02\1813.20-STY-001_B A14.1.1 October 2013 Cube Consulting Pty Ltd
Interpolation Date Wednesday - 19 June - 2013 - at 06:19:35Interpolation Run Number 39Interpolarion ipar file hounde_estimation_2013_21_39.iparWorking Directory d:/endeavour/2013_012_hounde/blockmodel_10_5_10
Input Assay File DetailsAssay File Location ../composites/cut_1m_ con_panel_hounde_june20Assay File Id 37 au_cutAssay String Numbers 1,99Assay Description Field 11
Assay File Constraint DetailsConstrain Assays N YAssay Constraint File domain_37Save Constrained Assays N domain_37_cutOutput Constrained Assay File LocationOutput Constrained Assay File Id
Interpolation Search DetailsOctant or Ellipsoid EllipsoidMax No of Adjacent Empty OctantsMinimum Number of Samples 6Maximum Number of Samples 40Limit Samples by Hole Id NHole Id FieldMaximum Number of Samples per HoleMaximum Search Distance for Major Axis 75Maximum Vertical Search Distance 1000Bearing of Major Axis 30Plunge of Major Axis 0Dip of Semi-Major Axis 75Major / Semi-Major Ratio 1Major / Minor Ratio 4
Pass Details Pass 1 Pass 2 Pass 3Pass Field pass passPass Field Value 1 2Pass Ratio 2Pass Minimum Samples 6 4Pass Maximum Samples 40 40
Interpolation Method DetailsInverse Distance or Ordinary Krigging Ordinary KrigingInverse Distance PowerNo of X Descretisation Points 2No of Y Descretisation Points 4No of Z Descretisation Points 2
Variogram Parameters if OK is chosenNumber of Structures 2Nugget 0.55Relative Nugget 55% Major/Semi Major/
Sill Range Azimuth Plunge Dip Major Ratio Minor RatioStructure 1 0.32 10 30 0 75 1 2Structure 2 0.13 50 30 0 75 1 4Structure 3 0 0 0 0 0 1 1Structure 4 0 0 0 0 0 1 1Structure 5 0 0 0 0 0 1 1
Interpolation Output FieldsDistance to Nearest Sample Field dnsAverage Distance Field avdNumber of Samples Field nsKriging Variance Field kv
Output Report File Name *.XLS au_cut_dom_37
Domain Name
Block Model DetailsBlock ModelBlock Model Field
Interpolator Output Report
Block Model Constraint DetailsConstrain EstimationEstimation Constraints File

HOUNDÉ GOLD PROJECT, BURKINA FASO FEASIBILITY STUDY NI 43-101 TECHNICAL REPORT
1813.20\25.02\1813.20-STY-001_B A14.1.1 October 2013 Cube Consulting Pty Ltd
Interpolation Date Wednesday - 19 June - 2013 - at 06:20:30Interpolation Run Number 41Interpolarion ipar file hounde_estimation_2013_21_39.iparWorking Directory d:/endeavour/2013_012_hounde/blockmodel_10_5_10
Input Assay File DetailsAssay File Location ../composites/cut_1m_ con_panel_hounde_june20Assay File Id 38 au_cutAssay String Numbers 1,99Assay Description Field 11
Assay File Constraint DetailsConstrain Assays N YAssay Constraint File domain_38Save Constrained Assays N domain_38_cutOutput Constrained Assay File LocationOutput Constrained Assay File Id
Interpolation Search DetailsOctant or Ellipsoid EllipsoidMax No of Adjacent Empty OctantsMinimum Number of Samples 6Maximum Number of Samples 40Limit Samples by Hole Id NHole Id FieldMaximum Number of Samples per HoleMaximum Search Distance for Major Axis 75Maximum Vertical Search Distance 1000Bearing of Major Axis 35Plunge of Major Axis 0Dip of Semi-Major Axis 50Major / Semi-Major Ratio 1Major / Minor Ratio 4
Pass Details Pass 1 Pass 2 Pass 3Pass Field pass passPass Field Value 1 2Pass Ratio 2Pass Minimum Samples 6 4Pass Maximum Samples 40 40
Interpolation Method DetailsInverse Distance or Ordinary Krigging Ordinary KrigingInverse Distance PowerNo of X Descretisation Points 2No of Y Descretisation Points 4No of Z Descretisation Points 2
Variogram Parameters if OK is chosenNumber of Structures 2Nugget 0.55Relative Nugget 55% Major/Semi Major/
Sill Range Azimuth Plunge Dip Major Ratio Minor RatioStructure 1 0.32 10 35 0 50 1 2Structure 2 0.13 50 35 0 50 1 4Structure 3 0 0 0 0 0 1 1Structure 4 0 0 0 0 0 1 1Structure 5 0 0 0 0 0 1 1
Interpolation Output FieldsDistance to Nearest Sample Field dnsAverage Distance Field avdNumber of Samples Field nsKriging Variance Field kv
Output Report File Name *.XLS au_cut_dom_38
Domain Name
Block Model DetailsBlock ModelBlock Model Field
Interpolator Output Report
Block Model Constraint DetailsConstrain EstimationEstimation Constraints File

HOUNDÉ GOLD PROJECT, BURKINA FASO FEASIBILITY STUDY NI 43-101 TECHNICAL REPORT
1813.20\25.02\1813.20-STY-001_B A14.1.1 October 2013 Cube Consulting Pty Ltd
Interpolation Date Wednesday - 19 June - 2013 - at 06:21:20Interpolation Run Number 43Interpolarion ipar file hounde_estimation_2013_21_39.iparWorking Directory d:/endeavour/2013_012_hounde/blockmodel_10_5_10
Input Assay File DetailsAssay File Location ../composites/cut_1m_ con_panel_hounde_june20Assay File Id 39 au_cutAssay String Numbers 1,99Assay Description Field 11
Assay File Constraint DetailsConstrain Assays N YAssay Constraint File domain_39Save Constrained Assays N domain_39_cutOutput Constrained Assay File LocationOutput Constrained Assay File Id
Interpolation Search DetailsOctant or Ellipsoid EllipsoidMax No of Adjacent Empty OctantsMinimum Number of Samples 6Maximum Number of Samples 40Limit Samples by Hole Id NHole Id FieldMaximum Number of Samples per HoleMaximum Search Distance for Major Axis 75Maximum Vertical Search Distance 1000Bearing of Major Axis 35Plunge of Major Axis 0Dip of Semi-Major Axis 85Major / Semi-Major Ratio 1Major / Minor Ratio 4
Pass Details Pass 1 Pass 2 Pass 3Pass Field pass passPass Field Value 1 2Pass Ratio 2Pass Minimum Samples 6 4Pass Maximum Samples 40 40
Interpolation Method DetailsInverse Distance or Ordinary Krigging Ordinary KrigingInverse Distance PowerNo of X Descretisation Points 2No of Y Descretisation Points 4No of Z Descretisation Points 2
Variogram Parameters if OK is chosenNumber of Structures 2Nugget 0.55Relative Nugget 55% Major/Semi Major/
Sill Range Azimuth Plunge Dip Major Ratio Minor RatioStructure 1 0.32 10 35 0 85 1 2Structure 2 0.13 50 35 0 85 1 4Structure 3 0 0 0 0 0 1 1Structure 4 0 0 0 0 0 1 1Structure 5 0 0 0 0 0 1 1
Interpolation Output FieldsDistance to Nearest Sample Field dnsAverage Distance Field avdNumber of Samples Field nsKriging Variance Field kv
Output Report File Name *.XLS au_cut_dom_39
Domain Name
Block Model DetailsBlock ModelBlock Model Field
Interpolator Output Report
Block Model Constraint DetailsConstrain EstimationEstimation Constraints File

HOUNDÉ GOLD PROJECT, BURKINA FASOFEASIBILITY STUDY NI 43-101 TECHNICAL REPORT
1813.20\25.02\1813.20-STY-001_B S14.2 October 2013 Cube Consulting Pty Ltd
APPENDIX 14.2SWATH PLOTS
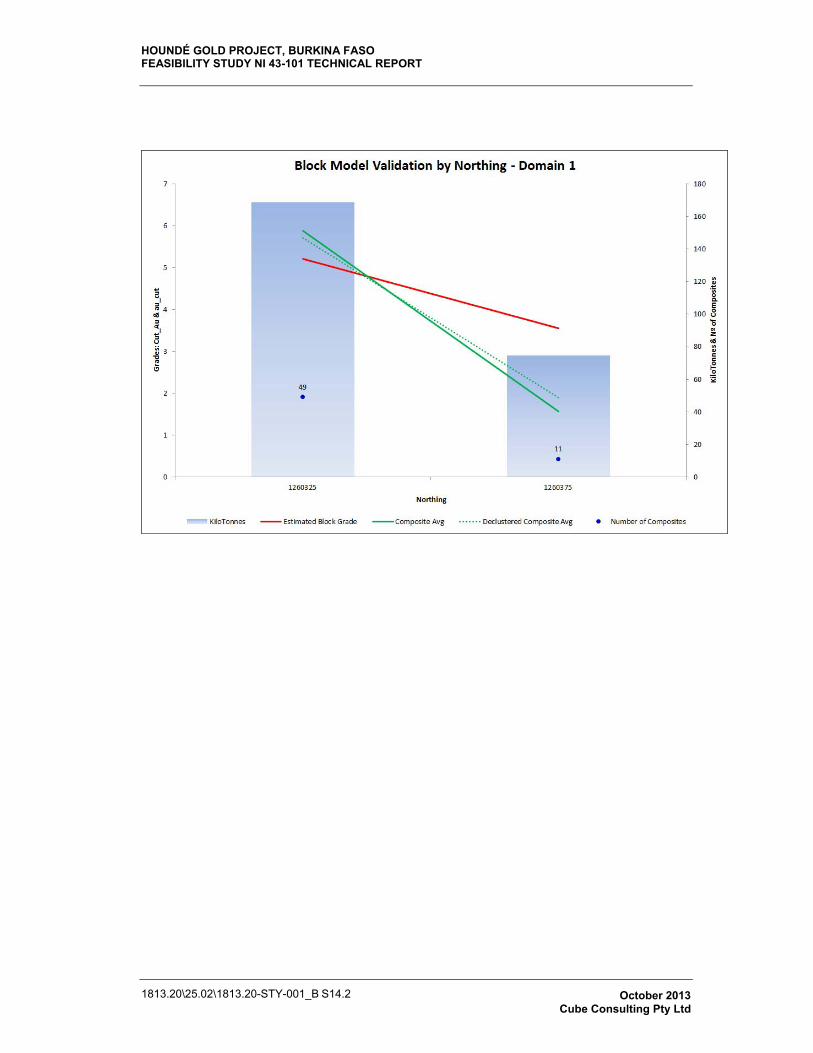
HOUNDÉ GOLD PROJECT, BURKINA FASOFEASIBILITY STUDY NI 43-101 TECHNICAL REPORT
1813.20\25.02\1813.20-STY-001_B S14.2 October 2013 Cube Consulting Pty Ltd
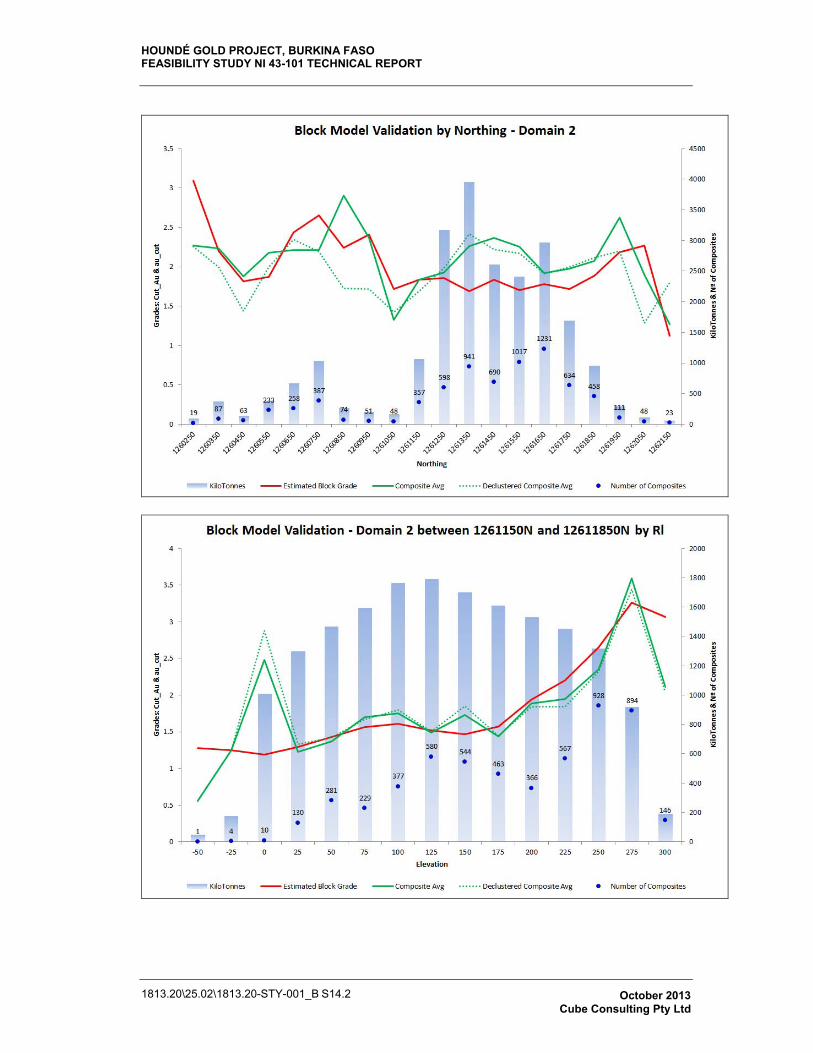
HOUNDÉ GOLD PROJECT, BURKINA FASOFEASIBILITY STUDY NI 43-101 TECHNICAL REPORT
1813.20\25.02\1813.20-STY-001_B S14.2 October 2013 Cube Consulting Pty Ltd
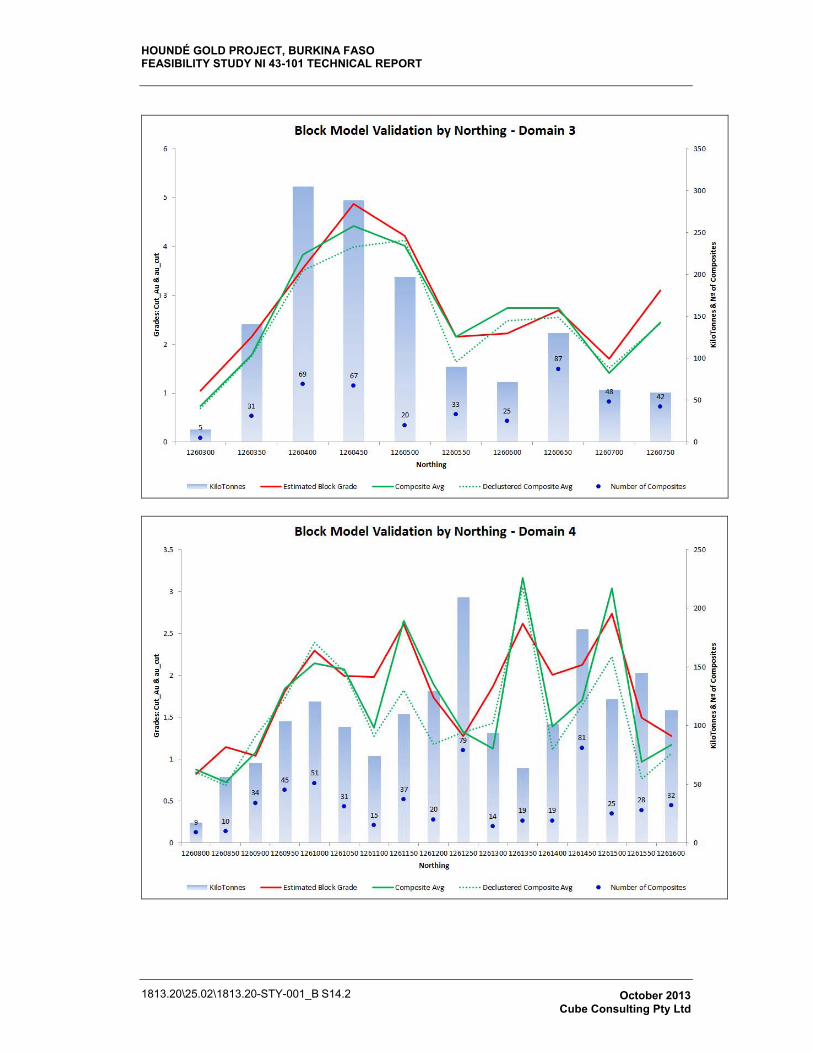
HOUNDÉ GOLD PROJECT, BURKINA FASOFEASIBILITY STUDY NI 43-101 TECHNICAL REPORT
1813.20\25.02\1813.20-STY-001_B S14.2 October 2013 Cube Consulting Pty Ltd
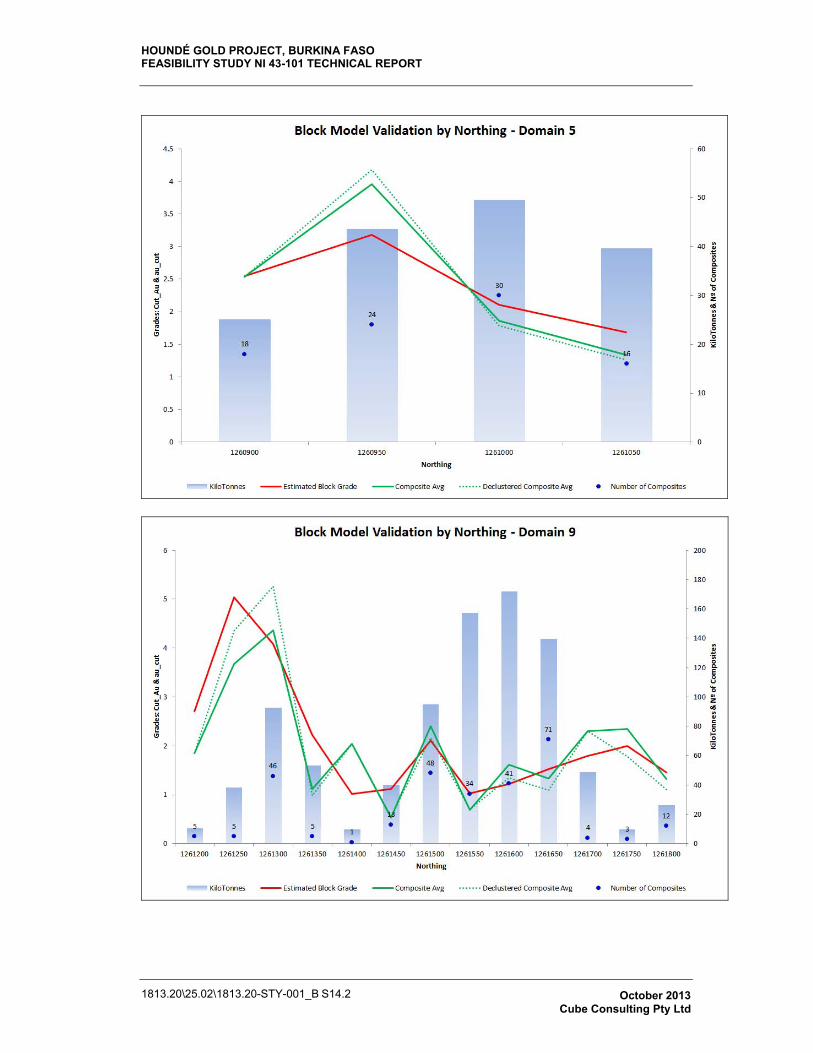
HOUNDÉ GOLD PROJECT, BURKINA FASOFEASIBILITY STUDY NI 43-101 TECHNICAL REPORT
1813.20\25.02\1813.20-STY-001_B S14.2 October 2013 Cube Consulting Pty Ltd
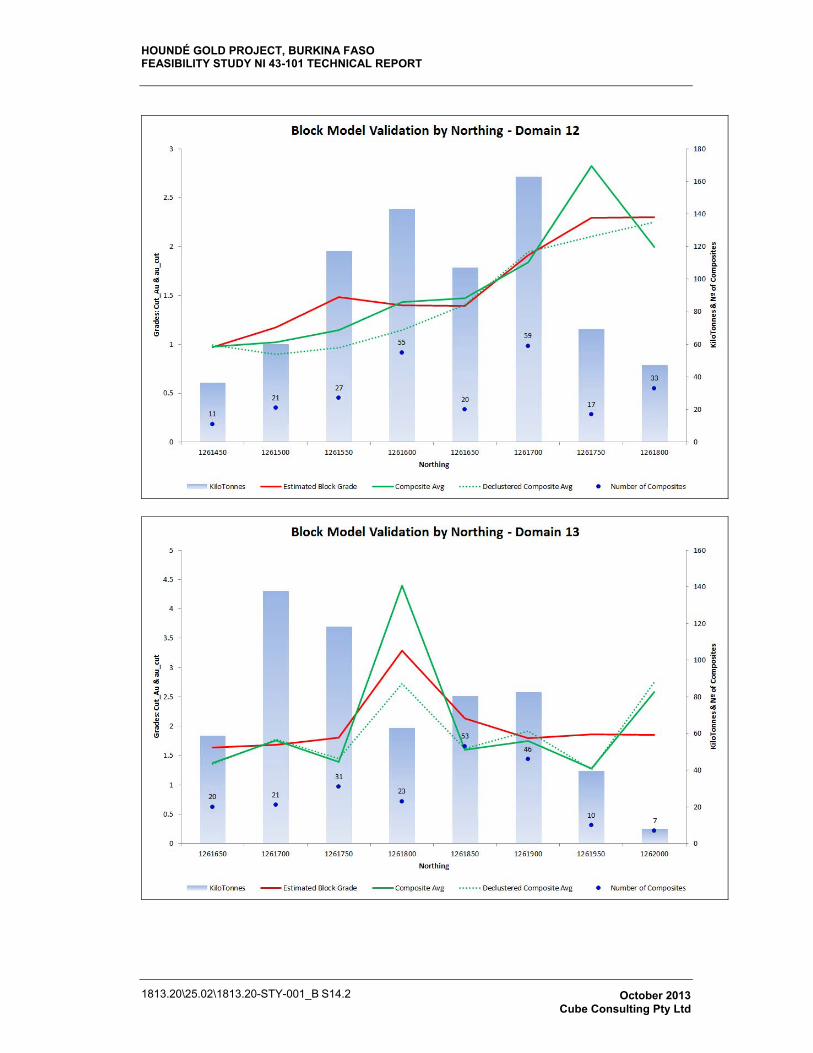
HOUNDÉ GOLD PROJECT, BURKINA FASOFEASIBILITY STUDY NI 43-101 TECHNICAL REPORT
1813.20\25.02\1813.20-STY-001_B S14.2 October 2013 Cube Consulting Pty Ltd
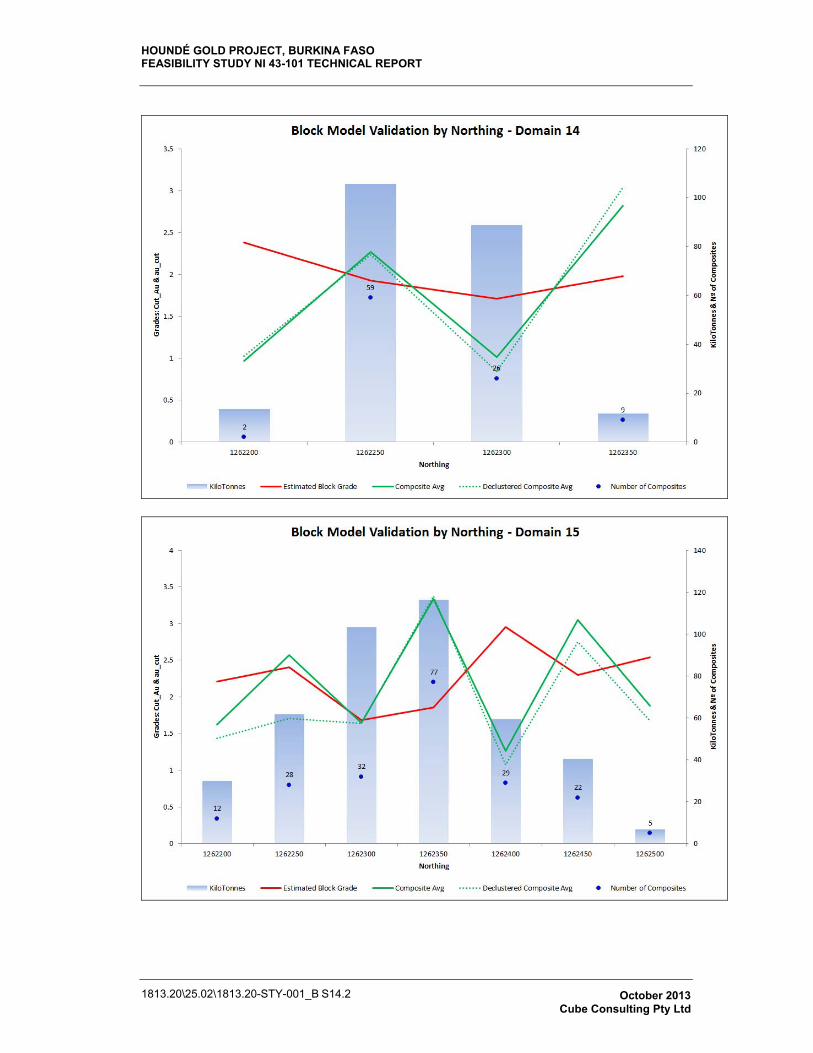
HOUNDÉ GOLD PROJECT, BURKINA FASOFEASIBILITY STUDY NI 43-101 TECHNICAL REPORT
1813.20\25.02\1813.20-STY-001_B S14.2 October 2013 Cube Consulting Pty Ltd
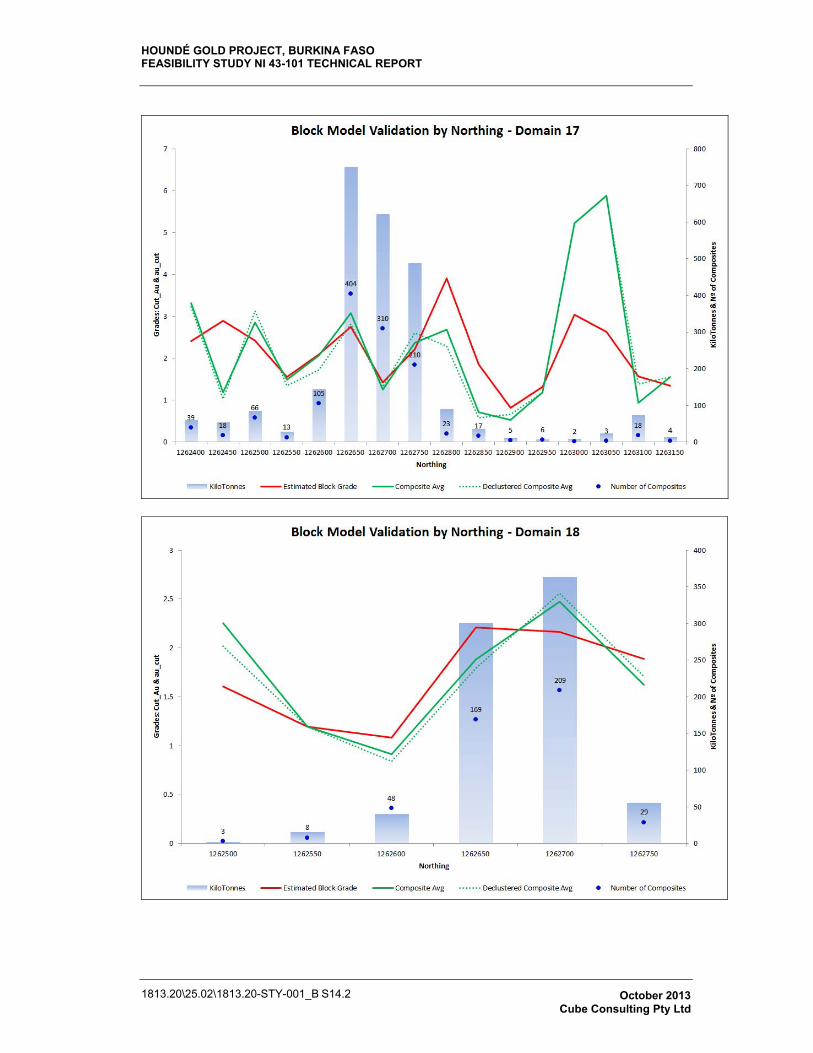
HOUNDÉ GOLD PROJECT, BURKINA FASOFEASIBILITY STUDY NI 43-101 TECHNICAL REPORT
1813.20\25.02\1813.20-STY-001_B S14.2 October 2013 Cube Consulting Pty Ltd
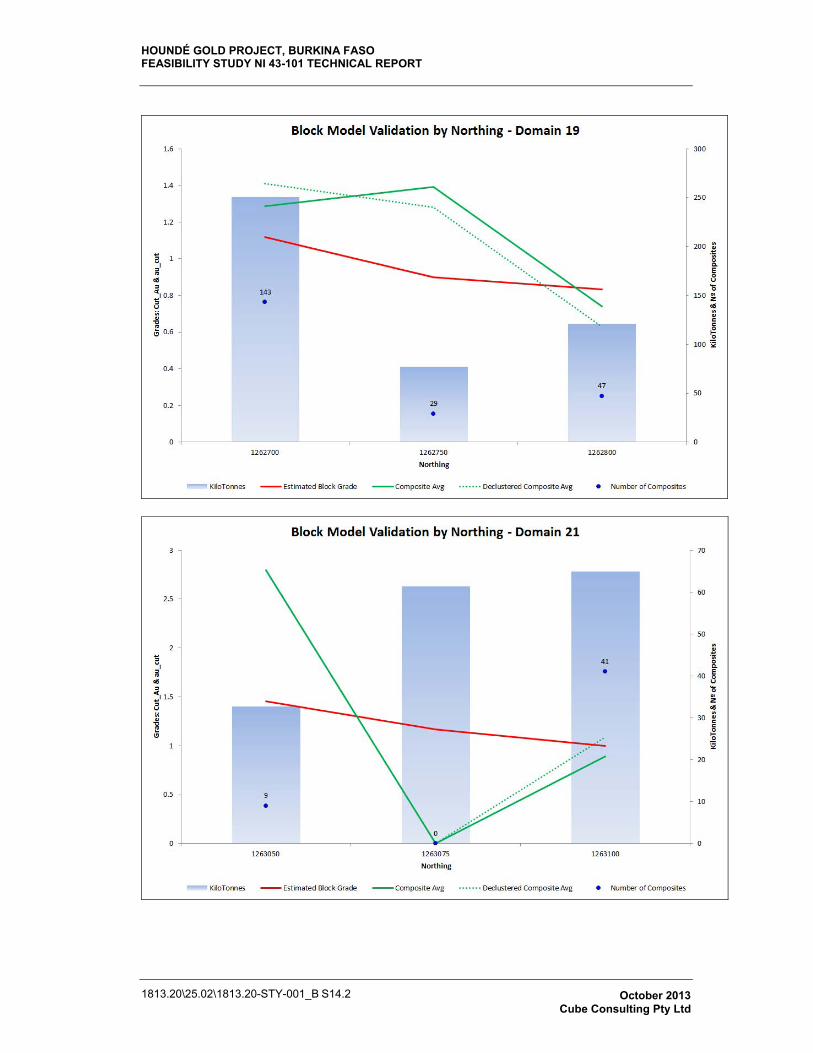
HOUNDÉ GOLD PROJECT, BURKINA FASOFEASIBILITY STUDY NI 43-101 TECHNICAL REPORT
1813.20\25.02\1813.20-STY-001_B S14.2 October 2013 Cube Consulting Pty Ltd
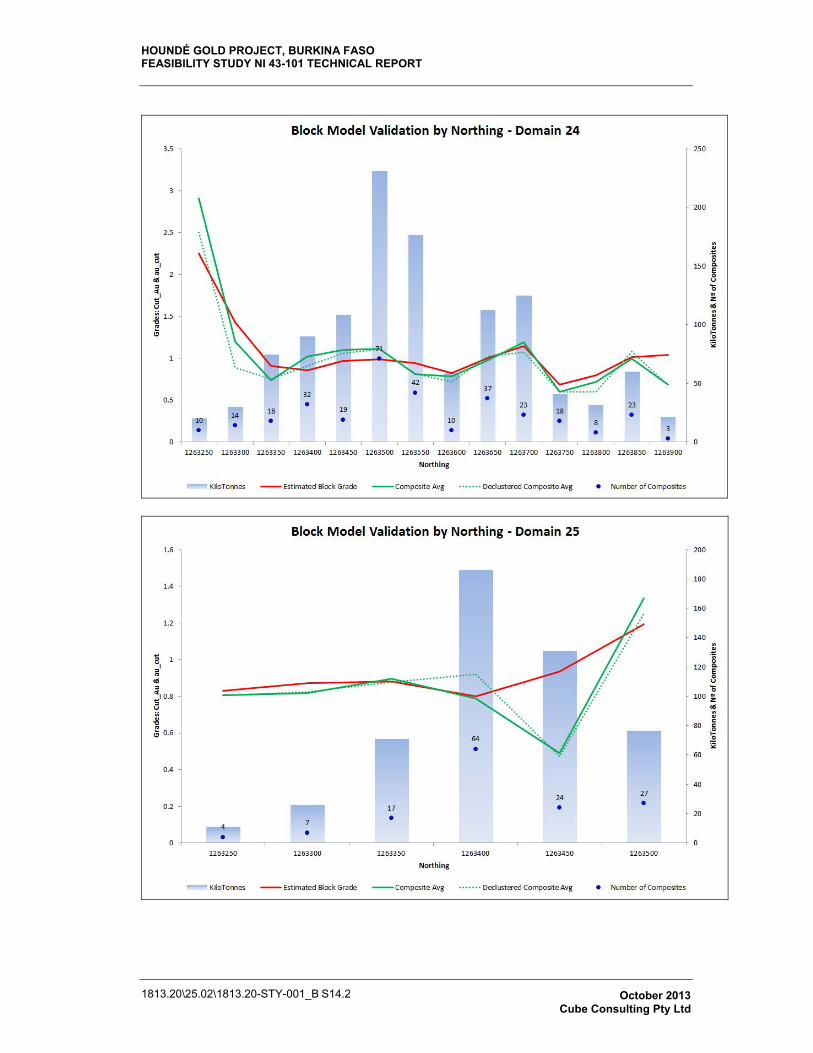
HOUNDÉ GOLD PROJECT, BURKINA FASOFEASIBILITY STUDY NI 43-101 TECHNICAL REPORT
1813.20\25.02\1813.20-STY-001_B S14.2 October 2013 Cube Consulting Pty Ltd
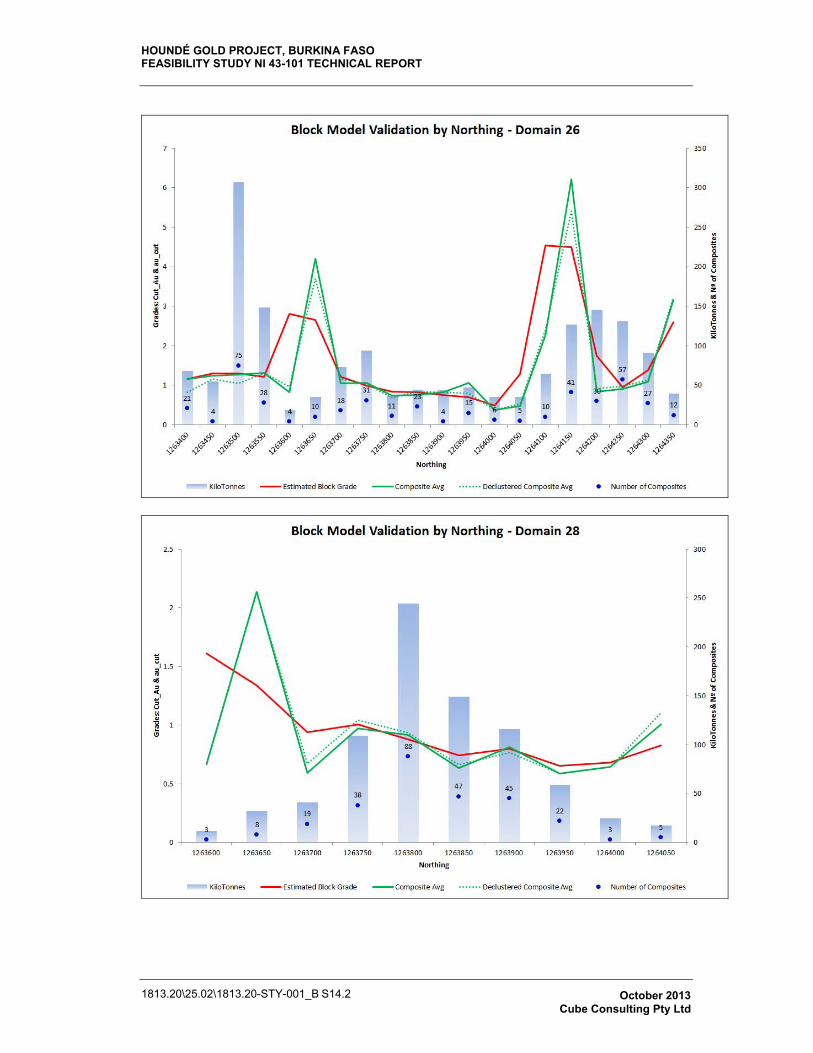
HOUNDÉ GOLD PROJECT, BURKINA FASOFEASIBILITY STUDY NI 43-101 TECHNICAL REPORT
1813.20\25.02\1813.20-STY-001_B S14.2 October 2013 Cube Consulting Pty Ltd
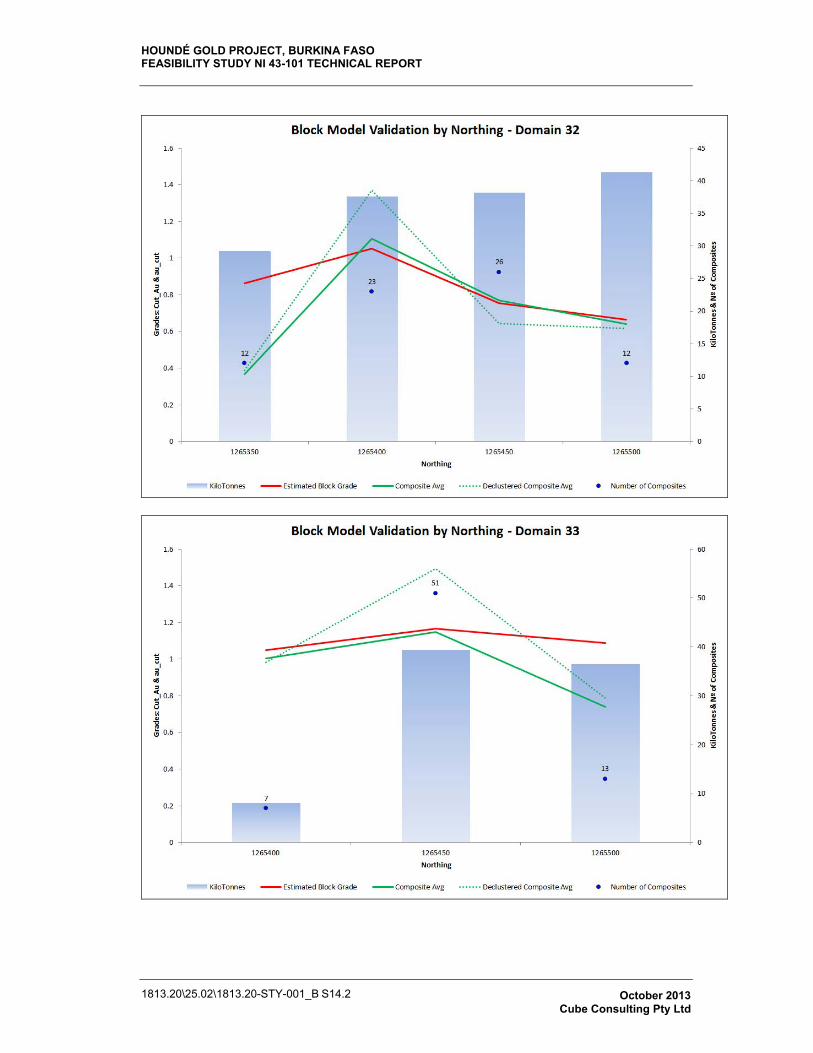
HOUNDÉ GOLD PROJECT, BURKINA FASOFEASIBILITY STUDY NI 43-101 TECHNICAL REPORT
1813.20\25.02\1813.20-STY-001_B S14.2 October 2013 Cube Consulting Pty Ltd
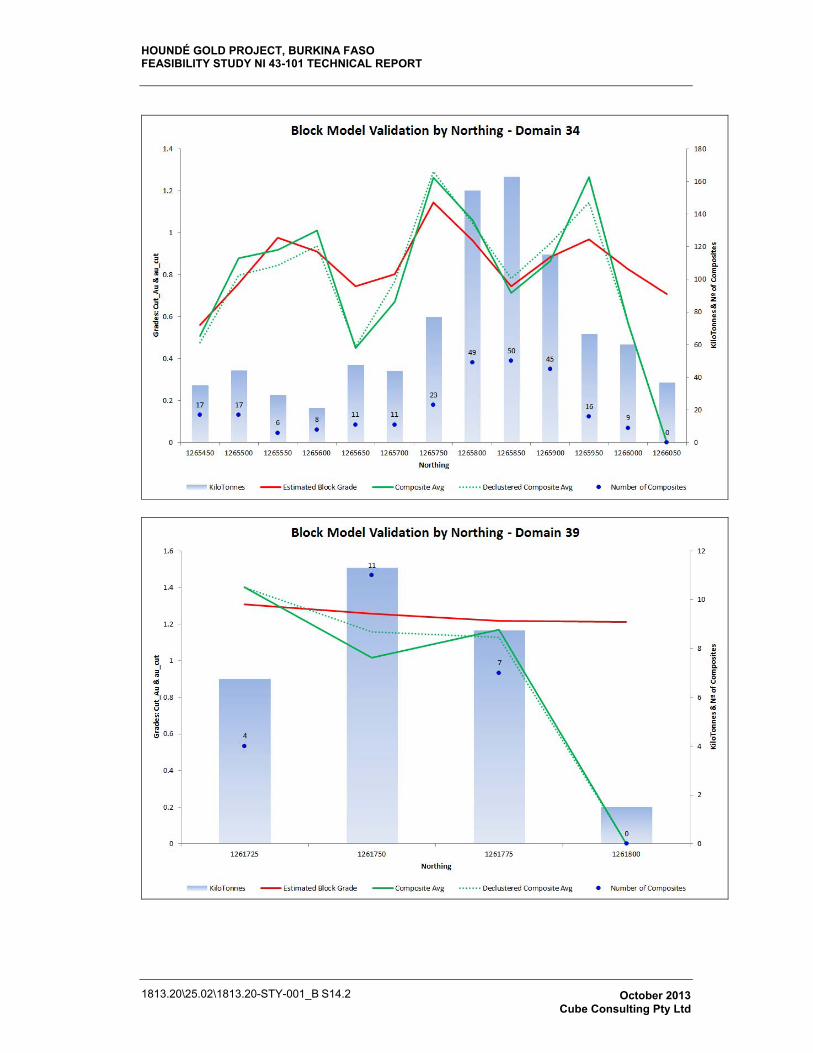
HOUNDÉ GOLD PROJECT, BURKINA FASOFEASIBILITY STUDY NI 43-101 TECHNICAL REPORT
1813.20\25.02\1813.20-STY-001_B S14.2 October 2013 Cube Consulting Pty Ltd
HOUNDÉ GOLD PROJECT, BURKINA FASOFEASIBILITY STUDY NI 43-101 TECHNICAL REPORT
1813.20\25.02\1813.20-STY-001_B S14.3 October 2013 Cube Consulting Pty Ltd
APPENDIX 14.3GRADE TONNAGE CURVES
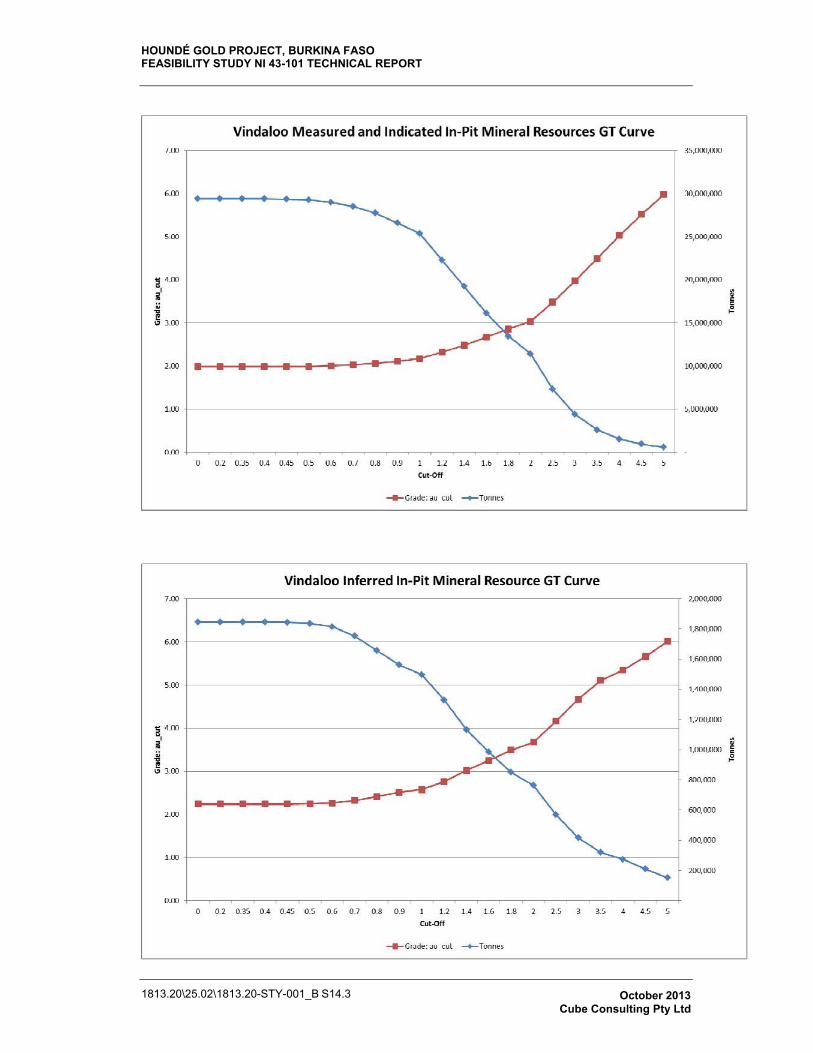
HOUNDÉ GOLD PROJECT, BURKINA FASOFEASIBILITY STUDY NI 43-101 TECHNICAL REPORT
1813.20\25.02\1813.20-STY-001_B S14.3 October 2013 Cube Consulting Pty Ltd

HOUNDÉ GOLD PROJECT, BURKINA FASO FEASIBILITY STUDY NI 43-101 TECHNICAL REPORT
1813.20\25.01\1813.20-STY-001_B S22 October 2013 Lycopodium Minerals Pty Ltd
APPENDIX 22.1
CASH FLOW MODEL
Endeavour Mining
HOUNDE GOLD PROJECT, BURKINA FASOFINANCIAL ANALYSIS
Feasibility Study
1813-CFA-001
Oct-13
E 4-Nov-13 CJvR MW MWD 1-Nov-13 NE CJvR MWC 31-Oct-13 NE CJvR MWB 30-Oct-13 NE CJvR MWA 25-Oct-13 NE
REV NO. DATE BYDESIGN
APPROVALPROJECT
APPROVAL
RE-ISSUED FOR STUDY
Lycopodium Minerals Pty Ltd, ABN: 34 055 880 209, Level 5, 1 Adelaide Terrace, East Perth, Western Australia 6004
RE-ISSUED FOR STUDY
ISSUED FOR STUDY
DRAFT FOR REVIEW
ISSUED FOR INTERNAL REVIEW
DESCRIPTION OF REVISION
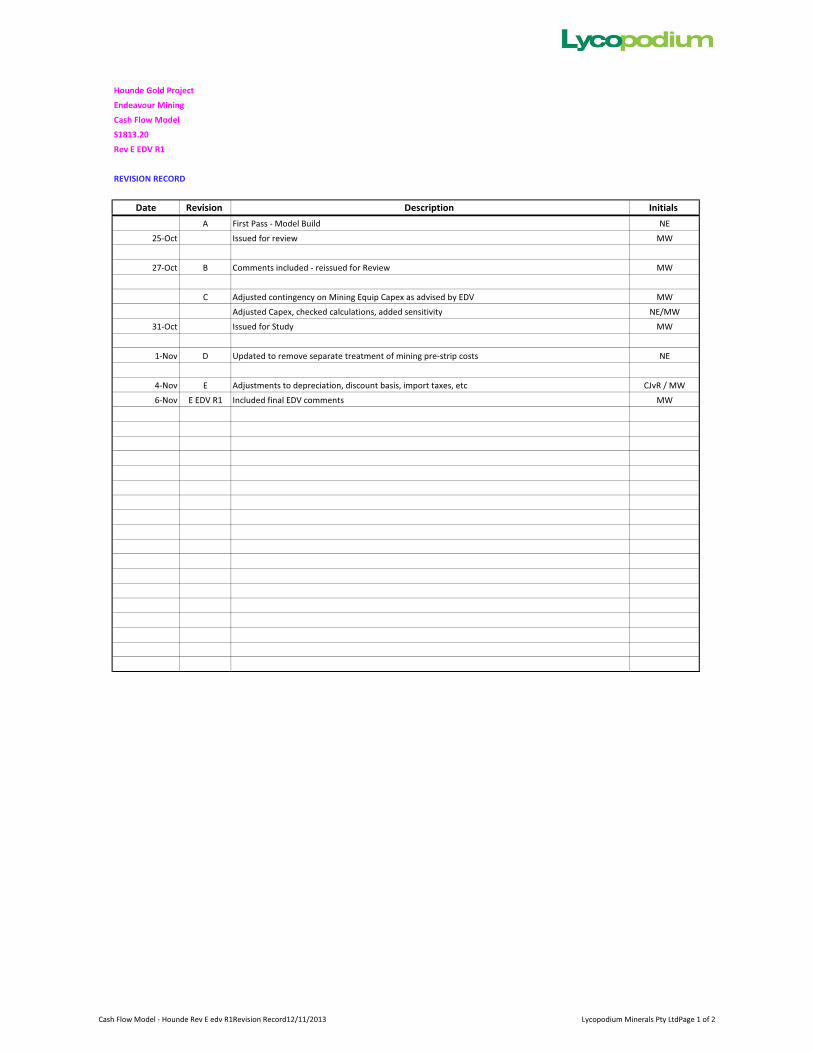
Cash Flow Model - Hounde Rev E edv R1Revision Record12/11/2013 Lycopodium Minerals Pty LtdPage 1 of 2
Hounde Gold Project
Endeavour Mining
Cash Flow Model
S1813.20
Rev E EDV R1
REVISION RECORD
Date Revision Description Initials
A First Pass - Model Build NE
25-Oct Issued for review MW
27-Oct B Comments included - reissued for Review MW
C Adjusted contingency on Mining Equip Capex as advised by EDV MW
Adjusted Capex, checked calculations, added sensitivity NE/MW
31-Oct Issued for Study MW
1-Nov D Updated to remove separate treatment of mining pre-strip costs NE
4-Nov E Adjustments to depreciation, discount basis, import taxes, etc CJvR / MW
6-Nov E EDV R1 Included final EDV comments MW
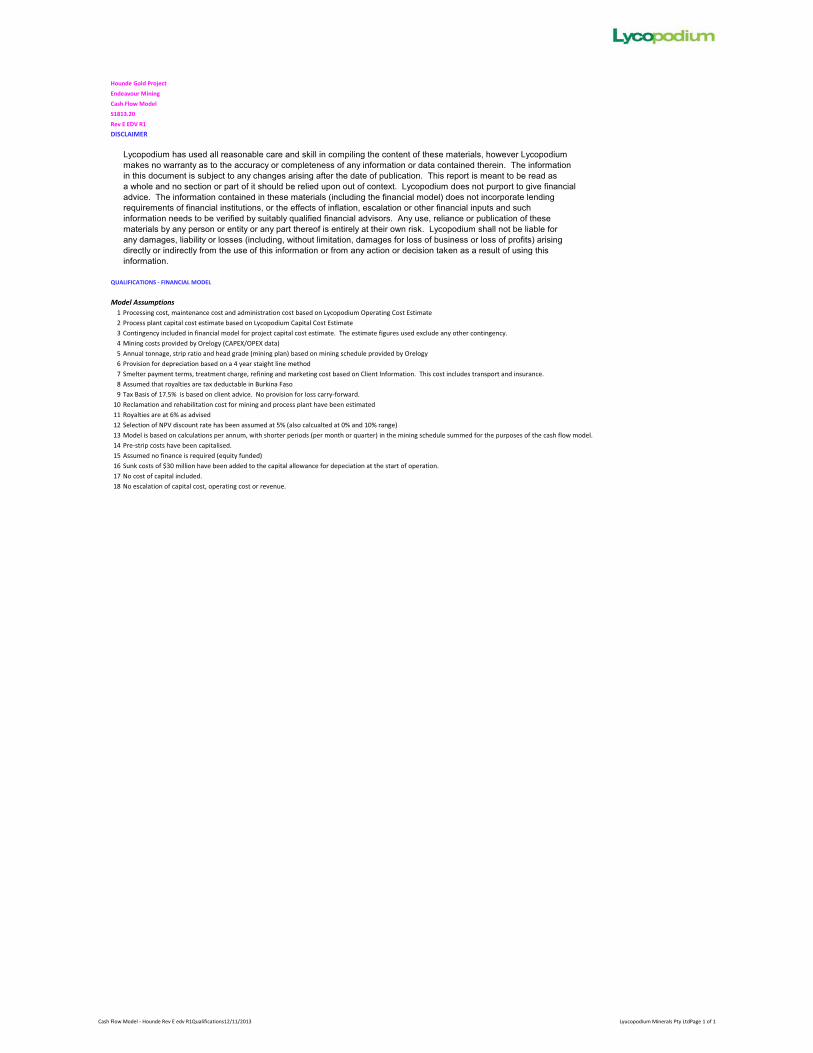
Cash Flow Model - Hounde Rev E edv R1Qualifications12/11/2013 Lyucopodium Minerals Pty LtdPage 1 of 1
Hounde Gold Project
Endeavour Mining
Cash Flow Model
S1813.20
Rev E EDV R1
DISCLAIMER
Lycopodium has used all reasonable care and skill in compiling the content of these materials, however Lycopodiummakes no warranty as to the accuracy or completeness of any information or data contained therein. The information in this document is subject to any changes arising after the date of publication. This report is meant to be read as a whole and no section or part of it should be relied upon out of context. Lycopodium does not purport to give financial advice. The information contained in these materials (including the financial model) does not incorporate lending requirements of financial institutions, or the effects of inflation, escalation or other financial inputs and such information needs to be verified by suitably qualified financial advisors. Any use, reliance or publication of these materials by any person or entity or any part thereof is entirely at their own risk. Lycopodium shall not be liable for any damages, liability or losses (including, without limitation, damages for loss of business or loss of profits) arising directly or indirectly from the use of this information or from any action or decision taken as a result of using thisinformation.
QUALIFICATIONS - FINANCIAL MODEL
Model Assumptions1 Processing cost, maintenance cost and administration cost based on Lycopodium Operating Cost Estimate2 Process plant capital cost estimate based on Lycopodium Capital Cost Estimate3 Contingency included in financial model for project capital cost estimate. The estimate figures used exclude any other contingency.4 Mining costs provided by Orelogy (CAPEX/OPEX data)5 Annual tonnage, strip ratio and head grade (mining plan) based on mining schedule provided by Orelogy6 Provision for depreciation based on a 4 year staight line method7 Smelter payment terms, treatment charge, refining and marketing cost based on Client Information. This cost includes transport and insurance. 8 Assumed that royalties are tax deductable in Burkina Faso9 Tax Basis of 17.5% is based on client advice. No provision for loss carry-forward.
10 Reclamation and rehabilitation cost for mining and process plant have been estimated11 Royalties are at 6% as advised12 Selection of NPV discount rate has been assumed at 5% (also calcualted at 0% and 10% range)13 Model is based on calculations per annum, with shorter periods (per month or quarter) in the mining schedule summed for the purposes of the cash flow model.14 Pre-strip costs have been capitalised.15 Assumed no finance is required (equity funded)16 Sunk costs of $30 million have been added to the capital allowance for depeciation at the start of operation.17 No cost of capital included.18 No escalation of capital cost, operating cost or revenue.
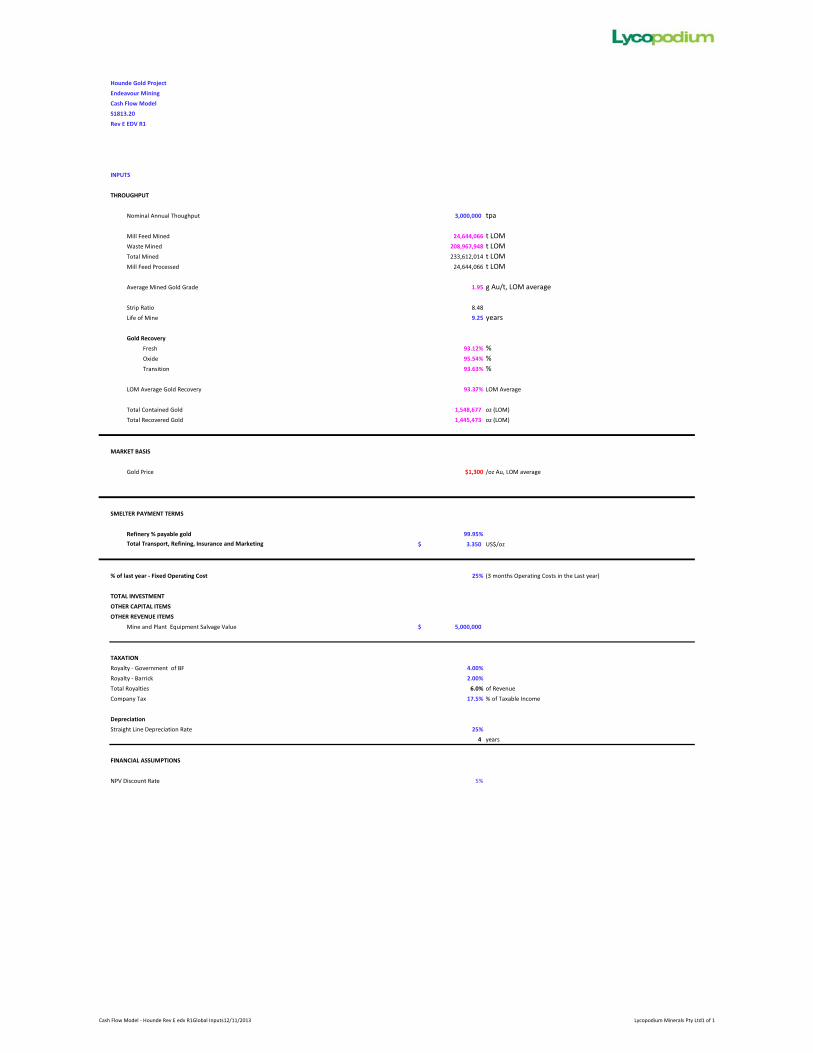
Cash Flow Model - Hounde Rev E edv R1Global Inputs12/11/2013 Lycopodium Minerals Pty Ltd1 of 1
Hounde Gold Project
Endeavour Mining
Cash Flow Model
S1813.20
Rev E EDV R1
INPUTS
THROUGHPUT
Nominal Annual Thoughput 3,000,000 tpa
Mill Feed Mined 24,644,066 t LOMWaste Mined 208,967,948 t LOMTotal Mined 233,612,014 t LOMMill Feed Processed 24,644,066 t LOM
Average Mined Gold Grade 1.95 g Au/t, LOM average
Strip Ratio 8.48
Life of Mine 9.25 years
Gold Recovery
Fresh 93.12% %Oxide 95.54% %Transition 93.63% %
LOM Average Gold Recovery 93.37% LOM Average
Total Contained Gold 1,548,677 oz (LOM)
Total Recovered Gold 1,445,473 oz (LOM)
MARKET BASIS
Gold Price $1,300 /oz Au, LOM average
SMELTER PAYMENT TERMS
Refinery % payable gold 99.95%
Total Transport, Refining, Insurance and Marketing 3.350$ US$/oz
% of last year - Fixed Operating Cost 25% (3 months Operating Costs in the Last year)
TOTAL INVESTMENT
OTHER CAPITAL ITEMS
OTHER REVENUE ITEMS
Mine and Plant Equipment Salvage Value 5,000,000$
TAXATION
Royalty - Government of BF 4.00%
Royalty - Barrick 2.00%
Total Royalties 6.0% of Revenue
Company Tax 17.5% % of Taxable Income
Depreciation
Straight Line Depreciation Rate 25%
4 years
FINANCIAL ASSUMPTIONS
NPV Discount Rate 5%
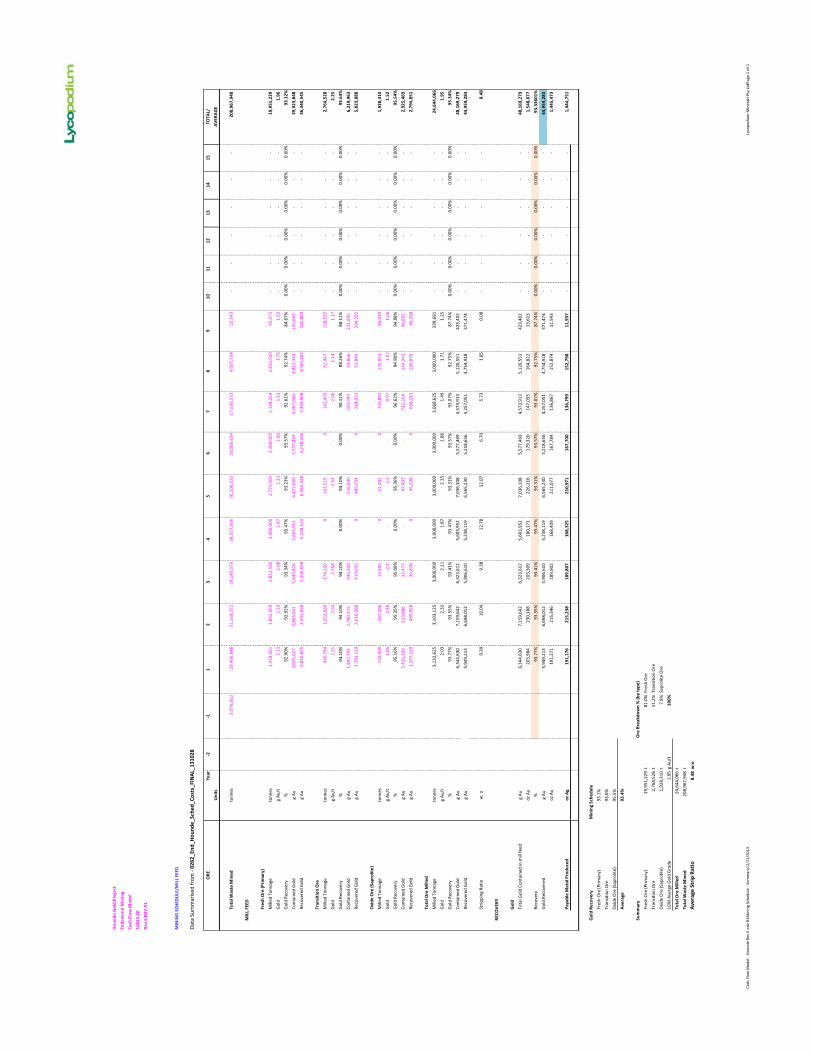
Cash
Flo
w M
odel
- Ho
unde
Rev
E e
dv R
1Min
ing
Sche
dule
- Su
mm
ary1
2/11
/201
3Ly
copo
dium
Min
eral
s Pty
Ltd
Page
1 o
f 1
Hou
nde
Gol
d Pr
ojec
t
Ende
avou
r M
inin
g
Cash
Flo
w M
odel
S181
3.20
Rev
E E
DV
R1
MIN
ING
SCH
EDU
LE/M
ILL
FEED
Data
Sum
mar
ised
from
- 02
62_E
nd_H
ound
e_Sc
hed_
Cost
s_FI
NA
L_13
1028
Year
-2-1
12
34
56
78
910
1112
1314
15TO
TAL/
Uni
tsA
VER
AG
E
Tota
l Was
te M
ined
tonn
es3,
076,
922
29,4
06,8
4831
,168
,372
28,1
45,0
7638
,327
,996
36,2
00,3
2020
,086
,634
17,5
92,5
334,
937,
704
25,5
43-
-
-
-
-
-
208,
967,
948
MIL
L FE
ED
Fres
h O
re (P
rim
ary)
Mill
ed T
onna
geto
nnes
1,41
8,92
11,
842,
969
2,81
2,50
03,
000,
000
2,77
5,00
03,
000,
000
2,19
4,26
42,
812,
500
95,0
75-
-
-
-
-
-
19,9
51,2
29
Gol
dg
Au/t
2.13
2.10
2.08
1.87
2.33
1.86
1.63
1.75
1.50
-
-
-
-
-
-
1.
96
Gol
d Re
cove
ry%
92.9
0%92
.92%
93.3
4%93
.47%
93.2
3%93
.57%
92.6
1%92
.74%
84.6
7%0.
00%
0.00
%0.
00%
0.00
%0.
00%
0.00
%93
.12%
Cont
aine
d G
old
g Au
3,02
5,62
7
3,
865,
641
5,84
5,82
6
5,
603,
952
6,47
2,66
0
5,
577,
469
3,56
7,66
0
4,92
2,34
3
142,
669
-
-
-
-
-
-
39,0
23,8
48
Reco
vere
d G
old
g Au
2,81
0,87
53,
591,
956
5,45
6,69
65,
238,
119
6,03
4,42
85,
218,
656
3,30
3,90
84,
565,
102
120,
804
-
-
-
-
-
-
36
,340
,545
Tran
siti
on O
re
Mill
ed T
onna
geto
nnes
940,
734
1,05
2,66
017
4,10
0
020
3,51
9
014
2,47
052
,447
19
8,59
7-
-
-
-
-
-
2,76
4,52
8
Gol
dg
Au/t
2.01
2.64
2.55
8
-
2.
54
-
2.06
1.14
1.
17-
-
-
-
-
-
2.25
Gol
d Re
cove
ry%
94.1
0%94
.10%
94.1
0%0.
00%
94.1
0%0.
00%
90.1
1%88
.26%
88.1
1%0.
00%
0.00
%0.
00%
0.00
%0.
00%
0.00
%93
.63%
Cont
aine
d G
old
g Au
1,89
2,79
4
2,
780,
115
445,
308
-
516,
040
-
293,
999
59
,866
23
1,84
0
-
-
-
-
-
-
6,
219,
963
Reco
vere
d G
old
g Au
1,78
1,11
92,
616,
088
419,
035
0
485,
594
0
264,
931
52,8
40
204,
282
-
-
-
-
-
-
5,
823,
888
Oxi
de O
re (S
apro
lite)
Mill
ed T
onna
geto
nnes
772,
970
207,
496
13,4
00
0
21,4
81
0
731,
891
135,
053
46
,019
-
-
-
-
-
-
1,
928,
310
Gol
dg
Au/t
1.85
2.48
2.4
-
2.2
-
0.97
1.07
1.06
-
-
-
-
-
-
1.
52
Gol
d Re
cove
ry%
95.1
6%95
.35%
95.0
8%0.
00%
95.3
6%0.
00%
96.6
2%94
.90%
94.8
8%0.
00%
0.00
%0.
00%
0.00
%0.
00%
0.00
%95
.54%
Cont
aine
d G
old
g Au
1,42
6,20
9
51
3,88
6
32,4
77
-
47,4
07
-
712,
254
14
4,34
2
48,8
93
-
-
-
-
-
-
2,
925,
469
Reco
vere
d G
old
g Au
1,35
7,21
948
9,96
830
,878
045
,208
068
8,21
313
6,97
6
46,3
88-
-
-
-
-
-
2,79
4,85
1
Tota
l Ore
Mill
ed
Mill
ed T
onna
geto
nnes
3,13
2,62
53,
103,
125
3,00
0,00
03,
000,
000
3,00
0,00
03,
000,
000
3,06
8,62
53,
000,
000
339,
691
-
-
-
-
-
-
24
,644
,066
Gol
d g
Au/t
2.03
2.31
2.11
1.87
2.35
1.86
1.49
1.71
1.25
-
-
-
-
-
-
1.
95
Gol
d Re
cove
ry%
93.7
7%93
.55%
93.4
1%93
.47%
93.3
1%93
.57%
93.0
7%92
.75%
87.7
4%0.
00%
0.00
%0.
00%
0.00
%0.
00%
0.00
%93
.34%
Cont
aine
d G
old
g Au
6,34
4,63
0
7,
159,
642
6,32
3,61
2
5,
603,
952
7,03
6,10
8
5,
577,
469
4,57
3,91
3
5,12
6,55
1
423,
402
-
-
-
-
-
-
48,1
69,2
79
Reco
vere
d G
old
g Au
5,94
9,21
3
6,
698,
012
5,90
6,61
0
5,
238,
119
6,56
5,23
0
5,
218,
656
4,25
7,05
1
4,75
4,91
8
371,
474
-
-
-
-
-
-
44,9
59,2
83
Strip
ping
Rat
iow
: o9.
3910
.04
9.38
12.7
812
.07
6.70
5.73
1.65
0.08
-
-
-
-
-
-
8.
48
REC
OV
ERY
Gol
d
Tota
l Gol
d Co
ntai
ned
in m
ill fe
edg
Au6,
344,
630
7,15
9,64
2
6,
323,
612
5,60
3,95
2
7,
036,
108
5,57
7,46
9
4,
573,
913
5,
126,
551
42
3,40
2
-
-
-
-
-
-
48
,169
,279
oz A
u20
3,98
4
230,
188
20
3,30
9
180,
171
22
6,21
6
179,
320
14
7,05
5
164,
822
13
,613
-
-
-
-
-
-
1,54
8,67
7
Reco
very
%93
.77%
93.5
5%93
.41%
93.4
7%93
.31%
93.5
7%93
.07%
92.7
5%87
.74%
0.00
%0.
00%
0.00
%0.
00%
0.00
%0.
00%
93.3
3601
%
Gol
d Re
cove
red
g Au
5,94
9,21
3
6,
698,
012
5,90
6,61
0
5,
238,
119
6,56
5,23
0
5,
218,
656
4,25
7,05
1
4,75
4,91
8
371,
474
-
-
-
-
-
-
44,9
59,2
83
oz A
u19
1,27
1
215,
346
18
9,90
2
168,
409
21
1,07
7
167,
784
13
6,86
7
152,
874
11
,943
-
-
-
-
-
-
1,44
5,47
3
Paya
ble
Met
al P
rodu
ced
oz A
g19
1,17
6
215,
238
18
9,80
7
168,
325
21
0,97
1
167,
700
13
6,79
9
15
2,79
8
11
,937
-
-
-
-
-
-
1,44
4,75
1
Gol
d R
ecov
ery
Min
ing
Sche
dule
Fres
h O
re (P
rimar
y)93
.1%
Tran
sitio
n O
re93
.6%
Oxi
de O
re (S
apro
lite)
95.5
%A
vera
ge93
.4%
Sum
mar
yO
re B
reak
dow
n %
(by
type
)
Fres
h O
re (P
rimar
y)19
,951
,229
t81
.0%
Fres
h O
reTr
ansi
tion
Ore
2,76
4,52
8t
11.2
%Tr
ansi
tion
Ore
Oxi
de O
re (S
apro
lite)
1,92
8,31
0t
7.8%
Sapr
olite
Ore
LOM
Ave
rge
Gol
d G
rade
1.95
g Au
/t10
0%
Tota
l Ore
Mill
ed24
,644
,066
tTo
tal W
aste
Min
ed20
8,96
7,94
8t
Ave
rage
Str
ip R
atio
8.48
w:o
OR
E
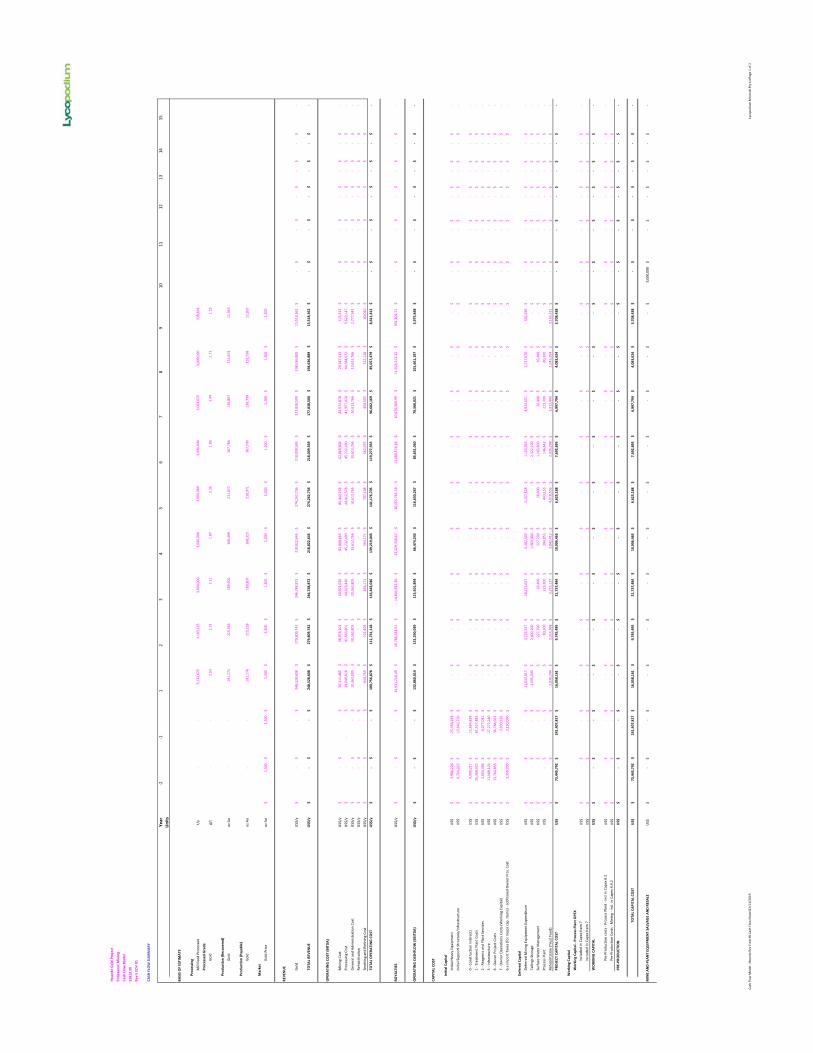
Cash
Flo
w M
odel
- Ho
unde
Rev
E e
dv R
1Cas
h Fl
ow M
odel
12/1
1/20
13Ly
copo
dium
Min
eral
s Pty
Ltd
Page
1 o
f 2
Hou
nde
Gol
d Pr
ojec
t
Ende
avou
r M
inin
g
Cash
Flo
w M
odel
S181
3.20
Rev
E E
DV
R1
CASH
FLO
W S
UM
MA
RY
Year
-2-1
12
34
56
78
910
1112
1314
15U
nits
BA
SIS
OF
ESTI
MA
TE
Proc
essi
ng
Mill
Fee
d Pr
oces
sed
t/y
-
-
3,
132,
625
3,10
3,12
53,
000,
000
3,00
0,00
03,
000,
000
3,00
0,00
03,
068,
625
3,00
0,00
033
9,69
1Pr
oces
sed
Gra
de
Gold
g/t
-
-
2.
032.
312.
111.
872.
351.
861.
491.
711.
25
Prod
ucti
on (R
ecov
ered
)
Gold
oz A
u-
-
191,
271
215,
346
189,
902
168,
409
211,
077
167,
784
136,
867
152,
874
11,9
43
Prod
ucti
on (P
ayab
le)
Gold
oz A
u-
-
191,
176
215,
238
189,
807
168,
325
210,
971
167,
700
136,
799
152,
798
11,9
37
Mar
ket
Gold
Pric
eoz
Au
1,30
0$
1,
300
$
1,
300
$
1,
300
$
1,
300
$
1,
300
$
1,
300
$
1,
300
$
1,
300
$
1,
300
$
1,30
0$
REV
ENU
E Gold
US$
/y-
$
-$
248,
528,
608
$
27
9,80
9,74
2$
246,
748,
872
$
21
8,82
2,64
5$
274,
262,
736
$
21
8,00
9,56
9$
177,
838,
500
$
19
8,63
6,88
9$
15
,518
,362
$
-
$
-
$
-
$
-
$
-
$
-
$
TOTA
L R
EVEN
UE
US$
/y-
$
-$
248,
528,
608
$
27
9,80
9,74
2$
246,
748,
872
$
21
8,82
2,64
5$
274,
262,
736
$
21
8,00
9,56
9$
177,
838,
500
$
19
8,63
6,88
9$
15
,518
,362
$
-$
-$
-$
-$
-$
-$
OPE
RATI
NG
CO
ST (B
ITD
A)
Min
ing
Cost
US$
/y-
$
-$
50,1
11,4
85$
58,9
76,1
03$
60,9
71,6
30$
82
,808
,616
$
85
,443
,254
$
62,8
69,6
04$
43
,572
,878
$
29
,547
,513
$
17
3,31
3$
-
$
-
$
-
$
-
$
-
$
-
$
Pr
oces
sing
Cost
US$
/y-
$
-39
,640
,828
$
41
,669
,801
$
44
,470
,440
$
45,2
32,4
90$
44,4
12,5
78$
45
,232
,490
$
41,9
57,0
20$
44,3
84,0
72$
5,62
0,14
7$
-$
-$
-$
-$
-$
-$
Gene
ral a
nd A
dmin
istra
tion
Cost
US$
/y-
$
-$
10,3
63,8
05$
10,3
63,8
05$
10,3
63,8
05$
10
,613
,766
$
10
,613
,766
$
10,6
13,7
66$
10
,613
,766
$
10
,613
,766
$
2,
777,
941
$
-
$
-
$
-
$
-
$
-
$
-
$
Re
habi
litat
ion
US$
/y-
$
-$
-$
-
$
-$
-
$
-$
-
$
-$
-
$
-$
-$
-$
-$
-$
-$
-$
Smel
ting
and
Refin
ing
Cost
US$
/y-
$
-$
640,
759
$
72
1,40
9$
636,
171
$
56
4,17
1$
707,
108
$
56
2,07
5$
458,
505
$
51
2,12
8$
40,0
10$
-$
-$
-$
-$
-$
-$
TOTA
L O
PER
ATI
NG
CO
STU
S$/y
-$
-
$
10
0,75
6,87
8$
111,
731,
118
$
11
6,44
2,04
6$
139,
219,
043
$
14
1,17
6,70
5$
119,
277,
935
$
96
,602
,169
$
85
,057
,479
$
8,
611,
412
$
-
$
-
$
-
$
-
$
-
$
-
$
RO
YALT
IES
US$
/y-
$
-$
14,9
11,7
16.4
9$
16
,788
,584
.51
$
14,8
04,9
32.3
0$
13
,129
,358
.67
$
16,4
55,7
64.1
8$
13
,080
,574
.14
$
10,6
70,3
09.9
9$
11
,918
,213
.32
$
93
1,10
1.71
$
-
$
-
$
-
$
-
$
-
$
-
$
OPE
RATI
NG
CA
SHFL
OW
(EB
ITD
A)
US$
/y-
$
-$
132,
860,
014
$
15
1,29
0,03
9$
115,
501,
894
$
66
,474
,243
$
11
6,63
0,26
7$
85,6
51,0
60$
70,5
66,0
21$
101,
661,
197
$
5,97
5,84
8$
-$
-$
-$
-$
-$
-$
CAPI
TAL
COST
Init
ial C
apit
al
Initi
al H
eavy
Equ
ipm
ent
US$
3,96
6,22
6$
75
,358
,293
$
-$
-
$
-$
-
$
-$
-
$
-$
-
$
-$
-$
-$
-$
-$
-$
-$
Initi
al S
uppo
rt S
truc
ture
/Inf
rast
ruct
ure
US$
6,70
4,02
3$
15
,642
,720
$
-$
-
$
-$
-
$
-$
-
$
-$
-
$
-$
-$
-$
-$
-$
-$
-$
0 - C
onst
ruct
ion
Indi
rect
s U
S$4,
999,
217
$
11,6
64,8
39$
-
$
-$
-
$
-$
-
$
-$
-
$
-$
-
$
-
$
-
$
-
$
-
$
-
$
-
$
1
- Tre
atm
ent P
lant
Cos
ts U
S$26
,368
,922
$
61
,527
,485
$
-$
-
$
-$
-
$
-$
-
$
-$
-
$
-$
-$
-$
-$
-$
-$
-$
2 - R
eage
nts a
nd P
lant
Ser
vice
s U
S$2,
604,
446
$
6,07
7,04
1$
-$
-
$
-$
-
$
-$
-
$
-$
-
$
-$
-$
-$
-$
-$
-$
-$
3 - I
nfra
stru
ctur
e U
S$11
,688
,103
$
27
,272
,240
$
-$
-
$
-$
-
$
-$
-
$
-$
-
$
-$
-$
-$
-$
-$
-$
-$
6 - O
wne
r Pro
ject
Cos
ts U
S$15
,764
,855
$
36
,784
,663
$
-$
-
$
-$
-
$
-$
-
$
-$
-
$
-$
-$
-$
-$
-$
-$
-$
7 - O
wne
r Ope
ratio
ns C
osts
(Wor
king
Cap
ital)
US$
-$
3,
930,
536
$
-
$
-$
-
$
-$
-
$
-$
-
$
-$
-
$
-
$
-
$
-
$
-
$
-
$
-
$
6.
a Im
port
Tax
es (f
or m
ajor
cap
. Ite
ms)
- ad
ditio
nal O
wne
r Pro
j. Co
st U
S$1,
350,
000
$
3,15
0,00
0$
-$
-
$
-$
-
$
-$
-
$
-$
-
$
-$
-$
-$
-$
-$
-$
-$
Def
ered
Cap
ital
Defe
rred
Min
ing
Equi
pmen
t Exp
endi
ture
US$
-$
-
$
11
,632
,917
$
3,
722,
927
$
18,2
72,6
47$
4,
482,
500
$
2,13
7,12
8$
1,
103,
055
$
4,93
4,65
1$
2,
727,
670
$
542,
926
$
-$
-$
-$
-$
-$
-$
Taili
ngs S
tora
ge U
S$-
$
-$
1,59
5,00
0$
2,
400,
200
$
-$
1,
969,
000
$
-$
2,
322,
100
$
-$
-
$
-$
-$
-$
-$
-$
-$
-$
Surf
ace
Wat
er M
anag
emen
t U
S$-
$
-$
-$
22
7,70
0$
26,4
00$
22
7,70
0$
26,4
00$
1,
185,
800
$
26,4
00$
26
,400
$
-
$
-
$
-
$
-
$
-
$
-
$
-
$
Pr
oces
s Pla
nt U
S$-
$
-$
-$
80
,300
$
223,
300
$
38
4,85
3$
443,
153
$
14
6,64
2$
223,
300
$
80
,300
$
-
$
-
$
-
$
-
$
-
$
-
$
-
$
Re
habi
litat
ion
(Tru
st F
und)
-$
-
$
2,
830,
244
$
3,31
4,36
8$
3,
215,
137
$
3,84
2,41
2$
4,
018,
506
$
2,93
5,29
8$
1,
813,
443
$
1,24
9,25
4$
3,
165,
512
$
-
$
-
$
-
$
-
$
-
$
-
$
PR
OJE
CT C
API
TAL
COST
US$
73,4
45,7
92$
241,
407,
817
$
16
,058
,161
$
9,
745,
495
$
21,7
37,4
84$
10,9
06,4
65$
6,62
5,18
8$
7,
692,
895
$
6,99
7,79
4$
4,
083,
624
$
3,70
8,43
8$
-$
-$
-$
-$
-$
-$
Wor
king
Cap
ital
Wor
king
Cap
ital
- Pr
oces
s Pl
ant
OPE
X
Incl
uded
in C
apex
Item
7 U
S$-
$
-$
-$
-
$
-$
-
$
-$
-
$
-$
-
$
-$
-$
-$
-$
-$
-$
-$
Incl
uded
in C
apex
Item
7 U
S$-
$
-$
-$
-
$
-$
-
$
-$
-
$
-$
-
$
-$
-$
-$
-$
-$
-$
-$
WO
RKIN
G C
API
TAL
US$
-$
-
$
-
$
-$
-
$
-$
-
$
-$
-
$
-$
-
$
-
$
-
$
-
$
-
$
-
$
-
$
Pre-
Prod
uctio
n co
sts -
Pro
cess
Pla
nt -
Incl
in C
apex
6.2
US$
-$
-
$
-
$
-$
-
$
-$
-
$
-$
-
$
-$
-
$
-
$
-
$
-
$
-
$
-
$
-
$
Pr
e-Pr
oduc
tion
Cost
s - M
inin
g - i
ncl.
in C
apex
4.4
.2 U
S$-
$
-$
-$
-
$
-$
-
$
-$
-
$
-$
-
$
-$
-$
-$
-$
-$
-$
-$
PRE-
PRO
DU
CTIO
N U
S$-
$
-$
-$
-
$
-$
-
$
-$
-
$
-$
-
$
-$
-$
-$
-$
-$
-$
-$
TOTA
L CA
PITA
L CO
ST U
S$73
,445
,792
$
24
1,40
7,81
7$
16,0
58,1
61$
9,74
5,49
5$
21
,737
,484
$
10
,906
,465
$
6,
625,
188
$
7,69
2,89
5$
6,
997,
794
$
4,08
3,62
4$
3,
708,
438
$
-
$
-
$
-
$
-
$
-
$
-
$
MIN
E A
ND
PLA
NT
EQU
IPM
ENT
SALV
AG
E A
ND
RES
ALE
US$
-$
-
$
-
$
-$
-
$
-$
-
$
-$
-
$
-$
-
$
5,
000,
000
$
-
$
-
$
-
$
-
$
-
$
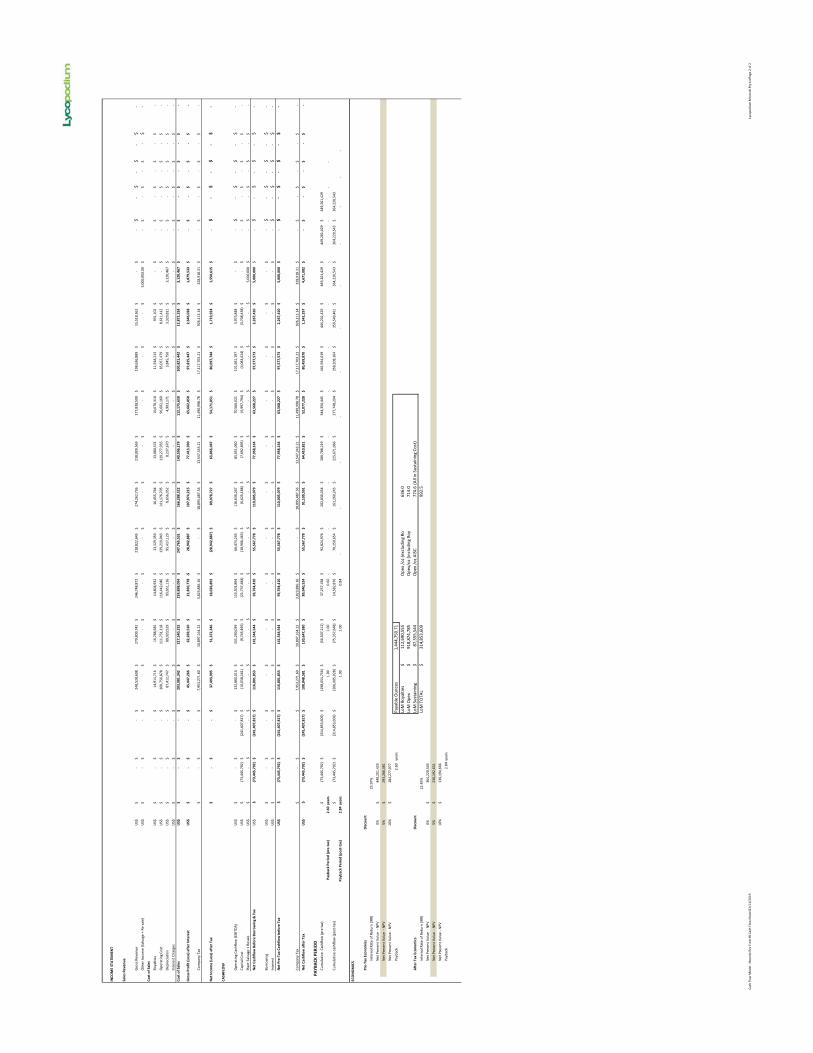
Cash
Flo
w M
odel
- Ho
unde
Rev
E e
dv R
1Cas
h Fl
ow M
odel
12/1
1/20
13Ly
copo
dium
Min
eral
s Pty
Ltd
Page
2 o
f 2
INCO
ME
STA
TEM
ENT
Sale
s R
even
ue
Gros
s Rev
enue
US$
-$
-
$
24
8,52
8,60
8$
279,
809,
742
$
24
6,74
8,87
2$
218,
822,
645
$
27
4,26
2,73
6$
218,
009,
569
$
17
7,83
8,50
0$
198,
636,
889
$
15,5
18,3
62$
-$
-$
-$
-
$
-
$
-$
Oth
er In
com
e (S
alva
ge +
Re-
sale
)U
S$-
$
-$
-$
-
$
-$
-
$
-$
-
$
-$
-
$
-$
5,00
0,00
0.00
$
-
$
-
$
-
$
-
$
-
$
Co
st o
f Sal
es
Roya
lties
US$
-$
-
$
14
,911
,716
$
16
,788
,585
$
14
,804
,932
$
13,1
29,3
59$
16,4
55,7
64$
13
,080
,574
$
10,6
70,3
10$
11,9
18,2
13$
931,
102
$
-$
-$
-$
-$
-$
-$
Ope
ratin
g Co
stU
S$-
$
-$
100,
756,
878
$
11
1,73
1,11
8$
116,
442,
046
$
13
9,21
9,04
3$
141,
176,
705
$
11
9,27
7,93
5$
96,6
02,1
69$
85,0
57,4
79$
8,61
1,41
2$
-$
-$
-$
-$
-$
-$
Depr
ecia
tion
US$
-$
-
$
87
,412
,747
$
89
,020
,529
$
93
,651
,116
$
95,4
17,1
29$
8,65
6,05
2$
8,
237,
670
$
4,90
3,17
1$
3,
845,
750
$
3,32
9,81
1$
3,12
0,46
7$
-$
-$
-$
-$
-$
Inte
rest
Cha
rges
US$
-$
-
$
-
$
-$
-
$
-$
-
$
-$
-
$
-$
-
$
-
$
-
$
-
$
-
$
-
$
-
$
Co
st o
f Sal
esU
S$-
$
-$
203,
081,
342
$
21
7,54
0,23
2$
224,
898,
094
$
24
7,76
5,53
1$
166,
288,
522
$
14
0,59
6,17
9$
112,
175,
650
$
10
0,82
1,44
2$
12
,872
,324
$
3,12
0,46
7$
-$
-$
-$
-$
-$
Gro
ss P
rofit
(Los
s) a
fter
Inte
rest
US$
-$
-
$
45
,447
,266
$
62
,269
,510
$
21
,850
,778
$
28
,942
,887
-$
107,
974,
215
$
77
,413
,390
$
65
,662
,850
$
97
,815
,447
$
2,
646,
038
$
1,
879,
533
$
-
$
-
$
-
$
-
$
-
$
Com
pany
Tax
-$
-
$
7,
953,
271.
60$
10
,897
,164
.22
$
3,82
3,88
6.16
$
-$
18
,895
,487
.56
$
13,5
47,3
43.2
1$
11
,490
,998
.78
$
17,1
17,7
03.2
1$
926,
113.
14$
328,
918.
31$
-
$
-
$
-
$
-
$
-
$
Net
Inco
me
(Los
s) a
fter
Tax
-$
-
$
37
,493
,995
$
51
,372
,346
$
18
,026
,892
$
(2
8,94
2,88
7)$
89,0
78,7
27$
63,8
66,0
47$
54,1
71,8
51$
80,6
97,7
44$
1,71
9,92
4$
1,55
0,61
5$
-$
-$
-
$
-
$
-$
CASH
FLO
W
Ope
ratin
g Ca
shflo
w (E
BITD
A)U
S$-
$
-$
132,
860,
014
$
15
1,29
0,03
9$
115,
501,
894
$
66
,474
,243
$
11
6,63
0,26
7$
85,6
51,0
60$
70
,566
,021
$
10
1,66
1,19
7$
5,
975,
848
$
-
$
-
$
-
$
-$
-$
-
$
Ca
pita
l Cos
tU
S$(7
3,44
5,79
2)$
(241
,407
,817
)$
(16,
058,
161)
$
(9
,745
,495
)$
(2
1,73
7,48
4)$
(10,
906,
465)
$
(6
,625
,188
)$
(7
,692
,895
)$
(6
,997
,794
)$
(4
,083
,624
)$
(3,7
08,4
38)
$
-
$
-
$
-
$
-
$
-
$
-
$
Pl
ant S
alva
ge +
Res
ale
US$
-$
-
$
-
$
-$
-
$
-$
-
$
-$
-
$
-$
-
$
5,
000,
000
$
-
$
-
$
-
$
-
$
-
$
N
et C
ashf
low
Bef
ore
Bor
row
ing
& T
axU
S$(7
3,44
5,79
2)$
(2
41,4
07,8
17)
$
11
6,80
1,85
3$
141,
544,
544
$
93
,764
,410
$
55
,567
,778
$
11
0,00
5,07
9$
77,9
58,1
64$
63,5
68,2
27$
97,5
77,5
73$
2,26
7,41
0$
5,00
0,00
0$
-$
-$
-
$
-
$
-$
Borr
owin
gU
S$-
$
-$
-$
-
$
-$
-
$
-$
-
$
-$
-
$
-$
-$
-$
-$
-
$
-
$
-$
Inte
rest
US$
-$
-
$
-
$
-$
-
$
-$
-
$
-$
-
$
-$
-
$
-
$
-
$
-
$
-$
-$
-
$
N
et P
re-T
ax C
ashf
low
bef
ore
Tax
US$
(73,
445,
792)
$
(241
,407
,817
)$
116,
801,
853
$
14
1,54
4,54
4$
93,7
64,4
10$
55,5
67,7
78$
110,
005,
079
$
77
,958
,164
$
63
,568
,227
$
97
,577
,573
$
2,
267,
410
$
5,
000,
000
$
-
$
-
$
-$
-$
-
$
Com
pany
Tax
-$
-
$
7,
953,
271.
60$
10
,897
,164
.22
$
3,82
3,88
6.16
$
-$
18
,895
,487
.56
$
13,5
47,3
43.2
1$
11
,490
,998
.78
$
17,1
17,7
03.2
1$
926,
113.
14$
328,
918.
31$
-
$
-
$
-
$
-
$
-
$
N
et C
ashf
low
aft
er T
axU
S$(7
3,44
5,79
2)$
(2
41,4
07,8
17)
$
10
8,84
8,58
1$
130,
647,
380
$
89
,940
,524
$
55
,567
,778
$
91
,109
,591
$
64
,410
,821
$
52
,077
,228
$
80
,459
,870
$
1,
341,
297
$
4,
671,
082
$
-
$
-
$
-
$
-
$
-
$
PAYB
ACK
PER
IOD
Cum
ulat
ive
Cas
hflo
w (p
re ta
x)(7
3,44
5,79
2)$
(314
,853
,609
)$
(198
,051
,756
)$
(5
6,50
7,21
2)$
37,2
57,1
98$
92
,824
,976
$
20
2,83
0,05
4$
280,
788,
219
$
34
4,35
6,44
5$
441,
934,
019
$
444,
201,
429
$
449,
201,
429
$
44
9,20
1,42
9$
449,
201,
429
$
Payb
ack
Peri
od (p
re-t
ax)
2.60
year
s1.
00
1.00
0.
60
-
--
--
--
--
--
Cum
ulat
ive
cash
flow
(pos
t-ta
x)(7
3,44
5,79
2)$
(314
,853
,609
)$
(206
,005
,028
)$
(7
5,35
7,64
8)$
14,5
82,8
76$
70
,150
,654
$
16
1,26
0,24
5$
225,
671,
066
$
27
7,74
8,29
4$
358,
208,
164
$
359,
549,
461
$
364,
220,
543
$
36
4,22
0,54
3$
364,
220,
543
$
Payb
ack
Peri
od (p
ost-
tax)
2.84
year
s1.
00
1.00
0.
84
-
--
--
--
--
--
ECO
NO
MIC
S
Pre-
Tax
Econ
omic
sD
isco
unt
Inte
rnal
Rat
e of
Ret
urn
(IRR)
25.9
7%N
et P
rese
nt V
alue
- N
PV0%
449,
201,
429
$
Net
Pre
sent
Val
ue -
NPV
5%29
3,26
6,38
1$
N
et P
rese
nt V
alue
- N
PV10
%18
4,27
7,07
7$
Payb
ack
2.60
ye
ars
Paya
ble
Oun
ces
1,44
4,75
0.71
LoM
Roy
altie
s11
2,69
0,55
5$
O
pex
/oz (
excl
udin
g Ro
636.
0Lo
M O
pex
918,
874,
785
$
Ope
x/oz
(inc
ludi
ng R
oy71
4.0
Aft
er T
ax E
cono
mic
sD
isco
unt
LoM
Sus
tain
ing
87,5
55,5
44$
Ope
x /o
z AIS
C77
4.6
(All
in S
usta
inin
g Co
st)
Inte
rnal
Rat
e of
Ret
urn
(IRR)
22.4
5%Lo
M T
OTA
L31
4,85
3,60
9$
99
2.5
Net
Pre
sent
Val
ue -
NPV
0%36
4,22
0,54
3$
N
et P
rese
nt V
alue
- N
PV5%
230,
192,
631
$
Net
Pre
sent
Val
ue -
NPV
10%
136,
194,
666
$
Payb
ack
2.84
year
s
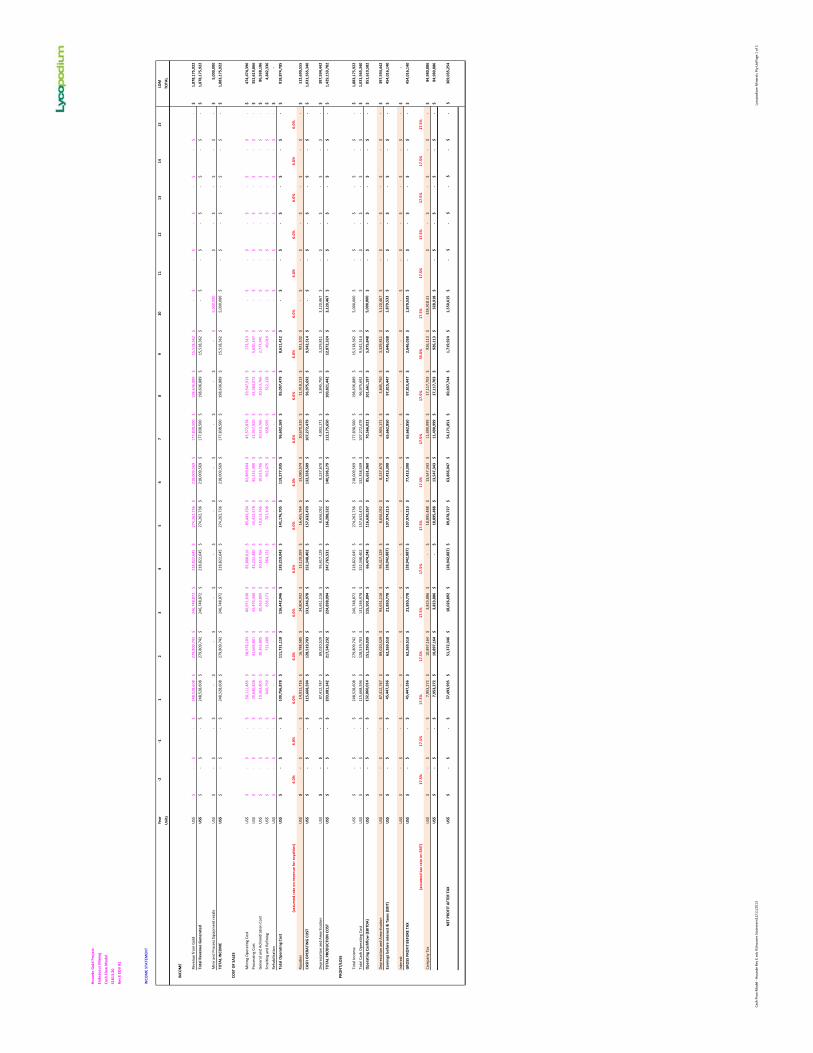
Cash
Flo
w M
odel
- Ho
unde
Rev
E e
dv R
1Inc
ome
Stat
emen
t12/
11/2
013
Lyco
podi
um M
iner
als P
ty L
tdPa
ge 1
of 1
Hou
nde
Gol
d Pr
ojec
t
Ende
avou
r M
inin
g
Cash
Flo
w M
odel
S181
3.20
Rev
E ED
V R
1
INCO
ME
STA
TEM
ENT
Year
-2-1
12
34
56
78
910
1112
1314
15LO
M
Uni
tsTO
TAL
INCO
ME
Reve
nue
from
Gol
dU
S$-
$
-$
248,
528,
608
$
27
9,80
9,74
2$
246,
748,
872
$
21
8,82
2,64
5$
274,
262,
736
$
21
8,00
9,56
9$
177,
838,
500
$
19
8,63
6,88
9$
15,5
18,3
62$
-$
-$
-$
-
$
-$
-
$
1,87
8,17
5,92
2$
Tota
l Rev
enue
Gen
erat
ed
US$
-$
-
$
24
8,52
8,60
8$
279,
809,
742
$
24
6,74
8,87
2$
218,
822,
645
$
27
4,26
2,73
6$
218,
009,
569
$
17
7,83
8,50
0$
198,
636,
889
$
15
,518
,362
$
-
$
-
$
-
$
-$
-
$
-$
1,
878,
175,
922
$
Min
e an
d Pr
oces
s Equ
ipm
ent r
esal
eU
S$-
$
-$
-$
-
$
-$
-$
-
$
-$
-
$
-$
-
$
5,
000,
000
$
-
$
-$
-
$
-$
5,
000,
000
$
TOTA
L IN
COM
EU
S$-
$
-$
248,
528,
608
$
27
9,80
9,74
2$
246,
748,
872
$
21
8,82
2,64
5$
274,
262,
736
$
21
8,00
9,56
9$
177,
838,
500
$
19
8,63
6,88
9$
15,5
18,3
62$
5,00
0,00
0$
-$
-$
-
$
-$
-
$
1,88
3,17
5,92
2$
COST
OF
SALE
S
Min
ing
Ope
ratin
g Co
stU
S$-
$
-$
50,1
11,4
85$
58
,976
,103
$
60,9
71,6
30$
82
,808
,616
$
85,4
43,2
54$
62
,869
,604
$
43,5
72,8
78$
29
,547
,513
$
17
3,31
3$
-
$
-
$
-
$
-$
-
$
-$
47
4,47
4,39
6$
Proc
essin
g Co
stU
S$-
$
-$
39,6
40,8
28$
41
,669
,801
$
44,4
70,4
40$
45
,232
,490
$
44,4
12,5
78$
45
,232
,490
$
41,9
57,0
20$
44
,384
,072
$
5,
620,
147
$
-
$
-
$
-
$
-$
-
$
-$
35
2,61
9,86
6$
Gen
eral
and
Adm
initr
atio
n Co
stU
S$-
$
-$
10,3
63,8
05$
10
,363
,805
$
10,3
63,8
05$
10
,613
,766
$
10,6
13,7
66$
10
,613
,766
$
10,6
13,7
66$
10
,613
,766
$
2,
777,
941
$
-
$
-
$
-
$
-$
-
$
-$
86
,938
,186
$
Smel
ting
and
Refin
ing
US$
-$
-
$
64
0,75
9$
721,
409
$
63
6,17
1$
56
4,17
1$
707,
108
$
56
2,07
5$
458,
505
$
51
2,12
8$
40,0
10$
-$
-$
-$
-
$
-$
-
$
4,84
2,33
6$
Reha
bilit
atio
nU
S$-
$
-$
-$
-
$
-$
-$
-
$
-$
-
$
-$
-
$
-
$
-
$
-
$
-$
-
$
-$
-
$
Tota
l Ope
rati
ng C
ost
US$
-$
-
$
10
0,75
6,87
8$
111,
731,
118
$
11
6,44
2,04
6$
139,
219,
043
$
14
1,17
6,70
5$
119,
277,
935
$
96
,602
,169
$
85,0
57,4
79$
8,61
1,41
2$
-$
-$
-$
-
$
-$
-
$
918,
874,
785
$
(ass
umed
rat
e on
rev
enue
for
roya
ltie
s)6.
0%6.
0%6.
0%6.
0%6.
0%6.
0%6.
0%6.
0%6.
0%6.
0%6.
0%6.
0%6.
0%6.
0%6.
0%6.
0%6.
0%
Roya
ties
US$
-$
-
$
14
,911
,716
$
16,7
88,5
85$
14
,804
,932
$
13,1
29,3
59$
16
,455
,764
$
13,0
80,5
74$
10
,670
,310
$
11,9
18,2
13$
931,
102
$
-$
-$
-$
-
$
-$
-
$
112,
690,
555
$
CASH
OPE
RATI
NG
CO
STU
S$-
$
-$
115,
668,
594
$
12
8,51
9,70
3$
131,
246,
978
$
15
2,34
8,40
2$
157,
632,
470
$
13
2,35
8,50
9$
107,
272,
479
$
96
,975
,692
$
9,
542,
514
$
-
$
-
$
-
$
-$
-
$
-$
1,
031,
565,
340
$
Depr
ecia
tion
and
Amor
tisat
ion
US$
-$
-
$
87
,412
,747
$
89,0
20,5
29$
93
,651
,116
$
95,4
17,1
29$
8,
656,
052
$
8,23
7,67
0$
4,
903,
171
$
3,84
5,75
0$
3,
329,
811
$
3,
120,
467
$
-
$
-
$
-$
-
$
-$
39
7,59
4,44
2$
TOTA
L PR
OD
UCT
ION
CO
STU
S$-
$
-$
203,
081,
342
$
21
7,54
0,23
2$
224,
898,
094
$
24
7,76
5,53
1$
166,
288,
522
$
14
0,59
6,17
9$
112,
175,
650
$
10
0,82
1,44
2$
12,8
72,3
24$
3,12
0,46
7$
-$
-$
-
$
-$
-
$
1,42
9,15
9,78
2$
PRO
FIT/
LOSS
Tota
l Inc
ome
US$
-$
-
$
24
8,52
8,60
8$
279,
809,
742
$
24
6,74
8,87
2$
218,
822,
645
$
27
4,26
2,73
6$
218,
009,
569
$
17
7,83
8,50
0$
198,
636,
889
$
15
,518
,362
$
5,
000,
000
$
-
$
-
$
-$
-
$
-$
1,
883,
175,
922
$
Tota
l Cas
h O
pera
ting
Cost
US$
-$
-
$
11
5,66
8,59
4$
128,
519,
703
$
13
1,24
6,97
8$
152,
348,
402
$
15
7,63
2,47
0$
132,
358,
509
$
10
7,27
2,47
9$
96,9
75,6
92$
9,54
2,51
4$
-$
-$
-$
-
$
-$
-
$
1,03
1,56
5,34
0$
Ope
rati
ng C
ashf
low
(EBI
TDA
)U
S$-
$
-$
132,
860,
014
$
15
1,29
0,03
9$
115,
501,
894
$
66
,474
,243
$
116,
630,
267
$
85
,651
,060
$
70,5
66,0
21$
10
1,66
1,19
7$
5,97
5,84
8$
5,00
0,00
0$
-$
-$
-
$
-$
-
$
851,
610,
582
$
Depr
ecia
tion
and
Amor
tisat
ion
US$
-$
-
$
87
,412
,747
$
89,0
20,5
29$
93
,651
,116
$
95,4
17,1
29$
8,
656,
052
$
8,23
7,67
0$
4,
903,
171
$
3,84
5,75
0$
3,
329,
811
$
3,
120,
467
$
-
$
-
$
-$
-
$
-$
39
7,59
4,44
2$
Earn
ings
bef
ore
inte
rest
& T
axes
(EBI
T)U
S$-
$
-$
45,4
47,2
66$
62
,269
,510
$
21,8
50,7
78$
(2
8,94
2,88
7)$
107,
974,
215
$
77
,413
,390
$
65,6
62,8
50$
97
,815
,447
$
2,
646,
038
$
1,
879,
533
$
-
$
-
$
-$
-
$
-$
45
4,01
6,14
0$
Inte
rest
US$
-$
-
$
-
$
-$
-
$
-
$
-$
-
$
-$
-
$
-$
-$
-$
-$
-
$
-$
-
$
-$
GRO
SS P
ROFI
T BE
FORE
TA
XU
S$-
$
-$
45,4
47,2
66$
62
,269
,510
$
21,8
50,7
78$
(2
8,94
2,88
7)$
107,
974,
215
$
77
,413
,390
$
65,6
62,8
50$
97
,815
,447
$
2,
646,
038
$
1,
879,
533
$
-
$
-
$
-$
-
$
-$
45
4,01
6,14
0$
(ass
umed
tax
rat
e on
EBI
T)17
.5%
17.5
%17
.5%
17.5
%17
.5%
17.5
%17
.5%
17.5
%17
.5%
17.5
%35
.0%
17.5
%17
.5%
17.5
%17
.5%
17.5
%17
.5%
Com
pany
Tax
US$
-$
-
$
7,
953,
272
$
10,8
97,1
64$
3,
823,
886
$
-
$
18,8
95,4
88$
13
,547
,343
$
11,4
90,9
99$
17
,117
,703
$
92
6,11
3$
32
8,91
8.31
$
-
$
-$
-
$
-$
84
,980
,886
$
US$
-$
-
$
7,
953,
272
$
10,8
97,1
64$
3,
823,
886
$
-
$
18,8
95,4
88$
13
,547
,343
$
11,4
90,9
99$
17
,117
,703
$
92
6,11
3$
32
8,91
8$
-
$
-
$
-$
-
$
-$
84
,980
,886
$
NET
PRO
FIT
AFT
ER T
AX
US$
-$
-
$
37
,493
,995
$
51,3
72,3
46$
18
, 026
,892
$
(28,
942,
887)
$
89
,078
,727
$
63,8
66,0
47$
54
,171
,851
$
80,6
97,7
44$
1,71
9,92
4$
1,55
0,61
5$
-$
-$
-
$
-$
-
$
369,
035,
254
$
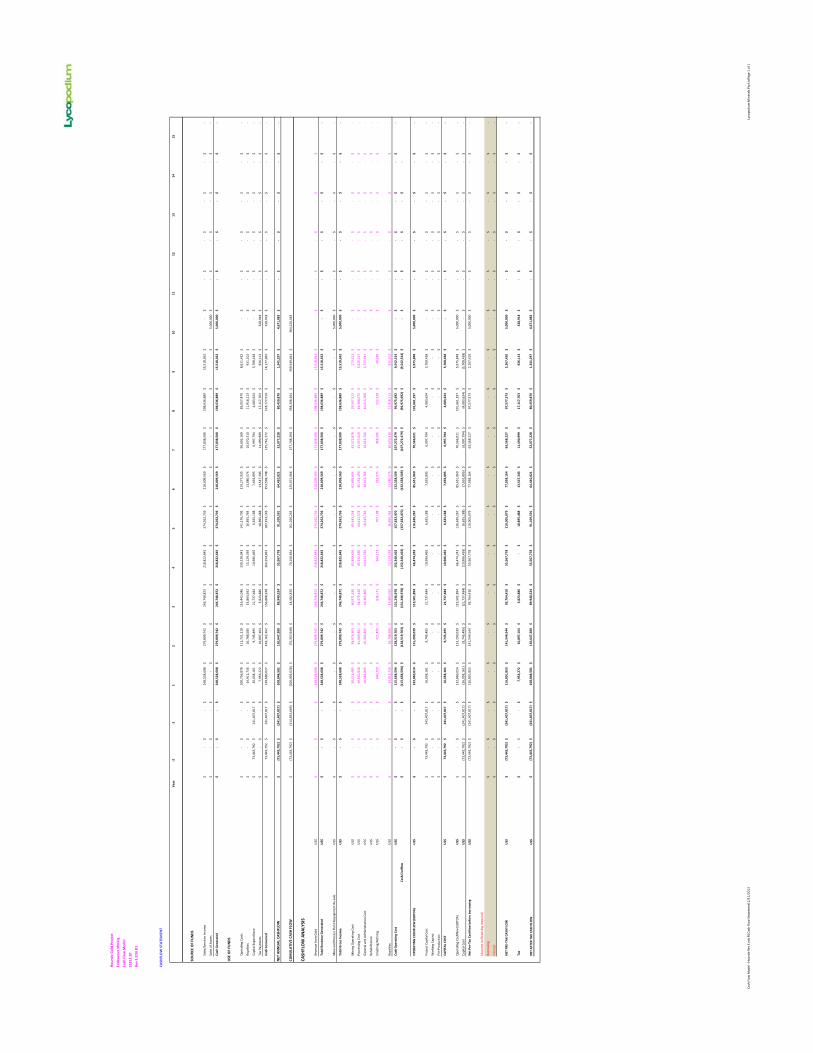
Cash
Flo
w M
odel
- Ho
unde
Rev
E e
dv R
1Cas
h Fl
ow S
tate
men
t12/
11/2
013
Lyco
podi
um M
iner
als P
ty L
tdPa
ge 1
of 1
Hou
nde
Gol
d Pr
ojec
t
Ende
avou
r M
inin
g
Cash
Flo
w M
odel
S181
3.20
Rev
E E
DV
R1
CASH
FLO
W S
TATE
MEN
T
Yea
r:-2
-11
23
45
67
89
1011
1213
1415
SOU
RCE
OF
FUN
DS
Sale
s/Se
rvic
es In
com
e-
$
-$
248,
528,
608
$
279,
809,
742
$
246,
748,
872
$
218,
822,
645
$
274,
262,
736
$
218,
009,
569
$
177,
838,
500
$
198,
636,
889
$
15,5
18,3
62$
-$
-
$
-$
-
$
-$
-
$
Sale
s of A
sset
s-
$
-$
-$
-
$
-$
-
$
-$
-
$
-$
-
$
-$
5,
000,
000
$
-$
-
$
-$
-
$
-$
Cash
Gen
erat
ed-
$
-$
248,
528,
608
$
279,
809,
742
$
246,
748,
872
$
218,
822,
645
$
274,
262,
736
$
218,
009,
569
$
177,
838,
500
$
198,
636,
889
$
15,5
18,3
62$
5,00
0,00
0$
-
$
-$
-
$
-$
-
$
USE
OF
FUN
DS
Ope
ratin
g Co
sts
-$
-
$
10
0,75
6,87
8$
11
1,73
1,11
8$
11
6,44
2,04
6$
13
9,21
9,04
3$
14
1,17
6,70
5$
11
9,27
7,93
5$
96
,602
,169
$
85
,057
,479
$
8,
611,
412
$
-$
-
$
-$
-
$
-$
-
$
Roya
lties
-$
-
$
14
,911
,716
$
16
,788
,585
$
14
,804
,932
$
13
,129
,359
$
16
,455
,764
$
13
,080
,574
$
10
,670
,310
$
11
,918
,213
$
93
1,10
2$
-$
-
$
-$
-
$
-$
-
$
Capi
tal E
xpen
ditu
re73
,445
,792
$
241,
407,
817
$
16
,058
,161
$
9,
745,
495
$
21,7
37,4
84$
10,9
06,4
65$
6,62
5,18
8$
7,
692,
895
$
6,99
7,79
4$
4,
083,
624
$
3,70
8,43
8$
-
$
-$
-
$
-$
-
$
-$
Tax
Paym
ents
-$
-
$
7,
953,
272
$
10,8
97,1
64$
3,82
3,88
6$
-
$
18,8
95,4
88$
13,5
47,3
43$
11,4
90,9
99$
17,1
17,7
03$
926,
113
$
32
8,91
8$
-$
-
$
-$
-
$
-$
Cash
Con
sum
ed73
,445
,792
$
241,
407,
817
$
13
9,68
0,02
7$
14
9,16
2,36
2$
15
6,80
8,34
8$
16
3,25
4,86
7$
18
3,15
3,14
5$
15
3,59
8,74
8$
12
5,76
1,27
2$
11
8,17
7,01
9$
14
,177
,065
$
32
8,91
8$
-$
-
$
-$
-
$
-$
NET
AN
NU
AL
CASH
FLO
W(7
3,44
5,79
2)$
(2
41,4
07,8
17)
$
10
8,84
8,58
1$
13
0,64
7,38
0$
89
,940
,524
$
55
,567
,778
$
91
,109
,591
$
64
,410
,821
$
52
,077
,228
$
80
,459
,870
$
1,
341,
297
$
4,67
1,08
2$
-
$
-$
-
$
-$
-
$
CUM
ULA
TIV
E CA
SH F
LOW
(73,
445,
792)
$
(314
,853
,609
)$
(206
,005
,028
)$
(7
5,35
7,64
8)$
14,5
82,8
76$
70,1
50,6
54$
161,
260,
245
$
225,
671,
066
$
277,
748,
294
$
358,
208,
164
$
359,
549,
461
$
364,
220,
543
$
CASH
FLO
W A
NA
LYSI
S
Reve
nue
from
Gol
dU
S$-
$
-$
248,
528,
608
$
279,
809,
742
$
246,
748,
872
$
218,
822,
645
$
274,
262,
736
$
218,
009,
569
$
177,
838,
500
$
198,
636,
889
$
15,5
18,3
62$
-$
-
$
-$
-
$
-$
-
$
Tota
l Rev
enue
Gen
erat
edU
S$-
$
-$
248,
528,
608
$
279,
809,
742
$
246,
748,
872
$
218,
822,
645
$
274,
262,
736
$
218,
009,
569
$
177,
838,
500
$
198,
636,
889
$
15,5
18,3
62$
-$
-
$
-$
-
$
-$
-
$
Min
e an
d Pr
oces
s Pla
nt R
equi
pmen
t Re-
sale
US$
-$
-
$
-
$
-$
-
$
-$
-
$
-$
-
$
-$
-
$
5,00
0,00
0$
-
$
-$
-
$
-$
-
$
Tota
l Gro
ss In
com
eU
S$-
$
-$
248,
528,
608
$
279,
809,
742
$
246,
748,
872
$
218,
822,
645
$
274,
262,
736
$
218,
009,
569
$
177,
838,
500
$
198,
636,
889
$
15,5
18,3
62$
5,00
0,00
0$
-
$
-$
-
$
-$
-
$
Min
ing
Ope
ratin
g Co
stU
S$-
$
-$
50,1
11,4
85$
58,9
76,1
03$
60,9
71,6
30$
82,8
08,6
16$
85,4
43,2
54$
62,8
69,6
04$
43,5
72,8
78$
29,5
47,5
13$
173,
313
$
-
$
-$
-
$
-$
-
$
-$
Proc
essin
g Co
stU
S$-
$
-$
39,6
40,8
28$
41,6
69,8
01$
44,4
70,4
40$
45,2
32,4
90$
44,4
12,5
78$
45,2
32,4
90$
41,9
57,0
20$
44,3
84,0
72$
5,62
0,14
7$
-
$
-$
-
$
-$
-
$
-$
Gen
eral
and
Adm
inist
ratio
n Co
stU
S$-
$
-$
10,3
63,8
05$
10,3
63,8
05$
10,3
63,8
05$
10,6
13,7
66$
10,6
13,7
66$
10,6
13,7
66$
10,6
13,7
66$
10,6
13,7
66$
2,77
7,94
1$
-
$
-$
-
$
-$
-
$
-$
Reha
bilit
atio
nU
S$-
$
-$
-$
-
$
-$
-
$
-$
-
$
-$
-
$
-$
-
$
-$
-
$
-$
-
$
-$
Smel
ting/
Refin
ing
US$
-$
-
$
64
0,75
9$
721,
409
$
63
6,17
1$
564,
171
$
70
7,10
8$
562,
075
$
45
8,50
5$
512,
128
$
40
,010
$
-$
-
$
-$
-
$
-$
-
$
Roya
lties
US$
-$
-
$
14
,911
,716
$
16
,788
,585
$
14
,804
,932
$
13
,129
,359
$
16
,455
,764
$
13
,080
,574
$
10
,670
,310
$
11
,918
,213
$
93
1,10
2$
-$
-
$
-$
-
$
-$
-
$
Cash
Ope
rati
ng C
ost
US$
-$
-
$
11
5,66
8,59
4$
12
8,51
9,70
3$
13
1,24
6,97
8$
15
2,34
8,40
2$
15
7,63
2,47
0$
13
2,35
8,50
9$
10
7,27
2,47
9$
96
,975
,692
$
9,
542,
514
$
-$
-
$
-$
-
$
-$
-
$
Cash
Out
flow
-$
-
$
(1
15,6
68,5
94)
$
(128
,519
,703
)$
(1
31,2
46,9
78)
$
(152
,348
,402
)$
(1
57,6
32,4
70)
$
(132
,358
,509
)$
(1
07,2
72,4
79)
$
(96,
975,
692)
$
(9
,542
,514
)$
-$
-
$
-$
-
$
-$
OPE
RATI
NG
CA
SHFL
OW
(EBI
TDA
)U
S$-
$
-$
132,
860,
014
$
151,
290,
039
$
115,
501,
894
$
66,4
74,2
43$
116,
630,
267
$
85,6
51,0
60$
70,5
66,0
21$
101,
661,
197
$
5,97
5,84
8$
5,
000,
000
$
-$
-
$
-$
-
$
-$
Proj
ect C
apita
l Cos
t73
,445
,792
$
241,
407,
817
$
16
,058
,161
$
9,
745,
495
$
21,7
37,4
84$
10,9
06,4
65$
6,62
5,18
8$
7,
692,
895
$
6,99
7,79
4$
4,
083,
624
$
3,70
8,43
8$
-
$
-$
-
$
-$
-
$
-$
Wor
king
Cap
iral
-$
-
$
-
$
-$
-
$
-$
-
$
-$
-
$
-$
-
$
-$
-
$
-$
-
$
-$
-
$
Pre-
Prod
uctio
n-
$
-$
-$
-
$
-$
-
$
-$
-
$
-$
-
$
-$
-
$
-$
-
$
-$
-
$
-$
CAPI
TAL
COST
US$
73,4
45,7
92$
24
1,40
7,81
7$
16,0
58,1
61$
9,74
5,49
5$
21
,737
,484
$
10
,906
,465
$
6,
625,
188
$
7,69
2,89
5$
6,
997,
794
$
4,08
3,62
4$
3,
708,
438
$
-$
-
$
-$
-
$
-$
-
$
Ope
ratin
g Ca
shflo
w (E
BITD
A)U
S$-
$
-$
132,
860,
014
$
151,
290,
039
$
115,
501,
894
$
66,4
74,2
43$
116,
630,
267
$
85,6
51,0
60$
70,5
66,0
21$
101,
661,
197
$
5,97
5,84
8$
5,
000,
000
$
-$
-
$
-$
-
$
-$
Capi
tal C
ost
US$
(73,
445,
792)
$
(241
,407
,817
)$
(16,
058,
161)
$
(9
,745
,495
)$
(21,
737,
484)
$
(1
0,90
6,46
5)$
(6,6
25,1
88)
$
(7
,692
,895
)$
(6,9
97,7
94)
$
(4
,083
,624
)$
(3,7
08,4
38)
$
-
$
-$
-
$
-$
-
$
-$
Net
Pre
-Tax
Cas
hflo
w b
efor
e bo
rrow
ing
US$
(73,
445,
792)
$
(241
,407
,817
)$
116,
801,
853
$
141,
544,
544
$
93,7
64,4
10$
55,5
67,7
78$
110,
005,
079
$
77,9
58,1
64$
63,5
68,2
27$
97,5
77,5
73$
2,26
7,41
0$
5,
000,
000
$
-$
-
$
-$
-
$
-$
(Ass
ume
no fi
nanc
ing
requ
ired)
Borr
owin
g -
$
-$
-$
-
$
-$
-
$
-$
-
$
-$
-
$
-$
-
$
-$
-
$
-$
-
$
-$
Inte
rest
-$
-
$
-
$
-$
-
$
-$
-
$
-$
-
$
-$
-
$
-$
-
$
-$
-
$
-$
-
$
NET
PRE
-TA
X CA
SHFL
OW
US$
(73,
445,
792)
$
(241
,407
,817
)$
116,
801,
853
$
141,
544,
544
$
93,7
64,4
10$
55,5
67,7
78$
110,
005,
079
$
77,9
58,1
64$
63,5
68,2
27$
97,5
77,5
73$
2,26
7,41
0$
5,
000,
000
$
-$
-
$
-$
-
$
-$
Tax
-$
-
$
7,
953,
272
$
10,8
97,1
64$
3,82
3,88
6$
-
$
18,8
95,4
88$
13,5
47,3
43$
11,4
90,9
99$
17,1
17,7
03$
926,
113
$
32
8,91
8$
-$
-
$
-$
-
$
-$
NET
AFT
ER T
AX
CASH
FLO
WU
S$(7
3,44
5,79
2)$
(2
41,4
07,8
17)
$
10
8,84
8,58
1$
13
0,64
7,38
0$
89
,940
,524
$
55
,567
,778
$
91
,109
,591
$
64
,410
,821
$
52
,077
,228
$
80
,459
,870
$
1,
341,
297
$
4,67
1,08
2$
-
$
-$
-
$
-$
-
$
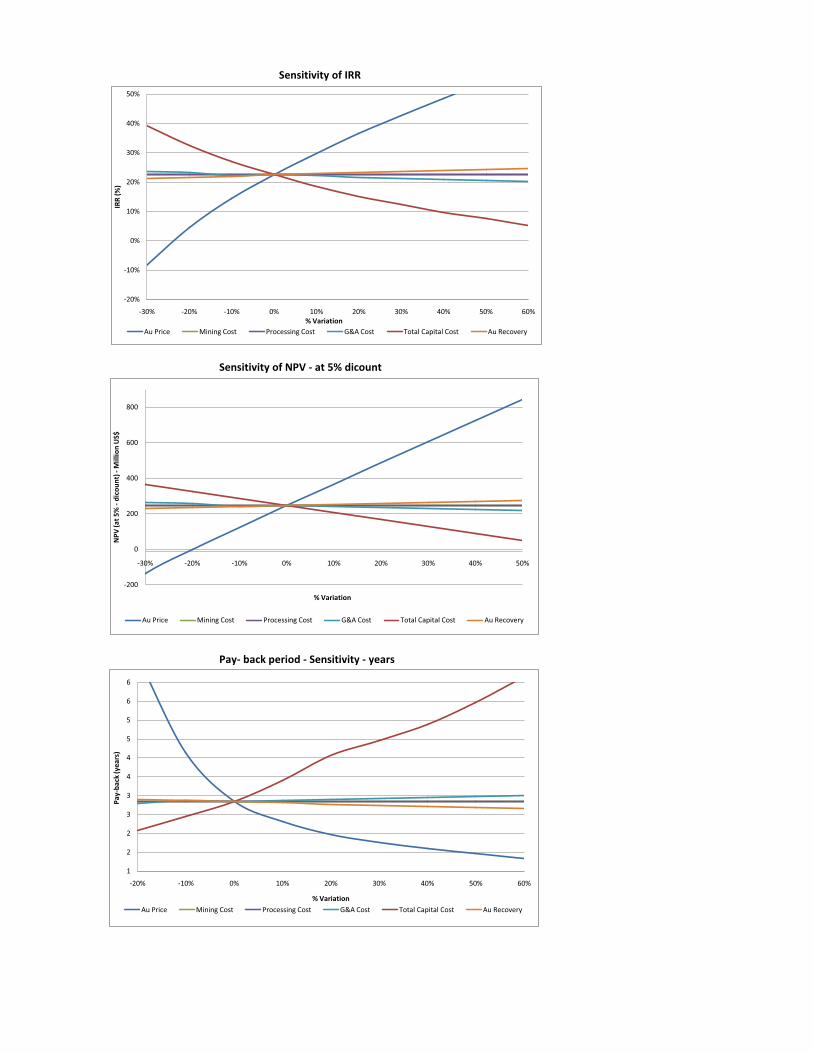
Sensitivity of IRR
Sensitivity of NPV - at 5% dicount
Pay- back period - Sensitivity - years
-20%
-10%
0%
10%
20%
30%
40%
50%
-30% -20% -10% 0% 10% 20% 30% 40% 50% 60%
IRR
(%)
% VariationAu Price Mining Cost Processing Cost G&A Cost Total Capital Cost Au Recovery
-200
0
200
400
600
800
-30% -20% -10% 0% 10% 20% 30% 40% 50%
NPV
(at 5
% -
dico
unt)
-M
illio
n U
S$
% Variation
Au Price Mining Cost Processing Cost G&A Cost Total Capital Cost Au Recovery
1
2
2
3
3
4
4
5
5
6
6
-20% -10% 0% 10% 20% 30% 40% 50% 60%
Pay-
back
(yea
rs)
% VariationAu Price Mining Cost Processing Cost G&A Cost Total Capital Cost Au Recovery
HOUNDÉ GOLD PROJECT, BURKINA FASO FEASIBILITY STUDY NI 43-101 TECHNICAL REPORT
1813.20\25.01\1813.20-STY-001_B S24 October 2013 Lycopodium Minerals Pty Ltd
APPENDIX 24.1
PROJECT RISK REGISTER
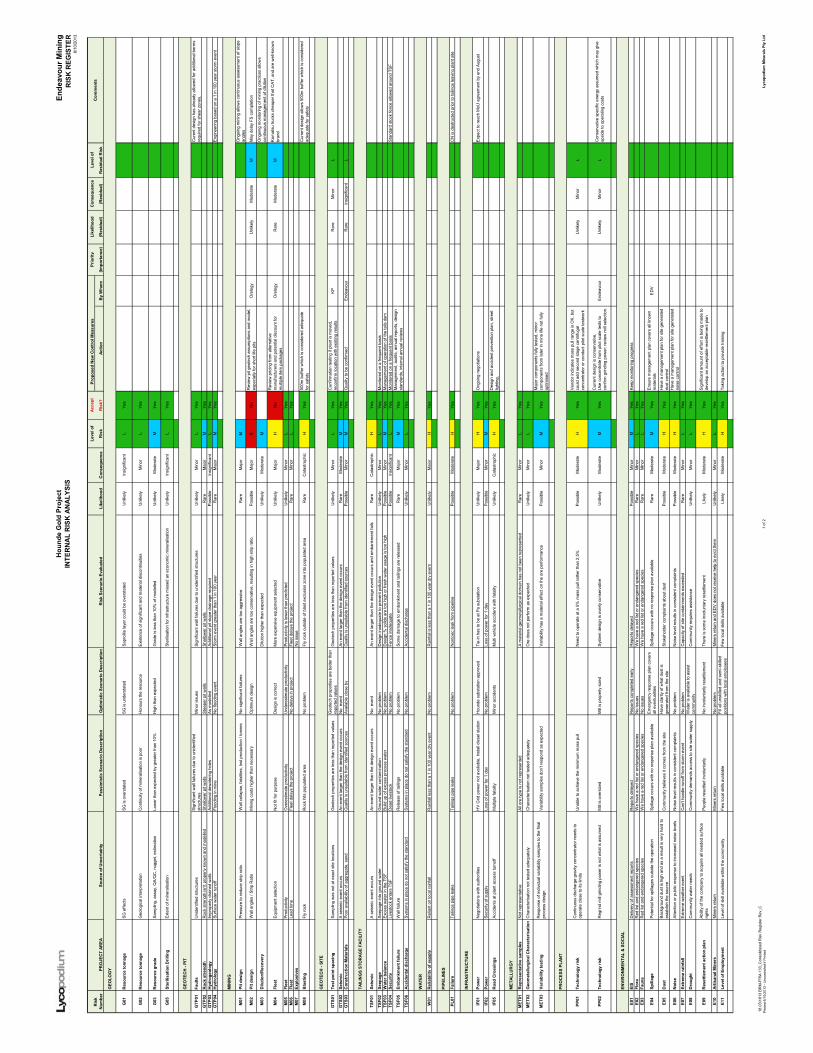
J
o
b
N
o
. 1
8
1
3
.2
0
Hou
nde
Gol
d Pr
ojec
tIN
TER
NA
L R
ISK
AN
ALY
SIS
Ende
avou
r Min
ing
RIS
K R
EGIS
TER
8/10
/201
3
18.
03\1
813
BR
M-F
RM
-133
_Con
solid
ated
Ris
k R
egis
ter R
ev_C
Prin
ted
8/10
/201
3 - U
ncon
trolle
d if
Prin
ted
1 of
2Ly
copo
dium
Min
eral
s Pt
y Lt
d
Leve
l of
Acce
pt
Pro
pose
d N
ew C
ontr
ol M
easu
res
Prio
rity
Like
lihoo
dC
onse
quen
ceLe
vel o
f
PRO
JEC
T AR
EASo
urce
of U
ncer
tain
tyR
isk
Ris
k?Ac
tion
By
Who
m(Im
port
ance
)(R
esid
ual)
(Res
idua
l)R
esid
ual R
isk
GEO
LOG
Y
G01
Res
ourc
e to
nnag
eS
G e
ffect
sS
G is
ove
rsta
ted
SG
is u
nder
stat
edS
apro
lite
laye
r cou
ld b
e ov
erst
ated
Unl
ikel
yIn
sign
ifica
ntL
Yes
G02
Res
ourc
e to
nnag
eG
eolo
gica
l int
erpr
etat
ion
Con
tinui
ty o
f min
eral
isat
ion
is p
oor
Hon
ours
the
reso
urce
Exis
tenc
e of
sig
nific
ant a
nd m
ater
ial d
isco
ntin
uitie
sU
nlik
ely
Min
orL
Yes
G03
Res
ourc
e gr
ade
Sam
plin
g, a
ssay
, QA
/QC
, nug
get,
estim
atio
nLo
wer
than
exp
ecte
d by
gre
ater
than
10%
Hig
h th
an e
xpec
ted
Gra
de is
less
than
10%
of m
odel
led
Unl
ikel
yM
oder
ate
MYe
s
G05
Ster
ilisa
tion
Dril
ling
Ext
ent o
f min
eral
isat
ion
Ste
rilis
atio
n fo
r inf
rast
ruct
ure
mis
sed
an e
cono
mic
min
eral
isat
ion
Unl
ikel
yIn
sign
ifica
ntL
Yes
GEO
TEC
H -
PIT
GTP
01Fa
ults
Uni
dent
ified
stru
ctur
esS
igni
fican
t wal
l fai
lure
s du
e to
uni
dent
ified
st
ruct
ures
Min
or is
sues
Sig
nific
ant w
all f
ailu
res
due
to u
nide
ntifi
ed s
truct
ures
Unl
ikel
yM
inor
LYe
sC
uren
t des
ign
has
alre
ady
allo
wed
for a
dditi
onal
ber
ms
requ
ired
for s
hear
zon
es.
GTP
02R
ock
stre
ngth
Roc
k st
reng
th is
n't p
rope
rly k
now
n an
d m
odel
led
Sha
llow
er p
it w
alls
Ste
eper
pit
wal
lsS
hallo
wer
pit
wal
lsR
are
Maj
orM
Yes
GTP
03H
ydro
geol
ogy
Impr
oper
ly d
rain
ed w
alls
Add
ition
al d
ewat
erin
g ho
les
As
mod
elle
dA
dditi
onal
pit
slop
e dr
aina
ge re
quire
dP
ossi
ble
Insi
gnifi
cant
LYe
sG
TP04
Hyd
rolo
gyS
urfa
ce w
ater
runo
ffFl
oodi
ng in
min
eN
o flo
odin
g ev
ent
Sto
rm e
vent
gre
ater
than
1 in
100
yea
rR
are
Maj
orM
Yes
Eng
inee
ring
base
d on
a 1
in 1
00 y
ear s
torm
eve
nt
MIN
ING
M01
Pit d
esig
nP
ress
ure
to re
duce
stri
p ra
tioW
all c
olla
pse,
fata
litie
s, lo
st p
rodu
ctio
n / t
onne
sN
o si
gnifi
cant
failu
res
Wal
l ang
les
are
too
aggr
essi
veR
are
Maj
orM
Ong
oing
min
ing
allo
ws
cont
inuo
us a
sses
smen
t of s
lope
an
gles
M02
Pit d
esig
nW
all a
ngle
s / S
trip
Rat
ioM
inin
g co
sts
high
er th
an n
eces
sary
Opt
imum
des
ign
Wal
l ang
les
are
too
cons
erva
tive,
resu
lting
in h
igh
strip
ratio
.P
ossi
ble
Maj
orE
No
Rev
iew
pit
geot
ech
assu
mpt
ions
and
mod
el,
espe
cial
ly fo
r sho
rt lif
e pi
tsO
relo
gyU
nlik
ely
Mod
erat
eM
May
del
ay F
S c
ompl
etio
n
M03
Dilu
tion/
Rec
over
yD
ilutio
n hi
gher
than
exp
ecte
dU
nlik
ely
Mod
erat
eM
Ong
oing
mon
itorin
g of
min
ing
prac
tices
allo
ws
cont
inuo
us m
anag
emen
t of d
ilutio
n
M04
Flee
tE
quip
men
t sel
ectio
nN
ot fi
t for
pur
pose
Des
ign
is c
orre
ctM
ore
expe
nsiv
e eq
uipm
ent s
elec
ted
Unl
ikel
yM
ajor
HN
oR
evie
w p
ricin
g fro
m a
ltern
ativ
e m
anuf
actu
rers
and
pot
entia
l dis
coun
t for
m
ultip
le it
em p
acka
ges
Ore
logy
Rar
eM
oder
ate
MK
omat
su tr
ucks
che
aper
that
CA
T, a
nd a
re w
ell-k
now
n br
and
M05
Flee
tP
rodu
ctiv
ityO
vere
stim
ate
prod
uctiv
ityU
nder
estim
ate
prod
uctiv
ityP
rodu
ctiv
ity is
low
er th
an p
redi
cted
Unl
ikel
yM
inor
LYe
sM
06Fl
eet
Lead
tim
e Fl
eet d
elay
s th
e pr
ojec
tN
o de
lays
in p
roje
ctFl
eet d
elay
s th
e pr
ojec
tR
are
Min
orL
Yes
M07
Expl
osiv
esN
o is
sue
M08
Bla
stin
gFl
y ro
ckR
ock
hits
pop
ulat
ed a
rea
No
prob
lem
Fly
rock
out
side
of b
last
exc
lusi
on z
one
into
pop
ulat
ed a
rea
Rar
eC
atas
troph
icH
Yes
500m
buf
fer w
hich
is c
onsi
dere
d ad
equa
te
for s
afet
yC
urre
nt d
esig
n al
low
s 50
0m b
uffe
r whi
ch is
con
side
red
adeq
uate
for s
afet
y
GEO
TEC
H -
SITE
GTS
01Te
st p
oint
spa
cing
Sam
plin
g w
as n
ot a
t exa
ct s
ite lo
catio
nsG
eote
ch p
rope
rties
are
less
than
repo
rted
valu
esG
eote
ch p
rope
rties
are
bet
ter t
han
repo
rted
valu
esG
eote
ch p
rope
rties
are
less
than
repo
rted
valu
esU
nlik
ely
Min
orL
Yes
Con
firm
atio
n te
stin
g if
plan
t is
mov
ed,
reco
nfirm
loca
tion
with
exis
ting
resu
ltsK
PR
are
Min
orL
GTS
02Se
ism
icA
sei
smic
eve
nt o
ccur
sA
n ev
ent l
arge
r tha
n th
e de
sign
eve
nt o
ccur
sN
o e
vent
An
even
t lar
ger t
han
the
desi
gn e
vent
occ
urs
Rar
eM
oder
ate
MYe
sG
TS03
Con
stru
ctio
n M
ater
ials
Poo
r ava
ilabi
lity
of a
ggre
gate
, san
dQ
ualit
y is
uns
uita
ble
from
iden
tifie
d so
urce
sA
vaila
ble
clos
e by
Qua
lity
is u
nsui
tabl
e fro
m id
entif
ied
sour
ces
Pos
sibl
eM
inor
MYe
sQ
ualit
y to
be
conf
irmed
End
eavo
urR
are
Insi
gnifi
cant
L
TAIL
ING
S ST
OR
AGE
FAC
ILIT
Y
TSF0
1Se
ism
icA
sei
smic
eve
nt o
ccur
sA
n ev
ent l
arge
r tha
n th
e de
sign
eve
nt o
ccur
sN
o e
vent
An
even
t lar
ger t
han
the
desi
gn e
vent
occ
urs
and
emba
nkm
ent f
ails
Rar
eC
atas
troph
icH
Yes
TSF0
2Se
epag
eS
eepa
ge in
to g
roun
d w
ater
Gro
und
wat
er c
onta
min
atio
nN
o pr
oble
mD
esig
n in
adeq
uate
to p
reve
nt p
ollu
tion
Unl
ikel
yM
inor
LYe
sM
onito
red
on a
freq
uent
bas
isTS
F03
Wat
er b
alan
ceE
xces
s w
ater
in th
e TS
FB
uild
up
of e
xces
s pr
oces
s w
ater
No
prob
lem
Des
ign
% s
olid
s ar
e to
o hi
gh o
r fre
sh w
ater
usa
ge is
too
high
Poss
ible
Min
orM
Yes
Man
agem
ent o
f ope
ratio
n of
the
tails
dam
TSF0
4Se
curit
yLi
vest
ock
ente
rs T
SF
Dea
d liv
esto
ckN
o pr
oble
mFe
nce
inad
equa
te
Pos
sibl
eIn
sign
ifica
ntL
Yes
Mon
itore
d on
a fr
eque
nt b
asis
Sta
ndar
d st
ock
fenc
e al
low
ed a
roun
d TS
F
TSF0
5Em
bank
men
t fai
lure
Wal
l fai
lure
Rel
ease
of t
ailin
gsN
o pr
oble
mS
ome
dam
age
to e
mba
nkm
ent a
nd ta
ilings
are
rele
ased
Rar
eM
ajor
MYe
sM
anag
emen
t, au
dits
, ann
ual r
epor
ts, d
esig
n st
anda
rds,
inte
rnal
ann
ual r
evie
ws
TSF0
6Ac
cide
ntal
dis
char
geS
yste
ms
in p
lace
do
not s
atis
fy th
e st
anda
rdS
yste
ms
in p
lace
do
not s
atis
fy th
e st
anda
rdN
o pr
oble
mA
ccid
enta
l dis
char
geU
nlik
ely
Min
orL
Yes
WAT
ER
W01
Rel
iabi
lity
of s
uppl
yR
elia
nt o
n lo
cal r
ainf
all
Rai
nfal
l les
s th
an a
1 in
100
yea
r dry
eve
ntN
o pr
oble
mR
ainf
all i
s le
ss th
an a
1 in
100
yea
r dry
eve
ntU
nlik
ely
Maj
orH
Yes
PIPE
LIN
ES
PL01
Failu
reTa
ilings
pip
e le
aks
Tailin
gs p
ipe
leak
sN
o pr
oble
mN
onto
xic le
ak fr
om p
ipel
ine
Pos
sibl
eM
oder
ate
HYe
sC
N is
des
truct
ed p
rior t
o ta
ilings
leav
ing
plan
t site
INFR
ASTR
UC
TUR
E
IF01
Pow
erN
egot
iatio
ns w
ith a
utho
ritie
sH
V G
rid p
ower
not
ava
ilabl
e, In
stal
l die
sel s
tatio
nH
ound
e su
bsta
tion
appr
oved
Tie-
in h
as to
be
at P
a su
bsta
tion
Unl
ikel
yM
ajor
HYe
sO
ngoi
ng n
egot
iatio
nsE
xpec
t to
reac
h M
oU a
gree
men
t by
end
Aug
ust
IF02
Pow
erS
ecur
ity o
f sup
ply
Loss
of p
ower
for 1
day
No
prob
lem
Loss
of p
ower
for 1
day
Pos
sibl
eM
inor
MYe
s
IF05
Roa
d C
ross
ings
Acc
iden
ts a
t pla
nt a
cces
s tu
rnof
fM
ultip
le fa
talit
yM
inor
acc
iden
tsM
ulti
vehi
cle
acci
dent
with
fata
lity
Unl
ikel
yC
atas
troph
icH
Yes
Des
ign
and
acci
dent
pre
vent
ion
plan
, stre
et
light
ing,
MET
ALLU
RG
Y
MET
01R
epre
sent
ativ
e sa
mpl
esN
ot re
pres
enta
tive
All
ore
type
is n
ot re
pres
ente
dA
mat
eria
l geo
met
allu
rgic
al d
omai
n ha
s no
t bee
n re
pres
ente
dR
are
Min
orL
Yes
MET
02G
eom
etal
lurg
ical
Cha
ract
eris
atio
nC
hara
cter
isat
ion
not t
este
d ad
equa
tely
Cha
ract
eris
atio
n no
t tes
ted
adeq
uate
lyO
re d
oes
not p
erfo
rm a
s ex
pect
edU
nlik
ely
Min
orL
Yes
MET
03Va
riabi
lity
test
ing
Res
pons
e of
indi
vidu
al v
aria
bilit
y sa
mpl
es to
the
final
pr
oces
s de
sign
Var
iabi
lity
sam
ples
don
’t re
spon
d as
exp
ecte
dV
aria
bilit
y ha
s a
mat
eria
l effe
ct o
n th
e or
e pe
rform
ance
Pos
sibl
eM
inor
MYe
sM
ajor
com
pone
nts
fully
test
ed, m
inor
co
mpo
nent
s fro
m la
ter i
n m
ine
life
not f
ully
op
timis
ed
PRO
CES
S PL
ANT
PP01
Tech
nolo
gy ri
skC
ontin
uous
dis
char
ge g
ravi
ty c
once
ntra
tor n
eeds
to
oper
ate
clos
e to
its
limits
Una
ble
to a
chie
ve th
e m
inim
um m
ass
pull
Nee
d to
ope
rate
at a
5%
mas
s pu
ll ra
ther
than
2.5
%P
ossi
ble
Mod
erat
eH
Yes
Ven
dor i
ndic
ates
mas
s pu
ll ra
nge
is O
K, b
ut
coul
d ad
d se
cond
sta
ge c
entri
fuga
l co
ncen
trato
r or c
ondu
ct p
ilot s
cale
test
wor
k U
nlik
ely
Min
orL
PP02
Tech
nolo
gy ri
skR
egrin
d m
ill gr
indi
ng p
ower
is n
ot w
hat i
s as
sum
edM
ill is
ove
rsiz
edM
ill is
pro
perly
siz
edS
yste
m d
esig
n is
ove
rly c
onse
rvat
ive
Unl
ikel
yM
oder
ate
MYe
sC
urre
nt d
esig
n is
con
serv
ativ
e,
Use
con
cent
rate
from
pilo
t sca
le te
sts
to
conf
irm g
rindi
ng p
ower
; rev
iew
mill
sele
ctio
n.E
ndea
vour
Unl
ikel
yM
inor
LC
onse
rvat
ive
spec
ific
ener
gy a
ssum
ed w
hich
may
giv
e up
side
to o
pera
ting
cost
s
ENVI
RO
NM
ENTA
L &
SO
CIA
L
E01
EIS
Del
iver
y of
ass
essm
ent r
epor
tsR
epor
ts d
elay
edR
epor
ts c
ompl
eted
ear
lyR
epor
ts d
elay
edP
ossi
ble
Min
orM
Yes
Kee
p m
onito
ring
prog
ress
E02
Flor
aR
ed li
st a
nd e
ndan
gere
d sp
ecie
sW
e ha
ve a
red
list o
r end
ange
red
spec
ies
No
issu
esW
e ha
ve a
red
list o
r end
ange
red
spec
ies
Rar
eM
inor
LYe
sE0
3Fa
una
Red
list
and
end
ange
red
spec
ies
We
have
a re
d lis
t or e
ndan
gere
d sp
ecie
s N
o is
sues
We
have
a re
d lis
t or e
ndan
gere
d sp
ecie
s R
are
Min
orL
Yes
E04
Spill
age
Pot
entia
l for
spi
llage
s ou
tsid
e th
e op
erat
ion
Spi
llage
occ
urs
with
no
resp
onse
pla
n av
aila
ble
Em
erge
ncy
resp
onse
pla
n co
vers
al
l eve
ntua
litie
sS
pilla
ge o
ccur
s w
ith n
o re
spon
se p
lan
avai
labl
eR
are
Mod
erat
eM
Yes
Ens
ure
man
agem
ent p
lan
cove
rs a
ll kn
own
mat
eria
lsE
DV
E05
Dus
tB
ackg
roun
d du
st is
hig
h an
d as
a re
sult
is v
ery
hard
to
esta
blis
h th
e so
urce
C
omm
unity
bel
ieve
s it
com
es fr
om th
e si
teH
ave
clar
ity o
f wha
t dus
t is
gene
rate
d fro
m th
e si
teS
take
hold
er c
ompl
aint
s ab
out d
ust
Pos
sibl
eM
oder
ate
HYe
sH
ave
a m
anag
emen
t pla
n fo
r site
gen
erat
ed
dust
con
trol
E06
Noi
seA
ttent
ion
or p
ublic
resp
onse
to in
crea
sed
nois
e le
vels
Noi
se le
vel r
esul
ts in
con
sist
ent c
ompl
aint
sN
o pr
oble
mN
oise
leve
l res
ults
in c
onsi
sten
t com
plai
nts
Pos
sibl
eM
oder
ate
HYe
sH
ave
a m
anag
emen
t pla
n fo
r site
gen
erat
ed
nois
e co
ntro
lE0
7Ex
trem
e ra
infa
llE
xtre
me
wea
ther
eve
ntC
an't
hand
le ru
noff
from
sto
rm e
vent
No
prob
lem
Cap
acity
of s
ite c
onta
inm
ents
exc
eede
dR
are
Min
orL
Yes
E08
Dro
ught
Com
mun
ity w
ater
nee
dsC
omm
unity
dem
ands
acc
ess
to s
ite w
ater
sup
ply
Wat
er is
ava
ilabl
e to
ass
ist
com
mun
ityC
omm
unity
requ
ires
assi
stan
ceU
nlik
ely
Min
orL
Yes
E09
Res
ettle
men
t act
ion
plan
Abi
lity
of th
e co
mpa
ny to
acq
uire
all
need
ed s
urfa
ce
right
sP
eopl
e re
settl
ed in
volu
ntar
ilyN
o in
volu
ntar
ily re
settl
emen
tTh
ere
is s
ome
invo
lunt
ary
rese
ttlem
ent
Like
lyM
oder
ate
HYe
sS
igni
fican
t am
ount
of e
ffort
is b
eing
mad
e to
de
velo
p an
acc
epta
ble
rese
ttlem
ent p
lan
E10
Artis
anal
Min
ers
Min
ers
retu
rnM
iner
s re
turn
No
prob
lem
Min
ers
retu
rn a
nd E
DV
doe
s no
t rec
eive
hel
p to
evi
ct th
emU
nlik
ely
Min
orL
Yes
E11
Leve
l of E
mpl
oym
ent
Leve
l of s
kill
avai
labl
e w
ithin
the
com
mun
ityFe
w lo
cal s
kills
ava
ilabl
eFi
ll al
l uns
kille
d an
d se
mi-s
kille
d po
sitio
ns w
ith lo
cal e
mpl
oyee
sFe
w lo
cal s
kills
ava
ilabl
eLi
kely
Mod
erat
eH
Yes
Taki
ng a
ctio
n to
pro
vide
trai
ning
Com
men
tsR
isk
Num
ber
Pess
imis
tic S
cena
rio D
escr
iptio
nO
ptim
istic
Sce
nario
Des
crip
tion
Like
lihoo
dC
onse
quen
ceR
isk
Scen
ario
Eva
luat
ed
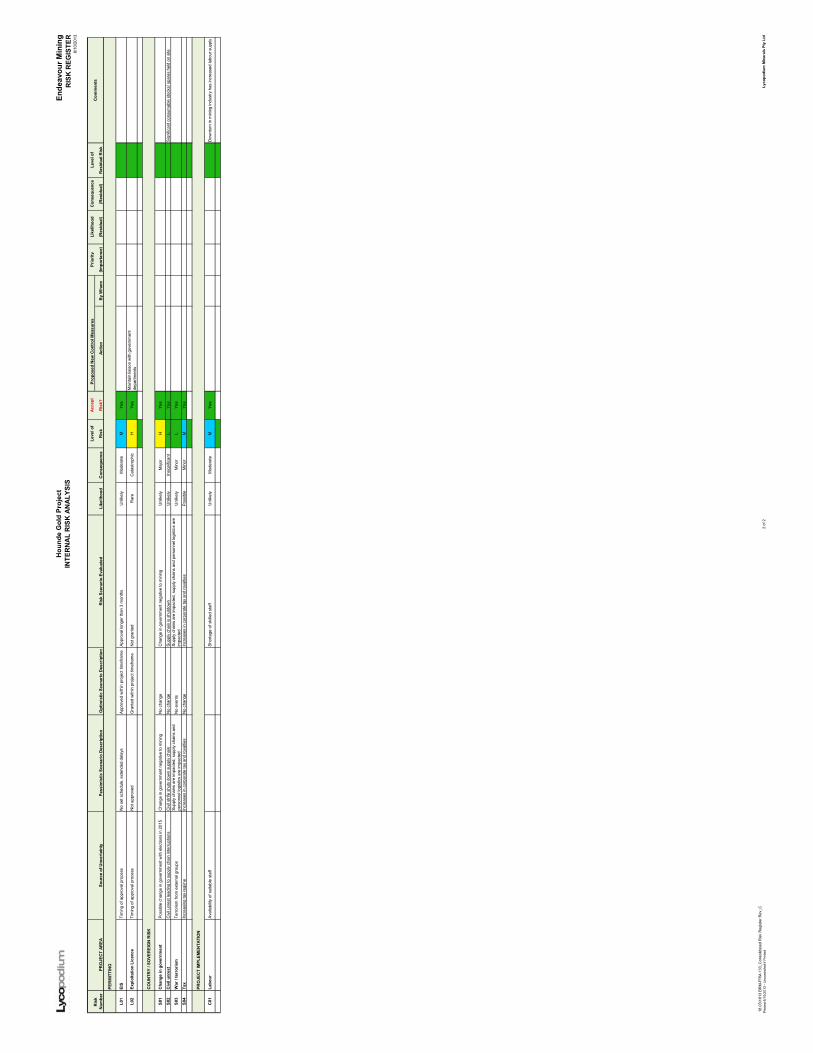
J
o
b
N
o
. 1
8
1
3
.2
0
Hou
nde
Gol
d Pr
ojec
tIN
TER
NA
L R
ISK
AN
ALY
SIS
Ende
avou
r Min
ing
RIS
K R
EGIS
TER
8/10
/201
3
18.
03\1
813
BR
M-F
RM
-133
_Con
solid
ated
Ris
k R
egis
ter R
ev_C
Prin
ted
8/10
/201
3 - U
ncon
trolle
d if
Prin
ted
2 of
2Ly
copo
dium
Min
eral
s Pt
y Lt
d
Leve
l of
Acce
pt
Pro
pose
d N
ew C
ontr
ol M
easu
res
Prio
rity
Like
lihoo
dC
onse
quen
ceLe
vel o
f
PRO
JEC
T AR
EASo
urce
of U
ncer
tain
tyR
isk
Ris
k?Ac
tion
By
Who
m(Im
port
ance
)(R
esid
ual)
(Res
idua
l)R
esid
ual R
isk
Com
men
tsR
isk
Num
ber
Pess
imis
tic S
cena
rio D
escr
iptio
nO
ptim
istic
Sce
nario
Des
crip
tion
Like
lihoo
dC
onse
quen
ceR
isk
Scen
ario
Eva
luat
ed
PER
MIT
TIN
G
L01
EIS
Tim
ing
of a
ppro
val p
roce
ss
No
set s
ched
ule,
ext
ende
d de
lays
App
rove
d w
ithin
pro
ject
tim
efra
me
App
rova
l lon
ger t
han
3 m
onth
sU
nlik
ely
Mod
erat
eM
Yes
L02
Expl
oita
tion
Lice
nce
Tim
ing
of a
ppro
val p
roce
ss
Not
app
rove
dG
rant
ed w
ithin
pro
ject
tim
efra
me
Not
gra
nted
Rar
eC
atas
troph
icH
Yes
Mai
ntai
n lia
ison
with
gov
ernm
ent
depa
rtmen
ts
CO
UN
TRY
/ SO
VER
EIG
N R
ISK
S01
Cha
nge
in g
over
nmen
tP
ossi
ble
chan
ge in
gov
ernm
ent w
ith e
lect
ions
in 2
015
Cha
nge
in g
over
nmen
t neg
ativ
e to
min
ing
No
chan
geC
hang
e in
gov
ernm
ent n
egat
ive to
min
ing
Unl
ikel
yM
ajor
HYe
s
S02
Civ
il un
rest
Civ
il un
rest
lead
ing
to s
uppl
y ch
ain
inte
rrupt
ions
Civ
il st
rife
shut
s do
wn
supp
ly c
hain
No
chan
geS
uppl
y ch
ain
is s
hutd
own
Unl
ikel
yIn
sign
ifica
ntL
Yes
Sig
nific
ant c
onsu
mab
le s
tock
s/ s
pare
s he
ld o
n si
te
S03
War
/ te
rror
ism
Terro
rism
from
ext
erna
l gro
ups
Sup
ply
chai
ns a
re im
pact
ed, s
uppl
y ch
ains
and
pe
rson
nel l
ogis
tics
are
impa
cted
No
even
tsS
uppl
y ch
ains
are
impa
cted
, sup
ply
chai
ns a
nd p
erso
nnel
logi
stic
s ar
e im
pact
edU
nlik
ely
Min
orL
Yes
S04
Tax
Incr
easi
ng ta
x re
gim
eIn
crea
ses
in c
orpo
rate
tax
and
roya
lties
No
chan
geIn
crea
ses
in c
orpo
rate
tax
and
roya
lties
Pos
sibl
eM
inor
MYe
s
PRO
JEC
T IM
PLEM
ENTA
TIO
N
C01
Labo
urA
vaila
bilit
y of
sui
tabl
e st
aff
Sho
rtage
of s
kille
d st
aff
Unl
ikel
yM
oder
ate
MYe
sD
ownt
urn
in m
inin
g in
dust
ry h
as in
crea
sed
labo
ur s
uppl
y


