Embed Size (px)
Citation preview
Bushmeat hunting, retaliatory killing, habitat
degradation and exotic species as threats to Fosa
(Cryptoprocta ferox) conservation
Samuel David Merson
Wadham College
University of Oxford
A thesis submitted for the degree of
Doctor of Philosophy
Trinity Term 2017
i
Acknowledgements
I am sincerely grateful to my funders, World Animal Protection, Megafaun, Duisburg
Zoo, The Kirk-Turner Fund, and the Pollard Fund at Wadham College. Their support
has made this research and this thesis a reality.
I’m very fortunate to have had two supportive supervisors in David and Luke.
I’ve grown as a scientist and conservationist under their tutelage, and I’m grateful to
have worked alongside them both.
Thank you to my examiners, Kathy Willis and Julia Jones. They gave their
invaluable time to my thesis, and provided useful feedback, and thought provoking
discussion to make this thesis a better product.
It would be extremely difficult to mention all of the many people that gave
guidance in the fulfillment of this thesis. Thank you to my colleagues at WildCRU, it
has been an absolutely inspirational place to work. Many thanks to Paul Johnson, and
Cedric Tan, I feel very fortunate to have had such helpful co-authors. I’m extremely
grateful to Herizo Andrianandrasana, Zoavina Randriana, and Tiana Harinhala in their
perseverance in translating English to Malagasy texts, including my very, very long
questionnaire.
Misaotra betsaka, I’ll be eternally grateful to the local Malagasy communities
that were accommodating, understanding and supportive of my research. Without
their most gracious hospitality, this research would not have been possible.
I’m immensely thankful to have met and worked with many wonderful people
in Madagascar. My time spent there impacted my life for the better. I’m very grateful
to Pierrot Rahajanirina, a jack-of-all-trades who was instrumental in helping me
implement my fieldwork in Madagascar. Many thanks to my many field assistants
with special mention to Fenohery, Naina, Solo, Noëlson, Fred, Domoina, Jean D,

ii
Sierra, and Neil. Additional thanks are owed to the various agencies that assisted with
fieldwork including MICET, Fanamby, Chances for Nature, and the Madagascar
National Parks offices.
I’m lucky to have made such great friends along this journey, in both Oxford
and London, and from all walks of life. You’ve certainly had to endure your fair share
of fosa stories, so to all of you, thank you, it’s been a pleasure, and fortunately it’s just
the beginning.
A part of this thesis is owed to David, my father. He has nurtured my
inquisitiveness and interest in science with a raft of popular science books since my
early years. Perhaps then, they were less appreciated gifts. Thank you for being
supportive and inspirational.
This thesis would not have been possible without the support of my mother,
Phillipa, whose emotional support and encouragement played the biggest role in my
journey to beginning and completing my DPhil. I owe you much of this thesis, thank
you.
And finally, as the saying goes, last but not least, my gratitude to my fiancé
Courtney. I’m sure you’re as glad as I am that this thesis is written. You’ve been
immensely supportive, and have patiently listened to my frustrations, fears, and the
constant, erratic array of thoughts going around in my head. I couldn’t imagine a
better partner in crime.
iii
Bushmeat hunting, retaliatory killing, habitat degradation and exotic
species as threats to Fosa (Cryptoprocta ferox) conservation
Abstract
Large carnivores are in global decline, chiefly resultant of anthropogenic persecution,
habitat reduction and disturbance. Fosas represent Madagascar’s largest carnivore,
occupying much of the island’s forest. This thesis examines the threats of bushmeat
hunting, retaliatory killing, habitat alteration and exotic species using sociological and
remote-sensing methodologies.
Habitat degradation was not associated with reduced fosa occupancy,
indicating some resilience within large, contiguous forests. However, competition
with exotic species (cats, dogs) was associated with reduced fosa occupancy and
potential temporal shifts towards greater nocturnality.
Poor households were more likely to consume protected species. Conversely,
wealthier households consumed more fish and eel. This pattern is reflected in
Malagasy reported taste preference to consume domesticated animals and certain
legally hunted wild species. Protected areas were not associated with reduced
protected species consumption.
Fosas’ predation was a major cause of rural poultry mortality. Predation was
more likely to occur in deciduous forests, in the dry season, during the evening. Fosa
predation, and lower education was associated with negative Malagasy attitudes.
Wealthy households, and those that had experienced fosa predation were most likely
to retaliatory kill a fosa.
Strategies to safeguard fosas’ long-term persistence should seek to improve
domestic husbandry, build robust coops with the use of watchdogs, promote
education, and reduce exotic species abundance.
Contents
Acknowledgements i
Abstract iii
Chapter 1. Thesis Introduction 1
Madagascar the threatened “eighth continent” 2
The fosa Cryptprocta ferox 4
Deforestation and anthropogenic disturbance 5
Madagascar’s wild meat appetite 9
Human-carnivore attitudes and persecution 10
Thesis aim and overview 12
References 15
Chapter 2. Exotic carnivore presence drives endemic carnivore 27
behavioural change and decline in Madagascar’s deciduous forests
Abstract 28
Introduction 30
Methods 33
Results 39
Discussion 47
References 54
Appendices 63
Chapter 3. Activity patterns of sympatric living exotic and endemic 65
carnivores (the fosa) in Western Madagascar’s deciduous forests
Abstract 66
Introduction 68
Methods 71
Results 74
Discussion 82
References 87
Chapter 4. Poverty and low taste preference drives the consumption 94
of protected species in Madagascar
Abstract 95
Introduction 97
Methods 100
Results 112
Discussion 122
References 132
Appendices 142
Chapter 5. Retaliatory killing and human perceptions of Madagascar’s 164
largest carnivore and livestock predator, the fosa (Cryptoprocta ferox)
Abstract 165
Introduction 167
Methods 169
Results 176
Discussion 185
References 194
Appendices 200
Chapter 6. Thesis Discussion 209
Threatened fosa, threatened Madagascar 210
Research Limitations 217
Threat mitigation, what must be done? 219
The fosa as a conservation tool 223
References 229
Appendices. FAppendix A
Novel Photographic and morphometric records of the 243
Western Falanouc Eupleres major in Ankarafantsika
National Park, Madagascar

1
Chapter One
Thesis Introduction
2
Madagascar the threatened “eighth continent”
Madagascar’s endemic plant and vertebrate species represent approximately 3.2% and
2.8% of the world’s species respectively (Myers et al. 2000). These high levels of
endemism, coupled with its rapid decline in forested habitats (Green and Sussman
1990; Harper et al. 2007; Moat and Smith 2007; Allnutt et al. 2013; Zinner et al.
2013; Vieilledent et al. 2017), have led to Madagascar’s worldwide recognition as a
conservation priority (Brooks et al. 2006; Funk and Fa 2010; Mittermeier et al. 2011;
Zachos and Habel 2011).
With a population nearing 25 million, Madagascar is a nation facing severe
socio-economic problems. Its population, growing rapidly at 2.7% per annum, is not
only one of the highest in the world, but also one of the poorest, recently ranking in
the top ten poorest countries by GPD per capita (The World Bank 2016).
Consequently, poverty estimates currently define 70% of the population as poor, with
the majority of Madagascar’s population, approximately 65%, living rurally (United
Nations 2015).
Madagascar’s continued political instability has hindered the government’s
ability to support its population and conserve its biodiverse forests. Despite recent
democratic elections in 2013 and increased economic growth, the effects of the 2009
coup d’etat are still being felt across the island. Corruption is rampant, with
Madagascar recently ranked 145 out of 176 countries in 2016 in the Corruption
Perception index (Transparency International 2016). This ineffectual governance has
ultimately played a significant role in the failure of conservation efforts to slow the
deforestation of Madagascar’s forests (Casse et al. 2004; Schuurman and Lowry Ii
2009; Randriamalala and Liu 2010; Horning 2012; Gore et al. 2013; Waeber et al.
2016; Remy 2017).
3
Recent research has estimated deforestation to have reduced Madagascar’s
natural forest cover to 8.9 million hectares in 2014 (15% of its national territory), with
around half of its forest located less than 100 m from the forest edge (Vieilledent et al.
2017). Annual deforestation rates (up to 2010) have consistently recorded annual
losses of 1 – 2.5% yr- -1
varying by forest type and region (Harper et al. 2007; Allnutt
et al. 2013; Grinand et al. 2013; Zinner et al. 2013). This deforestation has resulted in
highly disturbed, fragmented forests in which anthropogenic disturbance occurs
island-wide.
Madagascar’s fauna are consequently becoming increasingly threatened in the
form of greater exposure to poaching for consumption or trade (Golden 2009; Jenkins
et al. 2011; Razafimanahaka et al. 2012; Randriamamonjy et al. 2015; Borgerson et
al. 2016), exotic species (Ratsirarson and Goodman 1998; Gerber et al. 2012b; Kull et
al. 2014; Farris et al. 2015; Farris et al. 2016) and for carnivores, greater potential for
fatal interactions with villagers and their livestock (Hawkins 1998; Jones et al. 2008;
Kotschwar Logan et al. 2014). Unfortunately, knowledge of species’ response to these
anthropogenic disturbances remains poor, with limited research reporting species’
reaction to be typically negative, but fluctuate according to taxonomic group,
ecoregion and the relative importance of the proximate cause (Irwin et al. 2010).
Given Madagascar’s wildlife populations are likely to become increasingly exposed
to anthropogenic disturbance, it is crucial that we understand the impact humans may
have upon Madagascar’s forests and its wildlife.
In assessing landscape scale anthropogenic disturbance in Madagascar, the use
of an island-wide, large ranging species presents an ideal proxy. This study examines
Madagascar’s largest carnivore the fosa (Cryptoprocta ferox) as a model species in
studying the effects of human habitat alteration, disturbance, exploitation and
4
persecution. Fosas present one of the few native species in Madagascar to be present
nearly island-wide and occupy the largest home-range of any terrestrial mammal.
Furthermore, fosas’ innate biological characteristics (large body size, large home-
range, low population density) and conflict prone behavior (predation of livestock)
make them particularly susceptible to extinction (Woodroffe 2000; Gittleman 2001;
Kruuk 2002; Cardillo et al. 2004; Ripple et al. 2014). Consequently, fosas were used
in examining the effects of Madagascar’s rapidly altered habitat, invasive species
presence, hunting, and retaliatory killing.
The fosa Cryptoprocta ferox
Cryptoprocta ferox, Madagascar’s largest predator has been labeled a keystone
species for its important role atop the food chain (Dollar 2006). Locally known as the
fosa1, it weighs on average 6 - 7 kg, reaching overall lengths of 1.4 m (Hawkins 1998;
Dollar 2006), with tail and body of approximately equal length, fosas have evolved to
be equally apt in the trees or ground. This arboreal ability even extends to their
unusual mating behavior in which females mate with several males in the branches of
a large tree over the course of a week (Hawkins 1998). Gestation typically lasts six to
seven weeks, with two to four offspring born per litter (Albignac 1973). Females raise
young, with juveniles typically independent by age one and sexually mature by the
age of three to four years old (Albignac 1975). Females are territorial, with males not
maintaining strict territories (Lührs 2012). Most uncommon for a solitary species,
male fosas have been observed to create sibling dyads whilst hunting for larger prey,
such as sifakas (Lührs and Dammhahn 2009; Luhrs et al. 2012). Given their size and
1 Previously and more commonly referred to as ‘fossa’ in English, ‘fosa’ will be used in this thesis in align with Duckworth et al.’s (2014) attempt to reduce the use of similar common names within the Euplerids.
5
arboreal capabilities, fosas predominately prey upon lemurs (Hawkins 1998; Dollar et
al. 2007) making them the world’s only mammalian primate predator specialist.
Despite this preference, fosas also maintain a diverse diet (Dollar et al. 2007),
exploiting a surprisingly wide range of prey items, largely dependent upon the
region’s local fauna.
When considering fosa’s body size and metabolic requirements, they have
been found to occupy disproportionally large home ranges (McNab 1963; Lindstedt et
al. 1986; Lührs 2012). Females tend to maintain strict home ranges of 20 km2, whilst
males maintained overlapping home ranges increasing from 40 km2 to 50 km
2 during
the mating season (November to December)(Lührs 2012). Despite being found
ubiquitously across Madagascar, previous research has revealed low population
densities on the east and west coasts ranging from 0.17 - 0.26 adults per km2
(Hawkins and Racey 2005; Gerber et al. 2010). To date, much of our current
knowledge has been derived from studies investigating fosas’ biological, behavioural
and sociobiological curiosities, however limited research has examined the threats to
the population’s long-term viability.
Deforestation and anthropogenic disturbance
Madagascar’s original forest cover and subsequent deforestation rates have been a
highly controversial topic. Disputes over historical forest cover and the distribution
and extent of different vegetation types is still in discussion today (Kull 2000; Klein
2002; Scales 2012; McConnell and Kull 2014). This has made estimations of forest
loss difficult (McConnell and Kull 2014) and has plagued dialogue over the drivers of
recent and historical deforestation (Scales 2014).
6
Discourse on deforestation in Madagascar has mostly focused upon the
widespread and mostly irreversible effects of swidden agriculture, locally known as
‘tavy’ (Gade 1996; Kull 2002, 2004; Styger et al. 2007; Klanderud et al. 2010). As a
result much of Madagascar’s forest loss has largely been blamed upon poverty-driven
swidden cultivation (Sussman et al. 1994; Scales 2011; Horning 2012; Zinner et al.
2013; Scales 2014). Despite this, historical reductions in Madagascar’s forest may not
only be attributed to household subsistence (Green and Sussman 1990), but also to
French colonial driven increases in commercial agricultural production of cash crops
for export (Randrianja and Ellis 2009; Scales 2014), and timber concessions (Jarosz
1993; Kull 2000). In recent decades too, the important role of cash cropping by the
wealthy, by transient migrants, and/or for international export has been associated
with deforestation across different regions in Madagascar (Casse et al. 2004; Scales
2012; McConnell and Kull 2014; Scales 2014).
Furthermore, the collapse of democratic governance in 2009 has seen an
increase in the rate of loss, and illegal export of forest products (WWF 2001;
Randriamalala and Liu 2010). The booming exploitation of precious woods
(rosewood and ebony among others) has been widely documented and has reached
unheralded and mostly irreversible levels. (Schuurman and Lowry Ii 2009;
Randriamalala and Liu 2010). When considering Madagascar’s socioeconomic
conditions coupled with its ineffective governance, the effects of continued forest
exploitation and human encroachment are only likely to worsen. Questions must be
asked as to what effect this encroachment has on animal populations, and specifically
large-ranging, human-sensitive carnivores like fosas.
With large expanses of Madagascar’s forests now fragmented (Harper et al.
2007; Vieilledent et al. 2017), and few unperturbed areas remaining, edge effects are
7
a pervasive problem (Lehtinen et al. 2003; Watson et al. 2004; Lehman et al. 2006).
Exacerbating this issue is Madagascar’s mostly rural population, which is frequently
located within and around forested regions. This demographic heavily depends upon
the forest for its products, including its supplement of food, medical remedies,
construction materials, and agriculture.
Unfortunately, our knowledge of the effects of human disturbances upon
animal populations in Madagascar is limited (Irwin et al. 2010). Irwin et al.’s (2010)
review of species change to disturbed forests found several broad themes. Firstly,
overall species response to anthropogenic disturbance tended to be negative, with
different taxonomic groups reacting differently to different proximate factors.
Furthermore, species’ reactions varied across Madagascar’s distinct forest types, with
highly variable reactions amongst species of lower taxonomic groupings. This review
highlights the need for investigation into the effects of human habitat disturbance
upon Madagascar’s wildlife. Given fosas’ island-wide distribution and extinction
prone characteristics, they present an ideal model species to examine the effects of
island-wide anthropogenic disturbance.
Research has begun to illuminate the effects of anthropogenic habitat
disturbance upon Madagascar’s understudied carnivores and fosas. Given most of
Madagascar’s carnivores are elusive and difficult to observe, camera-traps provide an
ideal tool for monitoring populations and evaluating patterns of change (O'Connell et
al. 2010). Such methods were first used in Ranomafana National Park to examine the
impact of logging, and fragmentation on species composition, density and occupancy
of several native carnivores and fosas (Gerber et al. 2012b). Findings revealed fewer
native species in fragmented than continuous rainforests. Interestingly, fosas were
slightly more resilient and were recorded in similar densities in fragments nearer to
8
the forest (< 2.5km), and in primary and selectively-logged forests, whilst absent from
fragments > 15km from contiguous forest. Following Gerber’s initial investigation,
camera-traps were employed in Madagascar’s largest protected park, the northeastern
Masoala-Makira complex. Farris et al.’s (2015) study observed clear decreases in
native and increases in exotic carnivore occupancy as degradation increased. Feral
cats and domestic dogs were also demonstrated to maintain higher rates of occupancy
than half of all native species. Expanding upon their initial results, these studies also
examined the effect of human and invasive species’ presence on carnivore behaviour.
Dollar (1999) and Gerber et al. (2012a) noted fosas’ to exhibit more crepuscular
activity patterns, but overall to display cathemeral patterns in activity. Most notably
though, fosas were found to be absent throughout the diel cycle at sites where dogs
were most abundant. Likewise, Farris et al.’s (2014) observed similar results with a
high overlap between invasive and exotic carnivores, with fosas avoiding humans and
dogs across all seasons. Currently only a preliminary study has examined fosas’
activity in its deciduous habitat, recording the use of cathemeral activity from
radiotelemetry (Rahajanirina 2003). Despite this initial expansion of knowledge little
systematic research has been published from Madagascar’s western forests compared
to its humid counterpart (Waeber et al. 2015).
Madagascar’s western forests represent a distinct biome, inhabited by
communities living under different cultural and socio-economic conditions. These
deciduous forests also represents one of Madagascar’s most threatened forest types,
with estimated reductions in total forest cover of 97% (Smith 1997; WWF 2001).
Considering that Irwin et al.’s (2010) review found variances in species responses to
human habitat alteration across Madagascar’s distinct forest types, the need for
greater geographical scrutiny is vital. Given western Madagascar’s highly threatened
9
habitat is rapidly declining, future research is urgently required into the effects of
habitat alteration on its species’ occupancy and behavior, most notably, fosas.
Madagascar’s wild meat appetite
Whilst the eating of wild animals is nothing new (Barnosky et al. 2004), a burgeoning
global population, and greater human encroachment into previously undisturbed
forests presents bushmeat consumption as one of the biggest threats to tropical
vertebrates (Bennett and Robinson 2000; Brashares et al. 2004; Nasi et al. 2008;
Ripple et al. 2016). Consequently, bushmeat consumption has received considerable
academic attention worldwide, and in conservation ‘hotspots’ such as equatorial
Africa (Wilkie and Carpenter 1999; Walsh et al. 2003; East et al. 2005; Brashares et
al. 2011).
Despite bushmeat’s acknowledged threat, its exploration in Madagascar, a
conservation priority, has only recently begun gaining momentum. In what was one of
the first studies of the hunting of protected species in Madagascar, alarming rates of
consumption species’ remains were found in a transient raffia harvester’s camp
(García and Goodman 2003). Most notable was the hunting of large mammals, with a
minimum of 32 lemurs and 2 fosas consumed. An ensuing landmark study examined
hunting practices in villages nearby the Makira forest in NE Madagascar (Golden
2009). The hunting of 23 mammal species for consumption was found, with 57% of
villages having consumed fosas. Furthermore, the modelling of the villages’ hunting
rates whilst accounting for species’ life-history characteristics found hunting practices
to be unsustainable. Since this initial research, a number of studies have revealed the
illegal consumption of protected species across Madagascar (Jenkins and Racey 2008;
Jenkins et al. 2009; Randrianandrianina et al. 2010; Jenkins et al. 2011;
10
Razafimanahaka et al. 2012; Gardner and Davies 2014; Borgerson et al. 2016; Reuter
et al. 2016a; Reuter et al. 2016b).
Despite an increase in the academic examination of bushmeat consumption in
Madagascar, few studies have scrutinised its drivers, or its occurrence at a multi-site
scale. Several studies have revealed associations between poverty, poor health and the
consumption of bushmeat (Jenkins et al. 2011; Golden et al. 2014; Borgerson et al.
2016; Reuter et al. 2016b). Whilst one multi-site study revealed variations in the
consumption rates of protected species across eastern and western forests, with
consumption of protected species lower in areas where environmental education or
enforcement was greater (Razafimanahaka et al. 2012). In light of these significant
explorations, no studies have explored the different drivers of the consumption of
protected versus unprotected species across forests of varying protection and of
different forest types (rainforest versus dry deciduous). When considering
Madagascar’s immense poverty, booming population and frail political environment,
understanding the cultural, socioeconomic and geographical cues of bushmeat
consumption are critical in informing effective conservation. Equally important is the
evaluation of Madagascar’s governmental institutions in curbing hunting practices
within protected areas.
Human-carnivore attitudes and persecution
Large carnivore populations are in global decline, largely in the face of widespread
persecution (Woodroffe 2000; Ripple et al. 2014). Their biological characteristics
lend themselves to ‘conflict’ with pastoralists (Kissui 2008), with retaliatory killing
due to livestock predation a predictable narrative worldwide. Most academic attention
has focused upon large carnivore predation of livestock, epitomised by lion’s
11
predation of cattle in Africa (Woodroffe and Frank 2005; Lichtenfeld et al. 2015).
Despite the potential for this kind of persecution of carnivores in Madagascar, it has
been academically neglected.
Anecdotal reports have cited fosas as a culpable victim of collective group
hunting due to their predation of domestic fowl. Given fosas’ large home range
requirements (Hawkins and Racey 2005; Lührs 2012), in amalgamation with human
settlements’ continued encroachment on forests, poultry predation by fosas is likely,
and known. Furthermore, rural subsistence farmers, Madagascar’s poorest
demographic, are likely to be most intolerant to harmful impacts upon their
livelihoods (poultry theft) with retaliatory killing of fosas a likely repercussion.
Human attitudes towards fosas are equally important variables to be
considered when exploring their persecution. In Madagascar, taboos, known as fady
maintain influence over social norms and attitudes (Van Gennep 1904; Ruud 1960;
Lambek 1992; Jones et al. 2008; Sodikoff 2012), and are important in considering
their impact upon Malagasy interaction with fosa. Accounts of fady in south east
Madagascar have been recited, depicting fosas as a threat to lone children in the
forest, a livestock predator of piglets, fowl, and to be hated and feared (Ruud 1960).
Furthermore fosa are believed to scavenge on the bodies of dead ancestors, and fady
prohibiting their consumption has been reported across different regions of the island
(Ruud 1960; Jones et al. 2008). Other studies too, have observed fady restricting fosas
consumption (Jenkins et al. 2011; Golden and Comaroff 2015). In considering these
stories, understanding people’s attitudes towards fosas is important given its potential
influence on people’s propensity to persecute fosa.
In consideration of Golden’s (2009) estimation of unsustainable rates of fosa
mortality, few annual retaliatory killing events are necessary to have serious
12
implications for a sub-population’s long-term survival. In examining persecution of
carnivores in Madagascar, focus upon Madagascar’s largest, most conflict-prone
native carnivore is a vital first step in uncovering the impacts of persecution in its
most widespread form. Furthermore, enumerating fosas killed, and improving our
understanding of the drivers of this threat, is critical in providing a holistic
representation of the potential threats facing fosas, and many of Madagascar’s
wildlife as a whole.
Thesis Aim and Overview
This thesis seeks to examine the greatest threats to Madagascar’s wildlife,
deforestation and habitat alteration, while additionally investigating wildlife
persecution in the forms of bushmeat consumption and retaliatory killing. Fosa have
been used as a model species to examine these factors in greater detail, and to
investigate their effect upon one of Madagascar’s most important, widespread and
potentially extinction prone species. These topics will be investigated through four
interrelated chapters that will ultimately inform our understanding of Madagascar’s
threatened wildlife, with specific focus upon fosas and the measurement of their
conservation status.
Chapter One has discussed Madagascar, and its importance as a conservation
priority, whilst considering Madagascar’s enigmatic and flagship apex predator,
Cryptoprocta ferox. A summary of the most significant threats facing 21st century
Madagascar was discussed, placing into context their effect on wildlife, and most
notably, fosas.
13
Chapter Two discusses the impacts of anthropogenic habitat alteration upon fosa
occupancy. It centres upon a camera-trapping study of two sites of varying
anthropogenic disturbance in western Madagascar, Ankarafantsika National Park
(ANP) and Andranomena Special Reserve (ASR). Variances in habitat type, as well
as human and invasive species presence will be considered as variables impacting
fosa site occupancy.
Chapter Three examines the effect of human and invasive species presence upon
fosas’ temporal activity patterns. Data from chapter two will be used to examine any
alteration in fosa behaviour and its potentially damaging effects.
Chapter Four considers the implications of bushmeat hunting in Madagascar and its
effect upon fosas. Using household surveys of villages across six forests, it will
investigate the species affected and the socioeconomic, cultural and geographical
variables that drive its occurrence. Additionally, surveying of six forests of
contrasting protected status will allow the consideration of the effectiveness of the
Madagascar National Parks (MNP) in their management of illegal activities.
Chapter Five investigates the occurrence of fosa retaliatory killing due to poultry
depredation. Seasonal, temporal and poultry ownership practices will be discussed in
their potential influence upon poultry depredation. The additional role of
socioeconomic, cultural and geographic variables will be discussed as potential
drivers of poultry predation, retaliatory killing and Malagasy attitudes.
14
Chapter Six will consider the thesis’ combined results, and their implication for the
fosas’ long-term persistence. Future conservation strategies are proposed and
discussed, based on the data collected during the course of this DPhil.
15
References
Albignac, R., 1973. Mammife`res Carnivores. Faune de Madagascar 36. Paris
O.R.S.T.O.M, Paris.
Albignac, R., 1975. Breeding the fossa at Montpellier Zoo. International Zoo
Yearbook 15, 147-150.
Allnutt, T.F., Asner, G.P., Golden, C.D., Powell, G.V.N., 2013. Mapping recent
deforestation and forest disturbance in northeastern Madagascar. Tropical
Conservation Science 6, 1-15.
Barnosky, A.D., Koch, P.L., Feranec, R.S., Wing, S.L., Shabel, A.B., 2004. Assessing
the causes of Late Pleistocene extinctions on the continents. Science 306, 70-75.
Bennett, E.L., Robinson, J.G., 2000. Hunting of wildlife in tropical forests:
implications for biodiversity and forest peoples.
Borgerson, C., McKean, M.A., Sutherland, M.R., Godfrey, L.R., 2016. Who hunts
lemurs and why they hunt them. Biological Conservation 197, 124-130.
Brashares, J.S., Arcese, P., Sam, M.K., Coppolillo, P.B., Sinclair, A.R.E., Balmford,
A., 2004. Bushmeat hunting, wildlife declines, and fish supply in West Africa.
Science 306, 1180-1183.
Brashares, J.S., Golden, C.D., Weinbaum, K.Z., Barrett, C.B., Okello, G.V., 2011.
Economic and geographic drivers of wildlife consumption in rural Africa.
Proceedings of the National Academy of Sciences 108, 13931-13936.
Brooks, T.M., Mittermeier, R.A., da Fonseca, G.A., Gerlach, J., Hoffmann, M.,
Lamoreux, J.F., Mittermeier, C.G., Pilgrim, J.D., Rodrigues, A.S., 2006. Global
biodiversity conservation priorities. Science 313, 58-61.
16
Cardillo, M., Purvis, A., Sechrest, W., Gittleman, J.L., Bielby, J., Mace, G.M., 2004.
Human population density and extinction risk in the world's carnivores. PLoS
Biol 2, e197.
Casse, T., Milhøj, A., Ranaivoson, S., Randriamanarivo, J.R., 2004. Causes of
deforestation in southwestern Madagascar: what do we know? Forest Policy and
Economics 6, 33-48.
Dollar, L., 1999. Preliminary report on the status, activity cycle, and ranging of
Cryptoprocta ferox in the Malagasy rainforest, with implications for
conservation. Small Carnivore Conservation 20, 7-10.
Dollar, L., Ganzhorn, J., Goodman, S., 2007. Primates and Other Prey in the
Seasonally Variable Diet of Cryptoprocta ferox in the Dry Deciduous Forest of
Western Madagascar, In Primate Anti-Predator Strategies. eds S. Gursky, K.A.I.
Nekaris, pp. 63-76. Springer US.
Dollar, L.J., 2006. Morphometrics, diet, and conservation of Cryptoprocta ferox.
Duke University.
East, T., Kümpel, N.F., Milner-Gulland, E.J., Rowcliffe, J.M., 2005. Determinants of
urban bushmeat consumption in Rio Muni, Equatorial Guinea. Biological
Conservation 126, 206-215.
Farris, Z.J., Golden, C.D., Karpanty, S., Murphy, A., Stauffer, D., Ratelolahy, F.,
Andrianjakarivelo, V., Holmes, C.M., Kelly, M.J., 2015. Hunting, exotic
carnivores, and habitat loss: anthropogenic effects on a native carnivore
community, Madagascar. PLoS One 10, e0136456.
Farris, Z.J., Karpanty, S.M., Ratelolahy, F., Kelly, M.J., 2014. Predator–Primate
Distribution, Activity, and Co-occurrence in Relation to Habitat and Human
17
Activity Across Fragmented and Contiguous Forests in Northeastern
Madagascar. International Journal of Primatology.
Farris, Z.J., Kelly, M.J., Karpanty, S., Murphy, A., Ratelolahy, F., Andrianjakarivelo,
V., Holmes, C., 2016. The times they are a changin': Multi-year surveys reveal
exotics replace native carnivores at a Madagascar rainforest site. Biological
Conservation.
Funk, S.M., Fa, J.E., 2010. Ecoregion prioritization suggests an armoury not a silver
bullet for conservation planning. PLoS One 5, e8923.
Gade, D.W., 1996. Deforestation and Its Effects in Highland Madagascar. Mountain
Research and Development 16, 101-116.
García, G., Goodman, S.M., 2003. Hunting of protected animals in the Parc National
d'Ankarafantsika, north-western Madagascar. Oryx 37, 115-118.
Gardner, C.J., Davies, Z.G., 2014. Rural Bushmeat Consumption Within Multiple-use
Protected Areas: Qualitative Evidence from Southwest Madagascar. Human
Ecology 42, 21-34.
Gerber, B., Karpanty, S.M., Crawford, C., Kotschwar, M., Randrianantenaina, J.,
2010. An assessment of carnivore relative abundance and density in the eastern
rainforests of Madagascar using remotely-triggered camera traps. Oryx 44, 219.
Gerber, B.D., Karpanty, S.M., Randrianantenaina, J., 2012a. Activity patterns of
carnivores in the rain forests of Madagascar: implications for species
coexistence. Journal of Mammalogy 93, 667-676.
Gerber, B.D., Karpanty, S.M., Randrianantenaina, J., 2012b. The impact of forest
logging and fragmentation on carnivore species composition, density and
occupancy in Madagascar's rainforests. Oryx 46, 414-422.
Gittleman, J.L., 2001. Carnivore conservation. Cambridge University Press.
18
Golden, C.D., 2009. Bushmeat hunting and use in the Makira Forest, north-eastern
Madagascar: a conservation and livelihoods issue. Oryx 43, 386.
Golden, C.D., Bonds, M.H., Brashares, J.S., Rodolph Rasolofoniaina, B., Kremen, C.,
2014. Economic valuation of subsistence harvest of wildlife in Madagascar.
Conservation Biology 28, 234-243.
Golden, C.D., Comaroff, J., 2015. Effects of social change on wildlife consumption
taboos in northeastern Madagascar. Ecology and Society 20, 41.
Gore, M.L., Ratsimbazafy, J., Lute, M.L., 2013. Rethinking corruption in
conservation crime: insights from Madagascar. Conservation Letters 6, 430-
438.
Green, G.M., Sussman, R.W., 1990. Deforestation history of the eastern rain forests
of Madagascar from satellite images. Science 248, 212-215.
Grinand, C., Rakotomalala, F., Gond, V., Vaudry, R., Bernoux, M., Vieilledent, G.,
2013. Estimating deforestation in tropical humid and dry forests in Madagascar
from 2000 to 2010 using multi-date Landsat satellite images and the random
forests classifier. Remote Sensing of Environment 139, 68-80.
Harper, G.J., Steininger, M.K., Tucker, C.J., Juhn, D., Hawkins, F., 2007. Fifty years
of deforestation and forest fragmentation in Madagascar. Environmental
Conservation 34.
Hawkins, C.E., 1998. Behaviour and ecology of the fossa, Cryptoprocta ferox
(Carnivora: Viverridae) in a dry deciduous forest, western Madagascar.
University of Aberdeen.
Hawkins, C.E., Racey, P.A., 2005. Low population density of a tropical forest
carnivore, Cryptoprocta ferox: implications for protected area management.
Oryx 39.
19
Horning, N.R., 2012. Debunking three myths about Madagascar’s deforestation.
Madagascar Conservation & Development 7, 116-119.
Irwin, M.T., Wright, P.C., Birkinshaw, C., Fisher, B.L., Gardner, C.J., Glos, J.,
Goodman, S.M., Loiselle, P., Rabeson, P., Raharison, J.-L., 2010. Patterns of
species change in anthropogenically disturbed forests of Madagascar. Biological
Conservation 143, 2351-2362.
Jarosz, L., 1993. Defining and explaining tropical deforestation: shifting cultivation
and population growth in colonial Madagascar (1896-1940). Economic
Geography, 366-379.
Jenkins, R.K., Keane, A., Rakotoarivelo, A.R., Rakotomboavonjy, V.,
Randrianandrianina, F.H., Razafimanahaka, H.J., Ralaiarimalala, S.R., Jones,
J.P., 2011. Analysis of patterns of bushmeat consumption reveals extensive
exploitation of protected species in eastern Madagascar. PLoS One 6, e27570.
Jenkins, R.K., Rabearivelo, A., Chan, C.T., Andre, W.M., Randrianavelona, R.,
Randrianantoandro, J.C., 2009. The harvest of endemic amphibians for food in
eastern Madagascar. Tropical Conservation Science 2, 25-33.
Jenkins, R.K., Racey, P.A., 2008. Bats as bushmeat in Madagascar. Madagascar
Conservation & Development 3.
Jones, J.P.G., Andriamarovololona, M.M., Hockley, N., 2008. The Importance of
Taboos and Social Norms to Conservation in Madagascar. Conservation
Biology 22, 976-986.
Kissui, B.M., 2008. Livestock predation by lions, leopards, spotted hyenas, and their
vulnerability to retaliatory killing in the Maasai steppe, Tanzania. Animal
Conservation 11, 422-432.
20
Klanderud, K., Mbolatiana, H.Z.H., Vololomboahangy, M.N., Radimbison, M.A.,
Roger, E., Totland, Ø., Rajeriarison, C., 2010. Recovery of plant species
richness and composition after slash-and-burn agriculture in a tropical rainforest
in Madagascar. Biodiversity and Conservation 19, 187-204.
Klein, J., 2002. Deforestation in the Madagascar highlands–establishedtruth'and
scientific uncertainty. GeoJournal 56, 191-199.
Kotschwar Logan, M., Gerber, B.D., Karpanty, S.M., Justin, S., Rabenahy, F.N.,
2014. Assessing carnivore distribution from local knowledge across a human-
dominated landscape in central-southeastern Madagascar. Animal Conservation.
Kruuk, H., 2002. Hunter and hunted: relationships between carnivores and people.
Cambridge University Press.
Kull, C.A., 2000. Deforestation, erosion, and fire: degradation myths in the
environmental history of Madagascar. Environment and History 6, 423-450.
Kull, C.A., 2002. Madagascar aflame: landscape burning as peasant protest,
resistance, or a resource management tool? Political Geography 21, 927-953.
Kull, C.A., 2004. Isle of fire: the political ecology of landscape burning in
Madagascar. University of Chicago Press.
Kull, C.A., Tassin, J., Carrière, S.M., 2014. Approaching invasive species in
Madagascar. Madagascar Conservation & Development 9, 60-70.
Lambek, M., 1992. Taboo as cultural practice among Malagasy speakers. Man, 245-
266.
Lehman, S.M., Rajaonson, A., Day, S., 2006. Edge effects and their influence on
lemur density and distribution in southeast Madagascar. American Journal of
Physical Anthropology 129, 232-241.
21
Lehtinen, R.M., Ramanamanjato, J.-B., Raveloarison, J.G., 2003. Edge effects and
extinction proneness in a herpetofauna from Madagascar. Biodiversity &
Conservation 12, 1357-1370.
Lichtenfeld, L.L., Trout, C., Kisimir, E.L., 2015. Evidence-based conservation:
predator-proof bomas protect livestock and lions. Biodiversity and Conservation
24, 483-491.
Lindstedt, S.L., Miller, B.J., Buskirk, S.W., 1986. Home range, time, and body size in
mammals. Ecology 67, 413-418.
Lührs, M.-L., Dammhahn, M., 2009. An unusual case of cooperative hunting in a
solitary carnivore. Journal of Ethology 28, 379-383.
Lührs, M.L., 2012. Social organisation and mating system of the fosa (Crptoprocta
ferox). University of Gottingen, Gottingen.
Luhrs, M.L., Dammhahn, M., Kappeler, P., 2012. Strength in numbers: males in a
carnivore grow bigger when they associate and hunt cooperatively. Behavioral
Ecology 24, 21-28.
McConnell, W.J., Kull, C.A., 2014. Deforestation in Madagascar: Debates over the
island’s forest cover and challenges of measuring forest change. Conservation
and Environmental Management in Madagascar. IR Scales (ed.), 67-104.
McNab, B.K., 1963. Bioenergetics and the determination of home range size.
American naturalist, 133-140.
Mittermeier, R.A., Turner, W.R., Larsen, F.W., Brooks, T.M., Gascon, C., 2011.
Global biodiversity conservation: the critical role of hotspots, In Biodiversity
hotspots. pp. 3-22. Springer.
Moat, J., Smith, P.P., 2007. Atlas of the vegetation of Madagascar=. Royal Botanic
Gardens, Kew.
22
Myers, N., Mittermeier, R.A., Mittermeier, C.G., Da Fonseca, G.A., Kent, J., 2000.
Biodiversity hotspots for conservation priorities. Nature 403, 853-858.
Nasi, R., Brown, D., Wilkie, D., Bennett, E., Tutin, C., Van Tol, G., Christophersen,
T., 2008. Conservation and use of wildlife-based resources: the bushmeat crisis.
Secretariat of the Convention on Biological Diversity, Montreal. and Center for
International Forestry Research (CIFOR), Bogor. Technical Series 50.
O'Connell, A.F., Nichols, J.D., Karanth, K.U., 2010. Camera traps in animal ecology:
methods and analyses. Springer.
Rahajanirina, L.P., 2003. Contribution to the biological, ecological and ethological
study of Cryptoprocta ferox (Bennett, 1833) in the forest region of Tsimaloto,
Ankarafantsika National Park, Madagascar, In Department of Animal Biology.
University of Antananarivo.
Randriamalala, H., Liu, Z., 2010. Rosewood of Madagascar: Between democracy and
conservation. Madagascar Conservation & Development 5, 11-22.
Randriamamonjy, V.C., Keane, A., Razafimanahaka, H.J., Jenkins, R.K.B., Jones,
J.P.G., 2015. Consumption of bushmeat around a major mine, and matched
communities, in Madagascar. Biological Conservation 186, 35-43.
Randrianandrianina, F.H., Racey, P.A., Jenkins, R.K.B., 2010. Hunting and
consumption of mammals and birds by people in urban areas of western
Madagascar. Oryx 44, 411-415.
Randrianja, S., Ellis, S., 2009. Madagascar: a short history.
Ratsirarson, J., Goodman, S., 1998. Inventaire biologique de la forêt littorale de
Tampolo (Fenoarivo Atsinanana). Recherches pour le Développement. Série
Sciences Biologiques 14, 107-131.
23
Razafimanahaka, J.H., Jenkins, R.K.B., Andriafidison, D., Randrianandrianina, F.,
Rakotomboavonjy, V., Keane, A., Jones, J.P.G., 2012. Novel approach for
quantifying illegal bushmeat consumption reveals high consumption of
protected species in Madagascar. Oryx 46, 584-592.
Remy, O., 2017. 11. Rosewood democracy. Corruption, Natural Resources and
Development: From Resource Curse to Political Ecology, 142.
Reuter, K.E., Randell, H., Wills, A.R., Janvier, T.E., Belalahy, T.R., Sewall, B.J.,
2016a. Capture, Movement, Trade, and Consumption of Mammals in
Madagascar. PLoS One 11, e0150305.
Reuter, K.E., Randell, H., Wills, A.R., Sewall, B.J., 2016b. The consumption of wild
meat in Madagascar: drivers, popularity and food security. Environmental
Conservation, 1-11.
Ripple, W.J., Abernethy, K., Betts, M.G., Chapron, G., Dirzo, R., Galetti, M., Levi,
T., Lindsey, P.A., Macdonald, D.W., Machovina, B., 2016. Bushmeat hunting
and extinction risk to the world's mammals. Royal Society Open Science 3,
160498.
Ripple, W.J., Estes, J.A., Beschta, R.L., Wilmers, C.C., Ritchie, E.G., Hebblewhite,
M., Berger, J., Elmhagen, B., Letnic, M., Nelson, M.P., 2014. Status and
ecological effects of the world’s largest carnivores. Science 343, 1241484.
Ruud, J., 1960. Taboo: A study of Malagasy customs and beliefs. Oslo University
Press.
Scales, I.R., 2011. Farming at the Forest Frontier: Land Use and Landscape Change in
Western Madagascar, 1896—2005. Environment and History, 499-524.
Scales, I.R., 2012. Lost in translation: conflicting views of deforestation, land use and
identity in western Madagascar. The Geographical Journal 178, 67-79.
24
Scales, I.R., 2014. The drivers of deforestation and the complexity of land use in
Madagascar. Conservation and Environmental Management in Madagascar. IR
Scales (ed.), 105-125.
Schuurman, D., Lowry Ii, P.P., 2009. The Madagascar rosewood massacre.
Madagascar Conservation & Development 4.
Smith, A.P., 1997. Deforestation, fragmentation, and reserve design in western
Madagascar. Tropical forest remnants: ecology, management, and conservation
of fragmented communities. University of Chicago Press, Chicago, 415-441.
Sodikoff, G.M., 2012. Totem and taboo reconsidered: endangered species and moral
practice in Madagascar. The anthropology of extinction: essays on culture and
species death. Indiana University Press, Bloomington, Indiana, USA, 67-88.
Styger, E., Rakotondramasy, H.M., Pfeffer, M.J., Fernandes, E.C.M., Bates, D.M.,
2007. Influence of slash-and-burn farming practices on fallow succession and
land degradation in the rainforest region of Madagascar. Agriculture,
Ecosystems & Environment 119, 257-269.
Sussman, R.W., Green, G.M., Sussman, L.K., 1994. Satellite imagery, human
ecology, anthropology, and deforestation in Madagascar. Human Ecology 22,
333-354.
The World Bank, 2016. Indicators.
Transparency International, 2016. Corruption Perceptions Index. Transparency
International.
United Nations, 2015. World Urbanization Prospects: The 2014 Revision, , ed. P.D.
Department of Economic and Social Affairs.
Van Gennep, A., 1904. Tabou et totémisme à Madagascar: étude descriptive et
théorique. E. Leroux.
25
Vieilledent, G., Grinand, C., Rakotomalala, F.A., Ranaivosoa, R., Rakotoarijaona, J.-
R., Allnutt, T.F., Achard, F., 2017. Combining global tree cover loss data with
historical national forest-cover maps to look at six decades of deforestation and
forest fragmentation in Madagascar. bioRxiv.
Waeber, P.O., Wilmé, L., Mercier, J.-R., Camara, C., Lowry II, P.P., 2016. How
Effective Have Thirty Years of Internationally Driven Conservation and
Development Efforts Been in Madagascar? PLoS One 11, e0161115.
Waeber, P.O., Wilmé, L., Ramamonjisoa, B., Garcia, C., Rakotomalala, D.,
Rabemananjara, Z.H., Kull, C.A., Ganzhorn, J.U., Sorg, J.P., 2015. Dry forests
in Madagascar: neglected and under pressure. International Forestry Review 17,
127-148.
Walsh, P.D., Abernethy, K.A., Bermejo, M., Beyers, R., De Wachter, P., Akou, M.E.,
Huijbregts, B., Mambounga, D.I., Toham, A.K., Kilbourn, A.M., 2003.
Catastrophic ape decline in western equatorial Africa. Nature 422, 611-614.
Watson, J.E.M., Whittaker, R.J., Dawson, T.P., 2004. Habitat structure and proximity
to forest edge affect the abundance and distribution of forest-dependent birds in
tropical coastal forests of southeastern Madagascar. Biological Conservation
120, 311-327.
Wilkie, D.S., Carpenter, J.F., 1999. Bushmeat hunting in the Congo Basin: an
assessment of impacts and options for mitigation. Biodiversity & Conservation
8, 927-955.
Woodroffe, R., 2000. Predators and people: using human densities to interpret
declines of large carnivores. Animal Conservation 3, 165-173.
Woodroffe, R., Frank, L.G., 2005. Lethal control of African lions (Panthera leo): local
and regional population impacts. Animal Conservation 8, 91-98.
26
WWF, 2001. Madagascar Dry Deciduous Forests.
Zachos, F.E., Habel, J.C., 2011. Biodiversity hotspots: distribution and protection of
conservation priority areas. Springer Science & Business Media.
Zinner, D., Wygoda, C., Razafimanantsoa, L., Rasoloarison, R., T. Andrianandrasana,
H., Ganzhorn, J.U., Torkler, F., 2013. Analysis of deforestation patterns in the
central Menabe, Madagascar, between 1973 and 2010. Regional Environmental
Change 14, 157-166.
27
Chapter Two
Exotic carnivore presence drives endemic
carnivore behavioural change and decline in
Madagascar’s deciduous forests
28
Abstract
Anthropogenic habitat alteration, and exotic species invasion is threatening carnivores
globally. Understanding its impact is critical for creating localised, effective endemic
carnivore conservation programs. Madagascar’s Eupleridae have been described as
the least studied and most threatened group of carnivores worldwide (Brooke et al.
2014). To better understand anthropogenic disturbance’s impact, we provide the first
multi-region study of one of Madagascar’s most imperilled habitat, its deciduous
forests. Deforestation, fragmentation, human and exotic species presence were
considered as factors affecting the modelled occupancy of Madagascar’s largest
carnivore, the fosa (Cryptoprocta ferox). Two westerly deciduous forests,
Ankarafantsika National Park and Andranomena Special Reserve were remotely
surveyed using camera-trap grids. Our results revealed no clear patterns between
habitat degradation and fosa occupancy. A strong negative association was exhibited
between cats and fosas. Dogs were associated with fosa occupancy, however the
correlation was at best weak. Cat occupancy was negatively associated with birds, and
positively associated with contiguous forest and narrow trails. Conversely, dog
occupancy was best predicted by degraded forest, wider trails and exotic civet
presence. Our results suggest fosas are capable of navigating degraded landscape and
in the short-term, are resilient to disturbance inside contiguous forests. However, high
cat and dog occupancy represent a significant source of resource competition through
prey exploitation and interference. The spread of disease between exotic species,
fosas and their prey may be a considerable risk to their long-term health. Exotic
carnivore management strategies should be considered to reduce the widespread
predation of endemic species, and the transmission of disease.

29
Keywords: Madagascar, Eupleridae, deforestation, fragmentation, exotic, feral cat,
Menabe, Ankarafantsika.
This chapter forms the basis of a paper prepared for Oryx of which I am the lead
author and my co-authors are Luke J Dollar, Cedric Kai Wei Tan and David W
Macdonald.
30
Introduction
Fosas (Cryptoprocta ferox) are Madagascar’s largest endemic carnivores. They are
likely a keystone species (Dollar 2006) and play a critical role in ecosystems across
Madagascar as an apex predator of lemurs, small mammals, reptiles and birds (Dollar
et al. 2007; Hawkins and Racey 2008). Weighing on average 6-7 kg (Hawkins 1998;
Dollar 2006), male fosas have been estimated to occupy large home-ranges of up to
50 km2 during the mating season, with females maintaining annual ranges of 20 km
2
(Lührs and Kappeler 2013). Despite their wide-ranging behaviour, fosas are locally
rare, found at densities of 0.18 – 0.26 km-2
in a deciduous forest (Hawkins and Racey
2005) and 0.17 km-2
in an eastern rainforest (Gerber et al. 2010). Currently
categorized as Vulnerable on The IUCN Red List, fosas face threats from bushmeat
hunting (García and Goodman 2003; Golden 2009; Farris et al. 2015b), retaliatory
killing due to poultry predation (Hawkins 2016; Reuter et al. 2016), exotic species
(Gerber et al. 2012c; Farris et al. 2015c) and island-wide reduction and degradation of
habitat (Gerber et al. 2012b; Farris et al. 2015b). Although fosas’ geographic range
extends across much of the forested landscape, fragmentation means many forests are
likely incapable of supporting long-term populations (Hawkins and Racey 2005).
Deforestation has significantly reduced Madagascar’s overall forest cover,
with much of its remaining forest severely degraded (Harper et al. 2007; Allnutt et al.
2013; Vieilledent et al. 2017). This issue is exacerbated by Madagascar’s rapidly
growing population at 2.8% p.a., one of the fastest growing and poorest nations on
earth (The World Bank 2016). Despite this trend, the effects of anthropogenic
disturbance on Madagascar’s endemic species has been the subject of little research
(Irwin et al. 2010). In addressing these empirical deficits, fosas are of particular
interest as focal species for investigating the impacts of human forest disturbance.
31
Their innate biological characteristics (large body size and home-range, low
population density) make them particularly susceptible to extinction in the face of
human expansion (Ripple et al. 2014).
Published research documenting fosas’ persistence in human disturbed
landscapes is limited to studies in Madagascar’s eastern rainforests. Gerber et al.
(2012b) conducted photographic sampling in author-classified primary, selectively-
logged, and fragmented forests of varying distances to intact forest to examine its
effect on carnivore composition in Ranomafana National Park (RNP). The study
revealed lower endemic carnivore abundance in selectively logged and fragmented
forests, with high levels of exotic species in fragmented habitats. Fosas were absent
from fragments > 15 km from intact forest. Similarly in Masoala-Makira of
northeastern Madagascar comparable results have been found with lower native
carnivore and higher exotic carnivore occupancy in more degraded forests (Farris et
al. 2014; Farris et al. 2015b). A strong inverse relationship was observed between
proximity to village and fosa occupancy (Farris et al. 2014). Despite advances in
knowledge of anthropogenic disturbances’ effect on rainforest-dwelling fosas, no
similar research has yet been published from Madagascar’s deciduous forests.
Madagascar’s western deciduous forests represent one of its most abundant
forest types (Dufils 2003) and globally threatened ecoregions (Janzen 1988; Waeber
et al. 2015). Occupying most of the island’s west, deciduous forests encompass an
array of vegetation types, hosting important biodiversity and many narrow-ranged
endemic taxa (Waeber et al. 2015). Deforestation has been particularly devastating,
reducing much of the region’s existing forest cover (Smith 1997; Scales 2012), with
high rates of annual forest loss continuing today (Zinner et al. 2013). Nevertheless,
Madagascar’s dry forests have been neglected by conservation and research activities
32
compared to its higher-profile, eastern rainforests (Waeber et al. 2015). This relative
deficit in knowledge of Madagascar’s dry forest dwelling species’ persistence in a
now human-dominated landscape inhibits regional conservation efforts. Existing
literature reviews have documented Madagascar’s endemic species different
responses to anthropogenic change in deciduous versus rainforests (Gardner 2009;
Irwin et al. 2010). Given this discrepancy, it is critical to understand fosas’ response
to anthropogenic change inside deciduous forests and provide evidence to inform the
management of a keystone species.
This paper presents the first multi-region investigation of the effects of
anthropogenic disturbance, in the form of deforestation, as well as the impacts of
human and exotic species’ on deciduous forest living fosas. Unlike previous single
region rainforest studies, two deciduous forests of different regions were chosen,
Ankarafantsika National Park in the Marovoay region and Andranomena Special
Reserve in Menabe. These two regions encompass a sample of two of Madagascar’s
most important tracts of deciduous forest, contrasting in levels of forest cover and
human occupation. Ankarafantsika contains a mosaic of anthropogenic altered
habitats, and human settlements within the park’s borders. In contrast, Andranomena
encompasses one contiguous forest, with no settlements within its borders. These sites
collectively provide a sample of different forms of anthropogenic land-use across
western deciduous forests. Our objectives were to examine: 1) The effect of human
and exotic species presence on fosa occupancy; 2) The effect of different landscape
variables (measures of forest degradation) on fosa occupancy; and 3) The effect of
site on fosa occupancy. To fulfil these objectives, a camera-trapping grid was
established in each region, and the resulting detection data were used in occupancy
modelling.
33
Methods
Study sites
The northwest Ankarafantsika National Park (ANP) is Madagascar’s largest
continuous dry deciduous forest (1,350 km2) (Figure 1). At 37.73 km
2, the site
surrounds four villages along the Route Nationale 4 and is characterised by a variety
of landscapes from ‘old-growth’ forest (although not true old-growth, for the purpose
of classification, it is defined as contiguous forest that has not been deforested but is
currently, or has previously experienced some selective-logging and human
disturbance) to savannah, raffia plantations and rice fields. It also contains the park’s
designated tourist and research trail systems, linked to the local villages. The trails are
recurrently used by villagers and frequented by exotic species, such as zebu (Bos
primigenius indicus), domestic dog (Canis lupus familaris), feral cat (Felis sp.),
bushpig (Potamochoerus larvatus) and small Indian civet (Viverricula indica). Only
one other endemic carnivore occupies ANP, the western falanouc (Eupleres
major)(Merson et al. 2017).
Andranomena Special Reserve (ASR) is located in the central west region of
Menabe. Covering 64 km2, ASR is largely fragmented from the larger northern
Kirindy-Ambadira Forest Complex (Zinner et al. 2013). Two villages delimit ASR’s
north and southern boundaries. ASR encompasses 35.45 km2 of contiguous, mostly
‘old-growth’ forest (defined as in ANP forest), although it has lost many of its local
endemics to forest degradation (Smith et al. 1997; Ganzhorn and Schmid 1998). The
area is bisected by a grid system of trails established by the former forestry
commission (Figure 1). Despite the cessation of commercial logging, evidence of
widespread illegal logging was evident throughout the study. ASR contains a second
Euplerid, the bokiboky (Mungotictis decemlineata).
34
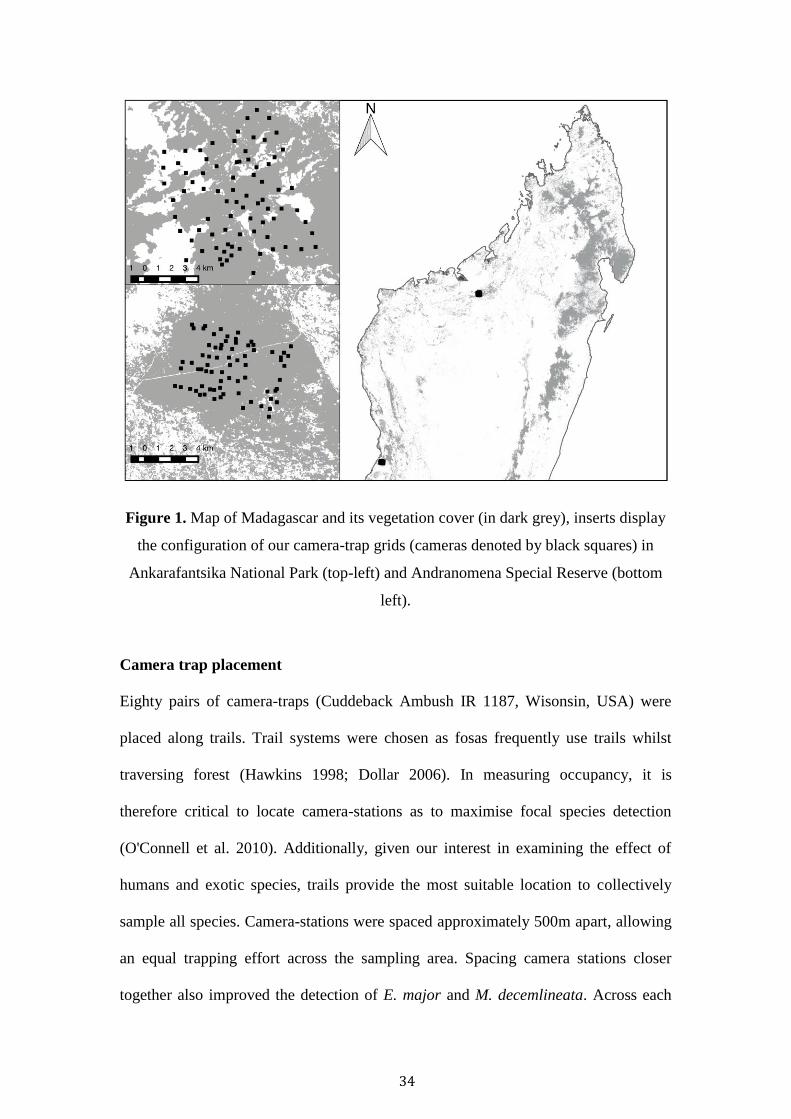
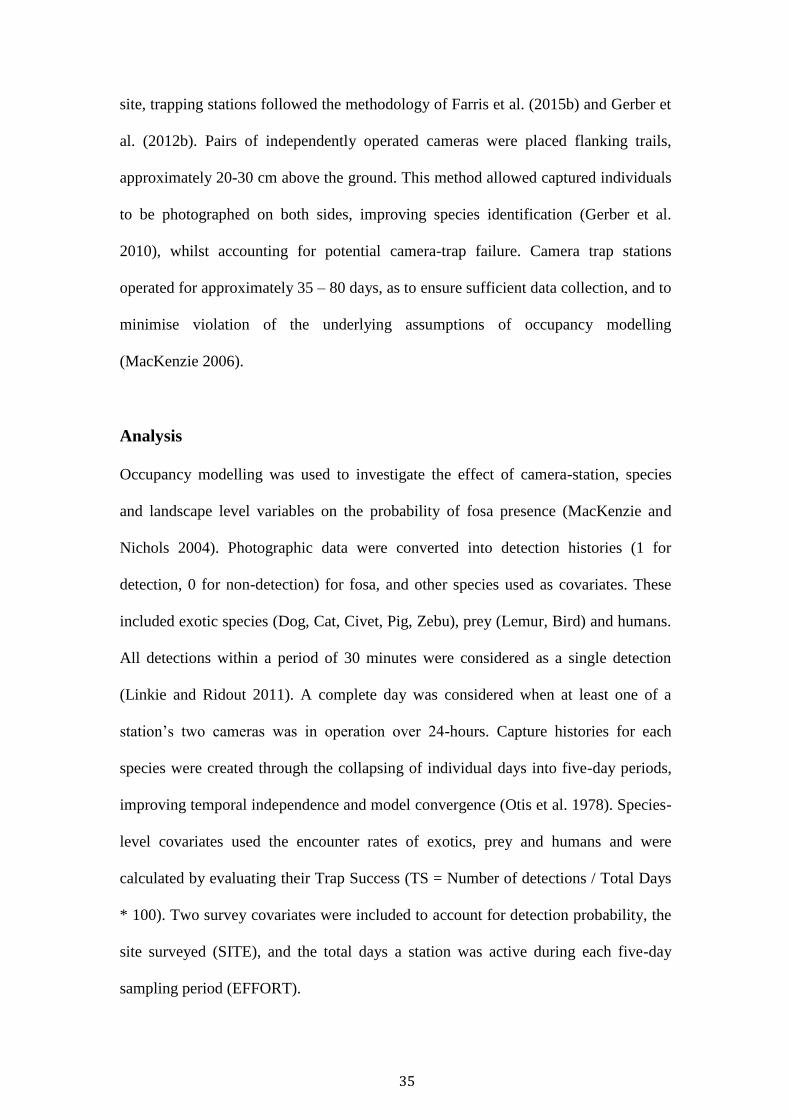
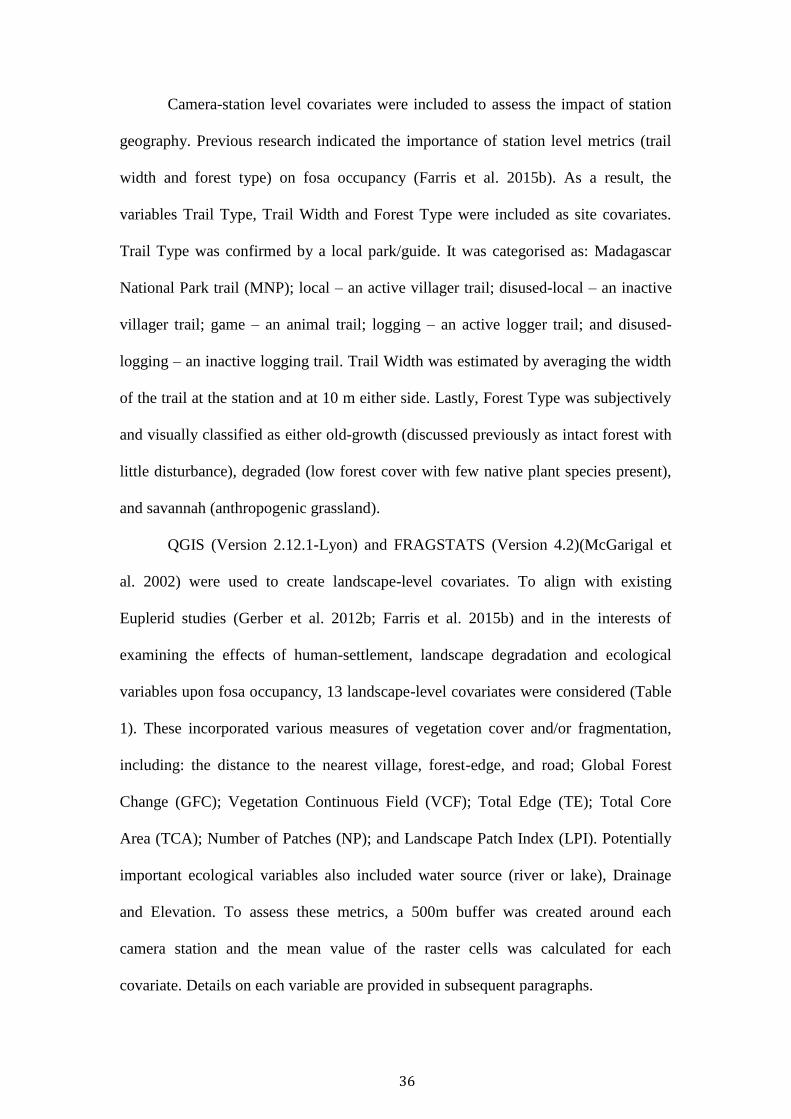
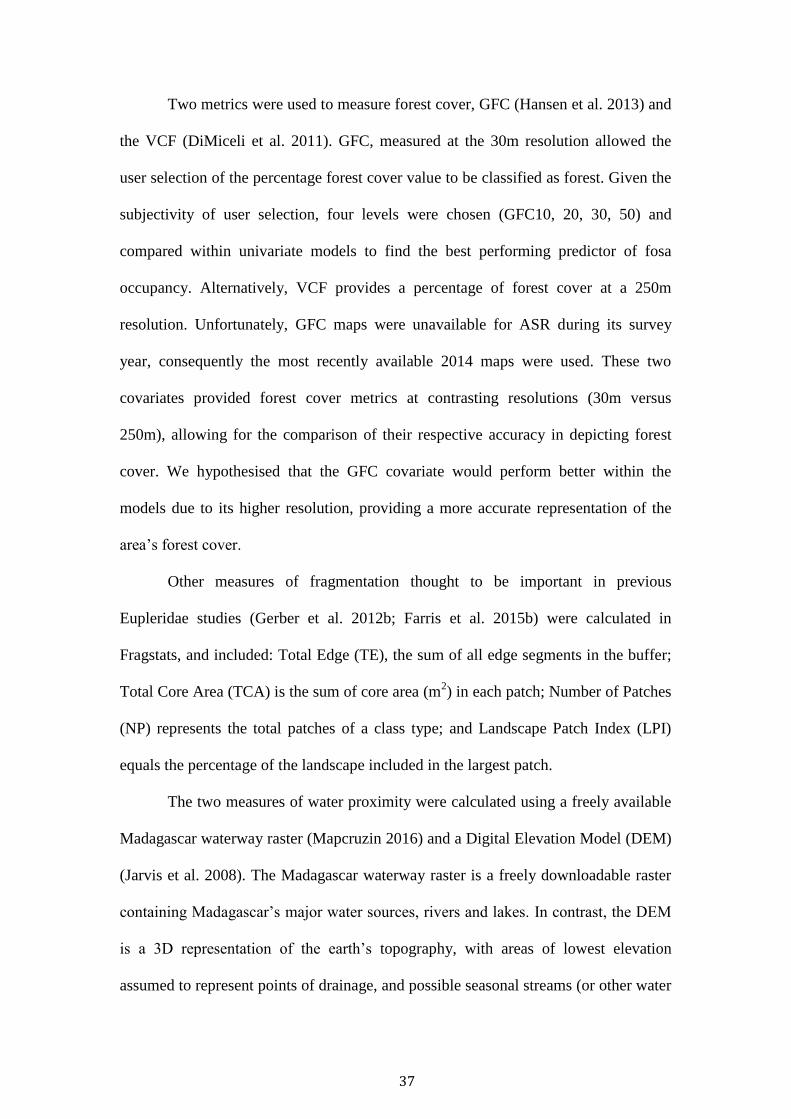
Figure 1. Map of Madagascar and its vegetation cover (in dark grey), inserts display
the configuration of our camera-trap grids (cameras denoted by black squares) in
Ankarafantsika National Park (top-left) and Andranomena Special Reserve (bottom
left).
Camera trap placement
Eighty pairs of camera-traps (Cuddeback Ambush IR 1187, Wisonsin, USA) were
placed along trails. Trail systems were chosen as fosas frequently use trails whilst
traversing forest (Hawkins 1998; Dollar 2006). In measuring occupancy, it is
therefore critical to locate camera-stations as to maximise focal species detection
(O'Connell et al. 2010). Additionally, given our interest in examining the effect of
humans and exotic species, trails provide the most suitable location to collectively
sample all species. Camera-stations were spaced approximately 500m apart, allowing
an equal trapping effort across the sampling area. Spacing camera stations closer
together also improved the detection of E. major and M. decemlineata. Across each
35
site, trapping stations followed the methodology of Farris et al. (2015b) and Gerber et
al. (2012b). Pairs of independently operated cameras were placed flanking trails,
approximately 20-30 cm above the ground. This method allowed captured individuals
to be photographed on both sides, improving species identification (Gerber et al.
2010), whilst accounting for potential camera-trap failure. Camera trap stations
operated for approximately 35 – 80 days, as to ensure sufficient data collection, and to
minimise violation of the underlying assumptions of occupancy modelling
(MacKenzie 2006).
Analysis
Occupancy modelling was used to investigate the effect of camera-station, species
and landscape level variables on the probability of fosa presence (MacKenzie and
Nichols 2004). Photographic data were converted into detection histories (1 for
detection, 0 for non-detection) for fosa, and other species used as covariates. These
included exotic species (Dog, Cat, Civet, Pig, Zebu), prey (Lemur, Bird) and humans.
All detections within a period of 30 minutes were considered as a single detection
(Linkie and Ridout 2011). A complete day was considered when at least one of a
station’s two cameras was in operation over 24-hours. Capture histories for each
species were created through the collapsing of individual days into five-day periods,
improving temporal independence and model convergence (Otis et al. 1978). Species-
level covariates used the encounter rates of exotics, prey and humans and were
calculated by evaluating their Trap Success (TS = Number of detections / Total Days
* 100). Two survey covariates were included to account for detection probability, the
site surveyed (SITE), and the total days a station was active during each five-day
sampling period (EFFORT).
36
Camera-station level covariates were included to assess the impact of station
geography. Previous research indicated the importance of station level metrics (trail
width and forest type) on fosa occupancy (Farris et al. 2015b). As a result, the
variables Trail Type, Trail Width and Forest Type were included as site covariates.
Trail Type was confirmed by a local park/guide. It was categorised as: Madagascar
National Park trail (MNP); local – an active villager trail; disused-local – an inactive
villager trail; game – an animal trail; logging – an active logger trail; and disused-
logging – an inactive logging trail. Trail Width was estimated by averaging the width
of the trail at the station and at 10 m either side. Lastly, Forest Type was subjectively
and visually classified as either old-growth (discussed previously as intact forest with
little disturbance), degraded (low forest cover with few native plant species present),
and savannah (anthropogenic grassland).
QGIS (Version 2.12.1-Lyon) and FRAGSTATS (Version 4.2)(McGarigal et
al. 2002) were used to create landscape-level covariates. To align with existing
Euplerid studies (Gerber et al. 2012b; Farris et al. 2015b) and in the interests of
examining the effects of human-settlement, landscape degradation and ecological
variables upon fosa occupancy, 13 landscape-level covariates were considered (Table
1). These incorporated various measures of vegetation cover and/or fragmentation,
including: the distance to the nearest village, forest-edge, and road; Global Forest
Change (GFC); Vegetation Continuous Field (VCF); Total Edge (TE); Total Core
Area (TCA); Number of Patches (NP); and Landscape Patch Index (LPI). Potentially
important ecological variables also included water source (river or lake), Drainage
and Elevation. To assess these metrics, a 500m buffer was created around each
camera station and the mean value of the raster cells was calculated for each
covariate. Details on each variable are provided in subsequent paragraphs.
37
Two metrics were used to measure forest cover, GFC (Hansen et al. 2013) and
the VCF (DiMiceli et al. 2011). GFC, measured at the 30m resolution allowed the
user selection of the percentage forest cover value to be classified as forest. Given the
subjectivity of user selection, four levels were chosen (GFC10, 20, 30, 50) and
compared within univariate models to find the best performing predictor of fosa
occupancy. Alternatively, VCF provides a percentage of forest cover at a 250m
resolution. Unfortunately, GFC maps were unavailable for ASR during its survey
year, consequently the most recently available 2014 maps were used. These two
covariates provided forest cover metrics at contrasting resolutions (30m versus
250m), allowing for the comparison of their respective accuracy in depicting forest
cover. We hypothesised that the GFC covariate would perform better within the
models due to its higher resolution, providing a more accurate representation of the
area’s forest cover.
Other measures of fragmentation thought to be important in previous
Eupleridae studies (Gerber et al. 2012b; Farris et al. 2015b) were calculated in
Fragstats, and included: Total Edge (TE), the sum of all edge segments in the buffer;
Total Core Area (TCA) is the sum of core area (m2) in each patch; Number of Patches
(NP) represents the total patches of a class type; and Landscape Patch Index (LPI)
equals the percentage of the landscape included in the largest patch.
The two measures of water proximity were calculated using a freely available
Madagascar waterway raster (Mapcruzin 2016) and a Digital Elevation Model (DEM)
(Jarvis et al. 2008). The Madagascar waterway raster is a freely downloadable raster
containing Madagascar’s major water sources, rivers and lakes. In contrast, the DEM
is a 3D representation of the earth’s topography, with areas of lowest elevation
assumed to represent points of drainage, and possible seasonal streams (or other water
38
sources) often overlooked by many freely available rasters. Using the Madagascar
waterway raster and the DEM derived drainage raster, the distance to perennial water
sources and seasonal streams was calculated. The final ecological covariate Elevation
was created from Shuttle Radar Topography Mission’s 90m raster (Carroll et al.
2009).
R package ‘unmarked’ (Version 0.11-0)(Fiske and Chandler 2011) was used
to run single species, single season occupancy. Prior to modelling a Pearson’s
Correlation test was used to eliminate multicollinearity. Correlated continuous
predictors with a modulus r > 0.6 were removed (that is the predictor that performed
worst in the univariate model) and the remaining covariates normalised. A stepwise
approach was taken to reduce the total number of competing covariates to be included
in the final model. These steps were reproduced for each of the carnivore occupancy
models. Firstly, the detection probability was modelled, with the most significant
combination of detection covariates selected. Potential covariates were then modelled
independently with site covariates, with the best performing uncorrelated covariates
retained (Table 1). Akaike Information Criterion (AIC) and model selection was used
to rank competing models, and those with an AIC < 2.0 reported. According to
Barbieri and Berger (2004), the model containing all covariates with a summed model
weight > 0.50 was considered the optimal predictive model. The benefit of this
strategy is that its describes the relative importance of each covariate, weighted by the
number of times it is included in the top ranking models (those with a delta AIC < 2),
and the relative rank of that particular model. However, this strategy may also be its
limitation, as given that the models are ranked relative to one another, this strategy
does not inform the user if the overall top models are good or appropriate, which can
potentially lead to spurious results (Doherty et al. 2012). This may be overcome by
39
having a good a priori reasoning for the inclusion of each covariate, and their
combinations in the model (Burnham and Anderson 2002; Burnham and Anderson
2004). Alternatively, where it may be difficult to identify the best model, model
averaging is often employed whereby the weighted average of the parameter estimates
are taken from each model (Symonds and Moussalli 2011). However, critics have
argued that this approach lacks demonstrable consistent improvements in prediction
accuracy (Richards 2005; Richards et al. 2011). Consequently, the summed model
weights approach was adopted.
A goodness-of-fit was run to examine the model’s likelihood of being correct
(p > 0.05) and how well the model fit the data (measuring overdispersion as c).
Species occupancy was predicted across both sites in relation to the most important
covariates.
Results
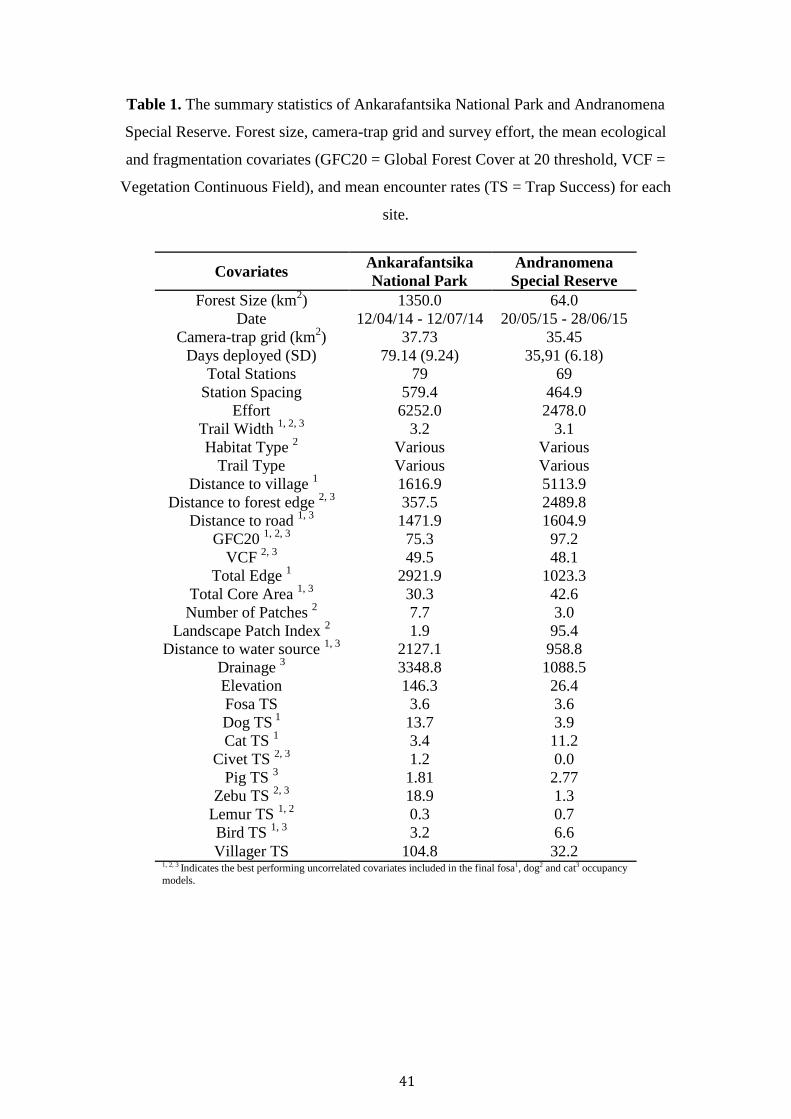
Landscape features and site detections
Across both sites a sampling effort of 8,730 nights recorded the presence of a total of
three native and three exotic carnivores (Table 1). Unfortunately, camera-trap theft
(26 units) in ASR resulted in a shortened survey period (79 days ANP, 36 days ASR).
The ANP landscape was overall more degraded with a forest cover of GFC 75.32,
with stations located in a mixture of savannah, old-growth and degraded forest. In
contrast stations inside ASR were almost exclusively located in contiguous forest
(GFC 97.16). The mean distance of stations to the nearest village in ANP (1616.9m),
and distance to forest edge (357.5m) was considerably less than ASR (Table 1).
In total 311 independent detections of fosas were recorded (226 ANP, 85
ASR). ANP only other Euplerid, E. major was detected only once, likewise ASR’s M.
40
decemlineata was detected twice. Small Indian civets were absent from ASR, and
were almost exclusively detected at savannah and degraded stations in ANP. These
low detections rates prohibited occupancy modelling for the three species. Trap
success was higher for dogs (13.66), zebu (18.92) and humans (104.81) in ANP,
whilst cats (11.24) and birds (6.58) were higher in ASR (Table 1).
41
Table 1. The summary statistics of Ankarafantsika National Park and Andranomena
Special Reserve. Forest size, camera-trap grid and survey effort, the mean ecological
and fragmentation covariates (GFC20 = Global Forest Cover at 20 threshold, VCF =
Vegetation Continuous Field), and mean encounter rates (TS = Trap Success) for each
site.
Covariates
Ankarafantsika
National Park
Andranomena
Special Reserve
Forest Size (km2) 1350.0 64.0
Date 12/04/14 - 12/07/14 20/05/15 - 28/06/15
Camera-trap grid (km2) 37.73 35.45
Days deployed (SD) 79.14 (9.24) 35,91 (6.18)
Total Stations 79 69
Station Spacing 579.4 464.9
Effort 6252.0 2478.0
Trail Width 1, 2, 3
3.2 3.1
Habitat Type 2 Various Various
Trail Type Various Various
Distance to village 1 1616.9 5113.9
Distance to forest edge 2, 3
357.5 2489.8
Distance to road 1, 3
1471.9 1604.9
GFC20 1, 2, 3
75.3 97.2
VCF 2, 3
49.5 48.1
Total Edge 1 2921.9 1023.3
Total Core Area 1, 3
30.3 42.6
Number of Patches 2 7.7 3.0
Landscape Patch Index 2 1.9 95.4
Distance to water source 1, 3
2127.1 958.8
Drainage 3 3348.8 1088.5
Elevation 146.3 26.4
Fosa TS 3.6 3.6
Dog TS 1
13.7 3.9
Cat TS 1 3.4 11.2
Civet TS 2, 3
1.2 0.0
Pig TS 3 1.81 2.77
Zebu TS 2, 3
18.9 1.3
Lemur TS 1, 2
0.3 0.7
Bird TS 1, 3
3.2 6.6
Villager TS 104.8 32.2 1, 2, 3 Indicates the best performing uncorrelated covariates included in the final fosa1, dog2 and cat3 occupancy
models.
42
Covariate and model validation
Our two survey covariates (site and effort) were contained in the best performing
detection model (Table S1). Consequently, they were included within all subsequent
modelling of occupancy with site covariates. Our correlation matrix revealed
significant correlations between competing covariates (Table S2). A total of 6
covariates (NP, LPI, VCF, Elevation, Villager and Forest Distance) were discarded
from the final fosa occupancy model. The Goodness-of-fit test revealed significant
overdispersion, and as a result 5 sites were removed (with a total of 42 detections).
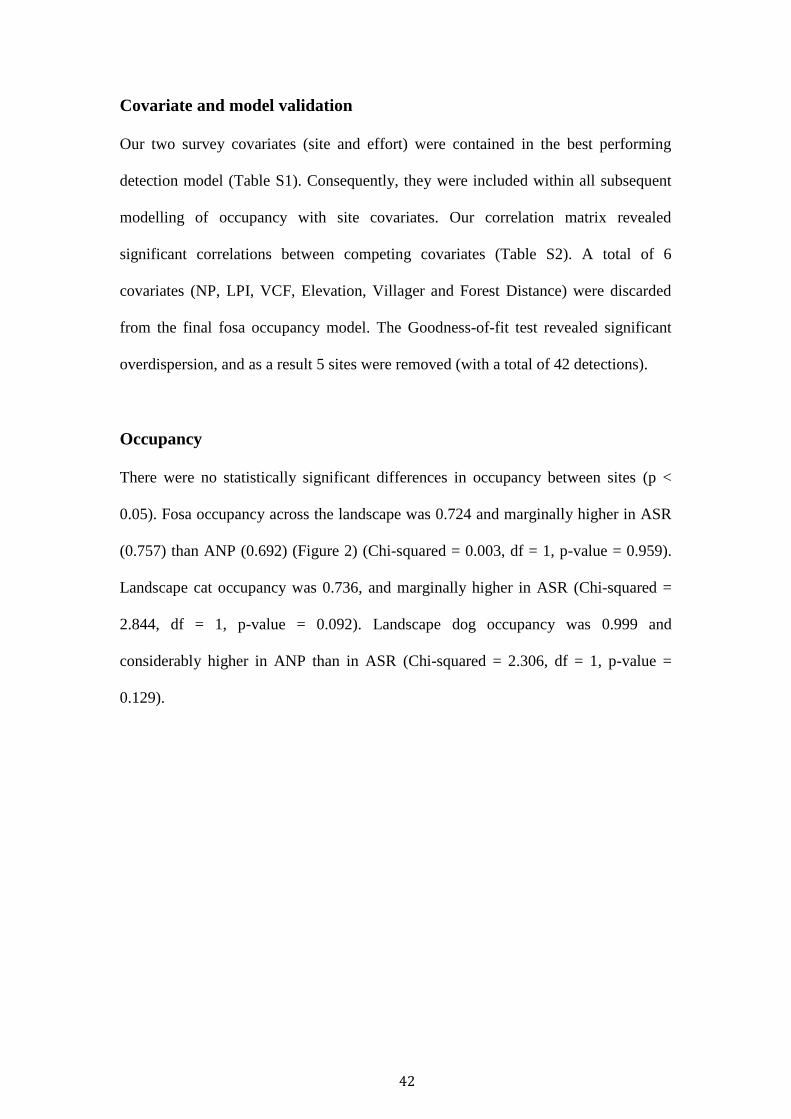
Occupancy
There were no statistically significant differences in occupancy between sites (p <
0.05). Fosa occupancy across the landscape was 0.724 and marginally higher in ASR
(0.757) than ANP (0.692) (Figure 2) (Chi-squared = 0.003, df = 1, p-value = 0.959).
Landscape cat occupancy was 0.736, and marginally higher in ASR (Chi-squared =
2.844, df = 1, p-value = 0.092). Landscape dog occupancy was 0.999 and
considerably higher in ANP than in ASR (Chi-squared = 2.306, df = 1, p-value =
0.129).
43
Figure 2. Estimated site occupancy for fosa, feral cat and dogs at Ankarafantsika
National Park (ANP) and Andranomena Special Reserve (ASR).
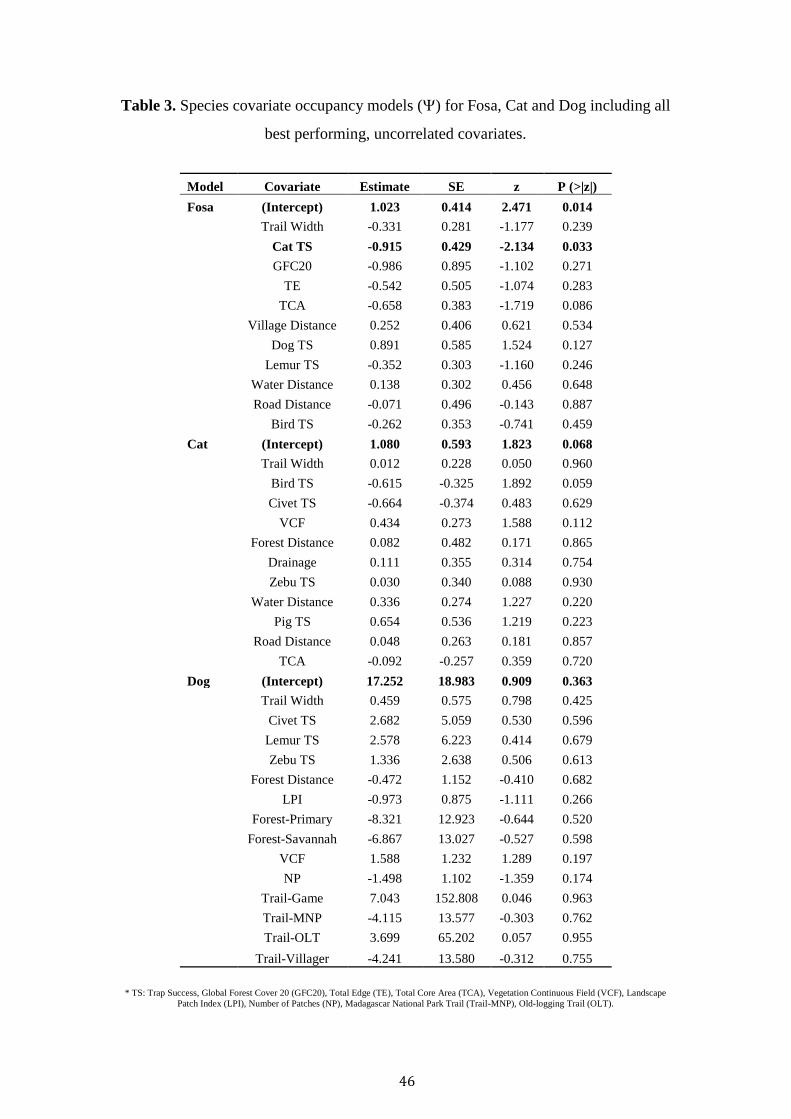
Cat TS, Dog TS, GFC20 and TCA were the most important covariates
(Summed Model Weight > 0.5) in explaining fosa occupancy across the landscape
(Table 2). Dog TS maintained a weak positive relationship with fosa occupancy,
whilst Cat TS, GFC20 and TCA displayed a negative relationship (Table 3).
Dog occupancy was best explained by Civet TS, Forest, NP and TW (Table
3). Civet TS and trail width was positively related to dog occupancy, whilst old-
growth, savannah and total patches negatively affected occupancy (Table 3). Finally,
cat occupancy was best explained by Bird TS, Trail Width and VCF. A negative
relationship was observed between Bird TS, Trail Width and cat occupancy, whist a
positive association was recorded with VCF (Table 3).
44
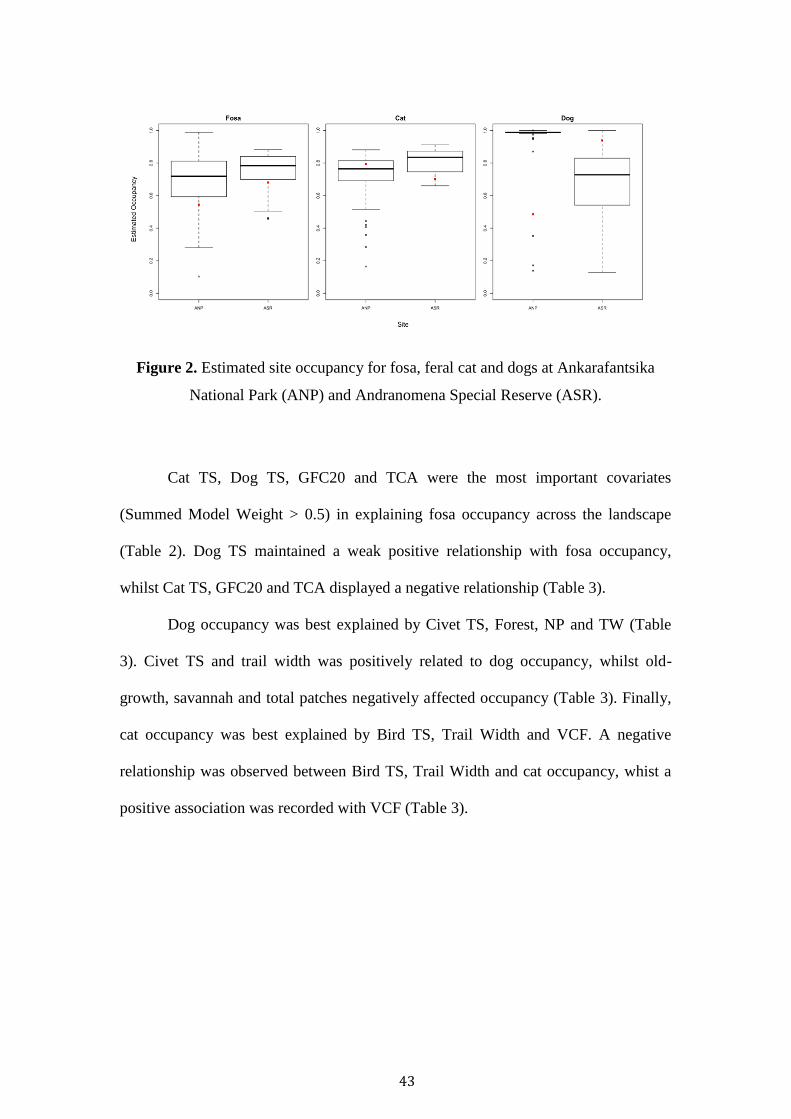
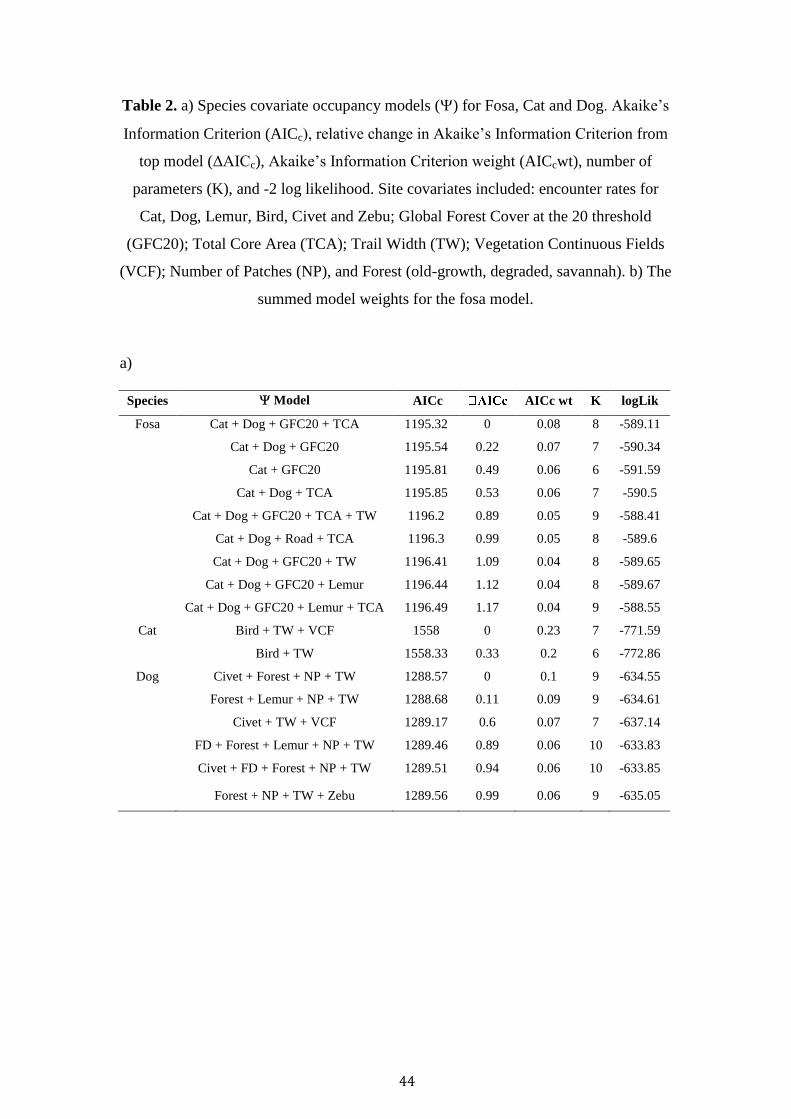
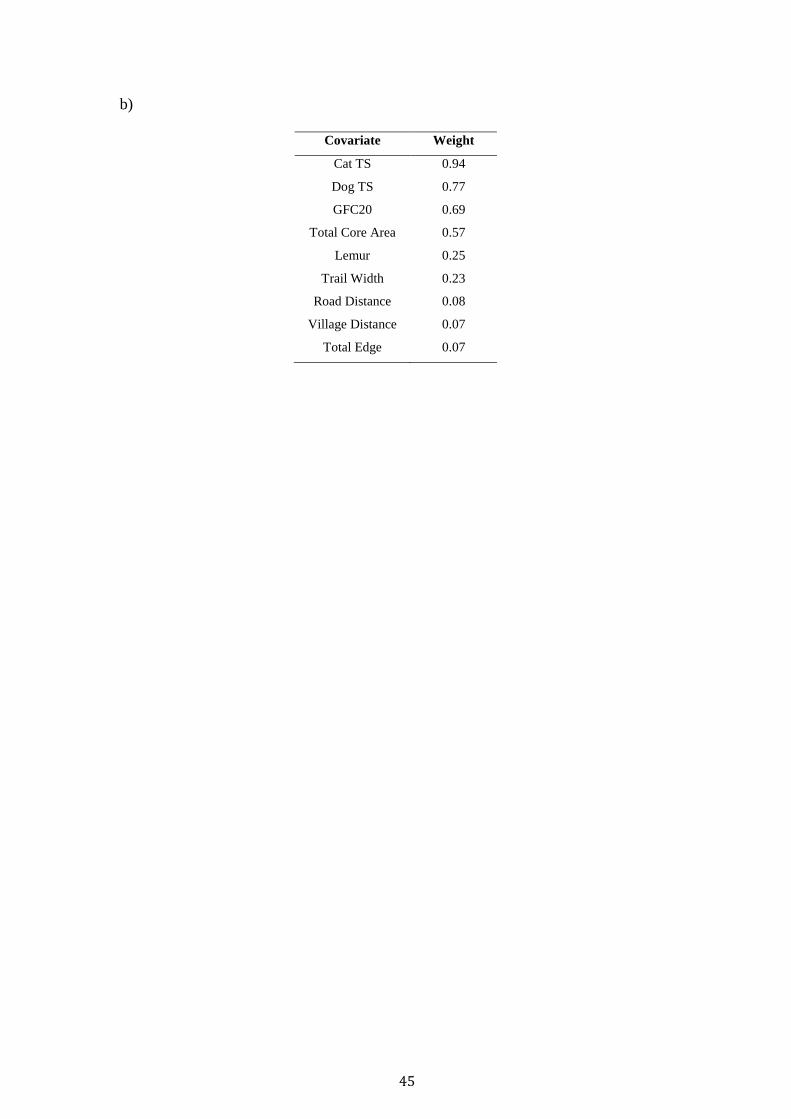
Table 2. a) Species covariate occupancy models () for Fosa, Cat and Dog. Akaike’s
Information Criterion (AICc), relative change in Akaike’s Information Criterion from
top model (ΔAICc), Akaike’s Information Criterion weight (AICcwt), number of
parameters (K), and -2 log likelihood. Site covariates included: encounter rates for
Cat, Dog, Lemur, Bird, Civet and Zebu; Global Forest Cover at the 20 threshold
(GFC20); Total Core Area (TCA); Trail Width (TW); Vegetation Continuous Fields
(VCF); Number of Patches (NP), and Forest (old-growth, degraded, savannah). b) The
summed model weights for the fosa model.
a)
Species Model AICc AICc wt K logLik
Fosa Cat + Dog + GFC20 + TCA 1195.32 0 0.08 8 -589.11
Cat + Dog + GFC20 1195.54 0.22 0.07 7 -590.34
Cat + GFC20 1195.81 0.49 0.06 6 -591.59
Cat + Dog + TCA 1195.85 0.53 0.06 7 -590.5
Cat + Dog + GFC20 + TCA + TW 1196.2 0.89 0.05 9 -588.41
Cat + Dog + Road + TCA 1196.3 0.99 0.05 8 -589.6
Cat + Dog + GFC20 + TW 1196.41 1.09 0.04 8 -589.65
Cat + Dog + GFC20 + Lemur 1196.44 1.12 0.04 8 -589.67
Cat + Dog + GFC20 + Lemur + TCA 1196.49 1.17 0.04 9 -588.55
Cat Bird + TW + VCF 1558 0 0.23 7 -771.59
Bird + TW 1558.33 0.33 0.2 6 -772.86
Dog Civet + Forest + NP + TW 1288.57 0 0.1 9 -634.55
Forest + Lemur + NP + TW 1288.68 0.11 0.09 9 -634.61
Civet + TW + VCF 1289.17 0.6 0.07 7 -637.14
FD + Forest + Lemur + NP + TW 1289.46 0.89 0.06 10 -633.83
Civet + FD + Forest + NP + TW 1289.51 0.94 0.06 10 -633.85
Forest + NP + TW + Zebu 1289.56 0.99 0.06 9 -635.05
45
b)
Covariate Weight
Cat TS 0.94
Dog TS 0.77
GFC20 0.69
Total Core Area 0.57
Lemur 0.25
Trail Width 0.23
Road Distance 0.08
Village Distance 0.07
Total Edge 0.07
46
Table 3. Species covariate occupancy models () for Fosa, Cat and Dog including all
best performing, uncorrelated covariates.
Model Covariate Estimate SE z P (>|z|)
Fosa (Intercept) 1.023 0.414 2.471 0.014
Trail Width -0.331 0.281 -1.177 0.239
Cat TS -0.915 0.429 -2.134 0.033
GFC20 -0.986 0.895 -1.102 0.271
TE -0.542 0.505 -1.074 0.283
TCA -0.658 0.383 -1.719 0.086
Village Distance 0.252 0.406 0.621 0.534
Dog TS 0.891 0.585 1.524 0.127
Lemur TS -0.352 0.303 -1.160 0.246
Water Distance 0.138 0.302 0.456 0.648
Road Distance -0.071 0.496 -0.143 0.887
Bird TS -0.262 0.353 -0.741 0.459
Cat (Intercept) 1.080 0.593 1.823 0.068
Trail Width 0.012 0.228 0.050 0.960
Bird TS -0.615 -0.325 1.892 0.059
Civet TS -0.664 -0.374 0.483 0.629
VCF 0.434 0.273 1.588 0.112
Forest Distance 0.082 0.482 0.171 0.865
Drainage 0.111 0.355 0.314 0.754
Zebu TS 0.030 0.340 0.088 0.930
Water Distance 0.336 0.274 1.227 0.220
Pig TS 0.654 0.536 1.219 0.223
Road Distance 0.048 0.263 0.181 0.857
TCA -0.092 -0.257 0.359 0.720
Dog (Intercept) 17.252 18.983 0.909 0.363
Trail Width 0.459 0.575 0.798 0.425
Civet TS 2.682 5.059 0.530 0.596
Lemur TS 2.578 6.223 0.414 0.679
Zebu TS 1.336 2.638 0.506 0.613
Forest Distance -0.472 1.152 -0.410 0.682
LPI -0.973 0.875 -1.111 0.266
Forest-Primary -8.321 12.923 -0.644 0.520
Forest-Savannah -6.867 13.027 -0.527 0.598
VCF 1.588 1.232 1.289 0.197
NP -1.498 1.102 -1.359 0.174
Trail-Game 7.043 152.808 0.046 0.963
Trail-MNP -4.115 13.577 -0.303 0.762
Trail-OLT 3.699 65.202 0.057 0.955
Trail-Villager -4.241 13.580 -0.312 0.755
* TS: Trap Success, Global Forest Cover 20 (GFC20), Total Edge (TE), Total Core Area (TCA), Vegetation Continuous Field (VCF), Landscape
Patch Index (LPI), Number of Patches (NP), Madagascar National Park Trail (Trail-MNP), Old-logging Trail (OLT).
47
Discussion
Our findings unveiled a mixed relationship between fosas, landscape degradation and
exotic species. No clear trends were apparent between fosas and degradation, however
a clear negative relationship existed between fosas and cats, with no discernable
pattern between fosas and dogs. Cats were negatively associated with birds, and
detected more frequently in contiguous forest with narrower trails. Alternatively, dogs
preferred degraded landscapes (but not savannah), with larger trails and in positive
association with civets. These results mostly conform to previous rainforest studies of
exotic species’ negative effect upon Madagascar’s endemic carnivores (Gerber et al.
2012b; Farris et al. 2015b; Farris et al. 2016). They suggest that fosas, capable of
traversing through degraded landscape, are more resilient to habitat disturbance
within contiguous forests than other Euplerids. However, the significant reduction and
fragmentation of forest across Madagascar likely inhibits their long-term persistence
across the landscape. Furthermore, the high prevalence of feral cats and dogs across
our sites present considerable competition with fosas through the consumption of
shared prey (Gould 1996; Brockman et al. 2008), and exclusion from habitat. The
spread of disease, such as toxoplasmosis (Pomerantz et al. 2016), between exotic
species, fosas and their prey is of concern, imperilling the fosas’ long-term population
health.
Exotic species impact upon fosa occupancy
Cats had the most pronounced negative association with fosa occupancy, likely
underpinned by inter-guild competition. Cats have been globally acknowledged for
their devastating effects on native wildlife through predation, competition,
hybridization and disease (Dickman 1996; Phillips et al. 2007; Medina et al. 2011). In
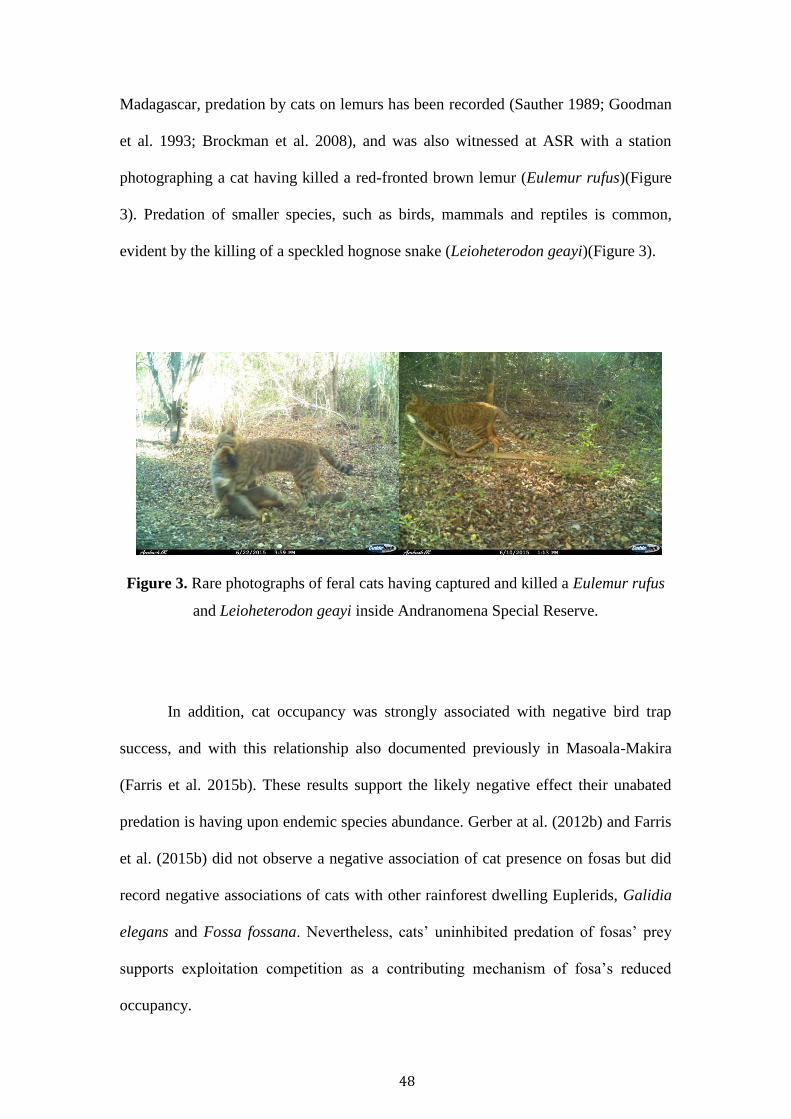
48
Madagascar, predation by cats on lemurs has been recorded (Sauther 1989; Goodman
et al. 1993; Brockman et al. 2008), and was also witnessed at ASR with a station
photographing a cat having killed a red-fronted brown lemur (Eulemur rufus)(Figure
3). Predation of smaller species, such as birds, mammals and reptiles is common,
evident by the killing of a speckled hognose snake (Leioheterodon geayi)(Figure 3).
Figure 3. Rare photographs of feral cats having captured and killed a Eulemur rufus
and Leioheterodon geayi inside Andranomena Special Reserve.
In addition, cat occupancy was strongly associated with negative bird trap
success, and with this relationship also documented previously in Masoala-Makira
(Farris et al. 2015b). These results support the likely negative effect their unabated
predation is having upon endemic species abundance. Gerber at al. (2012b) and Farris
et al. (2015b) did not observe a negative association of cat presence on fosas but did
record negative associations of cats with other rainforest dwelling Euplerids, Galidia
elegans and Fossa fossana. Nevertheless, cats’ uninhibited predation of fosas’ prey
supports exploitation competition as a contributing mechanism of fosa’s reduced
occupancy.
49
Within our sites, fosas and cats occupied similar, mostly nocturnal periods of
activity. Their temporal overlap is in contrast to previous rainforest studies in which
cats were recorded to be nocturnal and fosas crepuscular (Gerber et al. 2012c) or cats
diurnal and fosas nocturnal (Farris et al. 2015a). These previous patterns suggest that
where cats and fosas occupy similar temporal and/or geographical niches, cats may
exert a negative effect upon fosas. In understanding the mechanism of competition,
feral cats weigh considerably less than adult fosas (Brockman et al. 2008), suggesting
interference competition to be less likely. However, juveniles and sub-adult fosas are
of comparable weight to cats (Rahajanirina 2003), potentially permitting resource
interference between smaller fosas and adult cats.
In concordance with previous rainforest studies, Dog TS did not have a
negative association with fosa occupancy (Gerber et al. 2012b; Farris et al. 2015b).
This is distinct from dogs’ reported impact on another Euplerid Galidictis fasciata
(Gerber et al. 2012b) and incongruous with dogs’ globally damaging affect (Hughes
and Macdonald 2013). However, activity pattern analyses have found fosas to display
temporal activity shifts towards greater nocturnality, and/or absence from sites with
higher dog detections (Gerber et al. 2012a; Farris et al. 2015a. Considering dogs’
significantly larger size (Dollar Unpublished) and pack sociality, they represent a
more significant source of interference competition. Fosas’ adoption of greater
nocturnality is presumably to avoid inter-specific aggressions and has been recorded
amongst intra-guild carnivores of smaller size (Harrington et al. 2009). This temporal
partitioning may be obscuring dogs’ affect in occupancy models. In reality, dogs’
underlying impact upon fosa through temporal exclusion is likely significant,
reducing access to important diurnal prey species (such as the larger-bodied lemurs).
50
Whilst potentially not as effective as a resource competitor as cats, dogs’ greater
predatory impact upon Madagascar’s ecosystem is still significant.
Disease transmission between cats, dogs, and endemic species may have a
potential lethal impact through their widespread prevalence across the landscape.
Fatal cases of Toxoplasma gondii infection have been recorded in captive fosas
(Corpa et al. 2013) and lemurs (Spencer et al. 2004; Juan-Sallés et al. 2011; Siskos et
al. 2015), highlighting their vulnerability to lethal infections. Field research of exotic
and introduced carnivores in western Madagascar (including Ankarafantsika) has
revealed a raft of viruses and parasites, including canine parovirus and herpesvirus,
feline calicivirus and T. gondii (Pomerantz et al. 2016). The latter was prevalent in >
93% of captured fosas. These high infection rates are disconcerting when considering
fosas and lemurs’ fatal infection to T. gondii in captivity. It could then be expected,
that similar to worldwide species reductions to disease (Pedersen et al. 2007) that
these high infection rates have the potential to result in wild fosa mortalities and at the
very least, a negative impact on an infected individual’s long-term health.
Habitat degradation impact on fosa occupancy
Fosa occupancy was greater in ASR, likely associated with its greater forest cover,
and lower dog and human presence. However, within our models fosa occupancy was
not influenced by habitat degradation. This unclear trend in the association between
habitat degradation and species occupancy was also recorded with fosas and other
Euplerids in Madagascar’s easterly rainforests (Gerber et al. 2012b; Farris et al.
2015b). Despite this carnivore presence surveys have recorded fosa absence from
landscapes > 5 km (Kotschwar Logan et al. 2014) and forest fragments > 2.5 km from
the nearest contiguous forest (Gerber et al. 2012b). This suggests, that despite fosas’
51
resilience to habitat degradation within contiguous forest, they are unable to persist
far from intact forest. When considering Madagascar’s highly disturbed and severely
fragmented forests (Harper et al. 2007), it is likely that many are of insufficient size to
support long-term, sustainable fosa populations (Hawkins and Racey 2005).
Cat occupancy was greater in ASR, and positively linked to higher vegetation
cover and weakly associated with narrow trails. This could be attributed to their
avoidance of larger carnivores (dogs/fosas) and humans, whilst using trails frequented
by smaller species and prey. Farris et al. (2015b) found similar positive associations
with forest cover, likely confirming their preference to areas of greater prey
abundance.
Dogs recorded the highest landscape occupancy. In contrast to cats and fosas,
dogs displayed greater occupancy in ANP, and a positive association with large trails,
civets, and a negative association with old-growth forest, and savannah. Dogs’
positive association with trail width is likely due to their positive correlation with
humans, accompanying them during forest activities. Likewise their negative
association with old-growth forest and savannah implies their use of degraded habitat,
also frequented by humans. This supports the dogs’ positive association with
Ankarafantsika’s third exotic carnivore, the civet, which was rarely detected inside
old-growth forest.
Despite no association between habitat degradation and cat occupancy, dogs
were indirectly associated with degraded forest. This is in concordance with recent
easterly occupancy studies that revealed greater exotic carnivore presence in more
degraded landscapes. Stations located in ANP encompassed a mixed matrix of
savannah, and degraded forest, typically representative of forests surrounding rural
villages. Ankarafantsika recorded considerably high trap success of humans and other
52
exotics such as zebu and civet (absent from ASR), with half the number of birds
detected of ASR.
ASR was selected to represent a contiguous deciduous forest, of less
anthropogenic disturbance than ANP. However despite less fragmentation than ANP,
it was experiencing severe levels of illegal selective-logging at the time of surveying.
These high levels of unanticipated disturbance undoubtedly affected the overall
modelling of occupancy, reducing the distinctiveness of habitats degradation metrics.
Future surveys of Madagascar’s western forests must seek greater disparities in
landscape degradation to fully reveal its affects. Furthermore, stations were originally
spaced in anticipation of documenting the region’s other Eupleridae, the falanouc and
bokiboky. However, this spacing came at a cost, with occupancy estimates potentially
inflated due to fosas’ large ranging, theoretically permitting the traverse of several
stations in one day. In an ideal scenario, future camera-trap grids would be larger,
with greater spacing between individual stations, so as to be more ecologically
representative, encompassing more individual home-ranges and thus producing a
more accurate occupancy estimate (O'Connell et al. 2010).
Long-term implications
This research has contributed to our knowledge of the affects of anthropogenic
disturbance in Madagascar’s deciduous forests. Multi-year studies over greater spatial
scales are required to unravel the ‘snapshot’ view of single-season occupancy models.
Recent research on Madagascar’s eastern coast documented the first multi-year study
of these affects and revealed decreases in endemic species and replacement by exotic
carnivores (Farris et al. 2016). Fosas displayed stable occupancy during this period,
however their occupancy equilibrium fell below observed occupancy, indicating a
53
declining population. This supports our results reporting their apparent and at least
short-term resilience to habitat degradation inside contiguous forests. Despite this,
their long-term population decline is clear (Hawkins 2016). This is largely the result
of the severe reduction and fragmentation of Madagascar’s forests, the killing of
fosas’ for bushmeat and poultry depredation, and the rise in abundance of dogs and
cats, stoking competition and disease transmission. The potential impact of exotic
species was largely the focus of the discussion, and steps must be taken to mitigate
their impact upon fosas and the ecosystem as a whole. Cat and dog sterilisation
programs have been operating in rural villages surrounding ANP by author L. Dollar,
and more recently in Ranomafana National Park by the Mad Dog Initiative. Such
programs, in align with the culling of feral cats/dogs should be trialled, with their
effectiveness evaluated in reducing exotics, and improving native species abundance.
If effective at both the operational, and ecosystem level, we propose the incorporation
of these programs into an island-wide forest management strategy.
54
References
Allnutt, T.F., Asner, G.P., Golden, C.D., Powell, G.V.N., 2013. Mapping recent
deforestation and forest disturbance in northeastern Madagascar. Tropical
Conservation Science 6, 1-15.
Brockman, D.K., Godfrey, L.R., Dollar, L.J., Ratsirarson, J., 2008. Evidence of
invasive Felis silvestris predation on Propithecus verreauxi at Beza Mahafaly
Special Reserve, Madagascar. International Journal of Primatology 29, 135-152.
Brooke, Z.M., Bielby, J., Nambiar, K., Carbone, C., 2014. Correlates of research
effort in carnivores: body size, range size and diet matter. PLoS One 9, e93195.
Burnham, K.P., Anderson, D.R., 2002. Model selection and multimodel inference: a
practical information-theoretic approach. Springer, New York.
Burnham, K.P., Anderson, D.R., 2004. Multimodel inference: understanding AIC and
BIC in model selection. Sociological methods & research 33, 261-304.
Carroll, M., Townshend, J.R., DiMiceli, C.M., Noojipady, P., Sohlberg, R., 2009. A
new global raster water mask at 250 m resolution. International Journal of
Digital Earth 2, 291-308.
Corpa, J., García-Quirós, A., Casares, M., Gerique, A., Carbonell, M., Gómez-
Muñoz, M., Uzal, F.A., Ortega, J., 2013. Encephalomyelitis by Toxoplasma
gondii in a captive fossa (Cryptoprocta ferox). Veterinary parasitology 193,
281-283.
Dickman, C.R., 1996. Impact of exotic generalist predators on the native fauna of
Australia. Wildlife Biology 2, 185-195.
Dillon, A., Kelly, M.J., 2008. Ocelot home range, overlap and density: comparing
radio telemetry with camera trapping. Journal of Zoology 275, 391-398.
55
DiMiceli, C.M., Carroll, M.L., Sohlberg, R.A., Huang, C., Hansen, M.C., Townshend,
J.R.G., 2011. Annual global automated MODIS vegetation continuous fields
(MOD44B) at 250 m spatial resolution for data years beginning day 65, 2000–
2010, collection 5 percent tree cover. University of Maryland, College Park,
MD, USA.
Doherty, P.F., White, G.C., Burnham, K.P., 2012. Comparison of model building and
selection strategies. Journal of Ornithology 152, 317-323.
Dollar, L., Ganzhorn, J., Goodman, S., 2007. Primates and Other Prey in the
Seasonally Variable Diet of Cryptoprocta ferox in the Dry Deciduous Forest of
Western Madagascar, In Primate Anti-Predator Strategies. eds S. Gursky, K.A.I.
Nekaris, pp. 63-76. Springer US.
Dollar, L.J., 2006. Morphometrics, diet, and conservation of Cryptoprocta ferox.
Duke University.
Dufils, J.M., 2003. Remaining forest cover. The natural history of Madagascar, 88-96.
Farris, Z., Karpanty, S., Ratelolahy, F., Kelly, M., 2014. Predator–Primate
Distribution, Activity, and Co-occurrence in Relation to Habitat and Human
Activity Across Fragmented and Contiguous Forests in Northeastern
Madagascar. International Journal of Primatology 35, 859-880.
Farris, Z.J., Gerber, B.D., Karpanty, S., Murphy, A., Andrianjakarivelo, V.,
Ratelolahy, F., Kelly, M.J., 2015a. When carnivores roam: temporal patterns
and overlap among Madagascar's native and exotic carnivores. Journal of
Zoology 296, 45-57.
Farris, Z.J., Golden, C.D., Karpanty, S., Murphy, A., Stauffer, D., Ratelolahy, F.,
Andrianjakarivelo, V., Holmes, C.M., Kelly, M.J., 2015b. Hunting, exotic
56
carnivores, and habitat loss: anthropogenic effects on a native carnivore
community, Madagascar. PLoS One 10, e0136456.
Farris, Z.J., Kelly, M.J., Karpanty, S., Murphy, A., Ratelolahy, F., Andrianjakarivelo,
V., Holmes, C., 2016. The times they are a changin': Multi-year surveys reveal
exotics replace native carnivores at a Madagascar rainforest site. Biological
Conservation.
Farris, Z.J., Kelly, M.J., Karpanty, S., Ratelolahy, F., 2015c. Patterns of spatial co‐
occurrence among native and exotic carnivores in north‐eastern Madagascar.
Animal Conservation.
Fiske, I., Chandler, R., 2011. unmarked: An R package for fitting hierarchical models
of wildlife occurrence and abundance. Journal of Statistical Software 43, 1-23.
Ganzhorn, J., Schmid, J. 1998. Different population dynamics of Microcebus murinus
in primary and secondary deciduous dry forests of Madagascar. International
Journal of Primatology 19, 785-796.
García, G., Goodman, S.M., 2003. Hunting of protected animals in the Parc National
d'Ankarafantsika, north-western Madagascar. Oryx 37, 115-118.
Gardner, C.J., 2009. A review of the impacts of anthropogenic habitat change on
terrestrial biodiversity in Madagascar: Implications for the design and
management of new protected areas. Malagasy Nature 2, 29.
Gerber, B., Karpanty, S.M., Crawford, C., Kotschwar, M., Randrianantenaina, J.,
2010. An assessment of carnivore relative abundance and density in the eastern
rainforests of Madagascar using remotely-triggered camera traps. Oryx 44, 219.
Gerber, B.D., Karpanty, S.M., Randrianantenaina, J., 2012a. Activity patterns of
carnivores in the rain forests of Madagascar: implications for species
coexistence. Journal of Mammalogy 93, 667-676.
57
Gerber, B.D., Karpanty, S.M., Randrianantenaina, J., 2012b. The impact of forest
logging and fragmentation on carnivore species composition, density and
occupancy in Madagascar's rainforests. Oryx 46, 414-422.
Gerber, B.D., Karpanty, S.M., Randrianantenaina, J., Vuren, D.H.V., 2012c. Activity
patterns of carnivores in the rain forests of Madagascar: implications for species
coexistence. Journal of Mammalogy 93, 667-676.
Golden, C.D., 2009. Bushmeat hunting and use in the Makira Forest, north-eastern
Madagascar: a conservation and livelihoods issue. Oryx 43, 386.
Goodman, S.M., O’Connor, S., Langrand, O., 1993. A review of predation on lemurs:
implications for the evolution of social behavior in small, nocturnal primates, In
Lemur social systems and their ecological basis. pp. 51-66. Springer.
Gould, L., 1996. Vigilance behavior in naturally occurring ringtailed lemurs (Lemur
catta) during birth and lactation season. Inter. Jour. Primatol 17, 331-347.
Hansen, M.C., Potapov, P.V., Moore, R., Hancher, M., Turubanova, S.A., Tyukavina,
A., Thau, D., Stehman, S.V., Goetz, S.J., Loveland, T.R., 2013. High-resolution
global maps of 21st-century forest cover change. Science 342, 850-853.
Harper, G.J., Steininger, M.K., Tucker, C.J., Juhn, D., Hawkins, F., 2007. Fifty years
of deforestation and forest fragmentation in Madagascar. Environmental
Conservation 34.
Harrington, L.A., Harrington, A.L., Yamaguchi, N., Thom, M.D., Ferreras, P.,
Windham, T.R., Macdonald, D.W., 2009. The impact of native competitors on
an alien invasive: temporal niche shifts to avoid interspecific aggression.
Ecology 90, 1207-1216.
Hawkins, A.F., 2016. Cryptoprocta ferox, In The IUCN Red List of Threatened
Species. IUCN.
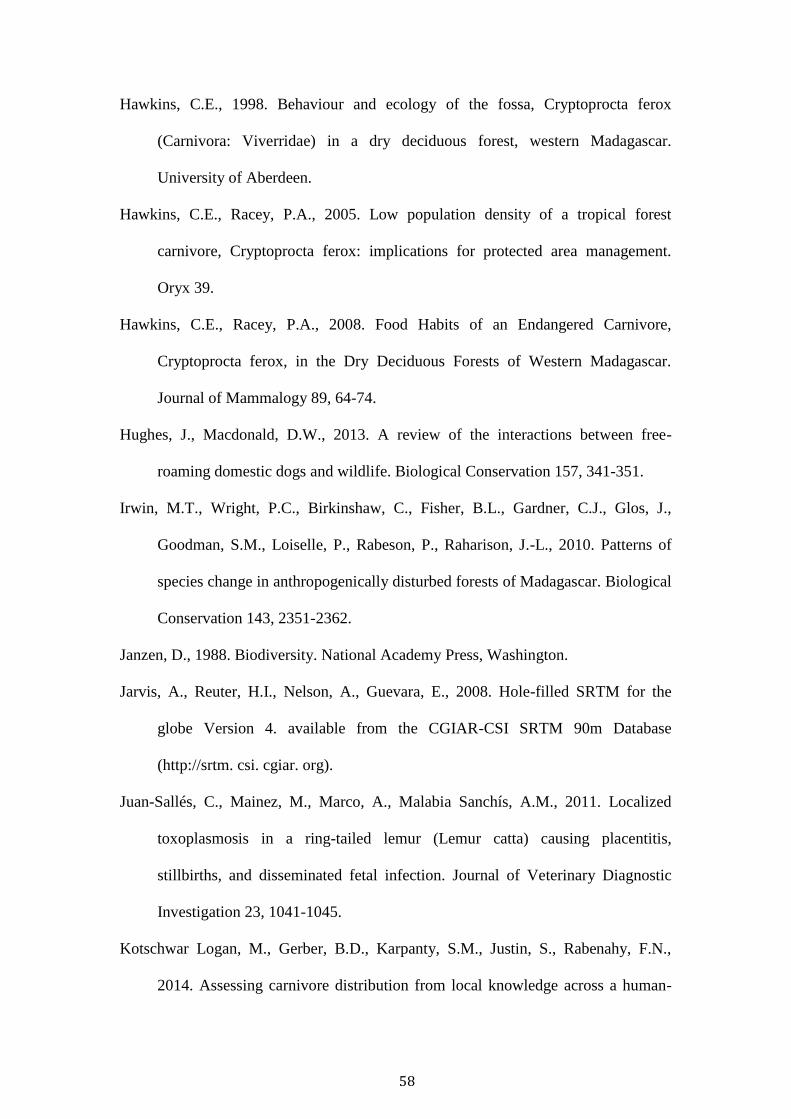
58
Hawkins, C.E., 1998. Behaviour and ecology of the fossa, Cryptoprocta ferox
(Carnivora: Viverridae) in a dry deciduous forest, western Madagascar.
University of Aberdeen.
Hawkins, C.E., Racey, P.A., 2005. Low population density of a tropical forest
carnivore, Cryptoprocta ferox: implications for protected area management.
Oryx 39.
Hawkins, C.E., Racey, P.A., 2008. Food Habits of an Endangered Carnivore,
Cryptoprocta ferox, in the Dry Deciduous Forests of Western Madagascar.
Journal of Mammalogy 89, 64-74.
Hughes, J., Macdonald, D.W., 2013. A review of the interactions between free-
roaming domestic dogs and wildlife. Biological Conservation 157, 341-351.
Irwin, M.T., Wright, P.C., Birkinshaw, C., Fisher, B.L., Gardner, C.J., Glos, J.,
Goodman, S.M., Loiselle, P., Rabeson, P., Raharison, J.-L., 2010. Patterns of
species change in anthropogenically disturbed forests of Madagascar. Biological
Conservation 143, 2351-2362.
Janzen, D., 1988. Biodiversity. National Academy Press, Washington.
Jarvis, A., Reuter, H.I., Nelson, A., Guevara, E., 2008. Hole-filled SRTM for the
globe Version 4. available from the CGIAR-CSI SRTM 90m Database
(http://srtm. csi. cgiar. org).
Juan-Sallés, C., Mainez, M., Marco, A., Malabia Sanchís, A.M., 2011. Localized
toxoplasmosis in a ring-tailed lemur (Lemur catta) causing placentitis,
stillbirths, and disseminated fetal infection. Journal of Veterinary Diagnostic
Investigation 23, 1041-1045.
Kotschwar Logan, M., Gerber, B.D., Karpanty, S.M., Justin, S., Rabenahy, F.N.,
2014. Assessing carnivore distribution from local knowledge across a human-
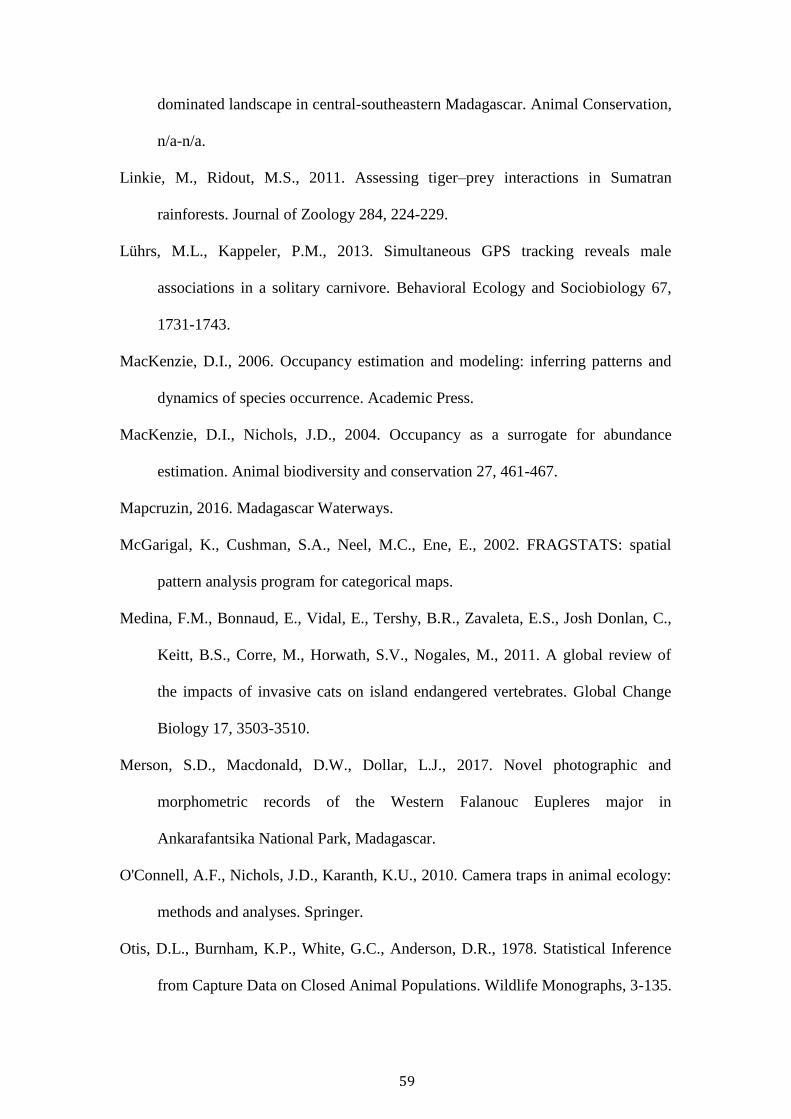
59
dominated landscape in central-southeastern Madagascar. Animal Conservation,
n/a-n/a.
Linkie, M., Ridout, M.S., 2011. Assessing tiger–prey interactions in Sumatran
rainforests. Journal of Zoology 284, 224-229.
Lührs, M.L., Kappeler, P.M., 2013. Simultaneous GPS tracking reveals male
associations in a solitary carnivore. Behavioral Ecology and Sociobiology 67,
1731-1743.
MacKenzie, D.I., 2006. Occupancy estimation and modeling: inferring patterns and
dynamics of species occurrence. Academic Press.
MacKenzie, D.I., Nichols, J.D., 2004. Occupancy as a surrogate for abundance
estimation. Animal biodiversity and conservation 27, 461-467.
Mapcruzin, 2016. Madagascar Waterways.
McGarigal, K., Cushman, S.A., Neel, M.C., Ene, E., 2002. FRAGSTATS: spatial
pattern analysis program for categorical maps.
Medina, F.M., Bonnaud, E., Vidal, E., Tershy, B.R., Zavaleta, E.S., Josh Donlan, C.,
Keitt, B.S., Corre, M., Horwath, S.V., Nogales, M., 2011. A global review of
the impacts of invasive cats on island endangered vertebrates. Global Change
Biology 17, 3503-3510.
Merson, S.D., Macdonald, D.W., Dollar, L.J., 2017. Novel photographic and
morphometric records of the Western Falanouc Eupleres major in
Ankarafantsika National Park, Madagascar.
O'Connell, A.F., Nichols, J.D., Karanth, K.U., 2010. Camera traps in animal ecology:
methods and analyses. Springer.
Otis, D.L., Burnham, K.P., White, G.C., Anderson, D.R., 1978. Statistical Inference
from Capture Data on Closed Animal Populations. Wildlife Monographs, 3-135.
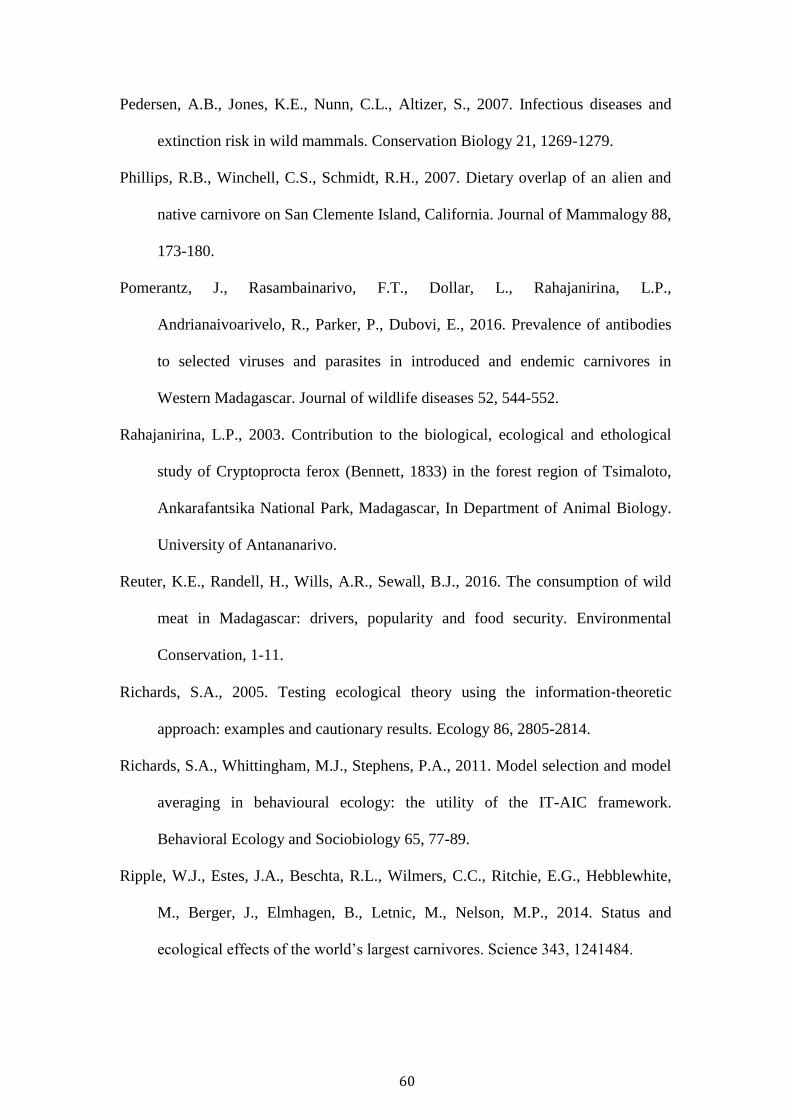
60
Pedersen, A.B., Jones, K.E., Nunn, C.L., Altizer, S., 2007. Infectious diseases and
extinction risk in wild mammals. Conservation Biology 21, 1269-1279.
Phillips, R.B., Winchell, C.S., Schmidt, R.H., 2007. Dietary overlap of an alien and
native carnivore on San Clemente Island, California. Journal of Mammalogy 88,
173-180.
Pomerantz, J., Rasambainarivo, F.T., Dollar, L., Rahajanirina, L.P.,
Andrianaivoarivelo, R., Parker, P., Dubovi, E., 2016. Prevalence of antibodies
to selected viruses and parasites in introduced and endemic carnivores in
Western Madagascar. Journal of wildlife diseases 52, 544-552.
Rahajanirina, L.P., 2003. Contribution to the biological, ecological and ethological
study of Cryptoprocta ferox (Bennett, 1833) in the forest region of Tsimaloto,
Ankarafantsika National Park, Madagascar, In Department of Animal Biology.
University of Antananarivo.
Reuter, K.E., Randell, H., Wills, A.R., Sewall, B.J., 2016. The consumption of wild
meat in Madagascar: drivers, popularity and food security. Environmental
Conservation, 1-11.
Richards, S.A., 2005. Testing ecological theory using the information‐theoretic
approach: examples and cautionary results. Ecology 86, 2805-2814.
Richards, S.A., Whittingham, M.J., Stephens, P.A., 2011. Model selection and model
averaging in behavioural ecology: the utility of the IT-AIC framework.
Behavioral Ecology and Sociobiology 65, 77-89.
Ripple, W.J., Estes, J.A., Beschta, R.L., Wilmers, C.C., Ritchie, E.G., Hebblewhite,
M., Berger, J., Elmhagen, B., Letnic, M., Nelson, M.P., 2014. Status and
ecological effects of the world’s largest carnivores. Science 343, 1241484.
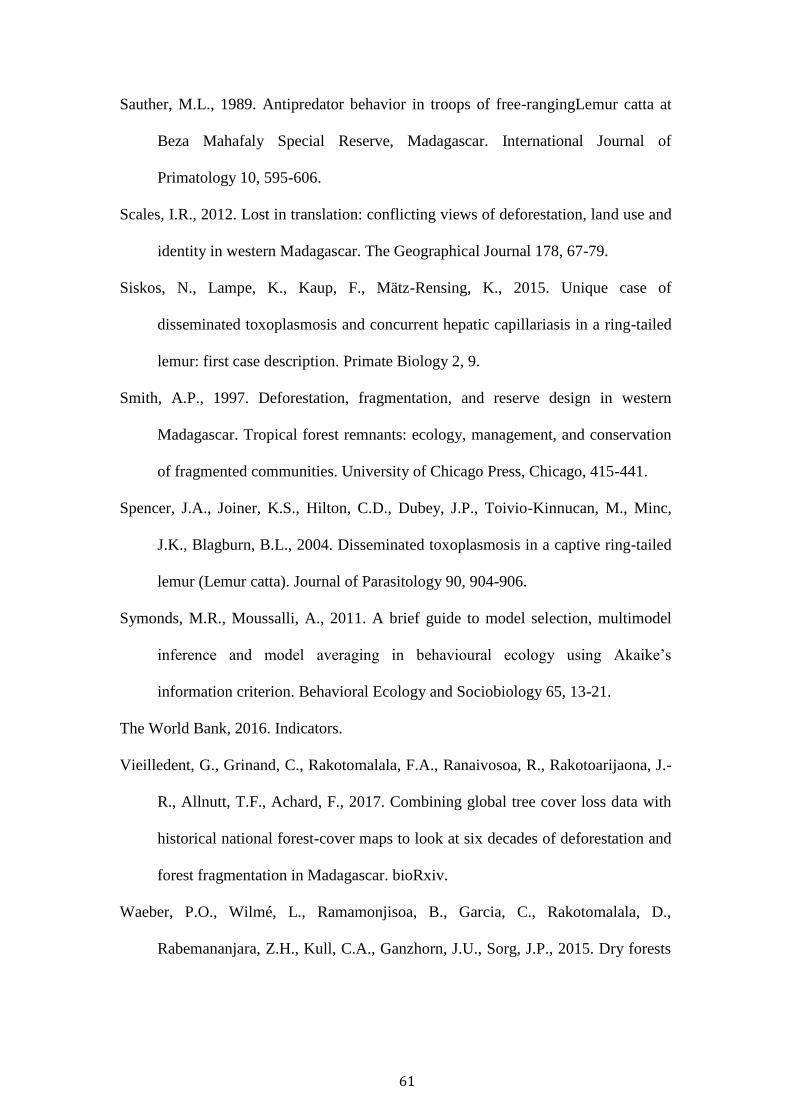
61
Sauther, M.L., 1989. Antipredator behavior in troops of free-rangingLemur catta at
Beza Mahafaly Special Reserve, Madagascar. International Journal of
Primatology 10, 595-606.
Scales, I.R., 2012. Lost in translation: conflicting views of deforestation, land use and
identity in western Madagascar. The Geographical Journal 178, 67-79.
Siskos, N., Lampe, K., Kaup, F., Mätz-Rensing, K., 2015. Unique case of
disseminated toxoplasmosis and concurrent hepatic capillariasis in a ring-tailed
lemur: first case description. Primate Biology 2, 9.
Smith, A.P., 1997. Deforestation, fragmentation, and reserve design in western
Madagascar. Tropical forest remnants: ecology, management, and conservation
of fragmented communities. University of Chicago Press, Chicago, 415-441.
Spencer, J.A., Joiner, K.S., Hilton, C.D., Dubey, J.P., Toivio-Kinnucan, M., Minc,
J.K., Blagburn, B.L., 2004. Disseminated toxoplasmosis in a captive ring-tailed
lemur (Lemur catta). Journal of Parasitology 90, 904-906.
Symonds, M.R., Moussalli, A., 2011. A brief guide to model selection, multimodel
inference and model averaging in behavioural ecology using Akaike’s
information criterion. Behavioral Ecology and Sociobiology 65, 13-21.
The World Bank, 2016. Indicators.
Vieilledent, G., Grinand, C., Rakotomalala, F.A., Ranaivosoa, R., Rakotoarijaona, J.-
R., Allnutt, T.F., Achard, F., 2017. Combining global tree cover loss data with
historical national forest-cover maps to look at six decades of deforestation and
forest fragmentation in Madagascar. bioRxiv.
Waeber, P.O., Wilmé, L., Ramamonjisoa, B., Garcia, C., Rakotomalala, D.,
Rabemananjara, Z.H., Kull, C.A., Ganzhorn, J.U., Sorg, J.P., 2015. Dry forests
62
in Madagascar: neglected and under pressure. International Forestry Review 17,
127-148.
Zinner, D., Wygoda, C., Razafimanantsoa, L., Rasoloarison, R., T. Andrianandrasana,
H., Ganzhorn, J.U., Torkler, F., 2013. Analysis of deforestation patterns in the
central Menabe, Madagascar, between 1973 and 2010. Regional Environmental
Change 14, 157-166.
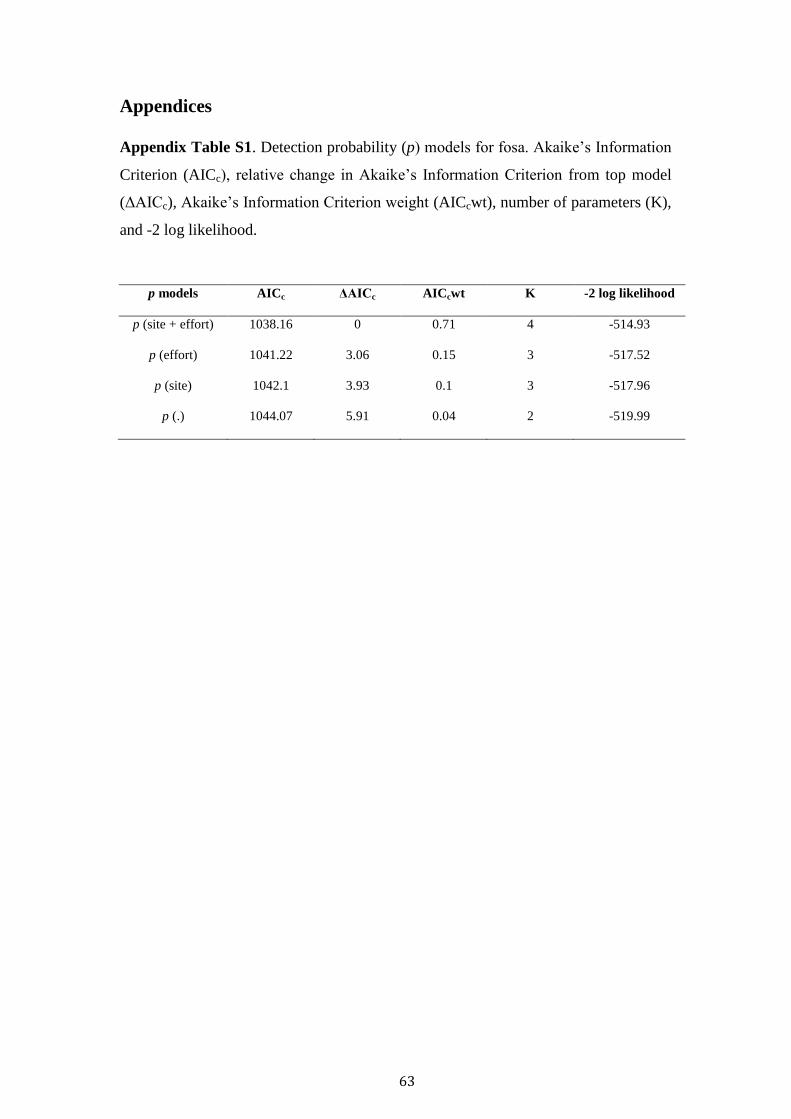
63
Appendices
Appendix Table S1. Detection probability (p) models for fosa. Akaike’s Information
Criterion (AICc), relative change in Akaike’s Information Criterion from top model
(ΔAICc), Akaike’s Information Criterion weight (AICcwt), number of parameters (K),
and -2 log likelihood.
p models AICc ΔAICc AICcwt K -2 log likelihood
p (site + effort) 1038.16 0 0.71 4 -514.93
p (effort) 1041.22 3.06 0.15 3 -517.52
p (site) 1042.1 3.93 0.1 3 -517.96
p (.) 1044.07 5.91 0.04 2 -519.99
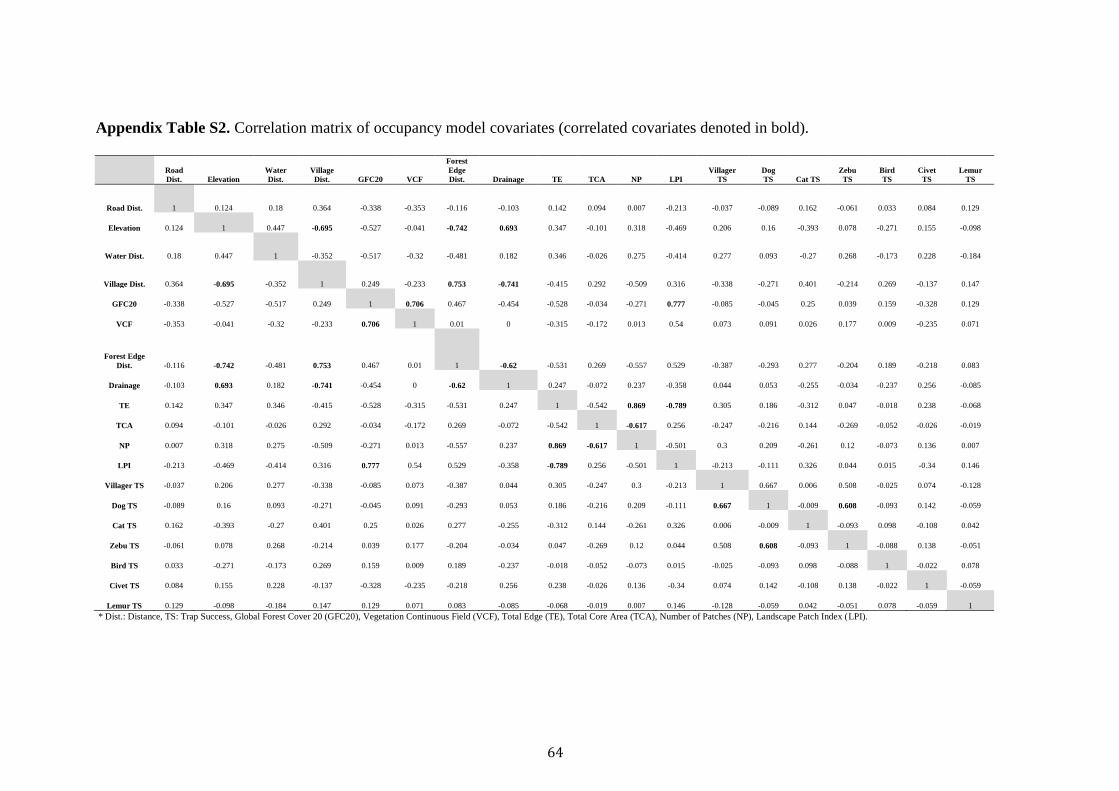
64
Appendix Table S2. Correlation matrix of occupancy model covariates (correlated covariates denoted in bold).
Road
Dist. Elevation
Water
Dist.
Village
Dist. GFC20 VCF
Forest
Edge
Dist. Drainage TE TCA NP LPI
Villager
TS
Dog
TS Cat TS
Zebu
TS
Bird
TS
Civet
TS
Lemur
TS
Road Dist. 1 0.124 0.18 0.364 -0.338 -0.353 -0.116 -0.103 0.142 0.094 0.007 -0.213 -0.037 -0.089 0.162 -0.061 0.033 0.084 0.129
Elevation 0.124 1 0.447 -0.695 -0.527 -0.041 -0.742 0.693 0.347 -0.101 0.318 -0.469 0.206 0.16 -0.393 0.078 -0.271 0.155 -0.098
Water Dist. 0.18 0.447 1 -0.352 -0.517 -0.32 -0.481 0.182 0.346 -0.026 0.275 -0.414 0.277 0.093 -0.27 0.268 -0.173 0.228 -0.184
Village Dist. 0.364 -0.695 -0.352 1 0.249 -0.233 0.753 -0.741 -0.415 0.292 -0.509 0.316 -0.338 -0.271 0.401 -0.214 0.269 -0.137 0.147
GFC20 -0.338 -0.527 -0.517 0.249 1 0.706 0.467 -0.454 -0.528 -0.034 -0.271 0.777 -0.085 -0.045 0.25 0.039 0.159 -0.328 0.129
VCF -0.353 -0.041 -0.32 -0.233 0.706 1 0.01 0 -0.315 -0.172 0.013 0.54 0.073 0.091 0.026 0.177 0.009 -0.235 0.071
Forest Edge
Dist. -0.116 -0.742 -0.481 0.753 0.467 0.01 1 -0.62 -0.531 0.269 -0.557 0.529 -0.387 -0.293 0.277 -0.204 0.189 -0.218 0.083
Drainage -0.103 0.693 0.182 -0.741 -0.454 0 -0.62 1 0.247 -0.072 0.237 -0.358 0.044 0.053 -0.255 -0.034 -0.237 0.256 -0.085
TE 0.142 0.347 0.346 -0.415 -0.528 -0.315 -0.531 0.247 1 -0.542 0.869 -0.789 0.305 0.186 -0.312 0.047 -0.018 0.238 -0.068
TCA 0.094 -0.101 -0.026 0.292 -0.034 -0.172 0.269 -0.072 -0.542 1 -0.617 0.256 -0.247 -0.216 0.144 -0.269 -0.052 -0.026 -0.019
NP 0.007 0.318 0.275 -0.509 -0.271 0.013 -0.557 0.237 0.869 -0.617 1 -0.501 0.3 0.209 -0.261 0.12 -0.073 0.136 0.007
LPI -0.213 -0.469 -0.414 0.316 0.777 0.54 0.529 -0.358 -0.789 0.256 -0.501 1 -0.213 -0.111 0.326 0.044 0.015 -0.34 0.146
Villager TS -0.037 0.206 0.277 -0.338 -0.085 0.073 -0.387 0.044 0.305 -0.247 0.3 -0.213 1 0.667 0.006 0.508 -0.025 0.074 -0.128
Dog TS -0.089 0.16 0.093 -0.271 -0.045 0.091 -0.293 0.053 0.186 -0.216 0.209 -0.111 0.667 1 -0.009 0.608 -0.093 0.142 -0.059
Cat TS 0.162 -0.393 -0.27 0.401 0.25 0.026 0.277 -0.255 -0.312 0.144 -0.261 0.326 0.006 -0.009 1 -0.093 0.098 -0.108 0.042
Zebu TS -0.061 0.078 0.268 -0.214 0.039 0.177 -0.204 -0.034 0.047 -0.269 0.12 0.044 0.508 0.608 -0.093 1 -0.088 0.138 -0.051
Bird TS 0.033 -0.271 -0.173 0.269 0.159 0.009 0.189 -0.237 -0.018 -0.052 -0.073 0.015 -0.025 -0.093 0.098 -0.088 1 -0.022 0.078
Civet TS 0.084 0.155 0.228 -0.137 -0.328 -0.235 -0.218 0.256 0.238 -0.026 0.136 -0.34 0.074 0.142 -0.108 0.138 -0.022 1 -0.059
Lemur TS 0.129 -0.098 -0.184 0.147 0.129 0.071 0.083 -0.085 -0.068 -0.019 0.007 0.146 -0.128 -0.059 0.042 -0.051 0.078 -0.059 1
* Dist.: Distance, TS: Trap Success, Global Forest Cover 20 (GFC20), Vegetation Continuous Field (VCF), Total Edge (TE), Total Core Area (TCA), Number of Patches (NP), Landscape Patch Index (LPI).
65
Chapter Three
Activity patterns of sympatric living exotic and
endemic carnivores (the fosa) in Western
Madagascar’s deciduous forests
66
Abstract
Western Madagascar’s deciduous forest is an important, threatened habitat to little-
known Eupleridae, such as the fosa Cryptoprocta ferox. Using camera-trap grids
established in two important deciduous forests, Ankarafantsika National Park and
Andranomena Special Reserve we report the impact of the activity of exotic
carnivores on that of the fosa. Three methodologies, kernel density, circular and wave
analysis were used to evaluate the activity pattern overlap between exotic Feral cats
Felis sp., domestic dogs Canis familiaris, exotic small Indian civets Viverricula
indica, and the endemic fosa. Our results showed fosas to be cathemeral, peaking in
activity in the evening and at dawn. Cats were nocturnal, whilst also highly active at
dusk. Civets did not display a dominant period of activity, but were relatively more
active in the night, and at dusk. In contrast, dogs were diurnal, and also active at
dawn, in alignment with human activity. Fosa activity significantly overlapped with
the nocturnal cat and civet, whilst being distinct from the diurnal dog and humans.
Our results suggest there is potentially a competitive impact of exotic feral dogs and
cats when present across fosas’ dry forest habitat. This highlights the need for further
examination into the impact of Madagascar’s exotic carnivores, and the experimental
trial to investigate the impact of their removal (or reduced abundance) on
Madagascar’s wildlife.
Keywords: Activity patterns, Madagascar, Eupleridae, Fosa, Cryptoprocta ferox,
deforestation, invasive species, Menabe, Ankarafantsika.

67
This chapter forms the basis of a paper prepared for Journal of Zoology of which I am
the lead author and my co-authors are Luke J Dollar, Cedric Kai Wei Tan and David
W Macdonald.
68
Introduction
Interspecific competition has been demonstrated to strongly influence the behaviour,
abundance and distribution of sympatric-living carnivores (Creel and Creel 1996;
Fedriani et al. 2000; Berger and Gese 2007). To facilitate coexistence, competing
carnivores typically define their niche through the distinction in diet (Bothma et al.
1984; Almeida Jácomo et al. 2004), space (Vanak et al. 2013) and/or temporal
activity patterns (Carothers and Jaksić 1984; Kronfeld-Schor and Dayan 2003;
Hayward and Slotow 2009).
Understanding sympatric species’ activity patterns is important, as it may have
evolutionary significance, ecological and physiological ramifications (Kronfeld-Schor
and Dayan 2003). The partitioning of species’ activity patterns may be shaped by two
species driven processes, exploitation and interference competition (Carothers and
Jaksić 1984; Kronfeld-Schor and Dayan 2003). Exploitation competition involves the
reduction of a shared resource between two organisms. In contrast, interference
competition exists when one organism reduces another’s ability to access a shared
resource. However, interspecies competition is not the only process to shape a
species’ activity but equally important is the influence of other abiotic mechanisms,
such as the lunar cycle (Owings and Lockard 1971; Cozzi et al. 2012). Given today’s
endemic species widely occupy disturbed landscapes (Haddad et al. 2015), potentially
competing with a host of new exotic competitors, understanding activity patterns is
now increasingly important.
Fosas (Cryptoprocta ferox, and commonly known as fossa, will be henceforth
described as ‘fosa’ in alignment with Duckworth et al. (2014) to reduce the usage of
similar common names in the Eupleridae) are Madagascar’s largest carnivore and the
world’s only mammalian primate predator specialist (Dollar et al. 2007; Hawkins and
69
Racey 2008). Occupying much of forested Madagascar, fosas are the country’s most
widely distributed carnivore, and are currently listed as ‘vulnerable’ by the IUCN Red
List (Hawkins 2016). Fosas are threatened by deforestation (Hawkins and Racey
2005; Gerber et al. 2012b), bushmeat consumption (Golden 2009; Farris et al. 2015b),
retaliatory killing (Kotschwar Logan et al. 2014), and exotic carnivores (Gerber et al.
2012c; Farris et al. 2015b).
Recent research has documented the potential impact of exotic carnivores on
Madagascar’s endemic carnivores’ spatio-temporal activity. These temporal impacts
have been well documented in eastern Madagascar, with studies in Ranomafana
National Park and Masoala-Makira reporting fosas to display cathemeral and
nocturnal activity, depending on the study and year (Dollar 1999; Gerber et al. 2012a;
Farris et al. 2015a). In western Madagascar, a deciduous forest radio-telemetry study
in Tsimaloto northwest Ankarafantsika National Park provided some evidence for
cathemeral activity as fosas’ principal behaviour in an area absent of dogs
(Rahajanirina 2003). Across deciduous forests and rainforests, fosas’ spatial
sensitivity to dogs has also been reported, with fosas notably absent at sites where
domestic dogs were abundant (Dollar 2006; Barcala 2009; Gerber et al. 2012a; Farris
et al. 2015a). However, despite Rahajanirina’s (2003) preliminary insight into the
activity of the fosa in northwest Ankarafantsika, a systematic investigation of exotic
and endemic carnivores temporal activity in deciduous forests is otherwise lacking.
Deciduous forests comprise some of the world’s most threatened forests
(Janzen 1988). In fact, the highest rates of deciduous deforestation in Africa were
recorded in Madagascar from 1980 – 2000 (Miles et al. 2006). It has previously been
estimated that only 3% of Madagascar’s deciduous forests remain (Smith 1997; WWF
2001), with its current cover likely much lower (Zinner et al. 2013). Unfortunately
70
research on deciduous forests has largely been neglected in favour of research
activities on Madagascar’s eastern rainforests (Waeber et al. 2015). Given activity
patterns are dictated by a combination of biotic (e.g. inter-species competition) and
abiotic (e.g. temperature, lunar cycle) factors (Kronfeld-Schor and Dayan 2003;
Vieira et al. 2017), it is necessary to understand a species’ temporal use of space
throughout its major habitats. Nevertheless, there has been little research documenting
the competitive effects of exotic species in one of the fosas’ major habitats and one of
Madagascar’s most threatened regions, its deciduous forests. As such, empirical study
is warranted to understand the extent of exotic-endemic species competition across
Madagascar’s landscape.
This study provides the first examination of fosas and exotic carnivores’ use
of the diel period in two different deciduous forested regions. Our objectives were to:
i) identify the major patterns of sympatric living exotic and endemic carnivore
temporal activity; ii) examine patterns of temporal overlap, or segregation; and iii)
examine differences in carnivore activity between the two study sites. Three
contrasting methodologies, kernel density analysis, wave, and circular analysis were
used to examine the principal periods of carnivore activity and periods of overlap or
segregation. Given previous studies use of kernel density analysis and resource
selection (Gerber et al. 2012c; Farris et al. 2015a) to examine activity patterns of
Madagascar’s carnivores, a comparison of all three methods will provide greater
scrutiny of each species’ activity pattern. This research provides much needed
evidence of the effects of exotic species on mammals occupying western deciduous
forests, and reports their impact across the fosas’ westerly range.
71
Methods
Sites
Two deciduous forests typical of Madagascar’s western landscape were identified in
the regions of Marovoay and Menabe. Located in the north-western region of
Marovoay, Ankarafantsika National Park (ANP) is Madagascar’s largest contiguous
deciduous forest (1,350 km2). The forest contains a variety of endemic species,
including two euplerids, the vulnerable fosa and the endangered Western Falanouc
Eupleres major (Merson et al. 2017). The camera-trap grid in ANP encompassed
37.73 km2 of habitat containing a mixture of old-growth forest, degraded forest, and
savannah surrounding three rural villages.
Madagascar’s western Menabe region contains some of the largest fragments
of deciduous forest. It is one of Madagascar’s most important landscapes, supporting
high levels of regional and local endemism, coupled with high annual deforestation
(Zinner et al. 2013). Covering 64 km2, Andranomena Special Reserve (ASR) is
situated approximately 30 km north of Morondava. Two species of euplerids persist,
the fosa and the endangered Bokiboky Mungotictis decemlineata (Hawkins 1998;
Razafimanantsoa 2003). The camera-trap grid in ASR covered 35.45 km2 of mostly
contiguous forest, although sections of ASR were experiencing high levels of illegal
logging during surveys.
Camera-trap placement
ANP and ASR were surveyed for 35 and 80 days respectively during April – June
2014, and May - June 2015. Approximately 80 pairs of camera-traps (Cuddeback
Ambush IR 1187, Wisonsin, USA) were spaced approximately 500 meters apart
within each site. Camera-stations were established on trails to improve detection of
72
focal carnivores species, the fosa (Dollar 2006), falanouc, bokiboky and exotic
carnivores (feral cat Felis sp., domestic dog Canis familiaris, exotic small Indian
civets Viverricula indica). Cameras were programmed to take only photos, every five
seconds, and were placed approximately 30 cm above ground, flanking trails to
improve species detection and account for potential camera-trap failure. Camera-
stations were in operation for 24 hours per day, allowing the detection of individual
species throughout the diel period, thus permitting the analysis of species’ temporal
activity.
Analysis
Any detection of a species within a thirty-minute period was recorded as a single
event (Linkie and Ridout 2011). In examining the dominant period of each species’
activity, the 24-hour period was separated into dawn, day, dusk and night. Dawn and
dusk (crepuscular) were classified as one hour before and after sunrise and sunset
respectively. Day (diurnal) was considered as the period between these hours, and
night (nocturnal) classified as the period outside. For each category of period, we
calculated the number of counts expected under an even distribution of counts
throughout the day, i.e. total counts divided by 24 multiplied by the number of hours
in that period. Thereafter, a chi-squared test (or Fisher exact test for the civet due to
low counts), and a post-hoc chi-squared test were performed against this even
distribution to determine if a species’ exhibited a dominant period of activity (dawn,
day, dusk, night).
Three statistical methods, kernel density, circular and wave analysis were
employed to examine the difference in activity pattern between two species. Given
previous studies of Madagascar’s rainforest dwelling carnivore activity patterns have
73
employed only kernel density analyses (Gerber et al. 2012a; Farris et al. 2015a), our
comparison of the three methodologies will provide greater scrutiny of each
carnivore’s activity pattern. Data collected from both sites (ANP and ASR) were
combined for all analyses except for the investigation of differences in inter-site
species activity patterns.
Analyses were conducted in R (Version 3.2.4). A species’ time of detection (t)
was measured separately for each method, and converted into radians ( = 2t/24).
Kernel density t was equal to the proportion of hours and minutes in one day. Circular
t was equal to the hour and minute (in proportion of an hour) of detection, and Wave t
was equal to the detection time rounded to the nearest hour.
Kernel density analysis presumes that individual detections represent a
random sample of the underlying distribution, with this probability density function
representing a species’ true activity pattern (Ridout and Linkie 2009). A measure of
overlap was calculated using program ‘overlap’ in R (Package 0.2.6)(Meredith and
Ridout 2014). The coefficient of overlap () was calculated on a scale of 0 – 1 ( = 1
indicating an identical density distribution)(Weitzman 1970). Several coefficient
measures were available, however 1 was chosen given its superiority for smaller
sample sizes (Ridout and Linkie 2009).
A species’ diel period activity represents a circular distribution (24 hour
clock), ideal for circular statistics (Zar 2010). A circular ANOVA was performed,
testing for significant difference in the mean activity time between different species.
An equal kappa test was performed to ensure homogeneity of concentration amongst
samples, and if the assumption was violated a non-parametric Watson-Wheeler test
was used (Pewsey et al. 2013). The circular analysis was conducted in R package
‘circular’ (3.2.2 Version)(Agostinelli and Lund 2013).
74
The final method, wave analysis, involves the prediction of daily activity as a
function of continuous trigonometric predictor variables (Zar 1996). Based on the
observed activity, four wave models were constructed representing the predicted daily
activity as one and two full 24-hour cycles (Sin, Cos, Sin2, Cos2). We then
tested for significant differences in periodicity between two species using the
interaction term between the particular wave and species. (Sin * Species; Cos *
Species, Sin2 * Species, Cos2 * Species). Species is a categorical factor with the
two species as separate levels. The model with the highest adjusted R2 was selected,
and the significance of the interaction between the wave and species reported.
Results
ANP and ASR camera grids were in operation for 79 ± 9.2 and 36 ± 6.2 days
respectively (camera theft reduced the ASR survey’s length). This resulted in a total
sampling effort of 8,730 nights. All locally present endemic and exotic carnivores
were photographed, however the falanouc (Merson et al. 2017) was detected only
once and the bokiboky twice, hence we excluded these species from analysis. Fosas
were independently detected on 311 events (226 ANP, 85 ASR), dogs 942 (850 ANP,
92 ASR), and cats 477 (209 ANP, 268 ASR). Civets were only detected in ANP and
in total 75 times.
Fosas were cathemeral with no significant periodicity in activity (Chi-squared
= 7.7392, df = 3, p-value = 0.05172), however there was a trend for increased activity
in the evening and at dawn (Table 1)(Figure 1). Civets displayed a significant
periodicity in activity (Fisher’s exact test, p = 0.042), with predominant activity at
dusk and in the evening (Figure 1). However, the post-hoc Fisher’s exact test revealed
no significant difference between each period (Table 2). Cats were significantly more
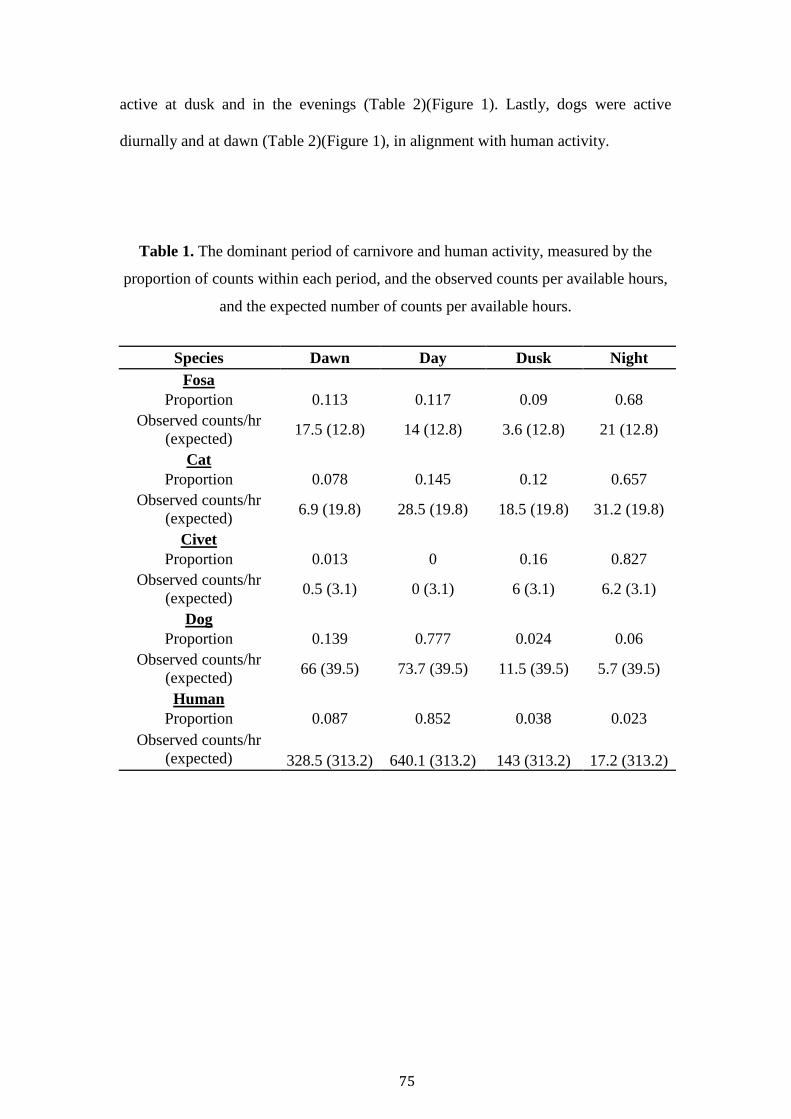
75
active at dusk and in the evenings (Table 2)(Figure 1). Lastly, dogs were active
diurnally and at dawn (Table 2)(Figure 1), in alignment with human activity.
Table 1. The dominant period of carnivore and human activity, measured by the
proportion of counts within each period, and the observed counts per available hours,
and the expected number of counts per available hours.
Species Dawn Day Dusk Night
Fosa
Proportion 0.113 0.117 0.09 0.68
Observed counts/hr
(expected) 17.5 (12.8) 14 (12.8) 3.6 (12.8) 21 (12.8)
Cat
Proportion 0.078 0.145 0.12 0.657
Observed counts/hr
(expected) 6.9 (19.8) 28.5 (19.8) 18.5 (19.8) 31.2 (19.8)
Civet
Proportion 0.013 0 0.16 0.827
Observed counts/hr
(expected) 0.5 (3.1) 0 (3.1) 6 (3.1) 6.2 (3.1)
Dog
Proportion 0.139 0.777 0.024 0.06
Observed counts/hr
(expected) 66 (39.5) 73.7 (39.5) 11.5 (39.5) 5.7 (39.5)
Human
Proportion 0.087 0.852 0.038 0.023
Observed counts/hr
(expected) 328.5 (313.2) 640.1 (313.2) 143 (313.2) 17.2 (313.2)
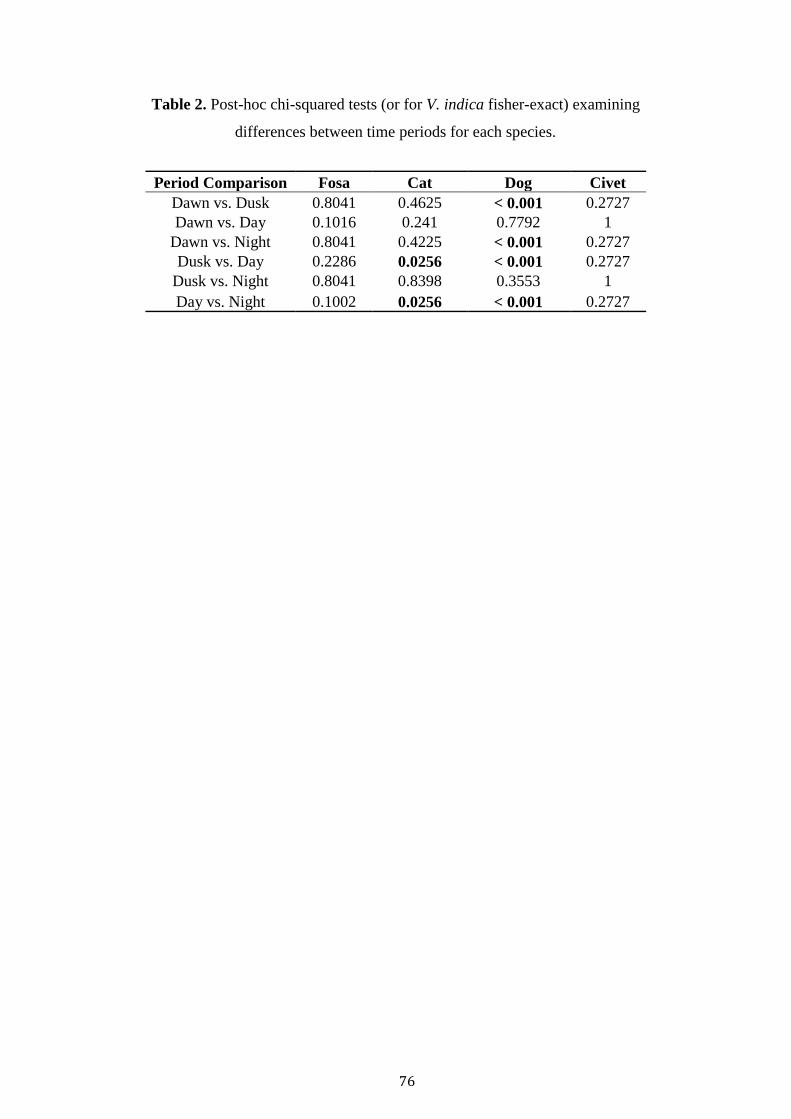
76
Table 2. Post-hoc chi-squared tests (or for V. indica fisher-exact) examining
differences between time periods for each species.
Period Comparison Fosa Cat Dog Civet
Dawn vs. Dusk 0.8041 0.4625 < 0.001 0.2727
Dawn vs. Day 0.1016 0.241 0.7792 1
Dawn vs. Night 0.8041 0.4225 < 0.001 0.2727
Dusk vs. Day 0.2286 0.0256 < 0.001 0.2727
Dusk vs. Night 0.8041 0.8398 0.3553 1
Day vs. Night 0.1002 0.0256 < 0.001 0.2727
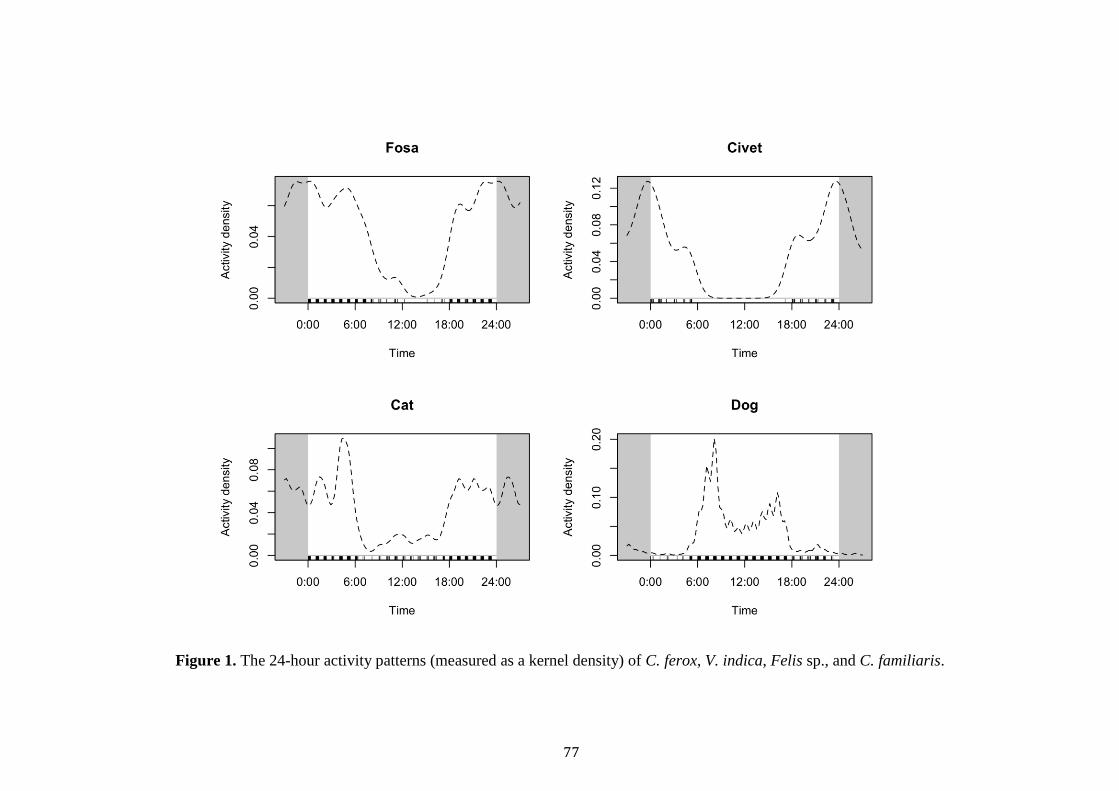
77
Figure 1. The 24-hour activity patterns (measured as a kernel density) of C. ferox, V. indica, Felis sp., and C. familiaris.
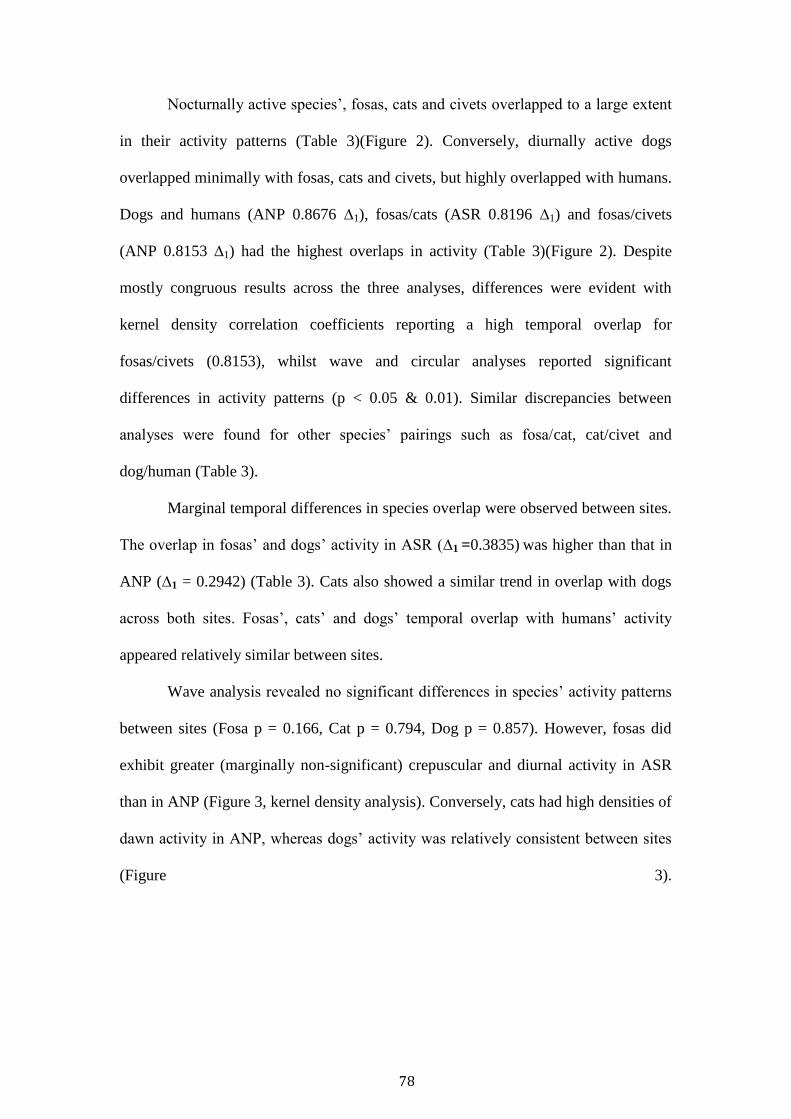
78
Nocturnally active species’, fosas, cats and civets overlapped to a large extent
in their activity patterns (Table 3)(Figure 2). Conversely, diurnally active dogs
overlapped minimally with fosas, cats and civets, but highly overlapped with humans.
Dogs and humans (ANP 0.8676 ∆1), fosas/cats (ASR 0.8196 ∆1) and fosas/civets
(ANP 0.8153 ∆1) had the highest overlaps in activity (Table 3)(Figure 2). Despite
mostly congruous results across the three analyses, differences were evident with
kernel density correlation coefficients reporting a high temporal overlap for
fosas/civets (0.8153), whilst wave and circular analyses reported significant
differences in activity patterns (p < 0.05 & 0.01). Similar discrepancies between
analyses were found for other species’ pairings such as fosa/cat, cat/civet and
dog/human (Table 3).
Marginal temporal differences in species overlap were observed between sites.
The overlap in fosas’ and dogs’ activity in ASR (∆1 =0.3835) was higher than that in
ANP (∆1 = 0.2942) (Table 3). Cats also showed a similar trend in overlap with dogs
across both sites. Fosas’, cats’ and dogs’ temporal overlap with humans’ activity
appeared relatively similar between sites.
Wave analysis revealed no significant differences in species’ activity patterns
between sites (Fosa p = 0.166, Cat p = 0.794, Dog p = 0.857). However, fosas did
exhibit greater (marginally non-significant) crepuscular and diurnal activity in ASR
than in ANP (Figure 3, kernel density analysis). Conversely, cats had high densities of
dawn activity in ANP, whereas dogs’ activity was relatively consistent between sites
(Figure 3).
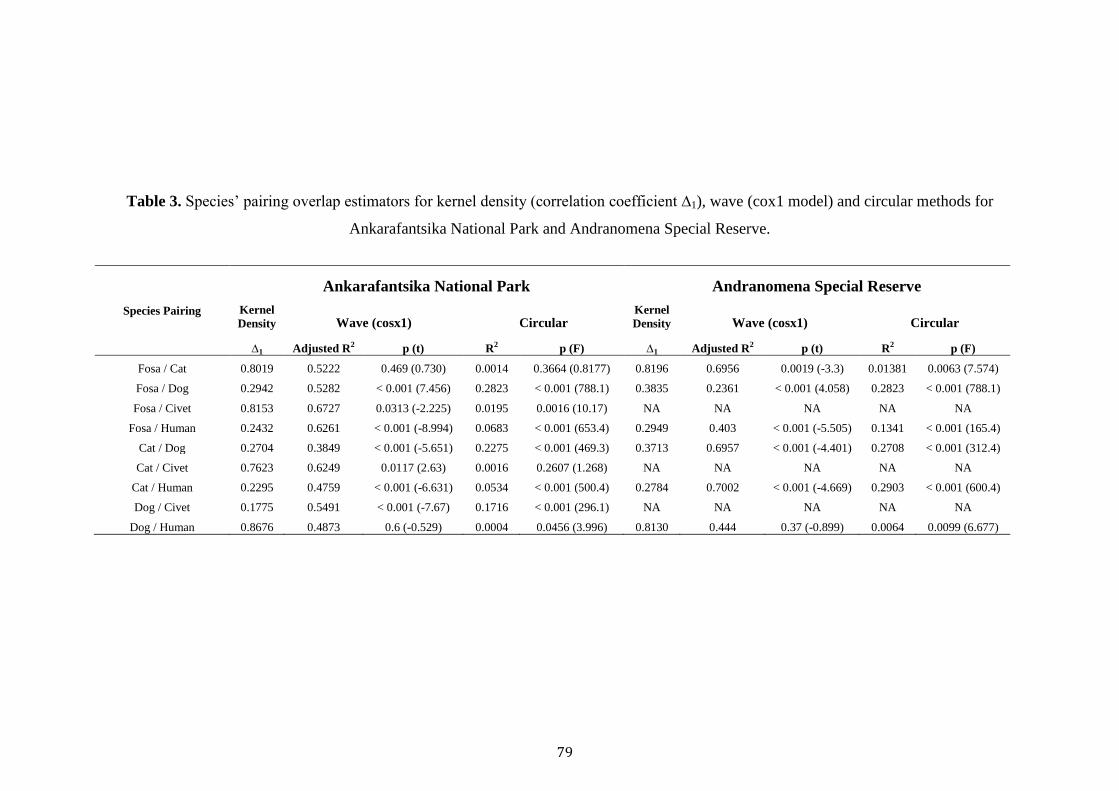
79
Table 3. Species’ pairing overlap estimators for kernel density (correlation coefficient ∆1), wave (cox1 model) and circular methods for
Ankarafantsika National Park and Andranomena Special Reserve.
Species Pairing
Ankarafantsika National Park Andranomena Special Reserve
Kernel
Density Wave (cosx1) Circular Kernel
Density Wave (cosx1) Circular
∆1 Adjusted R2 p (t) R2 p (F) ∆1 Adjusted R2 p (t) R2 p (F)
Fosa / Cat 0.8019 0.5222 0.469 (0.730) 0.0014 0.3664 (0.8177) 0.8196 0.6956 0.0019 (-3.3) 0.01381 0.0063 (7.574)
Fosa / Dog 0.2942 0.5282 < 0.001 (7.456) 0.2823 < 0.001 (788.1) 0.3835 0.2361 < 0.001 (4.058) 0.2823 < 0.001 (788.1)
Fosa / Civet 0.8153 0.6727 0.0313 (-2.225) 0.0195 0.0016 (10.17) NA NA NA NA NA
Fosa / Human 0.2432 0.6261 < 0.001 (-8.994) 0.0683 < 0.001 (653.4) 0.2949 0.403 < 0.001 (-5.505) 0.1341 < 0.001 (165.4)
Cat / Dog 0.2704 0.3849 < 0.001 (-5.651) 0.2275 < 0.001 (469.3) 0.3713 0.6957 < 0.001 (-4.401) 0.2708 < 0.001 (312.4)
Cat / Civet 0.7623 0.6249 0.0117 (2.63) 0.0016 0.2607 (1.268) NA NA NA NA NA
Cat / Human 0.2295 0.4759 < 0.001 (-6.631) 0.0534 < 0.001 (500.4) 0.2784 0.7002 < 0.001 (-4.669) 0.2903 < 0.001 (600.4)
Dog / Civet 0.1775 0.5491 < 0.001 (-7.67) 0.1716 < 0.001 (296.1) NA NA NA NA NA
Dog / Human 0.8676 0.4873 0.6 (-0.529) 0.0004 0.0456 (3.996) 0.8130 0.444 0.37 (-0.899) 0.0064 0.0099 (6.677)
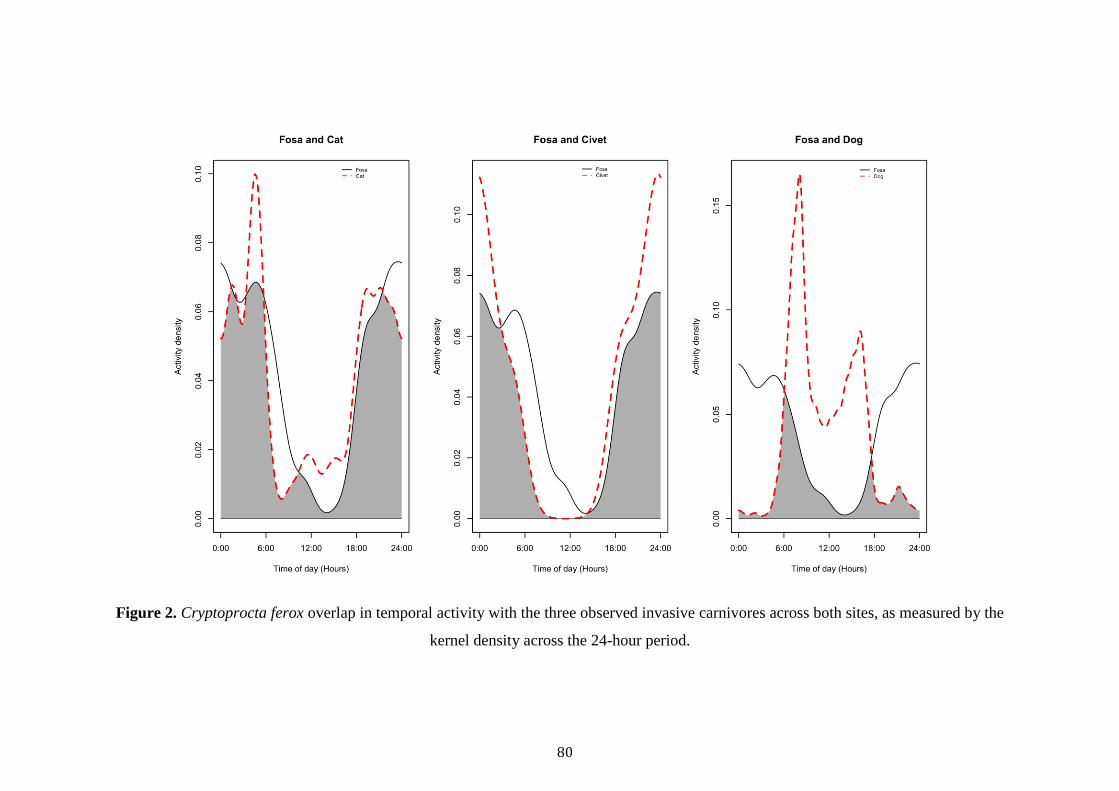
80
Figure 2. Cryptoprocta ferox overlap in temporal activity with the three observed invasive carnivores across both sites, as measured by the
kernel density across the 24-hour period.
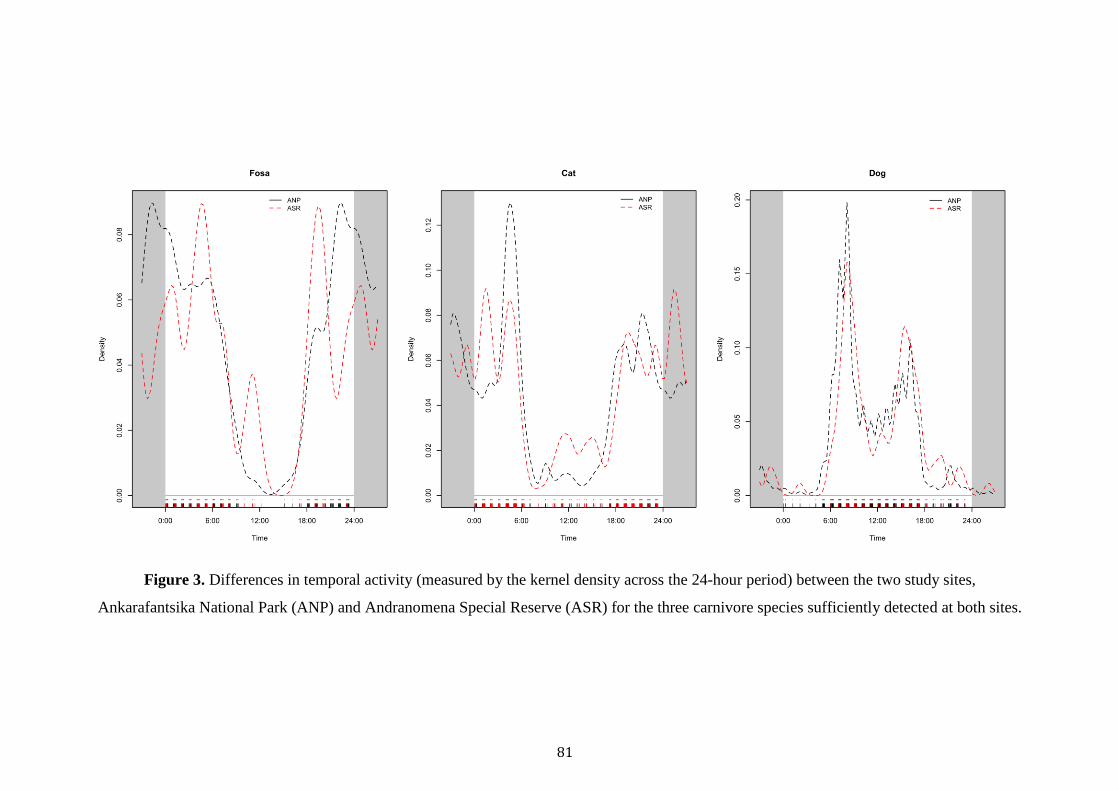
81
Figure 3. Differences in temporal activity (measured by the kernel density across the 24-hour period) between the two study sites,
Ankarafantsika National Park (ANP) and Andranomena Special Reserve (ASR) for the three carnivore species sufficiently detected at both sites.
82
Discussion
Fosas’ highly overlapped in activity with nocturnal cats and civets, while markedly
distinct from diurnal dogs and humans. The three methodologies were mostly
consistent, with higher kernel density overlap coefficients corresponding to
significant difference in activity patterns detected by wave and circular analyses. Our
results were mostly similar to previous rainforest studies in Ranomafana and
Masoala-Makira whereby fosas were observed to be cathemeral, but most active in
the crepuscular hours (Dollar 1999; Gerber et al. 2012a), or nocturnal (Farris et al.
2015a). Fosas’ activity pattern overlap with cats and civets, and fosas’ temporal
avoidance of dogs mirrored the results of previous rainforest studies. Previous
research in (then) dog-absent areas of ANP (Rahajanirina 2003) observed higher
nocturnality than estimated in our (dog present) ANP site, potentially suggesting
greater fosa nocturnality in association with increased dog presence. This association
could be confounded with other unaccountable factors, however, this behaviour has
been previously observed in Masoala-Makira (Farris et al. 2015a).
Carnivore overlap and competition
Fosas have previously been observed to display higher levels of diurnal activity in
sites absent of dogs (Dollar 1999; Rahajanirina 2003). Of particular comparative
interest was the study by Rahajanirina (2003) conducted in a remote section of our
shared ANP site. This site is devoid of human settlements inside the forest. In
contrast, our surveys documented fosas’ activity in an area of ANP with considerable
human activity and its associated dog presence. Previous ANP fosa trapping studies
have also observed a dramatic decrease in fosa captures (to zero) in association with
an increase in domestic dog captures. Following the euthanisation of captured dogs,
83
there was a subsequent rebound in fosa captures (Barcala 2009). The impact of dogs
(humans too) was also noticeable in examining differences in overlap between our
two sites. In ANP, fosas and cats overlapped less with dogs and humans compared to
ASR, with cats exhibiting a considerably higher capture rate in ASR. This is likely a
result of higher dog and human presence in ANP, evident by the tripled detection
rates of dogs and humans in ANP compared to ASR. Similar patterns have been
recorded in Masoala-Makira whereby fosas’ were observed to display greater
nocturnality at sites where human and dogs were most active, and greater diurnality at
sites where human and dogs were rare (Farris et al. 2015a). Likewise, Gerber et al.,
(2012a) observed fosas to mostly be absent at sites where dogs were most abundant
and active throughout the diel cycle, although other anthropogenic disturbances such
as forest degradation and fragmentation were likely influential too.
Domestic dogs represent a significant interspecific competitor to fosas. They
are considerably larger, and live in groups (Kleiman and Eisenberg 1973), having
been detected within the forest in pairs, and often accompanying humans during
forest-related activities. This is evident in our study where we found high degree of
overlap between dogs and humans in both study sites. Considering that dogs are a
prolific worldwide invasive predator (Hughes and Macdonald 2013), their potential
depletion of fosas’ prey is highly probable. However, dogs not only represent a source
of exploitation competition, but studies suggest a potential source of interference
competition too. Temporal niche shifts to maintain access to a species’ habitat, whilst
avoiding interspecific aggression has been observed between similar-sized invasive
and endemic carnivores (Harrington et al. 2009). Given dogs’ larger size and
sociality, fosa behavioural changes to greater nocturnality is a likely strategy to
reduce aggressive encounters whilst maintaining use of its habitat.
84
Fosas, cats and civets displayed the greatest temporal overlap, creating
potential for exploitation and interference competition. Of particular concern are feral
cats, a formidable worldwide invasive predator (Medina et al. 2011; Nogales et al.
2013) and a recognised predator of lemurs (Brockman et al. 2008) and other endemic
species. At ANP, feral cats have been recorded to weigh 2.9 – 5.5 kg (Brockman et al.
2008), significantly larger than local domestic cats and less than the average adult 6 –
7.4 kg female and male fosa (Hawkins 1998; Dollar 2006). Presumably, fosas’ larger
size would mostly prohibit interference competition, with male adult fosas (weighing
up to and over 11 kg) potentially capable of consuming smaller cats. In contrast, sub-
adult fosas are of comparable weight (Rahajanirina 2003; Dollar 2006), making inter-
species aggression and interference competition possible. Interestingly, a study of
fosa occupancy at our study sites, revealed that a higher presence of cats is negatively
associated with fosa presence. This negative association could potentially be an
artefact of shared temporality, with fosas detected less frequently at stations where
cats were active and/or abundant. Regardless of the underlying driver (interference
and/or exploitation competition), these occupancy and activity pattern results show
the potential negative impact that cats shared temporality is having on fosas.
Deciduous forest living civets recorded similar activity to that of their
rainforest counterparts (Gerber et al. 2012c; Farris et al. 2015a). Despite temporal
overlap with fosas, civets’ relatively small size and their preference for less forested
habitats means their direct competition with fosas is less likely. Civets however, are a
successful invasive carnivorous predator in islands across the Indian Ocean and parts
of Africa, capable of depleting shared smaller prey such as birds, reptiles and
mammals (Duckworth et al. 2015). Consequently, their predatory impact on
85
Madagascar’s endemic species should be evaluated, and strategies for their control
examined.
Analytical differences in methodologies
The kernel density overlap coefficient, and the circular and wave analyses’
significance tests were mostly congruous in their conclusion, i.e. high coefficient of
overlap (kernel density) was associated with an insignificant difference in activity
patterns (wave and circular). For species activity pattern comparisons including the
civet, a sample size effect could be applicable due to their low capture rate. Some
other differences did exist, potentially explained by circular/wave’s measurement of a
species’ peak times in activity, compared to kernel density’s measurement of overlap.
This means that species that significantly overlapped in activity, but maintained
different peaks in their activity, may result in contradicting results between kernel
density and wave/circular methodologies. Furthermore, there were also some
differences between the circular and wave analyses (i.e. wave estimated no significant
difference in human and dog activity, whilst circular estimated a significant
difference). These methodological differences could be the result of several factors.
Firstly, the circular method examines differences between mean peaks, while
assuming equal variance in time detected between species. Consequently, when
activity patterns are not unimodal, the circular approach could be misleading. In
contrast, the wave analysis examines differences between the peaks and troughs in a
species’ activity, accounting for the difference in variance in activity between species.
In conclusion, when examining a species’ activity pattern, an ecologist’s choice of a
particular statistical model should depend upon the objective of their research, with
86
the various models providing different insight into the distinct, often enigmatic,
aspects of a species temporal activity.
Conclusion
Our research provides evidence for shared temporality between fosas and exotic
carnivores. Shared temporal activity has the potential to create alternative forms of
intra-guild conflict in competition for resources. Consequently, sterilisation of
domestic carnivores (dogs/cats) and euthanisation of feral exotic species should be
considered as a potential strategy to reduce their impact upon Madagascar’s endemic
species. Such programs have been enacted by the Mad Dog Initiative in Ranomafana,
and explored in Barcala’s (2009) study in Ankarafantsika, where associations have
been observed between reduced dog and increased fosa trapping success. Support for
sterilisation programs has been reported in Ranomafana National Park, where 90% of
villagers’ approved the use of neuter programs if freely available (Valenta et al.
2016). If local sentiment is similar across Madagascar, the efficacy of such programs
should be studied to examine the relationship between exotic and endemic carnivore
abundance. With the control of exotic species (such as the feral cat) already a global
conservation priority, the efficacy of such programs is urgently needed to warrant
their implementation, and to ensure the integrity and continuance of Madagascar’s
biodiversity across its most important remaining habitats.
87
References
Agostinelli, C., Lund, U., 2013. R package circular: Circular Statistics (version 0.4-3).
URL https://r-forge. r-project. org/projects/circular.
Almeida Jácomo, A.T., Silveira, L., Diniz‐Filho, J.A.F., 2004. Niche separation
between the maned wolf (Chrysocyon brachyurus), the crab‐eating fox
(Dusicyon thous) and the hoary fox (Dusicyon vetulus) in central Brazil. Journal
of Zoology 262, 99-106.
Barcala, O., 2009. Invasive stray and feral dogs limit fosa (Cryptoprocta ferox)
populations in Ankarafantsika National Park, Madagascar. Duke University.
Berger, K.M., Gese, E.M., 2007. Does interference competition with wolves limit the
distribution and abundance of coyotes? Journal of Animal Ecology 76, 1075-
1085.
Bothma, J.d.P., Nel, J., Macdonald, A., 1984. Food niche separation between four
sympatric Namib Desert carnivores. Journal of Zoology 202, 327-340.
Brockman, D.K., Godfrey, L.R., Dollar, L.J., Ratsirarson, J., 2008. Evidence of
invasive Felis silvestris predation on Propithecus verreauxi at Beza Mahafaly
Special Reserve, Madagascar. International Journal of Primatology 29, 135-152.
Carothers, J.H., Jaksić, F.M., 1984. Time as a niche difference: the role of
interference competition. Oikos, 403-406.
Cozzi, G., Broekhuis, F., McNutt, J.W., Turnbull, L.A., Macdonald, D.W., Schmid,
B., 2012. Fear of the dark or dinner by moonlight? Reduced temporal
partitioning among Africa's large carnivores. Ecology 93, 2590-2599.
Creel, S., Creel, N.M., 1996. Limitation of African wild dogs by competition with
larger carnivores. Conservation Biology 10, 526-538.
88
Dollar, L., 1999. Preliminary report on the status, activity cycle, and ranging of
Cryptoprocta ferox in the Malagasy rainforest, with implications for
conservation. Small Carnivore Conservation 20, 7-10.
Dollar, L., Ganzhorn, J., Goodman, S., 2007. Primates and Other Prey in the
Seasonally Variable Diet of Cryptoprocta ferox in the Dry Deciduous Forest of
Western Madagascar, In Primate Anti-Predator Strategies. eds S. Gursky, K.A.I.
Nekaris, pp. 63-76. Springer US.
Dollar, L.J., 2006. Morphometrics, diet, and conservation of Cryptoprocta ferox.
Duke University.
Duckworth, J., Hawkins, A., Randrianasolo, H., Andrianarimisa, A., Goodman, S.,
2014. Suggested English names for Madagascar’s species of Carnivora. Small
Carnivore Conservation 50, 54-60.
Duckworth, J.W., Timmins, R.J., Muddapa, D., 2015. Viverricula indica, In The
IUCN Red List of Threatened Species.
Farris, Z.J., Gerber, B.D., Karpanty, S., Murphy, A., Andrianjakarivelo, V.,
Ratelolahy, F., Kelly, M.J., 2015a. When carnivores roam: temporal patterns
and overlap among Madagascar's native and exotic carnivores. Journal of
Zoology 296, 45-57.
Farris, Z.J., Golden, C.D., Karpanty, S., Murphy, A., Stauffer, D., Ratelolahy, F.,
Andrianjakarivelo, V., Holmes, C.M., Kelly, M.J., 2015b. Hunting, exotic
carnivores, and habitat loss: anthropogenic effects on a native carnivore
community, Madagascar. PLoS One 10, e0136456.
Fedriani, J.M., Fuller, T.K., Sauvajot, R.M., York, E.C., 2000. Competition and
intraguild predation among three sympatric carnivores. Oecologia 125, 258-270.
89
Gerber, B.D., Karpanty, S.M., Randrianantenaina, J., 2012a. Activity patterns of
carnivores in the rain forests of Madagascar: implications for species
coexistence. Journal of Mammalogy 93, 667-676.
Gerber, B.D., Karpanty, S.M., Randrianantenaina, J., 2012b. The impact of forest
logging and fragmentation on carnivore species composition, density and
occupancy in Madagascar's rainforests. Oryx 46, 414-422.
Gerber, B.D., Karpanty, S.M., Randrianantenaina, J., Vuren, D.H.V., 2012c. Activity
patterns of carnivores in the rain forests of Madagascar: implications for species
coexistence. Journal of Mammalogy 93, 667-676.
Golden, C.D., 2009. Bushmeat hunting and use in the Makira Forest, north-eastern
Madagascar: a conservation and livelihoods issue. Oryx 43, 386.
Haddad, N.M., Brudvig, L.A., Clobert, J., Davies, K.F., Gonzalez, A., Holt, R.D.,
Lovejoy, T.E., Sexton, J.O., Austin, M.P., Collins, C.D., 2015. Habitat
fragmentation and its lasting impact on Earth’s ecosystems. Science Advances
1, e1500052.
Harrington, L.A., Harrington, A.L., Yamaguchi, N., Thom, M.D., Ferreras, P.,
Windham, T.R., Macdonald, D.W., 2009. The impact of native competitors on
an alien invasive: temporal niche shifts to avoid interspecific aggression.
Ecology 90, 1207-1216.
Hawkins, A.F., 2016. Cryptoprocta ferox, In The IUCN Red List of Threatened
Species. IUCN.
Hawkins, C.E., 1998. Behaviour and ecology of the fossa, Cryptoprocta ferox
(Carnivora: Viverridae) in a dry deciduous forest, western Madagascar.
University of Aberdeen.
90
Hawkins, C.E., Racey, P.A., 2005. Low population density of a tropical forest
carnivore, Cryptoprocta ferox: implications for protected area management.
Oryx 39.
Hawkins, C.E., Racey, P.A., 2008. Food Habits of an Endangered Carnivore,
Cryptoprocta ferox, in the Dry Deciduous Forests of Western Madagascar.
Journal of Mammalogy 89, 64-74.
Hayward, M.W., Slotow, R., 2009. Temporal partitioning of activity in large African
carnivores: tests of multiple hypotheses. South African Journal of Wildlife
Research 39, 109-125.
Hughes, J., Macdonald, D.W., 2013. A review of the interactions between free-
roaming domestic dogs and wildlife. Biological Conservation 157, 341-351.
Janzen, D., 1988. Biodiversity. National Academy Press, Washington.
Kleiman, D.G., Eisenberg, J.F., 1973. Comparisons of canid and felid social systems
from an evolutionary perspective. Animal behaviour 21, 637-659.
Kotschwar Logan, M., Gerber, B.D., Karpanty, S.M., Justin, S., Rabenahy, F.N.,
2014. Assessing carnivore distribution from local knowledge across a human-
dominated landscape in central-southeastern Madagascar. Animal Conservation,
82-91.
Kronfeld-Schor, N., Dayan, T., 2003. Partitioning of time as an ecological resource.
Annual Review of Ecology, Evolution, and Systematics 34, 153-181.
Linkie, M., Ridout, M.S., 2011. Assessing tiger–prey interactions in Sumatran
rainforests. Journal of Zoology 284, 224-229.
Medina, F.M., Bonnaud, E., Vidal, E., Tershy, B.R., Zavaleta, E.S., Josh Donlan, C.,
Keitt, B.S., Corre, M., Horwath, S.V., Nogales, M., 2011. A global review of
91
the impacts of invasive cats on island endangered vertebrates. Global Change
Biology 17, 3503-3510.
Meredith, M., Ridout, M.S., 2014. The Overlap Package.
Merson, S.D., Macdonald, D.W., Dollar, L.J., 2017. Novel photographic and
morphometric records of the Western Falanouc Eupleres major in
Ankarafantsika National Park, Madagascar.
Miles, L., Newton, A.C., DeFries, R.S., Ravilious, C., May, I., Blyth, S., Kapos, V.,
Gordon, J.E., 2006. A global overview of the conservation status of tropical dry
forests. Journal of Biogeography 33, 491-505.
Nogales, M., Vidal, E., Medina, F.M., Bonnaud, E., Tershy, B.R., Campbell, K.J.,
Zavaleta, E.S., 2013. Feral cats and biodiversity conservation: the urgent
prioritization of island management. BioScience 63, 804-810.
Owings, D.H., Lockard, R.B., 1971. Different nocturnal activity patterns of
Peromyscus californicus and Peromyscus erenicus in lunar lighting.
Psychonomic Science 22, 63-64.
Pewsey, A., Neuhäuser, M., Ruxton, G.D., 2013. Circular statistics in R. Oxford
University Press.
Rahajanirina, L.P., 2003. Contribution to the biological, ecological and ethological
study of Cryptoprocta ferox (Bennett, 1833) in the forest region of Tsimaloto,
Ankarafantsika National Park, Madagascar, In Department of Animal Biology.
University of Antananarivo.
Razafimanantsoa, L., 2003. Mungotictis decemlineata, narrow-striped mongoose. The
natural history of Madagascar. The University of Chicago Press, Chicago, 1357-
1360.
92
Ridout, M.S., Linkie, M., 2009. Estimating overlap of daily activity patterns from
camera trap data. Journal of Agricultural, Biological, and Environmental
Statistics 14, 322-337.
Smith, A.P., 1997. Deforestation, fragmentation, and reserve design in western
Madagascar. Tropical forest remnants: ecology, management, and conservation
of fragmented communities. University of Chicago Press, Chicago, 415-441.
Valenta, K., Gettinger-Larson, J.A., Chapman, C.A., Farris, Z.J., 2016. Barking up the
right tree: Understanding local attitudes towards dogs in villages surrounding
Ranomafana National Park, Madagascar can benefit applied conservation.
Madagascar Conservation & Development 11, 87-90.
Vanak, A.T., Fortin, D., Thaker, M., Ogden, M., Owen, C., Greatwood, S., Slotow,
R., 2013. Moving to stay in place: behavioral mechanisms for coexistence of
African large carnivores. Ecology 94, 2619-2631.
Vieira, E.M., de Camargo, N.F., Colas, P.F., Ribeiro, J.F., Cruz-Neto, A.P., 2017.
Geographic Variation in Daily Temporal Activity Patterns of a Neotropical
Marsupial (Gracilinanus agilis). PLoS One 12, e0168495.
Waeber, P.O., Wilmé, L., Ramamonjisoa, B., Garcia, C., Rakotomalala, D.,
Rabemananjara, Z.H., Kull, C.A., Ganzhorn, J.U., Sorg, J.P., 2015. Dry forests
in Madagascar: neglected and under pressure. International Forestry Review 17,
127-148.
Weitzman, M.S., 1970. Measures of overlap of income distributions of white and
Negro families in the United States. US Bureau of the Census.
WWF, 2001. Southern Africa: Northwestern Madagascar, ed. WWF. WWF.
Zar, J.H., 1996. Biostatistical analysis–Prentice–Hall International. Inc., London.
Zar, J.H., 2010. Biostatistical analysis. Pearson Education India.
93
Zinner, D., Wygoda, C., Razafimanantsoa, L., Rasoloarison, R., T. Andrianandrasana,
H., Ganzhorn, J.U., Torkler, F., 2013. Analysis of deforestation patterns in the
central Menabe, Madagascar, between 1973 and 2010. Regional Environmental
Change 14, 157-166.
94
Chapter Four
Poverty and low taste preference drives the
consumption of protected species
in Madagascar
95
Abstract
Bushmeat consumption in Madagascar is increasingly acknowledged as one of the
major threats to its wild vertebrates. Nevertheless, few studies have examined the
drivers of the consumption of protected versus legally-hunted wild species, or
examined its variance across Madagascar’s forests and protected areas. This research
provides a novel study of the consumption of protected, unprotected, and fish/eel
species between forest types (deciduous and rainforest), as well as across a gradient
protected habitat (National Park, Reserve, Unprotected). 1750 households were
interviewed across four regions, including two national parks, two reserves, and two
unprotected forests. Household, demographic, socioeconomic, cultural, and
geographic variables were modelled. We found that poorer households reported
consuming greater quantities of protected species whereas wealthier households
reported consuming greater quantities of fish and eel. There was no evidence that
consumption of protected species was lower in protected areas, with households
located inside Andasibe-Mantadia National Park, Madagascar’s most visited protected
area, reported as consuming the greatest quantities of protected species. Malagasy
most favoured meat was from domestic animals, and fish. The consumption pattern of
wild species reflected interviewees’ high preference for specified unlisted, pest and
game species. Most protected species (such as lemurs and carnivores) were
interviewees’ least favoured wild foods. Given the lack of cultural affinity, and low
preference for the consumption of most protected species, our results suggest that
improving accessibility to domestic meat will reduce the consumption of protected
species.
Keywords: Bushmeat, food insecurity, hunting, illegal trade, lemurs, protected areas.

96
This chapter forms the basis of an article prepared for Animal Conservation of which
I am the lead author and my co-authors are Luke Dollar, Paul Johnson and David
Macdonald.
97
Introduction
Bushmeat consumption is one of the greatest threats to global biodiversity (Bennett
and Robinson 2000; Milner-Gulland and Bennett 2003; Fa et al. 2006; Ripple et al.
2016). Consequently, understanding its patterns and drivers is important in
developing effective conservation strategies to reduce its impact on wildlife
populations, and to ensure the livelihoods of those human populations who depend
upon it for subsistence are not jeopardized.
Madagascar, one of the world’s biodiversity hotspots, is widely acknowledged
as a conservation priority (Goodman and Benstead 2005; Brooks et al. 2006; Funk
and Fa 2010). Its rapidly growing human population is mostly rural and poor (IFAD
2016). In a protected area in northwest Madagascar, wild species are reportedly an
important source of nutrition for rural households (Golden et al. 2011), with similar
patterns of rural household dependence on bushmeat observed across Africa
(Brashares et al. 2011). Recent research has shown the consumption of protected
animals to be widespread (García and Goodman 2003; Randrianandrianina et al.
2010; Razafimanahaka et al. 2012; Golden et al. 2013b), with its occurrence
principally driven by poverty and poor health (Golden et al. 2011; Jenkins et al. 2011;
Golden et al. 2014a; Borgerson et al. 2016; Reuter et al. 2016b), often at
unsustainable rates (Golden 2009). Little research has examined its drivers across
large geographical areas, with current research almost exclusively focused on single
sites or single regions. Furthermore, our understanding of the potential different
drivers of the consumption unprotected versus protected species across Madagascar’s
protected and unprotected forests is unclear. Given Madagascar’s rural population
occupy an extremely diverse landscape, surrounding forests of different protected
status, the examination of the consumption of unprotected versus protected species at
98
a multi-region level is important for understanding spatial patterns at a national scale.
This has implications not only for Madagascar’s management of its protected species
and protected areas but also for protected species and protected area planning more
widely.
Madagascar’s legislation permits seasonal hunting of specified endemic
species, and unrestricted hunting of pests. This legislation is mostly in align with the
IUCN Red List and CITES (Rakotoarivelo et al. 2011), and forbids the hunting of
most of Madagascar’s endangered mammals. Given the illegal hunting of protected
species and the unsustainable exploitation of game species is widespread,
understanding the drivers of illegal and legally hunted species is important in
developing and enforcing Madagascar’s protected species framework.
Madagascar’s biodiversity is characterised by large abiotic and biotic variation
both between and within regions (Vences et al. 2009). This geographic variation
influences the species that are consumed across Madagascar’s different regions.
However, it has also been documented that the consumption of different species
across Madagascar is strongly influenced by a region’s cultural norms (Lambek 1992;
Cinner 2007; Jones et al. 2008; Golden and Comaroff 2015a; Golden and Comaroff
2015b). Madagascar has 18 ethnic groups that maintain different cultures and fady
(taboos). Research has highlighted the importance of understanding tribal cultures,
but its value for conservation has been disputed (Horning 2003; Golden and Comaroff
2015a; Golden and Comaroff 2015b). Furthermore, presumed generational erosion of
fady (Jenkins et al. 2011) may not be the ultimate cause, with inter-regional migration
reported to decrease adherence to local taboos (Golden and Comaroff 2015b),
supporting the need for multi-region bushmeat studies.
99
Madagascar’s protected areas encompass roughly 5.6% of its terrestrial area,
and are critical for ensuring the conservation of its biodiversity (UNEP-WCMC
2017). Unfortunately, the coup d’état in 2009 has been associated with a significant
increase in illegal activities (Randriamalala and Liu 2010; Allnutt et al. 2013;
Schwitzer et al. 2014; Waeber et al. 2016), following the subsequent breakdown in
government controls (Schwitzer et al. 2013). Recently, Madagascar’s protected area’s
effectiveness in reducing deforestation has been estimated to only marginally
decrease deforestation once accounting for other confounding factors (Eklund et al.
2016). In examining protected area’s efficacy in reducing wildlife consumption,
Razafimanahaka et al. (2012), reported the frequency of consumption of different
protected species (sifaka, brown lemur, fosa) to be lower in areas of greater
conservation awareness and protective legislation. Furthermore, the use of the
randomised response technique (a specialised method for investigating sensitive
behaviours) yielded higher estimates of bushmeat consumption in areas of greater
sensitivity (the implications of not using such techniques will be discussed in the
methods). Despite these advancements, there is still a lack of understanding of what
drives the consumption of protected and unprotected species across forests of varying
protection.
We document findings from the first comparative study of protected and
unprotected species consumption in different forest types and notional levels of
protection across Madagascar. In doing so, we are able to investigate the possible
influences of ethnic, cultural, socioeconomic, forest, and the legal species and park
protection framework.
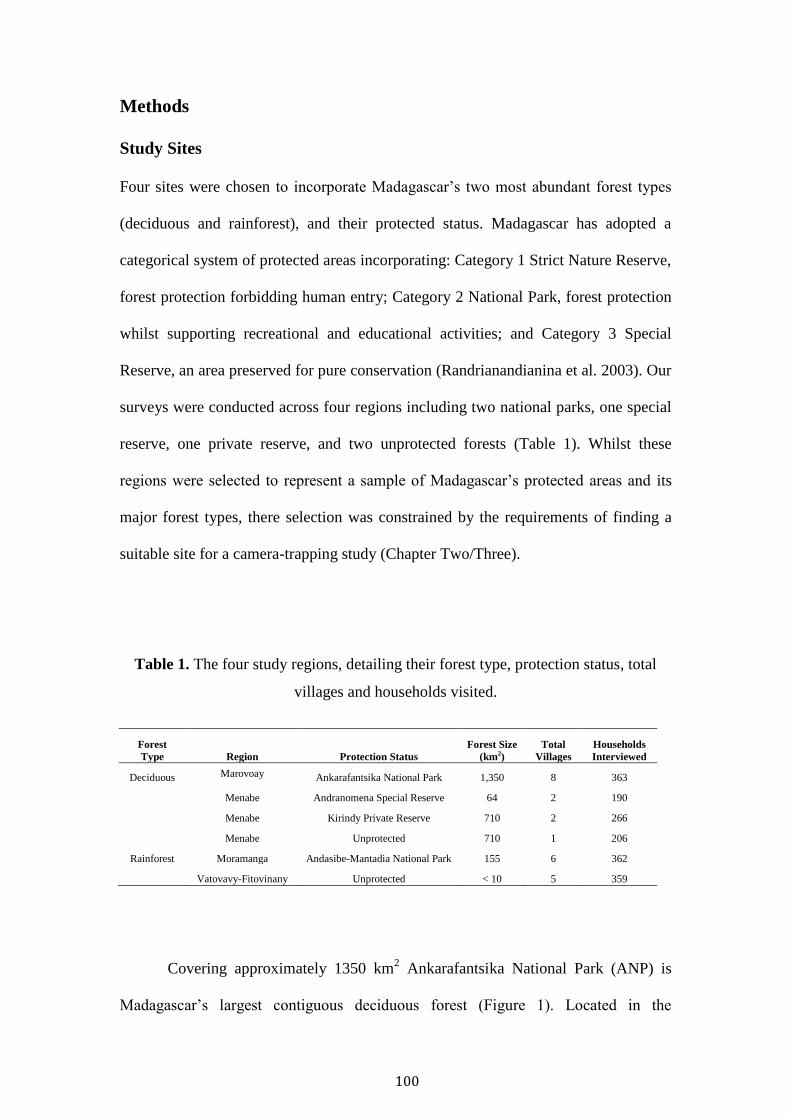
100
Methods
Study Sites
Four sites were chosen to incorporate Madagascar’s two most abundant forest types
(deciduous and rainforest), and their protected status. Madagascar has adopted a
categorical system of protected areas incorporating: Category 1 Strict Nature Reserve,
forest protection forbidding human entry; Category 2 National Park, forest protection
whilst supporting recreational and educational activities; and Category 3 Special
Reserve, an area preserved for pure conservation (Randrianandianina et al. 2003). Our
surveys were conducted across four regions including two national parks, one special
reserve, one private reserve, and two unprotected forests (Table 1). Whilst these
regions were selected to represent a sample of Madagascar’s protected areas and its
major forest types, there selection was constrained by the requirements of finding a
suitable site for a camera-trapping study (Chapter Two/Three).
Table 1. The four study regions, detailing their forest type, protection status, total
villages and households visited.
Forest
Type Region Protection Status
Forest Size
(km2)
Total
Villages
Households
Interviewed
Deciduous Marovoay Ankarafantsika National Park 1,350 8 363
Menabe Andranomena Special Reserve 64 2 190
Menabe Kirindy Private Reserve 710 2 266
Menabe Unprotected 710 1 206
Rainforest Moramanga Andasibe-Mantadia National Park 155 6 362
Vatovavy-Fitovinany Unprotected < 10 5 359
Covering approximately 1350 km2 Ankarafantsika National Park (ANP) is
Madagascar’s largest contiguous deciduous forest (Figure 1). Located in the
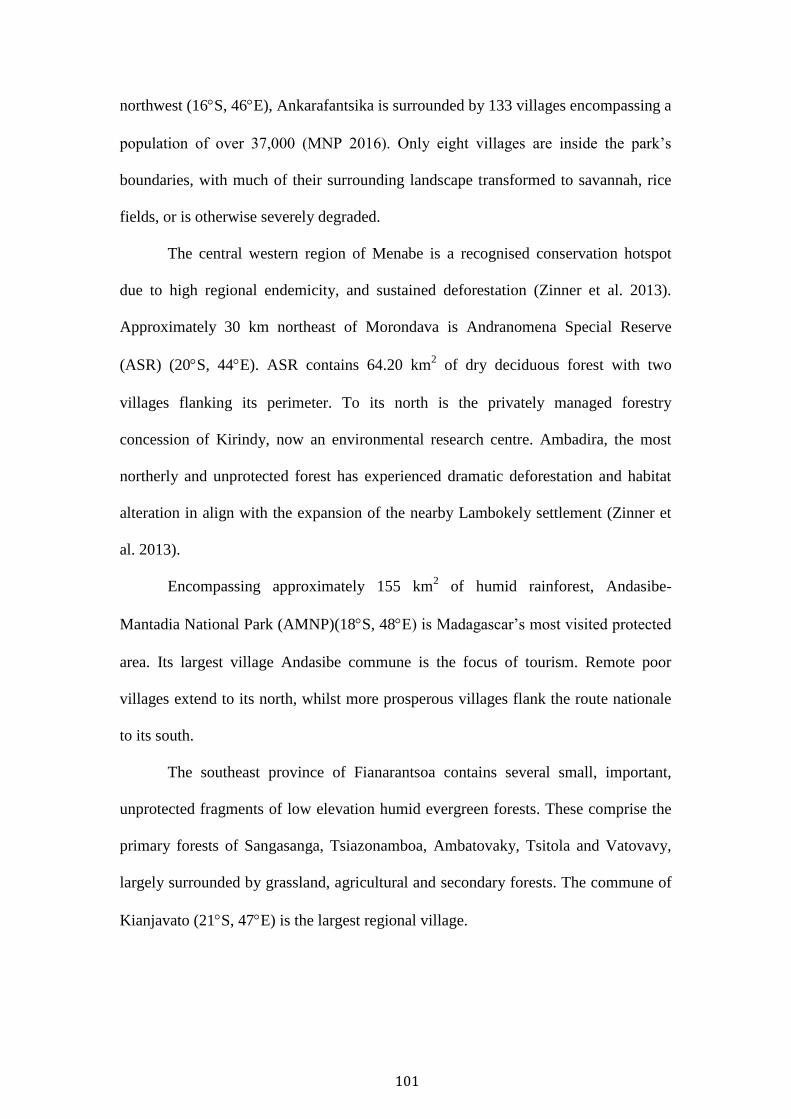
101
northwest (16S, 46E), Ankarafantsika is surrounded by 133 villages encompassing a
population of over 37,000 (MNP 2016). Only eight villages are inside the park’s
boundaries, with much of their surrounding landscape transformed to savannah, rice
fields, or is otherwise severely degraded.
The central western region of Menabe is a recognised conservation hotspot
due to high regional endemicity, and sustained deforestation (Zinner et al. 2013).
Approximately 30 km northeast of Morondava is Andranomena Special Reserve
(ASR) (20S, 44E). ASR contains 64.20 km2 of dry deciduous forest with two
villages flanking its perimeter. To its north is the privately managed forestry
concession of Kirindy, now an environmental research centre. Ambadira, the most
northerly and unprotected forest has experienced dramatic deforestation and habitat
alteration in align with the expansion of the nearby Lambokely settlement (Zinner et
al. 2013).
Encompassing approximately 155 km2 of humid rainforest, Andasibe-
Mantadia National Park (AMNP)(18S, 48E) is Madagascar’s most visited protected
area. Its largest village Andasibe commune is the focus of tourism. Remote poor
villages extend to its north, whilst more prosperous villages flank the route nationale
to its south.
The southeast province of Fianarantsoa contains several small, important,
unprotected fragments of low elevation humid evergreen forests. These comprise the
primary forests of Sangasanga, Tsiazonamboa, Ambatovaky, Tsitola and Vatovavy,
largely surrounded by grassland, agricultural and secondary forests. The commune of
Kianjavato (21S, 47E) is the largest regional village.
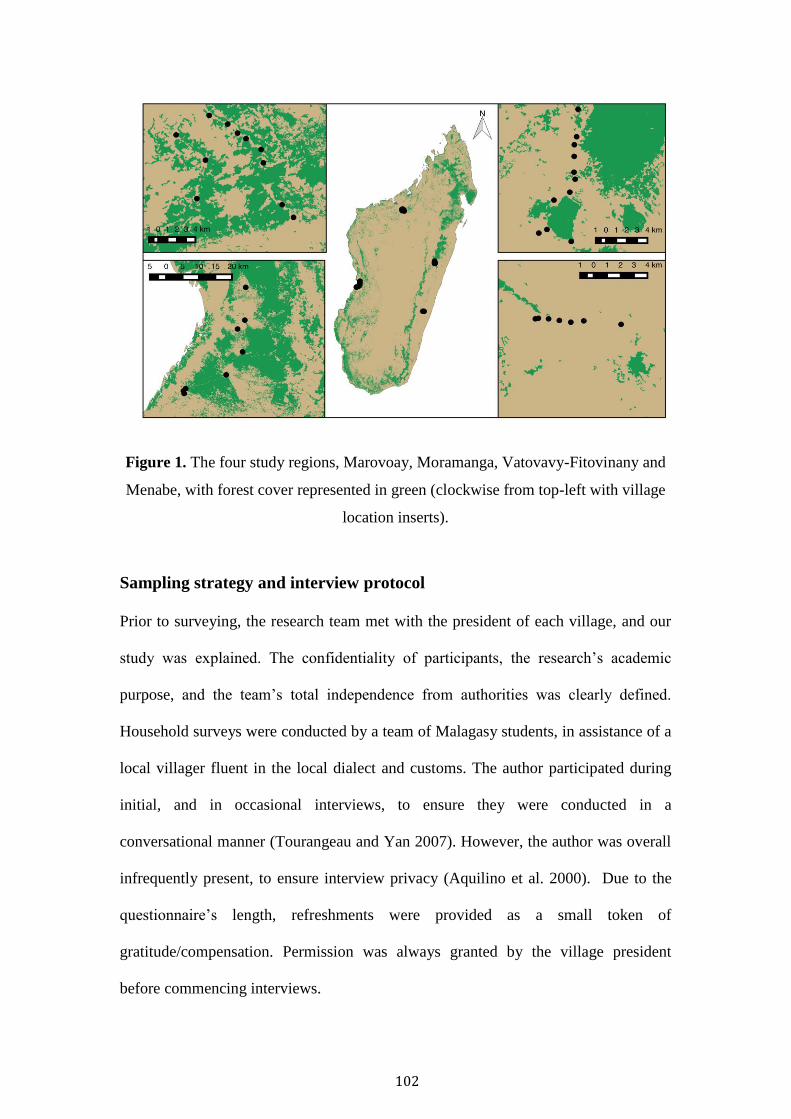
102
Figure 1. The four study regions, Marovoay, Moramanga, Vatovavy-Fitovinany and
Menabe, with forest cover represented in green (clockwise from top-left with village
location inserts).
Sampling strategy and interview protocol
Prior to surveying, the research team met with the president of each village, and our
study was explained. The confidentiality of participants, the research’s academic
purpose, and the team’s total independence from authorities was clearly defined.
Household surveys were conducted by a team of Malagasy students, in assistance of a
local villager fluent in the local dialect and customs. The author participated during
initial, and in occasional interviews, to ensure they were conducted in a
conversational manner (Tourangeau and Yan 2007). However, the author was overall
infrequently present, to ensure interview privacy (Aquilino et al. 2000). Due to the
questionnaire’s length, refreshments were provided as a small token of
gratitude/compensation. Permission was always granted by the village president
before commencing interviews.
103
Villages were classified as ‘small’ or ‘large’, roughly corresponding to their
size as either less than or greater than 100 households. Households located in rural
Malagasy villages can be difficult to identify, as many are often not be located nearby
the village centre, and may be located in distant hamlets (Poudyal et al. 2016). Given
these logistical difficulties, maps of household locations inside each village (and
surrounding hamlets) were created from the most recently available Google Earth
(Version 7.1) satellite imagery. In particularly remote locations, interviewers
stationed themselves inside distant hamlets to obtain a representative sample. The
location of these remote households was also confirmed with each village president,
and local guide. Furthermore, during surveys, the potential for prolonged household
(interviewee) absence was possible, due to the use of distant seasonal accommodation
during periods of intensive farming. This issue was discussed with the president of
each village, and where possible, villagers were asked to be available for interview
during certain days of the week. These methods were incorporated to establish a
systematic sampling strategy to reduce potential biases borne by the unrepresentative
sampling of certain demographics bound by location or profession (most commonly,
farmers).
During surveys of small villages all households were visited. The head of each
household was sought for interview, typically the man and primary hunter (Golden
2009). The study’s goals and structure were explained, including the interviewer and
author’s academic affiliations, and total independence from any local/national
authority (i.e. Madagascar National Parks). Their anonymity was assured, and after
any questions were answered, their verbal consent was acquired. If the household
head was absent at the time of the first visit, an additional two appointments were
104
scheduled, allowing for a maximum of three opportunities to conduct a household
interview within small villages.
In contrast, only a sample of households from large villages was sought for
interview. Each large village was divided into quadrants and sampled using East et
al.’s (2005) zig-zag method. This requires interviewers to bisect quadrants in a ‘zig-
zag’ trajectory, allowing households located on and off main roads to be visited.
Interviewers were instructed to sample every second household, and to visit the next
house if the previous tenant was unavailable.
Questionnaire design and implementation
In 2013, a pilot questionnaire of approximately 30 households was trialled in ANP,
providing the precursor to its current structure. The questionnaire underwent several
phases of revisions and improvements prior to household surveys in 2014/15.
Experience from this pilot questionnaire was used to train interviewers, ensuring the
core of each question was understood, and asked correctly, eliminating any translation
misunderstandings.
The questionnaire was structured into four segments recording the
interviewee’s 1) Demographic and socioeconomic information, 2) Livestock
ownership practices, 3) Dietary patterns, preferences and attitudes, and 4)
Conservation understanding and attitudes (Figure S1; S2). Interviewees remained
anonymous, however household demography, asset ownership, education, and
livelihood attainment was recorded to investigate demographic and/or socio-economic
drivers of bushmeat consumption.
To measure poverty, six equally weighted indicators were derived from
Alkire-Santos Multidimensional Poverty Index (MPI) (Alkire et al. 2015a). This
105
index assesses poverty through three dimensions (health, education and living
standards), and has been adopted by the United Nations Development Program in
assessing poverty and development in Madagascar. Whilst it is the most popular
poverty index, critics have questioned the appropriateness of any single index, and the
composition of various indicators (Ravallion 2011; Dotter and Klasen 2017). Despite
this, the MPI has been illustrated to be robust measure of acute poverty in over 100
countries (Alkire and Santos 2014). Unfortunately, due to data-collection
discrepancies, only the MPI’s most important contributor, the living standard
dimension was assessed, missing other important dimensions of poverty (Ferreira
2011; Alkire et al. 2015b). Consequently, we included six of its indicators: asset
ownership (i.e. bicycle, radio, TV, mobile phone); roof material; wall material; floor
material; access to electricity, and safe drinking water. These indicators were
considered appropriate in the context of the trial survey, and through discussion with
team members, but overall were found to be reliable between study sites.
The third section examined the interviewee’s dietary patterns. Data were
collected on respondent’s: most consumed foods; frequency of domestic and wild
meat consumed; domestic and wild meat preferences and attitudes; frequency,
seasonality, method of acquisition (i.e. hunted, bought, gift) and reasons for
consuming wild species; recording of hunter activities, and wildlife fady. Given the
four different study regions encompassed humid and deciduous forests that vary in
their relative seasonality, Madagascar’s two most pronounced seasons (dry from May
to November, wet from December to April) were used for classification. Interviewees
were asked to recall the frequency of individual species consumed during their
lifetime, previous year and previous week. The final section questioned interviewees
about their understanding of conservation, their attitudes and experiences of it.
106
Participants were asked to describe their general attitudes towards
conservation (or fosa, Chapter 5). In examining these relationships, we considered
Eagly and Chaiken’s (1993) definition of attitude as a ‘psychological tendency that is
expressed by evaluating a particular entity with some degree of favour or disfavour’.
This chapter seeks to understand the relationship between people’s attitude as a
potential driver of their behaviour, be that, consuming protected species, or killing a
fosa in retaliation (Chapter 5). In understanding this relationship, it’s worth
considering the theory of planned behaviour, the now most popular social-
psychological theory (Hardeman et al. 2002). It stipulates that behaviour is influenced
by attitude, subjective norms, and perceived behavioural control, with their relative
importance varying by behaviour (Ajzen 1991). In considering these potential drivers
of behaviour, knowing general attitudes alone, isn’t necessarily useful in predicting a
particular behaviour, as people often perform behaviours that contradict a particular
attitude (St John et al. 2011). Consequently, care must be taken when interpreting
interviewee’s general attitudes as predictors of particular behaviours.
Our questionnaire required respondents to directly answer sensitive questions
on potentially illegal (bushmeat consumption), and/or sensitive behaviours (retaliatory
killing of fosa, Chapter 5). As a result, the collected data is likely affected by non-
response (Groves and Peytcheva 2008) and social desirability biases (Fisher 1993;
King and Bruner 2000), potentially reducing its validity (Solomon et al. 2007; John et
al. 2010; Nuno and John 2015). There are popular techniques, such as the
Randomised Response Technique (RRT) (Warner 1965), the Normative Technique
(Miller 1984), and the unmatched-count technique (Hubbard et al. 1989) that have
been shown to improve reporting of information (John et al. 2010; Razafimanahaka et
al. 2012). These techniques assure anonymity to the interviewee, and estimate a
107
proportion of the population participating in a sensitive behaviour. Regression
techniques have also developed to examine the relationships between covariates and
the information derived from sensitive questioning methods such as RRT (van den
Hout et al. 2007), or the unmatched count technique (Imai 2011). Despite this, these
techniques were not implemented into our questionnaire due to the large sample sizes
required to negate the large sampling variances inherit within these methods
(Lensvelt-Mulders et al. 2005). This comes at a cost, with the potential impact of not
using sensitive question techniques illustrated by Razafimanahaka et al. (2012). This
study demonstrated a greater reporting of bushmeat consumption using RRT in areas
of greater sensitivity (protected versus unprotected area) than estimates derived from
direct questioning techniques. The potential for this underreporting must be
considered when interpreting patterns of bushmeat consumption between different
regions.
To reduce potential biases/non-response, several methods were implemented
to increase interviewee responsiveness. Firstly, anonymity was assured, which has
been shown to improve responsiveness (Singer et al. 1995). Secondly, the
questionnaire was structured in a decreasing order of intrusiveness (i.e. first asking
accounts of other people’s killing of fosas), which has been demonstrated to illicit
more truthful responses (Acquisti et al. 2012). Thirdly, interviews were conducted in
a conversational manner, and with the inclusion of a local villager. This was hoped to
reduce intrusiveness, and reduce the perceived threat of disclosure of interviewee
activities to authorities (Tourangeau and Yan 2007).
To assist participants during animal preference/consumption ranking and
recall exercises, picture cards were used to illustrate different domestic and wild
animals. During questioning of interviewee taste preferences of domestic and wild
108
animals, respondents were asked to rank: i) domestic; ii) wild; and iii) domestic and
wild animals collectively using picture cards from most to least preferred/consumed.
Likewise, to assist memory recall for consumption history exercises, picture cards
were created of a selection of the endemic species of each focal region, including all
of the local lemur and carnivore species, several common bird, tenrec and reptile
species. The use of identifiable images of local species also eliminated potential
translation issues associated with different regional Malagasy dialects.
Several steps were taken to prepare the contents of our extensive questionnaire
for dataset entry and analysis. Firstly, the questionnaire was administered and
recorded in Malagasy, and contained open-ended questions that required coding.
Consequently, coding was typically conducted at the end of each survey day by
individual interviewers (at least one was fluent in English) as a team exercise under
supervision of the lead author. This method ensured that responses were coded
correctly, and in unison. Lastly, as a result of the questionnaire’s structure (to reduce
intrusiveness), the ordering of several questions may have been influential on the
interviewee’s subsequent response. Specifically, when eliciting the interviewee’s
attitude towards fosas, their stated response is potentially affected
(negatively/positively) by the questions preceding it. Only one such response was
explored in detail (interviewee attitude towards fosa), and this effect was taken into
account in the interpretation of interviewees’ attitudes in Chapter 5).
Analysis
Three response variables were modelled to identify the best predictors of a
household’s: 1) consumption of protected (C1), 2) consumption of unprotected
species (C4); and 3) consumption of fish and eel (usually wild caught, potentially
109
aquaculture reared). Species protection status was defined in alignment with
Madagascar’s National Classification for Animal Species (Rakotoarivelo et al. 2011).
This report classifies species into one of three categories.
Category 1 (C1) contains protected species, which is split into Class 1 (C1C1)
those that are strictly protected (i.e. lemurs) and Class 2 (C1C2) those that may be
hunted under authorisation, commercial, sport or regulatory conditions (i.e. fosas may
be killed in defence of livestock). For analysis we grouped all Category 1 protected
species together into our first response variable (C1).
Category 2 (C2) species (i.e. bushpig) are defined as pest species that may be
hunted at all times, whilst Category 3 (C3)(i.e. tenrec) are game species permissibly
hunted under license. For analysis we grouped pest, game, and species unlisted under
Malagasy law (i.e. small indian civet) into our second response variable (C4). These
species were grouped together to represent unprotected species, as in reality, despite
certain legislative protection (i.e. game species), these hunting regulations are
unlikely to be known, monitored or followed (Keane et al. 2011; Rakotoarivelo et al.
2011).
Our final response variable included both fish and eel species (Tilapia, Carp
and Anguila sp.). These species are often wild caught in rural areas, but may also be
reared through aquaculture, and thus represent a transitory group between wild and
domestic species. This animal grouping was included in bushmeat preference
rankings but modelled as a distinct response variable.
Six variables were considered as potential predictors of bushmeat
consumption, including, Forest Size, Village Size, Household Distance, Household
Education, Poverty and Conservation Benefit (Table S1). Region was included as a
fixed blocking factor to encompass geographic variation. Village was included as a
110
random effect to allow for the nesting of households within villages. Continuous
predictors were standardised to z-scores to allow comparison and interpretation of
predictors.
Forest size was included to examine the possible effect of larger forests
(known to have greater species diversity and abundance) (Burkey 1989) on hunting
opportunities. Likewise, household distance to forest edge was included to assess the
possible impact of forest access. Village size was included as larger villages are
typically wealthier, and better endowed with infrastructure and access to markets,
affecting a household’s need for alternate livelihoods. Poverty was measured on a
continuous scale of increasing poverty from 0 – 1. Household education was included
to examine the impact of higher education on a household’s consumption of protected
species. They were defined (with their Malagasy equivalent in brackets) as: No
Education, Primary School (EPP); Junior Secondary (CEG); Senior Secondary (Lyceé
publics); and Tertiary (Université). Finally, the interviewee’s perceived benefit
(binary) from conservation was incorporated to assess the role of conservation in
reducing bushmeat consumption. It was anticipated that interviewees who said they
benefited from localised conservation would be less likely to disobey conservation
legislation.
Protected species were consumed by a minority (31.8%) of households, so
zeroes (non-consumption) dominated this response. We hypothesized that different
processes might affect whether households consumed any protected species,
compared with those that affected the quantity consumed by households that reported
having consumed at least one. To account for this, a hurdle approach was adopted
(Zuur et al. 2012). This involved two steps, firstly the modelling of the response
variable as a binary variable using a generalised linear mixed model where the levels
111
of the binary response were consumption of no protected species, and consumption of
at least one. Secondly, the modelling of only households to have consumed at least
one species (as a zero-truncated distribution). Zero-inflated generalised linear mixed
effect models (GLMMs) were conducted in R (Version 0.99.902) using the MCMC
package (Version 0.9-4)(Martin et al. 2017). This package fits models using a
Bayesian framework. We used uninformative priors for parameter estimates, and
80,000 iterations with a burn-in of 2000 and thinning of 10.
Model 1 examined which of the six variables discussed (i.e. Forest Size) is a
significant predictor of a household’s consumption of protected species (C1). Model 2
and Model 3 examined the predictors for the consumption of legally hunted species
(C4) and the predictors for the consumption of fish and eel. For each binary and
Poisson model, two models were run for each of the three response variables
(protected, unprotected, fish/eel). Firstly, a global model comprising all of the
predictors was created, and then a second model was produced containing only the
significant predictors reported from the global model. These significant predictors are
reported (Table S3, S4, S5).
For the binary models, the response variable recorded whether households had
consumed any individuals of that species’ category (1/0). The response variable for
the Poisson models was measured as the total individual animals reported to have
been consumed by the household during the previous year. Annual species counts
were used instead of mean weekly frequencies to account for seasonal and/or rare
events (Golden et al. 2013b). For Poisson models, some outliers with implausible
reported consumption rates were removed (~ 6 - 9% of households).
112
Research approval
Ethical clearance and research approval was granted by The University of Oxford’s
Central University Research Ethics Committee (Number: SSD/CUREC1A/14-010)
and the Madagascar Government (Permit:107/14-
109/15/MEEMF/SG/DGF/DCB.SAPT/SCB). To maintain interviewee anonymity,
individual villages will not be named in the results or discussion.
Results
During the successive austral winters of 2014 - 2015, a total of 1746 households were
interviewed (1325 males, mean age 42.4 ± 13.3 years; 410 females, 38.8 ±13.9 years).
565 households surrounded unprotected forests, 456 surrounded reserves, whilst 725
households surrounded national parks (Table 1). 77.5% of interviewees described
their principal livelihood to be derived from farming. Primary school (43.6%) and
junior secondary (24.6%) were the most common educational level, whilst a
substantial minority (22.5%) had no formal education.
Domestic and wild meat eating habits and preferences
The majority (57.9%) of respondents’ primary meat source was domestic animals,
consuming an average of 1.46 ± 1.13 days/week. Conversely 28.6% primarily
consumed wild meats (3.07 ± 1.63 days/week), and 13.5% consumed domestic and
wild meats equally. 95.2% of interviewees experience food shortages, with 65.4%
during the wet, dry season or entire year (19.8% respectively). Interviewees reported
experiencing/perceiving food shortages on average for 2.7 ± 1.8 SD months/year.
113
Chicken (52.7% of respondents), zebu (26.3%) and pigs (26.3%) were
interviewees’ favourite stated domestic meats. They were primarily favoured for their
good taste (79%), nutrition (6.5%) and also out of habit (5.1%).
Almost all (98.1%) respondents have consumed bushmeat during their
lifetime. Respondents’ favourite bushmeat was fish (26%), tenrec (21%), helmeted
guineafowl (20%), eel (16%), bushpig (11%), lemur (2%), and bat (1%). These
animals were preferred for their taste (42.7%), consumed out of habit (22.4%), easily
captured (11.7%) and locally sold (10.4%).
Aquatic species (44%)(fish and eel) was the most highly preferred and highly
ranked category, with tenrec (21%), birds (20%) and bushpig (12%) the other highly
preferred first ranking animals (Figure 2). The most highly preferred rank 5 and 6
animals were lemurs and carnivores, whilst bats were the lowest ranked group.
Aquatic animals were the overwhelmingly most consumed animal group
(Figure 2). Birds, bushpig and tenrecs were the other most consumed animals, whilst
carnivores, lemurs and bats were the least consumed species.
Domestic poultry (43.5%), ungulates (26%), and wild aquatic animals (15.7%)
were the most preferred wild and domestic species when collectively ranked (Figure
3). However tenrecs, lemurs, bushpigs and birds became more preferred within the
interviewees’ ranks four to ten.
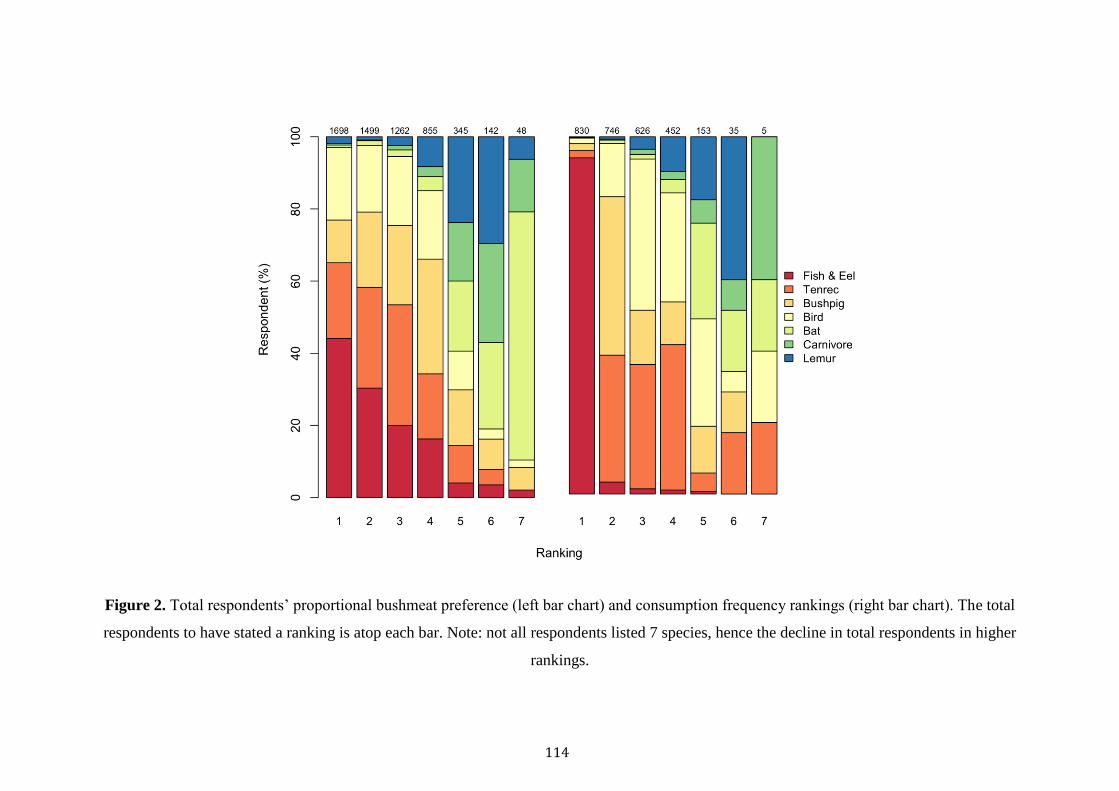
114
Figure 2. Total respondents’ proportional bushmeat preference (left bar chart) and consumption frequency rankings (right bar chart). The total
respondents to have stated a ranking is atop each bar. Note: not all respondents listed 7 species, hence the decline in total respondents in higher
rankings.
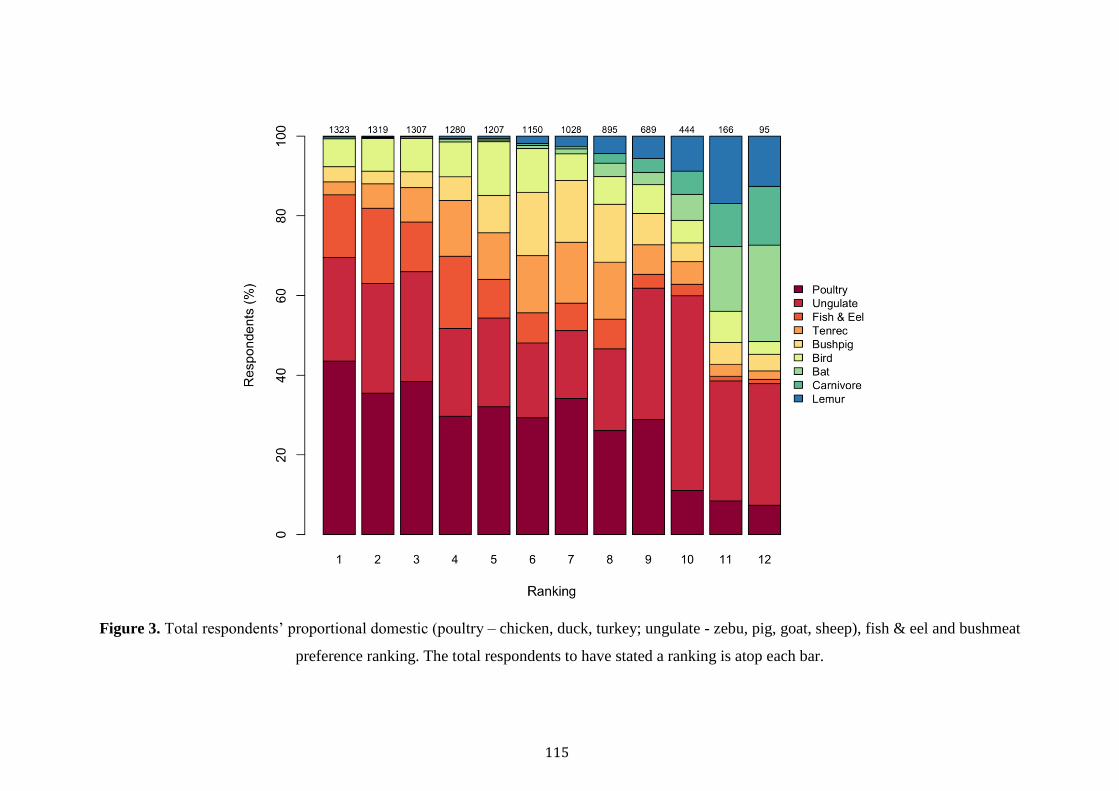
115
Figure 3. Total respondents’ proportional domestic (poultry – chicken, duck, turkey; ungulate - zebu, pig, goat, sheep), fish & eel and bushmeat
preference ranking. The total respondents to have stated a ranking is atop each bar.
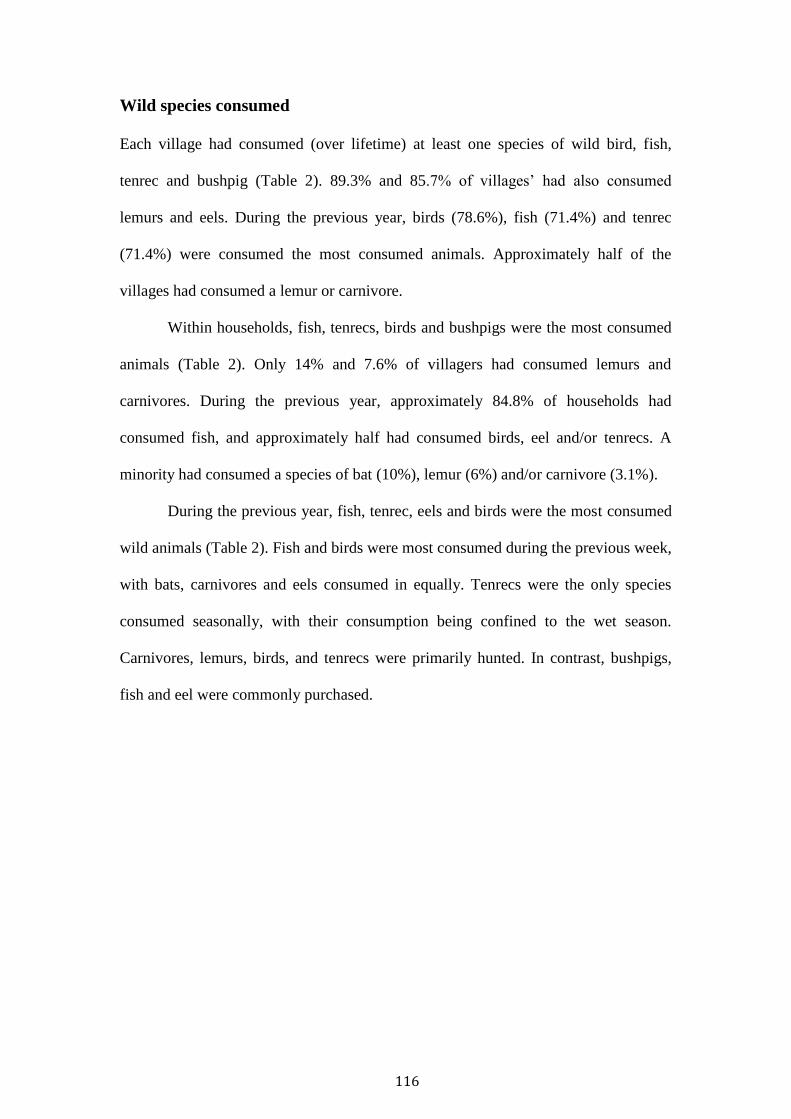
116
Wild species consumed
Each village had consumed (over lifetime) at least one species of wild bird, fish,
tenrec and bushpig (Table 2). 89.3% and 85.7% of villages’ had also consumed
lemurs and eels. During the previous year, birds (78.6%), fish (71.4%) and tenrec
(71.4%) were consumed the most consumed animals. Approximately half of the
villages had consumed a lemur or carnivore.
Within households, fish, tenrecs, birds and bushpigs were the most consumed
animals (Table 2). Only 14% and 7.6% of villagers had consumed lemurs and
carnivores. During the previous year, approximately 84.8% of households had
consumed fish, and approximately half had consumed birds, eel and/or tenrecs. A
minority had consumed a species of bat (10%), lemur (6%) and/or carnivore (3.1%).
During the previous year, fish, tenrec, eels and birds were the most consumed
wild animals (Table 2). Fish and birds were most consumed during the previous week,
with bats, carnivores and eels consumed in equally. Tenrecs were the only species
consumed seasonally, with their consumption being confined to the wet season.
Carnivores, lemurs, birds, and tenrecs were primarily hunted. In contrast, bushpigs,
fish and eel were commonly purchased.
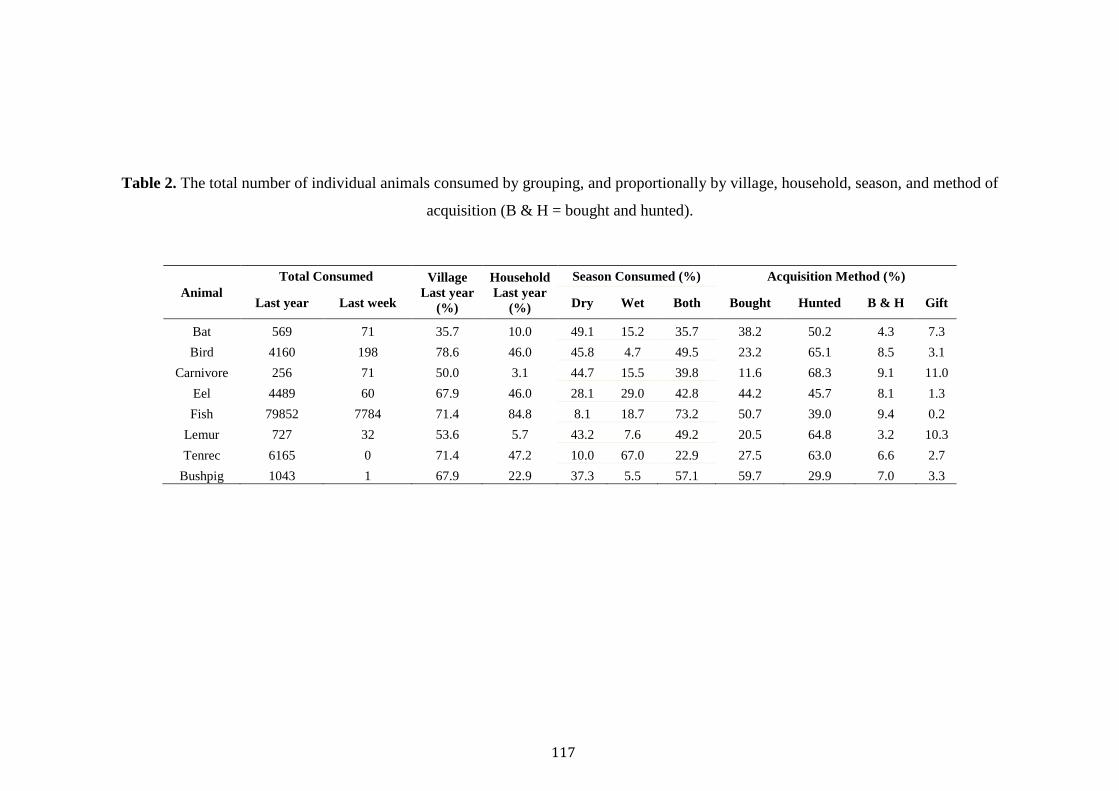
117
Table 2. The total number of individual animals consumed by grouping, and proportionally by village, household, season, and method of
acquisition (B & H = bought and hunted).
Animal
Total Consumed Village
Last year
(%)
Household
Last year
(%)
Season Consumed (%) Acquisition Method (%)
Last year Last week Dry Wet Both Bought Hunted B & H Gift
Bat 569 71 35.7 10.0 49.1 15.2 35.7 38.2 50.2 4.3 7.3
Bird 4160 198 78.6 46.0 45.8 4.7 49.5 23.2 65.1 8.5 3.1
Carnivore 256 71 50.0 3.1 44.7 15.5 39.8 11.6 68.3 9.1 11.0
Eel 4489 60 67.9 46.0 28.1 29.0 42.8 44.2 45.7 8.1 1.3
Fish 79852 7784 71.4 84.8 8.1 18.7 73.2 50.7 39.0 9.4 0.2
Lemur 727 32 53.6 5.7 43.2 7.6 49.2 20.5 64.8 3.2 10.3
Tenrec 6165 0 71.4 47.2 10.0 67.0 22.9 27.5 63.0 6.6 2.7
Bushpig 1043 1 67.9 22.9 37.3 5.5 57.1 59.7 29.9 7.0 3.3
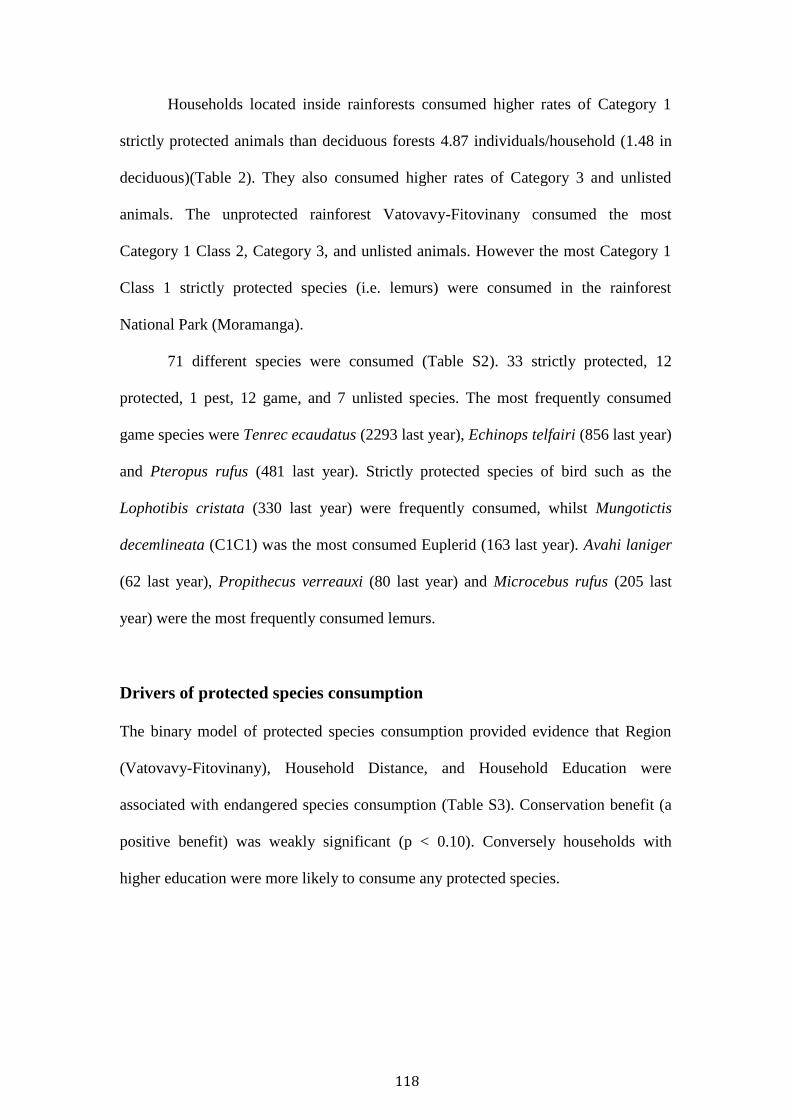
118
Households located inside rainforests consumed higher rates of Category 1
strictly protected animals than deciduous forests 4.87 individuals/household (1.48 in
deciduous)(Table 2). They also consumed higher rates of Category 3 and unlisted
animals. The unprotected rainforest Vatovavy-Fitovinany consumed the most
Category 1 Class 2, Category 3, and unlisted animals. However the most Category 1
Class 1 strictly protected species (i.e. lemurs) were consumed in the rainforest
National Park (Moramanga).
71 different species were consumed (Table S2). 33 strictly protected, 12
protected, 1 pest, 12 game, and 7 unlisted species. The most frequently consumed
game species were Tenrec ecaudatus (2293 last year), Echinops telfairi (856 last year)
and Pteropus rufus (481 last year). Strictly protected species of bird such as the
Lophotibis cristata (330 last year) were frequently consumed, whilst Mungotictis
decemlineata (C1C1) was the most consumed Euplerid (163 last year). Avahi laniger
(62 last year), Propithecus verreauxi (80 last year) and Microcebus rufus (205 last
year) were the most frequently consumed lemurs.
Drivers of protected species consumption
The binary model of protected species consumption provided evidence that Region
(Vatovavy-Fitovinany), Household Distance, and Household Education were
associated with endangered species consumption (Table S3). Conservation benefit (a
positive benefit) was weakly significant (p < 0.10). Conversely households with
higher education were more likely to consume any protected species.
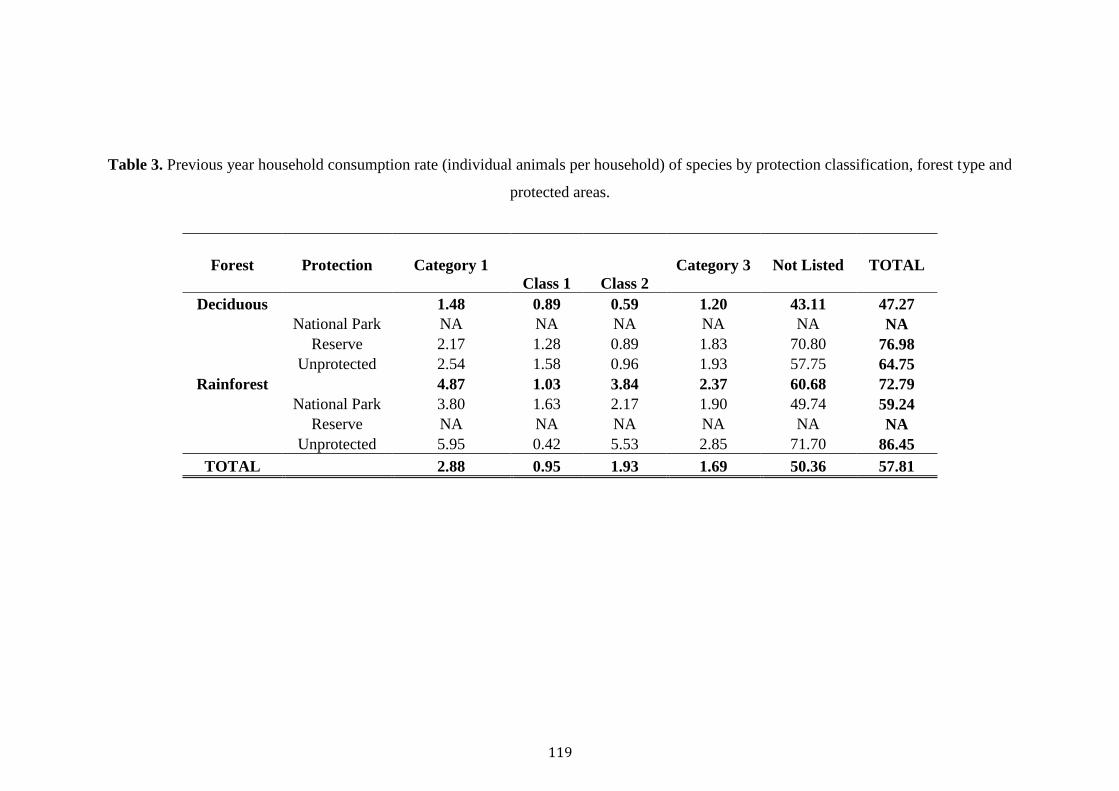
119
Table 3. Previous year household consumption rate (individual animals per household) of species by protection classification, forest type and
protected areas.
Forest Protection Category 1
Category 3 Not Listed TOTAL
Class 1 Class 2
Deciduous
1.48 0.89 0.59 1.20 43.11 47.27
National Park NA NA NA NA NA NA
Reserve 2.17 1.28 0.89 1.83 70.80 76.98
Unprotected 2.54 1.58 0.96 1.93 57.75 64.75
Rainforest
4.87 1.03 3.84 2.37 60.68 72.79
National Park 3.80 1.63 2.17 1.90 49.74 59.24
Reserve NA NA NA NA NA NA
Unprotected 5.95 0.42 5.53 2.85 71.70 86.45
TOTAL
2.88 0.95 1.93 1.69 50.36 57.81
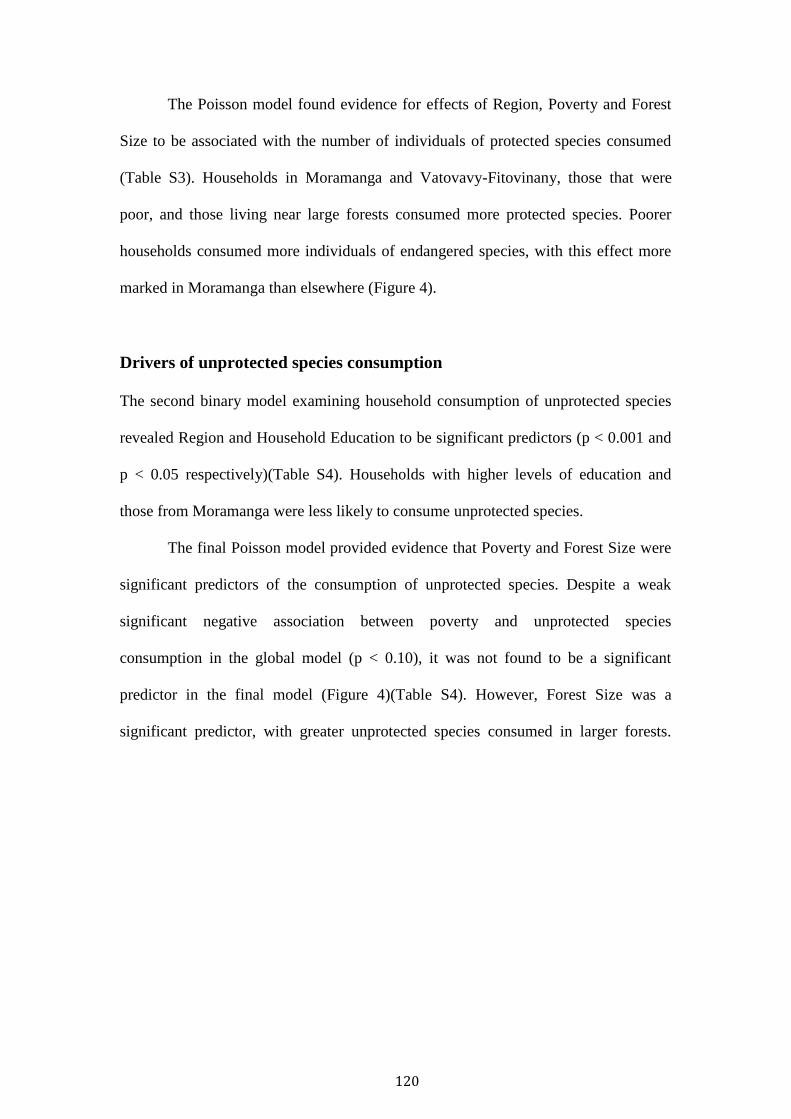
120
The Poisson model found evidence for effects of Region, Poverty and Forest
Size to be associated with the number of individuals of protected species consumed
(Table S3). Households in Moramanga and Vatovavy-Fitovinany, those that were
poor, and those living near large forests consumed more protected species. Poorer
households consumed more individuals of endangered species, with this effect more
marked in Moramanga than elsewhere (Figure 4).
Drivers of unprotected species consumption
The second binary model examining household consumption of unprotected species
revealed Region and Household Education to be significant predictors (p < 0.001 and
p < 0.05 respectively)(Table S4). Households with higher levels of education and
those from Moramanga were less likely to consume unprotected species.
The final Poisson model provided evidence that Poverty and Forest Size were
significant predictors of the consumption of unprotected species. Despite a weak
significant negative association between poverty and unprotected species
consumption in the global model (p < 0.10), it was not found to be a significant
predictor in the final model (Figure 4)(Table S4). However, Forest Size was a
significant predictor, with greater unprotected species consumed in larger forests.
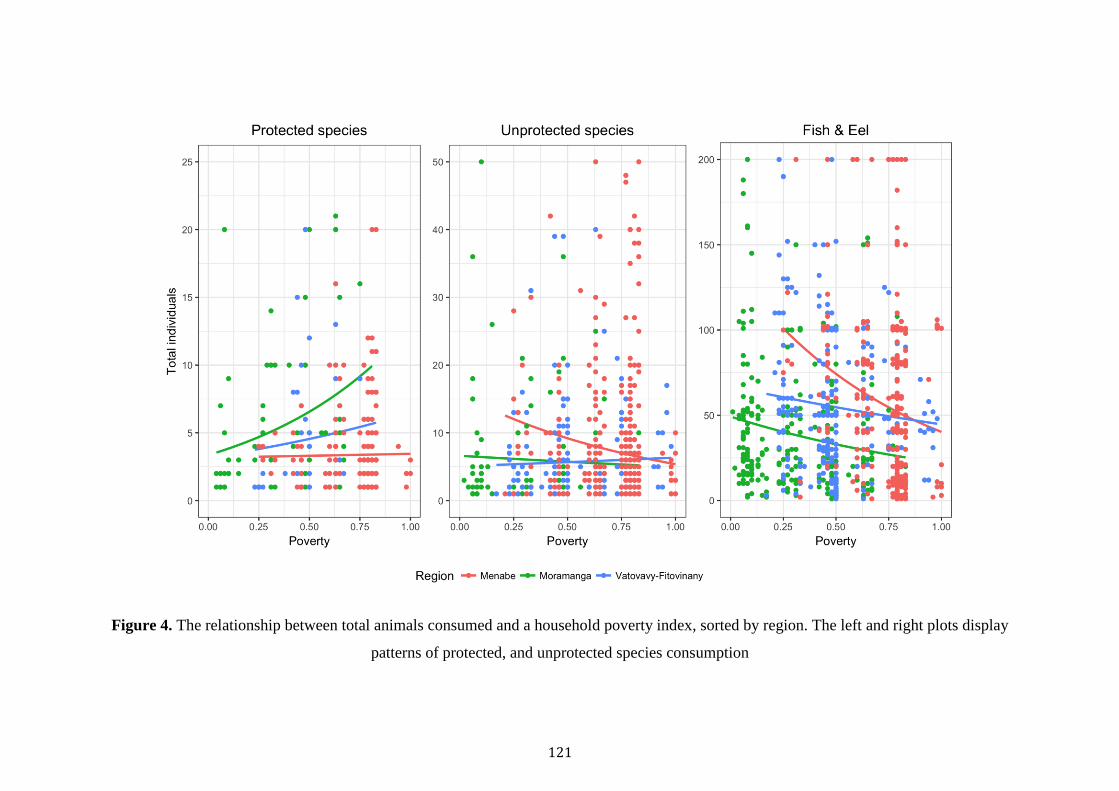
121
Figure 4. The relationship between total animals consumed and a household poverty index, sorted by region. The left and right plots display
patterns of protected, and unprotected species consumption
122
Drivers of fish/eel consumption
The significant predictors for the (binary) consumption of fish and eel included
Region, Poverty, Forest Size and Household Distance (Table S5). Households from
the region’s Moramanga and Vatovavy-Fitovinany, those adjacent to larger forests,
those at greater distances from the forest (p < 0.05), and those that were wealthy were
more likely to have consumed a fish/eel (p < 0.10).
The Poisson model of the significant predictors of fish/eel consumption
reported significant effects of poverty and household distance as in the binary model
(Table S5)(Figure 4). Households that perceived a benefit from conservation reported
consuming lower quantities of fish/eel (p < 0.10).
Discussion
The poorest households consumed protected species in the greatest quantities.
Conversely unprotected species were more likely to be consumed by wealthier
households, and where they were, they were consumed in greater quantities. Protected
areas were not associated with lower consumption of protected species, with
Moramanga households reporting the highest rates of strictly protected species
consumption. Households located in rainforest regions had higher consumption rates
of wild species from all categories (protected, game, pest, unlisted). These results
reflect interviewees’ reported preference for consuming domestic animals – they
suggest that when households are sufficiently wealthy domestic animals are consumed
in preference to endangered bushmeat species. Unlisted, pest and game species were
the most favoured wild animals. Our results suggest that the high preference for
domestic and unprotected species has potentially created a price barrier for poorer
123
households. Future efforts to reduce protected species consumption should focus on
improving accessibility and reducing domestic meat cost in rural Madagascar.
Domestic species favoured
Our respondents’ stated preferences for domestic animals and fish confirms previous
observations across Madagascar (Randrianandrianina et al. 2010; Jenkins et al. 2011;
Gardner and Davies 2014; Golden et al. 2014a; Golden et al. 2014b; Reuter et al.
2016b). Unlike continental Africa where wild species are often the favoured meat
variety (Njiforti 1996; East et al. 2005; Schenck et al. 2006), it is clear in Madagascar
that domestic meat is preferred. This suggests their consumption is likely regulated by
price and accessibility (Wilkie and Godoy 2001; Milner-Gulland and Bennett 2003;
Wilkie et al. 2005).
Bushmeat consumption
71 wild species were documented as consumed in this study. Patterns roughly
reflected preference rankings and Malagasy law with the unprotected/favoured
species most consumed. The most highly consumed (and favoured) endemic species
were those from Tenrecidae. Although hunting of tenrecs is supposedly regulated,
conflicting laws dictate different regulations for individual species. For instance, T.
ecaudatus (game) is seasonably huntable under license, whereas H. semispinosus
(Class 2 protected) is permissibly hunted under quota. Unfortunately hunters are
unlikely to know and follow these regulations (Keane et al. 2011; Rakotoarivelo et al.
2011), with hunting of tenrecs realistically unregulated. Currently, little research has
examined the sustainability of harvest rates, with few reports linking overhunting to
localised decline (Ganzhorn et al. 1990; Nicoll 2003). Given tenrecs are one of the
124
few preferred endemic species, future examination of our data would be useful in
evaluating the sustainability of current harvest rates considering species’ life-history
data.
In total, 31 strictly and 12 protected species were consumed. 23 species of
lemurs were eaten, including three of the five most consumed previous year species.
This included the vulnerable Microcebus rufus, the endangered Propithecus
verreauxi, and the critically endangered Eulemur mongoz (205, 80, 79 individuals).
Although lemurs were consumed by fewer than 10% of households, consumption
occurred in over half of villages. Previous research reported higher rates of household
lemur consumption in Masoala-Makira where up to 50% of households had consumed
some species of lemur (Golden 2009; Borgerson et al. 2016). Likewise, in our same
study site (Andasibe), Razafimanahaka et al. (2012) found household lemur
consumptions rates of >10% (varying by species), suggesting lemur consumption
occurs significantly less in Andasibe than Masoala-Makira. In comparing
discrepancies between our research, and previous studies in Andasibe, temporal
differences in annual consumption rates may be possible. However, what is more
likely is underreporting due to the use of direct questioning. The potential for
underreporting was demonstrated in Razafimanahaka et al.’s (2012) estimates of the
proportion of their Andasibe population to have consumed sifaka (Propithecus
diadema), where RRT produced an estimate of nearly four times that of direct
questioning.
In our study, the rainforest regions reported higher wild species consumption
rates. This could be reflected by higher overall species abundance and diversity in
tropical forests (Wilson 1999), presenting greater hunting opportunities. These results
do however contrast with Razafimanahaka et al. (2012) who reported higher
125
consumption rates of several species (sifaka, brown lemur, whistling duck, flying fox)
in deciduous forests compared to a rainforest. This could be due to the significant
variability between the different regions, and/or communities surveyed. This
highlights the need for greater sampling coverage (and indeed greater replicates over
time), improving the analyses’ robustness, and the interpretation of regional
consumption patterns.
Madagascar’s carnivores, the family Eupleridae, were some of the least
consumed mammals. However, one Euplerid, the endangered Mungotictis
decemlineata was one of the five most consumed protected species. Besides M.
decemlineata, the low consumption likely reflects most Euplerid’s unattractiveness as
bushmeat and their opportunistic consumption from both snaring, and retaliatory
killing during poultry predation (Golden 2009; Kotschwar Logan et al. 2004).
Few species were purchased, with the majority hunted by the interviewee.
Purchasing of preferred species (fish and bushpig) was common, whilst the least
preferred (lemur and carnivores) were mostly acquired by hunting. Previous research
has reported the trading of bushpig (Golden et al. 2014b), but has suggested
opportunistic hunting of wild species (Gardner and Davies 2014; Golden et al.
2014b). Reuter et al.’s (2016a) study reported hunting to be conducted mostly
informally, however purchases through restaurants, markets, and travelling merchants
were more formalised than previously estimated. Although protected species are
primarily hunted, our research supports recent suggestions of a more formalised,
albeit small bushmeat trade and/or greater rule breaking.
The majority of wild species were reportedly hunted all year, likely reflected
in an amalgamation of opportunistic hunting and persistent species presence. Tenrecs
were the only wet-season hunted species, with their vulnerability to opportunistic
126
hunting at least partially reduced during their austral aestivation (Gould and Eisenberg
1966; Lovegrove and Génin 2008; Golden et al. 2013a). Carnivores and bats were
primarily consumed during the dry season. Consumption of bats has previously been
linked to periods of food shortages (Goodman 2006; Jenkins and Racey 2008),
although our respondents typically experienced food shortages during the wet season.
Conversely, consumption of carnivores (particularly fosas) has been known to occur
in response to retaliatory killing during the dry season.
Major drivers of protected species consumption
The most likely explanation for the consumption of higher quantities of protected
species was poverty. Although the relationship between poverty and bushmeat is
complex, varying culturally and geographically, recent inter-country research has
revealed poorer rural households to consistently consume more bushmeat (Brashares
et al. 2011). In Madagascar, poverty, poor health and child malnutrition has been
shown to drive rural lemur consumption (Borgerson et al. 2016). Other research has
also drawn parallels between wealth, food insecurity and meat consumption (Golden
et al. 2011; Jenkins et al. 2011; Golden et al. 2014a; Reuter et al. 2016b). Given the
majority of consumed protected species were of low preference, poorer households
are more likely to consume them out of food insecurity.
Consumption of strictly protected species was most prevalent in the
Moramanga region. This region encompasses Andasibe-Mantadia National Park,
Madagascar’s most visited national park. Despite significant tourism revenue
(Newsome and Hassell 2014), its distribution is uneven, with isolated villages
typically financially neglected. Without greater park intervention and support,
protection status alone is unable to reduce protected species consumption by poor
127
households. Alarmingly, Andasibe-Mantadia likely represents the most sensitive area
for reporting bushmeat consumption, due to its high exposure to the MNP, tourism
and local NGOs. Consequently, interviewee underreporting was potentially significant
across this region, with previous studies reporting individual species consumption
rates to be up to four times higher through the use of sensitive questioning techniques
(Razafimanahaka et al. 2012).
Our observations on what drives the likelihood of consuming any protected
species were inconclusive. Households further from the forest, and those with higher
education were more likely to consume protected species. In practice this is unlikely,
and the direction of this reported effect is not well understood. There was little
evidence for a poverty effect, though there was an association with poverty among the
subset of households reporting some consumption – the poorest of these families
consumed more individuals of protected species. Households’ from Vatovavy-
Fitovinany, a region encompassing unprotected, fragmented rainforests were less
likely to consume protected species, but those that did, were more likely to have
consumed larger quantities of protected species. A local NGO, the Madagascar
Biodiversity Partnership (MBP), collaborates with households in reforestation and
livelihood improvement schemes, which may positively influence the likelihood of
households’ participating in bushmeat consumption. This negative association (albeit
statistically small) was reported between interviewee’s that perceived a conservation
benefit and their reported consumption of bushmeat. This could explain why
households overall consume less, but those that don’t receive conservation benefit
consumed higher quantities of protected species. However, in reality, other more
likely explanations include, reduced overall consumption due to, decreased hunting
opportunities in Vatovavy’s small forest fragments, supporting less abundant
128
biodiversity, and underreporting from households that participate with (or are aware
of) the MBP, and are less likely to reveal their hunting activities.
Forest Size was a significant predictor of protected species consumption in the
final Poisson model, with households near larger forests consuming more individuals.
This could be explained by the association of larger forests with greater species
diversity and abundance (Burkey 1989), consequently providing greater opportunities
for the hunting of wild species.
Major drivers of unprotected species consumption
Although Poverty was an insignificant predictor, it did display a negative association,
with this pattern worth discussing. Firstly, unlisted (helmeted guineafowl), pest
(bushpig) and game species (tenrec) are highly preferred over protected species.
Secondly, they are legally hunted and therefore commonly sold in Malagasy
restaurants and markets. The amalgamation of a legal marketplace and higher
preference drives price increases, ultimately limiting accessibility to wealthier
households. This phenomenon has been reported for tenrec and helmeted guineafowl,
noted for their high preference and cost in western Madagascar (Randrianandrianina
et al. 2010).
Regionally, households from Moramanga were less likely to have consumed
an unprotected species. This could be due to the conservation value of certain
endemic species (tenrec and bird species), and the significant MNP and NGO
(Association Mitsinjo) presence. Furthermore, despite the legality of consuming most
game species, the question is still likely sensitive in villages nearby these
conservation centres, which could have resulted in lower reporting. Furthermore,
much of the region is relatively wealthy due to the park’s tourism value, with
129
households potentially more financially able to afford higher preferred domestic
animals as a protein source. In contrast with the higher consumption of greater
quantities of protected species in Moramanga, this pattern is still not well understood,
and could be reflective of the widespread consumption of unprotected species, making
modelling of the predictors of binary consumption difficult.
Households with higher education were less likely to have consumed an
unprotected species. The underlying mechanism for this is not fully known, however
it could be associated with a greater knowledge of the moral (social norms) or
ecological consequences of the unsustainable consumption of certain unprotected
endemic species (i.e. tenrec).
Major drivers of fish/eel consumption
Wealthier households were more likely to have consumed a fish/eel and to have
consumed greater quantities. This pattern reinforces poverty’s role as a major driver
of wild species consumption. Poorer households were more likely to have consumed
greater quantities of protected species, wealthier household’s (albeit weakly
significant in the global model) were more likely to consume unprotected species and
very significantly likely to consume fish/eel. This pattern reflects Malagasy taste
preference rankings and shows more desirable species are consumed by the wealthy,
with less desirable species consumed by the poor.
Household’s from Moramanga and Vatovavy-Fitovinany, two rainforest
regions, and relatively wealthier regions than the baseline deciduous forest region of
Menabe consumed more fish/eel. Food security within Menabe is poor, with the
region suffering serious food production shortages, and its relative dry nature (lack of
130
water sources) likely underpins the association of greater fish/eel consumption in the
two rainforest regions.
Households further from the forest were more likely to have consumed
fish/eel, likely reflective of low access to forest dwelling species and greater
dependence upon common market sold animals. Likewise, Forest Size was reflective
of greater fish/eel consumption and presumably underpinned by previously outlined
reasons. Unsurprisingly larger villages with more developed markets and often
wealthier consumed more fish/eel. Surprisingly households that perceived benefitting
from conservation consumed smaller quantities of fish/eel, the direction of association
between these variables is not well understand, and unlikely of any significant value
in reality.
Conclusion
This research provides strong evidence that poverty is the principal driver of protected
species consumption in Madagascar. It supports a growing (Golden et al. 2014a;
Borgerson et al. 2016) body of literature documenting the consumption of endangered
mammals by Madagascar’s poorest and most food insecure. Given bushmeat is
considered undesirable compared with domestic meat, and that there is no clear
cultural affinity for it, our results suggest that improving domestic animal availability
would be a promising mechanism for decreasing the hunting of threatened species.
This could be achieved through improved poultry production programs, targeting
disease reduction (e.g. Newcastle’s disease), and improved husbandry techniques.
Such alternative livelihood approaches have been implemented with mixed success
(Van Vliet 2000; Roe et al. 2015; Wicander and Coad 2015; Wright et al. 2016).
Currently in NE Madagascar, programs aiming to improve Malagasy nutrition and
131
reduce bushmeat consumption through village poultry health improvement programs
are being trialled. These projects have potential, and their long-term success must be
monitored and evaluated (Van Vliet 2000; Roe at al. 2015). Furthermore, the local
context of bushmeat consumption, the applicability of the program across
households/communities, and the scalability of the intervention must be considered
(Wright et al. 2016). Such measures are needed to implement effective programs, to
ultimately protect Madagascar’s threatened species, and to alleviate poverty, food
insecurity and potential zoonotic disease transmission.
132
References
Acquisti, A., John, L.K., Loewenstein, G., 2012. The impact of relative standards on
the propensity to disclose. Journal of Marketing Research 49, 160-174.
Ajzen, I., 1991. The theory of planned behavior. Organizational behavior and human
decision processes 50, 179-211.
Alkire, S., Conconi, A., Roche, J.M., 2015a. Multidimensional Poverty Index 2015:
Brief Methodological Note and Results. University of Oxford, Oxford, UK.
Alkire, S., Foster, J., Seth, S., Roche, J.M., Santos, M.E., 2015b. Multidimensional
poverty measurement and analysis. Oxford University Press, USA.
Alkire, S., Santos, M.E., 2014. Measuring Acute Poverty in the Developing World:
Robustness and Scope of the Multidimensional Poverty Index. World
Development 59, 251-274.
Allnutt, T.F., Asner, G.P., Golden, C.D., Powell, G.V.N., 2013. Mapping recent
deforestation and forest disturbance in northeastern Madagascar. Tropical
Conservation Science 6, 1-15.
Aquilino, W.S., Wright, D.L., Supple, A.J., 2000. Response effects due to bystander
presence in CASI and paper-and-pencil surveys of drug use and alcohol use.
Substance Use & Misuse 35, 845-867.
Bennett, E.L., Robinson, J.G., 2000. Hunting of wildlife in tropical forests:
implications for biodiversity and forest peoples.
Borgerson, C., McKean, M.A., Sutherland, M.R., Godfrey, L.R., 2016. Who hunts
lemurs and why they hunt them. Biological Conservation 197, 124-130.
Brashares, J.S., Golden, C.D., Weinbaum, K.Z., Barrett, C.B., Okello, G.V., 2011.
Economic and geographic drivers of wildlife consumption in rural Africa.
Proceedings of the National Academy of Sciences 108, 13931-13936.
133
Brooks, T.M., Mittermeier, R.A., da Fonseca, G.A., Gerlach, J., Hoffmann, M.,
Lamoreux, J.F., Mittermeier, C.G., Pilgrim, J.D., Rodrigues, A.S., 2006. Global
biodiversity conservation priorities. Science 313, 58-61.
Burkey, T.V., 1989. Extinction in Nature Reserves: The Effect of Fragmentation and
the Importance of Migration between Reserve Fragments. Oikos 55, 75-81.
Cinner, J.E., 2007. The role of taboos in conserving coastal resources in Madagascar.
Traditional Marine Resource Management and Knowledge Information Bulletin
22, 15-23.
Dotter, C., Klasen, S., 2017. The multidimensional poverty index: achievements,
conceptual and empirical issues. Courant Research Centre: Poverty, Equity and
Growth-Discussion Papers.
Eagly, A.H., Chaiken, S., 1993. The psychology of attitudes. Harcourt Brace
Jovanovich College Publishers.
East, T., Kümpel, N.F., Milner-Gulland, E.J., Rowcliffe, J.M., 2005. Determinants of
urban bushmeat consumption in Rio Muni, Equatorial Guinea. Biological
Conservation 126, 206-215.
Eklund, J., Blanchet, F.G., Nyman, J., Rocha, R., Virtanen, T., Cabeza, M., 2016.
Contrasting spatial and temporal trends of protected area effectiveness in
mitigating deforestation in Madagascar. Biological Conservation 203, 290-297.
Fa, J.E., Albrechtsen, L., Brown, D., 2006. Bushmeat: the challenge of balancing
human and wildlife needs in African moist tropical forests, In Key Topics in
Conservation Biology. eds D.W. Macdonald, K. Service, pp. 208-222.
Blackwell Publishing, Oxford.
Ferreira, F.H., 2011. Poverty is multidimensional. But what are we going to do about
it? Journal of Economic Inequality 9, 493-495.
134
Fisher, R.J., 1993. Social desirability bias and the validity of indirect questioning.
Journal of consumer research 20, 303-315.
Funk, S.M., Fa, J.E., 2010. Ecoregion prioritization suggests an armoury not a silver
bullet for conservation planning. PLoS One 5, e8923.
Ganzhorn, J.U., Ganzhorn, A.W., Abraham, J.P., Andriamanarivo, L.,
Ramananjatovo, A., 1990. The impact of selective logging on forest structure
and tenrec populations in western Madagascar. Oecologia 84, 126-133.
García, G., Goodman, S.M., 2003. Hunting of protected animals in the Parc National
d'Ankarafantsika, north-western Madagascar. Oryx 37, 115-118.
Gardner, C.J., Davies, Z.G., 2014. Rural Bushmeat Consumption Within Multiple-use
Protected Areas: Qualitative Evidence from Southwest Madagascar. Human
Ecology 42, 21-34.
Golden, C., Comaroff, J., 2015a. The human health and conservation relevance of
food taboos in northeastern Madagascar. Ecology and Society 20.
Golden, C., Wrangham, R., Brashares, J., 2013a. Assessing the accuracy of
interviewed recall for rare, highly seasonal events: the case of wildlife
consumption in Madagascar. Animal Conservation 16, 597-603.
Golden, C.D., 2009. Bushmeat hunting and use in the Makira Forest, north-eastern
Madagascar: a conservation and livelihoods issue. Oryx 43, 386.
Golden, C.D., Bonds, M.H., Brashares, J.S., Rodolph Rasolofoniaina, B.J., Kremen,
C., 2014a. Economic valuation of subsistence harvest of wildlife in Madagascar.
Conservation Biology 28, 234-243.
Golden, C.D., Comaroff, J., 2015b. Effects of social change on wildlife consumption
taboos in northeastern Madagascar. Ecology and Society 20, 41.
135
Golden, C.D., Fernald, L.C., Brashares, J.S., Rasolofoniaina, B.R., Kremen, C., 2011.
Benefits of wildlife consumption to child nutrition in a biodiversity hotspot.
Proceedings of the National Academy of Sciences 108, 19653-19656.
Golden, C.D., Rabehatonina, J.G.C., Rakotosoa, A., Moore, M., 2014b. Socio-
ecological analysis of natural resource use in Betampona Strict Natural Reserve.
Madagascar Conservation & Development 9, 83-89.
Golden, C.D., Wrangham, R.W., Brashares, J.S., 2013b. Assessing the accuracy of
interviewed recall for rare, highly seasonal events: the case of wildlife
consumption in Madagascar. Animal Conservation 16, 597-603.
Goodman, S.M., 2006. Hunting of Microchiroptera in south-western Madagascar.
Oryx 40, 225.
Goodman, S.M., Benstead, J.P., 2005. Updated estimates of biotic diversity and
endemism for Madagascar. Oryx 39, 73-77.
Gould, E., Eisenberg, J.F., 1966. Notes on the biology of the Tenrecidae. Journal of
Mammalogy 47, 660-686.
Groves, R.M., Peytcheva, E., 2008. The impact of nonresponse rates on nonresponse
bias: a meta-analysis. Public opinion quarterly 72, 167-189.
Hardeman, W., Johnston, M., Johnston, D., Bonetti, D., Wareham, N., Kinmonth,
A.L., 2002. Application of the theory of planned behaviour in behaviour change
interventions: A systematic review. Psychology and health 17, 123-158.
Horning, N.R., 2003. How rules affect conservation outcomes. The Natural History of
Madagascar. SM Goodman and JP Benstead (eds), 146-153.
Hubbard, M.L., Casper, R.A., Lessler, J.T., 1989. Respondents’ reactions to item
count lists and randomized response. Proceedings of the Survey Research
Section’, American Statistical Association, Washington, DC, 544-448.
136
IFAD, 2016. Statistics.
Imai, K., 2011. Multivariate regression analysis for the item count technique. Journal
of the American Statistical Association 106, 407-416.
Jenkins, R.K., Keane, A., Rakotoarivelo, A.R., Rakotomboavonjy, V.,
Randrianandrianina, F.H., Razafimanahaka, H.J., Ralaiarimalala, S.R., Jones,
J.P., 2011. Analysis of patterns of bushmeat consumption reveals extensive
exploitation of protected species in eastern Madagascar. PLoS One 6, e27570.
Jenkins, R.K., Racey, P.A., 2008. Bats as bushmeat in Madagascar. Madagascar
Conservation & Development 3.
John, F.A.S., Edwards-Jones, G., Gibbons, J.M., Jones, J.P., 2010. Testing novel
methods for assessing rule breaking in conservation. Biological Conservation
143, 1025-1030.
Jones, J.P.G., Andriamarovololona, M.M., Hockley, N., 2008. The Importance of
Taboos and Social Norms to Conservation in Madagascar. Conservation
Biology 22, 976-986.
Keane, A., Ramarolahy, A.A., Jones, J.P., Milner‐Gulland, E., 2011. Evidence for the
effects of environmental engagement and education on knowledge of wildlife
laws in Madagascar. Conservation Letters 4, 55-63.
King, M.F., Bruner, G.C., 2000. Social desirability bias: A neglected aspect of
validity testing. Psychology and Marketing 17, 79-103.
Lambek, M., 1992. Taboo as cultural practice among Malagasy speakers. Man, 245-
266.
Lensvelt-Mulders, G.J., Hox, J.J., Van der Heijden, P.G., Maas, C.J., 2005. Meta-
analysis of randomized response research: Thirty-five years of validation.
Sociological methods & research 33, 319-348.
137
Lovegrove, B.G., Génin, F., 2008. Torpor and hibernation in a basal placental
mammal, the Lesser Hedgehog Tenrec Echinops telfairi. Journal of
Comparative Physiology B 178, 691-698.
Martin, A.D., Quinn, K.M., Park, J.H., 2017. Markov Chain Monte Carlo (MCMC)
Package. R Package 1.3-9.
Miller, J.D., 1984. A new survey technique for studying deviant behavior. George
Washington University.
Milner-Gulland, E.J., Bennett, E.L., 2003. Wild meat: the bigger picture. Trends in
ecology & evolution 18, 351-357.
MNP, 2016. Ankarafantsika National Park.
Newsome, D., Hassell, S., 2014. Tourism and conservation in Madagascar: the
importance of Andasibe National Park. Koedoe 56, 1-8.
Nicoll, M., 2003. The Natural History of Madagascar. The University of Chicago
Press, Chicago, USA.
Njiforti, H.L., 1996. Preferences and present demand for bushmeat in north
Cameroon: some implications for wildlife conservation. Environmental
Conservation 23, 149-155.
Nuno, A., John, F.A.S., 2015. How to ask sensitive questions in conservation: A
review of specialized questioning techniques. Biological Conservation 189, 5-
15.
Poudyal, M., Ramamonjisoa, B.S., Hockley, N., Rakotonarivo, O.S., Gibbons, J.M.,
Mandimbiniaina, R., Rasoamanana, A., Jones, J.P., 2016. Can REDD+ social
safeguards reach the ‘right’people? Lessons from Madagascar. Global
Environmental Change 37, 31-42.
138
Rakotoarivelo, A.R., Razafimanahaka, J.H., Rabesihanaka, S., Jones, J.P.G., Jenkins,
R.K.B., 2011. Laws and regulations on wildlife in Madagascar: progress and
future needs. Madagascar Conservation and Development 6, 37-44.
Randriamalala, H., Liu, Z., 2010. Rosewood of Madagascar: Between democracy and
conservation. Madagascar Conservation & Development 5, 11-22.
Randrianandianina, B.N., Andriamahaly, L.R., Harisoa, F.M., Nicoll, M.E., 2003. The
role of the protected areas in the management of the island’s biodiversity. The
natural history of Madagascar, 1423-1432.
Randrianandrianina, F.H., Racey, P.A., Jenkins, R.K.B., 2010. Hunting and
consumption of mammals and birds by people in urban areas of western
Madagascar. Oryx 44, 411-415.
Ravallion, M., 2011. On multidimensional indices of poverty. The Journal of
Economic Inequality 9, 235-248.
Razafimanahaka, J.H., Jenkins, R.K.B., Andriafidison, D., Randrianandrianina, F.,
Rakotomboavonjy, V., Keane, A., Jones, J.P.G., 2012. Novel approach for
quantifying illegal bushmeat consumption reveals high consumption of
protected species in Madagascar. Oryx 46, 584-592.
Reuter, K.E., Randell, H., Wills, A.R., Janvier, T.E., Belalahy, T.R., Sewall, B.J.,
2016a. Capture, Movement, Trade, and Consumption of Mammals in
Madagascar. PLoS One 11, e0150305.
Reuter, K.E., Randell, H., Wills, A.R., Sewall, B.J., 2016b. The consumption of wild
meat in Madagascar: drivers, popularity and food security. Environmental
Conservation, 1-11.
Ripple, W.J., Abernethy, K., Betts, M.G., Chapron, G., Dirzo, R., Galetti, M., Levi,
T., Lindsey, P.A., Macdonald, D.W., Machovina, B., 2016. Bushmeat hunting
139
and extinction risk to the world's mammals. Royal Society Open Science 3,
160498.
Schenck, M., Effa, E.N., Starkey, M., Wilkie, D., Abernethy, K., Telfer, P., Godoy,
R., Treves, A., 2006. Why people eat bushmeat: results from two-choice, taste
tests in Gabon, Central Africa. Human Ecology 34, 433.
Schwitzer, C., Mittermeier, R., Davies, N., Johnson, S., Ratsimbazafy, J.,
Razafindramanana, J., Louis, E., Rajaobelina, S., 2013. Lemurs of Madagascar:
a strategy for their conservation 2013–2016. Bristol, UK: IUCN SSC Primate
Specialist Group Report, Bristol Conservation and Science Foundation, and
Conservation International.
Schwitzer, C., Mittermeier, R.A., Johnson, S.E., Donati, G., Irwin, M., Peacock, H.,
Ratsimbazafy, J., Razafindramanana, J., Louis, E.E., Chikhi, L., 2014. Averting
lemur extinctions amid Madagascar's political crisis. Science 343, 842-843.
Singer, E., Von Thurn, D.R., Miller, E.R., 1995. Confidentiality assurances and
response: A quantitative review of the experimental literature. Public opinion
quarterly 59, 66-77.
Solomon, J., Jacobson, S.K., Wald, K.D., Gavin, M., 2007. Estimating illegal resource
use at a Ugandan park with the randomized response technique. Human
Dimensions of Wildlife 12, 75-88.
St John, F.A., Edwards-Jones, G., Jones, J.P., 2011. Conservation and human
behaviour: lessons from social psychology. Wildlife Research 37, 658-667.
Tourangeau, R., Yan, T., 2007. Sensitive questions in surveys. Psychological bulletin
133, 859.
140
UNEP-WCMC. 2007. Protected Area Country Profile for Madagascar from the World
Database of Protected Areas, October 2017. Available at:
www.protectedplanet.net
Van den Hout, A., van der Heijden, P.G., Gilchrist, R., 2007. The logistic regression
model with response variables subject to randomized response. Computational
Statistics & Data Analysis 51, 6060-6069.
Vences, M., Wollenberg, K.C., Vieites, D.R., Lees, D.C., 2009. Madagascar as a
model region of species diversification. Trends in ecology & evolution 24, 456-
465.
Waeber, P.O., Wilmé, L., Mercier, J.-R., Camara, C., Lowry II, P.P., 2016. How
Effective Have Thirty Years of Internationally Driven Conservation and
Development Efforts Been in Madagascar? PLoS One 11, e0161115.
Warner, S.L., 1965. Randomized response: A survey technique for eliminating
evasive answer bias. Journal of the American Statistical Association 60, 63-69.
Wilkie, D.S., Godoy, R.A., 2001. Income and price elasticities of bushmeat demand
in lowland Amerindian societies. Conservation Biology 15, 761-769.
Wilkie, D.S., Starkey, M., Abernethy, K., Effa, E.N., Telfer, P., Godoy, R., 2005.
Role of prices and wealth in consumer demand for bushmeat in Gabon, Central
Africa. Conservation Biology 19, 268-274.
Wilson, E.O. 1999. The diversity of life. WW Norton & Company.
Zinner, D., Wygoda, C., Razafimanantsoa, L., Rasoloarison, R., T. Andrianandrasana,
H., Ganzhorn, J.U., Torkler, F., 2013. Analysis of deforestation patterns in the
central Menabe, Madagascar, between 1973 and 2010. Regional Environmental
Change 14, 157-166.

141
Zuur, F., Savaliev, A., Ieno, E., 2012. Zero Inflated Models and Generalized Linear
Mixed Models with R. Highland Statistics Ltd, Newburgh, UK.
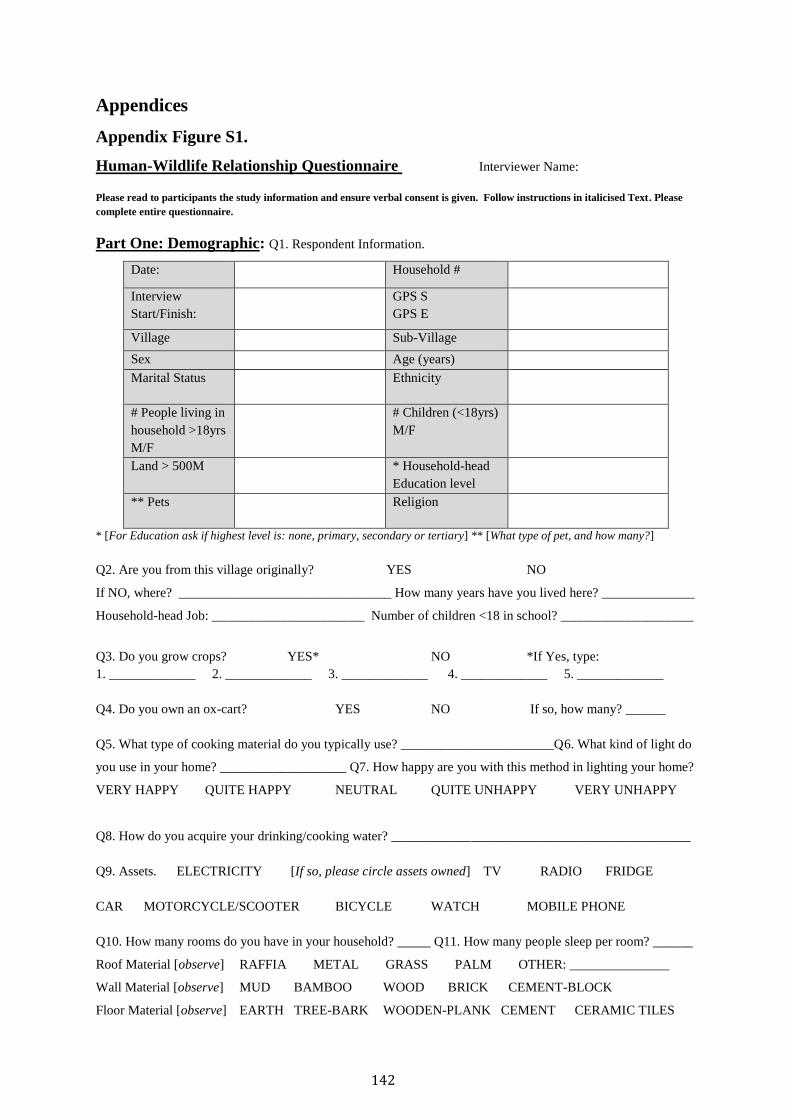
142
Appendices
Appendix Figure S1.
Human-Wildlife Relationship Questionnaire Interviewer Name:
Please read to participants the study information and ensure verbal consent is given. Follow instructions in italicised Text. Please
complete entire questionnaire.
Part One: Demographic: Q1. Respondent Information.
Date: Household #
Interview
Start/Finish:
GPS S
GPS E
Village Sub-Village
Sex Age (years)
Marital Status Ethnicity
# People living in
household >18yrs
M/F
# Children (<18yrs)
M/F
Land > 500M * Household-head
Education level
** Pets Religion
* [For Education ask if highest level is: none, primary, secondary or tertiary] ** [What type of pet, and how many?]
Q2. Are you from this village originally? YES NO
If NO, where? ________________________________ How many years have you lived here? ______________
Household-head Job: _______________________ Number of children <18 in school? ____________________
Q3. Do you grow crops? YES* NO *If Yes, type:
1. _____________ 2. _____________ 3. _____________ 4. _____________ 5. _____________
Q4. Do you own an ox-cart? YES NO If so, how many? ______
Q5. What type of cooking material do you typically use? _______________________Q6. What kind of light do
you use in your home? ___________________ Q7. How happy are you with this method in lighting your home?
VERY HAPPY QUITE HAPPY NEUTRAL QUITE UNHAPPY VERY UNHAPPY
Q8. How do you acquire your drinking/cooking water? _____________________________________________
Q9. Assets. ELECTRICITY [If so, please circle assets owned] TV RADIO FRIDGE
CAR MOTORCYCLE/SCOOTER BICYCLE WATCH MOBILE PHONE
Q10. How many rooms do you have in your household? _____ Q11. How many people sleep per room? ______
Roof Material [observe] RAFFIA METAL GRASS PALM OTHER: _______________
Wall Material [observe] MUD BAMBOO WOOD BRICK CEMENT-BLOCK
Floor Material [observe] EARTH TREE-BARK WOODEN-PLANK CEMENT CERAMIC TILES

143
Part 2: Wildlife-livestock relationship
Q1. If you own livestock, what breeds and how many do you own? [If no skip to Q16]
Quantity Protected Y/N? How?
1. Adult Chicken
2. Chick
Duck
Turkey
Goat
Pig
Zebu
Other
Q2. Do you allow your poultry to ALWAYS roam freely? YES NO
[If yes, skip to Q11. If no, please continue with the next question. Please tick multiple boxes if participant stores poultry in more than one
place/time.]
Q3. What poultry do you store? CHICKEN DUCK TURKEY OTHER: _________
Q4. Where do you store your poultry? COOP INSIDE-HOUSE OTHER: __________
Q4a. Ranking of coop quality (1 = Very weak, 5 = Very Strong)? ________ Photo number: ______________
Q5. What time of day do you store your poultry? MORNING MIDDAY AFTERNOON EVENING
Q6. What time of year do you store your poultry? DRY WET BOTH
Q7. Why do you store your poultry? ____________________________________________________________
__________________________________________________________________________________________
Q8. Do you set up snares to protect your poultry? YES NO [If no, skip to Q11]
Q8a. Where do you set up your snares? __________________________________________________________
__________________________________________________________________________________________
Q9. Have you ever found any animals in your snares? YES NO [If yes, fill in box below]
What type of
animal did
you find?
How many
times in your
lifetime?
How many
times since
last year?
What time of
year?
(dry/wet/both)
** What time
of day?
What did you do with the animal?
Wild cat
Fosa
Small Indian
civet
[* Since local event ** Morning/Midday/Afternoon/Evening]
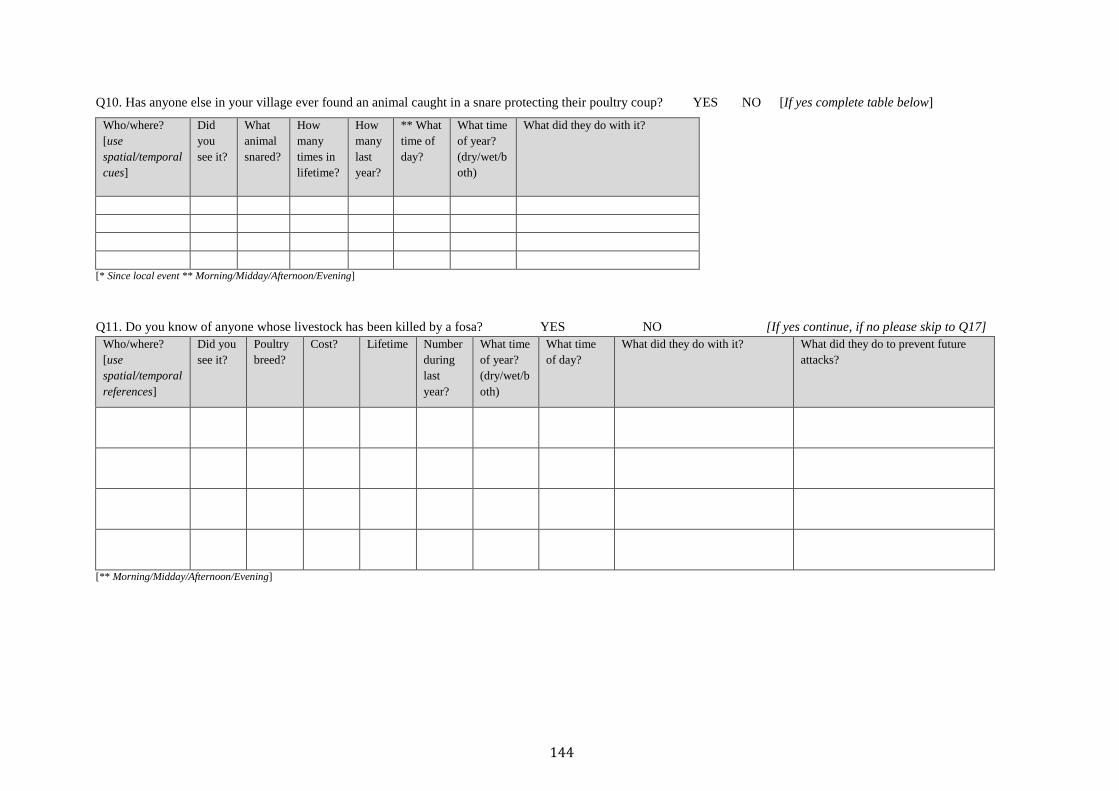
144
Q10. Has anyone else in your village ever found an animal caught in a snare protecting their poultry coup? YES NO [If yes complete table below]
Who/where?
[use
spatial/temporal
cues]
Did
you
see it?
What
animal
snared?
How
many
times in
lifetime?
How
many
last
year?
** What
time of
day?
What time
of year?
(dry/wet/b
oth)
What did they do with it?
[* Since local event ** Morning/Midday/Afternoon/Evening]
Q11. Do you know of anyone whose livestock has been killed by a fosa? YES NO [If yes continue, if no please skip to Q17]
Who/where?
[use
spatial/temporal
references]
Did you
see it?
Poultry
breed?
Cost? Lifetime Number
during
last
year?
What time
of year?
(dry/wet/b
oth)
What time
of day?
What did they do with it? What did they do to prevent future
attacks?
[** Morning/Midday/Afternoon/Evening]
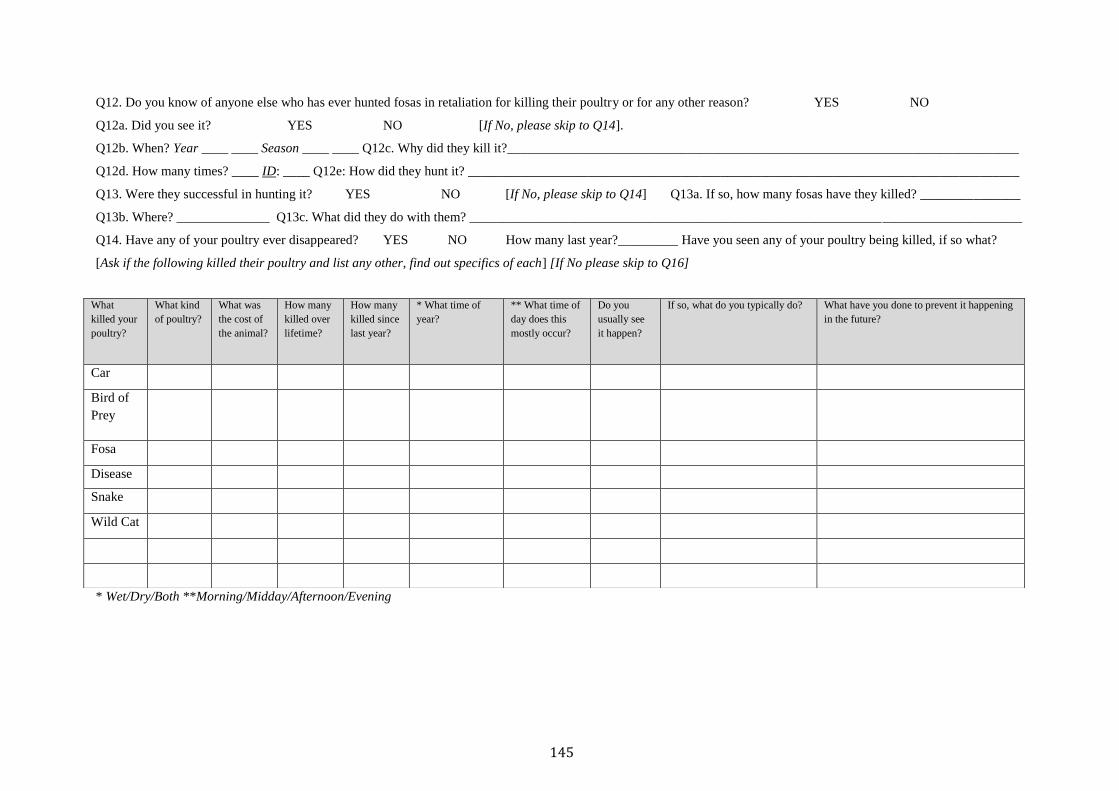
145
Q12. Do you know of anyone else who has ever hunted fosas in retaliation for killing their poultry or for any other reason? YES NO
Q12a. Did you see it? YES NO [If No, please skip to Q14].
Q12b. When? Year ____ ____ Season ____ ____ Q12c. Why did they kill it?_____________________________________________________________________________
Q12d. How many times? ____ ID: ____ Q12e: How did they hunt it? ___________________________________________________________________________________
Q13. Were they successful in hunting it? YES NO [If No, please skip to Q14] Q13a. If so, how many fosas have they killed? _______________
Q13b. Where? ______________ Q13c. What did they do with them? ___________________________________________________________________________________
Q14. Have any of your poultry ever disappeared? YES NO How many last year?_________ Have you seen any of your poultry being killed, if so what?
[Ask if the following killed their poultry and list any other, find out specifics of each] [If No please skip to Q16]
* Wet/Dry/Both **Morning/Midday/Afternoon/Evening
What
killed your
poultry?
What kind
of poultry?
What was
the cost of
the animal?
How many
killed over
lifetime?
How many
killed since
last year?
* What time of
year?
** What time of
day does this
mostly occur?
Do you
usually see
it happen?
If so, what do you typically do? What have you done to prevent it happening
in the future?
Car
Bird of
Prey
Fosa
Disease
Snake
Wild Cat

146
Q15. Have you (or anyone in your household) ever hunted fosas in retaliation for killing your poultry or for any
other reason? YES NO [If No, please skip to Q17]
Q15a. When? Year ____ ____ Season ____ ____ Q15b. Why? _______________________________________
__________________________________________________________________________________________
Q15c. How many times? ____________ Q15d: How do you hunt fosas? _______________________________
__________________________________________________________________________________________
Q16. Were you (or anyone in your household) successful in hunting fosas? YES NO [If No, skip to Q17]
Q16a. If so, how many fosas have you killed? ____________ Q16b. Where? ___________________________
Q16c. What did you do with it? _______________________________________________________________
Q17. How do you feel about the fosa?
STRONGLY DISLIKE QUITE DISLIKE NEUTRAL QUITE LIKE STRONGLY LIKE
Q18. Why do you feel this way? _______________________________________________________________
__________________________________________________________________________________________
Q19. Does the fosa provide any benefit to you? YES NO What benefit/why no benefit?
__________________________________________________________________________________________
Q20. Does the fosa provide any benefit to the ecosystem? YES NO What benefit/why no benefit?
__________________________________________________________________________________________
Q21. Why do you think the fosa wants to eat your poultry? __________________________________________
Q22. Are you scared of the fosa for your own safety? YES NO Why? ____________________
__________________________________________________________________________________________
Q23. Are you scared of the fossa for your poultry? YES NO Why? ____________________
__________________________________________________________________________________________
Q24. Do you think the fosa’s population should be controlled? YES NO Why? ____________
__________________________________________________________________________________________
Q25. Do you believe in any taboos relating to the fosa? YES NO If so, what taboos? _________
__________________________________________________________________________________________

147
Part 3: Diet
Q1. What are your household’s five most consumed foods (could you please rank them in most eaten)?
1. _____________ 2. _____________ 3. _____________ 4. _____________ 5. _____________
Q2. Do you consume these foods seasonally or perennially? [Please list]
DRY:____________________________________________________________________________________
WET:____________________________________________________________________________________
BOTH:___________________________________________________________________________________
Q3. What are your household’s five most accompaniments to rice/maize (could you please rank them)?
1. _____________ 2. _____________ 3. _____________ 4. _____________ 5. _____________
Q4 What are your household’s five most consumed fruits (could you please rank them)?
1. _____________ 2. _____________ 3. _____________ 4. _____________ 5. _____________
Q5. What is your primary source of meat? DOMESTIC ANIMAL WILD ANIMAL
Q6. On average how many days per week does at least one meal contain meat? Dom ___ Wild ___ None __
Q7. Is there a period of the year in which you have don’t have enough food?
Season: _______ From: _______ To: _______ #Months:________
Q8. What is your favourite domestic meat? _______________ Why? _________________________________
Q8a. TEST. Which of those animals have you ever seen in the forest? _________________________________
Q8b. Please rank in order of preference (only ranking what you have eaten):
Zebu ____ Duck ____ Goat ____ Chicken ____ Turkey ____ Pig ____ Sheep: ____ Other: ________
Q8c. Why did you rank the animals in this order? _________________________________________________
_________________________________________________________________________________________
Q8d. Please rank in order of most consumed (only ranking what you have eaten):
Zebu ____ Duck ____ Goat ____ Chicken ____ Turkey ____ Pig ____ Sheep: _____ Other: ______
Q8e. Why do you choose to eat domestic meat? __________________________________________________
_________________________________________________________________________________________
Q9. Have you ever eaten any of these animals before during your lifetime? YES NO
[If yes, please answer Q9a, If no please skip to Q12]
Q9a. What is your favourite wild meat? _______________ Why? ____________________________________
Q9b. Please rank in order of preference (only ranking what you have eaten):
Lemur ____ Bird ____ Tenrec ____ Reptile ____ Pig ____ Carnivore ____ Aquatic ____ Bats ____
Q9c. Why did you rank the animals in this order? _________________________________________________
_________________________________________________________________________________________
Q9d. Why do you choose to eat wild meat? ______________________________________________________
_________________________________________________________________________________________
Q10. Please rank in order of preference (only ranking what you have eaten):
Lemur ____ Bird ____ Tenrec ____ Reptile ____ Pig ____ Carnivore ____ Aquatic ____
Bats ____ Zebu ____ Duck ____ Goat ____ Chicken ____ Turkey ____ Pig ____
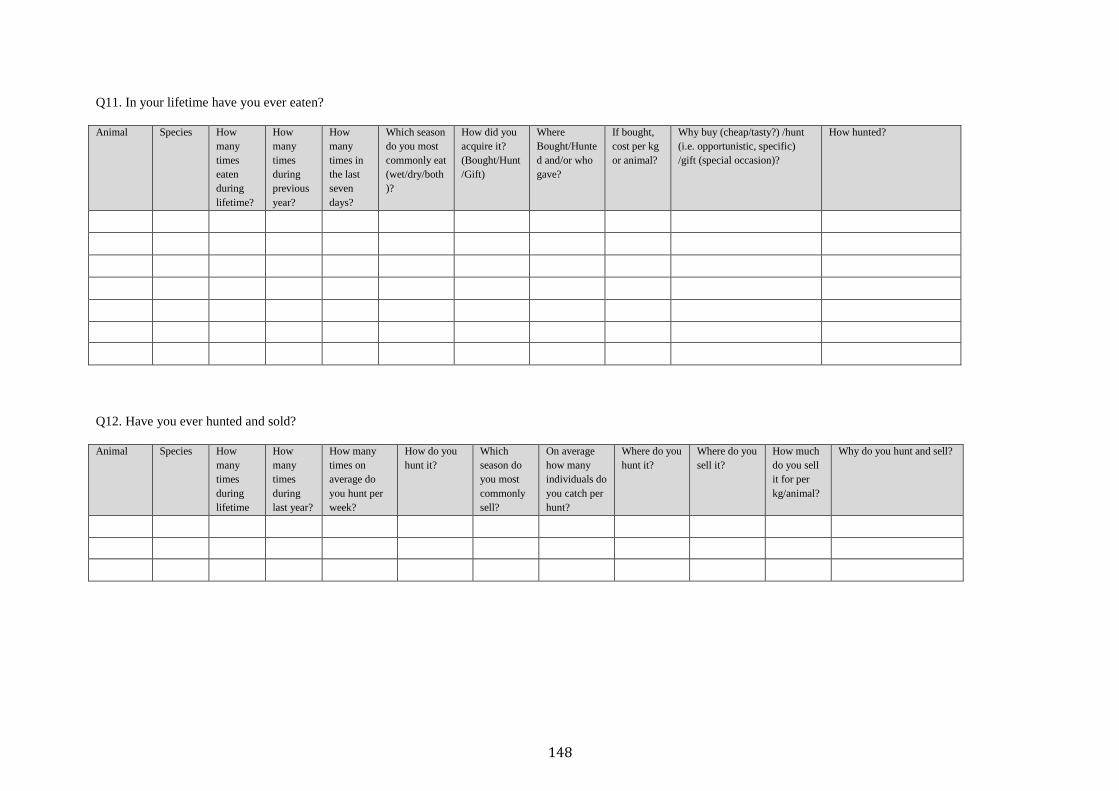
148
Q11. In your lifetime have you ever eaten?
Animal Species How
many
times
eaten
during
lifetime?
How
many
times
during
previous
year?
How
many
times in
the last
seven
days?
Which season
do you most
commonly eat
(wet/dry/both
)?
How did you
acquire it?
(Bought/Hunt
/Gift)
Where
Bought/Hunte
d and/or who
gave?
If bought,
cost per kg
or animal?
Why buy (cheap/tasty?) /hunt
(i.e. opportunistic, specific)
/gift (special occasion)?
How hunted?
Q12. Have you ever hunted and sold?
Animal Species How
many
times
during
lifetime
How
many
times
during
last year?
How many
times on
average do
you hunt per
week?
How do you
hunt it?
Which
season do
you most
commonly
sell?
On average
how many
individuals do
you catch per
hunt?
Where do you
hunt it?
Where do you
sell it?
How much
do you sell
it for per
kg/animal?
Why do you hunt and sell?

149
Q13. What type of wild animals have you tried to hunt for most in your life?
___________________________________________________________________________________
Q13a. Please rank in order hunting success (only animals that you have hunted).
Lemur __ Bird __ Tenrec __ Reptile __ Pig __ Carnivore __ Aquatic __ Bats __
Q13b. What animal was easiest to catch? _______________ Why? ____________________________
___________________________________________________________________________________
Q14. Are there any taboos relating to any wild animals in this area? YES NO
What?_____________________________________________________________________________
Part 4. Wildlife conservation
Q1. What do you think wildlife conservation is? ___________________________________________
__________________________________________________________________________________
Q2. Why would we conserve wildlife? ___________________________________________________
__________________________________________________________________________________
Q3. Who do we protect wildlife for? __________________ Why do you feel this way? ____________
__________________________________________________________________________________
Q4. Do you like wildlife conservation?
STRONGLY LIKE QUITE LIKE NEUTRAL QUITE LIKE STRONGLY LIKE
Q4a. Why do you feel this way? _______________________________________________________
__________________________________________________________________________________
Q4b. Do you receive any benefit from conservation? YES NO
What?_____________________________________________________________________________
Q5. Do you know that this is a protected (or unprotected) area? YES NO
Q5a. What does this mean? ____________________________________________________________
Q6. Why do you think the forest was protected? ____________________________________________
___________________________________________________________________________________
Q7. How do you feel about this forest being established as a protected (or unprotected) area?
STRONGLY LIKE QUITE LIKE NEUTRAL QUITE LIKE STRONGLY LIKE
Q7a. Why do you feel this way? ________________________________________________________
Q7b. Do you receive any benefit from this forest? YES NO
What? _____________________________________________________________________________
Q8. Has anyone ever spoken to you about conservation? YES NO
How many times? ______ Job? _____________ Who did they work for? ________________________
Where were they from? _______________________________________________________________
What did they tell you? _______________________________________________________________
___________________________________________________________________________________
Did this change your perception of wildlife conservation? YES NO
WHY?_____________________________________________________________________________

150
Appendix Figure S2.
Fanontaniana Fanadihadiana momba ny fifandraisan’ny olombelona sy ny
zavaboahary
Anaran’ny mpanadihady:
Vakio amin’ny olona hadihadianao ity alohan’ny hametrahanao fanontaniana aminy ary anontanio raha manaiky ny handray
anjara izy. * Araho tsara ny fanoroana voasoratra toy ny soratanana . Vitao hatramin’ny farany ny fanadihadiana.
Fizarana 1: Filazana ankapobeny: Q1. Momba ny hadihadiana:
Daty: Laharan’ny tokantrano#
Ora fanombohan’ny
fanadihadiana/ famaranana:
GPS S
GPS E
Fokontany Tanàna
Lahy sa Vavy Taona
Manambady sa tsia/Maty
vady sns..
Foko
# Isan’olona isan-tokantrano
>18 taonz.
#Lehilahy/Vehivavy
# Ankizy (< 18 taona)
#Lehilahy/Vehivavy
Tany > 500m2 * Fari-pianaran’ny
loham-pianakaviana
** isan’ny biby Finoana
* [tsy nianatra, ambaratongs voalohany, faharoa, fahatelo, ambony] ** [karazam-biby, firy?]
Q2. Teraka teto ve ianao? ENY TSIA
Raha tsia, avy aiza? ______________________________ Hafiriana ianao no nipetraka teto? __________________________
Asan’ny filoham-pianakaviana: _____________________ Isan’ny ankizy mianatra <18 taona i?: _______________________
Q3. Mamboly ve ianao? ENY* TSIA *Raha Eny, inona? ____________________________
1. _____________ 2. _____________ 3. _____________ 4. _____________ 5. _____________
Q4. Manana sarety ve? ENY TSIA Firy? _______________________________________
Q5: Inona no fomba fahandroana sakafo fampiasa ao an-trano? __________________________________________________
Q6. Inona ny jiro fampiasa ao an-trano? _________________________________Q7. Afa-po ve ianao amin’io karazanjiro io?
TENA FALY FALY TSISY AMBARA FALIFALY TSY FALY
Q8. Aiza no maka rano hosotroina/ ahandrahoana? ____________________________________________________________
Q9. Kojakoja ananana HERINARATRA [Ataovy anaty boribory] TV RADIO FRIGO
FIARA MOTO/SCOOTER BISIKILETA FAMANTARANANDRO FINDAY
Q10. Efitrano firy no misy ao an-tokantrano? _____________ Q11. Olona firy isan’efitra no miara-matory? _____________
Tafon-trano [jereo] RAFIA FANITSO BOZAKA SATRANA HAFA: ___________
Rindrina [jereo] TANY BARARATA HAZO BIRIKY SIMENITRA
Gorodona [jereo] TANY TREE-BARK HAZO SIMENITRA CARREAUX
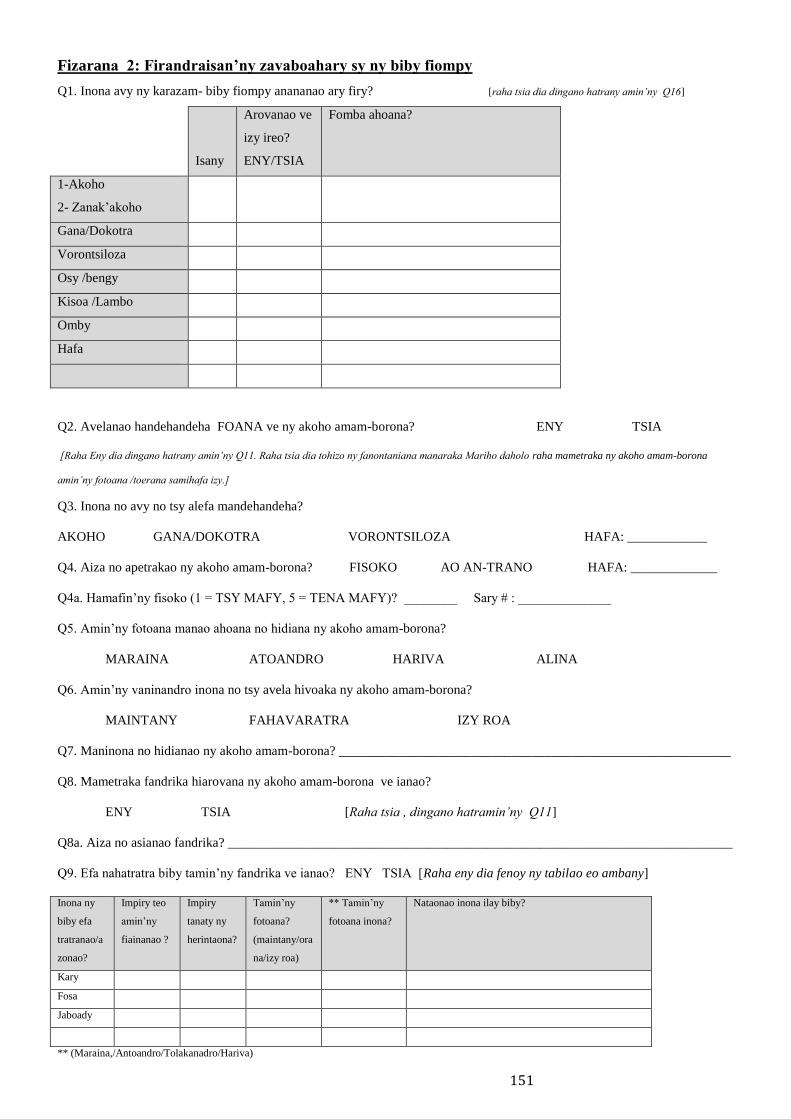
151
Fizarana 2: Firandraisan’ny zavaboahary sy ny biby fiompy
Q1. Inona avy ny karazam- biby fiompy anananao ary firy? [raha tsia dia dingano hatrany amin’ny Q16]
Isany
Arovanao ve
izy ireo?
ENY/TSIA
Fomba ahoana?
1-Akoho
2- Zanak’akoho
Gana/Dokotra
Vorontsiloza
Osy /bengy
Kisoa /Lambo
Omby
Hafa
Q2. Avelanao handehandeha FOANA ve ny akoho amam-borona? ENY TSIA
[Raha Eny dia dingano hatrany amin’ny Q11. Raha tsia dia tohizo ny fanontaniana manaraka Mariho daholo raha mametraka ny akoho amam-borona
amin’ny fotoana /toerana samihafa izy.]
Q3. Inona no avy no tsy alefa mandehandeha?
AKOHO GANA/DOKOTRA VORONTSILOZA HAFA: ____________
Q4. Aiza no apetrakao ny akoho amam-borona? FISOKO AO AN-TRANO HAFA: _____________
Q4a. Hamafin’ny fisoko (1 = TSY MAFY, 5 = TENA MAFY)? ________ Sary # : ______________
Q5. Amin’ny fotoana manao ahoana no hidiana ny akoho amam-borona?
MARAINA ATOANDRO HARIVA ALINA
Q6. Amin’ny vaninandro inona no tsy avela hivoaka ny akoho amam-borona?
MAINTANY FAHAVARATRA IZY ROA
Q7. Maninona no hidianao ny akoho amam-borona? ___________________________________________________________
Q8. Mametraka fandrika hiarovana ny akoho amam-borona ve ianao?
ENY TSIA [Raha tsia , dingano hatramin’ny Q11]
Q8a. Aiza no asianao fandrika? ____________________________________________________________________________
Q9. Efa nahatratra biby tamin’ny fandrika ve ianao? ENY TSIA [Raha eny dia fenoy ny tabilao eo ambany]
Inona ny
biby efa
tratranao/a
zonao?
Impiry teo
amin’ny
fiainanao ?
Impiry
tanaty ny
herintaona?
Tamin’ny
fotoana?
(maintany/ora
na/izy roa)
** Tamin’ny
fotoana inona?
Nataonao inona ilay biby?
Kary
Fosa
Jaboady
** (Maraina,/Antoandro/Tolakanadro/Hariva)
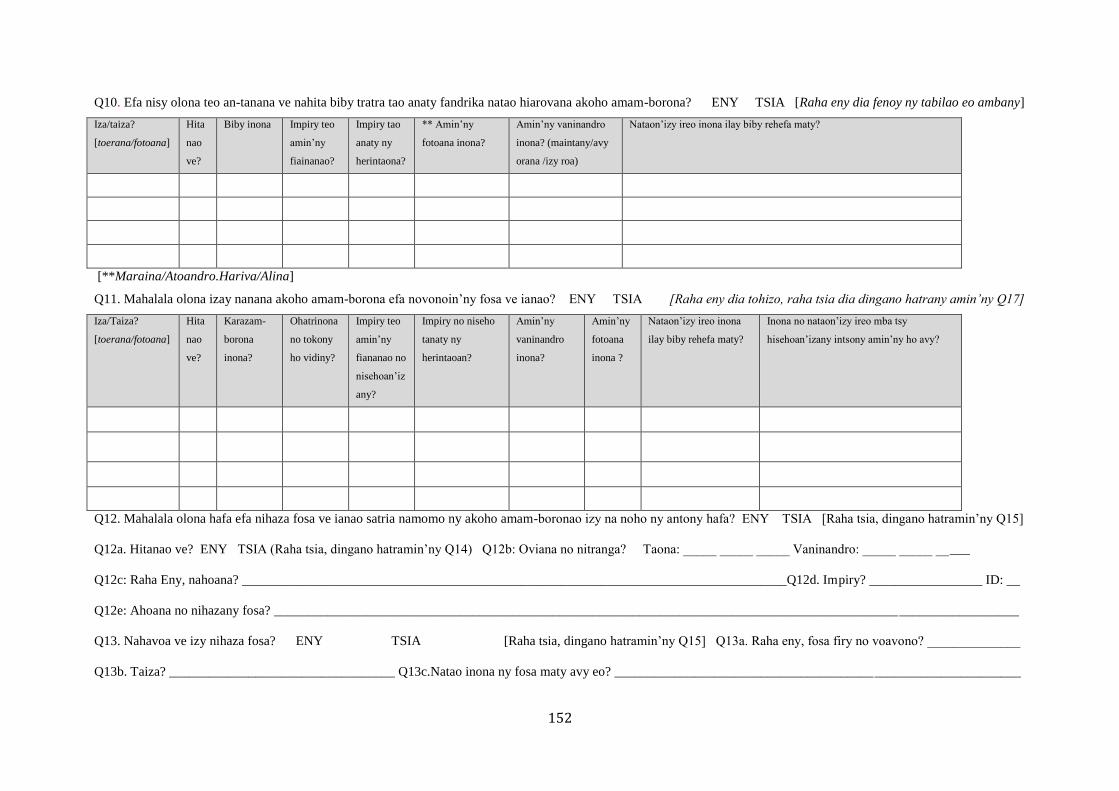
152
Q10. Efa nisy olona teo an-tanana ve nahita biby tratra tao anaty fandrika natao hiarovana akoho amam-borona? ENY TSIA [Raha eny dia fenoy ny tabilao eo ambany]
Iza/taiza?
[toerana/fotoana]
Hita
nao
ve?
Biby inona Impiry teo
amin’ny
fiainanao?
Impiry tao
anaty ny
herintaona?
** Amin’ny
fotoana inona?
Amin’ny vaninandro
inona? (maintany/avy
orana /izy roa)
Nataon’izy ireo inona ilay biby rehefa maty?
[**Maraina/Atoandro.Hariva/Alina]
Q11. Mahalala olona izay nanana akoho amam-borona efa novonoin’ny fosa ve ianao? ENY TSIA [Raha eny dia tohizo, raha tsia dia dingano hatrany amin’ny Q17]
Iza/Taiza?
[toerana/fotoana]
Hita
nao
ve?
Karazam-
borona
inona?
Ohatrinona
no tokony
ho vidiny?
Impiry teo
amin’ny
fiananao no
nisehoan’iz
any?
Impiry no niseho
tanaty ny
herintaoan?
Amin’ny
vaninandro
inona?
Amin’ny
fotoana
inona ?
Nataon’izy ireo inona
ilay biby rehefa maty?
Inona no nataon’izy ireo mba tsy
hisehoan’izany intsony amin’ny ho avy?
Q12. Mahalala olona hafa efa nihaza fosa ve ianao satria namomo ny akoho amam-boronao izy na noho ny antony hafa? ENY TSIA [Raha tsia, dingano hatramin’ny Q15]
Q12a. Hitanao ve? ENY TSIA (Raha tsia, dingano hatramin’ny Q14) Q12b: Oviana no nitranga? Taona: _____ _____ _____ Vaninandro: _____ _____ _____
Q12c: Raha Eny, nahoana? __________________________________________________________________________________Q12d. Impiry? _________________ ID: __
Q12e: Ahoana no nihazany fosa? ________________________________________________________________________________________________________________
Q13. Nahavoa ve izy nihaza fosa? ENY TSIA [Raha tsia, dingano hatramin’ny Q15] Q13a. Raha eny, fosa firy no voavono? ______________
Q13b. Taiza? __________________________________ Q13c.Natao inona ny fosa maty avy eo? _____________________________________________________________
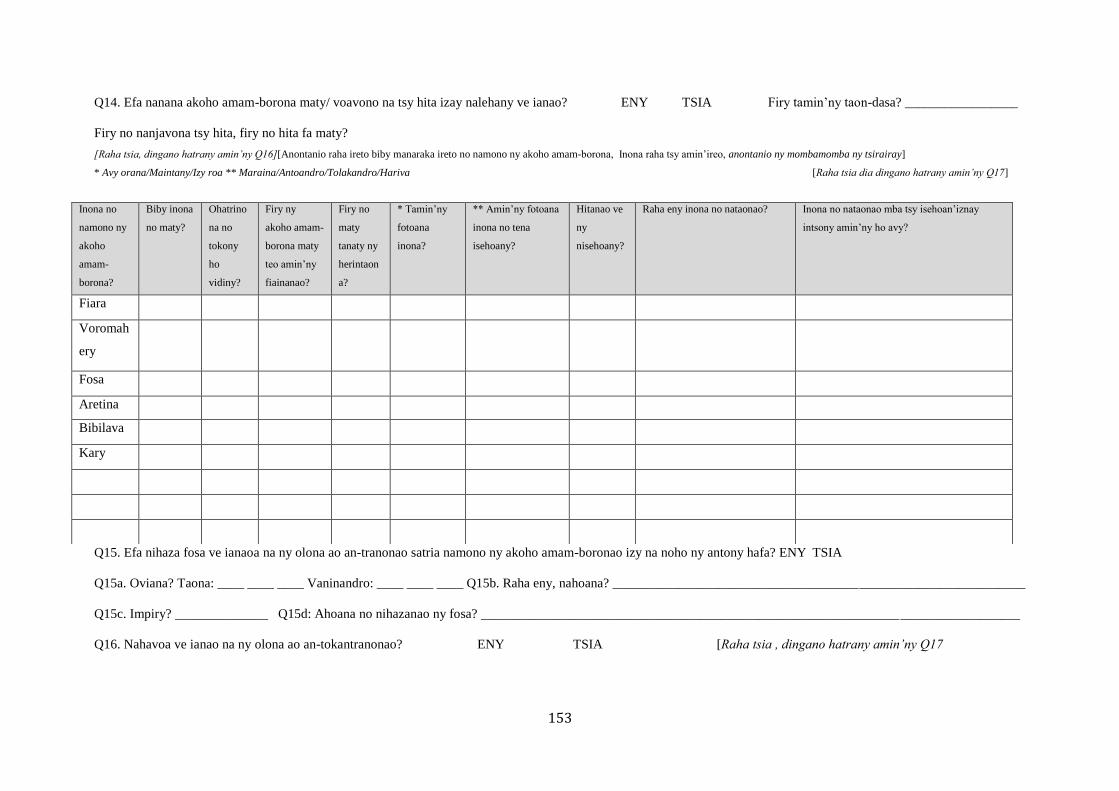
153
Q14. Efa nanana akoho amam-borona maty/ voavono na tsy hita izay nalehany ve ianao? ENY TSIA Firy tamin’ny taon-dasa? _________________
Firy no nanjavona tsy hita, firy no hita fa maty?
[Raha tsia, dingano hatrany amin’ny Q16][Anontanio raha ireto biby manaraka ireto no namono ny akoho amam-borona, Inona raha tsy amin’ireo, anontanio ny mombamomba ny tsirairay]
* Avy orana/Maintany/Izy roa ** Maraina/Antoandro/Tolakandro/Hariva [Raha tsia dia dingano hatrany amin’ny Q17]
Q15. Efa nihaza fosa ve ianaoa na ny olona ao an-tranonao satria namono ny akoho amam-boronao izy na noho ny antony hafa? ENY TSIA
Q15a. Oviana? Taona: ____ ____ ____ Vaninandro: ____ ____ ____ Q15b. Raha eny, nahoana? ______________________________________________________________
Q15c. Impiry? ______________ Q15d: Ahoana no nihazanao ny fosa? _________________________________________________________________________________
Q16. Nahavoa ve ianao na ny olona ao an-tokantranonao? ENY TSIA [Raha tsia , dingano hatrany amin’ny Q17
Inona no
namono ny
akoho
amam-
borona?
Biby inona
no maty?
Ohatrino
na no
tokony
ho
vidiny?
Firy ny
akoho amam-
borona maty
teo amin’ny
fiainanao?
Firy no
maty
tanaty ny
herintaon
a?
* Tamin’ny
fotoana
inona?
** Amin’ny fotoana
inona no tena
isehoany?
Hitanao ve
ny
nisehoany?
Raha eny inona no nataonao? Inona no nataonao mba tsy isehoan’iznay
intsony amin’ny ho avy?
Fiara
Voromah
ery
Fosa
Aretina
Bibilava
Kary

154
Q16a. Raha eny, firy ny fosa efa novonoinao? _____________ Q16b. Taiza no nitranga? _____________________________
Q16c. Nataonao inona ilay fosa rehefa maty? _________________________________________________________________
Q17. Manao ahoana ny fahitanao ny fosa?
TENA TIANAO TIANAO TSISY AMBARA TSY TIANAO TENA TSY TIANO
Q18. Inona no anton’izany? ______________________________________________________________________________
_____________________________________________________________________________________________________
Q19. Aminao, misy tombontsoa azo avy amin' ny fisian’ny fosa ve? ENY TSIA Inona ny tombony/
Nahoana no tsy misy tombony? ___________________________________________________________________________
Q20. Aminao, misy tombony ho an’ny forest tontolo iainana ve ny fosa? ENY TSIA Inona ny tombony/ Nahoana no tsy
misy tombony?________________________________________________________________________________________
Q21. Aminao, inona ny antony mety mahatonga ny fosa hininana ny akoho amam-boronao?___________________________
_____________________________________________________________________________________________________
Q22. Matahotra fosa ve ianao sao dia mandratra mamono anao izy? ENY TSIA Nahoana?_________________
_____________________________________________________________________________________________________
Q23. Matahotra fosa ve ianao sao dia mihinana ny akoho amam-borona izy? ENY TSIA Nahoana?_____________
_____________________________________________________________________________________________________
Q24. Aminao, tokony ho ferana ve ny isan’ny fosa anaty ala? ENY TSIA Nahoana?_______________________
_____________________________________________________________________________________________________
Q25. Mino ny fady mifandray amin’ny fosa ve eto amin’ity tanàna ity? ENY TSIA
Raha eny dia inona avy? _________________________________________________________________________________
Fizarana 3: Fihinanana hena
Q1. Inona no tena sakafo haninareo matetika ao an-trano? ( afaka alahatrao ve?)
1. _____________ 2. _____________ 3. _____________ 4. _____________ 5. _____________
Q2. Misy fotoana ve ny fihinananareo azy ireo sa mandava-taona (Mba tanisao azafady)
Maintany:_____________________________________________________________________________________________
Fahavaratra:___________________________________________________________________________________________
Izy roa:_______________________________________________________________________________________________
Q3. Inona no laoka tena fihinanareo ao an-trano? (Alaharo azafady)
1. _____________ 2. _____________ 3. _____________ 4. _____________ 5. _____________

155
Q4. Inona no voankazo tena fihinanareo ao an-trano? (Alaharo azafady)
1. _____________ 2. _____________ 3. _____________ 4. _____________ 5. _____________
Q5. Inona no hena tena fihinanareo? AVY AMIN’NY BIBY FIOMPY BIBY DIA (TSY OMPIANA)
Q6.Impiry isan-kerinandro ny sakafonareo no misy hena? Biby fiompy: ______ biby dia: ______ Tsy misy: ______
Q7. Isantaona, misy fotoana ahatsapanao tsy fahampiana ara-tsakafo ve ato an-tokantrano? ENY TSIA
Fotoana inona? ___________Volana inona? ___________hatramin’ny___________
Q8. Inona ny hena avy amin’ny biby fiompy tena tianao? _______________________ Nahoana? _______________________
_____________________________________________________________________________________________________
Aseho ny sary
Q8a. Iza amin’ireo biby ireo no efa hitanao tao anaty ala? _______________________________________________________
_____________________________________________________________________________________________________
Q8b: Alaharo araka ny itiavanao azy ny hena efa nohaninao?
OMBY: ____ GANA/DOKOTRA: ____ OSY/BENGY: ____ AKOHO: ____
VORONTSILOZA/KOLOKA: ____ KISOA/LAMBO: ____ ONDRY: ______ HAFA: ______
Q8c. Inona no anton’ny nandaharanao azy toy izao?____________________________________________________________
_____________________________________________________________________________________________________
Q8d. Please rank in order of most consumed (only ranking what you have eaten):
OMBY: ____ GANA/DOKOTRA: ____ OSY/ BENGY: ____ AKOHO: ____ VORONTSILOZA/ KOLOKA: ____
KISOA/ LAMBO: ____ ONDRY: _____ HAFA: ____
Q8d. Inona no mahatonga anao hihinana hena avy amin’ny biby fiompy? __________________________________________
_____________________________________________________________________________________________________
Q9. Efa nihinana ‘biby dia’ araka tahaka ireto amin’ny sary ireto ve ianao teo amin’ny fiainanao? ENY TSIA
[Raha eny, valio ny Q9a, raha tsia , dingano hatrany amin’ny Q12]
Q9a. Inona no biby dia tena tianao? ________________________ Nahoana? _______________________________________
_____________________________________________________________________________________________________
Q9b. Mba alaharo araka ny fitiavanao azy (ireo izay efa nohaninao ihany): Varika: ___ Vorona: ___
Trandraka: ___ Bibilava: ___ Lambo: ___ Biby mpihinan-kena (fosa, sns.): ___ Hazandrano: ___ Ramanavy: ___
Q9c. Inona no antony nandaharanao toy izao? ________________________________________________________________
Q9d. Inona no mahatonga anao hihinana hena avy amin’ny biby dia? ______________________________________________
Q10. Mba alaharo araka ny fitiavanao azy (ireo izay efa nohaninao ihany) Varika/Gidro: ___ Vorona: ___
Trandraka: ___ Bibilava: ___ Lambo: ___ Biby mphinan-kena hafa (Foasa, sns): ___ Hazandrano: ___ Ramanavy: ___
Omby: ____ Gana/Dokotra: ____ Osy: ____ Akoho ____ Vorontsiloza: ____ Kisoa: ____
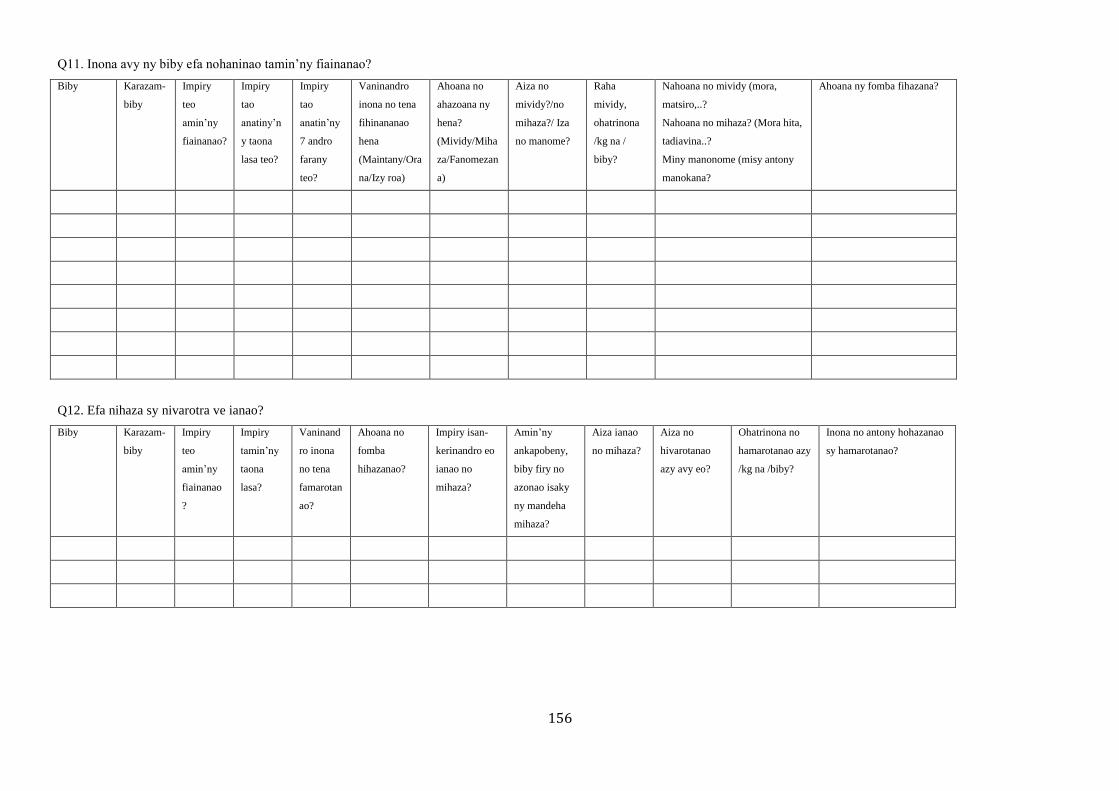
156
Q11. Inona avy ny biby efa nohaninao tamin’ny fiainanao?
Biby Karazam-
biby
Impiry
teo
amin’ny
fiainanao?
Impiry
tao
anatiny’n
y taona
lasa teo?
Impiry
tao
anatin’ny
7 andro
farany
teo?
Vaninandro
inona no tena
fihinananao
hena
(Maintany/Ora
na/Izy roa)
Ahoana no
ahazoana ny
hena?
(Mividy/Miha
za/Fanomezan
a)
Aiza no
mividy?/no
mihaza?/ Iza
no manome?
Raha
mividy,
ohatrinona
/kg na /
biby?
Nahoana no mividy (mora,
matsiro,..?
Nahoana no mihaza? (Mora hita,
tadiavina..?
Miny manonome (misy antony
manokana?
Ahoana ny fomba fihazana?
Q12. Efa nihaza sy nivarotra ve ianao?
Biby Karazam-
biby
Impiry
teo
amin’ny
fiainanao
?
Impiry
tamin’ny
taona
lasa?
Vaninand
ro inona
no tena
famarotan
ao?
Ahoana no
fomba
hihazanao?
Impiry isan-
kerinandro eo
ianao no
mihaza?
Amin’ny
ankapobeny,
biby firy no
azonao isaky
ny mandeha
mihaza?
Aiza ianao
no mihaza?
Aiza no
hivarotanao
azy avy eo?
Ohatrinona no
hamarotanao azy
/kg na /biby?
Inona no antony hohazanao
sy hamarotanao?
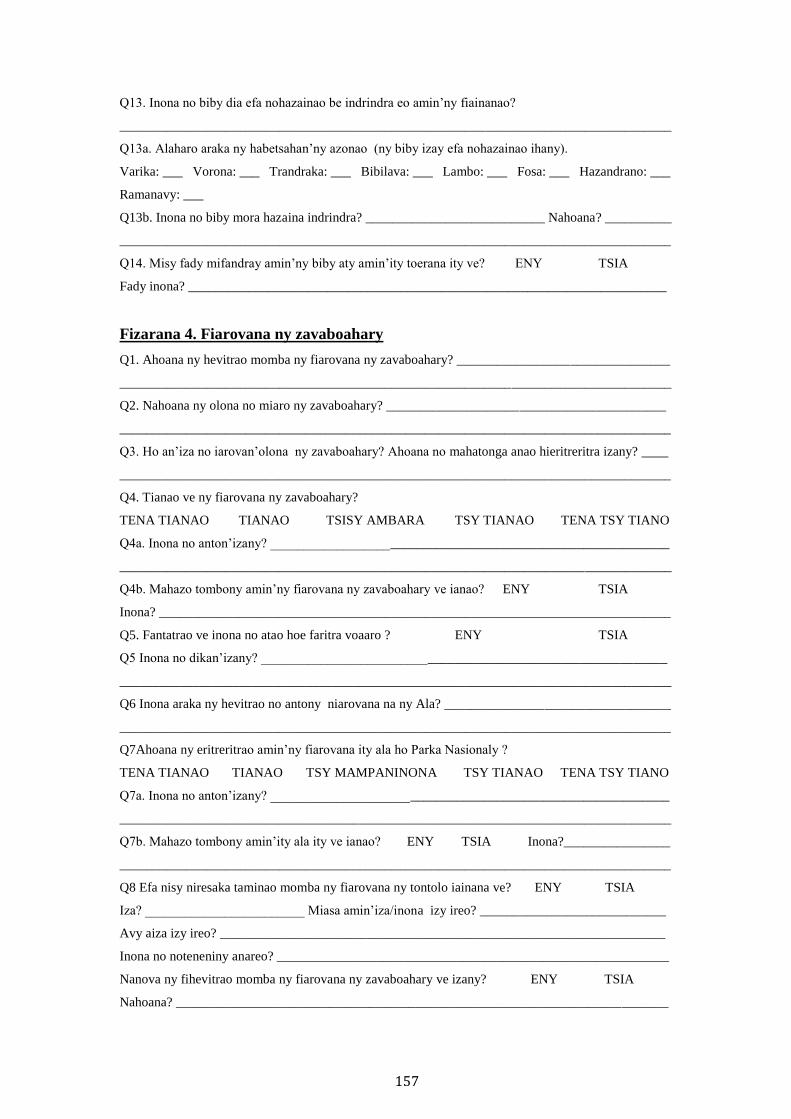
157
Q13. Inona no biby dia efa nohazainao be indrindra eo amin’ny fiainanao?
___________________________________________________________________________________
Q13a. Alaharo araka ny habetsahan’ny azonao (ny biby izay efa nohazainao ihany).
Varika: ___ Vorona: ___ Trandraka: ___ Bibilava: ___ Lambo: ___ Fosa: ___ Hazandrano: ___
Ramanavy: ___
Q13b. Inona no biby mora hazaina indrindra? ___________________________ Nahoana? __________
___________________________________________________________________________________
Q14. Misy fady mifandray amin’ny biby aty amin’ity toerana ity ve? ENY TSIA
Fady inona? ________________________________________________________________________
Fizarana 4. Fiarovana ny zavaboahary
Q1. Ahoana ny hevitrao momba ny fiarovana ny zavaboahary? ________________________________
___________________________________________________________________________________
Q2. Nahoana ny olona no miaro ny zavaboahary? __________________________________________
___________________________________________________________________________________
Q3. Ho an’iza no iarovan’olona ny zavaboahary? Ahoana no mahatonga anao hieritreritra izany? ____
___________________________________________________________________________________
Q4. Tianao ve ny fiarovana ny zavaboahary?
TENA TIANAO TIANAO TSISY AMBARA TSY TIANAO TENA TSY TIANO
Q4a. Inona no anton’izany? ____________________________________________________________
___________________________________________________________________________________
Q4b. Mahazo tombony amin’ny fiarovana ny zavaboahary ve ianao? ENY TSIA
Inona? _____________________________________________________________________________
Q5. Fantatrao ve inona no atao hoe faritra voaaro ? ENY TSIA
Q5 Inona no dikan’izany? _____________________________________________________________
___________________________________________________________________________________
Q6 Inona araka ny hevitrao no antony niarovana na ny Ala? __________________________________
___________________________________________________________________________________
Q7Ahoana ny eritreritrao amin’ny fiarovana ity ala ho Parka Nasionaly ?
TENA TIANAO TIANAO TSY MAMPANINONA TSY TIANAO TENA TSY TIANO
Q7a. Inona no anton’izany? ____________________________________________________________
___________________________________________________________________________________
Q7b. Mahazo tombony amin’ity ala ity ve ianao? ENY TSIA Inona?________________
___________________________________________________________________________________
Q8 Efa nisy niresaka taminao momba ny fiarovana ny tontolo iainana ve? ENY TSIA
Iza? ________________________ Miasa amin’iza/inona izy ireo? ____________________________
Avy aiza izy ireo? ___________________________________________________________________
Inona no noteneniny anareo? ___________________________________________________________
Nanova ny fihevitrao momba ny fiarovana ny zavaboahary ve izany? ENY TSIA
Nahoana? __________________________________________________________________________
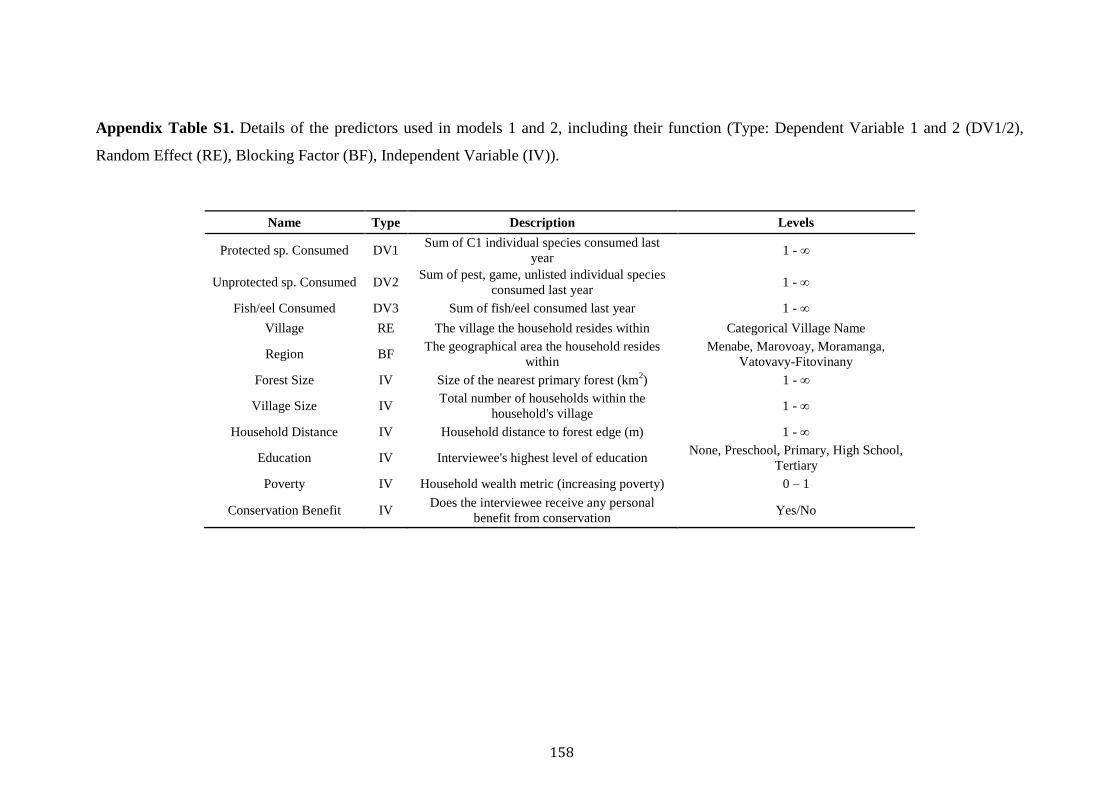
158
Appendix Table S1. Details of the predictors used in models 1 and 2, including their function (Type: Dependent Variable 1 and 2 (DV1/2),
Random Effect (RE), Blocking Factor (BF), Independent Variable (IV)).
Name Type Description Levels
Protected sp. Consumed DV1 Sum of C1 individual species consumed last
year 1 - ∞
Unprotected sp. Consumed DV2 Sum of pest, game, unlisted individual species
consumed last year 1 - ∞
Fish/eel Consumed DV3 Sum of fish/eel consumed last year 1 - ∞
Village RE The village the household resides within Categorical Village Name
Region BF The geographical area the household resides
within
Menabe, Marovoay, Moramanga,
Vatovavy-Fitovinany
Forest Size IV Size of the nearest primary forest (km2) 1 - ∞
Village Size IV Total number of households within the
household's village 1 - ∞
Household Distance IV Household distance to forest edge (m) 1 - ∞
Education IV Interviewee's highest level of education None, Preschool, Primary, High School,
Tertiary
Poverty IV Household wealth metric (increasing poverty) 0 – 1
Conservation Benefit IV Does the interviewee receive any personal
benefit from conservation Yes/No
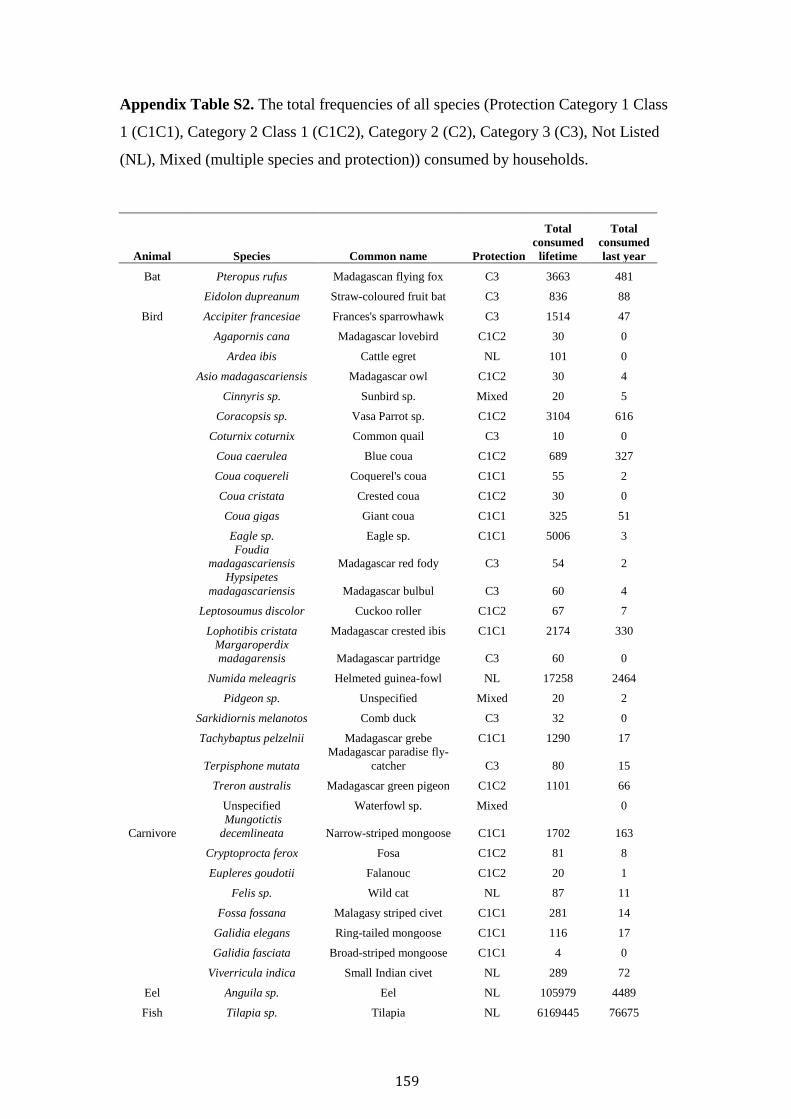
159
Appendix Table S2. The total frequencies of all species (Protection Category 1 Class
1 (C1C1), Category 2 Class 1 (C1C2), Category 2 (C2), Category 3 (C3), Not Listed
(NL), Mixed (multiple species and protection)) consumed by households.
Animal Species Common name Protection
Total
consumed
lifetime
Total
consumed
last year
Bat Pteropus rufus Madagascan flying fox C3 3663 481
Eidolon dupreanum Straw-coloured fruit bat C3 836 88
Bird Accipiter francesiae Frances's sparrowhawk C3 1514 47
Agapornis cana Madagascar lovebird C1C2 30 0
Ardea ibis Cattle egret NL 101 0
Asio madagascariensis Madagascar owl C1C2 30 4
Cinnyris sp. Sunbird sp. Mixed 20 5
Coracopsis sp. Vasa Parrot sp. C1C2 3104 616
Coturnix coturnix Common quail C3 10 0
Coua caerulea Blue coua C1C2 689 327
Coua coquereli Coquerel's coua C1C1 55 2
Coua cristata Crested coua C1C2 30 0
Coua gigas Giant coua C1C1 325 51
Eagle sp. Eagle sp. C1C1 5006 3
Foudia
madagascariensis Madagascar red fody C3 54 2
Hypsipetes
madagascariensis Madagascar bulbul C3 60 4
Leptosoumus discolor Cuckoo roller C1C2 67 7
Lophotibis cristata Madagascar crested ibis C1C1 2174 330
Margaroperdix
madagarensis Madagascar partridge C3 60 0
Numida meleagris Helmeted guinea-fowl NL 17258 2464
Pidgeon sp. Unspecified Mixed 20 2
Sarkidiornis melanotos Comb duck C3 32 0
Tachybaptus pelzelnii Madagascar grebe C1C1 1290 17
Terpisphone mutata
Madagascar paradise fly-
catcher C3 80 15
Treron australis Madagascar green pigeon C1C2 1101 66
Unspecified Waterfowl sp. Mixed
0
Carnivore
Mungotictis
decemlineata Narrow-striped mongoose C1C1 1702 163
Cryptoprocta ferox Fosa C1C2 81 8
Eupleres goudotii Falanouc C1C2 20 1
Felis sp. Wild cat NL 87 11
Fossa fossana Malagasy striped civet C1C1 281 14
Galidia elegans Ring-tailed mongoose C1C1 116 17
Galidia fasciata Broad-striped mongoose C1C1 4 0
Viverricula indica Small Indian civet NL 289 72
Eel Anguila sp. Eel NL 105979 4489
Fish Tilapia sp. Tilapia NL 6169445 76675
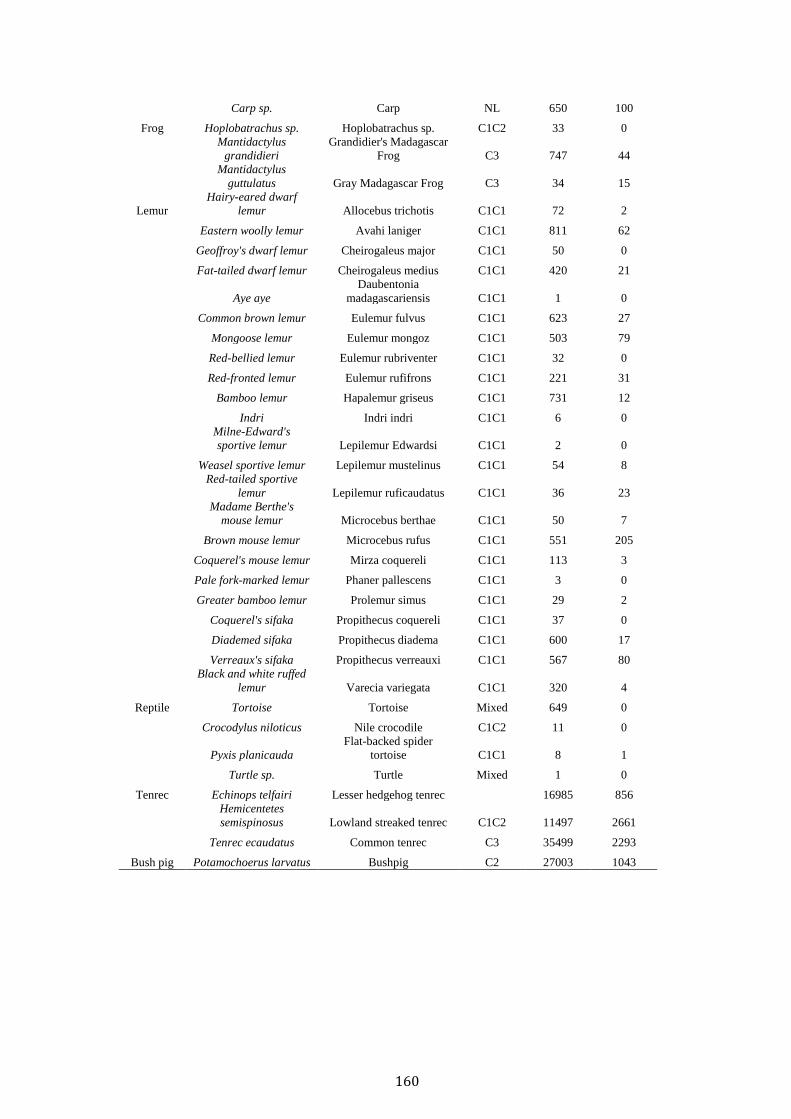
160
Carp sp. Carp NL 650 100
Frog Hoplobatrachus sp. Hoplobatrachus sp. C1C2 33 0
Mantidactylus
grandidieri
Grandidier's Madagascar
Frog C3 747 44
Mantidactylus
guttulatus Gray Madagascar Frog C3 34 15
Lemur
Hairy-eared dwarf
lemur Allocebus trichotis C1C1 72 2
Eastern woolly lemur Avahi laniger C1C1 811 62
Geoffroy's dwarf lemur Cheirogaleus major C1C1 50 0
Fat-tailed dwarf lemur Cheirogaleus medius C1C1 420 21
Aye aye
Daubentonia
madagascariensis C1C1 1 0
Common brown lemur Eulemur fulvus C1C1 623 27
Mongoose lemur Eulemur mongoz C1C1 503 79
Red-bellied lemur Eulemur rubriventer C1C1 32 0
Red-fronted lemur Eulemur rufifrons C1C1 221 31
Bamboo lemur Hapalemur griseus C1C1 731 12
Indri Indri indri C1C1 6 0
Milne-Edward's
sportive lemur Lepilemur Edwardsi C1C1 2 0
Weasel sportive lemur Lepilemur mustelinus C1C1 54 8
Red-tailed sportive
lemur Lepilemur ruficaudatus C1C1 36 23
Madame Berthe's
mouse lemur Microcebus berthae C1C1 50 7
Brown mouse lemur Microcebus rufus C1C1 551 205
Coquerel's mouse lemur Mirza coquereli C1C1 113 3
Pale fork-marked lemur Phaner pallescens C1C1 3 0
Greater bamboo lemur Prolemur simus C1C1 29 2
Coquerel's sifaka Propithecus coquereli C1C1 37 0
Diademed sifaka Propithecus diadema C1C1 600 17
Verreaux's sifaka Propithecus verreauxi C1C1 567 80
Black and white ruffed
lemur Varecia variegata C1C1 320 4
Reptile Tortoise Tortoise Mixed 649 0
Crocodylus niloticus Nile crocodile C1C2 11 0
Pyxis planicauda
Flat-backed spider
tortoise C1C1 8 1
Turtle sp. Turtle Mixed 1 0
Tenrec Echinops telfairi Lesser hedgehog tenrec
16985 856
Hemicentetes
semispinosus Lowland streaked tenrec C1C2 11497 2661
Tenrec ecaudatus Common tenrec C3 35499 2293
Bush pig Potamochoerus larvatus Bushpig C2 27003 1043
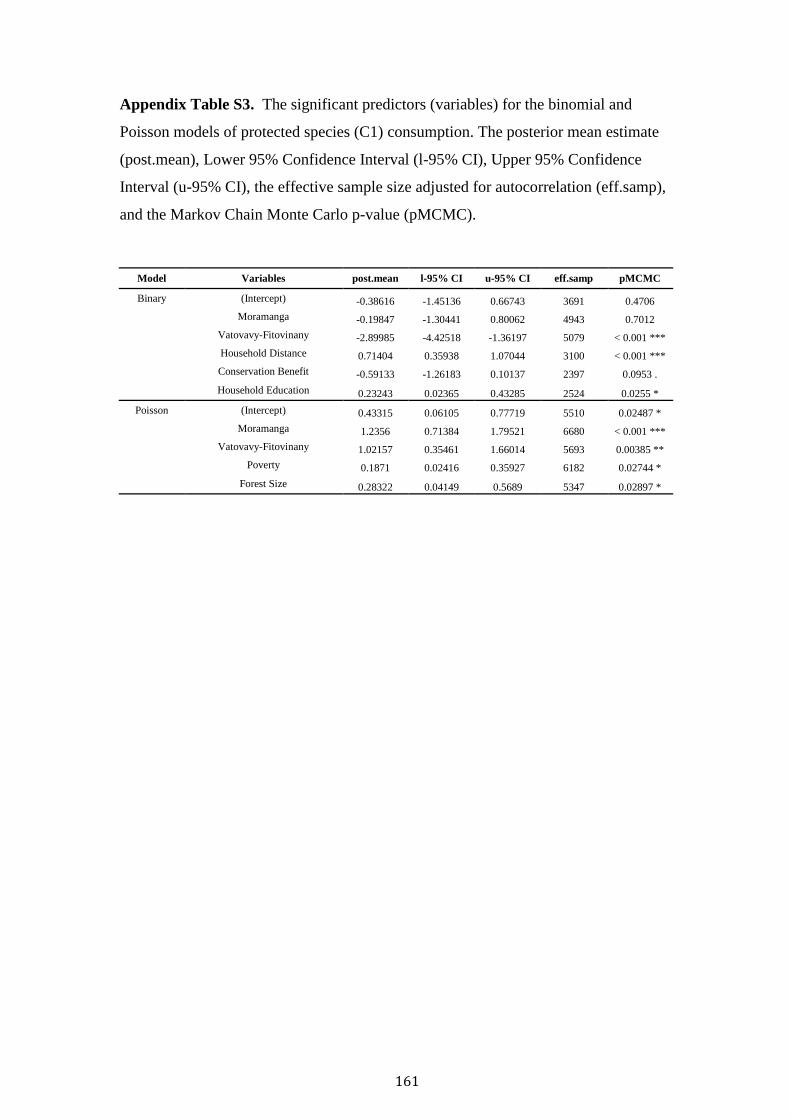
161
Appendix Table S3. The significant predictors (variables) for the binomial and
Poisson models of protected species (C1) consumption. The posterior mean estimate
(post.mean), Lower 95% Confidence Interval (l-95% CI), Upper 95% Confidence
Interval (u-95% CI), the effective sample size adjusted for autocorrelation (eff.samp),
and the Markov Chain Monte Carlo p-value (pMCMC).
Model Variables post.mean l-95% CI u-95% CI eff.samp pMCMC
Binary (Intercept) -0.38616 -1.45136 0.66743 3691 0.4706
Moramanga -0.19847 -1.30441 0.80062 4943 0.7012
Vatovavy-Fitovinany -2.89985 -4.42518 -1.36197 5079 < 0.001 ***
Household Distance 0.71404 0.35938 1.07044 3100 < 0.001 ***
Conservation Benefit -0.59133 -1.26183 0.10137 2397 0.0953 .
Household Education 0.23243 0.02365 0.43285 2524 0.0255 *
Poisson (Intercept) 0.43315 0.06105 0.77719 5510 0.02487 *
Moramanga 1.2356 0.71384 1.79521 6680 < 0.001 ***
Vatovavy-Fitovinany 1.02157 0.35461 1.66014 5693 0.00385 **
Poverty 0.1871 0.02416 0.35927 6182 0.02744 *
Forest Size 0.28322 0.04149 0.5689 5347 0.02897 *
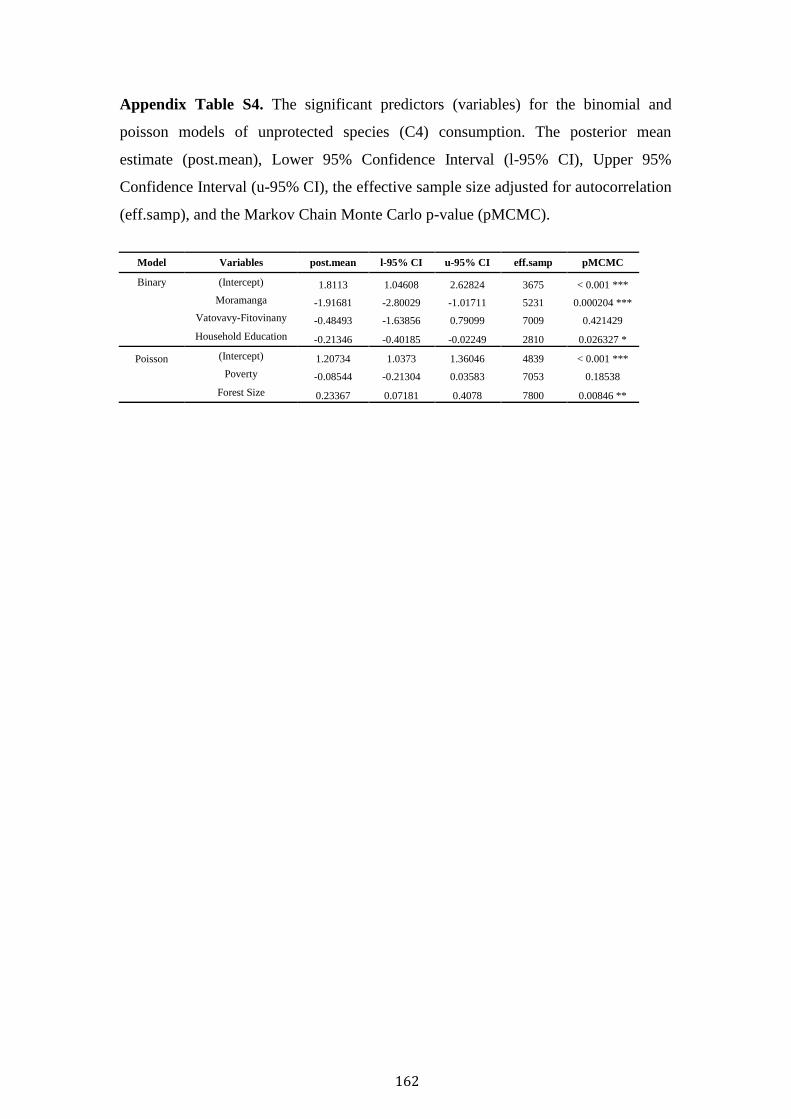
162
Appendix Table S4. The significant predictors (variables) for the binomial and
poisson models of unprotected species (C4) consumption. The posterior mean
estimate (post.mean), Lower 95% Confidence Interval (l-95% CI), Upper 95%
Confidence Interval (u-95% CI), the effective sample size adjusted for autocorrelation
(eff.samp), and the Markov Chain Monte Carlo p-value (pMCMC).
Model Variables post.mean l-95% CI u-95% CI eff.samp pMCMC
Binary (Intercept) 1.8113 1.04608 2.62824 3675 < 0.001 ***
Moramanga -1.91681 -2.80029 -1.01711 5231 0.000204 ***
Vatovavy-Fitovinany -0.48493 -1.63856 0.79099 7009 0.421429
Household Education -0.21346 -0.40185 -0.02249 2810 0.026327 *
Poisson (Intercept) 1.20734 1.0373 1.36046 4839 < 0.001 ***
Poverty -0.08544 -0.21304 0.03583 7053 0.18538
Forest Size 0.23367 0.07181 0.4078 7800 0.00846 **
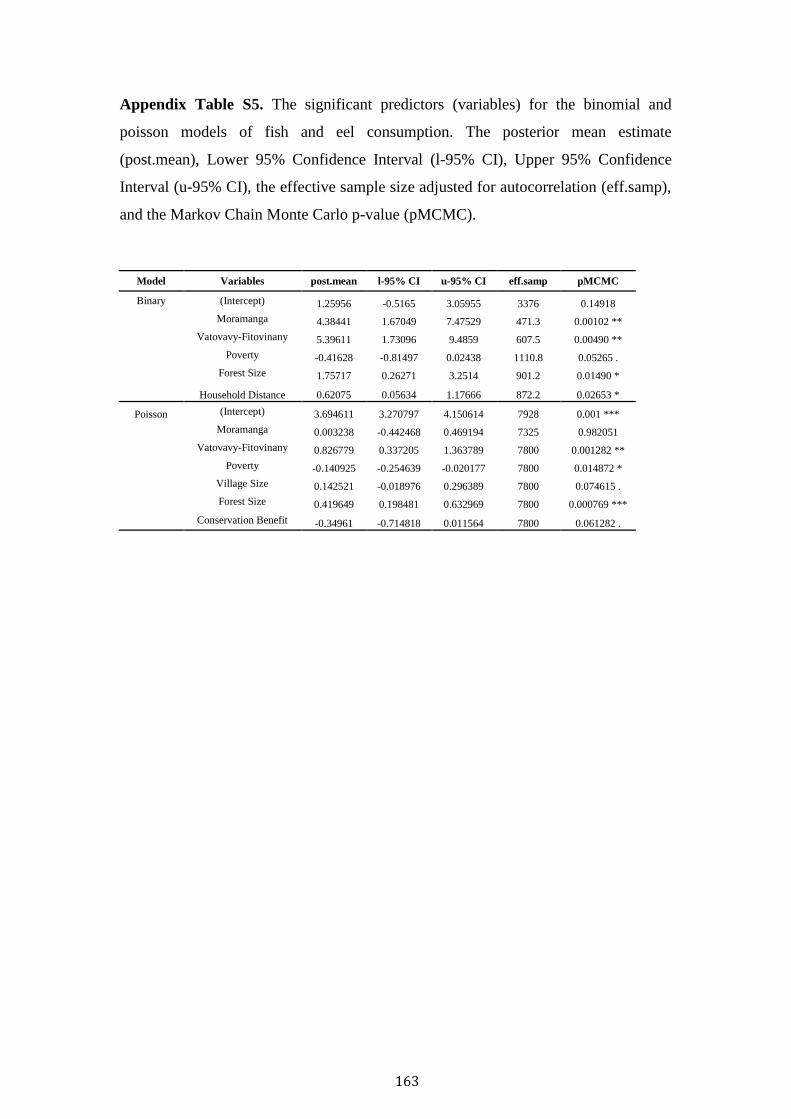
163
Appendix Table S5. The significant predictors (variables) for the binomial and
poisson models of fish and eel consumption. The posterior mean estimate
(post.mean), Lower 95% Confidence Interval (l-95% CI), Upper 95% Confidence
Interval (u-95% CI), the effective sample size adjusted for autocorrelation (eff.samp),
and the Markov Chain Monte Carlo p-value (pMCMC).
Model Variables post.mean l-95% CI u-95% CI eff.samp pMCMC
Binary (Intercept) 1.25956 -0.5165 3.05955 3376 0.14918
Moramanga 4.38441 1.67049 7.47529 471.3 0.00102 **
Vatovavy-Fitovinany 5.39611 1.73096 9.4859 607.5 0.00490 **
Poverty -0.41628 -0.81497 0.02438 1110.8 0.05265 .
Forest Size 1.75717 0.26271 3.2514 901.2 0.01490 *
Household Distance 0.62075 0.05634 1.17666 872.2 0.02653 *
Poisson (Intercept) 3.694611 3.270797 4.150614 7928 0.001 ***
Moramanga 0.003238 -0.442468 0.469194 7325 0.982051
Vatovavy-Fitovinany 0.826779 0.337205 1.363789 7800 0.001282 **
Poverty -0.140925 -0.254639 -0.020177 7800 0.014872 *
Village Size 0.142521 -0.018976 0.296389 7800 0.074615 .
Forest Size 0.419649 0.198481 0.632969 7800 0.000769 ***
Conservation Benefit -0.34961 -0.714818 0.011564 7800 0.061282 .
164
Chapter Five
Retaliatory killing and human perceptions of
Madagascar’s largest carnivore and livestock
predator, the fosa (Cryptoprocta ferox)
165
Abstract
Fosas (Cryptoprocta ferox) are Madagascar’s largest carnivores, occupying much of
the forested landscape. This study provides the first evaluation of fosas’ conflict with
humans, a problem for many small and medium sized carnivores worldwide. We
examined fosas’ predation of poultry, its spatio-temporal occurrence, and subsequent
retaliatory killing. Over 1750 households were interviewed across four regions,
encompassing Madagascar’s major forest types (deciduous/rainforest) and its major
protected area classifications (national park, reserve and unprotected forest). Fosa
predation was the third highest cause (15%) of poultry mortality, with coops
ineffective in reducing predation. Predation of poultry was more prevalent in
deciduous forests, and most common during the evenings of the dry season. Over half
of all interviewees disliked fosas, with loss of poultry the most commonly stated
reason. Respondents’ that had suffered poultry depredation and those with lower
educational attainment were more likely to dislike fosas. Interviewees that disliked
fosas and those that were wealthier were most prone to have killed a fosa. A
minimum of thirty fosas was killed in retaliation during the interview’s previous year.
Given fosas’ population is in decline, and most of Madagascar’s forests are too small
to support sustainable populations, these killings are likely to be detrimental to
vulnerable sub-populations. These results shed insight into the cultural perceptions
and predation patterns of a medium sized carnivore, with relevance to worldwide
human-wildlife conflict of often overlooked smaller carnivores. We suggest that
educational programs, watchdogs and robust coop construction may be effective tools
in improving attitudes and reducing retaliatory killing.

166
Keywords: Eupleridae, Livestock depredation, Human wildlife-conflict, Carnivores,
Conservation.
This chapter forms the basis of a paper to be submitted to Biodiversity and
Conservation of which I am the lead author. My co-authors are Luke J Dollar, Paul
Johnson and David W Macdonald.
167
Introduction
Carnivore populations are in global decline, with human conflict and retaliatory
killing a leading cause (Woodroffe 2000; Sillero-Zubiri and Laurenson 2001; Treves
and Karanth 2003; Cardillo et al. 2004; Lichtenfeld et al. 2015). While larger
carnivores may be particularly at risk, owing to larger home ranges, low population
densities, and low fecundity (Woodroffe and Ginsberg 1998; Cardillo et al. 2004),
conflict with carnivore populations is not limited to larger species. Across the globe
many small to medium carnivores are also persecuted, most often for their predation
upon domestic poultry (Macdonald et al. 2000; Macdonald and Feber 2015;
Macdonald et al. in press).
Madagascar’s carnivores, the Eupleridae, have been described as one of the
most understudied and threatened group of carnivores worldwide (Brooke et al.
2014). The Eupleridae’s largest carnivore, the fosa (Cryptoprocta ferox) weigh on
average 6 - 7 kg (Hawkins 1998; Dollar 2006) and are found across Madagascar’s
forested landscape. They are thought to be a keystone species due to their predation of
lemurs and other species (Dollar et al. 2007; Hawkins and Racey 2008a). Fosas
occupy home ranges of up to 50 km2 (Lührs and Kappeler 2013) at population
densities of 0.17 – 0.22 individual/km2 in rainforests and deciduous forests (Hawkins
and Racey 2005; Gerber et al. 2010). It is this extensive ranging and predation on
larger prey that leads them to encounter humans and their poultry. Knowledge of this
relationship however, has hitherto been largely anecdotal.
Fosas have reportedly been killed for straying into villages where they may be
perceived to be a threat to poultry (Albignac 1973; Hawkins 1998; Jones et al. 2008)
and other small livestock such as lambs (Gardner and Davies 2014). Recent research
in the southeast rainforest of Ranomafana National Park (Kotschwar Logan et al.
168
2014) suggests fosas are not believed to affect many poultry keepers: 21% of
interviewees who kept poultry reported predation within the previous year, with less
than 1% of these losses attributed to fosas. However, individual attacks can be
serious, with local farmers reporting incidents where fosas have killed all of their
poultry once they had gained entry into the coop (Albignac 1973), so called ‘surplus
killing’ which is likely to promote negative attitudes towards a predator, as has been
observed of the red fox in the UK (Kruuk 1972).
Negative attitudes towards fosas are not caused solely by poultry predation
(Kotschwar Logan et al. 2014). There are cultural taboos (known as fady) surrounding
them, the most commonly cited of which is the belief that they consume the remains
of villagers’ ancestor’s (Ruud, 1960; Jones et al. 2008). Their resemblance to dogs is
also a negative influence (Gardner and Davies 2014), perhaps partially explained by a
recent study purporting dogs to be overwhelmingly disliked in villages in
Ranomafana National Park (Valenta et al. 2016). There are currently no published
studies verifying these anecdotal accounts of human persecution of fosas. Given
fosas’ life history characteristics, potential persecution raises questions as to their
long-term persistence in a landscape shared with humans. In conserving fosas it is
critical that we understand this conflict.
This study examines fosas’ impact across four regions, encompassing a
sample of Madagascar’s protected and unprotected areas. Our objectives were to: 1)
Identify respondents’ livestock ownership and protective practices; 2) Examine the
frequency and cost of fosa predation relative to other causes of poultry mortality; 3)
Identify fosas’ primary temporal and seasonal periods of predation; 4) Estimate the
annual numbers of fosas killed and examine variation among the four regions; 5)
Identify the circumstances where predation of domestic poultry and therefore
169
retaliatory killing of fosas is most likely, and 5) explore interviewee attitudes towards
fosas. This information is fundamental for evaluating the retaliatory killing of fosas
and medium size predators in general, and understanding its socio-economic and
cultural drivers.
Methods
Study Area
Surveys were conducted across four sites in Madagascar. Sites were chosen (in align
with Chapter 4) to encompass a representative sample of two of the fosas’ most
extensive habitat types (deciduous and rainforest). Madagascar has a hierarchy of
protected areas ranging from; Category I, Strict Natural Reserve, forbidding visitor
entry; Category II, National Park, managed to allow public entry; and Category III,
Special Reserve which are preserved purely for conservation, with a minimal tourist
focus (MNP 2014). Our four sites incorporated two National Parks, one Special
Reserve, one Private Reserve, and two unprotected areas (Table 1).
Located in the Marovoay region, Ankarafantsika National Park (ANP)(1614’
S latitude, 4655’ E longitude) is Madagascar’s largest (1350 km2) tract of dry
deciduous forest. ANP is surrounded by a population of over 37,000 inhabitants in
133 villages and hamlets (MNP 2016). A road intersects the park’s southwest border
and is flanked by six rural villages. These villages, in addition to two villages to their
southwest (not located nearby any roads) are the only villages located inside the
forest.
The central western region of Menabe encompasses the largest fragments of
deciduous forest. Three forests are situated along a south-north axis in Menabe’s
north. Andranomena Special Reserve (ASR)(2017’ S latitude, 4450’ E longitude)
170
contains 64.20 km2 of forest with two large villages flanking its perimeter. North of
Andranomena is the privately managed Kirindy reserve (2004’ S latitude, 4466’ E
longitude), a former forestry concession and now a centre of research. Lastly
Ambadira, unprotected and our most northerly forest, is bordered by the large village
of Lambokely and has experienced significant deforestation and agricultural
conversion during recent years (Zinner et al. 2013).
Covering over 155 km2, Andasibe-Mantadia National Park (AMNP)(1823’ S
latitude, 4828’ E longitude) is located in the Moramanga region, and is one of the
largest and most visited of Madagascar’s protected areas. The commune of Andasibe
lies at its centre, and is surrounded by several villages to the north, whilst the closest
southerly villages are located along the Route Nationale 2.
Situated in the Southeast region of Vatovavy-Fitovinany, the commune of
Kianjavato (2138’ S latitude, 4787’ E longitude) is surrounded by several
unprotected, and fragmented primary forests of Sangasanga, Tsiazonamboa,
Ambatovaky, Tsitola and Vatovavy. These few remaining forests are
characteristically low elevation humid evergreens surrounded by grassland,
agricultural and secondary forests (Manjaribe et al. 2013).
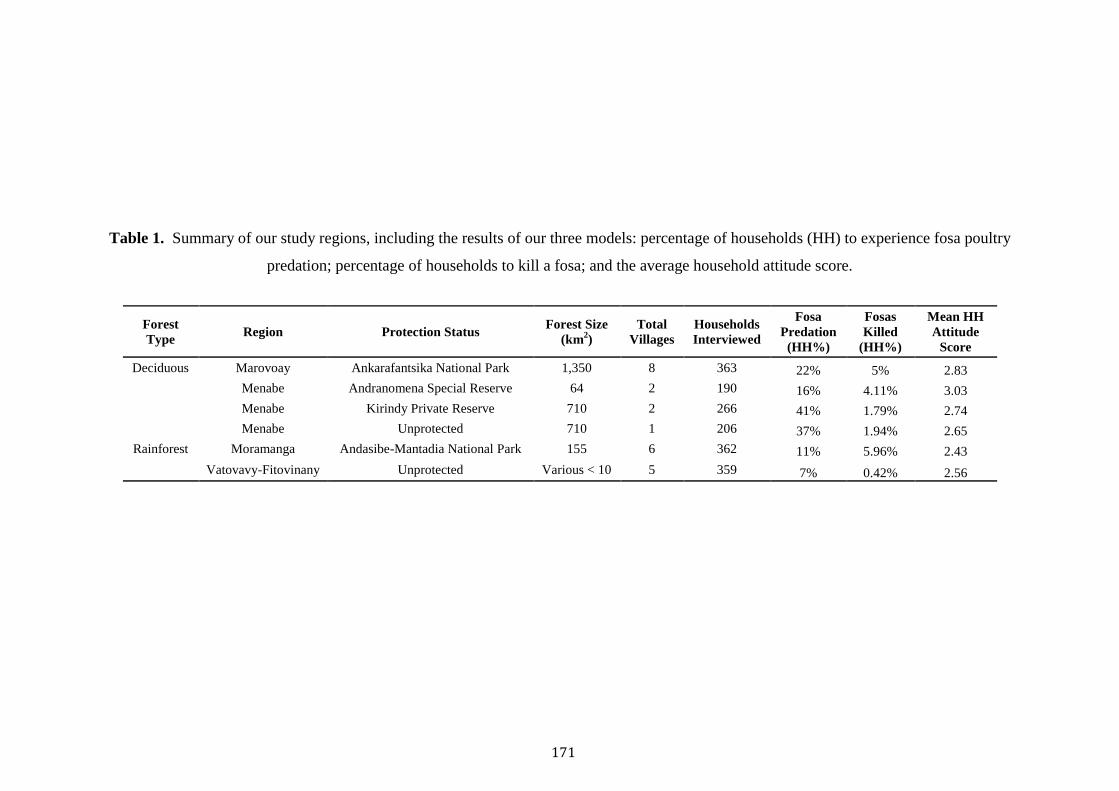
171
Table 1. Summary of our study regions, including the results of our three models: percentage of households (HH) to experience fosa poultry
predation; percentage of households to kill a fosa; and the average household attitude score.
Forest
Type Region Protection Status
Forest Size
(km2)
Total
Villages
Households
Interviewed
Fosa
Predation
(HH%)
Fosas
Killed
(HH%)
Mean HH
Attitude
Score
Deciduous Marovoay Ankarafantsika National Park 1,350 8 363 22% 5% 2.83
Menabe Andranomena Special Reserve 64 2 190 16% 4.11% 3.03
Menabe Kirindy Private Reserve 710 2 266 41% 1.79% 2.74
Menabe Unprotected 710 1 206 37% 1.94% 2.65
Rainforest Moramanga Andasibe-Mantadia National Park 155 6 362 11% 5.96% 2.43
Vatovavy-Fitovinany Unprotected Various < 10 5 359 7% 0.42% 2.56
172
Sampling strategy and interview protocol
Field staff were trained to interview independently within each village. Prior
to household interviews our research objectives were explained to the village
president who gave permission for survey commencement.
Villages were categorised as ‘small’ or ‘large’, roughly corresponding to
villages less than or greater than 100 households, During surveys all households in
small villages were visited, whilst only a sample of households within large villages
were interviewed.
Once a house was selected, its head was requested for interview and verbal
consent acquired. If the individual was absent a further two appointments were
scheduled.
Within larger villages, the area was divided into districts and sampled using
the zig-zag transect method (East et al. 2005). This method allows households not
located on streets to be visited and ensures a representative sample may be
extrapolated from populous villages. Each interviewer was instructed to walk a zig-
zag transect, sampling every second household. If the head of the household wasn’t
present or was unwilling to be interviewed the next household was surveyed. The
potential bias introduced by unwilling respondents was negligible as fewer than 2.5%
declined to participate.
Questionnaire design
A pilot questionnaire was devised and trialled in ANP during 2013. The results of the
pilot questionnaire were not used in this analysis, however the results and feedback
proved useful in the shaping its ultimate design.
173
The questionnaire (with background theories and additional methodology
detailed in Chapter 4) was divided into four sections addressing respondents’: i)
demographic and socioeconomic information; ii) livestock ownership history; iii)
dietary patterns; and iv) conservation perceptions and experiences. To promote trust,
participants remained anonymous (Singer et al. 1995), however they were asked to
reveal baseline demographic and socioeconomic information, such as employment,
education, ethnicity, household family structure, and livelihood indicators such as
asset ownership. Questionnaire section two aimed to record participants’ details of
livestock ownership, specifically: i) breed and quantity; ii) use of protective measures
such as coop or snares; iii) what they perceived to be the causes of poultry mortality,
both for the previous year and for their lifetime, and the season the causes were most
prevalent in; iv) their perceptions of the significance of fosas as a cause of poultry
mortality; and v) attitudes towards fosa. Participants were also asked sensitive
questions regarding the details of any fosa-conflict encounters, including: the number
killed; seasonal and temporal occurrence; reason for killing, and their use of any fosa
killed. Given the sensitivity of the question and interviewee’s potential reluctance to
answer truthfully, interviewees were also asked to report of known inhabitants of their
local village to have killed a fosa. This questioning-method was included to best
account for unreported mortalities, and to produce a more accurate enumeration of
fosas’ killed. Despite the potential for misinformation when incorporating third-party
estimates, claims were validated through the crosschecking of spatial-temporal
information. Given the killing of fosas within villages was a rarity, interviewees were
able to accurately recall these events, and interviewers were able to deduce the year
and location of each attack. These events were collated together as a team to ensue
pseudo-replication was mitigated.
174
Analysis
Data were analysed using the statistical package R (R Core Team 2016). Fisher Exact
Tests and Chi-Squared tests of Independence were used in the analysis of seasonality,
diel period, forest type, and interviewee coop usage’s relationship with fosa poultry
predation.
Three sets of generalised linear mixed effect models (GLMM) were used to
examine the association of our explanatory variables with three response variables, i)
fosas’ predation of poultry; ii) interviewees’ attitude towards fosas and, iii) retaliatory
killing of fosas (Appendix S1).
Last Year Predation was measured as a binary ‘yes/no’ response to a question
asking if the respondent had experienced fosa poultry depredation during the previous
year. Nine a priori variables thought to potentially impact a household’s susceptibility
to fosa predation included; Forest Size, Village Size, River Barrier, Household
Distance, Flock Size, Flock Coop, Flock Snare and Region (Appendix S1).
Region was included as a fixed blocking factor accounting for geographic
variation. This was included in all statistical models as an aspect of study design.
Given the nesting of households within villages the identities of individual villages
were included as levels of a random effect. Pearson’s Chi-squared tests of
Independence and Pearson Correlation Coefficients were used to identify collinearity
among predictors. Forest type and Protection were not included as predictors in the
GLMMs as they were highly confounded with Region.
A GLMM model with a binomial family and a logit link function (package
lmer 1.1 - 12) was used to model the binary response variable, Last Year Predation.
Akaike’s information criterion (AIC) was used to rank models according to the most
parsimonious set of predictors (Burnham and Anderson 2002). Model averaging was
175
not used for the reasons given in (Cade 2015), principally that with any non-trivial
level of collinearity among predictors, inevitable with most observational studies,
model averaged parameter estimates are unreliable. Instead, where no single model
was clearly dominant, we scrutinised the pattern of parameter estimates in the models
with highest weights.
Attitude towards fosas, measured on a 5-point likert scale was used as an
ordinal response variable and modelled with the fixed-effect predictors, Poverty,
Education, Protection, Poultry Owned, Lifetime predation, Conservation Benefit,
Conservation Experience, and Conservation Attitude (and Village identity as a
random effect). A cumulative logit function was fit using the R package ‘ordinal’
(version 2015.6-28). Model selection was as previously described.
The final series of models exploring the potential predictors influencing the
retaliatory killing of fosas followed the same set of methods prescribed in model one.
The binary response variable (did interviewee’s report having killed at least one fosa
during their lifetime) was thought to be potentially influenced by Poverty,
Conservation Experience, Conservation Benefit, Conservation Attitude, Attitude, and
Region (Appendix S1). The household’s relative poverty level was estimated using
several of the indicators contained within the Multidimensional Poverty Index
(MPI)(Alkire et al. 2015). This metric uses three dimensions (education, health and
living standard) to measure poverty, with weighted indicators within each dimension
combining to create a more representative estimate of poverty. Unfortunately given
the structure of our questionnaire our estimate contained only indicators from the
MPI’s living standard dimension. Our poverty estimate equally weighted six
indicators to create a relative estimate of household poverty measuring poverty in an
increasing scale from 0 to 1 (maximum poverty score 1.0). Our indicators included
176
assets ownership (i.e. mobile phone, radio, bicycle), roof material, wall material, floor
material, access to electricity and access to safe drinking water. Unfortunately, the
poverty metric was unavailable for one of the regions (Marovoay) due to changes in
the content of the questionnaire between the initial surveying of Marovoay in 2014
and the interviewing of the remaining regions in 2015. Consequently two series of
models were used for this response, with Poverty not included where all regions were
used and with Poverty included (excluding observations from Marovoay).
Results
In total 1746 households were interviewed (1325 male, 410 female, mean age 42.4 ±
13.3 and 38.8 ±13.9) over six months from April – June 2014, and May – August
2015 (Table 1). 725 households were interviewed within and surrounding national
parks, with 456 and 565 conducted within reserves and unprotected forests.
Respondents were overwhelmingly farmers (77.5%). Most respondents’ highest level
of educational attainment was either primary school (43.6%), or junior secondary
(24.6%). A substantial minority reported having no education (22.5%). Senior
secondary or tertiary education was not commonly reported (8.7% and 0.7%
respectively).
Livestock ownership and practices
Approximately 80% (n = 1391) of respondents owned livestock. Of these
respondents, chickens (45.6%), zebu (25.1%) and ducks (15.6%) were most
commonly owned. Chickens were also bred in the greatest numbers, with a mean of
15.4 (15.63 SD) owned per respondent.
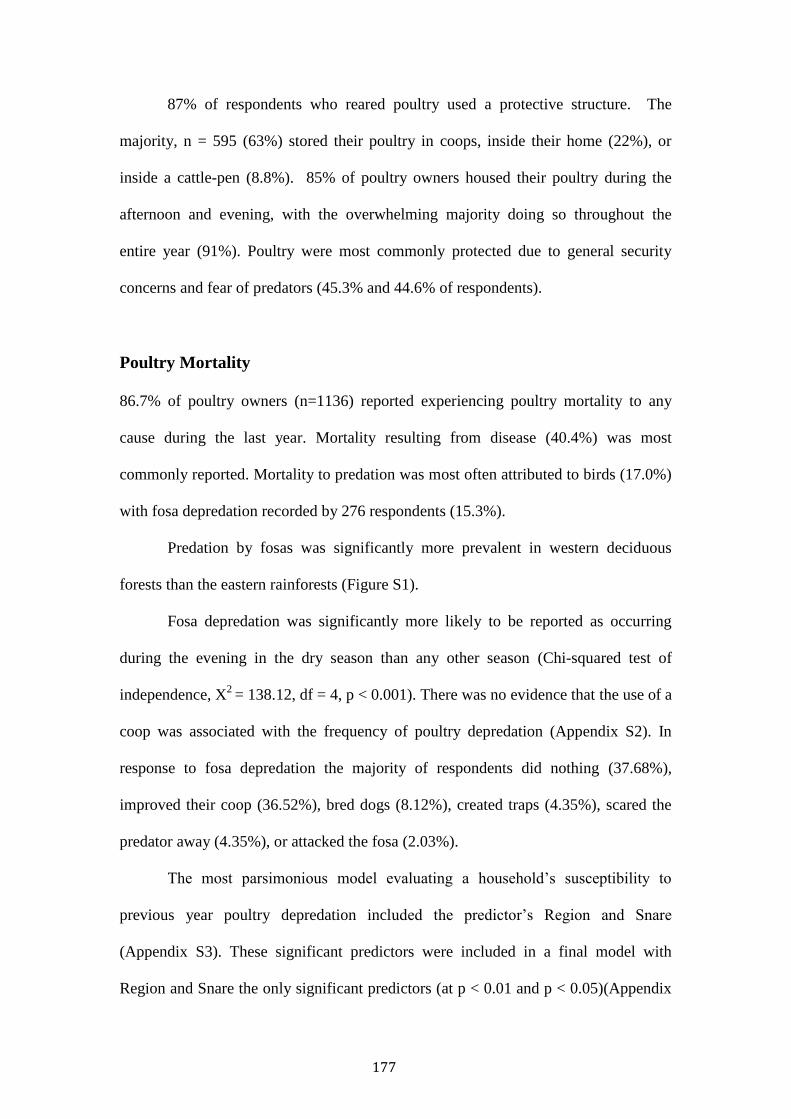
177
87% of respondents who reared poultry used a protective structure. The
majority, n = 595 (63%) stored their poultry in coops, inside their home (22%), or
inside a cattle-pen (8.8%). 85% of poultry owners housed their poultry during the
afternoon and evening, with the overwhelming majority doing so throughout the
entire year (91%). Poultry were most commonly protected due to general security
concerns and fear of predators (45.3% and 44.6% of respondents).
Poultry Mortality
86.7% of poultry owners (n=1136) reported experiencing poultry mortality to any
cause during the last year. Mortality resulting from disease (40.4%) was most
commonly reported. Mortality to predation was most often attributed to birds (17.0%)
with fosa depredation recorded by 276 respondents (15.3%).
Predation by fosas was significantly more prevalent in western deciduous
forests than the eastern rainforests (Figure S1).
Fosa depredation was significantly more likely to be reported as occurring
during the evening in the dry season than any other season (Chi-squared test of
independence, X2
= 138.12, df = 4, p < 0.001). There was no evidence that the use of a
coop was associated with the frequency of poultry depredation (Appendix S2). In
response to fosa depredation the majority of respondents did nothing (37.68%),
improved their coop (36.52%), bred dogs (8.12%), created traps (4.35%), scared the
predator away (4.35%), or attacked the fosa (2.03%).
The most parsimonious model evaluating a household’s susceptibility to
previous year poultry depredation included the predictor’s Region and Snare
(Appendix S3). These significant predictors were included in a final model with
Region and Snare the only significant predictors (at p < 0.01 and p < 0.05)(Appendix
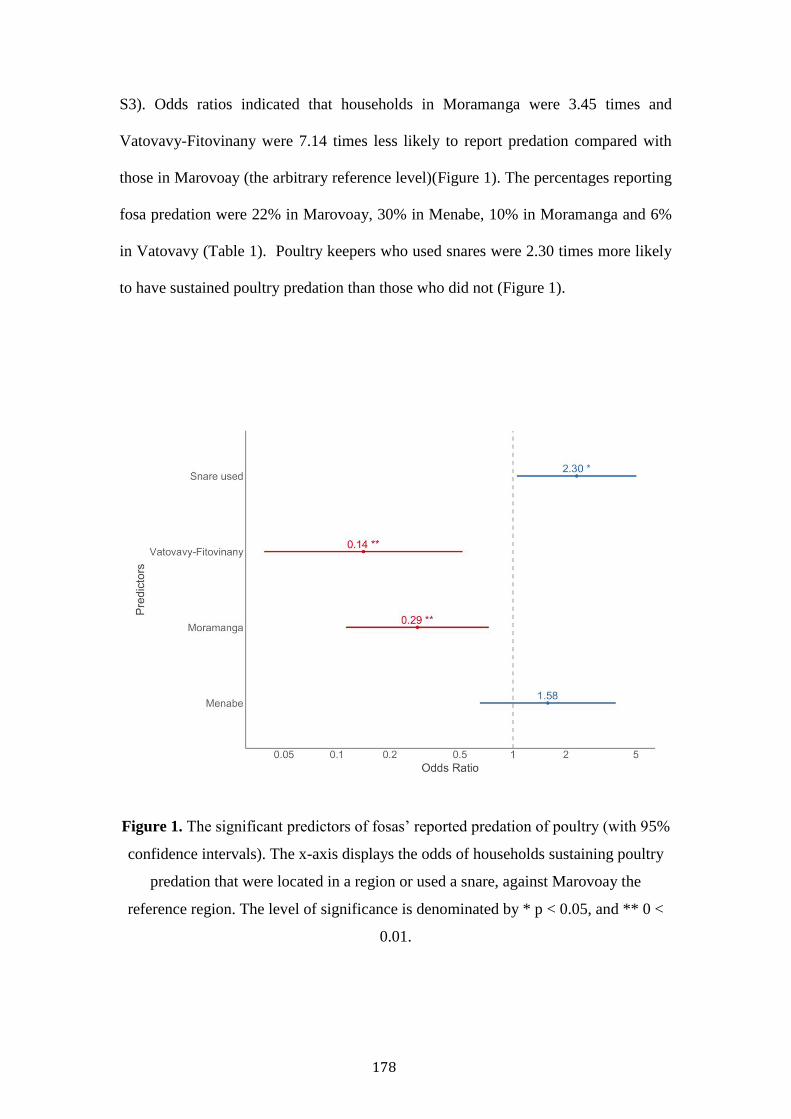
178
S3). Odds ratios indicated that households in Moramanga were 3.45 times and
Vatovavy-Fitovinany were 7.14 times less likely to report predation compared with
those in Marovoay (the arbitrary reference level)(Figure 1). The percentages reporting
fosa predation were 22% in Marovoay, 30% in Menabe, 10% in Moramanga and 6%
in Vatovavy (Table 1). Poultry keepers who used snares were 2.30 times more likely
to have sustained poultry predation than those who did not (Figure 1).
Figure 1. The significant predictors of fosas’ reported predation of poultry (with 95%
confidence intervals). The x-axis displays the odds of households sustaining poultry
predation that were located in a region or used a snare, against Marovoay the
reference region. The level of significance is denominated by * p < 0.05, and ** 0 <
0.01.
179
Attitudes
Over half of all respondents disliked fosas (responding either ‘Strongly Dislike’ or
‘Dislike’ to the question, 55.7% n= 967)(Figure 2). The most commonly stated
reasons were fosas’ depredation of poultry, their perception as their enemy and fosas’
reputedly fierce nature. Conversely, of the 22.4% of respondents that liked fosas
(responding ‘Like’ or ‘Strongly Like’, the principal reason was their status as a native
species, with interviewees also liking fosas as they believed them to be an impressive
animal. Other respondents reported mixed emotions because of their dislike of fosas’
poultry depredation but appreciation for their beneficial role in consuming pest
species such as rats.
Figure 2. The interviewees’ attitudes towards fosas and their prescribed reason.
180
74.4% (n = 1203) of respondents believed fosas were of no personal benefit,
mostly citing poultry depredation (44.8%)(Appendix S4). In contrast, the remaining
respondents (n = 414) saw fosas as beneficial for their role as a rat predator (23.9%),
source of tourism revenue (21.2%) and ecosystem component (16.5%). When asked if
respondents were fearful for their poultry, the majority of respondents who kept
poultry (52.6%, n = 713) weren’t concerned about fosas. The most popular reason
stated was the presence of geographical barriers surrounding their village (i.e. a
river)(33%)(Appendix S4). Conversely, respondents who were concerned for their
poultry most commonly cited fosas’ persistence whilst hunting (28%). The majority
(73%, n = 970) of respondents did not believe that fosa populations should be
controlled, principally due to their beliefs that fosas are one of god’s creations
(33.3%), that control isn’t a feasible solution (16.5%) or that fosas have a right to
survive (12.6%). The remaining interviewees believed that fosa overpopulation
increased poultry depredation (44.6%).
The models examining interviewee attitude towards fosas revealed the
strongest associations with Education, Lifetime Predation, and Region (Appendix S5).
Interviewees who have experienced fosa predation during their lifetime were
significantly more likely to have a negative attitude (Appendix S5)(Figure 3).
Likewise, interviewees’ with lower levels of educational attainment were also more
prone to exhibit negative attitudes (Figure 5). Interviewees from Moramanga and
Vatovavy-Fitovinany were more likely to hold a negative view of fosas compared
with those from Menabe (Appendix S5).
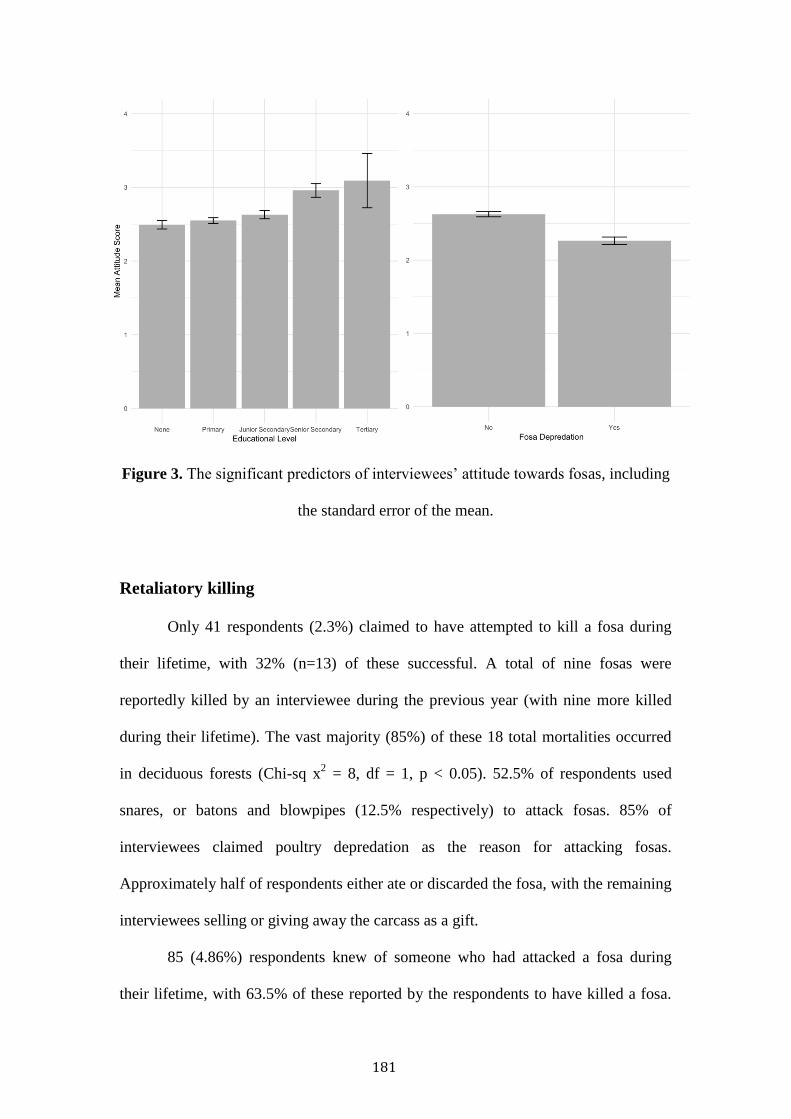
181
Figure 3. The significant predictors of interviewees’ attitude towards fosas, including
the standard error of the mean.
Retaliatory killing
Only 41 respondents (2.3%) claimed to have attempted to kill a fosa during
their lifetime, with 32% (n=13) of these successful. A total of nine fosas were
reportedly killed by an interviewee during the previous year (with nine more killed
during their lifetime). The vast majority (85%) of these 18 total mortalities occurred
in deciduous forests (Chi-sq x2 = 8, df = 1, p < 0.05). 52.5% of respondents used
snares, or batons and blowpipes (12.5% respectively) to attack fosas. 85% of
interviewees claimed poultry depredation as the reason for attacking fosas.
Approximately half of respondents either ate or discarded the fosa, with the remaining
interviewees selling or giving away the carcass as a gift.
85 (4.86%) respondents knew of someone who had attacked a fosa during
their lifetime, with 63.5% of these reported by the respondents to have killed a fosa.
182
21 fosas were purportedly killed in the previous year, with approximately 50 killed
during their lifetime. Combining reported killed by interviewees and those known to
have been killed locally, 30 were killed during the previous year. A further 25 fosas
were known to have been killed during the five preceding years, with 34 killed during
the remainder of their lifetime (Figure 4).
AMNP (Moramanga region) had the highest number of fosas killed during the
last year (13 individuals) and last five years (14 individuals)(Figure 4).
Ankarafantsika (Marovoay region) had the second highest number of individuals
killed (8) during the last year. Across the regions, 4% of households killed fosas in
Marovoay, 2% in Menabe, 4% in Moramanga, and 0% in Vatovavy-Fitovinany. No
patterns were discernible between forests of different ecoregion or protection level.
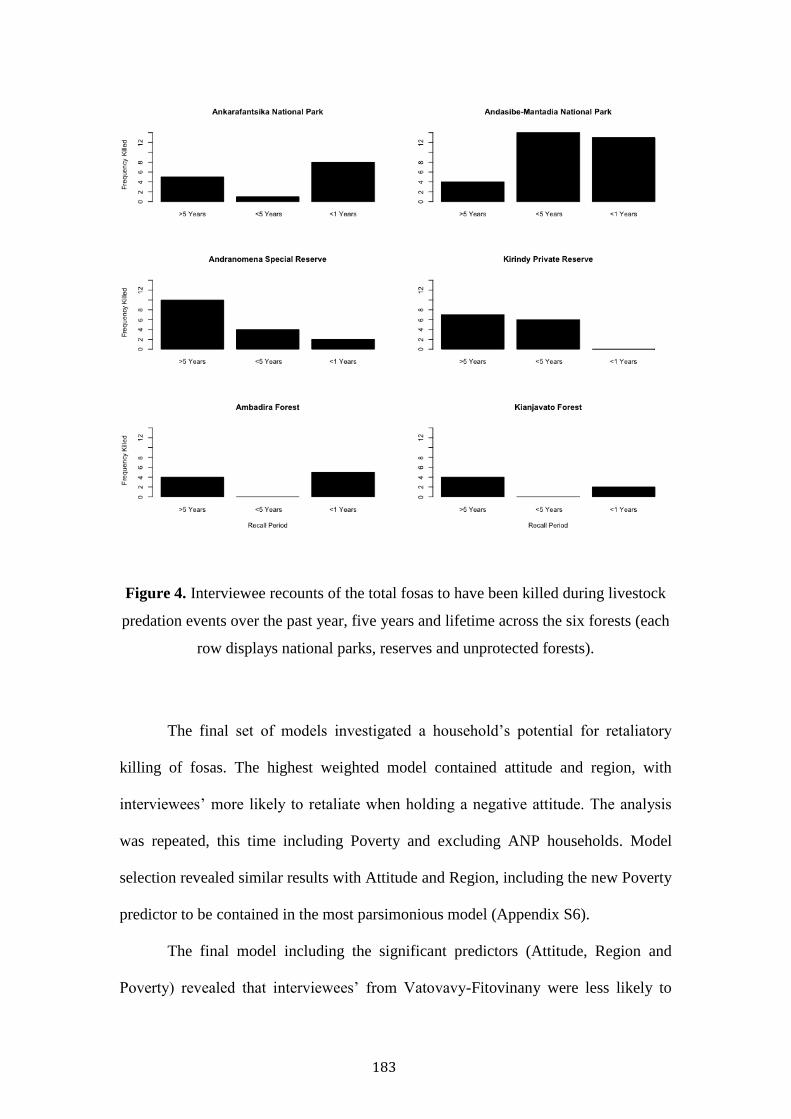
183
Figure 4. Interviewee recounts of the total fosas to have been killed during livestock
predation events over the past year, five years and lifetime across the six forests (each
row displays national parks, reserves and unprotected forests).
The final set of models investigated a household’s potential for retaliatory
killing of fosas. The highest weighted model contained attitude and region, with
interviewees’ more likely to retaliate when holding a negative attitude. The analysis
was repeated, this time including Poverty and excluding ANP households. Model
selection revealed similar results with Attitude and Region, including the new Poverty
predictor to be contained in the most parsimonious model (Appendix S6).
The final model including the significant predictors (Attitude, Region and
Poverty) revealed that interviewees’ from Vatovavy-Fitovinany were less likely to
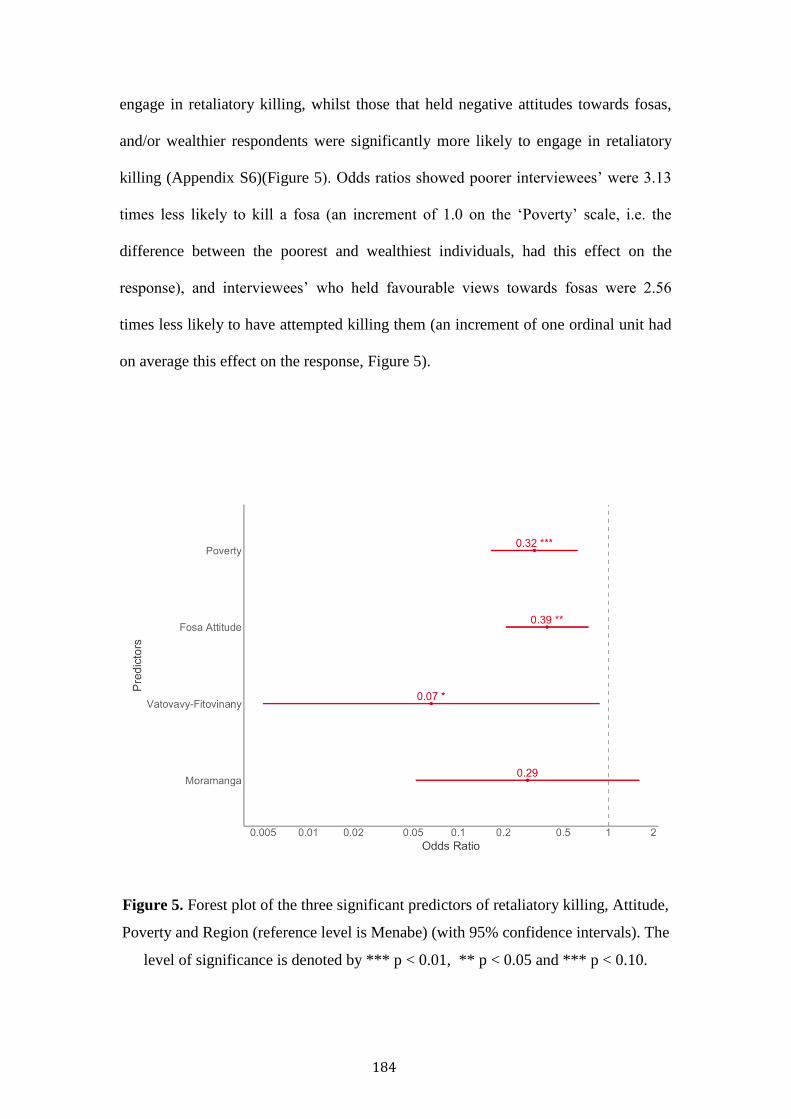
184
engage in retaliatory killing, whilst those that held negative attitudes towards fosas,
and/or wealthier respondents were significantly more likely to engage in retaliatory
killing (Appendix S6)(Figure 5). Odds ratios showed poorer interviewees’ were 3.13
times less likely to kill a fosa (an increment of 1.0 on the ‘Poverty’ scale, i.e. the
difference between the poorest and wealthiest individuals, had this effect on the
response), and interviewees’ who held favourable views towards fosas were 2.56
times less likely to have attempted killing them (an increment of one ordinal unit had
on average this effect on the response, Figure 5).
Figure 5. Forest plot of the three significant predictors of retaliatory killing, Attitude,
Poverty and Region (reference level is Menabe) (with 95% confidence intervals). The
level of significance is denoted by *** p < 0.01, ** p < 0.05 and *** p < 0.10.
185
Discussion
Fosa predation was perceived by the interviewees to be one of the greatest causes of
poultry mortality. Its occurrence was principally concentrated in Madagascar’s
western forests, and most often recorded during the dry season in the evening. There
was no evidence that poultry coops were effective in reducing fosa predation, likely
owing to their poor construction. Most interviewees’ disliked fosas, with poultry
predation the most commonly stated reason. Fosas were commonly liked due to their
endemicity, their impressiveness and their role as a rat predator. Interviewees that had
suffered poultry depredation and those with less education were most likely to dislike
fosas. Interviewees that disliked fosas and those that were wealthy were most likely to
have killed a fosa. We estimated that a minimum of thirty fosas was killed in
retaliation across our study regions during the year before interviews. Our results
suggest that a strategy to reduce retaliatory killing should focus upon educating
communities of fosas’ importance, whilst promoting the construction of sustainably
built, robust poultry coops, in align with the use of watchdogs.
Poultry depredation
Recent estimates from Ranomafana suggested that < 1% of households’ poultry
mortality was attributable to fosas (Kotschwar Logan et al. 2014), supporting
historical reports of anecdotally infrequent attacks (Albignac 1973; Hawkins 1998).
By contrast, approximately one in six interviewees’ in our study reported fosa
depredation. Together, these observations indicate that perceived predation by fosas is
not rare, but that it is not the most economically damaging agent. Disease killed
nearly 40% of interviewees’ poultry, with Newcastle disease the likely virus.
Newcastle disease has been previously reported as particularly virulent, and the
186
principal cause of rural poultry mortality in other areas of Madagascar (Maminiaina et
al. 2007). Poultry mortality from birds of prey was the second most common cause,
although its impact is less detrimental due to their predation of chicks (costing around
400 Ariary). Conversely fosas more commonly consume adult chickens, typically
valued at around 12,000 Ar (3,600 Ar = 1 USD). Fosas’ tendency to kill all chickens
when it has entered a coop, a previously acknowledged predation characteristic, can
result in a substantial cost to affected households (Albignac 1973; Merson personal
observation). With some 70% of Malagasy households currently living below the
poverty line (< 1 USD/day), the individual cost of fosas’ predation upon respondents’
livelihoods may be significant. In the absence effective coops, retaliatory killing of
nuisance fosas is the likely response.
Fosas’ predation of poultry was significantly more frequent in deciduous
forested regions. This may be attributable to higher fosa densities in deciduous forests
(Hawkins and Racey 2005; Gerber et al. 2010). Anecdotal reports also support these
estimates: trapping studies yield far greater trapping success in deciduous regions
(Luke Dollar unpublished, Merson personal observation). Higher fosa predation rates
may also be due to lower prey availability in accord with greater hibernation of
deciduous forest living species during dry seasons.
Throughout both forest types, poultry depredation was significantly more
likely to occur during the dry season (May to November). This pattern aligns with the
aestivation and torpor of many of Madagascar’s mammals, a common adaptation to
survive periods of low rainfall and reduced food availability during the austral winter
(Schmid 2000; Dausmann et al. 2009; Kobbe and Dausmann 2009; Lyman 2013).
Hawkins and Racey’s (2008b) dietary analysis found seasonal differences in the
relative frequency of prey species in the fosas’ diet. The analysis however didn’t refer
187
to differences in absolute numbers of prey species consumed between seasons. It
might then be possible that higher winter poultry predation is a preferred strategy to
combat reductions in species common during the summer months, such as tenrec
(Lovegrove and Génin 2008). Furthermore, most respondents claimed fosa poultry
predation occurred most frequently during the months of October – November. These
months not only represent the end of the dry season, a period in which fosas would
have felt the brunt of winter and its associated reductions in prey, but also coincide
with fosas’ mating season. A recent study of fosa sociobiology in western Madagascar
estimated increases in male home range during the breeding season from 40 to 50 km2
(Lührs 2012). These changes in male home range may increase the propensity for
overlap between fosas and human settlements. This promotes a scenario whereby
increased ranging behaviour, poor body condition and increased metabolic demands
create a higher propensity for settlement interaction in search of prey.
Lastly, fosa predation of poultry was significantly more prevalent during the
evening. Despite fosas’ cathemeral activity patterns, peaking during the crepuscular
hours (Dollar 1999; Gerber et al. 2012b), fosas are highly active during the evenings
(Farris et al. 2015a). Recent research revealed fosas to occupy distinct temporal
niches from humans and dogs (Gerber et al. 2012b; Farris et al. 2015a), a likely an
example of temporal exclusion, with fosas avoiding larger animals and humans. It
may then be expected, similar to other instances of carnivore livestock predation
(Patterson et al. 2004), that fosas would choose to hunt poultry when human activity
is presumably at its lowest during the evenings (when people are assumed to be
mostly asleep).
Households that used snares and those living in Menabe were significantly
more likely to experience fosa predation. The positive association with snare use is
188
likely explained by the proximate reason that households using snares have
experienced higher historic levels of fosa predation and are therefore more likely to
use snares in the future. Likewise, Menabe is a deciduous forest and contains Kirindy
Reserve, one of the few forests in Madagascar with a highly habituated fosa
population. Fosas in this sub-population may be less deterred by human presence, and
more willing to venture into villages. In addition, this region has historically and is
today experiencing severe rates of annual deforestation (Zinner et al. 2013), with
many of the remaining forests too small to sustain long-term fosa populations
(Hawkins and Racey 2005). Given fosas’ large home ranges, individuals in this region
may be more inclined to leave the forest, promoting interaction with nearby villages.
Attitudes
Fosa poultry predation was strongly linked to respondent attitudes, with twice as
many interviewees who reported losses disliking fosas. The most commonly cited
reason for disliking fosas was their predation of poultry, whilst peoples’ perception of
fosas as an enemy, and their similarity to dogs also stated. Alternatively, another
possible reason for the interviewee’s purported dislike for fosas could be the influence
of the questionnaire’s order. Interviewees were asked to state their attitude towards
fosas after describing any historical killings of fosas. As discussed in Chapter 4, this
could result in interviewees reporting their dislike for fosa as a result of negative
emotions generated from previous questioning.
Despite seemingly pragmatic reasons for Malagasy dislike of fosas, underlying
fady (taboos) may also have shaped modern perceptions. Fosas similarity to dogs was
mentioned. Dogs are frequently disliked in this culture due to their perceptions as
being dirty, and their occasional theft of food. Another underlying fady regularly cited
189
was their dislike of fosas as a result of their consumption of their ancestor’s remains.
Given some burial sites (for example tombs within mountainside caves) could be
easily accessed by foraging fosas, the claim may have some validity and has been
reported elsewhere (Ruud, 1960; Jones et al. 2008). Anecdotes have also been retold
across regions from Menabe to Andasibe, with stories occasionally heard of fosas
having eaten missing people, packs of fosas attacking and consuming zebu, and fosa
attacks upon lone individuals – often resulting in death. The validity of these stories is
unknown, however, given our understanding of fosas’ behaviour they are unlikely to
be true. These stories do however reinforce a fundamentally negative perception of
fosas. Our observation that attitudes were related to education suggests this is at least
partly reversible, perhaps by educational programs.
Fosas were commonly liked as a predator of rats, and as a native species and
interestingly appreciated for their aesthetic appeal. Educational programs highlighting
fosas’ benefit as a rat predator were initiated by co-author L. Dollar in ANP wherein
almost half of the total respondents that cited this reason were located. Such
educational programs show potential to change attitudes and ultimately reduce
retaliatory killing.
Interviewees’ who had experienced fosa predation, and those with lower
education were more likely to negatively perceive fosas. This could be expected as
students progressing through higher education are more likely to be exposed to the
concepts of conservation and its benefits. This conservation awareness therefore
influences interviewees’ attitudes, so that fosas are not purely perceived as a
livelihood damaging species, but also as a key component of Madagascar’s
ecosystem. Interestingly, interviewees’ from Moramanga were most likely to
negatively perceive fosas. This region encompassed AMNP, Madagascar’s most
190
visited national park. Despite its monetary benefits (employment, tourist revenue,
park fees), many of the households interviewed were within the poorest villages.
These villagers are still reliant upon traditional livelihoods and are typically not
receiving the benefits associated with the park. It is also probably relevant that this
region also recorded the greatest number of fosas killed during the previous year, and
five years. This highlights the relationship between attitude and retaliatory killing.
Retaliatory killing
A total of nine fosas were reportedly killed across the four regions during the previous
year, with this estimate increasing to thirty including third-party accounts. It is clear
that this should be interpreted as a minimum given the question’s sensitivity and the
interviewee’s probable reluctance to answer questions truthfully for fear of
persecution. Interpreting the impact of these mortalities is difficult, with current
island-wide population estimates likely to be inaccurate, and varying between 2,635 –
8,626 adults (Gerber et al. 2012a). However, when considering the current population,
it must be acknowledged that most of these sub-populations now persist in extremely
fragmented forests that are almost certainly too small for sustainable populations
(Hawkins and Racey 2005). Hence it is expected that the fosa population is decreasing
(Hawkins 2016). For some of these isolated populations, these additional mortalities
to human persecution can only accelerate the decline. It’s therefore foreseeable that
these annual rates of mortality are unsustainable, particularly within smaller forests
where negative anthropogenic influence and sub-population decline is at its greatest.
In absolute numbers AMNP and ANP, the two largest forests and national
parks, had the highest number of fosas killed during the previous year (including total
recorded). Despite offering the highest legal protection and greatest tourist visitors,
191
these forest’s protected status did not apparently reduce retaliatory killing compared
to forests of less protection. It would also be assumed that underreporting in these
regions would be at its highest, as increased forest protection, NGO, and tourism
presence, would likely result in greater sensitivity to report illegal or socially
undesirable behaviours (Razafimanahaka et al. 2012).
These results were congruent with our model, with the Vatovavy-Fitovinany
region the only significant region-level predictor of retaliatory killing. This region
contained the smallest forests, with households significantly less likely to have
reportedly killed a fosa. This may suggest that larger forests, with large fosa
populations such as ANP and AMNP offer greater conflict potential.
Respondents’ with negative attitudes towards fosas were most likely to kill
them for poultry predation. This result seems intuitive but must be considered in the
context of sociological theories discussed in Chapter 4, in that, general attitudes alone
aren’t always a determinant of a predicted behaviour (St John et al. 2010). Also,
contrary to our expectation, wealthier households were most likely to have killed
fosas. It was thought that poorer households with lower food security would be less
tolerant of fosa predation and most likely to retaliate. We speculate that perhaps these
households may have political or social power in association with greater wealth, and
feel at greater liberty to kill fosas than poorer households with presumed less
social/political power. Future research into community political and social structure
may reveal the truth of such speculation.
When asked what interviewees’ did with a killed fosas’ remains,
approximately half of respondents said they consumed the animal. Despite previous
studies indicating the existence of fady forbidding consumption in different regions
(Ruud, 1960; Gardner and Jones, 2014; Jones et al. 2008), this result further supports
192
the consumption of fosa across Madagascar (García and Goodman 2003; Golden
2009; Farris et al. 2015b; Reuter et al. 2016). This trend likely a reflect’s growing
poverty and food insecurity across Madagascar.
Fosas were principally killed in retaliation for their consumption of poultry.
This stems from a widespread and rational human’s inclination to protect livelihoods.
It is also likely to be exacerbated by the unclear and conflicting legislation defining
fosa protection (Rakotoarivelo et al. 2011). Despite protection under national law, this
legislation is confounded by separate legislation allowing the killing of nuisance
species that damage an individual’s property (Category 1, Class 2 Protected Species).
Under this interpretation of the law most villagers feel justified in killing fosas. Such
conflicting legislation is unhelpful and damaging to efforts to not only protect fosas,
but to also establish a common culture to conserve Madagascar’s native species.
Conclusion
Our results suggest that efforts to promote knowledge of the fosa could encourage
tolerance, even in the presence of some livelihood impact. Fosa predation was
reported by a minority of poultry keepers, where it was likely not as economically
important compared with the major poultry source of mortality, disease. In reducing
retaliatory killing, educational material has the potential to promote positive attitudes
based on fosas’ status as an iconic endemic species, tourist attraction and predator of
other pests, including rats. Furthermore, the design and creation of robust poultry
coops, in align with the use of watchdogs, an observed spatio-temporal deterrent of
fosas (Gerber et al. 2012a; Gerber et al. 2012b; Farris et al. 2015a; Farris et al. 2015b)
could reduce retaliatory killing. Co-author L. Dollar is currently developing such
coops, and their efficacy will soon be measured in the field. Given the island-wide

193
intrusion of humans into forested habitat, retaliatory killing reduction strategies must
be trialed and deployed to ensure the persistence of one of Madagascar’s most
important species.
194
References
Albignac R (1973) Mammife`res Carnivores. Faune de Ma- dagascar 36. Paris
O.R.S.T.O.M, Paris
Alkire S, Conconi A, Roche JM (2015) Multidimensional Poverty Index 2015: Brief
Methodological Note and Results. University of Oxford, Oxford, UK
Brooke ZM, Bielby J, Nambiar K, Carbone C (2014) Correlates of research effort in
carnivores: body size, range size and diet matter PloS one 9:e93195
doi:10.1371/journal.pone.0093195
Burnham KP, Anderson DR (2002) Model selection and multimodel inference: a
practical information-theoretic approach, 2 edn. Springer, New York
Cade BS (2015) Model averaging and muddled multimodel inferences Ecology
96:2370-2382
Cardillo M, Purvis A, Sechrest W, Gittleman JL, Bielby J, Mace GM (2004) Human
population density and extinction risk in the world's carnivores PLoS Biol
2:e197
Dausmann KH, Glos J, Heldmaier G (2009) Energetics of tropical hibernation Journal
of Comparative Physiology B 179:345-357
Dollar L (1999) Preliminary report on the status, activity cycle, and ranging of
Cryptoprocta ferox in the Malagasy rainforest, with implications for
conservation Small Carnivore Conservation 20:7-10
Dollar L, Ganzhorn J, Goodman S (2007) Primates and Other Prey in the Seasonally
Variable Diet of Cryptoprocta ferox in the Dry Deciduous Forest of Western
Madagascar. In: Gursky S, Nekaris KAI (eds) Primate Anti-Predator
Strategies. Developments in Primatology: Progress and Prospects. Springer
US, pp 63-76. doi:10.1007/978-0-387-34810-0_3
195
Dollar LJ (2006) Morphometrics, diet, and conservation of Cryptoprocta ferox. Duke
University
East T, Kümpel NF, Milner-Gulland EJ, Rowcliffe JM (2005) Determinants of urban
bushmeat consumption in Rio Muni, Equatorial Guinea Biological
Conservation 126:206-215
Farris ZJ, Gerber BD, Karpanty S, Murphy A, Andrianjakarivelo V, Ratelolahy F,
Kelly MJ (2015a) When carnivores roam: temporal patterns and overlap
among Madagascar's native and exotic carnivores Journal of Zoology 296:45-
57
Farris ZJ et al. (2015b) Hunting, exotic carnivores, and habitat loss: anthropogenic
effects on a native carnivore community, Madagascar PloS one 10:e0136456
García G, Goodman SM (2003) Hunting of protected animals in the Parc National
d'Ankarafantsika, north-western Madagascar Oryx 37:115-118
Gardner CJ, Davies ZG (2014) Rural Bushmeat Consumption Within Multiple-use
Protected Areas: Qualitative Evidence from Southwest Madagascar Human
Ecology 42:21-34 doi:10.1007/s10745-013-9629-1
Gerber B, Karpanty SM, Crawford C, Kotschwar M, Randrianantenaina J (2010) An
assessment of carnivore relative abundance and density in the eastern
rainforests of Madagascar using remotely-triggered camera traps Oryx 44:219
doi:10.1017/s0030605309991037
Gerber B, Karpanty SM, Randrianantenaina J (2012a) The impact of forest logging
and fragmentation on carnivore species composition, density and occupancy in
Madagascar's rainforests Oryx 46:414-422 doi:10.1017/s0030605311001116
Gerber BD, Karpanty SM, Randrianantenaina J, Vuren DHV (2012b) Activity
patterns of carnivores in the rain forests of Madagascar: implications for
196
species coexistence Journal of Mammalogy 93:667-676
doi:10.2307/23259962
Golden CD (2009) Bushmeat hunting and use in the Makira Forest, north-eastern
Madagascar: a conservation and livelihoods issue Oryx 43:386
doi:10.1017/s0030605309000131
Hawkins AF (2016) Cryptoprocta ferox. IUCN.
http://www.iucnredlist.org/details/5760/0. Accessed 17 November 2014
Hawkins CE (1998) Behaviour and ecology of the fossa, Cryptoprocta ferox
(Carnivora: Viverridae) in a dry deciduous forest, western Madagascar.
University of Aberdeen
Hawkins CE, Racey PA (2005) Low population density of a tropical forest carnivore,
Cryptoprocta ferox: implications for protected area management Oryx 39
doi:10.1017/s0030605305000074
Hawkins cE, Racey PA (2008a) Food Habits of an Endangered Carnivore,
Cryptoprocta ferox, in the Dry Deciduous Forests of Western Madagascar
Hawkins CE, Racey PA (2008b) Food Habits of an Endangered Carnivore,
Cryptoprocta ferox, in the Dry Deciduous Forests of Western Madagascar
Journal of Mammalogy 89:64-74 doi:10.2307/25145068
Jones JPG, Andriamarovololona MM, Hockley N (2008) The Importance of Taboos
and Social Norms to Conservation in Madagascar Conservation Biology
22:976-986 doi:10.2307/20183479
Kobbe S, Dausmann KH (2009) Hibernation in Malagasy mouse lemurs as a strategy
to counter environmental challenge Naturwissenschaften 96:1221-1227
Kotschwar Logan M, Gerber BD, Karpanty SM, Justin S, Rabenahy FN (2014)
Assessing carnivore distribution from local knowledge across a human-
197
dominated landscape in central-southeastern Madagascar Animal
Conservation:n/a-n/a doi:10.1111/acv.12137
Kruuk H (1972) Surplus killing by carnivores Journal of Zoology 166:233-244
Lichtenfeld LL, Trout C, Kisimir EL (2015) Evidence-based conservation: predator-
proof bomas protect livestock and lions Biodivers Conserv 24:483-491
doi:10.1007/s10531-014-0828-x
Lovegrove BG, Génin F (2008) Torpor and hibernation in a basal placental mammal,
the Lesser Hedgehog Tenrec Echinops telfairi Journal of Comparative
Physiology B 178:691-698
Lührs ML (2012) Social organisation and mating system of the fosa (Crptoprocta
ferox). University of Gottingen
Lührs ML, Kappeler PM (2013) Simultaneous GPS tracking reveals male associations
in a solitary carnivore Behavioral Ecology and Sociobiology 67:1731-1743
doi:10.1007/s00265-013-1581-y
Lyman CP (2013) Hibernation and torpor in mammals and birds. Elsevier,
Macdonald DW, Feber RE (2015) Wildlife conservation on farmland volume 2:
conflict in the countryside. OUP Oxford,
Macdonald DW, Newman C, Harrington LA (in press) Biology and Conservation of
Wild Musteloids. Oxford University Press, Oxford
Macdonald DW et al. (2000) Managing British mammals: case studies from the
hunting debate. Wildlife Conservation Research Unit Oxford,, UK,
Maminiaina OF, Koko M, Ravaomanana J, Rakotonindrina SJ (2007) [Epidemiology
of Newcastle disease in village poultry farming in Madagascar] Revue
scientifique et technique (International Office of Epizootics) 26:691-700
198
Manjaribe C, Frasier CL, Rakouth B, Louis EE (2013) Ecological restoration and
reforestation of fragmented forests in Kianjavato, Madagascar International
Journal of Ecology 2013
MNP (2014) Madagascar National Parks One Association, one mission.
http://www.parcs-madagascar.com/madagascar-national-
parks_en.php?Navigation=25. Accessed 20th November 2013
MNP (2016) Ankarafantsika National Park. http://www.parcs-madagascar.com/aire-
prot%C3%A9g%C3%A9e/parc-national-ankarafantsika. Accessed 8th August
2016
Patterson BD, Kasiki SM, Selempo E, Kays RW (2004) Livestock predation by lions
(Panthera leo) and other carnivores on ranches neighboring Tsavo National
Parks, Kenya Biological conservation 119:507-516
R Core Team (2016) R: A language and environment for statistical computing. R
Foundation for Statistical Computing, Vienna, Austria
Reuter KE, Randell H, Wills AR, Sewall BJ (2016) The consumption of wild meat in
Madagascar: drivers, popularity and food security Environmental
Conservation:1-11
Ruud, J., 1960. Taboo: A study of Malagasy customs and beliefs. Oslo University
Press.
Schmid J (2000) Daily torpor in the gray mouse lemur (Microcebus murinus) in
Madagascar: energetic consequences and biological significance Oecologia
123:175-183
Sillero-Zubiri C, Laurenson MK (2001) Interactions between carnivores and local
communities: conflict or co-existence? CONSERVATION BIOLOGY
SERIES-CAMBRIDGE-:282-312
199
Treves A, Karanth KU (2003) Human-Carnivore Conflict and Perspectives on
Carnivore Management Worldwide
Conflicto entre Humanos y Carnívoros y Perspectivas de la Gestión Mundial de
Carnívoros Conservation Biology 17:1491-1499 doi:10.1111/j.1523-
1739.2003.00059.x
Valenta K, Gettinger-Larson JA, Chapman CA, Farris ZJ (2016) Barking up the right
tree: Understanding local attitudes towards dogs in villages surrounding
Ranomafana National Park, Madagascar can benefit applied conservation
Madagascar Conservation & Development 11:87-90
Woodroffe R (2000) Predators and people: using human densities to interpret declines
of large carnivores Animal conservation 3:165-173
Woodroffe R, Ginsberg JR (1998) Edge Effects and the Extinction of Populations
Inside Protected Areas Science 280:2126-2128
doi:10.1126/science.280.5372.2126
Zinner D, Wygoda C, Razafimanantsoa L, Rasoloarison R, T. Andrianandrasana H,
Ganzhorn JU, Torkler F (2013) Analysis of deforestation patterns in the
central Menabe, Madagascar, between 1973 and 2010 Regional Environmental
Change 14:157-166 doi:10.1007/s10113-013-0475-x.
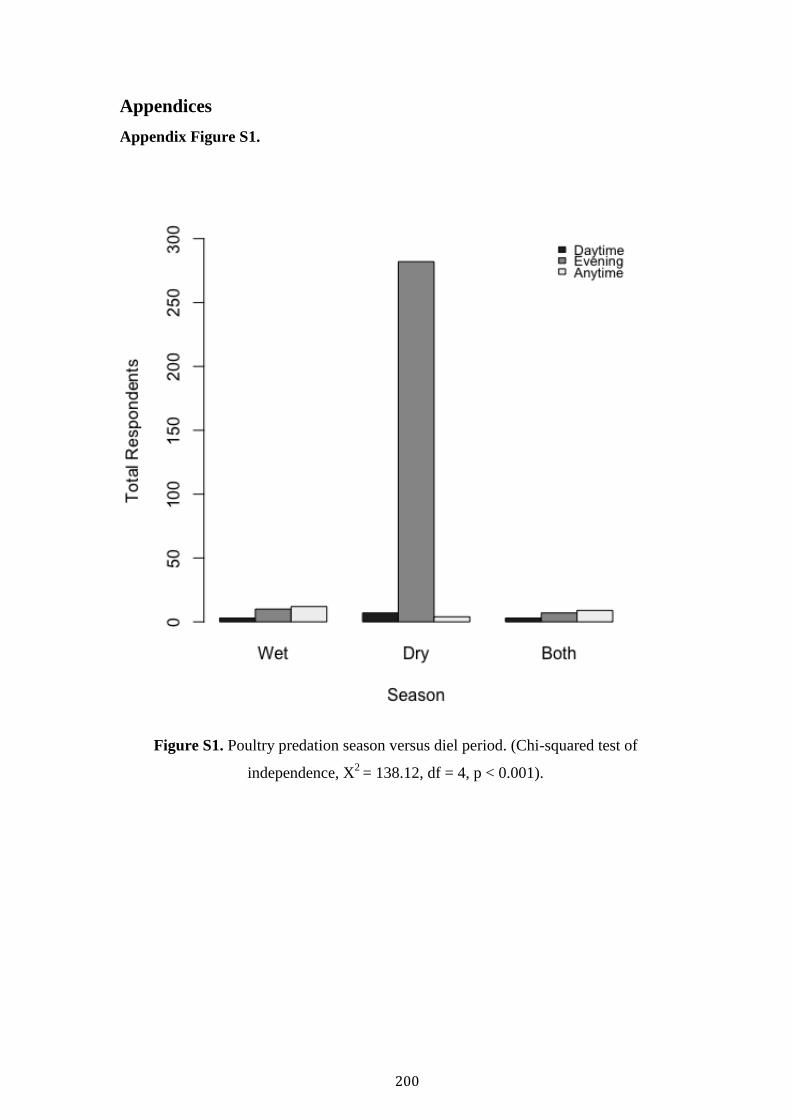
200
Appendices
Appendix Figure S1.
Figure S1. Poultry predation season versus diel period. (Chi-squared test of
independence, X2
= 138.12, df = 4, p < 0.001).
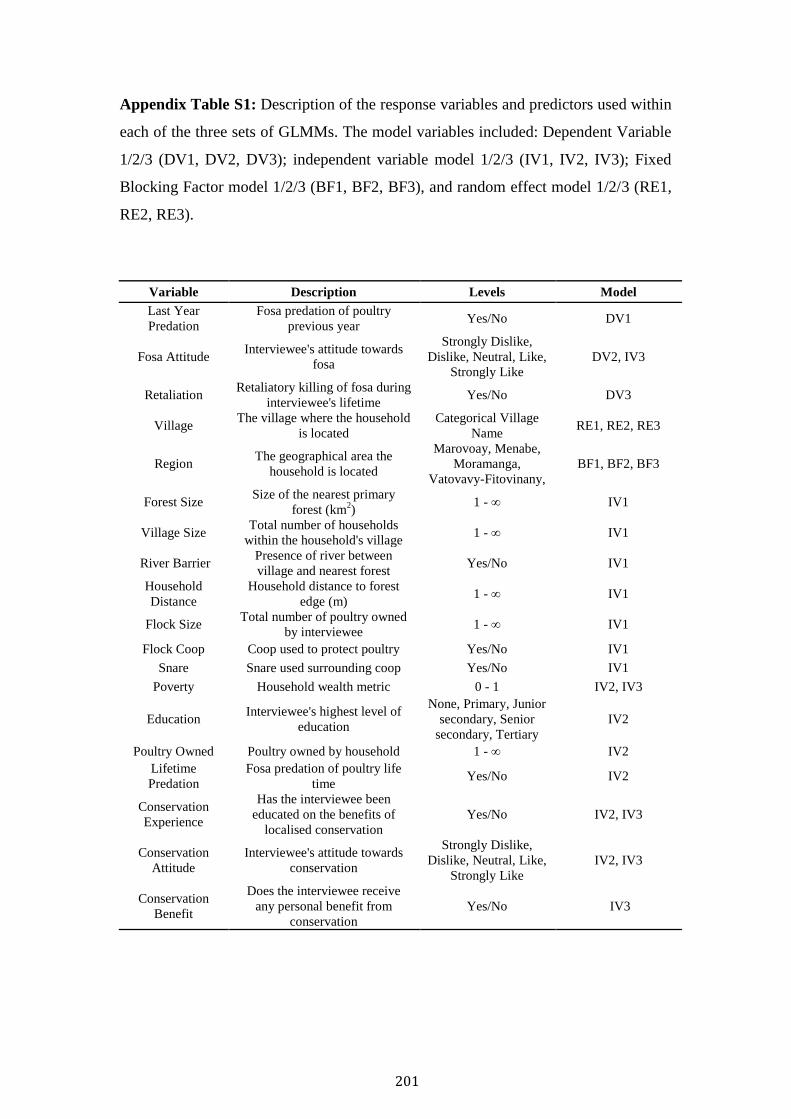
201
Appendix Table S1: Description of the response variables and predictors used within
each of the three sets of GLMMs. The model variables included: Dependent Variable
1/2/3 (DV1, DV2, DV3); independent variable model 1/2/3 (IV1, IV2, IV3); Fixed
Blocking Factor model 1/2/3 (BF1, BF2, BF3), and random effect model 1/2/3 (RE1,
RE2, RE3).
Variable Description Levels Model
Last Year
Predation
Fosa predation of poultry
previous year Yes/No DV1
Fosa Attitude Interviewee's attitude towards
fosa
Strongly Dislike,
Dislike, Neutral, Like,
Strongly Like
DV2, IV3
Retaliation Retaliatory killing of fosa during
interviewee's lifetime Yes/No DV3
Village The village where the household
is located
Categorical Village
Name RE1, RE2, RE3
Region The geographical area the
household is located
Marovoay, Menabe,
Moramanga,
Vatovavy-Fitovinany,
BF1, BF2, BF3
Forest Size Size of the nearest primary
forest (km2)
1 - ∞ IV1
Village Size Total number of households
within the household's village 1 - ∞ IV1
River Barrier Presence of river between
village and nearest forest Yes/No IV1
Household
Distance
Household distance to forest
edge (m) 1 - ∞ IV1
Flock Size Total number of poultry owned
by interviewee 1 - ∞ IV1
Flock Coop Coop used to protect poultry Yes/No IV1
Snare Snare used surrounding coop Yes/No IV1
Poverty Household wealth metric 0 - 1 IV2, IV3
Education Interviewee's highest level of
education
None, Primary, Junior
secondary, Senior
secondary, Tertiary
IV2
Poultry Owned Poultry owned by household 1 - ∞ IV2
Lifetime
Predation
Fosa predation of poultry life
time Yes/No IV2
Conservation
Experience
Has the interviewee been
educated on the benefits of
localised conservation
Yes/No IV2, IV3
Conservation
Attitude
Interviewee's attitude towards
conservation
Strongly Dislike,
Dislike, Neutral, Like,
Strongly Like
IV2, IV3
Conservation
Benefit
Does the interviewee receive
any personal benefit from
conservation
Yes/No IV3
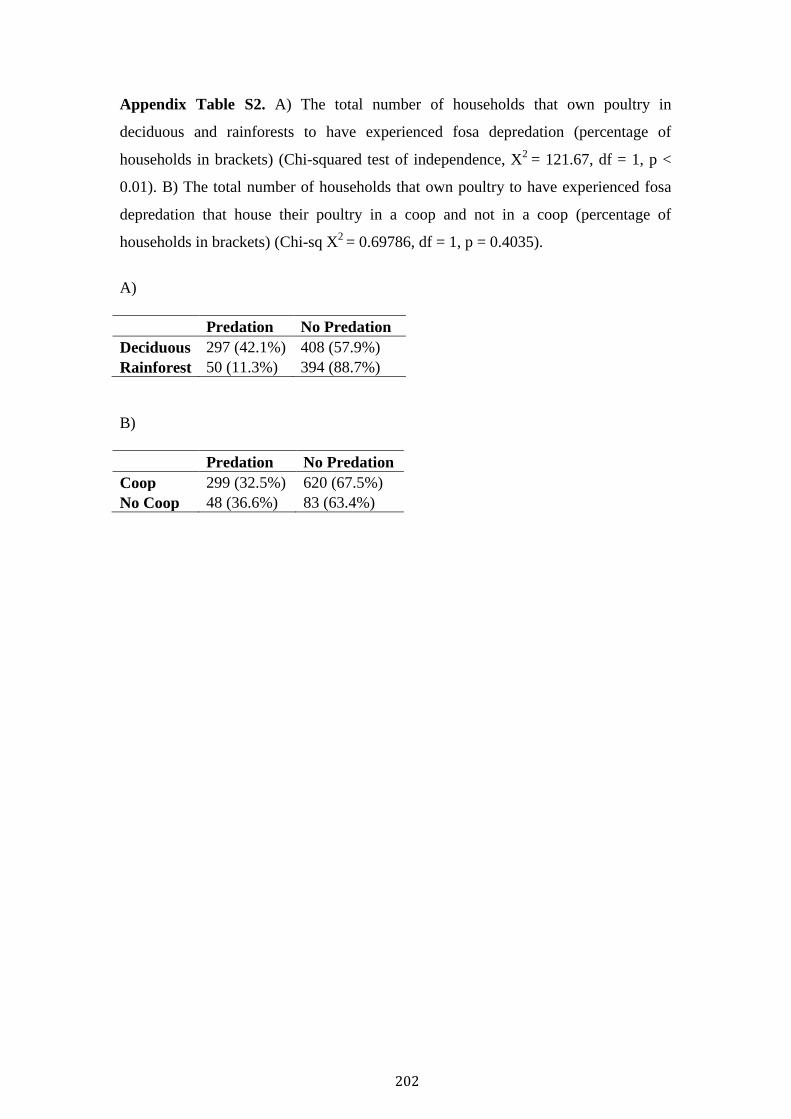
202
Appendix Table S2. A) The total number of households that own poultry in
deciduous and rainforests to have experienced fosa depredation (percentage of
households in brackets) (Chi-squared test of independence, X2
= 121.67, df = 1, p <
0.01). B) The total number of households that own poultry to have experienced fosa
depredation that house their poultry in a coop and not in a coop (percentage of
households in brackets) (Chi-sq X2
= 0.69786, df = 1, p = 0.4035).
A)
Predation No Predation
Deciduous 297 (42.1%) 408 (57.9%)
Rainforest 50 (11.3%) 394 (88.7%)
B)
Predation No Predation
Coop 299 (32.5%) 620 (67.5%)
No Coop 48 (36.6%) 83 (63.4%)
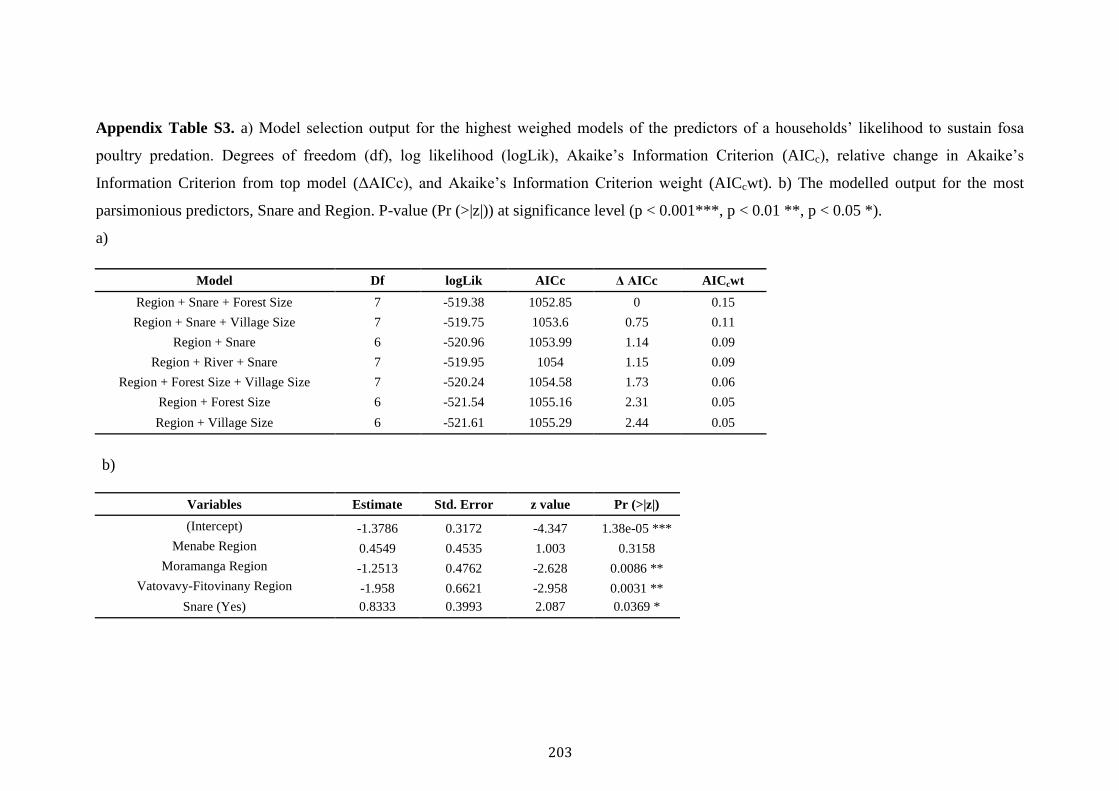
203
Appendix Table S3. a) Model selection output for the highest weighed models of the predictors of a households’ likelihood to sustain fosa
poultry predation. Degrees of freedom (df), log likelihood (logLik), Akaike’s Information Criterion (AICc), relative change in Akaike’s
Information Criterion from top model (ΔAICc), and Akaike’s Information Criterion weight (AICcwt). b) The modelled output for the most
parsimonious predictors, Snare and Region. P-value (Pr (>|z|)) at significance level (p < 0.001***, p < 0.01 **, p < 0.05 *).
a)
Model Df logLik AICc Δ AICc AICcwt
Region + Snare + Forest Size 7 -519.38 1052.85 0 0.15
Region + Snare + Village Size 7 -519.75 1053.6 0.75 0.11
Region + Snare 6 -520.96 1053.99 1.14 0.09
Region + River + Snare 7 -519.95 1054 1.15 0.09
Region + Forest Size + Village Size 7 -520.24 1054.58 1.73 0.06
Region + Forest Size 6 -521.54 1055.16 2.31 0.05
Region + Village Size 6 -521.61 1055.29 2.44 0.05
b)
Variables Estimate Std. Error z value Pr (>|z|)
(Intercept) -1.3786 0.3172 -4.347 1.38e-05 ***
Menabe Region 0.4549 0.4535 1.003 0.3158
Moramanga Region -1.2513 0.4762 -2.628 0.0086 **
Vatovavy-Fitovinany Region -1.958 0.6621 -2.958 0.0031 **
Snare (Yes) 0.8333 0.3993 2.087 0.0369 *
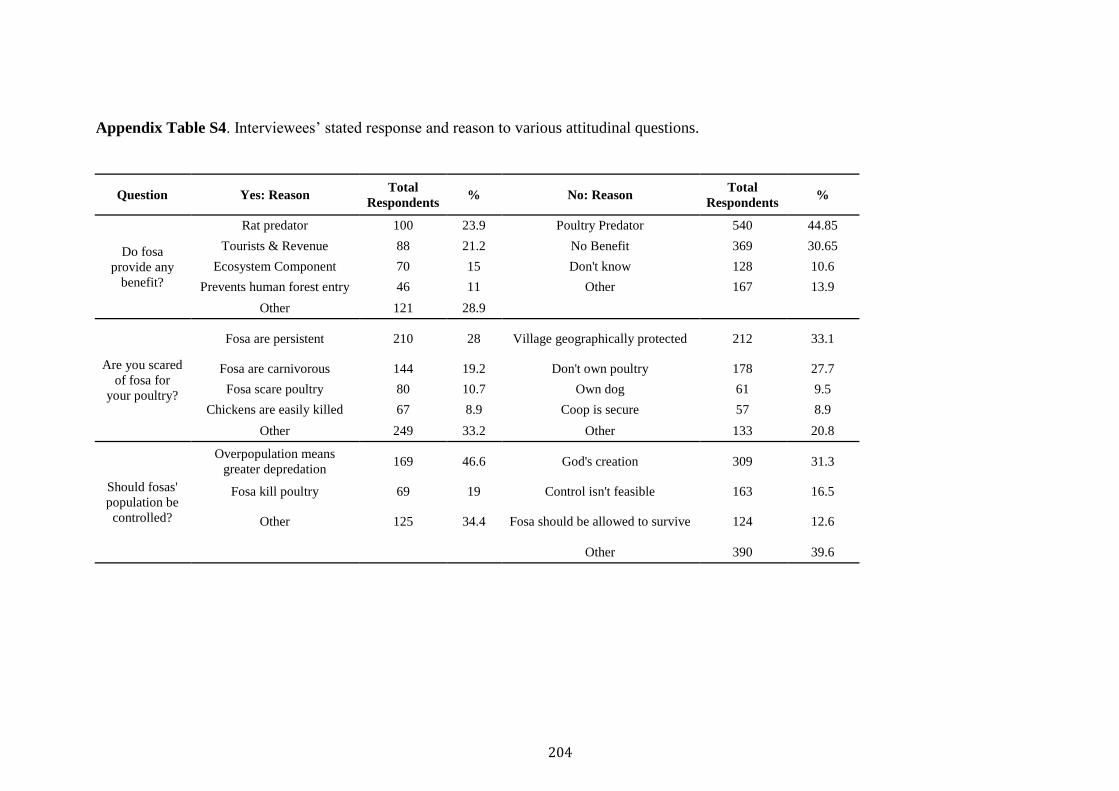
204
Appendix Table S4. Interviewees’ stated response and reason to various attitudinal questions.
Question Yes: Reason Total
Respondents % No: Reason
Total
Respondents %
Do fosa
provide any
benefit?
Rat predator 100 23.9 Poultry Predator 540 44.85
Tourists & Revenue 88 21.2 No Benefit 369 30.65
Ecosystem Component 70 15 Don't know 128 10.6
Prevents human forest entry 46 11 Other 167 13.9
Other 121 28.9
Are you scared
of fosa for
your poultry?
Fosa are persistent 210 28 Village geographically protected 212 33.1
Fosa are carnivorous 144 19.2 Don't own poultry 178 27.7
Fosa scare poultry 80 10.7 Own dog 61 9.5
Chickens are easily killed 67 8.9 Coop is secure 57 8.9
Other 249 33.2 Other 133 20.8
Should fosas'
population be
controlled?
Overpopulation means
greater depredation 169 46.6 God's creation 309 31.3
Fosa kill poultry 69 19 Control isn't feasible 163 16.5
Other 125 34.4 Fosa should be allowed to survive 124 12.6
Other 390 39.6
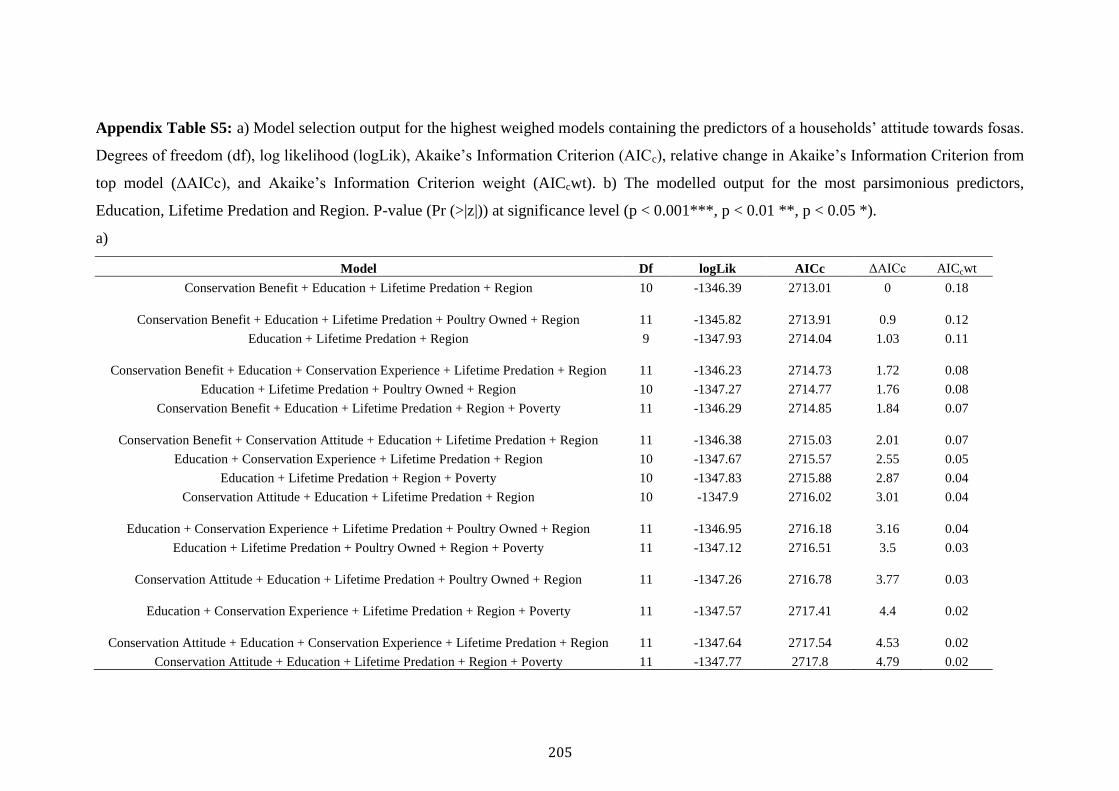
205
Appendix Table S5: a) Model selection output for the highest weighed models containing the predictors of a households’ attitude towards fosas.
Degrees of freedom (df), log likelihood (logLik), Akaike’s Information Criterion (AICc), relative change in Akaike’s Information Criterion from
top model (ΔAICc), and Akaike’s Information Criterion weight (AICcwt). b) The modelled output for the most parsimonious predictors,
Education, Lifetime Predation and Region. P-value (Pr (>|z|)) at significance level (p < 0.001***, p < 0.01 **, p < 0.05 *).
a)
Model Df logLik AICc ΔAICc AICcwt
Conservation Benefit + Education + Lifetime Predation + Region 10 -1346.39 2713.01 0 0.18
Conservation Benefit + Education + Lifetime Predation + Poultry Owned + Region 11 -1345.82 2713.91 0.9 0.12
Education + Lifetime Predation + Region 9 -1347.93 2714.04 1.03 0.11
Conservation Benefit + Education + Conservation Experience + Lifetime Predation + Region 11 -1346.23 2714.73 1.72 0.08
Education + Lifetime Predation + Poultry Owned + Region 10 -1347.27 2714.77 1.76 0.08
Conservation Benefit + Education + Lifetime Predation + Region + Poverty 11 -1346.29 2714.85 1.84 0.07
Conservation Benefit + Conservation Attitude + Education + Lifetime Predation + Region 11 -1346.38 2715.03 2.01 0.07
Education + Conservation Experience + Lifetime Predation + Region 10 -1347.67 2715.57 2.55 0.05
Education + Lifetime Predation + Region + Poverty 10 -1347.83 2715.88 2.87 0.04
Conservation Attitude + Education + Lifetime Predation + Region 10 -1347.9 2716.02 3.01 0.04
Education + Conservation Experience + Lifetime Predation + Poultry Owned + Region 11 -1346.95 2716.18 3.16 0.04
Education + Lifetime Predation + Poultry Owned + Region + Poverty 11 -1347.12 2716.51 3.5 0.03
Conservation Attitude + Education + Lifetime Predation + Poultry Owned + Region 11 -1347.26 2716.78 3.77 0.03
Education + Conservation Experience + Lifetime Predation + Region + Poverty 11 -1347.57 2717.41 4.4 0.02
Conservation Attitude + Education + Conservation Experience + Lifetime Predation + Region 11 -1347.64 2717.54 4.53 0.02
Conservation Attitude + Education + Lifetime Predation + Region + Poverty 11 -1347.77 2717.8 4.79 0.02
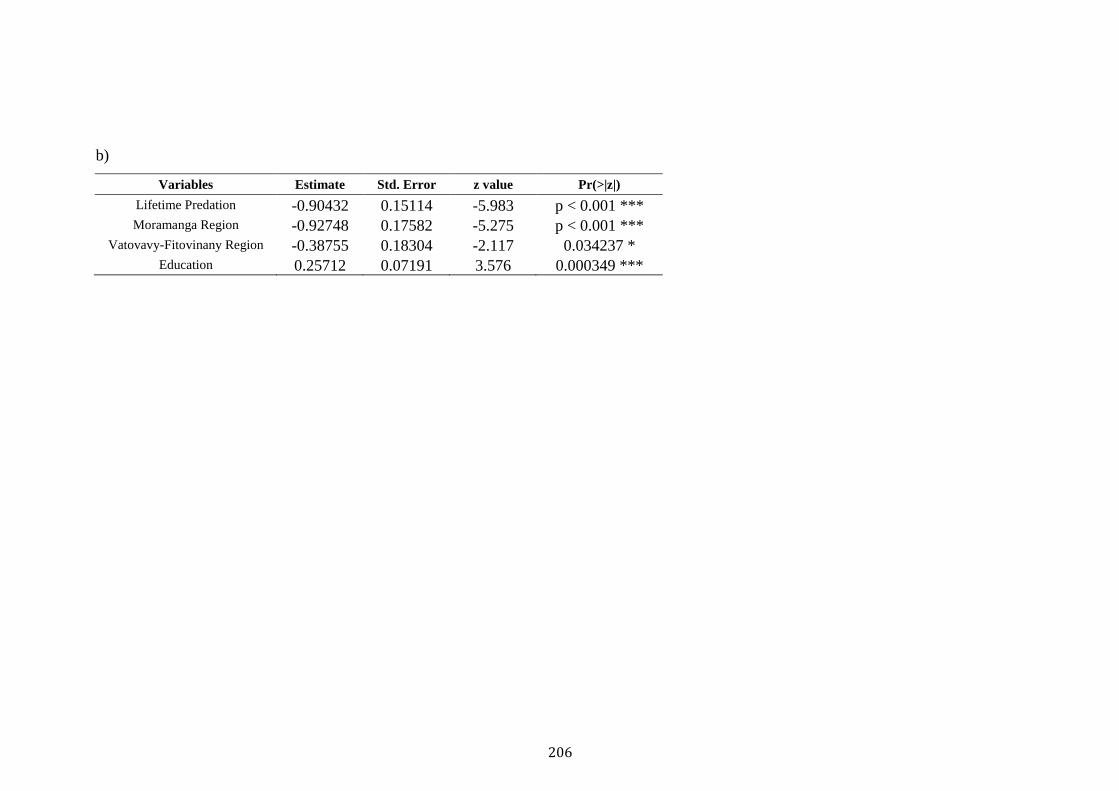
206
b)
Variables Estimate Std. Error z value Pr(>|z|)
Lifetime Predation -0.90432 0.15114 -5.983 p < 0.001 ***
Moramanga Region -0.92748 0.17582 -5.275 p < 0.001 ***
Vatovavy-Fitovinany Region -0.38755 0.18304 -2.117 0.034237 *
Education 0.25712 0.07191 3.576 0.000349 ***
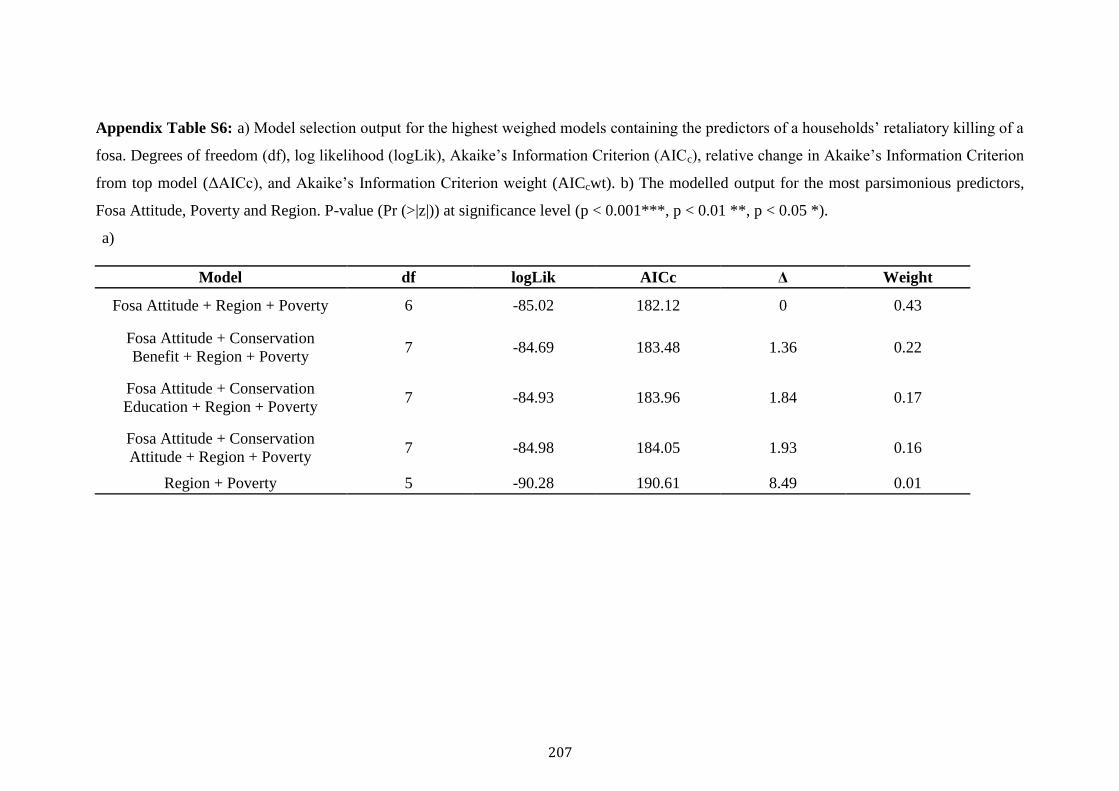
207
Appendix Table S6: a) Model selection output for the highest weighed models containing the predictors of a households’ retaliatory killing of a
fosa. Degrees of freedom (df), log likelihood (logLik), Akaike’s Information Criterion (AICc), relative change in Akaike’s Information Criterion
from top model (ΔAICc), and Akaike’s Information Criterion weight (AICcwt). b) The modelled output for the most parsimonious predictors,
Fosa Attitude, Poverty and Region. P-value (Pr (>|z|)) at significance level (p < 0.001***, p < 0.01 **, p < 0.05 *).
a)
Model df logLik AICc Δ Weight
Fosa Attitude + Region + Poverty 6 -85.02 182.12 0 0.43
Fosa Attitude + Conservation
Benefit + Region + Poverty 7 -84.69 183.48 1.36 0.22
Fosa Attitude + Conservation
Education + Region + Poverty 7 -84.93 183.96 1.84 0.17
Fosa Attitude + Conservation
Attitude + Region + Poverty 7 -84.98 184.05 1.93 0.16
Region + Poverty 5 -90.28 190.61 8.49 0.01
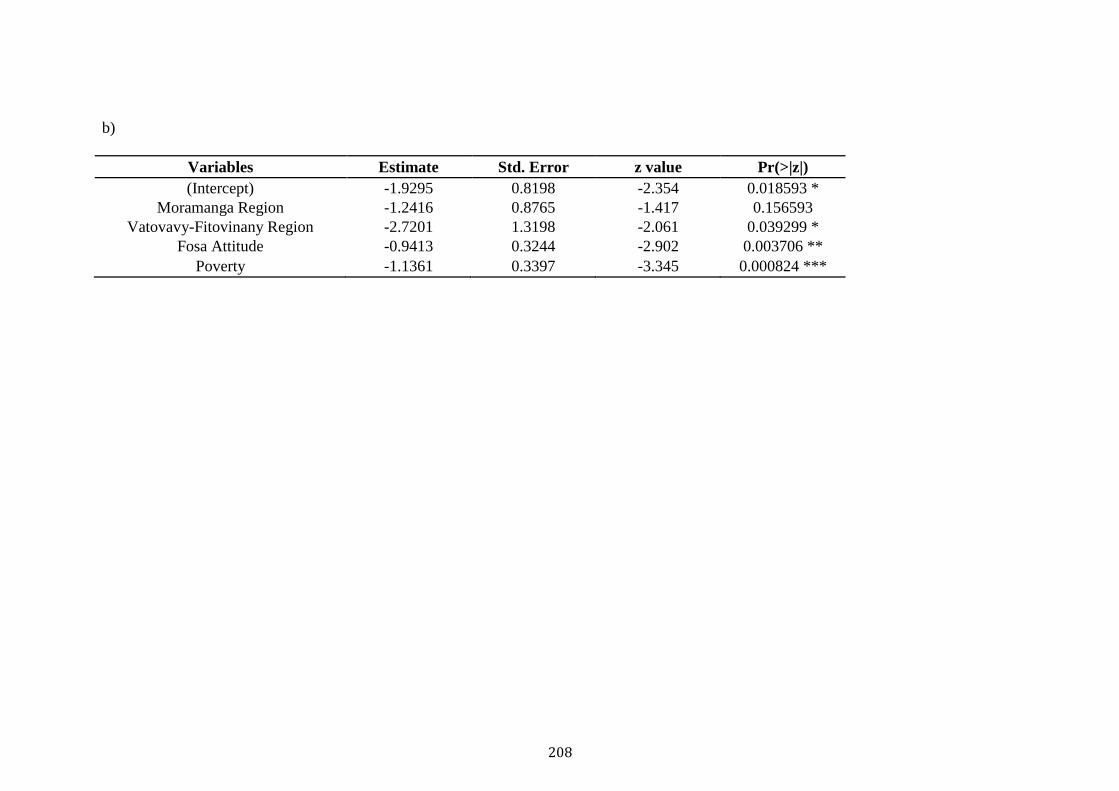
208
b)
Variables Estimate Std. Error z value Pr(>|z|)
(Intercept) -1.9295 0.8198 -2.354 0.018593 *
Moramanga Region -1.2416 0.8765 -1.417 0.156593
Vatovavy-Fitovinany Region -2.7201 1.3198 -2.061 0.039299 *
Fosa Attitude -0.9413 0.3244 -2.902 0.003706 **
Poverty -1.1361 0.3397 -3.345 0.000824 ***

209
Chapter Six
Thesis Discussion
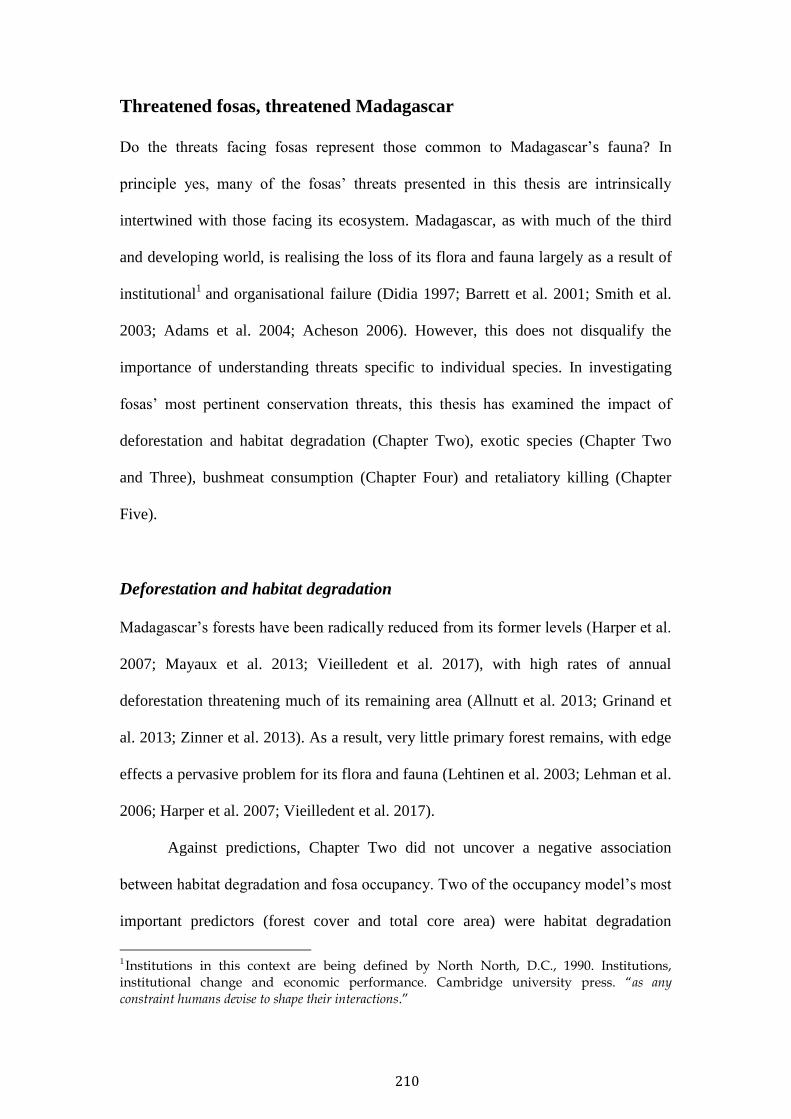
210
Threatened fosas, threatened Madagascar
Do the threats facing fosas represent those common to Madagascar’s fauna? In
principle yes, many of the fosas’ threats presented in this thesis are intrinsically
intertwined with those facing its ecosystem. Madagascar, as with much of the third
and developing world, is realising the loss of its flora and fauna largely as a result of
institutional1 and organisational failure (Didia 1997; Barrett et al. 2001; Smith et al.
2003; Adams et al. 2004; Acheson 2006). However, this does not disqualify the
importance of understanding threats specific to individual species. In investigating
fosas’ most pertinent conservation threats, this thesis has examined the impact of
deforestation and habitat degradation (Chapter Two), exotic species (Chapter Two
and Three), bushmeat consumption (Chapter Four) and retaliatory killing (Chapter
Five).
Deforestation and habitat degradation
Madagascar’s forests have been radically reduced from its former levels (Harper et al.
2007; Mayaux et al. 2013; Vieilledent et al. 2017), with high rates of annual
deforestation threatening much of its remaining area (Allnutt et al. 2013; Grinand et
al. 2013; Zinner et al. 2013). As a result, very little primary forest remains, with edge
effects a pervasive problem for its flora and fauna (Lehtinen et al. 2003; Lehman et al.
2006; Harper et al. 2007; Vieilledent et al. 2017).
Against predictions, Chapter Two did not uncover a negative association
between habitat degradation and fosa occupancy. Two of the occupancy model’s most
important predictors (forest cover and total core area) were habitat degradation
1Institutions in this context are being defined by North North, D.C., 1990. Institutions, institutional change and economic performance. Cambridge university press. “as any constraint humans devise to shape their interactions.”
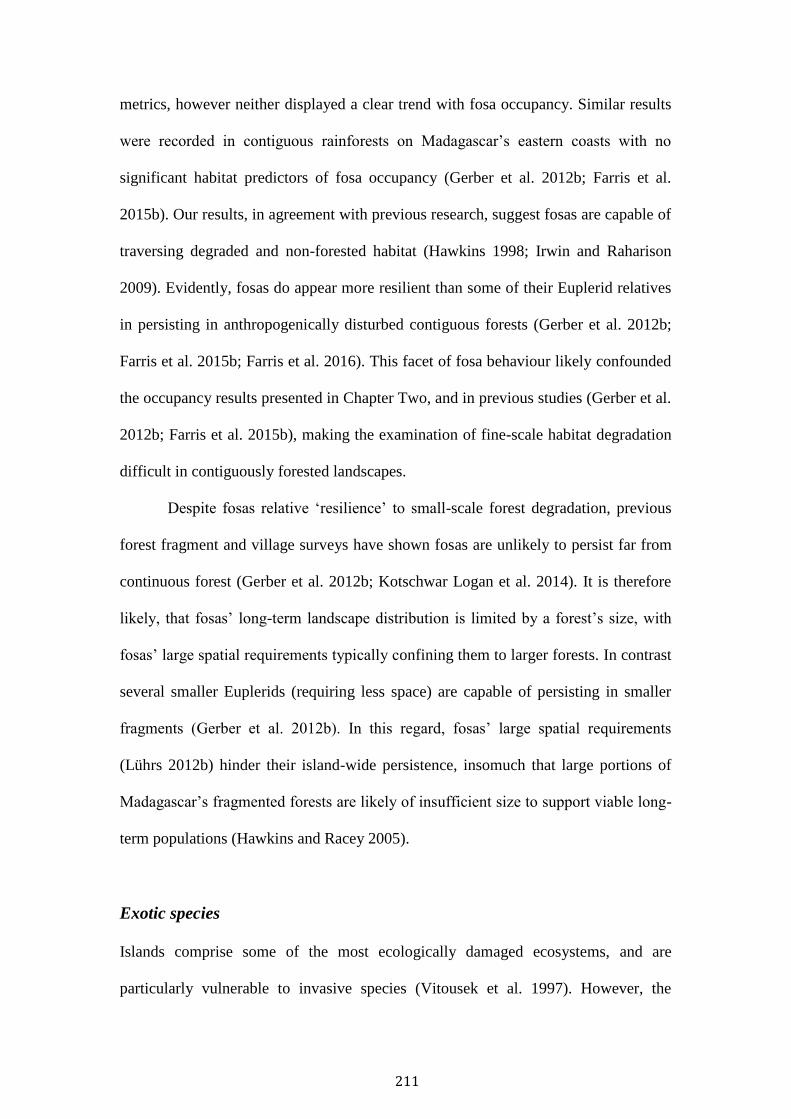
211
metrics, however neither displayed a clear trend with fosa occupancy. Similar results
were recorded in contiguous rainforests on Madagascar’s eastern coasts with no
significant habitat predictors of fosa occupancy (Gerber et al. 2012b; Farris et al.
2015b). Our results, in agreement with previous research, suggest fosas are capable of
traversing degraded and non-forested habitat (Hawkins 1998; Irwin and Raharison
2009). Evidently, fosas do appear more resilient than some of their Euplerid relatives
in persisting in anthropogenically disturbed contiguous forests (Gerber et al. 2012b;
Farris et al. 2015b; Farris et al. 2016). This facet of fosa behaviour likely confounded
the occupancy results presented in Chapter Two, and in previous studies (Gerber et al.
2012b; Farris et al. 2015b), making the examination of fine-scale habitat degradation
difficult in contiguously forested landscapes.
Despite fosas relative ‘resilience’ to small-scale forest degradation, previous
forest fragment and village surveys have shown fosas are unlikely to persist far from
continuous forest (Gerber et al. 2012b; Kotschwar Logan et al. 2014). It is therefore
likely, that fosas’ long-term landscape distribution is limited by a forest’s size, with
fosas’ large spatial requirements typically confining them to larger forests. In contrast
several smaller Euplerids (requiring less space) are capable of persisting in smaller
fragments (Gerber et al. 2012b). In this regard, fosas’ large spatial requirements
(Lührs 2012b) hinder their island-wide persistence, insomuch that large portions of
Madagascar’s fragmented forests are likely of insufficient size to support viable long-
term populations (Hawkins and Racey 2005).
Exotic species
Islands comprise some of the most ecologically damaged ecosystems, and are
particularly vulnerable to invasive species (Vitousek et al. 1997). However, the
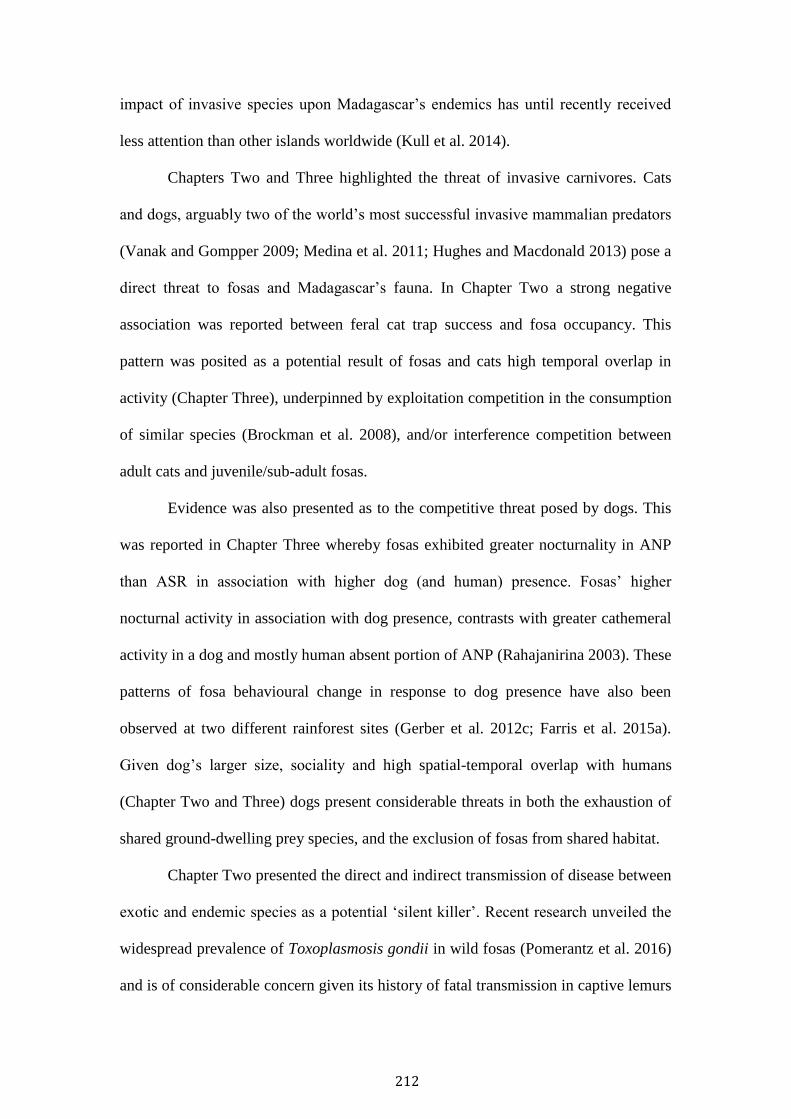
212
impact of invasive species upon Madagascar’s endemics has until recently received
less attention than other islands worldwide (Kull et al. 2014).
Chapters Two and Three highlighted the threat of invasive carnivores. Cats
and dogs, arguably two of the world’s most successful invasive mammalian predators
(Vanak and Gompper 2009; Medina et al. 2011; Hughes and Macdonald 2013) pose a
direct threat to fosas and Madagascar’s fauna. In Chapter Two a strong negative
association was reported between feral cat trap success and fosa occupancy. This
pattern was posited as a potential result of fosas and cats high temporal overlap in
activity (Chapter Three), underpinned by exploitation competition in the consumption
of similar species (Brockman et al. 2008), and/or interference competition between
adult cats and juvenile/sub-adult fosas.
Evidence was also presented as to the competitive threat posed by dogs. This
was reported in Chapter Three whereby fosas exhibited greater nocturnality in ANP
than ASR in association with higher dog (and human) presence. Fosas’ higher
nocturnal activity in association with dog presence, contrasts with greater cathemeral
activity in a dog and mostly human absent portion of ANP (Rahajanirina 2003). These
patterns of fosa behavioural change in response to dog presence have also been
observed at two different rainforest sites (Gerber et al. 2012c; Farris et al. 2015a).
Given dog’s larger size, sociality and high spatial-temporal overlap with humans
(Chapter Two and Three) dogs present considerable threats in both the exhaustion of
shared ground-dwelling prey species, and the exclusion of fosas from shared habitat.
Chapter Two presented the direct and indirect transmission of disease between
exotic and endemic species as a potential ‘silent killer’. Recent research unveiled the
widespread prevalence of Toxoplasmosis gondii in wild fosas (Pomerantz et al. 2016)
and is of considerable concern given its history of fatal transmission in captive lemurs
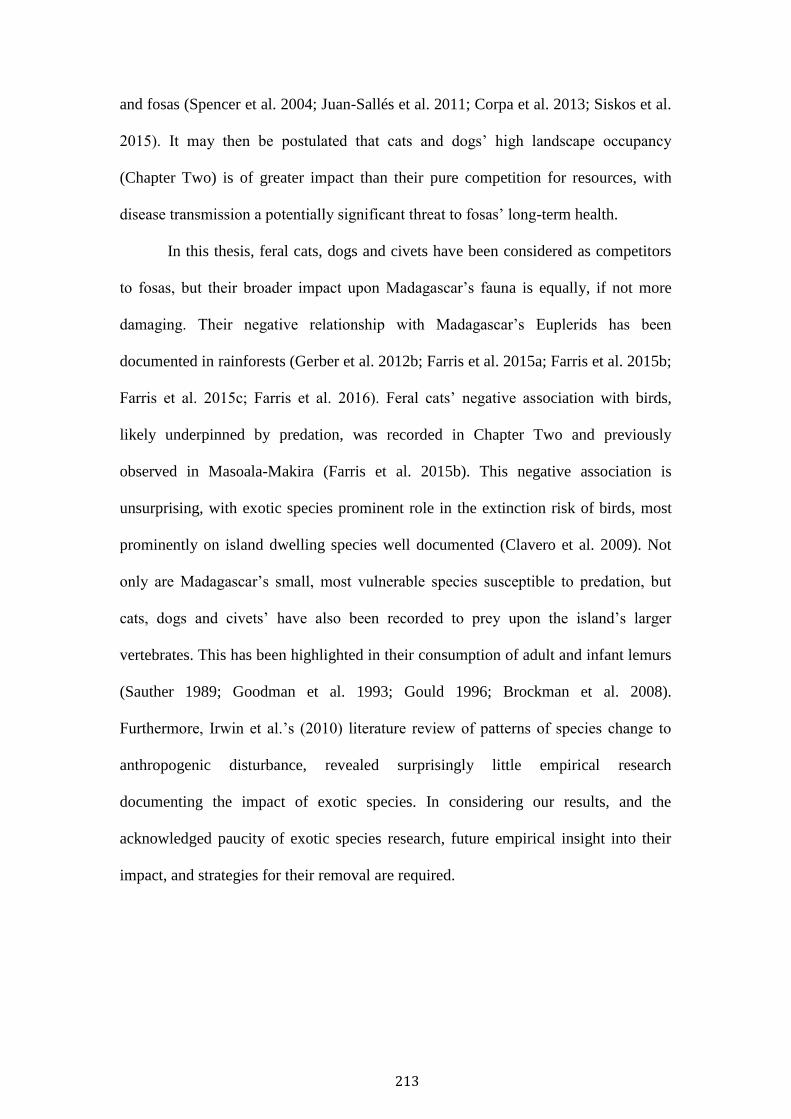
213
and fosas (Spencer et al. 2004; Juan-Sallés et al. 2011; Corpa et al. 2013; Siskos et al.
2015). It may then be postulated that cats and dogs’ high landscape occupancy
(Chapter Two) is of greater impact than their pure competition for resources, with
disease transmission a potentially significant threat to fosas’ long-term health.
In this thesis, feral cats, dogs and civets have been considered as competitors
to fosas, but their broader impact upon Madagascar’s fauna is equally, if not more
damaging. Their negative relationship with Madagascar’s Euplerids has been
documented in rainforests (Gerber et al. 2012b; Farris et al. 2015a; Farris et al. 2015b;
Farris et al. 2015c; Farris et al. 2016). Feral cats’ negative association with birds,
likely underpinned by predation, was recorded in Chapter Two and previously
observed in Masoala-Makira (Farris et al. 2015b). This negative association is
unsurprising, with exotic species prominent role in the extinction risk of birds, most
prominently on island dwelling species well documented (Clavero et al. 2009). Not
only are Madagascar’s small, most vulnerable species susceptible to predation, but
cats, dogs and civets’ have also been recorded to prey upon the island’s larger
vertebrates. This has been highlighted in their consumption of adult and infant lemurs
(Sauther 1989; Goodman et al. 1993; Gould 1996; Brockman et al. 2008).
Furthermore, Irwin et al.’s (2010) literature review of patterns of species change to
anthropogenic disturbance, revealed surprisingly little empirical research
documenting the impact of exotic species. In considering our results, and the
acknowledged paucity of exotic species research, future empirical insight into their
impact, and strategies for their removal are required.

214
Bushmeat consumption
Chapter Four examined the drivers, variance and impact of bushmeat consumption on
Madagascar’s wild species, including fish and eel that are both caught wild and
aquaculture reared. Domestic animals were the most highly preferred meat whilst,
whilst fish and eel were preferred over bushpig and tenrec, the other most highly
preferred wild (and legally huntable) species. Malagasy species protection laws offer
legal protection (Rakotoarivelo et al. 2011), with species classified as: strictly
protected species (Category 1 Class 1); protected species with hunting permitted
under authorisation (Category 1 Class 2); pest species allowing unrestricted hunting
(Category 2); and game species which are permissibly hunted under licence (Category
3). Most Category 1 Class 1 protected and endangered species, such as lemurs and
Euplerids were the least favoured meat. Consumption of wild species was principally
driven by wealth, with poorer households more likely to consume greater quantities of
protected species, whilst wealthier households were more likely to consume fish and
eel. These collective results suggest that there is little desire to consume most wild
species, with poorer households unable to afford domestic or highly preferred game
(tenrecs) and unprotected species (fish, eel, bushpig). The lack of preference for wild
species has been reported previously (Randrianandrianina et al. 2010; Jenkins et al.
2011) with poverty considered a major driver of protected species consumption
(Jenkins et al. 2011; Borgerson et al. 2016; Reuter et al. 2016).
In considering our results within Madagascar’s socio-economic and political
context, much of its most vulnerable fauna is facing an extremely threatened future.
The country’s rapidly growing population, one of the highest in Africa, is also one of
the poorest. Food security is of significant concern, with Madagascar exhibiting the
fourth highest rates chronic malnutrition, with half of its children suffering from
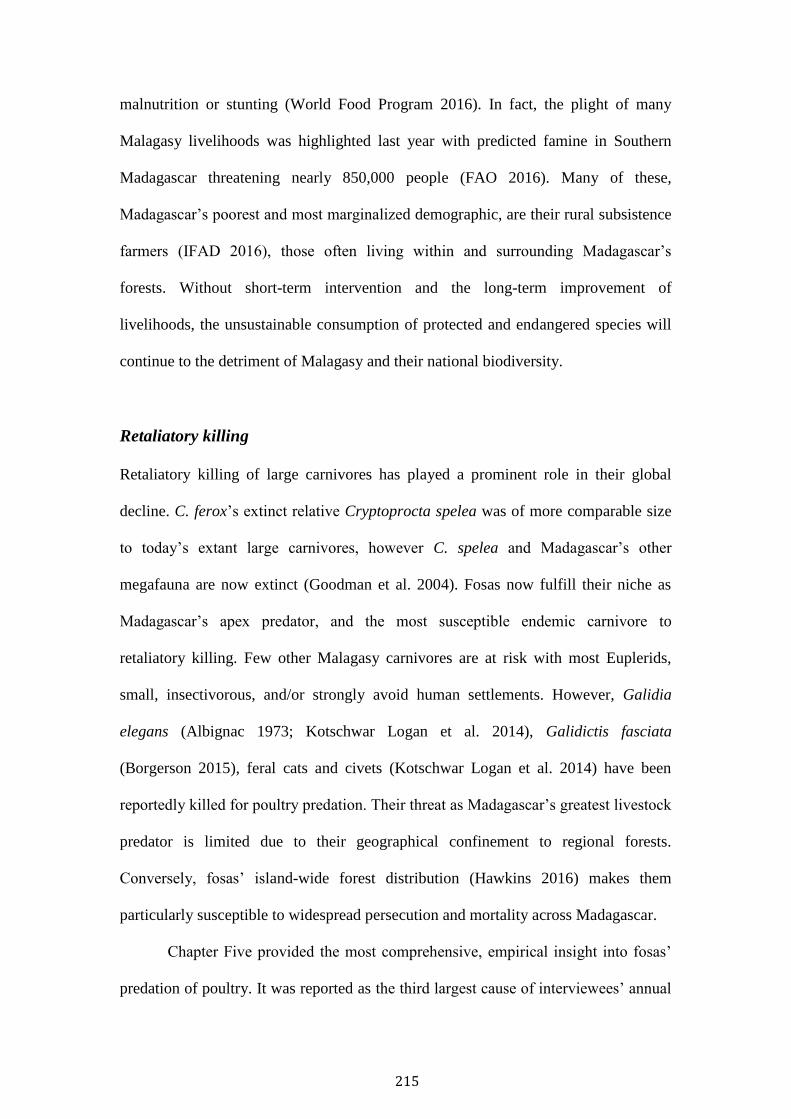
215
malnutrition or stunting (World Food Program 2016). In fact, the plight of many
Malagasy livelihoods was highlighted last year with predicted famine in Southern
Madagascar threatening nearly 850,000 people (FAO 2016). Many of these,
Madagascar’s poorest and most marginalized demographic, are their rural subsistence
farmers (IFAD 2016), those often living within and surrounding Madagascar’s
forests. Without short-term intervention and the long-term improvement of
livelihoods, the unsustainable consumption of protected and endangered species will
continue to the detriment of Malagasy and their national biodiversity.
Retaliatory killing
Retaliatory killing of large carnivores has played a prominent role in their global
decline. C. ferox’s extinct relative Cryptoprocta spelea was of more comparable size
to today’s extant large carnivores, however C. spelea and Madagascar’s other
megafauna are now extinct (Goodman et al. 2004). Fosas now fulfill their niche as
Madagascar’s apex predator, and the most susceptible endemic carnivore to
retaliatory killing. Few other Malagasy carnivores are at risk with most Euplerids,
small, insectivorous, and/or strongly avoid human settlements. However, Galidia
elegans (Albignac 1973; Kotschwar Logan et al. 2014), Galidictis fasciata
(Borgerson 2015), feral cats and civets (Kotschwar Logan et al. 2014) have been
reportedly killed for poultry predation. Their threat as Madagascar’s greatest livestock
predator is limited due to their geographical confinement to regional forests.
Conversely, fosas’ island-wide forest distribution (Hawkins 2016) makes them
particularly susceptible to widespread persecution and mortality across Madagascar.
Chapter Five provided the most comprehensive, empirical insight into fosas’
predation of poultry. It was reported as the third largest cause of interviewees’ annual
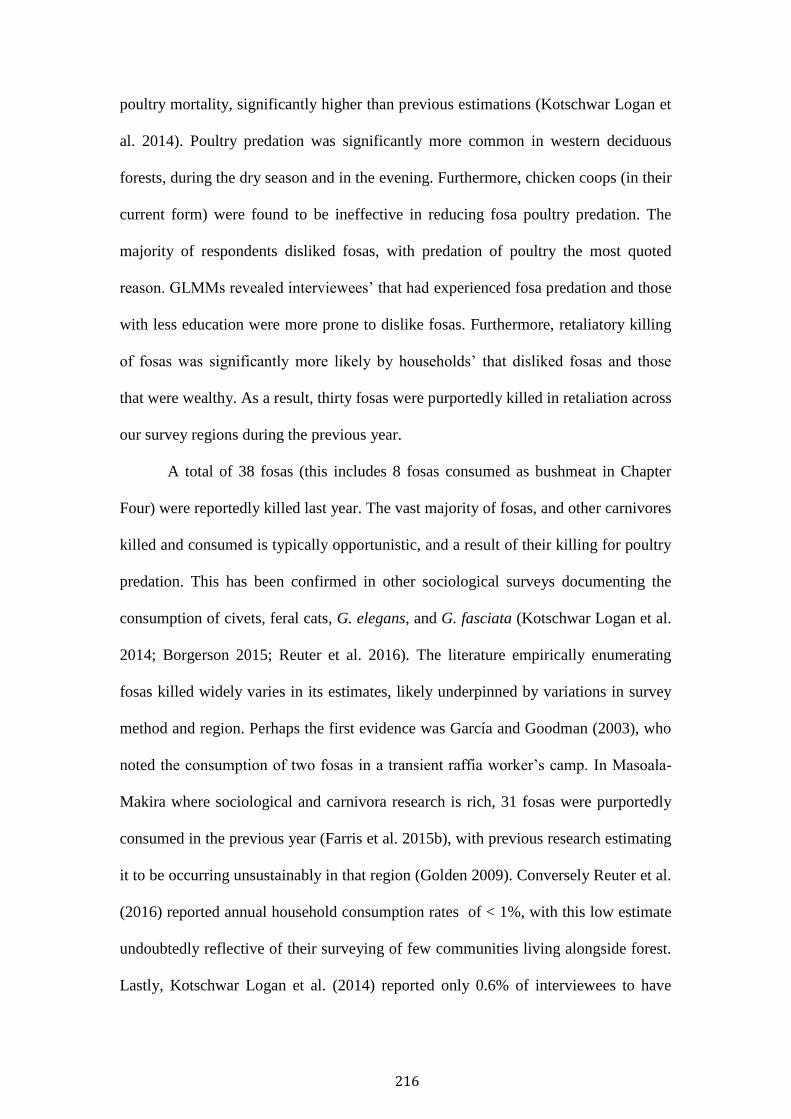
216
poultry mortality, significantly higher than previous estimations (Kotschwar Logan et
al. 2014). Poultry predation was significantly more common in western deciduous
forests, during the dry season and in the evening. Furthermore, chicken coops (in their
current form) were found to be ineffective in reducing fosa poultry predation. The
majority of respondents disliked fosas, with predation of poultry the most quoted
reason. GLMMs revealed interviewees’ that had experienced fosa predation and those
with less education were more prone to dislike fosas. Furthermore, retaliatory killing
of fosas was significantly more likely by households’ that disliked fosas and those
that were wealthy. As a result, thirty fosas were purportedly killed in retaliation across
our survey regions during the previous year.
A total of 38 fosas (this includes 8 fosas consumed as bushmeat in Chapter
Four) were reportedly killed last year. The vast majority of fosas, and other carnivores
killed and consumed is typically opportunistic, and a result of their killing for poultry
predation. This has been confirmed in other sociological surveys documenting the
consumption of civets, feral cats, G. elegans, and G. fasciata (Kotschwar Logan et al.
2014; Borgerson 2015; Reuter et al. 2016). The literature empirically enumerating
fosas killed widely varies in its estimates, likely underpinned by variations in survey
method and region. Perhaps the first evidence was García and Goodman (2003), who
noted the consumption of two fosas in a transient raffia worker’s camp. In Masoala-
Makira where sociological and carnivora research is rich, 31 fosas were purportedly
consumed in the previous year (Farris et al. 2015b), with previous research estimating
it to be occurring unsustainably in that region (Golden 2009). Conversely Reuter et al.
(2016) reported annual household consumption rates of < 1%, with this low estimate
undoubtedly reflective of their surveying of few communities living alongside forest.
Lastly, Kotschwar Logan et al. (2014) reported only 0.6% of interviewees to have
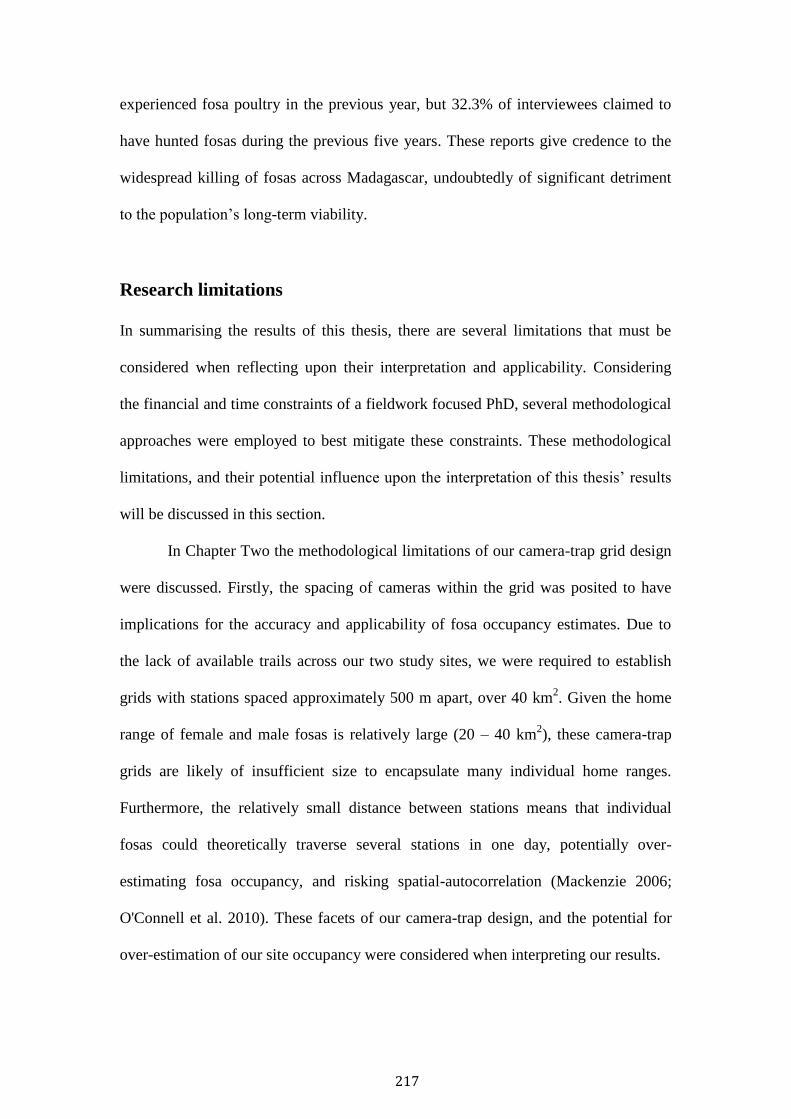
217
experienced fosa poultry in the previous year, but 32.3% of interviewees claimed to
have hunted fosas during the previous five years. These reports give credence to the
widespread killing of fosas across Madagascar, undoubtedly of significant detriment
to the population’s long-term viability.
Research limitations
In summarising the results of this thesis, there are several limitations that must be
considered when reflecting upon their interpretation and applicability. Considering
the financial and time constraints of a fieldwork focused PhD, several methodological
approaches were employed to best mitigate these constraints. These methodological
limitations, and their potential influence upon the interpretation of this thesis’ results
will be discussed in this section.
In Chapter Two the methodological limitations of our camera-trap grid design
were discussed. Firstly, the spacing of cameras within the grid was posited to have
implications for the accuracy and applicability of fosa occupancy estimates. Due to
the lack of available trails across our two study sites, we were required to establish
grids with stations spaced approximately 500 m apart, over 40 km2. Given the home
range of female and male fosas is relatively large (20 – 40 km2), these camera-trap
grids are likely of insufficient size to encapsulate many individual home ranges.
Furthermore, the relatively small distance between stations means that individual
fosas could theoretically traverse several stations in one day, potentially over-
estimating fosa occupancy, and risking spatial-autocorrelation (Mackenzie 2006;
O'Connell et al. 2010). These facets of our camera-trap design, and the potential for
over-estimation of our site occupancy were considered when interpreting our results.
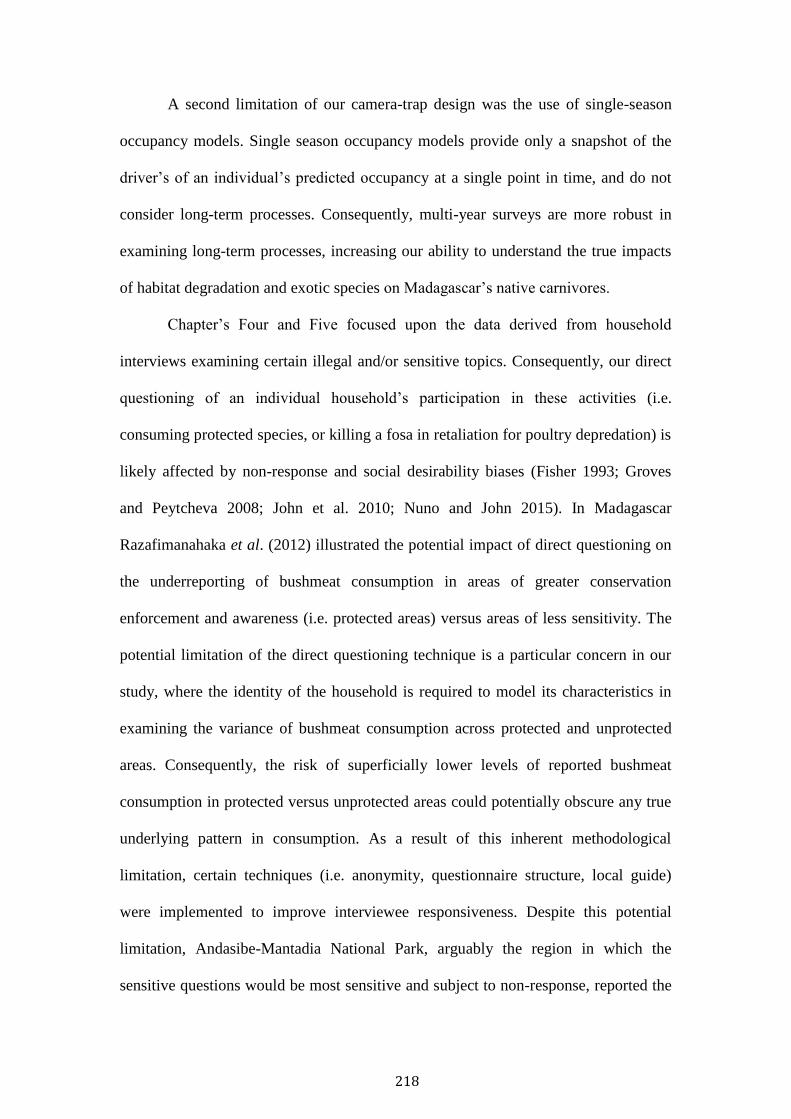
218
A second limitation of our camera-trap design was the use of single-season
occupancy models. Single season occupancy models provide only a snapshot of the
driver’s of an individual’s predicted occupancy at a single point in time, and do not
consider long-term processes. Consequently, multi-year surveys are more robust in
examining long-term processes, increasing our ability to understand the true impacts
of habitat degradation and exotic species on Madagascar’s native carnivores.
Chapter’s Four and Five focused upon the data derived from household
interviews examining certain illegal and/or sensitive topics. Consequently, our direct
questioning of an individual household’s participation in these activities (i.e.
consuming protected species, or killing a fosa in retaliation for poultry depredation) is
likely affected by non-response and social desirability biases (Fisher 1993; Groves
and Peytcheva 2008; John et al. 2010; Nuno and John 2015). In Madagascar
Razafimanahaka et al. (2012) illustrated the potential impact of direct questioning on
the underreporting of bushmeat consumption in areas of greater conservation
enforcement and awareness (i.e. protected areas) versus areas of less sensitivity. The
potential limitation of the direct questioning technique is a particular concern in our
study, where the identity of the household is required to model its characteristics in
examining the variance of bushmeat consumption across protected and unprotected
areas. Consequently, the risk of superficially lower levels of reported bushmeat
consumption in protected versus unprotected areas could potentially obscure any true
underlying pattern in consumption. As a result of this inherent methodological
limitation, certain techniques (i.e. anonymity, questionnaire structure, local guide)
were implemented to improve interviewee responsiveness. Despite this potential
limitation, Andasibe-Mantadia National Park, arguably the region in which the
sensitive questions would be most sensitive and subject to non-response, reported the
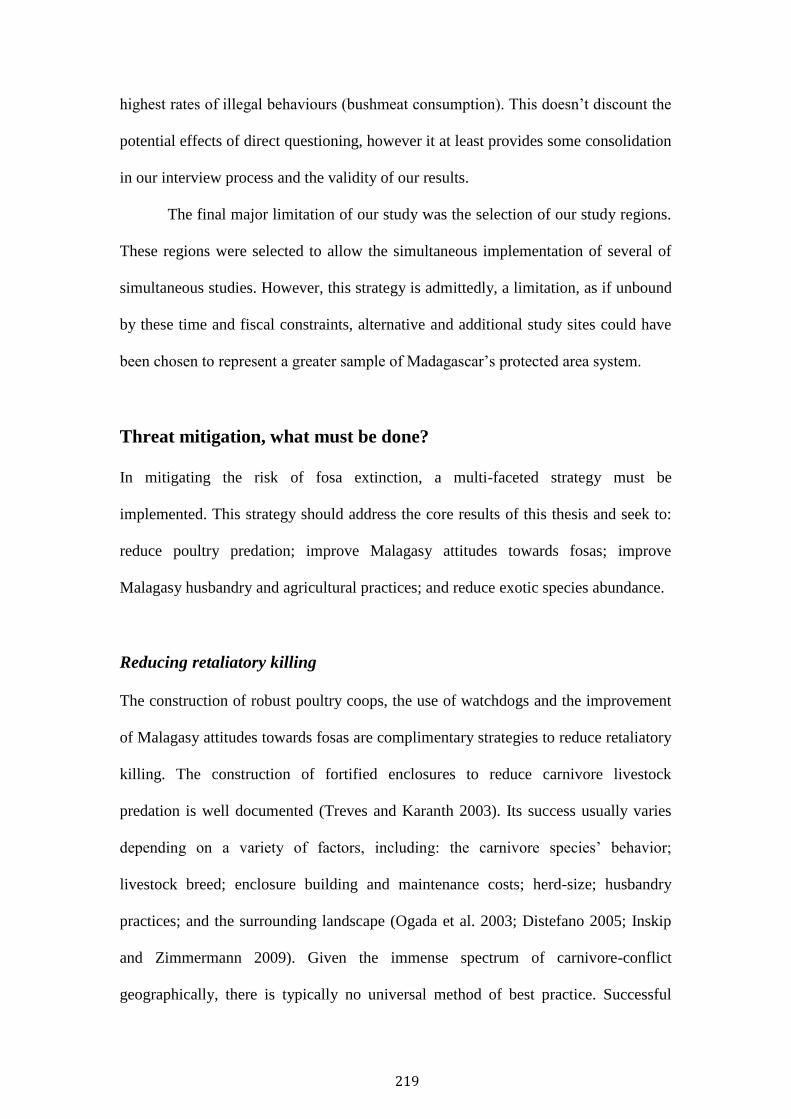
219
highest rates of illegal behaviours (bushmeat consumption). This doesn’t discount the
potential effects of direct questioning, however it at least provides some consolidation
in our interview process and the validity of our results.
The final major limitation of our study was the selection of our study regions.
These regions were selected to allow the simultaneous implementation of several of
simultaneous studies. However, this strategy is admittedly, a limitation, as if unbound
by these time and fiscal constraints, alternative and additional study sites could have
been chosen to represent a greater sample of Madagascar’s protected area system.
Threat mitigation, what must be done?
In mitigating the risk of fosa extinction, a multi-faceted strategy must be
implemented. This strategy should address the core results of this thesis and seek to:
reduce poultry predation; improve Malagasy attitudes towards fosas; improve
Malagasy husbandry and agricultural practices; and reduce exotic species abundance.
Reducing retaliatory killing
The construction of robust poultry coops, the use of watchdogs and the improvement
of Malagasy attitudes towards fosas are complimentary strategies to reduce retaliatory
killing. The construction of fortified enclosures to reduce carnivore livestock
predation is well documented (Treves and Karanth 2003). Its success usually varies
depending on a variety of factors, including: the carnivore species’ behavior;
livestock breed; enclosure building and maintenance costs; herd-size; husbandry
practices; and the surrounding landscape (Ogada et al. 2003; Distefano 2005; Inskip
and Zimmermann 2009). Given the immense spectrum of carnivore-conflict
geographically, there is typically no universal method of best practice. Successful
220
approaches should consider multi-faceted strategies, firmly entrenched in empirical
local knowledge and in complicit partnership with focal communities.
In considering poultry predation in Madagascar, current coops are structurally
ineffectual in reducing predation. Furthermore, despite interviewees reporting the
housing of poultry in the evenings, husbandry techniques in reality are more likely
unregulated, with poultry typically seen roaming villages freely. Previous attempts to
build poultry coops have been attempted by Durrell Wildlife Conservation Trust, with
little success due to the high cost of building coops for individual households.
Communities were also unwilling to house poultry within communal coops for fear of
theft and mismanagement. However, at present, supervisor L. Dollar is attempting the
construction of cost-effective, structurally robust coops for households. Ensuring
these coops are sustainably constructed, cost-effective and involve individual
household buy-ins will be key for their success.
The adoption of watchdogs is another strategy that has been successfully
implemented to deter livestock predators globally (Inskip and Zimmermann 2009;
Rigg et al. 2011). Our results, and previous research (Gerber et al. 2012a; Farris et al.
2015c) has shown dogs’ ability to spatio-temporally deter fosas. It might then be
inferred that a community’s dogs, tethered in the evening near poultry coops or
nearby households closest to the forest edge could be a successful deterrence
technique. Furthermore, ensuring dogs are tethered and not freely roaming through
the forest in the evenings would have the added benefit of reducing their nighttime
predation of endemic fauna.
A key driver of the retaliatory killing of fosas was negative human attitudes.
L. Dollar has previously initiated education programs informing communities of
fosas’ benefits through their consumption of rats, an agricultural pest and transmitter
221
of disease. This program did have notable success with most households in our
surveys reporting these positive attitudes towards fosas located within these educated
communities. The adoption of a multi-faceted strategy involving the construction of
poultry coops, implementation of watchdogs and education of fosas’ benefits for the
community and ecosystem is therefore an empirically supported strategy to reduce
poultry predation and improve community attitudes.
Reducing bushmeat consumption
Reducing food insecurity through improved husbandry and agricultural practices is
the logical response to reducing the consumption of Madagascar’s protected species.
However, caution must be taken when considering alternative livelihood approaches,
as their monitoring is often infrequent, and their subsequent success has been varied
and typically difficult to interpret (Roe et al. 2015; Wicander and Coad 2015).
Furthermore many of these alternative livelihood projects are based upon flawed
assumptions in terms of the appropriateness of the substitute, the applicability of the
substitute to every household and community, and the scalability of this intervention
to induce population-level reductions (Wright et al. 2016). In providing domesticated
sources of meat as an alternative source of protein, their availability, price and
cultural preferences must be considered (Van Vliet 2000).
Madagascar’s rural poor heavily rely upon bushmeat for nutrition (Jenkins and
Racey 2008; Randrianandrianina et al. 2010; Golden et al. 2011; Borgerson 2015;
Hunter et al. 2015), but do not prefer it to domestic meat. Chicken was our
interviewees’ most preferred meat, and a preference reported across Madagascar.
Unfortunately, rural poultry husbandry techniques are archaic, mired by disease and
wildlife predation. Across our sites over 40% of interviewees poultry died annually
222
to disease (likely Newcastle Disease). Reducing poultry mortality, through the
implementation of a vaccination program, the development of robust coops and the
trial of watchdogs is one potential solution (with the combined objective of reducing
retaliatory killing of fosas). Newcastle disease vaccination programs (in align with
overall husbandry improvements) are currently being trialled and implemented in
Makira-Masoala National Park in efforts to reduce bushmeat consumption, and
improve Malagasy health (Guest 2013). Successful poultry vaccination programs
(including poultry health, management, and biosecurity) have been implemented in
Tanzania (Msoffe et al. 2010). However, other Tanzanian poultry production projects
have reported improved human health was not necessarily associated with reduced
bushmeat if basic food security wasn’t met (Knueppel et al. 2009). This suggests that
the concept has utility, but that the successful implementation of these programs must
be carefully considered. In implementing these alternative livelihood programs, the
context of local bushmeat consumption must be considered (Van Vliet 2000; Golden
et al. 2011; Cundill et al. 2012). The program should be long-term, and it should
include conditionalities and sanctions (to avoid bushmeat hunting as additional
activity), whilst establishing monitoring protocols to evaluate the program’s success
(Roe et al. 2015; Wicander and Coad 2015), and refinement if needed.
Reducing exotic species abundance
Exotic species removal programs should be considered in reducing the abundance of
cats, dogs and civets in their competition with fosas, and predation of Madagascar’s
endemic species. Feral cat eradication programs have been widely implemented on
islands, with varying levels of success, typically associated with the island’s size and
eradication methods (Campbell et al. 2011; Nogales et al. 2013). Madagascar’s large
223
size almost certainly prohibits complete eradication of exotic species due to the high
cost, environmental and biological feasibility of such programs (Myers et al. 2000).
However, localised programs targeting protected areas, through the species specific
trapping of wild exotic carnivores, and the neutering of domestic dogs and cats in
local villages is an initial step. Such cage trapping programs have been used with
varied success (Campbell et al. 2011), however a dog euthanisation program in
Ankarafantsika by L. Dollar did result in a substantial increase in fosa trapping rates
in align with reduced dog trapping rates (Barcala 2009). Sterilisation programs,
implemented by L. Dollar in ANP and another such program in Ranomafana, the Mad
Dog Initiative are currently being implemented to reduce feral dogs/cats in
Madagascar’s forests. Insight from these programs should be used to investigate the
creation of an island-wide MNP led exotic-species reduction strategy, combining both
euthanisation and sterilisation strategies.
Deforestation and reduction in overall fosa habitat is clearly a significant
threat to their long-term persistence. However, the political and socio-economic
causes of its manifestation are beyond the scope of this discussion. It must be said that
reducing forest loss in Madagascar is the most important and challenging goal for
conservationists and the Malagasy government in protecting its biodiversity.
The fosa as a conservation tool
Conservationists’ have long used species as surrogates for the greater preservation of
ecosystems (Caro 2010). Species are often employed for their role as an indicator,
keystone, umbrella and/or flagship species (Wilcox 1984; Noss 1990; Caro and
O'Doherty 1999; Caro et al. 2004). When considering the difficulties of conservation
in Madagascar (Ganzhorn et al. 2001), the utilisation of such a species, may prove
224
useful in the conservation of forests, fundraising and luring of tourism to
impoverished regions. In considering the characteristics of keystone, umbrella and
flagship species, I propose fosa Cryptoprocta ferox as an ideal surrogate for the
conservation of Madagascar’s biodiversity.
The landmark proposal of the keystone species concept (Paine 1966; 1969)
has proved a useful tool for biologists in the conservation of biodiversity (Bond 1994;
Power and Mills 1995). Keystone species are those that are thought to have a
disproportionate effect upon the ecosystem in maintaining community integrity. They
range from large carnivores, such as North American wolves (McLaren and Peterson
1994), whose top down predation ensures a healthy population ceiling of herbivores.
To vastly different species like krill (Smith et al. 2007), whose trophic level is
relatively low, but whose extreme abundance support a large variety of species from
fish to filter feeders as large as basking sharks. Despite no experimental or
observational evidence to date, fosa are likely a keystone species within Madagascar’s
ecosystem (Dollar 2006). Fosas’ role as Madagascar’s apex predator, and their large
geographical distribution means their influence across Madagascar’s landscape is
pervasive. Fosas’ have been recorded to be prolific predators, predominately
consuming Madagascar’s largest terrestrial mammals, lemurs (Dollar et al. 2007;
Hawkins and Racey 2008b). However, they are also opportunists, capable of varying
their diet regionally (Goodman et al. 1997), whilst overall consuming a variety of
prey, including tenrecs, birds, rats, snakes, lizards, insects and crustaceans (Dollar et
al. 2007; Hawkins and Racey 2008a). The effect upon these species’ abundance is
significant, with fosa predation estimated to remove up to 19% of its prey population
per year (Hawkins and Racey 2008b). It is this large effect upon island-wide species
225
abundance and ecosystem composition that gives credence to fosa’s role as a keystone
species.
The umbrella species concept emphasizes the conservation of one species,
whose metaphorical umbrella protects co-occurring species. This concept is not
without controversy (Simberloff 1998; Andelman and Fagan 2000; Seddon and Leech
2008), however proponents argue for its simplicity and practicality for
conservationists in land-use planning (Fleishman et al. 2001; Caro 2003; Roberge and
Angelstam 2004; Caro 2010). Seddon and Leach (2008) reviewed the published
literature for criteria in selecting umbrella species. They proposed seven criteria:
”well-known biology; large home range size; high probability of population
persistence; co-occurrence of species of conservation interest; management needs
that are beneficial to co-occurring species; sensitivity to human disturbance; and
ease of monitoring.” From our current knowledge, and notwithstanding some
ignorance, fosas do largely qualify as an umbrella species. As it stands, fosa’s:
1. Biology and behaviour is well-known (Hawkins 1998; Dollar 2006;
Lührs 2012a).
2. Home-range is the largest of all Madagascar’s terrestrial species
(Lührs and Kappeler 2013).
3. Island-wide distribution (Hawkins 2016) provides relative
insurance, underwriting their population’s persistence.
4. Forest distribution and large territories (Lührs and Kappeler 2013)
encapsulate the spatial requirements of valuable co-occurring
species.
226
5. Require the conservation of large contiguous forests, and their
susceptibility to exotic species promotes the preservation of primary
forest.
6. Sensitivity to human disturbance is varied, but evident. The impact
of exotic species, invariably associated with human disturbance is
clear (Gerber et al. 2012b; Farris et al. 2015b). Fosas’ are equally
susceptibility to direct killing when human-settlements adjoin
forests.
7. Low population density and large home range can make monitoring
difficult. However, camera trapping of trail systems is a successful
monitoring tool. Baiting has also proven effective in identifying
individuals for more robust surveying analyses (Gerber et al. 2010).
In considering fosas’ attributes, and in entertaining other Malagasy species,
fosas suitability as an umbrella species is convincing. No extant species in
Madagascar occupy remotely comparable areas of forest, nor are distributed as
widely, perhaps crowning Madagascar’s apex predator its umbrella species.
Humans have long held an affinity with certain ‘charismatic’ species.
Conservationists have leveraged upon this relationship within the adoption of single-
species conservation programs in the broader preservation of ecosystems (Mittermeier
1988; Caro and O'Doherty 1999; Leader-Williams and Dublin 2000; Caro et al. 2004;
Smith and Sutton 2008). Such charismatic species have been coined ‘flagships’ and
have been redefined as “ a species used as the focus of broader conservation
marketing campaign based on its possession of one or more traits that appeal to the
target audience” (Verissimo et al. 2011). Given the widespread use of charismatic
227
species in conservation, academics have attempted to demystify their qualities, with
non-human charisma defined on the basis of its ecological (detectability to humans
i.e. size, temporal activity), aesthetic (appearance, behaviour) and corporeal qualities
(personal, often historical attachment) (Lorimer 2007). Recent research has also
sought to determine the likely charisma of a species, aiding flagship species selection.
Body size, IUCN status, but also baldness extent, threat to humans, and eye location
(forward or side facing) were deemed important attributes (Macdonald et al. 2015).
It’s unsurprising then, that megavertebrates have been most used as flagship species
by international institutions in conveying conservation issues to the public
(Mittermeier 1988; Leader-Williams and Dublin 2000).
Madagascar’s most emblematic species is undoubtedly the lemur, the world’s
most threatened group of vertebrates (Schwitzer et al. 2014). However, given fosas
potential as a keystone and umbrella species, their suitability as a flagship species is
likely much greater. This fact is mirrored by WWF’s global species program (2016)
which defines a flagship species as one that is selected as an ambassador of a habitat,
typically large and charismatic and whose conservation promotes the preservation of
other species. This highlights the typical selection of flagship species by conservation
institutions who are not only charismatic but also appropriate as an umbrella species
(Caro et al. 2004). In light of these conditions, and in considering fosa’s biological
characteristics, it is apparent that fosas exemplify a flagship species. Fosas’ represent
Madagascar’s largest terrestrial mammal, display enigmatic behavior, and possess an
attractive felid-like appearance - an important predictor of flagship suitability
(Macdonald et al. 2015). Fosas however, have not been fully utilised as a flagship
species, and are still largely unknown within western popular culture. When
considering the immediate threats to Madagascar’s forests, and the need to raise
228
awareness and boost rural economies, perhaps a threatened ambassador is what’s
needed.
The intention of this section is to propose fosas’ suitability as a keystone,
umbrella and flagship species, not to argue the merits of each concepts’ utility as a
conservation tool. All concepts have received praise for their conceptual and practical
utility in conservation (Caro 2010), but have also received criticism for ambiguity, the
requirement of detailed knowledge in selecting species, and lacking in empirical
evidence of their success (Mills et al. 1993; Seddon and Leech 2008). Alternatively,
the selection of multiple surrogate species of keystone, umbrella, and/or flagship
value has been proposed. This multi-species landscape approach selects different
species to encapsulate various landscape parameters and thus the requirements of
more species (Lambeck 1997). Regardless of the approach, fosas should be included
within any single/multi-species conservation program, with their biological utility
surpassing Madagascar’s other species. Looking to the future, Cryptoprocta ferox
could represent Madagascar’s conservation icon in leading the conservation of its
unique and important biodiversity.
229
References
Acheson, J.M., 2006. Institutional failure in resource management. Annual Review of
Anthropology. 35, 117-134.
Adams, W.M., Aveling, R., Brockington, D., Dickson, B., Elliott, J., Hutton, J., Roe,
D., Vira, B., Wolmer, W., 2004. Biodiversity conservation and the eradication
of poverty. Science 306, 1146-1149.
Albignac, R., 1973. Mammife`res Carnivores. Faune de Ma- dagascar 36. Paris
O.R.S.T.O.M, Paris.
Allnutt, T.F., Asner, G.P., Golden, C.D., Powell, G.V.N., 2013. Mapping recent
deforestation and forest disturbance in northeastern Madagascar. Tropical
Conservation Science 6, 1-15.
Andelman, S.J., Fagan, W.F., 2000. Umbrellas and flagships: efficient conservation
surrogates or expensive mistakes? Proceedings of the National Academy of
Sciences 97, 5954-5959.
Barcala, O., 2009. Invasive stray and feral dogs limit fosa (Cryptoprocta ferox)
populations in Ankarafantsika National Park, Madagascar. Duke University.
Barrett, C.B., Brandon, K., Gibson, C., Gjertsen, H., 2001. Conserving Tropical
Biodiversity amid Weak Institutions. BioScience 51, 497-502.
Bond, W., 1994. Keystone species, In Biodiversity and ecosystem function. pp. 237-
253. Springer.
Borgerson, C., 2015. Illegal Hunting on the Masoala Peninsula of Madagascar: Its
Extent, Causes, and Impact on Lemurs and Humans.
Borgerson, C., McKean, M.A., Sutherland, M.R., Godfrey, L.R., 2016. Who hunts
lemurs and why they hunt them. Biological Conservation 197, 124-130.
230
Brockman, D.K., Godfrey, L.R., Dollar, L.J., Ratsirarson, J., 2008. Evidence of
invasive Felis silvestris predation on Propithecus verreauxi at Beza Mahafaly
Special Reserve, Madagascar. International Journal of Primatology 29, 135-152.
Campbell, K., Harper, G., Algar, D., Hanson, C., Keitt, B., Robinson, S., 2011.
Review of feral cat eradications on islands. Island Invasives: Eradication and
Management’.(Eds CR Veitch, MN Clout and DR Towns.) pp, 37-46.
Caro, T., 2003. Umbrella species: critique and lessons from East Africa. Animal
Conservation 6, 171-181.
Caro, T., 2010. Conservation by proxy: indicator, umbrella, keystone, flagship, and
other surrogate species. Island Press.
Caro, T., Engilis, A., Fitzherbert, E., Gardner, T., 2004. Preliminary assessment of the
flagship species concept at a small scale. Animal Conservation 7, 63-70.
Caro, T.M., O'Doherty, G., 1999. On the use of surrogate species in conservation
biology. Conservation Biology 13, 805-814.
Clavero, M., Brotons, L., Pons, P., Sol, D., 2009. Prominent role of invasive species
in avian biodiversity loss. Biological Conservation 142, 2043-2049.
Corpa, J., García-Quirós, A., Casares, M., Gerique, A., Carbonell, M., Gómez-
Muñoz, M., Uzal, F.A., Ortega, J., 2013. Encephalomyelitis by Toxoplasma
gondii in a captive fossa (Cryptoprocta ferox). Veterinary parasitology 193,
281-283.
Cundill, G., Cumming, G., Biggs, D., Fabricius, C., 2012. Soft systems thinking and
social learning for adaptive management. Conservation Biology 26, 13-20.
Didia, D.O., 1997. Democracy, political instability and tropical deforestation. Global
Environmental Change 7, 63-76.
231
Dillon, A., Kelly, M.J., 2008. Ocelot home range, overlap and density: comparing
radio telemetry with camera trapping. Journal of Zoology 275, 391-398.
Distefano, E., 2005. Human-Wildlife Conflict worldwide: collection of case studies,
analysis of management strategies and good practices. SARD. Initiative Report,
FAO, Rome.
Dollar, L., Ganzhorn, J., Goodman, S., 2007. Primates and Other Prey in the
Seasonally Variable Diet of Cryptoprocta ferox in the Dry Deciduous Forest of
Western Madagascar, In Primate Anti-Predator Strategies. eds S. Gursky, K.A.I.
Nekaris, pp. 63-76. Springer US.
Dollar, L.J., 2006. Morphometrics, diet, and conservation of Cryptoprocta ferox.
Duke University.
FAO, 2016. Crop losses in southern Madagascar mean severe hunger likely to persist
into 2017, ed. F.a.A.O.o.t.U. Nations. FAO.
Farris, Z.J., Gerber, B.D., Karpanty, S., Murphy, A., Andrianjakarivelo, V.,
Ratelolahy, F., Kelly, M.J., 2015a. When carnivores roam: temporal patterns
and overlap among Madagascar's native and exotic carnivores. Journal of
Zoology 296, 45-57.
Farris, Z.J., Golden, C.D., Karpanty, S., Murphy, A., Stauffer, D., Ratelolahy, F.,
Andrianjakarivelo, V., Holmes, C.M., Kelly, M.J., 2015b. Hunting, exotic
carnivores, and habitat loss: anthropogenic effects on a native carnivore
community, Madagascar. PLoS One 10, e0136456.
Farris, Z.J., Kelly, M.J., Karpanty, S., Murphy, A., Ratelolahy, F., Andrianjakarivelo,
V., Holmes, C., 2016. The times they are a changin': Multi-year surveys reveal
exotics replace native carnivores at a Madagascar rainforest site. Biological
Conservation.
232
Farris, Z.J., Kelly, M.J., Karpanty, S., Ratelolahy, F., 2015c. Patterns of spatial co‐
occurrence among native and exotic carnivores in north‐eastern Madagascar.
Animal Conservation.
Fisher, R.J., 1993. Social desirability bias and the validity of indirect questioning.
Journal of consumer research 20, 303-315.
Fleishman, E., Blair, R.B., Murphy, D.D., 2001. Empirical validation of a method for
umbrella species selection. Ecological Applications 11, 1489-1501.
Ganzhorn, J.U., Lowry, P.P., Schatz, G.E., Sommer, S., 2001. The biodiversity of
Madagascar: one of the world’s hottest hotspots on its way out. Oryx 35, 346-
348.
García, G., Goodman, S.M., 2003. Hunting of protected animals in the Parc National
d'Ankarafantsika, north-western Madagascar. Oryx 37, 115-118.
Gerber, B., Karpanty, S.M., Crawford, C., Kotschwar, M., Randrianantenaina, J.,
2010. An assessment of carnivore relative abundance and density in the eastern
rainforests of Madagascar using remotely-triggered camera traps. Oryx 44, 219.
Gerber, B.D., Karpanty, S.M., Randrianantenaina, J., 2012a. Activity patterns of
carnivores in the rain forests of Madagascar: implications for species
coexistence. Journal of Mammalogy 93, 667-676.
Gerber, B.D., Karpanty, S.M., Randrianantenaina, J., 2012b. The impact of forest
logging and fragmentation on carnivore species composition, density and
occupancy in Madagascar's rainforests. Oryx 46, 414-422.
Gerber, B.D., Karpanty, S.M., Randrianantenaina, J., Vuren, D.H.V., 2012c. Activity
patterns of carnivores in the rain forests of Madagascar: implications for species
coexistence. Journal of Mammalogy 93, 667-676.
233
Golden, C.D., 2009. Bushmeat hunting and use in the Makira Forest, north-eastern
Madagascar: a conservation and livelihoods issue. Oryx 43, 386.
Golden, C.D., Fernald, L.C., Brashares, J.S., Rasolofoniaina, B.R., Kremen, C., 2011.
Benefits of wildlife consumption to child nutrition in a biodiversity hotspot.
Proceedings of the National Academy of Sciences 108, 19653-19656.
Goodman, S.M., Langrand, O., Rasolonandrasana, B.P.N., 1997. The food habits of
Cryptoprocta ferox in the high mountain zone of the Andringitra Massif,
Madagascar (Carnivora, Viverridae). mammalia 61, 185-192.
Goodman, S.M., O’Connor, S., Langrand, O., 1993. A review of predation on lemurs:
implications for the evolution of social behavior in small, nocturnal primates, In
Lemur social systems and their ecological basis. pp. 51-66. Springer.
Goodman, S.M., Rasoloarison, R.M., Ganzhorn, J.U., 2004. On the specific
identification of subfossil Cryptoprocta (Mammalia, Carnivora) from
Madagascar. ZOOSYSTEMA-PARIS- 26, 129-143.
Gould, L., 1996. Vigilance behavior in naturally occurring ringtailed lemurs (Lemur
catta) during birth and lactation season. Inter. Jour. Primatol 17, 331-347.
Grinand, C., Rakotomalala, F., Gond, V., Vaudry, R., Bernoux, M., Vieilledent, G.,
2013. Estimating deforestation in tropical humid and dry forests in Madagascar
from 2000 to 2010 using multi-date Landsat satellite images and the random
forests classifier. Remote Sensing of Environment 139, 68-80.
Groves, R.M., Peytcheva, E., 2008. The impact of nonresponse rates on nonresponse
bias: a meta-analysis. Public opinion quarterly 72, 167-189.
Guest, T., 2013. Fowl deeds in Madagascar, In African Farming. Alain Charles,
London.
234
Harper, G.J., Steininger, M.K., Tucker, C.J., Juhn, D., Hawkins, F., 2007. Fifty years
of deforestation and forest fragmentation in Madagascar. Environmental
Conservation 34.
Hawkins, A.F., 2016. Cryptoprocta ferox, In The IUCN Red List of Threatened
Species. IUCN.
Hawkins, C.E., 1998. Behaviour and ecology of the fossa, Cryptoprocta ferox
(Carnivora: Viverridae) in a dry deciduous forest, western Madagascar.
University of Aberdeen.
Hawkins, C.E., Racey, P.A., 2005. Low population density of a tropical forest
carnivore, Cryptoprocta ferox: implications for protected area management.
Oryx 39.
Hawkins, c.E., Racey, P.A., 2008a. Food Habits of an Endangered Carnivore,
Cryptoprocta ferox, in the Dry Deciduous Forests of Western Madagascar.
Hawkins, C.E., Racey, P.A., 2008b. Food Habits of an Endangered Carnivore,
Cryptoprocta ferox, in the Dry Deciduous Forests of Western Madagascar.
Journal of Mammalogy 89, 64-74.
Hughes, J., Macdonald, D.W., 2013. A review of the interactions between free-
roaming domestic dogs and wildlife. Biological Conservation 157, 341-351.
Hunter, D., Burlingame, B., Remans, R., Borelli, T., Cogill, B., Coradin, L., Golden,
C., Jamnadass, R., Kehlenbeck, K., Kennedy, G., 2015. Biodiversity and
nutrition. World Health Organistion/Secretariat of the UN Convention on
Biological Diversity.
IFAD, 2016. Statistics.
Inskip, C., Zimmermann, A., 2009. Human-felid conflict: a review of patterns and
priorities worldwide. Oryx 43, 18-34.
235
Irwin, M., Raharison, J.-L., 2009. Ecosystem in decay: factors influencing primate
species extinctions in forest fragments of Tsinjoarivo, Madagascar, In American
Journal of Physical Anthropology. pp. 155-155. WILEY-LISS DIV JOHN
WILEY & SONS INC, 111 RIVER ST, HOBOKEN, NJ 07030 USA.
Irwin, M.T., Wright, P.C., Birkinshaw, C., Fisher, B.L., Gardner, C.J., Glos, J.,
Goodman, S.M., Loiselle, P., Rabeson, P., Raharison, J.-L., 2010. Patterns of
species change in anthropogenically disturbed forests of Madagascar. Biological
Conservation 143, 2351-2362.
Jenkins, R.K., Keane, A., Rakotoarivelo, A.R., Rakotomboavonjy, V.,
Randrianandrianina, F.H., Razafimanahaka, H.J., Ralaiarimalala, S.R., Jones,
J.P., 2011. Analysis of patterns of bushmeat consumption reveals extensive
exploitation of protected species in eastern Madagascar. PLoS One 6, e27570.
John, F.A.S., Edwards-Jones, G., Gibbons, J.M., Jones, J.P., 2010. Testing novel
methods for assessing rule breaking in conservation. Biological Conservation
143, 1025-1030.
Juan-Sallés, C., Mainez, M., Marco, A., Malabia Sanchís, A.M., 2011. Localized
toxoplasmosis in a ring-tailed lemur (Lemur catta) causing placentitis,
stillbirths, and disseminated fetal infection. Journal of Veterinary Diagnostic
Investigation 23, 1041-1045.
Knueppel, D., Coppolillo, P., Msago, A., Msoffe, P., Mutekanga, D., Cardona, C.,
2009. Improving poultry production for sustainability in the Ruaha Landscape,
Tanzania. WildLife Conservation Society, 1-24.
Kotschwar Logan, M., Gerber, B.D., Karpanty, S.M., Justin, S., Rabenahy, F.N.,
2014. Assessing carnivore distribution from local knowledge across a human-
236
dominated landscape in central-southeastern Madagascar. Animal Conservation,
n/a-n/a.
Kull, C.A., Tassin, J., Carrière, S.M., 2014. Approaching invasive species in
Madagascar. Madagascar Conservation & Development 9, 60-70.
Lambeck, R.J., 1997. Focal species: a multi‐species umbrella for nature conservation.
Conservation Biology 11, 849-856.
Leader-Williams, N., Dublin, H.T., 2000. Charismatic megafauna asflagship species'.
CONSERVATION BIOLOGY SERIES-CAMBRIDGE-, 53-84.
Lehman, S.M., Rajaonson, A., Day, S., 2006. Edge effects and their influence on
lemur density and distribution in southeast Madagascar. American Journal of
Physical Anthropology 129, 232-241.
Lehtinen, R.M., Ramanamanjato, J.-B., Raveloarison, J.G., 2003. Edge effects and
extinction proneness in a herpetofauna from Madagascar. Biodiversity &
Conservation 12, 1357-1370.
Lorimer, J., 2007. Nonhuman charisma. Environment and Planning D: Society and
Space 25, 911-932.
Lührs, M.-L., 2012a. Social organisation and mating system of the fosa (Cryptoprocta
ferox).
Lührs, M.L., 2012b. Social organisation and mating system of the fosa (Crptoprocta
ferox). University of Gottingen, Gottingen.
Lührs, M.L., Kappeler, P.M., 2013. Simultaneous GPS tracking reveals male
associations in a solitary carnivore. Behavioral Ecology and Sociobiology 67,
1731-1743.
237
Macdonald, E., Burnham, D., Hinks, A., Dickman, A., Malhi, Y., Macdonald, D.,
2015. Conservation inequality and the charismatic cat: Felis felicis. Global
Ecology and Conservation 3, 851-866.
MacKenzie, D.I., 2006. Occupancy estimation and modeling: inferring patterns and
dynamics of species occurrence. Academic Press.
Mayaux, P., Pekel, J.-F., Desclée, B., Donnay, F., Lupi, A., Achard, F., Clerici, M.,
Bodart, C., Brink, A., Nasi, R., 2013. State and evolution of the African
rainforests between 1990 and 2010. Phil. Trans. R. Soc. B 368, 20120300.
McLaren, B.E., Peterson, R.O., 1994. Wolves, moose, and tree rings on Isle Royale.
Science 266, 1555.
Medina, F.M., Bonnaud, E., Vidal, E., Tershy, B.R., Zavaleta, E.S., Josh Donlan, C.,
Keitt, B.S., Corre, M., Horwath, S.V., Nogales, M., 2011. A global review of
the impacts of invasive cats on island endangered vertebrates. Global Change
Biology 17, 3503-3510.
Mills, L.S., Soulé, M.E., Doak, D.F., 1993. The keystone-species concept in ecology
and conservation. BioScience 43, 219-224.
Mittermeier, R.A., 1988. Primate diversity and the tropical forest. Biodiversity, 145-
154.
Msoffe, P.L., Bunn, D., Muhairwa, A., Mtambo, M., Mwamhehe, H., Msago, A.,
Mlozi, M., Cardona, C.J., 2010. Implementing poultry vaccination and
biosecurity at the village level in Tanzania: a social strategy to promote health
in free-range poultry populations. Tropical animal health and production 42,
253-263.
Myers, J.H., Simberloff, D., Kuris, A.M., Carey, J.R., 2000. Eradication revisited:
dealing with exotic species. Trends in ecology & evolution 15, 316-320.
238
Nogales, M., Vidal, E., Medina, F.M., Bonnaud, E., Tershy, B.R., Campbell, K.J.,
Zavaleta, E.S., 2013. Feral cats and biodiversity conservation: the urgent
prioritization of island management. BioScience 63, 804-810.
Noss, R.F., 1990. Indicators versus targets: shortcuts to the landscape\'s" Health"?
Nuno, A., John, F.A.S., 2015. How to ask sensitive questions in conservation: A
review of specialized questioning techniques. Biological Conservation 189, 5-
15.
O'Connell, A.F., Nichols, J.D., Karanth, K.U., 2010. Camera traps in animal ecology:
methods and analyses. Springer.
Ogada, M.O., Woodroffe, R., Oguge, N.O., Frank, L.G., 2003. Limiting Depredation
by African Carnivores: the Role of Livestock Husbandry
Limitando la Depredación de Carnívoros Africanos: el Papel de la Crianza de
Ganado. Conservation Biology 17, 1521-1530.
Paine, R.T., 1966. Food web complexity and species diversity. The American
Naturalist 100, 65-75.
Paine, R.T., 1969. A Note on Trophic Complexity and Community Stability.
American naturalist 103, 91-&.
Pomerantz, J., Rasambainarivo, F.T., Dollar, L., Rahajanirina, L.P.,
Andrianaivoarivelo, R., Parker, P., Dubovi, E., 2016. Prevalence of antibodies
to selected viruses and parasites in introduced and endemic carnivores in
Western Madagascar. Journal of wildlife diseases 52, 544-552.
Power, M.E., Mills, L.S., 1995. The keystone cops meet in Hilo. Trends in ecology &
evolution 10, 182-184.
Rahajanirina, L.P., 2003. Contribution to the biological, ecological and ethological
study of Cryptoprocta ferox (Bennett, 1833) in the forest region of Tsimaloto,
239
Ankarafantsika National Park, Madagascar, In Department of Animal Biology.
University of Antananarivo.
Rakotoarivelo, A.R., Razafimanahaka, J.H., Rabesihanaka, S., Jones, J.P.G., Jenkins,
R.K.B., 2011. Laws and regulations on wildlife in Madagascar: progress and
future needs. Madagascar Conservation and Development 6, 37-44.
Randrianandrianina, F.H., Racey, P.A., Jenkins, R.K.B., 2010. Hunting and
consumption of mammals and birds by people in urban areas of western
Madagascar. Oryx 44, 411-415.
Reuter, K.E., Randell, H., Wills, A.R., Sewall, B.J., 2016. The consumption of wild
meat in Madagascar: drivers, popularity and food security. Environmental
Conservation, 1-11.
Rigg, R., Finďo, S., Wechselberger, M., Gorman, M.L., Sillero-Zubiri, C.,
Macdonald, D.W., 2011. Mitigating carnivore–livestock conflict in Europe:
lessons from Slovakia. Oryx 45, 272-280.
Roberge, J.M., Angelstam, P.E.R., 2004. Usefulness of the umbrella species concept
as a conservation tool. Conservation Biology 18, 76-85.
Roe, D., Booker, F., Day, M., Zhou, W., Allebone-Webb, S., Hill, N.A., Kumpel, N.,
Petrokofsky, G., Redford, K., Russell, D., 2015. Are alternative livelihood
projects effective at reducing local threats to specified elements of biodiversity
and/or improving or maintaining the conservation status of those elements?
Environmental Evidence 4, 22.
Sauther, M.L., 1989. Antipredator behavior in troops of free-rangingLemur catta at
Beza Mahafaly Special Reserve, Madagascar. International Journal of
Primatology 10, 595-606.
240
Schwitzer, C., Mittermeier, R., Johnson, S., Donati, G., Irwin, M., Peacock, H.,
Ratsimbazafy, J., Razafindramanana, J., Louis, E.E., Chikhi, L., 2014. Averting
lemur extinctions amid Madagascar's political crisis. Science 343, 842-843.
Seddon, P.J., Leech, T., 2008. Conservation short cut, or long and winding road? A
critique of umbrella species criteria. Oryx 42, 240-245.
Simberloff, D., 1998. Flagships, umbrellas, and keystones: is single-species
management passé in the landscape era? Biological Conservation 83, 247-257.
Siskos, N., Lampe, K., Kaup, F., Mätz-Rensing, K., 2015. Unique case of
disseminated toxoplasmosis and concurrent hepatic capillariasis in a ring-tailed
lemur: first case description. Primate Biology 2, 9.
Smith, A.M., Sutton, S.G., 2008. The role of a flagship species in the formation of
conservation intentions. Human Dimensions of Wildlife 13, 127-140.
Smith, R.J., Muir, R.D., Walpole, M.J., Balmford, A., Leader-Williams, N., 2003.
Governance and the loss of biodiversity. Nature 426, 67-70.
Smith, W.O., Ainley, D.G., Cattaneo-Vietti, R., 2007. Trophic interactions within the
Ross Sea continental shelf ecosystem. Philosophical Transactions of the Royal
Society of London B: Biological Sciences 362, 95-111.
Spencer, J.A., Joiner, K.S., Hilton, C.D., Dubey, J.P., Toivio-Kinnucan, M., Minc,
J.K., Blagburn, B.L., 2004. Disseminated toxoplasmosis in a captive ring-tailed
lemur (Lemur catta). Journal of Parasitology 90, 904-906.
Treves, A., Karanth, K.U., 2003. Human‐carnivore conflict and perspectives on
carnivore management worldwide. Conservation Biology 17, 1491-1499.
Van Vliet, N., 2000. Livelihood alternatives for the unsustainable use of bushmeat.
Secretariat of the Convention on Biological Diversity.
241
Vanak, A.T., Gompper, M.E., 2009. Dogs Canis familiaris as carnivores: their role
and function in intraguild competition. Mammal Review 39, 265-283.
Verissimo, D., MacMillan, D.C., Smith, R.J., 2011. Toward a systematic approach for
identifying conservation flagships. Conservation Letters 4, 1-8.
Vieilledent, G., Grinand, C., Rakotomalala, F.A., Ranaivosoa, R., Rakotoarijaona, J.-
R., Allnutt, T.F., Achard, F., 2017. Combining global tree cover loss data with
historical national forest-cover maps to look at six decades of deforestation and
forest fragmentation in Madagascar. bioRxiv.
Vitousek, P.M., D'antonio, C.M., Loope, L.L., Rejmanek, M., Westbrooks, R., 1997.
Introduced species: a significant component of human-caused global change.
New Zealand Journal of Ecology, 1-16.
Wicander, S., Coad, L., 2015. Learning our lessons: a review of alternative livelihood
projects in Central Africa. IUCN.
Wilcox, B.A., 1984. In situ conservation of genetic resources: determinants of
minimum area requirements. National parks, conservation, and development:
the role of protected areas in sustaining society. Smithsonian Institution Press,
Washington, DC, 825.
World Food Program, 2016. Madagascar. WFP.
Wright, J.H., Hill, N.A., Roe, D., Rowcliffe, J.M., Kümpel, N.F., Day, M., Booker,
F., Milner‐Gulland, E., 2016. Reframing the concept of alternative livelihoods.
Conservation Biology 30, 7-13.
WWF, 2016. Global Species Programe: how WWF classifies species. WWF.
Zinner, D., Wygoda, C., Razafimanantsoa, L., Rasoloarison, R., T. Andrianandrasana,
H., Ganzhorn, J.U., Torkler, F., 2013. Analysis of deforestation patterns in the

242
central Menabe, Madagascar, between 1973 and 2010. Regional Environmental
Change 14, 157-166.
243
Appendices: Appendix A
Novel photographic and morphometric records
of the Western Falanouc Eupleres major in
Ankarafantsika National Park, Madagascar.
244
Abstract
Long-term research on Fosa Cryptoprocta ferox has been conducted in
Ankarafantsika National Park since 1999, with rare sightings of the forest’s second
elusive carnivore, the Western Falanouc Eupleres major. During annual carnivore
live-trapping from 1999-Present, a single Falanouc was captured on the 30th
of March
2002. Since this capture, two photographs have been taken of the Falanouc. In June
2011 a project volunteer photographed a Falanouc during the day whilst conducting
trap-checks. Recently, a second photograph was recorded during the largest
systematic camera-trapping study of Madagascar’s western carnivores. From April –
July 2014 eighty paired camera-traps operated on average for 79 days, recording a
sole image of the Western Falanouc at 01h18 on the 19 April 2014. Herein we discuss
the morphometrics and photographic records of the Western Falanouc from
Ankarafantsika National Park.
Malagasy Title
Fitantarana ara-tsary sy refy samihafa voaangona mikasika ny Fanaloka Andrefana
Eupleres major ao amin’ny Valanjavaboahary Ankarafantsika, Madagasikara
Malagasy Abstract
Notanterahana nanomboka ny taona 1999 tao amin’ny Valanjavaboahary
Ankarafantsika ny fikarohana lavitrezaka mikasika ny Fosa Cryptoprocta ferox.
Tamin’izany no nahitana tsindraindray karazambiby mpihinankena iray hafa izay tsy
mbola fahita, dia ny Fanaloka Andrefana Eupleres major. Nandritra ny fisamborana
velona ireo karazam-biby mpihinankena izay fanao isan-taona nanomboka ny taona
1999 ka hatramin’izao dia indray mandeha ihany no nahazoana Fanaloka Andrefana,
245
ny 30 Marsa 2002. Nanomboka teo dia sarina Fanaloka Andrefana roa no azo.
Tamin’ny Jona 2011 dia nisy mpikaroka mpilatsaka antsitrapo iray nahazo sarina
Fanaloka Andrefana anankiray nandritra ny andro mazava tamin’ny fisafoana ireo
fandrika napetrany. Vao tsy ela akory, nisy sary faharoa azo tamin’ny fakantsary
fandrika nandritra ilay fikaroahana lehibe indrindra mikasika ny biby mpihinankena
miaina amin’ny ilany andrefan’i Madagasikara. Ny volana Aprily ka hatramin’ny
Jolay 2014 dia fakantsary fandrika miisa 80 no napetraka tao anaty ala nandritra ny 79
andro ka sary tokan’ny Fanaloka Andrefana no azo ny 19 April 2014 tamin’ny 01 ora
sy 18mn maraina. Eto isika dia hiady hevitra mikasika ny refy samihafa sy ny
sarin’ny Fanaloka Andrefana araka ny tahirinkevitra vao nangonina tao amin’ny
Valanjavaboaharin’Ankarafantsika.
Keywords: Ankarafantsika, camera-trapping, Eupleres, Eupleridae, Falanouc.
This chapter forms the basis of a paper accepted to Small Carnivore Conservation:
Merson S, Dollar L. & Macdonald D. (2017). Novel camera-trap record of the
Western Falanouc Eupleres goudotti major in Ankarafantsika National Park. Small
Carnivore Conservation 56.
246
Introduction
A paucity of information currently exists on the two proposed sub-species of the
Genus Eupleres: Eupleres goudotii and Eupleres major (Albignac 1972). Each sub-
species is typically confined to the geographically distinct landscapes of the eastern
rainforests and western deciduous forests respectively (Hawkins 2008), despite
proposed distributional overlap in the northerly rainforest of Montagne d’Ambre
(Goodman and Helgen 2010). Much of our knowledge of the Falanouc has been
derived from museum specimens or personal communications with rural Malagasy
and hallmark studies (Goodman and Helgen 2010). Across its geographic range,
sightings and trappings of the Falanouc have been rare, which may be due to its
specialised diet of earthworms and nocturnal habits (Hawkins 2008). Recent
technological advances in remote camera sensing now afford greater opportunities to
document this enigmatic species.
The first camera-trap image of a Falanouc was recorded in Ranomafana
National Park (RNP) in 1997 (Dollar 1999). Over a decade later in the same forest
Gerber et al. (2012a) conducted the first systematic survey of Madagascar’s
carnivores using camera-traps, again documenting the eastern E. goudotii. This study
was followed by Farris et al. (2014)’s documentation of the Eastern Falanouc during
their extensive carnivore camera-trapping studies in the Masoala-Makira protected
complex in northeastern Madagascar. Conversely, Madagascar’s western dry
deciduous forests have received considerably less attention with only one recent
camera-trapping study of the Mariarano forest, located approximately 80km
northwest of Ankarafantsika National Park (ANP) (. During this survey, the first
camera-trap image of E. major was recorded from Madagascar’s west coast.
247
Ankarafantsika National Park (1612’ S, 4709’ E) has been the focus of long-
term Fosa capture surveys since 1999. The rarity in sightings of Ankarafantsika’s
second elusive carnivore, the Falanouc, has been described by Dollar (Division of
Arts & Sciences, Pfeiffer University, USA, verbally 2014), whose team have rarely
encountered Falanouc, with only a few confirmed sightings, one physical capture and
one volunteer photograph. From May to July 2014 we undertook the largest
systematic camera-trap study in West Madagascar to document the effects of
anthropogenic habitat disturbance upon Fosa occupancy. This study forms part of a
wider investigation documenting the major anthropogenic threats to the conservation
of the Fosa (Samuel Merson, Department of Zoology, The University of Oxford, UK,
written 2015).
Methods
Study Area
ANP is located approximately 105 km from the port hub of Mahajanga. At 1350 km2
ANP is the largest remaining tract of dry deciduous forest. The region is characterised
by an average temperature of 26C, with a dry season from May to November, and a
wet season from December to April. The Route Nationale 4 (RN4) bisects the south-
western portion of the forest and is flanked by six rural villages. These villages have a
significant influence upon the surrounding forest, with large tracts of primary forest
converted to savannah through slash and burn agriculture, rice fields and raffia
plantations. Ampijroroa, the former name of the Special Reserve adjacent (and now
incoprotated within) Ankarafantsika, is also the home to the local Madagascar
National Park’s headquarters, which operates tourism throughout the surrounding
area.
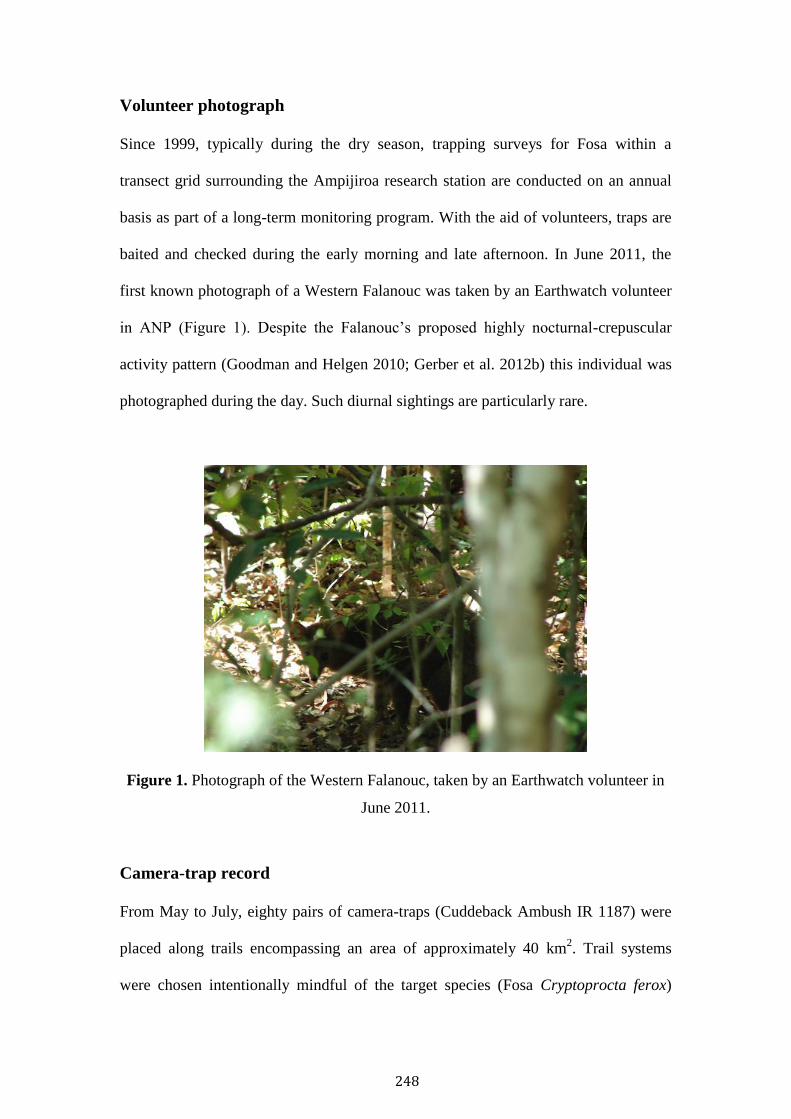
248
Volunteer photograph
Since 1999, typically during the dry season, trapping surveys for Fosa within a
transect grid surrounding the Ampijiroa research station are conducted on an annual
basis as part of a long-term monitoring program. With the aid of volunteers, traps are
baited and checked during the early morning and late afternoon. In June 2011, the
first known photograph of a Western Falanouc was taken by an Earthwatch volunteer
in ANP (Figure 1). Despite the Falanouc’s proposed highly nocturnal-crepuscular
activity pattern (Goodman and Helgen 2010; Gerber et al. 2012b) this individual was
photographed during the day. Such diurnal sightings are particularly rare.
Figure 1. Photograph of the Western Falanouc, taken by an Earthwatch volunteer in
June 2011.
Camera-trap record
From May to July, eighty pairs of camera-traps (Cuddeback Ambush IR 1187) were
placed along trails encompassing an area of approximately 40 km2. Trail systems
were chosen intentionally mindful of the target species (Fosa Cryptoprocta ferox)
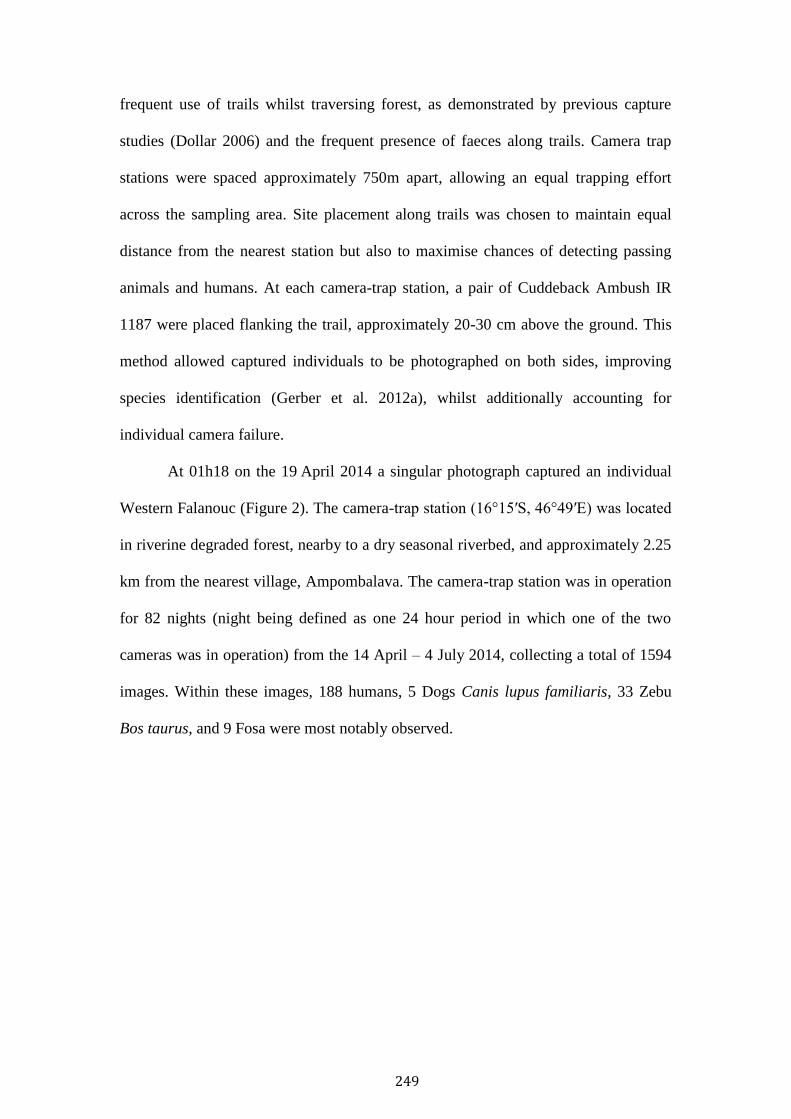
249
frequent use of trails whilst traversing forest, as demonstrated by previous capture
studies (Dollar 2006) and the frequent presence of faeces along trails. Camera trap
stations were spaced approximately 750m apart, allowing an equal trapping effort
across the sampling area. Site placement along trails was chosen to maintain equal
distance from the nearest station but also to maximise chances of detecting passing
animals and humans. At each camera-trap station, a pair of Cuddeback Ambush IR
1187 were placed flanking the trail, approximately 20-30 cm above the ground. This
method allowed captured individuals to be photographed on both sides, improving
species identification (Gerber et al. 2012a), whilst additionally accounting for
individual camera failure.
At 01h18 on the 19 April 2014 a singular photograph captured an individual
Western Falanouc (Figure 2). The camera-trap station (16°15′S, 46°49′E) was located
in riverine degraded forest, nearby to a dry seasonal riverbed, and approximately 2.25
km from the nearest village, Ampombalava. The camera-trap station was in operation
for 82 nights (night being defined as one 24 hour period in which one of the two
cameras was in operation) from the 14 April – 4 July 2014, collecting a total of 1594
images. Within these images, 188 humans, 5 Dogs Canis lupus familiaris, 33 Zebu
Bos taurus, and 9 Fosa were most notably observed.
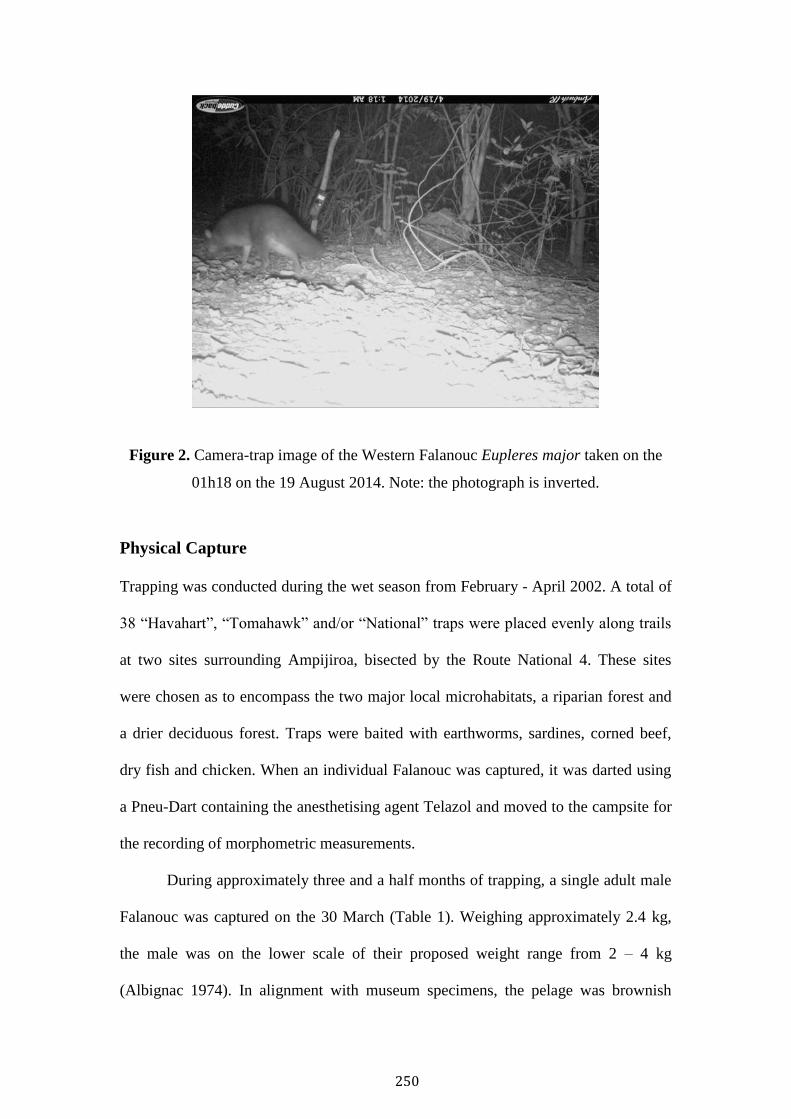
250
Figure 2. Camera-trap image of the Western Falanouc Eupleres major taken on the
01h18 on the 19 August 2014. Note: the photograph is inverted.
Physical Capture
Trapping was conducted during the wet season from February - April 2002. A total of
38 “Havahart”, “Tomahawk” and/or “National” traps were placed evenly along trails
at two sites surrounding Ampijiroa, bisected by the Route National 4. These sites
were chosen as to encompass the two major local microhabitats, a riparian forest and
a drier deciduous forest. Traps were baited with earthworms, sardines, corned beef,
dry fish and chicken. When an individual Falanouc was captured, it was darted using
a Pneu-Dart containing the anesthetising agent Telazol and moved to the campsite for
the recording of morphometric measurements.
During approximately three and a half months of trapping, a single adult male
Falanouc was captured on the 30 March (Table 1). Weighing approximately 2.4 kg,
the male was on the lower scale of their proposed weight range from 2 – 4 kg
(Albignac 1974). In alignment with museum specimens, the pelage was brownish
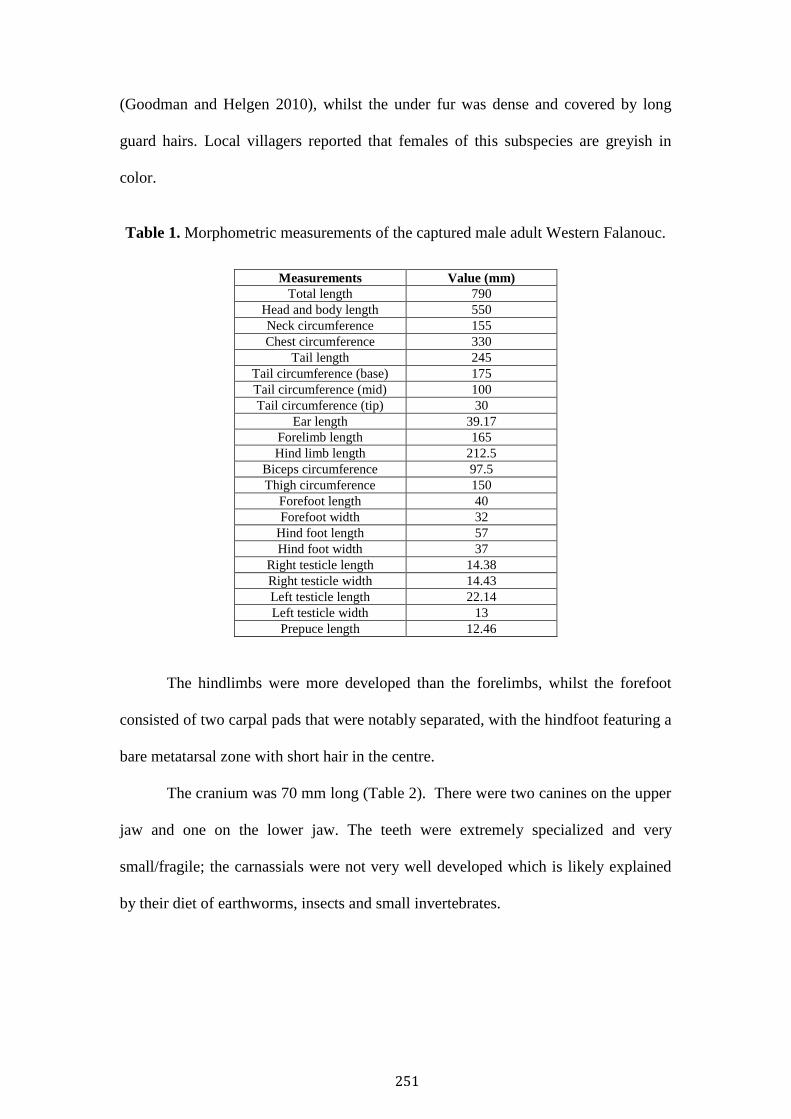
251
(Goodman and Helgen 2010), whilst the under fur was dense and covered by long
guard hairs. Local villagers reported that females of this subspecies are greyish in
color.
Table 1. Morphometric measurements of the captured male adult Western Falanouc.
Measurements Value (mm)
Total length 790
Head and body length 550
Neck circumference 155
Chest circumference 330
Tail length 245
Tail circumference (base) 175
Tail circumference (mid) 100
Tail circumference (tip) 30
Ear length 39.17
Forelimb length 165
Hind limb length 212.5
Biceps circumference 97.5
Thigh circumference 150
Forefoot length 40
Forefoot width 32
Hind foot length 57
Hind foot width 37
Right testicle length 14.38
Right testicle width 14.43
Left testicle length 22.14
Left testicle width 13
Prepuce length 12.46
The hindlimbs were more developed than the forelimbs, whilst the forefoot
consisted of two carpal pads that were notably separated, with the hindfoot featuring a
bare metatarsal zone with short hair in the centre.
The cranium was 70 mm long (Table 2). There were two canines on the upper
jaw and one on the lower jaw. The teeth were extremely specialized and very
small/fragile; the carnassials were not very well developed which is likely explained
by their diet of earthworms, insects and small invertebrates.
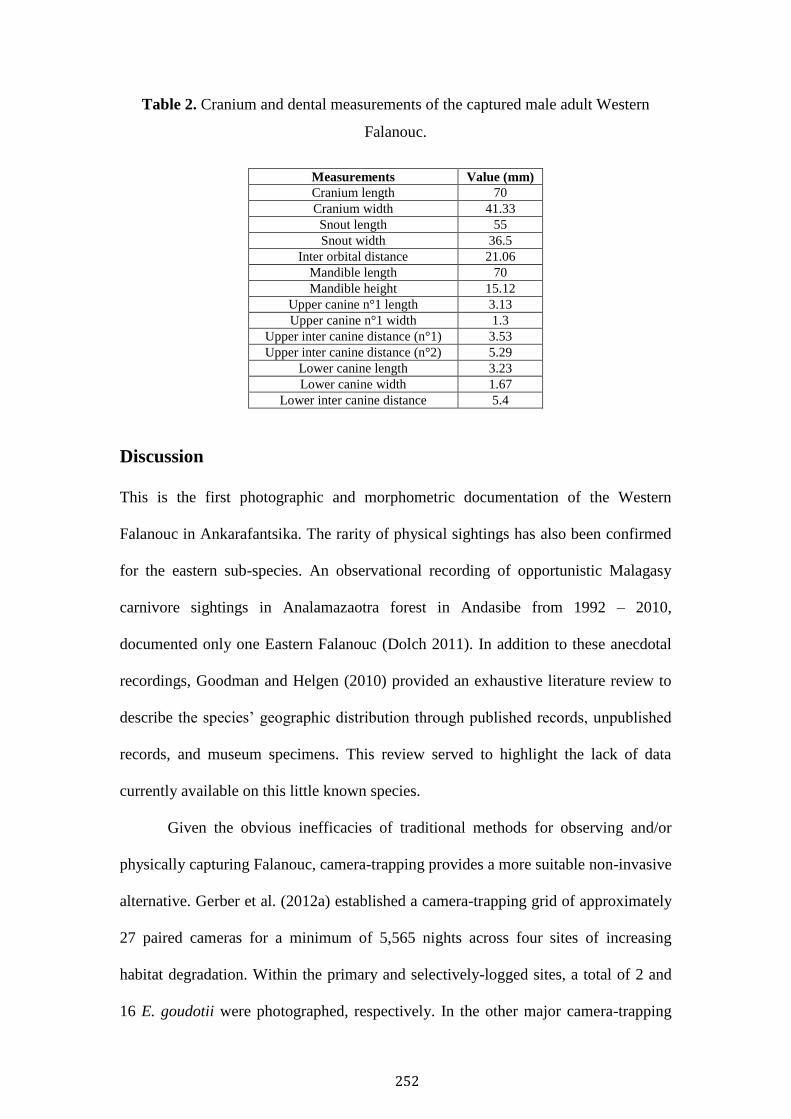
252
Table 2. Cranium and dental measurements of the captured male adult Western
Falanouc.
Measurements Value (mm)
Cranium length 70
Cranium width 41.33
Snout length 55
Snout width 36.5
Inter orbital distance 21.06
Mandible length 70
Mandible height 15.12
Upper canine n°1 length 3.13
Upper canine n°1 width 1.3
Upper inter canine distance (n°1) 3.53
Upper inter canine distance (n°2) 5.29
Lower canine length 3.23
Lower canine width 1.67
Lower inter canine distance 5.4
Discussion
This is the first photographic and morphometric documentation of the Western
Falanouc in Ankarafantsika. The rarity of physical sightings has also been confirmed
for the eastern sub-species. An observational recording of opportunistic Malagasy
carnivore sightings in Analamazaotra forest in Andasibe from 1992 – 2010,
documented only one Eastern Falanouc (Dolch 2011). In addition to these anecdotal
recordings, Goodman and Helgen (2010) provided an exhaustive literature review to
describe the species’ geographic distribution through published records, unpublished
records, and museum specimens. This review served to highlight the lack of data
currently available on this little known species.
Given the obvious inefficacies of traditional methods for observing and/or
physically capturing Falanouc, camera-trapping provides a more suitable non-invasive
alternative. Gerber et al. (2012a) established a camera-trapping grid of approximately
27 paired cameras for a minimum of 5,565 nights across four sites of increasing
habitat degradation. Within the primary and selectively-logged sites, a total of 2 and
16 E. goudotii were photographed, respectively. In the other major camera-trapping
253
study of East Madagascar’s carnivores Farris et al. (2015) amassed a total of 202
images of E. goudotii in Masoala-Makira. This large number of photographs was in
part due to an increased sampling effort of 15,253 nights across seven sites from
August 2008 – 2013. Within the western forests of Madagascar the sole camera-
trapping study of Malagasy carnivores captured six E. major across 24 sites during
227 nights in June – August 2012 (Evans et al. 2013). In contrast our total camera-
trapping grid was in collective operation for a total of 6,269 nights, capturing a single
image of E. major from April – July. Insofar as this low success rate is indicative of
very low population density, this raises at least the possibility that anthropogenic
pressures in Ankarafantsika could be responsible.
E. major and E. goudotii are currently listed as Endangered by the IUCN.
Much of Madagascar’s large fauna currently face significant pressures, predominately
deforestation and hunting, two threats that are under current investigation in our study
in Ankarafantsika. Within our study site, much of the landscape has been altered to
savannah, agricultural fields, or experiences severe human and invasive species
encroachment. Our camera-trapping grid encompassed a balanced mixture of these
different habitats, with 34 camera-trap stations located in primary forest, 20 in
degraded forest, and 25 found in savannah. Given much of this landscape has
experienced significant habitat alteration, in alignment with human and invasive
species presence, it could be expected that these factors collectively act as a strong
Falanouc deterrent. This baseline information should be helpful in ongoing
estimations of their population, distribution and ultimately in informing their
conservation.
254
References
Albignac, R., 1972. The Carnivora of Madagascar, In Biogeography and Ecology in
Madagascar. eds R. Battistini, G. Richard-Vindard, pp. 667-682. Springer
Netherlands.
Albignac, R., 1974. Observations éco-éthologiques sur le genre Eupleres, Viverridé
de Madagascar. Extrait de la Terre et la Vie, Revue d'Ecologie Appliquée 28,
321–351.
Dollar, L., 1999. Notice of Eupleres goudotii in the rainforest of southeastern
Madagascar. Small Carnivore Conservation 20, 30-31.
Dollar, L.J., 2006. Morphometrics, diet, and conservation of Cryptoprocta ferox.
Duke University.
Dolch, R., 2011. Species composition and relative sighting frequency of carnivores in
the Analamazaotra rainforest, eastern Madagascar. Small Carnivore Conservation
44, 44-47.
Evans, B., Rakotondraparany, F., Cole, L., Graham, S., Long, P., Gandola, R., 2013.
The carnivores of Mariarano forest, Madagascar: first insights. Small Carnivore
Conservation 49, 15-19.
Farris, Z.J., Gerber, B.D., Karpanty, S., Murphy, A., Andrianjakarivelo, V.,
Ratelolahy, F., Kelly, M.J., 2015. When carnivores roam: temporal patterns and
overlap among Madagascar's native and exotic carnivores. Journal of Zoology
296, 45-57.
Farris, Z.J., Karpanty, S.M., Ratelolahy, F., Kelly, M.J., 2014. Predator–Primate
Distribution, Activity, and Co-occurrence in Relation to Habitat and Human
Activity Across Fragmented and Contiguous Forests in Northeastern Madagascar.
International Journal of Primatology.
255
Gerber, B.D., Karpanty, S.M., Randrianantenaina, J., 2012a. The impact of forest
logging and fragmentation on carnivore species composition, density and
occupancy in Madagascar's rainforests. Oryx 46, 414-422.
Gerber, B.D., Karpanty, S.M., Randrianantenaina, J., Vuren, D.H.V., 2012b. Activity
patterns of carnivores in the rain forests of Madagascar: implications for species
coexistence. Journal of Mammalogy 93, 667-676.
Goodman, S.M., Helgen, K.M., 2010. Species limits and distribution of the Malagasy
carnivoran genus Eupleres (Family Eupleridae). mammalia 74.
Hawkins, A.F., 2008. Eupleres goudotii. The IUCN Red List of Threatened Species.
Version 2014.2.