Embed Size (px)
Citation preview

A&A manuscript no.(will be inserted by hand later)
Your thesaurus codes are:6(08.06.02; 08.12.1; 08.16.5; 10.15.2: NGC 2264
ASTRONOMYAND
ASTROPHYSICSFebruary 15, 1999
BVRI photometry of the star-forming region NGC 2264: the initialmass function and star-forming rate?E. Flaccomio1, G. Micela2, S. Sciortino2, F. Favata3, C. Corbally4 and A. Tomaney51 Dipartimento di Scienze Fisiche ed Astronomiche – Universita di Palermo2 Osservatorio Astronomico di Palermo G.S. Vaiana, Palazzo dei Normanni, I-90134 Palermo, Italy3 Astrophysics Division – Space Science Department of ESA, ESTEC, Postbus 299, NL-2200 AG Noordwijk, The Netherlands4 Vatican Observatory Research Group, University of Arizona, Tucson AZ 85721, USA5 Department of Astronomy, Columbia University, New York NY,USA
Received 1 September 1998 / Accepted 29 Janauary 1999
Abstract. The pre-main sequence (PMS) population in themass range between� 0:2 and� 3M� in southern part ofthe star-forming region NGC 2264 has been studied, determin-ing both the Initial Mass Function in the region as well as thestar-formation rates for different mass ranges. The sampleis acomposite one, derived through the union of samples obtainedthrough different techniques and each suffering from differentbiases: previously known PMS stars in the region from the lit-erature, photometrically-selected T Tauri candidates (from ourown photometric data, discussed in detail in the present paper)and X-ray selected PMS candidates (discussed in detail in acompanion paper) have been joined to form a sample whichwe show to be statistically complete (i.e. free from the biaseswhich affect each of the parent samples) down to' 0:6M�(while being incomplete at lower masses). Individual massesand ages have been derived by placing the individual stars onevolutionary tracks, allowing us to derive both the IMF and thestar formation rate.
The Initial Mass Function thus derived for NGC 2264shows evidence for a bimodal distribution of masses, with abreak in the IMF at around 1M�.
Key words: Stars: formation; Stars: late-type; Stars: pre-main sequence; Open clusters and associations: individual:NGC 2264
1. Introduction
Star-forming regions (SFRs) have always been the ideal lab-oratory for the study of the mechanisms of stellar formation,as well as for the study of the structure and time evolution ofnewly formed stellar systems from the early pre-main sequence(PMS) phase down to the young main sequence (MS). In spite
Send offprint requests to: Ettore Flaccomio ([email protected])? Based on observations with the VATT: the Alice P. Lennon Tele-scope and the Thomas J. Bannan Astrophysics Facility. Table3 isavailable in electronic form ar CDS via ftp 130.79.128.5
of the several advances which have been made possible by theavailability of new spectral domains (and notably of the soft X-ray band), and of the large attention which they have received inthe recent literature, several key questions regarding themech-anisms of star formation are still unanswered, both from an ob-servational as well as from a theoretical point of view.
In particular, the key issue of whether star formation is es-sentially an universal, self-regulating process (thus leading toan universal initial mass function – IMF) or whether its out-come depends strongly on the local conditions and/or on thetriggering event which started the collapse of the originalcloud(which would result in different IMFs for different regions) isstill unsolved. The derivation of the IMF, as well as of the star-formation rate in different SFRs with different observed condi-tions supplies an important constraint to whether star formationis an universal process or not.
At a distance of about 760 pc (Sung et al. 1997)1, and atan estimated age varying between3� 106 years (Walker 1956;Mermilliod 1981) and107 years (Sagar et al. 1986), the starforming region NGC 2264 allows us to study the earlier stagesof stellar evolution.
The disadvantage of its larger distance with respect toother well studied regions with similar characteristics (e.g. theTaurus-Auriga or Orion clouds) is compensated by two facts,which greatly ease the interpretation of the observationaldata:a smallinterstellar visual absorption (E(B �V) = 0:06 mag.;Perez et al. 1987) for the cluster members and the presence,inthe immediate proximity of the region, of an optically thickre-flection nebula (see e.g. Herbig 1954) that effectively obscuresbackground stars.
Figure 1 shows a photographic image (taken from theSTScI Digital Sky Survey) of the central part of NGC 2264,in which the presence of the cloud is clearly revealed by thedistinct decrease in the surface density of stars toward theareaaround and between the two brightest stars of the association: SMon (north) and W178 (HD47887, south). It can also be seen
1 Although the earlier study of Perez et al. (1987) estimatedthedistance at 950 pc

2 BVRI photometry of NGC 2264
Table 1. Optical characteristics of the VATT telescope.
Optical system aplanatic Gregorian, f/9Focal length 16.48 mPrimary mirror f/1.0, 1.83m. diameterSecondary mirror f/0.9, 0.38m. diameterVignetting-Free Field 72 mm diameter (15 arcmin)Image scale 12.52 arcsec/mmImage quality 0.1 arcsec within 6.8 arcmin from axisMounting altitude-azimuthal with derotator
that, contrary to most stellar associations that show a singleclustering of stars, NGC 2264 has a rather complicated spatialstructure: we can identify two physically distinct agglomera-tions, one to the North and one to the South (see Sagar et al.,1988).
Since the classical study of Walker (1956) suggested that alarge fraction of the stars in the area are in the pre-main se-quence stage, several workers have tried to characterize thestellar population of the region, using different techniques.Proper motion studies (Vasilevskis et al. 1965), X-ray obser-vations (Simon et al. 1985, Patten et al. 1994, Flaccomio et al.in prep.),H� surveys (Herbig 1954; Ogura 1984; Marcy 1980;Sung et al. 1997), IRAS infrared imaging (Margulis et al. 1989)and photometric studies (Adams et al. 1983; Rydgren 1979;Lada et al. 1993) have progressively enriched the knowledgeof the young stellar population of NGC 2264.
The identification of the optical counterparts of a deep X-ray survey of NGC 2264 using the ROSAT HRI instrument re-cently conducted by Flaccomio et al. (in prep.) shows that theexisting studies of the region do not provide an unbiased listof members down to sufficiently faint magnitudes. Therefore,CCD observations of part of the region in the Johnson-CousinBVRI bands were conducted, covering the 20 arcmin squareshown in Fig. 1. The area, which is roughly centered on thebright B1.5 V star W178, includes a good part of the southernstar-forming core as well as the characteristic cone nebula.
The observations and their reductions are discussed inSect. 2 of the present paper, while the results obtained are pre-sented and discussed in Sect. 3, and summarized in Sect. 4.
2. Observations and data reduction
2.1. Instrumentation and observations
The CCD frames discussed here were acquired at the VaticanAdvanced Technology Telescope (VATT) on Mt. Graham, inArizona, using the Columbia SpectraSource CCD camera, dur-ing the nights of December 2 and 3, 1996. The conditions werephotometric during both nights. A short summary of the opti-cal characteristics of the telescope is given in Table 1. TheCCDwas a 2048 pixel square Tektronic chip. At the plate scale of theVATT, each pixel spans about 0.33 arcsec in the sky, yieldinga square field of view of about 11 arcmin on a side. The filtersused closely reproduce the standard passbands of the Johnson-Cousin B, V, R and I filters.
Fig. 1. An image of NGC 2264 from the STScI Digital Sky Survey.The square (20 arcmin on a side) indicates the extent of the CCDframes which are discussed in the present paper. Note the distinct de-crease in star density toward the center of the region due to the pres-ence of the molecular cloud. North is up, east to left.
The square field shown in Fig. 1 was surveyed with a mo-saic made with four different and partially overlapping point-ings. Each of the four fields has been observed with the fourfilters and with four different exposure times, ranging from1to 200 seconds, in order to enhance the dynamic range of themeasurements preventing the saturation of the CCD. A totalof 64 CCD frames were thus obtained, in addition to the stan-dard calibration frames and to observations of 19 standard starsfrom Landolt (1992). A list of the CCD frames analyzed hereis shown in Table 2.
2.2. Data reduction and photometry
The reduction of the data was performed using the IRAF soft-ware and in particular the tasks provided in theCCDREDpack-age. At the time of the observations discussed here the VATTwas not yet fully operational, and in particular the collimationof the optics was still being worked on. As a result, the opticalquality of the individual CCD frames is not ideal, and severaldifferent approaches were explored to flat-field the data andtodetermine the shutter travel time. To optimally reduce the data,use was made of the program frames in addition to the calibra-tion frames. The data reduction process is discussed in detail inFlaccomio (1996).
The ’daofind’ source detection algorithm was used to de-tect individual stars in each frame, as well as to determine their
Flaccomio et al. 3
Table 2. Summary of observed fields
Date Type Ra Dec Texp(sec) Filter Ntot2 Dec. Object 6:41:27.4 09:21:24 100,10,2,1 VRI 12
” ” ” 200,20,2,1 B 4” 6:41:27.4 09:31:24 100,10,2,1 VRI 12” ” ” 200,10,2,1 B 4
Standard 9:21:28.0 2:46:06 2-10 BVRI 8” 6:51:29.0 -0:16:05 2-10 BVRI 8” 5:57:55.0 -0:09:07 5-10 BVRI 4
Dome Flat 5-9 BVRI 163 Dec. Object 6:40:46.9 09:21:24 100,10,2,1 VRI 12
” ” ” 200,20,2,1 B 4” 6:40:46.9 09:31:24 100,10,2,1 VRI 12” ” ” 200,20,2,1 B 4
Standard 7:27:29.0 -1:59:56 2-10 BVRI 8” 5:57:55.0 -0:09:07 2-10 BVRI 8
Dome Flat 5-10 BVRI 16Bias 0 6Dark 900-6900 19
Twilight Flat 1-35 BVRI 16
Total number of images 173
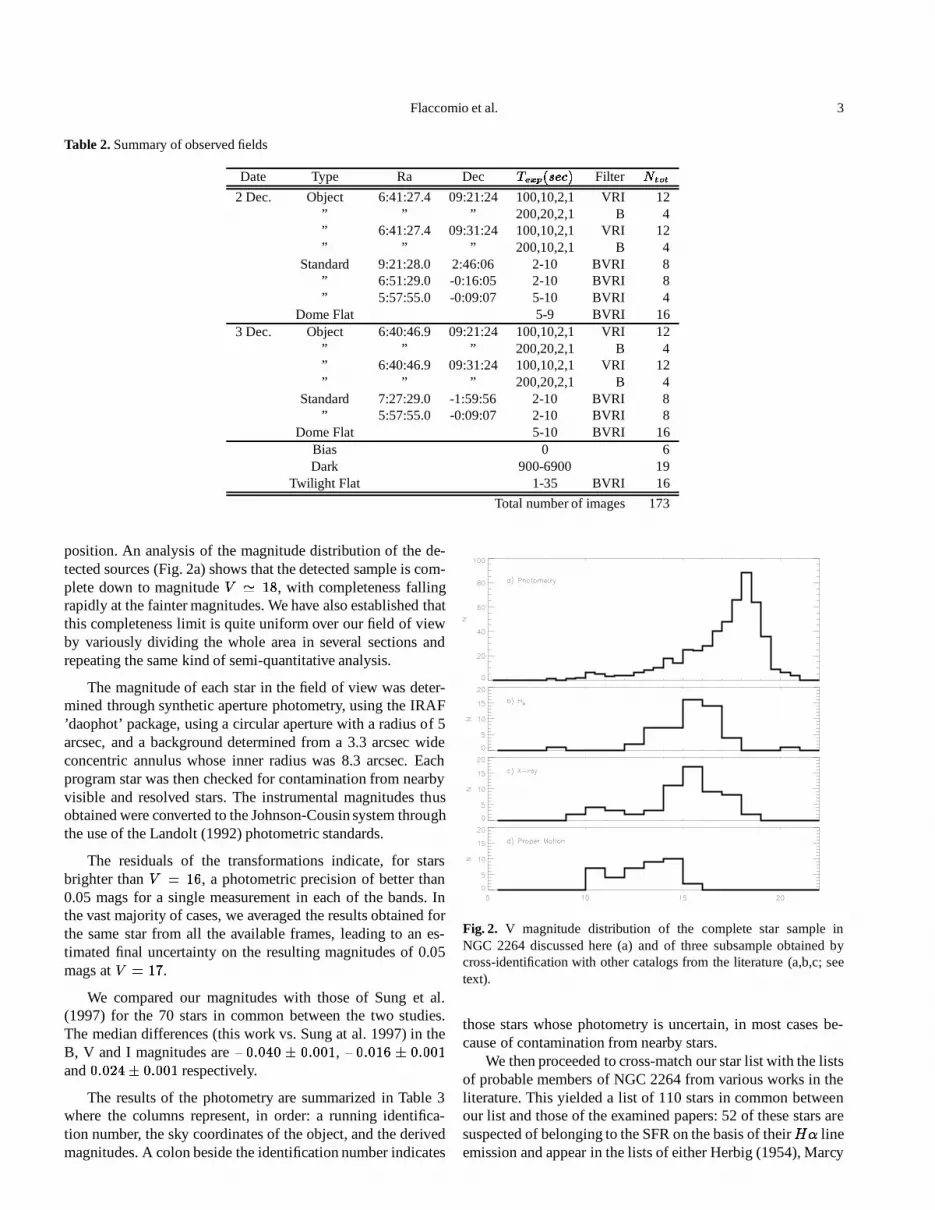
position. An analysis of the magnitude distribution of the de-tected sources (Fig. 2a) shows that the detected sample is com-plete down to magnitudeV ' 18, with completeness fallingrapidly at the fainter magnitudes. We have also establishedthatthis completeness limit is quite uniform over our field of viewby variously dividing the whole area in several sections andrepeating the same kind of semi-quantitative analysis.
The magnitude of each star in the field of view was deter-mined through synthetic aperture photometry, using the IRAF’daophot’ package, using a circular aperture with a radius of 5arcsec, and a background determined from a 3.3 arcsec wideconcentric annulus whose inner radius was 8.3 arcsec. Eachprogram star was then checked for contamination from nearbyvisible and resolved stars. The instrumental magnitudes thusobtained were converted to the Johnson-Cousin system throughthe use of the Landolt (1992) photometric standards.
The residuals of the transformations indicate, for starsbrighter thanV = 16, a photometric precision of better than0.05 mags for a single measurement in each of the bands. Inthe vast majority of cases, we averaged the results obtainedforthe same star from all the available frames, leading to an es-timated final uncertainty on the resulting magnitudes of 0.05mags atV = 17.
We compared our magnitudes with those of Sung et al.(1997) for the 70 stars in common between the two studies.The median differences (this work vs. Sung at al. 1997) in theB, V and I magnitudes are�0:040 � 0:001, �0:016 � 0:001and0:024� 0:001 respectively.
The results of the photometry are summarized in Table 3where the columns represent, in order: a running identifica-tion number, the sky coordinates of the object, and the derivedmagnitudes. A colon beside the identification number indicates
Fig. 2. V magnitude distribution of the complete star sample inNGC 2264 discussed here (a) and of three subsample obtained bycross-identification with other catalogs from the literature (a,b,c; seetext).
those stars whose photometry is uncertain, in most cases be-cause of contamination from nearby stars.
We then proceeded to cross-match our star list with the listsof probable members of NGC 2264 from various works in theliterature. This yielded a list of 110 stars in common betweenour list and those of the examined papers: 52 of these stars aresuspected of belonging to the SFR on the basis of theirH� lineemission and appear in the lists of either Herbig (1954), Marcy

4 BVRI photometry of NGC 2264
Fig. 3. V� I vs.B�V diagram for the stars in the NGC 2264 regionobserved in the present program. The solid and dotted lines respec-tively indicate the loci of the main sequence and of the giantbranch.X-ray, H� and proper motion selected members (see the text for de-tails) are indicated by different symbols. The arrow indicates the red-dening vector.
(1980), Ogura (1984) or Sung et al. (1997); another 39 starshave, according to the proper motion study by Vasilevskis etal.(1965), membership probabilities greater than 50 %. Finally, 61of our stars were found to be strong (30:2 <� logLX <� 31:2)X-ray emitters by Flaccomio et al. (in prep.). Distributions ofV magnitude for these three samples are given in Fig. 2b,c,d.
3. Results
3.1. Color-color diagrams
PMS stars are known to present several spectral peculiarities,both in their absorption/emission lines and in their overall spec-tral energy distribution (SED). While classical T-Tauri stars(CTTS) show strong deviations from the spectral energy distri-bution of normal stars, as well as strong emission lines, weak-line T-Tauri stars (WTTS), as their name implies, show little orno such peculiarities (Walter et al. 1988).
The SED of classical T-Tauri stars is usually characterizedby non-photospheric excesses both in the optical/ultraviolet(the so called ’veiling’) as well as in the infrared spectralre-gions. Both types of excess have been successfully related tothe emission of accretion disks (e.g. Bertout et al. 1988).
While the infrared excesses due to the presence of accre-tion disks usually show up at larger wavelengths than thoseobserved here, the blue contribution due to the hot accretingarea is known to be extend significantly down to, at least, theVphotometric band (see Hartigan et al. 1995).
Fig. 4. R� I vs.V�R diagram. The meaning of symbols and curvesis as in Fig. 3.
Such photometric excesses will cause the star to deviate, ina color-color plot, from either the main-sequence or the giantlocus. We have thus used the position of our stars in theV � Ivs.B�V andR�I vs.V�R planes to select likely PMS stars.Clearly such selection procedure is presumably biased towardCTTS and, in particular, toward the youngest and most activelyaccreting ones.
The color-color diagram shown in Fig. 3 indeed shows thata large fraction of the redder objects deviate from both the mainsequence and the giant loci. These deviations are most likelydue to blue excesses in the spectra of these objects and stronglysuggest their CTTS nature. This last point is reinforced by theevidence that most of the stars whoseH� line was detected inemission by Herbig (1954), Marcy (1980), Ogura (1984) andSung et al. (1997) are seen to deviate on average more than theX-ray sources (Flaccomio et al. in prep.): while the former aremostly CTTS, the latter are, more likely, dominated by WTTShaving less or no blue excess.
Figure 4 shows a color-color diagram computed using “red-der” colors than the ones used in Fig. 3; such a diagram isthus less affected by the blue excesses that were so evident inFig. 3. Nevertheless, a numbers of stars still deviate from boththe dwarf and the giant sequences.
Considering that field stars are prevalently MS objects(with possibly a few giants) those stars that lie significantlyabove either the Main Sequence in Fig. 3 or the giant locus inFig. 4 are, as already suggested, likely to be classical T-Tauristars and consequently members of NGC 2264.
The position of the few stars below and to the right of thelower of the sequences (i.e. the MS in Fig. 4 and the giant lo-cus in Fig. 3) can be explained assuming a larger than averagereddening. As the cloud right behind NGC 2264 can be consid-

Flaccomio et al. 5
eredtotally opaque, the most plausible possibility is that theseobject are NGC 2264 members either with a highcircumstel-lar absorption or partially embedded in the cloud. Foregroundstars indeed should be even less reddened than the average ’in-terstellar’ NGC 2264 value of E(B � V ) = 0:06, so that theyshould remain close enough to the MS not to be mistaken forcluster stars.
Following the previous discussion, we chose to select asNGC 2264 members those stars that, in one or both of the color-color diagrams, are more distant from the region bounded bythe MS and the giant locus than the photometric uncertaintieswould allow. Considering only stars brighter than V=17, whosephotometric error can be quite reliably estimated (i.e. 0.1mag.in both axis, with a2� confidence) we thus selected 46 likelymembers, 24 of which were previously unknown.
Although this selection criterium has resulted in a signifi-cant number of new members of the population of NGC 2264,the procedure adopted has no claim of completeness (as it istrue for the other membership criteria). Inspection of the color-color diagrams shows that known members with earlier spectraltypes do not show any photometric excesses, and thus that theadopted procedure preferentially selects later spectral types.
3.2. The membership catalog
Our NGC 2264 membership catalog, containing 141 members,is shown in Table 5. The first column refers to the identifica-tion number in Table 3. A colon besides this numbers signalsan uncertain photometry. We then list the sky position, photom-etry and derived physical parameters of the selected stars (seeSect. 3.3). The column labeled ”Memb” indicates the meth-ods by which each star was selected. The letters indicate: ’c’,stars selected because of their colors using the method dis-cussed above; ’x’, the counterparts of the X-ray sources listedby Flaccomio et al. (in prep.); ’h’, theH� stars from the cata-logs of Herbig (1954), Marcy (1980), Ogura (1984) and Sunget al. (1997); ’p’, the proper motion stars from Vasilevskiset al.(1965) with membership probabilities greater than 50%. Thelast column shows the result of the cross identifications.
Excluding the list by Sung et al. (1997), which include onlystars in the northern half of our field of view (RA >� 9:5), allof the other surveys entirely cover the area of the sky we studyin this paper. Anyway, none of these (largely overlapping) sam-ples is complete: Vasilevskis et al. (1965) proper-motion surveyhas a magnitude limit ofV ' 15, theH�-selected samples arestrongly biased toward the CTTS population, as is our photo-metrically selected sample. The X-ray sample, which is alsothe largest, is likely to include both CTTS and WTTS. It alsospans a larger range of spectral types than all the other samplesbut it is biased toward the more active stars.
We will show in the next subsection that, in building theMass Function for the observed part of NGC 2264, the differentbiases actually compensate each other to some degree and thatthe union of these samples reaches near completeness, at leastfor the most massive stars (M >� 0:6M�).
Fig. 5. H-R diagram of the photometrically-selected NGC 2264 mem-bers. Evolutionary tracks and isochrones from D’Antona & Mazzitelli(1998) are shown. The dashed line indicates the deuterium burninglocus and the cross on the left side of the diagram indicates typicaluncertainties.
3.3. The H-R diagram
Figure 5 shows the H-R diagram for the stars selected asNGC 2264 members, superimposed on the pre-main sequenceevolutionary tracks from D’Antona & Mazzitelli (1998). Bolo-metric luminosities for each star were derived from our pho-tometric data using the Bessel & Stringfellow (1993)BCI vs.V � I relation and assuming a distance of 760 pc; effectivetemperatures were calculated from the (de-reddened) V�I forstars with(V � I)o > 0:0, and from(B � V)o for the bluerones. In the first case we employed the Schmidt-Kaler (1982)color-temperature relation adapted with the aid of the Bessel(1990) color-color relation. In the second we used the Codeet al. (1976) relation. A correction for mean reddening (Perezet al. 1987) was applied to the photometry prior to these calcu-lations.
Although we adopted a distance of 760 pc (Sung et al.1997), a wide range of distance estimates are available in theliterature for NGC 2264. Perez et al. (1987), for example, ob-servationally derived individual extinction laws for eachstar,finding evidence of anomalous reddening, and obtaining a dis-tance of 950 pc, higher than most available distance estimate.Our adopted distance however, other than being the most re-cently obtained value, is also close to the average of all modernestimates.
In the determination of both the bolometric luminosity andthe effective temperature of low mass stars we used theV � Icolor indices andI magnitudes, which better represent the pho-tospheric emission of PMS stars (Kenyon & Hartmann 1990;

6 BVRI photometry of NGC 2264
Sung et al. 1997). Individual differential reddening and resid-ual color excesses may however introduce competing system-atic shifts in the effective temperature and bolometric correc-tion for each star. Other sources of uncertainty for the luminos-ity and/or temperature determination are the possible presenceof unresolved companions and, for CTTS, the occultation ofpart of the photosphere by circumstellar disks (see e.g. Kenyon& Hartmann 1990). The apparent positions of the few stars thatlie over the birthline in the H-R diagram may well be explainedby these systematics. The mass and age of individual stars werethus estimated by their positions on the D’Antona & Mazzitelli(1998) evolutionary tracks. Five stars in Fig. 5 appear to lie be-low the main sequence. For the four of these stars closest tothe main sequence we assumed the mass of the closest evolu-tionary track and the age of108 years, we have discarded theremaining one.
3.4. Dynamical Evolution and Mass Segregation
The area of the sky we study in this work does not cover theentire Star Formation Region (see Fig. 1) but only its southernpart around the bright star W178. Our result can thus only bestrictly valid for this region.
If the association has undergone significant dynamical evo-lution the observed mass and age spectra of our sample maydiffer from the initial distributions that we intend to study.Moreover, as indicated by several studies (see e.g. Sagar etal.,1988; Raboud & Mermilliod, 1998), mass segregation is alsopresent in young clusters with ages smaller than their relax-ation time. This fact has been interpreted as a result of inho-mogeneous formation conditions within the cloud leading theconcentration of massive stars toward its center.
We thus tried to study the spatial distribution of stars inrelation to stellar mass. A quantitative study is made ratherproblematic by the difficulty of defining a cluster center forNGC 2264. Sagar et al. (1988), for example, define two cen-ters, one corresponding to the bright star S Mon, north of oursurveyed region, the other close to the star W157 (our star 339in Table 5).
No clear mass segregation is apparent from the spatial dis-tribution of stars of different masses. Although this failure todetect mass segregation may be due to the small area investi-gated, it quite possibly reflects the actual situation. First: therelaxation time for NGC 2264, as calculated by Sagar et al.(1988) isLog(TE) � 7:4, greater than its age. Second: masssegregation in non-relaxed clusters has been usually observedonly for more massive stars (M=M� > 20, Raboud & Mermil-liod, 1998) than those considered; here we are interested onlyin the low mass (M=M� < 3:0) population of NGC 2264 andwe only derive masses and ages for these stars.
3.5. The Initial Mass Function in NGC 2264
In order to build a meaningful IMF it is of primary importanceto take into account the completeness of the star samples used.Here we assume that, for a given stellar mass, the observa-
Table 4. Completeness estimateLog(M=M�) X H� C-C All methods-0.15 0.40 0.80 0.40 1.00-0.05 0.50 1.00 0.25 1.000.05 0.00 0.33 0.17 0.780.15 0.14 0.14 0.00 0.760.25 0.60 0.40 0.00 0.960.35 0.38 0.00 0.00 1.00
tional biases of the proper motion sample are not correlatedwith those affecting the three other samples used (i.e. the onesselected on the basis of X-ray emission,H� emission, and ofstrong color excesses). It follows that, although by itselfbiasedtoward massive stars, the proper motion sample constitutes, ineach mass bin, a random sample of the whole population, freefrom the biases that affect the other samples. The proper motionmembers can therefore be used to derive the (mass dependent)selection efficiency of any of the other samples, e.g., for theX-ray sample:NXNtotal = NX&P:M:NP:M: (1)
whereNtotal refers to the total number of NGC 2264 mem-bers in the field of view,NX andNP:M: refer to members de-tected in X-rays and proper motion surveys, respectively, andNX&P:M: is the number of proper motion members detected inX-rays.
A similar calculation has been performed for all the con-sidered samples (i.e. X-ray,H�, color excess and proper mo-tion) as well as for their union in the mass range�0:2 <�Log(M=M�) <� 0:4, where the proper motion sample and theother three overlap to some degree. The results are shown inTable 4. For each considered mass bin we report the expectedselection efficiency of any of the methods. As expected, eachsample is individually incomplete, but the union of all the sam-ples represents reasonably well the actual NGC 2264 popula-tion in the considered mass range.
The resulting IMF is shown in Fig. 6; squares with errorbars derived from Poisson statistics represent the actual datawhile the solid-linehistogram, where different from zero,is thebias-corrected IMF derived as described above from the com-posite sample. The dashed line shows the Scalo (1986) localIMF with arbitrary normalization. While we could not estimatethe completeness of our sample forLog(M=M�) <� �0:2, thefall of the IMF in this mass range is most obviously due to thelimiting sensitivity of both the existing data and of our survey(and thus to the incompleteness of the resulting sample) at thelower-mass end.
The resulting observational, bias-corrected IMF shows ev-idence for a bimodal distribution, with a “bump” in the dis-tribution at the higher masses (' 2M�). We performed theKMM test (Ashman et al. 1994) to detect bimodality in an uni-variate data set. The test rejects with a high degree of signifi-cance (P=0.017 or P=0.015 depending on weather we assumehomoscedastic or heteroscedastic populations), the hypothesis

Flaccomio et al. 7
Fig. 6. Small squares: mass distribution for the sample of stars selectedas NGC 2264 members in the present work. Error bars are simplePoisson statistics estimates (i.e. the square root of the number of starsin each mass bin). Solid line histogram: bias-corrected IMF. Dashedline: Scalo (1986) IMF with arbitrary normalization.
of an unimodal distribution, thus giving support to the realityof the high mass excess. A similar result was recently obtained,for the northern part of NGC 2264, by Sung et al. (1997), whoperformed a study using UBVRI andH� photometry. The con-clusions of Sung et al. (1997) are based on a list of NGC 2264members which, due to partial spatial overlap of the two stud-ies, has only 18 stars in common with our list, so that the tworesults are indeed independent.
3.6. Star formation history
While individual stellar ages derived from the position of thestars on evolutionary tracks have a certain (possibly large) de-gree of uncertainty associated with them, because of the al-ready discussed uncertainties on the position of the stars in theH-R diagram as well as on the tracks themselves, the relativeages (and mass attribution)should be more accurate, thus yield-ing a useful picture regarding the time-evolution of the star-formation rate in the region.
In Fig. 7a we have plotted the star-formation rate (definedas the number of stars with age in each logarithmic age bindivided by the size – in years – of the bin) as a function ofthe estimated age for our sample of stars in NGC 2264. Thestar-formation rate is plotted for the complete sample (squaredots, with Poisson-statistics error bars) and for two subsamplessegregated by mass: stars with mass greater than 1.0M� withthe dark continuous curve and those with0:6 < M=M� < 1:0with the dashed lighter one. For these latter two samples wealso plot (Fig. 7b) the distribution of the logarithm of starages.
Fig. 7. a) Star formation rate vs. age. The square dots refer to the wholesample of NGC 2264 members discussed in the present paper, witherror bars derived on the basis of Poisson statistics. The two curvesrefer to stars withLog(M=M�) > 0:0 and�0:2 < Log(M=M�) <0:0 (solid and dashed lines respectively). b) Distribution of log(age)for the same two subsample described above.
Note that both of these subsamples are within the mass rangewhose completeness we have shown in the previous section.
The star-formation rate for NGC 2264 shows (in any massranges) a steep rise in formation activity at the early stages ofthe history of the SFR (i.e. at large stellar ages) and a subse-quent flattening. However, the presence of uncertainties intheindividual age attribution would introduce such a behaviorinthe presence of a star-formation activity which started suddenlyat some point in the past and then proceeds at constant rate. Toverify this, we produced simulated star-forming rate plotsun-der the assumption of a sudden turn-on in star formation whichthen proceeded at a constant rate, and with characteristic un-certainties equal to the ones we have derived from our sample.Indeed, the observed global star-forming rate for NGC 2264 iscompatible with this hypothesis.
The star-formation rate for the whole sample appears to in-dicate an age of about1–2 � 106 yr for the beginning of star for-mation while the two complete subsamples, which, on average,comprise more massive stars, indicate a larger age (� 107 yr).This fact may suggest a scenario of sequential star formation.However the total sample is very likely biased toward youngerstars, as can be seen from the HR diagram in Fig. 5. The lack oflow mass stars, which can likely be explained by a sensitivitylimit, clearly introduces such a bias. Interestingly, however, thecurve and the histogram that refer to the lower masses seem toshow a somewhat smaller typical age respect to the other one,hinting once again toward a sequential star formation. Thisdif-ference in age between the two samples can hardly be consid-

8 BVRI photometry of NGC 2264
ered significative, but it will be interesting, for future deeperobservations, to test this hypothesis.
In any case it seems clear that star forming activity is con-tinuing to the present day, as shown by the presence of a fewstars close (or formally above) the birthline in our sample,aswell as the reported presence of several very young objects inthe region (e.g. Castelaz & Grasdalen 1988).
To conclude this section, we note that a sequential star for-mation scenario had already been suggested for NGC 2264 byAdams et al. (1983). However their proposed sequence of starformation was exactly the opposite of what is suggested byour data, starting with low mass stars and proceeding gradu-ally with the onset of formation of more massive ones. Stahler(1985) had later reinterpreted the same data. He concluded that,due to the uncertainty in the dating of those stars that had al-ready reached the main sequence, the observations where in-stead compatible with a variety of star formation historiesandin particular with a contemporaneous onset of formation forallmasses. Our results however are not subject to the same criti-cism for two reasons. First, our sample of stars is comprisedofrelatively low mass stars and very few of them, if any, seem tohave reached the main sequence. Second, the effect describedby Stahler (1985) would tend to mask, and not to produce, thekind of mass-age relation we suggest.
4. Summary and Conclusions
The analysis of our CCD BVRI photometry in the southern partof the star-forming region NGC 2264 has lead to the identifica-tion of 24 previously unknown likely members of the associa-tion, on the basis of photometric color excesses. We have col-lected a critical compilation of the existing membership datafor NGC 2264, building a sample which we show to be sta-tistically complete forM >� 0:6M�. Through star positionson the evolutionary tracks of D’Antona & Mazzitelli (1998),we have estimated their individual masses and ages, which wehave then used to build an Initial Mass Function for the stud-ied part of the region as well as to determine the star-formationhistory as a function of time in the region.
Our main result is that the IMF seems to differ from thefield one (i.e. the Scalo 1986 IMF), due to the presence of a“bump” in the IMF at high masses
This features could point toward the presence of two some-what distinct star-formation mechanisms being at work inNGC 2264, one for low-mass and one for high-mass stars (seee.g. Larson, 1986; Silk 1985; Lee & Chun, 1986). Followingthe discussion of Larson (1986) one may envision a scenarioin which massive stars (such as the B1.5V star W178 which isat the center of the field studied here, or the O7V star S Mon)form at an early stage, and, due to the heating and/or strong ion-ization of the surrounding matter, prevent to some degree theformation of less massive stars, thus explaining the observedexcess of high-mass stars in the IMF. The likehood of such anhistory of star formation will be greatly enhanced if the sug-gested difference in stellar age between samples of differentmass will be confirmed with greater confidence.
We note that our conclusions are robust in the face of theexisting uncertainty in the distance to NGC 2264. If we wereto adopt the Perez et al. (1987) distance of 950 pc, in place ofthe 760 pc (Sung et al. 1997) which was assumed throughoutthe present paper, the absolute age and mass estimates wouldchange, thus shifting the mass at which the IMF shows a break,but the general conclusion about the presence of a bimodal IMFwould not change.
A more complete survey of the region, both covering awider area of the SFR and reaching down to fainter magni-tudes in order to achieving completeness at lower masses, willbe needed in the future to assess whether the bimodal struc-tures of the IMF and the difference in characteristic ages ofthehigh- and low-mass populations persist when a more completecensus of the region is taken. Both deep optical and X-ray ob-servations will be useful in this context.
Acknowledgements. EF, GM and SS acknowledge finan-cial support from MURST (Ministero della Universita e dellaRicerca Scientifica e Tecnologica). EF thanks the ”Universitadegli Studi di Palermo” for awarding a fellowship. We thankthe referee D. Raboud for his useful comments that helped toimprove this work.
References
Adams M. T., Strom K. M., Strom S. E. 1983, ApJS 53, 893Ashman K.M., Bird C.M., Zepf S.E. 1994, AJ 109, 2348Bessel M.S. 1990, P.A.S.P. 102, 1181.Bessel M.S., Stringfellow G.S. 1993, ARA&A 31, 433Bertout C., Basri G., Bouvier J. 1988, ApJ 330, 350Castelaz M. W., Grasdalen G. 1988, ApJ 335, 150Code A.D., Davis J., Bless R. C., Hanbury Brown R. 1976 ,
ApJ 203, 417D’Antona F., Mazzitelli I. 1998, Mem. S. A. It. Vol. 68. No. 4
(G. Micela, R. Pallavicini and S. Sciortino eds.)Flaccomio E. 1996, Tesi di Laurea in Fisica, Universita di
PalermoHartigan P., Edwards S., Ghandour L. 1995, ApJ 452, 736Herbig G. H. 1954, ApJ 119, 483Kenyon S. J., Hartmann L. W. 1990, ApJ 349, 197Lada C. J., Young E. T., Greene T. P. 1993, ApJ 408, 471Landolt A. U. 1992, AJ 104, 340Larson R. B. 1986, MNRAS 218, 409Lee S.-W., Chun M.Y. 1986, JKAS 19, 51.Marcy G. W. 1980, AJ 85, 230Margulis M., Lada C. J., Young E. T. 1989, ApJ 345, 906Mermilliod J.-C. 1981, A&A 97, 235Ogura K. 1984, PASJ 36, 139Patten B.M., Simon T., Strom S.E., Strom K.M. 1994, In Cool
Stars, Stellar System, and the Sun, ed. Caillault, J.P., A.S.P.Conf. Ser. 64, page 125
Perez M. R., The P. S., Westerlund B. E. 1987, PASP 99, 1050Raboud D., Mermilliod J.-C. 1998 A&A 333, 897Rydgren A. E. 1979, AJ 84, 90

Flaccomio et al. 9
Sagar R., Piskunov A. E., Miakutin V. I., Joshi U. C. 1986,MNRAS 220, 383
Sagar R., Myakutin V.I., Piskunov A.E., Dluzhnevskaya O.B.1988 MNRAS 234, 831
Scalo J.M. 1986, Fundamentals of Cosmic Physics, Vol 11.(Gordon and Breach)
Schmidt-Kaler T.H. 1982, In Stars and Star Clusters, Eds.Shaifers, K. E., Voigt, H.H., (Landolt-Bornstein New Se-ries, Volume 2b, Astronomy and Astrophysics), New York
Silk J. 1985, in I.A.U. Symposium 115, page 663.Simon T., Cash W., Snow T. P., J. 1985, ApJ 293, 542Stahler S.W. 1985, ApJ 293, 207Sung H., Bessell M. S., Lee S.-W. 1997, AJ 114, 2644Vasilevskis S., Sanders W. L., Balz A. G. A. 1965, AJ 70, 797Walker M. F. 1956, ApJS 2, 365Walter F.M., Brown A., Mathieu R.D., Myers P.C., Vrba F.J.
1988, AJ 96, 297

10 BVRI photometry of NGC 2264
Table 5. Catalog of members.N1 RA2000 DEC2000 V B � V V �R R� I Log(Lbol) Log(Teff ) M Log(Age) Memb:2 Ident:3h:m:s o:’:” [mag.] [mag.] [mag.] [mag.] [L�] [oK] [M� ] [years]
11 6:40:26.7 9:25:30.0 13.33 0.70 0.37 0.33 0.43 3.80 1.32 7.34 p V3629 6:40:28.5 9:35:51.0 15.91 1.41 0.85 0.95 -0.18 3.59 0.46 5.94 x W51, FX1231: 6:40:28.6 9:31: 4.0 14.13 1.19 0.71 0.77 0.38 3.63 0.50 5.38 h V38, O7732 6:40:28.6 9:21:48.0 16.83 1.30 0.63 1.01 -0.63 3.61 0.77 7.00 c33 6:40:28.7 9:21:55.0 13.59 1.87 1.01 1.01 0.85 3.57 — — c V3950 6:40:30.8 9:34:44.0 15.34 1.23 0.78 0.79 -0.06 3.61 0.53 5.92 h W55, S110, H1252: 6:40:31.1 9:31:10.0 15.16 1.29 0.73 0.86 0.02 3.61 0.49 5.77 xh W56, V41, O82, FX1658 6:40:31.8 9:36: 4.0 16.71 1.30 0.81 1.22 -0.39 3.57 0.42 6.08 c S11592 6:40:36.2 9:18:59.0 15.89 1.28 0.83 0.91 -0.21 3.60 0.50 6.01 xc FX18102 6:40:37.1 9:31:13.0 17.41 1.56 1.04 1.32 -0.51 3.55 0.32 6.05 x FX20106: 6:40:37.3 9:35:46.0 8.24 1.33 0.62 0.47 2.58 3.68 — — h W69, V49, S134110 6:40:37.8 9:34:57.0 16.50 1.02 0.89 1.18 -0.29 3.57 0.37 5.89 xhc S141, H16, FX23112 6:40:37.8 9:36: 0.0 15.20 2.56 0.44 1.52 0.18 3.58 0.31 4.98 c126 6:40:39.0 9:36: 3.0 16.19 1.30 0.87 1.18 -0.17 3.57 0.34 5.75 c S144129 6:40:39.3 9:34:48.0 16.46 1.42 1.01 1.05 -0.28 3.57 0.37 5.88 h S147134 6:40:40.0 9:35: 6.0 14.40 1.07 0.63 0.58 0.16 3.67 0.91 6.15 xhp W77, V54, S150, H18, FX26145: 6:40:40.8 9:27:57.0 16.32 1.21 0.79 0.78 -0.46 3.61 0.74 6.70 h O89149 6:40:41.1 9:33:60.0 15.88 0.50 0.76 0.67 -0.34 3.63 0.82 6.67 hcp V57, S155, H22157 6:40:41.9 9:22:57.0 16.01 1.06 0.59 0.71 -0.45 3.65 0.90 7.12 c158 6:40:42.1 9:33:40.0 12.02 0.56 0.31 0.31 0.95 3.82 1.70 6.92 hp W84, V59, S163161 6:40:42.4 9:25:15.0 16.15 2.12 1.20 1.17 0.00 3.55 0.23 4.82 c173 6:40:43.3 9:28:43.0 16.55 1.38 0.91 0.99 -0.39 3.59 0.50 6.24 h O91186 6:40:44.2 9:23:19.0 16.84 1.04 0.68 0.73 -0.74 3.64 0.70 7.47 c188 6:40:44.5 9:32:29.0 18.51 0.61 1.30 1.45 -0.74 3.52 0.22 6.12 x FX36194 6:40:45.0 9:28:46.0 14.25 1.00 0.58 0.54 0.18 3.68 1.11 6.30 hp V65, M364195 6:40:45.1 9:23:56.0 14.49 0.90 0.51 0.60 0.09 3.68 1.14 6.49 p V66197 6:40:45.4 9:21:12.0 14.79 2.09 1.09 1.07 0.44 3.56 0.24 3.91 c200 6:40:45.9 9:17:59.0 16.67 1.09 0.86 1.02 -0.45 3.59 0.55 6.37 c204 6:40:46.5 9:21:42.0 14.85 2.11 1.15 1.07 0.45 3.56 — — c207 6:40:46.8 9:32:33.0 17.67 2.13 0.75 1.25 -0.79 3.57 0.60 6.94 x FX40208 6:40:46.8 9:25:55.0 15.51 1.44 0.86 0.92 -0.03 3.60 0.42 5.74 h O92211 6:40:47.0 9:32:42.0 16.38 1.08 0.93 0.96 -0.33 3.59 0.48 6.12 xhc W95, S186, H26, FX41217 6:40:48.1 9:21:16.0 16.53 1.15 0.55 0.68 -0.69 3.66 0.75 7.68 c219 6:40:48.2 9:36:41.0 16.30 1.62 0.81 1.14 -0.27 3.58 0.42 5.95 xc W97, S191, FX44221 6:40:48.5 9:32:55.0 17.01 1.42 0.82 0.94 -0.64 3.60 0.71 6.92 x S193, FX45223: 6:40:48.6 9:22: 0.0 10.16 0.03 -0.02 0.03 1.76 3.99 2.50 6.57 xp V73, FX46224 6:40:48.6 9:36: 0.0 20.35 -0.50 2.35 1.48 -0.87 3.46 0.12 5.40 h O94226 6:40:48.8 9:17:12.0 16.41 1.09 0.75 0.79 -0.51 3.62 0.78 6.85 c230 6:40:49.2 9:23:51.0 15.99 1.26 0.84 0.81 -0.29 3.61 0.58 6.24 h H29250 6:40:51.4 9:28:46.0 16.05 1.12 0.79 0.81 -0.33 3.61 0.64 6.39 xhc H34, FX50262 6:40:53.6 9:30:41.0 11.67 0.51 0.26 0.30 1.08 3.83 1.78 6.87 xp W116, V83, S218, FX56263 6:40:53.6 9:33:27.0 14.56 0.99 0.58 0.58 0.08 3.67 1.00 6.36 xhp W115, V82, S217, H35, FX54264 6:40:54.0 9:29:53.0 17.16 1.46 0.96 0.99 -0.61 3.58 0.59 6.64 x FX57266 6:40:54.3 9:20: 5.0 11.81 0.54 0.30 0.31 1.03 3.82 1.71 6.91 x W118, FX58269 6:40:55.2 9:17:53.0 15.50 1.10 0.62 0.74 -0.22 3.64 0.84 6.54 c279 6:40:56.4 9:35:55.0 16.91 1.33 1.11 1.02 -0.42 3.56 0.39 6.07 hc W123, S232, H40281 6:40:56.6 9:30:17.0 15.90 1.28 1.02 1.28 0.07 3.55 0.24 4.75 xc W127, S235, FX63290 6:40:57.7 9:30:52.0 16.49 1.49 0.88 1.04 -0.36 3.58 0.48 6.15 h S238, O102294 6:40:58.4 9:33:33.0 10.21 -0.07 -0.02 0.02 1.74 4.13 — — xp W132, V91, S242, FX65297 6:40:58.6 9:36:15.0 17.06 1.37 0.98 1.68 -0.21 3.53 0.20 5.05 h H42298 6:40:58.7 9:30:59.0 13.78 1.10 0.61 0.57 0.40 3.67 0.95 5.87 hp V93, S244, S245, H43299 6:40:58.8 9:28:54.0 16.80 1.20 0.95 1.29 -0.32 3.56 0.33 5.86 c303 6:40:59.4 9:29:53.0 16.86 1.09 0.93 1.21 -0.40 3.56 0.38 6.02 hc O105304 6:40:59.5 9:28:45.0 16.14 1.24 0.78 0.92 -0.32 3.60 0.57 6.27 hc H45305 6:40:59.5 9:35:12.0 15.34 1.66 0.97 1.06 0.16 3.57 0.28 4.87 xh W136, S251, O104, FX71306 6:40:59.9 9:28:51.0 15.76 1.42 0.65 0.80 -0.29 3.63 0.76 6.52 xc FX73309 6:41: 0.4 9:29:17.0 14.81 1.24 0.64 0.69 0.04 3.65 0.75 6.10 x S257, FX75311 6:41: 0.6 9:24:12.0 10.20 0.05 0.04 0.06 1.71 3.96 2.50 6.55 p W138, V97313 6:41: 0.9 9:32:46.0 13.44 1.30 0.71 0.73 0.64 3.63 0.50 4.84 xh W139, V98, S260, H47, FX78314: 6:41: 1.1 9:34:54.0 15.81 0.95 0.83 0.87 -0.19 3.60 0.51 6.02 h O107315 6:41: 1.3 9:34:10.0 14.58 1.18 0.65 0.65 0.12 3.65 0.76 6.03 x V100, S263, FX80316 6:41: 1.4 9:28:14.0 10.69 0.02 0.04 0.08 1.50 3.95 2.39 6.64 p V102321 6:41: 2.5 9:34:57.0 14.06 0.95 0.52 0.51 0.23 3.70 1.38 6.54 x W149, V105, S271, FX85322 6:41: 2.5 9:35:14.0 15.30 1.22 0.69 0.71 -0.12 3.64 0.72 6.27 x W150, S272, FX86324 6:41: 2.7 9:27:25.0 9.17 -0.14 — — — — — — x V108, FX87328 6:41: 3.3 9:30: 6.0 16.82 1.72 0.93 1.36 -0.31 3.55 0.31 5.82 c S278330 6:41: 3.4 9:31:20.0 12.74 0.71 0.36 0.39 0.68 3.79 1.42 7.09 xp V109, S279, FX89335 6:41: 3.6 9:27:41.0 16.07 1.05 0.80 0.83 -0.33 3.61 0.61 6.34 xc FX90338 6:41: 4.0 9:23:33.0 14.32 0.66 0.36 0.38 0.05 3.79 — — p V116339 6:41: 4.0 9:35:22.0 16.47 1.40 0.92 1.12 -0.29 3.57 0.38 5.91 x S282, FX93340 6:41: 4.0 9:33: 3.0 10.08 -0.09 -0.03 0.00 1.80 4.16 — — p W157, V115, S283342 6:41: 4.2 9:24:53.0 15.44 0.72 0.70 0.80 -0.14 3.62 0.62 6.14 hc H49349 6:41: 4.6 9:36:29.0 10.88 0.04 0.03 0.13 1.42 3.94 2.15 6.74 xp W159, V118, S290, FX96351 6:41: 5.3 9:33:15.0 15.08 1.13 0.69 0.79 -0.00 3.63 0.59 5.93 x W160, S296, FX98353 6:41: 5.6 9:31: 2.0 15.41 1.38 0.84 0.94 0.01 3.60 0.41 5.69 x W162, S298, FX100

Flaccomio et al. 11
Table 5. Continue.N1 RA2000 DEC2000 V B � V V �R R� I Log(Lbol) Log(Teff ) M Log(Age) Memb:2 Ident:3h:m:s o:’:” [mag.] [mag.] [mag.] [mag.] [L�] [oK] [M� ] [years]
355 6:41: 5.8 9:27:18.0 16.30 1.48 0.90 1.45 -0.07 3.55 0.25 5.05 c356 6:41: 5.8 9:22:56.0 10.99 0.15 0.07 0.11 1.37 3.93 2.05 6.79 p W165, V121358 6:41: 5.9 9:35:52.0 13.79 0.89 0.45 0.44 0.29 3.74 1.36 7.00 hp V120, S301, S302360 6:41: 6.1 9:36:25.0 13.39 0.85 0.46 0.49 0.47 3.71 1.70 6.47 xhp W164, V122, S303, H53, FX101361 6:41: 6.2 9:29:32.0 17.67 4.81 0.89 1.61 -0.54 3.54 0.27 6.00 x FX103364 6:41: 6.3 9:28:40.0 17.32 1.68 1.10 1.01 -0.60 3.56 0.46 6.41 h H55365 6:41: 6.5 9:35:47.0 14.06 0.74 0.37 0.35 0.15 3.79 — — p V123, S304366 6:41: 6.7 9:34:47.0 16.14 1.29 0.84 0.98 -0.27 3.59 0.48 6.06 hc W166, O112367: 6:41: 6.7 9:27:34.0 12.94 0.96 0.68 0.64 0.79 3.65 0.66 5.00 hp V124, H54368 6:41: 6.7 9:29:26.0 17.45 1.11 0.83 1.07 -0.75 3.59 0.69 7.03 h S306, O114370 6:41: 6.9 9:27:50.0 14.91 1.10 0.74 0.80 0.09 3.62 0.51 5.72 xc FX105371: 6:41: 6.9 9:27:32.0 13.56 1.02 -0.56 0.94 0.32 3.88 — — h H56372 6:41: 7.1 9:31:20.0 17.75 1.55 1.00 1.31 -0.67 3.55 0.37 6.35 x FX107374: 6:41: 7.3 9:25:56.0 15.15 1.30 0.77 0.86 0.04 3.61 0.46 5.71 xh O115, FX106378 6:41: 7.8 9:30:43.0 15.61 1.16 0.70 0.66 -0.26 3.64 0.86 6.63 x W175, S310, FX109381 6:41: 8.8 9:23:44.0 14.73 1.28 0.79 0.85 0.21 3.61 0.42 5.51 x FX111383 6:41: 8.9 9:30:11.0 15.79 0.78 0.78 0.83 -0.23 3.61 0.57 6.16 hc S316, H58385: 6:41: 9.4 9:27:14.0 14.50 1.24 0.73 0.86 0.28 3.61 0.44 5.42 x V132, FX114386 6:41: 9.6 9:27:53.0 10.21 0.11 — — — — — — x V130, FX115391 6:41:10.1 9:28:35.0 16.00 0.32 0.82 0.80 -0.31 3.61 0.60 6.30 c398 6:41:11.6 9:26:33.0 15.18 1.30 0.84 0.86 0.06 3.60 0.43 5.65 xh W183, H59, FX116401 6:41:12.8 9:27:34.0 11.42 0.47 0.32 0.34 1.19 3.81 2.00 6.72 xp W189, V140, FX118402 6:41:12.8 9:26:16.0 13.56 0.88 0.67 0.62 0.53 3.66 0.72 5.50 hcp V139, H61404: 6:41:13.1 9:28: 9.0 16.77 1.15 0.91 0.89 -0.53 3.59 0.64 6.62 x FX124406 6:41:13.2 9:26:11.0 14.31 1.14 0.73 0.74 0.30 3.63 0.52 5.51 h H62407 6:41:13.9 9:26:42.0 16.48 1.34 0.87 1.00 -0.38 3.59 0.51 6.23 c409 6:41:14.3 9:33:23.0 15.53 1.28 0.79 0.86 -0.10 3.61 0.50 5.91 x W191, S335, FX126411 6:41:14.7 9:32:38.0 16.87 1.69 1.09 1.40 -0.22 3.54 0.24 5.35 x S336, FX127413 6:41:14.9 9:26:46.0 16.74 1.21 0.95 1.09 -0.40 3.57 0.42 6.09 hc H64416 6:41:15.7 9:26:18.0 13.80 1.16 0.68 0.71 0.47 3.64 0.56 5.40 x V147, FX129417 6:41:16.0 9:26:10.0 15.83 0.61 0.75 0.91 -0.22 3.61 0.54 6.10 c418 6:41:16.5 9:29:54.0 15.30 1.42 0.91 1.00 0.11 3.59 0.34 5.28 xh V150, S343, M368, FX131419 6:41:16.6 9:27:32.0 15.13 0.96 0.72 0.64 -0.07 3.64 0.75 6.25 hcp V151, H65420 6:41:16.7 9:36:23.0 17.60 1.38 1.08 1.41 -0.52 3.54 0.27 5.99 x FX132422 6:41:17.5 9:29:28.0 15.70 1.50 0.93 1.11 0.02 3.57 0.30 5.26 x S346, FX133424 6:41:17.8 9:33:39.0 15.32 1.21 0.74 0.80 -0.07 3.62 0.56 5.97 x W198, V152, S348, FX134426 6:41:18.1 9:33:56.0 14.91 1.07 0.72 0.63 0.01 3.65 0.73 6.12 xhp W199, V153, S349, H68, FX135427 6:41:18.2 9:31:32.0 18.43 1.55 1.00 1.46 -0.86 3.54 0.30 6.48 x FX136430: 6:41:18.9 9:26:31.0 17.17 1.09 1.11 1.13 -0.47 3.56 0.37 6.08 h H69431 6:41:19.3 9:30:30.0 13.88 0.86 0.46 0.41 0.25 3.75 1.23 7.16 p V154, S352434 6:41:19.5 9:31:46.0 14.31 1.18 0.67 0.66 0.24 3.65 0.68 5.78 xp V155, S353, FX138440 6:41:20.9 9:33:38.0 15.23 1.20 0.78 0.78 -0.03 3.62 0.53 5.87 xh W204, V159, S357, H70, FX141441 6:41:21.0 9:32:16.0 17.77 1.61 0.93 1.21 -0.76 3.56 0.48 6.69 x FX142445 6:41:22.6 9:29:41.0 15.75 1.04 0.59 0.55 -0.41 3.67 0.90 7.22 h S364, H71447 6:41:22.8 9:27:28.0 12.67 0.71 0.41 0.42 0.73 3.76 1.67 6.85 xp W208, V164, FX146449 6:41:23.6 9:33:58.0 11.32 0.34 0.21 0.20 1.21 3.88 2.00 6.79 p W209, V165, S366451 6:41:24.3 9:21:39.0 13.32 0.54 0.28 0.29 0.42 3.83 — — p V166452 6:41:24.3 9:32:47.0 16.73 1.50 0.94 1.21 -0.34 3.56 0.36 5.92 x S369, FX148453 6:41:24.6 9:26:24.0 13.38 0.73 0.40 0.37 0.43 3.78 1.30 7.20 p W210, V167458 6:41:26.6 9:23:55.0 12.68 0.44 0.24 0.25 0.67 3.85 — — p V169460 6:41:27.0 9:35: 8.0 14.37 1.01 0.57 0.56 0.14 3.68 1.06 6.33 x V170, S373, FX150462: 6:41:27.4 9:31:57.0 14.91 1.27 0.76 0.61 0.02 3.64 0.70 6.06 h S375, S376470 6:41:30.9 9:26:59.0 13.56 0.83 0.56 0.60 0.48 3.67 1.01 5.81 hcp W215, V178, H72473 6:41:32.8 9:19: 3.0 9.79 0.44 0.25 0.26 1.83 3.85 — — x W220, FX157476 6:41:34.1 9:34:44.0 16.80 2.67 1.53 1.58 0.13 3.50 — — c S399483 6:41:37.1 9:21: 0.0 11.58 0.62 0.32 0.34 1.13 3.81 1.92 6.77 p W224, V188488 6:41:38.1 9:32:14.0 15.83 2.07 1.15 1.18 0.11 3.55 0.23 4.59 c S416489 6:41:38.6 9:32:13.0 15.31 1.09 0.72 0.64 -0.14 3.64 0.79 6.39 h V189, S417, H76490 6:41:38.9 9:29:39.0 16.87 2.51 1.57 1.58 0.13 3.50 — — c S418501 6:41:41.0 9:33:56.0 14.33 1.93 1.02 1.11 0.61 3.56 — — cp V192, S424502 6:41:41.0 9:32:44.0 12.88 0.52 0.28 0.29 0.60 3.83 1.44 7.60 p V193, S426505 6:41:42.8 9:25: 8.0 16.63 1.11 0.84 0.92 -0.49 3.60 0.64 6.57 hc H78508 6:41:43.2 9:27: 1.0 12.46 0.89 0.46 0.47 0.84 3.72 2.00 6.11 p W230, V199511 6:41:44.2 9:25: 2.0 16.69 1.52 0.93 1.18 -0.34 3.56 0.37 5.95 h O129514 6:41:45.8 9:33: 3.0 15.09 2.04 1.05 1.14 0.34 3.56 0.23 4.13 c S443520 6:41:47.7 9:34:10.0 14.53 1.23 0.69 0.73 0.19 3.63 0.58 5.70 p V204, S448
Notes:1 Identification number (from Table 3), colons signal uncertain photometry.2 Membership criteria: ’c’, this paper (see text); ’x’, Flaccomio et al. (in prep.); ’h’, Herbig (1954), Marcy (1980),Ogura(1984) or Sung et al. (1997); ’p’, Vasilevskis et al. (1965) withmembership probabilities> 50%.3 Cross-identification; the one or two letter prefix indicatesthe original catalog while the number is the reference used by the authors of the catalog. The prefix stand for: ”W”, Walker(1956); ”V”, Vasilevskis et al. (1965);, ”S”, Sung et al. (1997); ”O”, Ogura (1984); ”M”, Marcy (1980); ”H”, Herbig (1954); ”FX”, Flaccomio et al. (in prep.).


