Embed Size (px)
Citation preview

The Astrophysical Journal, 733:101 (30pp), 2011 June 1 doi:10.1088/0004-637X/733/2/101C© 2011. The American Astronomical Society. All rights reserved. Printed in the U.S.A.
THE SINS SURVEY OF z ∼ 2 GALAXY KINEMATICS: PROPERTIES OFTHE GIANT STAR-FORMING CLUMPS∗
R. Genzel1,2
, S. Newman3, T. Jones
3, N. M. Forster Schreiber
1, K. Shapiro
3,4, S. Genel
1, S. J. Lilly
5, A. Renzini
6,
L. J. Tacconi1, N. Bouche
7,15, A. Burkert
8, G. Cresci
9, P. Buschkamp
1, C. M. Carollo
5, D. Ceverino
10, R. Davies
1,
A. Dekel10
, F. Eisenhauer1, E. Hicks
11, J. Kurk
1, D. Lutz
1, C. Mancini
6, T. Naab
12, Y. Peng
5, A. Sternberg
13,
D. Vergani14
, and G. Zamorani14
1 Max-Planck-Institut fur extraterrestrische Physik (MPE), Giessenbachstr. 1, D-85748 Garching, Germany; [email protected] Department of Physics, Le Conte Hall, University of California, Berkeley, CA 94720, USA
3 Department of Astronomy, Campbell Hall, University of California, Berkeley, CA 94720, USA4 Aerospace Research Laboratories, Northrop Grumman Aerospace Systems, Redondo Beach, CA 90278, USA
5 Institute of Astronomy, Department of Physics, Eidgenossische Technische Hochschule, ETH Zurich, CH-8093, Switzerland6 Osservatorio Astronomico di Padova, Vicolo dell’Osservatorio 5, Padova, I-35122, Italy
7 Department of Physics & Astronomy, University of California, Santa Barbara, Santa Barbara, CA 93106, USA8 Universitats-Sternwarte Ludwig-Maximilians-Universitat (USM), Scheinerstr. 1, Munchen, D-81679, Germany
9 Istituto Nazionale di Astrofisica–Osservatorio Astronomico di Arcetri, Largo Enrico Fermi 5, I – 50125 Firenze, Italy10 Racah Institute of Physics, The Hebrew University, Jerusalem 91904, Israel
11 Department of Astronomy, University of Washington, Box 351580, U.W., Seattle, WA 98195-1580, USA12 Max-Planck Institute for Astrophysics, Karl Schwarzschildstrasse 1, D-85748 Garching, Germany
13 School of Physics and Astronomy, Tel Aviv University, Tel Aviv 69978, Israel14 INAF Osservatorio Astronomico di Bologna, Via Ranzani 1, 40127 Bologna, Italy
Received 2010 November 24; accepted 2011 February 9; published 2011 May 11
ABSTRACT
We have studied the properties of giant star-forming clumps in five z ∼ 2 star-forming disks with deep SINFONIAO spectroscopy at the ESO VLT. The clumps reside in disk regions where the Toomre Q-parameter is below unity,consistent with their being bound and having formed from gravitational instability. Broad Hα/[N ii] line wingsdemonstrate that the clumps are launching sites of powerful outflows. The inferred outflow rates are comparable toor exceed the star formation rates, in one case by a factor of eight. Typical clumps may lose a fraction of their originalgas by feedback in a few hundred million years, allowing them to migrate into the center. The most active clumpsmay lose much of their mass and disrupt in the disk. The clumps leave a modest imprint on the gas kinematics.Velocity gradients across the clumps are 10–40 km s−1 kpc−1, similar to the galactic rotation gradients. Givenbeam smearing and clump sizes, these gradients may be consistent with significant rotational support in typicalclumps. Extreme clumps may not be rotationally supported; either they are not virialized or they are predominantlypressure supported. The velocity dispersion is spatially rather constant and increases only weakly with star formationsurface density. The large velocity dispersions may be driven by the release of gravitational energy, either at the outerdisk/accreting streams interface, and/or by the clump migration within the disk. Spatial variations in the inferredgas phase oxygen abundance are broadly consistent with inside-out growing disks, and/or with inward migrationof the clumps.
Key words: cosmology: observations – galaxies: evolution – galaxies: high-redshift – infrared: galaxies
Online-only material: color figures
1. INTRODUCTION
The rest-frame UV/optical morphologies of most z > 1“normal” star-forming galaxies (henceforth “SFGs”; Steidelet al. 1996, 2004; Franx et al. 2003; Noeske et al. 2007;Daddi et al. 2007; Cameron et al. 2010) are irregular and of-ten dominated by several giant (kpc size) star-forming clumps(Cowie et al. 1995; van den Bergh et al. 1996; Elmegreenet al. 2004, 2007, 2009; Elmegreen & Elmegreen 2005, 2006;Forster Schreiber et al. 2009, 2011). These clumpy, asym-metric structures often resemble z ∼ 0 mergers (Conseliceet al. 2003; Lotz et al. 2004). However, spatially resolvedstudies of the ionized gas kinematics of these clumpy galax-ies find a surprisingly large abundance of disks with coher-
∗ Based on observations at the Very Large Telescope (VLT) of the EuropeanSouthern Observatory (ESO), Paranal, Chile (ESO program IDs 076.A-0527,079.A-0341, 080.A-0330, 080.A-0339, 080.A-0635, 183.A-0781).15 Supported by the Marie Curie grant PIOF-GA-2009-236012 from theEuropean Commission.
ent rotation, especially among the more massive (M∗ � a few1010 M�) and bright (Ks AB � 21.8) systems (Forster Schreiberet al. 2006, 2009; Genzel et al. 2006, 2008; Weiner et al.2006; Wright et al. 2007; Law et al. 2007, 2009; Shapiroet al. 2008; Bournaud et al. 2008; Cresci et al. 2009; vanStarkenburg et al. 2008; Epinat et al. 2009; Lemoine-Busserolle& Lamareille 2010). These kinematic studies also find thathigh-z SFGs as a rule exhibit large local velocity dispersionsof their ionized gas component, with ratios of rotation velocityvc to local intrinsic velocity dispersion σ 0 ranging from 1 to 6.Observations of CO rotational line emission indicate that z ∼1–3 SFGs have large (∼30%–80%) baryonic cold gas fractions(Daddi et al. 2008, 2010a; Tacconi et al. 2008, 2010).
These basic observational properties can be understood in asimple physical framework, in which gravitational instabilityand fragmentation in semi-continuously fed, gas-rich disksnaturally leads to large turbulence and giant star-forming clumps(Noguchi 1999; Immeli et al. 2004a, 2004b; Bournaud et al.2007; Elmegreen et al. 2008; Genzel et al. 2008; Dekel et al.
1

The Astrophysical Journal, 733:101 (30pp), 2011 June 1 Genzel et al.
2009a; Bournaud 2010). A more detailed discussion of theseinstabilities follows in Section 2.4, where we show that gas-rich, marginally stable disks should have much larger and moremassive star-forming complexes than those in z ∼ 0 SFGs andthat these complexes should be located in regions where thevalue of the Toomre (1964) Q-parameter is below unity.
The most recent generation of cosmological galaxy evolutionmodels and simulations finds that the buildup of z > 1 SFGsin the mass range of 1010 to 1011 M� is dominated by smoothaccretion of gas and/or minor mergers (Keres et al. 2005, 2009;Dekel & Birnboim 2006; Bower et al. 2006; Kitzbichler &White 2007; Ocvirk et al. 2008; Dave 2008; Dekel et al. 2009b;Oser et al. 2010). In contrast, the overall cosmological massassembly of galaxies, especially of the most massive ones andat late times, is probably dominated by mergers (Bower et al.2006; Kitzbichler & White 2007; Naab et al. 2007, 2009; Guo& White 2008; Dave 2008; Genel et al. 2008). The large andsemi-continuous gas accretion in these “cold flows” or “coldstreams” may rapidly build up galaxy disks (Dekel et al. 2009b;Ocvirk et al. 2008; Keres et al. 2009; Oser et al. 2010). Ifthe incoming material is gas-rich, then violent gravitationalinstabilities in these disks could lead to the large star formationrates derived from observations (Genel et al. 2008; Dekel et al.2009a). The giant clumps are expected to migrate into the centervia dynamical friction and tidal torques on a timescale of
tin-spiral ≈ (vc/σ0)2tdyn(Rdisk) ∼ 10tdyn(Rdisk) < 0.5 Gyr, (1)
where they may form a central bulge and a remnant thick disk(Noguchi 1999; Immeli et al. 2004a, 2004b; Forster Schreiberet al. 2006; Genzel et al. 2006, 2008; Elmegreen et al. 2008;Carollo et al. 2007; Dekel et al. 2009a; Bournaud et al. 2009;Ceverino et al. 2010).
The efficacy of the “violent disk instability” for formingbulges by the in-spiral of the giant clumps hinges on thesurvival of the clumps in the presence of outflows driven bystellar winds, supernovae, and radiation pressure, even if sec-ular bulge growth may also occur directly from the diskwithout clump migration. This “star formation feedback” iswidely thought to be a key ingredient in the evolution of star-forming galaxies (Dekel & Silk 1986; Kauffmann et al. 1993;Finlator & Dave 2008; Efstathiou 2000; Bouche et al. 2010;Dutton et al. 2010). Local universe giant molecular clouds(GMCs) are prone to rapid expulsion of gas by this feedback ona timescale texpulsion ∼ Mclump/Mout, which probably dissipatesGMCs on a timescale of a few tens of megayears (Murray 2010).High-z clumps may live longer because their ratio of gravita-tional binding energy to star formation rate is ∼100 times largerthan in the local universe (Dekel et al. 2009a). Exactly howstable the high-z clumps are and how large their gas expulsiontimescales might be is a matter of current debate. Krumholz &Dekel (2010) find that the high-z clumps only lose a modestfraction (<50%) of their original mass by feedback as long asthe star formation efficiency per free-fall time does not signif-icantly exceed a few percent (similar to local SFGs; Kennicutt1998a). Murray et al. (2010a) and Genel et al. (2010) arguethat the majority of the clumps’ initial gas mass is expelled byfeedback in the form of momentum-driven winds.
While it is plausible that the very active high-z SFGsare naturally driven toward marginal gravitational instability(Q ∼ 1) by self-regulation (Quirk 1972; Gammie 2001; Thomp-son et al. 2005), the dominant agents responsible for the required(and observed) high-velocity dispersions are not known, andpossibly multi-factorial (Krumholz & Burkert 2010). Forster
Schreiber et al. (2006) proposed that the gravitational energyreleased by the accreting gas (including minor mergers) atthe interface of the cold streams and the disk may triggerthe large random motions. A similar explanation is favored byGenzel et al. (2008) and Khochfar & Silk (2009), while Dekelet al. (2009a) argue that smoother-than-average streams maynot be able to drive a large local velocity dispersion but in othercases accretion from the halo might drive the disk into stability(Q > 1). Instead, Immeli et al. (2004a, 2004b), Dekel et al.(2009a), and Ceverino et al. (2010) all favor gravitationaltorques in the disk and collisions between the giant clumps, ora combination of the gravitational torques and stellar feedback(Elmegreen & Burkert 2010) as the main drivers of the turbu-lence. If the main driver of the large velocity dispersions is stellarfeedback, and specifically radiation pressure on dust grains, onemight expect a correlation of the amplitude of turbulence withstar formation rate or surface density (Forster Schreiber et al.2006; Genzel et al. 2008; Murray et al. 2010a).
In this paper we present and analyze new high-qualitySINFONI/VLT integral field (IFU) spectroscopy (Eisenhaueret al. 2003; Bonnet et al. 2004) of five luminous, clumpyz ∼ 2 SFGs. We employed both laser guide star (LGS) andnatural guide star (NGS) adaptive optics (AO) to improve theangular resolution to an effective ∼0′′.2 FWHM. For all of thetargets, the quality of the derived spectra is much superior toprevious data, because of long integration times (9 to 19 hr infour of the targets) and/or the high surface brightness of theselected clumpy galaxies. With these data it is now possible, forthe first time, to study detailed line profiles on the scale of themost massive and largest clumps (1–3 kpc). Our measurementsdeliver interesting new constraints on the kinematic propertiesand lifetimes of the giant clumps. We adopt a ΛCDM cosmologywith Ωm = 0.27, Ωb = 0.046, and H0 = 70 km s−1 Mpc−1
(Komatsu et al. 2010), as well as a Chabrier (2003) initial stellarmass function (IMF).
2. OBSERVATIONS AND ANALYSIS
2.1. Source Selection, Observations, and Data Reduction
By selection, the five galaxies we discuss in this paperare massive (vc ∼ 250 km s−1, M∗ ∼ 1010.6 M�, Mdyn (R ∼10 kpc) � 1011 M�), luminous (star formation rates (SFR) ∼120–290 M� yr−1) and fairly large (Rdisk (HWHM) ∼3–6.5 kpc). They sample the upper range of mass and bolo-metric luminosity of the z ∼ 2 SFG “main sequence” (ForsterSchreiber et al. 2009; Noeske et al. 2007; Daddi et al. 2007).In this subset of the z ∼ 2 SFG population, data cubes withintegration times a few to 20 hr per galaxy have sufficient sig-nal to noise ratio (S/N) in a sufficient number of independentpixels (Npix ∼ 50–200) to extract the detailed properties of gi-ant clumps, each of which have intrinsic FWHM diameters of0′′.15–0′′.3 (Genzel et al. 2008).
As part of the SINS GTO survey (Forster Schreiber et al.2009) and the SINS/zCOSMOS ESO Large Program (seeMancini et al. 2011) of high-z galaxy kinematics carried outwith SINFONI at the VLT, we observed the Hα, [N ii], and[S ii] emission lines in the rest-frame UV-selected SFGs Q1623-BX599 (z = 2.332) and Q2346-BX482 (z = 2.258; Erb et al.2006b; Forster Schreiber et al. 2006, 2009), and in the rest-frameoptically selected SFGs D3a15504 (z = 2.383), ZC782941(z = 2.182; also called ZC407302 in Mancini et al. 2011),and ZC406690 (z = 2.196) (Kong et al. 2006; Genzel et al.2006, 2008; Forster Schreiber et al. 2009; Mancini et al. 2011;
2

The Astrophysical Journal, 733:101 (30pp), 2011 June 1 Genzel et al.
Y. Peng et al. 2011, in preparation). The two rest-UV-selectedsources were photometrically identified in optical imaging bytheir UnGR colors (satisfying the “BX” criteria), their redshiftconfirmed from optical spectroscopy, and first observed in thenear-IR with the long-slit spectrometer NIRSPEC on Keck II(Steidel et al. 2004; Adelberger et al. 2004; Erb et al. 2006b).The rest-optically-selected targets were identified based on Ks-band imaging and via the “BzK” color criterion for 1.4 < z <2.5 star-forming galaxies (Daddi et al. 2004), and followed-up with VLT/VIMOS optical spectroscopy to confirm theirredshift (Kong et al. 2006; Lilly et al. 2007). Prior to theSINFONI observations, none of them had near-IR spectroscopicdata. ZC782941 and ZC406690 were moreover specificallydrawn from the 1.7 deg2 zCOSMOS spectroscopic survey (Lillyet al. 2007) to be located within 30′′ of G < 16 mag starssuitable for Natural Guide Star adaptive optics (AO) assistedobservations.
The five galaxies span the range of kinematic properties foundin the SINS survey of z ∼ 2 SFGs (Forster Schreiber et al.2009). BX482 and ZC406690 are large clumpy, rotating diskswith a prominent ∼5 kpc ring of star formation. D3a15504is a large rotating disk with a central active galactic nucleus(AGN). ZC782941 is a more compact, rotating, and asymmetricdisk. The asymmetry is mainly caused by a compact clumpnorth of the main body of the galaxy, which may be a second,lower mass galaxy interacting with the main galaxy (a “minor”merger). BX599 is an example of the compact “dispersion-dominated” systems that tend to be common among lessmassive, UV-selected galaxies (Erb et al. 2006b; Law et al. 2007,2009). However, our new LGS AO SINFONI data now resolveBX599 spatially and reveal a substantial velocity gradient of150–200 km s−1 across ∼3 kpc. The observed ratio of half thevelocity gradient to the integrated velocity dispersion Δvgrad/(2σ int) ∼ 0.6. This is similar to several rotating disk galaxiesin the SINS survey (Forster Schreiber et al. 2009). BX599 maythus be a compact rotating disk. For a more detailed descriptionof the SINS and SINS/zCOSMOS surveys, source selection,and global galaxy properties, we refer to Forster Schreiber et al.(2009) and Mancini et al. (2011).
Table 1 summarizes integration times and the final FWHMangular resolutions in these galaxies. For a description ofthe data reduction methods and analysis tools we refer toSchreiber et al. (2004), Davies (2007), and Forster Schreiberet al. (2009). With the final data cubes in hand, we median-filtered the data by two spatial pixels and fitted Gaussian lineprofiles to each pixel with the fitting code LINEFIT (ForsterSchreiber et al. 2009). LINEFIT performs weighted fits tothe observed line profiles as a function of the two spatialcoordinates based on an input noise data cube and an inputspectral response function. The instrumental spectral responsefunction as obtained from OH sky lines is shown as a graydashed curve in the profiles shown in Figures 7–9. For the0′′.05 × 0′′.125 pixel scale in the K band we used here it isfit quite well by a Gaussian of FWHM ∼ 85 km s−1 (greencurve in the upper left panel of Figure 9), with some excessemission in the line wings relative to this best fitting Gaussian.For the analysis of the line profiles in our program galaxies,these small differences are negligible, however. LINEFIT takesthis instrumental line profile as inputs to compute intrinsicvelocity dispersions. Likewise, the velocity dispersions listed inTable 2 and shown in Figures A1 and A2 are intrinsic values afterremoval of the instrumental broadening (and any beam-smearedrotation).
Uncertainties of all fitted parameters are calculated through100 Monte Carlo simulations in which the spectrum of eachspatial pixel is perturbed assuming a Gaussian distribution ofthe rms from the input noise cube. The final integrated lineintensity, velocity, and velocity dispersion maps were thenmultiplied by a mask constructed from all pixels with Hα lineemission at >3σ significance. We compare the line emissionmaps to similar resolution (∼0.′′15–0.′′25 FWHM) images ofthe rest-frame UV/optical stellar continuum. In the case ofBX482, we use the Hubble Space Telescope (HST)/NIC2H-band image (through the F160W filter) of Forster Schreiberet al. (2011a). For ZC782941 and ZC406690, we use the HST/Advanced Camera for Surveys (ACS) I-band (F814W filter)images taken as part of the COSMOS survey (Koekemoer et al.2007). For D3a15504 we have taken and analyzed a 2 hr AO-assisted exposure of the galaxy with VLT/NACO in the Ks band,as part of our original SINS survey program (Forster Schreiberet al. 2009).
2.2. Modeling of the Velocity Fields
We identified the most prominent clumps from maps ofindividual Hα velocities (“channels”) or, in the case of clumpD in BX482, from the rest-frame optical continuum map. Foridentification as a clump, we required the presence of an obviouslocal maximum in at least two separate velocity channel maps.Figure 1 gives examples of such velocity channel maps forD3a15504 (top row), BX482 (middle rows), and ZC782941(bottom row), and marks the positions of the most prominentclumps by circles/ovals and alphabetical symbols. Our list ofclumps is meant to identify the brightest obvious clumps, andis not complete for the fainter clumps whose identification canbe more ambiguous. For BX482 (Figure 2, middle left column),ZC782941 (middle right column), ZC406690 (Figure 2, rightcolumn), and BX599 (Figure 9) the brightest clumps also standout in the velocity integrated Hα and the continuum maps. InD3a15504 and ZC782941 (clumps B–E), some of the clumps areless obvious or even washed out in the integrated maps becauseof diffuse integrated disk emission. We determined intrinsicHWHM clump radii from Gaussian fits to the appropriatevelocity channels and subtracted the instrumental resolution insquares.
In addition to the basic velocity and velocity dispersion mapsobtained from LINEFIT, we also constructed “residual” maps byremoving the large-scale velocity field. For this purpose we used“kinemetry” (Krajnovic et al. 2006; Shapiro et al. 2008) or sim-ple rotating disk models fitted to the Hα data (Genzel et al. 2006,2008; Cresci et al. 2009). The resulting velocity/dispersionmaps capture the large-scale kinematics, which can then be sub-tracted from the LINEFIT maps, in order to make local residualsstand out more clearly. For the purposes of the analysis presentedbelow, both methods give indistinguishable results.
To perform a kinemetry analysis, we require knowledge of thedynamical center, position angle, and inclination of a galaxy. Forthe high-S/N data presented here, we are able to determine thedynamical centers directly from the shapes of the isovelocitycontours. Position angles and inclinations are estimated fromthe orientations of the maximum velocity gradients (line ofnodes) and the minor to major axis ratios of the line andcontinuum emission. Using these inputs, we parameterize theobserved velocity fields as Fourier expansions along the angleϕ in the plane of the sky. Ideal, thin-disk rotation is describedby a cos(ϕ) term (see Shapiro et al. 2008 for more details). Todetermine the higher-order (local) variations of the velocity field
3

Th
eA
stro
ph
ysica
lJo
urn
al,733:101
(30pp),2011June
1G
en
ze
le
ta
l.
Table 1Observing Log
Galaxy Band/Pixel Scale Mode FWHM Resolution (arcsec) Integration Time, Observing Date Reference
Q1623-BX599 (z = 2.332) K 0.′′05 × 0.′′1 LGS 0.′′23 2h002010 Apr 12–13
Erb et al. 2006b; ForsterSchreiber et al. 2009
Q2346-BX482 (z = 2.258) K 0.′′05 × 0.′′1 LGS 0.′′25 9h302007 Oct 27–292007 Nov 13–152008 Jul 27–312009 Nov 11–13 and 17
Erb et al. 2006b; Genzel et al.2008; Cresci et al. 2009;Forster Schreiber et al. 2009
D3a15504 (z = 2.383) K 0.′′05 × 0.′′1 LGS, NGS 0.′′18 18h402006 Mar 16–202009 Apr 302009 May 1 and 162009 Jun 162010 Feb 11–132010 Mar 92010 Apr 2
Kong et al. 2006; Genzelet al. 2006; Genel et al. 2008;Cresci et al. 2009; ForsterSchreiber et al. 2009
ZC782941 (z = 2.182)(also ZC407302)
K 0.′′05 × 0.′′1 NGS 0.′′22 10h302007 Apr 16–232009 Apr 182010 Jan 9 and 132010 Feb 10
Genzel et al. 2008; Cresciet al. 2009; Forster Schreiberet al. 2009; Mancini et al.2011; Y. Peng et al. 2011, inpreparation
ZC406690 (z = 2.196) K 0.′′05 × 0.′′1 NGS 0.′′22 10h002010 Apr 172010 May 252010 Nov 30,
Mancini et al. 2011; Y. Penget al. 2011, in preparation
2010 Dec 7, 10, 29, 30, and 31,2011 Jan 2 and 3
4

The Astrophysical Journal, 733:101 (30pp), 2011 June 1 Genzel et al.
Table 2Derived Galaxy Properties
Source Row Number BX599 BX482 D3a15504 ZC782941 (ZC407302) ZC406690 ZC406690 ZC406690All Clump A Clumps A-F Clump A Clump A Clump B Clump C
Z 1 2.33 2.26 2.38 2.18 2.2 2.2 2.2DL (Gpc) 2 19.1 18.3 19.6 17.6 17.7 17.7 17.7kpc arcsec−1 3 8.33 8.38 8.3 8.42 8.41 8.41 8.41Fobs (Hα) 1e-16 (erg s−1 cm−2) 4 3.3 0.35 0.04 0.2 1.4 0.57 0.4A (Hα)a 5 0.73 1.1 1.8 2.1 1.1 1.1 1.1L (Hα)0 (erg s−1)b 6 2.8e43 3.8e42 9.4e41 5.2e42 1.4e43 5.7e42 4.0e42SFR (M� yr−1)c 7 66 12 3.3 17 40 11 14Mmol−gas M� c 8 3.3e10 7.8e9 3.0e9 8.7e9 1.6e10 7.8e9 9.6e09Σmol−gas (M� pc−2)c 9 4.4e3 2.1e3 6.9e2 4e3 8.4e3 1.4e3 1.8e3RHWHM−intr
c (kpc) 10 1.5 1 1 0.8 0.8 1.2 1.2Σstar−form (M� yr−1 kpc−1)b 11 4.6 2.7 0.72 5.7 13.6 1.6 2.2fbroad (= broad/total) 12 0.5(0.13) 0.32(0.08) 0.26(0.15) 0.31(0.1) 0.4(0.1) 0.6(0.1) �0.25[S ii] 6718/6733 13 . . . 0.7(0.2) 0.9(0.3) 1.1(0.35) 0.75(0.07) 1.09(0.1) . . .
σ clump km s−1 e 14 76(20) 62(3.4) 53(7) 95(7) 81(4) 88(4) 78(3)n(e)clump
d (cm—3) 15 . . . 2000( + ∞,–1000)900( + 2500, –700) 400( + 1100, –350) 1500( + 900, –400)420( + 230, –140) . . .
γ redf 16 1 1.5 1.5 2 2 2 2
L (Hα)broad,0 (erg s−1) 17 1.4e43 1.8e42 3.7e41 3.2e42 1.1e43 6.9e42 �2.0e42Δvmax (km s−1)g 18 1000 350 ∼400 420 440 810 . . .
Mbroad (M�) 19 4.5e8 6e7 1.2e7 1.1e8 3.6e8 2.2e8 �6.5e7dMout/dt (case 1)h (M� yr−1) 20 300 21 6 54 200 150 �22dMout/dt (case 2)h (M� yr−1) 21 68 5 1.4 13 46 34 �5dMout/dt (case 3)h (M� yr−1) 22 94 6.5 2.2 17.5 62 49 �7dMout 1/2/dt/SFRi 23 2.8 1.0 1.1 2.0 3.1 8.4 �0.9texpulsion
j (Myr) 24 360 1.2e3 1.6e3 520 265 170 <1.5e3t∗ (Myr)k 25 . . . 30–100 >1e3 80–800 100–3e4 80–800tZ (closed) (Myr)k 26 360 360 930 350 150 560 400tZ (leaky) (Myr)k 27 920 480 1600 650 260 2e4 510texpansion (Myr)k 28 120 310 360 140 86 120 . . .
tdiss/torbit 29 10 12 14 7 1.7 1.1 �10M∗,final/Mgas,0
l 30 0.27 0.49 0.48 0.34 0.25 0.11 �0.52Δv/(sin i 2 Rclump) (km s−1 kpc−1)m 31 . . . 19(–10) 30( ± 12) 42(10) 20(–30) 60( + 30) 30( + 15)4.4 Mdyn−rot (M�)n 32 . . . 4.3e8 1.1e9 1.1e9 2.2e8 2.1e9 2.1e9Mmol−gas/4.4 Mdyn−rot 33 . . . 18 3 8 75 4 5Mdyn−press (M�)o 34 . . . 2.1e9 1.5e9 3.9e9 2.8e9 5.2e9 3.9e9Mmol−gas/ (Mdyn−rot + Mdyn−press) 35 . . . 3.6 1.7 2.1 5.7 1.4 2.2Frad = L/c (dyn) 36 8.5e34 1.6e34 4.2e33 2.2e34 5.1e34 1.4e34 1.8e34(Δvmax dMout 1/2/dt)/ Frad 37 14 2 3 4 7 34 2
Notes.a A (Hα) = 7.4 E (B – V), with E (B – V)stars = 0.44 E (B – V)gas (Calzetti 2001).b Extinction-corrected.c SFR (M� yr−1) = L (Hα)0/(2.1e41 erg s−1), Mmol−gas (M�) = 1.2e9 SFR (M� yr−1) 0.75 R (kpc)0.54 (Equation (2), Kennicutt et al. 2007). L (Hα)0 is extinction-corrected. Radii here and elsewhere in the table (e.g., row 10) are “intrinsic” radii, with the instrumental resolution removed in squares.d From [S ii] 6718/6733 ratio (Osterbrock 1989).e Intrinsic local velocity dispersion, after removal of beam smeared rotation and instrumental resolution.f Correction for intrinsic differential extinction.g Δvmax = 〈vbroad〉 − 2σ broad.h Estimates of outflow rates (Appendix B) for two models of photodissociation/case B recombination and for collisional excitation.i Uses the average of the estimated of the two photodissociation/case B models in rows 20 and 21.j Timescale for expulsion of gas by outflows: texpulsion = 2Mmol−gas/ (dMout 1/2/dt). The lifetime of a clump is shorter, given that in addition to gas outflows there isalso star formation.k Time estimates from stellar age dating (Section 4.2.2), chemical enrichment (Section 4.2.3, Appendix C) and expansion (Section 4.2.4).l Ratio of final (stellar) mass at the time when all the gas is expelled by winds, relative to the initial gas mass, M∗,final/Mgas, t = 0 = 1/(1 + [(dMout/dt)/SFR]).m Maximum observed velocity gradient across clumps in “raw” velocity maps (in parentheses “residual” maps); positive sign is prograde and negative sign retrogradewith galaxy rotation.n Mdyn−rot (M�) = b 2.31e5 (RHWHM (kpc))3 (Δv (km s−1)/(2 sini RHWHM (kpc)))2.o Mdyn−press(M�) = b 5.63e5 (σ clump (km s−1))2 RHWHM (kpc).
and/or larger scale, non-axisymmetric deviations from simplerotational motion, we subtract this cos(ϕ) map from the observedvelocity field.
The disk models compute data cubes from input structuralparameters (cf. Cresci et al. 2009). For BX482 and ZC406690
we use input models with a ring surrounding a central (ex-tincted) bulge for the mass distribution, and for D3a15504 andZC782941 we use exponential disk models (Genzel et al. 2006,2008; S. Newman et al. 2011, in preparation). Dynamical model-ing and analysis of the rest-frame optical morphology indicates
5

The Astrophysical Journal, 733:101 (30pp), 2011 June 1 Genzel et al.
+270
v
+165 +90
+3401”
A
B
C
D
+60 +30
+300 +200+230
+130BX482z=2.26
A
C
-90
A
E
-160
D
E1”
B
-200
D3a15504 z=2.39 A
-130F
+130 G
D
1”
E
ZC782941z=2.18
-195
DCB
-125
D
CC
-160
ED
+90
A
-90
Figure 1. Maps of individual velocity “channels” of width ∼34 km s−1 in the Hα line of D3a15504 (top row), BX482 (middle two rows), and ZC782941 (bottom row).The maps are resampled to 0.′′025 per pixel and have a resolution of FWHM ∼ –0.′′18–0.′′25. Velocities relative to the systemic redshift indicated are given in km s−1.Circles/ovals and symbols denote the clumps identified in these galaxies. Crosses denote the kinematic centers of the galaxy rotation. The color scale is linear andautoscaled to the brightest emission in each channel.
(A color version of this figure is available in the online journal.)
K−band NACO
E
A
DCB
F
K − Hα
E
A
DCB
F
D3a15504 z=2.38
H − Hα
A
BC
D
BX482 z=2.26
Hα
D E
CB
A
ZC782941 z=2.18
I − Hα
DE
CB
A
I−band ACS
ED
CB
A
Hα
E
DCB
F
G
A
Hα
A
BC
D
H−band NIC
A
BC
D
ZC406690 z=2.19
I − Hα
A
B
C
D
A
B
C
D
I−band ACS
A
B
C
D
Hα
Figure 2. FWHM ∼ 0.′′2 Hα and rest-frame UV/optical continuum images of four massive luminous z ∼ 2 SFGs. All maps have been re-binned to 0.′′025 pixels. Toprow: three-color composites of integrated Hα line emission (red), and continuum (blue–green) images, along with the most prominent clumps identified by labels A,B,. . .. Middle: integrated SINFONI Hα emission. All four images are on the same angular scale, with the white vertical bar marking 1′′ (∼8.4 kpc). Bottom. HST NICH-band, ACS I-band, or NACO-VLT AO Ks-band images of the program galaxies, at about the same resolution as the SINFONI Hα maps. The color scale is linearand autoscaled.
(A color version of this figure is available in the online journal.)
6

The Astrophysical Journal, 733:101 (30pp), 2011 June 1 Genzel et al.
that this central component in BX482 has ∼20% of the total diskmass (Genzel et al. 2008; Forster Schreiber et al. 2011a, 2011b).In either case the absence and/or weakness of emission fromthe center has no influence on the analysis we discuss in thefollowing. Position angles and inclinations are determined asabove. The model data are then convolved with the angular andspectral resolution profiles and sampled at the observed pixelscales. The total dynamical mass Mdyn is then varied to achievea best-fit match to the observed rotation velocities. To studythe non-axisymmetric motions in a galaxy, the best-fit modelvelocity and velocity dispersion maps are subtracted from therespective observed maps.
We compare these residual maps with Hα surface bright-ness maps derived from the observed data cubes. Likewise, weconstructed [N ii]/Hα ratio maps from integrated line emissionmaps smoothed with a 3 pixel (0.′′15) kernel. We multipliedthese maps with a mask constructed from all pixels with Hαemission at >3σ significance. We also constructed pixel–pixelcorrelation plots of residual velocity dispersion (δσ = σ(data) − σ (model)) versus Hα surface brightness, and[N ii]/Hα line ratio versus Hα surface brightness. Before inves-tigating possible trends in these correlations, we culled pixelswith large δσ or [N ii]/Hα uncertainties. In addition, in the caseof D3a15504 (which has a prominent central bulge, AGN and anarrow line region), we also removed the nuclear region.
2.3. Determination of Star Formation Rates and Gas Masses
For calculating star formation rates and gas surface densitiesfrom the Hα data, we used the conversion of Kennicutt (1998b)modified for a Chabrier (2003) IMF (SFR = L (Hα)0/2.1 × 1041
erg s−1). We corrected the observed Hα fluxes for spatiallyuniform extinction with a Calzetti (2001) extinction curve(A (Hα) = 7.4 E(B – V)), including the extra “nebular”correction (Agas = Astars/0.44) introduced by Calzetti (2001).We determined E(B – V) from the integrated UV/opticalphotometry of the galaxies (row 5 in Table 2). Forster Schreiberet al. (2009) find that including the extra nebular correctionbrings Hα- and UV-continuum-based star formation rates ofz ∼ 2 SINS galaxies into best agreement.
We estimated molecular surface densities (and masses, in-cluding a 36% helium contribution) from Equation (8) ofKennicutt et al. (2007), modified for the Chabrier IMF usedhere,
log
(Σmol−gas
M� pc−2
)= 0.73 log
(Σstar−form
M� yr−1 kpc−2
)+ 2.91. (2)
Equation (2) is based on Hα, 24 μm, and CO observa-tions of M51 and is similar to results for larger samples ofz ∼ 0 SFGs (e.g., Equation (4) in Kennicutt 1998a, andFigure 4 of Genzel et al. 2010). It has the added advantageof being based on spatially resolved measurements of the gas tostar formation relation with a similar spatial resolution (0.5 kpc)as our high-z data and also covering a similar range of gassurface densities (10–103 M� pc−2). Figure 4 in Genzel et al.(2010; see also Daddi et al. 2010b) also shows that to within theuncertainties (of about a factor of two), z ∼ 0 and z ∼ 1–3 SFGs(with galaxy-integrated measurements of CO luminosities andSFRs) are fit by the same relation, although the gas masses fromthe best fits of Genzel et al. (2010) are ∼20% larger than esti-mated from Equation (2). In Equation (2) we did not correct thedata for the fraction of Hα emission from outflowing gas (seeSection 3.2). This correction is small, with the exception of the
brightest clumps where gas surface densities may be somewhatoverestimated.
The gas surface densities/masses and star formation ratesestimated from Equation (2) and listed in Table 2 are uncertainby at least a factor of two to three. In addition to the well-known issue of how to infer molecular gas column densities/masses from the integrated line flux of an optically thickCO rotational line (see the in-depth discussion in Tacconiet al. 2008 and Genzel et al. 2010), and the question ofwhether Equation (2) adequately describes the gas to starformation relation for the physical conditions on clump scales atz ∼ 2, there is the important issue of differential extinction. Wewill argue in Section 3.2 that the asymmetry of broad Hα/[N ii]line emission is direct evidence for such differential extinction.It is unclear, however, what the general impact of the differentialextinction would be on clump scales. One might naively expectthat the effect increases gas column densities/masses relative toaverages on larger scales. However, there are almost certainlyalso evolutionary effects, such that in a given aperture theremay be very high dust column densities in both neutral cloudsand H ii regions with relatively low extinction. Such spatialseparations of 300 pc to >1 kpc are seen in nearby spirals, suchas M51 (Rand & Kulkarni 1990), as well as at z ∼ 1 (Tacconiet al. 2010). As a result, the Kennicutt–Schmidt scaling relationin Equation (2) may break down or be significantly altered onsmall scales (e.g., Schruba et al. 2010 in M33 on �80 pc scales).
2.4. Spatial Distribution of the Toomre Q-parameter
A rotating, symmetric and thin gas disk is unstable togravitational fragmentation if the Toomre Q-parameter (Toomre1964) is �1. For a gas-dominated disk in a background potential(of dark matter and an old stellar component) Q is relatedto the local gas velocity dispersion σ 0 (assuming isotropy),circular velocity vc, epicyclic frequency κ (κ2 = 4 (vc/Rdisk)2 +Rdisk d(vc/Rdisk)2/dRdisk), gas surface density Σgas, and radius ofthe disk Rdisk via the relation (Binney & Tremaine 2008; Escala& Larson 2008; Elmegreen 2009; Dekel et al. 2009a)
Qgas = σ0κ
πGΣgas=
(σ0
vc
) (a(v2
cRdisk/G)
πR2diskΣgas
)
=(
σ0
vc
)(aMtot
Mgas
)=
(σ0
vc
) (a
fgas
). (3)
Here the constant a takes on the value of 1,√
2,√
3, and 2for a Keplerian, constant rotation velocity, uniform density andsolid body disk; fgas is the gas fraction within Rdisk. If the diskconsists of molecular (H2 + He), atomic (H i + He), and stellar (∗)components, Qtot
−1 = QH2−1 + QHi
−1 + Q∗−1 if all componentshave similar velocity dispersions. If there is a (young) stellarcomponent distributed similarly to the gas, the combined gas+ young star component will thus have a Qtot that is inverselyproportional to the sum of the gas and stellar surface densities.In that case fgas should be replaced by the mass fraction fyoung ofthat “young” component. Such a disk is unstable (or stable) tofragmentation by gravity, depending on whether Qtot is less (orgreater) than unity. Equation (3) can be rewritten as(
σ0
vc
)=
(z
Rdisk
)= Qfyoung
a, (4)
where z is the z-scale height of the disk. Gas-rich, marginallystable disks are thick and turbulent. The largest and fastest
7

The Astrophysical Journal, 733:101 (30pp), 2011 June 1 Genzel et al.
Hα
σobs
D3a15504 z = 2.39
ΔQ < 0.5
Figure 3. Hα Gaussian fit velocities (top left), Hα Gaussian fit dispersion (bottom left), and inferred Toomre Q-parameter (right, Equation (2)) for D3a15504. Shownin the top center is also the map of Hα-integrated flux from Figure 2. The locations of the main clumps (Figure 1) found in the individual velocity channel maps aredenoted by circles/ellipses. The Hα, velocity, and velocity dispersion maps (resolution 0.′′18 FWHM) were re-binned to 0.′′025 pixels. For construction of the Q-map,the data were smoothed to 0.′′25 FWHM. The typical uncertainties in the Q-values are ± 0.05 to ± 0.3 (1σ ) throughout most of the disk of D3a15504. Pixels withΔQ � 0.5 are masked out.
(A color version of this figure is available in the online journal.)
growing, Jeans-unstable mode not stabilized by rotation is the“Toomre scale/mass,” given by (Elmegreen 2009; Genzel et al.2008; Escala & Larson 2008; Dekel et al. 2009a)
RToomre ≈ 0.8Q−1a−2
(σ0
vc
)Rdisk
≈ 1
(fyoung
0.4
) (Rdisk
5 kpc
)kpc ∝ σ 2
0
Σgasand
MToomre ≈ 0.6Q−2a−4
(σ0
vc
)2
Mdisk
≈ 5 × 10⁹
(fyoung
0.4
)2 (Mdisk
1011M�
)M� ∝ σ 4
0
Σgas, (5)
where the numerical factors are for a flat rotation curve(a = 1.4). Gas-rich, marginally stable disks thus should havemuch larger and more massive star-forming complexes thanthose in z ∼ 0 SFGs with (cold) gas fractions of less than 10%and larger fractions of stabilizing old stellar disks and bulges.
For the four well-resolved disks/rings, we created maps ofthe Toomre parameter Q(x, y). We combined the computed gassurface density for each pixel (Equation (2)), with the best-fitting model rotation curve to compute the epicyclic frequencyκ and the velocity dispersion map to calculate Q(x, y) fromEquation (3). We then used different Monte Carlo realizationsand standard error propagations to compute maps of the uncer-tainties ΔQ.
3. RESULTS
Figures 1 and 2 show velocity channel maps and the integratedHα and continuum images for four of the five galaxies. Theintegrated Hα image of the fifth galaxy (BX599) is shown in the
top center panel of Figure 8. In this case, we do not have access toa high-resolution continuum image. The most prominent clumpsare labeled for each galaxy (see the more detailed discussion inSection 2.2). Tables 2 and 3 summarize the derived physicalproperties. A “typical” individual clump within the massive(M∗ ∼ 1010–1111 M�) BX/BzK galaxies in the SINS survey,such as an average clump in D3a15504, ZC782941, and BX482,accounts for a few percent of the UV/optical light of the entiregalaxy, has a current star formation rate of a few solar massesper year, and a stellar mass of one to a few times 109 M�(Table 2; Forster Schreiber et al. 2011b and references therein).The most extreme clumps in BX482 and ZC406690 make up∼10%–20% of the integrated Hα fluxes, have star formationrates of 10–40 solar masses per year and masses ∼1010 M�.
3.1. Giant Clumps are the Locations ofGravitational Instability
As discussed in the Introduction and Section 2.4, a plausiblehypothesis is that the ∼1–2 kpc diameter giant star-formingclumps in z > 1 SFGs represent the largest/most massivegravitationally unstable entities in the high-z disks. If this isindeed the case, an empirical determination of the Toomreparameter (Equation (2)) as a function of position should showthat clumps and their surroundings have Q � 1.
Following the methods discussed in the last section,Figures 3–6 give the Q-maps at a resolution of ∼0.′′22–0.′′25FWHM for D3a15504, BX482, ZC782941, and ZC406690,where we have only retained pixels with an rms uncertaintyΔQ < 0.3–0.5. As inputs for our calculations we used the ve-locity, velocity dispersion, and Hα-integrated flux maps shownin the left and middle panels of Figures 3–6. The central re-gions in all four galaxies should be neglected, for the followingreasons. The central few kpc of D3a15504 may be affected by
8
The Astrophysical Journal, 733:101 (30pp), 2011 June 1 Genzel et al.
σobs
BX482 z = 2.26
Δ < 0.5Q
Hα
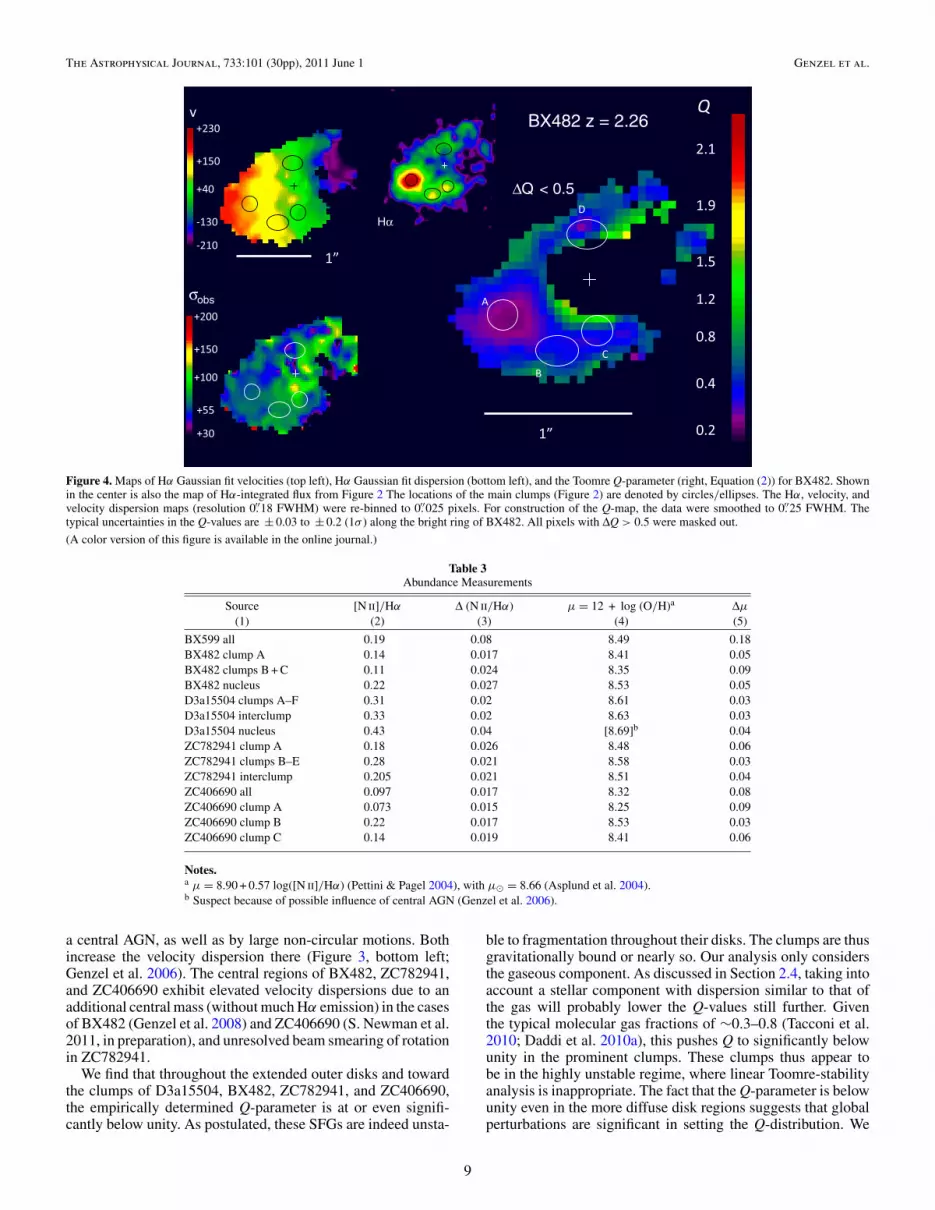
Figure 4. Maps of Hα Gaussian fit velocities (top left), Hα Gaussian fit dispersion (bottom left), and the Toomre Q-parameter (right, Equation (2)) for BX482. Shownin the center is also the map of Hα-integrated flux from Figure 2 The locations of the main clumps (Figure 2) are denoted by circles/ellipses. The Hα, velocity, andvelocity dispersion maps (resolution 0.′′18 FWHM) were re-binned to 0.′′025 pixels. For construction of the Q-map, the data were smoothed to 0.′′25 FWHM. Thetypical uncertainties in the Q-values are ± 0.03 to ± 0.2 (1σ ) along the bright ring of BX482. All pixels with ΔQ > 0.5 were masked out.
(A color version of this figure is available in the online journal.)
Table 3Abundance Measurements
Source [N ii]/Hα Δ (N ii/Hα) μ = 12 + log (O/H)a Δμ
(1) (2) (3) (4) (5)
BX599 all 0.19 0.08 8.49 0.18BX482 clump A 0.14 0.017 8.41 0.05BX482 clumps B + C 0.11 0.024 8.35 0.09BX482 nucleus 0.22 0.027 8.53 0.05D3a15504 clumps A–F 0.31 0.02 8.61 0.03D3a15504 interclump 0.33 0.02 8.63 0.03D3a15504 nucleus 0.43 0.04 [8.69]b 0.04ZC782941 clump A 0.18 0.026 8.48 0.06ZC782941 clumps B–E 0.28 0.021 8.58 0.03ZC782941 interclump 0.205 0.021 8.51 0.04ZC406690 all 0.097 0.017 8.32 0.08ZC406690 clump A 0.073 0.015 8.25 0.09ZC406690 clump B 0.22 0.017 8.53 0.03ZC406690 clump C 0.14 0.019 8.41 0.06
Notes.a μ = 8.90 + 0.57 log([N ii]/Hα) (Pettini & Pagel 2004), with μ� = 8.66 (Asplund et al. 2004).b Suspect because of possible influence of central AGN (Genzel et al. 2006).
a central AGN, as well as by large non-circular motions. Bothincrease the velocity dispersion there (Figure 3, bottom left;Genzel et al. 2006). The central regions of BX482, ZC782941,and ZC406690 exhibit elevated velocity dispersions due to anadditional central mass (without much Hα emission) in the casesof BX482 (Genzel et al. 2008) and ZC406690 (S. Newman et al.2011, in preparation), and unresolved beam smearing of rotationin ZC782941.
We find that throughout the extended outer disks and towardthe clumps of D3a15504, BX482, ZC782941, and ZC406690,the empirically determined Q-parameter is at or even signifi-cantly below unity. As postulated, these SFGs are indeed unsta-
ble to fragmentation throughout their disks. The clumps are thusgravitationally bound or nearly so. Our analysis only considersthe gaseous component. As discussed in Section 2.4, taking intoaccount a stellar component with dispersion similar to that ofthe gas will probably lower the Q-values still further. Giventhe typical molecular gas fractions of ∼0.3–0.8 (Tacconi et al.2010; Daddi et al. 2010a), this pushes Q to significantly belowunity in the prominent clumps. These clumps thus appear tobe in the highly unstable regime, where linear Toomre-stabilityanalysis is inappropriate. The fact that the Q-parameter is belowunity even in the more diffuse disk regions suggests that globalperturbations are significant in setting the Q-distribution. We
9

The Astrophysical Journal, 733:101 (30pp), 2011 June 1 Genzel et al.
ZC782941 z = 2.18
Δ
σobs
C
Hα
Figure 5. Maps of Hα Gaussian fit velocities (top left), Hα Gaussian fit dispersion (bottom left), and the Toomre Q-parameter (right, Equation (2)) for ZC782941.Shown in the center is also the map of Hα-integrated flux from Figure 2. The locations of the main clumps (Figure 2) are denoted by circles/ellipses. The Hα, velocity,and velocity dispersion maps (resolution 0.′′18 FWHM) were re-binned to 0.′′025 pixels. For construction of the Q-map, the data were smoothed to 0.′′25 FWHM. Thetypical uncertainties in the Q-values are ± 0.06 to ± 0.4 (1σ ) for most of the outer disk of ZC782941. Pixels with ΔQ > 0.5 were masked out.
(A color version of this figure is available in the online journal.)
σobs
v
ΔQ < 0.3Hα
ZC406690 z = 2.19
Figure 6. Maps of Hα Gaussian fit velocities (top left), Hα Gaussian fit dispersion (bottom left), and the Toomre Q-parameter (right, Equation (2)) for ZC406690.Shown in the center is also the map of Hα-integrated flux from Figure 2. The locations of the main clumps (Figure 2) are denoted by circles/ellipses. The Hα, velocity,and velocity dispersion maps (resolution 0.′′22 FWHM) were re-binned to 0.′′025 pixels. The typical uncertainties in the Q-values are ± 0.01 to ± 0.1 (1σ ) for most ofthe outer disk of ZC782941. Pixels with ΔQ > 0.3 were masked out.
(A color version of this figure is available in the online journal.)
conclude that the Q-maps in Figures 3–6 are consistent with thecommonly held view that the clumps form by gravitational in-stability. However, we cannot exclude the alternative possibilitythat the instability is driven by a large-scale compression, suchas experienced in a galaxy interaction or (minor) merger (e.g.,Di Matteo et al. 2007).
3.2. Evidence for Powerful Outflows on Clump Scales
UV spectroscopy of metal absorption lines and of Lyαemission lines provide compelling evidence for ubiquitous massoutflows in “normal” high-z (Pettini et al. 2000; Shapley et al.2003; Steidel et al. 2004, 2010; Weiner et al. 2009). More
10

The Astrophysical Journal, 733:101 (30pp), 2011 June 1 Genzel et al.
ZC406690 clump A
-2000 -1000 200010000
norm
aliz
ed li
ne in
tens
ity
0.0
0.5
1.0
ZC406690 integrated shifted
velocity offset (km/s) velocity offset (km/s)
velocity offset (km/s)velocity offset (km/s)
-2000 -1000 200010000
0.0
0.1
0.2 ZC406690 clump C
-2000 -1000 200010000
0.0
0.5
1.0
ZC406690 clump B
-2000 -1000 200010000
0.0
0.5
1.0
1”I − Hα
A
B
C
D
ZC406690 z = 2.19
ZC406690 region D
velocity offset relative to clump B(km/s)
-1000 10000
0.0
0.5
1.0
Figure 7. Hα spectra of ZC406690 (z = 2.195), for the entire galaxy (top left), as well as for selected clumps marked in the central Hα–ACS I-band composite(Figure 2). The dotted gray curves in all panels denote the SINFONI spectral response profile measured from OH sky lines. Before construction of the integratedspectrum, the galaxy rotation was removed for each pixel. The thin red curves show the broad Hα (clump A) or broad Hα + [N ii] (integrated spectrum, clump B)components obtained from multi-component Gaussian fits. For region D, the thin red curve is the scaled broad Hα component of clump B, and the velocity scale isrelative to the systemic velocity of nearby clump B.
(A color version of this figure is available in the online journal.)
recently, Shapiro et al. (2009) have reported broad Hα/[N ii]optical line emission from stacking of 47 z ∼ 2 SFG spectra inthe SINS survey. In both cases, the information is integrated overgalaxy (or intergalactic) scales and, in the case of absorptionlines, the location of the absorber along the line of sight isnot or only approximately (Steidel et al. 2010) constrained.Lyα is strongly self-absorbed so that any information on spatialdistribution and kinematics is washed out and strongly dependson modeling. The broad lines discussed by Shapiro et al. (2009)could originate in extended galactic winds coming from star-forming disks (similar to z ∼ 0 starburst galaxies; Armus et al.1990; Lehnert & Heckman 1996; Martin 1999, 2005; Rupkeet al. 2005; Veilleux et al. 2005; Strickland & Heckman 2009)or alternatively, in outflows driven by a central AGN.
3.2.1. Broad Wings of Hα Emission Associated with Clumps
Our data provide for the first time direct evidence for pow-erful outflows on the scale of individual star-forming clumps.Figures 7 and 8 show extracted spectral profiles for individualbright clumps, as well as for the entire galaxy in Q1623-BX599and ZC400690. We find that
1. the prominent clumps A and B in ZC406690 exhibit blueline wings extending 500 and 1000 km s−1 half-width atzero power (HWZP) from line center;
2. a more symmetric, broad component (FWHM 1000 km s−1,HWZP ∼ 1000 km s−1) is seen in the integrated spectrum
of ZC406690 and BX599. In the latter, the broad emissionoriginates in a compact region (intrinsic diameter � 3 kpc)centered within ∼1 kpc of the peak of narrow Hα emission(clump “A”; top panels in Figure 8);
3. somewhat blueshifted, broad components are also presentin clump A of ZC782941, the central pixels of clump Aof BX482, and perhaps in the average clump spectrum ofD3a15504;
4. there are no detectable broad wings in the off-clump galaxyemission of D3a15504 and BX482, or in the southernclumps of ZC782941.
Applying two or multi-component Gaussian fits, we find thattoward the clumps of the five SFGs in Table 2, the broad(Δv (FWHM)broad ∼ 300–1000 km s−1), modestly blueshifted(〈vbroad〉 – 〈vnarrow〉 ∼ −30–150 km s−1) components constitute<20%–60% of the total Hα line flux (row 12 in Table 2). Thebroad component fits are shown by thin continuous red lines inthe spectra in Figures 7–9. The evidence for these broad wingsis also apparent in the co-added spectrum of the clumps in allfive galaxies (Figure 9).
The line widths and flux fractions of the broad emissioncomponents in the five galaxies are in good agreement withthe stacking results of Shapiro et al. (2009). In the bin ofthe most massive, highest star formation rate galaxies (M∗ >7 × 10¹⁰ M�, comparable to our sample) Shapiro et al. (2009)find FWHMbroad ∼ 2200 ( + 400, −750) km s−1 and fbroad =
11

The Astrophysical Journal, 733:101 (30pp), 2011 June 1 Genzel et al.
ZC782941clump A
-1000 10000
0.0
0.5
1.0
0.5´
300 km/s
BX599 pa−390
HαA
BX599 z = 2.33
0.5´
Hα
BX482 clump A
velocity offset (km/s)
-1000 10000
line
inte
nsity
0.0
0.5
1.0
BX599clump A
-2000 -1000 200010000
0.0
0.5
1.0
D3a 15504average clumps
-1000 10000
0.0
0.5
1.0
Figure 8. Spectra and images of BX599, BX482, ZC782941, and D3a15504. Top left: Hα spectrum toward the center of the compact dispersion-dominatedgalaxy Q1623-BX599. Top center: integrated Hα map of BX599, sampled to 0.′′025 per pixel and smoothed to a resolution of 0.′′2 FWHM. Top right: position(up–down)–velocity (left–right) diagram of the Hα/[N ii] emission of BX599 in a software slit at position angle –39◦ through clump A in the central panel, constructedfrom ∼0.′′2 FWHM LGSF data, re-sampled to 0.′′025 and 16.7 km s−1 per pixel, half the original pixel scales. Bottom: Hα spectra of the brightest clump A in BX482(left), clump A in ZC782941 (middle), and an average of clumps A–E in D3a15504 (right). The thin red curves denote fits of the broad Hα component, or the broadHα + [N ii] components in these clumps, as obtained from multi-component Gaussian fits. In the case of BX599, the broad Hα emission required two components.The dotted gray curve is the SINFONI spectral response function.
(A color version of this figure is available in the online journal.)
0.31( + 0.04, −0.1). For comparison, the average spectrum inFigure 9 shows that the broad component constitutes about50% of the average emission from the brightest clumps. Thecontribution for the galaxy-wide averages in our sample is about30%, comparable to Shapiro et al. (2009). This comparison addsfurther support to our conclusion that the broad emission comesfrom individual giant star-forming clumps in the disks, ratherthan from the nuclear regions or the extended disks.
The fits of broad emission components in Figures 7–9 assumethat the local “narrow component” line profiles (after removalof large-scale motions) are Gaussians. This assumption needsjustification. The detection of the highest velocity gas in thewings is obviously independent of the assumption of line profilesin the core of the line. However, the quantitative determinationsof the relative fraction of the line flux in the broad componentlisted in row 12 of Table 2 and of the line profiles of the broadcomponent do depend on the assumption of the Gaussian shapeof the narrow component. The upper panels of Figure 9 give theco-added line profile of the regions between bright clumps (andon weaker clumps) in D3a15504, BX482, and ZC782941. Theupper left panel clearly shows that this “interclump” profile canindeed be well fitted by the instrumental line profile broadenedby a Gaussian of dispersion ∼75 km s−1. There may be a small
amount of excess emission in both blue- and redshifted linewings but this emission is less than 10%–15% of the totalflux. The upper right panel in Figure 9 shows a comparisonof this interclump spectrum with the co-added “bright clump”spectrum from the bottom left of Figure 9. The bright clumpspectrum is well fit by the interclump profile in its core and redwing but clearly shows highly significant blue excess emission.The profile of the broad component (only associated with thebright clumps) can then be inferred, without assumptions onintrinsic line profiles, by subtracting a suitable fraction F ofthe interclump profile from the bright clump profile such thatthe broad component has a reasonably smooth profile near lowvelocities. The dotted red curve in the bottom right panel inFigure 9 is the result for F = 0.75 but the result is very similar forF anywhere between 0.6 and 0.9. The average broad line profilehas an FWHM of 500 km s−1 and is blueshifted by −50 km s−1.This test confirms the Gaussian fit approach in Figures 7 and 8.
3.2.2. Broad [N ii] Emission
In the cases of clump B, the integrated galaxy profile andperhaps also clump A in ZC406690, the S/N is sufficient to seea blue wing in the 6585 Å [N ii] line similar to that in Hα. Theratio {[N ii]/Hα}broad in ZC406690 B/integrated is about 0.3.
12

The Astrophysical Journal, 733:101 (30pp), 2011 June 1 Genzel et al.
averageweaker clumps& interclump
-1000 10000
0.0
0.2
0.4
0.6
0.8
1.0
averagebright clumpsall 5 sources
velocity offset (km/s)
-2000 -1000 200010000
line
inte
nsity
0.0
0.2
0.4
0.6
0.8
1.0
bright clumps & residuals
-2000 -1000 200010000
0.0
0.2
0.4
bright clumpsvs. weakerclumps &interclump
-1000 10000
0.0
0.2
0.4
0.6
0.8
1.0
Figure 9. Average line profiles, compared to the instrumental line profile obtained from OH sky lines (dotted gray). Bottom left: average Hα/[N ii] spectrum (bluecontinuous) of the brightest clumps in D3a15504 (clumps A–F), BX482 (clump A), ZC782941 (clump A), ZC406690 (clumps A and B), and BX599 (clump A), aftershifting to a common centroid. Top left: average of “interclump-weaker-clump-emission” in BX482, D3a15504, and ZC782941 (red continuous curve). The greencontinuous curve is a Gaussian fit (FWHM 86 km s−1) to the instrumental profile, which is a good fit with some excess emission in the wings of the instrumentalprofile. The black continuous curve is the best fitting Gaussian to the “interclump” emission profile (FWHM 212 km s−1 or σ = 90 km s−1). A fit with the instrumentalprofile gives a similar result (FWHM 202 km s−1). Top right: comparison of the interclump (red) and bright clump average (blue), demonstrating that the core of thebright clump emission is fit well by the interclump profile and that there is clear excess in the blue wing. Bottom right: subtraction of 0.75 times the interclump profilefrom the bright clump profile (blue continuous) then results in the red residual profile, which is reasonably well fit by a Gaussian of FWHM 500 km s−1 centered at–48 km s−1 (black dotted).
(A color version of this figure is available in the online journal.)
This ratio is larger than in the narrow component of the star-forming clumps in ZC406690 ([N ii]/Hαnarrow ∼ 0.07–0.23).ZC782941 (clump A) may exhibit weak broad [N ii] lines aswell, as does the co-added bright clump spectrum in the bottompanels of Figure 9.
3.2.3. Outflow Velocities are Similar to Those Found fromUV-spectra and in Local Starbursts
The velocity widths of the blueshifted wings in our sam-ple are comparable to those seen in the UV metal-line ab-sorption components in z ∼ 2–3 SFGs studied by Pettiniet al. (2000) and Steidel et al. (2010). Steidel et al. (2010)find that the velocity centroids of the outflowing gas rangebetween 0 (systemic) and −500 km s−1, with an average (in89 z ∼ 2 BX galaxies) of –160 km s−1. The centroid of theblueshifted component in Figure 9 is −80 ± 20 km s−1, compa-rable to the values found by Steidel et al. (2010). The maximumblueshifted velocities (Δvmax,1 ∼ |〈v〉broad–2∗σ broad|) in our sam-ple range between 380 and 1000 km s−1 (the average spectrum inFigure 9 has 560 km s−1), which are also in good agreementwith the Δvmax–SFR and Δvmax–vc relations in z ∼ 0 star-
burst and ultra-luminous galaxies (Martin 2005; Veilleux et al.2005). For vc ∼ 250 km s−1 Martin (2005) finds in her sample ofz ∼ 0 ultra-luminous galaxies values of Δvmax,1 between 300and 750 km s−1. Veilleux et al. (2005) and Rupke et al. (2005)define the “maximum” wind speed as Δvmax,2 = |〈v〉broad −Δvbroad(FWHM)/2|. If this measure is applied to the galaxies inour sample we find values ranging between 260 and 640 km s−1
(Figure 9 gives 360 km s−1), or about two-thirds of the valuesgiven in Table 2. For a sample of z ∼ 0 luminous and ultra-luminous infrared galaxies, Rupke et al. (2005) find 〈Δvmax,2〉 =300–400 km s−1. In all these cases, some caution is requiredsince a detailed comparison of column-density-weighted meanabsorption profiles with rms-density-weighted emission profilesmay be misleading. The Δvmax–SFR and Δmax–vc relations inz ∼ 0 starburst and ultra-luminous galaxies have been inter-preted as support for a “cool” outflow driven by the momentumof the intrinsic hot wind due to supernovae and stellar winds(Lehnert & Heckman 1996; Martin 2005; Veilleux et al. 2005),and/or the radiation pressure from the star-forming regions ontodust grains mixed with the cold gas (Martin 2005; Murray et al.2005).
13

The Astrophysical Journal, 733:101 (30pp), 2011 June 1 Genzel et al.
It is thus eminently plausible to conclude that the broad,blueshifted Hα emission in the z ∼ 2 SFGs originates in warmionized outflows triggered by the intense star formation activityin the giant clumps. The alternative interpretation of narrow-or broad-line emission from a central AGN (Shapiro et al.2009) can be excluded for ZC406690, BX482, and D3a15504.Here the broad emission is associated with individual, off-center clumps participating in the general rotation of the galaxy.An AGN interpretation is possible in ZC782941 and BX599.In ZC782941, clump A is separated from and has a peculiarvelocity relative to the main body of the galaxy. This clump maythus be the center of a small intruding galaxy that is interactingwith the main part of ZC782941 (i.e., a “minor” merger).Broad emission from that central spot could conceivably comefrom a buried AGN. Likewise, in the case of the “dispersion-dominated,” compact galaxy BX599, the broad emission comesfrom the brightest emission component (of two, see Figure 8),which may be the center of the overall system.
The prevalence of asymmetric blueshifted line profiles inFigures 7–9 suggests that differential extinction is an importantfactor in determining line profiles and fluxes. Typical gas columndensities in the high-z SFGs range from 700 to 8000 M� pc−2
(row 9 in Table 2), corresponding to N(H) ∼ 1022.8–1023.9 cm−2,or visual extinctions of AV ∼ 30–400, for dust to gas ratiossimilar to the Milky Way. Dust opacities at high-z may besmaller because of clumpiness and lower metallicity (Reddyet al. 2010) but are plausibly sufficiently high to account forstrong differential extinction of Hα across SFG disks. If thisis correct, the interpretation of the blueshifted emission asoriginating in an outflow is strengthened further.
3.2.4. The Outflowing Gas is Extended on kpc-scales
The case of ZC406690 is particularly favorable for studyingthe properties of the outflowing component, as the “disk”emission from the clumps is narrow in velocity (due to the low(15◦–30◦) inclination) and the surface brightness is high becauseof the highly clumped emission. Clump A has ∼22% of thetotal Hα emission of the galaxy. In the most spectacular broad-component clump (clump B), the broad emission is clearlyoffset from the narrow emission component by 0.′′16 towardthe southeast. Toward region D (∼0.′′6 southeast of clump B),the line profile is completely dominated by blue emission. Thisblue gas cannot be part of the rotating gas ring that characterizesthe rest of the narrow Hα emission in ZC400690 (upper leftpanel in Figure 6). It has a similar center velocity as (butnarrower profile than) the broad emission closer to clump B(Figure 7). Region B may thus be dominated by a component inthe outflow. The projected broad emission associated with clumpB thus is extended over 1.3–5 kpc. Given the relatively lowinclination of the galaxy, the de-projected extent perpendicularto the galactic plane may be still larger, and may be comparableto the diameter of the star-forming ring in ZC406690 (∼10 kpc).In contrast, the Hα-faint but continuum bright clump C hasno discernible broad blueshifted component (Figure 7). Thesestrong spatial variations of the broad emission, as well as ofthe equivalent width Hα/2700 Å rest-frame continuum, may bedue to a combination of variable extinction and/or evolutionaryeffects in individual clumps.
3.2.5. The Fraction of Broad Emission May be Correlatedwith Star Formation Surface Density
The incidence of strong broad emission in our sample appearsto be most obvious for the highest surface brightness clumps
and, in turn, we do not detect the outflow component inthe “interclump” spectrum shown in the top left panel ofFigure 9. For the seven clumps in Table 2 and the interclumpspectrum, there may be correlation between the ratio of broadto narrow Hα component fluxes and star formation surfacedensity. A confirmation (or repudiation) of this tantalizing trendwould be interesting. This is because the ratio of broad tonarrow components is a measure of the ratio of outflow rateto star formation rate. Simple theoretical arguments for bothenergy- and momentum-driven winds lead to the expectationthat this ratio should be approximately constant (Heckman 2003;Veilleux et al. 2005; Murray et al. 2005). Outflows tap a fractionof the energy and/or momentum (both proportional to SFR)released by the young, massive stars. If the expansion velocityof the ionized gas does not strongly depend on SFR, the ratio ofoutflow rate to SFR is approximately constant as well. Martin(2005) and Weiner et al. (2009) find vout ∝ SFR0.3. The starformation surface density is proportional to gas surface densityif the near-linear KS relation of Genzel et al. (2010) and Daddiet al. (2010b) applies. Gas surface density in turn is proportionalto dust surface density in dusty sources, which in turn isproportional to dust opacity. A correlation of the ratio of broadto narrow Hα emission with Σstar form may support the proposal(Murray et al. 2005, 2010a) that the cold/warm outflows inmassive star-forming galaxies are driven to a significant extentby radiation pressure (Moutvout ∼ τdustL/c). Murray et al.(2010b) show that in that case galactic winds can only belaunched for star formation surface densities above a criticalvalue, Σstar form,crit > 0.1v2.5
c,250 km s−1R−25 kpc M� yr−1 kpc−2. All
five galaxies are above this limit.Given the emerging evidence for powerful winds from indi-
vidual clumps, the obvious next question is whether this “stellarfeedback” is the key agent driving the large-scale turbulence inhigh-z galactic disks, as proposed by Ostriker & Shetty (2010)and Lehnert et al. (2009). The next section will show, surpris-ingly perhaps, that this is not evident from our data.
3.3. Is the High-velocity Dispersion of z > 1 SFGs Driven byStar Formation Feedback?
Are the large local rms–velocity dispersions (i.e., localFWHM line widths) in ionized gas, germane to all high-z SFGsstudied so far, a direct result of the clump outflows discussedin the previous section? The large velocity dispersion may, forinstance, be driven by the mixing of the hot wind fluid withcooler clouds at the base of the outflows (Westmoquette et al.2007). If so, one would naively expect a correlation between therms dispersion and the surface brightness of Hα, as a measure ofstar formation surface density (but see Ostriker & Shetty 2010).
There is clearly a correlation of rms line width and thepowerful outflows in the extreme clumps ZC406690 A and B(bottom panel in Figure A1). But this increased line width isentirely due to the broad outflow component while the narrowline emission in these clumps does not vary significantly relativeto the surrounding.
Figure 10 shows galaxy-wide and clump averages of σ 0 (orσ clump) as a function of Σ∗, for those z > 1 SFGs with goodquality determinations. These include the best z ∼ 1.5–2.5 disksfrom the SINS survey (Cresci et al. 2009; Forster Schreiber et al.2009), and other recent surveys of z ∼ 1–2.5 SFGs (Wright et al.2007; van Starkenburg et al. 2008; Epinat et al. 2009; Lemoine-Busserolle & Lamareille 2010), mainly sampling fairly massive(Mdyn > 1010.5 M�) galaxies with radii R1/2 ∼ 2–10 kpc. Wealso include galaxy-wide averages of lower mass disks (∼a
14

The Astrophysical Journal, 733:101 (30pp), 2011 June 1 Genzel et al.
0
50
100
150
0.00001 0.001 0.1 10
clumps (this paper)σ
0=66*(Σ
star formation)0.1 (0.04)
σ0=72 (Σ
star formation)0.039 (0.022)
SINS disksLaw dispersion dominatedother disksJones lenses
Σstar formation
(Msun
yr-1kpc-2)
σ 0(k
m/s
)
Dib et al.
Figure 10. Dependence of intrinsic velocity dispersion on star formation surface density, for galaxy averages, as well as for individual giant star-forming clumps. Inall cases the effects of large-scale velocity gradients, beam smearing, and instrumental resolution were removed, if applicable, prior to estimating the local velocitydispersion. Open blue circles (and 1σ uncertainties) denote galaxy averages in SINS z ∼ 1.5–2.5 disks (Forster Schreiber et al. 2006, 2009; Genzel et al. 2006, 2008;Cresci et al. 2009; this paper) and open purple circles denote galaxy-averaged z ∼ 1–2 disks from Wright et al. (2007), van Starkenburg et al. (2008), Epinat et al.(2009), and Lemoine-Busserolle & Lamareille (2010). Open red squares are flux-weighted galaxy averages of dispersion-dominated z ∼ 1.5–2.5 SFGs from Law et al.(2009). Filled black squares denote the brightest clumps in BX482, D3a15504, ZC400690, and ZC782941, as well as the central region (clump) of BX599, and thefilled green triangles mark the flux-weighted dispersions in low-mass lensed z ∼ 2–3 LBGs of Jones et al. (2010). The dotted gray and dashed magenta lines are thebest-weighted and unweighted linear fits to the log-log representation of all data. The light blue shaded area on the right marks the region with Σ � 26 M�yr−1 kpc−2,where no UV-bright star-forming galaxies have so far been detected (Meurer et al. 1997, corrected to a Chabrier IMF). The gray hatched region shows the dependenceof HI velocity dispersions in z ∼ 0 SFGs, as collected by Dib et al. (2006).
(A color version of this figure is available in the online journal.)
few 109 M�) from the survey of z ∼ 1–3 lensed SFGs byJones et al. (2010), and from mostly lower mass (Mdyn ∼(0.3–3) × 1010 M�) and compact (R1/2 ∼ 0.9–2 kpc) but well-resolved (with AO) “dispersion dominated” z ∼ 1.5–3 SFGstaken from Law et al. (2009). Finally, we include our individualclump measurements in Table 2. This compilation samples awide range of gravitational potentials and star formation surfacedensities, from scales somewhat more active than “normal”z ∼ 0 SFGs (a few 10−2 M� yr−1 kpc−2) to the “Meurer” limit(∼20 M� yr−1 kpc−2). Above this limit, there appear to be noor few UV/optically bright SFGs at any redshift (Meurer et al.1997), with the exception of compact, gas-rich mergers at bothlow-z (ULIRGs) and high-z (submillimeter galaxies–SMGs).
The rms–velocity dispersion does appear to increase withstar formation surface density but only by a modest amount.The measurements included in Figure 10 sample more than twoorders of magnitude in Σ∗, yet σ 0 changes by less than a factorof two. A formal weighted fit only yields a marginally signifi-cant positive correlation (log(σ 0) ∼ 0.039 ( ± 0.022) log(Σ∗)).An unweighted fit to the same data gives a steeper slope(0.07 ± 0.025), as does a fit to only the SINS galaxies andclumps (0.1 ± 0.04), or a fit with only AO data sets from SINSand OSIRIS (0.12 ± 0.04). The scatter at any fixed star forma-tion surface density is almost as large as the overall trend and isformally larger than the measurement errors. This large scatter isat the root of the marginal significance (<3 standard deviations)of the overall correlation. It is not clear whether the overall trendof the high-z points connects to the region occupied by lower
surface star formation density, z ∼ 0 SFGs, as presented by Dibet al. (2006).
Recently, Green et al. (2010) have reported Hα integral fieldspectroscopy in a sample of lower mass, Hα bright star-forminggalaxies at z ∼ 0.1 (including a number of mergers), at a similarlinear resolution (∼2 kpc) as the z ∼ 2 AO data sets in thispaper. From their analysis, Green et al. (2010) infer that theluminosity-weighted, average velocity dispersions σ L scale withstar formation rates and, in their most active systems, take onvalues similar to those seen in high-z galaxies. They concludethat feedback is the main agent driving galactic turbulence at allredshifts. Unfortunately, it is not possible to directly compareσ L to the local velocity dispersions σ 0 that we are discussingin this paper. The luminosity-weighted quantity σ L places thestrongest weight on the bright central regions in each galaxy,where beam smearing in rotating disks creates artificially largevelocity dispersions, which is not or only partially removedin the analysis of Green et al. (2010). The quantity σ L thusnecessarily is an upper bound to σ 0. A more detailed comparisonof the Green et al. data set with our data is highly desirablebut requires the application of the same data analysis methods,which is beyond the scope of this paper (R. Davies et al. 2011,in preparation).
We have also looked for possible pixel-to-pixel variationsof σ 0 in the deep AO data on the four most extended SFGsreported in this paper. There is clearly an increase of the rmsdispersion toward clumps A and B in ZC406690 but this increaseappears to be entirely due to the powerful outflow component
15

The Astrophysical Journal, 733:101 (30pp), 2011 June 1 Genzel et al.
in these extreme clumps. The width of the narrow componentdoes not vary much in ZC406690. We find weak positive corre-lations between the residual velocity dispersion and Hα surfacebrightness in D3a15504, and possibly ZC782941, consistentwith the trends in Figure 10. There is no dependence of veloc-ity dispersion on Hα surface brightness in BX482 (Appendix A:Figures A1 and A2). To first order, the large velocity dispersionsin high-z SFGs appear to form a spatially constant “floor,” Anydifferences in σ 0 between intra- and interclump regions are notor only marginally significant, given the 1σ measurement errorsof typically 10–20 km s−1 (Figures A1 and A2).
Finally, we have checked for a dependence of σ 0 on massoutflow rate, discussed in Section 4.1 and listed in rows 20–22of Table 2. There is little evidence for such a correlation. Asthe spectra in Figures 7–9 show, there is an order of magnituderange of inferred outflow velocities at roughly constant rms linewidth for the different clumps in ZC406690, and the brightestclumps in BX482 and ZC782941 have comparable outflow ratesbut very different line widths.
We would like to emphasize that this relatively weak depen-dence of σ 0 on star formation surface density does not con-stitute an inconsistency with the detection of the broad Hαemission discussed in Section 3.2. This is because the broadline wings in Figures 7–9 do not greatly affect the FWHM linewidths in most of the clumps (with the exception of clumpsA and B in ZC406690), which are dominated by the narrowcomponent tracing star formation. Again with the exception ofZC406690, the inter-clump regions are not affected at all. How-ever, for the galaxy-wide estimates, σ 0 is by necessity estimatedfrom the line widths in the off-center parts of the galaxies, inorder to eliminate the impact of unresolved velocity gradients.This makes the determination of a local intrinsic line width inclumps near the center and in compact galaxies often tricky andunreliable. A case in point is BX599, where the observed disper-sion toward clump A is definitely broadened to an effective localσ of 125 km s−1. For the reasons just discussed, in Figure 10we use σ 0 ∼ 76 ± 20 km s−1, which is an estimate from the linewidth outside this bright clump.
With the possible exception of extreme clumps, local starformation feedback thus does not appear to directly drive thelocal rms–velocity dispersion of the ionized gas. While thestar formation-driven galactic outflows discussed in the lastsection are energetically capable of stirring up the ionized gasin the disk, it appears that the ordered outflows do manage tobreak out of the local environment. This is consistent with theobservations of Steidel et al. (2010), who find that the outflowinggas is transported to �100 kpc. For this breakout to be efficient,the clumps probably must have clumpy structure below ourcurrent resolution, with a small filling factor of the densestgas. Such substructure is hinted at from a comparison of thevelocity channel maps of the bright clump A in BX482, shownin the middle two rows of Figure 1. There are significant small-scale variations for clump A in these individual velocity maps,consistent with spatial-velocity substructure on sub-kpc scales.
The question remains whether the kinematics of the ionizedgas is a good proxy of that of the entire cold (molecular) gasin high-z SFGs. This important issue can soon be addressedwith high-resolution millimeter interferometric imaging of COrotation emission lines (see Tacconi et al. 2010; Daddi et al.2010a).
3.4. Are the Clumps Rotationally Supported?
Most of the available numerical simulations of the z > 1gas-rich disks predict that the gravitationally unstable clumpscontract, spin-up, and may approach a Jeans equilibrium withhalf or more of the support in rotation (Immeli et al. 2004a,2004b; Dekel et al. 2009a; Agertz et al. 2011; Aumer et al.2010; Ceverino et al. 2010). This is because in these simulationsthe angular momenta of the collapsing clumps are largelyconserved.
We have explored the evidence for rotation in our databy determining the velocity gradients across clumps in the“raw” and “residual” velocity maps. Figures 11 and 12 showthe residual velocity distributions in BX482, ZC406690, andD3a15504, after subtracting (by kinemetry or modeling) thelarge-scale velocity gradients caused by the overall galaxyrotation. Clump rotation should show up as a local gradientin these residual maps. If the clumps originally have a similarangular momentum direction as the galaxy, their rotation shouldbe prograde. For this reason, the right panels in Figures 11and 12 show position–velocity residual cuts through severalof the largest and best isolated clumps, along the maximumvelocity gradient (“line of nodes”) of the galactic rotation, wherethe largest effects are expected in most cases. We have alsoexplored other directions, with little difference in the results.
Velocity gradients are indeed present in the velocity mapsacross the clumps. In the “raw” maps, they are on aver-age comparable in magnitude and sign (δraw = (vmax−vmin)raw
2 sin(i)Rclump∼
30( ± 11) km s−1 kpc−1) to the large-scale velocity gradientsacross the galaxies but there are no large additional local gradi-ents. In D3a15504, caution is warranted as the largest gradients(through clumps C, E, and F) may also be interpreted as large-scale, radial streaming of the circumnuclear gas in a barredpotential, as discussed in Genzel et al. (2006). After subtractionof the large-scale velocity gradients from galaxy rotation, theinclination corrected “residual” velocity gradients typically areδresidual = (vmax−vmin)residual
2 sin(i)Rclump∼ ±15(±5) km s−1 kpc−1. These resid-
ual gradients are often retrograde (negative sign in row 31 ofTable 2).
Are these observed gradients consistent with the clump massestimates (row 8 of Table 2) in virial equilibrium? In principle,dynamical masses can be computed for rotationally supportedsystems if rotation velocity and inclination are known. However,most of the giant clumps have HWHM radii comparable to orslightly larger than our resolution, so that beam smearing playsan important role in lowering the expected velocity gradients.
To get a quantitative handle on how large these resolutioneffects are, we took two approaches. In the first, we constructedsimple toy models of rotationally supported clumps of differentmasses (5 × 10⁸ to 1010 M�), sizes (HWHM radii from 0.2 to1.7 kpc), and intrinsic density distributions (Gaussian or uni-form). For these model clumps, we calculated model data cubesfrom the input mass distributions, for a range of inclinationsand masses, and for a z-thickness of 〈z〉/〈R〉 ∼ 0.2 appropriatefor the high-z galaxies. We then convolved these models withthe spatial (∼0.′′2 FWHM) and spectral (85 km s−1 FWHM) in-strumental resolution, and sampled them at the pixel scales ofSINFONI. The left panel of Figure 13 shows the ratio of theclump mass to the empirical “rotational” dynamical mass of
16

The Astrophysical Journal, 733:101 (30pp), 2011 June 1 Genzel et al.
-50
0
50
-0.5 0 0.5-1.0
-0.5
0
0.5
1.0SE clump A
offset along pa −700 (arcsec)
velo
city
-mod
el (
km/s
)
rela
tive
fluxA
B
C
D
-40
-20
0
20
-0.6-0.4-0.20
-2
0
2
4
6
clump A
E-W offset (arcsec)
velo
city
-kin
emet
ry (
km/s
)
Ha
flux
(10-1
9er
gs-1
cm-2
pix-1
)
Figure 11. Velocity residual maps and position–velocity residual cuts across the brightest clump A in BX482 (top) and ZC406690 (bottom). The left panels are theresidual maps (velocity (data) minus velocity (model or kinemetry)), the right panels give position–velocity residual (and ± 1σ errors) cross-cuts across the brightestclumps in each galaxy, along the direction of the galaxy’s maximum velocity gradient (line of nodes). The red points and dashed curve denote the Hα flux (rightvertical axis) and the blue points and continuous curve denote the residual velocity (left vertical axis).
(A color version of this figure is available in the online journal.)
these model clumps, given by
Mdyn rot ∼ bβ
(vmax − vmin
2 sin(i)
)2R
G
∼ bβ2.3 · 105δ2km s−1 kpc−1R
3kpc (M�). (6)
Here δ is the observed velocity gradient across the observedsize of a clump (2R), after correction for the inclination of thegalaxy, and b and β are dimensionless numbers; β is dependenton the assumed density distribution (β = 1 and 1.16 for uniformand Gaussian clumps, for instance). Figure 13 shows that massestimates with Equation (6) require an average value of b =4.4 (with substantial scatter) for matching the toy model clumpmasses if R = RHWHM obs and if clump sizes are comparable toor larger than the beam sizes. This is mainly because the true“Keplerian” limit is only reached at R ∼ 1.5–2 RHWHM. Thiscan be best seen from the open symbols in the left panel ofFigure 13, which shows that for the same basic assumptions bapproaches unity for R = 2 RHWHM. In the following, we will usethe estimator at R = RHWHM since in the real data the confusingeffects of background and other clumps are less severe close tothe clumps’ cores.
In our second approach, we analyzed the properties of severalprominent clumps in an Mbaryon = 3 × 10¹⁰ M� galaxy in thecosmological adaptive mesh, hydro-simulations of Ceverino
et al. (2010) and D. Ceverino et al. (2011, in preparation), towhich publications we refer the reader for more details. Thesimulations have a resolution of 35–70 pc. At z = 2.3, thesimulated galaxy has a number of clumps of mass ∼3 × 10⁸ M�,radius ∼0.3 kpc, and intrinsic circular velocity of 70 km s−1.These clumps are largely rotationally supported. From thesimulation, we constructed data cubes of the Hα emission atdifferent resolutions and inclinations, which we then analyzedin the same manner as for SINS data cubes. At the resolutionof our SINS data, the clumps in the simulated galaxy exhibitclear rotational signatures, and we extracted velocity gradientsin the same manner as for the real SINS data. Since the intrinsicclump masses are known, it is then possible to compute b inEquation (6). The simulated galaxy has much smaller galaxyand clump masses and radii than the SINS galaxies. We expectthe clump quantities to scale with the galaxy properties, andvclump, rot ∼ Rclump ∼ (Mclump)1/3 ∼ (Mdisk)1/3 (Equation (5)). Sofor clumps 10 times more massive (as in the more massiveclumps in our sample), we expect the size and velocity ofthe typical clumps to be twice as large as the clumps in thesimulations. In order to refer to clumps twice as extended as thesimulated clumps, we can pretend that the beam smearing is halfthe true value, namely FWHM = 0.′′1 = 0.84 kpc. We read δ withthat smoothing and do not need to correct this value because Vand R scale similarly. The filled magenta triangle and open black
17

The Astrophysical Journal, 733:101 (30pp), 2011 June 1 Genzel et al.
0
50
100
-0.8 -0.6 -0.4 -0.2 0 0.2 0.4
0
50
100NW clump A
velo
city
-mod
el (
km/s
)
rela
tive
flux
-150
-100
-50
0
50
100
150
-0.2 0 0.2 0.4
-150
-100
-50
0
50
100
150
clump E
NW
clump D
velo
city
-mod
el (
km/s
)
rela
tive
flux
-100
-50
0
50
100
-0.4-0.2 0 0.2 0.4 0.6 0.8 1.0 1.2
-100
-50
0
50
100
clump F
NW
clump C
offset along pa-23 (arcsec)
velo
city
-mod
el (
km/s
)
rela
tive
flux
Figure 12. Velocity residual map of D3a15504 (left) and position–velocity cuts (right) through the five selected clumps along the line of nodes of the rotation of thegalaxy (white arrow in left panel). The red points and dashed curves in the right panel denote the Hα fluxes (right vertical axis) and the blue points and continuouscurves denote the residual velocities (left vertical axis).
(A color version of this figure is available in the online journal.)
circle in Figure 13 give the average and scatter of four clumps inthe simulated galaxy, scaled in this manner to clump masses of3 × 109 M� and 1010 M�, respectively. The inferred calibrationsfor b from the simulated galaxy are in excellent agreement withthose from the toy model clumps.
With this calibration (b = 4.4) for rotationally supportedclumps, we then proceeded to compute dynamical clumpmasses for the SINS clumps in Table 2, from the observed“raw” velocity gradients. The inferred “rotational” dynami-cal masses range between 2 × 10⁸ and 2 × 10⁹ M� (row 32of Table 2). As before, the gas masses were estimated fromEquation (2). The SINS galaxies have clump gas masses on av-erage 6.4 times larger (with a wide range from 3 to 75) than therotational dynamical masses estimated from their velocity gra-dients with b = 4.4. Including stellar masses further increasesthe discrepancy. For instance, the stellar mass of clump A in
BX482 A is ∼3 × 10⁹ M� (Forster Schreiber et al. 2011b), sothat the total clump mass is 1.4 times the gas mass. The discrep-ancy increases by another factor of ∼2 if “residual” velocitygradients are used for computing dynamical masses.
How can one understand this discrepancy? Extended Hαemission surrounding the clump may decrease the rotationalsignal. If the clumps were much smaller than our resolution,the rotational signal would be completely washed out bybeam smearing (Figure 13). In that case, Equation (6) withb = 4.4 would underestimate the dynamical masses significantly.However, the clumps should then in turn exhibit very largecentral velocity dispersions (100–170 km s−1) caused by thesame beam smearing.
Such large velocity dispersion maxima centered on theclumps are not observed in our sample, although the datashown in Figures 10, A1, and A2 are consistent with a modest
18

The Astrophysical Journal, 733:101 (30pp), 2011 June 1 Genzel et al.
0.5
1.0
0 0.1 0.2
0 0.5 1.0 1.5
ρ~Gauss, mass 5e8 - 1e10ρ~Gauss, 5e9, inclination 20-80 degreeρ ~ Gauss, 5e9 clumps, σ
0=0
Rclump
(intrinsic, HWHM) (arcsec)
Mcl
ump/(
Mro
t+M
disp
)
0
5
10
15
0 0.1 0.2
0 0.5 1.0 1.5
Ceverino simulation, scaled to 3e9 M sun clumpsCeverino simulation, scaled to 1e10 clumpsρ~uniform, 5e9 clumps, σ
0=0
HWHMobs
=0.11"
Rclump
(intrinsic, HWHM) (arcsec)
Mcl
ump/M
rot
Rclump
(kpc)
Figure 13. Properties of rotationally supported model clumps. Left panel: ratio of clump mass to the “rotation” mass estimator in Equation (6) (with b = 1), forGaussian and uniform density clumps of different intrinsic clump radii (HWHM for Gaussian, outer radius for uniform density), masses, and inclinations, convolvedwith the SINFONI spatial (FWHM 0.′′22) and spectral (FWHM 85 km s−1) resolutions and sampled with 0.′′05 and 34 km s−1 pixels. Filled symbols denote the estimatorin Equation (6) applied at the observed clump HWHM. The crossed black circle and the filled magenta triangle denote the ratio derived from an average of fourprominent clumps in a z = 2.3 galaxy from the adaptive mesh refinement (AMR) simulations of Ceverino et al. (2010), but scaled to clump masses of 1010 and 3 ×10⁹ M�, respectively. The simulated data were analyzed with the same method and effective resolution as the real SINFONI data sets. The right panel gives the ratioof the clump mass to the mass estimator in Equation (7), which combines the observed velocity gradient and velocity dispersion.
(A color version of this figure is available in the online journal.)
increase in velocity dispersion toward the clump centers. Genelet al. (2010) and Aumer et al. (2010) find in their simulationsthat clumps actually are minima in the galaxy-wide velocitydispersions, and argue that turbulence created on large scales isdissipated more efficiently in the dense clump environment. Ifthis were to apply to our SFGs, a significant amount of beam-smeared rotation could “hide” in the current velocity dispersionmaps.
If the clumps are supported by a combination of rotation andpressure, the appropriate measure for the dynamical mass is
Mdyn r+p = 2.33×10⁵Rkpcβd(2σ 2
km s−1 + δ2km s−1 kpc−1R
2kpc
)(M�),
(7)where β is defined as in Equation (6), and d is a dimensionlesscalibration factor. Our clump modeling suggests d = 0.4–1.2.For d = 1 and a clump velocity dispersion σ 0 between 50 and95 km s−1, the pressure term ranges between 1.5 and 5 × 10⁹ M�for the different clumps in Table 2 and appears to dominate overthe rotational mass. Equation (7) then yields an average ratioof gas mass to dynamical mass of ∼2d, and somewhat largerif stellar masses are included (row 35 of Table 2). For d =1 gas (plus stellar) masses still exceed the dynamical massesbut for d = 0.5 the estimates agree to within the uncertainties.The application of Equation (7) to the SINS clumps may thusgive a reasonable match to the estimated gas and stellar massesin these clumps, always keeping in mind the very substantialuncertainties in all these estimates. Note that the estimator(7) also works well for rotationally supported but unresolvedclumps.
The inferred discrepancy between the rotational massesfrom Equation (6) and the gas masses is most stronglydriven by the prominent clumps A in BX482 and ZC406690(Figure 11). Even when allowing for large uncertainties, therelatively small observed velocity gradients in these two casesappear inconsistent with rotational support. These clumps mayeither be largely pressure supported, with rotation contribut-
ing perhaps 10%–20% of the energy, or they are not virialized(Genel et al. 2010). In the smaller and probably more typi-cal clumps of D3a15504 and ZC782941, rotational support ismore significant and may even dominate, considering the un-certainties in our analysis, limitations in S/R, and the possiblecontamination by unrelated background emission. This is espe-cially true if most of the mass and rotation of the clumps are onscales much smaller than our beam, and at the same time theclumps are local minima in the galaxy-wide velocity dispersion.
There could also be physical reasons for low rotationalvelocities. The first is that the clouds may not be undergoingglobal collapse. Angular momentum may not be conserveddue to outward transport by large-scale torques or magneticfields. Milky Way GMCs also typically have little rotation(δ ∼ 45 km s−1 kpc−1; Blitz 1993; Phillips 1999), similar tothe values we find in our SINS clumps. A fraction of theseGMCs also have a retrograde velocity gradient with respect tothe rotation of the Milky Way (Blitz 1993), inconsistent withthe simple spin-up scenario from initially differentially rotatingdisk gas. The most extreme clumps may also not have enoughtime for virialization before much of the gas is expelled, as issuggested by the simulations of Genel et al. (2010).
3.5. Is the Velocity Dispersion Isotropic?
If the galactic turbulence is created by clump–clump inter-actions, the velocity dispersion may be anisotropic, with largerdispersion in the galactic plane than perpendicular to it, as in thesimulations of Aumer et al. (2010). Figure 14 is an attempt totest this prediction for those well-resolved disk galaxies withinthe SINS sample (Forster Schreiber et al. 2009) and other recentintegral field data (Wright et al. 2007; van Starkenburg et al.2008; Epinat et al. 2009; Lemoine-Busserolle & Lamareille2010), where a reasonably robust value of the inclination isknown from dynamical fitting (Cresci et al. 2009) or from thegeometric aspect ratio of the emission.
19

The Astrophysical Journal, 733:101 (30pp), 2011 June 1 Genzel et al.
0
2
4
6
8
10
12
14
0 0.2 0.4 0.6 0.8 1.0
5.3 ± 0.5
3.7 ± 0.3
edge-onface-on
sin (i)
v d/σ
0
0
50
100
0 0.2 0.4 0.6 0.8 1.0
y=35*(sqrt( 1 + (4-1)*x*x))other diskssecond best disksSINS best disks
58 ± 3
48 ± 4
edge-onface-on
sin (i)
σ 0(k
m/s
)
Figure 14. Dependence of intrinsic velocity dispersion σ 0 (left panel, corrected for large-scale velocity gradients, beam smearing, and instrumental resolution) andvc/σ 0 (right panel) on the inferred inclination (typical uncertainty ± 0.1 in sin(i)) for the SINS disks (filled and open blue circles) and disks from other publications(open red squares, see references in the caption of Figure 10). Mean and 1σ uncertainty in the mean are indicated for the ranges sin(i) less than and greater than 0.64.
(A color version of this figure is available in the online journal.)
Keeping in mind the large uncertainties in sin(i) (Δ sin(i) ∼± 0.15, including systematic effects), there is a tantalizing trendfor the more edge-on systems to have relatively larger line-of-sight dispersion σ 0 or smaller vc/σ 0 (see also Aumer et al.2010). Dividing up the data into two bins (sin(i) > 0.64 and<0.64), the two sets differ at ∼2σ–2.7σ . If real, this trendwould correspond to an anisotropy in the velocity dispersionellipsoid of σ plane/σ pole ∼ 2 (gray curve in Figure 14).
Two cautionary remarks are in order. One is that onlytwo of the highest inclination disks (sin(i) > 0.8) have AOdata sets, and these two have fairly low velocity dispersion.The highest inclination (and high quality) disk BX389 (Cresciet al. 2009; Genzel et al. 2008) does have a very high velocitydispersion (σ 0 = 87 ± 10 km s−1) but this result comes fromseeing limited data. The other is that in a highly inclineddisk velocity dispersion and rotation are more entangled thanin a more face-on system. As a result, the observed velocitydispersion in modest resolution data may be artificially increasedby unresolved rotation and confusion of different regions alongthe line of sight. Given these concerns, we consider the trend inFigure 14 tantalizing but not convincing.
3.6. Are There Spatial Variations in Chemical Abundances?
The flux ratio 6585 Å [N ii])/Hα in non-AGN SFGs is ameasure of the oxygen to hydrogen abundance ratio (Pettini& Pagel 2004; Erb et al. 2006a). It is thus interesting to askwhether the intense star-forming activity in the giant clumps isreflected in local enhancements in metallicity, and whether thereare abundance differences between the central and outer partsof the galaxies because of the expected inside-out evolution ofthe galaxies (e.g., Somerville et al. 2008).
We first analyzed specific regions from extracted spectra inorder to maximize the S/N, with the quantitative results listedin Table 3. Very significant variations in [N ii]/Hα are indeedpresent in ZC406690. This is easily seen by inspection of thespectra in Figure 7. The [N ii] line is weak toward clump A or
region D, while it is much stronger toward clumps B and C. Interms of inferred oxygen abundance (Table 3), these changescorrespond to an increase of more than a factor of two fromZO ∼ 0.4 Z� in clump A to ZO ∼ 0.70 Z� in clump B. ClumpsA, B, and C also form a downward sequence in the ratio ofHα line flux to rest-frame 2700 Å continuum flux density fromthe I-band imaging, which may be explained by a combinationof increasing extinction and increasing age. The observationsin ZC406690 may thus suggest a trend of increasing heavyelement abundance with age of the star-forming clumps in theyoung star-forming ring of this galaxy.
In the comparably young star-forming ring in BX482(Genzel et al. 2008; Forster Schreiber et al. 2011b) clumpsA–C and the rest of the Hα ring have similar abundances,while the central “cavity” near the kinematic center has an[N ii]/Hα ratio 2.7σ larger. The inferred oxygen abundanceincreases from ZO ∼ 0.56 Z� in the bright Hα star-formingring to ZO ∼ 0.73 Z� near the center. Correspondingly, ForsterSchreiber et al. (2011a, 2011b, Section 4.2.2) find an age gra-dient from <100 Myr in the ring clumps, to >200 Myr near thecenter. In the somewhat more mature galaxy ZC782941, theclumps near the kinematic center of the galaxy (B–E) have an[N ii]/Hα ratio 3.3σ times greater than in the outer clump A (orminor merger) and the interclump regions, corresponding to anincrease from 0.67 to 0.84 Z�.
Finally, the most mature galaxy (in terms of stellar age andabundances) in our sample, BzK15504, does not show anyevidence for a difference between clumps and interclump gas inthe main body of the disk. In our AO data, the [N ii] line is toofaint in the outer parts of the galaxy disk for reliable statementson the oxygen abundance. However, on the basis of seeinglimited data of D3a15504, which are sensitive to lower surfacebrightness, P. Buschkamp et al. (2011, in preparation) deduce∼0.3–0.5 Z� abundances in the outer disk. The circumnuclearregion has a higher [N ii]/Hα, corresponding to an increase inoxygen abundance from 0.9 Z� in the disk to 1.07 Z� near thenucleus.
20

The Astrophysical Journal, 733:101 (30pp), 2011 June 1 Genzel et al.
In agreement with our findings, P. Buschkamp et al. (2011, inpreparation) find that [N ii]/Hα increases from the outer regionstoward the nuclei in two additional massive and mature SFGs,BX610 (z = 2.2; see also Forster Schreiber et al. 2006) andBzK6004 (z = 2.4). In these cases the inferred abundancesappear to increase from slightly below solar (∼0.95 Z�) in theouter disk to supersolar (∼1.2 Z�) near the center. In all thesecases, one needs to caution that such line ratio gradients may becaused by the presence of a central AGN. Indeed this explanationmay apply to BzK15504 (Genzel et al. 2006). Evidence for aweak AGN causing a radial change in [N ii]/Hα and [O iii]/Hβline ratios has also been found for another z ∼ 1.5 SFG byWright et al. (2010).
We have also explored the data of BX482, BzK15504, andZC782941 in more detail by analyzing the [N ii]/Hα pixel-to-pixel variations statistically and by searching for correlationsbetween [N ii]/Hα and Σstar form. This analysis confirms the re-sults on selected regions that we discussed in the last paragraph,but does not reveal significant additional trends. This is perhapsnot surprising, since even with the superior data presented inthis paper, the typical average S/N per pixel in the [N ii] line ismodest.
In summary of this section, we find evidence for clump toclump and center to outer disk variations in the inferred gasphase oxygen abundance that are qualitatively consistent withthe expected rapid heavy-element enrichment in the young disks.The radial abundance gradients are broadly consistent withinside-out growth predicted from semi-analytic models (e.g.,Somerville et al. 2008). These inside-out gradients have theopposite trend of the gradients inferred by Cresci et al. (2010)for three z ∼ 3 Lyman break galaxies, which appear to haveminima of metallicity toward the brightest [O iii] emission linepeaks near the galaxy centers, perhaps as the result of recentaccretion of fresh, low-metallicity gas.
4. DISCUSSION
The most important results of the last section can be summa-rized as follows.
1. The giant star-forming clumps in the observed z ∼ 2 SFGsreside in regions where the Toomre Q-parameter is at orbelow unity. The giant clumps are thus plausibly boundand the high-z disks we have studied are unstable againstgravitational collapse on galactic scales.
2. The giant clumps are the launching sites of powerfuloutflows, probably driven by the energy and momentumreleased by massive stars and supernovae in the clumps.
3. Velocity gradients across clumps are modest (10–40 km s−1
kpc−1) and comparable to the large-scale galactic gradients.Given beam-smearing effects, finite S/N, and contamina-tion by diffuse emission, typical clumps may still be rota-tionally supported, but extreme clumps may not be. Thesemay either be predominantly pressure supported or they arenot virialized.
4. The large velocity dispersions are spatially fairly constant.With the exception of the extreme clumps in ZC406690, theclumps leave little or only relatively small local imprintson this distributed “floor” of galactic scale, local randommotions (“galactic turbulence”). The dependence of theamplitude of this floor on galactic or local star formationsurface density is modest. The change in velocity dispersionacross more than an order of magnitude in star formationsurface density is less than a factor of two and comparable
to the scatter of the dispersion at constant star formationsurface density throughout this range.
5. There are modest but significant clump to clump, andcenter to outer disk variations of the [N ii]/Hα ratios.Keeping in mind the possible contaminations from centralAGNs, these variations are broadly consistent with activenucleosynthesis in inside-out growing disks, and/or withclump migration in a disk that is fed semi-continuouslywith fresh gas from the halo.
In the following section, we analyze the impact of thesefindings on the issues of star formation feedback and galac-tic “turbulence.” We begin with a quantitative analysisof the derived mass outflow rates, followed by discussions ofthe implied lifetimes and evolution of the giant clumps andthe origin of their turbulence.
4.1. Estimates of Mass Outflow Rates
4.1.1. Modeling the Hα Emission in the Context ofCurrent Models of Galactic Winds
Previous work on z ∼ 0 galactic winds is based to a signifi-cant extent on observations of edge-on “starburst” galaxies withoptical emission lines, soft and hard X-ray emission, blueshiftedinterstellar absorption lines, outflowing molecular gas, or a non-thermal radio continuum halo (Heckman et al. 1990; Lehnert &Heckman 1996; Walter et al. 2002; Heckman 2003; Veilleuxet al. 2005; Strickland & Heckman 2009). According to the“standard” model, the winds are set up by supernovae and stel-lar winds injecting kinetic energy and momentum into the sur-rounding medium and creating an over-pressured bubble of hotgas. This bubble expands and sweeps up the ambient medium(Heckman 2003; Veilleux et al. 2005). An alternative or addi-tional mechanism is the effect of radiation pressure onto dustgrains, creating a “tepid” but massive, cool outflow in lumi-nous, “super-Eddington” galaxies (Murray et al. 2005, 2010a;Martin 2005). This model may explain the empirical linear scal-ing of outflow velocities with galaxy circular velocities in z ∼ 0ultra-luminous infrared galaxies (ULIRGs; Δvmax/vc ∼ 1.5–3;Martin 2005; Veilleux et al. 2005).
In a stratified disk, the bubble will expand preferentially alongthe minor axis of the disk, and will eventually “blow out”into the halo, although the magnitude and appearance of thisblow out may be strongly modified and lowered in a stronglyinhomogeneous interstellar medium (Cooper et al. 2008). Theescaping wind fluid sweeps up, entrains, and shocks ambientcloud material from the disk and halo (Veilleux et al. 2005and references therein). Optical emission lines may originate inthis shocked ambient medium. In nearby cases such as M82,Hα/[N ii] emission tends to come from compact filaments andknots at the edge of the X-ray emission nebulae that mayoriginate from internal shocks in the hot wind fluid and theinteraction of the hot gas with the ambient medium (Heckmanet al. 1993; Westmoquette et al. 2007). Alternatively, the warmand cool dusty gas may initially be lifted to hundreds of parsecsby radiation pressure, and only then further accelerated by thehot wind component (Murray et al. 2010a).
If this standard model also applies to the outflows inz ∼ 2 SFGs, the broad Hα/[N ii] emission is well suited forquantifying the mass, outflow rate, momentum, and energy inthe warm/cool component of the high-z winds. The fundamentaladvantages of the Hα measurements presented above for esti-mating mass outflow rates are that they directly yield outflow ve-locities, sizes and—if local electron densities are known—also
21

The Astrophysical Journal, 733:101 (30pp), 2011 June 1 Genzel et al.
hydrogen column densities/masses, without the need for an as-sumption of heavy element abundances or correction for line ra-diative transport. The greatest disadvantage of Hα is that the lineluminosity is proportional to “emission measure” (∝ ∫
n2edV ).
As a result, the derived mass outflow rates are sensitive to theadopted radial density structure but not to the geometry (e.g.,opening angle) of the outflow. The Hα emission is obviouslyalso sensitive to dust extinction in front of and mixed in with theoutflow. Such “wind” dust is clearly seen in the M82 outflow,for instance (Roussel et al. 2010). In our analysis, we have cor-rected for foreground extinction derived from the UV/opticalSED fitting of our galaxies (row 5 in Table 2). The preferentiallyblueshifted broad wings show that differential extinction alongthe line of sight does indeed play an important role in the inter-pretation (Section 3.2.1). Our current observations do not con-strain how this internal dust is distributed. We thus adopt first-order correction factors ranging between one and two (row 16 ofTable 2), depending on the asymmetry and blueshift of the broadline emission.
In analogy to z ∼ 0 winds, the most likely excitation mech-anism for the Hα emission is photoionization from the centralionization sources, or from hot, postshock gas in wind–gas col-lisions. If the gas is photoionized, the data can be analyzed withstandard case B recombination theory (Osterbrock 1989). InAppendix B, we present our detailed analysis with two differentmodeling assumptions on the density structure of the flow. Inprinciple, it may also be possible that the wind or postshockgas is hot enough that collisional ionization plays a role, al-though the evidence in z ∼ 0 starburst galaxies suggests thatthis mechanism is unlikely to dominate the overall excitation.For completeness we also derive in Appendix B the mass lossrates for pure collisional ionization, which turn out to be a factor�2 smaller than the recombination values. Table 2 (rows 20–23)lists the derived outflow rates.
4.1.2. Ionized Outflow Rates in Clumps Exceed Star Formation Rates
Our main finding is that the outflow rates in ionized gasare as large as or larger than the star formation rates. In themost extreme clump B in ZC406690, we infer an outflow rate8.4 times greater than the star formation rate. Depending onthe extinction corrections, geometries, modeling assumptions,etc., the exact values of the derived outflow rates are probablyuncertain by a factor of at least three (up and down). Ourfindings are in very good agreement with the conclusions ofErb et al. (2006a) and Erb (2008), who deduce ratios of outflowto star formation rates between 1 and 4 from an analysis of thez ∼ 2 stellar mass–metallicity and stellar mass–star formationrelations.
4.1.3. Correction for Other Gas Phases
These outflow estimates are probably lower limits, since inaddition to the warm ionized gas, there very likely are substantialcomponents of very hot as well as cold (atomic and molecular)gas. The latter may be especially important if radiation pressureonto dust grains in the outflows plays an important role, asthe dusty molecular gas is coupled strongly to UV radiation.Unfortunately, the relative contributions of the different gasphases are not well known even in z ∼ 0 SFGs. In the relativelylow-mass starburst galaxy M82, the mass of atomic hydrogenin the outflowing nebula is estimated to be about 5 × 10⁷ M�,which is comparable to the mass of hotter gas-producing X-rays(Heckman et al. 1990; Crutcher et al. 1978; Stark & Carlson1984; Nakai et al. 1987; Watson et al. 1984; Schaaf et al. 1989;
Fabbiano 1988), and about six times smaller than the amountof molecular gas associated with the outflow (∼3 × 10⁸ M�;Walter et al. 2002). In contrast, the mass of material responsiblefor optical line emission may be much smaller, ∼2 × 10⁵ M�.The warm and cold components in M82 move at roughly thesame velocity, whereas the hot wind fluid has a velocity around10 times larger. Thus, if one would scale directly from theseobservations of M82, the winds in z ∼ 2 SFGs would havemass outflow rates two to three orders of magnitudes greaterthan what is measured with Hα alone. It would seem highlyimplausible that this could apply to our z ∼ 2 SFGs.
However, the structure of galactic winds in relatively lowmass starburst galaxies (such as M82) at z ∼ 0 could verywell differ greatly from that of more luminous, denser, andmore massive galaxies at both low-z (such as ULIRGs)and high-z, altering the relative contributions of the differentwind components and drivers (supernovae versus stellar windsand radiation). Weiner et al. (2009) have shown that power-ful galactic winds are a common feature of most or all mas-sive, luminous SFGs at z ∼ 1, while at z ∼ 0 they are onlyfound in the relatively rare starburst and actively merging galax-ies. One possible explanation for these differences may be thatsupernova-driven hot gas may dominate in low-mass galaxies,while cooler, radiation-pressure-driven winds may dominate inmassive galaxies. In rows 36 and 37 of Table 2, we comparethe force of the outflows to that delivered by radiation. The ra-tios range from a few to about 30 (in clump B of ZC406690).Values at the lower end of this range could thus plausibly beunderstood in the radiation-driven wind picture, while valuesin the upper range would require very large optical depths andmultiple scattering of infrared photons (Murray et al. 2010a,2010b).
4.2. Clump Lifetimes and Evolution
4.2.1. Gas Expulsion Timescale
What do our observations tell us about the lifetimes of thegiant clumps? We address this question in several ways. A firstempirical estimate of the effect of gas expulsion by the outflowscomes from the ratio of the molecular gas masses of the clumpsto the outflow rates, with an upward correction by a factor oftwo based on the assumption that on average a clump is seenhalfway through its evolution. There may also be atomic gasassociated with the clumps but given their large gas columns(�102 M� pc−2) that atomic fraction is probably small (Blitz &Rosolowsky 2006). The gas expulsion times estimated in thismanner (row 24 in Table 2) range between 170 and 1600 Myr.
4.2.2. Stellar Ages
A second estimate for clump lifetimes can be made on thebasis of the stellar ages of clumps estimated from populationsynthesis modeling. Elmegreen et al. (2009; see also Elmegreen& Elmegreen 2005) fitted constant star formation and exponen-tially decaying models to 4–6-band ACS/NICMOS photometryof clump-cluster and chain galaxies in the Hubble Ultra DeepField. From this analysis they infer clump ages in z ∼ 2–3clump-cluster and chain galaxies ranging widely between 10and a few 102 Myr, with typical clumps having stellar ages of100–200 Myr and an upper envelope of about 300 Myr. In thecase of BX482 and D3a15504, it is possible to use the Hα-equivalent width as an age indicator that is fairly insensitiveto extinction (Forster Schreiber et al. 2011b). The analysis re-quires the subtraction of the interclump background. For the
22

The Astrophysical Journal, 733:101 (30pp), 2011 June 1 Genzel et al.
bright clumps A–C in BX482, the result is fairly immune tothe treatment of the background and yields fairly robust agesbetween 30 and 100 Myr (Forster Schreiber et al. 2011b). Inthe case of D3a15504, the clumps are not apparent in the fairlylow S/N NACO Ks image and even in the Hα image the back-ground is a significant contribution to the clump aperture fluxes.Only estimates based on integrated photometry at the location ofclumps (i.e., without subtraction of the underlying host galaxy’slight) can be reliably obtained. Inferred ages are in excess of∼1 Gyr and represent upper limits given the contribution of thehost galaxy’s stellar population. For ZC782941 and ZC406690,the ACS I-band images sample the rest-frame UV and the ra-tio of Hα to I-band flux density (rest frame 2700 Å) is verysensitive to extinction. No reliable ages can be deduced but wehave estimated age ranges (80–800 Myr for clumps A and B inZC406690) based on various plausible star formation historiesand extinctions. The deduced clump stellar ages are listed inrow 25 of Table 2.
The best available estimates of stellar ages of the giantclumps, while very uncertain, thus may set an upper limit tothe clumps’ stellar ages, and thus plausibly their lifetimes, of∼300 Myr. A cautionary remark is that the stellar lifetimesso deduced really sample only the average ages of the starsdominating the stellar (UV plus optical) light, and thus mayunderestimate the true ages of the star-forming clumps if thereis an underlying older population (Maraston et al. 2010). Inaddition, the assumption of constant star formation historiesmay introduce systematic uncertainties in z ∼ 2 galaxies withongoing large gas accretion (Maraston et al. 2010).
4.2.3. Metal Enrichment Timescale
Thirdly, we can also use the [N ii]/Hα ratio and the inferredoxygen abundances for obtaining upper limits to the clumpages. Given the [N ii]/Hα values in Table 3 we calculate themetallicity using the prescription of Pettini & Pagel (2004)and, assuming the solar ratio of mass in oxygen to total massin heavy elements, derive the total mass fraction of heavyelements (z). Assuming an initially zero metallicity, we use botha “closed-box” and “leaky box” model (Erb 2008) to determinethe time required to produce the observed z. The derivation ofthe timescale is discussed in more detail in Appendix C. Theclosed-box estimates range between 150 and 900 Myr (row 26in Table 2).
The timescales derived with the “leaky box” model are alllonger than those of the “closed-box” model, ranging fromcomparable ages to those about three times longer (see row27 in Table 2), with one outlier with an unrealistic “leakybox” enrichment timescale. There are a few objects with verylong metal enrichment timescales in the leaky box model. Theaforementioned outlier could arise from measured SFRs thatare much lower than in the past. As these estimates assumethat the gas forming the clumps begins with zero metal massfraction and therefore that all of the observed metals currentlyin the clumps were produced in them, they tell us about themaximum possible age of the clumps. The real metal enrichmenttimescales are smaller, since much of the gas in the clumps waslikely somewhat enriched when the clumps formed. To explorethis idea further, we have calculated the time required to enrichclump A of ZC406690 to the metallicity of clump B in thesame galaxy. Clump A is the brightest, highest Hα equivalentwidth, and thus likely the youngest clump in ZC406690, andtherefore could be representative of the initial metallicity offorming clumps. On the other hand, clump B appears to be
much more evolved and potentially past its peak in SFR. Withthe closed model, this timescale is 130 Myr, and 210 Myr withthe leaky model. These are more convincing ages for evolvedclumps like clump B, since they do not assume the clumpsformed from zero metallicity gas.
4.2.4. Expansion Timescale
Finally, we consider the Taylor–Sedov solution for an ex-plosion in the radiative phase to estimate the timescale for theoutflow to expand to its current size. In the Taylor–Sedov solu-tion (Osterbrock 1989), the radius of a shock is given by
Rs = 12.8
(texp
104
)2/5 (E51
n0
)1/5
pc, (8)
where texp is the time since the explosion in years, E51 isthe energy released by the SN in units of 1051 erg, andn0 ∼ 10−2 cm−3 is the ambient ISM density (McKee & Ostriker1977). We take Rs as the radius of the clump, assuming that theexpanding superbubble still follows this relation in the planeof the disk, even though the bubble has blown out along theminor axis. We estimate the input energy using a simple orderof magnitude calculation,
E = Mv2outtexpεff, (9)
where we use the outflow velocities and rates listed inTable 2 and εff ∼ 0.1 is an efficiency factor which takes intoaccount the fact that most of the energy is released perpendic-ular to the disk and not in the plane of the disk. The resultingtimescales are listed in row 28 of Table 2 and constitute lowerlimits to the clump lifetimes. The values for texp in Table 2 havea median of 130 Myr.
4.2.5. Average Lifetime and Fate of the Clumps
The discussion in the last sections suggests that the typicallifetimes of the giant gaseous clumps are probably less than1 Gyr, and on average perhaps closer to 500 Myr, with largeuncertainties and scatter. The powerful outflows probably playan important factor in setting these lifetimes. While the mea-surements are probably still too uncertain to be sure of thefinal outcome(s), less active clumps (BX482 A or the clumps inD3a15504) may convert approximately half of their initial gas tostars (row 30 in Table 2) and remain basically intact. Given thatthe in-spiral time by dynamical friction is also less than 500 Myr(Equation (1); Noguchi 1999; Immeli et al. 2004a, 2004b; Dekelet al. 2009a; Ceverino et al. 2010), these clumps could plausiblymigrate all the way to the nuclear region (row 29 in Table 2). Inthe most active and compact clumps (such as ZC406690 A andB), however, the feedback may disrupt the clumps before theyhave converted a substantial fraction of their initial gas to stars.Such clumps may disperse in the outer disk before having hadtime to migrate into the center. The dissolving stellar componentof the clump may still continue the in-spiral and contribute tothe secular buildup of a central bulge, albeit with smaller effi-ciency than assumed in the original work of Noguchi (1999) andImmeli et al. (2004a, 2004b). An interesting question is whetherglobular clusters might be formed in this environment (Shapiroet al. 2010) and, if so, how they would survive the strongfeedback.
Our findings are in broad agreement with an “average” ofthe current analytical estimates (Murray et al. 2010a, 2010b;Krumholz & Dekel 2010). The clump evolution in current
23

The Astrophysical Journal, 733:101 (30pp), 2011 June 1 Genzel et al.
hydro-simulations strongly depends on assumptions on subgridphysics, reflecting the different discussions in the analyticalwork. None of these cosmological simulations come close yetto capturing the spatial structure and physical complexity ofthe interstellar gas physics (cf. Wada & Norman 2001; Cooperet al. 2008). Exploring clump stability with different supernovaenergy feedback strengths, Elmegreen et al. (2008) find thatclumps live for a few hundred Myrs with the exception of a casewith very strong feedback efficiency. Long clump lifetimes werealso obtained by Ceverino et al. (2010), who also employeda supernova energy feedback scheme. In a recent simulationwith radiation pressure, momentum feedback based on theOppenheimer & Dave (2006) subgrid recipes, Genel et al.(2010) find that the clumps are disrupted on a timescale of50–100 Myr, much more rapidly than indicated by the othertheoretical estimates or our measurements. This is probablythe result of their more extreme assumptions on the feedbackefficiency, as compared to the original recipes of Oppenheimer& Dave (2006). As a result, the clumps in the Genel et al.(2010) simulation do not spiral inward much and do not havetime to virialize. At the opposite extreme, even without winds,realistic clumps tend to be stripped by tidal forces and they losemay be 50% of their mass before reaching the central bulge in400–500 Myr (Bournaud et al. 2007).
4.3. Origin of the Large Turbulent Velocities
What can our observations tell us about the origin of the largeturbulent velocities that are characteristic of all z � 1 SFGs?
The first obvious conclusion is that the velocity dispersionin the z ∼ 2 SFGs of our sample is not obviously driven bylocal stellar feedback. The near-“constant” floor of velocity dis-persion may instead point to a galaxy-wide driving mechanism,such as the release of gravitational energy. Such an energy re-lease could come from the inward clump migration in the diskand be driven by large-scale torques or clump–clump collisions.Theoretical support for this mechanism is found in the simu-lations of Immeli et al. (2004a, 2004b), Agertz et al. (2009),Ceverino et al. (2010), and others. Alternatively, gravitationalenergy might be released at the outer disk boundary by theaccreting gas streams/flows from the halo. Support for this ex-planation comes from the simulations of Genel et al. (2010) andS. Genel et al. (2011, in preparation), who find that the mostimportant driver of the local random motions is the accretionenergy. Alternatively, and perhaps similar to the situation in theMilky Way, multiple agents may be at work simultaneously.The small spatial variations may then be the consequence of thefast communication speed of the drivers, which may include thefast outflows that couple to the disk over a wide range of scales(Elmegreen & Scalo 2004).
Recent detailed studies of the turbulent structure functionin Milky Way GMCs also find little dependence of the cloudrandom motions on size/mass, environment, and star formationactivity of these clouds (Heyer & Brunt 2004; Brunt et al.2009). Brunt et al. (2009) conclude that GMC turbulence isdriven by a universal driver acting mostly on large scales, suchas supernova-driven turbulence, magneto-rotational instability,or spiral shock forcing. According to these authors, small-scale driving by sources internal to molecular clouds, such asoutflows, can be important on small scales, but cannot replicatethe observed large-scale velocity fluctuations in the molecularinterstellar medium.
A feedback-dominated scenario may still be viable if thefeedback “signal” is hidden by other dependencies. In a self-
gravitating disk with feedback-dominated turbulence the up-ward pressure generated by feedback is exactly compensated bythe weight of the gas column above it. Ostriker & Shetty (2010)argue that in this case and for a Kennicutt (1998b) gas–star for-mation relation, the average gas density thus scales with starformation surface density and the z-velocity dispersion is ap-proximately constant.
5. CONCLUSIONS
We have presented high-quality SINFONI/VLT integral fieldspectroscopy of five massive, active star-forming galaxies atz ∼ 2. Aided by natural and laser guide star adaptive optics,our data begin to constrain the nature and properties of thelargest (diameter 1.5–3 kpc) and most massive ((1–10) ×109 M�), giant star-forming clumps that are characteristic ofmany “normal” high-z star-forming galaxies.
We find clear evidence that the disks and giant star-formingclumps are unstable to gravitational collapse and fragmentation.The giant star-forming clumps plausibly represent the largestscale of gravitational instability in the high-z disks.
Spatially resolved, broad wings in Hα/[N ii] emission associ-ated with individual clumps make a strong case that the bright-est giant star-forming clumps launch massive galactic outflowsdriven by their intense star-forming activity. We estimate thatthe mass outflow rates are comparable to or larger than the starformation rates, in one case by a factor of eight. These findingsare in excellent agreement with other recent results on galacticoutflows in high-z galaxies. The lifetimes of the giant clumpsare strongly influenced and probably limited by these feedbackeffects to a few hundred million years but it is premature to besure of the average clump evolution. For the less active clumps, asignificant fraction of the original gas may be converted to starsat the end of this phase. Such clumps may even form boundentities that have a chance to migrate all the way to the nucleusand build up a bulge by secular effects. The most actively star-forming clumps may, however, be destroyed before they havea chance to spiral much inward. In these cases stellar feedbackand winds may thus limit the efficacy of the “violent disk insta-bility” mechanism for building central bulges. Our data suggestthat the presence of strong outflows and star formation surfacedensity is correlated, consistent with radiation pressure beingimportant in driving the outflows.
The local rms–velocity dispersion of the ionized gas increasesby less than a factor of two across a range of 20 in starformation surface density. This change is comparable to thescatter of velocity dispersions at any fixed star formation surfacedensity throughout this range. To first order, the large velocitydispersions in high-z galaxies are distributed as a spatiallyconstant “floor,” similar to the situation in Milky Way GMCs.We also see only relatively modest intraclump velocity gradientsindicative of clump rotation. Our analysis suggests that two ofthe brightest giant clumps cannot be rotationally supported;these clumps may instead either be mainly pressure supportedor they are not virialized. Given our limited angular resolutionand S/Ns, the situation for most other clumps is less clear andin these cases rotational support may be significant or evendominant.
The absence of a strong correlation between velocity dis-persion and star formation surface density suggests that stronglocal feedback is not the dominant driver of the large turbulentmotions, or that the feedback drives this turbulence mainly onsuper-clump scales, unless secondary dependencies “hide” thefeedback signal. The diffuse and spatially constant nature of
24

The Astrophysical Journal, 733:101 (30pp), 2011 June 1 Genzel et al.
-60
-40
-20
0
20
40
60
0 1 2 3 4 5 6 7
δσ = 0.33 (0.82)* F(Hα) -3.21(3.3)1σ uncertainty F(Hα)1σ uncertainty velocity dispersion residualΔσ< 30 km/s
BX 482 data rebinned to 0.1"
Hα flux (10-19 erg s-1cm-1pix-1)
velo
city
disp
ersi
onre
sidu
al(k
m/s
)
-50
0
50
100
0 1 2 3 4
fit uncertainties F(Hα)fit uncertainties Δσextra-nuclear Δσ<30 km/sδσ =19.1 (3.7)*F(Hα) -20.9 (8.7)
D3a15504 data rebinned to 0.1"
Figure A1. Dependence of residual velocity dispersion on the Hα surface brightness for D3a15504 (top) and BX 482 (bottom). The left maps show the spatialdistribution of the residuals (δσ = σ (data) minus σ (model) in upper plots and σ (data) minus σ (kinemetry averages) in lower plots) within each of the two galaxies.The input velocity dispersions are intrinsic values after removal of the instrumental broadening and beam-smeared large-scale velocity gradients (such as rotation).Minima and maxima of the color codes are indicated, as well as the location of the prominent clumps from Figure 2. Analysis of the two-dimensional maps requirescareful attention to error analysis, as most of the obvious variations in the D3a15504 velocity dispersion residual map, for instance, is caused by biases due to largeuncertainties of σ in low surface brightness regions. The right maps show the pixel-to-pixel correlations, after culling low significance data. Filled blue circles denotethose data with fit uncertainties Δσ less than 30 km s−1, after rebinning the data to 0.′′1 per pixel. For these data, the red and gray crosses denote the distribution of Hα
surface brightness and δσ 1σ errors, respectively. The black line is the weighted (wi = 1/Δσ i2) linear regression fit to the filled blue circles. Fit parameters (and 1σ
uncertainties in parentheses) are given in the legend.
(A color version of this figure is available in the online journal.)
the random motions we observe may favor that the large-scalerelease of gravitational energy is the key driver of the galactic“turbulence.” This release could either occur within the disk as aresult of the clumps’ inward migration, or at the outer boundaryof the disk as a result of the interaction with the gas streams andclumps/minor mergers coming in from the halo.
We find moderately significant evidence for clump–clumpand center–outer disk variations in the inferred gas phase oxygenabundance. These variations are qualitatively consistent withthe expected rapid heavy element enrichment in the youngdisks. The radial abundance gradients are broadly consistentwith the expected inside-out growth of the young galaxies andthe scenario of inward clump migration.
We thank the staff of Paranal Observatory for their support.We also acknowledge the support of our other colleagues onthe ESO Large Program 183.A-078: F. Bournaud, K. Caputi,A. Cimatti, E. Daddi, G. de Lucia, O. Gerhard, P. Johansson,S. Khochfar, O. LeFevre, V. Mainieri, H. McCracken, M.
Mignoli, and M. Scodeggio, as well as A. E. Shapley. We aregrateful to the referee, Frederic Bournaud, for his comments andsuggestions for improvement of our manuscript.
APPENDIX A
We have explored possible intra-galaxy variations of theintrinsic velocity dispersion σ 0 as a function of position inthe deep AO data on the four SFGs reported in this paper.To remove large-scale velocity dispersion gradients artificiallycreated by beam-smeared velocity gradients (caused by rotation,for instance) we analyze residual velocity maps (Section 2.2).Figures A1 and A2 give the results. We have found that the keyissue is error estimation and significance. Overlays of spatiallyresolved residual velocity dispersion as a function of positionon the Hα maps (Figures A1 and A2) at first glance seem toshow in several galaxies a mild trend for Hα bright clumpsto be associated with lower velocity dispersion than in thesurrounding regions. However, a more detailed analysis of the
25

The Astrophysical Journal, 733:101 (30pp), 2011 June 1 Genzel et al.
-80
-40
0
40
80
0 1 2 3 4 5 6 7
δσ = 5.75(2.27) *F(Hα) -37.1 (11)1σ uncertainty F(Hα)1σ uncertainty δσΔσ < 30 km/s
ZC782941 data rebinned to 0.1"
Hα flux (10-16 erg s-1cm-2 pix-1)
velo
city
disp
ersi
on r
esid
uals
(km
/s)
Figure A2. Dependence of residual velocity dispersion on Hα surface brightness for ZC782941 (top) and ZC406690 (bottom). The left maps show the spatialdistribution of the residuals (δσ = σ (data) minus σ (model) in lower plots and σ (data) minus σ (kinemetry averages) in upper plots) within each of the two galaxies.Minima and maxima of the color codes are indicated, as well as the location of the prominent clumps from Figure 2. The input velocity dispersions are intrinsic valuesafter removal of the instrumental broadening and beam-smeared large-scale velocity gradients (such as rotation). Analysis of the two-dimensional maps requirescareful attention to error analysis, as the apparent increases in the velocity dispersion residual map at the southern and northern edges of ZC782941, for instance, arecaused by biases due to large uncertainties of σ in low surface brightness regions. In the case of the ZC406690 dispersion residual map, the dispersion enhancements inthe integrated line profiles (as shown) near/on clumps A and B are almost entirely caused by the broad wind component affecting the rms dispersion of the overall lineprofiles (Figure 7). The narrow component does not show larger dispersions toward these clumps. The right graph shows the pixel-to-pixel correlation for ZC782941,after culling low significance data. Filled blue circles denote those data with fit uncertainties Δσ less than 30 km s−1 after rebinning the data to 0.′′1 per pixel. For thesedata, the red and gray crosses denote the distribution of Hα surface brightness and δσ 1σ errors, respectively. The black line is the weighted (wi = 1/Δσ i
2) linearregression fit to the filled blue circles. Fit parameters (and 1σ uncertainties in parentheses) are given in the legend.
(A color version of this figure is available in the online journal.)
fit uncertainties derived from our Monte Carlo bootstrappingmethod reveals that most of this trend is due to poor S/N inthe interclump region. When weighted fits to the pixel-to-pixelvariations of the residual velocity dispersions δσ (Section 2.2) asa function of ΣHα are considered for the higher S/N regions, onlyrelatively weak, or no (positive) correlations are found. Thesemild trends are in good agreement with the galaxy averages andselected clumps shown in Figure 10.
APPENDIX B
In this appendix we discuss our quantitative analysis of thebroad Hα emission for deriving estimates of the mass outflowsrates in the various galaxies of our sample.
B.1. Outflow Estimates for Photoionized, Recombining Gas
We estimate masses and outflow rates of the warm ion-ized gas in our program galaxies/clumps for three simple
models. In all models we assume an outflow into solid an-gle Ω and a radially constant mass loss rate and outflow ve-locity. The latter is motivated by observations of the M82outflow (e.g., McKeith et al. 1995) and theoretical workon both energy and momentum driven outflows (Veilleuxet al. 2005; Murray et al. 2005). In the first two modelswe assume that the gas is photoionized, and in case B re-combination with an electron temperature of T4 = 104 K(Osterbrock 1989). In the first model the average electron den-sity scales with R−2 (for a constant mass outflow rate) but thelocal electron density of filaments or compact clouds from whichthe Hα emission derives does not vary significantly with radiusand takes on a value of 〈n2
e〉1/2 ∼ 100 cm−3. This choice ismotivated by observations of electron densities in the z ∼ 0 out-flows derived from the [S ii] 6718/6733 Å doublet (Heckmanet al. 1990; Lehnert & Heckman 1996). In the second model weassume that the ionized gas fills the entire volume of the out-flow cone. In that case both the average and the local electron
26

The Astrophysical Journal, 733:101 (30pp), 2011 June 1 Genzel et al.
density scale with R−2. For purely photoionized gas of electrontemperature T4 = 104K and case B recombination, the effectivevolume emissivity is γHα(T ) = 3.56×10⁻²⁵T −0.91
4 erg cm−3 s−1
(Osterbrock 1989). The total ionized mass outflow rate can thenbe obtained from the extinction-corrected Hα luminosity LHα,0via
LHα,0 = γHα(T )∫
ΩR2ne(R)np(R)dR,
MH ii,He = μ ·∫
ΩR2npdR = μLHα,0
γHα(T )neff, and
Mout = ΩR2μn(R)vex = ζ · MH ii,He · vex
Rout. (B1)
Here μ = 1.36 · mp is the effective mass, for a 10% heliumfraction, and vex ≈ Δvmax in Table 2. Rout is the outer radiusof the outflow that is initially launched near the center of thedisk/clump at Rin � Rout. To compute an extinction-correctedluminosity for the broad component in Table 2 we correctedthe observed fluxes both for the general galaxy obscurationestimated from the UV-continuum colors (and a Calzetti 2001extinction law with Agas = Astars/0.44), as well as for additionaldifferential extinction through the clump/galaxy, as estimatedvery approximately from the asymmetry of the broad lineemission (factor γ red in Table 2). The expressions for ζ andneff depend on the assumed geometry and density distributionof the outflow and are different for our two models. For model1 we adopt neff = 〈n2
e〉1/2 = 100 cm−3 and Rout ∼ RHWHM. Formodel 2 we have neff = nin(Rin)Rin/Rout and given the galaxy-wide distribution of the outflowing gas in ZC406690 we assumeRout ∼ 6 kpc ∼ Rdisk ∼ 10 Rin. This assumption is motivatedby the modeling of UV absorption line gas velocities vout(R)(Figures 23 and 24 in Steidel et al. 2010). Because of the n2
e -scaling of the Hα emission, RHWHM ∼ 2.3 Rin. These choices forRout probably bound the true (emission weighted value) of Routfrom below and above. For both models (constant expansionvelocity) ζ = 1.
For model 2 we assume that near the launch point the ionizedgas in the wind is in pressure equilibrium with the star-forminggas in the clump, such that nin(Rin) ∼ ne,clump. One direct esti-mate for this base density comes from the [S ii] 6718/6733 Å ra-tio that can be determined empirically for several of the galaxies/clumps in Table 2, as shown in Figure B1. The average/medianof these estimates (row 15 in Table 2) is 900 cm−3. Unfortu-nately, the uncertainty is very large for each of the individualentries, sometimes including zero or infinite density. A secondestimate for the base density comes from estimates of the to-tal mass/gas densities in the giant clumps. Assuming that theclumps are virialized their average matter densities (gas plus
stars) are 〈nclump〉 ∼ σ 20
μGR2clump
, corresponding to densities be-
tween 10 and 40 M� pc−3, or 300 to 1100 H cm−3 for theclumps in Table 2, Figure 10 and in the well-resolved lensedSFGs observed by Jones et al. (2010). Assuming gas fractionsof about 50% (Tacconi et al. 2010; Daddi et al. 2010a), thiscorresponds to (cold) gas densities of 150–550 cm−3. Anotherapproach is to take the observed star formation densities andconvert to gas densities with the Kennicuut–Schmidt relation,as already discussed in Section 3.1. For clump A in ZC406690,for instance, this approach yields an average (cold gas) densityof ∼70 cm−3. The bottom line is that these average cold gasdensities across the giant clumps are very similar to those inMilky Way GMCs (〈ngas,GMC〉 ∼ 170 cm−3 (e.g., Blitz 1993;Harris & Pudritz 1994). However, in these GMCs the actual
rest wavelength (μm)
0.670 0.672 0.674
norm
aliz
ed li
ne in
tens
ity
-1.4
-1.3
-1.2
-1.1
-1.0
-0.9
-0.8
-0.7
-0.6
-0.5
-0.4
-0.3
-0.2
-0.1
0.0
0.1
0.2
D3a15504 clumps
BX482 A-C
ZC782941 A-E
ZC406690 A OH
ZC406690 B
[SII]
Figure B1. [S ii] 6718/6733 Å doublet spectra for the most prominent clumpsof four of our program galaxies. The locations of the two lines are shown by redarrows. An OH line strongly affects the blue side of the 6733 line in ZC406690A/B.
(A color version of this figure is available in the online journal.)
star-forming gas has much higher densities, nSF ∼ 104.5 cm−3,with local pressures of nSFTSF ∼ 106.4 ± 0.5 K cm−3. Assumingagain pressure equilibrium the ionized gas in these star-formingregions would have electron densities of 102.6 ± 0.5 cm−3 forTe (MW) ∼ 7000 K. If the high-z clumps have similar con-ditions, this consideration yields an upper limit to nin (Rin) ∼1200 cm−3, similar to the average value from the [S ii] line ratiosin Table 2. For model 2 we adopt nin(Rin) ∼ 1000 cm−3. Withthese assumptions model 2 yields outflow rates four times lowerthan for model 1.
Rows 21 and 22 of Table 2 list the derived ionized gasoutflow rates for these case B photoionization models, forindividual clumps and galaxy averages in the five galaxies ofour sample. The key finding in all clumps considered hereis that in the photoionized case the derived outflow rates arecomparable to or larger than the star formation rates, in onecase (clump B in ZC406690) by a factor of 8.4 in the average ofmodels 1 and 2.
B.2. Outflow Estimates for Collisional Ionization
If the gas temperature is high enough, it is possible that thegas responsible for the Hα emission is collisionally ionizedin the wind. Based on [S ii]/Hα, [OI]/Hα, and [N ii]/Hα lineratios, Heckman et al. (1990) and Veilleux & Rupke (2002)
27

The Astrophysical Journal, 733:101 (30pp), 2011 June 1 Genzel et al.
find that the outer region of the outflowing gas of M82 is likelyto be shock-heated by the galactic wind fluid, while the innerregion is photoionized by the starburst. Veilleux & Rupke (2002)characterize the ionization mechanism based on the [N ii]/Hαratio, such that values less than 0.5 are representative of H ii
regions and therefore indicative of ionization by O stars, whereaslarger values characterize HH objects and other regions forwhich shocks are important. The low [N ii]/Hα ratio foundin the inner region of the M82 outflow is unusual for a galacticwind and suggests that the gas is ionized by a relatively youngand active starburst (Veilleux & Rupke 2002). They furtherargue that, in the absence of an AGN, the large values of[N ii]/Hα found in the outer regions of the M82 wind nebulaeand characteristic of other galactic winds require an additionalheating source, namely shock-heating by the wind fluid. Ifthe gas is shock-heated, ionization can occur either throughphotoionization by EUV/soft X-rays produced in the shock orthrough collisional processes (Heckman et al. 1990).
We thus consider as our third model collisional ionization andexcitation of line radiation, which will dominate at high densitiesand temperatures. A simple model estimating the photoionizatonrate based on the size of clump A in ZC406690, an electrondensity of 100 cm−3, an average cross section for ionization of10−18 cm2, and photoionization of gas located 3 kpc from thedisk suggests that collisional ionization begins to dominate atT � 2 × 10⁴ K.
We estimate the mass outflow rate assuming collisionalexcitation and ionization at T = 2 × 10⁴K, which is also thepeak temperature for collisional-based emission (Goerdt et al.2010). For T = 105 K, the outflow rates are about an order ofmagnitude larger. The Hα luminosity becomes
LHα = γHα(T )∫
ΩR2ne(R)np(R)dR + hνHαqexc(T )
×∫
ΩR2ne(R)nH (R)dR, (B2)
where nH
np= γ (Hα)
hνHαqion, np ≈ ne ≈ 100 cm−3, and qexc =
7.1 × 10⁻¹² cm3 s−1, and qion = 3.4 × 10⁻¹² cm3 s−1 are thecollisional excitation and ionization rate coefficients, at Te ∼2 × 10⁴ K from Osterbrock (1989). The mass outflow rates forcollisional excitation are listed in row 22 of Table 2. The bottomline is that if the outflowing gas comes from collisionally excitedgas at Te ∼ 2 × 10⁴ K, the inferred masses and outflow rates arelowered by about a factor of two compared to the average caseB recombination cases (row 23 in Table 2). If the temperatureis lower, the difference is less.
We find relatively small values of [N ii]/Hα for the broadcomponents of clumps A and B in ZC406690 ([N ii]/Hα∼ 0.3), as well as for the stacked spectrum in Figure 9([N ii]/Hα � 0.4). These ratios favor the photoionization model.However, the analysis of Veilleux & Rupke (2002) is based onnear-solar metallicity galaxies in the local universe, whereasseveral of the high-z SFGs are less chemically evolved, andthus one might expect the critical [N ii]/Hα value differentiatingbetween shock-heated and photoionized gas to be lower as well.Nevertheless, it is likely that the gas outflowing from clumps Aand B of ZC406690 is primarily photoionized and not shock-heated, based on the relatively low [N ii]/Hα values in the broadcomponent of emission from these clumps, and the fact that theyappear to be very young, extremely active star-forming regions.We thus will adopt the case B/photoionization outflow rates asour base values for the further analysis.
APPENDIX C
In this appendix we derive the metal enrichment timescalesusing the “closed” and “leaky” box models from Erb (2008).Erb’s models are derived from the Kennicutt–Schmidt relation(Kennicutt 1998a) in order to determine the time dependenceof star formation and the effect of infall and outflow on themetallicity. For the “closed-box” model
d(ZMg
)dM∗
= yα (1 − Z) − αZ,
resulting in
dZ
dt= yα(1 − Z)SFR
Mg
,
for SFR = dM∗dt
and Mg = Mi − αM∗, (C1)
where Mg is the gas mass, Mi is the total initial mass, M∗ is thestellar mass, α is the mass fraction locked in stars (which wetake as 0.8). The parameter y is the true yield, which is the ratioof the mass of metals produced and ejected by star formationover the mass locked in stars. We follow Erb (2008) and adopty = 0.019. Assuming that y, α, and the star formation rate areconstant, and using the observed gas mass, as calculated withthe Kennicutt–Schmidt relation, and our observed value of themetal mass fraction, Z(tf ), we solve the differential equationnumerically to determine tz(the time required to produce Z(tZ))(see row 26 in Table 2).
We also consider a “leaky box” model (Erb 2008), where anoutflow component is included with an outflow rate equal to thatcalculated for the photoionization model with a constant localdensity (Table 2, row 20). In this case, Equation (C1) becomes
dZ
dt= yα (1 − Z) SFR
Mg
for Mg = Mi − αM∗ − f0M∗, (C2)
where f0 = MoutSFR is the mass fraction in the outflow with respect
to the SFR and Mout is the mass outflow rate.
REFERENCES
Adelberger, K. L., Steidel, C. C., Shapley, A. E., Hunt, M. P., Erb, D. K., Reddy,N. A., & Pettini, M. 2004, ApJ, 607, 226
Agertz, O., Lake, G., Teyssier, R., Moore, B., Mayer, L., & Romeo, A. B.2009, MNRAS, 392, 294
Agertz, O., Teyssier, R., & Moore, B. 2011, MNRAS, 410, 1391Armus, L., Heckman, T. M., & Miley, G. K. 1990, ApJ, 364, 471Asplund, M., Grevesse, N., Sauval, A. J., Allende Prieto, C., & Kiselman, D.
2004, A&A, 417, 751Aumer, M., Burkert, A., Johansson, P. H., & Genzel, R. 2010, ApJ, 719, 1230Binney, J., & Tremaine, S. 2008, Galactic Dynamics (2nd ed.; Princeton, NJ:
Princeton Univ. Press)Blitz, L. 1993, in Protostars and Planets III (A93–42937 17–90), ed. E. H. Levy
& J. I. Lunine (Tucson, AZ: Univ. Arizona Press), 125Blitz, L., & Rosolowsky, E. 2006, ApJ, 650, 933Bonnet, H., et al. 2004, ESO Messenger, 117, 17Bouche, N., et al. 2010, ApJ, 718, 1001Bournaud, F. 2010, in IAU Symp. 270, Computational Star Formation, ed.
Alves Elmegreen & Girart Trimble (Cambridge: Cambridge Univ. Press),arXiv:1009.0142
Bournaud, F., Elmegreen, B. G., & Elmegreen, D. M. 2007, ApJ, 670, 237Bournaud, F., Elmegreen, B. G., & Martig, M. 2009, ApJ, 707, L1Bournaud, F., et al. 2008, A&A, 486, 741Bower, R. G., Benson, A. J., Malbon, R., Helly, J. C., Frenk, C. S., Baugh, C.
M., Cole, S., & Lacey, C. G. 2006, MNRAS, 370, 645Brunt, C. M., Heyer, M. H., & Mac Low, M.-M. 2009, A&A, 504, 883
28

The Astrophysical Journal, 733:101 (30pp), 2011 June 1 Genzel et al.
Calzetti, D. 2001, PASP, 113, 1449Cameron, E., Carollo, C. M., Oesch, P. A., Bouwens, R. J., Illingworth, G. D.,
Trenti, M., Labbe, I., & Magee, D. 2010, arXiv:1007.2422Carollo, C. M., Scarlata, C., Stiavelli, M., Wyse, R. F. G., & Mayer, L. 2007, ApJ,
658, 960Ceverino, D., Dekel, A., & Bournaud, F. 2010, MNRAS, 404, 2151Chabrier, G. 2003, PASP, 115, 763Conselice, C. J., Bershady, M. A., Dickinson, M., & Papovich, C. 2003, AJ,
126, 1183Cooper, J. L., Bicknell, G. V., Sutherland, R. S., & Bland-Hawthorn, J.
2008, ApJ, 674, 157Cowie, L., Hu, E., & Songaila, A. 1995, AJ, 110, 1576Cresci, G., Mannucci, F., Maiolino, R., Marconi, A., Gnerucci, A., & Magrini,
L. 2010, Nature, 467, 811Cresci, G., et al. 2009, ApJ, 697, 115Crutcher, R. M., Rogstad, D. H., & Chu, K. 1978, ApJ, 225, 784Daddi, E., Dannerbauer, H., Elbaz, D., Dickinson, M., Morrison, G., Stern, D.,
& Ravindranath, S. 2008, ApJ, 673, L21Daddi, E., et al. 2004, ApJ, 617, 746Daddi, E., et al. 2007, ApJ, 670, 156Daddi, E., et al. 2010a, ApJ, 713, 686Daddi, E., et al. 2010b, ApJ, 714, L118Dave, R. 2008, MNRAS, 385, 147Davies, R. I. 2007, MNRAS, 375, 1099Dekel, A., & Birnboim, Y. 2006, MNRAS, 368, 2Dekel, A., Sari, R., & Ceverino, D. 2009a, ApJ, 703, 785Dekel, A., & Silk, J. 1986, ApJ, 303, 39Dekel, A., et al. 2009b, Nature, 457, 451Di Matteo, P., Combes, F., Melchior, A.-L., & Semelin, B. 2007, A&A, 468, 61Dib, S., Bell, E., & Burkert, A. 2006, ApJ, 638, 797Dutton, A. A., Van Den Bosch, F. C., & Dekel, A. 2010, MNRAS, 405, 1690Efstathiou, G. 2000, MNRAS, 317, 697Eisenhauer, F., et al. 2003, Proc. SPIE, 4841, 1548Elmegreen, B. G. 2009, in IAU Symp. 254, The Galaxy Disk in Cosmological
Context, ed. J. Andersen, J. Bland-Hawthorn, & B. Nordstrom (Cambridge:Cambridge Univ. Press), 289
Elmegreen, B. G., & Burkert, A. 2010, ApJ, 712, 294Elmegreen, B. G., Bournaud, F., & Elmegreen, D. M. 2008, ApJ, 688, 67Elmegreen, B. G., & Elmegreen, D. M. 2005, ApJ, 627, 632Elmegreen, B. G., & Elmegreen, D. M. 2006, ApJ, 650, 644Elmegreen, B. G., Elmegreen, D. M., Fernandez, M. X., & Lemonias, J. J.
2009, ApJ, 692, 12Elmegreen, B. G., & Scalo, J. 2004, ARA&A, 42, 211Elmegreen, D. M., Elmegreen, B. G., & Hirst, A. C. 2004, ApJ, 604, L21Elmegreen, D. M., Elmegreen, B. G., Ravindranath, S., & Cox, D. A. 2007, ApJ,
658, 763Epinat, B., et al. 2009, A&A, 504, 789Erb, D. K. 2008, ApJ, 674, 151Erb, D. K., Shapley, A. E., Pettini, M., Steidel, C. C., Reddy, N. A., & Adelberger,
K. L. 2006a, ApJ, 644, 813Erb, D. K., Steidel, C. C., Shapley, A. E., Pettini, M., Reddy, N. A., & Adelberger,
K. L. 2006b, ApJ, 646, 107Escala, A., & Larson, R. B. 2008, ApJ, 685, L31Fabbiano, G. 1988, ApJ, 330, 672Finlator, K., & Dave, R. 2008, MNRAS, 385, 2181Forster Schreiber, N. M., et al. 2006, ApJ, 645, 1062Forster Schreiber, N. M., et al. 2009, ApJ, 706, 1364Forster Schreiber, N. M., et al. 2011a, ApJ, 731, 65Forster Schreiber, N. M., et al. 2011b, ApJ, submittedFranx, M., et al. 2003, ApJ, 587, L79Gammie, C. F. 2001, ApJ, 553, 174Genel, S., et al. 2008, ApJ, 688, 789Genel, S., et al. 2010, arXiv:1011.0433Genzel, R., et al. 2006, Nature, 442, 786Genzel, R., et al. 2008, ApJ, 687, 59Genzel, R., et al. 2010, MNRAS, 407, 2091Goerdt, T., Dekel, A., Sternberg, A., Ceverino, D., Teyssier, R., & Primack, J.
R. 2010, MNRAS, 407, 613Guo, Q., & White, S. D. M. 2008, MNRAS, 384, 2Green, A. W., et al. 2010, Nature, 467, 684Harris, W. E., & Pudritz, R. E. 1994, ApJ, 429, 177Heckman, T., Armus, L., & Miley, G. K. 1990, ApJS, 74, 833Heckman, T. M. 2003, RevMexAA Conf. Ser., 17, 47Heckman, T. M., Lehnert, M. D., & Armus, L. 1993, in The Environment and
Evolution of Galaxies, ed. J. Michael Shull & H. A. Thronson (Astrophysicsand Space Science Library 188; Dordrecht: Kluwer), 455
Heyer, M. H., & Brunt, C. M. 2004, ApJ, 615, L45
Immeli, A., Samland, M., Gerhard, O., & Westera, P. 2004b, A&A, 413, 547Immeli, A., Samland, M., Westera, P., & Gerhard, O. 2004a, ApJ, 611, 20Jones, T. A., Swinbank, A. M., Ellis, R. S., Richard, J., & Stark, D. P.
2010, MNRAS, 404, 1247Kauffmann, G., White, S. D. M., & Guiderdoni, B. 1993, MNRAS, 264,
201Kennicutt, R. C., Jr. 1998a, ApJ, 498, 541Kennicutt, R. C., Jr 1998b, ARA&A, 36, 189Kennicutt, R. C., Jr., et al. 2007, ApJ, 671, 333Keres, D., Katz, N., Weinberg, D. H., & Dave, R. 2005, MNRAS, 363, 2Keres, D., Katz, N., Fardal, M., Dave, R., & Weinberg, D. H. 2009, MNRAS,
395, 160Khochfar, S., & Silk, J. 2009, ApJ, 700, L21Kitzbichler, M. G., & White, S. D. M. 2007, MNRAS, 376, 2Koekemoer, A., et al. 2007, ApJS, 172, 196Kong, X., et al. 2006, ApJ, 638, 72Komatsu, E., et al. 2010, arXiv:1001.4538Krumholz, M., & Burkert, A. 2010, arXiv:1003.4513Krumholz, M. R., & Dekel, A. 2010, MNRAS, 406, 112Law, D., Steidel, C. C., Erb, D. K., Larkin, J. E., Pettini, M., Shapley, A. E., &
Wright, S. A. 2007, ApJ, 669, 929Law, D. R., Steidel, C. C., Erb, D. K., Larkin, J. E., Pettini, M., Shapley, A. E.,
& Wright, S. A. 2009, ApJ, 697, 2057Lehnert, M. D., & Heckman, T. M. 1996, ApJ, 462, 651Lehnert, M. D., Nesvadba, N. P. H., Tiran, L. Le, Matteo, P. Di, van Driel, W.,
Douglas, L. S., Chemin, L., & Bournaud, F. 2009, ApJ, 699, 1660Lemoine-Busserolle, M., & Lamareille, F. 2010, MNRAS, 402, 2291Lilly, S. J., et al. 2007, ApJS, 172, 70Lotz, J. M., Miller, B. W., & Ferguson, H. C. 2004, ApJ, 613, 262Mancini, C., et al. 2011, ApJ, submittedMaraston, C., Pforr, J., Renzini, A., Daddi, E., Dickinson, M., Cimatti, A., &
Tonini, C. 2010, MNRAS, 407, 830Martin, C. L. 1999, ApJ, 513, 156Martin, C. L. 2005, ApJ, 621, 227McKee, C. F., & Ostriker, J. P. 1977, ApJ, 218, 148McKeith, C. D., Greve, A., Downes, D., & Prada, F. 1995, A&A, 293, 703Meurer, G. R., Heckman, T. M., Lehnert, M. D., Leitherer, C., & Lowenthal, J.
1997, AJ, 114, 54Murray, N. 2010, ApJ, in press (arXiv:1007.3270)Murray, N., Quataert, E., & Thompson, T. A. 2005, ApJ, 618, 569Murray, N., Quataert, E., & Thompson, T. A. 2010a, ApJ, 709, 191Murray, N., Menard, B., & Thompson, T. A. 2010b, ApJ, in press
(arXiv:1005.4419)Naab, T., Johansson, P. H., & Ostriker, J. P. 2009, ApJ, 699, L178Naab, T., Johansson, P. H., Ostriker, J. P., & Efstathiou, G. 2007, ApJ, 658,
710Nakai, N., Hayashi, M., Handa, T., Sofue, Y., Hasegawa, T., & Sasaki, M. 1987,
PASJ, 39, 685Noguchi, M. 1999, ApJ, 514, 77Noeske, K. G., Weiner, B. J., & Faber, S. M., et al. 2007, ApJ, 660, L43Ocvirk, P., Pichon, C., & Teyssier, R. 2008, MNRAS, 390, 1326Oppenheimer, B. D., & Dave, R. 2006, MNRAS, 373, 1265Oser, L., Ostriker, J. P., Naab, T., Johansson, P. H., & Burkert, A. 2010,
arXiv:1010.1381Osterbrock, D. 1989, Astrophysics of Gaseous Nebulae and Active Galactic
Nuclei (Mill Valley, CA: University Science Books)Ostriker, E. C., & Shetty, R. 2010, ApJ, submittedPettini, M., & Pagel, B. E. J. 2004, MNRAS, 348, L59Pettini, M., Steidel, C. C., Adelberger, K. L., Dickinson, M., & Giavalisco, M.
2000, ApJ, 528, 96Phillips, J. P. 1999, A&A. Suppl., 134, 241Quirk, W. 1972, ApJ, 176, L9Rand, R. J., & Kulkarni, S. R. 1990, ApJ, 349, L43Reddy, N. A., Erb, D. K., Pettini, M., Steidel, C. C., & Shapley, A. E. 2010, ApJ,
712, 1070Roussel, H., et al. 2010, A&A, 518, L66Rupke, D. S., Veilleux, S., & Sanders, D. B. 2005, ApJS, 160, 115Schaaf, R., et al. 1989, ApJ, 336, 762Schreiber, J., Thatte, N., Eisenhauer, F., Tecza, M., Abuter, R., & Horrobin,
M. 2004, in ASP Conf. Ser. 314, Astronomical Data Analysis Software andSystems XIII, ed. F. Ochsenbein, M. G. Allen, & D. Egret (San Francisco,CA: ASP), 380
Schruba, A., Leroy, A. K., Walter, F., Sandstrom, K., & Rosolowsky, E.2010, ApJ, 722, 1699
Shapiro, K. L., et al. 2008, ApJ, 682, 231Shapiro, K. L., et al. 2009, ApJ, 701, 955
29

The Astrophysical Journal, 733:101 (30pp), 2011 June 1 Genzel et al.
Shapiro, K. L., Genzel, R., & Forster Schreiber, N. M. 2010, MNRAS, 403, L36Shapley, A. E., Steidel, C. C., Pettini, M., & Adelberger, K. L. 2003, ApJ, 588,
65Shapley, A. E., et al. 2005, ApJ, 626, 698Somerville, R. S., et al. 2008, ApJ, 672, 776Stark, A. A., & Carlson, E. R. 1984, ApJ, 279, 122Steidel, C. C., Erb, D. K., Shapley, A. E., Pettini, M., Reddy, N., Bogosavljevic,
M., Rudie, G. C., & Rakic, O. 2010, ApJ, 717, 289Steidel, C. C., Giavalisco, M., Pettini, M., Dickinson, M., & Adelberger, K. L.
1996, ApJL, 462, L17Steidel, C. C., Shapley, A. E., Pettini, M., Adelberger, K. L., Erb, D. K., Reddy,
N. A., & Hunt, M. P. 2004, ApJ, 604, 534Strickland, D. K., & Heckman, T. M. 2009, ApJ, 697, 2030Tacconi, L. J., et al. 2008, ApJ, 680, 246Tacconi, L. J., et al. 2010, Nature, 463, 781Thompson, T., Quataert, E., & Murray, N. 2005, ApJ, 630, 167
Toomre, A. 1964, ApJ, 139, 1217Van Den Bergh, S, Abraham, R. G., Ellis, R. S., Tanvir, N. R., Santiago, B. X.,
& Glazebrook, K. G. 1996, AJ, 112, 359van Starkenburg, L., van der Werf, P. P., Franx, M., Labbe, I., Rudnick, G., &
Wuyts, S. 2008, A&A, 488, 99Veilleux, S., Cecil, G., & Bland-Hawthorn, J. 2005, ARA&A, 43, 769Veilleux, S., & Rupke, D. S. 2002, ApJ, 565, L63Wada, K., & Norman, C. A. 2001, ApJ, 547, 172Walter, F., Weiss, A., & Scoville, N. 2002, ApJ, 580, L21Watson, M. G., Stanger, V., & Griffiths, R. E. 1984, ApJ, 286, 144Weiner, B. J., et al. 2006, ApJ, 653, 1027Weiner, B. J., et al. 2009, ApJ, 692, 187Westmoquette, M. S., Smith, L. J., Gallagher, J. S., & Exter, K. M. 2007,
MNRAS, 381, 913Wright, S. A., et al. 2007, ApJ, 658, 78Wright, S. A., Larkin, J. E., Graham, J. R., & Ma, C. P. 2010, ApJ, 711, 1291
30


