Embed Size (px)
Citation preview

CIRIA C688 London, 2010
Flood resilience andresistance for criticalinfrastructureWill McBain Arup
David Wilkes Arup
Matthias Retter Arup
Classic House, 174–180 Old Street, London EC1V 9BPTEL: 020 7549 3300 FAX: 020 7253 0523EMAIL: [email protected] WEBSITE: www.ciria.org
Licensed copy:UNIVERSITY OF SURREY, 04/09/2015, Uncontrolled Copy, © CIRIA

Summary
This publication is the main output from CIRIA project RP913 Flood resilience and resistancefor critical infrastructure. It provides an overview of the regulatory framework and outlinesthe main issues now faced by the industry in this area. The publication states that floodresilience measures should be adopted as an integral part of individual organisations’business continuity management processes, whole-life asset management plans and climatechange adaptation strategies. CI (critical infrastructure) owners need to develop long-termstrategic investment approaches that allow for optimised investment decision making. Theeconomic regulators should aim to provide a framework to achieve this objective.
Flood resilience and resistance for critical infrastructure
McBain, W, Wilkes, D, Retter, M
CIRIA
CIRIA C688 © CIRIA 2010 RP913 ISBN: 978-086017-688-6
British Library Cataloguing in Publication Data
A catalogue record is available for this book from the British Library
Published by CIRIA, Classic house, 174-180 Old Street, London, EC1V 9BP
This publication is designed to provide accurate and authoritative information on the subject matter covered. It issold and/or distributed with the understanding that neither the authors nor the publisher is thereby engaged inrendering a specific legal or any other professional service. While every effort has been made to ensure the accuracyand completeness of the publication, no warranty or fitness is provided or implied, and the authors and publishershall have neither liability nor responsibility to any person or entity with respect to any loss or damage arising fromits use.
All rights reserved. No part of this publication may be reproduced or transmitted in any form or by any means,including photocopying and recording, without the written permission of the copyright-holder, application for whichshould be addressed to the publisher. Such written permission must also be obtained before any part of thispublication is stored in a retrieval system of any nature.
If you would like to reproduce any of the figures, text or technical information from this or any other CIRIApublication for use in other documents or publications, please contact the Publishing Department for more details oncopyright terms and charges at: [email protected] or tel: 020 7549 3300.
CIRIA C688ii
Keywords
Asset and facilities management, building envelope, construction process, flood riskmanagement, surface water drainage and flooding, sustainability
Reader interest
Flood riskmanagement,asset management
Classification
AVAILABILITY Open publication
CONTENT Factual record, original research,recommendations
STATUS Committee-guided
USER Experienced asset managers, engineers andtechnical managers new to the principles offlood risk management, consultants, regulatorsand decision makers, business continuitymanagers, commercial and contract managerswith an interest in flood risk management
Licensed copy:UNIVERSITY OF SURREY, 04/09/2015, Uncontrolled Copy, © CIRIA

Acknowledgements
This publication was produced as part of CIRIA’s continuing work in developing a suite ofdocuments for both infrastructure asset management and flood risk management. Theproject RP913 was carried out under contract to CIRIA by Arup.
Authors
Will McBain MA (Hons) PGDip CSci CWEM MCIWEM FRSA
Will McBain is an associate at Arup with 15 years experience of flood risk and waterresources management in the UK and overseas. He was lead editor of the living draftpractice guide to Planning Policy Statement 25 (PPS25). Will manages Arup’s NationalEngineering and Environmental Consultancy Agreement 2 (NEECA2) Framework with theEnvironment Agency.
David Wilkes BSc(Hons) CEng CWEM MICE FCIWEM
David is an associate director at Arup with over 30 years experience of flood risk and waterresources management. He has worked in a technical design capacity, at operational level,and as a public sector regulator. Before joining Arup, David spent over 20 years with theEnvironment Agency and its predecessors, including six years managing the ThamesBarrier.
Matthias Retter MSc PhD Cert CII
Matthias joined Arup in early 2008 following academic study in Germany, the US andSwitzerland. Matthias specialises in flood risk assessment, hydrological trends andsustainability.
Following CIRIA’s usual practice, the research was guided by a project steering group,which included:
Richard Ashley Pennine Water Group and University of Sheffield
Alex Back Veolia Water Central (formerly Three Valleys Water)
Mat Barber Cabinet Office
Beth Bear Institution of Civil Engineers
Derek Bell Barnsley Metropolitan Borough Council
Emma Culleton United Utilities
Paul Ditchfield Department for Environment, Food & Rural Affairs
Douglas Dodds National Grid
John Dora (chair) Network Rail
Ian Folkard RWE npower plc
David Gibson Hull City Council
Oliver Grant Environment Agency
Ian Harrison Newark and Sherwood District Council
David Hart Environment Agency
Steve Baldrance BT
Flood resilience and resistance for critical infrastructure, 2010 iiiLicensed copy:UNIVERSITY OF SURREY, 04/09/2015, Uncontrolled Copy, © CIRIA

Ian Hogg Scottish Water
Peter Jones Welsh Assembly Government
David Lloyd Business Continuity Institute
Shanti Majithia National Grid
Jim Moriarity London Underground
Fola Ogunyoye Royal Haskoning
Malcolm Payne London Underground
Peter Phipps Mott MacDonald Group
Mike Powell City of Bradford Metropolitan District Council
Paul Reeves Environment Agency Wales
David Sisson Lindsey Marsh Drainage Board and Association ofDrainage Authorities
Bridgette Sullivan-Taylor Warwick University
Claire Sunshine Environment Agency
David Mason South West Water
James Mason Environment Agency
Michael Whitehead Highways Agency
Jonathan Wright Mouchel
Project funders
CIRIA Core members
Environment Agency
Highways Agency
London Underground
National Grid
Network Rail
Scottish Water
South West Water
United Utilities
Veolia Three Valleys Water
CIRIA would also like to thank Arup for their substantial in-kind contribution in theproduction and dissemination of this publication.
CIRIA Project team
Ben Kidd Project manager
Supported by Philip Charles, Chris Chiverrell and Paul Shaffer
Other contributors
The development of this publication also used contributions from:
Tim Allmark Nuclear Installations Inspectorate
David Anderson Network Rail
Jonathan Aylwin Arup
CIRIA C688ivLicensed copy:UNIVERSITY OF SURREY, 04/09/2015, Uncontrolled Copy, © CIRIA

Rob Bailey Welsh Assembly Government
Steve Ball Homes and Communities Agency
Dean Beaumont BT
Colin Berghouse Environment Agency
Lee Bosher Loughborough University
Layla Branicki Warwick University
Alan Bromage Concrete Centre
David Brook Independent consultant
Andy Brown Anglian Water Services
Edward Bunting Department for Transport
Paul Buttery CE Electric
Alex Carter National Grid
Graham Cave Chartered Institute of Loss Adjustors
Tim Chapman Arup
Colin Church Severn Trent Water Ltd
Paul Conroy Halcrow
Steve Coupe Environment Agency
Gordan Davies Environment Agency
Mary Dhonau National Flood Forum
Manuela Escarameia HR Wallingford Ltd
Andy Ewens Gloucestershire Constabulary
Graham Fardell Arup
Mark Fletcher Arup
Randy Freed ICF International
David Funchall URS Corporation Ltd
Gavin George Flood Guards Systems Ltd
John Gibbs EDF Energy Networks
Colin Harris Arup
David Higginson Mouchel
Zoe Hutchinson Mouchel
Alan Hodder National Grid
Caroline Jackson Mouchel
Tony Jackson Network Rail
Mike Johnson Department for Communities and Local Government
Keith Jones University of Greenwich
Mari Jones Faber Maunsell
Mike Jones GHD (formerly Arup)
Russell Knight BAA Airports Ltd
Andy Limbrick Association of Electricity Providers
Andrew Mack United Utilities
Steven Male University of Leeds
Mark Maloney University of Leeds
Jim Marshall Water UK
Brian McGinnity London Underground
Flood resilience and resistance for critical infrastructure, 2010 vLicensed copy:UNIVERSITY OF SURREY, 04/09/2015, Uncontrolled Copy, © CIRIA

John McRobert Roads Service (Northern Ireland)
Jane Medforth Hull City Council
Ian Moodie Association of Drainage Authorities
Brian Morrow United Utilities
David Murphy Cabinet Office
Chris Netherton National Flood School
John Newman Department for Business, Innovation and Skills
Mick O’Malley Veolia Three Valleys Water
Will Owen Weather Intelligence
Mark Parker Gloucestershire County Council
Steven Parsley Yorkshire Water Services
Ian Peacock Arup
Andy Phillips Welsh Assembly Government
Arthur Philp Association of British Insurers
Frazer Rhodes Environment Agency
Nigel Riglar Gloucestershire County Council
Will Rogers URS Corporation Ltd
Santi Santhalingam Highways Agency
John Scoot Flood Control Ltd
Annette Senior National Grid
Robert Sharpe Tube Lines Ltd
Tim Spink Mott MacDonald
David Suddards Anglian Water Services
Bridgette E Sullivan-Taylor SOLAR unit, Warwick Business School, Warwick University
Paul Swift Mouchel
Andy Tagg HR Wallingford Ltd
Bruce Trayhurn RWE npower plc
Anna Trippitt CE Electric
David Turnbull Tyne and Wear Emergency Planning Unit
Andy Turner Environment Agency
Rosalind Turner Mott MacDonald Group
Gary Tustin Environment Agency
Kim Vanstone South West Water
Britt Warg Geodesign Barriers Ltd
Noel Wheatley Ofwat (formerly Environment Agency)
David Whensley Energy Network Association
Ron Whitehead Total Flood Solutions and Flood Protection Association
Doug Whitfield Environment Agency
Rod Wilkinson Severn Trent Water Ltd
Kate Zabatis United Utilities
CIRIA C688vi
Front cover image: National Grid switching station in Walham, Gloucester, the day after the floodinundation in July 2007 (courtesy Geodesign Barriers Ltd)
Licensed copy:UNIVERSITY OF SURREY, 04/09/2015, Uncontrolled Copy, © CIRIA

Executive summary
CIRIA project RP913 Flood resilience and resistance for critical infrastructure builds on previousCIRIA-managed collaborative research on property-level flood resilience (CLG, 2007) andwith the aim of addressing some of the critical infrastructure (CI) issues raised by recentsevere flooding in the UK. This publication, which is the main output from the project,provides an overview of how the risk posed to CI systems by flooding is now managedacross the UK.
CI comprises: “those facilities, systems, sites and networks necessary for the functioning ofthe country and the delivery of the essential services upon which daily life in the UKdepends” (CPNI, <http://www.cpni.gov.uk/glossary.aspx#01>). Flood resilience involvesdesigning an infrastructure asset, or adapting an existing infrastructure asset so thatalthough it comes into contact with floodwater during floods, no permanent damage iscaused, structural integrity is maintained and, if operational disruption does occur, normaloperation can resume rapidly after a flood has receded. Flood resistance involves designingan infrastructure asset, or adapting an existing infrastructure asset so that floodwater isexcluded during flood events and normal operation can continue with no disruptionoccurring to the essential services the asset provides. These two techniques have a centralrole to play in managing the flood risks associated with CI systems.
The publication provides an overview of the regulatory framework and outlines the mainissues now faced by the industry in this area. A brief introduction is given to the principlesof flood risk management (FRM) to place flood resilience and resistance into a widercontext. A range of case studies is provided that describes the lessons identified byinfrastructure owners and operators who have suffered flooding problems in the past.Flood risk management for CI across the UK is then considered with respect to:
� flood risk assessment
� adopting resilience and resistance measures
� investment prioritisation.
The conclusions and recommendations to this publication are summarised as follows:
The majority of flood risk assessment work undertaken to date by CI operators has madeuse of national flood maps prepared by the Environment Agency (EA), ScottishEnvironment Protection Agency (SEPA) and Northern Ireland Rivers Agency (NIRA).These maps provide information on a limited number of annual probabilities of events forriver and coastal flooding only, ignoring the presence of flood defences. These maps donot factor in an allowance for climate change (except in Northern Ireland). Now it ischallenging for operators to assess the degree of exposure to surface, groundwater andinfrastructure-failure flood hazards. The next generation of flood maps, and theirassociated hazard registers, need to address this issue, making better use of existinginformation and ensuring that new data is collated in a consistent format.
The main issue with adopting resilience and resistance measures is which standard to use.Sir Michael Pitt recommended that resistance to a 0.5 per cent (1 in 200) annualprobability flood would be a proportionate starting point for critical infrastructure. It iseasier to protect new infrastructure from flooding than it is to adapt and upgrade existinglegacy infrastructure. The 0.5 per cent (1 in 200) annual probability standard will be
Flood resilience and resistance for critical infrastructure, 2010 viiLicensed copy:UNIVERSITY OF SURREY, 04/09/2015, Uncontrolled Copy, © CIRIA

particularly challenging to achieve for roads and legacy rail infrastructure. It isrecommended that guidance on appropriate resilience/resistance standards is developedfor different categories of CI, which recognises the existing variations in both flood hazardexposure and resistance/resilience levels. This publication suggests a possible risk-basedframework for these standards.
Flood resilience measures should be adopted as an integral part of individualorganisations’ business continuity management processes, whole-life asset managementplans and climate change adaptation strategies. CI owners need to develop long-termstrategic investment approaches that allow for optimised investment decision making. Theeconomic regulators should aim to provide a framework to achieve this objective.
This publication is supported by two documents, which are available to download from theCIRIA website: <www.ciria.org/service/c688>
Supporting document 1: Overview of questionnaire survey results (May 2009)
Supporting document 2: Consultation workshop report (April 2009)
CIRIA C688viiiLicensed copy:UNIVERSITY OF SURREY, 04/09/2015, Uncontrolled Copy, © CIRIA

Contents
Acknowledgements . . . . . . . . . . . . . . . . . . . . . . . . . . . . . . . . . . . . . . . . . . . . . . . . . . . . . . . . . . . . .iii
Executive summary . . . . . . . . . . . . . . . . . . . . . . . . . . . . . . . . . . . . . . . . . . . . . . . . . . . . . . . . . . . .viii
Boxes . . . . . . . . . . . . . . . . . . . . . . . . . . . . . . . . . . . . . . . . . . . . . . . . . . . . . . . . . . . . . . . . . . . . . . . .xiii
Case studies . . . . . . . . . . . . . . . . . . . . . . . . . . . . . . . . . . . . . . . . . . . . . . . . . . . . . . . . . . . . . . . . . .xiii
Examples . . . . . . . . . . . . . . . . . . . . . . . . . . . . . . . . . . . . . . . . . . . . . . . . . . . . . . . . . . . . . . . . . . . . .xiii
Figures . . . . . . . . . . . . . . . . . . . . . . . . . . . . . . . . . . . . . . . . . . . . . . . . . . . . . . . . . . . . . . . . . . . . . . .xiii
Tables . . . . . . . . . . . . . . . . . . . . . . . . . . . . . . . . . . . . . . . . . . . . . . . . . . . . . . . . . . . . . . . . . . . . . . . .xiv
Acronyms and abbreviations . . . . . . . . . . . . . . . . . . . . . . . . . . . . . . . . . . . . . . . . . . . . . . . . . . . . .xv
1 Introduction . . . . . . . . . . . . . . . . . . . . . . . . . . . . . . . . . . . . . . . . . . . . . . . . . . . . . . . . . . . . . . .1
1.1 Background . . . . . . . . . . . . . . . . . . . . . . . . . . . . . . . . . . . . . . . . . . . . . . . . . . .1
1.2 The Pitt Review . . . . . . . . . . . . . . . . . . . . . . . . . . . . . . . . . . . . . . . . . . . . . . . .1
2 Scope . . . . . . . . . . . . . . . . . . . . . . . . . . . . . . . . . . . . . . . . . . . . . . . . . . . . . . . . . . . . . . . . . . . .2
3 Target audience . . . . . . . . . . . . . . . . . . . . . . . . . . . . . . . . . . . . . . . . . . . . . . . . . . . . . . . . . . . .3
4 Detailed definitions . . . . . . . . . . . . . . . . . . . . . . . . . . . . . . . . . . . . . . . . . . . . . . . . . . . . . . . . .4
4.1 Critical infrastructure (CI) . . . . . . . . . . . . . . . . . . . . . . . . . . . . . . . . . . . . . . . .4
4.2 Criticality . . . . . . . . . . . . . . . . . . . . . . . . . . . . . . . . . . . . . . . . . . . . . . . . . . . . .4
4.3 Interdependency . . . . . . . . . . . . . . . . . . . . . . . . . . . . . . . . . . . . . . . . . . . . . . .6
4.4 Resilience . . . . . . . . . . . . . . . . . . . . . . . . . . . . . . . . . . . . . . . . . . . . . . . . . . . . .6
4.5 Flood resistance and resilience . . . . . . . . . . . . . . . . . . . . . . . . . . . . . . . . . . . .7
4.6 Design standards and performance levels . . . . . . . . . . . . . . . . . . . . . . . . . . . .7
5 Regulatory context . . . . . . . . . . . . . . . . . . . . . . . . . . . . . . . . . . . . . . . . . . . . . . . . . . . . . . . .10
5.1 Introduction . . . . . . . . . . . . . . . . . . . . . . . . . . . . . . . . . . . . . . . . . . . . . . . . . .10
5.2 Planning for civil contingencies . . . . . . . . . . . . . . . . . . . . . . . . . . . . . . . . . . .10
5.2.1 Introduction . . . . . . . . . . . . . . . . . . . . . . . . . . . . . . . . . . . . . . . . . . .10
5.2.2 England . . . . . . . . . . . . . . . . . . . . . . . . . . . . . . . . . . . . . . . . . . . . . .10
5.2.3 Scotland . . . . . . . . . . . . . . . . . . . . . . . . . . . . . . . . . . . . . . . . . . . . . .11
5.2.4 Wales . . . . . . . . . . . . . . . . . . . . . . . . . . . . . . . . . . . . . . . . . . . . . . . . .11
5.2.5 Northern Ireland . . . . . . . . . . . . . . . . . . . . . . . . . . . . . . . . . . . . . . .11
5.3 Flood risk management (FRM) . . . . . . . . . . . . . . . . . . . . . . . . . . . . . . . . . . .11
5.3.1 Introduction . . . . . . . . . . . . . . . . . . . . . . . . . . . . . . . . . . . . . . . . . . .11
5.3.2 England . . . . . . . . . . . . . . . . . . . . . . . . . . . . . . . . . . . . . . . . . . . . . .12
5.3.3 Wales . . . . . . . . . . . . . . . . . . . . . . . . . . . . . . . . . . . . . . . . . . . . . . . . .12
5.3.4 Scotland . . . . . . . . . . . . . . . . . . . . . . . . . . . . . . . . . . . . . . . . . . . . . .13
5.3.5 Northern Ireland . . . . . . . . . . . . . . . . . . . . . . . . . . . . . . . . . . . . . . .13
5.4 Regulation of private utility companies . . . . . . . . . . . . . . . . . . . . . . . . . . . . .13
5.5 Regulation of publicly-owned service providers . . . . . . . . . . . . . . . . . . . . . .14
5.6 The spatial planning system . . . . . . . . . . . . . . . . . . . . . . . . . . . . . . . . . . . . .14
5.7 Summary . . . . . . . . . . . . . . . . . . . . . . . . . . . . . . . . . . . . . . . . . . . . . . . . . . . .15
Flood resilience and resistance for critical infrastructure, 2010 ixLicensed copy:UNIVERSITY OF SURREY, 04/09/2015, Uncontrolled Copy, © CIRIA

6 The principles of flood risk management (FRM) . . . . . . . . . . . . . . . . . . . . . . . . . . . . . . . .16
6.1 The components of flood risk: sources, pathways and receptors . . . . . . . . .16
6.2 The importance of strategic context . . . . . . . . . . . . . . . . . . . . . . . . . . . . . . .16
6.3 Flood frequency terminology . . . . . . . . . . . . . . . . . . . . . . . . . . . . . . . . . . . .17
6.4 Flood frequency and design flood level estimation . . . . . . . . . . . . . . . . . . .18
6.5 The management of uncertainty . . . . . . . . . . . . . . . . . . . . . . . . . . . . . . . . . .18
6.6 The flood risk management hierarchy . . . . . . . . . . . . . . . . . . . . . . . . . . . . .19
6.7 Standards of protection . . . . . . . . . . . . . . . . . . . . . . . . . . . . . . . . . . . . . . . . .19
6.8 Taking account of climate change . . . . . . . . . . . . . . . . . . . . . . . . . . . . . . . . .19
6.9 Flood risk management measures . . . . . . . . . . . . . . . . . . . . . . . . . . . . . . . . .20
6.10 The importance of whole-life asset management principles . . . . . . . . . . . .21
6.11 Off-site effects . . . . . . . . . . . . . . . . . . . . . . . . . . . . . . . . . . . . . . . . . . . . . . . . .21
6.12 Summary . . . . . . . . . . . . . . . . . . . . . . . . . . . . . . . . . . . . . . . . . . . . . . . . . . . .22
7 Issues in FRM for resilient infrastructure . . . . . . . . . . . . . . . . . . . . . . . . . . . . . . . . . . . . .23
7.1 Questionnaire responses . . . . . . . . . . . . . . . . . . . . . . . . . . . . . . . . . . . . . . . .23
7.2 Workshop outputs . . . . . . . . . . . . . . . . . . . . . . . . . . . . . . . . . . . . . . . . . . . . .24
7.3 Wider perspectives . . . . . . . . . . . . . . . . . . . . . . . . . . . . . . . . . . . . . . . . . . . . .24
7.3.1 Council for Science and Technology . . . . . . . . . . . . . . . . . . . . . . . .24
7.3.2 The ICE report: State of the nation . . . . . . . . . . . . . . . . . . . . . . . . . .24
7.3.3 Expecting the unexpected . . . . . . . . . . . . . . . . . . . . . . . . . . . . . . . .25
7.4 Joint policy statement on urban flood risk . . . . . . . . . . . . . . . . . . . . . . . . . .26
7.5 Summary . . . . . . . . . . . . . . . . . . . . . . . . . . . . . . . . . . . . . . . . . . . . . . . . . . . .27
8 Historic incidents and lessons identified . . . . . . . . . . . . . . . . . . . . . . . . . . . . . . . . . . . . . .28
8.1 Overview . . . . . . . . . . . . . . . . . . . . . . . . . . . . . . . . . . . . . . . . . . . . . . . . . . . .28
8.2 United Utilities and the Carlisle and Cumbria 2005 floods . . . . . . . . . . . . .29
8.2.1 What happened? . . . . . . . . . . . . . . . . . . . . . . . . . . . . . . . . . . . . . . .29
8.2.2 Lessons identified . . . . . . . . . . . . . . . . . . . . . . . . . . . . . . . . . . . . . . .29
8.3 National Grid and the June 2007 floods . . . . . . . . . . . . . . . . . . . . . . . . . . . .30
8.3.1 What happened? . . . . . . . . . . . . . . . . . . . . . . . . . . . . . . . . . . . . . . .30
8.3.2 Lessons identified . . . . . . . . . . . . . . . . . . . . . . . . . . . . . . . . . . . . . . .32
8.4 Ulley reservoir and the June 2007 floods . . . . . . . . . . . . . . . . . . . . . . . . . . .33
8.4.1 What happened? . . . . . . . . . . . . . . . . . . . . . . . . . . . . . . . . . . . . . . .33
8.4.2 Lessons identified . . . . . . . . . . . . . . . . . . . . . . . . . . . . . . . . . . . . . . .33
8.5 Network Rail and the summer 2007 floods . . . . . . . . . . . . . . . . . . . . . . . . .34
8.5.1 Background . . . . . . . . . . . . . . . . . . . . . . . . . . . . . . . . . . . . . . . . . . .34
8.5.2 What happened? . . . . . . . . . . . . . . . . . . . . . . . . . . . . . . . . . . . . . . .35
8.5.3 Lessons identified . . . . . . . . . . . . . . . . . . . . . . . . . . . . . . . . . . . . . . .36
8.6 Hull City Council and the June 2007 floods . . . . . . . . . . . . . . . . . . . . . . . . .37
8.6.1 What happened? . . . . . . . . . . . . . . . . . . . . . . . . . . . . . . . . . . . . . . .37
8.6.2 Lessons identified . . . . . . . . . . . . . . . . . . . . . . . . . . . . . . . . . . . . . . .38
8.7 Disruption of the M1 and M5 in summer 2007 . . . . . . . . . . . . . . . . . . . . . .38
8.7.1 What happened? . . . . . . . . . . . . . . . . . . . . . . . . . . . . . . . . . . . . . . .38
8.7.2 Lessons identified . . . . . . . . . . . . . . . . . . . . . . . . . . . . . . . . . . . . . . .39
8.8 Summary . . . . . . . . . . . . . . . . . . . . . . . . . . . . . . . . . . . . . . . . . . . . . . . . . . . .39
CIRIA C688xLicensed copy:UNIVERSITY OF SURREY, 04/09/2015, Uncontrolled Copy, © CIRIA

8.8.1 Flood sources and mechanisms . . . . . . . . . . . . . . . . . . . . . . . . . . . .39
8.8.2 Escalation of flood warnings . . . . . . . . . . . . . . . . . . . . . . . . . . . . . .39
8.8.3 Multi-agency emergency preparedness and incident management . . . . . . . . . . . . . . . . . . . . . . . . . . . . . . . . . . . . . . . . . . .39
8.8.4 Interdependencies . . . . . . . . . . . . . . . . . . . . . . . . . . . . . . . . . . . . . .39
8.8.5 Built-in resilience . . . . . . . . . . . . . . . . . . . . . . . . . . . . . . . . . . . . . . .40
9 Current practice in the assessment of flood risk to critical infrastructure . . . . . . . . . .41
9.1 Introduction . . . . . . . . . . . . . . . . . . . . . . . . . . . . . . . . . . . . . . . . . . . . . . . . . .41
9.2 Emerging issues in risk assessment . . . . . . . . . . . . . . . . . . . . . . . . . . . . . . . .41
9.3 International experience . . . . . . . . . . . . . . . . . . . . . . . . . . . . . . . . . . . . . . . .42
9.3.1 United States of America . . . . . . . . . . . . . . . . . . . . . . . . . . . . . . . . .42
9.3.2 European Union . . . . . . . . . . . . . . . . . . . . . . . . . . . . . . . . . . . . . . .43
9.3.3 Germany . . . . . . . . . . . . . . . . . . . . . . . . . . . . . . . . . . . . . . . . . . . . . .44
9.4 UK experience . . . . . . . . . . . . . . . . . . . . . . . . . . . . . . . . . . . . . . . . . . . . . . . .44
9.4.1 Overview . . . . . . . . . . . . . . . . . . . . . . . . . . . . . . . . . . . . . . . . . . . . . .44
9.4.2 National flood maps . . . . . . . . . . . . . . . . . . . . . . . . . . . . . . . . . . . . .45
9.4.3 FRA for new development . . . . . . . . . . . . . . . . . . . . . . . . . . . . . . . .46
9.4.4 FRA for existing infrastructure . . . . . . . . . . . . . . . . . . . . . . . . . . . .50
9.4.5 Assessing the consequences of flooding . . . . . . . . . . . . . . . . . . . . . .51
9.5 Energy sector . . . . . . . . . . . . . . . . . . . . . . . . . . . . . . . . . . . . . . . . . . . . . . . . .52
9.6 Communications sector . . . . . . . . . . . . . . . . . . . . . . . . . . . . . . . . . . . . . . . . .54
9.7 Transport sector . . . . . . . . . . . . . . . . . . . . . . . . . . . . . . . . . . . . . . . . . . . . . . .54
9.7.1 Highways . . . . . . . . . . . . . . . . . . . . . . . . . . . . . . . . . . . . . . . . . . . . .54
9.7.2 Rail . . . . . . . . . . . . . . . . . . . . . . . . . . . . . . . . . . . . . . . . . . . . . . . . . .55
9.8 Water sector . . . . . . . . . . . . . . . . . . . . . . . . . . . . . . . . . . . . . . . . . . . . . . . . . .55
9.8.1 Privatised water utilities . . . . . . . . . . . . . . . . . . . . . . . . . . . . . . . . . .55
9.8.2 Scottish Water . . . . . . . . . . . . . . . . . . . . . . . . . . . . . . . . . . . . . . . . . .58
9.9 Summary . . . . . . . . . . . . . . . . . . . . . . . . . . . . . . . . . . . . . . . . . . . . . . . . . . . .62
10 Current practice for adopting resistance and resilience measures . . . . . . . . . . . . . . . .63
10.1 The FRM hierarchy for critical infrastructure . . . . . . . . . . . . . . . . . . . . . . .63
10.2 Existing guidance on FRM for critical infrastructure . . . . . . . . . . . . . . . . . .63
10.3 Non structural measures . . . . . . . . . . . . . . . . . . . . . . . . . . . . . . . . . . . . . . . .64
10.3.1 Hazard identification, mapping and avoidance . . . . . . . . . . . . . . .64
10.3.2 Substitution and provision of reserve capacity . . . . . . . . . . . . . . . .64
10.3.3 Flood forecasting and warning . . . . . . . . . . . . . . . . . . . . . . . . . . . .64
10.3.4 Incident management and business continuity planning . . . . . . . .65
10.3.5 Emergency exercises . . . . . . . . . . . . . . . . . . . . . . . . . . . . . . . . . . . .65
10.4 Structural measures . . . . . . . . . . . . . . . . . . . . . . . . . . . . . . . . . . . . . . . . . . . .66
10.4.1 Fixed flood defences . . . . . . . . . . . . . . . . . . . . . . . . . . . . . . . . . . . .66
10.5 Flood resilient and resistant construction for buildings . . . . . . . . . . . . . . . .67
10.6 Temporary and demountable flood defences . . . . . . . . . . . . . . . . . . . . . . . .68
10.7 Design standards . . . . . . . . . . . . . . . . . . . . . . . . . . . . . . . . . . . . . . . . . . . . . .69
10.8 Energy sector . . . . . . . . . . . . . . . . . . . . . . . . . . . . . . . . . . . . . . . . . . . . . . . . .70
10.9 Transport sector . . . . . . . . . . . . . . . . . . . . . . . . . . . . . . . . . . . . . . . . . . . . . . .73
Flood resilience and resistance for critical infrastructure, 2010 xiLicensed copy:UNIVERSITY OF SURREY, 04/09/2015, Uncontrolled Copy, © CIRIA

10.9.1 Highways Agency . . . . . . . . . . . . . . . . . . . . . . . . . . . . . . . . . . . . . . .73
10.9.2 London Underground . . . . . . . . . . . . . . . . . . . . . . . . . . . . . . . . . . .74
10.9.3 Network Rail . . . . . . . . . . . . . . . . . . . . . . . . . . . . . . . . . . . . . . . . . .74
10.10 Water sector . . . . . . . . . . . . . . . . . . . . . . . . . . . . . . . . . . . . . . . . . . . . . . . . . .76
10.11 Communications sector . . . . . . . . . . . . . . . . . . . . . . . . . . . . . . . . . . . . . . . . .78
10.12 Publicly-funded FRM capital works . . . . . . . . . . . . . . . . . . . . . . . . . . . . . . .78
10.13 Summary . . . . . . . . . . . . . . . . . . . . . . . . . . . . . . . . . . . . . . . . . . . . . . . . . . . .81
11 Examples of FRM investment prioritisation . . . . . . . . . . . . . . . . . . . . . . . . . . . . . . . . . . . .82
11.1 Introduction . . . . . . . . . . . . . . . . . . . . . . . . . . . . . . . . . . . . . . . . . . . . . . . . . .82
11.2 Environment Agency . . . . . . . . . . . . . . . . . . . . . . . . . . . . . . . . . . . . . . . . . . .82
11.3 The approach advocated by Ofwat . . . . . . . . . . . . . . . . . . . . . . . . . . . . . . . .83
11.4 The approach adopted by Scottish Water . . . . . . . . . . . . . . . . . . . . . . . . . . .84
11.5 National Grid . . . . . . . . . . . . . . . . . . . . . . . . . . . . . . . . . . . . . . . . . . . . . . . . .87
11.6 Other . . . . . . . . . . . . . . . . . . . . . . . . . . . . . . . . . . . . . . . . . . . . . . . . . . . . . . .87
11.7 Summary . . . . . . . . . . . . . . . . . . . . . . . . . . . . . . . . . . . . . . . . . . . . . . . . . . . .88
12 Interdependencies and cross-sector collaboration . . . . . . . . . . . . . . . . . . . . . . . . . . . . . .89
13 Conclusions . . . . . . . . . . . . . . . . . . . . . . . . . . . . . . . . . . . . . . . . . . . . . . . . . . . . . . . . . . . . . .96
13.1 Regulatory regime . . . . . . . . . . . . . . . . . . . . . . . . . . . . . . . . . . . . . . . . . . . . .96
13.2 Historic incidents and lessons identified . . . . . . . . . . . . . . . . . . . . . . . . . . . .96
13.2.1 Flood sources and mechanisms . . . . . . . . . . . . . . . . . . . . . . . . . . . .96
13.2.2 Escalation of flood warnings . . . . . . . . . . . . . . . . . . . . . . . . . . . . . .96
13.2.3 Multi-agency emergency preparedness and incidentmanagement . . . . . . . . . . . . . . . . . . . . . . . . . . . . . . . . . . . . . . . . . . .97
13.2.4 Interdependencies . . . . . . . . . . . . . . . . . . . . . . . . . . . . . . . . . . . . . .97
13.2.5 Built-in resilience . . . . . . . . . . . . . . . . . . . . . . . . . . . . . . . . . . . . . . .97
13.3 Flood risk assessment . . . . . . . . . . . . . . . . . . . . . . . . . . . . . . . . . . . . . . . . . . .97
13.4 Adopting resistance and resilience measures . . . . . . . . . . . . . . . . . . . . . . . .98
13.5 Prioritisation of investment . . . . . . . . . . . . . . . . . . . . . . . . . . . . . . . . . . . . . .98
13.6 Interdependencies and cross-sector collaboration . . . . . . . . . . . . . . . . . . . .99
14 Recommendations . . . . . . . . . . . . . . . . . . . . . . . . . . . . . . . . . . . . . . . . . . . . . . . . . . . . . . .100
14.1 Next generation flood maps and hazard registers . . . . . . . . . . . . . . . . . . .100
14.2 Guidance on resistance and resilience standards . . . . . . . . . . . . . . . . . . . .100
14.3 Incentivisation of collaborative approaches . . . . . . . . . . . . . . . . . . . . . . . .101
14.4 Understanding whole-life costs and benefits . . . . . . . . . . . . . . . . . . . . . . . .101
14.5 Investment planning . . . . . . . . . . . . . . . . . . . . . . . . . . . . . . . . . . . . . . . . . .102
14.6 Alignment of public/private sector spend . . . . . . . . . . . . . . . . . . . . . . . . . .102
14.7 Improving the effectiveness of the emergency response . . . . . . . . . . . . . .102
14.8 Training in flood risk management for critical infrastructure . . . . . . . . . .102
References . . . . . . . . . . . . . . . . . . . . . . . . . . . . . . . . . . . . . . . . . . . . . . . . . . . . . . . . . . . . . . . . . .103
Acts, Codes, Regulations etc . . . . . . . . . . . . . . . . . . . . . . . . . . . . . . . . . . . . . . . . . . .110
Other useful websites . . . . . . . . . . . . . . . . . . . . . . . . . . . . . . . . . . . . . . . . . . . . . . . . .112
CIRIA C688xiiLicensed copy:UNIVERSITY OF SURREY, 04/09/2015, Uncontrolled Copy, © CIRIA

Boxes
Box 10.1 Design standards adopted by the Highways Agency . . . . . . . . . . . . .69
Box 10.2 Design standards adopted by Network Rail . . . . . . . . . . . . . . . . . . .70
Case studies
Case study 9.1 A pilot in the use of GIS by the HA’s Network Resilience Team . . . .55
Case study 9.2 United Utilities assessment of flood risk for water assets . . . . . . . . .57
Case study 9.3 Anglian Water’s assessments of sites threatened by sea level rise . . .57
Case study 9.4 Yorkshire Water Services Limited strategic level assessment . . . . . .58
Case study 9.5 Flood risk assessment by Veolia Water Central . . . . . . . . . . . . . . . . .58
Case study 9.6 Asset flood risk classification at Scottish Water . . . . . . . . . . . . . . . . .59
Case study 10.1 Experience of flooding at Great Yarmouth power station . . . . . . . .72
Case study 10.2 Highways Agency Exercise Extend . . . . . . . . . . . . . . . . . . . . . . . . . .73
Case study 10.3 Network Rail’s use of flood outlines for siting of telecommunicationsinstallations . . . . . . . . . . . . . . . . . . . . . . . . . . . . . . . . . . . . . . . . . . . . .76
Case study 10.4 Consideration of flood resilience versus resistance at theMythe WTW . . . . . . . . . . . . . . . . . . . . . . . . . . . . . . . . . . . . . . . . . . . .77
Case study 10.5 Flood resistance measures installed at Safeway superstore, Lewes . .80
Case study 11.1 Prioritisation of spending on flood risk for the 2010 to 2015 assetmanagement period for Veolia Water Central . . . . . . . . . . . . . . . . .84
Case study 11.2 Defence facility flood mitigation strategy and investment planning 2009 . . . . . . . . . . . . . . . . . . . . . . . . . . . . . . . . . . . . . . . . . . .87
Case study 12.1 Strategic infrastructure delivery plan in Gloucestershire . . . . . . . . .92
Case study 12.2 The Integrated Strategic Drainage Board in Hull . . . . . . . . . . . . . .92
Case study 12.3 Local resilience forum in Hull . . . . . . . . . . . . . . . . . . . . . . . . . . . . . .93
Case study 12.4 Flood risk and resilience in North Wales . . . . . . . . . . . . . . . . . . . . . .94
Case study 12.5 The Highways Agency working in partnership with the Environment Agency . . . . . . . . . . . . . . . . . . . . . . . . . . . . . . . . . . . . .95
Case study 12.6 Scope for collaboration between Network Rail and regional resilience forums . . . . . . . . . . . . . . . . . . . . . . . . . . . . . . . . . . . . . . . .95
Examples
Example 6.1 Use of demountable defences in place of fixed defences . . . . . . . . .21
Example 6.2 Use of flood defences in place of spatial planning measures . . . . . .21
Figures
Figure 4.1 The three dimensions of the criticality scale . . . . . . . . . . . . . . . . . . . .5
Figure 4.2 Design standards versus performance levels . . . . . . . . . . . . . . . . . . . .9
Figure 6.1 Flood sources, pathways and receptors . . . . . . . . . . . . . . . . . . . . . . .16
Figure 6.2 Design exceedance probabilities . . . . . . . . . . . . . . . . . . . . . . . . . . . .18
Figure 8.1 Temporary defences used at Walham substation . . . . . . . . . . . . . . . .31
Figure 8.2 Flood impact on the electricity grid in South Yorkshire during June 2007 . . . . . . . . . . . . . . . . . . . . . . . . . . . . . . . . . . . . . . . . . . . . . .32
Figure 8.3 Emergency stabilisation work undertaken at Ulley Dam (a) and avisualisation of the proposed new spillway designed by Arup forRotherham MBC (b) . . . . . . . . . . . . . . . . . . . . . . . . . . . . . . . . . . . . . .34
Flood resilience and resistance for critical infrastructure, 2010 xiiiLicensed copy:UNIVERSITY OF SURREY, 04/09/2015, Uncontrolled Copy, © CIRIA

Figure 8.4 Flooding of rail tracks at Adlestrop (River Evenlode) . . . . . . . . . . . .35
Figure 8.5 Analysis of significant asset failures of Network Rail caused during the summer 2007 floods . . . . . . . . . . . . . . . . . . . . . . . . . . . . . . . . . . .36
Figure 8.6 Flooding in Hull, June 2007 . . . . . . . . . . . . . . . . . . . . . . . . . . . . . . .37
Figure 9.1 Continuous improvement to protect critical infrastructure . . . . . . .42
Figure 9.2 The risk management process within “emergency preparedness” . .45
Figure 9.3 National infrastructure assets (transport and utilities infrastructure) in floodplain areas . . . . . . . . . . . . . . . . . . . . . . . . . . . . . . . . . . . . . . .51
Figure 9.4 Screen grab of GIS interface developed in NRT pilot study . . . . . .55
Figure 9.5 Risk matrix for prioritisation of investigations into the viability ofresilience measures . . . . . . . . . . . . . . . . . . . . . . . . . . . . . . . . . . . . . . .56
Figure 9.6 Schematic of Anglian Water assets at risk from sea level rise . . . . . .57
Figure 9.7 Flood risk exposure using the red, amber and green classifications 59
Figure 9.8 Scottish Water survey template example (WTW) . . . . . . . . . . . . . . .60
Figure 10.1 The basic components of a flood defence . . . . . . . . . . . . . . . . . . . . .66
Figure 10.2 Flood water penetration into buildings . . . . . . . . . . . . . . . . . . . . . . .68
Figure 10.3 An example of flood resistance measures used by members of theEnergy Networks Association . . . . . . . . . . . . . . . . . . . . . . . . . . . . . . .71
Figure 10.4 Hesco temporary barriers erected at Mythe WTW following the floodevents of 2007 . . . . . . . . . . . . . . . . . . . . . . . . . . . . . . . . . . . . . . . . . . .77
Figure 10.5 Actual flood resistant measure employed at the Mythe WTW (a) and a 3D model showing the site protected from flood water (b) . . .77
Figure 10.6 Examples of flood resistance measures installed at Safeways superstore, Lewes . . . . . . . . . . . . . . . . . . . . . . . . . . . . . . . . . . . . . . . .80
Figure 12.1 Visualisation of a major flood affecting an urban conurbation . . . . .89
Tables
Table 4.1 Criticality scale for national infrastructure . . . . . . . . . . . . . . . . . . . . .5
Table 4.2 Infrastructure criticality matrix . . . . . . . . . . . . . . . . . . . . . . . . . . . . . .6
Table 6.1 Flood frequency terminology . . . . . . . . . . . . . . . . . . . . . . . . . . . . . . .17
Table 6.2 Flood risk management hierarchy . . . . . . . . . . . . . . . . . . . . . . . . . . .19
Table 6.3 Indicative standards of protection for land-use types . . . . . . . . . . . .19
Table 6.4 Flood risk management measures . . . . . . . . . . . . . . . . . . . . . . . . . . .20
Table 7.1 Summary of issues identified in questionnaire survey . . . . . . . . . . .23
Table 9.1 Levels of flood risk assessment . . . . . . . . . . . . . . . . . . . . . . . . . . . . . .46
Table 9.2 Typical sources of information for flood risk assessments . . . . . . . . .47
Table 9.3 Flood zones in PPS25 . . . . . . . . . . . . . . . . . . . . . . . . . . . . . . . . . . . . .48
Table 9.4 Flood zones in Wales . . . . . . . . . . . . . . . . . . . . . . . . . . . . . . . . . . . . .48
Table 9.5 Flood risk vulnerability classification . . . . . . . . . . . . . . . . . . . . . . . . .50
Table 9.6 National Grid’s assets at risk . . . . . . . . . . . . . . . . . . . . . . . . . . . . . . .53
Table 10.1 The flood risk management hierarchy for critical infrastructure . . .63
Table 11.1 Outcome measures summary table . . . . . . . . . . . . . . . . . . . . . . . . . .82
Table 11.2 Datasets used to provide an initial ranking of priority flood alleviation projects . . . . . . . . . . . . . . . . . . . . . . . . . . . . . . . . . . . . . . .83
Table 11.3 Asset flood risk protection categories and aligned solutions . . . . . . .86
Table 11.4 Short, medium and long-term investment . . . . . . . . . . . . . . . . . . . .86
CIRIA C688xivLicensed copy:UNIVERSITY OF SURREY, 04/09/2015, Uncontrolled Copy, © CIRIA

Table 12.1 Examples of infrastructure asset vulnerability and functionaldependencies . . . . . . . . . . . . . . . . . . . . . . . . . . . . . . . . . . . . . . . . . . .90
Table 14.1 Concise definition of asset categories . . . . . . . . . . . . . . . . . . . . . . . .100
Table 14.2 Examples of resistance/resilience standards and performance levels that may be appropriate for CI assets in some sectors . . . . . . . . . .101
Flood resilience and resistance for critical infrastructure, 2010 xvLicensed copy:UNIVERSITY OF SURREY, 04/09/2015, Uncontrolled Copy, © CIRIA

Acronyms and abbreviations
AMP Asset management plan
ALA American Lifeline Alliance
ASCE American Society of Civil Engineers
BAP Biodiversity action plan
BGS British Geological Survey
BH Borehole
BBK Federal Office of Civil Protection and Disaster Assistance (US)
BRC British Red Cross
BT British Telecom
CCA Civil Contingencies Act
CCS Civil Contingencies Secretariat
CFMP Catchment flood management plan
CI Critical infrastructure
CIKR Critical infrastructure and key resources (US)
CIWEM Chartered Institution of Water and Environmental Management
CLG Communities and Local Government
CNI Critical national infrastructure
CPNI Centre for Protection of National Infrastructure
CRR Community Risk Register
CST Council for Science and Technology
DARD (NI) Department of Agriculture and Rural Development (NorthernIreland)
Defra Department for Environment, Food and Rural Affairs
DFE Design flood elevation
DfT Department for Transport
DHS Department of Homeland Security (US)
ECW Emergency customer welfare (HA)
ENA Energy Networks Association
EPCIP European Programme for Critical Infrastructure Protection
EPM Emergency planning manager (HA)
EPO Emergency planning officer (HA)
FEMA Federal Emergency Management Agency (US)
FHM Flood hazard maps
FRM Flood risk management
FRMP Flood risk management plans
GIS Geographical information systems
GSS Guaranteed standards scheme
HA Highways Agency
ICE Institution of Civil Engineers
IDB Internal Drainage Board
CIRIA C688xviLicensed copy:UNIVERSITY OF SURREY, 04/09/2015, Uncontrolled Copy, © CIRIA

IPC Infrastructure Planning Commission
IPPC Intergovernmental Panel on Climate Change
LI Landscape Institute
LiDAR Light detection and ranging
LPA Local planning authority
LRF Local resilience forum
LTAS Long-term asset strategy
LV Low voltage
MVA Megavolt amperes
NADB National Assets Database (US)
NaFRA National flood risk assessment
NAP New approaches programme
NFIP National Flood Insurance Program (US)
NHS National Health Service
NHT Natural Hazards Team
NIPP National infrastructure protection plan (US)
NIRA Northern Ireland Rivers Agency
NOS National Occupation Standards
NPV Net present value
NRD National Receptor Database
NRR National Risk Register
NRT Network Resilience Team (HA)
NSAC National Security Advice Centre
OCA Overall critical assessment
OHL Overhead line
OPA Overall performance assessment
OPM Output performance measures
ORR Office of Rail Regulation
PAN Planning Advice Note (Scotland)
pFRA Preliminary flood risk assessment
PMF Probable maximum flood
PPS Planning Policy Statement (England and Northern Ireland)
RAMCAP Risk assessment methodology for critical asset protection
RFRA Regional flood risk appraisal
RIBA Royal Institute of British Architects
RICS Royal Institution of Chartered Surveyors
RRF Regional Resilience Forums
RSPCA Royal Society for Prevention of Cruelty to Animals
RTPI Royal Town Planning Institute
RUSI Royal United Services Institute
RWPS Raw water pumping station
SEPA Scottish Environment Protection Agency
SFRA Strategic flood risk assessment
SHIRA Strategic Homeland Infrastructure Risk Assessment (US)
Flood resilience and resistance for critical infrastructure, 2010 xviiLicensed copy:UNIVERSITY OF SURREY, 04/09/2015, Uncontrolled Copy, © CIRIA

SMP Shoreline management plan
SPP Scottish Planning Policy
SRP Sector resilience plans
SS Substation
SSSI Sites of special scientific interest
STWL Severn Trent Water Ltd
SWMP Surface water management plan
TAN Technical Advice Note (Wales)
TOC Train operating company
TWPS Treated water pumping station
UKCIP United Kingdom Climate Impacts Programme
WAG Welsh Assembly Government
WICS Water Industry Commission for Scotland
WTW Water treatment works
WwTW Wastewater treatment works
YWSL Yorkshire Water Services Ltd
CIRIA C688xviiiLicensed copy:UNIVERSITY OF SURREY, 04/09/2015, Uncontrolled Copy, © CIRIA

1 Introduction
This chapter provides context to the publication, how and why it was initiated and whereit sits in relation to Sir Michael Pitt’s review of the 2007 floods.
1.1 BACKGROUND
Project RP913 Flood resilience and resistance for critical infrastructure was established byCIRIA, building upon previous CIRIA-managed collaborative research on property-levelflood resilience (CLG, 2007) and with the aim of addressing some of the criticalinfrastructure issues raised by recent severe flooding in the UK. The project sits withinthe Environment Agency Flood Risk Science Programme as part of the EnvironmentAgency’s joint Flood and Coastal Risk Management Programme with the Department ofEnvironment, Food and Rural Affairs (Defra). CIRIA established a project steering groupcomprising 26 organisations (see Acknowledgements) and chaired by John Dora of NetworkRail.
1.2 THE PITT REVIEW
Sir Michael Pitt’s Review published in December 2008 made several recommendationsregarding the need to increase the flood resilience of the nation’s critical infrastructure(Pitt, 2008). The review’s three recommendations pertinent to this publication were:
Recommendation 51: relevant government departments and the Environment Agencyshould work with infrastructure operators to identify the vulnerability and risk of assets toflooding and a summary of the analysis should be published in sector resilience plans(SRPs).
Recommendation 52: in the short-term, the UK Government and infrastructureoperators should work together to build a level of resilience into critical infrastructureassets that ensures continuity during a worst-case flood event.
Recommendation 53: a specific duty should be placed on economic regulators to buildresilience in critical infrastructure.
Pitt suggested that the Government’s National Security Strategy should aim to reduce themost substantial known risks to critical infrastructure resulting from natural hazardsthrough careful assessment of vulnerability and prudent action based on new centrallydefined standards.
Flood resilience and resistance for critical infrastructure, 2010 1Licensed copy:UNIVERSITY OF SURREY, 04/09/2015, Uncontrolled Copy, © CIRIA

2 Scope
This publication aims to identify lessons learnt from historic incidents, current practiceand research needs related to improving the flood resilience and resistance of criticalinfrastructure assets in general. The scope was to:
� plan, arrange and manage a consultation workshop
� undertake a questionnaire survey
� collate the workshop outputs and questionnaire responses and provide reportssummarising the results of these two exercises
� undertake a literature review providing:
� an overview of the problems of infrastructure flood risk
� a review of information from post-flood incident reports
� a review (primarily signposting) of current approaches from other sectors andtheir applicability to infrastructure assets
� a review of measures adopted by infrastructure asset owners using current,publicly available information on costs and benefits of resilience and resistancemeasures.
A questionnaire was completed and returned by 35 organisations and a copy of thefeedback report is included in Supporting document 1. Supporting document 2 givesinformation from a consultation workshop that was held in April 2009 and attended byover 40 organisations.
Numerous case studies were later provided by the participants. The questionnaireresponses, workshop outputs and case studies have been supplemented by a literaturereview to provide the supporting evidence for this publication. Following consultationwith the Steering Group, in the energy, communications, transport, and water sectors, thispublication has focused on:
� the assessment of flood risk to infrastructure assets
� experience to date of adopting resistance and resilience measures
� the prioritisation of investment in these measures
� the identification of research needs.
CIRIA C6882Licensed copy:UNIVERSITY OF SURREY, 04/09/2015, Uncontrolled Copy, © CIRIA

3 Target audience
It is foreseen that the outputs will be of primary interest to:
� all relevant government bodies and regulators
� utility providers (eg electricity, gas, water)
� waste management operators (eg treatment and disposal)
� telecommunications companies
� transport asset owners (eg Highways Agency, Network Rail, local authorities, airports,ports and navigation operators)
� local planning authorities
� local authority contingency/emergency planners
� public services (eg emergency services)
� consultants and designers
� facilities managers
� National Health Service Trusts
� the insurance industry
� the planning inspectorate.
Flood resilience and resistance for critical infrastructure, 2010 3Licensed copy:UNIVERSITY OF SURREY, 04/09/2015, Uncontrolled Copy, © CIRIA

4 Detailed definitions
This chapter provides a rationale for critical infrastructure and defines the followingterms as used in the context of this publication:
� criticality
� interdependency
� resilience
� flood resilience
� flood resistance.
4.1 CRITICAL INFRASTRUCTURE (CI)
The Centre for the Protection of National Infrastructure (CPNI) was formed from themerger of the National Infrastructure Security Co-ordination Centre (NISCC) and a partof MI5, the National Security Advice Centre (NSAC). CPNI is the government authorityfor protective security advice to the national infrastructure relating to national securitythreats. The UK’s national infrastructure is defined by government as (CPNI, 2010):
“those facilities, systems, sites and networks necessary for the functioning of the countryand the delivery of the essential services upon which daily life in the UK depends”.
The sectors that are considered to deliver “essential services” are:
� communications
� energy
� finance
� food
� government
� emergency services
� health
� transport
� water.
This publication focuses on the energy, water, transport and telecommunications sectors.
4.2 CRITICALITY
There are certain “critical” elements of national infrastructure: “the loss or compromise ofwhich would have a major impact on the availability or integrity of essential servicesleading to severe economic or social consequences or to loss of life in the UK. Thesecritical elements make up the critical national infrastructure (CNI)” (CPNI, 2010).
Categorisation of criticality is done using the Government criticality scale, which assignscategories for different degrees of severity of impact. Table 4.1 provides broaddescriptions of the types of infrastructure that would be categorised at the different levels
CIRIA C6884Licensed copy:UNIVERSITY OF SURREY, 04/09/2015, Uncontrolled Copy, © CIRIA

(more detailed and specific criteria for each sector is captured in the scale). For example,Category 5 (CAT 5) indicates infrastructure that would have the most severe impact whenit is disrupted. CAT 0 indicates infrastructure whose loss would be minimal whenconsidered in the national context.
Table 4.1 Criticality scale for national infrastructure (courtesy Cabinet Office)
The criticality scale includes three impact dimensions: impact on delivery of the nation’sessential services, economic impact (arising from loss of essential service) and impact onlife (arising from loss of essential service). These are illustrated in Figure 4.1.Infrastructure may be classified using any one of these factors. The designation shouldreflect the highest criticality category reached in either of the impact dimensions.
The following three factors provide the means to distinguish between different degrees ofseverity of impact on essential services:
� the degree of disruption to an essential service
� the extent of the disruption, in terms of population affected or geographical spread
� the length of time the disruption persists.
Figure 4.1 The three dimensions of the criticality scale (Mann, 2009)
Flood resilience and resistance for critical infrastructure, 2010 5
Criticalityscale
Description
CAT 5The loss of infrastructure that would have a catastrophic effect on the UK. These assetswill be of unique national importance and their loss would have national long-term effectsand may affect several sectors. Relatively few are expected to meet the Cat 5 criteria.
CAT 4Infrastructure of the highest importance to the sectors should fall within this category. Theeffect of loss of these assets on essential services would be severe and may affectprovision of essential services across the UK or to millions of citizens.
CAT 3Infrastructure of substantial importance to the sectors and the delivery of essentialservices, the loss of which could affect a large geographic region or many hundreds ofthousands of people.
CAT 2Infrastructure whose loss would have a significant affect on the delivery of essentialservices leading to loss, or disruption, of service to tens of thousands of people oraffecting whole counties or equivalents.
CAT 1Infrastructure whose loss could cause moderate disruption to service delivery, most likelyon a localised basis and affecting thousands of citizens.
CAT 0 The loss of infrastructure that would be minor (on national scale).
Licensed copy:UNIVERSITY OF SURREY, 04/09/2015, Uncontrolled Copy, © CIRIA

A “critical threshold” has been set on the scale and is the level above which the impacts ofloss are considered so severe that infrastructure falling into these categories should beconsidered to form part of the critical national infrastructure (CNI). The threshold is setat Category 3 (CAT 3).
Sponsor departments lead on identifying what infrastructure in their sector may beconsidered critical, in conjunction with sector experts at the Centre for the Protection ofNational Infrastructure (CPNI). Sponsor departments also lead on setting the essentialservice impact criteria (criticality) for their sector.
A criticality matrix, such as that shown in Table 4.2, can be used to assess the relativeimportance of the various components of an infrastructure system. The probability offailure and the nature of the consequences, or effects, of such a failure, can be used toattribute a relative priority for use in, for example, prioritising investment.
Table 4.2 Infrastructure criticality matrix
4.3 INTERDEPENDENCY
Infrastructure can be highly interconnected and failure of one asset system can have adirect and damaging knock-on effect on other essential services. For example, watercannot be treated or pumped without power, so a loss of power may result in a loss ofwater supply (see examples in Chapter 8). Scale effects can also be important – failure ofsome systems may have devastating effects on a local scale. Others might have mildereffects but on a regional or national scale. In determining the criticality of an asset systemthese scale effects and interdependencies need to be factored into the analysis.
4.4 RESILIENCE
Resilience, in the context of critical infrastructure, can be defined as the ability of an asset,or system of assets, to continue to provide essential services when threatened by anunusual event (such as an extreme flood, terrorist attack or flu epidemic), as well as itsspeed of recovery and ability to return to normal operation after the threat has receded.
As the nature of threats can change with time, resilience is closely related to a system’s“adaptive capacity”, which is its ability to adapt to a changing environment and continueto provide the essential services it was originally designed for. Climate change, and itsknock-on effects, is one such threat. Indeed climate change, and uncertainty about itsfuture consequences, is seen by many as the greatest threat faced by modern society. Thisissue is discussed further in Chapter 6.
CIRIA C6886
Failu
re p
roba
bilit
y
Virtually certain Significant Significant High High High
Probable Intermediate Significant Significant High High
Possible Low Intermediate Significant High High
Improbable Low Low Intermediate Significant High
Highly unlikely Low Low Intermediate Significant Significant
Trivial Low Moderate Extensive Catastrophic
Effects/degree of damage
Licensed copy:UNIVERSITY OF SURREY, 04/09/2015, Uncontrolled Copy, © CIRIA

Resilience is also related to the durability of a network or asset. Durability is a measure ofhow long an asset will last before it needs to be repaired or replaced. Further informationis provided in Chapter 10.
Resilient infrastructure can be defined as:
“those systems of assets that will be able to survive and perform well in an increasinglyuncertain future” (Male, 2009)
4.5 FLOOD RESISTANCE AND RESILIENCE
The CLG publication Improving the flood performance of new buildings – flood resilientconstruction (CLG, 2007) defines flood resilience and resistance for buildings. Thesedefinitions are adapted here to apply to infrastructure assets:
1 Flood resilience involves designing an infrastructure asset, or adapting aninfrastructure asset so that although it comes into contact with floodwater duringfloods, no permanent damage is caused, structural integrity is maintained and, whereoperational disruption occurs, normal operation can resume rapidly after a flood hasreceded.
2 Flood resistance involves designing an infrastructure asset, or adapting an existinginfrastructure asset, such that floodwater is excluded during flood events and normaloperation can continue with no disruption occurring to the essential services the assetprovides.
It should always be remembered that flood avoidance is the most effective means ofmanaging the flood risks associated with new infrastructure, ie that infrastructure andassets should be situated in locations outside of flood risk areas.
4.6 DESIGN STANDARDS AND PERFORMANCE LEVELS
Sir Michael Pitt recommended that a level of resilience be built into critical infrastructureassets to ensure continuity during a worst-case flood event. His review suggested that aminimum standard of 0.5 per cent (1 in 200) annual probability flood would be aproportionate starting point. He identified that the resilience of critical infrastructure tolow-probability, high-consequence events is a fundamental point of public interest. Herecommended that the government issues interim guidance to the regulators in the formof resilience obligations to be met by utilities companies that are based on governmentstandards to ensure essential services are appropriately protected.
Traditionally in the UK the one per cent (1 in 100) annual probability flood wasconsidered an appropriate standard of flood defence for dense urban areas at risk of riverflooding. A 0.5 per cent (1 in 200) annual probability flood was considered appropriatefor dense urban areas at risk of flooding from the sea. These index floods are used in thedesign of a range of infrastructure. For example, the one per cent (1 in 100) annualprobability flood is still used in the Highways Agency design manual (HA, 2006) to setbridge soffit levels. The Environment Agency uses this as the minimum acceptablestandard for protection of new residential property, although they expect this to includeclimate change over the development’s lifetime. In Scotland, the 0.5 per cent (1 in 200)annual probability flood is already adopted as the index flood for new property.
Where the consequences of flooding are particularly serious, for example, flooding ofnuclear installations or reservoir embankment failure, higher design standards have been
Flood resilience and resistance for critical infrastructure, 2010 7Licensed copy:UNIVERSITY OF SURREY, 04/09/2015, Uncontrolled Copy, © CIRIA

specified. For example, large raised reservoirs are categorised according to the risk posedby their failure. High risk (Category A) reservoirs are designed to safely pass the probablemaximum flood – a more onerous event than the 0.01 per cent (1 in 10,000) annualprobability event used for the design of lower risk Category B reservoirs.
Where the consequences of flooding are less onerous, less stringent standards have beenapplied. For example, in WRc (2006) specifies that sewers should accommodate the 3.3per cent (1 in 30) annual probability event, but surface water flooding is acceptable duringstorms that exceed this probability.
A risk-based approach is implicit within the existing design standards used in the designof infrastructure. Recently, certain sectors have adopted a more explicit risk-basedapproach that also reflects cost-benefit considerations. For example, since 1999, Defra hasconsidered the appropriate standard for flood protection for dense urban areas to beanywhere between a two per cent (1 in 50) to 0.5 per cent (1 in 200) annual probabilityflood, depending on the costs and benefits of the options identified. However, the designevent approach is still prevalent within much of the industry.
The issues associated with making changes in design standards, or shifting more fullytowards a risk-based approach, are summarised by Meyer (2006) as:
“Changing design practice from assuming a 100-year storm to a 500-year storm wouldcertainly cause much discussion and debate among the professional community, but at leastthe concept of a design storm is well known and accepted. If evidence can be found tosuggest the validity of making such a change, engineering practice would bechanged…eventually. However, something more traumatic to engineering practice, say, forexample, adopting a risk-based design approach to all infrastructure components could bedebated and discussed for a long time. Thus, it seems likely that the lead time needed formaking changes to design standards that reflect potential climate change-inducedenvironmental conditions could be very long. This further suggests that the research neededto lay the groundwork for such changes needs to be done even earlier than this”.
The approaches to designing for climate change advocated by Defra, the precautionaryand managed adaptive approaches, are being successfully adopted by some sectors alreadyin the UK and provide a good framework for the future. These approaches, which areexplained further in Section 6.8, have been built into PPS25 and are described in theaccompanying practice guide (CLG, 2009).
The Natural Hazards Team (NHT) of the Cabinet Office is consulting on the developmentof a sliding-scale approach to resilience standards for CNI (Mann, 2009). There is likely tobe significant discussion on this issue because bringing all existing CNI assets into linewith mandatory standards may have major cost implications. It may not be viable todevelop consistent standards that apply to all sectors. The transport sector in particular ismore exposed to the flood hazard than the other sectors. It would be disproportionatelyexpensive to upgrade roads and rail systems to be unaffected by levels of storm eventsthat a power station, water treatment works (WTW) and associated distribution networkswould not be affected by.
For critical infrastructure assets, design standards may need to be considered with regardto the overall level of performance expected of the assets during a range of designstandard events. It will seldom be realistic to expect even CAT 5 assets to be fullyoperational during very rare floods, but these assets may be designed to provide basicfunctionality during such events and certainly not to fail altogether. Figure 4.2 provides arationale for the consideration of design levels versus performance levels. In principle, itwould be possible for both design standards and performance levels to be set for assets
CIRIA C6888Licensed copy:UNIVERSITY OF SURREY, 04/09/2015, Uncontrolled Copy, © CIRIA

with varying degrees of criticality. However, if these standards are to be mandatory, thethresholds will need to be carefully considered to ensure that the cost of achieving thesemandatory standards is realistic.
Figure 4.2 Design standards versus performance levels (Male, 2009)
Flood resilience and resistance for critical infrastructure, 2010 9
Performance level
Fullyoperational
Operational Life safeNear
collapse
Design level
Frequent
Occasional
Rare
Very rare
Unacceptableperformance fornew construction
Safety critical objective
Essential/hazardous objective
Basic objective
Licensed copy:UNIVERSITY OF SURREY, 04/09/2015, Uncontrolled Copy, © CIRIA

5 Regulatory context
5.1 INTRODUCTION
In 2005 the Council of Europe published an analysis of inter-ministerial management ofmajor hazards (Council of Europe, 2005). The recommendations included the need for aninterdisciplinary approach to risk and the avoidance of “specialist mentality”. Thedocument advocated more common terminology, the need for risk inventories and inter-ministerial and government departmental management. These recommendations seem toapply without exception to the UK’s critical infrastructure.
This chapter provides a brief overview of the UK regulatory regime, outlining the rolesand responsibilities in the following areas:
� civil contingency planning
� flood risk management
� regulation of the privatised utilities’ asset management activities
� regulation of publicly owned essential service providers
� planning and building regulations related to the construction of new infrastructure.
Section 5.7 introduces some of the issues associated with the regulatory regime, which isdiscussed further in Chapter 7.
5.2 PLANNING FOR CIVIL CONTINGENCIES
5.2.1 Introduction
The legislative framework for civil protection across the UK is defined in the CivilContingencies Act (CCA) 2004, which defines roles and responsibilities for emergencyplanning. The Act divides local responders into two categories. Category 1 responders areat the core of the response to most emergencies. They include the emergency services,local authorities, National Health Service (NHS) bodies and environmental regulators.They are subject to the full set of civil protection duties. The majority of criticalinfrastructure owners and operators are Category 2 responders who are less likely to beinvolved in planning work but are heavily involved in incidents that affect their sector.They have a lesser set of duties including co-operating and sharing relevant informationwith other Category 1 and 2 responders.
5.2.2 England
In England the Civil Contingencies Secretariat (CCS) sits within the Cabinet Office andhas overall responsibility for civil contingency planning. They work in partnership withgovernment departments, the devolved administrations (Scottish Government, WelshAssembly Government and the Northern Ireland Office) and main stakeholders toimprove the UK’s ability to prepare for, respond to and recover from emergencies.
The NHT within the CCS provides a focal point for the provision of policy and guidancein this area in England. Sector sponsor departments are responsible for deciding the
CIRIA C68810Licensed copy:UNIVERSITY OF SURREY, 04/09/2015, Uncontrolled Copy, © CIRIA

appropriate security approach to be taken in their sectors and for preparing sectorresilience plans (SRPs). Category 1 and 2 organisations form regional resilience forums(RRFs) and local resilience forums (LRF), which are based on police areas. These aredesigned to help co-ordination and co-operation between responders at the local level.
The NHT has produced a draft strategic framework and policy statement, which is out toconsultation (Mann, 2009). The Government’s expectations, defined standards andguidance on good practice will be set out in a resilience plan for critical infrastructure tobe published in late 2010.
5.2.3 Scotland
The Scottish Parliament consented to Part 1 of the CCA being extended to Scotland.Scottish Resilience is a new body set up to co-ordinate civil contingencies in Scotland,supported by eight multi-agency strategic co-ordinating groups: Strathclyde, Lothian andBorders, Tayside, Grampian, Central, Fife, Highlands and Islands, and Dumfries andGalloway, similar to the LRFs in England.
5.2.4 Wales
In Wales, UK ministers make legislation and issue guidance in relation to CCAresponders, but they require the consent of the Welsh Assembly before taking action inrelation to a responder that falls within devolved competence. The Wales resilience forumhas been established to provide a forum for chief officers to discuss strategic issues ofemergency preparedness with Welsh Ministers. The PAN Wales Utility Group, withmembership of all main utility providers in Wales as well as Category 1 responderrepresentatives from Welsh LRFs, sits under the Wales resilience forum umbrella. Furtherinformation on the PAN Wales Utility Group can be found in Chapter 12. Information onthe Wales resilience forum can be found at the Wales prepared resilience website:<www.walesprepared.org>.
5.2.5 Northern Ireland
In Northern Ireland, Part 1 of the CCA only applies to certain bodies who exercise non-devolved functions (eg Maritime and Coastguard Agency, and the Police Service ofNorthern Ireland). The Office of the First Minister and Deputy First Minister (2005) hasdeveloped a civil contingencies framework.
5.3 FLOOD RISK MANAGEMENT (FRM)
5.3.1 Introduction
Asset owners have primary responsibility for managing the flood risks associated withtheir property. However, the UK Government can make provision for publicly-fundedflood risk management measures including:
� hazard mapping
� development control
� flood forecasting and warning
� incident management and emergency response
� flood alleviation infrastructure.
These publicly funded measures are largely focused on the protection of vulnerable
Flood resilience and resistance for critical infrastructure, 2010 11Licensed copy:UNIVERSITY OF SURREY, 04/09/2015, Uncontrolled Copy, © CIRIA

communities. However, the eligibility criteria for funding involve consideration of costsand benefits. Schemes that also protect critical infrastructure, and may have a highbenefit-cost ratio, should have an increased chance of receiving funding. In circumstanceswhere a particular infrastructure asset owner significantly benefits from construction of apublicly funded flood alleviation scheme, they may be asked to provide a contributiontowards the cost.
Responsibilities for FRM across the UK are summarised in Sections 5.3.2 to 5.3.5.
5.3.2 England
In England, Defra is the lead government department for the management of flood riskwith the Environment Agency as its executive agency. The Floods and Water ManagementBill is expected to receive assent during the parliamentary session 2009–2010. The Actwill seek to create a more comprehensive and risk-based regime for managing floodingand coastal erosion compared with the existing legislation, which mainly addresses theprovision of hard-engineered protection measures.
This Bill will give the Environment Agency a strategic overview for all types of flooding(from the sea, main rivers, other watercourses, surface water runoff and fromgroundwater). Also, the Agency will have powers to set up flood warning systems forflooding from all sources, and new enforcement duties in respect of reservoir safety. TheAgency will retain the permissive powers to build maintain and operate flood protectionworks where the flood risk is from the sea or from a main river.
Unitary or county local authorities will set the local strategy for managing flooding fromsurface water, ordinary watercourses and from groundwater. These authorities will alsohave permissive powers to undertake flood protection work associated with these types offlooding. Internal drainage boards (IDB) will have similar duties and permissive powersin their areas specifically in relation to land drainage matters.
It is worth noting that the term “permissive powers” provided to the EnvironmentAgency, unitary and county councils and IDB’s do not give an absolute responsibility toundertake flood risk management works in the general interest of a community.Ultimately it is the owners of land and property who have the primary responsibility formanaging the flood risks associated with their assets.
5.3.3 Wales
The Environment Agency also operates in Wales, but policy in Wales is set by the WelshAssembly Government (WAG), which is also the funding body for FRM activity. The WAGhas recognised the need for change and in 2007 launched the New ApproachesProgramme (NAP), coinciding with some of the worst summer flooding experienced inEngland, and to a lesser extent in Wales. The programme was initiated to tackle theproblems of both inland and tidal flooding, and coastal erosion, setting out an approachthat takes more account of changing risks and encourages use of a wider range ofsolutions than just constructing flood defences. The NAP aims to do much more tomanage the consequences of flooding by involving vulnerable communities in discussionsabout causes, issues and solutions, so that they are better able to respond effectively toflooding events.
A review undertaken by the Welsh Audit Office (Wales Audit Office, 2009) identified thatthe NAP has the potential to help develop an effective integrated response, but has so farbeen constrained by a lack of capacity and by unclear objectives, roles and processes. Thereport sets out seven main recommendations that detail the requirement for more
CIRIA C68812Licensed copy:UNIVERSITY OF SURREY, 04/09/2015, Uncontrolled Copy, © CIRIA
inclusive leadership from WAG, greater co-ordination with the Environment Agency inboth England and Wales and greater collaboration with stakeholders including localauthorities, private-sector organisations, the insurance industry and the public, to deliverthe NAP.
5.3.4 Scotland
Scotland has seen changes in its approach to the management of flood risk in recentyears, culminating in the new Flood Risk Management (Scotland) Act 2009. This Actreceived Royal Assent on 16 June 2009, and repeals the Flood Prevention (Scotland) Act1961. As with changes to legislation in England and Wales, the Act seeks a morecomprehensive risk-based approach to flood risk management.
The Scottish Environment Protection Agency (SEPA) is responsible for the production ofthe preliminary flood risk assessment (pFRA), flood hazard maps (FHM) and flood riskmaps. Local authorities will be responsible for delivering flood risk management plans(FRMP). The emerging flood risk management plans will be subject to approval byScottish ministers. Local authorities will have permissive powers to maintain and improveflood defences. SEPA will become the enforcement authority under the Reservoirs Act1975 (in place of the local authorities from mid 2011).
5.3.5 Northern Ireland
The lead department on flood risk in Northern Ireland is the Department of Agricultureand Rural Development (DARD), with the Rivers Agency as its executive agency. TheNorthern Ireland Assembly is preparing draft secondary legislation for flood riskmanagement. The direction of flood risk management over the period to 2021 is outlinedin the document by DARD (2008) and the Water Environment (Floods Directive)Regulations Northern Ireland 2009. Under the draft regulations the Department isrequired to:
� prepare river basin district flood risk assessments and flood hazard maps
� publish appropriate flood risk management plans by December 2015 that take accountof flood risk assessments, hazard maps and costs and benefits of possible work
� review and update flood risk management plans before 2021.
5.4 REGULATION OF PRIVATE UTILITY COMPANIES
In the UK, private utilities operate under licences issued and economically regulated byindependent agencies. These agencies control monopoly power, protect consumers andpromote competition. The principal utility regulators are Ofwat (water), Ofgem (energy)and Ofcom (telecommunications). The utility regulator regulates the electricity, gas andwater and sewerage industries in Northern Ireland. These agencies take the policy andguidance issued by the relevant government department into account in their regulatoryactivities.
All essential service providers are required to provide continuity of service. For example,the statutory guaranteed standards scheme (GSS) establishes minimum standards ofservice that each water company is required to provide consumers. A supply interruptionsindicator (DG3) shows the number of properties experiencing interruptions to their watersupply without advance warning for: between three and six hours, between 6 and 12hours, between 12 and 24 hours, and longer than 24 hours.
Flood resilience and resistance for critical infrastructure, 2010 13Licensed copy:UNIVERSITY OF SURREY, 04/09/2015, Uncontrolled Copy, © CIRIA

In deciding whether to impose a penalty for failure to achieve these performance levels“each enforcement authority will take account of the particular facts and circumstances ofthe case under consideration. This will include the extent to which the circumstancesunder which the contravention or failure arose were, or were not, outside the control ofthe undertaker or licensee” (statement of policy with respect to financial penaltiespursuant to Section 22A of the Water Industry Act 1991, Ofwat). In general watercompanies are not held liable to pay compensation in circumstances that are beyond theirreasonable control and extreme flooding is likely to fall in to this category (as noted in thePitt Review). This also highlighted that Ofgem requires electricity providers tocompensate customers for certain types of severe weather event.
In England and Wales, Network Rail is regulated by the Office of Rail Regulation (ORR).When disruption is experienced on the rail network, Network Rail is liable for the timerailway lines are not available to train operating companies (TOCs). Business interruptionis measured and payments are made to TOCs as a form of compensation as required byNetwork Rail’s operating licence. When damage to Network Rail assets occur materialdamage is accounted for as the cost for repairs. Costs for business interruption andmaterial damage are recorded routinely.
5.5 REGULATION OF PUBLICLY-OWNED SERVICE PROVIDERS
Important publicly owned service providers in the UK include the highways network and,in Scotland, the rail network. Water services are also publicly owned in Scotland andNorthern Ireland. The regulatory framework is outlined as:
The Highways Agency (HA) is an executive agency of the Department for Transport(DfT), and is responsible for operating, maintaining and improving the strategic roadnetwork on behalf of the Secretary of State for Transport. In Wales this work isundertaken by Transport Wales acting for the Welsh Assembly Government and inNorthern Ireland by the Roads Service within the Northern Ireland Executive. TransportScotland is the national transport agency for Scotland working directly for the ScottishGovernment.
In Scotland and Northern Ireland, the water industry is still publicly owned. The WaterIndustry Commission for Scotland (WICS) is a non-departmental public body withstatutory responsibility for regulation of water and sewerage services. Scottish Water isresponsible for providing water and waste water services, delivering the investmentpriorities of Scottish ministers within the funding allowed by the Water IndustryCommission for Scotland. Northern Ireland Water provides similar services in NorthernIreland, economically regulated by the utilities regulator.
5.6 THE SPATIAL PLANNING SYSTEM
Sir Michael Pitt was generally complimentary about the role played by the planningsystem in avoiding the creation of new flood risks in England, with some reservations,which will be discussed further in Chapter 9. This section contains a brief overview of theexisting regulatory framework.
In England, Communities and Local Government set the policy agenda for spatialplanning, which is then adopted by regional planning bodies and local planningauthorities. Planning Policy Statement 25 (PPS25) provides a comprehensive frameworkfor the national, regional and local consideration of food risk. Welsh planning policy iscontained in Planning Policy (Wales) to which Technical Advice Note 15 (TAN15) (WelshAssembly Government, 2004) provides guidance in respect of FRM. In Scotland, Scottish
CIRIA C68814Licensed copy:UNIVERSITY OF SURREY, 04/09/2015, Uncontrolled Copy, © CIRIA

Ministers are responsible for the national planning framework. Policy is set out in ScottishPlanning Policy 7 (SPP7) (Scottish Government, 2004) and Planning Advice Note (PAN)69 (Scottish Government, 2004) provides practical advice on planning and buildingstandards in areas where there is a risk of flooding (Scottish Government, 2004). InNorthern Ireland, the Department of the Environment is responsible for spatial planningand its policies on flood risk are set-out in Planning Policy Statement 15 (PPS15)(Northern Ireland Planning Service, 2006).
An important consideration is that much infrastructure development is covered by otherlegislation, such as the Electricity Act, Highways Act and Transport and Works Act, whichmeans that it is not subject to the normal planning process. Also, a wide range ofconstruction activity in the infrastructure sector is classified as “permitted development”and does not require planning permission, unless the planning authority withdrawspermitted development rights on flood risk grounds.
5.7 SUMMARY
In 2005 the Council of Europe published an analysis of inter-ministerial management ofmajor hazards. The recommendations included the need for an interdisciplinaryapproach to risk and the avoidance of a “specialist mentality”. The document advocatedmore common terminology, the need for risk inventories and inter-ministerial andgovernment departmental management. These recommendations seem to apply withoutexception to the UK’s critical infrastructure.
The regulatory regime in the UK is complex when considered across all sectors. Thecomplexity is heightened by the public-private sector mix. However, the CivilContingencies Act 2004 provides a common framework across the UK for civilcontingency planning. The issues raised by the Wales Audit Office regarding the need forclarity on the roles and responsibilities of stakeholders for all aspects of flood riskmanagement are common to all nations within the UK.
The Flood Risk Management (Scotland) Act 2009 provides an improved framework forco-ordinated action on flood risk. The enactment of the Floods and Water ManagementBill in England and Wales will provide an opportunity to simplify and rationalise howflood risk is managed and should clarify responsibilities and actions for improvement,particularly in respect of surface water flooding and groundwater flood risk. Also, inNorthern Ireland the changes in legislation signal a move to more complete andsustainable flood risk management, with greater transparency on the actions andcommitments to improvements from appropriate organisations and individuals.
There is a clear focus within the economic regulation of essential service provision onvalue for money for the customer. The focus of investment is on optimising the efficiencyof the service to the standards set by the regulator. This focus on economic efficiencymeans that there is little spare capacity within modern infrastructure systems. One of theobstacles for those considering measures to improve flood resilience within criticalinfrastructure is the customer’s willingness to pay for improvements, including provisionof further redundancy, through the regulated charging mechanisms.
PPS25, TAN15, SPP7 and PPS15 provide frameworks for ensuring that newinfrastructure, which requires planning permission, is flood resilient. However, there maybe a need to review the extent to which permitted development rights undermines theeffectiveness of these spatial planning policies. The primary issue with increasing theresilience of the UK’s infrastructure will relate to consideration of existing assets and notconstruction of new ones, thereby limiting the influence that the planning system can have.
Flood resilience and resistance for critical infrastructure, 2010 15Licensed copy:UNIVERSITY OF SURREY, 04/09/2015, Uncontrolled Copy, © CIRIA

6 The principles of flood risk management(FRM)
6.1 THE COMPONENTS OF FLOOD RISK: SOURCES, PATHWAYSAND RECEPTORS
Flood risk is a product of the likelihood of a flood event occurring and the severity of theconsequences:
The severity of the consequences of a flood will depend on how vulnerable a receptor is toflooding. The components of flood risk can best be analysed using the source-pathway-receptor model. “Sources” constitute flood hazards (anything with the potential to causeharm through flooding). “Pathways” represent the mechanisms by which the floodinghazard would cause harm. “Receptors” comprise the people, property, infrastructure andecosystems potentially affected should a flood occur. Assessing and managing flood riskcan involve consideration of all of the components listed in Figure 6.1.
Figure 6.1 Flood sources, pathways and receptors
6.2 THE IMPORTANCE OF STRATEGIC CONTEXT
Flood risk at a particular site should not be considered in isolation of an appreciation ofthe processes occurring at a wider catchment or coastal sediment unit scale. Anappreciation of these wider processes can help to ensure that the FRM solutions arestrategic and do not increase flood risk elsewhere. For example, the effect of numeroussmall interventions undertaken in isolation may have a cumulative effect on flood riskelsewhere in a catchment or along a coastline. Strategic solutions, such as construction offlood storage reservoirs, may be a more cost-effective and environmentally acceptablemeans of reducing flood risk to several sites, rather than installing local protectionmeasures. The location of a site within a catchment can also be a crucial consideration inassessing the likely effectiveness of temporary flood defence measures, for which timelyflood warnings and good access are crucial.
CIRIA C68816
Sources
Rainfall
River flows
Artificial drainage systems
Extreme sea levels
Wind-generated waves
Tidal storm surges
Tsunamis
Lakes/reservoirs
Canals
Groundwater
Mines/quarries
Pathways
Overtopping and failure of flooddefences
Breaching of natural ormanmade coastal defences
Failure of flood defencecomponents, eg barriers andgates
Inundation of floodplains
Inadequate drainage
Receptors
People
Domestic and commercialproperty
Emergency servicesinstallations
Infrastructure
Agriculture
Ecosystems
Flood risk = Likelihood of a flood occurring × Severity of consequences
Licensed copy:UNIVERSITY OF SURREY, 04/09/2015, Uncontrolled Copy, © CIRIA

In England and Wales, the Environment Agency’s catchment flood management plans(CFMPs) and the shoreline management plans (SMPs) prepared by the EnvironmentAgency and maritime local authorities are examples of studies designed to ensure that themanagement of flood risk to existing properties is undertaken strategically. To ensure thatthe planning of new development also takes adequate account of strategic flood riskissues, regional planning bodies prepare regional flood risk appraisals (RFRAs) and localplanning authorities (LPAs) prepare strategic flood risk assessments (SFRAs). For areaswith critical drainage problems, unitary or county authorities will also now preparesurface water management plans (SWMPs) that are designed to address flood risks fromall sources and especially from surface water runoff and from groundwater. Strategicdrainage partnerships are also being set up, for example in Hull, and a case study isprovided in Chapter 12 (Case study 12.2).
In Scotland, the Flood Risk Management (Scotland) Act 2009 requires flood riskassessments, hazard and risk maps to be prepared for river basin districts by SEPA. Localauthorities will support SEPA by becoming responsible for delivering local flood riskmanagement plans, comprising flood risk assessments and hazard maps for flooding fromall sources, including the sea, rivers, surface waters, sewers and ground water. These planswill involve Scottish Water to obtain information on the capacity of sewerage systems.
In Northern Ireland the new regulations will require production of preliminary flood riskassessments that will consider flooding from the sea, rivers, sewers and surface water.
6.3 FLOOD FREQUENCY TERMINOLOGY
Flood risk is generally expressed in terms of annual probability, ie the probability that aflood of a given magnitude will occur, or be exceeded, in any one year. This can beexpressed as a percentage (eg a one per cent annual probability) or chance (eg 1 in 100).This is illustrated for a range of annual probabilities in Table 6.1. This definition haslargely replaced the traditional, and potentially misleading, expression of return period.
Table 6.1 Flood frequency terminology
A low probability flood may have a significant likelihood of occurring over an extendedperiod. For example, a one per cent (1 in 100) annual probability event has a 53 per centprobability of occurring at least once within a 75 year period. So, if a structure or assethas a 75 year design life, there is very good chance that it will be exposed to a one percent (1 in 100) annual probability event during its lifetime. This concept is illustrated inFigure 6.2.
Flood resilience and resistance for critical infrastructure, 2010 17
Annual probability of occurring or beingexceeded in any one year
Annual chance of occurring or beingexceeded in any one year
2% 1 in 50
1.3% 1 in 75
1% 1 in 100
0.5% 1 in 200
0.1% 1 in 1000
Licensed copy:UNIVERSITY OF SURREY, 04/09/2015, Uncontrolled Copy, © CIRIA

Figure 6.2 Design exceedance probabilities
6.4 FLOOD FREQUENCY AND DESIGN FLOOD LEVEL ESTIMATION
Identifying flood frequency at a particular site and identifying what this means in terms ofdepth, duration and velocity is not straightforward. As a guide to the likely scope ofspecialist input a basic overview of these activities is described here:
Flood frequency: how often a flood of a given size is likely to occur, or be exceeded, isbest estimated using statistical analysis of long records of annual maxima measured dataof, for example, river flow, wave height or sea level. Where direct measurements are notavailable for a particular site, techniques exist for transferring or “pooling” data fromnearby or similar locations. In the case of rivers and sewers, several techniques also existfor estimating the runoff and peak flows generated by particular rainfall events based onthe characteristics of the areas (catchments) draining to them.
Hydraulic modelling: hydraulic modelling is regularly used to assess the flood levels andflooding mechanisms resulting from river/sewer flows or tidal events of a given annualprobability. Physical models and/or computational fluid dynamics software packages canbe used to assess highly complex hydraulic problems. More commonly, flood levels andmechanisms are investigated, and design flood levels derived, using commerciallyavailable one- or two-dimensional hydraulic modelling packages.
Establishing reliable flood frequency and depth data for surface and groundwaterflooding is particularly challenging. This is because historic records, of a type amenable tostatistical analysis, or that can be used to calibrate models, are often unavailable.
6.5 THE MANAGEMENT OF UNCERTAINTY
Even with river and coastal flooding, the derivation of flood levels for design purposes canbe associated with high levels of uncertainty unless high-quality calibration data isavailable. The sensitivity of designs to errors in flow and level estimation should beconsidered and an appropriate margin to allow for uncertainty (freeboard) should alwaysbe provided above an adopted design flood level. Professional consulting engineers andscientists have a duty of care to explain uncertainties and the potential implications ofthose uncertainties. They also need to consider the effects of floods that exceed the designstandard adopted, to ensure that the residual risks to people and property areappropriately managed.
CIRIA C68818Licensed copy:UNIVERSITY OF SURREY, 04/09/2015, Uncontrolled Copy, © CIRIA

6.6 THE FLOOD RISK MANAGEMENT HIERARCHY
Once the nature of the flood hazard is understood, there are numerous techniques thatcan be used to manage the associated flood risk. The hierarchy in Table 6.2 provides anindication of the effectiveness of different flood risk management measures.
Table 6.2 Flood risk management hierarchy
6.7 STANDARDS OF PROTECTION
An indication of the standards of protection that may be appropriate for different types ofasset is provided in Table 6.3. This is considered further in Section 10.8.
Table 6.3 Indicative standards of protection for land-use types
6.8 TAKING ACCOUNT OF CLIMATE CHANGE
The design for flood risk management measures to improve the resilience of existingassets should take climate change into account over the anticipated residual lifetime of theasset. There are two generic approaches to designing flood risk management measures totake account of climate change:
Flood resilience and resistance for critical infrastructure, 2010 19
Land-use typeIndicative standard of protection
(annual probability)
Residential/commercial property
Emergency service installations
Large raised reservoirs (above an urban area)
<1% (1 in 100)
<0.1% (1 in 1000)
<0.01% (1 in 10 000)
Flood riskmanagement
measureDescription Examples
Assess
Flood risk assessment to identify thesources of flooding, the mechanisms ofthe cause of flooding and theconsequences for the receptor inquestion.
A strategic flood risk assessment of anarea earmarked for regeneration thatconsiders all sources of flood risk, theirlikelihood of occurrence and theirpotential impact on receptors.
AvoidLocate land-uses vulnerable to the impactof flooding within areas at least risk.
Critical infrastructure, such as powerstations, should be located in areaswhere the risk of flooding is negligible.
SubstituteSubstitute land-uses incompatible withflooding with less vulnerable or watercompatible land-uses.
In the regeneration of a riverside urbanarea, existing housing within floodplainareas could be partially or whollysubstituted with amenity open space.
Control
Reduce the likelihood of a site flooding byinstalling new infrastructure or bymodifying the design of a development toprotect it from flooding. Adopt asustainable drainage strategy to controlrunoff from the site.
Construction of floodwalls andembankments to contain river or tidalwaters.
Installing an attenuation basin to reducethe rates at which runoff entersdownstream drainage systems.
Mitigate
Re-assess residual flood risks (the risksthat remain after the control measureshave been adopted) and adopt mitigationmeasures to minimise the impact ofthese.
Educate affected parties on the natureof the residual risk. Provide a floodwarning service. Ensure emergencyevacuation plans are in place.
Licensed copy:UNIVERSITY OF SURREY, 04/09/2015, Uncontrolled Copy, © CIRIA

1 Precautionary approach: this involves incorporating mitigation measures for potentialclimate change now.
2 Managed-adaptive approach: this involves making provision for mitigation measuresto be undertaken at a future date when there will also be greater certainty regardingthe likely affects of climate change on parameters, such as river flow and rainfall.
For new-build river bridges or culverts the precautionary approach is recommendedbecause of the potential for further costs on future adaptations. However, where a systemto reduce flood risk can be modified in the future, the managed-adaptive approach is amore sustainable solution.
In the UK precautionary allowances for net sea-level rise are provided by the Governmentbased on the Intergovernmental Panel on Climate Change’s (IPPC’s) third assessmentreport, the UK Climate Impacts Programme (UKCIP, 2009) and research into regionalvariations in vertical land movement. “Indicative sensitivity ranges” are provided forparameters, such as off-shore wind speed, wave height, river flow and rainfall intensity.This guidance will be updated shortly to take into account further outputs from theUKCIP.
6.9 FLOOD RISK MANAGEMENT MEASURES
The options in Table 6.4 can be taken to avoid, substitute, control or mitigate flood riskassociated with sources, pathways and receptors:
Table 6.4 Flood risk management measures (non-structural measures are shown in bold)
CIRIA C68820
Flood risk management measures
SOURCE CONTROLMeasures that reduce the
likelihood of highflows/water levels occurring
PATHWAY MODIFICATIONSMeasures that modify or
block the pathways taken byfloodwater to a site
RECEPTOR RESILIENCEMeasures that reduce the
vulnerability of receptors tothe impacts of a flood.
� land-use policies
� sustainable drainage
� detention basins
� filter drains/strips
� flow control systems
� infiltration basins/trenches
� permeable paving
� retention ponds
� soakaways/swales
� wetlands
� greenroofs/walls
� rainwater harvesting
� attenuation reservoirs
� river regulation
� river restoration andfloodplain rehabilitation
� oversized pipes/attenuationtanks within the drainagenetwork.
� ground raising
� construction of floodwallsand embankments
� construction of diversionchannels or tunnels
� removal or modification ofexisting structures
� demountable flooddefences
� temporary flood defences
� designing drainagenetworks for exceedance, egoverland flow routing
� managed realignment to“make space for water”
� flood resistance measures(dry-proofing).
� business continuitymanagement
� flood risk identification andmapping
� planning policies anddevelopment control
� risk transfer (eg floodinsurance)
� flood forecasting andwarning
� improved emergencyresponse procedures
� improved preparedness
� desktop incidentmanagement exercise
� feedback from lessonsidentified
� flood resilience measures(wet-proofing).
Licensed copy:UNIVERSITY OF SURREY, 04/09/2015, Uncontrolled Copy, © CIRIA

Details of measures appropriate to improving the flood resilience and resistance of criticalinfrastructure assets are provided in Chapter 10.
6.10 THE IMPORTANCE OF WHOLE-LIFE ASSET MANAGEMENTPRINCIPLES
The adoption of whole-life asset management principles is vital in the planning, appraisal,use, operation and maintenance of flood risk management measures of all kinds.Sustained investment is required to ensure that measures remain effective over theirlifetime and that sufficient resources are available for routine maintenance operations.The adoption of some measures will impose more operation and maintenance burdenthan others. Two examples are:
Example 6.1 Use of demountable defences in place of fixed defences
Example 6.2 Use of flood defences in place of spatial planning measures
Further guidance on whole-life asset management is provided in CIRIA C677 (Hooper etal, 2009).
6.11 OFF-SITE EFFECTS
Sustainable development should seek overall reductions in flood risk as well as improvingthe environment. An assessment should always be made of the potential off-site impacts ofFRM measures. For example, ground-raising operations may affect the capacity of a river/floodplain system, or reduce the areas available to temporarily store floodwater during aflood event. Such losses of conveyance and flood storage may result in the need formeasures to mitigate, or compensate for, off-site issues. Similarly, improving drainage toreduce flood risk at one location can have negative consequences downstream unlessspecific measures are adopted, such as the use of sustainable drainage systems.
Flood resilience and resistance for critical infrastructure, 2010 21
The capital cost of demountable defences can be less than that of fixed defences. However, it isimportant that such measures are adopted in conjunction with a fully developed set of operationalprocedures. The frequency that they will need to be brought into operation, and the costs, should becarefully considered by scheme appraisers and provision should be made for routine practice drills. Theprobability of the measures not being successfully deployed during a flood should be minimised, but theresidual risk of such a failure to deploy should be factored into the whole-life cost-benefit analysis,together with the full cost of maintaining such a system.
Avoiding the flood hazard is a very effective means of reducing liabilities for future generations. Anydecision to place an asset within an area that is prone to flooding, but to protect it with flood riskmanagement measures, should be made only on the basis of a full understanding of the whole-lifeoperation and maintenance burden associated with the measures adopted. The flood damagesassociated with design exceedance events should also be factored into the whole-life cost-benefitanalysis.
Licensed copy:UNIVERSITY OF SURREY, 04/09/2015, Uncontrolled Copy, © CIRIA

6.12 SUMMARY
The principles discussed are incorporated into existing guidance on flood riskmanagement for new development. Specifically, the practice guide to PPS25 covers:
� the assessment of flood risks of all kinds associated with new developments
� techniques for avoiding flood hazards
� the design of control measures, where new developments are unavoidably exposed toflood hazards
� the mitigation of off-site impact
� the assessment and management of residual risks.
RIBA (2009) provides a concise and well illustrated overview of the process of designingnew developments that are resilient to the impact of flooding, which embraces theprinciples discussed in this chapter. These principles apply equally to existing assets.However, making retrospective changes to existing assets to improve flood resilience ismore challenging than designing them to be flood resilient in the first place. Practical useof such measures is further confounded by a range of wider issues discussed in the nextchapter.
CIRIA C68822Licensed copy:UNIVERSITY OF SURREY, 04/09/2015, Uncontrolled Copy, © CIRIA

7 Issues in FRM for resilient infrastructure
7.1 QUESTIONNAIRE RESPONSES
The questionnaire survey requested participants to comment on what they see as the mainissues and constraints related to improving the flood resilience of critical infrastructure.The results are summarised by sector in Table 7.1.
Table 7.1 Summary of issues identified in questionnaire survey
Flood resilience and resistance for critical infrastructure, 2010 23
Sector Issues identified
Regional government
The low degree of collaboration between Civil Contingencies Act 2004Category 1 and 2 responders was raised as an important issue. There is alack of understanding of the role of the parties involved and an unwillingnessto share vital information. Further information on the CCA is provided inChapter 4.
Transport
No single organisation has been given the responsibility of co-ordinating theparties.
Co-ordination at present, although beneficial, has required significantresource allocation. It has been complex to achieve and has required a highdegree of management. This led to some companies being unable to afford toco-operate/collaborate.
A lack of standardisation and formatting was found to make collation of basicdata (eg location, duration, cause or severity of surface water flooding events)difficult.
Lack of shared understanding and valuation of community risk and the needto avoid risk-shifting between organisations.
The different rules, regulations and standards company work under hinder co-operation and co-ordination.
Commercial reasons not to co-operate.
Power
The lack of sharing of information for security, commercial and financialreasons. Reluctance to share resources during floods.
The lack of a formalised and established forum for such issues.
Water utility providers
Further constraints on sharing data and the importance of all sectors havingvisibility of interdependencies.
Time constraints will slow the process with funding being a problem.
Legislation/guidance would need to be enforced and embedded across allsectors by regulators/government/organisations.
Environmentalregulators
Funding scarcity, legal and security issues.
Building trust among organisations and the use of information- sharingprotocols where appropriate.
CommunicationThe lack of a forum probably at a reasonably local level to discuss strategybeing employed by different sectors.
Engineers/consultants
Differences in legislation, policies, aims and different sectors.
Lack of sharing due to competitive concerns and intellectual property rights.Lack of real knowledge and tools.
Licensed copy:UNIVERSITY OF SURREY, 04/09/2015, Uncontrolled Copy, © CIRIA

7.2 WORKSHOP OUTPUTS
There were several important learning points from the workshop as follows:
� it was agreed that physical resilience, such as the use of temporary or demountablebarriers, should be considered as a separate aspect to organisational resilience, whichwould be achieved through business continuity and contingency planning.Organisational resilience also includes the resilience of staff and operatives, which isvital for the effective operation of critical infrastructure assets
� individual sectors are at different stages of flood risk strategy development for theircritical infrastructure assets. Many sectors have already identified their sites most atrisk from flooding and are now involved in the process of selecting appropriatemeasures to improve resilience and resistance
� current co-ordination between sectors in the development of strategies andapproaches to improve flood resilience and resistance is low. Where co-ordination hasoccurred this has been via local and regional resilience forums, as well as in thedevelopment of strategic flood risk assessments (SFRA), catchment flood managementplans (CFMP) and surface water management plans (SWMP)
� fragmented governance is a significant barrier to collaboration between sectors. Thereis a need for co-ordination and leadership, potentially from the newly-formed NHTwithin the Cabinet Office, align the policies and approaches of different sectorregulators (Ofwat, Ofgem, Ofcom, ORR)
� there is a shortage of resources (funding, skills, people), as well as a shortage ofpolitical and public will, inhibiting many infrastructure asset owners from adoptinggood practice. Investment decisions have been and are based largely upon commercialaims and consumer pressure. Further information will be provided in Chapter 11
� the Floods and Water Management Bill 2009–2010 should contain provisions formanaging knowledge and information sharing, focused particularly on overcomingbarriers to information and knowledge sharing that arises through commercial andnational security sensitivities.
A full copy of the workshop outputs is provided in Supporting document 2.
7.3 WIDER PERSPECTIVES
7.3.1 Council for Science and Technology
In its recent report, the Council for Science and Technology (CST) identified that theresilience of the nation’s infrastructure is weakening due to (CST, 2009):
� its ageing infrastructure components
� greater complexity and interconnectivity between the different infrastructure sectors
� the fact that it is nearing maximum capacity because of increased social and economicpressures.
7.3.2 The ICE report: State of the nation
The recent Institution of Civil Engineers (ICE) report concluded that “very little iscurrently being done to ensure service continuity and security of supply and no agencyhas overall responsibility for defence against system failure” (ICE, 2009). Also, the UK’sregulatory systems are not driving delivery of sufficient new or upgraded critical
CIRIA C68824Licensed copy:UNIVERSITY OF SURREY, 04/09/2015, Uncontrolled Copy, © CIRIA

infrastructure – not all infrastructure is governed by a regulator, and maintenancefunding is rarely ring-fenced. The planning application process is highly protracted, andthere are few incentives in place to support increased private investment in reservenetwork capacity.
The report continues to state that: “impacts of climate change – flooding, risingtemperatures, wind, drought, rising sea level and heat waves – are a serious threat tocritical infrastructure, with flooding identified as the greatest threat to the UK”. Thereport also outlines that system failure can be caused by a lack of proper day-to-daymaintenance, or failure to recognise long-term delivery issues in the past.
The ICE’s recommendations are:
� establishing a new single point of authority for infrastructure resilience to co-ordinatethe work of the agencies responsible for defending critical infrastructure against allthreats
� that the newly created Natural Hazards Team is given the power to provide strongleadership to asset owners and ensure legislation is properly enforced
� that government revises the remit for sector regulators, such as Ofgem and Ofwat, toaddress asset resilience as well as consumer interests and empower them to ensureasset owners build in reserve capacity to critical infrastructure so they are prepared forany emergency scenario
� that government ensures that the new Planning Act and the Infrastructure PlanningCommission (IPC) effectively reform the planning system for major infrastructure(ICE, 2009).
7.3.3 Expecting the unexpected
In June 2008, a group of over 30 industry-leading experts convened at St George’sHouse, Windsor Castle, to debate the topic of ”expecting the unexpected”. The purposeof the workshop was to explore ideas about infrastructure resilience – or lack of it,examining the inter-dependence of infrastructure assets, the need for integratedmanagement of infrastructure assets, and how to develop communities better able tosurvive both natural and manmade disasters. The result from the workshop was a set ofprinciples for overcoming the barriers to improving resilience as follows:
1 Planning not plans
Planning for the consequence, rather than the cause, is more important. This leads toadaptation, not just mitigation, and a reduction in the likelihood of the unexpectedoccurring.
2 Remove the silos
Failures, both physical and organisational, mostly occur at the interfaces and are dueto lack of integrated thinking.
3 “Did you hear the one about”?
The need to communicate and imagine lives in a carbon-reduced world and how theyreact faced by threats to their world is best achieved by telling stories, not setting andenforcing rules and regulations.
4 Paradigm shift
There is a critical need for a major paradigm shift towards a new economy of payingthe true cost of peoples’ actions, of taking ownership of risks and of being accountable.
Flood resilience and resistance for critical infrastructure, 2010 25Licensed copy:UNIVERSITY OF SURREY, 04/09/2015, Uncontrolled Copy, © CIRIA

5 Follow the leader
A paradigm shift will require individual and multiple-leadership in communities,regions and nations.
6 Changing behaviours
The effect of human behaviour, both individually and in communities, needs moreresearch and recognition, especially in relation to its preparation for, and reaction to,threats on future prosperity.
These are highly relevant to this publication.
7.4 JOINT POLICY STATEMENT ON URBAN FLOOD RISK
Against a background of creating a more collaborative approach to the management ofurban flood risk, the need for sustainable solutions and the difficulties posed by climatechange a number of professional institutions have created a joint policy statement toinform and guide their members and the wider industry. Those institutions involved arethe Institution of Civil Engineers (ICE), Chartered Institution of Water andEnvironmental Management (CIWEM), Royal Institute of British Architects (RIBA), RoyalInstitution of Chartered Surveyors (RICS), Royal Town Planning Institute (RTPI), theRoyal United Services Institute (RUSI) and the Landscape Institute (LI). The six corepolicies of the approach are:
1 The role and responsibility of each stakeholder organisation involved with urban floodrisk should be clear and unequivocal, and there should be a clear hierarchy and line ofresponsibility between these organisations.
2 Responsible bodies should provide measures to manage flood risk within a nationalframework of performance standards. Drains, sewers and watercourses should berecognised as having a finite capacity and once this capacity is exceeded flooding willoccur.
3 For consistency and comparability common methodologies and terminologies for theassessment of flood risk in urban areas should be shared by all professionals.
4 The results of urban flood risk assessment should be available in a form that enablesmembers of the public to understand the risk they personally face.
5 Flood risk management should tackle all forms of flooding in an integrated way andshould fully exploit the amenity potential of water, waterways and wetlands in theurban environment.
6 New development should not increase the risk of flooding either locally or elsewhere.There should be a presumption against development within areas of significant floodrisk.
CIRIA C68826Licensed copy:UNIVERSITY OF SURREY, 04/09/2015, Uncontrolled Copy, © CIRIA

7.5 SUMMARY
The questionnaire and the workshop outputs support the findings of the CST and ICEreports. The main issues relate to:
� the growing risk of flooding associated with ageing infrastructure and increased floodfrequency resulting from climate change
� a high degree of interdependence between different infrastructure systems, which isnot well understood
� a high degree of fragmentation associated with:
� infrastructure ownership
� responsibilities for managing flood risk
� regulatory guidance on how to manage flood risk
� poor co-ordination between sectors
� obstacles to the effective sharing of knowledge and data
� a shortage of resources (funding, people and skills).
The ICE report (ICE, 2009), the outputs from the Windsor Castle event and the jointpolicy statement on urban flood risk indicate that there is already some consensus withinthe industry regarding what is required for flood risk to be managed more effectively. Butunfortunately, there is relatively little evidence that the silo mentality and commercialconfidentiality barriers are likely to be overcome.
Flood resilience and resistance for critical infrastructure, 2010 27Licensed copy:UNIVERSITY OF SURREY, 04/09/2015, Uncontrolled Copy, © CIRIA

8 Historic incidents and lessons identified
8.1 OVERVIEW
Every river, stream and artificial drainage system is sensitive to different types of stormevent. Localised summer storms can cause extreme flooding on sewers and minorwatercourses without causing problems on main river systems. Similarly, long-duration,relatively low-intensity storms can cause major floods on large rivers, while causing fewproblems for urban drainage systems. It should be no surprise that the flooding type thatattracts national media attention occurs on a reasonably regular basis.
In recent years, floods at Easter 1998, autumn 2000, autumn/winter 2005, summer 2007and winter 2009 have caused widespread disruption to critical infrastructure systems. The2007 floods however caused disruption on a more significant scale than the other events.The direct impact on the nation’s infrastructure were as follows:
� drinking water was cut-off from 138 194 people for 17 days due to flooding of MytheWTW in Gloucestershire (Ofwat, 2008a)
� 40 000 people were without electricity for 24 hours in Gloucestershire due todisruption of electricity transmission and distribution assets
� 9000 customers were on rota disconnection for several days in South Yorkshire andHumberside
� there were 148 flooding or bank-slip incidents on the rail network, causing widespreaddelays and temporary line closures
� closures also affected the motorway network (M1, M4, M5, M18, M25, M40, M50, andM54) and many local and trunk roads were also disrupted with repair costs estimatedat £40m–£60m (Pitt, 2008)
The following are two of the more notable near misses:
1 Ulley Dam, an amenity reservoir owned by Rotherham Metropolitan BoroughCouncil, suffered severe damage, the consequent breach risk resulting in the need toevacuate significant areas of Rotherham and close the M1. A breach was also perceivedto place a major electricity sub-station and Sheffield’s gas supply at risk.
2 Walham sub-station (which supplies 450 000 people in Gloucestershire) nearlyflooded. However, a plan was developed to sustain electricity supplies from othersources. Temporary defences were also deployed to protect the station against anylater flood peaks.
This chapter presents selected post-flooding incident reports that have been supplied bymembers of the project steering group and other collaborators. These case studies reflectthe impact of specific floods on a particular organisation and the lessons that organisationsidentified following their post-incident reporting procedures. The Mythe WTW isincluded later in Section 10.10.
CIRIA C68828Licensed copy:UNIVERSITY OF SURREY, 04/09/2015, Uncontrolled Copy, © CIRIA

8.2 UNITED UTILITIES AND THE CARLISLE AND CUMBRIA 2005FLOODS
Evidence submitted by: Emma Culleton, United Utilities
This included the combined treatment and network incident report (United Utilities,2005a) and the operations and maintenance department incident report (United Utilities,2005b).
8.2.1 What happened?
United Utilities (UU) provide water supply and wastewater treatment services to theNorth West Region as well as operating the electricity distribution network. Heavy rainbetween 6 to 8 January 2005 resulted in the highest ever recorded flows in the RiversEden, Caldew, Petteril and Kent (records to 2005). The flooding in Carlisle was thehighest recorded since at least 1771. It was described by the Meteorological Office as a 0.5per cent (1 in 200) annual probability event and resulted in several rivers overtoppingtheir banks.
There was major flooding of UU’s wastewater infrastructure across Cumbria and NorthLancashire, with 117 sites affected and the network in Carlisle flooded. By the early hoursof 9 January, UU’s water supply operations were affected and 18 WTW out of a total of137 were disrupted.
The electricity sub-station at Willowholme was under 1.5 m of water on 8 January, whichcut off power to 60 000 properties. The M6 was closed for some hours and many roadswere closed due to fallen trees. This affected diesel fuel delivery, which was partly neededto run power generators. Train services suffered significant disruption. For 24 hrs therewas very poor network coverage for mobile phones. All these interdependencies hinderedthe operational response.
8.2.2 Lessons identified
Following the flooding UU carried out an analysis of the resilience of their major facilities.The objectives of the study were to assess the current levels of flood protection available ateach of the company’s water treatment and sewage treatment facilities (includingpumping stations and combined sewer overflows) and to determine the most appropriatemeasures to mitigate flood risk at these sites.
Further recommendations were identified within UU’s post incident report, including thefollowing:
� review company mobile generators to ensure service level and reliability
� review provision of procurement work orders for out-of-hours incident managementusing external sources
� review water operational sites against asset standard to ascertain any deficiencies infuel storage levels
� better sharing of information on affected areas required with other agencies.
Flood resilience and resistance for critical infrastructure, 2010 29Licensed copy:UNIVERSITY OF SURREY, 04/09/2015, Uncontrolled Copy, © CIRIA

8.3 NATIONAL GRID AND THE SUMMER 2007 FLOODS
Evidence submitted by: Alex Carter and Doug Dodds, National Grid
8.3.1 What happened?
Several substations (SS) and power stations in South Yorkshire were affected by floodingin June 2007. Brinsworth SS was nearly flooded (see Section 8.4 on the Ulley dam).
Neepsend sub station
National Grid had no advance warning of the flash flooding at Neepsend substation. Fieldstaff became aware of the situation when they returned to site at lunchtime on 25 Juneand raised the issue with their local management at 12.30 pm. Water levels were risingrapidly and the site was evacuated for safety reasons at about 1.15 pm. Due to the risk ofloss of supply caused by the flooding, National Grid Control staff and CE ElectricDistribution Network Operator Control co-ordinated efforts to transfer as much demandas possible away from the Neepsend substation. During the period when demand wasbeing transferred, at 3.23 pm, the low voltage circuit-breakers on the two transformercircuits at Neepsend substation opened without instruction, most probably due to theeffects of flood water on control or protection equipment. This disconnected 41 Megavoltamperes (MVA) of demand (apparent power), amounting to about 36 000 CE Electricdomestic customers and loss of one of the three main in-feeds to the Sheffield area fromthe main interconnected transmission system. Following further reports from site staff thatthe floodwaters inside Neepsend substation had reached a depth of 1.2–1.5 m, the high-voltage circuits into the substation were switched off and the full substation made dead forsafety reasons. This operation started at about 6.00 pm on Monday. By 8.00 am on 26June Neepsend substation was again accessible and field staff attended site to assess thedamage and develop a recovery strategy.
Thorpe Marsh sub station
In parallel, flood risk at Thorpe Marsh was monitored through communication with fieldstaff and involving the Environment Agency. At this time the best advice of the Agency wasthat Thorpe Marsh was secure. However, water levels at Thorpe Marsh continued to riseand by the evening of 26 June concern rose as levels were approaching the level of thecontrol and protection systems that, if inundated, could cause uncontrolled equipmentoperations at the site, as had occurred at Neepsend. Sandbags were ordered to protect themost critical parts of the site and the Army was contacted, via Gold command, to provideboats to assist with movement around the site.
By early morning on 27 June, flood waters occupying part of the Thorpe Marshsubstation were affecting the site’s auxiliary systems. Starting at 7.30 am the site wasmade dead (the high-voltage substation was de-energised) in a controlled manner. Thede-energising of the substation did not result in loss of supplies to any customers. Military,fire brigade and site staff were set to work putting flood defences in place around criticalplant and equipment.
During the day, the essential site auxiliary and protection and control systems at ThorpeMarsh were protected from flooding by the actions of field staff and the emergencyservices and the risk of failure was considered reduced. Thorpe Marsh was restored toservice by 3.00 pm.
CIRIA C68830Licensed copy:UNIVERSITY OF SURREY, 04/09/2015, Uncontrolled Copy, © CIRIA

Walham sub station
Field staff at Walham substation worked over the weekend of 21–22 July to carry outplanned repair work. National Grid control staff were aware of the risk posed by risingriver levels and were monitoring water levels at various locations, including Walham,through telephone contact with field staff. There is a history of flooding around Walhamsubstation and the field staff reported water levels as high, but not abnormal for the site.On 22 July water levels started to gain height. Instructions were given to staff on site toplace sandbags around the critical circuit control cubicles and entry points to theprotection (relay) rooms at about 2.00 pm. The Fire Brigade was also in attendance toprovide pumping kits.
Gold Command was established by the authorities in Gloucester at about 3.45 pm, andthe first meeting was held at 4.10 pm with National Grid in attendance from 5.15 pm.Following the meeting the Environment Agency provided temporary emergency flooddefence systems for use at Walham that arrived on site by 9.00 pm. The military attendedWalham to assist in the installation of this system. This system was later replaced withflood bastions, as shown in Figure 8.1.
Figure 8.1 Temporary defences used at Walham substation
These geodesign barriers provided by the Environment Agency withstood the peak floodlevel, which occurred at around 5.30 am on 23 July.
Flood resilience and resistance for critical infrastructure, 2010 31Licensed copy:UNIVERSITY OF SURREY, 04/09/2015, Uncontrolled Copy, © CIRIA

A decision was made at the Gold Command meeting on the morning of 24 July to providea more robust flood defence system at Walham (Hesco Bastion) as further flooding waspredicted. This structure, shown here, was completed at 9.15 pm on 28 July and remainsin place until a joint permanent security and flood fence is installed.
During the evening of 21 July, National Grid control staff had developed a strategy thatcould be adopted in case the Walham protection relay room became affected by risingwater levels and the protection systems were rendered inoperable. This strategy wasachieved by configuring Walham substation to make the through route to South Walesindependent, allowing power to continue to be routed through Walham substation evenin the event of Walham flooding. This contributed to the security of the South Walesnetwork. Switching operations required to adopt the strategy were completed by 9.00 pmand the network at Walham was run in this configuration throughout the event. Nofurther flooding was experienced after the floodwater subsided on 24 July.
Cascading effects
These events had cascading effects in the national grid network. At one point, the demandin the Sheffield area was only supplied via Brinsworth SS. Figure 8.2 summarises theevents.
Figure 8.2 Flood impact on the electricity grid in South Yorkshire during June 2007
8.3.2 Lessons identified
Because of these events (and flooding events that occurred in 2000 and 2005), networkowners have carried out several individual reviews of flooding resilience and this hasresulted in better contingency planning and, in some areas, investment in improved flooddefences. The four substations affected by flooding in South Yorkshire have been protectedby recently installed defences. These measures are discussed further in Chapter 10.
CIRIA C68832Licensed copy:UNIVERSITY OF SURREY, 04/09/2015, Uncontrolled Copy, © CIRIA

8.4 ULLEY RESERVOIR AND THE SUMMER 2007 FLOODS
Evidence submitted by: Mark Maloney (University of Leeds), Annette Senior and Doug Dodds
(National Grid)
8.4.1 What happened?
Ulley reservoir is an earth embankment reservoir owned by Rotherham MetropolitanBorough Council and used as a recreational amenity. Following heavy rainfall and highflood outflows, one of the spillways at the reservoir failed. Masonry walls to the lowerspillway were partially destroyed allowing erosion of the embankment toe, leading tostability concerns. The reservoir contains 580 million litres of water.
A rapid response by the council, their professional advisers, the emergency services and alocal civil engineering contractor meant that the upstream end of the spillway wasblocked-off, water levels were lowered and 2500 tonnes of coarse limestone were insertedinto the scour hole within a relatively short period of time. However, the threat of a dambreach meant that a range of precautionary steps had to be taken to reduce the damagethat could have occurred if the embankment had failed. This included the evacuation ofabout 1000 people in the direct path of inundation. Roads were closed, most notably theM1 between junctions 32 and 36. National Grid reduced the pressure in a gas pipeline,which crosses the valley downstream of the dam. A railway line also runs due west of thedam and is the main line connection from Sheffield to Rotherham. Disruption of thisservice could have resulted in commuters being stranded and not being able to get towork, this is particularly important considering the location of Sheffield City Airport (abase of many rescue aircraft) and Rotherham District General Hospital.
One major perceived consequence of the Ulley dam collapse would have been the loss ofpower. Brinsworth sub station located North West of Ulley supplies electricity to largeareas of Sheffield and Rotherham. At 1.15 am on 26 June, Police sought representationfrom National Grid at Gold Command. National Grid staff were alerted to the risk toBrinsworth substation in the event of a breach of the nearby Ulley dam. Field staff wereevacuated from the substation and the local area but the substation remained live andoperational. The effect of dam breach on the substation was considered and options formaking the substation dead were prepared. An overhead line tower close to the M1 andin the direct path of the dam-water in the event of breach was identified as at risk, both tothe system and to the M1 (which had been closed). By the evening of 27 June, water levelsin the Ulley dam had dropped significantly, the risk of flooding at Brinsworth substationhad reduced and the risks to the overhead line (OHL) tower near to the M1 were re-assessed.
8.4.2 Lessons identified
The primary recommendation within a report later prepared under Section 10 of theReservoir Act 1975, was that a spillway should be constructed to current design standardsto accommodate the probable maximum flood. Construction of a new spillway is nowunder way (Figure 8.3).
This incident however has influenced the Environment Agency’s forthcoming guidance toreservoir owners on the preparation of reservoir flood plans, something covered by theFloods and Water Management Bill. It has been agreed by Defra, the Security Servicesand Water UK that undertakers can now release information on the areas at potential riskdue to dam failure to Category 1 responders.
Flood resilience and resistance for critical infrastructure, 2010 33Licensed copy:UNIVERSITY OF SURREY, 04/09/2015, Uncontrolled Copy, © CIRIA

Figure 8.3 Emergency stabilisation work undertaken at Ulley Dam (a) and a visualisationof the proposed new spillway designed by Arup for Rotherham MBC (b)
8.5 NETWORK RAIL AND THE SUMMER 2007 FLOODS
Evidence submitted by: John Dora, Network Rail (submitted in 2007)
8.5.1 Background
Network Rail delivers a reliable and safe rail network for train operating companies(TOCs) and ultimately, passenger and freight customers. Safety is the primary concern and£14m a day is spent on maintaining, improving and upgrading every aspect of the railwayinfrastructure. Network Rail owns some 40 000 bridges and 23 000 culverts on 16 000route-kilometres of railway.
Train operations can be disrupted when communication, signalling, control and powerdistribution systems come in contact with water, and when civil engineering assets aredamaged by water. Lines are closed where safety may become compromised. Modernrolling stock is susceptible to damage when passing through water, because of thedependence on electronics, use of small diameter wheels, under-slung air conditioningand power units, and roller bearings.
CIRIA C68834
a
b
Licensed copy:UNIVERSITY OF SURREY, 04/09/2015, Uncontrolled Copy, © CIRIA

8.5.2 What happened?
In June and July 2007, 265 individual Network Rail sites were recorded as being affectedby flooding, extreme rainfall and high water tables. Of these sites, 107 were whereperformance was affected, meaning that no damage was experienced, only delays andcancellations. At the remaining 158 sites, only 42 sites were subject to significant damagesuggesting that the 16 000 route kilometres of railway in Great Britain are remarkablyrobust when subjected to extreme rainfall. Examples of significant asset failures are shownin Figure 8.4.
Figure 8.4 Flooding of rail tracks at Adlestrop (River Evenlode), 21 July 2007(courtesy Network Rail)
The costs associated with the June and July floods amounted to £10.5m of materialdamage and £25.6m of business interruption. These costs do not reflect the economiccosts to the country as a whole. The sources of flooding were estimated to be as shown inFigure 8.5.
Flood resilience and resistance for critical infrastructure, 2010 35Licensed copy:UNIVERSITY OF SURREY, 04/09/2015, Uncontrolled Copy, © CIRIA

Figure 8.5 Analysis of significant asset failures of Network Rail caused during the summer 2007 floods
8.5.3 Lessons identified
At a tactical level, as well as undertaking immediate repairs, Network Rail engineers haveworked to understand why the railway was affected, what measures the company can takeitself to improve asset resilience and where co-operation with other organisations isnecessary. In-house solutions, such as making drainage systems more robust andincreasing the number of mobile pumps, are being examined.
London North Western Territory engineers have met with Environment Agency staff tounderstand the Agency’s River Tame flood risk management strategy because fiveNetwork Rail sites were affected within the Tame catchment. Network Rail is examiningopportunities for joint working and information sharing with the Agency that, in terms ofefficiencies and influence over capital works, should eventually deliver benefits to railwayinfrastructure. One of the potential barriers to success is the system of prioritisation usedby the Environment Agency, which is based on the number of houses protected, and notinfrastructure. Nevertheless in terms of progressing initiatives in this river corridor,working closely with the Agency and developing joint capital schemes is favoured.
In future, Network Rail is working to improve the resilience of its infrastructure toflooding and water action at local tactical, rail industry and national strategic levels. Aswell as using self-funded solutions, the organisation is in dialogue on strategic flood riskmanagement at specific sites with the Environment Agency. Network Rail provided thePitt Review team with comments on a range of issues including: the use of railwayembankments as flood defences, critical infrastructure and cross-sector commonstandards, achieving a sustainable balance in developing technical solutions and on localand regional resilience forums. These issues are described in more detail in Chapter 10.
Particular needs for the future, to aid contingency and engineering planning to improverail performance and to reduce the risk of asset failures, include:
� guidance for the Environment Agency, when developing flood risk investmentproposals, on appraising the risk (in economic terms) to transport infrastructure, andon balancing environmental with social and economic needs
� the development of common standards across sectors for critical infrastructure
� Network Rail access to the Environment Agency surface water flood risk susceptibilitymaps
� improved forecasting tools built around the risk maps and real-time and short-termforecasts
� methods to prove that bridge foundations are sound while river flows prevent diversfrom undertaking inspections
� further clarification and strengthening of the role of the regional resilience forums
� transport sector expertise on the Climate Change Committee
� participation in various studies and reports that will follow the Pitt Review.
CIRIA C68836Licensed copy:UNIVERSITY OF SURREY, 04/09/2015, Uncontrolled Copy, © CIRIA

Network Rail believes that more emphasis needs to be placed on routine maintenance.
8.6 HULL CITY COUNCIL AND THE SUMMER 2007 FLOODS
Evidence submitted by: David Gibson, Hull City Council
8.6.1 What happened?
During the summer of 2007, much of the Yorkshire region and other areas of the countrywere hit by severe flooding. Hull was one of the cities worst affected with an estimated8649 properties and other infrastructure damaged.
The city of Hull is 95 per cent at or below sea level and is vulnerable to all forms offlooding, but especially tidal flooding. The city has significant and effective flood defences.However, these are designed to protect the city from flooding from the River Hull orfrom the Humber Estuary, not from pluvial flooding. On 25 June, the city began toexperience prolonged and heavy rainfall. This followed earlier heavy rain on 15 June thathad already resulted in elevated groundwater levels. Surface water flooding started atabout 9.00 am and consisted of surface runoff with volumes of water exceeding thecapacity of the drainage system, leading to the drains rapidly becoming overwhelmed.
Across several areas of the city, 240 streets were flooded, meaning that potentially 15 961homes could have been affected. A major incident was declared at 9.30 am on 25 Juneand the Council immediately initiated emergency plan arrangements, establishing its ownincident room and sending a liaison officer to the multi-agency Silver Command, whichhad been established by the emergency services. City centre rest centres were quickly setup and many people were evacuated from their homes. Schools and roads were closedand the Council alone pumped away 65 million litres of excess surface water. The incidentroom remained staffed 24 hours a day for the next seven days.
Figure 8.6 Flooding in Hull, June 2007
In total 8649 homes in Hull were flood damaged, 91 of the city’s 99 schools were affectedalong with 1300 businesses. House-to-house surveys were carried out by Council staff
Flood resilience and resistance for critical infrastructure, 2010 37Licensed copy:UNIVERSITY OF SURREY, 04/09/2015, Uncontrolled Copy, © CIRIA

(totalling 27 000+ visits in all including repeat visits). Questionnaires were completed withhouseholders to assess the level of support needed, a database was established and caseswere graded gold, silver, bronze or not affected. Cases with a gold priority were those ingreatest need and each family with gold priority was assigned a case worker to supportthem through the recovery. Homes were cleaned and dried while some families stayed intemporary accommodation – over 21 000 gullies were cleared. The Hull Flood Fund wasestablished, a mobile advice service was set up and hardship relief funds were raised andallocated. Despite the devastation, vital pieces of infrastructure did not fail – drinking waterwas kept flowing, telephones and other utilities worked throughout. Hull swiftly moved tothe reconstruction phase, with pupils finally returning to all schools by February 2008.
8.6.2 Lessons identified
As Hull recovered on the ground the Council established an independent review bodyand undertook a “lessons identified” exercise. More widely the Council played a vital rolein the debrief processes conducted by the Humber LRF and the Government Office forYorkshire and the Humber and worked very closely with the Pitt Review team. Theinternal review revealed that staff, many of whom had experienced flooding,demonstrated commitment, perseverance and creativity in finding solutions to problemswith little accessible training. People worked together well across traditional serviceboundaries and outside of their normal roles.
Some scope for improvement was identified and the Council wanted to improve itsemergency planning arrangements to increase its effectiveness in responding to incidents.The internal review recommended that a more robust system was needed to respond toand escalate emergency warnings. For example, although Meteorological Office warningsare frequent and not always relevant to the city, the process for escalating warnings wasunclear. This was due to the frequency of severe weather warnings. There was nosuggestion that Hull was about to be flooded. The review identified that the warning on24 June was not escalated quickly enough. The review also showed that more clarity wasneeded for incident management and a stock of materials, such as sandbags, was requiredfor easy and early distribution.
The review of the LRF focused on areas where multi-agency working could bestrengthened in any future major incident. The regional process considered issues thathave wider application and may require discussions at a national level.
Hull City Council seized the opportunity to integrate its large-scale regenerationprogrammes, such as Building schools for the future (TeacherNet, 2009), and the housingmarket renewal pathfinder into its plans to improve the city’s infrastructure, defendagainst future flooding and continue improving the life of residents.
8.7 DISRUPTION OF THE M1 AND M5 IN SUMMER 2007
Evidence submitted by: Michael Whitehead, Highways Agency
8.7.1 What happened?
In June 2007 heavy rainfall in the Sheffield area caused the dam at Ulley reservoir toshow signs of failure. As a precaution the police closed a length of M1 that would flood ifthe dam were to fail. In the event, engineers were able to prevent failure of the dam, butthe incident showed that the M1 is at risk of flooding from this source.
In July 2007 heavy rainfall in Gloucestershire led to flooding of the M5, with an estimated
CIRIA C68838Licensed copy:UNIVERSITY OF SURREY, 04/09/2015, Uncontrolled Copy, © CIRIA

10 000 motorists stranded overnight. The flooding was caused mainly by surface waterflows running off nearby land and collecting in such quantity on the motorway that thedrainage system was overwhelmed.
8.7.2 Lessons identified
These incidents showed that flooding from sources, such as surface water andinfrastructure failure, can be as much of a threat to roads as flooding from rivers or hightides. As recommended in the Pitt Review the incidents showed that the HA needed toidentify the roads that were especially vulnerable to flooding from all possible sources, toconsider how flood warnings could be improved and how to support road users whobecome stranded.
8.8 SUMMARY
8.8.1 Flood sources and mechanisms
Effective management of flooding problems requires a good understanding of the sourcesand mechanisms responsible. While flooding from rivers and the sea is a major cause ofinfrastructure disruption, surface water, groundwater and the threat of infrastructurefailure are also important contributory factors. Localised surface water drainage problemsare a major issue for the transport sector in particular. Network Rail disruptions are moreoften caused by local drainage problems than by major fluvial flood events. The floodingin Hull was caused by complex mechanisms related to groundwater and urban drainage,rather than the more obvious risks of river and coastal flooding that threaten the city. Inthe case of Ulley Dam, infrastructure failure would have been the source of flooding hadthis structure actually failed. The Ulley Dam case study (see Section 8.4) also shows howthe threat of flooding can cause as much disruption as an actual flood.
8.8.2 Escalation of flood warnings
It is important that flood warnings are contextualised for discrete locations. In Hull,severe weather warnings are received fairly regularly from the Meteorological Office, butbecause the flood mechanisms are complex, the appropriate response is not always clear.Similarly, if the consequences of a particular event are not clear, as in the case of the UlleyDam incident, the approach to evacuation of affected parties has to proceed on aprecautionary basis, which may cause more disruption than if a detailed flood plan hadalready been in place for the reservoir.
8.8.3 Multi-agency emergency preparedness and incident management
The case studies illustrate how the contingency planning process worked reasonably well.It was most stretched where the flood mechanisms and consequences were poorlyunderstood, as at Ulley. Category 1 responders under the CCA are reliant on theknowledge of Category 2 responders when it comes to adopting appropriate actions onthe ground.
8.8.4 Interdependencies
Nearly all of the case studies illustrate the high level of interdependence between differentasset systems. Utilities were forced, often successfully, to work together with GoldCommand to buffer communities from the worst effects of the disruption. The highwaysystem provides a robust alternative to the rail network for car users and manycommercial operations. However, when both systems are inoperable this causes major
Flood resilience and resistance for critical infrastructure, 2010 39Licensed copy:UNIVERSITY OF SURREY, 04/09/2015, Uncontrolled Copy, © CIRIA

disruption. The provision of generators at critical facilities may buffer these from theeffects of power outage, but if roads are impassable, such generators will be vulnerable iffuel supplies cannot be replenished.
8.8.5 Built-in resilience
The effects of the events described could have been worse. Property flooding causedmonths of misery and disruption to householders and businesses. However, in most casesessential services lost because of flooding were restored within days. The National Grid’sexperience during the 2007 floods illustrated how a network can be managed to minimiseinterruptions to supply, even when vital assets were temporarily out of action. Similarly,the provision of independent power systems at UU’s main water treatment facilities is agood example of how existing business continuity processes, within organisationspreviously affected by flooding, are managing these issues.
The Hull case study shows how a heightened awareness of flooding issues resulting fromsuch events can have a positive effect on future regeneration and spatial planning decisionmaking (see Section 8.6). Solutions that combine new infrastructure provision withimproved flood protection are what policies, such as PPS25, aim to achieve. One aim forincreasing the flood resilience of the UK’s infrastructure will be to reinforce theimportance of this process in areas that are at risk of flooding, but have not experienced aflood in recent years.
CIRIA C68840Licensed copy:UNIVERSITY OF SURREY, 04/09/2015, Uncontrolled Copy, © CIRIA

9 Current practice in the assessment offlood risk to critical infrastructure
9.1 INTRODUCTION
This chapter provides an overview of emerging issues in risk assessment and themethodologies adopted in the United States and mainland Europe. The UK experience isthen described, with particular reference to established practice in the assessment of floodrisk to new development (including infrastructure). A description is then provided offlood risk assessment work undertaken to date in each sector. Conclusions can be made asto how the process of assessing risks to critical infrastructure could be improved.
9.2 EMERGING ISSUES IN RISK ASSESSMENT
The results of risk assessments are frequently used by others to define an appropriatemanagement response. Some of the important emerging issues in risk assessment andmanagement are related to the complex and changing nature of risks and how thisevolving “risk landscape” can be communicated to wider stakeholders, eg politicians,company directors, managers, funders, operatives, the media, pressure groups andtaxpayers/customers. The Centre for Security Studies at the Swiss Federal Institute ofTechnology (ETH Zürich) makes a range of recommendations that are relevant to thisstudy (Brunner and Sutter, 2008):
Develop a nuanced understanding of risk: the handbook acknowledges that stakeholdersperceive risks differently, not necessarily because they face different threats, but due tovarying vulnerability assessments. It recommends that analysts should understand theessential elements of the risk concept and develop a comprehensive picture of the risksthat are potentially relevant to their organisation. They should also be aware of thecomplexity and accelerated dynamic of a changing risk landscape. Finally, they shouldrecognise that risk analysis and management involves a long-term commitment andrequires a clear definition of values and objectives, a meaningful evaluation andprioritisation of identified risks and a lucid appreciation of the resources needed formitigating them.
Learn to think in alternative futures: risk experts need to consider many futures so thatthey can manage uncertainty by presenting alternative scenarios. They should confrontdecision makers with the reality of complexity and uncertainty, while aiming at reducingboth to a degree that allows formulating meaningful policy choices. A good example ofthis is the socio-economic scenarios developed by UKCIP in 2002 and updated in 2009.
Conceive uncertainty as a matter of degree: risk analysts should avoid classifying theworld as either certain, and open to precise prediction, or uncertain and completelyunpredictable. A sophisticated analysis identifying degrees of uncertainty is more likely toallow decision makers to choose the appropriate strategic responses.
Develop and use international networks of risk experts: sharing knowledge within andacross professional communities should be managed and encouraged. The cross-sectornature of critical infrastructure flood resilience means that there is significant scope forimprovements in the analytical frameworks being adopted by flood risk practitioners.
Flood resilience and resistance for critical infrastructure, 2010 41Licensed copy:UNIVERSITY OF SURREY, 04/09/2015, Uncontrolled Copy, © CIRIA

Zero risk is neither feasible nor desirable: it is usually impossible to cut the risks. Theobjective of risk mitigation is not to cut every single risk, but to aim for an adequate andjustifiable degree of residual risk.
Cultivate an open risk dialogue with the public: the final recommendation is that “asystematic and patient risk dialog that generates public awareness and understanding ofthe complexity of the risk landscape is crucially needed”. Given the customer focus ofservice providers and the fact that the customer will ultimately pay for any resiliencemeasures adopted, this recommendation is particularly pertinent.
9.3 INTERNATIONAL EXPERIENCE
9.3.1 United States of America
The US Department of Homeland Security (DHS) has recently developed a nationalinfrastructure protection plan (NIPP) with the aim of increasing the protection affordedto, and resilience of, their critical infrastructure and key resources (CIKR). This plan issupported by 18 sector-specific plans. Both the national plan and sector plans are basedon risk assessments and flooding is one of the risks considered. The NIPP riskmanagement framework is illustrated in Figure 9.1.
Figure 9.1 Continuous improvement to protect critical infrastructure
The NIPP framework calls for CIKR partners to assess risk from any scenario as afunction of consequence, vulnerability, and threat:
Risk = f (C,V,T)
where:
C = Consequence: the social, economic and environmental effects of an event
V = Vulnerability: degree of susceptibility to disruption
T = Threat: something with the potential to cause harm (a hazard).
NIPP provides a framework and guidance on the preparation of threat, vulnerability andconsequence assessments by each sector. This framework is central to the strategichomeland infrastructure risk assessment (SHIRA) process. The SHIRA involves an annualcollaborative process conducted in co-ordination with interested members of the CIKRprotection community to assess and analyse the risks to the nation’s infrastructure fromterrorism, as well as natural and manmade hazards. The DHS maintains and is improvingits comprehensive catalogue that includes an inventory and descriptive information aboutthe assets and systems that comprise the nation’s critical infrastructure. The NationalAssets Database (NADB) allows analysis of consequences, specific and commonvulnerabilities, dependencies, and interdependencies within and across sectors andgeographic regions.
CIRIA C68842Licensed copy:UNIVERSITY OF SURREY, 04/09/2015, Uncontrolled Copy, © CIRIA
Risk assessments are undertaken using the risk assessment methodology for critical assetprotection (RAMCAP) as outlined in the NIPP. As part of the risk assessment, utilitiesdevelop an inventory of asset components including physical, cyber, IT and staff and theyidentify the components that are most critical to their continued operation. The processproceeds broadly as follows:
� characterisation of the system, including its objectives and the services it provides
� identification and prioritisation of adverse consequences to be avoided
� determination of critical assets that might be subject to malevolent acts that couldresult in undesired consequences
� assessment of the likelihood (qualitative probability) of such malevolent acts byadversaries
� evaluation of existing countermeasures
� analysis of current risk and development of a prioritised plan for risk reduction.
In terms of flood-related threats, there are few countries that have assessed and mappedflood hazards (or threats) as comprehensively as has been undertaken in the UK. TheUnited States is a notable exception. The Federal Emergency Management Agency(FEMA), which is part of the DHS, co-ordinates production of detailed flood maps for theentire US. Flood zones are geographic areas that the FEMA has defined according tovarying levels of flood risk. Each zone reflects the severity or type of flooding in the areataking into account the presence and status of Federal flood control systems.
In the US most home insurance policies do not cover flood risk. The National FloodInsurance Program (NFIP), administered by FEMA, works closely with about 90 privateinsurance companies to offer flood insurance to property owners and renters in flood riskareas. To qualify for flood insurance, a community is required to join the NFIP and agreeto enforce sound floodplain management standards. The effort associated with keepingthese maps fully up-to-date should not be underestimated – some maps are reputedlyover 20 years old and, given their importance in setting insurance premiums, the mapscause occasional controversy.
9.3.2 European Union
The Council of the European Union adopted a Council Directive (2008/114/EC) on theidentification and designation of European critical infrastructures and the assessment ofthe need to improve their protection. This is supported by the European Programme forCritical Infrastructure Protection (EPCIP). The programme is heavily focused onterrorist-related threats.
The Council of Europe Major Hazards Agreement aims to develop disaster predictionresearch, risk management, post-crisis analysis and rehabilitation. Conferences, reportsand good practice guidance are outputs from their activities:<http://www.coe.int/t/dg4/majorhazards/default_EN.asp?>.
Perhaps of more direct relevance to this study is the EU Floods Directive (2007/60/EC) onthe assessment and management of flood risks which entered into force on 26 November2007. This Directive requires Member States to undertake a national preliminary floodrisk assessment by 2011 to identify areas where significant flood risk exists or might belikely. It also requires the preparation of catchment-based flood risk management plans by2015 setting out flood risk management objectives, actions and measures for those areas.This directive is driving advances in flood risk assessment and hazard mapping acrossEurope and the majority of Western European countries have now produced flood maps.
Flood resilience and resistance for critical infrastructure, 2010 43Licensed copy:UNIVERSITY OF SURREY, 04/09/2015, Uncontrolled Copy, © CIRIA
A handbook prepared by the European Exchange Circle on Flood Mapping provides anoverview of current practice across Europe (EXCIMAP, 2007). The flood mappingreferred to focuses on flooding from rivers and the sea. “Torrent flows” are discussed withregard to mountainous areas and a methodology developed in Austria is outlined.Groundwater flooding is discussed with reference to research by Defra, the EnvironmentAgency and the British Geological Survey (BGS). No examples are provided ofgroundwater flood hazard mapping on continental Europe. Flash flooding is discussed,but mainly in the context of Mediterranean ephemeral watercourses. The handbookadvocates meteorological and geomorphic analysis as the primary means of identifying theflash flood hazard.
9.3.3 Germany
Many European nations have prepared guidance on risk assessment for criticalinfrastructure. For example, the Federal Ministry of the Interior published a guide onprotecting critical infrastructures (2007), and Germany’s National Strategy for theprotection of critical infrastructure was published in June 2009. The following criteria areused to determine the criticality:
� life and health: if the process is disrupted, what will be the effect on human life andhealth?
� timeframe: if the process is disrupted, how long will it take to have an effect on theorganisation’s overall product/service? The shorter the time, the more critical theprocess
� magnitude: how much of the overall product/service will be affected if this process isinterrupted or completely stopped?
� contractual, regulatory or legal relevance: if the process is disrupted, what contractual,regulatory or legal consequences will this have for the organisation?
� economic damage: if the process is disrupted, what is the estimated financial damageto the organisation? The Federal Office of Civil Protection and Disaster Assistance(BBK) is finalising a vulnerability assessment for critical infrastructure during floods tobe published in early 2010. This will be co-authored by the United Nations University.
9.4 UK EXPERIENCE
9.4.1 Overview
Under the CCA, the UK government has prepared a National Risk Register (NRR) andguidance to regional and LRFs on risk assessment and the preparation of CommunityRisk Registers (CRR), and many are now publicly available. These are developed on aregional and local scale by Category 1 responders. The process is summarised in the HMGovernment document (2005), and summarised in Figure 9.2.
CIRIA C68844Licensed copy:UNIVERSITY OF SURREY, 04/09/2015, Uncontrolled Copy, © CIRIA
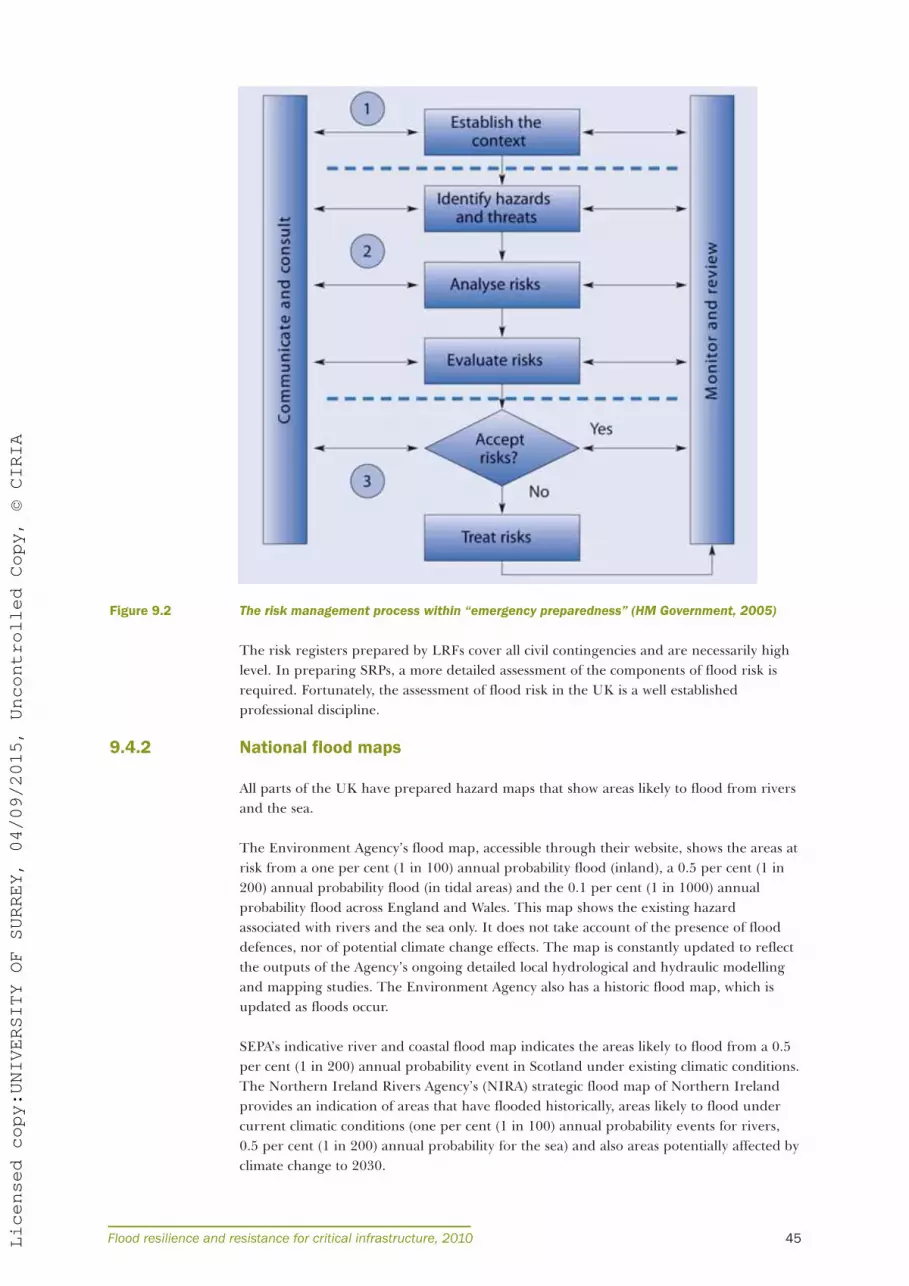
Figure 9.2 The risk management process within “emergency preparedness” (HM Government, 2005)
The risk registers prepared by LRFs cover all civil contingencies and are necessarily highlevel. In preparing SRPs, a more detailed assessment of the components of flood risk isrequired. Fortunately, the assessment of flood risk in the UK is a well establishedprofessional discipline.
9.4.2 National flood maps
All parts of the UK have prepared hazard maps that show areas likely to flood from riversand the sea.
The Environment Agency’s flood map, accessible through their website, shows the areas atrisk from a one per cent (1 in 100) annual probability flood (inland), a 0.5 per cent (1 in200) annual probability flood (in tidal areas) and the 0.1 per cent (1 in 1000) annualprobability flood across England and Wales. This map shows the existing hazardassociated with rivers and the sea only. It does not take account of the presence of flooddefences, nor of potential climate change effects. The map is constantly updated to reflectthe outputs of the Agency’s ongoing detailed local hydrological and hydraulic modellingand mapping studies. The Environment Agency also has a historic flood map, which isupdated as floods occur.
SEPA’s indicative river and coastal flood map indicates the areas likely to flood from a 0.5per cent (1 in 200) annual probability event in Scotland under existing climatic conditions.The Northern Ireland Rivers Agency’s (NIRA) strategic flood map of Northern Irelandprovides an indication of areas that have flooded historically, areas likely to flood undercurrent climatic conditions (one per cent (1 in 100) annual probability events for rivers,0.5 per cent (1 in 200) annual probability for the sea) and also areas potentially affected byclimate change to 2030.
Flood resilience and resistance for critical infrastructure, 2010 45Licensed copy:UNIVERSITY OF SURREY, 04/09/2015, Uncontrolled Copy, © CIRIA

The BGS has produced maps showing susceptibility to groundwater flood risk and theEnvironment Agency has recently produced pluvial flood risk susceptibility maps forEngland.
Flooding probability from rivers and the sea is relatively well defined across the UK,although further work is required to assess the nature of the flood hazard in areasprotected by flood defences. The main issue at present is how this information can beaccessed by CI operators, who only make use of 2D flood maps. Current areas of researchand development include urban drainage, reservoir breach, groundwater and pluvialflood risk.
9.4.3 FRA for new development
Flood risk assessments are required in support of the majority of applications for newdevelopment in the UK. PPS25, SPP7, TAN15 and PPS15 provide guidance to planningbodies on how they should take account of flood risk, as a material consideration, in theirspatial planning exercises. In England, regional planning bodies are responsible forpreparation of RFRAs and local authorities have to prepare SFRAs. Both levels of studyshould include flood risk from all sources.
CIRIA C624 (Lancaster et al, 2004) and the practice guide to PPS25 (CLG, 2009) refer tothree levels of site-specific flood risk assessment as described in Table 9.1.
Table 9.1 Levels of flood risk assessment (from CIRIA C624)
Typical sources of information used in FRA are summarised in Table 9.2. These areelaborated on in both CIRIA C624 (Lancaster et al, 2004) and the practice guide to PPS25(CLG, 2009).
CIRIA C68846
FRA level Description
Level 1
Screening study to identify whether there are any flooding or surface watermanagement issues related to a development site that may warrant furtherconsideration. This should be based on available existing information, includingnational flood maps, advice from the Environment Agency, SEPA or rivers agency.
Level 2
Scoping study to be undertaken if the Level 1 FRA indicates that the site may liewithin an area that is at risk of flooding or that the site may increase flood risk due toincreased runoff. This study should confirm the sources of flooding that may affect thesite and should include:
� an appraisal of the availability and adequacy of existing information
� a qualitative appraisal of the flood risk posed to the site, and potential impact onthe development on flood risk elsewhere
� an appraisal of the scope of possible measures to reduce the flood risk toacceptable levels.
The scoping study may identify that sufficient quantitative information is alreadyavailable to complete a flood risk assessment appropriate to the scale and nature ofthe development.
Level 3
Detailed study to be undertaken if the Level 2 FRA concludes that further quantitativeanalysis is required to assess flood risk issues related to the development site.
The study should include:
� quantitative appraisal of the potential flood risk to the development
� quantitative appraisal of the potential impact of development site on flood riskelsewhere
� quantitative demonstration of the effectiveness of any proposed mitigationmeasures.
Licensed copy:UNIVERSITY OF SURREY, 04/09/2015, Uncontrolled Copy, © CIRIA

Table 9.2 Typical sources of information for flood risk assessments
Level 3 studies can be relatively expensive. However, hydraulic models are increasinglyavailable for river systems. The Environment Agency invests heavily in hydrological andhydraulic modelling exercises and is increasingly able to provide model output data, fordiscrete locations, with an accompanying report, including
� all model node X/Y co-ordinate locations, levels and flows
� 1D model reservoir units
� 2D flood model grid data (not z-point data)
� model extents
� hydrographs
� breach location and widths
� velocity data (where already generated)
� dry access routes (where already generated)
� time of onset/duration of flooding (where already generated)
� hazard mapping and depth (where already generated).
The models are primarily river models, but coastal breach models are also becoming moreavailable. This facility, which applies to England and Wales, is not yet available in Scotlandor Northern Ireland.
Flood resilience and resistance for critical infrastructure, 2010 47
FRA level Typical sources of information
1
Ordnance Survey maps
National flood maps
National, regional and local planning guidance and policy statements
Regional and/or strategic flood risk assessments
Consultation with flood risk consultants to identify what, if any, flood risk issues need tobe considered.
Strategic studies, eg catchment flood management plans/shoreline management plansand surface water management plans.
2
Historic maps
Local libraries and newspaper reports
Interviews with local people
Walkover survey by a professional FRA practitioner to assess:
� potential sources of flooding
� likely routes for flood waters
� the site’s main features, including flood defences, and their condition.
Site survey to determine:
� general ground levels across the site
� levels of any formal or informal flood defences relevant to the site.
More detailed consultation with the LPA, Environment Agency and other bodies, which mayhave relevant information on flood risk.
3
Detailed topographical and/or hydrographic survey
Hydrological and hydraulic modelling (using existing models where these are available andsuitable)
Monitoring to assist with model calibration/verification
Continued consultation with the LPA, Environment Agency and other flood risk consultants.
Licensed copy:UNIVERSITY OF SURREY, 04/09/2015, Uncontrolled Copy, © CIRIA

Flood zones
For the purposes of planning new development, planning policy in the UK defines floodzones according to areas with a given probability of flooding. One of the primary tasks ofan FRA is to establish which zone a site lies within. The zones defined in PPS25 areoutlined in Table 9.3.
Table 9.3 Flood zones in PPS25 (based on Table D1 in PPS25)
In Scotland the risk framework in SPP7 is similar, but refers to flood risk areas and uses a0.5–0.1 per cent (1 in 200 to 1 in 1000) annual probability banding for the medium riskarea (zone 2 equivalent) for both rivers and the sea. High risk areas, defined as those atrisk from a 0.5 per cent (1 in 200) annual probability flood, are divided into areas whichare already built-up and those which are undeveloped/sparsely developed, with differentguidance provided on each.
In Northern Ireland PPS15 defines floodplain as per zone 3a in PPS25, but distinguishesbetween developed and undeveloped floodplain. In Wales the zones are defined within aprecautionary framework as shown in Table 9.4.
Table 9.4 Flood zones in Wales (from TAN15)
Matching land-use to degree of flood risk
Policies for England and the devolved administrations all provide an indication whereland-uses may be appropriate in the different flood zones. Perhaps due to pressure fordevelopment in England, the guidance in PPS25 is the most detailed. The sequential testin PPS25 requires local planning authorities to locate new development within areaswhere the risk of flooding is lowest. If no sites are available within flood zone 1, then thenext lowest site should be considered and so on, in sequence. The exception test inPPS25, which should also be applied by the local planning authority (LPA), allows certaintypes of development to proceed in spite of being in areas at heightened risk of floodingprovided:
� the flood risk is outweighed by wider sustainability benefits
� the site has been developed previously (ideally)
CIRIA C68848
Flood zone Annual probability of a flood occurring or being exceeded
1 Less than 0.1% (1 in 1000)
2Between 0.1% (1 in 1000) and 1% (1 in 100) for river flooding, between 0.1% (1 in 1000)and 0.5% (1 in 200) for flooding from the sea
3aGreater than 1% for river flooding and greater than 0.5% (1 in 200) for flooding from thesea
3b Functional floodplain
Flood zone Definition
A Little or no risk of river/coastal flooding
BAreas known to have flooded in the past due to presence of sedimentary deposits shownon BGS maps
CAreas within the 0.1% floodplain as shown on the Environment Agency flood map, sub-divided in C1 (developed) and C2 (undeveloped) floodplain
Licensed copy:UNIVERSITY OF SURREY, 04/09/2015, Uncontrolled Copy, © CIRIA

� the proposed development is protected to an acceptable standard and does notincrease flood risk elsewhere.
Further details of the sequential and exception tests can be found within Annex D ofPPS25.
Table 9.5 is based on PPS25 and indicates what land-uses are considered appropriate ineach flood zone (subject to no sites at lower risk being reasonably available). This could beused to infer what English government policy considers to be an “acceptable risk” fordifferent types of development. However, it would be wrong to make this inference. Allnew development located in areas at risk of flooding should be protected to anappropriate standard, which is discussed in the next chapter. A government consultationon minor amendments to PPS25 closed on 3 November 2009. In particular the followingchanges were proposed:
“Water treatment and sewage treatment plants shown as less vulnerable would be moved tothe essential infrastructure category, plus a clarification to the definition of this category.
Insertion of additional text providing for police, ambulance and fire stations which are notrequired to be operational during flooding to be treated as “less vulnerable”.
Insertion of additional text in the “highly vulnerable” category to clarify that where there isa need to locate bulk storage facilities requiring hazardous substances consent with port orother waterside facilities, or installations requiring hazardous substances consent that areassociated with energy infrastructure which need to be sited in coastal locations or highflood risk areas, these facilities and installations should be classified as “essentialinfrastructure”, rather than highly vulnerable.
Clarification that wind turbines for generating renewable energy should be treated as“essential infrastructure.”
There has been considerable debate about the precise definition of “functionalfloodplain”, which is defined in PPS25 as:
“land which would flood with an annual probability of 5 per cent (1 in 20) or greater inany year or is designed to flood in an extreme (0.1 per cent) flood, or at anotherprobability to be agreed between the local planning authority and the Environment Agency,including water conveyance routes”. The latest version of the accompanying practice guideclarifies that: “the definition allows flexibility to make allowance for local circumstancesand should not be defined on rigid probability parameters. Areas which would naturallyflood with an annual probability of 1 in 20 (5 per cent) or greater, but which areprevented from doing so by existing infrastructure or solid buildings, will not normally bedefined as functional floodplain” (CLG, 2009).
Flood resilience and resistance for critical infrastructure, 2010 49Licensed copy:UNIVERSITY OF SURREY, 04/09/2015, Uncontrolled Copy, © CIRIA

Table 9.5 Flood risk vulnerability classification
Notes
� Development is appropriate, subject to satisfying the sequential test
× Development should not be permitted
1 Table based on Tables D1, D2 and D3 of PPS 25. Refer to original tables for full descriptions.
2 Subject to a specific warning and evacuation plan.
3 If adequate pollution control measures are in place.
4 Excluding sleeping accommodation.
9.4.4 FRA for existing infrastructure
The three levels of site-specific flood risk assessment used for assessing and managing theflood risks associated with new development are equally applicable to assessing the risks toexisting infrastructure.
NaFRA
A possible starting point for those undertaking flood risk assessments for existinginfrastructure in England is the national flood risk assessment (NaFRA). NaFRA wasprepared by Defra and the Environment Agency and identifies the indicative number andtype of existing infrastructure assets in floodplain areas, as summarised in Figure 9.3.
CIRIA C68850
Typi
cal d
evel
opm
ents
Essentialinfrastructure
Highly vulnerable More vulnerable Less vulnerable Water compatible
Essential transportinfrastructure
Strategic utilityinfrastructure
Emergency servicestations
Basementdwellings
Caravans mobilehomes etcpermanentresidences
Hazardoussubstancesinstallations
Hospitals
Residentialinstitutions
Dwellings, hotels,halls of residenceetc
Nightclubs, pubsetc
Non residentialhealthcare,nurseries andeducation facilities.
Landfill and wastesites
Caravan, campingetc temporaryresidence (2)
Shops, offices,cafes andrestaurants,general industry,storage anddistribution
Buildings and landfor agriculture andforestry
Waste treatment
Mineral workingand processing
Water and sewageplants (3)
Flood controlinfrastructure
Water supplyinfrastructure
Sewage systems
Sand and gravelworkings
Docks marinas andwharves
Navigation facilities
Mod defence
Ship building andrepairs
Water basedrecreation (4)
Lifeguard andcoastguard stations
Amenity, natureconservation,outdoor sports
Essential sleepingfacilities for theabove (2)
Floo
d zo
nes
Zone 1 � � � � �
Zone 2 � Exception Test � � �
Zone 3a Exception Test × Exception Test � �
Zone 3b Exception Test × × × �
Licensed copy:UNIVERSITY OF SURREY, 04/09/2015, Uncontrolled Copy, © CIRIA
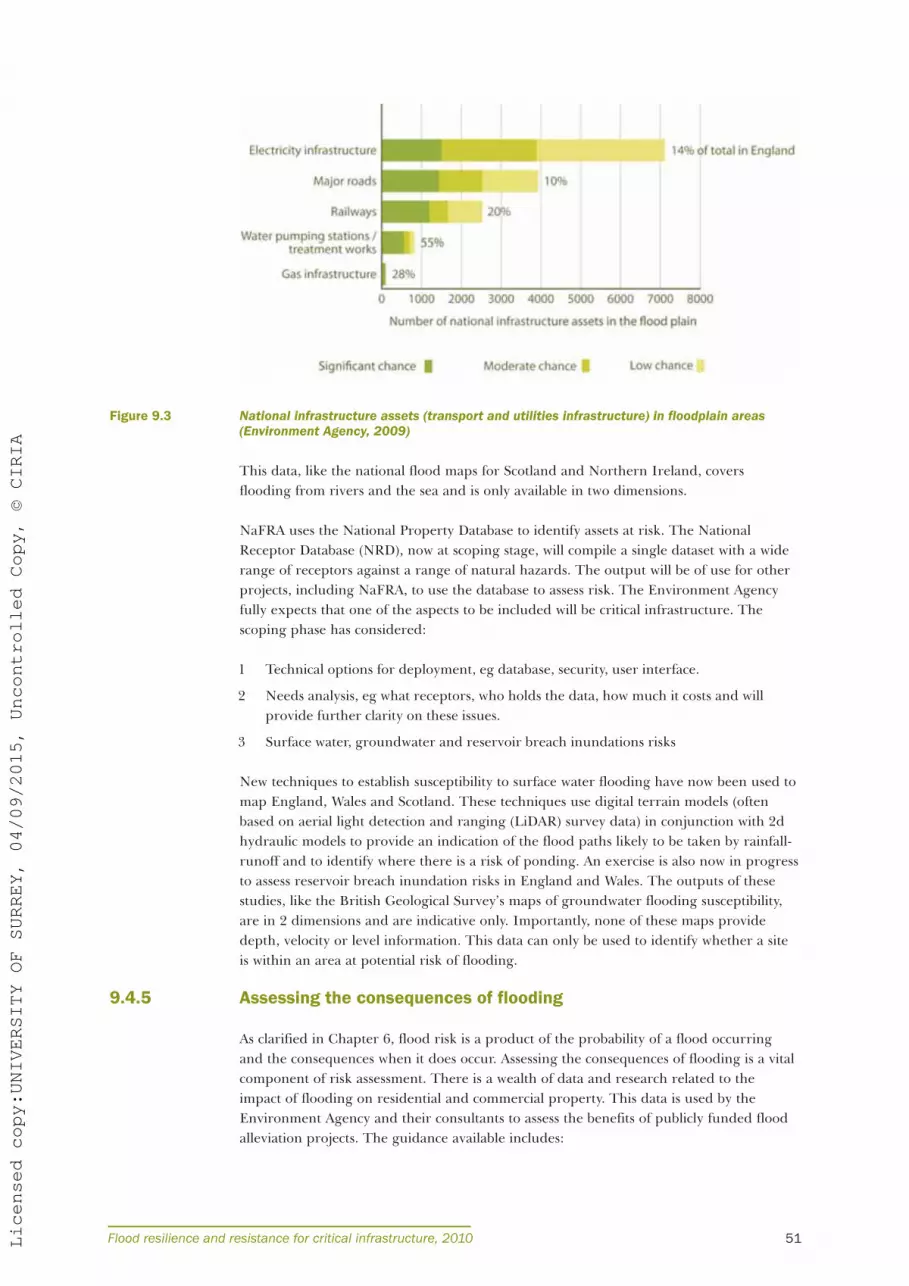
Figure 9.3 National infrastructure assets (transport and utilities infrastructure) in floodplain areas(Environment Agency, 2009)
This data, like the national flood maps for Scotland and Northern Ireland, coversflooding from rivers and the sea and is only available in two dimensions.
NaFRA uses the National Property Database to identify assets at risk. The NationalReceptor Database (NRD), now at scoping stage, will compile a single dataset with a widerange of receptors against a range of natural hazards. The output will be of use for otherprojects, including NaFRA, to use the database to assess risk. The Environment Agencyfully expects that one of the aspects to be included will be critical infrastructure. Thescoping phase has considered:
1 Technical options for deployment, eg database, security, user interface.
2 Needs analysis, eg what receptors, who holds the data, how much it costs and willprovide further clarity on these issues.
3 Surface water, groundwater and reservoir breach inundations risks
New techniques to establish susceptibility to surface water flooding have now been used tomap England, Wales and Scotland. These techniques use digital terrain models (oftenbased on aerial light detection and ranging (LiDAR) survey data) in conjunction with 2dhydraulic models to provide an indication of the flood paths likely to be taken by rainfall-runoff and to identify where there is a risk of ponding. An exercise is also now in progressto assess reservoir breach inundation risks in England and Wales. The outputs of thesestudies, like the British Geological Survey’s maps of groundwater flooding susceptibility,are in 2 dimensions and are indicative only. Importantly, none of these maps providedepth, velocity or level information. This data can only be used to identify whether a siteis within an area at potential risk of flooding.
9.4.5 Assessing the consequences of flooding
As clarified in Chapter 6, flood risk is a product of the probability of a flood occurringand the consequences when it does occur. Assessing the consequences of flooding is a vitalcomponent of risk assessment. There is a wealth of data and research related to theimpact of flooding on residential and commercial property. This data is used by theEnvironment Agency and their consultants to assess the benefits of publicly funded floodalleviation projects. The guidance available includes:
Flood resilience and resistance for critical infrastructure, 2010 51Licensed copy:UNIVERSITY OF SURREY, 04/09/2015, Uncontrolled Copy, © CIRIA

� Penning-Rowsell (2005) The benefits of flood and coastal risk management manual
� EFTEC (2007) Flood and coastal erosion risk management, economic valuation ofenvironmental effects
� Defra (2004) Revisions to economic appraisal on: reflecting socio-economic equity in appraisaland appraisal of human related intangible impacts of flooding
� Defra (2008a) Assessing and valuing the risk to life from flooding for use in appraisal of riskmanagement measures
� Defra (2008b) The valuation of agricultural land and output for appraisal purposes.
This guidance may be useful to infrastructure owners and operators. However, there is alack of specific guidance related to the social, economic and environmental impact ofdisruption to essential services.
The questionnaire and workshop (see Supportings documents 1 and 2) considered whatthe consequences of flood-related interruptions in the provision of essential services werefor essential service providers. The information collated indicated that loss of revenue andfinancial penalties, while a consideration, were less important factors than the effect onreputation.
The consequences of interrupted supply may be far more serious for the economy,communities affected, or for the environment and emergency services, than for theorganisation providing the service. Ofwat guidance (Ofwat, 2009b), for example, lists thefollowing as potential consequences of flooding-related disruption of water infrastructure:
� inconvenience of interruptions due to service loss
� anxiety and stress due to loss of service
� health risk due to contamination of water supply and the environment
� loss of production for non-household customers
� extra clean-up costs due to waste water mixing with flood water and entering property
� anxiety and stress due to wastewater entering customer property
� environmental pollution due to wastewater mixing with floodwater
� loss of state revenues due to non-functioning of the private sector
� costs associated with state support for provision of emergency supplies if interruptionis substantial
� tourism and commercial benefits from avoiding extended interruptions
� other.
Whether mandatory standards are imposed by central government or investment decisionmaking by infrastructure operators is wholly motivated by cost-benefit analysis, thevaluation of costs and the economic, social and environmental benefits of avoiding them,need to be quantified. Ultimately this will be decided by people’s willingness to pay.Further research is required in this area.
The following sections provide examples of flood risk assessment work being undertakenin each sector.
9.5 ENERGY SECTOR
Energy is required to ensure continued operation of the majority of critical infrastructuresystems. In 2005, partly in response to the Carlisle floods, the government ordered a
CIRIA C68852Licensed copy:UNIVERSITY OF SURREY, 04/09/2015, Uncontrolled Copy, © CIRIA

Flood resilience and resistance for critical infrastructure, 2010 53
study to identify the top 1000 substations most at risk from flooding. The Energy NetworkAssociation (ENA) has completed a study of substation vulnerability using data on floodrisk from rivers and the sea provided by the Environment Agency and SEPA.
The ENA has issued a report that formalises the approach to risk assessment and flooddefence prioritisation and recommends investment in mitigation (ENA, 2008). As Ofgemhave been involved in the development of this publication it is likely that proposals forimprovements in flood resilience included in the next price control submission will be wellreceived.
It has been identified that much of the vulnerable high risk equipment in substations,such as the primary circuits, are at a safe height but many control circuits and secondarywiring are at a lower level that can still cause the circuit to trip. A major design issue is thelocation of the switch board. Although much of the equipment is remotely operated, ifstaff cannot access the switch board due to flood water, and the substation is inundated,then there is still a possibility of failure.
A summary of the results of a risk assessment of National Grid’s assets using the nationalflood maps is provided in Table 9.6.
Table 9.6 National Grid’s assets at risk (courtesy National Grid)
National Grid is in discussions with the Meteorological Office and Environment Agencyabout the risk from surface water flooding and reservoir inundation. They have identifiedthat several of their towers are also at risk.
National Grid is aware that, unless the mechanisms responsible for flooding areunderstood, there is a risk that the investment in flood risk management measures will beinefficient. The organisation is in the process of obtaining LiDAR data to betterunderstand pluvial flood mechanisms, for example, where water is likely to flow andpond. Such site-specific studies help to better plan and design both temporary andpermanent solutions, as described in Chapter 10.
In the light of climate change and expected sea level rise British Energy is concerned withcoastal flooding of their production sites. Their assessment of coastal flood risk used themost severe high-emissions scenario published by the Intergovernmental Panel on ClimateChange, including an allowance for increased storm surges. British Energy concluded thatsea-level at their plants will rise by 0.9 m to 1.7 m over the coming century.
CategoryWith known
defencesWithout known
defences
Shown not at risk or above 0.1% annual probability flood 154 167
Site protected up to a 0.1% annual probability flood 46 18
Site at risk from flooding from 0.5% to 0.1% annualprobability flood
19 16
Site at risk from flooding from 1% to a 0.5% annualprobability flood
22 7
Site at risk from a 1% annual probability event or higher 14 47
255 255
Licensed copy:UNIVERSITY OF SURREY, 04/09/2015, Uncontrolled Copy, © CIRIA

9.6 COMMUNICATIONS SECTOR
British Telecom (BT) has around 7000 to 8000 sites including telephone exchanges thatmay be at risk. These systems are vital for issuing flood warnings and co-ordinatingemergency responses. About 500 BT major assets are known to be within floodplain areas.These are commonly situated in the centre of towns. The telecoms sector has legacyinfrastructure in a similar way to the transport sector. BT is starting the process of theassessment of flood risk and mitigation measures for their asset portfolio.
9.7 TRANSPORT SECTOR
Moving people, plant and resources around the country will be an essential component ofany flooding incident and post-event recovery. The strategic components of transportnetwork are inevitably the roads and the rail network. A general expectation is that theseservices will still be available during most extreme situations.
9.7.1 Highways
The HA is responsible for the construction, maintenance and operation of England’smotorways and major trunk road network (strategic road network). The strategic roadnetwork is used to carry around 80 per cent of national goods and services. Loss of thestrategic road network, or vital sections could have a significant effect on England’s abilityto operate, especially in times of crisis. The HA responds as a CCA level 2 responder andhas the duty to share data and information with other Cat 1 and Cat 2 responders.
The HA Network Resilience Team (NRT) is responsible for understanding and improvingthe resilience of the strategic road network. The team does this by engaging in thedifferent aspects of emergency management:
� anticipating and assessing risks
� preventing emergencies
� preparing for emergencies
� responding to emergencies.
The HA, in consultation with its service providers and the Environment Agency, hasidentified parts of HA network vulnerable to flooding. Early flood hotspot maps havebeen developed along with draft guidance for operational staff on how to use and developflood risk management strategies. Work is also being progressed into investigating andidentifying culverts posing a potential flooding risk together with a review of risks toflooding posed by climate change. The project is due to be completed in 2009.
The above hotspot assessment involved comparing details of past flooding incidents withmapping showing the theoretical risk of flooding from overland runoff, river or tidalflooding. The work showed how little information there is regarding the cause of theflooding, and a new flood register is being launched by the HA that will require its roadmanagers to record not only details of the flood and its effect on road users, but also themain cause of the flood.
The HA is also giving priority to the work needed to survey its drains, as any lack of assetknowledge will affect the response to a flood, compromise the necessary maintenance andretrofitting of systems to reduce flood risk.
CIRIA C68854Licensed copy:UNIVERSITY OF SURREY, 04/09/2015, Uncontrolled Copy, © CIRIA
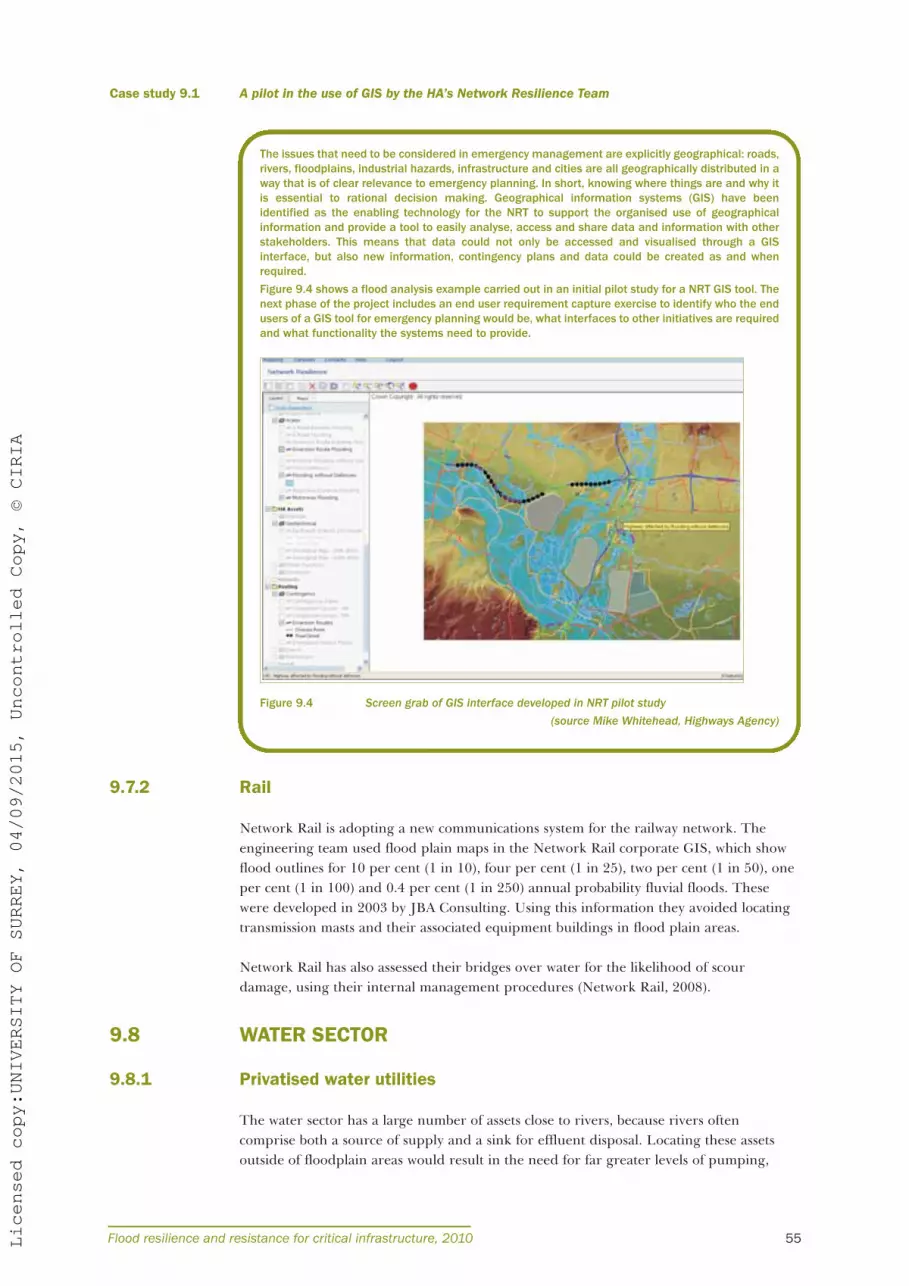
Case study 9.1 A pilot in the use of GIS by the HA’s Network Resilience Team
9.7.2 Rail
Network Rail is adopting a new communications system for the railway network. Theengineering team used flood plain maps in the Network Rail corporate GIS, which showflood outlines for 10 per cent (1 in 10), four per cent (1 in 25), two per cent (1 in 50), oneper cent (1 in 100) and 0.4 per cent (1 in 250) annual probability fluvial floods. Thesewere developed in 2003 by JBA Consulting. Using this information they avoided locatingtransmission masts and their associated equipment buildings in flood plain areas.
Network Rail has also assessed their bridges over water for the likelihood of scourdamage, using their internal management procedures (Network Rail, 2008).
9.8 WATER SECTOR
9.8.1 Privatised water utilities
The water sector has a large number of assets close to rivers, because rivers oftencomprise both a source of supply and a sink for effluent disposal. Locating these assetsoutside of floodplain areas would result in the need for far greater levels of pumping,
Flood resilience and resistance for critical infrastructure, 2010 55
The issues that need to be considered in emergency management are explicitly geographical: roads,rivers, floodplains, industrial hazards, infrastructure and cities are all geographically distributed in away that is of clear relevance to emergency planning. In short, knowing where things are and why itis essential to rational decision making. Geographical information systems (GIS) have beenidentified as the enabling technology for the NRT to support the organised use of geographicalinformation and provide a tool to easily analyse, access and share data and information with otherstakeholders. This means that data could not only be accessed and visualised through a GISinterface, but also new information, contingency plans and data could be created as and whenrequired.
Figure 9.4 shows a flood analysis example carried out in an initial pilot study for a NRT GIS tool. Thenext phase of the project includes an end user requirement capture exercise to identify who the endusers of a GIS tool for emergency planning would be, what interfaces to other initiatives are requiredand what functionality the systems need to provide.
Figure 9.4 Screen grab of GIS interface developed in NRT pilot study(source Mike Whitehead, Highways Agency)
Licensed copy:UNIVERSITY OF SURREY, 04/09/2015, Uncontrolled Copy, © CIRIA

which would both increase the carbon footprint of their operations and the vulnerabilityof their systems to failures in power supply.
Ofwat states in their methodology paper for 2010–2015 that each company should reviewhow its critical assets are at risk from surface water flooding and how it will meet theneeds of supplying consumers in extreme situations (Ofwat, 2009a). Each company shouldassess the risk to service in its application of common framework principles for assetmanagement.
General guidance on risk-based prioritisation of flood resilience measures has beenprepared for Ofwat by Halcrow (Ofwat, 2009c). The guidance refers to the flood riskassessment process in PPS25, provides guidance on calculating flood damages (seeReferences) and recommends the rationale for prioritisation based on the risk matrixshown in Figure 9.5.
Figure 9.5 Risk matrix for prioritisation of investigations into the viability of resilience measures(Ofwat, 2009c)
CIRIA C68856
Moderate risk (lowconsequence, highprobability): existing
measures should be inplace and hazards welldefined. Review climateimpacts and cost benefit
opportunities.
High risk: existingmeasures should be inplace and hazards welldefined. Review climate
impacts and pluvial risks.
High risk (highconsequence and
probability): existingmeasures should be inplace and hazards welldefined. Review climate
impacts and widerbenefits.
Low risk: do pluvialflooding appraisal. Check
contingency planning.Re-appraise in 10 years.
Moderate risk: dodetailed risk assessmentincluding surface water
flooding. Reviewcontingency planning,review climate impact.
Consider resiliencemeasure.
High risk: do riskassessment including
pluvial flooding. Reviewcontingency planning,review climate impact.
Consider resiliencemeasures and wider
benefits.
Lowest risk: riskassessment sufficient –
do nothing, maintainexisting resilience. Re-appraise in +10 years.
Low risk: do pluvialflooding appraisal. Check
contingency planning.Re-appraise in five years
Moderate risk (highconsequence, low
probability): do riskassessment including
pluvial flooding. Reviewcontingency planning.Review climate impact.
Consider resiliencemeasures.
Service consequences
Hazardprobability
Licensed copy:UNIVERSITY OF SURREY, 04/09/2015, Uncontrolled Copy, © CIRIA

Case study 9.2 United Utilities assessment of flood risk for water assets
Case study 9.3 Anglian Water’s assessments of sites threatened by sea level rise
Flood resilience and resistance for critical infrastructure, 2010 57
United Utilities (UU) identified the facilities to be included in their flood resilience programme usingthe following methodology.
A desktop study was completed using the Environment Agency flood map data to identify the typeand number of water facilities within flood zones 2 and 3. The Environment Agency’s flood zonelayers were overlaid on the company GIS, which maps the locations of all UU facilities. Facilitieswithin the GIS include all water and waste WTW, boreholes, service reservoirs, pumping stationsand pipe bridges. This study did not consider surface water flood risk, nor did it consider the risk ofimpounding reservoir failure due to flooding. A separate Dam portfolio risk assessment study hashowever ensured that the overflow capacity of all UU’s impounding reservoirs is in-line with currentstandards.
Analysis was then carried out of the facilities identified as being at risk of flooding using UU’sregional network model. The model was used to identify the number of properties which would beaffected by an outage of each asset taking into account the flexibility in the network and theopportunities for re-zoning (ie using other water sources). A significant number of these facilitiescould be supported by other sources were there to be an outage. The remainder of these facilitieswere deemed “critical” as they would lead to significant loss of supply were there to be an outage.
The impact of a loss of the energy supply to critical assets because of flooding was also assessed.In general the critical facilities were found to already have on-site generation to cater for loss ofenergy supply resulting from any event, including substation failure or loss of overhead lines.
The risk assessment process was concluded with a site visit to assess the current levels of floodprotection in place at each of the facilities identified as being at risk. While the assessment did notconsider climate change effects, it is intended that the design of flood resilience measures will.
Source: Emma Culleton, United Utilities
Climate change is a particularly serious issue in the east of England. Due to the extensive areas oflow-lying terrain, net sea-level rise is expected to affect this area more severely than elsewhere inthe UK. Anglian Water identified all areas within flood zone 2 (the 0.1 per cent (1 in 1000) annualprobability floodplain) and has produced a map of wastewater treatment works (WWTW) and WTWaffected by 0.4 metre rise in sea levels.
Source: Andy Brown, Anglian Water
Figure 9.6
Schematic of Anglian Waterassets at risk from sea level rise
Licensed copy:UNIVERSITY OF SURREY, 04/09/2015, Uncontrolled Copy, © CIRIA
Case study 9.4 Yorkshire Water Services Limited strategic level assessment
Case study 9.5 Flood risk assessment by Veolia Water Central
9.8.2 Scottish Water
Scottish Water initially undertook a preliminary flood risk assessment of its above-groundwater assets in 2007–2008, as a result of an overall investigation to target investment forasset resilience measurable failure modes. The primary focus for asset flood resiliencecentred on continuity of supply of wholesome potable water, resulting in the examinationof WTW, boreholes (BHs), raw water pumping stations (RWPS) and treated waterpumping stations (TWPS).
CIRIA C68858
Veolia’s assessment process adopted Ofwat’s service risk framework, which is an analyticalframework for assessing asset resilience to flooding (Ofwat, 2009c). Initially desktop analysis usingthe Environment Agency flood map identified that 109 sites were at risk. More detailedassessment, using information obtained from the Environment Agency’s flood mapping and datamanagement teams, coupled with on-site surveys of all 109 sites, identified that 61 sites werealready adequately protected. The site survey work included considering possible mitigationmeasures with the costs of which then factored into the overall cost.
The effect on customers was then assessed using Veolia’s established criticality rating for each site.This rating had already been developed for capital maintenance planning. The rating reflects
� the population served by each asset
� whether alternative supplies would be available and at what cost
� how long it would take to restore supplies by re-zoning, if this option is available.
The criticality ratings have been developed, however, on the assumption that single sites areaffected independently of each other. For some groups of sites this is unlikely to be the casebecause flooding of a valley might well affect many sites. Veolia carried out a simple assessmentbased on the criticality rating coupled with knowledge from the operations control staff. Theirknowledge of the physical relationship between sites and the availability of alternative suppliesreduced the list of sites where mitigation measures were required from 48 to 23. A further reviewwas undertaken focusing on the risk value of sites which resulted in a further three sites beingadded to the list. During the process described here, further Environment Agency maps based onrainfall became available via the local resilience forums.15 sites were surveyed and five consideredto be at risk of surface water flooding.
Alex Back, Veolia Water Central (formally Three Valleys Water)
Mouchel undertook strategic level flood risk assessments for Yorkshire Water Services Limited(YWSL). The study was required to provide YWSL with cost estimates for defending their criticalassets against flooding for their five year asset management plan (AMP5). Two concurrent studieswere undertaken: one for the clean water division and one for the wastewater division. Thewastewater study comprised two parts:
1 Initially 10 sites (WwTW and sewage pumping stations) were identified based on those witha history of flooding or which were particularly critical to YWSL’s operations. Site visits werethen undertaken to gather more specific information on the layout and flooding mechanisms.The site inspections assessed the following:
� the nature of the assets, their degree of criticality, site layout and general topography ofthe site and adjoining land
� details of the sources of flooding and any defences protecting the site
� possible future flood defences and any constraints which may impair their developmentand maintenance,
� the effect that future flood defences may have on nearby developments, as required byPPS25.
A database was developed to present and store all the data.
2 A range of other wastewater assets was identified as being at risk of fluvial or tidal floodingusing Environment Agency flood map (with a buffer zone added), supplemented by other siteswith a history of flooding from pluvial and groundwater sources.
A risk matrix was then developed based on the guidance by Ofwat (2009c) to determine the severityof flood risk to the assets. This took into account the probability of flooding and the consequencesof an asset being flooded. This matrix was later used to prioritise the investment planning.
Source: Caroline Jackson, Mouchel
Licensed copy:UNIVERSITY OF SURREY, 04/09/2015, Uncontrolled Copy, © CIRIA

Case study 9.6 Asset flood risk classification at Scottish Water
For this flood risk study “critical” assets were previously identified by Scottish Water, usingan existing defined rule set for criticality. This rule set being based around the followinginternally derived framework criteria:
� size, complexity and storage/standby capacity at the site
� performance of the site in terms of quality/compliance
� impact that the site has on costs, overall performance assessment (OPA) score andreputation
� quality of pro-active maintenance planning.
Each of these areas has varying degrees of weightings affecting ranking, from which anoverall critical assessment (OCA) score was derived. Assets are classed as high, medium orlow criticality. All assets that feature as high criticality (scored greater than 60 points out ofa possible 100) are considered to be “critical”.
Following on from a risk screening exercise a risk analysis was undertaken, whichcomprised of a vulnerability analysis via desktop surveys and impact analysis via site visits.A pro-forma questionnaire was used to gather information on the sites identified as beingat risk from the SEPA 0.5 per cent (1 in 200) annual probability floodplain analysis. Anextract is shown in Figure 9.8. This example is for a WTW.
Flood resilience and resistance for critical infrastructure, 2010 59
In considering flood risk exposure, three levels were identified using the red, amber and green riskexposure classification as indicated in Figure 9.6.
Figure 9.7 Flood risk exposure using the red, amber and green classifications
Source: Ian Hogg, Scottish Water
Licensed copy:UNIVERSITY OF SURREY, 04/09/2015, Uncontrolled Copy, © CIRIA

Figure 9.8 Scottish Water survey template example (WTW)
The questionnaire contained a matrix for particular asset processes, with each componentbeing assessed on vulnerability, probability of failure and consequence of failure. Thismatrix varied depending on the type of asset, with a different risk matrix used for WTW,water pumping stations and borehole components. Further text boxes were used in thequestionnaire to capture background information on the consequence of failure, currentprotection measures planned and recommendations for further actions.
For initial ranking purposes, an “asset flood risk score” was produced, where:
The probability of failure weighting factor uses 33 per cent for low probability, 75 per centfor medium and 100 per cent for high probability. Further refinements to align all thevarious asset types to a common risk currency were achieved by presenting the total assetflood risk score in percentage terms, independent of asset type where:
Asset processcomponent
Vulnerabilityscore
Probability offailure
Consequence offailure
Populationscore
Asset floodrisk score
Screening 10 10 10 10 40
Coagulation 1 1 10 10 7
Flocculation 1 1 10 10 7
Disinfection 1 1 10 10 7
Primary filtration 1 1 10 10 7
Secondary filtration 1 1 10 10 7
Treated water storage 1 1 1 10 4
Backwash watertreatment
1 1 10 10 7
Chemical dosing 1 1 10 10 7
Sludge disposal 1 1 3 10 5
Electrical panels 3 10 10 10 33
Electrical installation 3 10 10 10 33
Electricity supply 1 1 3 10 5
Access 1 10 10 10 31
Pumps 1 1 10 10 7
Buildings 3 10 3 10 26
Totals Total 235.27
1 = Not vulnerable3 = May be
vulnerable10 = Very vulnerable
1 = Low3 = Medium10 = High
1 = Insignificant3 = May be a
problem10 = Significant
problem
Asset flood risk 37%(aligned)
CIRIA C68860
Asset flood risk score = ∑ (vulnerability score + probability of failure score +consequence of failure score + population score) × probability of failure weightingfactor
Asset flood risk (aligned) (%) = total asset flood risk score/maximum total asset floodrisk score
Licensed copy:UNIVERSITY OF SURREY, 04/09/2015, Uncontrolled Copy, © CIRIA

By reviewing the information gathered at this interim stage, sites that featured highly interms of probability of failure were considered for further site visit investigations. Theinvestigations determined the potential impact should a water asset fail and were focusedon:
� all historically flooded water assets
� critical WwTWs and TWPS considered to be “at risk”
� BHs, RWPs and electrical substations associated with critical WwTWs considered to be“at risk”.
This resulted in a hierarchy of exposure to flood risk being established based upon thefollowing criteria:
� potential impact (population affected, availability of alternate supplies (storage andtankering)
� current exposure to flood risk (historic or predicted)
� time to start of outage (loss of supply).
This hierarchy was developed in preference to the initial ranked scoring system, due tothe uncertainties over the information contained in the SEPA flood maps, which areindicative only. As data improvements are recognised for flood mapping and climatechange, it is anticipated that a return to a risk-scoring approach to rank the assets mostvulnerable to flooding and most probable to affect customer service and environmentalpollution.
Flood resilience and resistance for critical infrastructure, 2010 61Licensed copy:UNIVERSITY OF SURREY, 04/09/2015, Uncontrolled Copy, © CIRIA

9.9 SUMMARY
Flood risk assessment to identify the precise nature of the risks is fundamental to any planto improve flood resilience. Unless those designing resilience measures have a goodunderstanding of the nature of the risk there is a danger that the measures will beinadequate or worse still be a complete waste of money. A review of internationalexperience of flood risk assessment implies that the flood hazard is better defined in theUK than elsewhere, with the possible exception of the United States.
The majority of organisations who have contributed to the development of thispublication have, in varying degrees, assessed the risk to their assets using national floodhazard maps such as those provided by the Environment Agency, SEPA and NIRA. Thesemaps provide indicative information on a limited number of annual probabilities of eventfor flooding from rivers and the sea only and do not generally include information onflood depths, the benefits afforded by existing defences or, except in Northern Ireland,variations that may occur due to climate change.
Some organisations have used the national flood maps to prioritise their investigationsand have then obtained more detailed information, including flood levels, at specific sites.This more detailed information is again largely pertaining to flooding from rivers and thesea, although some use has now been made of data on surface water flood susceptibility.Obtaining this data often required specialist consultants with knowledge of how to abstractthe necessary information from the Environment Agency’s flood mapping and datamanagement teams.
It is challenging for operators to assess the degree of exposure to surface, groundwaterand infrastructure failure flood hazards. SFRAs are a mechanism for providinginformation of this kind in England. SFRAs should also include an assessment andmapping of the implications of climate change. However, often local authorities, who areresponsible for producing SFRAs, as well as SWMPs, in areas with critical drainageproblems, face the same problems as infrastructure operators in generating thisinformation. Mapping of flood hazards from first principles is expensive. A risk-based,prioritised approach is required and the three levels of FRA advocated in the practiceguide (CLG, 2009) to PPS25 (screening, scoping and detailed study) provides a usefulframework when considered in conjunction with data on asset criticality.
Often information on flood levels for a wide range of annual probabilities, as well asquantitative data of use in assessing the implications of climate change has already beenderived by flood risk agencies or water companies, but accessing this information can bedifficult. There is a need for a national flood hazard register collating information onflood hazards from all sources in a consistent format and linked to a geographicalinformation system accessible to all operators of essential infrastructure.
To develop asset risk-rankings based on both probability and consequence, operators haveusually considered the direct consequences of flooding for their own operations andcustomers. Where exposure is slight, this may be sufficient. However, where assets systemsare highly exposed to the flood hazard, and high levels of investment are potentiallyrequired, valuing the full consequences may require a wider consideration of economic,environmental and social factors, as well as people’s willingness to pay. This process wouldbenefits from further research and guidance. This is discussed further in Chapter 11.
CIRIA C68862Licensed copy:UNIVERSITY OF SURREY, 04/09/2015, Uncontrolled Copy, © CIRIA

10 Current practice for adopting resistanceand resilience measures
10.1 THE FRM HIERARCHY FOR CRITICAL INFRASTRUCTURE
Providers of essential services, who are unacceptably exposed to the flood hazard, willneed to adopt a range of measures to manage the risks. A suggested hierarchy ofmeasures was introduced in Chapter 6, based on the practice guide to PPS25 (CLG,2009). This is adapted in Table 10.1 for the consideration of critical infrastructure.
Table 10.1 The flood risk management hierarchy for critical infrastructure
10.2 EXISTING GUIDANCE ON FRM FOR CRITICALINFRASTRUCTURE
No specific guidance on flood risk management for critical infrastructure is available inthe UK, which this publication aims to address. The most comprehensive design guidanceon flood resistance and resilience measures uncovered by the literature review is includedin a report by the ASCE (2006). This document categorises all structures on a grade of Ito IV where Category I structures are those that would cause minimal risk to human life ifthey failed and Category IV are essential facilities. The code covers all aspects of thedesign of civil structures in areas prone to flooding with a range of risk-based freeboardsrelative to the design flood elevation (DFE) for different types and categories of structure.
The American Lifeline Alliance (ALA) has developed three new publications (ALA, 2005a,b and c) providing utility system owners and operators with guidance on defining thescope of actions necessary to assess system performance during and after hazard events tosupport risk management decisions.
In Germany, a policy statement on flood risk management and critical infrastructure hasbeen prepared (Federal Office of Civil Protection and Disaster Assistance, 2006), with afollow-up guide that contains a checklist of flood resistance and resilience measures forbuildings and facilities (Federal Ministry of the Interior, 2007).
Flood resilience and resistance for critical infrastructure, 2010 63
FRM measure Example
AssessFlood risk assessment for a network of inter-connected CI systems commissioned by apartnership of asset owners and undertaken as an extension to a strategic flood riskassessment undertaken for a local authority
AvoidEnsure that the critical components of the asset system are not unacceptably exposedto the flood hazard by removing them from areas that are likely to flood
SubstituteWhere facilities are found to be at unacceptable risk, ensure that the essentialservices they provide can be substituted with alternatives during the period ofdisruption
ControlAdopt structural measures to make the asset flood resistant or flood resilient usingtemporary, demountable or permanent flood defences
MitigateAdopt measures, such as flood forecasting, warning, incident management andemergency response procedures and business continuity plans, to mitigate residualrisks
Licensed copy:UNIVERSITY OF SURREY, 04/09/2015, Uncontrolled Copy, © CIRIA

Sections 10.3 to 10.6 provide an overview of measures now used in the UK to manageflood risk, many of which are already being deployed by CI operators, as shown in thecase studies. Section 10.7 gives an overview of the issues associated with design standards.
10.3 NON STRUCTURAL MEASURES
10.3.1 Hazard identification, mapping and avoidance
Hazard identification and mapping is the subject of the previous chapter. The spatialplanning of new essential infrastructure such that flood hazards are avoided whereverpossible is the most effective means of managing flood risk. UK planning policy guidancepromotes this principle and is also designed to ensure that, where new assets areconstructed in flood risk areas, they are not only protected to an acceptable standardtaking climate change into consideration, but also do not increase flood risk elsewhere.Many infrastructure operators have powers to modify their assets, or construct certaintypes of new asset, without obtaining planning permission. If such ‘permitteddevelopment’ is to avoid creating new flood risks, it is important that operatorsnevertheless adopt the principles in PPS25, SPP7, TAN15 and PPS15.
10.3.2 Substitution and provision of reserve capacity
Substitution involves use of alternative assets to fulfil the functions of any assetstemporarily out of action due to flooding. A good example of this was National Grid’s useof alternative power generation facilities to feed the grid when Thorpe Marsh andNeepsend were temporarily out of action.
Reserve capacity is the capacity available within a system of supply that is not strictlyrequired to meet demand. For example, a water company’s service reservoirs may haveextra “redundant” capacity such that, if an unexpected failure occurs in a WTW, there issufficient potable water available to continue supplying customers until the WTW isrepaired. Provision of such “buffer” storage is a common technique used by watercompanies to reduce the risk of supply disruption.
10.3.3 Flood forecasting and warning
The Environment Agency, SEPA and NIRA provide a free forecasting and warning servicein the UK for river and coastal flooding. Coastal flood warnings can be provided severaldays in advance of an event occurring. In the upper catchments of rivers however, warninglead times can be very short, because the forecasts are based on rainfall-runoff models thatrequire measurements of actual rainfall depths to provide a forecast. Such forecasts are alsoless reliable than those that can be provided further down a river system, where real timemeasurements of river flow can be used to verify the outputs of rainfall-runoff models andany necessary adjustments can be made in the forecast. These forecasts can be used totrigger warnings using a variety of media directly to those in flood warning areas.
The need for appropriate escalation of these warnings to provide trigger levels forappropriate actions at a local level is one of the main lessons identified from recent floodevents in the UK as discussed in Chapter 8. To understand what these warnings mean fora particular asset can require further investigation to provide site specific triggers forspecific actions. Installing more river-level recorders close to a site may also help toimprove the accuracy of the forecasts.
Another important lesson identified was the need for better warnings of impendingpluvial and surface water flooding events. The Meteorological Office provides weather
CIRIA C68864Licensed copy:UNIVERSITY OF SURREY, 04/09/2015, Uncontrolled Copy, © CIRIA

forecasts and severe weather warnings. Weather radar can now be used to provideindicative estimates of rainfall depths based on observations of cloud cover. Such forecastsare not sufficiently reliable to provide accurate warnings of surface water flooding at aparticular location. However, if considered in conjunction with registers of known surfacewater flooding hot spots, and well developed incident management procedures, suchwarnings can be valuable to infrastructure operators.
10.3.4 Incident management and business continuity planning
Incident management procedures are designed to reduce the effects of a flood event byoptimising the response of all parties with a role to play in minimising the levels ofdisruption caused. An accurate forecast and timely flood warning, even if it is escalatedappropriately, is of limited use, if the appropriate responses are not clearly understood bythose responsible for incident management. Infrastructure operators need to be aware ofthe implications of flooding for their own assets as well as the systems on which theyremain functionally dependent, so that they can take appropriate actions to minimise therisk of the asset being affected. They also need to identify those parties potentially affectedby outage of their systems so that timely warnings can be provided if there is a risk ofoperational failure. An intimate knowledge of these effects and interdependencies issimilarly of little use, without a communication strategy designed to ensure that all parties,including the general public, are aware of what actions are appropriate at any one time.
Incident management is closely aligned to business continuity planning. Businesscontinuity plans should include registers of all issues with potential to disrupt businesscontinuity, as well as well-developed contingency protocols (eg BS 25999 1:2006, whichcovers business continuity management for extreme events). Such protocols may providevery good value for money when compared to structural solutions for maintaining servicecontinuity during rare floods. Often the business continuity plan for an asset will be thefirst port of call for those considering improvements in flood resilience.
10.3.5 Emergency exercises
Managing incident effectively cannot be achieved as an academic exercise. It frequentlyrequires co-operation between numerous organisations. Extreme events by their verynature occur only infrequently and often beyond the individual career experience of staffwho may be faced with managing the situation. Properly designed emergency exercisesand simulated incidents can help these individuals prepare for situations they could facein real time. Individual organisations often prepare and run their own exercises andtraining events for flood and emergency situations. Experience shows there is much to belearnt from flood emergency exercises where multiple agencies contribute and take part.A range of examples of planned and recent emergency exercises follows with furtherexamples provided in Section 10.9.1.
The Environment Agency is planning to stage Exercise Watermark to test thearrangements across England and Wales, and to respond to all aspects of severe, wide-area flooding. This is expected to be hosted between the 7 and 11 March 2011. However,as of September 2009, it is seeking support from Category 1 and 2 responders to assistwith the planning and development of the exercise.
In Wales, RAB Consultants were appointed via Environment Agency Wales to undertakethe development, delivery and review of exercise Watertight II, a strategic level, multi-agency exercise that explored inter-agency recovery and considered the welfare andeconomic issues that would arise when dealing with the recovery from major accidents.The exercise took place on 22 October 2009 in Colwyn Bay. The exercise was developedwith input from a multi-agency exercise design team, which consists of specialists from
Flood resilience and resistance for critical infrastructure, 2010 65Licensed copy:UNIVERSITY OF SURREY, 04/09/2015, Uncontrolled Copy, © CIRIA
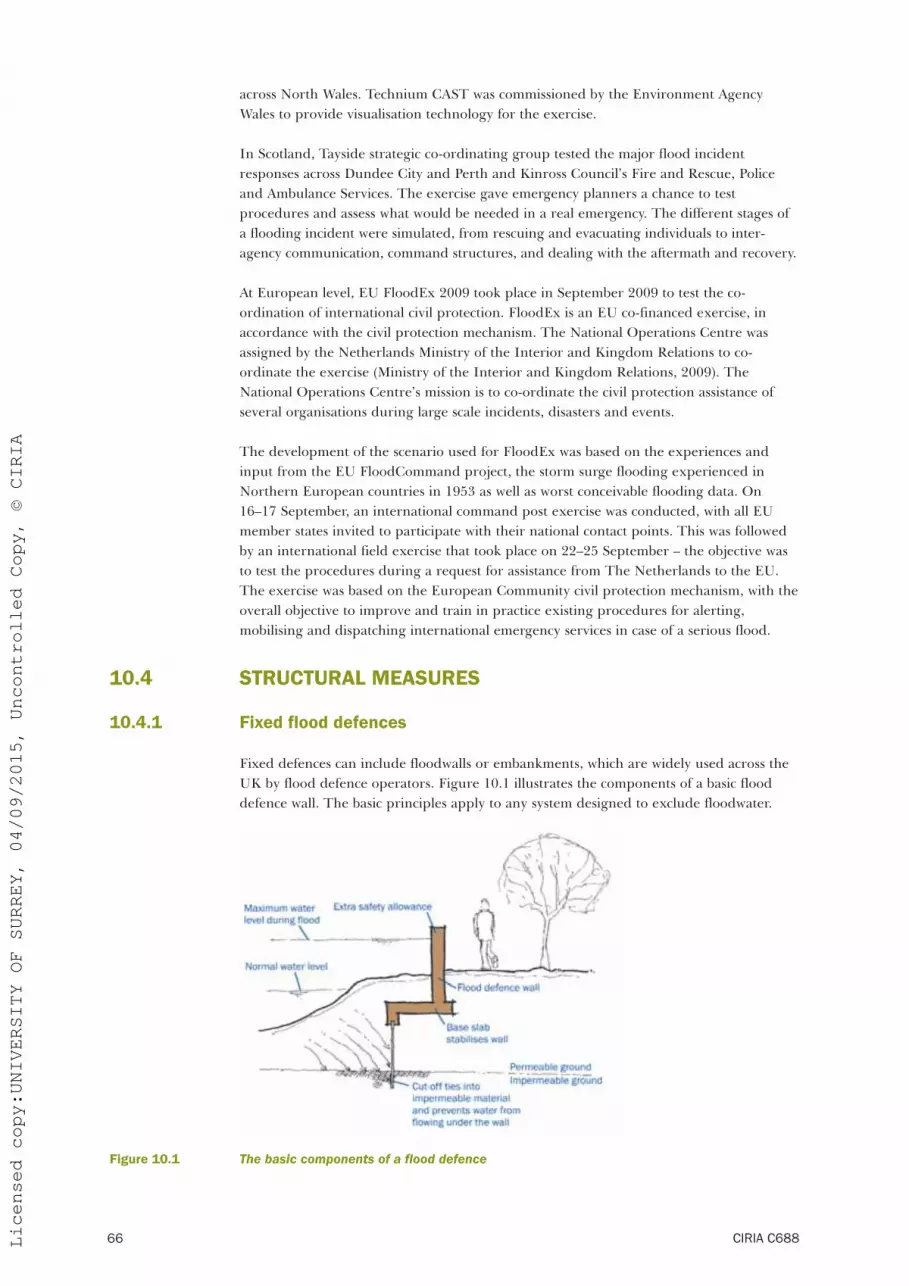
across North Wales. Technium CAST was commissioned by the Environment AgencyWales to provide visualisation technology for the exercise.
In Scotland, Tayside strategic co-ordinating group tested the major flood incidentresponses across Dundee City and Perth and Kinross Council’s Fire and Rescue, Policeand Ambulance Services. The exercise gave emergency planners a chance to testprocedures and assess what would be needed in a real emergency. The different stages ofa flooding incident were simulated, from rescuing and evacuating individuals to inter-agency communication, command structures, and dealing with the aftermath and recovery.
At European level, EU FloodEx 2009 took place in September 2009 to test the co-ordination of international civil protection. FloodEx is an EU co-financed exercise, inaccordance with the civil protection mechanism. The National Operations Centre wasassigned by the Netherlands Ministry of the Interior and Kingdom Relations to co-ordinate the exercise (Ministry of the Interior and Kingdom Relations, 2009). TheNational Operations Centre’s mission is to co-ordinate the civil protection assistance ofseveral organisations during large scale incidents, disasters and events.
The development of the scenario used for FloodEx was based on the experiences andinput from the EU FloodCommand project, the storm surge flooding experienced inNorthern European countries in 1953 as well as worst conceivable flooding data. On16–17 September, an international command post exercise was conducted, with all EUmember states invited to participate with their national contact points. This was followedby an international field exercise that took place on 22–25 September – the objective wasto test the procedures during a request for assistance from The Netherlands to the EU.The exercise was based on the European Community civil protection mechanism, with theoverall objective to improve and train in practice existing procedures for alerting,mobilising and dispatching international emergency services in case of a serious flood.
10.4 STRUCTURAL MEASURES
10.4.1 Fixed flood defences
Fixed defences can include floodwalls or embankments, which are widely used across theUK by flood defence operators. Figure 10.1 illustrates the components of a basic flooddefence wall. The basic principles apply to any system designed to exclude floodwater.
Figure 10.1 The basic components of a flood defence
CIRIA C68866Licensed copy:UNIVERSITY OF SURREY, 04/09/2015, Uncontrolled Copy, © CIRIA

The maximum water level constitutes the design flood level, with a given annualprobability of occurrence. The extra safety allowance above this level is known asfreeboard. In small, constrained watercourses water levels can be highly sensitive to smallincreases in flow and estimating design flood levels can be an imprecise process –freeboard allowances should be correspondingly generous. The Environment Agency hasprovided guidance on calculation of appropriate margins using a range of techniques(Kirby and Ash, 2000), which is being updated. Flood walls are seldom designed to befully watertight, but water seeping beneath and through a defence should be limited toacceptable levels – this often requires use of a seepage cut-off.
Design and construction of flood defences is a specialist field requiring input fromhydrologists, geotechnical and civil/structural engineers. The Construction (Design andManagement) Regulations 2007 (CDM2007) is likely to apply to projects involving designand construction of such measures.
The Concrete Centre has recently published guidance on the use of concrete for floodprotection (MPA–The Concrete Centre, 2009).
10.5 FLOOD RESILIENT AND RESISTANT CONSTRUCTION FORBUILDINGS
An important reference document by the Communities and Local Government establishestwo main strategies for achieving resilience: the applicability is dependent on the waterdepth the property is subjected to (CLG, 2007). The following definitions are taken fromthis publication:
Water exclusion strategy: where emphasis is placed on minimising water entry whilemaintaining structural integrity, and on using materials and construction techniques tohelp drying and cleaning. This strategy is favoured when low flood water depths areinvolved (not more than 0.3 m). This strategy can be considered as a resistance measurebut it is part of the aim to achieve overall building resilience.
Water entry plan: where emphasis is placed on allowing water into the building,facilitating draining and consequent drying. Standard masonry buildings are at significantrisk of structural damage if there is a water level difference between outside and inside ofabout 0.6 m or more. This strategy is favoured when high flood water depths are involved(greater than 0.6 m).
In the case of retrofitting of buildings to make them flood resistant, there are multiplepathways by which floodwater can pass through a set of resistance measures (see Figure10.3), that can make adopting a water exclusion strategy challenging. This is anotherreason why this technique is not recommended for flood depths greater than 300 mm.
Flood resilience and resistance for critical infrastructure, 2010 67Licensed copy:UNIVERSITY OF SURREY, 04/09/2015, Uncontrolled Copy, © CIRIA

Figure 10.2 Flood water penetration into buildings (adapted from ODPM, 2002 and CIRIA C624)
Flood resilience and water-entry strategies will often be more appropriate for assets athigh risk of flooding. Guidance has been generated by the National Flood Forum (2009)on a wide range of practical measures that can be undertaken to reduce the damageinflicted by floodwater to residential property and minimise the period it takes to get backto normal operation. Much of the CLG guidance on flood resilient buildings will also berelevant. It is important that specialist structural advice is sought wherever water-resistance measures, designed to retain more than 300 mm of water, are fitted to anexisting building.
10.6 TEMPORARY AND DEMOUNTABLE FLOOD DEFENCES
The definition of a temporary defence in Publicly Available Specification (PAS) 1188 (BSI,2003) is: “a removable flood protection system that is wholly installed during a flood eventand removed completely when water levels have receded”. This can be differentiated fromdemountable defences that have pre-prepared permanent foundations and/or mountingsystems. Full definitions and interim guidance are provided in the guidance by Defra andthe Environment Agency (2002). Suppliers and basic guidance on their use is providedup-to-date on the Environment Agency and SEPA websites. Further detailed guidancefrom the Environment Agency is being updated. There is now a range of BSI kite markedproducts available.
The Environment Agency is particularly experienced in the use of temporary flooddefences and was instrumental in setting up a kite mark scheme for these products. TheEnvironment Agency has produced a policy statement on their use (Environment Agency,
CIRIA C68868Licensed copy:UNIVERSITY OF SURREY, 04/09/2015, Uncontrolled Copy, © CIRIA
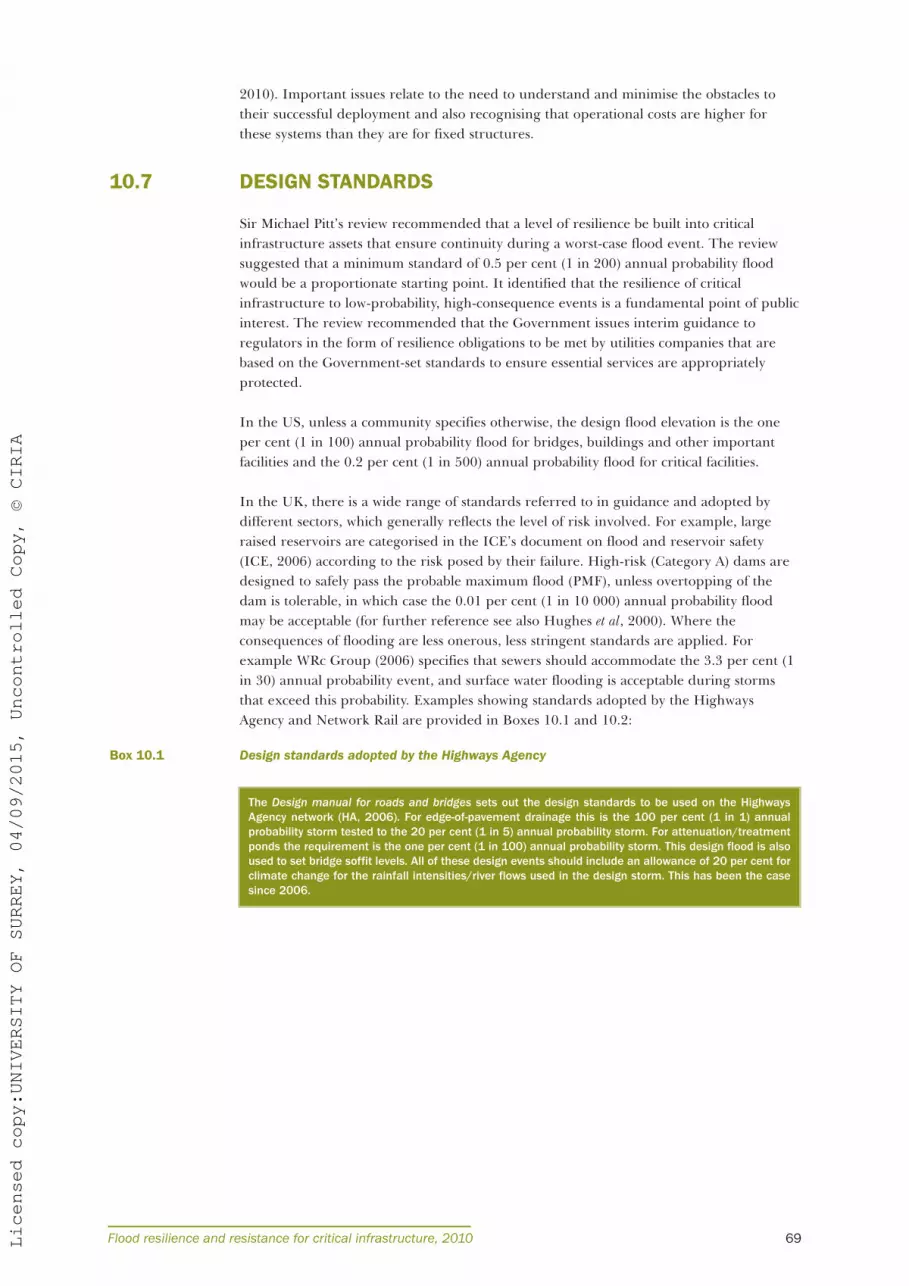
2010). Important issues relate to the need to understand and minimise the obstacles totheir successful deployment and also recognising that operational costs are higher forthese systems than they are for fixed structures.
10.7 DESIGN STANDARDS
Sir Michael Pitt’s review recommended that a level of resilience be built into criticalinfrastructure assets that ensure continuity during a worst-case flood event. The reviewsuggested that a minimum standard of 0.5 per cent (1 in 200) annual probability floodwould be a proportionate starting point. It identified that the resilience of criticalinfrastructure to low-probability, high-consequence events is a fundamental point of publicinterest. The review recommended that the Government issues interim guidance toregulators in the form of resilience obligations to be met by utilities companies that arebased on the Government-set standards to ensure essential services are appropriatelyprotected.
In the US, unless a community specifies otherwise, the design flood elevation is the oneper cent (1 in 100) annual probability flood for bridges, buildings and other importantfacilities and the 0.2 per cent (1 in 500) annual probability flood for critical facilities.
In the UK, there is a wide range of standards referred to in guidance and adopted bydifferent sectors, which generally reflects the level of risk involved. For example, largeraised reservoirs are categorised in the ICE’s document on flood and reservoir safety(ICE, 2006) according to the risk posed by their failure. High-risk (Category A) dams aredesigned to safely pass the probable maximum flood (PMF), unless overtopping of thedam is tolerable, in which case the 0.01 per cent (1 in 10 000) annual probability floodmay be acceptable (for further reference see also Hughes et al, 2000). Where theconsequences of flooding are less onerous, less stringent standards are applied. Forexample WRc Group (2006) specifies that sewers should accommodate the 3.3 per cent (1in 30) annual probability event, and surface water flooding is acceptable during stormsthat exceed this probability. Examples showing standards adopted by the HighwaysAgency and Network Rail are provided in Boxes 10.1 and 10.2:
Box 10.1 Design standards adopted by the Highways Agency
Flood resilience and resistance for critical infrastructure, 2010 69
The Design manual for roads and bridges sets out the design standards to be used on the HighwaysAgency network (HA, 2006). For edge-of-pavement drainage this is the 100 per cent (1 in 1) annualprobability storm tested to the 20 per cent (1 in 5) annual probability storm. For attenuation/treatmentponds the requirement is the one per cent (1 in 100) annual probability storm. This design flood is alsoused to set bridge soffit levels. All of these design events should include an allowance of 20 per cent forclimate change for the rainfall intensities/river flows used in the design storm. This has been the casesince 2006.
Licensed copy:UNIVERSITY OF SURREY, 04/09/2015, Uncontrolled Copy, © CIRIA

Box 10.2 Design standards adopted by Network Rail
In planning and designing measures to improve the resilience of existing infrastructure,often the cost of achieving new build standards can be disproportionate. Defra guidancespecifies that the appropriate standard for flood protection for existing dense urban areasat risk of fluvial flooding to be anywhere between a two per cent (1 in 50) to 0.5 per cent(1 in 200) annual probability flood, depending on the costs and benefits of the optionsidentified (Defra, 2009c). However, this guidance does not extend to prescribingappropriate indicative standards for critical infrastructure, which is discussed in therecommendations (Chapter 14) of this publication.
The following sections illustrate some of the resilience measures being adopted withineach sector.
10.8 ENERGY SECTOR
Several electricity substation sites have been fitted with temporary, demountable and fixedflood resistance measures following the work of ENA described in Section 9.4. A reporthas been issued to the Energy Emergencies Executive by the Substation Resilience-to-Flooding Task Group of the ENA, which outlines a variety of flood resistance measuresadopted and their associated costs (ENA, 2008). A range of data sheets for the productsthey have used are included in Appendix C of the ENA report. An example is provided inFigure 10.3.
CIRIA C68870
Civil engineering assets are:
� designed and maintained to be robust so that they remain fully operational during periods ofnormal and abnormal weather, and they do not fail catastrophically during periods of extremeweather
� designed so that they can be readily, and economically, repaired or replaced when their integrity orperformance is affected
� managed so that the safety of their users, and of the general public, is not at risk during periodsof extreme weather.
The predicted effects of climate change are taken into account in the design, construction, maintenanceand operation of civil engineering assets that have a long service life.
In the design of most (but not all) renewal and improvement works for civil engineering assets of NetworkRail, abnormal weather can initially be considered as:
� a 1 in 50 year event for primary routes
� a 1 in 25 year event for secondary routes
� a 1 in 10 year event for rural and freight only routes.
For all types of route, extreme weather can be considered as a 1 in 200 year event, but it may also beprudent or instructive to consider the difference in effects of a 1 in 500 year event when designing sometypes of asset, such as coastal defences.
Source: John Dora, Network Rail
Licensed copy:UNIVERSITY OF SURREY, 04/09/2015, Uncontrolled Copy, © CIRIA

Figure 10.3 An example of flood resistance measures used by members of the Energy NetworksAssociation (ENA, 2008)
Further to the guidance on the assessment and mitigation of flood risks discussed inSection 9.4, the ENA has established an emergency planning manager’s forum that allowssenior managers across the electricity industry to plan and develop good practice to dealwith storm incidents. They are sharing experiences and supporting each other withtechnical and manpower assistance during an emergency.
National Grid is developing a programme of resilience works based on development ofthe following for all sites known to be at risk that are not already protected:
� site-specific flood barrier deployment layout
� plan showing civil work required on each site to maximise the effectiveness of thetemporary barrier system
� long-term permanent defence options.
Flood resilience and resistance for critical infrastructure, 2010 71Licensed copy:UNIVERSITY OF SURREY, 04/09/2015, Uncontrolled Copy, © CIRIA

The results of surveys have refined the initial flood risk assessment, further reducing thenumber of sites at risk from the one per cent annual probability flood. A full report oneach site is expected March 2010. National Grid is committed to having permanentprotection on site for all sites without reliance on mobile flood defence barriers by 2020.They are seeking finance for permanent works through the 2012 price review. In themeantime many sites remain reliant on temporary flood barrier systems. They arecontinuing to develop their temporary flood barrier deployment capability. This hasincluded deployment exercises. National Grid has also adopted a flood risk monitoringprocess at Wokingham.
Less information has been provided or collated on power generation facilities. However,Case study 10.1 provided by RWE npower plc, demonstrates that even if the facilities arenot at risk, if supply routes are threatened this can have implications for continuity ofoperation. The case study illustrates that a range of simple measures can be taken tomanage the risks, if enough warning is received of an impending flood. Howeverunexpected situations (in this case a police roadblock), can highlight issues that may needto be taken into consideration in the future.
Case study 10.1 Experience of flooding at Great Yarmouth power station
CIRIA C68872
Great Yarmouth power station is a 400 MW combined cycle gas turbine power station located inGreat Yarmouth, Norfolk. The station is situated on a sandy peninsula 130 m east of the estuarineRiver Yare and 340 m west of the North Sea. The elevation of the site varies between 2.8 m and 5.6m above Ordnance Survey Datum.
The Environment Agency Flood Map indicates that the western half of the site is at risk of floodingfrom the River Yare and that the town of Great Yarmouth, including the station site, is at risk ofisolation from the mainland in the event of flooding.
On 8 Nov 2007 at about 16:00 hrs station staff received the first warnings of possible flooding fromthe Environment Agency’s Floodline flood warning service. Warnings were received by telephone, fax,email and SMS text message. The warning related to a predicted storm surge in the North Sea. It waspredicted that the main surge and highest threat of flooding would occur at high tide, about 07:00hthe next morning. Warnings were also received by radio (BBC Radio Norfolk) and a battery poweredradio was continuously monitored in the control room. Although adequate, it was noted that news onthe Environment Agency website was more useful than the announcements given over the radio,which were very generic in nature.
It is believed that the station may be capable of operation for a period of up to five days unlessflooding of the Turbine Hall itself (at 5 m elevation) occurred, but after five days, it would becomeincreasingly difficult to operate the station without supplies of spares and consumables that arenormally transported to the station by road.
It was decided that in the event of the flooding, the security guard would evacuate from hisGatehouse (at 2.8 m elevation) to the station control room located in the Turbine Hall (at 5 melevation), which is at relatively little risk of flooding. Should it be necessary he would switch offpower to the building at the main panel and would close the Gatehouse doors. It was agreed that hewould leave the main gate to the site open to help entry by the emergency services if necessary.Access to the site could also be helped by unlocking and opening an emergency gate (5.6 melevation) located on the eastern boundary of the site close to South Beach Parade Road. This gatewas identified as the exit route should flooding occur and evacuation of the station was called for.
During the night, station staff filled sandbags and placed them in front of the doors of the gasinsulated switchgear building, the electrochlorination building and the circulating water pumphouse.The sulphuric acid tank in the electrochlorination building was isolated to minimise the possibility ofan acid leak.
As it was predicted that station staff might be “cut-off” by flooding, a quantity of food and water waspurchased sufficient to last four persons for five days and this was stored in the control room. It wasalso verified that sufficient clothing, toiletries, etc. was available for the station staff.
As the surge approached, flooding did occur in areas of Great Yarmouth both north and south of thestation, however this flooding was very localised in nature and did not result in serious damage orinconvenience. There was a slight problem: station staff, attempting to enter Great Yarmouth to goto work and relieve the night shift, were stopped from entering the town by a police roadblock.However, this roadblock was lifted at about 07:30h. It is not known if police would have allowedaccess to the station had flooding been more severe in nature.
Source: Bruce Trayhurn, RWE npower plc
Licensed copy:UNIVERSITY OF SURREY, 04/09/2015, Uncontrolled Copy, © CIRIA

10.9 TRANSPORT SECTOR
10.9.1 Highways Agency
Recommendation 45 of the Pitt Review states that:
The HA, working through LRFs, should further consider the vulnerability of motorwaysand trunk roads to flooding, the potential for better warnings, strategic road clearance toavoid people becoming stranded and plans to support people who become stranded. (Pitt,2008)
In response to this recommendation the HA has introduced a range of measures outlinedas follows. These are in addition to the flood risk assessment and mapping work describedin Chapter 9.
Emergency planning managers and officers
In 2008, two new roles of emergency planning manager (EPM) and emergency planningofficer (EPO) for each region of the HA were introduced. These new roles are responsiblefor regional emergency planning and ensuring the Highways Agency discharges itsstatutory duties as a Category 2 responder under the Civil Contingencies Act 2004.
The EPMs and EPOs are undergoing training to ensure that they are in-line with theNational Occupational Standards (NOS) for Civil Contingencies and the EmergencyPlanning Society’s core competency framework, which maximise the potential capability ofstaff.
The EPMs are responsible for meeting the aims outlined in Recommendation 45 byformulating emergency plans and working closely with the LRFs, RRF and associatedworking groups.
Emergency planning exercise
The HA developed and delivered Exercise Extend in conjunction with West Mercia LRFas described in Case study 10.2.
Case study 10.2 Highways Agency Exercise Extend
Flood resilience and resistance for critical infrastructure, 2010 73
This multi-agency exercise was delivered in September 2008 to validate the West Mercia LRF draftevacuation framework and the HA emergency customer welfare (ECW) policy, as well as raisingawareness of the HMG evacuation and shelter guidance.
Exercise Extend focused on two flooding scenarios: evacuation of a major hospital and the in-situmanagement of a nursing home. This exercise was attended by over 100 delegates from the civilprotection community, including representation from the emergency services, local authorities,healthcare trusts, Government Office West Midlands, HA, DfT, military, British Red Cross (BRC) andother voluntary and private sector organisations. Exercise Extend was opened by Paul West, chiefconstable of West Mercia Constabulary, and chair of West Mercia LRF, who described the exerciseas a landmark event for the region.
Future exercises
One of the ways that the EPMs and EPOs are meeting Recommendation 45 is the development andanticipated delivery of six future multi-agency emergency exercises. The HA are planning tomanage further exercises in the financial year 2009–2010 within each of the other six agencyregions to test plans and processes with LRF partners for response to flooding with themesincluding strategic road clearance during an incident and the provision of ECW to strandedmotorists.
Source: Michael Whitehead, Highways Agency
Licensed copy:UNIVERSITY OF SURREY, 04/09/2015, Uncontrolled Copy, © CIRIA

Emergency customer welfare
In July 2006, following recommendations resulting from a detailed study, the HA Boardgave its approval for the development and later introduction of policy guidance and aservice capability for delivery of basic, emergency welfare to stranded motorists.
As part of a staged approach to emergency consumer welfare (ECW), interimarrangements were introduced in January 2007, with the British Red Cross (BRC)offering to provide voluntary assistance to the HA as part of their existing remit. Sincethen, more formal arrangements have been developed for providing ECW.
During 2006 BRC and WRVS (formerly known as Women’s Royal Voluntary Service) wereapproached by the HA to provide ECW support and in 2008 a memorandum ofunderstanding (MoU) outlining conditions was drafted and agreed for each organisation.These current agreements officially ended on 31 March 2009. The RSPCA agreed to leadon all animal welfare issues and will respond to provide emergency welfare to thosestranded on the HA’s network. Existing arrangements between the HA and RSPCA havebeen suitably updated to incorporate these other commitments.
The HA commissioned further work in February 2009 to produce a validation report todetermine to what extent the HA needs to be supported by third party organisations.
Access and egress from the highway system
Recommendation 45 states the HA should, in collaboration with LRF, consider strategicroad clearance to avoid people becoming stranded. With this in mind the HighwaysAgency secured funds to enable more access/egress points to be constructed on thenetwork. Area teams have been requested to identify suitable locations and a programmeof work will be developed for 2009–2010.
10.9.2 London Underground
London Underground applies demountable flood defences and also incorporates floodresistant, flood resilient or flood repairable building measures. London Underground alsocontributes towards publicly funded flood defences.
Tube Lines Limited operates an in-house flood forecasting and warning system, but alsoapplies temporary flood defences, demountable flood defences (ie removable systems withpermanent foundations and mountings) and permanent flood gates.
10.9.3 Network Rail
Current Network Rail guidance on flood resistance and resilience measures to takeaccount of the effects of climate change is as follows:
� for assets that are subject to the effects of water, such as drains, scour protectionsystems, retaining walls and earthworks, to be designed to the conditions described inTable B2 of PPS25
� for coastal and estuarine defences to be designed to the conditions described in TablesB1 and B2 of PPS25
� this advice could also be used when assessing the capacity of existing civil engineeringassets.
A guidance document by the Railway Group Standard (2004) is also used.
CIRIA C68874Licensed copy:UNIVERSITY OF SURREY, 04/09/2015, Uncontrolled Copy, © CIRIA

Network Rail made a submission to the Pitt Review team in 2007, in which three priorityareas are described:
1 The use of railway embankments as flood defences. Defra, the Environment Agencyand Network Rail have discussed this as a potentially economic way of protectingcommunities against flooding. However recognition should be made that the age,purpose and form of construction of railway embankments renders them unsuited toacting as formal flood defences. Network Rail has an obligation to maintain itsembankments as fit-for-purpose for carrying the railway and would look favourablyupon approaches to formalise and make funds available for the use of the railwaycorridor to help manage flood risks. Network Rail supports Pitt’s interim conclusionfor a local register of all the main flood risk management and drainage assets compiledby local authorities. Councils should work closely with asset owners, DfT and Defraover their local registers.
2 Network Rail has worked within the strategic flood planning framework run by theEnvironment Agency, for both inland and coastal flood and erosion planning.Experience of this process and evidence from the 2007 floods suggests to us that thisapproach has led to ten or more years of good (and developing) advice and guidanceconcerning people and property within the one per cent (1 in 100) annual probabilityfloodplain. However, this system has also led to a level of ignorance about theconsequences of more severe flooding events, the hindrance of recovery plans afterextreme events and a lack of attention to flood mitigation and national policy oninfrastructure, including rail.
Also, it is perceived that environmental considerations have affected the affordabilityand delivery of sound technical solutions to flooding and coastal erosion. This runscounter to the need to balance environmental concerns against social and economicfactors to achieve overall sustainability.
Pitt’s interim conclusion that the government should establish a systematic, co-ordinated, cross-sector campaign to reduce the disruption caused by natural events tocritical infrastructure and vital services is particularly welcomed by Network Rail.
3 Network Rail also welcomed the Pitt Review recommendation that the governmentshould develop and issue guidance on consistent and proportionate minimum levels ofprotection from flooding for critical infrastructure.
In their submission to the Pitt Review, Network Rail suggested that infrastructure isassessed against weather-based criteria for resilience. Network Rail advocatesstandards for infrastructure that set separate weather-based thresholds for trafficoperations and for structural integrity. For example, when the Network Rail primaryroute network is renewed it should permit safe operations in weather events up to atwo per cent (1 in 50) annual probability flood, and all civil engineering assets (whenrenewed) should be capable of withstanding adverse weather conditions for a 0.5 percent (1 in 200) annual probability flood. Consistent setting and application of weather-based standards would allow sectors to plan for, and respond to, extreme events morerobustly and with a more predictable outcome.
Flood resilience and resistance for critical infrastructure, 2010 75Licensed copy:UNIVERSITY OF SURREY, 04/09/2015, Uncontrolled Copy, © CIRIA

Case study 10.3 Network Rail’s use of flood outlines for siting of telecommunications installations
10.10 WATER SECTOR
Ofwat works with the industry and other stakeholders to develop a consistent andcoherent framework for assessing flooding risk and identifying cost-beneficial measures toimprove resilience of critical measures to improve the resilience of critical assets. Inparticular, Ofwat expects companies to be able to demonstrate that they have identifiedthe right set of measures to improve resilience, along with the timeframe for taking action.
CIRIA C68876
The FTN/GSM-R (qv) programme represents a £1.7bn investment to improve the reliability,availability, efficiency and safety of Britain’s railway through the adoption of proven modern digitaltelecommunications technology. It is the largest telecoms project ever to be undertaken on Britain’srailways. Over the six years from 2008 the project will provide a new, high functionality, digital radiosystem that will allow train drivers to speak directly with signallers across the entire network. Thisis GSM-R (global system for mobile communications – railway).
At the same time, the project is renewing the entire line-side fixed telecoms network that supportsall of the railway’s daily telecoms needs. This involves installing around 15 000 km of optical fibreand copper cables, 3000 new transmission sites, over 2250 new radio sites, seven new operationaltelephone exchanges and migration of circa 50 000 nr operational circuits. This is FTN (fixedtelecom network).
Why is this necessary?
Construction of the railway communications system (the collective name for FTN/GSM-R) will adoptnationally standardised equipment, significantly improving reliability and replacing ageinginfrastructure. It will provide a modern, highly structured and robust fixed telecoms networkdesigned to meet the operational needs of tomorrow’s railway and cater for Network Rail’s businesscommunications requirements.
Avoiding flood risk
The programme identified significant risks to system reliability where critical line-side equipmentmight become flooded. The programme’s engineering team approached the national structuresengineering policy team and sought access to the flood plain maps that reside in the Network Railcorporate GIS. These maps show flood outlines for 10 per cent, four per cent, two per cent, one percent and 0.4 per cent annual probability fluvial floods and were developed in 2003 by JBAConsulting. By avoiding the siting of, for example, transmission masts and their associatedequipment buildings in the flood plains as defined in the GIS the programme will achieve thedelivery of a flood-resistant communications system.
Source: John Dora, Network Rail
Licensed copy:UNIVERSITY OF SURREY, 04/09/2015, Uncontrolled Copy, © CIRIA

Case study 10.4 Consideration of flood resilience versus resistance at the Mythe WTW
Flood resilience and resistance for critical infrastructure, 2010 77
Flooding of the Rivers Severn and Avon in July and August 2007 affected the Mythe WTW in theGloucestershire area. Temporary defences, such as Hesco barriers and demountable defences on themain entrance and openings, were erected by Severn Trent Water Limited (STWL) following this eventto provide some level of protection should another such event occur (see Figure 10.4).
STWL commissioned Mouchel to undertake the designof the flood defences to protect the site while ensuringthe site maintained operational capability during a floodevent. A flood resilience assessment was carried out todetermine the most appropriate strategic defencetechnique.
The use of flood resilience techniques, such as localflood defences, flood-proofing and the raising ofsusceptible assets, were compared with the moretraditional approach of providing a flood defence barrier(a flood resistant technique).
A flood-resistant type scheme was the recommendedoption. As STWL requested that the site should remainfully operational for a flood event, the adoption of floodresilience techniques wholly or in part across the site willcompromise their operational capabilities. It would posesignificant health and safety risks to the operativesduring a flood event bearing in mind the potential depth(up to above 1 m) and velocity of flood water.
The flood resistant type scheme would be a defencearound the perimeter of the site comprising traditionalhard and soft defences where appropriate. As it is aroundthe perimeter of the site resilience measures, such as the
use of perimeter buildings as flood barriers where suitable, were investigated. Assessments of thesestructures and buildings across the site were undertaken to ascertain suitability for this purpose,such as flotation calculations and structural stability checks to ensure they could withstand thehydraulic forces.
Figure 10.5 Actual flood resistant measure employed at the Mythe WTW (a) and a 3D modelshowing the site protected from flood water (b)
STWL operational staff have been heavily involved with the choice of the final alignment so that thedefence does not impair their capability to operate the site during a flood event or otherwise.
Source: Paul Swift, Mouchel Ltd, Client: Severn Trent Water Limited. Principal contractor: Costain
Figure 10.4
Hesco temporary barriers erected atMythe WTW following the flood eventsof 2007
a b
Licensed copy:UNIVERSITY OF SURREY, 04/09/2015, Uncontrolled Copy, © CIRIA

CIRIA C68878
10.11 COMMUNICATIONS SECTOR
The UK’s major telecommunications companies including BT, Cable & Wireless, NTL andTHUS are all investing heavily in building “next generation networks” and arecollaborating on technical and commercial issues via the Ofcom sponsored NGNUK(2008). It is not clear to what extent flood risk is being factored into the design of thesesystems.
The HA, responsible for England’s motorways, has launched a ten year modernisationplan that will spend close to £500m on a single data network for the whole country.
As in the energy sector, Scada systems using radio links are widely used in the waterindustry to manage reservoirs and plants for monitoring and controlling water pressure,flows and reservoir levels. But these systems are then open to jamming and securityproblems relating to their use of the internet.
10.12 PUBLICLY-FUNDED FRM CAPITAL WORKS
Consideration of flood resilience for critical infrastructure needs to be undertaken withinthe context of a wider understanding of developments in publicly funded flood riskmanagement activity. This section focuses on recent developments in England, many ofwhich are mirrored in Wales, Scotland and Northern Ireland.
The forthcoming Floods and Water Management Bill is set to formalise evolutionarychanges in public sector flood risk management activity in England first set in motion bythe Easter 1998 floods. The intervening period has seen a move from flood defencetowards a “portfolio approach to flood risk management”. Defra’s strategy developed withthe Environment Agency was first put out to consultation in 2004. A programme ofactivities has also been introduced under the following themes:
� integrated approach: this theme focuses on the Environment Agency’s strategicoverview of flood risk from all sources. FRM policy is set strategically at rivercatchment scale by CFMPs and along the coast by SMPs. Strategies for capitalinvestment in flood risk management measures are then developed in flood riskmanagement strategies, which consider short, medium and long-term investmentneeds, taking climate change effects into consideration. There is a strong focus onflood hazard mapping, including consideration of pluvial, groundwater and nowreservoir breach flood hazards. Urban flood risk and integrated drainage also falls intothis theme, with local authorities tasked with preparing SWMPs for areas with criticaldrainage problems under the Environment Agency’s supervision
� achieving sustainable development: this theme covers new approaches to flood riskmanagement, and the development of “outcome measures” (discussed in Chapter 11)to prioritise expenditure. Also, sustainable techniques for achieving the government’sdevelopment agenda, including improved risk management, land-use planning andinvolving stakeholders. Flood alleviation projects are increasingly focused on workingin better harmony with natural processes, improving the environment and increasingbiodiversity. But the substantial focus is on community protection. The EnvironmentAgency has a target of increasing protection to 149 000 properties in the currentcomprehensive spending review period
� increasing resilience to flooding: climate change and coastal change adaptation andon helping communities to become more resilient. This includes the preparation ofguidance on flood resilient buildings developed with the Communities and LocalGovernment (see Section 10.5) as well as a grant scheme for local authorities,
Licensed copy:UNIVERSITY OF SURREY, 04/09/2015, Uncontrolled Copy, © CIRIA

administered by Defra, to encourage using resilience measures by residential propertyowners (Defra, 2009b). It also covers flood forecasting emergency preparedness andresponse
� funding: maximising funding opportunities. The majority of funding is from centralgovernment and it is recognised that the direct beneficiaries of flood alleviation workscould contribute more to the costs of such measures.
The regulatory framework, as outlined in Chapter 4, is different in Scotland, Wales andNorthern Ireland, but many of the themes from the Defra strategy (2004a) are mirroredin the approaches taken by the devolved administrations. This is important because:
� considerable sums of public money are being invested in flood risk managementcapital projects (>£250m pa in England and Wales)
� the Environment Agency and Defra have a major R&D programme, many of theoutputs of which are directly relevant to improving infrastructure flood resilience.Further details can be found at the Defra website www.defra.gov.uk
� a system of framework agreements is in place across England and Wales between theEnvironment Agency and consultants and contractors with specialist skills for adoptingflood resistance and resilience measures
� publicly funded resilience measures are focused on communities, and particularlyvulnerable residential properties, rather than on protection of critical infrastructure(discussed further in Chapter 11)
� pressure on the HM Treasury means that commercial beneficiaries of governmentspending on FRM activity may have to contribute directly towards the cost of schemesthat they benefit from.
The Environment Agency’s prioritisation of their capital spend takes the presence of CNIinto account, but information on the economic benefits of protecting this infrastructureare not necessarily factored into the initial ranking process (see Chapter 11). Case study10.5 is an example of flood resilience and resistance measures being adopted in othercritical infrastructure sectors.
Flood resilience and resistance for critical infrastructure, 2010 79Licensed copy:UNIVERSITY OF SURREY, 04/09/2015, Uncontrolled Copy, © CIRIA

Case study 10.5 Flood resistance measures installed at Safeway superstore, Lewes
CIRIA C68880
In the light of increasing flood awareness Safeway commissioned a risk assessment of all of theiroutlets and several stores were identified as being high flood risk. The most severely affected storewas in the town of Lewes in East Sussex and it was identified as the first to be defended.
Safeway’s requirements for the flood defence systems were stringent:
� the flood defence system should blend seamlessly with the store
� the flood barriers should not reduce any sales or warehouse space, should not obstructcustomers or trolleys and should be quickly operated by untrained staff
� all store refrigeration units were to remain operational during a flood event.
One of the most complex aspects of the flood defence was protecting the floor to ceiling windowswhich run along the entire supermarket front, these were not watertight and replacing them with apermanent flood wall was not acceptable to the client or to the local planning authorities.
The solution employed was to install a demountable barrier system inside the building immediatelynext to the windows. The system is left permanently in place, but it can be removed for cleaning andmaintaining the windows. The system is finished in Safeway corporate white to blend with thebuilding and incorporates an aluminium shelf running between the top of the barrier and the windowpreventing rubbish from being dropped behind the barrier and creating valuable extra display space.
The wide main entrance to the store presented problems as the area had to be completelyunrestricted and the barrier would be the last to be closed once the building was evacuated and themain doors locked.
The solution was to install an electrically operated drop-down barrier with manual over-ride. When notin use the barrier is housed in the ceiling void above the entrance and is automatically lowered bymeans of a secure key switch located outside the building.
Inside the store all emergency exit doors are fitted with slot-in barriers, with the flood boardsconveniently stored on wall brackets ready for immediate deployment in the event of a flood alert.
The warehouse loading bays are protected with slot-in barriers modified to clear the security rollershutters and accommodate the load leveller mechanism, without reducing warehouse and unloadingspace. In the plant room air intake and ventilation units are protected by semi-permanently installedbarriers that have been modified to give space around the units allowing free circulation of theairflow.
The one external concession that the local planners allowed was the construction of a bundedcompound for the emergency generator fuel store. This area is much lower than the main store andis at risk of flooding to a depth of two metres. A full height hinged watertight door was used to protectthe entrance to the compound.
Source: Flood Protection Association. Supplier: Flood Control Limited. Client: Safeway
Figure 10.6
Examples of flood resistancemeasures installed at Safewayssuperstore, Lewes
Licensed copy:UNIVERSITY OF SURREY, 04/09/2015, Uncontrolled Copy, © CIRIA

10.13 SUMMARY
A hierarchy of measures has been developed that can be used to manage the flood risksassociated with critical infrastructure (Table 10.1). One such hierarchy, that of avoidance,substitution, control and mitigation is embedded in latest spatial planning policy – mostexplicitly with the practice guide to PPS25 (CLG, 2009). When planning newinfrastructure, and modifying existing infrastructure, adoption of the principles ingovernment spatial planning policy, regardless of whether planning permission is actuallyrequired, should do much to improve flood resilience in the future. Industry guidance onasset management, maintenance and repair would benefit from inclusion of theseprinciples.
There is a wide range of options for improving the resilience of existing assets in floodrisk areas. These are both structural and non-structural. The case studies in Chapter 10illustrate that many non-structural measures are already being used including floodwarnings, incident-management procedures and business continuity plans.
There are several examples of where infrastructure operators have adopted physicalresilience measures. These comprise both fixed and demountable systems.
The standards of protection adopted have generally been aligned with existing industrypractice for new development: one per cent (1 in 100) annual probability in England, 0.5per cent (1 in 200) in Scotland. However, much of this work will have comprisedpermitted development.
Flood resilience and resistance for critical infrastructure, 2010 81Licensed copy:UNIVERSITY OF SURREY, 04/09/2015, Uncontrolled Copy, © CIRIA

11 Examples of FRM investmentprioritisation
11.1 INTRODUCTION
All infrastructure operators, whether public or private, are tightly regulated to ensure thatthey provide value for money. Communicating the benefits of long-term investments inbusinesses that do not reap immediate dividends for customers and/or shareholders isdifficult. There is little information available on people’s willingness to pay for measuresthat reduce the risk of occasional temporary disruption due to future flood events.Similarly, there are no rigorous studies available identifying what disruption to essentialservices by flooding costs the UK economy. This chapter provides some examples ofcurrent guidance and practice.
11.2 ENVIRONMENT AGENCY
As stated in Chapter 6, the focus of publicly funded flood risk management activities inthe UK is on the protection of existing residential properties and communities. Theoutcome measures summarised in Table 11.1 are used in England to prioritise the capitalspend.
Table 11.1 Outcome measures summary table
The schemes that achieve the highest scores are generally those that have a high benefit-to-cost ratio, protect large numbers of residential property. They also create newbiodiversity action plan (BAP) habitat or protect existing sites of special scientific interest(SSSI).
CIRIA C68882
Outcome measures Definition Minimum target
OM1
Economic benefits
Average benefit cost ratio across the capitalprogramme based on the present valuewhole-life costs and benefits of projectsdelivering in the SR07 period
5 to 1 average with allprojects having a benefit costratio robustly greater than 1
OM2
Household protected(see Note 1)
Number of households with improvedstandard of protection against flooding orcoastal erosion risk
145 000 households of which45 000 are at significant orgreater probability
OM3
Deprived householdsat risk
Number of households for which theprobability of flooding is reduced fromsignificant or greater through projectsbenefiting the most deprived 20% of areas
9000 of the 45 000households in OM2
OM4
Nationally importantwildlife sites
Hectares of SSSI land where there is aprogramme of measures in place (agreedwith Natural England) to reach targetcondition by 2010
24 000 hectares
OM5
UK biodiversity actionplan (BAP) habitats
Hectares of priority biodiversity action plan(BAP) habitat including intertidal created byMarch 2011
800 hectares – at least 300hectares should be intertidal
Licensed copy:UNIVERSITY OF SURREY, 04/09/2015, Uncontrolled Copy, © CIRIA

The Environment Agency uses a tool to prioritise flood alleviation schemes within itscapital programme. The ranking process is undertaken using a GIS-based system, theprimary input to which is the geographical area at risk from flooding associated with eachpotential project. A range of databases are included within this prioritisation tool as listedin Table 11.2. Those with an asterisk are used to establish an indicative outcome measurescore for the scheme, but information from the other databases, included the CNIdatabase, are taken into consideration in a review of the rankings.
Table 11.2 Datasets used to provide an initial ranking of priority flood alleviation projects
Note
* Datasets used to establish an indicative outcome measure score.
The NaFRA database is used to calculate the economic damages associated with floodingin a particular benefit area. At present, NaFRA does not take into consideration theeconomic benefit of protecting critical infrastructure, such as roads, railway lines andutilities.
Priority schemes are later introduced for full appraisal with scheme costs and benefitsconsidered in detail. Net present value costs and benefits are calculated for all shortlistedoptions, discounted at rates specified in HM Treasury (2003), generally over a 100 yearappraisal period. The rationale for economic appraisal is to identify the option thatprovides the highest overall benefit-to-cost ratio. However, this option often does notprovide an acceptable standard of protection. Defra issues guidance on indicativestandards of protection for different types of land-use and decision rules for theconsideration of options that have lower overall benefit-to-cost ratios but achieve anappropriate standard of protection. These decision rules are designed to ensure that moremoney is not committed to improving the standard of protection afforded by one schemethat would be more effectively spent elsewhere.
11.3 THE APPROACH ADVOCATED BY OFWAT
An industry-wide review into the 2007 floods and the implications for water andwastewater companies was presented by Water UK (2009). In analysing flood risk, Ofwat
Flood resilience and resistance for critical infrastructure, 2010 83
Dataset Needed for:
National flood risk assessment (NaFRA)* Economic damages
Risk bands
National Property Database (NPD v2)* Property numbers
SOA ward deprivation* Indices of multiple deprivation at SOA level
System asset management plan*
Whole-life cost
Viability
Cost profile
Environmental* designationsIndicator of possible legal constraints, needs oropportunities under EC Habitats Directive (1992)
National flood and coastal defence database Residual life/condition grade
Critical national infrastructure (CNI) Presence of CNI
Catchment vulnerability Identify locations of more vulnerable communities
S/CFMP policy units Policy direction
Licensed copy:UNIVERSITY OF SURREY, 04/09/2015, Uncontrolled Copy, © CIRIA
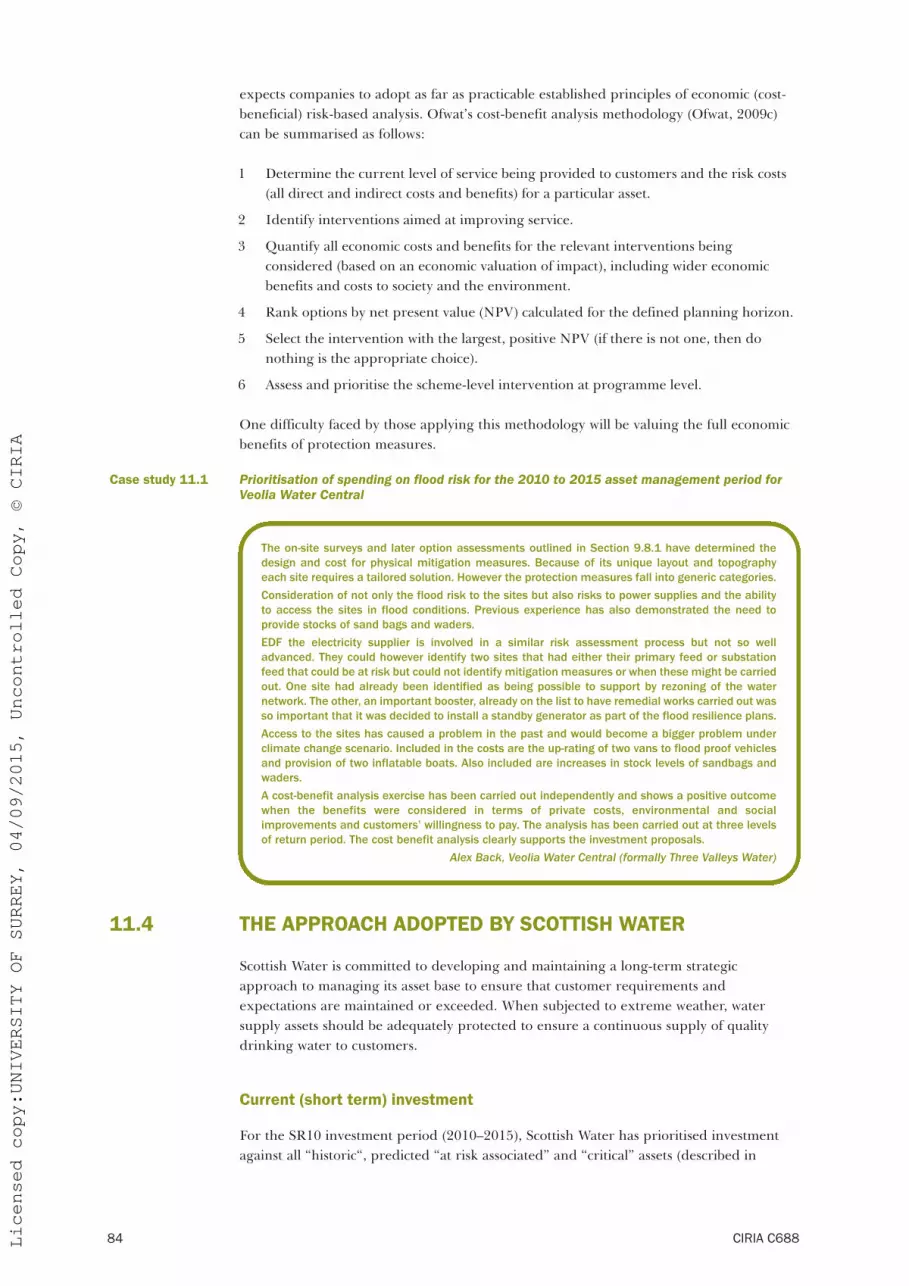
expects companies to adopt as far as practicable established principles of economic (cost-beneficial) risk-based analysis. Ofwat’s cost-benefit analysis methodology (Ofwat, 2009c)can be summarised as follows:
1 Determine the current level of service being provided to customers and the risk costs(all direct and indirect costs and benefits) for a particular asset.
2 Identify interventions aimed at improving service.
3 Quantify all economic costs and benefits for the relevant interventions beingconsidered (based on an economic valuation of impact), including wider economicbenefits and costs to society and the environment.
4 Rank options by net present value (NPV) calculated for the defined planning horizon.
5 Select the intervention with the largest, positive NPV (if there is not one, then donothing is the appropriate choice).
6 Assess and prioritise the scheme-level intervention at programme level.
One difficulty faced by those applying this methodology will be valuing the full economicbenefits of protection measures.
Case study 11.1 Prioritisation of spending on flood risk for the 2010 to 2015 asset management period forVeolia Water Central
11.4 THE APPROACH ADOPTED BY SCOTTISH WATER
Scottish Water is committed to developing and maintaining a long-term strategicapproach to managing its asset base to ensure that customer requirements andexpectations are maintained or exceeded. When subjected to extreme weather, watersupply assets should be adequately protected to ensure a continuous supply of qualitydrinking water to customers.
Current (short term) investment
For the SR10 investment period (2010–2015), Scottish Water has prioritised investmentagainst all “historic“, predicted “at risk associated” and “critical” assets (described in
CIRIA C68884
The on-site surveys and later option assessments outlined in Section 9.8.1 have determined thedesign and cost for physical mitigation measures. Because of its unique layout and topographyeach site requires a tailored solution. However the protection measures fall into generic categories.
Consideration of not only the flood risk to the sites but also risks to power supplies and the abilityto access the sites in flood conditions. Previous experience has also demonstrated the need toprovide stocks of sand bags and waders.
EDF the electricity supplier is involved in a similar risk assessment process but not so welladvanced. They could however identify two sites that had either their primary feed or substationfeed that could be at risk but could not identify mitigation measures or when these might be carriedout. One site had already been identified as being possible to support by rezoning of the waternetwork. The other, an important booster, already on the list to have remedial works carried out wasso important that it was decided to install a standby generator as part of the flood resilience plans.
Access to the sites has caused a problem in the past and would become a bigger problem underclimate change scenario. Included in the costs are the up-rating of two vans to flood proof vehiclesand provision of two inflatable boats. Also included are increases in stock levels of sandbags andwaders.
A cost-benefit analysis exercise has been carried out independently and shows a positive outcomewhen the benefits were considered in terms of private costs, environmental and socialimprovements and customers’ willingness to pay. The analysis has been carried out at three levelsof return period. The cost benefit analysis clearly supports the investment proposals.
Alex Back, Veolia Water Central (formally Three Valleys Water)
Licensed copy:UNIVERSITY OF SURREY, 04/09/2015, Uncontrolled Copy, © CIRIA

Section 9.8.2), regardless of the magnitude of customer impact. This entails putting inplace contingencies as soon as practicable, followed by protection measures thereafter.
The situation regarding waste water assets is less clear. Scottish Water has identified itsposition through alignment with SEPA 1:200 fluvial and coastal flood maps. Scottish Waterintends to clarify the risk position for the investment period 2010–2015 through a desktoprisk screening of all its WW assets. Also, it intends to carry out flood risk assessments ofcritical WwTW and WwPS.
Future investment approach
Scottish Water is wholly reliant on government approved funding, which is broadlycategorised under “capital maintenance”, “quality”, “growth” or “enhancement”.Prioritisation of investment is justified using Scottish Water’s Investment Support System(SWISS) tool. This tool considers “risk”, which is then promoted to a “need” and scoredconsistently against business output performance measures (OPMs). These are thenbalanced against “benefit” with regards to the “need”. This allows investment scenarios tobe tested, ranked and optimised solutions to be derived against allocated funds.
When considering investment against flood risk, the mechanisms of SWISS typicallyproduce low benefit scores due to the large investment costs, with the potential fordeferred investment decisions.
The true extent of a 0.5 per cent (1 in 200) annual probability floodplain and furtherclimate change elements are still unclear, particularly for assets classified as “at risk”. So, itis difficult to initially justify vast investment sums to adopt full-scale defence measures. Anideal situation would seek to employ an avoidance solution that reduces all aspects offlood-related risk but this is not always practical, either through cost-benefit or due tostrategic positioning of the asset affecting other stakeholders.
As investment cycles progress, a staged-solution investment approach that considersincreasing physical protection is possible through “mitigation”, “defence” or “avoidance”.Such defences would be either Scottish Water only, or involving joint stakeholders.Direction would be provided by SEPA acting as “competent authority” in response toobligations set out in the Flood Risk Management (Scotland) Act 2009 (ScottishGovernment, 2004). This will mean using the optimum level of flood resilience at theearliest opportunity, while considering possible future measures as data confidence inflood mapping and climate change impact predictions improves. Avoidance opportunitiesmay occur at an earlier stage within the 25 year strategy and planning window, asidentified through anticipated mid-life and end-of-life scenarios affecting assets. Theseopportunities whether through capital maintenance, quality, growth or enhancement canthen be considered to support the flood resilience investment need as identified via otherlinked long-term asset strategies (LTAS). For example:
1 Water quality enhancements to a vital process treatment sub-asset that allows theopportunity to elevate sub-assets to a higher safe level.
2 Asset rationalisation brought about through savings in asset life cycle costs as ScottishWater lessen leakage, or through stricter water quality legislation.
3 High capital maintenance anticipated through the need to replace ageing sub-assets.
The various increased levels of protection are categorised and aligned as shown inTable 11.3.
Flood resilience and resistance for critical infrastructure, 2010 85Licensed copy:UNIVERSITY OF SURREY, 04/09/2015, Uncontrolled Copy, © CIRIA

Table 11.3 Asset flood risk protection categories and aligned solutions
Investment prioritisation (25 year horizon)
In mapping out asset resilience LTAS, Scottish Water are considering the strategicapproach for flood resilience protection investment activities over the short, medium andlong-term. Flood protection methods to safeguard assets classified against flood riskexposure are being considered with respect to an investment timeline as shown inTable 11.4.
Table 11.4 Short, medium and long-term investment
CIRIA C68886
Protectioncategory
Cat 1 Cat 2 Cat 3 Cat 4 Cat 5
Solution(s)method
Unprotected Contingency Mitigation Defence Avoidance
SolutionDo nothing –accept risk
SecureProtectbuilding fabric
Divert floodpath
Upgrade/elevate/remove
Investmentperiod
Solution(s)method
SW flood risk exposureclassification
Comments
2010–2015
Contingency“Previously affected”, and“near misses”
Water assets
Mitigation“Previously affected”, and“near misses”
Water assets
Unprotected All classifications Waste water assets
Avoidance All assetsOpportunities – linked across otherLTAS for water and waste water assets
2015–2020
Contingency “At risk” (1:200) Water assets
Contingency“Previously affected”, and“near misses”
Waste water assets
Mitigation “At risk” Water assets
Mitigation“Previously affected”, and“near miss”
Waste water assets
Avoidance All assetsOpportunities – linked across otherLTAS for water and waste water assets
2020–2025
Contingency “At risk” (1:200) Waste water assets
Mitigation “At risk” (1:200) Waste water assets
Defence“Previously affected” and“near miss”
Water assets
Avoidance All assetsOpportunities – linked across otherLTAS for water and waste water assets
2025–2035
Defence“Previously affected” and“near miss
Waste water assets
Avoidance All assetsOpportunities – linked across otherLTAS for water and waste water assets
Licensed copy:UNIVERSITY OF SURREY, 04/09/2015, Uncontrolled Copy, © CIRIA

11.5 NATIONAL GRID
National Grid plan to prioritise their investment in permanent flood defence measuresbased on flood likelihood. Stage 1 of their programme will reduce risk to sites at risk froma one per cent annual probability flood. Stage 2 will aim to reduce risk to sites at risk froma 0.5 per cent annual probability flood. Flood risk will be managed with temporary flooddefence until permanent works can be installed.
11.6 OTHER
Case study 11.2 is for a defence facility and illustrates how other organisations, in a similarfashion to Scottish Water, are developing short, medium and long-term options forimproving flood resilience.
Case study 11.2 Defence facility flood mitigation strategy and investment planning 2009
Flood resilience and resistance for critical infrastructure, 2010 87
A high-value critical asset, situated on a floodplain has a history of severe flooding. Political andoperational demands meant this risk to the site had to be minimised, not only in the long-term butalso in the intervening period. As a result a programme was developed to reduce long-term-siteexposure to flooding while delivering maximum levels of site resilience with near-immediate effect.
Short-term solution
Retro-fit resistance measures to vulnerable buildings, which uses PAS 1188:1 (BSI, 2003),accredited flood guards to doors and vents and non-return valves to drainage etc. Other measuresinclude locating and sealing leak paths and resolving building fabric issues. This will require aminimal investment of £750 000 against 50+ buildings to be delivered within twelve months. Thesolutions are simple and require no consultation or planning permission. They can also be deployedby general staff with minimal training and warning. However, human intervention and maintenanceprogrammes are required and protection is limited by the structural strength of the buildings.
Medium-term solution
Build perimeter defences from a mixture of permanent and (rapidly-deployable) demountable floodprotection products as per PAS 1188:2 (BSI, 2003) accredited Rapidam. Underground seepagepaths and watercourses will require extra measures, such as penstocks and non-return valves. High-volume pumps will deal with groundwater, rainfall and any seepage.
This will provide further (or primary) levels of protection requiring an investment of circa £2m andwill take in the order of one year to design and construct. Planning of the demountable componentswill take into account the limitation of available flood warnings as well as emergency operationplans including the availability of manpower resources 24 hours a day, seven days a week.Maintenance programmes for both permanent and demountable components will be required.
Being of site scale, any displacement of floodwater may require the approval of the EnvironmentAgency. Hydrological modelling and consultation with various internal/external organisations willbe required to demonstrate that the measures will not increase flood risk elsewhere. It is possiblethat provision of compensatory floodplain storage may be required.
Long-term solution
In the long-term, critical functions are to be relocated to above 0.01 per cent (1 in 1000) annualprobability flood level as part of a scheme to replace an ageing facility with a state-of-the-art assetto take the organisation through the century. This will effectively remove the asset from exposureto the hazard.
Source: Gavin George, Flood Guards Systems Ltd
Licensed copy:UNIVERSITY OF SURREY, 04/09/2015, Uncontrolled Copy, © CIRIA

11.7 SUMMARY
Adopting physical resilience and resistance measures in the aftermath of the 2007 floodshas occurred most rapidly in areas affected by flooding during that event. This initialactivity has been more reactive rather than risk-based. However, risk-based investmentplans have been developed by some, particularly in the water and energy sectors. Forprivatised energy and water companies, this investment may need to be reviewedfollowing price determinations by the economic regulators.
Investment prioritisation requires adopting a long-term strategic approach. Floodmapping information is constantly improving, as is the understanding and mapping ofclimate change-related flood risks. These improvements need to be accompanied by agrowing understanding of costs, benefits and customer’s willingness to pay. Using thisinformation and taking a long-term view, owners will be better placed to balance risks andensure optimised investment decision making.
CIRIA C68888Licensed copy:UNIVERSITY OF SURREY, 04/09/2015, Uncontrolled Copy, © CIRIA

12 Interdependencies and cross-sectorcollaboration
Critical infrastructure is highly interdependent. Building a greater level of resilience intothe UK’s CI systems will not be achievable without high levels of collaboration within andbetween sectors.
During the project workshop (see Supporting document 2), one session aimed to identifythe principal vulnerable components of the main assets as well as the functionaldependencies contingent to their continued operation. The visualisation in Figure 12.1was used at the workshop as an aid to discussion.
Figure 12.1 Visualisation of a major flood affecting an urban conurbation (courtesy Arup)
The results of the workshop are contained in Supporting document 2, and the mainfindings are summarised in Table 12.1.
Flood resilience and resistance for critical infrastructure, 2010 89Licensed copy:UNIVERSITY OF SURREY, 04/09/2015, Uncontrolled Copy, © CIRIA

Table 12.1 Examples of infrastructure asset vulnerability and functional dependencies
CIRIA C68890
Asset Vulnerable components Functional dependencies
Water treatment works
Pumps
Sand filters
Chemical stores
Control room
Telemetry systems
Screen filters and valves
M&E equipment
Staff/operatives
Transport vans etc
Supply pipes
Power supply
Water
Communications and IT systems
Transport and access
Railway line and station
Track
M&E equipment including powertransmission
Lighting
Signals, fire alarms and telemetrysystems
Bridges, embankment, cuttings etc
Oil interceptors
Passengers
Trains
Power (for M&E equipment)
Communication (internal andexternal)
Transport and access
Water
Telephone exchange
Back-up generators
All equipment at low level
Diesel supply storage
People
Access
Radio/mobile
IT software
Cables entry
Power
Communication
Transport
Access
Water
Hospital
People – staff and patients
Equipment
Building services
Access
Supplies
A&E theatres
Chemical and fuel stores
Stores of medicine
Back-up systems and generators
Power (mains and standby)
Water
Communication
Transport
Emergency services
Staff
Food
Broadband antennae
Transmitters
Cables
IT software
Control systems (switch gear)
The structure itself
Power
Mains on standby (fuel stores)
Power station Generation equipment
Cables
Power supplies
Staff and operatives
Control room equipment
Fuel stores
Transport for fuel
Communication to link to grid
Cooling system
Waste removal
Security systems
Power
People
Access
Communication and IT systems
Water
Transport
Licensed copy:UNIVERSITY OF SURREY, 04/09/2015, Uncontrolled Copy, © CIRIA

Table 12.1 (contd) Examples of infrastructure asset vulnerability and functional dependencies
The workshop illustrated how cross-sector collaboration is the most effective means ofbuilding an understanding of inter-dependencies. It also demonstrated how usefulaccurate visualisation tools can be in highlighting the implications of flooding for networksof interconnected infrastructure systems.
The questionnaire survey and workshop identified that there are numerous obstacles toeffective collaboration, including:
� a lack of resources, ie funding, people and skills
� concerns over data sharing and national security or commercial sensitivity
� lack of a common technical vocabulary familiar to all parties
� a lack of accessibility to detailed flood data beyond the national flood maps and the useof non-standard formats for generation of the data that is available.
Also, there are instances where Category 2 responders have felt sidelined in the civilcontingency planning process. The Civil Contingencies Act 2004 requires organisations toco-operate and share information, assess the risk of emergencies and prepare emergencyplans, inform the public, provide business continuity advice and promote businesscontinuity management.
Case studies 12.1 to 12.6 illustrate the potential and actual benefits of collaborativeworking. Category 2 responders have been heavily involved with several projects.
Flood resilience and resistance for critical infrastructure, 2010 91
Electricity substation Back-up generators
Cables, transformers and otherequipment
Access
Security (many are unmanned)
Power
Communication and IT systems
Transport and access
Supermarket Equipment (tills, fridges, freezers)
Power supply (lights)
Supply chain (transport)
Access for staff/customers
IT systems
Security
Power
Access (transport)
Water
People
Fire station Vehicles
Equipment
Staff
Multi-agency control centre
IT and telecom systems
Access
Communications and IT systems
Transport and access (highways)
Power and fuel stores
Staff
Licensed copy:UNIVERSITY OF SURREY, 04/09/2015, Uncontrolled Copy, © CIRIA

Case study 12.1 Strategic infrastructure delivery plan in Gloucestershire
Case study 12.2 The Integrated Strategic Drainage Board in Hull
CIRIA C68892
Delivery and planning of infrastructure required a systematic approach that is flexible andresponsive to change. Collaboration ideally brings together infrastructure providers, localplanning authorities and local strategic partnerships. Addressing these issues GloucestershireCounty Council introduced their strategic infrastructure delivery plan. The plan is to co-ordinatethe work of service providers and other sectors and also covers the wider social, political andenvironmental considerations. There is a strong link to GIS that allow production of infrastructuremaps. It also allows the analysis of options for co-location of services.
Source: Nigel Riglar, Gloucestershire County Council
The floods that affected Hull in June 2007 were devastating to the built environment, primarilyhousing stock with well over 8000 properties affected and many others experiencing some damagefrom secondary flooding. The flood had immediate and on-going social and economic consequencesfor Hull and the wider region. The area is left with an indelible flood “memory”, with the directphysical and social consequences still evident and continually emerging, together with anembedded feeling of uncertainty within the city’s communities. Flood risk also presents uncertaintyto all forms of investor as well as local communities.
The Integrated Strategic Drainage Board for Hull was established following the floods. In December2008 a sub group, the Integrated Strategic Drainage Task Group, was formed as a multi-agencyresponse to the risk of all forms of flooding in Hull and the surrounding area. The partnerorganisations involved in the Partnership are Hull City Council, the Environment Agency, YorkshireWater Services and the East Riding of Yorkshire Council (as observer).
The focus of the partnership is to adopt fit for purpose investment programmes within the City ofHull, maximising all available resources to mitigate risk with the greatest integration of actions. Thepartners intend to use an evidence based approach to seek further funding from regional, nationaland European sources. The overall objective of the project was to provide the business andinvestment cases to mitigate the risk of all forms of flooding and create a flood mitigationinfrastructure programme for the City of Hull.
The Integrated Strategic Drainage Partnership is determining the scope for a comprehensiveintegrated drainage study. This will inform the work of the Partnership and assist them in developingrisk mitigation strategies. The Partnership is also scoping the areas for joint working at a local levelto realise more immediate benefit from emergency planning.
Achievements to date have included:
� securing bidding for £50 000 for pilot SWMP from Defra
� securing £40 000 from Environment Agency partnership agreement to add value to SWMP
� securing Environment Agency local levy funding for potential aqua-greens post SWMP
� SWMP works commissioned to report in October 2009.
Source: David Gibson, Hull City Council
Licensed copy:UNIVERSITY OF SURREY, 04/09/2015, Uncontrolled Copy, © CIRIA

Case study 12.3 Local resilience forum in Hull
Flood resilience and resistance for critical infrastructure, 2010 93
In response to the Civil Contingencies Act 2004 legislation Hull City Council, in partnership withresponders in the Humber sub-region, developed a new framework at a local level to provide civilprotection. The Humber local resilience forum is a chief officer led group made up of all Category 1responders who collectively formulate local policies and protocols to meet the requirements of theCivil Contingencies Act 2004. Several working sub groups have been established to consider specificaspects of emergency planning and civil contingency. Above the local resilience framework there isa regional resilience forum for Yorkshire and the Humber on which members of the Humber localresilience forum sit. Collectively this body formulates regional policies in-line with the CivilContingencies Act 2004 that supports the national framework.
Hull City Council operates an emergency planning partnership with other local authorities in theHumber area. In March 2007 the Humber Emergency Planning Partnership were awarded Beaconstatus. The Beacon Scheme identifies excellence in local government and recognises innovation.
Each member of the Humber Emergency Planning Partnership has developed its own emergencyplan. Hull City Council’s emergency plan documents clear procedures for activating the Council’sresponse to a major incident, provides actions for the Council’s strategic and tactical emergencymanagement teams and background information for use during the response to a major incident.The plan covers all the Council’s generic and specific emergency plans and those of its partners.
The emergency plan was tested in June 2007 when Hull experienced severe flooding. Hull CityCouncil and its partners responded quickly to the crisis enacting their emergency plan. Theapproach taken by the Humber Emergency Planning Partnership through the local resilience forumallowed the Council and its partners to address emergencies in a more effective, consistent andcomprehensive way. During the emergency most of Hulls emergency plan arrangements workedextremely well however adjustments were needed to take account of the nature of the flooding –pluvial as opposed to tidal or estuarine flooding. For example, several rest centres were identified inthe emergency plan but all were flooded. Rest centres in the city centre have now been identified.Valuable lessons were learned from the emergency and these have gone on to inform theemergency plan and the work of the Humber Emergency Planning Partnership.
Source: David Gibson, Hull City Council
Licensed copy:UNIVERSITY OF SURREY, 04/09/2015, Uncontrolled Copy, © CIRIA

Case study 12.4 Flood risk and resilience in North Wales
CIRIA C68894
In 1990 failure of the sea defences along the North Wales coast caused severe flooding at Towyn.The flood water affected much of the low voltage network and also several of the 11kV substationsin the area. The flood waters caused loss of supply to a significant number of customers. Therecovery and restoration of electricity supplies took weeks rather than days and in the 12 monthperiod following the flood there was a huge increase in the number of low voltage (LV) cable faultsexperienced.
It is difficult to translate from 1990 what the effect of such an event would be now. While thesituation in 1990 was bad, the extent of the flooding and the damage caused would have been farworse if say for instance the weather had been worse or there had been a high spring tide.
Engineering staff present at the time of the Towyn floods recall that Manweb (along with many otheragencies) received a considerable amount of good press at the time for their response to thesituation. Repair work and multi-agency co-operation was clearly visible and Manweb’s presence wasseen by the public and the media alongside other agencies who were all based by the cross roads atRhyl at the time. Agencies, such as BT, Water Board and the council, were all closely based so werein easy reach for communicating information. Multi-agency co-operation and communication wasparticularly good possibly due to the small geographical area that most organisations operatedwithin at that time.
Examples of multi-agency support included:
� regular information from the Water Board about the flood water. They then receivedinformation from Manweb about the supply of electricity to their critical pumping stations. Asthe flood water rose it was necessary to switch off supplies to certain areas for safety reasons.This affected supply to some of the pumping stations. Once the flood water started to recedethe pumping stations that could be switched back on were prioritised
� the police and other emergency services assisted in gaining access to properties so that staffcould make safe the supply intake positions
� the Fire Brigade assisted in pumping-out certain area’s so that Manweb staff could assessdamage and carry out repairs to the network.
After the event Manweb staff attended reviews and debrief meetings. One issue identified was thatcertain critical pumping stations were actually switched off due to where they were fed from on thenetwork.
This resulted in the Water Board reviewing the supply of electricity to some of their critical pumpingstations and in some cases installing generators.
Now customer expectations are far greater than 20 years ago. There is generally more reliance onelectricity and when power is lost the effects on the community are widespread. Industry and financeare also affected so it is not just domestic properties that are involved. Everyday services, such ascash machines, telecommunications, transport, media and retail outlets, may be severely affectedand this may also hinder the response and recovery process.
The future
In planning for future events some questions that may be considered include:
� understanding the inter-dependencies – how will the loss of power affect the community andother partner agencies?
� how to make the most of multi-agency working and benefit all involved
� the Environment Agency (and others) need to consider the resilience of their pumping stationsand other main assets particularly along the coast
� much greater transparency is required from partners and service providers to ensure thatdynamic “risks” can be accurately assessed on a regular and routine basis and certainly, attime of incident response and management.
The role of the local resilience fora and multi-agency partnership approach is embedded in tomainstream service provision for emergency responders.
Source: Paul M. Reeves (Environment Agency Wales) and Linda Lewis (Scottish Power).
Licensed copy:UNIVERSITY OF SURREY, 04/09/2015, Uncontrolled Copy, © CIRIA

Case study 12.5 The Highways Agency working in partnership with the Environment Agency
Case study 12.6 Scope for collaboration between Network Rail and regional resilience forums
Flood resilience and resistance for critical infrastructure, 2010 95
The Highways Agency are also continuing liaison with the Environment Agency regarding allaspects of flooding through its memorandum of understanding. The Environment Agency hasexchanged information regarding techniques for assessing the condition of drainage assets insupport of the development of Highways Agency drainage database. This will support future floodrisk management strategies.
Source: Michael Whitehead, Highways Agency.
Network Rail support the Pitt Review Recommendation 14 that local authorities should lead on themanagement of surface water flooding and drainage at the local level with the support of allresponsible organisations. It would be most welcoming if Councils would involve Network Rail inthis exercise.
Network Rail support the Pitt recommendation for further clarification and strengthening of therole of the regional resilience forums in contingency planning, and would welcome furtherinvolvement in command and control arrangements for flooding.
Network Rail would like transport sector expertise, including rail, to be included in the ClimateChange Committee proposed in the draft Climate Change Bill (OPSI, 2007).
Network Rail welcomes knowledge sharing on areas at risk from surface water flooding. NetworkRail’s transport infrastructure managers would benefit from such information being available at aregional level.
Source: John Dora, Network Rail
Licensed copy:UNIVERSITY OF SURREY, 04/09/2015, Uncontrolled Copy, © CIRIA

13 Conclusions
13.1 REGULATORY REGIME
The regulatory regime for critical infrastructure is complex when considered across allsectors. The complexity is heightened by the public/private sector mix. The CivilContingencies Act 2004 does however provide a common framework across the UK forcivil contingency planning. An overarching policy statement and strategic framework,such as the draft prepared by the Cabinet Office (Mann, 2009) for England, has thepotential to provide more clarity.
There is a focus within the economic regulation of essential service provision on value formoney for the customer. The focus on economic efficiency means that there is little sparecapacity within modern infrastructure systems, which leaves them potentially vulnerableto unexpected events.
The planning system provides a framework for ensuring that both new infrastructure andmodifications to existing infrastructure, which requires planning permission, is floodresilient. When planning new infrastructure, and modifying existing infrastructure,adoption of the principles in government spatial planning policy, regardless of whetherplanning permission is actually required, should do much to improve flood resilience inthe future. Industry guidance on asset management, maintenance and repair wouldbenefit from inclusion of these principles.
13.2 HISTORIC INCIDENTS AND LESSONS IDENTIFIED
13.2.1 Flood sources and mechanisms
Effective management of flooding problems requires a good understanding of the sourcesand mechanisms responsible. While flooding from rivers and the sea is a major cause ofinfrastructure disruption, surface water, groundwater and the threat of infrastructurefailure are also important contributory factors. Localised surface water drainage problemsare a major issue for the transport sector in particular. Network Rail disruptions are moreoften caused by local drainage problems than by major fluvial flood events. The floodingin Hull was caused by complex mechanisms related to groundwater and urban drainage,rather than the more obvious risks of river and coastal flooding which threaten the city. Inthe case of Ulley Dam, infrastructure failure would have been the source of flooding hadthis structure actually failed. The Ulley Dam case study also shows how the threat offlooding can cause as much disruption as an actual flood.
13.2.2 Escalation of flood warnings
It is important that flood warnings are contextualised for discrete locations. In Hull,severe weather warnings are received fairly regularly from the Meteorological Office, butbecause the flood mechanisms are complex, the appropriate response is not always clear.Similarly, if the consequences of a particular event are not clear, as in the case of the UlleyDam incident, the approach to evacuation of affected parties has to proceed on aprecautionary basis, which may cause more disruption than if a detailed flood plan hadalready been in place for the reservoir.
CIRIA C68896Licensed copy:UNIVERSITY OF SURREY, 04/09/2015, Uncontrolled Copy, © CIRIA

13.2.3 Multi-agency emergency preparedness and incident management
The case studies illustrate that the contingency planning process worked reasonably well.It was most stretched where the flood mechanisms and consequences were poorlyunderstood, as at Ulley. Category 1 responders under the CCA are highly reliant on theknowledge of Category 2 responders when it comes to adopting appropriate actions onthe ground.
13.2.4 Interdependencies
Nearly all of the case studies illustrate the high level of interdependence between differentasset systems. Utilities were forced, often very successfully, to work together with GoldCommand to buffer communities from the worst effects of the disruption. The railnetwork provides a robust alternative to the highway system for car users and manycommercial operations. However, when both systems are inoperable this causes majordisruption. The provision of generators at critical facilities may buffer these from theeffects of power outage, but if roads are impassable, such generators will be vulnerable iffuels supplies cannot be replenished.
13.2.5 Built-in resilience
The effects of the events described could have been worse. Property flooding causedmonths of misery and disruption to householders and businesses. However, in most casesessential services lost because of flooding were restored within a matter of days. TheNational Grid’s experience during the 2007 floods illustrated how a network can bemanaged to minimise interruptions to supply, even when vital assets were temporarily outof action. Similarly, the provision of independent power systems at United Utilities’ watertreatment facilities is a good example of how existing business continuity processes, withinorganisations previously affected by flooding, are picking-up these issues.
The Hull case study (see Section 8.6) shows how a heightened awareness of flooding issuesresulting from such events can have a positive effect on future regeneration and spatialplanning decision making. Solutions that combine new infrastructure provision withimproved flood protection are the aims of the policies set out in PPS25. An importantissue for increasing the flood resilience of the UK’s infrastructure will be in areas that areat risk of flooding, but have not experienced a flood in recent years.
13.3 FLOOD RISK ASSESSMENT
The results of this study indicate that CI operators are highly reliant on the outputs fromflood mapping undertaken by the Environment Agency, SEPA and NIRA. Good progresshas been made in many sectors in the assessment of flood risk to their assets using thesemaps, which demonstrates the value that such mapping brings. The majority oforganisations who have contributed to this study have assessed the risk to their assetsusing the national flood hazard maps produced by these agencies. The maps howeverprovide information on a limited number of annual probabilities of event for river andcoastal flooding only and do not factor in an allowance for climate change (except inNorthern Ireland).
Some organisations have used the national flood maps to prioritise their investigations andthen gone on to obtain more detailed information, including flood levels, at specific sites. Thismore detailed information is largely pertaining to river and coastal flooding. Obtaining thisdata required use of specialist consultants with knowledge of how to abstract the necessaryinformation from the relevant Agency’s flood mapping and data management teams.
Flood resilience and resistance for critical infrastructure, 2010 97Licensed copy:UNIVERSITY OF SURREY, 04/09/2015, Uncontrolled Copy, © CIRIA

It is now difficult for operators to assess the degree of exposure to surface, groundwaterand infrastructure-failure flood hazards. SFRAs are a mechanism for providinginformation of this kind in England. SFRAs are also intended to include an assessmentand mapping of the implications of climate change. However, often local authorities, whoare responsible for producing SFRAs, as well as SWMPs, in areas with critical drainageproblems, face the same problems as infrastructure operators in generating thisinformation. Mapping of flood hazards from first principles is expensive.
Often information on flood levels for a wide range of annual probabilities, as well asquantitative data of use in assessing the implications of climate change, has already beenderived by flood risk agencies or water companies, but accessing this information ischallenging.
13.4 ADOPTING RESISTANCE AND RESILIENCE MEASURES
There is a hierarchy of measures that can be used to manage the flood risks associatedwith critical infrastructure. This hierarchy of avoidance, substitution, control andmitigation is embedded in latest spatial planning policy – most explicitly with the practiceguide to PPS25 (CLG, 2009). When planning new infrastructure, and modifying existinginfrastructure, adoption of the principles in government spatial planning policy,regardless of whether planning permission is actually required, should help improve floodresilience in the future. Industry guidance on asset management, maintenance and repairwould benefit from inclusion of these principles.
There is a wide range of options for improving the resilience of existing assets in floodrisk areas. These are both structural and non structural. The case studies in Chapter 10illustrate that many non structural measures are already being used including floodwarnings, incident management procedures and business continuity plans. There areseveral examples of where infrastructure operators have used physical resiliencemeasures. These are primarily interim measures comprising temporary or demountablesystems as part of a short-term strategy to reduce exposure to the flood hazard. There areinconsistencies across the UK in how design standards are being applied and allowancesmade for potential climate change impacts.
13.5 PRIORITISATION OF INVESTMENT
Adopting physical resilience and resistance measures in the aftermath of the 2007 floodshas occurred most rapidly in areas affected by flooding during that event. This initialactivity has been more reactive rather than risk-based. However, risk-based investmentplans have been developed by some, particularly in the energy and water sectors. Itremains to be seen whether the investment proposed by privatised utility companies willneed to be reviewed following the price determinations by the economic regulators.
There is a lack of guidance to ensure consistent approaches are adopted for thequantification of the benefits of increasing the flood resilience of CI. Similarly, specificguidance on whole-life cost estimation for CI resilience and resilience measures forbusiness case preparation is unavailable. No research into people’s willingness to pay formeasures to reduce the frequency of disruption has yet been conducted.
CIRIA C68898Licensed copy:UNIVERSITY OF SURREY, 04/09/2015, Uncontrolled Copy, © CIRIA

13.6 INTERDEPENDENCIES AND CROSS-SECTORCOLLABORATION
Information on the nation’s critical infrastructure and the nature of the flood risksassociated with it is fragmented. There are issues around national security andcommercial sensitivity, but the principle of sharing knowledge from across sectors to builda comprehensive picture is accepted by many stakeholders. Unfortunately there isrelatively little evidence that these barriers are being overcome.
Flood resilience and resistance for critical infrastructure, 2010 99Licensed copy:UNIVERSITY OF SURREY, 04/09/2015, Uncontrolled Copy, © CIRIA

CIRIA C688100
14 Recommendations
14.1 NEXT GENERATION FLOOD MAPS AND HAZARD REGISTERS
As the agencies prepare the next generation of flood maps, there is an opportunity toprovide high resolution data on:
� flooding from surface and groundwater
� flooding from infrastructure failure, including flood defences and reservoirs
� depths, velocities and rates of onset for a range of annual probabilities of flood
� the likely effects of climate change on flood risk
� the degree of uncertainty associated with the information provided.
It may be beneficial for the Environment Agency, SEPA and NIRA to collaborate furtheron their respective mapping programmes to manage consistency across the UK.
However, these agencies are unlikely to be in a position to provide data on complex localflood mechanisms originating in minor watercourses, sewer systems and drainagenetworks. Data on these flood sources may be generated by others, such as localauthorities or CI operators. Formal, structured guidance is required on consistency,quality, transparency and standardisation of data formats where this data may be of use toothers, such as local resilience forums. For example, privatised water companies should berequired to provide information on sewer flooding to Ofwat in a consistent, geo-referenced format so that others can use this information to assess exposure to sewerflooding hazards.
14.2 GUIDANCE ON RESISTANCE AND RESILIENCE STANDARDS
It is recommended that guidance should be prepared on indicative design standards fordifferent categories of critical infrastructure. These standards should be developedcollaboratively, based on technical discussions within and between sectors. Tables 14.1 and14.2 provide an example of a possible rationale for this undertaking. However, asdiscussed in Section 5.6, development of these standards will need to take account of costsand benefits, each sector’s relative exposure to the flood hazard and existing relative levelof flood resilience.
Table 14.1 Concise definition of asset categories (courtesy of Cabinet Office)
Note
See Table 4.1 for fuller definition.
Asset category Concise definition
5 Assets, the loss of which would have catastrophic impact on the UK
4 Assets, the loss of which would affect millions of people
3 Assets, the loss of which would affect hundreds of thousands of people
2 Assets, the loss of which would affect tens of thousands of people
1 Assets, the loss of which would affect thousands of people
Licensed copy:UNIVERSITY OF SURREY, 04/09/2015, Uncontrolled Copy, © CIRIA

Flood resilience and resistance for critical infrastructure, 2010 101
Table 14.2 Examples of resistance/resilience standards and performance levels that may beappropriate for CI assets in some sectors
14.3 INCENTIVISATION OF COLLABORATIVE APPROACHES
There would appear to be significant scope to achieve efficiencies through collaborationwithin and between sectors. The Energy Network Association work is a good example ofhow one group acting for a substantial sub-sector has delivered results more effectivelythan if separate studies had been undertaken for each operator. It is recommended thatresearch is undertaken into how collaborative activity of this kind might be encouraged.This might include:
� collating and publishing “good news” examples, such as how money has been saved, orvalue added through collaborative working
� financial incentives, such as “starter grants” that help to establish cross-sector technicaltask groups, to assist resilience forums
� a cross-sector awards scheme for partnership working.
Areas where further opportunities are likely to exist to deliver flood resilience measuresmore efficiently through collaboration include:
� preparation of guidance
� flood risk assessment at UK-wide, national, regional and local levels
� appraisal of multi-functional infrastructure (eg road/rail embankments acting also asflood defences)
� procurement of specialist services for the appraisal and design of resilience measures
� procurement of construction works
� emergency response exercises.
14.4 UNDERSTANDING WHOLE-LIFE COSTS AND BENEFITS
With such a large legacy of existing infrastructure, approaches to upgrade establishedsystems will inevitably be more difficult than justifying and designing new systems of floodresilient infrastructure. There is a specific need to develop guidance on:
� quantifying the whole-life benefits of flood resilience
� unit cost data for estimating whole-life costs for construction, maintenance andoperation of resilience and resistance measures
� people’s willingness to pay for flood resilience measures.
Indicativedesign standard
(1 in x annualchance)
Target asset performance level
Unaffected(resistant)
Restrictedoperation(resilient)
Safe but notoperational(resilient)
Near failure
10–75 CAT 1
75–100 CAT 2 CAT 1
100–200 CAT 3 CAT 2 CAT 1
200–1000 CAT 4 CAT 3 CAT 2 CAT 1
> 1000 CAT 5 CAT 4 CAT 3 CAT 2
Licensed copy:UNIVERSITY OF SURREY, 04/09/2015, Uncontrolled Copy, © CIRIA

14.5 INVESTMENT PLANNING
It is recommended that industry sector regulators develop more substantial, price-basedincentives that stimulate investment in infrastructure resilience. CI owners need toconsider developing a longer-term strategic investment approach that allows for optimuminvestment to be justified against the backdrop of assets that are identified as being withinareas likely to be affected by flooding. Flood resilience measures should be adopted as anintegral part of individual organisations’ business continuity management processes,whole-life asset management plans (AMP) and climate change adaptation strategies. Thereis a requirement for guidance to aid consistency of approach in the planning of long-terminvestment in flood resilience measures.
14.6 ALIGNMENT OF PUBLIC/PRIVATE SECTOR SPEND
While publicly funded programmes of flood risk management measures are focused onreducing flood risk to communities, the national and community benefits of protectingcritical infrastructure from flooding are often poorly quantified. It is recommended thatthose responsible for setting policy, planning and delivering programmes of publiclyfunded FRM schemes should consider the protection of CI assets more explicitly in theirinitial prioritisation of capital schemes. For example, this might be achieved in Englandusing amended outcome measures. Working in partnership with CI owners and operatorsat a strategic level is likely to help better alignment of overall investment in flood riskmanagement measures. This process would be made easier by guidance on whole-lifecosts and benefits as recommended in Section 14.4.
14.7 IMPROVING THE EFFECTIVENESS OF THE EMERGENCYRESPONSE
The lessons identified in Chapter 10 show that there is scope for improvements as follows:
� business continuity plans need to include registers of all identified flood hazards at CIsites and protocols for managing incidents when they do occur
� flood forecasts need to be tailored to cover the specific flood hazards identified
� flood warnings need to be escalated appropriately, with specific trigger levels for therange of incident management responses detailed in a business continuity plan
� integration of resilience into asset management systems.
Use of computerised 3D visualisation techniques can be a powerful tool for use in bothtraining exercises and potentially to aid co-ordination of resources during flood events inreal time. These tools are however only as accurate as the input data and, whilepotentially applicable to simulation of real-time river or coastal flooding scenarios whereaccurate forecasts are available, these tools are unlikely to be of use for real timesimulation of flash flooding.
14.8 TRAINING IN FLOOD RISK MANAGEMENT FOR CRITICALINFRASTRUCTURE
It is recommended that remote learning and/or face-to-face training in flood riskmanagement for critical infrastructure is developed to ensure a common understandingand reinforce consistency of technical approaches and vocabularies.
CIRIA C688102Licensed copy:UNIVERSITY OF SURREY, 04/09/2015, Uncontrolled Copy, © CIRIA

References
AMERICAN LIFELINE ALLIANCE (2005a)Guideline for assessing the performance of oil and natural gas pipeline systems in natural hazard andhuman threat eventsA public-private partnership between the Federal Emergency Management Agency(FEMA) of the Department of Homeland Security (DHS) and the National Institute ofBuilding Sciences (NIBS), Alaska<http://www.dec.state.ak.us/SPAR/ipp/ara/documents/App%20I_ALA%20Guideline.pdf>
AMERICAN LIFELINE ALLIANCE (2005b)Flood-resistant local road systems: a report based on case studiesA report by the Federal Emergency Management Agency (FEMA) of the Department ofHomeland Security (DHS) and the National Institute of Building Sciences (NIBS), Alaska<http://www.americanlifelinesalliance.org/pdf/ALA_Flood-Roads_January2005.pdf>
AMERICAN LIFELINE ALLIANCE (2005c)Protecting our critical infrastructure: findings and recommendations from the American LifelinesAlliance roundtableA report by the Federal Emergency Management Agency (FEMA) of the Department ofHomeland Security (DHS) and the National Institute of Building Sciences (NIBS), Alaska<http://www.americanlifelinesalliance.org/pdf/RoundtableReportWebPosted081705.pdf>
AMERICAN SOCIETY OF CIVIL ENGINEERS (2006)Flood resistant design and constructionASCE/SEI 24-05, ASCE Press, Washington DC (ISBN: 0-78440-818-1)
ANGLICAN WATER (2009)Strategic direction statement 2010–2035Ref AW024/11/07, Corporate Communications, Anglian Water Services Limited,Cambridgeshire, UK<http://www.anglianwater.co.uk/_assets/media/strategic-direction-statement.pdf>
BRABHAHARAN, P, WILES, L M and FRIETAG, S (2006)Natural hazard road risk management Part lll: performance criteriaLand Transport New Zealand Research Report 296, NZ Transport Agency, Waka Kotahi(ISBN: 0-478-28708-9)
BRITISH ENERGY (2007)Climate change and replacement nuclear builtBritish Energy Group plc, Livingston, Scotland<http://www.british-energy.com/documents/Climate_Change_and_replacement_nuclear_build.pdf>
BSI KRITIS (2004)Analysis of critical infrastructures – the ACIS methodology (analysis of critical infrastructural sectors)Bundesamt für Sicherheit in der Informationstechnik, Bonn, Germany<https://www.bsi.bund.de/cae/servlet/contentblob/476040/publicationFile/28004/acis_paper_en_pdf.pdf>
Flood resilience and resistance for critical infrastructure, 2010 103Licensed copy:UNIVERSITY OF SURREY, 04/09/2015, Uncontrolled Copy, © CIRIA

BRUNNER, E and SUTER, M (2008)International critical information infrastructure protection (CIIP) handbook 2008/2009Center for Security Studies (CSS), ETH Zurich, Switzerland<http://www.crn.ethz.ch/>
CARTER, A (2009)Flooding in June and July 2007Transmission Performance Network Operations, National Grid<http://www.nationalgrid.com/NR/rdonlyres/AADCC1E5-D360-41FD-ADC1-84AE4E165748/18859/The_Floods_01Aug07.pdf>
CLG (2006)Planning Policy Statement 25: Development and flood riskCommunities and Local Government, London (ISBN: 978-0-11753-974-7)<http://www.communities.gov.uk/documents/planningandbuilding/pdf/planningpolicystatement25.pdf>
CLG (2007)Improving the flood performance of new buildings – flood resilient constructionCommunities and Local Government, London (ISBN: 978-1-85946-287-4)
CLG (2009)Planning Policy Statement 25: Development and flood risk – practice guideCommunities and Local Government, London (ISBN: 978-1-85112-936-2)
COUNCIL OF EUROPE (2005)Comparative analysis of the interministerial management of major hazards (AP/CAT 30)Institute Supérieur de Planification d’Urgences, Strasbourg<http://www.coe.int/t/dg4/majorhazards/prog/legal_en.asp. Available at:http://www.coe.int/t/dg4/majorhazards/ressources/APCAT/2005/APCAT-2005-30-e-AnalyseComp-GestionInterm.pdf>
CPNI (2010)Glossary of termsCentre for the Protection of National Infrastructure, London<http://www.cpni.gov.uk/glossary.aspx>
CST (2009)A national infrastructure for the 21st centuryCouncil for Science and Technology, London<http://www.cst.gov.uk/reports/files/national-infrastructure-report.pdf>
DARD (2008)Living with rivers and the seaDepartment of Agriculture and Rural Development, London (ISBN: 978-1-84807-080-6)
DEFRA (2004a)Making space for water strategyDepartment for Environment, Food and Rural Affairs, London
DEFRA (2004b)Defra guidance on the appraisal of human related intangible impacts of flooding and distributionalimpactsDepartment for Environment, Food and Rural Affairs, London
CIRIA C688104Licensed copy:UNIVERSITY OF SURREY, 04/09/2015, Uncontrolled Copy, © CIRIA

DEFRA (2008a)Assessing and valuing the risk to life from flooding for use in appraisal of risk management measuresDepartment for Environment, Food and Rural Affairs, London
DEFRA (2008b)The valuation of agricultural land and output for appraisal purposesDepartment for Environment, Food and Rural Affairs, London
DEFRA (2009a)Resilience grants pilot projectsDepartment for Environment, Food and Rural Affairs, London
DEFRA (2009b)Flooding funding and investment: investment targetsDepartment for Environment, Food and Rural Affairs, London<http://www.defra.gov.uk/environment/flooding/funding/targets.htm>
DEFRA and Environment Agency (2002)Temporary and demountable flood protection – interim guidance on useDraft R&D Publication 130/1, Department for Environment, Food and Rural Affairs,London
EFTEC (2007)Flood and coastal erosion risk management, economic valuation of environmental effects handbookHandbook for the Environment Agency for England and Wales<www.eftec.co.uk>
ENA (2009)Resilience to flooding of grid and primary substationsIssue 1, ETR 138, final engineering technical report to the Energy EmergenciesExecutive. Energy Networks Association, London <http://www.ena-eng.org/ENA-Docs/>
ENA (2009)Winter preparednessEnergy Networks Association, London<http://2009.energynetworks.org/latest-media-releases/2007/11/19/191107-winter-preparedness-and-flood-resilience-ena-updates.html>
ENVIRONMENT AGENCY (2006)Factual report on meteorology, hydrology and impacts of January 2005 flooding in CumbriaCumbria Floods Technical Report, Environment Agency, Bristol
ENVIRONMENT AGENCY (2009)National flood risk assessmentEnvironment Agency, Bristol<http://www.environment-agency.gov.uk/homeandleisure/floods/31662.aspx>
ENVIRONMENT AGENCY (2010)Kitemark scheme for flood protection products – Environment Agency adviceEnvironment Agency, Bristol<http://www.environment-agency.gov.uk/homeandleisure/floods/113219.aspx>
EUROPEAN COMMISSION (2008)Identification and designation of European critical infrastructures and the assessment of the need toimprove their protectionCouncil Directive 2008/114/EC
Flood resilience and resistance for critical infrastructure, 2010 105Licensed copy:UNIVERSITY OF SURREY, 04/09/2015, Uncontrolled Copy, © CIRIA
EXCIMAP (2007)Handbook on good practices for flood mapping in EuropeEuropean exchange circle on flood mapping, The Netherlands<http://ec.europa.eu/environment/water/flood_risk/flood_atlas/pdf/handbook_goodpractice.pdf>
FEDERAL MINISTRY OF THE INTERIOR (2007)Protecting critical infrastructures – risk and crisis managementFederal Ministry of the Interior, Germany <www.bmi.bund.de>
FEDERAL OFFICE OF CIVIL PROTECTION AND DISASTER ASSISTANCE (2006)Flood risk management and critical infrastructuresBundesamt für Bevölkerungsschutz und Katastrophenhilfe, BBK, Germany. Presentationin German available from:<http://www.regionale2010.de/fileadmin/user_shares/2010_bildwelten/Rheinkonferenz_2005/Rheinkonferenz_Vortraege/hochwasser/Lauwe.pdf>
HIGHWAYS AGENCY (2006)Design manual for roads and bridgesVolume 4 Section 2 HD 33/06 Surface and sub-surface drainage systems for highways<http://www.standardsforhighways.co.uk/dmrb/>
HM GOVERNMENT (2005)Emergency preparednessRef: 267619/1105/D40, Library and Information Services, Cabinet Office, York<http://www.cabinetoffice.gov.uk/media/131903/emergprepfinal.pdf>
HOOPER, R, ARMITAGE, R, GALLAGHER, A and OSORIO, T (2009)Whole-life infrastructure asset management: good practice guide for civil infrastructureC677, CIRIA, London (ISBN: 978-0-86017-677-0)
HUGHES, A, HEWLETT, H, SAMUELS, P G, MORRIS, M, SAYERS, P, MOFFAT, I,HARDING, A and TEDD, P (2000)Risk management for UK reservoirsC542, CIRIA, London (ISBN: 978-0-86017-542-1)
ICE (2006)Floods and reservoir safety3rd edition, Institution of Civil Engineers, London (ISBN: 978-0-72772-503-5)
ICE (2009)The state of the nation: defending critical infrastructureInstitution of Civil Engineers, London<http://www.ice.org.uk/downloads//ICE%20State%20of%20the%20Nation%20-%20Defending%20Critical%20Infrastructure.pdf>
IMBSEN, R A and MESA, L E (2002)“Development and implementation of a new seismic design bridge criteria for SouthCarolina”In: Proc Advances in engineering and technology for the seismic safety of bridges in the newmillennium, Portland, Oregon, 29 April to 1 May 2002, Nimis, R and Bruneau, M (eds) pp65–72
KIRBY, A M and ASH, J R V (2000)Fluvial freeboard guidance noteR&D Technical Report W187978-1857053630, Environment Agency, Bristol
CIRIA C688106Licensed copy:UNIVERSITY OF SURREY, 04/09/2015, Uncontrolled Copy, © CIRIA

LANCASTER, J W, PREENE, M and MARSHALL, C T (2004)Development and flood risk – guidance for the construction industryC624, CIRIA, London (ISBN: 978-0-86017-624-4)
MALE, S (2009)Resilient infrastructurePresentation to the Leeds asset management forum, Institute for Resilient Infrastructure,University of Leeds, 12 May 2009
MALONEY, M (2009)The effect of flooding on critical infrastructure and the systemic risksDissertation, University of Leeds
MANN, B (2009)Strategic framework and policy statement on improving the resilience of critical infrastructure todisruption from natural hazardsDefra Report. Cabinet Office, London<http://www.cabinetoffice.gov.uk/media/308367/sfps-consultation.pdf>
MASON, P J and HINKS, J L (2008)“Security of stepped masonry spillways: lessons from Ulley dam”Dams and Reservoirs 18, No 1, 5–8, Paper 1<http://www.thomastelford.com/journals/DocumentLibrary/18-5BDS145934.pdf>
MEYER, M D (2006)Design standards for US transportation infrastructure. The implications of climate changePaper commissioned by the Transportation Research Board Panel on Transportation andGlobal Climate Change, TRB Special Report 290, Transportation Research Board,Washington DC <http://onlinepubs.trb.org/onlinepubs/sr/sr290Meyer.pdf>
MINISTRY OF THE INTERIOR AND KINGDOM RELATIONS (2009)EU FloodEx 2009Ministry of the Interior and Kingdom Relations (Netherlands)<http://www.floodex.nl/about-floodex>
MPA – THE CONCRETE CENTRE (2009)Concrete and floodingRef: TCC/05/019, The Concrete Centre (ISBN: 978-1-904818-89-2)<http://www.concretecentre.com/pdf/MB_Concrete_Flooding.pdf>
MULTI-AGENCY (2005)Carlisle storms and associated floodingMulti-agency debrief report, Cabinet Office, London <http://www.cabinetoffice.gov.uk/>
NATIONAL FLOOD FORUM (2009)A guide to resistant and resilient repair after a floodA collaboration between National Flood Forum, Environment Agency, Association ofBritish Insurers and Chartered Institute of Loss Adjusters. Go to:<http://www.floodforum.org.uk/>
NETWORK RAIL (2008)Management of responses to extreme weather conditions at structures, earthworks and other keylocationsNetwork Rail Standard NR/L3/TRL/1010 Issue 2 (internal document)
Flood resilience and resistance for critical infrastructure, 2010 107Licensed copy:UNIVERSITY OF SURREY, 04/09/2015, Uncontrolled Copy, © CIRIA

NGNUK (2008)Next generation networksOfcom, London <http://www.ngnuk.org.uk/>
NORTHERN IRELAND PLANNING SERVICE (2006)Planning Policy Statement (PPS 15): Planning and flood riskDepartment of Environment, Northern Ireland, Belfast<http://www.planningni.gov.uk/index/policy/policy_publications/planning_statements/pps15.htm>
OFFICE OF THE FIRST MINISTER AND DEPUTY FIRST MINISTER (2005)The Northern Ireland civil contingencies frameworkRevised December 2005, Central Emergency Planning Unit, Nothern Ireland<http://cepu.nics.gov.uk/pubs/NI%20CCF.pdf>
OFWAT (2003)Statement of policy with respect to financial penalties pursuant to section 22A of the Water IndustryAct 1991Ofwat, Birmingham <http://www.ofwat.gov.uk/regulating/enforcement/pap_con_090731statementpenalties.pdf?download=Download>
OFWAT (2007)Water and sewerage services during the summer 2007 floodsOfwat, Birmingham <http://www.coulthard.org.uk/hullfloods/flood07_review131207.pdf>
OFWAT (2008a)Ofwat’s response to the Pitt Review’s learning lessons from the 2007 floods consultationOfwat, Birmingham<http://www.ofwat.gov.uk/legacy/aptrix/ofwat/publish.nsf/AttachmentsByTitle/res_ofw_pitreview.doc/$FILE/res_ofw_pitreview.doc>
OFWAT (2008b)Service and delivery performance of the water companies in England and Wales 2007–08,Supporting informationOfwat, Birmingham (ISBN: 1-904655-46-7)<http://www.ofwat.gov.uk/regulating/reporting/rpt_los_2007-08.pdf> and<http://www.ofwat.gov.uk/regulating/reporting/rpt_los_2007-08suppinfo.pdf>
OFWAT (2009a)Methodology paper: setting price limits for 2010–15: framework and approachOfwat, Birmingham (ISBN: 1 904655 44 0)<http://www.ofwat.gov.uk/pricereview/pap_pos_pr09method080327.pdf>
OFWAT (2009b)Ofwat’s view on companies’ draft business plansReissued 23 December 2008, Ofwat, Birmingham (ISBN: 1-904655-50-5).<http://www.ofwat.gov.uk/pricereview/pr04/pr04phase2/pap_pos_cis191208.pdf>
OFWAT (2009c)Asset resilience to flood hazards: development of an analytical frameworkOfwat, Birmingham<http://www.ofwat.gov.uk/pricereview/pr09phase2/ltr_pr0912_resilfloodhaz>
CIRIA C688108Licensed copy:UNIVERSITY OF SURREY, 04/09/2015, Uncontrolled Copy, © CIRIA

PENNING-ROWSELL, E, JOHNSON, C, TUNSTALL, S, TAPSELL, S, MORRIS, J,CHATTERTON, J, COKER, A and GREEN, C (2003)The benefits of flood and coastal defence: techniques and data for 2003Out of print. Flood Hazard Research Centre, Middlesex University, Enfield, UK
PENNING-ROWSELL, E (2005)The benefits of flood and coastal risk management manualLibri Publishing, Oxfordshire (ISBN: 1-90475-051-6). Available from:<http://www.libripublishing.co.uk>
PITT, M (2008)The Pitt Review – learning lessons from the 2007 floodsCabinet Office, London.<http://archive.cabinetoffice.gov.uk/pittreview/thepittreview/final_report.html>
RAILWAY GROUP STANDARD (2004)Scour and flooding – managing the riskGC/RT5143, Rail Safety and Standards Board, UK<http://www.rgsonline.co.uk/Railway_Group_Standards/Infrastructure/Railway%20Group%20Standards/GCRT5143%20Iss%201.pdf>
RIBA (2009)Designing for flood risksRoyal Institute of British Architects, London<http://www.architecture.com/Files/RIBAHoldings/PolicyAndInternationalRelations/Policy/Environment/2Designing_for_floodrisk.pdf>
SAVAGE, W U, NISHENKO, S P, HONEGGER, D G and KEMPNER, L Jr (2006)“Guideline for assessing the performance of electric power systems in natural hazard andhuman threat events”In: Proc 6th electrical transmission conference “Structural reliability in a changing world”,Birmingham, Alabama, 15–19 October 2006 (DOI: 10.1061/40790(218)4)<http://cedb.asce.org/cgi/WWWdisplay.cgi?0609904>
TEACHERNET (2009)Revised national programme for building schools for the futureDepartment for Children, Schools and Families, UK<http://www.teachernet.gov.uk/management/resourcesfinanceandbuilding/bsf/rnp/>
THE SCOTTISH GOVERNMENT (2004)Scottish Planning Advice Note PAN 69: Planning and building standards advice on floodingThe Scottish Government, Edinburgh (ISBN: 0-7559-425-X).<http://www.scotland.gov.uk/Publications/2004/08/19805/41594>
THE SCOTTISH GOVERNMENT (2004)Scottish Planning Policy 7 (SSP7) Planning and floodingThe Scottish Government, Edinburgh <http://www.scotland.gov.uk/Home>
UNITED UTILITIES (2005a)Wastewater operations: combined treatment and network incident reportRef 05/44, United Utilities, UK
UNITED UTILITIES (2005b)Operations and maintenance department incident reportRef 05/45, United Utilities, UK
Flood resilience and resistance for critical infrastructure, 2010 109Licensed copy:UNIVERSITY OF SURREY, 04/09/2015, Uncontrolled Copy, © CIRIA

WATER UK (2009)One year on: report of the water UK flooding implementation group – lessons learned from the floodsof summer 2007Water UK <http://www.water.org.uk/home/news/press-releases/flooding-report-one-year-on-/one-year-on-flooding-report.pdf>
WALES AUDIT OFFICE (2009)Coastal erosion and tidal flooding risks in WalesReport presented by the Auditor General to the National Assembly on 29 October 2009,Cardiff <http://www.wao.gov.uk/news_2913.asp>
WELSH ASSEMBLY GOVERNMENT (2004)Technical Advice Note (TAN) 15: Development and flood riskWelsh Assembly Government, Cardiff<http://wales.gov.uk/topics/planning/policy/tans/tan15?lang=en>
ACTS, CODES, REGULATIONS ETC
Acts
Civil Contingencies Act 2004<http://www.cabinetoffice.gov.uk/ukresilience/preparedness/ccact.aspx>
Electricity Act 1989<http://www.opsi.gov.uk/ACTS/acts1989/ukpga_19890029_en_1>
Flood Risk Management (Scotland) Act 2009 (2009 asp 6) (2009)<http://www.opsi.gov.uk/legislation/scotland/acts2009/pdf/asp_20090006_en.pdf>
Highways Act 1980<http://www.opsi.gov.uk/RevisedStatutes/Acts/ukpga/1980/cukpga_19800066_en_1>
Reservoir Act 1975<http://www.opsi.gov.uk/RevisedStatutes/Acts/ukpga/1975/cukpga_19750023_en_1>
Water Industry Act 1991<http://www.opsi.gov.uk/acts/acts1991/ukpga_19910056_en_1>
Bills
Floods and Water Management Bill 2009–2010<http://services.parliament.uk/bills/2009-10/floodandwatermanagement.html>
Codes
International Building Code (2009)<http://www2.iccsafe.org/states/2009ICodes/Building/Building_Frameset.html>
International Residential Code (2009)<http://www.energycodes.gov/codedevelop/pdfs/2009_IRCvsIECC_ARRA_23Sep09.pdf>
BS 25999-1:2006 Code of practice for business continuity management(ISBN: 978-0-58049-601-1)<http://shop.bsigroup.com/en/ProductDetail/?pid=000000000030157563>
CIRIA C688110Licensed copy:UNIVERSITY OF SURREY, 04/09/2015, Uncontrolled Copy, © CIRIA

Directives
EC Habitats Directive (1992): Council Directive 92/43/EEC on the conservation of naturalhabitats and of wild fauna and flora<http://eur-lex.europa.eu/LexUriServ/LexUriServ.do?uri=CELEX:31992L0043:EN:HTML>
EU Floods Directive 2007/60/EC (2007)<http://ec.europa.eu/environment/water/flood_risk/index.htm>
The Water Environment (Floods Directive) Regulations (Northern Ireland). StatutoryRules of Northern Ireland 2009 (No 376)<http://www.opsi.gov.uk/sr/sr2009/nisr_20090376_en_1>
Orders
Transport and Works Act Orders Unit (TWAOU)
Regulations
Construction (Design and Management) Regulations 2007 (CDM2007) (SI 320:2007)<http://www.opsi.gov.uk/si/si2007/pdf/uksi_20070320_en.pdf>
Publicly Available Specification (PAS)
PAS 1188-2:2009 Flood protection products. Specification. Part 2: Temporary products(ISBN: 978 0 580 62701 9).<http://shop.bsigroup.com/ProductDetail/?pid=000000000030180617>
PAS 1188-4:2009 Flood protection products. Specification. Part 4: Demountable products(ISBN: 978 0 580 62703 3).<http://shop.bsigroup.com/en/ProductDetail/?pid=000000000030180619>
Flood resilience and resistance for critical infrastructure, 2010 111Licensed copy:UNIVERSITY OF SURREY, 04/09/2015, Uncontrolled Copy, © CIRIA

OTHER USEFUL WEBSITES
Business Continuity Institute<http://www.thebci.org/>
Centre for the Protection of National Infrastructure<http://www.cpni.gov.uk/>
Chartered Insitution of Water and Environmental Management<http://www.ciwem.org/>
Defra<http://www.defra.gov.uk/>
Environment Agency<http://www.environment-agency.gov.uk/>
Infrastructure Planning Commission<http://infrastructure.independent.gov.uk>
Institute of Asset Management<http://www.theiam.org/>
Institution of Civil Engineers<http://www.ice.org.uk/homepage/index.asp>
Ofcom<http://www.ofcom.org.uk/>
Office of Rail Regulation<http://www.rail-reg.gov.uk/>
Ofgem<http://www.ofgem.gov.uk/>
Ofwat<http://www.ofwat.gov.uk/>
Scottish Resilience (part of Scottish Government)<http://www.scotland.gov.uk/Topics/Justice/public-safety/emergencies>
UK Resilience<http://www.cabinetoffice.gov.uk/ukresilience.aspx>
Wales Prepared (Wales Resilience)<http://www.walesprepared.org/>
CIRIA C688112Licensed copy:UNIVERSITY OF SURREY, 04/09/2015, Uncontrolled Copy, © CIRIA


