Embed Size (px)
Citation preview
1. metamorphic Geol., 1992, 10, 487-501
Calcite-graphite isotope thermometry: a test for polymetamorphism in marble, Tudor gabbro aureole, Ontario, Canada S . R. DUN" A N D J . W. VALLEY2 'Department of Geology & Geography, Mount Holyoke College, South Hadley, Massachusetts 01075, USA 2 Department of Geology & Geophysics, University of Wisconsin, Madison, Wisconsin 53706, USA
ABSTRACT Graphitization and coarsening of organic material in carbonate-bearing metasedimentary rocks is accompanied by carbon isotope exchange which is the basis of a refractory, pressure-independent geothermometer. Comparison of observed isotopic fractionations between calcite and graphite (A13Ccal-Gr) with independent petrological thermometers provides the following empirical calibration over the range 400-800" C: A13CCal-Gr = 5.81 x lo6 x T-*(K) - 2.61. This system has its greatest potential in marbles where calcite + graphite is a common assemblage and other geothermometers are often unavailable. The temperature dependency of this empirical calibration differs from theoretical calibrations; reasons for this are unclear but the new empirical calibration yields temperature estimates in better agreement with independent thermometry from several terranes and is preferred for geological applications.
Both calcite-graphite isotopic thermometry and calcite-dolomite solvus thermometry are applied to marble adjacent to the Tudor gabbro in the Grenville Province of Ontario, Canada. The marble has undergone two metamorphic episodes, early contact metamorphism and later regional metamorphism. Values of A13CCa,-Gr decrease regularly from c. 8%0 in samples over 2 km from the pluton to values of 3-4% within 200m of the contact. These samples appear to preserve fractionations from the early thermal aureole with the empirical geothermometer, and indicate temperatures of 450-500" C away from the intrusion and 700-750" C near the gabbro. This thermal profile around the gabbro is consistent with conductive heat flow models. In contrast, the distribution of Mg between calcite and dolomite has been completely reset during later regional metamorphism and yields uniform temperatures of c. 500" C, even at the contact.
Graphite textures are important for interpreting the results of the calcite-graphite thermometer. Coarsening of graphite approaching the Tudor gabbro correlates with the decrease in isotopic fractionations and provides textural evidence that graphite crystallization took place at the time of intrusion. In contrast to isotopic exchange during prograde metamorphism, which is facilitated by graphitization, retrogressive carbon isotopic exchange appears to require recrystallization of graphite which is sluggish and easily recognized texturally. Resistance of the calcite-graphite system to resetting permits thermometry in polymetamorphic settings to see through later events that have disturbed other systems.
Key words: calcite-dolomite; calcite-graphite; isotopic thermometry; polymetamorphism.
INTRODUCTION
During metamorphism, organic material is converted to graphite and carbon isotope exchange occurs between the graphite and any carbonate present. The distribution of I3C and '*C between coexisting calcite and graphite is sensitive to temperature and can therefore be applied as a geothermometer. Stable isotope thermometers have the advantage of requiring no significant pressure corrections (Clayton et al . , 1975).
The calcite-graphite geothermometer is problematic because of differences in calibration (Bottinga, 1969a; Valley & O'Neil, 1981; Wada & Suzuki, 1983; Morikiyo, 1984; Chacko et al . , 1991) and because disequilibrium isotopic fractionations can persist to moderately high
metamorphic temperatures (e.g. Kreulen & van Beek, 1983; Arneth et al . , 1985). A review of previous empirical calibrations emphasizes the importance of characterizing graphite textures in the interpretation of thermometric results.
We have applied the calcite-graphite isotope thermo- meter to samples of marble from an area near the Tudor gabbro in south-east Ontario, Canada, that has ex- perienced two metamorphic events, an early contact metamorphism and a later regional metamorphism. The results indicate that the isotopic system retains high- temperature contact metamorphic fractionations in samples from near the intrusion. In contrast, calcite- dolomite solvus thermometry applied to rocks from the same area yields only regional metamorphic temperatures
487
488 S . R. D U N N & J. W. VALLEY
and thus indicates that Mg exchange between calcite and dolomite has completely re-equilibrated during regional metamorphism.
Extracting quantitative temperature information from polymetamorphic rocks is particularly problematic because the equilibria imprinted during an early metamorphic episode become partially or completely reset during later metamorphism. Because graphite resists isotopic ex- change, the calcite-graphite isotopic system can 'see through' a regional metamorphism to provide quantitative temperature information in polymetamorphic settings.
O R I G I N OF GRAPHITE IN METASEDIMENTARY ROCKS
Most occurrences of disseminated graphite in metasedi- mentary rocks represent graphitized organic matter. Numerous studies have documented the transition from primary organic material in unmetamorphosed or low- grade metamorphic rocks to graphite in medium- to high-grade metamorphic rocks (French, 1964; Landis, 1971; Grew, 1974; Diessel et al., 1978; Itaya, 1981; Wedeking & Hayes, 1983). X-ray diffraction (XRD) monitors the graphitization process in which poorly organized, kerogen- or coal-like organic material is chemically matured and structurally reorganized into well-crystallized graphite. As graphitization proceeds, the broad diffraction band of kerogen or coal macerals at 3.6-3.8 A becomes sharper and gradually shifts to 3.35 A, the d,,, spacing of graphite. Structural reorganization is accompanied by chemical maturation, i.e. the loss of H, 0 and N (Grew, 1974; Itaya, 1981; Wedeking & Hayes, 1983).
High-resolution transmission electron microscopy (HRTEM) studies by Buseck & Huang (1985) showed that the carbonaceous material in low-grade metamorphic rocks consists of short, discontinuous carbon layers that are few in number and rather contorted. With increasing metamorphic grade the carbon layers progressively become longer, more numerous and more planar. In pelitic samples from the Narragansett Basin of Mas- sachusetts and Rhode Island, the carbon layers were found to be planar and to comprise c. 100% of the carbonaceous material only at staurolite grade and above. The HRTEM studies showed that graphitic material can possess various structural states within a single sample and that there can be significant structural variability between graphitic materials from equivalent metamorphic grades of different terranes as well as within a single terrane.
Laser Raman spectroscopy provides an additional means of characterizing graphite crystallinity. Studies of syntheti- cally graphitized carbon show that Raman spectra are sensitive to crystal size perpendicular to the c-axis and therefore to the degree of graphitization (Lespade et al., 1982). Pasteris & Wopenka (1989) obtained Raman spectra from natural materials representing a range of metamorphic conditions and confirmed that systematic variations in Raman scattering correlate with XRD and HRTEM results.
Some workers suggest an abiogenic origin for certain
graphite occurrences, especially vein-type graphite or graphite within igneous rocks (e.g. Rumble & Hoering, 1986). Lamb & Valley (1984, 1985) demonstrated through thermodynamic calculations in the C-0-H system that graphite will precipitate under certain conditions of cooling, fluid mixing or fluid infiltration into rocks with oxygen buffering capacity. Fluid mixing processes are suggested as a mechanism to account for both graphite formation and isotopic variation in vein deposits of New Hampshire (Rumble & Hoering, 1986). Such examples of carbon mobility are important in understanding aspects of fluid movement in metamorphic terranes, but there is no evidence that these processes produce the disseminated graphite common in metasedimentary rocks.
Carbon isotopic composition of graphite in metasediments
The carbon isotopic composition of graphitic material in metamorphic rocks is determined by the isotopic composition of the precursor, the effects of devolatilization and the effects of exchange with either a carbon-bearing fluid or solid. Typical ancient and modern organic carbon has 6I3C values of - 2 5 f 5 0 ~ (PDB) which contrasts sharply with marine carbonates that generally have 6I3C values near 0 % ~ (Degens, 1969; Eichmann & Schidlowski, 1975; Hayes et al., 1983).
McKirdy & Powell (1974) and Hayes et af. (1983) showed that the 6I3C of kerogen becomes greater during diagenesis and metamorphism. A small shift during diagenesis, from 613C values of c. - 3 0 % ~ to c. -25%W, coincides with a decrease in H/C ratios of the carbonaceous material from values of 1.0 to c. 0.15. This small isotopic shift results in part from the degassing of methane which preferentially removes "C (Bottinga, 1969a). A larger shift at the onset of metamorphism, from c. -25% to above -15%, accompanies the decrease in H/C ratios to values below 0.15, but this isotopic shift is too large to attribute to the small amount of methane evolved at this stage. A similar shift in the 6I3C values of graphitic material from the Alps correlates with increasing metamorphic grade from essentially unmetamorphosed rocks to staurolite schists (Hoefs & Frey, 1976). However, the graphite in many metamorphic rocks has retained 6I3C values below -20°?, comparable to primary organic matter (Barker & Friedman, 1969; Weis et al., 1981; Crawford & Valley, 1990). Small shifts in 6°C values of carbonaceous material, up to ~ Y w , may accompany the transition from low to moderate grades of metamorphism (e.g. Barker & Friedman, 1969), although these would be difficult to detect in most cases, but large shifts (>l0YW) have clearly not occurred in all cases. Therefore, the large shift in 6I3C that is sometimes observed is not inherent in the graphitization process and isotopic exchange with other carbon-bearing phases must be considered.
Calcite-graphite carbon isotope exchange
When sediment containing both organic material and abundant carbonate undergoes metamorphism, carbon
CALCITE-GRAPHITE ISOTOPE GEOTHERMOMETRY 489
1 Granulite Facies
I
ln Ambhibolite Facies 1 I In 2. m - m I D & Greenschist Facies F I - 3 Z
Unmetamorphosed 1 1
A Cal-Gr
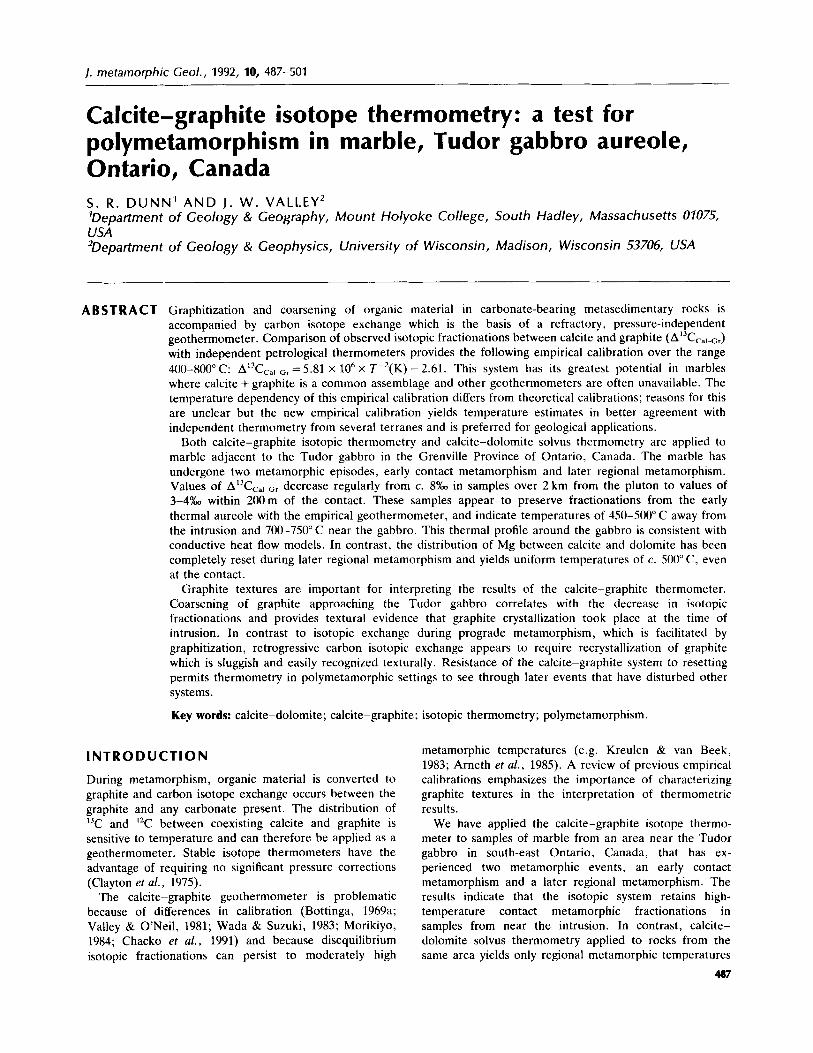
Fig. 1. The carbon isotope fractionation between coexisting calcite and carbonaceous material or graphite is shown for different metamorphic facies. Isotope exchange begins in the greenschist facies, but disequilibrium can persist even at high grades. Modified from Valley & O'Neil (1981); data sources are given in Valley & O'Neil (1981) with additional data from Wada & Suzuki (1983), Kreulen & van Beek (1983), Morikiyo (1984), Ghent & O'Neil(1985) and Arneth er al. (1985).
isotope exchange between them can shift the isotopic composition of the carbonate and the graphite produced (Valley & O'Neil, 1981). The magnitude of this shift can be large and depends on the relative amounts of carbon in the carbonate and in the graphite together with the magnitude of the equilibrium isotopic fractionation. As metamorphism proceeds, the "C/'*C fractionation is reduced between carbonate and graphitic material. Figure 1 shows ACal-Cr values from unmetamorphosed sediments and from metamorphic terranes that span low to high grades (ACal-Gr = 6"CCal - 6"Cc,,). Values of ACal.Cir decrease with increasing grade as a result of isotopic exchange and the smaller equilibrium fractionations that prevail at higher temperatures. Within the greenschist facies, nearly all samples have at least partially exchanged and many may have equilibrated. Disequilibrium in a significant number of samples, however, has persisted up to the amphibolite facies. As noted by Valley & O'Neil (1981), only in the upper amphibolite and granulite facies is the convergence to a narrow equilibrated range of A.Cal-Gr nearly complete.
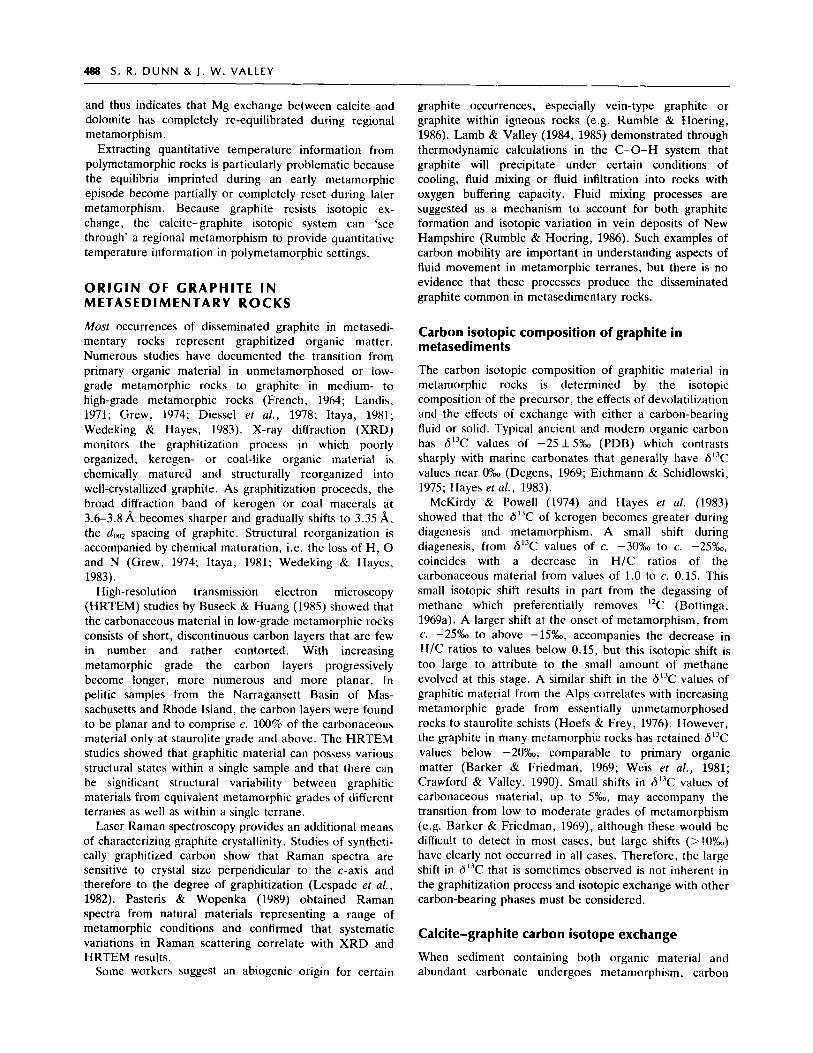
The carbonaceous material in low-grade metamorphic rocks remains isotopically light and this material may also be in an intermediate state between poorly organized organic matter and completely structured graphite. In marble where isotope values are dominated by the high 6I3C values of carbonate, isotopic exchange occurs with increasing metamorphic temperatures, resulting in higher di3C values for the carbonaceous material; this material at the same time becomes increasingly graphitized. HRTEM images of intermediate structure graphitic matter show domains or shells of well-crystallized carbon often
surrounding amorphous carbon (Fig. 2; Buseck & Huang, 1985). It is likely that significant isotopic differences exist between these domains with carbon isotope equilibration occurring during the process of crystallization. If this is true, then the progressive approach to isotopic equilibrium that is seen in low-grade samples is predicted to correspond to the increase in the proportion of crystalline over amorphous carbon.
CALCITE-GRAPHITE ISOTOPE THERMOMETRY
The sluggish isotopic exchange of graphite has thus far prevented experimental determination of equilibrium calcite-graphite fractionations. Synthetic graphitization experiments at temperatures in excess of 2000" C (e.g. Oberlin, 1984) are well above the temperatures of interest for crustal processes. Chacko et al. (1991) report that an experimental run at 800" C and 15 kbar for 170 h produced essentially no isotopic exchange between calcite and graphite. Thus, only empirical and theoretical calibrations are available for equilibrium calcite-graphite isotopic fractionations. Measured ACal-Gr values from rocks for which independent temperature determinations are avail- able are shown in Fig. 3. At temperatures below c. 500" C, ACII.Gr values vary widely due to disequilibrium, but at temperatures above 500" C the scatter decreases and the data converge, indicating an approach to, or attainment of, equilibrium. Equilibrium values are best estimated from the smallest fractionations observed at any given temperature and larger Ac,l-C, values result from incomplete "C exchange. The bold line in Fig. 3 represents the regression of a high-quality data set, to be discussed later, and yields the best available empirical calibration of the geothermometer.
Bottinga (1969a) determined theoretically the tempera- ture dependence of ACal-Grr but application of this calibration to natural data yields unreasonably high temperature estimates, up to 1500°C for some metamor- phic rocks. Valley & O'Neil (1981) measured values of ACal-Gr in marble from the Adirondack Mountains of New York State where regional metamorphic temperatures are particularly well-known. These results indicate that the fractionations predicted by Bottinga (1969a) are about 2%0 too large in the range of 600-800" C (Fig. 4) and constitute the first evidence that this system could provide reasonable temperature estimates for high-grade metamorphic rocks. The cause of this 2% discrepancy is explained by Chacko et al. (1991) who report an arithmetic error in Bottinga's (1969a) reduced partition function ratios for calcite. The recalculated fractionation curve of Chacko et al. (1991) is shifted c. 1.0-1.5X toward the smaller fractionation of Valley & O'Neil (1981) and has the same slope as Bottinga (1969a; Fig. 4).
Kreulen & van Beek (1983) present data for marbles from Naxos, Greece (Fig. 3), where ACal-Gr values are generally greater than those predicted by either Bottinga (1969a) or Chacko et al. (1991). Because of apparent disequilibrium, Kreulen & van Beek (1983) argue that the
Fig.
2.
Hig
h-re
solu
tion
tran
smis
sion
ele
ctro
n m
icro
scop
e im
ages
of
grap
hitic
m
ater
ial f
rom
low
-gra
de (c
hlor
ite z
one,
T =
400"
C) m
etas
edim
enta
ry r
ocks
sh
ow st
ruct
ural
ly im
mat
ure
inte
rior
s with
mod
erat
ely
wel
l-or
gani
zed
rim
s (a
, b)
whi
lst g
raph
ite fr
om a
med
ium
-gra
de sa
mpl
e (g
arne
t zon
e, T
= 50
0" C
) co
nsis
ts of
hig
hly
orga
nize
d la
yers
(c).
Thi
s pr
oces
s of
gra
phiti
zatio
n co
inci
des
with
car
bon
isot
ope
exch
ange
with
mor
e ra
pidl
y di
ffus
ing
calc
ite. I
nset
s ar
e op
tical
dif
frac
togr
ams.
Fro
m B
usec
k &
Hua
ng (1985), re
prod
uced
with
pe
rmis
sion
of a
utho
rs a
nd P
erga
mon
Pre
ss.
C A LC I T E- G RA PH I T E I S O T O P E C E O T H E R M 0 M E T R Y 491
calcite-graphite system will not provide a useful thermometer. We believe that the scatter in their data can be explained by incomplete isotopic exchange. The very fine-grained nature of the carbonaceous material in Naxos marble (J. B. H. Jansen, pers. comm., 1984) is in stark contrast to the coarse flake graphite (1-10mm diameter) analysed by Valley & O'Neil (1981) from the Adirondacks. The fine grain size of the Naxos samples suggests incomplete graphitization and we emphasize that assessing graphite textures is crucial in applying this system for geothermometry .
Wada & Suzuki (1983) determined the temperature dependence of ACal-Gr by calibration against the calcite- dolomite solvus thermometer using marbles collected from a contact aureole. Their fractionation curve had a greater slope than the theoretical curves or the relation proposed by Valley & O'Neil (1981). Wada & Suzuki's (1983) data range from 400 to 680" C and at temperatures over 600" C, where their data overlap with those of Valley & O'Neil (1981), the two data sets are in excellent agreement (Figs 3
Morikiyo (1984) measured ACal-Gr in marbles from the regionally metamorphosed Ryoke Belt in Japan and found a greater temperature dependence on ACal-Cr than other workers (Fig. 4). However, there is a larger temperature uncertainty in Morikiyo's study, especially at low grades, such that the temperature dependence of ACal-Gr is not well constrained below c. 500°C and some of these samples may not be equilibrated. Above 500" C Morikiyo's data are quite consistent with those of Valley & O'Neil (1981) and Wada & Suzuki (Figs 3 & 4).
In this study we combine new data with those of Valley
& 4).
Unrneta- \\ \
rnorphosed '\\\
a 1 4 -
10 .-
6 -
2 - u - - - - 1 1
100 300 500 700 Temperature ("C)
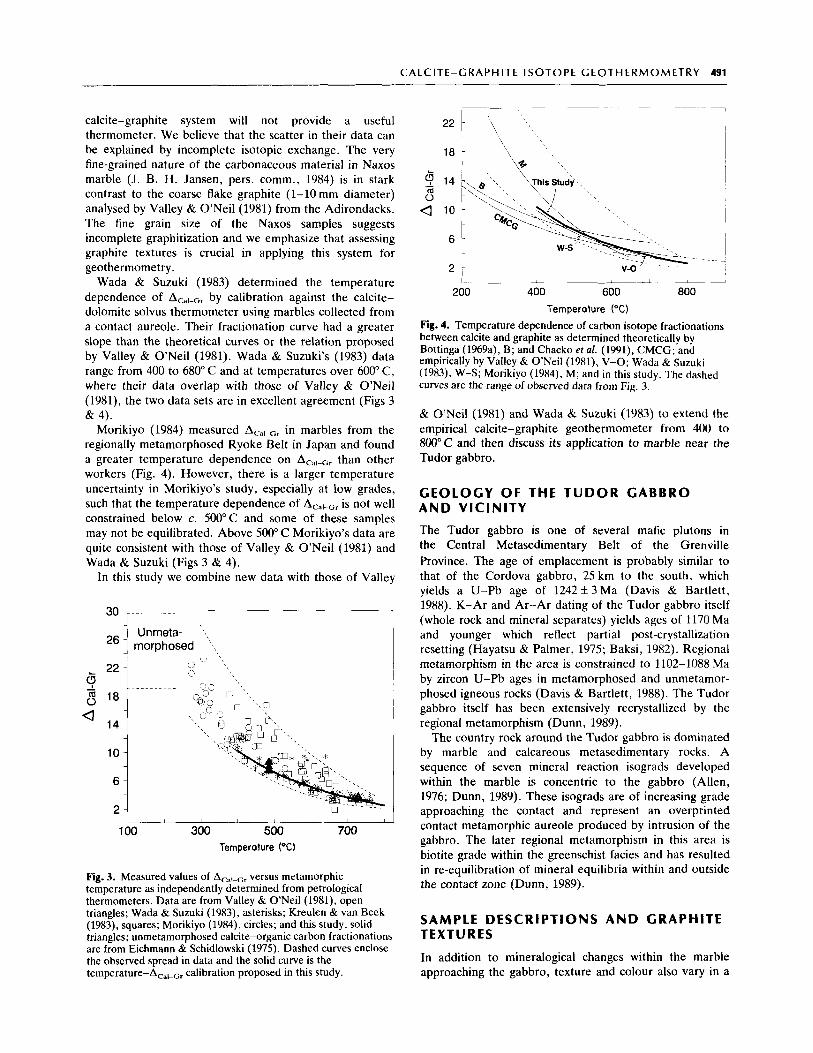
Fig. 3. Measured values of ACa,-Gr versus metamorphic temperature as independently determined from petrological thermometers. Data are from Valley & O'Neil (1981), open triangles; Wada & Suzuki (1983), asterisks; Kreulen & van Beek (1983), squares; Morikiyo (1984), circles; and this study, solid triangles; unmetamorphosed calcite-organic carbon fractionations are from Eichmann & Schidlowski (1975). Dashed curves enclose the observed spread in data and the solid curve is the temperature-A,,,-,, calibration proposed in this study.
, 1 i
I ' / 200 400 600 800
Temperature ("C) Fig. 4. Temperature dependence of carbon isotope fractionations between calcite and graphite as determined theoretically by Bottinga (1969a), B; and Chacko et al. (1991), CMCG; and empirically by Valley & O'Neil (1981), V-0; Wada & Suzuki (1983). W-S; Morikiyo (19841, M; and in this study. The dashed curves are the range of observed data from Fig. 3.
& O'Neil (1981) and Wada & Suzuki (1983) to extend the empirical calcite-graphite geothermometer from 400 to 800°C and then discuss its application to marble near the Tudor gabbro.
GEOLOGY OF THE T U D O R GABBRO AND V I C I N I T Y
The Tudor gabbro is one of several mafic plutons in the Central Metasedimentary Belt of the Grenville Province. The age of emplacement is probably similar to that of the Cordova gabbro, 25 km to the south, which yields a U-Pb age of 1242f 3 Ma (Davis & Bartlett, 1988). K-Ar and Ar-Ar dating of the Tudor gabbro itself (whole rock and mineral separates) yields ages of 1170 Ma and younger which reflect partial post-crystallization resetting (Hayatsu & Palmer, 1975; Baksi, 1982). Regional metamorphism in the area is constrained to 1102-1088 Ma by zircon U-Pb ages in metamorphosed and unmetamor- phosed igneous rocks (Davis & Bartlett, 1988). The Tudor gabbro itself has been extensively recrystallized by the regional metamorphism (Dunn, 1989).
The country rock around the Tudor gabbro is dominated by marble and calcareous metasedimentary rocks. A sequence of seven mineral reaction isograds developed within the marble is concentric to the gabbro (Allen, 1976; Dunn, 1989). These isograds are of increasing grade approaching the contact and represent an overprinted contact metamorphic aureole produced by intrusion of the gabbro. The later regional metamorphism in this area is biotite grade within the greenschist facies and has resulted in re-equilibration of mineral equilibria within and outside the contact zone (Dunn, 1989).
SAMPLE DESCRIPTIONS A N D GRAPHITE TEXTURES
In addition to mineralogical changes within the marble approaching the gabbro, texture and colour also vary in a
492 S . R. DUNN & J . W . VALLEY
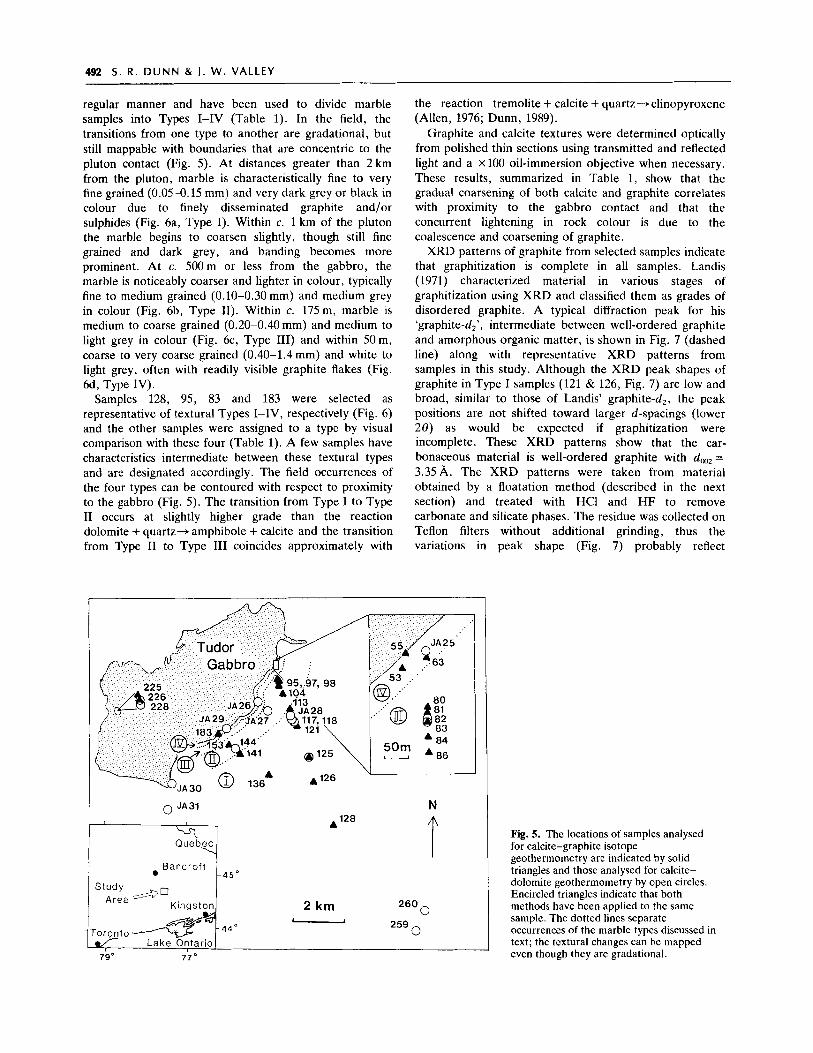
regular manner and have been used to divide marble samples into Types I-IV (Table 1). In the field, the transitions from one type to another are gradational, but still mappable with boundaries that are concentric to the pluton contact (Fig. 5). At distances greater than 2 km from the pluton, marble is characteristically fine to very fine grained (0.05-0.15 mm) and very dark grey or black in colour due to finely disseminated graphite and/or sulphides (Fig. 6a, Type I). Within c. 1 km of the pluton the marble begins to coarsen slightly, though still fine grained and dark grey, and banding becomes more prominent. At c. 500m or less from the gabbro, the marble is noticeably coarser and lighter in colour, typically fine to medium grained (0.10-0.30 mm) and medium grey in colour (Fig. 6b, Type 11). Within c. 175m, marble is medium to coarse grained (0.20-0.40 mm) and medium to light grey in colour (Fig. 6c, Type 111) and within 50m, coarse to very coarse grained (0.40-1.4 mm) and white to light grey, often with readily visible graphite flakes (Fig. 6d, Type IV).
Samples 128, 95, 83 and 183 were selected as representative of textural Types I-IV, respectively (Fig. 6) and the other samples were assigned to a type by visual comparison with these four (Table 1). A few samples have characteristics intermediate between these textural types and are designated accordingly. The field occurrences of the four types can be contoured with respect to proximity to the gabbro (Fig. 5) . The transition from Type I to Type I1 occurs at slightly higher grade than the reaction dolomite + quartz-+ amphibole + calcite and the transition from Type I1 to Type 111 coincides approximately with
the reaction tremolite + calcite + quartz-, clinopyroxene (Allen, 1976; Dunn, 1989).
Graphite and calcite textures were determined optically from polished thin sections using transmitted and reflected light and a x 100 oil-immersion objective when necessary. These results, summarized in Table 1, show that the gradual coarsening of both calcite and graphite correlates with proximity to the gabbro contact and that the concurrent lightening in rock colour is due to the coalescence and coarsening of graphite.
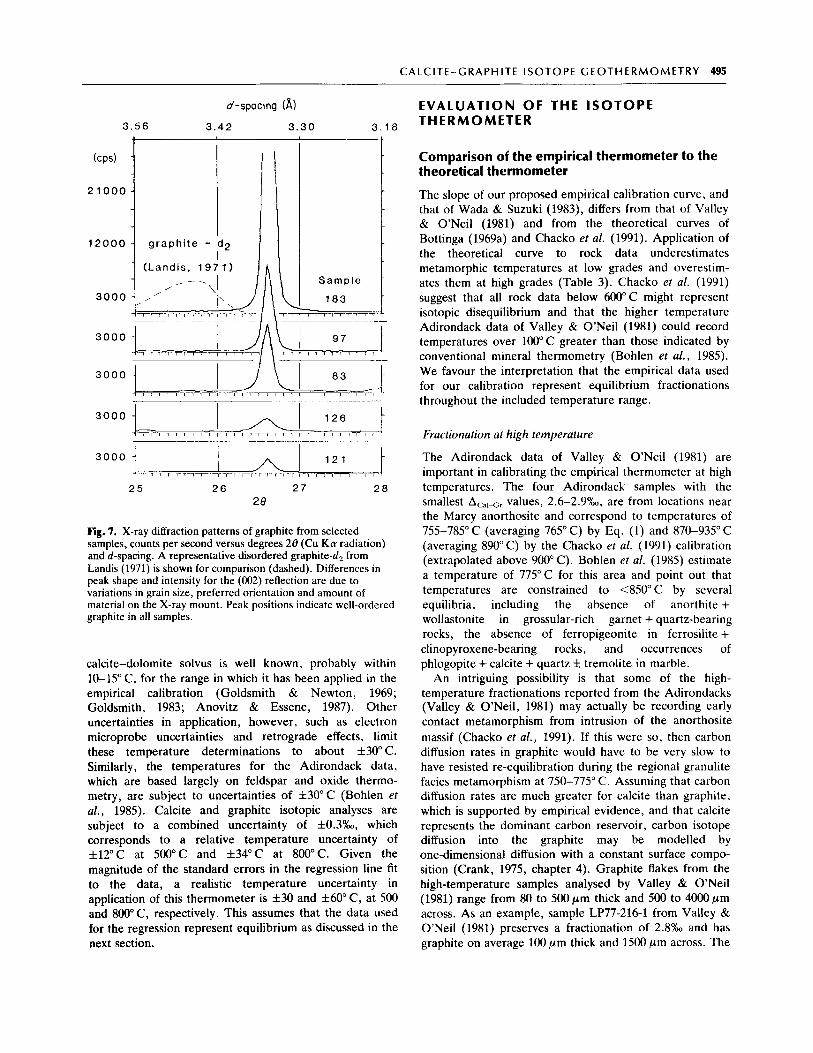
XRD patterns of graphite from selected samples indicate that graphitization is complete in all samples. Landis (1971) characterized material in various stages of graphitization using XRD and classified them as grades of disordered graphite. A typical diffraction peak for his 'graphite-d,', intermediate between well-ordered graphite and amorphous organic matter, is shown in Fig. 7 (dashed line) along with representative XRD patterns from samples in this study. Although the XRD peak shapes of graphite in Type I samples (121 & 126, Fig. 7) are low and broad, similar to those of Landis' graphite-d,, the peak positions are not shifted toward larger d-spacings (lower 28) as would be expected if graphitization were incomplete. These XRD patterns show that the car- bonaceous material is well-ordered graphite with d , = 3.35A. The XRD patterns were taken from material obtained by a floatation method (described in the next section) and treated with HC1 and HF to remove carbonate and silicate phases. The residue was collected on Teflon filters without additional grinding, thus the variations in peak shape (Fig. 7) probably reflect
r 0 JA31
Bancrof t 1450 1
N .I28
Study 1 Area I,:..".
0 2 krn 260
0 259 Toronto
LC . .
Lake Entariol 7 9 O 77
Fig. 5. The locations of samples analysed for calcite-graphite isotope geothermometry are indicated by solid triangles and those analysed for calcite- dolomite geothermometry by open circles. Encircled triangles indicate that both methods have been applied to the same sample. The dotted lines separate occurrences of the marble types discussed in text; the textural changes can be mapped even though they are gradational.
C A L C IT E - G R A P H I T E I S 0 T O P E G E 0 T H E R M 0 M E T R Y 493
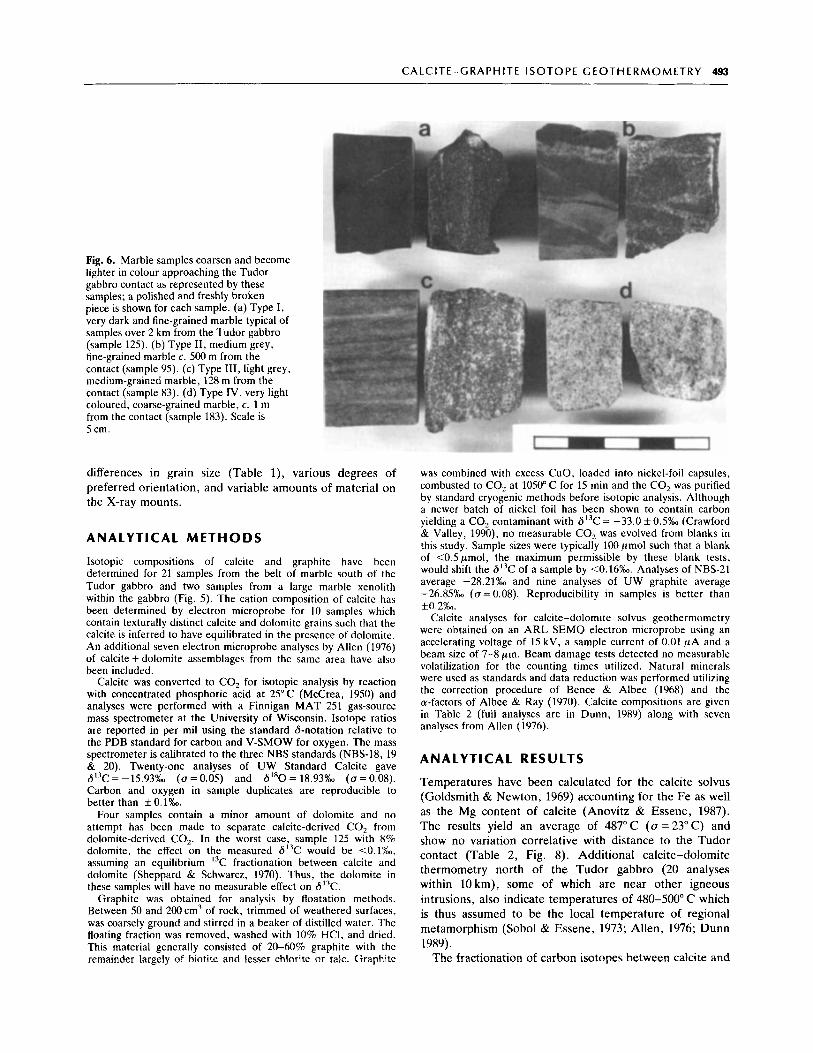
Fig. 6. Marble samples coarsen and become lighter in colour approaching the Tudor gabbro contact as represented by these samples; a polished and freshly broken piece is shown for each sample. (a) Type I, very dark and fine-grained marble typical of samples over 2 km from the Tudor gabbro (sample 125). (b) Type 11, medium grey, fine-grained marble c. 500 m from the contact (sample 95). (c) Type 111, light grey, medium-grained marble, 128 m from the contact (sample 83). (d) Type IV, very light coloured, coarse-grained marble, c. 1 m from the contact (sample 183). Scale is 5 cm.
differences in grain size (Table I) , various degrees of preferred orientation, and variable amounts of material on the X-ray mounts.
A N A L Y T I C A L M E T H O D S
Isotopic compositions of calcite and graphite have been determined for 21 samples from the belt of marble south of the Tudor gabbro and two samples from a large marble xenolith within the gabbro (Fig. 5). The cation composition of calcite has been determined by electron microprobe for 10 samples which contain texturally distinct calcite and dolomite grains such that the calcite is inferred to have equilibrated in the presence of dolomite. An additional seven electron microprobe analyses by Allen (1976) of calcite + dolomite assemblages from the same area have also been included.
Calcite was converted to CO, for isotopic analysis by reaction with concentrated phosphoric acid at 25°C (McCrea, 1950) and analyses were performed with a Finnigan MAT 251 gas-source mass spectrometer at the University of Wisconsin. Isotope ratios are reported in per mil using the standard ¬ation relative to the PDB standard for carbon and V-SMOW for oxygen. The mass spectrometer is calibrated to the three NBS standards (NBS-18, 19 & 20). Twenty-one analyses of UW Standard Calcite gave 6°C = -15.93% (a = 0.05) and 6I8O = 18.93% ( u = 0.08). Carbon and oxygen in sample duplicates are reproducible to better than f0.1"%0.
Four samples contain a minor amount of dolomite and no attempt has been made to separate calcite-derived CO, from dolomite-derived CO,. In the worst case, sample 125 with 8% dolomite, the effect on the measured 6°C would be <0.1%0, assuming an equilibrium I3C fractionation between calcite and dolomite (Sheppard & Schwarcz, 1970). Thus, the dolomite in these samples will have no measurable effect on 6I3C.
Graphite was obtained for analysis by floatation methods. Between 50 and 200 cm3 of rock, trimmed of weathered surfaces, was coarsely ground and stirred in a beaker of distilled water. The floating fraction was removed, washed with 10% HCI, and dried. This material generally consisted of 20-60% graphite with the remainder largely of biotite and lesser chlorite or talc. Graphite
was combined with excess CuO, loaded into nickel-foil capsules, combusted to CO, at 1050" C for 15 min and the CO, was purified by standard cryogenic methods before isotopic analysis. Although a newer batch of nickel foil has been shown to contain carbon yielding a CO, contaminant with 6I3C = -33.0 f 0.5"~ (Crawford & Valley, 1990), no measurable CO, was evolved from blanks in this study. Sample sizes were typically 100 pmol such that a blank of <0.5pmol, the maximum permissible by these blank tests, would shift the 613C of a sample by <0.16%. Analyses of NBS-21 average -28.21"h and nine analyses of UW graphite average -26.85% (a = 0.08). Reproducibility in samples is better than f0.2%.
Calcite analyses for calcite-dolomite solvus geothermometry were obtained on an ARL SEMQ electron microprobe using an accelerating voltage of 15 kV, a sample current of 0.01 p A and a beam size of 7-8 pm. Beam damage tests detected no measurable volatilization for the counting times utilized. Natural minerals were used as standards and data reduction was performed utilizing the correction procedure of Bence & Albee (1968) and the a-factors of Albee & Ray (1970). Calcite compositions are given in Table 2 (full analyses are in Dunn, 1989) along with seven analyses from Allen (1976).
A N A L Y T I C A L R E S U L T S
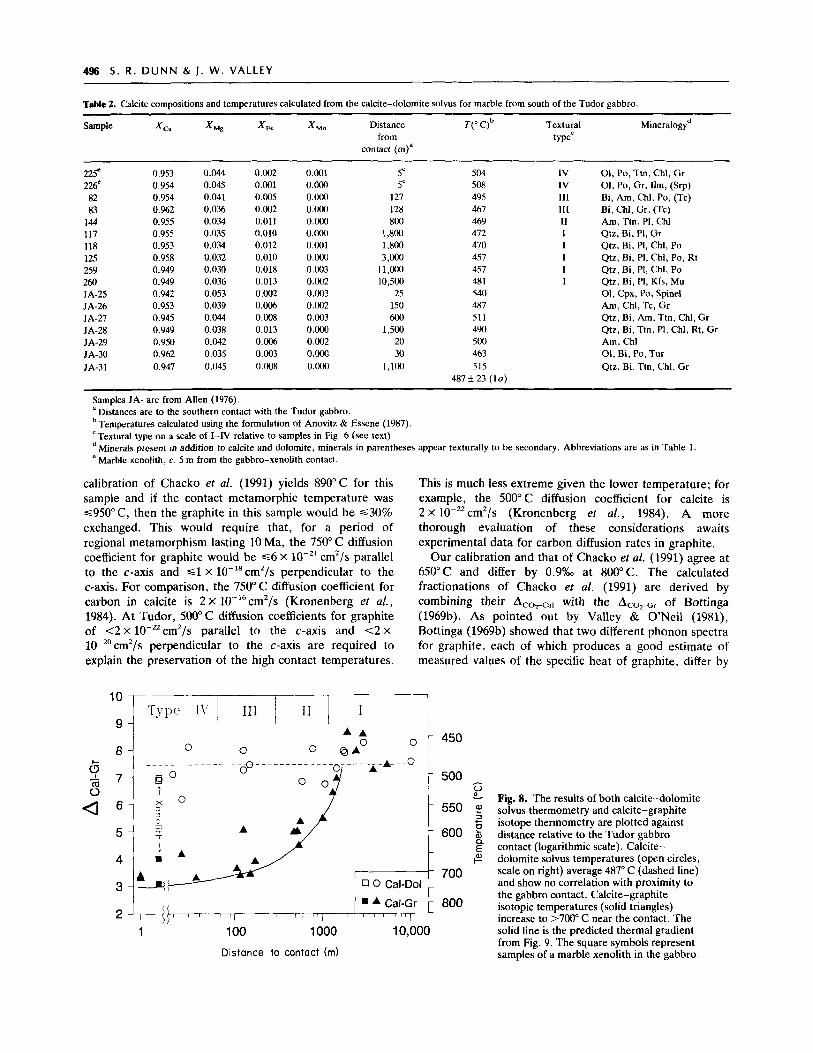
Temperatures have been calculated for the calcite solvus (Goldsmith & Newton, 1969) accounting for the Fe as well as the Mg content of calcite (Anovitz & Essene, 1987). The results yield an average of 487°C (a=23"C) and show no variation correlative with distance to the Tudor contact (Table 2, Fig. 8). Additional calcite-dolomite thermometry north of the Tudor gabbro (20 analyses within IOkm), some of which are near other igneous intrusions, also indicate temperatures of 480-500" C which is thus assumed to be the local temperature of regional metamorphism (Sobol & Essene, 1973; Allen, 1976; Dunn 1989).
The fractionation of carbon isotopes between calcite and
494 S. R. D U N N & J . W . VALLEY
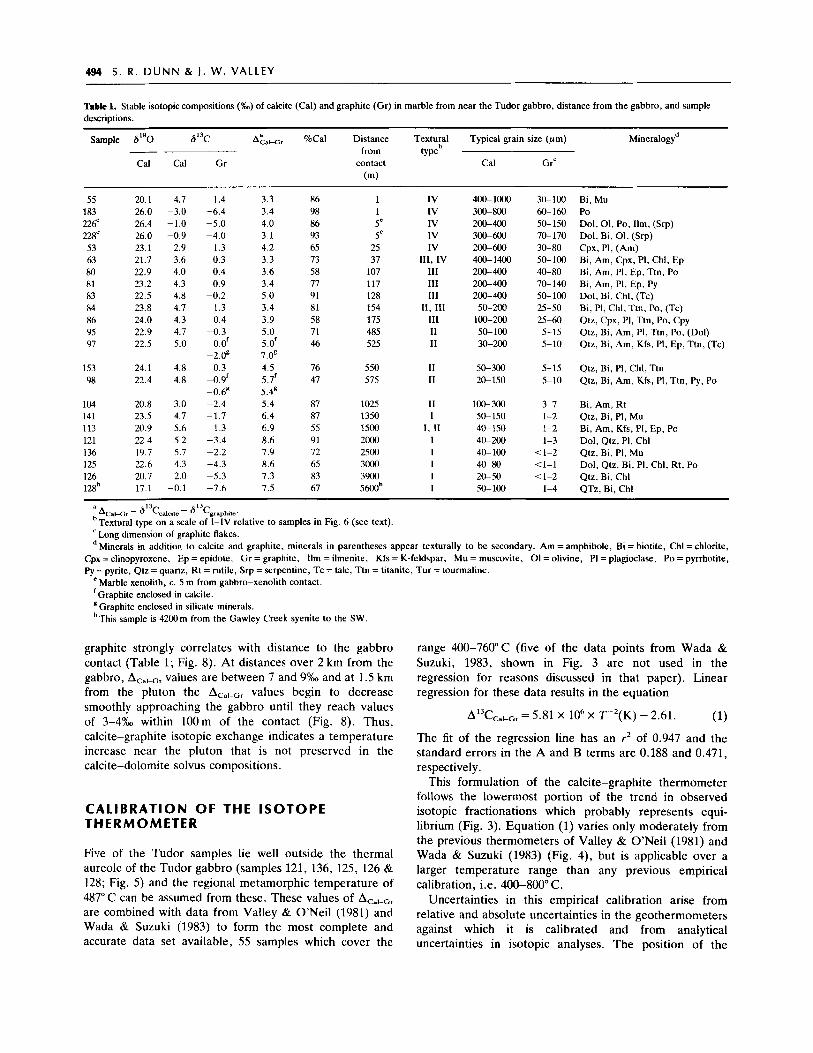
Table 1. Stable isotopic compositions (%) of calcite (Cal) and graphite (Gr) in marble from near the Tudor gabbro, distance from the gabbro, and sample descriptions.
Sample 6'*0 6% A&. %Cal Distance Textural Typical grain size (pm) Mineralogyd from typeb
Cal Cal Gr contact Cal GIC (4
55 183 226' 228' 53 63 80 81 83 84 86 95 97
153 98
104 141 113 121 136 125 126 12Sh
20.1 4.7 26.0 -3.0 26.4 -1.0 26.0 -0.9 23.1 2.9 21.7 3.6 22.9 4.0 23.2 4.3 22.5 4.8 23.8 4.7 24.0 4.3 22.9 4.1 22.5 5.0
24.1 4.8 22.4 4.8
20.8 3.0 23.5 4.7 20.9 5.6 22.4 5.2 19.7 5.7 22.6 4.3 20.7 2.0 17.1 -0.1
1.4 3.3 86 -6.4 3.4 98 -5.0 4.0 86 -4.0 3.1 93 -1.3 4.2 65 0.3 3.3 73 0.4 3.6 58 0.9 3.4 77
-0.2 5.0 91 I .3 3.4 81 0.4 3.9 58
-0.3 5.0 71 0.0' 5.0f 46
0.3 4.5 76 -2.f 7.0'
-0.9' 5.7' 47 -0.6' 5.4' -2.4 5.4 87 -1.7 6.4 87 -1.3 6.9 55 -3.4 8.6 91 -2.2 7.9 72 -4.3 8.6 65 -5.3 7.3 83 -7.6 7.5 67
1 1 5= 5e 25 37 107 117 128 154 175 485 525
550 575
1025 1350 1500 2000 2500 3000 3900 5mh
IV IV IV IV IV
111, IV 111 Ill 111
11, 1x1 I11 I1 I1
I1 I1
11 I
I , I1 I I I I I
400-1000 300-800 200-400 300-600 200-600 400-1400 200-400 200-400 200-400 50-200 100-200 50-100 30-200
50-300 20-150
100-300 50-150 40-150 40-200 40- 100 40-80 20-50 50-100
30-100 60-160 50-150 70-170 30-80 50-100 40-80 70-140 50-100 25-50 25-60 5-15 5-10
5-15 5-10
3-7 1-2 1-2 1-3
<I-2 <1-1 <l-2 1-4
Bi, Mu Po Dol, 01, Po, Ilm, (Srp) Dol, Bi, 01, (Srp) Cpx, PI, (Am) Bi, Am, Cpx, PI, Chl, Ep Bi, Am, PI, Ep, Ttn, Po Bi, Am, PI, Ep, Py Dol, Bi, Chl, (Tc) Bi, PI, Chl, Ttn, Po, (Tc) Qtz, Cpx, PI, Ttn, Po, Cpy Qtz, Bi, Am, PI, Ttn, Po, (Dol) Qtz, Bi, Am, Kfs, PI, Ep, Ttn, (Tc)
Qtz, Bi, PI, Chl, Ttn Qtz, Bi, Am, Kfs, P1, Ttn, Py, Po
Bi, Am, Rt Qtz, Bi, PI, Mu Bi, Am, Kfs, PI, Ep, Po Dol, Qtz, PI, Chl Qtz, Bi, PI, Mu Dol, Qtz, Bi, PI, Chl, Rt, Po Qtz, Bi, Chl QTz, Bi, Chl
13 13 A ~ a ~ r = ccalc,te - Cgraphute. Textural type on a scale of I-IV relative to samples in Fig. 6 (see text)
'Long dimension of graphite flakes. Minerals in addition to calcite and graphite, minerals in parentheses appear texturally to be secondary. Am = amphibole, Bi =biotite, Chl = chlorite,
Cpx = clinopyroxene, Ep = epidote, Gr = graphite, Ilm = ilmenite, Kfs = K-feldspar, Mu = muscovite, 01 =olivine, PI = plagioclase, Po = pyrrhotite, Py = pyrite, Qtz =quartz, Rt = rutile, Srp = serpentine, Tc = talc, Ttn = titanite, Tur = tourmaline.
'Marble xenolith, c. 5 m from gabbro-xenolith contact. Graphite enclosed in calcite. Graphite enclosed in silicate minerals.
hThis sample is 4200m from the Gawley Creek syenite to the SW.
graphite strongly correlates with distance to the gabbro contact (Table 1; Fig. 8). At distances over 2 km from the gabbro, ACa,-Gr values are between 7 and 9%0 and at 1.5 km from the pluton the ACa,-Gr values begin to decrease smoothly approaching the gabbro until they reach values of 3-4% within 100m of the contact (Fig. 8). Thus, calcite-graphite isotopic exchange indicates a temperature increase near the pluton that is not preserved in the calcite-dolomite solvus compositions.
CALIBRATION OF THE ISOTOPE THERMOMETER
Five of the Tudor samples lie well outside the thermal aureole of the Tudor gabbro (samples 121, 136, 125, 126 & 128; Fig. 5) and the regional metamorphic temperature of 487" C can be assumed from these. These values of ACal-Gr are combined with data from Valley & O'Neil (1981) and Wada & Suzuki (1983) to form the most complete and accurate data set available, 55 samples which cover the
range 400-760°C (five of the data points from Wada & Suzuki, 1983, shown in Fig. 3 are not used in the regression for reasons discussed in that paper). Linear regression for these data results in the equation
A'3CCal-Gr = 5.81 X lo6 X T 2 ( K ) - 2.61. (1) The fit of the regression line has an r2 of 0.947 and the standard errors in the A and B terms are 0.188 and 0.471, respectively.
This formulation of the calcite-graphite thermometer follows the lowermost portion of the trend in observed isotopic fractionations which probably represents equi- librium (Fig. 3). Equation (1) vanes only moderately from the previous thermometers of Valley & O'Neil (1981) and Wada & Suzuki (1983) (Fig. 4), but is applicable over a larger temperature range than any previous empirical calibration, i.e. 400-800" C.
Uncertainties in this empirical calibration arise from relative and absolute uncertainties in the geothermometers against which it is calibrated and from analytical uncertainties in isotopic analyses. The position of the
C A LC IT E - C R A P H I TE I S OTO PE G E OTH E RM 0 M ET R Y 495
(CPS)
2 1000
12000
3 0 0 0
d-spacing (A) 3.56 3.42 3.30 3.18
E V A L U A T I O N OF T H E I S O T O P E T H E R M O M E T E R
(Landis, 1 9 7 1 ) I I - , ' - \ I
- I I
Fig. 7. X-ray diffraction patterns of graphite from selected samples, counts per second versus degrees 28 (Cu Ka radiation) and d-spacing. A representative disordered graphite-d, from Landis (1971) is shown for comparison (dashed). Differences in peak shape and intensity for the (002) reflection are due to variations in grain size, preferred orientation and amount of material on the X-ray mount. Peak positions indicate well-ordered graphite in all samples.
calcite-dolomite solvus is well known, probably within 10-15" C, for the range in which it has been applied in the empirical calibration (Goldsmith & Newton, 1969; Goldsmith, 1983; Anovitz & Essene, 1987). Other uncertainties in application, however, such as electron microprobe uncertainties and retrograde effects, limit these temperature determinations to about f30" C. Similarly, the temperatures for the Adirondack data, which are based largely on feldspar and oxide thermo- metry, are subject to uncertainties of f30"C (Bohlen et al., 1985). Calcite and graphite isotopic analyses are subject to a combined uncertainty of f0.3%0, which corresponds to a relative temperature uncertainty of f12"C at 500°C and f34"C at 800°C. Given the magnitude of the standard errors in the regression line fit to the data, a realistic temperature uncertainty in application of this thermometer is f 3 0 and f60" C, at 500 and 800"C, respectively. This assumes that the data used for the regression represent equilibrium as discussed in the next section.
Comparison of the empirical thermometer to the theoretical thermometer
The slope of our proposed empirical calibration curve, and that of Wada & Suzuki (1983), differs from that of Valley & O'Neil (1981) and from the theoretical curves of Bottinga (1969a) and Chacko et a f . (1991). Application of the theoretical curve to rock data underestimates metamorphic temperatures at low grades and overestim- ates them at high grades (Table 3). Chacko et a f . (1991) suggest that all rock data below 600°C might represent isotopic disequilibrium and that the higher temperature Adirondack data of Valley & O'Neil (1981) could record temperatures over 100°C greater than those indicated by conventional mineral thermometry (Bohlen et a f . , 1985). We favour the interpretation that the empirical data used for our calibration represent equilibrium fractionations throughout the included temperature range.
Fractionation at high femperature
The Adirondack data of Valley & O'Neil (1981) are important in calibrating the empirical thermometer at high temperatures. The four Adirondack samples with the smallest ACa,-Gr values, 2.6-2.9"A, are from locations near the Marcy anorthosite and correspond to temperatures of 755-785°C (averaging 765°C) by Eq. (1) and 870-935°C (averaging 890" C) by the Chacko et a f . (1991) calibration (extrapolated above 900" C). Bohlen et a f . (1985) estimate a temperature of 775°C for this area and point out that temperatures are constrained to <850" C by several equilibria, including the absence of anorthite + wollastonite in grossular-rich garnet + quartz-bearing rocks, the absence of ferropigeonite in ferrosilite + clinopyroxene-bearing rocks, and occurrences of phlogopite + calcite + quartz f tremolite in marble.
An intriguing possibility is that some of the high- temperature fractionations reported from the Adirondacks (Valley & O'Neil, 1981) may actually be recording early contact metamorphism from intrusion of the anorthosite massif (Chacko et a f . , 1991). If this were so, then carbon diffusion rates in graphite would have to be very slow to have resisted re-equilibration during the regional granulite facies metamorphism at 750-775" C. Assuming that carbon diffusion rates are much greater for calcite than graphite, which is supported by empirical evidence, and that calcite represents the dominant carbon reservoir, carbon isotope diffusion into the graphite may be modelled by one-dimensional diffusion with a constant surface compo- sition (Crank, 1975, chapter 4). Graphite flakes from the high-temperature samples analysed by Valley & O'Neil (1981) range from 80 to 500 pm thick and 500 to 4000 pm across. As an example, sample LP77-216-1 from Valley & O'Neil (1981) preserves a fractionation of 2 . 8 % ~ and has graphite on average 100 pm thick and 1500 pm across. The
496 S . R. DUNN 81 J . W. VALLEY
Table 2. Calcite compositions and temperatures calculated from the calcite-dolomite solvus for marble from south of the Tudor gabbro. ~ ~ ~ ~~~ ~
Sample Xca xMg X M " Distance T(" C)b Textural Mineralogy"
contact (m)" from type'
225' 226' 82 83
144 117 118 125 259 260 JA-25 JA-26 JA-27 JA-28 JA-29 JA-30 JA-31
0.953 0.954 0.954 0.962 0.955 0.955 0.953 0.958 0.940 0.949 0.942 0.953 0.945 0.949 0.950 0.962 0.947
0.044 0.002 0.045 0.001 0.041 0.005 0.036 0.002 0.034 0.011 0.035 0.010 0.034 0.012 0.032 0.010 0.030 0.018 0.036 0.013 0.053 0.002 0.039 0.006 0.044 0.008 0.038 0.013 0.042 0.006 0.035 0.003 0.045 0.008
0.001 O.OO0 O.OO0 O.OO0 O.Oo0 O.Oo0 0.001 O.Oo0 0.003 0.002 0.003 0.002 0.003 0.000 0.002 0.000 0.000
5' 5e
127 128 800
1,800 1,800 3,000
11,ooo 10,500
25 150 600
1,500 20 30
1.100
504 508 495 467 469 472 470 457 457 481 540 487 511 490 500 463 515
487 f 23 (1 (7)
IV IV 111 111 I1 I I I I I
01, Po, Ttn, Chl, Gr 01, Po, Gr, Ilm, (Srp) Bi, Am, Chl, Po, (Tc) Bi, Chl, Gr, (Tc) Am, Ttn. PI, Chl Qtz, Bi. PI, Gr Qtz, Bi, PI, Chl, Po Qtz, Bi, PI, Chl, Po, Rt Qtz, Bi, P1, Chl, Po Qtz, Bi, PI, Kfs, Mu 01, Cpx, Po, Spinel Am. Chl, Tc, Gr Qtz, Bi, Am, Ttn, Chl, Gr Qtz, Bi, Ttn, PI, Chl, Rt, GI Am, Chl 01, Bi, Po, Tur Qtz, Bi. Ttn, Chl, Gr
~~ ~
Samples JA- are from Allen (1076). 'Distances are to the southern contact with the Tudor gabbro.
'Textural type on a scale of I-IV relative to samples in Fig. 6 (see text). "Minerals present in addition to calcite and dolomite, minerals in parentheses appear texturally to be secondary. Abbreviations are as in Table 1
Temperatures calculated using the formulation of Anovitz & Essene (1987).
Marble xenolith, c. 5 m from the gdbbro-xenolith contact.
calibration of Chacko et al. (1991) yields 890" C for this This is much less extreme given the lower temperature; for sample and if the contact metamorphic temperature was ~ 9 5 0 " C, then the graphite in this sample would be <30% exchanged. This would require that, for a period of regional metamorphism lasting 10 Ma, the 750" C diffusion coefficient for graphite would be 4 X lo-'' cm2/s parallel to the c-axis and G l X 10-'8cmZ/s perpendicular to the c-axis. For comparison, the 750" C diffusion coefficient for carbon in calcite is 2 x cm'/s (Kronenberg et al., 1984). At Tudor, 500°C diffusion coefficients for graphite of < 2 x 10-22cm2/s parallel to the c-axis and <2 x lo-'' cm2/s perpendicular to the c-axis are required to explain the preservation of the high contact temperatures.
example, the 500" C diffusion coefficient for calcite is 2 x 10-22cm'/s (Kronenberg et al., 1984). A more thorough evaluation of these considerations awaits experimental data for carbon diffusion rates in graphite.
Our calibration and that of Chacko et al. (1991) agree at 650°C and differ by 0.9% at 800°C. The calculated fractionations of Chacko et al. (1991) are derived by combining their Aco,-cal with the A,,,_,, of Bottinga (1969b). As pointed out by Valley & O'Neii (1981), Bottinga (1969b) showed that two different phonon spectra for graphite, each of which produces a good estimate of measured values of the specific heat of graphite, differ by
Type I t ' I 111 ~ I1 I I 450
- 500
550 z 600
- !?
3 c
Q E I-"
700
1 A Cat-Gr 1 800 1 1 00 1000 10,000
Distance to contact (rn)
Fig. 8. The results of both calcite-dolomite solvus thermometry and calcite-graphite isotope thermometry are plotted against distance relative to the Tudor gabbro contact (logarithmic scale). Calcite- dolomite solvus temperatures (open circles, scale on right) average 487" C (dashed line) and show no correlation with proximity to the gabbro contact. Calcite-graphite isotopic temperatures (solid triangles) increase to >7W0 C near the contact. The solid line is the predicted thermal gradient from Fig. 9. The square symbols represent samples of a marble xenolith in the gabbro.
C A LC IT E - C RAP H IT E I SOT 0 P E G E O T H E RM 0 MET RY 497
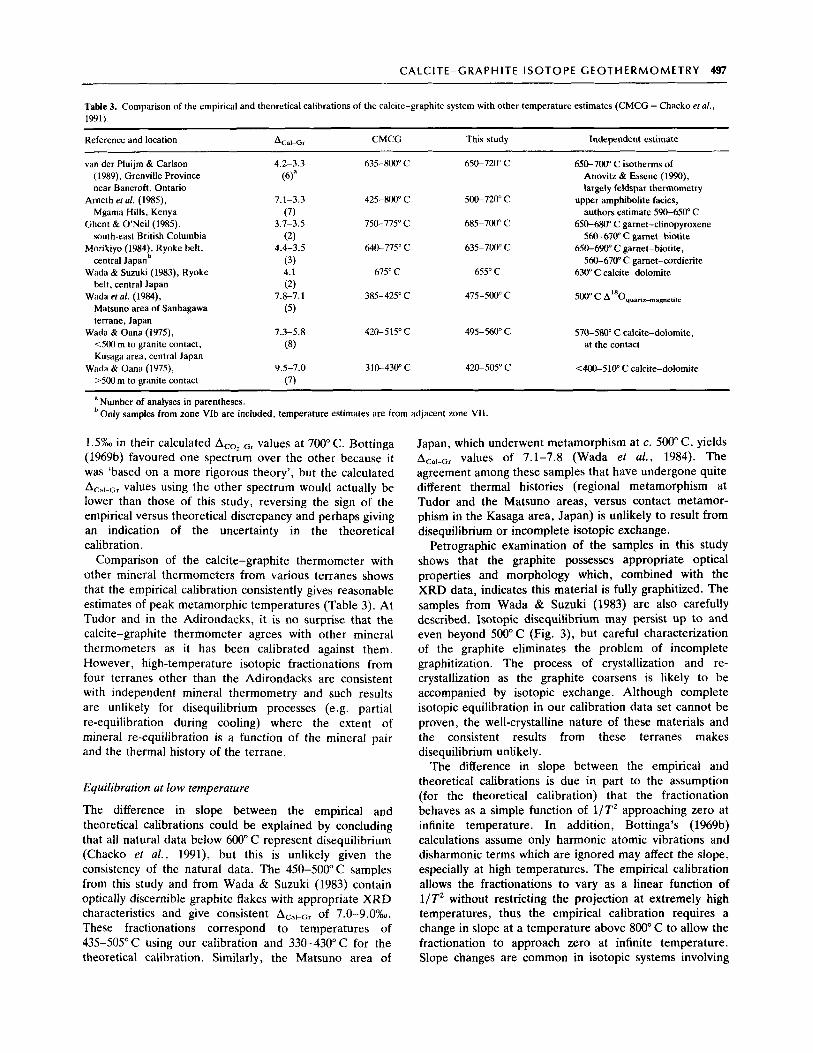
Table 3. Comparison of the empirical and theoretical calibrations of the calcite-graphite system with other temperature estimates (CMCG = Chacko eta/. , 1991).
Reference and location ~ ~~
ACaW.3 CMCG This study Independent estimate
van der Pluijm & Carlson (1989). Grenville Province near Bancroft, Ontario
Arneth el al. (1985). Mgama Hills, Kenya
Ghent & O'Neil(1985), south-east British Columbia
Morikiyo (1984), Ryoke belt, central Japanb
Wada & Suzuki (1983). Ryoke belt, central Japan
Wada el al. (1984). Matsuno area of Sanbagawa terrane, Japan
400 m to granite contact, Kusaga area, central Japan
>500 m to granite contact
Wada & Oana (1975),
Wada & Oana (1979,
~~
4.2-3.3
7.1-3.3 (7)
(2)
(3)
(2)
( 5 )
(8)
3.1-3.5
4.4-3.5
4.1
7.8-7.1
7.3-5.8
9.5-7.0 (7)
635-800' C
425-800" C
750-775" C
640-775" c
675" c
385-425" C
420-515°C
310-430" C
650-720" C
500-720" C
685-700" C
635-700" C
655" C
475-500" c
495-560" c
420-505" C
650-700" C isotherms of Anovitz & Essene (1990). largely feldspar thermometry
upper amphibolite facies, authors estimate 590-650" C
650-680" C garnet-clinopyroxene 560-670" C garnet-biotite
650-690" C garnet-biotite, 560-670" C garnet-cordierite
630" C calcite-dolomite
in 500" c A Oqua"r-mag"rtlte
570-580" C calcite-dolomite, at the contact
<400-510" C calcite-dolomite
a Number of analyses in parentheses. Only samples from zone VIb are included, temperature estimates are from adjacent zone VII.
1.5L in their calculated AC02-Gr values at 700" C. Bottinga (1969b) favoured one spectrum over the other because it was 'based on a more rigorous theory', but the calculated ACal-Gr values using the other spectrum would actually be lower than those of this study, reversing the sign of the empirical versus theoretical discrepancy and perhaps giving an indication of the uncertainty in the theoretical calibration.
Comparison of the calcite-graphite thermometer with other mineral thermometers from various terranes shows that the empirical calibration consistently gives reasonable estimates of peak metamorphic temperatures (Table 3). At Tudor and in the Adirondacks, it is no surprise that the calcite-graphite thermometer agrees with other mineral thermometers as it has been calibrated against them. However, high-temperature isotopic fractionations from four terranes other than the Adirondacks are consistent with independent mineral thermometry and such results are unlikely for disequilibrium processes (e.g. partial re-equilibration during cooling) where the extent of mineral re-equilibration is a function of the mineral pair and the thermal history of the terrane.
Equilibration at low temperature
The difference in slope between the empirical and theoretical calibrations could be explained by concluding that all natural data below 600" C represent disequilibrium (Chacko et al., 1991), but this is unlikely given the consistency of the natural data. The 450-500°C samples from this study and from Wada & Suzuki (1983) contain optically discernible graphite flakes with appropriate XRD characteristics and give consistent of 7.0-9.0"h. These fractionations correspond to temperatures of 435-505" C using our calibration and 330-430" C for the theoretical calibration. Similarly, the Matsuno area of
Japan, which underwent metamorphism at c. 500" C, yields ACal-Gr values of 7.1-7.8 (Wada et al . , 1984). The agreement among these samples that have undergone quite different thermal histories (regional metamorphism at Tudor and the Matsuno areas, versus contact metamor- phism in the Kasaga area, Japan) is unlikely to result from disequilibrium or incomplete isotopic exchange.
Petrographic examination of the samples in this study shows that the graphite possesses appropriate optical properties and morphology which, combined with the XRD data, indicates this material is fully graphitized. The samples from Wada & Suzuki (1983) are also carefully described. Isotopic disequilibrium may persist up to and even beyond 500°C (Fig. 3), but careful characterization of the graphite eliminates the problem of incomplete graphitization. The process of crystallization and re- crystallization as the graphite coarsens is likely to be accompanied by isotopic exchange. Although complete isotopic equilibration in our calibration data set cannot be proven, the well-crystalline nature of these materials and the consistent results from these terranes makes disequilibrium unlikely.
The difference in slope between the empirical and theoretical calibrations is due in part to the assumption (for the theoretical calibration) that the fractionation behaves as a simple function of 1/T2 approaching zero at infinite temperature. In addition, Bottinga's (1969b) calculations assume only harmonic atomic vibrations and disharmonic terms which are ignored may affect the slope, especially at high temperatures. The empirical calibration allows the fractionations to vary as a linear function of 1/T2 without restricting the projection at extremely high temperatures, thus the empirical calibration requires a change in slope at a temperature above 800" C to allow the fractionation to approach zero at infinite temperature. Slope changes are common in isotopic systems involving
498 S. R. D U N N & j . W . V A L L E Y
gases or fluid-melt and fluid-mineral systems, as discussed by O'Neil (1986), and are entirely possible for a system such as calcite-graphite where the vibrational modes of carbon in the two substances may vary with temperature in quite different manners.
Comparison of isotopic temperatures to a thermal model
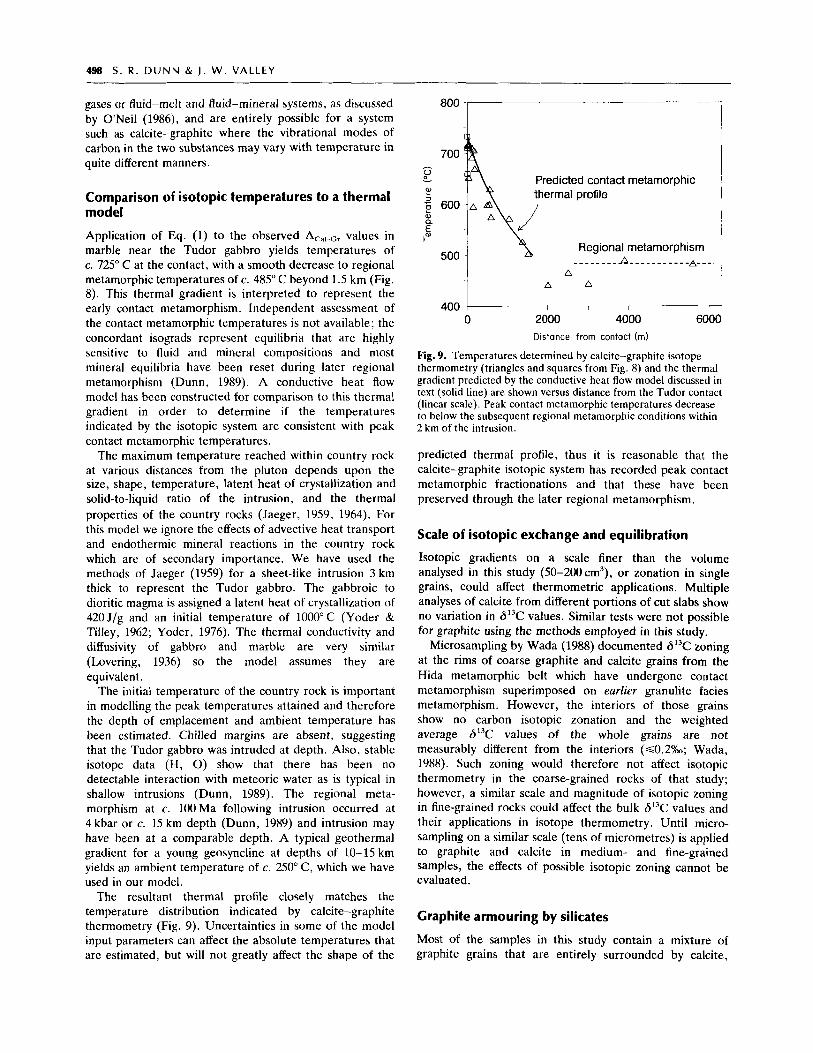
Application of Eq. (1) to the observed ACa,-Gr values in marble near the Tudor gabbro yields temperatures of c. 725" C at the contact, with a smooth decrease to regional metamorphic temperatures of c. 485" C beyond 1.5 km (Fig. 8). This thermal gradient is interpreted to represent the early contact metamorphism. Independent assessment of the contact metamorphic temperatures is not available; the concordant isograds represent equilibria that are highly sensitive to fluid and mineral compositions and most mineral equilibria have been reset during later regional metamorphism (Dunn, 1989). A conductive heat flow model has been constructed for comparison to this thermal gradient in order to determine if the temperatures indicated by the isotopic system are consistent with peak contact metamorphic temperatures.
The maximum temperature reached within country rock at various distances from the pluton depends upon the size, shape, temperature, latent heat of crystallization and solid-to-liquid ratio of the intrusion, and the thermal properties of the country rocks (Jaeger, 1959, 1964). For this model we ignore the effects of advective heat transport and endothermic mineral reactions in the country rock which are of secondary importance. We have used the methods of Jaeger (1959) for a sheet-like intrusion 3 km thick to represent the Tudor gabbro. The gabbroic to dioritic magma is assigned a latent heat of crystallization of 420J/g and an initial temperature of 1000°C (Yoder & TiIley, 1962; Yoder, 1976). The thermal conductivity and diffusivity of gabbro and marble are very similar (Lovering, 1936) so the model assumes they are equivalent.
The initial temperature of the country rock is important in modelling the peak temperatures attained and therefore the depth of emplacement and ambient temperature has been estimated. Chilled margins are absent, suggesting that the Tudor gabbro was intruded at depth. Also, stable isotope data (H, 0) show that there has been no detectable interaction with meteoric water as is typical in shallow intrusions (Dunn, 1989). The regional meta- morphism at c. 100Ma following intrusion occurred at 4 kbar or c. 15 km depth (Dunn, 1989) and intrusion may have been at a comparable depth. A typical geothermal gradient for a young geosyncline at depths of 10-15 km yields an ambient temperature of c. 250" C, which we have used in our model.
The resultant thermal profile closely matches the temperature distribution indicated by calcite-graphite thermometry (Fig. 9). Uncertainties in some of the model input parameters can affect the absolute temperatures that are estimated, but will not greatly affect the shape of the
800 1
Predicted contact metamorphic
Regional metamorphism - - - - - - _ _ A - _ _ ~ _ _ _ - - - - A - _ - .
, I , 0 2000 4000 6000
Distance from contact (m)
Fig. 9. Temperatures determined by calcite-graphite isotope thermometry (triangles and squares from Fig. 8) and the thermal gradient predicted by the conductive heat flow model discussed in text (solid line) are shown versus distance from the Tudor contact (linear scale). Peak contact metamorphic temperatures decrease to below the subsequent regional metamorphic conditions within 2 km of the intrusion.
predicted thermal profile, thus it is reasonable that the calcite-graphite isotopic system has recorded peak contact metamorphic fractionations and that these have been preserved through the later regional metamorphism.
Scale of isotopic exchange and equilibration
Isotopic gradients on a scale finer than the volume analysed in this study (50-200cm3), or zonation in single grains, could affect thermometric applications. Multiple analyses of calcite from different portions of cut slabs show no variation in 6'-'C values. Similar tests were not possible for graphite using the methods employed in this study.
Microsampling by Wada (1988) documented 613C zoning at the rims of coarse graphite and calcite grains from the Hida metamorphic belt which have undergone contact metamorphism superimposed on earlier granulite facies metamorphism. However, the interiors of those grains show no carbon isotopic zonation and the weighted average 6'-'C values of the whole grains are not measurably different from the interiors ( ~ 0 . 2 % ; Wada, 1988). Such zoning would therefore not affect isotopic thermometry in the coarse-grained rocks of that study; however, a similar scale and magnitude of isotopic zoning in fine-grained rocks could affect the bulk 6I3C values and their applications in isotope thermometry. Until micro- sampling on a similar scale (tens of micrometres) is applied to graphite and calcite in medium- and fine-grained samples, the effects of possible isotopic zoning cannot be evaluated.
Graphite armouring by silicates
Most of the samples in this study contain a mixture of graphite grains that are entirely surrounded by calcite,
CALCITE- G RAP H IT E I S OTO PE G E O T H E R M 0 MET R Y 499
grains that are entirely surrounded by silicate minerals, and grains that are partially surrounded by both calcite and silicates. Wada & Suzuki (1983) suggest that armouring of graphite by silicates can hinder the isotopic exchange between such graphite and calcite. Initial analyses of calcite and graphite in samples 97 and 98 gave corresponding Acal-Gr values that were larger than those for other samples at a similar distance from the intrusion, indicating either that isotopic equilibrium had not been attained in these samples or that retrogression had affected their isotopic fractionations. These two samples contain the greatest amount of silicate minerals of all the samples analysed (Table 1) and much of the graphite is seen optically to occur within silicate minerals; this suggests that armouring of graphite by silicates might contribute to this apparent isotopic disequilibrium. Graphite separates representing silicate- and calcite-hosted fractions were separately analysed from these samples to evaluate this possibility.
Graphite fractions were obtained by first reacting trimmed slabs in HCI until no further reaction could be produced. The slabs were gently disaggregated and free graphite was collected by the floatation method. This graphite is representative of graphite enclosed only by calcite. The remaining material was placed in a ceramic mortar and rolled, but not crushed, with a pestle to remove graphite flakes protruding from silicate grains. This material was rinsed, rolled again and rinsed again to remove graphite that was enclosed in both carbonate and graphite. The grains were then ground in water and the released graphite was collected by floatation. This graphite fraction is representative of graphite wholly enclosed within silicate minerals.
The isotopic compositions of the two graphite fractions from sample 98 differ by only 0.3% which is within analytical error, but in sample 97 they differ by 2.0% with the smaller 613C value for silicate-armoured graphite (Table 1). Multiple analyses of calcite scraped from three portions of this sample suggest that the 613C of calcite is uniform throughout and imply that isotopic exchange between calcite and silicate-armoured graphite was less complete (larger ACal-Gr) than that recorded by graphite enclosed within calcite.
These results are nearly identical with the findings of Wada & Suzuki (1983) regarding the effects of silicate armouring. They found several samples with disequi- librium calcite-graphite fractionations indicative of incom- plete isotopic exchange. The disequilibrium samples contain graphite wholly or partially enclosed within silicates. Wada & Suzuki (1983) analysed graphite associated with silicates and graphite associated with carbonates from two samples. In one sample the two graphite fractions are essentially the same, but in the other sample they differ by 1.8% with lower values for the silicate-armoured graphite.
Our results together with those of Wada & Suzuki (1983) show that silicate-armoured graphite is slower to equilibrate with calcite during prograde metamorphism, at least up to moderate grade. The best thermometric results
for samples from greenschist and amphibolite facies terranes will therefore be obtained where graphite is not extensively armoured by silicates. Microsampling methods applied to marble from the granulite facies detect no difference between graphite in silicates arid graphite in calcite (Arita & Wada, 1990). The diffusion barrier imposed by silicate armouring may be effectively overcome at granulite facies temperatures and above.
DISCUSSION
The calcite-graphite isotope geothermometer provides a quantitative record of contact metamorphic temperatures and regional metamorphic temperatures in marble around the Tudor gabbro. Calcite-dolomite solvus thermometry for the same area yields only temperatures that have been reset by later regional metamorphism. Thus, within the contact metamorphic aureole, the partitioning of Mg in the calcite-dolomite system was reset during regional meta- morphism at c. 500" C whilst the calcite-graphite isotopic system was not disturbed.
At the time of elevated contact metamorphic tempera- tures, calcite in dolomite-bearing rocks near the contact would presumably have had a greater Mg content than that presently observed. Calcite grains (stained with alizarin S) contain no visible exsolution features and those analysed by the electron microprobe are fairly uniform in composition; calcite has thus recrystallized under regional metamorphic conditions. Recrystallization has apparently not altered the carbon isotopic compositions of the calcite because the only other carbon-bearing phase is graphite which is very resistant to isotopic exchange once it has become highly crystalline. Limited fluid infiltration into some marble samples has had little or no effect on the 6°C values of calcite because the Xco? of the fluids was very low, <0.015, and the 6°C of the fluid was not greatly out of isotopic equilibrium with the marble (Dunn, 1989). In those samples that also contain dolomite, the quantities of dolomite are minor and the carbon isotopic fractionation between calcite and dolomite is small such that the isotopic composition of the calcite remains essentially unchanged.
Regional metamorphism was sufficiently penetrative to result in partial recrystallization of the Tudor gabbro, especially at its margins, and to have reset silicate- carbonate equilibria throughout the marble (Dunn, 1989). Marble is generally vulnerable to recrystallization, yet graphite, once coarse, resists recrystallization and the regional metamorphism at Tudor has not recrystallized the graphite.
Resetting calcite-graphite isotopic fractionations ap- parently requires graphite recrystallization which does not commonly occur upon cooling. However, post-peak metamorphic resetting of the calcite-graphite isotopic system has been observed in mylonitic marbles from a shear zone near Bancroft, Ontario (30 km north-west of the study area; van der Pluijm & Carlson, 1989). In that study, calcite and graphite have been recrystallized and the grains reduced in size by two orders of magnitude within mylonite zones. Values of ACal-Gr are greater in mylonites
500 S . R . DUNN & 1 . W . VALLEY
than their marble protolith, indicating carbon isotope resetting after the peak of metamorphism, almost certainly concurrent with deformation. Also, Weis (1980) describes texturally distinctive skeletal graphite which overgrows coarse graphite flakes in high-grade marble from the Adirondack Mountains of New York State. The skeletal graphite clearly formed later than the coarse flakes and the ACalGr for calcite-flake graphite is 2.6%0 (peak metamor- phic) whereas the ACal-Gr for calcite-skeletal graphite is 4.9X. Thus, the skeletal graphite exchanged with calcite at lower, post-peak metamorphic temperatures. Similarly, Arita & Wada (1990) document isotopic zonation in single graphite flakes from granulite facies marble (c. 1 . 5 0 ~ decrease in 6I3C values within 100pm of the graphite grain boundary). Zonation was observed only in grains with rough surfaces; a smooth surfaced grain was essentially homogeneous. The rough surfaces are inter- preted to be fine-grained graphite overgrowths on coarse flakes (Arita & Wada, 1990). In some instances, therefore, graphite does isotopically exchange with carbonate after the peak of metamorphism, but it is accompanied by recrystallization or late graphite growth that can be recognized texturally.
In summary, isotopic exchange between calcite and graphite forms the basis for a useful thermometer for marbles and is facilitated by recrystallization. Whether such exchange leads to equilibration or not determines if thermometry can be successfully applied and graphite textures must be evaluated when applying this thermo- meter. The refractory nature of graphite makes this system especially valuable as a test of polymetamorphism.
ACKNOWLEDGEMENTS
S.R.D. thanks K. Baker and J. Morrison for guidance in the UW stable isotope laboratory and E. Glover in the electron microprobe laboratory. We are very grateful to S. W. Bailey for sharing his X-ray expertise and laboratory. We thank D. Carmichael for assistance and encouragement. P. Brown, D. Elsenheimer and C. Johnson provided useful reviews of an earlier version of the manuscript. Helpful reviews by J. Bowman, T. Chacko and H. Wada are gratefully acknowledged. Support for this study was provided by the Petroleum Research Fund (18839-AC2), the National Science Foundation (EAR 85-08102 and EAR 88-05470), the Gas Research Institute (5086-260-1425), the Geological Society of America (Penrose grant 3416-85) and a Sigma XI grant-in-aid-of- research. S.R.D. also gratefully acknowledges the UW Alumni Research Fund, the Shell Foundation and the Department of Geology & Geophysics, University of Wisconsin.
REFERENCES
Albee, A. L. & Ray, L., 1970. Correction methods for electron probe microanalysis of silicates, oxides, carbonates, phosphates, and sulfides. Analytical Chemktry, 42, 1408- 1414.
Allen, J. M., 1976. Silicate-carbonate equilibria in calcareous metasediments of the Tudor Township area, Ontario: a test of
the P-T-X(C0,)-X(H,O) model of metamorphism. Unpubl. PhD Thesis, Queens University, Kingston, Ontario.
Anovitz, L. M. & Essene, E . J . , 1987. Phase equilibria in the system CaC0,-MgC0,-FeCO,. Journal of Petrology, 28,
Arita, Y. & Wada, H., 1990. Stable isotopic evidence for migration of metamorphic fluids along grain boundaries of marbles. Geochemical Journal, 24, 173-186.
Arneth, J. D., Schidlowski, M., Sarbos, B., Goerg, U. & Amstutz, G . C., 1985. Graphite content and isotopic fractionation between calcite-graphite pairs in metasediments from the Mgama Hills, southern Kenya. Geochimica ef Cosmochimica Acta, 49, 1553-1560.
Baksi, A. K., 1982. q’Ar-’YAr incremental heating studies on the Tudor gabbro, Grenville Province, Ontario: its bearing on the North American apparent polar wander path in late Proterozoic times. Geophysical Journal of the Astronomical Society, 70,
Barker, F. & Friedman, I . , 1969. Carbon isotopes in pelites of the Precambrian Uncompahgre formation, Needle Mountains, Colorado. Geological Society of America Bulletin, 80,
Bence, A. E. & Albee, A . L. , 1968. Empirical correction factors for the electron microanalysis of silicates and oxides. Journal of Geology, 76, 382-403.
Bohlen, S. R . , Valley, J. W. & Essene, E. J . , 1985. Metamorphism in the Adirondacks. I. Petrology, pressure, and temperature. Journal of Petrology, 26, 971-992.
Bottinga, Y., 1969a. Calculated fractionation factors for carbon and hydrogen isotope exchange in the system calcite-carbon dioxide-graphite-methane-hydrogen-water vapor. Geochimica el Cosmochimica Acta, 33, 49-64.
Bottinga, Y., 1969b. Carbon isotope fractionation between graphite, diamond, and carbon dioxide. Earth and Planerary Science Letters, 5 , 301-306.
Buseck, P. R. & Huang, B. J., 1985. Conversion of carbonaceous material to graphite during metamorphism. Geochimica et Cosmochimica Acta, 49, 2003-2016.
Chacko, T., Mayeda, T. K., Clayton, R. N. & Goldsmith, J. R., 1991. Oxygen and carbon isotope fractionations between CO, and calcite. Geochimica et Cosmochirnica A m , 55, 2867-2882.
Clayton, R. N., Goldsmith, J. R., Karel, K. J. , Mayeda, T . K . & Newton, R. C., 1975. Limits on the effect of pressure on isotopic fractionation. Geochimica et Cosmochimica Acta, 39,
Crank, J., 1975. The Mathematics of Diffusion, 2nd edn. Clarendon Press, Oxford, 414 pp.
Crawford, W. A. & Valley, J. W., 1990. Origin of graphite in the Pickering gneiss and the Franklin marble, Honeybrook Upland, Pennsylvanian Piedmont. Geological Society of America Bulletin, 102, 807-81 1.
Davis, D. W. & Bartlett, J . R., 1988. Geochronology of the Belmont metavolcanic complex and implications for crustal development in the Central Metasedimentary Belt, Grenville Province, Ontario. Canadian Journal of Earth Sciences, 25,
Degens, E. T., 1969. Biogeochemistry of stable isotopes. In: Organic Geochemistry, Methods and Results (eds Eglinton, G . & Murphy, M. T. J.), pp. 304-329. Springer-Verlag, New York.
Diessel, C. F. K . , Brothers, R. N. & Black, P. M., 1978. Coalification and graphitization in high-pressure schists in New Caledonia. Contributions to Mineralogy and Petrology, 68, 63-78.
Dunn, S. R., 1989. Metamorphism and stable isotope geochemistry of the Tudor gabbro and adjacent marble, Ontario, Canada. Unpubl. PhD Thesis, University of Wisconsin, Madison.
Eichmann, R. & Schidlowski, M., 1975. Isotopic fractionation between coexisting organic carbon-carbonate pairs in Pre- Cambrian sediments. Geochimica et Cosmochimica Acta, 39, 585-595.
389-414.
545-562.
1403-1408.
1197- 1201.
1751- 1759.
French, B. M., 1964. Graphitization of organic material in a progressively metamorphosed iron formation. Science, 146,
Ghent, E. D. & O’Neil, J . R. , 1985. Late Precambrian marbles of unusual carbon-isotope composition, southeastern British Columbia. Canadian Journal of Earth Sciences, 22, 324-329.
Goldsmith, J. R. , 1983. Phase relations of rhombohedra1 carbonates. In: Carbonates: Mineralogy and Chemistry (ed. Reeder, R. J .) , Mineralogical Society of America Reviews in Mineralogy, 11, 49-76.
Goldsmith, J . R. & Newton, R. C., 1969. P-T-X relations in the system CaC0,-MgCO, at high temperatures and pressures. American Journal of Scivnce, 267-A, 160-190.
Grew, E. S . , 1974. Carbonaceous material in some metamorphic rocks of New England and other areas. Journal of Geology, 82, 50-73.
Hayatsu, A. & Palmer, H. C. , 1975. K-Ar isochron study of the Tudor gabbro, Grenville Province, Ontario. Earth and Planetary Science Letters, 25, 208-212.
Hayes, J. M., Kaplan, I. R. & Wedeking, K. W., 1983. Precambrian organic geochemistry, preservation of the record. In: The Origin and Evolution of the Earth’s Earliest Biosphere (ed. Schopf, J. W.), pp. 93-134. Princeton University Press, Princeton, NJ.
Hoefs, J . & Frey, M., 1976. The isotopic composition of carbonaceous matter in a metamorphic profile from the Swiss Alps. Geochimica ef Cosmochimica Acta, 40, 945-951.
Itaya, T., 1981. Carbonaceous material in pelitic schists of the Sanbagawa metamorphic belt in central Shikoku, Japan. Lithos,
Jaeger, J . C., 1959. Temperatures outside a cooling intrusive sheet. American Journal of Science, 257, 44-54.
Jaeger, J. C., 1964. Thermal effects of intrusions. Reviews in Geophysics, 2, 443-466.
Kreulen, R. & van Beek, P. C. J . M., 1983. The calcite-graphite isotope thermometer; data on graphite-bearing marbles from Naxos, Greece. Geochimica et Cosmochimica Acta, 47,
Kronenberg, A. K., Yund, R. A. & Giletti, B. J., 1984. Carbon and oxygen diffusion in calcite: effects of Mn content and P(H,O). Physics and Chemistry of Minerals, 11, 101-112.
Lamb, W. M. & Valley, J. W., 1984. Metamorphism of reduced granulites in low-CO, vapour-free environments. Nature, 312, 56-58.
Lamb, W. M. & Valley, J . W., 1985. C-0-H fluid calculations and granulite genesis. In: The Deep Proterozoic Crust in the North Atlantic Provinces (eds Tobi, A. C. & Touret, J. L. R.), pp. 119-131. D. Reidel Publishing Co., Dordrecht.
Landis, C. A, , 1971. Graphitization of dispersed carbonaceous material in metamorphic rocks. Contributions to Mineralogy and Petrology, 30, 34-45.
Lespade, P., Al-Jashi, R. & Dresselhaus, M. S. , 1982. Model for Kaman scattering from incompletely graphitized carbons. Carbon, 20, 427-431.
Lovering, T. S. , 1936. Heat conduction in dissimilar rocks and the use of thermal models. Geological Society of America Bulletin,
McCrea, J . M., 1950. On the isotope chemistry of carbonates and a paleotemperature scale. Journal of Chemical Physics, 18, 849-857.
McKirdy, D. M. & Powell, T. G., 1974. Metamorphic alteration of carbon isotopic composition in ancient sedimentary organic
917-918.
14, 215-224.
1527-1530.
47, 87-100.
C A LC IT E - G RA P H I T E ISOTOPE G EOTH E RM 0 M ETRY 501 -
matter: new evidence from Australia and South Africa. Geology, 2, 591-595.
Morikiyo, T., 1984. Carbon isotopic study on coexisting calcite-graphite in the Ryoke metamorphic rocks, northern Kiso district, central Japan. contributions to Mineralogy and Petrology, 87, 251-259.
Oberlin, A., 1984. Carbonization and graphitization. Carbon, 6,
O’Neil, J . R., 1986. Theoretical and experimental aspects of isotopic fractionation. In: Stable Isotopes in High Temperature Geological Processes (eds Valley, J . W., O’Neil, J. R. & Taylor, H. P.), Mineralogical Society of America Reviews in Mineralogy, 16, 1-40.
Pasteris, J. D. & Wopenka, B., 1989. Raman spectra of carbonaceous material: sensitive indicators of degree of metamorphism (abstract). Geological Society of America, Abstracts with Programs, 21, A275.
van der Pluijm, B. A. & Carlson, K. A., 1989. Extension in the Central Metasedimentary Belt of the Ontario Grenville: timing and tectonic significance. Geology, 17, 161-164.
Rumble, D. 111 & Hoering, T. C., 1986. Carbon isotope geochemistry of graphite vein deposits from New Hampshire, USA. Geochimica et Cosmochimica Acta, 50, 1239-1247.
Sheppard, S. M. F. & Schwarcz, H . P., 1970. Fractionation of carbon and oxygen isotopes and magnesium between coexisting metamorphic calcite and dolomite. Contributions to Mineralogy and Petrology, 26, 161-198.
Sobol, J. W. & Essene, E. J., 1973. Petrology of Grenville marbles from southern Ontario (abstract). Geological Society of America, Abstracts with Programs, 5 , 815.
Valley, J. W. & O’Neil, J. R., 1981. 13C/’*C exchange between calcite and graphite: a possible thermometer in Grenville marbles. Geochimica et Cosmochimica Acta, 45, 411-419.
Wada, H., 1988. Microscale isotopic zoning in calcite and graphite crystals in marble. Nature, 331, 61-63.
Wada, H., Enami, M. & Yanagi, T., 1984. Isotopic studies of marbles in the Sanbagawa metamorphic terrain, central Shikoku, Japan. Geochemical Journal, 18, 61-73.
Wada, H. & Oana, S., 1975. Carbon and oxygen isotope studies of graphite bearing carbonates in the Kasuga area, Gifu Prefecture, central Japan. Geochemical Journal, 9, 149-160.
Wada, H. & Suzuki, K., 1983. Carbon isotope thermometry calibrated by dolomite-calcite solvus temperatures. Geochimica et Cosmochimica Acta, 47, 697-706.
Wedeking, K. W. & Hayes, J. M., 1983. Carbonization of Precambrian kerogens. In: Advances in Organic Geochemistry (eds Bjoroy, M. et al .) , pp. 546-553. John Wiley and Sons, New York.
Weis, P. L., 1980. Graphite skeleton crystals-a newly recognized morphology of crystalline carbon in metasedimentary rocks. Geology, 8, 296-297.
Weis, P. L., Friedman, I. & Gleason, J. P., 1981. The origin of graphite: evidence from isotopes. Geochimica et Cosmochimica Acta, 45, 2325-2332.
Yoder, H. S . Jr, 1976. Generation of Basaltic Magma. National Academy of Science Publishing Company, Washington, DC.
Yoder, H. S. Jr & Tilley, C. E., 1962. Origin of basalt magma: an experimental study of natural and synthetic rock systems. Journal of Petrology, 3, 342-532.
521-541.
Received 18 February 1991; revision accepted 8 September 1991.


![[www fisierulmeu ro] 33078008-Tudor-Sbenghe-Kinetologie-Profilactica-Terapeutica-Si-de-re](https://img.pdfslide.net/doc/110x75/631f04b7097e038f7c0945dc/www-fisierulmeu-ro-33078008-tudor-sbenghe-kinetologie-profilactica-terapeutica-si-de-re.jpg)


