Embed Size (px)
Citation preview
ARTICLE
Received 1 Aug 2014 | Accepted 2 Dec 2014 | Published 16 Jan 2015
Capacitance-modulated transistor detectsodorant binding protein chiral interactionsMohammad Yusuf Mulla1, Elena Tuccori2, Maria Magliulo1, Gianluca Lattanzi3, Gerardo Palazzo1,
Krishna Persaud2 & Luisa Torsi1
Peripheral events in olfaction involve odorant binding proteins (OBPs) whose role in the
recognition of different volatile chemicals is yet unclear. Here we report on the sensitive and
quantitative measurement of the weak interactions associated with neutral enantiomers
differentially binding to OBPs immobilized through a self-assembled monolayer to the gate of
an organic bio-electronic transistor. The transduction is remarkably sensitive as the transistor
output current is governed by the small capacitance of the protein layer undergoing minute
changes as the ligand–protein complex is formed. Accurate determination of the free-energy
balances and of the capacitance changes associated with the binding process allows
derivation of the free-energy components as well as of the occurrence of conformational
events associated with OBP ligand binding. Capacitance-modulated transistors open a new
pathway for the study of ultra-weak molecular interactions in surface-bound protein–ligand
complexes through an approach that combines bio-chemical and electronic thermodynamic
parameters.
DOI: 10.1038/ncomms7010 OPEN
1 Dipartimento di Chimica and CSGI, Universita degli Studi di Bari ‘Aldo Moro’, 70125 Bari, Italy. 2 School of Chemical Engineering and Analytical Science,The University of Manchester, Manchester M13 9PL, UK. 3 Dipartimento di Fisica ‘M. Merlin’, INFN and TIRES, Universita degli Studi di Bari ‘Aldo Moro’,70125 Bari, Italy. Correspondence and requests for materials should be addressed to L.T. (email: [email protected]).
NATURE COMMUNICATIONS | 6:6010 | DOI: 10.1038/ncomms7010 | www.nature.com/naturecommunications 1
& 2015 Macmillan Publishers Limited. All rights reserved.

Olfactory transduction is initiated when small volatilecompounds (odorant molecules) in air interact withmembrane-bound olfactory receptor proteins in olfactory
sensory neurons1,2 after partitioning through the aqueouscompartment of nasal mucus of vertebrates3 or the sensillumlymph in the antennae of insects. In the mucus or in the lymphsmall soluble odorant binding proteins (OBPs) are found, whichare secreted in high concentrations (millimolar range)4,5. Thebinding properties are characterized by a broad selectivity to arange of odorant ligands with dissociation constants (K) in themicromolar range4. The physiological role of OBPs in the odourperception process is still unclear. They may shuttle odorantmolecules from air to the olfactory receptors through the mucusor the lymph, or have a role in the odorant clearance mechanismafter the transduction of the olfactory signal6,7. Recent evidenceindicates direct involvement of OBPs in the recognition ofdifferent volatile chemicals in insects8–11.
OBPs are extremely stable to temperature, organic solvents andproteolytic digestion. They can be expressed in bacterial systemsat low cost, are easily purified12 and the binding properties can betailored through mutagenesis, making them attractive for anumber of biotechnological applications. Vertebrate OBPs arecharacterized by a hydrophobic b-barrel cavity13, where theligand is hosted and the monomeric porcine OBPs (pOBPs)14
form a useful model system to study binding affinities to odorantcompounds. While pOBPs are weakly negatively charged in purewater15, (S)-(þ )- and (R)-(� )-carvone enantiomers are odorantmolecules that bear a dipole moment16. Understanding of thenature of the ligand–protein interactions at a molecular level islimited, and little is yet known about the interaction of chiralmolecules with OBPs.
OBPs have been used as recognition elements in differenttransducing systems but the reported detection limits do not gobelow nanomolar level. However, lately bio-detection at very lowconcentrations has become possible using field-effect backgate17–19 and water-gated organic field-effect transistor(WGOFET)20 sensors21,22. Particularly relevant is the case of aback-gate OFET that can provide differential detection of carvoneenantiomers at the tens of micromolar concentration level19.WGOFETs are operated at very low voltages23 and can befabricated at low cost on flexible substrates24. In a bio-FET thegate electrode is generally modified with an electro-active bio-recognition element, and on exposure to the target molecule athreshold voltage (VT)25 shift that scales with the logarithm of theanalyte concentration26,27 has been so far generally measured.The scaling of VT with the concentration is a general property ofFET transduction28 since the reaction electrochemical Gibbs freeenergy (DG)29 changes the electrochemical potential of the gatemetal electrons, �me. In an ideal trap-free OFET, VT defines thegate bias needed to offset the mismatch between the gate metaland the semiconductor electrons electrochemical potential �me.When the reaction takes place at the gate, the �me is changed andVT shifts. As �m is equal to mþ nFV (m¼ chemical potential,F¼ Faraday’s constant, n¼moles of charges and V¼ electrostaticpotential), it is associated with strong long-range coulombinteractions (10–100 kJ mol� 1). This is why FETs generallyprovide sensitive detection in reactions that involve chargedspecies, but are less successful for quantitative detection of neutralspecies30. The Gibbs free energy (G) of interactions involvingneutral species coinvolves the system energy and entropy,ignoring the effect of net charges or monopoles31. G can beassociated with the interaction energy which accounts for weakshorter-range interactions such as dipole–dipole or dispersiveinteractions (B2 kJ mol� 1).
This article reports on the binding of (S)-(þ )- and (R)-(� )-carvone enantiomers to a pOBP-mutant-F88W, detected by
means of a WGOFET. With this approach we achieve thesensitive evaluation of energies as low as 1.1±0.5 kJ mol� 1,associated with neutral enantiomers differentially binding to apOBP immobilized through a self-assembled monolayer (SAM).The WGOFET output current is governed by the protein nano-layer capacitance where subtle changes can be transduced, with ahigh signal-to-noise ratio, due to the transistor current gain.Analysis of the free-energy balance and of the degree ofcapacitance decreases, provides strong support for the hypothesisthat on S-(þ )-carvone ligand binding the pOBP undergoes aconformational change that is not seen with the R-(� )enantiomer.
ResultsDissociation constants of pOBPs in solution. A competitivefluorescent binding assay performed on pOBPs in solution,returned for pOBP-carvone enantiomer complexes (pOBP-C)dissociation constants KSol
þ of 0.50±0.01 mM and KSol� of
1.22±0.05 mM, for the (S)-(þ)- and (R)-(�)-carvone, respec-tively. The data are reported in Fig. 1 and the details of thedissociation constants extraction are reported in the Methodsection. These data prove the pOBP-mutant-F88W to be chiralactive. The binding is relatively selective, and control experimentsindicate that 2-phenylethanol binds very weakly to pOBP(KSolB40 mM) (Fig. 1), while wasp-OBP is not capable ofdifferentiation between carvone enantiomers (SupplementaryFig. 1).
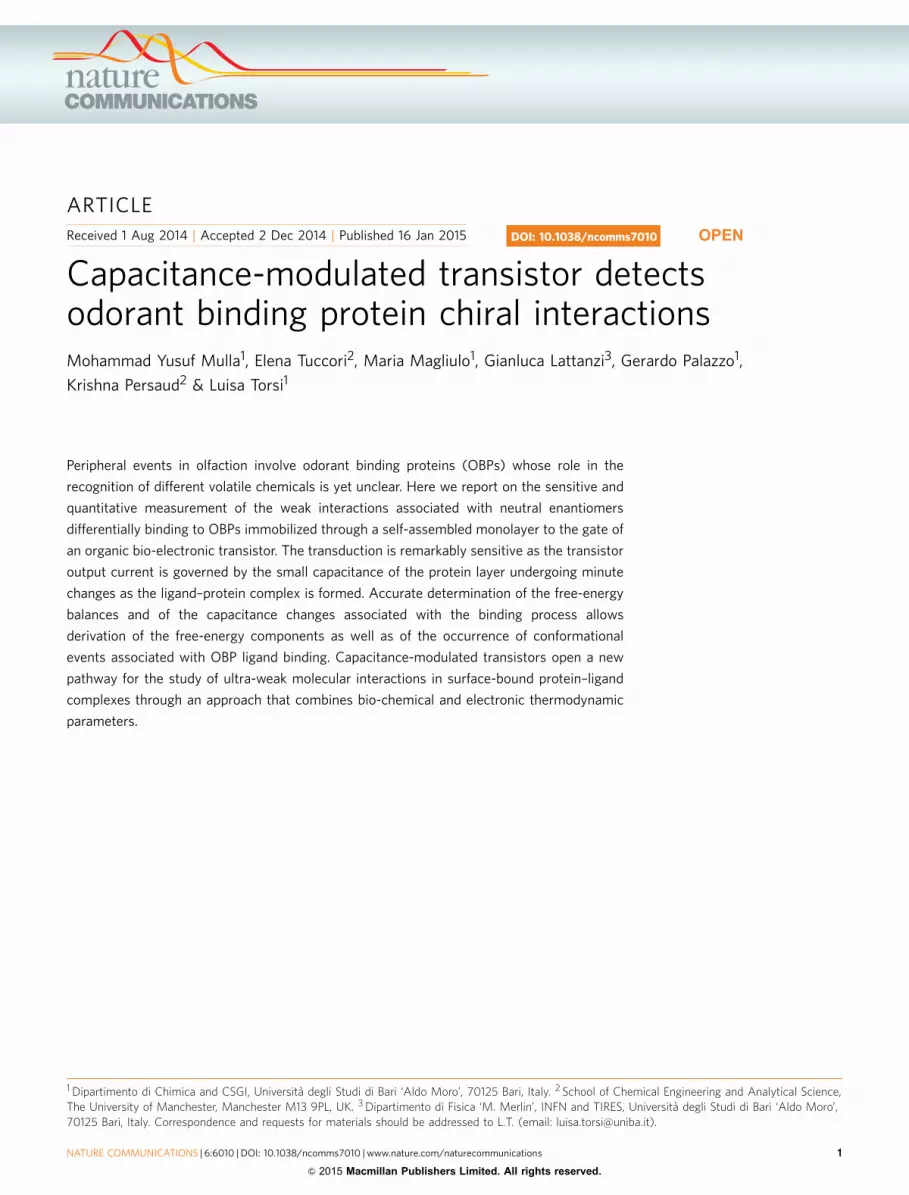
The pOBP-WGOFET functional mechanism. In Fig. 2a, aschematic of the pOBP-WGOFET organic bio-electronic32
structure is reported, showing source (S) and drain (D) contactscovered by a spin-coated poly[2,5-bis(3-tetradecylthiophen-2-yl)thieno[3,2-b]thiophene] (PBTTT-C14) p-type organic semi-conductor (OSC) deposited on a flexible substrate. A droplet ofwater is placed on the OSC hydrophobic surface and electricalcontact to the gate (G) is made through a gold plate whose waterexposed surface is functionalized with a very compact pOBP-SAM, schematically shown in Fig. 2b. An extensive surfacecharacterization of the pOBP-SAM is reported in the
0 5 10 15 20
20
30
40
50
60
70
80
90
100
110
S-(+)-carvoneR-(–)-carvone2-phenylethanol
Flu
ores
cenc
e in
tens
ity (
%)
[ligand] μM
Figure 1 | Competitive binding curves for carvone enantiomers and
2-phenylethanol. The affinity of binding of the porcine pOBP was measured
using the 1-AMA fluorescence probe. The fluorescent signal is reported
as a function of the ligand concentration. A decrease in fluorescence
intensity of 1-AMA with increasing concentrations of binding ligands is
seen. There is also clear difference in affinities between the carvone and the
2-phenylethanol ligands. Moreover, the decrease in fluorescence intensity
of 1-AMA for two enantiomers differs significantly, confirming the
differential selectivity of carvone enantiomers by pOBP-F88W.
ARTICLE NATURE COMMUNICATIONS | DOI: 10.1038/ncomms7010
2 NATURE COMMUNICATIONS | 6:6010 | DOI: 10.1038/ncomms7010 | www.nature.com/naturecommunications
& 2015 Macmillan Publishers Limited. All rights reserved.
Supplementary Information. The data in Supplementary Figs 2and 3 assess the surface coverage of the gold electrode byevaluating the electrochemical hindrance. In SupplementaryFigs 4–6, the SAM surface chemical composition is studied bymeans of X-ray photoelectron spectroscopy analysis, while inSupplementary Fig. 7 the pOBP-SAM morphology is evaluated byscanning electron microscopy.
A p-type FET is operated by applying negative VDS and VGS
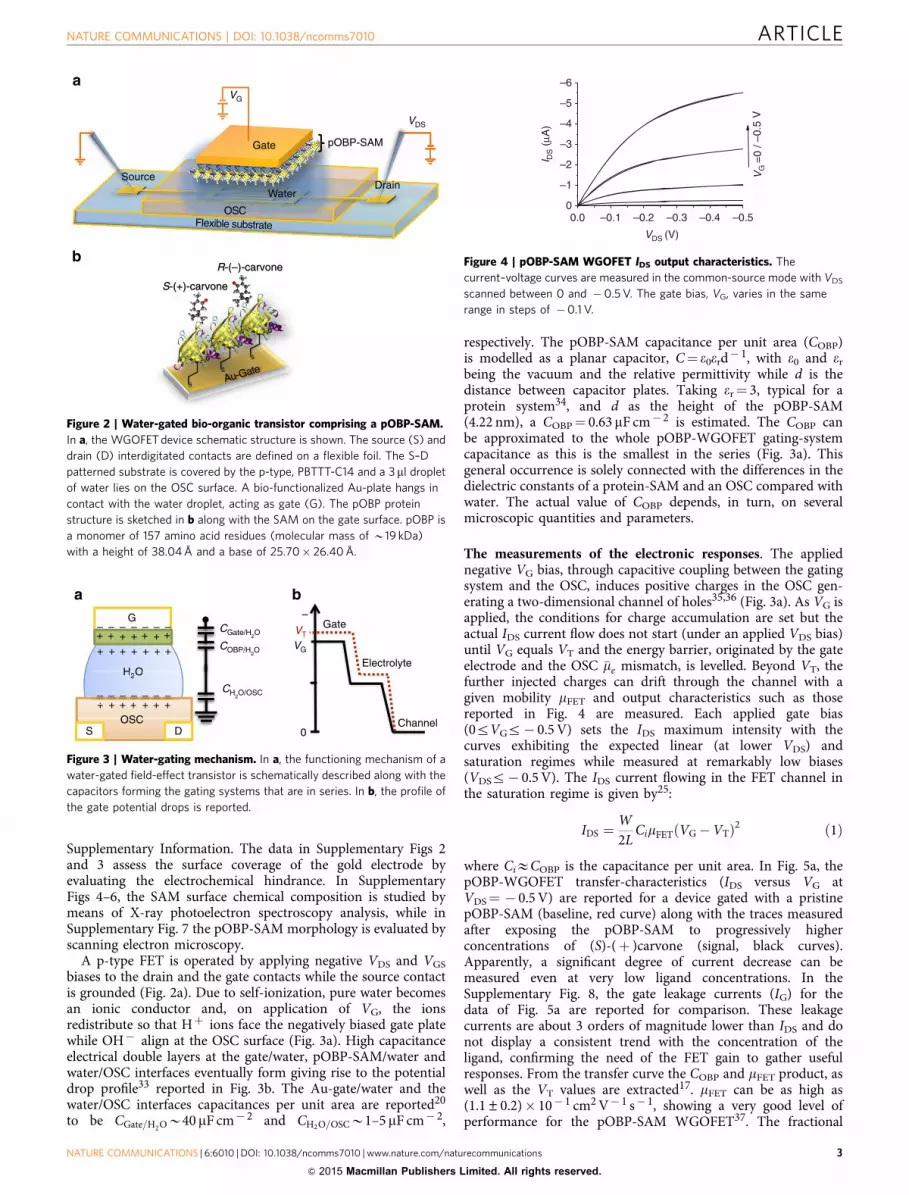
biases to the drain and the gate contacts while the source contactis grounded (Fig. 2a). Due to self-ionization, pure water becomesan ionic conductor and, on application of VG, the ionsredistribute so that Hþ ions face the negatively biased gate platewhile OH� align at the OSC surface (Fig. 3a). High capacitanceelectrical double layers at the gate/water, pOBP-SAM/water andwater/OSC interfaces eventually form giving rise to the potentialdrop profile33 reported in Fig. 3b. The Au-gate/water and thewater/OSC interfaces capacitances per unit area are reported20
to be CGate=H2OB40mF cm� 2 and CH2O=OSCB1–5 mF cm� 2,
respectively. The pOBP-SAM capacitance per unit area (COBP)is modelled as a planar capacitor, C¼ e0erd� 1, with e0 and er
being the vacuum and the relative permittivity while d is thedistance between capacitor plates. Taking er¼ 3, typical for aprotein system34, and d as the height of the pOBP-SAM(4.22 nm), a COBP¼ 0.63 mF cm� 2 is estimated. The COBP canbe approximated to the whole pOBP-WGOFET gating-systemcapacitance as this is the smallest in the series (Fig. 3a). Thisgeneral occurrence is solely connected with the differences in thedielectric constants of a protein-SAM and an OSC compared withwater. The actual value of COBP depends, in turn, on severalmicroscopic quantities and parameters.
The measurements of the electronic responses. The appliednegative VG bias, through capacitive coupling between the gatingsystem and the OSC, induces positive charges in the OSC gen-erating a two-dimensional channel of holes35,36 (Fig. 3a). As VG isapplied, the conditions for charge accumulation are set but theactual IDS current flow does not start (under an applied VDS bias)until VG equals VT and the energy barrier, originated by the gateelectrode and the OSC �me mismatch, is levelled. Beyond VT, thefurther injected charges can drift through the channel with agiven mobility mFET and output characteristics such as thosereported in Fig. 4 are measured. Each applied gate bias(0rVGr� 0.5 V) sets the IDS maximum intensity with thecurves exhibiting the expected linear (at lower VDS) andsaturation regimes while measured at remarkably low biases(VDSr� 0.5 V). The IDS current flowing in the FET channel inthe saturation regime is given by25:
IDS ¼W2L
CimFETðVG�VTÞ2 ð1Þ
where CiECOBP is the capacitance per unit area. In Fig. 5a, thepOBP-WGOFET transfer-characteristics (IDS versus VG atVDS¼ � 0.5 V) are reported for a device gated with a pristinepOBP-SAM (baseline, red curve) along with the traces measuredafter exposing the pOBP-SAM to progressively higherconcentrations of (S)-(þ )carvone (signal, black curves).Apparently, a significant degree of current decrease can bemeasured even at very low ligand concentrations. In theSupplementary Fig. 8, the gate leakage currents (IG) for thedata of Fig. 5a are reported for comparison. These leakagecurrents are about 3 orders of magnitude lower than IDS and donot display a consistent trend with the concentration of theligand, confirming the need of the FET gain to gather usefulresponses. From the transfer curve the COBP and mFET product, aswell as the VT values are extracted17. mFET can be as high as(1.1±0.2)� 10� 1 cm2 V� 1 s� 1, showing a very good level ofperformance for the pOBP-SAM WGOFET37. The fractional
Source
Water
OSCFlexible substrate
Au-Gates
s
s
VG
Drain
VDS
pOBP-SAMGate
S-(+)-carvone
R-(–)-carvone
S-(+)-carvone
R-(–)-carvone
Figure 2 | Water-gated bio-organic transistor comprising a pOBP-SAM.
In a, the WGOFET device schematic structure is shown. The source (S) and
drain (D) interdigitated contacts are defined on a flexible foil. The S–D
patterned substrate is covered by the p-type, PBTTT-C14 and a 3 ml droplet
of water lies on the OSC surface. A bio-functionalized Au-plate hangs in
contact with the water droplet, acting as gate (G). The pOBP protein
structure is sketched in b along with the SAM on the gate surface. pOBP is
a monomer of 157 amino acid residues (molecular mass of B19 kDa)
with a height of 38.04 Å and a base of 25.70� 26.40 Å.
OSCS D
G
+
+
+
++ + +
– – – – – – –
– – – – – – –
+ +
++
+++++++
+++
H2O
– – – – – – –+++++++
H2O
CGate/H2O
COBP/H2O
CH2O/OSC
0Channel
Electrolyte
VG
–
VTGate
Figure 3 | Water-gating mechanism. In a, the functioning mechanism of a
water-gated field-effect transistor is schematically described along with the
capacitors forming the gating systems that are in series. In b, the profile of
the gate potential drops is reported.
0.0 –0.1 –0.2 –0.3 –0.4 –0.50
–1
–2
–3
–4
–5
–6
I DS (
μA)
VDS (V)
VG
=0
/ –0.
5 V
Figure 4 | pOBP-SAM WGOFET IDS output characteristics. The
current–voltage curves are measured in the common-source mode with VDS
scanned between 0 and �0.5 V. The gate bias, VG, varies in the same
range in steps of �0.1 V.
NATURE COMMUNICATIONS | DOI: 10.1038/ncomms7010 ARTICLE
NATURE COMMUNICATIONS | 6:6010 | DOI: 10.1038/ncomms7010 | www.nature.com/naturecommunications 3
& 2015 Macmillan Publishers Limited. All rights reserved.

current decrease upon binding was evaluated from the transfercurves as DI/I¼ [(I� I0)I0
� 1] with I and I0 being IDS values atVG¼ � 0.5 V for the signal and for the base-line curves,respectively. DI/I was taken as the WGOFET electronicresponse as this normalizes the device-to-device variation inFET biosensors38, resulting in high response reproducibility.
Enantiomer binding to a pOBP-SAM. The binding curves of the(S)-(þ )-carvone, (R)-(� )-carvone and 2-phenylethanol ligandsto the pOBP-SAM are reported in Fig. 5b as DI/I versus ligandconcentration. The curves are distinguishable down to few tens ofpicomolar concentrations, showing that chiral differential detec-tion can be achieved at extremely low concentrations with aWGOFET. A control experiment, reported in Fig. 6, shows theIDS values measured using exactly the same pOBP-SAM gold gatealternating the exposure to the (S)-(þ )-carvone and (R)-(� )-carvone solutions. Between two subsequent exposures theAu-gate plate was rinsed thoroughly with water. The (þ ) and(� ) symbols in Fig. 6 mark the IDS values measured at differentconcentrations of the two enantiomers. The differential detectioneffect is clearly visible also in this experiment, already in the10–100 pM range, though to a lower extent compared with theresults of Fig. 5b. The S-(þ )-carvone traces return a maximumfractional decrease of B60%, this being very similar to the data
reported in Fig. 5b. A much higher response at saturation is seenfor the R-(� )-carvone. This can be explained considering thatthe memory effect impacts more on the weaker binding species.
The fitting of the (S)-(þ )-carvone binding curve (red solid linein Fig. 5b) is performed using Langmuir’s isotherm Y¼ bMAX(X/(KFETþX)), where Y is the DI/I electronic response proportional,through bmax, to the degree of saturation. X is the ligandconcentration and KFET is the dissociation constant. The fitting ofthe (R)-(� )-carvone (magenta solid curve in Fig. 5b) wascalculated using Hill’s binding model, also used to model the datarelevant to the 2-phenylethanol (blue curve). The Hill’s equationis Y¼ bMAX(Xa/(KFETþXa)), with a giving the degree ofcooperativity (a¼ 1 for non-cooperative, a41 and ao1 forpositive and negative cooperativity, respectively). The fit of theS-(þ )-carvone data to a Langmuir’s non-cooperative bindingisotherm39 returns a dissociation constant KFET
þ ¼ 0.81±0.05 nMand a plateau response at a saturation of (DI/I)þ ¼ 0.62±0.01,while the limit-of-detection is 50 pM and the limit-of-quantification is 150 pM. The detection of carvone enantiomershere performed is about 6 orders of magnitude better thanthe determinations performed with a back-gate device19.A comparison between the two systems is not straightforwardas they hold different device structures and different recognitionelements. However, it is a fact that in the WGOFET a directinteraction between the bio-recognition element layer and anelectronic interface, is created. The R-(� )-carvone data couldonly be accounted for by a Hill’s binding isotherm38 that, throughthe a coefficient, models the extent of cooperativity of a givenbinding site. The best-fit parameters, KFET
� ¼ 20±20 nM, plateauresponse at saturation of (DI/I)� ¼ 0.17±0.02 and a¼ 0.5±0.1,suggest an anti-cooperative binding for R-(� )-carvone. Hill’sequation successfully accounts also for the 2-phenylethanolbinding, exhibiting an anti-cooperative behaviour too(a¼ 0.3±0.1) but with a much higher KFET of 0.7±0.33 mM.The fitting of the S-(þ )-carvone to the Hill’s isotherm,performed as control, returns a KFET¼ 0.4±0.2 nM and ana¼ 1.1±0.1, consistent with the Langmuir’s fit. The errors aretaken as 1 s.d., as for all data presented.
An enantio-selectivity factor (ESF), taken as the ratio betweenthe slopes in the binding curves linear branch19 as high as 6.3 ismeasured here. The binding of the two carvone enantiomers tothe pOBP-SAM being characterized by markedly different levelsof cooperativity and an exceptionally high ESF, provides evidencethat different interactions indeed occur. Chiral detection is aresearch topic of great relevance40,41 and, to our knowledge, therehas been no previous report showing both differential detection at
100 101 102 103 104 105 106
0.0
–0.2
–0.4
–0.6a b
S-(+)-carvoneR-(–)-carvone2-phenylethanol
ΔI/I
[ligand] (pM)
0.0 –0.1 –0.2 –0.3 –0.4 –0.50.0
–0.4
–0.8
–1.2
–1.6
I DS (
μA)
VG (V)
pOBP-SAM
100 pM500 pM1 nM5 nM
Figure 5 | Electronic chiral differential detection of odorant molecules. In a, the device IDS versus VG transfer characteristics are reported both for a
pristine pOBP-SAM gate (red curve) and for a gate exposed to concentrations of (S)-(þ )-carvone in the 100 pM—5 nM range (black curves).
These curves were measured after the device stabilization had been performed and an average relative error of 5% is measured for the base-line curve.
In b, the binding curves gathering the DI/I data points measured with a WGOFET whose pOBP-SAM gate is exposed to the (R)-(� )- and (S)-(þ )-carvone
as well as the 2-phenylethanol ligands, in the 1 to 106 pM range, are reported. The data are plotted as the DI/I average values measured on three different
devices for each curve.
100 101 102 103 104 105 106
–1.0
–1.2
–1.4
–1.6
I DS (
μA)
[ligand] (pM)
S-(+)-carvone
R-(–)-carvone
Rinsing betweeneach step
Figure 6 | Chiral differential detection of carvone enantiomers performed
with the same gate electrode. The IDS values measured with a WGOFET
bearing the very same pOBP-SAM gate exposed, alternatively, to one of the
two carvone enantiomer solutions. Between two subsequent exposures, the
gate is rinsed thoroughly. The (þ ) and (� ) symbols mark the IDS current
values after exposure to the same concentration of either one of the two
carvone enantiomers, in the 1 to 106 pM concentration range.
ARTICLE NATURE COMMUNICATIONS | DOI: 10.1038/ncomms7010
4 NATURE COMMUNICATIONS | 6:6010 | DOI: 10.1038/ncomms7010 | www.nature.com/naturecommunications
& 2015 Macmillan Publishers Limited. All rights reserved.

low picomolar concentrations together with an ESF 46(refs 42,43).
DiscussionAll the dissociation constants evaluated with the WGOFET(KFET) are at least 3 orders of magnitude lower than thosemeasured in solution (KSol), although the scale of affinity ispreserved. A rationale for the differences in K values involves thesurface work (W) associated with a ligand binding to a layer oforderly immobilized receptors44. The change in the metal-gateelectron free energy, DEF, also needs to be accounted for. This isopposite to the molar free energy associated to the VT shift, sothat DEF¼ � nFDVT. Since DVT is the difference between the VT
at zero ligand concentration (no binding site occupied) and atsaturation (all the binding sites occupied) and F being a molarquantity, DEF is the electrostatic contribution to the molar freeenergy of the pOBP-C complex formation. The bindingequilibrium between a ligand and the pOBP can be written asLþ P$P�L, where L is the ligand (carvone enantiomers in thepresent case) that binds to the pOBP protein (P) to give the P–Lcomplex. As the pOBP-SAM is anchored to a gold-gate surface,the equilibrium involves a protein layer/water interface ratherthan a protein dissolved in solution. The overall interfacial effectcan be described considering the thermodynamic cycle reportedin Fig. 7. The cycle goes from the immobilized protein P (state I)to the immobilized complex P–L (state IV) involving twointermediate steps. The first step (I-II) concerns the release ofthe protein from the surface into the solution. The free-energychange associated encompasses the surface work needed torelease the protein, that is opposite to the work required toimmobilize the protein, DimmG(P), and the change in the gold-gate electron electrochemical potential when the protein layer isremoved ð�meðgate=PÞÞ. The second step (II-III) is the binding ofL to P taking place in solution with a free-energy changeDG�Sol¼RTln(KSol). The third step (III-IV) is theimmobilization of the complex P–L to the gold surface with afree-energy change including the surface work of immobilizationDimmG(P-L) and the change in the gold-gate electronelectrochemical potential when passing from bare gold to asurface coated with the immobilized P–L layer ð�meðgate=P�LÞÞ. Thefourth step (IV-I) closes the cycle and correspondsto�DG�FET¼RTln(KFET). Following the cycle, the bindingstandard molar Gibbs free energy probed with the WGOFET,DG�FET, is given by:
DG0FET ¼ DG0
SolþDEFþW ð2Þwhere W¼DimmG(P–L)—DimmG(P) is the binding surface workterm and DEF ¼ �meðgate=P�LÞ � �meðgate=PÞ is the change in the goldelectron electrochemical potential �me as the gold gate passes frombeing coated with the P–L to the P layer. DVT¼ � (DEF/nF)is the difference between VT at 0.1 mM and zero carvone
concentrations. The binding Gibbs energy on a gold gate issplit into a molecular interaction and a surface work contribution.The molecular interaction term is associated with the ligand–protein recognition energy in solution. The surface workcontribution describes the work spent to accommodate theligand into a protein bound to a surface. This term (DEFþW)includes the conformational rearrangements as well as the changeof the gold-gate electron energy.
The binding energy in solution DG�Sol¼RTln(KSol) is definedas the difference in standard chemical energy between thecomplex P–L and the reagent partners P and L. The DG�FET termcan be described considering the change in Gibbs free energybetween states IV and I. In this case the ligand binding causes thechange of physical-chemistry properties of the electrode (includ-ing not only the gold plate but also the pOBP-SAM) such as theinterfacial tension and the electrons electrochemical potential.The Gibbs energy equation for the system moving from state I tostate IV (keeping T and P constant) is44:
dG ¼gP�LdAP�Lþ gPAP
þ mP�L� mP�mLþ �meðgate=P�LÞ � �meðgate=PÞ
� �dx
ð3Þ
where mP, mL and mP–L are the chemical potentials of the protein,the ligand and the complex, respectively; x is the extent ofthe reaction variable; AP–L and AP are the surface areas of thegP–L and gP surface tensions, respectively. The dAP–L area increasefor the gP–L interfacial phase, corresponds to an area decrease� dAP of the gP interfacial phase. Thus, by using the relationdA¼ d AP–L¼ � dAP, equation 3 becomes:
dG ¼ðgP�L� gPÞdA
þ mP�L� mP�mLþ �meðgate=P�LÞ � �meðgate=PÞ
� �dx
ð4Þ
The change of the molar Gibbs energy of the reaction is thenobtained by taking the partial derivative with respect to x:
DGFET ¼@G@x
� �T;P
¼ DgGP�L
þ mP�L� mP� mLþDEF ð5Þ
where, Dg¼ (gP–L� gP) and GP–L¼ dx/dAP–L describe how thereaction proceeds when the surface is occupied by the complexP–L, that is, it is the surface density of the complex P–L that isconstant. By writing the chemical potential as a function of theactivity ai of the i-th species and recalling that at equilibriumDGFET¼ 0, equation 5 becomes:
DG�FET ¼ �RTln aP�LaPaL
� �eq¼ Dg
GP�Lþ m�P�L�m�P�m�L� �
þDEF
¼ DgGP�LþDG�SolþDEF
ð6Þ
where the activities are at equilibrium and thus the ratioaPaL/aP� L equals the dissociation constant. By identifying thesurface binding work W with Dg/GP–L, equation 2 is fullyrecovered. The comparison between equations 2 and 6 indicatesthat RTln(KFET) is actually the DG�FET encompassing themolecular recognition in solution, the surface work and theelectronic contribution.
From the KFETþ /� values extracted from the data in Fig. 5b,
DG0 þFET ¼ �ð49:2� 0:1Þ kJ mol� 1 and DG0 �
FET ¼ �ð41� 2ÞkJ mol� 1 are derived. For the pOBP in solution the figures are:DG0 þ
Sol ¼ �ð36:00� 0:05Þ kJ mol� 1 and DG0 �Sol ¼ �ð33:0
�0:1Þ kJ mol� 1. The DV þT ¼ �ð0:060 � 0:005Þ V for theS-(þ )- and DV �T ¼ �ð0:011 � 0:005Þ V for the R-(� )-enantiomers, result in DE0þ
F ¼ �ð5:8 � 0:5Þ kJ mol� 1 andDE0�
F ¼ �ð1:1 � 0:5Þ kJ mol� 1, respectively. All the DG� molarenergies estimated so far are shown in Table 1, along with the(DG0þ �DG0� ) chiral differential values. As DG0
FET
�� ��4 DG0Sol
�� ��
L(sol) + P(gate) + e(gate/P) P–L(gate) + e(gate/P–L)ΔG°FET
ΔG°Sol
C(sol) + P(sol) P–L(sol)
–ΔimmG(P) – �e(gate/P)ΔimmG(P–L) + �e(gate/P–L)
I
II III
IV
Figure 7 | The thermodynamic cycle. It describes the surface and
electrostatic effects on the binding equilibrium of proteins immobilized
on a gold surface.
NATURE COMMUNICATIONS | DOI: 10.1038/ncomms7010 ARTICLE
NATURE COMMUNICATIONS | 6:6010 | DOI: 10.1038/ncomms7010 | www.nature.com/naturecommunications 5
& 2015 Macmillan Publishers Limited. All rights reserved.

and they are both negative, the binding at the pOBP-SAM isfavoured compared with pOBP in solution. This occurrence likelyreflects the lower entropy change associated with ligands bindingto the orderly immobilized proteins (|DSFET|o|DSSol|, both beingnegative contributions). The surface work, W, accounts for afraction of the differences in DG�FET and DG�Sol (see equation 2),and since W holds indistinguishable values for the twoenantiomers (Table 1) the complex immobilization work wouldbe independent from the chiral interaction that involves mainlythe pOBP outer cavity. Accordingly, Table 1 shows that the chiraldifferential binding free energy DG0þ
FET�DG0�FET
� �for the
immobilized pOBP compares very well to the sum of theDG0þ
Sol �DG0�Sol
� �and DEþF �DE�F
� �of independently estimated
terms. Such an agreement is remarkable considering that theDG0
FET and the DG0Sol data are measured under different
experimental conditions. Indeed, while with the WGOFET thebinding of a ligand to the empty cavity takes place, in thefluorescent assay it is the displacement of a bound reporter ligandthat is studied.
Binding curves in Fig. 5b also indicate that the WGOFETresponse itself is markedly different for the two enantiomers. Atsaturation, the response to S-(þ )-carvone is in excess of 60%while it drops to o20% for the R-(� )-carvone. From equation 1(at constant mFET) the response can be written as:
DII¼ DCOBP
COBP� 2
DVT
VG�VTð Þ � 2DCOBP
COBP
DVT
VG�VTð Þ
¼ DCOBP
COBPþ FðDVTÞ ð7Þ
where only the second order terms in DVT/(VG–VT) weredisregarded. In principle, if |VT|oo|VG| and |DVT|oo|VG|equation 7 becomes:
DIIffi DCOBP
COBPð8Þ
In the present case at saturation, F(DVT)D0.1, while DCOBP/COBPD0.5, as it can be seen in Fig. 8a,b respectively. So, the
WGOFET output current is mostly affected by the COBP term.The WGOFET chiral large differential responses are thusassociated with subtle changes occurring in the protein uponligand binding, which lower the pOBP-SAM capacitance to alarge extent, as it can be explained through the simple modelreported in Fig. 9. The dielectric properties of a protein in thepOBP-SAM layer are described as being characterized by regionswith lower (green) or higher (light-blue) dielectric constants. Thegreen parts in Fig. 9 describe the plain protein regions (er¼ 3)while the light-blue ones are the regions characterized by thepresence of water (er¼ 80). Indeed the presence of water in pOBPhas been already proven45. In this model, repeated units arefeatured that represent the proteins, each one with its cavity filledwith water or with the odorant molecule. Each pOBP comprisestwo different protein regions (P, PC) and the elicited cavity (C).The cavity region is modelled with a capacitor, CC, characterizedby a er¼ 80 in the absence of the ligand as in this case water hasbeen shown to be present in the cavity. The cavity er becomesequal to 3 when it is filled with the carvone. The protein regions,all characterized by the same er¼ 3, can be modelled with a planeplates capacitor having a distance between the plates, d, as high asthe whole pOBP-SAM (P) or with a capacitor with a smaller ddue to the presence of the cavity (PC). These two regions holdcapacitances CP and CPC, respectively. Contiguous pOBPs areseparated by a high dielectric percolative path, W, addressed asthe ‘water channel’ holding a capacitance CW. The overall COBP
can be represented by the equivalent circuit, formed by the CP,CC, CPC and CW elements, reported also in Fig. 9. The capacitorsCC and CPC in series are in parallel with the capacitors associatedwith the water channel (CW) and the plain protein (CP),respectively.
Each different element (P, C and W) in the model contributesto the equivalent capacitance per unit surface with weightingfactors ap for the protein regions, ac for the cavity and aw for thewater channel. These weighting factors correspond also to theratio between the free surface occupied by a given elementand the entire unit, hence: apþ acþ aw¼ 1. Assuming thatthe cavity occupies approximately one-third of the total
Table 1 | Standard Gibbs free energies for the S-(þ ) and R-(� ) carvones binding to the pOBP.
DG0FET (kJ mol� 1) DG0
sol (kJ mol� 1) DE0F (kJ mol� 1) W (kJ mol� 1)
S-(þ ) � (49.2±0.1) � (36.00±0.05) � (5.8±0.5) � (7.2±0.5)R-(� ) � (41±2) � (33.0±0.1) � (1.1±0.5) � (7.9±2)DG0þ �DG0� � (7±2) � (3.0±0.2) � (4.7±1)
DG0FET ¼ � RTlnKFET is estimated from the WGOFET binding curves of Fig. 5b; DE0
F is the molar electrostatic energy evaluated from the WGOFET VT shift; DG0sol ¼ � RTlnKSol is the binding free energy of
the pOBP dissolved in solution; W ¼ DG0FET �DG0
Sol �DEF is the surface binding work.
100 101 102 103 104 105 106 100 101 102 103 104 105 106
0.0
–0.1
–0.2
–0.3
–0.4
–0.5 S-(+)carvone
R-(–)carvone
ΔC/C
[ligand] (pM)
0.05
0.00
–0.05
–0.10
–0.15ba
S-(+)carvone
R-(–)carvone
F (
ΔVT)
[ligand] (pM)
Figure 8 | Capacitance and threshold voltage contribution to current fractional changes. In a, the fractional changes of the capacitance, and in
b, the F(DVT) term data as extracted from the source–drain current measured on exposure to the (R)-(� )- and (S)-(þ )-carvone ligands in
the 1 to 106 pM range.
ARTICLE NATURE COMMUNICATIONS | DOI: 10.1038/ncomms7010
6 NATURE COMMUNICATIONS | 6:6010 | DOI: 10.1038/ncomms7010 | www.nature.com/naturecommunications
& 2015 Macmillan Publishers Limited. All rights reserved.

protein-SAM (d¼ 4.22 nm), the equivalent capacitance per unitsurface is:
COBP ¼ awe0ew
dþ ac
3e0
d1ewþ 2
ep
� �� 1
þ 1� aw � acð Þe0ep
d
ð9Þassuming ew¼ 80 and ep¼ 3, equation 9 becomes:
COBP ’e0
d3þ 77aw þ
32ac
� �ð10Þ
In general terms, the same formula holds also when the ligand(S)-(þ )-carvone or (R)-(� )-carvone is bound. Assuming thatthe cavity is completely filled by a medium with the samedielectric constant of the protein, we obtain:
CþOBP ’e0
d3þ 77aþw� �
ð11Þ
C�OBP ’e0
d3þ 77a�w� �
ð12Þ
The measured ratios DCOBP/COBP are therefore:
DCþOBP
COBP¼ 154 aþw � aw
� �� 3ac
6þ 154aw þ 3acð13Þ
DC�OBP
COBP¼ 154 a�w � aw
� �� 3ac
6þ 154aw þ 3acð14Þ
These last two equations were used to fit the measured chiralresponses DCþ /C¼ � 0.485 and DC� /C¼ � 0.17.
The model presented contains four unknown parameters,hence some hypotheses are needed to reduce the number ofdegrees of freedom. From the equations, it is apparent that thecrucial parameter is the weighting factor of the water channel thataffects the equivalent capacitance with a high numericalcoefficient. Since the experimental data show a remarkabledifference between the two responses measured for (S)-(þ )-carvone and (R)-(� )-carvone, the fitting had to be carried outassuming that the water channel disappears completely uponbinding of the (S)-(þ )-carvone, while it is largely unaffected
when (R)-(� )-carvone binds to the hydrophobic OBP cavity.With these hypotheses (corresponding to aþw ¼ 0 and a�w ¼ aw),we can estimate the unknown parameters as:
ac ¼ 66:0% ; aw ¼ 2:4% ð15Þ
As the high percolative and low er paths are in parallel, the overallcapacitance is dominated by the water channel capacitance. Thesurface occupied by the percolative channel is a mere 2.4% of thetotal surface of the protein exposed to the solvent (B7 nm2) andhence it may well-accommodate a few water molecules. Anyevent that interrupts the high dielectric pathway can drasticallylower the layer capacitance as this becomes suddenly dominatedby the low capacitance path of the protein. The measuredresponses can be fully accounted for by assuming that this waterchannel is indeed interrupted upon binding of the S-(þ )-carvone, while it is unaffected upon binding of the R-(� )-carvone, proving, though indirectly, the existence of a probablyvery subtle conformational change in the pOBP on chiralinteraction that dramatically impacts on the complex dielectricproperties and is efficiently transduced by the WGOFET.
In conclusion, a minute change in protein layer capacitance isshown to efficiently modulate a water-gated OFET, allowing forchiral differential detection with large enantiomeric discrimina-tion factor and accurate estimation of interaction energies as lowas few kilojoules per mole. This is a unique tool with generalapplicability that allows neutral ligand detection in the picomolarconcentration range. The FET binding curves modelling provideinformation on the electrochemical free energies derived from theFET dissociation constants while the electrostatic component isisolated from the threshold voltage shifts. These can be combinedwith the chemical free energies gathered from the complexformation in solution, overall providing a comprehensive pictureof the energy balances for a surface-bound pOBP-carvonecomplex undergoing chiral interactions. The computation of therelative decrease in capacitance on binding, associated to the FETbinding curves maximum relative current changes, providesstrong support to the hypothesis of pOBP undergoing aconformational change on binding of the S-(þ )-carvone. Thisstudy shows also that an ultra-sensitive detection system can beachieved with an organic bio-electronic device fabricated on aflexible substrate with low cost, printing compatible technology.
MethodspOBP expression. F88WH(6) is a pOBP where the wild-type phenylalanine atresidue 88 was substituted by tryptophan and a histidine tag (six residues) wasattached to the N terminus of the protein. F88WH(6) pOBP was expressed in abacterial system using the protocol described by Wei et al.46 A pET5b vectorcontaining the pOBP F88WH(6) sequence was used to transform Escherichia coliBL21(DE3) cells. Bacteria colonies were grown overnight in 10 ml Luria-Bertani/Miller broth containing 100 mg l� 1 of ampicillin. The culture was diluted 1:100with fresh medium and grown at 37 �C until a bacterial optical density atl¼ 600 nm of 0.7 was reached. At this stage, protein expression was induced byadding isopropylthio-D-galactoside (IPTG) to a final concentration of 0.4 mM.After 2 h at 37 �C, the cells were harvested by centrifugation, resuspended in50 mM Tris-HCl pH 7.4 and lysed by sonication. After centrifugation, the proteinwas found to be present in the supernatant. Protein purification was performed byusing combinations of chromatographic steps, anionic-exchange resins, followedby gel filtration. Hydrophobic ligands, present in the broth used to grow thebacteria and entering into the protein binding pocket, were removed by adelipidation process at pH 4.5 (ref. 47). The protein was then dialysed against50 mM sodium phosphate buffer, pH 7.4. The pOBP is characterized by ahydrophobic b-barrel cavity, whose inner surface is B500 Å2 (ref. 13). Theproteins, which have an isoelectric point of 4.55 (ref. 48) are negatively charged indeionized water. The (R)-(� )- and (S)-(þ )-carvone enantiomers are perceived asspearmint or caraway odours with human threshold for detection of 30 and420 nM (ref. 49), respectively. The weight ratio between pOBP and carvone isB1.5� 102 while the volume ratio between the b-barrel cavity and the carvonemolecule is B1.5–3.
G
COBP
W
Cw
Pc
C
Cpc
Cc
P
Cp
Figure 9 | Capacitive-modulated transduction of protein–ligand
interactions. The pOBP-SAM layer is detailed as an array of surface
immobilized proteins. For the capacitance model each pOBP comprises two
plain protein regions (P, PC) and a cavity (C). The cavity holds a capacitance
CC, while the protein regions can either be almost as high as the whole
pOBP-SAM or be smaller as in the presence of the cavity. These two
regions hold capacitances CP and CPC, respectively. Contiguous pOBPs are
separated by a high dielectric channel, W, holding a capacitance CW. COBP
can be represented by the equivalent circuit, formed by the CP, CC, CPC and
CW capacitances arranged as reported in the bottom of this panel.
NATURE COMMUNICATIONS | DOI: 10.1038/ncomms7010 ARTICLE
NATURE COMMUNICATIONS | 6:6010 | DOI: 10.1038/ncomms7010 | www.nature.com/naturecommunications 7
& 2015 Macmillan Publishers Limited. All rights reserved.

Competitive fluorescent binding assay. Emission fluorescence spectra wererecorded using a Perkin Elmer LS55 instrument at room temperature, with a 1 cmlight path quartz cuvette and 5 nm slits for both excitation and emission. Theaffinity of binding of pOBP was measured using the fluorescence probe 1-AMAas previously reported50. About 1 mM pOBP-F88W solution in 10 mM phosphatebuffer, pH 7.4, was titrated with aliquots of 1 mM 1-AMA in methanol to finalconcentrations of 0.25–8 mM. The probe was excited at 375 nm and thefluorescence spectra were recorded between 400 to 570 nm, monitoring the signalsbetween 480 and 490 nm. The dissociation constant (K1-AMA) for the OBP/1-AMAcomplex was calculated using the equation y¼ (Bmax� x)/(K1-AMAþ x), where y isthe degree of saturation, Bmax is the number of maximum binding sites, andK1-AMA is the dissociation constant50. The calculation was run using the softwareSigma Plot and a single binding site was considered for the OBP.
The affinity of pOBP-F88W towards S-(þ )-carvone and R-(� )-carvone and 2-phenylethanol was measured in competitive binding assays, using both pOBP andprobe at 1 mM as the final concentration. The ligand solutions, with concentrationsranging from 2 to 20 mM, were prepared in 10 mM phosphate buffer pH 7.4 andused for the binding experiments. Dissociation constants of competitors werecalculated from the corresponding IC50 values, using the equation: KSol¼ [IC50]/1þ [1-AMA]/K1-AMA, where [1-AMA] is the free concentration of the fluorescenceprobe and K1-AMA is the dissociation constant of the complex OBP/1-AMA.
For Polistes dominula OBP1 (Wasp-OBP), the same method was employedusing N-phenyl-1-naphthylamine (1-NPN) as fluorescent probe51. The probe wasexcited at 295 nm and emission spectra were recorded between 337–450 nm.
pOBP-SAM WGOFET device fabrication. PBTTT-C14 was dissolved(7 mg ml� 1) in a mixture of 1,2-dichlorobenzene and chloroform (9:1). Goldsource (S) and drain (D) interdigitated electrodes were photo-lithographicallydefined on a flexible substrate. The distance between two differently biased fingersis the channel length (L), while the perimeter of each set of equipotential fingers isthe channel width (W); they are 5 mm and 104mm, respectively. The substrate withpatterned electrodes was spin coated with a PBTTT-C14 solution at 7,000 r.p.m. for60 s and annealed at 120 �C for 10 min. A gold plate with an area of B3 10� 2 cm2
served as the gate (G) electrode. The SAM functionalizing protocol52 involved a50 mM solution of 3-mercaptopropionic acid (3MPA) in ethanol containing 5%acetic acid. N2 was bubbled through the 3MPA solution for at least 10 min toremove dissolved oxygen. The gold electrodes were immersed into the 3MPAsolution and kept in the dark under N2 for 18 h at 22 �C. The 3MPA SAM obtainedhad a height of 0.42 nm (ref. 52). For the bio-functionalization protocol, the SAMwas activated by immersion into a 100 mM 1-ethyl-3-dimethylaminopropylcarbodiimide hydrochloride and 200 mMN-hydroxysuccinimide aqueous solution for 1 h at 25 �C. Finally, the pOBPs(0.7 mg ml� 1 in 20 mM Na phosphate buffer, pH 8.0) were left to immobilize for2 h at 25 �C. Electrochemical inspection of the Au-electrode showed that after thebio-functionalization the electrode surface was passivated (Supplementary Fig. 2and Supplementary Fig. 3). X-ray photoelectron spectroscopy analysis showed thatthe appearance of nitrogen and sulfur peaks is only seen on the bio-functionalizedgate (Supplementary Fig. 4, Supplementary Fig. 5 and Supplementary Fig. 6). Alsothe scanning electron microscope micrographs of the pOBP-SAM gold surfaceshowed a very compact and smooth morphology clearly different from that of theAu-surface (Supplementary Fig. 7a,b).
WGOFET measurement of pOBP-carvone binding curves. The pOBP-SAM gatewas brought into contact with a previously dispensed 3 ml of deionized waterdroplet covering the OSC (Fig. 1a). The electrical characterization of the WGOFETwas carried out by a semiconductor parameter analyzer. For the output char-acteristics, the drain current (IDS) was measured as a function of the drain voltageVDS at gate voltages VGS, ranging between 0 and � 0.5 V, in steps of � 0.1 V.The curves were measured in the forward and reverse mode. For the transfercharacteristics IDS was measured as a function of VGS (þ 0.02 to � 0.5 V) atVDS¼ � 0.5 V. The device current was stabilized by cycling the measurement ofthe transfer curve until the overlap of subsequent traces was obtained. This processleads to the filling of the OSC low-mobility trap states leading to a stable VT
value17. After stabilization, the pOBP-SAM gate was incubated for 5 min in acarvone solution and the transfer characteristic was recorded. The DI/I is theelectronic response at a given concentration and the relevant dose–response curveis obtained by plotting these data points at all investigated concentrations as theaverage values over three replicates on different devices, with the relative errortaken as 1 s.d.
References1. Meierhenrich, U. J., Golebiowski, J., Fernandez, X. & Cabrol-Bass, D. The
molecular basis of olfactory chemoreception. Angew. Chem. Int. Ed. 43,6410–6412 (2004).
2. Buck, L. & Axel, R. A novel multigene family may encode odorant receptors: amolecular basis for odor recognition. Cell 65, 175–187 (1991).
3. Pevsner, F., Sklar, P. B., Hwang, P. M. & Snyder, S. H. Odorant-bindingprotein. sequence analysis and localization suggest an odorant transportfunction. Chem. Senses 1, 227–242 (1989).
4. Tegoni, M. et al. Mammalian odorant binding proteins. Biochim. Biophys. Acta1482, 229–240 (2000).
5. Pelosi, P. Odorant-binding proteins. Crit. Rev. Biochem. Mol. Biol. 29, 199–228(1994).
6. Bignetti, E. et al. Specificity of an immunoaffinity column for odorant-bindingprotein from bovine nasal mucosa. Chem. Senses 12, 601–608 (1987).
7. Pevsner, J., Hou, V., Snowman, A. M. & Snyder, S. H. Odorant-binding protein.Characterization of ligand binding. J. Biol. Chem. 265, 6118–6125 (1990).
8. Xu, P., Atkinson, R., Jones, D. N. M. & Smith, D. P. Drosophila OBP LUSH isrequired for activity of pheromone-sensitive neurons. Neuron 45, 193–200(2005).
9. Matsuo, T., Sugaya, S., Yasukawa, J., Aigaki, T. & Fuyama, Y. Odorant-bindingproteins OBP57d and OBP57e affect taste perception and host-plant preferencein Drosophila Sechellia. PLoS Biol. 5, e118 (2007).
10. Swarup, S., Williams, T. I. & Anholt, R. R. H. Functional dissection of odorantbinding protein genes in Drosophila melanogaster. Genes Brain Behav. 10,648–657 (2011).
11. Mao, Y. et al. Crystal and solution structures of an odorant-binding proteinfrom the southern house mosquito complexed with an oviposition pheromone.Proc. Natl Acad. Sci. USA 107, 19102–19107 (2010).
12. Pelosi, P., Mastrogiacomo, R., Iovinella, I., Tuccori, E. & Persaud, K. Structureand biotechnological applications of odorant-binding proteins. Appl. Microbiol.Biotechnol. 98, 61–70 (2014).
13. Spinelli, S. et al. the structure of the monomeric porcine odorant bindingprotein sheds light on the domain swapping mechanism. Biochemistry 37,7913–7918 (1998).
14. Vincent, F. et al. Complexes of porcine odorant binding protein with odorantmolecules belonging to different chemical classes. J. Mol. Biol. 300, 127–139(2000).
15. Paolini, S. et al. Amino acid sequence, post-translational modifications, bindingand labelling of porcine odorant-binding protein. Chem. Senses 23, 689–698(1998).
16. Lambert, J., Compton, R. N. & Crawford, T. D. The optical activity of carvone:a theoretical and experimental investigation. J. Chem. Phys. 136, 114512(2012).
17. Torsi, L., Magliulo, M., Manoli, K. & Palazzo, G. Organic field-effect transistorsensors: a tutorial review. Chem. Soc. Rev. 42, 8612–8628 (2013).
18. Angione, M. D. et al. Interfacial electronic effects in functional biolayersintegrated into organic field-effect transistors. Proc. Natl Acad. Sci USA 109,6429–6434 (2012).
19. Torsi, L. et al. A sensitivity-enhanced field-effect chiral sensor. Nat. Mater. 7,412–417 (2008).
20. Kergoat, L. et al. A water-gate organic field-effect transistor. Adv. Mater. 22,2565–2569 (2010).
21. Kim, T. H. et al. Single-carbon-atomic-resolution detection of odorantmolecules using a human olfactory receptor-based bioelectronic nose. Adv.Mater. 21, 91–94 (2009).
22. Yoon, H. et al. Polypyrrole nanotubes conjugated with human olfactoryreceptors: high-performance transducer for FET-type bioelectronic nose.Angew. Chem. Int. Ed. 48, 2755–2758 (2009).
23. Magliulo, M. et al. Sensors: electrolyte-gated organic field-effect transistorsensors based on supported biotinylated phospholipid bilayer. Adv. Mater. 25,1958–1958 (2013).
24. Dumitru, L. M. et al. Plain poly(acrylic acid) gated organic field-effecttransistors on a flexible substrate. ACS Appl. Mater. Interfaces 5, 10819–10823(2013).
25. Sze, S. M. & Kwok, K. N. G. Physics of Semiconductor Devices 3rd edn 293(Wiley, 2007).
26. Casalini, S., Leonardi, F., Cramer, T. & Biscarini, F. Organic field-effecttransistor for label-free dopamine sensing. Org. Electron. 14, 156–163 (2013).
27. Lai, S. et al. Ultralow voltage, OTFT-based sensor for label-free DNA detection.Adv. Mater. 25, 103–107 (2013).
28. Bergveld, P. Development, operation, and application of the ion-sensitivefield-effect transistor as a tool for electrophysiology. IEEE Trans. Biomed. Eng.19, 342–351 (1972).
29. Bard, A. J. & Faulkner, L. R. Electrochemical Methods: fundamentals andApplications 2nd Edition 79 (Wiley, 2001).
30. Janata, J. & Josowicz, M. Chemical modulation of work function as atransduction mechanism for chemical sensors. Acc. Chem. Res. 31, 241–248(1998).
31. Evans, D. F. & Wennestrom, H. in The Colloidal Domain: where Physics,Chemistry, Biology, and Technology Meet. Ch. 3 (VCH, 1994).
32. Rivnay, J., Owens, R. M. & Malliaras, G. G. The rise of organic bioelectronics.Chem. Mater. 26, 679–685 (2014).
33. Bernards, D. A. et al. Enzymatic sensing with organic electrochemicaltransistors. J. Mater. Chem. 18, 116–120 (2008).
34. Kukic, P. et al. Protein dielectric constants determined from NMR chemicalshift perturbations. J. Am. Chem. Soc. 135, 16968–16976 (2013).
ARTICLE NATURE COMMUNICATIONS | DOI: 10.1038/ncomms7010
8 NATURE COMMUNICATIONS | 6:6010 | DOI: 10.1038/ncomms7010 | www.nature.com/naturecommunications
& 2015 Macmillan Publishers Limited. All rights reserved.

35. Dodabalapur, A., Torsi, L. & Katz, H. E. Organic transistors: two-dimensionaltransport and improved electrical characteristics. Science 268, 270–271 (1995).
36. Laiho, A., Herlogsson, L., Forchheimer, R., Crispin, X. & Berggren, M.Controlling the dimensionality of charge transport in organic thin-filmtransistors. Proc. Natl Acad. Sci USA 108, 15069–15073 (2011).
37. Porrazzo, R., Bellani, S., Luzio, A., Lanzarini, E., Caironi, M. & Antognazza, M.R. Improving mobility and electrochemical stability of a water gated polymerfield-effect transistor. Org. Electron. 15, 2126–2134 (2014).
38. Ishikawa, F. N. et al. A calibration method for nanowire biosensors to suppressdevice-to-device variation. ACS Nano 3, 3969–3976 (2009).
39. Dill, K. A. & Bromberg, S. in Molecular Driving Forces : StatisticalThermodynamics in Chemistry & Biology. Ch. 27–28 (Garland Science, 2003).
40. Wattanakit, C. et al. Enantioselective recognition at mesoporous chiral metalsurfaces. Nat. Commun. 5, 3325 (2014).
41. Pernites, R. B., Venkata, S. K., Tiu, B. D. B., Yago, A. C. C. & Advincula, R. C.Nanostructured, molecularly imprinted, and template-patterned polythiophenesfor chiral sensing and differentiation. Small 8, 1669–1674 (2012).
42. Guo, L. et al. Discrimination of enantiomers based on LSPR biosensorsfabricated with weak enantioselective and non selective receptors. Biosens.Bioelectron. 47, 199–205 (2013).
43. Xu, L. et al. Highly selective recognition and ultrasensitive quantification ofenantiomers. J. Mater. Chem. B 1, 4478–4483 (2013).
44. Oliviero, G., Federici, S., Colombi, P. & Bergese, P. On the difference ofequilibrium constants of DNA hybridization in bulk solution and at thesolid-solution interface. J. Mol. Recognit. 24, 182–187 (2011).
45. Stepanenko, O. V. et al. Hydrophobic interactions and ionic networks play animportant role in thermal stability and denaturation mechanism of the porcineodorant-binding protein. Proteins 71, 35–44 (2008).
46. Wei, Y., Brandazza, A. & Pelosi, P. Binding of polycyclic aromatichydrocarbons to mutants of odorant-binding protein: a first step towardsbiosensors for environmental monitoring. Biochim. Biophys. Acta 1784,666–671 (2008).
47. Lautenschlager, C., Leal, W. S. & Clardy, J. Coil-to-helix transition and ligandrelease of Bombyx mori pheromone-binding protein. Biochem. Biophys. Res.Commun. 335, 1044–1050 (2005).
48. ProtParam tool from ExPASy Tools http://web.expasy.org/protparam/.49. Pelosi, P. & Viti, R. Specific anosmia to l-carvone: the minty primary odour.
Chem. Senses 3, 331–337 (1978).50. Meillour, P. N. et al. Phenylalanine 35 and tyrosine 82 are involved in the
uptake and release of ligand by porcine odorant-binding protein. Biochim.Biophys. Acta 1794, 1142–1150 (2009).
51. Zhang, S. et al. Binding characterization of recombinant odorant-bindingproteins from the parasitic wasp, microplitis mediator (Hymenoptera:Braconidae). J. Chem. Ecol. 37, 189–194 (2011).
52. Techane, S., Baer, D. R. & Castner, D. G. Simulation and modeling of self-assembled monolayers of carboxylic acid thiols on flat and nanoparticle goldsurfaces. Anal. Chem. 83, 6704–6712 (2011).
AcknowledgementsWe thank Martin Grell and Gaetano Scamarcio for useful discussions. NicolettaDitaranto is acknowledged for performing the X-ray photoelectron spectroscopy surfaceanalysis and Cinzia Di Franco and Maria Vittoria Santacroce for the morphologicalcharacterization. The ‘Gas sensor on flexible substrates for wireless applications�FlexSmell’ project, FP7-People-ITN-2008 under Grant Agreement 238454 and the PONproject ‘Laboratorio per lo Sviluppo Integrato delle Scienze e delle Tecnologie deiMateriali Avanzati e per dispositivi innovativi-LABORATORIO SISTEMA’ and thePRIN 2010-2011 ‘Nanostructured Soft Matter’ by the Italian MIUR (the Ministry ofEducation, Universities and Research) are acknowledged for partial financial supportof this work.
Author contributionsM.Y.M. and M.M. performed the FET measurements while E.T. worked on theexpression and purification of the OBPs and the complex formation measurements insolution. G.L. carried out the theoretical modelling of the capacitance while G.P. workedon the thermodynamics of the FET system. K.P. supervised all the work connected withthe pOBP production and binding in solution. L.T. supervised the work performed onthe FET and wrote the manuscript that was revised by all the authors.
Additional informationSupplementary Information accompanies this paper at http://www.nature.com/naturecommunications
Competing financial interests: The authors declare no competing financial interests.
Reprints and permission information is available online at http://npg.nature.com/reprintsandpermissions/
How to cite this article: Mulla, M. Y. et al. Capacitance-modulated transistordetects odorant binding protein chiral interactions. Nat. Commun. 6:6010doi: 10.1038/ncomms7010 (2015).
This work is licensed under a Creative Commons Attribution 4.0International License. The images or other third party material in this
article are included in the article’s Creative Commons license, unless indicated otherwisein the credit line; if the material is not included under the Creative Commons license,users will need to obtain permission from the license holder to reproduce the material.To view a copy of this license, visit http://creativecommons.org/licenses/by/4.0/
NATURE COMMUNICATIONS | DOI: 10.1038/ncomms7010 ARTICLE
NATURE COMMUNICATIONS | 6:6010 | DOI: 10.1038/ncomms7010 | www.nature.com/naturecommunications 9
& 2015 Macmillan Publishers Limited. All rights reserved.


