Embed Size (px)
Citation preview
University of Wollongong University of Wollongong
Research Online Research Online
Australian Institute for Innovative Materials - Papers Australian Institute for Innovative Materials
1-1-2019
Insights into the Electron Transfer Kinetics, Capacitance and Resistance Insights into the Electron Transfer Kinetics, Capacitance and Resistance
Effects of Implantable Electrodes Using Fourier Transform AC Voltammetry Effects of Implantable Electrodes Using Fourier Transform AC Voltammetry
on Platinum on Platinum
Alexander R. Harris University of Melbourne, University of Wollongong, [email protected]
Carrie Newbold University of Melbourne
Robert Cowan University of Melbourne
Gordon G. Wallace University of Wollongong, University of Melbourne, [email protected]
Follow this and additional works at: https://ro.uow.edu.au/aiimpapers
Part of the Engineering Commons, and the Physical Sciences and Mathematics Commons
Recommended Citation Recommended Citation Harris, Alexander R.; Newbold, Carrie; Cowan, Robert; and Wallace, Gordon G., "Insights into the Electron Transfer Kinetics, Capacitance and Resistance Effects of Implantable Electrodes Using Fourier Transform AC Voltammetry on Platinum" (2019). Australian Institute for Innovative Materials - Papers. 3723. https://ro.uow.edu.au/aiimpapers/3723
Research Online is the open access institutional repository for the University of Wollongong. For further information contact the UOW Library: [email protected]
Insights into the Electron Transfer Kinetics, Capacitance and Resistance Effects Insights into the Electron Transfer Kinetics, Capacitance and Resistance Effects of Implantable Electrodes Using Fourier Transform AC Voltammetry on Platinum of Implantable Electrodes Using Fourier Transform AC Voltammetry on Platinum
Abstract Abstract The charge transfer mechanism at the electrode-solution interface was assessed by Fourier transform AC voltammetry (FTACV). The faradaic reactions that occur within the safe potential window on platinum had slow electron transfer kinetics. The charge transfer mechanisms during short chronopotentiometric stimulation of cells, is most likely dominated by capacitance. Impedance was modelled with a single time constant. FTACV was fit with a 2-component equivalent circuit comprising a series capacitor and resistor. Capacitance and resistance varied with electrode potential, area, topography, surface functionality and solution composition. Capacitance correlated with charge storage capacity measured by voltammetry. Increased capacitance reduced the change in potential during chronopotentiometry. Increased resistance resulted in uncompensated resistance, and a larger change in potential during chronopotentiometry. Uncompensated resistance in tissue may lead to the measured potential of an electrode being considerably higher than its true potential, leading to a conservative estimate of the safe operating potential window. An impedance test is used to assess electrode performance in vivo. The impedance test is a function of capacitance, faradaic charge and resistance. Impedance test results allow electrode comparison, indicating changes in electrode-tissue interface, electrode failure and power usage, however use of Ohm's law to calculate an impedance value is not valid.
Disciplines Disciplines Engineering | Physical Sciences and Mathematics
Publication Details Publication Details Harris, A. R., Newbold, C., Cowan, R. & Wallace, G. G. (2019). Insights into the Electron Transfer Kinetics, Capacitance and Resistance Effects of Implantable Electrodes Using Fourier Transform AC Voltammetry on Platinum. Journal Of The Electrochemical Society, 166 (12), G131-G140.
This journal article is available at Research Online: https://ro.uow.edu.au/aiimpapers/3723

Insights into the Electron Transfer Kinetics, Capacitance and Resistance Effects of Implantable
Electrodes Using Fourier Transform AC Voltammetry on Platinum
Alexander R. Harris1,2, Carrie Newbold2,3, Robert Cowan2,3, Gordon G. Wallace1,2
1 ARC Centre of Excellence for Electromaterials Science, Intelligent Polymer Research Institute,
University of Wollongong, Wollongong, NSW, 2522, Australia
2 The HEARing CRC, 550 Swanston St, University of Melbourne, Melbourne, 3010, Australia
3 Department of Audiology & Speech Pathology, 550 Swanston St, University of Melbourne,
Melbourne, 3010, Australia
Email: [email protected]
Abstract
The charge transfer mechanism at the electrode-solution interface was assessed by Fourier transform
AC voltammetry (FTACV). The Faradaic reactions that occur within the safe potential window on
platinum had slow electron transfer kinetics. The charge transfer mechanisms during short
chronopotentiometric stimulation of cells, is most likely dominated by capacitance. Impedance was
modelled with a single time constant. FTACV was fit with a 2-component equivalent circuit comprising
a series capacitor and resistor. Capacitance and resistance varied with electrode potential, area,
topography, surface functionality and solution composition. Capacitance correlated with charge storage
capacity measured by voltammetry. Increased capacitance reduced the change in potential during
chronopotentiometry. Increased resistance resulted in uncompensated resistance, and a larger change
in potential during chronopotentiometry. Uncompensated resistance in tissue may lead to the measured
potential of an electrode being considerably higher than its true potential, leading to a conservative
estimate of the safe operating potential window. An impedance test is used to assess electrode
performance in vivo. The impedance test is a function of capacitance, Faradaic charge and resistance.
Impedance test results allow electrode comparison, indicating changes in electrode-tissue interface,
electrode failure and power usage, however use of Ohm’s law to calculate an impedance value is not
valid.
Keywords
Platinum; Fourier transform AC voltammetry; cochlear implant; capacitance; resistance
1. Introduction
Cells such as neurons and muscle fibres can be sensitive to and produce electrical current. In the case
of neurons, changes in local potential can induce an action potential. This action potential can propagate
and stimulate further neurons. Large numbers of neurons will form a neural circuit with extensive
synaptic connections. These neural circuits enable information processing and integration. For
instance, sound waves entering the outer ear are transformed by the inner ear mechanisms into an
electrophysiological signal that propagates up the auditorineural pathway to the brain 1. This pathway
serves to process the initial sound waves to provide information on source location, pitch, timbre,
intensity and timing, all of which lead to understanding of speech and music.
Trauma and disease can result in the degradation or failure of a neural circuit. In these cases, electrical
stimulation via a prosthetic device may be able to bypass the degraded neural circuit. In the case of
hearing, overexposure to loud sounds, ototoxic drugs or disease processes such as meningitis are some
of the causes of permanent sensorineural hearing loss 2, which is the direct result of injury or damage
to elements of the auditorineural pathway. In some cases, this may be overcome by hearing aids, which
amplify certain frequency components of the signal to compensate for reduced acoustic thresholds for
these sounds. However, for some of these conditions, which produce a severe-to-profound hearing loss,
a cochlear implant may be the only prosthetic option.
The cochlear implant functions by providing access to some of these auditory cues through direct
electrical stimulation of the neural elements in the cochlea, rather than the auditory-electrical
transformation which happens in normal hearing. The cochlear implant is composed of an array of
platinum electrodes embedded in a biocompatible silicone 3. The electrode array is surgically implanted
into the scala tympani within the cochlea. Sound received by an external microphone is converted in
an external speech processor into an electrical signal, which is then transmitted across the skin to the
implanted receiver-stimulator. The information is then used to stimulate specific auditory neurons
though activation of different electrodes along the electrode array. Activation occurs when current is
passed through the electrodes to induce activity in nearby auditory neurons.
Under general conditions, the current passed through the electrical circuit is carried by electrons,
whereas in tissue, this occurs through the movement of ions. The conversion of electrical to ionic
current occurs at the electrode-tissue interface. An important aspect in implanted prosthetics is an
understanding of the electrochemical mechanisms occurring at this interface to: ensure that the charge
injection is sufficient to induce an action potential, but not great enough to damage local tissue or the
electrode; ensure that the electrode surface remains stable and does not deteriorate nor release cytotoxic
species into the tissue; and that the injected charge is delivered to the target cells using the minimum
necessary voltage to limit power usage. To understand these interfaces and reaction mechanisms,
studies often assess electrodes in simple saline solutions by cyclic voltammetry, chronopotentiometry
or electrochemical impedance spectroscopy (EIS) 4. It is then inferred that similar mechanisms to those
modelled will occur in the complex tissue environments of the human body, and when using the very
short, high current density pulsing typically employed in implantable prosthetic devices. However to
date, little direct study of the electrochemical reactions occurring at the electrode-tissue interface in
cochlear implants has been undertaken.
To understand the electrode-tissue interface, it is important to note that both capacitance and Faradaic
reactions may occur. Capacitance charge is caused by the build-up of ions at the electrode-tissue
interface. Current flow therefore causes a changing electrode potential across the interface. In contrast,
Faradaic reactions involve the movement of electrons across the electrode-tissue interface, resulting in
the oxidation or reduction of a redox active species. Charge flow across the interface through Faradaic
mechanisms can occur without changing its potential. The charge delivered by Faradaic reactions will
depend on the concentration of redox active species at the electrode surface. In the body, redox active
species may be dissolved in solution (eg O2), so that its concentration at the electrode-tissue interface
is affected by mass transport; or adhered to the electrode surface (eg platinum oxide), where mass
transport doesn’t affect the reaction. There may be a finite amount of redox species present. These
surface confined redox reactions can also be called pseudo-capacitance. Redox reactions may be
chemically reversible or irreversible.
Charge transfer mechanisms available at a platinum electrode-tissue interface during electrical
stimulation are often assumed to be what occurs on a platinum electrode in contact with simple
electrolytes such as saline, PBS or 0.5 M H2SO4 567. This includes the formation and reduction of
platinum oxide, reduction of molecular oxygen, and the adsorption and stripping of hydride. However,
anion adsorption can also occur, with numerous studies showing chloride and phosphate anion
adsorption affecting charge transfer at the platinum-electrolyte interface 8910. These reactions are mostly
considered safe, with the reaction products being non-cytotoxic, although the reduction of dissolved
oxygen to hydrogen peroxide has been proposed as a possible damage mechanism 11. However, the
charge magnitude obtained from each reaction will depend on the solution composition, electrode
surface (area, chemical functionality, crystal plane and topography) and applied waveform. The
chemical reversibility of the reactions can also be affected by conditions, for instance the amount of
anion adsorption can change over time as the amount of oxide present on the electrode surface changes.
Adsorption of amino acids and proteins on the electrode surface may also affect the reaction
mechanisms available (eg. blocking anion adsorption or providing other Faradaic reactions) 12. To
accurately predict charge transfer at the electrode-tissue interface therefore requires careful control of
the modelled electrode surface and solution composition.
Other reactions that can occur on the platinum electrode surface include the reduction and oxidation of
water and of the electrolyte. These reactions can generate hydrogen and oxygen gas, reactive oxygen
species or other reactive products that may be cytotoxic. Stripping of the platinum can also occur,
leading to electrode corrosion. The safe potential window is therefore deemed to be the range of
electrode potentials that can be applied so that only capacitance and safe Faradaic reactions can occur.
The difficulty in defining the safe potential window was recently discussed 13. The amount of charge
that can pass through an electrode within the safe potential window is termed the charge storage capacity
or charge injection capacity. The charge storage capacity is typically measured from integrating a DC
potential sweep at relatively slow voltammetric scan rates. Dividing this by the electrode area provides
its charge density. However, implantable electrodes are normally used in a very short current pulse
mode, and the limitations of measuring charge storage capacity from DC cyclic voltammetry was
recently discussed 1314. The charge injection capacity is measured from a chronopotentiometric pulse,
being the amount of charge that can be injected before the electrode potential exceeds the safe potential
window. The effect of experimental conditions on the charge injection capacity of platinum was also
recently reported 14.
In general, these previous reports assume that all of the reaction mechanisms that occur at the electrode-
tissue interface are fast. However, Faradaic reactions are also affected by electron transfer kinetics.
The electrochemical reactions of some species, such as the oxidation of ferrocene, can have very fast
kinetics. Others reactions, including the reduction of protons to molecular hydrogen, can be very slow
15. Reactions that appear to be thermodynamically achievable in a cyclic voltammogram may be limited
by slow kinetics and play little role in a short chronopotentiometric pulse.
To gain a greater understanding of the charge transfer mechanisms that may occur at the platinum-tissue
interface, we used Fourier transform AC voltammetry (FTACV) 16. FTACV superimposes an AC signal
on a DC cyclic voltammogram, which is equivalent to running multiple cyclic voltammetric scan rates
and electrochemical impedance spectroscopy at all applied potentials simultaneously. This technique
has been used previously to understand electrochemical mechanisms and kinetics 17. It has also been
used to investigate electrode properties, including screen-printed electrodes developed for point-of-care
blood sensing 1819. In this system, changes in fabrication process and electrode design were found to
affect electron transfer rate, electrode capacitance and resistance. The high AC frequencies applied
during FTACV may therefore be more relevant in determining the charge transfer mechanisms and
charge injection capacity from electrical stimulation of implantable electrodes.
In simple conditions, reaction kinetics can be measured by voltammetry. Fast electron transfer kinetics
for a dissolved redox active species undergoing a one-electron redox reaction will produce a DC
voltammogram with peaks in the oxidation and reduction sweep separated by 59 mV and the ratio of
oxidation and reduction current peak heights would be 1. For a surface-confined reaction, the peak
separation between oxidation and reduction reactions should be 0 V. As the electron transfer rate
decreases, the peak separation will get larger and the peak heights decrease. In AC voltammetry at the
fundamental harmonic, fast electron transfer produces a Gaussian shaped peak with no peak splitting
from oxidation and reduction sweeps. With slow electron transfer, again the peak heights decrease and
peak splitting increases.
The electrochemical performance of implanted electrodes is typically also assessed by EIS which
applies an AC signal at a fixed potential. The impedance at 1 kHz is often reported to predict the
thermal noise and signal-to-noise ratio of neural recording electrodes. A recent study has demonstrated
low frequencies are more dependent on the electrode and are a stronger predictor of electrophysiological
performance 20. Implanted electrodes can also be assessed with an impedance test to determine
electrode failure and power usage. The impedance test applies a biphasic chronopotentiometric pulse
and uses Ohm’s law to calculate a resistance value from the measured potential. Variations of the
electrode-solution interface on the impedance test measurement and the validity of this method was
recently discussed 14. Equivalent circuit fitting of FTACV can provide resistance and capacitance
measurements, which may be of greater utility to assessing thermal noise, signal-to-noise ratio,
electrode failure and power usage of implantable electrodes.
In this article, changes to solution composition, electrode surface area, polishing method (affecting
topography and chemical functionality), capacitance and resistance of a platinum electrode were
investigated by FTACV. The reaction mechanisms and electron transfer kinetics available on implanted
electrodes are discussed. The impact of changing capacitance and resistance on charge injection is
investigated. Finally, the relationship between electrochemical methods and fitting of equivalent
circuits are discussed in relation to neural stimulation and impedance testing.
2. Materials and Methods
Chemicals
Phosphate-buffered saline (PBS: 154mM NaCl, 10 mM phosphate buffer, pH 7.4), sodium chloride,
potassium chloride, sodium bicarbonate, calcium chloride, D-glucose (Sigma-Aldrich), magnesium
chloride hexahydrate (Scharlau), monosodium phosphate (Biochemicals) and 98 % sulfuric acid (RCI
Labscan), were used as received. An artificial perilymph contained 125 mM NaCl, 3.5 mM KCl, 25
mM NaHCO3, 1.2 mM MgCl2, 1.3 mM CaCl2, 0.75 mM NaH2PO4 and 5 mM glucose 21.
Electrodes
Electrodes were 2 mm, 0.6 mm or 25 μm diameter platinum discs (CH Instruments) or a cochlear
implant with 22 half band, 0.3 mm2 nominal area platinum electrodes (donated by Cochlear Ltd). One
electrode of each type was tested. Disc electrodes were polished before every experiment with 0.3 μm
alumina slurry on Microcloth polishing cloth (Buehler), rinsed in deionised water and gently dried
(Kimwipe) before use. The cochlear implant was not mechanically polished before use and had not
been used for any in vivo studies. Acid polishing was achieved by cycling the electrode potential from
1.2 to -0.2 V at 50 mV s-1 for 50 cycles in 0.5 M H2SO4. Electrodes were tested in a 3-electrode
configuration using a Ag/AgCl (3 M KCl) as reference electrode and Pt wire as counter electrode.
Unless indicated, test solutions were degassed with nitrogen for at least 10 minutes.
Potentiostats
DC voltammetry, chronopotentiometry and electrochemical impedance spectroscopy (EIS) experiments
were performed on a CHI660E potentiostat (CH Instruments) whereas FTACV was performed on a
custom built potentiostat 16. The electrodes were connected to the potentiostat via alligator clips and
placed into a beaker of solution. To increase the electrode capacitance, two 0.3 mm2 platinum disc
electrodes were connected in parallel via alligator clips. To increase the electrode resistance, a resistor
was placed in series with a 0.3 mm2 platinum electrode via alligator clips.
Applied Waveforms and Analysis
To perform FTACV, a linear DC sweep from 0.8 to -0.8 and back to 0.8 V at 119.21 mV s-1 was applied
with five AC frequencies superimposed (37.22, 92.54, 230.07, 372.98 and 590.09 Hz) with 5 mV
amplitude (Figure S1a). These particular frequencies are chosen to minimise overlap in higher
harmonics, frequency sums and differences, although the use of small amplitude AC signals reduces
the power of these higher harmonics 18. A Fourier transform was applied to obtain the power spectrum
(Figure S1c), the frequency range of interest was selected with a bandwidth of 18 Hz, and an inverse
Fourier transform was applied (Figure S1d and e). A line was then drawn over the top of the current to
provide a current envelope (Figure S1f). The magnitude and phase angle were calculated over time and
used to calculate a 2-component series resistance (R) and capacitance (C) equivalent circuit from
regions that didn’t include significant Faradaic current (platinum oxide formation and removal would
still be included) or ringing artefacts at the start and end of the potential sweep. The median R and C
values were measured over the entire potential range and averaged from 2 repetitions of freshly prepared
electrodes.
EIS was performed at 0 V with an AC amplitude of 5 mV over a frequency range of 0.1-100,000 Hz.
Equivalent circuit fitting of the EIS data was performed with ZView (Scribner Associates).
Chronopotentiometic experiments were performed with a biphasic oxidation and reduction waveform
of equal pulse length and magnitude but no interphase gap or interpulse interval. 4 biphasic pulses were
applied. The charge density was 10 µC cm-2, a value typical of that used by modern cochlear implants.
The cochlear implant typically uses 25 µs current pulses, however the shortest pulse achievable on the
commercial potentiostat was 5 ms. Therefore the applied charge (Q) was calculated by multiplying the
charge density by the nominal electrode area (A); the current (i) for the 5 ms time pulse was then
calculated from the total charge passed and the time (t), i = Q / t; (5.65 µA on a 600 µm diameter
electrode resulting in 28.3 nC phase-1). This charge density and charge per phase is considered safe
according to the Shannon plot 22. The current was adjusted to ensure the same charge density of 10 µC
cm-2 was applied for each electrode size. By definition, the larger the change in potential measured
during the chronopotentiometric pulse, the smaller is the electrode’s charge injection capacity. To
eliminate variability from the open circuit potential, the change in potential from the second pulse was
measured (Figure 9a). The stability of the electrode to multiple pulsing was assessed by measuring the
change in potential from the end of the second pulse to the end of the last pulse (cumulative 6 pulses).
3. Results
Fourier Transform AC Voltammetry
The applied waveform in FTACV appears like a normal cyclic voltammogram but with a 5 mV
amplitude (Figure S1a). The measured total current appears noisy and is more easily visualised when
plotted as current versus time (See Figure S1b for a representative example). The Fourier transform of
the total current produces a power spectrum with a large component around 0 Hz associated with the
DC sweep and peaks at each of the applied AC frequencies (Figure S1c). No peaks were seen at any
other frequencies due to generation of higher harmonics. Selecting only the DC data and applying an
inverse Fourier transform generates a typical cyclic voltammogram (Figure S1d). The large current
spike at the start and end of the sweep (at 0.8 V) is an artefact of the Fourier transform function. An
inverse Fourier transform of an AC component produces a mirrored image that is easiest viewed as a
current-time plot, seen in Figure 1e for the 37.22 Hz component of the applied signal. The current
envelope is then plotted when viewing multiple plots simultaneously (Figure S1f).
The magnitude and phase angle of each AC component were calculated over time (a typical result is
seen in Figure S2). A simple 2-component RC equivalent circuit was then used to compare electrodes
under different conditions (Table 1). Both R and C varied with applied potential (Figure 1). Variations
in capacitance may be due to changes to the electrode chemical functionality or double layer. Variations
in resistance imply the 2-component equivalent circuit is not strictly valid, which will be further
discussed below. For a mechanically polished 0.6 mm diameter platinum electrode in degassed 0.1 M
NaCl, the resistance varied over the potential window from 3.1 to 5.2 kOhm while the capacitance
varied from 70 to 105 nF. A capacitance of 85 nF on a 0.3 mm2 electrode gives a unit capacitance of
28.3 µF cm-2.
Varying Solution Composition
A mechanically polished platinum electrode in degassed 0.1 M NaCl displays capacitance and Faradaic
current (Figure S1d). In the DC sweep, a reduction peak at -120 mV was seen due to platinum oxide
and oxygen reduction; an increasing reduction current below -500 mV was due to hydride adsorption;
on reversing the potential sweep direction, an oxidation current occurred up to -300 mV from hydride
stripping; further oxidation current began at 300 mV from platinum oxide formation. At potentials
above 0.8 V and below -0.8 V, water electrolysis can occur.
In the 37.22 Hz AC reduction sweep, a peak was seen at -120 mV and the current increased below -500
mV (Figure S1f and 2b). On the oxidation sweep, the current crossed-over itself at -650 mV, then
decreased at -300 mV. A small current peak was also seen at -20 mV. At higher frequencies the current
magnitude increased and the peaks became more resolved but didn’t change in potential (Figure S1f).
In PBS, the DC voltammetry had a reduction peak at -10 mV, and a large reduction current began
around -400 mV with a shoulder around -700 mV (Figure 2a). On the oxidation sweep a peak appeared
at -620 mV, decreasing in magnitude to -290 mV. Further oxidation current began around 260 mV. In
the 37.22 Hz AC reduction sweep a peak occurred at -600 mV and on the oxidation sweep a larger peak
was seen at -575 mV (Figure 2b). At higher frequencies, a smaller oxidation peak appeared at -40 mV.
An artificial perilymph was also assessed (Figure 2) with the DC voltammetry displaying a reduction
peak around -100 mV and larger reduction process beginning at -470 mV with a shoulder at -670 mV.
The oxidation sweep had a peak at -700 mV decreasing in magnitude to -300 mV and a further oxidation
process beginning at 120 mV. The 37.22 Hz AC reduction sweep had a peak at -710 mV. On the
oxidation sweep the current crossed-over itself at -590 mV, decreasing in current to -300 mV. A small
peak was also visible at 260 mV. At higher frequencies, oxidation peaks appear at -410 mV and -65
mV.
FTACV performed in a non-degassed 0.1 M NaCl solution displayed a larger reduction current at -190
mV in the DC voltammetry than in a degassed solution (data not shown). The AC components had
poorly defined peaks in the reduction sweep around -200 mV and in the oxidation sweep at 0 V. The
Faradaic processes became more resolved at higher AC frequencies.
The median resistance values varied slightly between experiments, ranging from 2.6 to 4.2 kOhm in the
different solutions (Table 1). The median capacitance was seen to increase when altering the solution
composition from 85 nF in degassed 0.1 M NaCl up to 116 nF in non-degassed 0.1 M NaCl.
Varying Electrode Surface
The electrode size was varied in degassed 0.1 M NaCl (data not shown). The current magnitude in both
DC and AC voltammograms increased with electrode size, but the peak potentials were highly
consistent. There was a large increase in capacitance and decrease in resistance when increasing the
electrode size (Table 1).
All of the electrodes tested above were mechanically polished, resulting in a heterogeneous surface with
varying levels of oxide and some organic residues present. Acid cleaning of the electrode leads to a
restructuring of the platinum and removal of the impurities. When this acid polished electrode was
placed into degassed 0.1 M NaCl, a significant change in voltammetric response was seen (Figure 3).
The DC voltammogram displayed reduction peaks at 180 mV and -350 mV with hydride reduction
beginning at -700 mV. On the oxidation sweep, a peak could be seen at -260 mV with shoulders around
-350 mV and -200 mV. In the 37.22 Hz AC reduction sweep, a peak appeared at -220 mV with
increasing current below -700 mV. On the oxidation sweep, peaks were found at -240 mV and -190
mV. At higher frequencies, further Faradaic processes became visible at 300, 30 and -310 mV on the
reduction sweep, and -630, -470 and 40 mV on the oxidation sweep. Fitting the 2-component equivalent
circuit to the acid polished electrode indicated a near fourfold increase in capacitance with very little
change in resistance compared to a mechanically polished electrode (Table 1).
FTACV of a cochlear implant electrode had a similar magnitude of capacitive current as an equivalent
sized planar disc electrode, but the Faradaic current was less prominent in both DC and AC
voltammograms (Figure 4). The median capacitance averaged from 5 electrodes was slightly smaller
than an equivalent sized planar disc electrode while the resistance value was slightly larger (Table 1).
Varying Capacitance and Resistance
The above experiments altered the platinum-solution interface, resulting in changes to the capacitance
and resistance of an equivalent circuit. An increase in electrode capacitance can also be achieved by
connecting 2 electrodes in parallel. While an increase in resistance can be made by placing a resistor
in series with the electrode.
Increased electrode capacitance resulted in a larger current magnitude in both DC and AC voltammetry
with no change in potential of the Faradaic processes (Figure 5a-b). The fitted capacitance increased
and the resistance decreased, consistent with a larger electrode area (Table 1).
When increasing the resistance, the DC voltammetry appears stretched out, with Faradaic peak heights
decreasing and shifting to larger potentials (Figure 5c). In the AC voltammetry, increasing resistance
reduces the current magnitude, and above 67 kOhm, the current appears almost independent of applied
potential (Figure 5d). With up to 145 kOhm added, the fitted resistance increased while capacitance
varied slightly; with an added 982 kOhm, the fitted capacitance dropped significantly (Table 1). There
was very good agreement between the fitted R and the added resistor values.
To obtain a more accurate equivalent circuit, EIS was performed (Figure 6). The Nyquist plot displayed
a semi-circle, with increased capacitance reducing the semi-circle height while increased resistance
shifted the semi-circle to higher real impedance. The total impedance decreased in magnitude with
increasing frequency. Increased capacitance reduced the total impedance at all frequencies while
increased resistance increased the total impedance at high frequencies. The phase angle was close to 0º
at high and low frequencies, and approached a -90º peak at intermediate frequencies. Increased
capacitance broadened the frequency range at -70º while increased resistance reduced the range and
peak height.
The presence of a semi-circle in the Nyquist plot indicates the electrode-solution interface behaves as a
single time constant, which is not generated in a simple RC equivalent circuit. An equivalent circuit
(inset Figure 6) consisting of a solution resistance in series with a constant phase element and a parallel
polarisation resistance gave a good fit, decreasing in quality with added resistance. Values for the fitted
solution and polarisation resistance and an admittance (Q0) and power (n) term for the constant phase
element are given in Table 2. Increasing the electrode capacitance was seen to increase the admittance
and reduce the resistance values. The added resistors increased the fitted resistance values with only a
small impact on the constant phase element parameters. Despite the simple RC model used to fit the
FTACV not being a strictly accurate equivalent circuit of the platinum-solution interface, comparison
between the fitted parameters in Tables 1 and 2 indicate a reasonable correlation between R, the solution
resistance values and the resistor values measured via a multimeter; C also correlated with the
admittance values.
Finally, the impact of capacitance and resistance on chronopotentiometry was investigated (Figure 7).
At time = 0, the electrode is at open circuit potential, there was some variability in the initial potential
due to differences in the electrode surface after polishing. An initial reduction pulse drives the electrode
to negative potentials while an oxidation pulse leads to more positive potentials. The impact of
changing the electrode-solution interface and pulse waveform on current pulsing was discussed
previously 14. Increasing the electrode capacitance resulted in a smaller change in potential on the
second pulse and for the cumulative 6 pulses (Table 3). Increasing the electrode resistance increased
the open circuit potential and the change in potential on the second pulse. However, the change in
potential from the cumulative 6 pulses was only affected at large resistances.
4. Discussion
General Considerations of Charge Transfer Mechanisms at the Electrode-Tissue Interface
The reaction mechanisms and charge injection capacity of implantable electrodes are typically
measured via slow scan rate voltammetry at relatively low charge densities. Under these conditions,
the diffusion length (L) is on the order of 1 µm ( 2L Dt= , where D is the diffusion factor). In
contrast, electrical stimulation in vivo is performed with short current pulses at high charge density.
The diffusion length may then be 2 or 3 orders of magnitude smaller. This reduces the amount of charge
that can be obtained from diffusion of redox species (reduction of oxygen) to the electrode.
Most of the safe electrochemical reactions available at the platinum-solution interface are surface
confined. Fast electron transfer should result in Gaussian shaped peaks in both the DC and AC
voltammetry. Hydride and anion adsorption approached this behaviour under certain conditions, but
the formation and reduction of platinum oxide showed very broad peaks with large splitting in the DC
voltammetry and was barely visible in the AC voltammetry (Figures S1, 2-4). The slow kinetics of
platinum oxide formation and reduction has been reported previously under a range of conditions 2324.
Acid polishing the electrode may increase the electron transfer kinetics (Figure 3), but this electrode
surface is a poor model of the electrode-tissue interface. This implies that the electron transfer kinetics
of the platinum oxide reaction is slower than the hydride and anion adsorption, but none of these
reactions can be considered fully reversible under these conditions.
Slow electron transfer of the surface confined redox reactions will limit the charge delivered through
these mechanisms during short chronopotentiometric pulsing. An electrochemical reaction with slow
kinetics can only be forced to proceed by the application of a very high overpotential. The implication
is that the majority of charge delivered during in vivo electrical stimulation will be supplied by the
electrode’s capacitance. Efforts to increase the charge storage capacity of implantable electrodes
through relatively slow and quasi-reversible Faradaic reactions from new electrode materials, such as
conducting polymers 25, may have limited benefit in increasing the charge injection capacity for in vivo
electrical stimulation. However, quantifying the relative amount of capacitance and each Faradaic
reaction mechanism occurring during chronopotentiometry is difficult 14.
Equivalent Circuits of the Electrode-Tissue Interface
Electrochemical cells can be modelled as an equivalent electrical circuit. These can aid in
understanding the charge transfer mechanisms occurring under different conditions. EIS of platinum
in degassed solution at 0 V vs Ag/AgCl displayed a single time constant (Figure 6). An equivalent
circuit was fitted with a solution resistance; and the interface between the electrode and electrolyte
solution double layer being modelled as a parallel constant phase element and polarisation resistance.
The use of a constant phase element rather than a capacitor is usually explained as surface roughness,
inhomogeneity in current distribution or inhomogeneity in the surface including ion adsorption 26.
Changes in electrode area and solution composition can affect the constant phase element and solution
resistance values while modifying the electrode surface should mainly affect the constant phase
element.
To gain an accurate understanding of EIS in an electrochemical cell, it should be performed across a
range of different electrode potentials. By only performing EIS at one potential, the equivalent circuit
doesn’t contain charge transfer information for many possible Faradaic reactions or variations in
capacitance with potential. In contrast, FTACV is able to provide equivalent circuit parameters at all
applied potentials. While the current homebuilt instrument only allows a 2-component equivalent
circuit, its accuracy was relatively good under the conditions tested and it allows easy comparison of
different electrode and solution conditions (Tables 1 and 2). The fitted capacitance and resistance varied
with potential (Figure 1). Variations in capacitance during FTACV have been shown previously with
ionic liquid on gold electrode 27 or of a glassy carbon electrode in 0.2 M KCl 18. In these systems, a U-
shaped response was seen. The potential dependence of capacitance can then enable measurement of
the point of zero charge of the electrode-solution interface. Different shaped responses may indicate
specific ion adsorption processes are occurring. The change in measured capacitance with potential in
the current work is most likely due to the inclusion of formation and removal of platinum oxide, anion
adsorption and changes in the electrical double layer being included in the fitting. The accuracy of the
2-component model after protein fouling and in vivo has not been assessed to date, although an EIS
study of protein adsorption on gold electrodes required a second time constant be included to fit the
data 28.
Comparison of Electroanalytical Techniques at the Electrode-Tissue Interface
A large charge injection capacity should allow delivery of high charge within the safe potential window.
A high charge density would allow the electrode area to be reduced, potentially enabling more targeted
electrical stimulation and reduction of device size and subsequent immune response.
The impact of experimental conditions on cyclic voltammetry in analysing charge storage capacity and
charge density has been discussed recently 2913. Briefly, the charge storage capacity varies with
voltammetric parameters, solution composition, electrode area and surface treatment. The Faradaic
reaction mechanisms at a platinum-tissue interface are not fully reversible, and so the charge storage
capacity measured from reduction and oxidation sweeps are not equal. The safe potential window is
also difficult to define. As a result, charge storage capacity measured via cyclic voltammetry must be
performed in a suitable model solution with clinically relevant electrodes using a standardised protocol.
The charge density can then be calculated using the geometric or an electrochemically active area, but
this must be specified 29. There is generally a good correlation between charge storage capacity
measured by cyclic voltammetry and voltage transients measured by chronopotentiometry 14. However,
the stability of an electrode during repeated current pulsing will not be measured from a single cyclic
voltammogram.
The impedance at 1 kHz is typically reported to gauge the thermal noise and signal-to-noise ratio of
neural recording. However, the utility of this measure in predicting in vivo electrophysiological
performance has been mixed 30313233. A large factor in this poor correlation has been the large biological
noise component during in vivo recordings. A novel surgical technique performing multiple neural
recording measures from an electrode was able to significantly reduce the biological noise 34. This
enabled correlation of EIS and electrophysiological response 20. A stronger correlation of impedance
at low frequencies (below the Maxwell-Wagner frequency) and electrophysiological behaviour was
found than the usually reported impedance at 1 kHz. This low frequency impedance is a function of
electrode area, indicating larger effective electrode areas will reduce thermal noise and increase the
signal-to-noise ratio 35.
FTACV may be able to provide charge storage capacity and impedance measures in the one experiment.
The parameters used in defining FTACV are the potential window, scan rate, number of sine waves,
the sine wave amplitude, phase and frequency. A measure of charge storage capacity by integrating an
AC voltammogram will be affected by each of these parameters, so they must be standardised. The
total current produces oxidation and reduction current during a potential sweep, so that integrating a
total current voltammogram would give a very small charge value (Figure S1b). Similarly, integration
of the total current from an AC component gives very little charge (Figure S1e). The charge from the
DC component and the envelope of the AC components can be obtained (Figure S1d and f). Both of
these components provide different charge values for the forward and reverse sweeps and are affected
by experimental conditions. As a result, the limitations in measuring charge storage capacity from
cyclic voltammetry would be the same with FTACV. In addition, a similar relationship between charge
storage capacity measured by FTACV and chronopotentiometry would be expected.
Equivalent circuit fitting of FTACV provided C and R values. While these may not be accurate
representations of the electrode-solution interface, they may provide useful measures of charge injection
capacity, thermal noise and signal-to-noise ratio. The calculated C and R values varied with potential
as the formation and removal of platinum oxide, anion adsorption and changes in the electrical double
layer are included in the fitting. Small changes in the potential window and scan rate have little impact
on the fitted parameters. As a result, the median values provide an easy measure for comparing different
electrodes and conditions. Unlike measures of charge storage capacity, the equivalent circuit fitting
should be performed over potential regions without significant Faradaic current. The fitted potential
region was kept within the water electrolysis window and excluded the reduction of oxygen, but regions
with pseudo-capacitance were included. There was a very good correlation between the C values
measured in this article and the charge storage capacities reported previously from cyclic voltammetry
under the same conditions 13.
As expected, the fitted R value was mainly affected by electrode area and the addition of resistors to the
electrochemical cell. The impact of electrode area was seen to affect the impedance at all measured
frequencies while added resistance had a greater impact at higher impedance frequencies (Figure 6).
Capacitance and Resistance Effects During Chronopotentiometry and Impedance Testing at the
Electrode-Tissue Interface
Stimulation of excitable cells is normally achieved with biphasic current (chronopotentiometric) pulses.
Analysis of chronopotentiometric pulsing of implantable electrodes is often performed by measuring
the rapid change in potential occurring in the first few µs (access voltage) and the subsequent slower
change in potential (polarisation voltage) 36. This assumes the access voltage is due to the solution
resistance and the polarisation voltage is due to a change in potential across the electrode-tissue
interface. Separating out each of these phases of a chronopotentiometric pulse can be achieved with a
dummy cell, but becomes harder in electrochemical cells.
An impedance test is also used to assess the performance of implants 373839. The test varies between
devices, but typically involves the use of Ohm’s law to calculate an impedance value from a biphasic
current pulse. The use of Ohm’s law requires a uniform conductor; an electrochemical system is not a
uniform conductor, as current is supplied by capacitance and/or Faradaic reactions 14. Therefore, an
impedance test can provide details on electrode failure and power usage but only estimates of tissue
resistance.
During a chronopotentiometric pulse, when charge is supplied by capacitance, the electrode potential
will increase over time, while charge generated from Faradaic reactions will result in a more stable
electrode potential. The charge transfer mechanisms and their kinetics depend on the composition of
the electrode-tissue interface, electrode area, applied charge density and pulse length 14. The Faradaic
charge transfer mechanisms at the platinum-solution interface are not fully reversible, so using a charge
balanced biphasic pulse doesn’t guarantee balanced reaction mechanisms. Multiple biphasic pulses can
then lead to a change in the electrode-tissue interface (eg. changes to chemical functionality, ion
adsorption, electrical double layer) and ratcheting of the electrode potential 4041.
The change in electrode potential during chronopotentiometry was shown previously to be affected by
electrode area, solution composition, electrode surface, current magnitude, pulse length, pulse polarity
and number of pulses 14. Here the capacitance and resistance are also shown to affect the
chronopotentiometric response. Increasing the electrode capacitance reduces the change in potential
while increasing the resistance increases the change in potential. This behaviour can be predicted from
the 2-component model fitting with FTACV.
The safe potential window assumes that all current (i) is supplied by capacitance (ic) and Faradaic (if)
current and that the measured potential (E) is the true potential at the electrode surface. The presence
of uncompensated resistance (Ru) also affects the electrode potential according to Eu = iRu.(where Eu is
the additional potential measured at the interface due to uncompensated resistance and E = Eu + Et
where Et is the true potential at the interface) When performing cyclic voltammetry, the presence of
iRu drop will require a larger applied potential to achieve the desired electrode potential. As a result,
iRu drop will shift Faradaic reactions to larger applied potentials and the safe potential window will
appear wider. In chronopotentiometry, the applied current is controlled so the measured potential will
become larger with added iRu drop. So while the measured potential may be significantly greater than
the safe potential window, the true electrode potential may still be within the safe potential window.
The impact of iRu drop will be noticed when the change in potential is greater than a few mV. For
instance, with an applied current of 5.65 µA, the effects of iRu drop will be noticeable with resistances
above 1 kOhm. For shorter current pulses with larger applied current, the effect of iRu drop will be
even greater.
Larger resistance and capacitance also increases the electrode time constant (RC) which leads to a
slower change in electrode potential with applied current. The larger time constant can be seen when
large resistors were added to the chronopotentiometric pulsing (Figure 7c-d). At very large resistances
(demonstrated at 982 kOhm), parasitic capacitance leads to shunting of charge. These effects of
resistance lead to a blurring of the access and polarisation voltages, preventing their separation.
Due to protein fouling and cell encapsulation, the impedance of an electrode in tissue is typically greater
than in simple solutions. This will lead to uncompensated resistance effects, which will vary between
electrodes and over time. As a result, the safe potential window in vivo may be wider than measured in
a highly conductive solution. Chronopotentiometric pulsing would also lead to larger changes in
potential. Performing an impedance test in vivo will result in a change in electrode potential with charge
being passed through capacitance, Faradaic reactions and uncompensated resistance. The mechanisms
involved in charge transfer will change over time due to the electrical stimulation and biological
processes such as protein adsorption and fibrosis. Deconvoluting the charge transfer mechanisms in
vivo is difficult but it does give an indication of the level of tissue impedance. A reduction in tissue
resistivity will reduce the uncompensated resistance and reduce power usage during electrical
stimulation.
Conclusions
Charge transfer from a platinum electrode into solution occurs through capacitance and Faradaic
mechanisms. The Faradaic mechanisms include platinum oxide formation and reduction, anion
adsorption, reduction of oxygen and hydride adsorption. These reactions all displayed slow electron
transfer on a mechanically polished electrode. Acid polishing of the electrode appeared to increase the
reaction kinetics, but this surface is a poor model of the electrode-tissue interface. Therefore, it is
expected that slow electron transfer at the platinum-tissue interface would also occur. Capacitance
would then dominate the charge transfer mechanisms at the platinum-tissue interface during electrical
stimulation of cells. The development of new materials with large charge storage capacities but slow
electron transfer may be of limited benefit in increasing the charge injection capacity of neural
stimulating electrodes. Increasing the electrode capacitance was found to have a bigger impact in
increasing its charge injection capacity.
The electrochemical properties of implantable electrodes are normally assessed in highly conductive
electrolytes. Increased resistance leads to uncompensated resistance effects so the true electrode
potential may be smaller than the measured potential. The impedance of tissue is larger and more
complex than in these highly conductive electrolytes. Therefore, the safe potential window and charge
injection capacity available in tissue may be wider than measured in the highly conductive electrolytes.
The level of uncompensated resistance may also vary between electrodes and over time. The safe
potential window on a cochlear implant may vary across the electrode array and as any fibrotic tissue
forms around the electrodes. An impedance test of the cochlear implant electrodes can give an estimate
of the level of uncompensated resistance.
The electrophysiological performance of implantable electrodes is often modelled by electrochemical
methods in simple electrolytes. A slow sweep DC cyclic voltammogram is used to calculate the charge
storage capacity and EIS is used to predict thermal noise and signal-to-noise ratio. FTACV is able to
measure a charge storage capacity and impedance response within one experiment. Unlike EIS,
FTACV also measures the impedance response over the whole potential range. FTACV may therefore
provide more information within a single experiment to better model electrophysiological performance.

Acknowledgements
The authors acknowledge the financial support of the HEARing CRC, established under the Australian
Government’s Cooperative Research Centres (CRC) Program. The CRC Program supports industry-led
collaborations between industry, researchers and the community. Funding from the Australian
Research Council Centre of Excellence Scheme (Project Number CE140100012) is gratefully
acknowledged. The authors thank the Materials Node of Australian National Fabrication Facility
(ANFF) and acknowledge use of the facilities.
References
1. D. R. Moore, P. A. Fuchs, A. Rees, A. Palmer, and C. J. Plack, The Oxford Handbook of Auditory
Science: The Auditory Brain, OUP Oxford, (2010).
2. L. R. Lustig, Hear. Res., 368, 3–9 (2018).
3. A. Dhanasingh and C. Jolly, Hear. Res., 356, 93–103 (2017).
4. S. F. Cogan, Annu. Rev. Biomed. Eng., 10, 275–309 (2008).
5. S. B. Brummer and M. J. Turner, Biomed. Eng. IEEE Trans., BME-24, 436–439 (1977).
6. S. B. Brummer and M. J. Turner, Biomed. Eng. IEEE Trans., BME-24, 440–443 (1977).
7. E. M. Hudak, D. W. Kumsa, H. B. Martin, and J. T. Mortimer, J. Neural Eng., 14, 46012 (2017).
8. V. S. Bagotzky, Y. B. Vassilyev, J. Weber, and J. N. Pirtskhalava, J. Electroanal. Chem. Interfacial
Electrochem., 27, 31–46 (1970).
9. N. Li and J. Lipkowski, J. Electroanal. Chem., 491, 95–102 (2000).
10. N. Garcia-Araez, V. Climent, E. Herrero, J. Feliu, and J. Lipkowski, J. Electroanal. Chem., 576,
33–41 (2005).
11. S. L. Morton, M. L. Daroux, and J. T. Mortimer, J. Electrochem. Soc., 141, 122–130 (1994).
12. D. B. Hibbert, K. Weitzner, and P. Carter, J. Electrochem. Soc., 148, E1–E7 (2001).
13. A. R. Harris, C. Newbold, P. Carter, R. Cowan, and G. G. Wallace, J. Neural Eng., 15, 46015
(2018).
14. A. R. Harris, C. Newbold, P. Carter, R. Cowan, and G. G. Wallace, Front. Neurosci.
15. A. J. Bard and L. R. Faulkner, Electrochemical Methods, 2nd ed., Wiley, New York, (2001).
16. A. M. Bond, N. Duffy, S. Guo, J. Zhang, and D. Elton, Anal. Chem., 77, 186A–195A (2005).
17. Y. Zhang, A. N. Simonov, J. Zhang, and A. M. Bond, Curr. Opin. Electrochem., 10, 72–81
(2018).
18. A. R. Harris et al., J. Solid State Electrochem., 12 (2008).
19. A. Konash et al., J. Solid State Electrochem., 13 (2009).
20. A. R. Harris, B. J. Allitt, and A. G. Paolini, Anal. (Cambridge, United Kingdom).
21. A. N. Salt, C. Kellner, and S. Hale, Hear. Res., 182, 24–33 (2003).
22. S. F. Cogan, K. A. Ludwig, C. G. Welle, and P. Takmakov, J. Neural Eng., 13, 21001 (2016).
23. S. W. Feldberg, C. G. Enke, and C. E. Bricker, J. Electrochem. Soc. , 110, 826–834 (1963).
24. S. Shibata and M. P. Sumino, Electrochim. Acta, 20, 739–746 (1975).
25. A. R. Harris and G. G. Wallace, Adv. Funct. Mater., 28, 1700587 (2018).
26. T. Pajkossy, J. Electroanal. Chem., 364, 111–125 (1994).
27. A. J. Lucio, S. K. Shaw, J. Zhang, and A. M. Bond, J. Phys. Chem. C, 121, 12136–12147 (2017).
28. T. Sun, W. M. Tsang, W.-T. Park, K. Cheng, and S. Merugu, Microsyst. Technol., 21, 1739–1747
(2015).
29. A. G. Paolini et al., Anal. Chem., 87, 738–746 (2014).
30. P. J. Rousche and R. A. Normann, J. Neurosci. Methods, 82, 1–15 (1998).
31. M. P. Ward, P. Rajdev, C. Ellison, and P. P. Irazoqui, Brain Res., 1282, 183–200 (2009).
32. S. R. Kane et al., Biomed. Eng. IEEE Trans., 60, 2153–2160 (2013).
33. K. H. Chen et al., J. Neural Eng., 11, 26004 (2014).
34. A. R. Harris et al., J. Neural Eng., 10, 016004 (2013).
35. A. R. Harris et al., Analyst, 140, 3164–3174 (2015).
36. M. Tykocinski, L. T. Cohen, and R. S. Cowan, Otol. Neurotol., 26, 948–956 (2005).
37. C. Newbold and et al., J. Neural Eng., 1, 218 (2004).
38. C. Newbold and et al., J. Neural Eng., 7, 56011 (2010).
39. C. Newbold and et al., J. Neural Eng., 8, 36029 (2011).
40. D. R. Merrill, M. Bikson, and J. G. R. Jefferys, J. Neurosci. Methods, 141, 171–198 (2005).
41. D. W. Kumsa, F. W. Montague, E. M. Hudak, and J. T. Mortimer, J. Neural Eng., 13, 56001
(2016).
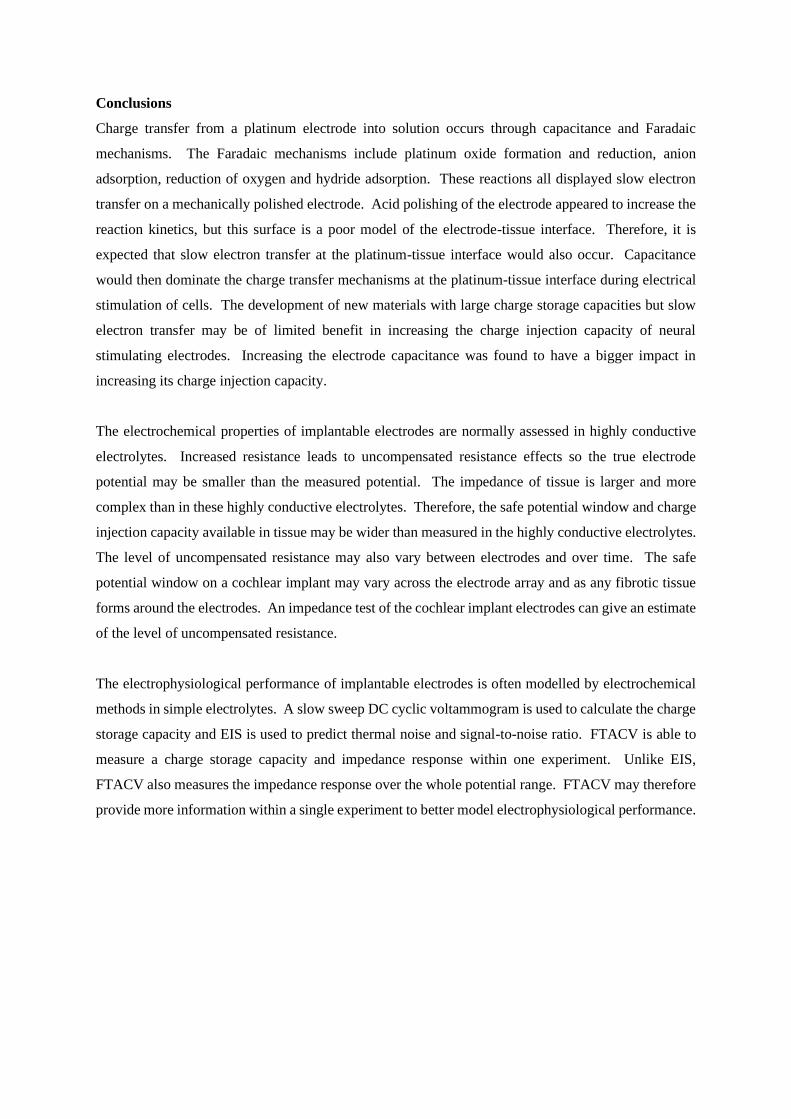
Table 1. Median resistance and capacitance measured from an RC equivalent circuit during FTACV on
a platinum electrode from different conditions.
Tested
Variable
Electrode
Diameter
Polish
Method
Solution Degassed Added Resistor
/kOhm
Resistance
/kOhm
Capacitance
/nF
Solution
Composition
600 μm Mechanical 0.1 M NaCl Yes - 4.2 85
600 μm Mechanical PBS Yes - 3.7 89
600 μm Mechanical Artificial
perilymph
Yes - 2.6 110
600 μm Mechanical 0.1 M NaCl No - 3.2 116
Electrode
Surface
2 mm Mechanical 0.1 M NaCl Yes - 0.42 1240
25 μm Mechanical 0.1 M NaCl Yes - 2600 0.18
600 μm Acid 0.1 M NaCl Yes - 2.9 335
Cochlear Implant - Artificial
perilymph
Yes - 5.5 (1.7) * 81 (34) *
Capacitance 2 parallel 600 μm Mechanical 0.1 M NaCl Yes - 1.3 267
Resistance
600 μm Mechanical 0.1 M NaCl Yes 1 4.6 77
600 μm Mechanical 0.1 M NaCl Yes 67 69 123
600 μm Mechanical 0.1 M NaCl Yes 145 147 109
600 μm Mechanical 0.1 M NaCl Yes 982 981 17
Median resistance and capacitance values measured over entire potential range was averaged from 2
repetitions. *Average (standard deviation) of 5 electrodes.
Table 2. Electrochemical impedance parameters from equivalent circuit fitting in degassed artificial
perilymph with varying capacitance and resistance.
Electrode Diameter Added Resistor
/kOhm
Solution
Resistance
/Ohm
Q0 / 10-9 S
s1/2
n Polarisation
Resistance
/MOhm
600 μm - 957 246 0.87 2.06
2 parallel 600 μm - 394 445 0.87 1.17
600 μm 1 1800 223 0.88 1.80
600 μm 67 67400 221 0.87 1.68
600 μm 145 145000 189 0.87 2.30
600 μm 982 911000 168 0.83 4.05
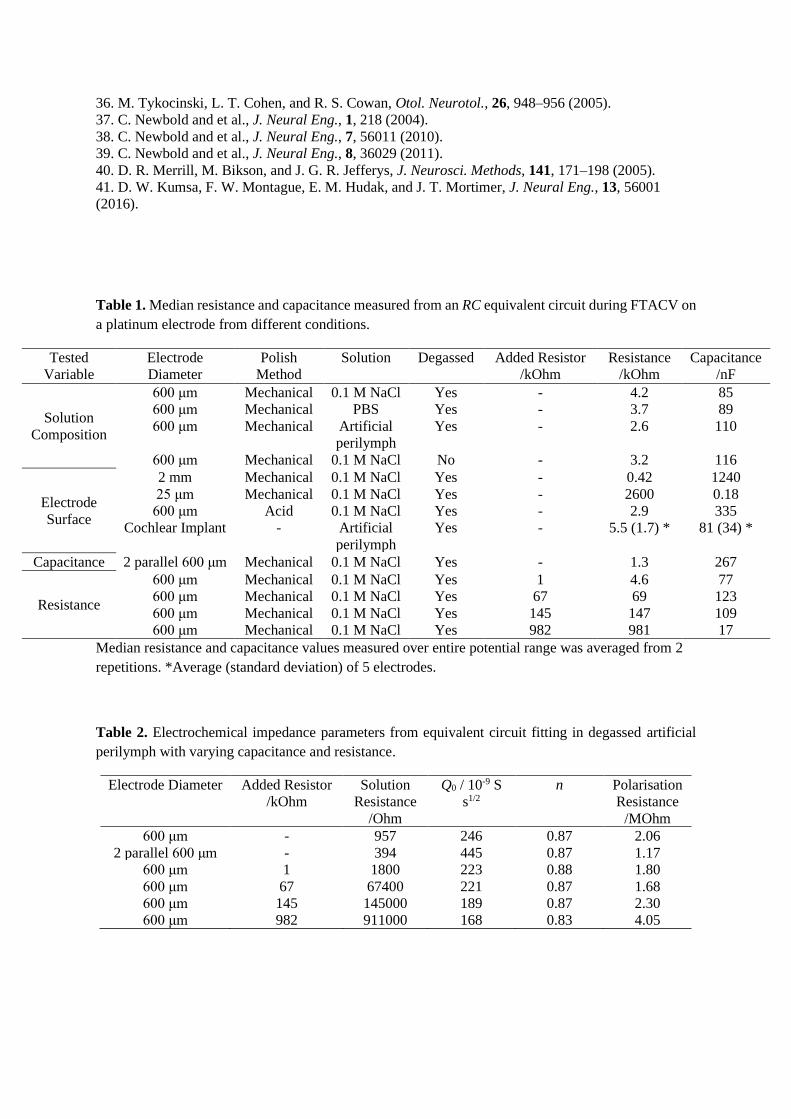
Table 3. Change in potential on a mechanically polished platinum electrode in degassed artificial
perilymph after a 5 ms pulse at 10 µC cm-2 with varying capacitance and resistance.
Electrode Diameter Initial Applied
Pulse Polarity
Added Resistor
/kOhm
Change in Potential /mV
Second Pulse Cumulative 6 Pulses
600 μm Cathodic - 269 28
600 μm Anodic - -263 -27
2 parallel 600 μm Cathodic - 169 10
2 parallel 600 μm Anodic - -162 -16
600 μm Cathodic 1 293 39
600 μm Anodic 1 -297 -28
600 μm Cathodic 67 1.01 36
600 μm Anodic 67 -1.01 -29
600 μm Cathodic 145 1.847 34
600 μm Anodic 145 -1.854 -28
600 μm Cathodic 982 6.674 407
600 μm Anodic 982 -6.655 -410
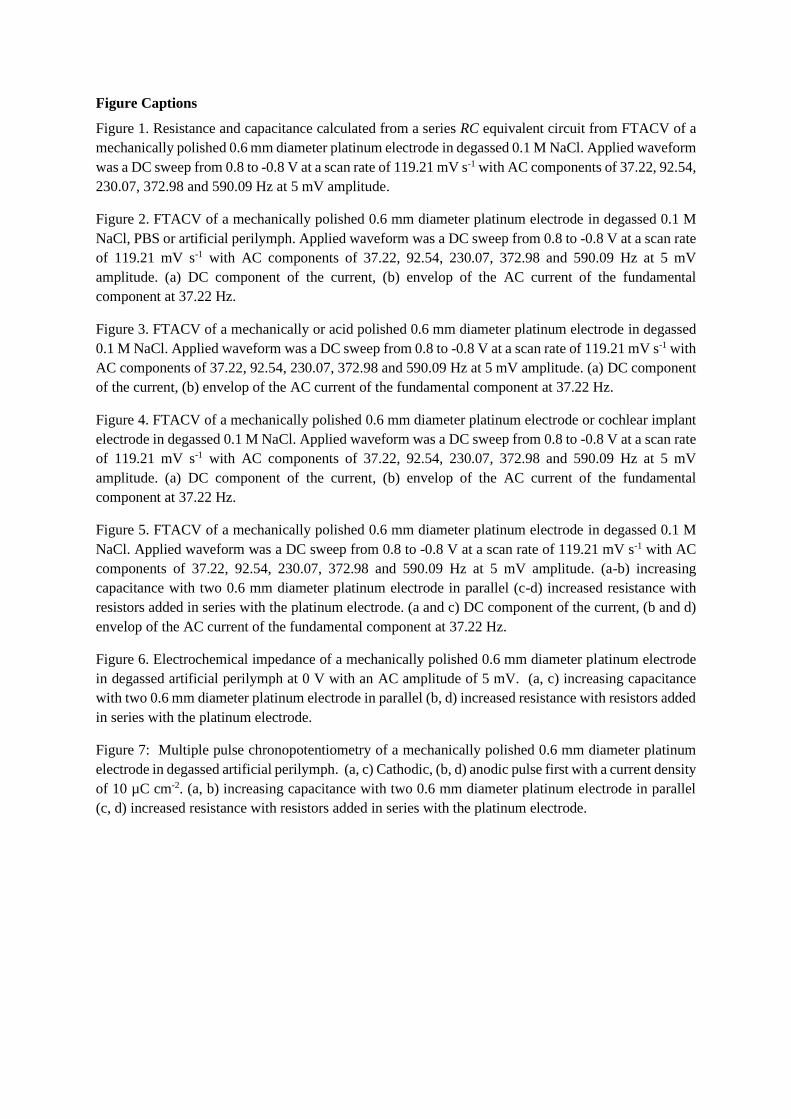
Figure Captions
Figure 1. Resistance and capacitance calculated from a series RC equivalent circuit from FTACV of a
mechanically polished 0.6 mm diameter platinum electrode in degassed 0.1 M NaCl. Applied waveform
was a DC sweep from 0.8 to -0.8 V at a scan rate of 119.21 mV s-1 with AC components of 37.22, 92.54,
230.07, 372.98 and 590.09 Hz at 5 mV amplitude.
Figure 2. FTACV of a mechanically polished 0.6 mm diameter platinum electrode in degassed 0.1 M
NaCl, PBS or artificial perilymph. Applied waveform was a DC sweep from 0.8 to -0.8 V at a scan rate
of 119.21 mV s-1 with AC components of 37.22, 92.54, 230.07, 372.98 and 590.09 Hz at 5 mV
amplitude. (a) DC component of the current, (b) envelop of the AC current of the fundamental
component at 37.22 Hz.
Figure 3. FTACV of a mechanically or acid polished 0.6 mm diameter platinum electrode in degassed
0.1 M NaCl. Applied waveform was a DC sweep from 0.8 to -0.8 V at a scan rate of 119.21 mV s-1 with
AC components of 37.22, 92.54, 230.07, 372.98 and 590.09 Hz at 5 mV amplitude. (a) DC component
of the current, (b) envelop of the AC current of the fundamental component at 37.22 Hz.
Figure 4. FTACV of a mechanically polished 0.6 mm diameter platinum electrode or cochlear implant
electrode in degassed 0.1 M NaCl. Applied waveform was a DC sweep from 0.8 to -0.8 V at a scan rate
of 119.21 mV s-1 with AC components of 37.22, 92.54, 230.07, 372.98 and 590.09 Hz at 5 mV
amplitude. (a) DC component of the current, (b) envelop of the AC current of the fundamental
component at 37.22 Hz.
Figure 5. FTACV of a mechanically polished 0.6 mm diameter platinum electrode in degassed 0.1 M
NaCl. Applied waveform was a DC sweep from 0.8 to -0.8 V at a scan rate of 119.21 mV s-1 with AC
components of 37.22, 92.54, 230.07, 372.98 and 590.09 Hz at 5 mV amplitude. (a-b) increasing
capacitance with two 0.6 mm diameter platinum electrode in parallel (c-d) increased resistance with
resistors added in series with the platinum electrode. (a and c) DC component of the current, (b and d)
envelop of the AC current of the fundamental component at 37.22 Hz.
Figure 6. Electrochemical impedance of a mechanically polished 0.6 mm diameter platinum electrode
in degassed artificial perilymph at 0 V with an AC amplitude of 5 mV. (a, c) increasing capacitance
with two 0.6 mm diameter platinum electrode in parallel (b, d) increased resistance with resistors added
in series with the platinum electrode.
Figure 7: Multiple pulse chronopotentiometry of a mechanically polished 0.6 mm diameter platinum
electrode in degassed artificial perilymph. (a, c) Cathodic, (b, d) anodic pulse first with a current density
of 10 µC cm-2. (a, b) increasing capacitance with two 0.6 mm diameter platinum electrode in parallel
(c, d) increased resistance with resistors added in series with the platinum electrode.
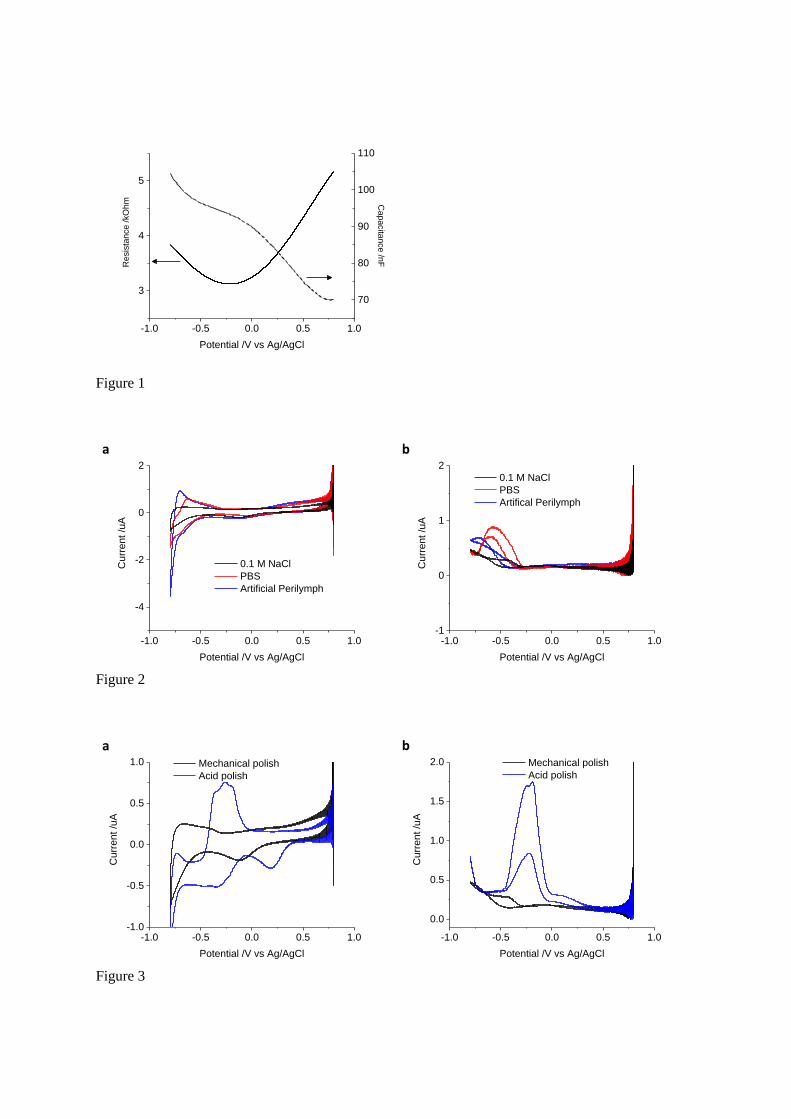
Figure 1
Figure 2
Figure 3
-1.0 -0.5 0.0 0.5 1.0
3
4
5
Potential /V vs Ag/AgCl
Resis
tance /kO
hm
70
80
90
100
110
Capacita
nce /n
F
-1.0 -0.5 0.0 0.5 1.0
-4
-2
0
2
0.1 M NaCl
PBS
Artificial Perilymph
Cu
rrent /u
A
Potential /V vs Ag/AgCl
-1.0 -0.5 0.0 0.5 1.0-1
0
1
2
0.1 M NaCl
PBS
Artifical Perilymph
Cu
rrent /u
A
Potential /V vs Ag/AgCl
-1.0 -0.5 0.0 0.5 1.0-1.0
-0.5
0.0
0.5
1.0 Mechanical polish
Acid polish
Cu
rrent /u
A
Potential /V vs Ag/AgCl
-1.0 -0.5 0.0 0.5 1.0
0.0
0.5
1.0
1.5
2.0 Mechanical polish
Acid polish
Cu
rrent /u
A
Potential /V vs Ag/AgCl
a
b
a
b
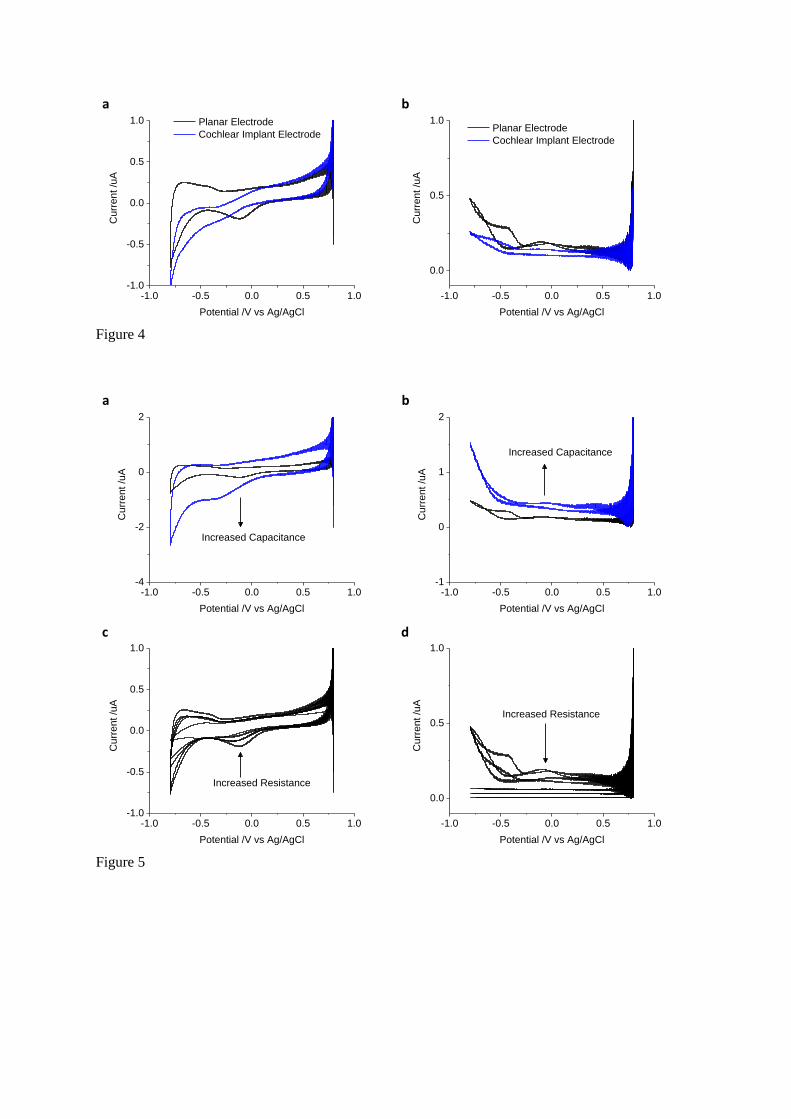
Figure 4
Figure 5
-1.0 -0.5 0.0 0.5 1.0-1.0
-0.5
0.0
0.5
1.0 Planar Electrode
Cochlear Implant Electrode
Cu
rrent /u
A
Potential /V vs Ag/AgCl
-1.0 -0.5 0.0 0.5 1.0
0.0
0.5
1.0 Planar Electrode
Cochlear Implant Electrode
Cu
rrent /u
A
Potential /V vs Ag/AgCl
-1.0 -0.5 0.0 0.5 1.0-4
-2
0
2
Cu
rrent /u
A
Potential /V vs Ag/AgCl
Increased Capacitance
-1.0 -0.5 0.0 0.5 1.0-1
0
1
2
Increased Capacitance
Cu
rrent /u
A
Potential /V vs Ag/AgCl
-1.0 -0.5 0.0 0.5 1.0-1.0
-0.5
0.0
0.5
1.0
Cu
rrent /u
A
Potential /V vs Ag/AgCl
Increased Resistance
-1.0 -0.5 0.0 0.5 1.0
0.0
0.5
1.0
Increased Resistance
Cu
rrent /u
A
Potential /V vs Ag/AgCl
a
b
a
b
c
d
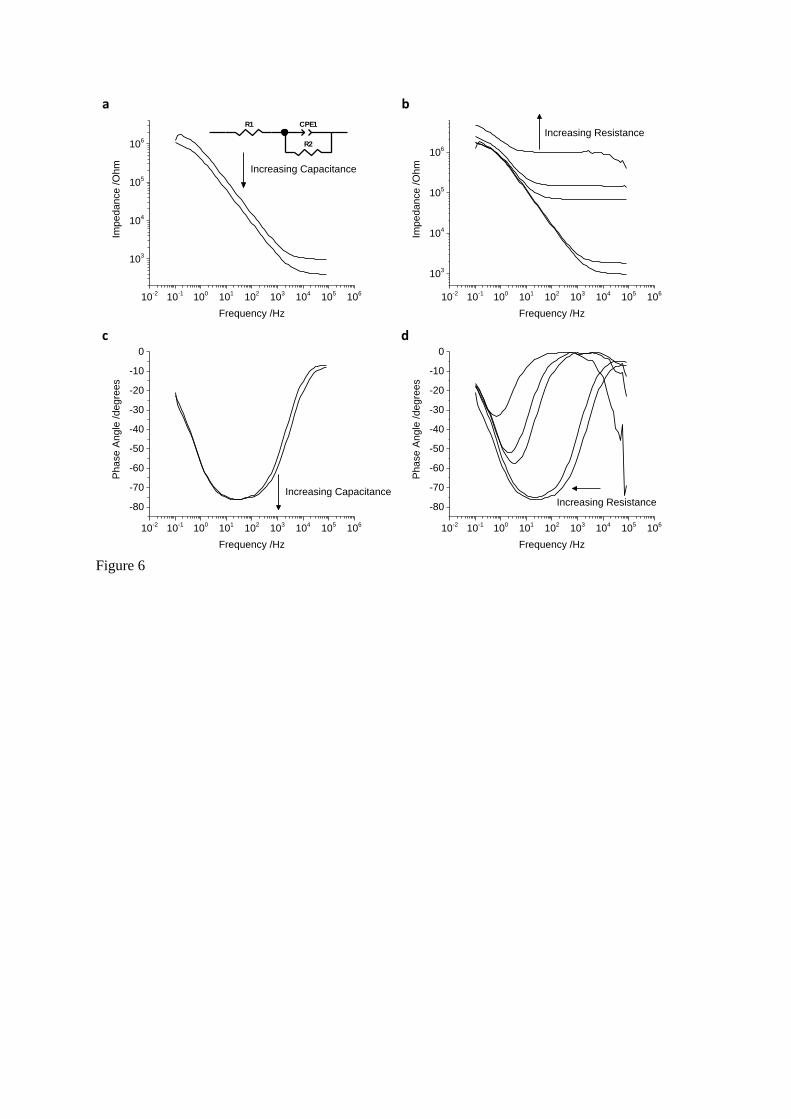
Figure 6
10-2
10-1
100
101
102
103
104
105
106
103
104
105
106
Imped
an
ce
/O
hm
Frequency /Hz
Increasing Capacitance
10-2
10-1
100
101
102
103
104
105
106
103
104
105
106
Imped
an
ce
/O
hm
Frequency /Hz
Increasing Resistance
10-2
10-1
100
101
102
103
104
105
106
-80
-70
-60
-50
-40
-30
-20
-10
0
Pha
se
Ang
le /degre
es
Frequency /Hz
Increasing Capacitance
10-2
10-1
100
101
102
103
104
105
106
-80
-70
-60
-50
-40
-30
-20
-10
0
Pha
se
Ang
le /degre
es
Frequency /Hz
Increasing Resistance
a
b
c
d
R1 CPE1
R2
Element Freedom Value Error Error %
R1 Free(+) 956.8 9.1394 0.9552
CPE1-T Free(+) 2.4587E-07 3.0456E-09 1.2387
CPE1-P Free(+) 0.87106 0.0020875 0.23965
R2 Free(+) 2.0582E06 33889 1.6465
Chi-Squared: 0.0053075
Weighted Sum of Squares: 0.74305
Data File: C:\Users\alexh\Documents\Cochlear\Neuron
exus analysis\Echem\180810\Pt 0p3mm AP d
egas EIS.txt
Circuit Model File:
Mode: Run Fitting / Freq. Range (0.001 - 1000000)
Maximum Iterations: 100
Optimization Iterations: 0
Type of Fitting: Complex
Type of Weighting: Calc-Modulus
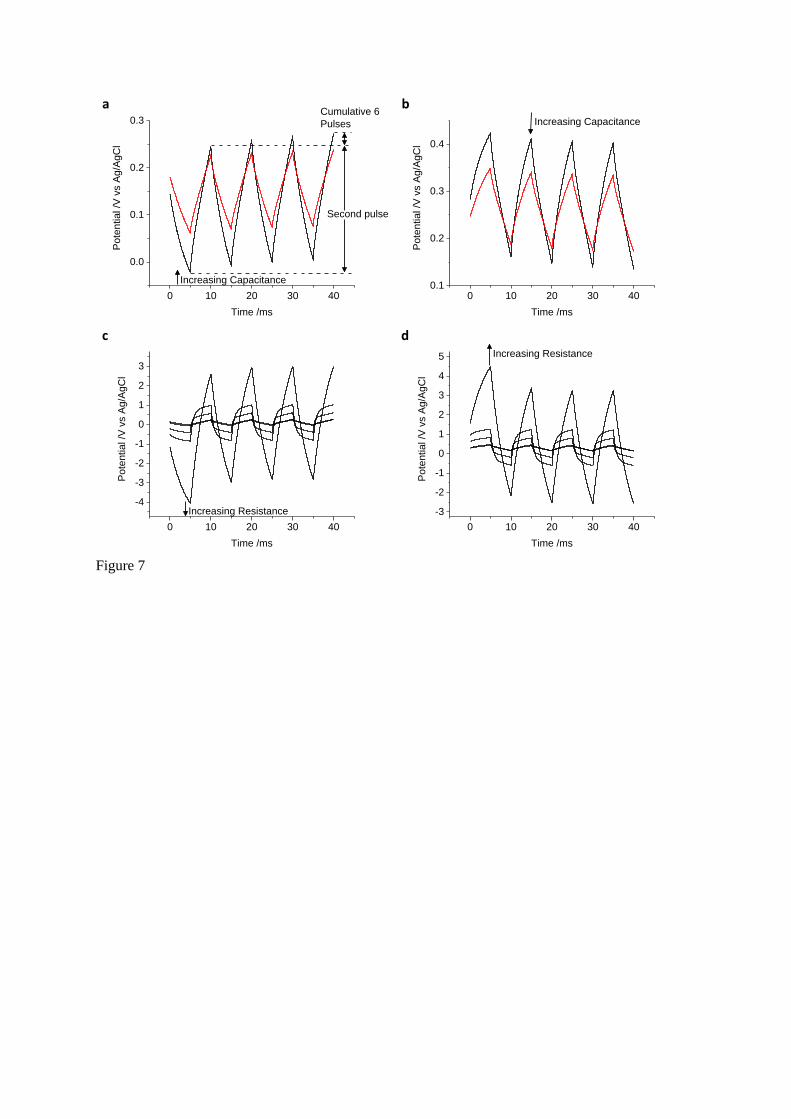
Figure 7
0 10 20 30 40
0.0
0.1
0.2
0.3P
ote
ntial /V
vs A
g/A
gC
l
Time /ms
Increasing Capacitance
Second pulse
Cumulative 6
Pulses
0 10 20 30 400.1
0.2
0.3
0.4
Pote
ntial /V
vs A
g/A
gC
l
Time /ms
Increasing Capacitance
0 10 20 30 40
-4
-3
-2
-1
0
1
2
3
Pote
ntial /V
vs A
g/A
gC
l
Time /ms
Increasing Resistance
0 10 20 30 40
-3
-2
-1
0
1
2
3
4
5
Pote
ntial /V
vs A
g/A
gC
l
Time /ms
Increasing Resistance
a
b
c
d


