Embed Size (px)
Citation preview
Cartographic PerspectivesJournal of the
North American CartographicInformation Society
Number 68, Winter 2011
Cartographic Perspectives, Number 68, Winter 2011 | 1
Cartographic PerspectivesJournal of the
North American CartographicInformation Society
Number 68, Winter 2011
I n t h I s I s s u e
7
29
65
75
83
3
87
93
96
98
L E T T E R F R O M T H E E D I T O R
Patrick Kennelly
The Search for a Radical Cartography Mark Denil
A Typology of Operators for Maintaining Legible Map Designs at Multiple Scales Robert E. Roth, Cynthia A. Brewer, & Michael S. Stryker
P E E R - R E V I E W E D A R T I C L E S
Top Ten Jewels of the Ort Library Map Collection MaryJo A. Price
Travels with iPad Maps Michael P. Peterson
Introducing “On the Horizon” Andrew Woodruff
Reviews W. Wilson, Russell S. Kirby, Jörn Seemann, Julia Siemer
Bogus Art Maps Tim Wallace
Student Map Competitions Daniel Huffman and Mathew Dooley
Instructions to Authors
C A R T O G R A P H I C C O L L E C T I O N S
T R AV E L L O G
O N T H E H O R I Z O N
R E V I E W S
V I S U A L F I E L D S
I N T H E M A R G I N A L I A
Cartographic Perspectives, Number 68, Winter 20112 |
E D I T O R
Patrick Kennelly Department of Earth and Environmental Science CW Post Campus of Long Island University 720 Northern Blvd. Brookville, NY 11548 [email protected]
Cartographic PerspectivesJournal of the
North American CartographicInformation Society
© 2 0 1 1 N A C I S I S S N 1 0 4 8 - 9 0 8 5
w w w. n a c i s . o r g
Sarah Battersby University of South Carolina
Cynthia Brewer The Pennsylvania State University
Mathew Dooley University of Wisconsin–River Falls
Matthew Edney University of Southern Maine University of Wisconsin–Madison
Sara Fabrikant University of Zürich
Amy Griffin University of New South Wales – ADFA
Fritz Kessler Frostburg State University
A. Jon Kimerling Oregon State University
Ian Muehlenhaus University of Wisconsin–LaCrosse
Margaret Pearce University of Kansas
Michael Peterson University of Nebraska at Omaha
Anthony RobinsonThe Pennsylvania State University
e d I t o r I a l B o a r d
s e c t I o n e d I t o r s
O N T H E H O R I Z O N
Andy Woodruff Axis Maps [email protected]
R E V I E W S
Mark Denil [email protected]
V I S U A L F I E L D S
Daniel Huffman [email protected]
C A R T O G R A P H I C C O L L E C T I O N S
Terri Robar University of Miami Libraries [email protected]
P R A C T I C A L C A R T O G R A P H E R ’ S C O R N E R
Alex Tait International Mapping Associates [email protected]
A B O U T T H E C O V E R : The cover is one of Tim Wallace’s “Bogus Art Maps,” as described in the Visual Fields section of this issue (see pages 93–95). This particular piece was inspired by the work of Francois Morellet.
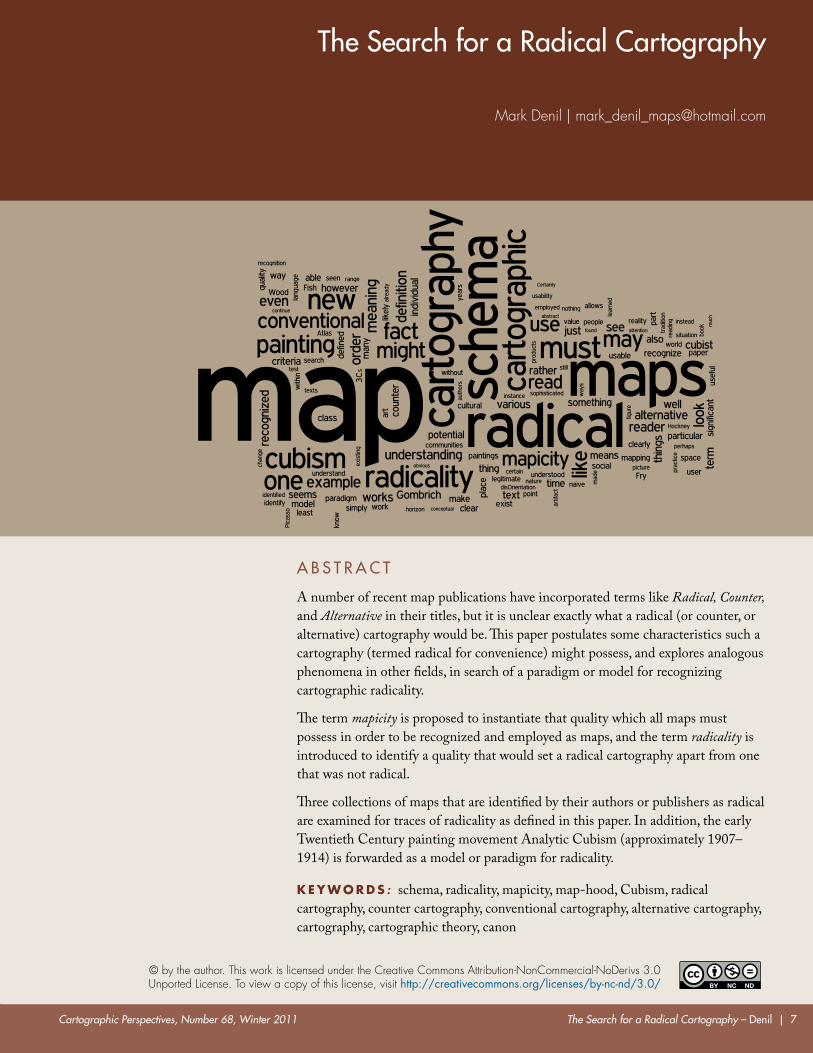
W O R D C L O U D S : The word clouds featured in this issue were produced using Wordle (http://www.wordle.net/). Complete text from each article was included.
C O P Y R I G H T N O T I C E : Unless otherwise noted, NACIS holds the copyrights to all items published in each issue. The opinions expressed are those of the author(s), and not necessarily the opinion of NACIS.
a s s I s ta n t e d I t o r s
Laura McCormick XNR Productions [email protected]
Robert Roth University of Wisconsin-Madison [email protected]
Cartographic Perspectives, Number 68, Winter 2011 | 3
l e t t e r F r o M t h e e d I t o r
“There’s no putting that genie back in the bottle.” From recent news articles, it would seem that we have an infestation of decarcerated genies that puts teeming bedbugs to shame. I have seen genie bylines on stories as varied as healthcare reform, nuclear power, the “Arab Spring” and Tahrir Square, medical marijuana (wouldn’t a bong analogy be more appropriate?), and video-on-demand.
As the new Editor of Cartographic Perspectives, why am I so anxious to move to an open access format, which could be likened to releasing freely our latest peer-reviewed content to all corners of the world? The truth is that the genie is already out of the bottle when it comes to academic research and publishing, and the most exciting new opportunities in publishing will be in directing and guiding the resulting flow of information.
At the great risk of mixing bottle metaphors, it is tempting but inaccurate to believe an editor akin to a sommelier, selecting fine wine for appreciative patrons in an exquisite restaurant. I can search for, but have limited power over securing, the best peer-reviewed content. It’s the producers of content who will choose their outlet, direct the flow of their articles, and ultimately define the bounds of their readership. In uncorking the genie’s bottle, we not only expand our audience of map tipplers and tasters alike, but also attract the best quality content.
What will remain constant with CP in spite of this change is the rigorous peer-review of content to ensure the academic quality of submitted publications. Without this essential element the genie is vigorless; the wine is vinegar. My commitment to rigorous academic review is reflected in the gravitas of my Editorial Board, with whom I am honored to work.
Cartographic Perspectives, Number 68, Winter 20114 |
I recognize, however, a changing expectation among readers and authors regarding the immediacy with which information is shared. As such, I am committed to providing authors with decisions regarding acceptance in as timely a manner as possible. Additionally, we with NACIS are currently working to move CP to Open Journal Systems (OJS), publication software used by some 10,000 journals worldwide. This change will, among other advantages, offer rapid distribution of peer-reviewed content upon final acceptance.
We have contracted with the Canadian Centre for Studies in Publishing (CCSP) Press to design, host, and maintain our manuscript management system. CCSP Press is affiliated with the Public Knowledge Project (PKP), which is housed at the Simon Fraser University (SFU) library. SFU library hosts approximately 200 journals, with CCSP Press providing publishing services to a number of these journals that have chosen an open access format. They successfully assisted other journals in the transition from a print to an open access, digital format, and I am confident that they will be able to deliver similar services that meet the specific needs of our organization and journal.
In the interim, I am pleased to introduce the first 2011 issue of CP while our OJS is under construction. It is in the format of previous Special Digital Issues (CP 64, 66, and 67), and would not have been possible without the hard work of my two Assistant Editors, Robert Roth, a newly minted Assistant Professor at the University of Wisconsin–Madison, and Laura McCormick of XNR Productions.
This issue contains two peer-reviewed articles on very different topics. The first, Mark Denil’s “A Search for a Radical Cartography,” takes on the important task of pinning down what radical cartography is. The second, Robert Roth, Cindy Brewer, and Michael Stryker’s “A Typology of Operators for Maintaining Legible Map Designs at Multiple Scales,” takes on the task of defining the important considerations in multiscale map design. Both have important implications for cartographic theory, practice, and education.
The Collections section article for this issue was written by MaryJo Price, Special Maps Librarian of the Lewis J. Ort Library at Frostburg State University. It discusses a number of maps from the collection of historical interest. I also would like to take this opportunity to thank outgoing Collections Section Editor Angie Cope for all of her hard work, and welcome Terri Robar as the new section editor. Terri is a Librarian Associate Professor at the University of Miami Libraries, a member of NACIS and frequent attendee of our annual conference, and a welcome addition to CP.
Cartographic Perspectives, Number 68, Winter 2011 | 5
The Collections piece is followed by a special “Travel Log” contributed by Michael Peterson. Michael hit the road last summer with an iPad, and made extensive use of the “Maps” app. He documents the pros and cons of this application, with insights into Maps as a navigation device and a “general travel companion.”
I am also excited to announce that Andy Woodruff of Axis Maps will be the first Section Editor of a new section entitled “On the Horizon.” This section was developing organically in previous Special Digital Issues of CP, with authors anxious to provide detailed tutorials on how to finesse the cartographic elements of new technologies. Andy lays out his vision for this section in this issue’s article, and invites contributions from our readership.
Mark Denil remains as Review Section Editor, and reviews for this issue provide an overview and critique of four varied and interesting works. The section “In the Marginalia,” which rotates from issue to issue annually, recognizes winners of the Student Poster and Dynamic Map Competitions announced at the NACIS conference in October of 2010. It also serves as a reminder for students to participate in these events this fall, and possibly have your map featured in this section next year.
Last but not least, Visual Fields offers new Section Editor Daniel Huffman, of the University of Wisconsin Cartography Lab, the opportunity to seek out visually striking work that is, in his words, “inspirational, beautiful, and intriguing.” This installment features examples of Tim Wallace’s “Bogus Art Maps,” sure to inspirit other cartographers who can’t remember the last time they actually made a map.
As we move from this to future issues, I take the liberty of making three wishes on behalf of CP. The first is that readership will expand, introducing more mapmakers to the NACIS community with all of its benefits of cartographic insight, guidance, and community. The second is that CP will be known for its effective and efficient dissemination of the current state of cartographic information. The third is that CP will become the first choice of more and more cartographic researchers when deciding where to submit their peer-reviewed content. These may seem like the dewy musings of a fledgling editor, but do not underestimate the power of a grateful genie unleashed!
-Patrick Kennelly

Cartographic Perspectives, Number 68, Winter 20116 |
Cartographic Perspectives, Number 68, Winter 2011 The Search for a Radical Cartography – denil | 7
the search for a radical cartography
Mark Denil | [email protected]
a B s t r a c t
A number of recent map publications have incorporated terms like Radical, Counter, and Alternative in their titles, but it is unclear exactly what a radical (or counter, or alternative) cartography would be. This paper postulates some characteristics such a cartography (termed radical for convenience) might possess, and explores analogous phenomena in other fields, in search of a paradigm or model for recognizing cartographic radicality.
The term mapicity is proposed to instantiate that quality which all maps must possess in order to be recognized and employed as maps, and the term radicality is introduced to identify a quality that would set a radical cartography apart from one that was not radical.
Three collections of maps that are identified by their authors or publishers as radical are examined for traces of radicality as defined in this paper. In addition, the early Twentieth Century painting movement Analytic Cubism (approximately 1907–1914) is forwarded as a model or paradigm for radicality.
k e y w o r d s : schema, radicality, mapicity, map-hood, Cubism, radical cartography, counter cartography, conventional cartography, alternative cartography, cartography, cartographic theory, canon
© by the author. This work is licensed under the Creative Commons Attribution-NonCommercial-NoDerivs 3.0 Unported License. To view a copy of this license, visit http://creativecommons.org/licenses/by-nc-nd/3.0/
Cartographic Perspectives, Number 68, Winter 20118 | The Search for a Radical Cartography – denil
I n t r o d u c t I o n
A number of recent map publications have incorporated terms like Radical, Counter, and Alternative in their titles, but it is not very clear what it is about them that might be radical, counter, or alternative. As well, although it is strongly implied to be obvious, just what the conventional, conservative, or standard counterparts of these radical, counter, or alternative maps might be like is also unexplained and unexamined.
One cannot avoid the assumption, whether implicit or explicit, that there is something integral to radical, counter, and/or alternative maps themselves that is itself radical, counter, and/or alternative: something, that is, constituting a radical cartography. This idea is particularly engaging from a theoretical standpoint, and raises a number of interesting questions. Just what would a radical (or counter, or alternative) cartography look like? What might such a thing be? Why would it exist? What character would it have, and how would that character contrast with the character of a conventional or standard cartography? Interesting as these questions are, the answers are not easy to glean directly from the works. Some of these works are accompanied by supporting texts that may or may not be of assistance. For the most part, however, we are left to our own devices.
We also should be able, by applying what we know about cartography and by examining precedents in other fields, to identify at least some of the characteristics a cartography would likely have to possess in order to qualify as radical.
For the sake of convenience, this paper will use the term radical to stand in for the general class of terms which might include counter and alternative (among others), and conventional for the postulated antonym.
W h at I s r a d I c a l I t y ?
There is an unmistakable appeal to a term like radical: there is something in it that speaks to the Romanticist spirit embedded in Western culture since the 1800s. The word conjures up visions of a Zapata, or of a Ché; of a Wilde in his cell; a Byron swimming the Hellespont; or a Marx in his garret. The attraction of these visions hinges on the concept of the sublime, a pivotal quality in 18th and 19th Century philosophy and aesthetics. The sublime counterbalanced the classical concept of beauty with a powerful experience of the uncontrollable, the dark, the dangerous, and the (possibly) threatening.
The concept of the sublime, central as it is to Romanticism, is far too broad to explore here; but that conceptual element, it can be noted, persists in cultural fields as diverse as the image of the artist in society, the pre-Kuhnian vision of the history of science as “development-by-accumulation” (Kuhn 1996, 2), and the notion of the grandeur of Nature (Burke 1844; Wood and Fels 2008). The appeal enjoyed by the phrase “Shock and Awe” amongst a certain class of commentators in recent memory is also rooted in echoes of the sublime.
There is, alongside the romanticism, a suggestion of hard-headed “realism” and pragmatic directness implied by the term radical. The late historian Howard Zinn, in his play Marx in Soho, wrote that “to be radical is simply to grasp at
There is an unmistakable appeal to a term like radical: there is something in it that speaks to the Romanticist spirit embedded in Western culture since the 1800s
Cartographic Perspectives, Number 68, Winter 2011 The Search for a Radical Cartography – denil | 9
the roots of a problem,” which is a definition that seems extremely pragmatic (Zinn 1999, 46). Either way, romantic or pragmatic, the caché evoked in employing a term such as radical is attractive, and the ambiguity of its reference serves only to compound that appeal.
With such a tremendous range of connotation attached to the term radical, the question then becomes not only what the authors of the various works consider radicality, but, perhaps more importantly, how should we, the potential users of these works, understand the term in a cartographic context. What litmus divides the radical from the conventional?
D E F I N I N G T H E M A P
Before we can undertake the definition of what it means to label a map as radical or conventional, we must understand how any map, radical, conventional, or otherwise, is differentiated from that which is not a map.
There has been and is a tremendous multiplicity of things that can, will, have been, and might be, identified and used as maps. Clearly, because of this tremendous range there is and can be no single comprehensive test of subject, content, medium, form, style, or use that will identify any and all maps. Equally clearly, people around the world have in the past and continue, every day, to identify and employ maps with what are, for the most part, results satisfactorily sufficient to themselves. In a substantial portion of instances, the identification of the map is not made from explicit labeling (as in titles like: “A Map of the Middle British Colonies in North America, First Published by Mr Lewis Evans, of Philadelphia, in 1755; and since corrected and improved, as also extended, with the Addition of New England, and bordering Parts of Canada, from Actual Surveys now lying at the Board of Trade” [Pownall 1949]), but instead through recognition by the user that the artifact displays particular and significant map-like qualities. We know a map when we see one.
There have been, over the years, countless attempts at defining the map. These have ranged from the sophisticated, for example: “... the map is the projection of a mental schema on a medium, the materialization of an abstract intellectual order extracted from the empirical Universe” ( Jacob 2006, 30), to the naive. An example of the latter would be something along the lines of: “[it is a] universal constant that any map must be geographic, it must show information about location or have a spatial reference” (anonymous). A sophisticated definition recognizes that any truly inclusive definition must take into account mappings of far more than the geographical. A particular map may deal with political, social, theoretical, cosmological, or esoteric conceptions (see the Inglehart – Welzel Cultural Map of the World in Jacobs 2009, 200), and the sophisticated definition must also recognize that a map might exist even where the sophisticated observer himself fails to see one. The naive definition, by contrast, works more simply, within the confines of a particularly defined paradigm of acceptability, just as, say, a book on Spanish grammar operates within the paradigm of the Spanish language while an essay on generative linguistics deals with issues across language boundaries.
The naive-to-sophisticated spectrum of definition discussed here hinges principally upon the definitions’ breadth of applicability. The naive definition
Cartographic Perspectives, Number 68, Winter 201110 | The Search for a Radical Cartography – denil
is intentionally narrow: by narrowing the class of maps it more facilely and precisely describes that which remains. It accomplishes this narrowing by excluding whole classes of things that are actually applicable, apply-able, and reliable as maps, but may differ superficially from the identified paradigm.
None of this is to imply that a naive definition is perforce a simple or simplistic one: it may be very complex and support an elaborate superstructure of typology and transformation. Wood, for example, in Rethinking the Power of Maps, identifies a particular map as counter-evidence to his thesis, but then grandly dismisses it as not “really” a map but as something that “was ‘really a diagram’” (Wood 2010, 20). It certainly must be convenient simply to send packing any map inconvenient to one’s argument, but the point here is not to critique Wood. Instead, it is to highlight how Wood is confident he can dismiss evidence as irrelevant to an argument about cartography simply by labeling the exhibit as a “diagram” (in other words: not a map). It is as if he had called it a Socialist.
In fact, however, in order to be more than an exercise in composition, a general theory of cartography must be able to describe and integrate all maps, no matter how marginal (or however tempting to marginalize). To realistically understand map-ness, and to usefully search for a radical cartography, a sophisticated and inclusive understanding of the term map is imperative. Still, this does not imply that a naive definition may not be perfectly workable, useful, and usable in a normal day-to-day life. In fact, a naive definition can make such decisions (specifically: is this a map?) much simpler, and it is likely that most people (whatever their theoretical position) adopt a simple “shorthand” definition in day-to-day life. Our need here, however, is sterner.
In light of the existence of so many differing, varied, and at times conflicting definitions for the map, it is clear that no universal criteria exists for determination of map-hood. Still, there is undeniable evidence that some sort of criteria is employed in making a determination, so one must conclude that the specific criteria for identification are variable, and are contingent upon some set of guidelines that, while not universal, are at least comprehensive enough to account for wide variety and variation in the identified maps.
W H AT T H I N G S A R E M A P S ?
In order for a category of “things that are maps” to exist, there must be some essence or characteristic that allows that state of being a map to be recognized and made operative. For convenience, we might think of this essence or characteristic as mapicity. It obviously cannot be an absolute commodity, but must be rather a conceptual value attributed to the map (or potential map) by a discriminating observer. This is hardly a novel concept, and is, in fact, an exact counterpart of that conceptual entity that in semiotics is recognized as an attribute of the underlying abstract object of the sign system. The concept of juiciness, for instance, which can be ascribed to, among other things, many varieties of fruit, is a well-known example of this category of conceptual entity (Barthes 1972).
Mapicity, then, is a term for that abstract quality that, when recognized as being present, allows an observer to define a thing as a map. As mentioned, it is not an absolute commodity, but is a learned recognition: in becoming a map reader,
in order to be more than an exercise in composition, a general theory of cartography must be able to describe and integrate all maps, no matter how marginal
Cartographic Perspectives, Number 68, Winter 2011 The Search for a Radical Cartography – denil | 11
one learns what sorts of artifacts will support a reading as a map and, as well, strategies on how to impose that reading and extract meaning from the thing.
The fact that recognition of mapicity is a literacy, and learned, is important. There have been, from time to time but notably in the 1970s, attempts to posit that map use and reading is innate to the human animal, in a way similar to assertions that language is a part of the shared human biological endowment. In this case, such possibilities are really neither here nor there, because no one seriously asserts that being innately predisposed to mapping confers an ability to recognize, read, or use any and all maps, or even any one particular map. Map recognition (and use, etc.) has to depend on more than such a supposed endowment. Specifically, it depends upon the actual state of the individual’s map literacy. Literacy, in turn, is grounded on mechanisms such as Noam Chomsky’s notions of competence and performance (Chomsky 1965), and Stanley Fish’s insights on interpretive communities (Fish 1980). Everyone who can read a map has, at some formative point, had to learn to do so. As experience (literacy) is gained, of course, it can be leveraged to speed this learning process (especially so, to the extent the new potential map exhibits familiar characteristics). Thus, whether or not mapping is an innate predisposition, the particular literacy that allows mapicity to be recognized is clearly learned.
Because mapicity serves as a tipping point between map and not-map, it is a test that all maps, radical or not, must pass to actually be maps. It is valuable to examine just how this test is employed.
The particular uses to which maps may be put are legion, and the specific ways in which various maps might function in a usable fashion are almost as varied. Similarly various are the proofs of value that maps can make to various audiences. Thus, while there is no particular use, means of employment, or appeal that a map must meet, nonetheless a map, in order to be a map, must have a use, must be usable, and must convince an audience of its value as a map (Denil 2003). This is to say that while the particulars are contingent, the criteria themselves are not.
The criteria of usefulness, usability, and believability are tests for a map; but we do not normally go about subjecting everything we encounter to these tests on the off chance we will discover a map. This is because we do not need to do this; we need only apply these detailed tests to such things we encounter that satisfy the criteria of mapicity, which is to say, we only attempt to read as maps the things we recognize as potential candidate maps. In becoming map readers, we learned not only how to read a map, but, as well, how to recognize suitable candidates for reading. How does that work?
The definition of what a map is or can be, what it means or how it can be used, and every criteria of map quality, is defined solely through a schema of mapicity understood through, and shared by, one or more cultural communities. It cannot be individual and idiosyncratic: someone who finds individual meaning unshared by others is considered insane. It is through communities sharing assumptions and conventions, recognizing common signals, and together reading common meaning into signs that a thing like a map is able to even exist as a meaning-bearing artifact (Fish 1980). Collectively, the vocabulary
Cartographic Perspectives, Number 68, Winter 201112 | The Search for a Radical Cartography – denil
of these individual signals, the grammar of their interaction, and the canon of exemplars of good practice, together form the schema, which can be thought of as a coherent terrain or horizon of understanding. The schema defines what for us, and the people who make up our interpretive community, is right, proper and appropriate for a map. Schemas are templates we use to quickly identify potential meaning-bearing (Gombrich 1960).
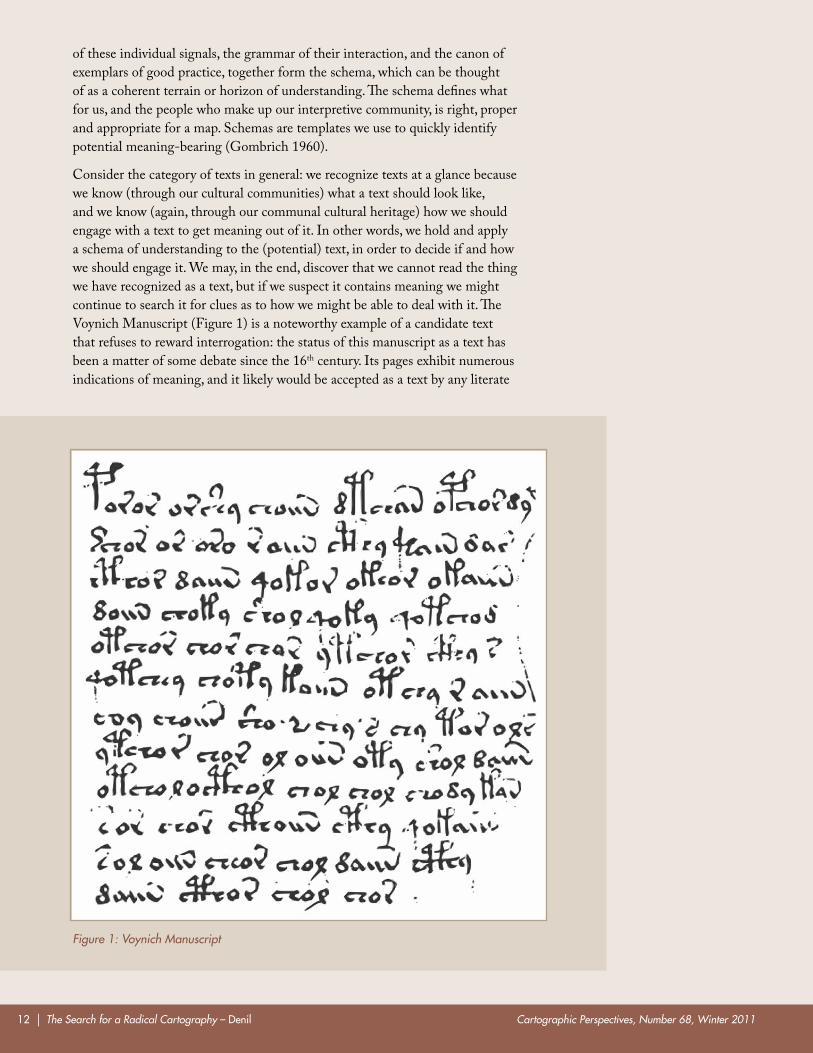
Consider the category of texts in general: we recognize texts at a glance because we know (through our cultural communities) what a text should look like, and we know (again, through our communal cultural heritage) how we should engage with a text to get meaning out of it. In other words, we hold and apply a schema of understanding to the (potential) text, in order to decide if and how we should engage it. We may, in the end, discover that we cannot read the thing we have recognized as a text, but if we suspect it contains meaning we might continue to search it for clues as to how we might be able to deal with it. The Voynich Manuscript (Figure 1) is a noteworthy example of a candidate text that refuses to reward interrogation: the status of this manuscript as a text has been a matter of some debate since the 16th century. Its pages exhibit numerous indications of meaning, and it likely would be accepted as a text by any literate
Figure 1: Voynich Manuscript
Cartographic Perspectives, Number 68, Winter 2011 The Search for a Radical Cartography – denil | 13
person encountering it unwarned. Regardless of the fact that no one has ever been able to unlock just what meaning might be embedded in the manuscript, readers of all sorts and levels of experience continue to engage it as a text, simply because it displays so many indications of being a legitimate text. They do so because a reader of texts (of whatever sort) possesses a schema for texts that shows how to look for meanings, and a reader will persist in looking for (and finding) meanings if that schema tells them such a search is legitimate.
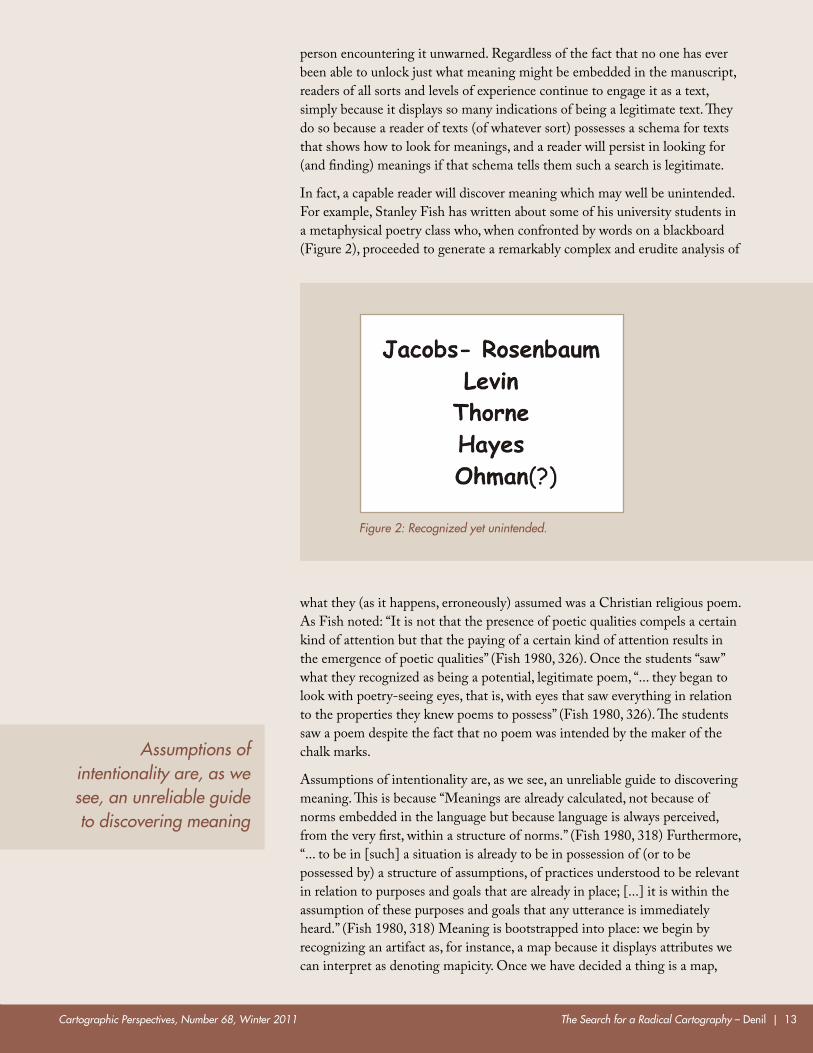
In fact, a capable reader will discover meaning which may well be unintended. For example, Stanley Fish has written about some of his university students in a metaphysical poetry class who, when confronted by words on a blackboard (Figure 2), proceeded to generate a remarkably complex and erudite analysis of
what they (as it happens, erroneously) assumed was a Christian religious poem. As Fish noted: “It is not that the presence of poetic qualities compels a certain kind of attention but that the paying of a certain kind of attention results in the emergence of poetic qualities” (Fish 1980, 326). Once the students “saw” what they recognized as being a potential, legitimate poem, “... they began to look with poetry-seeing eyes, that is, with eyes that saw everything in relation to the properties they knew poems to possess” (Fish 1980, 326). The students saw a poem despite the fact that no poem was intended by the maker of the chalk marks.
Assumptions of intentionality are, as we see, an unreliable guide to discovering meaning. This is because “Meanings are already calculated, not because of norms embedded in the language but because language is always perceived, from the very first, within a structure of norms.” (Fish 1980, 318) Furthermore, “... to be in [such] a situation is already to be in possession of (or to be possessed by) a structure of assumptions, of practices understood to be relevant in relation to purposes and goals that are already in place; [...] it is within the assumption of these purposes and goals that any utterance is immediately heard.” (Fish 1980, 318) Meaning is bootstrapped into place: we begin by recognizing an artifact as, for instance, a map because it displays attributes we can interpret as denoting mapicity. Once we have decided a thing is a map,
Assumptions of intentionality are, as we see, an unreliable guide to discovering meaning
Figure 2: Recognized yet unintended.
Cartographic Perspectives, Number 68, Winter 201114 | The Search for a Radical Cartography – denil
we proceed to read it as a map in the ways we know are the relevant and proper ways to behave in a map reading situation.
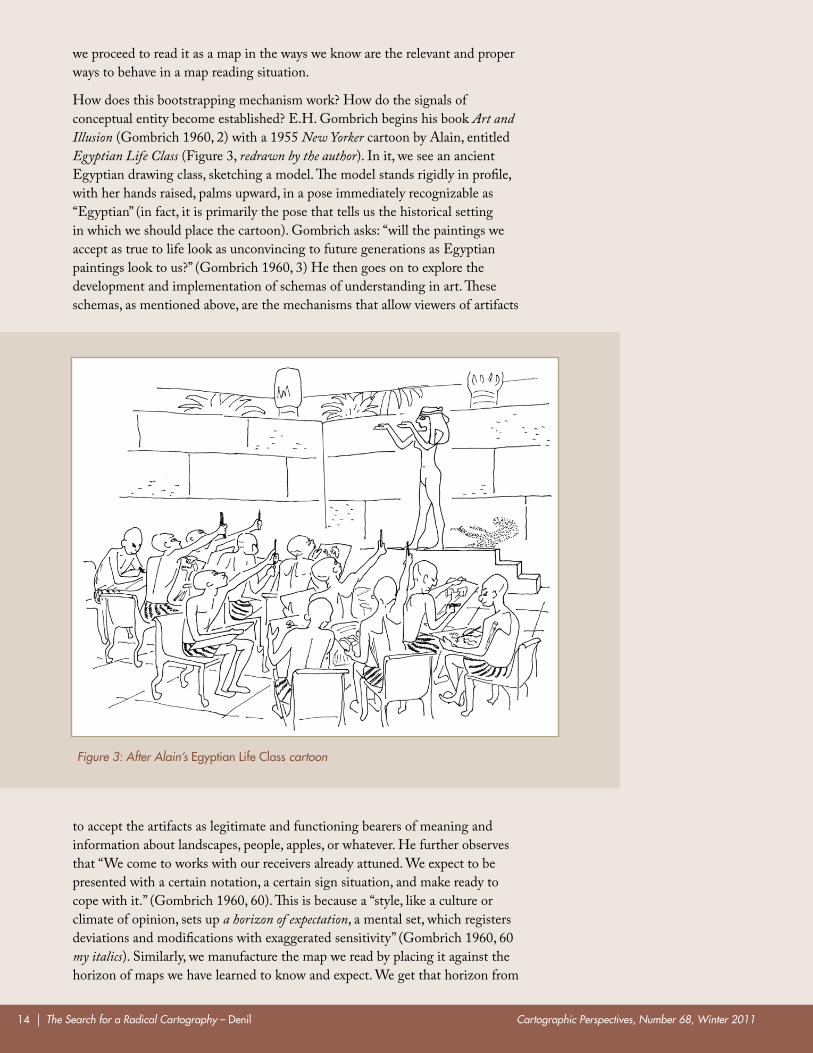
How does this bootstrapping mechanism work? How do the signals of conceptual entity become established? E.H. Gombrich begins his book Art and Illusion (Gombrich 1960, 2) with a 1955 New Yorker cartoon by Alain, entitled Egyptian Life Class (Figure 3, redrawn by the author). In it, we see an ancient Egyptian drawing class, sketching a model. The model stands rigidly in profile, with her hands raised, palms upward, in a pose immediately recognizable as “Egyptian” (in fact, it is primarily the pose that tells us the historical setting in which we should place the cartoon). Gombrich asks: “will the paintings we accept as true to life look as unconvincing to future generations as Egyptian paintings look to us?” (Gombrich 1960, 3) He then goes on to explore the development and implementation of schemas of understanding in art. These schemas, as mentioned above, are the mechanisms that allow viewers of artifacts
to accept the artifacts as legitimate and functioning bearers of meaning and information about landscapes, people, apples, or whatever. He further observes that “We come to works with our receivers already attuned. We expect to be presented with a certain notation, a certain sign situation, and make ready to cope with it.” (Gombrich 1960, 60). This is because a “style, like a culture or climate of opinion, sets up a horizon of expectation, a mental set, which registers deviations and modifications with exaggerated sensitivity” (Gombrich 1960, 60 my italics). Similarly, we manufacture the map we read by placing it against the horizon of maps we have learned to know and expect. We get that horizon from
Figure 3: After Alain’s egyptian life class cartoon
Cartographic Perspectives, Number 68, Winter 2011 The Search for a Radical Cartography – denil | 15
the culture that has allowed us to read maps by giving us ways to read and a canon of map exemplars.
Thus we see that it is only because we hold assumptions about purposes and goals, about ways and means, and about relevance and meaning, that we are able to read an artifact like a map as a text bearing meaning. A useable, convincing map, like a portrait, is the end product of a process of application and adjustment of expectation. No map or portrait is a faithful record of a reality, but is instead the construction of a relational model; at best it will persuade those who can read the code of the value, legitimacy, or applicability of that model.
When discovering any map, we recognize it and we try it out; we test it and we see how it performs, and we decide what we think about its status as a map. Andy Warhol once said, “it’s not what you are that counts, it’s what they think you are” (Warhol and Hackett 1980, 248). In the same way, it is not what the map really is that counts (whatever really means: paper? ink? molecules? electrons?), but what the user thinks it is.
What the user “thinks it is” will be both defined and constrained by the existing schema defining mapicity for the communities to which the user belongs. Any map has to pass this test of conformality to a norm.
F I n d I n g a p l a c e F o r r a d I c a l I t y
On the one hand, conformality to a schema is what divides the map from the not-map, and on the other hand such schemas are culturally bound and thus mutable. Here, then, is the space where cartographic radicality can be located. A truly radical cartography would be one where the accepted schema of mapicity, or significant parts of it, is broken down and replaced. Cartographic radicality, as a condition, would be connoted by a major paradigmatic shift: a change that introduces a new vocabulary, grammar, and syntax. These changes need not be so complete as to make the old schema so completely obsolete that it disappears, but the change would clearly represent a break with the past and a leap to a new schema. The change would lift the radical map out of the paradigm for determining use, usability, and persuasiveness applicable to a conventional map and present new context, means, criteria, and constraints for satisfying those demands.
Map users confronted by a radical map would clearly have to learn to read maps all over again. They would, in fact, likely have even to learn how the new artifact qualifies as a map, and how to recognize its attributes as signalizing its mapicity.
With this basic understanding of where a cartographic radicality would lie, let us consider some maps that are claiming radicality. These samples are all identified by their makers or publishers as radical (or counter, or alternative), and are widely available. Two are print publications (with supporting websites), while the first is a web only source.
A truly radical cartography would be one where the
accepted schema of mapicity, or significant parts of it, is
broken down and replaced
Cartographic Perspectives, Number 68, Winter 201116 | The Search for a Radical Cartography – denil
R A D I C A L C A R T O G R A P H Y. N E T
The website Radical Cartography [http://www.radicalcartography.net/] might seem to be an obvious place to look for radicality. This site, maintained by Bill Rankin, currently a PhD candidate at Harvard University, has very little explanation of just what it is about the cartography the author considers radical; indeed, the web site’s “About” page contains only an uncommented quotation from Jean Baudrillard. While his writings on Simulacra are provocative and engaging, it is never clear if Baudrillard intends “the generation of models of a real without origin or reality: a hyperreal” (Baudrillard 1994, 1, quoted in Rankin) to entail a new map, a new way of constructing a map, or a new understanding that shifts the locus or encapsulation of meaning for anything that might be a map. We are also left rather to guess how Mr. Rankin himself understands and engages M. Baudrillard’s speculations.
A tour through the cartographic products accessible on radicalcartography.net is often interesting and enlightening, but somewhat disappointing in regard to a search for cartographic radicality as we have defined it. What we find are a large number of works that map an impressive array of topics, often with useful and usable approaches, but in all but a few cases there is no map that would be found out of place in a conventional cartographic textbook. There are plenty of world maps on Arthur Robinson’s projection, and several re-mappings of U.S. Census demographic data, on what one assumes is an Albers Conic, and in general what seems to be a solidly conventional approach to displaying data (although his perfunctory argument for the superiority of zip code zones for analyzing demographic data is somewhat suspect).
Certainly, there are some very well constructed maps here. For instance, the legend used on the map: Value: Aggregate market value of all agricultural products sold in 2007, by county, is particularly interesting, and the dynamic Time Zone Studies map is also worthy of note.
There are also one or two “map mashups” to be found on radicalcartography.net, and this is a type of map less likely to be encountered in a conventional cartographic textbook. These caprices are being seen from many sources these days, and constitute something of a fashionable graphic exercise, rather like the earlier fashion for caricature maps showing The Netherlands as a lion, or Europe as a tussling mob in regional costume. Despite the growing number of examples, it is not clear where further developments along these lines could take place, or lead. Currently, certainly, most such mashups have significant shortcomings on the use and usability fronts.
T H E C O U N T E R C A R T O G R A P H I E S C O L L E C T I V E
The Counter Cartographies Collective [3Cs] is another source to which we might look for cartographic radicality. 3Cs is the group responsible for, among other works, the disOrientation Guide(s). 3Cs themselves describe their activities, in part, as:
Cartographic Perspectives, Number 68, Winter 2011 The Search for a Radical Cartography – denil | 17
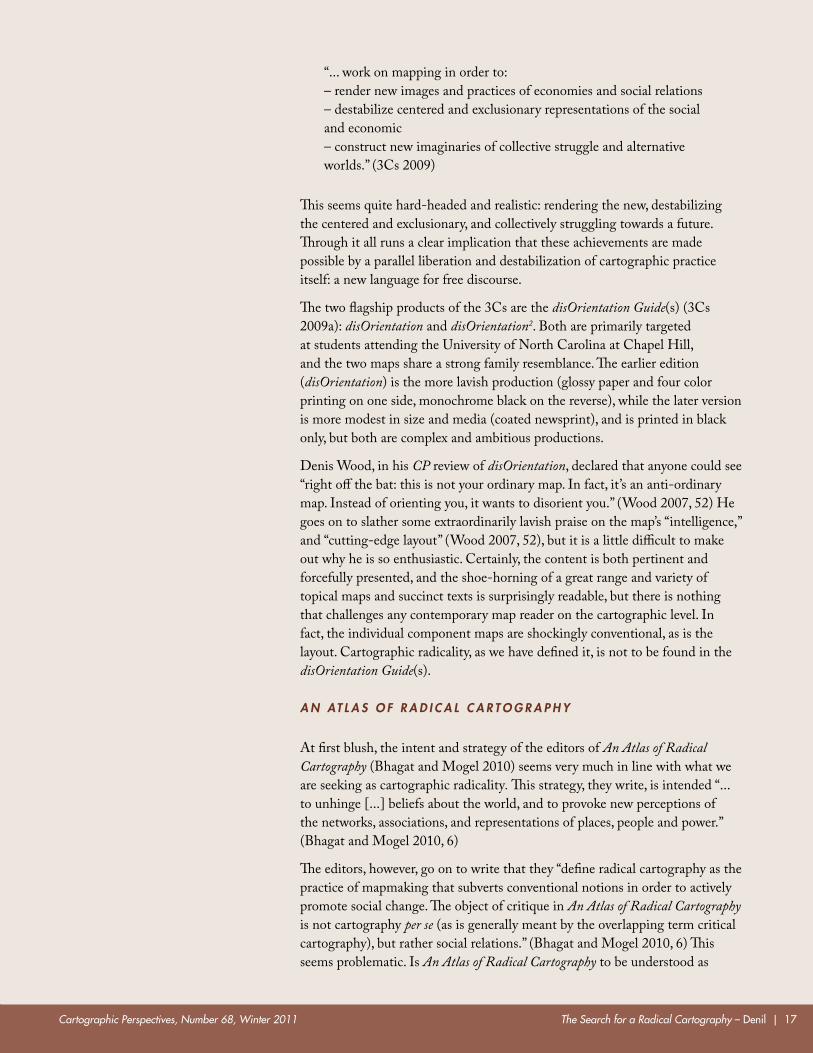
“... work on mapping in order to: – render new images and practices of economies and social relations – destabilize centered and exclusionary representations of the social and economic – construct new imaginaries of collective struggle and alternative worlds.” (3Cs 2009)
This seems quite hard-headed and realistic: rendering the new, destabilizing the centered and exclusionary, and collectively struggling towards a future. Through it all runs a clear implication that these achievements are made possible by a parallel liberation and destabilization of cartographic practice itself: a new language for free discourse.
The two flagship products of the 3Cs are the disOrientation Guide(s) (3Cs 2009a): disOrientation and disOrientation2. Both are primarily targeted at students attending the University of North Carolina at Chapel Hill, and the two maps share a strong family resemblance. The earlier edition (disOrientation) is the more lavish production (glossy paper and four color printing on one side, monochrome black on the reverse), while the later version is more modest in size and media (coated newsprint), and is printed in black only, but both are complex and ambitious productions.
Denis Wood, in his CP review of disOrientation, declared that anyone could see “right off the bat: this is not your ordinary map. In fact, it’s an anti-ordinary map. Instead of orienting you, it wants to disorient you.” (Wood 2007, 52) He goes on to slather some extraordinarily lavish praise on the map’s “intelligence,” and “cutting-edge layout” (Wood 2007, 52), but it is a little difficult to make out why he is so enthusiastic. Certainly, the content is both pertinent and forcefully presented, and the shoe-horning of a great range and variety of topical maps and succinct texts is surprisingly readable, but there is nothing that challenges any contemporary map reader on the cartographic level. In fact, the individual component maps are shockingly conventional, as is the layout. Cartographic radicality, as we have defined it, is not to be found in the disOrientation Guide(s).
A N AT L A S O F R A D I C A L C A R T O G R A P H Y
At first blush, the intent and strategy of the editors of An Atlas of Radical Cartography (Bhagat and Mogel 2010) seems very much in line with what we are seeking as cartographic radicality. This strategy, they write, is intended “... to unhinge [...] beliefs about the world, and to provoke new perceptions of the networks, associations, and representations of places, people and power.” (Bhagat and Mogel 2010, 6)
The editors, however, go on to write that they “define radical cartography as the practice of mapmaking that subverts conventional notions in order to actively promote social change. The object of critique in An Atlas of Radical Cartography is not cartography per se (as is generally meant by the overlapping term critical cartography), but rather social relations.” (Bhagat and Mogel 2010, 6) This seems problematic. Is An Atlas of Radical Cartography to be understood as
Cartographic Perspectives, Number 68, Winter 201118 | The Search for a Radical Cartography – denil
purely conventional cartography in the service of radical ends? That seems unlikely, but it is, in fact, largely what we find.
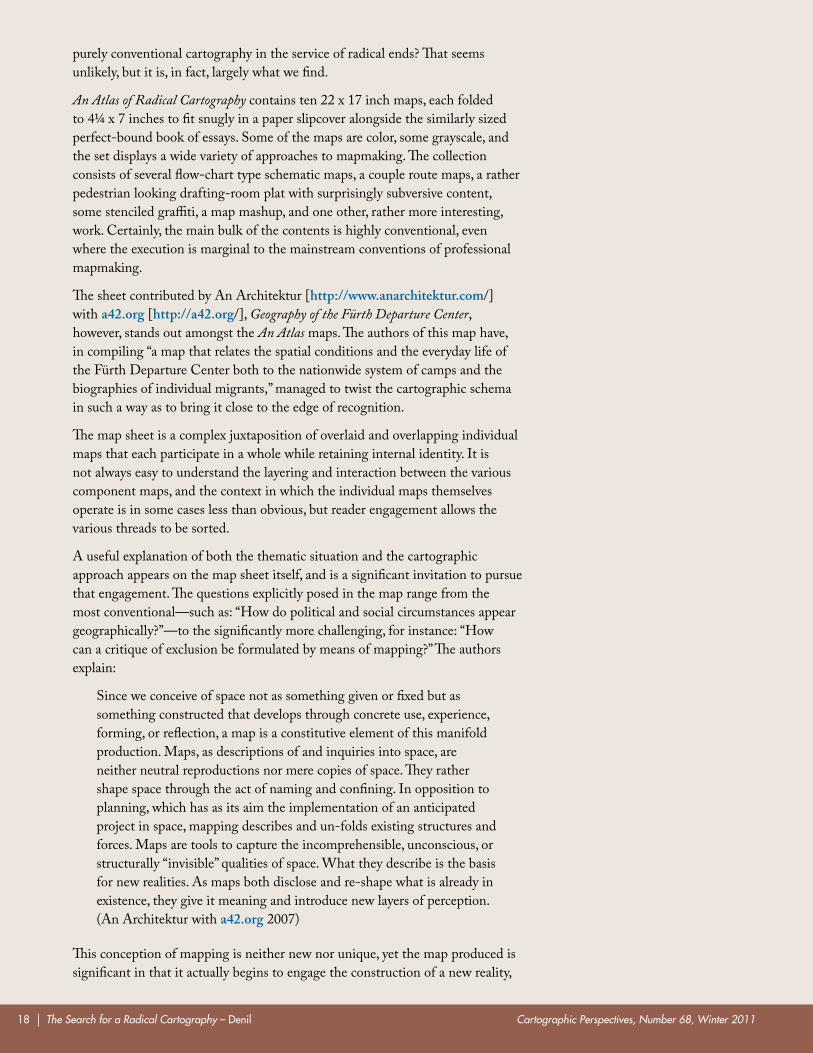
An Atlas of Radical Cartography contains ten 22 x 17 inch maps, each folded to 4¼ x 7 inches to fit snugly in a paper slipcover alongside the similarly sized perfect-bound book of essays. Some of the maps are color, some grayscale, and the set displays a wide variety of approaches to mapmaking. The collection consists of several flow-chart type schematic maps, a couple route maps, a rather pedestrian looking drafting-room plat with surprisingly subversive content, some stenciled graffiti, a map mashup, and one other, rather more interesting, work. Certainly, the main bulk of the contents is highly conventional, even where the execution is marginal to the mainstream conventions of professional mapmaking.
The sheet contributed by An Architektur [http://www.anarchitektur.com/] with a42.org [http://a42.org/], Geography of the Fürth Departure Center, however, stands out amongst the An Atlas maps. The authors of this map have, in compiling “a map that relates the spatial conditions and the everyday life of the Fürth Departure Center both to the nationwide system of camps and the biographies of individual migrants,” managed to twist the cartographic schema in such a way as to bring it close to the edge of recognition.
The map sheet is a complex juxtaposition of overlaid and overlapping individual maps that each participate in a whole while retaining internal identity. It is not always easy to understand the layering and interaction between the various component maps, and the context in which the individual maps themselves operate is in some cases less than obvious, but reader engagement allows the various threads to be sorted.
A useful explanation of both the thematic situation and the cartographic approach appears on the map sheet itself, and is a significant invitation to pursue that engagement. The questions explicitly posed in the map range from the most conventional—such as: “How do political and social circumstances appear geographically?”—to the significantly more challenging, for instance: “How can a critique of exclusion be formulated by means of mapping?” The authors explain:
Since we conceive of space not as something given or fixed but as something constructed that develops through concrete use, experience, forming, or reflection, a map is a constitutive element of this manifold production. Maps, as descriptions of and inquiries into space, are neither neutral reproductions nor mere copies of space. They rather shape space through the act of naming and confining. In opposition to planning, which has as its aim the implementation of an anticipated project in space, mapping describes and un-folds existing structures and forces. Maps are tools to capture the incomprehensible, unconscious, or structurally “invisible” qualities of space. What they describe is the basis for new realities. As maps both disclose and re-shape what is already in existence, they give it meaning and introduce new layers of perception. (An Architektur with a42.org 2007)
This conception of mapping is neither new nor unique, yet the map produced is significant in that it actually begins to engage the construction of a new reality,
Cartographic Perspectives, Number 68, Winter 2011 The Search for a Radical Cartography – denil | 19
or, if not new, of a reality perhaps heretofore inaccessible because of the way a map might have hitherto been expected to work. That is to say, this map works by cutting across the structure of the cartographic schema itself.
Here, then, is an example of something perhaps pointing the way towards the cartographic radicality we have been discussing. The authors of the Geography of the Fürth Departure Center map seem to be aiming at a subversion of “conventional notions” (with the end of social change) through, or at least by means of, a subversion of conventional cartographic notions.
C O L L E C T I V E LY
These three self-identified radical cartographies are representative of a wider class of practitioners, a class that sometimes identifies itself with terms such as “Experimental Geography.” Although this class is not defined as a movement by manifesto, much of the writing from and about the practitioners is declarative in tone, very much as is expected in a manifesto. There is a lot about “unhinging [of ] geography and cartography” (Bhagat and Mogel 2007, 9), and “destabiliz[ing] centered and exclusionary representations” (3Cs 2009), as well as “construct[ing] new imaginaries of collective struggle and alternative worlds” (3Cs 2009), and of simulations that are “no longer that of a territory, a referential being or substance [... but] the generation of models of a real without origin or reality: a hyperreal.” (Baudrillard 1994, 1, quoted in Rankin)
While there may, or may not, be significant political positions expounded in these various products, and while these positions may, or may not, be helped or hindered by the cartographic exposition of the arguments (just as these propositions may, or may not, be bound up stylistically in the map compositions), the point under consideration is whether the maps themselves are radical. That is, parochial thematic issues aside, do these maps destabilize the schema we have for recognizing and using maps?
It seems clear we can safely conclude that what we have in most of these examples (with the noted potential exception) is in fact a cartography of radicals and not a radical cartography. A map reader clearly recognizes each of the maps as maps, and most map literate people can read the maps. Perhaps readers cannot read the maps easily (certainly, many are confusing and oddly organized), but they pose no more difficulty than many other example maps (both amateur and professional) that do not claim radicality. Except, potentially, with the Fürth map, there is nothing new that must be learned, no assumptions that must be abandoned, nothing disturbing or cartographically challenging in any of it.
Now, this is not to say these various maps are not effective cartography; it is not to say they are not empowering to audiences; and it is not to say the various authors are not radical or not progressive (or not sufficiently radical or progressive). What it is to say is that there should not be a confusion between individual cartographic products, which must necessarily each have a parochial, situated, and editorial position, and cartography itself, which is an activity without particular subject matter but which relies upon an established and accepted schema to exist as a cartography. A politically or socially challenging map should not be mistaken for a cartographically challenging map.
Cartographic Perspectives, Number 68, Winter 201120 | The Search for a Radical Cartography – denil
l o o k I n g F o r a pa r a l l e l
Although we have placed the locus of a radical cartography in the disruption and replacement of the standard operative schema of understanding, we have not identified any historical instance of such a shift. In fact, it easily could be argued that there have never been, historically, any such radical paradigm shifts in the cartographic schema. There have been stylistic developments, changes of fashion, and advents of technological and mathematical innovation—and, of course, geographic discovery—but it is difficult to identify any real break in the continuity of the mapicity schema itself. Perhaps the facilitation of navigation by Portolan charts was such a shift, as it imposed demands for completeness and topology hitherto unrequired, but by and large maps have always been recognizable as maps. It is this fact that in part grounds the conservative reputation of cartography.
This claim for the persistence of the schema is important, and may not seem obvious if one confuses what we might call the look of maps with mapicity. Confusing as well can be the many cheese-paring classifications that allow categories of maps (such as: map, topographic map, diagram, sketch map, art map, thematic map, map-like-object, etc.) to pose as fundamental to the definition of map-hood. Taxonomic variations within the overall understanding of the map are irrelevant. Maps of every type are equally required to be useful as maps, usable as maps, and persuasive of their status (and value) as maps.
In point of fact, the slow growth and development of the map over the centuries has rather more reflected a steady (if decidedly non-linear) development, rather than the Kuhnian paradigm-replacement model of change found in the history of science.
Two examples may serve to illustrate the persistent, conservative nature of the cartographic schema. Consider the example of the Bronze Age petroglyph map at Capo di Ponte, at the site of Bedolina in Northern Italy (Lloris 1972, quoted in Jacobs 2006): it is recognizable as a map, and can be read as an historical and cadastral record without any great difficulty. It does not perhaps afford access to the same range of information as an ink-on-linen plat in the map room at City Hall, but it is recognizable. Consider as well a Marshall Islands “stick chart,” which can be recognized as a map of an island and sea swell network. Just anyone may not be able to use one to paddle to a distant destination, but recognition and use are quite different things. So long as one is ready to look for maps beyond sheets of paper, a stick chart is recognizable as a map. Many other examples are possible, and this review is not exhaustive, but the point remains that it is difficult to find a good example of such a shift.
This is not to argue that maps have not changed, both often and in various ways, but instead to maintain that the underlying schema is persistent. Although the cartographic schema has many facets, there is a remarkable commonality of mapicity across dramatic differences in style, theme, materials, culture, intention, technology, and time.
In the history of Western painting, by contrast, there have been a few such paradigmatic shifts, and among them there is at least one good example of just
Although the cartographic schema has many facets, there is a remarkable commonality of mapicity across dramatic differences in style, theme, materials, culture, intention, technology, and time
Cartographic Perspectives, Number 68, Winter 2011 The Search for a Radical Cartography – denil | 21
this sort of seismic break that still stirs the blood even a century after its advent. That example is Analytic Cubism.
T H E A D V E N T O F A N A LY T I C C U B I S M
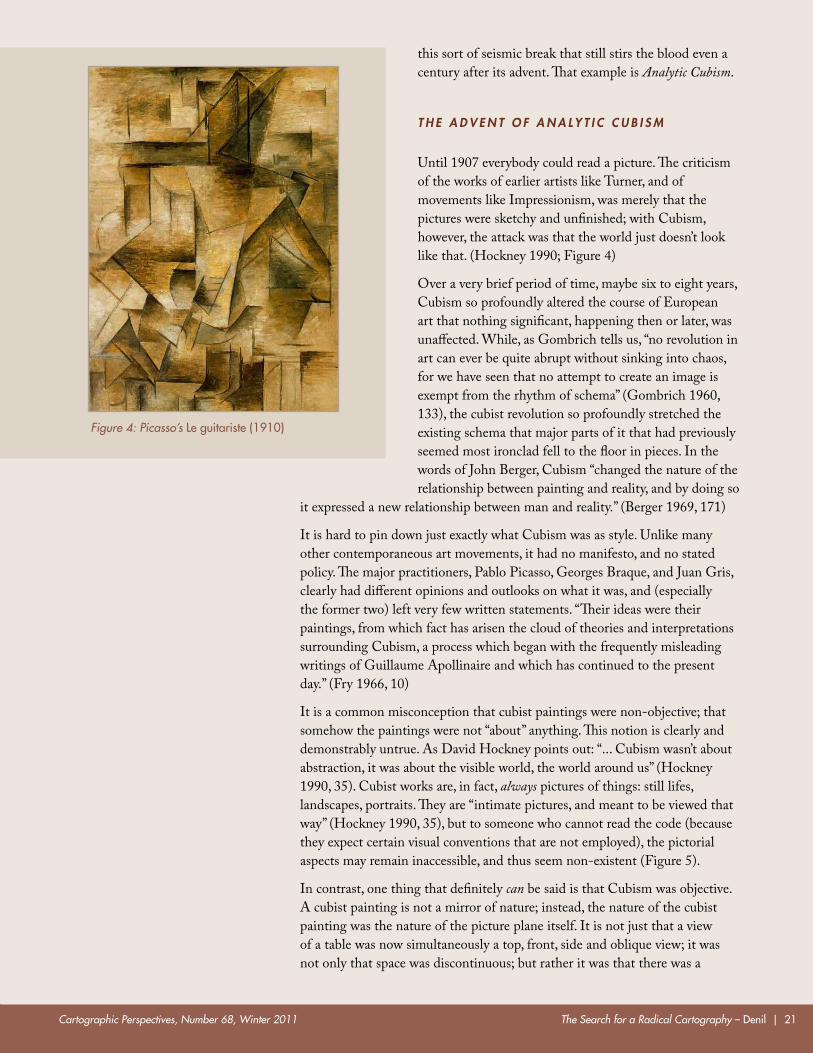
Until 1907 everybody could read a picture. The criticism of the works of earlier artists like Turner, and of movements like Impressionism, was merely that the pictures were sketchy and unfinished; with Cubism, however, the attack was that the world just doesn’t look like that. (Hockney 1990; Figure 4)
Over a very brief period of time, maybe six to eight years, Cubism so profoundly altered the course of European art that nothing significant, happening then or later, was unaffected. While, as Gombrich tells us, “no revolution in art can ever be quite abrupt without sinking into chaos, for we have seen that no attempt to create an image is exempt from the rhythm of schema” (Gombrich 1960, 133), the cubist revolution so profoundly stretched the existing schema that major parts of it that had previously seemed most ironclad fell to the floor in pieces. In the words of John Berger, Cubism “changed the nature of the relationship between painting and reality, and by doing so
it expressed a new relationship between man and reality.” (Berger 1969, 171)
It is hard to pin down just exactly what Cubism was as style. Unlike many other contemporaneous art movements, it had no manifesto, and no stated policy. The major practitioners, Pablo Picasso, Georges Braque, and Juan Gris, clearly had different opinions and outlooks on what it was, and (especially the former two) left very few written statements. “Their ideas were their paintings, from which fact has arisen the cloud of theories and interpretations surrounding Cubism, a process which began with the frequently misleading writings of Guillaume Apollinaire and which has continued to the present day.” (Fry 1966, 10)
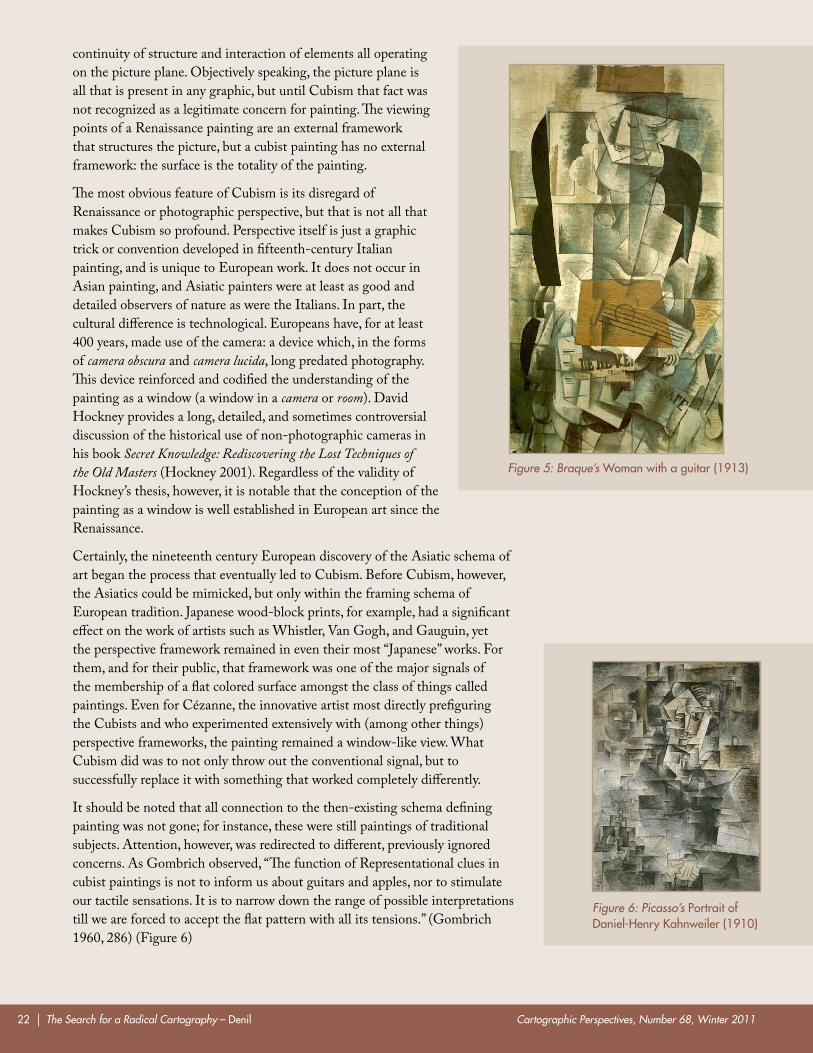
It is a common misconception that cubist paintings were non-objective; that somehow the paintings were not “about” anything. This notion is clearly and demonstrably untrue. As David Hockney points out: “... Cubism wasn’t about abstraction, it was about the visible world, the world around us” (Hockney 1990, 35). Cubist works are, in fact, always pictures of things: still lifes, landscapes, portraits. They are “intimate pictures, and meant to be viewed that way” (Hockney 1990, 35), but to someone who cannot read the code (because they expect certain visual conventions that are not employed), the pictorial aspects may remain inaccessible, and thus seem non-existent (Figure 5).
In contrast, one thing that definitely can be said is that Cubism was objective. A cubist painting is not a mirror of nature; instead, the nature of the cubist painting was the nature of the picture plane itself. It is not just that a view of a table was now simultaneously a top, front, side and oblique view; it was not only that space was discontinuous; but rather it was that there was a
Figure 4: Picasso’s le guitariste (1910)
Cartographic Perspectives, Number 68, Winter 201122 | The Search for a Radical Cartography – denil
continuity of structure and interaction of elements all operating on the picture plane. Objectively speaking, the picture plane is all that is present in any graphic, but until Cubism that fact was not recognized as a legitimate concern for painting. The viewing points of a Renaissance painting are an external framework that structures the picture, but a cubist painting has no external framework: the surface is the totality of the painting.
The most obvious feature of Cubism is its disregard of Renaissance or photographic perspective, but that is not all that makes Cubism so profound. Perspective itself is just a graphic trick or convention developed in fifteenth-century Italian painting, and is unique to European work. It does not occur in Asian painting, and Asiatic painters were at least as good and detailed observers of nature as were the Italians. In part, the cultural difference is technological. Europeans have, for at least 400 years, made use of the camera: a device which, in the forms of camera obscura and camera lucida, long predated photography. This device reinforced and codified the understanding of the painting as a window (a window in a camera or room). David Hockney provides a long, detailed, and sometimes controversial discussion of the historical use of non-photographic cameras in his book Secret Knowledge: Rediscovering the Lost Techniques of the Old Masters (Hockney 2001). Regardless of the validity of Hockney’s thesis, however, it is notable that the conception of the painting as a window is well established in European art since the Renaissance.
Certainly, the nineteenth century European discovery of the Asiatic schema of art began the process that eventually led to Cubism. Before Cubism, however, the Asiatics could be mimicked, but only within the framing schema of European tradition. Japanese wood-block prints, for example, had a significant effect on the work of artists such as Whistler, Van Gogh, and Gauguin, yet the perspective framework remained in even their most “Japanese” works. For them, and for their public, that framework was one of the major signals of the membership of a flat colored surface amongst the class of things called paintings. Even for Cézanne, the innovative artist most directly prefiguring the Cubists and who experimented extensively with (among other things) perspective frameworks, the painting remained a window-like view. What Cubism did was to not only throw out the conventional signal, but to successfully replace it with something that worked completely differently.
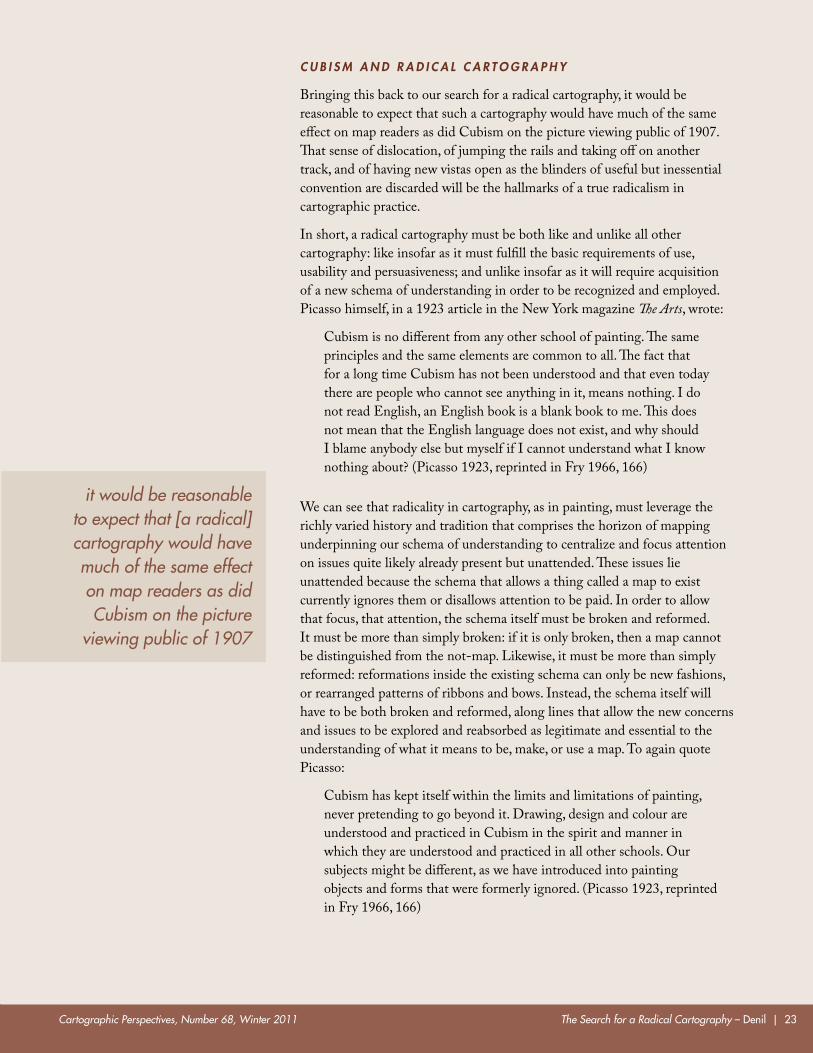
It should be noted that all connection to the then-existing schema defining painting was not gone; for instance, these were still paintings of traditional subjects. Attention, however, was redirected to different, previously ignored concerns. As Gombrich observed, “The function of Representational clues in cubist paintings is not to inform us about guitars and apples, nor to stimulate our tactile sensations. It is to narrow down the range of possible interpretations till we are forced to accept the flat pattern with all its tensions.” (Gombrich 1960, 286) (Figure 6)
Figure 5: Braque’s Woman with a guitar (1913)
Figure 6: Picasso’s portrait of daniel-henry kahnweiler (1910)
Cartographic Perspectives, Number 68, Winter 2011 The Search for a Radical Cartography – denil | 23
C U B I S M A N D R A D I C A L C A R T O G R A P H Y
Bringing this back to our search for a radical cartography, it would be reasonable to expect that such a cartography would have much of the same effect on map readers as did Cubism on the picture viewing public of 1907. That sense of dislocation, of jumping the rails and taking off on another track, and of having new vistas open as the blinders of useful but inessential convention are discarded will be the hallmarks of a true radicalism in cartographic practice.
In short, a radical cartography must be both like and unlike all other cartography: like insofar as it must fulfill the basic requirements of use, usability and persuasiveness; and unlike insofar as it will require acquisition of a new schema of understanding in order to be recognized and employed. Picasso himself, in a 1923 article in the New York magazine The Arts, wrote:
Cubism is no different from any other school of painting. The same principles and the same elements are common to all. The fact that for a long time Cubism has not been understood and that even today there are people who cannot see anything in it, means nothing. I do not read English, an English book is a blank book to me. This does not mean that the English language does not exist, and why should I blame anybody else but myself if I cannot understand what I know nothing about? (Picasso 1923, reprinted in Fry 1966, 166)
We can see that radicality in cartography, as in painting, must leverage the richly varied history and tradition that comprises the horizon of mapping underpinning our schema of understanding to centralize and focus attention on issues quite likely already present but unattended. These issues lie unattended because the schema that allows a thing called a map to exist currently ignores them or disallows attention to be paid. In order to allow that focus, that attention, the schema itself must be broken and reformed. It must be more than simply broken: if it is only broken, then a map cannot be distinguished from the not-map. Likewise, it must be more than simply reformed: reformations inside the existing schema can only be new fashions, or rearranged patterns of ribbons and bows. Instead, the schema itself will have to be both broken and reformed, along lines that allow the new concerns and issues to be explored and reabsorbed as legitimate and essential to the understanding of what it means to be, make, or use a map. To again quote Picasso:
Cubism has kept itself within the limits and limitations of painting, never pretending to go beyond it. Drawing, design and colour are understood and practiced in Cubism in the spirit and manner in which they are understood and practiced in all other schools. Our subjects might be different, as we have introduced into painting objects and forms that were formerly ignored. (Picasso 1923, reprinted in Fry 1966, 166)
it would be reasonable to expect that [a radical] cartography would have much of the same effect on map readers as did Cubism on the picture
viewing public of 1907
Cartographic Perspectives, Number 68, Winter 201124 | The Search for a Radical Cartography – denil
W h e r e s h o u l d W e l o o k ?
From whence will this revolution spring? Again, we can look to Cubism for a model. The cubist revolution arose not out of newcomers who couldn’t be bothered with old frameworks, but from skilled and brilliant practitioners in full command of all the historical schema and tradition of Western painting. The cubists were not hackers. Picasso did not paint the way he did because he was unschooled, naively believing himself unfettered by rules he did not understand. Quite to the contrary, he was a prodigy, and had mastered the canon that defined painting up until his time; he could (and often did) paint masterworks in a variety of conventional styles, and would have been a great painter in any era. He painted as he did because he choose to do so, and he was able to make the advances he did both because the time was right and because he knew his field backwards and forwards.
This is not to say that there can be no innovation (or even profound innovation) from outside the cartographic establishment; rather, it is to recognize that we will continue to build on tradition even if the direction that building takes seems completely unexpected.
The issue of a lasting phenomenon is critical. The Analytic phase of cubist practice, which has been taken here as a paradigm for radicality, lasted only a few years, and yet had a profound and lasting effect on how painting is seen and understood (Fry 1966, 9). In those few years, it produced a “final break with an artistic tradition almost 500 years old.” In the place of that tradition, “the cubists united a new interpretation of the external world with formal inventions adequate for that interpretation.” (Fry 1966, 41) This phenomenon did not take place in isolation; other twentieth-century art movements (one excellent example is Futurism, the founding of which predated Cubism), were violently shaken and redirected by exposure to the cubist revolution, and over time Cubism itself evolved and was influenced by later developments, particularly Surrealism. Nonetheless, it was Cubism, as Fry has noted, that took on the role of the normative twentieth-century artistic style (Fry 1966, 40). Certainly, Abstract Expressionism, which in the 1940s and 1950s engaged painting on its most basic, visceral level of paint on canvas, would, for example, have been inconceivable without Cubism, and it is, in fact, hard to think what any current painting would look like had Cubism not occurred. Similarly, a radical cartography would not be an end in itself, but would instead become an integral part of continuing cartographic practice, recognized and employed as a legitimate and valuable legacy amongst even its greatest detractors. It would, in fact, remake the schema.
None of this is to say that we should be making cubist maps, although a cubist map would certainly be an exciting thing to see and use. What this paper is trying to point out is that in a search for a radical cartography we should be looking for one that is as groundbreaking and useful, and as shocking and disturbing, as Cubism was and still is.
That last bit is key: ...and still is: because, after all, Cubism is still disturbing; triggering, as it does, “an almost unbearable tension” (Fry 1966, 20) in the viewer even today. Only when a useful, usable, and persuasive map can disturb and
What this paper is trying to point out is that in a search for a radical cartography we should be looking for one that is as groundbreaking and useful, and as shocking and disturbing, as Cubism was and still is
Cartographic Perspectives, Number 68, Winter 2011 The Search for a Radical Cartography – denil | 25
distress a viewer, after even 90 or 100 years, while at the same time becoming an indispensable part of the horizon of mapping, will we have a radical cartography.
c o n c l u s I o n
We have seen that a radical cartography must provide products that satisfy the basic criteria of mapicity. To wit: like any map, a radical map must be useful (in that it addresses a need), usable (in that it must be accessible to employment; that is, it must afford access to a milieu or situation in a manner employable by a potential user), and persuasive (which is to say that it must convince a potential user that it is itself a reliable, or at least a reasonable, characterization of that situation or milieu and that it would be advantageous to the user to employ it as a guide). Furthermore, a radical cartography also would have to satisfy the criteria of radicality: it would have to introduce into the schema elements or approaches that open avenues of usability previously held inaccessible, invisible, or perhaps even undesirable as seen through the lens of the existing schema.
This disruption of the cartographic schema, that schema which is the cultural underpinning of anyone’s ability to recognize and use a map, will necessarily be disturbing to any map user encountering the radical map for the first time. In and of itself, the disturbance is not radicality, but disturbance is an expected condition of the encounter with radicality.
Taking Analytic Cubism as a model for radicality, we can see that a radical cartography will have to not only discard what might seem to be key foundational aspects of the cartographic schema, but, as well, will replace these aspects with other usable affordances. Furthermore, a significant radical cartography would affect and re-frame the overall cartographic schema so that it itself eventually becomes a normative foundational element in that schema.
It seems clear that no radical cartography, in the sense of a cartography seriously challenging the existing cartographic schema, exists today, despite the earnest avowals and promotions of a variety of contemporary map makers. It seems equally clear that there are both opportunities and needs for the emergence of a radical cartography in today’s dynamically changing technological, social, and economic environment.
We were able, in the course of this discussion, to identify at least one map with characteristics perhaps pointing towards a radical cartography; there are likely more such characteristics emerging. Just as the Cubists took the work of the Japanese, along with that of the Africans and of Cézanne, and built upon it by applying the methods and techniques they found in these sources in innovative manners never previously attempted, there could well exist today the elements from which a radical cartography may be constructed.
Claims of radicality have been, and will no doubt continue to be, made. Basing the definitions of mapicity and radicality, as we do here, on the schema of map-hood as defined for us (with our complicity) by our cultural communities might seemingly devolve all immediate decisions onto the individual map reader. We also have seen that this individual (and by implication that cultural
Cartographic Perspectives, Number 68, Winter 201126 | The Search for a Radical Cartography – denil
community that made them a reader) may be variously prepared to make judgments on what might constitute radicality. It was radical for my ninety-year-old great grandfather to say he was going to dance with his wife on their seventieth anniversary, although dancing with one’s wife is not a radical act. It is conceivable that some particularly innocent or pedantic map reader may be so astonished by, say, Google Map, that s/he cannot, or will refuse to, understand what they are seeing, but isolated reactions cannot by themselves be definitive for the community.
In order to be of more than local, personal, or anecdotal value, mapicity and radicality have to be judged on the broadest ground of applicability. Understanding a map as “the projection of a mental schema on a medium, the materialization of an abstract intellectual order” ( Jacob 2006, 30), and understanding that it is the commonality and utility of the schema that allows any of us to agree that any particular thing is a map, is clearly prerequisite.
Claims of cartographic radicality are impossible to evaluate without clear and widely applicable definitions of mapicity and radicality. Mapicity is that quality that allows the artifact to be recognized as a legitimate candidate for the tests of use, usability, and persuasiveness (the test of maphood), and is a quality all maps must possess in order to be seen as maps. It is judged against a schema provided to the map reader by the various intersecting interpretive communities to which the reader belongs. Radicality is a quality that sets a radical map apart from the conventional, and operates on the level of subverting and remaking the schema. One expects the subversion of the schema will be disturbing to the reader because it presents unexpected affordances (and likely abandons others), through which it offers new possibilities. These definitions should be of utility in consideration of current and future claims of cartographic radicality.
r e F e r e n c e s
3Cs. 2009. Counter Cartographies Collective. 2009. Who are we? (short version), February, 19, 2009. http://www.countercartographies.org/component/content/article/27-who-we-are/53-who-is-3cs-short-version (accessed October 24, 2009)
3Cs. 2009a. Counter Cartographies Collective. 2009. disOrientation guides, December, 20, 2009 http://www.countercartographies.org/disorientation-guide-mainmenu-31/ (accessed July 24, 2010)
An Architektur with a42.org. 2007. Geography of the Fürth Departure Center. Map. Folded sheet in An Atlas of Radical Cartography. Edited by A. Bhagat and L. Mogel, L. Los Angeles, CA: The Journal of Aesthetics and Protest Press. http://www.an-atlas.com/contents/anarch_casascobb.html
Barthes, R. 1972. Mythologies. Translated by A. Lavers. 109–59. New York: Hill and Wang.
Baudrillard, J. 1994. Simulacra and Simulation. Translated by S.F. Glaser. Ann Arbor: University of Michigan Press.
Cartographic Perspectives, Number 68, Winter 2011 The Search for a Radical Cartography – denil | 27
Berger, J. 1969. The Moment of Cubism. In Berger, J., 1985, The Sense of Sight, 159–88. New York: Pantheon.
Bhagat, A., and Mogel, L., ed. 2007. An Atlas of Radical Cartography, Los Angeles, CA: The Journal of Aesthetics and Protest Press. http://www.an-atlas.com/
Burke, E. 1844 (1757). A Philosophical Inquiry into the Origin of our Ideas of the Sublime and the Beautiful. Edited by A. Mills. New York: Harper.
Chomsky, Noam. 1965. Aspects of the Theory of Syntax. Cambridge, MA: MIT Press.
Denil, M. 2003. Cartographic Design: Rhetoric and Persuasion. Cartographic Perspectives 45:8–67
Fish, S. 1980. Is There A Text in this Class? The Authority of Interpretive Communities. Cambridge, MA: Harvard University Press.
Fry, Edward. 1966. Cubism. New York and Toronto: Oxford University Press.
Gombrich, E.H. 1960. Art and Illusion: A Study in the Psychology of Pictorial Representation. Princeton, NJ: Princeton University Press.
Hockney, D. 1990. Picasso. Madras, India: Hanuman.
Hockney, David. 2001. Secret Knowledge: Rediscovering the Lost Techniques of the Old Masters. New York: Viking.
Jacob, Christian. 2006. The Sovereign Map. Conley, Tom, trans. Dahl, Edward, ed. Chicago: University of Chicago Press.
Jacobs, Frank. 2009. Strange Maps: An Atlas of Cartographic Curiosities. New York: Viking Studio.
Lloris, Miguel Beltrán. “Los grabados rupestres de Bedolina [Valcamonica],” Bolletino del Centro Camuno di Studi Preisorici 8. 1972:121–57.
Picasso, Pablo. ‘Picasso Speaks’, The Arts, New York, May 1923, 315–26: reprinted in Alfred Barr: Picasso, New York 1946, 270–1: reprinted in Fry 1966, 166.
Pownall, Thomas. 1949. A Topographical Description of the Dominions of The United States of America (2nd ed). Edited by Lois Mulkearn. Pittsburgh PA: Univ of Pittsburgh Press.
Voynich Manuscript. date unknown (late 15th Century?). General Collection, Beinecke Rare Book and Manuscript Library, Yale University. http://beinecke.library.yale.edu/digitallibrary/voynich.html
Cartographic Perspectives, Number 68, Winter 201128 | The Search for a Radical Cartography – denil
Warhol, A. and P. Hackett. 1980. Popism: The Warhol Sixties. San Diego, CA: Harcourt.
Wood, D. 2007. A review of disOrientation, Cartographic Perspectives 58:52–3
Wood, D. and J. Fels. 2008. The Natures of Maps: Cartographic Constructions of the Natural World. Chicago: Univ of Chicago Press.
Wood, D. with J. Fels and J. Krygier. 2010. Rethinking the Power of Maps. New York: Guilford Press. also excerpt available on web site Making Maps: DIY Cartography http://makingmaps.files.wordpress.com/2010/08/woodch1.pdf
Zinn, H. 1999. Marx in Soho: A Play on History. Boston: South End Press.
i l l u s t r at i o n s :
Figure 1: Voynich Manuscript (excerpt). Date unknown (late 15th Century?). General Collection, Beinecke Rare Book and Manuscript Library, Yale University. Image in the public domain http://en.wikipedia.org/wiki/File:Voynich_manuscript_excerpt.svg
Figure 2: Author, 2010. After Fish, S., 1980 Is There a Text in this Class? Cambridge, MA: Harvard University Press.
Figure 3: Author, 2010, pen and ink. After Alain (Brustlein), D. Egyptian Life Class, 1955, New Yorker magazine.
Figure 4: Picasso, P Le guitariste, 1910, oil on canvas, 100 x 73 cm, Musée National d’Art Moderne, Centre Georges Pompidou, Paris. Public domain in the United States. http://en.wikipedia.org/wiki/File:Le_guitariste.jpg
Figure 5: Braque, G. Woman with a Guitar, 1913, oil on canvas, 130 x 73 cm. Musée National d’Art Moderne, Centre Georges Pompidou, Paris, France. Public domain in the United States. http://www.artchive.com/artchive/b/braque/wmn_guit.jpg
Figure 6: Picasso, P. Portrait of Daniel-Henry Kahnweiler, 1910, oil on canvas, 101.1 x 73.3 cm. Art Institute of Chicago. Public domain in the United States. http://www.artic.edu/artaccess/AA_Modern/pages/MOD_1b_lg.shtml
Cartographic Perspectives, Number 68, Winter 2011 A typology of operators for maintaining legible map designs at multiple scales – roth et al. | 29
a typology of operators for maintaining legible map designs at multiple scales
Robert E. Roth1*, Cynthia A. Brewer2, & Michael S. Stryker2
[email protected], [email protected], [email protected]
a B s t r a c t
The potential for and ubiquity of multiscale mapping is growing as a result of contemporary research and development efforts in digital cartography. Past work on multiscale mapping discusses use of the ScaleMaster diag ram, a conceptual schematic for organizing, maintaining, and sharing the scale-dependent design specifications of a multiscale mapping project. Here, we present a typology of multiscale mapping operators that can be implemented at the decision points identified within the ScaleMaster diagram in order to maintain legible map designs when changing scale. The ScaleMaster typology of multiscale mapping operators draws in part on extant literature on generalization, which primarily focuses upon changes to the geometry of map features. We argue that this past work on generalization should be appended with other work in map design to generate a comprehensive list of decisions available to a cartographer when changing scale. This extension results in four higher-level categories of multiscale mapping operators: content, geometry, symbol, and label. In the following, each operator in the ScaleMaster typology is introduced and explained, with discussion organized
2GeoVISTA Center, Dept. of GeographyThe Pennsylvania State University
302 Walker BuildingUniversity Park, PA 16802
1Department of GeographyUniversity of Wisconsin–Madison
550 N. Park StreetMadison, WI 53706
© by the authors. This work is licensed under the Creative Commons Attribution-NonCommercial-NoDerivs 3.0 Unported License. To view a copy of this license, visit http://creativecommons.org/licenses/by-nc-nd/3.0/
Cartographic Perspectives, Number 68, Winter 201130 | A typology of operators for maintaining legible map designs at multiple scales – roth et al.
according to the four higher-level categories. For each operator, we include a formal definition, a standard two-character code for use in the ScaleMaster diagram, a sample illustration, a description of its use in the cartographic literature, and our approach to reconciling contradicting uses (where appropriate). The key contribution of this work is the synthesis and integration of existing generalization and map design research into a logical framework for use as a classroom teaching tool, a pragmatic guide for completing multiscale mapping projects, and a conceptual foundation for future scientific research.
k e y w o r d s : cartography multiscale mapping, generalization, scale, ScaleMaster, map design
I n t r o d u c t I o n : F r o M g e n e r a l I Z at I o n t o M u l t I s c a l e M a p p I n g
Generalization is the process of meaningfully abstracting the infinite complexity and diversity found in the real world into a single, targeted cartographic representation that is usable and useful for the given map scale and purpose (Müller and Wang 1992). As any well-trained cartographer will tell you, there is no one-click solution that automatically discriminates essential geographic information from irrelevant or excessive detail. Instead, generalization requires a comprehensive rethinking of how geographic data layers are maintained and displayed, and sometimes even how they are collected (Stoter et al. 2009). Further, it requires a wide variety of potential generalization solutions to customize the resulting map for a specific theme and purpose, and a cartographer with the knowledge to apply these solutions suitably to ensure that the map is an appropriate representation of the portrayed geographic phenomena. Although generalization is a formidable cartographic task, it is this very task that gives the map its power, allowing the cartographer to emphasize particular geographic phenomena and processes while deemphasizing others. As the distinguished academic cartographer Arthur Robinson and his colleagues (1995: 42) note, “the act of generalization gives the map its raison d’être.”
Multiscale mapping describes the cartographic practice of generating integrated designs of the same geographic topic at multiple (or perhaps all) cartographic scales (Spaccapietra et al. 2000). Although long a topic of critical importance, research and development on generalization has drawn increased attention in the past decade both within and beyond the discipline of cartography due to the broad potential and increasing ubiquity of multiscale maps. While closely related, multiscale mapping and generalization are not the same. Multiscale mapping describes the full set of map design decisions made across the range of supported map scales, with the primary goal of maintaining map legibility as scale changes. Generalization traditionally describes the design decisions made for a single scale, with the primary goal of meaningfully reducing detail once scale is fixed (Brewer and Buttenfield 2010). It could be said that generalization is the process that occurs at each output map scale in a multiscale mapping project; however, as we discuss in this article, alterations beyond “generalization” also can be applied to maintain legible map designs as scale changes.
Although generalization is a formidable cartographic task, it is this very task that gives the map its power, allowing the cartographer to emphasize particular geographic phenomena and processes while deemphasizing others
Cartographic Perspectives, Number 68, Winter 2011 A typology of operators for maintaining legible map designs at multiple scales – roth et al. | 31
Multiscale mapping is fundamental to at least three contemporary cartographic research and development efforts:
(1) Multiple Representation Databases: Multiple representation databases (MRDB) link several representations of the same geographic entity across scales, resolutions, or purposes (Kilpeläinen 1997; Sarjakoski 2007). For applications of MRDB for multiscale mapping, each individual representation is generalized for use at a particular range of scales. MRDB offers a technical solution for partially automating the multiscale mapping process and promises tighter integration of geographic data and map design, leading to easier map updates and a more consistent cartographic design across scales. MRDB functionality is continuing to improve in GIS software (e.g., the software product 1Spatial; http://www.1spatial.com/), and its increased implementation can be expected to support production cartography.
(2) National Mapping Agencies: The earliest multiscale maps were national mapping efforts chartered to catalog features in the natural and built landscape, with the U.S. Geological Survey (USGS) topographic series being one example. Today, many national mapping agencies (NMAs) are executing plans to construct consolidated repositories of digital geographic information and associated online map viewers for their national mapping products, integrating public domain datasets across themes and scale levels for general consumption (Stoter 2005). The goal of the current United States effort, referred to as The National Map (Clarke et al. 2003), is the release of harmonized government and volunteered datasets for multiscale display and download in The National Map Viewer. Prior work to extend a limited set of national hydrography datasets (NHD) with topologically coherent flow networks and enriched attributes is one contribution to the multiscale vision of The National Map (Buttenfield et al. 2010).
(3) Web Mapping Services: The popular on-demand web mapping services, and the associated web map mashups built atop these services, are at their core multiscale maps (Roth and Ross 2009). It is arguable that no development has increased the visibility of multiscale maps, and perhaps even cartography, more than web mapping services. Such services have empowered the general public to move beyond the “one-map” solution (Monmonier 1991)—or generation of a single, optimal map design emphasized within the communication paradigm—allowing them to navigate the world freely through a set of integrated multiscale designs and related interface conventions. The recent ability for users to edit cartographic styles across scales through such services as OpenStreetMap and Google Maps is a further step towards the democratization of cartography in which anyone can be a mapmaker and calls into question the degree to which multiscale mapping choices should be constrained by expert knowledge (Wallace 2010).
Despite its fundamental relationship to these three contemporary efforts within cartography, research on multiscale mapping is still in its infancy, with current practice outpacing scientifically-derived guidelines. Specifically, connections between cornerstone cartographic research on generalization and
connections between cornerstone cartographic
research on generalization and recent challenges in
multiscale mapping have been limited or implicit in nature
Cartographic Perspectives, Number 68, Winter 201132 | A typology of operators for maintaining legible map designs at multiple scales – roth et al.
recent challenges in multiscale mapping have been limited or implicit in nature. This article is designed to bridge this gap directly, connecting past work on generalization to current problems in multiscale mapping. The work reported here builds upon and formalizes past work on the ScaleMaster diagram, a schematic used to describe and organize multiscale mapping projects (Brewer and Buttenfield 2007; Brewer et al. 2007; Stryker et al. 2008; Roth et al. 2008; Brewer and Buttenfield 2010). Specifically, a comprehensive literature review was conducted to synthesize and organize extant literature relevant to multiscale mapping. This literature review appends research on generalization with research on map design, as multiscale mapping is broader than generalization alone. This review then was used to develop a typology of multiscale mapping operators for use with the ScaleMaster diagram, which includes four higher-level categories: content, geometry, symbol, and label. The purpose of the ScaleMaster typology, and associated literature review, is to provide a more complete understanding of how map appearance must change across scales to maintain readability and usefulness. The ScaleMaster typology is prepared so that it can be used as a classroom teaching tool, as a pragmatic guide for completing multiscale mapping projects, and as a conceptual foundation for future scientific research. Although description of a case study application of the typology is outside of the scope of this paper, the proposed typology successfully was applied and evaluated in concurrent ScaleMaster work (see Brewer et al. 2010).
The paper proceeds with four additional sections. In the following section, we briefly introduce the ScaleMaster diagram and its relationship to the work in multiscale mapping presented here. We then provide an extended review of key research on generalization; the focus in this review is upon research containing either informal lists or formal typologies of generalization operators. In the fourth section, we integrate this review on generalization with other work on map design and offer our primary contribution: the ScaleMaster typology of multiscale mapping operators. We conclude by offering summary remarks and future directions.
c o n t e X t: t h e s c a l e M a s t e r d I a g r a M a n d M u l t I s c a l e M a p p I n g o p e r at o r s
The broader context of this paper is the ScaleMaster diagram, a conceptual schematic for organizing, maintaining, and sharing the scale-dependent design specifications of a multiscale mapping project. Originally presented in 2003 at an Esri planning talk by Senior Cartographer Charlie Frye, the ScaleMaster concept was extended during a seminar offered by Cynthia Brewer in 2004 at Penn State and later formalized in a trio of publications by Brewer, Buttenfield, and colleagues (Brewer et al. 2007; Brewer and Buttenfield 2007; Brewer and Buttenfield 2010). The ScaleMaster diagram represents each feature type as a stack along the vertical axis and the range of project scales along the horizontal axis. Scales are marked along the horizontal axis that contain anchor data, such as a different data capture or a pre-processed generalization of the dataset (referred to as a level of detail, or LoD), or a decision point (i.e., a scale at which the map design requires modification). Each feature type, grouped by theme, has an
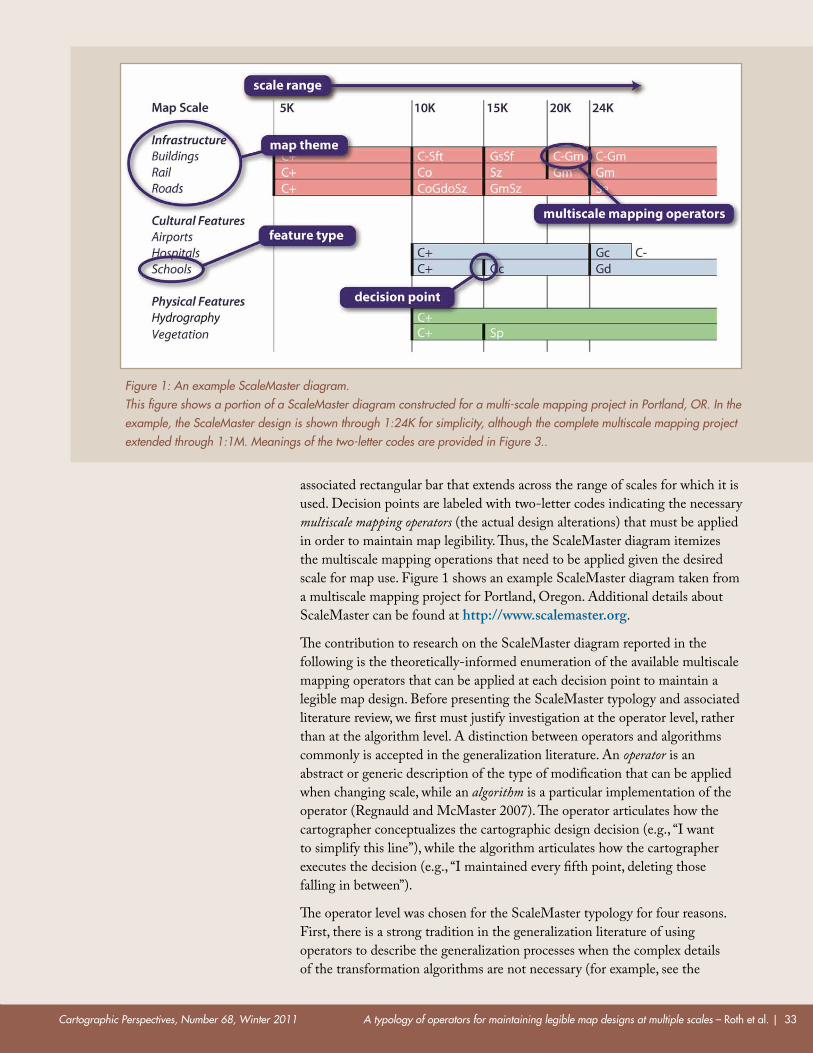
Cartographic Perspectives, Number 68, Winter 2011 A typology of operators for maintaining legible map designs at multiple scales – roth et al. | 33
associated rectangular bar that extends across the range of scales for which it is used. Decision points are labeled with two-letter codes indicating the necessary multiscale mapping operators (the actual design alterations) that must be applied in order to maintain map legibility. Thus, the ScaleMaster diagram itemizes the multiscale mapping operations that need to be applied given the desired scale for map use. Figure 1 shows an example ScaleMaster diagram taken from a multiscale mapping project for Portland, Oregon. Additional details about ScaleMaster can be found at http://www.scalemaster.org.
The contribution to research on the ScaleMaster diagram reported in the following is the theoretically-informed enumeration of the available multiscale mapping operators that can be applied at each decision point to maintain a legible map design. Before presenting the ScaleMaster typology and associated literature review, we first must justify investigation at the operator level, rather than at the algorithm level. A distinction between operators and algorithms commonly is accepted in the generalization literature. An operator is an abstract or generic description of the type of modification that can be applied when changing scale, while an algorithm is a particular implementation of the operator (Regnauld and McMaster 2007). The operator articulates how the cartographer conceptualizes the cartographic design decision (e.g., “I want to simplify this line”), while the algorithm articulates how the cartographer executes the decision (e.g., “I maintained every fifth point, deleting those falling in between”).
The operator level was chosen for the ScaleMaster typology for four reasons. First, there is a strong tradition in the generalization literature of using operators to describe the generalization processes when the complex details of the transformation algorithms are not necessary (for example, see the
Figure 1: An example ScaleMaster diagram. This figure shows a portion of a ScaleMaster diagram constructed for a multi-scale mapping project in Portland, OR. In the example, the ScaleMaster design is shown through 1:24K for simplicity, although the complete multiscale mapping project extended through 1:1M. Meanings of the two-letter codes are provided in Figure 3..
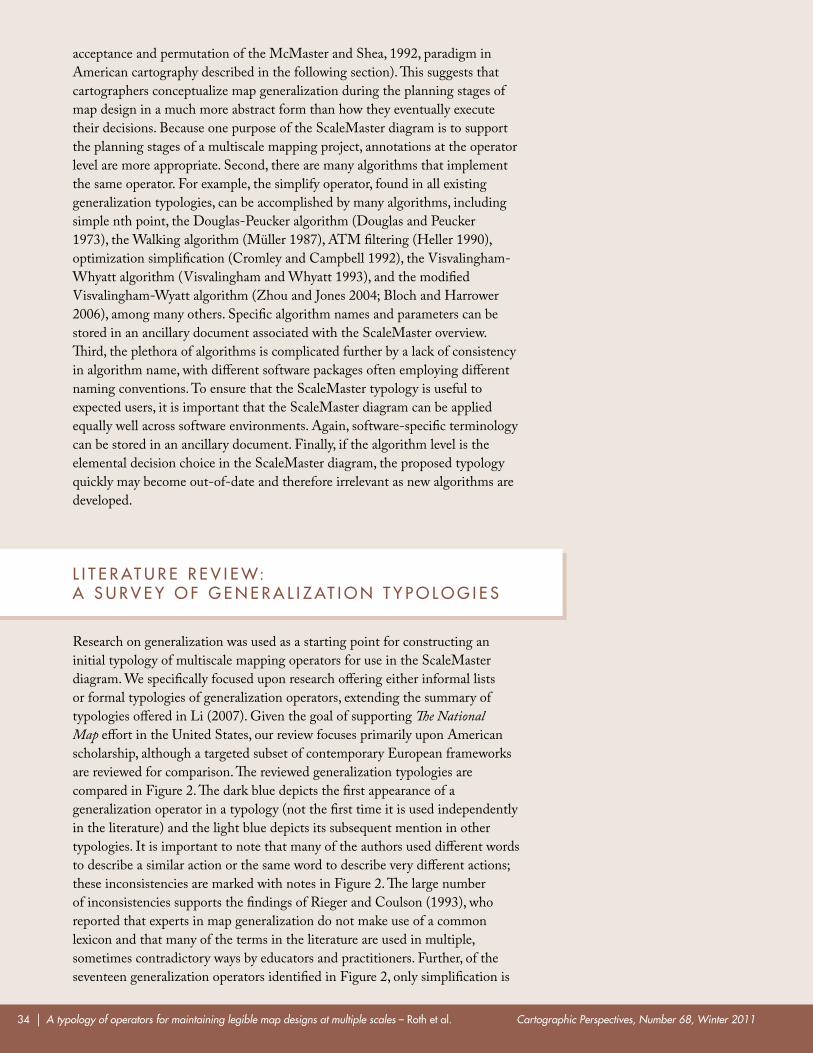
Cartographic Perspectives, Number 68, Winter 201134 | A typology of operators for maintaining legible map designs at multiple scales – roth et al.
acceptance and permutation of the McMaster and Shea, 1992, paradigm in American cartography described in the following section). This suggests that cartographers conceptualize map generalization during the planning stages of map design in a much more abstract form than how they eventually execute their decisions. Because one purpose of the ScaleMaster diagram is to support the planning stages of a multiscale mapping project, annotations at the operator level are more appropriate. Second, there are many algorithms that implement the same operator. For example, the simplify operator, found in all existing generalization typologies, can be accomplished by many algorithms, including simple nth point, the Douglas-Peucker algorithm (Douglas and Peucker 1973), the Walking algorithm (Müller 1987), ATM filtering (Heller 1990), optimization simplification (Cromley and Campbell 1992), the Visvalingham-Whyatt algorithm (Visvalingham and Whyatt 1993), and the modified Visvalingham-Wyatt algorithm (Zhou and Jones 2004; Bloch and Harrower 2006), among many others. Specific algorithm names and parameters can be stored in an ancillary document associated with the ScaleMaster overview. Third, the plethora of algorithms is complicated further by a lack of consistency in algorithm name, with different software packages often employing different naming conventions. To ensure that the ScaleMaster typology is useful to expected users, it is important that the ScaleMaster diagram can be applied equally well across software environments. Again, software-specific terminology can be stored in an ancillary document. Finally, if the algorithm level is the elemental decision choice in the ScaleMaster diagram, the proposed typology quickly may become out-of-date and therefore irrelevant as new algorithms are developed.
l I t e r at u r e r e V I e W: a s u r V e y o F g e n e r a l I Z at I o n t y p o l o g I e s
Research on generalization was used as a starting point for constructing an initial typology of multiscale mapping operators for use in the ScaleMaster diagram. We specifically focused upon research offering either informal lists or formal typologies of generalization operators, extending the summary of typologies offered in Li (2007). Given the goal of supporting The National Map effort in the United States, our review focuses primarily upon American scholarship, although a targeted subset of contemporary European frameworks are reviewed for comparison. The reviewed generalization typologies are compared in Figure 2. The dark blue depicts the first appearance of a generalization operator in a typology (not the first time it is used independently in the literature) and the light blue depicts its subsequent mention in other typologies. It is important to note that many of the authors used different words to describe a similar action or the same word to describe very different actions; these inconsistencies are marked with notes in Figure 2. The large number of inconsistencies supports the findings of Rieger and Coulson (1993), who reported that experts in map generalization do not make use of a common lexicon and that many of the terms in the literature are used in multiple, sometimes contradictory ways by educators and practitioners. Further, of the seventeen generalization operators identified in Figure 2, only simplification is
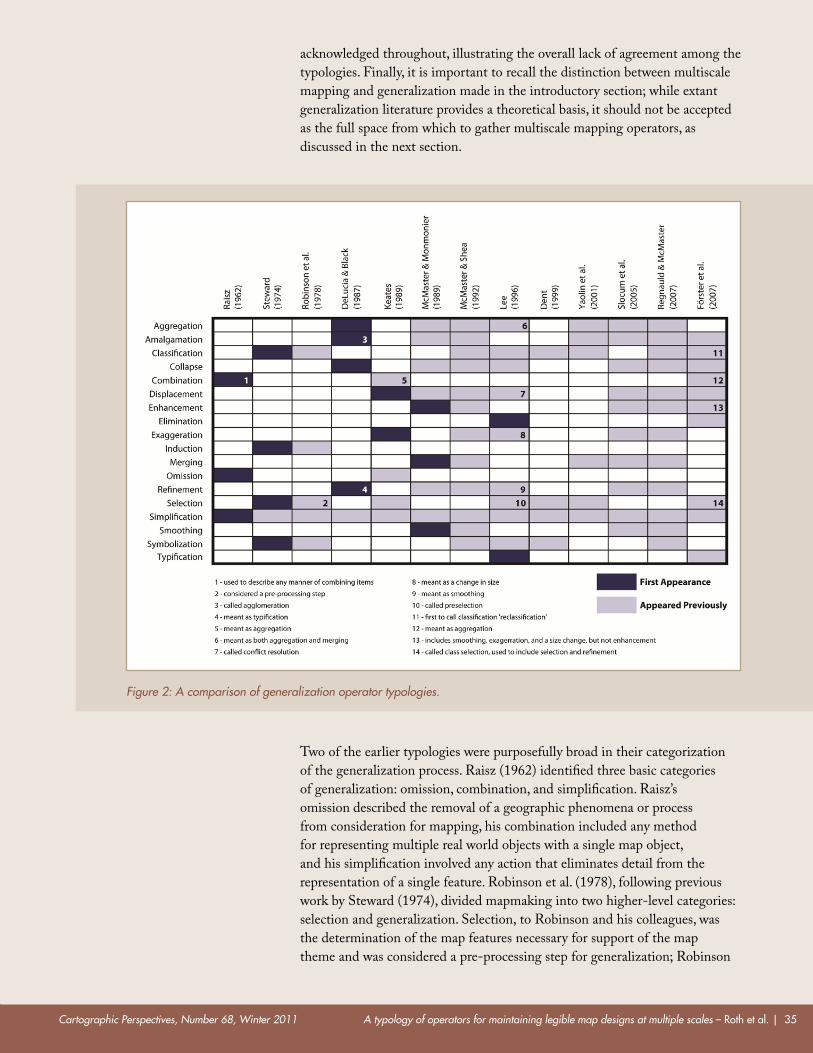
Cartographic Perspectives, Number 68, Winter 2011 A typology of operators for maintaining legible map designs at multiple scales – roth et al. | 35
acknowledged throughout, illustrating the overall lack of agreement among the typologies. Finally, it is important to recall the distinction between multiscale mapping and generalization made in the introductory section; while extant generalization literature provides a theoretical basis, it should not be accepted as the full space from which to gather multiscale mapping operators, as discussed in the next section.
Two of the earlier typologies were purposefully broad in their categorization of the generalization process. Raisz (1962) identified three basic categories of generalization: omission, combination, and simplification. Raisz’s omission described the removal of a geographic phenomena or process from consideration for mapping, his combination included any method for representing multiple real world objects with a single map object, and his simplification involved any action that eliminates detail from the representation of a single feature. Robinson et al. (1978), following previous work by Steward (1974), divided mapmaking into two higher-level categories: selection and generalization. Selection, to Robinson and his colleagues, was the determination of the map features necessary for support of the map theme and was considered a pre-processing step for generalization; Robinson
Figure 2: A comparison of generalization operator typologies.
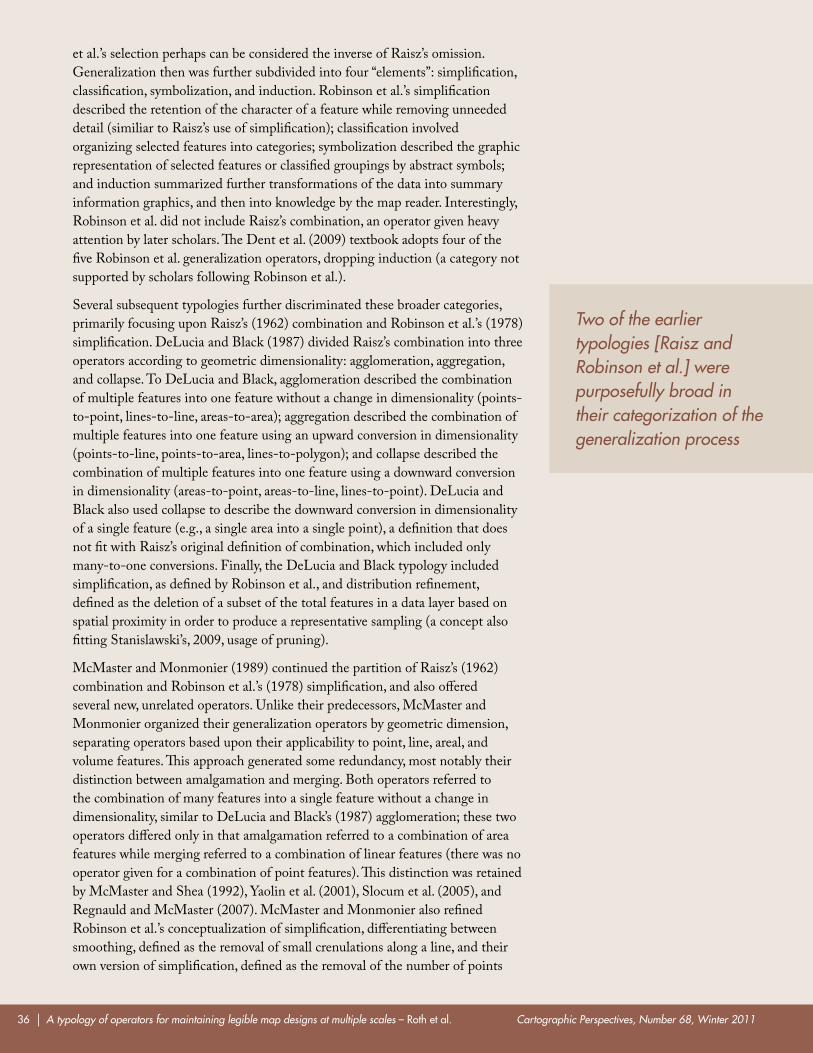
Cartographic Perspectives, Number 68, Winter 201136 | A typology of operators for maintaining legible map designs at multiple scales – roth et al.
et al.’s selection perhaps can be considered the inverse of Raisz’s omission. Generalization then was further subdivided into four “elements”: simplification, classification, symbolization, and induction. Robinson et al.’s simplification described the retention of the character of a feature while removing unneeded detail (similiar to Raisz’s use of simplification); classification involved organizing selected features into categories; symbolization described the graphic representation of selected features or classified groupings by abstract symbols; and induction summarized further transformations of the data into summary information graphics, and then into knowledge by the map reader. Interestingly, Robinson et al. did not include Raisz’s combination, an operator given heavy attention by later scholars. The Dent et al. (2009) textbook adopts four of the five Robinson et al. generalization operators, dropping induction (a category not supported by scholars following Robinson et al.).
Several subsequent typologies further discriminated these broader categories, primarily focusing upon Raisz’s (1962) combination and Robinson et al.’s (1978) simplification. DeLucia and Black (1987) divided Raisz’s combination into three operators according to geometric dimensionality: agglomeration, aggregation, and collapse. To DeLucia and Black, agglomeration described the combination of multiple features into one feature without a change in dimensionality (points-to-point, lines-to-line, areas-to-area); aggregation described the combination of multiple features into one feature using an upward conversion in dimensionality (points-to-line, points-to-area, lines-to-polygon); and collapse described the combination of multiple features into one feature using a downward conversion in dimensionality (areas-to-point, areas-to-line, lines-to-point). DeLucia and Black also used collapse to describe the downward conversion in dimensionality of a single feature (e.g., a single area into a single point), a definition that does not fit with Raisz’s original definition of combination, which included only many-to-one conversions. Finally, the DeLucia and Black typology included simplification, as defined by Robinson et al., and distribution refinement, defined as the deletion of a subset of the total features in a data layer based on spatial proximity in order to produce a representative sampling (a concept also fitting Stanislawski’s, 2009, usage of pruning).
McMaster and Monmonier (1989) continued the partition of Raisz’s (1962) combination and Robinson et al.’s (1978) simplification, and also offered several new, unrelated operators. Unlike their predecessors, McMaster and Monmonier organized their generalization operators by geometric dimension, separating operators based upon their applicability to point, line, areal, and volume features. This approach generated some redundancy, most notably their distinction between amalgamation and merging. Both operators referred to the combination of many features into a single feature without a change in dimensionality, similar to DeLucia and Black’s (1987) agglomeration; these two operators differed only in that amalgamation referred to a combination of area features while merging referred to a combination of linear features (there was no operator given for a combination of point features). This distinction was retained by McMaster and Shea (1992), Yaolin et al. (2001), Slocum et al. (2005), and Regnauld and McMaster (2007). McMaster and Monmonier also refined Robinson et al.’s conceptualization of simplification, differentiating between smoothing, defined as the removal of small crenulations along a line, and their own version of simplification, defined as the removal of the number of points
Two of the earlier typologies [Raisz and Robinson et al.] were purposefully broad in their categorization of the generalization process
Cartographic Perspectives, Number 68, Winter 2011 A typology of operators for maintaining legible map designs at multiple scales – roth et al. | 37
constituting the line. Finally, McMaster and Monmonier offered the operators displacement, defined as the positional adjustment of a feature to avoid coalescence with other features (after Keates, 1989); enhancement, defined as supplementary graphic marks to clarify or elevate the message imparted by a symbol; and refinement, an alteration of DeLucia and Black’s usage referring to the elimination of a subset of features based on attribute, rather than on spatial characteristics.
The McMaster and Shea (1992) text synthesized work from a previous Shea and McMaster (1989) proceedings paper along with the McMaster and Monmonier (1989) framework described above. A key addition of the McMaster and Shea typology was the broader-level distinction between spatial transformations and attribute transformations. Spatial transformations referred to generalization operators that alter the geographic or topological positioning of a feature, while attribute transformations referred to generalization operators that manipulate the statistical characteristics of a feature. As with most of the prior typologies, greater attention was given to the spatial transformations. Spatial transformations included the nine operators from the McMaster and Monmonier typology appended with Keates’ (1989) exaggeration, defined as the amplification of a portion of an object to emphasize or maintain a characteristic aspect of it. Attribute transformation included the Robinson et al. (1978) operators of classification and symbolization. The ten spatial transformation operators from McMaster and Shea were offered by Slocum et al. (2005) as a typology of vector-based operations. All twelve operators were adopted by Regnauld and McMaster (2007), although the ten spatial transformations (i.e., not classification and symbolization) were considered the “fundamental” generalization operators. Because of these mainstream reproductions, the McMaster and Shea (1992) paradigm is perhaps the most popular generalization typology in American cartography today.
In contrast to the American typologies, Foerster and colleagues (2007; 2010) offered a classification of operators organized according to Gruenreich’s (1985; 1992; 1995) division between model generalization and cartographic generalization, a dominant dichotomy in the European generalization literature. Model generalization describes the manipulation of the digital representations of geographic information stored in the database, while cartographic representation involves the manipulation of the graphic representations on the map page (Weibel and Dutton 1999). In the Foerster et al. typology, many of the operators present in the McMaster and Shea (1992) paradigm were identified as either model generalization or cartographic generalization; the amalgamation operator was included in both. Cartographic generalization operators included class selection, reclassification, collapse, combination, simplification, and amalgamation, while model generalization operators included enhancement, displacement, elimination, typification, and amalgamation.
Foerster et al.’s (2007) class selection appended Robinson’s et al.’s (1978) use of selection with McMaster and Shea’s (1992) use of refinement, describing this action as filtering of features based upon an attribute hierarchy. Foerster et al. used the term reclassification in a similar manner as Robinson et al.’s classification, adding the prefix to emphasize that the reclassification always
the McMaster and Shea (1992) paradigm
is perhaps the most popular generalization typology in American
cartography today
Cartographic Perspectives, Number 68, Winter 201138 | A typology of operators for maintaining legible map designs at multiple scales – roth et al.
is based upon an existing data model. Class selection and reclassification are executed first and followed by the model generalization operators collapse (similar to the DeLucia and Black, 1987, usage), combination (similar to DeLucia and Black’s aggregation operator), amalgamation (similar to the DeLucia and Black usage), and simplification (similar to the McMaster and Monmonier, 1989, usage). Interestingly, Foerster et al. eliminated the distinction between amalgamation and merging present in the McMaster and Monmonier typology. The cartographic generalization operator enhancement combined Keates’ (1989) and McMaster and Monmonier’s smoothing along with the squaring of buildings and enlargement of features. Foerster et al. borrowed the operators elimination and typification from the Lee (1996) Esri white paper, which described the removal of a graphic from the display and the replacement of a set of features with a representative subset respectively. Finally, Foerster et al.’s amalgamation matched the DeLucia and Black definition of the term, and displacement matched the Keates definition. Foerster et al. did not consider symbolization as a fundamental operator.
t h e s c a l e M a s t e r t y p o l o g y
The above review on generalization was used as a theoretical foundation for the development of a typology of multiscale mapping operators for use in the ScaleMaster diagram. In this section, we first introduce a higher-level framework for organizing the operators, which includes four categories: content, geometry, symbol, and label. This higher-level categorization takes a “cartographer-oriented” view of multiscale mapping, describing broader groupings of decisions available to a cartographer to maintain map legibility when shifting scales, compared to what could be termed “automation-oriented” or “computation-oriented” views presented by other, geometry-centric offerings in the generalization literature. After discussing the higher-level categorization, we then introduce each multiscale mapping operator included in the typology. It is important to note that we expect this set of operators to expand as practice and technology evolves, although we also expect the higher-level distinction to remain a useful framework for conceptualizing and organizing multiscale mapping operators.
I D E N T I F Y I N G H I G H E R - L E V E L C AT E G O R I E S O F M U L T I S C A L E M A P P I N G O P E R AT O R S
We were interested to find that many scholars organized their proposed generalization operators into a two-level hierarchy, with the operators classified into a set of higher-level categories. For instance, Robinson et al. (1978) distinguished between the higher-level categories of selection and generalization; McMaster and Monmonier (1989) organized operators according to dimensionality; McMaster and Shea (1992) distinguished between attribute and spatial transformations; and Foerster et al. (2007) organized operators according to model versus cartographic generalization. Such a higher-
The higher-level categorization takes a “cartographer-oriented” view of multiscale mapping...compared to what could be termed “automation-oriented” or “computation-oriented” views presented by other, geometry-centric offerings in the generalization literature
Cartographic Perspectives, Number 68, Winter 2011 A typology of operators for maintaining legible map designs at multiple scales – roth et al. | 39
level categorization emerged as we reconciled the existing generalization typologies and considered the generalization operator descriptions in the context of multiscale mapping. We identified four higher-level categories in total: geometry, content, symbol, and label; each is described in the following section.
The majority of generalization typologies focus upon geometric transformations (Foerster et al., 2007, also note this emphasis). The geometry category of the ScaleMaster typology follows Regnauld and McMaster’s (2007) “fundamental geometric generalization operators” and includes any manipulation of the points, lines, or polygons constituting a map feature. The prevalence of geometry operators perhaps is a result of the amount of attention given to Raisz’s (1962) combination and Robinson et al.’s (1978) simplification by subsequent scholars, and the associated promulgation of the McMaster and Shea (1992) paradigm. This prevalence also may be due to a past emphasis on developing computational techniques to automate the generalization process. However, manipulation of the vector linework alone is insufficient to produce a legible map in most mapping contexts, as Raisz and Robinson et al. identified early in the generalization literature.
Many scholars acknowledge in their typologies the impact that the content included in the map has on the map’s legibility. The content category of the ScaleMaster typology, a term borrowed from Monmonier (1996), describes the choices made to identify and organize the features for inclusion on the map. The content category expands Robinson et al.’s (1978) notion of selection to include other map organization operators, such as the classification of features into nominal or hierarchical categories and the stacking of feature types for display. Many of the reviewed generalization typologies included some form of content manipulation.
The third category is the fundamental component of cartographic representation: map symbolization. The symbol category of the ScaleMaster typology follows Robinson et al.’s (1978) broad symbolization operator and is defined as the graphic encoding of a feature on the map page. Symbolization is often missing from extant generalization categories (e.g., Raisz 1962; DeLucia and Black 1987; McMaster and Monmonier 1989; Foerster et al. 2007) or is considered to be something entirely different from the core set of generalization operators (e.g., McMaster and Shea 1992; Regnauld and McMaster 2007). Brewer and Buttenfield (2007; 2010) and Brewer et al. (2007), however, demonstrated that for intermediate scale ranges, legible designs can be maintained by adjusting the map content and symbols alone. Regardless of whether symbol operators are considered to be a form of “generalization,” they are invaluable for multiscale mapping and thus are included in the ScaleMaster typology. Many of the symbol operators are related to Bertin’s (1967|1983) visual variables, although it is important to note that the usage of these operators does not necessitate that the visual variables directly encode data attributes; a comparison of visual variable typologies is provided by Tyner (2010).
As with map symbolization, map labeling, or typography, also has received a great deal of attention by cartographers. Also, like map symbolization, much of the work on map labeling is not considered in the context of generalization
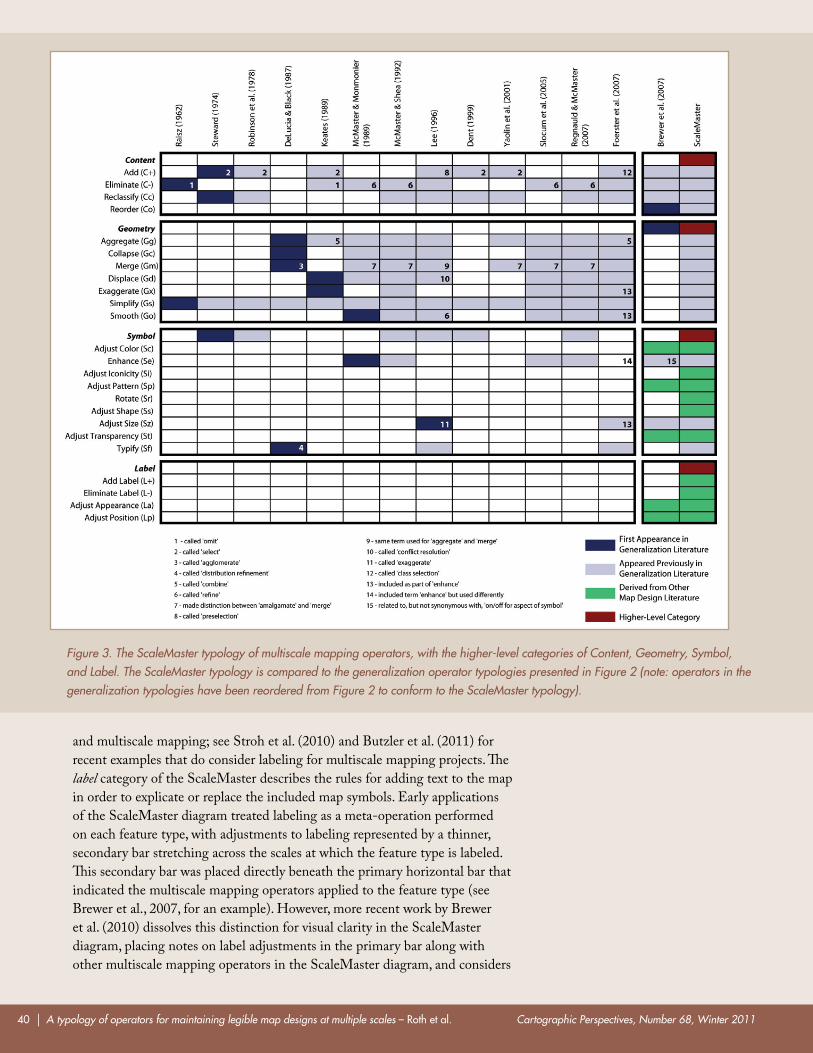
Cartographic Perspectives, Number 68, Winter 201140 | A typology of operators for maintaining legible map designs at multiple scales – roth et al.
and multiscale mapping; see Stroh et al. (2010) and Butzler et al. (2011) for recent examples that do consider labeling for multiscale mapping projects. The label category of the ScaleMaster describes the rules for adding text to the map in order to explicate or replace the included map symbols. Early applications of the ScaleMaster diagram treated labeling as a meta-operation performed on each feature type, with adjustments to labeling represented by a thinner, secondary bar stretching across the scales at which the feature type is labeled. This secondary bar was placed directly beneath the primary horizontal bar that indicated the multiscale mapping operators applied to the feature type (see Brewer et al., 2007, for an example). However, more recent work by Brewer et al. (2010) dissolves this distinction for visual clarity in the ScaleMaster diagram, placing notes on label adjustments in the primary bar along with other multiscale mapping operators in the ScaleMaster diagram, and considers
Figure 3. The ScaleMaster typology of multiscale mapping operators, with the higher-level categories of Content, Geometry, Symbol, and Label. The ScaleMaster typology is compared to the generalization operator typologies presented in Figure 2 (note: operators in the generalization typologies have been reordered from Figure 2 to conform to the ScaleMaster typology).
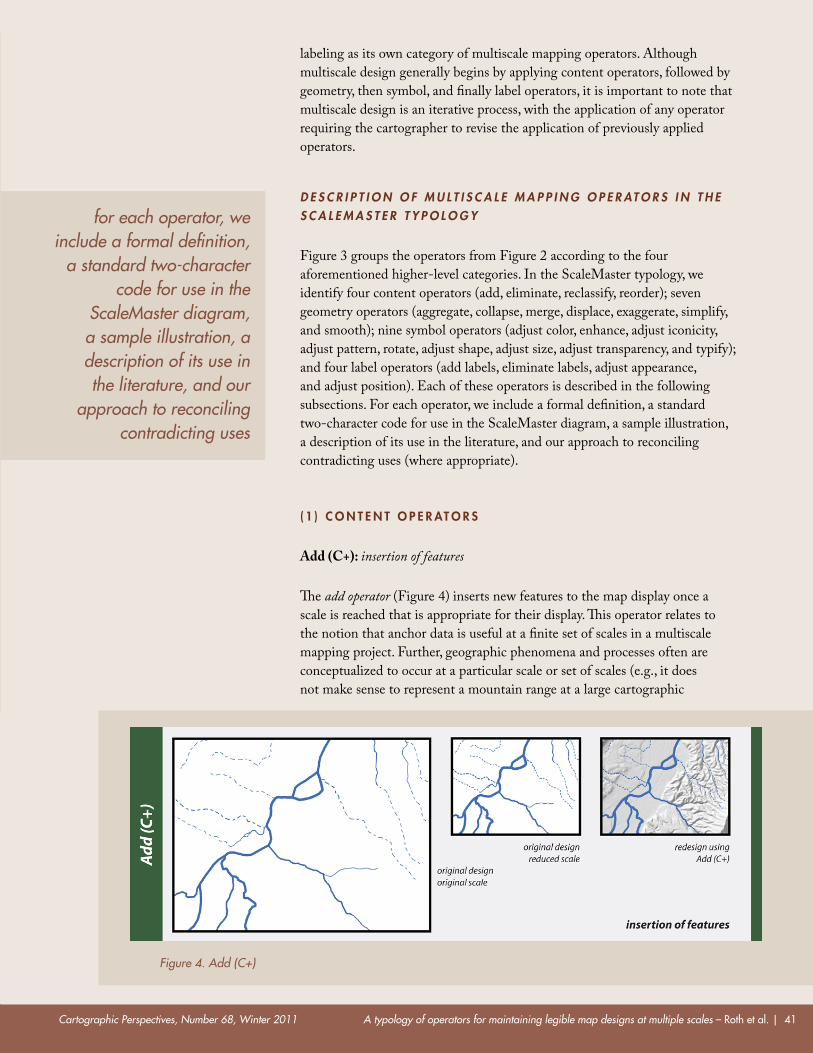
Cartographic Perspectives, Number 68, Winter 2011 A typology of operators for maintaining legible map designs at multiple scales – roth et al. | 41
labeling as its own category of multiscale mapping operators. Although multiscale design generally begins by applying content operators, followed by geometry, then symbol, and finally label operators, it is important to note that multiscale design is an iterative process, with the application of any operator requiring the cartographer to revise the application of previously applied operators.
D E S C R I P T I O N O F M U L T I S C A L E M A P P I N G O P E R AT O R S I N T H E S C A L E M A S T E R T Y P O L O G Y
Figure 3 groups the operators from Figure 2 according to the four aforementioned higher-level categories. In the ScaleMaster typology, we identify four content operators (add, eliminate, reclassify, reorder); seven geometry operators (aggregate, collapse, merge, displace, exaggerate, simplify, and smooth); nine symbol operators (adjust color, enhance, adjust iconicity, adjust pattern, rotate, adjust shape, adjust size, adjust transparency, and typify); and four label operators (add labels, eliminate labels, adjust appearance, and adjust position). Each of these operators is described in the following subsections. For each operator, we include a formal definition, a standard two-character code for use in the ScaleMaster diagram, a sample illustration, a description of its use in the literature, and our approach to reconciling contradicting uses (where appropriate).
( 1 ) C o N t e N t o p e r At o r S
Add (C+): insertion of features
The add operator (Figure 4) inserts new features to the map display once a scale is reached that is appropriate for their display. This operator relates to the notion that anchor data is useful at a finite set of scales in a multiscale mapping project. Further, geographic phenomena and processes often are conceptualized to occur at a particular scale or set of scales (e.g., it does not make sense to represent a mountain range at a large cartographic
Figure 4. Add (C+)
for each operator, we include a formal definition,
a standard two-character code for use in the
ScaleMaster diagram, a sample illustration, a description of its use in the literature, and our
approach to reconciling contradicting uses
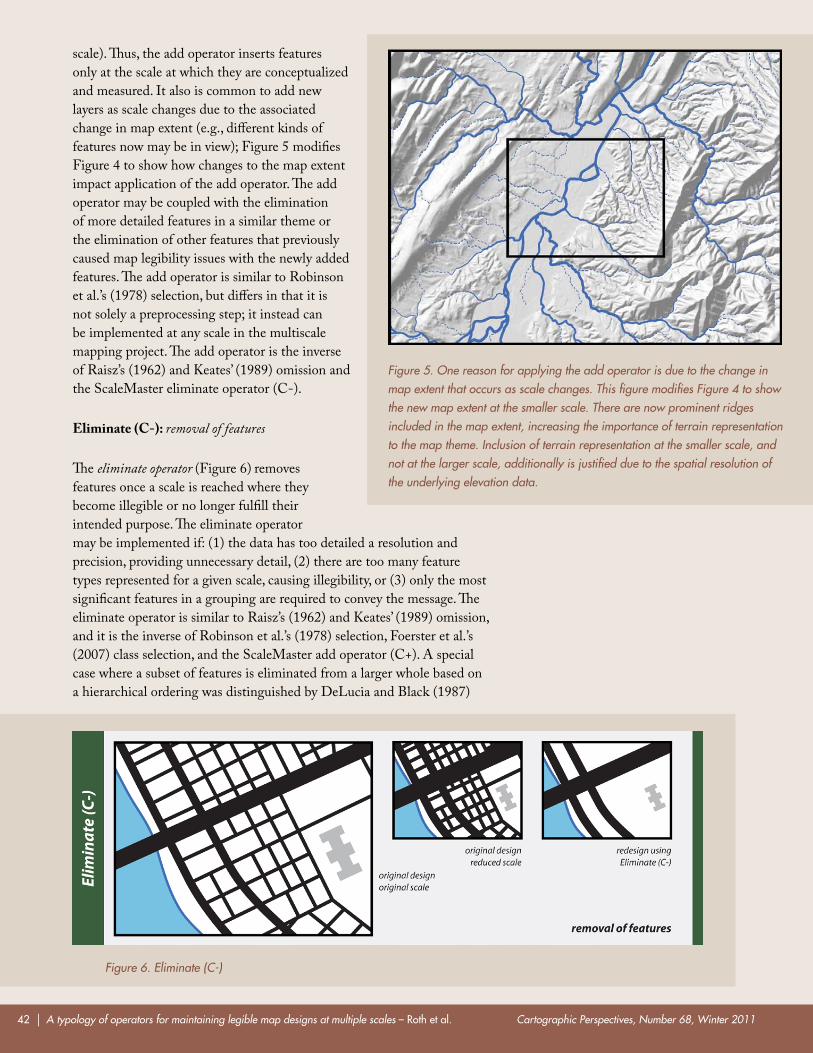
Cartographic Perspectives, Number 68, Winter 201142 | A typology of operators for maintaining legible map designs at multiple scales – roth et al.
scale). Thus, the add operator inserts features only at the scale at which they are conceptualized and measured. It also is common to add new layers as scale changes due to the associated change in map extent (e.g., different kinds of features now may be in view); Figure 5 modifies Figure 4 to show how changes to the map extent impact application of the add operator. The add operator may be coupled with the elimination of more detailed features in a similar theme or the elimination of other features that previously caused map legibility issues with the newly added features. The add operator is similar to Robinson et al.’s (1978) selection, but differs in that it is not solely a preprocessing step; it instead can be implemented at any scale in the multiscale mapping project. The add operator is the inverse of Raisz’s (1962) and Keates’ (1989) omission and the ScaleMaster eliminate operator (C-).
Eliminate (C-): removal of features
The eliminate operator (Figure 6) removes features once a scale is reached where they become illegible or no longer fulfill their intended purpose. The eliminate operator may be implemented if: (1) the data has too detailed a resolution and precision, providing unnecessary detail, (2) there are too many feature types represented for a given scale, causing illegibility, or (3) only the most significant features in a grouping are required to convey the message. The eliminate operator is similar to Raisz’s (1962) and Keates’ (1989) omission, and it is the inverse of Robinson et al.’s (1978) selection, Foerster et al.’s (2007) class selection, and the ScaleMaster add operator (C+). A special case where a subset of features is eliminated from a larger whole based on a hierarchical ordering was distinguished by DeLucia and Black (1987)
Figure 6. Eliminate (C-)
Figure 5. One reason for applying the add operator is due to the change in map extent that occurs as scale changes. This figure modifies Figure 4 to show the new map extent at the smaller scale. There are now prominent ridges included in the map extent, increasing the importance of terrain representation to the map theme. Inclusion of terrain representation at the smaller scale, and not at the larger scale, additionally is justified due to the spatial resolution of the underlying elevation data.
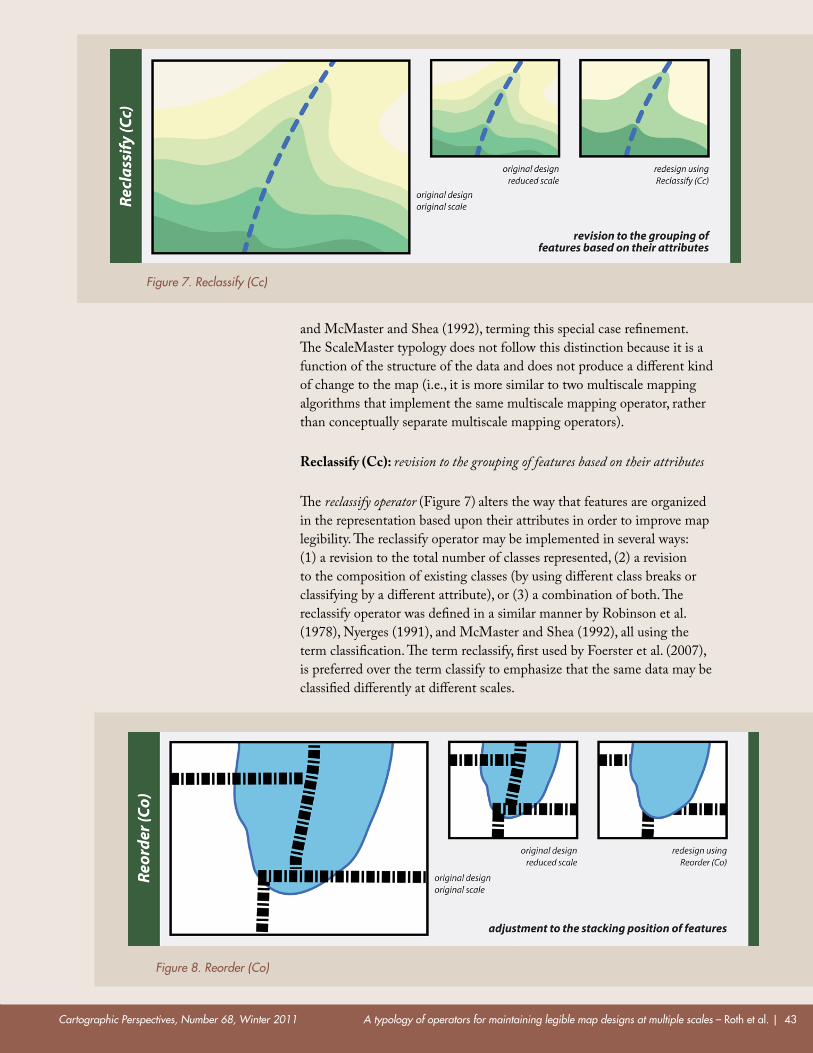
Cartographic Perspectives, Number 68, Winter 2011 A typology of operators for maintaining legible map designs at multiple scales – roth et al. | 43
and McMaster and Shea (1992), terming this special case refinement. The ScaleMaster typology does not follow this distinction because it is a function of the structure of the data and does not produce a different kind of change to the map (i.e., it is more similar to two multiscale mapping algorithms that implement the same multiscale mapping operator, rather than conceptually separate multiscale mapping operators).
Reclassify (Cc): revision to the grouping of features based on their attributes
The reclassify operator (Figure 7) alters the way that features are organized in the representation based upon their attributes in order to improve map legibility. The reclassify operator may be implemented in several ways: (1) a revision to the total number of classes represented, (2) a revision to the composition of existing classes (by using different class breaks or classifying by a different attribute), or (3) a combination of both. The reclassify operator was defined in a similar manner by Robinson et al. (1978), Nyerges (1991), and McMaster and Shea (1992), all using the term classification. The term reclassify, first used by Foerster et al. (2007), is preferred over the term classify to emphasize that the same data may be classified differently at different scales.
Figure 7. Reclassify (Cc)
Figure 8. Reorder (Co)
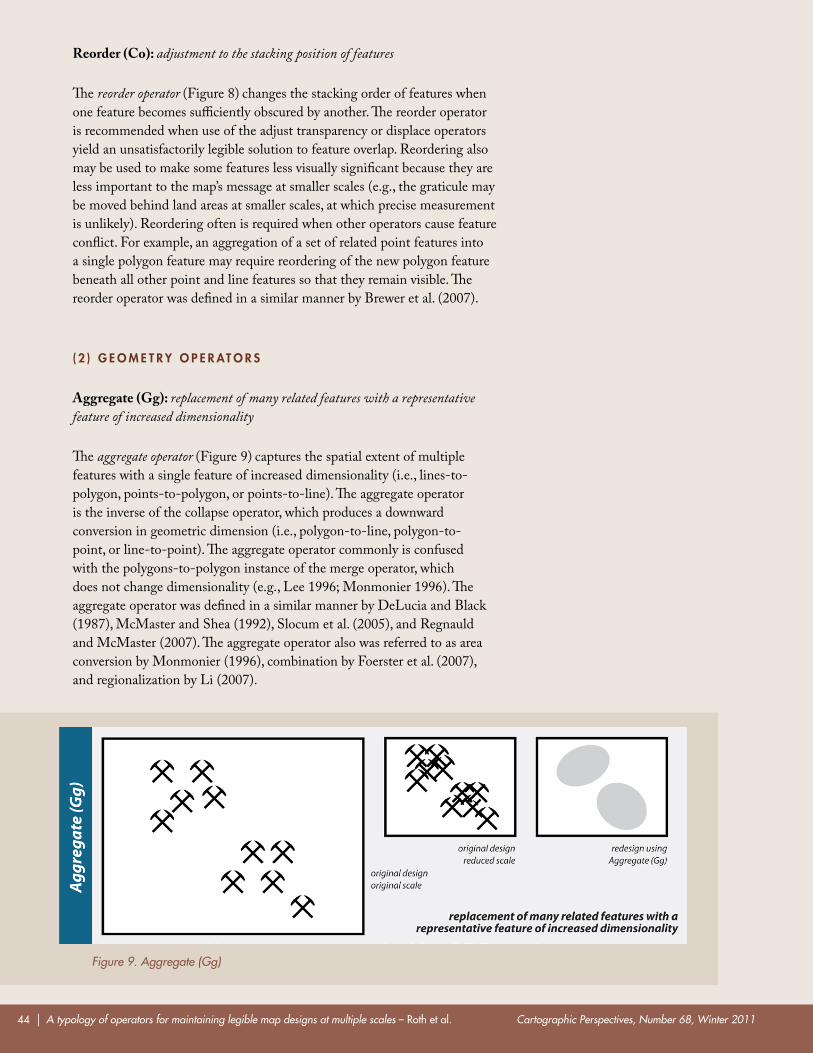
Cartographic Perspectives, Number 68, Winter 201144 | A typology of operators for maintaining legible map designs at multiple scales – roth et al.
Reorder (Co): adjustment to the stacking position of features
The reorder operator (Figure 8) changes the stacking order of features when one feature becomes sufficiently obscured by another. The reorder operator is recommended when use of the adjust transparency or displace operators yield an unsatisfactorily legible solution to feature overlap. Reordering also may be used to make some features less visually significant because they are less important to the map’s message at smaller scales (e.g., the graticule may be moved behind land areas at smaller scales, at which precise measurement is unlikely). Reordering often is required when other operators cause feature conflict. For example, an aggregation of a set of related point features into a single polygon feature may require reordering of the new polygon feature beneath all other point and line features so that they remain visible. The reorder operator was defined in a similar manner by Brewer et al. (2007).
( 2 ) g e o m e t r y o p e r At o r S
Aggregate (Gg): replacement of many related features with a representative feature of increased dimensionality
The aggregate operator (Figure 9) captures the spatial extent of multiple features with a single feature of increased dimensionality (i.e., lines-to-polygon, points-to-polygon, or points-to-line). The aggregate operator is the inverse of the collapse operator, which produces a downward conversion in geometric dimension (i.e., polygon-to-line, polygon-to-point, or line-to-point). The aggregate operator commonly is confused with the polygons-to-polygon instance of the merge operator, which does not change dimensionality (e.g., Lee 1996; Monmonier 1996). The aggregate operator was defined in a similar manner by DeLucia and Black (1987), McMaster and Shea (1992), Slocum et al. (2005), and Regnauld and McMaster (2007). The aggregate operator also was referred to as area conversion by Monmonier (1996), combination by Foerster et al. (2007), and regionalization by Li (2007).
Figure 9. Aggregate (Gg)
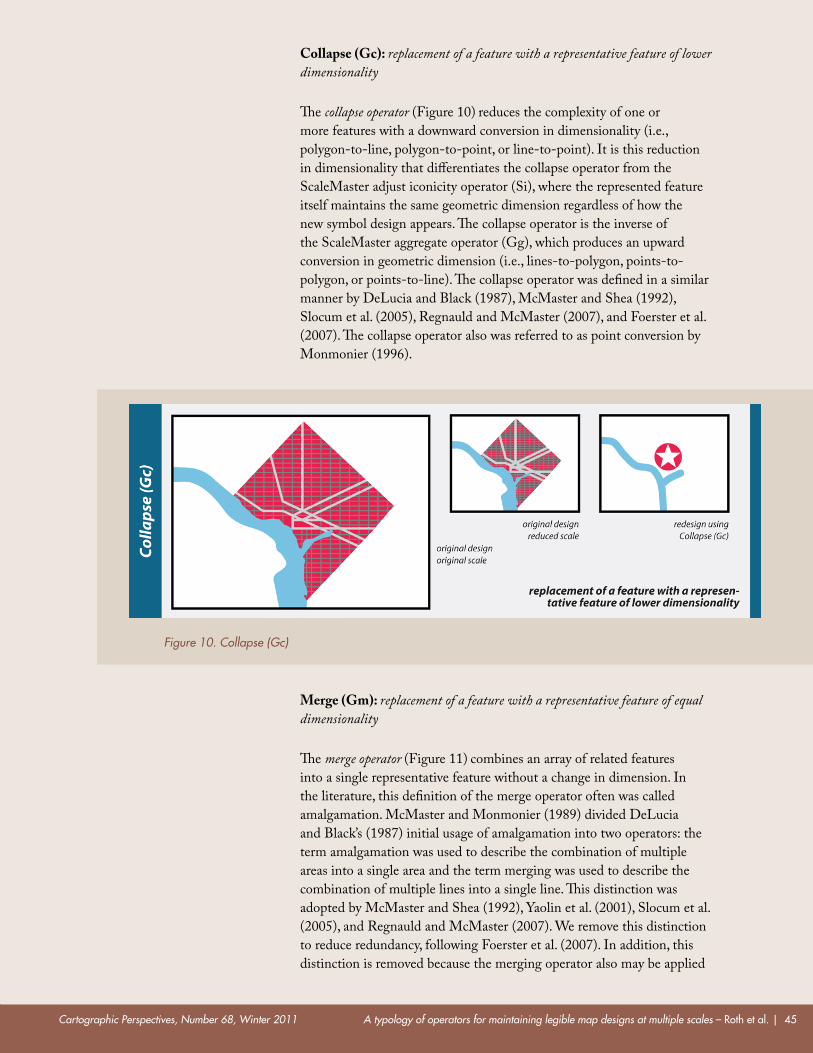
Cartographic Perspectives, Number 68, Winter 2011 A typology of operators for maintaining legible map designs at multiple scales – roth et al. | 45
Collapse (Gc): replacement of a feature with a representative feature of lower dimensionality
The collapse operator (Figure 10) reduces the complexity of one or more features with a downward conversion in dimensionality (i.e., polygon-to-line, polygon-to-point, or line-to-point). It is this reduction in dimensionality that differentiates the collapse operator from the ScaleMaster adjust iconicity operator (Si), where the represented feature itself maintains the same geometric dimension regardless of how the new symbol design appears. The collapse operator is the inverse of the ScaleMaster aggregate operator (Gg), which produces an upward conversion in geometric dimension (i.e., lines-to-polygon, points-to-polygon, or points-to-line). The collapse operator was defined in a similar manner by DeLucia and Black (1987), McMaster and Shea (1992), Slocum et al. (2005), Regnauld and McMaster (2007), and Foerster et al. (2007). The collapse operator also was referred to as point conversion by Monmonier (1996).
Merge (Gm): replacement of a feature with a representative feature of equal dimensionality
The merge operator (Figure 11) combines an array of related features into a single representative feature without a change in dimension. In the literature, this definition of the merge operator often was called amalgamation. McMaster and Monmonier (1989) divided DeLucia and Black’s (1987) initial usage of amalgamation into two operators: the term amalgamation was used to describe the combination of multiple areas into a single area and the term merging was used to describe the combination of multiple lines into a single line. This distinction was adopted by McMaster and Shea (1992), Yaolin et al. (2001), Slocum et al. (2005), and Regnauld and McMaster (2007). We remove this distinction to reduce redundancy, following Foerster et al. (2007). In addition, this distinction is removed because the merging operator also may be applied
Figure 10. Collapse (Gc)
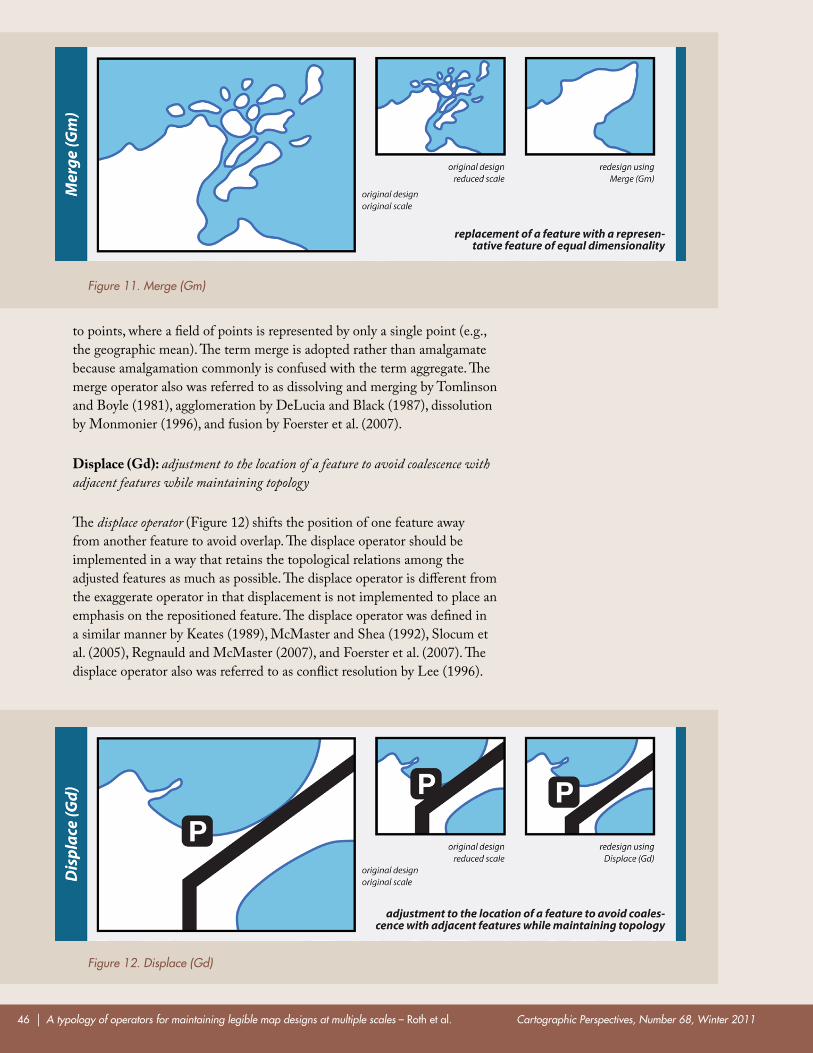
Cartographic Perspectives, Number 68, Winter 201146 | A typology of operators for maintaining legible map designs at multiple scales – roth et al.
to points, where a field of points is represented by only a single point (e.g., the geographic mean). The term merge is adopted rather than amalgamate because amalgamation commonly is confused with the term aggregate. The merge operator also was referred to as dissolving and merging by Tomlinson and Boyle (1981), agglomeration by DeLucia and Black (1987), dissolution by Monmonier (1996), and fusion by Foerster et al. (2007).
Displace (Gd): adjustment to the location of a feature to avoid coalescence with adjacent features while maintaining topology
The displace operator (Figure 12) shifts the position of one feature away from another feature to avoid overlap. The displace operator should be implemented in a way that retains the topological relations among the adjusted features as much as possible. The displace operator is different from the exaggerate operator in that displacement is not implemented to place an emphasis on the repositioned feature. The displace operator was defined in a similar manner by Keates (1989), McMaster and Shea (1992), Slocum et al. (2005), Regnauld and McMaster (2007), and Foerster et al. (2007). The displace operator also was referred to as conflict resolution by Lee (1996).
Figure 12. Displace (Gd)
Figure 11. Merge (Gm)
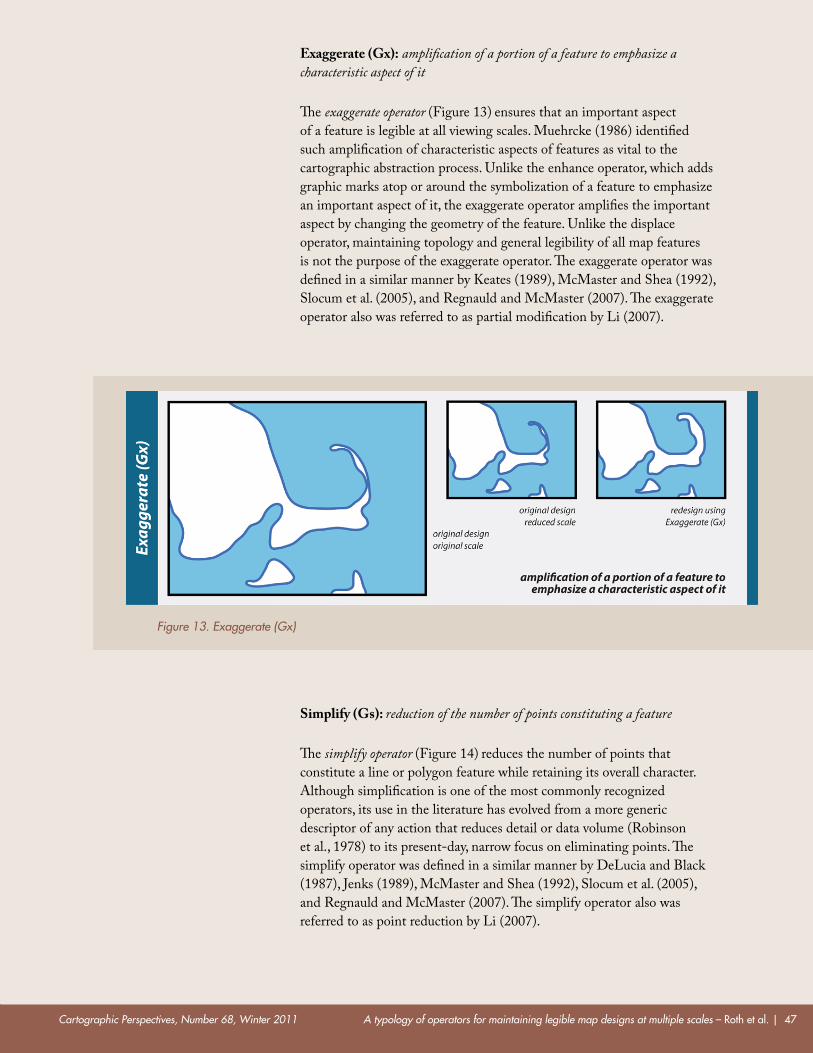
Cartographic Perspectives, Number 68, Winter 2011 A typology of operators for maintaining legible map designs at multiple scales – roth et al. | 47
Exaggerate (Gx): amplification of a portion of a feature to emphasize a characteristic aspect of it
The exaggerate operator (Figure 13) ensures that an important aspect of a feature is legible at all viewing scales. Muehrcke (1986) identified such amplification of characteristic aspects of features as vital to the cartographic abstraction process. Unlike the enhance operator, which adds graphic marks atop or around the symbolization of a feature to emphasize an important aspect of it, the exaggerate operator amplifies the important aspect by changing the geometry of the feature. Unlike the displace operator, maintaining topology and general legibility of all map features is not the purpose of the exaggerate operator. The exaggerate operator was defined in a similar manner by Keates (1989), McMaster and Shea (1992), Slocum et al. (2005), and Regnauld and McMaster (2007). The exaggerate operator also was referred to as partial modification by Li (2007).
Simplify (Gs): reduction of the number of points constituting a feature
The simplify operator (Figure 14) reduces the number of points that constitute a line or polygon feature while retaining its overall character. Although simplification is one of the most commonly recognized operators, its use in the literature has evolved from a more generic descriptor of any action that reduces detail or data volume (Robinson et al., 1978) to its present-day, narrow focus on eliminating points. The simplify operator was defined in a similar manner by DeLucia and Black (1987), Jenks (1989), McMaster and Shea (1992), Slocum et al. (2005), and Regnauld and McMaster (2007). The simplify operator also was referred to as point reduction by Li (2007).
Figure 13. Exaggerate (Gx)
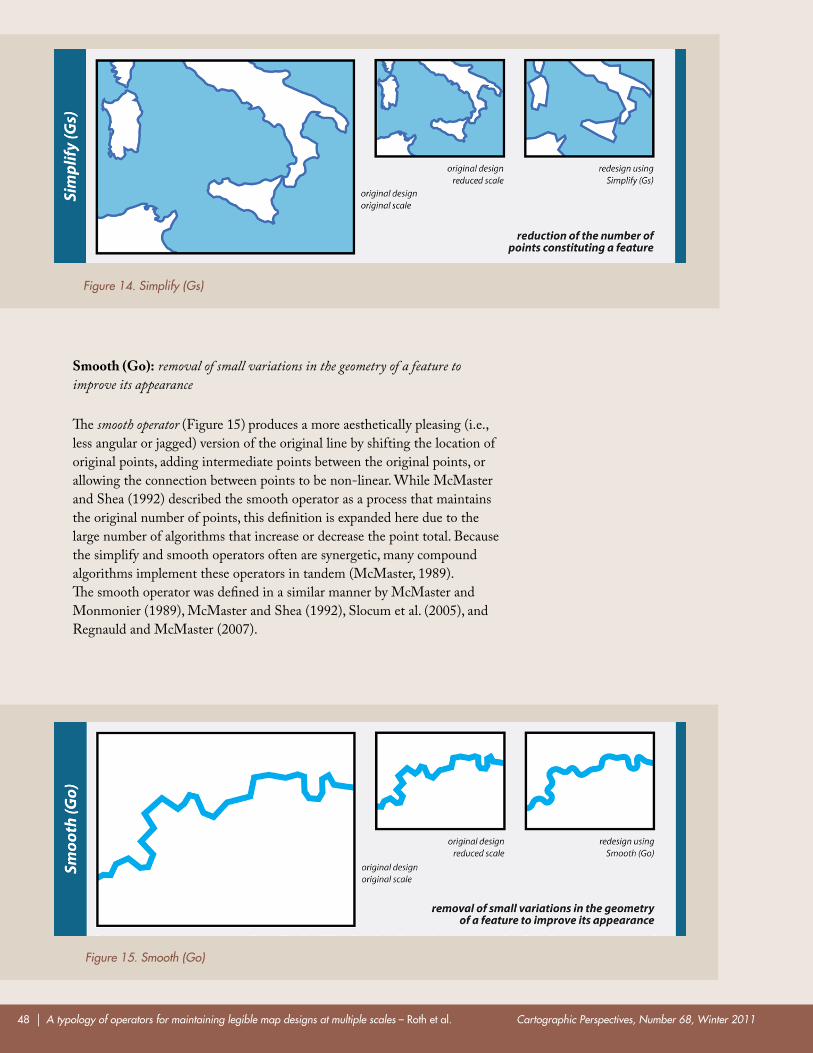
Cartographic Perspectives, Number 68, Winter 201148 | A typology of operators for maintaining legible map designs at multiple scales – roth et al.
Smooth (Go): removal of small variations in the geometry of a feature to improve its appearance
The smooth operator (Figure 15) produces a more aesthetically pleasing (i.e., less angular or jagged) version of the original line by shifting the location of original points, adding intermediate points between the original points, or allowing the connection between points to be non-linear. While McMaster and Shea (1992) described the smooth operator as a process that maintains the original number of points, this definition is expanded here due to the large number of algorithms that increase or decrease the point total. Because the simplify and smooth operators often are synergetic, many compound algorithms implement these operators in tandem (McMaster, 1989). The smooth operator was defined in a similar manner by McMaster and Monmonier (1989), McMaster and Shea (1992), Slocum et al. (2005), and Regnauld and McMaster (2007).
Figure 15. Smooth (Go)
Figure 14. Simplify (Gs)
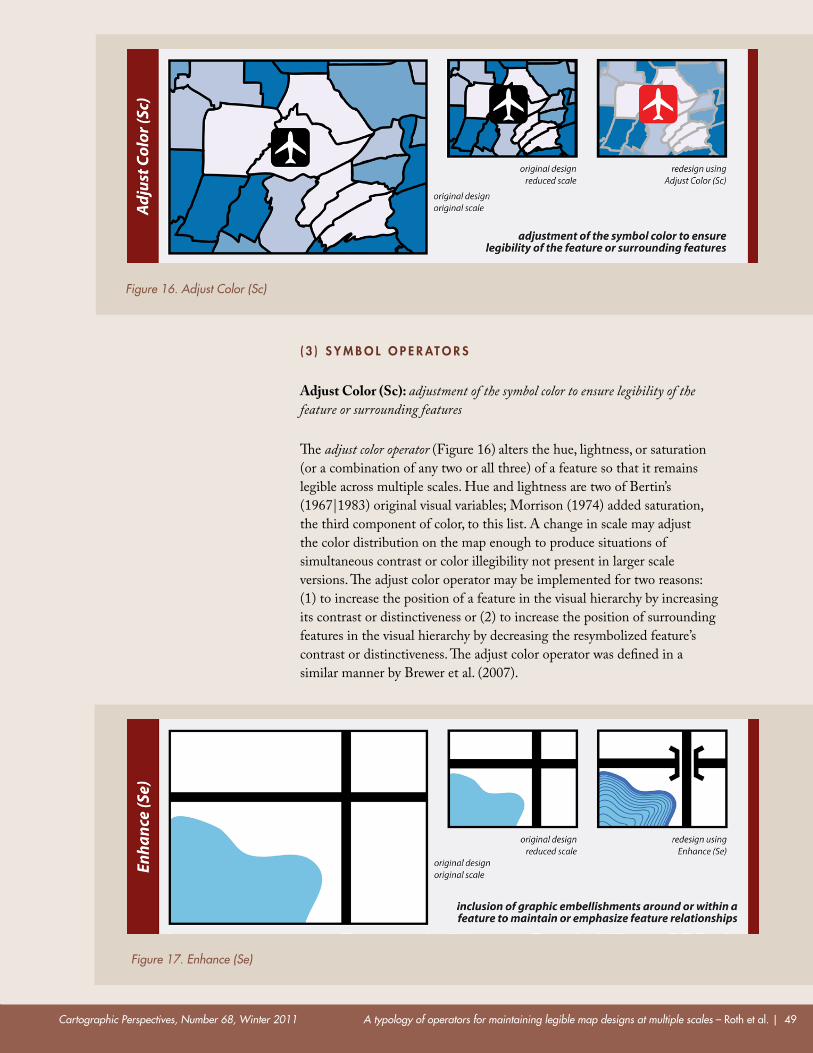
Cartographic Perspectives, Number 68, Winter 2011 A typology of operators for maintaining legible map designs at multiple scales – roth et al. | 49
( 3 ) S y m b o l o p e r At o r S
Adjust Color (Sc): adjustment of the symbol color to ensure legibility of the feature or surrounding features
The adjust color operator (Figure 16) alters the hue, lightness, or saturation (or a combination of any two or all three) of a feature so that it remains legible across multiple scales. Hue and lightness are two of Bertin’s (1967|1983) original visual variables; Morrison (1974) added saturation, the third component of color, to this list. A change in scale may adjust the color distribution on the map enough to produce situations of simultaneous contrast or color illegibility not present in larger scale versions. The adjust color operator may be implemented for two reasons: (1) to increase the position of a feature in the visual hierarchy by increasing its contrast or distinctiveness or (2) to increase the position of surrounding features in the visual hierarchy by decreasing the resymbolized feature’s contrast or distinctiveness. The adjust color operator was defined in a similar manner by Brewer et al. (2007).
Figure 16. Adjust Color (Sc)
Figure 17. Enhance (Se)
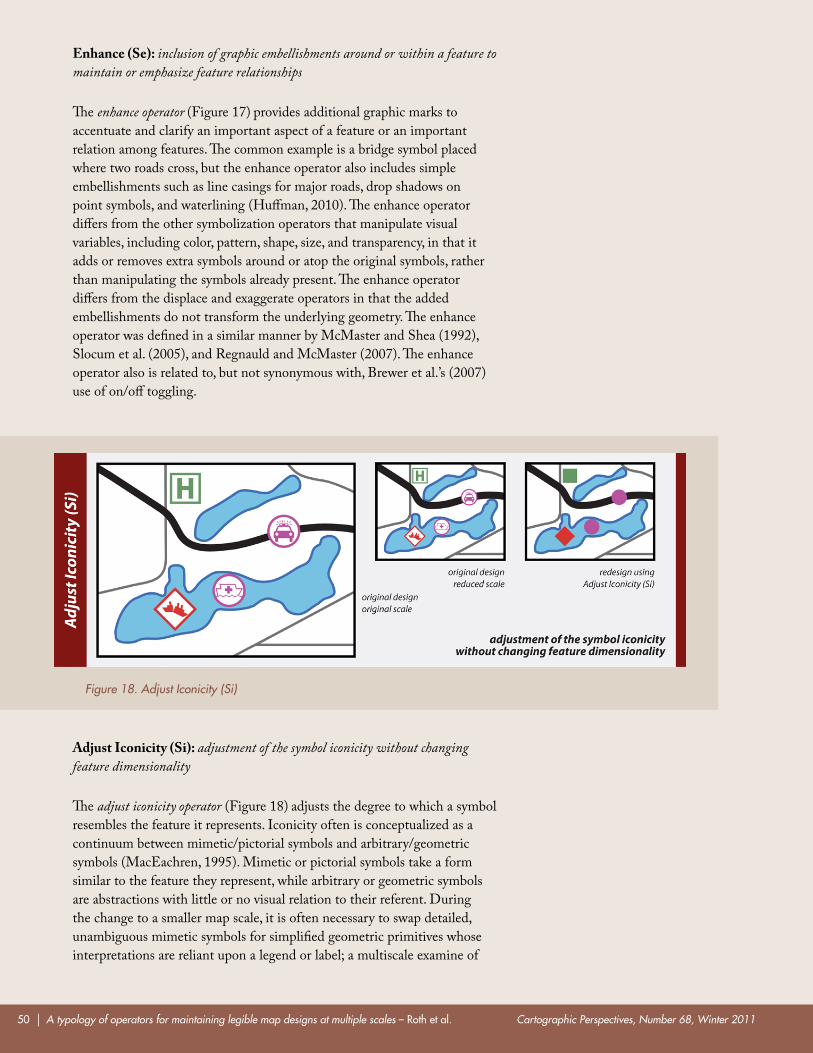
Cartographic Perspectives, Number 68, Winter 201150 | A typology of operators for maintaining legible map designs at multiple scales – roth et al.
Enhance (Se): inclusion of graphic embellishments around or within a feature to maintain or emphasize feature relationships
The enhance operator (Figure 17) provides additional graphic marks to accentuate and clarify an important aspect of a feature or an important relation among features. The common example is a bridge symbol placed where two roads cross, but the enhance operator also includes simple embellishments such as line casings for major roads, drop shadows on point symbols, and waterlining (Huffman, 2010). The enhance operator differs from the other symbolization operators that manipulate visual variables, including color, pattern, shape, size, and transparency, in that it adds or removes extra symbols around or atop the original symbols, rather than manipulating the symbols already present. The enhance operator differs from the displace and exaggerate operators in that the added embellishments do not transform the underlying geometry. The enhance operator was defined in a similar manner by McMaster and Shea (1992), Slocum et al. (2005), and Regnauld and McMaster (2007). The enhance operator also is related to, but not synonymous with, Brewer et al.’s (2007) use of on/off toggling.
Adjust Iconicity (Si): adjustment of the symbol iconicity without changing feature dimensionality
The adjust iconicity operator (Figure 18) adjusts the degree to which a symbol resembles the feature it represents. Iconicity often is conceptualized as a continuum between mimetic/pictorial symbols and arbitrary/geometric symbols (MacEachren, 1995). Mimetic or pictorial symbols take a form similar to the feature they represent, while arbitrary or geometric symbols are abstractions with little or no visual relation to their referent. During the change to a smaller map scale, it is often necessary to swap detailed, unambiguous mimetic symbols for simplified geometric primitives whose interpretations are reliant upon a legend or label; a multiscale examine of
Figure 18. Adjust Iconicity (Si)
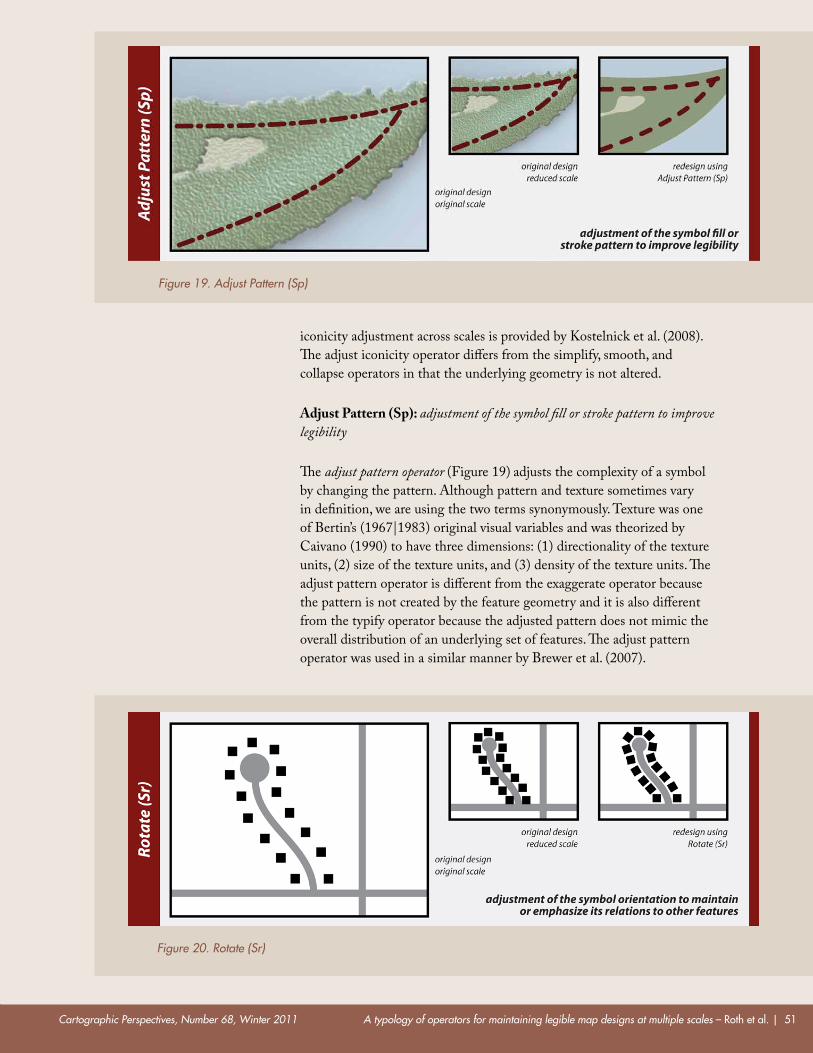
Cartographic Perspectives, Number 68, Winter 2011 A typology of operators for maintaining legible map designs at multiple scales – roth et al. | 51
iconicity adjustment across scales is provided by Kostelnick et al. (2008). The adjust iconicity operator differs from the simplify, smooth, and collapse operators in that the underlying geometry is not altered.
Adjust Pattern (Sp): adjustment of the symbol fill or stroke pattern to improve legibility
The adjust pattern operator (Figure 19) adjusts the complexity of a symbol by changing the pattern. Although pattern and texture sometimes vary in definition, we are using the two terms synonymously. Texture was one of Bertin’s (1967|1983) original visual variables and was theorized by Caivano (1990) to have three dimensions: (1) directionality of the texture units, (2) size of the texture units, and (3) density of the texture units. The adjust pattern operator is different from the exaggerate operator because the pattern is not created by the feature geometry and it is also different from the typify operator because the adjusted pattern does not mimic the overall distribution of an underlying set of features. The adjust pattern operator was used in a similar manner by Brewer et al. (2007).
Figure 19. Adjust Pattern (Sp)
Figure 20. Rotate (Sr)
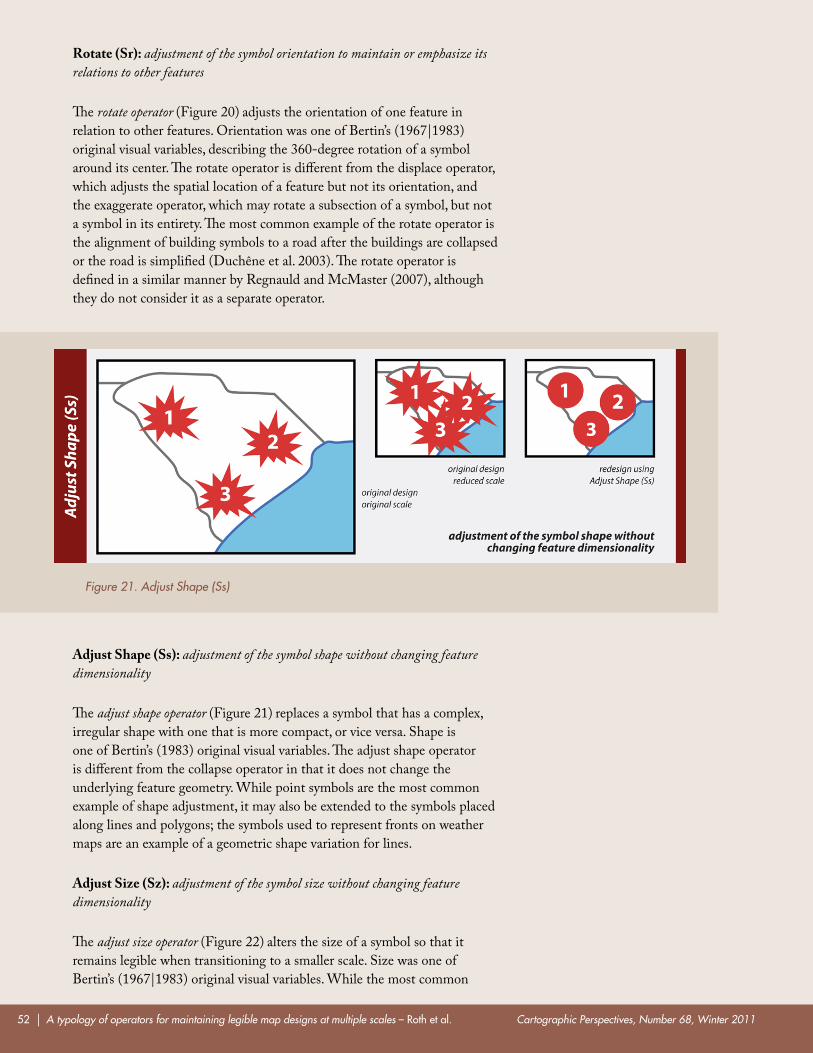
Cartographic Perspectives, Number 68, Winter 201152 | A typology of operators for maintaining legible map designs at multiple scales – roth et al.
Rotate (Sr): adjustment of the symbol orientation to maintain or emphasize its relations to other features
The rotate operator (Figure 20) adjusts the orientation of one feature in relation to other features. Orientation was one of Bertin’s (1967|1983) original visual variables, describing the 360-degree rotation of a symbol around its center. The rotate operator is different from the displace operator, which adjusts the spatial location of a feature but not its orientation, and the exaggerate operator, which may rotate a subsection of a symbol, but not a symbol in its entirety. The most common example of the rotate operator is the alignment of building symbols to a road after the buildings are collapsed or the road is simplified (Duchêne et al. 2003). The rotate operator is defined in a similar manner by Regnauld and McMaster (2007), although they do not consider it as a separate operator.
Adjust Shape (Ss): adjustment of the symbol shape without changing feature dimensionality
The adjust shape operator (Figure 21) replaces a symbol that has a complex, irregular shape with one that is more compact, or vice versa. Shape is one of Bertin’s (1983) original visual variables. The adjust shape operator is different from the collapse operator in that it does not change the underlying feature geometry. While point symbols are the most common example of shape adjustment, it may also be extended to the symbols placed along lines and polygons; the symbols used to represent fronts on weather maps are an example of a geometric shape variation for lines.
Adjust Size (Sz): adjustment of the symbol size without changing feature dimensionality
The adjust size operator (Figure 22) alters the size of a symbol so that it remains legible when transitioning to a smaller scale. Size was one of Bertin’s (1967|1983) original visual variables. While the most common
Figure 21. Adjust Shape (Ss)
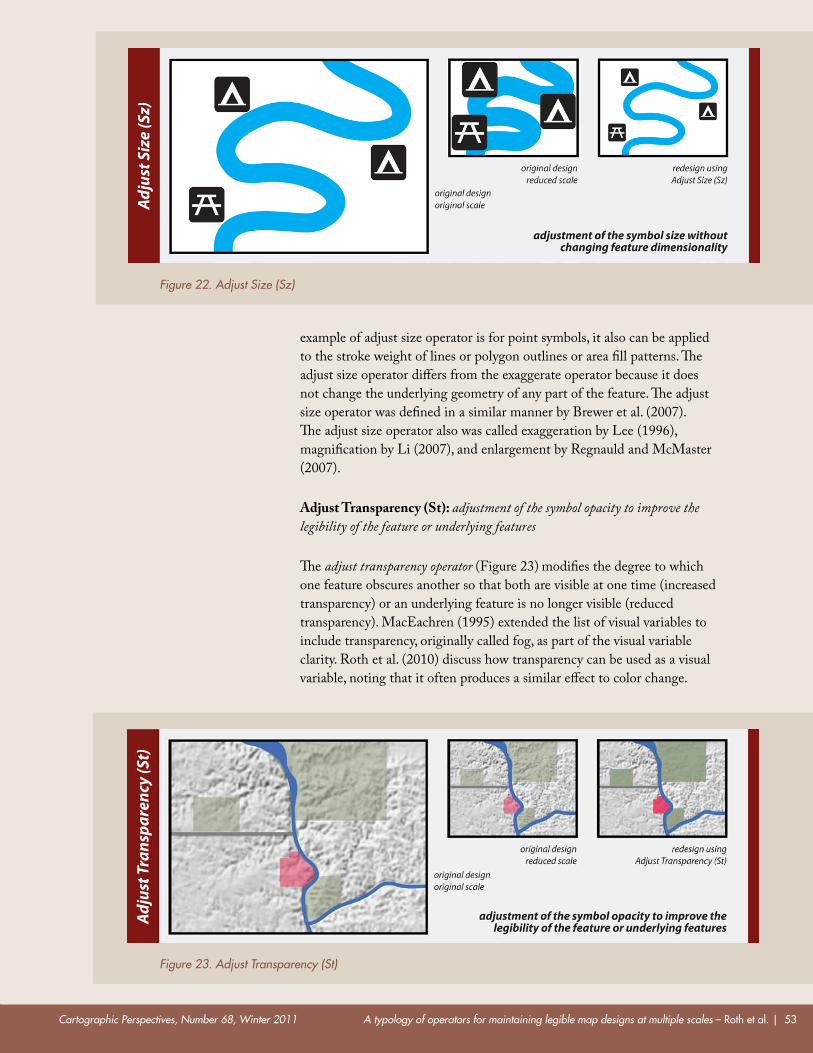
Cartographic Perspectives, Number 68, Winter 2011 A typology of operators for maintaining legible map designs at multiple scales – roth et al. | 53
example of adjust size operator is for point symbols, it also can be applied to the stroke weight of lines or polygon outlines or area fill patterns. The adjust size operator differs from the exaggerate operator because it does not change the underlying geometry of any part of the feature. The adjust size operator was defined in a similar manner by Brewer et al. (2007). The adjust size operator also was called exaggeration by Lee (1996), magnification by Li (2007), and enlargement by Regnauld and McMaster (2007).
Adjust Transparency (St): adjustment of the symbol opacity to improve the legibility of the feature or underlying features
The adjust transparency operator (Figure 23) modifies the degree to which one feature obscures another so that both are visible at one time (increased transparency) or an underlying feature is no longer visible (reduced transparency). MacEachren (1995) extended the list of visual variables to include transparency, originally called fog, as part of the visual variable clarity. Roth et al. (2010) discuss how transparency can be used as a visual variable, noting that it often produces a similar effect to color change.
Figure 23. Adjust Transparency (St)
Figure 22. Adjust Size (Sz)
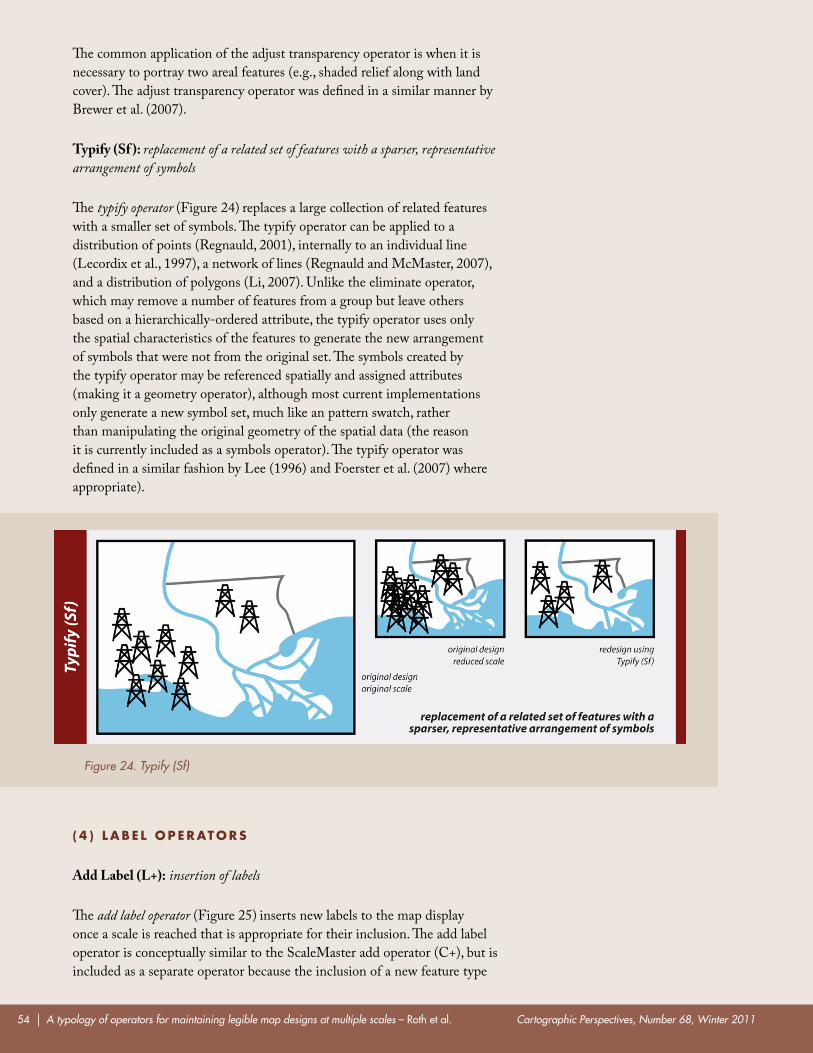
Cartographic Perspectives, Number 68, Winter 201154 | A typology of operators for maintaining legible map designs at multiple scales – roth et al.
The common application of the adjust transparency operator is when it is necessary to portray two areal features (e.g., shaded relief along with land cover). The adjust transparency operator was defined in a similar manner by Brewer et al. (2007).
Typify (Sf ): replacement of a related set of features with a sparser, representative arrangement of symbols
The typify operator (Figure 24) replaces a large collection of related features with a smaller set of symbols. The typify operator can be applied to a distribution of points (Regnauld, 2001), internally to an individual line (Lecordix et al., 1997), a network of lines (Regnauld and McMaster, 2007), and a distribution of polygons (Li, 2007). Unlike the eliminate operator, which may remove a number of features from a group but leave others based on a hierarchically-ordered attribute, the typify operator uses only the spatial characteristics of the features to generate the new arrangement of symbols that were not from the original set. The symbols created by the typify operator may be referenced spatially and assigned attributes (making it a geometry operator), although most current implementations only generate a new symbol set, much like an pattern swatch, rather than manipulating the original geometry of the spatial data (the reason it is currently included as a symbols operator). The typify operator was defined in a similar fashion by Lee (1996) and Foerster et al. (2007) where appropriate).
( 4 ) l a b e l o p e r at o r s
Add Label (L+): insertion of labels
The add label operator (Figure 25) inserts new labels to the map display once a scale is reached that is appropriate for their inclusion. The add label operator is conceptually similar to the ScaleMaster add operator (C+), but is included as a separate operator because the inclusion of a new feature type
Figure 24. Typify (Sf)
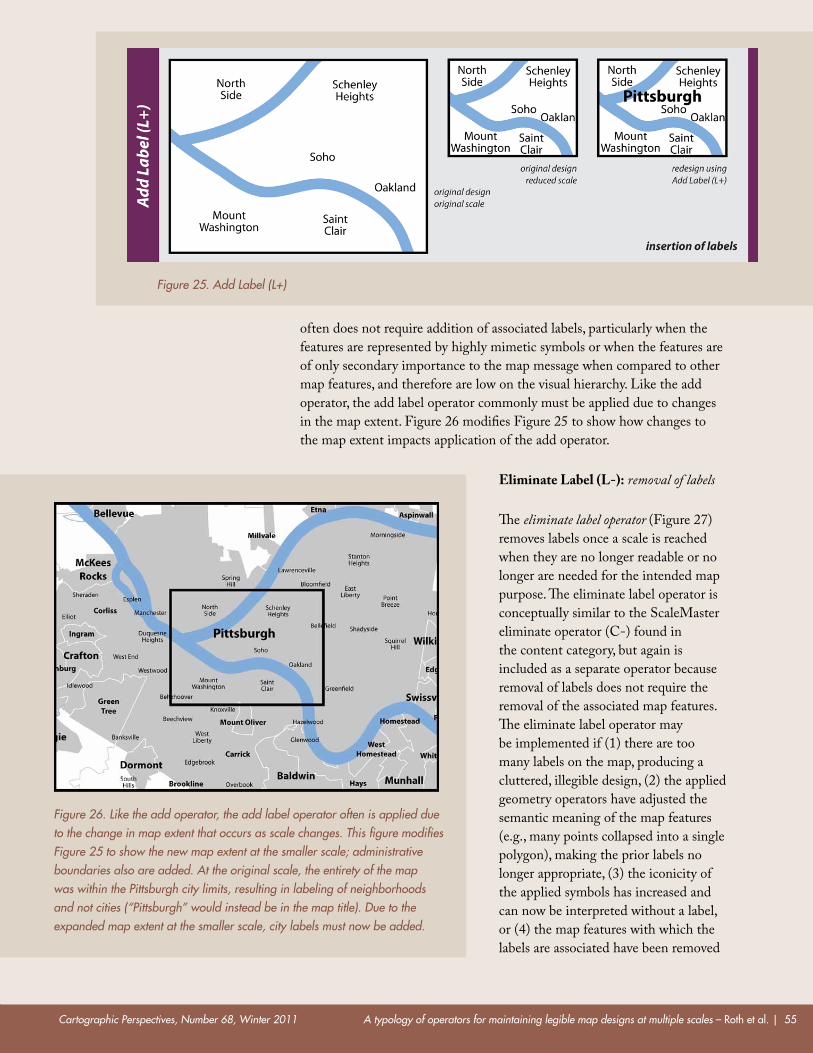
Cartographic Perspectives, Number 68, Winter 2011 A typology of operators for maintaining legible map designs at multiple scales – roth et al. | 55
Figure 25. Add Label (L+)
often does not require addition of associated labels, particularly when the features are represented by highly mimetic symbols or when the features are of only secondary importance to the map message when compared to other map features, and therefore are low on the visual hierarchy. Like the add operator, the add label operator commonly must be applied due to changes in the map extent. Figure 26 modifies Figure 25 to show how changes to the map extent impacts application of the add operator.
Eliminate Label (L-): removal of labels
The eliminate label operator (Figure 27) removes labels once a scale is reached when they are no longer readable or no longer are needed for the intended map purpose. The eliminate label operator is conceptually similar to the ScaleMaster eliminate operator (C-) found in the content category, but again is included as a separate operator because removal of labels does not require the removal of the associated map features. The eliminate label operator may be implemented if (1) there are too many labels on the map, producing a cluttered, illegible design, (2) the applied geometry operators have adjusted the semantic meaning of the map features (e.g., many points collapsed into a single polygon), making the prior labels no longer appropriate, (3) the iconicity of the applied symbols has increased and can now be interpreted without a label, or (4) the map features with which the labels are associated have been removed
Figure 26. Like the add operator, the add label operator often is applied due to the change in map extent that occurs as scale changes. This figure modifies Figure 25 to show the new map extent at the smaller scale; administrative boundaries also are added. At the original scale, the entirety of the map was within the Pittsburgh city limits, resulting in labeling of neighborhoods and not cities (“Pittsburgh” would instead be in the map title). Due to the expanded map extent at the smaller scale, city labels must now be added.
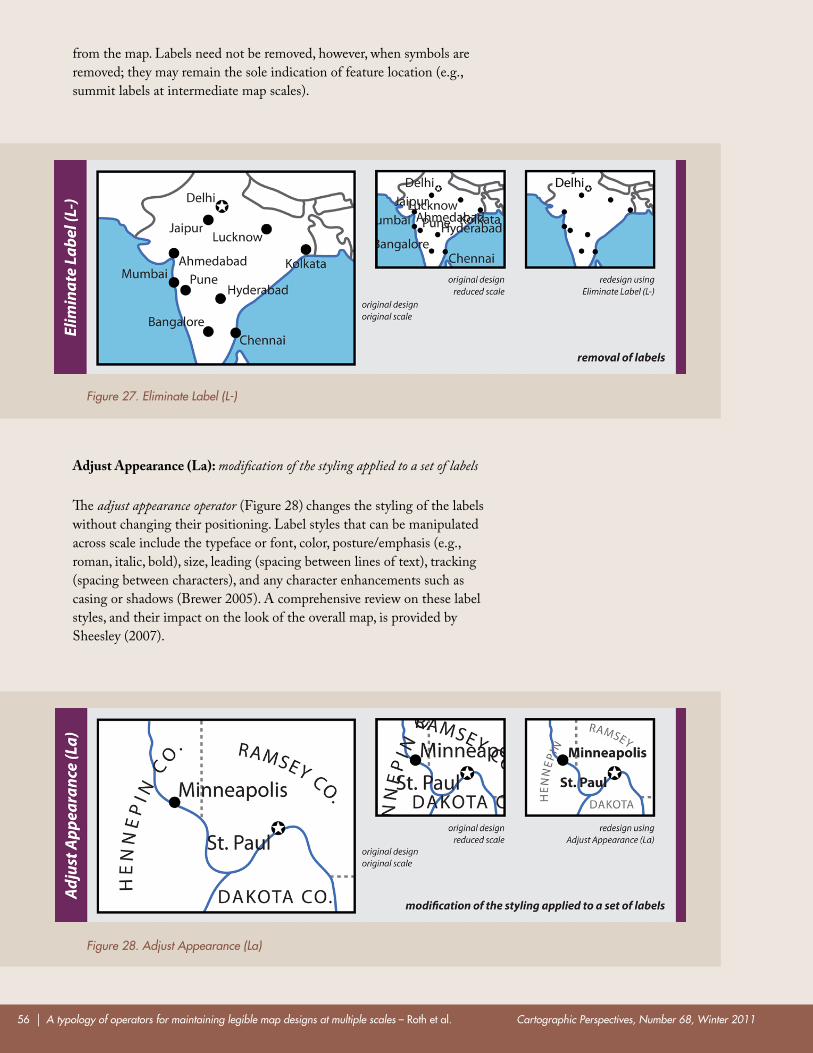
Cartographic Perspectives, Number 68, Winter 201156 | A typology of operators for maintaining legible map designs at multiple scales – roth et al.
from the map. Labels need not be removed, however, when symbols are removed; they may remain the sole indication of feature location (e.g., summit labels at intermediate map scales).
Adjust Appearance (La): modification of the styling applied to a set of labels
The adjust appearance operator (Figure 28) changes the styling of the labels without changing their positioning. Label styles that can be manipulated across scale include the typeface or font, color, posture/emphasis (e.g., roman, italic, bold), size, leading (spacing between lines of text), tracking (spacing between characters), and any character enhancements such as casing or shadows (Brewer 2005). A comprehensive review on these label styles, and their impact on the look of the overall map, is provided by Sheesley (2007).
Figure 28. Adjust Appearance (La)
Figure 27. Eliminate Label (L-)
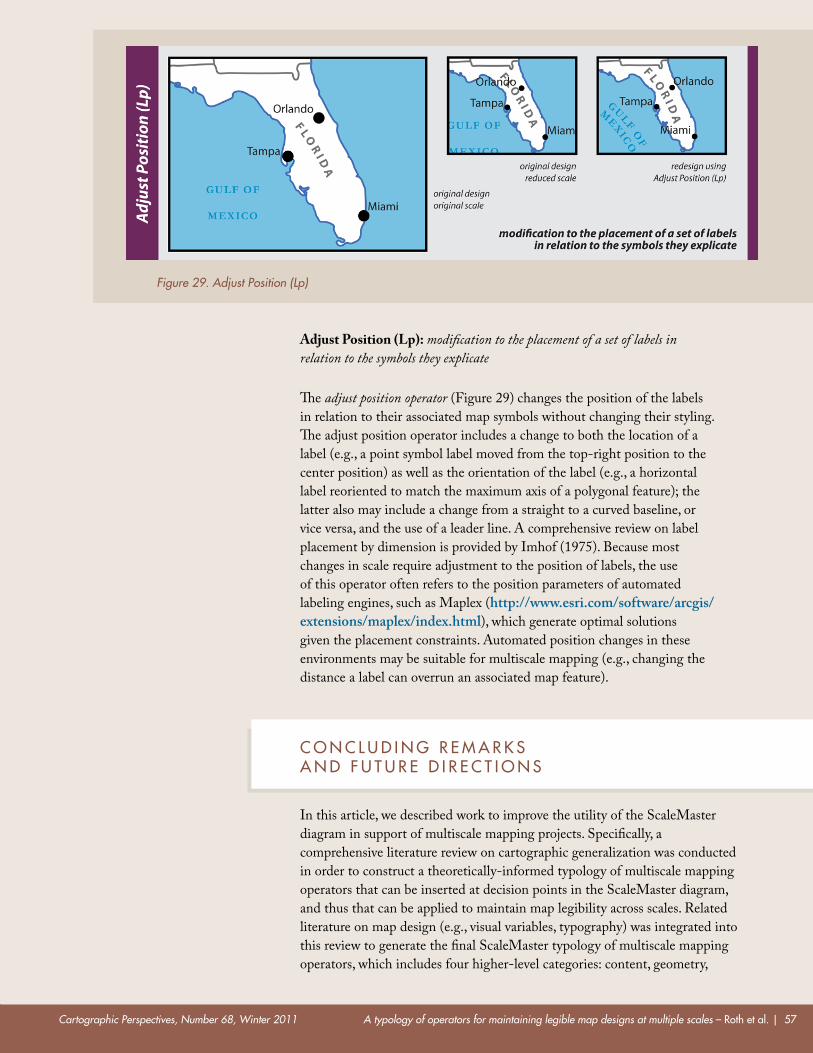
Cartographic Perspectives, Number 68, Winter 2011 A typology of operators for maintaining legible map designs at multiple scales – roth et al. | 57
Adjust Position (Lp): modification to the placement of a set of labels in relation to the symbols they explicate
The adjust position operator (Figure 29) changes the position of the labels in relation to their associated map symbols without changing their styling. The adjust position operator includes a change to both the location of a label (e.g., a point symbol label moved from the top-right position to the center position) as well as the orientation of the label (e.g., a horizontal label reoriented to match the maximum axis of a polygonal feature); the latter also may include a change from a straight to a curved baseline, or vice versa, and the use of a leader line. A comprehensive review on label placement by dimension is provided by Imhof (1975). Because most changes in scale require adjustment to the position of labels, the use of this operator often refers to the position parameters of automated labeling engines, such as Maplex (http://www.esri.com/software/arcgis/extensions/maplex/index.html), which generate optimal solutions given the placement constraints. Automated position changes in these environments may be suitable for multiscale mapping (e.g., changing the distance a label can overrun an associated map feature).
c o n c l u d I n g r e M a r k s a n d F u t u r e d I r e c t I o n s
In this article, we described work to improve the utility of the ScaleMaster diagram in support of multiscale mapping projects. Specifically, a comprehensive literature review on cartographic generalization was conducted in order to construct a theoretically-informed typology of multiscale mapping operators that can be inserted at decision points in the ScaleMaster diagram, and thus that can be applied to maintain map legibility across scales. Related literature on map design (e.g., visual variables, typography) was integrated into this review to generate the final ScaleMaster typology of multiscale mapping operators, which includes four higher-level categories: content, geometry,
Figure 29. Adjust Position (Lp)
Cartographic Perspectives, Number 68, Winter 201158 | A typology of operators for maintaining legible map designs at multiple scales – roth et al.
symbol, and label. We anticipate the typology, and its associated review of past work, to be useful in three ways: (1) as a classroom teaching tool, (2) as a guide for multiscale mapping practitioners, and (3) as a conceptual foundation for future scientific research. As stated above, we expect the set of operators to increase as technology and practice evolves, although we also expect the higher-level categorization to remain a useful framework for conceptualizing and organizing multiscale mapping operators.
Multiscale mapping is a topic of increasing importance to academic and practicing cartographers, with application to such contemporary cartographic efforts as MRDB, national mapping agencies, and web mapping services. The ScaleMaster diagram, and the associated multiscale mapping typology described here, has much promise to facilitate these efforts. However, key technological and scientific improvements remain, such as:
ScaleMaster as a Service: While the ScaleMaster diagram has proven to be a useful organization tool, its construction is not straightforward and often completed in an informal manner (e.g., in Excel or using pen/paper). A potential advance is to provide a service to formalize and expedite the ScaleMaster diagram construction process and also allow for digital notes to be included describing the algorithmic or design parameters for each applied multiscale mapping operator. Such a service should leverage existing geocollaboration technologies, allowing team members to construct, review, and annotate their project’s associated ScaleMaster.
ScaleMaster as an Interface: Perhaps the ultimate vision of the ScaleMaster diagram is integration with desktop GIS software that offers multiscale mapping functionality. Here, the ScaleMaster diagram becomes an interface for manipulating multiscale map design, rather than an ancillary document for recording the design decisions. A logical interface metaphor for the ScaleMaster diagram would be a horizontal interface associated with each layer in the vertical layer stack, allowing users to insert decision points and apply operators interactively. As online mapping matures, ScaleMaster could alternatively be viewed as an interface to a map delivery source that allows the user to retrieve maps (or the underlying data) suited for a particular scale or resolution.
The Science of ScaleMaster: A by-product of developing ScaleMaster services and interfaces is that trained and untrained cartographers alike would be able to generate inappropriate multiscale map designs more quickly and more easily. Likewise, no single ScaleMaster provides a ‘best’ solution; there are trade-offs among pairs of operators that need to be considered when finalizing a multiscale map design (Cecconi et al. 2002). For example, geometry operators, which leverage the computation power of a computer, may generate cartographically suboptimal solutions in comparison to symbol operators, which generate tailored solutions but require a large amount of manual adjustment and cartographic license. The science of multiscale mapping needs to catch up to its practice in order to understand how best to apply the available multiscale mapping operators across map scales and
Cartographic Perspectives, Number 68, Winter 2011 A typology of operators for maintaining legible map designs at multiple scales – roth et al. | 59
map themes; the multiscale mapping typology described here could be used as a framework for such testing. A result of this work would be a set of design guidelines for multiscale mapping projects.
Multiscale mapping is an aspect of mapmaking growing in use and inviting innovation. Through the new discussion forum of Cartographic Perspectives, we invite feedback about the ScaleMaster typology of multiscale mapping operators offered here and ideas for expanding the utility of the ScaleMaster diagram in support of multiscale mapping projects.
a c k n o W l e d g e M e n t s
We are grateful for the advice on this typology that was provided by Barbara Buttenfield, Charlie Frye, and E. Lynn Usery. We would also like to thank Carolyn Fish and Douglas Schoch for their assistance with the Portland multiscale mapping project posted to the ScaleMaster website (http://www.scalemaster.org), and the associated ScaleMaster diagram used in this paper. Finally, we would like to thank Jess Acosta, Mamata Akella, and Chelsea Hanchett for their help in refining the ScaleMaster concept.
r e F e r e n c e s
Bertin, J. 1967|1983. Semiology of Graphics: Diagrams, Networks, Maps. Madison, WI: University of Wisconsin Press.
Bloch, M., and M. Harrower. 2006. MapShaper.org: A map generalization web service. In: Proceedings of AutoCarto 2006. Vancouver, WA.
Brewer, C. A. 2005. Designing better maps: A guide for GIS users. Redlands, CA: Esri Press.
Brewer, C. A., and B. P. Buttenfield. 2007. Framing guidelines for multi-scale map design using databases at multiple resolutions. Cartographic and Geographic Information Science. 34(1): 3–15.
Brewer, C. A., and B. P. Buttenfield. 2010. Mastering map scale: Balancing workloads using display and geometry change in multi-scale mapping. Geoinformatica. 14(2): 221–239.
Brewer, C. A., B. P. Buttenfield, C. Frye, and J. Acosta. 2007. ScaleMaster: Multi-scale mapmaking from multiple database resolutions and for multiple map purposes. In: Proceedings of the International Cartographic Conference. Moscow, Russia.
Cartographic Perspectives, Number 68, Winter 201160 | A typology of operators for maintaining legible map designs at multiple scales – roth et al.
Brewer, C. A., C. L. Hanchett, B. P. Buttenfield, and E. L. Usery. 2010. Performance of map symbol and label design with format and display resolution options through scale for the The National Map. In: Proceedings of AutoCarto 2010. Orlando, FL.
Buttenfield, B. P., L. V. Stanislawski, and C. A. Brewer. 2010. Multiscale representations of water: Tailoring generalization sequences to specific physiographic regimes. In: Proceedings of GIScience 2010. Zurich, Switzerland.
Butzler, S. J., C. A. Brewer, and W. J. Stroh. 2011. Establishing classification and hierarchy in populated place labeling for multiscale mapping for The National Map. Cartography and Geographic Information Science. 38(2).
Caivano, J. 1990. Visual texture as a semiotic system. Semiotica. 80(3-4): 239–252.
Cecconi, A., R. Weibel, and M. Barrault. 2002. Improving automated generalisation for on-demand web mapping by multiscale databases. In: Symposium on Geospatial Theory, Processing, and Applications. Ottawa, Canada: ISPRS/IGU.
Clarke, K. C., M. R. Armstrong, D. J. Cowen, D. P. Koepp, X. Lopez, R. D. Miller, G. W. Teselle, W. R. Tobler, and N. V Meyer. 2003. Weaving a National Map: A review of the U.S. Geological Survey concept of The National Map. Washington, DC: The National Research Council of the National Academies, The National Academies Press.
Cromley, R., and G. Campbell. 1992. Integrating quantitative and qualitative aspects of digital line simplification. The Cartographic Journal. 29(1): 25–30.
DeLucia, A., and R. Black. 1987. Comprehensive approach to automatic feature generalization. In: Proceedings of the 13th International Cartographic Conference. Morelia, Mexico.
Dent, B. D., J. S. Torguson, and T. W. Hodler. 2009. Cartography: Thematic map design. Boston, MA: WCB/McGraw-Hill.
Douglas, D. H., and T. K. Peucker. 1973. Algorithms for the reduction of the number of points required to represent a digitized line or its caricature. The Canadian Cartographer. 10(2): 112–122.
Duchêne, C., S. Bard, X. Barillot, A. Ruas, J. Trévisan, and F. Holzapfel. 2003. Quantitative and qualitative description of building orientation. In: Fifth Workshop on Progress in Automated Map Generalisation. Paris, France.
Foerster, T. 2010. Web-based architecture for on-demand maps: Integrating meaninful generalization processing. PhD Dissertation. Enschede, The
Cartographic Perspectives, Number 68, Winter 2011 A typology of operators for maintaining legible map designs at multiple scales – roth et al. | 61
Netherlands: International Institute for Geo-Information Science and Earth Observation.
Foerster, T., J. Stoter, and B. Kobben. 2007. Towards a formal classification of generalization operators. In: Proceedings of the 23rd International Cartographic Conference. Moscow, Russia.
Gruenreich, D. 1985. Computer-assisted generalization. In: Papers CERCO-Cartography Course. Frankfurt, Germany: Institut fur Angewandte Geodasie.
Gruenreich, D. 1992. ATKIS - A topographic information system as a basis for GIS and digital cartography in Germany. In: R. Vinken (Ed.) From Digital Map Series to Geo-Information Systems, Geologisches Jarhrbuch Series A. Hannover, Germany: Federal Institute of Geosciences and Resources.
Gruenreich, D. 1995. Development of computer-assisted generalization. In: J.-C. Muller, J.-P. Langrange, and R. Weibel (Eds.) GIS and Generalization: Methodology and Practice. London, England: Taylor & Francis.
Heller, M. 1990. Triangulation algorithms for adaptive terrain modeling. In: 4th International Symposium on Spatial Data Handling (SDH ’90). Zurich, Switzerland: International Geographical Union.
Huffman, D. 2010. On waterlines, and why modern Cartography needs them. Cartographic Perspectives. 66: 23–30.
Imhof, E. 1975. Positioning Names on Maps. The American Cartographer. 2(2): 128–144.
Jenks, G. F. 1989. Geographic logic in line generalization. Cartographica. 26(1): 27–42.
Keates, J. 1989. Cartographic design and production. Harlow, UK: Longman Scientific.
Kilpeläinen, T. 1997. Multiple representation and generalization of geo-databases for topographic maps. PhD Dissertation. Helsinki, Finland: Finnish Geodetic Institute.
Kostelnick, J. C., J. E. Dobson, S. L. Egbert, and M. D. Dunbar. 2008. Cartographic symbols for humanitarian demining. The Cartographic Journal. 45(1): 18–31.
Lecordix, F., C. Plazanet, and J.-P. Lagrange. 1997. A platform for research in generalization: Application to caricature. GeoInformatica. 1(2): 161–182.
Lee, D. 1996. Automation of map generalization: The cutting-edge technology. Esri White Paper Series. Redlands, CA: Esri.
Cartographic Perspectives, Number 68, Winter 201162 | A typology of operators for maintaining legible map designs at multiple scales – roth et al.
Li, Z. 2007. Algorithmic foundation of multi-scale spatial representation. Boca Raton, FL: CRC Press, Taylor & Francis Group.
MacEachren, A. M. 1995. How maps work. New York, NY: The Guilford Press.
McMaster, R. 1989. The integration of simplification and smoothing routines in line generalization. Cartographica. 26(1): 101–121.
McMaster, R., and M. Monmonier. 1989. A conceptual framework for quantitative and qualitative raster-mode generalization. In: GIS/LIS ’89. Orlando, FL.
McMaster, R., and K. Shea. 1992. Generalization in Digital Cartography, Washington, DC: Association of American Geographers Press.
Monmonier, M. 1991. Ethics and map design. Six strategies for confronting the traditional one-map solution. Cartographic Perspectives. 10: 3–8.
Monmonier, M. 1996. How to lie with maps. Chicago, IL: University of Chicago Press.
Morrison, J. 1974. A theoretical framework for cartographic generalization with the emphasis on the process of symbolization. International Yearbook of Cartography. 14: 115–127.
Muehrcke, P. 1986. Map Use: Reading, analysis, and interpretation. Madison, WI: JP Publications.
Müller, J. C. 1987. Fractal and automated line generalization. The Cartographic Journal. 24(1): 27–34.
Müller, J. C., and Z. Wang. 1992. Area-patch generalization: A competitive approach. The Cartographic Journal. 29(2): 137–144.
Nyerges, T. 1991. Representing geographical meaning. In: B. Buttenfield and R. McMaster (Eds.) Map Generalization: Making Rules for Knowledge Representation. Harlow, UK: Longman Group.
Raisz, E. 1962. Principles of Cartography. New York, NY: McGraw-Hill.
Regnauld, N. 2001. Contextual building typification in automated map generalization. Algorithmica. 30(2): 312–333.
Regnauld, N. and R. McMaster. 2007. A synoptic view of generalisation operators. In: W. A. Mackaness, A. Ruas, and L. T. Sarjakoski (Eds.) Generalisation of geographic information: Cartographic modelling and applications. Amsterdam, The Netherlands: Elsevier.
Cartographic Perspectives, Number 68, Winter 2011 A typology of operators for maintaining legible map designs at multiple scales – roth et al. | 63
Rieger, M., and M. Coulson. 1993. Consensus or confusion: Cartographers’ knowledge of generalization. In: Proceedings of the 17th International Cartographic Conference. Barcelona, Spain.
Robinson, A. H., R. Sale, and J. Morrison. 1978. Elements of Cartography. New York, NY: John Wiley & Sons.
Robinson, A. H., J. L. Morrison, P. C. Muehrcke, A. J. Kimerling, and S. C. Guptill. 1995. Elements of Cartography. New York, NY: John Wiley & Sons.
Roth, R. E., and K. S. Ross. 2009. Extending the Google Maps API for event animation mashups. Cartographic Perspectives. 64: 21–40.
Roth, R. E., M. Stryker, and C. A. Brewer. 2008. A typology of multi-scale mapping operators. In: T. Cova (Ed.) Proceedings of GIScience 2008. Park City, UT.
Roth, R. E., A. W. Woodruff, and Z. F. Johnson. 2010. Value-by-alpha Maps: An alternative technique to the cartogram. The Cartographic Journal. 47(2): 130–140.
Sarjakoski, L. T. 2007. Conceptual models of generalization and multiple representation. In: W. A. Mackaness, A. Ruas, and L. T. Sarjakoski (Eds.) Generalisation of geographic information: Cartographic modelling and applications. Amsterdam, The Netherlands: Elsevier.
Shea, K., and R. McMaster. 1989. Cartographic generalization in a digital environment: When and how to generalize. In: Proceedings of AutoCarto. Baltimore, MD.
Sheesley, B. C. 2007. TypeBrewer: Design and evaluation of a help tool for selecting map typography. Phd Dissertation. Madison, WI: University of Wisconsin–Madison.
Slocum, T. A., R. B. McMaster, F. C. Kessler, and H. H. Howard. 2005. Thematic cartography and geographic visualization. Upper Saddle River, NJ: Pearson Prentice Hall.
Spaccapietra, S., C. Parent, and C. Vangenot. 2000. GIS databases: From multiscale to multirepresentation. In: B. Y. Choueiry and T. Walsh (Eds.) Spatial Abstraction, Reformulation, and Approximation (SARA). Horseshoe Bay, Texas: Springer.
Stanislawski, L. V. 2009. Feature pruning by upstream drainage area to support automated generalization of the United States National Hydrography Dataset. Computers, Environment, and Urban Systems. 33(5): 325–333.
Cartographic Perspectives, Number 68, Winter 201164 | A typology of operators for maintaining legible map designs at multiple scales – roth et al.
Steward, H. 1974. Cartographic Generalization: Some concepts and explanation. The Canadian Cartographer. 11(1): 1–50.
Stoter, J., J. V. Smaalen, N. Bakker, and P. Hardy. 2009. Specifying map requirements for automated generalization of topographic data. The Cartographic Journal. 46(3): 214–227.
Stoter, J. E. 2005. Generalisation within NMA’s in the 21st century. In: Proceedings of the International Cartographic Conference. A Coruña, Spain.
Stroh, W. J., S. J. Butzler, and C. A. Brewer. 2010. Establishing classification and hierarchy in populated place labeling for multiscale mapping for The National Map. In: Proceedings of AutoCarto 2010. Orlando, FL.
Stryker, M., R. E. Roth, and C. A. Brewer. 2008. ScaleMaster.org: Illustrating and constructing the multi-scale mapping process. In: T. Cova (Ed.) Proceedings of GIScience 2008. Park City, UT.
Tomlinson, R., and A. Boyle. 1981. The state of development of systems for handling natural resources inventory data. Cartographica. 18(4): 65–95.
Tyner, J. A. 2010. Principles of map design. New York, NY: The Guilford Press.
Visvalingham, M., and J. D. Whyatt. 1993. Line generalization by repeated elimination of points. The Cartographic Journal. 30(1): 45–51.
Wallace, T. 2010. The University of Wisconsin–Madison Arboretum Map. Cartographic Perspectives. 66: 31–40.
Weibel, R. and G. Dutton. 1999. Generalising spatial data and dealing with multiple representations. In: P. A. Longley, M. F. Goodchild, D. J. Maguire, and D. W. Rhind (Eds.) Geographical Information Systems, 1: Principles and Technical Issues. New York, NY: Wiley & Sons.
Yaolin, L., M. Molenaar, and A. D. Tinghua. 2001 Frameworks for generalization constraints and operations based on object-oriented data structures in database generalization. In: Proceedings of the 20th International Cartographic Conference. Beijing, China.
Zhou, S., and C. B. Jones. 2004. Shape-aware line generalisation with weighted effective area. In: P. Fisher (Ed.) Developments in Spatial Data Handling 11th International Symposium on Spatial Data Handling (SDH ‘04’). Leicester, UK: Springer.
Cartographic Perspectives, Number 68, Winter 2011 Top Ten Jewels of the Ort Library Map Collection – price | 65
I n t r o d u c t I o n
The Lewis J. Ort Library (www.frostburg.edu/dept/library) is part of Frostburg State University (www.frostburg.edu), located in Frostburg, in the western mountains of Maryland. The Ort Library houses a notable map collection of topographic maps including regional coverage at 1:24,000 and 1:62,500 scales; and GSGS (General Service, General Staff [Great Britain]), AMS (Army Map Service), and DMS (Defense Mapping Agency) maps from the 1930s forward. Other maps include navigational and aeronautic charts, Census maps, and maps from National Geographic publications. Older maps, along with maps of regional interest and importance, are housed in the Special Collections Room of the Library.
With a plethora of maps to choose from, I selected my “Top Ten” based on uniqueness in their content, condition, and age, as well as on their value to regional history and geography. The maps are divided into categories that follow the history and geology of the region. These five categories are: Braddock Road; Military lots and land grants of the Revolutionary War; City of Frostburg; Coal Mine Maps; and Garrett County, Maryland.
top ten Jewels of the ort library Map collectionMary Jo A. Price, Special Collections Librarian
Geography Department Liaison, Lewis J. Ort Library
Frostburg State University1 Stadium Drive
Frostburg, MD 21532
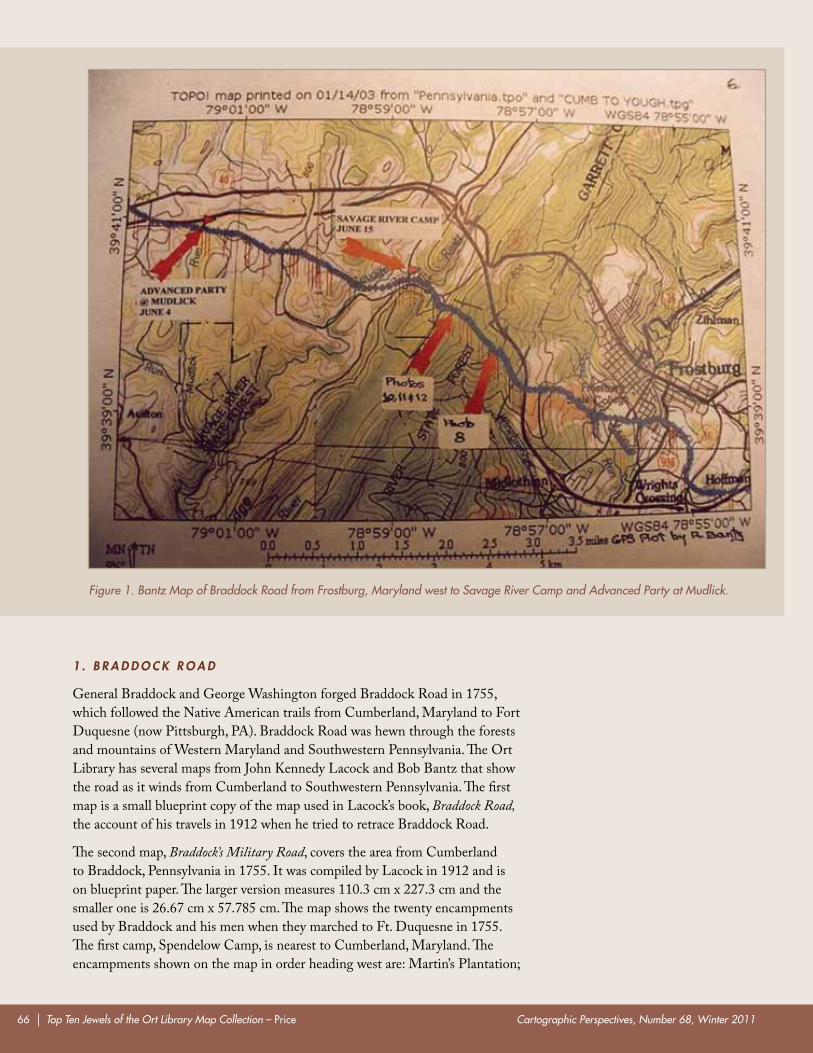
Cartographic Perspectives, Number 68, Winter 201166 | Top Ten Jewels of the Ort Library Map Collection – price
1 . B R A D D O C k R O A D
General Braddock and George Washington forged Braddock Road in 1755, which followed the Native American trails from Cumberland, Maryland to Fort Duquesne (now Pittsburgh, PA). Braddock Road was hewn through the forests and mountains of Western Maryland and Southwestern Pennsylvania. The Ort Library has several maps from John Kennedy Lacock and Bob Bantz that show the road as it winds from Cumberland to Southwestern Pennsylvania. The first map is a small blueprint copy of the map used in Lacock’s book, Braddock Road, the account of his travels in 1912 when he tried to retrace Braddock Road.
The second map, Braddock’s Military Road, covers the area from Cumberland to Braddock, Pennsylvania in 1755. It was compiled by Lacock in 1912 and is on blueprint paper. The larger version measures 110.3 cm x 227.3 cm and the smaller one is 26.67 cm x 57.785 cm. The map shows the twenty encampments used by Braddock and his men when they marched to Ft. Duquesne in 1755. The first camp, Spendelow Camp, is nearest to Cumberland, Maryland. The encampments shown on the map in order heading west are: Martin’s Plantation;
Figure 1. Bantz Map of Braddock Road from Frostburg, Maryland west to Savage River Camp and Advanced Party at Mudlick.
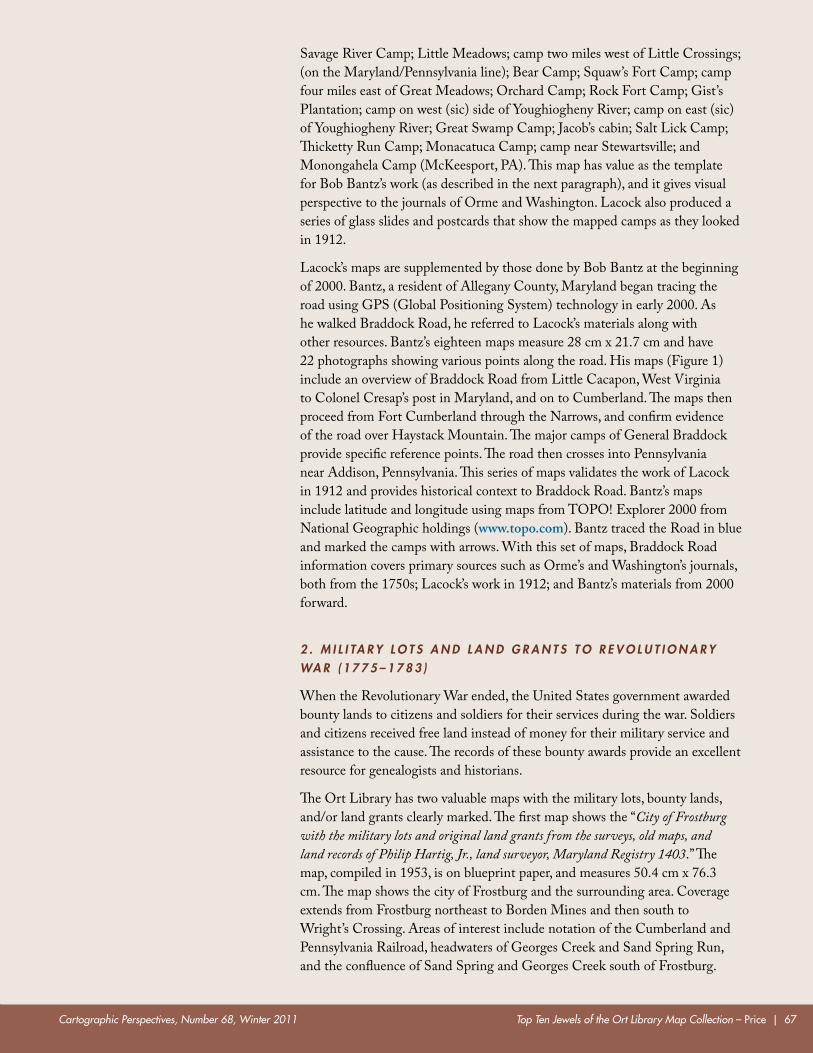
Cartographic Perspectives, Number 68, Winter 2011 Top Ten Jewels of the Ort Library Map Collection – price | 67
Savage River Camp; Little Meadows; camp two miles west of Little Crossings; (on the Maryland/Pennsylvania line); Bear Camp; Squaw’s Fort Camp; camp four miles east of Great Meadows; Orchard Camp; Rock Fort Camp; Gist’s Plantation; camp on west (sic) side of Youghiogheny River; camp on east (sic) of Youghiogheny River; Great Swamp Camp; Jacob’s cabin; Salt Lick Camp; Thicketty Run Camp; Monacatuca Camp; camp near Stewartsville; and Monongahela Camp (McKeesport, PA). This map has value as the template for Bob Bantz’s work (as described in the next paragraph), and it gives visual perspective to the journals of Orme and Washington. Lacock also produced a series of glass slides and postcards that show the mapped camps as they looked in 1912.
Lacock’s maps are supplemented by those done by Bob Bantz at the beginning of 2000. Bantz, a resident of Allegany County, Maryland began tracing the road using GPS (Global Positioning System) technology in early 2000. As he walked Braddock Road, he referred to Lacock’s materials along with other resources. Bantz’s eighteen maps measure 28 cm x 21.7 cm and have 22 photographs showing various points along the road. His maps (Figure 1) include an overview of Braddock Road from Little Cacapon, West Virginia to Colonel Cresap’s post in Maryland, and on to Cumberland. The maps then proceed from Fort Cumberland through the Narrows, and confirm evidence of the road over Haystack Mountain. The major camps of General Braddock provide specific reference points. The road then crosses into Pennsylvania near Addison, Pennsylvania. This series of maps validates the work of Lacock in 1912 and provides historical context to Braddock Road. Bantz’s maps include latitude and longitude using maps from TOPO! Explorer 2000 from National Geographic holdings (www.topo.com). Bantz traced the Road in blue and marked the camps with arrows. With this set of maps, Braddock Road information covers primary sources such as Orme’s and Washington’s journals, both from the 1750s; Lacock’s work in 1912; and Bantz’s materials from 2000 forward.
2 . M I L I TA R Y L O T S A N D L A N D G R A N T S T O R E V O L U T I O N A R Y WA R ( 1 7 7 5 – 1 7 8 3 )
When the Revolutionary War ended, the United States government awarded bounty lands to citizens and soldiers for their services during the war. Soldiers and citizens received free land instead of money for their military service and assistance to the cause. The records of these bounty awards provide an excellent resource for genealogists and historians.
The Ort Library has two valuable maps with the military lots, bounty lands, and/or land grants clearly marked. The first map shows the “City of Frostburg with the military lots and original land grants from the surveys, old maps, and land records of Philip Hartig, Jr., land surveyor, Maryland Registry 1403.” The map, compiled in 1953, is on blueprint paper, and measures 50.4 cm x 76.3 cm. The map shows the city of Frostburg and the surrounding area. Coverage extends from Frostburg northeast to Borden Mines and then south to Wright’s Crossing. Areas of interest include notation of the Cumberland and Pennsylvania Railroad, headwaters of Georges Creek and Sand Spring Run, and the confluence of Sand Spring and Georges Creek south of Frostburg.
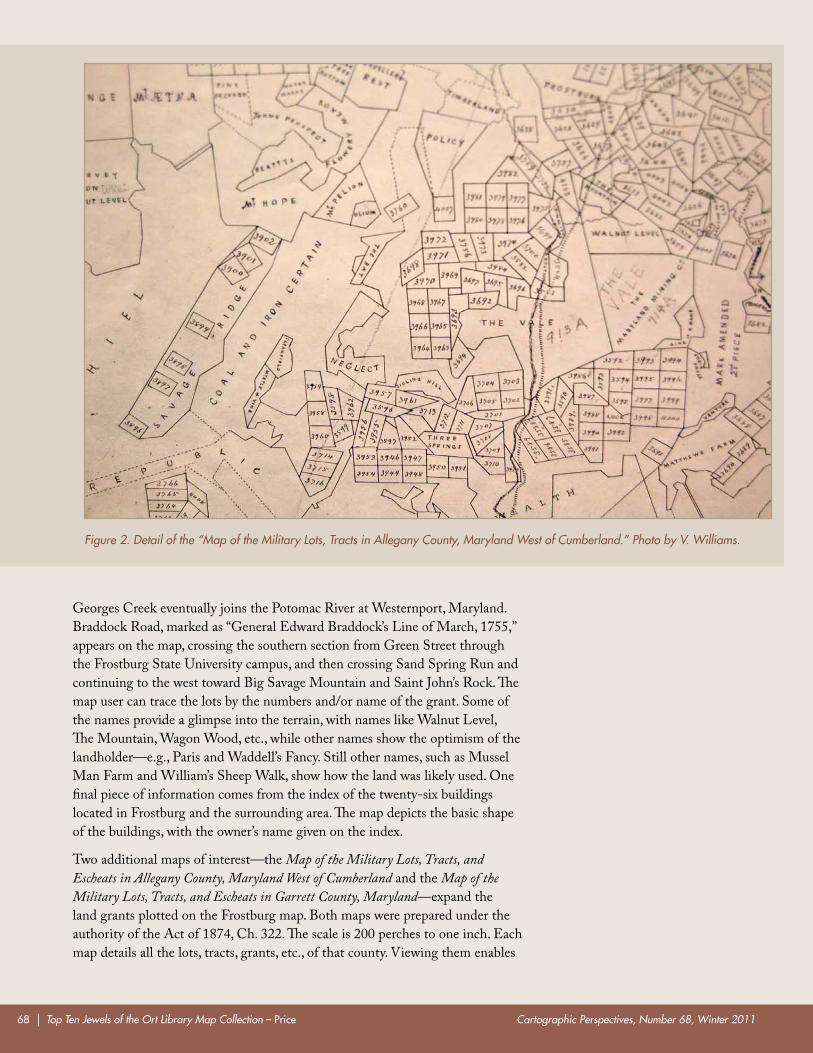
Cartographic Perspectives, Number 68, Winter 201168 | Top Ten Jewels of the Ort Library Map Collection – price
Georges Creek eventually joins the Potomac River at Westernport, Maryland. Braddock Road, marked as “General Edward Braddock’s Line of March, 1755,” appears on the map, crossing the southern section from Green Street through the Frostburg State University campus, and then crossing Sand Spring Run and continuing to the west toward Big Savage Mountain and Saint John’s Rock. The map user can trace the lots by the numbers and/or name of the grant. Some of the names provide a glimpse into the terrain, with names like Walnut Level, The Mountain, Wagon Wood, etc., while other names show the optimism of the landholder—e.g., Paris and Waddell’s Fancy. Still other names, such as Mussel Man Farm and William’s Sheep Walk, show how the land was likely used. One final piece of information comes from the index of the twenty-six buildings located in Frostburg and the surrounding area. The map depicts the basic shape of the buildings, with the owner’s name given on the index.
Two additional maps of interest—the Map of the Military Lots, Tracts, and Escheats in Allegany County, Maryland West of Cumberland and the Map of the Military Lots, Tracts, and Escheats in Garrett County, Maryland—expand the land grants plotted on the Frostburg map. Both maps were prepared under the authority of the Act of 1874, Ch. 322. The scale is 200 perches to one inch. Each map details all the lots, tracts, grants, etc., of that county. Viewing them enables
Figure 2. Detail of the “Map of the Military Lots, Tracts in Allegany County, Maryland West of Cumberland.” Photo by V. Williams.
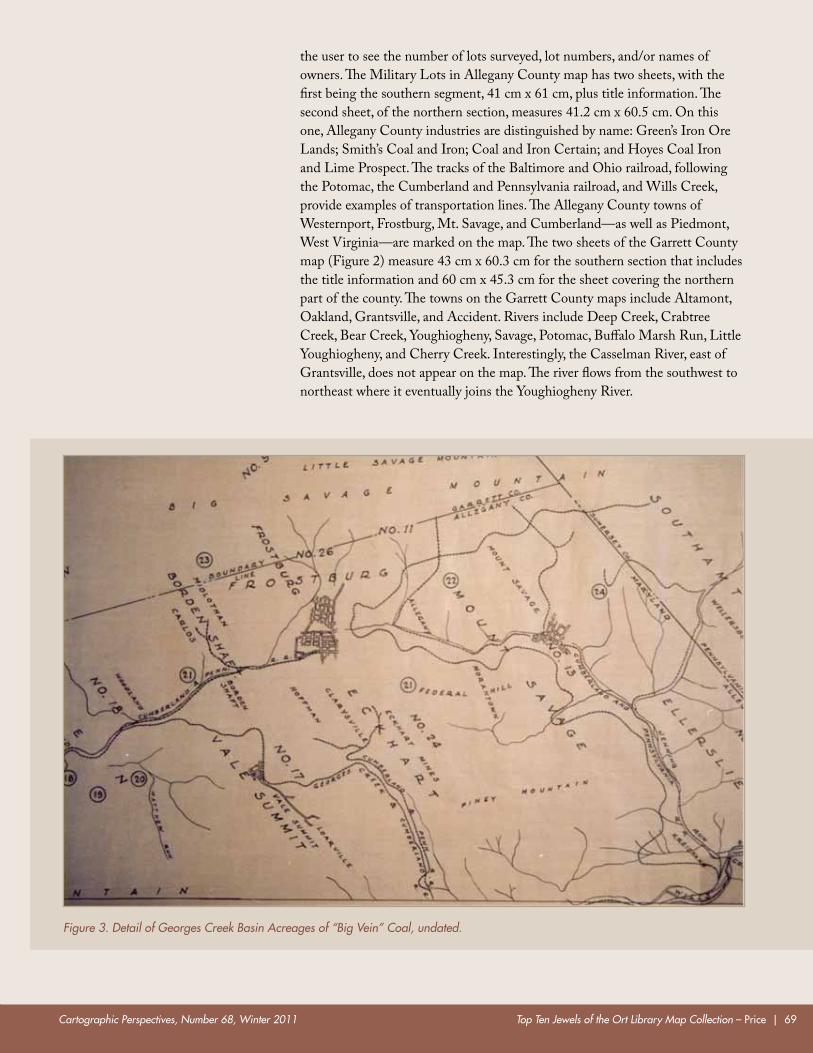
Cartographic Perspectives, Number 68, Winter 2011 Top Ten Jewels of the Ort Library Map Collection – price | 69
the user to see the number of lots surveyed, lot numbers, and/or names of owners. The Military Lots in Allegany County map has two sheets, with the first being the southern segment, 41 cm x 61 cm, plus title information. The second sheet, of the northern section, measures 41.2 cm x 60.5 cm. On this one, Allegany County industries are distinguished by name: Green’s Iron Ore Lands; Smith’s Coal and Iron; Coal and Iron Certain; and Hoyes Coal Iron and Lime Prospect. The tracks of the Baltimore and Ohio railroad, following the Potomac, the Cumberland and Pennsylvania railroad, and Wills Creek, provide examples of transportation lines. The Allegany County towns of Westernport, Frostburg, Mt. Savage, and Cumberland—as well as Piedmont, West Virginia—are marked on the map. The two sheets of the Garrett County map (Figure 2) measure 43 cm x 60.3 cm for the southern section that includes the title information and 60 cm x 45.3 cm for the sheet covering the northern part of the county. The towns on the Garrett County maps include Altamont, Oakland, Grantsville, and Accident. Rivers include Deep Creek, Crabtree Creek, Bear Creek, Youghiogheny, Savage, Potomac, Buffalo Marsh Run, Little Youghiogheny, and Cherry Creek. Interestingly, the Casselman River, east of Grantsville, does not appear on the map. The river flows from the southwest to northeast where it eventually joins the Youghiogheny River.
Figure 3. Detail of Georges Creek Basin Acreages of “Big Vein” Coal, undated.
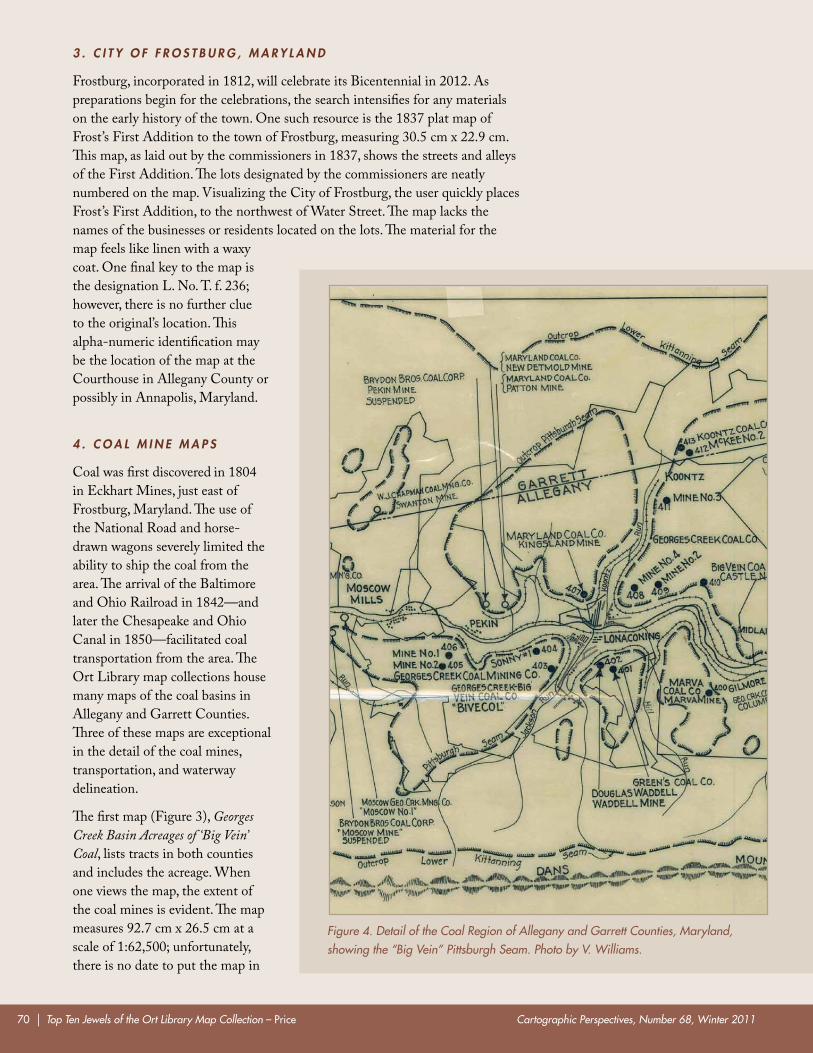
Cartographic Perspectives, Number 68, Winter 201170 | Top Ten Jewels of the Ort Library Map Collection – price
3 . C I T Y O F F R O S T B U R G , M A R Y L A N D
Frostburg, incorporated in 1812, will celebrate its Bicentennial in 2012. As preparations begin for the celebrations, the search intensifies for any materials on the early history of the town. One such resource is the 1837 plat map of Frost’s First Addition to the town of Frostburg, measuring 30.5 cm x 22.9 cm. This map, as laid out by the commissioners in 1837, shows the streets and alleys of the First Addition. The lots designated by the commissioners are neatly numbered on the map. Visualizing the City of Frostburg, the user quickly places Frost’s First Addition, to the northwest of Water Street. The map lacks the names of the businesses or residents located on the lots. The material for the map feels like linen with a waxy coat. One final key to the map is the designation L. No. T. f. 236; however, there is no further clue to the original’s location. This alpha-numeric identification may be the location of the map at the Courthouse in Allegany County or possibly in Annapolis, Maryland.
4 . C O A L M I N E M A P S
Coal was first discovered in 1804 in Eckhart Mines, just east of Frostburg, Maryland. The use of the National Road and horse-drawn wagons severely limited the ability to ship the coal from the area. The arrival of the Baltimore and Ohio Railroad in 1842—and later the Chesapeake and Ohio Canal in 1850—facilitated coal transportation from the area. The Ort Library map collections house many maps of the coal basins in Allegany and Garrett Counties. Three of these maps are exceptional in the detail of the coal mines, transportation, and waterway delineation.
The first map (Figure 3), Georges Creek Basin Acreages of ‘Big Vein’ Coal, lists tracts in both counties and includes the acreage. When one views the map, the extent of the coal mines is evident. The map measures 92.7 cm x 26.5 cm at a scale of 1:62,500; unfortunately, there is no date to put the map in
Figure 4. Detail of the Coal Region of Allegany and Garrett Counties, Maryland, showing the “Big Vein” Pittsburgh Seam. Photo by V. Williams.
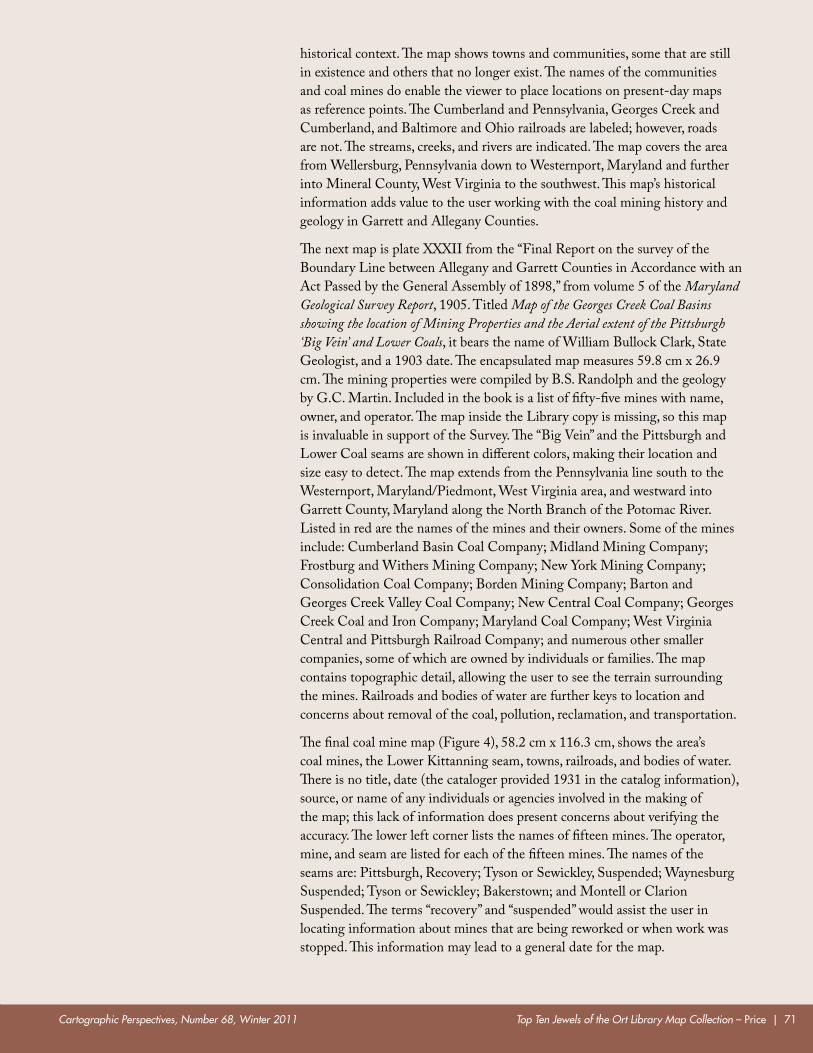
Cartographic Perspectives, Number 68, Winter 2011 Top Ten Jewels of the Ort Library Map Collection – price | 71
historical context. The map shows towns and communities, some that are still in existence and others that no longer exist. The names of the communities and coal mines do enable the viewer to place locations on present-day maps as reference points. The Cumberland and Pennsylvania, Georges Creek and Cumberland, and Baltimore and Ohio railroads are labeled; however, roads are not. The streams, creeks, and rivers are indicated. The map covers the area from Wellersburg, Pennsylvania down to Westernport, Maryland and further into Mineral County, West Virginia to the southwest. This map’s historical information adds value to the user working with the coal mining history and geology in Garrett and Allegany Counties.
The next map is plate XXXII from the “Final Report on the survey of the Boundary Line between Allegany and Garrett Counties in Accordance with an Act Passed by the General Assembly of 1898,” from volume 5 of the Maryland Geological Survey Report, 1905. Titled Map of the Georges Creek Coal Basins showing the location of Mining Properties and the Aerial extent of the Pittsburgh ‘Big Vein’ and Lower Coals, it bears the name of William Bullock Clark, State Geologist, and a 1903 date. The encapsulated map measures 59.8 cm x 26.9 cm. The mining properties were compiled by B.S. Randolph and the geology by G.C. Martin. Included in the book is a list of fifty-five mines with name, owner, and operator. The map inside the Library copy is missing, so this map is invaluable in support of the Survey. The “Big Vein” and the Pittsburgh and Lower Coal seams are shown in different colors, making their location and size easy to detect. The map extends from the Pennsylvania line south to the Westernport, Maryland/Piedmont, West Virginia area, and westward into Garrett County, Maryland along the North Branch of the Potomac River. Listed in red are the names of the mines and their owners. Some of the mines include: Cumberland Basin Coal Company; Midland Mining Company; Frostburg and Withers Mining Company; New York Mining Company; Consolidation Coal Company; Borden Mining Company; Barton and Georges Creek Valley Coal Company; New Central Coal Company; Georges Creek Coal and Iron Company; Maryland Coal Company; West Virginia Central and Pittsburgh Railroad Company; and numerous other smaller companies, some of which are owned by individuals or families. The map contains topographic detail, allowing the user to see the terrain surrounding the mines. Railroads and bodies of water are further keys to location and concerns about removal of the coal, pollution, reclamation, and transportation.
The final coal mine map (Figure 4), 58.2 cm x 116.3 cm, shows the area’s coal mines, the Lower Kittanning seam, towns, railroads, and bodies of water. There is no title, date (the cataloger provided 1931 in the catalog information), source, or name of any individuals or agencies involved in the making of the map; this lack of information does present concerns about verifying the accuracy. The lower left corner lists the names of fifteen mines. The operator, mine, and seam are listed for each of the fifteen mines. The names of the seams are: Pittsburgh, Recovery; Tyson or Sewickley, Suspended; Waynesburg Suspended; Tyson or Sewickley; Bakerstown; and Montell or Clarion Suspended. The terms “recovery” and “suspended” would assist the user in locating information about mines that are being reworked or when work was stopped. This information may lead to a general date for the map.
Cartographic Perspectives, Number 68, Winter 201172 | Top Ten Jewels of the Ort Library Map Collection – price
Although these three coal mine maps show the same basic information, with little variation on presentation, each map lends additional details and information to increase the users’ information about the coal region and adds to the history of the coal mining region of Allegany and Garrett Counties.
5 . G E O L O G I C S U R V E Y O F G A R R E T T C O U N T Y, M A R Y L A N D
Many geologic maps of Garrett County, Maryland have been produced over the years, showing topography, geologic formations, physiology, and forest/vegetation. The condition of these maps in the Lewis J. Ort Library collection ranges from pristine to dog-eared, laminated, encapsulated, backed with linen, and more.
This final map (Figure 5) on the list has been trimmed to a rectangle measuring 113.34 cm x 18.1 cm (the overall measurements being 108.5 cm x 90.5 cm), backed with linen, and covered with a black, impermeable material. This map comes from the John J. Rutledge Collection, received in 1987. The map collection, donated by Alma Rutledge Goldberg, contained about 404 maps and 501 books on coal. Dr. Rutledge was appointed by Governor Ritchie as the first Chief Mine Engineer for the state of Maryland and continued in that position until his death in 1952. Dr. Rutledge himself probably cut the map and carefully
Figure 5. Detail of Map of Garrett County Showing the Geological Formations and Agricultural Soils, 1902.
Cartographic Perspectives, Number 68, Winter 2011 Top Ten Jewels of the Ort Library Map Collection – price | 73
backed it with the linen so that he could use it in the field. The map easily folds into a manageable size, allowing the user to easily transport it for field work.
The map shows Permian and Carboniferous formations, providing the names of the coal, shale, and limestone beds, as well as the sections, including Dunkard, Monongahela, Conemaugh, Allegheny, Pottsville, Mauch Chunk, Greenbrier, and Pocono. The columnar section lists Hampshire and Jennings as the two formations within the Devonian period. This visual shows the shale and sandstones present descending from 1,200 feet to 5,000 feet. The legend designates the Permian, Carboniferous, and Devonian layers by color and other markings. The geology description is on the left; soil types, surveyed from 1897–1898 by Clarence W. Dorsey, are described on the right. The description of the geology and soils for river bottoms, terrains, and glades provide more information for the user working with Garrett County soils and geology.
Four vertical cross-sections, A-A through D-D, provide another viewpoint to the geology. Cross-sections labeled A-A and D-D bisect Garrett County, while B-B and C-C begin at the state lines and go to the county’s center. B-B is in the eastern portion and C-C is in the western portion of the county. A-A runs from Detmold Hill (close to the Allegany County line) and extends to the Pennsylvania line. B-B goes from southeast of Bittinger to the West Virginia/Pennsylvania/Maryland line in the northern section of the county. C-C bisects from Shaw in Mineral County, West Virginia to a point northeast of McHenry, Maryland. D-D bisects the county at the Potomac River east of Stoyer, Maryland and terminates at Preston County, West Virginia northeast of Corinth, West Virginia.
The towns, railroads, ridges/mountain tops, and bodies of water provide points of reference on the map, allowing the user to find the same points on present-day maps. A final key for the map is the text Conventional Signs, which gives the symbols for coal, fire clay, limestone, mines and quarries in operation, coal mines and quarries not working, and prospect coal.
Maps add a visual way to obtain information for research, travel, exploration, and learning. The map collection of the Ort Library enables students, staff, faculty, areas residents, and visitors to research and explore areas of particular interest. These unique and historic maps lend an exciting way to retrieve facts and information. Maps, whether computer generated or hand-drawn antiques, will always fascinate and entice users.

Cartographic Perspectives, Number 68, Winter 201174 | Top Ten Jewels of the Ort Library Map Collection – price
Cartographic Perspectives, Number 68, Winter 2011 Travels with iPad Maps – peterson | 75
The iPad is a larger version of Apple’s iPod Touch, a non-phone version of the Apple’s hugely popular iPhone. Inside the iPad is a circuit board the size of the iPhone/iPod Touch and large battery to power the 9.7”, 1024 x 768 pixel screen. The iPhone, iPod Touch, and the iPad share the same iOS operating system. Two models of the iPad were introduced in April 2010. One version communicates only through WiFi while the second includes the possibility of a 3G cellular data connection. Initially, the iPad was limited to AT&T. The least-expensive data plan through AT&T is $15 a month for a maximum of 250 MB. A $30 plan initially provided unlimited data download, but was changed to a $25 option with a 2 GB maximum within a matter of weeks after the introduction of the original iPad. The iPad 2, with a faster processor and front and back cameras, was released in March 2011. The new version has the same display size and resolution as the original model. The user now has a choice of a 3G connection through Verizon.
Reviewed here is the Maps application that comes with Apple’s iPad. Maps is essentially a stand-alone implementation of Google Maps and is available on all three iOS platforms. Normally, Google Maps would be accessed through a browser, and this is still possible through iPad’s integrated Safari application. The Maps application provides a direct connection to Google Maps with an improved user interface, although there is some reduction in functionality. For example, it is not possible within the Maps application to change a calculated route by clicking and
travel log
travels with ipad MapsMichael P. Peterson | [email protected]
Department of Geography / GeologyUniversity of Nebraska at Omaha
Omaha, NE 68182
Cartographic Perspectives, Number 68, Winter 201176 | Travels with iPad Maps – peterson
dragging a line to a new location. In exchange for this loss in functionality, the two-finger zoom function is cleanly implemented to quickly change the scale of the map.
The most important feature of iPad Maps is the close integration with the GPS, Wi-Fi, and/or cell tower triangulation location-finding abilities of the device to show the current location. This is symbolized with a pulsating blue dot and a surrounding circle that becomes smaller as the positioning becomes more accurate—a form of data uncertainty symbolization.
The question addressed here is how iPad Maps works as a navigation device and as a general travel companion. It should be made clear that the iPad is not sold as a navigation device. While car mounts are available for the iPad that would allow the driver to view the map while driving, evaluation of the Maps application was always done by a passenger. The Maps application that comes with the iPad requires considerable attention and should not be operated while driving. Separate applications are available for an extra fee that would allow hands-free navigation using the iPad, but these were not tested.
The 32GB, WiFi+3G iPad that I ordered was shipped directly from Shanghai, China, and arrived at the beginning of May 2010. It connected to WiFi immediately upon startup. Once on WiFi, the 250 MB monthly 3G connection was easy to purchase from AT&T. Testing was done with iPad Maps over a four-month period in which approximately 10,000 miles were logged. All driving was within the United States and stretched from the states of New York to California.
To put this evaluation in context, let me divulge that I am usually not an early adopter. I still don’t have my own cell phone. My wife has a four-year old Motorola flip-up model with none of the fancy features of the modern, status-symbol smart phone. Talking to my daughter recently, I was puzzled by the strange beeps that I heard. My daughter informed me in a patient but quizzical voice that younger people reserve for the old that I was getting another call and told me what I needed to do to answer it.
The almost ubiquitous GPS navigation device has also not infiltrated our car. We experienced GPS-assisted navigation in car rentals in both Japan and Germany and were less than impressed. The glorified arrow that substitutes for a map display did not help me form a mental map of the environment, or provide a sense of well-being that comes from knowing where you are and what’s around. My German helped me comprehend the instructions offered by the device in Germany, and it did help us find places, but the Japanese model spewed an indecipherable litany of instructions, none of which I understood. The Japanese have implemented an interesting system that allows the GPS device to find a location based on a phone number of the destination. Having no idea how to input a phone number, I stopped at a gas station and a gentleman there was more than happy to enter the phone number with the included remote control. The in-dash GPS then led us through the night to the isolated hotel in the mountains using straight, left and right arrows and the reassuring dot moving along a random line. At that point, I didn’t much care about the sense of well-being that comes from knowing what’s around.
The most important feature of the iPad Maps is the close integration with the GPS, Wi-Fi, and/or cell tower triangulation location-finding abilities of the device to show the current location
Cartographic Perspectives, Number 68, Winter 2011 Travels with iPad Maps – peterson | 77
I n I t I a l e Va l u at I o n o F t h e i pa d F o r n aV I g at I o n
Initial impressions of the device varied based on the person using it. When I was driving, the passenger was usually my wife, who is perfectly comfortable with paper maps. I had purposely tucked our battered travel atlas away under the luggage, forcing her to use the iPad. She eventually adapted to the touch interface and two-finger zooming and appreciated the pulsating dot that would show our current position. Also attractive was zooming, and the ability of the device to find a location, plot a route, and determine the travel time. This was especially useful within cities where the Maps application could be used to quickly change between map scales. But, being a map user who orients the map in the direction of travel, my wife was disappointed when she tried rotating iPad Maps in a similar way. With the integrated accelerometer, the iPad dutifully re-oriented the map to the north no matter in which direction the device was turned. She concluded that the device was “designed by men” (a switch on the side of the iPad stops the re-orienting feature).
Everyone used the device differently. Our grown children reached for the device immediately upon entering the car. They would use the Safari browser to check a webpage, or to chat. The Maps application was used only when necessary.
When I was a passenger, I kept Maps open—switching often to the “Satellite” view and comparing the countryside to the view from above. Traveling with a complete set of air photos and having them appear automatically as one moved through the environment was a new experience. Anyone with a geography background would appreciate this feature and the device should be a part of any course in air photo interpretation or remote sensing.
I later had the opportunity to take students on a field trip using the iPad. Seeing the current location clearly indicated on an air photo while walking through the environment was also new to them. The experience made it easy to interpret every feature depicted on the photo. Of course, this was much easier standing in the shade. It is almost impossible to use the iPad in direct sunlight.
s p e e d o F d ata c o M M u n I c at I o n
The single, major limitation of the iPad for travel is the speed of data communication. AT&T’s 3G network only covers a small part of the United States (blue shading in Figure 1). Further, while 3G is capable of download speeds up to 1.75 MB/s, this speed was never achieved in real-world testing. AT&T implements a much slower EDGE/GPRS data communication network in much of the United States (orange shading in Figure 1). The EDGE/GPRS network is rated at speeds of between 75–384 Kbps, 23 times slower than 3G. Most of the United States either has no AT&T coverage or a much slower “Partner EDGE/GPRS” data connection at only 75–388 Kbps.
The single, major limitation of the
iPad for travel is the speed of data
communciation
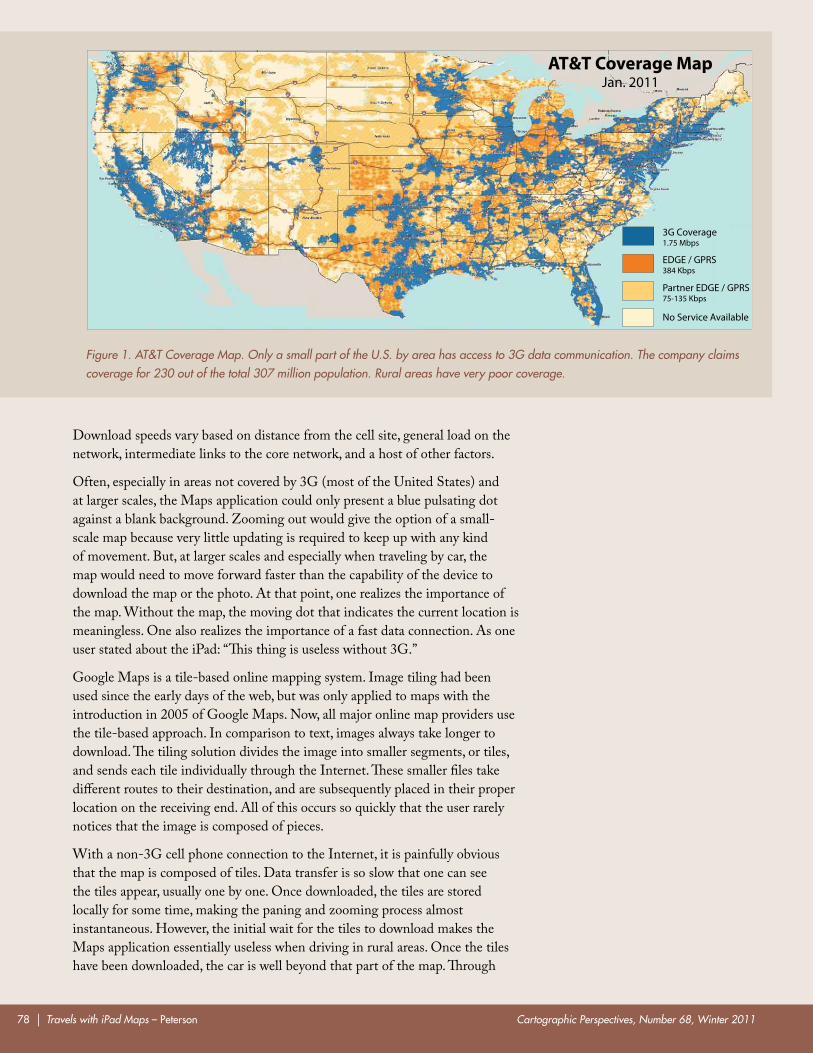
Cartographic Perspectives, Number 68, Winter 201178 | Travels with iPad Maps – peterson
Download speeds vary based on distance from the cell site, general load on the network, intermediate links to the core network, and a host of other factors.
Often, especially in areas not covered by 3G (most of the United States) and at larger scales, the Maps application could only present a blue pulsating dot against a blank background. Zooming out would give the option of a small-scale map because very little updating is required to keep up with any kind of movement. But, at larger scales and especially when traveling by car, the map would need to move forward faster than the capability of the device to download the map or the photo. At that point, one realizes the importance of the map. Without the map, the moving dot that indicates the current location is meaningless. One also realizes the importance of a fast data connection. As one user stated about the iPad: “This thing is useless without 3G.”
Google Maps is a tile-based online mapping system. Image tiling had been used since the early days of the web, but was only applied to maps with the introduction in 2005 of Google Maps. Now, all major online map providers use the tile-based approach. In comparison to text, images always take longer to download. The tiling solution divides the image into smaller segments, or tiles, and sends each tile individually through the Internet. These smaller files take different routes to their destination, and are subsequently placed in their proper location on the receiving end. All of this occurs so quickly that the user rarely notices that the image is composed of pieces.
With a non-3G cell phone connection to the Internet, it is painfully obvious that the map is composed of tiles. Data transfer is so slow that one can see the tiles appear, usually one by one. Once downloaded, the tiles are stored locally for some time, making the paning and zooming process almost instantaneous. However, the initial wait for the tiles to download makes the Maps application essentially useless when driving in rural areas. Once the tiles have been downloaded, the car is well beyond that part of the map. Through
Figure 1. AT&T Coverage Map. Only a small part of the U.S. by area has access to 3G data communication. The company claims coverage for 230 out of the total 307 million population. Rural areas have very poor coverage.
AT&T Coverage MapJan. 2011
3G Coverage1.75 Mbps
EDGE / GPRS384 Kbps
Partner EDGE / GPRS75-135 Kbps
No Service Available
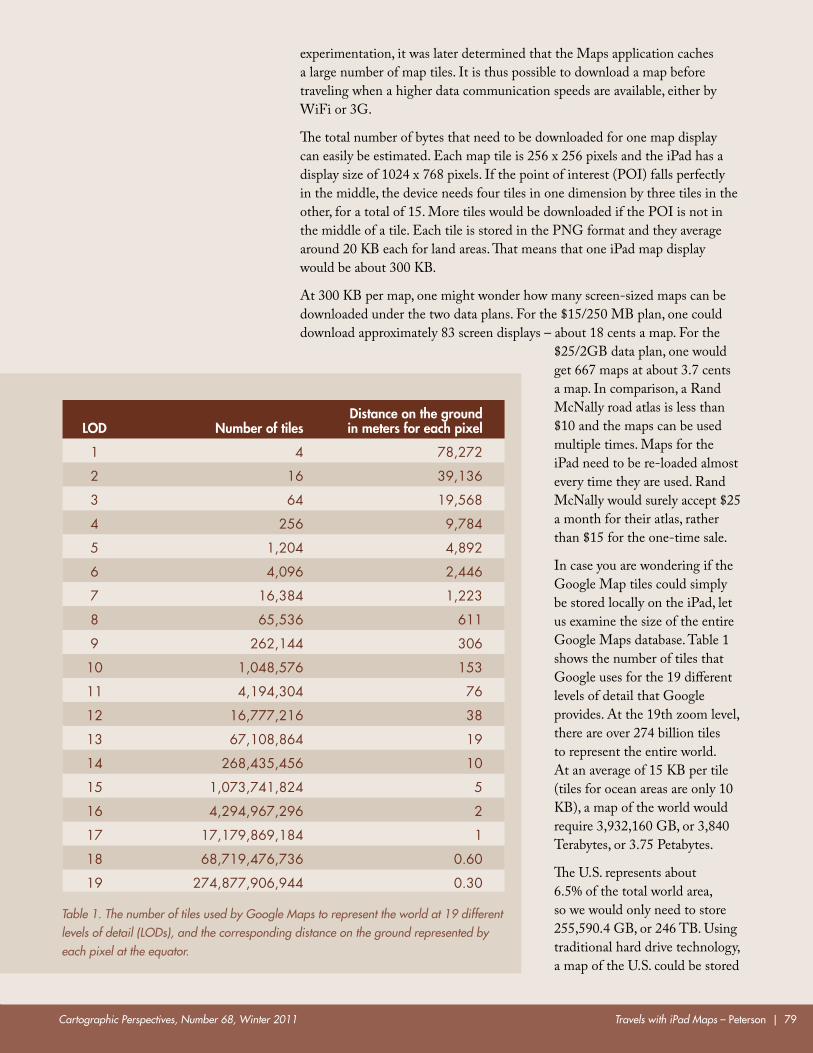
Cartographic Perspectives, Number 68, Winter 2011 Travels with iPad Maps – peterson | 79
experimentation, it was later determined that the Maps application caches a large number of map tiles. It is thus possible to download a map before traveling when a higher data communication speeds are available, either by WiFi or 3G.
The total number of bytes that need to be downloaded for one map display can easily be estimated. Each map tile is 256 x 256 pixels and the iPad has a display size of 1024 x 768 pixels. If the point of interest (POI) falls perfectly in the middle, the device needs four tiles in one dimension by three tiles in the other, for a total of 15. More tiles would be downloaded if the POI is not in the middle of a tile. Each tile is stored in the PNG format and they average around 20 KB each for land areas. That means that one iPad map display would be about 300 KB.
At 300 KB per map, one might wonder how many screen-sized maps can be downloaded under the two data plans. For the $15/250 MB plan, one could download approximately 83 screen displays – about 18 cents a map. For the
$25/2GB data plan, one would get 667 maps at about 3.7 cents a map. In comparison, a Rand McNally road atlas is less than $10 and the maps can be used multiple times. Maps for the iPad need to be re-loaded almost every time they are used. Rand McNally would surely accept $25 a month for their atlas, rather than $15 for the one-time sale.
In case you are wondering if the Google Map tiles could simply be stored locally on the iPad, let us examine the size of the entire Google Maps database. Table 1 shows the number of tiles that Google uses for the 19 different levels of detail that Google provides. At the 19th zoom level, there are over 274 billion tiles to represent the entire world. At an average of 15 KB per tile (tiles for ocean areas are only 10 KB), a map of the world would require 3,932,160 GB, or 3,840 Terabytes, or 3.75 Petabytes.
The U.S. represents about 6.5% of the total world area, so we would only need to store 255,590.4 GB, or 246 TB. Using traditional hard drive technology, a map of the U.S. could be stored
Table 1. The number of tiles used by Google Maps to represent the world at 19 different levels of detail (LODs), and the corresponding distance on the ground represented by each pixel at the equator.
LOD
1
2
3
4
5
6
7
8
9
10
11
12
13
14
15
16
17
18
19
Number of tiles
4
16
64
256
1,204
4,096
16,384
65,536
262,144
1,048,576
4,194,304
16,777,216
67,108,864
268,435,456
1,073,741,824
4,294,967,296
17,179,869,184
68,719,476,736
274,877,906,944
Distance on the groundin meters for each pixel
78,272
39,136
19,568
9,784
4,892
2,446
1,223
611
306
153
76
38
19
10
5
2
1
0.60
0.30
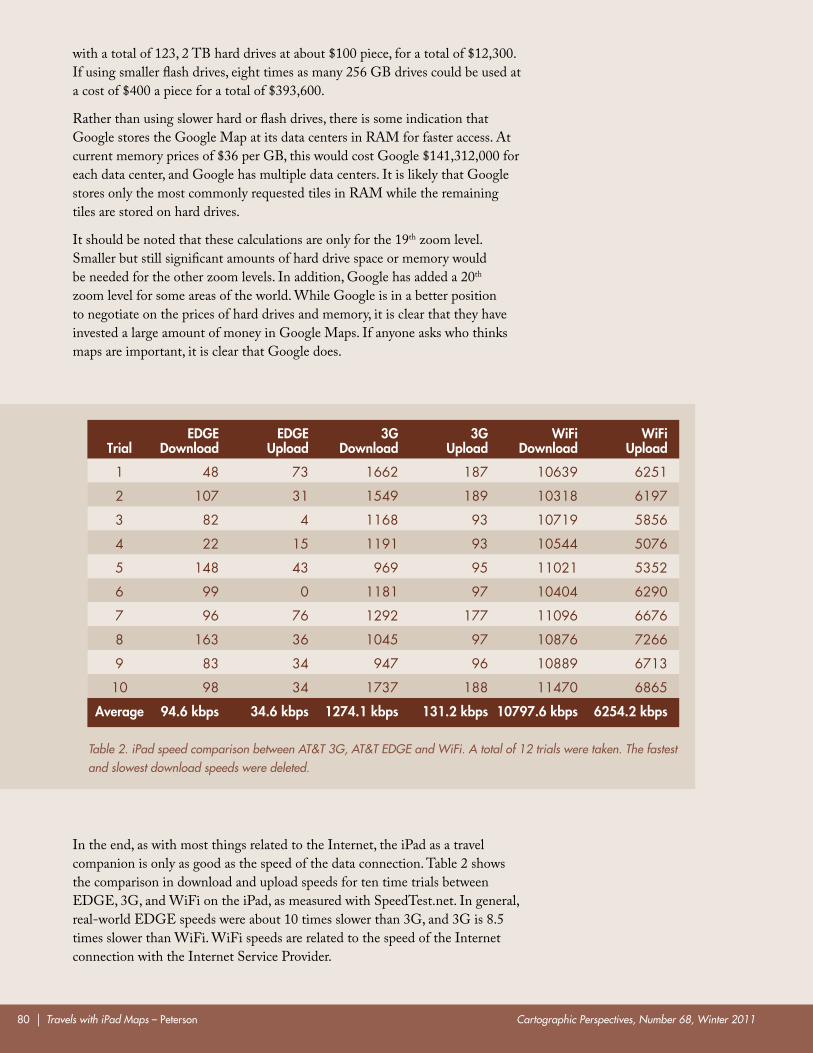
Cartographic Perspectives, Number 68, Winter 201180 | Travels with iPad Maps – peterson
with a total of 123, 2 TB hard drives at about $100 piece, for a total of $12,300. If using smaller flash drives, eight times as many 256 GB drives could be used at a cost of $400 a piece for a total of $393,600.
Rather than using slower hard or flash drives, there is some indication that Google stores the Google Map at its data centers in RAM for faster access. At current memory prices of $36 per GB, this would cost Google $141,312,000 for each data center, and Google has multiple data centers. It is likely that Google stores only the most commonly requested tiles in RAM while the remaining tiles are stored on hard drives.
It should be noted that these calculations are only for the 19th zoom level. Smaller but still significant amounts of hard drive space or memory would be needed for the other zoom levels. In addition, Google has added a 20th zoom level for some areas of the world. While Google is in a better position to negotiate on the prices of hard drives and memory, it is clear that they have invested a large amount of money in Google Maps. If anyone asks who thinks maps are important, it is clear that Google does.
In the end, as with most things related to the Internet, the iPad as a travel companion is only as good as the speed of the data connection. Table 2 shows the comparison in download and upload speeds for ten time trials between EDGE, 3G, and WiFi on the iPad, as measured with SpeedTest.net. In general, real-world EDGE speeds were about 10 times slower than 3G, and 3G is 8.5 times slower than WiFi. WiFi speeds are related to the speed of the Internet connection with the Internet Service Provider.
Table 2. iPad speed comparison between AT&T 3G, AT&T EDGE and WiFi. A total of 12 trials were taken. The fastest and slowest download speeds were deleted.
Trial
1
2
3
4
5
6
7
8
9
10
Average
EDGEDownload
48
107
82
22
148
99
96
163
83
98
94.6 kbps
EDGEUpload
73
31
4
15
43
0
76
36
34
34
34.6 kbps
WiFiDownload
10639
10318
10719
10544
11021
10404
11096
10876
10889
11470
10797.6 kbps
WiFiUpload
6251
6197
5856
5076
5352
6290
6676
7266
6713
6865
6254.2 kbps
3GDownload
1662
1549
1168
1191
969
1181
1292
1045
947
1737
1274.1 kbps
3GUpload
187
189
93
93
95
97
177
97
96
188
131.2 kbps
Cartographic Perspectives, Number 68, Winter 2011 Travels with iPad Maps – peterson | 81
c o n c l u s I o n
For portability and interactivity in map use, iPad and Maps is an amazing combination. Of course, a similar experience of navigating with an online map and GPS could be emulated with a notebook computer, an attached GPS device, and a data plan from a cell phone company. iPad Maps integrates all of this in a sleek ½” thick, 1.6 lb device. The two-finger interface is also easy to learn and the GPS integration is effortless. With a 3G data connection, the device will instantly tell you where you are. It may require some patience, but the iPad will tell you where you are going and how to get there. The Satellite view, normally a series of air photos that are stitched together, provides a new and unparalleled travel experience.
The most disappointing aspect of the device is the slowness of AT&T’s data communication. The company’s 3G coverage is minimal, covering only the larger cities. Most of the U.S. either has no coverage, or a slower EDGE/GPRS data communication with rated speeds between 75–384 Kbps. Real-world speeds for this data connection were only between 22–163 Kbps in ten time trials. In comparison to WiFi at more than 10 Mbps (10,000 Kbps), these speeds are extremely slow. Initial reports indicate that Verizon has slower 3G connection speeds but the area coverage is greater.
Data connection coverage problems can be partially avoided by viewing the maps (and images) while still connected through WiFi or 3G. The Maps application caches a certain amount of map tiles and can be used later even without a data connection. As long as all tiles for multiple zoom levels have been downloaded, the functionality of iPad Maps is the same. One can zoom in and out and the device indicates the current location. Any functionality that requires a data connection will continue to be painfully slow, such as determining the distance to a location.
The iPad is just the first of a new generation of Internet-enabled, slate computers. The popularity of these portable devices is evidenced by reports that Apple had sold 19 million by March 2011. One of the main applications of the device will be the display of maps. The use of online maps with these devices will become less frustrating with faster wireless data communications and better applications that store more of the downloaded maps in memory.
e p I l o g u e
After the U.S. experience, the author had a chance to use the iPad while driving in three foreign countries: Costa Rica, France, and Ireland. The 3G connection was never activated. Replacing the internal SIM card so that the device would have connected through a local mobile provider would have been possible but was considered too difficult and expensive. Data plans are even more costly outside the U.S. Even without 3G, the Maps application proved to be a very useful travel companion.
For portability and interactivity
in map use, iPad and Maps is an amazing
combination
Cartographic Perspectives, Number 68, Winter 201182 |
Before traveling to Costa Rica, Maps was used to cache multiple scales of maps of the areas we planned to travel. Although Google does not have a very complete map of the country, the map was often better than the paper map we had purchased. WiFi was much more accessible in Europe and so the Google Maps application was used each evening to cache the maps that would be necessary for the following day. The maps for these countries are very complete, including the smallest of roads.
Although we only used WiFi for data transfer in our foreign travels, it is still important to obtain the 3G version of the iPad as this is the only model that is GPS-enabled.
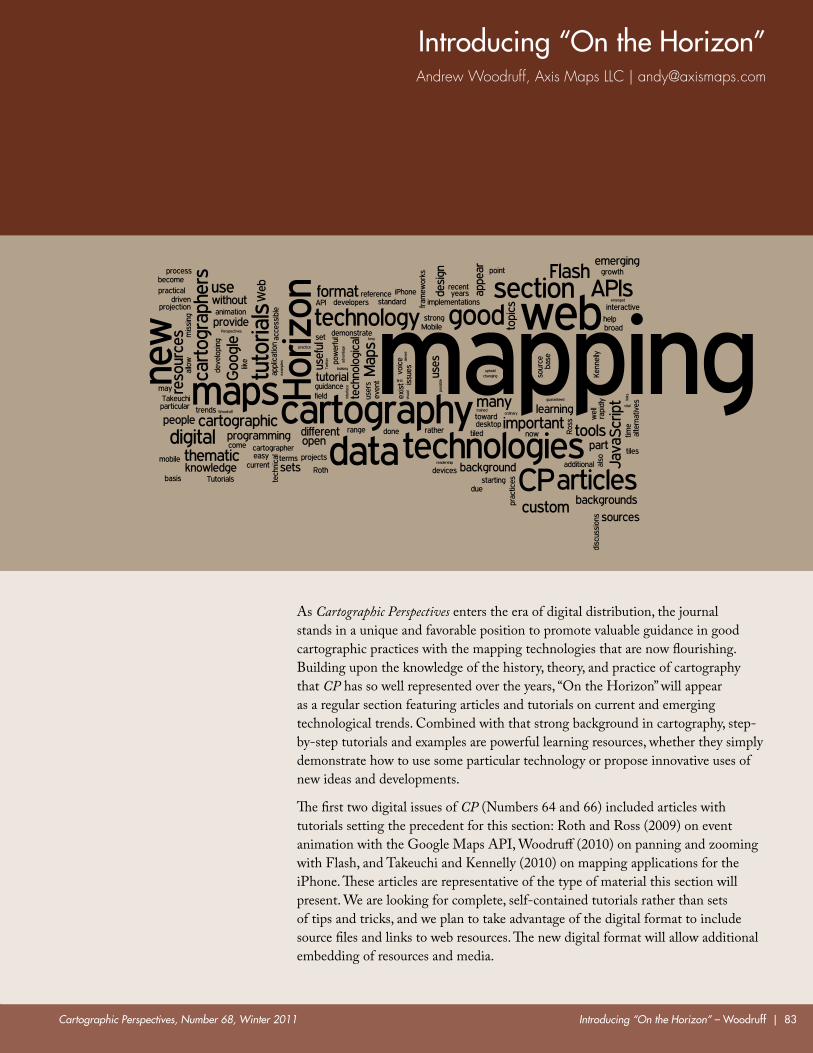
Cartographic Perspectives, Number 68, Winter 2011 Introducing “On the Horizon” – Woodruff | 83
Introducing “on the horizon”Andrew Woodruff, Axis Maps LLC | [email protected]
As Cartographic Perspectives enters the era of digital distribution, the journal stands in a unique and favorable position to promote valuable guidance in good cartographic practices with the mapping technologies that are now flourishing. Building upon the knowledge of the history, theory, and practice of cartography that CP has so well represented over the years, “On the Horizon” will appear as a regular section featuring articles and tutorials on current and emerging technological trends. Combined with that strong background in cartography, step-by-step tutorials and examples are powerful learning resources, whether they simply demonstrate how to use some particular technology or propose innovative uses of new ideas and developments.
The first two digital issues of CP (Numbers 64 and 66) included articles with tutorials setting the precedent for this section: Roth and Ross (2009) on event animation with the Google Maps API, Woodruff (2010) on panning and zooming with Flash, and Takeuchi and Kennelly (2010) on mapping applications for the iPhone. These articles are representative of the type of material this section will present. We are looking for complete, self-contained tutorials rather than sets of tips and tricks, and we plan to take advantage of the digital format to include source files and links to web resources. The new digital format will allow additional embedding of resources and media.
Cartographic Perspectives, Number 68, Winter 201184 | Introducing “On the Horizon” – Woodruff
With open access to this section, CP has an excellent opportunity to play an important role in emerging, highly technical mapping, especially on the web. In one capacity, it can be an interface between sometimes disparate groups: people from programming backgrounds developing and implementing new mapping technologies, and people from cartography backgrounds incorporating new technologies in their work. The recent explosive growth in mapping technology not only has been driven by developers, but also tends to result in products aimed at developers, not cartographers or end users. “On the Horizon” can help lower barriers to entering emerging technologies by explaining these to cartographers in useful, practical terms. With explanations and tutorials accessible to anyone, it can become a reliable resource for mapmakers beyond the core CP readership. The quick path to publication permitted by the new format assures that articles and tutorials will appear with the timeliness required in a rapidly changing technological field, without a lag during which an article’s relevance might decrease or specific steps in a tutorial become obsolete.
Equally important is the background and credibility CP can give to implementations of technology presented in this section. CP has a strong tradition of blending scholarship with practical mapping, something that “On the Horizon” aims to uphold. The cartographer’s voice is missing from a lot of web mapping, and a potential risk is that more and more mapping will be driven by technology rather than good cartographic practices. “On the Horizon” can help CP raise its voice in this important conversation. Not every tutorial needs to come from a traditionally educated and trained cartographer, but its appearance in these pages comes with the understanding that it has some basis in the accumulated knowledge and wisdom of the field of cartography and that it was written with thoughtful purpose. Between CP authors and readers, it is guaranteed that articles and discussions here will be geared toward demonstrating the use of new technologies for sound cartography.
“On the Horizon” can cover a broad range of technological topics, from brand new tools to more efficient uses of existing technologies. There is no predefined set of topics, but a few avenues come to mind as being important current trends in digital cartography that will be worth addressing in this section:
J AVA S C R I P T M A P P I N G
The Flash platform, with its vector graphics capabilities and powerful scripting language, has long been a good choice for interactive maps. In recent years, viable open source JavaScript alternatives have emerged, in part due to missing Flash support on some mobile devices. Frameworks such as OpenLayers (http://openlayers.org/) and Polymaps (http://polymaps.org/) have simplified custom JavaScript mapping; however, the process remains inherently less visual than many Flash projects and carries a steeper learning curve for people without programming backgrounds. Tutorials in “On the Horizon” will reach cartographers of all stripes and provide starting points for JavaScript mapping and some particular frameworks.
cp has a strong tradition of blending scholarship with practical mapping, something that “On the Horizon” aims to uphold
Cartographic Perspectives, Number 68, Winter 2011 Introducing “On the Horizon” – Woodruff | 85
T I L E D B A S E M A P S
Many web mapping frameworks appear to be moving toward a standardized format that uses tiled raster base maps. The maps consist of a tessellation of 256-pixel square tiles at different scales in the Mercator projection, such as exist in Google Maps, and increasingly form the basis of interactive thematic maps on the web. Several tools such as TileMill (http://tilemill.com/) and scripts and plug-ins for familiar mapping and design software have made designing custom tile sets relatively easy, but there is certainly room for more guidance on how to create and implement these tiles. Importantly, “On the Horizon” can provide a venue for the effective use of tiled base maps, or even alternatives, for thematic web mapping. This is a standard that grew out of reference mapping and carried less-than-ideal characteristics, such as its projection to thematic maps. Demonstrating the application of good thematic mapping principles is vital to the continued growth of web mapping.
M O B I L E M A P P I N G
Mapping and location-based services for mobile devices are a distinctive subset of cutting-edge cartography, as they can involve different technologies from those used in ordinary desktop web mapping. Takeuchi and Kennelly (2011) have provided a tutorial on making an iPhone mapping application that serves as a beginning point for users without a programming background. Mobile mapping also provides new opportunities and constraints for design and interaction that do not apply to desktop and web mapping, such as touch interfaces that allow a different set of interactions from what is possible in, say, Flash.
W E B M A P P I N G A P I S
Web mapping APIs like Google Maps perhaps have entered maturity now, permitting standard map displays and interactivity as well as customization, and they are an easy starting point for developing many web maps. Web resources such as the Google Maps API documentation itself provide good introductions to basic mapping. Where “On the Horizon” can contribute is in showing how to use web mapping APIs and build additional custom functionality for more advanced cartography, as Roth and Ross (2009) have done with event animation and Peterson (2008) has done with choropleth maps. Meanwhile, articles of this nature are mindful of the cartographic limitations of some mapping APIs, wherein basemap design is constrained or fixed, data are privately owned, and the maps themselves are subject to certain terms of service—issues that may restrict the most useful implementations.
B I G D ATA
A large part of any cartographic workflow is acquiring data, and there exist some massive, freely available data sets on the web that may be useful
Demonstrating the application of good
thematic mapping principles is vital to
the continued growth of web mapping
Cartographic Perspectives, Number 68, Winter 201186 | Introducing “On the Horizon” – Woodruff
in a broad range of mapping projects. For example, reference data from OpenStreetMap, demographic data from the U.S. Census, and social data from sources like Twitter and Flickr are the subjects of many and varied maps. Some data are accessible through APIs, and some tools simplify the process of retrieving and sorting through data from huge sources. Tutorials on such tools and APIs and on custom solutions will further open these data sources to cartographers.
As section editor for “On the Horizon,” I look forward to receiving articles on, and learning from resulting discussions of, the above topics and many more. It is an exciting time to be a cartographer. This is in no small part due to rapidly advancing technology, but at the same time the complexity and vastness of said technology can be overwhelming. It is my hope that “On the Horizon” will facilitate the exchange of technical knowledge within the cartography community; demonstrate how new technologies can assist good cartography; and show how new cartographers can utilize good technologies.
r e F e r e n c e s
Takeuchi, K., and P. Kennelly. 2010. Creating mapping applications for the iPhone. Cartographic Perspectives 66: 71–84.
Roth, R. E. and K. Ross. 2009. Extending the Google Maps API for event animation mashups. Cartographic Perspectives 64: 21–40.
Peterson, M. 2008. Choropleth Google Maps. Cartographic Perspectives 60: 80–83.
Woodruff, A.W. 2010. Programming panning and zooming in interactive maps. Cartographic Perspectives 66: 59–69.
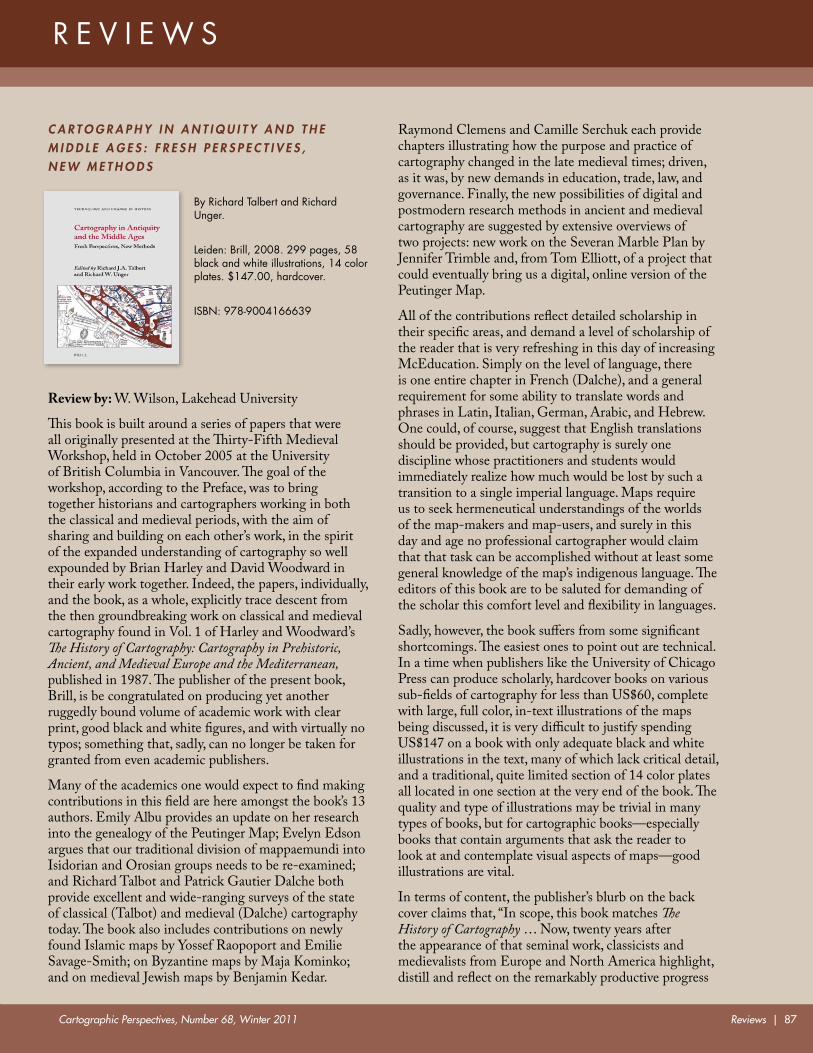
Cartographic Perspectives, Number 68, Winter 2011 Reviews | 87
R e v i e w s
C A R T O G R A P H Y I N A N T I q U I T Y A N D T H E M I D D L E A G E S : F R E S H P E R S P E C T I V E S , N E W M E T H O D S
By Richard Talbert and Richard Unger.
Leiden: Brill, 2008. 299 pages, 58 black and white illustrations, 14 color plates. $147.00, hardcover.
isBN: 978-9004166639
Review by: W. Wilson, Lakehead University
This book is built around a series of papers that were all originally presented at the Thirty-Fifth Medieval Workshop, held in October 2005 at the University of British Columbia in Vancouver. The goal of the workshop, according to the Preface, was to bring together historians and cartographers working in both the classical and medieval periods, with the aim of sharing and building on each other’s work, in the spirit of the expanded understanding of cartography so well expounded by Brian Harley and David Woodward in their early work together. Indeed, the papers, individually, and the book, as a whole, explicitly trace descent from the then groundbreaking work on classical and medieval cartography found in Vol. 1 of Harley and Woodward’s The History of Cartography: Cartography in Prehistoric, Ancient, and Medieval Europe and the Mediterranean, published in 1987. The publisher of the present book, Brill, is be congratulated on producing yet another ruggedly bound volume of academic work with clear print, good black and white figures, and with virtually no typos; something that, sadly, can no longer be taken for granted from even academic publishers.
Many of the academics one would expect to find making contributions in this field are here amongst the book’s 13 authors. Emily Albu provides an update on her research into the genealogy of the Peutinger Map; Evelyn Edson argues that our traditional division of mappaemundi into Isidorian and Orosian groups needs to be re-examined; and Richard Talbot and Patrick Gautier Dalche both provide excellent and wide-ranging surveys of the state of classical (Talbot) and medieval (Dalche) cartography today. The book also includes contributions on newly found Islamic maps by Yossef Raopoport and Emilie Savage-Smith; on Byzantine maps by Maja Kominko; and on medieval Jewish maps by Benjamin Kedar.
Raymond Clemens and Camille Serchuk each provide chapters illustrating how the purpose and practice of cartography changed in the late medieval times; driven, as it was, by new demands in education, trade, law, and governance. Finally, the new possibilities of digital and postmodern research methods in ancient and medieval cartography are suggested by extensive overviews of two projects: new work on the Severan Marble Plan by Jennifer Trimble and, from Tom Elliott, of a project that could eventually bring us a digital, online version of the Peutinger Map.
All of the contributions reflect detailed scholarship in their specific areas, and demand a level of scholarship of the reader that is very refreshing in this day of increasing McEducation. Simply on the level of language, there is one entire chapter in French (Dalche), and a general requirement for some ability to translate words and phrases in Latin, Italian, German, Arabic, and Hebrew. One could, of course, suggest that English translations should be provided, but cartography is surely one discipline whose practitioners and students would immediately realize how much would be lost by such a transition to a single imperial language. Maps require us to seek hermeneutical understandings of the worlds of the map-makers and map-users, and surely in this day and age no professional cartographer would claim that that task can be accomplished without at least some general knowledge of the map’s indigenous language. The editors of this book are to be saluted for demanding of the scholar this comfort level and flexibility in languages.
Sadly, however, the book suffers from some significant shortcomings. The easiest ones to point out are technical. In a time when publishers like the University of Chicago Press can produce scholarly, hardcover books on various sub-fields of cartography for less than US$60, complete with large, full color, in-text illustrations of the maps being discussed, it is very difficult to justify spending US$147 on a book with only adequate black and white illustrations in the text, many of which lack critical detail, and a traditional, quite limited section of 14 color plates all located in one section at the very end of the book. The quality and type of illustrations may be trivial in many types of books, but for cartographic books—especially books that contain arguments that ask the reader to look at and contemplate visual aspects of maps—good illustrations are vital.
In terms of content, the publisher’s blurb on the back cover claims that, “In scope, this book matches The History of Cartography … Now, twenty years after the appearance of that seminal work, classicists and medievalists from Europe and North America highlight, distill and reflect on the remarkably productive progress
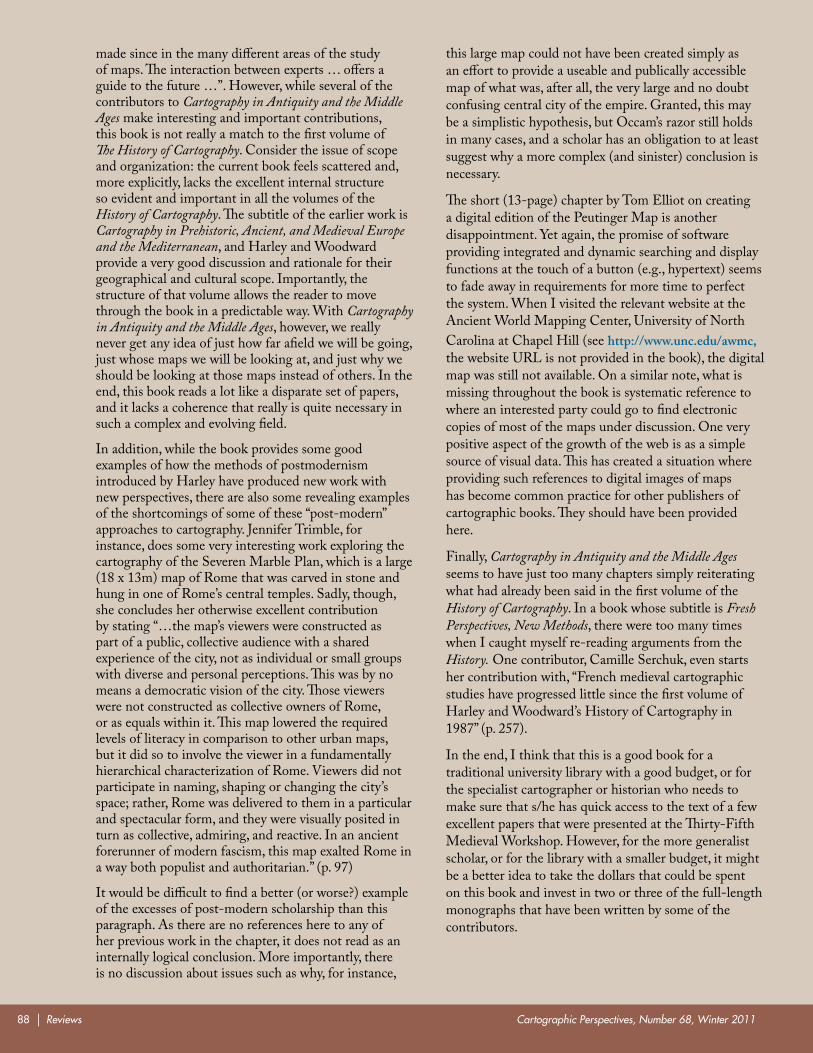
Cartographic Perspectives, Number 68, Winter 201188 | Reviews
made since in the many different areas of the study of maps. The interaction between experts … offers a guide to the future …”. However, while several of the contributors to Cartography in Antiquity and the Middle Ages make interesting and important contributions, this book is not really a match to the first volume of The History of Cartography. Consider the issue of scope and organization: the current book feels scattered and, more explicitly, lacks the excellent internal structure so evident and important in all the volumes of the History of Cartography. The subtitle of the earlier work is Cartography in Prehistoric, Ancient, and Medieval Europe and the Mediterranean, and Harley and Woodward provide a very good discussion and rationale for their geographical and cultural scope. Importantly, the structure of that volume allows the reader to move through the book in a predictable way. With Cartography in Antiquity and the Middle Ages, however, we really never get any idea of just how far afield we will be going, just whose maps we will be looking at, and just why we should be looking at those maps instead of others. In the end, this book reads a lot like a disparate set of papers, and it lacks a coherence that really is quite necessary in such a complex and evolving field.
In addition, while the book provides some good examples of how the methods of postmodernism introduced by Harley have produced new work with new perspectives, there are also some revealing examples of the shortcomings of some of these “post-modern” approaches to cartography. Jennifer Trimble, for instance, does some very interesting work exploring the cartography of the Severen Marble Plan, which is a large (18 x 13m) map of Rome that was carved in stone and hung in one of Rome’s central temples. Sadly, though, she concludes her otherwise excellent contribution by stating “…the map’s viewers were constructed as part of a public, collective audience with a shared experience of the city, not as individual or small groups with diverse and personal perceptions. This was by no means a democratic vision of the city. Those viewers were not constructed as collective owners of Rome, or as equals within it. This map lowered the required levels of literacy in comparison to other urban maps, but it did so to involve the viewer in a fundamentally hierarchical characterization of Rome. Viewers did not participate in naming, shaping or changing the city’s space; rather, Rome was delivered to them in a particular and spectacular form, and they were visually posited in turn as collective, admiring, and reactive. In an ancient forerunner of modern fascism, this map exalted Rome in a way both populist and authoritarian.” (p. 97)
It would be difficult to find a better (or worse?) example of the excesses of post-modern scholarship than this paragraph. As there are no references here to any of her previous work in the chapter, it does not read as an internally logical conclusion. More importantly, there is no discussion about issues such as why, for instance,
this large map could not have been created simply as an effort to provide a useable and publically accessible map of what was, after all, the very large and no doubt confusing central city of the empire. Granted, this may be a simplistic hypothesis, but Occam’s razor still holds in many cases, and a scholar has an obligation to at least suggest why a more complex (and sinister) conclusion is necessary.
The short (13-page) chapter by Tom Elliot on creating a digital edition of the Peutinger Map is another disappointment. Yet again, the promise of software providing integrated and dynamic searching and display functions at the touch of a button (e.g., hypertext) seems to fade away in requirements for more time to perfect the system. When I visited the relevant website at the Ancient World Mapping Center, University of North Carolina at Chapel Hill (see http://www.unc.edu/awmc, the website URL is not provided in the book), the digital map was still not available. On a similar note, what is missing throughout the book is systematic reference to where an interested party could go to find electronic copies of most of the maps under discussion. One very positive aspect of the growth of the web is as a simple source of visual data. This has created a situation where providing such references to digital images of maps has become common practice for other publishers of cartographic books. They should have been provided here.
Finally, Cartography in Antiquity and the Middle Ages seems to have just too many chapters simply reiterating what had already been said in the first volume of the History of Cartography. In a book whose subtitle is Fresh Perspectives, New Methods, there were too many times when I caught myself re-reading arguments from the History. One contributor, Camille Serchuk, even starts her contribution with, “French medieval cartographic studies have progressed little since the first volume of Harley and Woodward’s History of Cartography in 1987” (p. 257).
In the end, I think that this is a good book for a traditional university library with a good budget, or for the specialist cartographer or historian who needs to make sure that s/he has quick access to the text of a few excellent papers that were presented at the Thirty-Fifth Medieval Workshop. However, for the more generalist scholar, or for the library with a smaller budget, it might be a better idea to take the dollars that could be spent on this book and invest in two or three of the full-length monographs that have been written by some of the contributors.
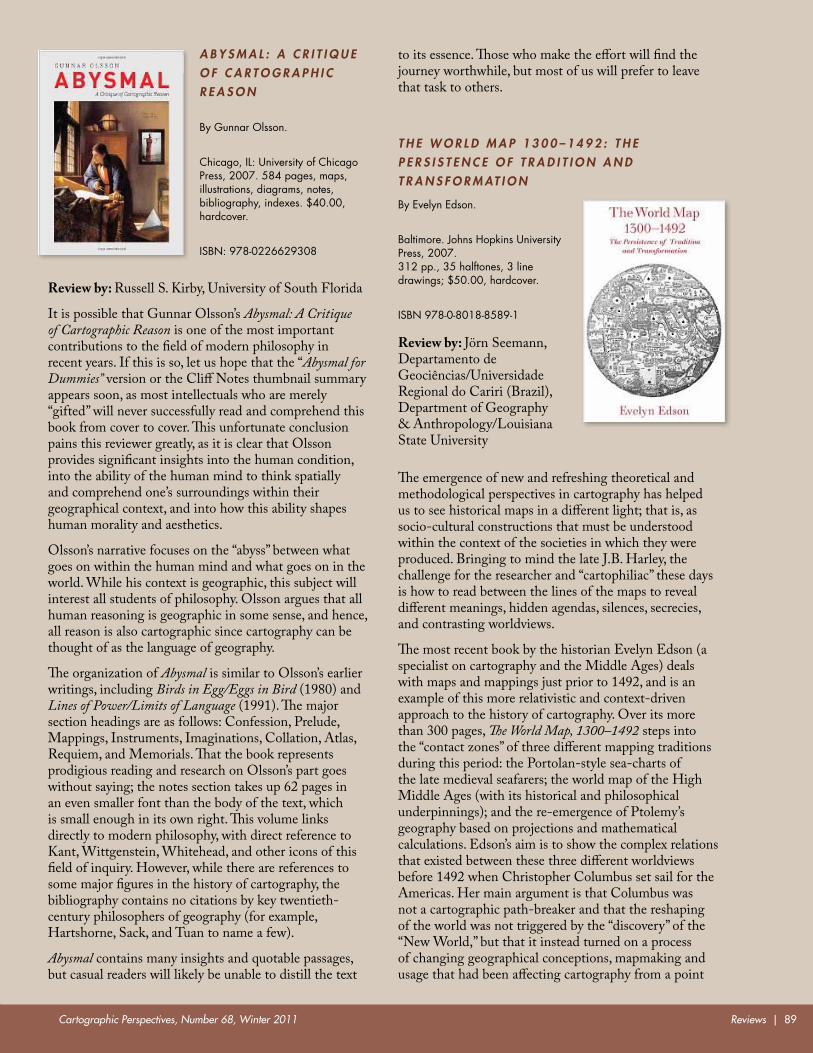
Cartographic Perspectives, Number 68, Winter 2011 Reviews | 89
A B Y S M A L : A C R I T I q U E O F C A R T O G R A P H I C R E A S O N
By Gunnar Olsson.
Chicago, iL: University of Chicago Press, 2007. 584 pages, maps, illustrations, diagrams, notes, bibliography, indexes. $40.00, hardcover.
isBN: 978-0226629308
Review by: Russell S. Kirby, University of South Florida
It is possible that Gunnar Olsson’s Abysmal: A Critique of Cartographic Reason is one of the most important contributions to the field of modern philosophy in recent years. If this is so, let us hope that the “Abysmal for Dummies” version or the Cliff Notes thumbnail summary appears soon, as most intellectuals who are merely “gifted” will never successfully read and comprehend this book from cover to cover. This unfortunate conclusion pains this reviewer greatly, as it is clear that Olsson provides significant insights into the human condition, into the ability of the human mind to think spatially and comprehend one’s surroundings within their geographical context, and into how this ability shapes human morality and aesthetics.
Olsson’s narrative focuses on the “abyss” between what goes on within the human mind and what goes on in the world. While his context is geographic, this subject will interest all students of philosophy. Olsson argues that all human reasoning is geographic in some sense, and hence, all reason is also cartographic since cartography can be thought of as the language of geography.
The organization of Abysmal is similar to Olsson’s earlier writings, including Birds in Egg/Eggs in Bird (1980) and Lines of Power/Limits of Language (1991). The major section headings are as follows: Confession, Prelude, Mappings, Instruments, Imaginations, Collation, Atlas, Requiem, and Memorials. That the book represents prodigious reading and research on Olsson’s part goes without saying; the notes section takes up 62 pages in an even smaller font than the body of the text, which is small enough in its own right. This volume links directly to modern philosophy, with direct reference to Kant, Wittgenstein, Whitehead, and other icons of this field of inquiry. However, while there are references to some major figures in the history of cartography, the bibliography contains no citations by key twentieth-century philosophers of geography (for example, Hartshorne, Sack, and Tuan to name a few).
Abysmal contains many insights and quotable passages, but casual readers will likely be unable to distill the text
to its essence. Those who make the effort will find the journey worthwhile, but most of us will prefer to leave that task to others.
T H E W O R L D M A P 1 3 0 0 – 1 4 9 2 : T H E P E R S I S T E N C E O F T R A D I T I O N A N D T R A N S F O R M AT I O N
By evelyn edson.
Baltimore. Johns Hopkins University Press, 2007. 312 pp., 35 halftones, 3 line drawings; $50.00, hardcover.
isBN 978-0-8018-8589-1
Review by: Jörn Seemann, Departamento de Geociências/Universidade Regional do Cariri (Brazil), Department of Geography & Anthropology/Louisiana State University
The emergence of new and refreshing theoretical and methodological perspectives in cartography has helped us to see historical maps in a different light; that is, as socio-cultural constructions that must be understood within the context of the societies in which they were produced. Bringing to mind the late J.B. Harley, the challenge for the researcher and “cartophiliac” these days is how to read between the lines of the maps to reveal different meanings, hidden agendas, silences, secrecies, and contrasting worldviews.
The most recent book by the historian Evelyn Edson (a specialist on cartography and the Middle Ages) deals with maps and mappings just prior to 1492, and is an example of this more relativistic and context-driven approach to the history of cartography. Over its more than 300 pages, The World Map, 1300–1492 steps into the “contact zones” of three different mapping traditions during this period: the Portolan-style sea-charts of the late medieval seafarers; the world map of the High Middle Ages (with its historical and philosophical underpinnings); and the re-emergence of Ptolemy’s geography based on projections and mathematical calculations. Edson’s aim is to show the complex relations that existed between these three different worldviews before 1492 when Christopher Columbus set sail for the Americas. Her main argument is that Columbus was not a cartographic path-breaker and that the reshaping of the world was not triggered by the “discovery” of the “New World,” but that it instead turned on a process of changing geographical conceptions, mapmaking and usage that had been affecting cartography from a point
Cartographic Perspectives, Number 68, Winter 201190 | Reviews
far earlier in time. Edson uses more than 30 maps to point out the degree to which these distinct traditions blend and interchange, or exclude themselves from other cartographic narratives. These different worldviews were manifested in the maps and show a dynamic power-field between tradition and transformation in mapmaking.
In her introductory section, the author discusses the example of a nautical atlas created in 1436 by the Venetian merchant Andrea Bianco. The atlas includes elements from the three distinct traditions that form the pillars of Edson’s analysis: Portolan-type navigational routes in the Mediterranean and Black Seas and the Atlantic and North Sea coast; a Ptolemy-style map of the known world to pinpoint locations and landmarks mathematically; and a medieval mappamundi with the East at the top and decorated with the pictures of Paradise, dragons and dog-headed men. The subsequent eight chapters of The World Map present a kind of jigsaw puzzle of different mapmakers and mapping traditions in different places. Piece by piece, Edson assembles a complete image of the mapping scenario of the fourteenth and fifteenth centuries and indicates how new “discoveries” literally started to break the frame of the traditional map, and how new details brought by missionaries, merchants, and seafarers—and obtained through the use of new instruments such as the astrolabe or the compass—were incorporated in the maps.
Chapters one, two, and five discuss the “purest” forms of these distinct cartographic narratives. First, Edson uses the illustrative example of the thirteenth century Hereford Cathedral map, a late medieval mappamundi, in order to indicate the fusion of “history, geography, botany, zoology, ethnology, and theology into one harmonious and dazzling whole” (p. 31). The Pisa chart (chapter two), considered the oldest known marine chart (about 1275–1300), is a representative of the second tradition: a map with the North at the top, many place names, a scale, color-coding of different features and highly elaborated wind-roses whose innumerate rhumb lines radiate from their centers and almost destroy the aesthetics of the map. Chapter five relates the recovery of Ptolemy’s geography in the late fourteenth century and the production of maps with projections and grids of latitudes and longitudes that provided a systematic vision of the world based on the abstract principles of Euclidean geometry.
In contrast to these “pure” narratives, the other chapters of the book are dedicated to the several “mixed” forms and counter-movements. Chapter three reports on the blending of the medieval world map and sea chart and the merging of Catholic universal history and geographically precise cartography. Besides several samples from the Catalan Atlas that was produced in Majorca in the 1370s (and representing the worldview of a Jewish Balearic cartographer; probably Abraham Cresques), Edson also presents the example of Marino
Sanudo’s world map from 1321; the Sanudo map shows a concern with the dwindling territorial extent of Roman Catholic Christianity, and urges Papal approval for Crusade-style military action. While chapter four deals with the type of geographical knowledge (hovering between fact and fiction) that was created by travelers, missionaries, and merchants (such as Ibn Battuta, William Rubruck, and Marco Polo), or charlatans and plagiarists (such as John Mandeville), chapter seven presents an account of a “backwater school of geography” (p. 188) that demonstrated that “maps did not have to be up-to-date in order to be valuable to the map-using public” (p. 169). Conservative world maps such as the one included in Ranulf Higden’s Polychronicon demonstrated the survival of medieval myths in cartography. Among other features, the map locates Noah’s Ark in Armenia, shows Paradise (with Adam and Eve) as a real place, and has the Red Sea colored in red.
In chapter six, the author analyzes the world map created around 1450 by the Italian monk Fra Mauro, “nearly six feet in diameter, painted on parchment glued to wood panels” (p. 141). This map represents an early attempt to merge the three traditions in one map: The south is at the top, while at the center of the map is the holy city of Jerusalem. The contents, while supposedly based on “trustworthy” accounts and “reliable reports” from merchants and seafarers, also mention classical and medieval authors such as Pliny and Macrobius as references.
These earlier chapters of the book lead to a final section that deals with the transformation of the world map at the end of the fifteenth century as exemplified by the so-called “Columbus Map,” by the world map of Henricus Martellus Germanus, and by Martin Behaim’s globe. The confirmation of the existence of a “new” continent in 1492 resulted in a “breaking of the frame” of the world map in order to include “the reports that poured in from all sides” (p. 226). Edson summarizes her tour through the mapped world between 1300 and 1492 by stating that “before America was discovered, there was a place to put it on the map.” (p. 227) The tensions between the mathematical, the divine, and the practical aspects of maps resulted in a complex and dynamic landscape of mapmaking that was ready to deal with a new world.
The World Map: 1300–1492 is a fascinating tour-de-force of the mapping activities at the brink of 1492, frequently seen as a “magical date” for cartography. Evelyn Edson not only draws a picture of the coexistence of the three different mapping traditions during that period, but also reveals their different forms of interaction and resistance. There were, however, rarely clear-cut edges between the three forms, which should not be seen as opposing, but as complementary, worldviews. Edson is able to point out that mapmaking during this period was anything but static; new spaces, imaginary or real, were mapped quickly, and consequently the map was conceived as
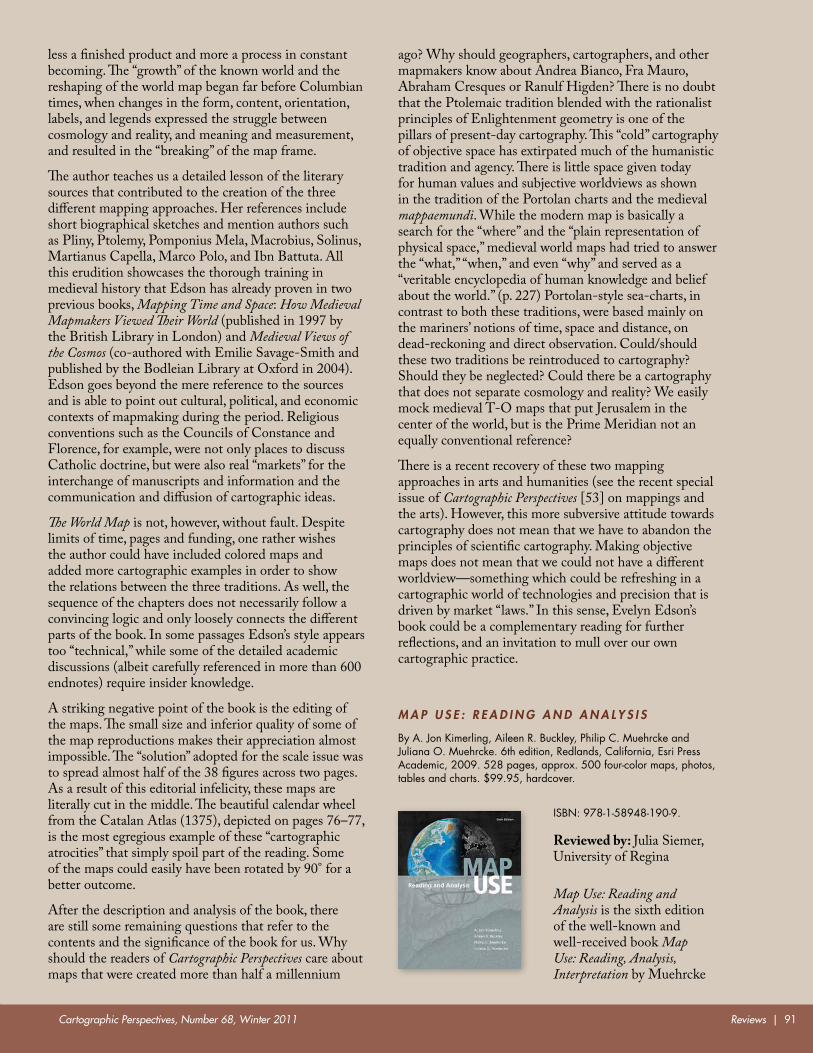
Cartographic Perspectives, Number 68, Winter 2011 Reviews | 91
less a finished product and more a process in constant becoming. The “growth” of the known world and the reshaping of the world map began far before Columbian times, when changes in the form, content, orientation, labels, and legends expressed the struggle between cosmology and reality, and meaning and measurement, and resulted in the “breaking” of the map frame.
The author teaches us a detailed lesson of the literary sources that contributed to the creation of the three different mapping approaches. Her references include short biographical sketches and mention authors such as Pliny, Ptolemy, Pomponius Mela, Macrobius, Solinus, Martianus Capella, Marco Polo, and Ibn Battuta. All this erudition showcases the thorough training in medieval history that Edson has already proven in two previous books, Mapping Time and Space: How Medieval Mapmakers Viewed Their World (published in 1997 by the British Library in London) and Medieval Views of the Cosmos (co-authored with Emilie Savage-Smith and published by the Bodleian Library at Oxford in 2004). Edson goes beyond the mere reference to the sources and is able to point out cultural, political, and economic contexts of mapmaking during the period. Religious conventions such as the Councils of Constance and Florence, for example, were not only places to discuss Catholic doctrine, but were also real “markets” for the interchange of manuscripts and information and the communication and diffusion of cartographic ideas.
The World Map is not, however, without fault. Despite limits of time, pages and funding, one rather wishes the author could have included colored maps and added more cartographic examples in order to show the relations between the three traditions. As well, the sequence of the chapters does not necessarily follow a convincing logic and only loosely connects the different parts of the book. In some passages Edson’s style appears too “technical,” while some of the detailed academic discussions (albeit carefully referenced in more than 600 endnotes) require insider knowledge.
A striking negative point of the book is the editing of the maps. The small size and inferior quality of some of the map reproductions makes their appreciation almost impossible. The “solution” adopted for the scale issue was to spread almost half of the 38 figures across two pages. As a result of this editorial infelicity, these maps are literally cut in the middle. The beautiful calendar wheel from the Catalan Atlas (1375), depicted on pages 76–77, is the most egregious example of these “cartographic atrocities” that simply spoil part of the reading. Some of the maps could easily have been rotated by 90° for a better outcome.
After the description and analysis of the book, there are still some remaining questions that refer to the contents and the significance of the book for us. Why should the readers of Cartographic Perspectives care about maps that were created more than half a millennium
ago? Why should geographers, cartographers, and other mapmakers know about Andrea Bianco, Fra Mauro, Abraham Cresques or Ranulf Higden? There is no doubt that the Ptolemaic tradition blended with the rationalist principles of Enlightenment geometry is one of the pillars of present-day cartography. This “cold” cartography of objective space has extirpated much of the humanistic tradition and agency. There is little space given today for human values and subjective worldviews as shown in the tradition of the Portolan charts and the medieval mappaemundi. While the modern map is basically a search for the “where” and the “plain representation of physical space,” medieval world maps had tried to answer the “what,” “when,” and even “why” and served as a “veritable encyclopedia of human knowledge and belief about the world.” (p. 227) Portolan-style sea-charts, in contrast to both these traditions, were based mainly on the mariners’ notions of time, space and distance, on dead-reckoning and direct observation. Could/should these two traditions be reintroduced to cartography? Should they be neglected? Could there be a cartography that does not separate cosmology and reality? We easily mock medieval T-O maps that put Jerusalem in the center of the world, but is the Prime Meridian not an equally conventional reference?
There is a recent recovery of these two mapping approaches in arts and humanities (see the recent special issue of Cartographic Perspectives [53] on mappings and the arts). However, this more subversive attitude towards cartography does not mean that we have to abandon the principles of scientific cartography. Making objective maps does not mean that we could not have a different worldview—something which could be refreshing in a cartographic world of technologies and precision that is driven by market “laws.” In this sense, Evelyn Edson’s book could be a complementary reading for further reflections, and an invitation to mull over our own cartographic practice.
M A P U S E : R E A D I N G A N D A N A LY S I S
By A. Jon Kimerling, Aileen R. Buckley, Philip C. Muehrcke and Juliana O. Muehrcke. 6th edition, Redlands, California, esri Press Academic, 2009. 528 pages, approx. 500 four-color maps, photos, tables and charts. $99.95, hardcover.
isBN: 978-1-58948-190-9.
Reviewed by: Julia Siemer, University of Regina
Map Use: Reading and Analysis is the sixth edition of the well-known and well-received book Map Use: Reading, Analysis, Interpretation by Muehrcke
Cartographic Perspectives, Number 68, Winter 201192 | Reviews
and Muehrcke, who were later joined by co-author A. Jon Kimerling. The recent change of publisher to Esri Press included the addition of Aileen R. Buckley as a new co-author.
This current edition of Map Use is divided into Map Reading (Part 1), Map Analysis (Part 2), and three appendices (on digital cartographic data, selected navigation and GPS abbreviations and acronyms, and mathematical tables of values such as mapping units and geographic coordinates of major American cities), plus an extensive glossary and an index.
Part 1: Map Reading forms the main part of the book. It comprises ten chapters covering fundamental principles on how the environment is represented in the form of abstract, generalized maps. Topics like map scale, coordinate systems and projections, land partitioning systems, relief representation, qualitative and quantitative thematic maps, geographic data, image maps, and map accuracy and uncertainty are discussed.
Part 2: Map Analysis focuses on more technical hands-on aspects of map use, for instance: distance and direction finding, area and volume measurements, navigation, and use of the global positioning system (GPS). The eight chapters that comprise Part 2 include three chapters on surface and spatial analysis as well as on spatial association analysis. The latter two include map analysis techniques by use of analytic tools offered in geographic information systems (GIS). Major spatial statistics operations are explained (pattern analysis, Moran’s I autocorrelation index, nearest neighbor statistics, and others). This topic, typically not found in comparable map use reference books, is a very useful addition—particularly for GIS users who wish to gain a better understanding of maps and their use and analysis. This newly added content is a good example of how this edition of Map Use accounts for the change in mapping from the exclusive use of paper maps to computerized mapping, often by means of GIS. Despite the technological advances, map users still need to understand the underlying principles of maps to be able to use them effectively. This book provides GIS users with these fundamental principles and will help improve their ability to think and communicate visually by means of maps. In addition to GIS-relevant aspects, the book addresses modern technology like GPS and interactive and online maps, thus offering new possibilities in a teaching environment for hands-on exercises on how maps work. At the same time, theories like cartographic communication theory, which were discussed in detail in earlier editions, are omitted. The authors acknowledge the importance of the topic of map interpretation, and state that this topic was singled out for attention in future publishing initiatives. One can only hope communication theory will be added again in a future edition of the book, to offer a more complete and up-to-date introduction to map use and understanding.
The book was designed for use in an undergraduate level introductory course. Therefore, upon request, it is complemented by an instructors’ resource CD, featuring lab exercises with answer keys and basic, yet useful, PowerPoint presentations for each chapter of the book. In addition to this, the web pages for this book on the publisher’s website offer a student resource page that includes the same exercises and presentations as well as links to some of Esri’s free GIS introductory exercises.
The four-color maps and graphics throughout the book are mostly of good quality, although some of the scans (for example, Figures 5.4 and 5.5 on page 86) are of surprisingly low resolution and thereby detract the otherwise attractive look and feel of the book. Another, more irritating, printing related issue is the very strong chemical smell of the book, which, even after weeks on my desk, has not yet disappeared.
My only major criticism is the often-missing “international” component. Although the book includes some international aspects (e.g., land partitioning systems in the U.S. and Canada, and brief explanations of some European grid coordinate systems), it has a very strong focus on mapping-related aspects in and of the United States, which continues throughout all of Parts 1 and 2 and the appendices. It would have been beneficial to include more information on international mapping (such as international cartographic data sources) and map use (perhaps cultural influence in map design and interpretation). Furthermore, a separate section on current international topographic mapping standards, paper and digital, would clearly have benefited the book. The lack of international content is even more surprising considering the worldwide acceptance of previous editions of Map Use and of the publisher’s (Esri Press) international distribution capabilities. To be truly successful internationally, this important factor should be addressed in future editions.
The regional focus also became evident when I tried to obtain an evaluation copy of this book. Suprisingly, it proved to be impossible for me, as an instructor at a Canadian university, to receive a free copy from the publisher.
Despite this criticism, I recommend the book as a very useful resource for fundamental principles of map use and analysis. Because it can be used both for general reference and as an undergraduate textbook, I have chosen it as a textbook for my introductory map reading course at the University of Regina, Saskatchewan.
A seventh edition of Map Use: Reading and Analysis is expected in Fall 2011.
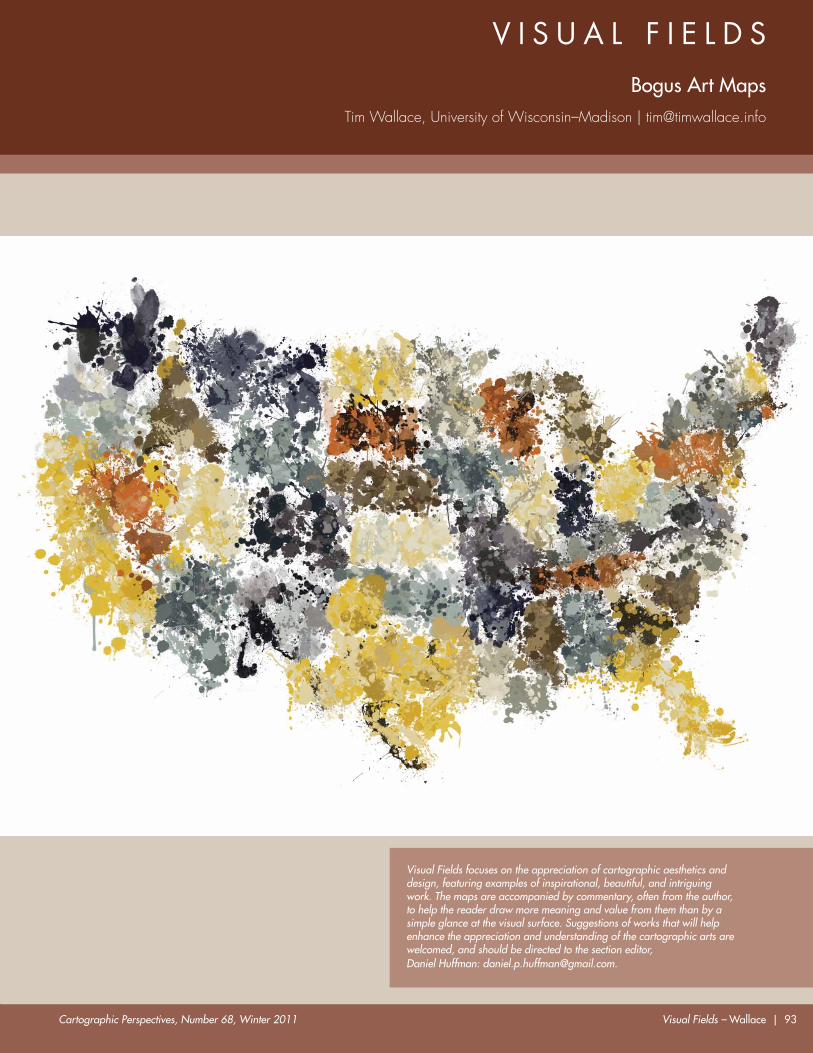
Cartographic Perspectives, Number 68, Winter 2011 Visual Fields – Wallace | 93
v i s U A L F i e L d s
Bogus art MapsTim Wallace, University of Wisconsin–Madison | [email protected]
Visual Fields focuses on the appreciation of cartographic aesthetics and design, featuring examples of inspirational, beautiful, and intriguing work. The maps are accompanied by commentary, often from the author, to help the reader draw more meaning and value from them than by a simple glance at the visual surface. Suggestions of works that will help enhance the appreciation and understanding of the cartographic arts are welcomed, and should be directed to the section editor, Daniel Huffman: [email protected].
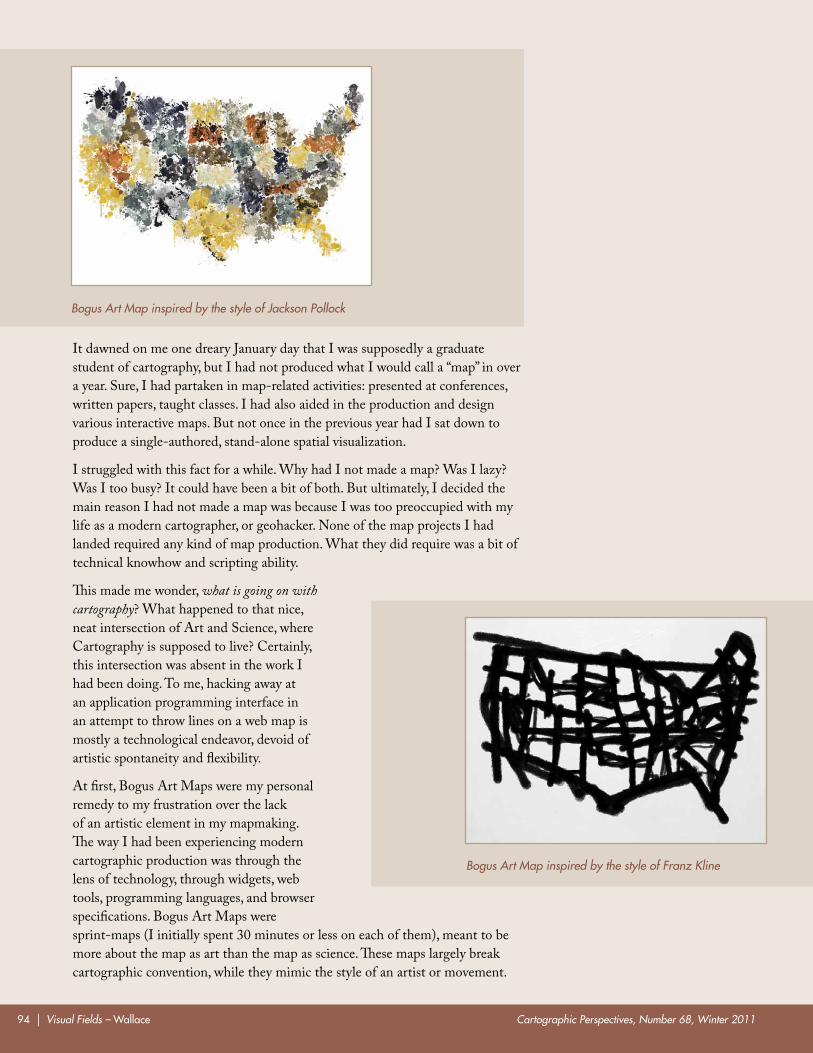
Cartographic Perspectives, Number 68, Winter 201194 | Visual Fields – Wallace
It dawned on me one dreary January day that I was supposedly a graduate student of cartography, but I had not produced what I would call a “map” in over a year. Sure, I had partaken in map-related activities: presented at conferences, written papers, taught classes. I had also aided in the production and design various interactive maps. But not once in the previous year had I sat down to produce a single-authored, stand-alone spatial visualization.
I struggled with this fact for a while. Why had I not made a map? Was I lazy? Was I too busy? It could have been a bit of both. But ultimately, I decided the main reason I had not made a map was because I was too preoccupied with my life as a modern cartographer, or geohacker. None of the map projects I had landed required any kind of map production. What they did require was a bit of technical knowhow and scripting ability.
This made me wonder, what is going on with cartography? What happened to that nice, neat intersection of Art and Science, where Cartography is supposed to live? Certainly, this intersection was absent in the work I had been doing. To me, hacking away at an application programming interface in an attempt to throw lines on a web map is mostly a technological endeavor, devoid of artistic spontaneity and flexibility.
At first, Bogus Art Maps were my personal remedy to my frustration over the lack of an artistic element in my mapmaking. The way I had been experiencing modern cartographic production was through the lens of technology, through widgets, web tools, programming languages, and browser specifications. Bogus Art Maps were sprint-maps (I initially spent 30 minutes or less on each of them), meant to be more about the map as art than the map as science. These maps largely break cartographic convention, while they mimic the style of an artist or movement.
Bogus Art Map inspired by the style of Franz Kline
Bogus Art Map inspired by the style of Jackson Pollock
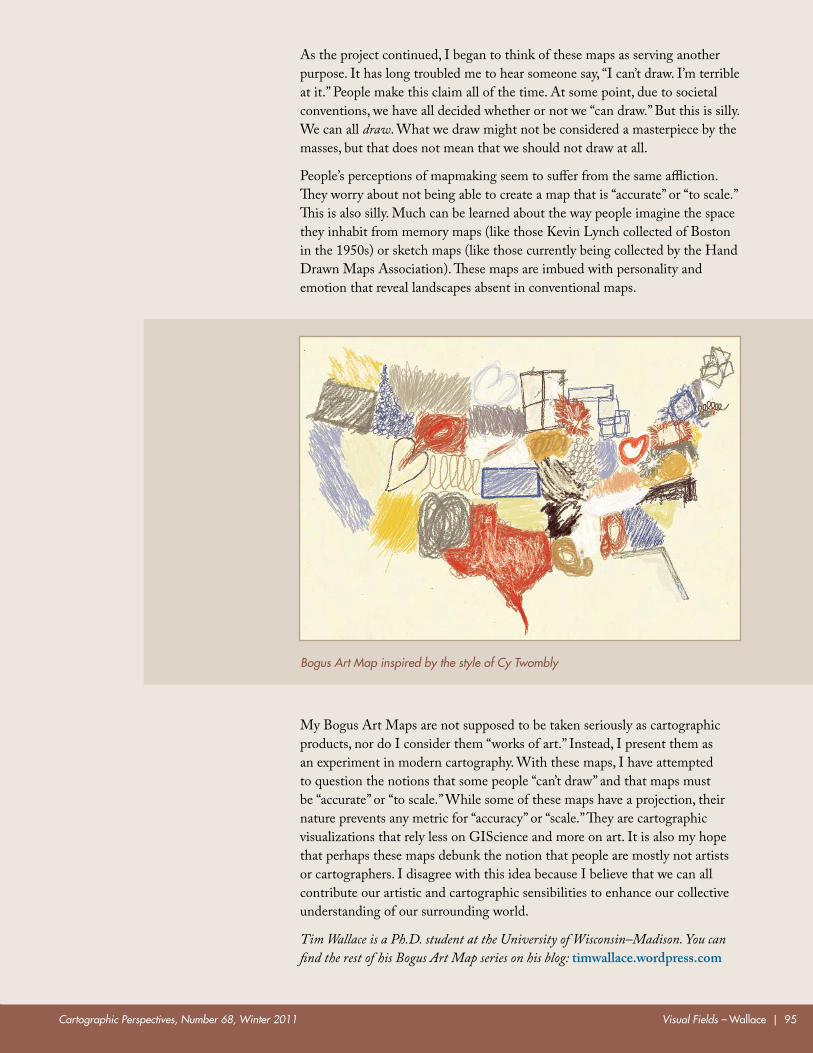
Cartographic Perspectives, Number 68, Winter 2011 Visual Fields – Wallace | 95
As the project continued, I began to think of these maps as serving another purpose. It has long troubled me to hear someone say, “I can’t draw. I’m terrible at it.” People make this claim all of the time. At some point, due to societal conventions, we have all decided whether or not we “can draw.” But this is silly. We can all draw. What we draw might not be considered a masterpiece by the masses, but that does not mean that we should not draw at all.
People’s perceptions of mapmaking seem to suffer from the same affliction. They worry about not being able to create a map that is “accurate” or “to scale.” This is also silly. Much can be learned about the way people imagine the space they inhabit from memory maps (like those Kevin Lynch collected of Boston in the 1950s) or sketch maps (like those currently being collected by the Hand Drawn Maps Association). These maps are imbued with personality and emotion that reveal landscapes absent in conventional maps.
My Bogus Art Maps are not supposed to be taken seriously as cartographic products, nor do I consider them “works of art.” Instead, I present them as an experiment in modern cartography. With these maps, I have attempted to question the notions that some people “can’t draw” and that maps must be “accurate” or “to scale.” While some of these maps have a projection, their nature prevents any metric for “accuracy” or “scale.” They are cartographic visualizations that rely less on GIScience and more on art. It is also my hope that perhaps these maps debunk the notion that people are mostly not artists or cartographers. I disagree with this idea because I believe that we can all contribute our artistic and cartographic sensibilities to enhance our collective understanding of our surrounding world.
Tim Wallace is a Ph.D. student at the University of Wisconsin–Madison. You can find the rest of his Bogus Art Map series on his blog: timwallace.wordpress.com
Bogus Art Map inspired by the style of Cy Twombly
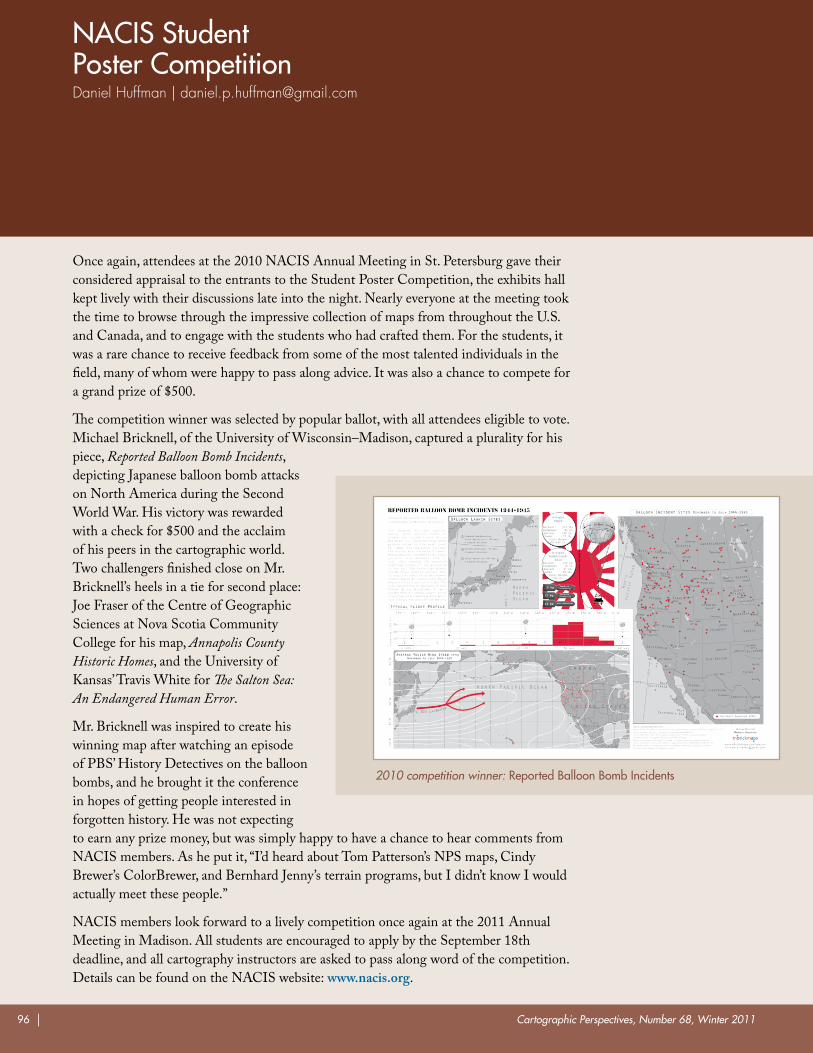
Cartographic Perspectives, Number 68, Winter 201196 |
nacIs student poster competitionDaniel Huffman | [email protected]
Once again, attendees at the 2010 NACIS Annual Meeting in St. Petersburg gave their considered appraisal to the entrants to the Student Poster Competition, the exhibits hall kept lively with their discussions late into the night. Nearly everyone at the meeting took the time to browse through the impressive collection of maps from throughout the U.S. and Canada, and to engage with the students who had crafted them. For the students, it was a rare chance to receive feedback from some of the most talented individuals in the field, many of whom were happy to pass along advice. It was also a chance to compete for a grand prize of $500.
The competition winner was selected by popular ballot, with all attendees eligible to vote. Michael Bricknell, of the University of Wisconsin–Madison, captured a plurality for his piece, Reported Balloon Bomb Incidents, depicting Japanese balloon bomb attacks on North America during the Second World War. His victory was rewarded with a check for $500 and the acclaim of his peers in the cartographic world. Two challengers finished close on Mr. Bricknell’s heels in a tie for second place: Joe Fraser of the Centre of Geographic Sciences at Nova Scotia Community College for his map, Annapolis County Historic Homes, and the University of Kansas’ Travis White for The Salton Sea: An Endangered Human Error.
Mr. Bricknell was inspired to create his winning map after watching an episode of PBS’ History Detectives on the balloon bombs, and he brought it the conference in hopes of getting people interested in forgotten history. He was not expecting to earn any prize money, but was simply happy to have a chance to hear comments from NACIS members. As he put it, “I’d heard about Tom Patterson’s NPS maps, Cindy Brewer’s ColorBrewer, and Bernhard Jenny’s terrain programs, but I didn’t know I would actually meet these people.”
NACIS members look forward to a lively competition once again at the 2011 Annual Meeting in Madison. All students are encouraged to apply by the September 18th deadline, and all cartography instructors are asked to pass along word of the competition. Details can be found on the NACIS website: www.nacis.org.
2010 competition winner: reported Balloon Bomb Incidents
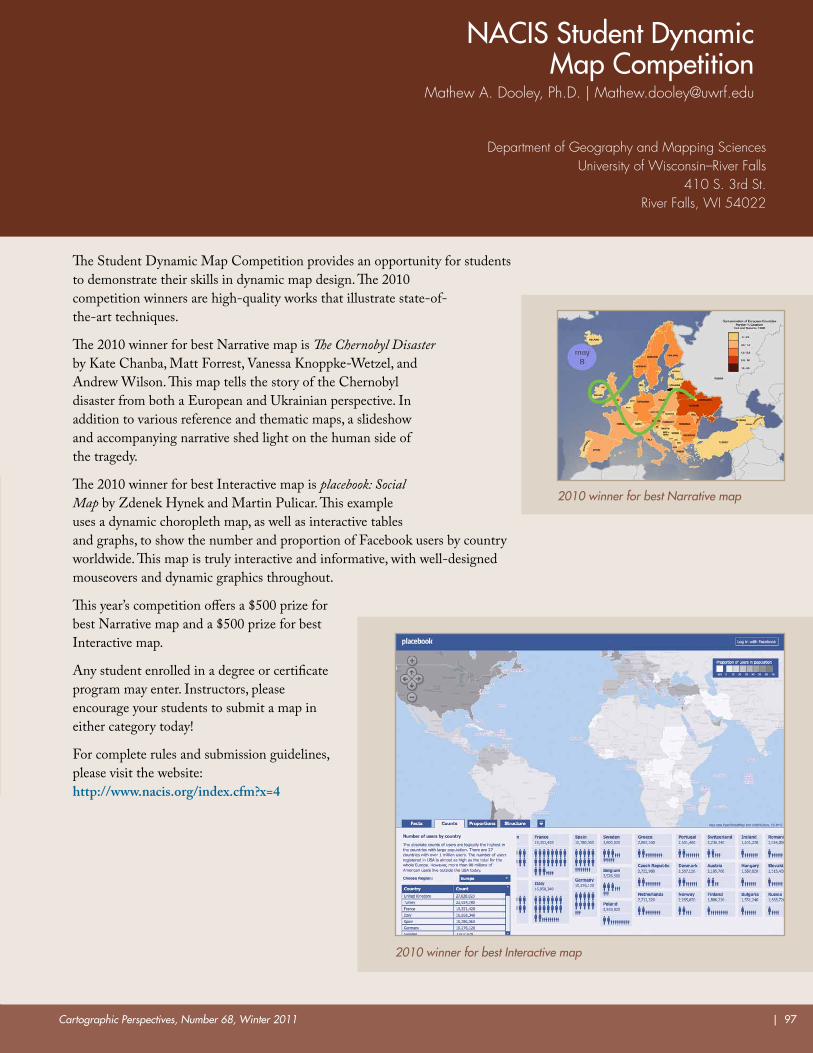
Cartographic Perspectives, Number 68, Winter 2011 | 97
nacIs student dynamic Map competition
Mathew A. Dooley, Ph.D. | [email protected]
Department of Geography and Mapping SciencesUniversity of Wisconsin –River Falls
410 S. 3rd St.River Falls, WI 54022
The Student Dynamic Map Competition provides an opportunity for students to demonstrate their skills in dynamic map design. The 2010 competition winners are high-quality works that illustrate state-of-the-art techniques.
The 2010 winner for best Narrative map is The Chernobyl Disaster by Kate Chanba, Matt Forrest, Vanessa Knoppke-Wetzel, and Andrew Wilson. This map tells the story of the Chernobyl disaster from both a European and Ukrainian perspective. In addition to various reference and thematic maps, a slideshow and accompanying narrative shed light on the human side of the tragedy.
The 2010 winner for best Interactive map is placebook: Social Map by Zdenek Hynek and Martin Pulicar. This example uses a dynamic choropleth map, as well as interactive tables and graphs, to show the number and proportion of Facebook users by country worldwide. This map is truly interactive and informative, with well-designed mouseovers and dynamic graphics throughout.
This year’s competition offers a $500 prize for best Narrative map and a $500 prize for best Interactive map.
Any student enrolled in a degree or certificate program may enter. Instructors, please encourage your students to submit a map in either category today!
For complete rules and submission guidelines, please visit the website: http://www.nacis.org/index.cfm?x=4
2010 winner for best Interactive map
2010 winner for best Narrative map
Cartographic Perspectives, Number 68, Winter 201198 | Instructions to Authors
TITLE PAGE: The title serves as the author’s invitation to a diverse audience. It should be chosen wisely. The title section should include the full name(s) of the author(s) and academic or other professional affiliation(s).
ABSTRACT: An abstract of 250 words or less should summarize the purpose, methods, and major findings of the paper.
kEYWORDS: Five to ten keywords should be listed at the end of the abstract.
REFERENCES: References should be cited parenthetically in the text, following the author-date system as described in The Chicago Manual of Style, 16th ed. (http://www.chicagomanualofstyle.org). When a direct quote, include the page number. Examples: (Doe 2001) and (Doe 2001, 38).
Books: Invert first named author’s name (last name, first initial, and middle initial). Middle initials should be given wherever known.
For books with multiple authors, authors’ names are listed in the order in which they appear on the title page, with the last author’s name preceded by a comma and and. (Note: With more than ten authors, invert first author’s name and follow it with a comma and the words et al. without italics in the reference list.)
Name of author(s). Year. Title in Italics. City of Publication: Publisher Name.
MacEachren, A. M. 1995. How Maps Work. New York: Guilford Press.
A. H. Robinson, J. L. Morrison, P. C. Muehrcke, A. J. Kimerling, and S. C. Guptill. 1995. Elements of Cartography, 6th Edition. New York: John Wiley & Sons.
Articles in Periodicals: Author’s or authors’ names as in Books, above. Year. “Title of Article.” Title of Periodical, volume number, page numbers [follow punctuation and spacing shown in the following example].
Peterson, M. 2008. “Choropleth Google Maps.” Cartographic Perspectives 60:80–83.
Articles in edited volumes: Author’s or authors’ names as in Books, above. Year. “Title of Article. Title of Edited Volume in Italics, edited by [Editor’s or Editors’ names, not inverted], page numbers. City of Publication: Publisher’s Name.
Bassett, T. J. 1998. “Indigenous Mapmaking in Intertropical Africa.” The History of Cartography. Vol. 2, Book 3: Cartography in the Traditional African, American, Arctic, Australian, and Pacific Societies, edited by David Woodward and G. Malcolm Lewis, [page #]. Chicago and London: University of Chicago Press.
Websites: Websites may be generally referenced in running text (“On its website, the Evanston Public Library Board of Trustees states . . .”) rather than with a URL listing. For more formal citations, use the following format: Author’s or authors’ names as in Books, above. Year. “Title of Document” in quotation marks. Title of Complete Work (if relevant) in italics. Access date. URL.
Cartography Associates. 2009. “David Rumsey Donates 150,000 Maps to Stanford University.” David Rumsey Map Collection. Accessed January 3, 2011. http://www.davidrumsey.com/blog/2009/8/29/david-rumsey-donates-150-000-maps-to-stanford.
Maps: Maps should be treated similarly to books, to the extent possible. Specific treatment may vary, however, and it is often preferable to list the map title first. Provide sufficient information to clearly identify the document.
A Plan of the City of New York and its Environs. P. Andrews, sold by A. Dury in Dukes Court, St. Martins Lane, surveyed by John Montressor, 1775.
E-mail correspondence: E-mail messages may be cited in running text (“In an e-mail message to the author on October 31, 2005, John Doe revealed . . .”) instead of in a
i N s T R U C T i O N s T O A U T H O R s
Cartographic Perspectives (CP) publishes original articles demonstrating creative and rigorous research in cartography and geographic visualization under open source licensing. Papers undergo double-blind peer review; those accepted for publication must meet the highest standards of scholarship, address important research problems and issues, and appeal to a diverse audience.
Articles should be submitted online, in OpenOffice, Microsoft Word, or RTF file format. Each manuscript is reviewed by the editor, one or more members of the editorial board, and at least one external reviewer. By uploading to the CP website, authors agree to not submit the manuscript elsewhere until the CP editor has reached a decision. Any submitted manuscript must not duplicate substantial portions of previously published material.
s p e C i F i C a t i o n s
Cartographic Perspectives, Number 68, Winter 2011 Instructions to Authors | 99
note or an in-text citation, and they are rarely listed in a bibliography or reference list.
Additional examples: For additional examples, please consult The Chicago Manual of Style, 16th ed. (http://www.chicagomanualofstyle.org).
REFERENCES LIST: The list of references should begin in a separate section, immediately after the text and Notes. Entitle the section “References” and list all references alphabetically by the author’s last name, then chronologically. Provide full, unabbreviated titles of books and periodicals.
NOTES: Notes should be used sparingly, i.e., only when substantive enough to amplify arguments in the text. They should be addressed to a single point in the manuscript. Notes should be numbered sequentially in the text and will appear under the heading “Notes” at the end of the text.
UNITS OF MEASURE: Cartographic Perspectives uses the International System of Units (metric). Other units should be noted in parentheses.
EqUATIONS: Equations should be numbered sequentially and parenthetically on the right-hand edge of the text. If special type styles are required, instructions should be provided in the margin adjoining the first case of usage. Authors should carefully distinguish between capital and lower-case letters, Latin and Greek characters, and letters and numerals.
TABLES: Tables should be discussed in the text and denoted by call-outs therein, but the meaning of a table should be clear without reading the text. Each table should have a descriptive title as well as informational column headings. Titles should accent the relationships or patterns presented in the table.
ILLUSTRATIONS: Maps, graphs, and photos should convey ideas efficiently and tastefully. Graphics should be legible, clean, and clearly referenced by call-outs in the text. Sound principles of design should be employed in the construction of graphic materials, and the results should be visually interesting and attractive.
All graphics must be in digital form, either digitally generated or scanned. Preferred formats are .tif, .eps, .jpg, or press-ready .pdf. Additionally, the following guidelines should be followed:
Illustrations should be designed to fit the page and column format of CP. Maximum width is 17.5 cm (7.0 inches). Common intermediate sizes are 11.25 cm (4.5 inches) and 6.25 cm (2.5 inches). The editor reserves the right to make minor size adjustments.
• Black and white monochrome images should be submitted as bitmap (1-bit) mode. The suggested minimum
resolution for this type of image is between 900 and 1200 dpi.
• Black and white halftone images and combination halftones should be submitted in grayscale format. The suggested minimum resolution for this type of image is 600 dpi.
• Color halftone images should be submitted in CMYK color mode. The suggested minimum resolution for this type of image is 300 dpi at size.
• Files should be free of color functions, including Postscript color management, transfer curves, halftone screen assignments, and black generation functions. Files should not include references to ICC profiles or be in a color space other than monochrome, CMYK, or grayscale.
• Digital art files should be cropped to remove non-printing borders (such as unnecessary white space around an image).
• Art should be created or scaled to the size intended for print, or larger.
• Image orientation should be the same as intended for print.
• For vector .eps files, fonts should be embedded or converted to outlines.
• Type sizes below 6 point should be avoided.
• A fine neatline defining the graphic field is recommended as a visual boundary separating text and graphic. The neatline should be at least .5 point.
• Press-ready Acrobat .pdf files should be submitted, without compression, in CMYK format with no subsetting of fonts. All fonts should be embedded. Document security should be disabled. If you require assistance creating .pdf files of your artwork, contact the assistant editor.
• Captions should not be part of the graphic and will be added by the assistant editor. Please supply captions within the text of the article.
For questions on specific guidelines for graphics, please contact Laura McCormick, CP Assistant Editor, ([email protected]).
PERMISSIONS: If a manuscript incorporates a substantial amount of previously published material, the author is obliged to obtain written permission from the holder of the copyright and to bear all costs for the right to use copyrighted materials.
LICENSE: Articles submitted to CP will be distributed under the Creative Commons Attribution 3.0 Unported license. For a description of the terms of this license, please see: http://creativecommons.org/licenses/by/3.0/
i N s T R U C T i O N s T O A U T H O R s ( C O N T i N U e d )
Cartographic PerspectivesJournal of the
North American CartographicInformation Society
Number 68, Winter 2011


![The English pilot. [cartographic material] : The fourth book](https://img.pdfslide.net/doc/110x75/6337ecb4746760620a090c21/the-english-pilot-cartographic-material-the-fourth-book-.jpg)


