Embed Size (px)
Citation preview
Cartographic Perspectives, Number 88, 2017 Indexing the Jacaranda Atlas – Molyneux | 28
© by the author(s). This work is licensed under the Creative Commons Attribution-NonCommercial-NoDerivatives 4.0 International License. To view a copy of this license, visit http://creativecommons.org/licenses/by-nc-nd/4.0/.
DOI: 10.14714/CP88.1462
Craig MolyneuxSpatial Vision
Indexing the Jacaranda Atlas
PRACT ICAL CARTOGRAPHER'S CORNER
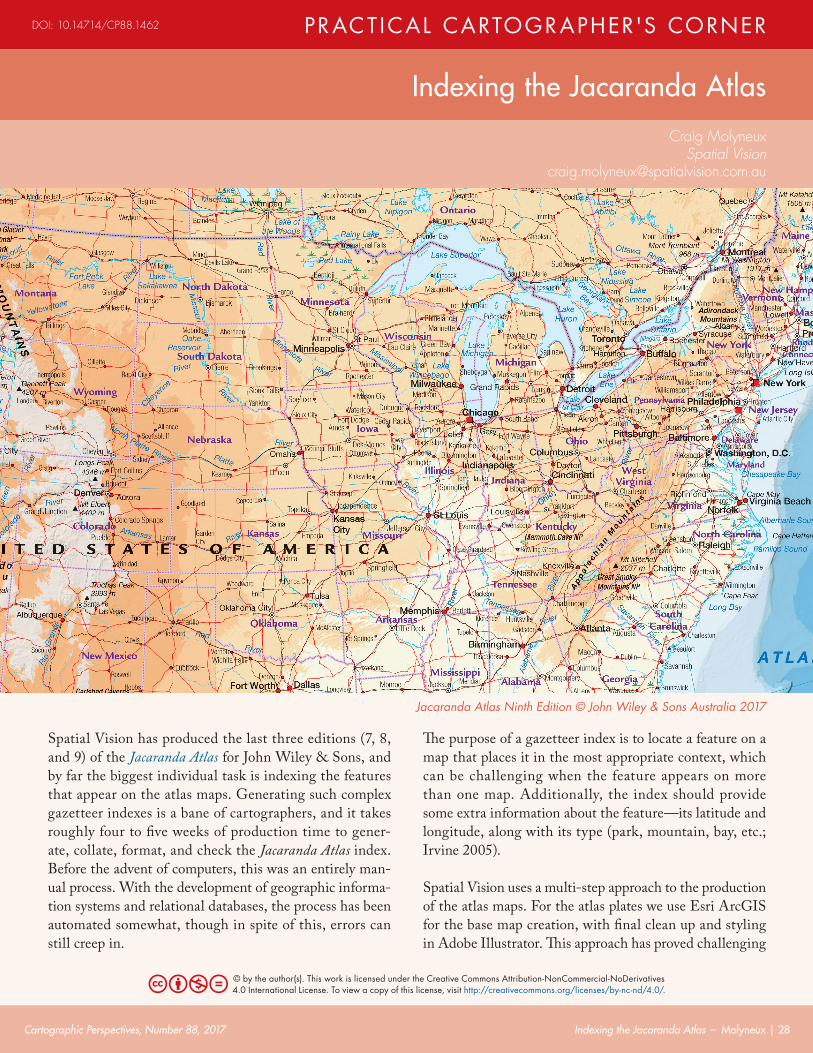
Spatial Vision has produced the last three editions (7, 8, and 9) of the Jacaranda Atlas for John Wiley & Sons, and by far the biggest individual task is indexing the features that appear on the atlas maps. Generating such complex gazetteer indexes is a bane of cartographers, and it takes roughly four to five weeks of production time to gener-ate, collate, format, and check the Jacaranda Atlas index. Before the advent of computers, this was an entirely man-ual process. With the development of geographic informa-tion systems and relational databases, the process has been automated somewhat, though in spite of this, errors can still creep in.
The purpose of a gazetteer index is to locate a feature on a map that places it in the most appropriate context, which can be challenging when the feature appears on more than one map. Additionally, the index should provide some extra information about the feature—its latitude and longitude, along with its type (park, mountain, bay, etc.; Irvine 2005).
Spatial Vision uses a multi-step approach to the production of the atlas maps. For the atlas plates we use Esri ArcGIS for the base map creation, with final clean up and styling in Adobe Illustrator. This approach has proved challenging
Jacaranda Atlas Ninth Edition © John Wiley & Sons Australia 2017
Cartographic Perspectives, Number 88, 2017 Indexing the Jacaranda Atlas – Molyneux | 29
when creating indexes, as any map edits need to be done in ArcGIS, then re-exported to Illustrator. The index is derived from the ArcGIS .mxd files created for each atlas plate. As deadlines loom, shortcuts are often taken with label adjustments, which are not reflected in the master ArcGIS files. This then requires a thorough manual check of the index text to ensure everything is correct—a timely and costly process.
Here, I propose an alternative approach (one that has been tried and tested) to map production and index generation for atlases that takes place entirely within one produc-tion environment: Adobe Illustrator and its MAPublisher plugin. The indexing process uses a little known (and un-documented) feature of MAPublisher to create additional data for the labels to make indexing easier.
All good maps are dependent upon good data, and in order to improve the speed of index creation, we need to improve the quality of the data. We can do this by adding additional feature classes to the core datasets that will as-sist later in the indexing process.
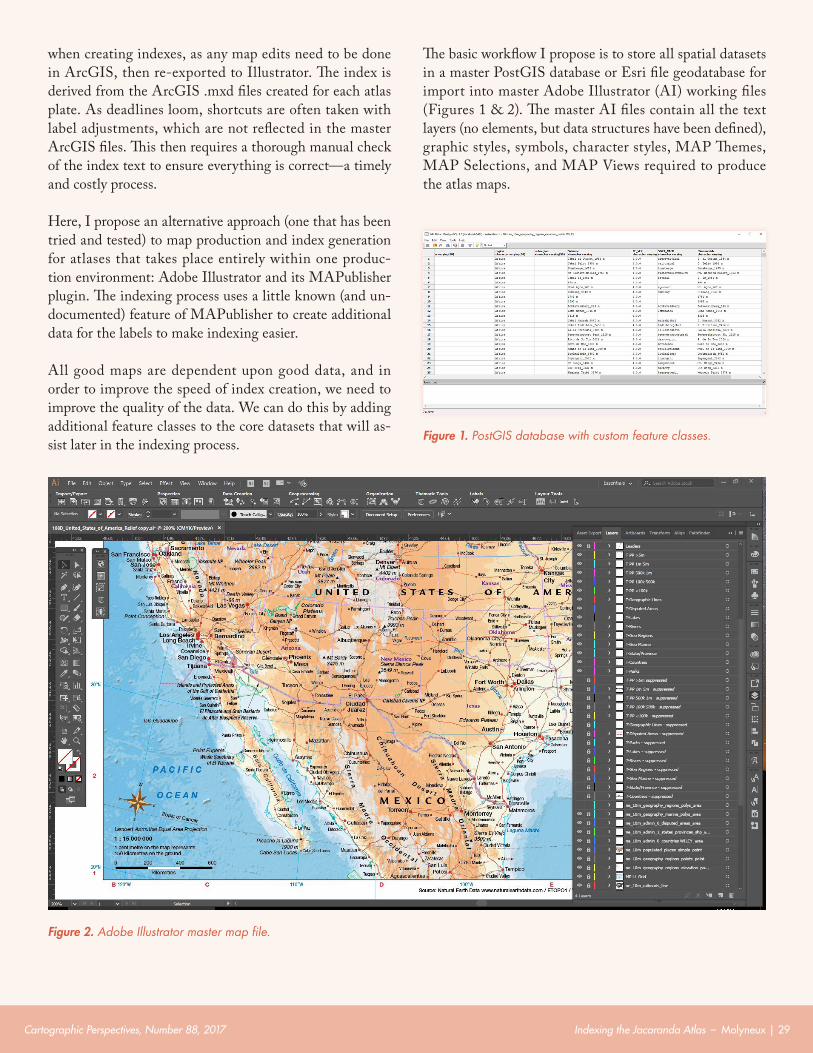
The basic workflow I propose is to store all spatial datasets in a master PostGIS database or Esri file geodatabase for import into master Adobe Illustrator (AI) working files (Figures 1 & 2). The master AI files contain all the text layers (no elements, but data structures have been defined), graphic styles, symbols, character styles, MAP Themes, MAP Selections, and MAP Views required to produce the atlas maps.
Figure 1. PostGIS database with custom feature classes.
Figure 2. Adobe Illustrator master map file.
Cartographic Perspectives, Number 88, 2017 Indexing the Jacaranda Atlas – Molyneux | 30
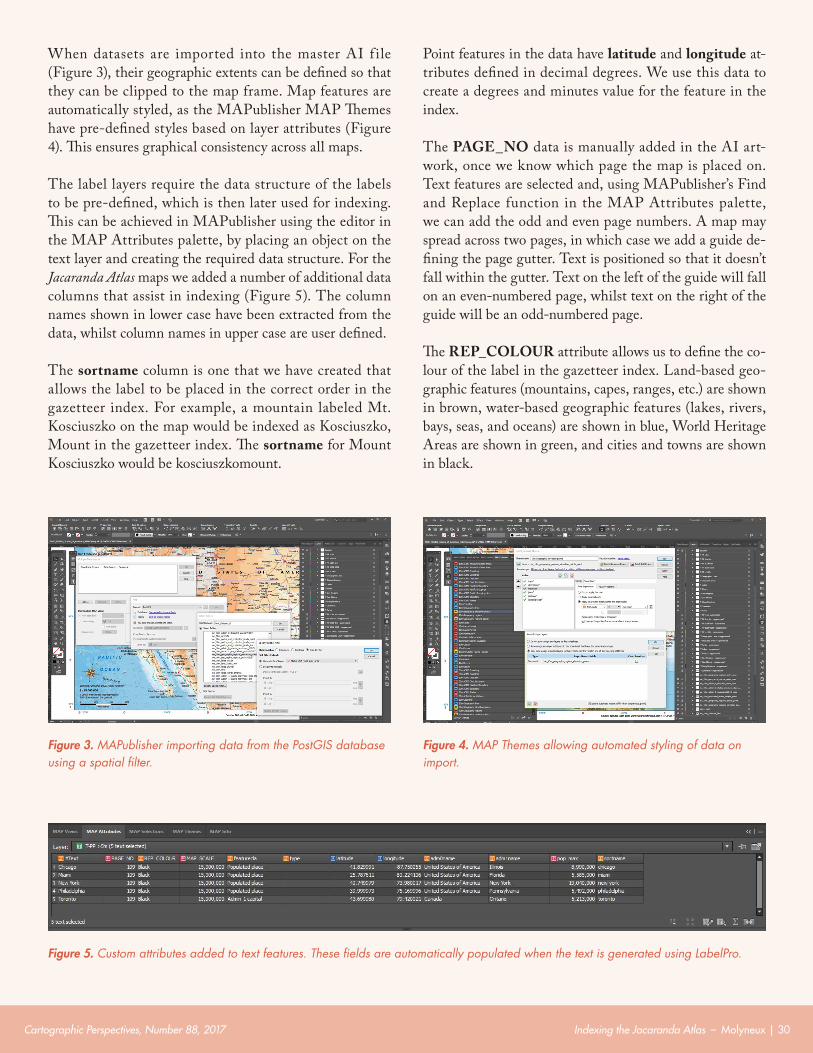
When datasets are imported into the master AI f ile (Figure 3), their geographic extents can be defined so that they can be clipped to the map frame. Map features are automatically styled, as the MAPublisher MAP Themes have pre-defined styles based on layer attributes (Figure 4). This ensures graphical consistency across all maps.
The label layers require the data structure of the labels to be pre-defined, which is then later used for indexing. This can be achieved in MAPublisher using the editor in the MAP Attributes palette, by placing an object on the text layer and creating the required data structure. For the Jacaranda Atlas maps we added a number of additional data columns that assist in indexing (Figure 5). The column names shown in lower case have been extracted from the data, whilst column names in upper case are user defined.
The sortname column is one that we have created that allows the label to be placed in the correct order in the gazetteer index. For example, a mountain labeled Mt. Kosciuszko on the map would be indexed as Kosciuszko, Mount in the gazetteer index. The sortname for Mount Kosciuszko would be kosciuszkomount.
Point features in the data have latitude and longitude at-tributes defined in decimal degrees. We use this data to create a degrees and minutes value for the feature in the index.
The PAGE_NO data is manually added in the AI art-work, once we know which page the map is placed on. Text features are selected and, using MAPublisher’s Find and Replace function in the MAP Attributes palette, we can add the odd and even page numbers. A map may spread across two pages, in which case we add a guide de-fining the page gutter. Text is positioned so that it doesn’t fall within the gutter. Text on the left of the guide will fall on an even-numbered page, whilst text on the right of the guide will be an odd-numbered page.
The REP_COLOUR attribute allows us to define the co-lour of the label in the gazetteer index. Land-based geo-graphic features (mountains, capes, ranges, etc.) are shown in brown, water-based geographic features (lakes, rivers, bays, seas, and oceans) are shown in blue, World Heritage Areas are shown in green, and cities and towns are shown in black.
Figure 3. MAPublisher importing data from the PostGIS database using a spatial filter.
Figure 4. MAP Themes allowing automated styling of data on import.
Figure 5. Custom attributes added to text features. These fields are automatically populated when the text is generated using LabelPro.
Cartographic Perspectives, Number 88, 2017 Indexing the Jacaranda Atlas – Molyneux | 31
The MAP_SCALE attribute contains the map scale, e.g., 15,000,000. When we have multiple instances of the same feature we use the MAP_SCALE to select the best scale the feature is represented on and remove the other duplicates.
Where multiple cities or towns have the same name, such as Richmond (Australia: Tasmania, Victoria, New South Wales, Queensland and South Australia; New Zealand; United States: Utah, Virginia), we need to differentiate these by specifying the country followed by the state or province. The adm0name (country) and adm1name (state) are pulled from the Natural Earth data to facilitate this.
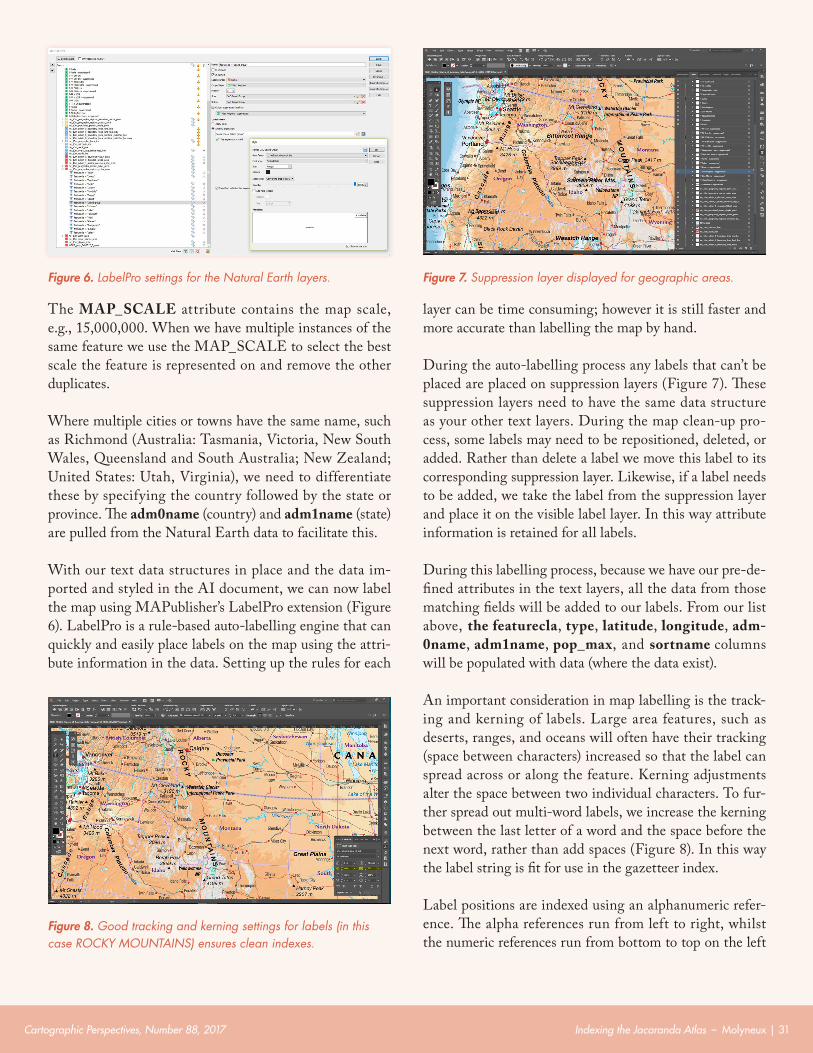
With our text data structures in place and the data im-ported and styled in the AI document, we can now label the map using MAPublisher’s LabelPro extension (Figure 6). LabelPro is a rule-based auto-labelling engine that can quickly and easily place labels on the map using the attri-bute information in the data. Setting up the rules for each
layer can be time consuming; however it is still faster and more accurate than labelling the map by hand.
During the auto-labelling process any labels that can’t be placed are placed on suppression layers (Figure 7). These suppression layers need to have the same data structure as your other text layers. During the map clean-up pro-cess, some labels may need to be repositioned, deleted, or added. Rather than delete a label we move this label to its corresponding suppression layer. Likewise, if a label needs to be added, we take the label from the suppression layer and place it on the visible label layer. In this way attribute information is retained for all labels.
During this labelling process, because we have our pre-de-fined attributes in the text layers, all the data from those matching fields will be added to our labels. From our list above, the featurecla, type, latitude, longitude, adm-0name, adm1name, pop_max, and sortname columns will be populated with data (where the data exist).
An important consideration in map labelling is the track-ing and kerning of labels. Large area features, such as deserts, ranges, and oceans will often have their tracking (space between characters) increased so that the label can spread across or along the feature. Kerning adjustments alter the space between two individual characters. To fur-ther spread out multi-word labels, we increase the kerning between the last letter of a word and the space before the next word, rather than add spaces (Figure 8). In this way the label string is fit for use in the gazetteer index.
Label positions are indexed using an alphanumeric refer-ence. The alpha references run from left to right, whilst the numeric references run from bottom to top on the left
Figure 6. LabelPro settings for the Natural Earth layers. Figure 7. Suppression layer displayed for geographic areas.
Figure 8. Good tracking and kerning settings for labels (in this case ROCKY MOUNTAINS) ensures clean indexes.
Cartographic Perspectives, Number 88, 2017 Indexing the Jacaranda Atlas – Molyneux | 32
side of the map. The location of the first char-acter of the label is referenced in this manner. Note also, that because this is a student atlas, the alpha references of ‘I’ and ‘O’ are includ-ed. In some atlases these letters are not used because of the potential confusion with the numerals ‘1’ and ‘0,’ however for students this can be misleading if they are left out.
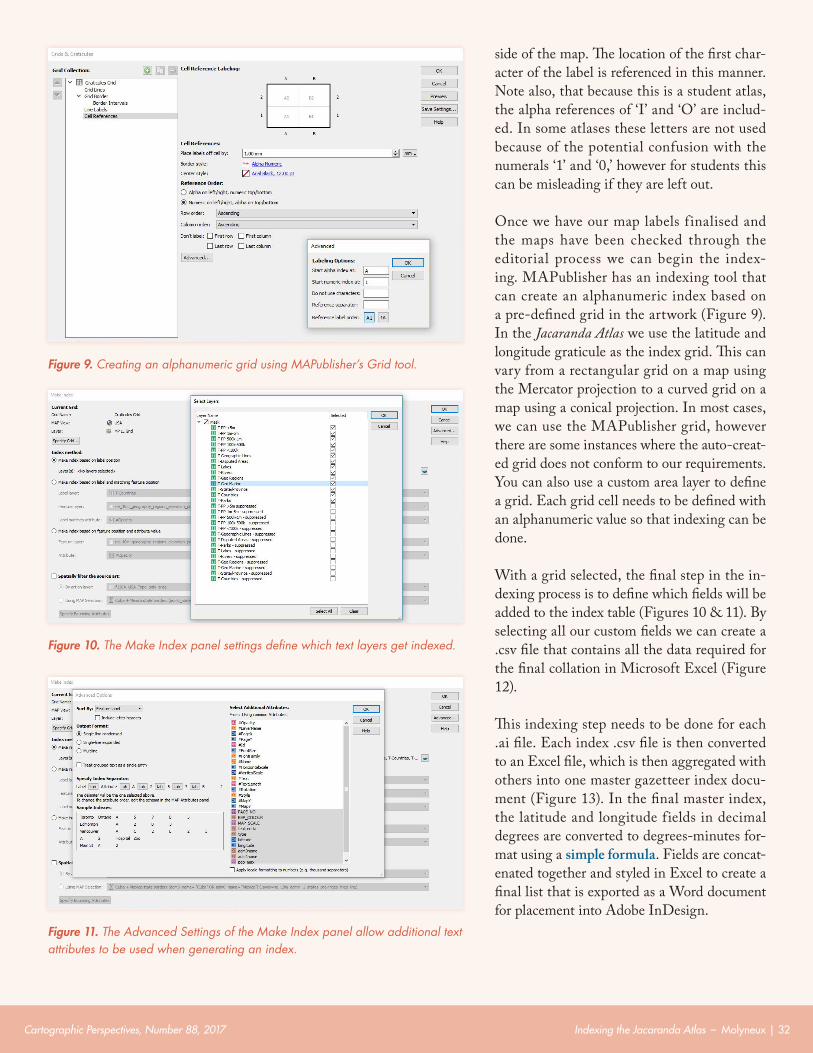
Once we have our map labels finalised and the maps have been checked through the editorial process we can begin the index-ing. MAPublisher has an indexing tool that can create an alphanumeric index based on a pre-defined grid in the artwork (Figure 9). In the Jacaranda Atlas we use the latitude and longitude graticule as the index grid. This can vary from a rectangular grid on a map using the Mercator projection to a curved grid on a map using a conical projection. In most cases, we can use the MAPublisher grid, however there are some instances where the auto-creat-ed grid does not conform to our requirements. You can also use a custom area layer to define a grid. Each grid cell needs to be defined with an alphanumeric value so that indexing can be done.
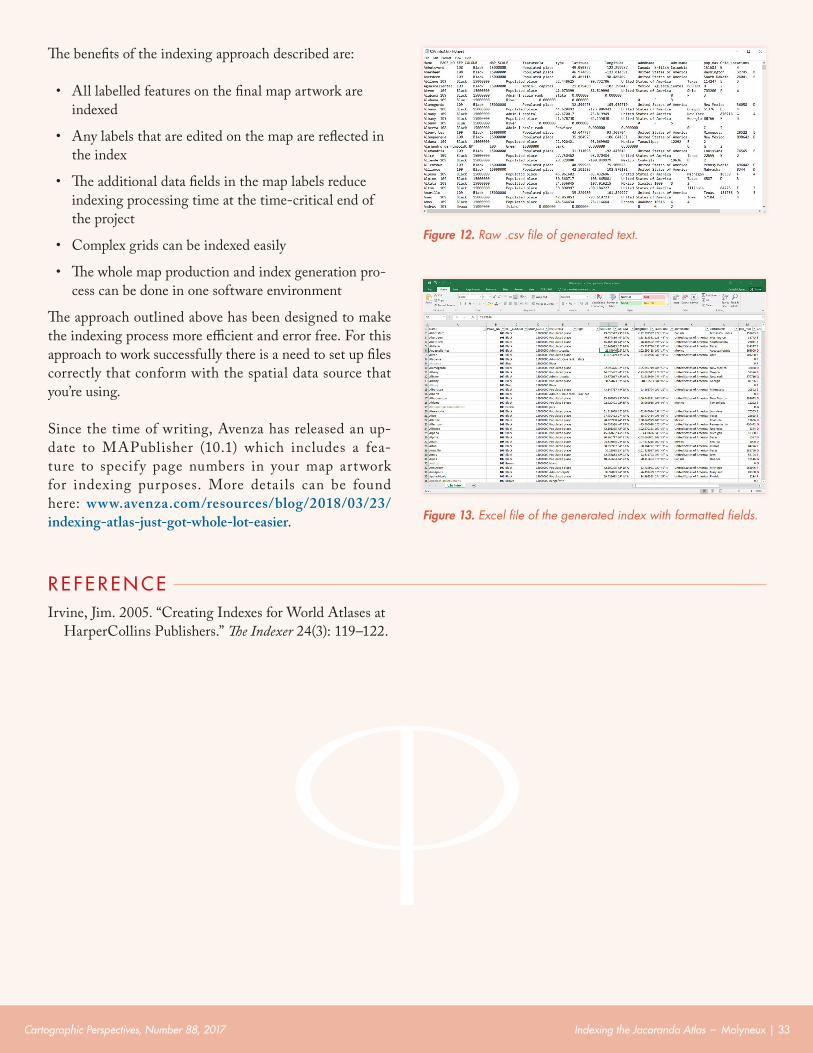
With a grid selected, the final step in the in-dexing process is to define which fields will be added to the index table (Figures 10 & 11). By selecting all our custom fields we can create a .csv file that contains all the data required for the final collation in Microsoft Excel (Figure 12).
This indexing step needs to be done for each .ai file. Each index .csv file is then converted to an Excel file, which is then aggregated with others into one master gazetteer index docu-ment (Figure 13). In the final master index, the latitude and longitude fields in decimal degrees are converted to degrees-minutes for-mat using a simple formula. Fields are concat-enated together and styled in Excel to create a final list that is exported as a Word document for placement into Adobe InDesign.
Figure 9. Creating an alphanumeric grid using MAPublisher’s Grid tool.
Figure 10. The Make Index panel settings define which text layers get indexed.
Figure 11. The Advanced Settings of the Make Index panel allow additional text attributes to be used when generating an index.
Cartographic Perspectives, Number 88, 2017 Indexing the Jacaranda Atlas – Molyneux | 33
The benefits of the indexing approach described are:
• All labelled features on the final map artwork are indexed
• Any labels that are edited on the map are reflected in the index
• The additional data fields in the map labels reduce indexing processing time at the time-critical end of the project
• Complex grids can be indexed easily
• The whole map production and index generation pro-cess can be done in one software environment
The approach outlined above has been designed to make the indexing process more efficient and error free. For this approach to work successfully there is a need to set up files correctly that conform with the spatial data source that you’re using.
Since the time of writing, Avenza has released an up-date to MAPublisher (10.1) which includes a fea-ture to specify page numbers in your map artwork for indexing purposes. More details can be found here: www.avenza.com/resources/blog/2018/03/23/indexing-atlas-just-got-whole-lot-easier.
R E FE R E N C EIrvine, Jim. 2005. “Creating Indexes for World Atlases at
HarperCollins Publishers.” The Indexer 24(3): 119–122.
Figure 13. Excel file of the generated index with formatted fields.
Figure 12. Raw .csv file of generated text.


![The English pilot. [cartographic material] : The fourth book](https://img.pdfslide.net/doc/110x75/6337ecb4746760620a090c21/the-english-pilot-cartographic-material-the-fourth-book-.jpg)


