Embed Size (px)
Citation preview
MASTERARBEIT
Constructing Parallel Narratives in
Cartographic Storytelling zur Erlangung des akademischen Grades
Master of Science
im Rahmen des Studiums
Cartography eingereicht von
Stephanie Fovenyessy Matrikelnummer 11939015
ausgeführt am Institut für Geodäsie und Geoinformation der Fakultät für Mathematik und
Geoinformation der Technischen Universität Wien
Betreuung
Betreuer: Prof. Dr. Georg Gartner
Betreuer: Dr. Franz-Benjamin Mocnik
Rezensent: Edyta Bogucka, MSc.
Wien, 10.10.2021 ___________________ ___________________
Unterschrift (Verfasserin) Unterschrift (Betreuer)

MASTER THESIS
Constructing Parallel Narratives in
Cartographic Storytelling For the Achievement of the Academic Title
Master of Science
Within the Degree Course
Cartography Submitted By
Stephanie Fovenyessy Student ID 11939015
Completed at the Department of Geodesy and Geoinformation of the Faculty for Mathematics
and Geoinformation at the Technical University Vienna
Supervision
Supervisor: Prof. Dr. Georg Gartner
Supervisor: Dr. Franz-Benjamin Mocnik
Reviewer: Edyta Bogucka, MSc.
Vienna, 10.10.2021 ___________________ ___________________
Signature (Author) Signature (Supervisor)


Master thesis Constructing Parallel Narratives in Cartographic Storytelling
Stephanie Fovenyessy
2021


Statement of Authorship Herewith I declare that I am the sole author of the submitted Master’s thesis entitled: “Constructing Parallel Narratives in Cartographic Storytelling” I have fully referenced the ideas and work of others, whether published or unpublished. Literal or analogous citations are clearly marked as such. Munich, 10.10.2021 Stephanie, Fovenyessy


I
Acknowledgements First I am immensely grateful for the opportunity to take part in this CartographyMaster’sprogram.Myexperiencesoverthepasttwoyearshavepositivelycontributedtomygrowthbothacademicallyandpersonally.Iwillalwayscherishtheseexperiences.SecondIwouldsincerelyliketothankbothofmysupervisorsandmyreviewerforalwaysprovidingpositivesupport.ProfessorGartner–thankyouverymuchforsupportingmefromthebeginningandforhelpingmetonarrowdownmyideas.Dr.Franz-BenjaminMocnik–thankyouverymuchforcontinuallysupportingmeandkeepingmeontrack.Ourdiscussionsalwayshelpedtomotivateme.EdytaBogucka–thankyouforalwaysprovidingmewithnewideas.Thirdly,IespeciallywouldliketothankthemembersoftheresearchgroupBioInvasions–globalchange–MacroecologyattheUniversityofWien,FranzEssl,BerndLenzner,Dr.Wolf-ChristianSaul,andDr.JonathanJeschke,formeetingwithmeonsomanyoccasionsandprovidingmewithdataontheirInvasiveAlienSpecies(IAS)Scenarios.Finally, would like to thank everyone else involved in supporting the thesis processincluding,BarendKöbben,JulianeCron,andWangshuWang.

II
III
Abstract Thisthesisaimstoprovideanunderstandingonhowparallelnarrativescanbeappliedin cartographic storytelling. An increase in research on cartographic storytelling hasoutlinedtechniquesandstructuresusedtoconveystories.Thisthesiswillexpanduponthisresearchandfocusonthepresentationofparallelnarrativesincartographicstories.Parallel narratives arewidely used in both literature and film and are defined as thepresentationofmultiplenarrativesinonestory.Thenarrativesarelinkedbyacommontheme and often present opposing views or sides to one story. Design elements andstructures in both visual/cartographic storytelling and parallel narratives will bepresentedinordertounderstandwhatdesignelementsandstructuresareimportantincartographicparallelnarrativestories.Throughaqualitativecontentanalysisofexistingexamplesofparallelnarrativesincartographicstoriesatypologyofparallelnarrativesincartographicstoriesispresented.Thetypologyofparallelnarrativeshelpstodescribethevariousstructureandpresentationofparallelnarratives incartographicstories.Acase study further examines how certain elements of a visual story contribute to thedisplayofaparallelnarrativeinacartographicstorytelling.

IV
V
Table of Contents
1. Introduction .......................................................................................................................... 1
1.1. Background and Motivation ....................................................................................................... 1
1.2. Research Identification ............................................................................................................... 2 1.2.1. Research Objectives ............................................................................................................................ 2 1.2.2. Research Questions ............................................................................................................................ 3 1.2.3. Research Methodology ....................................................................................................................... 3
1.3. Thesis Structure .......................................................................................................................... 4
2. Visual and Cartographic Storytelling .................................................................................... 5
2.1. Stories and Narratives ................................................................................................................ 5
2.2 Visual Storytelling ........................................................................................................................ 6 2.2.1 Narrative Design Patterns .................................................................................................................... 8 2.2.2 Narrative Visualization Elements ......................................................................................................... 8 2.2.3 Interactivity .......................................................................................................................................... 9
2.3. Traditional Cartography and Narratives ................................................................................... 10
2.4 Cartographic Storytelling ........................................................................................................... 11 2.4.1 Genre ................................................................................................................................................. 13 2.4.2. Map Layout ....................................................................................................................................... 14 2.4.3. Trope ................................................................................................................................................. 17
3. Parallel Narratives .............................................................................................................. 20
3.1. Definition and Use .................................................................................................................... 20
3.2. Parallel Narratives in Literature ............................................................................................... 21
3.3. Parallel Narratives in Film ......................................................................................................... 23 3.3.1 Ensemble films (linear narratives) ..................................................................................................... 24 3.3.2 Non-linear films ................................................................................................................................. 25
4. Parallel Narratives in Cartographic Storytelling ................................................................. 27
4.1 Quantitative Content Analysis ................................................................................................... 27 4.1.1 Existing Examples ............................................................................................................................... 27 4.1.2 Codes ................................................................................................................................................. 29 4.1.3 Coding Analysis .................................................................................................................................. 31 4.2.3 Card Sorting ....................................................................................................................................... 33
4.2 Results ....................................................................................................................................... 36 4.2.1 Coding Results .................................................................................................................................... 36 4.2.2 Typology of Parallel Narratives in Cartographic Storytelling ............................................................. 40
5. Case Study: Cartographic Parallel Narrative Storytelling with Invasive Alien Species Scenarios ................................................................................................................................ 52
5.1 Data Acquisition ........................................................................................................................ 52
5.2 Design Goals and Opportunities ................................................................................................ 54
5.3 Design Outcome ........................................................................................................................ 56
5.4 Pre-Study Questionnaire ........................................................................................................... 61 5.4.1 Methodology ..................................................................................................................................... 61
VI
5.4.2 Results ................................................................................................................................................ 62
6. Discussion ........................................................................................................................... 64
6.1 Limitations ................................................................................................................................. 64
7. Conclusion ........................................................................................................................... 66
7.1 Addressing the Research Questions .......................................................................................... 66
7.2 Outlook ...................................................................................................................................... 69
References .............................................................................................................................. 71
Appendix ................................................................................................................................. 78
Appendix I – Complete coding table of existing examples .............................................................. 78
Appendix II – Table of code definitions ........................................................................................... 79
Appendix III – Coding Results Table ................................................................................................ 83
Appendix IV – ESRI Scrolling IAS Scenarios Story ............................................................................ 84
Appendix V – Questionnaire questions ........................................................................................... 85
Appendix VI – Questionnaire Answers ............................................................................................ 87
VII
List of Figures: Figure1.Threeactnarrativecurve.CreatedbasedonfiguresbyNussbaumerKnaflic(2020). .................... 6 Figure2.SevenGenresforvisualstorytellingpresentedbySegelandHeer(2010).Thegenres
aremagazinestyle,annotatedchart,partitionedposter,flowchart,comicstrip,slideshow,andfilm/video/animation. ......................................................................................................................... 9
Figure3.VisualrepresentationsofthethreeinteractivityformatsdefinedbySegelandHeer(2010).ImagesobtainedfromNarrativeVisualization:TellingStorieswithDatabySegelandHeer(2010). ....................................................................................................................................... 10
Figure4.CartographicstorygenrespresentedbyRoth(2020).Thesevengenresarecategorizedbythetechniqueusedtoenforcelinearitythroughthenarrative(R.E.Roth,2020).Thesevengenresarestaticvisualstories,narratedanimation,longforminfographics,multimediavisualexperiences,dynamicslideshows,personalizedstorymaps,andcompilations.ImageobtainedfromCartographicDesignasVisualStorytelling:SynthesisandReviewofMap-BasedNarratives,Genres,andTropesbyRobertE.Roth(2020). ....................... 13
Figure5.Fourmaplayouts,fullmap,embeddedmap,referencemap,andpartialmap,describedbyMichaelGaigg.IllustrationstakenfromthewebsiteMapUIPatterns(Gaigg,n.d.). ......................... 16
Figure6.Visualrepresentationsofthreegroupingsofmaplayoutstyles.MaplayoutstylesareSinglemapvsMapseries,Fragmentedmapvsfluidmap,anddynamicmapvsstablemap(Muehlenhaus,2011).ImagesobtainedfromGenealogyThatCounts:UsingContentAnalysistoExploretheEvolutionofPersuasiveCartographybyIanMuehlenhaus(2011). .............. 17
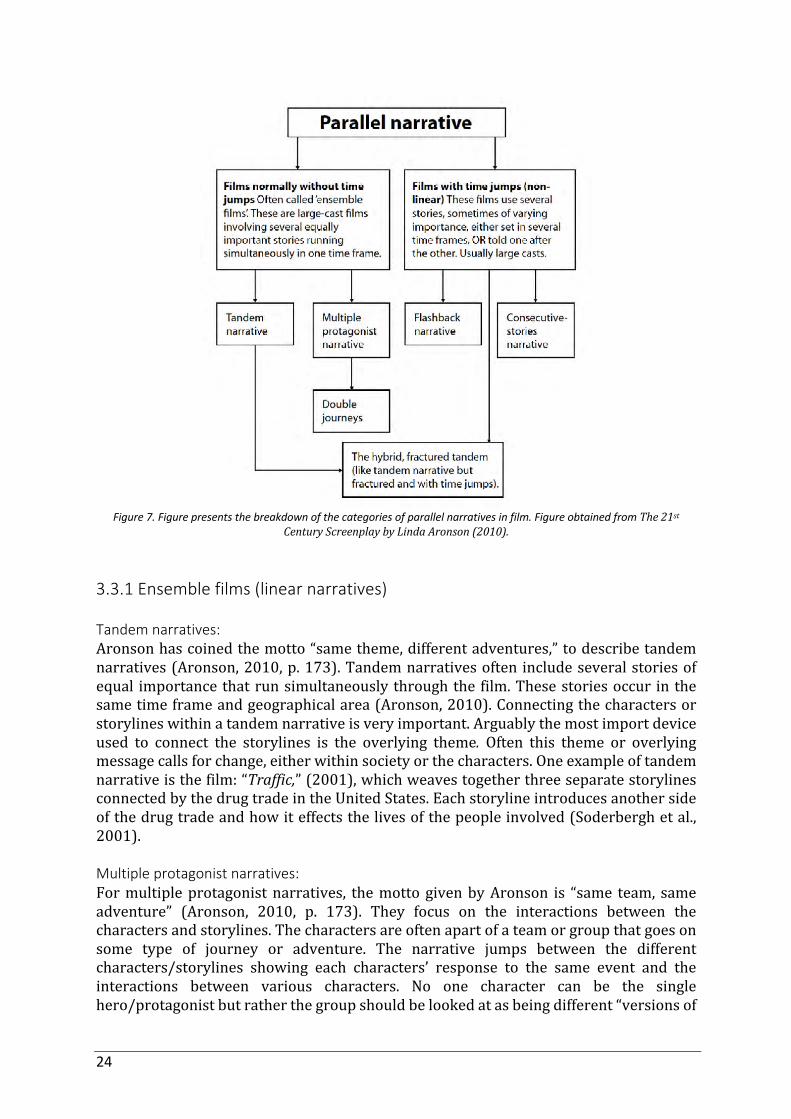
Figure 7. Figure presents the breakdown of the categories of parallel narratives in film. Figure obtained from The21stCenturyScreenplaybyLindaAronson(2010). ................................................ 24
Figure8.Imageofthe53cardsusedincardsortinggroupedintothefinalizedcategories.Thegroupingsarelabeled1-7whichcorrespondstothecategoriesdiscussedintheresultssection(4.2.2)(seealsoFigure9;Table9).Thecirclednumbersoneachcardcorrespondtothenumbersgiventoeachcartographicstorycollectedforqualitativecontentanalysis(AppendixI). .............................................................................................................................................. 35
Figure9.VisualexampleofeachCartographicParallelNarrativeStorycategory.Linesineachvisualizationrepresenttextelementsandthehexagonsrepresentimages,infographics,symbols,andothermapfeatures. ............................................................................................................ 41
Figure10.RadioRivalry-RedSoxandYankeesRadioNetworksbyTimWallace(2011). .......................... 42 Figure11.EarthquakeRisk/VolcanoRiskpublishedinNationalGeographic(Prueitt&Mellett,
1985). ......................................................................................................................................................... 43 Figure12.GreatMigrations,publishedintheNovember2010issueofNationalGeographic
Magazine(Pepple,2010). ......................................................................................................................... 44 Figure13.Screenshotsfromthecartographicstory,TimetoChoose,publishedbythe
ConservationLandsFoundation(VanCityStudios,n.d.).Thecartographicstoryisascrollingstorythatcouldnotbefullypresentedhereduetolength.Thefirstpictureisfromtheintroductiontothecartographicstoryandpresentsanoverviewmap.Thefollowingtwopicturesaretwoofthenarrativespresentedasyouscrolldown.Asyouscrollthemapontheleftzoomstonewthelocation. ............................................................................ 46
Figure14.WhatifitwasyourcitybyAlbertoLucasLópez(López,2015). ................................................... 47 Figure15.SlaveryintheUnitedStates,byBillRankin(Rankin,2016). ......................................................... 48 Figure16.Mapsdepictingthedifferencesinmapprojections(AlbaGon,2020).Thisfigurehas
beenreducedinsizetofitononepage.Normalviewingofthisfigurewouldusescrollingtomovethroughthestoryfromonemaptothenext. ............................................................................ 50
Figure17.StaticIASscenarioscartographicparallelnarrativestory.Thisfigurehasbeenscaledtofitonthepage,butwasoriginallyslightlylarger. ............................................................................... 58
Figure18.ScrollingIASscenarioscartographicparallelnarrativestory(AppendixIV).ThisfigurepresentsthreescreenshotsfromtheESRIStoryMap.Thefirstscreenshotshowstheintroductiontext.ScrollingdownwouldbringupthesecondscreenshotwiththesymbolsandAmbrosiaspeciesdescriptionandtheAmbrosiaimage.Thethirdimageshowsthesecondscenario. ........................................................................................................................................ 60

VIII
IX
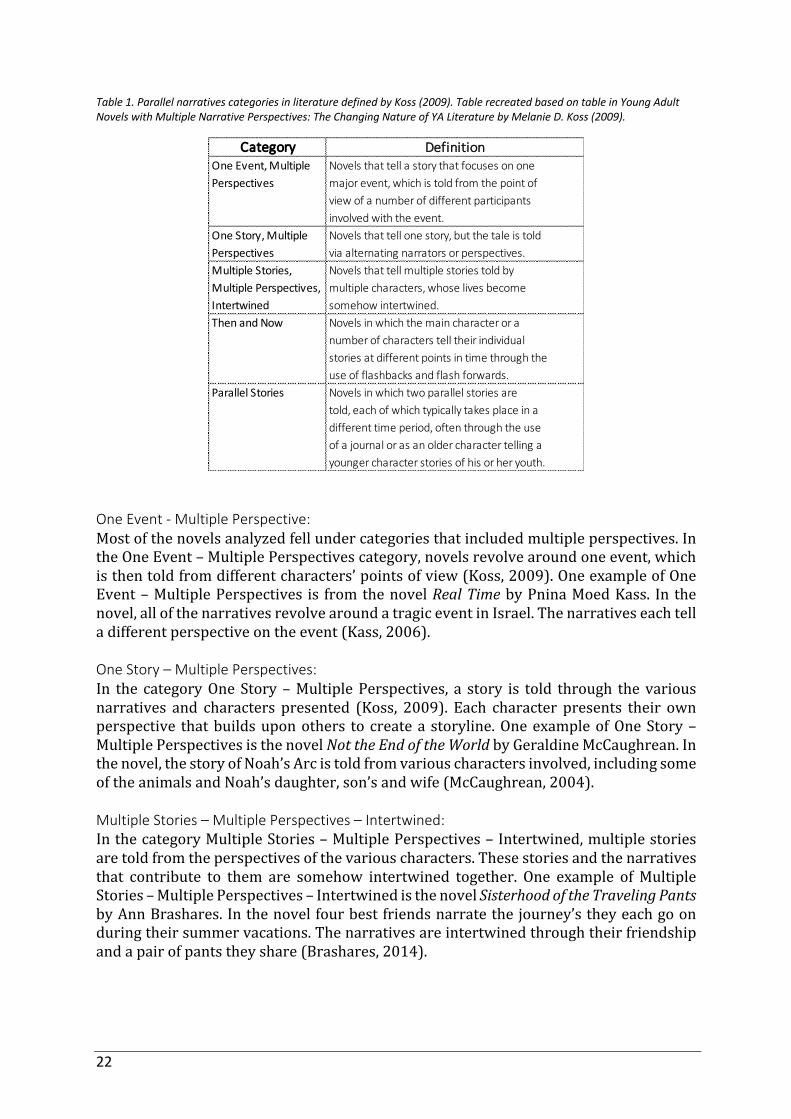
List of Tables: Table 1. Parallel narratives categories in literature defined by Koss (2009). Table recreated based on
table in Young Adult Novels with Multiple Narrative Perspectives: The Changing Nature of YA Literature by Melanie D. Koss (2009). ......................................................................................................... 22
Table2.Resultsofcodecategory–Genre.Thistableshowthenumberofcartographicparallelnarrativestoriesthatpresentedeachgenreaswellasthepercentageofthetotal. ............................ 36
Table3.Resultsofcodecategory–MapLayout.Thistableshowthenumberofcartographicparallelnarrativestoriesthatpresentedeachmaplayoutaswellasthepercentageofthetotal. ........................................................................................................................................................... 37
Table4.Resultsofcodecategory–InteractivityFormat.Thistableshowthenumberofcartographicparallelnarrativestoriesthatwereinteractiveandhowmanypresentedeachinteractivityformat. .................................................................................................................................. 37
Table5.Resultsofcodecategory–Trope.Thistableshowthenumberofcartographicparallelnarrativestoriesthatpresentedeachtropeaswellaseachmethodused. .......................................... 38
Table6.Resultsofcodecategory–NarrativePattern.Thistableshowthenumberofcartographicparallelnarrativestoriesthatpresentedeachnarrativepatternaswellasthepercentageofthetotal. ............................................................................................................................. 38
Table 7. Results of code category – Visual Narrative Tactics. This table show the number of cartographic narrative stories that presented each visual narrative tactic as well as the percentage of the total. .............................................................................................................................. 39
Table 8. Results of code category – Parallel Narrative Tactics. This table show the number of cartographic parallel narrative stories that presented each parallel narrative tactic as well as the percentage of the total. ........................................................................................................................ 39
Table9.Thistablepresentsthedefinitionofeachcategory.Theexamplecolumnisinreferencetonumbersgiventoexistingexamplesofcartographicparallelnarrativesstoriesusedinthequalitativecontentanalysis.InformationcorrespondingtoeachnumbercanbefoundinAppendixI. ............................................................................................................................................. 51

X
1
1. Introduction
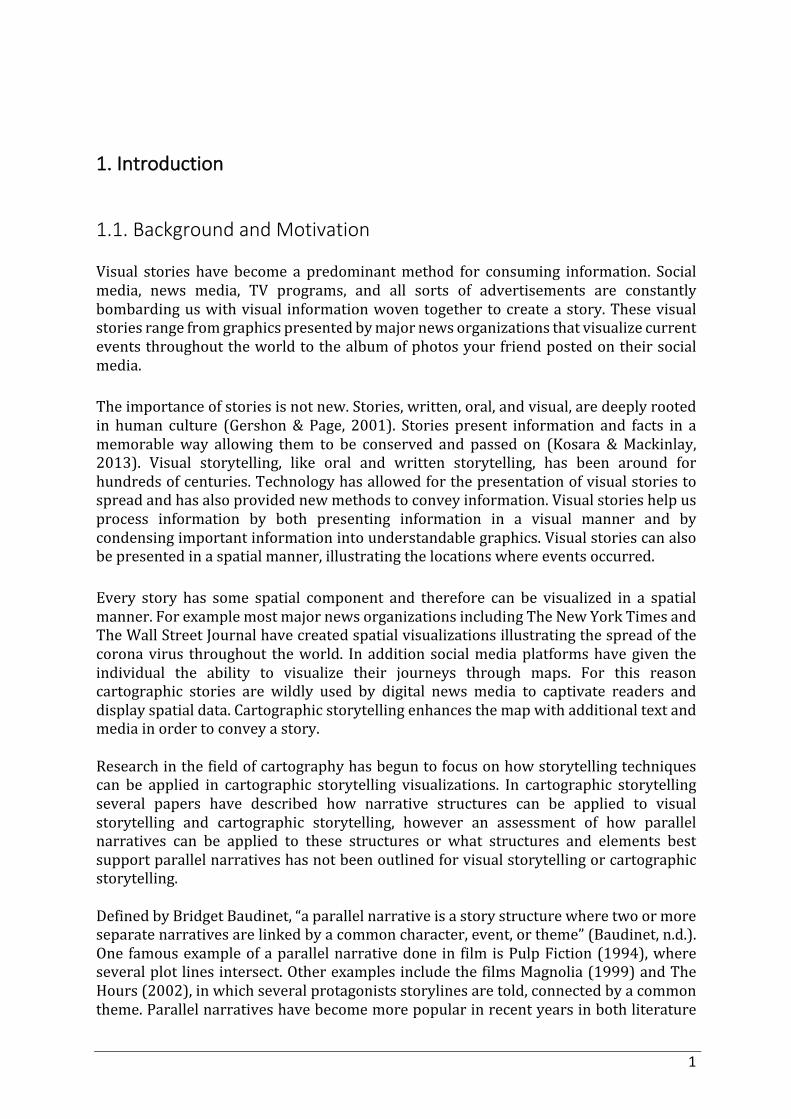
1.1. Background and Motivation Visual stories have become a predominantmethod for consuming information. Socialmedia, news media, TV programs, and all sorts of advertisements are constantlybombardinguswithvisual informationwoventogethertocreateastory.Thesevisualstoriesrangefromgraphicspresentedbymajornewsorganizationsthatvisualizecurrenteventsthroughouttheworldtothealbumofphotosyourfriendpostedontheirsocialmedia. Theimportanceofstoriesisnotnew.Stories,written,oral,andvisual,aredeeplyrootedin human culture (Gershon& Page, 2001). Stories present information and facts in amemorableway allowing them to be conserved and passed on (Kosara &Mackinlay,2013). Visual storytelling, like oral and written storytelling, has been around forhundredsofcenturies.Technologyhasallowedforthepresentationofvisualstoriestospreadandhasalsoprovidednewmethodstoconveyinformation.Visualstorieshelpusprocess information by both presenting information in a visual manner and bycondensingimportantinformationintounderstandablegraphics.Visualstoriescanalsobepresentedinaspatialmanner,illustratingthelocationswhereeventsoccurred. Every story has some spatial component and therefore can be visualized in a spatialmanner.ForexamplemostmajornewsorganizationsincludingTheNewYorkTimesandTheWallStreetJournalhavecreatedspatialvisualizationsillustratingthespreadofthecoronavirus throughout theworld. Inadditionsocialmediaplatformshavegiven theindividual the ability to visualize their journeys through maps. For this reasoncartographic stories are wildly used by digital news media to captivate readers anddisplayspatialdata.Cartographicstorytellingenhancesthemapwithadditionaltextandmediainordertoconveyastory.Researchinthefieldofcartographyhasbeguntofocusonhowstorytellingtechniquescan be applied in cartographic storytelling visualizations. In cartographic storytellingseveral papers have described how narrative structures can be applied to visualstorytelling and cartographic storytelling, however an assessment of how parallelnarratives can be applied to these structures or what structures and elements bestsupportparallelnarrativeshasnotbeenoutlinedforvisualstorytellingorcartographicstorytelling.DefinedbyBridgetBaudinet,“aparallelnarrativeisastorystructurewheretwoormoreseparatenarrativesarelinkedbyacommoncharacter,event,ortheme”(Baudinet,n.d.).Onefamousexampleofaparallelnarrativedone in filmisPulpFiction(1994),whereseveralplotlinesintersect.OtherexamplesincludethefilmsMagnolia(1999)andTheHours(2002),inwhichseveralprotagonistsstorylinesaretold,connectedbyacommontheme.Parallelnarrativeshavebecomemorepopularinrecentyearsinbothliterature
2
andfilm.Theypresentacomplexandmorerealisticdepictionoftheworldaroundusbyoftenexaminingmultiplesidesofastory.Onlinenewsandsocialmediaisrapidlyexpandingintoeverydaylifeandourabilitytoconsumeawidevarietyofmediaandinformationiseveradapting.Thisallowsforarapidintake of all sorts of local, regional and international stories. With so many storiesspreadinganddevelopinginrealtimeitisalwaysimportanttounderstandthattherearetwoormoresidestoeverystory.Currentresearchonstructuringstoriesincartographicstorytellinghasfocusedonthepresentationofonenarrative.This thesis will address how parallel narratives can be constructed in cartographicstorytelling.Focuswillbeputondeterminingwhatdesignelementshelptopresentanddistinguishbetweenmultiplenarrativesaswellasthecreationofatypologyforparallelnarrativesincartographicstorytelling. 1.2. Research Identification 1.2.1. Research Objectives Theoverallobjectiveofthisthesisistoexaminehowparallelnarrativesareappliedincartographic storytelling and develop a typology that describes the presentation ofparallelnarrativesincartographicstorytelling.Inordertoaccomplishthisobjectivefoursub-objectiveshavebeenoutlined.Thefoursub-objectivesareasfollows:Objective 1: Thefirstobjectiveistoexaminethedesignelementsandtechniquesusedtoenhanceandstructureastoryinbothvisualandcartographicstorytelling.Inordertoconceptualizemethodsforvisualizingparallelnarrativesincartographicstorytelling,currentresearchonvisualmethodsusedinvisualstoriesandcartographicstorieswillbeoutlined.Focuswillbeonvisualizationtechniquesusedtopresentthestructureorflowofthestoryaswellasdevicesincludedthathighlightoremphasizeimportantpiecesofthestory. Objective 2: Thesecondobjectiveistoexamineparallelnarrativestructurespresentinliteratureandfilm in order to develop and apply these structures and methods to cartographicstorytelling. Structures describe how the various storylines are organized in thenarrative.Parallelnarrativestructuresinbothliteratureandfilmarewellresearchedandsummarizingthesestructureswillhelptoapplythemtocartographicstorytelling.Objective 3: Thethirdobjectiveistodevelopatypologycategorizingthetypesofparallelnarrativesincartographicstories.Basedoninformationcollectedinobjectivesoneandtwo,existingexamplesofparallelnarrativesincartographicstorieswillbeidentifiedandexaminedinordertoidentifyimportantstructuresandtechniquesusedspecificallyincartographicstoriesthatpresentparallelnarratives.
3
Objective 4: Thefourthobjectiveistotestmethodsofpresentingparallelnarrativesincartographicstorytelling discovered by objective three. This objective aims to gain a betterunderstanding on how viewers understand the presentation of parallel narratives incartographic storytelling. In order to achieve this objective cartographic parallelnarrativestorieswillbecreatedwithdataprovidedbytheresearchgroupBioInvasions–globalchange–MacroecologyattheUniversityofWien.Therefore,asub-objectivewillbetocreateacartographicparallelnarrativestorywithmethodsoutlinedinobjectthree.
1.2.2. Research Questions Tomeettheaboveobjectives,severalresearchquestionsmustbeaddressed.ResearchQuestion1:Whataretheimportanttechniquesusedincartographicstorytellingtotellastory?
- Howarevisualandcartographicstoriesstructured?- Whatelements(devices)dovisualandcartographicstoriesusetoemphasize
andenhanceastory?ResearchQuestion2:Howareparallelnarrativespresentedinliteratureandfilm?
- Whatdefinesaparallelnarrative?- Whattypologyisthereforparallelnarrativesinliteratureandfilm?
ResearchQuestion3:Howcancartographicparallelnarrativestoriesbeclassified?
- Whattechniquesorcharacteristicsdoexistingexamplesofparallelnarrativesincartographicstorieshave?
ResearchQuestion4:Whatdesignelementsortechniquesaremosteffectiveindistinguishingbetweenaswellasprovidingacomparisonofparallelnarrativesincartographicstorytelling?
- How can the data from the research group BioInvasions – global change –MacroecologyattheUniversityofWienbepresentedinacartographicstory.
1.2.3. Research Methodology Severalstepswillbetakeninordertoanswertheresearchquestions.Firstaliteraturereviewwilltakeplaceitordertomeetobjectivesoneandtwo.Currentliteratureonvisualandcartographicstorytellingwillbeexaminedinordertodiscoverandcategorizedesignelements and techniques that aid in thepresentation of visual stories andnarratives.Current literature on parallel narratives will be examined in order understand theclassifications of parallel narratives. In order to examine the presentation of parallelnarrativesincartographicstoriesaqualitativecontentanalysiswillbeconducted.Thecontent of the existing examples of parallel narratives in cartographic storieswill beanalyzed based on both cartographic and parallel narrative techniques discoveredthroughtheliteraturereviews.Thequalitativecontentanalysiswillincludecodingandcardsorting.
4
Inordertotestcertaindesignelementsthatwerefoundtocontributetothepresentationofparallelnarratives incartographicstories thoughthequalitativecontentanalysis,acasestudywillbedeveloped.ThecasestudywillbeconductedwithresearchfromtheprojectAlienScenariosdevelopedbytheresearchgroupBioInvasions–globalchange–Macroecologyat theUniversityofWien.Thecasestudywilldeveloptwocartographicparallelnarrativestories.Totestdesignelementsinbothstoriesaquestionnairewillbedevelopedandsentouttothegeneralpublic.1.3. Thesis Structure Thisthesisisbrokenupintosevenchapters.Thefirstchapterprovidesthebackgroundandmotivationforthisthesisalongwiththeresearchobjectives.Thefollowingfourchaptersaddresseachoftheresearchobjectivesandquestionsoutlinedinchapterone.Thesecondchapterdiscussesvisualstorytellingandcartographicstorytelling.Thethirdchapterdiscussesparallelnarrativesinliteratureandfilm.Thefourthchapteroutlinesthemethodologyusedtodevelopatypologyofparallelnarrativesincartographicstorytellingaswellastheresults.Thefifthchapterdiscussesthecasestudydevelopedtotestmethodsusedtopresentparallelnarrativesincartographicstorytelling.Thefinaltwochapterspresentanassessmentandconclusiononthisthesis.Thesixthchapterpresentsthediscussionwithlimitations.Thefinalchapterpresentstheanswerstotheresearchquestionsandfutureresearchalongwiththeconclusion.
5
2. Visual and Cartographic Storytelling
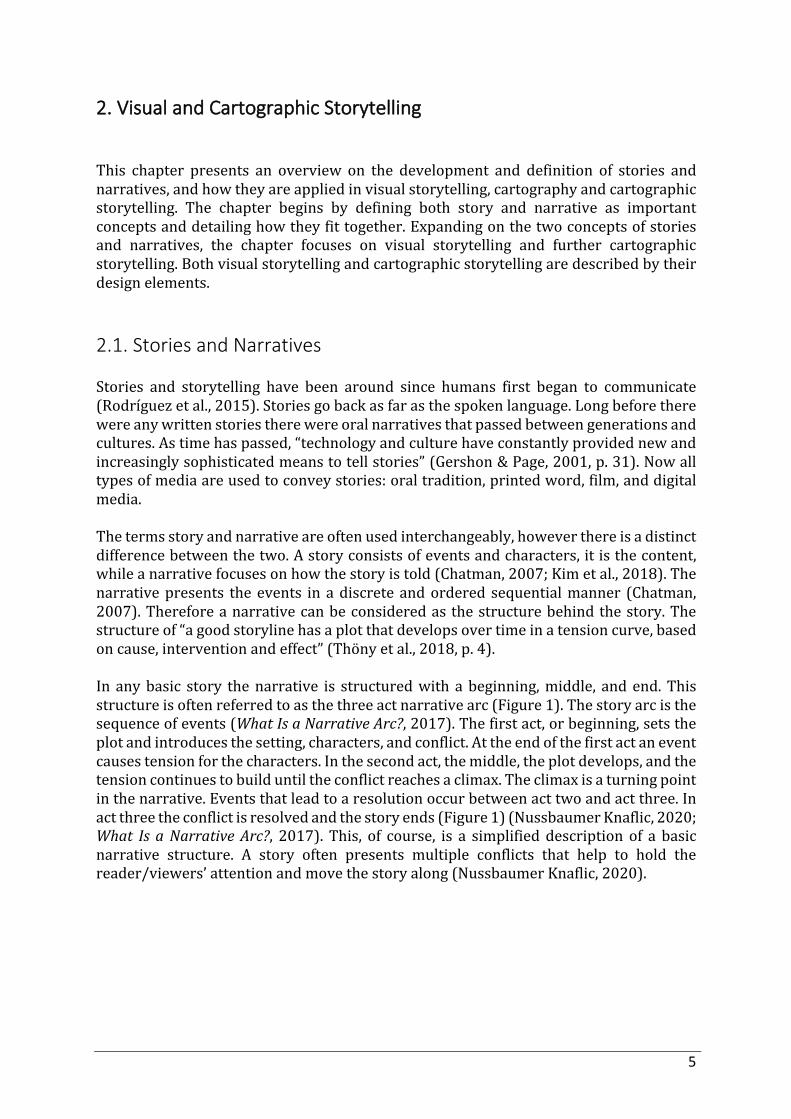
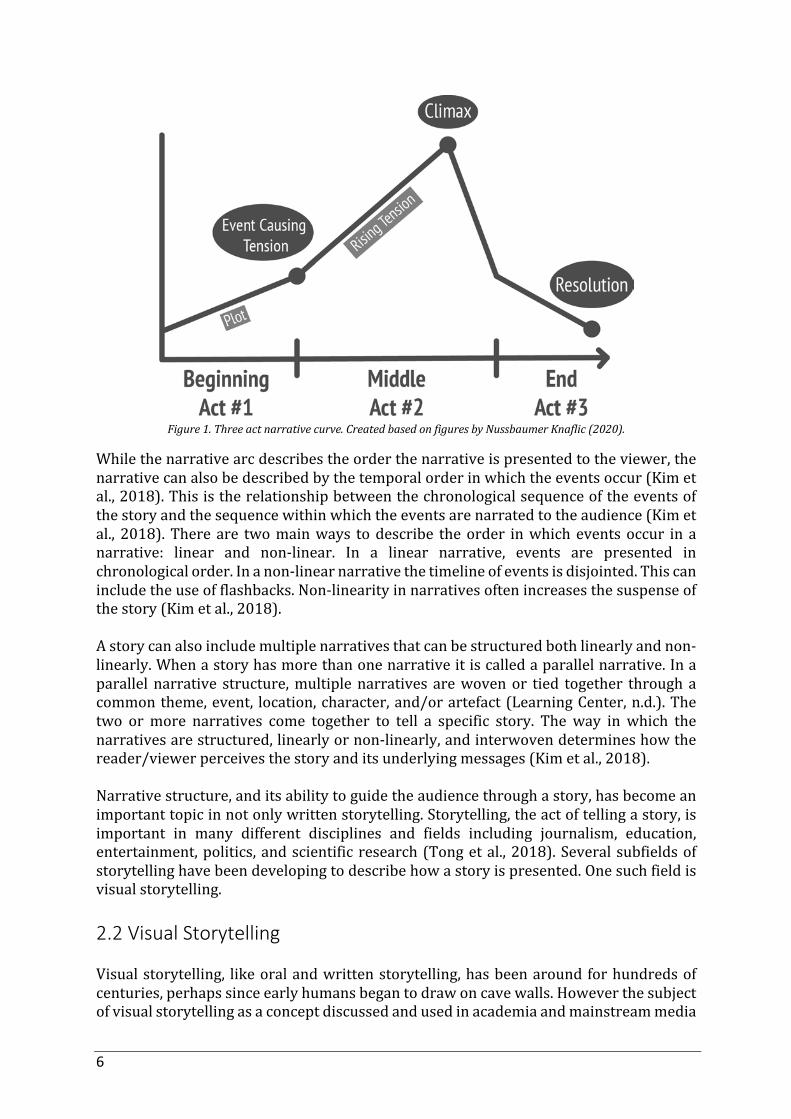
This chapter presents an overview on the development and definition of stories andnarratives,andhowtheyareappliedinvisualstorytelling,cartographyandcartographicstorytelling. The chapter begins by defining both story and narrative as importantconceptsanddetailinghowtheyfittogether.Expandingonthetwoconceptsofstoriesand narratives, the chapter focuses on visual storytelling and further cartographicstorytelling.Bothvisualstorytellingandcartographicstorytellingaredescribedbytheirdesignelements.2.1. Stories and Narratives Stories and storytelling have been around since humans first began to communicate(Rodríguezetal.,2015).Storiesgobackasfarasthespokenlanguage.Longbeforetherewereanywrittenstoriestherewereoralnarrativesthatpassedbetweengenerationsandcultures.Astimehaspassed,“technologyandculturehaveconstantlyprovidednewandincreasinglysophisticatedmeanstotellstories”(Gershon&Page,2001,p.31).Nowalltypesofmediaareusedtoconveystories:oraltradition,printedword,film,anddigitalmedia.Thetermsstoryandnarrativeareoftenusedinterchangeably,howeverthereisadistinctdifferencebetweenthetwo.Astoryconsistsofeventsandcharacters,itisthecontent,whileanarrativefocusesonhowthestoryistold(Chatman,2007;Kimetal.,2018).Thenarrativepresents theevents in adiscrete andordered sequentialmanner (Chatman,2007).Thereforeanarrativecanbeconsideredasthestructurebehindthestory.Thestructureof“agoodstorylinehasaplotthatdevelopsovertimeinatensioncurve,basedoncause,interventionandeffect”(Thönyetal.,2018,p.4).In anybasic story thenarrative is structuredwith abeginning,middle, andend.Thisstructureisoftenreferredtoasthethreeactnarrativearc(Figure1).Thestoryarcisthesequenceofevents(WhatIsaNarrativeArc?,2017).Thefirstact,orbeginning,setstheplotandintroducesthesetting,characters,andconflict.Attheendofthefirstactaneventcausestensionforthecharacters.Inthesecondact,themiddle,theplotdevelops,andthetensioncontinuestobuilduntiltheconflictreachesaclimax.Theclimaxisaturningpointinthenarrative.Eventsthatleadtoaresolutionoccurbetweenacttwoandactthree.Inactthreetheconflictisresolvedandthestoryends(Figure1)(NussbaumerKnaflic,2020;What Is aNarrative Arc?, 2017). This, of course, is a simplified description of a basicnarrative structure. A story often presents multiple conflicts that help to hold thereader/viewers’attentionandmovethestoryalong(NussbaumerKnaflic,2020).
6
Figure1.Threeactnarrativecurve.CreatedbasedonfiguresbyNussbaumerKnaflic(2020).
Whilethenarrativearcdescribestheorderthenarrativeispresentedtotheviewer,thenarrativecanalsobedescribedbythetemporalorderinwhichtheeventsoccur(Kimetal.,2018).Thisistherelationshipbetweenthechronologicalsequenceoftheeventsofthestoryandthesequencewithinwhichtheeventsarenarratedtotheaudience(Kimetal., 2018).Thereare twomainways todescribe theorder inwhicheventsoccur in anarrative: linear and non-linear. In a linear narrative, events are presented inchronologicalorder.Inanon-linearnarrativethetimelineofeventsisdisjointed.Thiscanincludetheuseofflashbacks.Non-linearityinnarrativesoftenincreasesthesuspenseofthestory(Kimetal.,2018).Astorycanalsoincludemultiplenarrativesthatcanbestructuredbothlinearlyandnon-linearly.Whenastoryhasmorethanonenarrativeitiscalledaparallelnarrative.Inaparallel narrative structure,multiplenarratives arewovenor tied together throughacommontheme,event, location,character,and/orartefact(LearningCenter,n.d.).Thetwo ormore narratives come together to tell a specific story. The way in which thenarrativesarestructured,linearlyornon-linearly,andinterwovendetermineshowthereader/viewerperceivesthestoryanditsunderlyingmessages(Kimetal.,2018).Narrativestructure,anditsabilitytoguidetheaudiencethroughastory,hasbecomeanimportanttopicinnotonlywrittenstorytelling.Storytelling,theactoftellingastory,isimportant in many different disciplines and fields including journalism, education,entertainment,politics,andscientificresearch(Tongetal.,2018).Severalsubfieldsofstorytellinghavebeendevelopingtodescribehowastoryispresented.Onesuchfieldisvisualstorytelling.2.2 Visual Storytelling Visualstorytelling, likeoralandwrittenstorytelling,hasbeenaroundforhundredsofcenturies,perhapssinceearlyhumansbegantodrawoncavewalls.Howeverthesubjectofvisualstorytellingasaconceptdiscussedandusedinacademiaandmainstreammedia
7
isrelativelynew(Tongetal.,2018).Traditionally,visualizationswereusedtosupportanarrative as supplementary information. Visual storytelling presents a storyindependentlyoftraditionaltextorvideo(Figueiras,2014).Visualstorytellingcombinesdataandastorytopresentviewerswithavisualdisplay.Data iscollectedandprocessedbeforevisual techniquesareapplied.Creatingavisualnarrativeentails“usingatool,suchasTableauorMicrosoftExceltovisuallyanalyzedataandtogeneratevisualizationsviavectorgraphicsorimagesforpresentation”,andthendeciding “how to thread the representations into a compelling yet understandablesequence”(Hullmanetal.,2013,p.2406).ThesevisualrepresentationsaredescribedbyTongetal.as:“asetofstorypieces,visualizedtosupportoneormoreintendedmessages”(Tongetal.,2018,p.2).Whenthedataandthe“storypieces”areconnectedorpresentedinameaningfulwaythattheviewercanunderstandastoryistold(Tongetal.,2018).Visualstorytellingcanbeusedtoexplain:“tounderstandwhatispresentinthedata”andtocommunicate:“todisplayanddiscussvisualizationswiththepublicbytellingstoriesbasedonthedataandthefacts”(Rodríguezetal.,2015,p.3).Withoutthestorytellingelement of the visualization the audiencewould lack explanations about theplot andwouldhavetorelyontheirownabilitytointerpretthedatacorrectly(Figueiras,2014).Visualstoriesandnarrativescanbebrokendownjustlikewrittenstoriesandnarratives.The visual story is comprised of the events and characters. The characters in thevisualizationare“visualelementsrepresentingdatapoints”(Kwan-LiuMaetal.,2012,p.1).Theeventsarethe“patternsindatasetsrepresentedinvisualizations”(Hullmanetal., 2013, p. 2406). Kwan-Liu Ma et al also describes what the setting and plot arecomprisedof inavisualstorybynotingthatthesettingofavisualizationis“allofthebackground information a viewer needs to know in order to contextualize andcomprehend the visualization” (Kwan-Liu Ma et al., 2012, p. 1). The plot of the“visualization arises from the from the juxtaposition of its visual elements, how theyinteractandcomparewithoneother,andhowtheyevolveovertime”(Kwan-LiuMaetal., 2012, p. 1). The visual narrative is the structure of the characters and transitionsbetweenevents(Tongetal.,2018).The narrative structure of visual stories differs from literature and film because theinformationthatmighthavebeenpresentedin100pagesoftextoranhouroffilmisnowcondensedtoasmallergraphicalrepresentation.Rothdescribesacharacteristicofvisualstoriesaspartialstatingthat“visualstoriesprivilegebrevityovercompleteness”(R.E.Roth,2020,p.3).Visualnarrativespresentasmallersetofcharactersandeventsthatcanbeusedto“exemplifybroaderpatternsandtrends”(R.E.Roth,2020,p.3).Thebasicelementsofathreeactnarrativearccanfurtherbeexaminedwhenlookingatvisualnarratives(Figure1).Thefirstelementthatmustbeincludedinavisualnarrativestructureisa“navigationalcomponent”thatindicatestotheviewerwheretostartandhowtoprogressthroughthevisualization(Cohn,2013,p.414).Thisisimportantbecausestatic visualizations are two dimensional and therefore “lack a temporal sequence orrelevantlinearaxistoinformaplotline”(R.E.Roth,2020,p.5).Eachactmustincludespecificvisualelementstoenforcethelinearityanddirectionofthenarrative(R.E.Roth,2020). In the beginning the viewer should understand the subject and charactersinvolved in the visualization. The conflict arises as the viewer understands therelationshipbetweenthevariouscharacters.Symbols,text,animation,andothergraphics
8
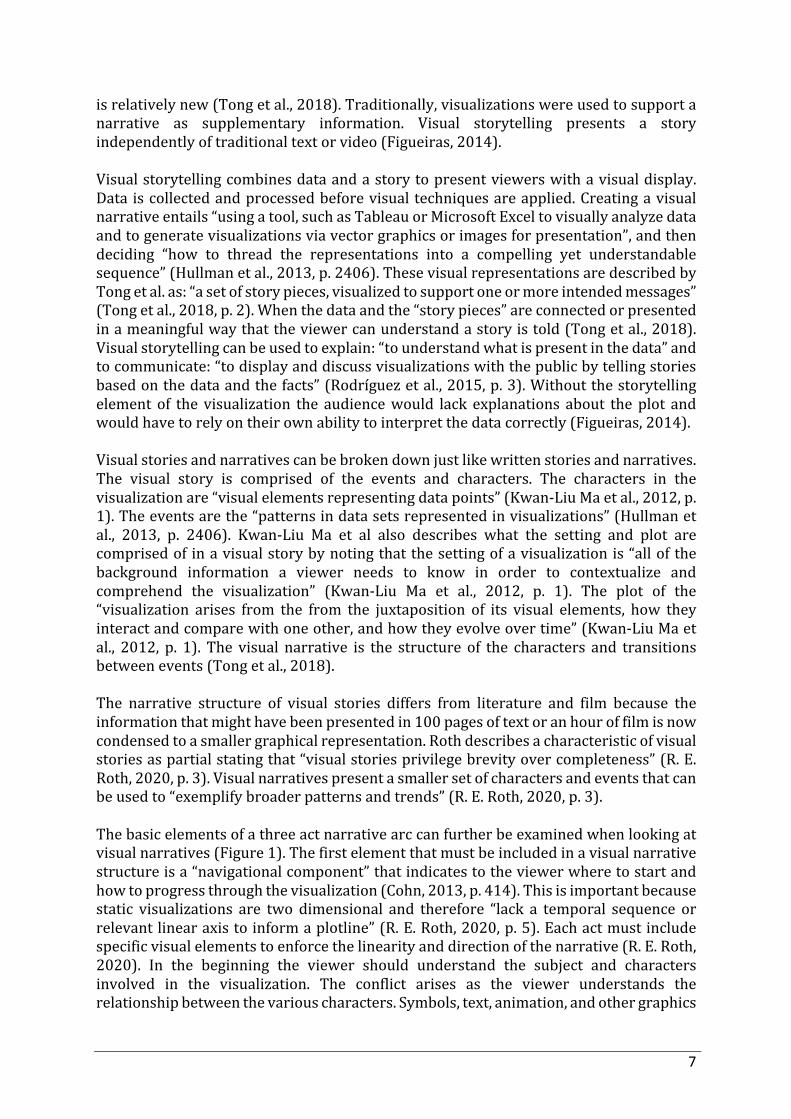
canhelphighlightkeyrelationships.Theresolutionofthevisualstorycanbepresentedastheresourcesincluded, invitingtheviewertodotheirownresearchintothetopicsconclusionortheauthorcanchoosetoexcludearesolutionfromthevisualizationleavingtheviewerwithamemorablecliff-hanger(R.E.Roth,2020).Inaddition tonarrativestructure thedesignerof thevisual storycan introduceothernarrativeelementstoinfluencethewayinwhichthestoryistold.Theseelementscanbegrouped into several categories including narrative design patterns, narrativevisualizationelements,andinteractivity(Bachetal.,2018;Segel&Heer,2010). 2.2.1 Narrative Design Patterns NarrativeDesignPatternsaretechniquesusedtoeffectflowandargumentationindata-drivenvisualnarratives(NAPACards,2016).Narrativedesignpatternsarenotexclusiveandareoftencombinedtofurtherthedesigner’sintentincreatingthevisualization.Theuseofnarrativedesignpatternscanbebrokendownintofiveintentions:argumentation,flow, framing,emotion,andengagement(Bachetal.,2018).Narrativedesignpatternsthat support argumentation with “different ways to present, support, reinforce,contradictordiscussagivenmessage”(Bachetal.,2018,p.6).Thesenarrativedesignpatternsinclude:compare,concertize,repetition,andrhetoricalquestion.Flowpatternshelp structure the narrative and include: exploration, gradual reveal, repetition, andspeed-up/slow-down (Bach et al., 2018). Framingpatterns help to dictate theway inwhich the audience perceives the visualization. Framing patterns include: familiarsetting,make-a-guess,defamiliarization,conventionbreaking,silentdata,andphysicalmetaphors(Bachetal.,2018).Emotionpatternshelptosparkemotionsintheaudiencemaking the visualization more relatable and memorable. These narrative patternsinclude: familiar setting, gradual visual reveal, humans-behind-the-dots, rhetoricalquestion,silentdata,anduser-finds-themselves(Bachetal.,2018).Thefinalnarrativepattern engagement, connects the viewer to the story and includes patterns such as:addressingtheaudience,breakingthe4thwall,calltoaction,exploration,makeaguess,rhetoricalquestion,anduserfindsthemselves(Bachetal.,2018).Allofthesenarrativepatterns2.2.2 Narrative Visualization Elements Segel andHeer have outlined several key concepts related to narrative visual designelements.These includegenre, visualnarrative tactics, andnarrative structure tactics(Segel&Heer,2010).Genredescribesmediathatsharesimilarities.SegelandHeerhaveoutlinedsevengenresfor visual narratives: magazine style, annotated chart, partitioned poster, flow chart,comicstrip,slideshow,andfilm/video/animation(Figure 2)(Segel&Heer,2010).Thecategoriesaredefinedbythe“numberofframes”and“theorderofthevisualelements”inthevisualization(Segel&Heer,2010,p.8).
9
Figure2.SevenGenresforvisualstorytellingpresentedbySegelandHeer(2010).Thegenresaremagazinestyle,
annotatedchart,partitionedposter,flowchart,comicstrip,slideshow,andfilm/video/animation.
VisualNarrativeTacticsaredevicesusedtoenhanceandassistthestory(Segel&Heer,2010). One category of visual narrative tactics is highlighting. Highlighting helpsemphasizecertainfeaturesinthevisualizationandincludeszooming,presentingcloseups,andanimations(Segel&Heer,2010). Narrativestructuretacticsaredevicesused in thevisualizationthathelp facilitate theorderandstructureof thenarrativeand include interactivityandmessaging (Segel&Heer,2010).Narrativestructuretacticsincludeinteractivityandmessaging.Interactivitywillbediscussedinthefollowingsection.Messagingisimportantinvisualstorytellingand is used to communicate elements of the story that cannot be visualized or needclarification.Annotations, captions, information texts,andsummariesarea fewof thewaysmessagingcanbeputintoavisualization(Segel&Heer,2010).
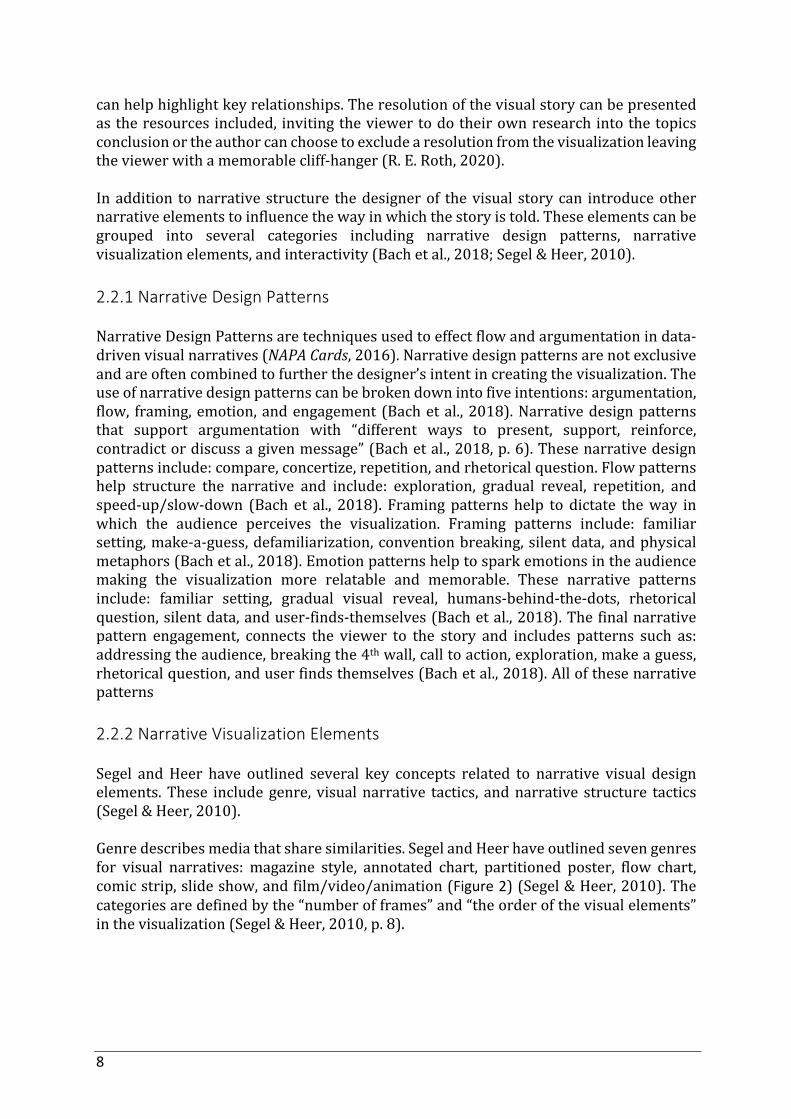
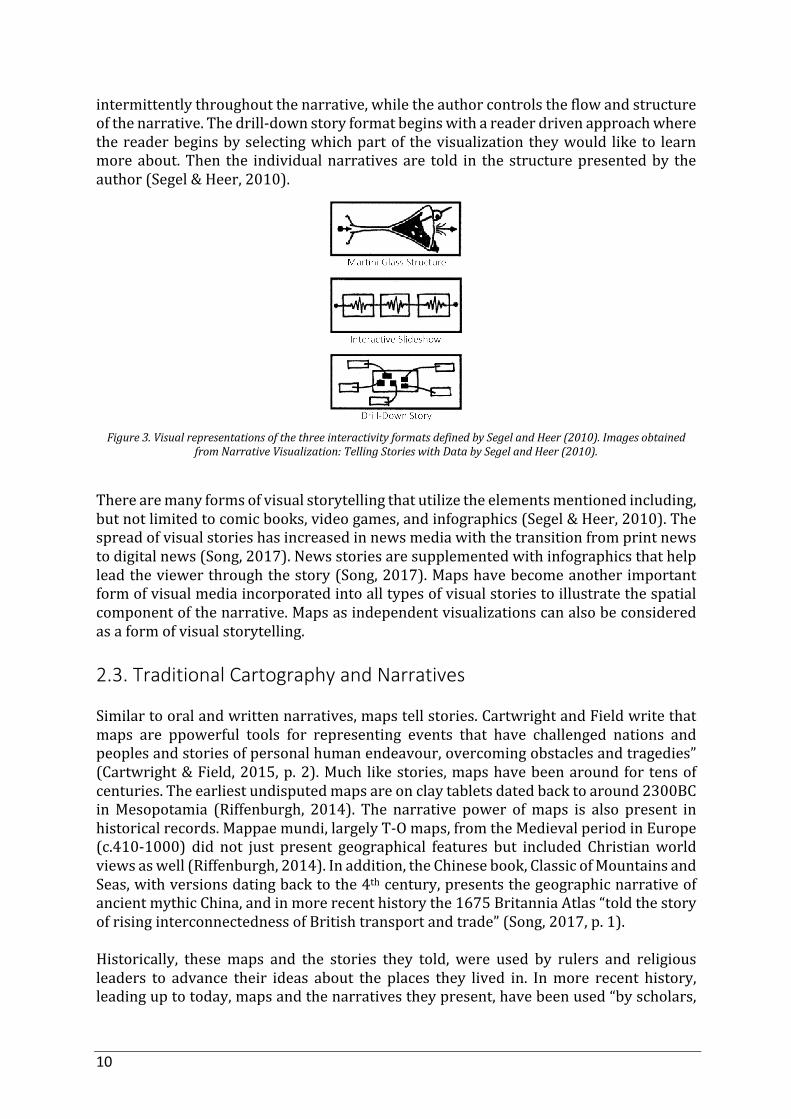
2.2.3 Interactivity Interactivity is increasingly integrated into web-based visual storytelling. It can be areallyimportantstrategyinvisualstorytelling.Includinganinteractiveelementintothevisualizationcanmakethestorymorememorableandpersonable.Interactivityallowsuserstomanipulateandexplorethevisualizationastheychoose(Segel&Heer,2010).Therearemanytechniques,detailedbySegelandHeer(2010)thatprovideaninteractivedisplay includinghoverhighlighting,navigationbuttons,details-on-demand, layer list,infopanel,andinfopop-up. Interactivitycanalsobeexaminedbytheroleitplaysindeterminingthesequencingofthe narrative in the visualization. In an interactive visualization the linearity of thenarrativeisdeterminedbyboththeuserandtheauthor(Segel&Heer,2010).Whenthereaderoruserofthevisualizationmakesthedecisionsthatmovethenarrativealong,itis called reader-driven, and when the author of the visualization determines thesequencingofthenarrative,itiscalledauthor-driven.SegelandHeer(2010)outlinethreeschemas that combine both reader-driven and author-driven approaches: themartiniglass structure, the interactive slideshow, and the drill-down story (Figure 3). In themartiniglassstructurethevisualizationbeginswithanauthordrivenapproachinwhichtheauthorportraystheinformationtheyconsidertobeimportantforthenarrative.Thenthevisualizationopensupandtheviewerisabletoexplorethedatahowtheychoose(Segel & Heer, 2010). The interactive slideshow format allows viewers to interact
10
intermittentlythroughoutthenarrative,whiletheauthorcontrolstheflowandstructureofthenarrative.Thedrill-downstoryformatbeginswithareaderdrivenapproachwherethereaderbeginsbyselectingwhichpartof thevisualizationtheywould liketo learnmoreabout.Then the individualnarrativesare told in the structurepresentedby theauthor(Segel&Heer,2010).
Figure3.VisualrepresentationsofthethreeinteractivityformatsdefinedbySegelandHeer(2010).Imagesobtained
fromNarrativeVisualization:TellingStorieswithDatabySegelandHeer(2010).
Therearemanyformsofvisualstorytellingthatutilizetheelementsmentionedincluding,butnotlimitedtocomicbooks,videogames,andinfographics(Segel&Heer,2010).Thespreadofvisualstorieshasincreasedinnewsmediawiththetransitionfromprintnewstodigitalnews(Song,2017).Newsstoriesaresupplementedwithinfographicsthathelpleadtheviewerthroughthestory(Song,2017).Mapshavebecomeanotherimportantformofvisualmediaincorporatedintoalltypesofvisualstoriestoillustratethespatialcomponentofthenarrative.Mapsasindependentvisualizationscanalsobeconsideredasaformofvisualstorytelling.2.3. Traditional Cartography and Narratives Similartooralandwrittennarratives,mapstellstories.CartwrightandFieldwritethatmaps are ppowerful tools for representing events that have challenged nations andpeoplesandstoriesofpersonalhumanendeavour,overcomingobstaclesandtragedies”(Cartwright&Field,2015,p.2).Much likestories,mapshavebeenaroundfortensofcenturies.Theearliestundisputedmapsareonclaytabletsdatedbacktoaround2300BCinMesopotamia (Riffenburgh, 2014). The narrative power ofmaps is also present inhistoricalrecords.Mappaemundi,largelyT-Omaps,fromtheMedievalperiodinEurope(c.410-1000) did not just present geographical features but included Christianworldviewsaswell(Riffenburgh,2014).Inaddition,theChinesebook,ClassicofMountainsandSeas,withversionsdatingbacktothe4thcentury,presentsthegeographicnarrativeofancientmythicChina,andinmorerecenthistorythe1675BritanniaAtlas“toldthestoryofrisinginterconnectednessofBritishtransportandtrade”(Song,2017,p.1).Historically, thesemaps and the stories they told, were used by rulers and religiousleaders to advance their ideas about the places they lived in. Inmore recent history,leadinguptotoday,mapsandthenarrativestheypresent,havebeenused“byscholars,
11
journalists,activists,lobbyistandindividualstotellnon-fictionalstories,assupporttoolsin their research and to assist in developing arguments about places” (Caquard &Cartwright,2014,p.101).CaquardandBrynedescribethatmapstellstoriesinbothafigurativeandliteralsense(Caquard&Bryne,2009).Mapstellstoriesinafigurativesensebecausemaps“arenotwhattheyseem:theyarenotanobjectiveandneutralrepresentationofreality”(Caquard&Bryne,2009,p.374).Thereisanentiresubcategoryofcartographycalled“persuasivemaps”,“suggestivemaps”,or“propagandamaps”inwhichthepresentationofaccurateinformation is not a priority (Muehlenhaus, 2011, p. 29). Persuasivemaps facilitate aspecificinterpretationfromthemapoverothers(Muehlenhaus,2011).Mapstellstoriesinaliteralsensebecauseinrelationtotheplacestheyrepresenttheydepict“howtogetthere,wholivesthere,andhowtheplacehaschangedovertime”(Caquard&Bryne,2009,p.374).Maps also tell stories in the way that individual viewers perceive the informationpresented. Inprocessingandsynthesizing informationpresented inamap theviewerbringstheirownexperienceandbackground.Differentviewerscaneachhaveadifferentoutlookorunderstandingofacertainmap,thereforecreatingtheirownnarrative.It can then be argued that a stand-alone map “propose[s] facts, relationships,correlations,andsituationsthatsuggestorsupportsomestory,”butdoesnothavethenarrativepowertotellacompletestory(Denil,2017,p.19).Tobestpresentthenarrativebehindthemap,themap“need[s]tobeenhancedwithrichmediaartefacts”thatillustratethe tension, conflict, and resolution (Cartwright & Field, 2015, p. 2). This leads tocartographic storytelling, which combines the map and the story it presents withadditionaltextandmediaelementstoenhanceanddirectthenarrative.2.4 Cartographic Storytelling Justabouteverystorycanbetoldthroughcartographicstorytelling,“asalleventsoccurinaspatialorgeographiccontext”(Song,2017,p.5).Whilenewfocushasbeenputoncartographicstorytellingasaresultofadvancesintechnologyincludingbutnotlimitedtowidespreadinternet,mobileandsocialmediause, itactuallyhasbeenapartof thepractice of cartography since the beginning. For example maps from antiquity werepopularbecausetheypresentedaculturalnarrative,notbecausetheypresentedfactsorwere even accurate (R. E. Roth, 2020). In addition, inmany indigenous communitiesspatialnarrativeswereapartofperformanceandoraldiscourse(Caquard,2013).The recent increase in popularity of visual narratives including map-based visualnarrativeshasproducedavarietyofnewsub-topics.“Cartographicstorytelling”,“storymap”, “fictional cartography”, “narrative atlas”, “geospatial storytelling”, “spatialnarratives”,and“map-basedvisualstorytelling”areamongsomeofthetermsundertheumbrella of cartography, emphasizing its relationship with narratives, that haveincreased inpopularity (Caquard,2013,p.135;R.E.Roth,2020,p.1).Manydifferentauthorshaveputforthdistinctdefinitionsforspecifictermsbutforthepurposeofthisresearchtheterm“cartographicstorytelling”willbeusedtodescribeall“cartographicrepresentationsthatexhibitnarrativeelements”(R.E.Roth,2020,p.3).
12
Cartographicstorytellingisdatadrivenandcombinesbothartandscience(R.E.Roth,2020). It is a form of visualmedia that presents amap or series ofmaps alongwithinformation graphics or additional text to advance a spatial story (Song, 2017).Cartographicstoriesare“toolsforprovidinganexplicit,spatial,andvisualcomplementtotheimplicitgeographiccomponentsofatextualstoryorargument”(Song,2017,p.5).Cartographicstorytellingismorecommonandmorewidespreadtodaydueto“digitalandweb-basedmechanismsforauthoringandsharinginformation”(Song,2017,p.2).Thedigitaltoolsthatarenowavailableforincorporatingspatialcontentintostorieshaveallowedformapstobecomemoreinteractive,personalized,andaccessible(Caquard&Bryne, 2009). Cartographic stories can be created by anyone online who wants todocumentandgeotagtheirownjourneys(Caquard,2013).Additionally,professionalsinnumerous fields including journalismand computer science are creating cartographicstoriesforcommercialandpoliticalpurposes(R.E.Roth,2015).Ascartographicstoriesarebecomingamorepopularformofstorytelling,researchhasbeguntofocusonhownarrativesarepresentedincartographicstorytellingandwhatelementsandtechniquescanbeimplementedtobestpresentthenarratives.Theconceptofa threearcnarrative incartographic storytelling isverysimilar to therepresentation of the three arc narrative in visual storytelling [Figure 1]. Thecartographicstoryshouldpresentanelementthatindicatestotheviewerweretostartandhowtoprogressthroughthevisualization(Cohn,2013).Sincemapsareoften“two-dimensionalandthusoftenlackatemporalsequenceorrelevantlinearaxistoinformaplotline” it is important to introduce an element that enforces linearity through thecartographicstory(R.E.Roth,2020,p.5).Justasinvisualstorytelling,inthebeginningtheviewershouldunderstandthesubjectandcharactersinvolvedinthevisualization.Thesecondpartofthenarrativearcrepresentsadevelopmentintheplotleadinguptoaconflict.Rothcommentsthatthismakesthe“visualstorytellingapproachbestsuitedforexplainingchangeratherthanstabilityingeographicphenomenaandprocesses”(R.E.Roth,2020,p.7).Followingtheclimax,theresolutionmaybeshapedbythepersuasiverhetoricusedbytheauthortopresentoneinterpretationofthestoryoverothers(R.E.Roth,2020).Asnotedinvisualstorytelling,theresolutionofthecartographicstorycanbepresentedastheresourcesincludedortheauthorcanchoosetoexcludearesolutionfrom the visualization inviting the viewer to do their own research into the topicsconclusionandleavingtheviewerwithamemorablecliff-hanger(R.E.Roth,2020).Asmanycartographic researchershavepointedout, research into thedesignofmap-basedvisualstoriesisnew(Caquard,2013;Cartwright&Field,2015;R.E.Roth,2015;Song,2017).Therefore,outlinedinformationonguidelines,structuresandelementstoemploywhencreatingacartographicstoryisstilldeveloping(Song,2017).ResearcherssuchasRothhavebeeninstrumentalinexaminingstructures,methodsanddevicesusedtopresent cartographic stories.Rothoutlinesvisual storytellingelements, genresandtropesadaptedtocartographicstorytelling(R.E.Roth,2020).Cartographicstorytellinggenrescategorizecartographicstoriesbythewayinwhichtheyenforcelinearitythroughthevisualization(R.E.Roth,2020).Additionally,itisimportanttoexaminehowthemapispresentedinthecartographicstory.Thisisconsideredthemaplayout.Cartographicstorytellingtropesarerhetoricdevicesusedtoprogressthestory(R.E.Roth,2020).
13
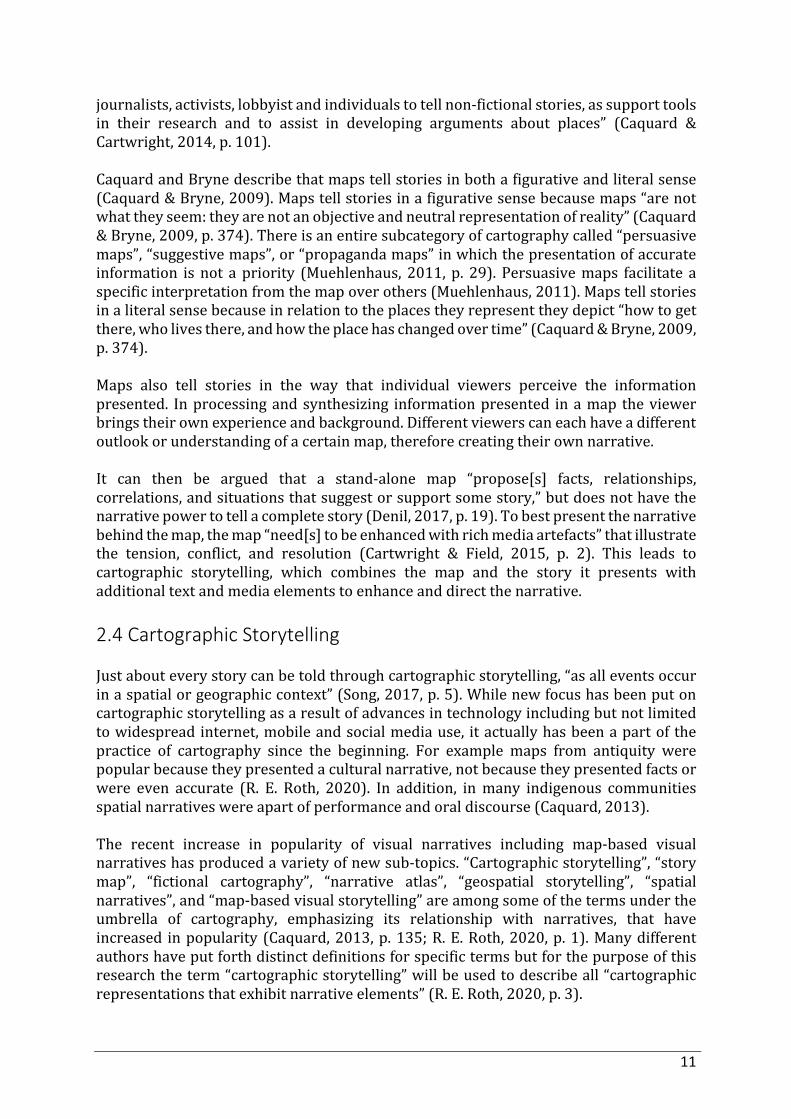
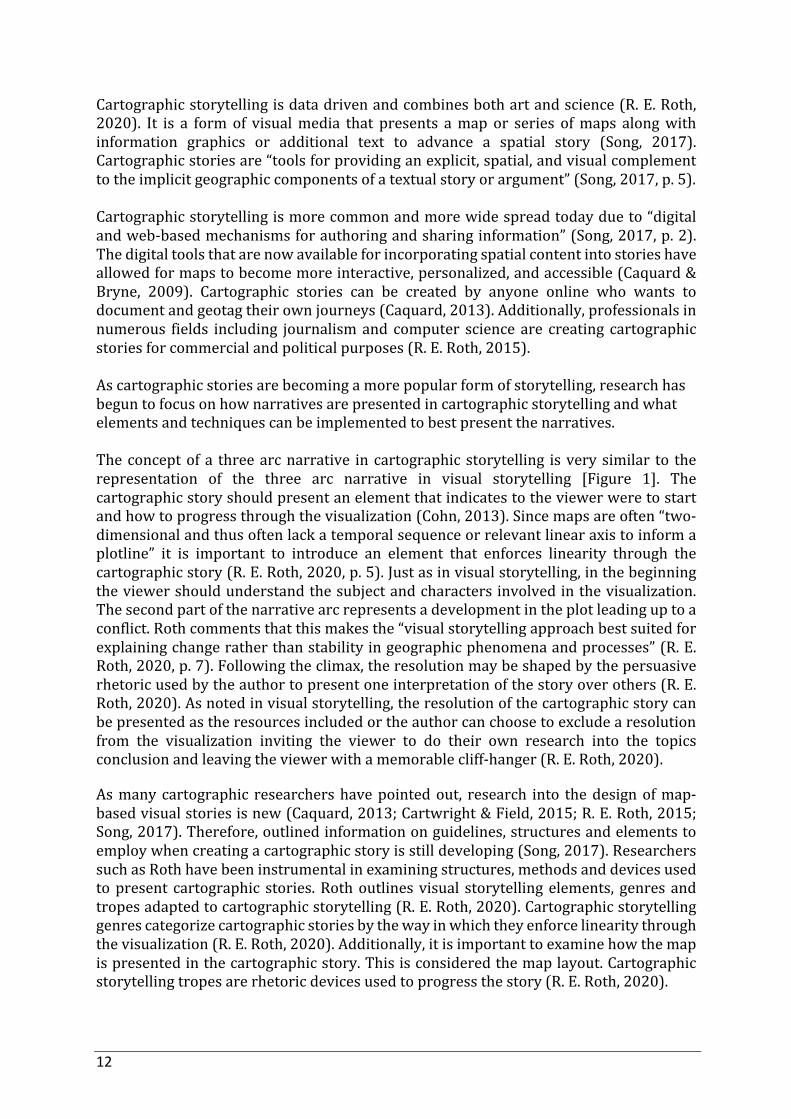
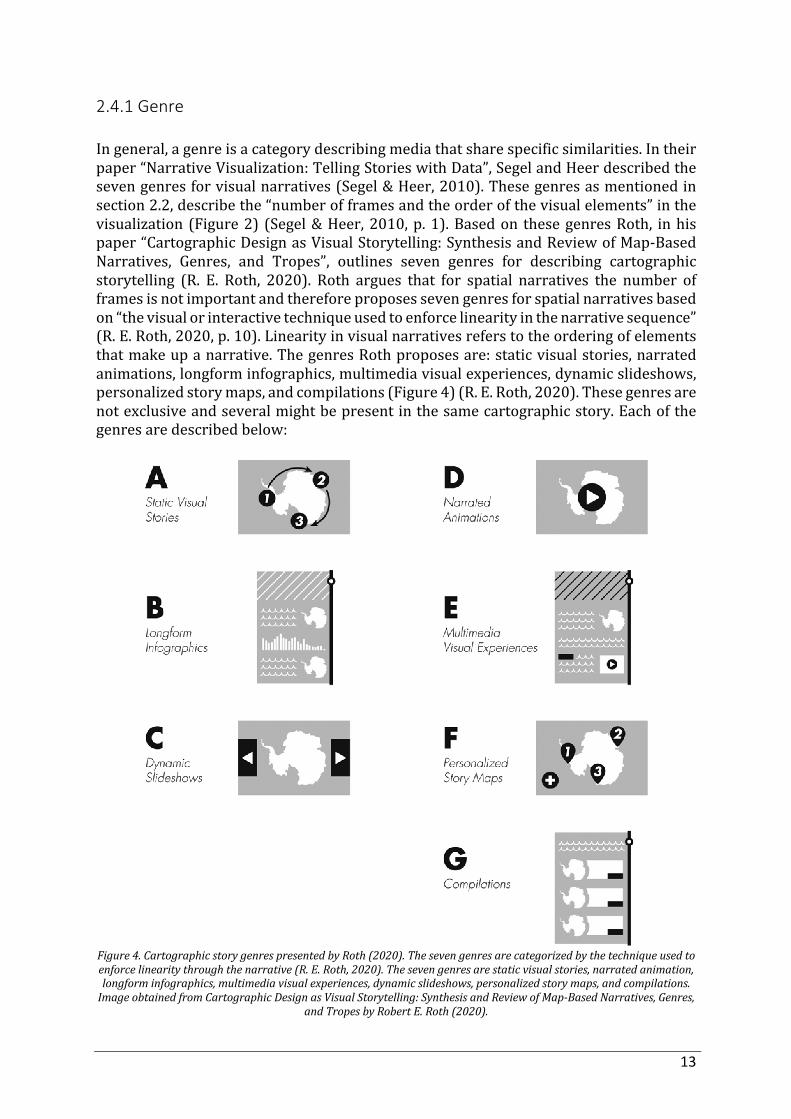
2.4.1 Genre Ingeneral,agenreisacategorydescribingmediathatsharespecificsimilarities.Intheirpaper“NarrativeVisualization:TellingStorieswithData”,SegelandHeerdescribedthesevengenresforvisualnarratives(Segel&Heer,2010).Thesegenresasmentionedinsection2.2,describethe“numberofframesandtheorderofthevisualelements”inthevisualization (Figure2) (Segel&Heer,2010,p.1).Basedon thesegenresRoth, inhispaper“CartographicDesignasVisualStorytelling:SynthesisandReviewofMap-BasedNarratives, Genres, and Tropes”, outlines seven genres for describing cartographicstorytelling (R. E. Roth, 2020). Roth argues that for spatial narratives the number offramesisnotimportantandthereforeproposessevengenresforspatialnarrativesbasedon“thevisualorinteractivetechniqueusedtoenforcelinearityinthenarrativesequence”(R.E.Roth,2020,p.10).Linearityinvisualnarrativesreferstotheorderingofelementsthatmakeupanarrative.ThegenresRothproposesare:staticvisualstories,narratedanimations,longforminfographics,multimediavisualexperiences,dynamicslideshows,personalizedstorymaps,andcompilations(Figure4)(R.E.Roth,2020).Thesegenresarenotexclusiveandseveralmightbepresentinthesamecartographicstory.Eachofthegenresaredescribedbelow:
Figure4.CartographicstorygenrespresentedbyRoth(2020).Thesevengenresarecategorizedbythetechniqueusedtoenforcelinearitythroughthenarrative(R.E.Roth,2020).Thesevengenresarestaticvisualstories,narratedanimation,longforminfographics,multimediavisualexperiences,dynamicslideshows,personalizedstorymaps,andcompilations.ImageobtainedfromCartographicDesignasVisualStorytelling:SynthesisandReviewofMap-BasedNarratives,Genres,
andTropesbyRobertE.Roth(2020).
14
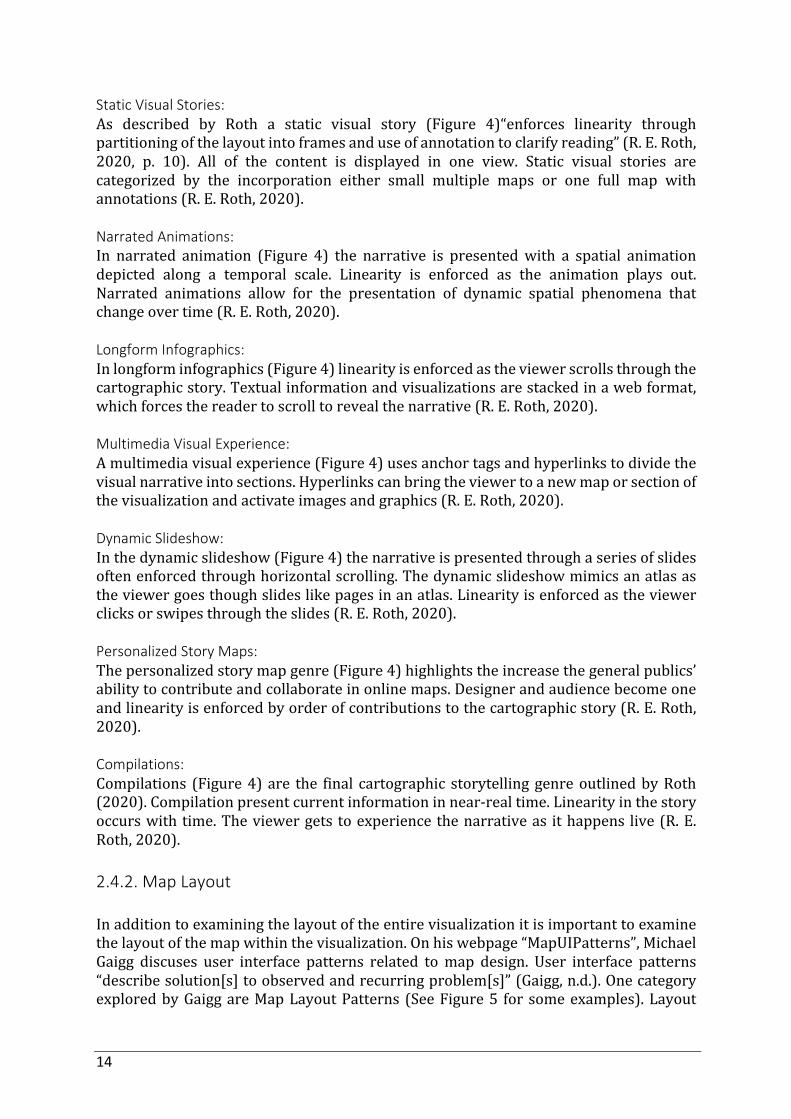
Static Visual Stories: As described by Roth a static visual story (Figure 4)“enforces linearity throughpartitioningofthelayoutintoframesanduseofannotationtoclarifyreading”(R.E.Roth,2020, p. 10). All of the content is displayed in one view. Static visual stories arecategorized by the incorporation either small multiple maps or one full map withannotations(R.E.Roth,2020).Narrated Animations: In narrated animation (Figure 4) the narrative is presentedwith a spatial animationdepicted along a temporal scale. Linearity is enforced as the animation plays out.Narrated animations allow for the presentation of dynamic spatial phenomena thatchangeovertime(R.E.Roth,2020).Longform Infographics: Inlongforminfographics(Figure4)linearityisenforcedastheviewerscrollsthroughthecartographicstory.Textualinformationandvisualizationsarestackedinawebformat,whichforcesthereadertoscrolltorevealthenarrative(R.E.Roth,2020).Multimedia Visual Experience: Amultimediavisualexperience(Figure4)usesanchortagsandhyperlinkstodividethevisualnarrativeintosections.Hyperlinkscanbringtheviewertoanewmaporsectionofthevisualizationandactivateimagesandgraphics(R.E.Roth,2020).Dynamic Slideshow: Inthedynamicslideshow(Figure4)thenarrativeispresentedthroughaseriesofslidesoftenenforcedthroughhorizontalscrolling.Thedynamicslideshowmimicsanatlasastheviewergoesthoughslideslikepagesinanatlas.Linearityisenforcedastheviewerclicksorswipesthroughtheslides(R.E.Roth,2020).Personalized Story Maps: Thepersonalizedstorymapgenre(Figure4)highlightstheincreasethegeneralpublics’abilitytocontributeandcollaborateinonlinemaps.Designerandaudiencebecomeoneandlinearityisenforcedbyorderofcontributionstothecartographicstory(R.E.Roth,2020).Compilations: Compilations (Figure4) are the final cartographic storytellinggenreoutlinedbyRoth(2020).Compilationpresentcurrentinformationinnear-realtime.Linearityinthestoryoccurswithtime.Theviewergets toexperiencethenarrativeas ithappens live(R.E.Roth,2020).2.4.2. Map Layout Inadditiontoexaminingthelayoutoftheentirevisualizationitisimportanttoexaminethelayoutofthemapwithinthevisualization.Onhiswebpage“MapUIPatterns”,MichaelGaigg discuses user interface patterns related tomap design. User interface patterns“describesolution[s]toobservedandrecurringproblem[s]”(Gaigg,n.d.).OnecategoryexploredbyGaiggareMapLayoutPatterns (SeeFigure5 forsomeexamples).Layout
15
patternsdescribehowthemapispresentedinthevisualization,includingthestructureof the map and visualization. There are many ways to describe the layout of a mapespeciallyasitisappliedindifferentmediumssuchaswebdesignandmobiledesign.Forsimplicitythemorecommonandgenerallayoutswillbefocusedonhereasfollows:Full Map Layout: The full map layout (Figure 5) might be considered as the basic cartographicvisualization.Inthefullmaplayout,themapisatthecoreofthevisualizationandmaytakeuptheentirevisualization.Informationcanbeaddedontopoforsurroundingthemapbutremainssecondarytothemapitself.Thereforethefullmaplayoutmaximizesthelevelofdetailtheviewercanobserveinthemap(Gaigg,n.d.).Embedded Map Layout: Theembeddedmaplayout(Figure5)ismostoftenusedinwebsitesandthereforelendsitselfwelltobeincorporatedinweb-basedlongforminfographics.Intheembeddedmapthelayoutthemapisinsertedintothewebpagewithmapdatafromathirdpartyprovider(Gaigg, n.d.). Third party provider examples include ESRI, USGS, andMapBox. Mediaprovidersoftenuseembeddedmapswhentheydon’thavethetechnologicalcapabilitiestocreatetheirownmaps.Anembeddedmapoftentakesuptheentirewebpageorspansthefullwidthofawebbasedinfographic(Gaigg,n.d.).Reference Map Layout: Thereferencemaplayout(Figure5)isgenerallysmallerthanthefullmaporembeddedmaplayout.Itpresentsthemapasanadditionalviewforcontextpurposes(Gaigg,n.d.).Incartographicstorytellingareferencemapisaddedtoanotherlayoutwhenadditionalspatialinformationwouldbenefittheunderstandingofthecartographicstory.Partial Map Layout: Thepartialmaplayout(Figure5)presentsthemapandadditionalinformationsidebyside.Itisusedwhenthemapandtheadditionalcontentareofequalimportance(Gaigg,n.d.).Thisallowstheviewertoeasilyjumpbetweentheinformationandthemap.Thesidebysidemaplayoutcanbeconsideredasasub-categoryofthepartialmaplayout.Inthesidebysidemaplayout,twoormoremapsarepresentedsidebyside.Themapsareof equal importance in the visualization and comparing the maps is the primarymotivationforthevisualization.
16
Figure5.Fourmaplayouts,fullmap,embeddedmap,referencemap,andpartialmap,describedbyMichaelGaigg.
IllustrationstakenfromthewebsiteMapUIPatterns(Gaigg,n.d.).
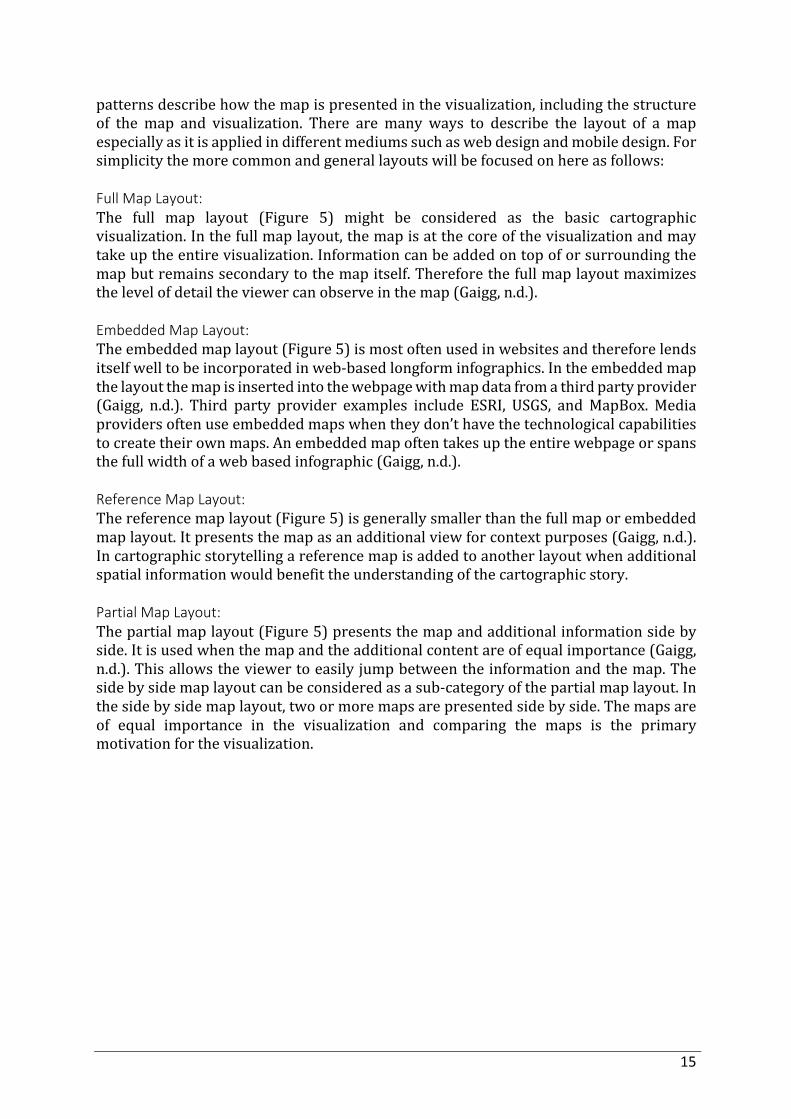
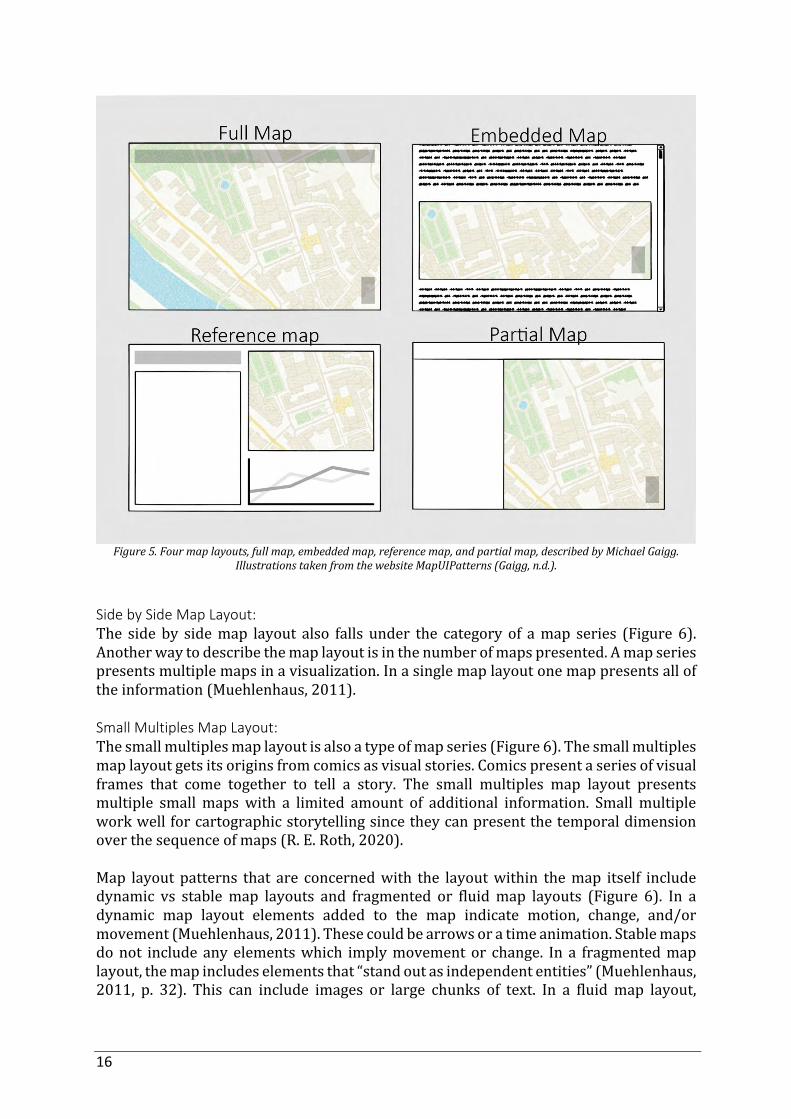
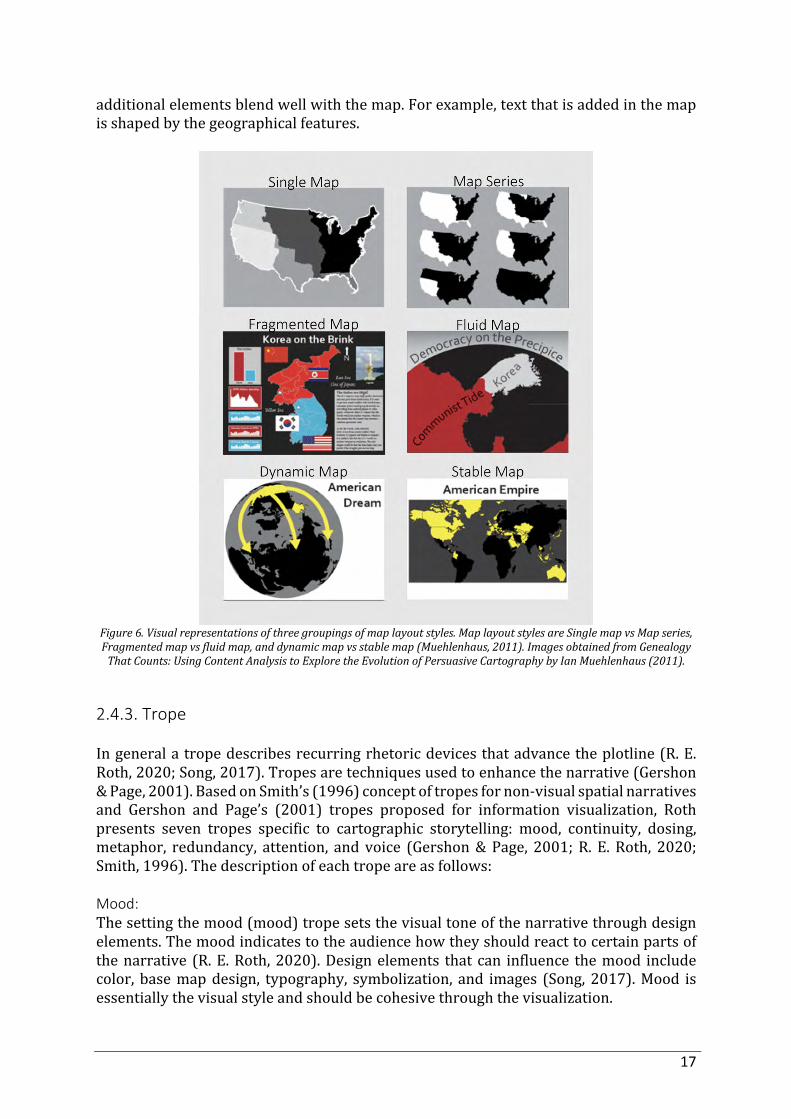
Side by Side Map Layout: The side by sidemap layout also falls under the category of amap series (Figure 6).Anotherwaytodescribethemaplayoutisinthenumberofmapspresented.Amapseriespresentsmultiplemapsinavisualization.Inasinglemaplayoutonemappresentsalloftheinformation(Muehlenhaus,2011).Small Multiples Map Layout: Thesmallmultiplesmaplayoutisalsoatypeofmapseries(Figure6).Thesmallmultiplesmaplayoutgetsitsoriginsfromcomicsasvisualstories.Comicspresentaseriesofvisualframes that come together to tell a story. The small multiples map layout presentsmultiple smallmapswith a limited amount of additional information. Smallmultipleworkwellforcartographicstorytellingsincetheycanpresentthetemporaldimensionoverthesequenceofmaps(R.E.Roth,2020).Map layout patterns that are concernedwith the layoutwithin themap itself includedynamic vs stablemap layouts and fragmented or fluidmap layouts (Figure 6). In adynamic map layout elements added to the map indicate motion, change, and/ormovement(Muehlenhaus,2011).Thesecouldbearrowsoratimeanimation.Stablemapsdonot include any elementswhich implymovementor change. In a fragmentedmaplayout,themapincludeselementsthat“standoutasindependententities”(Muehlenhaus,2011, p. 32). This can include images or large chunks of text. In a fluidmap layout,
17
additionalelementsblendwellwiththemap.Forexample,textthatisaddedinthemapisshapedbythegeographicalfeatures.
Figure6.Visualrepresentationsofthreegroupingsofmaplayoutstyles.MaplayoutstylesareSinglemapvsMapseries,Fragmentedmapvsfluidmap,anddynamicmapvsstablemap(Muehlenhaus,2011).ImagesobtainedfromGenealogyThatCounts:UsingContentAnalysistoExploretheEvolutionofPersuasiveCartographybyIanMuehlenhaus(2011).
2.4.3. Trope Ingeneralatropedescribesrecurringrhetoricdevicesthatadvancetheplotline(R.E.Roth,2020;Song,2017).Tropesaretechniquesusedtoenhancethenarrative(Gershon&Page,2001).BasedonSmith’s(1996)conceptoftropesfornon-visualspatialnarrativesand Gershon and Page’s (2001) tropes proposed for information visualization, Rothpresents seven tropes specific to cartographic storytelling: mood, continuity, dosing,metaphor, redundancy, attention, and voice (Gershon&Page, 2001;R. E.Roth, 2020;Smith,1996).Thedescriptionofeachtropeareasfollows:Mood: Thesettingthemood(mood)tropesetsthevisualtoneofthenarrativethroughdesignelements.Themoodindicatestotheaudiencehowtheyshouldreacttocertainpartsofthenarrative (R.E.Roth,2020).Designelements thatcan influence themood includecolor, basemapdesign, typography, symbolization, and images (Song,2017).Mood isessentiallythevisualstyleandshouldbecohesivethroughthevisualization.
18
Continuity: Enforcing linearity, or continuity, establishes a specific order for processing thevisualization.Thisdoesnotmeanthatthecartographicnarrativehastobelinearandcanalso be non-linear. Continuity brings the elements of the visual narrative into anorganized structure (R. E. Roth, 2020). Continuity can include the use of scrolling,swiping,arrows,titles,numberedsections,aselectionbar,andtimelinestostructurethecartographicstory.Dosing: Information dosing (dosing) involves grouping of information to reduce the overallcomplexityofthevisualization.Dosingdividesthevisualizationupintoindividualstoryframes sequenced together. Dosing also includes separating the visualization intosectionsanddeterminingthespeedatwhichananimatedvisualizationisviewed(R.E.Roth,2020).Metaphor: The visual simile, or metaphor, trope presents a visual analogy to facilitate a betterunderstandingofcomplexinformation.Amapsymbolthat’sdesignisassociatedwiththeconceptitisrepresentingonthemapisacommonmetaphorusedincartography(R.E.Roth, 2020). The metaphor trope often includes visual juxtaposition techniques tocompare related or unrelated concepts. Other techniques include benchmarking,cartooning,andhyperrealism(Song,2017).Redundancy: The effective redundancy (redundancy) trope introduces repetition of importantinformationtoenforcestorythemes.Repeatedelementsmayincludecolors,symbols,orgraphicsto“developvisualmotifs”throughoutthenarrative(Song,2017,p.14).AsRothdescribes,“redundancyteachestheaudienceasinglevisualsyntaxforacquiringcriticalinformationintheopeningsceneandthenconsistentlyappliesthissyntaxthroughoutthestory”(R.E.Roth,2020,p.20).Attention: Focus attention (attention) draws the viewers’ attention to key information in thevisualization(R.E.Roth,2020;Song,2017).Therearemanytechniquesforfocusingtheviewers’ attention. Roth outlines nine techniques: highlighting through outlines,highlighting though shading, leader lineswith label, arrowswith label, frame, opacitymask,numbering,zooming,andtextlabeling(R.E.Roth,2020).Voice: Voice,thefinaltropeoutlinedbyRoth(2020),allowsfortheaudiencetofeelincludedorreflected in the cartographic story (R.E.Roth, 2020).Thevoicepresented canbe thedesigners,characters,ortheaudiences(R.E.Roth,2020).Voicemakesthestorymorepersonable“allowingbothdesignersandtheaudiencetodrawfromtheirexperiences,opinions, and values when interpreting the story” (Song, 2017, p. 16). Personalcommentaryandquotationsareakeytechniqueusedtoincludevoiceinthecartographicstory(R.E.Roth,2020).

19
Cartographic storytelling guidelines, structures and elements can also be taken fromvisualstorytellingmethodsasdiscussedinsection2.2.VisualStorytellingcanalsoapplyto cartographic storytelling. For example, narrative design patterns, visual narrativetactics,messaging,andinteractivitycanallbeappliedtocartographicstorytellingaswell.Genre,map layout,and tropeare three importantdesignelements thatarespecific tocartographic storytelling, however additional elements that are not specific tocartographicstorytellingarealsoused.Theseincludeelementsusedinvisualstorytellingsuchasnarrativedesignpattern,visualnarrativeelements,andinteractivity.Design elements used in both visual and cartographic storytelling are important tounderstandwhenexaminingdesignelementsincartographicparallelnarrativestories.Inadditionitalsoimportanttounderstandelementsandstructuresspecifictoparallelnarratives.
20
3. Parallel Narratives
Inthischapterparallelnarrativeswillbepresentedanddefinedbycurrentpresentationformsinbothliteratureandfilm.Parallelnarrativesareanimportantnarrativestructureusedinbothliteratureandfilm.Somuchsothatresearchondifferentformsofparallelnarrativeshasbeendonewithbothmediums.Examininghowmedia,suchasliteratureandfilm,presentandstructuretheparallelnarrativeswillprovideinsightforapplyingparallelnarrativestocartographicstorytelling.3.1. Definition and Use Parallelnarratives,alsoreferredtoasmultiplenarrativesorduelnarratives,arepresentinmanynarrativemediasuchasbooks,TVshowsandmovies.Parallelnarrativespresentmultiple storylines, and followmultiple protagonists’ distinct stories. No character isfocusedonas theonlymain character, andno storyline isprivilegedover theothers.These stories are interwoven together with a common theme, event, or character(LearningCenter,n.d.).Thisstructureoftenhighlightsalargermacrostory/themethatconnectsallofthestorylines(Camboni,2012).Combiningmultiplestorylinesallowsforthepresentationofmultipleperspectivesandexperiences across generations or cultures (Wright, 2017). As stated by Roth in herthesis,LifeisMessy:Anexplorationofparallelnarratives,“parallelnarrativesarethemosteffectivestorytellingmodeinrealisticallydepictingthechaosandrandomnessoflife”(J.Roth, 2010, p. 15). Parallel narratives provide the readers or viewers with multipleperspectives,whichismorerealisticandrelatabletotheireverydaylives.Therelatabilityandcomplexityhasledtoanincreaseintheusageofparallelnarratives.In both books and film, parallel narratives have become increasingly popular. WhenexaminingtheincreaseduseofparallelnarrativesinYoungAdultnovels,Kossmakestheargument that textualand technological changes insocietyasawholearedriving theincreaseindemandforparallelnarrativesinmedia(Koss,2009).Kossarguesthatsocietyasawholeisbecomingmoreacceptingofdiversityanddifferingviewpoints.Technologyhasalsochangedanddevelopedrapidlyinrecentdecades.Mostofsocietyisaccustomedtousingmultipledigitalmediaplatformstogain informationandcommunicate(Koss,2009).Astechnologyandsocietyarechanging,becomingmorecomplexandacceptingofdifferences,sotooisthepresentationofinformationandtheformatofnarratives.The complexity in parallel narratives forces the reader to “sort through, analyze, andorganize” information while “occasionally juggling conflicting information fromunreliablenarrators”(Koss,2009,p.77).Whilethiscanbemorecomplicated,itisalsomorerewardingwhenpiecesofthenarrativepuzzleareputtogether.Voiceandstructurearethereforeimportantinassistingthereader/audiencetounderstandandseparatethevariousnarratives.Even though less conventional than the single protagonist, single storyline narrative,everycharacterisstillthe“maincharacter”or“hero”intheirownnarrative.Eachmain
21
characterorprotagonistneedstheirownstoryarccompletewithconflictandresolution(HowtoWriteaNovelwithMultiplePointsofView,n.d.).Structuringparallelnarrativesinordertopreventconfusionforthereader/audiencewhendistinguishingthenarrativesisimportant.Inbooks,chaptershelptobreakupthevariouspointsofviewpresented.Additionallyifeachchapteristitledasthecharacter,location,ortimeframeofaspecificnarrativethereaderisabletounderstandwhichnarrativeisabouttobepresented(HowtoWriteaNovelwithMultiplePointsofView,n.d.).Filmsoftenusethepresenceofcertaincharacterorlocationstoseparatenarratives.Visualelementssuchaslightingcanalsobeused.Categoriesofparallelnarrativesaredescribedinbothliteratureandfilm.Thecategorieseach define a generalized method for the presentation of parallel narratives. Thestructure as well as the interaction between the multiple narratives is important inseparatingthecategoriesofparallelnarratives.Parallelnarrativestoriesmaynotalwaysexplicitlyfallintoonecategory.Currentliteratureonparallelnarrativesinliteratureandfilmsdoesnotpresentaunifiedtaxonomy.Therethedifferentmodesofpresentingparallelnarrativesclassifiedinboth.Whilethevariouscategoriesinbothliteratureandfilmcouldbecomparedandgroupedintolargercategoriestorepresentparallelnarrativesingeneral,distinctionsbetweenthetwoclassificationsareimportant.Textandfilmmediausedifferentmethodstoillustratemultiplenarrativesandthiscancomeacross inthetaxonomyofparallelnarratives ineachclassification.3.2. Parallel Narratives in Literature Inastudydonetoexaminethe increase inmultiplenarratives inYoungAdultNovels,Koss,analyzeda listof205bookspublishedbetween1999and2007.Asaresult, fivedistinct categories emerged for novels written usingmultiple narrative perspectives.These categories were: One event - Multiple Perspectives, One story - MultiplePerspectives,Multiplestories-MultiplePerspectives-Intertwined,ThenandNow,andParallel Stories (Table 1) (Koss, 2009). The categories are classified by the link thatconnects thenarratives.The linksareevent,story, time,andartifact.Thestory link isbrokendownfurtherbythenumberofstoriestold.Dothenarrativesbuildoneachastimeprogressesordoeseachnarrativehavea sub-story that is somehow interwovenwiththeothersub-stories..Thesefivecategoriesaredetailedbelow:
22
Table 1. Parallel narratives categories in literature defined by Koss (2009). Table recreated based on table in Young Adult Novels with Multiple Narrative Perspectives: The Changing Nature of YA Literature by Melanie D. Koss (2009).
One Event - Multiple Perspective: Mostofthenovelsanalyzedfellundercategoriesthatincludedmultipleperspectives.IntheOneEvent–MultiplePerspectivescategory,novelsrevolvearoundoneevent,whichisthentoldfromdifferentcharacters’pointsofview(Koss,2009).OneexampleofOneEvent–MultiplePerspectives is fromthenovelRealTimebyPninaMoedKass. In thenovel,allofthenarrativesrevolvearoundatragiceventinIsrael.Thenarrativeseachtelladifferentperspectiveontheevent(Kass,2006).One Story – Multiple Perspectives: In the categoryOneStory–MultiplePerspectives, a story is told through thevariousnarratives and characters presented (Koss, 2009). Each character presents their ownperspective thatbuildsuponothers tocreatea storyline.OneexampleofOneStory–MultiplePerspectivesisthenovelNottheEndoftheWorldbyGeraldineMcCaughrean.Inthenovel,thestoryofNoah’sArcistoldfromvariouscharactersinvolved,includingsomeoftheanimalsandNoah’sdaughter,son’sandwife(McCaughrean,2004).Multiple Stories – Multiple Perspectives – Intertwined: InthecategoryMultipleStories–MultiplePerspectives–Intertwined,multiplestoriesaretoldfromtheperspectivesofthevariouscharacters.Thesestoriesandthenarrativesthat contribute to them are somehow intertwined together. One example ofMultipleStories–MultiplePerspectives–IntertwinedisthenovelSisterhoodoftheTravelingPantsbyAnnBrashares.Inthenovelfourbestfriendsnarratethejourney’stheyeachgoonduringtheirsummervacations.Thenarrativesareintertwinedthroughtheirfriendshipandapairofpantstheyshare(Brashares,2014).
Category DefinitionOne Event, MultiplePerspectives
Novels that tell a story that focuses on onemajor event, which is told from the point ofview of a number of different participantsinvolved with the event.
One Story, MultiplePerspectives
Novels that tell one story, but the tale is toldvia alternating narrators or perspectives.
Multiple Stories,Multiple Perspectives,Intertwined
Novels that tell multiple stories told bymultiple characters, whose lives becomesomehow intertwined.
Then and Now Novels in which the main character or anumber of characters tell their individualstories at different points in time through theuse of flashbacks and flash forwards.
Parallel Stories Novels in which two parallel stories aretold, each of which typically takes place in adifferent time period, often through the useof a journal or as an older character telling ayounger character stories of his or her youth.
23
Then and Now: TheremainingtwocategoriesthatdonotfallunderthegroupingofmultipleperspectivesareThenandNowandParallelStories.InThenandNownovels,onestorywithmultiplenarrativesistoldduringdifferenttimeperiods.Thisincludesthenarrativesofasinglecharacter as they present different perspectives at different times in their life. Oneexample of Then and Now narratives is the novel Turnabout by Margaret PetersonHaddix. In thenovel twoolderwomenparticipate in an experiment thatmakes themgraduallyreverse inageandgrowyoungerandyounger(Haddix,2012).Themultiplestoriesaretoldatdifferenttimesintheirlivesastheygrowyounger.Parallel Stories:InParallelStoriesnovels,morethanonestoryistold,oftenduringdifferenttimeperiods(Koss,2009).Thestoriesareoftenconnectedthoughanartifactlikeajournalorbook.OneexampleofParallelStoriesisthenovelEndymionSpringbyMatthewSkelton.Inthenovel,thebookEndymionSpringconnectstwonarratives.Thefirstispresentedfromthepointofviewofthechildrenwhofindthebookinalibraryinthe21stcenturyandthesecondiswrittenfromthepointofviewofthemanwhowrotethebookin1453(Skelton,2008).3.3. Parallel Narratives in Film Inthecomprehensiveguidetowritingfilms,The21stCenturyScreenplay,Aronson(2010)outlinessixmodesforpresentingparallelnarrativesinfilm.Thesemodesare:tandem,multiple protagonist, double journey, flashback, consecutive-stories and fracturedtandem (Figure 7). Aronson breaks these into two groups: ensemble films (linearnarratives) and non-linear films. Linearity refers to the temporal structure of thenarrative.Linearnarrativestellthestoryinchronologicalorder(LearningCenter,n.d.).Ensemble films are linear narratives and include tandem, multiple protagonist anddouble journey narratives (Aronson, 2010). Nonlinear/fractured narratives arepresentedoutofchronologicalorder.Thestoryjumpsaroundinthetimeline,oftenwithflashbacks.Nonlinearfilmsincludeflashback,consecutivestoriesandfracturedtandem.Thetwocategoriesalongwiththeirrespectivemodesaredetailedbelow:
24
Figure 7. Figure presents the breakdown of the categories of parallel narratives in film. Figure obtained from The21st
CenturyScreenplaybyLindaAronson(2010).
3.3.1 Ensemble films (linear narratives) Tandem narratives: Aronsonhascoinedthemotto“sametheme,differentadventures,”todescribetandemnarratives(Aronson,2010,p.173).Tandemnarrativesoftenincludeseveralstoriesofequal importancethatrunsimultaneouslythroughthe film.Thesestoriesoccur inthesametimeframeandgeographicalarea(Aronson,2010).Connectingthecharactersorstorylineswithinatandemnarrativeisveryimportant.Arguablythemostimportdeviceused to connect the storylines is the overlying theme. Often this theme or overlyingmessagecallsforchange,eitherwithinsocietyorthecharacters.Oneexampleoftandemnarrativeisthefilm:“Traffic,”(2001),whichweavestogetherthreeseparatestorylinesconnectedbythedrugtradeintheUnitedStates.Eachstorylineintroducesanothersideofthedrugtradeandhowiteffectsthelivesofthepeopleinvolved(Soderberghetal.,2001).Multiple protagonist narratives: Formultipleprotagonistnarratives, themottogivenbyAronson is “same team, sameadventure” (Aronson, 2010, p. 173). They focus on the interactions between thecharactersandstorylines.Thecharactersareoftenapartofateamorgroupthatgoesonsome type of journey or adventure. The narrative jumps between the differentcharacters/storylines showing each characters’ response to the same event and theinteractions between various characters. No one character can be the singlehero/protagonistbutratherthegroupshouldbelookedatasbeingdifferent“versionsof
25
thesameprotagonist”(Aronson,2010,p.174).Forexampleinthebookandsubsequentfilm,“TheJaneAustenBookClub,”(2007),agroupofsixcharacterschangeandreacttoeventsintheirlivesastheycometogethertoreadAusten’ssixmajornovels(Swicordetal.,2007).Notonecharacterstandsoutastheprotagonistandeachcharacterchangesinresponsetotheircommonexperienceinthebookclub.Double journey narratives: Thedoublejourneynarrativeisaversionofthemultipleprotagonistnarrative.Inthisversiontwospecificcharacters’journeysinteractastheyeithercometowardseachother,runinparallelwitheachother,orjourneyapart.Bothcharactersareprotagonistswiththeir own storyline and have their own sub-characters. Often these two charactersrepresent different sides of an issue or different responses to a social convention(Aronson,2010).Intheanimatedfilm“FindingNemo,”(2003),fatherandsonclownfishgoonseparatejourneystofindeachotheraftergettingseparated.Whileontheirjourneytofindeachotherphysically,theybothalsogoonanemotionaljourneytoreconnectasMarlin,thefather,learnstoacceptthathissonNemoisgettingolderandNemolearnstolistentohisfather’sconcerns(Stantonetal.,2003).3.3.2 Non-linear films Flashback narratives: Flashback narratives present viewers with a glimpse into the past. They allow theaudiencetogetabetterunderstandingofpasteventsinthestoryline.Theyalsobreakupthetraditionalsequenceofathreepartnarrativebytakingtheviewertoanothertimeorplaceinthepastinanefforttohelpthembetterunderstandthecurrentsituation.Therearevariousdifferenttypesofflashbacksusedinfilmandliterature–illustration/memoryflashbacks,regretflashbacks,bookendflashbacks,previewflashbacksandlife-changingincident flashbacks (Aronson, 2010). For example, in themovie “The Usual Suspects,”(1995),memory flashbacksareused toaddsuspenseasRogerKintexplains toAgentDaveKujantheseriesofeventsthatledhimandtheothersuspectstotheshipthathadsetfire(Singeretal.,1995).Consecutive-stories: Thenarrativesofconsecutivestoriespresenttwoormoreseparatestoriesoneaftertheother.Storylinesareconnectedinthenarrativethoughthecontentineachstoryandthestructureofthestories.Consecutivestoriescanbebrokendownintothreemaingroupsbasedonmessageandstructure,whichareasfollows:storieswalkingintothepicture,different perspectives of the same event and different consequences triggered by thesameevent.Forexample, inthefilm“LolaRennt”(1998)timerestartstwicetorevealdifferentscenariostriggeredbythesameevent.ThemaincharacterLolarelivesthe20minutesshehastofindanddeliver100,000DeutscheMark’stoherboyfriendbeforehegets killed for themoney (Tykwer et al., 1999). The three storylines share the samecontentbutrevealdifferentconsequence’sbasedonLola’sactions.Fractured tandem: Thefracturedtandemnarrativeisanon-lineartandemnarrative.Inthesenarrativesthemultiplestorylinesstillhaveequalimportancebutaretoldnon-linearly.AsdescribedbyAronson,thestorylinesareeither,“fromdifferenttimeframes”orallofthestorylinesarenottoldinchronologicalorder(Aronson,2010,p.376).Thefilm“TheHours”(2002)is

26
oneexampleofafracturedtandemnarrative.Thefilmexaminesadaythelivesofthreewomenfromdifferentgenerationswhoareallconnectedbythenovel“Mrs.Dalloway”(Daldry et al., 2003). The film switches between the three storylines,which are fromdifferent time framesbuteach isequally importantandbound togetherresulting inafracturedtandemnarrative.Parallelnarrativemodesinbothliteratureandfilmbothhighlighttheimportanceofthenarrativesconnectboththroughtheoverallthemeandhowthenarrativesarephysicallyorvisuallyconnectedorinterwoventogetherinthestory.Thetechniquesusedtotellastory inboth literatureandfilmarebothverydifferent fromcartographicstorytellinghowever, just as the three-act narrative structure is still applied when developingcartographicstories,sotocanparallelnarrativestructures.
27
4. Parallel Narratives in Cartographic Storytelling
This chapter will describe the methodology used to develop a typology for thepresentation of parallel narratives in cartographic storytelling and the resultingcategorization.Aqualitativecontentanalysisofexistingexamplesofparallelnarrativesincartographicstorieswillbeconductedbasedondesignelementspresentedinvisualnarratives, cartographic stories, andparallelnarratives.Aqualitative content analysiswill allow for a better understanding on how parallel narratives are presented incartographicstories.Basedontheexistingexamplesandthequalitativecontentanalysis,cardsortingwill takeplaceinordertofindgroupingsofcartographicstoriesthatwilllead to the development of a typology for the presentation of parallel narratives incartographic storytelling.Results of thequalitative content analysiswill bepresentedalongwiththeresultingtypologyofparallelnarrativesincartographicstorytelling.4.1 Quantitative Content AnalysisContentanalysisdescribesarangeofanalyticalapproachesfrominterpretiveanalysestotextualanalyses(Hsieh&Shannon,2005).Contentanalysisisusedtoquantifyqualitativedatabycodingdataintospecificcategoriesandthenanalyzingtheresultsusingstatistics(Hsieh & Shannon, 2005). There are three main approaches to qualitative contentanalysis: conventional, directed, and summative content analysis (Hsieh & Shannon,2005).Withconventionalcontentanalysisqualitativecategoriesaredeterminedduringthe process of coding based on the data. With directed content analysis qualitativecategoriesaredeterminedbeforecodingbasedonpriorresearchandexistingtheories(Hsieh&Shannon,2005).Withsummativecontentanalysiskeywordsorcontentfromprevious literature are used as categories for coding. The aim of summative contentanalysis is to explore and interpret the usage of the keywords or content (Hsieh &Shannon,2005).Forthisstudy,examplesofcartographicstorieswithparallelnarrativeswerecollectedasthedatatoanalyze.Acombinationofconventional,directed,andsummativecontentanalysis was then used to examine the examples of parallel narratives found incartographicstories.Initially,variablestocodebyweretakenfromexistingresearchandtheory.Uponexaminingseveralparallelnarrativecartographicstories,additionalcodeswereincludedtobetteraddressandunderstandthepresentationofparallelnarrativesin the cartographic stories. Once coding was complete, results were interpreted toprovide a better understanding onwhat role the codes played in the presentation ofparallelnarrativeswithinthecartographicstories.Thencardsortingprovidedaplatformforcategorizingtypesofcartographicparallelnarrativesandledtothecreationofthetaxonomyofparallelnarrativesincartographicstorytelling.4.1.1 Existing Examples Researchintothedistinctiononwhatitmeanstohaveparallelnarrativesincartographicstoriesisnotyetpresent.Certainquestionsarisewhentryingtodeterminewhatitlooks
28
liketohaveparallelnarrativesincartographicstories.Doesthereneedtobeonemapwithparallelnarrativesormultiplemapseachdisplayingadifferentnarrative?Doesanymapthatdisplaystwovariablescountasanexampleofaparallelnarrative?Forexample,doesamapoftheUnitedStates’presidentialelectionresultsbystate,withbluedenotingdemocratandreddenotingrepublicancountasaparallelnarrative?Topresentadefinitionforparallelnarrativesincartographicstoriesthatcanbeappliedwhenexaminingmaps,thedefinitionofbothparallelnarrativesinliteratureandfilm,andthedefinitionofcartographicstorieswillbeexaminedandcombined.Parallelnarrativesarestoriesthatinterweavetwoormorenarratives,whichareconnectedbyacommontheme.Eachnarrative is equal in importance andhas its own story arc. Cartographicstories presentmapswith additional text andmedia that both enhances the viewer’sunderstanding of the story and provides a specific interpretation of the data beingvisualized.Therefore,parallelnarrativesincartographicstorytellingcanbedefinedasamaporcombinationofmapsthatwithadditionaltextandmediapresenttwoormorenarrativesinterwovenbyacommontheme.Inconclusiontherecanbeoneormorethanonemapusedtopresentparallelnarrativesincartographicstories.However,notjustanymap displaying multiple variables can count as a parallel narrative in cartographicstorytellingsinceadditionaltextormediaisneededforittobeacartographicstory.Whileparallelnarrativesincartographicstorytellinghavenotpreviouslybeendefined,manycartographicstories,publishedbynewsorganizations,cartographers,andotherscientific researchers, present parallel narratives. Through researching various newsplatforms,visualnarrativepublishingsites,creativenetworkingsites,andcartographicvisualization platforms, 64 cartographic stories were collected. Upon furtherexamination11were removedbecause they either did not present twonarratives orcouldnotbeclassifiedascartographicstory.Thisleft53examplesofcartographicstoriesthat visualized parallel narratives (Appendix I – Complete coding table of existing examples).Theexamplesofparallelnarrativecartographicstorieshaveawiderangeoftopics,fromclimatechangeandanimalmigrationstohistoryandhumandevelopment.Eachstoryisdesigned in its own way with different visualization techniques, narrative structuretacticsandmaplayout.Whileeachcartographicparallelnarrativeisdifferenttherearesimilaritiesinstructureanddesignthatcanbefound.Both cartographic stories andparallel narrativeshavedistinct taxonomies that groupcartographicstoriesandparallelnarrativesbysimilardesignelementsandstructures.Since the presentation of parallel narratives in cartographic stories has not beenthoroughly researched, no such taxonomies exist to group cartographic parallelnarratives.Whileanattemptcouldbemadetofitcartographicparallelnarratives intoeitherthecategoriesofcartographicstorytellingorthecategoriesofparallelnarratives,neitherwouldproperlydescribetherelationshipbetweenthecartographicstoryandtheparallelnarrativesitpresents.Themaingoalofthisquantitativecontentanalysisistocreateataxonomyforcartographicparallelnarratives.
29
4.1.2 Codes Codinghelpstoexaminetrendsincartographicstoriesthatcontainparallelnarratives.Codingisatwo-stepprocesswhichinvolves(1)definingvariablesofinterest(thecodes)and (2) labeling these variables when they are present in the examined map(Muehlenhaus, 2011). This section will outline and define the codes used in thisqualitativecontentanalysis.The variables of interest selected to code were identified from current literature oncartographicstorytellingtechniques,andthepresentationofparallelnarrativesintextand film. A list of 56 variable codeswere compiled and explicitly defined. The list ofvariable codeswas refinedas themapswerecoded.Variableswereaddedwhennewtechniquesthatplayedaroleinvisualizingparallelnarrativesincartographicstorytellingwerenoted. In additionvariable codes thatwerenotpresent in any codedmapwereremoved.Thefinallistof51variablecodeswassubdividedintosevenbroadercategories:genre,map layout, interactivity, trope, narrative pattern, visual narrative tactics, andparallelnarrativetacticsasdescribedinchapter2,sections2.2and2.4(AppendixII).Genre: Genre explicitly comprises of the taxonomy of visual storytelling genres proposed byRoth (Figure4) (R.E.Roth,2020).Rothdefines thevisual storytellinggenresby “thevisualorinteractivetechniqueusedtoenforcelinearityinthenarrative”(R.E.Roth,2020,pg.25).Thishelpstodefinewhatelementsofthevisualizationmovethenarrativealong.Genre categorization for codingwas broken down into static visual stories, longforminfographic, dynamic slideshow, narrated animation, multimedia visual experience,personalizedstorymap,andcompilation. Map Layout: MapLayoutdescribeshowthemap(s)ispresentedinthevisualizationandthelayoutofelements in themap. Map layout categories were derived fromMichael Gaigg’s MapLayout Patterns (Figure 5) and Ian Muehlenhaus’ Layout/Rhetoric codes (Figure 6)(Gaigg, n.d.; Muehlenhaus, 2011). Map layout categorization was broken down intoembeddedmap,referencemap,sidebyside,fullmap,partitionedmap,smallmultiples,singlemapvsmapseries,fragmentedvsfluidlayout,anddynamicvs.stable.Interactivity Format: Interactivity Format refers to the three common schemas for interactivity in visualnarrativesproposedbySegelandHeer(2010).Allthreeinteractivityschemascombineauthor-driven and reader-driven approaches. Interactivity format classification wasbroken down into categorizing the cartographic story as interactive or not, and if socategorizingthetypeofinteractivestructureaseithermartiniglassstructure,interactiveslideshow,and/ordrilldownstory.Trope: Trope is defined by Roth (2020) as visual storytelling techniques that enhance thenarrative and advance theplotline. Song (2017) andRoth (2020)bothdetail a list ofseventropesusedincartographicstorytellingthatwillbeusedhereascodes.Thecodes
30
used under the category trope include setting the mood (mood), enforcing linearity(continuity),informationdosing(dosing),visualsimile(metaphor),effectiveredundancy(redundancy),voice,andfocusattention(attention).Narrative Patterns: NarrativePatternsaretechniquesusedtoeffectflowandargumentationindata-drivenvisualnarratives (NAPACards,2016).Narrativepatternshelpsupportargumentation,flow, framing,emotion,andengagement in thevisualization(Bachetal.,2018).Codescategorized under the narrative pattern’s classification were broken down intoincorporatingtheaudience,repetition, juxtaposition,humanbehindthedot,rhetoricalquestion, familiar setting, call to action, gradual visual reveal, defamiliarization, andconcretize.Visual Narrative Tactics: VisualNarrativeTacticsaredevicesusedtoenhanceandassistthestory(Segel&Heer,2010).Forthisstudy,codingvisualnarrativetacticsarecomprisedofseveraltechniquesdiscussed by Segel and Heer (2010) as both visual narrative and narrative structuretactics.Here they are subdivided into three categories: highlighting, interactivity, andmessaging.Highlightingreferstovisualdevicesusedtoenhanceanddrawthereader’sattentiontocertainaspectsofthevisualnarrative.Highlightingcodesincludecloseups,featuredistinction,audio,timeanimation,andzooming.Interactivityreferstothedevicesincluded in thevisualization thatallowspecificuser interaction (Segel&Heer,2010).Interactivitycodesaredividedintolayerlist,visitedmarker,markerlist,infopanel,andinfo pop up. Messaging refers to the format in which text media is added to thevisualization inorder toenhanceand/orstructure thenarrative.Messagingcodesaredividedinto:annotation,infotext,captions,andsummary.Inaddition,imageandvideocodeswereaddedtovisualnarrativetactics.Parallel Narrative Tactics: Thereisnoresearchavailableonthepresentationofparallelnarrativesineithervisualorcartographicstorytelling.Therefore,codesusedtoanalyzeparallelnarrativetacticsincartographic storieswere derived from elements of parallel narratives that had beendefined within literature and film. Codes for parallel narrative tactics include colorseparating narratives, number of narratives, link, contrasting or complementarynarratives,andsequence.Colorseparatingnarrativesdistinguishesifcolorplaysaroleinseparatingthenarratives.Asdiscussedwithparallelnarrativesinliteratureandfilm,structuringparallelnarrativesinordertopreventconfusionforthereader/audiencewhendistinguishingthenarrativesis important. It was noted that color often plays a role in distinguishing stories incartographicstories.Thedistinction in thenumber of stories canbemadebetween two stories andmanystoriesinresearchdoneonparallelstoriesinliteratureandfilm.Themorenarrativesinastorythelessinformationanauthorcanprovideforeach.Therefore,itisimportanttodeterminehowthenumberofnarrativesplaysaroleincreatingacartographicstory.Linkdenotestheelementofastorythatconnectsthevariousnarratives.Whatmakesacombination of multiple narratives one story vs multiple stories is the connection
31
betweenthenarrativesthatillustratealargertheme.Narrativesshareacommonthemebutareoftenconnectedfurtherbyacommoncharacter,event,location,orsubject–thisisthelink.Contrastingorcomplementarynarrativesdenoteswhetherthenarrativesworktogetherand build upon each other to present a story or whether they provide different anddistinct information that is connected by a larger theme. Narratives that arecomplementary add information to the story that builds upon previous narratives.Contrastingnarrativescouldbeviewedseparatelybutthecombinationofthenarrativesiswhattellsthefullstoryandpresentationofalargertheme.Sequencereferstotheorderingofthenarrativesinthestory.Incartographicstoriestheorderingofnarrativesisnotalwaysasclearasinliteratureorfilmsincebothnarrativescanbepresentedatthesametimeinthevisualframe.Linearnarrativespresenttheorderofeventsinachronologicalorder.Therefore,inacartographicstorythenarrativesarechronologicallyordered,anddesignelementsindicatetotheviewerwheretobeginthevisualization. Non-linear narratives present events out of chronological order. Forexample,incartographicstoriestheeventsofeachnarrativemapmayoccuratthesametime,buteachmapisviewedoneaftertheother.Simultaneousnarrativespresenteventsthatoccuratthesametime.Oneexampleincartographicstoriesiswhentheeventsofthenarrativestakeplaceatthesametimeandarealsopresentedtothevieweratthesametimewithnodistinctionofwhichnarrativeshouldbereadfirst.4.1.3 Coding AnalysisAs part of the analysis, eachmapwas investigated in the samemanner for all of thevariablecodes.Whenacodewasaddedoradjustedallmapswerereevaluated.Codingproduced four different types of data measurements, depending on the code. (1)Measurementsweregivenbyan“X”ifthecartographicstorypresentedacode.Nothingwas added if the cartographic story did not present a code. (2) Binary or trinarymeasurements(e.g.singlemapormapseries)weretakentodistinguishbetweentwoorthree opposing concepts. (3)Measurementswere descriptive.When an ‘X’was givendenotingthatacartographicstorypresentedacode,additionalinformationwasincludedto distinguish certain characteristics of the code in the cartographic story. (4)Measurementswerequantitativeandproducedanumber(AppendixII).Twocodingsessionstookplaceinordertomakesurethateverycartographicstorywascodedintheexactsamemanner.Uponexaminationofthe56codesandcodingresults,five codes were removed because they either were not represented in any map oroverlappedwithothercodes.Thecodesremovedwere:genre–personalizedstorymap,genre – compilation, trope – voice, trope – effective redundancy, and visual narrativetactics–featuredistinction.Thisresultedin51finalcodes.Thecodinganalysisresultsforeachofthesevencategoriesareasfollows:Genre: In coding each cartographic story for genre, it was found that the category was notexclusive.Somecartographicstoriespresentedmorethanonegenre.MeasurementsforeachgenreweregivenwithanXifthecartographicstorypresentedthatgenre.
32
Map Layout: Incodingforeachcartographicstoryformaplayoutitwasfoundthatthecategorywasnot exclusive. Depending on the number of maps presented, the format of thecartographicstoryandtheplatformused,differentcombinationsofmap layoutswerepresented.Thefirstsixmaplayoutcodes:embeddedmap,referencemap,sidebyside,fullmap,partialmap,andsmallmultiplesweremeasuredbyanXifthecartographicstoryincludedthatmaplayout.Theremainingthreemaplayouts:singlemapvsmapseries,fragmented layoutvs fluid layout,anddynamicvsstablewereallmeasuredbybinarymeasurements.Eachmapeitherpresentedoneortheother.Interactivity Format: In coding each cartographic story for interactivity format, the first code labeled asInteractivity,wasmeasuredwith anX if the cartographic storywas interactive. If thecartographic story was interactive then it was investigated to see if the interactivityformatwasamartiniglassstructure,aninteractiveslideshow,oradrilldownstory.Eachinteractivecartographicstorywasclassifiedasatleastoneoftheformats.Trope: Incodingeachcartographicstory the tropecategorywasnotexclusive.Severalof thecartographicparallelnarratives’storiespresentedfiveofthesixtropes.Thefourtropecodes:settingthemood,enforcinglinearity,informationdosing,andfocusattentionwerefoundtobethemostprevalenttropes.Incodingforthesefourtropesitwasnotedthatadistinction could bemade in the way that each cartographic parallel narrative storypresentedthetrope.Codingforthesettingthemoodcodepresentedfourmethodsthatwere frequently used: images, color, basemap, and font. In coding for the enforcinglinearitycode,sevenmethodswerefrequentlyusedtoenforcelinearity.Thesemethodsweretheuseofatimeline,titles,scrolling,selectionbar,numbers,animations,andpages.Each of these methods helped to distinguish between narratives. Coding for theinformationdosingcodepresentedthreemethodsthatwere frequentlyused:selectedstories, infographics, and images. Selected stories are a general termused to indicatewhenadditionaltextwasincludedonaspecificpieceofthenarrative.Thedescriptionsof infographics or images was noted when the cartographic parallel narrative storyincludedinfographicsorimagesthatprovidedadditionalinformationtothenarratives.Codingforthefocusattentioncodepresentedfourmethodsthatwerefrequentlyused:color, symbols, text, and infographics. All of these methods were included in themeasurementof thespecific tropeasdescriptivemeasurements.Theremainingtrope,visualsimilewasmeasuredwithanXifpresentedinthecartographicparallelnarrativestory.Narrative Pattern: Incodingeachcartographicstory,thenarrativepatterncategorywasnotexclusive.Manyofthecartographicstoriespresentedtwoormorenarrativepatterns.Measurementsforeach narrative patternwere givenwith an X if the cartographic story presented thatnarrativepattern.Visual Narrative Tactics: Incodingeachcartographicstory,thevisualnarrativetacticcategorywasnotexclusive.Many of the cartographic stories presented two or more visual narrative tactics.
33
MeasurementsforeachvisualnarrativetacticweregivenwithanXifthecartographicstorypresentedthatvisualnarrativetactic.Parallel Narrative Tactics: Thecodesforparallelnarrativetacticsweremeasuredinseveraldifferentways.Thefirstcode,colorseparatingnarratives,wasmeasuredwithanXifcolorwasusedtoseparatethe narratives. The second code, number of narratives, wasmeasured quantitatively.Eachcartographicstorywasgivenanumberbasedonthenumberofparallelnarrativesitpresented.Thethirdcode,link,wasmeasuredbyfourdescriptivemethods.Whilealloftheparallelnarrativesineachstorysharedacommontheme,additionalmethodswereusedtofurtherlinkthenarratives.Thesemethodsusedcharacters,event,location,andsubject.The fifthcode,contrastingorcomplimentary,wasmeasuredbinarilywith theparallelnarrativeseitherbeingcontrastingorcomplimentary.Thefinalcode,sequence,wasmeasuredwiththreedescriptivemethods:linear,non-linear,andsimultaneous.Eachcartographicparallelnarrativestorywasexclusivelyonetypeofsequence.Onceeverymapwascodedforandreviewedasecondtimecardsortingofeachmaptookplaceinordertoconceptualizethetypologyofparallelnarrativesincartographicstories.4.2.3 Card Sorting Card sorting is a qualitative research method often utilized in user experience (UX)design.UXdesignreferstotheimplementationofdesignelementsthatsupportusabilityinproducts. Incardsorting,researchparticipantssortspecifictopicswrittenoncardsintogroupingsthattheyfeelmakesensetothem.Thistypeofresearchhelpstocreateabetter user interface thatmatches the users understanding of the information (Groß,2016;Sherwin,2018).There are various types of card sorting: open vs. closed card sorting, moderated vs.unmoderated card sorting, and paper vs. digital card sorting. In open card sortingcategories are not predefined, while in closed card sorting category names arepredeterminedbytheresearcher.Moderatedcardsortinginvolvesinteractionsbetweentheparticipantsandthefacilitatororresearcher.Thefacilitatorcangainvaluableinsightintotheparticipants’decisionsbyaskingthemspecificquestionsoraskingthemtothinkaloud.Unmoderatedcardsortingontheotherhand,involvesnointeractionbetweenthefacilitatorandtheparticipant.Inpapercardsortingthetopicsarewrittenorillustratedonphysicalcards.Thisallowstheparticipant to interactdirectlywith thematerial. Indigital card sorting, a software or web based tool is used to create online cards forparticipantstosort(Sherwin,2018).For the purpose of this study open, partially moderated, paper card sorting wasperformed.Afterdrawingouteachcartographicnarrativedesignontopiecesofpaperapartially moderated sorting session took place with no predefined categories. Afacilitator, whose background includes research done with card sorting but wasunfamiliarwiththepreviouslyresearchedmaps,assistedinaskingquestionsaboutthemapvariablesandstructures indicatedonthecards.This leadtogroupingsofcertaincartographicstoriestogether.

34
Cartographicstoriesweregroupedtogetherbasedonhowthenarrativeswithinthestorywerepresentedandhowtheyinteracted.Cartographicstoriesarecategories,intogenres,bythewayitenforcesthedirectionofthenarrativetotheviewer.Parallelnarrativesinliteratureandfilmarecategorizedbytheelementsthatconnectthenarrativesandhowtheyarepositionedtogetherinthestory.Bothofthesecategorizationsweretakenintoconsiderationwhencategorizingparallelnarrativesincartographicstories.Basedonthegroupingsofcardsasecondcardsortingtookplacetorefinethecategoriesbasedonspecificdefinitions(Figure8).Thesegroupingsbecamethefoundationforthecreationofthetaxonomyofparallelnarrativesincartographicstorytelling.
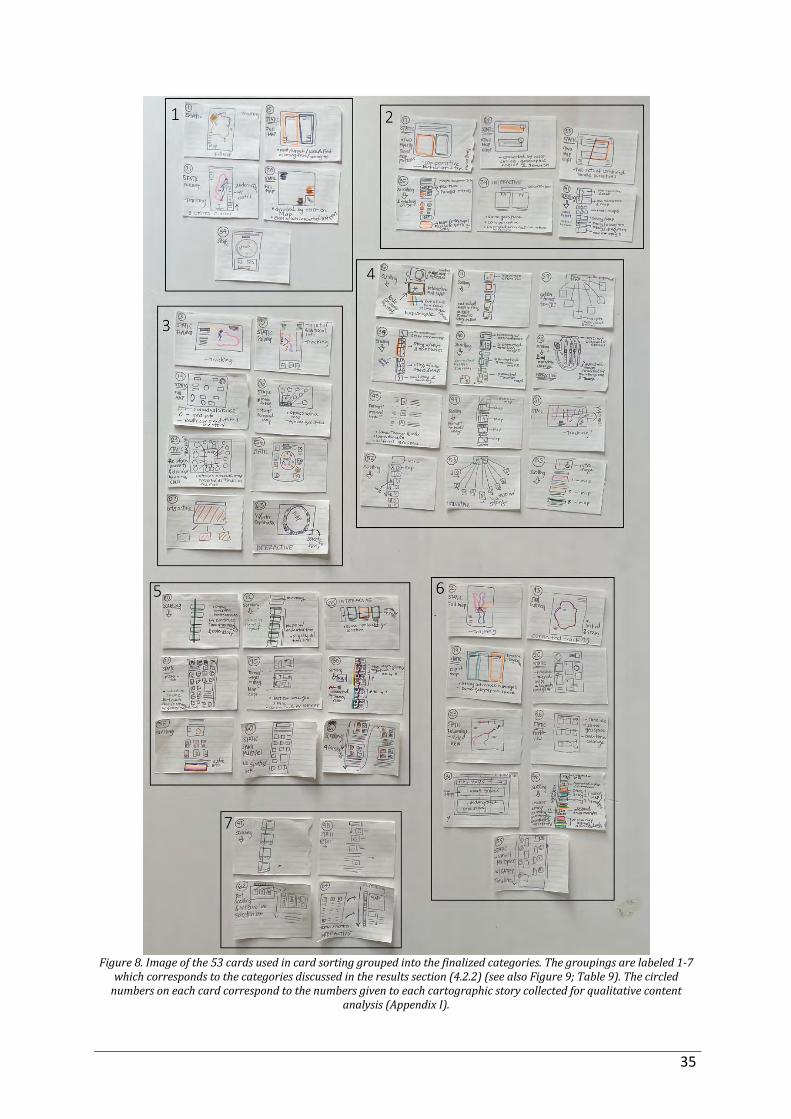
35
Figure8.Imageofthe53cardsusedincardsortinggroupedintothefinalizedcategories.Thegroupingsarelabeled1-7whichcorrespondstothecategoriesdiscussedintheresultssection(4.2.2)(seealsoFigure9;Table9).Thecirclednumbersoneachcardcorrespondtothenumbersgiventoeachcartographicstorycollectedforqualitativecontent
analysis(AppendixI).
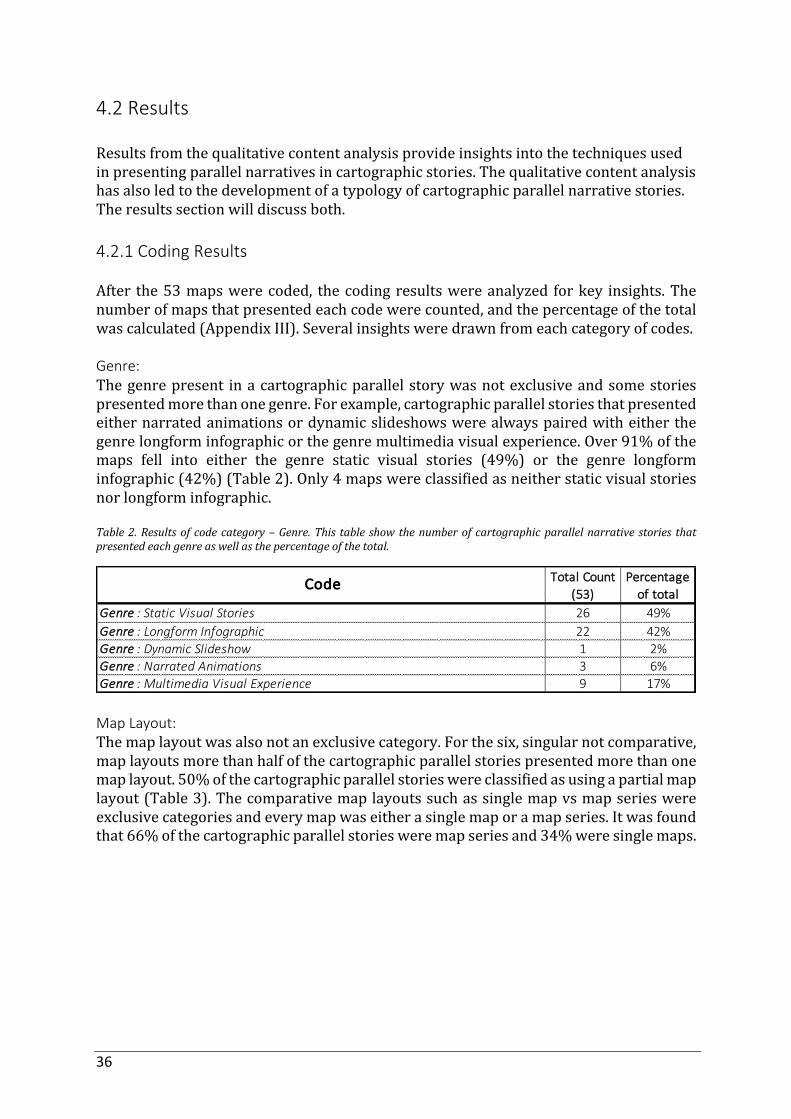
36
4.2 Results Resultsfromthequalitativecontentanalysisprovideinsightsintothetechniquesusedinpresentingparallelnarrativesincartographicstories.Thequalitativecontentanalysishasalsoledtothedevelopmentofatypologyofcartographicparallelnarrativestories.Theresultssectionwilldiscussboth.4.2.1 Coding Results After the53mapswerecoded, thecodingresultswereanalyzed forkey insights.Thenumberofmapsthatpresentedeachcodewerecounted,andthepercentageofthetotalwascalculated(AppendixIII).Severalinsightsweredrawnfromeachcategoryofcodes.
Genre: Thegenrepresent inacartographicparallelstorywasnotexclusiveandsomestoriespresentedmorethanonegenre.Forexample,cartographicparallelstoriesthatpresentedeithernarratedanimationsordynamicslideshowswerealwayspairedwitheitherthegenrelongforminfographicorthegenremultimediavisualexperience.Over91%ofthemaps fell into either the genre static visual stories (49%) or the genre longforminfographic(42%)(Table2).Only4mapswereclassifiedasneitherstaticvisualstoriesnorlongforminfographic.Table2.Resultsof codecategory–Genre.This table showthenumberof cartographicparallelnarrative stories thatpresentedeachgenreaswellasthepercentageofthetotal.
Map Layout: Themaplayoutwasalsonotanexclusivecategory.Forthesix,singularnotcomparative,maplayoutsmorethanhalfofthecartographicparallelstoriespresentedmorethanonemaplayout.50%ofthecartographicparallelstorieswereclassifiedasusingapartialmaplayout(Table3).Thecomparativemaplayoutssuchassinglemapvsmapserieswereexclusivecategoriesandeverymapwaseitherasinglemaporamapseries.Itwasfoundthat66%ofthecartographicparallelstoriesweremapseriesand34%weresinglemaps.
Total Count (53)
Percentage of total
26 49%22 42%1 2%3 6%9 17%
Genre : Static Visual StoriesGenre : Longform InfographicGenre : Dynamic SlideshowGenre : Narrated AnimationsGenre : Multimedia Visual Experience
Code
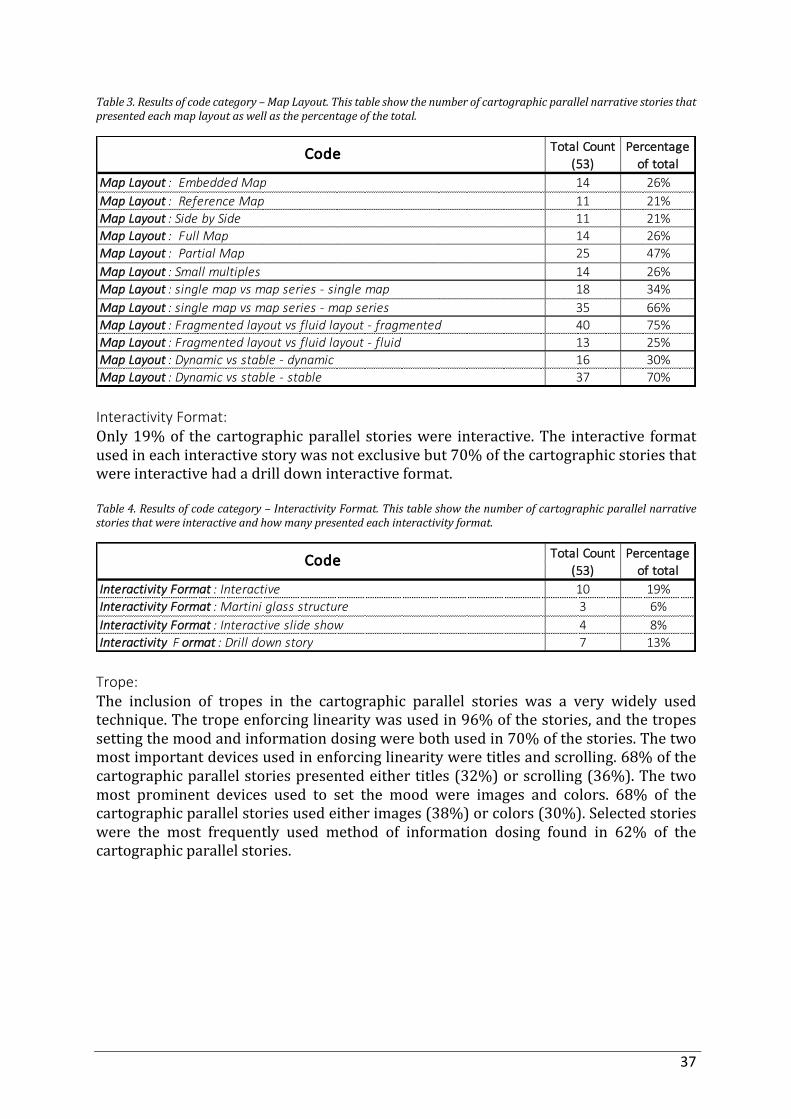
37
Table3.Resultsofcodecategory–MapLayout.Thistableshowthenumberofcartographicparallelnarrativestoriesthatpresentedeachmaplayoutaswellasthepercentageofthetotal.
Interactivity Format: Only19%of thecartographicparallel storieswere interactive.The interactive formatusedineachinteractivestorywasnotexclusivebut70%ofthecartographicstoriesthatwereinteractivehadadrilldowninteractiveformat.Table4.Resultsofcodecategory–InteractivityFormat.Thistableshowthenumberofcartographicparallelnarrativestoriesthatwereinteractiveandhowmanypresentedeachinteractivityformat.
Trope: The inclusion of tropes in the cartographic parallel stories was a very widely usedtechnique.Thetropeenforcinglinearitywasusedin96%ofthestories,andthetropessettingthemoodandinformationdosingwerebothusedin70%ofthestories.Thetwomostimportantdevicesusedinenforcinglinearityweretitlesandscrolling.68%ofthecartographicparallelstoriespresentedeithertitles(32%)orscrolling(36%).Thetwomost prominent devices used to set the mood were images and colors. 68% of thecartographicparallelstoriesusedeitherimages(38%)orcolors(30%).Selectedstorieswere the most frequently used method of information dosing found in 62% of thecartographicparallelstories.
Total Count (53)
Percentage of total
14 26%11 21%11 21%14 26%25 47%14 26%18 34%35 66%40 75%13 25%16 30%37 70%
Map Layout : Dynamic vs stable - dynamicMap Layout : Dynamic vs stable - stable
Map Layout : Small multiplesMap Layout : single map vs map series - single mapMap Layout : single map vs map series - map seriesMap Layout : Fragmented layout vs fluid layout - fragmentedMap Layout : Fragmented layout vs fluid layout - fluid
Map Layout : Embedded MapMap Layout : Reference MapMap Layout : Side by SideMap Layout : Full MapMap Layout : Partial Map
Code
Total Count (53)
Percentage of total
10 19%3 6%4 8%7 13%Interactivity F ormat : Drill down story
Code
Interactivity Format : InteractiveInteractivity Format : Martini glass structureInteractivity Format : Interactive slide show
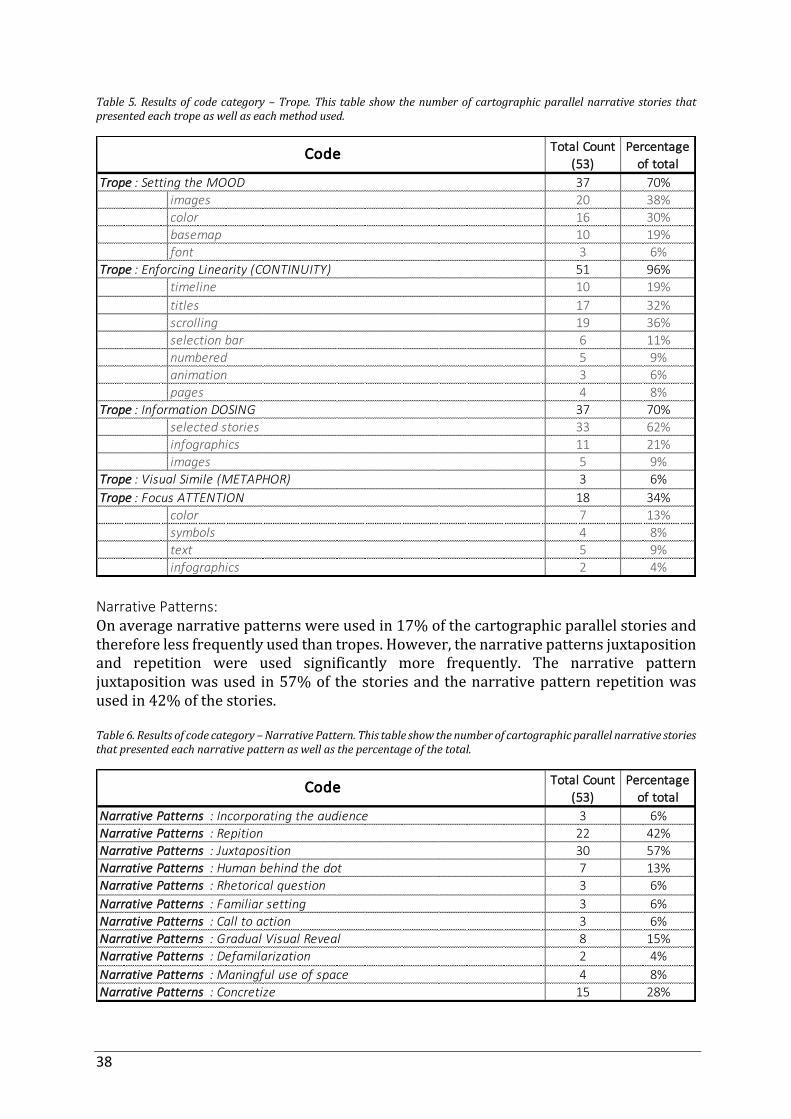
38
Table5.Resultsof codecategory–Trope.This table showthenumberof cartographicparallelnarrative stories thatpresentedeachtropeaswellaseachmethodused.
Narrative Patterns: Onaveragenarrativepatternswereusedin17%ofthecartographicparallelstoriesandthereforelessfrequentlyusedthantropes.However,thenarrativepatternsjuxtapositionand repetition were used significantly more frequently. The narrative patternjuxtapositionwasused in57%of thestoriesandthenarrativepatternrepetitionwasusedin42%ofthestories.Table6.Resultsofcodecategory–NarrativePattern.Thistableshowthenumberofcartographicparallelnarrativestoriesthatpresentedeachnarrativepatternaswellasthepercentageofthetotal.
Total Count (53)
Percentage of total
37 70%images 20 38%color 16 30%basemap 10 19%font 3 6%
51 96%timeline 10 19%titles 17 32%scrolling 19 36%selection bar 6 11%numbered 5 9%animation 3 6%pages 4 8%
37 70%selected stories 33 62%infographics 11 21%images 5 9%
3 6%18 34%
color 7 13%symbols 4 8%text 5 9%infographics 2 4%
Trope : Visual Simile (METAPHOR)Trope : Focus ATTENTION
Code
Trope : Setting the MOOD
Trope : Enforcing Linearity (CONTINUITY)
Trope : Information DOSING
Total Count (53)
Percentage of total
3 6%22 42%30 57%7 13%3 6%3 6%3 6%8 15%2 4%4 8%15 28%
Narrative Patterns : Gradual Visual Reveal Narrative Patterns : DefamilarizationNarrative Patterns : Maningful use of spaceNarrative Patterns : Concretize
Code
Narrative Patterns : JuxtapositionNarrative Patterns : Human behind the dotNarrative Patterns : Rhetorical questionNarrative Patterns : Familiar settingNarrative Patterns : Call to action
Narrative Patterns : Incorporating the audienceNarrative Patterns : Repition
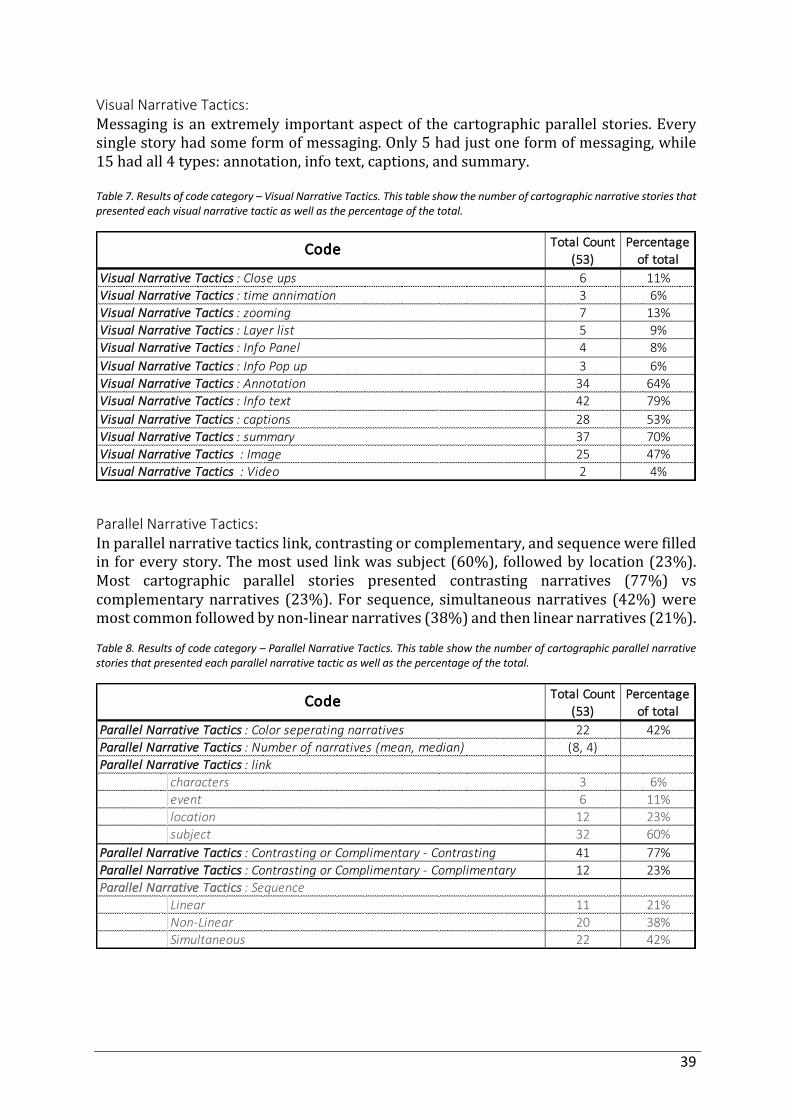
39
Visual Narrative Tactics: Messaging isanextremely importantaspectof thecartographicparallelstories.Everysinglestoryhadsomeformofmessaging.Only5hadjustoneformofmessaging,while15hadall4types:annotation,infotext,captions,andsummary.Table 7. Results of code category – Visual Narrative Tactics. This table show the number of cartographic narrative stories that presented each visual narrative tactic as well as the percentage of the total.
Parallel Narrative Tactics: Inparallelnarrativetacticslink,contrastingorcomplementary,andsequencewerefilledinforeverystory.Themostusedlinkwassubject(60%), followedby location(23%).Most cartographic parallel stories presented contrasting narratives (77%) vscomplementarynarratives (23%).For sequence, simultaneousnarratives (42%)weremostcommonfollowedbynon-linearnarratives(38%)andthenlinearnarratives(21%).Table 8. Results of code category – Parallel Narrative Tactics. This table show the number of cartographic parallel narrative stories that presented each parallel narrative tactic as well as the percentage of the total.
Total Count (53)
Percentage of total
6 11%3 6%7 13%5 9%4 8%3 6%34 64%42 79%28 53%37 70%25 47%2 4%
Visual Narrative Tactics : ImageVisual Narrative Tactics : Video
Code
Visual Narrative Tactics : Info Pop upVisual Narrative Tactics : AnnotationVisual Narrative Tactics : Info textVisual Narrative Tactics : captionsVisual Narrative Tactics : summary
Visual Narrative Tactics : Close upsVisual Narrative Tactics : time annimationVisual Narrative Tactics : zoomingVisual Narrative Tactics : Layer listVisual Narrative Tactics : Info Panel
Total Count (53)
Percentage of total
22 42%(8, 4)
characters 3 6%event 6 11%location 12 23%subject 32 60%
41 77%12 23%
Linear 11 21%Non-Linear 20 38%Simultaneous 22 42%
Parallel Narrative Tactics : link
Parallel Narrative Tactics : Contrasting or Complimentary - ContrastingParallel Narrative Tactics : Contrasting or Complimentary - ComplimentaryParallel Narrative Tactics : Sequence
Code
Parallel Narrative Tactics : Color seperating narrativesParallel Narrative Tactics : Number of narratives (mean, median)
40
Analysisofthecodingresultsprovidedabetterunderstandingofimportantfeaturesincartographic parallel narratives. Visual cards were created of each map in order toperform card sorting and classify a taxonomy for parallel narratives in cartographicstorytelling. 4.2.2 Typology of Parallel Narratives in Cartographic Storytelling Quantitativecontentanalysis,whichincludedcodingandcardsorting,ledtothegroupingof existing examples into categories. Categorization was based on several conceptsincluding: what linked the two narratives, how the two narratives interacted in thevisualization,andwhatvisualelementsguidedtheviewerbetweenthenarratives.Asaresult seven categorieswere defined. The typology of cartographic parallel narrativestoriesis:(1)TwoNarratives–OneMap,(2)TwoNarratives–MultipleMaps,(3)ManyNarratives–OneMap, (4)ManyNarratives –MultipleMaps– SpatialConnection, (5)ManyNarratives–MultipleMaps–NoSpatialConnection,(6)SameSpace–TemporalProgression,and(7)SameSpace–DifferentPointsofView(Figure9).Thefollowingsectionoutlineseachcategoryandatablewiththedefinitionsisprovidedattheendof.Two Narratives – One Map InTwoNarratives–OneMap(seeFigure9),twonarrativesaretoldthroughonemapinthecartographicstory.Thevisualizationfocusesontwocharactersthatarebothofequalimportanceinthenarrative.Thesenarrativesoftenpresentopposingviewsonthesameeventortheme.Withonemapthetwonarrativesinteractinthesamemap.Thisallowstheviewertoinspecthowthenarrativesinteractspatially.Becauseonlyonemapisusedtopresent twonarratives, colorbecomesan important techniqueused to structurallyseparatethetwonarratives.Eachnarrativeisrepresentedonthemapwithadifferentcoloredcartographicfeature.Thisisusuallyredandblue.AnalysisofthecodingresultsforthefivecartographicparallelnarrativescategorizedasTwoNarrative–OneMaphighlightedseveralcharacteristicsthattheyallshared:allwereclassifiedasgenre–staticvisualstories,allweremaplayout–singlemap,allusedtheparallelnarrativetactic–colorseparatingstories,eachstoryhadexactlytwonarratives,andallofthemwereparallelnarrativetactic–contrastingnarratives.Additionally,80%oftheTwoNarrative–OneMapcartographicparallelnarrativespresentedsimultaneoussequencenarratives.
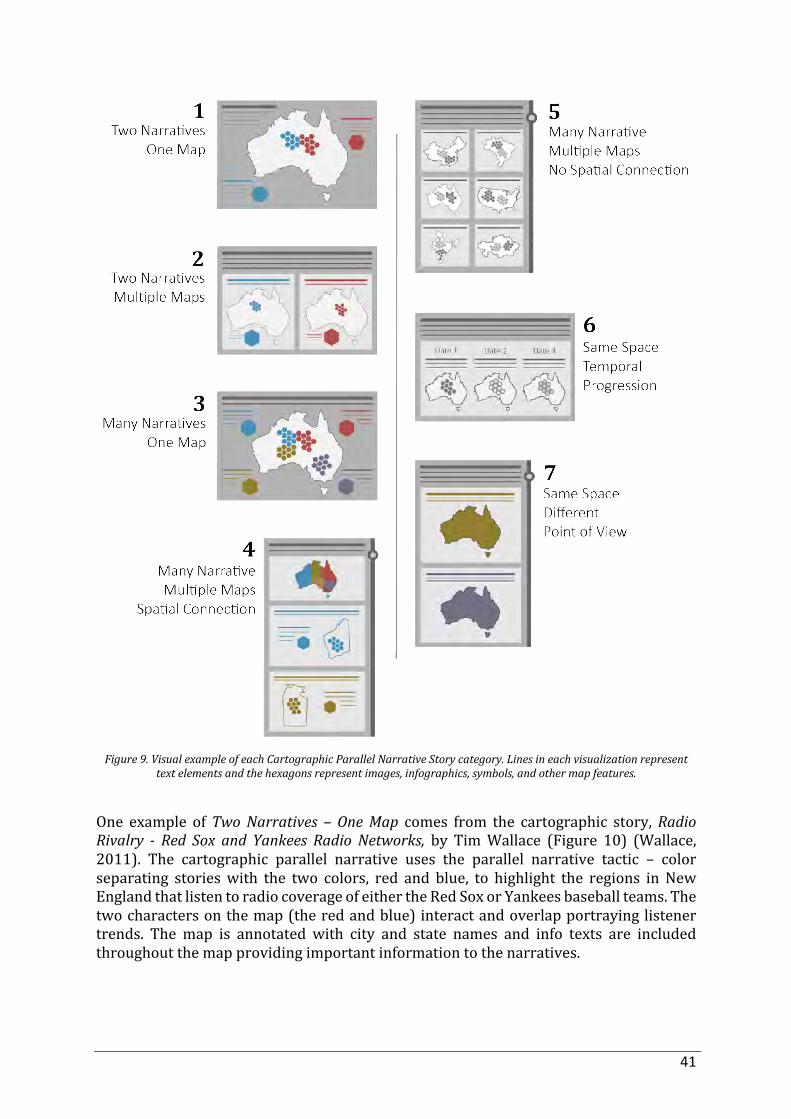
41
Figure9.VisualexampleofeachCartographicParallelNarrativeStorycategory.Linesineachvisualizationrepresent
textelementsandthehexagonsrepresentimages,infographics,symbols,andothermapfeatures.
One example ofTwoNarratives – OneMap comes from the cartographic story,RadioRivalry - Red Sox and Yankees Radio Networks, by TimWallace (Figure 10) (Wallace,2011). The cartographic parallel narrative uses the parallel narrative tactic – colorseparating storieswith the two colors, red and blue, to highlight the regions in NewEnglandthatlistentoradiocoverageofeithertheRedSoxorYankeesbaseballteams.Thetwocharactersonthemap(theredandblue) interactandoverlapportrayinglistenertrends. The map is annotated with city and state names and info texts are includedthroughoutthemapprovidingimportantinformationtothenarratives.
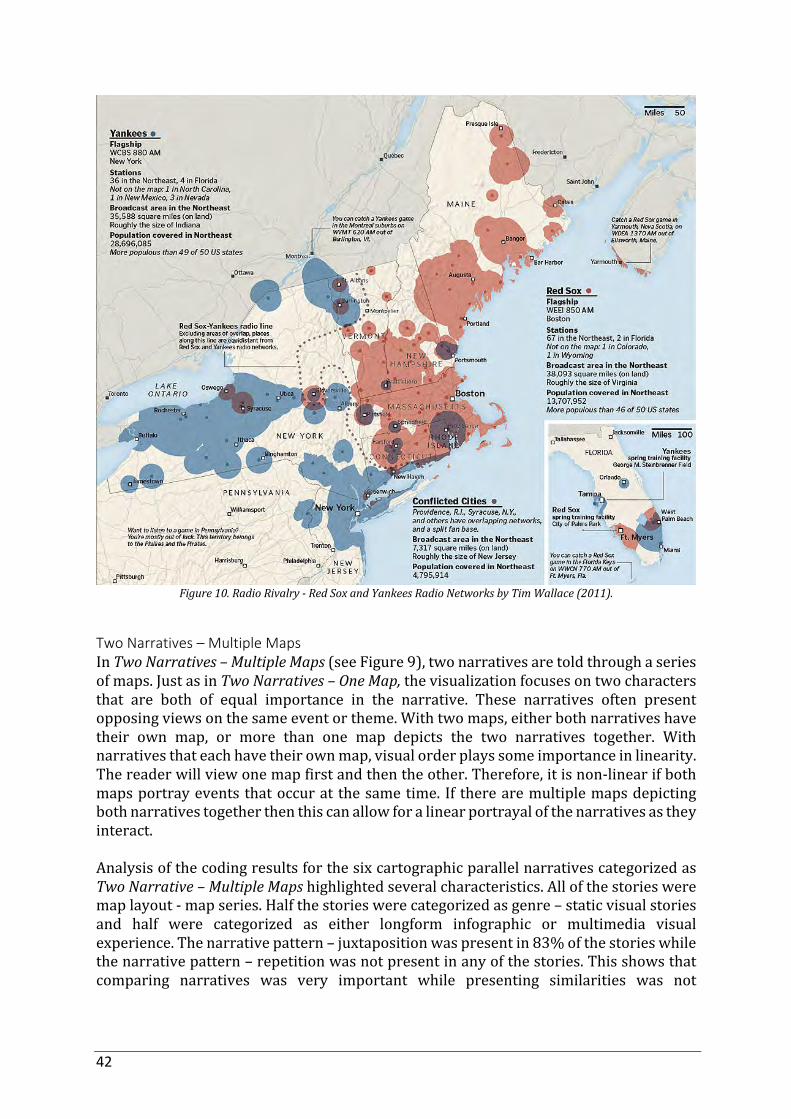
42
Figure10.RadioRivalry-RedSoxandYankeesRadioNetworksbyTimWallace(2011).
Two Narratives – Multiple Maps InTwoNarratives–MultipleMaps(seeFigure9),twonarrativesaretoldthroughaseriesofmaps.JustasinTwoNarratives–OneMap,thevisualizationfocusesontwocharactersthat are both of equal importance in the narrative. These narratives often presentopposingviewsonthesameeventortheme.Withtwomaps,eitherbothnarrativeshavetheir own map, or more than one map depicts the two narratives together. Withnarrativesthateachhavetheirownmap,visualorderplayssomeimportanceinlinearity.Thereaderwillviewonemapfirstandthentheother.Therefore,itisnon-linearifbothmapsportrayeventsthatoccuratthesametime. If therearemultiplemapsdepictingbothnarrativestogetherthenthiscanallowforalinearportrayalofthenarrativesastheyinteract.AnalysisofthecodingresultsforthesixcartographicparallelnarrativescategorizedasTwoNarrative–MultipleMapshighlightedseveralcharacteristics.Allofthestoriesweremaplayout-mapseries.Halfthestorieswerecategorizedasgenre–staticvisualstoriesand half were categorized as either longform infographic or multimedia visualexperience.Thenarrativepattern–juxtapositionwaspresentin83%ofthestorieswhilethenarrativepattern–repetitionwasnotpresentinanyofthestories.Thisshowsthatcomparing narratives was very important while presenting similarities was not
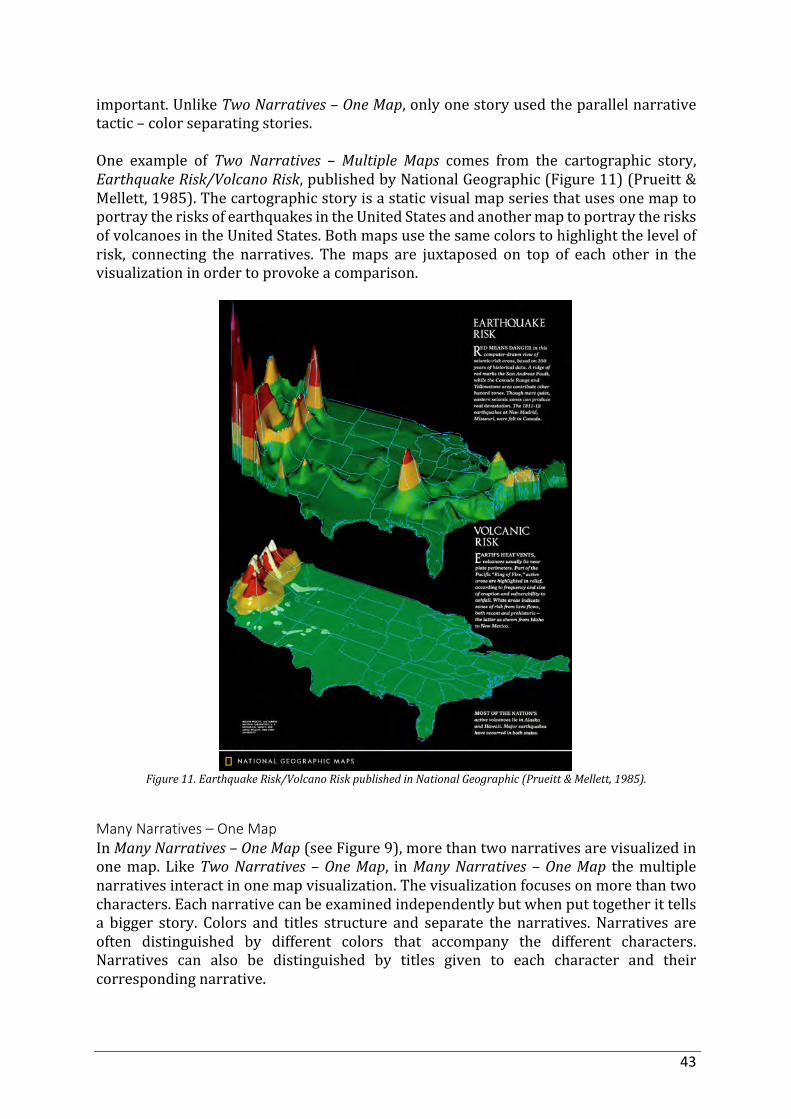
43
important.UnlikeTwoNarratives–OneMap,onlyonestoryusedtheparallelnarrativetactic–colorseparatingstories.One example of Two Narratives – Multiple Maps comes from the cartographic story,EarthquakeRisk/VolcanoRisk,publishedbyNationalGeographic(Figure11)(Prueitt&Mellett,1985).ThecartographicstoryisastaticvisualmapseriesthatusesonemaptoportraytherisksofearthquakesintheUnitedStatesandanothermaptoportraytherisksofvolcanoesintheUnitedStates.Bothmapsusethesamecolorstohighlightthelevelofrisk, connecting the narratives. Themaps are juxtaposed on top of each other in thevisualizationinordertoprovokeacomparison.
Figure11.EarthquakeRisk/VolcanoRiskpublishedinNationalGeographic(Prueitt&Mellett,1985).
Many Narratives – One Map InManyNarratives–OneMap(seeFigure9),morethantwonarrativesarevisualizedinonemap.LikeTwoNarratives –OneMap, inManyNarratives –OneMap themultiplenarrativesinteractinonemapvisualization. Thevisualizationfocusesonmorethantwocharacters.Eachnarrativecanbeexaminedindependentlybutwhenputtogetherittellsa bigger story. Colors and titles structure and separate the narratives.Narratives areoften distinguished by different colors that accompany the different characters.Narratives can also be distinguished by titles given to each character and theircorrespondingnarrative.
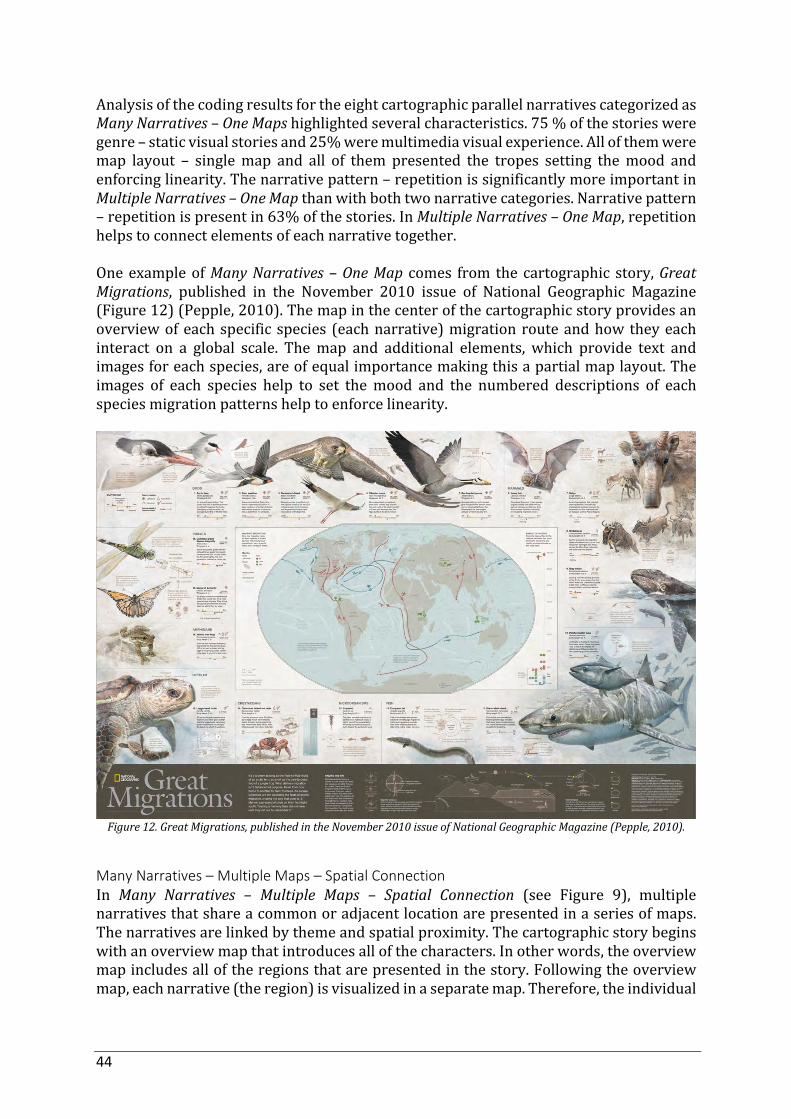
44
AnalysisofthecodingresultsfortheeightcartographicparallelnarrativescategorizedasManyNarratives–OneMapshighlightedseveralcharacteristics.75%ofthestoriesweregenre–staticvisualstoriesand25%weremultimediavisualexperience.Allofthemweremap layout – singlemap and all of them presented the tropes setting themood andenforcinglinearity.Thenarrativepattern–repetitionissignificantlymoreimportantinMultipleNarratives–OneMapthanwithbothtwonarrativecategories.Narrativepattern–repetitionispresentin63%ofthestories.InMultipleNarratives–OneMap,repetitionhelpstoconnectelementsofeachnarrativetogether.OneexampleofManyNarratives–OneMap comes from thecartographic story,GreatMigrations, published in the November 2010 issue of National Geographic Magazine(Figure12)(Pepple,2010).Themapinthecenterofthecartographicstoryprovidesanoverviewofeachspecific species (eachnarrative)migrationrouteandhowtheyeachinteract on a global scale. Themap and additional elements, which provide text andimagesforeachspecies,areofequalimportancemakingthisapartialmaplayout.Theimages of each species help to set themood and the numbered descriptions of eachspeciesmigrationpatternshelptoenforcelinearity.
Figure12.GreatMigrations,publishedintheNovember2010issueofNationalGeographicMagazine(Pepple,2010).
Many Narratives – Multiple Maps – Spatial Connection In Many Narratives – Multiple Maps – Spatial Connection (see Figure 9), multiplenarrativesthatshareacommonoradjacentlocationarepresentedinaseriesofmaps.Thenarrativesarelinkedbythemeandspatialproximity.Thecartographicstorybeginswithanoverviewmapthatintroducesallofthecharacters.Inotherwords,theoverviewmapincludesalloftheregionsthatarepresentedinthestory.Followingtheoverviewmap,eachnarrative(theregion)isvisualizedinaseparatemap.Therefore,theindividual
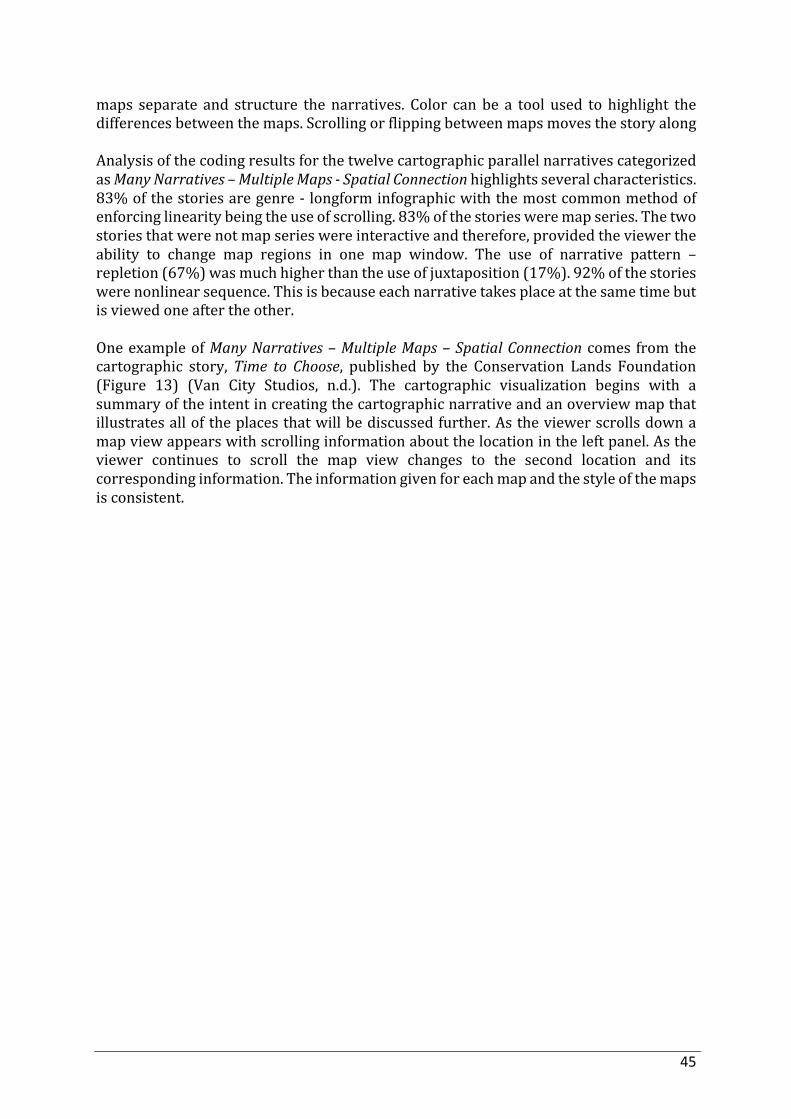
45
maps separate and structure the narratives. Color can be a tool used to highlight thedifferencesbetweenthemaps.ScrollingorflippingbetweenmapsmovesthestoryalongAnalysisofthecodingresultsforthetwelvecartographicparallelnarrativescategorizedasManyNarratives–MultipleMaps-SpatialConnectionhighlightsseveralcharacteristics.83%ofthestoriesaregenre-longforminfographicwiththemostcommonmethodofenforcinglinearitybeingtheuseofscrolling.83%ofthestoriesweremapseries.Thetwostoriesthatwerenotmapserieswereinteractiveandtherefore,providedtheviewertheability to change map regions in one map window. The use of narrative pattern –repletion(67%)wasmuchhigherthantheuseofjuxtaposition(17%).92%ofthestorieswerenonlinearsequence.Thisisbecauseeachnarrativetakesplaceatthesametimebutisviewedoneaftertheother.OneexampleofManyNarratives–MultipleMaps–SpatialConnectioncomes fromthecartographic story,Time to Choose, published by the Conservation Lands Foundation(Figure 13) (Van City Studios, n.d.). The cartographic visualization begins with asummaryoftheintentincreatingthecartographicnarrativeandanoverviewmapthatillustratesalloftheplacesthatwillbediscussedfurther.Astheviewerscrollsdownamapviewappearswithscrollinginformationaboutthelocationintheleftpanel.Astheviewer continues to scroll the map view changes to the second location and itscorrespondinginformation.Theinformationgivenforeachmapandthestyleofthemapsisconsistent.
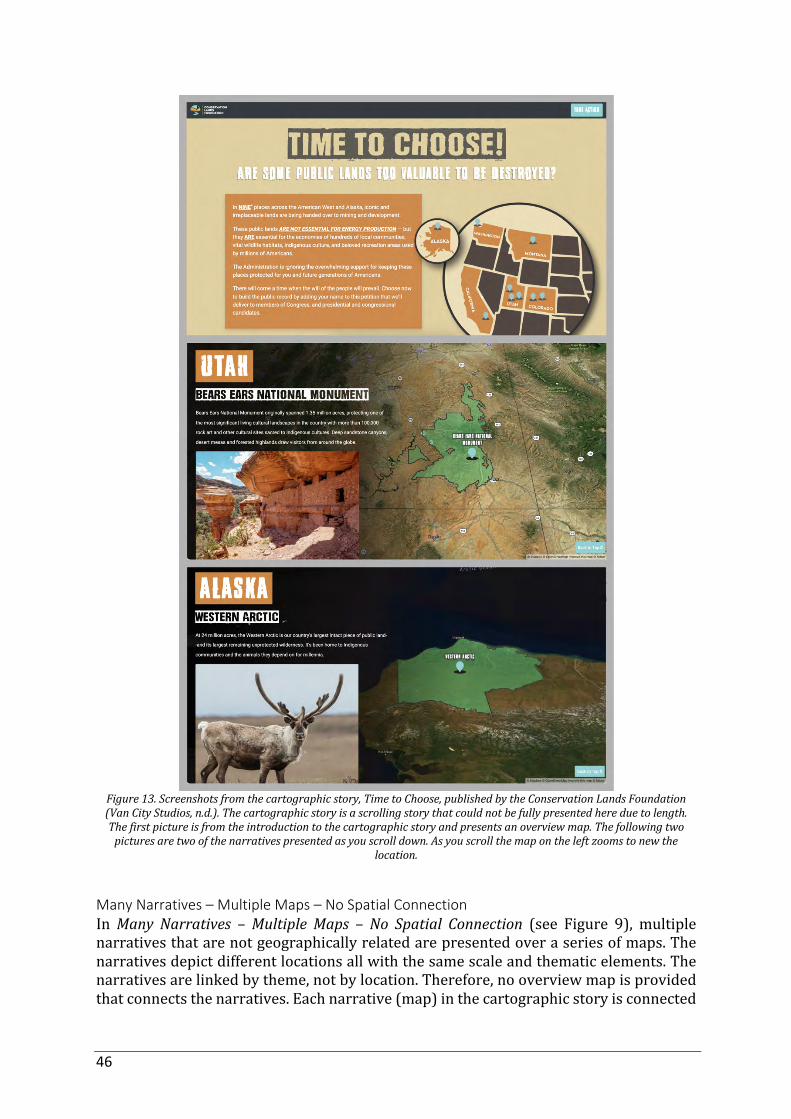
46
Figure13.Screenshotsfromthecartographicstory,TimetoChoose,publishedbytheConservationLandsFoundation(VanCityStudios,n.d.).Thecartographicstoryisascrollingstorythatcouldnotbefullypresentedhereduetolength.Thefirstpictureisfromtheintroductiontothecartographicstoryandpresentsanoverviewmap.Thefollowingtwopicturesaretwoofthenarrativespresentedasyouscrolldown.Asyouscrollthemapontheleftzoomstonewthe
location.
Many Narratives – Multiple Maps – No Spatial Connection InMany Narratives – Multiple Maps – No Spatial Connection (see Figure 9), multiplenarrativesthatarenotgeographicallyrelatedarepresentedoveraseriesofmaps.Thenarrativesdepictdifferentlocationsallwiththesamescaleandthematicelements.Thenarrativesarelinkedbytheme,notbylocation.Therefore,nooverviewmapisprovidedthatconnectsthenarratives.Eachnarrative(map)inthecartographicstoryisconnected
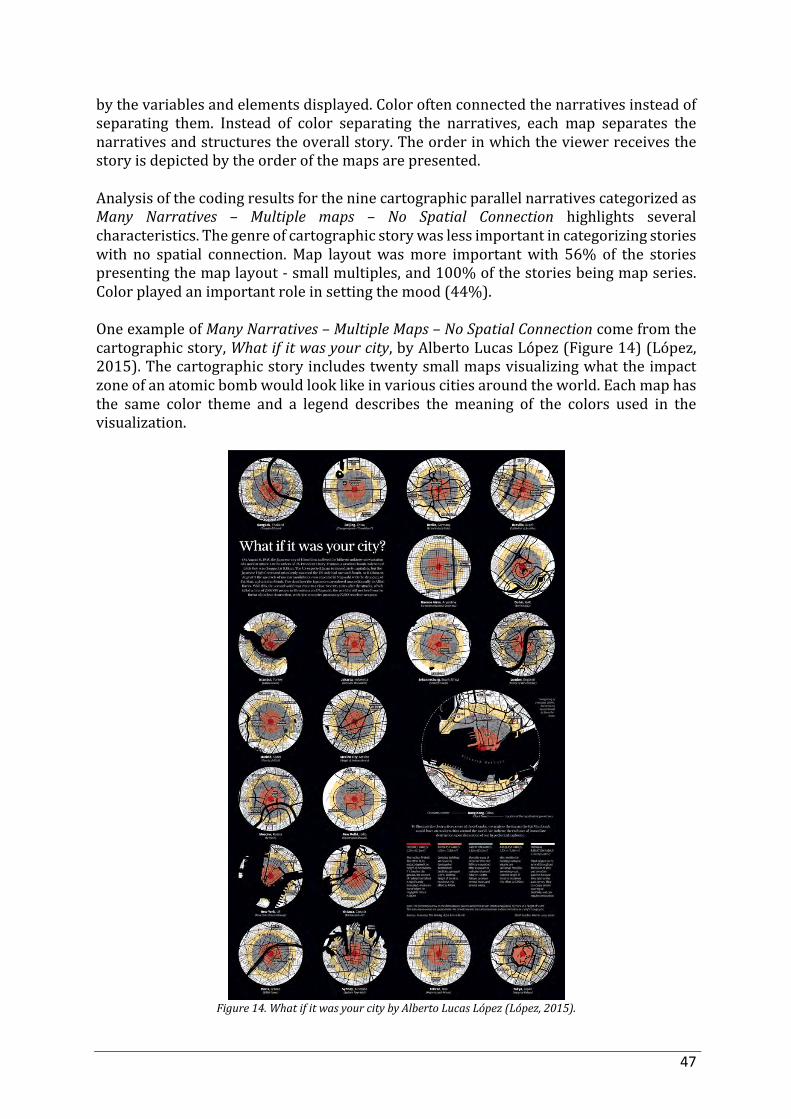
47
bythevariablesandelementsdisplayed.Coloroftenconnectedthenarrativesinsteadofseparating them. Instead of color separating the narratives, each map separates thenarrativesandstructurestheoverallstory.Theorderinwhichtheviewerreceivesthestoryisdepictedbytheorderofthemapsarepresented.AnalysisofthecodingresultsfortheninecartographicparallelnarrativescategorizedasMany Narratives – Multiple maps – No Spatial Connection highlights severalcharacteristics.Thegenreofcartographicstorywaslessimportantincategorizingstorieswith no spatial connection.Map layoutwasmore importantwith 56% of the storiespresentingthemaplayout-smallmultiples,and100%ofthestoriesbeingmapseries.Colorplayedanimportantroleinsettingthemood(44%).OneexampleofManyNarratives–MultipleMaps–NoSpatialConnectioncomefromthecartographicstory,Whatifitwasyourcity,byAlbertoLucasLópez(Figure14)(López,2015).Thecartographicstoryincludestwentysmallmapsvisualizingwhattheimpactzoneofanatomicbombwouldlooklikeinvariouscitiesaroundtheworld.Eachmaphasthe same color theme and a legend describes the meaning of the colors used in thevisualization.
Figure14.WhatifitwasyourcitybyAlbertoLucasLópez(López,2015).
48
Same Space – Temporal Progression InSameSpace–TemporalProgression(seeFigure9), twoormorenarrativesaretoldaboutthesamelocationoveraseriesoftime. Eachnarrativepresentsthesamelocationat a different point or spanof time. The inclusion of dates or a timeline separate thenarrativesandstructuresthestory.Atimelinecanbeeitheranimatedortext.AnalysisofthecodingresultsfortheninecartographicparallelnarrativescategorizedasSameSpace–TemporalProgressionhighlightsseveralcharacteristics.89%ofthestorieswerestaticvisualstoriesand67%weremapseries.Mostsignificantly,incomparisontoother categories, timelines played an important role in enforcing linearity and werepresentin78%ofthestories.Also,incontrasttoallothercategoriesmost(89%)ofthestorieswerecomplimentarynarrativeswithlinearsequencing.OneexampleofSameSpace–TemporalProgressioncomesfromthecartographicstory,American Slavery, by Bill Rankin (Figure 15) (Rankin, 2016). The cartographic storyfeaturesninemapsdepictingeverytenyearsfrom1790–1870.Datesplacedaboveeachmap make up a timeline. Each map uses the same colors and dots to indicate thepercentageofslavesandnumberofpeoplewithinaregionof250sqmi.Themapsarejuxtaposedsidebysidesothattheviewercanobservethechangesovertime.
Figure15.SlaveryintheUnitedStates,byBillRankin(Rankin,2016).
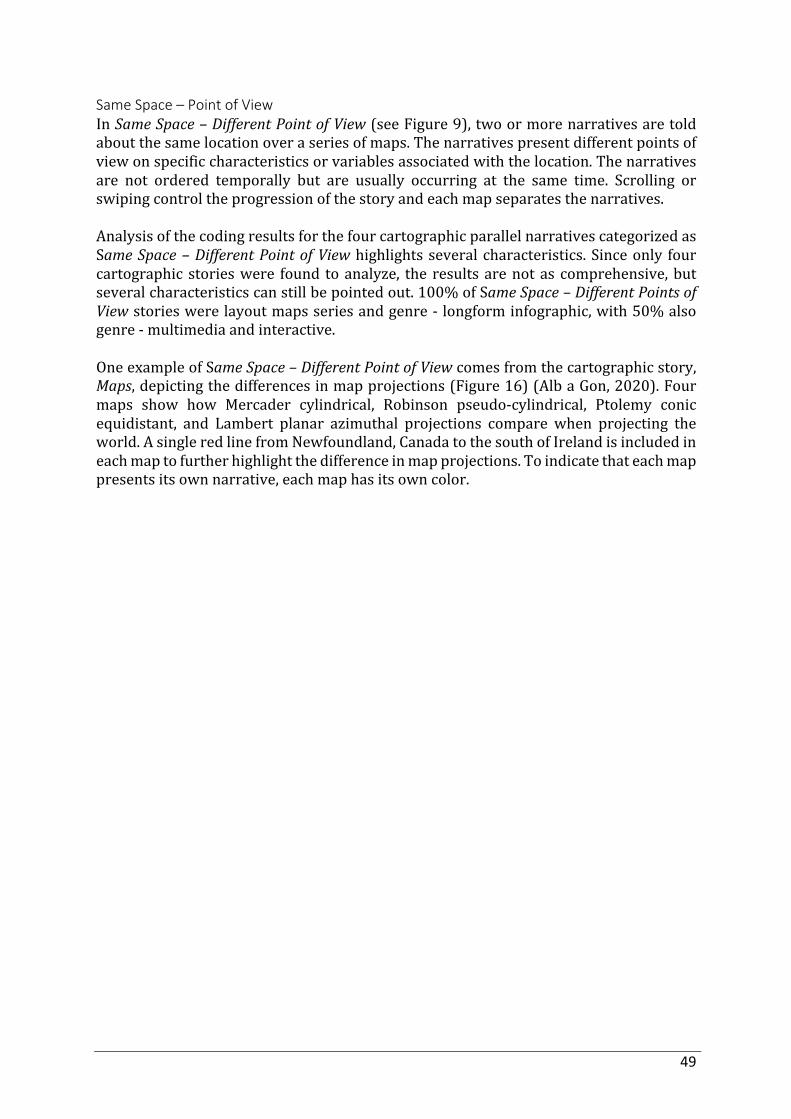
49
Same Space – Point of View InSameSpace–DifferentPointofView(seeFigure9),twoormorenarrativesaretoldaboutthesamelocationoveraseriesofmaps.Thenarrativespresentdifferentpointsofviewonspecificcharacteristicsorvariablesassociatedwiththelocation.Thenarrativesare not ordered temporally but are usually occurring at the same time. Scrolling orswipingcontroltheprogressionofthestoryandeachmapseparatesthenarratives.AnalysisofthecodingresultsforthefourcartographicparallelnarrativescategorizedasSameSpace–DifferentPointofViewhighlightsseveralcharacteristics.Sinceonly fourcartographic storieswere found toanalyze, the resultsarenotas comprehensive,butseveralcharacteristicscanstillbepointedout.100%ofSameSpace–DifferentPointsofViewstorieswerelayoutmapsseriesandgenre-longforminfographic,with50%alsogenre-multimediaandinteractive.OneexampleofSameSpace–DifferentPointofViewcomesfromthecartographicstory,Maps,depictingthedifferencesinmapprojections(Figure16)(AlbaGon,2020).Fourmaps show how Mercader cylindrical, Robinson pseudo-cylindrical, Ptolemy conicequidistant, and Lambert planar azimuthal projections compare when projecting theworld.AsingleredlinefromNewfoundland,CanadatothesouthofIrelandisincludedineachmaptofurtherhighlightthedifferenceinmapprojections.Toindicatethateachmappresentsitsownnarrative,eachmaphasitsowncolor.
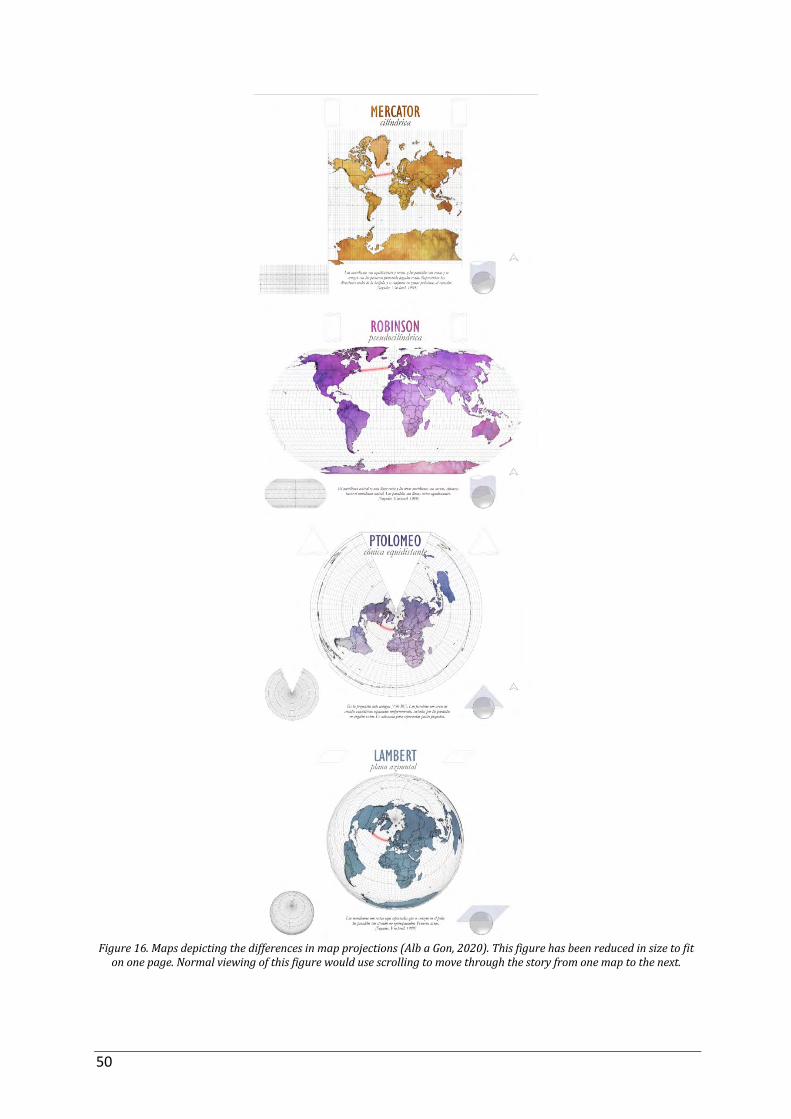
50
Figure16.Mapsdepictingthedifferencesinmapprojections(AlbaGon,2020).Thisfigurehasbeenreducedinsizetofitononepage.Normalviewingofthisfigurewouldusescrollingtomovethroughthestoryfromonemaptothenext.
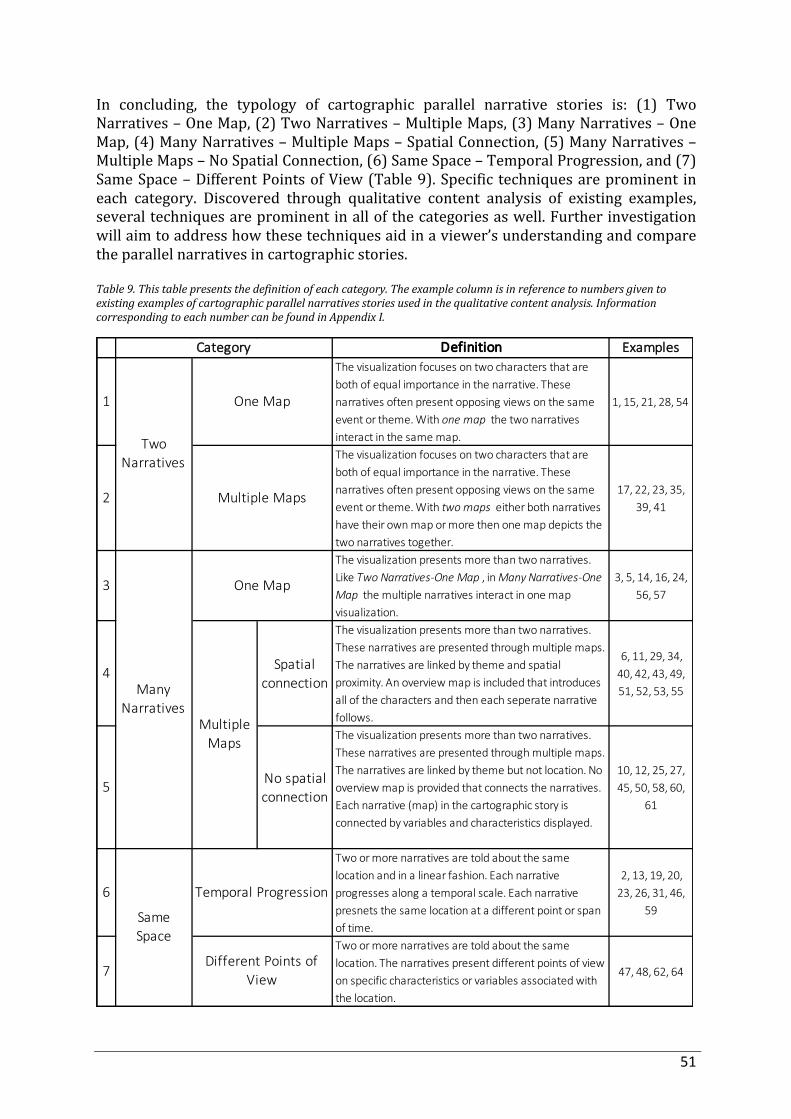
51
In concluding, the typology of cartographic parallel narrative stories is: (1) TwoNarratives–OneMap,(2)TwoNarratives–MultipleMaps,(3)ManyNarratives–OneMap,(4)ManyNarratives–MultipleMaps–SpatialConnection,(5)ManyNarratives–MultipleMaps–NoSpatialConnection,(6)SameSpace–TemporalProgression,and(7)SameSpace–DifferentPointsofView(Table9).Specific techniquesareprominent ineach category. Discovered through qualitative content analysis of existing examples,severaltechniquesareprominentinallofthecategoriesaswell.Furtherinvestigationwillaimtoaddresshowthesetechniquesaidinaviewer’sunderstandingandcomparetheparallelnarrativesincartographicstories.Table9.Thistablepresentsthedefinitionofeachcategory.Theexamplecolumnisinreferencetonumbersgiventoexistingexamplesofcartographicparallelnarrativesstoriesusedinthequalitativecontentanalysis.InformationcorrespondingtoeachnumbercanbefoundinAppendixI.
Definition Examples
1
The visualization focuses on two characters that are both of equal importance in the narrative. These narratives often present opposing views on the same event or theme. With one map the two narratives interact in the same map.
1, 15, 21, 28, 54
2
The visualization focuses on two characters that are both of equal importance in the narrative. These narratives often present opposing views on the same event or theme. With two maps either both narratives have their own map or more then one map depicts the two narratives together.
17, 22, 23, 35, 39, 41
3
The visualization presents more than two narratives. Like Two Narratives-One Map , in Many Narratives-One Map the multiple narratives interact in one map visualization.
3, 5, 14, 16, 24, 56, 57
4 Spatial connection
The visualization presents more than two narratives. These narratives are presented through multiple maps. The narratives are linked by theme and spatial proximity. An overview map is included that introduces all of the characters and then each seperate narrative follows.
6, 11, 29, 34, 40, 42, 43, 49, 51, 52, 53, 55
5 No spatial connection
The visualization presents more than two narratives. These narratives are presented through multiple maps. The narratives are linked by theme but not location. No overview map is provided that connects the narratives. Each narrative (map) in the cartographic story is connected by variables and characteristics displayed.
10, 12, 25, 27, 45, 50, 58, 60,
61
6
Two or more narratives are told about the same location and in a linear fashion. Each narrative progresses along a temporal scale. Each narrative presnets the same location at a different point or span of time.
2, 13, 19, 20, 23, 26, 31, 46,
59
7
Two or more narratives are told about the same location. The narratives present different points of view on specific characteristics or variables associated with the location.
47, 48, 62, 64
Same Space
Temporal Progression
Different Points of View
Category
Two Narratives
One Map
Multiple Maps
Many Narratives
One Map
Multiple Maps
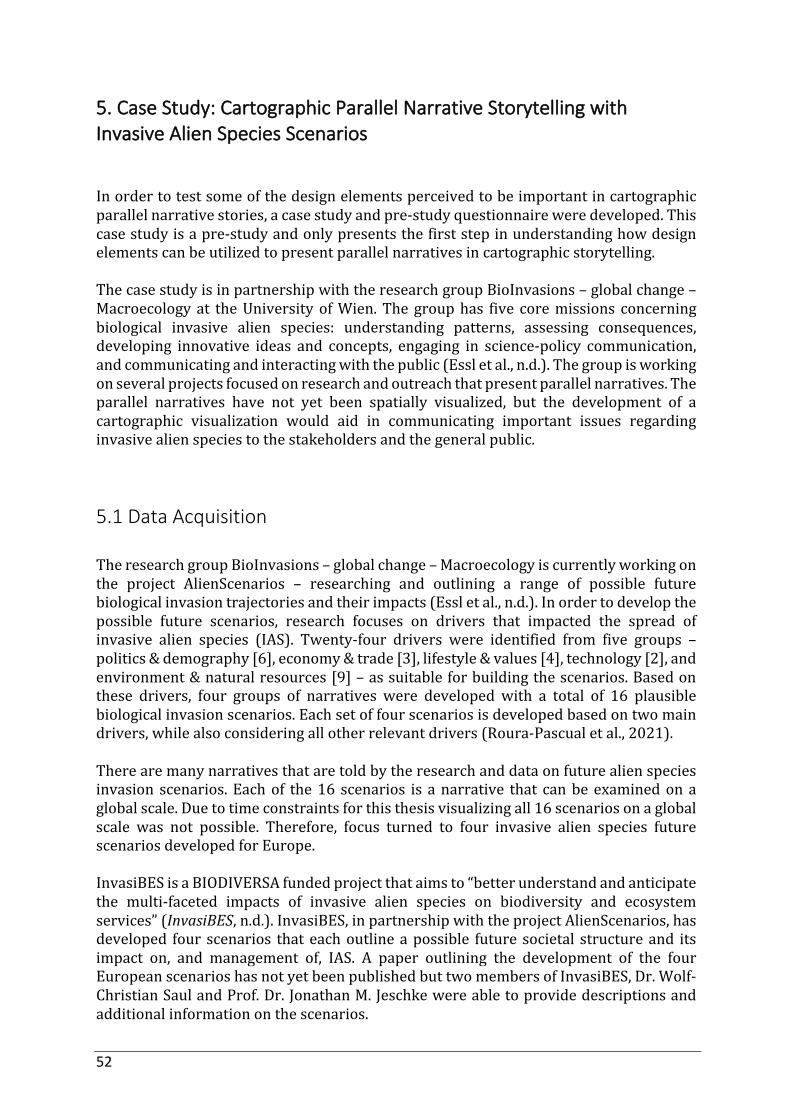
52
5. Case Study: Cartographic Parallel Narrative Storytelling with Invasive Alien Species Scenarios
Inordertotestsomeofthedesignelementsperceivedtobeimportantincartographicparallelnarrativestories,acasestudyandpre-studyquestionnaireweredeveloped.Thiscasestudyisapre-studyandonlypresentsthefirststepinunderstandinghowdesignelementscanbeutilizedtopresentparallelnarrativesincartographicstorytelling.ThecasestudyisinpartnershipwiththeresearchgroupBioInvasions–globalchange–Macroecologyat theUniversityofWien.Thegrouphas five coremissions concerningbiological invasive alien species: understanding patterns, assessing consequences,developing innovative ideas and concepts, engaging in science-policy communication,andcommunicatingandinteractingwiththepublic(Essletal.,n.d.).Thegroupisworkingonseveralprojectsfocusedonresearchandoutreachthatpresentparallelnarratives.Theparallel narratives have not yet been spatially visualized, but the development of acartographic visualization would aid in communicating important issues regardinginvasivealienspeciestothestakeholdersandthegeneralpublic. 5.1 Data Acquisition TheresearchgroupBioInvasions–globalchange–Macroecologyiscurrentlyworkingonthe project AlienScenarios – researching and outlining a range of possible futurebiologicalinvasiontrajectoriesandtheirimpacts(Essletal.,n.d.).Inordertodevelopthepossible future scenarios, research focuses on drivers that impacted the spread ofinvasive alien species (IAS). Twenty-four drivers were identified from five groups –politics&demography[6],economy&trade[3],lifestyle&values[4],technology[2],andenvironment&naturalresources[9]–assuitableforbuildingthescenarios.Basedonthese drivers, four groups of narratives were developed with a total of 16 plausiblebiologicalinvasionscenarios.Eachsetoffourscenariosisdevelopedbasedontwomaindrivers,whilealsoconsideringallotherrelevantdrivers(Roura-Pascualetal.,2021).Therearemanynarrativesthataretoldbytheresearchanddataonfuturealienspeciesinvasion scenarios.Eachof the16 scenarios is anarrative that canbeexaminedonaglobalscale.Duetotimeconstraintsforthisthesisvisualizingall16scenariosonaglobalscale was not possible. Therefore, focus turned to four invasive alien species futurescenariosdevelopedforEurope.InvasiBESisaBIODIVERSAfundedprojectthataimsto“betterunderstandandanticipatethe multi-faceted impacts of invasive alien species on biodiversity and ecosystemservices”(InvasiBES,n.d.).InvasiBES,inpartnershipwiththeprojectAlienScenarios,hasdeveloped four scenarios thateachoutlineapossible future societal structureand itsimpact on, and management of, IAS. A paper outlining the development of the fourEuropeanscenarioshasnotyetbeenpublishedbuttwomembersofInvasiBES,Dr.Wolf-ChristianSaulandProf.Dr.JonathanM.Jeschkewereabletoprovidedescriptionsandadditionalinformationonthescenarios.
53
ThefourspecificscenariosdevelopedforEuropearecalledLostinEurope,BigTechrulesEurope, Back to nature, and Technological (pseudo-)panacea (Saul & Jeschke, n.d.).Important characteristics that separate these four scenarios include the increase ordecreaseofinternationaltradeandtraderegulations,thefocusonscientifictechnologicaladvancement,theabilityofagovernmenttocooperatewithothergovernments,andthelevelofenvironmentalawareness.In the Lost (in) Europe scenario, international trade is reduced and there is adisintegration of the EU. There is a lack of scientific literacy and increased land usecontributestoenvironmentaldegradation.ForIASthismeansthatthereisadecreaseinregulations and introduction of IAS goes largely uncontrolled and expands due toincreasedlanduse(Saul&Jeschke,n.d.).IntheBigTechRulesEuropescenario,thereisanincreaseintradeandtechnology.Urbanpopulation grows, while rural population decrease’s and people become increasinglydisconnected from nature. For IAS, thismeans an it has the ability to expand due toincreased trade and a general lack of concern for the effect of IAS on the localenvironment(Saul&Jeschke,n.d.).IntheBacktoNaturescenario,ruralareasgrowinpopulationaspeoplereturntoruralareasfromurbanareas.Tradedecreasesandthereislowtechnologicalinnovation.Thereisahighenvironmentalawarenessbutlackofcommonenvironmentalregulations.ForIAS,thismeansanoveralldecreaseintheintroductionofIASbutalreadyestablishedIASareabletocontinuetospread(Saul&Jeschke,n.d.).In the Technological (pseudo-)panacea scenario, there is an increase in trade andtechnology,butalsoanincreaseintraderegulations.Thereisalsoahighbutstabilizedecologicalfootprintduetoahighenvironmentalawareness.Thegeneralsocietalbeliefisthat society can solve all environmental problems. For IAS, thismeans an increase inintroducedIASduetotradebutalsoanincreaseinmanagementandregulations(Saul&Jeschke,n.d.).Asthenarrativesarecomparativescenariosforthefuture,presentingthenarrativesinparallelwouldgiveviewersabetterunderstandingoftherelationshipbetweencertaindriversandtheireffectsineachscenarios.InordertounderstandhowtovisualizethefourparallelscenariosinawaythatisbeneficialfortheAlienScenariosproject,severalmeetings were held with two members of the research group BioInvasions – globalchange–Macroecology,FranzEsslandBerndLenzner,andtwomembersofInvasiBES,Dr.Wolf-Christian Saul andDr. Jonathan Jeschke. Inmeetingswith Franz Essl, BerndLenzner, Dr.Wolf-Christian Saul, and Dr. Jonathan Jeschke, the objective for creatingcartographicparallelnarratives for the IAS scenarioswasdiscussedand thedataandinformationtobeincludedwasoutlined.WhilethefourscenariosaredevelopedforEurope,thedataisnotquantitativeorspatiallyreferencedandthereforecan’tsimplybevisualizedusingageospatialanalysissoftware.InmeetingswithFranzEssl,BerndLenzner,Dr.Wolf-ChristianSaul,andDr. JonathanJeschke it was suggested that creating visualizations of stylized landscapes based offthreeregions,northern,central,andsouthernEurope,wouldhelptocommunicatethe
54
impactthatinvasivespeciesmighthaveoneachregion.Astylizedlandscapedepictsaregion(landscape)that isnotarealplacebutratherarepresentationofmanyplaces.Whencreatingastylizedgeographicallandscapespecificspatiallyreferenceddatawouldnotbeneeded.ItwasthenwasproposedthatincludingaspeciesforeachregionwouldhelpviewersbetterunderstandtheconceptofIAS.OriginallyitwasproposedtocreatecartographicparallelnarrativesforeachregioninEurope as well as for a variety of different invasive species; however, due to timeconstraintsonlyonecartographicparallelnarrativecouldbecreated.CentralEuropewaschosentobethelandscapelocationasthatiswheretheresearchgroupislocatedandthereforwouldbemostbeneficial foroutreach. Itwasalsoproposed to include threespecies,oneplant,oneanimal,andoneaquatic;however,duetotimeconstraintsonlyonewasselected.FollowingfurtherdiscussionswithFranzEssl,BerndLenzner,Dr.Wolf-ChristianSaul,andDr.JonathanJeschke,itwasdecidedthatthegroupcouldprovidethemost information on the speciesAmbrosia artemisiifolia (annual ragweed). Ambrosia(ragweed) is an invasive plant species in Europe. It is currently spreading inmost ofcentralEuropeandisspreadingnorthduetoclimatechange.Ambrosiathrivesinsummercropfields,roadverges,railwaystations,andopenruderalsites.SpreadofAmbrosiaisconcerningbecauseofitshighlyallergicpollenandyieldlossesininfestedfields(Essletal.,2015).The spreadandmanagementofAmbrosiawouldoccurdifferently in eachof the fouroutlinedscenarios.AnoutlineofAmbrosia’sresponsetoeachofthefourscenarioswascreatedbasedontheimplicationforIASineachscenario,characteristicsoftheAmbrosiaspecies,aswellasratingsonimportantdriversforAmbrosiaineachscenariooutlinedbyFranzEssl(F.Essl,personalcommunication,September28,2021). 5.2 Design Goals and Opportunities Therearemanydifferentwaystocreateacartographicparallelnarrative,asshowninchapter4.Manydesigndecisionsdependonboththedataandtheaudience.Whoyouwanttobeabletounderstandthecartographicstory is justas importantaswhatyouwant to show. The aim for the research group BioInvasions – global change –Macroecologywastopresentacartographicvisualizationforoutreachpurposesthatthegeneral public can understand. This means the messaging should be clear andunderstandableandthedesignshouldbeengaging.Thetypeofdataisalsoimportantindecidingwhatvisualizationtechniquesshouldbeincluded.OnegoalofthiscasestudyistotestdesignelementsperceivedtobeimportantincartographicparallelnarrativesaswellasexaminehowtheIAScartographicparallelnarrativefitsintothetypologyoutlinedinchapter4.EachoftheEuropeanIASscenariospresentsadifferentpossiblefutureforonelandscaperegion.Therefore,eachnarrativeisaboutthesamelocationandtimebutpresentsdifferentperspectives.ThismeansthatitisnotconsideredasaSameSpace–TemporalProgressionoraMultipleMaps–NoSpatialConnectioncartographicparallelnarrative.Furthermore,thenarrativesdonotinteractandcannotbedisplayedononemapwithoutoverlappingbecausetheydisplaydataatthe exact same location. This means that it cannot be aMany Narratives – One Mapcartographicparallelnarrative. It isalsonotaMultipleNarratives–SpatialConnection
55
cartographic parallel narratives eitherbecause there is no overviewmap that is thenbrokendownintosmallerregions.Therefore,thetypeofcartographicparallelnarrativethattheEuropeanIASscenariospresentisaSameSpace–DifferentPointofView.Basedonthecontentanalysisofexistingexamplesofparallelnarrativesincartographicstories presented in section 4.2.2, only four examples presentSame Space –DifferentPointofViewnarratives.ThisisaverysmallsamplesizeandthereforthereisnotenoughsamplestoconcludewhatcartographicandparallelnarrativeelementsandtechniquesaremostprevalentinSameSpace–DifferentPointofViewstories.Itwouldbebeneficialto create several cartographic parallel narratives that utilize different techniques tofurtherexaminethetypologyofSameSpace–DifferentPointofView.ThereareseveralimportantdesignchoicestochoosefromwhencreatingaSameSpace–DifferentPointofViewcartographicparallelnarrative.Designchoicesdiscussedherewillbe narrowed down by the design elements (codes) discussed in section 4.1.2, whichinclude genre, map layout, interactivity, tropes, narrative patterns, visual narrativetactics,andparallelnarrativetactics:
- AllfouroftheSameSpace–DifferentPointofViewcartographicparallelstoriesexaminedinchapter4werelongforminfographicswithtwoofthemalsoincludingmultimedia visual experiences. However, with only four examples it shouldfurther be explored if creating a static visual story could also present thenarrativesinavisuallypleasingandunderstandableway.
- Shouldthecartographicstorypresentasinglemaporamapseries?TheEuropean
IAS Scenarios storyhas fournarratives that eachdepict information about thesameareaandwouldneedtooverlapifpresentedonthesamemap.Ifasinglemapwastobeusedtovisualizethenarratives,itwouldhavetobedividedequallyintofoursectionswithequalcharacteristics.Thedistinctionbetweeneachnarrativewouldhavetobeobvious.Thiscouldbedonewithcolorcodednarratives.Anotheroptionwouldbetohaveamapseriesinwhicheachnarrativeispresentedonadifferent map. If visualized in a map series, options for map layout includeembedded,sidebyside,andsmallmultiples.
- Shouldthecartographicparallelnarrativesbeinteractive?Interactivityisuseful
inuserengagement.UserscouldselectwhatdriversofIAStheywouldliketoaddtothemapdisplayanduseaselectionbartoswitchbetweenthenarratives.Userscouldalsohoveroverorclickoncertainfeaturestoretrieveextrainformation.
- What tropes should be included or emphasized to enhance the narratives?
Enforcing linearity is especially important in visualizing parallel cartographicnarratives.Linearityhelpstodirecttheviewerthroughthestory.Thecartographicparallelnarrativecouldusetitles,numbers,scrollingoraselectionbartoenforcelinearity.
- What narrative patterns would aid in supporting the intended message. Howcouldthesenarrativepatternsbeappliedinthecartographicstory.Juxtaposingmight be an important narrative pattern to include to aid in the comparisonbetweenscenarios.
56
- The IASscenariospresentsastory thatmightrequirea lotof text toguide the
generalpublicthroughthestoryline.Howshouldmessagingbeusedthroughoutthecartographicstoryandwhatinformationshouldbehighlighted.
- In deciding how to display the parallelism of the narratives formatting isimportant. Thenarratives can be viewed separately or together.When viewedtogether it is important to be able to distinguish between the narratives andvariousdesignelementscanbeincludedtohelpseparatethenarratives.
Allofthesedesignopportunitieswouldaccomplishthedesigngoalshowevernotallofthemcouldbetested.Thedesignoutcomesarediscussedinthefollowingsection. 5.3 Design Outcome The finaldesignoutcomeproduced twocartographicparallelnarrativestories for theinvasivealienspecies(IAS)scenariosinEurope:onestaticstoryandonescrollingstory.Bothstoriesincludedthesamemaps,text,titles,colors,symbols,andimages.Thestoriesdifferedinthewaythateachmap,text,title,symbol,andimagewaspresented.Bothofthecartographicparallelstoriesseparatedthenarrativesintofourmaps.SincetheconceptofIASscenariosisquitecomplexalready,itwasdecidedthatseparatingthenarrativesbymapswouldhelpintheunderstandingoftheseparatescenarios.EachmapportraysthelandscapeofacityinCentralEurope.Eachmaphasthesameroadsandriverto indicate that the fourmapsdepict thesamecity.Eachmapuses thesamecolors toindicateurbanareasandruralareasandthesamesymbolstoindicatewhereAmbrosiaisspreadingandwhereithasbeenmanaged.Bothofthecartographicparallelstoriesincludethesametext.Asummary/introductiontextwasaddedtobothstoriestoexplainthebackgroundbehindtheIASscenariosandsummarizedthefourscenariosvisualized.Inaddition,informationtextwasincludedtoboth to introduce the species Ambrosia artemisiifolia and also to inform the generalpublicwhomightnotbeawareofthespeciesbeforeviewingthestory.Aninformationtextdescribingeachofthefourscenariosinmoredetailwasalsoincludedandeachmapwasannotatedwithexplanatoryinformation.Bothofthecartographicparallelstoriesusedtitlestoidentifyeachnarrative.Eachmapwastitledwiththescenarioitportrayed.Titleswerealsousedtointroducethestoryandtohighlighttheselectedspecies.Inadditiontotitles,symbolswereincludedtohighlightimportantdriversineachscenario.Bothof thecartographicparallelstorieshave thesamecolorschemetoset themood.Earthtoneswerechosensincethetopiccentersaroundenvironmentalawareness.Colorwasnotusedtoseparatethenarrativessincecolorwasalreadybeingusedtopresentinformation in each narrative and too many colors might have overwhelmed thevisualization.Inaddition,colorscanbeassociatedwithemotionssuchasgood(green)orbad(red)andhappy(yellow)orsad(grey).Assigningacolor toeachnarrativemighthaveinfluencedandbiasedtheviewers’understandingofeachnarrative.Inaddition,one
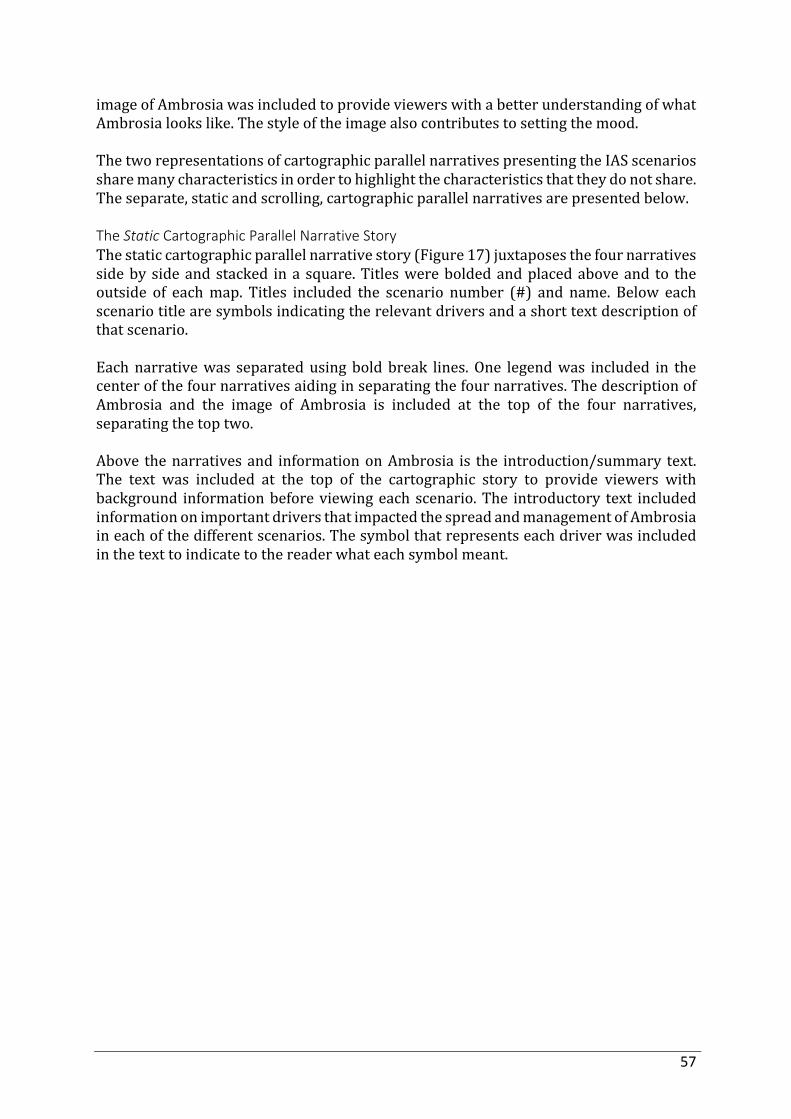
57
imageofAmbrosiawasincludedtoprovideviewerswithabetterunderstandingofwhatAmbrosialookslike.Thestyleoftheimagealsocontributestosettingthemood.ThetworepresentationsofcartographicparallelnarrativespresentingtheIASscenariossharemanycharacteristicsinordertohighlightthecharacteristicsthattheydonotshare.Theseparate,staticandscrolling,cartographicparallelnarrativesarepresentedbelow.The Static Cartographic Parallel Narrative Story Thestaticcartographicparallelnarrativestory(Figure17)juxtaposesthefournarrativessideby sideandstacked ina square.Titleswereboldedandplacedaboveand to theoutside of eachmap. Titles included the scenario number (#) and name. Below eachscenariotitlearesymbolsindicatingtherelevantdriversandashorttextdescriptionofthatscenario.Eachnarrativewas separatedusingboldbreak lines.One legendwas included in thecenterofthefournarrativesaidinginseparatingthefournarratives.ThedescriptionofAmbrosia and the image of Ambrosia is included at the top of the four narratives,separatingthetoptwo.Above thenarrativesand informationonAmbrosia is the introduction/summary text.The text was included at the top of the cartographic story to provide viewers withbackground informationbeforeviewingeachscenario.The introductory text includedinformationonimportantdriversthatimpactedthespreadandmanagementofAmbrosiaineachofthedifferentscenarios.Thesymbolthatrepresentseachdriverwasincludedinthetexttoindicatetothereaderwhateachsymbolmeant.
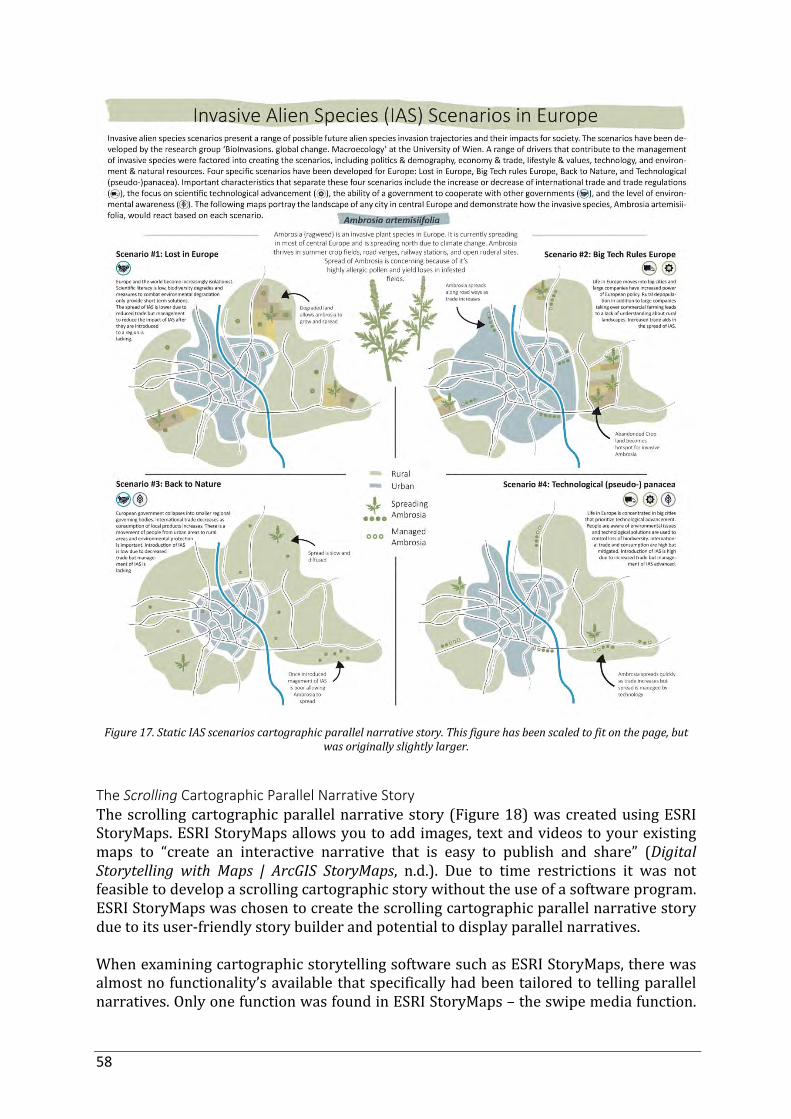
58
Figure17.StaticIASscenarioscartographicparallelnarrativestory.Thisfigurehasbeenscaledtofitonthepage,but
wasoriginallyslightlylarger.
The Scrolling Cartographic Parallel Narrative Story Thescrollingcartographicparallelnarrativestory(Figure18)wascreatedusingESRIStoryMaps.ESRIStoryMapsallowsyoutoaddimages,textandvideostoyourexistingmaps to “create an interactive narrative that is easy to publish and share” (DigitalStorytelling with Maps | ArcGIS StoryMaps, n.d.). Due to time restrictions it was notfeasibletodevelopascrollingcartographicstorywithouttheuseofasoftwareprogram.ESRIStoryMapswaschosentocreatethescrollingcartographicparallelnarrativestoryduetoitsuser-friendlystorybuilderandpotentialtodisplayparallelnarratives.WhenexaminingcartographicstorytellingsoftwaresuchasESRIStoryMaps,therewasalmostnofunctionality’savailablethatspecificallyhadbeentailoredtotellingparallelnarratives.OnlyonefunctionwasfoundinESRIStoryMaps–theswipemediafunction.
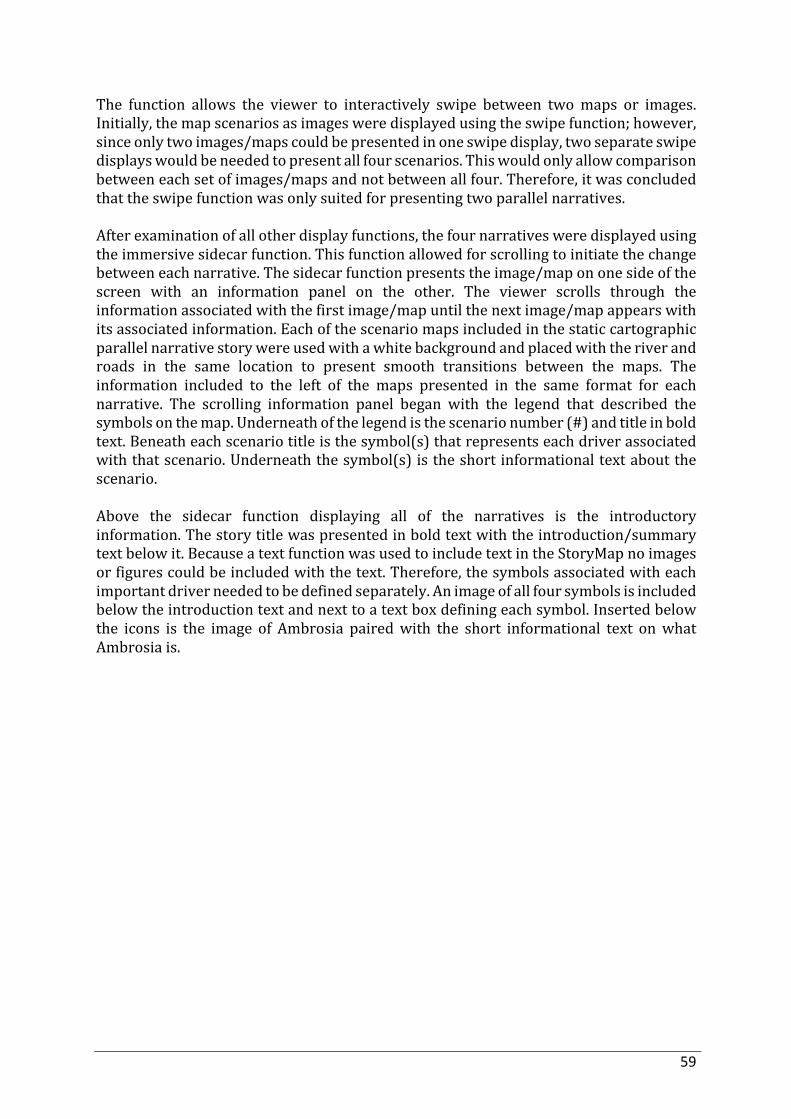
59
The function allows the viewer to interactively swipe between twomaps or images.Initially,themapscenariosasimagesweredisplayedusingtheswipefunction;however,sinceonlytwoimages/mapscouldbepresentedinoneswipedisplay,twoseparateswipedisplayswouldbeneededtopresentallfourscenarios.Thiswouldonlyallowcomparisonbetweeneachsetofimages/mapsandnotbetweenallfour.Therefore,itwasconcludedthattheswipefunctionwasonlysuitedforpresentingtwoparallelnarratives.Afterexaminationofallotherdisplayfunctions,thefournarrativesweredisplayedusingtheimmersivesidecarfunction.Thisfunctionallowedforscrollingtoinitiatethechangebetweeneachnarrative.Thesidecarfunctionpresentstheimage/mapononesideofthescreen with an information panel on the other. The viewer scrolls through theinformationassociatedwiththefirstimage/mapuntilthenextimage/mapappearswithitsassociatedinformation.Eachofthescenariomapsincludedinthestaticcartographicparallelnarrativestorywereusedwithawhitebackgroundandplacedwiththeriverandroads in the same location to present smooth transitions between the maps. Theinformation included to the left of the maps presented in the same format for eachnarrative. The scrolling information panel began with the legend that described thesymbolsonthemap.Underneathofthelegendisthescenarionumber(#)andtitleinboldtext.Beneatheachscenariotitleisthesymbol(s)thatrepresentseachdriverassociatedwiththatscenario.Underneaththesymbol(s)istheshortinformationaltextaboutthescenario.Above the sidecar function displaying all of the narratives is the introductoryinformation.Thestorytitlewaspresentedinboldtextwiththeintroduction/summarytextbelowit.BecauseatextfunctionwasusedtoincludetextintheStoryMapnoimagesorfigurescouldbeincludedwiththetext.Therefore,thesymbolsassociatedwitheachimportantdriverneededtobedefinedseparately.Animageofallfoursymbolsisincludedbelowtheintroductiontextandnexttoatextboxdefiningeachsymbol.Insertedbelowthe icons is the image of Ambrosia pairedwith the short informational text onwhatAmbrosiais.
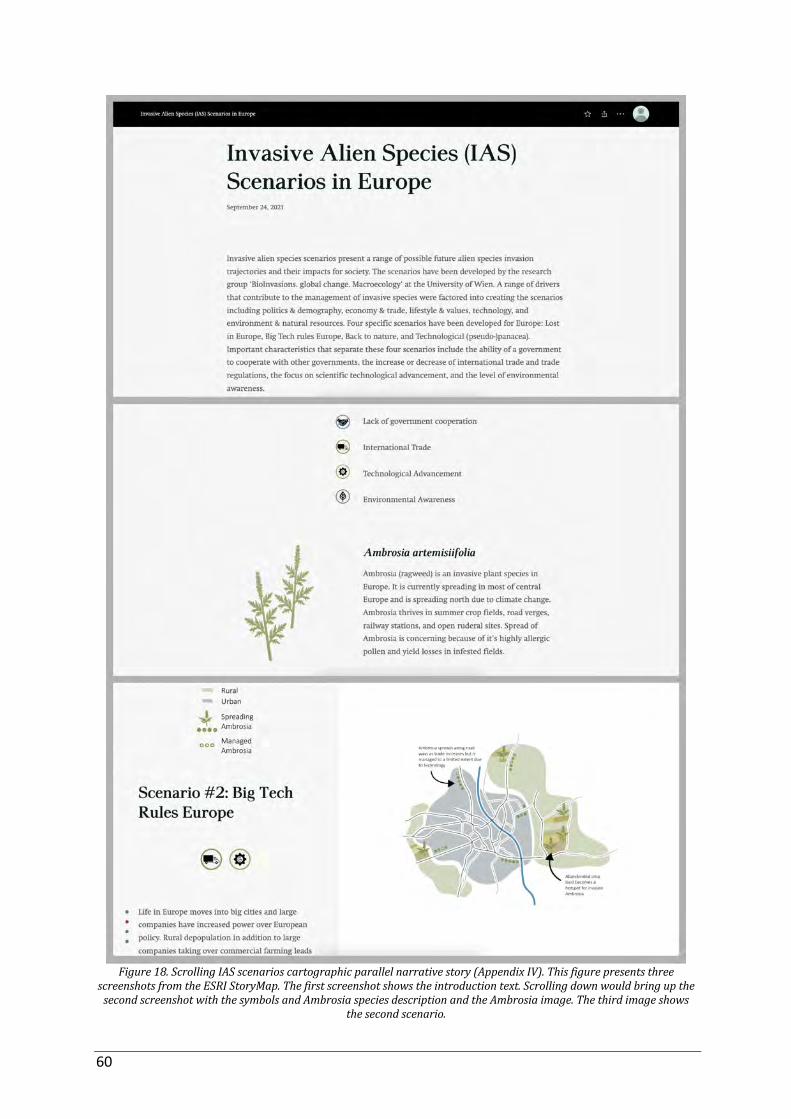
60
Figure18.ScrollingIASscenarioscartographicparallelnarrativestory(AppendixIV).Thisfigurepresentsthree
screenshotsfromtheESRIStoryMap.Thefirstscreenshotshowstheintroductiontext.ScrollingdownwouldbringupthesecondscreenshotwiththesymbolsandAmbrosiaspeciesdescriptionandtheAmbrosiaimage.Thethirdimageshows
thesecondscenario.
61
5.4 Pre-Study Questionnaire In order to test the usability of both the static and scrolling European IAS scenariocartographicparallelnarrativestories,apre-studyquestionnairewasdeveloped.Thisisa pre-study questionnaire because it will only examine a smaller subset of conceptsrelated to cartographic parallel narrative stories. The case study and resultingcartographicparallelnarrativestoriesonlypresentsonetypeoftypologyofcartographicparallel narratives. Therefore, only the Same Space – Different Point of View will beexaminedwiththisquestionnaire,aswellasasmallsubsetoftechniquesusedtopresentparallelnarrativesincartography.5.4.1 Methodology Studyquestionsweredevelopedtoaddresstheviewersperceptionofparallelnarrativesinboththestaticandscrollingcartographicstories.Thequestionsweredividedintofoursections.Thefirstsetofquestionsaddressedthestaticstory.Thesecondsetofquestionsaddressedthescrollingstory.Thethirdsetofquestionsaskeduserstocomparethestaticandscrollingstories.Thefourthsetofquestionsaskedtheusersabouttheirbackgroundinformationonthesubject.Question answerswerepresented in three formats: as a slider Likert scale, fill in theblank,ormultiplechoice.Answerswereformattedasfillintheblankwhenthequestionwaseitheroptionalandaskedforanyfurtherdetailsorwhenthequestionaskedfortheparticipanttostateanumber.Answerswereformattedasmultiplechoicefortwoselecteitherorquestions.MostanswerswereformattedasaLikertsliderscalefrom0to10(AppendixV).Severalfreesurveysiteswereexaminedincludinggoogleforms,SurveyMonkey,Survio,FreeOnlineSurvey,andTypeform.FreeOnlineSurveys.comwaschosentobuildthesurveybecauseitallowedimagestobedisplayedatvariousscalesandlinkstobeincludedinquestions and additional text. Using FreeOnlineSurvey.com the format and questionsweredividedintosixpages.Thefirstpageofthequestionnaireinformedtheusersthatnopersonaldatawouldbecollectedandprovidedadefinitionofbothcartographicstoriesandparallelnarratives.Thesecondpagewastitled:“StaticParallelCartographicStory”andpresentedthestaticEuropeanIASscenarioscartographicparallelnarrativestoryfollowedbysixquestions.The questions asked users to identify how many narratives they thought the storypresented,ratetheuseoftitles,breaklines,andsymbolsinseparatingthenarratives,andrateifitwouldbemorebeneficialtoviewthenarrativesseparately.Thethirdpagewastitled:“Scrolling(ESRI)ParallelCartographicStory”andpresentedalinktotheEuropeanIASscenarioscartographicparallelnarrativeESRIStoryMap.Userswereaskedtoopenthelinkandthenanswersixquestions.Thequestionsaskeduserstoidentify howmanynarratives they thought the storypresented, rate theuse of titles,scrolling,andsymbolsinseparatingthenarratives,andrateifitwouldbemorebeneficialtoviewthenarrativesseparately.
62
The fourthpageof thequestionnairewas titled: “Comparing theParallelCartographicStories”andhadfourquestions.Thequestionsaskeduserstoidentifyhoweffectiveeachstory was at presenting a comparison between the narratives and which story theypreferred.The fifth page of the questionnaire asked the users to rate usage ofmaps aswell aspreviousknowledgeonthetopicsofcartographicstoriesandparallelnarrative.Thefinalpageconcludedthequestionnaireandinformeduserswherethedatausedtocreatethecartographicnarrativescamefromaswellasstatedthatthevisualizationsarebasedonassumptionsandarepredictions,notfacts.ThesurveywaspostedonsocialmediaplatformssuchasLinkedInandFacebookandsentouttoprofessionalandsocialcontactsusingWhatsAppandEmail.Thesurveywasopenfor10days.Thequestionnairegot37responseswith29ofthosebeingcompleteresponses.Onlythe29completeresponseswereanalyzedintheresults.5.4.2 Results Thequestionnaireresultsprovidedinterestinginsightsintounderstandinghowparallelnarrativesandparallelnarrativetechniquesarereceivedandunderstood(AppendixVI).Static cartographic parallel narrative story question results: On average, users considered the static story to have 4 narratives. Only one personguessed2narrativesandonepersonguessed6.Ofthethreedevicesusedtoseparatethefournarratives,usersfoundbreaklinestobemosteffectivegivinganaverageratingof8,86.Secondwastheuseoftitleswithanaverageratingof8,55.Symbolswereperceivedastheleasteffectivedevicesusedtoseparatethenarrativesinthestaticstorywithanaverageratingof6,59.Whenaskedhowbeneficialitwouldbetoseparatethenarratives,with0beingnotbeneficialatalland10beingverybeneficial,onaverageusersratedita4,21.62%ofusersscoreditbelowa5,indicatingthatmostvieweditasnotbeneficial.Scrolling cartographic parallel narrative story question results: Onaverage,usersconsideredthestaticstorytohave4,03narrativeswithalluserssaying4andonlyonesaying5.Ofthethreedevicesusedtoseparatethefournarratives(titles,scrolling,andsymbols),usersfoundtitlestobemosteffectivegivinganaverageratingof8,17.Aclosesecondwastheuseofscrollingwithanaverageratingof8,07.Symbolswereperceivedastheleasteffectivedevicesusedtoseparatethenarrativesinthescrollingstorywithanaverageratingof7.Whenaskedhowbeneficialitwouldbetoseparatethenarratives,with0beingnotbeneficialatalland10beingverybeneficial,onaverageusersratedita3,86.69%ofusersscoreditbelowa5, indicatingthatmostvieweditasnotbeneficial.In comparing thequestionresults fromthestatic cartographic storyand thescrollingcartographicstory,severaldifferencescanbenoted.Onaverage,devicesusedinthestaticstorywereratedhigherthandevicesusedinthescrollingstory,althoughsymbolswere

63
rated higher in the scrolling story. In addition, on average users rated the benefit ofseparatingthenarrativeslowerforthescrollingstory.Comparing the parallel cartographic stories question results:Thefirsttwoquestionsinthissectionaskedusershoweffective(0beingnoteffectiveatalland10beingveryeffective)theythoughteachstorywasatpresentingacomparisonbetweenthenarratives.Onaverage,usersratedthestaticasa7,83ineffectivenessandthescrollingstoryasa7,03ineffectiveness.However,forbothstories55%oftheusersratedtheeffectivenessasan8orabove.Thethirdquestioninthissectionaskeduserswhichcartographicstorytheylikedbest.48%oftheuserssaidtheylikedthestaticstorybestand52%ofuserssaidtheylikethescrollingstorybest.Background knowledge questions: Three final questionswere asked in order to understand the background knowledgeusersbring to thequestionnaire.Whenaskedhowoften theyusemaps (0beingveryrarelyand10beingveryfrequently),usersonaveragerateditat8,59with83%ofusersratingitan8orabove.Whenaskedhowfamiliartheyarewithcartographicstories(0beingneverheardofthetermbeforeand10ashavingaverygoodunderstandingoftheterm),usersonaveragerateditat5,10.Whenaskedhowfamiliartheyarewithparallelnarratives (0 being never heard of the term before and 10 as having a very goodunderstandingoftheterm),usersonaveragerateditat4,59.Inconclusion theseresultsshowthat felt thatviewer thenarratives togetheraided intheirunderstandingofthestoryandthatcertaindesignelementsweremoreeffectiveindistinguishing between the narratives and therefore enforcing the viewersunderstandingthatthereweremultiplenarratives.
64
6. Discussion
Theresultsofthisthesispresentthefirststepinunderstandinghowtopresentparallelnarrativesincartographicstories.Throughqualitativecontentanalysissevencategoriesofparallelnarrativesweredeveloped:(1)TwoNarratives–OneMap,(2)TwoNarratives–MultipleMaps,(3)ManyNarratives–OneMap,(4)ManyNarratives–MultipleMaps–SpatialConnection, (5)ManyNarratives–MultipleMaps–NoSpatialConnection, (6)SameSpace–TemporalProgression,and(7)SameSpace–DifferentPointsofView.Thesecategorieswereinvestigatedfurtheranddefined.Thesecategorieshelptounderstandthevariouswaysthatparallelnarrativescanbepresentedincartographicstorytelling.Understandinghowtovisualizetwoormorenarrativesisimportantinordertoprovideviewers with complex, yet understandable, visualizations that can present multipleperspectives.6.1 Limitations Several limitations thatmayhave impacted the results of this study shouldbenoted.Further research (discussed in chapter 7.2) should be conducted to address theselimitations.Pointsoflimitationcanbedividedintocartographicstorytellingtechniques,quantitativecontentanalysis,andcasestudy.Cartographic Storytelling Techniques: Researchintocartographicstorytellingisstilldevelopingandthereforenotallmethodstechniquesmaybeoutlinedinresearchyet.Thisiswhytechniquesforpresentingvisualstorieswerealsopresentedandusedforqualitativecontentanalysis.Inadditionnotallof the techniques that are discussed when it comes to visual storytelling could bepresented.Therefore,itislikelythatnotalldesigntechniquesthatcouldbeimportantinpresentingandstructuringacartographicparallelnarrativestorieswereanalyzedinthisstudy.Qualitative Content Analysis: Thequalitativecontentanalysiswaslimitedbyseveralfactorsthatmayhaveaffectedtheresults.Thefirstlimitationisthenumberofexamplesthatwerecollected.Cartographicstorieswerecollectedfromvariousmedia,design,andcartographicsites,howevernoteveryplatformcouldbeexhaustivelysearchedtherefornoteverycartographicstorythatpresentsparallelnarrativeswascollected.Collectedcartographicstoriescouldpresentabiasbasedontheplatformsandwebsitesthattheywerecollectedfrom.Thismighthavealsohaveaeffectedonthepercentageforeachcodingcategory.Specifically,only17%ofthe cartographic parallel narrative storieswere considered interactive. This could bebecausesoftware,suchasESRIStoryMaps,thatsupportsinteractivityisnotdesignedtopresentmultiplecartographicnarratives. Itcouldalsobebecause ingeneral thereareless interactive cartographic stories or it could be that non-interactive cartographicstoriesweremoreprevalentonthesitesusedincollectingexamples.Case Study: Thecasestudypresentedonetypeofcartographicparallelnarrativestoryandthereforeonlythiscategorycouldbeexamined.InadditionthedevelopmentoftheEuropeanIAS
65
scenario cartographic parallel narrative stories was limited by time constraints andtechnical abilities. Certain design elements, such as interactivity,were not able to beexploredforthisreason.Anotherlimitationinthecasestudywasthepresentationanddistributionofthepre-studyquestionnaire.Thequestionnaireitself limitedthesizeofthestaticparallelnarrativestory,whichcouldhaveimpactedtheparticipantsperceptionof the narratives. The scrolling parallel narrative story presented with a link in thequestionnaire.Whileparticipantswereadvisedtoviewthequestionnaireonacomputer,confirmation that theydid thiswasnot required.Therefore, if the scrolling storywasviewedonasmartphoneorothersmallerscreenthepresentationandlayoutwouldhavebeenalteredandimpactedtheparticipantsperceptionofthenarratives.Inadditiontothe presentation of the stories in the questionnaire, the distribution and number ofparticipants is also a limitation to the results. The questionnaire was primarilydistributed using Facebook, LinkedIn andWhatsApp therefore, participantswere notcompletelyrandomandcouldhavepresentedabias.
66
7. Conclusion
Inconclusion,thisthesispresentsthefirststepintheexaminationofparallelnarrativesincartographicstorytelling.Research on visual storytelling and cartographic storytelling led to the collection ofdesign elements and structures used to present a story in visualizations such as acartographic story. Research on parallel narratives resulted in understanding whatdefinesaparallelnarrativeandhowparallelnarrativesarecategorized.A qualitative content analysis was conducted in which 53 examples of cartographicparallelnarrativestorieswereexaminedbasedonthedesignelementspresentedintheresearchonbothvisual/cartographicstorytellingandparallelnarratives.Basedon thequalitativecontentanalysisofexistingexamplesofcartographicparallelnarrative stories seven categories were outlined to describe cartographic parallelnarrative stories. These categories are Two Narratives – One Map, Two Narratives –MultipleMaps,ManyNarratives–OneMap,ManyNarratives–MultipleMaps–SpatialConnection,Many Narratives – Multiple Maps – No Spatial Connection, Same Space –TemporalProgression,andSameSpace–DifferentPointsofView.Apre-studycasestudyusingdatafromtheresearchgroupBioInvasions–globalchange–MacroecologyandtheprojectAlienScenarioswasconductedtotestthedesignelementsthat were found to be important in presenting parallel narratives in cartographicstorytelling.Thecasestudyandquestionnairerevealedthatthepresentationofparallelnarrativeswasusefulforinunderstandingthestory.Thecasestudyalsorevealedthatcertain design elements did better support the presentation and comparison of theparallelnarrativesinthecartographicparallelnarrativestories. Presented in this conclusion are the answers to the research questions outlined inchapter1.2.2aswellassuggestionsforfutureresearch. 7.1 Addressing the Research Questions Theanswerstotheresearchquestionssetinchapter1.2.2aresummarizedbelow. Research Question 1:Whataretheimportanttechniquesusedincartographicstorytellingtotellastory?
- Howarevisualandcartographicstoriesstructured?- Whatelements(devices)dovisualandcartographicusetoemphasizeand
enhanceastory?Inordertoanswerthefirstresearchquestionbothvisualandcartographicstorytellingwereresearchedandpresented.Examiningvisualstorytelling,inadditiontocartographicstorytelling,isimportantbecausecartographicstorytellingisaformofvisualstorytellingandutilizesmanyvisualstorytellingtechniques.Visualandcartographicstoriesuseda
67
widevarietyoftechniques,devicesandstructurestopresentastory.Insummarytheycanbebrokendownintoseveralcategories:genre,maplayout,interactivity,messaging,trope,narrativepatterns,visualnarrativetactics,andvisualstructuretactics.Genresinbothvisualandcartographicstoriesdescribehowthenarrativeisstructured.Invisualnarratives,SegelandHeer(2010,p.8)categorizesgenresbythe“numberofframes”and“orderofthevisualelements”.Incartographicnarratives,Roth(2020,p.10)categorizesgenresbythe“techniqueusedtoenforcelinearity”.Maplayoutsarealsousedtostructurethecartographicstoryaswellastheinformationpresentedinthemap.Manylayoutshelptodeterminehowmuchinformationispresentedinsideaswellasoutsideofthemapdisplay.Interactivity is an important devices used in visual and cartographic storytelling.Interactivity provides the user with a little bit to total control over the narrativeprogression.Interactivitygivesuserstheabilitytodecidehowtheyreadthestory.Narrativedesignpatternsaretechniquesthathelppresenttheflowandargumentationbehindastory(Bachetal.,2018).Visual design elements (discussed in chapter 4 and 5 as visual narrative tactics) aredevicesusedtoenhanceandassistinpresentingthestory.Theyarebrokendownintogenre,visualnarrativetactics,andnarrativestructuretactics(Segel&Heer,2010).Visualnarrativetacticsincludehighlightingandnarrativestructuretacticsincludeinteractivityandmessaging.Interactivitywasdiscussedseparatelybecauseoftheroleitplayedinthesequenceofnarratives.Therearemanyvisualdesignelementsthatcanbeusedinbothvisualandcartographicstorytelling.Visualdesignelementsthataidinstructuringandprogressingthestorylinewerefocusedoninthisstudy.Research Question 2:Howareparallelnarrativespresentedinliteratureandfilm?
- Whatdefinesaparallelnarrative?- Whattypologyisthereforparallelnarrativesinliteratureandfilm?
Aparallelnarrativeisdefinedbythepresentationoftwoormorenarrativesinonestory.Parallelnarrativesinterweavemultiplenarrativestogetherbasedonacommonthemeandadditionallyareconnectedbyanevent,character,orartifact.Allofthenarrativesareequally focused on so that the reader or viewer has an equal understanding of each.Because the reader or viewer is forced to understand multiple plotlines, multiplenarrativestendtobemorecomplexthansingularnarratives.Thisiswhythestructureanddevicesusedtodistinguishbetweenthenarrativesisimportant.Literature and film present two separatemodes for classifying parallel narratives. Inliterature,parallelnarrativesareclassifiedbythelinkthatconnectsthenarratives.Thelinksareevent, story, time,andartifact.Thestory link isbrokendown furtherby thenumberofstoriestold.Dothenarrativesbuildoneachastimeprogressesordoeseachnarrativehaveasub-storythatissomehowinterwovenwiththeothersub-stories.Thecategories are: One event - Multiple Perspectives, One story - Multiple Perspectives,Multiplestories-MultiplePerspectives-Intertwined,ThenandNow,andParallelStories
68
(Koss,2009).Infilm,parallelnarrativesarefirstclassifiedbythelinearityofthestoryand second by the interaction between the narratives. The categories are: tandem,multiple protagonist, double journey, flashback, consecutive-stories and fracturedtandem(Aronson,2010). Research Question 3:Howcancartographicparallelnarrativestoriesbeclassified?
- Whattechniquesorcharacteristicsdoexistingexamplesofparallelnarrativesincartographicstorieshave?
Qualitativecontentanalysiswasusedtodeterminehowcartographicparallelnarrativestoriescouldbeclassified.Theywereclassifiedintosevencategories:(1)TwoNarratives–OneMap,(2)TwoNarratives–MultipleMaps,(3)ManyNarratives–OneMap,(4)ManyNarratives–MultipleMaps–SpatialConnection,(5)ManyNarratives–MultipleMaps–NoSpatialConnection,(6)SameSpace–TemporalProgression,and(7)SameSpace–DifferentPointsofView.Categorizationwasbasedonseveralconceptsincluding:whatlinked the twonarratives, how the twonarratives interacted in the visualization, andwhatvisualelementsguidedtheviewerbetweenthenarrativesThequalitativecontentanalysispresentedabetterunderstandingofwhattechniquesareusedincartographicparallelnarrativestories.Forgenresofcartographicstories,staticvisual stories and longform infographicswere both usedmore frequently than othergenres.Thepartialmap layoutwas themost frequentlyusedmap layout.Moreof theexamplespresentedmultiplemapswithmostofthesinglemapexamplesfallingunderthetwocategoriescontainingOneMap.Thetropes,settingthemood,enforcinglinearityandinformationdosing,wereallheavilyusedincreatingcartographicparallelnarrativestories.Thesetropeswereimportantinpresentingmultiplenarratives.Importantvisualnarrative tactics were the use of repetition and juxtaposition. Color was a commonmethodusedtoseparatethenarratives.MorenarrativeswereclassifiedascontrastingwithamajorityofthenarrativesthatwereclassifiedascomplimentaryfallingunderthecategorySameSpace–TemporalProgression.Research Question 4:Whatdesignelementsortechniquesaremosteffectiveindistinguishingbetweenaswellasprovidingacomparisonofparallelnarrativesincartographicstorytelling?
- How can the data from the research group BioInvasions – global change –MacroecologyattheUniversityofWienbepresentedinacartographicstory?
Thedatafromthe researchgroupBioInvasions–globalchange–MacroecologyattheUniversity ofWien presented as a Same Space – Different Point of View cartographicparallelnarrativestory.Designelementsarenotexclusivetoonecategoryofcartographicparallelnarrativestoryandtherefordecisionsstillneededtobedecideduponbasedonthespecificdata.Althoughtherearemanydifferentwaystodisplaythenarrativesitwasdecidedtocreatetwocartographicstories,onestaticandonescrolling,basedonseveralfactors.A questionnaire was designed to test what design elements or techniques are mosteffective in distinguishing between as well as providing a comparison of parallelnarrativesinboththestaticandscrollingcartographicparallelnarrativestory.Asaresultitwasdiscoveredthatthedevicesusedinbothstoriesdidprovideparticipantswiththe
69
generalunderstandingthattherewasfournarrativesineachstory.Forthestaticstorybreaklineswereratedthehighestintheireffectivenessinseparatingthenarratives.Forthescrollingstorytitleswereratedthehighest intheireffectivenessinseparatingthenarratives.7.2 Outlook This thesis only presents the first step into research on the presentation of parallelnarrativesincartographicstorytelling.Therearemanyavenuesforcontinuedresearch.Future research on parallel narratives in cartographic storytelling should focus ondevelopingabetterunderstandingofhowtechniques,structures,anddesignelementsareusedindisplayingparallelnarratives.Thisincludesfurtherresearchontechniques,structures,anddesignelementsthatareusedincartographicstorytelling,whichwouldresultinmorecodestobeusedinanalysisofexistingexamples.Inaddition,thisincludesthecollectionandanalysisofmoreexamplesofcartographicparallelnarrativesstories.Thiscouldaddtothedevelopmentofthecategoriesofparallelnarrativesincartographicstorytelling outlined in this thesis or it could present contradictions that modify thecategories.Whilethecasestudyusedonesoftwareplatform,ESRIStoryMaps,tocreatethescrollingIAS scenarios cartographic parallel narrative story, current platforms that help userscreatetheirowncartographicstorywerenotexamined.Platformsandsoftware,suchasESRI,thathelpuserscreatecartographicstoriescouldbeexaminedbasedontheirabilitytoprovidedevicesthatsupportthepresentationofparallelnarratives.Theseprogramscontinuallydevelopnewfeaturethatmakethecartographicstorytellingprocessmoreintuitiveanduserfriendly.Ifcurrentlytheydonotcontainfeaturesthatallowuserstopresentparallelnarratives,willfeaturesbeaddedasthediscussiononparallelnarrativesincartographicstorytellingcontinues?Futureresearchcouldalsopresentamoreindepthcasestudyoneachcategoryofparallelnarratives in cartographic storytelling.Each category shouldbe researched further tobetterunderstandwhattechniquesandstructurescanbeusedineach.Finallyfutureresearchshouldexaminehowparallelnarrativescanbeusedtoenhanceusers understanding of complex concepts. The presentations of parallel narratives inliteratureand filmhave increasedbecause theypresent a complexandmore realisticdepictionoftheworldaroundus.Onlinenewsandsocialmediaisrapidlyexpandingintoeverydaylife.Thisallowsforarapidintakeofallsortsoflocal,regionalandinternationalstories.Withsomanystoriesspreadinganddevelopinginrealtimeitisalwaysimportanttounderstandthattherearetwoormoresidetoeacheverystory.Cartographicstorieshave long been used to present and advance one narrative and it is time to betterunderstandhowcartographicstorytellingcandisplayparallelnarrativesthatcanbetterrepresentthecomplexrealitybehindmoststories.

70
71
References
Alb a Gon. (2020, August 5). Maps. Behance.
https://www.behance.net/gallery/101946121/maps
Aronson, L. (2010). The 21st century screenplay: A comprehensive guide to writing
tomorrow’s films. Allen & Unwin.
Bach, B., Stefaner, M., Boy, J., Drucker, S., Bartram, L., Wood, J., Ciuccarelli, P., Engelhardt,
Y., Köppen, U., & Tversky, B. (2018). Narrative Design Patterns for Data-Driven
Storytelling. In N. H. Riche, C. Hurter, N. Diakopoulos, & S. Carpendale (Eds.), Data-
Driven Storytelling (1st ed., pp. 107–133). A K Peters/CRC Press.
https://doi.org/10.1201/9781315281575-5
Brashares, A. (2014). The sisterhood of the traveling pants. Ember.
Camboni, M. (2012). Parallel Lives: Tandem Narratives in Film. RMIT University.
Caquard, S. (2013). Cartography I: Mapping narrative cartography. Progress in Human
Geography, 37(1), 135–144. https://doi.org/10.1177/0309132511423796
Caquard, S., & Bryne, A. (2009). Mapping Globalization: A Conversation between a
Filmmaker and a Cartographer. The Cartographic Journal, 46(4), 372–378.
https://doi.org/10.1179/000870409X12554350947340
Caquard, S., & Cartwright, W. (2014). Narrative Cartography: From Mapping Stories to the
Narrative of Maps and Mapping. The Cartographic Journal, 51(2), 101–106.
https://doi.org/10.1179/0008704114Z.000000000130
Cartwright, W., & Field, K. (2015). Exploring cartographic storytelling. Reflections on
mapping real-life and fictional stories. 9.
72
Chatman, S. (2007). Story and discourse: Narrative structure in fiction and film. Cornell
University Press.
Cohn, N. (2013). Visual Narrative Structure. Cognitive Science, 37(3), 413–452.
https://doi.org/10.1111/cogs.12016
Daldry, S., Streep, M., Kidman, N., & Moore, J. (2003, February 14). The Hours [Drama,
Romance]. Paramount Pictures, Miramax, Scott Rudin Productions.
Denil, M. (2017). Storied Maps. Cartographic Perspectives, 84, 5–22.
https://doi.org/10.14714/CP84.1374
Digital Storytelling with Maps | ArcGIS StoryMaps. (n.d.). Retrieved October 6, 2021, from
https://www.esri.com/en-us/arcgis/products/arcgis-storymaps/overview
Essl, F. (2021, September 28). Ragweed_EurASNs Excel Document [Personal
communication].
Essl, F., Biró, K., Brandes, D., Broennimann, O., Bullock, J. M., Chapman, D. S., Chauvel, B.,
Dullinger, S., Fumanal, B., Guisan, A., Karrer, G., Kazinczi, G., Kueffer, C., Laitung, B.,
& Lavoie, C. (2015). Biological Flora of the British Isles: Ambrosia artemisiifolia.
Journal of Ecology, 103(4), 1069–1098. https://doi.org/10.1111/1365-2745.12424
Essl, F., Lenzner, B., Liu, D., García, A., Glaser, M., Schertler, A., Omer, A., Vorstenbosch, T.,
& Latombe, G. (n.d.). Bio Invasions—Global change. Macroecology. Bio Invasions -
Global Change. Macroecology.
Figueiras, A. (2014). How to Tell Stories Using Visualization. 9.
Gaigg, M. (n.d.). Map UI Patterns. Retrieved August 25, 2021, from
https://www.mapuipatterns.com/
Gershon, N., & Page, W. (2001). What storytelling can do for information visualization.
Communications of the ACM, 44(8), 31–37. https://doi.org/10.1145/381641.381653
73
Groß, S. (2016, May 27). Card Sorting – What, how and why? Testbirds.
https://www.testbirds.com/blog/card-sorting-what-how-and-why/
Haddix, M. P. (2012). Turnabout. Paw Prints.
How to Write a Novel with Multiple Points of View. (n.d.). NY Book Editors. Retrieved August
26, 2021, from https://nybookeditors.com/2016/09/write-novel-multiple-points-
view/
Hsieh, H.-F., & Shannon, S. (2005). Three Approaches to Qualitative Content Analysis.
Qualitative Health Research, 15, 1277–1288.
https://doi.org/10.1177/1049732305276687
Hullman, J., Drucker, S., Riche, N. H., Bongshin Lee, Fisher, D., & Adar, E. (2013). A Deeper
Understanding of Sequence in Narrative Visualization. IEEE Transactions on
Visualization and Computer Graphics, 19(12), 2406–2415.
https://doi.org/10.1109/TVCG.2013.119
InvasiBES. (n.d.). Elabs. Retrieved October 3, 2021, from
http://elabs.ebd.csic.es/web/invasibes/home
Kass, P. (2006). Real time. Grafia.
Kim, N. W., Bach, B., Im, H., Schriber, S., Gross, M., & Pfister, H. (2018). Visualizing Nonlinear
Narratives with Story Curves. IEEE Transactions on Visualization and Computer
Graphics, 24(1), 595–604. https://doi.org/10.1109/TVCG.2017.2744118
Koss, M. D. (2009). Young Adult Novels with Multiple Narrative Perspectives: The Changing
Nature of YA Literature. The ALAN Review, 36(3).
https://doi.org/10.21061/alan.v36i3.a.9
74
Kwan-Liu Ma, Liao, I., Frazier, J., Hauser, H., & Kostis, H.-N. (2012). Scientific Storytelling
Using Visualization. IEEE Computer Graphics and Applications, 32(1), 12–19.
https://doi.org/10.1109/MCG.2012.24
Learning Center. (n.d.). How to Structure a Story: The Fundamentals of Narrative. Aurthor
Learning Center. Retrieved June 22, 2021, from
https://www.authorlearningcenter.com/writing/fiction/w/plot-planning/6366/how-
to-structure-a-story-the-fundamentals-of-narrative---article
López, A. L. (2015). What if it was your city [Map]. South China Morning Post.
https://www.scmp.com/infographics/article/1848416/infographic-atomic-bomb-
what-if-it-was-your-city
McCaughrean, G. (2004). Not the end of the world. Oxford University Press.
Muehlenhaus, I. (2011). Genealogy That Counts: Using Content Analysis to Explore the
Evolution of Persuasive Cartography. Cartographica: The International Journal for
Geographic Information and Geovisualization, 46(1), 28–40.
https://doi.org/10.3138/carto.46.1.28
NAPA Cards. (2016). Napa Cards. http://napa-cards.net/#info
Nussbaumer Knaflic, C. (2020, May 21). The structure(s) of story. Storytelling with Data.
https://www.storytellingwithdata.com/blog/2020/5/21/the-structures-of-story
Pepple, S. (2010). Great Migrations [Map]. National Geographic Magazine.
Prueitt, M., & Mellett, J. (1985). Earthquake and Volcanic Risk [Map]. National Geographic
Maps.
Rankin, B. (2016). American Slavery. Radical Cartography.
http://www.radicalcartography.net/index.html?slavery
Riffenburgh, B. (2014). Mapping the World: The Story of Cartography. Carlton Books.
75
Rodríguez, M. T., Nunes, S., & Devezas, T. (2015). Telling Stories with Data Visualization.
Proceedings of the 2015 Workshop on Narrative & Hypertext - NHT ’15, 7–11.
https://doi.org/10.1145/2804565.2804567
Roth, J. (2010). Life is Messy: An Exploration of Parallel Narrative. RMIT University.
Roth, R. E. (2015). Interactivity and Cartography: A Contemporary Perspective on User
Interface and User Experience Design from Geospatial Professionals. Cartographica:
The International Journal for Geographic Information and Geovisualization, 50(2),
94–115. https://doi.org/10.3138/cart.50.2.2427
Roth, R. E. (2020). Cartographic Design as Visual Storytelling: Synthesis and Review of Map-
Based Narratives, Genres, an. THE CARTOGRAPHIC JOURNAL, 33.
https://doi.org/10.1080/00087041.2019.1633103
Roura-Pascual, N., Leung, B., Rabitsch, W., Rutting, L., Vervoort, J., Bacher, S., Dullinger, S.,
Erb, K.-H., Jeschke, J. M., Katsanevakis, S., Kühn, I., Lenzner, B., Liebhold, A. M.,
Obersteiner, M., Pauchard, A., Peterson, G. D., Roy, H. E., Seebens, H., Winter, M., …
Essl, F. (2021). Alternative futures for global biological invasions [Preprint]. Ecology.
https://doi.org/10.1101/2021.01.15.426694
Saul, Dr. W.-C., & Jeschke, Prof. Dr. J. M. (n.d.). European ASNs [Personal Correspondence
PowerPoint Presentation].
Segel, E., & Heer, J. (2010). Narrative Visualization: Telling Stories with Data. IEEE
Transactions on Visualization and Computer Graphics, 16(6), 1139–1148.
https://doi.org/10.1109/TVCG.2010.179
Sherwin, K. (2018, March 18). Card Sorting: Uncover Users’ Mental Models for Better
Information Architecture. Nielsen Norman Group.
https://www.nngroup.com/articles/card-sorting-definition/
76
Singer, B., Spacey, K., Byrne, G., & Palminteri, C. (1995, August 16). The Usual Suspects
[Crime, Mystery, Thriller]. PolyGram Filmed Entertainment, Spelling Films
International, Blue Parrot.
Skelton, M. (2008). Endymion Spring. Delacorte Press.
Smith, J. M. (1996). Geographical Rhetoric: Modes and Tropes of Appeal. Annals of the
Association of American Geographers, 86(1), 1–20. https://doi.org/10.1111/j.1467-
8306.1996.tb01743.x
Soderbergh, S., Douglas, M., Toro, B. D., & Zeta-Jones, C. (2001, January 5). Traffic [Crime,
Drama, Thriller]. Compulsion Inc., Initial Entertainment Group (IEG), Splendid Medien
AG.
Song, Z. (2017). MAP-BASED VISUAL STORYTELLING: AN ASSESSMENT OF EMERGING
GENRES AND TROPES. UNIVERSITY OF WISCONSIN–MADISON.
Stanton, A., Unkrich, L., Brooks, A., DeGeneres, E., & Gould, A. (2003, May 30). Finding
Nemo [Animation, Adventure, Comedy]. Pixar Animation Studios, Walt Disney
Pictures.
Swicord, R., Baker, K., Dancy, H., & Brenneman, A. (2007, October 5). The Jane Austen Book
Club [Comedy, Drama, Romance]. Mockingbird Pictures, John Calley Productions.
Thöny, M., Schnürer, R., Sieber, R., Hurni, L., & Pajarola, R. (2018). Storytelling in Interactive
3D Geographic Visualization Systems. ISPRS International Journal of Geo-Information,
7(3), 123. https://doi.org/10.3390/ijgi7030123
Tong, C., Roberts, R., Borgo, R., Walton, S., Laramee, R., Wegba, K., Lu, A., Wang, Y., Qu, H.,
Luo, Q., & Ma, X. (2018). Storytelling and Visualization: An Extended Survey.
Information, 9(3), 65. https://doi.org/10.3390/info9030065
77
Tykwer, T., Potente, F., Bleibtreu, M., & Knaup, H. (1999, June 18). Lola rennt [Crime, Drama,
Thriller]. X-Filme Creative Pool, Arte Deutschland TV, Westdeutscher Rundfunk
(WDR).
Van City Studios. (n.d.). Time to Choose! Are Some Public Lands Too Valuable To Be
Destroyed? Conservation Lands Foundation. Retrieved September 14, 2021, from
https://www.conservationlands.org/time_to_choose
Wallace, T. (2011). Radio Rivalry—Red Sox and Yankees Radio Networks [Map].
bostonography. https://bostonography.com/wp-
content/uploads/2011/07/bostonography0710radioRivalry.png
What is a Narrative Arc? • A Guide to Storytelling Structure. (2017, July 18). Reedsy.
https://blog.reedsy.com/narrative-arc/
Wright, S. E. (2017, July 6). Writing a Dual Narrative. Susan Elliot Wright.
https://susanelliotwright.co.uk/writing-a-dual-narrative/
78
Appendix
Appendix I – Complete coding table of existing examples Seeattachedfile“QCAData.xlsx”
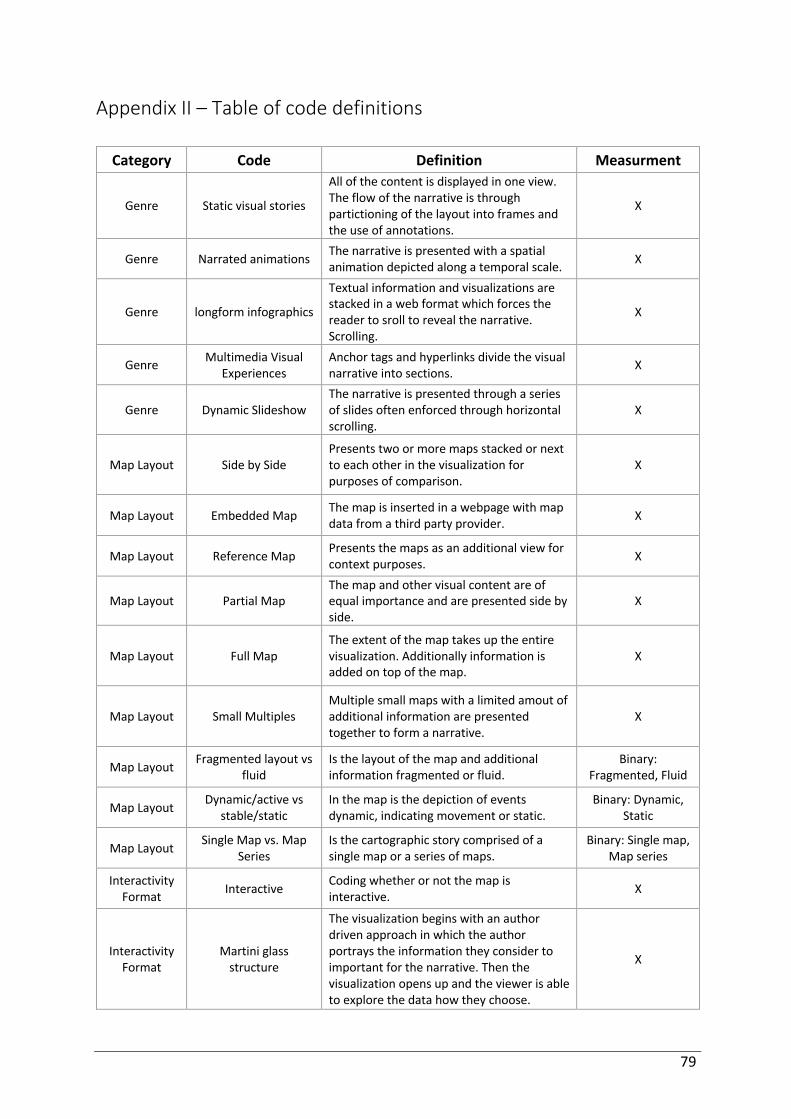
79
Appendix II – Table of code definitions
Category Code Definition Measurment
Genre Static visual stories
All of the content is displayed in one view. The flow of the narrative is through partictioning of the layout into frames and the use of annotations.
X
Genre Narrated animations The narrative is presented with a spatial animation depicted along a temporal scale. X
Genre longform infographics
Textual information and visualizations are stacked in a web format which forces the reader to sroll to reveal the narrative. Scrolling.
X
Genre Multimedia Visual Experiences
Anchor tags and hyperlinks divide the visual narrative into sections. X
Genre Dynamic Slideshow The narrative is presented through a series of slides often enforced through horizontal scrolling.
X
Map Layout Side by Side Presents two or more maps stacked or next to each other in the visualization for purposes of comparison.
X
Map Layout Embedded Map The map is inserted in a webpage with map data from a third party provider. X
Map Layout Reference Map Presents the maps as an additional view for context purposes. X
Map Layout Partial Map The map and other visual content are of equal importance and are presented side by side.
X
Map Layout Full Map The extent of the map takes up the entire visualization. Additionally information is added on top of the map.
X
Map Layout Small Multiples Multiple small maps with a limited amout of additional information are presented together to form a narrative.
X
Map Layout Fragmented layout vs fluid
Is the layout of the map and additional information fragmented or fluid.
Binary: Fragmented, Fluid
Map Layout Dynamic/active vs stable/static
In the map is the depiction of events dynamic, indicating movement or static.
Binary: Dynamic, Static
Map Layout Single Map vs. Map Series
Is the cartographic story comprised of a single map or a series of maps.
Binary: Single map, Map series
Interactivity Format Interactive Coding whether or not the map is
interactive. X
Interactivity Format
Martini glass structure
The visualization begins with an author driven approach in which the author portrays the information they consider to important for the narrative. Then the visualization opens up and the viewer is able to explore the data how they choose.
X
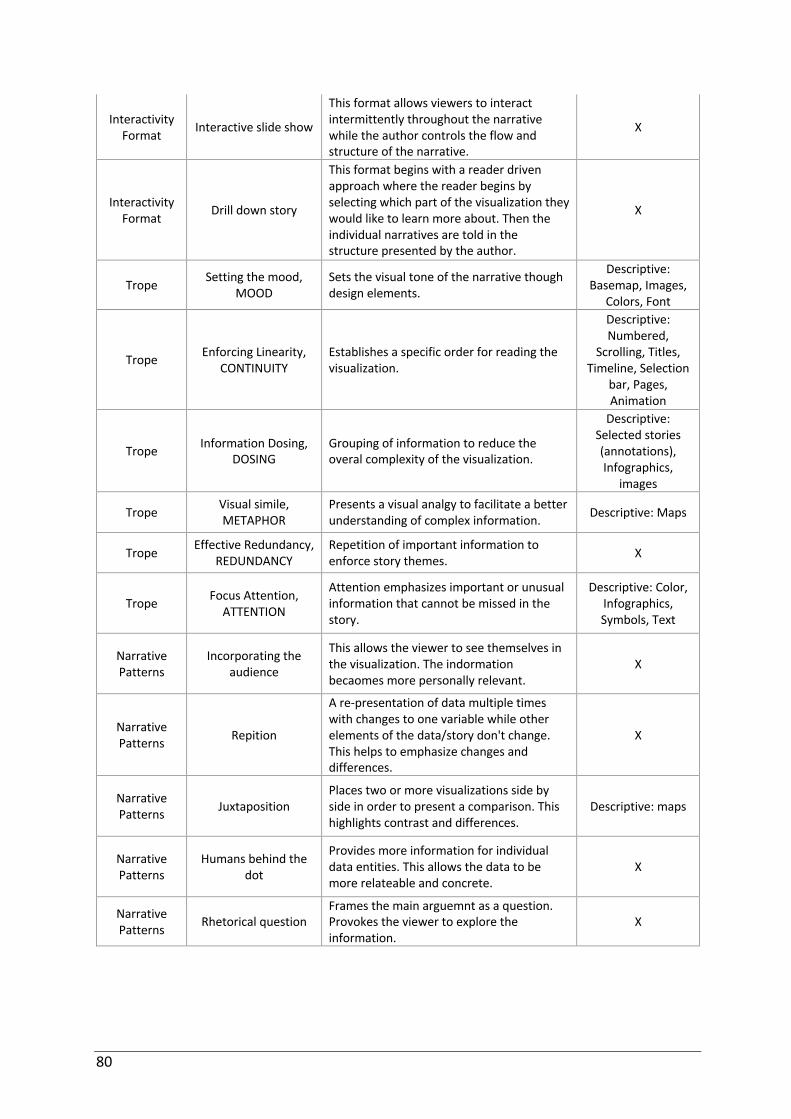
80
Interactivity Format Interactive slide show
This format allows viewers to interact intermittently throughout the narrative while the author controls the flow and structure of the narrative.
X
Interactivity Format Drill down story
This format begins with a reader driven approach where the reader begins by selecting which part of the visualization they would like to learn more about. Then the individual narratives are told in the structure presented by the author.
X
Trope Setting the mood, MOOD
Sets the visual tone of the narrative though design elements.
Descriptive: Basemap, Images,
Colors, Font
Trope Enforcing Linearity, CONTINUITY
Establishes a specific order for reading the visualization.
Descriptive: Numbered,
Scrolling, Titles, Timeline, Selection
bar, Pages, Animation
Trope Information Dosing, DOSING
Grouping of information to reduce the overal complexity of the visualization.
Descriptive: Selected stories (annotations), Infographics,
images
Trope Visual simile, METAPHOR
Presents a visual analgy to facilitate a better understanding of complex information. Descriptive: Maps
Trope Effective Redundancy, REDUNDANCY
Repetition of important information to enforce story themes. X
Trope Focus Attention, ATTENTION
Attention emphasizes important or unusual information that cannot be missed in the story.
Descriptive: Color, Infographics, Symbols, Text
Narrative Patterns
Incorporating the audience
This allows the viewer to see themselves in the visualization. The indormation becaomes more personally relevant.
X
Narrative Patterns Repition
A re-presentation of data multiple times with changes to one variable while other elements of the data/story don't change. This helps to emphasize changes and differences.
X
Narrative Patterns Juxtaposition
Places two or more visualizations side by side in order to present a comparison. This highlights contrast and differences.
Descriptive: maps
Narrative Patterns
Humans behind the dot
Provides more information for individual data entities. This allows the data to be more relateable and concrete.
X
Narrative Patterns Rhetorical question
Frames the main arguemnt as a question. Provokes the viewer to explore the information.
X
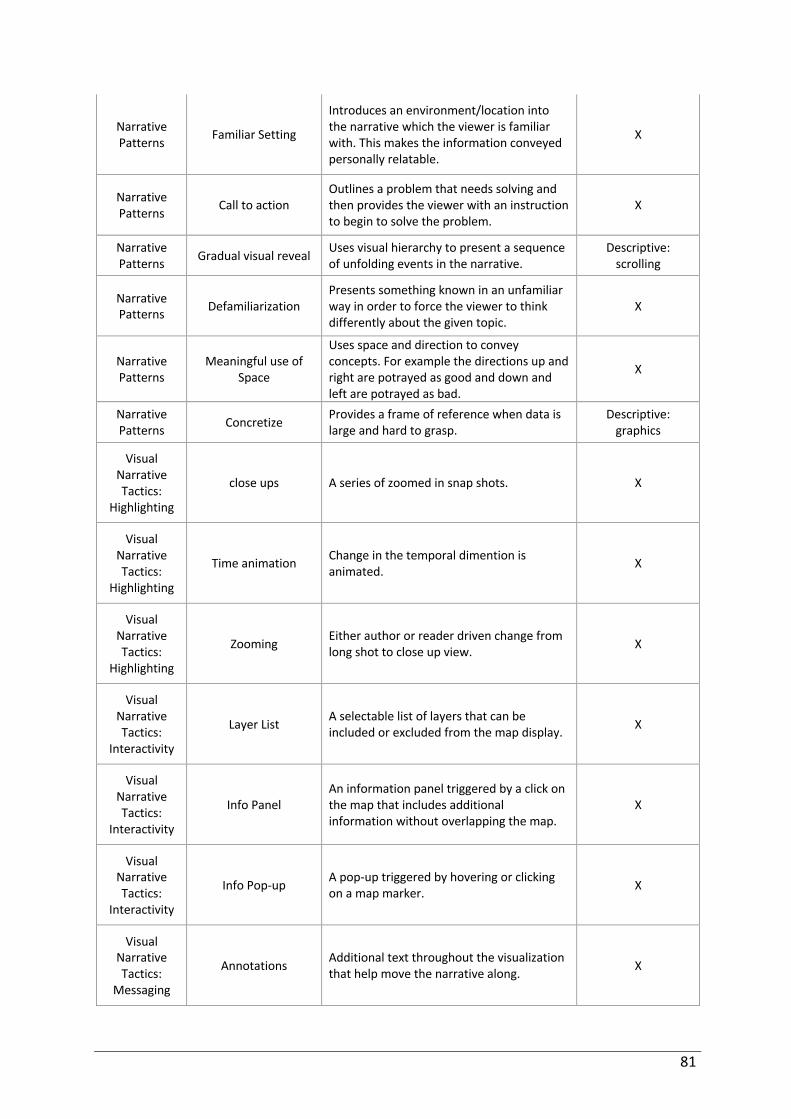
81
Narrative Patterns Familiar Setting
Introduces an environment/location into the narrative which the viewer is familiar with. This makes the information conveyed personally relatable.
X
Narrative Patterns Call to action
Outlines a problem that needs solving and then provides the viewer with an instruction to begin to solve the problem.
X
Narrative Patterns Gradual visual reveal Uses visual hierarchy to present a sequence
of unfolding events in the narrative. Descriptive:
scrolling
Narrative Patterns Defamiliarization
Presents something known in an unfamiliar way in order to force the viewer to think differently about the given topic.
X
Narrative Patterns
Meaningful use of Space
Uses space and direction to convey concepts. For example the directions up and right are potrayed as good and down and left are potrayed as bad.
X
Narrative Patterns Concretize Provides a frame of reference when data is
large and hard to grasp. Descriptive:
graphics
Visual Narrative Tactics:
Highlighting
close ups A series of zoomed in snap shots. X
Visual Narrative Tactics:
Highlighting
Time animation Change in the temporal dimention is animated. X
Visual Narrative Tactics:
Highlighting
Zooming Either author or reader driven change from long shot to close up view. X
Visual Narrative Tactics:
Interactivity
Layer List A selectable list of layers that can be included or excluded from the map display. X
Visual Narrative Tactics:
Interactivity
Info Panel An information panel triggered by a click on the map that includes additional information without overlapping the map.
X
Visual Narrative Tactics:
Interactivity
Info Pop-up A pop-up triggered by hovering or clicking on a map marker. X
Visual Narrative Tactics:
Messaging
Annotations Additional text throughout the visualization that help move the narrative along. X
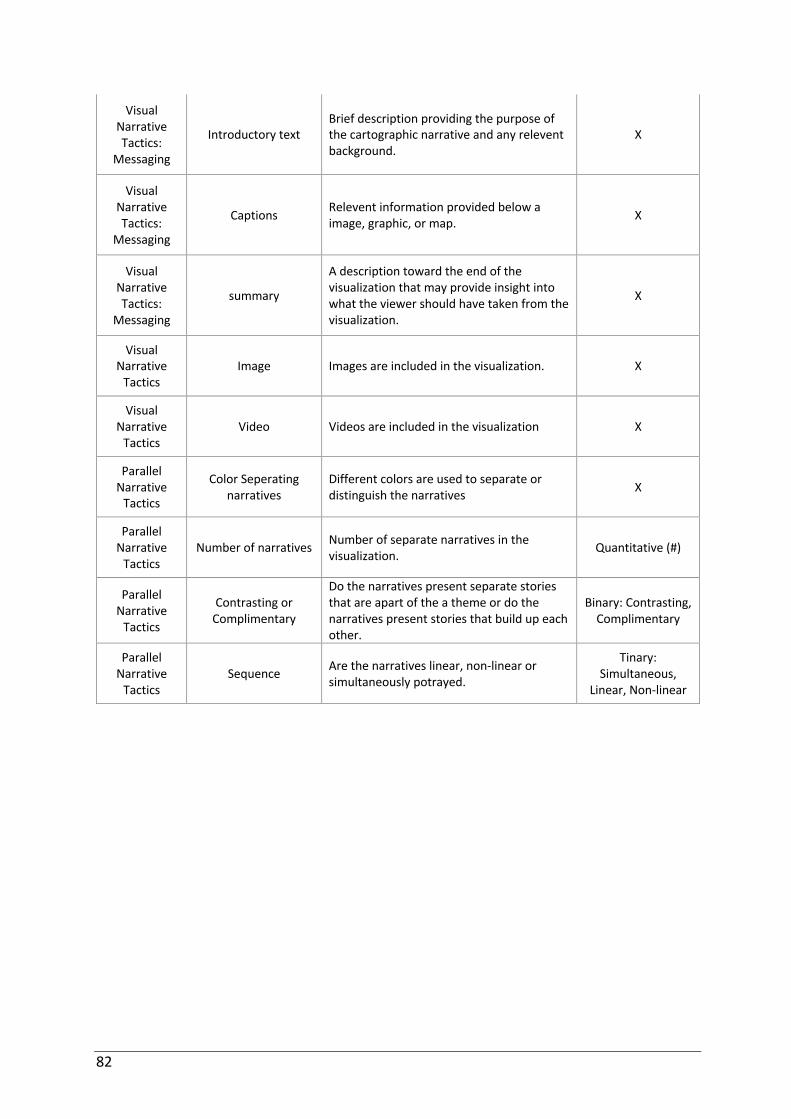
82
Visual Narrative Tactics:
Messaging
Introductory text Brief description providing the purpose of the cartographic narrative and any relevent background.
X
Visual Narrative Tactics:
Messaging
Captions Relevent information provided below a image, graphic, or map. X
Visual Narrative Tactics:
Messaging
summary
A description toward the end of the visualization that may provide insight into what the viewer should have taken from the visualization.
X
Visual Narrative
Tactics Image Images are included in the visualization. X
Visual Narrative
Tactics Video Videos are included in the visualization X
Parallel Narrative
Tactics
Color Seperating narratives
Different colors are used to separate or distinguish the narratives X
Parallel Narrative
Tactics Number of narratives Number of separate narratives in the
visualization. Quantitative (#)
Parallel Narrative
Tactics
Contrasting or Complimentary
Do the narratives present separate stories that are apart of the a theme or do the narratives present stories that build up each other.
Binary: Contrasting, Complimentary
Parallel Narrative
Tactics Sequence Are the narratives linear, non-linear or
simultaneously potrayed.
Tinary: Simultaneous,
Linear, Non-linear
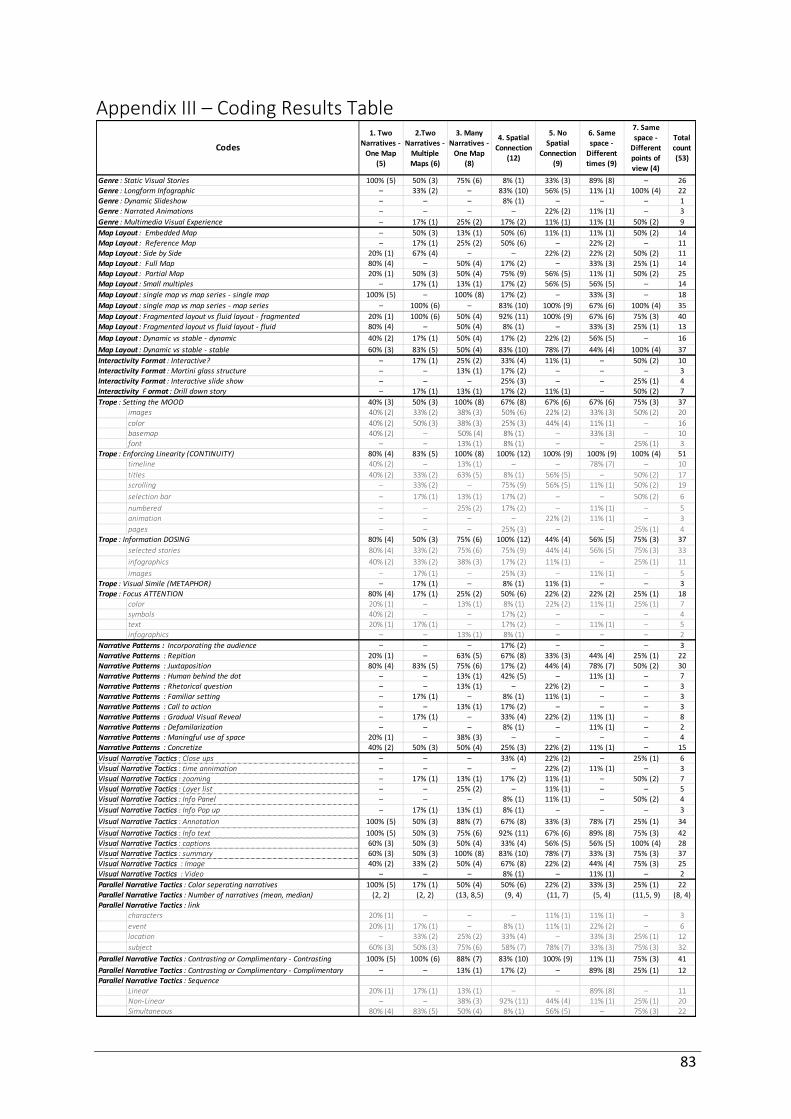
83
Appendix III – Coding Results Table
1. Two Narratives -
One Map (5)
2.Two Narratives -
Multiple Maps (6)
3. Many Narratives -
One Map (8)
4. Spatial Connection
(12)
5. No Spatial
Connection (9)
6. Same space -
Different times (9)
7. Same space -
Different points of view (4)
Total count (53)
100% (5) 50% (3) 75% (6) 8% (1) 33% (3) 89% (8) – 26– 33% (2) – 83% (10) 56% (5) 11% (1) 100% (4) 22– – – 8% (1) – – – 1– – – – 22% (2) 11% (1) – 3– 17% (1) 25% (2) 17% (2) 11% (1) 11% (1) 50% (2) 9– 50% (3) 13% (1) 50% (6) 11% (1) 11% (1) 50% (2) 14– 17% (1) 25% (2) 50% (6) – 22% (2) – 11
20% (1) 67% (4) – – 22% (2) 22% (2) 50% (2) 1180% (4) – 50% (4) 17% (2) – 33% (3) 25% (1) 1420% (1) 50% (3) 50% (4) 75% (9) 56% (5) 11% (1) 50% (2) 25
– 17% (1) 13% (1) 17% (2) 56% (5) 56% (5) – 14100% (5) – 100% (8) 17% (2) – 33% (3) – 18
– 100% (6) – 83% (10) 100% (9) 67% (6) 100% (4) 3520% (1) 100% (6) 50% (4) 92% (11) 100% (9) 67% (6) 75% (3) 4080% (4) – 50% (4) 8% (1) – 33% (3) 25% (1) 1340% (2) 17% (1) 50% (4) 17% (2) 22% (2) 56% (5) – 1660% (3) 83% (5) 50% (4) 83% (10) 78% (7) 44% (4) 100% (4) 37
– 17% (1) 25% (2) 33% (4) 11% (1) – 50% (2) 10– – 13% (1) 17% (2) – – – 3– – – 25% (3) – – 25% (1) 4– 17% (1) 13% (1) 17% (2) 11% (1) – 50% (2) 7
40% (3) 50% (3) 100% (8) 67% (8) 67% (6) 67% (6) 75% (3) 37images 40% (2) 33% (2) 38% (3) 50% (6) 22% (2) 33% (3) 50% (2) 20color 40% (2) 50% (3) 38% (3) 25% (3) 44% (4) 11% (1) – 16basemap 40% (2) – 50% (4) 8% (1) – 33% (3) – 10font – – 13% (1) 8% (1) – – 25% (1) 3
80% (4) 83% (5) 100% (8) 100% (12) 100% (9) 100% (9) 100% (4) 51timeline 40% (2) – 13% (1) – – 78% (7) – 10titles 40% (2) 33% (2) 63% (5) 8% (1) 56% (5) – 50% (2) 17scrolling – 33% (2) – 75% (9) 56% (5) 11% (1) 50% (2) 19selection bar – 17% (1) 13% (1) 17% (2) – – 50% (2) 6numbered – – 25% (2) 17% (2) – 11% (1) – 5animation – – – – 22% (2) 11% (1) – 3pages – – – 25% (3) – – 25% (1) 4
80% (4) 50% (3) 75% (6) 100% (12) 44% (4) 56% (5) 75% (3) 37selected stories 80% (4) 33% (2) 75% (6) 75% (9) 44% (4) 56% (5) 75% (3) 33infographics 40% (2) 33% (2) 38% (3) 17% (2) 11% (1) – 25% (1) 11images – 17% (1) – 25% (3) – 11% (1) – 5
– 17% (1) – 8% (1) 11% (1) – – 380% (4) 17% (1) 25% (2) 50% (6) 22% (2) 22% (2) 25% (1) 18
color 20% (1) – 13% (1) 8% (1) 22% (2) 11% (1) 25% (1) 7symbols 40% (2) – – 17% (2) – – – 4text 20% (1) 17% (1) – 17% (2) – 11% (1) – 5infographics – – 13% (1) 8% (1) – – – 2
– – – 17% (2) – – – 320% (1) – 63% (5) 67% (8) 33% (3) 44% (4) 25% (1) 2280% (4) 83% (5) 75% (6) 17% (2) 44% (4) 78% (7) 50% (2) 30
– – 13% (1) 42% (5) – 11% (1) – 7– – 13% (1) – 22% (2) – – 3– 17% (1) – 8% (1) 11% (1) – – 3– – 13% (1) 17% (2) – – – 3– 17% (1) – 33% (4) 22% (2) 11% (1) – 8– – – 8% (1) – 11% (1) – 2
20% (1) – 38% (3) – – – – 440% (2) 50% (3) 50% (4) 25% (3) 22% (2) 11% (1) – 15
– – – 33% (4) 22% (2) – 25% (1) 6– – – – 22% (2) 11% (1) – 3– 17% (1) 13% (1) 17% (2) 11% (1) – 50% (2) 7– – 25% (2) – 11% (1) – – 5– – – 8% (1) 11% (1) – 50% (2) 4– 17% (1) 13% (1) 8% (1) – – – 3
100% (5) 50% (3) 88% (7) 67% (8) 33% (3) 78% (7) 25% (1) 34100% (5) 50% (3) 75% (6) 92% (11) 67% (6) 89% (8) 75% (3) 4260% (3) 50% (3) 50% (4) 33% (4) 56% (5) 56% (5) 100% (4) 2860% (3) 50% (3) 100% (8) 83% (10) 78% (7) 33% (3) 75% (3) 3740% (2) 33% (2) 50% (4) 67% (8) 22% (2) 44% (4) 75% (3) 25
– – – 8% (1) – 11% (1) – 2100% (5) 17% (1) 50% (4) 50% (6) 22% (2) 33% (3) 25% (1) 22
(2, 2) (2, 2) (13, 8,5) (9, 4) (11, 7) (5, 4) (11,5, 9) (8, 4)
characters 20% (1) – – – 11% (1) 11% (1) – 3event 20% (1) 17% (1) – 8% (1) 11% (1) 22% (2) – 6location – 33% (2) 25% (2) 33% (4) – 33% (3) 25% (1) 12subject 60% (3) 50% (3) 75% (6) 58% (7) 78% (7) 33% (3) 75% (3) 32
100% (5) 100% (6) 88% (7) 83% (10) 100% (9) 11% (1) 75% (3) 41– – 13% (1) 17% (2) – 89% (8) 25% (1) 12
Linear 20% (1) 17% (1) 13% (1) – – 89% (8) – 11Non-Linear – – 38% (3) 92% (11) 44% (4) 11% (1) 25% (1) 20Simultaneous 80% (4) 83% (5) 50% (4) 8% (1) 56% (5) – 75% (3) 22
Map Layout : Small multiples
Codes
Genre : Static Visual StoriesGenre : Longform InfographicGenre : Dynamic SlideshowGenre : Narrated AnimationsGenre : Multimedia Visual ExperienceMap Layout : Embedded MapMap Layout : Reference MapMap Layout : Side by SideMap Layout : Full MapMap Layout : Partial Map
Trope : Enforcing Linearity (CONTINUITY)
Map Layout : single map vs map series - single mapMap Layout : single map vs map series - map seriesMap Layout : Fragmented layout vs fluid layout - fragmentedMap Layout : Fragmented layout vs fluid layout - fluidMap Layout : Dynamic vs stable - dynamicMap Layout : Dynamic vs stable - stableInteractivity Format : Interactive?Interactivity Format : Martini glass structureInteractivity Format : Interactive slide showInteractivity F ormat : Drill down storyTrope : Setting the MOOD
Narrative Patterns : Defamilarization
Trope : Information DOSING
Trope : Visual Simile (METAPHOR)Trope : Focus ATTENTION
Narrative Patterns : Incorporating the audienceNarrative Patterns : RepitionNarrative Patterns : JuxtapositionNarrative Patterns : Human behind the dotNarrative Patterns : Rhetorical questionNarrative Patterns : Familiar settingNarrative Patterns : Call to actionNarrative Patterns : Gradual Visual Reveal
Visual Narrative Tactics : summary
Narrative Patterns : Maningful use of spaceNarrative Patterns : ConcretizeVisual Narrative Tactics : Close upsVisual Narrative Tactics : time annimationVisual Narrative Tactics : zoomingVisual Narrative Tactics : Layer listVisual Narrative Tactics : Info PanelVisual Narrative Tactics : Info Pop upVisual Narrative Tactics : AnnotationVisual Narrative Tactics : Info textVisual Narrative Tactics : captions
Parallel Narrative Tactics : Contrasting or Complimentary - ComplimentaryParallel Narrative Tactics : Sequence
Visual Narrative Tactics : ImageVisual Narrative Tactics : VideoParallel Narrative Tactics : Color seperating narrativesParallel Narrative Tactics : Number of narratives (mean, median)Parallel Narrative Tactics : link
Parallel Narrative Tactics : Contrasting or Complimentary - Contrasting
84
Appendix IV – ESRI Scrolling IAS Scenarios Story Seeunderhttps://arcg.is/1OWSjv
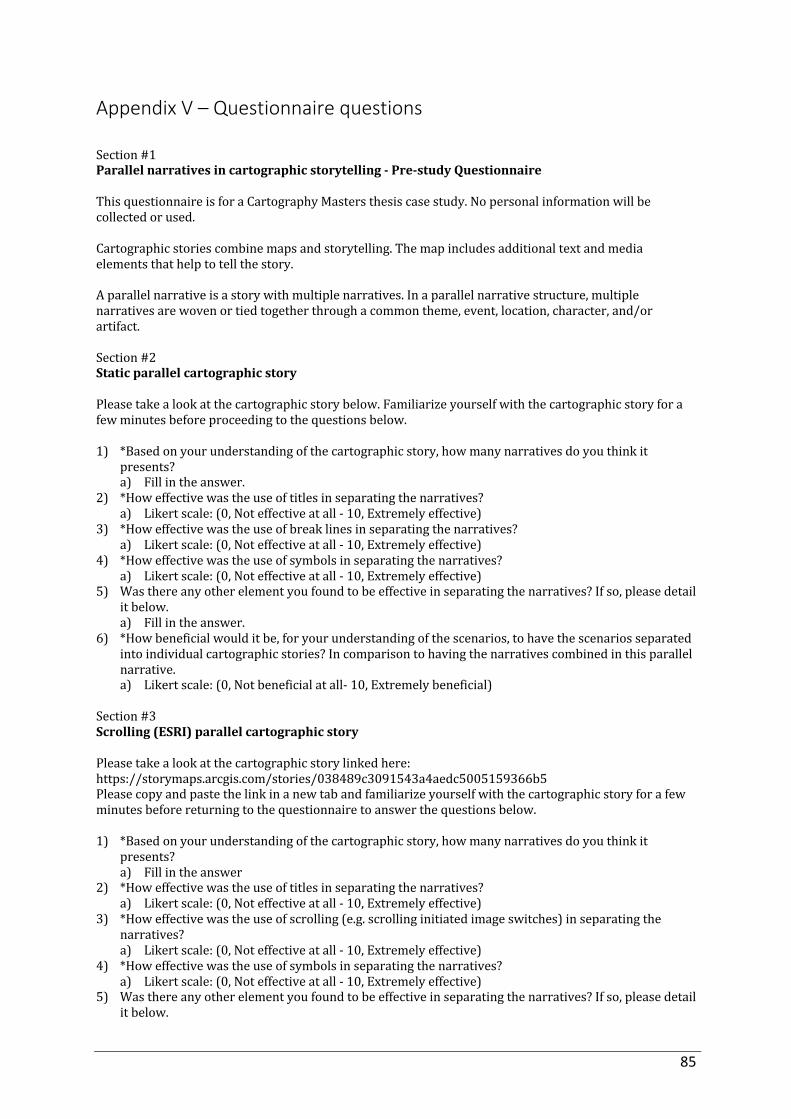
85
Appendix V – Questionnaire questions Section#1Parallelnarrativesincartographicstorytelling-Pre-studyQuestionnaireThisquestionnaireisforaCartographyMastersthesiscasestudy.Nopersonalinformationwillbecollectedorused.Cartographicstoriescombinemapsandstorytelling.Themapincludesadditionaltextandmediaelementsthathelptotellthestory.Aparallelnarrativeisastorywithmultiplenarratives.Inaparallelnarrativestructure,multiplenarrativesarewovenortiedtogetherthroughacommontheme,event,location,character,and/orartifact.Section#2StaticparallelcartographicstoryPleasetakealookatthecartographicstorybelow.Familiarizeyourselfwiththecartographicstoryforafewminutesbeforeproceedingtothequestionsbelow.1) *Basedonyourunderstandingofthecartographicstory,howmanynarrativesdoyouthinkit
presents?a) Fillintheanswer.
2) *Howeffectivewastheuseoftitlesinseparatingthenarratives?a) Likertscale:(0,Noteffectiveatall-10,Extremelyeffective)
3) *Howeffectivewastheuseofbreaklinesinseparatingthenarratives?a) Likertscale:(0,Noteffectiveatall-10,Extremelyeffective)
4) *Howeffectivewastheuseofsymbolsinseparatingthenarratives?a) Likertscale:(0,Noteffectiveatall-10,Extremelyeffective)
5) Wasthereanyotherelementyoufoundtobeeffectiveinseparatingthenarratives?Ifso,pleasedetailitbelow.a) Fillintheanswer.
6) *Howbeneficialwoulditbe,foryourunderstandingofthescenarios,tohavethescenariosseparatedintoindividualcartographicstories?Incomparisontohavingthenarrativescombinedinthisparallelnarrative.a) Likertscale:(0,Notbeneficialatall-10,Extremelybeneficial)
Section#3Scrolling(ESRI)parallelcartographicstoryPleasetakealookatthecartographicstorylinkedhere:https://storymaps.arcgis.com/stories/038489c3091543a4aedc5005159366b5Pleasecopyandpastethelinkinanewtabandfamiliarizeyourselfwiththecartographicstoryforafewminutesbeforereturningtothequestionnairetoanswerthequestionsbelow.1) *Basedonyourunderstandingofthecartographicstory,howmanynarrativesdoyouthinkit
presents?a) Fillintheanswer
2) *Howeffectivewastheuseoftitlesinseparatingthenarratives?a) Likertscale:(0,Noteffectiveatall-10,Extremelyeffective)
3) *Howeffectivewastheuseofscrolling(e.g.scrollinginitiatedimageswitches)inseparatingthenarratives?a) Likertscale:(0,Noteffectiveatall-10,Extremelyeffective)
4) *Howeffectivewastheuseofsymbolsinseparatingthenarratives?a) Likertscale:(0,Noteffectiveatall-10,Extremelyeffective)
5) Wasthereanyotherelementyoufoundtobeeffectiveinseparatingthenarratives?Ifso,pleasedetailitbelow.
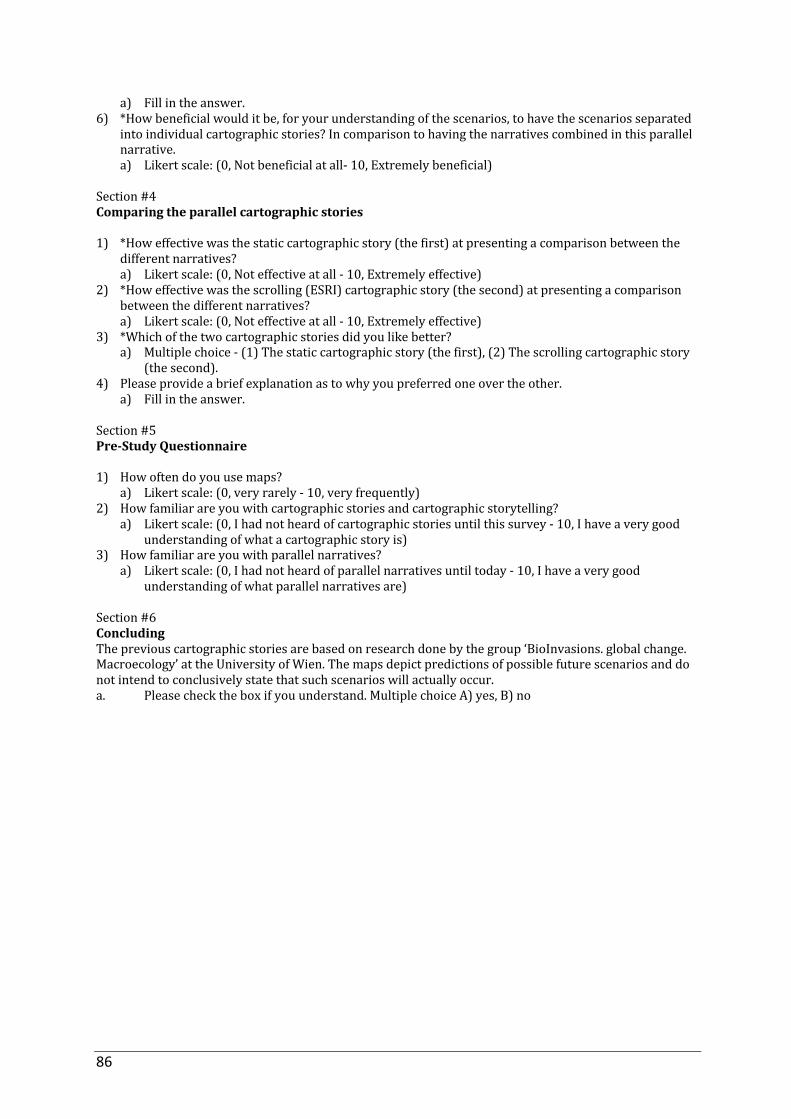
86
a) Fillintheanswer.6) *Howbeneficialwoulditbe,foryourunderstandingofthescenarios,tohavethescenariosseparated
intoindividualcartographicstories?Incomparisontohavingthenarrativescombinedinthisparallelnarrative.a) Likertscale:(0,Notbeneficialatall-10,Extremelybeneficial)
Section#4Comparingtheparallelcartographicstories1) *Howeffectivewasthestaticcartographicstory(thefirst)atpresentingacomparisonbetweenthe
differentnarratives?a) Likertscale:(0,Noteffectiveatall-10,Extremelyeffective)
2) *Howeffectivewasthescrolling(ESRI)cartographicstory(thesecond)atpresentingacomparisonbetweenthedifferentnarratives?a) Likertscale:(0,Noteffectiveatall-10,Extremelyeffective)
3) *Whichofthetwocartographicstoriesdidyoulikebetter?a) Multiplechoice-(1)Thestaticcartographicstory(thefirst),(2)Thescrollingcartographicstory
(thesecond).4) Pleaseprovideabriefexplanationastowhyyoupreferredoneovertheother.
a) Fillintheanswer.Section#5Pre-StudyQuestionnaire1) Howoftendoyouusemaps?
a) Likertscale:(0,veryrarely-10,veryfrequently)2) Howfamiliarareyouwithcartographicstoriesandcartographicstorytelling?
a) Likertscale:(0,Ihadnotheardofcartographicstoriesuntilthissurvey-10,Ihaveaverygoodunderstandingofwhatacartographicstoryis)
3) Howfamiliarareyouwithparallelnarratives?a) Likertscale:(0,Ihadnotheardofparallelnarrativesuntiltoday-10,Ihaveaverygood
understandingofwhatparallelnarrativesare)
Section#6ConcludingThepreviouscartographicstoriesarebasedonresearchdonebythegroup‘BioInvasions.globalchange.Macroecology’attheUniversityofWien.Themapsdepictpredictionsofpossiblefuturescenariosanddonotintendtoconclusivelystatethatsuchscenarioswillactuallyoccur.a. Pleasechecktheboxifyouunderstand.MultiplechoiceA)yes,B)no

87
Appendix VI – Questionnaire Answers Seeattachedfile“ReportParallelnarrativesincartographicstorytelling-Pre-studyQuestionnaire.pdf”


![[Digital Storytelling Toolkit] - idigstories](https://img.pdfslide.net/doc/110x75/631f847185e2495e151068a0/digital-storytelling-toolkit-idigstories.jpg)


![Philips' chamber of commerce atlas [cartographic material]](https://img.pdfslide.net/doc/110x75/6329672abfbc0e63240918c2/philips-chamber-of-commerce-atlas-cartographic-material.jpg)

