Embed Size (px)
Citation preview
Vol. 8(41), pp. 5129-5148, 24 October, 2013
DOI: 10.5897/AJAR10.009
ISSN 1992-1950 ©2013 Academic Journals
http://www.academicjournals.org/AJAR
African Journal of Agricultural
Research
Full Length Research Paper
Effects of cattle and manure management on the nutrient economy of mixed farms in East Africa: A
scenario study
Snijders Paul1, Hugo van der Meer2, Davies Onduru3, Peter Ebanyat4, Kebebe Ergano5, Joshua Zake6, Bram Wouters1*, Louis Gachimbi7† and Herman van Keulen2
1Livestock Research, Wageningen University and Research Centre, P.O. Box 65, 8200 AB Lelystad, the Netherlands. 2Agrosystems Research, Plant Research International, Wageningen University and Research Centre, P.O. Box 616,
6700 AP Wageningen, the Netherlands. 3ETC-East Africa, P.O. Box 76378, Nairobi, Kenya.
4School of Agricultural Science, Makerere University, P.O. Box 7062, Kampala, Uganda.
5Debub University, P.O. Box 5, Awassa, Ethiopia.
6Environmental Alert, P.O. Box 11259, Kampala, Uganda.
7Kenya Agricultural Research Institute, P.O. Box 14733, Nairobi, Kenya.
Accepted 14 January, 2013
This paper explores effects of animal and manure management in a dairy unit on the nutrient economy of crop-livestock farms in East Africa. For this purpose, 8 cattle management scenarios have been developed based on farming systems in Mbeere, Kenya (extensive), Wakiso, Uganda (semi-intensive) and Kibichoi, Kenya (intensive). Three baseline scenarios represent present-day cattle management; five improved scenarios use the same dairy breeds but have improved nutrition, using younger grass, more legumes and moderate amounts of concentrates. These improvements strongly increase milk production per cow, but also N, P and K excretion in manure. The 8 cattle management scenarios are combined with 2 levels of manure management technology: a baseline technology, reflecting actual manure management and related losses of plant nutrients, and an improved technology with lower losses. Nutrient losses for each technology level have been derived from a thorough analysis of published information. This showed that current systems of collection and storage of the excreta of confined dairy cows are associated with large nutrient losses, in particular of N. These losses cause serious deficits on the N, P and K balances of the crop-livestock farms. Therefore, significant external N, P and K inputs and better manure management are required to sustain the production levels assumed and to avoid further soil fertility depletion in the region. The paper identifies several possibilities for this and concludes that there is a strong need for integral on-farm studies aiming at development of sustainable dairy production systems. Key words: Dairy systems, manure storage, manure composition, N cycling efficiency, NPK balances, soil fertility, Napier grass, legumes, forage quality.
INTRODUCTION Soil fertility depletion in smallholder farms is considered the fundamental biophysical cause of declining per capita
food production in Sub-Saharan Africa (SSA), and soil fertility replenishment is the only way to effectively
5130 Afr. J. Agric. Res. address this problem (Sanchez et al., 1996; Buresh et al., 1997; Aune and Bationo, 2008). This requires external inputs of nutrients via inorganic fertilisers and legumes, in combination with effective recycling of nutrients in production systems by means of proper handling and utilisation of animal manure, crop residues, biodegradable waste and green manure crops. Although this is widely accepted in agricultural research, adoption of corresponding technologies in farming practice in SSA is slow, as can be observed in statistics of fertilizer use and crop yields (FAOSTAT, 2011).
Ruminant livestock play an important role in the nutrient economy of traditional farming systems in SSA by grazing natural grasslands and depositing part of the excreta on cropland or in fixed enclosures (boma, kraal) during overnight corralling. In addition, ruminants may convert crop residues and weeds into manure. Animal manure still is an important source of nutrients for the food crops grown by smallholder farmers in SSA (Powell et al., 1996; Van Beek et al., 2009; Zake et al., 2010). This was also observed in INMASP, a project on ‘Integrated Nutrient Management to Attain Sustainable Productivity increases in East African farming systems’ (De Jager et al., 2007; Onduru et al., 2008) conducted in Kenya, Uganda and Ethiopia between 2002 and 2005. Smallholder farmers in Central Kenya, for example, highly value dairy cows for the production of manure, in addition to providing milk and cash (Lekasi et al., 2003). In INMASP, farmers identified insufficient manure, labour and knowledge on manure management and application as important constraints to using manure.
The rapidly increasing human and livestock populations in SSA lead to transformation of traditional crop and livestock management practices, based on shifting cultivation and transhumance, to more sedentary forms of production (Steinfeld, 1998; Powell et al., 2004). These developments reduce the contribution of natural grasslands to ruminant nutrition and increase that of cultivated forages, crop residues and weeds. As a consequence, the role of ruminant livestock in the nutrient economy of smallholder farms is changing, viz. from collecting nutrients from the communal grasslands outside the farm and depositing them inside the farm to extracting them from the fields inside the farm. This will enhance soil fertility depletion unless these developments are accompanied by an increase in the use of external nutrient inputs.
Economic growth and urbanisation cause an increasing demand for animal products which may stimulate intensification of livestock production systems (Steinfeld, 1998; Powell et al., 2004; Aune and Bationo, 2008) through the use of inorganic fertilisers, forage legumes and feed supplements like concentrates. Powell and Williams (1995) indicated an increasing risk for nutrient
losses if the transition from open grazing to stall feeding is not accompanied by proper manure hand-ling and utilisation techniques. Information on the recycling efficiency of nutrients excreted by confined livestock in SSA is very limited (Rufino et al., 2006). Moreover, existing studies often address only one aspect of manure management, whereas an integrated approach of production, handling and utilisation is necessary, because the recycling efficiency of one step in this part of the nutrient cycle affects the recycling efficiencies of subsequent steps.
The objective of this paper is to explore the effects of variations in dairy cattle management (breed, nutrition) and manure management on the nutrient (NPK) economy of mixed farms in East Africa, using a scenario approach. The scenarios discussed have been derived from the variation in farming systems observed in the INMASP project, as well as from farmers’ suggestions and expert knowledge. First some characteristics of these farming systems will be described, followed by an outline of the scenario approach and the characteristics of hypothetical farms developed in the scenarios. Scenarios concentrate on forage, cattle and manure management because of their important role in nutrient cycling through smallholder crop-livestock systems in East Africa (Lekasi et al., 2003; De Jager et al., 2007; Van Beek et al., 2009). MATERIALS AND METHODS Characteristics of farms participating in INMASP
INMASP surveys (Walaga et al., 2002; Onduru et al., 2008; Van Beek et al., 2009) have shown that the majority of farms in the participating villages can be classified into 3 groups (Table 1). These groups, comprising mainly smallholder mixed crop-livestock farms, vary with respect to region/country, agro-ecology, production intensity, and market access. The main farm characteristics at the 3 study sites are presented in Table 1 and discussed below.
Group 1: Extensive grazing systems
In Mbeere (semi-arid Kenya), the prevailing livestock management system is extensive communal grazing of local breeds of cattle and goats, with an animal density of 1 Tropical Livestock Unit ha
-1 (1
TLU, equivalent to a live weight of 250 kg). Important reasons to keep livestock are provision of draft power, manure and social and cultural values associated with livestock.
About 90% of the forage ingested during the rainy season originates from communal grazing lands outside the farm, complemented with some Napier (elephant) grass (Pennisetum purpureum Schumach.), crop residues from cereals, legumes and banana, and weeds. Limited or no use of concentrates was recorded. Maize, sorghum, and cowpea are important food crops.
Cattle are mainly kept in open kraals (bomas), about 25% being fitted with a roof. Manure management is poor. No concrete floors, bedding material or separate drains for urine collection are used. Manure often remains in the boma until transported to the field, or is
*Corresponding author. E-mail:[email protected], Tel: + 31-320-293374. Fax: + 31-320-293591. † Dr. Louis Gachimbi passed away in an accident in March 2012
Snijders et al. 5131
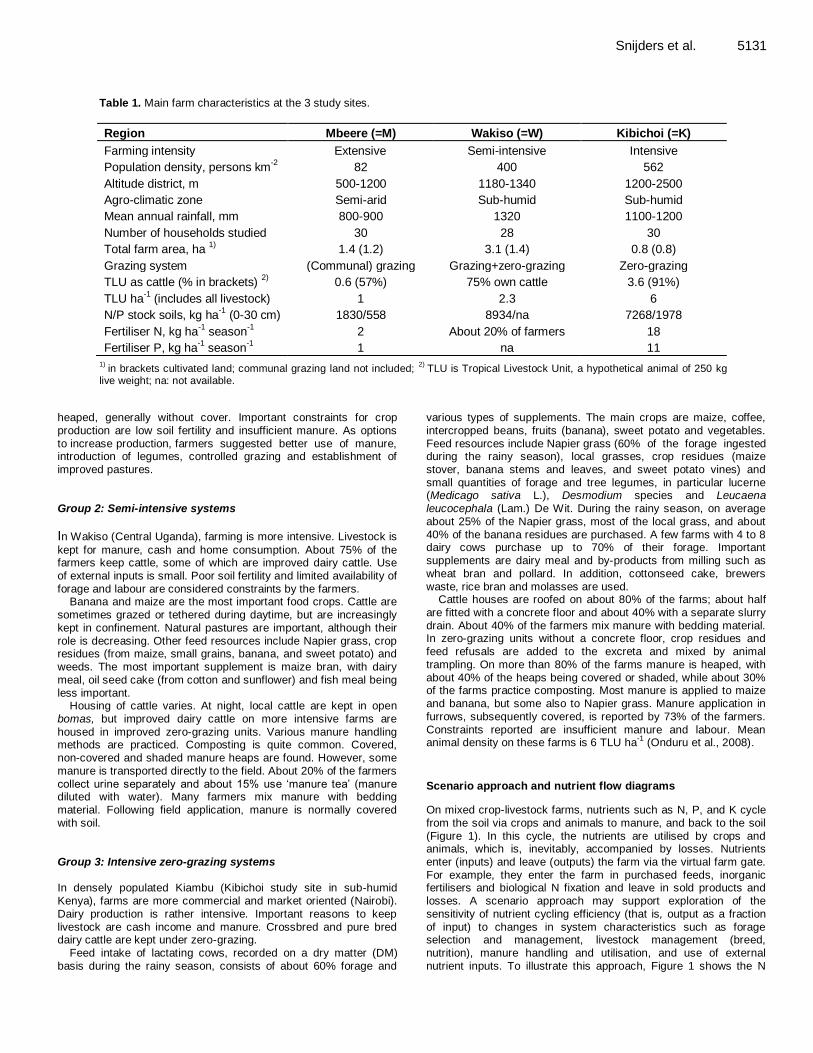
Table 1. Main farm characteristics at the 3 study sites.
Region Mbeere (=M) Wakiso (=W) Kibichoi (=K)
Farming intensity Extensive Semi-intensive Intensive
Population density, persons km-2 82 400 562
Altitude district, m 500-1200 1180-1340 1200-2500
Agro-climatic zone Semi-arid Sub-humid Sub-humid
Mean annual rainfall, mm 800-900 1320 1100-1200
Number of households studied 30 28 30
Total farm area, ha 1) 1.4 (1.2) 3.1 (1.4) 0.8 (0.8)
Grazing system (Communal) grazing Grazing+zero-grazing Zero-grazing
TLU as cattle (% in brackets) 2) 0.6 (57%) 75% own cattle 3.6 (91%)
TLU ha-1
(includes all livestock) 1 2.3 6
N/P stock soils, kg ha-1
(0-30 cm) 1830/558 8934/na 7268/1978
Fertiliser N, kg ha-1 season
-1 2 About 20% of farmers 18
Fertiliser P, kg ha-1 season
-1 1 na 11
1)
in brackets cultivated land; communal grazing land not included; 2)
TLU is Tropical Livestock Unit, a hypothetical animal of 250 kg live weight; na: not available.
heaped, generally without cover. Important constraints for crop production are low soil fertility and insufficient manure. As options to increase production, farmers suggested better use of manure, introduction of legumes, controlled grazing and establishment of improved pastures.
Group 2: Semi-intensive systems
In Wakiso (Central Uganda), farming is more intensive. Livestock is
kept for manure, cash and home consumption. About 75% of the farmers keep cattle, some of which are improved dairy cattle. Use of external inputs is small. Poor soil fertility and limited availability of forage and labour are considered constraints by the farmers.
Banana and maize are the most important food crops. Cattle are
sometimes grazed or tethered during daytime, but are increasingly kept in confinement. Natural pastures are important, although their role is decreasing. Other feed resources include Napier grass, crop residues (from maize, small grains, banana, and sweet potato) and weeds. The most important supplement is maize bran, with dairy meal, oil seed cake (from cotton and sunflower) and fish meal being less important.
Housing of cattle varies. At night, local cattle are kept in open bomas, but improved dairy cattle on more intensive farms are
housed in improved zero-grazing units. Various manure handling methods are practiced. Composting is quite common. Covered, non-covered and shaded manure heaps are found. However, some manure is transported directly to the field. About 20% of the farmers collect urine separately and about 15% use ‘manure tea’ (manure diluted with water). Many farmers mix manure with bedding material. Following field application, manure is normally covered with soil.
Group 3: Intensive zero-grazing systems In densely populated Kiambu (Kibichoi study site in sub-humid Kenya), farms are more commercial and market oriented (Nairobi). Dairy production is rather intensive. Important reasons to keep livestock are cash income and manure. Crossbred and pure bred dairy cattle are kept under zero-grazing.
Feed intake of lactating cows, recorded on a dry matter (DM) basis during the rainy season, consists of about 60% forage and
various types of supplements. The main crops are maize, coffee, intercropped beans, fruits (banana), sweet potato and vegetables. Feed resources include Napier grass (60% of the forage ingested during the rainy season), local grasses, crop residues (maize stover, banana stems and leaves, and sweet potato vines) and small quantities of forage and tree legumes, in particular lucerne (Medicago sativa L.), Desmodium species and Leucaena
leucocephala (Lam.) De Wit. During the rainy season, on average about 25% of the Napier grass, most of the local grass, and about 40% of the banana residues are purchased. A few farms with 4 to 8 dairy cows purchase up to 70% of their forage. Important supplements are dairy meal and by-products from milling such as wheat bran and pollard. In addition, cottonseed cake, brewers waste, rice bran and molasses are used.
Cattle houses are roofed on about 80% of the farms; about half
are fitted with a concrete floor and about 40% with a separate slurry drain. About 40% of the farmers mix manure with bedding material. In zero-grazing units without a concrete floor, crop residues and feed refusals are added to the excreta and mixed by animal trampling. On more than 80% of the farms manure is heaped, with about 40% of the heaps being covered or shaded, while about 30% of the farms practice composting. Most manure is applied to maize and banana, but some also to Napier grass. Manure application in furrows, subsequently covered, is reported by 73% of the farmers.
Constraints reported are insufficient manure and labour. Mean animal density on these farms is 6 TLU ha
-1 (Onduru et al., 2008).
Scenario approach and nutrient flow diagrams
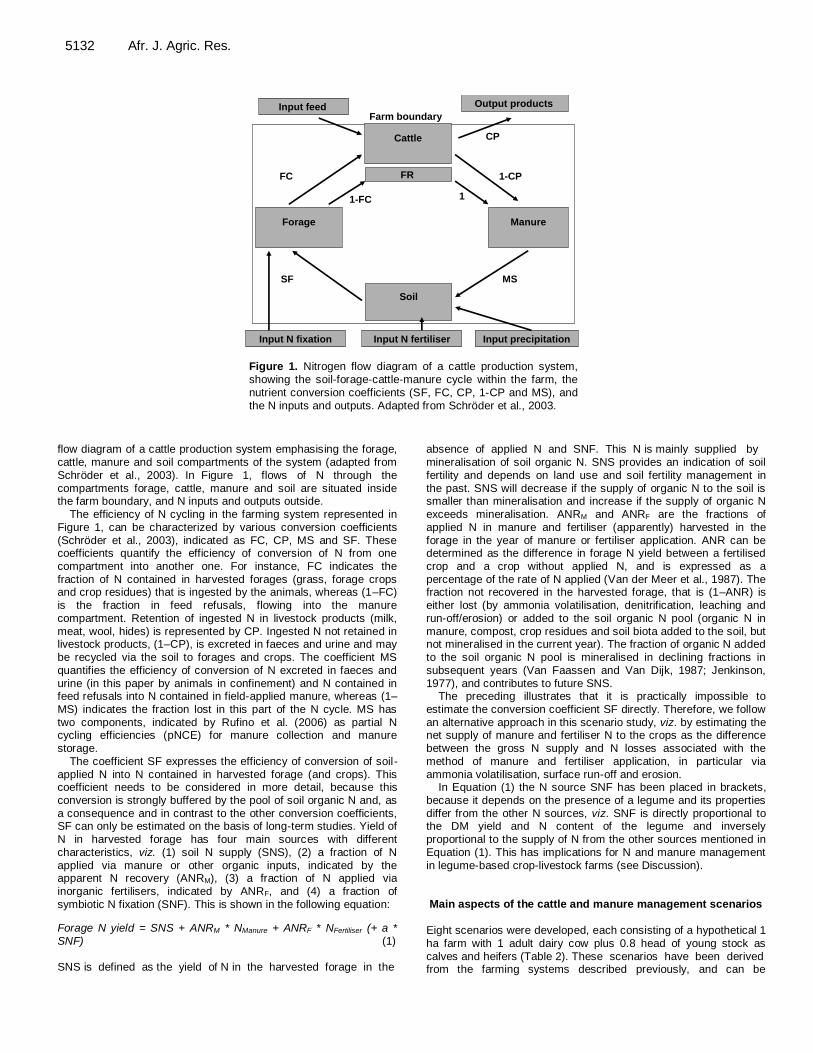
On mixed crop-livestock farms, nutrients such as N, P, and K cycle from the soil via crops and animals to manure, and back to the soil
(Figure 1). In this cycle, the nutrients are utilised by crops and animals, which is, inevitably, accompanied by losses. Nutrients enter (inputs) and leave (outputs) the farm via the virtual farm gate. For example, they enter the farm in purchased feeds, inorganic fertilisers and biological N fixation and leave in sold products and losses. A scenario approach may support exploration of the sensitivity of nutrient cycling efficiency (that is, output as a fraction of input) to changes in system characteristics such as forage selection and management, livestock management (breed,
nutrition), manure handling and utilisation, and use of external nutrient inputs. To illustrate this approach, Figure 1 shows the N
5132 Afr. J. Agric. Res.
Cattle
ManureForage
Soil
SF
Farm boundary
FC 1-CP
Input N fertiliser Input precipitation
Input feed Output products
FR
1-FC 1
CP
Input N fixation
MS
Figure 1. Nitrogen flow diagram of a cattle production system, showing the soil-forage-cattle-manure cycle within the farm, the
nutrient conversion coefficients (SF, FC, CP, 1-CP and MS), and the N inputs and outputs. Adapted from Schröder et al., 2003.
flow diagram of a cattle production system emphasising the forage, cattle, manure and soil compartments of the system (adapted from Schröder et al., 2003). In Figure 1, flows of N through the compartments forage, cattle, manure and soil are situated inside the farm boundary, and N inputs and outputs outside.
The efficiency of N cycling in the farming system represented in Figure 1, can be characterized by various conversion coefficients (Schröder et al., 2003), indicated as FC, CP, MS and SF. These coefficients quantify the efficiency of conversion of N from one compartment into another one. For instance, FC indicates the fraction of N contained in harvested forages (grass, forage crops and crop residues) that is ingested by the animals, whereas (1–FC) is the fraction in feed refusals, flowing into the manure
compartment. Retention of ingested N in livestock products (milk, meat, wool, hides) is represented by CP. Ingested N not retained in livestock products, (1–CP), is excreted in faeces and urine and may be recycled via the soil to forages and crops. The coefficient MS quantifies the efficiency of conversion of N excreted in faeces and urine (in this paper by animals in confinement) and N contained in feed refusals into N contained in field-applied manure, whereas (1–MS) indicates the fraction lost in this part of the N cycle. MS has
two components, indicated by Rufino et al. (2006) as partial N cycling efficiencies (pNCE) for manure collection and manure storage.
The coefficient SF expresses the efficiency of conversion of soil-applied N into N contained in harvested forage (and crops). This coefficient needs to be considered in more detail, because this conversion is strongly buffered by the pool of soil organic N and, as a consequence and in contrast to the other conversion coefficients, SF can only be estimated on the basis of long-term studies. Yield of
N in harvested forage has four main sources with different characteristics, viz. (1) soil N supply (SNS), (2) a fraction of N applied via manure or other organic inputs, indicated by the apparent N recovery (ANRM), (3) a fraction of N applied via inorganic fertilisers, indicated by ANRF, and (4) a fraction of symbiotic N fixation (SNF). This is shown in the following equation:
Forage N yield = SNS + ANRM * NManure + ANRF * NFertiliser (+ a *
SNF) (1)
SNS is defined as the yield of N in the harvested forage in the
absence of applied N and SNF. This N is mainly supplied by mineralisation of soil organic N. SNS provides an indication of soil fertility and depends on land use and soil fertility management in the past. SNS will decrease if the supply of organic N to the soil is smaller than mineralisation and increase if the supply of organic N exceeds mineralisation. ANRM and ANRF are the fractions of applied N in manure and fertiliser (apparently) harvested in the forage in the year of manure or fertiliser application. ANR can be determined as the difference in forage N yield between a fertilised crop and a crop without applied N, and is expressed as a percentage of the rate of N applied (Van der Meer et al., 1987). The fraction not recovered in the harvested forage, that is (1–ANR) is either lost (by ammonia volatilisation, denitrification, leaching and
run-off/erosion) or added to the soil organic N pool (organic N in manure, compost, crop residues and soil biota added to the soil, but not mineralised in the current year). The fraction of organic N added to the soil organic N pool is mineralised in declining fractions in subsequent years (Van Faassen and Van Dijk, 1987; Jenkinson, 1977), and contributes to future SNS.
The preceding illustrates that it is practically impossible to estimate the conversion coefficient SF directly. Therefore, we follow
an alternative approach in this scenario study, viz. by estimating the net supply of manure and fertiliser N to the crops as the difference between the gross N supply and N losses associated with the method of manure and fertiliser application, in particular via ammonia volatilisation, surface run-off and erosion.
In Equation (1) the N source SNF has been placed in brackets, because it depends on the presence of a legume and its properties differ from the other N sources, viz. SNF is directly proportional to the DM yield and N content of the legume and inversely
proportional to the supply of N from the other sources mentioned in Equation (1). This has implications for N and manure management in legume-based crop-livestock farms (see Discussion).
Main aspects of the cattle and manure management scenarios
Eight scenarios were developed, each consisting of a hypothetical 1
ha farm with 1 adult dairy cow plus 0.8 head of young stock as calves and heifers (Table 2). These scenarios have been derived
from the farming systems described previously, and can be
Snijders et al. 5133
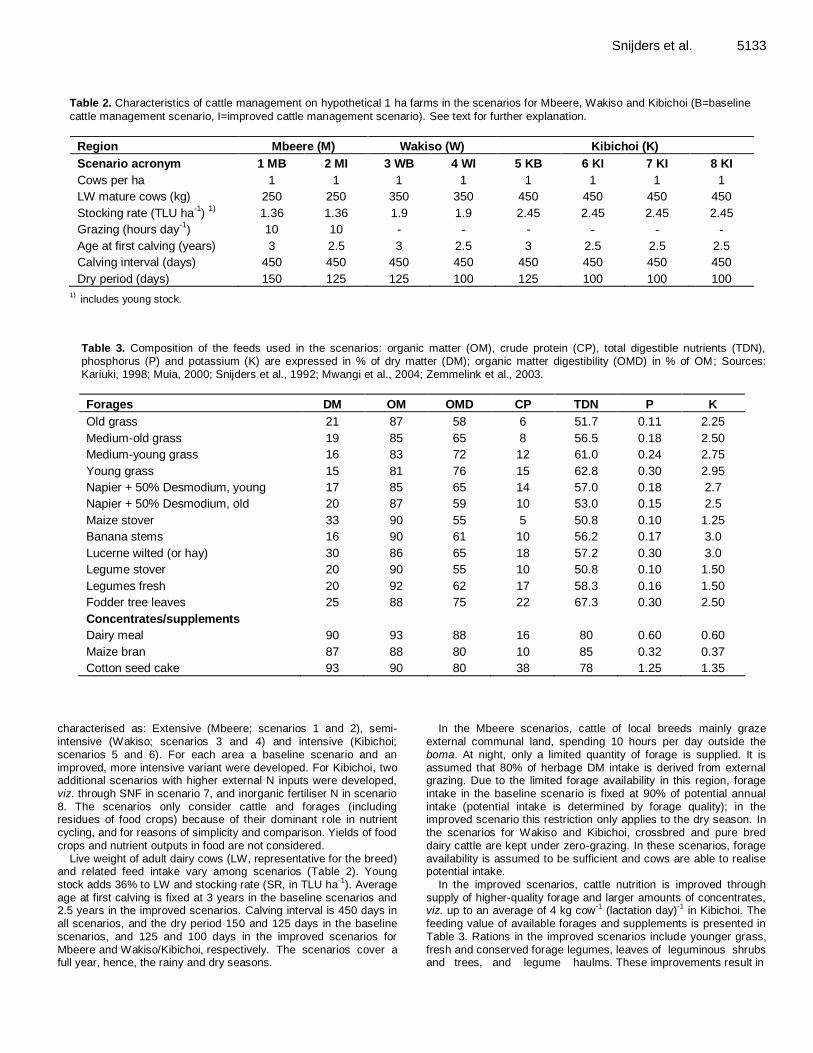
Table 2. Characteristics of cattle management on hypothetical 1 ha farms in the scenarios for Mbeere, Wakiso and Kibichoi (B=baseline
cattle management scenario, I=improved cattle management scenario). See text for further explanation.
Region Mbeere (M) Wakiso (W) Kibichoi (K)
Scenario acronym 1 MB 2 MI 3 WB 4 WI 5 KB 6 KI 7 KI 8 KI
Cows per ha 1 1 1 1 1 1 1 1
LW mature cows (kg) 250 250 350 350 450 450 450 450
Stocking rate (TLU ha-1)
1) 1.36 1.36 1.9 1.9 2.45 2.45 2.45 2.45
Grazing (hours day-1
) 10 10 - - - - - -
Age at first calving (years) 3 2.5 3 2.5 3 2.5 2.5 2.5
Calving interval (days) 450 450 450 450 450 450 450 450
Dry period (days) 150 125 125 100 125 100 100 100 1)
includes young stock.
Table 3. Composition of the feeds used in the scenarios: organic matter (OM), crude protein (CP), total digestible nutrients (TDN), phosphorus (P) and potassium (K) are expressed in % of dry matter (DM); organic matter digestibility (OMD) in % of OM; Sources: Kariuki, 1998; Muia, 2000; Snijders et al., 1992; Mwangi et al., 2004; Zemmelink et al., 2003.
Forages DM OM OMD CP TDN P K
Old grass 21 87 58 6 51.7 0.11 2.25
Medium-old grass 19 85 65 8 56.5 0.18 2.50
Medium-young grass 16 83 72 12 61.0 0.24 2.75
Young grass 15 81 76 15 62.8 0.30 2.95
Napier + 50% Desmodium, young
17 85 65 14 57.0 0.18 2.7
Napier + 50% Desmodium, old 20 87 59 10 53.0 0.15 2.5
Maize stover 33 90 55 5 50.8 0.10 1.25
Banana stems 16 90 61 10 56.2 0.17 3.0
Lucerne wilted (or hay) 30 86 65 18 57.2 0.30 3.0
Legume stover 20 90 55 10 50.8 0.10 1.50
Legumes fresh 20 92 62 17 58.3 0.16 1.50
Fodder tree leaves 25 88 75 22 67.3 0.30 2.50
Concentrates/supplements
Dairy meal 90 93 88 16 80 0.60 0.60
Maize bran 87 88 80 10 85 0.32 0.37
Cotton seed cake 93 90 80 38 78 1.25 1.35
characterised as: Extensive (Mbeere; scenarios 1 and 2), semi-intensive (Wakiso; scenarios 3 and 4) and intensive (Kibichoi; scenarios 5 and 6). For each area a baseline scenario and an improved, more intensive variant were developed. For Kibichoi, two additional scenarios with higher external N inputs were developed, viz. through SNF in scenario 7, and inorganic fertiliser N in scenario 8. The scenarios only consider cattle and forages (including residues of food crops) because of their dominant role in nutrient
cycling, and for reasons of simplicity and comparison. Yields of food crops and nutrient outputs in food are not considered.
Live weight of adult dairy cows (LW, representative for the breed) and related feed intake vary among scenarios (Table 2). Young stock adds 36% to LW and stocking rate (SR, in TLU ha
-1). Average
age at first calving is fixed at 3 years in the baseline scenarios and 2.5 years in the improved scenarios. Calving interval is 450 days in all scenarios, and the dry period 150 and 125 days in the baseline scenarios, and 125 and 100 days in the improved scenarios for
Mbeere and Wakiso/Kibichoi, respectively. The scenarios cover a full year, hence, the rainy and dry seasons.
In the Mbeere scenarios, cattle of local breeds mainly graze external communal land, spending 10 hours per day outside the boma. At night, only a limited quantity of forage is supplied. It is assumed that 80% of herbage DM intake is derived from external grazing. Due to the limited forage availability in this region, forage intake in the baseline scenario is fixed at 90% of potential annual intake (potential intake is determined by forage quality); in the improved scenario this restriction only applies to the dry season. In
the scenarios for Wakiso and Kibichoi, crossbred and pure bred dairy cattle are kept under zero-grazing. In these scenarios, forage availability is assumed to be sufficient and cows are able to realise potential intake.
In the improved scenarios, cattle nutrition is improved through supply of higher-quality forage and larger amounts of concentrates, viz. up to an average of 4 kg cow
-1 (lactation day)
-1 in Kibichoi. The
feeding value of available forages and supplements is presented in Table 3. Rations in the improved scenarios include younger grass,
fresh and conserved forage legumes, leaves of leguminous shrubs and trees, and legume haulms. These improvements result in
5134 Afr. J. Agric. Res. higher organic matter digestibility (OMD) and crude protein (CP) content, increasing feed intake and milk production. Dry periods are bridged by older, ‘reserved’ grass, with or without Desmodium, crop residues, and in some scenarios legume-derived hay and tree leaves. In the scenarios 3 to 6 for Wakiso and Kibichoi, grass is assumed to be a mixture of cultivated Napier grass and finer local grasses such as Kikuyu grass (Pennisetum clandestinum Hochst ex Chiov.). In the more intensive scenarios 7 and 8 for Kibichoi, only a few potentially important forages are used (Kariuki, 1998): in scenario 7 a mixture of Napier grass and Greenleaf Desmodium (Desmodium intortum (Mill.) Urb.), with some lucerne and maize stover, and in scenario 8 N-fertilised Napier grass and maize stover. Feed refusals are fixed at 10% of DM and 5% of N, P and K
contained in zero-grazed forages and crop residues. This indicates that the animals refuse the poorest parts of the forages. Feed refusals are added to manure solids.
Rations were composed separately for lactating cows, dry cows and young stock and for the rainy and dry seasons. Forage types were selected first, using among others generally 2 grass qualities per season. These qualities varied between old and medium-old grass during the dry season in the baseline scenarios and medium-young and young grass during the rainy season in the improved
scenarios (Table 3). To ensure balanced rations for energy and protein supply, quantities of each forage and type of concentrate were varied. However, in some scenarios balancing was a problem, resulting for example in scenario 7 in energy-limited milk production, because of the relatively low digestibility of the Napier-Desmodium mixtures (Table 3). Rations for dry cows often contained a protein surplus.
Manure management
The cattle management scenarios described in the preceding paragraph were combined with 2 levels of manure management technology, viz. a baseline and an improved technology. The baseline technology represents the traditional systems of collection, storage and field application of manure. In the improved technology improved practices of manure handling and application are
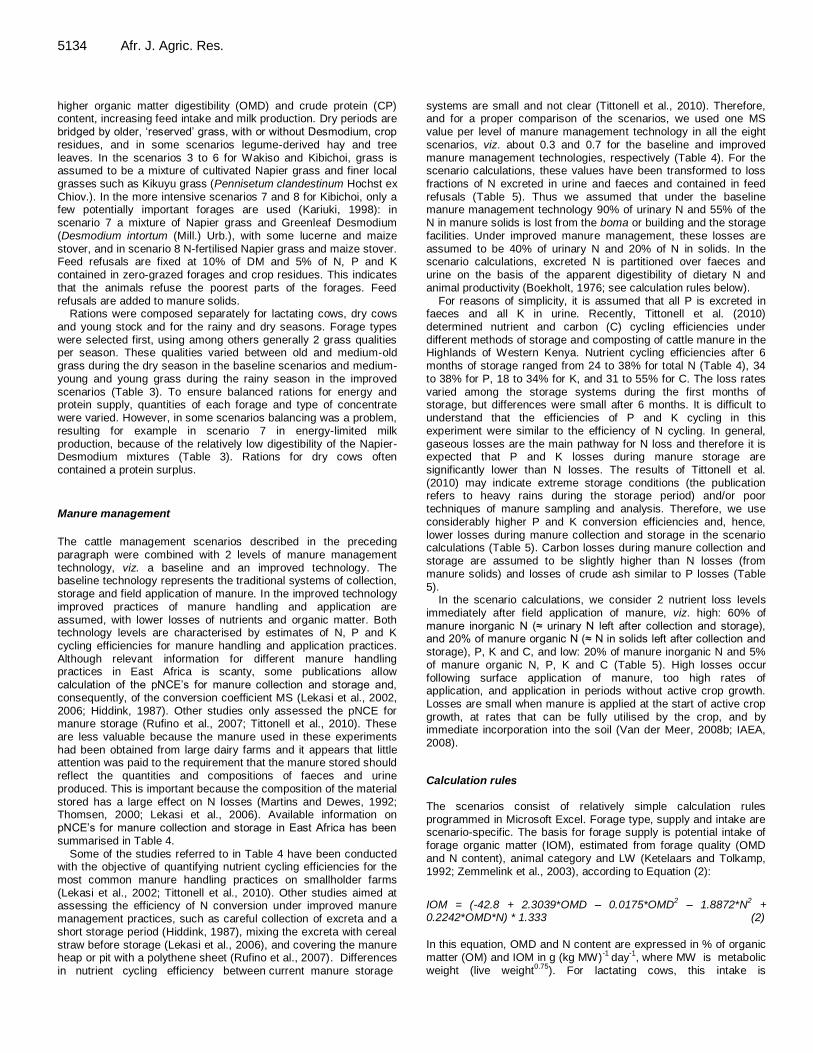
assumed, with lower losses of nutrients and organic matter. Both technology levels are characterised by estimates of N, P and K cycling efficiencies for manure handling and application practices. Although relevant information for different manure handling practices in East Africa is scanty, some publications allow calculation of the pNCE’s for manure collection and storage and, consequently, of the conversion coefficient MS (Lekasi et al., 2002, 2006; Hiddink, 1987). Other studies only assessed the pNCE for manure storage (Rufino et al., 2007; Tittonell et al., 2010). These are less valuable because the manure used in these experiments had been obtained from large dairy farms and it appears that little attention was paid to the requirement that the manure stored should reflect the quantities and compositions of faeces and urine produced. This is important because the composition of the material stored has a large effect on N losses (Martins and Dewes, 1992; Thomsen, 2000; Lekasi et al., 2006). Available information on pNCE’s for manure collection and storage in East Africa has been
summarised in Table 4. Some of the studies referred to in Table 4 have been conducted
with the objective of quantifying nutrient cycling efficiencies for the most common manure handling practices on smallholder farms (Lekasi et al., 2002; Tittonell et al., 2010). Other studies aimed at assessing the efficiency of N conversion under improved manure management practices, such as careful collection of excreta and a short storage period (Hiddink, 1987), mixing the excreta with cereal
straw before storage (Lekasi et al., 2006), and covering the manure heap or pit with a polythene sheet (Rufino et al., 2007). Differences in nutrient cycling efficiency between current manure storage
systems are small and not clear (Tittonell et al., 2010). Therefore, and for a proper comparison of the scenarios, we used one MS value per level of manure management technology in all the eight scenarios, viz. about 0.3 and 0.7 for the baseline and improved manure management technologies, respectively (Table 4). For the scenario calculations, these values have been transformed to loss fractions of N excreted in urine and faeces and contained in feed refusals (Table 5). Thus we assumed that under the baseline manure management technology 90% of urinary N and 55% of the N in manure solids is lost from the boma or building and the storage facilities. Under improved manure management, these losses are assumed to be 40% of urinary N and 20% of N in solids. In the scenario calculations, excreted N is partitioned over faeces and
urine on the basis of the apparent digestibility of dietary N and animal productivity (Boekholt, 1976; see calculation rules below).
For reasons of simplicity, it is assumed that all P is excreted in faeces and all K in urine. Recently, Tittonell et al. (2010) determined nutrient and carbon (C) cycling efficiencies under different methods of storage and composting of cattle manure in the Highlands of Western Kenya. Nutrient cycling efficiencies after 6 months of storage ranged from 24 to 38% for total N (Table 4), 34 to 38% for P, 18 to 34% for K, and 31 to 55% for C. The loss rates
varied among the storage systems during the first months of storage, but differences were small after 6 months. It is difficult to understand that the efficiencies of P and K cycling in this experiment were similar to the efficiency of N cycling. In general, gaseous losses are the main pathway for N loss and therefore it is expected that P and K losses during manure storage are significantly lower than N losses. The results of Tittonell et al. (2010) may indicate extreme storage conditions (the publication refers to heavy rains during the storage period) and/or poor
techniques of manure sampling and analysis. Therefore, we use considerably higher P and K conversion efficiencies and, hence, lower losses during manure collection and storage in the scenario calculations (Table 5). Carbon losses during manure collection and storage are assumed to be slightly higher than N losses (from manure solids) and losses of crude ash similar to P losses (Table 5).
In the scenario calculations, we consider 2 nutrient loss levels
immediately after field application of manure, viz. high: 60% of manure inorganic N (≈ urinary N left after collection and storage), and 20% of manure organic N (≈ N in solids left after collection and storage), P, K and C, and low: 20% of manure inorganic N and 5% of manure organic N, P, K and C (Table 5). High losses occur following surface application of manure, too high rates of application, and application in periods without active crop growth. Losses are small when manure is applied at the start of active crop growth, at rates that can be fully utilised by the crop, and by immediate incorporation into the soil (Van der Meer, 2008b; IAEA, 2008).
Calculation rules The scenarios consist of relatively simple calculation rules programmed in Microsoft Excel. Forage type, supply and intake are scenario-specific. The basis for forage supply is potential intake of forage organic matter (IOM), estimated from forage quality (OMD and N content), animal category and LW (Ketelaars and Tolkamp, 1992; Zemmelink et al., 2003), according to Equation (2):
IOM = (-42.8 + 2.3039*OMD – 0.0175*OMD2 – 1.8872*N
2 +
0.2242*OMD*N) * 1.333 (2)
In this equation, OMD and N content are expressed in % of organic matter (OM) and IOM in g (kg MW)
-1 day
-1, where MW is metabolic
weight (live weight0.75
). For lactating cows, this intake is
Snijders et al. 5135 Table 4. Partial N cycling efficiencies (pNCE) for manure collection and manure storage derived from experiments in East Africa [the
conversion coefficient MS is the product of both pNCE values and indicates the efficiency of conversion of N excreted in faeces and urine (with or
without additions of N in feed refusals or straw) into N contained in field-applied manure].
Reference pNCE
manure collection
pNCE manure storage
MS Description
Lekasi et al. (2002) 0.54-0.57 1) 0.37-0.39 0.21
Experiment with 5 groups of 4 immature Holstein steers; 60 days of daily collection of excreta and feed refusals; 84 days of storage and composting of faeces, urine and feed refusals
Lekasi et al. (2006) 0.52-0.56 1) 0.69-0.85 0.36-0.46
Experiment with 3 groups of 3 immature Holstein steers on a ‘high concentrate’ diet; 61 days of collection of excreta; 90 days of storage and composting of excreta with added cereal straw
Lekasi et al. (2006) 0.65-0.69 1) 0.59-0.69 0.39-0.44 Idem, but steers on a ‘low concentrate’ diet
Hiddink (1987) 0.79-0.80 0.43-0.67 0.34-0.54 Experiments in April and June 1986 (wet and dry season, respectively) with 5 dairy cows; 6 days of collection of excreta; 21 days of storage on a heap
Hiddink (1987) 0.79-0.80 0.81-0.83 0.64-0.66 Idem, but storage in a pit
Tittonell et al. (2010) 0.24-0.38 Storage and composting of a mixture of manure and maize stover during 6 months in a pit or a heap in the open air, and a heap under roof
Rufino et al. (2007) ca. 0.50 Storage and composting of manure (faeces and some urine, collected on a large dairy farm) on an uncovered heap during 6 months
Rufino et al. (2007) ca. 0.65-0.80 Idem, but storage on a heap covered with a polythene film 1)
calculated from the published information on N intake by the animals and N contained in collected faeces and urine, and estimated N retentions in
liveweight gain, assuming average liveweight gains of 0.6 kg steer-1
day-1
in Lekasi et al. (2002) and with the ‘high concentrate’ diet in Lekasi et al.
(2006), and 0.45 kg steer-1
day-1
with the ‘low concentrate’ diet in Lekasi et al. (2006). These liveweight gains are derived from comparable feeding experiments in Malawi (Addy and Thomas, 1977a,b).
Table 5. Assumed nutrient losses (in %) for the baseline and improved manure management technologies [for manure
handling the percentages refer to the amounts of nutrients excreted in faeces, urine and added with feed refusals; for field
application they refer to the amounts contained in the manure applied to the field].
Compound Baseline technology Improved technology
Manure handling
N/P from solid manure 55/30 20/10
N/K from urine 90/40 40/20
Carbon (organic matter) 60 30
Crude ash 30 10
Field application
Manure inorganic N 60 20
Manure Norg, P, K 20 5
Fertiliser N 30 10
multiplied by 1.1. Actual forage intake can be lower than potential intake because of limited forage availability (Mbeere)
and concentrate supplementation. Beyond a supplementation level of 2 kg concentrates cow
-1 day
-1, 1 kg concentrate is set to
5136 Afr. J. Agric. Res. replace 0.3 kg forage DM (Muia, 2000), provided that forage intake is not constrained. Forage supply is set to 10/9 * intake, to account for feed refusals. Energy, CP and P requirements for maintenance, milk production, and LW gain are based on NRC (1989). Maintenance requirements of cows during grazing (Mbeere) are increased by 20%. For lactating cows, fat-and-protein-corrected milk production (4% fat and 3.33% protein) is derived from feed supply after subtracting requirements for maintenance and LW gain. Requirements for LW gain of young stock are derived from an assumed increase in LW from 7.5% of mature LW for a calf at birth, to 90% for a heifer at first calving. Dry cows and young stock are fed according to requirements.
Calculation of N partitioning over faeces and urine is based on an
equation proposed by Boekholt (1976):
DN/IT = a*IN/IT + b (3)
where IN/IT is the total N content and DN/IT the apparently digestible N content of the feed ingested (both in g N/kg DM), a is the true digestibility of dietary N (no dimension), and b is metabolic faecal N (also in g N/kg IT). On the basis of the results of many digestion experiments with lactating dairy cows on rations of forage (mainly hay and grass silage) and concentrates at Wageningen University, Boekholt (1976) calculated values for a and b of 0.833 and -5.3, respectively. Validation of these parameter values with the results of a large number of feeding experiments with dairy cows and growing cattle in various countries showed a close relationship between measured and calculated apparent N digestibilities (Van Evert et al., in preparation). Therefore, these values were used in the scenario calculations.
Multiplication of DN/IT with DM intake yields the intake of apparently digestible N. This equals the sum of N retained in milk and LW gain and N excreted in urine. The remainder of ingested N, that is, the apparently indigestible N, is excreted in faeces. Hence, Equation (3), in combination with knowledge of N intake, dietary N concentration, and N retention in milk and LW gain allows calculation of the partition of N excretion over faeces and urine.
Nutrient balances of the forage-livestock unit of the farm In this study, 3 different nutrient balances of the forage-livestock unit in the scenario farms are distinguished. Each of the balances can be drawn up for N, P and K. The 3 balances are:
1. The external nutrient balance, defined as external nutrient inputs minus external nutrient outputs (Figure 1). The external nutrient
balance presents the gross contribution of the forage-livestock unit
to the nutrient balance of the whole farm. 2. The net nutrient balance, defined as external nutrient balance minus manure handling losses and losses immediately after field application of manure and inorganic fertilisers purchased for forage production (Table 5). The net nutrient balance indicates the net contribution of the forage-livestock unit to the stock of nutrients on the farm. 3. The soil nutrient balance, defined as net supply of nutrients to the
soil via animal manure, compost, inorganic fertiliser, and symbiotic N fixation minus N yield in the harvested forage (grass, forage crops, and crop residues used in the rations). Net supply of nutrients equals gross supply minus losses immediately after application of organic and inorganic fertilisers (Table 5).
Nutrient inputs, outputs, surpluses or deficits are expressed in kg ha
-1 year
-1. Nutrient inputs through atmospheric deposition are not
considered in this study, because quantitative information from SSA is scarce and, in general, the fate of these inputs and, particularly,
their availability for crop production is uncertain. The definitions indicate that the net nutrient balance and soil nutrient balance can
be improved by reducing manure handling and application losses, and if these improvements are not sufficient, by increasing the use of external nutrient inputs. In case of grazing outside the farm (scenarios 1 and 2), the nutrients in ingested forage are considered as inputs, and the nutrients excreted in faeces and urine in the grazing area, assumed to be 10/24 * total excretion, as outputs. Symbiotic N fixation by legumes is included as an external N input, assuming that 75% of the N in forage legumes and leguminous crop residues fed to the animals is derived from fixation. For the Napier/Desmodium mixture it is assumed that the legume contains 70% of total N harvested. Non-symbiotic N fixation is not considered, nor are the nutrients in crop parts for human consumption, such as grains and tubers. Nutrients in non-harvested
crop parts, such as stubbles and roots, derived from manure, fertiliser or symbiotic N fixation are also excluded, but contribute to the pool of nutrients and organic matter in the soil and to soil nutrient supply.
Home consumption of milk by humans and calves is assumed to be 300 kg cow
-1 year
-1 in all scenarios, any additional milk being
sold. In the nutrient balances, the nutrients contained in all the milk produced have been considered as output. Cattle sales are included in the nutrient balances and are, after correction for
mortality, arbitrarily assumed to be 70% of LW gain. This LW gain is considered as an annual output to keep herd size constant. Nutrient contents in milk are assumed to be 5.3 g N, 0.92 g P, and 1.5 g K (kg)
-1, and in live weight 25.4 g N, 7.4 g P, and 1.7 g K (kg)
-1 (IAEA,
2008; Jongbloed et al., 1985). In calculating the net N balance and the soil N balance, the input
of fertiliser N is corrected for N losses by ammonia volatilisation immediately after field application (Table 5). These losses amount to 30% of fertiliser N (urea) after broadcasting (baseline technology)
and to 10% when measures are taken to reduce ammonia losses (improved technology), such as direct incorporation into the soil, use of a urease inhibitor or use of another source of N such as calcium ammonium nitrate or ammonium nitrate.
RESULTS Effects of cattle and manure management on the N economy of the forage-livestock units Total feed use varies between 2,578 and 6,016 kg DM (cow + young stock)
-1 year
-1 in the scenarios 1 and 8,
respectively (Table 6). Live weight of the cows (Table 2) and local feeding practices significantly affect total feed use and net DM intake (compare scenarios 1, 3 and 5). Improvement of animal nutrition at each location (scenarios 2, 4, and 6-8 compared to scenarios 1, 3, and 5, respectively) is mainly effectuated through an increase in the supply of concentrates and use of younger grass and more legumes, whereas differences in total forage use are small (Table 6).
Annual milk production and LW gain have been estimated from ration composition and feeding standards. Cattle breed and nutrition have a large effect on animal performance, in particular on milk production that varies between 280 and 4,360 kg cow
-1 year
-1 in the scenarios 1
and 8, respectively (Table 7). Total N content of the forages and concentrates used has been calculated from the composition of the ration and the chemical composition of its components (Tables 6 and 3,
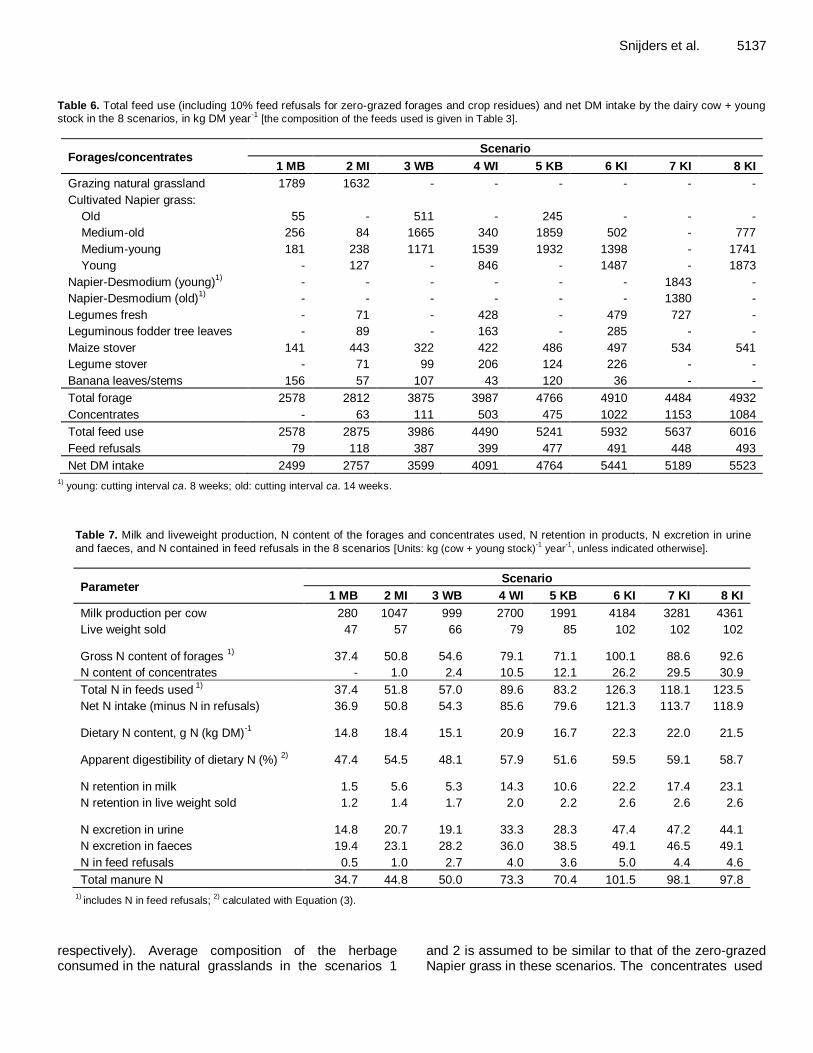
Snijders et al. 5137 Table 6. Total feed use (including 10% feed refusals for zero-grazed forages and crop residues) and net DM intake by the dairy cow + young stock in the 8 scenarios, in kg DM year
-1 [the composition of the feeds used is given in Table 3].
Forages/concentrates Scenario
1 MB 2 MI 3 WB 4 WI 5 KB 6 KI 7 KI 8 KI
Grazing natural grassland 1789 1632 - - - - - -
Cultivated Napier grass:
Old 55 - 511 - 245 - - -
Medium-old 256 84 1665 340 1859 502 - 777
Medium-young 181 238 1171 1539 1932 1398 - 1741
Young - 127 - 846 - 1487 - 1873
Napier-Desmodium (young)1)
- - - - - - 1843 -
Napier-Desmodium (old)1)
- - - - - - 1380 -
Legumes fresh - 71 - 428 - 479 727 -
Leguminous fodder tree leaves - 89 - 163 - 285 - -
Maize stover 141 443 322 422 486 497 534 541
Legume stover - 71 99 206 124 226 - -
Banana leaves/stems 156 57 107 43 120 36 - -
Total forage 2578 2812 3875 3987 4766 4910 4484 4932
Concentrates - 63 111 503 475 1022 1153 1084
Total feed use 2578 2875 3986 4490 5241 5932 5637 6016
Feed refusals 79 118 387 399 477 491 448 493
Net DM intake 2499 2757 3599 4091 4764 5441 5189 5523 1)
young: cutting interval ca. 8 weeks; old: cutting interval ca. 14 weeks.
Table 7. Milk and liveweight production, N content of the forages and concentrates used, N retention in products, N excretion in urine
and faeces, and N contained in feed refusals in the 8 scenarios [Units: kg (cow + young stock)-1
year-1
, unless indicated otherwise].
Parameter Scenario
1 MB 2 MI 3 WB 4 WI 5 KB 6 KI 7 KI 8 KI
Milk production per cow 280 1047 999 2700 1991 4184 3281 4361
Live weight sold 47 57 66 79 85 102 102 102
Gross N content of forages 1)
37.4 50.8 54.6 79.1 71.1 100.1 88.6 92.6
N content of concentrates - 1.0 2.4 10.5 12.1 26.2 29.5 30.9
Total N in feeds used 1)
37.4 51.8 57.0 89.6 83.2 126.3 118.1 123.5
Net N intake (minus N in refusals) 36.9 50.8 54.3 85.6 79.6 121.3 113.7 118.9
Dietary N content, g N (kg DM)-1 14.8 18.4 15.1 20.9 16.7 22.3 22.0 21.5
Apparent digestibility of dietary N (%) 2)
47.4 54.5 48.1 57.9 51.6 59.5 59.1 58.7
N retention in milk 1.5 5.6 5.3 14.3 10.6 22.2 17.4 23.1
N retention in live weight sold 1.2 1.4 1.7 2.0 2.2 2.6 2.6 2.6
N excretion in urine 14.8 20.7 19.1 33.3 28.3 47.4 47.2 44.1
N excretion in faeces 19.4 23.1 28.2 36.0 38.5 49.1 46.5 49.1
N in feed refusals 0.5 1.0 2.7 4.0 3.6 5.0 4.4 4.6
Total manure N 34.7 44.8 50.0 73.3 70.4 101.5 98.1 97.8 1)
includes N in feed refusals; 2)
calculated with Equation (3).
respectively). Average composition of the herbage consumed in the natural grasslands in the scenarios 1
and 2 is assumed to be similar to that of the zero-grazed Napier grass in these scenarios. The concentrates used
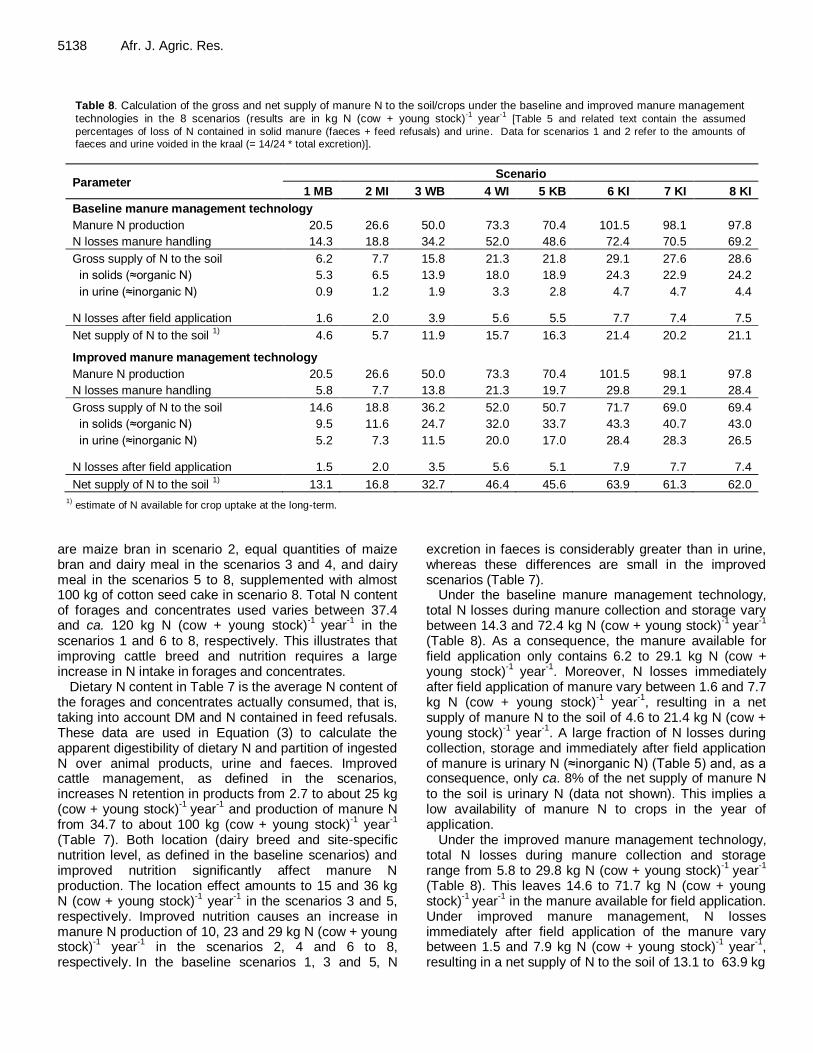
5138 Afr. J. Agric. Res.
Table 8. Calculation of the gross and net supply of manure N to the soil/crops under the baseline and improved manure management technologies in the 8 scenarios (results are in kg N (cow + young stock)
-1 year
-1 [Table 5 and related text contain the assumed
percentages of loss of N contained in solid manure (faeces + feed refusals) and urine. Data for scenarios 1 and 2 refer to the amounts of
faeces and urine voided in the kraal (= 14/24 * total excretion)].
Parameter Scenario
1 MB 2 MI 3 WB 4 WI 5 KB 6 KI 7 KI 8 KI
Baseline manure management technology
Manure N production 20.5 26.6 50.0 73.3 70.4 101.5 98.1 97.8
N losses manure handling 14.3 18.8 34.2 52.0 48.6 72.4 70.5 69.2
Gross supply of N to the soil 6.2 7.7 15.8 21.3 21.8 29.1 27.6 28.6
in solids (≈organic N) 5.3 6.5 13.9 18.0 18.9 24.3 22.9 24.2
in urine (≈inorganic N) 0.9 1.2 1.9 3.3 2.8 4.7 4.7 4.4
N losses after field application 1.6 2.0 3.9 5.6 5.5 7.7 7.4 7.5
Net supply of N to the soil 1) 4.6 5.7 11.9 15.7 16.3 21.4 20.2 21.1
Improved manure management technology
Manure N production 20.5 26.6 50.0 73.3 70.4 101.5 98.1 97.8
N losses manure handling 5.8 7.7 13.8 21.3 19.7 29.8 29.1 28.4
Gross supply of N to the soil 14.6 18.8 36.2 52.0 50.7 71.7 69.0 69.4
in solids (≈organic N) 9.5 11.6 24.7 32.0 33.7 43.3 40.7 43.0
in urine (≈inorganic N) 5.2 7.3 11.5 20.0 17.0 28.4 28.3 26.5
N losses after field application 1.5 2.0 3.5 5.6 5.1 7.9 7.7 7.4
Net supply of N to the soil 1) 13.1 16.8 32.7 46.4 45.6 63.9 61.3 62.0
1)
estimate of N available for crop uptake at the long-term. are maize bran in scenario 2, equal quantities of maize bran and dairy meal in the scenarios 3 and 4, and dairy meal in the scenarios 5 to 8, supplemented with almost 100 kg of cotton seed cake in scenario 8. Total N content of forages and concentrates used varies between 37.4 and ca. 120 kg N (cow + young stock)
-1 year
-1 in the
scenarios 1 and 6 to 8, respectively. This illustrates that improving cattle breed and nutrition requires a large increase in N intake in forages and concentrates.
Dietary N content in Table 7 is the average N content of the forages and concentrates actually consumed, that is, taking into account DM and N contained in feed refusals. These data are used in Equation (3) to calculate the apparent digestibility of dietary N and partition of ingested N over animal products, urine and faeces. Improved cattle management, as defined in the scenarios, increases N retention in products from 2.7 to about 25 kg (cow + young stock)
-1 year
-1 and production of manure N
from 34.7 to about 100 kg (cow + young stock)-1
year-1
(Table 7). Both location (dairy breed and site-specific nutrition level, as defined in the baseline scenarios) and improved nutrition significantly affect manure N production. The location effect amounts to 15 and 36 kg N (cow + young stock)
-1 year
-1 in the scenarios 3 and 5,
respectively. Improved nutrition causes an increase in manure N production of 10, 23 and 29 kg N (cow + young stock)
-1 year
-1 in the scenarios 2, 4 and 6 to 8,
respectively. In the baseline scenarios 1, 3 and 5, N
excretion in faeces is considerably greater than in urine, whereas these differences are small in the improved scenarios (Table 7).
Under the baseline manure management technology, total N losses during manure collection and storage vary between 14.3 and 72.4 kg N (cow + young stock)
-1 year
-1
(Table 8). As a consequence, the manure available for field application only contains 6.2 to 29.1 kg N (cow + young stock)
-1 year
-1. Moreover, N losses immediately
after field application of manure vary between 1.6 and 7.7 kg N (cow + young stock)
-1 year
-1, resulting in a net
supply of manure N to the soil of 4.6 to 21.4 kg N (cow + young stock)
-1 year
-1. A large fraction of N losses during
collection, storage and immediately after field application of manure is urinary N (≈inorganic N) (Table 5) and, as a consequence, only ca. 8% of the net supply of manure N to the soil is urinary N (data not shown). This implies a low availability of manure N to crops in the year of application.
Under the improved manure management technology, total N losses during manure collection and storage range from 5.8 to 29.8 kg N (cow + young stock)
-1 year
-1
(Table 8). This leaves 14.6 to 71.7 kg N (cow + young stock)
-1 year
-1 in the manure available for field application.
Under improved manure management, N losses immediately after field application of the manure vary between 1.5 and 7.9 kg N (cow + young stock)
-1 year
-1,
resulting in a net supply of N to the soil of 13.1 to 63.9 kg
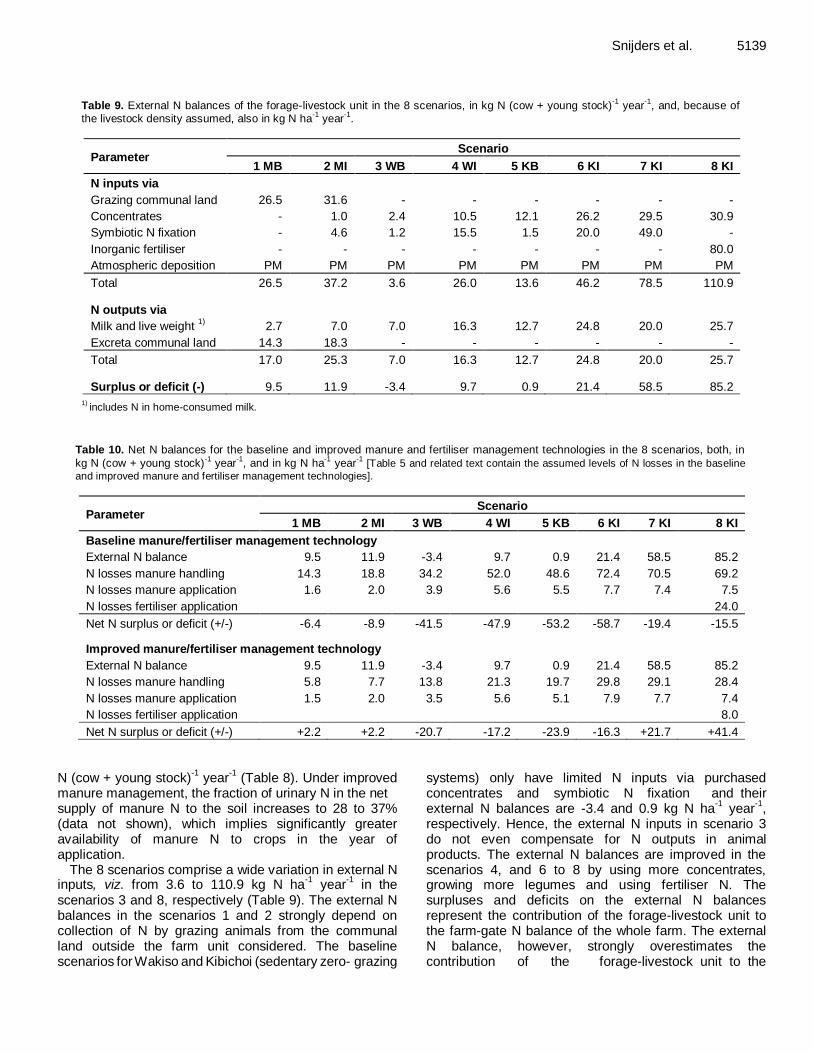
Snijders et al. 5139
Table 9. External N balances of the forage-livestock unit in the 8 scenarios, in kg N (cow + young stock)-1
year-1
, and, because of the livestock density assumed, also in kg N ha
-1 year
-1.
Parameter Scenario
1 MB 2 MI 3 WB 4 WI 5 KB 6 KI 7 KI 8 KI
N inputs via
Grazing communal land 26.5 31.6 - - - - - -
Concentrates - 1.0 2.4 10.5 12.1 26.2 29.5 30.9
Symbiotic N fixation - 4.6 1.2 15.5 1.5 20.0 49.0 -
Inorganic fertiliser - - - - - - - 80.0
Atmospheric deposition PM PM PM PM PM PM PM PM
Total 26.5 37.2 3.6 26.0 13.6 46.2 78.5 110.9
N outputs via
Milk and live weight 1)
2.7 7.0 7.0 16.3 12.7 24.8 20.0 25.7
Excreta communal land 14.3 18.3 - - - - - -
Total 17.0 25.3 7.0 16.3 12.7 24.8 20.0 25.7
Surplus or deficit (-) 9.5 11.9 -3.4 9.7 0.9 21.4 58.5 85.2 1)
includes N in home-consumed milk.
Table 10. Net N balances for the baseline and improved manure and fertiliser management technologies in the 8 scenarios, both, in
kg N (cow + young stock)-1
year-1
, and in kg N ha-1
year-1
[Table 5 and related text contain the assumed levels of N losses in the baseline
and improved manure and fertiliser management technologies].
Parameter Scenario
1 MB 2 MI 3 WB 4 WI 5 KB 6 KI 7 KI 8 KI
Baseline manure/fertiliser management technology
External N balance 9.5 11.9 -3.4 9.7 0.9 21.4 58.5 85.2
N losses manure handling 14.3 18.8 34.2 52.0 48.6 72.4 70.5 69.2
N losses manure application 1.6 2.0 3.9 5.6 5.5 7.7 7.4 7.5
N losses fertiliser application 24.0
Net N surplus or deficit (+/-) -6.4 -8.9 -41.5 -47.9 -53.2 -58.7 -19.4 -15.5
Improved manure/fertiliser management technology
External N balance 9.5 11.9 -3.4 9.7 0.9 21.4 58.5 85.2
N losses manure handling 5.8 7.7 13.8 21.3 19.7 29.8 29.1 28.4
N losses manure application
1.5 2.0 3.5 5.6 5.1 7.9 7.7 7.4
N losses fertiliser application 8.0
Net N surplus or deficit (+/-) +2.2 +2.2 -20.7 -17.2 -23.9 -16.3 +21.7 +41.4
N (cow + young stock)
-1 year
-1 (Table 8). Under improved
manure management, the fraction of urinary N in the net supply of manure N to the soil increases to 28 to 37% (data not shown), which implies significantly greater availability of manure N to crops in the year of application.
The 8 scenarios comprise a wide variation in external N inputs, viz. from 3.6 to 110.9 kg N ha
-1 year
-1 in the
scenarios 3 and 8, respectively (Table 9). The external N balances in the scenarios 1 and 2 strongly depend on collection of N by grazing animals from the communal land outside the farm unit considered. The baseline scenarios for Wakiso and Kibichoi (sedentary zero- grazing
systems) only have limited N inputs via purchased concentrates and symbiotic N fixation and their external N balances are -3.4 and 0.9 kg N ha
-1 year
-1,
respectively. Hence, the external N inputs in scenario 3 do not even compensate for N outputs in animal products. The external N balances are improved in the scenarios 4, and 6 to 8 by using more concentrates, growing more legumes and using fertiliser N. The surpluses and deficits on the external N balances represent the contribution of the forage-livestock unit to the farm-gate N balance of the whole farm. The external N balance, however, strongly overestimates the contribution of the forage-livestock unit to the
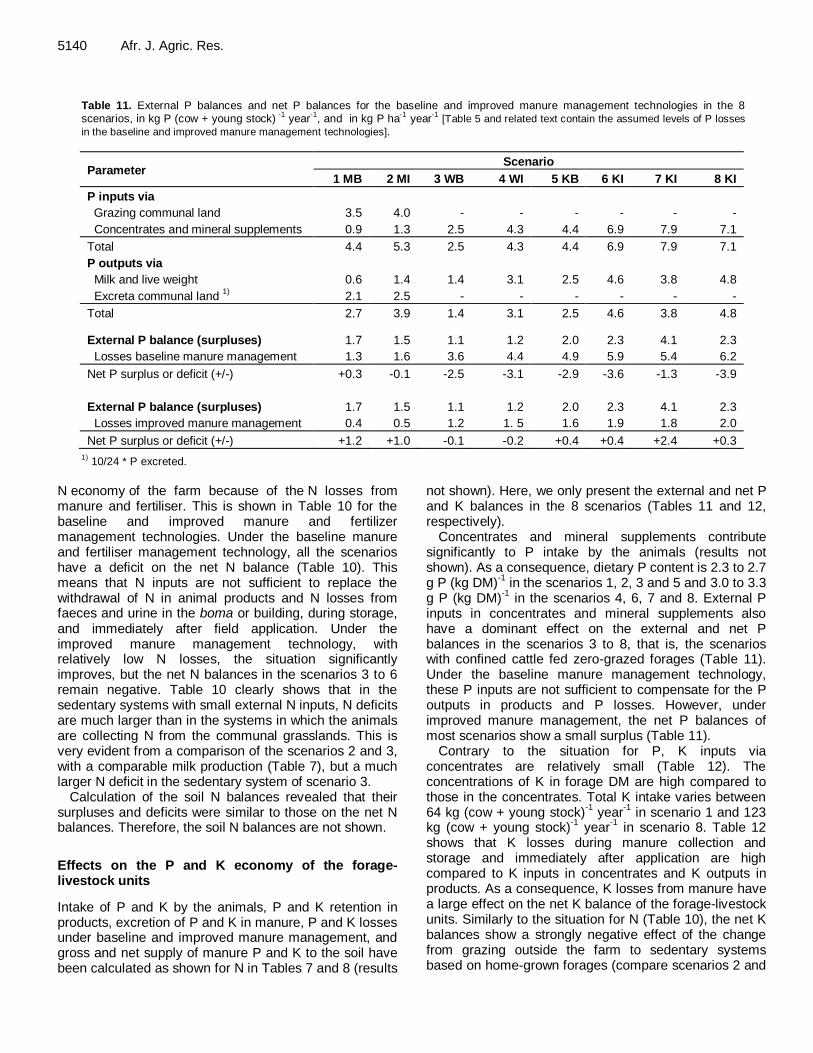
5140 Afr. J. Agric. Res.
Table 11. External P balances and net P balances for the baseline and improved manure management technologies in the 8 scenarios, in kg P (cow + young stock)
-1 year
-1, and in kg P ha
-1 year
-1 [Table 5 and related text contain the assumed levels of P losses
in the baseline and improved manure management technologies].
Parameter Scenario
1 MB 2 MI 3 WB 4 WI 5 KB 6 KI 7 KI 8 KI
P inputs via
Grazing communal land 3.5 4.0 - - - - - -
Concentrates and mineral supplements 0.9 1.3 2.5 4.3 4.4 6.9 7.9 7.1
Total 4.4 5.3 2.5 4.3 4.4 6.9 7.9 7.1
P outputs via
Milk and live weight 0.6 1.4 1.4 3.1 2.5 4.6 3.8 4.8
Excreta communal land 1) 2.1 2.5 - - - - - -
Total 2.7 3.9 1.4 3.1 2.5 4.6 3.8 4.8
External P balance (surpluses) 1.7 1.5 1.1 1.2 2.0 2.3 4.1 2.3
Losses baseline manure management 1.3 1.6 3.6 4.4 4.9 5.9 5.4 6.2
Net P surplus or deficit (+/-) +0.3 -0.1 -2.5 -3.1 -2.9 -3.6 -1.3 -3.9
External P balance (surpluses) 1.7 1.5 1.1 1.2 2.0 2.3 4.1 2.3
Losses improved manure management 0.4 0.5 1.2 1. 5 1.6 1.9 1.8 2.0
Net P surplus or deficit (+/-) +1.2 +1.0 -0.1 -0.2 +0.4 +0.4 +2.4 +0.3
1) 10/24 * P excreted.
N economy of the farm because of the N losses from manure and fertiliser. This is shown in Table 10 for the baseline and improved manure and fertilizer management technologies. Under the baseline manure and fertiliser management technology, all the scenarios have a deficit on the net N balance (Table 10). This means that N inputs are not sufficient to replace the withdrawal of N in animal products and N losses from faeces and urine in the boma or building, during storage, and immediately after field application. Under the improved manure management technology, with relatively low N losses, the situation significantly improves, but the net N balances in the scenarios 3 to 6 remain negative. Table 10 clearly shows that in the sedentary systems with small external N inputs, N deficits are much larger than in the systems in which the animals are collecting N from the communal grasslands. This is very evident from a comparison of the scenarios 2 and 3, with a comparable milk production (Table 7), but a much larger N deficit in the sedentary system of scenario 3.
Calculation of the soil N balances revealed that their surpluses and deficits were similar to those on the net N balances. Therefore, the soil N balances are not shown.
Effects on the P and K economy of the forage-livestock units
Intake of P and K by the animals, P and K retention in products, excretion of P and K in manure, P and K losses under baseline and improved manure management, and gross and net supply of manure P and K to the soil have been calculated as shown for N in Tables 7 and 8 (results
not shown). Here, we only present the external and net P and K balances in the 8 scenarios (Tables 11 and 12, respectively).
Concentrates and mineral supplements contribute significantly to P intake by the animals (results not shown). As a consequence, dietary P content is 2.3 to 2.7 g P (kg DM)
-1 in the scenarios 1, 2, 3 and 5 and 3.0 to 3.3
g P (kg DM)-1
in the scenarios 4, 6, 7 and 8. External P inputs in concentrates and mineral supplements also have a dominant effect on the external and net P balances in the scenarios 3 to 8, that is, the scenarios with confined cattle fed zero-grazed forages (Table 11). Under the baseline manure management technology, these P inputs are not sufficient to compensate for the P outputs in products and P losses. However, under improved manure management, the net P balances of most scenarios show a small surplus (Table 11).
Contrary to the situation for P, K inputs via concentrates are relatively small (Table 12). The concentrations of K in forage DM are high compared to those in the concentrates. Total K intake varies between 64 kg (cow + young stock)
-1 year
-1 in scenario 1 and 123
kg (cow + young stock)-1
year-1
in scenario 8. Table 12 shows that K losses during manure collection and storage and immediately after application are high compared to K inputs in concentrates and K outputs in products. As a consequence, K losses from manure have a large effect on the net K balance of the forage-livestock units. Similarly to the situation for N (Table 10), the net K balances show a strongly negative effect of the change from grazing outside the farm to sedentary systems based on home-grown forages (compare scenarios 2 and
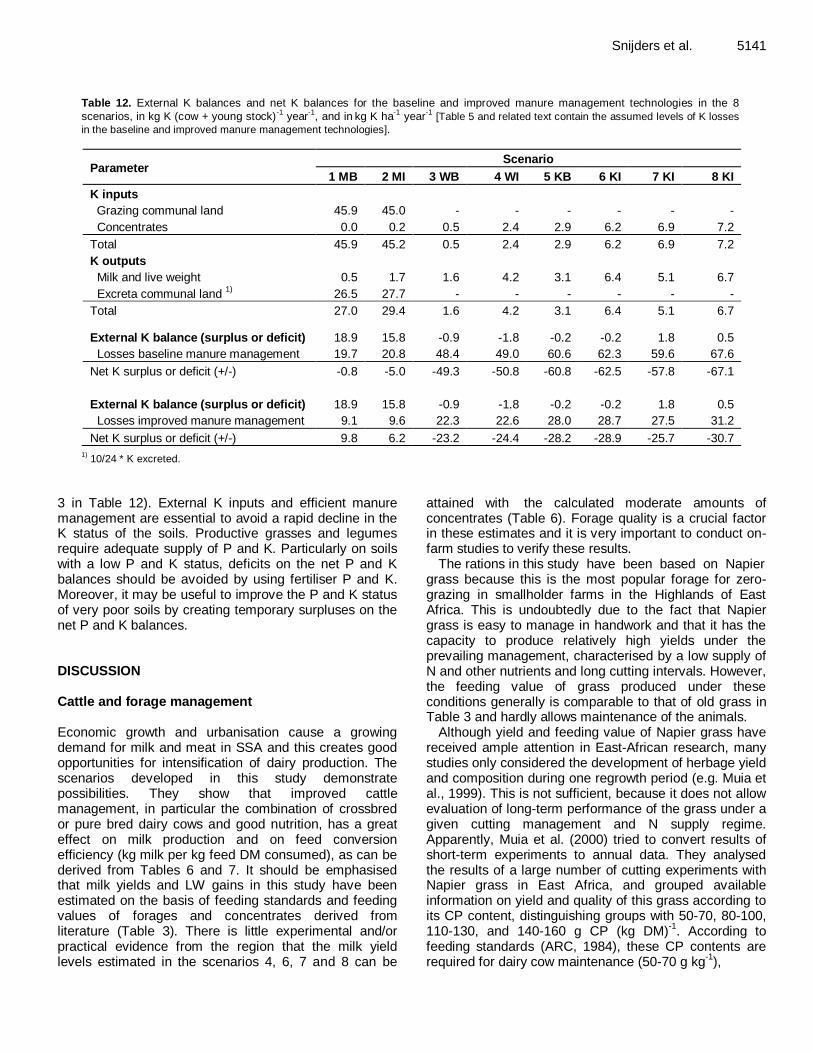
Snijders et al. 5141
Table 12. External K balances and net K balances for the baseline and improved manure management technologies in the 8
scenarios, in kg K (cow + young stock)-1
year-1
, and in kg K ha
-1 year
-1 [Table 5 and related text contain the assumed levels of K losses
in the baseline and improved manure management technologies].
Parameter Scenario
1 MB 2 MI 3 WB 4 WI 5 KB 6 KI 7 KI 8 KI
K inputs
Grazing communal land 45.9 45.0 - - - - - -
Concentrates 0.0 0.2 0.5 2.4 2.9 6.2 6.9 7.2
Total 45.9 45.2 0.5 2.4 2.9 6.2 6.9 7.2
K outputs
Milk and live weight 0.5 1.7 1.6 4.2 3.1 6.4 5.1 6.7
Excreta communal land 1) 26.5 27.7 - - - - - -
Total 27.0 29.4 1.6 4.2 3.1 6.4 5.1 6.7
External K balance (surplus or deficit) 18.9 15.8 -0.9 -1.8 -0.2 -0.2 1.8 0.5
Losses baseline manure management 19.7 20.8 48.4 49.0 60.6 62.3 59.6 67.6
Net K surplus or deficit (+/-) -0.8 -5.0 -49.3 -50.8 -60.8 -62.5 -57.8 -67.1
External K balance (surplus or deficit) 18.9 15.8 -0.9 -1.8 -0.2 -0.2 1.8 0.5
Losses improved manure management 9.1 9.6 22.3 22.6 28.0 28.7 27.5 31.2
Net K surplus or deficit (+/-) 9.8 6.2 -23.2 -24.4 -28.2 -28.9 -25.7 -30.7 1)
10/24 * K excreted.
3 in Table 12). External K inputs and efficient manure management are essential to avoid a rapid decline in the K status of the soils. Productive grasses and legumes require adequate supply of P and K. Particularly on soils with a low P and K status, deficits on the net P and K balances should be avoided by using fertiliser P and K. Moreover, it may be useful to improve the P and K status of very poor soils by creating temporary surpluses on the net P and K balances. DISCUSSION Cattle and forage management Economic growth and urbanisation cause a growing demand for milk and meat in SSA and this creates good opportunities for intensification of dairy production. The scenarios developed in this study demonstrate possibilities. They show that improved cattle management, in particular the combination of crossbred or pure bred dairy cows and good nutrition, has a great effect on milk production and on feed conversion efficiency (kg milk per kg feed DM consumed), as can be derived from Tables 6 and 7. It should be emphasised that milk yields and LW gains in this study have been estimated on the basis of feeding standards and feeding values of forages and concentrates derived from literature (Table 3). There is little experimental and/or practical evidence from the region that the milk yield levels estimated in the scenarios 4, 6, 7 and 8 can be
attained with the calculated moderate amounts of concentrates (Table 6). Forage quality is a crucial factor in these estimates and it is very important to conduct on-farm studies to verify these results.
The rations in this study have been based on Napier grass because this is the most popular forage for zero-grazing in smallholder farms in the Highlands of East Africa. This is undoubtedly due to the fact that Napier grass is easy to manage in handwork and that it has the capacity to produce relatively high yields under the prevailing management, characterised by a low supply of N and other nutrients and long cutting intervals. However, the feeding value of grass produced under these conditions generally is comparable to that of old grass in Table 3 and hardly allows maintenance of the animals.
Although yield and feeding value of Napier grass have received ample attention in East-African research, many studies only considered the development of herbage yield and composition during one regrowth period (e.g. Muia et al., 1999). This is not sufficient, because it does not allow evaluation of long-term performance of the grass under a given cutting management and N supply regime. Apparently, Muia et al. (2000) tried to convert results of short-term experiments to annual data. They analysed the results of a large number of cutting experiments with Napier grass in East Africa, and grouped available information on yield and quality of this grass according to its CP content, distinguishing groups with 50-70, 80-100, 110-130, and 140-160 g CP (kg DM)
-1. According to
feeding standards (ARC, 1984), these CP contents are required for dairy cow maintenance (50-70 g kg
-1),
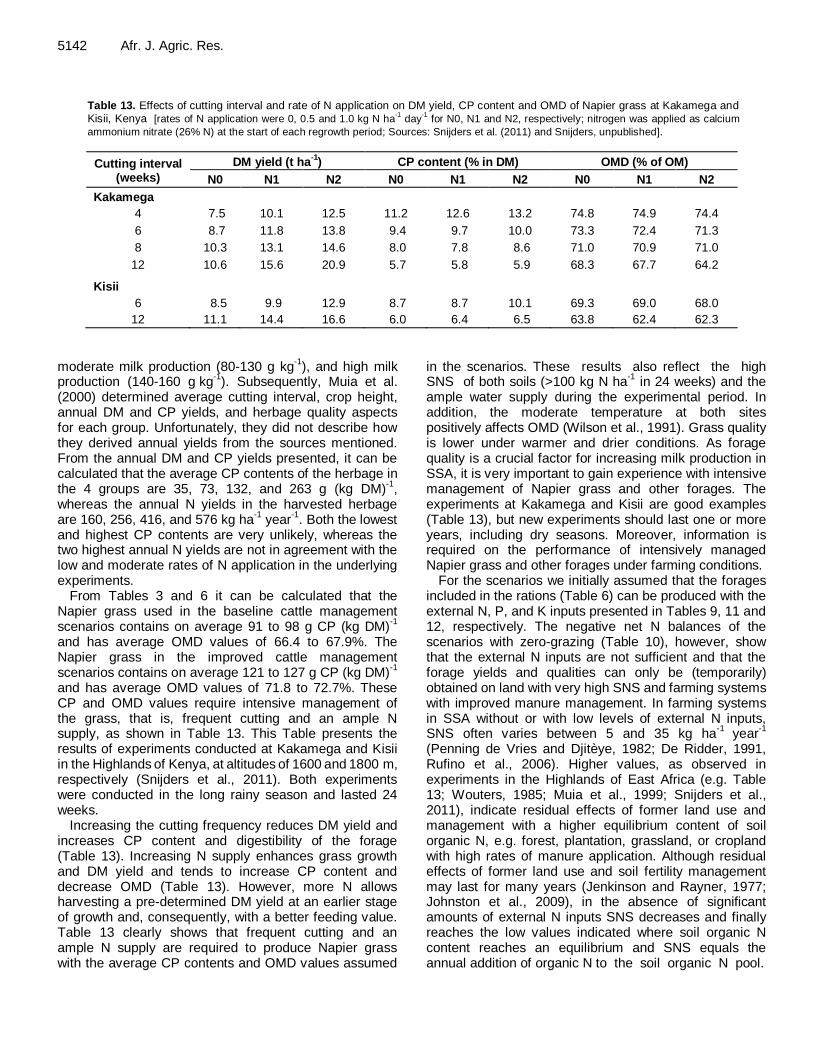
5142 Afr. J. Agric. Res.
Table 13. Effects of cutting interval and rate of N application on DM yield, CP content and OMD of Napier grass at Kakamega and Kisii, Kenya [rates of N application were 0, 0.5 and 1.0 kg N ha
-1 day
-1 for N0, N1 and N2, respectively; nitrogen was applied as calcium
ammonium nitrate (26% N) at the start of each regrowth period; Sources: Snijders et al. (2011) and Snijders, unpublished].
Cutting interval (weeks)
DM yield (t ha-1) CP content (% in DM) OMD (% of OM)
N0 N1 N2 N0 N1 N2 N0 N1 N2
Kakamega
4 7.5 10.1 12.5 11.2 12.6 13.2 74.8 74.9 74.4
6 8.7 11.8 13.8 9.4 9.7 10.0 73.3 72.4 71.3
8 10.3 13.1 14.6 8.0 7.8 8.6 71.0 70.9 71.0
12 10.6 15.6 20.9 5.7 5.8 5.9 68.3 67.7 64.2
Kisii
6 8.5 9.9 12.9 8.7 8.7 10.1 69.3 69.0 68.0
12 11.1 14.4 16.6 6.0 6.4 6.5 63.8 62.4 62.3
moderate milk production (80-130 g kg
-1), and high milk
production (140-160 g kg-1
). Subsequently, Muia et al. (2000) determined average cutting interval, crop height, annual DM and CP yields, and herbage quality aspects for each group. Unfortunately, they did not describe how they derived annual yields from the sources mentioned. From the annual DM and CP yields presented, it can be calculated that the average CP contents of the herbage in the 4 groups are 35, 73, 132, and 263 g (kg DM)
-1,
whereas the annual N yields in the harvested herbage are 160, 256, 416, and 576 kg ha
-1 year
-1. Both the lowest
and highest CP contents are very unlikely, whereas the two highest annual N yields are not in agreement with the low and moderate rates of N application in the underlying experiments.
From Tables 3 and 6 it can be calculated that the Napier grass used in the baseline cattle management scenarios contains on average 91 to 98 g CP (kg DM)
-1
and has average OMD values of 66.4 to 67.9%. The Napier grass in the improved cattle management scenarios contains on average 121 to 127 g CP (kg DM)
-1
and has average OMD values of 71.8 to 72.7%. These CP and OMD values require intensive management of the grass, that is, frequent cutting and an ample N supply, as shown in Table 13. This Table presents the results of experiments conducted at Kakamega and Kisii in the Highlands of Kenya, at altitudes of 1600 and 1800 m, respectively (Snijders et al., 2011). Both experiments were conducted in the long rainy season and lasted 24 weeks.
Increasing the cutting frequency reduces DM yield and increases CP content and digestibility of the forage (Table 13). Increasing N supply enhances grass growth and DM yield and tends to increase CP content and decrease OMD (Table 13). However, more N allows harvesting a pre-determined DM yield at an earlier stage of growth and, consequently, with a better feeding value. Table 13 clearly shows that frequent cutting and an ample N supply are required to produce Napier grass with the average CP contents and OMD values assumed
in the scenarios. These results also reflect the high SNS of both soils (>100 kg N ha
-1 in 24 weeks) and the
ample water supply during the experimental period. In addition, the moderate temperature at both sites positively affects OMD (Wilson et al., 1991). Grass quality is lower under warmer and drier conditions. As forage quality is a crucial factor for increasing milk production in SSA, it is very important to gain experience with intensive management of Napier grass and other forages. The experiments at Kakamega and Kisii are good examples (Table 13), but new experiments should last one or more years, including dry seasons. Moreover, information is required on the performance of intensively managed Napier grass and other forages under farming conditions.
For the scenarios we initially assumed that the forages included in the rations (Table 6) can be produced with the external N, P, and K inputs presented in Tables 9, 11 and 12, respectively. The negative net N balances of the scenarios with zero-grazing (Table 10), however, show that the external N inputs are not sufficient and that the forage yields and qualities can only be (temporarily) obtained on land with very high SNS and farming systems with improved manure management. In farming systems in SSA without or with low levels of external N inputs, SNS often varies between 5 and 35 kg ha
-1 year
-1
(Penning de Vries and Djitèye, 1982; De Ridder, 1991, Rufino et al., 2006). Higher values, as observed in experiments in the Highlands of East Africa (e.g. Table 13; Wouters, 1985; Muia et al., 1999; Snijders et al., 2011), indicate residual effects of former land use and management with a higher equilibrium content of soil organic N, e.g. forest, plantation, grassland, or cropland with high rates of manure application. Although residual effects of former land use and soil fertility management may last for many years (Jenkinson and Rayner, 1977; Johnston et al., 2009), in the absence of significant amounts of external N inputs SNS decreases and finally reaches the low values indicated where soil organic N content reaches an equilibrium and SNS equals the annual addition of organic N to the soil organic N pool.
The net N balances in Table 10 present a measure of
the sustainability of the production systems. A deficit indicates that more external N inputs are required to produce the forage quantities and qualities required and to maintain soil fertility and crop production level. A small surplus may allow (1) use of some manure on food crops (this should be included as nutrient outputs in the external N, P, and K balances), (2) a slightly higher forage yield and/or forage CP content than assumed, and (3) an increase in soil organic N content, particularly in soils that have been depleted over a long period of time. A large N surplus also causes additional N losses. Advantages of forage legumes in crop-livestock farms Forage legumes have important advantages for smallholder crop-livestock farms: 1. In symbiosis with specific Rhizobium bacteria, forage legumes are able to fix sufficient N for maximum (not N-limited) growth. This requires adequate supply of other nutrients, and in some cases inoculation of the seeds with the specific Rhizobium strains. 2. The CP content of forage legumes is considerably higher than that of tropical grasses, particularly at ageing. This is very useful in production systems where protein supply is limiting animal performance. 3. Deeply rooting legumes, such as lucerne, may utilise plant nutrients (and water) from deeper soil layers. Lucerne may require application of P and K for good establishment, but once established, it may produce high yields for several years without responding to additional fertilisation (Van der Meer, unpublished information). 4. Legumes may grow better than grasses in periods with limited water supply (Mwangi et al., 2004). This is very important for forage supply in such periods. 5. Legume roots and above-ground biomass are relatively rich in N and, therefore, legumes have a positive residual effect on available N for subsequent non-leguminous crops (Spiertz and Sibma, 1986).
The most important criteria for selection of forage legumes are a high DM yield, high contents of CP and Digestible Organic Matter, a high voluntary intake, and adequate availability of seeds and in some cases of inoculants.
It has already been mentioned that symbiotic N fixation (SNF) is directly proportional to legume growth and inversely proportional to N supply from the other sources mentioned in Equation (1). The supply of inorganic N from soil organic matter, manure and fertiliser has a direct as well as an indirect negative effect on SNF. The direct effect expresses the fact that even well-nodulated legumes utilise inorganic N at the expense of SNF. The indirect effect is observed in grass/legume mixtures where the grass component responds strongly to the
Snijders et al. 5143
supply of inorganic N, suppressing legume growth and SNF. Hence, low or moderate rates of N application to a grass/legume mixture with a vigorous legume component increase DM and N yield of the grass component and reduce DM and N yield of the legume. The net effect on the mixture generally is a small positive effect on DM yield but no effect or even a small negative effect on N yield (Whiteman, 1980; Sibma and Spiertz, 1986; Spiertz and Sibma, 1986; Van der Meer, 2002). Therefore, it is advisable to apply available manure only to non-leguminous crops and to apply fertiliser P and K to the legumes and grass/legume mixtures according to requirements. Moreover, rotation of legumes and non-leguminous crops may be useful in soil fertility management.
The negative effect of applied N on legume yield and SNF also has consequences for the N balances of farming systems with legumes. Reducing a deficit on an N balance by increasing other N inputs may have a limited effect or no effect at all, because of the negative effect of these inputs on SNF. Therefore, the soil N balance of a cropping system with legumes should exclude the fields with legumes from the balance, as shown for the 8 scenarios in Table 14.
Deficits on the N balances in Table 14 can be eliminated by using fertiliser N on the Napier grass or increasing the area under forage legumes and grass/legume mixtures. Surpluses indicate the amount of manure N that can be used on non-leguminous food crops. This shows another important advantage of forage legumes in N-deficient farming systems, viz. they permit a (sustainable) supply of manure N to non-leguminous food crops, provided that they are supplied with sufficient P, K and other nutrients required by the legume and the Rhizobium bacteria. This means that the deficits on the net P and K balances (Tables 11 and 12) should preferably be alleviated by using fertiliser P and K on the legume fields. The N surplus in scenario 8 can also be used to increase DM yield and CP content of the grass. Manure management and utilisation
Improvements of dairy cattle breed and nutrition are associated with (and not possible without) a large increase in N, P and K intake by the animals and, consequently, in excretion of N, P and K in faeces and urine (Table 7 contains that information for N; results for P and K not shown). Analysis of published information revealed that present-day manure management practices are associated with large nutrient losses, in particular of N
(Tables 4 and 5). Based on this, we assumed for the baseline manure management technology 90% loss of urinary N due to partial collection of the urine and large losses through ammonia volatilisation from the floor of the building and the manure heap, and 55% loss of N contained in manure solids through leaching of N
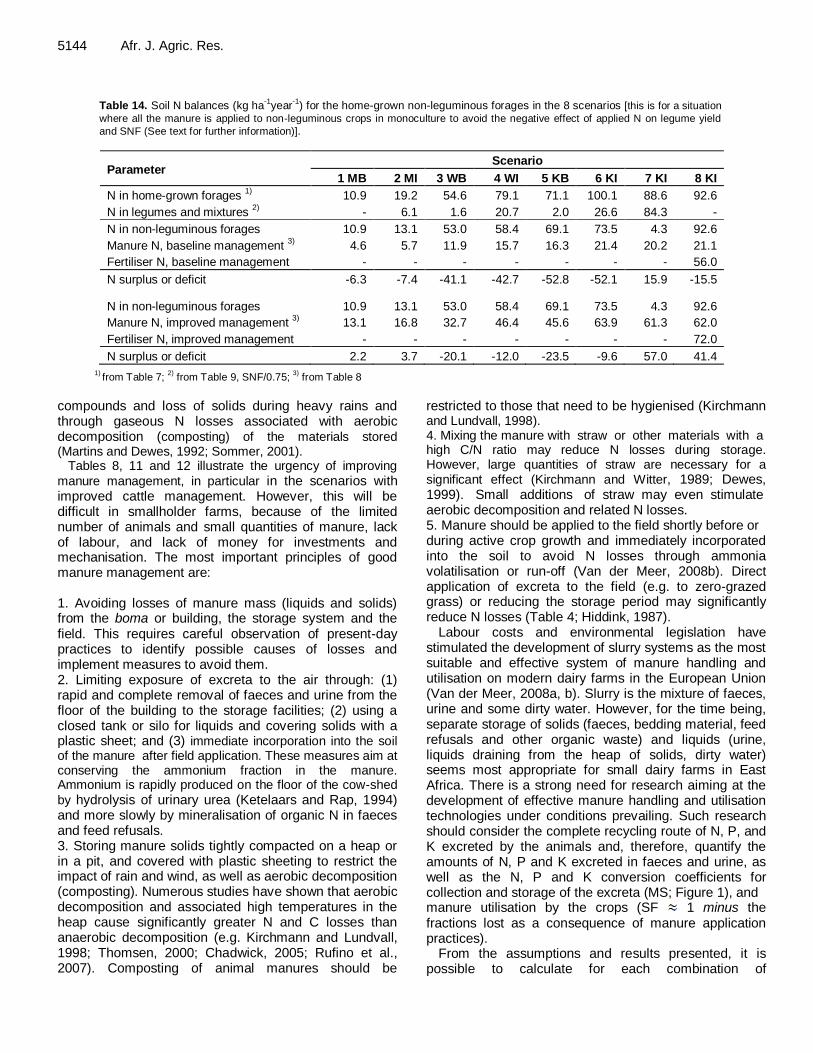
5144 Afr. J. Agric. Res.
Table 14. Soil N balances (kg ha-1
year-1
) for the home-grown non-leguminous forages in the 8 scenarios [this is for a situation
where all the manure is applied to non-leguminous crops in monoculture to avoid the negative effect of applied N on legume yield
and SNF (See text for further information)].
Parameter Scenario
1 MB 2 MI 3 WB 4 WI 5 KB 6 KI 7 KI 8 KI
N in home-grown forages 1)
10.9 19.2 54.6 79.1 71.1 100.1 88.6 92.6
N in legumes and mixtures 2)
- 6.1 1.6 20.7 2.0 26.6 84.3 -
N in non-leguminous forages 10.9 13.1 53.0 58.4 69.1 73.5 4.3 92.6
Manure N, baseline management 3)
4.6 5.7 11.9 15.7 16.3 21.4 20.2 21.1
Fertiliser N, baseline management - - - - - - - 56.0
N surplus or deficit -6.3 -7.4 -41.1 -42.7 -52.8 -52.1 15.9 -15.5
N in non-leguminous forages 10.9 13.1 53.0 58.4 69.1 73.5 4.3 92.6
Manure N, improved management 3)
13.1 16.8 32.7 46.4 45.6 63.9 61.3 62.0
Fertiliser N, improved management - - - - - - - 72.0
N surplus or deficit
2.2 3.7 -20.1 -12.0 -23.5 -9.6 57.0 41.4
1) from Table 7;
2) from Table 9, SNF/0.75;
3) from Table 8
compounds and loss of solids during heavy rains and through gaseous N losses associated with aerobic decomposition (composting) of the materials stored (Martins and Dewes, 1992; Sommer, 2001). Tables 8, 11 and 12 illustrate the urgency of improving
manure management, in particular in the scenarios with improved cattle management. However, this will be difficult in smallholder farms, because of the limited number of animals and small quantities of manure, lack of labour, and lack of money for investments and mechanisation. The most important principles of good manure management are: 1. Avoiding losses of manure mass (liquids and solids) from the boma or building, the storage system and the field. This requires careful observation of present-day practices to identify possible causes of losses and implement measures to avoid them. 2. Limiting exposure of excreta to the air through: (1) rapid and complete removal of faeces and urine from the floor of the building to the storage facilities; (2) using a closed tank or silo for liquids and covering solids with a plastic sheet; and (3) immediate incorporation into the soil of the manure after field application. These measures aim at conserving the ammonium fraction in the manure. Ammonium is rapidly produced on the floor of the cow-shed
by hydrolysis of urinary urea (Ketelaars and Rap, 1994) and more slowly by mineralisation of organic N in faeces and feed refusals. 3. Storing manure solids tightly compacted on a heap or in a pit, and covered with plastic sheeting to restrict the impact of rain and wind, as well as aerobic decomposition (composting). Numerous studies have shown that aerobic decomposition and associated high temperatures in the heap cause significantly greater N and C losses than anaerobic decomposition (e.g. Kirchmann and Lundvall, 1998; Thomsen, 2000; Chadwick, 2005; Rufino et al., 2007). Composting of animal manures should be
restricted to those that need to be hygienised (Kirchmann and Lundvall, 1998). 4. Mixing the manure with straw or other materials with a high C/N ratio may reduce N losses during storage. However, large quantities of straw are necessary for a
significant effect (Kirchmann and Witter, 1989; Dewes, 1999). Small additions of straw may even stimulate aerobic decomposition and related N losses. 5. Manure should be applied to the field shortly before or during active crop growth and immediately incorporated into the soil to avoid N losses through ammonia volatilisation or run-off (Van der Meer, 2008b). Direct application of excreta to the field (e.g. to zero-grazed grass) or reducing the storage period may significantly reduce N losses (Table 4; Hiddink, 1987).
Labour costs and environmental legislation have stimulated the development of slurry systems as the most suitable and effective system of manure handling and utilisation on modern dairy farms in the European Union (Van der Meer, 2008a, b). Slurry is the mixture of faeces, urine and some dirty water. However, for the time being, separate storage of solids (faeces, bedding material, feed refusals and other organic waste) and liquids (urine, liquids draining from the heap of solids, dirty water) seems most appropriate for small dairy farms in East Africa. There is a strong need for research aiming at the development of effective manure handling and utilisation technologies under conditions prevailing. Such research should consider the complete recycling route of N, P, and K excreted by the animals and, therefore, quantify the amounts of N, P and K excreted in faeces and urine, as well as the N, P and K conversion coefficients for collection and storage of the excreta (MS; Figure 1), and manure utilisation by the crops (SF 1 minus the fractions lost as a consequence of manure application practices).
From the assumptions and results presented, it is possible to calculate for each combination of
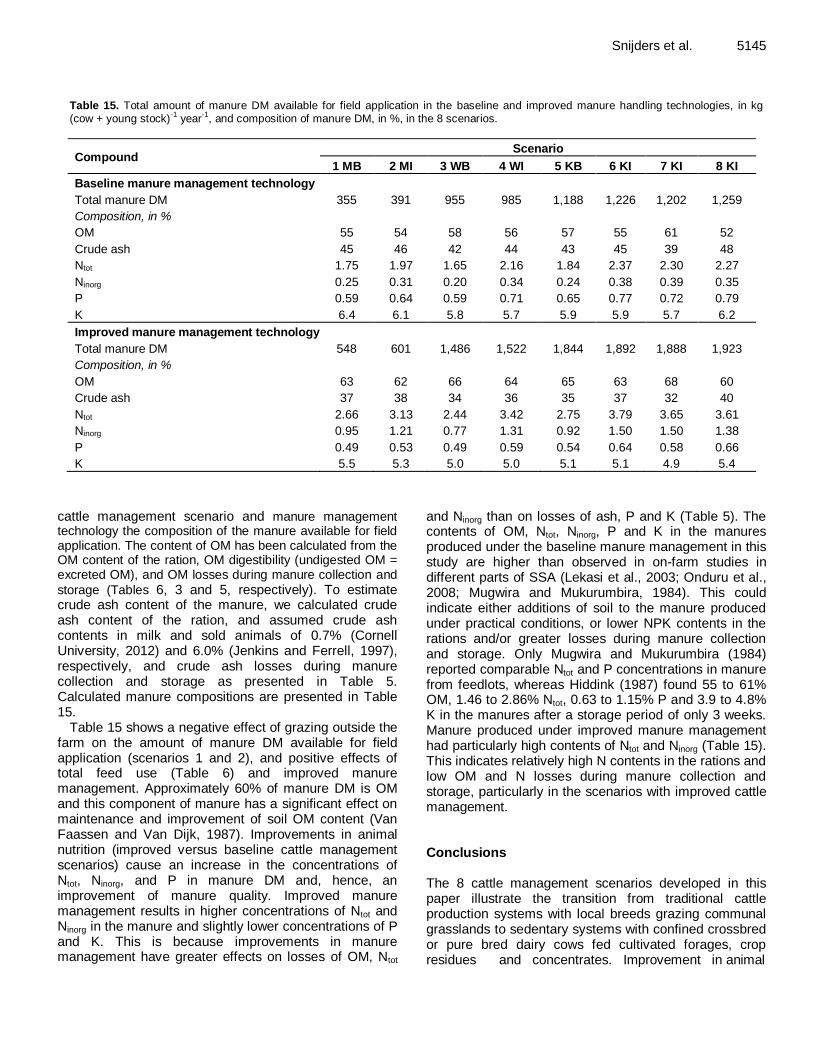
Snijders et al. 5145
Table 15. Total amount of manure DM available for field application in the baseline and improved manure handling technologies, in kg (cow + young stock)
-1 year
-1, and composition of manure DM, in %, in the 8 scenarios.
Compound Scenario
1 MB 2 MI 3 WB 4 WI 5 KB 6 KI 7 KI 8 KI
Baseline manure management technology
Total manure DM
355 391 955 985 1,188 1,226 1,202 1,259
Composition, in %
OM 55 54 58 56 57 55 61 52
Crude ash
45 46 42 44 43 45 39 48
Ntot 1.75 1.97 1.65 2.16 1.84 2.37 2.30 2.27
Ninorg 0.25 0.31 0.20 0.34 0.24 0.38 0.39 0.35
P 0.59 0.64 0.59 0.71 0.65 0.77 0.72 0.79
K 6.4 6.1 5.8 5.7 5.9 5.9 5.7 6.2
Improved manure management technology
Total manure DM 548 601 1,486 1,522 1,844 1,892 1,888 1,923
Composition, in %
OM 63 62 66 64 65 63 68 60
Crude ash 37 38 34 36 35 37 32 40
Ntot 2.66 3.13 2.44 3.42 2.75 3.79 3.65 3.61
Ninorg 0.95 1.21 0.77 1.31 0.92 1.50 1.50 1.38
P 0.49 0.53 0.49 0.59 0.54 0.64 0.58 0.66
K 5.5 5.3 5.0 5.0 5.1 5.1 4.9 5.4
cattle management scenario and manure management technology the composition of the manure available for field application. The content of OM has been calculated from the OM content of the ration, OM digestibility (undigested OM = excreted OM), and OM losses during manure collection and
storage (Tables 6, 3 and 5, respectively). To estimate crude ash content of the manure, we calculated crude ash content of the ration, and assumed crude ash contents in milk and sold animals of 0.7% (Cornell University, 2012) and 6.0% (Jenkins and Ferrell, 1997), respectively, and crude ash losses during manure collection and storage as presented in Table 5. Calculated manure compositions are presented in Table 15.
Table 15 shows a negative effect of grazing outside the farm on the amount of manure DM available for field application (scenarios 1 and 2), and positive effects of total feed use (Table 6) and improved manure management. Approximately 60% of manure DM is OM and this component of manure has a significant effect on maintenance and improvement of soil OM content (Van Faassen and Van Dijk, 1987). Improvements in animal nutrition (improved versus baseline cattle management scenarios) cause an increase in the concentrations of Ntot, Ninorg, and P in manure DM and, hence, an improvement of manure quality. Improved manure management results in higher concentrations of Ntot and Ninorg in the manure and slightly lower concentrations of P and K. This is because improvements in manure management have greater effects on losses of OM, Ntot
and Ninorg than on losses of ash, P and K (Table 5). The contents of OM, Ntot, Ninorg, P and K in the manures produced under the baseline manure management in this study are higher than observed in on-farm studies in different parts of SSA (Lekasi et al., 2003; Onduru et al., 2008; Mugwira and Mukurumbira, 1984). This could indicate either additions of soil to the manure produced under practical conditions, or lower NPK contents in the rations and/or greater losses during manure collection and storage. Only Mugwira and Mukurumbira (1984) reported comparable Ntot and P concentrations in manure from feedlots, whereas Hiddink (1987) found 55 to 61% OM, 1.46 to 2.86% Ntot, 0.63 to 1.15% P and 3.9 to 4.8% K in the manures after a storage period of only 3 weeks. Manure produced under improved manure management had particularly high contents of Ntot and Ninorg (Table 15). This indicates relatively high N contents in the rations and low OM and N losses during manure collection and storage, particularly in the scenarios with improved cattle management. Conclusions The 8 cattle management scenarios developed in this paper illustrate the transition from traditional cattle production systems with local breeds grazing communal grasslands to sedentary systems with confined crossbred or pure bred dairy cows fed cultivated forages, crop residues and concentrates. Improvement in animal
5146 Afr. J. Agric. Res. nutrition is essential for improvement in dairy cow performance and this requires ample supply of forages with a good feeding value and high voluntary intake. Use of concentrates in the scenarios is moderate because of the limited availability of concentrate ingredients in SSA. Depending on cattle breed and nutrition level, milk production per cow varies from 280 kg year
-1 in the
baseline scenario for Mbeere to over 4,000 kg year-1
in improved scenarios for Kibichoi.
These improvements in milk production are associated with (and not possible without) a great increase in N, P and K intake by the cows and, consequently, in N, P and K excretion in faeces and urine. Analyses of published information revealed that prevailing practices of manure management involve large nutrient losses, in particular of N. Based on this information, we assumed for the baseline manure management technology efficiencies of conversion of N, P and K excreted by confined dairy cattle into N, P and K contained in field-applied manure of ca. 30, 70 and 60%, respectively. This illustrates that under the current manure management practices, livestock manure is rather a drain on than a source of nutrients in crop-livestock farms. Even under strongly improved manure management technology, N, P and K losses from manure are high compared to N, P and K outputs in milk and LW gain.
The scenario calculations clearly show that the transition from traditional herding of cattle in communal grasslands with collection of manure in a boma for use on food crops to sedentary husbandry systems based on home-grown forages has a very negative effect on the net nutrient balances. This aggravates the problem of soil fertility depletion in crop-livestock farms unless ample quantities of external N, P and K inputs are used (as shown for N in the scenarios 7 and 8), and manure management technology is radically improved.
Improvements in cattle management and milk production as defined in the scenarios are largely based on the use of high-quality forages. Although Napier grass is extensively used in smallholder dairy farms in East Africa and, hence, in the cattle management scenarios developed in this paper, experience with intensive management of this grass and other forages in this region is limited. Therefore, it is necessary to study effects of intensive management, that is, frequent cutting or grazing and ample N supply on yield, feeding value and persistency of Napier grass and other forages under farming conditions. In general, it is necessary to conduct integral on-farm studies aiming at development of sustainable dairy production systems based on intensively managed grasses and legumes.
An important advantage of forage legumes in the actual farming systems in SSA is that they allow use of available manure on non-leguminous food and forage crops, provided that the legume (and Rhizobium bacteria) receive sufficient P, K and other nutrients for good performance. This may be an attractive nutrient
management strategy for smallholder crop-livestock farms in SSA. REFERENCES
Addy BL, Thomas D (1977a). Intensive fattening of beef cattle by stall
feeding on the Lilongwe Plain, Malawi. I. Type of forage and level and type of supplementation. Trop. Anim. Health Prod. 9:127-134.
Addy BL, Thomas D (1977b). Intensive fattening of beef cattle by stall feeding on the Lilongwe Plain, Malawi. II. Utilisation of crop residues, crop by-products and leucaena. Trop. Anim. Health Prod. 9:191-196.
ARC (1984). The nutrient requirements of ruminant livestock (Suppl. No. 1). Agricultural Research Council, Commonwealth Agricultural Bureaux, Farnham Royal, UK.
Aune JB, Bationo A (2008). Agricultural intensification in the Sahel – The ladder approach. Agric. Syst. 98:119-125.
Boekholt HA (1976). De stikstofhuishouding van het melkrund en de
betekenis van de gluconeogenese uit aminozuren [in Dutch]. PhD Thesis, Wageningen University, Wageningen, The Netherlands. P.207. Available at:
http://library.wur.nl/WebQuery/wda?q=Boekholt%2C+1976. Buresh RJ, Sanchez PA, Calhoun F (eds) (1997). Replenishing Soil
Fertility in Africa. Proceedings of an international Symposium, held at
Indianapolis, Indiana, USA. Soil Science Society of America Special Publication Number 51. Soil Science Society of America and American Society of Agronomy, Madison, Wisconsin, USA, p. 251.
Chadwick DR (2005). Emissions of ammonia, nitrous oxide and methane from cattle manure heaps: effect of compaction and covering. Atmos. Environ. 39:787-799.
Cornell University (2012). Milk Facts. Milk Composition. http://www.milkfacts.info/Milk%20Composition/Milk%20Composition%20Page.htm.
De Jager A, Onduru DD, Gachimbi LN, Muchena F, Gachini G, Van Beek CL (2007). Farmers Field Schools and Integrated Nutrient Management in Kenya. In: De Jager A: Practice Makes Perfect. PhD
Thesis, Wageningen University, Wageningen, The Netherlands. Available at: http://edepot.wur.nl/121923.
De Ridder N (1991). La production végétale potentielle et actuelle. In:
Breman H, de Ridder N (eds) Manuel sur les pâturages des pays sahéliens, p. 23-60. Éditions Karthala, Paris, France. ISBN: 2-86537-339-8.
Dewes T (1999). Ammonia emissions during the initial phase of microbial degradation of solid and liquid cattle manure. Bioresource Technol. 70:245-248.
FAOSTAT (2011). Data on crop yields and fertiliser use. Available at: http://www.fao.org/corp/statistics/en/.
Hiddink B (1987). Manure recycling within the zero-grazing system in
Kenya. Student Report. Department of Field Crops and Grassland Science, Wageningen Agricultural University, Wageningen, The Netherlands, P. 51.
IAEA (2008). Guidelines for sustainable manure management in Asian livestock production systems. IAEA-TECDOC-1582. International Atomic Energy Agency (IAEA), Vienna, Austria, 118 pp. Available at:
http://www-pub.iaea.org/MTCD/Publications/PDF/TE_1582_web.pdf. Jenkins TG, Ferrell CL (1997). Changes in proportions of empty body
depots and constituents for nine breeds of cattle under various feed
availabilities. J. Anim. Sci. 75:95-104. Jenkinson DS (1977). Studies on the decomposition of plant material in
soil. V. The effects of plant cover and soil type on the loss of carbon
from 14
C labelled ryegrass decomposing under field conditions. J. Soil Sci. 28:424-434.
Jenkinson DS, Rayner JH (1977). The turnover of soil organic matter in
some of the Rothamsted classical experiments. Soil Sci. 123(5):298-305.
Johnston AE, Poulton PR, Coleman K (2009). Soil organic matter: its
importance in sustainable agriculture and carbon dioxide fluxes. Adv. Agron. 101:1-57.
Jongbloed AW, Steg A, Simons BCM, Janssen WMMA, Lenis NP, Meijs
JAC, Vreman K (1985). Mededeling 15, Research Institute for
Livestock Feeding and Nutrition (IVVO-DLO), Lelystad, The Netherlands.
Kariuki JN (1998). The potential of improving Napier grass under
smallholder dairy farmers’ conditions in Kenya. PhD Thesis, Wageningen University, Wageningen, The Netherlands. Available at: http://edepot.wur.nl/193548.
Ketelaars JJMH, Rap H (1994). Ammonia volatilization from urine applied to the floor of a dairy cow barn. In: ‘t Mannetje L, Frame J (eds) Grassland and Society. Proceedings of the 15
th General
Meeting of the European Grassland Federation, pp. 413-417. Wageningen Pers, Wageningen, The Netherlands.
Ketelaars JJMH, Tolkamp BJ (1992). Toward a new theory of feed intake regulation in ruminants 1. Causes of differences in voluntary feed intake: critique of current views. Livest. Prod. Sci. 30:269-296.
Kirchmann H, Lundvall A (1998). Treatment of solid animal manures:
identification of low NH3 emission practices. Nutr. Cycling Agroecosyst. 51:65-71.
Kirchmann H, Witter E (1989). Ammonia volatilization during aerobic
and anaerobic manure decomposition. Plant Soil 115:35-41. Lekasi JK, Tanner JC, Kimani SK, Harris PJC (2002). Manure
management methods to enhance nutrient quantity and quality on
smallholdings in the Central Kenya Highlands. Biol. Agric. Hortic. 19:315-332.
Lekasi JK, Tanner JC, Kimani SK, Harris PJC (2003). Cattle manure
quality in Maragua District, Central Kenya: effect of management practices and development of simple methods of assessment. Agric. Ecosyst. Environ. 94:289-298.
Lekasi JK, Tanner JC, Kimani SK, Harris PJC (2006). Effects of poultry litter amended steer diets and subsequent manure collecting systems
on nutrient recovery in composted manures. Biol. Agric. Hortic.
23:413-428. Martins O, Dewes T (1992). Loss of nitrogenous compounds during
composting of animal wastes. Bioresource Technol. 42:103-111.
Mugwira LM, Mukurumbira LM (1984). Comparative effectiveness of manure from the communal areas and commercial feedlots as plant nutrient sources. Zimbabwe Rhod. Agric. J. 81:241-250.
Muia JMK (2000). Use of Napier grass to improve smallholder milk production in Kenya. PhD Thesis, Wageningen University, Wageningen, The Netherlands, 259 pages. Available at:
http://edepot.wur.nl/197266. Muia JMK, Tamminga S, Mbugua PN, Kariuki JN (1999). Optimal stage
of maturity for feeding napier grass (Pennisetum purpureum) to dairy
cows in Kenya. Trop. Grasslands 33:182-190. Muia JMK, Tamminga S, Mbugua PN, Kariuki JN (2000). The nutritive
value of Napier grass (Pennisetum purpureum) and its potential for
milk production with or without supplementation: a review. Trop. Sci. 40:109-131.
Mwangi DM, Cadisch G, Thorpe W, Giller KE (2004). Harvesting management options for legumes intercropped in napier grass in the
central highlands of Kenya. Trop. Grasslands 38:234-244. NRC (National Research Council) (1989). Nutrient requirements of dairy
cattle, 6th revised edition. National Academic Press, Washington DC,
USA. Onduru DD, Snijders P, Muchena FN, Wouters B, De Jager A,
Gachimbi L, Gachini GN (2008). Manure and soil fertility
management in sub-humid and semi-arid farming systems of sub-Saharan Africa: Experiences from Kenya. Int. J. Agric. Res. 3(3):166-187.
Penning de Vries FWT, Djitèye MA (eds) (1982). La productivité des pâturages sahéliens. Une étude des sols, des végétations et de l’exploitation de cette resource naturelle. Centre for Agricultural
Publishing and Documentation, Wageningen, The Netherlands (in French).
Powell JM, Fernández-Rivera S, Hiernaux P, Turner MD (1996).
Nutrient cycling in integrated rangeland/cropland systems of the Sahel. Agric. Syst. 52 (2/3):143-170.
Powell JM, Pearson RA, Hiernaux PH (2004). Crop-Livestock
Interaction in the West African Drylands. Review and Interpretation. Agron. J. 96:469-483.
Powell JM, Williams TO (1995). An overview of mixed farming systems
in Sub-Saharan Africa. In: Powell JM et al. (eds) Livestock and
Snijders et al. 5147
sustainable nutrient cycles in mixed-farming systems of Sub-Sahara Africa. Volume II: Technical Papers, pp. 21-31. Proceedings of an International Conference, Addis Ababa, Ethiopia. International
Livestock Centre for Africa (ILCA), Addis Ababa, Ethiopia. Rufino MC, Rowe EC, Delve RJ, Giller KE (2006). Nitrogen
cyclingefficiencies through resource-poor African crop-livestock
systems. Review. Agriculture, Ecosyst. Environ. 112:261-282. Rufino MC, Tittonell P, van Wijk MT, Castellanos-Navarrete A, Delve
RJ, de Ridder N, Giller KE (2007). Manure as a key resource within
smallholder farming systems: Analysing farm-scale nutrient cycling efficiencies with the NUANCES framework. Livest. Sci. 112:273-287.
Sanchez PA, Izac A-MN, Valencia I, Pieri C (1996). Soil fertility
replenishment in Africa: A concept note. In: Breth SA (ed) Achieving greater impact from research investment in Africa, Sasakawa Africa Association, Mexico City, Mexico. pp. 200-207.
Schröder JJ, Aarts HFM, ten Berge HFM, van Keulen H, Neeteson JJ (2003). An evaluation of whole-farm nitrogen balances and related indices for efficient nitrogen use. Eur. J. Agron. 20:33-44.
Sibma L, Spiertz JHJ (1986). Dry matter production and nitrogen utilization in cropping systems with grass, lucerne and maize. 1. Comparison of crop characteristics, growth and production.
Netherlands J. Agric. Sci. 34:25-35. Snijders PJM, Nahuis H, Wekesa F, Wouters AP (1992). 1. Yield and
quality of a mixture of Napier grass and greenleaf Desmodium at two
cutting regimes. 2. Vegetative propagation of Greenleaf Desmodium. Kenya Agricultural Research Institute, Naivasha, Kenya.
Snijders PJM, Wouters AP, Kariuki JN (2011). Effect of cutting
management and nitrogen supply on yield and quality of Napier grass (Pennisetum purpureum). Report 544, Wageningen UR Livestock
Research, Lelystad, The Netherlands, P. 98 Available at:
http://library.wur.nl/WebQuery/edepot/191662. Sommer SG (2001). Effect of composting on nutrient loss and nitrogen
availability of cattle deep litter. Eur. J. Agron. 14:123-133. Available
at: http://library.wur.nl/WebQuery/edepot/191662. Spiertz JHJ, Sibma L (1986). Dry matter production and nitrogen
utilization in cropping systems with grass, lucerne and maize. 2.
Nitrogen yield and utilization. Netherlands J. Agric. Sci. 34:37-47. Steinfeld H (1998). Livestock and their interactions with the
environment: An overview. In: Gill M et al. (eds) Foods, lands and
livelihoods – setting the research agendas for animal science. Occasional Publication 21, pp. 53-66. British Society of Animal Sciences, Penicuik, Midlothian, Scotland.
Thomsen IK (2000). C and N transformations in 15
N cross-labelled solid ruminant manure during anaerobic and aerobic storage. Bioresource Technol. 72:267-274.
Tittonell P, Rufino M, Janssen BH, Giller KE (2010). Carbon and nutrient losses during manure storage under traditional and improved practices in smallholder crop-livestock systems – evidence from Kenya. Plant Soil 328:253-269.
Van Beek CL, Onduro DD, Gachimbi LN, de Jager A (2009). Farm nitrogen flows of four farmer field schools in Kenya. Nutr. Cycling Agroecosyst. 83:63-72.
Van der Meer HG (2008a). Optimising manure management for GHG outcomes. Australian J. Exp. Agric. 48:38-45.
Van der Meer HG (2008b). Production and utilization of livestock
manure in The Netherlands. In: Matsunaka T, Sawamoto T (eds) Animal Manure – Pollutant or Resource? Proceedings of a Parallel Symposium of the International Conference on Sustainable
Agriculture, p. 55-99. Rakuno Gakuen University Extension Center, Ebetsu, Hokkaido 069-8501, Japan. ISBN 978-4-902786-07-1 C3461.
Van der Meer HG (ed) (2002). Reducing inputs and losses of nitrogen and energy on dairy farms. Final Report Project AIR3 CT92-0332. Note 210, Plant Research International, Wageningen UR,
Wageningen, The Netherlands, 208 pp. + Annexes. Available at: http://library.wur.nl/WebQuery/wurpubs/332592.
Van der Meer HG, Thompson RB, Snijders PJM, Geurink JH (1987).
Utilization of nitrogen from injected and surface-spread cattle slurry applied to grassland. In: Van der Meer et al. (eds) Animal manure on
grassland and fodder crops. Fertilizer or Waste? Dev. Plant Soil Sci.
30:47-71. Martinus Nijhoff Publishers, Dordrecht, The Netherlands.
5148 Afr. J. Agric. Res. ISBN 90-247-3568-8. Van Faassen HG, van Dijk H (1987). Manure as a source of nitrogen
and phosphorus in soils. In: Van der Meer et al. (eds) Animal manure
on grassland and fodder crops. Fertilizer or Waste? Dev. Plant Soil Sci. 30:27-45. Martinus Nijhoff Publishers, Dordrecht, The
Netherlands. ISBN 90-247-3568-8. Walaga C, Zake J, Nagawa F (2002). Wakiso Sub-County, Agriculture
Sector Baseline Study Report. INMASP Uganda, Central Report No.
1. Environmental Alert, PO Box 1259, Kampala, Uganda. Whiteman PC (1980). Tropical pasture science. Oxford University
Press, Oxford, UK, P.392 .
Wilson JR, Deinum B, Engels FM (1991). Temperature effects on anatomy and digestibility of leaf and stem of tropical and temperate forage species. Netherlands J. Agric. Sci. 39:31-48.
Wouters AP (1985). Uninterrupted growth of Napier grass (var. Banagrass) at two levels of nitrogen application. National Dairy Development Project, Ministry of Agriculture and Livestock
Development, Naivasha, Kenya.
Zake J, Tenywa JS, Kabi F (2010). Improvement of manure
management for crop production in Central Uganda. J. Sustain.
Agric. 34:595-617. Zemmelink G, Ifar S, Oosting SJ (2003). Optimum utilization of feed
resources: model studies and farmers’ practices in two villages in
East Java, Indonesia. Agric. Syst. 76:77-94.


