Embed Size (px)
Citation preview

Vol.59 - No. 10 MINERVA STOMATOLOGICA 519
Juvenile idiopathic arthritis ( JIA) is a com-mon disease in childhood.1 It causes joint
inflammation, typically before 16 years of age. The cause of the illness is unknown, and it persists for at least six weeks.2 The reported prevalence of JIA is 0.07 to 4.01 per 1000 individuals, and the yearly inci-dence is 0.008 to 0.226 per 1000 individu-als.3 Females are affected three times more often than males.4
The most important manifestation of the disease is chronic synovitis with epithelial proliferation, resulting in increased synovial fluid production and pressure within the af-fected joint(s).4
A recent study reported that the temporo-mandibular joint (TMJ) is affected in 75% of acute cases and in 69% of chronic cases at the time of diagnosis.5 When the TMJ is af-fected, there is often no pain, which delays the diagnosis and treatment.6 Inflammation of the TMJ leads to bone resorption affect-ing the condyle head and fossa.7 The con-dylar abnormalities can range from slight erosion and flattening of the articular sur-
Aim. The aim of this study was to show the importance of Cone Beam Computerized To-mography (CBCT) to volumetrically quanti-fy temporomandibular joint (TMJ) damage in patients with juvenile idiopathic arthritis (JIA), measuring condylar and mandibular real volumes.Methods. Thirty-four children with temporo-mandibular involvement by JIA were obser-ved by CBCT. Four were excluded because of several imaging noises. The mandible was isolated from others craniofacial structures; the whole mandibular volume and its com-ponents’ volumes (condyle, ramus, emibody, emisymphysis on right side and on left side) has been calculated by a 3D volume rende-ring technique.Results. The results show a highly significant statistical difference between affected side volumetric values versus normal side volu-metric values, above all on condyle region (P<0.01), while there was no statistical diffe-rence between right versus left side.Conclusion. The CBCT represents a huge im-provement in understanding of the condyle and mandibular morphological changes, even in the early stages of the JIA. In children the JIA can lead to TMJ damage with facial deve-lopment and growth alterations.Key words: Arthritis, juvenile idiopathic - Cone-beam computed tomography - Tem-poromandibular joint disorders.
1Department of Orthodontics and Gnatology School of Dentistry, Dental Hygiene School
University of Milan, Milan, Italy 2Department of Orthodonticsand Oral
Surgery, Dental and Stomatologic Clinic,School of Dentistry, University of Milan
Milan, Italy
ORIGINAL ARTICLESMINERVA STOMATOL 2010;59:519-34
G. FARRONATO 1, U. GARAGIOLA 2, V. CARLETTI 2, P. CRESSONI 2, L. MERCATALI 2, D. FARRONATO 2
Change in condylar and mandibular morphology in juvenile idiopathic arthritis:
Cone Beam volumetric imaging
Received on January 11, 2010. Accepted for publication on September 15, 2010.
Corresponding author: G. Farronato, IRCCS Department of Surgical, Reconstructive and Diagnostic Sciences, Univer-sity of Milan, via Della Commenda 10, 20122 Milan, Italy. E-mail: [email protected]
Anno: 2010Mese: OctoberVolume: 59No: 10Rivista: MINERVA STOMATOLOGICACod Rivista: MINERVA STOMATOL
Lavoro: 3241-MSTtitolo breve: Biomaterials affect the biological activities and responses of cellsprimo autore: PAPPALARDOpagine: 519-34
MIN
ERVA M
EDICA
COPYRIGHT®

520 MINERVA STOMATOLOGICA October 2010
FARRONATO CONE BEAM VOLUMETRIC IMAGING
faces to severe destruction of the condyle head.8 TMJ damage is frequently associated with early-onset disease, female gender, polyarticular subtype,9 and positive antinu-clear antibodies (ANA).6
TMJ involvement manifests clinically as a reduction in the capacity to open the mouth and radiographically as reduced condylar translation.10 TMJ involvement is suspected when only condylar rotation occurs during mouth opening.11
In very young patients, TMJ involvement affects condylar growth, altering mandibu-lar development and function.12 When both TMJs are affected, reduced masticatory ef-ficiency and altered facial appearance (bird face) can result; unilateral involve-ment produces asymmetric development of the mandible with deviation to the af-fected side during mouth opening.13 Facial alterations may be attributable to condylar damage, reduced function, and corticos-teroid therapy.14 Reported facial alterations have included a backward shifted mandi-ble with impaired function, reduced facial posterior height, backward rotation of the mandible, an obtuse gonial angle, increased facial convexity, antegonial notching, and bone apposition in the gonial zone.14 These changes in JIA are best diagnosed using magnetic resonance imaging (MRI),15 which is considered the gold standard for the early identification of damage.16
Ultrasound (US) is also used as a diag-nostic screening method for TMJ involve-ment in JIA,17 although it is less reliable.5, 16 The panoramic radiograph is routinely used in dental examinations, including TMJ in-volvement in JIA, but is not the most sensi-ble choice,11 as it cannot be used to analyze condylar translation or the range of man-dibular movement.15
Most morphological analyses involve ce-phalometric analysis of lateral radiographs. However, it is difficult to obtain a correct lateral radiograph showing cervical spine involvement without producing an anoma-lous head position.18 Frontal radiographs can be used to evaluate asymmetry in sub-jects with unilateral TMJ involvement, as they show mandibular length asymmetry,
symphysis deviation, mandibular body in-clination, and ramus vertical height asym-metry.19 The degree of condylar asymme-try can also be analyzed using cone beam computerize tomography (CBCT), which shows that condylar asymmetry is a com-mon feature of TMJ involvement in JIA.20
Materials and methods
This study enrolled 34 patients with JIA, diagnosed according to the International League of Associations for Rheumatol-ogy revised criteria.2 Children with cardiac pacemakers, metal implants or clips, or dental braces were excluded. All patients were examined clinically and radiographi-cally to evaluate the arthritic involvement of the TMJs.
The clinical examination was subdivided into three parts: facial observation, intraoral observation, and TMJ functional analysis. Radiographically, the TMJ was examined using CBCT, a new method that reduces the X-ray dosage compared with that of tradi-tional computed tomography (CT).21, 22
CBCT uses a cone-shaped X-ray beam instead of the collimated fan beam used in spiral CT. The tube-detector system ro-tates 360° around the patient’s head using a constant beam angle,23 with the patient in an upright position, as in a standard pano-ramic machine. The field size was 30 × 40 mm, and the scan time was 10 s (i.e., the lowest scan time for children). The CBCT system was capable of imaging a large por-tion of the maxillofacial and cranial com-plex in one exposure; it also provided a two-dimensional (2D) digital cephalogram option.24, 25
The data were captured using an I-CAT™ cone beam 3-D imaging system (Imaging Sciences International, Hatfield, PA, USA) and processed using I-CAT Vision viewing software (Croall Radiography, San Jose, CA, USA), which allows visualization and meas-urement of the images in three dimensions (3D). All cone beam scanners come with preinstalled software for image manipula-tion, for added image functionality.
MIN
ERVA M
EDICA
COPYRIGHT®

Vol.59 - No. 10 MINERVA STOMATOLOGICA 521
CONE BEAM VOLUMETRIC IMAGING FARRONATO
The imaging tools included multi-planner reformatting (MPR) and maximum intensity projection (MIP). Typically, 3D volume data are acquired in the axial plane, and MPR creates sagittal, coronal, and transverse im-ages from those axial images. These images allow effective visualization of the section-to-section changes in the scanned structure. MPR images are available with all prein-stalled cone beam scanner software. The software also allows measurements of the slices to be made. The cone beam images can be used to generate accurate 3D pano-ramic slices along a specified curve by using either the preinstalled software that comes with the cone beam machine or third-party software. Panoramic images generated from cone beam scanners are more accurate than conventional panoramic images, because there is no tissue superimposition or image distortion, i.e., 1-to-1 scale images, which allows accurate measurements.
The MIP algorithm evaluates each cone beam voxel along a ray through the viewer’s line of site, and the maximum voxel value is selected as the pixel to be displayed in the resulting image. This representation al-lows the viewer to appreciate the depth of rendering. The 3D volume rendering tech-nique represents the entire volume of the cone beam data by summing the values of each voxel along the viewer’s line of sight through the complete dataset. The process occurs repeatedly to determine the pixel value to be displayed in the resulting image. The 3D volume rendering allows realistic visualization of 3D volume data, characteri-zation of disease, and an appreciation of anatomic relationships.
Initially, CBCT systems reconstruct the projection data to provide standard view-ing layouts in three orthogonal planes: the frontal, lateral, and superior (axial) planes.24 Then, the computer makes a 3D reconstruc-tion representative of the volumetric dataset using MIP. The resulting CT images are im-ported via Mimics software (Materialise NV, Leuven, Belgium) for 3D images and then converted into Digital Imaging and Com-munications in Medicine (DICOM) format (Nema, Rosslyn, VA, USA).
The mandible is isolated from other craniofacial structures using a manual pro-cedure, and the total mandibular volume is calculated by volume rendering (range, 226-3071 gray scale). Next, the mandible is separated into the condyle, ramus, hemi-body, and hemisymphysis, on the right and left sides. Two planes of reference are se-lected to construct these parts: the anatomic symmetry axis and articular plane. The ana-tomic symmetry axis is constructed using a plane passing through the lower inter-inci-sor point to the middle menton (the lowest point of the symphysis in the frontal plane). The articular plane is perpendicular to the anatomic symmetry axis, passing from the sella (geometric centre of the sella turcica in the lateral plane) to the nasion (fronto-nasal suture in the lateral plane).
First, the mandible is divided into the right and left hemimandibles, along the symmetry axis. Then, the operator cuts the hemimandibles using planes parallel to the anatomic symmetry axis, passing through the ipsilateral menton (the lowest point of the symphysis in the lateral plane), to cre-ate the hemisymphysis. The condyles are obtained from sections of a plane parallel to the articular plane passing through the lowest point of the mandibular notch (Ar).
The rest of the hemimandible is cut in the region of the mandible angle by the plane bisecting the angle formed between the lower and posterior borders of the man-dible in the lateral plane. The upper part is the mandibular ramus, and the lower part is the body of the mandible. The same cuts are made for the opposite side. Finally, the volume of each part is calculated using ap-propriate software (Figures 1-5).
All of the volumes are calculated in cu-bic millimeters (mm3). In the present study, all of the measurements were made by the same researcher to reduce error. The values were calculated twice, 15 days apart, and the mean values were analyzed. Student’s t test was used to determine statistical significance, which was identified by a P value <0.05.
This study was performed in accordance with the principles of the Declaration of Helsinki.25
MIN
ERVA M
EDICA
COPYRIGHT®

522 MINERVA STOMATOLOGICA October 2010
FARRONATO CONE BEAM VOLUMETRIC IMAGING
Results
Four subjects were excluded because ra-diographic noise prevented correct defini-tion of the anatomy. Ultimately, 30 children were analyzed, 23 females and 7 males, with an average age of 11.90 years (range, 4-14 years).
The following facial features were iden-tified: facial asymmetry in 15 patients, bird face in five, and no deformities in 14. The in-traoral examination revealed the presence of dental open bite and increased overjet in 10 patients, midline deviation in 12, and no oc-clusal anomalies in 20. TMJ functional analy-
Figure 1.—Mandible volume in the frontal view.
Figure 2.—Mandible volume in the right lateral view.
Figure 3.—Mandible volume in the left lateral view.
Figure 4.—Normal condyle volume.
Figure 5.—Abnormal condyle volume.
MIN
ERVA M
EDICA
COPYRIGHT®

Vol.59 - No. 10 MINERVA STOMATOLOGICA 523
CONE BEAM VOLUMETRIC IMAGING FARRONATO
sis showed the presence of deviation toward the affected side during opening in 27 chil-dren, crepitations and clicking on opening and closing in 30, and slight pain in two.
The average volume of the right hemi-mandible was 19 933.27 mm3 (range, 12061.58-27606.39), and that of the left hemimandible was 20262.08 mm3 (range,
Table I.—�Affected versus normal side volumetric values in juvenile idiopathic arthritis.
Patient Age
Hemymandiblevolume Condyle volume Ramus volume Hemybody volume Hemysymphisys
volume
Affected Normal Affected Normal Affected Normal Affected Normal Affected Normal
CB 13 21443.23 23520.54 817.73 935.25 4669.25 5000.18 13334.22 14854.53 2622.03 2730.58
SB 11 19803.25 23083.42 385.06 1077.56 4103.62 5189.43 13760.84 14911.32 1553.73 1905.11
CZ 10 23257.29 23436 746.24 1027.66 4608.05 4670.44 15201.07 15448.5 2358.12 2633.21
MR 18 17573.12 19915.72 614.84 1046.88 2493.78 2973.94 11774.7 13773.74 2121.16 2689.8
SDC 16 23474.49 26141.19 623.7 1030.45 4270.06 4851.77 15057.62 17909.64 2931.04 2941.4
CZ 14 24462.76 24563.34 556.93 647.11 5067.29 5529.77 15873.81 16327.06 2412.07 2612.06
VM 13 16660.13 19730.87 438.72 1096.73 3069.53 3634.69 13624.34 11547.93 1375.11 1603.95
FS 8 12061.58 15225.79 317.95 720.8 2219.17 2629.75 8083.08 10040.18 1441.38 1835.06
CG 9 17682.46 18576.98 516.56 653.97 2908.47 3010.77 12879.18 13635.73 1275.95 1378.81
IS 12 20248.36 20356.84 808.97 831.52 4120.56 4531.87 13225.67 13428.61 1659.3 1998.7
MC 17 21212.98 23012.77 951.48 1412.8 4218.05 4237.16 14160.62 14719.91 1882.83 2642.9
FC 8 20087.47 20186.59 509.76 731.66 3662.28 4401.62 13425.43 13431.98 1849.78 2261.55
MI 11 16492.99 18133.67 416.78 638.84 2974.41 3388.22 10646.56 11493.51 2455.24 2613.1
VN 15 22833.88 27606.39 522.76 1293.16 4535.86 5967.85 18478.78 14989.82 1866.6 2785.44
GPP 12 21427.03 22394.04 588.21 737.47 4088.58 4717.65 14529.24 13959.77 2409.68 2790.47
MDE 13 14907.77 14969.71 312.09 348.07 3184.61 3508.42 9704.33 10315.15 1059.94 1444.87
MF 13 19250.39 19673.19 710.07 839.03 4010.8 4502.48 12557.61 12922.7 1480.23 1900.66
RR 10 18117.63 18211.45 494.18 558.73 3914.06 4086.81 11451.88 11804.68 1998.53 2020.21
SB 9 20258.42 20896.42 865.65 906.38 3275.24 4018.07 12693.88 14120.85 2593.95 2680.82
CA 13 18843.37 19098.59 647.33 688.87 4099.61 4443 12105.05 12111.84 1896.42 1949.84
AG 5 14428.02 16434.96 324 974.68 2527.22 2846.72 8988.33 10245.66 2367.9 2588.47
AG 16 22884.73 24852.8 731.7 1139.86 5094.38 5772.38 13857.31 14848.18 3201.34 3092.38
MB 4 12955.192 15221.94 347.332 754.29 2836.02 3144.35 8318.65 9770.36 1453.19 1552.94
ABC 16 21306.37 22897.13 518.02 813.74 4227.22 4465.69 13612.01 14351.52 2949.12 3266.18
SNB 15 21804.1 22405.32 470.47 492.66 4702.61 4923.23 13793.48 14300 2594.73 2932.24
LS 14 24122.45 24525.95 1743.64 1860 4561.82 4575.86 15137.72 15808.69 2295.44 2665.23
SR 9 16257.06 18206.55 368.04 882.44 2957.44 4271.1 10349.99 10644.21 2408.8 2581.59
GE 11 19513.81 23893.2 378.32 1232.26 4210.62 5119.42 12439.82 15091.68 2449.84 2485.05
AF 9 17443.87 19919.7 409.74 813.94 3042.31 3553.2 11638.99 13335.92 2216.64 2352.83
AT 13 18152.31 19802.87 522.28 1099.75 3362.73 4144.39 11365 11914.64 2644.09 2902.3
Average 11.9 19298.88 20896.46 588.62 909.55 3767.19 4270.34 12735.64 13401.94 2127.47 2394.59
test t 0.03 0.00004 0.01 0.12 0.03
MIN
ERVA M
EDICA
COPYRIGHT®
524 MINERVA STOMATOLOGICA October 2010
FARRONATO CONE BEAM VOLUMETRIC IMAGING
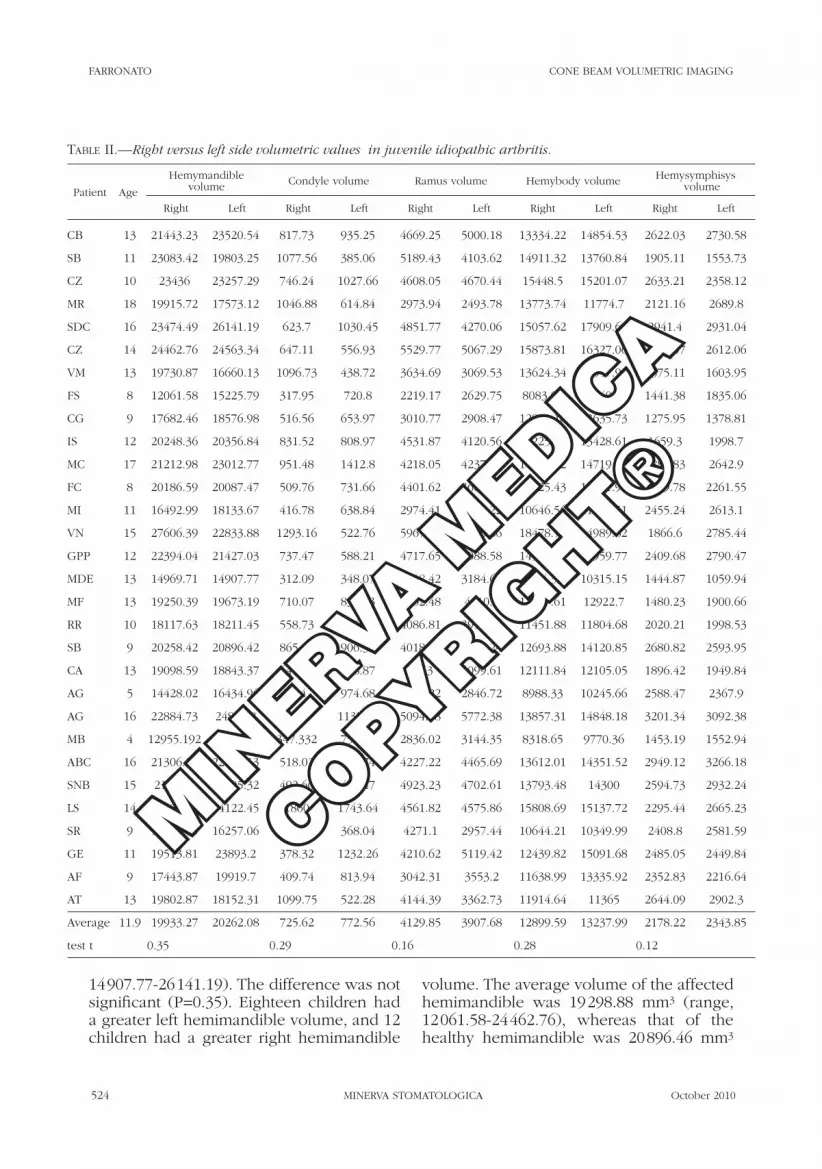
14907.77-26141.19). The difference was not significant (P=0.35). Eighteen children had a greater left hemimandible volume, and 12 children had a greater right hemimandible
volume. The average volume of the affected hemimandible was 19298.88 mm3 (range, 12061.58-24462.76), whereas that of the healthy hemimandible was 20896.46 mm3
Table II.—�Right versus left side volumetric values in juvenile idiopathic arthritis.
Patient Age
Hemymandiblevolume Condyle volume Ramus volume Hemybody volume Hemysymphisys
volume
Right Left Right Left Right Left Right Left Right Left
CB 13 21443.23 23520.54 817.73 935.25 4669.25 5000.18 13334.22 14854.53 2622.03 2730.58
SB 11 23083.42 19803.25 1077.56 385.06 5189.43 4103.62 14911.32 13760.84 1905.11 1553.73
CZ 10 23436 23257.29 746.24 1027.66 4608.05 4670.44 15448.5 15201.07 2633.21 2358.12
MR 18 19915.72 17573.12 1046.88 614.84 2973.94 2493.78 13773.74 11774.7 2121.16 2689.8
SDC 16 23474.49 26141.19 623.7 1030.45 4851.77 4270.06 15057.62 17909.64 2941.4 2931.04
CZ 14 24462.76 24563.34 647.11 556.93 5529.77 5067.29 15873.81 16327.06 2412.07 2612.06
VM 13 19730.87 16660.13 1096.73 438.72 3634.69 3069.53 13624.34 11547.93 1375.11 1603.95
FS 8 12061.58 15225.79 317.95 720.8 2219.17 2629.75 8083.08 10040.18 1441.38 1835.06
CG 9 17682.46 18576.98 516.56 653.97 3010.77 2908.47 12879.18 13635.73 1275.95 1378.81
IS 12 20248.36 20356.84 831.52 808.97 4531.87 4120.56 13225.67 13428.61 1659.3 1998.7
MC 17 21212.98 23012.77 951.48 1412.8 4218.05 4237.16 14160.62 14719.91 1882.83 2642.9
FC 8 20186.59 20087.47 509.76 731.66 4401.62 3662.28 13425.43 13431.98 1849.78 2261.55
MI 11 16492.99 18133.67 416.78 638.84 2974.41 3388.22 10646.56 11493.51 2455.24 2613.1
VN 15 27606.39 22833.88 1293.16 522.76 5967.85 4535.86 18478.78 14989.82 1866.6 2785.44
GPP 12 22394.04 21427.03 737.47 588.21 4717.65 4088.58 14529.24 13959.77 2409.68 2790.47
MDE 13 14969.71 14907.77 312.09 348.07 3508.42 3184.61 9704.33 10315.15 1444.87 1059.94
MF 13 19250.39 19673.19 710.07 839.03 4502.48 4010.8 12557.61 12922.7 1480.23 1900.66
RR 10 18117.63 18211.45 558.73 494.18 4086.81 3914.06 11451.88 11804.68 2020.21 1998.53
SB 9 20258.42 20896.42 865.65 906.38 4018.07 3275.24 12693.88 14120.85 2680.82 2593.95
CA 13 19098.59 18843.37 647.33 688.87 4443 4099.61 12111.84 12105.05 1896.42 1949.84
AG 5 14428.02 16434.96 324 974.68 2527.22 2846.72 8988.33 10245.66 2588.47 2367.9
AG 16 22884.73 24852.8 731.7 1139.86 5094.38 5772.38 13857.31 14848.18 3201.34 3092.38
MB 4 12955.192 15221.94 347.332 754.29 2836.02 3144.35 8318.65 9770.36 1453.19 1552.94
ABC 16 21306.37 22897.13 518.02 813.74 4227.22 4465.69 13612.01 14351.52 2949.12 3266.18
SNB 15 21804.1 22405.32 492.66 470.47 4923.23 4702.61 13793.48 14300 2594.73 2932.24
LS 14 24525.95 24122.45 1860 1743.64 4561.82 4575.86 15808.69 15137.72 2295.44 2665.23
SR 9 18206.55 16257.06 882.44 368.04 4271.1 2957.44 10644.21 10349.99 2408.8 2581.59
GE 11 19513.81 23893.2 378.32 1232.26 4210.62 5119.42 12439.82 15091.68 2485.05 2449.84
AF 9 17443.87 19919.7 409.74 813.94 3042.31 3553.2 11638.99 13335.92 2352.83 2216.64
AT 13 19802.87 18152.31 1099.75 522.28 4144.39 3362.73 11914.64 11365 2644.09 2902.3
Average 11.9 19933.27 20262.08 725.62 772.56 4129.85 3907.68 12899.59 13237.99 2178.22 2343.85
test t 0.35 0.29 0.16 0.28 0.12
MIN
ERVA M
EDICA
COPYRIGHT®

Vol.59 - No. 10 MINERVA STOMATOLOGICA 525
CONE BEAM VOLUMETRIC IMAGING FARRONATO
(range, 14969.71-27606.39). The difference was significant (P=0.03).
The average volume did not differ signifi-cantly (P=0.29) between the right condyle (725.62 mm3; range, 312.09-1860.00) and left condyle (772.56 mm3; range, 348.07-1743.64). Nineteen children had a greater left condyle volume, and 11 children had a greater right condyle volume. The volume of the affected condyle averaged 588.62 mm3 (range, 312.09-1743.64), whereas that of the healthy side averaged 909.55 mm3
(range. 348.07-1 860). The difference was highly significant (P<0.001).
The average volume of the right ramus (4 129.85 mm3; range, 2 219.17-5 967.85) was not significantly different (P=0.16) from that of the left ramus (3 907.68 mm3; range, 2 493.78-5 772.38). Twelve children had a greater left ramus volume, and 18 had a greater right ramus volume. The affected ramus had an average volume of 3 767.19 mm3 (range, 2 219.17-5 094.38), whereas the average volume of the healthy side
Table III.—�Affected versus normal side volumetric values in females with juvenile idiopathic arthritis.
Patient Age
Hemymandiblevolume Condyle volume Ramus volume Hemybody volume Hemysymphisys
volume
Affected Normal Affected Normal Affected Normal Affected Normal Affected Normal
CB 13 21443.23 23520.54 817.73 935.25 4669.25 5000.18 13334.22 14854.53 2622.03 2730.58
CZ 10 23257.29 23436 746.24 1027.66 4608.05 4670.44 15201.07 15448.5 2358.12 2633.21
SDN 16 23474.49 26141.19 623.7 1030.45 4270.06 4851.77 15057.62 17909.64 2931.04 2941.4
VM 13 16660.13 19730.87 438.72 1096.73 3069.53 3634.69 13624.34 11547.93 1375.11 1603.95
FS 8 12061.58 15225.79 317.95 720.8 2219.17 2629.75 8083.08 10040.18 1441.38 1835.06
CG 9 17682.46 18576.98 516.56 653.97 2908.47 3010.77 12879.18 13635.73 1275.95 1378.81
IS 12 20248.36 20356.84 808.97 831.52 4120.56 4531.87 13225.67 13428.61 1659.3 1998.7
MC 17 21212.98 23012.77 951.48 1412.8 4218.05 4237.16 14160.62 14719.91 1882.83 2642.9
MI 11 16492.99 18133.67 416.78 638.84 2974.41 3388.22 10646.56 11493.51 2455.24 2613.1
VN 15 22833.88 27606.39 522.76 1293.16 4535.86 5967.85 18478.78 14989.82 1866.6 2785.44
MDE 13 14907.77 14969.71 312.09 348.07 3184.61 3508.42 9704.33 10315.15 1059.94 1444.87
MF 13 19250.39 19673.19 710.07 839.03 4010.8 4502.48 12557.61 12922.7 1480.23 1900.66
SB 9 20258.42 20896.42 865.65 906.38 3275.24 4018.07 12693.88 14120.85 2593.95 2680.82
CA 13 18843.37 19098.59 647.33 688.87 4099.61 4443 12105.05 12111.84 1896.42 1949.84
AG 5 14428.02 16434.96 324 974.68 2527.22 2846.72 8988.33 10245.66 2367.9 2588.47
AG 16 22884.73 24852.8 731.7 1139.86 5094.38 5772.38 13857.31 14848.18 3201.34 3092.38
ABC 16 21306.37 22897.13 518.02 813.74 4227.22 4465.69 13612.01 14351.52 2949.12 3266.18
SNB 15 21804.1 22405.32 470.47 492.66 4702.61 4923.23 13793.48 14300 2594.73 2932.24
LS 14 24122.45 24525.95 1743.64 1860 4561.82 4575.86 15137.72 15808.69 2295.44 2665.23
SR 9 16257.06 18206.55 368.04 882.44 2957.44 4271.1 10349.99 10644.21 2408.8 2581.59
GE 11 19513.81 23893.2 378.32 1232.26 4210.62 5119.42 12439.82 15091.68 2449.84 2485.05
AF 9 17443.87 19919.7 409.74 813.94 3042.31 3553.2 11638.99 13335.92 2216.64 2352.83
AT 13 18152.31 19802.87 522.28 1099.75 3362.73 4144.39 11365 11914.64 2644.09 2902.3
Average 12.17 19327.83 21013.80 615.75 944.91 3776.09 4263.77 12736.29 13394.76 2175.05 2435.03
test t 0.05 0.0005 0.03 0.16 0.06
MIN
ERVA M
EDICA
COPYRIGHT®

526 MINERVA STOMATOLOGICA October 2010
FARRONATO CONE BEAM VOLUMETRIC IMAGING
(4 270.34 mm3; range, 2 629.75-5 967.85) was significantly greater (P=0.01).
The right hemibody volume averaged 12 899.59 mm3 (range, 8 083.08-18 478.78), and the left averaged 13 237.99 mm3 (range, 9 770.36-17 909.64). The difference was not significant (P=0.27). Twenty children had a greater left hemibody volume, and 10 children had a greater right hemibody volume. The average volume did not differ significantly (P=0.12) between the affected hemibody (12 735.64 mm3; range, 8 083.08-18 478.78) and the healthy side (13 401.94 mm3; range, 9 770.36-17 909.64).
The right hemisymphysis had an average volume of 2 178.22 mm3 (range, 1 275.95-3 201.34), and the left averaged 2 343.85 mm3 (range, 1 059.94-3 266.18). The differ-ence was not significant (P=0.12). Twenty children had a greater left hemisymphysis volume, and 10 had a greater right hemisym-physis volume. The average volume of the affected hemisymphysis (2 127.47 mm3; range, 1 059.94-3 201.34) was significantly lower (P=0.02) than that of the healthy side (2 394.59 mm3; range, 1 378.81-3 266.18) (Tables I, II).
Summarizing the data, there was a very significant difference in volume between the healthy and affected condyles (P<0.001), and the volumes of the hemimandible, ra-mus, and hemisymphysis differed signifi-
cantly; however, there was no difference in volume between the hemibodies. The data did not show any statistical differences be-tween right side versus left side.
Gender differences
In males, the only significant difference in volume was that between the healthy and affected condyles (P=0.002). This was prob-ably due to the small sample size (N.=7). In females, there were significant differences in volume for the condyle, ramus and hemi-mandible, and ramus (Tables III-VI); no dif-ferences for the hemibody.
Discussion
JIA of the mandibular condyle produces morphological and surface changes, includ-ing cortical erosion, flattening, sclerosis, osteophyte formation, and reduced inter-articular space.26, 27
Previously, the TMJ has been evaluated using conventional plane linear projections such as panoramic, lateral, posteroanterior, TMJ-specific, and transcranial radiographs. Additional imaging studies have applied conventional multi-slice CT, MRI, radionu-clide bone scans, and US. The routine use of these diagnostic methods in orthodontics
Table IV.—�Affected versus normal side volumetric values in males with juvenile idiopathic arthritis.
Patient Age
Hemymandiblevolume Condyle volume Ramus volume Hemybody volume Hemysymphisys
volume
Affected Normal Affected Normal Affected Normal Affected Normal Affected Normal
SB 11 19803.25 23083.42 385.06 1077.56 4103.62 5189.43 13760.84 14911.32 1553.73 1905.11
MR 18 17573.12 19915.72 614.84 1046.88 2493.78 2973.94 11774.7 13773.74 2121.16 2689.8
CZ 14 24462.76 24563.34 556.93 647.11 5067.29 5529.77 15873.81 16327.06 2412.07 2612.06
FC 8 20087.47 20186.59 509.76 731.66 3662.28 4401.62 13425.43 13431.98 1849.78 2261.55
GPP 12 21427.03 22394.04 588.21 737.47 4088.58 4717.65 14529.24 13959.77 2409.68 2790.47
RR 10 18117.63 18211.45 494.18 558.73 3914.06 4086.81 11451.88 11804.68 1998.53 2020.21
MB 4 12955.192 15221.94 347.332 754.29 2836.02 3144.35 8318.65 9770.36 1453.19 1552.94
Average 11.00 19203.78 20510.93 499.47 793.39 3737.95 4291.94 12733.51 13425.56 1971.16 2261.73
test t 0.24 0.002 0.14 0.29 0.11
MIN
ERVA M
EDICA
COPYRIGHT®

Vol.59 - No. 10 MINERVA STOMATOLOGICA 527
CONE BEAM VOLUMETRIC IMAGING FARRONATO
has been limited by the cost and radiation dosage. Consequently, clinicians often have only panoramic, lateral, and posteroante-rior cephalograms for detecting TMJ disor-ders, and these 2D radiographs are used to evaluate 3D anatomical structures. This can result in distortion and differential magnifi-cation of the craniofacial complex,28 which may lead to identification errors, reduced measurement accuracy, and an incorrect di-agnosis.
Conventional radiography is not very
useful for evaluating bone erosion, particu-larly at the early stage of the disease. Ultra-sound is better for detecting erosions and can also evaluate synovitis. MRI is the most sensitive method for detecting and monitor-ing early structural damage in JIA, including bone erosion and pre-erosive feature such as synovitis, bone marrow edema or ostei-tis, and tendinous and ligamentous abnor-malities.
The compact size and relatively low radi-ation dosage of CBCT make it ideally suited
Table V.—�Affected versus normal side volumetric values in females with juvenile idiopathic arthritis.
Patient Age
Hemymandiblevolume Condyle volume Ramus volume Hemybody volume Hemysymphisys
volume
Affected Normal Affected Normal Affected Normal Affected Normal Affected Normal
CB 13 21443.23 23520.54 817.73 935.25 4669.25 5000.18 13334.22 14854.53 2622.03 2730.58
CZ 10 23436 23257.29 746.24 1027.66 4608.05 4670.44 15448.5 15201.07 2633.21 2358.12
SDN 16 23474.49 26141.19 623.7 1030.45 4851.77 4270.06 15057.62 17909.64 2941.4 2931.04
VM 13 19730.87 16660.13 1096.73 438.72 3634.69 3069.53 13624.34 11547.93 1375.11 1603.95
FS 8 12061.58 15225.79 317.95 720.8 2219.17 2629.75 8083.08 10040.18 1441.38 1835.06
CG 9 17682.46 18576.98 516.56 653.97 3010.77 2908.47 12879.18 13635.73 1275.95 1378.81
IS 12 20248.36 20356.84 831.52 808.97 4531.87 4120.56 13225.67 13428.61 1659.3 1998.7
MC 17 21212.98 23012.77 951.48 1412.8 4218.05 4237.16 14160.62 14719.91 1882.83 2642.9
MI 11 16492.99 18133.67 416.78 638.84 2974.41 3388.22 10646.56 11493.51 2455.24 2613.1
VN 15 27606.39 22833.88 1293.16 522.76 5967.85 4535.86 18478.78 14989.82 1866.6 2785.44
MDE 13 14969.71 14907.77 312.09 348.07 3508.42 3184.61 9704.33 10315.15 1444.87 1059.94
MF 13 19250.39 19673.19 710.07 839.03 4502.48 4010.8 12557.61 12922.7 1480.23 1900.66
SB 9 20258.42 20896.42 865.65 906.38 4018.07 3275.24 12693.88 14120.85 2680.82 2593.95
CA 13 19098.59 18843.37 647.33 688.87 4443 4099.61 12111.84 12105.05 1896.42 1949.84
AG 5 14428.02 16434.96 324 974.68 2527.22 2846.72 8988.33 10245.66 2588.47 2367.9
AG 16 22884.73 24852.8 731.7 1139.86 5094.38 5772.38 13857.31 14848.18 3201.34 3092.38
ABC 16 21306.37 22897.13 518.02 813.74 4227.22 4465.69 13612.01 14351.52 2949.12 3266.18
SNB 15 21804.1 22405.32 492.66 470.47 4923.23 4702.61 13793.48 14300 2594.73 2932.24
LS 14 24525.95 24122.45 1860 1743.64 4561.82 4575.86 15808.69 15137.72 2295.44 2665.23
SR 9 18206.55 16257.06 882.44 368.04 4271.1 2957.44 10644.21 10349.99 2408.8 2581.59
GE 11 19513.81 23893.2 378.32 1232.26 4210.62 5119.42 12439.82 15091.68 2485.05 2449.84
AF 9 17443.87 19919.7 409.74 813.94 3042.31 3553.2 11638.99 13335.92 2352.83 2216.64
AT 13 19802.87 18152.31 1099.75 522.28 4144.39 3362.73 11914.64 11365 2644.09 2902.3
Average 12.17 19864.47 20477.16 732.33 828.33 4093.92 3945.94 12813.20 13317.84 2225.01 2385.06
test t 0.27 0.18 0.28 0.22 0.17
MIN
ERVA M
EDICA
COPYRIGHT®

528 MINERVA STOMATOLOGICA October 2010
FARRONATO CONE BEAM VOLUMETRIC IMAGING
for imaging the craniofacial region, includ-ing the TMJ. The CBCT image acquisition process has several differences compared with traditional CT: the patient is not usu-ally supine, the image gathered is in voxel (volume element) format, the X-ray dose absorbed by the patient is substantially low-er, and the device is more readily available and less expensive.
The CBCT scanner uses a cone-shaped X-ray beam rather than a conventional linear cone beam to obtain images of the bony structures of the skull. Conventional CT produces a set of consecutive slices of the patient, whereas CBCT provides volu-metric data, permitting 3D reconstruction of the jawbones, mandibular condyle, and TMJ. CBCT images produce an undistorted, accurate 3D view of the jaws. While CBCT can provide cross-sectional (buccolingual), axial, coronal, sagittal, and panoramic views, a conventional radiograph shows a 2D image.
Furthermore, in a panoramic image, all of the structures between the X-ray tube and image detector are superimposed on one other; with CBCT, it is possible to separate the various structures.
Compared with CBCT, conventional CT and MRI have the disadvantages of requir-ing much more chair time and greater com-pliance of children; particularly in very young children, general anesthesia or con-
scious sedation may be required. CT and MRI can be especially difficult to perform on patients who are unable to sit or hold still for a long period of time. By contrast, CBCT can be performed within 10-40 s, de-pending on the imaged region and the de-sired quality of the image.
Early initiation and optimal adjustment of aggressive therapy with disease-modifying anti-rheumatic drugs have been extremely successful in preventing irreversible joint damage. Therefore, the accurate and early diagnosis of JIA and the sensitive moni-toring of the disease process are essential. Advanced imaging technology capable of identifying even the slightest trace of ero-sive joint damage may enable the predic-tion of future structural and functional de-terioration.
Analyses have found a strong correlation between the hemimandible and ramus on the same side. Consequently, the condy-lar damage arises unilaterally as decreased growth of the ramus and deviation of the mandible toward the affected condyle.29, 30 Normal physiological growth of the condyle occurs on the opposite side. There was no significant correlation between the affected condyle and hemibody on the same side. This occurs because the mandibular body grows in different ways; ramus growth de-pends on the condylar cartilage, and thus where this is damaged, mandibular devel-
Table VI.—�Right versus left side volumetric values in males with juvenile idiopathic arthritis.
Patient Age
Hemymandiblevolume Condyle volume Ramus volume Hemybody volume Hemysymphisys
volume
Affected Normal Affected Normal Affected Normal Affected Normal Affected Normal
SB 11 23083.42 19803.25 1077.56 385.06 5189.43 4103.62 14911.32 13760.84 1905.11 1553.73
MR 18 19915.72 17573.12 1046.88 614.84 2973.94 2493.78 13773.74 11774.7 2121.16 2689.8
CZ 14 24462.76 24563.34 647.11 556.93 5529.77 5067.29 15873.81 16327.06 2412.07 2612.06
FC 8 20186.59 20087.47 509.76 731.66 4401.62 3662.28 13425.43 13431.98 1849.78 2261.55
GPP 12 22394.04 21427.03 737.47 588.21 4717.65 4088.58 14529.24 13959.77 2409.68 2790.47
RR 10 18117.63 18211.45 558.73 494.18 4086.81 3914.06 11451.88 11804.68 2020.21 1998.53
MB 4 12955.192 15221.94 347.332 754.29 2836.02 3144.35 8318.65 9770.36 1453.19 1552.94
Average 11.00 20159.34 19555.37 703.55 589.31 4247.89 3781.99 13183.44 12975.63 2024.46 2208.44
test t 0.37 0.17 0.18 0.44 0.22
MIN
ERVA M
EDICA
COPYRIGHT®

Vol.59 - No. 10 MINERVA STOMATOLOGICA 529
CONE BEAM VOLUMETRIC IMAGING FARRONATO
opment is altered. Regarding the symphy-sis, both female and male patients showed significant changes in the growth of the soft tissues and bone in the symphyseal region.
Conclusions
In patients with JIA, TMJ involvement is often asymptomatic and can lead to severe craniofacial growth disturbances and facial deformities if not treated in the initial stage. TMJ arthritis in JIA patients is difficult to di-agnose at an early stage, as there are rela-tively few symptoms and clinical findings. The pathological process can affect growth long before radiographic changes are seen. None of the clinical signs or symptoms of TMJ dysfunction are predictors of bony de-struction of the TMJ.
CBCT provides useful information to supplement clinical and laboratory exami-nations in the diagnosis and treatment of JIA. Patients with CBCT evidence of TMJ damage cannot be identified reliably by clinical examinations. CBCT represents an improvement in quantifying the morpho-logical changes of the condyle and mandi-ble. Furthermore, it gives an accurate pic-ture of these structures in JIA and allows the acquisition of true volumetric measure-ments of the mandibular components. The use of CBCT and the 3D diagnostic protocol in young patients with JIA enabled reliable, accurate, and precise quantitative and volu-metric images of the condylar and mandib-ular structures and their dimensional rela-tionships.
References
1. Ilowite NT. Current treatment of juvenile rheumatoid arthritis. Pediatrics 2002;109:109-15.
2. Petty RE, Southwood TR, Baum J, Bhettay E, Glass DN, Manners P et al. Revision of the proposed clas-sification criteria for juvenile idiopathic arthritis: Dur-ban, 1997. J Rheumatol 1998;25:1991-4.
3. Manners PJ, Bower C. Worldwide prevalence of juve-nile arthritis why does it vary so much? J Rheumatol 2002;29:1520-30.
4. Ganik R, Williams FA. Diagnosis and management of juvenile rheumatoid arthritis with TMJ involvement. Cranio 1986;4:254-62.
5. Weiss PF, Arabshahi B, Johnson A, Bilaniuk LT, Zar-
now D, Cahill AM et al. High prevalence of temporo-mandibular joint arthritis at disease onset in children with juvenile idiopathic arthritis, as detected by mag-netic resonance imaging but not by ultrasound. Ar-thritis Rheum 2008;58:1189-96.
6. Pedersen TK, Jensen JJ, Melsen B, Herlin T. Resorp-tion of the temporomandibular condylar bone ac-cording to subtypes of juvenile chronic arthritis. J Rheumatol 2001;28:2109-15.
7. Pedersen TK, Grønhøj J, Melsen B, Herlin T. Condylar condition and mandibular growth during early func-tional treatment of children with juvenile chronic ar-thritis. Eur J Orthod 1995;17:385-94.
8. Walton AG, Welbury RR, Thomason JM, Foster HE. Oral health and juvenile idiopathic arthritis: a review. Rheumatology (Oxford) 2000;39:550-5.
9. Karhulahti T, Ylijoki H, Rönning O. Mandibular con-dyle lesions related to age at onset and subtypes of juvenile rheumatoid arthritis in 15-year-old children. Scand J Dent Res 1993;101:332-8.
10. Kreiborg S, Bakke M, Kirkeby S, Michler L, Vedtofte P, Seidler B et al. Facial growth and oral function in a case of juvenile rheumatoid arthritis during an 8-year period. Eur J Orthod 1990;12:119-34.
11. Twilt M, Mobers SM, Arends LR, ten Cate R, van Suijlekom-Smit L. Temporomandibular involve-ment in juvenile idiopathic arthritis. J Rheumatol 2004;31:1418-22.
12. Grosfeld O. The orthodontist in the team-treatment for children with rheumatoid arthritis. Eur J Orthod 1989;11:120-4.
13. Corradi A, Tramontana F, Gattinara M, Lomater C. Ar-trite reumatoide giovanile: diagnostica per immagini ( Juvenile Rheumatoid Arthritis: image diagnostics). Riv Ital Pediatr 1994;20:68-80
14. Rönning O, Barnes SA, Pearson MH, Pledger DM. Ju-venile chronic arthritis: a cephalometric analysis of the facial skeleton. Eur J Orthod 1994;16:53-62.
15. Pedersen TK, Küseler A, Gelineck J, Herlin T. A prospective study of magnetic resonance and ra-diographic imaging in relation to symptoms and clinical findings of the temporomandibular joint in children with juvenile idiopathic arthritis. J Rheuma-J Rheuma-tol 2008;35:1668-75.
16. Müller L, Kellenberger CJ, Cannizzaro E, Ettlin D, Schraner T, Bolt IB et al. Early diagnosis of temporo-Early diagnosis of temporo-mandibular joint involvement in juvenile idiopathic arthritis: a pilot study comparing clinical examina-tion and ultrasound to magnetic resonance imaging. Rheumatology (Oxford) 2009;48:680-5.
17. Jank S, Haase S, Strobl H, Michels H, Häfner R, Missmann M et al. Sonographic investigation of the temporomandibular joint in patients with juvenile idiopathic arthritis: a pilot study. Arthritis Rheum 2007;57:213-8.
18. Stabrun AE. Impaired mandibular growth and micro-gnathic development in children with juvenile rheu-matoid arthritis. A longitudinal study of lateral cepha-lographs. Eur J Orthod 1991;13:423-34.
19. Stabrun AE. Mandibular morphology and posi-tion in juvenile rheumatoid arthritis. A study on postero-anterior radiographs. Eur J Orthod 1985;7:288-98.
20. Huntjens E, Kiss G, Wouters C, Carels C. Condylar asymmetry in children with juvenile idiopathic arthri-tis assessed by cone-beam computed tomography. Eur J Orthod 2008;30:545-51.
21. Cevidanes LH, Styner MA, Proffit WR. Image analy-sis and superimposition of 3-dimensional cone-beam
MIN
ERVA M
EDICA
COPYRIGHT®

530 MINERVA STOMATOLOGICA October 2010
FARRONATO CONE BEAM VOLUMETRIC IMAGING
computed tomography models. Am J Orthod Dento-facial Orthop 2006;75:895-903.
22. Jacobson A, Jacobson RL. Radiographic cephalome-try: from basics to 3-D imaging. 2nd ed. Hanover Park, IL: Quintessence; 2006.
23. Tsiklakis K, Syriopoulos K, Stamatakis HC. Radio-graphic examination of the temporomandibular joint using cone beam computed tomography. Dentomax-illofac Radiol 2004;33:196-201.
24. Farman AG, Scarfe WC. The basics of maxillofacial cone beam computed tomography. Semin Orthod 2009;15:2-13.
25. Rits IA. Declaration of Helsinki. Recommendations guiding doctors in clinical research. World Med J 1964;11:281.
26. Bellintani C, Ghiringhelli P, Gherloni V, Gattinara M, Farronato G, Fantini F. Temporomandibular joint involvement in juvenile idiopathic arthritis: treat-
ment with an orthodontic appliance. Reumatismo 2005;57:201-7.
27. Farronato G, Carletti V, Maspero C, D Farronato, Gi-annini L, Bellintani C. Craniofacial growth in children affected by juvenile idiopathic arthritis involving the temporomandibular joint: functional therapy man-agement. J Clin Pediatr Dent 2009;33:351-7.
28. Alexiou K, Stamatakis H, Tsiklakis K. Evaluation of the severity of temporomandibular joint osteoarthritic changes related to age using cone beam computed tomography. Dentomaxillofac Radiol 2009;38:141-7.
29. Laskin DM, Greene CS, Hylander WL. Temporoman-dibular disorders: an evidence-based approach to diagnosis and treatment. Hanover Park, IL: Quintes-sence Publishing; 2006.
30. Pirttiniemi P, Peltomäki T, Müller L, Luder HU. Abnor-mal mandibular growth and the condylar cartilage. Eur J Orthod 2009;31:1-11.
Cambiamenti nella morfologia condilaree mandibolare nell’artrite idiopatica giovanile:ricostruzione volumetrica mediante TomografiaComputerizzata Cone Beam
L’artrite idiopatica giovanile (AIG) è una malattia comune dell’infanzia 1, che provoca infiammazi-
one delle articolazioni, in genere prima dei 16 anni. La causa della malattia non è nota, e persiste per almeno sei settimane 2. La prevalenza riportata di AIG è 0,07-4,01 per 1000 persone, e l’incidenza an-nuale è di 0,008-0,226 per 1000 persone 3. I pazienti di sesso femminile sono colpite tre volte più spesso a quelli di sesso maschile 4.
La manifestazione più importante della malattia è la sinovite cronica, con la proliferazione epiteliale, e conseguente aumento della produzione del fluido sinoviale e la pressione all’interno delle articolazio-ni interessate 4.
Uno studio recente ha riportato che l’articolazione temporo-mandibolare (ATM) è interessata nel 75% dei casi acuti e nel 69% dei casi cronici al momento della diagnosi 5. Quando l’ATM è colpita, spesso non vi è dolore, ritardando la diagnosi e il tratta-mento 6. L’infiammazione della ATM porta a rias-sorbimento osseo che interessa la testa del condilo e la fossa 7. Le anomalie condilari possono variare da lieve erosione e appiattimento delle superfici ar-ticolari a gravi distruzioni della testa del condilo 8. Il coinvolgimento dell’ ATM è spesso associato ad un esordio precoce, al sesso femminile, al sottotipo poliarticolare 9, e alla positività agli anticorpi anti-nucleo (ANA) 6.
Il coinvolgimento articolare si manifesta clinica-
mente come una riduzione della capacità di aprire la bocca e radiograficamente come riduzione della traslazione condilare 10; e deve essere sospettata quando si verifica solo la rotazione condilare du-rante l’apertura della bocca 11.
Nei pazienti molto giovani, il coinvolgimento dell’ATM influisce sulla crescita condilare, alterando lo sviluppo della mandibola e la funzione 12. Quan-do entrambe le ATM sono interessate, una ridotta ef-ficienza masticatoria ed un alterato aspetto del volto (faccia a uccello) possono essere la conseguenza. Il coinvolgimento unilaterale produce uno sviluppo asimmetrico della mandibola con deviazione verso il lato colpito, durante l’apertura della bocca 13.
Le alterazioni del viso possono essere attribui-bili al danno condilare, alla ridotta funzione, e alla terapia con corticosteroidi 14. Le alterazioni facciali riportate in letteratura includono una mandibola spostata all’indietro con funzione compromessa, una ridotta altezza facciale posteriore, la rotazi-one all’indietro della mandibola, un angolo goni-aco ottuso, un aumento della convessità facciale, un’anomalia antegoniale, e un’apposizione ossea nella zona goniaca 14. Questi cambiamenti nella AIG sono meglio diagnosticati usando la risonanza mag-netica (MRI) 15, che è considerata il gold standard per l’individuazione precoce del danno 16.
Gli ultrasuoni (US) vengono utilizzati anche come un metodo diagnostico di screening per la
MIN
ERVA M
EDICA
COPYRIGHT®

Vol.59 - No. 10 MINERVA STOMATOLOGICA 531
CONE BEAM VOLUMETRIC IMAGING FARRONATO
sualizzazione e la misurazione delle immagini in tre dimensioni (3D). Tutti gli scanner cone beam sono forniti con il software preinstallato per la manipo-lazione delle immagini, e per la funzionalità delle immagini aggiunte.
Gli strumenti di imaging includeranno la rifor-mattazione multi planner (multi-planner reformat-ting, MPR) e la proiezione di massima intensità (maximum intensity projection, MIP). In genere, i dati volumetrici 3D vengono acquisiti sul piano as-siale, e l’MPR crea immagini sagittali, coronali e tra-sversali da quelle immagini assiali. Queste immagini permettono la visualizzazione effettiva dei cambia-menti sezione per sezione nella struttura acquisita. Immagini MPR sono disponibili con tutti i softwa-re preinstallatI con scanner cone beam. Il software permette inoltre misurazioni delle sezioni da effet-tuare. Le immagini cone beam possono essere uti-lizzate per generare accurate sezioni panoramiche tridimensionali lungo una curva definita utilizzan-do il software preinstallato che viene fornito con la macchina cone beam o altro software. Le immagini panoramiche generate da scanner cone beam sono più precise di quelle tradizionali, perché non vi è sovrapposizione di tessuti né distorsione di imma-gini, vale a dire le immagini sono in scala 1 a 1, e consentono misurazioni accurate.
L’algoritmo MIP valuta ogni voxel cone beam lungo un raggio attraverso la linea dell’osservato-re del sito, e il valore massimo voxel è selezionato come il pixel da visualizzare nell’immagine risultan-te. Questa rappresentazione permette all’osservato-re di apprezzare la profondità di rendering.
La tecnica rendering 3D del volume rappresenta l’intero volume dei cone beam sommando i valori di ogni voxel lungo la linea dell’osservatore attraverso il set di dati completo. Il processo si è verificato più volte per determinare il valore del pixel da visualiz-zare nella immagine risultante. Il rendering 3D del volume permette una visualizzazione realistica 3D dei dati del volume, la caratterizzazione della malat-tia, una precisa valutazione dei rapporti anatomici.
Inizialmente, i sistemi CBCT ricostruiscono i dati della proiezione per fornire un layout di visualizza-zione standard nei tre piani ortogonali: piano fron-tale, laterale e superiore (assiale) 24. Poi, il computer crea una rappresentativa ricostruzione 3D della se-rie di dati volumetrici utilizzando il MIP. Le imma-gini risultanti dalla TC vengono importate tramite il software Mimics (Materialise NV, Leuven, Belgio) per le immagini in 3D e poi convertito in formato Digital Imaging and Communications in Medicine (DICOM) (Nema, Rosslyn, VA, USA).
La mandibola viene isolata dalle altre strutture cranio-facciali con una procedura manuale, e il vo-lume totale della mandibola è calcolato con il ren-dering del volume (range, 226-3071 nella scala dei grigi). Successivamente, la mandibola è separata nel condilo, ramo, emicorpo, ed emisinfisi, sui lati de-stro e sinistro. Due piani di riferimento sono sele-
valutazione dell’ATM nell’AIG 17, anche se è meno affidabile 5, 16. La radiografia panoramica è un esame normalmente utilizzato in odontoiatria ma consid-erando il coinvolgimento ATM nella AIG, non è la scelta più attendibile 11, in quanto non può essere utilizzato per analizzare la traslazione condilare o l’entità del movimento mandibolare 15.
La maggior parte delle analisi morfologiche comprendono l’analisi cefalometrica sulle teleradi-ografie latero-laterali. Tuttavia, è difficile ottenere una corretta teleradiografia laterale che mostra il coinvolgimento del rachide cervicale senza pro-durre una posizione anomala della testa 18. Le tel-eradiografie frontali possono essere utilizzate per valutare l’asimmetria nei soggetti con coinvolgimen-to dell’ATM unilaterale, come mostrano l’asimmetria della lunghezza mandibolare, le deviazione delle sinfisi, l’inclinazione del corpo della mandibola, e l’asimmetria dell’altezza verticale del ramo 19.
Il grado di asimmetria condilare può anche es-sere analizzato utilizzando la tomografia compu-terizzata cone beam (CBCT). La CBCT dimostra che l’asimmetria condilare è una caratteristica comune nel coinvolgimento dell’ATM nei pazienti con AIG 20.
Materiali e metodi
Questo studio ha considerato 34 pazienti con AIG, diagnosticata secondo i criteri della Lega In-ternazionale delle Associazioni per la Reumatologia 2. I bambini con pacemaker cardiaci, impianti me-tallici o clip, o apparecchi ortodontici fissi metallici sono stati esclusi. Tutti i pazienti sono stati esamina-ti clinicamente e radiograficamente per valutare il coinvolgimento artritico dell’ATM. L’esame clinico è stato suddiviso in tre parti: l’osservazione del volto, l’osservazione intraorale, e l’analisi funzionale ATM.
Radiograficamente, l’ATM è stata esaminata me-diante la CBCT, un nuovo metodo che riduce il do-saggio delle radiazioni ionizzanti rispetto a quello della tradizionale tomografia computerizzata (TC) 21, 22. Le CBCT utilizza un fascio di raggi X a forma di cono al posto del fascio altamente collimato uti-lizzato nella TC spirale. Il tubo del sistema rivelatore ruota di 360° attorno alla testa del paziente con un angolo del fascio costante 23, con il paziente in posi-zione eretta, come per una panoramica standard. La dimensione del campo è stata impostata a 30 × 40 mm, e il tempo di scansione a 10 s (cioè, il più bas-so tempo per i bambini). Il sistema CBCT è stato in grado di valutare una grande porzione del comples-so cranio-maxillo-facciale in una esposizione, ma ha anche fornito un’opzione cefalometrica digitale bidimensionale (2D) 25.
I dati sono stati acquisiti utilizzando un sistema di imaging 3-D Cone Beam I-CAT™ (Imaging Scien-ces International, Hatfield, PA, USA) e trattati con un software di visualizzazione I-CAT Vision (Croall Radiografia, San Jose, CA, USA), che consente la vi-
MIN
ERVA M
EDICA
COPYRIGHT®

532 MINERVA STOMATOLOGICA October 2010
FARRONATO CONE BEAM VOLUMETRIC IMAGING
quello della emimandibola sinistra è stato 20262,08 mm3 (range: 14907,77-26141,19). La differenza non è risultata significativa (P=0,35). Diciotto bambini avevano un volume della emimandibola più grande a sinistra, e 12 bambini presentavano un maggiore volume nell’emimandibola destra. Il volume medio della emimandibola del lato affetto è stato 19298,88 mm3 (range: 12061,58-24462,76), mentre quello emimandibola era del lato sano era 20896,46 mm3 (range: 14 969,71-27606,39). La differenza è risultata significativa (P=0,03).
Il volume medio tra il condilo destro (725,62 mm3; range: 312,09-1860,00) e il condilo di sinistra (772,56 mm3; range: 348,07-1743,64) non differiva in modo significativo (P=0,29). Diciannove bambini hanno avuto un volume maggiore al condilo di si-nistra, e 11 bambini al condilo destro. Il volume del condilo del lato colpito da AIG era in media 588,62 mm3 (range: 312,09-1743,64), mentre quella del lato sano 909,55 mm3 (range: 348,07-1 860). La differen-za è risultata altamente significativa (P<0,001).
Il volume medio del ramo destro (4129,85 mm3; range: 2219,17-5967,85) non era significativamente differente (P=0,16), da quella del ramo di sinistra (3907,68 mm3; range: 2493,78-5772,38). Dodici bam-bini avevano un volume più grande in corrispon-denza del ramo di sinistra, e 18 avevano un volume più grande al ramo destro. Il ramo del lato affetto ha avuto un volume medio di 3 767,19 mm3 (range: 2219,17-5094,38), mentre il volume medio del lato sano (4270,34 mm3; range: 2629,75-5 967,85) era si-gnificativamente maggiore (P=0,001).
Il volume dell’emicorpo destro era in media 12899,59 mm3 (range: 8083,08-18478,78), e quel-lo di sinistra una media di 13237,99 mm3 (range: 9770,36-17909,64). La differenza non era significa-tiva (P=0,27). Venti bambini hanno avuto un volu-me maggiore nell’emicorpo di sinistra, e 10 bam-bini avevano un maggiore volume all’emicorpo di destra. Il volume medio non differiva in modo si-gnificativo (P=0,12) tra gli emicorpi del lato colpito (12735,64 mm3; range: 8 083,08-18478,78) e la parte sana (13401,94 mm3; range: 9770,36-17909,64).
L’emisinfisi destra aveva un volume medio di 2178,22 mm3 (range: 1 275,95-3 201,34), e la sini-stra in media 2343,85 mm3 (range: 1059,94-3266,18). La differenza non era significativa (P=0,12). Venti bambini hanno avuto un volume maggiore dell’emi-sinfisi sinistra, e 10 avevano un maggiore volume di quella destra. Il volume medio dell’emifinfisi del lato colpito (2127,47 mm3; range: 1059,94-3201,34) è stato significativamente inferiore (P=0,02) rispetto a quello del lato sano (2394,59 mm3; range: 1378,81-3266,18) (Tabelle I, II).
Riassumendo i dati, è stata evidenziata una diffe-renza molto significativa in termini di volume tra i condili sani e i condili patologici (P<0,001), ed i vo-lumi dell’emimandibola, del ramo, ed emisinfisi dif-ferivano in modo significativo, tuttavia, non c’è stata alcuna differenza di volume tra gli emicorpi. Inoltre
zionati per costruire queste parti: l’asse di simmetria anatomico e il piano articolare. L’asse di simmetria anatomico è costruito utilizzando un piano che pas-sa attraverso il punto intercisivo inferiore al centro del mento (il punto più basso della sinfisi sul piano frontale). Il piano articolare è perpendicolare all’as-se di simmetria anatomica, passante dalla sella (cen-tro geometrico della sella turcica sul piano sagittale) al nasion (sutura fronto-nasale sul piano sagittale).
In primo luogo, la mandibola si divide in emi-mandibola destra e sinistra, lungo l’asse di simme-tria. Poi, l’operatore taglia l’emimandibola con piani paralleli all’asse di simmetria anatomica, che passa attraverso il Menton ipsilaterale (il punto più basso della sinfisi sul piano sagittale), per creare l’emisin-fisi. I condili sono ottenuti da sezioni di un piano parallelo al piano articolare passante per il punto più basso dell’incisura mandibolare (Ar).
Il resto dell’emimandibola è tagliata nella regione dell’angolo mandibola dal piano bisecante l’ango-lo formato tra il bordo posteriore e inferiore della mandibola sul piano sagittale.
La parte superiore è il ramo della mandibola, e la parte inferiore è il corpo della mandibola. Simili se-zioni sono state eseguite per il lato opposto. Infine, il volume di ogni parte viene calcolato utilizzando un software adeguato (Figure 1-5).
Tutti i volumi sono calcolati in millimetri cubi (mm3). Nel presente studio, tutte le misurazioni sono state effettuate dallo stesso ricercatore per ri-durre l’errore. I valori sono stati calcolati due vol-te, 15 giorni di distanza, e i valori medi sono stati analizzati. Il t test di Student è stato utilizzato per determinare la significatività statistica, che è stato identificato da un valore di P <0,05.
Questo studio è stato condotto in conformità con i principi della Dichiarazione di Helsinki 25.
Risultati
Quattro soggetti sono stati esclusi perché alcune immagini radiografiche non chiare hanno impedi-to una corretta definizione dell’anatomia. Sono stati analizzati 30 bambini, 23 di sesso femminile e 7 di sesso maschile, con un’età media di 11,9 anni (ran-ge: 4-14 anni).
Le seguenti caratteristiche facciali sono state indi-viduate: asimmetria facciale in 15 pazienti, bird-face in cinque, e nessuna deformità orofacciale in 14. L’esame intraorale ha rivelato la presenza di morso aperto dentale e overjet aumentato in 10 pazienti, la deviazione della linea mediana in 12, e nessu-na anomalia occlusale in 20. L’analisi funzionale dell’ATM ha mostrato la presenza di deviazione ver-so il lato colpito durante l’apertura in 27 bambini, crepitazioni e click in apertura e chiusura in 30, e dolore lieve in due.
Il volume medio dell’emimandibola destra è sta-to di 19933,27 mm3 (range: 12061,58-27606,39), e
MIN
ERVA M
EDICA
COPYRIGHT®

Vol.59 - No. 10 MINERVA STOMATOLOGICA 533
CONE BEAM VOLUMETRIC IMAGING FARRONATO
del cranio. La TC convenzionale produce una serie di fette consecutive del paziente, mentre la CBCT fornisce dati volumetrici, che consente la ricostru-zione 3D della maxilla, mandibola, condilo e ATM.
Le immagini CBCT producono una reale e pre-cisa visualizzazione 3D delle mascelle. Mentre la CBCT è in grado di fornire diverse immagini tridi-mensionali cross-sectional (buccolinguali, assiali, coronali, sagittali, e panoramica) una radiografia convenzionale mostra solamente una immagine bi-dimensionale 2D.
Inoltre, in una rx panoramica, dove tutte le strut-ture anatomiche tra il tubo a raggi X e il rivelatore le immagini si sovrappongono, con le CBCT, è possi-bile separare le varie strutture.
Rispetto alle CBCT, la TC convenzionale e RM presentano lo svantaggio di richiedere molto più tempo di seduta e un maggiore collaborazione dei bambini; in particolare nei bambini molto piccoli, l’anestesia generale o la sedazione cosciente pos-sono essere richieste. Le TC e le RM possono essere particolarmente difficili da eseguire su pazienti che non sono in grado di sedersi o stare fermi immo-bili per un lungo periodo di tempo. Al contrario, la CBCT può essere eseguita in 10-40 s, a seconda della regione programmata e la qualità desiderata dell’immagine.
Un inizio precoce e la regolazione ottimale della terapia aggressiva mediante farmaci anti-reumatici sono stati estremamente efficaci nel prevenire danni irreversibili alle articolazioni. Pertanto, la diagnosi precoce ed accurata di AIG e il monitoraggio sen-sibile del processo di malattia sono essenziali. Una tecnologia avanzata di imaging in grado di indivi-duare anche la minima traccia di danno articolare erosivo può consentire la previsione del futuro de-terioramento strutturale e funzionale.
L’analisi dei dati ha trovato una forte correlazione tra il ramo e l’emimandibola, sullo stesso lato. Di conseguenza, il danno condilare si manifesta uni-lateralmente come diminuzione della crescita del ramo e deviazione della mandibola verso il con-dilo colpito 29, 30. La normale crescita fisiologica del condilo si trova sul lato opposto. Non vi era alcuna correlazione significativa tra il condilo colpito e l’emicorpo sullo stesso lato. Ciò si verifica perché il corpo della mandibola cresce con modalità diverse; la crescita del ramo dipende dalla cartilagine con-dilare e, quindi, se questo è danneggiato, lo svilup-po della mandibola è alterato. Per quanto riguarda la sinfisi, sia i pazienti maschili e femminili hanno mostrato cambiamenti significativi nella crescita dei tessuti molli e ossei nella regione sinfisaria.
Conclusioni
Nei pazienti con AIG, il coinvolgimento dell’ar-ticolazione temporo-mandibolare è spesso asinto-matica e può portare a gravi disturbi della crescita cranio-facciale e malformazioni facciali, se non trat-
i dati non hanno mostrato alcuna differenza statisti-camente significativa tra lato destro e lato sinistro.
Nei maschi, l’unica differenza significativa in termini di volume è stata quella tra i condili sani e quelli ammalati (P=0,002). Questo è stato probabil-mente a causa delle piccole dimensioni del campio-ne (N=7). Nelle femmine, vi erano differenze signifi-cative in termini di volume per il condilo, il ramo ed emimandibola (Tabelle III,VI).
Discussione
L’artrite idiopatica giovanile del condilo mandi-bolare produce cambiamenti morfologici e di su-perficie, quali l’erosione corticale, l’appiattimento, la sclerosi, la formazione di osteofiti,
e un ridotto spazio articolare 26, 27. In precedenza, l’ATM è stata valutata utilizzan-
do proiezioni lineari su piani convenzionali con le tradizionali radiografie: panoramica, laterale, postero-anteriore, ATM-specifiche, e transcra-niali. Ulteriori studi di imaging hanno applicato TC multi-slice convenzionali, MRI, scansioni os-see con radionuclidi, ed ultrasuoni. L’impiego di routine di questi metodi diagnostici in orto-donzia è stato limitato dai costi e dalle alte dosi di radiazioni. Di conseguenza, i medici spesso hanno a disposizione solo la panoramica, le te-leradiografie laterale e postero-anteriore per rile-vare disordini articolari, e queste radiografie 2D sono utilizzate per valutare in 3D delle strutture anatomiche tridimensionali. Ciò può causare di-storsioni ed un diverso ingrandimento del com-plesso cranio-facciale 28, che può portare a errori di identificazione, ad una ridotta precisione nelle misurazioni, e ad una diagnosi errata.
La radiografia convenzionale non è molto utile per valutare l’erosione ossea del condilo, in parti-colare nella fase precoce della malattia. Gli ultra-suoni sono migliori nel rilevare erosioni e possono anche valutare sinovite. La risonanza magnetica è il metodo più sensibile per la rilevazione e il monito-raggio dei primi danni strutturali in AIG, quali l’ero-sione ossea e le lesioni pre-erosiva, come la sinovi-te, l’edema del midollo osseo o osteite, e anomalie tendinee e legamentose.
Le dimensioni compatte e le dosi di radiazioni relativamente basse rendono la Cone Beam ideale per l’imaging della regione cranio-facciale, compre-sa l’ATM. Il processo di acquisizione delle immagini CBCT ha molte differenze rispetto alle TC tradizio-nali: il paziente non è di solito in posizione supina, l’immagine è raccolta in voxel (elementi di volume), il formato, la dose di radiazioni ionizzanti assorbita dal paziente è notevolmente inferiore, e il dispositi-vo è più prontamente disponibile e meno costoso. Lo scanner CBCT utilizza un fascio di raggi X a for-ma di cono, piuttosto che un fascio convenzionale lineare per ottenere immagini delle strutture ossee
MIN
ERVA M
EDICA
COPYRIGHT®

534 MINERVA STOMATOLOGICA October 2010
FARRONATO CONE BEAM VOLUMETRIC IMAGING
graphy, CBCT) nel quantificare volumetricamente i danni alla articolazione temporomandibolare in pazienti con artrite idiopatica giovanile (AIG), misu-rando i volumi reali condilari e mandibolari.
Metodi. Trentaquattro bambini affetti da AIG con il coinvolgimento temporomandibolare sono sta-ti osservati mediante la CBTC. Quattro sono stati esclusi a causa di parecchio rumore nelle immagi-ni. La mandibola è stata isolata dalle altre strutture cranio-facciali. Il volume dell’intera mandibola e i volumi delle sue componenti (condilo, ramo, emi-corpo, emisinfisi) sia sul lato destro e sul lato sini-stro sono stati calcolati da una tecnica di rendering volumetrica 3D.
Risultati. I risultati mostrano una differenza sta-tistica altamente significativa tra i valori volumetrici del lato colpito rispetto ai valori volumetrici del lato normale soprattutto in corrispondenza della regione del condilo (P>0,01), mentre non mostrano alcuna differenza statistica tra lato destro rispetto al lato si-nistro.
Conclusioni. La CBCT rappresenta un enorme miglioramento nella comprensione dei cambiamen-ti morfologici condilari e mandibolari persino nelle prime fasi dell’AIG. L’AIG può provocare nei bambi-ni un danno alle articolazioni temporomandibolari con alterazioni dello sviluppo e crescita facciale.
Parole chiave: Artrite idiopatica giovanile - Tomo-grafia computerizzata cone beam - Disordini tem-poromandibolari.
tati in fase iniziale. L’ATM in pazienti affetti da AIG è difficile da diagnosticare in fase iniziale, in quanto i sintomi e risultati clinici sono relativamente pochi. Il processo patologico può influenzare la crescita molto tempo prima che i cambiamenti radiografici vengono visti. Nessuno dei segni clinici o sintomi di disfunzione dell’ATM sono predittori di distruzione ossea dell’ATM.
La CBCT fornisce informazioni utili a completare esami clinici e di laboratorio nella diagnosi e nel trattamento di AIG. I pazienti sottoposti a CBCT con evidenza di danno ATM non possono essere identificati in maniera attendibile mediante l’esame clinico. La CBCT rappresenta un miglioramento nel quantificare i cambiamenti morfologici del condilo e della mandibola, dando un quadro pre-ciso di queste strutture nelle AIG, e permettendo l’acquisizione di una vera misurazione volumetrica dei componenti della mandibola. L’uso della CBCT e il protocollo diagnostico 3D nei giovani pazienti con AIG ha messo a disposizione immagini quan-titative e volumetriche affidabili, accurate e precise delle strutture condilari, mandibolari e dei loro rap-porti dimensionali.
Riassunto
Obiettivo. Lo scopo di questo studio è quello di mostrare l’importanza della tomografia computeriz-zata cone beam (Cone Beam Computerized Tomo-
MIN
ERVA M
EDICA
COPYRIGHT®


