Embed Size (px)
Citation preview
1
Changes in North Sea macrofauna communities and species
distribution between 1986 and 2000
Ingrid Krönckea, Henning Reissa*, Jaqueline D. Eggletonb, John Aldridgeb, Magda J.N. Bergmanc, Sabine Cochraned, Johan A. Craeymeersche, Steven Degraerf, Nicolas Desroyg, Jean-Marie Dewarumezh, Gerard C.A. Duineveldc, Karel Essinki, Hans Hillewaertj, Marc S.S. Lavaleyec, Andreas Mollk, Stefan Nehringl, Richard Newellm, Eivind Ougn, Thomas Pohlmannk, Eike Rachoro, Mike Robertsonp, Heye Rumohrq, Michaela Schratzbergerb, Rebecca Smithb, Edward Vanden Bergher, Jan van Dalfsens, Gert van Hoeyf, Magda Vincxf, Wouter Willemsf, Hubert L. Reesb
Abstract
The North Sea Benthos Project 2000 was initiated as a follow-up to the 1986 ICES
North Sea Benthos Survey with the major aim to identify changes in the macrofauna
species distribution and community structure in the North Sea and their likely causes.
The results showed that the large-scale spatial distribution of macrofauna
communities in the North Sea hardly changed between 1986 and 2000, with the main
divisions at the 50 m and 100 m depth contours. Water temperature and salinity as
well as wave exposure, tidal stress and primary production were influential
environmental factors on a large (North Sea-wide) spatial scale.
The increase in abundance and regional changes in distribution of various species
with a southern distribution in the North Sea in 2000 were largely associated with an
increase in sea surface temperature, primary production and, thus, food supply. This
can be most likely related to the North Sea hydro-climate change in the late 1980s
influenced by the variability in the North Atlantic Oscillation (NAO). Only one cold-
temperate species decreased in abundance in 2000 at most of the stations.
Indications for newly established populations of offshore non-native species were not
found.
2
Differences in macrofauna community structure on localised spatial scales were
predominantly found north of the 50 m depth contour off the British coast along the
Flamborough Head Front towards the Dogger Bank, off the coast of Jutland and at
the Frisian Front. These changes were most likely attributed to stronger frontal
systems in 2000 caused by the increased inflow of Atlantic water masses in relation
to the hydro-climate change in the late 1980s.
Keywords: long-term variability, distribution shift, NAOI, regime shift, non-native
species, benthic communities
Authors: a Senckenberg, Department for Marine Research, Südstrand 40, 26382 Wilhelmshaven, Germany b Centre for Environment, Fisheries and Aquaculture Science, Pakefield Road, Lowestoft, Suffolk NR33 0HT, UK c Netherlands Institute of Sea Research, PO Box 59, 1792 AB Den Burg, Texel, The Netherlands d Akvaplan-niva as, Polarmiljøsenteret, 9296 Tromsø, Norway e Wageningen IMARES, Institute for Marine Resources and Ecosystem Studies, PO Box 77, 4400 AB Yerseke, The Netherlands f University of Ghent, Marine Biology Section, Ghent, Belgium. Present address S. Degraer: Royal Belgian Institute of Natural Sciences, Management Unit of the North Sea Mathematical Model, Marine Ecosystem Management Section, Gulledelle 100, 1200 Brussels, Belgium; Present address G. van Hoey: Institute for Agricultural and Fisheries Research (ILVO Fisheries), Ankerstraat 1, 8400 Oostende, Belgium g CRESCO – IFREMER, Laboratoires Environnement Littoral & Ressources Aquacoles Finistère - Bretagne Nord, Station de Dinard, 38 Rue du Port Blanc,35801 DINARD – France h Station Marine de Wimereux, UMR CNRS 8187 LOG, 28 Avenue Foch, BP 80, 62930 Wimereux, FRANCE i Rijksinstitut voor Kust en Zee (RIKZ), Postbus 207, 9750 AE Haren, The Netherlands j Institute for Agricultural and Fisheries Research (ILVO Fisheries), Ankerstraat 1, 8400 Oostende, Belgium
3
k Institute of Oceanography, Centre for Marine and Climate Research (ZMAW), University of Hamburg, Bundesstrasse 53, 20146 Hamburg, Germany l Bundesamt für Gewässerkunde, Am Mainzer Tor 1, 56068 Koblenz, Germany m Marine Ecological Surveys Ltd., Monmouth Place 24a, Bath BA1 2AY, UK n Norwegian Institute for Water Research (NIVA), Branch Office South, Televeien 3, 4879 Grimstad, Norway o Alfred-Wegener-Institute for Polar and Marine Research, 27515 Bremerhaven, Germany
p Marine Scotland – Science, Scottish Government, Marine Laboratory, PO Box 101, Victoria Road, Aberdeen, AB11 9DB, UK
q Leibniz Institute for Marine Research, IfM-GEOMAR, Düsternbrooker Weg 20, 24105 Kiel, Germany r Flanders Marine Institute (VLIZ), Wandelaarkaai 7, B-8400 Oostende Belgium. Present address: The State University of New Jersey, New Brunswick, NJ, USA s IMARES, Postbus 57, 1780 AB Den Helder, The Netherlands. Present address: Deltares, P.O. Box 177, 2600 MH Delft, The Netherlands *corresponding author Phone: +49 (0) 4421 9475 266 Fax: +49 (0) 4421 9475 222 E-mail: [email protected]
4
1. Introduction
The North Sea macrofauna has been studied regularly on local or on national (EEZ)
scales since the beginning of the last century. A summary of the various regional and
long-term data sets is given in Kröncke and Bergfeld (2003).
Data sets covering the whole North Sea are very limited. For the macrofauna, one
data set is available from the North Sea Benthos Survey (NSBS) in 1986 initiated by
the ICES Benthos Ecology Working Group (Künitzer et al., 1992; Heip and
Craeymeersch, 1995; Craeymeersch et al., 1997). The data from surveys from 1980
to 1985 in the northern North Sea by Basford and Eleftheriou (1988), Eleftheriou and
Basford (1989) and Basford et al. (1990; 1993) were added to the NSBS. The
detailed analyses by Künitzer et al. (1992) and Craeymeersch et al. (1997) identified
eight macrofauna communities, which reflected the three étages of Glémarec (1973)
defined by the <50 m, >50 m and >100 m depth contours. Most species occurred
either south of the 50 m depth contour or north of it. Species with a southern
distribution occurred in the central North Sea but never north of the 100 m contour
and species with a northern distribution were not found south of the 50 m depth
contour. The distribution of other species was mainly related to certain sediment
types.
Changes in sublittoral North Sea benthic communities in the last decades have been
found in different areas (Ibanez and Dauvin, 1988; Rachor, 1990; Frid et al., 1996;
1999; Kröncke et al., 1998; 2001; Wieking and Kröncke, 2001; Dippner and Kröncke,
2003; Franke and Gutow, 2004; Schröder, 2005; van Hoey et al., 2005; Rees et al.,
2006; Reiss et al., 2006; van Hoey et al., 2007; Neumann et al., 2008; 2009a, b;
Schückel et al., 2010; Lindley et al., 2010). Most shifts in the community structure
were directly or indirectly correlated to the variability of the North Atlantic Oscillation
5
Index (NAOI) in winter, especially to the increase in NAOI since the late 1980, and
resulted in the increase in warm-temperate species, a decrease in cold-temperate
species or the invasion of non-native species. Since similar changes were found in
the North Sea plankton (e.g. Beaugrand, 2004; Bonnet and Frid, 2004; Wiltshire and
Manly, 2004; Kirby et al., 2007; McQuatters-Gollop et al., 2007) and in North Sea fish
stocks in the same period (Ehrich and Stransky, 2001; Reid et al., 2001a; Kirby et al.,
2006; Ehrich et al., 2007), Reid and Edwards (2001) and Beaugrand (2004)
concluded that a “regime shift” had occurred at the end of the 1980s, which was
directly related to a significant increase in the NAOI (Hurrell, 1995). The time series
of the first principal component of the Sea Surface Temperature (SST) anomalies in
the North Sea during this period was highly correlated to the NAOI (Dippner, 1997).
Consequently, during positive NAOI winters, the moderating influence of the ocean
results in unusually warm winter temperatures, as has been found in many years
since 1988 (Hurrell, 1995). The winters of 1978/79, 1981/82, 1984/85, 1985/86,
1995/96 and 1996/97 were cold and related to a negative NAOI. The mean annual
SST has increased in the last decades by 1.1°C (Beare et al., 2002).
The North Sea Benthos Project (NSBP) 2000 (Rees et al., 2007) was initiated by the
members of the ICES Benthos Ecology Working Group as a follow-up to the earlier
1986 ICES North Sea Benthos Survey (NSBS). The major aim of the NSBP 2000
was to compare the spatial distribution of macrofauna communities and species with
that of the 1986 NSBS, in order to identify any changes and their likely causes. The
1986 NSBS reflects the spatial distribution of species and communities after three
cold winters, while the communities studied during the NSBP 2000 were influenced
by the hydro-climate change at the end of the 1980s as well as by the cold winters of
1995/96 and 1996/97.
6
The aims of this study were therefore 1) to compare the spatial distribution of
macrofauna species, 2) to identify any decrease in cold-temperate or increase in
warm-temperate species, 3) to compare the spatial distribution of communities in order
to examine the influence of changes in the hydro-climate and primary production at the
end of the 1980s.
2. Material and Methods
2.1 Macrofauna data 1986 – North Sea Benthos Survey (NSBS)
The North Sea Benthos Survey (NSBS) was carried out during April 1986. At each
station the macrofauna was sampled either by 0.1 m2 van Veen grab or by 0.068 m2
box corer (Künitzer et al., 1992). Generally, three replicates were taken per station,
and the macrofauna samples retained on a 1 mm mesh sieve were fixed in 4%
buffered formalin.
The area north of 58°N was not sampled during the NSBS in 1986. Therefore, data
from this area, sampled by Eleftheriou and Basford (1989) between 1980 and 1985,
were included in the analysis. The same sampling gear was used, but samples were
sieved over a 0.5 mm mesh. A detailed description of methods used is given in
Künitzer et al. (1992) and Heip et al. (1992).
2.2 Macrofauna data 2000 – North Sea Benthos Project (NSBP)
Although quasi-synoptic sampling was intended for late spring to summer in 2000,
several regions of the North Sea could only be covered by including material from
adjacent years (mainly 2001). Most of the infauna sampling for NSBP 2000 was
conducted with a 0.1 m2 van Veen grab; Dutch and Scottish samples were obtained
7
with box corers (0.068 m² and 0.25 m², respectively), English samples mostly with a
0.1 m2 Day or Hamon grab, depending on the sediment type. Samples were sieved
over 1 mm mesh and fixed in 4-5% formalin. Sieving was done before fixing, except
for some of the samples from Belgian waters, where they were fixed before sieving.
Generally, two to three replicates per station were taken. In total 1349 stations were
sampled, but only 156 stations were used in this study (see below). A more detailed
description of methods used for sampling and processing the infauna is given by
Vanden Berghe et al. (2007).
Information on species feeding modes and zoogeographical distribution was obtained
from available literature (e.g. Fauchald and Jumars, 1979; Hartmann-Schröder, 1996;
Lincoln, 1979; Wieking and Kröncke, 2001).
2.3 Environmental variables
The environmental variables included in this study were depth, sediment
characteristics (including % mud and median grain size), average water temperature
and salinity (winter and summer), stratification of the water column, chlorophyll
content of the surface water column, tidal stress and peak wave stress (see Vanden
Berghe et al., 2007).
Most 1986 NSBS and NSBP 2000 data contributors collected information on the
sediment granulometry during the individual infauna surveys, but procedures were
not standardised. Therefore, all sediment datasets were collated into a uniform
database and reprocessed (see Hillewaert, 2007).
Data on temperature and salinity were derived from the hydrodynamic Hamburg
Shelf Ocean Model (HAMSOM), which is a three-dimensional, baroclinic primitive
equation model for simulations of oceanic and coastal and shelf sea dynamics
(Backhaus, 1985). It has a horizontal resolution of 12 minutes in latitude and 20
8
minutes in longitude and a vertical resolution up to a maximum of nineteen layers.
For details of the specific HAMSOM application see Pohlmann (1996).
The ECOlogical North Sea Model HAMburg (ECOHAM1) was used to estimate the
primary production of the water column. ECOHAM1 is a model that can be used to
calculate annual and long-term phytoplankton dynamics, nutrient transport, and
primary productivity for shelf seas in a three-dimensional physical environment
(Skogen and Moll, 2000). It is based on a simple phosphorus/nitrogen cycle and
takes four state variables into account, namely three pelagic variables:
phytoplankton, phosphate (DIP), nitrogen (DIN), and one for benthic detritus. The
horizontal grid size of the numerical model is 20 × 20 km, the vertical resolution is 5
m for the upper 50 m and increasing layer thickness below 50 m up to a maximum of
19 layers. The ECOHAM1 model was validated using observed chlorophyll (Moll,
1998), phosphate concentrations (Moll, 2000), and primary production values
(Skogen and Moll, 2000).
Tidal parameters were generated using a three-dimensional hydrodynamic model
(Davies and Aldridge, 1993), run in depth-integrated form on a grid of approximately
3.5-km resolution covering the European continental shelf. Average and peak wave
stress were calculated from a one-year model run covering the period September
1999 to September 2000, on a grid of approximately 12-km resolution, using the
WAM spectral wave model run at the Proudman Oceanographic Laboratory (Osuna
and Wolf, 2005). The stratification parameter ‘S’ was derived from the formulation
presented in Pingree and Griffiths (1978), using modelled M2 tidal velocities and
measured depths at the benthic stations.
Sea surface temperature (SST) anomalies were obtained from ICES Annual reports
(ICES, 2006).
9
- Figure 1 -
2.4 Data analysis
Instead of using the published results of the 1986 NSBS data (Künitzer et al., 1992),
data were re-analysed since both datasets (1986 and 2000) had to be taxonomically
adjusted to allow comparisons. All abundance data were standardized to 1 m²
sampling area. The two datasets (1986 and 2000) were reduced to stations with
matching positions or at least those relatively close to each other (Fig. 1). The
nearest stations were determined using GIS software (ArcView 3.1) and a dataset
was created including stations with a maximum distance of 21 sm. In total, 85
stations had identical positions and 71 stations had a mean difference in the position
of 7.5 ± 5.1 sm, of which most were situated in the northern North Sea.
We used the PRIMER v6 program package to perform cluster analyses and
multidimensional scaling of abundance data of 1986 and 2000 to reveal similarities
between stations in each year (Clarke and Warwick, 1994). Similarities were
calculated using the Bray-Curtis coefficient. Fourth-root transformation was used
prior to computation. Similarity percentage analysis (SIMPER) was used to identify
species which were mainly responsible for differences in community structure. The
similarity among the community structures was tested using the RELATE routine in
PRIMER v6. The main clusters were classified based on a range of similarity levels
of about 25 to 35 % and 20 to 30% for the cluster analyses results of 1986 and 2000
data, respectively.
The comparison between the community structure (clusters) of 1986 and 2000 was
based on the 1986 clusters. Thus, communities revealed with the 1986 data were
compared with the corresponding stations in 2000, irrespective of community
10
classification of the 2000 stations in the separate analysis. The significance of any
differences in community structure at stations sampled in 1986 and 2000 was tested
with the Analysis of Similarities (ANOSIM) routine.
In addition, the data of 1986 and 2000 were combined in one dataset and a cluster
analysis was carried out to estimate differences in the cluster classification. A high
similarity between stations was assumed, when both corresponding stations were
grouped in the same sub-cluster, a medium similarity when grouped in the same
main cluster but different sub-clusters, and a low similarity when grouped in different
main clusters.
Since different gears were used for sampling, the Hurlbert Index (ESn), a less
sample-size dependent diversity index, was used, which is based on the rarefaction
technique of Sanders (1968), modified by Hurlbert (1971). In this index the expected
number of species (ES) is calculated for a specified number of randomly-sampled
individuals, e.g. 100 individuals (ES 100) as used in the present study.
We analysed the relationship between macrofauna community structure and
environmental variables via canonical correspondence analysis (CCA) using
CANOCO 4.5 (ter Braak and Smilauer, 1998).
3. Results
3.1 Differences in species distribution and abundance
On a North Sea wide scale neither a clear latitudinal distribution shift of species
(based on the reduced station grid), nor a range expansion of species into the North
Sea or newly established non-native species were found, although 43 taxa of the
overall 455 taxa were detected in 2000 but not in 1986. The majority of these taxa
11
were rare with 88 % found at less than five stations in 2000 (40 % only at one
station).
- Figure 2 -
However, significant changes in the abundance of species with a core distribution in
the southern North Sea were found, hereinafter referred to as ‘southern’ species (Fig.
2). In 2000, the abundance of small ‘southern’ bivalve species such as the surface-
deposit feeding Abra alba, the suspension-feeding Corbula gibba and the
subsurface-deposit feeding Nucula nitidosa increased at the Oyster Ground (e.g. 4 to
30 or 104 m-2). A higher abundance of the warm-temperate interface-feeding brittle
star Acrocnida brachiata in 2000 was found in the German Bight as well as at the
Dogger Bank “Tail End”, where it was associated with an increase in abundance of
the ‘southern’ interface-feeding polychaete Lanice conchilega (2 to 128 m-2) and the
‘southern’ sand-licking sea urchin Echinocyamus pusillus (10 to 49 m-2). The
‘southern’ and interface-feeding bivalve Tellina spp. also increased at the Tail End
but decreased in other areas of the Dogger Bank. Tellina spp., L. conchilega and the
‘southern’ sand-licking amphipod Urothoe poseidonis also occurred in higher
numbers in 2000 along the southern coastal 30 m depth contour. The abundance of
the interface-feeding polychaetes Spiophanes bombyx (eurytherm) (97 to 367 m-2)
and Myriochele spp. (cold-temperate) (3 to 232 m-2) as well as the cold-temperate
omnivorous Paramphinome jeffreysii (8 to 128 m-2) increased especially north of the
50 m depth contour.
Species such as the eurytherm sand-licking amphipod Bathyporeia spp. and the
eurytherm interface-feeding polychaete Magelona spp. and eurytherm suspension-
feeding Phoronida increased in abundance in 2000 in some areas e.g. in the eastern
North Sea, but in others they decreased. The cold-temperate subsurface-deposit
12
feeding polychaete Ophelia borealis is the only species, which decreased in
abundance in 2000 at most of the stations.
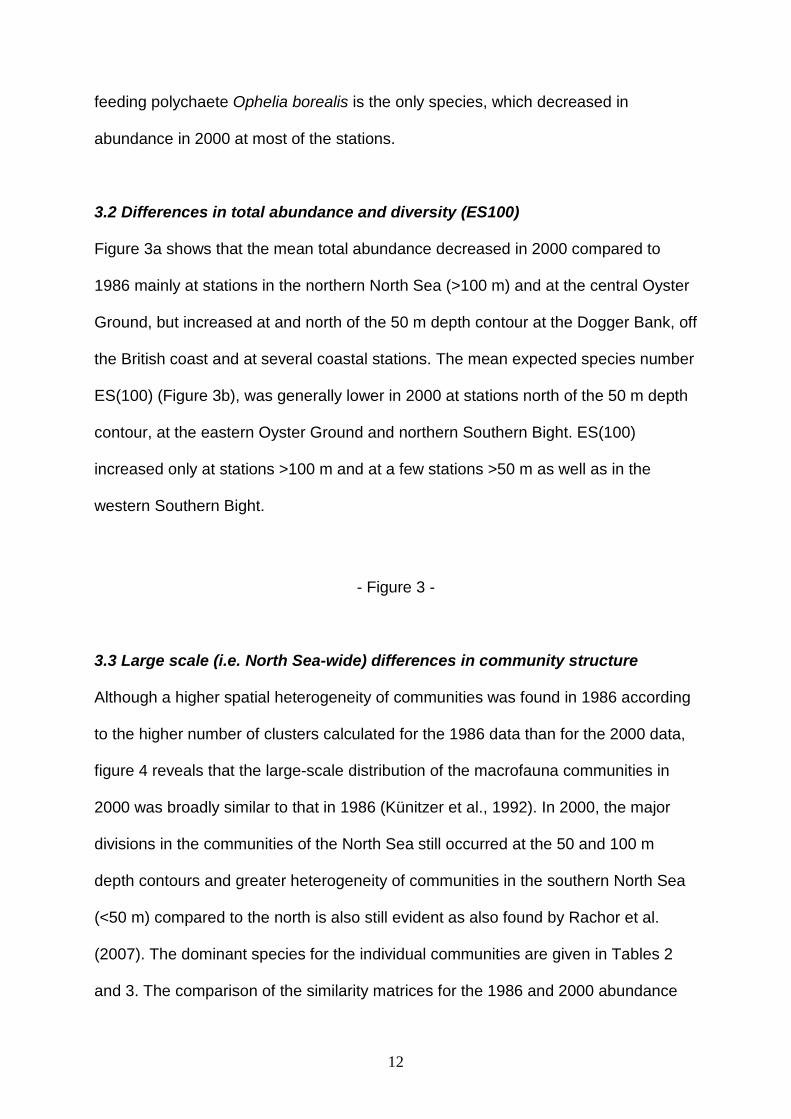
3.2 Differences in total abundance and diversity (ES100)
Figure 3a shows that the mean total abundance decreased in 2000 compared to
1986 mainly at stations in the northern North Sea (>100 m) and at the central Oyster
Ground, but increased at and north of the 50 m depth contour at the Dogger Bank, off
the British coast and at several coastal stations. The mean expected species number
ES(100) (Figure 3b), was generally lower in 2000 at stations north of the 50 m depth
contour, at the eastern Oyster Ground and northern Southern Bight. ES(100)
increased only at stations >100 m and at a few stations >50 m as well as in the
western Southern Bight.
- Figure 3 -
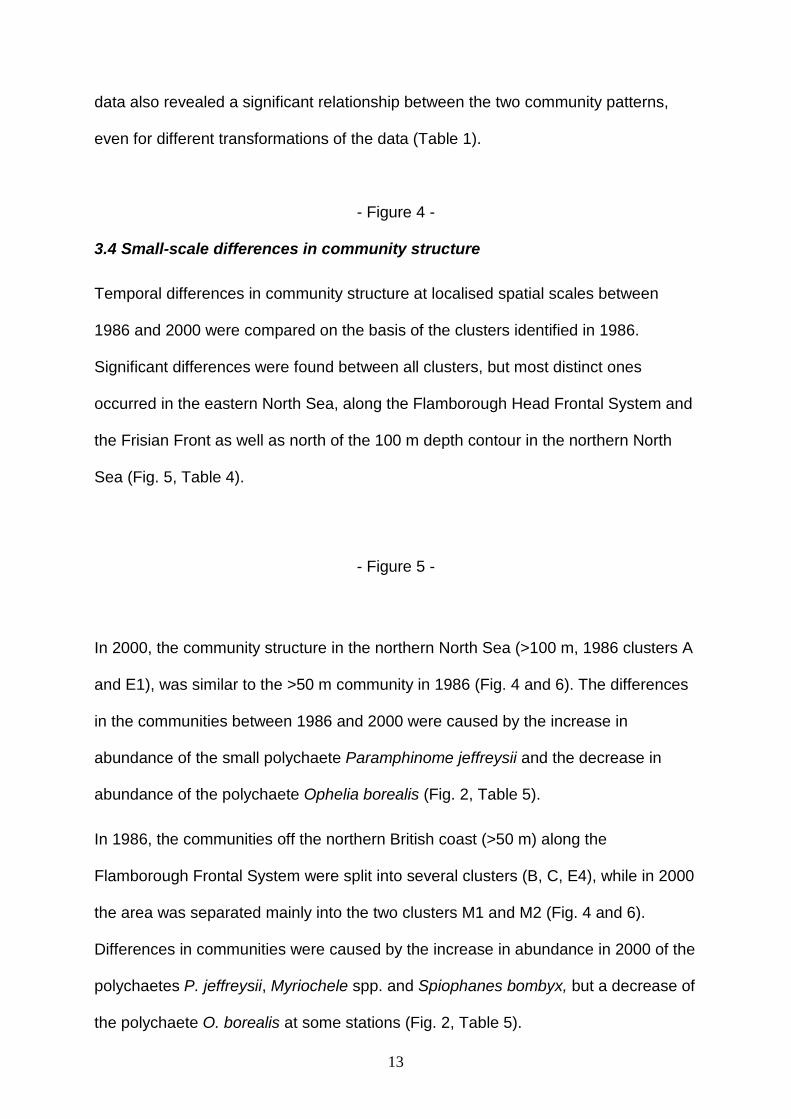
3.3 Large scale (i.e. North Sea-wide) differences in community structure
Although a higher spatial heterogeneity of communities was found in 1986 according
to the higher number of clusters calculated for the 1986 data than for the 2000 data,
figure 4 reveals that the large-scale distribution of the macrofauna communities in
2000 was broadly similar to that in 1986 (Künitzer et al., 1992). In 2000, the major
divisions in the communities of the North Sea still occurred at the 50 and 100 m
depth contours and greater heterogeneity of communities in the southern North Sea
(<50 m) compared to the north is also still evident as also found by Rachor et al.
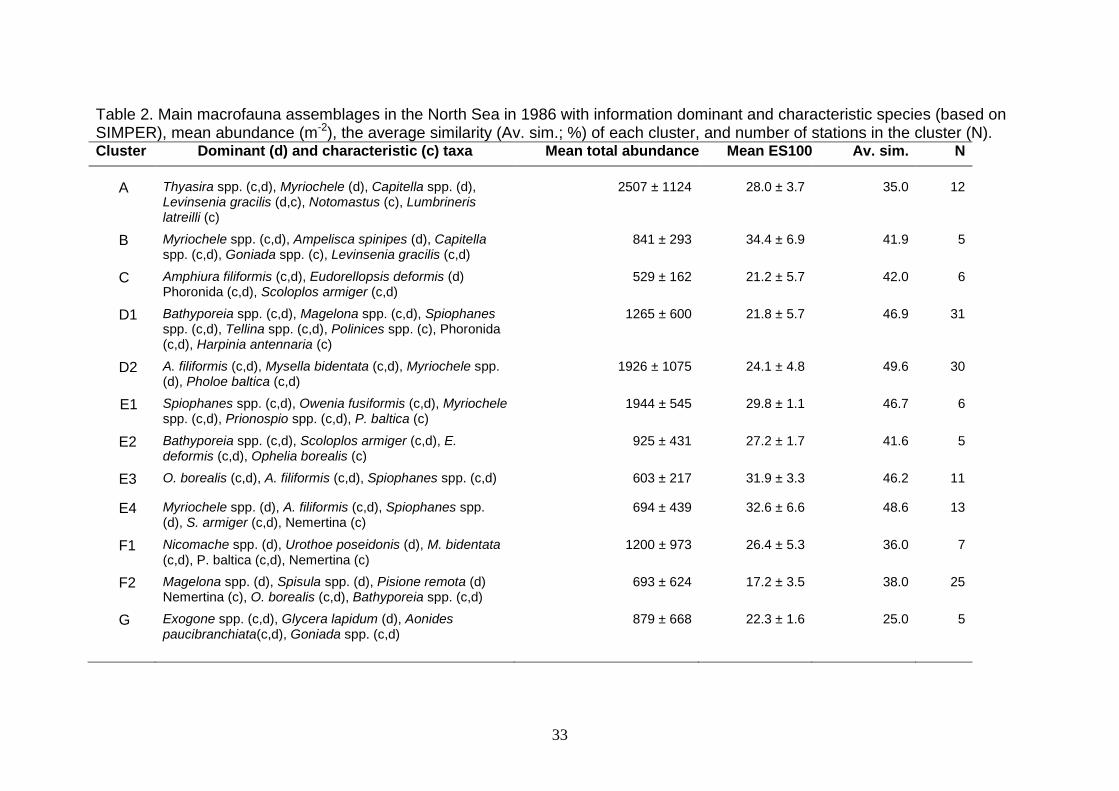
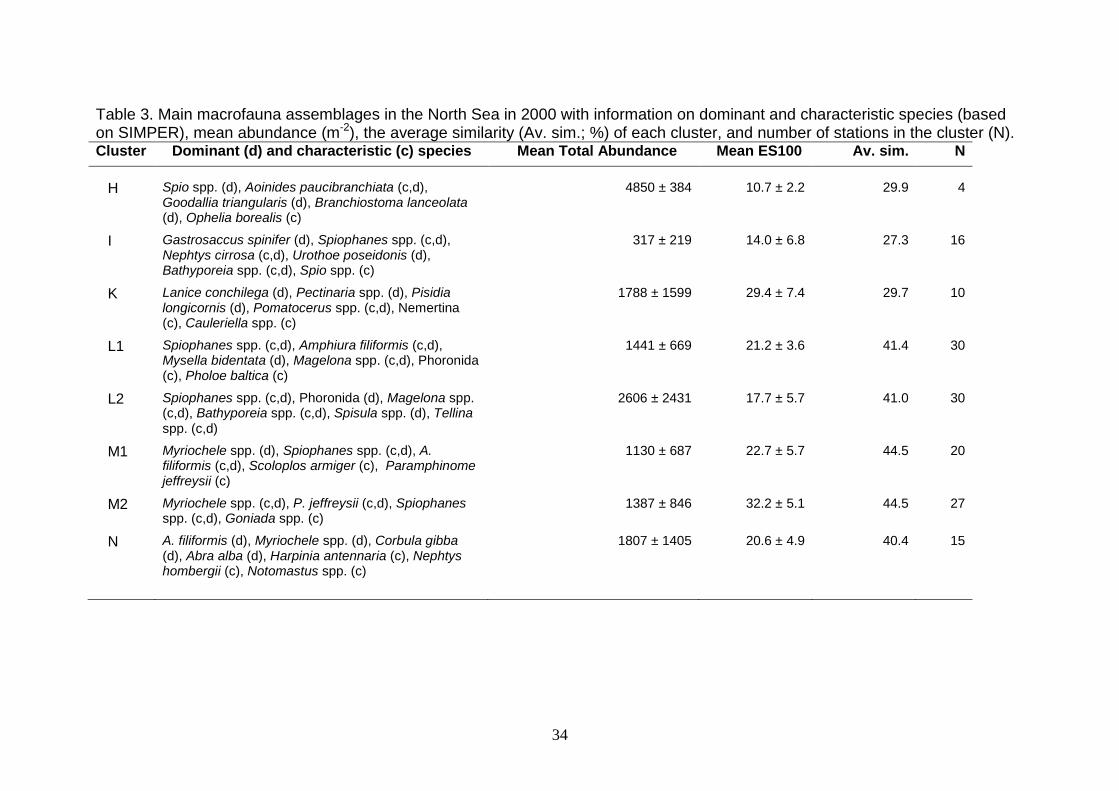
(2007). The dominant species for the individual communities are given in Tables 2
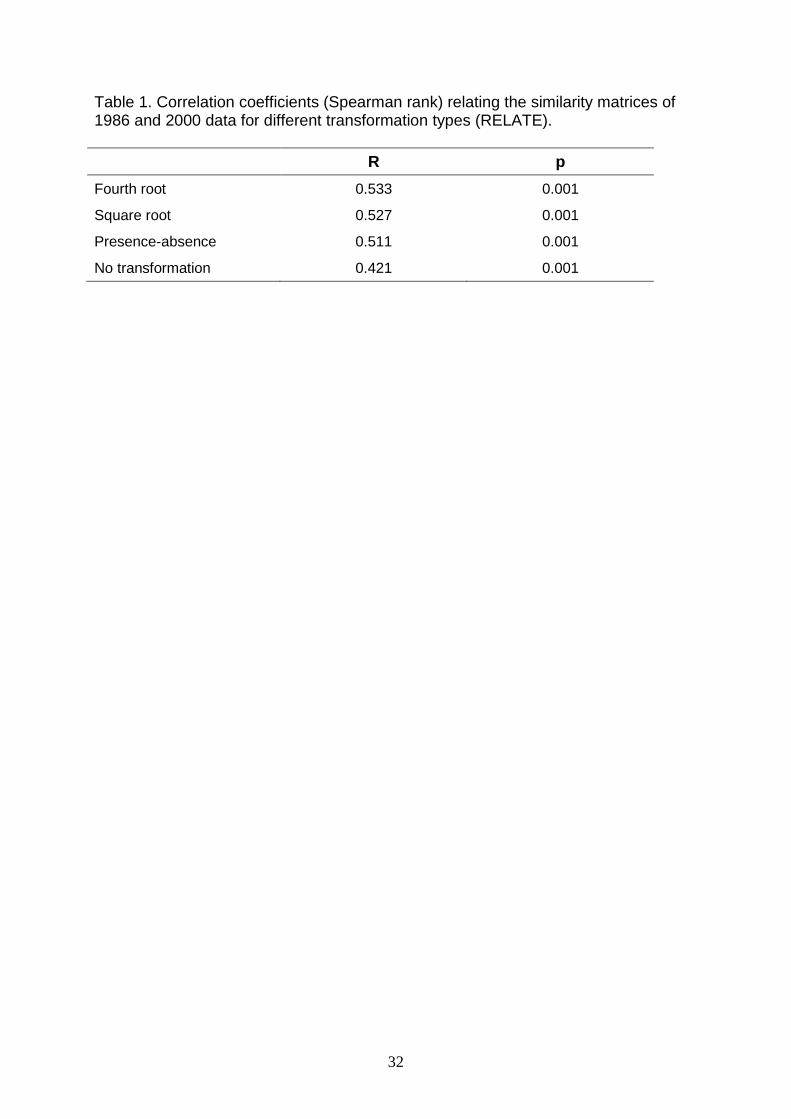
and 3. The comparison of the similarity matrices for the 1986 and 2000 abundance
13
data also revealed a significant relationship between the two community patterns,
even for different transformations of the data (Table 1).
- Figure 4 -
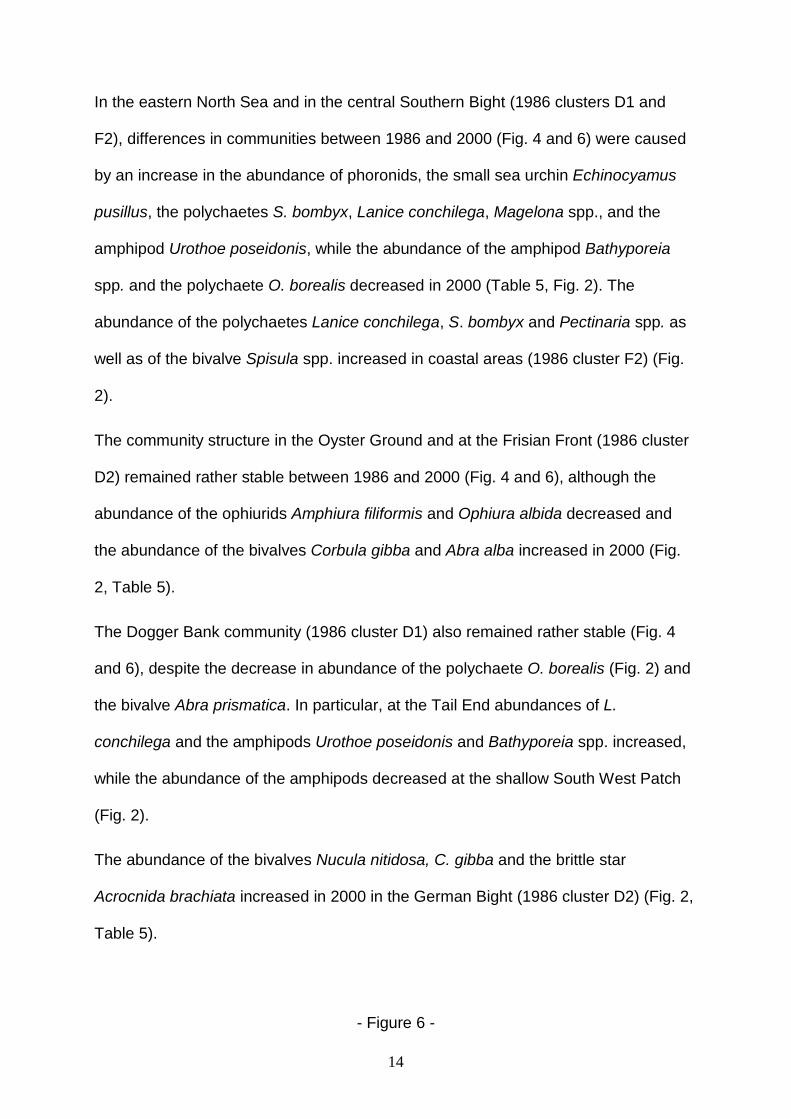
3.4 Small-scale differences in community structure
Temporal differences in community structure at localised spatial scales between
1986 and 2000 were compared on the basis of the clusters identified in 1986.
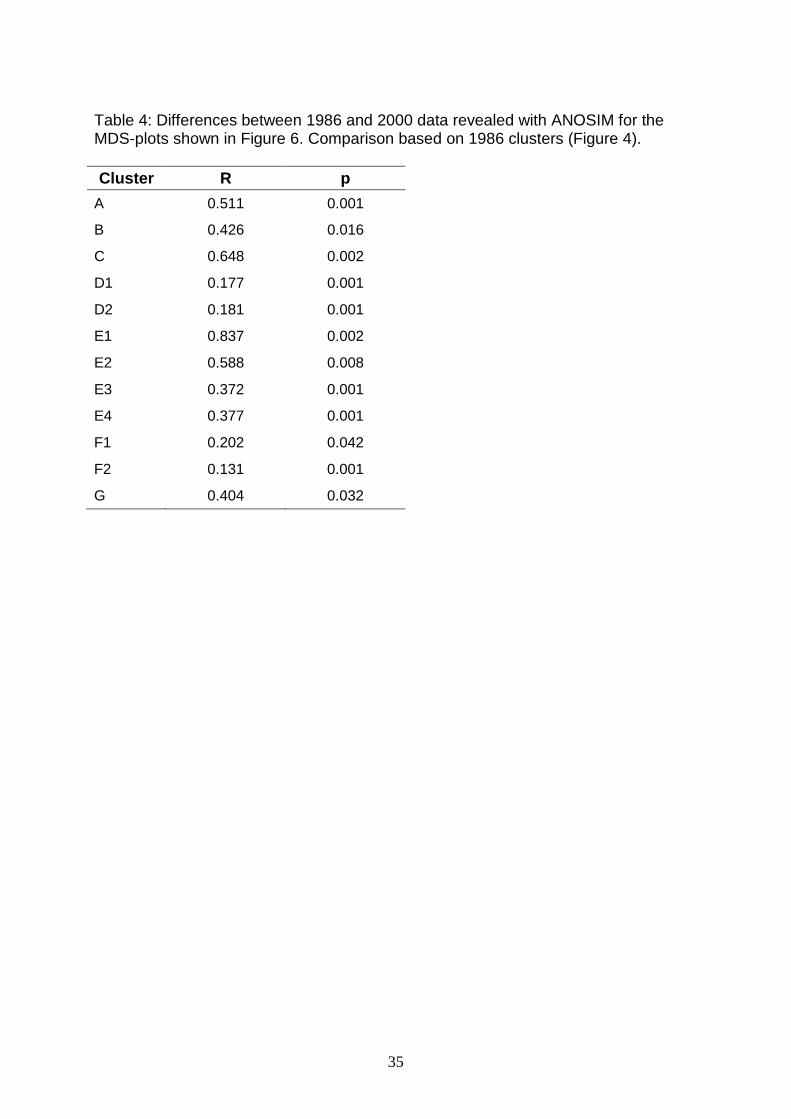
Significant differences were found between all clusters, but most distinct ones
occurred in the eastern North Sea, along the Flamborough Head Frontal System and
the Frisian Front as well as north of the 100 m depth contour in the northern North
Sea (Fig. 5, Table 4).
- Figure 5 -
In 2000, the community structure in the northern North Sea (>100 m, 1986 clusters A
and E1), was similar to the >50 m community in 1986 (Fig. 4 and 6). The differences
in the communities between 1986 and 2000 were caused by the increase in
abundance of the small polychaete Paramphinome jeffreysii and the decrease in
abundance of the polychaete Ophelia borealis (Fig. 2, Table 5).
In 1986, the communities off the northern British coast (>50 m) along the
Flamborough Frontal System were split into several clusters (B, C, E4), while in 2000
the area was separated mainly into the two clusters M1 and M2 (Fig. 4 and 6).
Differences in communities were caused by the increase in abundance in 2000 of the
polychaetes P. jeffreysii, Myriochele spp. and Spiophanes bombyx, but a decrease of
the polychaete O. borealis at some stations (Fig. 2, Table 5).
14
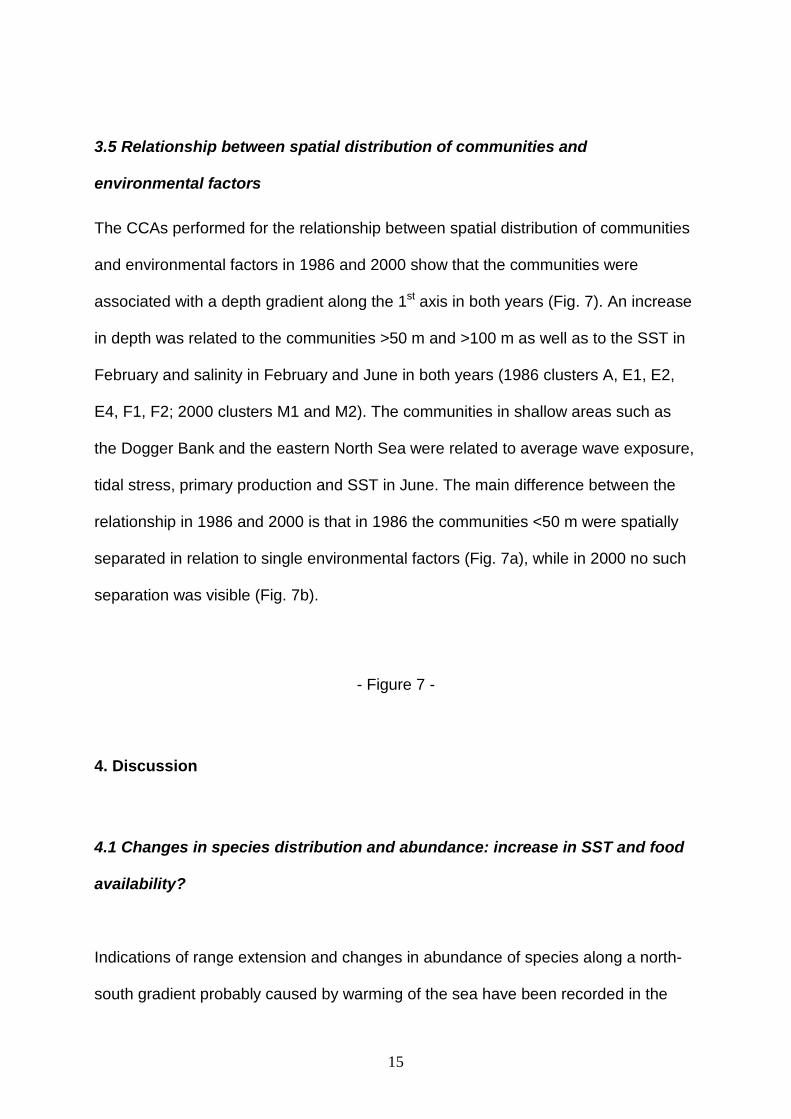
In the eastern North Sea and in the central Southern Bight (1986 clusters D1 and
F2), differences in communities between 1986 and 2000 (Fig. 4 and 6) were caused
by an increase in the abundance of phoronids, the small sea urchin Echinocyamus
pusillus, the polychaetes S. bombyx, Lanice conchilega, Magelona spp., and the
amphipod Urothoe poseidonis, while the abundance of the amphipod Bathyporeia
spp. and the polychaete O. borealis decreased in 2000 (Table 5, Fig. 2). The
abundance of the polychaetes Lanice conchilega, S. bombyx and Pectinaria spp. as
well as of the bivalve Spisula spp. increased in coastal areas (1986 cluster F2) (Fig.
2).
The community structure in the Oyster Ground and at the Frisian Front (1986 cluster
D2) remained rather stable between 1986 and 2000 (Fig. 4 and 6), although the
abundance of the ophiurids Amphiura filiformis and Ophiura albida decreased and
the abundance of the bivalves Corbula gibba and Abra alba increased in 2000 (Fig.
2, Table 5).
The Dogger Bank community (1986 cluster D1) also remained rather stable (Fig. 4
and 6), despite the decrease in abundance of the polychaete O. borealis (Fig. 2) and
the bivalve Abra prismatica. In particular, at the Tail End abundances of L.
conchilega and the amphipods Urothoe poseidonis and Bathyporeia spp. increased,
while the abundance of the amphipods decreased at the shallow South West Patch
(Fig. 2).
The abundance of the bivalves Nucula nitidosa, C. gibba and the brittle star
Acrocnida brachiata increased in 2000 in the German Bight (1986 cluster D2) (Fig. 2,
Table 5).
- Figure 6 -
15
3.5 Relationship between spatial distribution of communities and
environmental factors
The CCAs performed for the relationship between spatial distribution of communities
and environmental factors in 1986 and 2000 show that the communities were
associated with a depth gradient along the 1st axis in both years (Fig. 7). An increase
in depth was related to the communities >50 m and >100 m as well as to the SST in
February and salinity in February and June in both years (1986 clusters A, E1, E2,
E4, F1, F2; 2000 clusters M1 and M2). The communities in shallow areas such as
the Dogger Bank and the eastern North Sea were related to average wave exposure,
tidal stress, primary production and SST in June. The main difference between the
relationship in 1986 and 2000 is that in 1986 the communities <50 m were spatially
separated in relation to single environmental factors (Fig. 7a), while in 2000 no such
separation was visible (Fig. 7b).
- Figure 7 -
4. Discussion
4.1 Changes in species distribution and abundance: increase in SST and food
availability?
Indications of range extension and changes in abundance of species along a north-
south gradient probably caused by warming of the sea have been recorded in the
16
North Atlantic (e.g. Southward et al., 2004; Mieszkowska et al., 2006), but mainly for
species of intertidal or coastal habitats and less so for species in off-shore waters.
For the reduced station grid used for this study, 455 macrofauna species were
included in the analyses, while the entire NSBP 2000 dataset contained more than
1 500 taxa (Rees et al. 2007), of which many were rare species with one or a few
records only. However, we haven’t found clear indications for an immigration of non-
native macrofauna species or neozoans in the subtidal North Sea as did Neumann et
al. (2010) recently for the epifaunal non-native decapod species Goneplax
rhomboides. Furthermore, we found no clear indication of a large-scale latitudinal
shift in the distribution of macrofauna species in the North Sea, but the detection of
these shifts might be hampered by the inconsistencies of the sampling schemes and,
consequently the low number of comparable stations used in this study (see above).
In contrast to off-shore waters the environmental conditions along the coastal regions
of the North Sea change more gradually, enabling a more continuous range
expansion of species. Thus, distribution shifts of several intertidal species of up to 50
km per decade were observed (Helmuth et al., 2006). In the deeper waters of the
North Sea, the large-scale bathymetrical and hydrographical conditions mainly trigger
the spatial patterns of environmental gradients, which may act as barriers for further
north-south range expansions in the North Sea (e.g. the differences in bottom
temperature, stratification and currents north and south of the 50 m depth contour).
This is supported by the finding of corresponding separation in benthic communities
along the depth contours, which remained rather stable over the studied time period
(see below).
Instead, we found an increase in abundance and a spatial extension within the core
distribution areas of macrofauna species in the North Sea, which might be related to
17
a SST mediated increase in pelagic or benthic primary production (McQuatters-
Gollop et al. 2007).
The abundance of species with a core distribution in the southern North Sea, such as
the small bivalves Abra alba, Corbula gibba and Nucula nitidosa increased in the
entire Oyster Ground towards the southern flank of the Dogger Bank between 1986
and 2000. These deposit-feeding species are also common in the nutrient enriched
inner German Bight and seem to benefit from the higher food supply (Rachor, 1980;
Kröncke et al., 2004; McQuatters-Gollop et al., 2007).
Also the increase in abundance of ’southern’ interface- and suspension-feeding
species such as the bivalve Tellina spp., the polychaete Lanice conchilega and the
warm-temperate ophiurid A. brachiata as well as the sandlicking sea urchin E.
pusillus at the Dogger Bank Tail End or off Jutland in 2000 gives evidence for an SST
mediated increase in pelagic and benthic primary production and food availability in
these areas (Bauerfeind et al., 1990; Niermann, 1996; Kröncke et al., 2001, 2004,
subm.; Wieking and Kröncke, 2001).
The increase in abundance of the ophiurid A. brachiata in 2000 at the Dogger Bank
and especially in the German Bight, where this species was hardly found in 1986,
seems to be a response to higher water temperatures since the late 1980s and
higher sediment mobility, since it is a warm-temperate species and buries deeper in
the sediment than the eurytherm A. filiformis (Ursin, 1960). A. brachiata was also
previously found in increased numbers in shallow exposed parts of the Dogger Bank,
compared with the late 1980s (Wieking and Kröncke 2003). This finding was related
to rising SST and hydrodynamic energy related to the changes in the NAO
(Siegismund and Schrum, 2001; Beare et al., 2002).
18
North of the 50 m depth contour, the substantial increase in abundance of
Paramphinome jeffreysii and of the interface-feeding polychaetes S. bombyx and
Myriochele spp. seemed also to be related to the increase in food availability
(Pearson and Mannvik, 1998). Calmer conditions and better light penetration might
have enhanced the subsurface primary production usual in these areas (Riegman et
al., 1990; Nielsen et al., 1993; Richardson et al., 1998), which feeds also benthic
foraminiferans, the favourite prey for P. jeffreysii (Pearson et al., 1996).
In contrast, the cold-temperate polychaete species Ophelia borealis had decreased
in abundance in the entire North Sea from 1986 until 2000. Also Wieking and
Kröncke (2001) found a decrease in abundance of this species at the Dogger Bank in
the late 1990s, which they attributed to the increase in SST since 1988.
Since this study is based on the comparison of two time periods only, general
conclusions about consistency of changes are difficult to draw, but other long-term
studies on a more local scale showed similar trends of an increase in abundance of
‘southern’ or warm-temperate species and a decrease of northern or cold-temperate
species in the southern North Sea (Kröncke et al. 2001; Wieking and Kröncke 2003).
These changes were also found for other ecosystem components of the North Sea
such as plankton and fish (see introduction), which were also related to hydro-climate
change since the late 1980s.
4.2 Changes in community structure on a North Sea wide spatial scale The large-scale spatial distribution of the North Sea macrofauna communities in 2000
(NSBP) (see also Rachor et al., 2007) was rather similar to that in 1986 (NSBS) as
19
described by Künitzer et al. (1992). The major divisions in community structure still
occur at the 50 and 100 m depth contours, and correspond with the three étages
described by Glémarec (1973). These divisions were also found for epifauna and fish
by Zühlke et al. (2001), Callaway et al. (2002) and Reiss et al. (2009a). Künitzer et al.
(1992) identified water temperature, different water masses, sediment structure and
food availability as important influences on North Sea benthic communities.
Similarly, the CCAs of this study revealed that water depth and hydrographic
variables such as bottom water temperature, bottom water salinity, tidal stress and
stratification were the most important environmental factors structuring the
macrofauna communities. This was also found for epifauna and fish communities
(Callaway et al., 2002; Rees et al., 2007; Ehrich et al., 2009; Reiss et al., 2009a),
suggesting similar underlying drivers for structuring large scale community patterns
of the majority of benthic ecosystem components in the North Sea.
4.3 Changes in community structure on localised spatial scales
On localised spatial scales differences between the 1986 and the 2000 macrofauna
communities occurred mainly north of the 50 m and the 100 m depth contours as well
as in the eastern North Sea, at the Frisian Front and in the coastal Southern Bight.
The differences in total abundance and in community structure found at >100 m
depth were partly caused by the use of different mesh sizes in this region in 1986
(0.5 mm) and 2000 (1 mm). Nevertheless, the diversity (ES100) was slightly higher in
2000, which was not expected since the use of smaller mesh sizes in 1986 should
have led to a higher diversity in 1986. Also the strong increase in abundance of the
small polychaete P. jeffreysii in 2000, as also found by Schückel et al. (2010), cannot
20
be attributed to the differences in the mesh size used, since this species should be
more efficiently sampled with smaller meshes. Nevertheless, changes in community
structure between 1986 and 2000 can be more reliably discussed for the areas <100
m, where the same mesh size was used in sample processing.
Significant changes in community structure between 1986 and 2000 were found for
all communities (Table 4), but the most distinct changes occurred north of the 50 m
depth contour off the British coast along the Flamborough Head frontal system and
its extension north of the Dogger Bank, along the Frisian Front and along the eastern
North Sea frontal system (Fig. 4) (Otto et al., 1990; Hill et al., 1994). Some of these
changes were caused by an increase in abundance of short lived polychaete species
(Table 5). These opportunistic species are characterised by the ability to respond
quickly on changes in food availability. Thus, by comparing two time periods only, our
findings may rather reflect short-term responses of macrofauna than consistent long-
term trends. However, this increase in abundance of opportunistic species was
frequently found in different regions of the North Sea over the last decades, ranging
from off-shore areas to the intertidal (e.g. Reise, 1982; Beukema 1991; Kröncke,
1992; Kraan et al. 2011), indicating a consistent large-scale trend in North Sea
macrofauna communities.
As mentioned above, most obvious changes in macrofauana communities were
found in regions with frontal systems, which are areas of enhanced primary
production. Frontal systems are influenced by changes in e.g. wind direction,
currents, flow velocities and flushing times (Otto et al., 1990; Hill et al., 1994;
Siegismund, 2001). The NAOI related hydro-climate change at the end of the 1980s
coincided with an increased inflow of Atlantic water masses in particular through the
Fair Isle current and from the North. This probably resulted in stronger frontal
21
conditions, in particular along the Flamborough Frontal system and north of the
Dogger Bank (Reid et al., 2001b; Siegismund, 2001; Siegismund and Schrum, 2001;
Wieking and Kröncke, 2001), but also along the Frisian Front (Amaro et al., 2007;
van Nes et al., 2007) due to changes in inflow of Atlantic water masses through the
English Channel into the southern North Sea. Frontal systems are typically areas of
enhanced primary production and food supply for the benthos. The increase in SST
and the changes in the hydro-climate seem to have also enhanced the primary
production in these areas, which may have caused increasing abundances of
macrofauna species sensitive to organic enrichment.
4.4 Other stressors
Beside the climate related changes in the benthic communities discussed above,
several other anthropogenic impacts such as commercial fishing, oil and gas
exploitation, dredging and eutrophication are known to influence the North Sea
benthos to varying degrees, of which fishing might be considered the most important
one, at least in terms of the large spatial scale of potential impacts (e.g. OSPAR,
2000). Thus, it is possible that trawling disturbance may be responsible for the
changes in the macrofauna communities and species distribution in the North Sea
observed in this study. The southern North Sea is characterised by heavily beam
trawling activity, which can affect diversity, secondary production and species
composition of benthic communities on various spatial scales (Rumohr and Kujawski,
2000; Kaiser et al., 2000; Jennings et al., 2001; Hiddink et al., 2006; Callaway et al.,
2007; Reiss et al., 2009b). Furthermore, Callaway et al. (2002) hypothesised that the
high diversity of sessile epibenthic species in the northern North Sea might be
caused by the less severe impact of otter trawling in this area compared to intensive
beam trawling in the southern North Sea.
22
Unfortunately, detailed information about the changes of total fishing effort between
1986 and 2000 in the North Sea is relatively sparse. The effort of the UK fleet landing
in Scotland, which mainly comprises fishing activities with otter trawls in the central
and northern North Sea, did not change markedly within this time period (Greenstreet
et al., 2009). In contrast, Jennings et al. (1999) described an increase in beam
trawling and a decrease in otter trawling effort in the southern North Sea from 1985
to 1995, but the beam trawling effort seemed to have decreased again during the last
decade (Neumann et al., 2009a). However, the changes in fishing effort summarized
for such large areas of the North Sea can hardly be related to the changes in the
different benthic communities, because fishing effort is known to be very patchily
distributed (Rijnsdorp et al., 1998; Jennings et al., 1999) and response of
macrofauna on fishing disturbance can vary significantly on small spatial scales
(Reiss et al. 2009b).
Nevertheless, demersal fishing has been carried out across the entire North Sea and
undoubtedly affected benthic communities. Without detailed information on the
distribution of fishing effort and temporal trends, it cannot be ruled out as a possible
causal factor for the changes in macrofauna communities observed in this study. But
the observed large-scale changes in macrofauna communities seem to rather reflect
the variation in hydroclamatic conditions than to follow trends expected from
variations in fishing (see also Craeymeersch et al., 2007).
Acknowledgements
We thank the captains and crews of all research vessels involved in the NSBP 2000
for their help with sampling, as well as all research scientists, technicians and
students of all institutes involved for their help with sorting the samples and
23
identifying the organisms. This publication is initiated and facilitated by the Study
Group on the North Sea Benthos Project 2000 (NSBP) and the Benthos Ecology
Working Group (BEWG), which are expert groups of the International Council for the
Exploration of the Sea (ICES). We thank the anonymous referees for their valuable
comments. The work of I. Kröncke and H. Reiss is a contribution to the Research
Centre “Biodiversity and Climate (BiK-F)” funded by LOEWE.
5. References
Amaro, T.P.F., Duineveld, G.C.A., Bergman, M.J.N., Witbaard, R., Scheffer, M., 2007. The consequences of changes in abundance of Callianassa subterranea and Amphiura filiformis on sediment erosion at the Frisian Front (south-eastern North Sea). Hydrobiologia 589, 273-285.
Backhaus, J.O., 1985. A three-dimensional model for simulation of shelf sea dynamics. Deutsche Hydrographische Zeitschrift 38, 165-187.
Basford, D., Eleftheriou, A., 1988. The benthic environment of the North Sea (56-Degrees to 61-Degrees N). Journal of the Marine Biological Association of the United Kingdom 68, 125-141.
Basford, D.J., Eleftheriou, A., Davies, I.M., Irion, G., Soltwedel, T., 1993. The ICES North Sea benthos survey: the sedimentary environment. ICES Journal of Marine Science 50, 71-80.
Basford, D.J., Eleftheriou, A., Raffaelli, D., 1990. The infauna and epifauna of the northern North Sea. Netherlands Journal of Sea Research 25, 165-173.
Bauerfeind, E., Hickel, W., Niermann, U., Westernhagen, H. v., 1990. Phytoplankton biomass and potential nutrient limitation of phytoplankton development in the southeastern North Sea in spring 1985 and 1986. Netherlands Journal of Sea Research 25, 131-142.
Beare, D.J., Batten, S., Edwards, M., Reid, D.G., 2002. Prevalence of boreal Atlantic, temperate Atlantic and neretic zooplankton in the North Sea between 1958 and 1998 in relation to temperature, salinity, stratification intensity and Atlantic inflow. Journal of Sea Research 48, 29-49.
Beaugrand, G., 2004. The North Sea regime shift: evidence, causes, mechanisms and consequences. Progress in Oceanography 60, 245-262.
24
Beukema, J. J., 1991. Changes in composition of bottom fauna of a tidal-flat area during a period of eutrophication. Marine Biology 111, 293-301.
Bonnet, D., Frid, C., 2004. Seven copepod species considered as indicators of water-mass influence and changes: results from a Northumberland coastal station. ICES Journal of Marine Science 61, 485-491.
Callaway, R., Alsvag, J., De Boois, I., Cotter, J., Ford, A., Hinz, H., Jennings, S., Kröncke, I., Lancaster, J., Piet, G., Prince, P., Ehrich, S., 2002. Diversity and community structure of epibenthic invertebrates and fish in the North Sea. ICES Journal of Marine Science 59, 1199-1214.
Callaway, R., Engelhard, G.H., Dann, J., Cotter, J., Rumohr H.,2007. One century of North Sea epibenthos and fishing: comparison between 1902-1912, 1982-1985 and 2000. Marine Ecology Progress Series 346, 27-43.
Clarke, K.R., Warwick, R.M., 1994. Change in marine communities: an approach to
statistical analysis and interpretation, Plymouth Marine Laboratory, Plymouth, UK., 130 pp.
Craeymeersch, J.A., Heip, C.H.R., Buijs, J., 1997. Atlas of the North Sea benthic infauna. ICES Cooperative Research Report 218, 1-86.
Craeymeersch, J.A., Bergman, M.J.N. Duineveld, G.C.A. Kröncke, I. Reiss H., 2007 Fishing practices. In: Rees, H. L., Eggleton, J. D., Rachor, E., Vanden Berghe, E. (Eds.), Structure and dynamics of the North Sea benthos. ICES Cooperative Research Report 288, 156-172.
Davies, A.M., Aldridge, J.N., 1993. A numerical model study of parameters
influencing tidal currents in the Irish Sea. Journal of Geophysical Research 98, 7049-7068.
Dippner, J.,W., Kröncke, I. 2003. Forecast of climate-induced change in macrozoobenthos in the southern North Sea in spring. Climate Research 25, 179-182.
Dippner, J.W. 1997. Long-term variability of a stochastic forced pelagic ecosystem model. Environmental Modeling and Assessment 2, 37-42.
Ehrich, S., Adlerstein, S., Brockmann, U., Floeter, J., Garthe, S., Hinz, H., Kröncke, I., Neumann, H., Reiss, H., Sell, A. F., Stein, M., Stelzenmüller, V., Stransky, C., Temming, A., Wegner, G., and Zauke, G.-P., 2007. 20 years of the German Small-Scale Bottom Trawl Survey (GSBTS): A review. Senckenbergiana maritima 37, 13-82.
Ehrich, S., Stransky, C., 2001. Spatial and temporal changes in the southern species component of North Sea fish assemblages. Senckenbergiana maritima 31, 143-150.
Eleftheriou, A., Basford, D.J., 1989. The macrobenthic infauna of the offshore northern North Sea. Journal of the Marine Biological Association of the United Kingdom 69, 123-143.
25
Fauchald, K., Jumars, P.A., 1979. The diet of worms: A study of polychaete feeding guilds. Oceanogr. Marine Biology Annual Review 17, 193-284.
Franke, H.-D., Gutow, L., 2004. Long-term changes in the macrozoobenthos around the rocky island of Helgoland (German Bight, North Sea). Helgoland Marine Research 58, 303-310.
Frid, C.L.J., Buchanan, J.B., Garwood, P.R., 1996. Variability and stability in benthos: twenty-two years of monitoring off Northumberland. ICES Journal of Marine Science 53, 978-980.
Frid, C.L.J., Clark, R.A., Hall, J.A., 1999. Long-term changes in the benthos on a heavily fished ground off the NE coast of England. Marine Ecology Progress Series 188, 13-20.
Glémarec, M., 1973. The benthic communitites of the European North Atlantic continental shelf. Oceanography and Marine Biology: an Annual Review 11, 263-289.
Greenstreet, S.P.R., Holland, G.J., Fraser, T.W.K., Allen, V.J., 2009. Modelling demersal fishing effort based on landings and days absence from port, to generate indicators of "activity". ICES Journal of Marine Science, 66, 886-901.
Hartmann-Schröder, G., 1996. Annelida, Borstenwürmer, Polychaeta. In: Die Tierwelt Deutschlands und der angrenzenden Meeresteile, 2. Auflage.
Heip, C., Basford, D., Craeymeersch, J., Dewarumez, J.M., Dörjes, J., De Wilde, P., Duineveld, G., Eleftheriou, A., Herman, P. M. J., Niermann, U., Kingston, P., Künitzer, A., Rachor, E., Rumohr, H., Soetaert, K., Soltwedel, T., 1992. Trends in biomass, density and diversity of North Sea macrofauna. ICES Journal of Marine Science 49, 13-22.
Heip, C., Craeymeersch, J.A., 1995. Benthic community structures in the North Sea. Helgoländer Meeresuntersuchungen 49, 313-328.
Helmuth, B., Mieszkowska, N., Moore, P., Hawkins, S.J., 2006. Living on the edge of two changing worlds: Forecasting the responses of rocky intertidal ecosystems to climate change. Annual Review of Ecology Evolution and Systematics 37, 373-404.
Hiddink, J.G., Jennings, S., Kaiser, M. J., Queirós, A.M., Duplisea, D.E., Piet, G.J., 2006. Cumulative impacts of seabed trawl disturbance on benthic biomass, production, and species richness in different habitats. Canadian Journal of Fisheries and Aquatic Sciences 63, 721-736.
Hill, A.E., James, I.D., Linden, P.F., Matthews, J.P., Prandle, D., Gmitrowicz, E.M., Smeed, D.A., Lwiza, K.M.M., Durazo, R., Fox, A.D., Bowers, D.G., 1994. Dynamics of tidal mixing fronts in the North Sea. In Charnock, H., Dyer, K.R., Huthnance, J.M., Liss, P.S., Simpson J.H., Tett P.B. (Eds.), Understanding the North Sea system. The Royal Society, Chapman & Hall. pp. 53-68.
Hillewaert, H., 2007. The North Sea environment - sediment particle size. In: Rees, H.L., Eggleton, J.D., Rachor E., Vanden Berghe E. (Eds.), Structure and
26
dynamics of the North Sea benthos. ICES Cooperative Research Report 288, 30-35.
Holmes, S.P., Miller, N., 2006. Aspects of the ecology and population genetics of the bivalve Corbula gibba. Marine Ecology Progress Series 315, 129-140.
Hurlbert, S.H., 1971. The non-concept of species diversity: A critique and alternative parameters. Ecology 52, 577-586.
Hurrell, J.W., 1995. Decadal trends in the North Atlantic Oscillation: regional temperatures and precipitation. Science 269, 676-679.
Ibanez, F., Dauvin, J.-C.,1988. Long-term changes (1977- 1987) in muddy fine sand Abra alba-Melinna palmata community in Western English Channel: multivariate time-series analysis. Marine Ecology Progress Series 49, 65-81.
ICES 2006. ICES Report on Ocean Climate 2005. ICES Cooperative Research Report 280, 53pp.
Jennings, S., Alsvag, J., Cotter, A.J., Ehrich, S., Greenstreet, S.P.R., Jarre-Teichmann, A., Mergardt, N., Rijnsdorp, A.D., Smedstad, O., 1999. Fishing effects in northeast Atlantic shelf seas: patterns in fishing effort, diversity and community structure. III. International trawling effort in the North Sea: an analysis of spatial and temporal trends. Fisheries Research 40, 125-134.
Jennings, S., Dinmore, T.A., Duplisea, D.E., Warr, K.J., Lancaster, J.E., 2001. Trawling disturbance can modify benthic production processes. Journal of Animal Ecology 70, 459-475.
Kaiser, M.J., Ramsay, C.A., Richardson, C.A., Spence, F.E., Brand, A.R., 2000. Chronic fishing disturbance has changed shelf sea benthic community structure. Journal of Animal Ecology 69, 494-503.
Kirby, R.R., Johns, D.G., Lindley, J.A., 2006. Fathers in hot water: rising sea temperatures and a Northeastern Atlantic pipefish baby boom. Biology Letters 2, 597-600.
Kirby, R.R., Beaugrand, G., Lindley, J.A., Richardson, A.J., Edwards, M., Reid, P.C., 2007. Climate effects and benthic-pelagic coupling in the North Sea. Marine Ecology Progress Series 330, 31-38.
Kraan, C., Dekinga, A., and Piersma, T., 2011. Now an empty mudflat: past and present benthic abundances in the western Dutch Wadden Sea. Helgoland Marine Research 65, 51-58.
Kröncke, I., 1992. Macrofauna standing stock of the Dogger Bank. A comparison: III. 1950-54 versus 1985-87. A final summary. Helgoländer Meeresuntersuchungen 46, 137-169.
Kröncke, I. (subm.). Dogger Bank macrofauna communities in the 20th century caused by fishing and climate. Estuarine, Coastal and Shelf Sciences
Kröncke, I., Bergfeld, C., 2003. North Sea benthos: a review. Senckenbergiana maritima 33, 205-268.
27
Kröncke, I., Dippner, J.W., Heyen, H., Zeiss, B., 1998. Long-term changes in macrofaunal communities off Norderney (East Frisia, Germany) in relation to climate variability. Marine Ecology Progress Series 167, 25-36.
Kröncke, I., Stoeck, T., Wieking, G., Palojärvi, A., 2004. Relationship between structural and trophic aspects of microbial and macrofaunal communities in different areas of the North Sea. Marine Ecology Progress Series 282, 13-31.
Kröncke, I., Zeiss, B., Rensing, C., 2001. Long-term variability in macrofauna species composition off the island of Norderney (East Frisia, Germany) in relation to changes in climatic and environmental condition. Senckenbergiana maritima 31, 65-82.
Künitzer, A., Basford, D., Craeymeersch, J.A., Dewarumez, J.-M., Dörjes, J., Duineveld, G.C.A., Eeleftheriou, A., Heip, C., Herman, P., Kingston, P., Niermann, U., Rachor, E., Rumohr, H., de Wilde, P.A.J., 1992. The benthic infauna of the North Sea: species distribution and assemblages. ICES Journal of Marine Science 49, 127-143.
Lincoln, R.J., 1979. British marine Amphipoda: Gammaridea. British Museum, London, pp. 657.
Lindley, J.A., Beaugrand, G., Luczak, C., Dewarumez, J.-M., Kirby, R.R., 2010. Warm-water decapods and the trophic amplification of climate in the North Sea. Biology Letters 6, 773-776 .
McQuatters-Gollop, A., Raitsos, D.E., Edwards, M., Pradhan, Y., Mee, L.D., Lavender, S.J., and Attrill, M.J., 2007. A long-term chlorophyll data set reveals regime shift in North Sea phytoplankton biomass unconnected to nutrient trends. Limnology and Oceanography 52, 635-648.
Mieszkowska, N., Kendall, M.A., Hawkins, S.J., Leaper, R., Williamson, P., Hardman-Mountford, N.J., Southward, A.J., 2006. Changes in the range of some common rocky shore species in Britain - a response to climate change? Hydrobiologia 555, 241-251.
Moll, A., 2000. Assessment of three-dimensional physical-biological ECOHAM1 simulations by quantified validation for the North Sea with ICES and ERSEM data. ICES Journal of Marine Science 57, 1060-1068.
Neumann, H., Ehrich, S., Kröncke, I., 2008. Effects of cold winters and climate on the temporal variability of an epibenthic community in the German Bight. Climate Research 37, 241-251.
Neumann, H., Reiss, H., Rakers, S., Ehrich, S., Kröncke, I., 2009a. Temporal variability in southern North Sea epifauna communities after the cold winter of 1995/1996. ICES Journal of Marine Science 66, 2233-2243.
Neumann, H., Ehrich, S., Kröncke, I., 2009b. Variability of epifauna and temperature in the northern North Sea. Marine Biology 156, 1817–1826.
28
Neumann H, Kröncke I, Ehrich S., 2010. Establishment of the angular crab Goneplax rhomboides (Linnaeus, 1758) (Crustacea, Decapoda, Brachyura) in the southern North Sea. Aquatic Invasion 5, S27 - S30.
Nielsen, T.G., Løkkegaard, B., Richardson, K., Pedersen, F.B., Hansen, L., 1993. Structure of plankton communities in the Dogger Bank area (North Sea) during a stratified situation. Marine Ecology Progress Series 95, 115-131.
Niermann, U., 1996. Fluctuation and mass occurence of Phoronis mülleri (Phoronidea) in the south-eastern North Sea during 1983-1988. Senckenbergiana maritima 28, 65-79.
Osuna, P., Wolf, J., 2005. Results from a one-year run of a wave model for the UK continental shelf. ICES Document Internal Document No. 17.
OSPAR Commission 2000. Quality Status Report 2000, Region II – Greater North Sea. OSPAR Commission, London, 136pp.
Otto, L., Zimmerman, J.T.F., Furnes, G.K., Mork, M., Saetre, R., Becker, G., 1990.
Review of the physical oceanography of the North Sea. Netherlands Journal of Sea Research 26, 161-238.
Pearson, T.H., Mannvik, H.P., 1998. Long-term changes in the diversity and faunal structure of benthic communities in the northern North Sea: natural variability or induced instability? Hydrobiologia 375/376, 317-329.
Pearson, T.H., Mannvik, H.P., Evans, R., Falk-Petersen, S., 1996. The benthic communities of the Snorre field in the northern North Sea (61 degrees 30' N 2 degrees 10' E) .1. The distribution and structure of communities in undisturbed sediments. Journal of Sea Research 35, 301-314.
Pingree, R. D., Griffiths, D. K., 1978. Tidal fronts on shelf seas around British Isles. Journal of Geophysical Research 83, 4615-4622.
Pohlmann, T., 1996. Predicting the thermocline in a circulation model of the North Sea .1. Model description, calibration and verification. Continental Shelf Research 16, 131-146.
Rachor, E., 1980. The inner German Bight- an ecological sensitive area as indicated by the bottom fauna. Helgoländer Meeresuntersuchungen 33, 522-530.
Rachor, E., 1990. Changes in sublittoral zoobenthos in the German Bight with regard to eutrophication. Netherlands Journal of Sea Research 25, 209-227.
Rachor E., Reiss, H., Degraer, S., Duineveld, G.C.A., van Hoey, G, Lavaleye, M., Willems, W., Rees, H.L., 2007. Structure, distribution, and characterizing species of North Sea macro-zoobenthos communities in 2000. In: Rees, H.L., Eggleton, J.D., Rachor, E., Vanden Berghe, E. (Eds.), Structure and dynamics of the North Sea benthos. ICES Cooperative Research Report 288, 46-59.
Rees, H.L., Eggleton, J.D., Rachor, E., Vanden Berghe, E., 2007. Structure and dynamics of the North Sea benthos. ICES Cooperative Research Report 288, 258pp.
29
Rees, H.L., Pendle, M.A., Limpenny, D.S., Mason, C.E., Boyd, S.E., Birchenough, S., Vivian, C.M.G., 2006. Benthic responses to organic enrichment and climatic events in the western North Sea. Journal of the Marine Biological Association of the United Kingdom 86, 1-18.
Reid, P.C., Borges, M.F., Svendsen, E., 2001a. A regime shift in the North Sea circa 1988 linked to changes in the North Sea horse mackerel fishery. Fisheries Research 50, 163-171.
Reid, P.C., Edwards, M., 2001. Long-term changes in the fishery, pelagos and benthos of the North Sea. Senckenbergiana maritima 31, 107-115.
Reid, P.C., Holliday, N.P., Smyth, T.J., 2001b. Pulses in the eastern margin current and warmer water off the north west European shelf linked to North Sea ecosystem changes. Marine Ecology Progress Series 215, 283-287.
Reise, K., 1982. Long-term changes in the macrobenthic invertebrate fauna of the Wadden Sea: are polychaetes about to take over? Netherlands Journal of Sea Research 16, 29-36.
Reiss, H., Degraer, S., Duineveld, G., Kröncke, I., Craeymeersch, J., Rachor, E., Aldridge, J. N., Eggleton, J., Hillewaert, H., Lavaleye, M., Moll, A., Pohlmann, T., Robertson, M., Vanden Berghe, E., Van Hoey, G., and Rees, H. L., 2009a. Spatial patterns of infauna, epifauna and demersal fish communities in the North Sea. ICES Journal of Marine Science 67, 278-293.
Reiss, H., Greenstreet, S.P.R., Sieben, K., Ehrich, S., Quirijns, F., Piet, G., Robinson, L., Wolff, W.J., Kröncke, I., 2009b. Effects of fishing disturbance on benthic communities and secondary production within an intensively fished area. Marine Ecology Progress Series 394, 201-213.
Reiss, H., Meybohm, K., Kröncke, I. 2006. Cold winter effects on benthic macrofauna communities in near- and offshore regions of the North Sea. Helgoland Marine Research 60, 224-238.
Reiss, H., Wieking, G., Kröncke, I., 2007. Microphytobenthos of the Dogger Bank: a comparison between shallow and deep areas using phytopigment composition of the sediment. Marine Biology 150, 1061-1071.
Richardson, K., Nielsen, T.G., Pedersen, F.B., Heilmann, J.P., Lokkegaard, B., Kaas, H., 1998. Spatial heterogeneity in the structure of the planktonic food web in the North Sea. Marine Ecology Progress Series 168, 197-211.
Riegman, R., Malschaert, H., Colijn, F., 1990. Primary production of phytoplankton at a frontal zone located at the northern slope of the Dogger Bank (North Sea). Marine Biology 105, 329-336.
Rijnsdorp, A.D., Buys, A.M., Storbeck, F., Visser, E.G., 1998. Micro-scale distribution of beam trawl effort in the southern North Sea between 1993 and 1996 in relation to the trawling frequency of the sea bed and the impact on benthic organisms. ICES Journal of Marine Science 55, 403-419.
30
Rumohr, H., Kujawski, T., 2000. The impact of trawl fishery on the epifauna of the southern North Sea. ICES Journal of Marine Science 57, 1389-1394.
Sanders, H.L., 1968. Marine benthic diversity: a comparative study. The American Naturalist 102, 243-282.
Schröder, A., 2005. Community dynamics and development of soft bottom macrozoobenthos in the German Bight (North Sea) 1969 - 2000. Berichte zur Polar- und Meeresforschung, 181 pp.
Schückel, U., Ehrich, S., Kröncke, I., 2010. Temporal variability of three macrofauna communities and the hydro-climate in the northern North Sea. Estuarine, Coastal and Shelf Science 89, 1-11.
Siegismund, F., 2001. Long-term changes in the flushing times of the ICES-boxes. Senckenbergiana maritima 31, 151-167.
Siegismund, F., Schrum, C., 2001. Decadal changes in the wind forcing over the North Sea. Climate Research 18, 39-45.
Skogen, M.D., Moll, A., 2000. Interannual variability of the North Sea primary production: comparison from two model studies. Continental Shelf Research 20, 129-151.
Southward, A.J., Hiscock, K., Kerckhof, F., Moyse, J., Elfimov, A.S., 2004. Habitat and distribution of the warm-water barnacle Solidobalanus fallax (Crustacea: Cirripedia). Journal of the Marine Biological Association of the United Kingdom 84 (6), 1169-1177.
ter Braak, C.J.F., Smilauer, P., 1998. CANOCO reference manual and user's guide to Canoco for windows: software for Canonical Community Ordination (version 4), Microcomputer Power, Ithaca, NY, 352 pp.
Ursin, E., 1960. A quantitative investigation of the echinoderm fauna of the central North Sea. Meddelelser fra Danmarks Fiskeri-Og Havundersogelser 2, 1-204.
Van Hoey, G., Vincx, M., Degraer, S., 2005. Small-to large-scale geographical patterns within the macrobenthic Abra alba community. Estuarine, Coastal and Shelf Science 64, 751-763.
Van Hoey, G., Vincx, M., Degraer, S., 2007. Temporal variability in the Abra alba community determined by global and local events. Journal of Sea Research 58, 144-155.
van Nes, E.H., Amaro, T., Scheffer, M., Duineveld, G.C.A., 2007. Possible mechanisms for a marine benthic regime shift in the North Sea. Marine Ecology Progress Series 330, 39-47.
Vanden Berghe, E., Rees, H.L., Eggleton, J.D., 2007. NSBP 2000 data management. In: Rees, H.L., Eggleton, J.D., Rachor, E., Vanden Berghe, E. (Eds.), Structure and dynamics of the North Sea benthos. ICES Cooperative Research Report 288, 7-22.
31
Wieking, G., Kröncke, I., 2001. Decadal changes in macrofauna communities on the Dogger Bank caused by large-scale climate variability. Senckenbergiana maritima 31, 125-141.
Wieking, G., Kröncke, I., 2003. Macrofauna communities of the Dogger Bank (central North Sea) in the late 1990s: spatial distribution, species composition and trophic structure. Helgoland Marine Research 57, 34-46.
Wiltshire, K.H., Manly, B.F.J., 2004. The warming trend at Helgoland Roads, North Sea: Phytoplankton response. Helgoland Marine Research 58, 269-273.
Zühlke, R., Alsvag, J., De Boois, I., Cotter, J., Ehrich, S., Ford, A., Hinz, H., Jarre-Teichmann, A., Jennings, S., Kröncke, I., Lancaster, J., Piet, G., Prince, P. 2001. Epibenthic diversity in the North Sea. Senckenbergiana maritima, 31, 269-281.
32
Table 1. Correlation coefficients (Spearman rank) relating the similarity matrices of 1986 and 2000 data for different transformation types (RELATE). R p Fourth root 0.533 0.001
Square root 0.527 0.001
Presence-absence 0.511 0.001
No transformation 0.421 0.001
33
Table 2. Main macrofauna assemblages in the North Sea in 1986 with information dominant and characteristic species (based on SIMPER), mean abundance (m-2), the average similarity (Av. sim.; %) of each cluster, and number of stations in the cluster (N). Cluster Dominant (d) and characteristic (c) taxa Mean total abundance Mean ES100 Av. sim. N
A Thyasira spp. (c,d), Myriochele (d), Capitella spp. (d),
Levinsenia gracilis (d,c), Notomastus (c), Lumbrineris latreilli (c)
2507 ± 1124 28.0 ± 3.7 35.0 12
B Myriochele spp. (c,d), Ampelisca spinipes (d), Capitella spp. (c,d), Goniada spp. (c), Levinsenia gracilis (c,d)
841 ± 293 34.4 ± 6.9 41.9 5
C Amphiura filiformis (c,d), Eudorellopsis deformis (d) Phoronida (c,d), Scoloplos armiger (c,d)
529 ± 162 21.2 ± 5.7 42.0 6
D1 Bathyporeia spp. (c,d), Magelona spp. (c,d), Spiophanes spp. (c,d), Tellina spp. (c,d), Polinices spp. (c), Phoronida (c,d), Harpinia antennaria (c)
1265 ± 600 21.8 ± 5.7 46.9 31
D2 A. filiformis (c,d), Mysella bidentata (c,d), Myriochele spp. (d), Pholoe baltica (c,d)
1926 ± 1075 24.1 ± 4.8 49.6 30
E1 Spiophanes spp. (c,d), Owenia fusiformis (c,d), Myriochele spp. (c,d), Prionospio spp. (c,d), P. baltica (c)
1944 ± 545 29.8 ± 1.1 46.7 6
E2 Bathyporeia spp. (c,d), Scoloplos armiger (c,d), E. deformis (c,d), Ophelia borealis (c)
925 ± 431 27.2 ± 1.7 41.6 5
E3 O. borealis (c,d), A. filiformis (c,d), Spiophanes spp. (c,d) 603 ± 217 31.9 ± 3.3 46.2 11
E4 Myriochele spp. (d), A. filiformis (c,d), Spiophanes spp. (d), S. armiger (c,d), Nemertina (c)
694 ± 439 32.6 ± 6.6 48.6 13
F1 Nicomache spp. (d), Urothoe poseidonis (d), M. bidentata (c,d), P. baltica (c,d), Nemertina (c)
1200 ± 973 26.4 ± 5.3 36.0 7
F2 Magelona spp. (d), Spisula spp. (d), Pisione remota (d) Nemertina (c), O. borealis (c,d), Bathyporeia spp. (c,d)
693 ± 624 17.2 ± 3.5 38.0 25
G Exogone spp. (c,d), Glycera lapidum (d), Aonides paucibranchiata(c,d), Goniada spp. (c,d)
879 ± 668 22.3 ± 1.6 25.0 5
34
Table 3. Main macrofauna assemblages in the North Sea in 2000 with information on dominant and characteristic species (based on SIMPER), mean abundance (m-2), the average similarity (Av. sim.; %) of each cluster, and number of stations in the cluster (N). Cluster Dominant (d) and characteristic (c) species Mean Total Abundance Mean ES100 Av. sim. N
H Spio spp. (d), Aoinides paucibranchiata (c,d),
Goodallia triangularis (d), Branchiostoma lanceolata (d), Ophelia borealis (c)
4850 ± 384 10.7 ± 2.2 29.9 4
I Gastrosaccus spinifer (d), Spiophanes spp. (c,d), Nephtys cirrosa (c,d), Urothoe poseidonis (d), Bathyporeia spp. (c,d), Spio spp. (c)
317 ± 219 14.0 ± 6.8 27.3 16
K Lanice conchilega (d), Pectinaria spp. (d), Pisidia longicornis (d), Pomatocerus spp. (c,d), Nemertina (c), Cauleriella spp. (c)
1788 ± 1599 29.4 ± 7.4 29.7 10
L1 Spiophanes spp. (c,d), Amphiura filiformis (c,d), Mysella bidentata (d), Magelona spp. (c,d), Phoronida (c), Pholoe baltica (c)
1441 ± 669 21.2 ± 3.6 41.4 30
L2 Spiophanes spp. (c,d), Phoronida (d), Magelona spp. (c,d), Bathyporeia spp. (c,d), Spisula spp. (d), Tellina spp. (c,d)
2606 ± 2431 17.7 ± 5.7 41.0 30
M1 Myriochele spp. (d), Spiophanes spp. (c,d), A. filiformis (c,d), Scoloplos armiger (c), Paramphinome jeffreysii (c)
1130 ± 687 22.7 ± 5.7 44.5 20
M2 Myriochele spp. (c,d), P. jeffreysii (c,d), Spiophanes spp. (c,d), Goniada spp. (c)
1387 ± 846 32.2 ± 5.1 44.5 27
N A. filiformis (d), Myriochele spp. (d), Corbula gibba (d), Abra alba (d), Harpinia antennaria (c), Nephtys hombergii (c), Notomastus spp. (c)
1807 ± 1405 20.6 ± 4.9 40.4 15
35
Table 4: Differences between 1986 and 2000 data revealed with ANOSIM for the MDS-plots shown in Figure 6. Comparison based on 1986 clusters (Figure 4). Cluster R p
A 0.511 0.001
B 0.426 0.016
C 0.648 0.002
D1 0.177 0.001
D2 0.181 0.001
E1 0.837 0.002
E2 0.588 0.008
E3 0.372 0.001
E4 0.377 0.001
F1 0.202 0.042
F2 0.131 0.001
G 0.404 0.032
36
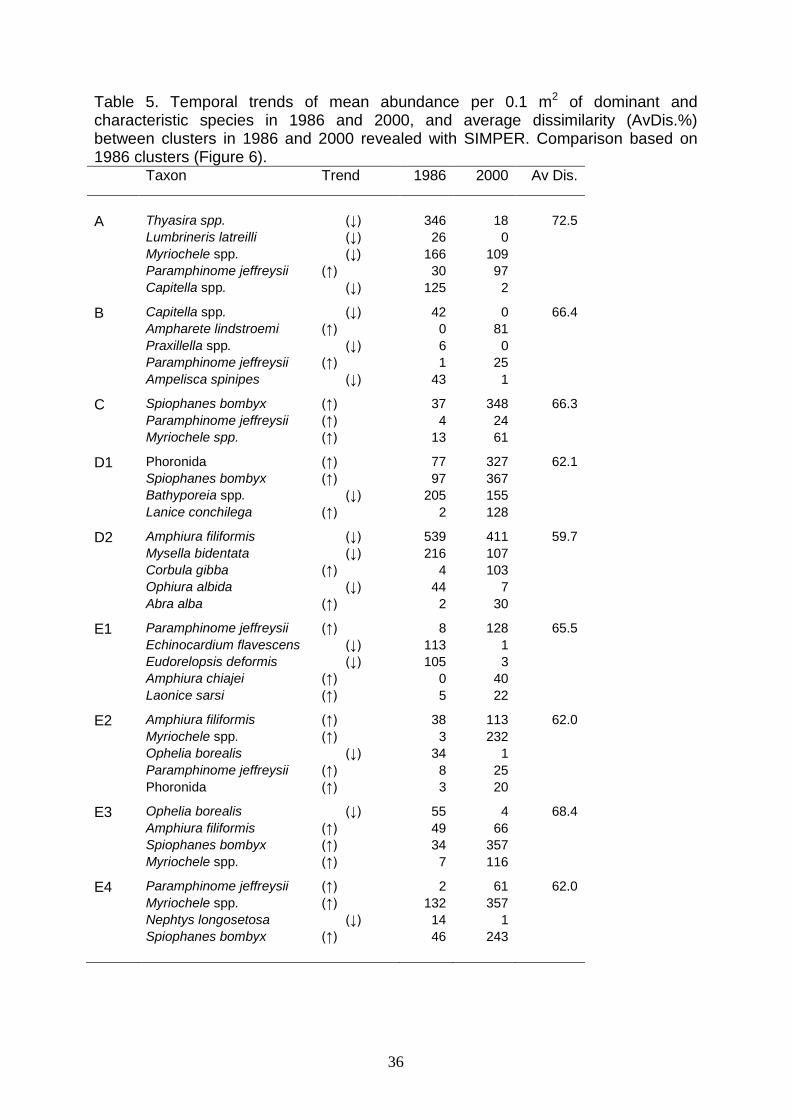
Table 5. Temporal trends of mean abundance per 0.1 m2 of dominant and characteristic species in 1986 and 2000, and average dissimilarity (AvDis.%) between clusters in 1986 and 2000 revealed with SIMPER. Comparison based on 1986 clusters (Figure 6). Taxon Trend 1986 2000 Av Dis.
A Thyasira spp. (↓) 346 18 72.5 Lumbrineris latreilli (↓) 26 0 Myriochele spp. (↓) 166 109 Paramphinome jeffreysii (↑) 30 97 Capitella spp. (↓) 125 2 B Capitella spp. (↓) 42 0 66.4 Ampharete lindstroemi (↑) 0 81 Praxillella spp. (↓) 6 0 Paramphinome jeffreysii (↑) 1 25 Ampelisca spinipes (↓) 43 1 C Spiophanes bombyx (↑) 37 348 66.3 Paramphinome jeffreysii (↑) 4 24 Myriochele spp. (↑) 13 61 D1 Phoronida (↑) 77 327 62.1 Spiophanes bombyx (↑) 97 367 Bathyporeia spp. (↓) 205 155 Lanice conchilega (↑) 2 128 D2 Amphiura filiformis (↓) 539 411 59.7 Mysella bidentata (↓) 216 107 Corbula gibba (↑) 4 103 Ophiura albida (↓) 44 7 Abra alba (↑) 2 30 E1 Paramphinome jeffreysii (↑) 8 128 65.5 Echinocardium flavescens (↓) 113 1 Eudorelopsis deformis (↓) 105 3 Amphiura chiajei (↑) 0 40 Laonice sarsi (↑) 5 22 E2 Amphiura filiformis (↑) 38 113 62.0 Myriochele spp. (↑) 3 232 Ophelia borealis (↓) 34 1 Paramphinome jeffreysii (↑) 8 25 Phoronida (↑) 3 20 E3 Ophelia borealis (↓) 55 4 68.4 Amphiura filiformis (↑) 49 66 Spiophanes bombyx (↑) 34 357 Myriochele spp. (↑) 7 116 E4 Paramphinome jeffreysii (↑) 2 61 62.0 Myriochele spp. (↑) 132 357 Nephtys longosetosa (↓) 14 1 Spiophanes bombyx (↑) 46 243
37
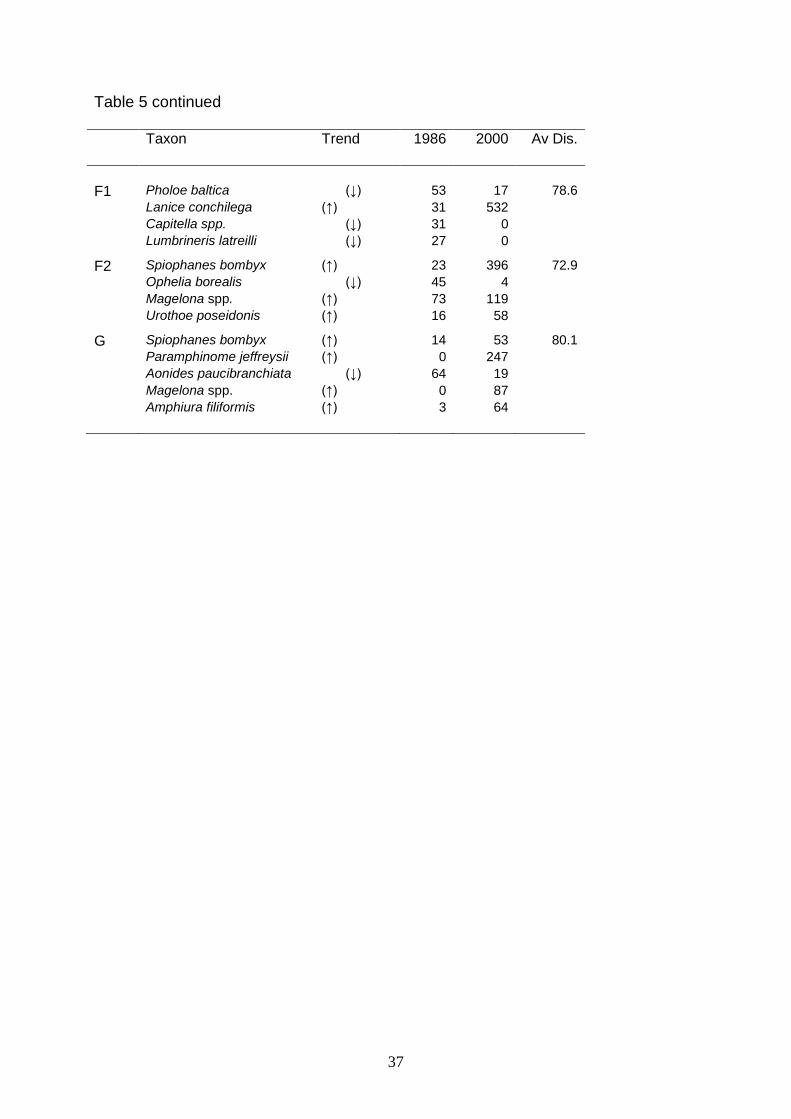
Table 5 continued Taxon Trend 1986 2000 Av Dis.
F1 Pholoe baltica (↓) 53 17 78.6 Lanice conchilega (↑) 31 532 Capitella spp. (↓) 31 0 Lumbrineris latreilli (↓) 27 0 F2 Spiophanes bombyx (↑) 23 396 72.9 Ophelia borealis (↓) 45 4 Magelona spp. (↑) 73 119 Urothoe poseidonis (↑) 16 58 G Spiophanes bombyx (↑) 14 53 80.1 Paramphinome jeffreysii (↑) 0 247 Aonides paucibranchiata (↓) 64 19 Magelona spp. (↑) 0 87 Amphiura filiformis (↑) 3 64
38
Figures
Figure 1: Location of sampling stations in the North Sea.
Figure 2: Species distribution maps with mean total abundance (m-2) classes
superimposed given as the sum for both years (19986 and 2000), where black
represents presence in 2000 and white represents presence in 1986. Where a
species was present at a station in both years, the pies are proportionally divided
accordingly. Species absences in both years are displayed as a cross.
Figure 3: Differences in a) mean abundance per m2 and b) mean ES(100) between
1986 and 2000. Green dots indicate an increase and red dots a decrease in 2000
compared to 1986.
Figure 4: Spatial distribution of macrofauna communities in 1986 (left) and 2000
(right) based on fourth-root transformed abundance data. Symbols denoting
individual communities are not corresponding between 1986 and 2000.
Figure 5: Differences in the cluster classification between 1986 and 2000 based on
combined data sets (1986 and 2000) with fourth-root transformed abundance data.
Small-sized circles represent stations which were classified identically in 1986 and
2000. The largest circles represent stations classified in different main clusters.
39
Figure 6: MDS-plots revealing similarities between communities of single clusters for
4th root transformed abundance data of 1986 () and 2000 (), based on 1986
cluster separation.
Figure 7: Triplots of the CCA ordination for macrofauna communities and
environmental parameters in 1986 and 2000. The vector lines represent the
relationship of environmental variables to the ordination axes and their length is
proportional to their relative significance. (Wave = peak wave stress; AvWave =
average wave stress; TempS = summer bottom temperature; TempW = winter
bottom temperature; SalS = summer bottom salinity; SalW = winter bottom salinity;
PrimPro = primary production; TidalStr = tidal stress; Median = median grain size)