Embed Size (px)
Citation preview

Chapter 22 Public Services
Chapter 22 1
Public Services 2
22.1 Affected Environment 3
This section describes the affected environment related to public 4 services for the dam and reservoir modifications proposed under SLWRI 5 action alternatives. The public services addressed are fire protection, 6 emergency services, law enforcement, and schools. Utilities, sewer 7 services, and water supply are analyzed in Chapter 21, “Utilities and 8 Service Systems,” of this DEIS. 9
Because of the potential influence of the proposed modification of 10 Shasta Dam and water deliveries over a large geographic area, the 11 SLWRI includes both a primary study area and an extended study area. 12 The primary study area has been further divided into the Shasta Lake 13 and vicinity portion and the upper Sacramento River (Shasta Dam to 14 Red Bluff) portion. The extended study area has been further divided 15 into the lower Sacramento River and Delta portion, and the CVP/SWP 16 service areas portion. 17
The public services setting for Shasta Lake and vicinity consists of the 18 portion of Shasta County above Shasta Dam. Public services needs in 19 this region are influenced by rugged, mountainous terrain, rural lakeside 20 communities, and Shasta Lake. The public services setting for the upper 21 Sacramento River portion of the primary study area consists of Shasta 22 County below Shasta Dam and Tehama County. Public services needs in 23 this area are influenced by topography and population densities. Four 24 incorporated cities—the Cities of Shasta Lake, Redding, Anderson, and 25 Red Bluff—create an urban setting in the otherwise rural upper 26 Sacramento Valley, which is characterized by rolling hills with 27 mountains to the north, east, and west. 28
The public services setting for the extended study area consists of 24 29 counties downstream from Red Bluff and encompasses all areas served 30 by the CVP and the SWP. 31
Table 22-1 lists the public service providers considered in this DEIS. 32
33
22-1 Draft – June 2013

Shasta Lake Water Resources Investigation Environmental Impact Statement
Table 22-1. Key Public Service Providers 1 Fire Protection Services
U.S. Forest Service
California Department of Forestry and Fire Protection
Shasta County Fire Department
Tehama County Fire Department
Redding Fire Department
Shasta Lake Fire Protection District
Anderson Fire Protection District
Red Bluff Fire Department
Corning Volunteer Fire Department
Emergency Services California Highway Patrol
California Office of Emergency Services
Shasta County Sheriff’s Office
Tehama County Sheriff’s Department
Shasta Area Safety Communications Agency
Shasta Regional Medical Center
Mercy Medical Center Redding
Shasta Community Health Center
St. Elizabeth Community Hospital
Law Enforcement U.S. Forest Service
U.S. Bureau of Land Management
California Highway Patrol
California Department of Fish and Wildlife
Shasta County Sheriff’s Office
Tehama County Sheriff’s Department
Red Bluff Police Department
Corning Police Department
Schools Gateway Unified School District
2
22.1.1 Fire Protection Services 3 Fire protection services consist of fire suppression, emergency 4 dispatching, specialized training, fire prevention, fire safety education, 5 and emergency medical response. Chapter 9 (Hazards and Hazardous 6 Materials and Waste) describes the fire risk and provides historic fire 7 data for the primary and extended study areas. 8
22-2 Draft – June 2013

Chapter 22 Public Services
Shasta Lake and Vicinity 1 The Shasta County Fire Department (SCFD) and the California 2 Department of Forestry and Fire Protection (Cal Fire) respond to 3 nonwildland fires in the Shasta Lake and vicinity portion of the primary 4 study area. Nonwildland fires consist of structural, chemical, petroleum, 5 electrical, vehicle, and other fires that involve human-made materials. 6 Cal Fire and USFS are responsible primarily for wildland fires, which 7 consist of fires in vegetated areas such as forests, chaparral, and 8 grassland. 9
Cal Fire and USFS generally respond according to established 10 jurisdictional boundaries. Under an agreement with the U.S. Department 11 of the Interior, Bureau of Land Management (BLM), Cal Fire provides 12 fire protection resources for lands managed by BLM throughout the 13 primary study area. Additionally, a fire protection agreement between 14 Cal Fire and USFS provides for the sharing of fire protection resources 15 to augment the capabilities of each agency (USFS 1995). In practice, 16 SCFD, Cal Fire, and USFS provide mutual assistance when needed. 17
The National Interagency Fire Center, located in Boise, Idaho, assists 18 with wildland fire suppression nationwide. The center represents a 19 collaboration among seven Federal agencies: the Bureau of Indian 20 Affairs, BLM, USFS, USFWS, the National Park Service, the National 21 Weather Service, and the Office of Aircraft Services. These agencies 22 work together to coordinate and support wildland fire and disaster 23 operations. Cal Fire and the California Emergency Management Agency 24 (Cal EMA) (formerly Governor’s Office of Emergency Services (OES)) 25 work closely with these agencies to manage wildland fire operations. 26
Upper Sacramento River (Shasta Dam to Red Bluff) 27 Fire protection services in the upper Sacramento River portion of the 28 primary study area are similar to those in the Shasta Lake and vicinity 29 portion. SCFD and the Tehama County Fire Department (TCFD) are 30 responsible primarily for nonwildland fires, and Cal Fire and USFS 31 respond primarily to wildland fires. 32
In Shasta County, the Redding Fire Department, SCFD, and Cal Fire 33 have mutual aid agreements to ensure adequate fire protection services 34 and to share resources. Under these agreements, the agencies respond to 35 emergencies in Shasta County that are in adjacent jurisdictions. 36
Fire departments serving the unincorporated areas of Shasta County 37 include 1 SCFD station that is housed in Redding, 12 community fire 38 districts, and 19 volunteer fire companies. Cal Fire operates several fire 39 stations during the off-season winter months, through an agreement with 40 BLM and local fire departments. The community fire districts operate 41
22-3 Draft – June 2013

Shasta Lake Water Resources Investigation Environmental Impact Statement
autonomously; the remaining fire departments, fire stations, and the 1 Shasta County Fire District fall under the jurisdiction of SCFD. 2
The Cities of Shasta Lake, Redding, and Anderson are incorporated 3 cities in Shasta County. Fire protection in Redding is provided by the 4 Redding Fire Department, which has 8 fully equipped stations and 72 5 full-time employees. The City of Shasta Lake provides fire protection, 6 supported by 3 fire stations with 27 employees. The Anderson Fire 7 Protection District provides service to Anderson and operates 2 fire 8 stations with 15 employees. 9
Shasta and Tehama counties share fire protection resources along their 10 shared county line, through a mutual aid agreement. Like SCFD, TCFD 11 has mutual aid agreements with local fire protection agencies that 12 operate in the county. One difference between Shasta and Tehama 13 counties is the level of integration with Cal Fire: TCFD is fully 14 integrated with Cal Fire, which administers fire protection services in all 15 unincorporated areas of the county except for the areas covered by the 16 Gerber and Capay fire protection districts. 17
TCFD provides fire protection services for the residents of Tehama 18 County through a network of 16 fire stations and 15 volunteer fire 19 companies. Five of the stations, Los Molinos, Corning, Bowman, El 20 Camino, and Antelope, are staffed 24 hours a day, year round. The 21 distribution of stations places most residents of Tehama County within 22 5 road miles of a responding fire station. 23
Red Bluff and Corning are incorporated cities in Tehama County; both 24 cities provide fire protection services for their residents. Fire protection 25 in Red Bluff is provided by the Red Bluff Fire Department. The Corning 26 Volunteer Fire Department, which employs full-time staff assisted by 27 volunteers, provides fire protection for the incorporated area of Corning. 28
Other fire protection services in Tehama County include the Gerber Fire 29 Protection District, Lassen Volcanic National Park, Capay Fire 30 Protection District, and Cottonwood Fire Protection District. 31
Lower Sacramento River and Delta and CVP/SWP Service Areas 32 Fire protection services in the extended study area are similar to those 33 discussed for the primary study area. However, urban population 34 densities are higher in parts of the extended study area, which influences 35 the types and extent of the fire protection services that are provided. 36 Cities and counties in the extended study area provide fire protection 37 services primarily for nonwildland fires, and Cal Fire and USFS provide 38 fire protection services primarily for wildland fires. 39
22-4 Draft – June 2013

Chapter 22 Public Services
22.1.2 Emergency Services 1 Emergency services consist of emergency preparation, response, and 2 recovery efforts. Emergencies range from calls for medical assistance to 3 individuals, to large-scale disasters, such as evacuations resulting from 4 wildland fires and floods. 5
Shasta Lake and Vicinity 6 The Shasta County Sheriff’s Office (SCSO) is responsible for 7 coordinating emergency services on Shasta Lake and in the 8 unincorporated areas of Shasta County upstream from Shasta Dam. 9 Large-scale emergency services are handled by SCSO, in cooperation 10 with the State emergency response network run by Cal EMA. As of 11 1996, OES (now Cal EMA) had designated emergency service 12 “Operational Areas” for all California counties, cities, and special 13 districts (e.g., school, water, and waste reclamation districts). Shasta 14 Lake and vicinity is located in the Region 3 Operational Area, which 15 consists of 12 Northern California counties. Emergency services 16 providers can be called on to assist with emergencies that occur in their 17 designated region and to assist the Central and South emergency 18 services regions. Cal Fire, USFS, BLM, the Federal Emergency 19 Management Agency, and the American Red Cross also provide 20 assistance in large-scale emergencies. 21
SCSO provides emergency services, including patrol boats and deputies, 22 at Shasta Lake from a substation at Bridge Bay Marina. Medical aid is 23 provided by Shasta County fire departments and private ambulance 24 companies, including land and air ambulance services, based in the 25 Redding area. 26
Upper Sacramento River (Shasta Dam to Red Bluff) 27 Emergency services in the upper Sacramento River area are similar to 28 those described in the previous section. SCSO is responsible for 29 coordinating emergency services in the Shasta County part of the upper 30 Sacramento River area, and the Tehama County Sheriff’s Department is 31 responsible for coordinating emergency services in the Tehama County 32 part. Both county agencies coordinate emergency services with Cal 33 EMA and serve as the emergency services headquarters during declared 34 public emergencies. 35
A number of emergency services agencies in Shasta County have 36 formed a joint-powers agency, called the Shasta Area Safety 37 Communications Agency, to consolidate emergency services related to 38 fire, medical services, and law enforcement. Current participants include 39 the Redding Fire Department, the Redding Police Department, and 40 SCSO. American Medical Response, Redding Medical Center, and 41 Mercy Medical Center in Redding participate in the Shasta Area Safety 42 Communications Agency under a contractual agreement for ambulance 43
22-5 Draft – June 2013

Shasta Lake Water Resources Investigation Environmental Impact Statement
services. Emergency medical response is also provided by St. Elizabeth 1 Community Hospital in Red Bluff. 2
The Tehama County Sheriff’s Department is responsible for emergency 3 services coordination in Tehama County. In addition, TCFD responds to 4 some medical emergencies in Tehama County. 5
The California Highway Patrol (CHP), Northern Division, provides 6 ground and air support for emergencies along the Interstate 5 (I-5) 7 corridor and State highways throughout the primary study area. CHP 8 maintains two A-star helicopters and two Cessna airplanes that are used 9 to assist other agencies with search and rescue, and fire response. In 10 addition, CHP assists with traffic control during emergencies. 11
Emergency services in the upper Sacramento River area are also 12 supplemented by Cal Fire, USFS, the Federal Emergency Management 13 Agency, and the American Red Cross. 14
Several hospitals and other facilities in Shasta and Tehama County 15 provide emergency and urgent care services. Shasta Regional Medical 16 Center, Mercy Medical Center Redding, and Shasta Community Health 17 Center are located in Redding and serve the Shasta Lake and Redding 18 areas. St. Elizabeth Community Hospital is located in Red Bluff and 19 serves Tehama County. 20
Lower Sacramento River and Delta and CVP/SWP Service Areas 21 Emergency services in the extended study area are similar to those 22 discussed for the primary study area. Cities and counties in the extended 23 study area are primarily responsible for providing emergency services, 24 and they receive assistance from regional, State, and Federal agencies 25 for emergencies that require resources beyond the capability of the local 26 jurisdiction. 27
22.1.3 Law Enforcement 28 Law enforcement services consist of crime prevention, investigation, 29 and apprehension of lawbreakers and include duties to keep the peace 30 and protect life and property. Law enforcement agencies often enter into 31 cooperative aid agreements with neighboring or overlapping law 32 enforcement jurisdictions to consolidate resources and facilitate 33 communication. 34
Shasta Lake and Vicinity 35 Law enforcement services in the Shasta Lake and vicinity portion of the 36 primary study area are provided by SCSO, CHP, CDFW, BLM, and 37 USFS. In general, the nature of an offense or law enforcement duty 38 establishes jurisdiction. SCSO has primary responsibility for conflicts 39 between people and most violations of State law, CHP handles most 40
22-6 Draft – June 2013
Chapter 22 Public Services
traffic violations, CDFW enforces State fish and game laws, and 1 BLM/USFS handle violations of Federal law. 2
Agencies responsible for law enforcement on Shasta Lake and the 3 surrounding area carry out their duties from several locations. SCSO 4 operates a substation in the city of Shasta Lake with nine assigned 5 deputies and another substation in Lakehead with two resident deputies. 6 Because of the nature and volume of human activity around Shasta 7 Lake, SCSO also maintains a substation at Bridge Bay Marina, located 8 on the main dock above the store. SCSO’s boat dock is located on the 9 main dock near the substation. Services provided by SCSO include 10 search and rescue, safety patrol boats, boating safety education, 11 emergency services, and animal control. 12
USFS and BLM use Federal law enforcement officers with jurisdiction 13 on Federal lands. USFS and BLM do not assume the Sheriff’s 14 responsibilities; instead, they enforce the Federal codes that govern 15 public behavior on lands managed by USFS and BLM. The CDFW 16 Northern District enforcement unit is based in Redding and provides law 17 enforcement related to State fish and game laws in Shasta, Trinity, and 18 Tehama counties. 19
Traffic law enforcement along I-5, State routes, and State highways is 20 provided primarily by the Northern Division of CHP. CHP operates 21 several offices in the primary study area, including offices in Redding 22 and Red Bluff. 23
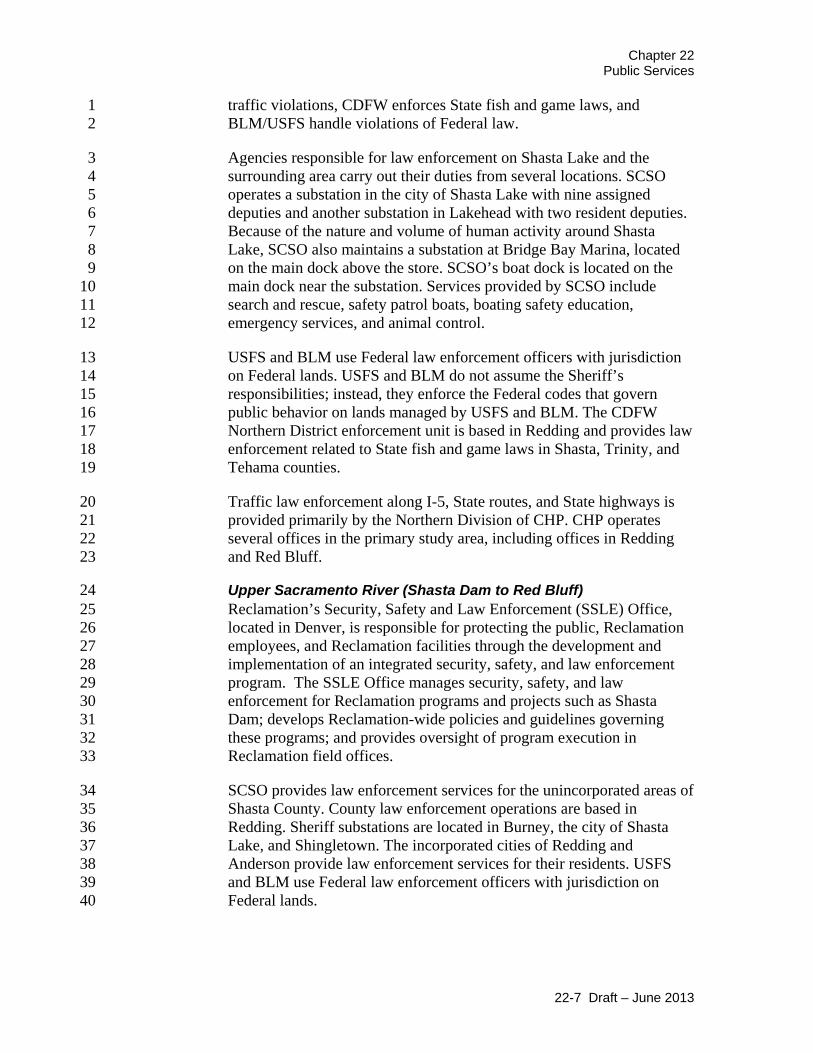
Upper Sacramento River (Shasta Dam to Red Bluff) 24 Reclamation’s Security, Safety and Law Enforcement (SSLE) Office, 25 located in Denver, is responsible for protecting the public, Reclamation 26 employees, and Reclamation facilities through the development and 27 implementation of an integrated security, safety, and law enforcement 28 program. The SSLE Office manages security, safety, and law 29 enforcement for Reclamation programs and projects such as Shasta 30 Dam; develops Reclamation-wide policies and guidelines governing 31 these programs; and provides oversight of program execution in 32 Reclamation field offices. 33
SCSO provides law enforcement services for the unincorporated areas of 34 Shasta County. County law enforcement operations are based in 35 Redding. Sheriff substations are located in Burney, the city of Shasta 36 Lake, and Shingletown. The incorporated cities of Redding and 37 Anderson provide law enforcement services for their residents. USFS 38 and BLM use Federal law enforcement officers with jurisdiction on 39 Federal lands. 40
22-7 Draft – June 2013

Shasta Lake Water Resources Investigation Environmental Impact Statement
The Tehama County Sheriff’s Department office is located in Red Bluff. 1 The sheriff is the chief law enforcement officer of Tehama County, with 2 jurisdiction throughout the unincorporated county, the incorporated 3 cities, and State-owned property. The incorporated cities of Red Bluff 4 and Corning provide law enforcement services for their residents. 5
Lower Sacramento River and Delta and CVP/SWP Service Areas 6 Law enforcement services in the extended study area are similar to those 7 discussed for the primary study area. Counties maintain sheriff’s 8 departments that have jurisdiction within the county boundaries, and 9 incorporated cities maintain police departments that have jurisdiction 10 within the city limits. However, urban population densities are higher in 11 parts of the extended study area, which influences the types and extent 12 of law enforcement services provided. USFS and BLM use Federal law 13 enforcement officers with jurisdiction on Federal lands. 14
22.1.4 Schools 15 School districts are autonomous entities responsible for providing 16 educational services for elementary, middle school, and high school 17 students. Districts elect their own governing boards and appoint their 18 own superintendents. County offices of education assist the school 19 districts with administrative and curricular support. 20
Shasta Lake and Vicinity 21 No schools are located in the Shasta Lake and vicinity portion of the 22 primary study area. The Gateway Unified School District serves 23 residents in this area and previously operated Canyon Elementary in 24 Lakehead. This school, however, is currently closed. 25
Upper Sacramento River (Shasta Dam to Red Bluff) 26 School districts in the upper Sacramento River area serve students in 27 levels kindergarten through grade 12. Shasta County is served by 25 28 school districts, and Tehama County is served by 21 school districts. 29 The California Community College system provides continuing 30 education services at locations in Shasta County and Tehama County. 31 Simpson University, located in Redding, also provides college-level 32 educational services. 33
The Gateway Unified School District operates several schools in Shasta 34 County. Mountain Lakes High School (grades 10 through 12) and Shasta 35 Lake Alternative School (kindergarten through grade 12) are located at 36 the northeast corner of the intersection of Lake Boulevard and Shasta 37 Dam Boulevard. 38
Lower Sacramento River and Delta and CVP/SWP Service Areas 39 Educational services in the extended study area are similar to those 40 discussed for the primary study area. Cities and counties form school 41
22-8 Draft – June 2013

Chapter 22 Public Services
districts to provide educational services for children between 6 and 18 1 years of age. Numerous community colleges and 4-year colleges and 2 universities are also located in the extended study area. Urban 3 population densities are higher in parts of the extended study area, which 4 influences the variety of educational services provided. 5
22.2 Regulatory Framework 6
22.2.1 Federal 7
Shasta-Trinity National Forest Land and Resource Management 8 Plan 9 USFS personnel conduct their responsibilities for regulating the use of 10 and protecting national forest lands under Title 36 and sections of Titles 11 16, 18, and 21 of the Code of Federal Regulations. Public services 12 directives from the Code of Federal Regulations are integrated into the 13 Shasta-Trinity National Forest Land and Resource Management Plan 14 (LRMP), which includes the following topics: fire and fuels 15 management, facilities management, law enforcement, and land 16 management. 17
The LRMP identifies goals, standards, and guidelines related to public 18 services in Shasta-Trinity National Forest. The following goals, 19 standards, and guidelines related to public services in Shasta-Trinity 20 National Forest have been excerpted from the LRMP (USFS 1995): 21
Fire and Fuels Goals (LRMP, p. 4-4) 22 • Achieve a balance of fire suppression capability and fuels 23
management investments that are cost effective and able to meet 24 ecosystem objectives and protection responsibilities. 25
Fire and Fuels Standards and Guidelines (LRMP, p. 4-17) 26 • Wildland fires will receive an appropriate suppression response 27
that may range from confinement to control. Unless a different 28 suppression response is authorized in this plan, or subsequent 29 approved plans, all suppression responses will have an objective 30 of “control.” 31
• All wildland fires, on or threatening private land protected by 32 agreement with the State of California, will receive a “control” 33 suppression response. 34
• Fire prevention efforts will be designed to minimize human-35 caused wildfires commensurate with the resource values at risk. 36
22-9 Draft – June 2013

Shasta Lake Water Resources Investigation Environmental Impact Statement
Facilities Goals (LRMP, p. 4-4) 1 • Provide and maintain those administrative facilities that 2
effectively and safely serve the public and USFS workforce. 3
Facilities Standards and Guidelines (LRMP, p. 4-17) 4 • Manage, construct, and maintain buildings and administrative 5
sites to meet applicable codes and to provide the necessary 6 facilities to support resource management. 7
• Closure of roads and/or selected areas to assist in management 8 of Forest resources may be made by regulatory and/or physical 9 devices on the road for the following purpose[s]: safety, fire, 10 and general administrative purposes. 11
Law Enforcement Goals (LRMP, p. 4-5) 12 • Establish priority in law enforcement activities as follows: (a) 13
provide for employee and public safety, (b) protect resources 14 and property, (c) provide for the accomplishment of 15 management objectives, and (d) prevent violation of laws and 16 associated loss and damage. 17
Law Enforcement Standards and Guidelines (LRMP, p. 4-21) 18 • Protect the public interest by a thorough and aggressive 19
program of violation prevention, violation detection, 20 investigation and apprehension of violators, and prosecution. 21
U.S. Bureau of Land Management Resource Management Plan 22 BLM manages a number of public lands adjacent to the Sacramento 23 River corridor downstream from Shasta Dam. The study area falls under 24 two BLM districts (Northern California and Central California) and the 25 resource management plans of three BLM field offices: Redding, Ukiah, 26 and Mother Lode (BLM 2006a). The purpose of BLM’s resource 27 management plans is to provide overall direction for managing and 28 allocating public resources in each planning area. The Resource 29 Management Plan (RMP) for the Redding field office states that any fire 30 occurring on public lands would be suppressed. 31
22.2.2 State 32
Standardized Emergency Management Systems 33 The Standardized Emergency Management Systems law (Government 34 Code Section 8607) directs Cal EMA (formerly OES) to establish, 35 implement, and maintain a coordinated emergency response system. The 36 California Mutual Aid Agreement defines responsibilities and resource 37 sharing between agencies to ensure that adequate resources, facilities, 38 and other support are provided to jurisdictions when their own resources 39 are insufficient to cope with the needs of a given emergency. 40
22-10 Draft – June 2013

Chapter 22 Public Services
California Education Code 1 The California Education Code provides educational goals and 2 requirements for the educational providers in the state (Title 5 of the 3 California Code of Regulations). It governs school district formation and 4 operation, county board of education authorities and responsibilities, and 5 educational criteria for children between 6 and 18 years of age. 6
California Fire Plan 7 The California Fire Plan provides guidance for reducing the risk of 8 wildfire. The following are the basic principles of the fire plan: 9
• Community involvement 10
• Community risk assessment 11
• Development of solutions and implementation of projects 12
22.2.3 Regional and Local 13
Shasta County General Plan 14 The Shasta County General Plan (Shasta County 2004) identifies goals, 15 objectives, and policies related to public services in Shasta County. Fire 16 protection and law enforcement services are discussed in the section 17 titled “Fire Safety and Sheriff Protection.” Schools are discussed in the 18 section titled “Public Facilities.” 19
Tehama County General Plan Update 2009–2029 20 The Tehama County General Plan Update 2009–2029 (Tehama County 21 2009) identifies goals, objectives, and policies for public services in 22 Tehama County. The public services element of the general plan 23 addresses concerns associated with growth and development as they 24 relate to public services, including schools. The safety element addresses 25 potential dangers and damages associated with fire, floods, earthquakes, 26 landslides, and other hazards. 27
22.3 Environmental Consequences and Mitigation Measures 28
22.3.1 Methods and Assumptions 29 This section addresses potential impacts associated with implementation 30 of the project on the following public services: law enforcement, fire 31 protection, emergency services, and schools. The analysis is based on a 32 review of planning documents applicable to the project area, 33 consultation with various agencies, and field reconnaissance. 34
22.3.2 Criteria for Determining Significance of Effects 35 An environmental document prepared to comply with the NEPA must 36 consider the context and intensity of the environmental effects that 37
22-11 Draft – June 2013

Shasta Lake Water Resources Investigation Environmental Impact Statement
would be caused by, or result from, the proposed action. Under NEPA, 1 the significance of an effect is used solely to determine whether an EIS 2 must be prepared. An environmental document prepared to comply with 3 the CEQA must identify the potentially significant environmental effects 4 of a project. A “[s]ignificant effect on the environment” means a 5 substantial, or potentially substantial, adverse change in any of the 6 physical conditions within the area affected by the project” (State CEQA 7 Guidelines, Section 15382). CEQA also requires that the environmental 8 document propose feasible measures to avoid or substantially reduce 9 significant environmental effects (State CEQA Guidelines, Section 10 15126.4(a)). 11
The following significance criteria are based on guidance provided by 12 the State CEQA Guidelines and consider the context and intensity of the 13 environmental effects as required under NEPA. Impacts of an alternative 14 on public services would be significant if project implementation would 15 do any of the following: 16
• Interfere with emergency services 17
• Degrade the level of service of a public service 18
• Require relocating public service facilities 19
• Require substantial improvements to the facilities or level of 20 staffing of a public service to maintain its existing level of 21 service 22
22.3.3 Topics Eliminated from Further Consideration 23 No topics were eliminated from consideration. 24
22.3.4 Direct and Indirect Effects 25
No-Action Alternative 26 The impact discussion for the No-Action Alternative addresses Shasta 27 Lake and vicinity and the upper Sacramento River together because this 28 alternative would not affect land use in any of the primary study area 29 locations. It also addresses the lower Sacramento River and Delta and 30 the CVP/SWP service areas together because the distance from the 31 project area would result in similar impacts. 32
Shasta Lake and Vicinity, Upper Sacramento River (Shasta Dam to 33 Red Bluff), Lower Sacramento River and Delta, and CVP/SWP 34 Service Areas 35 Impact PS-1 (No-Action): Disruption of Public Services Under the No-36 Action Alternative, no new facilities would be constructed in the 37 primary or extended study areas, and no changes in Reclamation’s 38
22-12 Draft – June 2013

Chapter 22 Public Services
existing facilities or operations would occur that would directly or 1 indirectly result in the disruption of public services in the project area. 2 Therefore, no impact would occur. Mitigation is not required for the No-3 Action Alternative. 4
Impact PS-2 (No-Action): Degraded Level of Public Services Under the 5 No-Action Alternative, no new facilities or infrastructure would be 6 constructed in the primary or extended study areas and no changes in 7 Reclamation’s existing facilities or operations would occur that would 8 directly or indirectly result in degraded levels of public services in the 9 project area. Therefore, no impact would occur. Mitigation is not 10 required for the No-Action Alternative. 11
Impact PS-3 (No-Action): Relocation of Public Service Facilities 12 Under the No-Action Alternative, no new facilities would be constructed 13 in the primary or extended study areas and no changes in Reclamation’s 14 existing facilities or operations would occur that would directly or 15 indirectly result in the relocation of public service facilities in the project 16 area. Therefore, no impact would occur. Mitigation is not required for 17 the No-Action Alternative. 18
CP1 – 6.5-Foot Dam Raise, Anadromous Fish Survival and Water 19 Supply Reliability 20 The impact discussion for CP1 addresses Shasta Lake and vicinity and 21 upper Sacramento River together because impacts from construction 22 activities would affect both areas. It also addresses the lower 23 Sacramento River and Delta and the CVP/SWP service areas together 24 because their distance from the project area would result in similar 25 impacts. 26
Shasta Lake and Vicinity and Upper Sacramento River (Shasta 27 Dam to Red Bluff) 28 Impact PS-1 (CP1): Short-Term Disruption of Public Services Project 29 construction could result in short-term disruption of emergency services 30 response as well as short-term disruption to school bus services 31 throughout the Gateway Unified School District. Short-term traffic 32 delays and access restrictions would require traffic controls and 33 coordination with public services agencies. Although Reclamation 34 would implement measures to lessen short-term disruption of public 35 services, this impact would be potentially significant. 36
Construction activities associated with enlarging Shasta Dam and related 37 infrastructure (e.g., road relocations, bridge replacements) near the dam 38 and near relocation sites for utilities, roads, and structures could 39 temporarily disrupt transportation and circulation patterns in the vicinity, 40 which could affect emergency services response and school bus service. 41 Emergency preparedness, emergency communications, and emergency 42
22-13 Draft – June 2013

Shasta Lake Water Resources Investigation Environmental Impact Statement
supplies, including food and shelter for emergency crews and public 1 services staff, could also be affected by project implementation because 2 of temporary increases in the work force. 3
Direct impacts could include disruption of traffic flows and street 4 operations through temporary lane closures, detours, blockages, and 5 restrictions on curbside parking; these impacts could result in delays for 6 emergency services vehicles and school buses traveling through or 7 around construction zones. In addition, project construction could cause 8 short-term interruptions in power and telecommunications services, 9 which could affect emergency response capabilities in the primary study 10 area. 11
Construction activities that could disrupt emergency services and school 12 bus service in the primary study area include road and bridge 13 replacement, telecommunications facility replacement, power facility 14 replacement, vegetation clearing for utility relocation, structure removal, 15 marina relocation, and emergency services facility relocation. 16 Reclamation estimates that construction activities for CP1 would take 17 4.5 years. 18
Routes proposed for transporting construction materials to the dam 19 consist of I-5 and local roads, particularly Shasta Dam Boulevard and 20 Lake Boulevard. These routes are used primarily by Reclamation 21 personnel to access the Shasta Dam facilities, by visitors and tourists, 22 and by residents of the city of Shasta Lake. At this time, no detours or 23 lane closures are proposed for the portions of Shasta Dam Boulevard 24 and Lake Boulevard that serve the city of Shasta Lake. Road closures 25 would likely be required adjacent to the facilities in the immediate 26 vicinity of Shasta Dam and Reclamation’s Northern California Area 27 Office. 28
The Gateway Unified School District covers Shasta Lake and vicinity 29 and portions of the upper Sacramento River area. Project construction 30 could result in traffic delays and the need to reroute local traffic to 31 ensure public health and safety. School bus routes could be temporarily 32 affected by road closures and detours during project construction in 33 communities around Shasta Lake. 34
Several roads around Shasta Lake would be affected by infrastructure, 35 utility, and marina relocation activities. These activities could require 36 road closures, detours, or traffic restrictions. 37
Emergency supplies and resources that could be affected by project 38 implementation include food, shelter for emergency crews and local 39 residents, and public services staff and equipment. Project construction 40 activities are located within commuting distance of Redding, where 41
22-14 Draft – June 2013

Chapter 22 Public Services
ample food and shelter are available in emergencies. The Cal EMA 1 network could supplement local emergency services staffing and 2 equipment levels. However, Cal EMA may not be able to provide 3 assistance when wildfires in the state require Cal EMA resources. 4
Construction activities at Shasta Dam and various locations surrounding 5 Shasta Lake could affect emergency response capabilities throughout 6 Shasta County (i.e., in a portion of the upper Sacramento River area) 7 because the areas share emergency services resources and 8 responsibilities. 9
In summary, project construction could result in short-term disruption of 10 school bus services throughout the Gateway Unified School District. 11 Short-term traffic delays and access restrictions would require traffic 12 controls and coordination with public services agencies. Therefore, this 13 impact would be potentially significant. Mitigation for this impact is 14 proposed in Section 22.3.5. 15
Impact PS-2 (CP1): Degraded Level of Public Services Project 16 implementation could temporarily degrade local public resources. 17 Although Reclamation would provide affected public services providers 18 (e.g., law enforcement, fire protection, emergency services) with 19 sufficient funding and support to ensure that levels of public services 20 would not be substantially degraded by construction activities, this 21 impact would be potentially significant. 22
Project implementation could result in short-term degradation of levels 23 of public services, including law enforcement, fire protection, and 24 emergency services. This conclusion is based on the size of the project 25 and proposed locations for construction activity associated with 26 infrastructure alterations. The relocation of infrastructure combined with 27 possible consolidation of recreational facilities (e.g., USFS 28 administrative facilities, campgrounds, boat ramps, marinas) could result 29 in changing demands for public services. Project construction activities 30 proposed around Shasta Lake could require local, State, and Federal 31 agencies to change the locations of some public services, which could 32 affect the areas where the public services are currently located. 33
Project implementation could also result in degraded levels of public 34 services in the upper Sacramento River portion of the primary study area 35 because the Shasta Lake area and parts of the upper Sacramento River 36 area share public services. Project construction activities at Shasta Lake 37 could require the use of public services resources that could be needed 38 simultaneously for public services assistance in the upper Sacramento 39 River area. 40
22-15 Draft – June 2013

Shasta Lake Water Resources Investigation Environmental Impact Statement
Reclamation estimates that CP1 would take 4.5 years to complete. 1 Public services levels that are increased as a result of the project would 2 return to pre-project levels once construction activities were completed. 3 However, project implementation could temporarily degrade local public 4 resources. This impact would be potentially significant. Mitigation for 5 this impact is proposed in Section 22.3.5. 6
Impact PS-3 (CP1): Relocation of Public Services The project would 7 require relocation of some public service facilities in the Shasta Lake 8 and vicinity portion of the primary study area. No public services 9 facilities in the upper Sacramento River portion of the primary study 10 area would need to be relocated. This impact would be less than 11 significant. 12
The Whiskeytown-Shasta-Trinity National Recreation Area is managed 13 by USFS, which has several facilities throughout the reservoir area. Two 14 USFS facilities would be inundated and thus would require relocation or 15 replacement. The work station located in the Lakeshore area would be 16 inundated by raising Shasta Dam and would have to be relocated to an 17 area above the new full pool. The new facility would contain all of the 18 features that exist at the current facility. The inundated facility would be 19 demolished and hauled to waste. At Turntable Bay, another USFS 20 facility would be inundated by the raising of Shasta Dam. Additional 21 space at Turntable Bay would allow for the facility to be relocated on fill 22 in the current location. Also, the SCSO substation and dock at the 23 Bridge Bay Marina could need to be relocated within the marina 24 complex. Reclamation would construct the replacement facilities before 25 abandonment and demolition of the existing facilities, thereby ensuring 26 that levels of public services provided by these facilities would not be 27 adversely affected by the relocation process. This impact would be less 28 than significant. Mitigation for this impact is not needed, and thus not 29 proposed. 30
Lower Sacramento River and Delta and CVP/SWP Service Areas 31 Impact PS-4 (CP1): Short-Term Disruption of Public Services Project 32 implementation would not disrupt public services in the extended study 33 area because of the distance of the extended study area from project 34 elements that could affect public services. The northern end of the 35 extended study area would be more than 30 miles from the nearest 36 project construction activities. Emergency services providers with 37 mutual aid agreements that could be called on to assist with emergencies 38 resulting from project activities are located in the primary study area. 39 Project construction activities in the primary study area that could 40 disrupt public services would be too far removed from the extended 41 study area to disrupt emergency services or law enforcement serving 42 areas south of Red Bluff. Project implementation would not disrupt 43 school bus service in the extended study area because school districts 44
22-16 Draft – June 2013

Chapter 22 Public Services
located in the extended study area would not operate school bus routes 1 in or near project construction activities. Therefore, no impact would 2 occur. Mitigation for this impact is not needed, and thus not proposed. 3
Impact PS-5 (CP1): Degraded Levels of Public Services Construction 4 activities are not expected to affect public service levels in the extended 5 study area. Existing facilities, personnel, and equipment in the extended 6 study area could provide short-term assistance for project-related public 7 services needs without degrading public services levels in the extended 8 study area. This impact would be less than significant. 9
The northern end of the extended study area would be more than 30 10 miles from the nearest project construction activities. Public services 11 providers with mutual aid agreements that could be called on to assist 12 with law enforcement, fire suppression, or other emergencies resulting 13 from project activities are located in the primary study area. Project 14 construction activities around Shasta Lake are too far removed from the 15 extended study area to disrupt public services below Red Bluff. Public 16 services providers located in the extended study area could be called on 17 by Cal EMA to assist with large-scale emergencies in the primary study 18 area that resulted from project implementation. However, existing 19 facilities, personnel, and equipment in the extended study area would be 20 adequate to maintain current levels of service while providing assistance 21 to the primary study area. 22
Indirect impacts on public services in the extended study area could 23 result from traffic accidents associated with the transport of project 24 materials and workers. Some project materials and workers could 25 originate in the extended study area, requiring northbound travel to the 26 primary study area. At this time, Reclamation estimates that the project 27 would employ 350 workers. Project-related travel that would likely 28 occur on I-5, the railway, or via air transport is not anticipated to result 29 in accidents in the extended study area that would require significant 30 response from law enforcement, fire protection, or emergency services 31 providers; however, the fact that traffic accidents resulting from project-32 related travel could occur in the extended study area means that the 33 possibility of travel-related accidents would exist. Existing facilities, 34 personnel, and equipment in the extended study area are expected be 35 adequate to maintain current levels of service while providing assistance 36 for any such accidents. 37
Existing facilities, staff, and equipment in the extended study area would 38 be capable of providing short-term assistance for project-related public 39 services needs without degrading levels of public services in the 40 extended study area. Therefore, this impact would be less than 41 significant. Mitigation for this impact is not needed, and thus not 42 proposed. 43
22-17 Draft – June 2013
Shasta Lake Water Resources Investigation Environmental Impact Statement
Impact PS-6 (CP1): Relocation of Public Services Facilities Project 1 implementation would not result in the relocation of public services 2 facilities in the extended study area. Therefore, public services in the 3 extended study area would not be affected by relocation of public 4 services facilities. No impact would occur. Mitigation for this impact is 5 not needed, and thus not proposed. 6
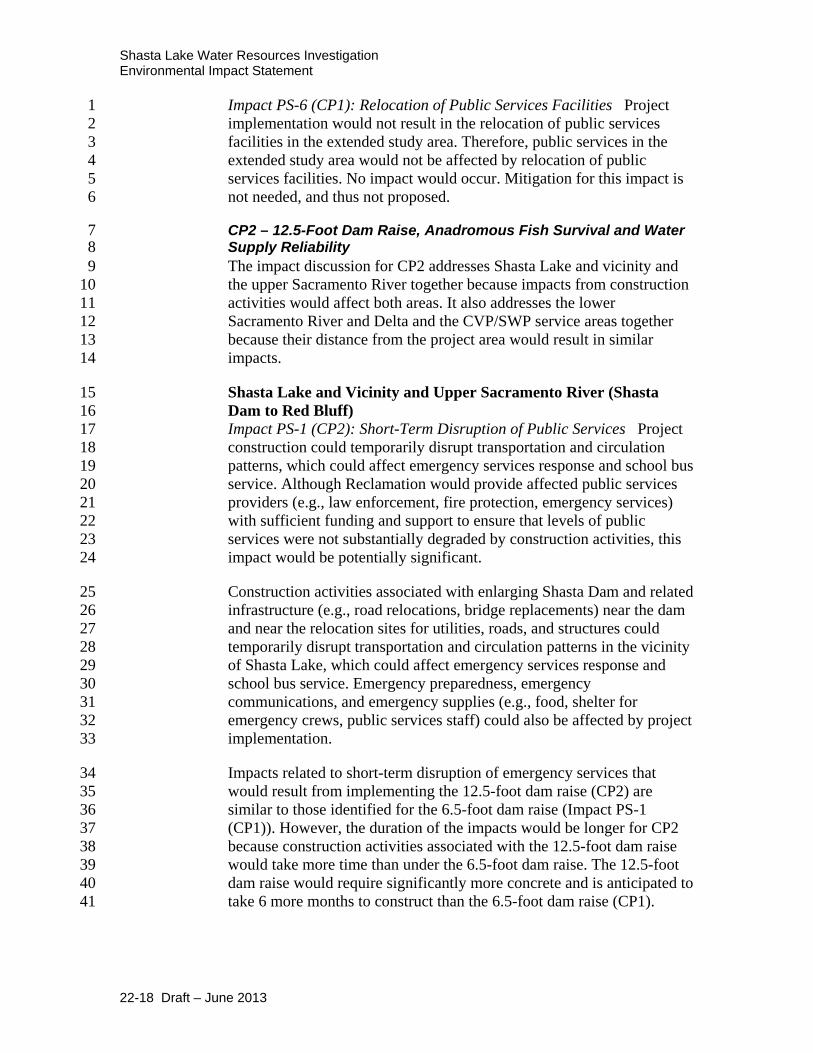
CP2 – 12.5-Foot Dam Raise, Anadromous Fish Survival and Water 7 Supply Reliability 8 The impact discussion for CP2 addresses Shasta Lake and vicinity and 9 the upper Sacramento River together because impacts from construction 10 activities would affect both areas. It also addresses the lower 11 Sacramento River and Delta and the CVP/SWP service areas together 12 because their distance from the project area would result in similar 13 impacts. 14
Shasta Lake and Vicinity and Upper Sacramento River (Shasta 15 Dam to Red Bluff) 16 Impact PS-1 (CP2): Short-Term Disruption of Public Services Project 17 construction could temporarily disrupt transportation and circulation 18 patterns, which could affect emergency services response and school bus 19 service. Although Reclamation would provide affected public services 20 providers (e.g., law enforcement, fire protection, emergency services) 21 with sufficient funding and support to ensure that levels of public 22 services were not substantially degraded by construction activities, this 23 impact would be potentially significant. 24
Construction activities associated with enlarging Shasta Dam and related 25 infrastructure (e.g., road relocations, bridge replacements) near the dam 26 and near the relocation sites for utilities, roads, and structures could 27 temporarily disrupt transportation and circulation patterns in the vicinity 28 of Shasta Lake, which could affect emergency services response and 29 school bus service. Emergency preparedness, emergency 30 communications, and emergency supplies (e.g., food, shelter for 31 emergency crews, public services staff) could also be affected by project 32 implementation. 33
Impacts related to short-term disruption of emergency services that 34 would result from implementing the 12.5-foot dam raise (CP2) are 35 similar to those identified for the 6.5-foot dam raise (Impact PS-1 36 (CP1)). However, the duration of the impacts would be longer for CP2 37 because construction activities associated with the 12.5-foot dam raise 38 would take more time than under the 6.5-foot dam raise. The 12.5-foot 39 dam raise would require significantly more concrete and is anticipated to 40 take 6 more months to construct than the 6.5-foot dam raise (CP1). 41
22-18 Draft – June 2013

Chapter 22 Public Services
The increased amount of infrastructure demolition and relocation 1 activity associated with CP2 would also require more time than under 2 CP1. More structures would need to be demolished and relocated, and 3 additional power and telecommunication lines would need to be 4 relocated. Additional septic systems and wells would also require 5 demolition and relocation, and 20 additional road segments would need 6 to be realigned for CP2. The increased construction activity in the Shasta 7 Lake and vicinity portion of the primary study area under CP2 would 8 extend the duration of potential disruption to emergency services and 9 school bus service in that area. This impact would be potentially 10 significant. Mitigation for this impact is proposed in Section 22.3.5. 11
Impact PS-2 (CP2): Degraded Levels of Public Services Project 12 implementation could cause short-term degradation of levels of public 13 services, including law enforcement, fire protection, and emergency 14 services. Although Reclamation would provide affected public services 15 providers (e.g., law enforcement, fire protection, emergency services) 16 with sufficient funding and support to ensure that levels of public 17 services would not be substantially degraded, this impact would be 18 potentially significant. 19
Project implementation could result in short-term degradation of levels 20 of public services, including law enforcement, fire protection, and 21 emergency services. This conclusion is based on the size of the project 22 and proposed locations for construction activity associated with 23 infrastructure alterations. The relocation of infrastructure combined with 24 possible consolidation of recreational facilities (e.g., campgrounds, boat 25 ramps, marinas) could result in changing demands for public services. 26 Project construction activities proposed around Shasta Lake could 27 require local, State, and Federal agencies to change the locations of 28 some public services, which could affect the areas where the resources 29 are currently located. 30
This impact would be similar to Impact PS-2 (CP1). However, the 31 impacts would last longer for CP2 than CP1 because more time would 32 be needed to complete project construction under the 12.5-foot dam 33 raise. Reclamation estimates that CP2 would take 5 years to complete. 34 Project implementation could temporarily degrade local public services. 35 This impact would be potentially significant. Mitigation for this impact 36 is proposed in Section 22.3.5. 37
Impact PS-3 (CP2): Relocation of Public Services Facilities This 38 impact would be similar to Impact PS-3 (CP1). Facility relocation would 39 not degrade levels of public services when the public service agencies 40 relocated to their new facilities. This impact would be less than 41 significant. Mitigation for this impact is not needed, and thus not 42 proposed. 43
22-19 Draft – June 2013

Shasta Lake Water Resources Investigation Environmental Impact Statement
Lower Sacramento River and Delta and CVP/SWP Service Areas 1 Impact PS-4 (CP2): Short-Term Disruption of Public Services This 2 impact would be similar to Impact PS-4 (CP1). Project implementation 3 would not disrupt public services in the extended study area because of 4 the distance of the extended study area from project elements that could 5 affect public services. No impact would occur. Mitigation for this impact 6 is not needed, and thus not proposed. 7
Impact PS-5 (CP2): Degraded Levels of Public Services This impact 8 would be similar to Impact PS-5 (CP1). Project construction activities 9 are not expected to affect public services levels in the extended study 10 area. Existing facilities, staff, and equipment in the extended study area 11 would be capable of providing short-term assistance for project-related 12 public services needs without degrading levels of public services in the 13 extended study area. This impact would be less than significant. 14 Mitigation for this impact is not needed, and thus not proposed. 15
Impact PS-6 (CP2): Relocation of Public Services Facilities This 16 impact would be identical to Impact PS-6 (CP1). Project implementation 17 would not result in the relocation of public service facilities in the 18 extended study area. No impact would occur. Mitigation for this impact 19 is not needed, and thus not proposed. 20
CP3 – 18.5-Foot Dam Raise, Agricultural Water Supply Reliability 21 and Anadromous Fish Survival 22 The impact discussion for CP3 addresses Shasta Lake and vicinity and 23 the upper Sacramento River together because impacts from construction 24 activities would affect both areas. It also addresses the lower 25 Sacramento River and Delta and the CVP/SWP service areas together 26 because their distance from the project area would result in similar 27 impacts. 28
Shasta Lake and Vicinity and Upper Sacramento River (Shasta 29 Dam to Red Bluff) 30 Impact PS-1 (CP3): Short-Term Disruption of Public Services Project 31 construction could temporarily disrupt transportation and circulation 32 patterns, which could affect emergency services response and school bus 33 service. Although Reclamation would provide affected public services 34 providers (e.g., law enforcement, fire protection, emergency services) 35 with sufficient funding and support to ensure that levels of public 36 services were not substantially degraded by construction activities, this 37 impact would be potentially significant. 38
Construction activities associated with enlarging Shasta Dam and the 39 related infrastructure (e.g., road relocations, bridge replacements) near 40 the dam and near the relocation sites for utilities, roads, and structures 41 could temporarily disrupt transportation and circulation patterns in the 42
22-20 Draft – June 2013

Chapter 22 Public Services
vicinity, which could affect emergency services response and school bus 1 service. Emergency preparedness, emergency communications, and 2 emergency supplies (food, shelter for emergency crews, public services 3 staff) could also be affected by project implementation. 4
This impact would be similar to Impact PS-1 (CP1). However, the 5 impact would last longer for CP3 because construction activities 6 associated with the 18.5-foot dam raise would take more time than for 7 the 6.5-foot dam raise. Reclamation estimates that the 18.5-foot dam 8 raise would take 5 years. The 18.5-foot dam raise would require 9 significantly more concrete and is anticipated to take 6 more months to 10 construct than the 6.5-foot dam raise (CP1). The increased amount of 11 infrastructure demolition and relocation activity associated with CP3 12 would also require more time than for CP1. Almost twice as many 13 structures would need to be demolished and relocated, and additional 14 power and telecommunication lines would require removal and 15 relocation. Additional septic systems and wells would be abandoned and 16 relocated, and 25 more road segments would be realigned. The increased 17 construction activity at Shasta Dam and in the surrounding area would 18 extend the time of potential disruption to emergency services. This 19 impact would be potentially significant. Mitigation for this impact is 20 proposed in Section 22.3.5. 21
Impact PS-2 (CP3): Degraded Levels of Public Services Project 22 implementation could cause short-term degradation of levels of public 23 services, including law enforcement, fire protection, and emergency 24 services. Although Reclamation would provide affected public services 25 providers (e.g., law enforcement, fire protection, emergency services) 26 with sufficient funding and support to ensure that levels of public 27 services were not substantially degraded, this impact would be 28 potentially significant. 29
Project implementation could result in short-term degradation of levels 30 of public services, including law enforcement, fire protection, and 31 emergency services. This conclusion is based on the size of the project 32 and proposed locations for construction activity associated with 33 infrastructure alterations. The relocation of infrastructure, combined 34 with possible consolidation of recreational facilities (e.g., campgrounds, 35 boat ramps, marinas), could result in changing demands for public 36 services. Project construction activities proposed around Shasta Lake 37 could require local, State, and Federal agencies to change the locations 38 of some public services, which could affect the areas where the public 39 services are currently located. 40
This impact would be similar to Impact PS-2 (CP1). However, the 41 impact would last longer for CP3 than for CP1 because more time would 42 be needed to complete project construction for the 18.5-foot dam raise. 43
22-21 Draft – June 2013

Shasta Lake Water Resources Investigation Environmental Impact Statement
This impact would be potentially significant. Mitigation for this impact 1 is proposed in Section 22.3.5. 2
Impact PS-3 (CP3): Relocation of Public Services Facilities This 3 impact would be similar to Impact PS-3 (CP1). Facilities relocation 4 would not degrade levels of public services while the public services 5 agencies are relocating to new facilities. This impact would be less than 6 significant. Mitigation for this impact is not needed, and thus not 7 proposed. 8
Lower Sacramento River and Delta and CVP/SWP Service Areas 9 Impact PS-4 (CP3): Short-Term Disruption of Public Services This 10 impact would be similar to Impact PS-4 (CP1). Project implementation 11 would not disrupt public services in the extended study area because of 12 the distance of the extended study area from project elements that could 13 affect public services. No impact would occur. Mitigation for this impact 14 is not needed, and thus not proposed. 15
Impact PS-5 (CP3): Degraded Levels of Public Services This impact 16 would be similar to Impact PS-5 (CP1). Project construction activities 17 are not expected to affect public services levels in the extended study 18 area. Existing facilities, staff, and equipment in the extended study area 19 would be capable of providing short-term assistance for project-related 20 public services needs without degrading levels of public services in the 21 extended study area. This impact would be less than significant. 22 Mitigation for this impact is not needed, and thus not proposed. 23
Impact PS-6 (CP3): Relocation of Public Services Facilities This 24 impact would be identical to Impact PS-6 (CP1). Project implementation 25 would not result in the relocation of public services facilities in extended 26 study area. No impact would occur. Mitigation for this impact is not 27 needed, and thus not proposed. 28
CP4 – 18.5-Foot Dam Raise, Anadromous Fish Focus with Water 29 Supply Reliability 30 The impact discussion for CP4 addresses Shasta Lake and vicinity and 31 the upper Sacramento River together because impacts from construction 32 activities would affect both areas. It also addresses the lower 33 Sacramento River and Delta and the CVP/SWP service areas together 34 because their distance from the project area would result in similar 35 impacts. 36
Shasta Lake and Vicinity and Upper Sacramento River (Shasta 37 Dam to Red Bluff) 38 Impact PS-1 (CP4): Short-Term Disruption of Public Services Project 39 construction could temporarily disrupt transportation and circulation 40 patterns, which could affect emergency services response and school bus 41
22-22 Draft – June 2013

Chapter 22 Public Services
service. Although Reclamation would provide affected public services 1 providers (e.g., law enforcement, fire protection, emergency services) 2 with sufficient funding and support to ensure that levels of public 3 services were not substantially degraded by construction activities, this 4 impact would be potentially significant. 5
This impact would be similar to Impact PS-1 (CP3). Construction 6 activities associated with enlarging Shasta Dam and related 7 infrastructure (e.g., road relocations, bridge replacements) near the dam 8 and near the relocation sites for utilities, roads, and structures could 9 temporarily disrupt transportation and circulation patterns in the vicinity 10 of Shasta Lake, which could affect emergency services response and 11 school bus service. Emergency preparedness, emergency 12 communications, and emergency supplies (e.g., food, shelter for 13 emergency crews, public services staff) could also be affected by project 14 implementation. In addition, gravel augmentation and the habitat 15 restoration activities along the upper Sacramento River would slightly, 16 but not substantially, increase the potential for short-term disruption of 17 public services in the primary study area. This impact would be 18 potentially significant. Mitigation for this impact is proposed in Section 19 22.3.5. 20
Impact PS-2 (CP4): Degraded Levels of Public Services Project 21 implementation could cause short-term degradation of levels of public 22 services, including law enforcement, fire protection, and emergency 23 services. Although Reclamation would provide affected public services 24 providers (e.g., law enforcement, fire protection, emergency services) 25 with sufficient funding and support to ensure that levels of public 26 services were not substantially degraded, this impact would be 27 potentially significant. 28
This impact would be similar to Impact PS-2 (CP3). Project 29 implementation could result in short-term degradation of levels of public 30 services, including law enforcement, fire protection, and emergency 31 services. This conclusion is based on the size of the project and 32 proposed locations for construction activity associated with 33 infrastructure alterations. The relocation of infrastructure, combined 34 with possible consolidation of recreational facilities (e.g., campgrounds, 35 boat ramps, marinas), could result in changing demands for public 36 services. Project construction proposed around Shasta Lake could 37 require local, State, and Federal agencies to change the location of some 38 public services, which could affect the areas where the public services 39 are currently located. In addition, gravel augmentation and the habitat 40 restoration activities along the upper Sacramento River would slightly, 41 but not substantially, increase the potential for degradation of public 42 services. This impact would be potentially significant. Mitigation for 43 this impact is proposed in Section 22.3.5. 44
22-23 Draft – June 2013

Shasta Lake Water Resources Investigation Environmental Impact Statement
Impact PS-3 (CP4): Relocation of Public Services Facilities This 1 impact would be similar to Impact PS-3 (CP1). Facilities relocation 2 would not degrade levels of public services while the public services 3 agencies are relocating to new facilities. This impact would be less than 4 significant. Mitigation for this impact is not needed, and thus not 5 proposed. 6
Lower Sacramento River and Delta and CVP/SWP Service Areas 7 Impact PS-4 (CP4): Short-Term Disruption of Public Services This 8 impact would be similar to Impact PS-4 (CP1). Project implementation 9 would not disrupt public services in the extended study area because of 10 the distance of the extended study area from project elements that could 11 affect public services. fore no impact would occur. Mitigation for this 12 impact is not needed, and thus not proposed. 13
Impact PS-5 (CP4): Degraded Levels of Public Services This impact 14 would be similar to Impact PS-5 (CP1). Project construction activities 15 are not expected to affect public services levels in the extended study 16 area. Existing facilities, staff, and equipment in the extended study area 17 would be capable of providing short-term assistance for project-related 18 public services needs without degrading levels of public services in the 19 extended study area. This impact would be less than significant. 20 Mitigation for this impact is not needed, and thus not proposed. 21
Impact PS-6 (CP4): Relocation of Public Services Facilities This 22 impact would be identical to Impact PS-6 (CP1). Project implementation 23 would not result in the relocation of public services facilities in the 24 extended study area. No impact would occur. Mitigation for this impact 25 is not needed, and thus not proposed. 26
CP5 – 18.5-Foot Dam Raise, Combination Plan 27 The impact discussion for CP5 addresses Shasta Lake and vicinity and 28 the upper Sacramento River together because impacts from construction 29 activities would affect both areas. It also addresses the lower 30 Sacramento River and Delta and the CVP/SWP service areas together 31 because their distance from the project area would result in similar 32 impacts. 33
Shasta Lake and Vicinity and Upper Sacramento River (Shasta 34 Dam to Red Bluff) 35 Impact PS-1 (CP5): Short-Term Disruption of Public Services Project 36 construction could temporarily disrupt transportation and circulation 37 patterns, which could affect emergency services response and school bus 38 service. Although Reclamation would provide affected public services 39 providers (e.g., law enforcement, fire protection, emergency services) 40 with sufficient funding and support to ensure that levels of public 41
22-24 Draft – June 2013

Chapter 22 Public Services
services were not substantially degraded by construction activities, this 1 impact would be potentially significant. 2
This impact would be similar to Impact PS-1 (CP3). Construction 3 activities associated with enlarging Shasta Dam and related 4 infrastructure (e.g., road relocations, bridge replacements) near the dam 5 and near relocation sites for utilities, roads, and structures could 6 temporarily disrupt transportation and circulation patterns in the vicinity, 7 which could affect emergency services response and school bus service. 8 Emergency preparedness, emergency communications, and emergency 9 supplies (e.g., food, shelter for emergency crews, public service staff) 10 could also be affected by project implementation. In addition, gravel 11 augmentation and the habitat restoration activities along the upper 12 Sacramento River would slightly, but not substantially, increase the 13 potential for short-term disruption of public services in the primary 14 study area. This impact would be potentially significant. Mitigation for 15 this impact is proposed in Section 22.3.5. 16
Impact PS-2 (CP5): Degraded Levels of Public Services Project 17 implementation could cause short-term degradation of levels of public 18 services, including law enforcement, fire protection, and emergency 19 services. Although Reclamation would provide affected public services 20 providers (e.g., law enforcement, fire protection, emergency services) 21 with sufficient funding and support to ensure that levels of public 22 services were not substantially degraded, this impact would be 23 potentially significant. 24
This impact would be similar to Impact PS-2 (CP3). Project 25 implementation could result in short-term degradation of levels of public 26 services, including impacts on law enforcement, fire protection, and 27 emergency services. This conclusion is based on the size of the project 28 and proposed locations for construction activity associated with 29 infrastructure alterations. Project construction activities proposed around 30 Shasta Lake could require local, State, and Federal agencies to change 31 the location of some public services, which could affect the areas where 32 the public services are currently located. In addition, gravel 33 augmentation and the habitat restoration activities along the upper 34 Sacramento River would slightly, but not substantially, increase the 35 potential for degradation of public services. This impact would be 36 potentially significant. Mitigation for this impact is proposed in Section 37 22.3.5. 38
Impact PS-3 (CP5): Relocation of Public Services Facilities This 39 impact is similar to Impact PS-3 (CP1). Facilities relocation would not 40 degrade levels of public service while the public service agencies are 41 relocating to new facilities. This impact would be less than significant. 42 Mitigation for this impact is not needed, and thus not proposed. 43
22-25 Draft – June 2013

Shasta Lake Water Resources Investigation Environmental Impact Statement
Lower Sacramento River and Delta and CVP/SWP Service Areas 1 Impact PS-4 (CP5): Short-Term Disruption of Public Services This 2 impact would be similar to Impact PS-4 (CP1). Project implementation 3 would not disrupt public services in the extended study area because of 4 the distance of the extended study area from project elements that could 5 affect public services. No impact would occur. Mitigation for this impact 6 is not needed, and thus not proposed. 7
Impact PS-5 (CP5): Degraded Levels of Public Services This impact 8 would be similar to Impact PS-5 (CP1). Project construction activities 9 are not expected to affect public services levels in the extended study 10 area. Existing facilities, staff, and equipment in the extended study area 11 would be capable of providing short-term assistance for project-related 12 public services needs without degrading levels of public services in the 13 extended study area. This impact would be less than significant. 14 Mitigation for this impact is not needed, and thus not proposed. 15
Impact PS-6 (CP5): Relocation of Public Services Facilities This 16 impact would be identical to Impact PS-6 (CP1). Project implementation 17 would not result in the relocation of public services facilities in the 18 extended study area. No impact would occur. Mitigation for this impact 19 is not needed, and thus not proposed. 20
22.3.5 Mitigation Measures 21 Table 22-2 presents a summary of mitigation measures for public 22 services. 23
Table 22-2. Summary of Mitigation Measures for Public Services 24
25 26
Impact No-Action Alternative CP1 CP2 CP3 CP4 CP5
Impact PS-1: Disruption of Public Services (Shasta Lake and Vicinity and Upper Sacramento River)
LOS before Mitigation NI PS PS PS PS PS
Mitigation Measure None required.
PS-1: Coordinate and Assist Public Services Agencies.
LOS after Mitigation NI LTS LTS LTS LTS LTS
Impact PS-2: Degraded Level of Public Services (Shasta Lake and Vicinity and Upper Sacramento River)
LOS before Mitigation NI PS PS PS PS PS
Mitigation Measure None required.
PS-2: Provide Support to Public Services Agencies.
LOS after Mitigation NI LTS LTS LTS LTS LTS
Impact PS-3: Relocation of Public Service Facilities (Shasta Lake and Vicinity and Upper Sacramento River)
LOS before Mitigation NI LTS LTS LTS LTS LTS
Mitigation Measure None required. None needed; thus, none proposed.
LOS after Mitigation NI LTS LTS LTS LTS LTS
22-26 Draft – June 2013

Chapter 22 Public Services
Table 22-2. Summary of Mitigation Measures for Public Services (contd.) 1
2
No-Action Alternative 3 No mitigation measures are required for the No-Action Alternative. 4
CP1 – 6.5-Foot Dam Raise, Anadromous Fish Survival and Water 5 Supply Reliability 6 No mitigation is required for Impacts PS-3 (CP1) through PS-6 (CP1). 7 Mitigation is provided below for impacts of CP1 related to short-term 8 disruption of public services (PS-1) and degraded levels of public 9 services in the primary study area (PS-2). 10
Mitigation Measure PS-1 (CP1): Coordinate and Assist Public 11 Services Agencies Reclamation will coordinate all proposed road 12 closures, detours, and traffic control measures with the Shasta County 13 Sheriff’s Office and Tehama County Sheriff’s Office, which are the 14 designated Cal EMA (formerly OES) headquarters for the primary study 15 area. 16
Reclamation will appoint a public liaison to communicate construction 17 schedules, road closures, and project activities to the public. The liaison 18 will organize and conduct public meetings for the purpose of 19 communicating project information. The liaison will meet with all 20 affected public services agencies to coordinate public meetings and 21 information exchanges. 22
Impact No-Action Alternative CP1 CP2 CP3 CP4 CP5
Impact PS-4: Short-Term Disruption of Public Services (Lower Sacramento River, Delta, CVP/SWP Service Areas)
LOS before Mitigation NI NI NI NI NI NI
Mitigation Measure None required. None needed; thus, none proposed.
LOS after Mitigation NI NI NI NI NI NI
Impact PS-5: Degraded Levels of Public Services (Lower Sacramento River, Delta, CVP/SWP Service Areas)
LOS before Mitigation NI LTS LTS LTS LTS LTS
Mitigation Measure None required. None needed; thus, none proposed.
LOS after Mitigation NI LTS LTS LTS LTS LTS
Impact PS-6: Relocation of Public Services Facilities (Lower Sacramento River, Delta, CVP/SWP Service Areas)
LOS before Mitigation NI NI NI NI NI NI
Mitigation Measure None required. None needed; thus, none proposed.
LOS after Mitigation NI NI NI NI NI NI Key: LOS = level of significance LTS = less than significant NI = no impact PS = potentially significant
22-27 Draft – June 2013

Shasta Lake Water Resources Investigation Environmental Impact Statement
Reclamation will obtain all necessary permits and/or authorizations from 1 public services agencies for matters requiring agency approval and/or 2 cooperation. 3
Reclamation will meet with public services agencies to determine traffic 4 controls for infrastructure, utility, and structure relocation. 5
Reclamation will develop and implement a monitoring plan to track the 6 effectiveness of this mitigation measure, and will make adjustments, if 7 necessary. 8
Traffic Control and Safety Assurance Plan Reclamation will implement 9 Mitigation Measure Trans-1 as described in Chapter 20, “Transportation 10 and Traffic,” to reduce adverse effects of road closures and detours or 11 partial road closures on access to local streets and adjacent uses. 12
Implementation of this mitigation measure would reduce Impact PS-1 13 (CP1) to a less-than-significant level. 14
Mitigation Measure PS-2 (CP1): Provide Support to Public Services 15 Agencies Reclamation will provide affected public services providers 16 (e.g., law enforcement, fire protection, emergency services) with 17 sufficient funding and support to ensure that levels of public services are 18 not substantially degraded by construction activities. Reclamation will 19 coordinate with affected providers to develop a mutual understanding of 20 the amount and schedule of financial and administrative support 21 required to reduce this impact to a less-than-significant level. 22
Reclamation will develop and implement a monitoring plan to track the 23 effectiveness of this mitigation measure, and will make adjustments, if 24 necessary. 25
Implementation of this mitigation measure would reduce Impact PS-2 26 (CP1) to a less-than-significant level. 27
CP2 – 12.5-Foot Dam Raise, Anadromous Fish Survival and Water 28 Supply Reliability 29 No mitigation is required for Impacts PS-3 (CP2) through PS-6 (CP2). 30 Mitigation is provided below for the impacts of CP2 related to short-31 term disruption of public services (PS-1) and degraded levels of public 32 services (PS-2) in the primary study area. 33
Mitigation Measure PS-1 (CP2): Coordinate and Assist Public 34 Services Agencies This mitigation measure is identical to Mitigation 35 Measure PS-1 (CP1). Implementation of this mitigation measure would 36 reduce Impact PS-1 (CP2) to a less-than-significant level. 37
22-28 Draft – June 2013

Chapter 22 Public Services
Mitigation Measure PS-2 (CP2): Provide Support to Public Services 1 Agencies This mitigation measure is identical to Mitigation Measure 2 PS-2 (CP1). Implementation of this mitigation measure would reduce 3 Impact PS-2 (CP2) to a less-than-significant level. 4
CP3 – 18.5-Foot Dam Raise, Anadromous Fish Survival and Water 5 Supply Reliability 6 No mitigation is required for Impacts PS-3 (CP3) through PS-6 (CP3). 7 Mitigation is provided below for the impacts of CP3 related to short-8 term disruption of public services (PS-1) and degraded levels of public 9 services (PS-2) in the primary study area. 10
Mitigation Measure PS-1 (CP3): Coordinate and Assist Public 11 Services Agencies This mitigation measure is identical to Mitigation 12 Measure PS-1 (CP1). Implementation of this mitigation measure would 13 reduce Impact PS-1 (CP3) to a less-than-significant level. 14
Mitigation Measure PS-2 (CP3): Provide Support to Public Services 15 Agencies This mitigation measure is identical to Mitigation Measure 16 PS-2 (CP1). Implementation of this mitigation measure would reduce 17 Impact PS-2 (CP3) to a less-than-significant level. 18
CP4-18.5 Foot Dam Raise, Anadromous Fish Focus with Water 19 Supply Reliability 20 No mitigation is required for Impacts PS-3 (CP4) through PS-6 (CP4). 21 Mitigation is provided below for the impacts of CP4 related to short-22 term disruption of public services (PS-1) and degraded levels of public 23 services (PS-2) in the primary study area. 24
Mitigation Measure PS-1 (CP4): Coordinate and Assist Public 25 Services Agencies This mitigation measure identical to Mitigation 26 Measure PS-1 (CP1). Implementation of this mitigation measure would 27 reduce Impact PS-1 (CP4) to a less-than-significant level. 28
Mitigation Measure PS-2 (CP4): Provide Support to Public Services 29 Agencies This mitigation measure is identical to Mitigation Measure 30 PS-2 (CP1). Implementation of this mitigation measure would reduce 31 Impact PS-2 (CP4) to a less-than-significant level. 32
CP5 – 18.5-Foot Dam Raise, Combination Plan 33 No mitigation is required for Impacts PS-3 (CP5) through PS-6 (CP5). 34 Mitigation is provided below for the impacts of CP5 related to short-35 term disruption of public services (PS-1) and degraded levels of public 36 services (PS-2) in the primary study area. 37
Mitigation Measure PS-1(CP5): Coordinate and Assist Public 38 Services Agencies This mitigation measure is identical to Mitigation 39
22-29 Draft – June 2013

Shasta Lake Water Resources Investigation Environmental Impact Statement
Measure PS-1 (CP1). Implementation of this mitigation measure would 1 reduce Impact PS-1 (CP5) to a less-than-significant level. 2
Mitigation Measure PS-2 (CP5): Provide Support to Public Services 3 Agencies This mitigation measure is identical to Mitigation Measure 4 PS-2 (CP1). Implementation of this mitigation measure would reduce 5 Impact PS-2 (CP5) to a less-than-significant level. 6
22.3.6 Cumulative Effects 7 Implementing the proposed SLWRI alternatives would not have a 8 significant cumulative effect on public services in the primary study 9 area. As described above, CP1– CP5 would result in short-term 10 disruption of public services, would degrade the levels of public services 11 provided, and would require the relocation of public services facilities in 12 the primary study area. These effects would be of greater magnitude and 13 duration with the larger dam raises. Thus, effects of CP2 would be 14 similar to but greater than those of CP1, and similar to but less than 15 those of CP3–CP5. Although Mitigation Measures PS-1 and PS-2 would 16 enhance the coordination of public services during project 17 implementation, the adverse effects of CP1–CP5 would not be 18 eliminated, particularly regarding short-term disruption of public 19 services. Only two of the present or reasonably foreseeable future 20 actions, Antlers Bridge Replacement and the Iron Mountain Restoration 21 Plan, are located in the immediate vicinity of Shasta Lake and would 22 have the potential to result in short-term disruption of public services, 23 would degrade the levels of public services provided, or would require 24 the relocation of public services facilities in the primary study area. The 25 Antlers Bridge replacement is currently under construction and is 26 expected to be completed in 2015, before any of the action alternatives 27 would begin. With respect to the Iron Mountain Mine Restoration Plan, 28 this activity would be unlikely to occur simultaneously with the action 29 alternatives. Therefore, construction activities related to implementation 30 of the proposed SLWRI alternatives would not contribute considerably 31 to significant cumulative impacts on public services. 32
The effects of CP1–CP5 on public services would diminish with 33 distance from project construction sites, and the alternatives would not 34 have cumulatively considerable impacts on public services downstream 35 from Red Bluff (i.e., in the extended study area). 36
37
22-30 Draft – June 2013

Chapter 23 Power and Energy
Chapter 23 1
Power and Energy 2
This chapter describes the environmental and regulatory settings of power and 3 energy, as well as environmental consequences and mitigation measures, as they 4 pertain to the SLWRI action alternatives. The discussion of power and energy 5 existing conditions and the potential impacts of the program alternatives on 6 power and energy encompass the Pit 7 Powerplant upstream from Shasta 7 Reservoir as well as the CVP/SWP water service areas and associated facilities. 8
23.1 Affected Environment 9
Shasta Lake is an integral part of the CVP, and the proposed changes in storage 10 and releases affect system operations throughout the CVP. This change in CVP 11 operations and the dedication of a portion of the storage in Shasta Lake to 12 operate for the SWP affect the operations of the entire SWP system. Locally, 13 the potential changes in operations could affect the upstream Pit 7 Powerplant. 14
The CVP is a multipurpose project with 20 storage facilities, 5 pumping plants, 15 11 hydroelectric powerplants, and 500 miles of major canals, as well as 16 conduits, tunnels, and related facilities. Because the CVP generates more power 17 than it uses, the excess power is marketed through the Western Power Authority 18 (Authority). 19
The SWP is a multipurpose project with 32 storage facilities. Major SWP 20 facilities include 17 pumping plants, 8 hydroelectric powerplants, and 660-plus 21 miles of aqueducts and pipelines. Because the SWP uses more energy than it 22 generates from its hydroelectric facilities, DWR has exchange agreements with 23 other utility companies and has developed other power resources. DWR sells 24 surplus power, when it is available, to minimize the net cost of pumping energy. 25
For a more in-depth description of the affected environment, see the Power and 26 Energy Technical Report. 27
23.1.1 Shasta Lake and Vicinity 28 The Shasta Division of the CVP contains Shasta Dam, Lake, and Powerplant, 29 and Keswick Dam, Reservoir, and Powerplant; it captures water from the 30 Sacramento River basin. Shasta Powerplant is located just below Shasta Dam as 31 part of the Shasta Division. Water from the dam is released through five 15-foot 32 penstocks leading to the 5 main generating units and 2 station service units with 33 a maximum generation capacity of 715 megawatts (MW). Shasta Powerplant is 34 a peaking plant and generally runs when demand for electricity is high. Its 35
23-1 Draft – June 2013

Shasta Lake Water Resources Investigation Environmental Impact Statement
power is dedicated first to meeting the requirements of CVP facilities. The 1 remaining energy is marketed to customers in Northern California. The 2007 net 2 annual generation of Shasta Powerplant was 1,914,175 megawatt-hours (MWh). 3
23.1.2 Upper Sacramento River (Shasta Dam to Red Bluff Pumping Plant) 4 CVP powerplants located downstream from Shasta Reservoir but upstream from 5 the Red Bluff Pumping Plant are Trinity, Lewiston, Judge Francis Carr, and 6 Spring Creek powerplants of the Trinity River Division and Keswick 7 Powerplant of the Shasta Division. The Trinity River Division captures 8 headwaters from the Trinity River basin and diverts surplus water to the 9 Sacramento River. 10
Trinity Dam stores water from the Trinity River in Trinity Reservoir and makes 11 releases to the Trinity River through Trinity Powerplant. Downstream, Lewiston 12 Dam makes minimum required releases to the Trinity River through Lewiston 13 Powerplant and diverts water into Clear Creek Tunnel and through Judge 14 Francis Carr Powerplant to Whiskeytown Reservoir. Some Whiskeytown 15 Reservoir releases are made through Spring Creek Power Conduit and 16 Powerplant into Keswick Reservoir in the Shasta Division. The remaining 17 releases from Whiskeytown Reservoir are made to Clear Creek. Releases from 18 Keswick Reservoir are made through Keswick Powerplant to the Sacramento 19 River. 20
Keswick Powerplant belongs to the Shasta Division, is located at Keswick Dam, 21 and has 3 generating units with a total capacity of 105 MW. Keswick 22 Powerplant is a run-of-the-river facility, creating Shasta Powerplant’s afterbay 23 and providing uniform flows to the Sacramento River. 24
23.1.3 Lower Sacramento River and Delta 25 Two CVP powerplants, Folsom and Nimbus, are located between Red Bluff 26 Pumping Plant and the Delta. Both powerplants belong to the Folsom Unit on 27 the American River. 28
Folsom Powerplant is a peaking powerplant, located at the foot of Folsom Dam 29 on the north side of the American River. Water from the dam is released 30 through three 15-foot-diameter penstocks to 3 generating units with a maximum 31 capacity of 199 MW. Folsom Dam was constructed by USACE and, on 32 completion, was transferred to Reclamation for coordinated operation as an 33 integral part of the CVP. 34
Nimbus Dam forms Lake Natoma to act as an afterbay for Folsom Powerplant. 35 It allows dam operators to coordinate power generation and flows in the lower 36 American River channel during normal reservoir operations. Nimbus 37 Powerplant, with 2 units and a maximum capacity of 13.5 MW, is a run-of-the-38 river facility and provides station service backup for Folsom Powerplant. 39
23-2 Draft – June 2013

Chapter 23 Power and Energy
23.1.4 CVP/SWP Service Areas 1 There are a number of generation facilities and pumping facilities in the greater 2 CVP/SWP service areas, beyond the specific geographies discussed above. 3 These facilities are discussed below. 4
CVP Generation Facilities 5 The CVP powerplants located in the CVP south-of-Delta service area include 6 New Melones Powerplant in the New Melones Unit of the CVP East Side 7 Division, and the William R. Gianelli and O'Neill Pumping-Generating Plants 8 in the San Luis Unit of the CVP West San Joaquin Division. The latter two, 9 with dual functions of generating electricity and pumping water, are jointly 10 owned by Reclamation and DWR. 11
New Melones Dam was completed in 1979, and inundated the original Melones 12 Dam and created New Melones Reservoir on the Stanislaus River. New 13 Melones Powerplant, located on the north bank immediately downstream from 14 the dam, is a peaking plant. The powerplant contains 2 units and a maximum 15 capacity of 300 MW. 16
The San Luis Unit, part of both the CVP and SWP, was authorized in 1960. 17 Reclamation and the State of California constructed and operate this unit 18 jointly; 45 percent of the total cost was contributed by the Federal government 19 and the remaining 55 percent by the State of California. The joint-use facilities 20 are O'Neill Dam and Forebay, B.F. Sisk San Luis Dam, San Luis Reservoir, 21 William R. Gianelli Pumping-Generating Plant, Dos Amigos Pumping Plant, 22 Los Banos and Little Panoche Reservoirs, and San Luis Canal from O'Neill 23 Forebay to Kettleman City, together with the necessary switchyard facilities. 24 The Federal-only portion of the San Luis Unit includes O'Neill Pumping-25 Generating Plant and Intake Canal, Coalinga Canal, Pleasant Valley Pumping 26 Plant, and San Luis Drain. 27
San Luis Reservoir serves as the major storage reservoir, and O'Neill Forebay 28 acts as an equalizing basin for the upper stage, dual-purpose pumping-29 generating plant. O’Neill Pumping-Generating Plant takes water from the Delta-30 Mendota Canal and discharges it into the O'Neill Forebay, where the California 31 Aqueduct (SWP feature) flows directly. William R. Gianelli Pumping-32 Generating Plant lifts water from O'Neill Forebay and discharges it into San 33 Luis Reservoir. During releases from the reservoir, these plants generate electric 34 power by reversing flow through the turbines. Water for irrigation is released 35 into the San Luis Canal and flows by gravity to Dos Amigos Pumping Plant, 36 where the water is lifted more than 100 feet to permit gravity flow to the canal 37 terminus at Kettleman City. The SWP canal system continues to southern 38 coastal areas. 39
O'Neill Pumping-Generating Plant consists of an intake channel, leading off the 40 Delta-Mendota Canal, and six pumping-generating units. Normally, these units 41 operate as pumps to lift water from 45 to 53 feet into O'Neill Forebay; each unit 42
23-3 Draft – June 2013

Shasta Lake Water Resources Investigation Environmental Impact Statement
can discharge 700 cubic feet per second (cfs) and has a rating of 6,000 1 horsepower (hp). Water is occasionally released from the forebay to the Delta-2 Mendota Canal, and these units then operate as generators; each unit has a 3 generating capacity of about 4.2 MW. 4
William R. Gianelli Pumping-Generating Plant, the joint Federal-State facility 5 located at San Luis Dam, lifts water by pump-turbines from O'Neill Forebay 6 into San Luis Reservoir. During the irrigation season, water is released from 7 San Luis Reservoir back through the pump-turbines to the forebay and energy is 8 reclaimed. Each of the eight pumping-generating units has a capacity of 63,000 9 hp as a motor and 53 MW as a generator. As a pumping plant to fill San Luis 10 Reservoir, each unit lifts 1,375 cfs at a design dynamic head of 290 feet. As a 11 generating plant, each unit passes 2,120 cfs at a design dynamic head of 197 12 feet. 13
SWP Generation Facilities 14 Among the eight SWP hydroelectric powerplants, three powerplants are located 15 in the Lake Oroville vicinity and the remaining in the south-of-Delta area. 16
Lake Oroville, the SWP’s largest reservoir, stores winter and spring runoff from 17 the Feather River watershed and releases water for SWP needs. These releases 18 generate power at three powerplants: Edward Hyatt Pumping-Generating Plant, 19 Thermalito Diversion Dam Powerplant, and Thermalito Pumping-Generating 20 Plant (Oroville Facilities). DWR schedules hourly releases through the Oroville 21 Facilities to maximize the amount of energy produced when power values are 22 highest. Because the downstream water supply does not depend on hourly 23 releases, water released for power in excess of local and downstream 24 requirements is conserved by pump-back operation during off-peak times into 25 Lake Oroville. Energy prices primarily dictate hourly operations for the power 26 generation facilities. 27
The remaining five SWP powerplants are the jointly owned William R. Gianelli 28 Pumping-Generating Plant, Alamo Powerplant, Mojave Siphon Powerplant, 29 Devil Canyon Powerplant, and Warne Powerplant. They generate about one-30 sixth of the total energy used by the SWP. Alamo Powerplant uses the 133-foot 31 head between Tehachapi Afterbay and Pool 43 of the California Aqueduct to 32 generate electricity. Mojave Siphon Powerplant generates electricity from water 33 flowing downhill after its 540-foot lift by Pearblossom Pumping Plant. Devil 34 Canyon Powerplant generates electricity with water from Silverwood Lake, 35 with more than 1,300 feet of head, the highest water head1 in a powerplant in 36
1 Potential hydropower generation is a function of the hydraulic net head and rate of fluid flow. The net head is the actual head available for power generation and is used for computing the energy generated. The net head is the gross head minus the head losses due to intake structures, penstocks, and outlet works. The gross or static head is the vertical distance between the tailwater elevation and the forebay water surface elevation (i.e., the height of water in the reservoir relative to its height after discharge). The head losses are generally assumed to be 2 to 10 percent of the gross head, depending on the configuration of the powerhouse structure.
23-4 Draft – June 2013

Chapter 23 Power and Energy
the SWP system. Warne Powerplant uses the 725-foot drop from Peace Valley 1 Pipeline to generate electricity with its Pelton wheel turbines. 2
CVP Pumping Facilities 3 CVP pumping plants that move water from the Delta to CVP service areas in 4 the Central Valley include C.W. “Bill” Jones Pumping Plant, O’Neill and 5 William R. Gianelli Pumping-Generating Plants, Dos Amigo Pumping Plant, 6 and SWP Banks Pumping Plant. Reclamation constructed and operates C.W. 7 “Bill” Jones Pumping Plant. Harvey O. Banks Pumping Plant is an SWP 8 facility; however, Reclamation has access to its pumping capacity by use of the 9 Joint Point of Diversion, described in the State Water Resources Control 10 Board’s Water Right Decision 1641. The remaining plants, described 11 previously, are joint-use facilities between the two agencies under the San Luis 12 Unit. 13
C.W. “Bill” Jones Pumping Plant, formerly Tracy Pumping Plant, is a 14 component of the CVP Delta Division. Construction of the plant started in 1947 15 and was completed in 1951, with an inlet channel, pumping plant, and discharge 16 pipes. Delta water is lifted 197 feet and is carried about 1 mile into the Delta-17 Mendota Canal. Each of the 6 pumps at C.W. “Bill” Jones Pumping Plant is 18 powered by a 22,500-hp motor and is capable of pumping 767 cfs. The intake 19 canal includes the C.W. “Bill” Jones Fish Screen, which was built to intercept 20 downstream migrant fish to be returned to the main channel, to resume their 21 journey to the ocean. 22
Dos Amigos Pumping Plant is a joint CVP/SWP facility, located 17 miles south 23 of O’Neill Forebay on the San Luis Canal. It lifts water 113 feet to permit 24 gravity flow to the terminus of San Luis Canal at Kettleman City. The plant 25 contains 6 pumping units, each capable of delivering 2,200 cfs at 125 feet of 26 head. 27
SWP Pumping Facilities 28 Among the SWP pumping plants, plants that historically consumed most of the 29 energy are William R. Gianelli Pumping-Generating Plant (SWP share), Harvey 30 O. Banks Pumping Plant, Dos Amigos Pumping Plant (SWP share), Ira J. 31 Chrisman Pumping Plant, and A.D. Edmonston Pumping Plant. 32
Harvey O. Banks Pumping Plant is located 2.5 miles southwest of Clifton Court 33 Forebay on the California Aqueduct. The plant is the first pumping plant for the 34 California Aqueduct and the South Bay Aqueduct. It provides the necessary 35 head2 for water in the California Aqueduct to flow for approximately 80 miles 36 south, past O'Neill Forebay and San Luis Reservoir to Dos Amigos Pumping 37 Plant (another jointly owned facility, as previously described). Harvey O. Banks 38 Pumping Plant initially flows into Bethany Reservoir, where the South Bay 39
2 In pumping plants, the design head is the gross head plus the head losses due to intake structures.
23-5 Draft – June 2013

Shasta Lake Water Resources Investigation Environmental Impact Statement
Aqueduct truly begins. The design head is 236–252 feet and installed capacity is 1 10,670 cfs with 333,000 hp. 2
Along the California Aqueduct, Pearblossom, Chrisman, and Edmonston 3 pumping plants historically consumed the highest amount of energy. 4 Pearblossom Pumping Plant lifts water about 540 feet and discharges it 3,479 5 feet above mean sea level (msl), the highest point along the entire California 6 Aqueduct. Chrisman and Edmonston pumping plants provide 524 and 1,970 feet 7 of lift, respectively, to convey California Aqueduct water across the Tehachapi 8 Mountains. 9
23.2 Regulatory Framework 10
There are two categories of regulatory framework for hydropower: Federal 11 regulations for CVP hydroelectric operations, and State regulations for the 12 SWP. 13
23.2.1 Federal 14 Reclamation operates the CVP system for water supply, environmental and 15 hydropower purposes, under various acts authorizing specific projects and with 16 other laws, permits, and enabling legislation (see the Hydrology, Hydraulics, 17 and Water Management Technical Report in the Physical Resources Appendix 18 for details). 19
The power generated by the CVP is marketed through contracts with the 20 Western Area Power Administration (Western). Western, created in 1977 under 21 the U.S. Department of Energy Organization Act, markets and transmits electric 22 power throughout 15 western states. Western's Sierra Nevada Customer Service 23 Region (also known as the Sierra Nevada Region) markets and transmits power 24 generated from the CVP and the Washoe Project in excess of CVP use. 25
The 2004 Marketing Plan for the Sierra Nevada Region specifies the terms and 26 conditions under which Western markets power from the CVP and the Washoe 27 Project that began on January 1, 2005. This marketing plan resulted in the 28 existing power marketing contract between Western and the CVP that expires 29 on December 31, 2024. 30
23.2.2 State 31 DWR is currently seeking a new 50-year hydroelectric license from the Federal 32 Energy Regulatory Commission to operate the Oroville Facilities. The DEIS is 33 available for public review and comment. The initial Federal Energy Regulatory 34 Commission license for the Oroville Facilities, issued on February 11, 1957, 35 expired on January 31, 2007. Currently, the Oroville Facilities are operating 36 under a license that was issued by the Federal Energy Regulatory Commission, 37 effective February 1, 2007, and being renewed each year in anticipation of 38 issuance of the new 50-year license. 39
23-6 Draft – June 2013

Chapter 23 Power and Energy
23.2.3 Regional and Local 1 No known regional or local regulations govern power and energy resources. 2
23.3 Environmental Consequences and Mitigation Measures 3
The purpose of this section is to provide information about hydropower 4 generation, energy use, and impacts on existing hydropower facilities from the 5 SLWRI study alternatives described in the DEIS. Hydropower modeling for the 6 DEIS was conducted to identify potential impacts from the SLWRI on 7 hydropower generation and consumption at CVP and SWP facilities, which are 8 operated by Reclamation and DWR, respectively. This section describes the 9 analytical methodology used to calculate, for all alternatives, the hydropower 10 generation and pumping energy required at existing CVP and SWP hydropower 11 facilities. This chapter also describes criteria for determining significant impacts 12 associated with the SLWRI alternatives, and lists those impacts. 13
23.3.1 Methods and Assumptions 14 Council on Environmental Quality regulations and the State CEQA Guidelines 15 address NEPA and CEQA requirements for describing the potential 16 environmental consequences of alternatives in an EIS and EIR, respectively. 17 NEPA and CEQA requirements guide the assessments presented in this section. 18 Appendix F of the State CEQA Guidelines addresses energy conservation, and 19 NEPA directs that energy requirements and conservation potential are to be 20 evaluated. This impact assessment is based on quantitative data regarding 21 changes to hydropower resources that could occur under the program 22 alternatives in geographic locales within the study area. 23
Several modeling tools were used for the SLWRI hydropower analysis. The 24 CalSim-II model was used to simulate project operations and LongTermGen 25 (LTGen) and State Water Project Power (SWPPower) power tools were used to 26 quantify the hydropower generation and pumping energy associated with each 27 alternative. A spreadsheet postprocessor was used to evaluate impacts to the Pit 28 7 Powerplant. 29
Power Modeling Tools 30 Energy estimates were made using the Benchmark Study Team (BST) power 31 modeling tools LTGen, Version 1.18, and SWPPower, BST April 2010 Version, 32 for CVP and SWP facilities, respectively. LTGen and SWPPower use 33 operations data from CalSim-II simulations to predict energy generation and 34 consumption throughout the CVP and SWP. Methods applied to evaluate power 35 generation are discussed below. 36
For each alternative, outputs from CalSim-II simulation were input to LTGen 37 and SWPPower, to simulate power generation and consumption throughout the 38 CVP and SWP systems, respectively. These CalSim-II outputs included 39 reservoir releases, conveyance flow rates, and end-of-month reservoir storage 40
23-7 Draft – June 2013

Shasta Lake Water Resources Investigation Environmental Impact Statement
data. Both LTGen and SWPPower are monthly models. Their simulation 1 periods are from October 31, 1921 to September 30, 2003. 2
In LTGen and SWPPower, energy generation is a function of turbine 3 configuration, reservoir release, net head, and duration of generation. Net head 4 is the actual head available for power generation; it is reservoir water surface 5 elevation (a function of storage) minus tailrace elevation (a function of release). 6
Similarly, the calculation of energy required for pumping in both models is a 7 function of pump configuration, pumping rate, pumping head (i.e., net head 8 with hydraulic losses), and duration of pumping. Detailed descriptions of 9 LTGen and SWPPower are included in Chapter 8 of the Modeling Appendix. 10
CalSim-II 11 CalSim-II is the application of the Water Resources Integrated Modeling 12 System software to the CVP/SWP. This application was jointly developed by 13 Reclamation and DWR for planning studies related to CVP/SWP operations. 14 The primary purpose of CalSim-II is to evaluate the water supply reliability of 15 the CVP and SWP at current and/or future levels of development (e.g., 2005 or 16 2030), with and without various assumed future facilities, and with different 17 modes of facility operations. Geographically, the model covers the drainage 18 basin of the Delta, and CVP/SWP exports to the San Francisco Bay Area, San 19 Joaquin Valley, Central Coast, and Southern California. 20
CalSim-II typically simulates system operations for an 82-year period, using a 21 monthly time step. The model assumes that facilities, land use, water supply 22 contracts, and regulatory requirements are constant over this period, 23 representing a fixed level of development (e.g., 2005 or 2030). The historical 24 flow record from October 1921 to September 2003, adjusted for the influences 25 of land use changes and upstream flow regulation, is used to represent the 26 possible range of water supply conditions. Major Central Valley rivers, 27 reservoirs, and CVP/SWP facilities are represented by a network of arcs and 28 nodes. CalSim-II uses a mass balance approach to route water through this 29 network. Simulated flows are mean flows for the month; reservoir storage 30 volumes correspond to end-of-month storage. 31
Monthly CalSim-II model results are intended to be used for comparative 32 purposes. It is important to differentiate between “absolute” or “predictive” 33 modeling applications and “comparative” applications. In “absolute” 34 applications, the model is run once to predict a future outcome; errors or 35 assumptions in formulation, system representation, data, and operational criteria 36 all contribute to total error or uncertainty in model results. In “comparative” 37 applications, the model is run twice, once to represent a baseline condition (no 38 project) and a second time with a specific change (project) to assess the change 39 in the outcome due to the input change. In this comparative mode (the mode 40 used for this DEIS), the difference between the two simulations is of principal 41 importance. Potential errors or uncertainties that exist in the “no project” 42
23-8 Draft – June 2013

Chapter 23 Power and Energy
simulation are also present in the “project” simulation, such that their impacts 1 are reduced when assessing the change in outcomes. 2
Spreadsheet Postprocessors 3 For analysis of impacts from each alternative on generation from the Pit 7 4 Powerplant, a spreadsheet postprocessor was used in lieu of a model. Since no 5 model was available for Pit 7 Powerplant operations, an evaluation of potential 6 impacts of the SLWRI alternatives, as simulated using CalSim-II on recent 7 historical data, was used instead. 8
The spreadsheet postprocessor interpolated CalSim-II output for Shasta 9 Reservoir storage to determine the reservoir water surface elevation. The water 10 surface elevations for each alternative were compared to historical Pit 7 11 Powerplant tailwater elevations, to calculate the change in net head at the Pit 7 12 Powerplant. Changes in net head at the Pit 7 Powerplant were assumed to be 13 small enough so that turbine/generator efficiencies would be unaffected. For 14 each alternative, the monthly generation was determined by multiplying 15 historical average monthly generation by the ratio of the alternative-reduced net 16 head compared to the historical net head (assumed to be 200 feet, based on 17 historical average) raised to the 1.5 power. 18
23.3.2 Criteria for Determining Significance of Effects 19 The thresholds of significance for impacts to power and energy are based on the 20 environmental checklist in Appendix G of the State CEQA Guidelines, as 21 amended. These thresholds also encompass the factors taken into account under 22 NEPA to determine the significance of an action in terms of its context and the 23 intensity of its impacts. An alternative would be considered to have a potentially 24 significant impact on regional hydropower production if the change in the 25 average annual energy generation or consumption (over the 82-year period of 26 simulation) by the CVP/SWP is greater than 5 percent, as shown in Table 23-1. 27
A threshold of 5 percent was selected as the threshold of significance for 28 hydroelectric generation for several reasons, including seasonal and annual 29 hydrologic variability, short-term operations decisions that may affect water 30 level in storage, and regional power market demands and prices that may dictate 31 hydropower facilities operations. All these factors could contribute to 32 potentially substantial variations in hydropower generation on a monthly or 33 annual basis. As a result, generation variations of less than 5 percent would not 34 be considered significant. Significance statements are relative to both existing 35 conditions (2005) and future conditions (2030), unless stated otherwise. 36
37
23-9 Draft – June 2013

Shasta Lake Water Resources Investigation Environmental Impact Statement
Table 23-1. Impact Indicators and Significance Criteria for Energy 1 Generation and Usage 2 Impact Indicator Significance Criterion
Shasta Powerplant Energy Generation
Decrease in average annual Shasta Powerplant hydropower generation of more than 5 percent.
CVP System Energy Generation
Decrease in average annual CVP system hydropower generation of more than 5 percent.
SWP System Energy Generation
Decrease in average annual SWP system hydropower generation of more than 5 percent.
CVP System Pumping Energy Use
Increase in average annual CVP system pumping energy use of more than 5 percent.
SWP System Pumping Energy Use
Increase in average annual SWP system pumping energy use of more than 5 percent.
Pit 7 Powerplant Energy Generation
Decrease in average annual Pit 7 hydropower generation of more than 5 percent.
Key: CVP = Central Valley Project SWP = State Water Project
Shasta Powerplant Energy Generation 3 Changes in Shasta Powerplant operations due to any of the SLWRI alternatives 4 could directly affect hydropower generation caused by changes in head and 5 flow available for hydropower generation, A significant reduction in energy 6 generation at Shasta Powerplant could require purchase of energy to meet CVP 7 pumping energy demands, or a reduction in power revenue. 8
CVP System Energy Generation 9 Changes in CVP operations due to any of the SLWRI alternatives could result 10 in reoperation of other CVP hydropower generation facilities, and could result 11 in a systemwide decrease in CVP hydropower generation. A significant 12 reduction in CVP energy generation could require purchase of energy to meet 13 CVP pumping energy demands, or a reduction in power revenue. 14
SWP System Energy Generation 15 Changes in SWP operations due to any of the SLWRI alternatives could result 16 in reoperation of SWP generation facilities, and could result in a systemwide 17 decrease in SWP hydropower generation. A significant reduction in SWP 18 energy generation could require purchase of energy to meet SWP pumping 19 energy demands, or a reduction in power revenue. 20
CVP Pumping Energy Use 21 Changes in CVP operations due to any of the SLWRI alternatives could result 22 in changes in operations of the CVP pumping plants. A significant increase in 23 CVP system pumping energy use could require purchase of energy to meet CVP 24 pumping energy demands, or a reduction in power revenue. 25
SWP Pumping Energy Use 26 Changes in SWP operations due to any of the SLWRI alternatives could result 27 in changes in operations of the SWP pumping plants. A significant increase in 28
23-10 Draft – June 2013

Chapter 23 Power and Energy
SWP system pumping energy use could require purchase of energy to meet 1 SWP pumping energy demands, or a reduction in power revenue. 2
Pit 7 Powerplant Energy Generation 3 The Pit 7 Powerplant is owned and operated by the Pacific Gas and Electric 4 Company. Increases in Shasta Lake water surface elevations could increase the 5 tailwater elevation below the Pit 7 Powerplant, reducing the net head and 6 decreasing generation. 7
23.3.3 Direct and Indirect Effects 8 This section describes the environmental consequences of the SLWRI 9 comprehensive plans, and proposed mitigation measures for any impacts 10 determined to be significant or potentially significant. All comprehensive plans 11 are compared to a baseline to allow evaluation of potential impacts. For the 12 existing condition a 2005 level of development) CalSim-II simulation without 13 any Shasta enlargement is used. Similarly, for the future condition a 2030 level 14 of development CalSim-II simulation, the No-Action Alternative, is used as a 15 baseline. Each of the comprehensive plans where simulated using the same 16 levels of development so that any changes from the baseline hydropower 17 generation or consumption can be attributed the alternative. Detailed tables of 18 the monthly energy generation and energy consumption associated with each 19 comprehensive plan are included in Attachment 18 of the Modeling Appendix. 20
The No-Action Alternative and five SLWRI comprehensive plans are described 21 in the following subsections. Potential effects of the existing condition, No-22 Action Alternative, and various SLWRI comprehensive plans on energy 23 generation and usage are also described. 24
No-Action Alternative 25 Under the No-Action Alternative, the Federal government would take 26 reasonably foreseeable actions, as discussed in Chapter 2, but would take no 27 additional action toward implementing a specific plan to help increase 28 anadromous fish survival in the upper Sacramento River, nor would help 29 address the growing water reliability issues in California. Shasta Dam would not 30 be modified, and the CVP would continue operating similar to the existing 31 condition. Changes in regulatory conditions and water supply demands would 32 result in differences in flows on the Sacramento River and in the Delta between 33 existing and future conditions. Possible changes include the following: 34
• Firm Level 2 Federal refuge deliveries 35
• SWP deliveries based on full Table A amounts 36
• Full implementation of the Grassland Bypass Project 37
• Implementation of salinity management actions similar to the Vernalis 38 Adaptive Management Plan 39
23-11 Draft – June 2013

Shasta Lake Water Resources Investigation Environmental Impact Statement
• Implementation of the South Bay Aqueduct Improvement and 1 Enlargement Project 2
• Increased San Joaquin River diversions for water users in the Stockton 3 Metropolitan Area after completion of the Delta Water Supply Project 4
• Increased Sacramento River diversions by Freeport Regional Water 5 Project agencies 6
• San Joaquin River Restoration Program Full Restoration Flows 7
This alternative is used as a basis of comparison for future condition 8 comparisons. Table 23-2 summarizes the simulated average annual hydropower 9 generation and energy use for the No-Action Alternative. 10
Table 23-2. Simulated Average Annual Energy Generation and Use for No-11 Action Alternative 12
Existing (GWh)
No Action (GWh)
Change (GWh)
Percent Change
Impact Hydro-1 – Decrease in Shasta Powerplant Energy Generation
2,151 2,154 3 0%
Impact Hydro-2 – Decrease in CVP System Energy Generation
4,909 4,897 -12 0%
Impact Hydro-3 – Decrease in SWP System Energy Generation
4,427 4,513 86 2%
Impact Hydro-4 – Increase in CVP System Pumping Energy Use
1,445 1,447 2 0%
Impact Hydro-5 – Increase in SWP System Pumping Energy Use
7,600 7,933 333 4%
Impact Hydro-6 – Decrease in Pit 7 Powerplant Energy Generation
529 529 0 0%
Key: CVP = Central Valley Project GWh = gigawatt-hour SWP = State Water Project
Impact Hydro-1 (No-Action): Decrease in Shasta Powerplant Energy 13 Generation Simulated annual average Shasta Powerplant energy generation 14 for the No-Action Alternative is shown in Table 23-2. Under the No-Action 15 Alternative, there would be an increase in simulated average annual generation 16 of 3 gigawatt-hour (GWh) (0 percent). This impact would be beneficial. 17 Mitigation is not required for the No-Action Alternative. 18
23-12 Draft – June 2013

Chapter 23 Power and Energy
Impact Hydro-2 (No-Action): Decrease in CVP System Energy Generation 1 Simulated average annual CVP system energy generation for the No-Action 2 Alternative is shown in Table 23-2. Under the No-Action Alternative, there 3 would be a decrease in simulated average annual energy generation of 12 GWh 4 (0 percent). This impact would be less than significant. Mitigation is not 5 required for the No-Action Alternative. 6
Impact Hydro-3 (No-Action): Decrease in SWP System Energy Generation 7 Simulated average annual CVP system energy generation for the No-Action 8 Alternative is shown in Table 23-2. Under the No-Action Alternative, there 9 would be an increase in simulated average annual energy generation of 86 GWh 10 (2 percent). This impact would be beneficial. Mitigation is not required for the 11 No-Action Alternative. 12
Impact Hydro-4 (No-Action): Increase in CVP System Pumping Energy 13 Use Simulated average annual CVP pumping energy use for the No-Action 14 Alternative is shown in Table 23-2. Under the No-Action Alternative, there 15 would be an increase in simulated average annual pumping energy use of 2 16 GWh (0 percent). This impact would be less than significant. Mitigation is not 17 required for the No-Action Alternative. 18
Impact Hydro-5 (No-Action): Increase in SWP System Pumping Energy 19 Use Simulated average annual SWP pumping energy use for the No-Action 20 Alternative is shown in Table 23-2. Under the No-Action Alternative, there 21 would be an increase in simulated average annual pumping energy use of 333 22 GWh (4 percent). This impact would be less than significant. Mitigation is not 23 required for the No-Action Alternative. 24
Impact Hydro-6 (No-Action): Decrease in Pit 7 Powerplant Energy 25 Generation Simulated average annual Pit 7 Powerplant energy generation for 26 the No-Action Alternative is shown in Table 23-2. Under the No-Action 27 Alternative, there would be no change in simulated average annual energy 28 generation at the Pit 7 Powerplant. Therefore, no impact would occur. 29 Mitigation is not required for the No-Action Alternative. 30
CP1 – 6.5-Foot Dam Raise, Anadromous Fish Survival and Water Supply 31 Reliability 32 CP1 focuses on increasing water supply reliability and increasing anadromous 33 fish survival. This plan primarily consists of raising Shasta Dam by 6.5 feet, 34 which, in combination with spillway modifications, would increase the height of 35 the reservoir’s full pool by 8.5 feet and enlarge the total storage capacity in the 36 reservoir by 256,000 acre-feet. The existing temperature control device (TCD) 37 would also be extended to achieve efficient use of the expanded cold-water 38 pool. Shasta Dam operational guidelines would continue essentially unchanged, 39 except during dry years3 and critical years, when 70 thousand acre-feet (TAF) 40
3 Throughout this document, water year types are defined according to the Sacramento Valley Index Water Year Hydrologic Classification unless specified otherwise.
23-13 Draft – June 2013

Shasta Lake Water Resources Investigation Environmental Impact Statement
and 35 TAF, respectively, of the increased storage capacity in Shasta Reservoir 1 would be reserved to specifically focus on increasing M&I deliveries. CP1 2 would help reduce future water shortages by increasing drought year and 3 average year water supply reliability for agricultural, and municipal and 4 industrial (M&I) deliveries. In addition, the increased depth and volume of the 5 cold-water pool in Shasta Reservoir would contribute to improving seasonal 6 water temperatures for anadromous fish in the upper Sacramento River. Table 7 23-3 summarizes the simulated average annual hydropower generation and 8 energy use for CP1. 9
Table 23-3. Simulated Average Annual Energy Generation and Use for CP1 10
Impact Hydro-1 (CP1): Decrease in Shasta Powerplant Energy Generation 11 Simulated average annual Shasta Powerplant energy generation for CP1 is 12 shown in Table 23-3. Under CP1, there would be an increase in simulated 13 average annual generation under both existing and future levels of 40 GWh (2 14 percent). This impact would be beneficial. Mitigation for this impact is not 15 needed, and thus not proposed. 16
Impact Hydro-2 (CP1): Decrease in CVP System Energy Generation 17 Simulated average annual CVP system generation for CP1 is shown in Table 18
Existing (GWh)
CP1 (GWh)
Change Future (GWh)
CP1 (GWh)
Change (GWh) Percent GWh Percent
Impact Hydro-1 – Decrease in Shasta Energy Generation
2,151 2,191 40 2% 2,154 2,194 40 2%
Impact Hydro-2 – Decrease in CVP System Energy Generation
4,909 4,948 39 1% 4,897 4,937 40 1%
Impact Hydro-3 – Decrease in SWP System Energy Generation
4,427 4,440 13 0% 4,513 4,527 14 0%
Impact Hydro-4 – Increase in CVP System Pumping Energy Use
1,445 1,453 8 1% 1,447 1,458 11 1%
Impact Hydro-5 – Increase in SWP System Pumping Energy Use
7,600 7,642 42 1% 7,933 7,979 46 1%
Impact Hydro-6 – Decrease in Pit 7 Powerplant Energy Generation
529 525 -4 -1% 529 525 -4 -1%
Key: CVP = Central Valley Project GWh = gigawatt-hour SWP = State Water Project
23-14 Draft – June 2013

Chapter 23 Power and Energy
23-3. Under CP1, there would be an increase in simulated average annual 1 energy generation of 39 GWh (1 percent) and 40 GWh (1 percent) under 2 existing and future levels, respectively. This impact would be beneficial. 3 Mitigation for this impact is not needed, and thus not proposed. 4
Impact Hydro-3 (CP1): Decrease in SWP System Energy Generation 5 Simulated average annual CVP system generation for CP1 is shown in Table 6 23-3. Under CP1, there would be an increase in simulated average annual 7 energy generation of 13 GWh (0 percent) and 14 GWh (0 percent) under 8 existing and future levels, respectively. This impact would be less than 9 significant. Mitigation for this impact is not needed, and thus not proposed. 10
Impact Hydro-4 (CP1): Increase in CVP System Pumping Energy Use 11 Simulated average annual CVP pumping energy use for CP1 is shown in Table 12 23-3. Under CP1, there would be an increase in simulated average annual 13 pumping energy use of 8 GWh (1 percent) and 11 GWh (1 percent) under 14 existing and future levels, respectively. This impact would be less than 15 significant. Mitigation for this impact is not needed, and thus not proposed. 16
Impact Hydro-5 (CP1): Increase in SWP System Pumping Energy Use 17 Simulated average annual SWP pumping energy use for CP1 is shown in Table 18 23-3. Under CP1, there would be an increase in simulated average annual 19 pumping energy use of 42 GWh (1 percent) and 46 GWh (1 percent) under 20 existing and future levels, respectively. This impact would be less than 21 significant. Mitigation for this impact is not needed, and thus not proposed. 22
Impact Hydro-6 (CP1): Decrease in Pit 7 Powerplant Energy Generation 23 Simulated average annual Pit 7 generation for CP1 is shown in Table 23-3. 24 Under CP1, the 6.5-foot Shasta Dam raise option, the operating range of net 25 head would decrease from about 173 to 204 feet to about 168 to 193 feet, an 26 approximately 4 percent decrease in net head. Under CP1, there would be a 27 decrease in simulated average annual generation of about 4 GWh (1 percent) 28 and 4 GWh (1 percent) under existing and future levels, respectively. This 29 impact would be less than significant. Mitigation for this impact is not needed, 30 and thus not proposed. 31
CP2 – 12.5-Foot Dam Raise, Anadromous Fish Survival and Water Supply 32 Reliability 33 As with CP1, CP2 focuses on increasing water supply reliability and increasing 34 anadromous fish survival. CP2 primarily consists of raising Shasta Dam by 12.5 35 feet, which, in combination with spillway modifications, would increase the 36 height of the reservoir’s full pool by 14.5 feet and enlarge the total storage 37 capacity in the reservoir by 443,000 acre-feet. The existing TCD would also be 38 extended to achieve efficient use of the expanded cold-water pool. Shasta Dam 39 operational guidelines would continue essentially unchanged, except during dry 40 years and critical years, when 120 TAF and 60 TAF, respectively, of the 41 increased storage capacity in Shasta Reservoir would be reserved to specifically 42
23-15 Draft – June 2013

Shasta Lake Water Resources Investigation Environmental Impact Statement
focus on increasing M&I deliveries. CP2 would help reduce future water 1 shortages by increasing drought year and average year water supply reliability 2 for agricultural and M&I deliveries. In addition, the increased depth and volume 3 of the cold-water pool in Shasta Reservoir would contribute to improving 4 seasonal water temperatures for anadromous fish in the upper Sacramento 5 River. Table 23-4 summarizes the simulated average annual hydropower 6 generation and energy use for CP2. 7
Table 23-4. Simulated Average Annual Energy Generation and Use for CP2 8
9 Impact Hydro-1 (CP2): Decrease in Shasta Powerplant Energy Generation 10 Simulated average annual Shasta Powerplant energy generation for CP2 is 11 shown in Table 23-4. Under CP2, there would be an increase in simulated 12 average annual generation of 70 GWh (3 percent) and 67 GWh (3 percent) 13 under existing and future levels, respectively. This impact would be beneficial. 14 Mitigation for this impact is not needed, and thus not proposed. 15
Impact Hydro-2 (CP2): Decrease in CVP System Energy Generation 16 Simulated average annual CVP system generation for CP2 is shown in Table 17 23-4. Under CP2, there would be an increase in simulated average annual 18 energy generation of 71 GWh (1 percent) and 69 GWh (1 percent) under 19
Existing (GWh)
CP2 (GWh)
Change Future (GWh)
CP2 (GWh)
Change GWh Percent GWh Percent
Impact Hydro-1 – Decrease in Shasta Powerplant Energy Generation
2,151 2,221 70 3% 2,154 2,221 67 3%
Impact Hydro- 2 – Decrease in CVP System Energy Generation
4,909 4,980 71 1% 4,897 4,966 69 1%
Impact Hydro- 3 – Decrease in SWP System Energy Generation
4,427 4,444 17 0% 4,513 4,535 22 0%
Impact Hydro- 4 – Increase in CVP System Pumping Energy Use
1,445 1,458 13 1% 1,447 1,464 17 1%
Impact Hydro-5 – Increase in SWP System Pumping Energy Use
7,600 7,660 60 1% 7,933 8,005 72 1%
Impact Hydro-6 – Decrease in Pit 7 Powerplant Energy Generation
529 520 -9 -2% 529 522 -7 -1%
Key: CVP = Central Valley Project GWh = gigawatt-hour SWP = State Water Project
23-16 Draft – June 2013

Chapter 23 Power and Energy
existing and future levels, respectively. This impact would be beneficial. 1 Mitigation for this impact is not needed, and thus not proposed. 2
Impact Hydro-3 (CP2): Decrease in SWP System Energy Generation 3 Simulated average annual CVP system generation for CP2 is shown in Table 4 23-4. Under CP2, there would be an increase in simulated average annual 5 energy generation of 17 GWh (0 percent) and 22 GWh (0 percent) under 6 existing and future levels, respectively. This impact would be beneficial. 7 Mitigation for this impact is not needed, and thus not proposed. 8
Impact Hydro-4 (CP2): Increase in CVP System Pumping Energy Use 9 Simulated average annual CVP pumping energy use for CP2 is shown in Table 10 23-4. Under CP2, there would be an increase in simulated average annual 11 pumping energy use of 13 GWh (1 percent) and 17 GWh (1 percent) under 12 existing and future levels, respectively. This impact would be less than 13 significant. Mitigation for this impact is not needed, and thus not proposed. 14
Impact Hydro-5 (CP2): Increase in SWP System Pumping Energy Use 15 Simulated average annual SWP pumping energy use for CP2 is shown in Table 16 23-4. Under CP2, there would be an increase in simulated average annual 17 pumping energy use of 60 GWh (1 percent) and 72 GWh (1 percent) under 18 existing and future levels, respectively. This impact would be less than 19 significant. Mitigation for this impact is not needed, and thus not proposed. 20
Impact Hydro-6 (CP2): Decrease in Pit 7 Powerplant Energy Generation 21 Simulated average annual Pit 7 generation for CP2 is shown in Table 23-4. 22 Under CP2 the operating range of net head would decrease from about 173 to 23 204 feet to about 168 to 193 feet, an approximately 4 percent decrease in net 24 head. Under CP2, there would be a decrease in simulated average annual 25 generation of about 9 GWh (2 percent) and 7 GWh (1 percent) under existing 26 and future levels, respectively. This impact would be less than significant. 27 Mitigation for this impact is not needed, and thus not proposed. 28
CP3 – 18.5-Foot Dam Raise, Agricultural Water Supply Reliability and 29 Anadromous Fish Survival 30 CP3 focuses on increasing agricultural water supply reliability while also 31 increasing anadromous fish survival. This plan primarily consists of raising 32 Shasta Dam by 18.5 feet, which, in combination with spillway modifications, 33 would increase the height of the reservoir’s full pool by 20.5 feet and enlarge 34 the total storage capacity in the reservoir by 634,000 acre-feet. The existing 35 TCD would also be extended to achieve efficient use of the expanded cold-36 water pool. Because CP3 focuses on increasing agricultural water supply 37 reliability, none of the increased storage capacity in Shasta Reservoir would be 38 reserved for increasing M&I deliveries. Operations for water supply, 39 hydropower, and environmental and other regulatory requirements would be 40 similar to existing operations, with the additional storage retained for water 41 supply reliability and to expand the cold-water pool for downstream 42
23-17 Draft – June 2013

Shasta Lake Water Resources Investigation Environmental Impact Statement
anadromous fisheries. Simulations of CP3 did not involve any changes to the 1 modeling logic for deliveries or flow requirements; all rules for water 2 operations were updated to include the new storage but were not otherwise 3 changed. Table 23-5 summarizes the simulated average annual hydropower 4 generation and energy use for CP3. 5
Table 23-5. Simulated Average Annual Energy Generation and Use for CP3 6
Impact Hydro-1 (CP3): Decrease in Shasta Powerplant Energy Generation 7 Simulated average annual Shasta Powerplant energy generation for CP3 is 8 shown in Table 23-5. Under CP3, there would be an increase in simulated 9 average annual generation of 97 GWh (5 percent) and 95 GWh (4 percent) 10 under existing and future levels, respectively. This impact would be beneficial. 11 Mitigation for this impact is not needed, and thus not proposed. 12
Impact Hydro-2 (CP3): Decrease in CVP System Energy Generation 13 Simulated average annual CVP system generation for CP3 is shown in Table 14 23-5. Under CP3, there would be an increase in simulated average annual 15 energy generation of 98 GWh (2 percent) and 95 GWh (2 percent) under 16 existing and future levels, respectively. This impact would be beneficial. 17 Mitigation for this impact is not needed, and thus not proposed. 18
Existing (GWh)
CP3 (GWh)
Change Future (GWh)
CP3 (GWh)
Change GWh Percent GWh Percent
Impact Hydro-1 – Decrease in Shasta Powerplant Energy Generation
2,151 2,248 97 5% 2,154 2,249 95 4%
Impact Hydro-2 – Decrease in CVP System Energy Generation
4,909 5,007 98 2% 4,897 4,992 95 2%
Impact Hydro-3 – Decrease in SWP System Energy Generation
4,427 4,429 2 0% 4,513 4,508 -5 0%
Impact Hydro-4 – Increase in CVP System Pumping Energy Use
1,445 1,468 23 2% 1,447 1,482 35 2%
Impact Hydro-5 – Increase in SWP System Pumping Energy Use
7,600 7,606 6 0% 7,933 7,917 -16 0%
Impact Hydro-6 – Decrease in Pit 7 Powerplant Energy Generation
529 514 -15 -3% 529 514 -15 -3%
Key: CVP = Central Valley Project GWh = gigawatt-hour SWP = State Water Project
23-18 Draft – June 2013

Chapter 23 Power and Energy
Impact Hydro-3 (CP3): Decrease in SWP System Energy Generation 1 Simulated average annual CVP system generation for CP3 is shown in Table 2 23-5. Under CP3, there would be an increase in simulated average annual 3 energy generation of 2 GWh (0 percent) under the existing level and a decrease 4 of 5 GWh (0 percent) under the future level. This impact would be beneficial 5 under the existing level and less than significant under the future level. 6 Mitigation for this impact is not needed, and thus not proposed. 7
Impact Hydro-4 (CP3): Increase in CVP System Pumping Energy Use 8 Simulated average annual CVP pumping energy use for CP3 is shown in Table 9 23-5. Under CP3, there would be an increase in simulated average annual 10 pumping energy use of 23 GWh (2 percent) and 35 GWh (2 percent) under 11 existing and future levels, respectively. This impact would be less than 12 significant. Mitigation for this impact is not needed, and thus not proposed. 13
Impact Hydro-5 (CP3): Increase in SWP System Pumping Energy Use 14 Simulated average annual SWP pumping energy use for CP3 is shown in Table 15 23-5. Under CP3, there would be an increase in simulated average annual 16 pumping energy use of 6 GWh (0 percent) under the existing level and a 17 decrease of 16 GWh (0 percent) under the future level. This impact would be 18 less than significant and beneficial under the existing level and less than 19 significant under the future level. Mitigation for this impact is not needed, and 20 thus not proposed. 21
Impact Hydro-6 (CP3): Decrease in Pit 7 Powerplant Energy Generation 22 Simulated average annual Pit 7 Powerplant generation for CP3 is shown in 23 Table 23-5. Under CP3 the operating range of net head would decrease to about 24 156 to 181 feet, an approximate 10 percent reduction in net head. Under CP3, 25 there would be a decrease in simulated average annual generation of 15 GWh (3 26 percent) under both the existing and future levels. This impact would be less 27 than significant. Mitigation for this impact is not needed, and thus not proposed. 28
CP4 – 18.5-Foot Dam Raise, Anadromous Fish Focus With Water Supply 29 Reliability 30 CP4 focuses on increasing anadromous fish survival while also increasing water 31 supply reliability. By raising Shasta Dam 18.5 feet, in combination with 32 spillway modifications, CP4 would increase the height of the reservoir full pool 33 by 20.5 feet and enlarge the total storage capacity in the reservoir by 634,000 34 acre-feet. The existing TCD would also be extended to achieve efficient use of 35 the expanded cold-water pool. The additional storage created by the 18.5-foot 36 dam raise would be used to improve the ability to meet temperature objectives 37 and habitat requirements for anadromous fish during drought years and increase 38 water supply reliability. Of the increased reservoir storage space, about 378,000 39 acre-feet would be dedicated to increasing the supply of cold water for 40 anadromous fish survival purposes. Operations for the remaining portion of 41 increased storage (approximately 256,000 acre-feet) would be the same as for 42 CP1, with 70 TAF and 35 TAF reserved to specifically focus on increasing 43
23-19 Draft – June 2013

Shasta Lake Water Resources Investigation Environmental Impact Statement
M&I deliveries during dry and critical years, respectively. CP4 also includes 1 augmenting spawning gravel and restoring riparian, floodplain, and side channel 2 habitat in the upper Sacramento River. Table 23-6 summarizes the simulated 3 average annual hydropower generation and energy use for CP4. 4
Table 23-6. Simulated Average Annual Energy Generation and Use for CP4 5
Impact Hydro-1 (CP4): Decrease in Shasta Powerplant Energy Generation 6 Simulated average annual Shasta Powerplant energy generation for CP4 is 7 shown in Table 23-6. Under CP4, there would be an increase in simulated 8 average annual generation of 118 GWh (5 percent) and 119 GWh (6 percent) 9 under existing and future levels, respectively. This impact would be beneficial. 10 Mitigation for this impact is not needed, and thus not proposed. 11
Impact Hydro-2 (CP4): Decrease in CVP System Energy Generation 12 Simulated average annual CVP system generation for CP4 is shown in Table 13 23-6. Under CP4, there would be an increase in simulated average annual 14 energy generation of 117 GWh (2 percent) and 119 GWh (2 percent) under 15 existing and future levels, respectively. This impact would be beneficial. 16 Mitigation for this impact is not needed, and thus not proposed. 17
Existing (GWh)
CP4 (GWh)
Change Future (GWh)
CP4 (GWh)
Change GWh Percent GWh Percent
Impact Hydro-1 – Decrease in Shasta Powerplant Energy Generation
2,151 2,269 118 5% 2,154 2,273 119 6%
Impact Hydro-2 – Decrease in CVP System Energy Generation
4,909 5,026 117 2% 4,897 5,016 119 2%
Impact Hydro-3 – Decrease in SWP System Energy Generation
4,427 4,440 13 0% 4,513 4,527 14 0%
Impact Hydro-4 – Increase in CVP System Pumping Energy Use
1,445 1,453 8 1% 1,447 1,458 11 1%
Impact Hydro-5 – Increase in SWP System Pumping Energy Use
7,600 7,642 42 1% 7,933 7,979 46 1%
Impact Hydro-6 – Decrease in Pit 7 Powerplant Energy Generation
529 519 -10 -2% 529 519 -10 -2%
Key: CVP = Central Valley Project GWh = gigawatt-hour SWP = State Water Project
23-20 Draft – June 2013

Chapter 23 Power and Energy
Impact Hydro-3 (CP4): Decrease in SWP System Energy Generation 1 Simulated average annual CVP system generation for CP4 is shown in Table 2 23-6. Under CP4, there would be an increase in simulated average annual 3 energy generation of 13 GWh (0 percent) and 14 GWh (0 percent) under 4 existing and future levels, respectively. This impact would be less than 5 significant. Mitigation for this impact is not needed, and thus not proposed. 6
Impact Hydro-4 (CP4): Increase in CVP System Pumping Energy Use 7 Simulated average annual CVP pumping energy use for CP4 is shown in Table 8 23-6. Under CP4, there would be an increase in simulated average annual 9 pumping energy use of 8 GWh (1 percent) and 11 GWh (1 percent) under 10 existing and future levels, respectively. This impact would be less than 11 significant. Mitigation for this impact is not needed, and thus not proposed. 12
Impact Hydro-5 (CP4): Increase in SWP System Pumping Energy Use 13 Simulated average annual SWP pumping energy use for CP4 is shown in Table 14 23-6. Under CP4, there would be an increase in simulated average annual 15 pumping energy use of 42 GWh (1 percent) under both the existing and future 16 levels. This impact would be less than significant. Mitigation for this impact is 17 not needed, and thus not proposed. 18
Impact Hydro-6 (CP4): Decrease in Pit 7 Powerplant Energy Generation 19 Simulated average annual Pit 7 Powerplant generation for CP4 is shown in 20 Table 23-6. Under CP4 the operating range of net head would decrease to about 21 156 to 181 feet, an approximate 10 percent reduction in net head. Under CP4, 22 there would be a decrease in simulated average annual generation of 10 GWh (2 23 percent) under both the existing and future levels. This impact would be less 24 than significant. Mitigation for this impact is not needed, and thus not proposed. 25
CP5 – 18.5-Foot Dam Raise, Combination Plan 26 CP5 primarily focuses on increasing water supply reliability, anadromous fish 27 survival, Shasta Lake area environmental resources, and recreation 28 opportunities. By raising Shasta Dam 18.5 feet, in combination with spillway 29 modifications, CP5 would increase the height of the reservoir full pool by 20.5 30 feet and enlarge the total storage capacity in the reservoir by 634,000 acre-feet. 31 The existing TCD would be extended to achieve efficient use of the expanded 32 cold-water pool. Shasta Dam operational guidelines would continue essentially 33 unchanged, except during dry years and critical years, when 150 TAF and 75 34 TAF, respectively, of the increased storage capacity in Shasta Reservoir would 35 be reserved to specifically focus on increasing M&I deliveries. CP5 also 36 includes constructing additional fish habitat in and along the shoreline of Shasta 37 Lake and along the lower reaches of its tributaries; augmenting spawning gravel 38 and restoring riparian, floodplain, and side channel habitat in the upper 39 Sacramento River; and increasing recreation opportunities at Shasta Lake. CP5 40 would help reduce future water shortages by increasing drought year and 41 average year water supply reliability for agricultural and M&I deliveries. In 42 addition, the increased depth and volume of the cold-water pool in Shasta 43
23-21 Draft – June 2013
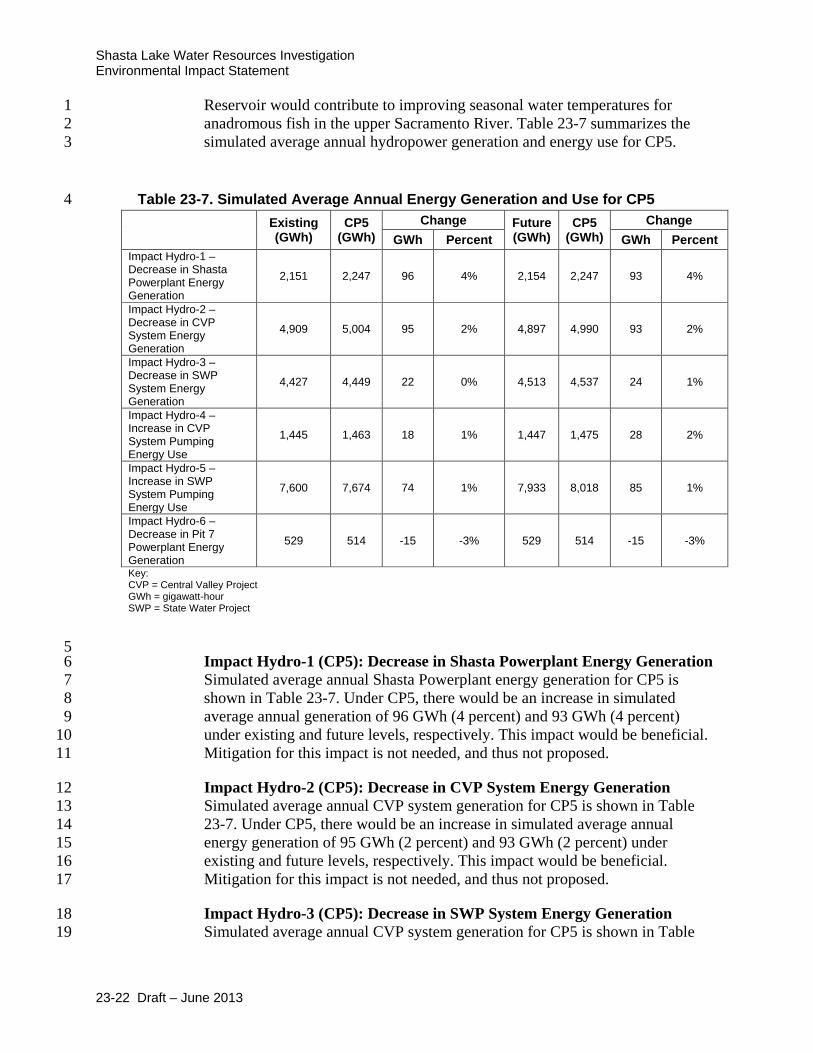
Shasta Lake Water Resources Investigation Environmental Impact Statement
Reservoir would contribute to improving seasonal water temperatures for 1 anadromous fish in the upper Sacramento River. Table 23-7 summarizes the 2 simulated average annual hydropower generation and energy use for CP5. 3
Table 23-7. Simulated Average Annual Energy Generation and Use for CP5 4
5 Impact Hydro-1 (CP5): Decrease in Shasta Powerplant Energy Generation 6 Simulated average annual Shasta Powerplant energy generation for CP5 is 7 shown in Table 23-7. Under CP5, there would be an increase in simulated 8 average annual generation of 96 GWh (4 percent) and 93 GWh (4 percent) 9 under existing and future levels, respectively. This impact would be beneficial. 10 Mitigation for this impact is not needed, and thus not proposed. 11
Impact Hydro-2 (CP5): Decrease in CVP System Energy Generation 12 Simulated average annual CVP system generation for CP5 is shown in Table 13 23-7. Under CP5, there would be an increase in simulated average annual 14 energy generation of 95 GWh (2 percent) and 93 GWh (2 percent) under 15 existing and future levels, respectively. This impact would be beneficial. 16 Mitigation for this impact is not needed, and thus not proposed. 17
Impact Hydro-3 (CP5): Decrease in SWP System Energy Generation 18 Simulated average annual CVP system generation for CP5 is shown in Table 19
Existing (GWh)
CP5 (GWh)
Change Future (GWh)
CP5 (GWh)
Change GWh Percent GWh Percent
Impact Hydro-1 – Decrease in Shasta Powerplant Energy Generation
2,151 2,247 96 4% 2,154 2,247 93 4%
Impact Hydro-2 – Decrease in CVP System Energy Generation
4,909 5,004 95 2% 4,897 4,990 93 2%
Impact Hydro-3 – Decrease in SWP System Energy Generation
4,427 4,449 22 0% 4,513 4,537 24 1%
Impact Hydro-4 – Increase in CVP System Pumping Energy Use
1,445 1,463 18 1% 1,447 1,475 28 2%
Impact Hydro-5 – Increase in SWP System Pumping Energy Use
7,600 7,674 74 1% 7,933 8,018 85 1%
Impact Hydro-6 – Decrease in Pit 7 Powerplant Energy Generation
529 514 -15 -3% 529 514 -15 -3%
Key: CVP = Central Valley Project GWh = gigawatt-hour SWP = State Water Project
23-22 Draft – June 2013

Chapter 23 Power and Energy
23-7. Under CP5, there would be an increase in simulated average annual 1 energy generation of 22 GWh (0 percent) and 24 GWh (1 percent) under 2 existing and future levels, respectively. This impact would be less than 3 significant. Mitigation for this impact is not needed, and thus not proposed. 4
Impact Hydro-4 (CP5): Increase in CVP System Pumping Energy Use 5 Simulated average annual CVP pumping energy use for CP5 is shown in Table 6 23-7. Under CP5, there would be an increase in simulated average annual 7 pumping energy use of 18 GWh (1 percent) and 28 GWh (2 percent) under 8 existing and future levels, respectively. This impact would be less than 9 significant. Mitigation for this impact is not needed, and thus not proposed. 10
Impact Hydro-5 (CP5): Increase in SWP System Pumping Energy Use 11 Simulated average annual SWP pumping energy use for CP5 is shown in Table 12 23-7. Under CP5, there would be an increase in simulated average annual 13 pumping energy use of 74 GWh (1 percent) and 85 GWh (1 percent) under 14 existing and future levels, respectively. This impact would be less than 15 significant. Mitigation for this impact is not needed, and thus not proposed. 16
Impact Hydro-6 (CP5): Decrease in Pit 7 Powerplant Energy Generation 17 Simulated average annual Pit 7 Powerplant generation for CP5 is shown in 18 Table 23-7. Under CP5 the operating range of net head would decrease to about 19 156 to 181 feet, an approximate 10 percent reduction in net head. Under CP5, 20 there would be a decrease in simulated average annual generation of 15 GWh (3 21 percent) under both the existing and future levels. This impact would be less 22 than significant. Mitigation for this impact is not needed, and thus not proposed. 23
23.3.4 Mitigation Measures 24 Table 23-8 presents a summary of impacts and mitigation measures for power 25 and energy. No potentially significant impacts have been identified; therefore, 26 no mitigation is required. 27
23-23 Draft – June 2013
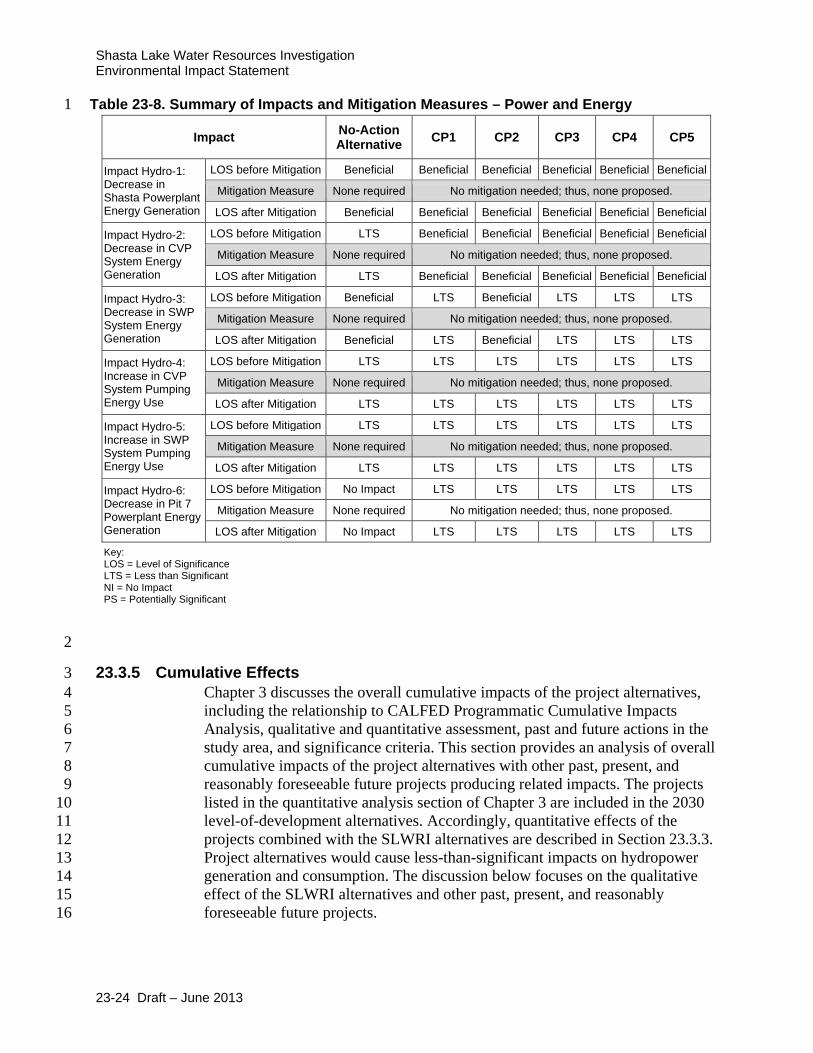
Shasta Lake Water Resources Investigation Environmental Impact Statement
Table 23-8. Summary of Impacts and Mitigation Measures – Power and Energy 1
2
23.3.5 Cumulative Effects 3 Chapter 3 discusses the overall cumulative impacts of the project alternatives, 4 including the relationship to CALFED Programmatic Cumulative Impacts 5 Analysis, qualitative and quantitative assessment, past and future actions in the 6 study area, and significance criteria. This section provides an analysis of overall 7 cumulative impacts of the project alternatives with other past, present, and 8 reasonably foreseeable future projects producing related impacts. The projects 9 listed in the quantitative analysis section of Chapter 3 are included in the 2030 10 level-of-development alternatives. Accordingly, quantitative effects of the 11 projects combined with the SLWRI alternatives are described in Section 23.3.3. 12 Project alternatives would cause less-than-significant impacts on hydropower 13 generation and consumption. The discussion below focuses on the qualitative 14 effect of the SLWRI alternatives and other past, present, and reasonably 15 foreseeable future projects. 16
Impact No-Action Alternative CP1 CP2 CP3 CP4 CP5
Impact Hydro-1: Decrease in Shasta Powerplant Energy Generation
LOS before Mitigation Beneficial Beneficial Beneficial Beneficial Beneficial Beneficial
Mitigation Measure None required No mitigation needed; thus, none proposed.
LOS after Mitigation Beneficial Beneficial Beneficial Beneficial Beneficial Beneficial
Impact Hydro-2: Decrease in CVP System Energy Generation
LOS before Mitigation LTS Beneficial Beneficial Beneficial Beneficial Beneficial
Mitigation Measure None required No mitigation needed; thus, none proposed.
LOS after Mitigation LTS Beneficial Beneficial Beneficial Beneficial Beneficial
Impact Hydro-3: Decrease in SWP System Energy Generation
LOS before Mitigation Beneficial LTS Beneficial LTS LTS LTS
Mitigation Measure None required No mitigation needed; thus, none proposed.
LOS after Mitigation Beneficial LTS Beneficial LTS LTS LTS
Impact Hydro-4: Increase in CVP System Pumping Energy Use
LOS before Mitigation LTS LTS LTS LTS LTS LTS
Mitigation Measure None required No mitigation needed; thus, none proposed.
LOS after Mitigation LTS LTS LTS LTS LTS LTS
Impact Hydro-5: Increase in SWP System Pumping Energy Use
LOS before Mitigation LTS LTS LTS LTS LTS LTS
Mitigation Measure None required No mitigation needed; thus, none proposed.
LOS after Mitigation LTS LTS LTS LTS LTS LTS
Impact Hydro-6: Decrease in Pit 7 Powerplant Energy Generation
LOS before Mitigation No Impact LTS LTS LTS LTS LTS
Mitigation Measure None required No mitigation needed; thus, none proposed.
LOS after Mitigation No Impact LTS LTS LTS LTS LTS
Key: LOS = Level of Significance LTS = Less than Significant NI = No Impact PS = Potentially Significant
23-24 Draft – June 2013

Chapter 23 Power and Energy
The effects of climate change on operations at Shasta Lake could potentially 1 result in changes to power and energy. As described in the Climate Change 2 Projection Appendix, climate change could result in higher reservoir releases in 3 the winter and early spring due to an increase in runoff during these times. 4 Similarly, climate change could result in lower reservoir inflows and 5 Sacramento tributary flows during the late spring and summer due to a 6 decreased snow pack. This reduction in inflow and tributary flow could result in 7 Shasta Lake storage being reduced due to both a reduced ability to capture 8 flows and an increased need to make releases to meet downstream requirements. 9
CP1 – 6.5-Foot Dam Raise, Anadromous Fish Survival and Water Supply 10 Reliability 11 When combined with other past, present, and reasonably foreseeable future 12 projects, a change in river flows and reservoir elevations would be likely. Since 13 Shasta Reservoir is operated to meet flow and water quality requirements in the 14 Sacramento River and Delta, any new project or program along the Sacramento 15 River and in the Delta could potentially impact the CVP and SWP facility 16 hydropower generation and consumption of CP1. With the implementation of 17 many of the projects, Shasta Reservoir could be reoperated, which would result 18 in changes to the Sacramento River flow regime and reservoir elevations, and 19 could cause a potentially significant impact on CVP/SWP facility hydropower 20 generation and consumption. 21
As stated previously, effects of climate change on operations of Shasta Lake 22 could include increased inflows and releases at certain times of the year, and 23 decreased inflows and storage at other times. The additional storage associated 24 with CP1 would potentially diminish these effects and allow Shasta Lake to 25 capture some of the increased runoff in the winter and early spring for release in 26 late spring and summer. Additionally, the increased storage volume would 27 allow Shasta Lake to maintain greater storage and potentially greater 28 hydropower generation. Therefore, the addition of anticipated effects of climate 29 change would not result in CP1 having a significant cumulative impact. 30
CP2 – 12.5-Foot Dam Raise, Anadromous Fish Survival and Water Supply 31 Reliability 32 When combined with other past, present, and reasonably foreseeable future 33 projects, a change in river flows and reservoir elevations would be likely. Since 34 Shasta Reservoir is operated to meet flow and water quality requirements in the 35 Sacramento River and Delta, any new project or program along the Sacramento 36 River and in the Delta could potentially impact the CVP and SWP facility 37 hydropower generation and consumption of CP2. With the implementation of 38 many of the projects, Shasta Reservoir could be reoperated, which would result 39 in changes to the Sacramento River flow regime and reservoir elevations, and 40 could cause a potentially significant impact on CVP/SWP facility hydropower 41 generation and consumption. 42
23-25 Draft – June 2013

Shasta Lake Water Resources Investigation Environmental Impact Statement
As stated previously, effects of climate change on operations of Shasta Lake 1 could include increased inflows and releases at certain times of the year, and 2 decreased inflows and storage at other times. The additional storage associated 3 with CP2 would potentially diminish these effects and allow Shasta Lake to 4 capture some of the increased runoff in the winter and early spring for release in 5 late spring and summer. Additionally, the increased storage volume would 6 allow Shasta Lake to maintain greater storage and potentially greater 7 hydropower generation. Therefore, the addition of anticipated effects of climate 8 change would not result in CP2 having a significant cumulative impact. 9
CP3 – 18.5-Foot Dam Raise, Agricultural Water Supply Reliability and 10 Anadromous Fish Survival 11 When combined with other past, present, and reasonably foreseeable future 12 projects, a change in river flows and reservoir elevations would be likely. Since 13 Shasta Reservoir is operated to meet flow and water quality requirements in the 14 Sacramento River and Delta, any new project or program along the Sacramento 15 River and in the Delta could potentially impact the CVP and SWP facility 16 hydropower generation and consumption of CP3. With the implementation of 17 many of the projects, Shasta Reservoir could be reoperated, which would result 18 in changes to the Sacramento River flow regime and reservoir elevations, and 19 could cause a potentially significant impact on CVP/SWP facility hydropower 20 generation and consumption. 21
As stated previously, effects of climate change on operations of Shasta Lake 22 could include increased inflows and releases at certain times of the year, and 23 decreased inflows and storage at other times. The additional storage associated 24 with CP3 would potentially diminish these effects and allow Shasta Lake to 25 capture some of the increased runoff in the winter and early spring for release in 26 late spring and summer. Additionally, the increased storage volume would 27 allow Shasta Lake to maintain greater storage and potentially greater 28 hydropower generation. Therefore, the addition of anticipated effects of climate 29 change would not result in CP3 having a significant cumulative impact. 30
CP4 – 18.5-Foot Dam Raise, Anadromous Fish Focus With Water Supply 31 Reliability 32 When combined with other past, present, and reasonably foreseeable future 33 projects, a change in river flows and reservoir elevations would be likely. Since 34 Shasta Reservoir is operated to meet flow and water quality requirements in the 35 Sacramento River and Delta, any new project or program along the Sacramento 36 River and in the Delta could potentially impact the CVP and SWP facility 37 hydropower generation and consumption of CP4. With the implementation of 38 many of the projects, Shasta Reservoir could be reoperated, which would result 39 in changes to the Sacramento River flow regime and reservoir elevations, and 40 could cause a potentially significant impact on CVP/SWP facility hydropower 41 generation and consumption. 42
23-26 Draft – June 2013

Chapter 23 Power and Energy
As stated previously, effects of climate change on operations of Shasta Lake 1 could include increased inflows and releases at certain times of the year, and 2 decreased inflows and storage at other times. The additional storage associated 3 with CP4 would potentially diminish these effects and allow Shasta Lake to 4 capture some of the increased runoff in the winter and early spring for release in 5 late spring and summer. Additionally, the increased storage volume would 6 allow Shasta Lake to maintain greater storage and potentially greater 7 hydropower generation. Therefore, the addition of anticipated effects of climate 8 change would not result in CP4 having a significant cumulative impact. 9
CP5 – 18.5-Foot Dam Raise, Combination Plan 10 When combined with other past, present, and reasonably foreseeable future 11 projects, a change in river flows and reservoir elevations would be likely. Since 12 Shasta Reservoir is operated to meet flow and water quality requirements in the 13 Sacramento River and Delta, any new project or program along the Sacramento 14 River and in the Delta could potentially impact the CVP and SWP facility 15 hydropower generation and consumption of CP5. With the implementation of 16 many of the projects, Shasta Reservoir could be reoperated, which would result 17 in changes to the Sacramento River flow regime and reservoir elevations, and 18 could cause a potentially significant impact on CVP/SWP facility hydropower 19 generation and consumption. 20
As stated previously, effects of climate change on operations of Shasta Lake 21 could include increased inflows and releases at certain times of the year, and 22 decreased inflows and storage at other times. The additional storage associated 23 with CP5 would potentially diminish these effects and allow Shasta Lake to 24 capture some of the increased runoff in the winter and early spring for release in 25 late spring and summer. Additionally, the increased storage volume would 26 allow Shasta Lake to maintain greater storage and potentially greater 27 hydropower generation. Therefore, the addition of anticipated effects of climate 28 change would not result in CP5 having a significant cumulative impact. 29
30
23-27 Draft – June 2013

Shasta Lake Water Resources Investigation Environmental Impact Statement
1
This page left blank intentionally. 2 3
23-28 Draft – June 2013
Chapter 24 Environmental Justice
Chapter 24 1
Environmental Justice 2
24.1 Affected Environment 3
24.1.1 Minority and Low-Income Populations 4 The environmental setting of a project area can be viewed from both a 5 geographic perspective and a human perspective. The physical environment 6 provides a geographical context for the populations to be evaluated in this EIS. 7 The human perspective encompasses race, ethnic origin, and economic status of 8 affected groups. 9
The intent of an environmental justice evaluation under Executive Order 12898, 10 Federal Actions to Address Environmental Justice in Minority and Low Income 11 Populations (1994), is to identify communities and groups that meet 12 environmental justice criteria, and suggest strategies to reduce potential adverse 13 impacts of projects on affected groups. 14
In its guide to environmental justice under NEPA, the Council on 15 Environmental Quality (CEQ) (1997) encourages agencies to consider all of the 16 following groups in the scoping process: 17
• Religious organizations 18
• Newspapers, radio, and other media 19
• Civic associations 20
• Minority business associations 21
• Environmental and environmental justice organizations 22
• Legal aid providers 23
• Homeowners’, tenants’, and neighborhood watch groups 24
• Federal, State, local, and tribal governments 25
• Rural cooperatives 26
• Business and trade organizations 27
24-1 Draft – June 2013

Shasta Lake Water Resources Investigation Environmental Impact Statement
• Community and social service organizations 1
• Universities, colleges, vocational, and other schools 2
• Labor organizations 3
• Civil rights organizations 4
• Local schools and libraries 5
• Senior citizens’ groups 6
• Public health agencies and clinics 7
Shasta Lake and Vicinity 8 This section reviews minority and low-income communities situated near the 9 reservoir, and those that directly depend on it for social, economic, cultural, 10 historic, occupational, recreational, or other needs deemed significant by these 11 communities. 12
Table 24-1 depicts a historically white population that is slowly diversifying 13 and income levels consistently below the statewide average, resulting in 14 relatively higher poverty rates among all ethnic groups. In 2010, the population 15 of Shasta County was approximately 16.6 percent minority (nonwhite) and 16 approximately 17.7 percent low-income, compared to statewide populations of 17 42.4 percent minority and 15.5 percent low-income. The slightly higher local 18 poverty rate is not meaningfully greater than the statewide rate. 19
Lakehead-Lakeshore Community The Lakehead-Lakeshore community is 20 located along Shasta Lake’s northernmost reach, the Sacramento River Arm. 21 Lakehead, an unincorporated seasonal community of approximately 1,500 22 residents (U.S. Census Bureau 2010a), is adjacent to Interstate 5 and includes 23 typical services found near a major interstate highway. Lakehead provides a 24 variety of campgrounds, boat ramps, and marinas. The Lakehead community 25 includes low-income and minority residents and workers who could be affected 26 by project construction and changes in outdoor recreation patterns resulting 27 from the project. 28
Tourism and Outdoor Recreation Industry Shasta Lake and its vicinity are 29 recreation destinations that draw visitors from throughout California. Most 30 facilities in the area depend on Shasta Lake to draw visitors and customers. 31 The tourism and outdoor recreation service industries are included in this 32 discussion because this group includes a community of lower-paid service 33 workers that could be affected by project actions related to Shasta Dam. 34 A change in recreation opportunities could affect employment and revenue 35 patterns, as well as social and recreational opportunities for minority or low-36 income residents. With the exception of Lakehead, the settlement and 37
24-2 Draft – June 2013

Chapter 24 Environmental Justice
recreation-related development along Shasta Lake falls within unincorporated 1 Shasta County. Residents and workers are dispersed throughout Shasta County, 2 and affected minority and low-income communities are reflected in 3 demographic data for Shasta County as shown in Table 24-1. 4
Table 24-1. Ethnicity, Income, and Poverty Trends in Shasta and Tehama 5 Counties and California 6
Topic Shasta County
Tehama County
State of California
Rac
e/Et
hnic
ity
White, 2010 153,726 51,721 21,453,934
White, 2000–2010 (% change) 5.4 8.8 6.4
Black or African American, 2010 1,548 406 2,299,072
Black or African American, 2000–2010 (% change) 26.4 27.7 1.6
American Indian, including Alaskan Natives, 2010 4,950 1,644 362,801
American Indian, including Alaskan Natives, 2000–2010 (% change) 9.3 41.3 8.8
Asian or Pacific Islander, 2010 4,662 732 5,005,393
Asian or Pacific Islander, 2000–2010 (% change) 37.0 47.9 31.2
Two or more races (total), 2010 7,846 2,702 1,815,384
Two or more races (total), 2000–2010 (% change) 38.6 42.3 12.9
Hispanic Origin (any race), 2010 14,878 13,906 14,013,719
Hispanic Origin (any race), 2000–2010 (% change) 65.3 56.8 27.8
Inco
me/
Pove
rty
Median Household Income, 2000 $34,335 $31,206 $47,493
Median Household Income, 2010 $42,931 $39,392 $59,641
% Change, 2000–2010 25.0 26.2 25.5
% of Individuals Below Poverty Level, 2000 15.4 17.3 14.2
% of Individuals Below Poverty Level, 2010 17.7 19.5 15.5
% Change, 2000–2010 2.3 2.2 1.3
% of Children (< 18) Below Poverty Level, 2000 21.0 24.0 19.0
% of Children (< 18) Below Poverty Level, 2010 23.4 27.9 21.6
% Change, 2000–2010 2.4 3.9 2.6
Sources: U.S. Census Bureau 2002a, 2002b, 2002c, 2009a, 2010b
24-3 Draft – June 2013

Shasta Lake Water Resources Investigation Environmental Impact Statement
Areas of Native American Concern As described in Chapter 14, “Cultural 1 Resources,” the Sacramento River and its major tributaries, particularly the Pit 2 and McCloud rivers, were the focus of intensive Native American occupation 3 during historic times, with a variety of religious, economic, historic, and other 4 values identified here for Native American groups. Ten groups, including those 5 listed by the Native American Heritage Commission, represent Native 6 American interests in the study area. They include Grindstone Indian Rancheria, 7 Paskenta Band of Nomlaki Indians, Pit River Environmental Council, Pit River 8 Tribe of California, Redding Rancheria, Shasta Nation, United Tribe of 9 Northern California, Inc., Winnemem Wintu Tribe, Wintu Educational and 10 Cultural Council, and the Wintu Tribe of Northern California. 11
The Winnemem Wintu have identified important localities within the study 12 area, many of which are locations where ceremonies are regularly conducted. 13 Along the McCloud River, these include Children’s Rock, Coyote Rock, 14 Dekkas Rock, doctoring pools near Nawtawaket Creek, Eagle Rock and 15 Samwel Cave, Hirz Bay, Kaibai village, North Gray Rocks, Puberty Rock, 16 Saddle Rock, and Watawacket village and spiritual area. Along the Sacramento 17 River, important localities include the Antlers area, Delta area, Doney Creek, 18 Gregory Creek, LaMoine area, Packers Bay, Pollard’s area, middle Salt Creek, 19 and Sims area. The Winnemem Wintu have strong traditional and contemporary 20 connections with the land, and their ongoing use of many archaeological and 21 religious sites is fundamental to the well-being of their culture, particularly the 22 education of their youth. 23
The Winnemem Wintu have also documented the location of some 155 24 ancestral villages within the Shasta Lake area. At least 81 village locations are 25 known along the lower McCloud River and lower Pit River. An additional 73 26 villages are known to have existed on the east side of the Sacramento River. 27 These village locations once contained between one and 30 houses each, some 28 had associated cemeteries and each had a power place. Some of these villages 29 are already under the waters of Shasta Lake, while others are just above the 30 current Shasta Lake water level. The Winnemem Wintu have estimated that 120 31 of the known villages are still accessible (above the current high-water line). 32
Members of the Pit River Madesi Band stated that 22 ethnographic villages and 33 associated burial grounds are located within the existing reservoir and proposed 34 reservoir areas. One tribal member also noted that several Traditional Cultural 35 Properties (TCP) exist within the Pit 6 and Pit 7 Dam areas. 36
Upper Sacramento River (Shasta Dam to Red Bluff) 37 Many social and public services are provided and a range of resource-dependent 38 cultural activities take place in the cities of Shasta Lake, Redding, Anderson, 39 Cottonwood, and Red Bluff. Each of these communities could be affected 40 during project operation as a result of improved flood protection, enhanced 41 water supply reliability, and increased recreational opportunities and spending 42 related to improved salmonid habitat. Redding and Shasta County may be most 43
24-4 Draft – June 2013

Chapter 24 Environmental Justice
affected because local residents, businesses, public services, and fiscal resources 1 likely would also be affected by construction-related spending and activities. 2
Groups affected by the project could include minority and low-income 3 populations such as transient and seasonal workers, Native American and 4 Hispanic/Latino populations, and low-income water and electric utility 5 customers. In 2010, the population of Tehama County was approximately 18.0 6 percent minority (nonwhite) and 19.5 percent low-income, compared to 7 statewide populations of 42.4 percent minority and 15.5 percent low-income 8 (Table 24-1). Poverty levels in Shasta and Tehama counties were exceeding 9 statewide levels in 2010. 10
These groups often share the need for a reliable income and low costs of living, 11 access to steady jobs, the need to protect the profitability of businesses that 12 affect their personal income, access to high-quality public services, access to 13 affordable and diverse housing, and a desire to enjoy a high quality of life. 14
Minority and low-income populations in the upper Sacramento River portion of 15 the primary study area, many of which are employed by local agricultural 16 operations, are especially susceptible to changes in employment opportunities. 17 Changes in water and power supply reliability or delivery costs can have a 18 major effect on the cost of living and on the operating costs and financial health 19 of local businesses and employers. Changes in the frequency and duration of 20 flooding along the Sacramento River and in the Delta also could affect 21 agricultural operations and business owners and employees. 22
Lower Sacramento River and Delta 23 As discussed in Chapter 16, “Socioeconomics, Population, and Housing,” this 24 portion of the extended study area includes Red Bluff, the largest city in 25 Tehama County with a population of 13,825 in 2010, and nine counties to the 26 south. In 2010, the population of those nine counties totaled 4,226,027 (DOF 27 2010). The minority population of the nine counties was 42.6 percent overall, 28 which is approximately the same as the statewide populations of 42.4 percent. 29 Glenn County had the lowest proportion of minority populations, while 30 Sacramento and San Joaquin counties had the highest proportion (U.S. Census 31 Bureau 2010c). In 2010, poverty levels in the region ranged from 10 percent to 32 20 percent, with low-income populations exceeding the 15.5 percent state 33 poverty level in Butte, Glenn, Sacramento, San Joaquin, and Yolo counties 34 (U.S. Census Bureau 2009b). 35
Regional employment and labor trends are generally consistent with statewide 36 trends. In 2010, approximately 15.6 percent of the labor force in the nine-county 37 area was unemployed, compared to 7.7 percent statewide (U.S. Census Bureau 38 2009b). Butte, Colusa, Sacramento, San Joaquin, Solano, and Sutter counties 39 registered higher unemployment rates than California as a whole. The counties 40 with the highest unemployment rates in 2010 were characterized by greater 41 dependence on the agricultural industry and less industrial diversity. Five of the 42
24-5 Draft – June 2013
Shasta Lake Water Resources Investigation Environmental Impact Statement
six counties with unemployment rates above the statewide average maintained 1 more than 60 percent of their land mass in agricultural production. 2 Unemployment rates tend to be higher in rural areas than in urban areas because 3 farm work is typically seasonal or temporary. 4
The lower Sacramento River region becomes increasingly urbanized as the river 5 flows past the city of Sacramento and toward the Delta. Along its course, the 6 river passes through low-density agricultural and suburban metropolitan areas 7 and near high-density centers of commerce and culture such as Sacramento. In 8 the Delta, a complex network of highways and urban infrastructure is integrated 9 with canals, dikes, and levees. Heavily engineered water control and 10 conveyance systems have promoted and sustained a successful agriculture 11 industry and protected the region against damaging floods. 12
CVP/SWP Service Areas 13 The CVP and SWP service areas include 36 of California’s 58 counties, 14 accounting for 91 percent (38,648,090 residents) of California’s population in 15 2010 (DOF 2010). Minority groups have been steadily increasing and such 16 ethnic diversification is expected to continue. As shown in Table 24-1, the 17 population of individuals in California identifying themselves as Asian–Pacific 18 Islander or multiracial experienced double-digit population growth, while those 19 identifying themselves as Black or African American experienced the least 20 amount of growth between 2000 and 2010 (U.S. Census Bureau 2010b). 21 Hispanics are the most numerous minority group in California, and many 22 members of this ethnic group work on farms that receive some or all of their 23 water from the CVP. In general, rural agricultural counties have smaller 24 minority populations than urban counties. 25
Poverty levels for both individuals and children increased slightly between 2000 26 and 2010. The percentage of people below the poverty level is expected to 27 follow national and statewide economic trends. Generally, poverty rates tend to 28 be higher in rural counties than in urban counties. Despite these differences, 29 each of California’s major urban areas has pockets of low-income 30 neighborhoods with high poverty (and unemployment) rates. Minority and low-31 income communities that might be affected by the project include communities 32 adjacent to construction projects, gateway and service communities providing 33 support to construction-related activities, and low-income customers of water 34 and power utilities who might experience higher rates as a result of costs of 35 project-related system improvements. 36
These residents and workers may be most vulnerable to increases in CVP water 37 and power costs and, conversely, would benefit from improved flood protection 38 and CVP water and power supply reliability. Central Valley farm workers and 39 other workers employed by businesses in the region that supply goods and 40 services to agricultural operations also could benefit. 41
24-6 Draft – June 2013

Chapter 24 Environmental Justice
24.2 Regulatory Framework 1
24.2.1 Federal 2
Executive Order 12898 3 The purpose of Executive Order 12898 (part of which is excerpted in the 4 introduction to this chapter) is to identify and address the disproportionate 5 placement of adverse environmental, economic, social, or health impacts from 6 Federal actions and policies on minority and/or low-income communities. This 7 order requires lead agencies to evaluate impacts on minority or low-income 8 populations during preparation of environmental and socioeconomic analyses of 9 projects or programs that are proposed, funded, or licensed by Federal agencies. 10
In addition to the direction referenced above, Executive Order 12898 includes 11 the following requirements: 12
• Each Federal agency shall conduct its programs, policies, and activities 13 that substantially affect human health or the environment, in a manner 14 that ensures that such programs, policies, and activities do not have the 15 effect of excluding persons (including populations) from participation 16 in, denying persons (including populations) the benefits of, or 17 subjecting persons (including populations) to discrimination under, 18 such programs, policies, and activities, because of their race, color, or 19 national origin. (Section 2-2) 20
• Each Federal agency shall work to ensure that public documents, 21 notices, and hearings relating to human health or the environment are 22 concise, understandable, and readily accessible to the public. (Section 23 5-5(c)) 24
In addition, the presidential memorandum accompanying the executive order 25 states that “(e)ach Federal agency shall analyze the environmental effects, 26 including human health, economic and social effects, of Federal actions, 27 including effects on minority communities and low-income communities, when 28 such analysis is required by the NEPA of 1969.” 29
Two documents provide some measure of guidance to agencies required to 30 implement Executive Order 12898. The first is Environmental Justice Guidance 31 Under the National Environmental Policy Act (December 1997), published by 32 CEQ. The second document, the Final Guidance for Incorporating 33 Environmental Justice Concerns (April 1998) published in the U.S. 34 Environmental Protection Agency’s NEPA Compliance Analysis, serves as a 35 guide for incorporating environmental justice goals into preparation of the EIS 36 under NEPA. These documents provide specific guidelines for assessing 37 environmental justice effects associated with a proposed Federal project. 38
24-7 Draft – June 2013

Shasta Lake Water Resources Investigation Environmental Impact Statement
24.2.2 State 1 There are no State plans, policies, regulations, or laws related to environmental 2 justice applicable to the project. However, Senate Bill 115 (Chapter 690, 3 Statutes of 1999), signed into law in 1999, defined environmental justice in 4 statute and established the Governor’s Office of Planning and Research as the 5 coordinating agency for State environmental justice programs (California 6 Government Code, Section 65040.12). This law further required the California 7 Environmental Protection Agency to develop a model environmental justice 8 mission statement for boards, departments, and offices within the agency by 9 January 1, 2001 (Public Resources Code, Sections 72000–72001). The purpose 10 of this program is to inform decision-makers by providing guidance on 11 environmental justice issues. 12
24.2.3 Regional and Local 13 There are no regional or local plans, policies, regulations, or laws related to 14 environmental justice applicable to the project. 15
24.3 Environmental Consequences and Mitigation Measures 16
This section describes the potential environmental consequences of the project 17 alternatives as they relate to environmental justice. This analysis relies on 18 demographic data provided in the Socioeconomics, Population, and Housing 19 Technical Report and incorporates that information as necessary to describe 20 potential effects on minority and low-income communities. 21
24.3.1 Methods and Assumptions 22 According to CEQ and U.S. Environmental Protection Agency guidelines 23 established to assist Federal and State agencies, a minority population is present 24 in a project area if (1) the minority population of the affected area exceeds 50 25 percent, or (2) the minority-population percentage of the affected area is 26 meaningfully greater than the minority-population percentage in the general 27 population or other appropriate unit of geographic analysis. By the same rule, a 28 low-income population exists if the project area consists of 50 percent or more 29 people living below the poverty threshold, as defined by the U.S. Census 30 Bureau, or is meaningfully greater than the poverty percentage of the general 31 population or other appropriate unit of geographic analysis. 32
The CEQ guidance indicates that when agencies determine whether 33 environmental effects are disproportionately high and adverse, they are to 34 consider whether there is or would be an impact on the natural or physical 35 environment (as defined by NEPA) that would adversely affect a minority 36 population or low-income population. 37
None of the published guidelines define the term “disproportionately high and 38 adverse,” but CEQ includes a nonquantitative definition stating that an effect is 39
24-8 Draft – June 2013

Chapter 24 Environmental Justice
disproportionate if it appreciably exceeds the risk or rate to the general 1 population (CEQ 1997). 2
The following population characteristics are considered in this analysis: 3
• Race and ethnicity 4
• Per-capita income as it relates to the poverty level 5
The relevant demographic data were obtained from the U.S. Census Bureau and 6 the California Department of Finance. Data are presented at the county level to 7 accommodate the geographic size of each portion of the study area. 8
In this analysis, a county is considered to have a minority population if its 9 nonwhite population is greater than 50 percent or is meaningfully larger than the 10 general (statewide) nonwhite population. Low-income areas are defined as 11 counties in which the percentage of the population below poverty status exceeds 12 50 percent, or is meaningfully greater than the general population (average 13 statewide poverty level). 14
Native American Outreach 15 Public and stakeholder coordination meetings were conducted on behalf of 16 Reclamation with Native American tribal groups whose traditional territories 17 overlap the primary study area. Seven tribal groups were invited to an 18 information meeting held on April 4, 2007, in Redding, California. The purpose 19 of the meeting was to provide general information about the project, initiate 20 Section 106 consultation with groups desiring to participate in the project, and 21 introduce Elena Nilsson as the Native American Tribal Coordination study lead. 22 Invitations were sent to the Grindstone Rancheria, Paskenta Rancheria, Pit 23 River Tribe, Redding Rancheria, Shasta Nation, Winnemem Wintu, and the 24 Wintu Tribe and Toyon-Wintu Center. The meeting was attended by 25 representatives from the Winnemem Wintu and the Madesi Band of the Pit 26 River Tribe. 27
Between August 2007 and March 2008, nine meetings were held with Native 28 American groups whose traditional territories overlap with the primary study 29 area. These included meetings and/or workshops with groups and individuals 30 representing major tribes and/or extended family groups in the Shasta/Redding 31 area regarding potential effects on cultural resources from a plan to enlarge 32 Shasta Dam. The purposes of the meetings were to solicit, clarify, and 33 document major concerns and issues regarding the project, and to establish a 34 preferred method/approach to maintaining effective communication during the 35 remainder of the project study and in future endeavors. Five groups participated 36 in these meetings: Grindstone Indian Rancheria (one meeting), Paskenta Band 37 of Nomlaki Indians (one meeting), Pit River Tribe (three meetings), Shasta 38 Nation (one meeting), and Winnemem Wintu (three meetings). 39
24-9 Draft – June 2013

Shasta Lake Water Resources Investigation Environmental Impact Statement
24.3.2 Criteria for Determining Disproportionately High and Adverse Effects 1 To make a finding that disproportionately high and adverse effects would likely 2 fall on minority or low-income populations, three conditions must be met 3 simultaneously: 4
• There must be a minority or low-income population in the impact zone. 5
• A high and adverse impact must exist. 6
• The impact must be disproportionately high and adverse on the 7 minority or low-income population. 8
24.3.3 Topics Eliminated from Further Consideration 9 No topics related to environmental justice that are included in the significance 10 criteria listed above have been eliminated from further consideration. All 11 relevant topics are analyzed below. 12
Effects on sites considered sacred by local Native American communities in the 13 upper Sacramento River portion of the primary study area and the lower 14 Sacramento River and Delta and CVP and SWP service areas have been 15 eliminated from further discussion. No impacts on these resources are 16 anticipated as a result of changes in Shasta Dam operations (i.e., storage and 17 release scenarios). Furthermore, any construction activities near sites considered 18 sacred by local Native American communities would require mitigation as 19 stated in Chapter 14 “Cultural Resources”, including compliance with Section 20 106 of the National Historic Preservation Act (NHPA). As a result, no 21 disproportionately high and adverse effects on Native American populations 22 would be expected; therefore, potential effects related to this topic in these 23 geographic regions are not discussed further in this EIS. 24
24.3.4 Direct and Indirect Effects 25
No-Action Alternative 26
Shasta Lake and Vicinity 27 Impact EJ-1 (No-Action): Potential Disproportionate High and Adverse Effect 28 on Minority and Low-Income Populations in the Vicinity of Shasta Lake 29 Communities at Shasta Lake and in the vicinity would remain below minority 30 and low-income thresholds as they relate to environmental justice. Adverse 31 construction-related impacts would be avoided, and construction-related 32 employment opportunities and gains within local economies would not be 33 realized. Existing adverse effects on minority or low-income populations do not 34 constitute a disproportionately high and adverse impact. No disproportionately 35 high and adverse effects on minority or low-income populations would occur. 36
Shasta County would maintain its steady population growth under the No-37 Action Alternative. Between 1990 and 2010, the population increased by 25.3 38
24-10 Draft – June 2013

Chapter 24 Environmental Justice
percent, with total population projected to reach 196,087 by 2020 (DOF 2010, 1 2012). The minority (nonwhite) population, including the Winnemem Wintu 2 Tribe and other Native Americans, is projected to account for 16.6 percent of 3 the total population in Shasta County in 2020, slightly more than the current 4 14.3 percent representation, but less than the 62.5 percent minority population 5 projected statewide for 2020. 6
As described in Table 24-1, the poverty level in Shasta County increased by 2.3 7 percent during 2000 to 2010, and unemployment rates in Shasta County were 8 mostly steady during 2000 to 2010, fluctuating between 6.0 and 8.1 percent. 9 However, the poverty and unemployment rates are expected to decrease as the 10 economy recovers. Employment opportunities continue to be provided in the 11 region by major employment sectors such as trade, transportation, and utilities; 12 government; educational, and health services; and leisure and hospitality 13 industries (see Chapter 16, “Socioeconomics, Population, and Housing”). 14 Professional and business services and education and health services are 15 projected to be the leading growth industries in Shasta County; these are also 16 the top two anticipated growth industries statewide. No disproportionately high 17 or adverse impacts on minority or low-income communities are anticipated 18 under the No-Action Alternative. Mitigation is not required for the No-Action 19 Alternative. 20
Impact EJ-2 (No-Action): Potential Disproportionate High and Adverse Effect 21 on Native American Populations from Disturbance or Loss of Sacred Locations 22 in the Vicinity of Shasta Lake Shasta Dam would not be enlarged; no 23 infrastructure would be removed, modified, or relocated; and no changes in 24 Reclamation’s Shasta Lake operations would occur. No disproportionately high 25 and adverse effects on Native American populations would occur. 26
Under the No-Action Alternative, Shasta Dam would not be enlarged; no 27 infrastructure would be removed, modified, or relocated; and no changes in 28 Reclamation’s Shasta Lake operations would occur. Therefore, there would be 29 no effect on several locations in the vicinity of Shasta Lake that are considered 30 sacred by local Native American communities. No disproportionately high and 31 adverse effects on Native American populations would occur. Mitigation is not 32 required for the No-Action Alternative. 33
Upper Sacramento River (Shasta Dam to Red Bluff) 34 Impact EJ-3 (No-Action): Potential Disproportionate High and Adverse Effect 35 on Minority and Low-Income Populations in the Upper Sacramento River Area 36 Communities in the upper Sacramento River portion of the primary study area 37 would remain below minority and low-income thresholds for environmental 38 justice. The No-Action Alternative would not cause long-term operational 39 changes; therefore, communities adjacent to the Sacramento River would not be 40 affected by long-term changes to environmental and recreational conditions. 41 Construction-related gains within this area would not be realized. Existing 42 adverse effects on minority or low-income populations would not be 43
24-11 Draft – June 2013

Shasta Lake Water Resources Investigation Environmental Impact Statement
disproportionately high and adverse. No disproportionately high and adverse 1 effects on minority or low-income populations would occur. 2
Tehama County would maintain its steady population growth under the No-3 Action Alternative. Between 1990 and 2010, the population increased by 27.2 4 percent, with total population projected to reach 68,769 by 2020 (DOF 2010). 5 The minority (nonwhite) population is projected to account for 31 percent of the 6 total population in Tehama County in 2020, an increase of nearly 7 percent from 7 the current 23.9 percent level, but less than the 62.5 percent minority population 8 projected statewide for 2020. 9
As described in Chapter 16, “Socioeconomics, Population, and Housing,” 10 during 2000 to 2010, the poverty level in Tehama County increased by 2.2 11 percent and unemployment rates in Tehama County fluctuated between 6.4 and 12 8.8 percent. Tehama County is similar to neighboring Shasta County in 13 employment and income trends, and dominant employment sectors. Projected 14 growth industries differ between the two counties, however; Tehama County is 15 projected to experience economic growth in construction and information 16 services (see Chapter 16, “Socioeconomics, Population, and Housing”). These 17 sectors are the third and fifth largest anticipated growth areas statewide. 18
Because the No-Action Alternative would not change existing or projected 19 future conditions, it would not have a disproportionately high or adverse effect 20 on minority or low-income communities. Mitigation is not required for the No-21 Action Alternative. 22
Lower Sacramento River and Delta 23 Impact EJ-4 (No-Action): Potential Disproportionate High and Adverse Effect 24 on Minority and Low-Income Populations in the Lower Sacramento River and 25 Delta Area Some communities within the lower Sacramento River and Delta 26 portion of the extended study area contain minority and low-income populations 27 above environmental justice thresholds; however, continuing the existing and 28 projected future conditions under the No-Action Alternative would not affect 29 those populations. No disproportionately high and adverse effects on minority 30 or low-income populations would occur. 31
The lower Sacramento River and Delta portion of the extended study area 32 includes Butte, Colusa, Contra Costa, Glenn, Sacramento, San Joaquin, Solano, 33 Sutter, and Yolo counties. In 2010, the population of the nine-county region was 34 4,226,027. This number is expected to grow by 47.5 percent to 6,294,088 by 35 2020 (DOF 2010, 2012). The minority (nonwhite) population is projected to 36 account for 63.8 percent of the total population in the lower Sacramento River 37 and Delta area by 2020, with minority populations exceeding 50 percent in 38 Colusa, Sacramento, San Joaquin, Solano, Sutter, and Yolo counties. Although 39 the minority population in the lower Sacramento River and Delta area is 40 projected to exceed 50 percent by 2020, the 63.8 percent representation would 41
24-12 Draft – June 2013

Chapter 24 Environmental Justice
not be meaningfully greater than the statewide minority population, which is 1 projected to be 62.5 percent. 2
In 2010, poverty levels in the nine-county region ranged from 10 percent to 20 3 percent, with low-income populations exceeding the 15.5 percent statewide 4 poverty level in Butte, Glenn, Sacramento, San Joaquin, and Yolo counties 5 (U.S. Census Bureau 2009b). Employment and labor trends in the lower 6 Sacramento River and Delta portion of the extended study area are generally 7 consistent with statewide trends. In 2010, approximately 15.6 percent of the 8 labor force in the nine-county area was classified as unemployed, compared to a 9 statewide total of 7.7 percent. Butte, Colusa, Sacramento, San Joaquin, Solano, 10 and Sutter counties registered higher unemployment rates than the state as a 11 whole in 2010. Generally, the counties with the highest unemployment rates in 12 2010 were characterized by greater dependence on the agricultural industry and 13 less industrial diversity. Five of the six counties with unemployment rates above 14 the statewide average maintained more than 60 percent of their land mass in 15 agricultural production. Unemployment rates tend to be higher in rural areas 16 than in urban areas because farm work is typically seasonal or temporary. 17
The lower Sacramento River and Delta portion of the extended study area has 18 some low-income populations and some counties with a higher unemployment 19 rate than the statewide average. However, the No-Action Alternative would not 20 change the existing or projected future conditions. Therefore, the No-Action 21 Alternative would not have disproportionately high and adverse effects on 22 minority or low-income populations. Mitigation is not required for the No-23 Action Alternative. 24
CVP/SWP Service Areas 25 Impact EJ-5 (No-Action): Potential Disproportionate High and Adverse Effect 26 on Minority and Low-Income Populations in the CVP/SWP Service Areas 27 Some communities within the CVP and SWP service areas contain minority and 28 low-income populations above environmental justice thresholds; however, 29 adverse effects on CVP and SWP customers within these communities do not 30 constitute a disproportionately high and adverse impact. Continuing the existing 31 and projected future conditions under the No-Action Alternative would not 32 affect these populations. No disproportionately high and adverse effects on 33 minority or low-income populations would occur. 34
The CVP and SWP service areas are so expansive that they may be considered 35 synonymous with the entire state of California for environmental justice 36 purposes. Together, the CVP and SWP service areas include 36 of California’s 37 58 counties, accounting for 91 percent (39 million residents) of California’s 38 population in 2010. The state’s population has increased by almost 30 percent 39 since 1990 and is projected to increase by approximately 32 percent to more 40 than 51 million people by 2020 (DOF 2010). Continued ethnic diversification is 41 expected. Minority groups have been steadily increasing their proportion of the 42 state population. The population of individuals in California identifying 43
24-13 Draft – June 2013

Shasta Lake Water Resources Investigation Environmental Impact Statement
themselves as Asian–Pacific Islander or multiracial experienced double-digit 1 population growth, while those identifying themselves as Black or African 2 American experienced the least amount of growth between 2000 and 2010 (U.S. 3 Census Bureau 2010b). Hispanics are the most numerous minority group in 4 California, and many members of this ethnic group work on farms that receive 5 some or all of their water from the CVP. In general, rural agricultural counties 6 have smaller minority populations than urban counties. 7
Poverty levels for both individuals and children in California increased slightly 8 between 2000 and 2010. The percentage of people below the poverty level in 9 Shasta County is expected to follow national and statewide economic trends. 10 Generally, poverty rates tend to be higher in rural counties than in urban 11 counties. Despite these overall differences, each of the state’s major urban areas 12 has pockets of low-income neighborhoods with high poverty rates. 13
California’s total labor force increased just over 2 percent from 2002 to 2005, 14 adding between 100,000 and 200,000 individuals each year. Between 2004 and 15 2005, the labor force increased by approximately 188,000 individuals. This was 16 the largest annual increase over the 4-year period. California’s total labor force 17 exceeded 18.8 million in 2010. The state’s unemployment rate was lowest in 18 2000 (5.0 percent), and has been increasing since 2003. Unemployment in 2010 19 registered at 7.7 percent, greater than the state’s 2001 unemployment rate of 5.4. 20 This observed increase in the unemployment rate at the state level has coincided 21 with similar national employment trends. Like poverty, unemployment rates 22 tend to be lower in urban areas than in rural areas of the state; however, high 23 unemployment rates are often found in low-income neighborhoods of major 24 urban centers. 25
Although the CVP and SWP service areas have some low-income populations, 26 the No-Action Alternative would not change the existing or projected future 27 conditions. Therefore, no disproportionately high and adverse effects on 28 minority or low-income populations would occur. Mitigation is not required for 29 the No-Action Alternative. 30
CP1 – 6.5-Foot Dam Raise, Anadromous Fish Survival and Water Supply 31 Reliability 32 Shasta Lake and Vicinity 33 Impact EJ-1 (CP1): Potential Disproportionate High and Adverse Effect on 34 Minority and Low-Income Populations in the Vicinity of Shasta Lake 35 Communities adjacent to the project construction site may experience 36 temporary or short-term adverse environmental effects because of construction 37 activities and changes in project conditions and operations. However, neither 38 construction-related nor operational effects would disproportionately affect 39 minority or low-income populations in the vicinity of Shasta Lake. Increased 40 employment and income opportunities could also result from project 41 construction activities, and would not be disproportionately distributed among 42
24-14 Draft – June 2013

Chapter 24 Environmental Justice
minority and low-income populations. No disproportionately high and adverse 1 effects on minority or low-income populations would occur. 2
Under this alternative, the dam would be raised by 6.5 feet over a 54-month 3 construction period. Residents near Shasta Dam, as well as others who may 4 commute or otherwise travel near construction sites, would be exposed to a 5 range of potentially adverse environmental and public health effects over a 54-6 month construction period (see Engineering Appendix). Temporary and/or 7 short-term adverse noise, visual, and air quality effects could result; in addition, 8 motorists could be delayed, and access to recreation opportunities or local 9 businesses could be temporarily reduced. Negative health effects could also 10 result if hazardous materials were to be accidentally released into the 11 environment during construction. 12
Nonwhite individuals, including the Winnemem Wintu Tribe and other Native 13 Americans, accounted for 16.6 percent of Shasta County’s total population in 14 2010, well below the 50 percent threshold for a minority population. This 15 percentage is also substantially less than the 2010 statewide nonwhite 16 population of 42.4 percent. Likewise, the poverty rate in Shasta County was 17 17.7 percent in 2010, well below the 50 percent threshold and slightly greater 18 than the 15.5 percent statewide poverty rate. Therefore, the percentages of 19 minority and low-income individuals in populations in Shasta County are well 20 below threshold levels for a minority or low-income population. Therefore, 21 minority and low-income populations would not be disproportionately affected 22 by these adverse effects. 23
Increased employment and income opportunities may result from construction 24 under CP1, which could benefit minority and low-income populations. Project 25 construction under CP1 could increase the number of jobs available, or could 26 improve business conditions and incomes for workers who are already 27 employed by businesses that would directly or indirectly benefit from project-28 related construction spending. The project would require a labor force of 300 29 people drawn directly from the Shasta Lake area. Most (85 percent) of the 30 construction materials and supplies would be purchased in the vicinity; these 31 materials and supplies would constitute 60 percent of total construction costs. 32 As described above, the percentages of minority and low-income individuals in 33 Shasta County populations are well below threshold levels for minority and 34 low-income populations, and employment effects would not be 35 disproportionately distributed among these groups. Selected minority and low-36 income individuals may be potentially affected. Such economic and job-related 37 impacts would be beneficial. Mitigation for this impact is not needed, and thus 38 not proposed. 39
Impact EJ-2 (CP1): Potential Disproportionate High and Adverse Effect on 40 Native American Populations from Disturbance or Loss of Sacred Locations in 41 the Vicinity of Shasta Lake The local Native American community has 42 identified several locations in the vicinity of Shasta Lake that they consider to 43
24-15 Draft – June 2013

Shasta Lake Water Resources Investigation Environmental Impact Statement
be sacred. Notable among these locations are the Winnemem Wintu’s Puberty 1 Rock and the doctoring pools near Nawtawaket Creek and the Pit River Madesi 2 Band’s ethnographic villages, associated burial grounds, and several TCPs. CP1 3 would have a substantial adverse effect on several of these locations in the 4 vicinity of Shasta Lake. Because the Winnemem Wintu and Pit River Madesi 5 Band members attach religious and cultural significance to these locations, the 6 disturbance or loss of resources associated with these locations would result in a 7 disproportionately high and adverse effect on Native American populations in 8 the vicinity of Shasta Lake. 9
Two tribes, the Winnemem Wintu and the Pit River Madesi Band, live within 10 the vicinity of Shasta Lake, where they continue to actively practice many 11 aspects of their traditional culture. Both groups have related that a complex 12 cultural landscape of village sites, ceremonial areas, sacred sites, burial sites, 13 and resource areas would be affected directly by CP1. 14
Two particularly important Winnemem Wintu locations that would be affected 15 by CP1 are Puberty Rock and the doctoring pools near Nawtawaket Creek. CP1 16 could submerge Puberty Rock for longer periods, restricting the Winnemen 17 Wintu from holding the puberty ceremony at this important location. Relocating 18 the rock to higher ground is not possible; in the Winnemem Wintu’s worldview, 19 its location is preordained and connected with the nearby “two sisters” 20 mountain (Bolliboka Mountain). Puberty Rock also marks the location of an 21 extensive village with housepits and burials, situated at Kabyai Creek, west of 22 the McCloud River near the McCloud Campground. CP1 would inundate 23 additional burials at this location, which would require removal and relocation. 24 The Winnemem Wintu have estimated that 120 ancestral villages are still 25 accessible above the current high-water line of Shasta Lake and would be 26 adversely affected by CP1. 27
Pit River Madesi Band members state that 22 ethnographic villages, associated 28 burial grounds, and several TCPs are located within the existing reservoir and 29 proposed inundation or fluctuation areas. 30
Winnemem Wintu and Pit River Madesi Band members attach religious and 31 cultural significance to several locations in the vicinity of Shasta Lake; 32 therefore, the disturbance and loss of resources associated with these locations 33 would result in a disproportionately high and adverse effect on Native American 34 populations in the vicinity of Shasta Lake. Mitigation for this impact is not 35 proposed because no feasible mitigation (or action alternative) is available to 36 avoid or minimize the high and adverse effect. However, Reclamation is 37 committed to and will comply with the Federal NHPA Section 106 consultation 38 process to avoid, minimize, or mitigate any significant, adverse impacts to 39 cultural resources and historic properties due to CP1, to the extent possible. 40 Additional information on cultural resources mitigation is located in Chapter 14, 41 “Cultural Resources.” 42
24-16 Draft – June 2013

Chapter 24 Environmental Justice
Upper Sacramento River (Shasta Dam to Red Bluff) 1 Impact EJ-3 (CP1): Potential Disproportionate High and Adverse Effect on 2 Minority and Low-Income Populations in the Upper Sacramento River Area 3 Effects from project-related construction are not anticipated in the upper 4 Sacramento River area downstream from Shasta Dam. In the long term, 5 operational changes resulting from CP1 could reduce the risk of flooding and 6 enhance environmental and recreational conditions in this area. These 7 operational effects would not constitute a disproportionately high and adverse 8 impact on minority and low-income populations. No disproportionately high 9 and adverse effects on minority or low-income populations would occur. 10
In Tehama County, nonwhite individuals accounted for 18.0 percent of the total 11 population in 2010. This is roughly half of the 50 percent threshold for a 12 minority population. This level also is substantially less than the statewide 13 nonwhite population of 42.4 percent. The poverty level in Tehama County was 14 19.5 percent in 2010, also well below the 50 percent threshold and slightly 15 higher than the 15.5 percent statewide poverty rate. From 2000 to 2010, poverty 16 levels in Tehama County increase at a rate of 2.2 percent, outpacing the 17 statewide poverty rate (1.3 percent) by 0.9 percent over approximately the same 18 time. Based on this trend, and the comparatively consistent poverty rates 19 between Tehama County and the statewide population, poverty levels in 20 Tehama County are not meaningfully greater than poverty levels statewide. 21 Therefore, the percentages of minority and low-income individuals in 22 populations in Tehama County are well below threshold levels for minority and 23 low-income populations. Thus, disproportionately high and adverse effects on 24 minority or low-income populations would not occur. 25
Communities along the upper Sacramento River portion of the primary study area 26 would not be exposed to direct construction-related impacts associated with CP1. 27
Raising Shasta Dam would add 256,000 acre-feet of cold-water storage to the 28 overall capacity of the reservoir. This operational change would be beneficial 29 for two reasons. CP1 would reduce the risk of flooding downstream from Shasta 30 Dam and consequently reduce potentially adverse social, economic, and 31 environmental effects because of flooding for property owners, businesses, and 32 workers. In addition, CP1 would improve environmental and recreational 33 conditions by enhancing habitat for fish and wildlife, benefiting anglers, 34 hunters, and wildlife viewers. 35
These beneficial impacts would not be disproportionately distributed among 36 minority and low-income populations, because representation of these groups in 37 the population of Tehama County is well below threshold levels. Selected 38 minority and low-income individuals may be potentially affected; however, 39 these environmental and recreational effects would be beneficial. Mitigation for 40 this impact is not needed, and thus not proposed. 41
24-17 Draft – June 2013

Shasta Lake Water Resources Investigation Environmental Impact Statement
Lower Sacramento River and Delta 1 Impact EJ-4 (CP1): Potential Disproportionate High and Adverse Effect on 2 Minority and Low-Income Populations in the Lower Sacramento River and 3 Delta Area Operational effects of CP1 would be similar to those described for 4 the upper Sacramento River portion of the primary study area under Impact EJ-5 2 (CP1). However, because the beneficial effects (reduction of flooding risk and 6 improved environmental and recreational conditions) would diminish with 7 distance from the project site, the benefits in this area would be less. No 8 disproportionately high or adverse effects on minority or low-income 9 populations would occur. 10
Operational effects of CP1 on minority and low-income populations in the 11 lower Sacramento River and Delta portion of the extended study area would be 12 similar to those described for the upper Sacramento River portion of the primary 13 study area under Impact EJ-2 (CP1). However, benefits in the lower Sacramento 14 River and Delta area resulting from the reduced risk of flooding and improved 15 environmental and recreational conditions would be less than described for the 16 upper Sacramento River area because the lower Sacramento River and Delta is 17 located at a greater distance from the project site. Minority and low-income 18 populations would not be disproportionately affected. No disproportionately 19 high or adverse effects on minority or low-income populations would occur. 20 Mitigation for this impact is not needed, and thus not proposed. 21
CVP/SWP Service Areas 22 Impact EJ-5 (CP1): Potential Disproportionate High and Adverse Effect on 23 Minority and Low-Income Populations in the CVP/SWP Service Areas Direct 24 construction-related impacts are not anticipated in the CVP and SWP service 25 areas. The project could result in adverse indirect impacts because of water and 26 power rate increases for customers within the CVP and SWP service areas. 27 Employment opportunities and personal incomes may increase because of 28 operational changes that improve the reliability of the water supply and power 29 for businesses and others. Minority and low-income populations would not be 30 disproportionately affected. No disproportionately high and adverse effects on 31 minority or low-income populations would occur. 32
Utility customers in communities within the CVP and SWP service areas may 33 experience indirect, adverse effects through rate increases as a result of CP1. 34 Project-related water storage and hydroelectric facility improvements may be 35 funded partly through increased rates for water and power services. However, 36 such adverse effects would not disproportionately affect minority or low-37 income populations. 38
Operational changes resulting from CP1 may increase employment 39 opportunities and water and power reliability in the CVP and SWP 40 communities, which would be beneficial for individual utility customers and 41 businesses. Selected minority and low-income individuals may be beneficially 42 affected by increased employment opportunities. Such beneficial employment-43
24-18 Draft – June 2013

Chapter 24 Environmental Justice
related impacts would not disproportionately affect minority and low-income 1 populations. Thus, no disproportionately high and adverse effects on minority or 2 low-income populations would occur. Mitigation for this impact is not needed, 3 and thus not proposed. 4
CP2 – 12.5-Foot Dam Raise, Anadromous Fish Survival and Water Supply 5 Reliability 6 Shasta Lake and Vicinity 7 Impact EJ-1 (CP2): Potential Disproportionate High and Adverse Effect on 8 Minority and Low-Income Populations in the Vicinity of Shasta Lake 9 Communities adjacent to the project construction site may experience 10 temporary and/or short-term adverse environmental effects because of 11 construction activities and changes in project conditions and operations. 12 However, neither construction-related nor operational effects would 13 disproportionately affect minority or low-income populations in the vicinity of 14 Shasta Lake. Therefore, no disproportionately high and adverse effects on 15 minority or low-income populations would occur. 16
Effects on minority and low-income populations would be similar to those 17 described above for Impact EJ-1 (CP1), except that the dam would be raised by 18 12.5 feet and the construction period likely would extend for up to 6 additional 19 months. The beneficial effects and less-than-significant adverse impacts would 20 be similar to those described under Impact EJ-1 (CP1) because the types of 21 work and the predicted workforce would be similar under each alternative. As 22 described under Impact EJ-1 (CP1), the percentages of minority and low-23 income individuals in populations in Shasta County are well below threshold 24 levels for a minority or low-income population. Therefore, disproportionately 25 high and adverse effects on minority or low-income populations would not 26 occur. Mitigation for this impact is not needed, and thus not proposed. 27
Impact EJ-2 (CP2): Potential Disproportionate High and Adverse Effect on 28 Native American Populations from Disturbance or Loss of Sacred Locations in 29 the Vicinity of Shasta Lake The local Native American community has 30 identified several locations in the vicinity of Shasta Lake that they consider to 31 be sacred. Notable among these locations are the Winnemem Wintu’s Puberty 32 Rock and the doctoring pools near Nawtawaket Creek and the Pit River Madesi 33 Band’s ethnographic villages, associated burial grounds, and several TCPs. CP2 34 would have a substantial adverse effect on several of these locations in the 35 vicinity of Shasta Lake. Because the Winnemem Wintu and Pit River Madesi 36 Band members attach religious and cultural significance to these locations, the 37 disturbance or loss of resources associated with these locations would result in a 38 disproportionately high and adverse effect on Native American populations in 39 the vicinity of Shasta Lake. 40
This impact would be similar to but slightly greater than Impact EJ-2 (CP1) 41 because the inundation area under CP2 would be slightly greater than under 42 CP1. A disproportionately high and adverse effect on Native American 43
24-19 Draft – June 2013

Shasta Lake Water Resources Investigation Environmental Impact Statement
populations would occur. Mitigation for this impact is not proposed because no 1 feasible mitigation (or action alternative) is available to avoid or minimize the 2 high and adverse effect. However, Reclamation is committed to and will 3 comply with the Federal NHPA Section 106 consultation process to avoid, 4 minimize, or mitigate any significant, adverse impacts to cultural resources and 5 historic properties due to CP2, to the extent possible. Additional information on 6 cultural resources mitigation is located in Chapter 14, “Cultural Resources.” 7
Upper Sacramento River (Shasta Dam to Red Bluff) 8 Impact EJ-3 (CP2): Potential Disproportionate High and Adverse Effect on 9 Minority and Low-Income Populations in the Upper Sacramento River Area 10 Effects from project-related construction are not anticipated in the upper 11 Sacramento River area downstream from Shasta Dam. In the long term, 12 operational changes resulting from CP2 could reduce the risk of flooding and 13 enhance environmental and recreational conditions in this area. These 14 operational effects would not constitute a disproportionately high and adverse 15 impact on minority and low-income populations. No disproportionately high 16 and adverse effects on minority or low-income populations would occur. 17
This impact would be similar to Impact EJ-3 (CP1). CP2 would provide 18 187,000 acre-feet more cold-water storage capacity than CP1. Greater storage 19 capacity would reduce the risk of flooding and, along with increased cold water, 20 would benefit downstream fisheries and recreation resources and users. Also, as 21 described under Impact EJ-3 (CP1), the percentages of minority and low-22 income individuals in populations in Tehama County are well below threshold 23 levels for minority and low-income populations. Thus, disproportionately high 24 and adverse effects on minority or low-income populations would not occur. 25 Mitigation for this impact is not needed, and thus not proposed. 26
Lower Sacramento River and Delta 27 Impact EJ-4 (CP2): Potential Disproportionate High and Adverse Effect on 28 Minority and Low-Income Populations in the Lower Sacramento River and 29 Delta Area Operational effects of CP2 would be similar to those described for 30 the upper Sacramento River portion of the primary study area under Impact EJ-31 4 (CP2). However, because the beneficial effects (reduction of flooding risk and 32 improved environmental and recreational conditions) would diminish with 33 distance from the project site, the benefits in this area would be less. No 34 disproportionately high or adverse effects on minority or low-income 35 populations would occur. 36
This impact would be similar to Impact EJ-4 (CP1). Under CP2, reduced 37 flooding and beneficial effects on fisheries and recreation resources also would 38 occur in the lower Sacramento River and Delta portion of the extended study 39 area. However, the beneficial effects would be less than along the upper 40 Sacramento River because benefits would diminish with increasing distance 41 from the project site. As in the upper Sacramento River portion of the primary 42 study area, the additional 187,000 acre-feet of reservoir storage would provide 43
24-20 Draft – June 2013

Chapter 24 Environmental Justice
somewhat greater benefits under CP2 than under CP1. Minority and low-1 income populations would not be disproportionately affected. No 2 disproportionately high or adverse effects on minority or low-income 3 populations would occur. Mitigation for this impact is not needed, and thus not 4 proposed. 5
CVP/SWP Service Areas 6 Impact EJ-5 (CP2): Potential Disproportionate High and Adverse Effect on 7 Minority and Low-Income Populations in the CVP/SWP Service Areas Direct 8 construction-related impacts are not anticipated in the CVP and SWP service 9 areas. The project could result in adverse indirect impacts because of water and 10 power rate increases for customers within the CVP and SWP service areas. 11 Employment opportunities and personal incomes may increase because of 12 operational changes that improve the reliability of the water supply and power 13 for businesses and others. Minority and low-income populations would not be 14 disproportionately affected. No disproportionately high and adverse effects on 15 minority or low-income populations would occur. 16
This impact would be similar to Impact EJ-5 (CP1). Construction costs under 17 CP2 would be greater than under CP1, because of the increased need for 18 construction materials and an additional 6 months of construction. These 19 increased costs would result in slightly greater increases in water and power 20 rates than under CP1. However, such adverse effects would not 21 disproportionately affect minority and low-income populations. Operational 22 benefits would be similar to those of CP1, and minority or low-income 23 populations would not be disproportionately affected. Therefore, no 24 disproportionately high and adverse effects on minority or low-income 25 populations would occur. Mitigation for this impact is not needed, and thus not 26 proposed. 27
CP3 – 18.5-Foot Dam Raise, Agricultural Water Supply Reliability and 28 Anadromous Fish Survival 29 Shasta Lake and Vicinity 30 Impact EJ-1 (CP3): Potential Disproportionate High and Adverse Effect on 31 Minority and Low-Income Populations in the Vicinity of Shasta Lake 32 Communities adjacent to the project construction site may experience 33 temporary and/or short-term adverse environmental effects because of 34 construction activities and changes in project conditions and operations. 35 However, neither construction-related nor operational effects would 36 disproportionately affect minority or low-income populations in the vicinity of 37 Shasta Lake. No disproportionately high or adverse effects on minority or low-38 income populations would occur. 39
This impact would be similar to Impact EJ-1 (CP1). Under CP3, the effects on 40 minority and low-income populations would be similar to those described above 41 for Impact EJ-1 (CP1), except that the dam would be raised by 18.5 feet and the 42 construction period would extend for at least 6 additional months and require an 43
24-21 Draft – June 2013

Shasta Lake Water Resources Investigation Environmental Impact Statement
additional 50 construction workers. The beneficial impacts and less-than-1 significant adverse impacts would be similar to those described under CP1 2 because the types of work and the predicted workforce would be similar under 3 each alternative. As described under Impact EJ-1 (CP1), the percentages of 4 minority and low-income individuals in populations in Shasta County are well 5 below threshold levels for a minority or low-income population. Therefore, 6 disproportionately high effects on minority or low-income populations would 7 not occur (nor would disproportionately high and beneficial effects). Mitigation 8 for this impact is not needed, and thus not proposed. 9
Impact EJ-2 (CP3): Potential Disproportionate High and Adverse Effect on 10 Native American Populations from Disturbance or Loss of Sacred Locations in 11 the Vicinity of Shasta Lake The local Native American community has 12 identified several locations in the vicinity of Shasta Lake that they consider to 13 be sacred. Notable among these locations are the Winnemem Wintu’s Puberty 14 Rock and the doctoring pools near Nawtawaket Creek and the Pit River Madesi 15 Band’s ethnographic villages, associated burial grounds, and several TCPs. CP3 16 would have a substantial adverse effect on several of these locations in the 17 vicinity of Shasta Lake. Because the Winnemem Wintu and Pit River Madesi 18 Band members attach religious and cultural significance to these locations, the 19 disturbance or loss of resources associated with these locations would result in a 20 disproportionately high and adverse effect on Native American populations in 21 the vicinity of Shasta Lake. 22
This impact would be similar to but slightly greater than Impact EJ-2 (CP2) 23 because the inundation area under CP3 would be slightly greater than under 24 CP2. A disproportionately high and adverse effect on Native American 25 populations would occur. Mitigation for this impact is not proposed because no 26 feasible mitigation (or action alternative) is available to avoid or minimize the 27 high and adverse effect. However, Reclamation is committed to and will 28 comply with the Federal NHPA Section 106 consultation process to avoid, 29 minimize, or mitigate any significant, adverse impacts to cultural resources and 30 historic properties due to CP3, to the extent possible. Additional information on 31 cultural resources mitigation is located in Chapter 14, “Cultural Resources.” 32
Upper Sacramento River (Shasta Dam to Red Bluff) 33 Impact EJ-3 (CP3): Potential Disproportionate High and Adverse Effect on 34 Minority and Low- Income Populations in the Upper Sacramento River Area 35 Effects from project-related construction are not anticipated in the upper 36 Sacramento River area downstream from Shasta Dam. In the long term, 37 operational changes resulting from CP3 could reduce the risk of flooding and 38 enhance environmental and recreational conditions in this area. These beneficial 39 operational effects would not be disproportionately distributed among minority 40 and low-income populations. No disproportionately high and adverse effects on 41 minority or low-income populations would occur. 42
24-22 Draft – June 2013

Chapter 24 Environmental Justice
This impact would be similar to Impact EJ-3 (CP1). CP3 would provide 1 378,000 acre-feet more cold-water storage capacity than CP1. Greater storage 2 capacity would reduce the risk of flooding and, along with increased cold water, 3 would benefit downstream fisheries and recreation resources and users. Also, as 4 described under Impact EJ-3 (CP1), the percentages of minority and low-5 income individuals in populations in Tehama County are well below threshold 6 levels for minority and low-income populations. Thus, disproportionately high 7 and adverse effects on minority or low-income populations would not occur. 8 Mitigation for this impact is not needed, and thus not proposed. 9
Lower Sacramento River and Delta 10 Impact EJ-4 (CP3): Potential Disproportionate High and Adverse Effect on 11 Minority and Low-Income Populations in the Lower Sacramento River and 12 Delta Area Operational effects of CP3 would be similar to those described for 13 the upper Sacramento River portion of the primary study area under Impact EJ-14 3 (CP3). However, because the beneficial effects (reduction of flooding risk and 15 improved environmental and recreational conditions) would diminish with 16 distance from the project site, the benefits in this area would be less. No 17 disproportionately high or adverse effects on minority or low-income 18 populations would occur. 19
This impact would be similar to Impact EJ-4 (CP1). Under CP3, reduced 20 flooding and beneficial effects on fisheries and recreation resources also would 21 occur in the lower Sacramento River and Delta portion of the extended study 22 area. However, the beneficial effects would be less than along the upper 23 Sacramento River because benefits would diminish with increasing distance 24 from the project site. As in the upper Sacramento River portion of the primary 25 study area, the additional 378,000 acre-feet of reservoir storage would provide 26 somewhat greater benefits under CP3 than under CP1. Minority and low-27 income populations would not be disproportionately affected. No 28 disproportionately high or adverse effects on minority or low-income 29 populations would occur. Mitigation for this impact is not needed, and thus not 30 proposed. 31
CVP/SWP Service Areas 32 Impact EJ-5 (CP3): Potential Disproportionate High and Adverse Effect on 33 Minority and Low-Income Populations in the CVP/SWP Service Areas Direct 34 construction-related impacts are not anticipated in the CVP and SWP service 35 areas. The project could result in adverse indirect impacts because of water and 36 power rate increases for customers within the CVP and SWP service areas. 37 Employment opportunities and personal incomes may increase because of 38 operational changes that improve the reliability of the water supply reliability 39 and power for businesses and others. Minority and low-income populations 40 would not be disproportionately affected. No disproportionately high or adverse 41 effects on minority or low-income populations would occur. 42
24-23 Draft – June 2013

Shasta Lake Water Resources Investigation Environmental Impact Statement
This impact would be similar to Impact EJ-5 (CP1). Construction costs under 1 CP3 would be greater than under CP1 because of the increased need for 2 construction materials and an additional 6 months of construction. These 3 increased costs would result in slightly greater increases in water and power 4 rates than under CP1. However, such adverse effects would not 5 disproportionately affect minority and low-income populations. Operational 6 benefits would be similar to those of CP1, and minority and low-income 7 populations would not be disproportionately affected. Therefore, no 8 disproportionately high and adverse effects on minority or low-income 9 populations would occur. Mitigation for this impact is not needed, and thus not 10 proposed. 11
CP4 – 18.5-Foot Dam Raise, Anadromous Fish Focus with Water Supply 12 Reliability 13 Shasta Lake and Vicinity 14 Impact EJ-1 (CP4): Potential Disproportionate High and Adverse Effect on 15 Minority and Low-Income Populations in the Vicinity of Shasta Lake 16 Communities adjacent to the project construction site may experience 17 temporary and/or short-term adverse environmental effects because of 18 construction activities and changes in project conditions and operations. 19 However, neither construction-related nor operational effects would be 20 disproportionately distributed among minority or low-income populations in the 21 vicinity of Shasta Lake. No disproportionately high and adverse effects on 22 minority or low-income populations would occur. 23
This impact would be similar to Impact EJ-1 (CP1). Under CP4, the effects on 24 minority and low-income populations would be similar to those described above 25 for Impact EJ-1 (CP1), except that the dam would be raised by 18.5 feet and the 26 construction period would extend for at least 6 additional months and require an 27 additional 50 construction workers. The beneficial effects and less-than-28 significant adverse impacts would be similar to those described under CP1 29 because the types of work and the predicted workforce would be similar under 30 each alternative. As described under Impact EJ-1 (CP1), the percentages of 31 minority and low-income individuals in populations in Shasta County are well 32 below threshold levels for a minority or low-income population. Therefore, 33 adverse and beneficial effects would not be disproportionately distributed 34 among minority or low-income populations. No disproportionately high and 35 adverse effects on minority or low-income populations would occur. Mitigation 36 for this impact is not needed, and thus not proposed. 37
Impact EJ-2 (CP4): Potential Disproportionate High and Adverse Effect on 38 Native American Populations from Disturbance or Loss of Sacred Locations in 39 the Vicinity of Shasta Lake The local Native American community has 40 identified several locations in the vicinity of Shasta Lake that they consider to 41 be sacred. Notable among these locations are the Winnemem Wintu’s Puberty 42 Rock and the doctoring pools near Nawtawaket Creek and the Pit River Madesi 43 Band’s ethnographic villages, associated burial grounds, and several TCPs. CP4 44
24-24 Draft – June 2013

Chapter 24 Environmental Justice
would have a substantial adverse effect on several of these locations in the 1 vicinity of Shasta Lake. Because the Winnemem Wintu and Pit River Madesi 2 Band members attach religious and cultural significance to these locations, the 3 disturbance or loss of resources associated with these locations would result in a 4 disproportionately high and adverse effect on Native American populations in 5 the vicinity of Shasta Lake. 6
This impact would be similar to Impact EJ-2 (CP3), but the frequency and 7 timing of inundation may vary. Disproportionately high and adverse effects on 8 Native American populations would occur. Mitigation for this impact is not 9 proposed because no feasible mitigation is available. Mitigation for this impact 10 is not proposed because no feasible mitigation (or action alternative) is available 11 to avoid or minimize the high and adverse effect. However, Reclamation is 12 committed to and will comply with the Federal NHPA Section 106 consultation 13 process to avoid, minimize, or mitigate any significant, adverse impacts to 14 cultural resources and historic properties due to CP4, to the extent possible. 15 Additional information on cultural resources mitigation is located in Chapter 14, 16 “Cultural Resources.” 17
Upper Sacramento River (Shasta Dam to Red Bluff) 18 Impact EJ-3 (CP4): Potential Disproportionate High and Adverse Effect on 19 Minority and Low-Income Populations in the Upper Sacramento River Area 20 Effects from project-related construction are not anticipated in the upper 21 Sacramento River area downstream from Shasta Dam. In the long term, 22 operational changes resulting from CP4 could reduce the risk of flooding and 23 enhance environmental and recreational conditions in this area. These beneficial 24 operational effects would not constitute a disproportionately high and adverse 25 impact on minority and low-income populations. No disproportionately high 26 and adverse effects on minority or low-income populations would occur. 27
This impact would be similar to Impact EJ-3 (CP1). CP4 would provide 28 378,000 acre-feet more cold-water storage capacity than CP1. Greater storage 29 capacity would reduce the risk of flooding and, along with increased cold water, 30 would benefit downstream fisheries and recreation resources and users. Also, as 31 described under Impact EJ-3 (CP1), the percentages of minority and low-32 income individuals in populations in Tehama County are well below threshold 33 levels for minority and low-income populations. Minority and low-income 34 populations would not be disproportionately affected. No disproportionately 35 high and adverse effects on minority or low-income populations would occur. 36 Mitigation for this impact is not needed, and thus not proposed. 37
Lower Sacramento River and Delta 38 Impact EJ-4 (CP4): Potential Disproportionate High and Adverse Effect on 39 Minority and Low-Income Populations in the Lower Sacramento River and 40 Delta Area Operational effects of CP4 would be similar to those described for 41 the upper Sacramento River portion of the primary study area under Impact EJ-42 3 (CP4). However, because the beneficial effects (reduction of flooding risk and 43
24-25 Draft – June 2013

Shasta Lake Water Resources Investigation Environmental Impact Statement
improved environmental and recreational conditions) would diminish with 1 distance from the project site, the benefits in this area would be less. No 2 disproportionately high and adverse effects on minority or low-income 3 populations would occur. 4
This impact would be similar to Impact EJ-4 (CP1). Under CP4, reduced 5 flooding and beneficial effects on fisheries and recreation resources also would 6 occur in the lower Sacramento River and Delta portion of the extended study 7 area. However, the beneficial effects would be less than along the upper 8 Sacramento River because benefits would diminish with increasing distance 9 from the project site. As in the upper Sacramento River portion of the primary 10 study area, the additional 378,000 acre-feet of reservoir storage would provide 11 somewhat greater benefits under CP4 than under CP1. Minority and low-12 income populations would not be disproportionately affected. No 13 disproportionately high or adverse effects on minority or low-income 14 populations would occur. Mitigation for this impact is not needed, and thus not 15 proposed. 16
CVP/SWP Service Areas 17 Impact EJ-5 (CP4): Potential Disproportionate High and Adverse Effect on 18 Minority and Low-Income Populations in the CVP/SWP Service Areas Direct 19 construction-related impacts are not anticipated in the CVP and SWP service 20 areas. The project could result in adverse indirect impacts because of water and 21 power rate increases for customers within the CVP and SWP service areas. 22 Employment opportunities and personal incomes may increase because of 23 operational changes that improve the reliability of the water supply and power 24 to businesses and others. Minority and low-income populations would not be 25 disproportionately affected. No disproportionately high and adverse effects on 26 minority or low-income populations would occur. 27
This impact would be similar to Impact EJ-5 (CP1). Construction costs under 28 CP4 would be greater than under CP1 because of the increased need for 29 construction materials and an additional 6 months of construction and require an 30 additional 50 construction workers. These increased costs would result in 31 slightly greater increases in water and power rates than under CP1. However, 32 such adverse effects would not disproportionately affect minority and low-33 income populations. Operational benefits would be similar to those under CP1, 34 and minority and low-income populations would not be disproportionately 35 affected. Therefore, no disproportionately high and adverse effects on minority 36 or low-income populations would occur. Mitigation for this impact is not 37 needed, and thus not proposed. 38
CP5 – 18.5-Foot Dam Raise, Combination Plan 39 Shasta Lake and Vicinity 40 Impact EJ-1 (CP5): Potential Disproportionate High and Adverse Effect on 41 Minority and Low-Income Populations in the Vicinity of Shasta Lake 42 Communities adjacent to the project construction site may experience 43
24-26 Draft – June 2013

Chapter 24 Environmental Justice
temporary adverse environmental effects because of construction activities and 1 changes in project conditions and operations. However, the construction activity 2 in any specific area would be short-term, and neither construction-related nor 3 operational effects would constitute a high and adverse impact on minority or 4 low-income populations in the vicinity of Shasta Lake. No disproportionately 5 high and adverse effects on minority or low-income populations would occur. 6
This impact would be similar to Impact EJ-1 (CP1). Under CP5, the effects on 7 minority and low-income populations would be similar to those described above 8 for Impact EJ-1 (CP1), except that the dam would be raised by 18.5 feet and the 9 construction period would extend for at least 6 additional months and require an 10 additional 60 construction workers. The beneficial effects and less-than-11 significant adverse impacts would be similar to those described under CP1 12 because the types of work and the predicted workforce would be similar under 13 each alternative. As described under Impact EJ-1 (CP1), the percentages of 14 minority and low-income individuals in populations in Shasta County are well 15 below threshold levels for a minority or low-income population. Therefore, 16 minority and low-income populations would not be disproportionately affected. 17 No disproportionately high and adverse effects on minority or low-income 18 populations would occur. Mitigation for this impact is not needed, and thus not 19 proposed. 20
Impact EJ-2 (CP5): Potential Disproportionate High and Adverse Effect on 21 Native American Populations from Disturbance or Loss of Sacred Locations in 22 the Vicinity of Shasta Lake The local Native American community has 23 identified several locations in the vicinity of Shasta Lake that they consider to 24 be sacred. Notable among these locations are the Winnemem Wintu’s Puberty 25 Rock and the doctoring pools near Nawtawaket Creek and the Pit River Madesi 26 Band’s ethnographic villages, associated burial grounds, and several TCPs. CP5 27 would have a substantial adverse effect on several of these locations in the 28 vicinity of Shasta Lake. Because Winnemem Wintu and Pit River Madesi Band 29 members attach religious and cultural significance to these locations, the 30 disturbance or loss of resources associated with these locations would result in a 31 disproportionately high and adverse effect on Native American populations in 32 the vicinity of Shasta Lake. 33
This impact would be the same as Impact EJ-2 (CP3). Disproportionately high 34 and adverse effects on Native American populations would occur. Mitigation 35 for this impact is not proposed because no feasible mitigation (or action 36 alternative) is available to avoid or minimize the high and adverse effect. 37 However, Reclamation is committed to and will comply with the Federal NHPA 38 Section 106 consultation process to avoid, minimize, or mitigate any significant, 39 adverse impacts to cultural resources and historic properties due to CP5, to the 40 extent possible. Additional information on cultural resources mitigation is 41 located in Chapter 14, “Cultural Resources.” 42
24-27 Draft – June 2013

Shasta Lake Water Resources Investigation Environmental Impact Statement
Upper Sacramento River (Shasta Dam to Red Bluff) 1 Impact EJ-3 (CP5): Potential Disproportionate High and Adverse Effect on 2 Minority and Low-Income Populations in the Upper Sacramento River Area 3 Effects from project-related construction are not anticipated in the upper 4 Sacramento River area downstream from Shasta Dam. In the long term, 5 operational changes resulting from CP5 could reduce the risk of flooding and 6 enhance environmental and recreational conditions in this area. These 7 operational effects would not constitute a disproportionately high and adverse 8 impact on minority and low-income populations. No disproportionately high 9 and adverse effects on minority or low-income populations would occur. 10
This impact would be similar to Impact EJ-3 (CP1). CP5 would provide 11 378,000 acre-feet more cold-water storage capacity than CP1. Greater storage 12 capacity would reduce the risk of flooding and, along with increased cold water, 13 would benefit downstream fisheries and recreation resources and users. Also, as 14 described under Impact EJ-3 (CP1), the percentages of minority and low-15 income individuals in populations in Tehama County are well below threshold 16 levels for minority and low-income populations. Therefore, minority and low-17 income populations would not be disproportionately affected. No 18 disproportionately high and adverse effects on minority or low-income 19 populations would occur. Mitigation for this impact is not needed, and thus not 20 proposed. 21
Lower Sacramento River and Delta 22 Impact EJ-4 (CP5): Potential Disproportionate High and Adverse Effect on 23 Minority and Low-Income Populations in the Lower Sacramento River and 24 Delta Area Operational effects of CP5 would be similar to those described for 25 the upper Sacramento River portion of the primary study area under Impact EJ-26 3 (CP5). However, because the beneficial effects (reduction of flooding risk and 27 improved environmental and recreational conditions) would diminish with 28 distance from the project site, the benefits in this area would be less. No 29 disproportionately high and adverse effects on minority or low-income 30 populations would occur. 31
This impact would be similar to Impact EJ-4 (CP1). Under CP5, reduced 32 flooding and beneficial effects on fisheries and recreation resources also would 33 occur in the lower Sacramento River and Delta portion of the extended study 34 area. However, the beneficial effects would be less than along the upper 35 Sacramento River because benefits would diminish with increasing distance 36 from the project site. As in the upper Sacramento River portion of the primary 37 study area, the additional 378,000 acre-feet of reservoir storage would provide 38 somewhat greater benefits under CP5 than under CP1. Minority and low-39 income populations would not be disproportionately affected. No 40 disproportionately high or adverse effects on minority or low-income 41 populations would occur. Mitigation for this impact is not needed, and thus not 42 proposed. 43
24-28 Draft – June 2013

Chapter 24 Environmental Justice
CVP/SWP Service Areas 1 Impact EJ-5 (CP5): Potential Disproportionate High and Adverse Effect on 2 Minority and Low-Income Populations in the CVP/SWP Service Areas Direct 3 construction-related impacts are not anticipated in the CVP and SWP service 4 areas. The project could result in adverse indirect impacts because of water and 5 power rate increases for customers within the CVP and SWP service areas. 6 Employment opportunities and personal incomes may increase because of 7 operational changes that improve the reliability of the water supply and power 8 for businesses and others. Minority and low-income populations would not be 9 disproportionately affected. Therefore, no disproportionately high and adverse 10 effects on minority or low-income populations would occur. 11
This impact would be similar to Impact EJ-5 (CP1). Construction costs under 12 CP5 would be greater than under CP1 because of increased materials, an 13 additional 6 months of construction, and 60 additional construction workers. 14 These increased costs would result in slightly greater increases in water and 15 power rates than under CP1. However, such adverse effects would not 16 disproportionately affect minority and low-income populations. Operational 17 benefits would be similar to those under CP1, and minority and low-income 18 populations would not be disproportionately affected. Therefore, no 19 disproportionately high and adverse effects on minority or low-income 20 populations would occur. Mitigation for this impact is not needed, and thus not 21 proposed. 22
24.3.5 Mitigation Measures 23 Table 24-2 presents a summary of effects and mitigation measures for 24 environmental justice. 25
No-Action Alternative 26 No mitigation measures are needed for this alternative. 27
CP1 – 6.5-Foot Dam Raise, Anadromous Fish Survival and Water Supply 28 Reliability 29 No mitigation measures are needed for Impacts EJ-1 (CP1), EJ-3 (CP1), EJ-4 30 (CP1), or EJ-5 (CP1). No feasible mitigation is available for Impact EJ-2 (CP1). 31 The disturbance or loss of resources associated with locations considered by the 32 Winnemem Wintu and Pit River Madesi Band members to have religious and 33 cultural significance would result in an unmitigable disproportionately high and 34 adverse effect on Native American populations in the vicinity of Shasta Lake. 35
24-29 Draft – June 2013

Shasta Lake W
ater Resources Investigation
Environmental Im
pact Statement
24-30 Draft – June 2013
Table 24-2. Summary of Mitigation Measures for Environmental Justice
Impact No-Action Alternative CP1 CP2 CP3 CP4 CP5
Impact EJ-1: Potential Disproportionate High and Adverse Effect on Minority and Low-Income Populations in the Vicinity of Shasta Lake
Effect before Mitigation NDHA NDHA NDHA NDHA NDHA NDHA
Mitigation Measure None required. None needed; thus, none proposed.
Effect after Mitigation NDHA NDHA NDHA NDHA NDHA NDHA
Impact EJ- Impact EJ-2: Potential Disproportionate High and Adverse Effect on Native American Populations in the Vicinity of Shasta Lake
Effect before Mitigation NDHA DHA DHA DHA DHA DHA
Mitigation Measure None required. No feasible mitigation is available to reduce impact.
Effect after Mitigation NDHA DHA DHA DHA DHA DHA
Impact EJ- Impact EJ-3: Potential Disproportionate High and Adverse Effect on Minority and Low-Income Populations in the Upper Sacramento River Area
Effect before Mitigation NDHA NDHA NDHA NDHA NDHA NDHA
Mitigation Measure None required. None needed; thus, none proposed.
Effect after Mitigation NDHA NDHA NDHA NDHA NDHA NDHA
Impact EJ- Impact EJ-4: Potential Disproportionate High and Adverse Effect on Minority and Low-Income Populations in the Lower Sacramento River and Delta Area
Effect before Mitigation NDHA NDHA NDHA NDHA NDHA NDHA
Mitigation Measure None required. None needed; thus, none proposed.
Effect after Mitigation NDHA NDHA NDHA NDHA NDHA NDHA
Impact EJ- Impact EJ-5: Potential Disproportionate High and Adverse Effect on Minority and Low-Income Populations in the CVP/SWP Service Areas
Effect before Mitigation NDHA NDHA NDHA NDHA NDHA NDHA
Mitigation Measure None required. None needed; thus, none proposed.
Effect after Mitigation NDHA NDHA NDHA NDHA NDHA NDHA
Key: DHA = Disproportionately high and adverse NDHA = Not disproportionately high and adverse
Chapter 24 Environmental Justice
CP2 – 12.5-Foot Dam Raise, Anadromous Fish Survival and Water Supply 1 Reliability 2 No mitigation measures are needed for Impacts EJ-1 (CP2), EJ-3 (CP2), EJ-4 3 (CP2), or EJ-5 (CP2). No feasible mitigation is available for Impact EJ-2 (CP2). 4 The disturbance or loss of resources associated with locations considered by the 5 Winnemem Wintu and Pit River Madesi Band members to have religious and 6 cultural significance would result in an unmitigable disproportionately high and 7 adverse effect on Native American populations in the vicinity of Shasta Lake. 8
CP3 – 18.5-Foot Dam Raise, Anadromous Fish Survival and Water Supply 9 No mitigation measures are needed for Impacts EJ-1 (CP3), EJ-3 (CP3), EJ-4 10 (CP3), or EJ-5 (CP3). No feasible mitigation is available for Impact EJ-2 (CP3). 11 The disturbance or loss of resources associated with locations considered by the 12 Winnemem Wintu and Pit River Madesi Band members to have religious and 13 cultural significance would result in an unmitigable disproportionately high and 14 adverse effect on Native American populations in the vicinity of Shasta Lake. 15
CP4 – 18.5-Foot Dam Raise, Anadromous Fish Focus with Water Supply 16 Reliability 17 No mitigation measures are needed for Impacts EJ-1 (CP4), EJ-3 (CP4), EJ-4 18 (CP4), or EJ-5 (CP4). No feasible mitigation is available for Impact EJ-2 (CP4). 19 The disturbance or loss of resources associated with locations considered by the 20 Winnemem Wintu and Pit River Madesi Band members to have religious and 21 cultural significance would result in an unmitigable disproportionately high and 22 adverse effect on Native American populations in the vicinity of Shasta Lake. 23
CP5 – 18.5-Foot Dam Raise, Combination Plan 24 No mitigation measures are needed for Impacts EJ-1 (CP5), EJ-3 (CP5), EJ-4 25 (CP5), or EJ-5 (CP5). No feasible mitigation is available for Impact EJ-2 (CP5). 26 The disturbance or loss of resources associated with locations considered by the 27 Winnemem Wintu and Pit River Madesi Band members to have religious and 28 cultural significance would result in an unmitigable disproportionately high and 29 adverse effect on Native American populations in the vicinity of Shasta Lake. 30
24.3.6 Cumulative Effects 31 In the primary study area (i.e., Shasta Lake and vicinity and the upper 32 Sacramento River from Shasta Dam to Red Bluff), minority and low-income 33 populations are not disproportionately represented. Identified construction 34 effects would be less than significant, and minority and low-income populations 35 would not be disproportionately affected. 36
Some communities within the extended study area (i.e., the lower Sacramento 37 River and Delta and the CVP and SWP service areas) exceed minority and low-38 income thresholds. These communities, along with the general population, 39 would benefit from project effects that would reduce future water shortages by 40 improving water supply reliability for both average and drought years. The 41 greatest benefit would be provided by CP3, CP4, and CP5, which would 42
24-31 Draft – June 2013

Shasta Lake Water Resources Investigation Environmental Impact Statement
provide an additional 634,000 acre-feet of storage capacity. CP1 and CP2 would 1 provide only 256,000 and 443,000 acre-feet of increased storage capacity, 2 respectively, with correspondingly reduced benefits. 3
Alternatives that would incorporate the greatest increase to dam height would 4 result in the greatest project cost because of higher costs for construction 5 materials and longer construction periods. These increased costs may be 6 reflected in increased utility rates that could be combined with other utility rate 7 increases. Such rate increases would be incremental and would be experienced 8 by the general population, along with minority and low-income communities. 9
Therefore, the project would not contribute to disproportionate placement of 10 environmental impacts on low-income and minority populations or 11 communities, and no cumulatively considerable impacts would result. 12
The disturbance or loss of resources associated with locations considered by 13 Winnemem Wintu and Pit River Madesi Band members to have religious and 14 cultural significance would result in a disproportionately high and adverse effect 15 on Native American populations in the vicinity of Shasta Lake. Therefore, the 16 project would contribute to disproportionate placement of environmental 17 impacts on Native American populations and would result in a cumulatively 18 considerable incremental contribution to a significant and unavoidable 19 cumulative impact. 20
21
24-32 Draft – June 2013
Chapter 25 Wild and Scenic River Considerations for McCloud River
Chapter 25 1
Wild and Scenic River Considerations for 2
McCloud River 3
This chapter describes the effects of the dam and reservoir modifications 4 proposed under SLWRI action alternatives on the wild and scenic river values 5 of the lower McCloud River, one of the major tributaries to Shasta Lake. 6
This chapter differs from the other chapters in this DEIS in that it concerns only 7 the McCloud River and does not discuss other portions of the primary study 8 area nor the extended study area. The study area for this chapter consists of the 9 lower McCloud River from the McCloud River Bridge to the confluence with 10 Little Bollibokka Creek (Figure 25-1). 11
The primary focus of this chapter is the wild and scenic river values of the 12 lower McCloud River, particularly the reach that would periodically be newly 13 inundated if Shasta Dam and Shasta Lake were enlarged. The discussion and 14 analysis concentrate on the values for which the McCloud River has been 15 determined eligible for listing under the Federal Wild and Scenic Rivers Act 16 ((Federal WSRA); Public Law 90-542, as amended; 16 U.S. Code 1271-1287) 17 and for which a portion of the river is protected under the California Public 18 Resources Code, Section 5093.542 (State PRC). Section 5093.542 was 19 established through enactment of the California Wild and Scenic Rivers Act, as 20 amended (Sections 5093.50 – 5093.70). 21
This chapter also differs from the other chapters in that it first provides 22 background information and then discusses the regulatory framework to provide 23 context for the affected environment section. 24
25.1 Background 25
Segments of the McCloud River have been determined eligible for listing under 26 the Federal WSRA and are protected under the State PRC. The river has not 27 been formally listed as wild and scenic under either the Federal WSRA or State 28 PRC. 29
25-1 Draft – June 2013

Shasta Lake Water Resources Investigation Environmental Impact Statement
1 Figure 25-1. Lower McCloud River Study Area 2
25-2 Draft – June 2013

Chapter 25 Wild and Scenic River Considerations for McCloud River
The USFS evaluated the eligibility of the McCloud River for listing as wild and 1 scenic under the Federal WSRA during preparation of the Shasta-Trinity 2 National Forest (STNF) Land and Resource Management Plan (LRMP) in 1994 3 (USFS 1994). Although the LRMP found the McCloud River eligible for 4 listing, the LRMP direction was to not formally designate any reach of the river 5 as wild and scenic. Instead, the direction was to manage the lower McCloud 6 River under a Coordinated Resource Management Plan (CRMP; USFS 1995a). 7 The coordinated resource management plan (CRMP) is a coordinated effort 8 between landowners and stakeholders with a vested interest in the river. The 9 CRMP requires its signatories to protect the values that make it eligible for 10 Federal designation as wild and scenic and contains a provision stating that the 11 USFS reserves the right to pursue designation if the CRMP is terminated or fails 12 to protect these values. 13
The California Resources Agency (Resources Agency) evaluated the McCloud 14 River in the late 1980s (Jones & Stokes Associates 1988) to determine whether 15 it was eligible for listing under the State PRC. The Resources Agency study 16 found it eligible, but the California legislature declined to add the river to the 17 California wild and scenic river system. The legislature instead passed an 18 amendment to the California Wild and Scenic Rivers Act to protect the river’s 19 free-flowing condition and the river’s fishery below McCloud Dam through the 20 State PRC. 21
As described in more detail under “Regulatory Framework,” the State PRC and 22 Federal WSRA share several similar components: the establishment of a wild 23 and scenic rivers system; the purpose of protecting certain rivers in their “free-24 flowing” condition; the identification of extraordinary or outstandingly 25 remarkable values (ORV) that make such rivers eligible for protection; a study 26 process and procedure for including rivers in the system; and classifications of 27 “wild,” “scenic,” and “recreational.” Both the Federal WSRA and State PRC 28 prohibit new water impoundments on designated rivers, and both contain 29 directives to government agencies to use their powers to further the policies of 30 the legislation. 31
The Federal WSRA establishes a larger wild and scenic river corridor—32 typically at least 0.25 mile on each side of the river—than the State PRC and 33 requires Federal agencies to manage the public lands in the corridor to protect 34 the river’s free-flowing character and ORVs. In addition, the Federal agency 35 managing rivers that are Federally designated as wild and scenic is required to 36 develop and implement a management plan that will ensure the river’s 37 protection. In contrast, the State PRC provides protection only to the first line of 38 permanent riparian vegetation and does not require a management plan. 39
The length of the lower McCloud River that was determined to be eligible for 40 wild and scenic river status differs between the Federal and State evaluations. 41 The USFS defined the lower McCloud River more narrowly than the Resources 42 Agency, considering the portion of the river that is currently periodically 43
25-3 Draft – June 2013

Shasta Lake Water Resources Investigation Environmental Impact Statement
inundated by Shasta Lake – referred to in this chapter as the transition reach – 1 as part of the lake rather than part of the river. The USFS defined the lower 2 river as extending from McCloud Dam downstream to an elevation of 1,070 feet 3 mean sea level (msl) (approximately 22 total river miles), which corresponds to 4 the current full-pool elevation of Shasta Lake. The Resources Agency’s study 5 report included approximately 5,400 feet of the transition reach (down to the 6 McCloud River Bridge) as part of the lower river’s segments (approximately 23 7 total river miles). 8
In its evaluation, the USFS divided the McCloud River into 10 segments 9 encompassing 46 total river miles: three segments along the upper McCloud 10 River (24 river miles above McCloud Reservoir) and seven segments along the 11 lower McCloud River (22 river miles below McCloud Dam). Numbering of the 12 upper McCloud River segments began at the headwaters and counted 13 downstream, but numbering of the lower McCloud River segments began at the 14 downstream extent and counted upstream. The USFS concluded that all 10 15 segments of the McCloud River were eligible for listing as a Federal wild and 16 scenic river because they are free flowing, possess good water quality, and 17 exhibit ORVs in the areas of cultural and historical resources, fisheries, 18 geology, and scenic resources. Part of the lowermost segment – Segment 4 – 19 would be periodically inundated if Shasta Lake is expanded. Segment 4 extends 20 from about 5,400 feet upstream from the McCloud River Bridge, beginning at 21 an elevation of 1,070 feet msl, to about Little Bollibokka Creek. The lower 22 extent of this segment corresponds with the current full-pool elevation of Shasta 23 Lake based on Reclamation geographic information system data. Figure 25-2 24 shows the downstream extent of Segment 4. 25
The Resources Agency’s report also identified 10 segments, but its evaluation 26 encompassed only 43 total river miles and the numbering of segments began at 27 the headwaters and counted downstream along the entire river. The segments 28 included six along the upper river (20 river miles above McCloud Reservoir) 29 and four along the lower river (23 river miles below McCloud Dam). Eight of 30 the 10 segments were determined eligible for State wild and scenic river status. 31 Segment 10 extends from the McCloud River Bridge to the northern border of 32 Section 9, Township 36 North, Range 3 West, which is just upstream from the 33 river’s confluence with Tuna Creek. Approximately 5,400 feet of the transition 34 reach is included in Segment 10; the portion of the transition reach downstream 35 from the bridge was determined ineligible. The downstream extent of Segment 36 10 is shown on Figure 25-2. 37
25-4 Draft – June 2013

Chapter 25 Wild and Scenic River Considerations for McCloud River
1 Figure 25-2. Differences in State and Federal Segments and Transition Reach 2
25-5 Draft – June 2013

Shasta Lake Water Resources Investigation Environmental Impact Statement
25.2 Regulatory Framework 1
25.2.1 Federal 2
Federal Wild and Scenic Rivers Act 3 The Federal WSRA, enacted in 1968, established the National Wild and Scenic 4 Rivers System “to preserve rivers with outstanding natural, cultural, and 5 recreational values in a free-flowing condition for the enjoyment of present and 6 future generations.” To be eligible for inclusion in the system, a river must be 7 free-flowing and exhibit ORVs. Free-flowing means “existing or flowing in a 8 natural condition without impoundment, diversion, straightening, rip-rapping, or 9 other modification of the waterway” (16 United States Code (USC) Section 10 1286). ORVs are scenic, recreational, geologic, fish and wildlife, historic, 11 cultural, or other similar values (16 USC Section 1271). Depending on the 12 specific conditions of a river, it may be designated as “wild,” “scenic,” or 13 “recreation.” Different segments of a single river can receive different 14 designations; in other words, some segments can be designated wild, some 15 scenic, and some recreation or combinations of these designations. 16
Through the development and approval of the STNF LRMP, the USFS 17 determined that segments of the McCloud River are eligible for inclusion in the 18 national system; however, the river has not been formally designated and thus is 19 not afforded protections under the Federal WSRA. Instead, the McCloud River 20 CRMP was developed “to protect the [river’s] unique and outstandingly 21 remarkable features,” thereby maintaining its eligibility. 22
The USFS evaluation concluded that the lower McCloud River, from McCloud 23 Dam downstream about 22 miles to the river’s transition to Shasta Lake at about 24 1,070 feet msl, provides outstanding cultural, fisheries, and geologic values, and 25 its corridor has been classified as a highly sensitive visual area by the USFS 26 (USFS 1994 and 1995b). The entire river corridor contains prehistoric and 27 historic sites from past use by Indian tribes, late 1800 and early 1900 resorts, 28 and logging activities. The lower river provides habitat for trout species (bull 29 trout/Dolly Varden, which is believed to be extinct, and rainbow trout, which 30 has been transplanted all over the world) and is considered a “blue ribbon trout 31 fishery” (USFS 1994). Outstanding geologic values include rock outcrops, 32 cascades, and pools. Based on the ORVs, the STNF determined that the lower 33 McCloud River meets the eligibility requirements for designation under the 34 Federal WSRA. 35
Shasta-Trinity National Forest Land and Resources Management Plan 36 The STNF LRMP is a forest-wide land use plan developed to guide resource 37 management within the forest (USFS 1995b). For planning purposes, the STNF 38 is divided into six land allocations for which specific management prescriptions 39 are identified. The land allocations include Congressionally Reserved Areas, 40 Late-Successional Reserves, Administratively Withdrawn Areas, Riparian 41 Reserves and Key Watersheds, Matrix Lands, and Adaptive Management Areas. 42
25-6 Draft – June 2013

Chapter 25 Wild and Scenic River Considerations for McCloud River
Management areas were identified within the STNF to establish management 1 direction in response to the issues and resources of each distinct area. The 2 Management Area defined for the McCloud River provides resource direction 3 for recreational use, specifically fishing and viewing waterfalls, and 4 management of old-growth habitat. Management of the wild and scenic river 5 ORVs of the McCloud River is deferred to the CRMP. 6
Coordinated Resource Management Plan 7 In 1990, certain public agencies and private parties with interests in the 8 management of lands adjacent to the McCloud River executed a memorandum 9 of understanding to pursue preparation of a CRMP. The memorandum was 10 signed by representatives of the USFS, CDFW, The Nature Conservancy, 11 Pacific Gas and Electric Company (PG&E), the Bollibokka Land Company, 12 Crane Mills, McCloud River Co-Tenants, Sierra Pacific Industries, and the 13 Hearst Corporation. In 1991, the same signatories, along with California Trout 14 Inc., signed another memorandum of understanding to establish the framework 15 for and approve the CRMP. The CRMP was adopted in July 1991. In 2007, the 16 property owned by the Bollibokka Land Company was sold to Westlands Water 17 District, which is not a party to the CRMP. 18
The CRMP provides a framework for the coordination of management activities 19 among the participants to ensure that the characteristics of the river that make it 20 eligible for Federal wild and scenic river designation are protected. The CRMP 21 provides specific conditions for the USFS’ management of the river and states 22 that the USFS “reserves the right to pursue [Federal wild and scenic river] 23 designation” if the CRMP is terminated or significantly impaired or if the 24 CRMP fails to protect the values that make the river suitable for such 25 designation. 26
25.2.2 State 27
California Public Resource Code, Sections 5093.50-5093.70 28 Sections 5093.50–5093.70 were added to the State PRC in 1972, through 29 enactment of the California Wild and Scenic Rivers Act, to preserve certain 30 rivers that possess extraordinary scenic, recreational, fishery, or wildlife values 31 in their free-flowing state. The State PRC identifies, classifies, and provides 32 protection for specific rivers or river segments, as approved by the legislature. 33 Rivers or river segments that are specifically identified and classified in the 34 State PRC comprise the State Wild and Scenic Rivers System. As described in 35 Section 5093.50, rivers or river segments included in the State system must 36 possess “extraordinary scenic, recreational, fishery, or wildlife values”; the 37 State PRC does not define what constitutes “extraordinary.” 38
Various amendments to the California Wild and Scenic Rivers Act have been 39 passed, adding related legislation to the State PRC. In 1986, Assembly Bill 40 (AB) 3101 (Statutes 1986, Chapter 894) established a study process to help 41 determine eligibility for potential additions to the State system (State PRC 42
25-7 Draft – June 2013

Shasta Lake Water Resources Investigation Environmental Impact Statement
Section 5093.547 and Section 5093.548). Additionally, protection for river 1 segments can be provided without formally identifying them as part of the State 2 system. 3
In 1989, an amendment to the California Wild and Scenic Rivers Act was 4 passed, adding Section 5093.542 to the State PRC to protect the McCloud River 5 fishery, which it describes as “one of the finest wild trout fisheries in the state.” 6 It further declares that “The continued management of river resources in their 7 existing natural condition represents the best way to protect the unique fishery 8 of the McCloud River” and that “maintaining the McCloud River in its free-9 flowing condition to protect its fishery is the highest and most beneficial use of 10 the waters of the McCloud River.” The amendment provides protection to the 11 McCloud River fishery and its “natural” and “free-flowing” condition from 12 Algoma to the confluence with Huckleberry Creek (upper McCloud River), and 13 0.25 mile downstream from the McCloud Dam to the McCloud River Bridge 14 (lower McCloud River). Although the Legislature declared that the McCloud 15 River possessed “extraordinary resources” in the context of the State PRC, the 16 Legislature’s action stopped short of formally designating the river as wild and 17 scenic. 18
25.3 Affected Environment 19
This section defines “affected environment” as the wild and scenic 20 characteristics of the lower McCloud River that could be affected by the 21 proposed modifications to Shasta Dam and Shasta Lake. It briefly describes the 22 McCloud River from its headwaters to the McCloud Arm of Shasta Lake. It 23 then describes the wild and scenic values of Segment 4 identified in the USFS 24 evaluation and the values provided protection in the State PRC. 25
Descriptions of the river and its characteristics were derived primarily from the 26 following sources: 27
• Wild and Scenic Rivers Evaluation, Appendix E to the EIS for the 28 Shasta-Trinity National Forest Land and Resources Management Plan 29 (USFS 1994) 30
• Lower McCloud River and McCloud Arm Watershed Analyses (USFS 31 1998a and 1998b) 32
• McCloud River Wild and Scenic River Report (Jones & Stokes 33 Associates 1988) 34
• Lower McCloud River Wild Trout Area Fishery Management Plan, 35 2004 through 2009 (Rode and Dean 2004) 36
• Lower McCloud River Habitat Typing Report (USFS 2001) 37
25-8 Draft – June 2013

Chapter 25 Wild and Scenic River Considerations for McCloud River
25.3.1 The McCloud River 1
McCloud River Basin 2 The McCloud River basin drains an area of approximately 800 square miles 3 (USFS 1998a) in northern Shasta County and southern Siskiyou County, 4 southeast of Mount Shasta. The river originates in an area of the STNF near 5 Colby Meadows at approximately 4,250 feet above msl (Rode and Dean 2004). 6 From its headwaters to Shasta Lake, the river is approximately 59 miles long. 7 McCloud Reservoir, part of PG&E’s McCloud-Pit Hydroelectric Project, 8 separates the upper river from the lower river. The lower McCloud River 9 transitions into the McCloud Arm of Shasta Lake upstream from the McCloud 10 River Bridge (Figure 25-3). 11
Upper McCloud River 12 The upper McCloud River is an approximately 36-mile reach from the river’s 13 origins at Colby Meadows downstream to the transition with McCloud 14 Reservoir. The river basin above the reservoir drains an area of approximately 15 403 square miles. Mean monthly flows in the upper McCloud River range from 16 766 cubic feet per second (cfs) in October to over 1,000 cfs in March, April, and 17 May (PG&E 2006). 18
McCloud Reservoir 19 The McCloud Reservoir is a major component of PG&E’s McCloud-Pit 20 Hydroelectric Project, which was constructed in 1965 and operates under 21 license from the Federal Energy Regulatory Commission (FERC). The 22 McCloud Reservoir is approximately 5 miles long and has a storage capacity of 23 approximately 35,200 acre-feet of water. The McCloud-Pit Hydroelectric 24 Project diverts approximately 75 percent of the upper McCloud River’s flow 25 through a pipeline to Iron Canyon Reservoir, then conveys it downslope and 26 discharges it into the Pit River at the Pit 6 powerhouse, upstream from the Pit 27 River Arm of Shasta Lake (PG&E 2006). The remaining 25 percent of flows 28 provide base flow for the lower McCloud River, a considerable reduction from 29 historic flow volumes (Jones & Stokes Associates 1988). 30
Lower McCloud River 31 The lower McCloud River flows southwesterly through a deep canyon with 32 steep slopes approximately 22 miles from McCloud Dam downstream to the 33 transition with Shasta Lake. Vegetation along the lower river is predominately 34 mixed-conifer and Douglas-fir forest. This stretch of river receives runoff from 35 a 404-square-mile area of the lower McCloud River basin and the 95-square-36 mile Squaw Valley Creek basin. It provides exceptional fishing opportunities 37 and includes two long-established fishing clubs, the Bollibokka Club and the 38 McCloud River Club. The Nature Conservancy’s McCloud River Preserve also 39 encompasses a portion of the lower McCloud River. 40
25-9 Draft – June 2013

Shasta Lake Water Resources Investigation Environmental Impact Statement
1 Figure 25-3. Regional Location 2
25-10 Draft – June 2013

Chapter 25 Wild and Scenic River Considerations for McCloud River
Flows in the lower McCloud River have been controlled by releases from 1 McCloud Dam since 1965 (PG&E 2006). Under its current FERC license, 2 PG&E’s McCloud-Pit Hydroelectric Project maintains a minimum instream 3 flow of 50 cfs from May through November and 40 cfs from December through 4 April through controlled releases. Accordingly, flows in the lower McCloud 5 River are highly regulated, and annual flows in the river below McCloud Dam 6 do not follow a pattern typical of an unimpaired mountain river in northern 7 California. Prior to dam construction, flows in the lower river were considerably 8 higher, estimated to be in the range of 924 to 1,245 cfs (mean monthly flows) 9 from June to October (Jones & Stokes Associates 1988, citing U.S. Geological 10 Survey (USGS) for the period of 1967 to 1985). 11
McCloud Arm of Shasta Lake 12 The construction of Shasta Dam between 1938 and 1945 converted part of the 13 lower McCloud River into the McCloud Arm of Shasta Lake. The McCloud 14 Arm is more than 16 miles long, with approximately 70 miles of shoreline. It 15 drains an area of approximately 41,000 acres (USFS 1998b). Water levels in the 16 arm fluctuate with the lake’s water levels, and during periods of lower water 17 levels, a water line, known as the “bathtub ring,” is evident along the banks. 18 During extended periods of lower water levels, vegetation may become 19 established on the exposed banks. 20
The upper extent of the lake encompasses the transition reach, which varies 21 between about 920 and 1,070 feet msl. Because of the effects of Shasta Lake on 22 the McCloud Arm, the STNF determined that the transition reach did not meet 23 the eligibility requirements of a wild and scenic river (USFS 1994). The USFS 24 defined the upper limit of the McCloud Arm as an elevation of 1,070 feet, or 25 approximately 5,400 feet above the McCloud River Bridge. This elevation 26 corresponds to the lower limit of Segment 4. A portion of the transition reach – 27 from the McCloud River Bridge to the 1,070-foot elevation – is included in the 28 segments of the river provided protection under the State PRC. 29
The transition reach provides a corridor for fish migrating between Shasta Lake 30 and the lower McCloud River and contributes to the unique fishery of the river. 31 Common fish in the McCloud Arm include rainbow trout, spotted bass, riffle 32 sculpin, and speckled dace (North State Resources, Inc. 2008). 33
Water temperatures in the McCloud Arm become warmer as the river 34 transitions to Shasta Lake. The warmer temperatures associated with Shasta 35 Lake support warmwater fish, but the cooler temperatures of the transition reach 36 may prevent some fish from migrating upstream into the lower river. Water 37 temperatures in the transition reach may be suitable for warmwater species. 38
25-11 Draft – June 2013

Shasta Lake Water Resources Investigation Environmental Impact Statement
25.3.2 The McCloud River’s Wild and Scenic Values 1 This section focuses on the wild and scenic river characteristics and ORVs of 2 the lower McCloud River identified by the USFS in the wild and scenic river 3 evaluation performed for the STNF LRMP (USFS 1994) and the wild and 4 scenic river characteristics and extraordinary value protected under the State 5 PRC. 6
The McCloud River’s fishery and its free-flowing condition are identified in 7 both the USFS evaluation and the State PRC. These characteristics are 8 discussed first, followed by a discussion of the wild and scenic characteristics 9 and values – water quality, geology, cultural/historical resources, and visual 10 quality/scenery – that are identified only in the USFS evaluation. 11
Specific information is lacking concerning the river reach that could 12 periodically be inundated if Shasta Dam and Shasta Lake were enlarged because 13 the lands along this part of the river are privately owned and access for 14 biological and other surveys has been limited; therefore, general information 15 concerning the lower McCloud River as a whole is provided for some resource 16 areas. This section also includes a brief description of the current transition 17 reach (see Figure 25-1) because the reach of the river that would be newly 18 inundated would likely take on the characteristics of the existing transition 19 reach. 20
Fishery 21 The fishery of the lower McCloud River is unique; the river is considered a 22 premier trout fishery, despite the ongoing effects of McCloud Dam and Shasta 23 Lake on the river’s flows and water quality. To characterize the fishery, this 24 section includes descriptions of the aquatic habitat in USFS Segment 4, the 25 Resources Agency’s Segment 10, and the transition reach as well as the fish 26 species that inhabit the study area. 27
Aquatic Habitat The lower McCloud River is characterized as a series of 28 alternating riffles, pools, and cascading pocket water occurring along a broad, 29 boulder-studded river channel within a confined, heavily timbered valley. A 30 narrow band of montane riparian vegetation (typically less than 25 feet wide) 31 dominated by willows, white alders, and Oregon ash occurs along the river 32 banks adjacent to steep hill slopes with mixed conifer-Douglas-fir forest (USFS 33 2001). 34
In 2001, the USFS prepared a Habitat Typing Report to characterize aquatic 35 habitats in the lower McCloud River from the McCloud River Bridge to 36 McCloud Dam. The report divided the lower river into four reaches: McCloud 37 Dam to Ladybug Creek, Ladybug Creek to Clairborne Creek, Clairborne Creek 38 to Tuna Creek, and Tuna Creek to McCloud River Bridge. The reach from Tuna 39 Creek to McCloud River Bridge includes all of Segment 4 and nearly all of 40 Segment 10, including the portion of the transition reach that is part of Segment 41
25-12 Draft – June 2013

Chapter 25 Wild and Scenic River Considerations for McCloud River
10. Data are not available for the transition reach below the McCloud River 1 Bridge downstream to Shasta Lake. 2
The dominant aquatic habitat in the reach of the lower river from Tuna Creek to 3 McCloud River Bridge includes runs (20 percent), mid-channel pools (18 4 percent), low-gradient riffles (18 percent), lateral scour pools from bedrock (11 5 percent), and pocket water (10 percent) (USFS 2001). This reach provides most 6 of the corner pool (100 percent), glide (89 percent), and cascade (50 percent) 7 habitats in the lower river. 8
The portion of the transition reach upstream from McCloud River Bridge is 9 dominated by low-gradient riffles and mid-channel pools, with some pocket 10 water, glides, runs, and lateral scour pools. Glide habitat is the dominant aquatic 11 habitat between the 1,070-foot and 1,080-foot elevations, and pocket water is 12 the dominant aquatic habitat between the 1,080-foot and 1,090-foot elevations. 13 The habitat within the current transition reach represents a fraction of the total 14 available aquatic habitat within the lower McCloud River and provides a small 15 portion of the habitats within the reach from the McCloud River Bridge to Tuna 16 Creek. 17
The diversity of riffles, flatwater habitat, and pools is influenced by the 18 presence of boulders and cobble substrate and variations in flow conditions. The 19 lower river is dominated by boulders with pockets of gravel present at pool 20 tailouts and in velocity breaks behind large boulders. The riffles are generally 21 higher gradient channel sections with turbulent surface flow and uniform cobble 22 and boulder substrates. While swift pocket water in the lower McCloud River 23 often appears more like a riffle than a run, the habitable eddies, or pockets, 24 created behind the boulders that characterize this habitat type make it 25 functionally more similar to the other flatwater habitats (USFS 2001). 26 Typically, flatwater and pools are the principal habitats used by the trout in the 27 McCloud River for rearing and feeding (Wales 1939, Rode and Dean 2004, 28 USFS 2001). 29
The USFS (2001) reported that the aquatic habitat within the transition reach 30 has undergone type conversions caused by aggradation and scour of sediments 31 for about 3,700 feet upstream from the McCloud River Bridge. When Shasta 32 Lake is drawn down, large, wide, low-gradient riffles with channel braiding 33 dominate in this reach. When the lake is at full pool and at intermediate levels 34 of drawdown, the transition reach becomes inundated, but a unidirectional 35 current created by the lower McCloud River’s inflow is detectable throughout 36 the inundation zone, slowing as it approaches the flat water of Shasta Lake. To 37 varying degrees, this fluctuating backwater effect converts this reach to a deep, 38 wide, slow-moving riverine habitat transitioning to lacustrine habitat near the 39 bottom of the transition reach. 40
25-13 Draft – June 2013

Shasta Lake Water Resources Investigation Environmental Impact Statement
Fish Species The current composition and distribution of fish species 1 inhabiting the lower McCloud River and Shasta Lake reflect the historic fishery, 2 the operational effects of Shasta Dam and McCloud Dam, and the introduction 3 of nonnative fish species into the river and Shasta Lake. The completion of 4 Shasta Dam in 1945 eliminated all runs of anadromous fish in the river (Rode 5 and Dean 2004). The historic fishery included Chinook salmon (Oncorhynchus 6 tshawytscha), steelhead (O. mykiss irideus), rainbow trout (O. mykiss), and the 7 only known California occurrence of the bull trout (Salvelinus confluentus). The 8 bull trout is believed to have been extirpated from the lower McCloud River and 9 is possibly extinct in California. Today, the fishery is dominated by rainbow 10 trout and brown trout (Salmo trutta), an introduced species that migrates 11 between Shasta Lake and the lower McCloud River. Other nonnative species 12 also migrate up the lower McCloud River, including spotted bass (Micropterus 13 punctulatus), but bass have not been confirmed upstream from Tuna Falls, a 14 high-gradient rapid at the confluence with Tuna Creek. Despite the change in 15 fish species in this 22-mile reach, the lower McCloud River is still considered 16 one of California’s premier trout streams. 17
Fish observed in the river downstream from the Tuna Creek confluence during a 18 survey conducted in summer 2007 included rainbow trout, spotted bass, 19 speckled dace (Rhinichthys osculus), sculpin spp. (Cottus spp.), Sacramento 20 sucker (Catostomus occidentalis), and Sacramento pikeminnow (Ptychocheilus 21 grandis) (North State Resources, Inc. 2008). Other fish that occur in this reach 22 include brown trout, brook trout (Salvelinus fontinalis), hardhead 23 (Mylopharodon conocephalus), and smallmouth bass (Micropterus dolomieui). 24 The status of the riverine fish species of the lower McCloud River is identified 25 in Table 25-1. 26
Rainbow Trout Fluvial and adfluvial populations of rainbow trout use the 27 habitat available throughout the lower McCloud River. The McCloud River 28 rainbow trout became known as “the rainbow of the fish culturist” because eggs 29 from that population accounted for transplants of rainbow trout in the 1880s to 30 the eastern states and several other countries. 31
The rainbow trout that inhabit the McCloud River are a vigorous, active fish 32 that primarily inhabit swifter portions of pool and pocket water habitats. Adults 33 migrate into the lower McCloud River from Shasta Lake in the spring and fall 34 months, presumably to spawn. Suitable spawning habitat in the study area is 35 limited, and the trout likely migrate further upstream to spawn (North State 36 Resources, Inc. 2008). 37
Although the genetic origin of these fish has not been evaluated, the numerous 38 strains of rainbow trout planted in Shasta Lake over the years have likely 39 resulted in some introgression among migratory rainbow trout in the lower 40 McCloud River. The degree to which this migratory population of rainbow trout 41 contributes to the native trout fishery of the river is not specifically known; 42 however, available data do not indicate that it is substantial. 43
25-14 Draft – June 2013

Chapter 25 Wild and Scenic River Considerations for McCloud River
Table 25-1. Riverine Fish Species of the Lower McCloud River 1 Species Current Status Comments
Sacramento sucker (Catostomus occidentalis) Common Native, non-game species, observed during 2007
surveys
Riffle sculpin (Cottus gulosus) Common Native, non-game species, observed during 2007
surveys
Smallmouth bass (Micropterus dolomieui) Uncommon Introduced sport species in Shasta Lake, moves into
lower river from lake, warmwater species
Spotted bass (Micropterus punctulatus) Uncommon
Introduced sport species in Shasta Lake, moves into lower river from lake, observed during 2007 surveys, warmwater species
Hardhead (Mylopharodon conocephalus) Uncommon Native, non-game species
Rainbow trout (Oncorhynchus mykiss) Abundant
Native trout species, subject to special angling regulations, coldwater species, observed during 2007 surveys
Sacramento squawfish (=pikeminnow) (Ptychocheilus grandis)
Common Native, non-game species, observed during 2007 surveys
Speckled dace (Rhinichthys osculus) Common Observed during 2007 surveys
Brown trout (Salmo trutta) Common
Introduced sport species found throughout the river, migrates from Shasta Lake to spawn in lower river, subject to special angling regulations, coldwater species
Bull trout (Salvelinus confluentus) CE; Extinct
Native, believed extirpated from entire river by mid-1970s, a few restoration experiments performed in upper river tributaries, coldwater species
Brook trout (Salvelinus fontinalis) Rare
Introduced sport species, stocking in upper river and tributaries discontinued, very rarely observed in lower river, coldwater species
Sources: Wales 1939, Tippets and Moyle 1978, Rode and Dean 2004, Moyle 2002, CDFW, unpublished data, North State Resources, Inc. 2008 Key: CE = California Endangered CDFW = California Department of Fish and Wildlife
Rainbow trout typically mature in their second to third year and move upstream 2 to spawn in the lower McCloud River and its tributaries from February to June. 3 The eggs typically hatch in 3 to 4 weeks, depending on water temperature, and 4 fry emerge 2 to 3 weeks later. The fry remain in quiet waters close to shore, 5 among cobbles, or under overhanging vegetation for several weeks. As the fish 6 grow, they move into swifter water habitats. 7
In the river, this species forms feeding station hierarchies, which they 8 aggressively defend, and prey on aquatic and terrestrial insects drifting in the 9 current. They also eat active bottom invertebrates. It has been reported that 10 McCloud River rainbow trout tend to be more bottom-oriented when feeding 11 than rainbow trout elsewhere. 12
25-15 Draft – June 2013

Shasta Lake Water Resources Investigation Environmental Impact Statement
In reservoirs, rainbow trout form loose schools and feed on both invertebrates 1 and other fish, although fish dominate their diet as they grow larger. Preferred 2 prey in Shasta Lake is the threadfin shad. Trout growth in Shasta Lake is more 3 rapid than for fluvial trout. The optimum temperature range for growth and for 4 completion of most life stages of rainbow trout is between 50 and 70 degree 5 Fahrenheit (°F), though they seem to prefer and thrive at temperatures in the 6 lower two-thirds of this range. Rainbow trout in lakes and streams seldom live 7 for more than 6 years. 8
Brown Trout Like the rainbow trout, fluvial and adfluvial populations of 9 brown trout use habitat throughout the lower McCloud River, but this species 10 migrates more between the lake and river. It is not as abundant as the rainbow 11 trout. CDFW biologists suggest that this species occupies an ecological niche 12 previously occupied by bull trout in the lower McCloud River (Rode and Dean 13 2004). 14
Only some of the brown trout migrating from Shasta Lake that passed a lower 15 river counting weir were observed upstream in the Wild Trout Management 16 Area (segments 7, 8, 9, and 10), so the actual extent of the spawning grounds of 17 migratory brown trout is not fully known. 18
Brown trout mature in their second or third year. Some fish may mature in the 19 river while others may migrate to Shasta Lake to feed, returning to spawn on a 20 recurring basis. The stimulus for upstream migration is often a rise in stream 21 flow or changing lake temperatures. Spawning takes place from November 22 through December when water temperatures fall below 50°F. Eggs typically 23 hatch within 7 to 8 weeks, depending on water temperature. Fry emerge from 24 the gravel 3 to 6 weeks later. The habitats used by juvenile brown trout are 25 similar to those used by rainbow trout; however, as brown trout grow, they tend 26 to select habitats with slower water and more cover. In the riverine 27 environment, brown trout prefer slow, deep pools with abundant boulder and 28 bedrock ledge cover. The timing of emigration of juvenile brown trout to Shasta 29 Lake is not known. 30
Fluvial brown trout have diets similar to those of rainbow trout, but appear to 31 feed more on the stream bottom for benthic prey than rainbows. As brown trout 32 grow, their diet expands to include larger invertebrate prey and fish. Larger 33 brown trout are voracious predators, especially on fish, including young 34 salmonids. In Shasta Lake, adult brown trout prefer threadfin shad as a staple 35 prey. 36
Brown trout growth in the lower McCloud River appears to increase after age 3, 37 which has been attributed to their migration to Shasta Lake to exploit the forage 38 fish populations. Brown trout growth is best at temperatures ranging from 45 to 39 69°F, though they seem to prefer and dominate other trout species near the 40 upper half of this range. 41
25-16 Draft – June 2013
Chapter 25 Wild and Scenic River Considerations for McCloud River
Spotted Bass and Smallmouth Bass Black basses and other sunfishes dominate 1 in the littoral zones of Shasta Lake. Spotted bass and smallmouth bass are now 2 the most common black basses in Shasta Lake, with spotted bass having 3 become most frequent over the past 20 years. Both spotted and smallmouth bass 4 occupy shallow, low-gradient habitat offered by Shasta Lake and its tributaries. 5 They can be found throughout Shasta Lake and in the lower ends of the main 6 tributary streams, including the lower McCloud River. However, the extent to 7 which black bass have colonized the lower McCloud River is not currently 8 known. 9
Smallmouth bass and spotted bass share similar life histories, and these 10 similarities may account for their persistence in Shasta Lake compared to that of 11 largemouth bass, which have declined in numbers. Both smallmouth and spotted 12 bass mature in their second or third year and spawn in the late spring. 13 Smallmouth will spawn at cooler temperatures (55 to 61°F) than spotted bass 14 (greater than or equal to 65°F). Both species seek quiet shallow areas over mud, 15 sand, gravel, and rocky, debris-littered bottoms to spawn in both lakes and 16 streams. This type of spawning habitat is available in the transition reach of the 17 lower McCloud River, especially when lake levels are high. 18
Juvenile bass feed on small invertebrates until they are large enough to prey on 19 small fish and large invertebrates. Temperature preferences and optimal growth 20 for both species of black basses is attained in the range from 68 to 81°F. 21 Because of the year-round cool temperatures (less than or equal to 68°F) of the 22 lower McCloud River, temperatures preferred by bass only occur during the late 23 summer and early fall months upstream from the transition reach. Therefore, the 24 temperature regime of the lower McCloud River may limit intrusions of bass 25 from the lake. However, spotted bass were observed in the lower river below 26 the confluence of Tuna Creek during summer fish surveys (North State 27 Resources, Inc. 2008). 28
Free-Flowing Condition 29 The Federal WSRA defines free flowing as “existing or flowing in natural 30 condition without impoundment, diversion, straightening, rip-rapping, or other 31 modification of the waterway” (16 USC Section 1286). The State PRC defines 32 free-flowing as “existing or flowing without artificial impoundment, diversion, 33 or other modification of the river.” It states, however, that the “presence of low 34 dams, diversion works, and other minor structures does not automatically bar a 35 river’s inclusion in the system.” 36
Base flows in the lower McCloud River are partially controlled by releases from 37 McCloud Reservoir in accordance with PG&E’s FERC license and include 38 precipitation and inflow from tributaries. The lower McCloud River experiences 39 seasonal fluctuations and large variations in base flows (USFS 1998a). Releases 40 from McCloud Reservoir into the lower river are heavily regulated, with a 41 minimum release requirement of 50 cfs from May through November and 40 cfs 42 from December through April; the releases are typically well above these 43
25-17 Draft – June 2013

Shasta Lake Water Resources Investigation Environmental Impact Statement
minimum requirements and tend to stay above 100 cfs (USFS 1998a). Tributary 1 contributions are the most noticeable flows during storm events, but are 2 substantially reduced during low-flow conditions. Because of the minimum 3 release requirements from McCloud Reservoir, spring and summer flows are 4 considerably more stable than they would be under unregulated conditions. 5
PG&E monitors lower McCloud River flows in accordance with its FERC 6 license at a gaging station in Segment 4 upstream from Shasta Lake (0.2 mile 7 downstream from Big Bollibokka Creek); the most recent available water data 8 record covers the water year October 2006–September 2007 (USGS 2007). For 9 this period, measured mean monthly flows ranged from 235 cfs in August to a 10 high of 1,185 cfs in February, with maximum flows as high as 5,010 cfs. 11
12 13 14 15 16 17
Over the course of the year, the transition from lake to river expands and contracts over a distance of about 1.7 miles due to changing water levels in Shasta Lake (Figure 25-2). During April and May of wet years, the transition reach extends about 1 mile (5,400 feet) upstream from the McCloud River Bridge to the full pool elevation of 1,070 feet msl, the downstream boundary of Segment 4. As described in Chapter 6, “Hydrology, Hydraulics, and Water Management” Shasta Lake reaches full-pool elevation about one year in three. 18
Despite upstream and downstream dams and diversions, the lower McCloud 19 River meets the definition of a free-flowing river under both the Federal WSRA 20 and State PRC. 21
Water Quality 22 The water quality of the lower McCloud River is influenced by natural 23 processes and land use activities, including PG&E’s McCloud-Pit Hydroelectric 24 Project, timber management activities, and roads. Overall, the water quality of 25 the river is rated as good (USFS 1998). Glacial silt gives the river “a beautiful 26 turquoise color typical of rivers draining glacial valleys in British Columbia and 27 Alaska” (Jones & Stokes Associates 1998). 28
Turbidity and water temperature are two important factors that influence the 29 water quality of the river and affect aquatic habitat. Turbidity is caused by 30 suspended sediment transported from upstream waters and in surface runoff, 31 particularly from disturbed landscapes, such as timber harvest areas or roads. 32 Water temperature is affected by a variety of conditions, such as river flows, 33 solar radiation, and density of vegetation along the river, but is closely tied to 34 the temperature of the flows released from the McCloud Reservoir. 35
The turbidity of the lower McCloud River is influenced by the water quality and 36 water levels of the McCloud Reservoir and runoff from upland areas throughout 37 the basin. Turbidity levels are generally low during most of the year, ranging 38 from 5–10 nephelometric turbidity units, but can spike to more than 900 units 39 during periods of intense rainfall and flood flows (PG&E 2006). 40
25-18 Draft – June 2013

Chapter 25 Wild and Scenic River Considerations for McCloud River
Sediment becomes trapped at McCloud Dam and is released into the lower river 1 during large storm events, temporarily increasing turbidity levels, especially in 2 the upper segments of the lower river. Testing of the McCloud Dam bypass 3 valve can cause high turbidity for a short period when sediment is discharged 4 from the reservoir into the lower McCloud River. Surface runoff, especially 5 after the first storms of the wet season, can contribute large amounts of turbid 6 runoff from upland areas. 7
The length of the transition reach depends on the water year type. As the 8 transition reach moves upstream, sediment within the reach is remobilized and 9 turbidity levels respond accordingly. Periodic fluctuations in water levels can 10 result in erosion along the banks and localized increases in turbidity levels in 11 the transition reach and the McCloud Arm. 12
The year-round cool water temperature regime of the lower McCloud River 13 inhibits the productivity of its fishery, but provides high-quality holding habitat 14 for salmonids, contributing to the river’s unique value as a tributary to Shasta 15 Lake. The controlled releases from McCloud Dam appear to have a direct 16 bearing on the water temperatures downstream. Water temperatures tend to be 17 higher in Segment 4 than immediately below McCloud Dam. Data recorded at 18 PG&E’s monitoring station on the river just upstream from Shasta Lake (0.2 19 mile downstream from Big Bollibokka Creek) indicate that water temperature 20 ranges from the high 30s to the upper 60s (°F), with lower temperatures in the 21 winter and higher temperatures in the summer (PG&E 2006). 22
The infusion of cooler water from the lower McCloud River influences water 23 temperatures in the transition reach throughout the year. The degree of influence 24 depends on the amount of discharge from the river and Shasta Lake levels. The 25 temperatures throughout the lower McCloud River also control to some degree 26 the distribution of the warmwater fishery known to occupy the river below Tuna 27 Falls. 28
Outstandingly Remarkable Values Identified in USFS Evaluation 29 Cultural/Historical Resources Cultural resources include archaeological 30 sites, historical structures and sites, and areas of religious or cultural 31 significance to Native Americans. Significant resources that provide important 32 information on the prehistory and history of an area or that are considered 33 sacred to Native Americans can contribute to wild and scenic river values. 34
The McCloud River basin was part of a major center of occupation by the 35 Wintu people, who occupied the McCloud River area at the time of Euro-36 American contact in the 1800s. Although much of the Wintu territory was 37 overrun with miners and other opportunistic Euro-Americans, the lower 38 McCloud River was left largely untouched due in part to a lack of easily mined 39 materials and the ruggedness of the terrain (Yoshiyama and Fisher 2001), but 40 also because of the resistance of the Wintu to incursions into their territory. 41 Because of its generally undisturbed nature, the significance of the lower 42
25-19 Draft – June 2013
Shasta Lake Water Resources Investigation Environmental Impact Statement
McCloud River to prehistoric and ethnographic records of this area of 1 California’s history is considered to be great (Jones & Stokes Associates 1988). 2
Within the 0.25-mile corridor deemed eligible by the USFS, three formally 3 recorded sites and other known sites contribute to the lower river’s ORVs 4 because they provide important information on the use of the area from before 5 the Late Archaic Period (1300 to 150 before present, calibrated using 6 radiocarbon dating ) to the Historic Era (1840 to present). Three Wintu villages, 7 called Tsekerenwaitsogi, Klolwakut, and Boloibaki, are thought to have been 8 located in the general area of the present-day Bollibokka Club headquarters 9 (Guilford-Kardell 1980), which is part of the former Wintu territory. These 10 villages likely represent the typical lifestyle of the Wintu at the time of Euro-11 American contact, when they lived in permanent villages near rivers and 12 streams and were semi-sedentary, foraging people (DuBois 1935). As part of 13 the Wintu occupation of this area, prehistoric, historic, and modern Traditional 14 Cultural Properties, sacred locations, and important use areas are located 15 throughout the lower McCloud River basin (outside of the 0.25 mile corridor), 16 including features such as mountains, unique landforms, caves, distinctive rock 17 outcrops, waterfalls, pools, springs, and resource gathering areas. 18
Point McCloud Bridge (known as McCloud River Bridge in this chapter) is a 19 historical resource that was constructed in 1940 and altered in 1986; the bridge 20 would be subject to relocation in conjunction with SLWRI activities. The 21 Bollibokka Club is a historical resource located on the north bank of the river 22 between the confluence of Big Bollibokka Creek on the east and Wittawaket 23 Creek on the west. Buildings associated with the club were built between the 24 1860s and 1920s by Austin and Rueben Hills, the founders of Hill’s Brothers 25 Coffee, and previous owners (Lucas and Stienstra 2007). A log cabin dates from 26 the 1860s, and other structures date from the ownership of the Hills Family, 27 including the clubhouse built in 1924 and a structure built of river cobble in 28 1915 (Whitney 2004). Although these resources could be eligible for listing on 29 the National Register of Historic Places, they have not been formally evaluated. 30
The fishery of the lower McCloud River was also very important to prehistoric 31 and historic uses of the area. The Native Americans in the lower McCloud River 32 basin conducted communal fish drives of salmon or steelhead at night, which 33 brought together many communities and provided opportunities for trade and 34 social networking, including the parsing out of the catch among the people and 35 villages involved (DuBois 1935). Fish, including salmon, steelhead, Sacramento 36 sucker, freshwater shellfish, and lamprey, were an important part of the Native 37 American diet in this area. When the northern mines opened in the 1800s, 38 settlers moved into the area, and the McCloud River and other rivers’ fisheries 39 provided important sources of food. In the early years of settlement, fish and 40 game in the area were used for subsistence; however, this changed with the 41 formation of the State of California and increased fishery management and 42 recreational fishing. 43
25-20 Draft – June 2013

Chapter 25 Wild and Scenic River Considerations for McCloud River
Geology The lower McCloud River flows through a number of geologic 1 formations, including the McCloud Limestone formation. This formation 2 contains fossilized remains of invertebrate and vertebrate fauna that provide 3 important scientific information on the history of California, and it has a high 4 potential for research. According to the USFS (1998b), the limestone features 5 exposed at a number of locations around Shasta Lake are unique and contribute 6 to worldwide paleontological knowledge. The McCloud Limestone contains 36 7 species of corals, some of which may form the basis of a new taxonomic group. 8
Because of its very diverse fossil faunas, the mountainous terrain between the 9 McCloud and Pit arms of Shasta Lake is perhaps California’s single most 10 important area for paleontological research (Munthe and Hirschfield 1978, cited 11 in USFS 1998b). The limestone outcrops on the ridge immediately northwest of 12 McCloud River Bridge (several hundred vertical feet above Shasta Lake) have 13 produced several large Mississippian and Pennsylvanian invertebrate faunas. 14 Because this period is poorly represented on the West Coast, this fossiliferous 15 limestone is important to understanding the late Paleozoic evolution in this part 16 of the country (USFS 1998b). Limestone outcrops adjacent to the McCloud 17 Arm also provide habitat for several special-status species, such as Shasta 18 salamander, Shasta eupatorium, Howell’s cliff-maids, and Shasta snow-wreath 19 (Reclamation 2003). 20
Exposed outcrops of the limestone formation are visible from the lower 21 McCloud River in and upslope of the transition reach and contribute to its 22 scenic values. 23
Visual Quality/Scenery The visual setting of the lower McCloud River 24 upstream from Shasta Lake includes views of the river, limestone rock outcrops, 25 adjacent coniferous and oak forests, and infrastructure associated with the 26 Bollibokka and McCloud River clubs. A USGS stream gage has also been in 27 place for a number of years. The pristine nature of the lower river provides for 28 high-quality scenic views. However, the scenic views of the lower McCloud 29 River are enjoyed by only a limited number of viewers, consisting primarily of 30 private landowners, club members, and their guests. 31
Views of the river include “picturesque cascading whitewater, and deep, long, 32 green- or turquoise-colored pools,” with Douglas-fir and black and canyon oaks 33 dominating the steep slopes and hillsides along the river (Jones & Stokes 34 Associates 1988). Several buildings are present at the Bollibokka Club 35 headquarters, but these structures blend in with the visual setting. The transition 36 reach exhibits some evidence of fluctuating surface water elevations associated 37 with changes in water levels of Shasta Lake. Areas that are noticeably affected 38 by the reservoir levels exhibit “a bathtub ring of steep, treeless slopes with 39 occasional deposits of alluvium.” 40
25-21 Draft – June 2013

Shasta Lake Water Resources Investigation Environmental Impact Statement
The scenic views make most of the lower McCloud River, including Segment 4, 1 eligible as a scenic river under the Federal WSRA (USFS 1994). To be 2 classified as a scenic river, the river must be free of impoundments, be 3 accessible in places by roads, and have a river basin/shoreline that is largely 4 undeveloped. Segment 4 does not contain any human-made or other 5 impoundments that affect its free-flowing conditions. Roads to the Bollibokka 6 Club provide access to portions of Segment 4 for members of the club and their 7 guests. Currently, public access is limited to pedestrians on USFS lands along 8 the shoreline of Shasta Lake. For these reasons, the USFS has determined that 9 this segment meets the eligibility requirements of a scenic river under the 10 Federal WSRA. 11
25.4 Environmental Consequences and Mitigation Measures 12
This section identifies how the characteristics of the lower McCloud River that 13 make it eligible for listing under the State PRC and Federal WSRA could be 14 affected by each alternative and whether the alternatives would conflict with the 15 provisions of the STNF LRMP and the CRMP. 16
25.4.1 Methods and Assumptions 17 This analysis of environmental consequences focuses on the effects of proposed 18 modifications to Shasta Dam and Shasta Lake on the McCloud River’s free-19 flowing conditions, its water quality, and the ORVs (cultural resources, 20 fisheries, geology, and scenery) that make it eligible for listing as a wild and 21 scenic river under the Federal WSRA. In large part, the environmental effects 22 are based on computer modeling of water levels and the anticipated changes in 23 the environment due to fluctuations in water levels and expansion of the 24 transition reach. Physical effects to the free-flowing conditions, water quality, 25 and ORVs are analyzed in terms of their effects on the eligibility of the river for 26 wild and scenic river designation. While aquatic habitat data are used to 27 quantify the relative impact to fishery values, a qualitative analysis is provided 28 for most resources because of a lack of quantitative data and the subjective 29 nature of the values. Information to support the analysis was generated from 30 available literature and planning documents and technical studies prepared as 31 part of the SLWRI as well as other chapters in this DEIS. 32
CalSim Modeling 33 The CalSim-II computer model was used to assist in the evaluation of the 34 potential impacts of the project alternatives on water-related resources. The 35 model used historical data on California hydrology to represent the variety of 36 weather and hydrologic patterns, including wet periods and droughts, under 37 which water storage and conveyance facilities would be operated. Two 38 scenarios (base cases) of demands for, and storage and conveyance of, water 39 were used in model runs: 2005 facilities and demands (“existing conditions”) 40 and forecasted 2030 demands and reasonably foreseeable projects and facilities 41 (“future conditions”). A model run was conducted for each of these base cases 42
25-22 Draft – June 2013

Chapter 25 Wild and Scenic River Considerations for McCloud River
combined with each alternative so that the effects of the No-Action Alternative 1 and the action alternatives could be evaluated for both existing and future 2 conditions. 3
The analysis focuses on the environmental effects in the portion of segment 4 4 that would periodically be inundated. These effects are discussed in the 5 following section. 6
Gage Data 7 PG&E, in coordination with USGS, monitors McCloud River flows in 8 accordance with its FERC license for the McCloud-Pit Hydroelectric Project at 9 a gaging station just upstream from the McCloud River Bridge, approximately 10 0.2 mile downstream from Big Bollibokka Creek (USGS 11368000 McCloud 11 River above Shasta Lake, California). The station measures mean, minimum, 12 and maximum monthly flows in the lower McCloud River. The most recent 13 available water data record covers the water year of October 2011 to September 14 2012 (USGS 2012). This data was used to describe flow conditions in the lower 15 McCloud River. 16
Water Quality Monitoring 17 Current and historical water quality monitoring data for the McCloud River 18 have been collected by federal and state agencies as well as PG&E and The 19 Nature Conservancy. The California Department of Water Resources maintains 20 water quality information on the McCloud River in the California Data 21 Exchange Center database. The Nature Conservancy monitors water quality at 22 the McCloud River Preserve. Water quality monitoring of the lower McCloud 23 River includes measures of water temperature, dissolved oxygen, pH, specific 24 conductance, and turbidity, as well as correlated data on weather, air 25 temperature, and debris movement. PG&E monitors water quality in 26 compliance with its FERC license. Available information on water quality was 27 used to describe the setting of the lower river and assess changes in water 28 quality that would occur as a result of the Shasta Dam modification alternatives. 29
Habitat Typing 30 The USFS stream habitat typing performed in 1999 and 2000 (STNF, December 31 2001 unpublished data report, as found in USFS 2001) was used to describe 32 aquatic habitat in the lower McCloud River and to assess the changes in aquatic 33 habitat from implementation of the Shasta Dam modification alternatives. The 34 habitat typing data were used in conjunction with the CalSim-II modeling 35 results, digitized orthophotographs, and high-resolution topographic data to 36 provide habitat maps and graphic depictions of the distribution of aquatic 37 habitat in the lower river below Little Bollibokka Creek. A longitudinal profile, 38 using water surface elevations, was generated to illustrate habitats; it does not 39 provide an accurate representation of channel geometry. 40
25-23 Draft – June 2013
Shasta Lake Water Resources Investigation Environmental Impact Statement
A quantitative evaluation of the aquatic habitats was performed using digital 1 images and the USFS habitat typing data in an integrated geographic 2 information systems environment. Longitudinal habitat delineation was 3 determined from the habitat typing data, with minor adjustments to match 4 photo-interpreted habitat, and incorporated into the geographic information 5 systems in conjunction with water surface elevations generated through the 6 CalSim-II modeling results. Estimates of aquatic habitat areas were generated 7 from digitized wetted stream perimeters. These measurements were based on 8 orthophotographs taken April 25, 2001. While the absolute amount of riverine 9 habitat can vary with flow, the relative proportions of different types of habitat 10 remain relatively constant. Therefore, we used the relative proportions of 11 aquatic habitat types to compare impacts to the transition reach with the entire 12 lower river. 13
25.4.2 Criteria for Determining Significance of Effects 14 The following significance criteria were developed based on guidance provided 15 by the State CEQA Guidelines, other Federal and State guidance, and consider 16 the context and intensity of the environmental effects as required under NEPA. 17 (Please see Chapter 3, “Considerations for Describing the Affected 18 Environment and Environmental Consequences) for an explanation of the 19 distinction between significance under NEPA and significance under CEQA.) 20 Impacts of an alternative on the wild and scenic river values of the lower 21 McCloud River would be significant if project implementation would: 22
• Affect the eligibility for Federal listing as a wild and scenic river of any 23 portion of the lower McCloud River above the 1,070-foot elevation 24
• Conflict with the Shasta-Trinity National Forest Land and Resource 25 Management Plan or with management of the McCloud River under the 26 Coordinated Resource Management Plan 27
• Conflict with the protection provided the lower McCloud River under 28 the State PRC 29
25.4.3 Direct and Indirect Effects 30
No-Action Alternative 31 Under the No-Action Alternative, Reclamation would not pursue an action to 32 enlarge Shasta Dam to help increase anadromous fish survival in the upper 33 Sacramento River and address the growing water supply reliability issues in 34 California. Water levels in Shasta Lake and the transition reach would continue 35 to fluctuate similar to current conditions. USFS Segment 4 and the Resources 36 Agency’s Segment 10 would not be affected by this alternative. 37
25-24 Draft – June 2013

Chapter 25 Wild and Scenic River Considerations for McCloud River
Impact WASR-1 (No-Action): Effect on McCloud River’s Eligibility for 1 Listing as a Federal Wild and Scenic River Under the No-Action 2 Alternative, the current maximum elevation of water levels in the transition 3 reach would not be increased, and Segment 4 would not be affected. 4 Fluctuations in water levels would continue to be similar to current conditions, 5 with water levels reaching the maximum elevation of 1,070 feet msl – the 6 downstream boundary of Segment 4 – in the transition reach for a brief period 7 (typically a few days in May) during wet years. 8
The average monthly water surface of Shasta Lake would continue to fluctuate 9 based on the water year, with a maximum elevation of 1,053 feet msl in April of 10 an average water year and 1,070 feet msl in April and May of a wet year. These 11 fluctuations would not affect the free-flowing conditions and water quality of 12 Segment 4. The ORVs that make the river eligible for designation as a Federal 13 wild and scenic river would continue to be affected only by ongoing natural 14 processes and land use activities, and all of Segment 4 would remain eligible for 15 listing under the Federal WSRA. Therefore, there would be no impact. 16 Mitigation is not required for the No-Action Alternative. 17
Impact WASR-2 (No-Action): Conflict with Shasta-Trinity National Forest 18 Land and Resource Management Plan Under the No-Action Alternative, the 19 STNF LRMP would continue to be implemented as it has in the past, with no 20 changes in the management of the McCloud River’s free-flowing condition, 21 water quality, and ORVs. Therefore, there would be no impact. Mitigation is not 22 required for the No-Action Alternative. 23
Impact WASR-3 (No-Action): Conflict with the California Public 24 Resources Code, Section 5093.542—McCloud River Fishery Under the No-25 Action Alternative, the protections afforded the McCloud River by the State 26 PRC would not be affected. River conditions would not be modified, and the 27 provisions of the State PRC would continue to protect the river. Therefore, there 28 would be no impact. Mitigation is not required for the No-Action Alternative. 29
Impact WASR-4 (No-Action): Conflict with the California Public 30 Resources Code, Section 5093.542—Free-Flowing Conditions Under the 31 No-Action Alternative, the protections afforded the McCloud River by the State 32 PRC would not be affected. River conditions would not be modified, and the 33 provisions of the State PRC would continue to protect the river. Therefore, there 34 would be no impact. Mitigation is not required for the No-Action Alternative. 35
CP1 – 6.5-Foot Dam Raise, Anadromous Fish Survival and Water Supply 36 Reliability 37 CP1 would involve a 6.5-foot raise of Shasta Dam, which would increase the 38 lake’s gross pool by 8.5 feet and enlarge the total storage space in the lake by 39 256,000 acre-feet. This increase would equate to an increase of about 1,100 40 acres of surface area occupied by Shasta Lake when the lake is full. CP1 41 includes measures to increase water supply reliability while contributing to 42
25-25 Draft – June 2013

Shasta Lake Water Resources Investigation Environmental Impact Statement
increased survival of anadromous fish. Shasta Dam operational guidelines 1 would continue essentially unchanged, except during dry years and critical 2 years, when 70 thousand acre-feet (TAF) and 35 TAF, respectively, of the 3 increased storage capacity in Shasta Reservoir would be reserved to specifically 4 focus on increasing municipal and industrial (M&I) deliveries. 5
Impact WASR-1 (CP1): Effect on McCloud River’s Eligibility for Listing 6 as a Federal Wild and Scenic River Under CP1, the increased gross pool of 7 Shasta Lake would expand the current transition reach up to the 1,078-foot 8 elevation, resulting in adverse effects on the characteristics of approximately 9 1,470 feet of Segment 4. The rest of the McCloud River would remain eligible 10 for designation as a Federal wild and scenic river. This impact would be 11 significant. 12
Under CP1, approximately 1,470 feet, or 11 percent, of Segment 4 would be 13 periodically inundated. This increase in the transition reach to a maximum 14 elevation of 1,078 feet msl would equate to a 16 percent increase over the 15 current transition reach. The length of time during the year when the transition 16 reach is inundated and the maximum elevation of the inundation area would 17 vary by the type of water year (wet, above normal, below normal, average, dry, 18 or critical). 19
Within the expanded transition reach, flow conditions and fisheries would 20 periodically be affected, with the timing and duration of the effects similar to 21 those that occur in the current transition reach. Over time, the expansion of the 22 bathtub ring would affect water quality, geology, and visual quality/scenery in 23 the affected portion of Segment 4. Erosion of soils along the river could expose 24 buried cultural resources, and periodic inundation could permanently alter 25 cultural resource values and features in the transition reach important to Native 26 Americans. These effects could reduce the total length of the lower McCloud 27 River that is eligible for wild and scenic river designation by about 1,470 feet 28 (approximately 1.2 percent of the total length of the lower river). 29
Free-Flowing Conditions Under CP1, the currently free-flowing section of the 30 lower McCloud River would be reduced by about 1,470 feet or about 1.2 31 percent. The flow characteristics of the affected portion of Segment 4 would 32 periodically be modified, resulting in slower moving waters and a wider river 33 channel. When inundated, the affected portion would retain some current, but 34 flow velocities would decrease with distance downstream. This modification 35 would not meet the definition of a free-flowing river under the Federal WSRA. 36
Because free-flowing conditions are a fundamental requirement for wild and 37 scenic river eligibility, the 1,470-foot reach of Segment 4 that would be affected 38 by CP1 would become ineligible for listing under the Federal WSRA. 39
Water Quality As Shasta Lake’s water levels rise, vegetation and soils along 40 the banks of the affected portion of Segment 4 would become inundated. Most 41
25-26 Draft – June 2013

Chapter 25 Wild and Scenic River Considerations for McCloud River
or all of the vegetation that is inundated would eventually die and be washed or 1 fall into the river, bringing with it sediment and other materials that could affect 2 water quality. Soils in the affected portion of Segment 4 would erode as water 3 levels rise and fall, causing an increase in turbidity. These effects would likely 4 be most noticeable during the initial inundation periods, since the river corridor 5 is likely to eventually stabilize as the soil is eroded to bedrock. 6
Within the approximately 1,470-foot reach of Segment 4 that would be affected 7 under CP1, water temperatures would fluctuate relative to temperatures 8 immediately upstream. Similar to flow, these changes would vary by water year 9 type. Increased turbidity and warmer water temperatures would be most 10 noticeable along the affected portion of Segment 4 because this area has not 11 been previously exposed to periodic inundations. 12
Adverse effects on water quality would be associated with the periodic 13 fluctuations in the water levels of Shasta Lake. Because water quality is a 14 fundamental requirement for wild and scenic river eligibility, the 1,470-foot 15 reach of Segment 4 that would be affected by CP1 would become ineligible for 16 listing under the Federal WSRA. 17
Outstandingly Remarkable Values As described above under Affected 18 Environment, the ORVs that make Segment 4 of the McCloud River eligible for 19 listing as a wild and scenic river are cultural/historical resources, fisheries, 20 geology, and visual quality/scenery. 21
Cultural/Historical Resources Under CP1, erosion of rock outcrops and 22 expansion of the bathtub ring in an approximately 1,470-foot reach of Segment 23 4 could expose buried or previously undiscovered prehistoric cultural resources 24 associated with Wintu occupation of the area and historic recreational uses of 25 the area. As this reach becomes inundated, any exposed resources would be 26 susceptible to the effects of water, which could damage or otherwise alter their 27 values, affecting their eligibility for listing on the National Register of Historic 28 Places and reducing their importance for providing information on past use 29 within the corridor. As the water recedes, exposed resources would be 30 susceptible to wind and rain and could be visible, potentially exposing them to 31 theft or vandalism. These adverse effects would be localized along the corridor 32 of the affected portion of Segment 4 and would likely only affect a small 33 portion of the cultural resources that may be associated with the lower McCloud 34 River basin. 35
The historic structures associated with the Bollibokka Club occur outside of the 36 area that would be affected by the expanded transition reach and would not be 37 affected. However, unrecorded resources associated with the Wintu village 38 locations may occur within the corridor along the river and could be subjected 39 to periodic inundation, deposition, and scour within the upper portions of the 40 expanded transition reach. Portions of three other recorded sites could also be 41 subject to similar impacts within the expanded transition reach, which could 42
25-27 Draft – June 2013

Shasta Lake Water Resources Investigation Environmental Impact Statement
result in damage to resources within the sites. Although these sites may provide 1 information on the area’s history or prehistory, none of these sites has been 2 evaluated for listing on the National Register of Historic Places. 3
Sacred sites important to Native Americans have not been specifically 4 identified, and access to lands adjacent to the reach that would be periodically 5 inundated under CP1 is limited because all of these lands are privately owned. 6
The cultural resources located along the 1,470-foot reach of Segment 4 that 7 would be affected under CP1 would be subject to the effects of periodic 8 inundation. 9
Fisheries Aquatic habitat in the 1,470-foot expansion of the transition 10 reach would be affected during periodic inundations, resulting in potential 11 adverse effects on the fish that occur in the river. Potential adverse effects on 12 fish could include a reduction in spawning habitat for trout in the expanded 13 transition reach and an increase in the range of warmwater fish in the lower 14 McCloud River. Fishing opportunities would not be affected more than they are 15 now with the periodic fluctuations in river levels. 16
Under CP1, the transition reach would be extended by about 1,470 feet to the 17 1,078-foot elevation, resulting in a larger inundation area when Shasta Lake 18 water levels are the highest. Aquatic habitat in the affected portion of Segment 4 19 consists primarily of flatwater habitat (52 percent glide, 19 percent mid-channel 20 pool, and 13 percent run), with pocket water (11 percent) and a small, low-21 gradient riffle (5 percent) in the lower portion of the segment. With the periodic 22 inundations, sediment deposition could cause flatwater habitat to convert to 23 riffle habitat, resulting in a reduction in flatwater habitat of less than 3 percent 24 of the total lower McCloud River’s flatwater habitat. During the inundation 25 period, riffle and pool habitat (approximately 1.2 percent of the total lower 26 McCloud River) would be converted to flatwater habitat. Also, riparian 27 vegetation along the newly inundated banks of the affected portion of Segment 28 4 would be expected to die, which could affect water temperatures and reduce 29 cover for fish in this reach. The extent of these effects would depend on the 30 frequency, duration, and surface elevation of the inundation, which would vary 31 depending on the type of water year and water levels of Shasta Lake. 32
The migration of fish, especially trout, between the lower McCloud River and 33 Shasta Lake is an important attribute of the unique trout fishery. Many of the 34 rainbow and brown trout that occupy the lower McCloud River spend part of 35 their lives rearing in Shasta Lake, feeding on the abundant prey in the lake and 36 attaining large sizes that would not be possible if they reared only in the river. 37 Upon returning to the river to spawn, these lake-reared fish provide the trophy-38 sized trout, particularly brown trout, for which the lower McCloud River is 39 renowned (Rode and Dean 2004). Based on a survey that extended up to Tuna 40 Falls (North State Resources, Inc. 2008), the reach of Segment 4 that would 41 periodically be inundated does not contain any barriers or impediments to fish 42
25-28 Draft – June 2013

Chapter 25 Wild and Scenic River Considerations for McCloud River
movement or migration, and CP1 would not create any. Consequently, trout 1 migration through the transition reach to upstream spawning areas would not be 2 impaired. 3
Conversely, warmwater fish movement between the lake and river is not likely 4 to be facilitated by the expanded transition reach. Warmwater fish from Shasta 5 Lake, such as spotted bass, have been observed throughout the lower McCloud 6 River, at least up to the confluence with Tuna Creek (North State Resources, 7 Inc. 2008). Nonnative warmwater species inhabiting Shasta Lake (e.g., 8 smallmouth bass and spotted bass) are known to exploit riverine and transitional 9 habitats and are effective predators of juvenile trout. No barriers have been 10 observed in the transition reach that could prevent warmwater fish from moving 11 upstream, and no barriers would be created by the expansion of the transition 12 reach. Warmwater fish would continue to be able to move between the lake, the 13 transition reach, and lower McCloud River (Segment 4). 14
Aquatic habitat changes could affect how fluvial resident trout use habitat 15 within the affected portion of Segment 4. General effects may range from 16 temporary displacement of trout to upstream habitats at high water levels to 17 degraded riverine habitat suitability within the transition reach. 18
Suitable spawning habitat for rainbow and brown trout in the expanded 19 transition reach is limited because of the few pools and riffles available during 20 the spring and fall when these species spawn. Based on the USFS habitat data 21 and more recent reconnaissance surveys, the amount of spawning gravels in the 22 expanded transition reach represents only a small percentage of the suitable 23 spawning habitat in the lower McCloud River. However, any effect on 24 spawning habitat would be considered adverse. 25
Geology During periods of maximum inundation in the 1,470-foot 26 portion of Segment 4 that would be affected under CP1, some rock outcrops 27 may become inundated and could erode, but the overall geologic value of the 28 McCloud Limestone features would not be adversely affected. 29
Visual Quality/Scenery The visual quality of the affected portion of 30 Segment 4 would decrease as the vegetation along the banks becomes inundated 31 and eventually dies, the bathtub ring expands, and evidence of flow is reduced. 32 These conditions would be similar to those in the current transition reach. The 33 affected portion of Segment 4 would no longer have the qualities that 34 contributed to its classification by the USFS as “scenic.” 35
CP1 would result in making approximately 1,470 feet of the lower McCloud 36 River ineligible for listing as wild and scenic. This impact would be significant. 37 Mitigation for this impact is not currently available. Additional studies will be 38 conducted to determine if feasible mitigation measures could be developed. 39 Since no mitigation is currently available, this impact would be significant and 40 unavoidable. 41
25-29 Draft – June 2013

Shasta Lake Water Resources Investigation Environmental Impact Statement
Impact WASR-2 (CP1): Conflict with Shasta-Trinity National Forest Land 1 and Resource Management Plan The inundation of approximately 1,470 feet 2 of Segment 4 would not conflict with the provisions in the STNF Land and 3 Resource Management Plan to protect the ORVs that make the McCloud River 4 eligible for listing under the Federal WSRA. Although raising Shasta Dam 5 would result in inundation of part of Segment 4, the McCloud River and the 6 adjoining lands in this part of the segment are not National Forest System lands 7 and therefore not subject to the LRMP. Management of the river’s ORVs under 8 the STNF LRMP and the CRMP would not be affected. No land use changes 9 would occur along the river, and the USFS and signatories to the CRMP would 10 be able to continue implementing provisions of their plans that apply to the 11 river. Because the LRMP does not apply to the private lands in Segment 4, 12 there would be no impact and no mitigation is required. 13
Impact WASR-3 (CP1): Conflict with the California Public Resources 14 Code, Section 5093.542—McCloud River Fishery The State PRC includes 15 provisions that protect the McCloud River fishery with an emphasis on wild 16 trout. Implementation of proposed modifications to Shasta Dam and Shasta 17 Lake could conflict with this element of the State PRC. 18
The proposed modifications to Shasta Dam and Shasta Lake would result in 19 temporary and periodic fluctuations in water levels within the expanded 20 transition reach, affecting about 1.2 percent of the lower McCloud River and its 21 associated fishery habitat. Under CP1, the transition reach would be extended 22 by about 1,470 feet, a 16 percent increase over the current transition reach; this 23 entire area would be inundated only during peak water levels in the spring of 24 wet years. The primary impact of the expansion of the transition reach would be 25 conversion of aquatic habitat in a manner similar to that described under Impact 26 WASR-1 and Impact WASR-2 and comparable to the habitat conversion that 27 can be observed in the current transition reach downstream. While the overall 28 impacts to the fishery (populations and habitat) are small in the context of the 29 entire lower McCloud River, the impacts would conflict with the State PRC. 30 This impact would be potentially significant. Mitigation for this impact is not 31 currently available; however, ongoing efforts to develop and implement the 32 Comprehensive Mitigation Strategy described in Chapter 2 are focusing on 33 identifying and developing feasible mitigation measures to reduce this impact. 34 Since mitigation for this impact is currently under development, the significance 35 after mitigation has not yet been determined. 36
Impact WASR-4 (CP1): Conflict with the California Public Resources 37 Code, Section 5093.542—Free-Flowing Conditions The State PRC includes 38 provisions that protect the free-flowing conditions of the McCloud River. 39 Implementation of proposed modifications to Shasta Dam and Shasta Lake 40 could conflict with this element of the State PRC. 41
The proposed modifications to Shasta Dam and Shasta Lake would result in 42 temporary and periodic fluctuations in water levels within the expanded 43
25-30 Draft – June 2013

Chapter 25 Wild and Scenic River Considerations for McCloud River
transition reach, affecting about 1.2 percent of the lower McCloud River. Under 1 CP1, the transition reach would be extended by about 1,470 feet, a 16 percent 2 increase over the current transition reach; this entire area would be inundated 3 only during peak water levels in the spring of wet years. The free-flowing 4 conditions of the river would not be adversely affected beyond the upstream 5 extension of the transition reach. The primary impact of the expansion of the 6 transition reach would be modifications to the free-flowing character in a 7 manner similar to that described under Impact WASR-1 and Impact WASR-2. 8 While the overall impacts to the free-flowing conditions that would occur 9 within this transition reach are small in the context of the lower McCloud River 10 (1.2 percent), the impacts would conflict with the State PRC. This impact would 11 be significant. Mitigation for this impact is not currently available. Additional 12 studies will be conducted to determine if feasible mitigation measures could be 13 developed. Since no mitigation is currently available, this impact would be 14 significant and unavoidable. 15
CP2 – 12.5-Foot Dam Raise, Anadromous Fish Survival and Water Supply 16 Reliability 17 CP2 would involve a 12.5-foot raise of Shasta Dam, which would increase the 18 lake’s gross pool by 14.5 feet and enlarge the total storage space in the lake by 19 443,000 acre-feet. This increase would equate to an increase of about 1,850 20 acres of surface area when the lake is full. CP2 also includes measures to 21 increase water supply reliability while contributing to increased survival of 22 anadromous fish. Shasta Dam operational guidelines would continue essentially 23 unchanged, except during dry years and critical years, when 120 TAF and 60 24 TAF, respectively, of the increased storage capacity in Shasta Reservoir would 25 be reserved to specifically focus on increasing M&I deliveries. CP2 would help 26 reduce future water shortages through increasing drought year and average year 27 water supply reliability for agricultural and M&I deliveries. In addition, the 28 increased depth and volume of the cold-water pool in Shasta Reservoir would 29 contribute to improving seasonal water temperatures for anadromous fish in the 30 upper Sacramento River. 31
Impact WASR-1 (CP2): Effect on McCloud River’s Eligibility for Listing 32 as a Federal Wild and Scenic River Impact WASR-1 (CP2) would be similar 33 to Impact WASR-1 but would affect 1270 feet more of Segment 4 than CP1. 34 Implementation of CP2 would reduce the total length of the McCloud River that 35 is eligible for wild and scenic river designation by about 2,740 feet 36 (approximately 2.3 percent of the total length of the lower river). The rest of the 37 lower McCloud River would remain eligible for listing. 38
Under CP2, approximately 2,740 feet, or 21 percent, of Segment 4 would be 39 periodically inundated. The transition reach would increase to a maximum 40 elevation of 1,084 feet msl, which would extend it by about 2,740 feet (a 30 41 percent increase over the current transition reach), inundating a larger portion of 42 the lower McCloud River within the study area and Segment 4. The inundated 43 area would increase to approximately 51 total acres (an increase of 18 acres 44
25-31 Draft – June 2013

Shasta Lake Water Resources Investigation Environmental Impact Statement
over existing conditions and 9 acres more than CP1 conditions), with a 1 maximum width of approximately 530 feet (an increase of 60 feet over existing 2 conditions) and a total length of approximately 11,740 linear feet (2.22 miles). 3 The extension of the transition reach by approximately 2,740 feet would affect 4 approximately 21 percent of Segment 4. Additional impacts under CP2 5 compared with CP1 would be minimal and would be limited to the additional 6 440-foot extension of the transition reach and about 15 additional feet on both 7 sides of the river. 8
During a wet year, the maximum average water surface elevation of Shasta 9 Lake would be 1,080 feet msl, with a peak elevation of 1,084 feet msl during 10 May. This is an increase of 15 feet above the existing maximum average. 11 During an average water year, the maximum average water surface elevation 12 would increase to 1,051 feet msl, an increase of 11 feet above existing 13 conditions. During dry and critical water years, the change would be on the 14 order of 5 to 9 feet in elevation. 15
The increased gross pool of Shasta Lake would expand the current transition 16 reach up to the 1,084-foot elevation, a 30 percent increase. Flow conditions and 17 fisheries in the 2,740-foot reach of Segment 4 would periodically be affected, 18 with the timing and duration of the effects similar to those in the current 19 transition reach. Over time, the expansion of the bathtub ring would adversely 20 affect water quality, geology, and visual quality/scenery. Erosion of soils along 21 the river could expose buried cultural resources, and periodic inundation could 22 permanently alter cultural resource values and features in the transition reach 23 important to Native Americans. 24
Free-Flowing Conditions As discussed under Impact WASR-1 (CP1), the flow 25 characteristics of the extended transition reach under CP2 would be periodically 26 modified, resulting in slower moving waters and a wider river channel. This 27 modification would not meet the definition of a free-flowing river under the 28 Federal WSRA. The width of the transition reach would be increased by 29 approximately 30 feet on both sides of the river. Flow conditions and the river’s 30 free-flowing nature upstream from the expanded transition reach would remain 31 similar to current conditions. 32
Because free-flowing conditions are a fundamental requirement for wild and 33 scenic river eligibility, the 2,740-foot reach of Segment 4 that would be affected 34 by CP2 would become ineligible for listing under the Federal WSRA. 35
Water Quality Under CP2, increased turbidity and warmer water temperatures 36 would be most noticeable along the expanded 2,740 feet of the transition reach 37 and in the 30-foot corridor on either side of the transition reach because these 38 areas have not been previously exposed to periodic inundations. As discussed 39 under Impact WASR-1 (CP1), effects on water quality would be associated with 40 the periodic increases in water levels of Shasta Lake. 41
25-32 Draft – June 2013

Chapter 25 Wild and Scenic River Considerations for McCloud River
Because water quality is a fundamental requirement for wild and scenic river 1 eligibility, the 2,740-foot reach of Segment 4 that would be affected by CP2 2 would become ineligible for listing under the Federal WSRA. 3
Outstandingly Remarkable Values As described above under Affected 4 Environment, the ORVs that make Segment 4 of the McCloud River eligible for 5 listing as a wild and scenic river are cultural/historical resources, fisheries, 6 geology, and visual quality/scenery. 7
Cultural/Historical Resources Impacts would be the same as discussed 8 under Impact WASR-1 (CP1); however, a slightly larger portion of the three 9 recorded sites and possible resources associated with the known Wintu villages 10 would be inundated. 11
The cultural resources located along the 2,740-foot reach of Segment 4 that 12 would be affected under CP2 would be subject to the effects of periodic 13 inundation. 14
Fisheries Aquatic habitat in the affected 2,740-foot segment consists of 15 pocket water and a lateral scour pool. The potential conversion of flatwater 16 habitat to riffle habitat in the 2,740-foot segment would be similar to but greater 17 than under WASR-1 (CP1), and overall impacts to aquatic habitat and fish 18 would be similar to those discussed under Impact WASR-1 (CP1). 19
Geology Impacts would be the same as discussed under Impact WASR-1 20 (CP1); the geologic values of the lower McCloud River would not be adversely 21 affected. 22
Visual Quality/Scenery Impacts would be the same as discussed under 23 Impact WASR-1 (CP1). The affected portion of Segment 4 would no longer 24 have the qualities that contributed to its classification by the USFS as “scenic.” 25
CP2 would result in making approximately 2,740 feet of the lower McCloud 26 River ineligible for listing as wild and scenic. This impact would be significant. 27 Mitigation for this impact is not currently available. Additional studies will be 28 conducted to determine if feasible mitigation measures could be developed. 29 Since no mitigation is currently available, this impact would be significant and 30 unavoidable. 31
Impact WASR-2 (CP2): Conflict with Shasta-Trinity National Forest Land 32 and Resource Management Plan The inundation of approximately 2,740 feet 33 of Segment 4 would not conflict with the provisions in the STNF Land and 34 Resource Management Plan to protect the ORVs that make the McCloud River 35 eligible for listing under the Federal WSRA. There would be no impact, and no 36 mitigation is required. 37
Impact WASR-3 (CP2): Conflict with the California Public Resources 38 Code, Section 5093.542 —McCloud River Fishery The impact would be 39
25-33 Draft – June 2013

Shasta Lake Water Resources Investigation Environmental Impact Statement
similar to WASR-3 (CP1) but the magnitude of the impact would be greater 1 under CP2 because of the longer transition reach. Under CP2, the proposed 2 modifications to Shasta Dam and Shasta Lake would result in temporary and 3 periodic fluctuations in water levels within the expanded transition reach, 4 affecting about 2.3 percent of the lower McCloud River. Under CP2, the reach 5 affected by Shasta Lake water levels would be extended by about 2,740 feet, a 6 30 percent increase over the current transition reach; this entire area would be 7 inundated only during peak water levels in the spring of wet years. The primary 8 impact of the expansion of the transition reach would be conversion of aquatic 9 habitat in a manner similar to the habitat conversion that can be observed in the 10 current transition reach downstream. While the overall impacts to the fishery 11 (populations and habitat) are small in the context of the entire lower McCloud 12 River, the impacts would conflict with the State PRC. This impact would be 13 potentially significant. Mitigation for this impact is not currently available; 14 however, ongoing efforts to develop and implement the Comprehensive 15 Mitigation Strategy described in Chapter 2 are focusing on identifying and 16 developing feasible mitigation measures to reduce this impact. Since mitigation 17 for this impact is currently under development, the significance after mitigation 18 has not yet been determined. 19
Impact WASR-4 (CP2): Conflict with the California Public Resources 20 Code, Section 5093.542—Free-Flowing Conditions The impact would be 21 similar to WASR-4 (CP1) but the magnitude of the impact would be greater 22 under CP2 because of the longer transition reach. Under CP2, the proposed 23 modifications to Shasta Dam and Shasta Lake would result in temporary and 24 periodic fluctuations in water levels within the expanded transition reach, 25 affecting about 2.3 percent of the lower McCloud River. Under CP2, the reach 26 affected by Shasta Lake water levels would be extended by about 2,740 feet, a 27 30 percent increase over the current transition reach; this entire area would be 28 inundated only during peak water levels in the spring of wet years. The free-29 flowing conditions of the river would not be adversely affected beyond the 30 upstream extension of the transition reach. While the overall impacts to the free-31 flowing conditions that would occur within this transition reach are small in the 32 context of the lower McCloud River (2.3 percent), the impacts would conflict 33 with the State PRC. This impact would be significant. Mitigation for this impact 34 is not currently available. Additional studies will be conducted to determine if 35 feasible mitigation measures could be developed. Since no mitigation is 36 currently available, this impact would be significant and unavoidable. 37
CP3, 4, 5 – 18.5-Foot Dam Raise, with Variations 38 CP3, CP4, and CP5 would involve an 18.5-foot raise of Shasta Dam, which 39 would increase the lake’s gross pool by 20.5 feet and enlarge the total storage 40 space in the lake by 634,000 acre-feet. This increase would equate to an 41 increase of about 2,500 acres of surface area when the lake is full. CP3, CP4, 42 and CP5 include variations in measures to increase water supply reliability 43 while contributing to increased survival of anadromous fish. 44
25-34 Draft – June 2013

Chapter 25 Wild and Scenic River Considerations for McCloud River
CP3 involves measures to increase agricultural water supply reliability and 1 survival of anadromous fish. Because CP3 focuses on increasing agricultural 2 water supply reliability, none of the increased storage capacity in Shasta 3 Reservoir would be reserved for increasing M&I deliveries. Operations for 4 water supply, hydropower, and environmental and other regulatory 5 requirements would be similar to existing operations, with the additional storage 6 retained for water supply reliability and to expand the cold-water pool for 7 downstream anadromous fisheries. 8
CP4 would be used to improve the ability to meet temperature objectives and 9 habitat requirements for anadromous fish during drought years and increase 10 water supply reliability. Of the increased reservoir storage space under CP4, 11 about 378,000 acre-feet would be dedicated to increasing the supply of cold 12 water for anadromous fish survival purposes. For CP4, operations for the 13 remaining portion of increased storage (approximately 256,000 acre-feet) would 14 be the same as in CP1, with 70 TAF and 35 TAF reserved to specifically focus 15 on increasing M&I deliveries during dry and critical years, respectively. CP4 16 includes augmenting spawning gravel and restoring riparian, floodplain, and 17 side channel habitat in the upper Sacramento River. 18
CP5 would help reduce future water shortages through increasing drought year 19 and average year water supply reliability for agricultural and M&I deliveries. 20 Shasta Dam operational guidelines would continue essentially unchanged, 21 except during dry years and critical years, when 150 TAF and 75 TAF, 22 respectively, of the increased storage capacity in Shasta Reservoir would be 23 reserved to specifically focus on increasing M&I deliveries. CP5 also includes 24 constructing additional fish habitat in and along the shoreline of Shasta Lake 25 and along the lower reaches of its tributaries; augmenting spawning gravel and 26 restoring riparian, floodplain, and side channel habitat in the upper Sacramento 27 River; and increasing recreation opportunities at Shasta Lake. 28
Impacts associated with CP3, CP4, and CP5 would be very similar to those 29 described for CP1 and CP2, but the increased water levels of Shasta Lake would 30 affect a longer reach of the lower McCloud River. Because of their similarities, 31 and in an effort to reduce redundancy, only the differences between the plans 32 are described below. 33
Impact WASR-1 (CP3, 4, 5): Effect on McCloud River’s Eligibility for 34 Listing as a Federal Wild and Scenic River Implementation of CP3, CP4, 35 and CP5 would reduce the total length of the McCloud River that is eligible for 36 wild and scenic river designation by about 3,550 feet (less than 3 percent of the 37 total length of the lower river). The rest of the lower McCloud River would 38 remain eligible for listing. 39
Under CP3, 4, and 5, the extent of the transition reach would increase to a 40 maximum elevation of 1,090 feet msl, which would extend the current transition 41 reach by about 3,550 feet (a 39 percent increase over the current transition 42
25-35 Draft – June 2013
Shasta Lake Water Resources Investigation Environmental Impact Statement
reach), inundating a larger portion of the lower McCloud River within the study 1 area and Segment 4. The inundated area would increase to approximately 60 2 total acres (an increase of 27 acres over existing conditions, and 9 acres more 3 than CP2 conditions), with a maximum width of approximately 610 feet (an 4 increase of 140 feet over existing conditions) and a total length of 5 approximately 12,550 linear feet (2.38 miles). The extension of the transition 6 reach by approximately 3,550 feet would affect approximately 26 percent of 7 Segment 4. Additional impacts under CP3, 4, and 5 compared with CP1 and 8 CP2 would be minimal and would be limited to the additional 810-foot 9 extension of the transition reach and about 20 additional feet on either side of 10 the river. 11
During a wet year, the maximum average water surface elevation of Shasta 12 Lake would be 1,086 feet msl, with a peak elevation of 1,090 feet msl during 13 May. This is an increase of 21 feet above the existing maximum average. 14 During an average water year, the maximum average water surface elevation 15 would increase to 1,054 feet msl, an increase of 14 feet above existing 16 conditions. During dry and critical water years, the change would be on the 17 order of 6 to 13 feet in elevation. 18
The increased gross pool of Shasta Lake would expand the current transition 19 reach by approximately 3,550 feet (810 feet beyond CP2’s effects) up to the 20 1,090-foot elevation, resulting in a 39 percent increase in the transition reach. 21 Within the expanded transition reach, flow conditions and fisheries would 22 periodically be affected, with the timing and duration of the effects similar to 23 those in the current transition reach. Over time, the expansion of the bathtub 24 ring would affect water quality, geology, and visual quality/scenery. Erosion of 25 soils along the river could expose buried cultural resources, and periodic 26 inundation could permanently alter cultural resource values and features in the 27 transition reach important to Native Americans. 28
Free-Flowing Conditions As discussed under Impact WASR-1 (CP1), the flow 29 characteristics of the extended transition reach under CP3, CP4, and CP5 would 30 be temporarily modified, resulting in slower moving waters and a wider river 31 channel. This modification would not meet the definition of a free-flowing river 32 under the Federal WSRA. The width of the transition reach would be increased 33 by approximately 70 feet on either side of the river. Flow conditions and the 34 river’s free-flowing nature upstream from the expanded transition reach would 35 remain similar to current conditions. 36
Because free-flowing conditions are a fundamental requirement for wild and 37 scenic river eligibility, the 3,550-foot reach of Segment 4 that would be affected 38 by CP1 would become ineligible for listing under the Federal WSRA. 39
Water Quality Under CP3, 4, and 5, increased turbidity and warmer water 40 temperatures would be most noticeable along the expanded 3,550-foot reach of 41 the transition reach and in the 70-foot corridor on either side of the transition 42
25-36 Draft – June 2013

Chapter 25 Wild and Scenic River Considerations for McCloud River
reach because these areas have not been previously exposed to periodic 1 inundations. Under these plans, the wider affected river corridor could result in 2 greater temporary effects on water quality because more vegetation would be 3 temporarily inundated and more soils would be exposed. As discussed under 4 Impact WASR-1 (CP1), effects on water quality would be associated with the 5 periodic increases in water levels of Shasta Lake. 6
Because water quality is a fundamental requirement for wild and scenic river 7 eligibility, the 3,550-foot reach of Segment 4 that would be affected by CP3, 8 CP4, and CP5 would become ineligible for listing under the Federal WSRA. 9
Outstandingly Remarkable Values As described above under Affected 10 Environment, the ORVs that make Segment 4 of the McCloud River eligible for 11 listing as a wild and scenic river are cultural/historical resources, fisheries, 12 geology, and visual quality/scenery. 13
Cultural/Historical Resources Impacts would be similar to those 14 discussed under Impact WASR-1 (CP1). Under CP3, CP4, and CP5, the wider 15 affected river corridor could result in greater effects on cultural resources 16 because of the wider inundated area and increased erosion. Larger portions of 17 the three recorded sites and known Wintu villages would become inundated. 18
The cultural resources located along the 3,550-foot reach of Segment 4 that 19 would be affected under CP3, CP4, and CP5 would be subject to the effects of 20 periodic inundation. 21
Fisheries Aquatic habitat in the additional 810-foot segment under CP3, 22 CP4, and CP5 consists of a mid-channel pool and a lateral scour pool. The 23 potential conversion of flatwater habitat to riffle habitat in the 3,550-foot reach 24 of Segment 4 that would be affected under these plans be similar to but greater 25 than under WASR-1 (CP1), and overall impacts to aquatic habitat and fish 26 would be similar to those discussed under Impact WASR-1 (CP1). 27
Geology Impacts would be the same as discussed under Impact WASR-1 28 (CP1), except additional rock outcrops could become inundated because of the 29 wider affected corridor. 30
Visual Quality/Scenery Impacts would be similar to those discussed 31 under Impact WASR-1 (CP1). Under these plans, the wider affected river 32 corridor could result in greater effects on the visual setting because of the wider 33 inundated area and increased impacts on vegetation. The water line would also 34 be visible at a higher elevation and could be more noticeable. The affected 35 portion of Segment 4 would no longer have the qualities that contributed to its 36 classification by the USFS as “scenic.” 37
CP3, 4, and 5 would result in making approximately 3,550 feet of the lower 38 McCloud River ineligible for listing as wild and scenic. This impact would be 39 significant. Mitigation for this impact is not currently available. Additional 40
25-37 Draft – June 2013

Shasta Lake Water Resources Investigation Environmental Impact Statement
studies will be conducted to determine if feasible mitigation measures could be 1 developed. Since no mitigation is currently available, this impact would be 2 significant and unavoidable. 3
Impact WASR-2 (CP3, 4, 5): Conflict with Shasta-Trinity National Forest 4 Land and Resource Management Plan The inundation of approximately 5 3,550 feet of Segment 4 would not conflict with the provisions in the STNF 6 Land and Resource Management Plan to protect the ORVs that make the 7 McCloud River eligible for listing under the Federal WSRA. There would be no 8 impact, and no mitigation is required. 9
Impact WASR-3 (CP3, 4, 5): Conflict with the California Public Resources 10 Code, Section 5093.542—McCloud River Fishery The impact would be 11 similar to WASR-3 (CP1), but the magnitude of the impact would be greater 12 under CP3, CP4, and CP5 because of the longer transition reach. Under CP3, 13 CP4, and CP5, the proposed modifications to Shasta Dam and Shasta Lake 14 would result in temporary and periodic fluctuations in water levels within the 15 expanded transition reach, affecting about 3 percent of the lower McCloud 16 River. Under CP3, CP4, and CP5, the reach affected by Shasta Lake water 17 levels would be extended by about 3,550 feet, a 39 percent increase over the 18 current transition reach; this entire area would be inundated only during peak 19 water levels in the spring of wet years. The primary impact of the expansion of 20 the transition reach would be conversion of aquatic habitat in a manner similar 21 to the habitat conversion that can be observed in the current transition reach 22 downstream. While the overall impacts to the fishery (populations and habitat) 23 are small in the context of the entire lower McCloud River, the impacts would 24 conflict with the State PRC. This impact would be potentially significant. 25 Mitigation for this impact is not currently available; however, ongoing efforts to 26 develop and implement the Comprehensive Mitigation Strategy described in 27 Chapter 2 are focusing on identifying and developing feasible mitigation 28 measures to reduce this impact. Since mitigation for this impact is currently 29 under development, the significance after mitigation has not yet been 30 determined. 31
Impact WASR-4 (CP3, 4, 5): Conflict with the California Public Resources 32 Code, Section 5093.542—Free-Flowing Conditions The impact would be 33 similar to WASR-4 (CP1), but the magnitude of the impact would be greater 34 under CP3, CP4, and CP5 because of the longer transition reach. Under CP3, 35 CP4, and CP5, the proposed modifications to Shasta Dam and Shasta Lake 36 would result in temporary and periodic fluctuations in water levels within the 37 expanded transition reach, affecting about 3 percent of the lower McCloud 38 River. Under CP3, CP4, and CP5, the reach affected by Shasta Lake water 39 levels would be extended by about 3,550 feet, a 39 percent increase over the 40 current transition reach; this entire area would be inundated only during peak 41 water levels in the spring of wet years. The free-flowing conditions of the river 42 would not be adversely affected beyond the upstream extension of the transition 43 reach. The primary impact of the expansion of the transition reach would be 44
25-38 Draft – June 2013
Chapter 25 Wild and Scenic River Considerations for McCloud River
conversion of aquatic habitat in a manner similar to the habitat conversion that 1 can be observed in the current transition reach downstream. While the overall 2 impacts to the free flowing conditions that would occur within this transition 3 reach are small in the context of the lower McCloud River (3 percent), the 4 impacts would conflict with the State PRC. This impact would be significant. 5 Mitigation for this impact is not currently available. Additional studies will be 6 conducted to determine if feasible mitigation measures could be developed. 7 Since no mitigation is currently available, this impact would be significant and 8 unavoidable. 9
25.4.4 Mitigation Measures 10 Table 25-2 presents a summary of mitigation measures for wild and scenic 11 rivers. 12
No specific mitigation measures are proposed at this point in the planning 13 process. Ongoing efforts to develop and implement the Comprehensive 14 Mitigation Strategy described in Chapter 2 will focus on identifying and 15 determining if feasible mitigation measures could be developed and 16 implemented to reduce the impacts described under WASR-1, WASR-3 and 17 WASR-4 to less-than-significant levels. 18
19
25-39 Draft – June 2013

Shasta Lake Water Resources Investigation Environmental Impact Statement
Table 25-2. Summary of Mitigation Measures for Wild and Scenic Rivers 1
2
25.4.5 Topics Eliminated from Further Consideration 3 No topics related to the eligibility of the McCloud River for listing under the 4 Federal WSRA, the compatibility of the alternatives with the STNF LRMP or 5 the CRMP, or their compatibility with the State PRC providing protection to the 6 McCloud River were eliminated from further consideration. 7
25.4.6 Cumulative Effects 8 Significant effects were identified related to the compatibility of the project 9 with the State PRC, Section 5093.542. The potential effects would be of greater 10 magnitude and duration with the larger dam raises (i.e., CP3 through CP5 would 11 have greater potential effects than CP1 and CP2). These impacts may also be 12 associated with two reasonably foreseeable future actions that could affect the 13 McCloud River: the relicensing of PG&E’s McCloud-Pit Project and the pilot 14 project to reintroduce anadromous salmonid populations upstream of Shasta 15 Dam. FERC has issued the Final EIS for the relicensing of the McCloud-Pit 16
Impact No-Action Alternative CP1 CP2 CP3 CP4 CP5
Impact WASR-1: McCloud River’s Eligibility for Listing as a Federal Wild and Scenic River
LOS before Mitigation NI S S S S S
Mitigation Measure
None required. No feasible mitigation available to reduce impact.
LOS after Mitigation NI SU SU SU SU SU
Impact WASR-2: Conflict with Shasta-Trinity National Forest, Land and Resource Management Plan
LOS before Mitigation NI NI NI NI NI NI
Mitigation Measure
None required. None required. .
LOS after Mitigation NI NI NI NI NI NI
Impact WASR-3: Conflict with California Public Resources Code, Section 5093.542 -McCloud River Fishery
LOS before Mitigation NI PS PS PS PS PS
Mitigation Measure
None required. Mitigation for this impact is under development.
LOS after Mitigation NI [TBD] [TBD] [TBD] [TBD] [TBD]
Impact WASR-4: Conflict with California Public Resources Code, Section 5093.542 - Free-Flowing Conditions
LOS before Mitigation NI S S S S S
Mitigation Measure
None required. No feasible mitigation available to reduce impact.
LOS after Mitigation NI SU SU SU SU SU
Key: CP = Comprehensive Plan LOS = level of significance NI = no impact PS = potentially significant S = significant SU = significant and unavoidable
25-40 Draft – June 2013
Chapter 25 Wild and Scenic River Considerations for McCloud River
Project. However, the relicensing process for the McCloud-Pit Project is 1 ongoing, and the conditions that may be required under a new FERC license are 2 uncertain. The potential effects of the relicensing on the lower McCloud River 3 are therefore unknown. The 2009 NMFS Biological Opinion described in 4 Chapter 3 requires Reclamation to implement a pilot project that would provide 5 passage for anadromous salmonids upstream of Shasta Dam. This project could 6 reintroduce anadromous salmonids to the lower McCloud River. At this point in 7 the planning process, the details of this project are ill-defined and the potential 8 for success is uncertain. Therefore, the potential effects of this future action on 9 the lower McCloud River are unknown. Given the information available on 10 these future actions, the potential for project-related impacts to be cumulatively 11 considerable would be less than significant and could, in fact, result in benefits 12 to some of the values and resources of the lower McCloud River. 13
14
25-41 Draft – June 2013

Shasta Lake Water Resources Investigation Environmental Impact Statement
1
This page left blank intentionally. 2
25-42 Draft – June 2013

Chapter 26 Other Required Disclosures
Chapter 26 1
Other Required Disclosures 2
26.1 Significant Adverse Effects that Cannot be Avoided If a 3 Project is Implemented 4
Section 21100(b)(2)(A) of CEQA requires an EIR to include a detailed 5 statement setting forth “any significant effect on the environment that cannot be 6 avoided if the project is implemented.” Chapters 4 through 25 of this DEIS 7 analyze in detail all of the project’s potentially significant environmental 8 impacts, including cumulative impacts; list feasible mitigation measures that 9 could avoid, minimize, rectify, reduce or eliminate, or compensate for the 10 project’s significant impacts; and specify whether these mitigation measures 11 would reduce the impacts to a less-than-significant level. If no feasible 12 mitigation measure is available to reduce a significant impact to a less-than-13 significant level, then the impact would be a significant and unavoidable 14 impact. 15
After consideration of actions, operations, and features to avoid, mitigate, 16 and/or compensate for adverse effects, the action alternatives would likely result 17 in the following significant and unavoidable direct and indirect impacts: 18
• Geology, Geomorphology, Minerals, and Soils – Loss or diminished 19 availability of known mineral resources that would be of future value to 20 the region; lost or diminished soil biomass productivity; and substantial 21 soil erosion or loss of topsoil due to shoreline processes (all action 22 alternatives). 23
• Air Quality and Climate – Short-term emissions of criteria air 24 pollutants and precursors at Shasta Lake and vicinity during project 25 construction (all action alternatives). 26
• Botanical Resource – Loss of Multi-Species Conservation Strategy 27 (MSCS) covered species; loss of USFS sensitive, U.S. Department of 28 the Interior, Bureau of Land Management (BLM) sensitive, or 29 California Rare Plant Rank (CRPR) species; loss of jurisdictional 30 waters; and loss of general vegetation habitats (all action alternatives). 31
• Wildlife Resources – Take and loss of habitats for the Shasta 32 salamander, bald eagle, northern spotted owl, and Pacific fisher; impact 33 on the foothill yellow-legged frog, tailed frog, northwestern pond turtle, 34 purple martin, special-status bats, American marten, ringtail, terrestrial 35
26-1 Draft – June 2013

Shasta Lake Water Resources Investigation Environmental Impact Statement
mollusks, and their habitat; impact on willow flycatcher, Vaux’s swift, 1 yellow warbler, yellow-breasted chat, long-eared owl, northern 2 goshawk, Cooper’s hawk, great blue heron, and osprey, and their 3 foraging and nesting habitat; permanent loss of general wildlife habitat; 4 take and loss of foraging and nesting habitat for other birds of prey and 5 migratory bird species; and loss of critical deer winter and fawning 6 range (all action alternatives). 7
• Agriculture and Important Farmlands – Direct and indirect 8 conversion of forest land to nonforest uses in the vicinity of Shasta 9 Lake (all action alternatives). 10
• Land Use and Planning – Conflicts with existing land use goals and 11 policies of affected jurisdictions (Shasta Lake and vicinity and upper 12 Sacramento River), and disruption of existing land uses (Shasta Lake 13 and vicinity and upper Sacramento River) (all action alternatives). 14
• Cultural Resources – Inundation of Traditional Cultural Properties 15 (all action alternatives). 16
• Aesthetics and Visual Resources – Degradation and/or obstruction of 17 a scenic view from key observation points, and generation of increased 18 daytime glare and/or nighttime lighting (all action alternatives). 19
• Wild and Scenic River Considerations for McCloud River – Effect 20 on McCloud River’s eligibility for listing as a Federal Wild and Scenic 21 River and conflicts with the California Public Resources Code, Section 22 5093.542 (all action alternatives). 23
The action alternatives could also result in the following significant and 24 unavoidable cumulative impacts (i.e., an impact would make a considerable 25 contribution to a significant cumulative effect): 26
• Geology, Geomorphology, Minerals, and Soils – Cumulative effects 27 from use of soil and mineral resources, leading to diminished regional 28 availability of cement, concrete sand, and aggregate and loss of soil 29 productivity (all action alternatives). 30
• Air Quality and Climate – Cumulative effects from emissions of 31 nitrogen oxide during project construction (all action alternatives). 32
• Hydrology, Hydraulics, and Water Management – Cumulative 33 effects on south Delta water levels, X2 position, and Delta outflow (all 34 action alternatives). 35
• Botanical Resources and Wetlands – Cumulative effects from 36 increased water delivery in the service areas and growth-related loss of 37
26-2 Draft – June 2013

Chapter 26 Other Required Disclosures
sensitive plant communities and special-status plant species (all action 1 alternatives). 2
• Wildlife Resources – Cumulative effects from inundation at Shasta 3 Lake, leading to take and loss of habitat for numerous special-status 4 species at Shasta Lake and vicinity (all action alternatives). 5
• Cultural Resources – Inundation of places of Native American 6 cultural significance (all action alternatives). 7
• Aesthetics and Visual Resources – Changes to aesthetic values and 8 resources at Shasta Lake (all action alternatives). 9
• Environmental Justice – Cumulative effects from disproportionate 10 placement of environmental impacts on Native American populations, 11 leading to disturbance or loss of resources associated with locations 12 considered by the Winnemem Wintu and Pit River Madesi Band 13 members to have religious and cultural significance in the vicinity of 14 Shasta Lake (all action alternatives). 15
Feasible mitigation will be implemented to reduce these impacts but would not 16 be sufficient to reduce these impacts to a less-than-significant level. 17
26.2 Relationship of Short-Term Uses and Long-Term 18 Productivity 19
NEPA requires consideration of “the relationship between short-term uses of 20 man’s environment and the maintenance and enhancement of long-term 21 productivity” (40 Code of Federal Regulations 1502.16). This involves using all 22 practicable means and measures, including financial and technical assistance, in 23 a manner calculated to: foster and promote the general welfare; to create and 24 maintain conditions under which man and nature can exist in productive 25 harmony; and fulfill the social, economic, and other requirements of present and 26 future generations of Americans. 27
All action alternatives analyzed in this DEIS would involve new construction, 28 such as raising Shasta Dam, replacing bridges, and relocating/reconstructing 29 recreational facilities and access roads adversely affected by higher reservoir 30 levels. Specific activities would modify the Pit River Bridge, modify/replace six 31 other bridges, relocate various recreation facilities, utilities and related 32 infrastructure, and inundate numerous small segments of existing paved and 33 unpaved roads. All of the action alternatives would result in indirect and 34 induced employment, which may support hiring in businesses that would 35 provide materials to the construction effort; in service-related industries that 36 would provide food, beverages, and other goods to construction workers; or in 37 more technical industries, such as consulting firms and other businesses (see 38
26-3 Draft – June 2013

Shasta Lake Water Resources Investigation Environmental Impact Statement
Chapter 16, “Socioeconomics, Population, and Housing”). Sales and profits for 1 businesses that support the construction industry in the primary study area 2 would increase over the 4.5- to 5-year construction period. 3
Potential habitat- and recreation-related losses caused by enlarging the dam and 4 reservoir would irreversibly affect habitats and developments near the dam 5 inundation area. Impacts on habitat areas within the dam inundation area would 6 be mitigated by preservation of similar habitats elsewhere. Construction 7 activities would include short-term uses of capital, labor, fuels, and construction 8 materials; habitats; and recreation areas. General commitments of construction 9 materials are largely irreversible because most construction materials are 10 unsalvageable. 11
Potential benefits of the action alternatives include an increase in water supply 12 reliability and a reduction in the probability of experiencing a potential flood-13 related loss of resources, property, and human life. Environmental uses and 14 habitat for a variety of aquatic and terrestrial species along the Sacramento 15 River and waterways within the primary and extended study areas would be 16 maintained and potentially enhanced with the proposed mitigation. No adverse 17 effects would pose a long-term risk to health and safety. 18
26.3 Irreversible and Irretrievable Commitments of Resources 19
The State CEQA Guidelines require a discussion of the significant irreversible 20 environmental changes that would be caused by implementation of the proposed 21 project. In addition, an EIS prepared under NEPA must analyze irreversible and 22 irretrievable commitments of resources, such as soils, wetlands, waterfowl 23 habitat, and cultural resources (40 Code of Federal Regulations, Section 24 1502.16). 25
The irreversible and irretrievable commitment of resources is the permanent 26 loss of resources for future or alternative purposes. Irreversible and irretrievable 27 resources are those that cannot be recovered or recycled, or those that are 28 consumed or reduced to unrecoverable forms. The action alternatives would 29 result in the irreversible and irretrievable commitment of the following energy 30 and material resources during project construction and maintenance: 31
• Construction materials, including such resources as soil and rocks 32
• Land area committed to new/expanded project facilities and water 33 inundation areas 34
• Energy expended in the form of electricity, gasoline, diesel fuel, and oil 35 for equipment and transportation vehicles that would be needed for 36 project construction, operations, and maintenance 37
26-4 Draft – June 2013

Chapter 26 Other Required Disclosures
Nonrenewable resources are expected to account for a minimal portion of the 1 region’s resources; the project’s use of nonrenewable resources would not affect 2 the availability of these resources for other needs within the region. 3 Construction activities would not result in inefficient use of energy or natural 4 resources. The selected construction contractors would use best available 5 engineering techniques, construction and design practices, and equipment-6 operating procedures. Furthermore, mitigation would be provided to offset any 7 loss of habitat areas and other land uses within the proposed dam inundation 8 areas. Long-term project operation would not result in substantial long-term 9 consumption of energy and natural resources, and increased energy production 10 would result from the additional storage capacity at Shasta Lake. 11
26.4 Growth-Inducing Impacts 12
CEQA requires that an EIR discuss how a project may induce growth. NEPA 13 requires that an EIS consider indirect effects of a project, which are often the 14 result of growth inducement. A project is considered potentially growth 15 inducing if it is reasonably foreseeable that the project may foster economic or 16 population growth or may result in the construction of additional housing 17 (California Code of Regulations, Section 15126.2(d)). The increase in water 18 supply reliability that would result from the construction of any of the proposed 19 action alternatives would be potentially growth inducing because it would foster 20 economic growth and potentially remove an obstacle to development. 21
The purpose of this section is to disclose how the action alternatives that are 22 analyzed in this DEIS could be growth inducing and to describe how the 23 potential resulting environmental effects would be addressed. In Napa Citizens 24 for Honest Government v. Napa County Board of Supervisors (2001) 91 25 Cal.App.4th 342, 367–371 [110 Cal.Rptr.2d 579], the California Court of 26 Appeal, Fourth District, provided clear direction on the standards for disclosure 27 of growth-inducing effects in an EIR that also is relevant to an EIS. The lead 28 agency also may consider mitigation measures for the anticipated effects. 29 Growth-inducing impacts are evaluated for the project alternatives in 30 accordance with the California Court of Appeal finding in Napa Citizens for 31 Honest Government v. Napa County Board of Supervisors (2001): 32
Neither CEQA itself, nor the cases that have interpreted it, 33 require an EIR to anticipate and mitigate the effects of a 34 particular project on growth on other areas. In circumstances 35 such as these, it is sufficient that the final EIR (FEIR) warns 36 interested persons and governing bodies of the probability that 37 additional housing will be needed so that they can take steps to 38 prepare for or address that probability. The FEIR need not 39 forecast the impact that the housing will have on as yet 40 unidentified areas and propose measures to mitigate that 41
26-5 Draft – June 2013
Shasta Lake Water Resources Investigation Environmental Impact Statement
impact. That process is best reserved until such time as a 1 particular housing project is proposed. 2
The increase in water supply reliability resulting from the action alternatives 3 would make additional water resources available for municipal, industrial, and 4 agricultural uses in the CVP and SWP service areas. The additional water 5 resources could be used for actions that sustain and support growth. 6
Growth-inducing effects resulting from the increase in water supply reliability 7 that were caused by the action alternatives would be indirect. However, 8 Reclamation’s ability to forecast the extent and location of these effects 9 throughout its extensive service area is extremely limited. More than likely, the 10 effects would be spread throughout the CVP and SWP service areas, would 11 change annually, and would depend on how the additional water supply stored 12 in Shasta Lake is ultimately used. Because the potential indirect, growth-13 inducing effects are speculative, amorphous, and not site specific, no feasible 14 mitigation measures are available or proposed. No mitigation measure could be 15 feasibly applied across the entire CVP and SWP service areas. Direct impacts 16 on traffic and air quality and changes to the jobs/housing balance would be 17 evaluated and mitigated by the local land use agency during general plan 18 updates and project-specific application review. The following potential effects 19 of an increase in water supply reliability are discussed: 20
• Existing fallow agricultural land and rangeland may be converted to 21 irrigated row crops or irrigated orchard. This land use change could 22 increase effects of local economic growth on farmers and could result 23 in more local employment opportunities. 24
• If water supply is an obstacle to expansion of industrial facilities, this 25 obstacle may be removed. Increased industrial capacity could result in 26 economic growth and provide more local employment opportunities. 27
• If water supply is an obstacle to residential development, this obstacle 28 may be removed, and local land use authorities may be encouraged to 29 approve residential development projects on currently zoned 30 agricultural land: 31
− Residential development would result in the construction of 32 houses. 33
− Residential development may cause economic growth through the 34 collection of development fees. 35
The project analysis covers the primary study area and an extended study area. 36 The primary study area encompasses Shasta Dam and Shasta Lake; inflowing 37 rivers and streams including the Sacramento River, McCloud River, Pit River, 38 and Squaw Creek; and the Sacramento River downstream to about Red Bluff 39
26-6 Draft – June 2013

Chapter 26 Other Required Disclosures
Pumping Plant. Because of the potential influence of Shasta Dam modification 1 on natural resources along the Sacramento River as well as on other programs 2 and projects in the Central Valley, the project also evaluates an extended study 3 area that includes the Sacramento River basin downstream from Red Bluff 4 Pumping Plant, the American River basin, the Delta, the San Joaquin River 5 basin, and the CVP and SWP service areas. 6
The extended study area includes CVP and SWP reservoirs and the portions of 7 tributaries that are downstream from these reservoirs and affect the Sacramento 8 River, San Joaquin River, Trinity River, and Delta flows. These reservoirs and 9 tributaries include Lake Oroville, Folsom Lake, Millerton Lake, San Luis 10 Reservoir, New Melones Reservoir, and Trinity Lake, and portions of the 11 Trinity, Feather, American, and Stanislaus rivers. The CVP and SWP service 12 areas include much of the Sacramento and San Joaquin valleys, and substantial 13 portions of the Bay Area and Southern California. 14
The following sections describe mechanisms that could be growth inducing and 15 analyze potential growth-inducing effects of the action alternatives. 16
26.4.1 Increased Construction Work 17 The action alternatives would create new construction jobs in the primary study 18 area, but this temporary effect would not be growth inducing. Concrete workers, 19 workers with large-scale construction experience, general laborers, and others 20 would be drawn from the local construction industry. These jobs would 21 represent a relatively small increase (i.e., less than 0.5 percent) in the total labor 22 force in the two counties of the primary study area (Shasta and Tehama 23 counties), but also would represent a substantial increase in employment for 24 many of the cities surrounding the project, where employment has consistently 25 been below the state average (EDD 2010, 2011). Therefore, jobs created by the 26 action alternatives would be serviced by the local workforce and would not be 27 growth inducing (see Chapter 16, “Socioeconomics, Population, and Housing”). 28
26.4.2 Increased Flood Risk Reduction 29 The action alternatives also are anticipated to provide some flood risk reduction 30 benefits, but these benefits would not be growth inducing. The added reservoir 31 capacity at Shasta Lake would give Reclamation greater flexibility in using the 32 reservoir for flood management purposes, thereby increasing the threshold at 33 which seasonal heavy-rain events produce flood conditions downstream from 34 Shasta Dam. The benefits of this increase in reservoir capacity and related flood 35 management options would be most evident along the upper Sacramento River 36 in the primary study area, and would decrease downstream where other major 37 tributaries, such as the Feather and American Rivers, join the Sacramento River. 38 Structures in and inhabitants of this floodplain experience the most direct 39 effects from storage releases during flood events. The action alternatives would 40 reduce the frequency, magnitude, and duration of some potential future flood 41 events, like those that have affected structures and residents in this part of the 42 primary study area in the past. 43
26-7 Draft – June 2013

Shasta Lake Water Resources Investigation Environmental Impact Statement
As a result of the added reservoir capacity, the overall risk of flooding and its 1 related consequences below Shasta Dam is expected to be reduced. Although 2 heavy-rain events would continue to occur in the region, and potentially 3 increase as a result of global climate change, enlarging the dam is intended to 4 provide greater flexibility in flood management in the lower Sacramento River 5 and Delta area because of the increased capacity of the reservoir. As a result, 6 less damage to existing structures in or near the lower Sacramento River and 7 Delta floodplains would be expected over time although the probability of 8 certain flood events of a substantial size would not be decreased from the 9 increased reservoir capacity at Shasta Lake. Most importantly, the flood risk 10 reduction benefits of the dam enlargement would not change the existing 11 floodplain or Federal Emergency Management Agency flood zone designations, 12 so the action alternatives would not remove an obstacle to development or even 13 reduce any obstacles to development. Flood risk reduction benefits from any of 14 the action alternatives, therefore, are not growth inducing. 15
26.4.3 Increased Water Supply Reliability 16 Implementing any of the action alternatives would improve water supply 17 reliability in the primary and extended study areas. This improved water supply 18 reliability would better accommodate existing water contracts by increasing the 19 available water supply in some years. The environmental consequences of these 20 contracts have been (and in the future will be) evaluated in separate 21 environmental review processes. The improvement in water supply reliability 22 would not change long-term contract amounts or deliveries within their existing 23 historical ranges. 24
A variety of factors indirectly influence business, residential, and population 25 growth in the region. Among these are city and county general plans and 26 policies, and the availability of utility services, public schools, and 27 transportation services. Water is one of the primary public services needed to 28 support urban development, including businesses, industry (including 29 agriculture), and housing; a deficiency in water service capacity could constrain 30 future development. 31
Implementing any of the action alternatives also would increase water yield, 32 which would have the potential to be growth inducing. The expected increase in 33 water yield relative to the CVP and SWP service areas would be small (i.e., less 34 than 1 percent), and this new yield likely would be provided to a number of 35 geographic areas within the CVP and SWP service areas. Also, a substantial 36 portion of this water would substitute for groundwater pumping, would allow 37 for changes in agricultural irrigation practices, or would return idle cropland to 38 production. For this reason, implementing any of the action alternatives would 39 result in beneficial effects on agricultural resources, which would intrinsically 40 benefit the economies in the affected localities. An increase in the reliability of 41 water provided to agricultural areas would not necessarily lead to a direct 42 increase in population because the water primarily would service existing 43 agricultural lands and would not be expected to foster expansion into 44
26-8 Draft – June 2013
Chapter 26 Other Required Disclosures
undeveloped natural communities. Substantial acreages of existing agricultural 1 lands are idle because of reduced water reliability, and some of these existing 2 acreages would receive water and be put back into agricultural production. 3 However, the cumulative effect of a more reliable water source would be to 4 increase agricultural effectiveness, a key economic sector in the region, which 5 could indirectly result in growth-inducing impacts by bringing more money into 6 the local economies. 7
The proposed action alternatives would increase water supply reliability for 8 agricultural and/or municipal and industrial (M&I) uses. Agriculture is the most 9 important segment of the economy below Shasta Dam and throughout 10 California’s Central Valley. Anticipated increases in agricultural water supply 11 reliability are based on simulated CVP and SWP irrigation deliveries. The 12 average annual increase in CVP and SWP irrigation deliveries under action 13 alternatives would be up to 62,200 acre-feet per year. Anticipated increases in 14 M&I water supply reliability are estimated based on simulated increases in CVP 15 and SWP M&I deliveries. The average annual increase in CVP and SWP M&I 16 deliveries under action alternatives would be up to 25,000 acre-feet per year. 17
Anticipated increases in total water supply reliability are based on the sum of 18 simulated increases in agricultural and M&I water supply reliability. Average 19 annual increases in total water supply reliability under action alternatives would 20 be up to 75,900 acre-feet per year. Therefore, the action alternatives would 21 result in increases in agricultural and/or M&I water supply reliability, which 22 potentially would be a growth-inducing effect. 23
If residential development is constrained by water supply, then increased water 24 supply reliability may remove an obstacle to residential development. 25 Therefore, any of the action alternatives potentially would be growth inducing. 26 Local land use authorities are required to demonstrate sufficient water supply 27 reliability, pursuant to Senate Bill 610 (Chapter 643, Statutes of 2001), in 28 addition to completion of a water supply evaluation required by CEQA. Water 29 supply reliability may be demonstrated with surface water, water contracts, 30 groundwater, and combinations thereof. Impacts on the physical environment 31 would be evaluated and mitigated at a project level. The locations of potential 32 residential development on existing agricultural or rangeland cannot be 33 predicted, and because of the speculative and amorphous nature of potential 34 growth-inducing impacts, no feasible mitigation for impacts of the action 35 alternatives is available at this time. 36
Increased reliability of the water supply could reduce a limitation on growth 37 throughout the primary and extended study areas; however, any project that 38 could affect natural resources or otherwise accommodate growth in the study 39 areas would have to comply with existing planning documents and would be 40 subject to project-specific public environmental analysis and review. The effects 41 of subsequent growth would be analyzed in general plan EIRs and in project-42 level CEQA compliance documents for the local jurisdictions in which the 43
26-9 Draft – June 2013

Shasta Lake Water Resources Investigation Environmental Impact Statement
growth would occur. Mitigation of these potential effects would be the 1 responsibility of these local jurisdictions, not Reclamation. 2
In summary, the expected increase in water yield relative to the entire CVP 3 service area would be extremely small and could be provided to any number of 4 geographic areas within the CVP service area (and in part would substitute for 5 ongoing groundwater pumping). Water provided to agriculture would be used 6 primarily if not exclusively to return idle cropland to production. Furthermore, 7 it would be speculative to identify specific areas where growth could occur or 8 the indirect effects on specific community service facilities in a particular 9 service area. For these and other reasons specified above, the growth-inducing 10 effects from the action alternatives are limited, minimal, and can be effectively 11 mitigated through local jurisdictions as needed. 12
26.5 Identification of Environmental Preferences for Action 13 Alternatives 14
CEQ Regulations require identification of an environmentally preferable 15 alternative, and the CEQA Guidelines require identification of an 16 environmentally superior alternative. However, the CEQ Guidelines and CEQA 17 Guidelines do not require adoption of the environmentally preferable/superior 18 alternative as the preferred alternative for implementation. The Final EIS will 19 identify a preferred alternative. The selection of the preferred alternative is 20 independent of the identification of the environmentally preferable/superior 21 alternative, although the identification of both will be based on the information 22 presented in this EIS. 23
Section 1505.2(b) of the CEQ Regulations requires the NEPA lead agency to 24 identify the environmentally preferable alternative in a Record of Decision. The 25 CEQ Regulations define the environmentally preferable alternative as “…the 26 alternative that will promote the national environmental policy as expressed in 27 NEPA's Section 101. Ordinarily, this means the alternative that causes the least 28 damage to the biological and physical environment; it also means the alternative 29 which best protects, preserves, and enhances historic, cultural, and natural 30 resources”. Similar to the environmentally preferable alternative under NEPA, 31 the CEQA Guidelines, Sections 15120 and 15126.6(e)(2), require identification 32 of an environmentally superior alternative. If the environmentally superior 33 alternative is the “no project” alternative, the CEQA Guidelines, Section 34 15126.6(e)(2), require identification of 1 an environmentally superior alternative 35 among the action alternatives. 36
Each action alternative generally has similar characteristics as all alternatives 37 vary based on combinations of dam raise height, water management, and 38 environmental restoration, and gravel augmentation. The primary distinguishing 39 factors between action alternatives are related to dam raise height, water supply 40 reliability, anadromous fish survival, and other project objectives. CP1, CP2, 41
26-10 Draft – June 2013
Chapter 26 Other Required Disclosures
and CP3 primarily address water supply reliability and anadromous fish 1 survival; however, each of these plans also would contribute to other project 2 objectives. Furthermore, the likelihood that each of these three plans would 3 meet its intended objectives is very high because the plans generally would not 4 rely on any other actions. However, CP4 would emphasize anadromous fish 5 survival through an increase in the Shasta Lake storage dedicated to cold-water 6 supply each year, Sacramento River environmental restoration, and gravel 7 augmentation, and CP5 specifically addresses reservoir area environmental 8 restoration and gravel augmentation. For Sacramento River and reservoir area 9 environmental restoration, success would depend on the continued effectiveness 10 of the environmental restoration facilities/features proposed as part of the 11 SLWRI – enhanced lake area spawning and rearing habitat, increased native 12 vegetation, and new riparian rehabilitation areas – well past completion of 13 construction. 14
Impacts associated with each alternative are summarized at the end of each 15 resource chapter and in Table S-1 in the Summary. 16
26.5.1 Least Environmentally Damaging Practicable Alternative 17 The SLWRI would require discharge of dredged or fill material into waters of 18 the United States. Section 404 of the Clean Water Act (CWA) authorizes 19 USACE to issue permits for the discharge of dredged or fill material into waters 20 of the United States, including wetlands (33 U.S. Code [USC] 1344). 21 Guidelines promulgated by the U.S. Environmental Protection Agency and 22 commonly known as the Section 404(b)(1) Guidelines (40 CFR 230 et seq.), 23 regulatory guidelines of USACE (33 CFR 320 et seq.), and NEPA guidelines 24 (40 CFR 1500 et seq.) are substantive environmental criteria used to evaluate 25 permit applications submitted to USACE. An analysis of practicable alternatives 26 is the primary screening mechanism used by USACE to determine the 27 appropriateness of permitting a discharge. A key element of this approval is the 28 requirement that USACE approve only the Least Environmentally Damaging 29 Practicable Alternative (LEDPA), in accordance with guidance provided by 30 Section 404(b)(1) of the CWA. 31
An alternative is considered practicable if it is available and capable of being 32 implemented after considering cost, existing technology, and logistics in light of 33 overall project purposes (40 CFR 230.3[q]). Practicable alternatives may 34 include placing a project in an area not owned by the applicant that could be 35 reasonably obtained by the project applicant to achieve the overall purpose of 36 the project (40 CFR 230.10[a][2]). 37
The LEDPA would be determined on the basis of the entire environmental 38 review and identified in the Record of Decision, consistent with Section 39 404(b)(1) of the Federal CWA, which requires that only the Least 40 Environmentally Damaging Practicable Alternative may be approved and 41 implemented by a Federal agency. This EIS provides a substantive portion of 42
26-11 Draft – June 2013

Shasta Lake Water Resources Investigation Environmental Impact Statement
the environmental information necessary for USACE to determine the LEDPA 1 consistent with Section 404(b)(1) guidelines. 2
26.5.2 Environmentally Preferable Alternative/Environmentally Superior 3 Alternative 4
CEQ Regulations require identification of an environmentally preferable 5 alternative, and the CEQA Guidelines require identification of an 6 environmentally superior alternative as discussed above. 7
Construction-related impacts would be similar for all of the action alternatives, 8 and the significance determinations for each of the action alternatives generally 9 are the same. Varying magnitudes of impacts generally would be related to the 10 height of the dam raise because additional construction resources would be 11 required for the larger raise and more land would be affected within the larger 12 inundation area. All of the action alternatives would provide additional 13 opportunities for flood risk reduction and increased anadromous fish survival; 14 they also would provide greater water supply reliability during extremely dry 15 years, which would benefit all water users. CP1 and CP2 would have less of an 16 impact on land uses within the reservoir area than the other action alternatives 17 because they would raise the dam by 6.5 feet and 12.5 feet, respectively, 18 compared to the 18.5-foot increase proposed under CP3, CP4, and CP5. 19 However, water supply reliability and anadromous fish survival would be 20 maximized with the larger raise. 21
This EIS provides a substantive portion of the environmental information 22 necessary for Reclamation to determine the Environmentally Preferable 23 Alternative. However, the public and other agencies reviewing a Draft EIS can 24 assist the lead agency to develop and determine environmentally preferable 25 alternatives by providing their views in comments on the Draft EIS. 26 Accordingly, and consistent with NEPA requirements, the environmentally 27 preferable alternative will be identified in the in the Final EIS and Record of 28 Decision. 29
26.6 Compliance with Applicable Laws, Policies, and Plans 30
For more detailed descriptions of the laws, policies, and plans listed below, see 31 Section 3.4, “Regulatory Framework.” 32
26.6.1 Federal Requirements 33
National Environmental Policy Act 34 NEPA requires that an appropriate document be prepared to ensure that Federal 35 agencies accomplish the Act’s purposes. The Council on Environmental Quality 36 has adopted regulations and other guidance that provide detailed procedures for 37 Federal agencies to follow in implementing NEPA. Once finalized, Reclamation 38
26-12 Draft – June 2013

Chapter 26 Other Required Disclosures
would use the Final EIS to comply with Council on Environmental Quality 1 regulations and document NEPA compliance. 2
Clean Water Act 3 Section 404 A Section 404(b)(1) alternatives information package will be 4 prepared for the action alternatives and submitted to USACE and the U.S. 5 Environmental Protection Agency. In addition, Reclamation will obtain a 6 Section 404 permit before filling any waters of the United States. USACE will 7 issue a Record of Decision that addresses pertinent consideration and 8 implementation requirements. Section 404 also requires that the Least 9 Environmentally Damaging Practicable Alternative be identified and 10 implemented by an authorized Federal agency. 11
Section 401 Water quality certification requires evaluation of potential 12 impacts in light of water quality standards and CWA Section 404 criteria 13 governing discharge of dredged and fill materials into waters of the United 14 States. The Federal government delegates water pollution control authority 15 under Section 401 of the CWA to the states. Refer to the Porter-Cologne Water 16 Quality Control Act discussion below. 17
Rivers and Harbors Act 18 In USACE’s Sacramento District, navigable waters of the United States in the 19 project area that are subject to the requirements of the Rivers and Harbors Act 20 include the Sacramento River and all waterways in the Sacramento–San Joaquin 21 drainage basin affected by tidal action. Sections of the River and Harbors Act 22 applicable to the action alternatives are described below. 23
Section 9 All of the action alternatives include construction of dikes. A 24 Section 9 approval would be required before construction of any dikes. 25 Reclamation would obtain approval from the Chief of Engineers and the 26 Secretary of the Army before construction of any dikes in navigable waters of 27 the United States. 28
Section 10 A Section 10 permit would be required before any activity that 29 would alter waters of the United States. To comply with the Rivers and Harbors 30 Act, Reclamation would apply for a permit from USACE’s Sacramento District 31 before construction, and that application would be processed simultaneously 32 with the CWA Section 404 permit application. This DEIS evaluates the 33 environmental effects that the action alternatives would have on waters of the 34 United States, including navigable waters. 35
Section 13 The Central Valley Regional Water Quality Control Board has 36 jurisdiction within the primary study area. The Federal government delegates 37 water pollution control authority to states under Section 402 of the CWA. Refer 38 to the Porter-Cologne Water Quality Control Act discussion below. 39
26-13 Draft – June 2013
Shasta Lake Water Resources Investigation Environmental Impact Statement
Federal Endangered Species Act 1 Reclamation has coordinated with USFWS and NMFS regarding potential 2 project effects on Federally listed species. The potential effects of the SLWRI 3 on endangered and threatened species are described in Chapter 11, “Fisheries 4 and Aquatic Ecosystems”; Chapter 12, “Botanical Resources and Wetlands”; 5 and Chapter 13, “Wildlife Resources.” Reclamation will prepare the appropriate 6 biological assessments to address potential impacts on Federally listed species 7 and will consult with USFWS and NMFS regarding impacts of the proposed 8 action. 9
Magnuson-Stevens Fishery Conservation and Management Act 10 Chapter 11, “Fisheries and Aquatic Ecosystems,” discusses impacts on fisheries 11 and fisheries habitat. Reclamation will coordinate with NMFS to ensure that 12 recommended measures be put into the Preferred Plan that would minimize 13 adverse modifications to Essential Fish Habitat. The specific implementation 14 plan will analyze the significance of modifications to Essential Fish Habitat and 15 will support the habitat assessments included for restoration-specific actions 16 during Endangered Species Act, Section 7 consultations. 17
Fish and Wildlife Coordination Act 18 Compliance with the Fish and Wildlife Coordination Act (FWCA) involves 19 assessing the impacts of the proposed action on preservation, conservation, and 20 enhancement of fish and wildlife habitat and preparation of a FWCA Report. 21 Reclamation will be required to include recommendations for preserving 22 affected habitats, mitigating their loss, and enhancing such habitats, in its 23 documentation of compliance. Documentation of compliance with the FWCA is 24 a separate analysis of habitats of concern to USFWS, NMFS, and CDFW, and 25 does not replace the analysis required by Section 7 of the Federal Endangered 26 Species Act. 27
Migratory Bird Treaty Act 28 Chapter 13, “Wildlife Resources,” evaluates potential impacts on migratory bird 29 species and identifies mitigation measures to reduce impacts on birds, nests, and 30 eggs. In addition, Reclamation will implement all feasible measures included in 31 the FWCA Report discussed above. Reclamation will comply with the 32 Migratory Bird Treaty Act by implementing mitigation measures described in 33 the DEIS and in the FWCA Report, before and during implementation of the 34 proposed action. 35
Bald and Golden Eagle Protection Act 36 USFWS has proposed new permit regulations to authorize the take of bald and 37 golden eagles under the Bald and Golden Eagle Protection Act, generally when 38 the take to be authorized is associated with otherwise lawful activities (72 39 Federal Register 31141–31155, June 5, 2007). With delisting of the bald eagle 40 in 2007, the Bald and Golden Eagle Protection Act is the primary law that 41 protects bald eagles as well as golden eagles. As discussed in Chapter 13, 42 “Wildlife Resources,” suitable habitat is not present for golden eagle in the 43
26-14 Draft – June 2013

Chapter 26 Other Required Disclosures
primary study area; however, each of the action alternatives would have a 1 significant and unavoidable impact on the bald eagle. Therefore, Reclamation 2 will consult with USFWS to implement the reasonable and prudent alternative 3 and conservation measures to reduce impacts on the bald eagle. 4
Safe Drinking Water Act 5 Water used for domestic purposes must be treated in accordance with Federal 6 and State standards by the local or regional water supply. Reclamation will be in 7 compliance with the Safe Drinking Water Act because the action alternatives 8 would not change existing license requirements or impede enforcement of 9 primary drinking water standards. 10
Farmland Protection Policy Act 11 As a Federal agency preparing environmental compliance documents, 12 Reclamation has included in its analysis a farmland assessment designed to 13 minimize adverse impacts on Prime and Unique Farmlands and provide for 14 mitigation as appropriate. Chapter 10, “Agriculture and Important Farmland,” 15 evaluates potential effects of the action alternatives on Important Farmland. 16
National Forest Management Act 17 As discussed in Chapter 1, “Introduction,” USFS is a cooperating agency in this 18 DEIS. Under the National Forest Management Act, any decision emanating 19 from a NEPA process must comply with the Land and Resource Management 20 Plan (LRMP) to authorize an action on lands managed by Shasta-Trinity 21 National Forest (STNF). Significant impacts on lands and resources managed 22 by STNF are discussed in Chapter 4, “Geology, Geomorphology, Minerals, and 23 Soils”; Chapter 12, “Botanical Resources and Wetlands”; Chapter 13, “Wildlife 24 Resources”; Chapter 17, “Land Use and Planning”; Chapter 18, “Recreation and 25 Public Access”; and Chapter 19, “Aesthetics and Visual Resources.” These 26 impacts may require nonsignificant, project-specific amendments to the LRMP. 27
The National Forest Management Act also requires that USFS maintain viable 28 populations of existing native and desired nonnative species in the planning 29 area. Reclamation will meet this requirement by preparing a biological 30 evaluation and associated management indicator species assessment. Those 31 documents will be used by USFS to make a finding that the actions disclosed in 32 the record of decision, issued by Reclamation, will be consistent with the 33 LRMP. 34
Federal Land Policy and Management Act 35 As described in Chapter 3, “Considerations for Describing the Affected 36 Environment and Environmental Consequences,” the Federal Land Policy 37 Management Act directs USFS and BLM to manage public lands under the 38 principles of multiple use and sustained yield. Under the Federal Land Policy and 39 Management Act, the use and occupancy of public lands requires authorization 40 by a land management agency, typically under the auspices of a special-use 41 permit. As the principal land management agency for the Shasta Unit of the 42
26-15 Draft – June 2013

Shasta Lake Water Resources Investigation Environmental Impact Statement
Whiskeytown-Shasta-Trinity National Recreation Area, USFS and, to a lesser 1 degree, BLM, will need to use the Final EIS to support issuance of 2 authorizations to various parties, pursuant to the Federal Land Policy and 3 Management Act. 4
Wild and Scenic Rivers Act 5 Section 7 of the Federal Wild and Scenic Rivers Act requires STNF to manage 6 the outstandingly remarkable values of the McCloud River, consistent with the 7 objectives, standards, and guidelines of its LRMP. The evaluation in the LRMP 8 concluded that the lower McCloud River, from McCloud Dam downstream 9 about 22 miles to the river’s transition to Shasta Lake at about 1,070 feet mean 10 sea level, provides outstanding cultural, fisheries, and geologic values, and its 11 corridor has been classified as a highly sensitive visual area by USFS (USFS 12 1995). Based on the outstandingly remarkable values, STNF determined that the 13 lower McCloud River meets the eligibility requirements for designation under 14 the Federal Wild and Scenic Rivers Act. Chapter 25, “Wild and Scenic River 15 Considerations for McCloud River,” evaluates potential effects of the SLWRI 16 on the McCloud River. 17
Federal Water Project Recreation Act 18 Compliance with the Federal Water Project Recreation Act is achieved by 19 documenting the consideration of recreation opportunities in USACE reports 20 and NEPA documents. Within this DEIS, Reclamation has taken into 21 consideration and addressed outdoor recreation and fish and wildlife 22 enhancement in the primary and extended study areas. 23
National Historic Preservation Act 24 Under Section 106 of the National Historic Preservation Act, Federal agencies 25 must consider effects to eligible resources (“historic properties”) from the 26 proposed undertaking, in consultation with the California State Historic 27 Preservation Officer (SHPO) and other parties. This includes affording the 28 Advisory Council a reasonable opportunity to comment on such undertakings. 29 For this project, consultation between Reclamation, USFS, any other applicable 30 Federal agencies, SHPO, and other consulting parties would include 31 consideration of possible options for avoiding, minimizing, or mitigating 32 adverse effects. If SHPO, Reclamation, USFS, other applicable Federal 33 agencies, and the Council (if participating) agree to measures to resolve adverse 34 effects to historic properties, these are formalized in a Memorandum of 35 Agreement (MOA). Other consulting parties may be invited to sign the MOA. 36 The Section 106 process (36 CFR Part 800.14) is completed once the terms of 37 the MOA have been met. Alternatively, the Federal agencies may elect to enter 38 into a programmatic agreement that would be developed as an alternative 39 procedure to implement the Section 106 process (36 CFR Part 800.14). In rare 40 cases, if consultation fails to result in agreement on resolving adverse effects, 41 consultation may be terminated pursuant to the process detailed in 36 CFR Part 42 800.7. 43
26-16 Draft – June 2013

Chapter 26 Other Required Disclosures
Indian Trust Assets 1 When adverse impacts on Indian Trust Assets (ITA) cannot be avoided, 2 appropriate mitigation or compensation will be provided. ITAs consist of lands 3 that have been deeded to tribes or on which tribes have a historical legal claim. 4 However, no such lands are within the primary study area. Thus, the SLWRI 5 would have no impact on ITAs. Because ITAs have been evaluated and the 6 SLWRI would have no impact on these resources, the SLWRI would comply 7 with ITAs. 8
Executive Order 11988 (Flood Hazard Policy) 9 As discussed in Chapter 6, “Hydrology, Hydraulics, and Water Management,” 10 all of the action alternatives would have an effect on floodplains in the primary 11 study area. However, none of the action alternatives would increase flood flows, 12 and feasible mitigation would be implemented to compensate for the impact of 13 altered flow on riparian and wetland communities. 14
Executive Order 11990 (Protection of Wetlands) 15 As discussed in Chapter 12, “Botanical Resources and Wetlands,” a wetland 16 delineation will be prepared for the Preferred Plan and a USACE Section 404 17 permit will be obtained before construction. Reclamation will identify the 18 location of sensitive habitats by conducting a wetland delineation, avoid and 19 minimize impacts to the extent feasible, and compensate for any losses. 20 However, implementation of any of the action alternatives would result in 21 significant and unavoidable impacts on wetlands. 22
Executive Order 12898 (Environmental Justice Policy) 23 As discussed in Chapter 24, “Environmental Justice,” the disturbance or loss of 24 resources associated with locations considered by Winnemem Wintu and Pit 25 River Madesi Band members to have religious and cultural significance would 26 result in a disproportionately high and adverse effect on Native American 27 populations in the vicinity of Shasta Lake. Therefore, the project would 28 contribute to disproportionate placement of environmental impacts on Native 29 American populations and would result in a cumulatively considerable 30 incremental contribution to a significant and unavoidable cumulative impact. 31 No feasible mitigation is available to reduce this high and adverse effect. 32 Compliance with Executive Order 12898 occurs through the identification of 33 this effect and acknowledgement of the lack of feasible mitigation measures 34 available to reduce it. 35
Americans with Disabilities Act 36 The Americans with Disabilities Act of 1990 is a comprehensive law 37 prohibiting discrimination against people with disabilities in employment 38 practices, use of public transportation, use of telecommunication facilities, and 39 use of public accommodations. Title II of the ADA applies to government 40 facilities and requires that reasonable modifications must be made to services 41 and programs so that they are readily accessible to and usable by people with 42 disabilities. If any alternative proposed under the SLWRI is approved and 43
26-17 Draft – June 2013

Shasta Lake Water Resources Investigation Environmental Impact Statement
authorized, Reclamation would make every reasonable effort to make any new 1 construction or improvement fully compliant with ADA requirements. If it is 2 found to be infeasible to make a new construction or improvement element fully 3 ADA compliant, Reclamation would obtain any required waivers or 4 modifications to the ADA standards. 5
Executive Order 13007 (Indian Sacred Sites) and Memorandum of April 6 29, 1994 7 EO 13007 defines a sacred site as "any specific, discrete, narrowly delineated 8 location on Federal land that is identified by an Indian tribe, or Indian individual 9 determined to be an appropriately authoritative representative of an Indian 10 religion, as sacred by virtue of its established religious significance to, or 11 ceremonial use by, an Indian religion; provided that the tribe or appropriately 12 authoritative representative of an Indian religion has informed the agency of the 13 existence of such a site.” 14
Potential impacts of the action alternatives on Native American sacred sites are 15 addressed in Chapter 14, “Cultural Resources.” Reclamation will continue to 16 coordinate with federally recognized tribes to address potential impacts on 17 sacred sites. 18
Executive Order 13112 (National Invasive Species Management Plan) 19 A weed management plan is within the scope of the action alternatives and 20 would include methods for managing the spread of invasive plant species. 21 Because the details of the weed management plan have not been finalized at the 22 time of this writing, this DEIS identifies preparation and implementation of a 23 weed management plan as a mitigation measure. Developing and implementing 24 the weed management plan as a mitigation measure demonstrates compliance 25 with Executive Order 13112. Reclamation will demonstrate continued 26 compliance with this executive order by implementing the methods described in 27 the weed management plan. 28
Federal Clean Air Act 29 As discussed in Chapter 5, “Air Quality and Climate,” the SLWRI would not 30 result in long-term effects on air quality. Because the effects of the action 31 alternatives on air quality have been evaluated and mitigated to the extent 32 possible, any of the action alternatives would comply with the Federal Clean 33 Air Act. 34
Federal Transit Administration 35 This DEIS evaluates potential groundborne-vibration impacts on sensitive 36 receptors, including the maximum sensitivity of 65 vibration decibels for 37 hospitals, high-technology manufacturing, and laboratory facilities. Some 38 construction activities associated with the action alternatives could result in 39 groundborne vibrations exceeding 65 vibration decibels. However, sensitive 40 receptors would need to be within 250 feet of the activities to be affected, and 41 no sensitive receptors would be within this distance. Reclamation has 42
26-18 Draft – June 2013

Chapter 26 Other Required Disclosures
demonstrated consistency with this policy by evaluating the construction 1 activities that would generate the maximum possible groundborne vibration at 2 the highest sensitive uses. 3
Federal Energy Regulatory Commission 4 Changes to hydroelectric facilities on the Pit River, including instream flow 5 releases or modifications to downstream structures, may necessitate a license 6 amendment from the Federal Energy Regulatory Commission. Reclamation will 7 support Pacific Gas and Electric Company in any application to the Federal 8 Energy Regulatory Commission for necessary license amendments before 9 implementing any action alternatives that would affect Pit River flows. 10
U.S. Coast Guard 11 The SLWRI has the potential to affect several bridges over inflows to Shasta 12 Lake. Reclamation will coordinate with the U.S. Coast Guard in respect to these 13 potential impacts. 14
26.6.2 State Requirements 15
California Environmental Quality Act 16 This document has been prepared in accordance with CEQA and may be used 17 by State lead, responsible, and trustee agencies that would be involved in 18 project review and approval of certain aspects of the proposed project under 19 their jurisdiction. 20
California Endangered Species Act 21 Evaluations have been conducted for State-listed endangered and threatened 22 species, and have determined that the proposed action would affect several 23 State-listed species. Effects on those species are discussed in Chapter 11, 24 “Fisheries and Aquatic Ecosystems”; Chapter 12, “Botanical Resources and 25 Wetlands”; and Chapter 13, “Wildlife Resources.” Reclamation will prepare 26 appropriate biological assessments to address potential impacts on Federally 27 listed species, and will consult with CDFW regarding impacts of the proposed 28 action on State-listed species. 29
California Fish and Game Code—Fully Protected Species 30 This DEIS identifies potential actions that could result in take of fully protected 31 species, and Reclamation will work closely with CDFW to evaluate methods to 32 avoid impacts on fully protected species. 33
California Fish and Game Code Section 1602—Streambed Alteration 34 A CDFW streambed alteration agreement must be obtained for any project that 35 would result in an impact on a river, stream, or lake. This DEIS identifies 36 potential actions within the proposed action that would require the alteration of 37 stream features, subject to Section 1602 of the California Fish and Game Code. 38 This document requires Reclamation to secure an approved streambed alteration 39 agreement before performing any actions subject to Section 1602. 40
26-19 Draft – June 2013

Shasta Lake Water Resources Investigation Environmental Impact Statement
California Fish and Game Code Sections 5900–5904, 5930–5948, 7261, 1 and 7370—Fish Passage 2 This DEIS identifies actions that could affect fish passage, and Reclamation will 3 work closely with CDFW to evaluate methods to avoid impacts on sturgeon, 4 fish passage, and designated “Heritage Trout Waters.” Potential impacts on 5 fisheries are described in Chapter 11, “Fisheries and Aquatic Ecosystems.” 6
California Native Plant Protection Act 7 All action alternatives are evaluated in this DEIS for consistency with this Act. 8 Mitigation measures are provided, as necessary, to minimize potential take of 9 listed and special-status plants under the California Native Plant Protection Act. 10
California Native Plant Society Species Designations 11 This DEIS identifies plants of concern on California Native Plant Society lists 12 that may be affected by the action alternatives, using these lists as a method of 13 identifying species of concern. Mitigation and minimization measures will be 14 implemented, as necessary, to reduce the significance of potential impacts on 15 these species of concern. 16
Central Valley Flood Control Act of 2008 17 Reclamation has developed the action alternatives in a manner that is consistent 18 with the Central Valley Flood Control Act, and the action alternatives would not 19 inhibit development and implementation of the Central Valley Flood Protection 20 Plan. 21
Central Valley Flood Protection Board Encroachment Permit 22 Certain action alternatives would require work along the Sacramento River in 23 areas that may be subject to Title 23; the river is managed for flood control, and 24 thus it contains features subject to Central Valley Flood Protection Board 25 jurisdiction. Reclamation will secure encroachment permits, as needed, to 26 satisfy Title 23 before performing any work along relevant reaches of the 27 Sacramento River that contain flood control features subject to Central Valley 28 Flood Protection Board jurisdiction. 29
Water Rights 30 The action alternatives do not include any actions that would require 31 acquisition, use, or modification of water rights. Therefore, the action 32 alternatives would comply with all existing water rights in the primary and 33 extended study areas. 34
California Public Resources Code 35 The Legislature has declared that the McCloud River, which is within the 36 primary study area, possesses “extraordinary resources” in the context of 37 Section 5093.542 of the California Public Resources Code, established through 38 enactment of the Wild and Scenic Rivers Act, as amended (Sections 39 5093.50through 5093.70). However, the Legislature’s action stopped short of 40 formally designating the river as wild and scenic. Chapter 25, “Wild and Scenic 41
26-20 Draft – June 2013

Chapter 26 Other Required Disclosures
River Considerations for McCloud River,” evaluates potential effects of the 1 action alternatives on the McCloud River. New legislation may be required for 2 State support and/or participation in any of the action alternatives. 3
The California Public Resources Code also contains several other sections 4 relevant to the project. Compliance with provisions of the California Public 5 Resources Code is achieved in this DEIS by analyzing the impact of the action 6 alternatives on recreation opportunities. Chapter 18, “Recreation and Public 7 Access,” discusses effects on Shasta Lake and the surrounding recreation areas 8 under the action alternatives. 9
California Harbors and Navigation Code 10 Significant modifications to facilities on Shasta Lake may necessitate 11 coordination with the California Department of Boating and Waterways and/or 12 the U.S. Coast Guard. Reclamation will coordinate with them as necessary. 13
Porter-Cologne Water Quality Control Act 14 Action alternatives that have the potential to adversely affect water quality are 15 identified in this DEIS. Measures necessary for compliance with the Act would 16 need to achieve consistency with implementation programs under the water 17 quality control plan for the Sacramento River basin, and with the Central Valley 18 Regional Water Quality Control Board’s waste discharge requirements. Other 19 necessary actions likely would include application for and finalization of 20 National Pollutant Discharge Elimination System permits and Section 401 water 21 quality certifications. 22
California Land Conservation Act of 1965 (Williamson Act) 23 Approximately 51 percent of Shasta County’s farmland is under Williamson 24 Act contracts (Shasta County 2004). Williamson Act lands affected by the 25 action alternatives are discussed in Chapter 10, “Agriculture and Important 26 Farmland.” 27
California Clean Air Act 28 This DEIS evaluates the contribution of the action alternatives to any violation 29 of air quality standards and identifies mitigation measures to help achieve 30 consistency with the State implementation plan’s attainment goal before 31 implementation of any of the alternative actions. 32
California Scenic Highway Program 33 On the south side of Shasta Lake, portions of State Route 151 are an officially 34 designated State Scenic Highway. County Road A18 is an officially designated 35 County Scenic Highway, and it also is located on the southern side of Shasta 36 Lake. Portions of Interstate 5, as it approaches Shasta Lake and crosses the Pit 37 River Bridge, are considered eligible for designation as a State Scenic Highway. 38 Impacts on scenic highways are discussed in Chapter 19, “Aesthetics and Visual 39 Resources.” 40
26-21 Draft – June 2013

Shasta Lake Water Resources Investigation Environmental Impact Statement
State Lands Commission Land Use Lease 1 In the primary study area, the lands under the jurisdiction of the California State 2 Lands Commission include areas along the Sacramento River, north of Red 3 Bluff. Work on the Sacramento River would require a lease from the California 4 State Lands Commission. Reclamation will coordinate with the California State 5 Lands Commission and obtain a State Lands Commission Land Use Lease 6 before starting work in areas under the Commission’s jurisdiction. 7
California Surface Mining and Reclamation Act 8 In general, the Surface Mining and Reclamation Act of 1975 (SMARA) requires 9 that the lead agency approve a permit and a reclamation plan, and that an 10 approved financial assurance be posted for the reclamation of the mined land. If 11 borrow is required from borrow site(s), not previously permitted under 12 SMARA, Reclamation will either obtain a SMARA permit or an exemption 13 from SMARA for all borrow sites before beginning borrow activities. 14
State of California General Plan Guidelines 15 Chapter 8, “Noise and Vibration,” evaluates long-term effects on noise levels in 16 the primary and extended study areas. Long-term changes in noise levels 17 associated with any of the alternative actions would be less than significant. All 18 alternative actions would comply with the appropriate noise guidelines based on 19 Reclamation’s evaluation of long-term compatibility of the actions with noise 20 levels. 21
California Department of Transportation 22 Highway improvements or modifications that may be necessary as part of this 23 project may require an encroachment permit, issued through the California 24 Department of Transportation (Caltrans). The project may involve 25 modifications to roadways that Caltrans considers “complex,” and Reclamation 26 would need extensive communication with the Caltrans Department of 27 Engineering Services and/or structure-specific encroachment permits. The 28 requirements are detailed in the Caltrans Encroachment Permits Manual, which 29 is available at the Caltrans Web site. 30
26.6.3 Local Plans and Policies 31
Shasta County Air Quality Management District’s Authority to Construct 32 and Permit to Operate 33 Reclamation would obtain an Authority to Construct permit before building or 34 installing any new emissions unit or modifying any existing emissions unit that 35 requires a permit, if necessary. Reclamation also would obtain a Permit to 36 Operate after all construction is completed and the emission unit is ready for 37 operation, if needed. 38
Other Local Permits and Requirements 39 Several other local permits and requirements may apply to the action 40 alternatives. Shasta and Tehama counties and their public works departments 41
26-22 Draft – June 2013
Chapter 26 Other Required Disclosures
will require compliance with local plans and ordinances, such as the county 1 general plan, zoning ordinances, grading plan, and various use permits. Utility 2 easements and various encroachments also may be required. 3
4
26-23 Draft – June 2013
Shasta Lake Water Resources Investigation Environmental Impact Statement
1
This page left blank intentionally. 2 3
26-24 Draft – June 2013

Chapter 27 Public Involvement, Consultation, and Coordination
Chapter 27 1
Public Involvement, Consultation, and 2
Coordination 3
This chapter summarizes completed, ongoing, and anticipated public outreach 4 and agency involvement efforts related to development of the SLWRI, 5 including activities that satisfy NEPA requirements for public scoping and 6 agency consultation and coordination. Efforts to engage the public, 7 stakeholders, Federally recognized tribes, Native American tribal groups, and 8 public agencies are an important role in the SLWRI. These efforts are guided by 9 the Strategic Agency and Public Involvement Plan (Reclamation 2003a), and 10 include a broad range of activities designed to accomplish official and 11 supplementary outreach goals. Chapter 29, “DEIS Distribution List,” lists the 12 entities receiving a copy of the DEIS. Reclamation encourages review of this 13 DEIS and will continue to solicit public and agency input on the proposed 14 action. 15
The Strategic Agency and Public Involvement Plan features four main 16 objectives: 17
• Stakeholder Identification – Identifying and involving individuals, 18 groups, and other entities that have an expressed or implied interest in 19 the SLWRI. 20
• Project Transparency – Informing stakeholders and the public of 21 study results in a timely, unbiased fashion through a variety of 22 methods, including stakeholder and/or public meetings, Web postings, 23 and mailings. 24
• Issues and Concerns Resolution – Gaining awareness of the issues 25 and concerns of stakeholders and the public early in the process, and 26 responding to these issues in an effective and timely manner. 27
• Project Implementation – Assisting policy-makers in understanding 28 project purposes and benefits, and demonstrating that the project has 29 met all necessary requirements to be implemented. 30
27-1 Draft – June 2013

Shasta Lake Water Resources Investigation Environmental Impact Statement
27.1 Public Involvement Through Project Scoping 1
Public scoping activities are conducted as part of compliance with both NEPA 2 and CEQA, but are more formalized under NEPA. Scoping allows agencies, 3 stakeholders, organizations, and other interested parties to identify resources to 4 be evaluated, issues that may require environmental review, reasonable 5 alternatives to consider, and potential mitigation if significant adverse effects 6 are identified. The scoping process helps with early identification of problems 7 to be studied, and also helps to eliminate from detailed study issues that are not 8 critical to the decision at hand. Scoping also provides decision makers with 9 insight on the issues and concerns that the public believes should be considered 10 as part of the feasibility study. Public scoping activities performed for the 11 SLWRI environmental documentation process are described below. 12
27.1.1 Notice of Intent to Propose an Environmental Impact Statement 13 Reclamation initiated the scoping process by publishing a notice of intent to 14 prepare an EIS and a notice of public scoping meetings pursuant to NEPA on 15 October 7, 2005, in the Federal Register (Volume 70, pages 58744–58746). The 16 opportunity for submitting written comments on the notice of intent extended 17 through December 6, 2005. 18
On the same day that the notice of intent and notice of meetings were published 19 in the Federal Register, Reclamation announced the scoping meetings to be 20 held in a news release posted on the project Web site and distributed via e-mail 21 to media in the extended study area. The release was also distributed to 22 agencies, stakeholders, organizations, and other interested parties. A second 23 news release on October 20, 2005, announced an additional scoping meeting to 24 be held in Red Bluff, and was published in display advertisements that 25 Reclamation purchased in newspapers within the immediate study area in 26 Redding, Red Bluff, and Dunsmuir. 27
27.1.2 Public Scoping Meetings 28 In 2005, seven public scoping meetings were conducted in an “open house” 29 format throughout California to update the public on the status of the proposed 30 action and to solicit and receive input on alternatives, project related concerns, 31 and issues to be addressed in the environmental review process. Project team 32 members from Reclamation and its consultants staffed informational 33 workstations and interacted with meeting participants to provide information 34 and answer questions. Attendance ranged from very light for meetings held in 35 Concord, Fresno, and Los Angeles at 2, 2 and 4 people, respectively. 36 Attendance was comparatively stronger in Dunsmuir, Redding, Red Bluff and 37 Sacramento at 11, 39, 20 and 10 people, respectively. The proximity to the 38 projects, and advertisements in three local newspapers, likely contributed to a 39 stronger attendance in the northern cities. 40
The meetings were attended by private citizens, Federal and State agency 41 personnel, local government representatives, political representatives, members 42
27-2 Draft – June 2013

Chapter 27 Public Involvement, Consultation, and Coordination
of the media, Native American tribes, Native American groups, and business 1 owners, and representatives of private industry, utilities, environmental interest 2 groups, and nongovernmental organizations. 3
Displays of information were presented at each meeting on large-scale panels at 4 a series of four workstations. Information included on these panels is 5 summarized as follows. 6
Background 7 This workstation described Shasta Dam and Shasta Lake, authorization of the 8 Federal feasibility study and other pertinent guidance, the CALFED Bay-Delta 9 Program Record of Decision (ROD) relating to enlarging Shasta Dam and 10 Shasta Lake, and the primary and extended study areas. 11
Environmental Overview 12 This workstation summarized the major resource areas to be evaluated, defined 13 the biological, socioeconomic, physical, and cultural environments, and 14 identified potential impacts on those environments. The workstation also 15 included information on the Federal environmental review process and Federal 16 and State regulatory requirements and processes. 17
Study Process 18 This workstation presented information on water resources problems and needs 19 being addressed in the SLWRI environmental documents. The primary and 20 secondary study objectives were identified along with the overall study mission. 21 The workstation also included information about the Federal plan formulation 22 process, including the development of the SLWRI initial alternatives and the 23 formulation of comprehensive alternatives. 24
Initial Alternatives 25 This workstation described the initial alternatives formulated, potential major 26 features associated with potential enlargement of Shasta Dam and Shasta Lake 27 that are likely to be considered in future studies, and potential environmental 28 restoration features to be included in the alternatives. 29
The Environmental Scoping Report (Reclamation 2006) describes the scoping 30 process, comments received during scoping, and how these comments would be 31 addressed as part of the SLWRI and in support documentation (e.g. Feasibility 32 Report and EIS). 33
27.2 PDEIS Outreach 34
In advance of this DEIS, Reclamation released the Preliminary Draft 35 Environmental Impact Statement and the Draft Feasibility Report. This 36 February 2012 release was followed by an October 2012 Reclamation news 37 release requesting additional public comment on the Draft Feasibility Report for 38
27-3 Draft – June 2013

Shasta Lake Water Resources Investigation Environmental Impact Statement
input on potential cost, benefits and impacts of enlarging Shasta Dam and 1 Reservoir. In December 2012, Reclamation extended the comment period for 2 review of the document from December 28, to January 28, 2013, to allow time 3 for additional public comments on the Draft Feasibility Report. 4
27.3 Other Public Outreach 5
In addition to scoping activities, other public outreach activities have included 6 the following: 7
• Release of major previous Reclamation studies and reports 8 investigating potential enlargement of Shasta Dam and Reservoir 9 included: Enlarged Shasta Lake Investigation Preliminary Findings 10 Report (1983), Shasta Dam and Reservoir Enlargement, Appraisal 11 Assessment of the Potential for Enlarging Shasta Dam and Reservoir 12 (1999), SLWRI Strategic Agency and Public Involvement Plan (2003b), 13 SLWRI Mission Statement Milestone Report (2003a), SLWRI Initial 14 Alternatives Information Report (2004a), SLWRI Environmental 15 Scoping Report (2006), and SLWRI Plan Formulation Report (2007). 16 As described above, Reclamation also completed the Preliminary DEIS 17 (2011a), Draft Feasibility Report (2011b), and supporting technical 18 appendices for the SLWRI in November 2011. These documents were 19 released to the public in February 2012, to share study findings and 20 provide additional opportunities for public and stakeholder input. 21
• Release of two project information papers associated with milestone 22 reports- the Mission Statement Milestone Report (Reclamation 2003b) 23 and the Initial Alternatives Information Report (Reclamation 2004a) –24 in support of public outreach. 25
• Stakeholder workshops during development of the SLWRI (multiple 26 years) 27
• Project briefings to Federal, state and local elected officials, water and 28 hydropower interest groups, and environmental interest groups in 2003. 29
• Project update meetings with property owners and/or business interests 30 in the Shasta Lake area (multiple years) 31
• Presentations to the California Water Commission, Bay-Delta Public 32 Advisory Committee, and related agency presentations (multiple years) 33
• Briefings to resource management groups and stakeholders (multiple 34 years) 35
• Project Web site for the SLWRI (www.usbr.gov/mp/slwri/index.html) 36
27-4 Draft – June 2013

Chapter 27 Public Involvement, Consultation, and Coordination
Future meetings will focus primarily on public outreach related to the release of 1 this DEIS. 2
27.4 Consultation and Coordination 3
Reclamation has consulted various public agencies and organizations during the 4 public outreach process and throughout development of the SLWRI DEIS to 5 obtain feedback on the investigation. Consultations have assisted Reclamation 6 in determining the scope of the DEIS, developing project components and 7 objectives, identifying the range of alternatives, and defining potential 8 environmental impacts, impact significance, and mitigation measures. 9
27.4.1 Consultation and Coordination with Agencies 10 Reclamation conducts ongoing consultation and coordination efforts with 11 agencies. The SLWRI study management structure includes the active 12 participation of numerous cooperating agencies and other stakeholders on a 13 Project Coordination Team (PCT) and Study Management Team and in 14 Technical Working Groups. Cooperating agencies for the SLWRI, pursuant to 15 NEPA, include USFS, Colusa Indian Community Council of the Cachil Dehe 16 Band of Wintun Indians, USACE, and U.S. Department of the Interior, Bureau 17 of Indian Affairs. Other participants in the PCT include USFWS, NMFS, U.S. 18 Department of the Interior, Bureau of Land Management, DWR, CDFW, and 19 other Federal and State agencies. These groups were active contributors to the 20 ongoing development and/or review of the alternative plans that are addressed 21 herein and in supporting documentation. 22
The PCT is among the most effective means of communication between 23 agencies, continuing to provide for regular participation by numerous 24 cooperating agencies. Regularly scheduled bimonthly meetings have been held 25 and continue to be held, for the purpose of project coordination and decision 26 making, with invitations extended to all cooperating agencies and other 27 CALFED Bay-Delta Program agencies and the Central Valley Regional Water 28 Quality Control Board. 29
Key elements of these coordination activities are the Planning Aid 30 Memorandum and Coordination Act Report, documents issued by USFWS. A 31 draft Planning Aid Memorandum outlining areas of potential concern was 32 circulated among the resource agencies in the first quarter of 2007. 33 Development of the Coordination Act Report began in summer 2007, with 34 circulation of a draft in 2008. 35
27.4.2 Consultation and Coordination with Tribal Governments 36 Consistent with a memorandum from the President on April 29, 1994, 37 Reclamation and the cooperating agencies will continue to actively engage 38 Federally recognized tribal governments in planning and developing the 39 investigation, and will consult with each tribe on a government-to-government 40
27-5 Draft – June 2013

Shasta Lake Water Resources Investigation Environmental Impact Statement
basis before taking actions that could affect such tribal governments. Under 1 Federal Trust responsibility, Reclamation will provide full disclosure (benefits 2 and negative impacts) of the project, allow time for tribal review/consultation, 3 and receive comments and/or suggestions for alternatives. 4
The PCT held several coordination meetings with Federally recognized tribes 5 during 2007 and 2008. Tribes were invited to an informal meeting held on April 6 4, 2007, in Redding, California, to provide general information about the 7 SLWRI and determine tribal participation interests. Additionally, from August 8 2007 to November 2008, members of the PCT held six separate meetings with 9 four Federally recognized tribes whose traditional territories overlap with the 10 SLWRI project area. The purposes of the meetings were to solicit, clarify, and 11 document major concerns and issues regarding the SLWRI, and to establish a 12 preferred method or approach for maintaining effective communication with 13 each tribe during the remainder of the feasibility study and in future endeavors. 14
27.4.3 Coordination with Native American Tribal Groups 15 In accordance with Executive Order 12898, Native Americans – including 16 Federally-recognized and non-Federally recognized tribes – are considered 17 minority populations, and are encouraged as stakeholder groups to participate in 18 the ongoing investigation. Several groups, such as the Winnemem Wintu and 19 Shasta Nation, have expressed significant interest in the SLWRI. In response, 20 the PCT conducted 10 meetings and dialogues in 2007 and 2008 with Native 21 American groups whose traditional homelands overlap with the SLWRI study 22 area; four of these meetings engaged non-Federally recognized Native 23 American groups. Groups were invited to an April 4, 2007, informal meeting to 24 receive general information about the SLWRI and to identify their interests for 25 project participation. As with Federally recognized tribes, meetings were held 26 with Native American groups to solicit, clarify, and document major concerns 27 and issues regarding the SLWRI, and to establish each group’s preferred 28 method or approach for receiving communications about the SLWRI during the 29 remainder of the study. 30
27.5 Major Topics of Interest 31
The focus of interest varied among the outreach activities, but a common theme 32 centered on potential impacts on the Shasta Lake area that could result from 33 enlargement of the reservoir. 34
The public, stakeholders, and other Federal agencies, and State and local 35 agencies identified several areas of concern during SLWRI meetings and 36 workshops. Key topics included potential adverse effects on cultural resources 37 in the Shasta Lake area; recreation and recreation providers in the 38 Whiskeytown-Shasta-Trinity National Recreation Area; terrestrial special-status 39 species around Shasta Lake, including State-designated fully protected species, 40 aquatic special-status species in the Sacramento River and Sacramento-San 41
27-6 Draft – June 2013

Chapter 27 Public Involvement, Consultation, and Coordination
Joaquin Delta (including delta smelt); the lower McCloud River and its special 1 designation under California Public Resources Code 5093.542(c); Delta water 2 quality; south Delta water levels; Central Valley hydrology below CVP and 3 SWP facilities and resulting effects on water supplies for water contractors and 4 other water users; and consistency with the CALFED Bay-Delta Program ROD. 5 These topics are described in more detail in Section 1.6, “Areas of 6 Controversy/Issues to Be Resolved.” 7
27.6 Next Steps in the Environmental Review Process 8
This DEIS will be circulated for public and agency review and comment for 90 9 days following the date when the U.S. Environmental Protection Agency 10 publishes the notice of availability of weekly receipt of environmental impact 11 statements in the Federal Register. During this public comment period, 12 Reclamation intends to hold public meetings/hearings in Los Banos, Redding 13 and Sacramento to solicit and receive public input on the DEIS. These meetings 14 will be formatted similar to public scoping with an open house preceding a 15 formal public hearing. The open house will include project information stations 16 staffed by project team member available to respond to attendee’s questions. 17 The open house will conclude with a presentation. At the conclusion of the open 18 house, a public hearing will be initiated consistent with NEPA guidelines. 19 Comments provided during the public hearing will be addressed in the Final 20 EIS. In addition, written comments from the public, reviewing agencies, and 21 stakeholders will be accepted during the public comment period. 22
A Final EIS will be prepared and circulated in accordance with NEPA 23 requirements and will include responses to all comments. When the Final EIS is 24 complete, Reclamation will publish the document, and the notice of availability 25 will be printed in the Federal Register, which will mark the start of a minimum 26 30-day waiting period before Reclamation issues its ROD on the investigation. 27 The date of the release of the Final EIS has not been determined. In the ROD, 28 which is the final step in the NEPA process, Reclamation will document its 29 decision on which actions, if any, to take to address the primary objectives. It 30 will also describe other risk reduction plans it considered, identify any 31 mitigation plans, and describe factors and comments taken into consideration 32 when making its decision. 33
To date, CEQA scoping has not been initiated. This process will commence 34 after a State lead agency is identified. 35
36
27-7 Draft – June 2013

Shasta Lake Water Resources Investigation Environmental Impact Statement
1
This page left blank intentionally. 2 3
27-8 Draft – June 2013

Chapter 28 DEIS Distribution List
Chapter 28 1
DEIS Distribution List 2
This chapter provides locations where this DEIS is available for review and 3 provides an overview the governmental entities, organizations, and interested 4 parties that received copies of this DEIS. This list includes agencies and 5 organizations that were involved in the scoping process for the proposed action, 6 requested a copy of the DEIS, or that may use the DEIS for discretionary or 7 informational purposes. 8
9 28.1 Document Availability
The public distribution of this DEIS emphasizes the use of electronic media to 10 ensure cost-effective, broad availability to the public and interested parties. This 11 DEIS is available on the Internet at Reclamation’s Web site, 12 <http://www.usbr.gov/mp/slwri/documents.html>. The DEIS is also available 13 for review at the following locations: 14
U.S. Department of the Interior, Bureau of Reclamation Library 15 2800 Cottage Way 16 Sacramento, CA 95825 17
Bureau of Reclamation, Northern California Area Office 18 16349 Shasta Dam Boulevard 19 Shasta Lake, CA 96019 20
U.S. Department of the Interior, Natural Resources Library 21 1849 C Street NW, Main Interior Building 22 Washington, D.C., 20240 23
Dunsmuir Branch Library 24 5714 Dunsmuir Avenue 25 Dunsmuir, CA 96025 26
Shasta County Public Library, 27 Redding Library 28 1100 Parkview Avenue 29 Redding, CA 96001 30
Kern County Library, 31 Holloway-Gonzales Branch 32
28-1 Draft – June 2013

Shasta Lake Water Resources Investigation Environmental Impact Statement
506 East Brundage Lane 1 Bakersfield, CA 93307 2
Concord Library 3 2900 Salvio Street 4 Concord, CA 94519 5
Los Banos Public Library 6 1312 South 7th Street 7 Los Banos, CA 93635 8
Napa City-County Library 9 580 Coombs St. 10 Napa, California 94559 11
12 28.2 Agencies and Organizations Receiving Copies of the DEIS
All persons, agencies, and organizations listed in this chapter have been 13 informed of the availability of and locations to obtain the DEIS. Parties listed 14 below have received an electronic or hard copy of the main body of this DEIS 15 or the entire DEIS, including appendices. 16
28.2.1 Federal Agencies 17 • U.S. Army Corps of Engineers18
• U.S. Department of Interior, Fish and Wildlife Service19
• U.S. Department of Interior, Bureau of Indian Affairs20
• U.S. Department of Interior, Bureau of Land Management21
• U.S. Department of Agriculture, Forest Service22
• U.S. Department of Commerce, National Marine Fisheries Service23
• U.S. Environmental Protection Agency24
28.2.2 State Agencies 25 • California Water Commission26
• California Department of Boating and Waterways27
• California Department of Conservation28
• California Department of Education29
• California Department of Fish and Wildlife30
28-2 Draft – June 2013

Chapter 28 DEIS Distribution List
• California Department of Public Health 1
• California Department of Parks and Recreation 2
• California Department of Toxic Substances Control 3
• California Department of Transportation 4
• California Department of Water Resources 5
• California Department of Food and Agriculture 6
• California Department of Forestry and Fire Protection 7
• California Environmental Protection Agency 8
• California Highway Patrol 9
• California Air Resources Board 10
• California Central Valley Flood Protection Board 11
• Central Valley Regional Water Quality Control Board 12
• California Governor’s Office of Planning and Research 13
• State Water Resources Control Board 14
• California Energy Commission 15
• Delta Protection Commission 16
• Delta Stewardship Council 17
• Native American Heritage Commission 18
• State Lands Commission 19
• Office of Historic Preservation 20
28.2.3 Regional and Local Entities 21 • Shasta County 22
• Tehama County 23
• Siskiyou County 24
• Trinity County 25
28-3 Draft – June 2013

Shasta Lake Water Resources Investigation Environmental Impact Statement
• Shasta County Air Quality Management District 1
• Tehama County Air Quality Management District 2
• City of Anderson 3
• City of Corning 4
• City of Dunsmuir 5
• City of Mount Shasta 6
• City of Redding 7
• City of Red Bluff 8
• City of Shasta Lake 9
28.2.4 Tribal Interests 10 • Grindstone Indian Rancheria 11
• Paskenta Band of Nomlaki Indians 12
• Pit River Environmental Council 13
• Pit River Tribe of California 14
• Redding Rancheria 15
• Shasta Nation 16
• United Tribe of Northern California, Inc. 17
• Winnemem Wintu Tribe 18
• Wintu Educational and Cultural Council 19
• Wintu Tribe of Northern California 20
• Lone Pine Paiute-Shoshone Tribe 21
• Cortina Indian Rancheria 22
• Wintu Tribe of Northern California 23
• Cantara Indian Rancheria 24
• Montgomery Creek (Pit River) 25
28-4 Draft – June 2013

Chapter 28 DEIS Distribution List
• Roaring Creek Tribe 1
• The United Tribe of Northern California, Inc. 2
• Robinson Rancheria, Band of Pomo Indians 3
28.2.5 Other Interested Parties 4 • Over 250 non-governmental organizations representing environmental, 5
agricultural, business and related interests 6
• Over 50 water districts, irrigation districts, other water purveyors, and 7 related utilities 8
• Over 50 media outlets 9
• Over 180 private business interests 10
• Over 1,000 individuals, including reservoir area property owners 11
12
28-5 Draft – June 2013

Shasta Lake Water Resources Investigation Environmental Impact Statement
1
This page left blank intentionally. 2 3
28-6 Draft – June 2013

Chapter 29 List of EIS Preparers
Chapter 29 List of EIS Preparers
Following is a list of persons who contributed to preparation of this DEIS.
This list is consistent with the requirements set forth in NEPA and CEQA (40 CFR 1502.17 and Section 15129 of the State CEQA Guidelines).
29.1 Federal
Reclamation (NEPA Lead Agency)
Ron Ganzfried Senior Reviewer
Katrina Chow Project Manager
Carolyn Bragg Environmental Resources
Jared Vauk Geology
Greg Mangano Geology
Russ Yaworsky Water Operations
Tom Fitzhugh Water Operations
Steve Lloyd Engineering
Tom Hepler Engineering
Bill Taylor Engineering
Bob Gee Planning
Craig Stroh Economics
Julie Bowen Real Estate
Chuck Johnson Recreation
Scott Springer Recreation
John Hannon Fisheries Biologist
Patricia Rivera Indian Trust Assets
Anastasia Leigh Cultural Resources
Laureen Perry Cultural Resources
Louis Moore Public Affairs
Michael Tansey Climate Change
David Hansen GIS
29-1 Draft – June 2013

Shasta Lake Water Resources Investigation Environmental Impact Report
29.2 Non-Federal
29.2.1 Consultants Name Qualifications Participation
MWH
Mary Paasch, P.E. B.S., Agricultural Engineering; M.S., Agricultural Engineering; 17 years of experience.
Project Manager
Danelle Bertrand B.S., Civil Engineering; M.S., Civil Engineering; 6 years of experience.
Project Planner
Vanessa Welsh B.S., Watershed Science; M.A. Environmental Law and Policy; 8 years of experience.
Project Planner and Document Coordination
Jill Chomycia, P.H. B.S., Geological Sciences; M.S., Soil Sciences; M.S., Hydrology; 9 years of experience.
Project Planner
William Smith, P.E. B.S., Forest Engineering; 36 years of experience.
Water Quality, Water Management and Power and Energy
Ian Buck B.S., Civil Engineering; 3 years of experience.
Engineering, Recreation, Real Estate and Cost Estimating
Andy Draper, P.E. B.S., General Engineering; M.S., Irrigation Engineering; Ph.D., Water Resources; 34 years of experience.
Water Quality; Hydrology, Hydraulics, and Water Management
Stephanie Theis B.S., Fisheries Ecology; Graduate Studies, Applied Ecology and Conservation Biology; 23 years of experience.
Fisheries and Aquatic Ecosystems
Vincent Barbara B.S., Agriculture/Business Policy; M.A., Economics; 5 years of experience.
Economics
Erica Bishop B.S., Geography; M.S., Water Resources/ Geography; 9 years of experience.
Geology, Geomorphology, Minerals and Soils
Rajaa Hassan, P.E. B.S., Civil Engineering; M.S., Civil and Environmental Engineering; 12 years of experience.
Power and Energy
Heather Shannon B.S., Geology; M.S., Hydrology; 9 years of experience.
Geology, Geomorphology, Minerals, and Soils
29-2 Draft – June 2013

Chapter 29 List of EIS Preparers
Name Qualifications Participation
MWH (contd.)
Craig Altare, P.G. B.S., Geological Sciences; M.S., Hydrology; 9 years of experience.
Geology and Water Quality
Barbara McDonnell B.A., Biology; M.A., Biology; 37 years of experience.
NEPA/CEQA Specialist
Meredith Parkin B.S, Human Nutrition and Food Science; 13 years of experience.
NEPA/CEQA Specialist
Eric Clyde, P.E. B.S., Civil Engineering; M.S., Civil Engineering; 35 years of experience.
Engineering; Hydrology, Hydraulics, and Water Management.
Shankar Parvathinathan B.E., Chemical Engineering; M.S., Environmental Engineering; Ph.D., Environmental Engineering; 12 years of experience.
Engineering and Hydraulics
Jeff Payne, P.E. B.S., Civil Engineering; M.S., Water Resources Engineering; 14 years of experience.
Climate Change
David Altare, P.E. B.S., Biology; B.S., Civil Engineering; 8 years of experience.
Hydrology and Hydraulics, Fisheries and Aquatic Ecosystems
Robert Filgas, P.E. B.S., Civil Engineering; 27 years of experience.
Engineering
Philip Salzman, P.E. B.S. Civil Engineering; B.A. Biological Sciences; 17 years of experience.
Engineering
Matthew Carpenter, P.E. B.S., Civil Engineering; 14 years of experience.
Engineering
Alicia DuPree B.S., Civil Engineering; 8 years of experience.
Engineering
Perry Holland, P.E. B.S., Civil Engineering; M.S., Civil and Environmental Engineering; 9 years of experience.
Engineering
Andrew Nishihara B.S., Bioengineering; 4 years of experience.
Engineering
James Loucks, P.E. B.S., Construction Engineering; 32 years of experience.
Cost Estimating
Don Crone, P.E. B.S., Civil Engineering; 38 years of experience.
Cost Estimating
Paul Smith B.S., Civil Engineering; 46 years of experience.
Cost Estimating
29-3 Draft – June 2013
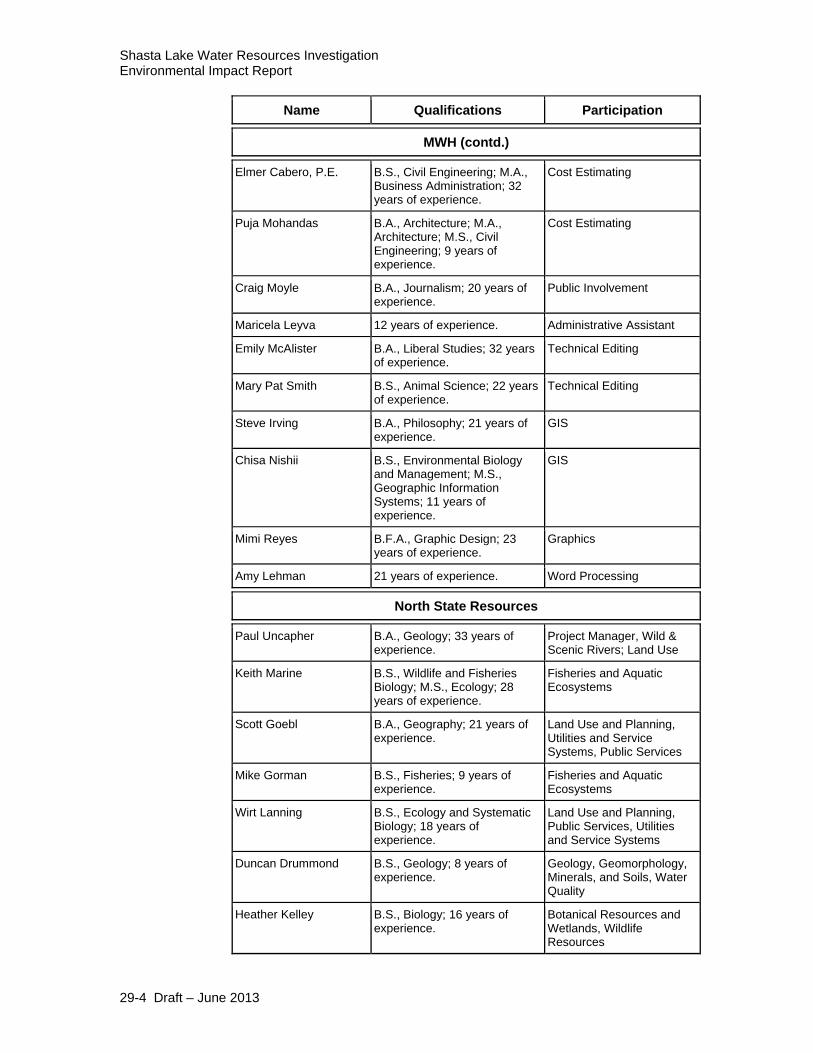
Shasta Lake Water Resources Investigation Environmental Impact Report
Name Qualifications Participation
MWH (contd.)
Elmer Cabero, P.E. B.S., Civil Engineering; M.A., Business Administration; 32 years of experience.
Cost Estimating
Puja Mohandas B.A., Architecture; M.A., Architecture; M.S., Civil Engineering; 9 years of experience.
Cost Estimating
Craig Moyle B.A., Journalism; 20 years of experience.
Public Involvement
Maricela Leyva 12 years of experience. Administrative Assistant
Emily McAlister B.A., Liberal Studies; 32 years of experience.
Technical Editing
Mary Pat Smith B.S., Animal Science; 22 years of experience.
Technical Editing
Steve Irving B.A., Philosophy; 21 years of experience.
GIS
Chisa Nishii B.S., Environmental Biology and Management; M.S., Geographic Information Systems; 11 years of experience.
GIS
Mimi Reyes B.F.A., Graphic Design; 23 years of experience.
Graphics
Amy Lehman 21 years of experience. Word Processing
North State Resources
Paul Uncapher B.A., Geology; 33 years of experience.
Project Manager, Wild & Scenic Rivers; Land Use
Keith Marine B.S., Wildlife and Fisheries Biology; M.S., Ecology; 28 years of experience.
Fisheries and Aquatic Ecosystems
Scott Goebl B.A., Geography; 21 years of experience.
Land Use and Planning, Utilities and Service Systems, Public Services
Mike Gorman B.S., Fisheries; 9 years of experience.
Fisheries and Aquatic Ecosystems
Wirt Lanning B.S., Ecology and Systematic Biology; 18 years of experience.
Land Use and Planning, Public Services, Utilities and Service Systems
Duncan Drummond B.S., Geology; 8 years of experience.
Geology, Geomorphology, Minerals, and Soils, Water Quality
Heather Kelley B.S., Biology; 16 years of experience.
Botanical Resources and Wetlands, Wildlife Resources
29-4 Draft – June 2013

Chapter 29 List of EIS Preparers
Name Qualifications Participation
North State Resources (contd.)
Len Lindstrand III B.S., Wildlife Management; Minors in Fisheries Management and Forestry; 20 years of experience.
Botanical Resources and Wetlands, Wildlife Resources
Constance Carpenter B.A., History; B.S., Range Resources with emphasis in Fire Ecology; M.S., Forest Resources; 22 years of experience.
Aesthetics and Visual Resources
Kathryn McDonald B.A., English; 33 years of experience.
Writing and Technical Editing
Sylvia Cantu A.A., Court Reporting; 31 years of experience.
Word Processing
Charles Shoemaker B.S., Wildlife Biology (currently enrolled in M.S. program); 12 years of experience.
GIS
Tom Koler Ph.D., Business Management/Geomorphology, 35 years of experience
Geology, Geomorphology, Minerals, and Soils, Water Quality
Michal Hupp B.S., Forest Management, 38 years of experience
Land Use, Vegetation
Sara Tona B.S., Genetics and Plant Biology, 4 years of experience
Botanical Resources and Wetlands, Wildlife Resources
Kurt Bainbridge B.S., Wildlife Management and Conservation, 8 years of experience
Botanical Resources and Wetlands, Wildlife Resources
Teri Mooney M.S., GIS science and Technology, 20 years of experience
GIS
Andy Lindeman B.S., Civil Engineering, 4 years of experience
Geology, Geomorphology, Minerals, and Soils
Julian Colescott M.S., Zoology and Physiology, 23 years of experience
Botanical Resources and Wetlands, Wildlife Resources
Tim Reilly B.S., Soil Science, 36 years of experience
Geology, Geomorphology, Minerals, and Soils
Mariah McPherson M.S., Civil and Environmental Engineering, 8 years of experience
Geology, Geomorphology, Minerals, and Soils
29-5 Draft – June 2013

Shasta Lake Water Resources Investigation Environmental Impact Report
Name Qualifications Participation
AECOM (contd.) (Under subcontract to MWH)
Phil Dunn B.S., Zoology; M.S., Fisheries Biology; 30 years of experience.
NEPA/CEQA Specialist
John Hunter
B.A., Environmental Studies; M.A., Ecological and Systematic Biology; Ph.D., Plant Biology; 23 years of experience.
NEPA/CEQA Specialist; Botanical Resources; Wildlife Resources
Stephanie Rasmussen B.S., Environmental Biology and Management; 8 years of experience.
EIS Coordination
Kerry McWalter
B.S., Environmental Engineering; M.E., Aquatic Ecology; 10 years of experience.
Water Quality
Kara Baker
B.A., Political Science and Environmental Science; M.S., Civil and Environmental Engineering; 7 years of experience.
Water Quality
Chris Fitzer
B.A., Geography (Environmental Concentration); MURP, Environmental Planning (Watershed/Water Resource Concentration); 15 years of experience.
Fisheries and Aquatic Ecosystems
Stephen Pagliughi
B.S., Fisheries and Wildlife Science; M.S., Fisheries Biology; 20 years of experience.
Fisheries and Aquatic Ecosystems
Leo Edson B.S., Biological Sciences; 23 years of experience. Wildlife Resources
Demian Ebert B.A., Biology; 21 years of experience. Wildlife Resources
Kelly Holland B.A., Environmental Studies; M.S., Environmental Science; 15 years of experience.
Wildlife Resources
Petra Unger M.S., Botany (minors in Soil Science and Zoology); 16 years of experience.
Botanical Resources and Wetlands
Jim Vogel
B.S., Forest Recreation Resource Management; M.S., Forest Recreation Resource Management; Ph.D., Natural Resource Recreation and Tourism; 14 years of experience.
Recreation and Public Access
29-6 Draft – June 2013

Chapter 29 List of EIS Preparers
Name Qualifications Participation
AECOM (contd.) (Under subcontract to MWH)
Anne Ferguson B.S., Natural Resource Recreation and Tourism; M.S., Environmental Sustainability; 10 years of experience.
Recreation and Public Access
Andrew Bayne B.A., Health and Human Performance; 10 years of experience.
Transportation and Traffic
Jenifer King B.S., Biology; 17 years Socioeconomics, Population, and Housing; Environmental Justice; Agriculture and Important Farmlands; Other Required Disclosures
Julie Nichols B.A., Political Science (with honors); M.S., Journalism; 21 years of experience.
Technical Editing
Lisa Clement B.S., Environmental and Resource Sciences; 13 years of experience.
GIS
Brian Perry 28 years of experience. Graphics
Charisse Case 16 years of experience. Word Processing
Hanson Environmental, Inc. (Under subcontract to MWH)
Chuck Hanson B.S., Fisheries Biology; M.S., Fisheries Biology; Ph.D., Ecology and Fisheries Biology; 32 years of experience.
Delta Fisheries and Aquatic Ecosystems
Kristie Karkanen B.A., Communications; 7 years of experience.
Delta Fisheries and Aquatic Ecosystems
Far Western Anthropological Research Group, Inc. (Under subcontract to MWH)
Brian Byrd B.A., Anthropology; M.A., Anthropology; Ph.D., Anthropology; 35 years of experience.
Cultural Resources
William Hildebrandt B.A., Anthropology; M.A., Anthropology; Ph.D., Anthropology; 35 years of experience.
Cultural Resources
Kelly McGuire B.A., Cultural Anthropology; M.A., Cultural Anthropology; 35 years of experience.
Cultural Resources
29-7 Draft – June 2013

Shasta Lake Water Resources Investigation Environmental Impact Report
Name Qualifications Participation
Far Western Anthropological Research Group, Inc. (contd.) (Under subcontract to MWH)
Melissa Cascella B.A., History; B.S., Anthropology; M.A., Cultural Resources Management; 8 years of experience.
Cultural Resources
Wendy Masarweh A.A., Anthropology and Art; UC Berkeley Extension Graphic Design Certificate Program; 22 years of experience.
Cultural Resources
Anna Starkey B.A., Anthropology; 4 years of experience.
Cultural Resources
Aaron Buehring B.A., Anthropology; 5 years of experience.
Cultural Resources
Ryan Mitchell B.S., Evolution and Ecology; B.S., Anthropology; 5 years of experience.
Cultural Resources
Kathleen Montgomery A.A., General Education; B.A., Communications, Graphic Arts; 6 years of experience.
Cultural Resources
Daniel Troglin B.A., Anthropology; 9 years of experience.
Cultural Resources
Melissa Johnson B.S., Anthropology; B.A., History; 4 years of experience.
Cultural Resources
Paul Brandy B.S., Wildlife and Conservation Biology; M.S., Natural Resources Management (Wildlife); 10 years of experience.
GIS
Sharon A. Waechter B.A., Anthropology; M.A., Anthropology; M.A. English; 35 years of experience.
Cultural Resources
Tammara Norton B.A., Anthropology; B.A., Art; 30 years of experience.
Word Processing
Alejandra Jimenez Degree in process, Anthropology; 2 years of experience.
Word Processing
Lin Wang A.A.. Accounting, International Accounting System; B.A., Accounting; 20 years of experience.
Word Processing
Jennifer Collier 16 years of experience. Word Processing
Andrea Kuhner B.S., Chemistry; 9 years of experience.
Word Processing
29-8 Draft – June 2013

Chapter 29 List of EIS Preparers
Name Qualifications Participation
JRP Historical Consulting (Under subcontract to MWH)
Stephen Wee M.A.. History; 34 years of experience.
Cultural Resources
Mark Beason M.A.. History; 5 years of experience.
Cultural Resources
Steven Melvin M.A.. Public History; 6 years of experience.
Cultural Resources
Ascent Environmental (Under subcontract to MWH)
Honey Walters BS environmental science and chemistry MS atmospheric science 15 years
Senior Air Quality, Climate Change, and Noise Specialist
Dimitri Antoniou BS environmental management and protection MS city and regional planning 5 years
Air Quality, Climate Change, and Noise Analyst
URS (Under subcontract to MWH)
Elena Nilsson M.A., Anthropology; 32 years of experience.
Cultural Resources
Cascade Economics (Under subcontract to MWH)
Michael Taylor A.B., Computer Science; M.S., Agricultural and Resource Economics; Ph.D., Agricultural and Resource Economics; 25 years of experience.
Socioeconomics
Westwater Research (Under subcontract to MWH)
Harry Seely B.S., Economics; M.S., Natural Resources and Agricultural Economics; 18 years of experience
Socioeconomics
MGE Engineers (Under subcontract to MWH)
Bob Sennett B.S., Civil and Structural Engineering; M.S., Civil and Structural Engineering; 20 years of experience.
Engineering
29-9 Draft – June 2013

Shasta Lake Water Resources Investigation Environmental Impact Report
This page left blank intentionally.
29-10 Draft – June 2013

Chapter 30 References
Chapter 30 References
Summary
AEP. See Association of Environmental Professionals.
Association of Environmental Professionals. 2010. California Environmental Quality Act (CEQA) Statute and Guidelines. Association of Environmental Professionals. Palm Desert, California.
CALFED. See CALFED Bay-Delta Program.
CALFED Bay-Delta Program. 2000 (August 28). Final Programmatic Record of Decision. Sacramento, California.
California Department of Water Resources. 2009 (December). California Water Plan Update 2009, Bulletin 160-09. Sacramento, California.
CEQ. See Council on Environmental Quality.
Council on Environmental Quality. 2009 (December). Draft Proposed National Objectives, Principles, and Standards for Water and Related Resources Implementation Studies. Executive Office of the President. Washington, D.C.
DWR. See California Department of Water Resources.
National Marine Fisheries Service. 2009a (June 4). Biological Opinion and Conference Opinion on the Long-Term Central Valley Project and State Water Project. Southwest Region. Long Beach, California.
———. 2009b (October). Public Draft Recovery Plan for the Evolutionarily Significant Units of Sacramento River Winter-run Chinook Salmon and Central Valley Spring-run Chinook Salmon and the Distinct Population Segment of Central Valley Steelhead. Sacramento Protected Resources Division.
NMFS. See National Marine Fisheries Service.
Reclamation. See U.S. Department of the Interior, Bureau of Reclamation.
30-1 Draft – June 2013

Shasta Lake Water Resources Investigation Environmental Impact Statement
U.S. Department of Agriculture, Forest Service. 1995a. Shasta-Trinity National Forest Land and Resource Management Plan.
———. 1995b. Coordinated Resource Management Plan.
U.S. Department of the Interior, Bureau of Reclamation. 2000 (December). U.S. Department of the Interior, Record of Decision, Trinity River Mainstem Fishery Restoration Final Environmental Impact Statement/Environmental Impact Report.
———.2004 (June). Shasta Lake Water Resources Investigation Initial Alternatives Information Report. Mid-Pacific Region. Sacramento, California.
———. 2007 (December). Shasta Lake Water Resources Investigation Plan Formulation Report. Mid-Pacific Region. Sacramento, California.
———. 2008a (March). Water Supply and Yield Study.
———. 2008b. Biological Assessment on the Continued Long-Term Operations of the CVP and SWP (2008 OCAP BA).
———. 2011a (November). Draft Shasta Lake Water Resources Investigation Feasibility Report.
———. 2011b (November). Preliminary Draft Environmental Impact Statement (EIS).
U.S. Department of the Interior, Bureau of Reclamation, and California Department of Water Resources. 1986 (November). Agreement Between the United States of America and the State of California for Coordinated Operation of the Central Valley Project and the State Water Project. Sacramento, California.
U.S. Department of the Interior, Fish and Wildlife Service. 2008 (December 15). Biological Opinion on the Coordinated Operations of the Central Valley Project and State Water Project in California. Final. Sacramento, California.
USFS. See U.S. Department of Agriculture, Forest Service.
USFWS. See U.S. Department of the Interior, Fish and Wildlife Service.
U.S. Water Resources Council. 1983 (March). Economic and Environmental Principles and Guidelines for Water and Related Land Resources Implementation Studies. Washington, D.C.
WRC. See U.S. Water Resources Council.
30-2 Draft – June 2013

Chapter 30 References
Chapter 1, “Introduction”
CALFED. See CALFED Bay-Delta Program.
CALFED Bay-Delta Program. 2000a (August 28). Final Programmatic Record of Decision. Sacramento, California.
———. 2000b (July). Final Programmatic Environmental Impact Statement/Environmental Impact Report. Prepared by U.S. Department of the Interior, Bureau of Reclamation, U.S. Fish and Wildlife, National Marine Fisheries Service, U.S. Environmental Protection Agency, Natural Resources Conservation Service, U.S. Army Corps of Engineers, and California Resources Agency. Sacramento, California.
California Department of Finance. 2010 (June). E-3 Race / Ethnic Population Estimates with Age and Sex Detail, 2000–2008. Sacramento, California. <http://www.dof.ca.gov/ research/demographic/data/e-3/>. Accessed April 13, 2011.
California Department of Fish and Game. 2010. Draft 3-09-2010 Grand Tab Table. CDFW Upper Sacramento River Basin Salmonid Monitoring Datasets. <http://www.fws.gov/stockton/afrp/documents/ GrandTab_030910.pdf>. Accessed February 26, 2011.
California Department of Water Resources. 2003 (October). California’s Groundwater, Bulletin 118 Update 2003. Sacramento, California.
———. 2005 (December). California Water Plan Update, Bulletin 160-05. Sacramento, California.
———. 2006 (July). Progress on Incorporating Climate Change and Management of California’s Water Resources. Technical Memorandum Report. Sacramento, California.
———. 2009. California Water Plan Update, Bulletin 160-09. Sacramento, California.
California Public Utilities Commission. 2011. Renewables Portfolio Standard Quarterly Report 1st Quarter 2011. California Public Utilities Commission website. http://www.cpuc.ca.gov/PUC/energy/Renewables/. Accessed June 15, 2011.
California Water Boards, State Water Resources Control Board, and California Environmental Protection Agency. 2006. Water Quality Control Plan for the San Francisco Bay/Sacramento-San Joaquin Delta Estuary. December.
30-3 Draft – June 2013

Shasta Lake Water Resources Investigation Environmental Impact Statement
California Water Boards, SWRCB, and CalEPA. See California Water Boards, State Water Resources Control Board, and California Environmental Protection Agency.
CDFG. See California Department of Fish and Game.
CEQ. See Council on Environmental Quality.
Council on Environmental Quality. 2009. Draft Proposed National Objectives, Principles, and Standards for Water and Related Resources Implementation Studies. Executive Office of the President. Washington, D.C.
DOF. See California Department of Finance.
DWR. See California Department of Water Resources.
Huber-Lee, Annette; Yates, David; Purkey, David; Yu, Winston, and Benjamin Runkle. 2003. Water, Climate, Food, and Environment in the Sacramento Basin.
National Marine Fisheries Service. 1993. Biological Opinion for the Operation of the Federal Central Valley Project and the California State Water Project. Southwest Region. Long Beach, California. February.
———. 2004 (October). Biological Opinion on the Long-Term Central Valley Project and State Water Project Operations Criteria and Plan. Southwest Region. Long Beach, California.
———. 2009a (October). Public Draft Recovery Plan for the Evolutionarily Significant Units of Sacramento River Winter-run Chinook Salmon and Central Valley Spring-run Chinook Salmon and the Distinct Population Segment of Central Valley Steelhead. Sacramento Protected Resources Division.
———. 2009b (June 4). Biological Opinion and Conference Opinion on the Long-Term Central Valley Project and State Water Project. Southwest Region. Long Beach, California.
NMFS. See National Marine Fisheries Service.
Reclamation. See U.S. Department of the Interior, Bureau of Reclamation.
U.S. Department of Agriculture, Forest Service. 1994. Northwest Forest Plan Record of Decision. Aquatic Conservation Strategy.
30-4 Draft – June 2013

Chapter 30 References
———. 1995. Shasta-Trinity National Forest Land and Resource Management Plan. Pacific Southwest Region. Shasta-Trinity National Forest, Redding, California.
———. 2005 (March). Upper Trinity River Watershed Analysis.
U.S. Department of Agriculture, Forest Service, and U.S. Department of the Interior, Bureau of Land Management. 2001. Record of Decision and Standards and Guidelines for Amendments to the Survey and Manage, Protection Buffer, and other Mitigation Measures Standards and Guidelines. U.S. Department of Agriculture, Forest Service, and U.S. Department of the Interior, Bureau of Land Management. January 2001.
———. 2011. 2011 Settlement Agreement in Litigation over the Survey and Manage Mitigation Measure in Conservation Northwest et al. v. Sherman et al., Case No. 08-1067-JCC. Seattle, Washington.
U.S. Department of the Interior, Bureau of Reclamation. 1983 (September). Enlarged Shasta Lake Investigation, Preliminary Findings Report.
———. 1999a. Shasta Dam and Reservoir Enlargement, Appraisal Assessment of the Potential for Enlarging Shasta Dam and Reservoir. Mid-Pacific Region. Sacramento, California.
———. 1999b (October). Central Valley Project Improvement Act, Programmatic Environmental Impact Statement. Sacramento, California.
———. 2003a (March). Shasta Lake Water Resources Investigation, Mission Statement Milestone Report. Mid-Pacific Region. Sacramento, California.
———. 2003b (March). Shasta Lake Water Resources Investigation, Strategic Agency and Public Involvement Plan. Mid-Pacific Region. Sacramento, California.
———. 2004 (June). Shasta Lake Water Resources Investigation, Initial Alternatives Information Report. Mid-Pacific Region. Sacramento, California.
———. 2006 (February). Shasta Lake Water Resources Investigation, Environmental Scoping Report. Mid-Pacific Region, Sacramento, California.
———. 2007 (December). Shasta Lake Water Resources Investigation Plan Formulation Report. Mid-Pacific Region. Sacramento, California.
———. 2008a (March). Water Supply and Yield Study.
30-5 Draft – June 2013

Shasta Lake Water Resources Investigation Environmental Impact Statement
———. 2008b (August). Biological Assessment on the Continued Operations of the Central Valley Project and the State Water Project. Mid-Pacific Region. Sacramento, California.
———. 2011a (April). Secure Water Act Section 9503(c) Reclamation Climate Change and Water 2011. Denver, Colorado.
———. 2011b (November). Draft Shasta Lake Water Resources Investigation Feasibility Report.
U.S. Department of the Interior, Fish and Wildlife Service. 2008 (December). Formal Endangered Species Act Consultation on the Proposed Operations of the Central Valley Project (CVP) and State Water Project (SWP). Final. Sacramento, California.
USFS. See U.S. Department of Agriculture, Forest Service.
USFS and BLM. See U.S. Department of Agriculture, Forest Service and U.S. Department of the Interior, Bureau of Land Management.
USFWS. See U.S. Department of the Interior, Fish and Wildlife Service.
U.S. Water Resources Council. 1983 (March). Economic and Environmental Principles and Guidelines for Water and Related Land Resources Implementation Studies. Washington, D.C.
WRC. See U.S. Water Resources Council.
Chapter 2, “Alternatives”
CALFED. See CALFED Bay-Delta Program.
CALFED Bay-Delta Program. 2000 (August 28). Final Programmatic Record of Decision. Sacramento, California.
California Department of Fish and Game and U.S. Department of the Interior, Bureau of Reclamation. 1960 (April). Memorandum of Agreement. Sacramento, California.
CDFG and Reclamation. See California Department of Fish and Game and U.S. Department of the Interior, Bureau of Reclamation.
CEQ. See Council on Environmental Quality.
Council on Environmental Quality. 2009 (December). Draft Proposed National Objectives, Principles, and Standards for Water and Related Resources Implementation Studies. Executive Office of the President. Washington, D.C.
30-6 Draft – June 2013

Chapter 30 References
———. 2011 (January). Appropriate Use of Mitigation and Monitoring and Clarifying the Appropriate Use of Mitigated Findings of No Significant Impact. Memorandum for Heads of Federal Departments and Agencies. Washington, D.C.
National Marine Fisheries Service. 2009 (June 4). Biological Opinion and Conference Opinion on the Long-Term Operations of the Central Valley Project and State Water Project. Southwest Region. Long Beach, California.
NMFS. See National Marine Fisheries Service.
Reclamation. See U.S. Department of the Interior, Bureau of Reclamation.
Reclamation and DWR. See U.S. Department of the Interior, Bureau of Reclamation, and California Department of Water Resources.
State Water Resources Control Board. 1995 (May). Water Quality Control Plan for the San Francisco Bay/Sacramento-San Joaquin Estuary, 95-1 WR. Sacramento, California.
———. 2000 (March). Revised Water Right Decision 1641. In the Matter of: Implementation of Water Quality Objectives for the San Francisco Bay/Sacramento-San Joaquin Delta Estuary; A Petition to Change Points of Diversion of the Central Valley Project and the State Water Project in the Southern Delta; and A Petition to Change Places of Use and Purposes of Use of the Central Valley Project. Sacramento, California.
SWRCB. See State Water Resources Control Board.
USACE. See U.S. Army Corps of Engineers.
U.S. Army Corps of Engineers. 1977. Flood Control Diagrams. Water Management. Sacramento District Projects, California.
U.S. Department of the Interior, Bureau of Reclamation. 1999 (October). Central Valley Project Improvement Act, Programmatic Environmental Impact Statement. Sacramento, California.
———. 2000 (December). Record of Decision, Trinity River Mainstem Fishery Restoration Final Environmental Impact Statement/Environmental Impact Report.
———. 2003a (March). Shasta Lake Water Resources Investigation, Strategic Agency and Public Involvement Plan. Mid-Pacific Region. Sacramento, California.
30-7 Draft – June 2013

Shasta Lake Water Resources Investigation Environmental Impact Statement
———. 2003b (March). Shasta Lake Water Resources Investigation, Mission Statement Milestone Report. Mid-Pacific Region. Sacramento, California.
———. 2006 (February). Shasta Lake Water Resources Investigation, Environmental Scoping Report. Mid-Pacific Region, Sacramento, California.
———. 2008 (August). Biological Assessment on the Continued Operations of the Central Valley Project and the State Water Project. Mid-Pacific Region. Sacramento, California.
U.S. Department of the Interior, Bureau of Reclamation, and California Department of Water Resources. 1986 (November). Agreement Between the United States of America and the State of California for Coordinated Operation of the Central Valley Project and the State Water Project. Sacramento, California.
U.S. Department of the Interior, Fish and Wildlife Service. 2001. Final Restoration Plan for the Anadromous Fish Restoration Program: A Plan to Increase Natural Production of Anadromous Fish in the Central Valley of California. Prepared for the USFWS under the direction of the Anadromous Fish Restoration Program Core Group. Released as a Revised Draft on May 30, 1997 and Adopted as a Final on January 9, 2001. Stockton, California.
———. 2008 (December 15). Formal Endangered Species Act Consultation on the Proposed Operations of the Central Valley Project (CVP) and State Water Project (SWP). Final. Sacramento, California.
USFWS. See U.S. Department of the Interior, Fish and Wildlife Service.
U.S. Water Resources Council. 1983 (March). Economic and Environmental Principles and Guidelines for Water and Related Land Resources Implementation Studies. Washington, D.C.
WRC. See U.S. Water Resources Council.
Chapter 3, “Considerations for Describing the Affected Environment and Environmental Consequences”
ARB. See California Air Resources Board.
Bay Delta Conservation Plan. 2012. Bay Delta Conservation Plan. 2012 (February). Bay Delta Conservation Plan Administrative Draft Environmental Impact Statement/Environmental Impact Report.
BDCP. See Bay Delta Conservation Plan.
30-8 Draft – June 2013

Chapter 30 References
BLM. See Bureau of Land Management.
CALFED. See CALFED Bay-Delta Program.
CALFED Bay-Delta Program. 2000 (July). Final Programmatic Environmental Impact Statement/Environmental Impact Report. Prepared by U.S. Department of the Interior, Bureau of Reclamation, U.S. Fish and Wildlife, National Marine Fisheries Service, U.S. Environmental Protection Agency, Natural Resources Conservation Service, U.S. Army Corps of Engineers, and California Resources Agency. Sacramento, California.
———. 2011. Levee System Integrity Program. Available: <http://www.calwater.ca.gov/calfed/objectives/Levee_System_Integrity.html>. Accessed April 12, 2011.
California Air Resources Board. 2008 (October 24). Preliminary Draft Staff Proposal: Recommended Approaches for Setting Interim Significance Thresholds for Greenhouse Gases under the California Environmental Quality Act. Sacramento, California.
California Department of Fish and Game. 2011. Draft Invasive Non-Native Plant (Weed) Management Plan for the Mouth of Cottonwood Creek Wildlife Area.
California Department of Transportation. 2002 (February 20). Transportation Related Earthborne Vibrations. TAV-02-01-R9601. Division of Environmental Analysis, Office of Noise, Air Quality and Hazardous Management. Sacramento, California.
———. Caltrans Highway Design Manual. 2012. Available: <http://www.dot.ca.gov/hq/oppd/hdm/hdmtoc.htm>. Accessed April 10, 2013.
California Department of Transportation and U.S. Department of Transportation, Federal Highway Administration. 2007 (January). Replacement of the Antlers Bridge (Bridge No. 06-0089) Initial Study/Mitigated Negative Declaration and Environmental Assessment/Finding of No Significant Impact. State Clearinghouse. Sacramento, California, and Washington, D.C.
California Department of Water Resources. 2007. Final Environmental Impact Statement (EIS) Oroville Facilities FERC relicensing
———. 2009. California Department of Water Resources. 2009 (November). North Bay Aqueduct Alternative Intake Project Environmental Impact Report Notice of Completion and Environmental Document Transmittal.
30-9 Draft – June 2013

Shasta Lake Water Resources Investigation Environmental Impact Statement
———. 2010. California Department of Water Resources. 2010 (March). Dutch Slough Tidal marsh Restoration Project Final Environmental Impact Report.
———. 2011a. South Bay Aqueduct Enlargement. Available: <http://www.water.ca.gov/engineering/Projects/Current/SBA_Enlargement/>. Accessed February 24, 2011.
———. 2011b. In-Delta Storage. Sacramento, California. Available: <http://www.water.ca.gov/storage/indelta/ index.cfm>. Accessed April 12, 2011. Sacramento, California.
———. 2012. Central Valley Flood Protection Plan (CVFPP).
———. 2012. State Plan of Flood Control Descriptive Document.
———. 2012 Flood Control System Status Report.
———.2012. Central Valley Flood Protection Plan (CVFPP).
Caltrans. See California Department of Transportation.
Caltrans and FHWA. See California Department of Transportation and U.S. Department of Transportation, Federal Highway Administration.
CEQ. See Council on Environmental Quality.
Central Valley Regional Water Quality Control Board. 2011 The Water Quality Control Plan for the California Regional Water Quality Control Board: Central Valley Region, the Sacramento River Basin and San Joaquin River Basin.
City of West Sacramento. 2012. [City of West Sacramento 2012 reference missing – seems to be Final EIS/EIR for West Sac. Levee Improvements Program]
Council on Environmental Quality. 1997 (January). Considering Cumulative Effects under the National Environmental Policy Act. Executive Office of the President. Washington, D.C.
———. 2005 (June 24). Guidance on the Consideration of Past Actions in Cumulative Effects Analysis. Environmental Statement Memorandum No. ESM05-2. Executive Office of the President. Washington, D.C.
CVRWQCB. See Central Valley Regional Water Quality Control Board.
Conservation Fund. 2010. The Conservation Fund. 2010. Fremont Landing Conservation Bank Fact Sheet.
30-10 Draft – June 2013

Chapter 30 References
DFG. See California Department of Fish and Game.
DOI. See U.S. Department of the Interior.
DWR. See California Department of Water Resources.
Delta Stewardship Council. 2013. Available: <http://deltacouncil.ca.gov/faq#n852>. Accessed January 22, 2013.
East Bay Municipal Utility District. 2012. Available: <http://www.ebmud.com/about-ebmud/news/project-updates/>. Accessed November 12, 2012.
EBMUD. See East Bay Municipal Utility District.
ESA. See Environmental Science Associates.
Environmental Science Associates. 2010. Environmental Science Associates. 2010 (February). North Bay Aqueduct Alternative Intake Project Scoping Report.
Federal Transit Administration. 2006 (May). Transit Noise and Vibration Impact Assessment. FTA-VA-90-1003-06. Washington, D.C.
FTA. See Federal Transit Administration.
Governor’s Office of Planning and Research. 2003 (October). State of California General Plan Guidelines. Sacramento, California.
IMMTC. See Iron Mountain Mine Trustee Council.
Iron Mountain Mine Trustee Council. 2002 (April). Final Restoration Plan for Natural Resource Injuries from Iron Mountain Mine. Report of the Iron Mountain Mine Natural Resource Trustee Council, U.S. Fish and Wildlife Service, U.S. Bureau of Land Management, U.S. Bureau of Reclamation, California Department of Fish and Wildlife, and National Oceanic and Atmospheric Administration.
National Marine Fisheries Service. 2004 (October). Biological Opinion on the Long-Term Central Valley Project and State Water Project Operations Criteria and Plan. Southwest Region. Long Beach, California.
———. 2009 (June 4). Biological Opinion and Conference Opinion on the Long-Term Central Valley Project and State Water Project. Southwest Region. Long Beach, California.
National Oceanic and Atmospheric Administration. 2009 (May 26). Restoration Activities. Case: Iron Mountain Mine, California. Available:
30-11 Draft – June 2013

Shasta Lake Water Resources Investigation Environmental Impact Statement
<http://www.darrp.noaa.gov/southwest/iron/restore.html>. Accessed April 12, 2011.
NMFS. See National Marine Fisheries Service.
NOAA. See National Oceanic and Atmospheric Administration.
OPR. See Governor’s Office of Planning and Research.
Reclamation. See U.S. Department of the Interior, Bureau of Reclamation.
Reclamation and DWR. See U.S. Department of the Interior, Bureau of Reclamation, and California Department of Water Resources.
Reclamation, USFWS, and DFG. See U.S. Department of the Interior, Bureau of Reclamation, U.S. Fish and Wildlife Service, California Department of Fish and Game.
Resources Agency. See The Resources Agency, State of California.
Sacramento Area Flood Control Agency. 2007 (November 29). Final Environmental Impact Report on the Natomas Levee Improvement Program Landside Improvements Project. State Clearinghouse #2007062016. Sacramento, California. Prepared by EDAW, Sacramento, California.
SAFCA. See Sacramento Area Flood Control Agency.
SCAQMD. See Shasta County Air Quality Management District.
Shasta County Air Quality Management District. 2004. Shasta County General Plan.
State Water Resources Control Board. 2011. State Water Resources Control Board. Annual Report. Available: < http://www.waterboards.ca.gov/water_issues/programs/stormwater/industrial.shtml. Accessed: July 01, 2010.
SWRCB. See State Water Resources Control Board.
The Resources Agency, State of California. 2003 (September). Sacramento River Conservation Area Forum Handbook. Prepared by the Sacramento River Advisory Council established by Senate Bill 1086, authored by Senator Jim Nielsen, and revised and updated by the Sacramento River Conservation Area Forum. Sacramento, California.
USACE. See U.S. Army Corps of Engineers.
30-12 Draft – June 2013

Chapter 30 References
U.S. Army Corps of Engineers. 2012. “USACE Delta News”. Available: http://www.spk.usace.army.mil/Missions/CivilWorks/SacramentoSanJoaquinDelta.aspx. Accessed November 12, 2012.
U.S. Department of Agriculture, Forest Service. 1995. Shasta-Trinity National Forest Land and Resource Management Plan. Pacific Southwest Region. Shasta-Trinity National Forest, Redding, California.
———. 1996 (March). Management Guide: Shasta and Trinity Units of the Whiskeytown-Shasta-Trinity National Recreation Area. Pacific Southwest Region. Shasta-Trinity National Forest. Redding, California.
U.S. Department of the Interior, U.S. Department of the Army, and U.S. Department of Energy. 2007. Potential Hydroelectric Development at Existing Federal Facilities for Section 1834 of the Energy Policy Act of 2005.
U.S. Department of the Interior, Bureau of Land Management. 1993. Redding Resource Management Plan.
U.S. Department of the Interior, Bureau of Reclamation. 2008. Biological Assessment on the Continued Long-Term Operations of the CVP and SWP (2008 OCAP BA).
———. 2012. Delta Islands and Levees Feasibility Study.
U.S. Department of the Interior, Bureau of Reclamation, and California Department of Water Resources. 1986 (November). Agreement Between the United States of America and the State of California for Coordinated Operation of the Central Valley Project and the State Water Project. Sacramento, California.
———. 2004. 2004 Operations Criteria and Plan (OCAP) Biological Assessment (BA). June.
U.S. Department of the Interior, Bureau of Reclamation, U.S. Fish and Wildlife Service, California Department of Fish and Game. 2011. Suisun Marsh Habitat Management, Preservation, and Restoration Plan. Final Environmental Impact Statement/Environmental Impact Report.
U.S. Department of the Interior, Fish and Wildlife Service. 1999. Draft Recovery Plan for the Giant Garter Snake (Thamnopsis gigas). U.S. Fish and Wildlife Service, Portland, Oregon. ix+ 192 pp.
———.2005 (February). Reinitiation of Formal and Early Section 7 Endangered Species Consultation on the Coordinated Operations of the Central Valley Project and State Water Project and the Operational
30-13 Draft – June 2013

Shasta Lake Water Resources Investigation Environmental Impact Statement
Criteria and Plan to Address Potential Critical Habitat Issues. Sacramento, California.
———. 2006 (September). Giant Garter Snake (Thamnophis gigas) 5-Year Review: Summary and Evaluation. Sacramento, California.
———.2008. Formal Endangered Species Act Consultation on the Proposed Coordinated Operations of the Central Valley Project (CVP) and State Water Project (SWP). Available: http://www.fws.gov/sacramento/es/documents/SWP-VP_OPs_BO_12-15_final_OCR.pdf. Accessed December 17, 2008.
USFWS. See U.S. Department of the Interior, Fish and Wildlife Service.
Chapter 4, “Geology, Geomorphology, Minerals, and Soils”
CALFED Bay-Delta Program. 2000a (July). Final Programmatic Environmental Impact Statement/Environmental Impact Report. Prepared by U.S. Department of the Interior, Bureau of Reclamation, U.S. Fish and Wildlife, National Marine Fisheries Service, U.S. Environmental Protection Agency, Natural Resources Conservation Service, U.S. Army Corps of Engineers, and California Resources Agency. Sacramento, California.
———. 2000b (August 28). Final Programmatic Environmental Impact Statement and Environmental Impact Report. Programmatic Record of Decision. Sacramento, California.
California Department of Conservation, Division of Mines and Geology. 1997. Fault-Rupture Hazard Zones in California, Alquist-Priolo Earthquake Fault Zoning Act with Index to Earthquake Fault Zones1 Maps. Special Publication 42.
———. 2006a. Chapter 7.5 Earthquake Fault Zoning. Available: <http://www.consrv.ca.gov/cgs/codes/prc/Pages/chap-7-5.aspx>. Accessed April 21, 2011.
———. Office of Mine Reclamation. 2006b. SMARA Frequently Asked Questions. Available: <http://www.consrv.ca.gov/OMR/smara/faq.htm>. Accessed September 10, 2007.
CALFED. See CALFED Bay-Delta Program.
California Department of Water Resources. 1992. Sacramento Valley Westside Tributary Watersheds Erosion Study.
30-14 Draft – June 2013

Chapter 30 References
———. 2003 (October). California’s Groundwater, Bulletin 118 Update 2003. Sacramento, California.
California Department of Water Resources and U.S. Department of the Interior, Bureau of Reclamation. 2006 (May). North-of-the-Delta Offstream Storage Investigation Initial Alternatives Information Report. DWR Division of Planning and Local Assistance and Reclamation Mid-Pacific Division. Sacramento, California. Prepared by URS, Sacramento, California. Available: <http://www.usbr.gov/mp/nodos/docs/index.html.>
California Geological Survey. 2003. Seismic Hazards Mapping. Available: <http://www.conservation.ca.gov/cgs/shzp/article10.htm>. Accessed September 8, 2007.
CCWD. See Contra Costa Water District.
CDMG. See California Department of Conservation, Division of Mines and Geology.
CH2M HILL 2001. Final Report: Redding Basin Water Resources Management Plan Phase 2C Report
———. 2005. Final Cottonwood Creek Strategic Watershed Plan.
———. 2007 (September).Cottonwood Creek Watershed Management Plan.
City of Redding. 2000 (October 3). City of Redding 2000–2020 General Plan. Adopted by Resolution No. 2000-166. Development Services Department. Redding, California.
———. 2005. City of Redding Local Hazard Mitigation Plan. Redding, California.
Contra Costa Water District. 2006. Contra Costa Water District Alternative Intake Project Draft Environmental Impact Report/Environmental Impact Statement. Concord, California.
DWR. See California Department of Water Resources.
DWR and Reclamation. See California Department of Water Resources and U.S. Department of the Interior, Bureau of Reclamation.
Graham Matthews & Associates 2007. Clear Creek Geomorphic Monitoring Project WY 2006 Annual Report.
30-15 Draft – June 2013

Shasta Lake Water Resources Investigation Environmental Impact Statement
Hackel, O. 1966. Summary of the Geology of the Great Valley. In Geology of Northern California. California Division of Mines and Geology Bulletin 190. Sacramento, California.
Jennings, C.W. 1975. Fault Map of California with Locations of Volcanoes, Thermal Springs, and Thermal Wells. Scale 1:750,000. California Division of Mines and Geology Geologic Data Map Series, Map No. 1.
———. 1994. Fault Activity Map of California and Adjacent Areas, with Locations and Ages of Recent Volcanic Eruptions. California Geologic Data Map Series. Department of Conservation, Division of Mines and Geology.
Jennings, O.P. 1938. Geomorphic Map of California. Revisions of the text by D.L. Wagner, 2002.
Matthews. 2003. CALFED Bay-Delta Program Project # 97-N07. Final Report – Hydrology, Geomorphology, and Historic Channel Changes of lower Cottonwood Creek, Shasta and Tehama Counties, California
Miles, S.R. 1999. Pacific Southwest Region Soil Interpretations. Prepared for U.S. Department of Agriculture, Forest Service.
Miller, C.D. 1980. Potential Hazards from Future Eruptions in the Vicinity of Mount Shasta Volcano, Northern California. U.S. Geological Survey. Washington, D.C.
Miller, D. 2003. Net-Trace Technical Documentation. Earth Systems Institute.
Morris, G.L., and J. Fan. 1997. Reservoir Sedimentation Handbook.
Norris, R.M., and R.W. Webb. 1990. Geology of California. Second Edition.
North State Resources, Inc. 2003 (December). Shasta Enlargement Technical Report: Volume I, Natural Resource Characterization. Redding, California.
NRCS. See U.S. Natural Resources Conservation Service.
NSR. See North State Resources, Inc.
PacifiCorp. 2010. Power Generation, Geothermal Resource Study. Portland, Oregon.
Page, R.W. 1985. Geology of the Fresh Ground-Water Basin of the Central Valley, California, With Texture Maps And Sections, U.S. Geological Survey Professional Paper 1401-C.
30-16 Draft – June 2013

Chapter 30 References
Petersen, M.D. 1999. Seismic Shaking Hazard Maps of California. California Department of Conservation, Division of Mines and Geology. Map Sheet 48.
Petersen, M.D., W.A. Bryant, C.H. Cramer, T. Cao, and M. Reichle. 1996. California Department of Conservation, Division of Mines and Geology: Probabilistic Seismic Hazard Assessment for the State of Geological Survey. Open File Report 96-706, Appendix A-California Fault Parameters.
Reclamation. See U.S. Department of the Interior, Bureau of Reclamation.
Shasta County. 2004 (September). Shasta County General Plan. Redding, California.
U.C. Berkeley. See University of California at Berkley.
UC Berkeley. 2003. The removal of Saeltzer Dam on Clear Creek: an update. UC Berkeley Water Resources Center Collections and Archives.
———. 2011. Saeltzer Dam Removal on Clear Creek: 11 Years Later – An Assessment of upstream channel changes since the dam’s removal. UC Berkeley Water Resources Center Collections and Archives.
U.S. Department of Agriculture, Forest Service. 1994. Final Environmental Impact Statement for the Shasta-Trinity National Forest Land and Resource Management Plan. Shasta-Trinity National Forest. Redding, California.
———. 1995 (April 28). Record of Decision for the Environmental Impact Statement for the Shasta-Trinity National Forest Land and Resource Management Plan. Pacific Southwest Region. Shasta-Trinity National Forest. Redding, California.
———. 1998 (March). Lower McCloud River Watershed Analysis. Shasta-Trinity National Forest, Shasta-McCloud Management Unit.
———. 2000. Shasta Lake West Watershed Analysis: USDA Forest Service, Shasta-Trinity National Forest.
———. 2012. Technical Memorandum: Registered Federal Caves along Shasta Lake. Shasta-Trinity National Forest. Redding, California.
U.S. Department of the Interior, Bureau of Reclamation. 2009. Shasta Lake Water Resources Investigation Geology Report 2 – Phase 1 Feasibility Report for the Shasta Dam Enlargement Project. Mid-Pacific Region. Sacramento, California.
30-17 Draft – June 2013

Shasta Lake Water Resources Investigation Environmental Impact Statement
———. 2012. Draft CVPIA Fiscal Year 2013 Annual Work Plan.
U.S. Department of the Interior, Geological Survey. 2005. Mineral Resources Data System Reston, Virginia. Available: <http://tin.er.usgs.gov/mrds/>. Accessed September 11, 2007.
USFS. See U.S. Department of Agriculture, Forest Service.
USGS. See U.S. Department of the Interior, Geological Survey.
U.S. Natural Resources Conservation Service. 1995. State Soil Geographic Data Base. U.S. Department of Agriculture.
Western Shasta Resource Conservation District. 1996. Lower Clear Creek Watershed Analysis.
Western Shasta Resource Conservation District and Cow Creek Watershed Management Group. 2001. Cow Creek Watershed Assessment. November 2001.
———. 2005 (March). Cow Creek Watershed Management Plan.
WSRCD. See Western Shasta Resource Conservation District.
WSRCD and CCWMG. See Western Shasta Resource Conservation District and Cow Creek Watershed Management Group.
Chapter 5, “Air Quality and Climate”
Ahrens, D. C. 2003. Meteorology Today; an Introduction to Weather, Climate, & the Environment. Brooks Cole, Inc. Pacific Grove, California.
ARB. See California Air Resources Board.
California Air Pollution Control Officers Association. 2008 (January). CEQA & Climate Change: Evaluating and Addressing Greenhouse Gas Emissions from Projects Subject to the California Environmental Quality Act. Sacramento, California.
California Air Resources Board. 2004. Air Basin and County Map Boundaries. Available: <http://www.arb.ca.gov/desig/adm/basincnty.htm>. Last updated September 9, 2004. Accessed April 18, 2011.
———. 2008 (October 24). Preliminary Draft Staff Proposal: Recommended Approaches for Setting Interim Significance Thresholds for Greenhouse Gases under the California Environmental Quality Act. Sacramento, California.
30-18 Draft – June 2013

Chapter 30 References
———. 2009. The California Almanac of Emissions and Air Quality. 2009 Edition. Sacramento, California.
———. 2010a. Area Designations. Available: <http://www.arb.ca.gov/desig/adm/adm.htm>. Last updated September 7, 2010. Accessed April 19, 2011.
———. 2010b. Ambient Air Quality Standards. Available: <http://www.arb.ca.gov/research/aaqs/aaqs2.pdf>. Last updated September 8, 2010. Accessed April 18, 2011.
———. 2011. Historical Air Quality Data. Available: <http://www.arb.ca.gov/adam/topfour/topfour1.php>. Accessed April 20, 2011.
California Climate Action Registry. 2009 (January). General Reporting Protocol, Version 3.1. Los Angeles, California.
CAPCOA. See California Air Pollution Control Officers Association.
CCAR. See California Climate Action Registry.
COLE Development Group. 2011 (February 24). COLE 1605(b) Report for California Filtered for Forest Type Group: Douglas-fir Group, Ponderosa Pine Group, Tanoak/Laurel Group.
EPA. See U.S. Environmental Protection Agency.
FedCenter.gov. See Federal Facilities Environmental Stewardship & Compliance Assistance Center.
Federal Facilities Environmental Stewardship & Compliance Assistance Center. 2011. EO 13514. Available: <http://www.fedcenter.gov/programs/eo13514/>. Accessed April 11, 2011.
Godish, T. 2004. Air Quality. Lewis Publishers. Chelsea, Michigan.
Governor’s Office of Planning and Research. 2008 (June 19). CEQA and Climate Change: Addressing Climate Change through California Environmental Quality Act (CEQA) Review. Sacramento, California.
Intergovernmental Panel on Climate Change. 2007 (February). Climate Change 2007: The Physical Science Basis. Contribution of Working Group I to the Fourth Assessment Report of the IPCC. Geneva, Switzerland.
IPCC. See Intergovernmental Panel on Climate Change.
30-19 Draft – June 2013

Shasta Lake Water Resources Investigation Environmental Impact Statement
Northern Sacramento Valley Planning Area Districts. 2010 (June 7). Northern Sacramento Valley Planning Area 2009 Triennial Air Quality Attainment Plan. Prepared by the Sacramento Valley Air Quality Engineering and Enforcement Professionals.
NSVPAD. See Northern Sacramento Valley Planning Area Districts.
OPR. See Governor’s Office of Planning and Research.
Reclamation. See U.S. Department of the Interior, Bureau of Reclamation.
Seinfeld, J.H., and S.N. Pandis. 1998. Atmospheric Chemistry and Physics. John Wiley & Sons, Inc. New York, New York.
Shasta County. 2004 (September). Shasta County General Plan. Redding, California.
U.S. Department of the Interior, Bureau of Reclamation. 2007 (December). Shasta Lake Water Resources Investigation Plan Formulation Report. Mid-Pacific Region. Sacramento, California.
U.S. Environmental Protection Agency. 2010a. Nitrogen Dioxide. Available: <http://www.epa.gov/air/nitrogenoxides/>. Accessed September 20, 2010.
———. 2010b. Final Rule: Prevention of Significant Deterioration and Title V Greenhouse Gas Tailoring Rule. Fact Sheet.
———. 2011a. Particulate Matter. Available: <http://www.epa.gov/air/particlepollution/>. Last updated March 16, 2011. Accessed April 19, 2011.
———. 2011b. National Ambient Air Quality Standards (NAAQS). Available: <http://www.epa.gov/air/criteria.html>. Last updated April 18, 2011. Accessed April 19, 2011.
Chapter 6, “Hydrology, Hydraulics, and Water Management”
CALFED. See CALFED Bay-Delta Program.
CALFED Bay-Delta Program. 2000 (July). Final Programmatic Environmental Impact Statement/Environmental Impact Report. Prepared by U.S. Department of the Interior, Bureau of Reclamation, U.S. Fish and Wildlife, National Marine Fisheries Service, U.S. Environmental Protection Agency, Natural Resources Conservation Service, U.S. Army Corps of Engineers, and California Resources Agency. Sacramento, California.
30-20 Draft – June 2013

Chapter 30 References
California Department of Fish and Game and U.S. Department of the Interior, Bureau of Reclamation. 1960 (April). Memorandum of Agreement. Sacramento, California.
California Department of Water Resources. 1999. California State Water Project Atlas. Sacramento, California.
———. 2003a (May). Settlement Agreement by and Among the Planning and Conservation League, Plumas County Flood Control and Water Conservation District, Citizens Planning Association of Santa Barbara County, Inc., and the State of California Department of Water Resources, Kern Water Bank Authority, and those State Water Project Contractors Identified Herein. Sacramento, California.
———. 2003b (October). California’s Groundwater, Bulletin 118 Update 2003. Sacramento, California.
———. 2005 (October). CalSim-II Model Sensitivity Analysis Study, Technical Memorandum Report. Bay-Delta Office. Sacramento, California.
———. 2009. (June) Methodology for Flow and Salinity Estimates in the Sacramento-San Joaquin Delta and Suisun Marsh. Sacramento, California.
CDFG and Reclamation. See California Department of Fish and Game and U.S. Department of the Interior, Bureau of Reclamation.
Close, A., W.M. Haneman, J.W. Labadie, D.P. Loucks, J.R. Lund, D.C. McKinney, and J.R. Stedinger. 2003. A Strategic Review of CALSIM II and Its Use for Water Planning, Management and Operations in Central California. Prepared for the California Bay Delta Authority Science Program of Bay Governments. Oakland, California.
DWR. See California Department of Water Resources.
Ford, D., L. Grober, T. Harmon, J.R. Lund, and D. McKinney. 2006 (January). Review Panel Report; San Joaquin River Valley CalSim II Model Review.
National Marine Fisheries Service. 2009 (June 4). Biological Opinion and Conference Opinion on the Long-Term Central Valley Project and State Water Project Operations Criteria and Plan Southwest Region. Long Beach, California.
NMFS. See National Marine Fisheries Service.
Reclamation. See U.S. Department of the Interior, Bureau of Reclamation.
30-21 Draft – June 2013

Shasta Lake Water Resources Investigation Environmental Impact Statement
Reclamation and DWR. See U.S. Department of the Interior, Bureau of Reclamation, and California Department of Water Resources.
Shasta County Water Agency. 1998 (November). Coordinated AB 3030 Groundwater Management Plan for the Redding Groundwater Basin, Shasta County Water Agency. Redding, California.
State Water Resources Control Board. 1995 (May). Water Quality Control Plan for the San Francisco Bay/Sacramento-San Joaquin Delta Estuary, 95-1 WR. Sacramento, California.
———. 1999. Division of Water Rights, California Environmental Protection Agency. A Guide to Water Transfers.
———. 2000 (March). Revised Water Right Decision 1641. In the Matter of: Implementation of Water Quality Objectives for the San Francisco Bay/Sacramento-San Joaquin Delta Estuary; A Petition to Change Points of Diversion of the Central Valley Project and the State Water Project in the Southern Delta; and A Petition to Change Places of Use and Purposes of Use of the Central Valley Project. Sacramento, California.
SWRCB. See State Water Resources Control Board.
Tehama County Flood Control and Water Conservation District. 1996 (November). Coordinated AB 3030 Groundwater Management Plan, prepared by D. Keppen and S. Slater. Gerber, California.
USACE. See U.S. Army Corps of Engineers.
U.S. Army Corps of Engineers. 1977 (January). Shasta Dam and Lake, Report on Reservoir Regulation for Flood Control. U.S. Army Corps of Engineers, Sacramento District. Sacramento, California.
U.S. Department of the Interior, Bureau of Reclamation. 1999 (October). Central Valley Project Improvement Act, Programmatic Environmental Impact Statement. Sacramento, California.
———. 2000 (December). U.S. Department of the Interior, Record of Decision, Trinity River Mainstem Fishery Restoration Final Environmental Impact Statement/Environmental Impact Report.
———. 2004 (June). Long-Term Central Valley Project Operations Criteria and Plan Biological Assessment.
30-22 Draft – June 2013

Chapter 30 References
U.S. Department of the Interior, Bureau of Reclamation, and California Department of Water Resources. 1986 (November). Agreement Between the United States of America and the State of California for Coordinated Operation of the Central Valley Project and the State Water Project. Sacramento, California.
————. 2003 (July). Environmental Water Account Draft Environmental Impact Statement/Environmental Impact Report. Sacramento, California.
———. 2004a. Response Plan for Water Level Concerns in the South Delta Under Water Rights Decision 1641. Sacramento, California.
———. 2004b. Response Plan for Water Quality Concerns in the South Delta Under Water Rights Decision 1641. Sacramento, California.
———. 2006a (January). CalSim-II San Joaquin River Peer Review Response.
U.S. Department of the Interior, Fish and Wildlife Service. 1993 (September 9). Formal Consultation on Effects of the Proposed Los Vaqueros Reservoir Project on Delta Smelt, Contra Costa County, California. Sacramento, California.
———. 2008 (December 15). Biological Opinion on the Coordinated Operations of the Central Valley Project and State Water Project in California. Final. Sacramento, California.
———. 2011 (February 24). Biological Opinion on the Los Vaqueros Reservoir Expansion Project, Contra Costa County, California. Sacramento, California.
USFWS. See U.S. Department of the Interior, Fish and Wildlife Service.
Chapter 7, “Water Quality”
Bartholow, J. M., R. B. Hanna, L. Saito, D. Lieberman, and M. Horn. 2001. Simulated Limnological Effects of the Shasta Lake Temperature Control Device. Environmental Management 27(4):609-627.
CALFED. See CALFED Bay-Delta Program.
CALFED Bay-Delta Program. 2000a. Ecosystem Restoration Program Plan Volume 1: Ecological Attributes of the San Francisco Bay-Delta Watershed. Final Programmatic Environmental Impact Statement/Environmental Impact Report Technical Appendix. Sacramento, California.
30-23 Draft – June 2013

Shasta Lake Water Resources Investigation Environmental Impact Statement
———. 2000b (July). Final Programmatic Environmental Impact Statement/Environmental Impact Report. Chapter 5.1, Water Supply and Water Management. Prepared by U.S. Department of the Interior, Bureau of Reclamation, U.S. Fish and Wildlife, National Marine Fisheries Service, U.S. Environmental Protection Agency, Natural Resources Conservation Service, U.S. Army Corps of Engineers, and California Resources Agency. Sacramento, California.
———. 2000c (July). Water Quality Program Plan. Final Programmatic Environmental Impact Statement/Environmental Impact Report Technical Appendix. Sacramento, California.
———. 2003 (March). Environmental Water Program: Restoring Ecosystem Processes through Geomorphic High Flow Prescriptions. Sacramento, California. Prepared by Stillwater Sciences, Inc., Berkeley, California.
California Bay-Delta Authority. 2005 (June). Sacramento River–Chico Landing Subreach Habitat Restoration Project Draft Environmental Impact Report. State Clearinghouse #2004112024. Sacramento, California. Lead agency: California Bay-Delta Authority. Project proponent: The Nature Conservancy. Prepared by EDAW, Sacramento, California.
California Department of Water Resources. 2001 (December). Sanitary Survey Update Report. Division of Planning and Local Assistance, and Municipal Water Quality Investigations Program. Sacramento, California.
———. 2002 (February). Draft DSM Tutorial: An Introduction to the Delta Simulation Model II (DSM2) for Simulation of Hydrodynamics and Water Quality of the Sacramento–San Joaquin Delta.
———. 2005 (October). CalSim-II Model Sensitivity Analysis Study. Technical Memorandum Report. Bay-Delta Office. Sacramento, California.
CBDA. See California Bay-Delta Authority.
Central Valley Regional Water Quality Control Board. 2002 (April). Upper Sacramento River TMDL for Cadmium, Copper, and Zinc. Final Report. Sacramento, California.
———. 2003a. Metal Distributions within Shasta Lake, Shasta County, California, Interim Report. (Phil Woodward.)
———. 2003b. 2002 CWA Section 303(d) List of Water Quality Limited Segment, Central Valley Regional Water Quality Control Board. Approved by the U.S. Environmental Protection Agency, July 2003.
30-24 Draft – June 2013

Chapter 30 References
———. 2007a. 2006 CWA Section 303(d) List of Water Quality Limited Segment, Central Valley Regional Water Quality Control Board. Approved by the U.S. Environmental Protection Agency, June 28, 2007.
———. 2007b (May). Basin Plan Amendments to the Water Quality Control Plan for the Sacramento River and San Joaquin River Basins for the Control of Diazinon and Chlorpyrifos Runoff into the Sacramento and Feather Rivers. Final Staff Report. Sacramento, California.
———. 2009 (September). The Water Quality Control Plan for the Sacramento River and San Joaquin River Basins (Basin Plan). Fourth edition. Originally published 1998. Rancho Cordova, California. Available: <http://www.waterboards.ca.gov/centralvalley/water_issues/basin_plans/>.
———. 2011 (October). Revised pages to: The Water Quality Control Plan for the Sacramento River and San Joaquin River Basins (Basin Plan). Fourth edition. Originally published 1998. Rancho Cordova, California. Available: <http://www.waterboards.ca.gov/centralvalley/water_issues/basin_plans/>.
Close, A., W.M. Haneman, J.W. Labadie, D.P. Loucks, J.R. Lund, D.C. McKinney, and J.R. Stedinger. 2003. A Strategic Review of CALSIM II and Its Use for Water Planning, Management and Operations in Central California. Prepared for the California Bay Delta Authority Science Program of Bay Governments. Oakland, California.
CVRWQCB. See Central Valley Regional Water Quality Control Board.
Davis, J.A., A.R. Melwani, S.N. Bezalel, J.A. Hunt, G. Ichikawa, A. Bonnema, W.A. Heim, D. Crane, S. Swenson, C. Lamerdin, and M. Stephenson. 2010. Contaminants in Fish from California Lakes and Reservoirs, 2007–2008: Summary Report on a Two-Year Screening Survey. A Report of the Surface Water Ambient Monitoring Program. California State Water Resources Control Board, Sacramento, California.
Domagalski, J.L., D.L. Knifong, P.D. Dileanis, L.R. Brown, J.T. May, V. Connor, and C.N. Alpers. 2000. Water Quality in the Sacramento River Basin, California, 1994–1998. U.S. Geological Survey Circular 1215.
DWR. See California Department of Water Resources.
EPA. See U.S. Environmental Protection Agency.
Ford, D., L. Grober, T. Harmon, J.R. Lund, and D. McKinney. 2006 (January). Review Panel Report; San Joaquin River Valley CalSim II Model Review.
30-25 Draft – June 2013

Shasta Lake Water Resources Investigation Environmental Impact Statement
Jassby, A.D., W.J. Kimmerer, S.G. Monismith, C. Armor, J.E. Cloern, T.M. Powell, J.R. Schubel, and T.M. Vendlinski. 1995. Isohaline Position as a Habitat Indicator for Estuarine Populations. Ecological Applications 5(1):272-289.
National Marine Fisheries Service. 2004 (October). Biological Opinion on the Long-Term Central Valley Project and State Water Project Operations Criteria and Plan. Southwest Region. Long Beach, California.
———. 2009 (February). Biological Opinion for the Operation of the Federal Central Valley Project and the California State Water Project. Southwest Region. Long Beach, California.
NMFS. See National Marine Fisheries Service.
North State Resources, Inc. 2007. Bully Hill Mine Assessment Technical Memorandum. Unpublished report to U.S. Department of the Interior, Bureau of Reclamation.
NSR. See North State Resources, Inc.
Reclamation. See U.S. Department of the Interior, Bureau of Reclamation.
Reclamation and DWR. See U.S. Department of the Interior, Bureau of Reclamation, and California Department of Water Resources.
San Francisco Bay Regional Water Quality Control Board. 2007. 2006 CWA Section 303(d) List of Water Quality Limited Segments, San Francisco Bay Regional Water Quality Control Board. Approved by the U.S. Environmental Protection Agency, June 28, 2007.
SFBRWQCB. See San Francisco Bay Regional Water Quality Control Board.
State Water Resources Control Board. No Date. Water Quality Control Plan for the Control of Temperature in the Coastal and Interstate Waters and Enclosed Bays of California. Sacramento, California.
———. 1995 (May). Water Quality Control Plan for the San Francisco Bay/Sacramento–San Joaquin Delta Estuary. 95-1 WR. Sacramento, California.
———. 1999 (November). Final Environmental Impact Report for Implementation of the 1995 Bay/Delta Water Quality Control Plan. Volume I. State Clearinghouse Number 97-122056.
———. 2000 (March). Revised Water Right Decision 1641. In the Matter of: Implementation of Water Quality Objectives for the San Francisco Bay/Sacramento-San Joaquin Delta Estuary; A Petition to Change Points
30-26 Draft – June 2013

Chapter 30 References
of Diversion of the Central Valley Project and the State Water Project in the Southern Delta; and A Petition to Change Places of Use and Purposes of Use of the Central Valley Project. December 29, 1999. Revised in accordance with Order WR 2000-02, March 15, 2000. Sacramento, California.
———. 2006a (October 25). Proposed 2006 CWA Section 303(d) List Of Water Quality Limited Segments. Sacramento, California.
———. 2006b (December). Water Quality Control Plan for the San Francisco Bay/Sacramento–San Joaquin Delta Estuary. Sacramento, California.
Stillwater Sciences. 2006 (November 22). Sacramento River Ecological Flows Study: State of the System Report. Public review draft. Berkeley, California. Prepared for The Nature Conservancy.
SWRCB. See State Water Resources Control Board.
Tehama County. 2009 (March). Tehama County General Plan Update 2009–2029. Red Bluff, California. Prepared for Tehama County by PMC. Chico, California.
U.S. Department of Agriculture, Forest Service. 1995 (April 28). Shasta-Trinity National Forest Land and Resource Management Plan. Shasta-Trinity National Forest. Redding, California.
———. 1996 (March). Management Guide: Shasta and Trinity Units of the Whiskeytown-Shasta-Trinity National Recreation Area. Pacific Southwest Region. Shasta-Trinity National Forest. Redding, California.
———. 1998 (May). McCloud Arm Watershed Assessment. Shasta-Trinity National Forest. Redding, California.
U.S. Department of the Interior, Bureau of Reclamation, and California Department of Water Resources. 2005 (October). South Delta Improvements Program Draft Environmental Impact Statement/Environmental Impact Report. Sacramento, California. State Clearinghouse No. 2002092065. Bureau of Reclamation Mid-Pacific Region and DWR Bay-Delta Office, Sacramento, California. Prepared by Jones & Stokes, Sacramento, California.
U.S. Department of the Interior, Geological Survey. 1978. An Evaluation of Problems Arising from Acid Mine Drainage in the Vicinity of Shasta Lake, Shasta County, California. Water Resources Investigations Report, 78-32. Denver, Colorado.
30-27 Draft – June 2013

Shasta Lake Water Resources Investigation Environmental Impact Statement
———. 2000a. Water-Quality Assessment of the Sacramento River Basin, California: Water-Quality, Sediment and Tissue Chemistry, and Biological Data, 1995–1998. Open-File Report 2000-391.
———. 2000b. Metals Transport in the Sacramento River, California, 1996–1997. Volume 2: Interpretation of Metal Loads. U.S. Geological Survey Water-Resources Investigations Report 00-4002. In cooperation with Sacramento Regional County Sanitation District, California State Water Resources Control Board, U.S. Environmental Protection Agency, U.S. Department of Commerce, and National Marine Fisheries Service. Sacramento, California.
U.S. Environmental Protection Agency. 2009 (June). EPA Iron Mountain Mine Superfund Site Fact Sheet: EPA Accelerating Cleanup Efforts at Iron Mountain Mine Site Supporting Local Economy with Recovery Act Funds. Region 9, San Francisco, California.
USFS. See U.S. Department of Agriculture, Forest Service.
USGS. See U.S. Department of the Interior, Geological Survey.
Vermeyen, T.B. 1997 (August 10–15). Modifying Reservoir Release Temperatures Using Temperature Control Curtains. Proceedings of Theme D: Energy and Water: Sustainable Development, 27th IAHR Congress, San Francisco, California.
Wright, S.A., and D.H. Schoellhamer. 2004 (May). Trends in the Sediment Yield of the Sacramento River, California, 1957–2001. San Francisco Estuary and Watershed Science 2(2): Article 2.
Chapter 8, “Noise and Vibration”
Acoustical Society of America. 1997. 133rd Meeting Lay Language Papers: HyperSonicTM Sound. Presented by Elwood G. Norris, American Technology Corporation, on June 17, 1997. Available: <http://www.acoustics.org/ press/133rd/2pea.html>. Accessed April 18, 2011.
ASA. See Acoustical Society of America.
California Department of Transportation. 1998 (October). Technical Noise Supplement, A Technical Supplement to the Traffic Noise Analysis Protocol. Environmental Program, Environmental Engineering—Noise, Air Quality, and Hazardous Waste Management Office. Sacramento, California.
30-28 Draft – June 2013

Chapter 30 References
———. 2002a (February 20). Transportation Related Earthborne Vibrations. TAV-02-01-R9601. Division of Environmental Analysis, Office of Noise, Air Quality, and Hazardous Waste Management. Sacramento, California.
———. 2002b (January). Airport Land Use Planning Handbook. Sacramento, California. Prepared by Shutt Moen Associates in association with Brown-Buntin Associates and Gatzke, Dillon & Ballance. Santa Rosa, California.
———. 2006. Traffic Volumes. Available: <http://traffic-counts.dot.ca.gov/>. Accessed September 2007.
———. 2011. Traffic and Vehicle Data Systems Unit. Available; http://traffic-counts.dot.ca.gov. Accessed: March 2013.
Caltrans. See California Department of Transportation.
Egan, M. D. 1988. Architectural Acoustics. McGraw-Hill, Inc.
EPA. See U.S. Environmental Protection Agency.
FAA. See Federal Aviation Administration.
Federal Aviation Administration. 2012. Airport Master Record. Shasta County, California. Available: http://www.ger1.com/5010web/REPORTS/O85.pdf. Accessed: March 2013.
Federal Transit Administration. 2006 (May). Transit Noise and Vibration Impact Assessment. FTA-VA-90-1003-06. Washington, D.C.
FTA. See Federal Transit Administration.
Governor’s Office of Planning and Research. 2003 (October). State of California General Plan Guidelines. Sacramento, California.
Lipscomb, D.M., and A.C. Taylor, Jr. 1978. Noise Control Handbook of Principles and Practices. Van Nostrand Reinhold Co. New York.
OPR. See Governor’s Office of Planning and Research.
Shasta County. 2004. Noise Element of the Shasta County General Plan. Redding, California.
Tehama County. 2009 (March). Tehama County General Plan Update 2009–2029. Red Bluff, California. Prepared for Tehama County by PMC. Chico, California.
30-29 Draft – June 2013
Shasta Lake Water Resources Investigation Environmental Impact Statement
U.S. Environmental Protection Agency. 1974 (March). Information on Levels of Environmental Noise Requisite to Protect Public Health and Welfare with an Adequate Margin of Safety. Washington, D.C.
Chapter 9, “Hazards and Hazardous Materials and Waste”
AEP. See Association of Environmental Professionals.
Association of Environmental Professionals. 2010. California Environmental Quality Act (CEQA) Statute and Guidelines. Association of Environmental Professionals. Palm Desert, California.
BLM. See U.S. Department of the Interior, Bureau of Land Management.
Cal Fire. See California Department of Forestry and Fire Protection.
Cal Fire and Tehama Fire-Safe Council. See California Department of Forestry and Fire Protection and Tehama Fire-Safe Council.
California Department of Forestry and Fire Protection. 2005. 2005 Fire Plan: Shasta-Trinity Unit.
———. 2007. Fire Hazard Severity Zoning: Draft. Fire and Resource Assessment Program. Sacramento, California.
———. 2008. Very High Fire Hazard Severity Zones in LRA, as Recommended by CAL FIRE. Fire and Resource Assessment Program. Sacramento, California.
———. 2009. Fire Perimeters: Wildfires: 1950–2009. Fire and Resource Assessment Program. Sacramento, California.
California Department of Forestry and Fire Protection and Tehama Fire-Safe Council. 2005. Tehama-Glenn Unit Fire Management Plan 2005.
California Department of Toxic Substances Control. 2012. DTSC’s Hazardous Waste and Substances Site List: Site Cleanup (Cortese List). Available: <http://www.dtsc.ca.gov/SiteCleanup/Cortese_List.cfm>. Accessed November 2012.
Cantara Trustee Council. 2007. Final Report on the Recovery of the Upper Sacramento River -Subsequent to the 1991 Cantara Spill. Cantara Trustee Council, Redding, California.
Central Valley Regional Water Quality Control Board. 2010. Order No. R5-2010-0127. Rescinding Waste Discharge Requirements/NPDES Permits.
30-30 Draft – June 2013

Chapter 30 References
CVRWQCB. See Central Valley Regional Water Quality Control Board.
DTSC. See California Department of Toxic Substances Control.
EPA. See U.S. Environmental Protection Agency.
SCFD. See Shasta County Fire Department.
Shasta County. 2004. Shasta County General Plan – Public Safety Group. 5.4 Fire Safety and Sheriff Protection. Redding, California.
Shasta County Fire Department. 2007. Shasta County Fire Department Master Plan. Redding, California.
State Board of Forestry and Fire Protection and California Department of Forestry and Fire Protection. 2010. Strategic Fire Plan for California.
State Water Resources Control Board. 2012. GeoTracker. Available: <http://geotracker.waterboards.ca.gov/>. Accessed November 2012.
State Water Resources Control Board, California Regional Water Quality Control Boards, and California Coastal Commission. 2008. Annual Work Plan: Annual Progress Report for Federal Clean Water Act Section 319 Program (July 2007 through June 2008). State of California, Environmental Protection Agency, State Water Resources Control Board. Sacramento, California.
SWRCB. See State Water Resources Control Board.
SWRCB et al. See State Water Resources Control Board, California Regional Water Quality Control Boards, and California Coastal Commission.
Tehama County. 2009. Tehama County General Plan Update 2009–2029. Red Bluff, California. Prepared for Tehama County by PMC. Chico, California.
U.S. Department of Agriculture, Forest Service. 1995. Shasta-Trinity National Forest Land and Resource Management Plan. Pacific Southwest Region. Shasta-Trinity National Forest, Redding, California.
———. 1996 (March). Management Guide for the Shasta and Trinity Units of the Whiskeytown-Shasta-Trinity National Recreation Area. Pacific Southwest Region. Shasta-Trinity National Forest, Redding, California.
———. 1998 (May). McCloud Arm Watershed Analysis. Shasta-Trinity National Forest. Redding, California
30-31 Draft – June 2013

Shasta Lake Water Resources Investigation Environmental Impact Statement
———. 2009. Schedule of Proposed Actions (SOPA), Shasta-Trinity National Forest (04/01/2009 through 06/31/2009). Shasta-Trinity National Forest. Redding, California.
———. 2011. Schedule of Proposed Action (SOPA), Shasta-Trinity National Forest (01/01/2011 to 03/31/2011). Shasta-Trinity National Forest. Redding, California.
U.S. Department of the Interior, Bureau of Land Management. 1992 (July). Proposed Redding Resource Management Plan and Final Environmental Impact Statement. California State Office, Ukiah District, Redding Resource Area. Redding, California.
———. 2006a. Resource Management Plans for California’s Public Lands. Sacramento, California.
———. 2006b. Ukiah Resource Management Plan. U.S. Department of the Interior, Bureau of Land Management, Ukiah Field Office. Ukiah, California.
———. 2008. Sierra Resource Management Plan and Record of Decision. U.S. Department of the Interior, Bureau of Land Management, Folsom Field Office. Folsom, California.
U.S. Environmental Protection Agency. 2008. Iron Mountain Mine Superfund Site Fact Sheet. Environmental Protection Agency. Available: <http://yosemite.epa.gov/r9/sfund/r9sfdocw.nsf/vwsoalphabetic/Iron+Mountain+Mine?OpenDocument>. Accessed July 22, 2008.
———. 2013. CERCLIS hazardous waste sites, California. http://www.epa.gov/superfund/sites/cursites/ (accessed March 2013).
USFS. See U.S. Department of Agriculture, Forest Service.
Western Shasta Resources Conservation District. 2010. Lakehead Area Strategic Fuels Reduction Plan Update: 2010. Prepared for Shasta County by the Western Shasta Resources Conservation District. Anderson, California.
WSRCD. See Western Shasta Resource Conservation District.
Chapter 10, “Agriculture and Important Farmlands”
Cal Fire. See California Department of Forestry and Fire Protection.
30-32 Draft – June 2013

Chapter 30 References
California Department of Conservation. 2009. Williamson Act Program Lands by County as Mapped by the California Department of Conservation. Sacramento, California.
———. 2010a. Important Farmland by County as Mapped by the California Department of Conservation. Sacramento, California. Available: <http://www.conservation.ca.gov/dlrp/fmmp/products/Pages/DownloadGISdata.aspx>. Accessed August 10, 2010.
———. 2010b (February). California Conservation (Williamson) Act Status Report 2010. Available: <http://www.conservation.ca.gov/dlrp/lca/ stats_reports/Pages/index.aspx>. Accessed November 28, 2012.
———. 2011 (January). California Farmland Conversion Report 2006–2008. Division of Land Resource Protection, Farmland Mapping and Monitoring Program. Sacramento, California.
California Department of Forestry and Fire Protection. 2010 (June). California’s Forests and Rangelands: 2010 Assessment. Fire and Resource Assessment Program. Sacramento, California.
California Department of Water Resources. 2009. Sacramento–San Joaquin River Delta—Integrated Water Management. California Water Plan Update 2009, Volume 3. Sacramento, California.
———. 2011. California State Water Project Overview. Available: <http://www.water.ca.gov/swp/>. Accessed April 12, 2011.
California Department of Water Resources and U.S. Department of the Interior, Bureau of Reclamation. 2006 (May). North-of-the-Delta Offstream Storage Investigation Initial Alternatives Information Report. DWR Division of Planning and Local Assistance and Reclamation Mid-Pacific Division. Sacramento, California. Prepared by URS, Sacramento, California. Available: <http://www.usbr.gov/mp/nodos/docs/index.html.>
Delta Protection Commission. 2010. Draft Land Use and Resource Management Plan for the Primary Zone of the Delta. Adopted by the Delta Protection Commission February 25, 2010. Walnut Grove, California.
DOC. See California Department of Conservation.
DPC. See Delta Protection Commission.
DWR. See California Department of Water Resources.
DWR and Reclamation. See California Department of Water Resources and U.S. Department of the Interior, Bureau of Reclamation.
30-33 Draft – June 2013

Shasta Lake Water Resources Investigation Environmental Impact Statement
EDAW. 2006. Colusa Subreach Planning Pest and Regulatory Effect Study. Final Design Study. Sacramento, California. Prepared for The Nature Conservancy, Chico, California.
NRCS. See U.S. Department of Agriculture, Natural Resources Conservation Service.
Reclamation. See U.S. Department of the Interior, Bureau of Reclamation.
Reclamation and DWR. See U.S. Department of the Interior, Bureau of Reclamation, and California Department of Water Resources.
Resources Agency. See The Resources Agency, State of California.
Shasta County. 2004 (September). Shasta County General Plan 2004. Redding, California.
———. 2011. Shasta County Crop and Livestock Report. Available: <http://www.co.shasta.ca.us/index/ag_index/ag_programs/ag_prog_crop_stats.aspx>. Accessed November 13, 2012.
Sokolow, A.D., S.V. Hammond, M. Norton, and E.E. Schmidt. 2010. California Communities Deal with Conflict and Adjustment at the Urban-Agricultural Edge. University of California Agriculture. Richmond, California.
Tehama County. 2009 (March). Tehama County General Plan 2009–2029. Red Bluff, California. Prepared for Tehama County by PMC. Chico, California.
The Resources Agency, State of California. 1989 (January). Upper Sacramento River Fisheries and Riparian Habitat Management Plan. Prepared by an Advisory Council established by Senate Bill 1086, authored by Senator Jim Nielsen. Sacramento, California.
———. 2003. Sacramento River Conservation Area Forum Handbook. Prepared by an Advisory Council established by Senate Bill 1086, authored by Senator Jim Nielsen, Sacramento, California.
USDA. See U.S. Department of Agriculture.
U.S. Department of Agriculture. 2007a. Census of Agriculture: Shasta County. Available: <http://www.agcensus.usda.gov/Publications/2007/Online_Highlights/County_Profiles/California/cp06089.pdf>. Accessed November 13, 2012.
30-34 Draft – June 2013

Chapter 30 References
———. 2007b. Census of Agriculture: Tehama County. Available: <http://www.agcensus.usda.gov/Publications/2007/Online_Highlights/County_Profiles/California/cp06103.pdf>. Accessed November 13, 2012.
———. 2007c. Census of Agriculture: California. Available: <http://www.agcensus.usda.gov/Publications/2007/Online_Highlights/County_Profiles/California/cp99006.pdf>. Accessed November 13, 2012.
U.S. Department of Agriculture, Natural Resources Conservation Service. 2006. Farmland Protection Program and Land Evaluation and Site Assessment System. Available: <http://www.ca.nrcs.usda.gov/ programs/frpp.html>. Accessed February 2006.
U.S. Department of the Interior, Bureau of Reclamation. 2007 (December). Shasta Lake Water Resources Investigation Plan Formulation Report. Mid-Pacific Region. Sacramento, California.
———. 2009. Central Valley Project: General Description. Available: <http://www.usbr.gov/projects/Project.jsp?proj_name=Central+Valley+Project>. Last updated August 31, 2009. Accessed April 12, 2011.
U.S. Department of the Interior, Bureau of Reclamation, and California Department of Water Resources. 2005 (October). South Delta Improvements Program EIS/EIR. Volume 1: Environmental Impact Statement/Environmental Impact Report. Draft. Chapter 7, “Land and Water Use, Social Issues, and Economics.” State Clearinghouse #2002092065. Sacramento, California. Prepared by Jones & Stokes, Sacramento, California.
Chapter 11, “Fisheries and Aquatic Ecosystems”
Bachmann, S. 2000. Shasta Lake West Watershed Analysis. U.S. Forest Service. Washington, D.C.
Bartholow, J., R.B. Hanna, L. Saito, and M.J. Horn. 2001. Simulated Limnological Effects of the Shasta Lake Temperature Control Device. Environmental Management 27(4):609–626.
Bartholow, J.M. 2003. Modeling Chinook Salmon with Salmod on the Sacramento River, California: Project Completion Report.
Baumgartner, S. California Department of Fish and Wildlife, Sacramento, California. 2006—personal communication.
———. California Department of Fish and Wildlife, Sacramento, California. 2008—personal communication.
30-35 Draft – June 2013

Shasta Lake Water Resources Investigation Environmental Impact Statement
Baxter, R., K. Hieb, S. DeLeon, K. Fleming, and J. Orsi. 1999 (November). Report on the 1980–1995 Fish, Shrimp, and Crab Sampling in the San Francisco Estuary, California. The Interagency Ecological Program for the Sacramento-San Joaquin Estuary. Technical Report 63.
Baxter, R., R. Breuer, L. Brown, L. Conrad, F. Feyrer, S. Fong, K. Gehrts, L. Grimaldo, B. Herbold, P. Hrodey, A. Mueller-Solger, T. Sommer, and K. Souza. 2010. Interagency Ecological Program 2010 Pelagic Organism Decline Work Plan and Synthesis of Results. The Interagency Ecological Program for the San Francisco Estuary. December.
Baxter, R.D., W. Harrell, and L. Grimaldo. 1996. 1995 Splittail Spawning Investigations. IEP Newsletter 9(4):27–31.
Bell, M.C. 1990. Fisheries Handbook of Engineering Requirements and Biological Criteria, third edition. U.S. Army Corps of Engineers, Office of the Chief of Engineers, Fish Passage Development and Evaluation Program. Portland, Oregon.
Benson, A.J., and R.M. Kipp. 2011. Potamopyrgus antipodarum. U.S. Geological Survey Nonindigenous Aquatic Species Database. Available: <http://nas.er.usgs.gov/queries/factsheet.aspx?SpeciesID=1008>. Revision Date: March 14, 2011.
Bondesen, P., and E.W. Kaiser. 1949. Hydrobia (Potamopyrgus) jenkinsi (Smith) in Denmark Illustrated by Its Ecology. Oikos 1, 252–281.
Boulton, A.J., S.E. Stibbe, N.B. Grimm, and S.G. Fisher. 1991. Invertebrate Recolonization of Small Patches of Defaunated Hyporheic Sediments in a Sonoran Desert Stream. Freshwater Biology 26:267–277.
Bowler, P.A. 1991. The Rapid Spread of the Freshwater Hydrobiid Snail Potamopyrgus antipodarum (Gray) in the Middle Snake River, Southern Idaho. In Proceedings of the Desert Fishes Council 21:173–182.
Buer, K. 1994 (August 1). Use of Alternative Gravel Sources for Fishery Restoration and Riparian Habitat Enhancement in Shasta and Tehama Counties, California. Internal memorandum to J. Siperek, G. Stacey, and T. Mills from K. Buer, Senior Engineering Geologist, California Department of Water Resources, Northern District, Red Bluff, California.
Burau, J.R., J.W. Gartner, and M.T. Stacey. 1998. Results from the Hydrodynamic Element of the 1994 Entrapment Zone Study in Suisun Bay. In Report of the 1994 Entrapment Zone Study, ed. Wim Kimmerer. Technical Report 56. Interagency Ecological Program for the San Francisco Bay-Delta Estuary.
30-36 Draft – June 2013
Chapter 30 References
CALFED. See CALFED Bay-Delta Program.
CALFED Bay-Delta Program. 2000a (July). Multi-Species Conservation Strategy. Sacramento, California.
———. 2000b (July). Final Programmatic Environmental Impact Statement/Environmental Impact Report. Prepared by U.S. Department of the Interior, Bureau of Reclamation, U.S. Fish and Wildlife, National Marine Fisheries Service, U.S. Environmental Protection Agency, Natural Resources Conservation Service, U.S. Army Corps of Engineers, and California Resources Agency. Sacramento, California.
———. 2000c (August). Final Programmatic Record of Decision. Sacramento, California.
California Department of Fish and Game. 2011 (February 1). GrandTab, California Central Valley Sacramento and San Joaquin River Systems Chinook Salmon Escapement Hatcheries and Natural Areas. Fisheries Branch, Anadromous Resources Assessment. Sacramento, California.
California Department of Water Resources. 2006. Available: <ftp://ftp.delta.dfg.ca.gov/salvage/>.
California Urban Water Agencies. 1994 (March 7). Evaluation of Potential Effects of the Proposed EPA Salinity Standard on the Biological Resources of the San Francisco Bay/Sacramento–San Joaquin Estuary (Draft). Prepared by R2 Resource Consultants, Inc. for The California Urban Water Agencies, Sacramento, California.
Cantara Trustee Council. 2007. Final Report on the Recovery of the Upper Sacramento River—Subsequent to the 1991 Cantara Spill. Cantara Trustee Council, Redding, California.
CDFW. See California Department of Fish and Game.
Chapman, D.W., and T.C. Bjornn. 1969. Distribution of Salmonids in Streams, with Special Reference to Food and Feeding. In Symposium on Salmon and Trout in Streams, ed. T.G. Northcote, 153–176. H.R. MacMillan Lectures in Fisheries, University of British Columbia. Vancouver, BC, Canada.
City of Colusa. 2007 (October 30). City of Colusa General Plan 2005–2025. Adopted by Resolution No. 07-30. Colusa, California. Prepared by Pacific Municipal Consultants, Chico, California, and North Fork Association, Auburn, California.
30-37 Draft – June 2013

Shasta Lake Water Resources Investigation Environmental Impact Statement
City of Redding. 2000 (October 3). City of Redding 2000–2020 General Plan. Adopted by Resolution No. 2000-166. Development Services Department, Redding, California.
Cloern, J.E., & Jassby, A.D. (2012). Drivers of change in estuarine‐coastal ecosystems: Discoveries from four decades of study in San Francisco Bay. Reviews of Geophysics, 50(4).
Close, A, W.M. Haneman, J.W. Labadie, D.P. Loucks, J.R. Lund, D.C. McKinney, and J.R. Stedinger. 2003. A Strategic Review of CALSIM II and Its Use for Water Planning, Management and Operations in Central California. Prepared for the California Bay Delta Authority Science Program of Bay Governments, Oakland, California.
Cohen, A.N. 2007. Potential Distribution of Zebra Mussels (Dressena polymorpha) and Quagga Mussels (Dressena bugensis) in California, Phase 1 Report. San Francisco Estuary Institute, Oakland, California, and Center for Research on Aquatic Bioinvasions, Richmond, California. Prepared for the California Department of Fish and Wildlife, Sacramento, California.
Coull, B.C. 1988. Ecology of the Marine Meiofauna. In Introduction to the Study of Meiofauna, ed. R.P. Higgins and H. Thiel, 18–38. Smithsonian Institute Press. Washington, D.C.
Coull, B.C., and G.T. Chandler. 1992. Pollution and Meiofauna: Field, Laboratory and Mesocosm Studies. Oceanography and Marine Biology Annual Review 30:191–271.
CUWA. See California Urban Water Agencies.
Deas, M.L., C.L. Lowney, G.K. Meyer, J.D. Anderson, C.B. Cook, J.J. Fellos, M.M. Kirkland, X. Wang, G.T. Orlob, and I.P. King. 1997. Sacramento River Temperature Modeling Project. Report 97-01.
DWR. See California Department of Water Resources.
Finnell, L.M., and E.B. Reed. 1969. The Diel Vertical Movements of Kokanee Salmon Oncorhynchus nerka, in Granby Reservoir, Colorado. Transactions of the American Fisheries Society 2:245–252.
Frest, T.J. and E.J. Johannes. 1995. Freshwater Mollusks of the Upper Sacramento System, California, with Particular Reference to the Cantara Spill. 1994 Yearly report to California Department of Fish & Game. Deixis Consultants, Seattle, Washington. iii + 88 pp., appendices. Contract #FG2106R1.
30-38 Draft – June 2013

Chapter 30 References
Glenn County. 1993 (June 15). Glenn County General Plan, Volume I, Policies. Glenn County Planning and Public Works Agency, Willows, California.
Haynes, A., B.J.R. Taylor, and M.E. Varley. 1985. The Influence of the Mobility of Potamopyrgus jenkinsi (Smith, E.A.) (Prosobranchia: Hydrobiidae) on Its Spread. Archives of Hydrobiologie 103:497–508.
Herbold, B. 1994. Habitat Requirements of Delta Smelt. Interagency Ecological Studies Program for the Sacramento–San Joaquin Estuary Newsletter, Winter.
Howard, K., S.J. Hayes, and D.F. Evenson. 2010. Yukon River Chinook Salmon Stock Status and Action Plan 2010: a Report to the Alaska Board of Fisheries. Alaska Department of Fish and Game, Divisions of Sport Fish and Commercial Fisheries.
Jassby, A.D., James E. Cloern, Anke B. Muller. 2003. California Agriculture 57(4):104:109. Phytoplankton fuels Delta food web. Accessed: http://ucanr.org/repository/cao/landingpage.cfm?article=ca.v057n04p104&fulltext=yes. Available: March 27, 2013.
Jassby, A.D., W.J. Kimmerer, S.G. Monismith, C. Armor, J.E. Cloern, T.M. Powell, J.R. Schubel, and T.M. Vendlinski. 1995. Isohaline Position as a Habitat Indicator for Estuarine Populations. Ecological Applications 5(1):272-289.
Jones & Stokes Associates, Inc. 1988. McCloud River Wild and Scenic River Study Report: Final Study Report. Sacramento, California. Prepared for the Resources Agency of California, Sacramento, California.
———. 1998. Trinity River Restoration Project Reservoir Fisheries Evaluation. May 25, 1999. (JSA 95-068). Sacramento, California. Prepared for CH2M HILL, Redding, California.
Junk, W.J., P.B. Bayley, and R.E. Sparks. 1989. The Flood Pulse Concept in River Floodplain Systems. Canadian Journal of Fisheries and Aquatic Science 106:110–127.
Kimmel, B.L., and A.W. Groeger. 1986. Limnological and Ecological Changes Associated with Reservoir Aging,. In Reservoir Fisheries Management: Strategies for the 80's, ed. G.E. Hall, 103–109. American Fisheries Society. American Fisheries Society, Allen Press. Lawrence, Kansas.
Kimmerer, W. 1992. An Evaluation of Existing Data in the Entrapment Zone of the San Francisco Bay Estuary. Technical Report 3, Interagency Ecological Studies Program for the Sacramento–San Joaquin Estuary.
30-39 Draft – June 2013

Shasta Lake Water Resources Investigation Environmental Impact Statement
Kimmerer, W.J. 2004. Open-Water Processes of the San Francisco Estuary: from physical forcing to biological responses. San Francisco Estuary and Watershed Science. Vol. 2, Issue 1 (February 2004), Article 1.
Kimmerer, W.J., J.R. Burau, and W.A. Bennett. 2002. Persistence of Tidally-Oriented Vertical Migration by Zooplankton in a Temperate Estuary. Estuaries 23(3):359–371.
Kondolf, G.M., T. Griggs, E.W. Larsen, S. McBain, M. Tompkins, J.G. Williams, and J. Vick. 2000. Flow Regime Requirements for Habitat Restoration Along the Sacramento River between Colusa and Red Bluff. CALFED Bay-Delta Program Integrated Storage Investigation, Sacramento, California.
Koski, M.L., and B.M. Johnson. 2002. Functional Response of Kokanee Salmon (Oncorhynchus nerka) to Daphnia at Different Light Levels. Canadian Journal of Fisheries and Aquatic Sciences 59(4):707–716.
Lee, D.P. 1999. Water Level Fluctuation Criteria for Black Bass in California Reservoirs. Reservoir Research and Management Project. Information Leaflet No. 12.
Leopold, L.B., M.G. Wolman, and J.P. Miller. 1964. Fluvial Processes in Geomorphology. W.H. Freeman and Co., San Francisco, California.
Lieberman, D.M., and M.J. Horn. 1998. Pre- and post-operational effects of a temperature control device on physical, chemical, and biological attributes of Shasta Lake, California: phase 1, spring 1995 through fall 1997. USGS Open File Report 98-251. U.S. Geological Survey and U.S. Bureau of Reclamation, Denver, Colorado. 126p.
Lindley, S.T., R.S. Schick, E. Mora, P.B. Adams, J.J. Anderson, S. Greene, C. Hanson, B.P. May, D. McEwan, R.B. MacFarlane, C. Swanson, and J.G. Williams. 2007. Framework for Assessing Viability of Threatened and Endangered Chinook Salmon and Steelhead in the Sacramento‐San Joaquin Basin. San Francisco Estuary & Watershed Science Volume 5, Issue 1. Article 4. Available: <http://repositories.cdlib.org/jmie/sfews/vol5/iss1/art4>.
Lund, J., J. Mount, W. Bennett, J. Durand, W. Fleenor, E. Hanak, and P. Moyle. 2012. Aquatic Ecosystem Stressors in the Sacramento-San Joaquin Delta. Public Policy Institute of California.
Newcombe, C.P, and J.O. Jensen. 1996. Channel Suspended Sediment and Fisheries: A Synthesis for Quantitative Assessment of Risk and Impact. North American Journal of Fisheries Management. Volume 16, Number 4.
30-40 Draft – June 2013

Chapter 30 References
MacNally R, J.R. Thomson, W.J. Kimmerer, F. Feyrer, K.B. Kewman, A. Sih, W.A. Bennett, L. Brown, E. Fleischman, S.D. Culberson, and G. Castillo. 2010. Analysis of pelagic species decline in the upper San Francisco Estuary using multivariate autoregressive modeling (MAR). Ecological Applications 20(5):1417-1430.
Meng, L., and P. B. Moyle. 1995. Status of Splittail in the Sacramento–San Joaquin Estuary. Transactions of the American Fisheries Society 124:538–549.
Micheli, E.R., J.W. Kirchner, and E.W. Larsen. 2004. Quantifying the Effect of Riparian Forest versus Agricultural Vegetation on River Meander Migration Rates, Central Sacramento River, California, USA. River Research and Applications. published online in Wiley InterScience (www.interscience.wiley.com). DOI: 10. 1002/rra.756.
Miranda, L.E., W.L. Shelton, and T.D. Bryce. 1984. Effects of Water Level Manipulation on Abundance, Mortality, and Growth of Young-Of-Year Largemouth Bass in West Point Reservoir, Alabama-Georgia. North American Journal of Fisheries Management 4:314–320.
Mitchell, D.F. 1982. Effects of Water Level Fluctuation on Reproduction of Largemouth Bass, Micropterus salmoides, at Millerton Lake, California, in 1973. California Fish and Game 68(2):68–77.
Moyle, P.B. 2002. Inland Fishes of California. Revised edition. University of California Press. Berkeley, California.
Moyle, P.B., R.D. Baxter, T. Sommer, T.C. Foin, and S.A. Matern. 2004. Biology and Population Dynamics of Sacramento Splittail (Pogonichthys macrolepidotus) in the San Francisco Estuary: a review. San Francisco Estuary and Watershed Science 2(2):1–47.
Müller, K. 1974. Stream Drift as a Chronobiological Phenomenon in Running Water Ecosystems. Annual Review of Ecology and Systematics 5:309–323.
Naiman, R.J. 1998. Biotic Stream Classification. In River Ecology and Management: Lessons from the Pacific Coastal Region, ed. R.J. Naiman and R.E. Bilby, 97–119. Springer. New York.
National Marine Fisheries Service. 1993. Biological Opinion for the Operation of the Federal Central Valley Project and the California State Water Project. Southwest Region. Long Beach, California.
———. 2000. Biological Opinion for the Proposed Operation of the Federal Central Valley Project and the State Water Project for December 1, 1999
30-41 Draft – June 2013

Shasta Lake Water Resources Investigation Environmental Impact Statement
through March 31, 2000. Northwest and Southwest Regional Sustainable Fisheries Divisions.
———. 2005 (February). Green Sturgeon (Acipenser medirostris) Status Review Update. Biological Review Team, Santa Cruz Laboratory, Southwest Fisheries Science Center.
———. 2009 (October). Public Draft Recovery Plan for the Evolutionarily Significant Units of Sacramento River Winter-run Chinook Salmon and Central Valley Spring-run Chinook Salmon and the Distinct Population Segment of Central Valley Steelhead. Sacramento Protected Resources Division.
Nevares, S., R. Liebig. 2009. Fish Populations in Project-Affected Stream Reaches. Technical Memorandum 18 (TM-18). McCloud-Pit Project, FERC Project No. 2106.
Nichols, F.H., M.M. Pamatmat. 1988. The Ecology of the Soft-Bottom Benthos of San Francisco Bay: A Community Profile. U.S. Fish and Wildlife Service. Biological Report 85(7.23) 73 pp.
NMFS. See National Marine Fisheries Service.
Ozen, O., and R.L. Noble. 2002. Relationship between Water Level Fluctuations and Largemouth Bass Spawning in a Puerto Rico Reservoir. In Black Bass: Ecology, Conservation, and Management, ed. D. P. Phillip and M. S. Ridgway. American Fisheries Society. Bethesda, Maryland.
Pennak, R.W. 1989. Fresh-water Invertebrates of the United States: Protozoa to Mollusca. 3rd Edition. 628 p.
Petrusso, P.A., and D.B. Hayes. 2001. Invertebrate Drift and Feeding Habits of Juvenile Chinook Salmon in the Upper Sacramento River, California. California Fish and Game 87(1):1–18.
Ploskey, G.R. 1986. Impacts of Water-Level Changes on Reservoir Ecosystems, with Implications for Fisheries Management. In Reservoir fisheries Management: Strategies for the 80s, ed. G.E. Hall and M.J. Van Den Avyle. American Fisheries Society, Southern Division. Bethesda, Maryland.
Proctor, T., B. Kerans, and P. Clancey. 2007. National Management and Control Plan for the New Zealand mudsnail Potamopyrgus antipodarum. Prepared for the Aquatic Nuisance Species Task Force by the New Zealand Mudsnail Management and Control Plan Working Group.
30-42 Draft – June 2013

Chapter 30 References
Quinn, T.P. 2005. The Behavior and Ecology of Pacific Salmon and Trout. University of Washington Press. Seattle, Washington.
Ratcliff, D.R. 2006. Evaluating the Impactiveness of Grass Bed Treatments as a Habitat for Juvenile Bass in a Drawdown Reservoir. Master’s thesis. Utah State University, Logan, Utah.
Reclamation. See U.S. Department of the Interior, Bureau of Reclamation.
Reeves, G.H., P.A. Bisson, and J.M. Dambacher. 1998. Fish Communities. In River Ecology And Management: Lessons from the Pacific Coastal region, ed. R.J. Naiman and R.E. Bilby, 200–234. Springer. New York.
Resources Agency. See The Resources Agency, State of California.
RHJV. See Riparian Habitat Joint Venture.
Riparian Habitat Joint Venture. 2004. The Riparian Bird Conservation Plan: A Strategy for Reversing the Decline of Riparian Associated Birds in California. Version 2.0. California Partners in Flight and the Riparian Habitat Joint-Venture. Stinson Beach, California.
Rode, M. 1988. California Wild Trout Management Program: McCloud River Wild Trout Area Management Plan. Inland Fisheries Administrative Report. California Department of Fish and Wildlife. Redding, California.
———. 1989. Administrative Draft—California Wild Trout Management Program, McCloud River Wild Trout Area Management Plan. California Department of Fish and Wildlife, Inland Fisheries. Sacramento, California.
Rode, M., and M. Dean. 2004. Lower McCloud River Wild Trout Area Fishery Management Plan 2004 through 2009. California Department of Fish and Wildlife, Northern California, North Coast Region. Redding, California.
Rosenfield, J.A., R.D. Baxter. 2007 . Population dynamics and distribution patterns of longfin smelt in the San Francisco estuary. Transactions of the American Fisheries Society 136:1577-1592.
Rosenfield, J.A. 2010 . Life history conceptual model and sub-models for longfin smelt, San Francisco Estuary population. Delta Regional Ecosystem Restoration Implementation Plan, May 2010.Ruhl, C.A., P.E. Smith, J.J. Simi, and J.R. Burau. 2006. The Pelagic Organism Decline and Long-Term Trends in Sacramento–San Joaquin Delta Hydrodynamics. CALFED Science Conference, October 23-25, 2006, Sacramento, California.
30-43 Draft – June 2013
Shasta Lake Water Resources Investigation Environmental Impact Statement
Rundle, S.D., and A.G. Hildrew. 1990. The Distribution of Micro-Arthropods in Some Southern English Streams: the Influence of Physicochemistry. Freshwater Biology 23:411–432.
Sacramento County. 1993 (December). Land Use Element. In the 1993 County of Sacramento General Plan. Adopted December 15, 1993, and revised May 2, 1997, including Policy Amendments per the Agricultural-Residential Study adopted on February 11, 2004, by Resolution No. 2004-0174, Control No. 02-GPB-0379. Planning and Community Development Department. Sacramento, California.
Sacramento River Watershed Program. 2002 (June). 2000–2001 Annual Monitoring Report. Sacramento, California.
Sacramento River Watershed Keeper. 2013. Available: <http://www.sacriver.org/aboutwatershed/roadmap/watersheds/feather/lower-feather-river-watershed>. Accessed: March 27, 2013.
Saito, L., B.M. Johnson, J. Bartholow, and R. Blair Hanna. 2001. Assessing Ecosystem Effects of reservoir Operations Using Food Web-Energy Transfer and Water Quality Models. Ecosystems 4:105–125.
San Francisco Estuary Project. 2011. State of the Bay Report. Available: < http://www.sfestuary.org/about-the-estuary/sotb/>. Accessed: March 20, 2013.
Schaffter, R.G., P.A. Jones, and J.G. Karlton. 1983. Sacramento River and Tributaries Bank Protection and Erosion Control Investigation—Evaluation of Impacts on Fisheries. California Department of Fish and Wildlife. Prepared for U.S. Army Corps of Engineers, Sacramento District, Sacramento, California.
SFEP. See San Francisco Estuary Project.
Shasta County. 2004 (September). Shasta County General Plan 2004. Redding, California.
Simi, J., and C. Ruhl. 2005. Summary of Delta Hydrology Data Water Years 1985–2004. In IEP Synthesis of 2005 Work to Evaluate the Pelagic Organism Decline (POD) in the Upper San Francisco Estuary.
Smock, L.A. 1996. Macroinvertebrate Movements: Drift, Colonization and Emergence. Chapter 17 in Methods in Stream Ecology, ed. F.R. Hauer and G.A. Lamberti. Academic Press, San Diego, California.
Sommer, T.R., L. Conrad, G. O’Leary, F. Feyrer, and W.C. Harrell. 2002. Spawning and Rearing of Splittail in a Model Floodplain Wetland. Transactions of the American Fisheries Society 131:966–974.
30-44 Draft – June 2013

Chapter 30 References
Sommer, T.R, M.L. Nobriega, W.C. Harrell, W. Batham, and W.J. Kimmerer. 2001. Floodplain Rearing of Juvenile Chinook Salmon: Evidence of Enhanced Growth and Survival. Canadian Journal of Fisheries and Aquatic Sciences 58:325–333.
Sommer, T.R., R. Baxter, and B. Herbold. 1997. Resilience of Splittail in the Sacramento–San Joaquin Estuary. Transactions of the American Fisheries Society 126:961–976.
Sommer, T.R., W.C. Harrell, M.L. Nobriga, and R. Kurth. 2003. Floodplain as Habitat for Native Fish: Lessons from California’s Yolo Bypass. California Department of Water Resources and UC Davis Department of Wildlife, Fisheries and Conservation Biology, Sacramento and Davis, California. In California Riparian Systems: Processes and floodplain management, ecology, and restoration, ed. P.M. Faber, 81–87. 2001 Riparian Habitat and Floodplains Conference Proceedings. Riparian Habitat Joint Venture, Sacramento, California.
Spidle, A.P., J.E. Marsden, and B. May. 1994. Identification of the Great Lakes Quagga Mussel as Dressenia bugensis from the Dnieper River, Ukraine, on the Basis of Allozyme Variation. Canadian Journal of Fisheries and Aquatic Science 51:1485–1489.
Stables, T.B., G.L. Thomas, S.L. Thiesfeld, and B.G. Pauley. 1990. Effects of Reservoir Enlargement and Other Factors on the Yield of Wild Rainbow and Cutthroat Trout in Spada Lake, Washington. North American Journal of Fisheries Management 10:305–314.
Stevens, D.E., D.W. Kohlhorst, L.W. Miller, and D.W. Kelley. 1985. The Decline of Striped Bass in the Sacramento–San Joaquin Estuary, California. Transactions of the American Fisheries Society 114:12–30.
Stevens, D.E., and L.W. Miller. 1983. Effects of River Flow on Abundance of Young Chinook Salmon, American Shad, Longfin Smelt, and Delta Smelt in the Sacramento–San Joaquin River System. North American Journal of Fisheries Management 3:425–437.
Stillwater Sciences. 2006. Sacramento River Ecological Flow Study: State of the System Report. Berkeley, California. Prepared for The Nature Conservancy, Arlington, Virginia.
Stuber, R.J., G. Gebhart, and O.E. Maughan. 1982. Habitat Suitability Index Models: Largemouth Bass. U.S. Fish and Wildlife Service. Washington, D.C.
30-45 Draft – June 2013

Shasta Lake Water Resources Investigation Environmental Impact Statement
The Resources Agency, State of California. 1989 (January). Upper Sacramento River Fisheries and Riparian Habitat Management Plan. Prepared by an Advisory Council established by Senate Bill 1086, authored by Senator Jim Nielsen. Sacramento, California.
———. 2003 (September). Sacramento River Conservation Area Forum Handbook. Sacramento, California. Prepared by the Sacramento River Advisory Council established by Senate Bill 1086, authored by Jim Nielsen, and revised and updated by the Sacramento River Conservation Area Forum. Sacramento, California.
Thomson J.R., W.J. Kimmerer, L.R. Brown, K.B. Newman, R. MacNally, W.A. Bennett, F. Feyrer, and E. Fleishman. 2010. Bayesian change point analysis of abundance trends for pelagic fishes in the upper San Francisco Estuary. Ecological Applications 20(5):1431-1448.
Trush, W.J., S.M. McBain, and L.B. Leopold. 2000. Attributes of an Alluvial River and Their Relation to Water Policy and Management. Proceedings of the National Academy of Sciences 97:11858–11863.
Unger, P.A. 1994. Quantifying Salinity Habitat of Estuarine Species. Newsletter. Interagency Ecological Program for the Sacramento–San Joaquin Estuary, Autumn:7–10.
USACE. See U.S. Army Corps of Engineers.
USACE and The Reclamation Board. See U.S. Army Corps of Engineers and State of California Reclamation Board.
U.S. Army Corps of Engineers. 1999 (March). Sacramento–San Joaquin Comprehensive Study Post Flood Assessment, Regulated Flood Flow Frequency Analysis for the Sacramento/San Joaquin River Basins and Delta Tributaries.
U.S. Army Corps of Engineers and State of California Reclamation Board. 2002 (December 20). Sacramento and San Joaquin River Basins California Comprehensive Study. Interim report. Sacramento District. Sacramento, California.
U.S. Department of Agriculture, Forest Service. 2003. Sierra Nevada Forest Plan Amendment: Draft Supplemental Environmental Impact Statement. Vallejo, California.
U.S. Department of the Interior, Bureau of Reclamation. 2004 (June). Shasta Lake Water Resources Investigation Initial Alternatives Information Report. Mid-Pacific Region. Sacramento, California.
30-46 Draft – June 2013

Chapter 30 References
U.S. Department of the Interior, Fish and Wildlife Service. 2008 (December). Formal Endangered Species Act Consultation on the Proposed Operations of the Central Valley Project (CVP) and State Water Project (SWP). Final. Sacramento, California.
USFS. See U.S. Department of Agriculture, Forest Service.
USFWS. See U.S. Department of the Interior, Fish and Wildlife Service.
Vogel, D.A., and K.R. Marine. 1991. Guide to Upper Sacramento River Chinook Salmon Life History. CH2M HILL, Redding, California. Prepared for the U.S. Department of the Interior, Bureau of Reclamation, Central Valley Project.
Wang, J.C.S. 1986. Fishes of the Sacramento–San Joaquin Estuary and Adjacent Waters, California: A Guide to the Early Life Histories. IEP Technical Report No. 9. California Department of Water Resources and California Department of Fish and Wildlife, Sacramento, California, and U.S. Department of the Interior, Bureau of Reclamation, and U.S. Fish and Wildlife Service, Washington, D.C.
Wanger. 2007. Case 1:05-cv-01207-OWW-NEW.
Waters, T.F. 1965. Interpretation of Invertebrate Drift in Streams. Ecology 46:327–334.
———. 1972. The Drift of Stream Insects. Annual Review of Entomology 17:253–272.
———. 1995. Sediment in Streams—Sources, Biological Effects and Control. American Fisheries Society Monograph 7, Bethesda, Maryland.
Weaver J. and S. Mehalick. 2008. Hat Creek 2008 Summary Report. State of California Resources Agency. Department of Fish and Game. Heritage and Wild Trout Program. Rancho Cordova, California.
Weidlein, W.D. 1971. Summary progress report on the Shasta Lake Trout management investigations, 1967 through 1970. Inland Fisheries Administrative Report 71-13. California Department of Fish and Wildlife, Inland Fisheries, Redding, California.
Wilber D.H., and D.G. Clarke. 2001. Biological effects of suspended sediments: a review of suspended sediment impacts on fish and shellfish with relation to dredging activities in estuaries. North American Journal of Fisheries Management 21(4):855-75.
30-47 Draft – June 2013

Shasta Lake Water Resources Investigation Environmental Impact Statement
Wiley, M.J., and S.L. Kohler. 1984. Behavioral Adaptations of Aquatic Insects. In The Ecology of Aquatic Insects, ed. V. Resh and D. Rosenberg. New York, New York: Praeger Press, CBS Inc.
Zustak, J. 2007. U.S. Forest Service, Washington, D.C. Personal communication.
———. U.S. Fish and Wildlife Service, Washington, D.C. 2009—personal communication.
Chapter 12, “Botanical Resources and Wetlands”
Bagstad, K.J., J.C. Stromberg, and S.J. Lite. 2005. Response of Herbaceous Riparian Plants to Rain and Flooding on the San Pedro River, Arizona, USA. Wetlands 25(1):210–223.
Baldwin et al. 2012. The Jepson Manual Vascular Plants of California. Second Edition. University of California Press.
BLM. See U.S. Department of the Interior, Bureau of Land Management.
Bossard, C.C., J.M. Randall, and M.C. Hoshovsky. 2000. Invasive Plants of California’s Wildlands. University of California Press. Berkeley, California.
Burns, R.M., and B.H. Honkala. 1990. Silvics of North America: Volume 2, Hardwoods. Agricultural Handbook 654. U.S. Forest Service. Washington, D.C.
CALFED. See CALFED Bay-Delta Program.
CALFED Bay-Delta Program. 2000a (July). Ecosystem Restoration Program Plan Volume I: Ecological Attributes of the San Francisco Bay-Delta Watershed. Final Programmatic Environmental Impact Statement/Environmental Impact Report Technical Appendix. Sacramento, California.
———. 2000b (August 28). Final Programmatic Environmental Impact Statement and Environmental Impact Report. Programmatic Record of Decision. Sacramento, California.
———. 2000c (July). Multi-Species Conservation Strategy. Sacramento, California.
———. 2000d (August). Final Programmatic Record of Decision. Sacramento, California.
30-48 Draft – June 2013

Chapter 30 References
California Bay-Delta Authority. 2005 (June). Sacramento River–Chico Landing Subreach Habitat Restoration Project Draft Environmental Impact Report. State Clearinghouse No. 2004112024. Sacramento, California. Lead agency: California Bay-Delta Authority. Project proponent: The Nature Conservancy. Prepared by EDAW, Sacramento, California.
California Department of Water Resources. 2012. 2012 Central Valley Flood Protection Plan. Attachment 9B, Status and Trends of the Riparian and Riverine Ecosystems of the Systemwide Planning Area. Sacramento, California
California Invasive Plant Council. 2006 (February). California Invasive Plant Inventory. Cal-IPC Publication 2006-02. Berkeley, California.
———. 2012. California Invasive Plant Council Web site. Available: <http://www.cal-ipc.org/>. Accessed December 2012.
Cal-IPC. See California Invasive Plant Council.
California Native Plant Society. 2011. Electronic Inventory of Rare and Endangered Vascular Plants of California. Available: <http://cnps.web.aplus.net/cgi-bin/inv/inventory.cgi>. Accessed July 11, 2011.
California Natural Diversity Database. 2007 (March). Rarefind: A Database Application for the Use of the California Department of Fish and Wildlife’s Natural Diversity Database. California Natural Heritage Division, California Department of Fish and Wildlife, Sacramento, California.
CBDA. See California Bay-Delta Authority.
City of Colusa. 2007 (May). City of Colusa Draft General Plan. Colusa, California.
City of Redding. 2000 (October 3). City of Redding 2000–2020 General Plan. Adopted by Resolution No. 2000-166. Development Services Department, Redding, California.
CNDDB. See California Natural Diversity Database.
CNPS. See California Native Plant Society.
Conard, S.G., R.L. MacDonald, and R.F. Holland. 1977. Riparian Vegetation and Flora of the Sacramento Valley. Pages 47–55 in A. Sands (ed.), Riparian Forests of California: Their Ecology and Conservation. Institute of Ecology Publication No. 15. University of California. Davis, California.
30-49 Draft – June 2013

Shasta Lake Water Resources Investigation Environmental Impact Statement
DeWoody, J., L. Lindstrand III, V. Hipkins, and J.K. Nelson.2012a. Population Genetics of Neviusia Cliftonii (Shasta Snow-Wreath): Patterns of Diversity in a Rare Endemic. Western North American Naturalist 72(4) pp. 457-472.
DeWoody, J., V. Hipkins, J.K. Nelson, and L. Lindstrand III. 2012b. Genetic Structure of Vaccinium parvifolium (Ericaceae) in Northern California Reveals Potential Systematic Distinctions. Madrono 59(4):196–210.
DWR. See California Department of Water Resources.
Environmental Laboratory. 1987. Corps of Engineers Wetlands Delineation Manual. U.S. Army Engineer Waterways Experiment Station. Vicksburg, Mississippi.
Fremier, A.K. 2003. Floodplain Age Modeling Techniques to Analyze Channel Migration and Vegetation Patch Dynamics along the Sacramento River, California. Master’s thesis. University of California, Davis, Davis, California.
Friedman, J.M., and G.T. Auble. 1999. Mortality of Riparian Box Elder from Sediment Mobilization and Extended Inundation. Regulated Rivers; Research and Management 15:463–476.
Glenn County. 1993 (June 15). Glenn County General Plan, Volume I, Policies. Glenn County Planning and Public Works Agency. Willows, California.
Harris, R.R. 1987. Occurrence of Vegetation on Geomorphic Surfaces in the Active Floodplain of a California Alluvial Stream. The American Midland Naturalist 118(2):393–405.
Holland, R.F. 1986. Preliminary Descriptions of the Terrestrial Natural Communities of California. The Resources Agency, California Department of Fish and Wildlife, Nongame-Heritage Program. Sacramento, California.
Hunter, J.C., J.C. Sterling, W.P. Widdowson, E.C. Beedy, D. Stralberg, and N. Nur. 2003. The Abundance and Distribution of Non-native Woody Species in Sacramento Valley Riparian Zones. C. Pirosko (ed.), Proceedings California Invasive Plant Council Symposium Volume 7: 2003, 39-45. California Invasive Plant Council, Berkeley, California.
Hunter, J.C., K.B. Willett, M.C. McCoy, J.F. Quinn, and K.E. Keller. 1999. Prospects for Preservation and Restoration of Riparian Forests in the Sacramento Valley, California. Environmental Management 24(1):65–75.
30-50 Draft – June 2013
Chapter 30 References
Karrenberg, S., P.J. Edwards, and J. Kollmann. 2002. The Life History of Salicaeae Living in the Active Zone of Floodplains. Freshwater Biology 47:733–748.
Keddy, P.A. 2000. Wetland Ecology: Principles and Conservation. Cambridge University Press, New York.
Larsen, E.W., A.K. Fremier, and S.E. Greco. 2006. Cumulative Effective Stream Power and Bank Erosion on the Sacramento River, California, USA. Journal of the American Water Resources Association 42(4):1077–1097.
Leyer, I. 2005. Predicting Plant Species’ Responses to River Regulation: The Role of Water Level Fluctuations. Journal of Applied Ecology 42:239–250.
Lindstrand, L. 2005. California Noteworthy Collections: Neviusia cliftonii. J.R. Shevock, B. Ertter, and D. Taylor. Madroño 52: 126–127.
Lindstrand, L., III, and J. Nelson. 2006. Habitat, Geologic, and Soil Characteristics of Shasta Snow-Wreath (Neviusia cliftonii) Populations. Madrono 53(1):65–68.
Lite, S.J., and J.C. Stromberg. 2005. Surface Water and Ground-water Thresholds for Maintaining Populus–Salix Forests, San Pedro River, Arizona. Biological Conservation 125:153–167.
Mahoney, J.M., and S.B. Rood. 1998. Streamflow Requirements for Cottonwood Seedling Recruitment—An Integrative Model. Wetlands 18:634–645.
Marty, J.T. 2005. Effects of Cattle Grazing on Diversity in Ephemeral Wetlands. Conservation Biology 19(5):1626–1632.
Mayer, K.E., and W.F. Laudenslayer (eds.). 1988. A Guide to the Wildlife Habitats of California. California Department of Forestry and Fire Protection. Sacramento, California.
National Forest Genetics Laboratory. 2010. Population Genetics of Vaccinium parvifolium (Huckleberry). Lab Report, NFGEL Project #238. Placerville, California.
Nelson, J.R. 1994. Rare Plant Survey Guidelines. In M.W. Skinner and B.M. Pavlick (eds.), Inventory of Rare and Endangered Vascular Plants of California. California Native Plant Society. Sacramento, California.
NRCS. See U.S. Department of Agriculture, Natural Resources Conservation Service.
30-51 Draft – June 2013

Shasta Lake Water Resources Investigation Environmental Impact Statement
Pyke, C.R. 2004. Simulating Vernal Pool Hydrologic Regimes for Two Locations in California, USA. Ecological Modelling 173:109–127.
Reclamation. See U.S. Department of the Interior, Bureau of Reclamation.
Reed, P.B., Jr. 1988. National List of Plant Species that Occur in Wetlands: California (Region 0). U.S. Fish and Wildlife Service. Washington, D.C.
Resources Agency. See The Resources Agency, State of California.
RHJV. See Riparian Habitat Joint Venture.
Riparian Habitat Joint Venture. 2004. The Riparian Bird Conservation Plan: A Strategy for Reversing the Decline of Riparian Associated Birds in California. Version 2.0. California Partners in Flight and the Riparian Habitat Joint Venture. Stinson Beach, California.
Roberts, M.D., D.R. Peterson, D.E. Jukkola, and V.L. Snowden. 2002. A Pilot Investigation of Cottonwood Recruitment on the Sacramento River. The Nature Conservancy. Chico, California.
Robins, J.D., and J.E. Vollmar. 2002. Livestock Grazing and Vernal Pools. J.E. Vollmar (ed.), Wildlife and Rare Plant Ecology of Eastern Merced County’s Vernal Pool Grasslands, 401-430. Vollmar Consulting, Berkeley, California.
Sacramento County. 1993 (December). County of Sacramento General Plan Land Use Element. Adopted December 15, 1993, and revised May 2, 1997, including Policy Amendments per the Agricultural-Residential Study adopted on February 11, 2004, by Resolution No. 2004-0174, Control No. 02-GPB-0379. Planning and Community Development Department. Sacramento, California.
Sawyer, J.O., and T. Keeler-Wolf. 1995. A Manual of California Vegetation. California Native Plant Society. Sacramento, California.
Sawyer, J.O., T. Keeler-Wolf, and J.M. Evens. 2009. A Manual of California Vegetation. Second edition. California Native Plant Society Press. Sacramento, California.
Shasta County. 2004 (September). Shasta County General Plan. Redding, California.
Soil Survey Staff. See Soil Survey Staff, U.S. Natural Resources Conservation Service.
30-52 Draft – June 2013

Chapter 30 References
Soil Survey Staff, U.S. Natural Resources Conservation Service. 2010. Web Soil Survey. Available: <http://websoilsurvey.nrcs.usda.gov/>. Accessed December 12, 2010.
Solomeshch, A.I., M.G. Barbour, and R.F. Holland. 2007. Vernal Pools. Barbour, M.G., T. Keeler-Wolf, and A.A. Schoenherr (eds.), Terrestrial Vegetation of California, 394-424. University of California Press. Berkeley, California.
Stillwater Sciences. 2007. Linking Biological Responses to River Processes: Implications for Conservation and Management of the Sacramento River—a Focal Species Approach. Final Report. Berkeley, California. Prepared for The Nature Conservancy, Chico, California.
Tehama County. 2009 (March). Tehama County General Plan Update 2009–2029. Red Bluff, California. Prepared for Tehama County by PMC. Chico, California.
The Resources Agency, State of California. 1989 (January). Upper Sacramento River Fisheries and Riparian Habitat Management Plan. Prepared by an Advisory Council established by Senate Bill 1086, authored by Jim Nielsen. Sacramento, California.
———. 2003 (September). Sacramento River Conservation Area Forum Handbook. Prepared by the Sacramento River Advisory Council established by Senate Bill 1086, authored by Senator Jim Nielsen, and revised and updated by the Sacramento River Conservation Area Forum. Sacramento, California.
Toner, M., and P. Keddy. 1997. River Hydrology and Riparian Wetlands: A Predictive Model for Ecological Assembly. Ecological Applications 7(1):236–246.
Tu, M. 2000. Vegetation Patterns and Processes of Natural Regeneration in Periodically Flooded Riparian Forests in the Central Valley of California. Dissertation. University of California, Davis. Davis, California.
Tyler, C.M., B. Kuhn, and F.W. Davis. 2006. Demography and Recruitment Limitations of Three Oak Species in California. Quarterly Review of Biology 81(2):127–152.
University of California. 2011. Consortium of California Herbaria. Available: <http://ucjeps.berkeley.edu/consortium>. Accessed June 7, 2011.
USACE. See U.S. Army Corps of Engineers.
30-53 Draft – June 2013

Shasta Lake Water Resources Investigation Environmental Impact Statement
U.S. Army Corps of Engineers. 2006. Interim Regional Supplement to the Corps of Engineers Wetland Delineation Manual: Arid West Region. U.S. Army Engineer Research and Development Center.
U.S. Department of Agriculture, Forest Service. 1995. Shasta-Trinity National Forest Land and Resource Management Plan. Pacific Southwest Region. Shasta-Trinity National Forest, Redding, California.
———. 1996 (March). Management Guide for the Shasta and Trinity Units of the Whiskeytown-Shasta-Trinity National Recreation Area. Pacific Southwest Region. Shasta-Trinity National Forest, Redding, California.
———. 2007. Personal communications regarding USFS Region 5 sensitive species list and information from various U.S. Forest Service personnel to Ginger Bolen, North State Resources.
———. 2011. Forest Service Manual, Series 2900 – Invasive Species Management, Amendment 2900-2011-1, effective December 5, 2011.
U.S. Department of Agriculture, Natural Resources Conservation Service. 2006. Field Indicators of Hydric Soils in the United States. Version 6.0. G. W. Hurt and L. M. Vasilas (eds.). U.S. Department of Agriculture. In cooperation with the National Technical Committee for Hydric Soils.
U.S. Department of Agriculture, Forest Service, and U.S. Department of the Interior, Bureau of Land Management. 1994. Record of Decision for Amendments to Forest Service and Bureau of Land Management Planning Documents within the Range of the Northern Spotted Owl. April 13, 1994.
———. 2001. Record of Decision and Standards and Guidelines for Amendments to the Survey and Manage, Protection Buffer, and other Mitigation Measures Standards and Guidelines. U.S. Department of Agriculture, Forest Service, and U.S. Department of the Interior, Bureau of Land Management. January 2001.
———. 2011. 2011 Settlement Agreement in Litigation over the Survey and Manage Mitigation Measure in Conservation Northwest et al. v. Sherman et al., Case No. 08-1067-JCC (W.D. Wash.). FS-Memorandum, BLM-Instruction Memorandum No. OR-2011-063. July 21, 2011.
U.S. Department of the Interior, Bureau of Land Management. 1992 (July). Proposed Redding Resource Management Plan and Final Environmental Impact Statement. Redding Resource Area, California.
———. 1993 (June). Redding Resource Management Plan and Record of Decision. Redding Resource Area, California.
30-54 Draft – June 2013

Chapter 30 References
U.S. Department of the Interior, Bureau of Reclamation. 2003 (March). Shasta Lake Water Resources Investigation, Mission Statement Milestone Report. Mid-Pacific Region. Sacramento, California.
———. 2004. Shasta Lake Water Resources Investigation Initial Alternatives Information Report. Mid-Pacific Region. Sacramento, California.
———. 2007 (March). Draft Shasta Lake Water Resources Investigation Plan Formulation Report. Mid-Pacific Region. Sacramento, California.
U.S. Department of the Interior, Fish and Wildlife Service. 2001 (May). Environmental Assessment for Proposed Restoration Activities on the Sacramento River National Wildlife Refuge (Ryan, Ohm, Haleakala, Pine Creek, Kaiser, Phelan Island, Koehnen, Hartley Island, and Stone Units). Willows, California. Prepared by Jones & Stokes, Sacramento, California.
———. 2005 (June). Sacramento River National Wildlife Refuge Final Comprehensive Conservation Plan and Environmental Assessment and Finding of No Significant Impact. Prepared by U.S. Fish and Wildlife Service Region 1, California/Nevada Refuge Planning Office, Sacramento, California, and Sacramento National Wildlife Complex, Willows, California.
———. 2006 (February 10). Endangered and Threatened Wildlife and Plants; Designation of Critical Habitat for Four Vernal Pool Crustaceans and Eleven Vernal Pool Plants; Final Rule. Federal Register 71:7117–7316.
———. 2007 (August 16). Database of Federal Endangered and Threatened Species that Occur in or May be Affected by Projects in the Shasta Dam, Redding, Enterprise, Cottonwood, Ball’s Ferry, Bend, and Red Bluff East U.S. Geological Survey 7½-Minute Quadrangles.
———. 2008 (December). Formal Endangered Species Act Consultation on the Proposed Operations of the Central Valley Project (CVP) and State Water Project (SWP). Final. Sacramento, California.
———. 2011. 2011. Online Database of Federal Endangered and Threatened Species that Occur in or May be Affected by Projects in Shasta County. Document Number: 110210023103. February 10, 2011. http://www.fws.gov/sacramento/es/spp_lists/auto_list.cfm.
USFS. See U.S. Department of Agriculture, Forest Service.
USFS and BLM. See U.S. Department of Agriculture, Forest Service, and U.S. Department of the Interior, Bureau of Land Management.
USFWS. See U.S. Department of the Interior, Fish and Wildlife Service.
30-55 Draft – June 2013

Shasta Lake Water Resources Investigation Environmental Impact Statement
Vaghti, M.G., and S.E. Greco. 2007. Riparian Vegetation of the Great Valley. Pages 425–449 in M.G. Barbour, T. Keeler-Wolf, and A. Schoenherr (eds.), Terrestrial Vegetation of California. University of California Press. Berkeley, California.
Van Eck, W.H.J.M., J.P.M. Lenssen, H.M. van de Steeg, C.W.P.M. Blom, and H. de Kroon. 2006. Seasonal Dependent Effects of Flooding on Plant Species Survival and Zonation: a Comparative Study of 10 Terrestrial Grassland Species. Hydrobiologia 565:59–69.
Williams, C.A., and D.J. Cooper. 2005. Mechanisms of Riparian Cottonwood Decline along Regulated Rivers. Ecosystems 8:382–395.
Chapter 13, “Wildlife Resources”
Baldwin et al. 2012. The Jepson Manual Vascular Plants of California. Second Edition. University of California Press.
Belluomini, L. 1980. Nongame Wildlife Investigations: Status of the Ringtail in California. Prepared for California Department of Fish and Wildlife.
BLM. See U.S. Department of the Interior, Bureau of Land Management.
Burke, T.E., J.S. Applegarth, and T.R. Weasma. 1999. Management Recommendations for Survey and Manage Terrestrial Mollusks Version 2.0.
CALFED. See CALFED Bay-Delta Program.
CALFED Bay-Delta Program. 2000a (July). Ecosystem Restoration Program Plan. Volume I. Ecological Attributes of the San Francisco Bay-Delta Watershed. Final Programmatic Environmental Impact Statement/Environmental Impact Report Technical Appendix. Sacramento, California.
———. 2000b (July). Multi-Species Conservation Strategy. Sacramento, California.
———. 2000c (July). Final Programmatic Environmental Impact Statement/Environmental Impact Report. Prepared by U.S. Department of the Interior, Bureau of Reclamation, U.S. Fish and Wildlife, National Marine Fisheries Service, U.S. Environmental Protection Agency, Natural Resources Conservation Service, U.S. Army Corps of Engineers, and California Resources Agency. Sacramento, California.
———. 2000d (August). Final Programmatic Record of Decision. Sacramento, California.
30-56 Draft – June 2013

Chapter 30 References
California Bay-Delta Authority. 2005 (June). Sacramento River–Chico Landing Subreach Habitat Restoration Project Draft Environmental Impact Report. Sacramento, California. State Clearinghouse No. 2004112024. Lead agency: California Bay-Delta Authority. Project proponent: The Nature Conservancy. Prepared by EDAW, Sacramento, California.
California Department of Fish and Game. 1994. Amphibian and Reptile Species of Special Concern in California, Western Pond Turtle: California Department of Fish and Wildlife.
———. 1998. Critical Deer Range (ds277). Redding, California.
———. 2003. Comprehensive Management Plan for the Sacramento River Wildlife Area. Sacramento, California.
California Natural Diversity Database. 2012 (August). Rarefind: A Database Application for the Use of the California Department of Fish and Wildlife’s Natural Diversity Database: Query of Shasta Dam, Redding, Enterprise, Cottonwood, Balls Ferry, Bend, and Red Bluff East Quadrangles only. California Natural Heritage Division, California Department of Fish and Wildlife, Sacramento, California.
CBDA. See California Bay-Delta Authority.
CDFG. See California Department of Fish and Game.
City of Colusa. 2007 (October 30). City of Colusa General Plan 2005–2025. Adopted by Resolution No. 07-30. Colusa, California. Prepared by Pacific Municipal Consultants, Chico, California, and North Fork Associates, Auburn, California.
City of Redding. 2000 (October 3). City of Redding 2000–2020 General Plan. Adopted by Resolution No. 2000-166. Development Services Department, Redding, California.
CNDDB. See California Natural Diversity Database.
Fremier, A.K. 2003. Floodplain Age Modeling Techniques to Analyze Channel Migration and Vegetation Patch Dynamics along the Sacramento River, California. Master’s thesis. University of California, Davis. Davis, California.
Glenn County. 1993 (June 15). Glenn County General Plan. Volume 1, Policies. Glenn County Planning and Public Works Agency, Willows, California.
Mayer, K.E., and W.F. Laudenslayer Jr. (eds.). 1988. A Guide to Wildlife Habitats of California. California Department of Forestry and Fire Protection. Sacramento, California.
30-57 Draft – June 2013

Shasta Lake Water Resources Investigation Environmental Impact Statement
National Marine Fisheries Service. 2009 (June 4). Biological Opinion and Conference Opinion on the Long-Term Central Valley Project and State Water Project. Southwest Region. Long Beach, California.
NMFS. See National Marine Fisheries Service.
Pagel, J.E. 1992. Protocol for Observing Known and Potential Peregrine Falcon Eyries in the Pacific Northwest. Paper read at symposium on peregrine falcons in the Pacific Northwest, January 16–17, 1991, at Medford, Oregon.
Reclamation. See U.S. Department of the Interior, Bureau of Reclamation.
Resources Agency. See The Resources Agency, State of California.
RHJV. See Riparian Habitat Joint Venture.
Riparian Habitat Joint Venture. 2004. The Riparian Bird Conservation Plan: A Strategy for Reversing the Decline of Riparian Associated Birds in California. Version 2.0. California Partners in Flight and the Riparian Habitat Joint Venture. Stinson Beach, California.
Sacramento County. 2011 (November 9). Sacramento County General Plan of 2005-2030 as Amended November 9, 2011. Prepared by the Community Planning and Development Department, Sacramento County, California.
Shasta County. 2004 (September). Shasta County General Plan. Redding, California.
Shuford, W.D., and T. Gardali (eds.). 2008. California Bird Species of Special Concern: A Ranked Assessment of Species, Subspecies, and Distinct Populations of Birds of Immediate Conservation Concern in California. Studies of Western Birds 1. Western Field Ornithologists, Camarillo, California, and California Department of Fish and Wildlife, Sacramento, California.
Sutter County. 2010 (September). Sutter County 2030 General Plan. Public Draft. Yuba City, California. Prepared in consultation with PBS&J, DKS Associates, West Yost Associates, and Willdan Financial Services.
Tehama County. 2009 (March). Tehama County General Plan Update 2009–2029. Red Bluff, California. Prepared for Tehama County by PMC. Chico, California.
The Nature Conservancy, Stillwater Sciences, and ESSA Technologies. 2008 (March). Sacramento River Ecological Flows Study. Final Report. Chico, California; Berkeley, California; and Vancouver, B.C., Canada.
30-58 Draft – June 2013

Chapter 30 References
Prepared for CALFED Ecosystem Restoration Program, Sacramento, California.
The Resources Agency, State of California. 1989 (January). Upper Sacramento River Fisheries and Riparian Habitat Management Plan. Prepared by an Advisory Council established by Senate Bill 1086, authored by Senator Jim Nielsen. Sacramento, California.
———. 2003 (September). Sacramento River Conservation Area Forum Handbook. Sacramento, California. Prepared by the Sacramento River Advisory Council established by Senate Bill 1086, authored by Jim Nielsen, and revised and updated by the Sacramento River Conservation Area Forum. Sacramento, California.
TNC et al. See The Nature Conservancy, Stillwater Sciences, and ESSA Technologies.
University of Michigan Museum of Zoology. 2009. UMMZ, Amphibian and Reptile Catalogue. Available: <http://quod.lib.umich.edu/cgi/i/image/image-idx?id=S-AMPH3IC-X-71495%5DNOFILE>. Accessed February 5, 2009.
U.S. Department of Agriculture, Forest Service. 1995 (April 28). Shasta-Trinity National Forest Land and Resource Management Plan. Pacific Southwest Region. Shasta-Trinity National Forest, Redding, California.
———. 1996 (March). Management Guide for the Shasta and Trinity Units of the Whiskeytown-Shasta-Trinity National Recreation Area. Pacific Southwest Region. Shasta-Trinity National Forest, Redding, California.
———. 2007. Shasta-Trinity Forest Web site list of plants, the USFS Region 5 sensitive animals list and information from various USFS personnel to Ginger Bolen of North State Resources.
U.S. Department of Agriculture, Forest Service, and U.S. Department of the Interior, Bureau of Land Management. 1994. Record of Decision for Amendments to Forest Service and Bureau of Land Management Planning Documents Within the Range of the Northern Spotted Owl. April 13, 1994.
———. 2001. Record of Decision and Standards and Guidelines for Amendments to the Survey and Manage, Protection Buffer, and other Mitigation Measures Standards and Guidelines. U.S. Department of Agriculture, Forest Service, and U.S. Department of the Interior, Bureau of Land Management. January 2001.
———. 2011. 2011 Settlement Agreement in Litigation over the Survey and Manage Mitigation Measure in Conservation Northwest et al. v.
30-59 Draft – June 2013

Shasta Lake Water Resources Investigation Environmental Impact Statement
Sherman et al., Case No. 08-1067-JCC (W.D. Wash.). FS-Memorandum, BLM-Instruction Memorandum No. OR-2011-063. July 21, 2011.
U.S. Department of the Interior, Bureau of Land Management. 1992 (July). Proposed Redding Resource Management Plan and Final Environmental Impact Statement. Redding Resource Area, California.
———. 1993 (June). Redding Resource Management Plan and Record of Decision. Redding Resource Area, California.
———. 2005 (August). Proposed Amendment and Environmental Assessment to Amend the Redding Resource Management Plan To Allow Land Sales. Redding Field Office. Redding, California.
U.S. Department of the Interior, Bureau of Reclamation. 2003. Shasta Lake Water Resources Investigation, Mission Statement Milestone Report. Mid-Pacific Region. Sacramento, California. March.
———. 2004 (June). Shasta Lake Water Resources Investigation Initial Alternatives Information Report. Mid-Pacific Region, Sacramento, California.
———. 2007 (March). Shasta Lake Water Resources Investigation Plan Formulation Report. Mid-Pacific Region, Sacramento, California.
U.S. Fish and Wildlife Service. 1999 (July). Conservation Guidelines for the Valley Elderberry Longhorn Beetle.
———. 2001 (May). Final Environmental Assessment for Proposed Restoration Activities on the Sacramento River National Wildlife Refuge (Ryan, Ohm, Haleakala, Pine Creek, Kaiser, Phelan Island, Koehnen, Hartley Island, and Stone Units). Sacramento River National Wildlife Refuge, Willows, California. Prepared by Jones & Stokes, Sacramento, California.
———. 2005a (August). Revised Guidance on Site Assessments and Field Surveys for the California Red-Legged Frog.
———. 2005b (June). Sacramento River National Wildlife Refuge Final Comprehensive Conservation Plan and Environmental Assessment and Finding of No Significant Impact. Prepared by U.S. Fish and Wildlife Service Region 1, California/Nevada Refuge Planning Office, Sacramento, California, and Sacramento National Wildlife Refuge Complex, Willows, California.
30-60 Draft – June 2013
Chapter 30 References
———. 2006 (February 10). Endangered and Threatened Wildlife and Plants; Designation of Critical Habitat for Four Vernal Pool Crustaceans and Eleven Vernal Pool Plants; Final Rule. Federal Register 71:7117–7316.
———. 2007. National Bald Eagle Management Guidelines.
———. 2008 (December). Formal Endangered Species Act Consultation on the Proposed Operations of the Central Valley Project (CVP) and State Water Project (SWP). Final. Sacramento, California.
———. 2011. Online Database of Federal Endangered and Threatened Species that Occur in or May be Affected by Projects in the Shasta Dam, Redding, Enterprise, Cottonwood, Balls Ferry, Bend, and Red Bluff East U.S. Geological Survey 7½-Minute Quadrangles. Last updated September 18, 2011.
USFS. See U.S. Department of Agriculture, Forest Service.
USFS and BLM. See U.S. Department of Agriculture, Forest Service, and U.S. Department of the Interior, Bureau of Land Management.
USFWS. See U.S. Fish and Wildlife Service.
Yolo County. 2009 (November 10). 2030 Countywide General Plan. Adopted November 2009, Resolution No. 09-189. Planning and Public Works Department. Woodland, California.
Chapter 14, “Cultural Resources”
Baker, S. 1990. Archaeological Investigations in the Tower House District, Whiskeytown Unit of the Whiskeytown-Shasta-Trinity National Recreation Area, Shasta County, California. Report submitted to National Park Service, Western Region, San Francisco, California.
Basgall, M.E., and W.R. Hildebrandt. 1989. Prehistory of the Sacramento River Canyon, Shasta County, California. Center for Archaeological Research at Davis Publication No. 9. University of California, Davis.
Bevill, R., and E. Nilsson. 1993. Cultural Resources Survey of the Bend Bridge Park Area, Tehama County, California. Report T-L-150 on file, Northeast Information Center. California State University, Chico.
Broughton, J. 1988. Archaeological Patterns of Prehistoric Fish Exploitation in the Sacramento Valley. Unpublished master’s thesis, California State University, Chico.
30-61 Draft – June 2013

Shasta Lake Water Resources Investigation Environmental Impact Statement
Byrd, B.F., P. Brandy, W.R. Hildebrandt, S. Wee, M. Beason, and T. Webb. 2008. Draft Cultural Resources Alternatives Assessment for the Shasta Lake Water Resources Investigation, Shasta and Tehama Counties, California. Far Western Anthropological Research Group, Inc., and JRP Historical Consulting, Davis, California. Submitted to MWH Americas, Inc., Sacramento, California. Prepared on behalf of U.S. Department of the Interior, Bureau of Reclamation, Mid-Pacific Region, Sacramento, California.
Clewett, S.E., and E. Sundahl. 1982. Clikapudi Archaeological District: 1981 Field Research. Report on file at Shasta-Trinity National Forests, Redding, California.
DuBois, C.A. 1935. Wintu Ethnography. University of California Publications in American Archaeology and Ethnology, Vol. 36. University of California Press, Berkeley, California. pp. 1–148.
Fredrickson, D.A. 1974. Cultural Diversity in Early Central California: A View from the North Coast Ranges. Journal of California Anthropology 1(1):41–54.
George, J. 1981. Faunal Analysis of SHA-266. Unpublished Master’s thesis. California State University, Chico.
Goldschmidt, W.R. 1951. Nomlaki Ethnography. University of California Publications in American Archaeology and Ethnology 42(4):303–443.
———. 1978. Nomlaki. In Handbook of North American Indians, California, Volume 8, ed. R. F. Heizer, 341–349. Smithsonian Institution, Washington, D.C.
Greenway, G.B. 1982. Projectile Point Variability at Dead Man’s Cave (CA-THE-290) in the Southern Cascade Mountains of Northeastern California. Unpublished master’s thesis. California State University, Sacramento.
Haynes, G.M. 2002. The Early Settlement of North America: The Clovis Era. Cambridge University Press. Cambridge.
Hildebrandt, W.R., and J.F. Hayes. 1983. Archaeological Investigations on Pilot Ridge: Six Rivers and Shasta-Trinity National Forests. Report submitted to Six Rivers National Forest, Eureka, California.
———.1993. Settlement Pattern Change in the Mountains of Northwest California: A View from Pilot Ridge. In There Grows a Green Tree: Papers in Honor of David A. Fredrickson, ed. G. White, P. Mikkelsen, W.R. Hildebrandt, and M.E. Basgall, 107–120. Publication No. 11. Center for Archaeological Research, University of California, Davis.
30-62 Draft – June 2013

Chapter 30 References
Johnson, J.J. 1978. Yana. In Handbook of North American Indians, California, Volume 8, ed. R. F. Heizer, 225–235. Smithsonian Institution. Washington, D.C.
———. 1984. Groundstone Assemblages in Northeastern California. Unpublished Ph.D. dissertation. University of California, Davis.
Kowta, M., B. Hamusek, W. Dreyer, R. Bevill, P. Lydon, and E. Wohlgemuth. 2000. Archaeology of the Platina Site, CA-SHA-279, Shasta County, California. Report submitted to Shasta-Trinity National Forest and U.S. Bureau of Land Management, Redding, California.
LaPena, F.R. 1978. Wintu. In Handbook of North American Indians, California, Volume 8, ed. R. F. Heizer, 324–340. Smithsonian Institution. Washington, D.C.
Nilsson, E., W.R. Hildebrandt, and S.A. Waechter. 2008. DRAFT Native American Tribal Coordination, Shasta Lake Water Resources Investigation, California. Far Western Anthropological Research Group, Inc., Davis, California and URS Group. Prepared on behalf of US Bureau of Reclamation Mid-Pacific Region, Sacramento, California. Submitted to MWH Americas, Inc., Sacramento, California.
Olmsted, D.L., and O.C. Stewart. 1978. Achumawi. In Handbook of North American Indians, California, Volume 8, ed. R. F. Heizer, 225–235. Smithsonian Institution, Washington, D.C.
Parker, P.L., and T.F. King. [1990] 1998. National Register Bulletin 38, Guidelines for Evaluating and Documenting Traditional Cultural Properties. Reprint. National Park Service. Washington, D.C.
Sapir, E., and L. Spier. 1943. Notes on the Culture of the Yana. University of California Anthropological Records 3(3):252–253.
Sundahl, E. 1982. The Shasta Complex in the Redding Area, California. Unpublished master’s thesis. California State University, Chico.
———. 1992a. Cultural Patterns and Chronology in the Northern California Sacramento Drainage. In Proceedings of the Society for California Archaeology 5, ed. M.D. Rosen, L.E. Christenson, and D. Laylander, 89–112.
———. 1992b. Archaeological Investigations in the Squaw Creek Drainage, Shasta County, California, Volume 1: Overview. Shasta College Archaeological Laboratory, Redding, California. Submitted to Shasta-Trinity National Forests.
30-63 Draft – June 2013

Shasta Lake Water Resources Investigation Environmental Impact Statement
———. 1999. Archaeological Investigations at CA-SHA-2611/H, The Moccasin Creek Site. Shasta College Archaeological Laboratory. Redding, California.
Sundahl, E., and W. Henn. 1993. Borax Lake Pattern Assemblages on the Shasta-Trinity National Forests, North-Central California. In Journal of California and Great Basin Anthropology 15(1):73–89.
Wohlgemuth, E. 1992. Plant Macrofossils from CA-SHA-47 and CA-SHA-236, Redding, California. In Archaeological Investigations at CA-SHA-47 and CA-SHA-236, Redding, Shasta County, California, by T. Vaughan. Report submitted to Northeast Information Center, Department of Anthropology, California State University, Chico.
Chapter 15, “Indian Trust Assets”
Reclamation. See U.S. Department of the Interior, Bureau of Reclamation.
U.S. Department of the Interior. 1995 (December). Departmental Responsibilities for Indian Trust Resources. Departmental Manual, Part 512, Chapter 2.
U.S. Department of the Interior, Bureau of Reclamation. 2000 (April). Principles for Discharge of the Secretary’s Trust Responsibility. Order No. 3215.
Chapter 16, “Socioeconomics, Population, and Housing”
California Department of Finance. 2010 (May). E-5 Population and Housing Estimates for Cities, Counties, and the State, 2001 and 2010, with 2000 Benchmark. Available: <http://www.dof.ca.gov/research/demographic/ reports/estimates/e-5/2011-20/view.php>. Accessed October 31, 2012.
———. 2012 (May). Interim Population Projections for California and Its Counties 2010-2050. Available: <http://www.dof.ca.gov/research/demographic/reports/projections/interim/view.php>. Accessed October 31, 2012.
California Employment Development Department. 2010a. Labor Force and Employment Rates for Counties. Shasta County, Tehama County, and California. EDD Labor Market Information Division. Available: <http://www.labormarketinfo.edd.ca.gov/?pageid=133>. Accessed December 6, 2012.
———. 2010b. Labor Force and Employment Rates for Cities and Census Designated Places. Anderson, Redding, Red Bluff Shasta Lake, and
30-64 Draft – June 2013
Chapter 30 References
Tehama. EDD Labor Market Information Division. Available: <http://www.labormarketinfo.edd.ca.gov/?pageid=133>. Accessed December 6, 2012.
———. 2010c. Labor Force and Employment Rates for Counties. Shasta County, Siskiyou County Tehama County, and Trinity County. EDD Labor Market Information Division. Available: <http://www.labormarketinfo.edd.ca.gov/?pageid=133>. Accessed December 18, 2012.
———. 2010d. Historical Data for Measures of Income in Shasta County, Siskiyou County Tehama County, and Trinity County. EDD Labor Market Information Division. Available: <http://www.labormarketinfo. edd.ca.gov/cgi/databrowsing/local AreaProQSSelection.asp?menu Choice=localAreaPro&selectedindex=>. Accessed December 14, 2012.
———. 2013a. Major Employers in Counties, 2013. Shasta County. Available: http://www.labormarketinfo.edd.ca.gov/majorer/countymajorer.asp?CountyCode=000089>. Accessed December 7, 2012.
———. 2013b. Major Employers for Counties, 2013. Tehama County. Available: <http://www.labormarketinfo.edd.ca.gov/majorer/countymajorer.asp?CountyCode=000103>. Accessed December 7, 2012.
DOF. See California Department of Finance.
EDD. See California Employment Development Department.
Glenn County. 2009 (November). County of Glenn, State of California, Final Budget for the Fiscal Year 2009–2010. Willows, California.
Reclamation. See U.S. Department of the Interior, Bureau of Reclamation.
Sacramento County. 2009. 2009-10 Adopted Final Budget. Available: <http://www.ofm.saccounty.net/FiscalYear200910BudgetInformation/Pages/200910AdoptedFinalBudget.aspx >. Accessed December 13, 2012.
Shasta County. 2004 (September). Shasta County General Plan. Redding, California.
———. 2011 (March). Shasta County 2009–2014 Housing Element. Redding, California.
State of California. 2012 (June 28). California State Budget 2012–13. Enacted Budget Summary. Sacramento, California. Available: <http://www.ebudget.ca.gov/Enacted/BudgetSummary/BSS/BSS.html>. Accessed November 27, 2012.
30-65 Draft – June 2013

Shasta Lake Water Resources Investigation Environmental Impact Statement
Tehama County. 2009 (March). Tehama County General Plan Update 2009–2028. Red Bluff, California. Prepared for Tehama County by PMC. Chico, California.
U.S. Census Bureau. 2002. California—Census 2000 Demographic Profile Highlights. American FactFinder Fact Sheet. Available: <http://factfinder.census.gov/servlet/SAFFFacts?_event=Search&geo_id=05000US06103&_geoContext=01000US%7C04000US06%7C05000US06103&_street=&_county=&_cityTown=&_state=04000US06&_zip=&_lang=en&_sse=on&ActiveGeoDiv=geoSelect&_useEV=&pctxt=fph&pgsl=050&_submenuId=factsheet_1&ds_name=DEC_2000_SAFF&_ci_nbr=null&qr_name=null®=null%3Anull&_keyword=&_industry=>. Accessed April 12, 2011.
———. 2010a. 2010 Demographic Profile: California and Shasta and Tehama Counties. Available: <http://www.census.gov/popfinder/?s=06>. Accessed November 13, 2012.
———. 2010b. 2010 Demographic Profile: Butte, Contra Costa, Colusa, Glenn, Sacramento, San Joaquin, Solano, Sutter, and Yolo Counties. Available: <http://www.census.gov/popfinder/?s=06>. Accessed November 13, 2012.
———. 2011a. 2009-2011 Community Survey Selected Economic Characteristics, 2009: Shasta and Tehama Counties and California. Available: <http://factfinder2.census.gov/faces/tableservices/jsf/pages/productview.xhtml?fpt=table>. Accessed November 13, 2012.
———. 2011b. 2009–2011 Community Survey Selected Economic Characteristics, 2009: Butte, Contra Costa, Colusa, Glenn, Sacramento, San Joaquin, Solano, Sutter, and Yolo Counties. Available: <http://factfinder2.census.gov/faces/tableservices/jsf/pages/productview.xhtml?fpt=table>. Accessed November 13, 2012.
U.S. Department of the Interior, Bureau of Reclamation. 2004. Shasta Lake Water Resources Investigation Initial Alternatives Information Report. Mid-Pacific Region. Sacramento, California.
Chapter 17, “Land Use and Planning”
BLM. See U.S. Department of the Interior, Bureau of Land Management.
City of Anderson. 2007 (May 1). City of Anderson General Plan. Anderson, California.
City of Red Bluff. 1993. City of Red Bluff General Plan. Red Bluff, California.
30-66 Draft – June 2013

Chapter 30 References
City of Redding. 2000 (October 3). City of Redding 2000–2020 General Plan. Adopted by Resolution No. 2000-166. Development Services Department, Redding, California.
City of Shasta Lake. 1999. City of Shasta Lake General Plan and Final Environmental Impact Report. Shasta Lake, California. Prepared by Diaz and Associates.
Reclamation. See U.S. Department of the Interior, Bureau of Reclamation.
Shasta County. 2003. Shasta County Zoning Code. Redding, California.
———. 2004 (September). Shasta County General Plan. Redding, California.
Tehama County. 2009. Tehama County General Plan Update 2009–2029. Red Bluff, California.
U.S. Department of Agriculture, Forest Service. 1995. Shasta-Trinity National Forest Land and Resource Management Plan. Pacific Southwest Region. Shasta-Trinity National Forest, Redding, California.
———. 1996 (March). Management Guide: Shasta and Trinity Units of the Whiskeytown-Shasta-Trinity National Recreation Area. Pacific Southwest Region. Shasta-Trinity National Forest. Redding, California.
U.S. Department of the Interior, Bureau of Land Management. 1993. Redding Resource Management Plan. Redding, California.
———. 2006. Resource Management Plans for California’s Public Lands. Sacramento, California.
U.S. Department of the Interior, Bureau of Reclamation. 2007. Draft Shasta Lake Water Resources Investigation Utilities and Miscellaneous Minor Infrastructure.
USFS. See U.S. Department of Agriculture, Forest Service.
Chapter 18, “Recreation and Public Access”
BLM. See U.S. Department of the Interior, Bureau of Land Management.
California Department of Boating and Waterways. 2011a. A Boating Trail Guide to the Sacramento River from Redding to Red Bluff. Available: <http://www.dbw.ca.gov/Pubs/Redding/INDEX.HTM>. Accessed January 24, 2011.
30-67 Draft – June 2013

Shasta Lake Water Resources Investigation Environmental Impact Statement
———. 2011b. Safe Boating Hints for the Sacramento River (booklet). Available: <http://www.dbw.ca.gov/Pubs/Sacriver/SactoRiver.pdf>. Accessed January 25, 2011.
California Department of Fish and Game. 2004 (February). Comprehensive Management Plan for the Sacramento River Wildlife Area. Sacramento, California.
———. 2011. Mouth of Cottonwood Creek Wildlife Area Web page. Available: <http://www.dfg.ca.gov/ lands/wa/region1/moithofcottonwood.html>. Accessed January 26, 2011.
California Department of Parks and Recreation. 1990 (January). William B. Ide Adobe State Historic Park General Plan. Approved by the Park and Recreation Commission in January 1990. Sacramento, California.
California Department of Water Resources. 2011a. California Data Exchange Center Web site. Operational Hydrologic Data—Shasta Dam (USBR) (SHA). Available: <http://cdec.water.ca.gov/cgi-progs/queryDaily?SHA>. Accessed April 6, 2011.
———. 2011b. California Data Exchange Center Web site. Operational Hydrologic Data—Sacramento River at Bend Bridge (BND). Available: <http://cdec.water.ca.gov/cgi-progs/queryDaily?BND&d=06-Apr-2011+14:01>. Accessed April 6, 2011.
California State University, Chico, Geographical Information Center. 2006. Sacramento River Recreational and Public Access Guide (RecWeb). Accessed January 27, 2006. Available: <http://www.sacramentoriver.org/access_site.php>. Accessed January 27, 2006.
CDFG. See California Department of Fish and Game.
City of Anderson. 2007 (May 1). City of Anderson General Plan Recreation Element. Anderson, California.
City of Redding. 2000 (October 3). City of Redding 2000–2020 General Plan. Adopted by Resolution No. 2000-166. Development Services Department, Redding, California.
———. 2004. Parks, Trails, and Open Space Master Plan. Redding, California.
CSUC. See California State University, Chico, Geographical Information Center.
DBW. See California Department of Boating and Waterways.
30-68 Draft – June 2013

Chapter 30 References
DWR. See California Department of Water Resources.
Fly Fishing Connection. 2003. Fish Variety on the Sacramento. Available: <http://www.sacramentoriver.org/article.php?article_id=28> and <http://www.flyfishingconnection.com/calowersacramento.html>. Last updated June 30, 2003. Accessed January 27, 2006.
Graefe, A., J.D. Absher, Y. Ye, and G.P. Nyaupane. 2005. Shasta and Trinity Lakes Boating Carrying Capacity Study. Report submitted to the U.S. Forest Service, Pacific Southwest Research Station.
Healthy Shasta. 2008. Sacramento River Trail Map. Available: <http://www.healthyshasta.org/local_maps.php>. Last updated June 2008. Accessed January 25, 2011.
———. 2009. Keswick Area Nonmotorized Trails Map. Available: <http://www.healthyshasta.org/local_maps.php>. Last Updated 2009. Accessed January 25, 2011.
Reclamation. See U.S. Department of the Interior, Bureau of Reclamation.
Shasta County. 2004 (September). Shasta County General Plan. Redding, California.
ShastaLake.com. 2011. Commercial Services at Shasta Lake Web site. Available: <http://www.shaslake.com/services/>. Accessed January 25, 2011.
State Parks. See California Department of Parks and Recreation.
Tehama County. 2009 (March). Tehama County General Plan Update 2009–2029. Red Bluff, California. Prepared for Tehama County by PMC. Chico, California.
Turtle Bay Exploration Park. 2011. Turtle Bay Exploration Park Map. Available: <http://www.turtlebay.org/map>. Accessed January 25, 2011.
Tuthill, B. 2005. California Creeks: Sacramento River from Redding to Red Bluff. Available: <http://www.cacreeks.com/sac-red.htm>. Accessed January 9, 2006.
U.S. Census Bureau. 2011. Shasta County Quick Facts Web site. Available: <http://quickfacts.census.gov/qfd/states/06/06089.html>. Accessed January 25, 2011.
U.S. Department of Agriculture, Forest Service. 1995a. Shasta-Trinity National Forest Land and Resource Management Plan. Pacific Southwest Region. Shasta-Trinity National Forest, Redding, California.
30-69 Draft – June 2013

Shasta Lake Water Resources Investigation Environmental Impact Statement
———. 1995b (February). Mendocino National Forest Land and Resource Management Plan. Mendocino National Forest, Willows, California.
———. 1996 (March). Management Guide for the Shasta and Trinity Units of the Whiskeytown-Shasta-Trinity National Recreation Area. Pacific Southwest Region. Shasta-Trinity National Forest, Redding, California.
———. 2007. Raise Shasta Dam Study (Attachment 1—Current Acreage for Public Facilities). Information to support mitigation analysis provided to AECOM via e-mail by Shasta-Trinity National Forest, National Recreation Area Management Unit (February 2007).
———. 2010a (March). Boat Ramps at Shasta Lake. Shasta-Trinity National Forest, Redding, California.
———. 2010b (July). Shasta Unit Camping. Whiskeytown-Shasta-Trinity National Recreation Area. Shasta-Trinity National Forest, Redding, California.
———. 2010c (March). Shasta Lake Trails Guide. Shasta-Trinity National Forest, Redding, California.
———. 2011 (April). Recreation Facilities Guide—Shasta-Trinity National Forest. Shasta-Trinity National Forest, Redding, California.
U.S. Department of the Interior, Bureau of Land Management. No date. Sacramento River Boating Information—Balls Ferry to Red Bluff. Redding, California.
———. 1992 (July). Proposed Redding Resource Management Plan and Final Environmental Impact Statement. California State Office, Ukiah District, Redding Resource Area. Redding, California.
———. 2006. Redding Field Office Web site. Available: <http://www.ca.blm.gov/redding/>. Updated January 18, 2006. Accessed January 27, 2006.
U.S. Department of the Interior, Bureau of Reclamation. 2003 (February). Shasta Lake Water Resources Investigation, Shasta Reservoir Area Inventory. Mid-Pacific Region. Sacramento, California.
———. 2010 (February 16). Shasta Dam Access Permit (for Shasta-Chappie OHV Area users). Shasta Lake, California.
U.S. Department of the Interior, Fish and Wildlife Service. 2005 (June). Sacramento River National Wildlife Refuge Final Comprehensive Conservation Plan and Environmental Assessment and Finding of No Significant Impact. Prepared by U.S. Fish and Wildlife Service Region
30-70 Draft – June 2013

Chapter 30 References
1, Sacramento River National Wildlife Refuge Complex, Sacramento, California, and Sacramento National Wildlife Refuge Complex, Willows, California.
USFS. See U.S. Department of Agriculture, Forest Service.
USFWS. See U.S. Department of the Interior, Fish and Wildlife Service.
Chapter 19, “Aesthetics and Visual Resources”
California Department of Transportation. 1992. The California Scenic Highway System: A list of eligible and officially designated routes. Available: <http://www.dot.ca.gov/hq/LandArch/scenic/cahisys.html>. Accessed December 11, 2010.
California Department of Transportation, and U.S. Department of Transportation, Federal Highway Administration. 2007 (January). Replacement of the Antlers Bridge (Bridge No. 06-0089) Initial Study/Mitigated Negative Declaration and Environmental Assessment/Finding of No Significant Impact. State Clearinghouse. Sacramento, California and Washington, D.C.
Caltrans. See California Department of Transportation.
DOT. See U.S. Department of Transportation.
Reclamation. See U.S. Department of the Interior, Bureau of Reclamation.
Shasta County. 1994. Shasta County General Plan. Section 6.8, Scenic Highways. Redding, California.
Soares, J.R. 1992. Best Short Hikes In and Around the Northern Sacramento Valley. Chapter 2, Shasta Lake National Recreation Area. The Mountaineer Books.
Trails.com, Inc. 2007. Shasta-Trinity NRA—Shasta Lake Unit Campgrounds. Trails.com, Inc. Available: <http://www.trails.com/tcatalog_trail.asp?trailid=HGS410-006B>. Accessed September 29, 2007.
U.S. Department of Agriculture, Forest Service. 1995a (April 28). Record of Decision for the Final Environmental Impact Statement for the Shasta-Trinity National Forests Land and Resource Management Plant. Pacific Southwest Region. Shasta-Trinity National Forest. Redding, California.
30-71 Draft – June 2013

Shasta Lake Water Resources Investigation Environmental Impact Statement
———. 1995b. Shasta-Trinity National Forest Land and Resource Management Plan. Pacific Southwest Region. Shasta-Trinity National Forest, Redding, California.
———. 1996 (March). Management Guide for the Shasta and Trinity Units of the Whiskeytown-Shasta-Trinity National Recreation Area. Pacific Southwest Region. Shasta-Trinity National Forest, Redding, California.
———. 2007. Geographic Information System Mapping Layers. Provided to North State Resources, Inc., Redding, California, by the U.S. Forest Service, Pacific Southwest Region, Shasta-Trinity National Forest. Redding, California.
U.S. Department of the Interior, Bureau of Reclamation. 2005. Shasta Lake Water Resources Investigation, Shasta and Tehama Counties, California: 70 Federal Register 58744–58746.
———. 2006. Folsom Dam Safety and Flood Damage Reduction Final Environmental Impact Statement/Environmental Impact Report. Vol. III: Final EIS/EIR. Mid-Pacific Region. Folsom, California.
U.S. Department of Transportation, Federal Highway Administration. 1981. Visual Impact Assessment for Highway Projects. Office of Environmental Policy. Washington, D.C.
USFS. See U.S. Department of Agriculture, Forest Service.
Chapter 20, “Transportation and Traffic”
CALFED. See CALFED Bay-Delta Program.
CALFED Bay-Delta Program. 2000a (July). Final Environmental Impact Statement/Environmental Impact Report for the CALFED Bay-Delta Program. Prepared by U.S. Department of the Interior, Bureau of Reclamation, U.S. Fish and Wildlife, National Marine Fisheries Service, U.S. Environmental Protection Agency, Natural Resources Conservation Service, U.S. Army Corps of Engineers, and California Resources Agency. Sacramento, California.
———. 2000b (August 28). Final Programmatic Environmental Impact Statement and Environmental Impact Report. Programmatic Record of Decision. Sacramento, California.
California Department of Transportation. 2006 (May). Standard Specifications, State of California Business, Transportation and Housing Agency, Department of Transportation. Sacramento, California.
30-72 Draft – June 2013

Chapter 30 References
———. 2011. Ramp Volumes on the California State Freeway System District 2.
Caltrans. See California Department of Transportation.
California Department of Transportation and U.S. Department of Transportation, Federal Highway Administration. 2007 (January). Replacement of the Anlters Bridge (Bridge No. 06-0089), Initial Study/Mitigated Negative Declaration and Environmental Assessment/Finding of No Significant Impact. Shasta County, California.
Caltrans and Federal Highway Administration. See California Department of Transportation and U.S. Department of Transportation, Federal Highway Administration.
City of Sacramento. 2005. General Plan Update Technical Background Report. Sacramento, California.
Institute of Transportation Engineers. 1989 (September). Traffic Access and Impact Studies for Site Development. Transportation Planners Council. Washington, D.C.
ITE. See Institute of Transportation Engineers.
Reclamation. See U.S. Department of the Interior, Bureau of Reclamation.
Shasta County. 2004 (September). Shasta County General Plan. Redding, California.
Shasta County Regional Transportation Planning Agency. 2010. Regional Transportation Plan for Shasta County. Redding, California.
Shasta County RTPA. See Shasta County Regional Transportation Planning Agency.
U.S. Department of the Interior, Bureau of Reclamation. 2004. Shasta Lake Water Resources Investigation Initial Alternatives Information Report. Mid-Pacific Region. Sacramento, California.
Chapter 21, “Utilities and Service Systems”
BLM. See U.S. Department of the Interior, Bureau of Land Management.
Cal Recycle. See California Department of Resources Recycling and Recovery.
30-73 Draft – June 2013

Shasta Lake Water Resources Investigation Environmental Impact Statement
California Department of Resources Recycling and Recovery. 2010. Solid Waste Information System. Available: <http://www.calrecycle.ca.gov/SWFacilities/Directory/Search.aspx#DOWNLOAD>. Last updated: data updated continuously. Accessed December 20, 2010.
California Department of Water Resources. 2009. California Water Plan Update 2009: Integrated Water Management.
California Integrated Waste Management Board. 2008. Disposal Reporting System (DRS) Single-Year Countywide Origin Detail, July 07, 2008. Available: <http://www.ciwmb.ca.gov/ LgCentral/DRS/Reports/Orgin/WFOrgin.asp>. Accessed July 24, 2008.
CIWMB. See California Integrated Water Management Board.
DWR. See California Department of Water Resources.
Reclamation. See U.S. Department of the Interior, Bureau of Reclamation.
U.S. Department of Agriculture, Forest Service. 1995. Shasta-Trinity National Forest Land and Resource Management Plan. Pacific Southwest Region. Shasta-Trinity National Forest, Redding, California.
U.S. Department of the Interior, Bureau of Land Management. 1993. Redding Resource Management Plan. Redding, California.
———. 2006. Resource Management Plans for California’s Public Lands. Sacramento, California.
U.S. Department of the Interior, Bureau of Reclamation. 2005. Final Environmental Assessment for the Long-Term Contract Renewal Shasta and Trinity River Divisions.
———. 2007. Draft Shasta Lake Water Resources Investigation Utilities and Miscellaneous Minor Infrastructure.
USFS. See U.S. Department of Agriculture, Forest Service.
Chapter 22, “Public Services”
Shasta County. 2004 (September). Shasta County General Plan. Redding, California.
Tehama County. 2009 (March). Tehama County General Plan Update 2009–2029. Red Bluff, California. Prepared for Tehama County by PMC. Chico, California.
30-74 Draft – June 2013

Chapter 30 References
U.S. Department of Agriculture, Forest Service. 1995. Shasta-Trinity National Forest Land and Resource Management Plan. Pacific Southwest Region. Shasta-Trinity National Forest, Redding, California.
U.S. Department of the Interior, Bureau of Land Management. 2006. Resource Management Plans for California’s Public Lands. Sacramento, California.
BLM. See U.S. Department of the Interior, Bureau of Land Management.
USFS. See U.S. Department of Agriculture, Forest Service.
Chapter 23, “Power and Energy”
CALFED. See CALFED Bay-Delta Program.
CALFED Bay-Delta Program. 2000 (August 28). Final Programmatic Environmental Impact Statement and Environmental Impact Report. Programmatic Record of Decision. Sacramento, California.
California Department of Water Resources. 2003. Settlement Agreement by and Among the Planning and Conservation League, Plumas County Flood Control and Water Conservation District, Citizens Planning Association of Santa Barbara County, Inc., and the State of California Department of Water Resources, Kern Water Bank Authority, and those State Water Project Contractors Identified Herein.
DWR. See California Department of Water Resources.
Chapter 24, “Environmental Justice”
California Department of Finance. 2010 (May). E-5 Population and Housing Estimates for Cities, Counties, and the State, 2001 and 2010, with 2000 Benchmark. Available: <http://www.dof.ca.gov/research/demographic/reports/estimates/e-5/2011-20/view.php>. Accessed October 31, 2012.
———. 2012 (May). Interim Population Projections for California and Its Counties 2010–2050. Available: <http://www.dof.ca.gov/research/demographic/reports/projections/interim/view.php>. Accessed October 31, 2012.CEQ. See Council on Environmental Quality.
CEQ. See Council on Environmental Quality.
30-75 Draft – June 2013
Shasta Lake Water Resources Investigation Environmental Impact Statement
Council on Environmental Quality. 1997. Environmental Justice: Guidance Under the National Environmental Policy Act. Executive Office of the President, Washington, D.C.
DOF. See California Department of Finance.
U.S. Census Bureau. 2002a. California—Census 2000 Demographic Profile Highlights. Fact Sheet. Available: <http://factfinder.census.gov/servlet/SAFFFacts?_event=Search&geo_id=05000US06103&_geoContext=01000US%7C04000US06%7C05000US06103&_street=&_county=&_cityTown=&_state=04000US06&_zip=&_lang=en&_sse=on&ActiveGeoDiv=geoSelect&_useEV=&pctxt=fph&pgsl=050&_submenuId=factsheet_1&ds_name=DEC_2000_SAFF&_ci_nbr=null&qr_name=null®=null%3Anull&_keyword=&_industry=>. Accessed April 12, 2011.
———. 2002b. Shasta County, California—Census 2000 Demographic Profile Highlights. Fact Sheet. Available: <http://factfinder.census.gov/servlet/SAFFFacts?_event=Search&geo_id=04000US06&_geoContext=01000US%7C04000US06&_street=&_county=Shasta+county&_cityTown=Shasta+county&_state=04000US06&_zip=&_lang=en&_sse=on&ActiveGeoDiv=geoSelect&_useEV=&pctxt=fph&pgsl=040&_submenuId=factsheet_1&ds_name=DEC_2000_SAFF&_ci_nbr=null&qr_name=null®=null%3Anull&_keyword=&_industry=>. Accessed April 12, 2011.
———. 2002c. Tehama County, California—Census 2000 Demographic Profile Highlights. Fact Sheet. Available: <http://factfinder.census.gov/servlet/SAFFFacts?_event=Search&geo_id=05000US06089&_geoContext=01000US%7C04000US06%7C05000US06089&_street=&_county=Tehama+county&_cityTown=Tehama+county&_state=04000US06&_zip=&_lang=en&_sse=on&ActiveGeoDiv=geoSelect&_useEV=&pctxt=fph&pgsl=050&_submenuId=factsheet_1&ds_name=DEC_2000_SAFF&_ci_nbr=null&qr_name=null®=null%3Anull&_keyword=&_industry=>. Accessed April 12, 2011.
———. 2009a. 2009–2011 Community Survey Selected Economic Characteristics, 2009: Shasta and Tehama Counties and California. Available: <http://factfinder2.census.gov/faces/tableservices/jsf/pages/productview.xhtml?fpt=table>. Accessed November 13, 2012.
———. 2009b. 2009–2011 Community Survey Selected Economic Characteristics, 2009: Butte, Contra Costa, Colusa, Glenn, Sacramento, San Joaquin, Solano, Sutter, and Yolo Counties. Available: <http://factfinder2.census.gov/faces/tableservices/jsf/pages/productview.xhtml?fpt=table>. Accessed November 13, 2012.
30-76 Draft – June 2013
Chapter 30 References
———. 2010a. DP-1: 2010 Profile of General Population and Housing Characteristics. Census Tract 125, Shasta County, California. Available: <http://www.census.gov/popfinder/?s=06>. Accessed November 20, 2012.
———. 2010b. 2010 Demographic Profile: California and Shasta and Tehama Counties. Available: <http://www.census.gov/popfinder/?s=06>. Accessed November 13, 2012.
———. 2010c. 2010 Demographic Profile: Butte, Contra Costa, Colusa, Glenn, Sacramento, San Joaquin, Solano, Sutter, and Yolo Counties. Available: <http://www.census.gov/popfinder/?s=06>. Accessed November 13, 2012.
Chapter 25, “Wild and Scenic River Considerations for McCloud River”
California Department of Fish and Wildlife. Unpublished data. Region 1 stream files, Redding, California.
CDFW. See California Department of Fish and Wildlife.
DuBois, C.A. 1935. Wintu Ethnography. University of California Publications in American Archaeology and Ethnography, Vol. 36. University of California Press, Berkeley, California. pp. 1-148.
Guilford-Kardell, M. 1980. Papers on Wintu Ethnography: 239 Wintu Villages in Shasta County circa 1850. Occasional Papers of the Redding Museum, 1. Redding Museum and Art Center, Redding, California. Prepared with J. Dotta.
Jones & Stokes Associates, Inc. 1988. McCloud River Wild and Scenic River Study Report: Final Study Report. Prepared for The Resources Agency, State of California. Sacramento, California.
Lucas, G., and T. Stienstra. 2007. Land Sale Leads to Worries Over Dam. San Francisco Chronicle, January 28: A-1.
Moyle, P.B. 2002. Inland Fishes of California. Revised edition. University of California Press. Berkeley, California.
North State Resources, Inc. 2008. Technical Memorandum: Lower McCloud River Fish Habitat Survey.
Pacific Gas and Electric Company. 2006. McCloud-Pit Hydroelectric Project: FERC Project 2106. Relicensing Pre-Application Document.
30-77 Draft – June 2013

Shasta Lake Water Resources Investigation Environmental Impact Statement
PG&E. See Pacific Gas and Electric Company.
Reclamation. See U.S. Department of the Interior, Bureau of Reclamation.
Rode, M., and M. Dean. 2004. Lower McCloud River Wild Trout Area Fishery Management Plan, 2004 through 2009. State of California, the Resources Agency, Department of Fish and Wildlife. Original prepared by M. Rode in 1989. Revised and updated by M. Dean in 2004.
Tippets, W.E., and P.B. Moyle. 1978. Epibenthic Feeding by Rainbow Trout (Salmo gairdneri) in the McCloud River, California. Journal of Animal Ecology 47:549–559.
U.S. Department of Agriculture, Forest Service. 1994. Wild and Scenic Rivers Evaluation. Appendix E to the Final Environmental Impact Statement: Land and Resource Management Plan, Shasta-Trinity National Forest. Pacific Southwest Region. Redding, California.
———. 1995a (April 28). Record of Decision for the Final Environmental Impact Statement for the Shasta-Trinity National Forests Land and Resource management Plan. Pacific Southwest Region. Shasta-Trinity National Forest. Redding, California.
———. 1995b. Shasta-Trinity National Forest Land and Resource Management Plan. Pacific Southwest Region. Shasta-Trinity National Forest, Redding, California.
———. 1998a (March). Lower McCloud River Watershed Analysis. Shasta-Trinity National Forest, Shasta-McCloud Management Unit.
———. 1998b (May). McCloud Arm Watershed Analysis. Shasta-Trinity National Forest. Redding, California.
———. 2001. Lower McCloud River Habitat Typing Report. Unpublished office report. Shasta-Trinity National Forest, Redding, California.
U.S. Department of the Interior, Bureau of Reclamation. 2003 (November). Ecosystem Restoration Opportunities in the Upper Sacramento River Region. Office Report, Shasta Lake Water Resources Investigation.
U.S. Department of the Interior, Geological Survey. 2007. Water Data Report 2007: 11368000 McCloud River above Shasta Lake, California. Records were collected by Pacific Gas and Electric Company, under general supervision of the U.S. Geological Survey, in connection with Federal Energy Regulatory Commission project no. 2106.
USFS. See U.S. Department of Agriculture, Forest Service.
30-78 Draft – June 2013

Chapter 30 References
USGS. See U.S. Department of the Interior, Geological Survey.
Wales, J.H. 1939. General Report of Investigations on the McCloud River Drainage in 1938. California Fish and Game 25(4):272–309.
Whitney, D. 2004. Concrete Solution for Water Shortage? Raising Shasta Dam’s Height Looms Large among Ideas to Boost State’s Dwindling Storage. Los Angeles Times, November 21. Available: <http://www.watershedportal.org/news/news_html?ID=165>. Accessed March 4, 2009.
Yoshiyama, R.M., and F.W. Fisher. 2001. Long Time Past: Baird Station and the McCloud Wintu. Fisheries 26(3):6–22.
Chapter 26, “Other Required Disclosures”
California Employment Development Department. 2010 (December). California Labor Market Review. Labor Market Information Division. Sacramento, California.
———. 2011. Unemployment Rates (Labor Force) Tool. Unemployment Rate, Employment, and Labor Force Information. Available: <http://www.labormarketinfo.edd.ca.gov/cgi/dataanalysis/AreaSelection.asp?tableName=Labforce>. Accessed April 12 and June 7, 2011.
EDD. See California Employment Development Department.
Shasta County. 2004 (September). Shasta County General Plan. Redding, California.
U.S. Department of Agriculture, Forest Service. 1995. Shasta-Trinity National Forest Land and Resource Management Plan. Pacific Southwest Region. Shasta-Trinity National Forest. Redding, California.
USFS. See U.S. Department of Agriculture, Forest Service.
Chapter 27, “Public Involvement, Consultation, and Coordination”
Reclamation. See U.S. Department of the Interior, Bureau of Reclamation.
U.S. Department of the Interior, Bureau of Reclamation. 1983 (September). Enlarged Shasta Lake Investigation, Preliminary Findings Report.
———. 1999. Shasta Dam and Reservoir Enlargement, Appraisal Assessment of the Potential for Enlarging Shasta Dam and Reservoir. Mid-Pacific Region. Sacramento, California.
30-79 Draft – June 2013

Shasta Lake Water Resources Investigation Environmental Impact Statement
———. 2003a (March). Shasta Lake Water Resources Investigation, Strategic Agency and Public Involvement Plan. Mid-Pacific Region. Sacramento, California.
———. 2003b (March). Shasta Lake Water Resources Investigation, Mission Statement Milestone Report. Mid-Pacific Region. Sacramento, California.
———. 2004 (June). Shasta Lake Water Resources Investigation, Initial Alternatives Information Report. Mid-Pacific Region. Sacramento, California.
———. 2006 (February). Shasta Lake Water Resources Investigation, Environmental Scoping Report. Mid-Pacific Region, Sacramento, California.
———. 2007 (December). Shasta Lake Water Resources Investigation Plan Formulation Report. Mid-Pacific Region. Sacramento, California.
———. 2011a (November). Draft Shasta Lake Water Resources Investigation Feasibility Report.
———. 2011b (November). Preliminary Draft Environmental Impact Statement (EIS).
Chapter 28, “DEIS Distribution List”
None.
Chapter 29, “List of Preparers”
None.
30-80 Draft – June 2013
Chapter 31 Index
Chapter 31 1
Index 2
A 3 access roads: 2-(32, 70, 82). 7-283. 12-(142, 145). 13-(180, 190). 14-(5, 17). 4
17-25. 18-(29-33, 49-54, 62-66). 19-(15, 60, 64). 20-(25, 31). 26-3. 5 aesthetics: Chapter 19. 6 agricultural land: 1-(11, 15, 20, 23, 24, 28, 17, 18, 21). 2-9. 3-(62, 64). 4-7
(42-44). 6-17. Chapter 10. 11-(4, 9). 12-(27, 30, 32, 90, 97, 181). 13-(26, 8 64, 65, 83, 88, 248, 249). 17-7. 21-8. 26-(6, 8). 9
air basins: Chapter 5. 10 air quality: 1-(21, 27, 28). 3-(10, 16, 21, 50, 62, 64). 4-(41, 44, 46). Chapter 5. 11
9-1. 10-13. 17-(9, 25, 26). 20-(33, 34, 37, 38, 41, 44-46). 21-30. 24-15. 12 26-(1, 2, 6, 18, 21, 22). 13
air quality attainment plan: 5-24. 14 Alquist-Priolo Earthquake Fault Zone: 4-49. 15 Alquist-Priolo Earthquake Fault Zoning Act: 4-(15, 49). 16 alternatives—see CP1, CP2, CP3, CP4, and CP5 17 ambient air quality standards: 3-62. 5-(5-7, 10, 11, 14, 22, 24). 18 American River: 1-(22, 23). 3-(3, 15, 41, 42, 44, 60). 6-(2, 3, 8, 14, 31, 61, 64, 19
66). 9-1. 11-(5, 38, 60, 122, 123, 176, 224, 271, 298, 324, 328, 329, 331, 20 332, 334). 12-(2, 30, 122, 183). 17-(7, 19, 20, 24). 18-(45-48, 58-60, 72, 21 73, 79, 80, 85, 86, 91-95). 21-19. 23-2. 26-7. 22
anadromous fish species: 1-15. 11-91. 23 Anderson-Cottonwood Irrigation District: 1-20. 6-(1, 2, 28). 10-1. 11-(3, 47, 24
56). 12-88. 13-77. 18-12. 25 APE—see area of potential effects 26 aquatic habitat: 2-(8, 14, 28, 36, 54, 56, 59, 60-62, 95, 100). 3-(28, 32, 41). 27
4-(58, 61, 62, 70, 77, 84, 89, 94, 97-105). 6-21. 7-(86, 133, 177, 220, 28 230). 10-23. Chapter 11. 12-(145, 165). 13-(28, 57, 96-98, 126, 219). 29 25-(12, 13, 18, 22-24, 28-30, 33, 37-39). see also fish habitat 30
ARB—see California Air Resources Board 31 archaeology: 3-51. 32 area of potential effects (APE): 14-(13-15). 33 areas of controversy: 1-(31, 32, 37, 38). 34 35 B 36 BA—see biological assessment 37 Bay-Delta—see San Francisco Bay/Sacramento–San Joaquin River Delta (Bay-38
Delta) 39 beneficial uses: 1-(13, 36). 2-(29, 41, 44, 48, 56, 63). 3-(26, 27, 32, 38, 60). 40
6-(21, 22, 34). 7-(1, 3, 4, 6, 8, 11, 17, 18, 20, 24, 28, 29, 31, 33, 34, 39-41
31-1 Draft – June 2013

Shasta Lake Water Resources Investigation Environmental Impact Statement
41, 43-49, 80, 82, 84-89, 128, 129, 131-134, 172, 173, 175-177, 178, 1 216-222, 225, 226, 228-231, 270-274). 11-(8, 36). 12-72. 17-19. 21-23. 2
best management practice (BMP): 2-(26, 29, 30, 32). 5-30. 7-(22, 24, 25, 80, 81, 3 84, 88, 128, 172, 225, 271, 278, 282, 283, 284). 9-45. 11-92. 12-178. 21-4 22. 5
Big Backbone Creek: 4-(1, 8, 23, 24, 27, 53). 11-(53, 206, 251). 12-(38). 6 biological assessment (BA): 1-(1, 34). 2-(3, 20, 40). 3-(4-6). 7-(27, 28). 11-33. 7
26-(14, 19). 8 biological opinion (BO): 1-(2, 8, 34). 2-(18, 19, 40). 3-(4-6, 13, 24). 6-(13, 14, 9
15), 7-(11, 12, 27, 28, 87, 177, 221). 11-(5, 33-35, 326). 12-(83, 123). 10 13-(76, 131, 133, 157, 179, 208, 242). 11
BLM—see U.S. Bureau of Land Management 12 BMP—see best management practice 13 BO—see biological opinion 14 boat launching: 2-25. 18-(6, 14, 39, 41, 45, 56-59, 69-71, 76, 79, 83, 85). 19-(5, 15
68, 72). 21-33. 16 boating: 1-27. 3-61. 7-8. 17-(5, 7, 13). Chapter 18. 19-(4, 12, 64). 20-(5, 31). 17
22-7. 18 boating safety: 18-(7, 38). 22-7. 19 Butte County: 3-(30, 31). 5-1. 6-28. 7-35. 8-20. 10-(3, 6). 12-(34, 51, 53). 16-(4, 20
7). 17-16. 21 22 C 23 CAA—see Clean Air Act 24 CAAQS—see California ambient air quality standards 25 Cal/EPA—see California Environmental Protection Agency 26 CALFED Bay-Delta Program: 1-4. 3-(11, 15). 6-21. 7-19. 11-(15, 31). 12-32. 27
13-31. 27-(5, 7). 28 CALFED Multi-Species Conservation Strategy (MSCS): 11-(10-15, 45). 29
12-(32-35, 51-57, 85, 98, 108, 125, 134, 143, 149, 156, 161, 162, 167, 30 170, 173, 178, 182). 13-(26-31, 58-61, 79, 94, 96, 97, 99, 100, 102, 105, 31 107, 112, 113, 117, 134-142, 144, 145, 147, 157-164, 167, 168, 180-32 184, 196-200). 26-1. 33
CALFED Programmatic Environmental Impact Statement/Environmental 34 Impact Report (Programmatic EIS/EIR): 1-(36, 37). 3-(11, 38, 47). 4-(1, 35 101). 36
CALFED Programmatic Record of Decision (CALFED ROD): 1-(4, 13, 37). 37 2-(5-7). 3-(38, 47). 4-76. 6-(38, 39). 11-45. 12-85. 13-(79, 94, 134, 157, 38 196). 39
CALFED ROD—see CALFED Programmatic Record of Decision 40 California Air Resources Board (ARB): 1-27. 5-(7, 8, 10, 14, 17-20, 22-27, 41
29-31, 67). 28-3. 42 California ambient air quality standards (CAAQS): 5-(7, 14, 24). 43 California Bay-Delta Authority (CBDA): 3-36. 7-19. 11-45. 12-(85, 86). 13-79. 44 California Clean Air Act (CCAA): 3-62. 5-(14, 22). 26-21. 45 California Department of Boating and Waterways: 1-27. 3-61. 26-21. 28-2. 46
31-2 Draft – June 2013

Chapter 31 Index
California Department of Finance: 16-14. 24-9. 1 California Department of Fish and Wildlife (CDFW): 1-(27, 33). 2-(6, 31, 50, 2
56). 3-(29-31, 36, 40, 48, 58, 59). 4-48. 6-(20, 37). 11-(10-15, 17, 18, 3 19, 25, 26, 35-38, 41, 45, 48, 54, 55, 59, 70, 71, 144, 193, 240, 315, 330. 4 12-(32, 33, 52-55, 75, 82-84, 86, 90, 92, 95, 121, 158, 161, 162, 164, 5 166, 169, 172, 174-176, 180, 181, 183, 184, 186). 13-(25-27, 73, 75-77, 6 79, 82, 84, 87, 133, 217-228, 230, 242-243, 248). 18-(8, 13, 15, 19). 7 22-(6, 7). 25-(7, 15, 16). 26-(14, 19). 27-5. 28-2. 8
California Department of Parks and Recreation (State Parks): 1-27. 5-20. 7-24, 9 18-(13, 15, 20). 28-2. 10
California Department of Toxic Substances Control: 1-27. 6-25. 9-(11, 18). 11 21-(24, 25). 28-3. 12
California Department of Transportation (Caltrans): 1-27. 2-32. 3-(44, 45, 64). 13 5-66. 8-(8, 9, 12, 28). 9-(18, 19, 29, 32, 36, 39, 42, 44, 45). 12-58. 17-2. 14 19-(73, 99). 20-(2, 6, 51). 21-(15, 16). 26-22. 28-3. 15
California Department of Water Resources (DWR): 1-(9, 22, 24, 27, 32, 33). 16 3-(4, 5, 16, 30, 31, 34-37, 39, 40, 42, 44, 61). 6-(5, 6, 11, 13, 21-24, 17 31-38). 7-(18, 33-35, 37-39). 10-22. 11-(5, 26, 35-38, 53, 66, 79). 12-30. 18 13-27. 16-(19, 21). 21-23. 23-(1, 3, 4-8). 27-5. 19
California Endangered Species Act (CESA): 1-(8, 13, 27). 3-(58, 62). 11-(41, 20 45). 12-(82, 83, 85, 181). 13-(64, 65, 75, 76, 79, 248). 26-19. 21
California Environmental Protection Agency (Cal/EPA): 5-18. 6-11. 9-(18, 27, 22 29, 31, 33, 35, 36, 39). 16-10. 21-24. 28-3. 23
California Environmental Quality Act (CEQA): 1-(1, 5, 36). 24 California Geological Survey (CGS): 4-(15, 22). 25 California Highway Patrol (CHP): 1-27. 9-(18, 19, 26, 29, 32, 36, 39, 42, 44, 26
45). 22-(2, 6, 7). 28-3. 27 California Native Plant Protection Act (CNPPA): 3-62. 12-83. 26-19. 28 California Native Plant Society (CNPS): 3-63. 12-(2, 32, 33, 35, 51, 55, 57, 84, 29
181, 183, 184). 26-20. 30 California Natural Diversity Database (CNDDB): 12-(2, 33, 51, 55, 56, 84). 31
13-(2, 28, 61, 64, 77, 128). 32 CalSim-II model: 3-(4, 16). 6-(31-33, 39, 49, 75, 82) 7-(37-39, 56, 78, 79, 82, 33
126, 127, 130, 170, 171, 174, 214, 215, 217, 227, 267, 268). 10-(24, 34 26-28, 32). 11-(49, 50, 52, 53, 59, 66, 67, 80, 81, 86, 122, 149, 152, 175, 35 198, 203, 223, 244, 247, 270, 298). 12-(91, 99, 103). 13-(86, 126, 130, 36 173, 178, 179). 16-(20, 21). 18-(24, 25, 38-43, 45-48, 95). 23-(7-9, 11). 37 25-(22-24). 38
Caltrans—see California Department of Transportation 39 campgrounds: 1-(29, 32). 2-(25, 36, 83). 9-(7, 25). 12-(1, 38, 58, 78, 108, 126, 40
143). 13-(1, 222). 14-5. 17-(5, 13, 26, 36). Chapter 18. 19-(2, 4, 5, 7, 12, 41 13, 15-19, 59, 60, 63-72, 81, 83, 84, 86, 89, 91, 95). 21-(11, 30, 33). 42 22-(15, 19, 21, 23). 24-2. see also camping 43
camping: 12-78. 17-2. Chapter 18. 19-(4, 12, 68, 69). see also campgrounds 44 canoeing: 7-(29, 86). 17-5. 18-41. 45
31-3 Draft – June 2013

Shasta Lake Water Resources Investigation Environmental Impact Statement
carbon monoxide (CO): 3-62. 5-(3, 4, 7, 25, 26, 28, 29, 31, 33, 34, 35, 38, 40, 1 41, 46, 47, 50-52, 55, 56, 59-61). 2
carryover storage: 1-8. 2-(18, 21, 24, 41, 48, 54, 63, 94). 6-(5, 16). 7-(81, 83, 3 84, 131, 175, 218, 228). 11-335. 4
CBDA—see California Bay-Delta Authority 5 CCAA—see California Clean Air Act 6 CDFW see California Department of Fish and Wildlife 7 Census Bureau—see U.S. Census Bureau 8 Central Valley fall-/late fall–run Chinook salmon: see fall-/late fall–run 9
Chinook salmon 10 Central Valley Project Improvement Act (CVPIA): 1-(2, 4, 13, 15, 36). 2-(38, 11
43, 46, 50, 54, 60). 3-(13, 15, 19, 23, 25, 34). 6-(13, 15, 16). 7-9. 11-(3, 12 30, 31, 36, 37). 13
Central Valley Regional Water Quality Control Board (CVRWQCB): 2-(29, 14 32). 3-(21, 47, 61). 7-6. 9-(8, 11). 11-(30, 45, 336-340). 12-(73, 86). 15 13-79. 21-12. 26-13. 28-3. 16
CEQ—see Council on Environmental Quality 17 CEQA—see California Environmental Quality Act 18 CESA—see California Endangered Species Act 19 CGS—see California Geological Survey 20 Chinook salmon: 1-(6-9). 2-(38, 43, 46, 52, 53, 56, 57, 60, 87, 95, 97, 100). 21
3-(5, 19, 23, 25, 28, 30, 31-33, 47). 6-(14, 20, 47). 9-11. Chapter 11. 22 18-(44, 58, 71, 77, 84). 25-14. 23
CHP—see California Highway Patrol 24 circulation: 7-7. 11-64. 17-(21, 22). 20-(7, 26, 32, 56, 57). 22-(13, 18, 20, 25
22-25). 27-5. 26 Clean Air Act (CAA): 1-27. 3-50, 4-46. 5-(10-14, 22, 24). 9-12. 26-18. 27 Clean Water Act (CWA): 1-(26, 28, 36). 2-(29, 30, 32, 102). 3-(20, 26, 46-49, 28
61, 62), 4-(45, 46, 48, 49). 6-24. 7-(3, 13, 14, 18-22, 24, 25, 31, 278). 29 9-12. 11-(29, 30). 12-(27, 72, 73, 96). 13-(73, 77). 21-21. 26-(11, 13). 30
climate: 1-(12, 37). 3-(1, 10, 21). 4-(27, 30, 43, 46, 65, 72, 79, 101-105). 31 Chapter 5. 6-(134, 135, 137-141). 9-(2, 4). 10-(2, 3, 19). 11-(2, 17, 18, 32 78, 335-341). 12-(29, 57, 181, 184-188). 13-(248-252). 18-(2, 11, 33 96-97). 19-99. 23-(25-27). 26-(1-2, 8, 18). 34
climate change: 1-(9, 11, 12). 3-(2, 3, 10, 13, 16, 25, 27). 4-(101-105). 5-(1, 9, 35 12, 15, 17-22, 29, 30, 34, 45, 49, 54, 59, 64, 69, 70, 72). 6-(134, 135, 36 137-141) 7-(285, 287-289). 9-48. 10-(13, 27, 28, 51-53). 11-(78, 37 335-341). 12-(181, 184-188). 13-(248-252). 18-(96-97). 23-(25-27). 38 26-8. 39
CNDDB—see California Natural Diversity Database 40 CNEL—see community noise equivalent level 41 CNPPA—see California Native Plant Protection Act 42 CNPS—see California Native Plant Society 43 CO—see carbon monoxide 44 COA—see Coordinated Operations Agreement 45
31-4 Draft – June 2013

Chapter 31 Index
Colusa County: 3-32. 5-1. 6-28. 7-35. 8-20. 10-3. 13-131. 16-7. 24-(5, 12). 1 17-16. 2
common plant communities: 12-27. 3 community-noise-equivalent-level (CNEL): 3-64, 8-(5, 8-10, 12, 13, 16, 18, 29, 4
29). 5 Comprehensive Environmental Response, Compensation, and Liability Act 6
(Superfund): 9-(8, 12, 18, 21). 7-16. 7 Comprehensive Plan 1—see CP1 8 Comprehensive Plan 2—see CP2 9 Comprehensive Plan 3—see CP3 10 Comprehensive Plan 4—see CP4 11 Comprehensive Plan 5—see CP5 12 concrete: 1-18. 2-(34, 68-70, 76-79, 92). 4-(32, 64, 70, 77, 84, 89, 102-105). 13
5-(33, 34, 46, 50, 54, 59). 6-1. 8-(25, 26). 9-51. 14-9. 16-(15, 23, 31). 14 19-8. 20-9. 21-33. 22-(18, 21). 26-(2, 7). 15
construction equipment: 2-(30, 76, 92). 3-64. 5-(25-27, 33, 41, 42, 45, 49, 53, 16 58, 67). 7-305. 8-(6, 7, 22, 25-28, 31, 35, 37, 38). 9-(23, 26, 29-31, 34, 17 38, 40). 13-(95, 110). 19-(81, 84, 86-89, 91, 94, 96-100). 18
construction footprint: 12-(109, 112). 13-(95, 135, 158, 230). 19 construction staging areas—see staging areas 20 consultation: 1-(1, 25-27, 38, 45). 2-(18, 28, 31). 3-(4, 5, 45, 48, 57). 6-13. 21
7-(12, 13, 27). 9-20. 11-(28, 29, 33, 38, 41, 70). 12-(72, 82, 92, 121, 22 161, 162). 13-(57, 65, 67, 73, 75, 131, 133, 190, 217, 220-228, 230, 242, 23 243). 14-(10-15, 17, 18, 29, 30). 22-11. 24-(9, 16, 20, 22, 25, 27). 24 26-(14, 16). 27-(1, 5, 6). 25
Contra Costa County: 3-(32, 37). 7-35. 8-20. 10-22. 16-31. 17-16. 24-(12). 26 cooperating agency: 1-(1, 26, 27). 26-15. 27 Coordinated Operations Agreement (COA): 2-40. 3-(5, 6). 6-(19, 24-25). 7-35. 28
11-(32, 33). 29 cottonwood: 2-(8, 64). 10-(17, 18). 12-(5, 6, 8, 23, 24, 27, 28, 31, 93, 99, 100, 30
103, 117-119, 164-166, 176). 13-(21, 23, 127). 31 cottonwood-willow woodland: 10-18. 12-31. 32 Council on Environmental Quality (CEQ): 2-(1, 27, 28, 101). 3-(2, 3, 9, 11). 33
5-(12, 13). 16-7. 19-98. 23-7. 24-(1, 7). 26-(12, 13). 34 CP1: 2-(16, 19, 23, 34-41, 42, 44, 45, 47, 49, 55, 56, 63, 66, 68, 69, 72-74, 78, 35
81-82, 84-86, 91, 100). 36 CP2: 2-(16, 19, 23, 36, 41-45, 47, 66, 68, 69, 72-74, 78, 81, 82, 84-86, 91, 100). 37 CP3: 2-(16, 19, 23, 36, 45-48, 55, 62, 68, 69, 72-74, 78, 81, 82, 84-86, 91, 100). 38 CP4: 2-(16-19, 23, 36, 48-57, 60, 64, 68, 69, 72-74, 78, 81, 82, 84-87, 91, 98-39
100). 40 CP5: 2-(16, 19, 20, 23, 36, 57-63, 64, 68, 69, 72-74, 78, 81, 82, 84-87, 89-91, 41
100). 42 critical habitat: 1-15. 2-23. 3-(48, 72). 7-(12, 27). 11-(28, 34). 12-(54, 72, 101, 43
120, 130, 138, 144, 151, 152, 157, 184-187). 13-(58, 60, 66, 67, 128, 44 132, 156, 178, 195, 207). 45
31-5 Draft – June 2013

Shasta Lake Water Resources Investigation Environmental Impact Statement
cultural resources: 1-(27, 32, 34, 38). 2-(23, 91). 3-(2, 41, 51, 63). 6-34. 12-80. 1 Chapter 14. 17-(11, 18). 24-(9, 10, 16, 20, 22, 25, 27). 25-(19, 22, 26-28, 2 32, 33, 36, 37). 26-(2-4, 8, 18). 27-6. 3
cumulative impacts: 1-38. 3-(1, 10-17, 21, 22). 4-(101-105). 5-70. 6-134. 7-(3, 4 284, 285). 11-(334-341). 12-(182-188). 13-250. 15-4. 17-39. 19-(98, 5 99). 21-53. 22-30. 23-(24-27). 24-32. 26-(1, 2, 17). 6
CVPIA—see Central Valley Project Improvement Act 7 CVRWQCB—see Central Valley Regional Water Quality Control Board 8 CWA—see Clean Water Act 9 10 D 11 debris: 2-(32, 50, 54, 62, 88, 89, 92). 3-(47, 58). 4-(13, 17, 19, 20, 27, 49, 60, 12
76, 97-99). 5-23. 7-(26, 80, 282). 9-(5, 7, 8). 11-(18, 41, 80, 120, 327, 13 329-333). 12-177. 13-113. 14-(6, 8). 18-(7, 38). 21-50. 25-(17, 23). 14
Delta Protection Act: 10-20. 15 Delta Protection Commission: 7-19. 10-(22, 23). 28-3. 16 Delta Simulation Model 2 (DSM2): 6-(31, 33, 34, 36). 7-39. 17 delta smelt: 1-(15, 34). 3-(5, 34, 35). 6-(15, 37). 7-(12, 27). 11-(7, 9, 11, 28, 18
33-35, 38, 61, 62, 64-67, 69, 141-147, 190-196, 237-243, 273, 274, 19 312-318). 27-7. 20
dewatering: 11-(6, 18, 52, 58). 12-31. 21 diesel fuel: 26-4. 22 dikes: 2-(29, 35, 39, 44, 47, 55, 62, 64, 71, 72, 79). 3-(35, 49). 4-7. 5-(33, 35, 23
46, 50, 54, 59). 7-23. 12-1. 13-1. 17-(27, 32). 19-77. 21-34. 24-6. 26-13. 24 dissolved oxygen (DO): 7-(5, 7, 29). 11-(7, 18, 25, 92, 93). 25-23. 25 diversions: 1-(15, 17, 22, 23). 2-(8, 32, 96). 3-(23, 32, 33, 53, 58). 6-(1-5, 8, 9, 26
20-23, 36-39, 52, 53). 7-(6, 7, 13, 17, 18, 34, 35, 283, 287). 10-(1-3, 27 31-34). 11-(1, 4, 8, 32, 41, 47, 59, 61, 63, 73, 114, 122, 123, 171, 175, 28 176, 219, 223, 224, 266, 269, 271, 298, 334, 341). 12-(27, 31, 83, 98, 29 115, 122, 124). 13-(76, 81, 130, 131, 133, 177, 178). 18-(29, 49, 61, 74, 30 81). 21-(2, 5, 9-11). 23-12. 25-(6, 17, 18). 31
DO—see dissolved oxygen 32 docks: 8-(10, 15, 21). 9-15. 17-5. 18-(5, 6, 37, 49, 50, 62). 19-(17, 64, 66, 67, 33
72). 22-(7, 16). 34 drainage basin: 6-(2). 7-35. 26-13. 35 drainage pattern: 2-97.12-(69-71). 36 dredged material: 7-37. 37 dredging: 6-36. 7-(16, 88). 11-(7, 25). 13-(74). 17-19. 38 drought: 1-(8, 9, 12, 13). 2-(15, 21, 26, 39, 49, 100). 3-(18, 36). 6-(12, 40-42, 39
75). 7-(79, 128, 216, 225). 10-(2, 4, 7, 13, 27, 28, 32-34, 37, 38, 40, 41, 40 43, 44, 46, 51). 11-(29, 79, 148, 243, 275, 335). 12-(91, 108, 125, 130, 41 142, 149). 13-126. 16-(20-22, 50). 18-24. 21-(6, 8). 23-(14, 16, 19, 21). 42 24-31. 25-(22, 31, 35). 43
dry years: 1-(9). 2-(37, 42, 44, 49). 6-(6, 40, 41, 45, 52, 95, 103, 122). 7-(53, 79, 44 83, 128, 225). 10-(4, 5). 11-(61, 63, 65, 68, 79, 114, 143, 147, 148, 192, 45 195, 196, 239, 242, 275, 299, 314, 318). 12-(108, 115, 116, 125, 130, 46
31-6 Draft – June 2013

Chapter 31 Index
149). 16-(22, 33, 41, 49, 56, 62). 18-(7, 41, 45). 19-9. 21-6. 23-(13, 21). 1 25-(26, 31, 35). 2
DSM 2 Model—see Delta Simulation Model 2(DSM2) 3 dust, fugitive dust: 5-(4, 26, 33-35, 37, 38, 40, 41, 46, 47, 50, 51, 54-56, 59-61, 4
65, 66, 68). 5 DWR—see California Department of Water Resources 6 7 E 8 earthquake: 2-58. 3-36. 4-(14-16, 20-23, 34, 45, 46, 48, 49, 51, 56). 8-6. 22-11. 9 easements: 3-65. 9-(11, 24). 10-(19, 23). 11-48. 12-(90, 161-163). 13-(83, 84, 10
217-223, 225-229). 17-37. 18-21. 21-20. 26-22. 11 EC—see electrical conductivity 12 ecological reserves: 18-19. 13 ecosystem: 1-(3, 6, 9, 12-15 ,17, 38). 2-(5, 10, 22, 23, 36, 39, 53, 54, 58, 100). 14
3-(1, 13, 14, 24, 27, 29, 31, 34-36, 41, 42, 59). 6-22. 7-(16, 226). 15 Chapter 11. Chapter 12. Chapter 13. 14-(24, 25, 27, 29). 9-(9, 16, 17). 16 17-(9, 10). 18-93. 22-9. 17
ecosystem restoration: 1-(4, 15, 37). 2-(26, 38, 39, 43, 47). 3-(13, 14, 24, 34, 36, 18 41, 43). 7-(19, 225). 9-9. 14-17. 19
Ecosystem Restoration Program (ERP): 11-(31). 12-(85, 105). 13-79. 20 effluent: 3-33. 7-44. 21-(12, 15, 21). 21 elderberry shrubs: 13-(58, 126, 190, 192, 214, 241-244, 247). 22 electrical conductivity (EC): Chapter 7. 23 electrical service and infrastructure: Chapter 21. 24 electricity: 1-16. 2-(22, 88). 8-10. 14-6. 16-(18, 67). 18-8. 23-(1-5). 26-4. 25 emergency services: 9-(1, 2, 18, 44, 45). 16-4. 21-(1, 20). Chapter 22. 26 employment: 10-13. Chapter 16. 20-8. 24-(2, 5, 6, 10, 10-15, 18, 21, 23, 26, 29). 27
26-(3, 6, 7). see also jobs 28 Endangered Species Act, California—see California Endangered Species Act 29
(CESA) 30 Endangered Species Act, Federal (ESA): 1-(8, 13, 26, 27). 2-31. 3-(5, 26, 31, 31
47, 48, 52, 58). 7-(12, 27). 11-(27, 28, 32-34, 38, 40, 41, 45, 123, 175, 32 223, 271). 12-(71-73, 82, 83, 85, 181). 13-(64-68, 75, 76, 79, 86, 131, 33 242, 248). 26-14. 34
energy: 1-(16, 27, 38). 2-(39, 99). 3-(2, 3, 15, 42, 43). 8-(2, 5, 26). 10-13. 35 11-(119, 122, 125, 175, 177, 223, 225, 270, 273, 298, 300). 16-(7, 11, 36 18, 32, 66). 21-(18, 19, 24). Chapter 23. 26-(4, 5, 18). 37
entrainment: 6-(15, 21, 22). 7-33. 11-(33, 56, 58, 65, 66, 67, 69, 97, 102, 107, 38 112, 144-147, 162, 165, 167, 170, 193-196, 210, 213, 215, 218, 240-39 242, 256, 259, 262, 265, 274, 286, 289, 291, 294, 315-318, 326). 40
environmental commitments: 2-(23, 26, 34, 42, 45, 49, 58). 4-(52, 65, 67, 73, 41 74, 80, 81, 85, 86, 90, 91). 7-(80, 81, 128, 172, 219, 229). 11-(86, 91-93, 42 152, 159, 207, 208, 252, 253, 270, 282, 293, 297). 43
environmental justice: 3-(2, 54). 16-(9, 10). Chapter 24. 26-15. 44 Environmental Protection Agency—see U.S. Environmental Protection Agency 45 EPA—see U.S. Environmental Protection Agency 46
31-7 Draft – June 2013

Shasta Lake Water Resources Investigation Environmental Impact Statement
erosion: 2-(10, 29, 33, 67, 71). 3-(34, 41). Chapter 4. 7-(8, 9, 14, 25, 26, 31, 32, 1 35, 36, 39, 45, 80, 81, 84, 86-88, 128, 129, 132, 172, 173, 176, 219, 226, 2 228, 286). 9-(8, 14, 26). 11-(4, 18, 54, 62, 63, 80, 86, 91-93, 119-121, 3 124, 132, 136, 152, 203, 336-339, 341). 12-(30, 89, 99, 103, 114, 117, 4 118, 147). 13-(32, 83, 96, 98, 100, 127, 128, 131, 136, 138, 154, 155, 5 159, 161, 176, 178, 181, 189, 194, 197, 205, 207). 18-(50, 62). 19-(10, 6 95). 21-32. 25-(19, 26, 27, 32, 36, 37). 26-1. 7
ERPP—see Ecosystem Restoration Program Plan 8 ESA—see Endangered Species Act, Federal 9 ESU—see evolutionarily significant unit 10 ethnicity: 16-(1, 3, 5, 14). 24-(3, 9). 11 evolutionarily significant unit (ESU): 11-(28, 29). 12 excavation: 2-(68, 71, 73, 74, 79, 82, 89). 3-(44, 63). 4-(46, 50, 51). 7-(22, 26, 13
219, 229). 8-(24, 27, 30-32, 34). 9-25. 12-(73, 145, 146, 152). 13-(105, 14 106, 108, 111, 113, 117, 192, 206, 217, 229). 14-(6, 8, 12, 13). 17-36. 15 19-99. 21-(28, 49). 16
executive order: 3-(45). 5-(12, 17, 18, 20). 15-3. 16-9. 17 existing (2005) conditions: 4-(56, 57, 66, 68, 69, 75, 79-82, 86-88, 91-93, 18
97-101). 6-(10, 35, 39, 42, 44-46, 48-51, 53, 55, 57, 59-63, 65, 66, 19 68-71, 73-77, 81, 83, 85, 86, 88-102, 104-111, 113-119, 123-130). 20 7-(25, 36, 37, 41, 47-49, 53, 82, 83, 87, 94, 123, 130, 131, 133, 138, 21 164, 167, 174, 175, 177, 182, 208, 211, 217, 218, 221, 227, 228, 261, 22 264, 278, 285). 10-(26-29, 32-34, 37, 38, 40, 41, 43-47, 51). 11-(49, 23 52-55, 59-61, 65, 66, 72-76, 80, 81, 83, 84, 93-95, 97-100, 105, 109, 24 110, 113, 114, 116, 118, 122, 123, 126-146, 149-155, 159-201, 208-248, 25 253-318). 12-(32, 91, 97, 164). 13-(87, 91-93, 128, 176, 177). 16-(16, 26 18, 37, 41, 49, 62, 67). 18-(24, 26, 37, 39, 40, 43, 45, 46, 56, 59, 69, 72, 27 76, 79, 83). 19-(80-82). 23-(1, 11). 25-(22, 32, 36). 28
extended study area: 1-(17, 22-24, 28). 29 30 F 31 fall-/late fall-run Chinook salmon: 1-(6, 9). 11-(3, 5, 7, 11, 15, 37, 55, 56, 104-32
113, 165-167, 169, 170, 213-215, 217, 259, 261, 262, 264, 265, 289-33 291, 293, 294). 34
farming: 2-22. 3-2. 10-(6, 21). 11-63. 14-4. 35 Farmland Mapping and Monitoring Program (FMMP): 10-(7, 19, 25). 36 Farmland of Statewide Importance: 4-44. 10-(7, 11, 21, 22, 25). 37 Farmland Protection Policy Act (FPPA): 3-51. 10-16. 26-15. 38 faults: 3-39. 4-(2, 15, 20-22, 31, 49, 60). 39 Feather River: 1-(17, 22, 24). 3-(3, 44). 4-(69, 75, 82, 88, 93). 6-(2, 3, 7, 8, 28, 40
31, 61, 63). 10-6. 11-(5-7, 25, 46, 47, 60, 122, 123, 175, 176, 223, 224, 41 270, 271, 297, 298, 324, 328, 329, 331, 332, 334). 12-(30, 87, 122, 183). 42 13-(68, 80, 81). 18-(45-48, 58-60, 72, 73, 79, 80, 85, 86, 91-95). 23-4. 43 26-7. 44
Federal Endangered Species Act—see Endangered Species Act, Federal (ESA) 45 Federal Highway Administration (FHWA): 8-(7, 29). 20-6. 46
31-8 Draft – June 2013

Chapter 31 Index
Federal Transit Administration (FTA): 3-(44, 55, 64). 8-(11, 28). 26-18. 1 FHWA—see Federal Highway Administration 2 field crops: 10-(2, 3). 13-26. 3 fire protection: 1-27. 2-85. 8-10. 9-(1, 4, 17, 28). 16-4. 17-(19, 29). 21-(1, 6, 4
8-10). Chapter 22. 5 fish habitat: 2-(8, 10, 36, 57-59, 61, 64, 90, 98, 90). 3-(23, 24, 48). 4-(29, 88). 6
6-41. 7-(25, 225). 9-37. Chapter 11. 12-149. 13-196. 17-(11, 18). 18-(38, 7 56, 69, 75, 82). 23-21. 25-35. 26-14. see also aquatic habitat 8
fish migration: 2-8. 3-25. 11-(21, 24, 91, 123, 175, 223, 271). 9 fish mortality: 11-(144, 240, 316). 10 fish protection: 3-34. 11 fishing: 3-(54, 59). 7-(8, 20). 11-(9, 54). 12-86. 14-5. 17-(5, 7, 13). Chapter 18. 12
19-(4, 12, 64, 69). 20-5. 25-(7, 9, 20, 28). 13 flood control: 1-(3, 12, 15, 24). 2-(9, 14, 22, 37, 39, 40, 42, 46, 49, 58, 97). 14
3-(14, 26, 29, 33, 34, 37, 40-42, 50, 60). 4-52. 6-(3, 7, 18, 27, 34, 35). 15 7-(4, 36, 82). 11-(1, 3-8, 38, 62, 132, 136, 334). 13-248. 16-(18, 27, 30, 16 37, 38, 45, 47, 48, 53, 54, 59, 60, 67). 26-20. 17
flood management: 1-(12, 15). 2-(9, 10, 22, 40, 97). 3-(14, 40). 6-(1, 6-9, 13, 18 17-19, 34, 35, 42, 89, 95, 104, 112, 120, 123, 135-141). 26-(7, 8). 19
flooding: 1-(15, 16). 2-22. 3-40. 4-61. 6-8. 11-(12, 125). 12-(69-71, 96, 110, 20 116, 122, 126, 135, 143, 150, 181). 13-(63, 114, 145, 155, 167, 176, 21 178, 249). 16-(17, 27, 28, 30, 36, 37, 39, 45, 46, 48, 53, 54, 59, 60, 64). 22 17-28. 18-97. 24-(5, 17, 18, 20, 22, 23, 25, 26, 28). 26-8. 23
floodplain bypasses: 11-(4, 6, 124-126, 176, 177, 225, 272, 299). 12-(30, 31). 24 FMMP—see Farmland Mapping and Monitoring Program 25 Folsom Lake—see Folsom Reservoir 26 Folsom Reservoir (Folsom Lake): 1-(22, 23). 6-(8, 61, 64, 65). 11-(38, 122, 27
123, 176, 224, 271, 298). 18-(46, 48). 26-7. 28 forbs: 12-(21-26). 13-(19-22, 24, 62). 29 FPPA—see Farmland Protection Policy Act 30 FTA—see Federal Transit Administration 31 fuel: 2-(30, 90, 91). 3-34. 5-(3, 9, 11, 14, 19, 21, 31, 44, 48, 49, 53, 58, 62, 65, 32
67). 7-(282, 283). 9-(1, 4, 5, 8-10, 14, 16, 24, 25-27, 31, 34, 38, 40). 33 11-93. 12-(77, 79). 13-(72, 96, 98). 17-(9, 17). 22-9. 26-4. 34
35 G 36 gasoline (gas): 5-(3, 4, 11, 33, 39). 6-25. 9-(23, 31, 34). 18-(5, 6). 19-61. 21-(1, 37
10, 18, 19, 28). 26-4. see also petroleum 38 geographic information system (GIS): 2-10. 4-(53, 54, 62, 70, 77, 84, 89). 39
11-21. 12-(36, 109). 13-84. 25-4. 40 geologic hazards: Chapter 4. 7-(35, 36). 21-32. 41 geology: Chapter 4. 7-(9, 25, 39, 45, 80, 81, 129). 12-36. 19-1. 25-(4, 12, 21, 42
22, 26, 27, 29, 32, 33, 36-38). 43 geomorphology: Chapter 4. 7-(9, 35, 45, 80, 81, 129). 11-(1, 121). 12-(30, 142, 44
180). 13-180. 45 giant garter snake: 13-(59, 62, 64). 46
31-9 Draft – June 2013

Shasta Lake Water Resources Investigation Environmental Impact Statement
GIS—see geographic information system 1 glare: 19-(6, 10, 11, 80-88, 90-100). 26-2. 2 Glenn County: 3-32. 5-1. 6-(11, 28). 7-35. 8-20. 10-3. 11-44. 12-(84, 85, 119). 3
13-(77, 78, 131). 16-(3-5, 7). 18-18. 20-3. 24-(5, 12). 17-16. 4 global study area—see climate change 5 Governor’s Office of Planning and Research (OPR): 3-(34, 64). 5-(15, 17, 20, 6
21, 22, 30). 8-12. 24-8. 7 grading: 2-(74, 86-88). 3-(63, 65). 4-(46, 50-52, 86, 91). 5-(26, 41, 57, 65, 66). 8
7-(22, 35, 36, 219). 8-(24, 25, 30). 12-(145, 146). 13-(74, 105, 106, 108, 9 111, 113, 117, 191-193, 206). 17-12. 18-92. 19-(6, 10). 21-50. 26-22. 10
grains: 2-(59, 61, 90). 4-35. 11 grassland: 2-20. 3-(13, 16, 20, 21). 9-4. 12-(5-7, 22, 27, 31, 35, 51-54, 58-60, 12
79, 93, 113, 128, 137). 13-(5, 6, 19, 25, 62, 63, 65, 120, 149, 171). 13 18-11. 22-3. 14
greenhouse gases (GHG): 3-(2, 3, 10, 27). Chapter 5. 15 ground shaking: 4-(14, 15, 20, 49, 51, 56, 60). 16 ground-disturbing activities: 2-29. 7-(84, 132, 176, 219, 228, 278, 279). 12-(75, 17
114, 115, 129, 137, 143, 147, 151). 13-(70, 95). 18 groundwater: 1-22. 2-(9, 96). 3-(17, 30, 33, 59, 61). 4-(34, 42, 43). Chapter 6. 19
7-(8, 14, 19, 28, 38). 9-9. 10-(1, 2, 4, 7, 12, 33, 35). 11-(21, 123, 175, 20 176, 223, 224, 271, 298). 12-(29, 69-71, 73, 83, 92, 120). 13-(73, 77, 21 85). 21-(2, 5-11, 20, 23). 26-(8-10). 22
groundwater quality: Chapter 6. 7-(3, 36). 23 growth-inducing impacts: 1-38. 26-9. 24 25 H 26 haul routes: 11-93. 20-(9, 25, 32, 34, 38, 42, 45, 47, 52, 53, 56). 27 hazardous materials: 2-(30, 32). 7-282. Chapter 9. 11-(93, 159). 21-24. 24-15. 28 hazardous waste: 1-27. Chapter 9. 21-(17, 21, 24, 33, 34, 38, 40, 41). 29 Hazardous Waste Control Act: 9-(17, 18). 21-24. 30 heavy metals: 7-(4, 17, 46, 88, 286). 9-(8, 10). 11-48. 12.-88. 13-81. 31 herbicides: 6-12. 9-(7, 9). 12-177. 13-242. 32 high water: 2-(32, 40). 6-18. 7-12. 11-(4, 6). 12-(30, 73). 13-(23, 32, 74). 14-23. 33
18-(19, 32). 19-(7, 11, 65, 69, 70). 24-(4, 16). 25-29. 34 high-flow events: 4-(66-68, 74, 75, 81, 82, 86, 87, 91-93, 102-105). 7-86. 11-4. 35
12-(31, 187). 13-(91, 250-252). 16-(28, 30). 18-96. 36 historic buildings: 19-80. 37 historical resources: 14-(11, 12, 19, 20-22, 24, 25, 27, 28-31). 25-(4, 12, 19, 27, 38
33, 37). 39 houseboats: 1-32. 2-79. 12-94. 18-(1, 2, 6). 19-4. 20-5. 40 human remains: 14-(7, 12, 20). 41 hunting: 3-54. 13-75. 14-4. 15-3. 17-(10, 13). 18-(11, 12, 15, 19). 19-4. 42 hydraulics: 2-(40, 55, 99). Chapter 6. 43 hydrodynamics: 1-22. 6-(3, 31, 33). 7-(37, 39, 56). 11-(143, 190, 192, 239, 44
314). 45 hydroelectric power: 1-2. 14-5. 23-(1, 4). 46
31-10 Draft – June 2013

Chapter 31 Index
hydrologic modeling: 7-(85, 87, 286). 11-(49, 126, 129, 133, 136, 177, 180, 1 182, 184, 225, 227, 230, 232, 299, 302, 305, 307). 2
hydropower: 1-(2, 6, 13, 16, 24). 3-(15, 43, 57). 6-(34, 41). 11-(20, 197). 3 12-134. 21-(1, 19). Chapter 23. 25-35. 27-4. 4
5 I 6 I-5—see Interstate-5 7 income: 2-(25, 27). 3-54. 10-13. Chapter 16. 24-(1-3, 5-29, 30-32). 8 Indian tribes: 14-(13, 14). 15-3. 16-9. 25-6. see Native Americans 9 Indian Trust Assets (ITA): 3-56. Chapter 15. 26-17. 10 industry: 3-38. 8-21. 10-3. 11-44. 12-84. 13-77. 14-(4, 5). Chapter 16. 17-16. 11
18-20. 21-32. 24-(2, 5, 6, 13). 26-(4, 7, 8). 27-3. 12 intactness: 19-(2, 3, 64, 69). 13 Interstate 5 (I-5): 2-(45, 52, 77, 96). 3-(44, 46). 8-(7-9, 28). 9-(8, 9, 27, 28, 32, 14
35, 38, 41). 12-(21, 68). 13-19. 14-5. 16-12. 17-(1, 2, 6, 21, 25). 18-2. 15 Chapter 19. 20-(1-5, 30, 32). 21-(15, 16, 18). 22-(6, 7, 14, 17, 68). 24-2. 16 26-21. 17
invasive species: 2-33. 3-(24, 55). 11-(24, 25, 31). 12-(27, 57, 61, 78-82, 181). 18 13-(25, 74). 26-18. 19
invertebrates: 11-(9, 18, 23, 26, 27, 61, 64, 120, 125, 129). 12-78. 13-(58, 62, 20 126, 190, 192). 25-(15-17). 21
ITA—see Indian Trust Assets 22 23 J 24 jet skis: 18-1. 25 jobs: Chapter 16. 24-(5, 15). 26-(6, 7). see also employment 26 27 K 28 kayaking: 18-41. 29 Keswick Dam: 1-20. 2-(8, 21, 24, 38, 43, 46, 50, 53, 60, 86, 87, 96). 3-29. 30
4-(16, 32, 43, 67, 86, 91), 6-(1, 2, 7, 14, 17-21, 35, 47, 49, 50, 52). 7-(4, 31 6, 11-13, 16, 30-32, 83, 86-89, 130, 174, 218, 286). 9-10. 11-(2, 3, 15, 32 16, 21, 22, 26, 33, 46, 47, 53, 54, 57, 91, 114, 119, 120, 124, 170, 171, 33 218, 219, 266). 12-(87, 89, 99, 130, 138, 151). 13-(80, 81, 83, 123-125, 34 128, 152, 153, 174, 175, 187, 188, 190, 203, 204). 14-(1, 5, 8). 17-21. 35 18-(8, 11-14, 18, 21, 40-43, 78). 21-(9, 18). 23-(1, 2). 36
37 L 38 lake alteration agreement: 2-32. see also streambed alteration agreement 39 Lake Oroville: 1-22. 4-91. 11-(123, 124, 225, 272, 299). 23-4. 26-7. 40 Land and Resource Management Plan (LRMP): 1-(14, 30), 31). 3-(52, 56). 41
4-47. 7-(24-26). 8-39. 9-(13, 14). 11-(38, 39). 12-(73-75, 80, 96). 42 13-(68-70). 17-(2, 8-10, 17, 18, 28, 29, 31, 32, 37, 39). 18-(16, 17). 43 19-(4, 5, 72-75, 80-82, 84-89, 91, 93, 94, 96-98, 100). 21-(21, 25, 32, 44 51). 22-(9, 10). 25-(3, 6, 12, 22, 25, 30, 38, 40). 26-(15, 16). 45
landfill: 2-(84, 91). 7-23. 8-(10, 15). 9-(7, 10, 11, 16, 21, 26, 29). Chapter 21. 46
31-11 Draft – June 2013

Shasta Lake Water Resources Investigation Environmental Impact Statement
landowners: 1-46. 2-33. 3-(35, 36, 62). 7-279. 9-19. 10-(3, 21). 11-(46, 47). 1 12-(75, 81, 86, 90). 13-(79-81, 83). 18-15. 21-32. 25-(3, 21). 2
landscaping: 3-(42, 63). 7-20. 12-(26, 78). 13-24. 21-5. 3 landslides: 4-(13, 17, 19, 20, 49, 56, 60, 76). 8-6. 22-11. 4 law enforcement:. Chapter 22 5 leachfields: 21-31. 6 lead agency: 1-(1, 25, 26). 2-1. 3-8. 4-(46, 49). 5-(16, 21, 22). 12-84. 19-98. 7
26-(10, 12, 21). 27-7. 8 levees: 1-(4, 15, 16, 27, 36, 37). 2-(22, 53, 89). 3-(14, 22, 34, 35, 40-43, 60). 9
4-(22, 27, 30, 44, 45). 6-(3, 6-8). 7-23. 10-(4, 18). 11-(4, 5, 7, 125). 10 12-(30-32). 13-(126, 131, 248). 24-6. 11
level of service 20-(7, 8, 26). 12 level of significance (LOS): 3-8. 4-(94-96). 5-(23, 64). 6-(132, 133). 7-13
(270-277). 8-36. 9-43. 10-49. 11-(320-326). 12-(156-160). 13-14 (209-216). 14-31. 16-(63-65).17-5. 18-(88-91). 19-93. 20-(48-50). 15 21-(25, 26, 47, 48). 22-(12, 25-27). 23-24. 25-40. 16
liquefaction: 4-(33, 34, 42, 43, 49, 51, 56, 57). 17 listed species—see special-status species 18 livestock: 2-90. 10-(2-4, 20). 11-25. 19 logging: 7-1. 11-92. 14-4. 20-35. 25-6. 20 LOS—see level of significance 21 LRMP—see Land and Resource Management Plan 22 23 M 24 M&I—see municipal and industrial 25 mammals: 7-(12, 22). 12-75. 13-(19, 21-26, 61, 64, 70, 126, 127, 191, 193). 26 marinas: 1-(16, 29, 32). 2-(25, 36, 67, 89, 81-83). 9-(7, 8, 14, 15). 11-19. 17-(5, 27
27-29, 36). 18-(2, 5, 6, 16, 28, 30-34, 36, 37, 48, 50-54, 60-62, 64-67, 28 73, 80, 92). 19-(2, 4, 5, 7, 9, 11, 61, 62, 64, 67, 70-72, 99). 21-(10, 11, 29 21, 30). 22-(14-16, 19, 21, 23). 24-2. 30
marsh: 11-(9, 11, 44). 12-(5, 8, 24, 28, 29, 31, 32, 35, 51, 53, 55, 56, 59-64, 85, 31 96). 13-(26, 62-64, 127, 191, 193). 32
maximum diversion: 21-5. 33 MBTA—see Migratory Bird Treaty Act 34 McCloud River: 1-(17, 18, 32, 33, 38). 2-(10, 57, 60, 64, 66, 75, 76, 83, 84, 89, 35
90). 3-(2, 15, 44, 60, 61). 4-(1, 17, 23, 24, 27, 57). 6-2. 7-3. 8-11. 9-(1, 36 4, 5). 11-(13, 17, 20, 24, 25, 42, 53, 76, 88, 89, 157, 205, 206, 251, 281). 37 12-(108, 126, 143). 13-(117, 249). 14-(3-5, 10, 11). 17-(1, 6, 26). 18-5. 38 19-(4, 18, 69, 70, 73, 74, 80). 20-(2, 5, 35). 21-15. 24-(4, 16). Chapter 39 25. 26-(2, 6, 16, 20). 27-7. 40
memorandum of understanding (MOU): 2-31. 3-47. 10-22. 25-7. 41 mercury: 4-33. 7-(3-7, 14, 16, 17, 24, 30, 31, 88). 9-(7, 9, 10, 25, 27, 37). 42 Migratory Bird Treaty Act (MBTA): 3-(51, 52). 13-(68, 75, 76). 26-14. 43 mineral resources: 3-(44, 45). 4-(1, 31-33, 56, 58, 64, 70, 77, 84, 89, 94). 17-14. 44
26-(1, 2). 45
31-12 Draft – June 2013

Chapter 31 Index
mining: 1-(14, 17, 28). 2-(95, 97). 3-(21, 22, 24, 34, 62, 63, 75). 4-(19, 23, 1 28-32, 34, 48-50, 67, 68, 75, 82, 87, 92). Chapter 7. 9-(9, 10, 25). 2 11-(20, 48). 12-(24, 27, 38, 88). 13-(20, 21, 57, 82, 85). 14-(4, 7, 9,). 17-3 (5, 11). 19-(59, 61). 26-21. 4
Mokelumne River: 6-(8, 9, 67). 5 MOU—see memorandum of understanding 6 MSCS—see CALFED Multi-Species Conservation Strategy 7 municipal and industrial (M&I): 1-(2, 3, 5, 9, 22, 24, 36). 2-(5, 7, 19, 21, 22, 24, 8
37-45, 47, 49, 54, 55, 58, 60, 61, 63). 3-(36, 39, 41). 6-(3, 5, 6, 10-12, 9 22, 40-42, 75-82, 95, 103, 112, 120, 123). 7-(4, 8, 17, 34, 35, 41, 43, 79, 10 128, 172, 216, 225). 10-(2, 6, 30, 34, 35, 38, 39, 41, 42, 45, 47). 11-(79, 11 148, 197, 244, 275). 12-(108, 125, 134, 142, 149, 184, 186). 17-(6, 8). 12 21-(2, 5-8, 10, 21). 23-(14, 16, 17, 20, 21). 25-(26, 31, 35). 26-9. 13
14 N 15 NAAQS—see national ambient air quality standards 16 NAHC—see Native American Heritage Commission 17 national ambient air quality standards (NAAQS): 3-51. 5-(10, 11). 18 National Environmental Policy Act (NEPA): 1-(1, 5, 24-26, 28, 34, 35, 36). 19
2-(1, 2, 20, 27, 57, 102). 3-(2-4, 6, 9, 17, 22, 42, 45, 46, 48, 56, 57). 20 4-(55-57): 5-(12, 27). 6-(33, 34). 7-(27, 28, 40). 8-(11, 22). 9-49. 10-(24, 21 25). 11-(35, 70, 71). 12-(95, 96). 13-(86-88). 14-(12, 18, 19). 16-(9, 10, 22 16, 17). 17-(23, 29). 18-25. 19-(74, 75, 79, 98). 20-(25, 26). 21-25. 22-23 (11, 12). 23-(7, 9). 24-(1, 7, 8). 25-24. 26-(3-5, 10-13, 15, 16). 27-(1, 2, 24 5, 7). 25
National Historic Preservation Act (NHPA): 1-(27, 34). 3-50. 14-(7, 11, 12, 15, 26 22, 24, 26, 27, 29, 31-33). 24-(10, 16, 20, 22, 25, 27). 26-16. 27
National Marine Fisheries Service (NMFS): 1-(2, 8, 13, 26, 27, 34, 42). 2-(6, 28 19, 20, 31, 40, 50, 56). 3-(5, 6, 13, 15, 24, 32, 36, 47, 48). 6-(13, 14, 20). 29 7-(11-13, 27, 28, 133, 177, 221). 11-(5, 9-15, 21, 27-29, 31, 33-38, 50, 30 65, 70, 71, 78, 144, 147, 193, 196, 240, 243, 274, 315, 318, 326-328, 31 330, 331, 333, 335). 12-(71, 164, 166, 169, 172). 13-(66, 67, 131, 133, 32 157, 179, 208). 25-41. 26-14. 27-5. 28-2. 33
National Pollutant Discharge Elimination System (NPDES): 1-28. 2-29. 4-(46, 34 48). 7-(21, 22, 28, 31, 278). 9-11. 11-30. 12-73. 21-21. 26-21. 35
National Recreation Area (NRA): 1-(2, 4, 26-29). 2-(11, 25, 81, 84). 3-56. 36 4-(12, 31, 48). 9-(1, 2, 4, 8, 14). 11-40. 12-(77, 78). 13-72. 17-(2, 5, 6, 8, 37 10, 11, 14, 18, 23, 28, 29, 31, 32, 37, 39). 18-(1-3, 5, 16, 17, 27). 19-(4, 38 5, 12, 59, 60, 72-75, 78, 81, 82). 20-1. 21-(1, 22). 22-16. 26-16. 27-6. 39
National Register of Historic Places (NRHP): 3-51. 14-(7-9, 11, 13, 14, 18). 40 25-(20, 28). 41
national wildlife refuge: 9-11. 11-(46, 48). 12-(87, 88). 13-(80, 82). 18-15. 42 Native American Heritage Commission (NAHC): 1-28. 14-(25, 26, 28, 30). 43
24-4. 28-3. 44
31-13 Draft – June 2013

Shasta Lake Water Resources Investigation Environmental Impact Statement
Native American: 1-(28, 32, 34). 3-54. 4-32. 7-(20, 21). 12-(72, 73). 24-(4, 5, 1 9-11, 15, 16, 19, 22, 24, 25, 27, 29, 30-32). 25-(19, 20, 28, 32, 36). 2 26-(3, 17, 18). 27-(1, 3, 6). see Indian tribes 3
native plants: 2-(88, 89). 3-62. 12-(61, 77, 78, 83, 84, 96, 181). 13-242. 26-(19, 4 20). 5
natural community conservation plan (NCCP): 11-(45, 71). 12-(85, 95, 96). 6 13-(79, 87). 17-24. 7
natural gas service and infrastructure: Chapter 21. 8 Natural Resources Conservation Service (NRCS): 3-(51, 67). 10-(19, 20). 9 navigable waters: 3-49. 4-45. 7-22. 11-29. 12-73. 26-13. 10 NCCP—see natural community conservation plan 11 NEPA—see National Environmental Policy Act 12 nesting: 2-(10, 64). 3-58. 11-(18, 84). Chapter 13. 13 NHPA—see National Historic Preservation Act 14 NMFS—see National Marine Fisheries Service 15 No-Action Alternative: 2-(2, 20-23). 16 noise: 2-75. 3-(1, 64). 4-52. 7-33. Chapter 8. 11-(61-63). 13-(99-103, 105, 106, 17
108, 110, 111, 113, 137, 160). 16-10. 17-(22, 25-27, 36). 18-35. 18 21-(30-33, 37, 40, 42, 45). 24-15. 26-22. 19
nonnative plants: 2-10. 3-29. 12-(29, 57-60). 13-25. 20 NPDES—see National Pollutant Discharge Elimination System 21 NRA—see National Recreation Area 22 NRCS—see Natural Resources Conservation Service 23 NRHP—see National Register of Historic Places 24 25 O 26 OCAP—see Operations Criteria and Plan 27 odor: 5-(27, 28, 32, 42, 47, 52, 56, 61, 64, 70). 7-30. 21-31. 28 Office of Emergency Services: 9-(18, 45). 22-(2, 3). 29 Office of Historic Preservation: 1-27. 14-9. 28-3. 30 open space: 3-62. 10-(3, 12, 21, 23). 11-44. 12-(85, 90). 13-(78, 83). 17-(2, 6, 8, 31
13, 19, 29, 37). 18-(13, 15, 20-23). 19-95. 32 operations and maintenance: 2-(2, 23, 39, 44, 47, 49, 55, 63). 3-40. 9-(31, 34). 33
26-4. 34 Operations Criteria and Plan (OCAP): 1-(1, 34). 2-(20, 40). 3-70. 6-13. 7-(27, 35
28, 287). 11-(34, 50, 123, 175, 223, 271). 12-(122, 123). 13-(179, 208). 36 OPR—see Governor’s Office of Planning and Research 37 ozone: 3-62. 5-(3-8, 11, 24, 28, 33, 45, 49, 53, 58). 38 39 P 40 Pacific Gas and Electric Company (PG&E): 3-(15, 43, 44). 14-5. 21-(17, 18, 41
19). 23-11. 25-(7, 9, 11, 17-19, 23, 40). 26-18. 42 pedestrians: 18-(13-15). 19-71. 25-22. 43 permit: 1-(26-30). 2-(23, 26, 29, 32, 81). 3-(31, 46, 50, 60, 64, 65). 4-(45, 46, 44
49, 50, 52, 66, 73, 80, 85, 91). 5-(13, 14, 19, 22-24, 34). 6-(23, 38, 39). 45 7-(21-23, 28, 31, 32, 34, 35, 80, 128, 172, 278, 279). 9-(7, 13, 26). 46
31-14 Draft – June 2013

Chapter 31 Index
11-(28-31, 41, 70, 72, 86, 92, 93, 123, 175, 223, 271). 12-(73, 79, 83, 1 92, 121, 145, 165, 166, 169, 172). 13-(67, 74, 76, 77, 133). 18-(6, 8, 14, 2 19, 79). 19-61. 21-(12, 16, 17, 21, 23, 25, 26, 34, 38, 40, 41, 49, 50). 3 22-28. 23-6. 26-(11, 13-15, 17, 20, 21, 22). 4
pesticides: 6-12. 7-(4, 5, 7, 17, 24, 30, 219, 229). 9-(7, 9). 11-20. 5 petroleum: 2-(81, 84, 85). 7-(84, 219, 228, 286). 9-(9, 21, 23, 25, 26, 29, 31, 6
34). 11-94. 22-3. see also gas, gasoline 7 PG&E—see Pacific Gas and Electric Company 8 picnicking: 17-5. 18-(5, 6, 11-16, 20, 29, 39, 49, 50, 51, 61, 62, 64). 19-(4, 17, 9
66, 67). 21-33. 10 pile driving: 8-(7, 26-28). 11 Pit River: 1-(17, 18, 20). 2-(8, 10, 64, 71, 89). 3-(44, 57). 4-(1, 8-10, 12, 23, 24, 12
27, 33, 57, 65, 67, 72, 73, 79). 6-2. 7-(3, 4). 8-11. 9-(1, 4, 5). 11-(12, 14, 13 17, 18, 20, 25, 46, 53, 76, 88, 156, 205, 206, 251). 12-86. 13-(30, 80, 14 249). 14-(3-5, 9-11, 18, 23). 15-3. 17-1. 19-(4, 5, 8, 15, 19, 57, 62, 66, 15 71, 72). 21-(15, 34). 24-(4, 9, 16, 19, 22, 24, 25, 27, 29, 31, 32). 25-9. 16 26-(3, 6, 18). 17
PM10: 4-8. 5-(3-8, 25, 26, 28, 29, 31, 33-35, 38, 40, 41, 45-47, 49-52, 54-61, 65, 18 68-70). 19
PM2.5: 4-46. 5-(3-8, 26, 33-34, 40, 41, 46, 47, 50-52, 54-56, 59-61, 70). 20 pollution, nonpoint-source: 3-61. 7-(3, 22). 12-83. 13-77. 21-21. 21 pollution, point-source: 3-61. 12-83. 13-77. 17-11. 21-21. 22 power: 1-(2, 36). 2-(25, 38, 47, 54, 61, 71, 82, 84, 86, 99). 3-(2, 18, 23, 41, 43). 23
5-(44, 53, 62). 6-(15, 16, 47). 7-(12, 29, 45, 86). 9-(7, 23, 24, 27). 10- 6. 24 11-(30, 50). 12-(146, 175). 13-(70, 121). 14-(5, 9, 11). 16-(19-22, 31-33, 25 40, 41, 49, 50, 55, 56, 61, 62, 65, 66). 17-(11, 27). 19-9. 21-(18, 19, 22, 26 24, 29, 31, 33, 37, 39, 40, 50, 51). Chapter 21. 22-(14, 19, 21). Chapter 27 23. 24-(4-6, 18, 21, 23, 24, 26, 29). 28
powerplants: 2-(35, 71, 96). 5-(34, 50, 59). 6-(1, 2, 18, 20, 47). 7-(23, 45, 84, 29 88). 9-11. 10-6. 14-5. 18-8. 21-34. Chapter 23. 30
precipitation: 1-(12, 18). 2-9. 4-(27, 33, 53, 54). 6-21. 7-185. 10-(5, 6, 51). 31 11-(2, 335). 12-70. 17-27. 18-(2, 11). 21-15. 25-17. see also rainfall and 32 snowfall 33
preconstruction surveys: 12-(158, 176, 180, 186). 13-(209-212, 214, 217, 219, 34 222-230, 232-237, 239-243, 245-247). 35
predation: 11-(8, 18, 23, 52, 56, 58, 59, 97, 102, 107, 112, 125, 162, 165, 167, 36 170, 210, 213, 215, 218, 256, 259, 262, 265, 286, 289, 291, 294). 37 13-227. 38
preferred alternative: 1-35. 2-(2, 101, 102). 3-39. 26-10. 39 prehistory: 3-51. 14-(12, 20). 25-(19, 28). 40 prey: 11-(16, 23, 92, 93). 13-(76, 90, 121, 149, 171, 184, 201, 212). 25-(15-17, 41
29). 26-2. see also predation 42 primary study area: 1-(17-21, 34, 35). 43 Prime Farmland: 4-44. 10-(7, 11, 20-22, 25). 44 project area—see primary study area and extended study area 45 propane: 9-9. 21-19. 46
31-15 Draft – June 2013

Shasta Lake Water Resources Investigation Environmental Impact Statement
public participation: 2-1. 3-(57, 58). 5-13. 1 public safety: 2-14. 9-16. 16-(3, 13). 17-(27, 36). 22-10. 2 public services: 2-37. 9-(1, 43, 44, 45, 47). 13-(134, 157, 180). 16-(4, 10). 3
17-17. 18-22. 21-(1, 21, 24, 32, 52, 53). Chapter 22. 24-(4, 5). 26-8. 4 public transportation: 17-22. 5 pumping capacity: 6-(22, 69). 23-5. 6 pumps: 2-(31, 79, 87). 3-(18, 34, 36). 5-39. 6-(4, 5, 10, 15, 17, 21, 23, 36). 7
7-(33, 283). 8-(7, 25). 9-23. 11-65. 14-6. 21-(6, 11, 15, 16, 33). 23-5. 8 9 Q – not used 10 11 R 12 railroad: 1-30. 2-(35, 36, 39, 44, 45, 47, 55, 62, 64, 71-73, 77-79). 3-53. 7-(1, 3). 13
8-38. 11-20. 12-27. 18-8. 19-(9, 58, 64). 20-(1, 3, 4, 31, 34, 36, 37, 39, 14 41, 44, 46). 21-(24, 34). 15
rainfall: 1-12. 4-33. 5-15. 6-7. 7-(48, 83, 87, 119, 131,150, 158, 175, 218, 228). 16 18-(83, 96). 25-(18, 29). see also precipitation 17
raptors: 3-58. 13-(9, 19, 22, 24-26, 68, 70, 76, 110, 121, 127, 149, 171, 191, 18 193, 212, 214, 229-230, 234, 237, 240-241, 243, 247). 19
RBDD—see Red Bluff Diversion Dam 20 record of decision (ROD): 1-(4, 13, 25, 26, 28, 31, 37). 2-(5-7, 21, 40, 104). 21
3-(38, 47). 4-(47, 76). 6-(13, 16). 7-(27, 80, 128, 172). 11-(31, 35, 39, 22 45. 12-75-77, 85). 13-(27, 70-72, 79, 94, 134, 157, 196). 17-(11, 12, 18). 23 18-17. 26-(10, 11, 13-15). 27-(3, 7). 24
recreation: 1-(2, 6, 16, 24, 26, 27, 29, 30, 32, 38). 2-(7, 11, 14, 22, 24, 25, 25 36-39, 42-44, 46, 47, 49, 54, 55, 57, 58, 60, 62, 64, 67, 73, 79-84, 91, 26 96, 97, 100). 3-(2, 29, 36, 41, 50, 53, 56, 60, 61, 64). 4-88. 6-(34, 41). 27 7-(1, 4, 8, 11, 17, 20, 23-26, 29, 45, 86, 225). 8-(6, 7, 12, 13, 15, 17, 21, 28 25, 27, 30-32, 34, 35). 9-(1, 8, 13, 14, 16, 25, 28, 30, 34). 10-(13, 18, 29 45). 11-(10, 20, 25, 42, 44, 69, 274, 575). 12-(68, 77, 81, 84, 90, 115, 30 149-151). 13-(5, 73, 75, 77, 82, 84, 100, 103, 108, 134, 157, 180, 31 196-201). 14-(1, 5, 21, 24, 25, 27, 29). 17-(2, 5, 9, 10-14). Chapter 18. 32 19-(2-4, 59,-65, 67, 69-76, 78, 81-83, 86, 88, 90, 92, 94, 96-99). 20-(5, 33 8, 28, 31, 33, 37, 41, 44, 46). 21-(1, 6, 10, 11, 22, 27, 32-36, 38, 39, 34 41-46). 22-(15, 19, 21, 23). 23-21. 24-(2-4, 11, 15, 17, 18, 20, 22, 23, 35 25, 26, 28). 25-(3, 6, 7, 20, 27, 35). 26-(3, 4, 16, 20). 27-6. 36
recreational facilities: 3-61. 8-(7, 23). 9-(7, 8, 30, 34). 10-(45, 46). 13-(134, 157, 37 180). 17-(25, 26, 28, 30, 31, 33, 34). Chapter 18. 19-(61, 83, 86, 88, 90, 38 92). 20-(32, 33, 37, 41, 44, 46). 21-30. 22-(15, 21, 23). 26-3. 39
Red Bluff—see Red Bluff Diversion Dam 40 Red Bluff Diversion Dam (RBDD): 1-(9, 20, 22,). 2-8. 6-(1, 2, 11, 15, 18-20, 41
32, 45-47, 50, 51). 7-(4-6, 8, 9, 11, 14, 15, 26, 28, 37, 43, 48, 49, 51, 54, 42 87, 88, 118, 119, 149, 150, 158, 181). 11-(3, 47). 13-81. 28-4. 43
Red Bluff Pumping Plant (RBPP): 1-(5, 9, 17-20, 22). 2-(5, 24, 38, 43, 46, 50, 44 53, 60, 86, 87, 95, 97, 100). 4-(13, 45, 86, 91). 6- (2, 5, 15, 20-21, 50, 45 52, 58). 7 (4, 31, 86, 89, 134, 178, 222, 231, 286). 9-1. 10-3. 11-(3, 15, 46
31-16 Draft – June 2013

Chapter 31 Index
16, 31, 54-57, 114, 116, 117, 119, 122, 124, 125, 165, 170-173, 175, 1 218-221, 223, 225, 266-269, 271, 295, 296, 298). 12-(2, 26, 28, 30, 51-2 52, 53-55, 87, 98-99, 103, 118, 122, 130,132, 138, 140, 151, 153,). 13-3 (25, 58, 64, 85, 130-131). 4
Redding: 1-(2, 17, 18, 20). 2-52. 3-(34, 56). 4-(16, 20, 21, 42). 6-(10, 11, 17, 18, 5 26-28). 7-15. 8-(8-10). 9-(10, 16). 10-(2, 18). 11-(2, 3, 44, 47). 12-(27, 6 81, 84, 87-90). 13-(1, 58, 73, 77, 78, 81, 83, 84). 14-(1, 4-6, 8, 9, 17). 7 16-(3, 6, 8, 12, 17). 17-(1, 6, 11, 12, 14-16, 18, 22, 23). 18-(1, 8, 11-15, 8 18, 20, 22). 19-(3, 11, 73, 76). 20-(1, 3, 4-6, 25, 42). 21-(1, 2, 5-10, 12, 9 16, 18, 19, 22, 23, 25, 34). 22-(1-8, 10, 14). 24-(4, 9). 27-2, 6, 7. 28-4. 10
refuges: 1-23. 3-23. 6-(5, 6, 15, 34, 35, 54, 55, 57, 72-81, 91, 93, 99-101, 11 108-110, 116-118, 122, 127-129, 133. 7-24. 9-11. 11-31. 12-88. 13-82. 12 18-19. see also game refuges and wildlife refuges 13
residential areas: 8-6. 17-13. 19-78. 21-5. 14 Resource Conservation and Recovery Act: 9-11. 21-21. 15 revegetation: 2-33. 4-(65, 73, 80, 85, 90). 7-(80, 128, 172). 11-(86, 92, 93). 16
12-(114, 147, 158, 161, 162, 175, 177, 180, 187). 17 riparian communities: 12-(27, 28, 31, 99-101, 103, 116-119, 122, 123, 130, 132, 18
138, 140, 144, 147, 151, 153). 13-(91, 248). 26-15. 19 riparian scrub: 12-(31, 35, 59, 62-64). 13-25. 20 riparian woodland: 10-18. 11-44. 12-(30, 31, 35, 51, 52, 54, 59, 60, 62-64, 85). 21
13-(25, 58, 60, 62). 22 riprap: 2-(71, 72, 92). 4-(30, 44). 7-(23, 26). 11-(4, 19, 26). 12-(21, 30, 57). 23
13-(19, 74, 131). 24 Rivers and Harbors Act: 1-26. 3-49. 12-73. 26-13. 25 roadways: 2-(29, 34, 35, 39, 44, 47, 55, 62, 64, 70, 73-75). 3-64. 4-(86, 91), 26
5-(41, 43). 8-(7, 9, 15, 28). 9-(1, 24, 27, 28, 32, 35, 38, 41). 11-6. 12-(1, 27 71, 177). 13-(1, 242). 17-(25, 26). 19-(11, 12, 59, 60, 63, 64, 73, 78, 83, 28 84, 86, 88, 90, 92, 95, 98). Chapter 20. 21-1. 26-22. 29
ROD—see record of decision 30 roosting: 13-(22, 23, 61-63, 101, 103, 113, 114, 127, 138, 145, 161, 167, 191, 31
193, 221, 227). 32 runoff: 1-(12, 17, 22). 2-(29, 39, 41, 45, 48, 63). 4-(33, 45, 46). 6-(1, 7, 17, 22, 33
24, 43, 45, 134, 135, 137-140). Chapter 7. 9-(7, 11, 26). 10-13. 11-(2, 7, 34 20, 86, 91, 93, 152, 203, 336-338, 340, 341). 12-(31, 70), 13-173. 19-9. 35 21-15. 23-(4, 25-27). 25-(9, 18, 19). 36
37 S 38 Sacramento County: 1-23. 3-17. 6-(27-29). 8-20. 10-(12, 22). 11-(38, 44). 39
12-85. 13-78. 16-(3, 5, 7). 17-(7, 16). 40 Sacramento River Conservation Area: 2-(54, 62). 3-(13, 29). 10-(23, 24). 41
11-(45, 47, 330). 12-(86, 87, 101, 105, 119, 123, 164). 13-(79-81, 129). 42 Sacramento River Flood Control Project (SRFCP): 2-22. 6-7. 43 Sacramento River National Wildlife Refuge: 12-88. 13-82. 18-15. 44 safety—see public safety 45
31-17 Draft – June 2013

Shasta Lake Water Resources Investigation Environmental Impact Statement
salinity: 1-(17, 22). 2-(26, 39). 3-(14, 35, 38, 39). 6-(11, 15, 21, 22, 32, 33). 1 7-(7, 8, 17, 18, 30, 32, 34, 36, 38, 39, 41, 43, 50, 51-58, 64, 65, 67-69, 2 71-79, 90-100, 106, 107, 110, 111, 113-125, 127, 134-144, 150, 151, 3 154, 155, 157-169, 171, 178-188, 194, 195, 198, 199, 201-213, 215, 4 222-224, 232-241, 247, 248, 251, 252, 254-266, 268, 274-277, 286). 5 11-(8, 9, 25, 27, 61, 63, 73, 129, 138, 139, 187, 234, 235, 273, 309, 310, 6 325, 335-337, 339-341). 12-(32, 91, 97). 23-11. 7
salmon: 1-(6-9). 2-(15, 38, 43, 46, 50, 52-54, 56, 57, 60, 62, 87, 88, 95, 97, 8 100). 3-(5, 13, 14, 19, 23, 25, 26, 28, 30-33, 47, 48, 60). 4-43. 6-(14, 20, 9 47). 7-(11-13, 27, 45, 87). 9-11. Chapter 11. 13-(180, 192).14-(3-5). 10 18-(11, 44, 58, 71, 77, 78, 84). 24-4. 25-(14, 16, 19, 20, 40, 41). 11
San Andreas Fault system: 4-(21, 22). 12 San Francisco Bay: 1-(22-24). 3-5. 4-44. 5-6. 6-(19, 31). 7-(7,10, 17, 18, 21, 13
33). 10-(6, 7, 12). 11-(7-10, 31, 44, 61, 63). 12-2. 17-(8, 16). 20-5. 23-8. 14 San Francisco Bay/Sacramento–San Joaquin River Delta (Bay-Delta): 1-(22). 15
3-(24, 27, 34, 40). 6-(21, 24). 7-(30, 31, 36). 11-8. 12-(2, 31). 13-(26, 16 64). 17
San Joaquin County: 6-29. 10-22. 16-(3, 4, 7). 18 Scenic Highway Program: 3-63. 19-(73, 77, 80-82, 84, 86, 88, 90, 92, 93). 19
26-21. 20 schools: 3-55. 18-22. Chapter 22. 24-2. 25-16. 26-8. 21 scoping: 1-(5, 32, 38). 2-(5, 7, 16, 95). 3-(13, 27, 32, 34, 45). 5-(19, 20, 30). 9-8. 22
24-1. 27-(1-4, 7). 28-1 23 scour: 4-(29, 67), 7-9. 11-(58, 62, 63, 118, 119, 124, 132, 136, 174, 176, 222, 24
224, 269, 272, 297, 299). 12-(28, 69, 70, 117, 119, 164). 13-(127, 248). 25 25-(13, 28, 33, 37). 26
Secretary of the Interior: 1-(4, 5, 26). 3-(23, 51). 13-67. 17-(17, 19). 27 Section 10: 3-49. 11-28. 12-73. 13-68. 26-13. 28 Section 401: 1-28. 2-32. 3-(47, 62). 4-(48, 49). 7-(21, 28, 31). 11-30. 12-(73, 29
83). 13-77. 26-(13, 21). 30 Section 402: 1-28. 2-29. 7-21. 11-30. 12-73. 26-13. 31 Section 404: 1-26. 2-32. 3-(46, 47). 7-(21-23, 31, 80, 128, 172). 11-29. 12-(27, 32
73, 96). 13-(73, 74, 77). 26-(11-13, 17). 33 Section 404(b)(1): 3-46. 26-(11-13). 34 Section 7: 3-(5, 48). 11-(28, 33, 42). 12-71-72. 13-(66, 242). 26-(14, 16). 35 sediment transport: 4-(29, 30, 43, 44, 53, 54, 61, 62, 66, 67, 70, 77, 84, 89). 36
7-(9-11, 81, 85, 132, 176, 220, 226, 230). 11-(118, 124, 174, 176, 222, 37 224, 269, 270, 272, 297, 299) 25-19. 38
sedimentation: 2-29. 4-(52, 67, 74, 81, 86, 91, 92). 7-(11, 21, 31, 35, 80, 84, 39 219, 228, 229). 11-(54, 86, 91, 92, 152, 203, 336-339, 341, 13-(96, 98, 40 136, 159, 181, 197). 18-14. 41
seepage: 7-22. 10-2. 21-15. 42 seismic hazards: Chapter 4. 9-19. 43 sensitive plant communities: Chapter 12. 26-3. 44
31-18 Draft – June 2013

Chapter 31 Index
sensitive receptors: 5-(24, 28, 31, 32, 41, 42, 47, 51, 52, 56, 61, 64, 69). 8-(7, 1 11, 22, 23-38). 9-(22, 27, 28, 30, 32, 33, 35, 36, 38, 39, 41-48). 19-(78, 2 83). 20-(33, 34, 38, 41, 44, 47). 26-18. 3
Shasta-Trinity National Forest (STNF): 1-(14, 26, 27, 30). 3-(5, 56). 4-(41, 47, 4 48). 7-(3, 24, 25). 8-(35, 39). 9-(2, 13). 11-(19, 38, 39, 80). 12-(73, 74, 5 96). 13-(68, 69, 70). 17-(2, 8, 17). 18-(16, 17, 20). 19-(4, 5, 13, 74, 80, 6 81, 84-89, 91, 93, 94, 96-98). 20-55. 21-(16, 21, 25, 32, 51). 22-9. 25-(3, 7 6, 7, 9, 11, 12, 22, 23, 25, 30, 34, 38, 40). 26-(15, 16). 8
SHPO—See State Historic Preservation Officer 9 Sierra Nevada: 4-(13,-15, 20, 31). 5-3. 6-2. 7-28. 10-6. 12-(35, 37). 13-(5, 57, 10
61). 17-7. 23-(6). 11 significance criteria: 3-6. 4-(56, 101). 5-(27, 28, 30). 6-(34, 89, 95, 99, 103, 108, 12
112, 116, 120, 123, 127, 134). 7-(40, 285). 8-22. 9-20. 10-25. 11-(71, 13 334). 12-(84, 95-97,). 13-(86-88). 14-18. 16-17. 17-23. 18-(25, 26). 14 19-(77-79). 21-25. 22-12. 23-(10, 24, 57). 25-24. 15
siltation: 6-36. 7-21. 16 siphons: 3-18. 6-36. 17 SLC—see State Lands Commission 18 sloughs: 3-(35, 46). 6-(3, 4, 7, 8, 13, 16, 17, 37, 42). 11-(6, 7, 9, 33, 65, 120). 19
12-(30, 122). 13-(25, 62-64). 17-19. 20 snowfall: 5-15. 18-2. see also precipitation 21 snowpack: 1-12. 18-96. 22 socioeconomics: 1-38. 3-46. Chapter 16. 23 Soil Conservation Service—see Natural Resources Conservation Service 24 soil disturbance: 7-45. 12-114. 25 soil surveys: 4-45. 26 soils: 2-29. 3-(1, 20). Chapter 4. 7-(1, 2, 7, 33). 10-(1, 20). 11-91. 12-(29, 53, 27
57, 58, 69, 70, 71, 117, 164). 13-63. 19-(11, 64, 71, 83, 85-90, 92, 100). 28 21-33. 25-(26, 27, 32, 36, 37). 26-(1, 4). 29
solid waste: Chapter 21. 30 special-status species: 1-(34, 35). 2-68. 3-32. 10-(27, 28). Chapter 11. Chapter 31
12. Chapter 13. 17-(11, 18). 25-21. 27-6. 32 species of special concern: Chapter 13. 33 spill prevention and control plan: 2-30. 34 spring-run Chinook salmon: 1-(6, 8, 9). 3-(25, 26, 30, 32). 6-(13, 14). 7-25. 35
11-(3, 5, 10, 15, 28, 34, 55, 56, 78, 99-103, 162-165, 210-213, 256-259, 36 286-289). 37
Squaw Creek: 2-57. 4-(1, 24, 26, 49, 60, 66, 72). 6-2. 7-(3, 4, 8, 14, 15, 46, 49, 38 84, 90, 131, 175). 9-1. 11-(17, 18, 20, 53, 88, 156, 205, 206, 251). 12-(6, 39 7,8, 25, 36, 28, 66-69, 71, 110-114, 127-129, 136). 13-(6, 20, 28, 29, 30, 40 95, 97, 99, 101, 102, 104, 107, 109, 110, 112, 115-120, 135-137, 41 139-141, 143, 144, 146-149, 158, 159, 161, 162, 164-166, 168-171). 42 14-(2, 3). 17-1. 18-(38, 53, 66). 19-(71). 20-(2, 36, 39). 26-6. 43
SRFCP— see Sacramento River Flood Control Project 44 staging areas—2-(90, 91). 5-67. 7-283. 8-37. 9-(25, 45). 11-91. 13-(65, 244). 45
17-(26, 36). 18-8. 46
31-19 Draft – June 2013

Shasta Lake Water Resources Investigation Environmental Impact Statement
stakeholders: 1-(24, 25, 32). 2-12. 3-23. 11-(35-37). 12-(78, 89, 157, 163, 168, 1 171, 174, 179). 13-83. 19-80. 25-3. 27-(1, 2, 4-7). 28-9. 2
State Historic Preservation Officer (SHPO): 14-(8, 11, 13-15). 26-16. 3 State Lands Commission (SLC): 1-27. 3-63. 17-19. 18-(13, 14). 26-21. 28-3. 4 State Parks—see California Department of Parks and Recreation 5 State Route 151 (SR 151): 19-(6, 12, 13, 57, 58, 60, 73, 81, 82, 84-88, 90-92). 6
26-21. 7 State Route 273 (SR 273): 17-6. 20-1. 8 State Route 299 (SR 299): 19-73. 20-2. 9 State Route 36 (SR 36): 20-3. 10 State Water Resources Control Board (SWRCB): 1-(8, 17, 28, 33, 35). 2-(40). 11
3-(18, 19, 47, 60). 4-48. 5-20. 6-(19-25, 33, 37, 38). 7-(4, 18, 20, 21, 28, 12 31-35, 39, 43, 50, 53, 56, 59, 62, 66, 70). 9-8. 11-(8, 30, 32, 36, 37, 50, 13 175, 223, 271). 12-69. 13-77. 23-5. 21-(23, 26). 28-3. 14
State-owned: 3-68. 20-6. 22-8. 15 steelhead: 1-8. 2-40. 3-(5, 13, 25, 26, 30-33). 6-(14). 7-(27Chapter 11. 18-(11, 16
77). 25-(14, 20). 17 storage facilities: 1-(23, 24). 6-1. 9-9. 11-63. 23-1. 18 stormwater permit: 2-53. 7-278. 21-21. 19 stormwater pollution prevention plan (SWPPP): 2-(29, 30, 74). 7-(22, 32, 219, 20
229, 270, 271, 278). 11-(92, 93, 336-340). 21 streambed alteration agreement: 1-24. 2-32. 4-48. 11-37. 12-(83, 175,176). 22
13-77. 26-19. 23 study area—see primary study area and extended study area 24 Superfund—see Comprehensive Environmental Response, Compensation, and 25
Liability Act 26 suspended load: 4-44. 7-10. 27 Sutter County: 3-(32, 42). 5-1. 6-27. 7-33. 8-20. 10-3. 11-(6, 44). 12-(85). 28
13-(78). 16-7. 17-(7, 16). 29 swimming: 7-(8, 20, 26). 9-14. 18-(1, 6, 12-15, 42-44, 46, 47, 57, 59, 70-72, 76, 30
77, 80, 83, 84, 86). 19-4. 31 SWPPP—see storm water pollution prevention plan 32 SWRCB—State Water Resources Control Board 33 34 T 35 TCD—see temperature control device 36 TDS—see total dissolved solids 37 Tehama County: 1-(20, 28). 3-(30, 32, 45, 56, 65). 4-(28, 33). 5-(1, 25, 29). 38
7-33. 8-(13, 18, 19-21, 38). 9-(5, 20, 44, 45). 10-(1-3, 11, 23-25). 11-39 (44, 46). 12-(76, 78). 13-(73-75). 14-(1, 2, 4). 16-(1-3, 6-8, 10, 12-18, 40 23, 24). 17-(1, 6, 14, 21, 23). 18-(13, 14, 18, 21, 22). 20-(1, 3, 7). 21-(1, 41 10, 12, 15, 17, 18, 25, 35). 22-(1, 4-8, 11). 24-(3, 5, 12, 17, 20, 23, 25, 42 28). 26-(7, 22). 43
telecommunications: 2-(84, 86). Chapter 21. 44 telephone service: 21-19. 45
31-20 Draft – June 2013

Chapter 31 Index
temperature: 1-(4, 8, 9, 14, 20). 2-(8, 14, 17, 21, 24, 28, 35, 37-39, 41-44, 46-49, 1 54, 56, 60, 63, 70, 71, 94, 96-98, 100). 3-(13, 20, 23, 25, 28, 31, 38). 2 4-(33, 83). 5-(3, 7-9, 68). 6-(14, 16, 18, 20, 40-43, 47, 120). 7-(19, 26, 3 29, 30, 37, 42-48, 50-52, 54, 89-91, 116-118, 120-122, 147-149, 4 151-154, 157-161, 165-169, 180-184). 8-3. 9-(2, 4, 5, 48). 10-23. 11-(2, 5 3, 5, 7, 8, 16-18, 25, 33, 37, 47-50, 54, 56, 58-60, 68, 71, 72, 78, 79, 6 91-93, 97-99, 102, 103, 107, 108, 112-118, 120, 122, 123, 125, 148, 7 159, 162, 165, 167, 170-176, 192, 193, 208, 210, 213, 215, 218-224, 8 243, 253, 256, 259, 262, 265-271, 275, 283, 286, 289, 291, 294-298, 9 315, 323, 324, 334, 335). 12-(72, 87, 108, 125, 142, 149). 13-(81, 180, 10 249). 18-(2, 11, 42, 44, 57, 58, 70, 71, 77, 84, 89). 23-(14, 16, 19, 22). 11 25-(11, 15-19, 23, 27, 28, 31, 33, 35, 37). 12
temperature control device (TCD): 1-(8, 9). 2-(14, 21, 24, 35, 37, 42, 46, 49, 58, 13 69, 71, 96, 97). 4-83. 5-(35, 46, 50, 55, 60). 6-(15, 20, 40, 41, 47, 95, 14 103, 112, 120, 122). 7-(11, 12, 14, 37, 42, 44, 45, 49, 85, 116, 147). 15 11-(17, 50, 55, 79, 115, 148, 171, 197, 219, 243, 247, 269, 275). 16 12-(107, 125, 134, 142, 149). 13-180. 21-34. 23-(13, 15, 17, 19, 21). 17
threatened species—see special-status species 18 timberlands—see logging 19 timber: 2-68. 3-(22, 53, 56). 4-(28, 29, 47). 7-2. 9-13. 10-(13, 23). 12-74. 13-69. 20
17-(2, 6, 8-10, 13). 18-(21, 38, 39, 56, 69, 75, 82, 88, 92-96). 19-74. 21 21-22. 25-18. 22
TMDL—see total maximum daily load 23 topography: 2-(6, 30, 76). 4-(2, 17, 19, 23, 31, 43, 51, 55). 8-(8, 25, 26). 9-(2, 24
4). 12-(29, 30, 145). 17-1. 19-(6, 7, 10, 12, 58-62, 65, 66, 68-72). 22-1. 25 total dissolved solids (TDS): 6-12. 7-(7, 17). 26 total maximum daily load (TMDL): 7-(6, 13,19, 21, 23, 28, 44, 53). 27 toxic substances: 5-14. 9-27. 28 traffic: 2-(71, 74, 76-78). 3-(2, 45). 5-(21, 26, 65-67). 6-17. 7-25. 8-(3, 5-9, 14, 29
15, 17, 22-25, 27-35, 38). 9-(24, 27, 28, 32, 35, 36, 38, 39, 41, 44). 30 10-12. 12-(114, 115, 147). 13-(96, 98). 16-10. 17-(22, 25-27). 18-(2, 28, 31 48, 60, 74, 81). 19-(11, 58, 69, 71, 94, 95, 99). Chapter 20. 21-(30, 33, 32 51). 22-(6, 7, 13-15, 17, 27, 28). 26-6. 33
traffic control plan: 20-(51, 52). 34 trails: 2-(36, 60, 62, 79, 82). 9-14. 13-244. 14-(1, 5, 21, 24, 25, 27, 29). 17-7. 35
18-(5, 6, 8, 12-16, 18, 22, 23, 30-34, 51, 53, 54, 63-66). 21-45. 36 transportation: 1-(27, 38). 2-(26, 27, 32, 68). 3-(2, 31, 41, 44, 64). 4-50. 5-(3, 37
10, 14, 17, 20, 66). 7-151. 8-(7-9, 11, 12, 14-18, 20, 21, 29). 9-(4, 8, 9, 38 18, 19, 24, 30, 34, 37, 40, 44, 45). 10-1. 11-20. 14-(4, 5). 16-(3, 12). 39 17-(6, 22, 26). 18-32. Chapter 20. 21-(24, 30, 37, 41, 42, 45). 22-(13, 18, 40 20, 22-25). 24-11. 26-(4, 8). 41
trash—see waste disposal, solid waste 42 tribes: 1-34. 3-(50, 54). 7-(19, 20). 12-(72, 73). 14-(1, 3, 9, 10, 13, 14, 17). 43
15-(1, 3, 4). 16-9. 24-(4, 9, 11, 15, 16). 25-6. 26-(17, 18). 27-(1, 3, 6). 44 Trinity Reservoir: 1-20. 6-49. 23-2. 45
31-21 Draft – June 2013

Shasta Lake Water Resources Investigation Environmental Impact Statement
trucks: 2-(30, 74, 86, 91). 5-(4, 33, 66). 7-177. 8-(13, 21, 25). 9-(32, 33, 36, 39). 1 18-78. 20-(26, 29, 30, 34, 35, 38, 42, 43, 45, 47). 21-50. 2
trustee agency: 1-27. 3 turbidity: 7-(1, 2, 4, 6, 7, 8, 10, 23, 28, 42, 45, 46, 49, 151, 157-159). 11-(54, 63, 4
64, 86, 91, 92, 152, 158, 203, 207, 252, 282). 12-32. 25-(18, 19, 23, 27, 5 33, 37). 6
7 U 8 U.S. Army Corps of Engineers (USACE): 1-(1, 26). 2-32. 3-(33, 40-43, 46, 47, 9
49). 4-55. 6-(17, 18, 23). 7-(20-22, 29). 11-(29, 70). 12-(65, 73, 92, 121, 10 145, 146, 161, 162). 13-(73, 133). 18-21. 23-2. 26-(11-13, 16, 17). 27-5. 11
U.S. Bureau of Land Management (BLM): 1-26. 2-6. 3-(29, 52, 55, 56). 4-47. 12 7-25. 9-16. 10-24. 11-40. 12-(33-35, 58, 75-77, 81, 90, 98, 108, 110, 13 135, 143, 150, 156, 162, 168, 170, 173, 179, 182). 13-(26-31, 58, 59, 61, 14 70, 71, 73, 84, 94, 96, 100, 107, 111, 112, 134, 135, 138, 142-145, 157, 15 158, 160, 164, 166, 167, 180, 181, 183, 196, 197, 199, 200, 226). 16-9. 16 17-(6, 8, 11, 12, 14, 17, 18). 18-(8, 11-15, 18, 20, 21, 43, 79). 19-(58, 17 59, 76). 21-(22, 23). 22-(2, 3, 5-8, 10). 25-1. 26-(1, 15, 16). 27-5. 18
U.S. Census Bureau: 16-14. 24-(8, 9). 19 U.S. Department of Agriculture (USDA): 10-19. 12-(57, 58). 13-75. 20 U.S. Environmental Protection Agency (EPA): 1-27. 3-(46, 47, 49, 50, 55). 21
5-(7, 10-14, 19, 25, 27). 6-(11, 30, 33, 34). 7-(6, 15, 17-19, 24, 31). 22 8-(12, 25, 27). 9-(10, 12, 18, 29). 11-36. 12-(72, 89). 13-(79, 83). 23 21-(20, 21, 34). 24-(7-8). 26-(11, 13). 27-7. 24
U.S. Fish and Wildlife Service (USFWS): 1-(1, 2, 13, 26, 34, 36). 2-(6, 18, 20, 25 31, 40, 50, 56, 98). 3-(4, 5, 6, 24, 26, 47, 48). 6-(15, 37). 7-(11, 25, 26). 26 11-(10-15, 21, 27-29, 31, 33-38, 41, 45, 48, 54-55, 65, 70, 71, 144, 147, 27 193, 196, 240, 243, 274, 315, 318, 326-328, 330, 331, 333). 12-(2, 33, 28 51-55, 71, 72, 75, 86, 88, 90, 92, 95, 121, 161, 162, 164, 166, 169, 172). 29 13-(2, 27, 28, 56-58, 65-67, 73, 75, 79, 82, 84, 87, 122, 131, 133, 150, 30 157, 172, 179, 185, 195, 202, 208, 220-222, 226, 241, 242). 18-15. 31 21-10. 22-3. 26-(14, 15). 27-5. 32
U.S. Forest Service (USFS): 1-(1, 3, 14, 16, 20, 26-31). 2-(6, 25, 36, 79, 81, 82, 33 84). 3-(52, 56). 4-(23, 41, 47, 53). 7-(24, 27). 9-(2, 5, 7, 13, 21, 23, 44, 34 45). 11-(10-15, 37, 38, 40, 76, 88, 156, 205, 251, 281). 12-(1, 32-34, 37, 35 51-55, 58, 68, 73, 75-78, 79-81, 98, 108, 109-110, 126, 135, 143, 150, 36 156, 161-162, 163, 168, 170, 173, 179, 182). 13-(1, 26-32, 58-61, 68, 37 70-72, 94, 96-97, 100, 102, 105, 107, 111-112, 117, 134-136, 138-140, 38 142-146, 157-161, 163-164, 166-168, 180-184, 196-200, 217-222, 225-39 226, 228, 243). 14-(2, 5, 13, 14). 16-(9, 14). 17-(5, 6, 8, 11, 12, 17, 18, 40 26-29, 31, 32, 37). 18-(1, 2, 5, 6, 13, 16, 17, 25, 27, 30-34, 38, 51-54, 41 63-67, 92). 19-(4, 5, 61, 63-68, 70, 72, 74, 77, 78, 80, 81). 20-(1, 2, 30, 42 31, 35, 36, 39). 21-(10, 19, 32, 51). 22-(3-10, 15, 16). 25-(3, 4, 6-8, 11-43 13, 17, 19-24, 29, 30, 33, 38). 26-(1, 15, 16). 27-5. 28-2. 44
U.S. Geological Survey (USGS): 4-(29, 33, 46). 7-(6, 9, 11, 15, 16). 11-54. 45 13-58. 25-(11, 21, 23). 46
31-22 Draft – June 2013

Chapter 31 Index
UBC—see Uniform Building Code 1 unemployment: 16-(1, 2, 4, 5, 15, 23-25, 35, 43, 51, 57). 24-(5, 6, 11-14). 2 Uniform Building Code (UBC): 4-(21, 34, 51, 56). 8-16. 3 Union Pacific Railroad (UPRR): 2-(45, 77-79, 96). 8-(8, 10). 9-(8, 9). 17-(2, 6, 4
27). 19-(4, 62, 63, 65, 71). 20-(2, 4, 5). 21-34. 5 Unique Farmland: 3-51. 10-(7, 11, 20-22, 25, 42). 26-15. 6 unity: 19-(2, 3). 7 uplands: 4-(13, 41, 61). 11-11. 12-(70, 71, 92). 13-(99, 104, 137, 160). 19-(11, 8
60, 61, 64, 66-68). 9 USACE—see U.S. Army Corps of Engineers 10 USDA—see U.S. Department of Agriculture 11 USFS—see U.S. Forest Service 12 USFWS: see U.S. Fish and Wildlife Service 13 USGS—see U.S. Geological Survey 14 utilities: 2-(25, 26, 36, 39, 44, 47, 55, 62, 64, 73, 81, 82, 84-86). 3-(2, 37, 41, 15
43). 5-(4, 18, 25, 33, 35, 43, 46, 50, 54, 59). 8-(13, 18). 9-(23, 30, 33). 16 12-(1, 114). 13-(1, 134, 157, 180). 14-(1, 21, 24, 25, 27, 29). 17-(25-34, 17 37). 19-(9, 82, 85, 87, 89, 91). 20-7. Chapter 21. 22-(1, 13, 18, 20, 23, 18 25). 24-(6, 11). 19
20 V 21 valley elderberry longhorn beetle (VELB): 13-(58, 62, 64, 190-193, 241, 242, 22
244). 23 valley oak riparian woodland: 10-18. 12-31. 24 vegetation: 2-(10, 29, 30, 33, 39, 44, 47, 52, 53, 55, 59, 61, 62, 64, 65, 67, 87, 25
88, 89). 3-(22, 34, 41, 47, 58, 59). 4-(27, 29, 30, 55, 60, 62, 65, 72, 73, 26 79, 80, 85, 87, 90, 92). 5-(9, 27, 33, 43, 45, 48, 52, 57, 62). 7-(8, 80, 27 128, 172, 219, 229, 283). 8-(25-27). 9-(2, 4-6, 16, 23, 24, 30, 34). 28 10-(13, 17, 18, 20, 24). 11-(2, 4, 7, 18-20, 24, 41, 47, 48, 51, 52, 80, 81, 29 83, 120, 125, 149, 197, 244, 334, 335). Chapter 12. 13-(2, 5, 19-27, 32, 30 61-64, 72, 74, 76-78, 81, 82, 85, 90-92, 94-109, 110-114, 117, 119, 31 121-123, 126, 127, 129, 130, 134-145, 147-151, 155, 157-164, 166-172, 32 177, 180-185, 190-194, 197-202, 205, 206, 214, 217-230, 243, 244, 33 247-252. 17-(2, 11, 18, 19, 29). 18-(14, 38, 39, 56, 69, 75, 78, 82). 34 19-(1-3, 5-7, 10-12, 58-61, 63, 65-71, 77, 81, 82, 85, 86-91). 20-9. 35 21-(28, 30-32, 37, 40, 42, 45). 22-14. 25-(3, 9, 11, 12, 15, 18, 27, 28, 30, 36 37, 38). 26-(1, 11). 37
vehicle trips: 3-21. 5-(39, 40, 43, 47, 48, 51, 52, 56, 58, 61, 62). 8-22. 20-56. 38 VELB—see valley elderberry longhorn beetle 39 vibration: 3-(1, 55). Chapter 8. 26-(18, 22). 40 views: 18-6. Chapter 19. 26-2. 41 visibility: 4-43. 5-7. 19-2. 42 visual and aesthetic resources: Chapter 19. 43 vividness: 19-(2, 3). 44 VOC—see volatile organic compounds 45 volatile organic compounds (VOC): 5-(3, 23, 24) 46
31-23 Draft – June 2013

Shasta Lake Water Resources Investigation Environmental Impact Statement
1 W 2 WAPA—see Western Area Power Administration 3 waste discharge requirements (WDR): 3-62. 7-(26, 29). 9-11. 21-(23, 26). 4
26-21. 5 waste disposal: 4-66. 9-(7, 12, 16, 29, 31, 33, 35, 36, 39). Chapter 21. 6 wastewater: 2-(25, 36, 83-85). 4-(34, 52, 56, 58, 66, 73, 80, 85, 90, 91, 95, 7
102-105). 7-(3, 7, 8, 19, 44). 9-(7, 23). Chapter 21. 8 wastewater treatment plants: 2-86. 9-7. Chapter 21. 9 water exports: 11-145. 10 water level: 1-34. 2-(36, 37, 59, 64, 69, 78). 4-53. Chapter 6. 7-31. 9-8. 11-(18, 11
19, 21, 24, 83). 12-29. 14-11. 17-(5, 24). 18-(7, 25, 26). 19-(4, 10, 11, 12 57, 66-68, 71, 83). 24-4. 25-(11, 18, 19, 21, 22, 24, 25, 27-31, 33-35, 13 37-39). 26-2. 27-7. 14
water quality: 1-(4, 6, 9, 12, 14, 16, 17, 23, 28, 34, 36, 37). 2-(5, 11, 14, 22, 23, 15 24, 26, 28, 29, 32, 38-41, 44, 47, 55, 62, 63, 100). 3-(1, 13, 20, 26-28, 16 30, 33, 35, 36, 38, 39, 41, 45, 47, 61, 62). 4-(28, 45, 46, 48). 6-(5, 10-12, 17 18-26, 33, 34, 36-38, 42, 43, 61, 64, 67, 94, 103, 112, 120, 122, 131, 18 133-140). Chapter 7. 9-(9-11, 18, 21, 26). 10-(4, 18, 27, 28). 11-(2, 5, 19 17, 30, 32-36, 77, 86, 92, 93, 125, 158, 207, 252, 282, 322, 335, 336, 20 338-341). 12-(72, 73, 83, 89). 13-(77, 83). 17-(7, 10, 11, 18-20, 26). 21 18-96. 21-(6, 23, 30-33, 37, 40, 42, 45). 23-(25-27). 25-(4, 12, 18, 22, 22 23, 25-27, 32, 33, 36, 37). 26-(13, 21). 23
water quality control plan (WQCP): 2-40. 6-(19-21, 24). 7-(3, 6, 32, 33, 34, 40, 24 43). 11-(32, 33). 17-(19, 20). 21-23. 25
water quality standards: 3-(26, 45, 47, 61). 6-(21, 24). Chapter 7. 11-(30, 32, 26 34). 12-(72, 73, 83). 13-77. 26-13. 27
water table: 12-(116, 119). 16-31. 28 water transfers: 1-(4, 22, 36). 2-9. 6-(23, 35). 11-30. 29 waterfowl: 12-56. 13-25. 18-(12, 19). 26-4. 30 water-skiing: 19-4. 20-5. 31 WDR—see waste discharge requirements 32 weirs: 6-(3, 6-8, 36, 59). 11-6. 33 wells: 2-86. 6-(13, 25). 7-19. 10-(2, 4). 21-(5, 6, 8-11, 20, 21). 22-(19, 21). 34 Western Area Power Administration (WAPA): 11-38. 16-(19, 21). 21-(18, 19). 35
23-6. 36 wet year: 3-32. 4-(97-101). 6-69. 11-(6, 61, 68, 114, 147, 287). 12-(31, 115). 37
16-(33, 41, 49, 62). 18-41-43. 25-(18, 25, 30-32, 34, 36, 38, 39). 38 wetland communities: 11-(323, 324, 328, 329, 331-334). 12-(28, 31, 32, 99, 39
103, 106, 115, 116, 119, 121-124, 130, 131, 133, 138, 140, 141, 144, 40 147, 148, 151, 153, 154, 157-159, 164-167, 169, 171, 172, 174, 175, 41 178, 180). 13-(62-64, 213-215, 231, 250-252). 26-17. 42
Whiskeytown-Shasta-Trinity National Recreation Area: 1-(2, 4, 26, 27). 2-25. 43 3-56. 9-(1, 14). 12-77. 13-72. 17-(2, 10, 18). 18-(2, 3, 5, 16, 17). 19-(4, 44 5, 12, 74, 75, 81). 20-1. 21-(1, 22). 22-16. 26-16. 27-6. 45
31-24 Draft – June 2013

Chapter 31 Index
wild and scenic rivers: 1-(32, 38). 3-(2, 53, 56, 60, 61). 17-(6, 7, 18, 20). 1 Chapter 25. 26-(2, 16, 20). 2
wildlife: 1-(2, 4, 5, 14-16, 23, 34, 36, 38). 2-(10, 23). 3-(2, 23, 29, 41, 45, 47, 3 48, 50, 53, 58-60). 6-(6, 15, 20, 22, 24). 7-(13, 24, 43). 9-11. 10-(1, 3, 4 12, 13). 11-(5, 23, 25, 26, 28-30, 39-42, 47). 12-(33, 57, 71, 74, 77, 83, 5 85, 88, 181). Chapter 13. 17-(6, 18, 20). 18-(8, 12, 13, 15, 19,). 19-(1, 2, 6 74). 21-(22, 33, 37, 40, 42, 45). 24-17. 25-(6, 7). 26-16. 7
wildlife habitat: 1-34. 2-10. 7-29. 10-3. 11-(39, 44). 12-(61, 84, 90). Chapter 13. 8 17-(2, 10, 11, 14, 18). 18-(19, 21, 96). 26-(2, 14). 9
wildlife refuges: 1-23. 6-(6, 15, 54, 72). 7-24. 9-11. 11-31. 12-88. 13-82. 10 18-(15, 19). see also refuges and game refuges 11
wildlife viewing: 11-40. 13-70. 18-(11, 15). 12 Williamson Act: 3-62. 10-(1, 13, 15, 21, 22, 24-29, 31-46, 48, 49, 51, 52). 13
26-21. 14 willow scrub: 12-(27, 31, 117). 15 winter-run Chinook salmon: 1-(6, 8, 9). 2-(52, 53, 88, 95, 97). 3-(25, 26, 31, 16
32). 6-(14, 18, 20, 47). 7-(12, 13, 27, 45, 87). 9-11. 11-(3, 10, 15, 21, 28, 17 29, 33, 34, 37, 55, 56, 71, 78, 93-99, 144, 159-162, 208-210, 253-256, 18 283-286, 335). 19
WQCP—see water quality control plan 20 21 X 22 X2: 6-(15, 22, 34, 37, 38, 91, 98, 107, 115, 121, 126, 132, 135-137, 139, 140). 23
7-(33, 36, 43, 49, 78, 79, 90, 126-127, 170, 171, 214, 215, 224, 267, 24 268, 277). 11-(8, 63, 64, 69, 138-141, 187-190, 234-237, 273, 309-312, 25 325, 335-341). 26-2. 26
27 Y 28 Yolo County: 3-(32, 33). 5-1. 6-(27, 28). 7-35. 8-20. 10-(3, 22). 11-44. 12-85. 29
13-(78, 131). 16-(4, 7). 17-(7, 16). 20-5. 24-(5, 12, 13). 30 31 Z 32 zoning: 3-(65). 4-(15, 23, 49, 56). 8-(19, 21). 10-25. 17-(11-13, 16, 20, 23, 24, 33
28, 29, 31, 32, 37, 39). 21-(23, 32). 26-22. 34 35
31-25 Draft – June 2013

Shasta Lake Water Resources Investigation Environmental Impact Statement
This page left blank intentionally. 1 2
31-26 Draft – June 2013