Embed Size (px)
Citation preview


ENGINEERINGGEOLOGY
FIELDMANUAL
SECOND EDITION
VOLUME II
2001
U.S. Department of the InteriorBureau of Reclamation

ii
The Mission of the Department of the Interior is to protectand provide access to our Nation’s natural and culturalheritage and honor our trust responsibilities to tribes.
The Mission of the Bureau of Reclamation is to manage,develop, and protect water and related resources in anenvironmentally and economically sound manner in theinterest of the American public.
Information contained in this manual regardingcommercial products or firms may not be used foradvertising or promotional purposes and is not anendorsement of any product or firm by the Bureau ofReclamation.
The information contained in this manual was developedfor the Bureau of Reclamation; no warranty as to theaccuracy, usefulness, or completeness is expressed orimplied.

iii
Acknowledgments for Second Edition
Volume 2
The original compilation and preparation of this manualinvolved many engineering geologists, geophysicists, andengineers within Reclamation. Their input is greatly appre-ciated. This second edition incorporates comments on thefirst edition and technological changes since the first editionwas prepared approximately 13 years ago. Without the com-ments and input from the Denver, Regional, and AreaOffices, the revision would not have happened. Specialthanks to Sam Bartlett for his support and input throughoutthe preparation of the second edition and to James Krulikwho saw to the completion of this edition.
Although there are too many people to acknowledge individu-ally who contributed to the revisions and the second edition,Jack Cunningham, Robert Bianchi, Jeff Farrar, DavidGillette, Sandy Kunzer, Richard Markiewicz, RonaldPearson, Peter Rohrer, Ulrich Schimschal, and Andy Viksnemade especially significant contributions. Mark McKeownmade notable contributions, wrote several new chapters, andedited the second edition.
Continued recognition is given to Jerry S. Dodd who initiatedthe manual; Jerry’s successor, Newcomb Bennett, who keptthe manual moving; and to Steve D. Markwell, who saw thefirst edition completed. We extend our thanks and apprecia-tion to Louis R. Frei, who helped establish and documentmany geological standards of practice; to Richard H. Throner,who wrote much of the original manual and assembled andserved on committees for preparation and review; to Sam R.Bartlett, who compiled and printed the early loose leaf ver-sion of the manual; and to Mel Hill, who completed the publi-cation of the first edition. To the Regional Geologists andtheir staffs and the many geotechnical engineers who offeredcomments incorporated into the manual, we extend ourthanks and appreciation for their work as well. The manualwould not be complete without the drawings and figures; tothe engineering and physical science technicians we extendour gratitude and thanks. We further acknowledge RobertRood and Patty Alexander, the technical writers who assistedin the editing and helped prepare the manual for printing.

v
FOREWORD TO THE SECOND EDITION
VOLUME 2
Approximately 13 years have gone by since the firstedition of the manual was published, and technology,methodology, and missions have changed significantly.This second edition incorporates many modifications andadditions. The Global Positioning System (GPS) hasrevolutionized how we survey and locate ourselves in thefield, computers are used extensively to collect andevaluate data, and computer aided modeling, design, anddrafting are almost universal. Reclamation’s current mis-sion places greater emphasis on maintenance and safetyof infrastructure, dam safety analyses and modifications,and water resource management than on design andconstruction of new hydraulic structures. Techniques forthese activities are reflected in this edition.
A few of this edition’s most significant changes to themanual are the addition of a section on water testing forgrouting, an expanded chapter on permeability testing, achapter on the global positioning system, a significantlymodified chapter on rip rap, a chapter on foundationpreparation, treatment, and cleanup, a chapter on wax-ing, preserving, and shipping samples, and an index tofacilitate finding relevant information. Many othersuggested revisions and improvements collected since themanual was first published also are incorporated.Volume I contains material commonly needed in the field,and Volume II includes reference and supplementaryinformation and materials.
As in the first edition, the Engineering Geology FieldManual presents the practices for the collection of geologicdata obtained by the Bureau of Reclamation. The manualestablishes common guidelines, procedures, and conceptsfor the collection, evaluation, and presentation of geologicinformation. The analysis of geologic conditions, the

vi
preparation of designs and specifications, and effectivemonitoring of construction require consistent, compre-hensive, and timely geologic information. The use ofthese guidelines by all Reclamation engineering geologistscollecting, documenting, evaluating, and presenting geo-logical and geotechnical data promotes consistency, helpsassure that the required evaluations and data are com-plete, and promotes integration and coordination of geo-logical and engineering activities.
The Engineering Geology Field Manual forms the basis forthe mutually beneficial exchange of ideas by geologistsand engineers. Experienced geologists will find usefulreminders, new procedures, and special techniques, whileless experienced engineering geologists and those fromother disciplines can use the manual to expand theirfamiliarity with geology as practiced in the geotechnicalfield.
Review and comments on the manual are encouraged, andif you have comments or suggested additions, pleaseforward them to the Engineering Geology Group atReclamation’s Technical Service Center.
Richard H. ThronerChief, Geotechnical Services Division

CONTENTS
Page
Chapter 13 Surface Geophysical Investigations . . . . . . . . . . . . . . . . . . . . . . . . . . 1
Introduction . . . . . . . . . . . . . . . . . . . . . . . . . . 1Seismic Surveys . . . . . . . . . . . . . . . . . . . . . . . 3
Seismic Refraction Surveys . . . . . . . . . . . . 3Seismic Reflection Surveys . . . . . . . . . . . . 4Shear Wave Surveys . . . . . . . . . . . . . . . . . 5Surface Wave Surveys . . . . . . . . . . . . . . . . 6Vibration Surveys . . . . . . . . . . . . . . . . . . . . 9
Electrical Resistivity Surveys . . . . . . . . . . . . 9Electrical Resistivity Profiling Surveys . . 10Electrical Resistivity Sounding Surveys . . 11Electrical Resistivity Dipole-Dipole Surveys . . . . . . . . . . . . . . . . . . . . . . . . . . . 11
Electromagnetic Conductivity Surveys . . . . . 13Electromagnetic Conductivity Profiling Surveys . . . . . . . . . . . . . . . . . . . 13Electromagnetic Conductivity Sounding Surveys . . . . . . . . . . . . . . . . . . . 14
Ground Penetrating Radar Surveys . . . . . . . 14Purpose . . . . . . . . . . . . . . . . . . . . . . . . . . . . 14Applications . . . . . . . . . . . . . . . . . . . . . . . . 15
Self-Potential Surveys . . . . . . . . . . . . . . . . . . 15Purpose . . . . . . . . . . . . . . . . . . . . . . . . . . . . 15Applications . . . . . . . . . . . . . . . . . . . . . . . . 16
Magnetic Surveys . . . . . . . . . . . . . . . . . . . . . . 17Purpose . . . . . . . . . . . . . . . . . . . . . . . . . . . . 17Applications . . . . . . . . . . . . . . . . . . . . . . . . 17
Gravity Surveys . . . . . . . . . . . . . . . . . . . . . . . 18Purpose . . . . . . . . . . . . . . . . . . . . . . . . . . . . 18Applications . . . . . . . . . . . . . . . . . . . . . . . . 18
Glossary . . . . . . . . . . . . . . . . . . . . . . . . . . . . . 19Bibliography . . . . . . . . . . . . . . . . . . . . . . . . . . 36

FIELD MANUAL
viii
Page
Chapter 14 Borehole Geophysical and Wireline Surveys . . . . . . . . . . . . . . . . . . 37
Introduction . . . . . . . . . . . . . . . . . . . . . . . . . . 37Electric Logging Techniques . . . . . . . . . . . . . 37
Spontaneous Potential (SP) Log . . . . . . . . 38Single-Point Resistance Log . . . . . . . . . . . 41Multiple Electrode Array Log . . . . . . . . . . 42Microlog . . . . . . . . . . . . . . . . . . . . . . . . . . . 46Induction Log . . . . . . . . . . . . . . . . . . . . . . . 47
Nuclear Radiation Logging Techniques . . . . 47Gamma Ray (Natural Gamma) Log . . . . . 49Natural Gamma Spectral Log . . . . . . . . . . 50Density or Gamma-Gamma Log . . . . . . . . 51Neutron Log . . . . . . . . . . . . . . . . . . . . . . . . 52Neutrino Log . . . . . . . . . . . . . . . . . . . . . . . . 55
Acoustic/Seismic Logging Techniques . . . . . . 56Acoustic Velocity Log . . . . . . . . . . . . . . . . . 57Acoustic Borehole Imaging Log . . . . . . . . 61Cross-Hole Seismic Test . . . . . . . . . . . . . . . 64Seismic Tomography . . . . . . . . . . . . . . . . . 66Borehole Optical Systems . . . . . . . . . . . . . 67Borehole Image Processing System (BIPS) . . . . . . . . . . . . . . . . . . . . . 73
Other Wireline Systems . . . . . . . . . . . . . . . . 73Borehole Caliper Log . . . . . . . . . . . . . . . . . 74Directional Surveys . . . . . . . . . . . . . . . . . . 75Borehole Fluid Temperature Log . . . . . . . . 77Borehole Gravity Log . . . . . . . . . . . . . . . . . 78Magnetic Log . . . . . . . . . . . . . . . . . . . . . . . 80Flowmeter Log . . . . . . . . . . . . . . . . . . . . . . 81
Bibliography . . . . . . . . . . . . . . . . . . . . . . . . . . 81

CONTENTS
ix
Page
Chapter 15 Remote Sensing Techniques . . 83Introduction . . . . . . . . . . . . . . . . . . . . . . . . . . 83
Imaging Systems . . . . . . . . . . . . . . . . . . . . 83Resolution . . . . . . . . . . . . . . . . . . . . . . . . . . 84
Photography . . . . . . . . . . . . . . . . . . . . . . . . . . 85Thermal Infrared Imagery . . . . . . . . . . . . . . 86Multispectral Scanner Imagery . . . . . . . . . . 86Airborne Imaging Spectroscopy . . . . . . . . . . . 87Satellite Multispectral Scanner Imagery . . . 89Radar Imagery . . . . . . . . . . . . . . . . . . . . . . . . 90Side Scan Sonar . . . . . . . . . . . . . . . . . . . . . . . 91Single- and Multi-Beam Sonar . . . . . . . . . . . 91Applications to Engineering Geology . . . . . . 92Bibliography . . . . . . . . . . . . . . . . . . . . . . . . . . 93
Chapter 16 Water Testing for Grouting . . . 95Introduction . . . . . . . . . . . . . . . . . . . . . . . . . . 95Procedure . . . . . . . . . . . . . . . . . . . . . . . . . . . . 99
Calculations . . . . . . . . . . . . . . . . . . . . . . . . 99Geologic Data . . . . . . . . . . . . . . . . . . . . . . . 100Stepped Pressure Tests . . . . . . . . . . . . . . . 100Back Pressures . . . . . . . . . . . . . . . . . . . . . . 104Test Equipment . . . . . . . . . . . . . . . . . . . . . 105
Water Takes Relative to Grout Takes . . . . . . 105Depth of Grouting . . . . . . . . . . . . . . . . . . . . . 106Bibliography . . . . . . . . . . . . . . . . . . . . . . . . . . 106
Chapter 17 Water Testing and Permeability . . . . . . . . . . . . . . . . . . . . . . . . . 107
General . . . . . . . . . . . . . . . . . . . . . . . . . . . . . . 107Transmissivity . . . . . . . . . . . . . . . . . . . . . . 107Porosity . . . . . . . . . . . . . . . . . . . . . . . . . . . . 108

FIELD MANUAL
x
Page
Chapter 17 Water Testing and Permeability (continued)
General (continued)Storage . . . . . . . . . . . . . . . . . . . . . . . . . . . . 108Geologic Conditions . . . . . . . . . . . . . . . . . . 109Selecting the Appropriate Test . . . . . . . . . 111Stable Boreholes . . . . . . . . . . . . . . . . . . . . . 112Unstable Boreholes . . . . . . . . . . . . . . . . . . 112Permeability Testing in Rock . . . . . . . . . . 113
Pressure Permeability Tests in Stable Rock . 118Methods of Testing . . . . . . . . . . . . . . . . . . . 119Cleaning Test Sections . . . . . . . . . . . . . . . . 119Length of Test Section . . . . . . . . . . . . . . . . 120Size of Rod or Pipe to Use in Tests . . . . . . 121Pumping Equipment . . . . . . . . . . . . . . . . . 121Swivels for Use in Tests . . . . . . . . . . . . . . . 126Location of Pressure Gauges . . . . . . . . . . . 126Water Meters . . . . . . . . . . . . . . . . . . . . . . . 126Length of Time for Tests . . . . . . . . . . . . . . 127Pressures Used in Testing . . . . . . . . . . . . . 127Arrangement of Equipment . . . . . . . . . . . . 128Pressure Permeability Tests . . . . . . . . . . . 128Multiple Pressure Tests . . . . . . . . . . . . . . . 136
Gravity Permeability Tests . . . . . . . . . . . . . . 139Cleaning and Developing Test Sections . . 140Measurement of Water Levels Through
Protective Pipe . . . . . . . . . . . . . . . . . . . . 140Pumping Equipment and Controls . . . . . . 140Water Meters . . . . . . . . . . . . . . . . . . . . . . . 141Length of Time for Tests . . . . . . . . . . . . . . 141Arrangement of Equipment . . . . . . . . . . . . 142Gravity Permeability Test - Method 1 . . . . 142

CONTENTS
xi
Page
Chapter 17 Water Testing and Permeability (continued)
Gravity Permeability Tests (continued)Gravity Permeability Test - Method 2 . . . . 147Gravity Permeability Test - Method 3 . . . . 153Gravity Permeability Test - Method 4 . . . . 157
Falling Head Tests . . . . . . . . . . . . . . . . . . . . . 162Tests Below the Static Water Level . . . . . . 162Tests Above the Water Table . . . . . . . . . . . 164
Slug Tests . . . . . . . . . . . . . . . . . . . . . . . . . . . . 166Selecting the Slug Test . . . . . . . . . . . . . . . . 166Conducting the Slug Test . . . . . . . . . . . . . . 167Hvorslev Slug Test . . . . . . . . . . . . . . . . . . . 167Bouwer Slug Test . . . . . . . . . . . . . . . . . . . . 168
Piezometer Test . . . . . . . . . . . . . . . . . . . . . . . 174Equipment . . . . . . . . . . . . . . . . . . . . . . . . . 175Procedure . . . . . . . . . . . . . . . . . . . . . . . . . . 176Calculations . . . . . . . . . . . . . . . . . . . . . . . . 177Limitations . . . . . . . . . . . . . . . . . . . . . . . . . 178
Bibliography . . . . . . . . . . . . . . . . . . . . . . . . . 182
Chapter 18 Riprap . . . . . . . . . . . . . . . . . . . . . 183Introduction . . . . . . . . . . . . . . . . . . . . . . . . . . 183Evaluation . . . . . . . . . . . . . . . . . . . . . . . . . . . 188
Quality . . . . . . . . . . . . . . . . . . . . . . . . . . . . 188Shape . . . . . . . . . . . . . . . . . . . . . . . . . . . . . 189Weight and Size . . . . . . . . . . . . . . . . . . . . . 191Gradation . . . . . . . . . . . . . . . . . . . . . . . . . . 192Durability . . . . . . . . . . . . . . . . . . . . . . . . . . 194Quantity . . . . . . . . . . . . . . . . . . . . . . . . . . . 195Cost . . . . . . . . . . . . . . . . . . . . . . . . . . . . . . . 196

FIELD MANUAL
xii
Page
Chapter 18 Riprap (continued)Investigation Stages . . . . . . . . . . . . . . . . . . . 197
Reconnaissance . . . . . . . . . . . . . . . . . . . . . . 198Feasibility . . . . . . . . . . . . . . . . . . . . . . . . . . 198Design . . . . . . . . . . . . . . . . . . . . . . . . . . . . . 199Construction . . . . . . . . . . . . . . . . . . . . . . . . 200
Reports . . . . . . . . . . . . . . . . . . . . . . . . . . . . . . 200Sampling . . . . . . . . . . . . . . . . . . . . . . . . . . . . 202
Shipping . . . . . . . . . . . . . . . . . . . . . . . . . . . 203Testing . . . . . . . . . . . . . . . . . . . . . . . . . . . . 203
Waste in Riprap Production . . . . . . . . . . . . . 205Gradation Requirements . . . . . . . . . . . . . . 206Production Methods . . . . . . . . . . . . . . . . . . 206
Chapter 19 Blast Design . . . . . . . . . . . . . . . . 209Introduction . . . . . . . . . . . . . . . . . . . . . . . . . . 209
Properties and Geology of the Rock Mass . 209Characterizing the Rock Mass . . . . . . . . . . 210Rock Density and Hardness . . . . . . . . . . . . 211Voids and Zones of Weakness . . . . . . . . . . 211Jointing . . . . . . . . . . . . . . . . . . . . . . . . . . . . 213Bedding/Foliation . . . . . . . . . . . . . . . . . . . . 215
Surface Blasting . . . . . . . . . . . . . . . . . . . . . . . 218Blast Hole Diameter . . . . . . . . . . . . . . . . . . 218Blast Patterns . . . . . . . . . . . . . . . . . . . . . . . 223Burden . . . . . . . . . . . . . . . . . . . . . . . . . . . . 225Subdrilling . . . . . . . . . . . . . . . . . . . . . . . . . 228Collar Distance (Stemming) . . . . . . . . . . . . 229Spacing . . . . . . . . . . . . . . . . . . . . . . . . . . . . 231Hole Depth . . . . . . . . . . . . . . . . . . . . . . . . . 233Delays . . . . . . . . . . . . . . . . . . . . . . . . . . . . . 235Powder Factor . . . . . . . . . . . . . . . . . . . . . . . 237

CONTENTS
xiii
Page
Chapter 19 Blast Design (continued)Surface Blasting (continued)
Secondary Blasting . . . . . . . . . . . . . . . . . . . 241Underground Blasting . . . . . . . . . . . . . . . . . . 243
Opening Cuts . . . . . . . . . . . . . . . . . . . . . . . 243Blasting Rounds . . . . . . . . . . . . . . . . . . . . . 246Delays . . . . . . . . . . . . . . . . . . . . . . . . . . . . . 250Powder Factor . . . . . . . . . . . . . . . . . . . . . . . 251
Controlled Blasting Techniques . . . . . . . . . . 253Line Drilling . . . . . . . . . . . . . . . . . . . . . . . . 254Presplitting . . . . . . . . . . . . . . . . . . . . . . . . . 255Smooth Blasting . . . . . . . . . . . . . . . . . . . . . 257Cushion Blasting . . . . . . . . . . . . . . . . . . . . 259
Riprap Blasting Techniques . . . . . . . . . . . . . 261Bibliography . . . . . . . . . . . . . . . . . . . . . . . . . . 264Glossary . . . . . . . . . . . . . . . . . . . . . . . . . . . . . 264
Chapter 20 Water Control . . . . . . . . . . . . . . . 299Introduction . . . . . . . . . . . . . . . . . . . . . . . . . . 299Exploration Program . . . . . . . . . . . . . . . . . . . 304Design Data Requirements, Responsibilities, and Methods of Collection and Presentation . . . . . . . . . . . . . . . . . . . . . . . . . 305
Surface Data . . . . . . . . . . . . . . . . . . . . . . . . 307Subsurface Data . . . . . . . . . . . . . . . . . . . . . 307Other Data . . . . . . . . . . . . . . . . . . . . . . . . . 308Presentation of Data . . . . . . . . . . . . . . . . . 309
Monitoring . . . . . . . . . . . . . . . . . . . . . . . . . . . 309Groundwater Monitoring . . . . . . . . . . . . . . 312Groundwater Monitoring Locations . . . . . 312Groundwater Monitoring
Instrumentation . . . . . . . . . . . . . . . . . . . 313

FIELD MANUAL
xiv
Page
Chapter 20 Water Control (continued)Monitoring (continued)
Monitoring Discharges From Dewatering Systems . . . . . . . . . . . . . . . . 314
Monitoring Water and Ground Surfaces and Structures . . . . . . . . . . . . . . . . . . . . . 316
Performance Evaluation During Construction . . . . . . . . . . . . . . . . . . . . . . . . . 318Final Reporting . . . . . . . . . . . . . . . . . . . . . . . 318Bibliography . . . . . . . . . . . . . . . . . . . . . . . . . . 318
Chapter 21 Foundation Preparation,Treatment, and Cleanup . . . . . . . . . . . . . . . . 321
Earthfill Dams . . . . . . . . . . . . . . . . . . . . . . . . 321Shaping . . . . . . . . . . . . . . . . . . . . . . . . . . . . 321Soil Foundations . . . . . . . . . . . . . . . . . . . . . 325Rock Foundations . . . . . . . . . . . . . . . . . . . . 328
Concrete Arch Dams . . . . . . . . . . . . . . . . . . . 339Shaping . . . . . . . . . . . . . . . . . . . . . . . . . . . . 339Dental Treatment . . . . . . . . . . . . . . . . . . . . 340Protection Against Piping . . . . . . . . . . . . . 342Foundation Irregularities . . . . . . . . . . . . . 342
Concrete Gravity Dams . . . . . . . . . . . . . . . . . 343Shaping . . . . . . . . . . . . . . . . . . . . . . . . . . . . 344Dental Treatment . . . . . . . . . . . . . . . . . . . . 344Protection Against Piping . . . . . . . . . . . . . 346Foundation Irregularities . . . . . . . . . . . . . 346
Cleanup . . . . . . . . . . . . . . . . . . . . . . . . . . . . . 347Cleaning . . . . . . . . . . . . . . . . . . . . . . . . . . . 348Water Removal . . . . . . . . . . . . . . . . . . . . . . 348
Bibliography . . . . . . . . . . . . . . . . . . . . . . . . . . 349

CONTENTS
xv
Page
Chapter 22 Penetration Testing . . . . . . . . . 351Introduction . . . . . . . . . . . . . . . . . . . . . . . . . . 351
History . . . . . . . . . . . . . . . . . . . . . . . . . . . . 351Standard Penetration Testing . . . . . . . . . . . . 351
Equipment and Procedures . . . . . . . . . . . . 351Information Obtainable by SPT . . . . . . . . 356Testing Cohesionless Soils . . . . . . . . . . . . . 359
Drilling Methods . . . . . . . . . . . . . . . . . . . . . . 361Fluid Rotary Drilling . . . . . . . . . . . . . . . . . 361Hollow-Stem Augers . . . . . . . . . . . . . . . . . . 364Rotary Casing Advancers . . . . . . . . . . . . . . 369Summary of Drilling Effects . . . . . . . . . . . 370
Procedure Variables . . . . . . . . . . . . . . . . . . . . 371Hammer Blow Rate . . . . . . . . . . . . . . . . . . 371Limiting Blow Counts . . . . . . . . . . . . . . . . 375Penetration per Blow or Blows per 0.1 Foot (3 cm) . . . . . . . . . . . . . . . . . . 375
Equipment and Mechanical Variables . . . . . 376Sampler Barrel . . . . . . . . . . . . . . . . . . . . . . 376Sampler Shoe . . . . . . . . . . . . . . . . . . . . . . . 377Sample Retainers . . . . . . . . . . . . . . . . . . . . 377Sampler Liners . . . . . . . . . . . . . . . . . . . . . 378Sampler Length . . . . . . . . . . . . . . . . . . . . . 379Sampler Vent Ports . . . . . . . . . . . . . . . . . . 379Hammers, Anvils, Rods, and Energy Effects . . . . . . . . . . . . . . . . . . . . . . . . . . . . 379Safety Hammers . . . . . . . . . . . . . . . . . . . . . 380Donut Hammers . . . . . . . . . . . . . . . . . . . . . 381Rope and Cathead Operations . . . . . . . . . . 381Automatic Hammers . . . . . . . . . . . . . . . . . 382Spooling Winch Hammers . . . . . . . . . . . . . 383Drill Rods . . . . . . . . . . . . . . . . . . . . . . . . . . 384

FIELD MANUAL
xvi
Page
Chapter 22 Penetration Testing (continued)Equipment and Mechanical Variables (continued)
Drill Rod Length . . . . . . . . . . . . . . . . . . . . . 384Summary . . . . . . . . . . . . . . . . . . . . . . . . . . . . 385
How Good is the SPT Test . . . . . . . . . . . . . 385Becker-Hammer Penetration Testing for Gravelly Soils . . . . . . . . . . . . . . . . . . . . . . . . 387
Introduction . . . . . . . . . . . . . . . . . . . . . . . . 387Role of BPT in Exploration . . . . . . . . . . . . 388Equipment . . . . . . . . . . . . . . . . . . . . . . . . . 389Harder-Seed Method of BPT Interpretation . . . . . . . . . . . . . . . . . . 390Testing for the Harder-Seed Method of Interpretation . . . . . . . . . . . . . . . . . . . . . . 391Sy Method of BPT Interpretation . . . . . . . 392Testing for the Sy Method of Interpretation . . . . . . . . . . . . . . . . . . . . . . 393Discussion of Methods . . . . . . . . . . . . . . . . 393Contracting for Becker Drilling Services . 394
Cone Penetration Test . . . . . . . . . . . . . . . . . . 395Test History . . . . . . . . . . . . . . . . . . . . . . . . 395Test Procedure . . . . . . . . . . . . . . . . . . . . . . 397Advantages and Disadvantages . . . . . . . . . 398Data Obtainable . . . . . . . . . . . . . . . . . . . . . 400Economics . . . . . . . . . . . . . . . . . . . . . . . . . . 407
Bibliography . . . . . . . . . . . . . . . . . . . . . . . . . . 407
Chapter 23 Handling and Transporting Rock and Soil Samples . . . . . . . . . . . . . . . . . . 409
Introduction . . . . . . . . . . . . . . . . . . . . . . . . . . 409Sample Protection . . . . . . . . . . . . . . . . . . . . . 411

CONTENTS
xvii
Page
Chapter 23 Handling and Transporting Rockand Soil Samples (continued)
Storage Containers . . . . . . . . . . . . . . . . . . . . 420Shipping Containers . . . . . . . . . . . . . . . . . . . 421Core Handling . . . . . . . . . . . . . . . . . . . . . . . . 422Identification of Samples . . . . . . . . . . . . . . . . 423Transportation Requirements and
Procedures . . . . . . . . . . . . . . . . . . . . . . . . . 424Upright Handling and Shipping of
Samples . . . . . . . . . . . . . . . . . . . . . . . . . . . . 426Storage Environment . . . . . . . . . . . . . . . . . . . 427Recommended Equipment . . . . . . . . . . . . . . . 427
Chapter 24 Care, Retention, and Disposal of Drill Core, Soil, and Rock Samples . . . . . 431
General . . . . . . . . . . . . . . . . . . . . . . . . . . . . . . 431Location of Storage Facilities . . . . . . . . . . . . 432
Storage During Investigations . . . . . . . . . . 433Storage During Construction . . . . . . . . . . . 433Storage During Operation and Maintenance . . . . . . . . . . . . . . . . . . . . . . . 434
Conditions of Storage . . . . . . . . . . . . . . . . . . . 434Length of Storage . . . . . . . . . . . . . . . . . . . . . . 435
Proposed Structures or Projects . . . . . . . . . 435Design Investigations and Completed Structures or Projects . . . . . . . . . . . . . . . . 436Disposal of Core and Samples . . . . . . . . . . 437
Retention of Rock Core and Samples . . . . . . 438Bibliography . . . . . . . . . . . . . . . . . . . . . . . . . . 438

FIELD MANUAL
xviii
Page
Chapter 25 Global Positioning System . . . 439System Description . . . . . . . . . . . . . . . . . . . . 439
GPS System Design . . . . . . . . . . . . . . . . . . 439GPS Basic Operating Concepts . . . . . . . . . 440Navigation (NAV) Message . . . . . . . . . . . . 442
GPS Accuracy . . . . . . . . . . . . . . . . . . . . . . . . . 444Dilution of Precision . . . . . . . . . . . . . . . . . . 444Satellite Position and Clock Errors . . . . . . 445Atmospheric Delay of Satellite Signals . . . 445Selective Availability and Anti-Spoofing . 446GPS Signal Obstruction . . . . . . . . . . . . . . . 447Multipath Interference . . . . . . . . . . . . . . . . 449Differential GPS . . . . . . . . . . . . . . . . . . . . . 449
Quality of Measurement . . . . . . . . . . . . . . . . 450Satellite Geometry . . . . . . . . . . . . . . . . . . . 450Ideal Satellite Constellation . . . . . . . . . . . 450DOP Effects . . . . . . . . . . . . . . . . . . . . . . . . 450Quality Indicators . . . . . . . . . . . . . . . . . . . 452User Measurement Accuracy . . . . . . . . . . . 456User Equivalent Range Error . . . . . . . . . . 457Space and Control Segment Errors . . . . . . 458Wide Area GPS Enhancement . . . . . . . . . . 460Atmospheric Errors . . . . . . . . . . . . . . . . . . 460User Equipment Errors . . . . . . . . . . . . . . . 461
Error Source Summary . . . . . . . . . . . . . . . . . 461Satellite Geometry . . . . . . . . . . . . . . . . . . . 462Equipment . . . . . . . . . . . . . . . . . . . . . . . . . 462Datums and Coordinate Systems . . . . . . . 463

CONTENTS
xix
APPENDICES
Appendix Page
A Abbreviations and AcronymsCommonly Used in Bureau ofReclamation EngineeringGeology . . . . . . . . . . . . . . . . . . . . . . . 465
B Nomograph Relating the Densityof an Explosive in G/cc, theDiameter of the Explosive in Inches,and the Pounds of Explosive per Lineal Foot . . . . . . . . . . . . . . . . . . . . . 471
C Chart Showing RipabilityVersus Seismic Velocity for a D11N Bulldozer . . . . . . . . . . . . . . . . 473
D Charts Showing Weight ofMaterials Required for TypicalLaboratory Tests . . . . . . . . . . . . . . . 475
E Useful Conversion FactorsMetric and English Units(Inch-Pound) . . . . . . . . . . . . . . . . . . 489
Index . . . . . . . . . . . . . . . . . . . . . . . . . . . . . 491

FIELD MANUAL
xx
TABLES
Table Page
13-1 Determining moduli and ratios fortypical velocities of earth materialsfrom refraction surveys . . . . . . . . . . . . 6
13-2 Typical velocities of earth materials . . . 713-3 Representative values of resistivity . . . . 1017-1 A glossary of abbreviations and
definitions used in permeability calculations . . . . . . . . . . . . . . . . . . . . . 110
18-1 Rock types and typical usable quantities of riprap . . . . . . . . . . . . . . . 208
19-1 Typical rocks, densities, and unit weights . . . . . . . . . . . . . . . . . . . . . . . . . 212
19-2 Approximate burden charge diameter ratios for bench blasting . . . . . . . . . . . 227
19-3 Typical powder factors for surfaceblasting . . . . . . . . . . . . . . . . . . . . . . . . 239
19-4 Parameters for presplitting . . . . . . . . . . 25819-5 Parameters for smooth blasting . . . . . . . 25819-6 Parameters for cushion blasting . . . . . . 26222-1 Penetration resistance and soil
properties based on the SPT . . . . . . . . 35722-2 Estimated variability of SPT N values . 37223-1 Rock- and soil-sample categories for
handling and transportation . . . . . . . 41225-1 Expected values of dilution of precision . 45125-2 FOM related to EPE . . . . . . . . . . . . . . . . 45525-3 TFOM related to ETE . . . . . . . . . . . . . . . 45625-4 Typical GPS receiver error budget . . . . . 45725-5 URA index and values . . . . . . . . . . . . . . 459

CONTENTS
xxi
FIGURES
Figure Page
13-1 Simplified diagram of a seismic refraction test . . . . . . . . . . . . . . . . . . . 4
13-2 Types of surface waves . . . . . . . . . . . . . . 813-3 Dipole resistivity array . . . . . . . . . . . . . . 1214-1 Spontaneous potential survey
elements . . . . . . . . . . . . . . . . . . . . . . . . 3914-2 Electric log showing SP and resistivity
in different beds . . . . . . . . . . . . . . . . . 4014-3 Single-point resistivity array . . . . . . . . . 4214-4 Multiple-electrode resistivity arrays . . . 4414-5 Focused current, or guard, resistivity
array . . . . . . . . . . . . . . . . . . . . . . . . . . 4614-6 Microlog resistivity logging device . . . . . 4814-7 Gamma-gamma logging sonde . . . . . . . . 5114-8 Nuetron logging sonde . . . . . . . . . . . . . . 5314-9 Typical curve responses for nuclear
radiation logs . . . . . . . . . . . . . . . . . . . . 5414-10 Elements of a simple wireline acoustic
velocity device . . . . . . . . . . . . . . . . . . . 5814-11 Acoustic log presentations . . . . . . . . . . . 5914-12 Sample of intensity modulated
acoustic log . . . . . . . . . . . . . . . . . . . . . 6014-13 Acoustic borehole imaging system . . . . . 6214-14 Traces of planar discontinuities
intercepting the borehole (left) as they appear on the acoustic boreholeimaging record (right) . . . . . . . . . . . . . 63
14-15 Cross-hole seismic test . . . . . . . . . . . . . . 6514-16 Borehole television logging system . . . . 6814-17 Borehole film camera . . . . . . . . . . . . . . . 70

FIELD MANUAL
xxii
FIGURES (continued)
Figure Page
14-18 Projection of borehole wall image intothe film plane from the conical mirrorof the borehole film camera . . . . . . . . 72
14-19 Log of six-arm mechanical caliper . . . . . 7614-20 Elements of borehole gravity logging . . . 7916-1 Bar chart showing relationship of
test pressure and Lugeons in laminar flow . . . . . . . . . . . . . . . . . . . . 101
16-2 Bar chart showing relationshipof test pressure and Lugeons inturbulent flow . . . . . . . . . . . . . . . . . . . 101
16-3 Bar chart showing relationshipof test pressure and Lugeons when fractures are washing out . . . . . . . . . . 102
16-4 Bar chart showing relationshipof test pressure and Lugeons whenfractures are filling or swelling . . . . . 102
16-5 Bar chart showing relationshipof test pressure and Lugeons when rock is hydrofractured orjoints are jacked open . . . . . . . . . . . . . 103
16-6 Continuously recorded plot of pressure and flow . . . . . . . . . . . . . . . . 104
17-1 Head loss in a 10-foot (3-m) section ofAX (1.185-inch- [30.1-mm-] inside diameter [ID] drill rod . . . . . . . . . . . . . 122
17-2 Head loss in a 10-foot (3-m) section of BX (1.655-inch [42.0-mm] ID) drill rod . . . . . . . . . . . . . . . . . . . . . . . . 123

CONTENTS
xxiii
FIGURES (continued)
Figure Page
17-3 Head loss in a 10-foot (3-m) section ofNX (2.155-inch [54.7-mm] ID) drill rod . . . . . . . . . . . . . . . . . . . . . . . . 124
17-4 Head loss in a 10-foot (3-m) section of1¼-inch [32-mm] ID) steel pipe . . . . . 125
17-5 Permeability test for use in saturatedor unsaturated consolidated rock andwell indurated soils . . . . . . . . . . . . . . . 129
17-6 Location of zone 1 lower boundary foruse in unsaturated materials . . . . . . . 131
17-7 Conductivity coefficients for permeability determination inunsaturated materials with partially penetrating cylindrical test wells . . . . . . . . . . . . . . . . . . . . . . . 133
17-8 Conductivity coefficients for semi-spherical flow in saturated materialsthrough partially penetratingcylindrical test wells . . . . . . . . . . . . . . 134
17-9 Plots of simulated, multiple pressurepermeability tests . . . . . . . . . . . . . . . . 138
17-10 Gravity permeability test (Method 1) . . 14517-11 Gravity permeability test (Method 2) . . 14917-12 Gravity permeability test (Method 3) . . 15417-13 Gravity permeability test (Method 4) . . 15917-14 Plot of h2 versus d for gravity
permeability test (Method 4) . . . . . . . 16017-15 Hvorslev piezometer test . . . . . . . . . . . . 168

FIELD MANUAL
xxiv
FIGURES (continued)
Figure Page
17-16a Shape factors for computing permeability from variable head tests . . . . . . . . . . . . . . . . . . . . . . . . . . . 169
17-16b Shape factor coefficient Fs . . . . . . . . . . . 17117-17 Slug test on partially penetrating,
screened well in unconfined aquiferwith gravel pack and developed zonearound screen . . . . . . . . . . . . . . . . . . . 173
17-18 Dimensionless parameters A, B, and Cas a function of �/re (F for calculationof ln [de/re]) . . . . . . . . . . . . . . . . . . . . . 175
17-19 Data and computation sheet for piezometer permeability test . . . . . . . 179
17-20 Chart for determining Ca if upwardpressure exists in the test zone . . . . . 180
17-21 Sample calculation for the piezometertest with upward pressure in thetest zone . . . . . . . . . . . . . . . . . . . . . . . . 181
18-1 Riprap properly placed on bedding . . . . 18318-2 Improperly designed, obtained,
and placed riprap . . . . . . . . . . . . . . . . 18518-3 Hand-placed riprap . . . . . . . . . . . . . . . . . 18618-4 Dumped riprap . . . . . . . . . . . . . . . . . . . . 18718-5 Tabular rock fragment . . . . . . . . . . . . . . 19018-6 Stationary grizzly . . . . . . . . . . . . . . . . . . 19318-7 Rock rake . . . . . . . . . . . . . . . . . . . . . . . . . 19319-1 Effect of jointing on the stability of an
excavation (plan view) . . . . . . . . . . . . . 21419-2 Tight and open corners caused by
jointing (plan view) . . . . . . . . . . . . . . . 215

CONTENTS
xxv
FIGURES (continued)
Figure Page
19-3 Stemming through weak material andopen beds . . . . . . . . . . . . . . . . . . . . . . . 216
19-4 Two methods of breaking a hardcollar zone . . . . . . . . . . . . . . . . . . . . . . 217
19-5 The effect of large and small blast holes on unit costs . . . . . . . . . . . . . . . . 219
19-6 The effects of jointing on selection ofblast hole size . . . . . . . . . . . . . . . . . . . 221
19-7 Three basic types of drill patterns . . . . . 22319-8 Corner cut staggered pattern with
simultaneous initiation within rows (blast hole spacing, S, is twice the burden, B) . . . . . . . . . . . . . . . . . . . . . . 224
19-9 V-Echelon blast round (true spacing, S, is twice the true burden, B) . . . . . . . . 224
19-10 Isometric view of a bench blast . . . . . . . 22519-11 Comparison of a 12¼-inch- (300-mm)
diameter blast hole (stiff burden) on the left with a 6-inch- (150-mm)diameter blast hole (flexible burden) on the right . . . . . . . . . . . . . . . . . . . . . 228
19-12 Effects of too small and too large spacing . . . . . . . . . . . . . . . . . . . . . . . . . 232
19-13 Staggered blast pattern with alternate delays (blast hole spacing, S, is 1.4 times the burden, B) . . . . . . . . . . . 233
19-14 Staggered blast pattern with progressive delays (blast hole spacing, S, is 1.4 times the burden, B) . . . . . . . . . . . . . . . . . . . . . . 234
FIELD MANUAL
xxvi
FIGURES (continued)
Figure Page
19-15 The effect of inadequate delays between rows . . . . . . . . . . . . . . . . . . . . 237
19-16 Types of opening cuts . . . . . . . . . . . . . . . 24019-17 Six designs for parallel hole cuts . . . . . . 24519-18 Blast round for soft rock using sawed
kerf (numbers on loaded holes show delay in milliseconds) . . . . . . . . . . . . . 247
19-19 Nomenclature for blast holes in a heading round . . . . . . . . . . . . . . . . . . . 248
19-20 Angled cut blast rounds . . . . . . . . . . . . . 24819-21 Parallel hole cut blast rounds . . . . . . . . 24919-22 Fragmentation and shape of muckpile
as a function of type of cut . . . . . . . . . 25019-23 Fragmentation and shape of muckpile
as a function of delay . . . . . . . . . . . . . 25119-24 Typical burn cut blast round delay
pattern (numbers on loaded holes show delay in milliseconds) . . . . . . . . 252
19-25 Typical V-cut blast round delay pattern (numbers on loaded holesshow delay in milliseconds) . . . . . . . . 252
19-26 Shape of muckpile as a function of firing order . . . . . . . . . . . . . . . . . . . . . . 253
19-27 Typical presplit blast hole loading . . . . . 25619-28 Typical smooth blasting pattern
(Burden, B, is larger than spacing, S. Numbers on loaded
holes show delay in milliseconds . . . . 25919-29 Cushion blasting techniques . . . . . . . . . 260

CONTENTS
xxvii
FIGURES (continued)
Figure Page
20-1 Limits of dewatering methods for different materials . . . . . . . . . . . . . . . 301
20-2 Aquifer test, plan, and sections. . . . . . . . . . . . . . . . . . . follows page 310
20-3 Aquifer test data . . . . . . . . . . . . . . . . . . . 31021-1 Example foundation treatment details
from specifications . . . . . . . . . . . . . . . . 32422-1 ASTM and Reclamation SPT sampler
requirements . . . . . . . . . . . . . . . . . . . . 35222-2 Safety hammer . . . . . . . . . . . . . . . . . . . . 35422-3 Donut hammer . . . . . . . . . . . . . . . . . . . . 35522-4 Example of rod type and wireline type
hollow-stem augers . . . . . . . . . . . . . . . 36622-5 Results of SPT with six different
drills—ASCE Seattle study . . . . . . . . 38622-6 Mechanical cone penetrometers . . . . . . . 39622-7 Typical electrical cone penetrometers . . 39622-8 Example CPT data plot . . . . . . . . . . . . . 40122-9 Chart for estimating the soil
behavior type . . . . . . . . . . . . . . . . . . . . 40222-10 Chart for estimating the soil
behavior type and the coefficient of permeability . . . . . . . . . . . . . . . . . . 403
22-11 Relationships between cone tip resistance, relative density, andeffective vertical stress . . . . . . . . . . . . 404
22-12 Empirical cone factor, Nk, for clays . . . . 40522-13 Comparison of various cyclic resistance
ratio (CRR) curves and field data . . . . 40623-1 Properly boxed and labeled core . . . . . . . 412

FIELD MANUAL
xxviii
FIGURES (continued)
Figure Page
23-2 Core storage area with boxes neatlyarranged and separated by spacersfor ventilation . . . . . . . . . . . . . . . . . . . 413
23-3 Example core box construction . . . . . . . .. . . . . . . . . . . . . . . . . . . follows page 422
25-1 Satellite signal structure . . . . . . . . . . . . 44125-2 Satellite ranging intersections . . . . . . . . 443

Chapter 13
SURFACE GEOPHYSICALINVESTIGATIONS
Introduction
Surface geophysical surveys have been applied to mineraland petroleum exploration for many years. A magneticcompass was used in Sweden in the mid-1600s to find ironore deposits. The lateral extent of the Comstock ore bodywas mapped using self-potential methods in the 1880s. Avery crude type of seismic survey measured the energyresulting from blasting operations in Ireland in the late1800s. The idea that energy travels through a materialwith a certain velocity came from this survey. DuringWorld War I, geophysical techniques were used to locateartillery pieces. Anti-submarine warfare in World War IIled to magnetic and sonar surveys.
The main emphasis of geophysical surveys in theformative years was petroleum exploration. Technologydeveloped for oil and gas surveys led to the use of geo-physical surveys in many important facets of geotechnicalinvestigations. Geophysical surveys have been applied tocivil engineering investigations since the late 1920s, whenseismic and electrical resistivity surveys were used fordam siting studies. A seismic survey was performed inthe 1950s in St. Peter’s Basilica to locate buriedcatacombs prior to a renovation project. From the late1950s until the present time, geophysical techniques havehad an increasing role in both groundwater explorationand in geotechnical investigations. Geophysical surveysare now used routinely as part of geological investigationsand to provide information on site parameters (i.e., inplace dynamic properties, cathodic protection, depth tobedrock) that in some instances are not obtainable byother methods. Values derived from seismic geophysicalsurveys are obtained at strain levels different from somesite parameters obtained by other means.

FIELD MANUAL
2
All geophysical techniques are based on the detection ofcontrasts in different physical properties of materials. Ifcontrasts do not exist, geophysical methods will not work.Reflection and refraction seismic methods contrast com-pressional or shear wave velocities of different materials.Electrical methods depend on the contrasts in electricalresistivities. Contrasts in the densities of differentmaterials permit gravity surveys to be used in certaintypes of investigations. Contrasts in magnetic suscepti-bilities of materials permit magnetic surveying to be usedin some investigations. Contrasts in the magnitude of thenaturally existing electric current within the earth can bedetected by self-potential (SP) surveys.
Seismic refraction surveys are used to map the depth tobedrock and to provide information on the compressionaland shear wave velocities of the various units overlyingbedrock. Velocity information also can be used to calcu-late in place small-strain dynamic properties of theseunits. Electrical resistivity surveys are used to provideinformation on the depth to bedrock and information onthe electrical properties of bedrock and the overlyingunits. Resistivity surveys have proven very useful indelineating areas of contamination within soils and rockand also in aquifer delineation. Gravity and magneticsurveys are not used to the extent of seismic andresistivity surveys in geotechnical investigations, butthese surveys have been used to locate buried utilities.Self-potential surveys have been used to map leakagefrom dams and reservoirs.
Geophysical surveys provide indirect information. Theobjective of these surveys is to determine characteristicsof subsurface materials without seeing them directly.Each type of geophysical survey has capabilities andlimitations and these must be understood and consideredwhen designing a geophysical investigations program.

SURFACE GEOPHYSICAL INVESTIGATIONS
3
Geophysical interpretations should be correlatedwith real “ground-truth”data such as drill hole logs.It is very important that the results of geophysicalsurveys be integrated with the results of othergeologic investigations so that accurate interpre-tation of the geophysical surveys can be made.
The following sections provide the theory behind andguidelines for uses of geophysical surveys, particularly ingeotechnical investigations. Although this chapter doesnot provide all the detail necessary, the theory and inter-pretation methods involved in geophysical surveying areincluded in references in the bibliography. The referencesshould be used to supplement the materials presented inthis chapter.
Seismic Surveys
Seismic Refraction Surveys
Purpose.—Seismic refraction surveys are used to deter-mine the compressional wave velocities of materials fromthe ground surface to a specified depth within the earth.For most geotechnical investigations, the maximum depthof interest will be specified by the nature of the project.In many cases the objective of a seismic refraction surveyis to determine the configuration of the bedrock surfaceand the compressional wave velocities of the underlyingmaterials. Bedrock may be defined by compressionalwave velocities. The information obtained from a seismicrefraction survey is used to compute the depths to varioussubsurface layers and the configurations of these layers.The thickness of the layers and the velocity contrastsbetween the layers govern the effectiveness and the accu-racy of the survey. Seismic refraction surveys do notprovide all compressional wave velocities or delineate all

FIELD MANUAL
4
Figure 13-1.—Simplified diagram of a seismic refraction test.
subsurface layers. Seismic refraction interpretationassumes that layer velocities increase with depth.
Applications.—Seismic refraction surveys have beenused in many types of exploration programs and geotech-nical investigations. The initial application of thesesurveys was mapping of salt domes in the early days of oilexploration. Seismic refraction surveys are now routinelyused in foundation studies for construction projects andsiting studies, fault investigations, dam safety analyses,and tunnel alignment studies. Seismic refraction surveysare also used to estimate rippability (Appendix C). Figure13-1 is a schematic of a seismic refraction test.
Seismic Reflection Surveys
Purpose.—Seismic reflection surveys have been usedsuccessfully in petroleum and geothermal explorationprojects and to investigate for shallow coal. The informa-tion obtained from seismic reflection surveys can be usedto define the geometry of the different subsurface layersand structural features.

SURFACE GEOPHYSICAL INVESTIGATIONS
5
Applications.—High resolution seismic reflectionsurveys provide definitive information on the locationsand types of faults, as well as the location of buriedchannels. Shallow, high resolution seismic reflectionsurveys are playing an increasingly important role ingeotechnical investigations. When correctly used, seismicreflection surveys may provide data that seismicrefraction surveys can not (e.g., velocity reversalinformation). However, compressional (P) wave velocityinformation derived from reflection surveys may not be asaccurate as from refraction surveys. The compressionalwave velocities are needed for the analysis of thereflection records themselves and for seismic refractionsurveys, uphole velocity surveys, and sonic logs.
Shear Wave Surveys
Purpose.—Shear (S) waves travel through a medium ata slower velocity than compressional (P) waves and arriveafter compressional waves. Other types of secondaryarrivals also exist due to reflections, combinations ofreflections and refractions, and surface waves. Field sur-vey techniques are designed to suppress compressionaland unwanted reflected or refracted wave arrivals. Thefield procedure optimizes shear wave generation as wellas the polarity of the wave energy.
Applications.—For geotechnical investigations, shearwave velocities provide information on the low-straindynamic properties of a given material. The relationshipsbetween compressional wave velocity, shear wave velocity,density, and in place dynamic properties of materials areshown in table 13-1. The compressional wave velocity canbe determined from refraction surveys, the shear wavevelocity from shear wave surveys, and the density fromborehole geophysics or laboratory testing. The cross-holeseismic method is a common procedure used to determine

FIELD MANUAL
6
Table 13-1.—Determining moduli and ratios for typicalvelocities of earth materials from refraction surveys
Vp = Compressional wave velocity (ft/s) (m/s)Vs = Shear wave velocity (ft/s) (m/s)E = Young's Modulus (lb/in2) (MPa)G = Shear Modulus (lb/in2) (MPa)K = Bulk Modulus (lb/in2) (MPa)µ = Poisson's Ratio� = Density (in situ) (lb/ft3) (kg/m3)
Shear Modulus: G = �Vs2
Young's Modulus: E = 2G(1+�) Bulk Modulus: K = �(Vp-4/3Vs
2)Velocity Ratio: Vp/Vs
Poisson's Ratio: µ = (.05) [Vp/Vs]2-2/[Vp/Vs]
2-1\
material dynamic properties. Compressional waves andshear waves are generated in one drill hole, and theseismic wave arrivals are received in companion drillhole(s). The seismic source(s) and receiver(s) are locatedat equal depths (elevations) for each recording. Drill holedeviation surveys are performed in each drill hole toaccurately determine the distances between each of thedrill holes at all recording intervals. For typical seismicvelocities of earth materials, see table 13-2.
Surface Wave Surveys
Purpose.—Surface wave surveys produce and recordsurface waves and their characteristics. Surface waveshave lower frequencies and higher amplitudes than otherseismic waves. Surface waves result from the construc-tive and destructive interference of refracted and reflectedseismic waves. Surface waves that travel along theboundaries of a body are called Stanley waves. Surfacewaves are the slowest type of seismic
SURFACE GEOPHYSICAL INVESTIGATIONS
7
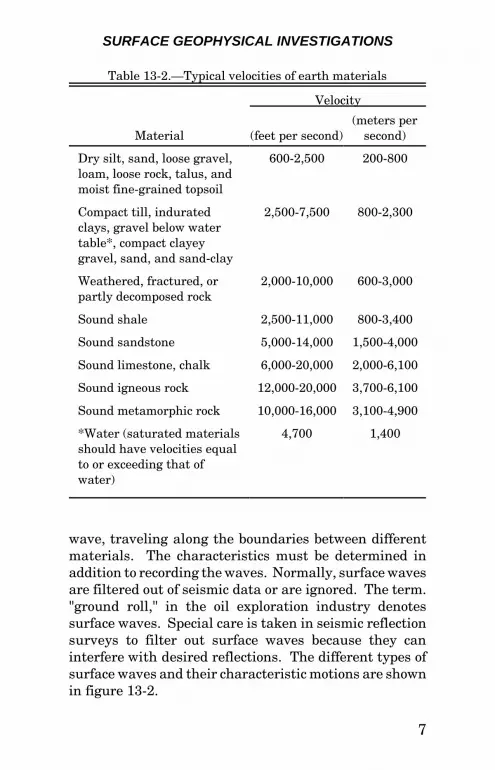
Table 13-2.—Typical velocities of earth materials
Material
Velocity
(feet per second)(meters per
second)
Dry silt, sand, loose gravel,loam, loose rock, talus, andmoist fine-grained topsoil
600-2,500 200-800
Compact till, induratedclays, gravel below watertable*, compact clayeygravel, sand, and sand-clay
2,500-7,500 800-2,300
Weathered, fractured, orpartly decomposed rock
2,000-10,000 600-3,000
Sound shale 2,500-11,000 800-3,400
Sound sandstone 5,000-14,000 1,500-4,000
Sound limestone, chalk 6,000-20,000 2,000-6,100
Sound igneous rock 12,000-20,000 3,700-6,100
Sound metamorphic rock 10,000-16,000 3,100-4,900
*Water (saturated materialsshould have velocities equalto or exceeding that ofwater)
4,700 1,400
wave, traveling along the boundaries between differentmaterials. The characteristics must be determined inaddition to recording the waves. Normally, surface wavesare filtered out of seismic data or are ignored. The term."ground roll," in the oil exploration industry denotessurface waves. Special care is taken in seismic reflectionsurveys to filter out surface waves because they caninterfere with desired reflections. The different types ofsurface waves and their characteristic motions are shownin figure 13-2.

FIELD MANUAL
8
Figure 13-2.—Types of surface waves.
Applications.—The principal application of surface wavesurveying for geotechnical investigations is to determinethe type and characteristics of surface waves that canexist at a site. This information is used to determine pre-ferred site frequencies and for earthquake designanalysis.

SURFACE GEOPHYSICAL INVESTIGATIONS
9
Vibration Surveys
Purpose.—Vibration surveys measure the vibrationlevels produced by mechanical or explosive sources. Oncethese levels are determined, structures can be designed toreduce the possibility of vibration damage.
Applications.—Vibration surveys have been performedfor quarrying and mining operations, excavations,measuring the effects of traffic on sensitive equipment,and measuring the effects of aircraft (sonic vibrations) onurban areas and historical buildings. Many manufactur-ing and research facilities contain extremely sensitiveequipment with very small vibration tolerances. Vibra-tion surveys can be very useful in determining the exactlevels of allowable vibration and in designing proceduresto reduce vibration levels produced by construction andblasting activities. The same type of vibration survey canbe used in quarrying and/or mining operations to reducevibration levels while maintaining rock breakage andfragmentation.
Electrical Resistivity Surveys
The electrical resistivity of any material depends largelyon its porosity and the salinity of the water in the porespaces. Although the electrical resistivity of a materialmay not be diagnostic, certain materials have specificranges of electrical resistivity. In all electrical resistivitysurveying techniques, a known electrical current is passedthrough the ground between two (or more) electrodes. Thepotential (voltage) of the electrical field resulting from theapplication of the current is measured between two (ormore) additional electrodes at various locations. Since thecurrent is known, and the potential can be measured, anapparent resistivity can be calculated. The separation
FIELD MANUAL
10
between the current electrodes depends on the type ofsurveying being performed and the required investigationdepth.
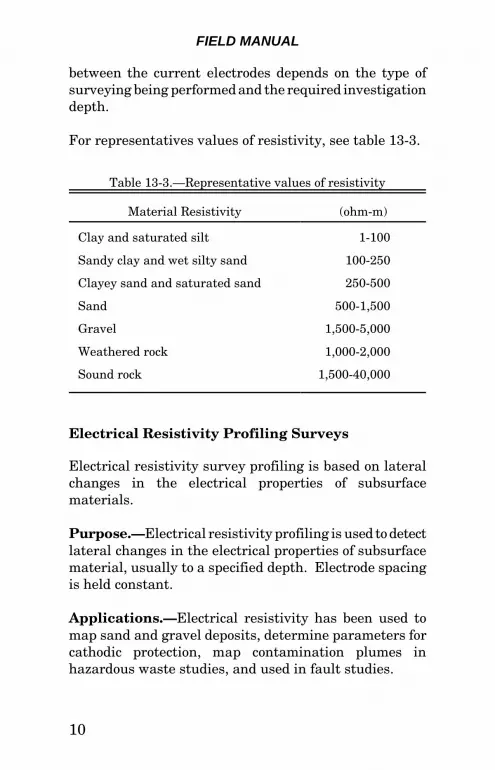
For representatives values of resistivity, see table 13-3.
Table 13-3.—Representative values of resistivity
Material Resistivity (ohm-m)
Clay and saturated silt 1-100
Sandy clay and wet silty sand 100-250
Clayey sand and saturated sand 250-500
Sand 500-1,500
Gravel 1,500-5,000
Weathered rock 1,000-2,000
Sound rock 1,500-40,000
Electrical Resistivity Profiling Surveys
Electrical resistivity survey profiling is based on lateralchanges in the electrical properties of subsurfacematerials.
Purpose.—Electrical resistivity profiling is used to detectlateral changes in the electrical properties of subsurfacematerial, usually to a specified depth. Electrode spacingis held constant.
Applications.—Electrical resistivity has been used tomap sand and gravel deposits, determine parameters forcathodic protection, map contamination plumes inhazardous waste studies, and used in fault studies.

SURFACE GEOPHYSICAL INVESTIGATIONS
11
Electrical Resistivity Sounding Surveys
Electrical resistivity sounding surveys measure verticalchanges in the electrical properties of subsurfacematerials. The electrode spacing used for resistivitysounding is variable, with the center point of the electrodearray remaining constant. The depth of investigationincreases as the electrode spacing increases.
Purpose.—Resistivity soundings are used to investigatevariations of resistivity with depth. Electrode spacing isvaried.
Applications.—Electrical resistivity soundings are com-monly used for aquifer and aquaclude delineation ingroundwater investigations. The technique has been usedfor bedrock delineation studies where there is not a suf-ficient velocity contrast to permit seismic surveying.Vertical electrical soundings have been used for largescale mineral investigations, geothermal investigations,cathodic protection and toxic waste studies, and inconjunction with self-potential surveys for seepageinvestigations.
Electrical Resistivity Dipole-Dipole Surveys
Dipole-dipole surveying potential electrodes may have anyposition with respect to the pair of current electrodes.When the current and potential electrodes are positionedalong the same line, the array is referred to as an axialdipole array (figure 13-3). The current electrodes areseparated from the potential electrodes by an interval, n,which is some multiple of the current and potential elec-trodes separation, a. The separation of the current andpotential electrodes is normally equal.

FIE
LD
MA
NU
AL
12
Figure 13-3.—Dipole resistivity array.

SURFACE GEOPHYSICAL INVESTIGATIONS
13
Purpose.—Dipole-dipole arrays are used to determineboth the lateral and vertical changes in electricalproperties of subsurface materials with one electrodearray.
Applications.—The dipole-dipole array has limitedapplications in engineering and groundwater geophysics.This type of electrode array has been used primarily inmineral and geothermal exploration. The method hasbeen used to delineate abandoned mines, mappingsaltwater/fresh water interfaces, and mapping buriedstream channels.
Electromagnetic Conductivity Surveys
Electromagnetic Conductivity Profiling Surveys
Electromagnetic (EM) surveying uses time-varying, lowfrequency, electromagnetic fields induced into the earth.A transmitter, receiver, and a buried conductor arecoupled by electrical circuitry through electromagneticinduction. The characteristics of electromagnetic wavepropagation and attenuation by a material can permitinterpretation of the electrical conductivities of thesubsurface materials.
Purpose.—Since electrical conductivity is the reciprocalof electrical resistivity, electromagnetic surveys are usedto provide resistivity information on subsurface materials.Electromagnetic conductivity profiling surveys are spe-cifically used to determine lateral changes in conductivityof the subsurface materials.
Applications.—Electromagnetic surveys have been usedprimarily for mineral exploration; and with the exceptionof magnetic surveys, EM surveys are the most commonly

FIELD MANUAL
14
used geophysical surveys for minerals. EM surveys havebeen used in engineering and groundwater investigations.The method is found to be particularly useful in mappingcontaminant plumes and buried metallic waste such asmetal drums containing hazardous chemicals. EM sur-veys are suited to hazardous waste studies because thesurveying procedure does not require equipment to touchpotentially contaminated ground. The method has beenused to locate buried pipes and cables and to locatelandmines.
Electromagnetic Conductivity Sounding Surveys
Purpose.—Electromagnetic conductivity sounding sur-veys are used to determine vertical changes in con-ductivity of subsurface material.
Applications.—Electromagnetic sounding surveys canlocate areas of permafrost, gravel deposits, map bedrocktopography, and provide general geological information.EM sounding and profiling surveys have been applied tomapping areas of salt water intrusion, archaeologicalinvestigations, and fault studies.
Ground Penetrating Radar Surveys
Purpose
Ground penetrating radar (GPR) surveys have the samegeneral characteristics as seismic surveys. The depth ofinvestigation with GPR is extremely shallow when com-pared to seismic surveys. This disadvantage is partiallyoffset by the much better resolution of GPR.

SURFACE GEOPHYSICAL INVESTIGATIONS
15
Applications
Ground penetrating radar surveys can be used for avariety of very shallow geotechnical investigations,including the locations of pipes or other buried manmadeobjects such as timbers, very high resolution mapping ofnear-surface geology, and detecting cavities, piping, andleakage in dams. The applications are limited by the veryshallow penetration depth of the very high radarfrequencies. Silts, clays, salts, saline water, the watertable, and any other conductive materials in the sub-surface severely restrict or stop penetration of radar.
Self-Potential Surveys
Purpose
Self-potential ([SP] spontaneous potential or naturalpotential) is the natural electrical potential existingwithin the earth due to many causes. These causes can beclassified broadly into two groups (excluding manmadecauses):
Mineralization Potential.—Mineralization potential iscommonly the result of chemical concentration cellsformed when conductive mineral deposits, such asgraphite or sulfide, are intersected by the water table.Mineralization potentials are almost always negative andmay have values up to several hundred millivolts. Back-ground potentials can be either positive or negative andusually have values of only a few tens of millivolts.
Background Potential.—Background potential iscommonly the result of (a) two electrolytes of differentconcentration being in contact with one another,(b) electrolytes flowing through a capillary system or

FIELD MANUAL
16
porous media, (c) an electrolyte in contact with a solid,and (d) electromagnetically induced telluric (large scaleflow in the earth’s crust) currents.
The background potentials developed by electrolytes flow-ing through a capillary system or porous media (calledelectro-filtration or streaming potentials) are used tostudy seepage. Water flowing through a capillary systemcollects and transports positive ions from the surroundingmaterials. The positive ions accumulate at the exit pointof the capillary, leaving a net positive charge. Theuntransported negative ions accumulate at the entrypoint of the capillary leaving a net negative charge. If thestreaming potentials developed by this process are ofsufficient magnitude to measure, the entry point and theexit point of zones of concentrated seepage may bedetermined from the negative and positive self potentialanomalies.
Applications
Self-potential surveys have been used to map the lateralextent of mineral deposits and, in some instances, provideinformation of the configuration of the deposits. Anotherexploration application has been to map the depth to andconfiguration of certain geothermal areas. Normally, ingeothermal applications, self-potential surveying is usedin conjunction with other geophysical surveys (gravity,seismic, and electrical).
In geotechnical investigations, self-potential surveys havebeen used to map leakage paths from dams. Self-potential surveying has also been used to map leaks fromcanals and buried pipelines that transport liquids.Detachment walls and lateral limits of some landslidemasses have been mapped with self-potential surveys.

SURFACE GEOPHYSICAL INVESTIGATIONS
17
Self-potential surveying may play an important role inhazardous waste investigations and in monitoring leakagefrom dams.
Magnetic Surveys
Purpose
Magnetic surveys measure anomalous conditions withinthe Earth’s magnetic field. The Earth’s magnetic fieldresembles the field of a bar magnet. The field is twice asstrong in the polar regions than at the equator. Theintensity of the field in the polar regions is approximately60,000 gammas; while at the equator, the intensity isapproximately 30,000 gammas. The Earth’s magneticfield is not symmetrical but contains many large per-turbations due to local variations in magnetic materialsand larger magnetic features. Within the Earth’s field,anomalies on the order of one gamma to several thousandgammas are detected by magnetic surveys. The smalleranomalies can be detected with complex instruments, andthe larger anomalies can be detected with simpler instru-ments and field techniques.
Applications
Magnetic surveys have their widest applications in petro-leum and mineral exploration programs. For applicationsin petroleum exploration, the application is somewhatsimpler because the sources of most magnetic anomalieslie within the basement complex and the overlyingsediments are often "transparent" to magnetic surveys.
In geotechnical investigations, magnetic surveys havebeen used to detect buried barrels of contaminated

FIELD MANUAL
18
materials and to detect and map buried pipelines.Magnetic surveys have also been used in archaeologicalinvestigations.
Gravity Surveys
Purpose
Gravity anomalies are the result of contrasts in densitiesof materials in the Earth. If all the materials within theEarth were layered horizontally and were of uniformdensity, there would be no density contrasts. Densitycontrasts of different materials are controlled by anumber of different factors; the most important are thegrain density of the particles forming the material, theporosity of the material, and the interstitial fluids withinthe material. Generally, soil and shale specific gravitiesrange from 1.7 to 2.2. Massive limestone specific gravitiesaverage 2.7. While this range of values may appear to befairly large, local contrasts will be only a fraction of thisrange. A common order of magnitude for local densitycontrasts is 0.25. Density contrasts can be determined bycalculating the gravity effect of a known model andcomparing that effect with the observed gravitydetermined from a gravity survey.
Applications
Gravity surveys provide an inexpensive determination ofregional structures that may be associated withgroundwater aquifers or petroleum traps. Gravity sur-veys have been one of the principal exploration tools inregional petroleum exploration surveys. Gravity surveyshave somewhat limited applications in geotechnicalinvestigations. Gravity surveys have been used to obtaininformation on bedrock depths and the top of rock

SURFACE GEOPHYSICAL INVESTIGATIONS
19
configuration in areas where it has not been possible orpractical to use other geophysical techniques. Micro-gravity (high-precision) surveys have been used in a fewinstances to obtain information on the success of groutingprograms. In these cases, microgravity surveys are per-formed before and after grouting operations and densitycontrasts of the two surveys are compared. Microgravitysurveys have been used for archaeological investigations.
Glossary
A
Accelerometer – Transducer with output proportional toacceleration. A moving coil geophone (type oftransducer) with a response proportional tofrequency may operate as an accelerometer.
Acoustic Logging – borehole log of any of severalaspects of acoustic-wave propagation (e.g., a sonic,amplitude, character, or three-dimensional log).
Air Wave – Energy from a shot which travels in the airat the velocity of sound.
Amplitude – The size of a signal, either in the ground orafter amplification. Usually measured from the zeroor rest position to a maximum excursion. Theamplitude of a signal has units based on themeasurement of the signal (e.g., acceleration (inchper square second [in/sec2]), velocity (inches persecond [in/sec]) or displacement (inches [in]).
Analog – (1) A continuous physical variable (such as volt-age or rotation) that has a direct relationship toanother variable (such as acceleration) with one

FIELD MANUAL
20
proportional to the other. (2) Continuous as opposedto discrete or digital.
Anomaly – A deviation from normal or the expected. Forexample, a travel time anomaly, Bouger anomaly,free-air anomaly.
Apparent Velocity – (1) The velocity that a wave-frontregisters on a line of geophones. (2) The inverseslope of a time-distance curve.
Automatic Gain Control (AGC) – The outputamplitude controls the gain of a seismic amplifier,usually individual for each channel; but sometimes,multi-channel devices are used.
B
Basement (Complex) – (1) generally of igneous andmetamorphic rocks overlain unconformably bysedimentary strata. (2) Crustal layer beneath asedimentary layer and above the Mohorovicicdiscontinuity.
Bedrock – Any solid rock exposed at the surface of theearth or overlain by unconsolidated material.
Bit – A binary digit; either a 1 (one) or 0 (zero).
Body Waves – The only waves that travel through theinterior of a body consisting of P-waves and S-waves.
Byte – Word.
C
Cable – The assembly of electrical conductors used toconnect geophone groups or other instruments.

SURFACE GEOPHYSICAL INVESTIGATIONS
21
Casing – Tubing or pipe used to line drill holes or shot-holes to keep them from caving.
Cathodic Protection – Electrical corrosion protectionfor pile foundations, electrical grounding mats, bur-ied pipelines, or any metal subject to corrosion.
Channel – (1) A single series of interconnected devicesthrough which geophysical data can flow from sourceto recorder. (2) An elongated depression or geologicalfeature. (3) An allocated portion of the radio fre-quency spectrum.
Channel Wave – An elastic wave propagated in a layerof lower velocity than layers on either side. Energyis largely prevented from escaping from the channelbecause of repeated total reflection at the channelboundaries or because rays that tend to escape arerefracted back toward the channel.
Character. – (1) The recognizable aspect of a seismicevent, usually displayed in the waveform thatdistinguishes the event from other events. Usually,a frequency or phasing effect, often not definedprecisely and dependent upon subjective judgment.
Common Depth Point (CDP). – The same portion ofsubsurface that produces reflections at differentoffset distances on several profiles.
Compressional Wave – An elastic body wave withparticle motion in the direction of propagation.Same as P-waves, longitudinal wave, dilatationwave, irrotational.
Converted Wave – A wave that is converted fromlongitudinal to transverse, or vice versa, uponreflection or refraction at oblique incidence from aninterface.

FIELD MANUAL
22
Critical Angle – Angle of incidence, �c, for which therefracted ray grazes the contact between two media(of velocities V1 and V2):
sin �c = V1/V2
Critical Distance – (1) The offset at which a refractedevent becomes the first break; cross-over distance.(2) The offset at which the reflection time equals therefraction time (i.e., the offset at which the reflectionoccurs at the critical angle).
Crossfeed (Crosstalk) – Interference resulting from theunintentional pickup of information or noise fromanother channel.
D
Datum – (1) The arbitrary reference level to which meas-urements are corrected. (2) The surface from whichseismic reflection times or depths are measured,corrections having been made for local topographicand/or weathering variations. (3) The reference levelfor elevation measurements, often sea level.
Delay Time – (l) In refraction work, the additional timetaken for a wave to follow a trajectory to and along aburied marker over that which would have beentaken to follow the same marker hypothetically atthe ground surface or at a reference level. Normally,delay time exists separately under a source andunder a detector and depends on the depth of themarker at wave incidence and emergence points.Shot delay time plus geophone delay time equalsintercept time. (2) Delay produced by a filter.(3) Time lag introduced by a delay cap.

SURFACE GEOPHYSICAL INVESTIGATIONS
23
Diffraction – (1) Scattered energy which emanates froman abrupt irregularity, particularly common wherefaults cut reflecting interfaces. The diffracted energyshows greater curvature than a reflection (except incertain cases where there are buried foci), althoughnot necessarily as much as the curve of maximumconvexity. Diffraction frequently blends with areflection and obscures the fault location or becomesconfused with dip. (2) Interference produced byscattering at edges. (3) Causes energy to be trans-mitted laterally along a wave crest. When a portionof a wave train is interrupted by a barrier,diffraction allows waves to propagate into the regionof the barrier's geometric shadow.
Digital – Representation of quantities in discrete units.An analog system represents data as a continuoussignal.
Dipole – A pair of closely spaced current electrodes thatapproximates a dipole field from a distant pair ofvoltage detecting electrodes.
E
Elastic Constants –
(1) Bulk modulus, k. – The stress-strain ratio underhydrostatic pressure.
kP
V V= ∆
∆ /
where �P = pressure change, V = volume, and �V =volume change.

FIELD MANUAL
24
(2) Shear modulus, �. – rigidity modulus, Lame'sconstant. The stress-strain ratio for simple shear.
µ = F A
L L
t /
/∆
where Ft = tangential force, A = cross-sectional area,L = distance between shear planes, and �L = sheardisplacement. Shear modulus can also be expressedin terms of other moduli as:
µσ
=+E
( )1
where E = Young's modulus, and � = Poisson's ratio.
(3) Young's modulus, E. – The stress-strain ratiowhen a rod is pulled or compressed.
EF A
L L= ∆
∆/
/
where �F/A = stress (force per unit area), L =original length, and �L = change in length.
(4) Lame' constant, �. – a tube is stretched in theup-direction by a tensile stress, S, giving an upwardstrain, s, and S’ is the lateral tensile stress needed toprevent lateral contraction, then:
λ = S
s
'
This constant can also be expressed in terms ofYoung’s modulus, E, and Poisson’s ratio, �:

SURFACE GEOPHYSICAL INVESTIGATIONS
25
λ σσ σ
=+ −
E
( )( )1 1 2
Electromagnetic – Periodically varying field, such aslight, radio waves, radar.
End Line – Shotpoints that are shot near the end of thespread.
F
Fan Shooting – An early use of the refraction seis-mograph to find salt domes within a thick, low-velocity section; detectors located in widely spacedfan-like arrays radiating from the shot locations.
Filter – (1) A device that discriminates against some ofthe input information. The discrimination is usuallyon the basis of frequency, although other bases suchas wavelength or moveout (see velocity filter) may beused. The act of filtering is called convolution.(2) Filters may be characterized by their impulseresponse or, more usually, by their amplitude andphase response as a function of frequency. (3) Band-pass filters are often specified by successively listingtheir low-cutoff and high-cutoff points. (4) Notchfilters reject sharply at a particular frequency.(5) Digital filters filter data numerically in the timedomain. Digital filtering can be the exact equivalentof electrical filtering. Digital filtering is very versa-tile and permits easy filtering according toarbitrarily chosen characteristics.
First Break or First Arrival – The first recorded signalattributable to seismic wave travel from a source.First breaks on reflection records provide informa-tion about weathering. Refraction work is based
FIELD MANUAL
26
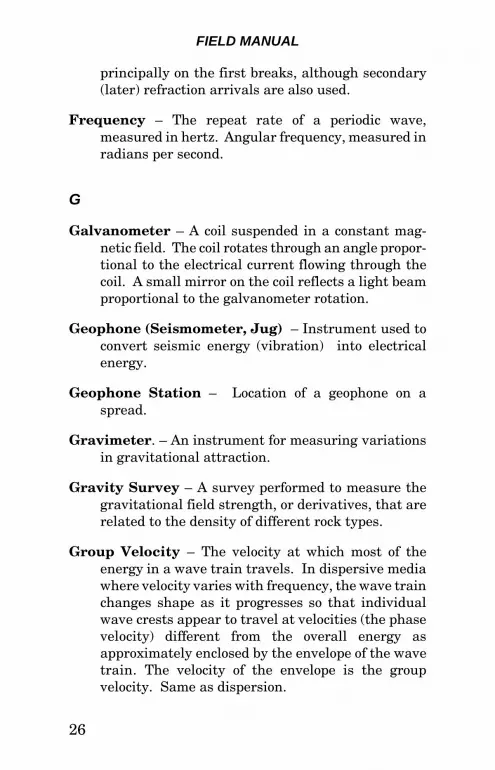
principally on the first breaks, although secondary(later) refraction arrivals are also used.
Frequency – The repeat rate of a periodic wave,measured in hertz. Angular frequency, measured inradians per second.
G
Galvanometer – A coil suspended in a constant mag-netic field. The coil rotates through an angle propor-tional to the electrical current flowing through thecoil. A small mirror on the coil reflects a light beamproportional to the galvanometer rotation.
Geophone (Seismometer, Jug) – Instrument used toconvert seismic energy (vibration) into electricalenergy.
Geophone Station – Location of a geophone on aspread.
Gravimeter. – An instrument for measuring variationsin gravitational attraction.
Gravity Survey – A survey performed to measure thegravitational field strength, or derivatives, that arerelated to the density of different rock types.
Group Velocity – The velocity at which most of theenergy in a wave train travels. In dispersive mediawhere velocity varies with frequency, the wave trainchanges shape as it progresses so that individualwave crests appear to travel at velocities (the phasevelocity) different from the overall energy asapproximately enclosed by the envelope of the wavetrain. The velocity of the envelope is the groupvelocity. Same as dispersion.

SURFACE GEOPHYSICAL INVESTIGATIONS
27
H
Head Wave – See refraction wave.
Hidden Layer – A layer that cannot be detected byrefraction methods; typically, a low velocity layerbeneath a high velocity layer.
Hydrodynamic Wave – A seismic surface wavepropagated along a free surface. The particle motionis elliptical and prograde (M2 type Rayleigh orSezawa) (e.g., Rayleigh-type wave dependent uponlayering).
Hydrophone (Pressure Detector) – A detector sensi-tive to variations in pressure, as compared to ageophone, which is sensitive to motion. Used whenthe detector can be placed below a few feet of watersuch as in marine or marsh applications or as a wellseismometer. The frequency response of the hydro-phone depends on the depth beneath the surface.
I
In-line Offset – Shot points that are in line, but offset toa spread.
L
Lead – An electrical conductor (wire cable) used toconnect electrical devices. Geophones are connectedto cables at the takeouts via leads on the geophones.
Love Wave – A surface seismic wave associated with lay-ering. This wave is characterized by horizontalmotion perpendicular to the direction of propagation,with no vertical motion.

FIELD MANUAL
28
Low-velocity Layer (LVL) – The surface layer that haslow seismic velocity.
M
Magnetic Survey – A survey to measure the magneticfield or its components as a means of locatingconcentrations of magnetic materials or determiningdepth to basement.
Mis-tie – (1) The time difference obtained on carrying areflection event or some other measured quantityaround a loop; or the difference of the values atidentical points on intersecting lines or loops. (2) Inrefraction shooting, the time difference from reversedprofiles that gives erroneous depth and dipcalculations.
Multiple – Seismic energy that has been reflected morethan once (e.g., long-path multiple, short-pathmultiple, peg-leg multiple, and ghosts).
N
Noise – (1) Any undesired signal or disturbance that doesnot represent any part of a message from a specifiedsource. (2) Sometimes restricted to random energy.(3) Seismic energy that is not resolvable as re-flections. Noise can include microseisms, shot-generated noise, tape-modulation noise, andharmonic distortions. Sometimes divided into co-herent noise (including non-reflection coherentevents) and random noise (including wind noise,instrument noise, and all other energy which is non-coherent). (3) Random noise can be attenuated bycompositing signals from independent measure-ments. (4) Sometimes restricted to seismic energy

SURFACE GEOPHYSICAL INVESTIGATIONS
29
not derived from the shot explosion. (5) Disturbancesin observed data due to more or less random inhomo-geneities in surface and near-surface material.
Noise Analysis – A profile or set of profiles used togather data for an analysis of coherent noise. Usedto design geophone arrays in reflection surveys.
Noise Survey (Ground Noise Survey) – A survey ofambient, continuous seismic noise levels within agiven frequency band. This technique is a useful toolfor detecting some geothermal reservoirs becausethey are a source of short-period seismic energy.
O
On-line – Shot points that are not at any point on aspread other than at the ends.
Original Data – (1) Any element of data generateddirectly in the field in the investigation of a site.(2) A new element of data resulting from a directmanipulation or compilation of field data.
Oscillograph – A device that records oscillations as acontinuous graph of corresponding variation in anelectric current or voltage.
Oscilloscope – A device that visually displays anelectrical wave on a screen (e.g., on a cathode raytube).

FIELD MANUAL
30
P
Phase Velocity – The velocity of any given phase (suchas a trough or a wave of single frequency); it maydiffer from group velocity because of dispersion.
Plant – The manner in which a geophone is placed or thecoupling to the ground.
Primacord – An explosive rope that can be used to eitherconnect explosive charges or to detonate separatelyas a primary energy source.
Profile – The series of measurements made from severalshotpoints to a recording spread from which aseismic data cross section or profile can beconstructed.
R
Radar – An exploration method where microwaves aretransmitted into a medium and are reflected back byobjects or layers. The reflected microwaves are re-ceived and processed to provide an image of thesubsurface. May be used for shallow penetrationsurveys.
Rayleigh Wave – A seismic wave propagated along afree surface. The particle motion is elliptical andretrograde.
Ray Path – The path of a seismic wave. A line every-where perpendicular to wave-fronts (in isotropicmedia).
Reconnaissance – (1) A general examination of a regionto determine its main features, usually preliminaryto a more detailed survey. (2) A survey to determine

SURFACE GEOPHYSICAL INVESTIGATIONS
31
regional geological structures or to determinewhether economically prospective features exist,rather than to map an individual structure.
Reflection Survey – A survey of geologic structure usingmeasurements made of arrival times of seismicwaves that have been reflected from acousticimpedance change interfaces.
Refraction Survey – A survey of geologic structureusing compressional or head waves. Head wavesinvolve energy that enters a high-velocity medium(refractor).
Refraction Wave (Headwave, Mintrop Wave,Conical Wave) – Wave travel from a point sourceobliquely downward to and along a relatively highvelocity formation or marker and then obliquelyupward. Snell's law is obeyed throughout the tra-jectory. Angles of incidence and of emergence at themarker are critical angles. Refracted waves typicallyfollowing successively deeper markers appear as firstarrivals with increasing range (shot to detectordistance). Refracted waves following differentmarkers may have different arrival times for anygiven range. Refracted waves cannot arise for anglesof incidence less than the critical angle for any givenmarker. At the critical angle, the refracted wavepath (and travel time) coincides with that of a wideangle reflection.
Refractor (Refraction Marker) – An extensive,relatively high-velocity layer underlying lower velo-city layers that transmits a refraction wave nearlyhorizontally.
FIELD MANUAL
32
Resistivity – An electrical property of rock reflecting theconductivity of an electrical current. Resistivity isthe ratio of electric field intensity to current density.
Resistivity Meter – A general term for an instrumentused to measure the in place resistivity of soil androck materials.
Resistivity Survey – A survey that measures electricfields and earth resistivity of a current induced intothe ground.
Reverse Profile – A refraction seismic profile generatedby shooting both ends of a spread.
Roll-along – A mechanical or electrical switch thatconnects different geophones (or geophone groups) tothe recording instruments. The use of a roll-alongswitch permits common depth point reflection datato be easily acquired in the field.
S
Seismic Amplifier – An electronic device used to in-crease the electrical amplitude of a seismic signal.
Seismic Camera – A recording oscillograph used tomake a seismic record.
Seismic Cap – A small explosive designed to be deto-nated by an electric current that detonates anotherexplosive. These caps are designed to provide veryaccurate time control on the shot.
Seismic Velocity – The rate of propagation of seismicwaves through a medium.
Seismogram – A seismic record.

SURFACE GEOPHYSICAL INVESTIGATIONS
33
Self-potential (Spontaneous Potential, NaturalPotential, SP) – The direct current or slowlyvarying natural ground voltage between nearby non-polarizing electrodes.
Shear Wave – A body wave with the particle motionperpendicular to the direction of propagation. (Sameas S-wave, equivoluminal, transverse wave.)
Shooter – The qualified, licensed individual (powder-man) in charge of all shot point operations andexplosives on a seismic crew.
Shot Depth – The distance from the surface down to theexplosive charge. The shot depth is measured to thecenter or bottom of the charge with small charges.The distances to both the top and bottom of thecolumn of explosives are measured with largecharges.
Shot Instant (Time Break, TB, Zero Time) – Theinstant at which a shot is detonated.
Shot Point – Location of the energy source used ingenerating a particular seismogram.
Signal Enhancement – A process used in seismographsand resistivity systems to improve the signal-to-noise ratio by real-time adding (stacking) ofsuccessive waveforms from the same source point.Random noise tends to cancel out, and the coherentsignal tends to add or stack.
Snell’s Law – When a wave crosses a boundary betweentwo isotropic mediums, the wave changes directionsuch that the sine of the angle of incidence of thewave divided by the velocity of the wave in the firstmedium equals the sine of the angle of refraction of

FIELD MANUAL
34
the wave in the second medium divided by thevelocity of the wave in the second medium (seecritical angle).
Spread – The layout of geophone groups from which datafrom a single shot are simultaneously recorded.
Stanley Wave – A type of seismic surface wave prop-agated along an interface.
Surface Wave – Energy that travels along or near thesurface (ground roll).
T
Takeout – The connections on a multiconductor cable forconnecting geophones. May refer to the short cableleads from the geophones (pigtails).
Time Break – The mark on a seismic record that indi-cates the shot instant or the time the seismic wavewas generated.
Trace – A record of one seismic channel. This channelmay contain one or more geophones.
V
Vibration Monitor – A sensitive, calibrated recorder ofground and structural acceleration and velocity.Measurements are made to determine vibrationamplitudes and modal frequencies of buildings,towers, etc., under ambient conditions, as well as todetect potentially damaging vibrations caused byblasting, pile driving, etc.

SURFACE GEOPHYSICAL INVESTIGATIONS
35
Vibroseis – A seismic energy source consisting of con-trolled frequency input into the earth by way of largetruck mounted vibrators. Trademark of ContinentalOil Company (Conoco).
W
Wave Length – The distance between successive similarpoints on two adjacent cycles of a wave measuredperpendicular to the wavefront.
Wave Train – (1) The sum of a series of propagatingwave fronts emanating from a single source. (2) Thecomplex wave form observed in a seismogramobtained from an explosive source.
Weathering Spread – A short-spaced geophone intervalrefraction spread used to provide corrections torefraction data caused by delay times in near-surface, low-velocity materials.
WWV(B) – The National Institute of Standards and Tech-nology (NIST) radio stations that broadcast time andfrequency standards.
For the definition of other geophysical terms used in thismanual, refer to: Glossary of Terms Used in GeophysicalExploration, Society of Exploration Geophysicists, Tulsa,Oklahoma, 1984.

FIELD MANUAL
36
Bibliography
Mooney, H.M., Handbook of Engineering Geophysics,Volume 1: Seismic, Bison Instruments, Inc., Minneapolis,Minnesota, 1984.
Telford, W.M., et al., Applied Geophysics, CambridgeUniversity Press, New York, New York, 1976.
U.S. Corps of Engineers, Geophysical Exploration forEngineering and Environmental Investigations,Engineering Manual EM 111-1-1802, 1995.
U.S. Geological Survey, Application of Surface Geophysicsto Ground-Water Investigations, Chapter D1, Book 2,Techniques of Water-Resources Investigations of theUnited States Geological Survey, 1974.
Van Blaricom, R., compiler, Practical Geophysics II for theExploration Geologist, Second Edition, Northwest MiningAssociation, Spokane, Washington, 1992.
Ward, S.H., editor, Geotechnical and EnvironmentalGeophysics, Society of Exploration Geophysics, Tulsa,Oklahoma, 1990.

Chapter 14
BOREHOLE GEOPHYSICALAND WIRELINE SURVEYS
Introduction
Wireline surveys determine physical properties in andbeyond the wall of a borehole by devices attached to acable, or wireline. Subsurface geologic conditions andengineering characteristics can be derived directly orindirectly from the wide variety of measurable propertiesavailable by wireline surveying. Wireline logging tech-niques commonly are classified by the kind of energy thatis input (active systems) or received (passive systems),including electric, seismic or acoustic, nuclear, magnetic,gravity, or optical. Logging tools are also classifiedaccording to whether they are for use in open holes orcased holes. Data from several methods are oftencombined to evaluate a single geologic or engineeringcharacteristic. This chapter describes the methods anddiscusses the application of borehole wireline surveying togeotechnical exploration and investigation.
Electric Logging Techniques
An electric log is a continuous record of the electricalproperties of the fluids and geologic materials in andaround a borehole. Electric logging is performed in theuncased portion of a borehole by passing electric currentthrough electrodes in the logging device, or sonde, and outinto the borehole and the geologic medium. Otherelectrodes located on the surface or in the boreholecomplete the circuit to the source and recording device.Electric logging surveys are efficient and cost effectivebecause the process is automated and several electricalproperties are measured simultaneously by combiningseveral electrode configurations in the same tool.

FIELD MANUAL
38
Electric logging techniques can be used in geotechnicalinvestigations to assess the variation with depth ofgeologic materials and associated fluids. Electric logsfrom two or more boreholes are used to correlate anddetermine the continuity of geologic strata or zones thathave similar electrical properties. Since the electricalproperties depend on physical characteristics, theporosity, mineral composition, water content (saturation),water salinity, lithology, and continuity of the beddingcan often be deduced. Borehole electric logs are also thebest source of control for surface electrical surveys byproviding subsurface layer resistivities. Electric logcorrelation of continuous layers from borehole to boreholeis relatively simple. The interpretation of physicalproperties from electric logs can be ambiguous andcomplicated. Different combinations of water content,salinity, mineralogy, porosity, and borehole peculiaritiescan produce similar electric logs.
Spontaneous Potential (SP) Log
The spontaneous potential or SP logging device recordsthe difference in potential in millivolts between a fixedelectrode at the surface and an electrode in a borehole(figure 14-1). The measured potential difference changesas the electrical potential between the borehole fluid andthe fluids in the various strata opposite the sondechanges. The spontaneous potential device commonly isincorporated into the multiple-electrode resistivity sondeso that resistivity and SP logs are acquired simulta-neously. Figure 14-2 illustrates a typical SP resistivitylog. The recording is a relative measurement of thevoltage in the borehole. Readings opposite shales or claysare relatively constant and form the shale baseline, or"shale line." The SP curve typically deflects to the left orright opposite permeable formations depending on thesalinity of the drilling mud. Sandstone and other porous

BOREHOLE GEOPHYSICAL AND WIRELINE SURVEYS
39
Figure 14-1.—Spontaneous potential surveyelements.
and permeable strata allow the different fluids to mix andproduce salinity of the pore fluid with respect to theborehole fluid and the clay content of the strata. TheSP peaks are commonly displayed to the left of the shaleline because negative potentials are more commonlyencountered. In fresh water, SP anomalies are typicallyinverted (i.e., they appear to the right of the shalebaseline).
SP logs are used in combination with resistivity logs todefine strata boundaries for correlation and to infer thelithology of the strata as a function of permeability andresistivity. The shape of the SP curve depends on thedrilling mud used and the geologic strata encountered.For example, the SP curve for a shale bed would indicatezero deflection (the shale line in figure 14-2), and the

FIELD MANUAL
40
Figure 14-2.—Electric log showing SP andresistivity in different beds.

BOREHOLE GEOPHYSICAL AND WIRELINE SURVEYS
41
resistivity curve would indicate low resistivity because ofbound water in the clay and trapped water in the shale.Generally, the SP and resistivity curves converge oppositeshale strata (A in figure 14-2) and diverge oppositepermeable fresh water sands (B in figure 14-2). Alimestone bed, which usually is highly resistive butdevelops little spontaneous potential, would produce alarge resistivity deflection but a subdued SP peak (C infigure 14-2). A permeable sand bed with pore water ofhigh salinity typically would produce little resistivitydeflection but a large negative SP peak (D in figure 14-2).The determination of lithologies from SP logs should bedone cautiously because many factors contribute to themagnitudes and directions of the curve deflections. TheSP log is best used with resistivity and other logs to detectstrata boundaries and to correlate strata betweenboreholes. The SP log is also used to determine formationwater resistivities.
Single-Point Resistance Log
Single-point resistance loggers are the simplest electricalmeasuring devices. A current can flow between a singleelectrode placed in a borehole and another electrode at theground surface (figure 14-3). The earth between theelectrodes completes the circuit. Single-point resistancelogs are not commonly used in modern logging operationsbut illustrate the principal of down-hole electric logging.The resistance, R, of the circuit (electrodes plus earth) canbe calculated from Ohm’s Law, R = V/I, where V is themeasured voltage drop and I is the current through thecircuit. The resistance of a circuit is determined by theconductor’s size, shape, and resistivity, p, an intrinsicproperty of a material. Resistance of the conductor (theearth) is a convenient and useful property determined bypore fluid content, pore fluid composition, lithology, andcontinuity of strata. The resistivity of the measured

FIELD MANUAL
42
Figure 14-3.—Single-point resistivity array.
section of earth is determined from p = KR, where K is ageometric factor which differs for different electrodeconfigurations and R is the measured resistance V/I. Asingle point resistance log measures an apparentresistance of a section made up of borehole fluid and thevarious individual strata between the borehole and theground surface electrode. The multiple electrode arraysdiscussed below are designed to narrow and better definethe measured sections so that individual strata arerepresented more accurately by the logs.
Multiple Electrode Array Log
Wireline electrical systems using multiple electrodearrays in the borehole provide better resolution of
BOREHOLE GEOPHYSICAL AND WIRELINE SURVEYS
43
resistivity and associated properties of individual stratawithin the subsurface than can be achieved with thesingle-point array. Multiple electrode arrays include theshort- and long-normal array, lateral array, and focused-current or guard logging systems. Current electrodesusually are designated A and B, and potential electrodesare designated M and N. "Normal" arrays place the in-hole current electrode far away, at effective infinity(figure 14-4A). "Lateral" devices place the two potentialelectrodes close together with respect to the in-holecurrent electrode (figure 14-4B). Conventional modernlogging systems use a sonde made up of two normaldevices and one lateral device to produce three resistivitylogs and the SP log simultaneously.
The normal resistivity arrays (figure 14-4A) are calledshort normal or long normal depending on the spacing ofthe in-hole current (A and B) and potential (M and N)electrodes. The industry standard AM electrode spacingis 16 inches (in) for the short normal and 64 in for thelong normal. The normal arrays measure the electricalpotential at the in-hole electrode M. The greater thespacing between the current and measuring electrodes,the greater the effective penetration (effective penetrationdistance = ½ AM) of the device into the surroundinggeologic medium.
The lateral resistivity array is shown in figure 14-4B. Theactual positions of the electrodes may vary from thecircuit shown, but the resistivity measurements are thesame. The lateral array spacing is measured from theA current electrode to the center (0) of the potentialelectrode configuration and is called the AO spacing. Thelateral array measures the potential difference, orgradient, between the two in-hole potential electrodes andis also called the gradient array. The influence of the

FIELD MANUAL
44
Figure 14-4.—Multiple-electrode resistivityarrays. (A and B are current electrodes.
M and N are potential electrodes.)
geologic medium away from the borehole (the effectivepenetration of the system) is greatest for the lateral arraywith an 18-foot 8-in spacing and least for a 16-in shortnormal array.

BOREHOLE GEOPHYSICAL AND WIRELINE SURVEYS
45
The focused-current, or guard, resistivity device is a mod-ified single-electrode array in which "guard" current elec-trodes are placed above and below a central currentelectrode and two pairs of potential electrodes(figure 14-5). Current in the central and guard electrodesis adjusted so that zero potential exists between thepotential electrodes and the current is thus forced orfocused to flow out into the geologic medium in a narrowband. The device then measures the potential between thesonde electrodes and a reference electrode at the groundsurface. Focusing the current into a band ofpredetermined thickness gives the focused array muchgreater thin bed and stratum boundary resolution thanthe other arrays.
Geotechnical applications for multiple-electrode resistivityarrays include apparent resistivity and an approximationof true resistivities of individual strata or zones.Resistivity data aid in the interpretation of surfaceelectrical surveys, which generally are less expensive toconduct than down-hole surveys and can be applied overlarge areas. Since the depth of penetration of themeasuring circuit into the geologic medium varies withthe electrode spacing, logs of the various arrays (short-and long-normal and lateral) can be analyzed collectivelyto evaluate the effects of bed thickness, borehole fluids,drilling mudcake, variations in fluids, and permeabilitiesof strata at various distances from the borehole. Thecurve shapes of the logs for several boreholes permitcorrelation of strata and zones from borehole to borehole.Normal devices produce better boundary definition ofthick strata than do lateral devices, but lateral logs aremore effective in delineating thin strata and thin, highlyresistive zones. The focused logs discriminate moresharply between different strata, define strata boundariesbetter, and give a better approximation of true stratumresistivity than do normal or lateral logs. Porosity and

FIELD MANUAL
46
Figure 14-5.— Focused current, or guard,
resistivity array.
water content of strata and salinity of pore fluids can becalculated from the logs if sufficient information isobtained.
Microlog
Special purpose electric logging devices are available tosupplement or, in some cases, replace standard resistivity

BOREHOLE GEOPHYSICAL AND WIRELINE SURVEYS
47
logs. The microlog (also called contact log, microsurvey,and minilog) records variations in resistivity of a narrow,shallow zone near the borehole wall. The microlog sondeis equipped with three closely spaced electrodes placed ona rubber pad which is pressed against the borehole wall(figure 14-6). Microlog electrode spacings are about 1 to2 in (2.5 to 5 centimeters [cm]). Depth of investigation forthe microlog is about 3 in (7.5 cm) from the borehole wall.Normal, lateral, and guard arrays can be configured inthe microlog survey. Porous permeable zones allow themud cake to penetrate the strata, and the resultingmicrolog will indicate resistivities close to that of themud.
Induction Log
Induction logging is performed in dry boreholes orboreholes containing nonconducting fluids. Inductionlogging can be done in holes cased with polyvinyl chloride(PVC) casing. The induction logger is housed in a sondethat uses an induction coil to induce a current in thegeologic medium around a borehole. The induction loggeris a focused device and produces good thin-bed resolutionat greater distances from the borehole than can beachieved with normal spacing devices. A primaryadvantage over other devices is that the induction loggerdoes not require a conductive fluid in the borehole.
Nuclear Radiation Logging Techniques
A nuclear radiation log is a continuous record of thenatural or induced radiation emitted by geologic materialsnear the borehole. Nuclear radiation logging is performedby raising a sonde containing a radiation detector or a de-tector and a radioactive source up a borehole and record-ing electrical impulses produced by a radiation detector.

FIELD MANUAL
48
Figure 14-6.—Microlog resistivity logging device.
Nuclear radiation logging can be used in geotechnicalinvestigations to correlate strata between boreholes, aidin determining lithology, and derive or measure directlymany physical parameters of the subsurface materials,

BOREHOLE GEOPHYSICAL AND WIRELINE SURVEYS
49
including bulk density, porosity, water content, andrelative clay content. Most nuclear radiation loggingsystems can be operated in cased boreholes, giving theman advantage over electrical wireline logging systems.Nuclear logs can also be run in old boreholes, which aremore likely to be cased than recent boreholes. The logsare among the simplest to obtain and interpret, but thecalibrations required for meaningful quantitative inter-pretations must be meticulously performed. Nuclearradiation logging tools should be calibrated in controlledcalibration pits. Under favorable conditions, nuclearborehole measurements approach the precision of directdensity tests of rock cores. The gamma-gamma densitylog and the neutron water content log require the use ofisotopic sources of nuclear radiation. Potential radiationhazards necessitate thorough training of personnelworking around the logging sources.
Three common wireline nuclear radiation systems are thegamma ray or natural gamma logger, the gamma-gammaor density logger, and the neutron logger. The gamma-gamma and neutron devices require the use of aradioactive source material. The gamma ray device is apassive system and does not use a radioactive source. Allthe systems employ an in-hole sonde containing thesource and detector. Most devices require a boreholediameter of at least 2 in (5 cm) and investigate a zoneextending 6 to 12 in (15 to 30 cm) from the borehole.Applications differ for the three systems and depend onthe properties measured.
Gamma Ray (Natural Gamma) Log
The gamma ray or natural gamma radiation deviceprovides a continuous record of the amount of naturalgamma radiation emitted by geologic materials near thesonde. The gamma-ray detector converts incoming

FIELD MANUAL
50
gamma radiation to electrical impulses proportional to thenumber of rays detected and sends the amplified electricalimpulses to the surface. Gamma ray logs generally revealthe presence of shale or clay beds because clay mineralscommonly contain the potassium isotope K40 ,which is theprimary source of natural gamma radiation in most sedi-ments. Shales and clays usually produce a high gammaray count, or a peak on the log.
The relative density of a stratum is also indicated bynatural gamma ray logs because gamma radiation isabsorbed more by dense materials than by less densematerials. Gamma ray logging can be conducted in casedboreholes and is sometimes used in place of SP logging todefine shale (clay) and non-shale (non-clay) strata. Thenatural gamma ray and neutron logs are usually runsimultaneously from the same sonde and recorded side-by-side. The gamma ray log also infers the effectiveporosity in porous strata with the assumption that highgamma counts are caused by clay filling the pores of thestrata. Gamma ray logs are used to correct gamma-gamma density logs. Gamma ray logs are standard inradiation logging systems.
Natural Gamma Spectral Log
Spectral logging permits the identification of thenaturally occurring radioactive isotopes of potassium,uranium, and thorium which make up the radiationdetected by the natural gamma ray detector. Spectrallogging technology allows the detection and identificationof radioactive isotopes that contaminate water resources,or are introduced as tracer elements in hydrologic studies.

BOREHOLE GEOPHYSICAL AND WIRELINE SURVEYS
51
Figure 14-7.—Gamma-gamma logging sonde.
Density or Gamma-Gamma Log
The gamma-gamma or density logging device measuresthe response of the geologic medium to bombardment bygamma radiation from a source in the sonde. Electrons inthe atoms of the geologic medium scatter and slow downthe source gamma rays, impeding their paths to thedetector. Figure 14-7 illustrates the operation of thegamma-gamma device. Since electron density is propor-tional to bulk density for most earth materials, stratawith high bulk densities impede the source gamma raysmore than low density strata and produce correspondinglylower counts at the detector. The primary use of thegamma-gamma log is determining bulk density. If bulkdensity and grain density are known from samples and iffluid density can be determined, the porosity can becalculated. Gamma-gamma logs can also be used forcorrelation of strata between boreholes.
Gamma-gamma logging is best conducted in uncasedboreholes using decentralizing devices to keep the sonde

FIELD MANUAL
52
against the borehole wall. The system is affected by bore-hole diameter and wall irregularities and must becarefully calibrated for the effects of hole diameter, decayof the strength of the radioactive source, natural gammaradiation in the geologic medium, and borehole fluid den-sity. A caliper log is commonly run to permit calibrationfor hole diameter. Some logging systems simultaneouslydisplay the gamma ray count on one side of the log andbulk density on the other side, with the bulk density logautomatically corrected for the effects of mud cake andwall irregularity.
Neutron Log
Neutron logging is an active system that measures theresponse of the geologic medium to emission of neutronradiation from a source located in the sonde. Neutronsemitted by the source are captured by certain atoms,especially hydrogen nuclei, in the strata near the sonde.Figure 14-8 illustrates the operation of the neutronlogging device. Collision of neutrons with atoms of thegeologic medium causes secondary emission of neutronsand gamma rays, a portion of which are picked up by thedetector. A high concentration of hydrogen atoms nearthe source captures a greater number of neutrons andproduces a smaller counting rate at the detector.
Neutron detectors may detect gamma (neutron-gamma) orneutron (neutron-neutron) radiation. Water and hydro-carbons contain high concentrations of hydrogen atoms.If the fluid in the strata is assumed to be water, theneutron log is an indicator of the amount of water present.Determination of volumetric water content (weight ofwater per unit volume measured) is a principal use ofneutron logging. In saturated materials, the neutron logcan be an indicator of porosity, the ratio of the volume ofvoid space to the total volume. Bulk densities fromgamma-gamma logs, grain densities from samples, caliper

BOREHOLE GEOPHYSICAL AND WIRELINE SURVEYS
53
Figure 14-8.—Neutron logging sonde.
log data, and natural gamma log information can be com-bined with the volumetric water contents from neutronlogs to calculate the more commonly used geotechnicalparameters of water content by weight, wet and drydensity, void ratio, porosity, saturation, and lithology.
Neutron logs and natural gamma radioactive logs can beobtained through thick borehole casing and are usuallyrun together. Figure 14-9 illustrates the format of thetandem logs and typical responses for several lithologies.The response of different lithologies to the natural gammaand neutron devices is controlled directly by the amountof radioactive material present (especially the claycontent) and the fluid content and indirectly by theporosity and bulk density of the material. For example,the saturated sand of figure 14-9 absorbs neutronradiation, produces a correspondingly low neutron logcount, and produces a low natural gamma count becauseof the lack of clay in its pores.

FIELD MANUAL
54
Figure 14-9.—Typical curve responsesfor nuclear radiation logs.

BOREHOLE GEOPHYSICAL AND WIRELINE SURVEYS
55
Neutron activation or spectral logs provide spectral anal-yses of the geologic medium near the borehole to detectthe presence of certain elements. The spectral loggingsonde activates a neutron source in bursts of shortduration and activates the gamma ray detector onlyduring the source bursts. As a result, only certainradiation ("prompt" gamma rays) is detected. The systemproduces a plot of counts versus gamma ray energy.Peaks on the energy/count plot identify specific elements,for example carbon, silicon, magnesium, or chlorine.Spectral logs may have application to groundwaterquality investigations.
Neutrino Log
Neutrino logs are not necessarily a borehole log, but themethod can and often is performed in drill holes.Neutrino sources are located throughout the universewith the closest and most useful source being the sun.Using the sun as a neutrino source eliminates the needfor a special source, and there are no handling andlicensing problems that are often associated with othernuclear logs. Neutrinos penetrate the earth with little tono impediment, so neutrino logs can be run at any time ofday or night. Logging tools generally consist of strings ofwidely spaced photomultiplier tubes (PMT) placed intothe borehole. High-energy neutrinos passing through therock will occasionally interact with the rock and create amuon. These muons emit Cherenkov light when passingthrough the array and are tracked by measuring thearrival times of these Cherenkov photons at the PMTs.Resolution is high because the source (Sun) only subtendshalf a degree at this distance (93 million miles fromEarth). Neutrino logging is particularly useful in casedholes and when fluid in the hole is not a factor. New orold holes can be logged no matter what the hole contains.These logs are often used for tomography. Tomography is

FIELD MANUAL
56
particularly useful and convenient because, as the Earthrotates, the source penetrates a full 360 degrees, similarto CAT scan or Magnetic Resonance Imaging. Adrawback is that 24 hours is required to run a completeneutrino tomography log.
Acoustic/Seismic Logging Techniques
Wireline acoustic/seismic logging systems use medium- tohigh-frequency acoustic (sonic) energy emitted from asonde to image the borehole wall or to obtain seismicvelocities of the geologic material in the wall or in theformation away from the borehole. Acoustic systems usesonic energy generated and propagated in a fluid such aswater. Seismic systems use sonic energy propagatedthrough the ground in geologic materials. The threesystems discussed in this section are the acoustic velocitylogger, an acoustic and seismic energy system; a boreholeimaging device, an acoustic system; and the cross-holeseismic technique, a seismic technique.
The borehole imaging and acoustic velocity systems areused in geotechnical investigations to evaluate geologicconditions including attitude and occurrence of dis-continuities and solution cavities and in determining theeffective porosity and elastic properties of rock. Thedown-hole systems also supply subsurface information forinterpreting surface-applied geophysical surveys. Thefrequency of the energy pulse produced by the sonde’stransducer determines whether the energy penetrates theborehole wall for acoustic/seismic velocity surveys.Medium frequencies are used in acoustic/seismic velocitysurveys. The energy is reflected from the wall for imagingsurveys. High frequencies are used in acoustic/seismicvelocity surveys. Borehole imaging velocity devicesgenerate compressional (P-wave) energy. The acoustic

BOREHOLE GEOPHYSICAL AND WIRELINE SURVEYS
57
velocity device generates primarily compressional energybut also generates shear (S-wave) energy if the shearwave velocity exceeds the fluid velocity. The cross-holeseismic technique generates P- and S-wave energies anddetermines their velocities.
Acoustic Velocity Log
The continuous acoustic velocity (sonic) logger measuresand records the velocity of acoustic energy (seismic waves)in the material adjacent to the borehole. A transmitterlocated at one end of the sonde generates an electro-mechanical pulse that is transmitted through the bore-hole fluid into the borehole wall and by refraction to areceiver located at the other end of the sonde(figure 14-10). The propagation velocities of the seismicwaves can be calculated by travel times and distancetraveled from transmitter to receiver. The devices mustbe operated in a fluid-filled borehole. Compressionalwave oscillations set up by the sonde’s transmitter in theborehole fluid set up, in turn, oscillations in the boreholewall. Compressional, shear, and surface waves propagatein and along the wall and then, as compressional waves,back through the borehole fluid to the receiver.Compressional waves have the highest velocity and arrivefirst, followed by the shear waves and the surface waves.Devices with two receivers cancel the borehole fluid traveltimes so that only the refracted wave paths through theborehole wall are measured. Single-receiver devicesrequire the borehole fluid acoustic velocity and boreholediameter for calculation of seismic velocities. The acousticpulses generated at the transmitter are in the lowerultrasonic range around 20 kilohertz (kHz).
The simplest acoustic logging devices display a singlegraphical trace or waveform of the arrival of each pulse

FIELD MANUAL
58
Figure 14-10.—Elements of a simple wirelineacoustic velocity device.
and are called amplitude-modulated devices. Intensity-modulated acoustic logging devices record the entirecontinuous acoustic wave (see figure 14-11). Intensity-modulated, or three-dimensional (3-D), devices expresswave frequency by the width of light and dark bands and

BO
RE
HO
LE
GE
OP
HY
SIC
AL
AN
D W
IRE
LIN
E S
UR
VE
YS59
Figure 14-11.—Acoustic log presentations. The intensitymodulated waveform wave frequency by the width of the
band, amplitude by the shading intensity of the band.

FIELD MANUAL
60
amplitude by the degree of light or dark shading (figures14-11 and 14-12). The P-wave, S-wave, and surface wavearrivals can be discerned on the 3-D records. Strata orzones of different seismic velocity produce contrastingsignatures on the 3-D log. The phyllite zones infigure 14-12 represent softer materials of lower seismicvelocity than the metabasalts and produce correspond-ingly later arrival times. Fractures or other discon-tinuities can often be seen as disruptions in the bands.
Figure 14-12.—Sample of intensity modulatedacoustic log. Lithologies from core samples.
In addition to determining seismic velocities to aid inter-pretation of seismic surveys, 3-D logs show lithologiccontacts, geologic structure, and solution features. The P-and S-wave velocities can be used directly to calculate thedynamic elastic properties of rock, including Poisson’sratio, Young’s modulus, and bulk and shear moduli. Forexample, Poisson’s ratio is calculated using:
µ =−
−1 2 2 2
2 2
V V
V Vp s
p s

BOREHOLE GEOPHYSICAL AND WIRELINE SURVEYS
61
where Vp and Vs are the compressional and shear wavevelocities, respectively. The effective porosity of the stratacan also be evaluated.
Acoustic velocity devices require a borehole diameter of3 in or greater. The in-place geologic materials must havecompressional wave velocities higher than the velocity ofthe borehole fluid (approximately 4,800 feet per second[ft/sec] [1,450 meters per second (m/sec)] for water) for thewaves to be refracted and detected. Soils generally do nothave sufficiently high seismic velocities for acousticvelocity logging. The wave train (trace) type velocityloggers often are equipped with a radiation logging deviceand caliper on the same sonde for simultaneous acousticand natural gamma ray logging and borehole diametermeasurement.
Acoustic Borehole Imaging Log
The acoustic borehole imaging device uses high-frequencyacoustic waves to produce a continuous 360-degree imageof the borehole wall. Physical changes in the boreholewall are visible as changes in image intensity or contrast.Proprietary trade names for the acoustic borehole imagingdevice include "Televiewer" and "Seisviewer."Figure 14-13 illustrates the operation of an acoustic bore-hole imaging device. A piezoelectric transducer and direc-tion indicating magnetometer are rotated by a motorinside the tool housing at approximately three revolutionsper second (rps). The transducer emits pulses of acousticenergy toward the borehole wall at a rate of about2,000 pulses per second at a frequency of about2 megahertz (MHz). The high-frequency acoustic energydoes not penetrate the borehole wall, and the acousticbeams are reflected from the borehole wall back to atransducer. The intensity of the reflected energy is afunction of the physical condition of the borehole wall,

FIELD MANUAL
62
Figure 14-13.—Acoustic borehole imaging system.
including texture (rough or smooth) and hardness (afunction of the elasticity and density of the material). Theimage is oriented to magnetic north with every revolutionof the transducer. Fractures, cavities, and other opendiscontinuities produce low-amplitude acoustic reflectionsand are readily discerned in their true orientation, width,and vertical extent on the image.
The acoustic borehole imaging device can detect discon-tinuities as small as 1/8 in (3 millimeters [mm]) wide and

BOREHOLE GEOPHYSICAL AND WIRELINE SURVEYS
63
Figure 14-14.—Traces of planar discontinuitiesintercepting the borehole (left) as they appear
on the acoustic borehole imaging record (right).
can sometimes distinguish contrasting lithologies.Discontinuities, contacts, and other linear featuresintercepting the borehole at an angle other than90 degrees produce a characteristic sinusoidal trace thatcan be used to determine the strikes and dips of thefeatures. Figure 14-14 shows how planar discontinuitiesof different orientations appear on the acoustic imaginglog. Vugs and solution cavities are displayed as black

FIELD MANUAL
64
areas, and their traces can be analyzed to determine theirsize (in two dimensions) and percentage of the borehole.The device can also be used to inspect casing and wellscreens for defects. The acoustic imaging device must beoperated in a fluid-filled borehole.
Cross-Hole Seismic Test
Cross-hole tests are conducted by generating a seismicwave in a borehole and recording the arrival of theseismic pulse with geophones placed at the same depth inanother (receiver) borehole. Source and geophones areplaced at several regular depth intervals in the boreholesto determine seismic wave velocities of each material.Compressional and shear wave velocities can bedetermined with the cross-hole test. Figure 14-15 illu-strates the essential features of a cross-hole seismic test.The seismic source may be either an explosive or amechanical device. A vertical hammer device, clamped tothe borehole wall, is the typical source arrangement.Cross-hole geophones configured in triaxial arrays areused because directional detectors are necessary toidentify the S-wave arrival. Two or more receiver holesare sometimes used.
The raw data of cross-hole tests are the times required forP- and S-waves to travel from the seismic source in oneborehole to the detectors in the receiver hole or holes. Thecorresponding P- and S-wave arrival times can be used tocalculate seismic velocities as the ratios of distance totravel time, assuming the arrivals are direct (non-refracted) arrivals. If refraction through a faster zoneoccurs, true velocities must be calculated, similar to sur-face refraction seismic calculations.

BOREHOLE GEOPHYSICAL AND WIRELINE SURVEYS
65
Figure 14-15.—Cross-hole seismic test.
Borehole spacing (distance) is critical in cross-hole tests.Generally, spacing should be no greater than 50 feet (ft)(15 meters [m]) or less than 10 ft (3 m). Borehole deviation surveys should be conducted prior to testing todetermine precise spacing between holes at each shotpointdepth.
Cross-hole tests have several applications in engineeringgeology. S-wave cross-hole tests provide data on materialproperties for static and dynamic stress analysis. In addi-tion to providing true P- and S-wave velocities at differentdepths, cross-hole surveys can detect seismic anomaliessuch as zones of low velocity underlying a zone of higher

FIELD MANUAL
66
velocity or a layer with insufficient thickness or velocitycontrast to be detected by surface refraction tests.
Seismic Tomography
Tomography is a method of constructing an image of somephysical property inside an object from energy sentthrough the object in many directions. Much like medicaltomography (such as a CAT scan) is used to create imagesof features inside the human body; geophysical tomo-graphy is used to create images of features beneath theground or within engineered structures. There areseveral types of geophysical tomography. Cross-holeseismic tomography is one of the most common types ofgeophysical tomography. Cross-hole seismic tomographyinvolves sending seismic energy from one borehole toanother. A transmitter is lowered into one borehole, andthe transmitted seismic energy is recorded by a string ofreceivers located in the second borehole. The positions ofthe transmitter and receivers are varied so that theseismic energy is transmitted between the two boreholesover a large depth range and at many different angles.The arrival times of the transmitted seismic energy areused to construct an image of seismic P-wave velocity ofthe geologic materials between the two boreholes. Inaddition, the amplitudes of the transmitted signals maysometimes be used to construct an image of the apparentattenuation of the geologic materials. Attenuation is ameasure of the amount of energy loss of the seismic signaland is related to such factors as material type, degree ofcompaction or cementation, porosity, saturation, andfracturing. Cross-hole seismic tomography may be usedto image geologic features such as solution cavities,fracture zones, and lithologic contacts. Tomography mayalso be used to evaluate engineered structures such asconcrete cut-off walls, grout curtains, and concrete dams.
BOREHOLE GEOPHYSICAL AND WIRELINE SURVEYS
67
Borehole Optical Systems
Borehole optical logging systems include borehole film-recording cameras and borehole television cameras.Optical logging systems permit viewing and recordingvisible features in the walls of dry or water-filledboreholes, wells, casing, pipelines, and small tunnels.
Borehole cameras are an important supplement togeotechnical drilling and sampling programs because thecameras show geologic and construction features in placeand in relatively undisturbed condition. The aperture(opening), true orientation (strike and dip), and frequency(number per foot of borehole) of discontinuities in the rockmass can be determined with optical logging systems.The effective or fracture porosity associated with opendiscontinuities can be derived also. The occurrence andsize of solution cavities, the rock type from visualexamination of rock and mineral textures and color of theborehole wall, and the location of stratigraphic contactscan be determined. Other geotechnical applicationsinclude inspecting contacts of rock or soil against concreteand of the interior of rock or concrete structures. Opticallogging systems permit viewing soft or open zones in rockthat may be overlooked in normal drilling and samplingoperations. Zones of poor sample recovery or of drillingfluid loss can be investigated.
Borehole Television Camera.—Borehole televisionsystems provide real-time viewing of the interior of a dryor water-filled borehole. The typical system (figure 14-16)consists of a down-hole probe and surface-mounted cablewinch, control unit, power supply, television monitor, andvideo tape unit. The down-hole probe contains atelevision camera facing vertically downward toward apartially reflecting mirror inclined 45 degrees to the axis

FIELD MANUAL
68
Figure 14-16.—Borehole television logging system.
of the probe. A compass/clinometer used to determine theorientation of features in the borehole wall and theinclination of the borehole can be viewed selectivelythrough the mirror by varying the relative intensities oflamps located above and below the plane of the mirror. Amotor within the probe rotates the camera and mirrorassembly (or the mirror only) 380 degrees in areciprocating fashion (clockwise, then counterclockwise)as the probe is lowered or raised within the hole. The

BOREHOLE GEOPHYSICAL AND WIRELINE SURVEYS
69
operator controls the motion and logging speed of theprobe. A full image of the borehole wall is obtained witheach rotation.
A viewing head can be attached to the probe to allow axialviewing of the hole directly ahead. The probe ascent ordescent and camera rotation can be slowed or stopped forexamination of borehole features. The entire viewingsequence is usually videotaped.
Borehole television systems are commonly used to inspectlarge concrete structures and rock for defects, determinethe effectiveness of grouting operations, check the con-dition of concrete joints, estimate the volume of cavitieswithin a rock or soil mass, and inspect the screens ofwater wells. Television images can be used to determineattitudes of discontinuities but are less effective forcomplete borehole mapping than the borehole film camerasystems that portray the borehole walls as discrete, full-color, separate images more suitable for detailed studyand measurement.
Borehole Film Camera.—The borehole film camera pro-duces consecutive, over-lapping, 16-mm color still photo-graphs of 360 degree, 1-in (25-mm) sections of the walls ofNX or larger boreholes. The system consists of a down-hole probe and surface- mounted lowering device,metering units, and power supply. Figure 14-17illustrates the down-hole probe. The probe consists of a16-mm camera mounted in line with the probe axis andfacing a truncated conical mirror, which is surrounded bya cylindrical quartz window. A film magazine and filmdrive mechanism are mounted above the camera in theprobe housing. A ring-shaped strobe illuminates the bore-hole wall in synchronization with the camera’s filmadvance. Film advance, probe movement, and strobelighting are synchronized to expose a frame every 3/4 in

FIELD MANUAL
70
Figure 14-17.—Borehole film camera.

BOREHOLE GEOPHYSICAL AND WIRELINE SURVEYS
71
(20 mm) along the hole, so that a photograph with 1/4-in(6-mm) overlap of every 360-degree, 1-in (25-mm) sectionis taken. The truncation of the conical mirror allows thecamera simultaneously to photograph acompass/clinometer located directly beneath the mirror.Photographs produced by the camera are viewedindividually (still frame) using a special projector. Theimage of the mirror face is projected onto a flat film plane.The outer ring of the image "doughnut" represents thebase, and the inner ring is the top of the 1-in section ofthe borehole wall. Planar discontinuities intersecting theborehole wall produce a trace on the image like theshaded curve of figure 14-18 (top). In a vertical borehole,the outer and inner rings of the image "doughnut" arehorizontal traces. Points of intersection of planardiscontinuities with a ring thus define the strike of thefeature in vertical boreholes. The compass area in thecenter of the image of figure 14-18 shows the bearing ofintersecting planes. The dip of the feature can bedetermined graphically by counting the number of succes-sive frames in which the feature appears. A steeplydipping plane intersects several frames, a gently dippingplane only a few frames, and a horizontal plane intersectsone frame. The thickness or width of the discontinuitycan also be measured directly from the image. Data frominclined boreholes must be corrected to true strike, dip,and width. The NX borehole film camera is a proven toolfor supplying subsurface data in difficult drilling andsampling situations and for providing completequantitative information on discontinuities and boreholeanomalies. Strike can be measured accurately to about 1degree, dip (or inclination) to about 5 degrees, andthickness or width of discontinuities to a hundredth of aninch (0.1 mm) or better.

FIELD MANUAL
72
Figure 14-18.—Projection of borehole wall image into the film plane from the conical mirror of
the borehole film camera.

BOREHOLE GEOPHYSICAL AND WIRELINE SURVEYS
73
In operation, the borehole film camera probe is lowered tothe bottom of the hole and raised by a hand-crankedwinch at a logging speed of between 5 and 10 feet perminute (ft/min). A single load of film can photograph75 to 90 ft of borehole. Since the camera has no shutteror light metering capability, the aperture must be presetto satisfy lighting requirements of hole diameter andreflectivity of the borehole wall. The lens aperture rangesfrom f 2.8 for dark rock to f 22 for light colored rock. Themaximum range (depth of field) is about 12 in. Boreholeslarger than NX require centering of the probe in the hole.
Borehole Image Processing System (BIPS)
The Borehole Image Processing System (BIPS) uses directoptical observation of the borehole wall in both air andclear-fluid filled holes. The BIPS tool has a smallfluorescent light ring that illuminates the borehole wall.A conical mirror in a clear cylindrical window projects a360-degree optical slice of borehole wall into the cameralens. The tool also contains a digital azimuth sensor thatdetermines the orientation of the image. The opticalimages are digitized and stored.
The BIPS analysis provides color images of the boreholewall. In a two-dimensional (2-D) projection, planarfeatures that intersect the borehole wall appear assinusoids. Processing allows the borehole wall to beviewed like a core, regardless of whether core was actuallyrecovered. Strike and dip of planar features intersectingthe borehole wall are determined during processing.
Other Wireline Systems
This section discusses wireline devices that are availablefor supplementary or special purpose applications. These

FIELD MANUAL
74
systems include the borehole caliper log, directionalsurveys, borehole temperature log, borehole gravity log,magnetic log, and flowmeter log.
Borehole Caliper Log
The borehole caliper log provides a continuous record ofchanges in borehole diameter determined by a probeequipped with tensioned mechanical arms or an acoustictransducer. Caliper or borehole diameter logs are one ofthe most useful and simple of all logs obtained in boreholegeophysics. Caliper logs provide the physical size of adrill hole and should be run in all borings in which othergeophysical logging is anticipated. Caliper logs provideindirect information on subsurface lithology and rockquality. Borehole diameter varies with the hardness,fracture frequency, and cementation of the variousmaterials penetrated. Borehole caliper surveys can beused to accurately identify washouts or swelling or to helpdetermine the accurate location of fractures or solutionopenings, particularly in borings with core loss. Caliperlogs can also identify more porous zones in a boring bylocating the intervals in which excessive mud filter cakehas built up on the walls of the borehole. One of themajor uses of borehole caliper logs is to correct forborehole diameter effects. Caliper logs also can be used toplace water well screens, position packers for pressuretesting in foundation investigations for dams or otherlarge engineering structures, and help estimate groutvolumes in solution or washout zones.
Mechanical calipers are standard logging serviceequipment available in one-, two-, three-, four-, or six-armprobe designs. Multiple-arm calipers convert the positionof feelers or bow springs to electrical signals in the probe.The electrical signals are transmitted to the surfacethrough an armored cable. Some caliper systems average

BOREHOLE GEOPHYSICAL AND WIRELINE SURVEYS
75
the movement of all the arms and record only the changein average diameter with depth, and others provide themovements of the individual arms as well as an averagediameter. The shape or geometry of the borehole crosssection can be determined with the individual caliper armreadings. A six-arm caliper capable of detecting diameterchanges as small as 1/4 inch in 6-in to 30-in diameterboreholes produces a record like that shown onfigure 14-19. The six arms are read as three pairs so thatthe diameter in three directions is recorded in addition tothe average diameter.
Mechanical calipers are lowered to the bottom of the bore-hole in closed position, the arms are released, and the toolis raised. The calipers must be calibrated against aknown minimum and maximum diameter before logging.
The acoustic caliper measures the distance from anacoustic transducer to the borehole wall. Individualdiameter readings for each of four transducers mounted90 degrees apart are obtained and also the average of thefour readings. A special purpose acoustic caliper designedfor large or cavernous holes (6 ft to 100 ft in diameter)uses a single rotating transducer to produce a continuousrecord of the hole diameter.
Directional Surveys
In some situations, borehole deviation must be accuratelydetermined. Several methods of accomplishing this havebeen devised. Borehole survey instruments initiallyconsisted of single or multiple picture (multishot) camerasthat photographed a compass and plumb bob at selectedlocations in the borehole. Depths were based on thelength of cable in the borehole. The camera was retrievedfrom the hole, and the film developed and interpreted.

FIELD MANUAL
76
Figure 14-19.—Log of six-arm mechanical caliper.

BOREHOLE GEOPHYSICAL AND WIRELINE SURVEYS
77
A fluxgate compass or gyroscope is commonly used todayto measure azimuth and an inclinometer to measuredeviation from vertical. The information is thenelectronically transmitted to the surface via a cable. Thismethod provides a continuous survey of the hole and notjust checks at intervals. Systems are also available thatuse accelerometers and gyroscopic sensors to surveyboreholes and provide real time data via a cable orultrasonically via the mud.
Borehole Fluid Temperature Log
The standard borehole fluid temperature logging devicecontinuously records the temperature of the water ordrilling fluid in an open or cased borehole as a sonde israised or lowered in the borehole. The standard, orgradient device uses a single thermistor (thermal resistor)that responds to temperature variations in the fluid. Asmall change in temperature produces a large change inresistance, which is converted to a change in electricalcurrent. A differential device is sometimes used to recorddifferences in temperature between two positions in theborehole by the use of two thermistors or one thermistorand a memory unit within the control module. The logproduced by the temperature device shows temperature asa function of depth.
Temperature logging is usually performed before standardgeophysical logging operations to permit correction ofother logs (e.g., the resistivity logs) for the effects of bore-hole fluid temperature. Temperature logs can also beused to locate the source and movement of fluids into orout of the borehole and identify zones of waste dischargeor thermal pollution in groundwater. Grouted zonesbehind casing can be located by the cement heat ofhydration.

FIELD MANUAL
78
The temperature probe must be calibrated against a testfluid of known temperature immediately before tempera-ture logging. Borehole fluids must be allowed to reach astable temperature after drilling operations before loggingcan be conducted. Open boreholes take longer to stabilizebecause of the differences in thermal conductivity of thevarious materials encountered.
Borehole Gravity Log
A borehole gravity meter (or gravimeter) detects andmeasures variations in the force of gravity. The devicedetermines the bulk density of a large volume of soil orrock between a pair of measuring stations in the borehole(figure 14-20). The bulk density (�) is proportional to themeasured difference in gravity (G) between the twostations and inversely proportional to the verticaldistance (Z) between the stations:
∆G G G= −1 2 ρ = ∆∆G
Z
The borehole gravity meter has been used primarily bythe oil industry to determine the porosity (especiallyporosity because of fractures and vugs). Porosity iscalculated using standard equations relating bulkdensity, fluid density, and specific gravity of solids(matrix density). Although density and porosity are alsoprovided by the gamma-gamma density logger (see“Nuclear Radiation Logging Techniques”), because of thelarge volume and radius of investigation, gravity meterdata are less affected by borehole effects such as mudcakeand irregular hole diameter. Gravity meter densitydeterminations are more representative of the geologicmedium away from the borehole than are gamma-gamma

BOREHOLE GEOPHYSICAL AND WIRELINE SURVEYS
79
logs. The radius of investigation of the gravity meter isan estimated five times the difference in elevationbetween the measuring stations (see figure 14-20).
The borehole gravity meter is not a continuous recordinginstrument. The tool must be positioned at a preselectedmeasurement station, allowed to stabilize, and then a
Figure 14-20.—Elements of borehole gravity logging.

FIELD MANUAL
80
measurement taken. Instrument readings are convertedto gravity values using a conversion table. Bulk densityis then calculated using the difference in gravity valuesand depth between the two stations. Usually two or threetraverses are made in the hole at repeated stations andthe values averaged. The precision of the methodincreases with decreasing distance between measuringstations.
Surveys may be conducted in cased or uncased holes.Several corrections to the data are necessary, includingcorrections for earth-moon tides, instrument drift,borehole effects, subsurface structure, gravity anomalies,hole deviation from vertical, and the free-air verticalgravity gradient. The instrument should be calibrated tocorrect for drift and tides. The borehole gravity logger isavailable commercially but is not a standard log. Anapparent advantage over other bulk density/porosity log-ging methods is the reduction of borehole effects and thegreater sample volume.
Magnetic Log
The magnetic field in an uncased borehole is the result ofthe Earth’s magnetic field and any induced or remnantmagnetism. These fields can be directly measured.Magnetic susceptibility is the degree that a material iseffected by a magnetic field and is the basis for thelogging technique. Susceptibility logs measure the changeof inductance in a coil caused by the adjacent boreholewall. The magnetic susceptibility is proportional to theamount of iron-bearing minerals in the rock.

BOREHOLE GEOPHYSICAL AND WIRELINE SURVEYS
81
Flowmeter Log
A flowmeter measures fluid flow in boreholes. A flow-meter log provides information about locations wherefluid enters or leaves the borehole through permeablematerial or fractures intersecting the borehole.
Conventional flowmeters employ a spinner or propellordriven by fluid moving through the borehole. High resolu-tion flowmeters such as the heat pulse flowmeter canmeasure very low flow rates. Heat pulse flowmeters havea heating element that heats borehole fluid. The flow rateand direction of the heated fluid pulse is measured bydetectors located above and below the heat element. Elec-tromagnetic flowmeters induce a voltage in electricallyconductive borehole fluid moving at a right angle througha magnetic field. The induced voltage is proportional tothe velocity of the conductive borehole fluid.
Bibliography
Hearst, J. R, and Nelson, P.H., Well Logging for PhysicalProperties, McGraw-Hill Book Co., New York, 1985.
Labo, J., A Practical Introduction to Borehole Geophysics,Society of Exploration Geophysicists, Tulsa, Oklahoma,1987.

Chapter 15
REMOTE SENSING TECHNIQUES
Introduction
This chapter briefly summarizes the capabilities,limitations, and requirements of typical remote sensingtechniques. Depending on the nature of the data and theobjective of the study, geologic interpretation of remotelysensed data may be simple or complicated. Remotesensing is a tool that makes some tasks easier, makespossible some tasks that would otherwise be impossible,but is inappropriate for some tasks. Depending on theindividual situation, remote sensing may be extremelyvaluable. Some remote sensing interpretations canstand on their own with confidence, but for most,establishing ground truth is essential.
Imaging Systems
There are three main types of imaging systems, two ofwhich are widely used in terrestrial applications:
Photographic.—Cameras and film are used.Photography provides the best spatial resolution but lessflexibility in spectral data collection and imageenhancement. Spatial resolution is dependent on alti-tude, focal length of lenses, and the types of film used. Spectral resolution is limited to visible and near infraredwavelengths.
Electronic Spectral Sensors.— Detectors are used,usually scanners, that may have less spatial resolutionthan photographs but can gather spectral data over widespectral ranges that enable a wide variety of imagingprocessing, mineral, and geologic identification. Theseremote sensing systems include satellites, such asLandsat, airborne sensors carried on aircraft, and

FIELD MANUAL
84
spectrometers carried on the ground. This type ofremote sensing has several categories, including multi-spectral, hyperspectral, and imaging spectroscopy.
Vidicon. – A television-type system. Vidicon systemsgenerally are inferior to other types both spatially andspectrally. They are used mostly on space probesbecause of operational constraints.
Resolution
Two types of resolution are important to remote sensing.
Spatial.— The sharpness of an image and the minimumsize of objects that can be distinguished in the image area function of spatial resolution.
Spectral.—The width or wavelength range of the part ofthe electromagnetic spectrum the sensor or film canrecord and the number of channels a sensor uses definesspectral resolution. The electromagnetic spectrum is anordered array of electromagnetic radiation based onwavelength. Certain portions of the electromagneticspectrum, including the visible, reflective infrared,thermal infrared, and microwave bands, are useful forremote sensing applications. Rocks, minerals,vegetation, and manmade materials have identifyingspectral signatures and distinctive absorptive andreflective spectral characteristics. Given sufficientspectral data, digital image processing can generallyidentify unique spectral signatures. In practice,instrument limitations or cost limits on computerprocessing may preclude identification of somematerials.

REMOTE SENSING TECHNIQUES
85
Photography
The uses of aerial photography in engineering geologyare discussed in Volume 1, chapter 6. A brief descriptionof types is presented below.
Panchromatic photography records images essentiallyacross the entire visible spectrum and, with proper filmand filters, also can record into the near-infraredspectrum. In aerial photography, blue generally isfiltered out to reduce the effects of atmospheric haze.
Natural color images are recorded in the natural colorsseen by the human eye in the visible portion of thespectrum.
False-color infrared images are recorded using part ofthe visible spectrum and part of the near-infrared, butthe colors in the resultant photographs are arbitrary andnot natural. Infrared film commonly is used and is lessaffected by haze than other types.
Multispectral photographs acquired by multiple camerassimultaneously recording different portions of thespectrum can facilitate interpretation.
Terrestrial photographs acquired on the ground or at lowaltitude with photogrammetric cameras can be used tomap geologic features such as strike and dip of joints,faults, and geologic contacts. This type of geologicphotogrammetry can also be done from historicconstruction photographs if enough survey controlfeatures can be located in the photographs and tied topresent control or known points. Terrestrial photogram-metry has proven useful on several dam projects inwhich mapping of geologic features by standard methodswas very difficult or impossible.

FIELD MANUAL
86
Thermal Infrared Imagery
Thermal infrared systems create images by scanning andrecording radiant temperatures of surfaces. Somecharacteristics of thermal image data are generic todigital image data, and enable computer imageprocessing. Other characteristics are unique to thermalinfrared images and make thermal image data valuableinterpretive tools.
Thermal infrared imagery can be interpreted using con-ventional photogeologic techniques in conjunction withthe thermal properties of materials, instruments, andenvironmental factors that affect the data. Wherethermal characteristics of a material are unique, thermalinfrared imagery can be easy to interpret and can be agreat help in geologic studies. Thermal characteristicsof a material can vary with moisture content, differentialsolar heating, and topography making interpretationmore difficult and ambiguous.
Multispectral Scanner Imagery
Multispectral scanner (MSS) images are a series ofimages of the same target acquired simultaneously indifferent parts of the electromagnetic spectrum.MSS images are an array of lines of sequentially scanneddigital data. They may have unique distortions and mayor may not have high resolution or information content.Scanner systems consist of scanning mechanisms,spectral separators, detectors, and data recorders.
A digital image is actually an array of numerical dataand can be computer processed for a variety of purposes.Geometric distortions caused by sensor characteristicscan be removed or distortions can be introduced.

REMOTE SENSING TECHNIQUES
87
Computer processing can be used to precisely register adigital image to a map or another image. Various typesof data (e.g., thermal and visible imagery or a digitalimage and digitized gravity data) can be merged into asingle image. Subtle information, difficult to interpret oreven to detect, can sometimes be extracted from animage by digital processing.
Airborne Imaging Spectroscopy
The “image,” or data, consist of an array of reflectedspectra collected in a two-dimensional array of pixels.Specific spectral features may be identified and pixelswith the same spectral wavelength feature may bemapped in colors. Different colors are assigned todifferent reflectance spectra, and an image is generatedfrom these classifications. A number of differentairborne systems are becoming available with variousspatial and spectral characteristics. A few commerciallyavailable systems are capable of recording 10 or morespectral bands simultaneously, ranging from ultravioletto thermal infrared wavelengths. The key factor inspectral identification of materials, geologic features, orvegetation is the system’s spectral resolution or numberof channels. Currently, the premier sensor for imagingspectroscopy is the National Aeronautics and SpaceAdministration (NASA) Jet Propulsion Laboratoryairborne visible and infrared imaging spectrometer(AVIRIS). AVIRIS simultaneously collects data over aspectral range of 0.4 micron to 2.4 microns in 224channels. The number of channels and very high qualityof data allow discrimination of very small spectralabsorption features and, therefore, the user candistinguish and map hundreds of types of minerals orvegetation. The AVIRIS instrument is operated by JetPropulsion Laboratory (JPL) onboard a NASA ER-2

FIELD MANUAL
88
(modified U-2). Commonly operating at an altitude of63,000 feet, the spatial resolution is approximately20 meters. The AVIRIS instrument is also operated byJPL onboard a twin-engine aircraft at lower altitudes.The spatial resolution is approximately 1 meter. Thesize of data sets and the number of separate spectralbands on some airborne systems may require dataconsolidation or careful selection of data subsets forspecial processing. Because the Earth’s atmosphereintroduces it’s own spectral absorption features along thelight path from the ground to the sensor, removal ofatmospheric spectral features is essential to properanalysis of spectroscopy or hyperspectral data. Groundcalibration spectra using a field spectrometer operatingover the same wavelength ranges and resolutioncollected at the same time as the overflight is generallyrequired to achieve the highest quality mapping anddiscrimination of materials. Interpretation usually in-volves normal photogeologic techniques along withknowledge of spectral characteristics and the datamanipulations applied. The spectral imaging data canbe analyzed with specialized commercially availablesoftware, which relies primarily on statistical analysesand projection of a few spectral features in an image.Software being developed at the U.S. Geological Survey(USGS) Imaging Spectroscopy Laboratory is based on acomparison of laboratory spectral features of severalhundred minerals and materials in a spectral library.This software, known as “Tetracorder,” rapidly identifiesand maps all the key spectral features of knownminerals or materials in each pixel of an AVIRIS or otherhyperspectral image. The companion field spectrometercan also be used in its own right to collect bothlaboratory and field spectra of materials foridentification. Applications may include distinguishingdifferent types of clay minerals (e.g., expansive or not) asthe geologist maps in the field in real time.

REMOTE SENSING TECHNIQUES
89
High resolution can be obtained and, with proper bandselection and processing, complex geochemistry, min-eralogy, vegetation, or other materials information canbe mapped from the imagery. These technologies havebeen used very successfully in mapping large areas forseveral environmental/engineering geology relatedprojects. Because of the complexity of the geology andthe size of the area studied, the calibration and analysisof imaging spectroscopy data is not trivial. The volumeof high quality data that can be collected using imagingspectroscopy over immense areas in one flight mayprovide an advantage over any other traditional methodof mapping in certain applications.
Satellite Multispectral Scanner Imagery
Landsat is the NASA satellite for civilian remote sensingof the Earth’s land surface. The Landsat MSS recordsseven bands at 30-meter resolution. The MSS is usefulfor some geological applications, although it is orientedprimarily toward agricultural uses. The Landsat 7 isequipped also with a thematic mapper (TM) that hasincreased spatial and spectral resolution compared to theMSS.
SPOT, a French satellite, provides panchromatic imagerywith up to 10-meter spatial resolution. MSS imagery iscapable at 20-meter resolution of stereo imaging. Othercommercially available satellites designed for rapid andrepeated imagery of customer-selected sites are alsobeing put in orbit to produce imagery of any area. Inaddition, archives of once classified satellite imagerygathered by United States spy satellites have becomeavailable to the public and government agencies and maybe a source of data and images.

FIELD MANUAL
90
Satellite imagery provides a synoptic view of a large areathat is most valuable for regional studies. Withincreasing resolution and new sensors, site-specificgeologic mapping with satellite images is also of value toengineering geology.
Radar Imagery
Radar is an active remote sensing method (as opposed topassive methods like photography and thermal infrared)and is independent of lighting conditions and cloudiness.Some satellite radar imagery is available, like Landsat,and coverage may be useful for regional geologic studies.Side-looking airborne radar (SLAR) produces a radarimage of the terrain on one side of the airplaneequivalent to low-oblique aerial photography. Radarinterferometry is a quickly emerging field of radarremote sensing. Radar interferometry techniques willdetect very small changes in topography, such as thosecaused by landslide movements, fault displacements,erosion, or accretion, and can be mapped remotely overlarge areas.
Radar imagery has some unusual distortions thatrequire care in interpretation. Resolution is affected byseveral factors, and the reflectivity of target materialsmust be considered. The analysis and interpretation ofradar imagery requires knowledge of the imagingsystem, the look direction, and the responses of thetarget materials.
Radar can penetrate clouds and darkness and, to someextent, vegetation or even soil. Distortions, image geo-metry, and resolution can complicate interpretation, ascan a lack of multispectral information.

REMOTE SENSING TECHNIQUES
91
Side Scan Sonar
Side Scan Sonar (SSS) is used for underwater surveysand not remote sensing in the typical sense of usingaerial or space platforms to image the Earth’s surface.SSS produces images underwater and may have usefulapplications to engineering geologic studies of reservoirs,dams, and other structures or surfaces hidden by water.SSS works by sending out acoustic energy and sensingthe return of the acoustic signal. Materials on the bottomsurface under water reflect the signal at differentstrengths depending on the material properties and theangles of incidence and reflection of the signal. Thevarying strength of signal return is then used to form animage. An image of the reflected signal that looks like ablack and white aerial photograph is the output. Theacoustic signal is generated by a torpedo-like instrumentthat is towed behind a boat by cable. Resolution ofobjects or features on the bottom of a reservoir varieswith the frequency of the signal generated and the heightof the torpedo above the bottom of the water body.
Single- and Multi-Beam Sonar
Other types of sonar devices that can be used to map thetopographic surface of a reservoir bottom include single-beam and multi-beam sonar. These devices send a directacoustic signal and measure the time of return. This istranslated to a depth to the bottom or feature. Bysending continuous signals along a line of survey, aprofile of the bottom is developed. When multiple linesare tied together in criss-crossing patterns with GlobalPositioning System (GPS) positions being recordedsimultaneously, a topographic map of the bottom can begenerated. Multi-beam systems send out multiple beams

FIELD MANUAL
92
at different angles simultaneously, thereby generating atopographic surface over much larger areas in greaterdetail than single-beam systems.
Applications to Engineering Geology
The most useful form of remote sensing for engineeringgeology applications is aerial photography because of itshigh resolution, high information content, and low cost.Various scales of aerial photography are available forregional and site studies, for both detecting and mappinga wide variety of geologic features.
Applications of other forms of remote sensing toengineering geology depend on the nature of the problemto be solved and the characteristics of the site geology.Some problems can best be solved using remote sensing;for others, remote sensing is of little value. In somecases, the only way to find out if remote sensing can dothe job is to try it.
Appropriate remote sensing data are often not availablefor the area of interest, and the data must be acquiredspecifically for the project. Mission planning and timeand cost estimating are critical to a remote sensing datacollection program. Numerous factors make planning aremote sensing mission more complicated than planninga conventional aerial photographic mission. Remotesensing mission planning is best done in consultationwith someone with experience in the field.
Estimating the cost of data acquisition is relatively easy.Estimating the cost of interpretation is a function of thetime and image processing required and is much harder.Some forms of remote sensing are inexpensive to acquireand require little processing to be useful. Other forms

REMOTE SENSING TECHNIQUES
93
may be expensive to acquire or may require muchprocessing, perhaps needing experimentation to deter-mine what will work in an untried situation. The costmust be weighed against the benefits.
Bibliography
Two excellent reference books on remote sensing andapplications to geology are:
Sabins, F.F., Remote Sensing Principles and Interpreta-tion, 2nd edition: Freeman, New York, 449 p., 1987.
Siegal, B.S., and Gillespie, A. R., editors, Remote Sensingin Geology, Wiley & Sons, New York, 702 p., 1980.
For a thorough treatment of remote sensing ("more thanyou ever wanted to know about remote sensing"),including a 287-page chapter on geological applicationswith abundant color images, see:
Colwell, R N., editor, Manual of Remote Sensing,2nd edition, Falls Church, Virginia, American Society ofPhotogrammetry, 2724 p., 1983.

Chapter 16
WATER TESTING FORGROUTING
Introduction
Water testing is necessary for evaluating seepagepotential and for determining whether grouting isnecessary or practical. Water testing for designing agrout program is often secondary to the main purpose ofthe water testing program, which is to determinepermeabilities for seepage evaluation or control. Designof an exploration program for water testing for groutingcan be significantly different from permeability testingfor the design of a dam or tunnel because of the desiredresults, the restricted area of a damsite, or the oftenhigh-cover linear tunnel site. Regardless of the mainreason for the investigations, design of a program forwater testing for grouting should consider:
(1) The type of structure to be built. Water testingfor evaluating and grouting a dam foundation issignificantly different than water testing for atunnel. More drill holes are generally available fortesting in dam foundations where seepage potentialis the primary concern and grouting is secondary.Relatively few drill holes are available forevaluating tunnel alignments because of the greatdepths often necessary and the linear nature of atunnel. A great deal of judgment is necessary inevaluating the data for tunnels because of the smallsample size. Ground conditions are of primaryinterest, and permeability and groutability aresecondary, especially if the tunnel will be lined.
(2) The geologic conditions at the site and thevariations between areas or reaches.Generalizations based on other sites are usuallyinaccurate because geologic conditions depend on the

FIELD MANUAL
96
interrelationship of the local depositional, tectonic,and erosional history that uniquely determinegeologic conditions important to the permeabilityand groutability of a site. Damsite foundationpermeabilities can vary over short distances becauseof lithology and fracture changes, faults, or stressrelief in the abutments. Tunnel studies compoundthe difficulties because of the linear nature of thestructure, the often high cover, and access problems.Proper evaluation of water test results requires thatthe values be correlated with geologic conditions.The permeability values should be noted and plottedon the drill logs along with the water takes and testpressures. The test interval should be drawn on thelog so that the water test data can be related tofracture data.
(3) The level of seepage control desired. Seepagequantities beneath a dam in the arid West may beinsignificant compared to those in an area withabundant rainfall. Infiltration into a tunnel may beinsignificant in one area but, because of overlyingcultural and environmental features, may be thecontrolling factor in a dewatering, excavation, orlining design. The economic value of the water mayalso be a significant factor.
(4) Groutability and permeability are not necessarilyrelated. A highly fractured rock or a gravel may bevery permeable but essentially ungroutable usingstandard cement grout. Water test data must becorrelated with geologic data to properly assessgroutability.
(5) Groutability depends on fracture openness andnumber. Connectivity is not necessarily importantbecause of the relatively limited travel of grout.

WATER TESTING FOR GROUTING
97
(6) Permeability depends on fracture openness,number, and connectivity. Highly fractured rockwith low connectivity will have low permeability,and a slightly fractured rock with high connectivitycan have high permeability.
(7) Exploratory drill hole orientations introduce asignificant bias into water test results. The orienta-tion of the drill hole relative to the fractures has adirect effect on the number of fractures interceptedby the hole. Vertical boreholes intercept very fewvertical fractures and can provide very misleadingwater test information on rock mass permeabilityand groutability. A vertical hole drilled in amaterial that has predominantly vertical fractureslike flat-bedded sediments will not intercept thefractures that control the rock mass permeability.Drill holes should be oriented to cross as manyfractures as possible not only for more meaningfulpermeability tests but also to get more meaningfulrock mass design parameters. If a preferred holeorientation is not practical, the results may beadjusted for the orientation bias.
(8) Water test calculation results can be verymisleading. Water test calculations based on a10-foot (3-meter [m]) interval with one 1/4-inch(6-millimeter [mm]) fracture taking water can havea significantly different seepage and grout potentialthan a 10-foot (3 m) interval with dozens ofrelatively tight fractures taking the same amount ofwater. Each water test must be evaluatedindividually to determine what the data reallymean.
(9) Different rock types, geologic structures, or insitu stresses have different jacking and

FIELD MANUAL
98
hydrofracture potential and, therefore, differentmaximum acceptable water testing and groutingpressures. Dam foundations are more sensitive tojacking and hydro-fracturing than tunnels. Damfoundations can be seriously damaged by jackingand hydrofracturing. A dam foundation ininterbedded sedimentary rock with high horizontalin situ stresses is very sensitive to jacking. A damfoundation in hard, massive granite is almostunjackable and may have to be hydrofracturedbefore any movement can take place. Tunnels areless susceptible to jacking because of overburdendepth and may benefit from jacking open fracturesto provide grout travel and closure of ungroutedfractures.
(10) Rock mass permeability or groutability cannotbe determined by drill holes alone. Mapping andanalysis of the fractures are necessary factors indetermining seepage potential and groutability.Drill holes usually do not provide a realisticcharacterization of fracture orientations andconnectivity. All these data should be integrated todetermine rock mass permeability or groutability.
(11) Rules of thumb are not good substitutes forusing data and judgment in making decisions ingrouting unless specifically developed for the siteconditions.
(12) Hydraulic models are a tool that can be used toevaluate seepage potential and groutability butdepend on realistic design and data inputparameters. Water test-derived permeability andgroutability are important parameters for hydraulicmodels. Water tests must be carefully evaluated toensure that bad test data are not used in models.

WATER TESTING FOR GROUTING
99
taketest pressure psi
× 155.
( )take
test
bar
pressure bars× 10
( )
Models large enough to approach characterizing asite are usually very large and expensive. Thetendency is to build models that are small andeconomical and, therefore, have a limited connectionwith reality. Realistic parameters are difficult toobtain in quality or quantity. Few explorationprograms provide a statistically significant samplesize to fully characterize a site, especially tunnels.Model input parameters and design should be partof any modeling report so the output can be properlyevaluated.
Procedure
Calculations
Permeabilities can be calculated in lugeons, feet per year(ft/yr), centimeters per second (cm/sec), or other unitsfrom the same basic field data. Lugeons are used in thefollowing discussion because these units are commonlyused in the grouting industry. Chapter 17 has athorough discussion of testing and calculating in otherpermeability units. One Lugeon equals:
(1) 1 liter per minute per meter (l/min/m) at apressure of 10 bars
(2) 0.0107 cubic feet per minute (ft3/min) at142 pounds per inch (psi)
(3) 1 x 10⁻⁵ cm/sec
(4) 10 ft/yr
The formula for calculating Lugeons (lu) is:

FIELD MANUAL
100
Take is in liters per meter per minute or cubic feet perfoot per minute. One bar equals 14.5 psi. Takes shouldbe measured after flows have stabilized and should berun for 5-10 minutes at each pressure step.
Geologic Data
The geologic data should be examined to determine theoptimum drill hole orientations and locations. Geologicstructure, such as bedding and rock type, can be used toset the initial maximum water test pressures. Easilyjacked or hydrofractured rock should initially be watertested at a pressure of 0.5 psi per foot (2.2 kilogram persquare centimeter per meter [kg/cm2/m]) of overburdenand increased pressures based on stepped pressure testsor jacking tests.
Stepped Pressure Tests
Stepped pressure tests are the best method of conductingwater tests. Pressures are stepped up to the maximumpressure and then stepped down through the originalpressures. Comparison of the calculated permeabilityvalues and the pressure versus flow curves for the stepscan provide clues as to whether the flow is laminar, ifjacking or hydrofracturing is occurring, and if fracturesare being washed out or plugged. Single pressure testscan be misleading because of all the unknown pressureand flow variables affecting the test. The Lugeon valuefor the test interval should be determined by analysis ofthe individual test values and not necessarily by anaverage. The individual tests are used to determinewhat is happening in the rock, and one value of the fivetests is usually the appropriate value to use.
Figures 16-1 through 16-5 are bar chart plots showingthe relationship of pressure to Lugeon values for the

WATER TESTING FOR GROUTING
101
0
20
40
60
80
100
PSI / Lugeons
Test
Laminar Flow
Pressure 25 50 100 50 25
Lugeons 21 23 22 23 22
1 2 3 4 5
Figure 16-1.—Bar chart showing relationshipof test pressure and Lugeons in laminar flow.
0
20
40
60
80
100
PSI / Lugeons
Test
Turbulent Flow
Pressure 25 50 100 50 25
Lugeons 38 28 15 27 39
1 2 3 4 5
Figure 16-2.—Bar chart showing relationshipof test pressure and Lugeons in turbulent flow.

FIELD MANUAL
102
0
20
40
60
80
100
PSI / Lugeons
Test
Washing
Pressure 25 50 100 50 25
Lugeons 21 24 28 33 37
1 2 3 4 5
Figure 16-3.—Bar chart showing relationshipof test pressure and Lugeons when fractures
are washing out.
0
20
40
60
80
100
PSI / Lugeons
Test
Filling or Swelling
Pressure 25 50 100 50 25
Lugeons 32 28 21 16 12
1 2 3 4 5
Figure 16-4.—Bar chart showing relationshipof test pressure and Lugeons when fractures
are filling or swelling.

WATER TESTING FOR GROUTING
103
0
10
20
30
40
50
60
70
80
90
100
PSI / Lugeons
Test
Jacking or Hydrofracturing
Pressure 25 50 100 50 25
Lugeons 23 21 43 22 21
1 2 3 4 5
Figure 16-5.—Bar chart showing relationshipof test pressure and Lugeons when rock ishydrofractured or joints are jacked open.
more common types of water test results. Figure 16-1is a plot of laminar flow in the fractures. Thepermeability is essentially the same no matter what thepressure and resultant water take. Figure 16-2 is a plotof turbulent flow in the fractures. Permeabilitydecreases as the pressure and resultant flow increasesbecause of the turbulent flow in the fractures. Figure 16-3 is a plot of flow in fractures that increase in size as thewater washes material out of the openings. Permeabilityincreases because fractures are enlarged by the test.Figure 16-4 is a plot of flow in fractures that are beingfilled and partially blocked as water flows or thefractures are in swelling rock that closes fractures overtime because of the introduction of water by the test.Figure 16-5 is a plot of testing in rock that is beingjacked along existing fractures or rock that is beingfractured by the highest water test pressure. Flow islaminar at the lower pressures.

FIELD MANUAL
104
Hydrofracturing/Jacking Test
0
100
200
300
400
500
600
700
800
900
1 2 3 4 5 6 7 8 9 10 11 12 13 14 15 16 17 18 19 20 21
Flow (Q)
Pre
ssu
re
Pressure - Hydrofrac
Pressure - Jacking
Figure 16-6.—Continuously recorded plotof pressure and flow.
Combinations of these types of flow can occur andrequire careful analysis. If the pressures are increasedto where jacking or hydrofracturing is occurring, thedesign grout pressures can be set as high as possible toget effective grout injection yet preclude fracturing or, ifappropriate, induce fracturing. Hydrofracture tests areeasier to analyze if a continuous pressure and flowrecording is obtained. The resolution of a step test maynot be adequate to separate hydrofracturing fromjacking. Figure 6 is a plot of a continuously recordedhydrofracture/jacking test.
Back Pressures
Back pressures should be measured after every test todetermine if the hole holds pressure and if fracturing orjacking has occurred. If the hole holds pressure andbackflow occurs while releasing the pressure, hydro-fracturing or jacking may have occurred at the testpressure.

WATER TESTING FOR GROUTING
105
Test Equipment
Test equipment can affect the test results. At moderateto high flows, the friction loss caused by the piping andthe packer should be considered. Significant loss ofpressure occurs between the gauge and the packer. Athigh flows, the plumbing system “permeability” can bethe controlling factor and not the permeability of the testinterval. If meters and gauges are located in optimumrelation to each other and close to the hole, thearrangement of pipe, hose, etc., will not seriouslyinfluence shallow tests although sharp bends in hose, 90-degree fittings on pipes, and unnecessary changes in pipe and hose diameters should be avoided. Layingthe system out on the ground and pumping water through the plumbing to determine the capacity of the system is a good idea, especially if using small-diameter piping or wireline packers.
Water Takes Relative to Grout Takes
Water takes alone may be an indication of whethergrouting is necessary, and Lugeon calculations may notbe necessary after enough water tests with subsequentgrouting provide sufficient data to determine acorrelation. This shortcut is usually used during theactual grouting because not enough data are availablefrom exploration unless a test grout section isconstructed. The correlation can change if the geologicdomain in a foundation changes, so any correlation mustbe continuously checked.

FIELD MANUAL
106
Depth of Grouting
Grouting depth for dam foundations is commonlydetermined by a rule of thumb related to dam height. Abetter method is to base the depth on water test dataand geologic data. Weathered rock and fracture surfacesare an indication of permeable rock. Grouting to tight,unweathered rock, where practical, makes more sensethan trying to grout tight, impermeable rock or notgrouting pervious rock because of a rule-of-thumbapproach.
Grouting in tunnels should be based on the thickness ofthe disturbed zone around the periphery of the tunneland the depth necessary to get the desired results whengrouting natural fractures. A machine-bored tunnel willhave a much shallower disturbed zone than aconventionally excavated (drill-blast) tunnel and mayrequire less or no grouting.
Bibliography
Ewart, Friedrich-Karl, Rock Permeability and Grouta-bility Related to Dams and Reservoirs, lecture notes,University of Paderborn, Germany, September 1994.
Water Resources Commission N.S.W., Grouting Manual,3rd edition, Australia, 1980.

Chapter 17
WATER TESTING FOR PERMEABILITY
General
Most rock and soil contains numerous open spaces wherewater may be stored and through which water can move.Permeability, or hydraulic conductivity, is a measure ofthe ease of movement of fluid and gas through the openspaces and fractures. The properties of soil and rockhave significant impact on water movement through theinterstitial spaces. Water movement through soil androck significantly impacts the ability to control waterduring construction. The movement of water throughslopes must be known to understand the stability ofslopes. Permeability in this chapter is consideredsynonymous with the term hydraulic conductivity and isa measurement of the groundwater flow through a cross-sectional area. This chapter discusses how to measurepermeability and how to best determine or estimateappropriate permeability values.
In addition to permeability, there are other hydrologicparameters that may impact the understanding ofgroundwater but are either more difficult to determineor are not a significant consideration in most engineeringsituations. These other hydraulic parameters ofsubsurface materials are transmissivity, porosity, andstorage. For a more detailed explanation of thesehydrologic parameters and the methods used to obtainedthe values, see chapters 5, 6, and 10 of the ReclamationGroundwater Manual.
Transmissivity
Transmissivity is the average permeability multiplied bythe saturated thickness. Transmissivity is particularlyimportant in areas with multiple aquifers. Determiningthe aquifer thickness may not be practical or necessary

FIELD MANUAL
108
if permeability and recharge are relatively low and theneed for groundwater control is short term.Transmissivity values are often based on individualpermeability values or averaged permeability values. Itis important that any permeability value used with thesaturated thickness of an aquifer be appropriate andrepresentative. Since most aquifers are rarelyhomogeneous and isotropic, any field derived data mustbe qualified by indicating if averaging or selecting thehighest or lowest permeability value for a particular siteis appropriate.
Porosity
Porosity is the percentage of interstitial space within thesoil or rock relative to the total volume of soil or rock.Porosity is not necessarily directly proportional topermeability. Porosity is a significant factor inunderstanding the stability of soil and rock, but only theeffective porosity, the interconnected pores, contribute topermeability. Not all pores or interstitial spaces areconnected. Porosities are typically high for sands andgravels (30-40 percent) with high permeabilities (10 to10-2 cm/sec). Clays have higher porosities (45-55 percent)but have very low permeabilities (10-6 to 10-8 cm/sec).Effective porosity is important in high permeabilitymaterials, but the total porosity is rarely relevant exceptin contaminant transport modeling. In the field, porosityis typically estimated by borehole geophysics.
Storage
Storage is a dimensionless term defined as the volume ofwater released from or taken into interstitial spaces inthe soil or rock. Storage is often interchanged with theterms specific yield, effective porosity, coefficient ofstorage, and storativity. The water stored within theeffective porosity is controlled by the material’s ability to

WATER TESTING FOR PERMEABILITY
109
retain and to release water. Understanding storage isparticularly important in high permeability materials orlocalized zones connected with a large source of water.
A glossary of abbreviations and definitions is shown intable 17-1 that are used in the various permeabilitycalculations. Not all the parameters listed in the tableare necessary for every calculation. These parametersare derived from the Groundwater Manual, chapter 10.Abbreviations used in the figures and text of this chapterare consistent throughout the chapter. Definitions applyto angled holes as well as vertical wells.
Geologic Conditions
Understanding and measuring the above parameters isimportant, but understanding the hydrogeologicconditions is essential. Obtaining representative andappropriate hydrologic values is critical in any siteinvestigation. Identifying the water bearing zones andselecting the appropriate test method is very important.Improper test methods, poor well construction, andimproper isolation can significantly impact any testdesign. It is essential that the various aquifers andboundaries in heterogeneous settings be identified andthat the various water surfaces existing at the site belocated. Obtaining values without a good understandingof subsurface conditions can be misleading and canresult in surprises once the actual site conditions areexposed. Obtaining water level data and permeabilityvalues has little value without an understanding of thefactors controlling the groundwater. Proper evaluationof permeability values requires that the values becorrelated with geologic conditions.

FIELD MANUAL
110
Table 17-1.—A glossary of abbreviations anddefinitions used in permeability calculations
K = Coefficient of permeability in feet (meters) per yearunder a unit gradient.
Q = Steady flow into the well in ft3/sec [m3/sec].
H = The effective head of water in the well in feet (m). Forpacker tests, determining the effective head is definedin figure 17-5. The effective head may be natural orinduced.
a = Exposed surface area of the test section in ft2 (m2). Notethat this area in an uncased borehole or using a singlepacker for some tests would include the exposed area atthe bottom of the borehole.
� = Length of test (packer tests) or screened (perforated)section of well isolated from the adjacent material infeet (m).
r = The radius to the borehole sidewall.re = The effective radius to borehole sidewall that is reduced
because of an obstruction such as a slotted riser(perforated casing), caved material, gravel, or sandpack.
r1 = The outer radius of a riser or casing.
rc = The inside radius of a riser or casing.D = Distance from the ground surface to the bottom of the
test section.U = Thickness of unsaturated materials above the water
surface, including the capillary zone.Tu = U-D+H = The distance from the induced water surface
in the well to the static natural water surface.S = Thickness of saturated material overlying a relatively
impermeable layer.Cu = Conductivity coefficient for unsaturated materials with
partially penetrating cylindrical test wells.Cs = Conductivity coefficient for saturated materials with
partially penetrating cylindrical test wells.

WATER TESTING FOR PERMEABILITY
111
Selecting the Appropriate Test
There are numerous ways to determine or estimatepermeabilities. The appropriate method for estimatingpermeabilities must be based on the subsurfaceconditions and how significantly the values obtained willimpact the project. The required level of understandingof the subsurface water conditions should be weighedrelative to the cost and the impact on stability andconstructability of the feature and on the changes inquality and quantity of water important to the site. Soilclassification and Standard Penetration Testing (SPT)blow counts provide crude estimates of soilpermeabilities. There are numerous geophysicalmethods for estimating permeabilities by usingflowmeters, acoustic velocities, and gamma boreholelogging techniques. The Reclamation Ground WaterManual, chapters 8 and 10, provides detailedexplanations of various test methods for determiningpermeabilities. Except for the aquifer tests, mostmethods described in this chapter determine the verticalor horizontal permeability.
The most accurate test method for determining per-meability is conducting a relatively long-term aquifertest. This method is not covered in this chapter. A full-term aquifer test (pumping test as described in chapter8 of the Reclamation Ground Water Manual) is rarelyjustified during initial site investigations because of thecost and time required to perform an aquifer test andpossibly handle the discharged water. This chapterdiscusses the less costly methods used to determinepermeability. These methods are less accurate,primarily because these tests are too short in durationand because the interval being tested is not necessarily“truly” undisturbed, open, dimensioned as assumed, andrepresentative.

FIELD MANUAL
112
Stable Boreholes
Packer tests are commonly performed in boreholesbecause the tests are inexpensive and can be performedquickly, with minimal disruption to the primary task ofmost site investigations, which is determining thesubsurface materials and geology. The GravityPermeability Test Method 1 for consolidated material isused only within the vadose zone and is the preferredmethod if the packer test method cannot be used. Theprincipal problem of any gravity permeability testmethod is that a uniform supply of water is necessary sothat a constant head can be maintained above the staticwater surface. The falling head tests should be used instable boreholes if the packer test and gravity tests (bothabove and below the static water surface) cannot beperformed.
Unstable Boreholes
There are a number of permeability tests that can beused in unstable materials such as soils that arenoncohesive, uncemented, or unindurated or fracturedrock that collapses into the borehole. Slug tests are usedprimarily when water availability or usage is a problem.Piezometer tests are good where water surfaces are highand where water bearing units are relatively thinlayered but significant. Unfortunately, the piezometertest is limited to relatively shallow depths (around 20feet [6 m]) and is rarely successful in cohesionless orgravelly or coarser soils. Gravity permeability tests areused in unstable soils or in rock. Gravity permeabilitytests require costly construction techniques, delay orprevent further advancement of the borehole, andrequire a supply of water. Borehole permeabilities are appropriate for the intervaltested unless the test interval is greater than 10 feet

WATER TESTING FOR PERMEABILITY
113
(3 m). For intervals greater than 10 feet (3 m), the testmay not be an accurate reflection of the entire saturatedcolumn. The permeability values should be plotted onthe drill log, along with the water take and testpressures. The test interval should be drawn on the logso that the water test data can be related to fracturedata.
Permeability Testing in Rock
Permeability tests are routinely performed in rock,particularly by pressure or packer tests. Thepermeability calculation assumes laminar flow in anisotropic, homogeneous medium. In reality, the testwater take is effectively controlled by fractures becausethe intact rock permeability is effectively zero in mostcases. The water may be flowing into one or into manyfractures in the test interval, but the permeabilitycalculation assumes laminar flow in an isotropic,homogeneous medium. The length of the test interval isgoverned by the rock characteristics. Typically, the testinterval may be 10 feet (3 m) long, but the water can begoing into one ¼-inch (8-mm) fracture. Test intervalsgreater than 20 feet (6 m) are inadvisable because,typically, there are a few fractures or a relatively smallzone that controls the groundwater flow in bedrock. Thecalculated permeability of the packer test interval maybe a magnitude different from the actual rock masspermeability. Only in the case of a highly fractured rockmass is the calculated permeability relatively reliableand the result is still a relative or effective permeability.
Orientation.—The orientation of the drill hole relativeto the fractures significantly affects the number offractures intercepted by the hole and the perceivedpermeability. A vertical hole drilled in a material thathas predominantly vertical fractures such as flat-beddedsediments will not intercept the predominant control on

FIELD MANUAL
114
the rock mass permeability. The drill holes should beoriented to cross as many fractures as possible not onlyfor more meaningful permeability tests, but also to getmeaningful rock mass design parameters. If holeorientation is not practical, the results may be correctedfor the orientation bias.
Jacking.—The pressure used for the water test shouldconsider geologic structure. Flat-lying, beddedsediments are very susceptible to jacking along beddingplanes. The combination of weak bedding planes,typically low vertical confining pressures, or highhorizontal in place stresses can result in jacking andapparently high permeabilities. Test pressures of halfthe typical pressure of 1 pound per square inch per foot(psi/ft) (0.2 kg/cm 2/m) of depth are often appropriate.
Hydrofracturing.—In place stresses in many areas arenot lithostatic and horizontal stresses are significantlylower than vertical stresses. The theoretical overburdenstress (roughly 1 pound per square inch per foot depth[0.2 kg/cm2/m]) is typically used to determine the testpressure. If the horizontal stress is much lower than thevertical stress, hydrofracturing can occur, resulting in aninduced high permeability value.
Stepped Pressure Tests.—Stepped pressure tests arean effective method of conducting water tests. Pressuresare stepped up to the maximum pressure and thenstepped down through the original pressures. Compari-son of the calculated permeability values and thepressure versus flow curves for the steps can tell youwhether the flow is laminar, if jacking or hydrofracturingis occurring, and if fractures are being washed out. Ifthe pressures are increased to where jacking orhydrofracturing is occurring, the design grout pressurescan be set as high as possible to get effective grout

WATER TESTING FOR PERMEABILITY
115
injection, yet preclude fracturing or induce fracturing ifdesired. Chapter 16 discusses these tests in detail.
Test Equipment.—The test equipment can affect thetest results. At moderate to high flows, the friction lossand restriction because of the piping (plumbing) and thepacker is important. Significant pressure loss occursbetween the gauge and the packer. At high flows, theplumbing system “permeability” can be the controllingfactor rather than the permeability of the test interval.If meters and gauges are located in relation to each otheras recommended, the arrangement of pipe, hose, etc.,will not seriously influence the tests, although sharpbends in hose, 90-degree fittings on pipes, andunnecessary changes in pipe and hose diameters shouldbe avoided. Laying the system out on the ground andpumping water through the plumbing to determine thecapacity of the system is a good idea, especially if usingsmall diameter piping or wireline packers.
In many investigations, information on the permeabilityof saturated or unsaturated materials is required.Permeability within the vadose zone, including thecapillary fringe, is typically estimated by permeameteror gravity permeability tests. Permeability tests withinsaturated materials are typically performed as a fallinghead, packer, or aquifer test. Water within theunsaturated zone is suspended within the material butis primarily moving downward by gravity. Inunsaturated conditions, the material permeabilities areobtained by one of several field permeameter tests.Since the material is not saturated, permeability testsrequire more equipment and a lot of water. These testsmeasure the volume of water flowing laterally whilemaintaining a constant head.
Laboratory permeability tests of subsurface materialsusually are not satisfactory. Test specimens are seldom

FIELD MANUAL
116
undisturbed, and a specimen typically represents only alimited portion of the investigated material. Field testshave been devised that are relatively simple and lesscostly than aquifer pumping tests (although aquifer testsdo provide relatively accurate permeability values).These tests are usually conducted in conjunction withexploratory drilling or monitoring existing wells. Permeability testing of existing monitoring wells mayhelp determine material characteristics when evaluationof existing data indicates gaps or when it is necessary toconfirm previous assumptions. Properly conducted andcontrolled permeability tests will yield reasonablyaccurate and reliable data. Several locations may needto be tested to provide data on spatial variations ofsubsurface material characteristics.
The quality of water used in permeability tests isimportant. The presence of only a few parts per millionof turbidity or air dissolved in water can plug soil androck voids and cause serious errors in test results.Water should be clear and silt free. To avoid pluggingthe soil pores with air bubbles, use water that is a fewdegrees warmer than the temperature of the test section.
For some packer tests, pumps of up to 250 gallons perminute (gal/min) (950 liters per minute [L/min]) capacityagainst a total dynamic head of 160 feet (50 m) may berequired.
The tests described below provide semiquantitativevalues of permeability. There have been numerous typesof permeability tests devised with varying degrees ofaccuracy and usefulness. The tests described below arerelatively simple and generally provide usefulpermeability data. If the tests are performed properly,the values obtained are sufficiently accurate for someengineering purposes. The tests assume laminar flow

WATER TESTING FOR PERMEABILITY
117
and a homogeneous medium. These conditions are notoften encountered, and fracture flow is what usuallyoccurs in rock. The equations given for computingpermeability are applicable to laminar flow. The velocitywhere turbulent flow occurs depends, in part, on thegrain size of the materials tested. A maximum averagevelocity for laminar flow is about 0.1 foot per second(ft/sec) (25 millimeters per second [mm/sec]). If thequotient of the water intake in cubic units per seconddivided by the open area of the test section in squareunits times the estimated porosity of the tested materialis greater than 0.10, the various given equations may notbe accurate or applicable. The values obtained are notabsolute and can vary from the true permeability by plusor minus an order of magnitude.
Length, volume, pressure, and time measurementsshould be made as accurately as available equipmentwill permit, and gauges should be checked periodicallyfor accuracy. Keep the accuracy of the results in mindwhen determining the needed accuracy of the measure-ments. Results should be reported in feet per year orcentimeters per second for most engineering uses.
In an open hole test, the total open area of the testsection is computed by:
a = 2�r�+�r2
where:
a = total open area of the hole face plus the hole bottomr = radius of the hole� = length of the test section of the hole
When perforated casing is used and the open area issmall, the effective radius, re, is used instead of theactual radius, r.

FIELD MANUAL
118
ap = total open area of perforationsa = area of each perforation
If fabricated well screens are used, estimates of thescreen open area generally can be obtained from thescreen manufacturer.
Permeability tests are divided into four types: pressuretests, constant head gravity tests, falling head gravitytests, and slug tests. In pressure tests and falling headgravity tests, one or two packers are used to isolate thetest section in the hole. In pressure tests, water is forcedinto the test section through combined applied pressureand gravity head or the tests can be performed usinggravity head only. In falling head tests, only gravityhead is used. In constant head gravity tests, no packersare used, and a constant water level is maintained. Slugtests use only small changes in water level, generallyover a short time.
Pressure Permeability Tests in Stable Rock
Pressure permeability tests are run using one or twopackers to isolate various zones or lengths of drill hole.The tests may be run in vertical, angled, or horizontalholes. Compression packers, inflatable packers, leathercups, and other types of packers have been used forpressure testing. Inflatable packers are usually moreeconomical and reliable because they reduce testing timeand ensure a tighter seal, particularly in rough-walled,oversize, or out-of-round holes. The packer(s) areinflated through tubes extending to a tank of compressedair or nitrogen at the surface. If a pressure sensinginstrument is included, pressure in the test section is

WATER TESTING FOR PERMEABILITY
119
transmitted to the surface. Although this arrangementpermits an accurate determination of test pressures,manual observations should still be made to permit anestimate of permeability if pressure sensors fail. Whendouble packers are used, the hole can be drilled to totaldepth and then tested. When a single packer is used, thehole is advanced and tested in increments.
Methods of Testing
In stable rock the hole is drilled to the total depthwithout testing. Two inflatable packers 5 to 10 feet (1.5to 3 m) apart are installed on the drill rod or pipe usedfor making the test. The section between the packers isperforated. The perforations should be at least ¼ inch(6 mm) in diameter, and the total area of all perforationsshould be more than two times the inside cross-sectionalarea of the pipe or rod. Tests are made beginning at thebottom of the hole. After each test, the packers areraised the length of the test section, and another test ismade of the appropriate section of the hole.
In unstable rock, the hole is drilled to the bottom of eachtest interval. An inflatable packer is set at the top of theinterval to be tested. After the test, the hole is thendrilled to the bottom of the next test interval.
Cleaning Test Sections
Before testing, the test section should be surged withclear water and bailed or flushed out to clean cuttingsand drilling fluid from the hole. If the test section isabove the water table and will not hold water, watershould be poured into the hole during the surging, thenbailed out as rapidly as possible. When a completed holeis tested using two packers, the entire hole can becleaned in one operation. Although cleaning the hole isfrequently omitted, failing to clean the hole may result

FIELD MANUAL
120
in a permeable rock appearing to be impermeablebecause the hole wall is sealed by cuttings or drillingfluid.
Alternatives to surging and bailing a drill hole inindurated or consolidated material before pressuretesting include rotating a stiff bristled brush whilejetting with water. The jet velocity should be at least150 ft/sec (45 m/sec). This velocity is approximately1.4 gal/min per 1/16-inch- (5.3 L/min per 2-mm-)diameter hole in the rod. The drill hole should be blownor bailed out to the bottom after jetting.
Length of Test Section
The length of the test section is governed by thecharacter of the rock, but generally a length of 10 feet(3 m) is acceptable. Occasionally, a good packer sealcannot be obtained at the planned depth because ofbridging, raveling, fractures, or a rough hole. If a goodseal cannot be obtained, the test section length should beincreased or decreased or test sections overlapped toensure that the test is made with well-seated packers.On some tests, a 10-foot (3-m) section will take morewater than the pump can deliver, and no back pressurecan be developed. If this occurs, the length of the testsection should be shortened until back pressure can bedeveloped, or the falling head test might be tried.
The test sections should have an �/2r ratio greater than5, where r is the radius of the hole and � is the length ofthe test section. The packer should not be set inside thecasing when making a test unless the casing has beengrouted in the hole. Test sections greater than 20 feet(6 m) long may not allow sufficient resolution ofpermeable zones.
WATER TESTING FOR PERMEABILITY
121
Size of Rod or Pipe to Use in Tests
Drill rods are commonly used to make pressure andpermeability tests. NX and NW rods can be used if thetake does not exceed 12 to 15 gallons per minute (45 to60 liters per minute) and the depth to the top of the testsection does not exceed 50 feet (15 m). For general use,1¼-inch (32-mm) or larger pipe is better. Figures 17-1through 17-4 show head losses at various flow rates per10-foot (3-m) section for different sizes of drill rod and1¼-inch (32-mm) pipe. These figures were compiledfrom experimental tests. Using 1¼-inch (32-mm) pipe,particularly where holes 50 feet (15 m) or deeper are tobe tested, is obviously better than using smaller pipe.The couplings on 1¼-inch (32-mm) pipe must be turneddown to 1.8 inch (45 mm) outside diameter for use in AXholes.
Pumping Equipment
Mud pumps should not be used for pumping the waterfor permeability tests. Mud pumps are generally of themultiple cylinder type and produce a uniform but largefluctuation in pressure. Many of these pumps have amaximum capacity of about 25 gal/min (100 L/min), andif not in good condition, capacities may be as small as18 gal/min (70 L/min). Tests are often bad becausepumps do not have sufficient capacity to develop backpressure in the length of hole being tested. When thishappens, the tests are generally reported as “tookcapacity of pump, no pressure developed.” This resultdoes not permit a permeability calculation and onlyindicates that the permeability is probably high. Thefluctuating pressures of multiple cylinder pumps, evenwhen an air chamber is used, are often difficult to readaccurately because the high and low readings must beaveraged to determine the approximate true effective

FIELD MANUAL
122
Figure 17-1.—Head loss in a 10-foot (3-m) section of AX (1.185-inch- [30.1-mm-] inside
diameter [ID] drill rod.

WATER TESTING FOR PERMEABILITY
123
Figure 17-2.—Head loss in a 10-foot (3-m) section of BX (1.655-inch
[42.0-mm] ID) drill rod.
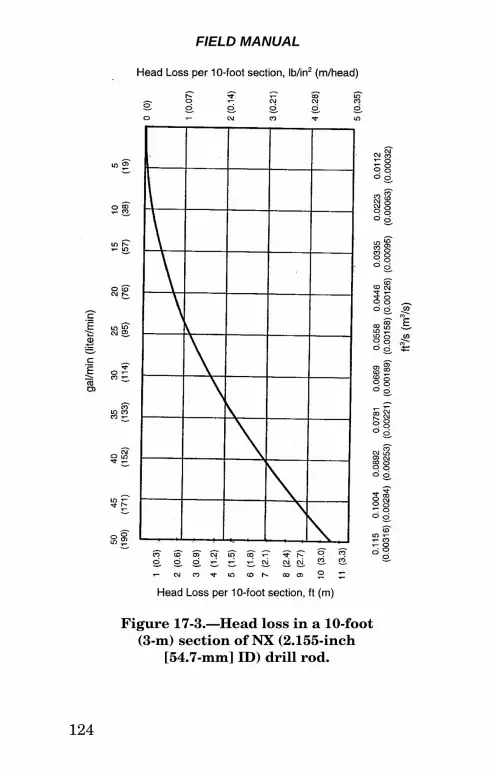
FIELD MANUAL
124
Figure 17-3.—Head loss in a 10-foot(3-m) section of NX (2.155-inch
[54.7-mm] ID) drill rod.

WATER TESTING FOR PERMEABILITY
125
Figure 17-4.—Head loss in a 10-foot(3-m) section of 1¼-inch (32-mm) steel pipe.

FIELD MANUAL
126
pressure. In addition, mud pumps occasionally develophigh peak pressures that may fracture the rock or blowout a packer.
Permeability tests made in drill holes should beperformed using centrifugal or positive displacementpumps (Moyno type) having sufficient capacity to developback pressure. A pump with a capacity of up to250 gal/min (950 L/min) against a total head of 160 feet(48 m) is adequate for most testing. Head and dischargeof these pumps are easily controlled by changingrotational speed or adjusting the discharge valve.
Swivels for Use in Tests
Swivels used for pressure testing should be selected forminimum head losses.
Location of Pressure Gauges
The ideal location for a pressure gauge is in the testsection, but as close to the packer as possible.
Water Meters
Water deliveries in pressure tests may range from lessthan 1 gal/min (3.8 L/min) to as much as 400 gal/min(1,500 L/min). No one meter is sufficiently accurate atall ranges. Two meters are recommended: (1) a 4-inch(100-mm) propeller or impeller-type meter to measureflows between 50 and 350 gal/min (200 and 1,300 L/min),and (2) a 1-inch (25-mm) disk-type meter for flowsbetween 1 and 50 gal/min (4 and 200 L/min). Each metershould be equipped with an instantaneous flow indicatorand a totalizer. Water meters should be testedfrequently.

WATER TESTING FOR PERMEABILITY
127
Inlet pipes should be available to minimize turbulentflow into each meter. The inlet pipes should be at least10 times the diameter of the meter inlet.
Length of Time for Tests
The minimum length of time to run a test depends on thenature of the material tested. Tests should be run untilthree or more readings of water take and pressure takenat 5-minute intervals are essentially equal. In testsabove the water table, water should be pumped into thetest section at the desired pressure for about 10 minutesin coarse materials or 20 minutes in fine-grainedmaterials before making measurements.
Stability is obtained more rapidly in tests below thewater table than in unsaturated material. Whenmultiple pressure tests are made, each pressuretheoretically should be maintained until stabilizationoccurs. This procedure is not practical in some cases,but good practice requires that each pressure bemaintained for at least 20 minutes, and take andpressure readings should be made at 5-minute intervalsas the pressure is increased and for 5 minutes aspressure is decreased.
Pressures Used in Testing
The pressure used in testing should be based on the rockbeing tested. Relatively flat-lying, bedded rock should betested at 0.5 lbs/in2 per foot (0.1 kg/cm2/m) of depth tothe test interval to prevent uplift or jacking of the rock.Relatively homogeneous but fractured rock can be testedat 1 lb/in2 per foot (0.2 kg/cm2/m) of test interval depth.Relatively unfractured rock can be tested at 1.5 lb/in2 perfoot (0.3kg/cm2/m) of test interval depth.

FIELD MANUAL
128
Arrangement of Equipment
The recommended arrangement of test equipmentstarting at the source of water is: source of water;suction line; pump; waterline to settling and storagetank or basin, if required; suction line; centrifugal orpositive displacement pump; line to water meter inletpipe; water meter; short length of pipe; valve; waterlineto swivel; sub for gauge; and pipe or rod to packer. Allconnections should be kept as short and straight aspossible, and the number of changes in hose diameter,pipe, etc., should be kept as small as possible.
All joints, connections, and hose between the watermeter and the packer or casing should be tight, andthere should be no water leaks.
Pressure Permeability Tests
A schematic of the following two methods is shown infigure 17-5.
Method 1: The hole is drilled, cleaned, the tools areremoved, a packer is seated the test interval distanceabove the bottom of the hole, water under pressure ispumped into the test section, and readings arerecorded. The packer is then removed, the hole isdrilled the test interval length deeper, cleaned, thepacker is inserted using the length of the newly drilledhole as the test section, and the test performed.
Method 2: The hole is drilled to the final depth,cleaned, and blown out or bailed. Two packers spacedon pipe or drill stem to isolate the desired test sectionare used. Tests should be started at the bottom of thehole. After each test, the pipe is lifted a distance equalto l, shown on figure 17-5, and the test is repeated untilthe entire hole is tested.
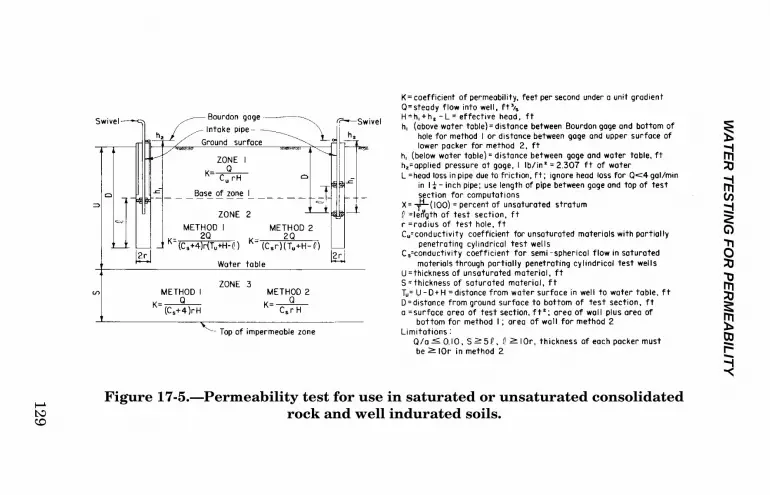
WA
TE
R T
ES
TIN
G F
OR
PE
RM
EA
BIL
ITY
129
Figure 17-5.—Permeability test for use in saturated or unsaturated consolidated rock and well indurated soils.

FIELD MANUAL
130
Data required for computing the permeability may not beavailable until the hole has encountered the water tableor a relatively impermeable bed. The required data foreach test include:
• Radius, r, of the hole, in feet (meters).
• Length of test section, �, the distance between thepacker and the bottom of the hole, Method 1, orbetween the packers, Method 2, in feet (meters).
• Depth, h1, from pressure gauge to the bottom of thehole, Method 1, or from gauge to the upper surface oflower packer in Method 2. If a pressure transducer isused, substitute the pressure recorded in the testsection before pumping for the h1 value.
• Applied pressure, h2, at the gauge, in feet (meters), orthe pressure recorded during pumping in the testsection if a transducer is used.
• Steady flow, Q, into well at 5-minute intervals, incubic feet per second (ft3/sec) (cubic meters per second[m3/sec]).
• Nominal diameter in inches (mm) and length of intakepipe in feet (m) between the gauge and upper packer.
• Thickness, U, of unsaturated material above the watertable, in feet (m).
• Thickness, S, of saturated material above a relativelyimpermeable bed, in feet (m).
• Distance, D, from the ground surface to the bottom ofthe test section, in feet (m).
• Time that the test is started and the time measure-ments are made.

WATER TESTING FOR PERMEABILITY
131
Figure 17-6.—Location of zone 1 lowerboundary for use in unsaturated materials.
• Effective head, the difference in feet (m) between theelevation of the free water surface in the pipe and theelevation of the gauge plus the applied pressure. If apressure transducer is used, the effective head in thetest section is the difference in pressure before wateris pumped into the test section and the pressurereadings made during the test.
The following examples show some typical calculationsusing Methods 1 and 2 in the different zones shown infigure 17-5. Figure 17-6 shows the location of the zone 1lower boundary for use in unsaturated materials.
Pressure permeability tests examples using Methods 1and 2:

FIELD MANUAL
132
Zone 1, Method 1
Given: U = 75 feet, D = 25 feet, � = 10 feet, r =0.5 foot, h1 = 32 feet, h2 = 25 lb/in2 = 57.8 feet, and Q = 20 gal/min = 0.045 ft3/sec
From figure 17-4: head loss, L, for a 1¼-inch pipe at20 gal/min is 0.76 foot per 10-foot section. If thedistance from the gauge to the bottom of the pipe is22 feet, the total head loss, L, is (2.2) (0.76) = 1.7 feet.
H = h1 + h2 - L = 32 + 57.8 - 1.7 = 88.1 feet ofeffective head, Tu = U - D + H = 75 - 25 + 88.1 =138.1 feet
The values for X and Tu/� lie in zone 1 (figure 17-6). To determine the unsaturated conductivitycoefficient, Cu, from figure 17-7:
then:

WATER TESTING FOR PERMEABILITY
133
Figure 17-7.—Conductivity coefficientsfor permeability determination in
unsaturated materials with partiallypenetrating cylindrical test wells.
Zone 2
Given: U, �, r, h2, Q, and L are as given in example1, D = 65 feet, and h1 = 72 feet
If the distance from the gauge to the bottom of theintake pipe is 62 feet, the total L is (6.2) (0.76) =4.7 feet.
H = 72 + 57.8 - 4.7 = 125.1 feet

FIELD MANUAL
134
Figure 17-8.—Conductivity coefficientsfor semispherical flow in saturated
materials through partially penetratingcylindrical test wells.
Tu = 75 - 65 + 125.1 = 135.1 feet
The test section is located in zone 2 (figure 17-6). Todetermine the saturated conductivity coefficient, Cs,from figure 17-8:

WATER TESTING FOR PERMEABILITY
135
Method 1:
Method 2:
Zone 3
Given:
U,�, r, h2, Q, and L are as given in example 1, D =100 feet, h1 = 82 feet, and S = 60 feet

FIELD MANUAL
136
If the distance from the gauge to the bottom of theintake pipe is 97 feet, the total L is (9.7) (0.76) =7.4 feet.
H = 82 + 57.8 - 7.4 = 132.4 feet
Method 1:
Method 2:
Multiple Pressure Tests
Multiple pressure tests are pressure permeability teststhat apply the pressure in three or more approximatelyequal steps. For example, if the allowable maximumdifferential pressure is 90 lb/in2 (620 kilopascal [kPa]),the test would be run at pressures of about 30, 60, and90 lb/in2 (210 kPa, 415 kPa, and 620 kPa).
Each pressure is maintained for 20 minutes, and watertake readings are made at 5-minute intervals. The

WATER TESTING FOR PERMEABILITY
137
pressure is then raised to the next step. After thehighest step, the process is reversed and the pressuremaintained for 5 minutes at the same middle and lowpressures. A plot of take against pressure for the fivesteps is then used to evaluate hydraulic conditions.These tests are also discussed in chapter 16.
Hypothetical test results of multiple pressure tests areplotted in figure 17-9. The curves are typical of thoseoften encountered. The test results should be analyzedusing confined flow hydraulic principles combined withdata obtained from the core or hole logs.
Probable conditions represented by plots in figure 17-9are:
1. Very narrow, clean fractures. Flow is laminar,permeability is low, and discharge is directlyproportional to head.
2. Practically impermeable material with tightfractures. Little or no intake regardless of pressure.
3. Highly permeable, relatively large, open fracturesindicated by high rates of water intake and no backpressure. Pressure shown on gauge caused entirelyby pipe resistance.
4. Permeability high with fractures that are relativelyopen and permeable but contain filling materialwhich tends to expand on wetting or dislodges andtends to collect in traps that retard flow. Flow isturbulent.
5. Permeability high, with fracture filling materialwhich washes out, increasing permeability with time.Fractures probably are relatively large. Flow isturbulent.

FIELD MANUAL
138
Figure 17-9.—Plots of simulated, multiplepressure permeability tests.
6. Similar to 4, but fractures are tighter and flow islaminar.
7. Packer failed or fractures are large, and flow isturbulent. Fractures have been washed clean; highlypermeable. Test takes capacity of pump with little orno back pressure.

WATER TESTING FOR PERMEABILITY
139
8. Fractures are fairly wide but filled with clay gougematerial that tends to pack and seal when underpressure. Takes full pressure with no water intakenear end of test.
9. Open fractures with filling that tends to first blockand then break under increased pressure. Probablypermeable. Flow is turbulent.
Gravity Permeability Tests
Gravity permeability tests are used primarily in uncon-solidated or unstable materials. Gravity tests areperformed in unconsolidated materials but are typicallyperformed at greater depths. Gravity tests can be runonly in vertical or near-vertical holes. A normal testsection length is 5 feet (1.5 m). If the material is stable,stands without caving or sloughing, and is relativelyuniform, sections up to 10 feet (3 m) long may be tested.Shorter test sections may be used if the length of thewater column in the test section is at least five times thediameter of the hole. This length to diameter ratio isused in attempting to eliminate the effect of the bottomof the borehole. The diameter of the borehole sidewallsis the outside of any screen and annular packing of sandand or gravel. After each test, the casing for open holetests is driven to the bottom of the hole, and a new testsection is opened below the casing. If perforated casingis used, the pipe can be driven to the required depth andcleaned out, or the hole can be drilled to the requireddepth and the casing driven to the bottom of the hole andthe hole cleaned out.

FIELD MANUAL
140
Cleaning and Developing Test Sections
Each newly opened test section should be developed bysurging and bailing. Development should be done slowlyand gently so that a large volume of loosely packedmaterial is not drawn into the hole and only thecompaction caused by drilling is broken down and thefines will be removed from the formation.
Measurement of Water Levels Through Protective Pipe
Measuring water depths inside a ¾- to 1½-inch- (20- to40-mm-) small-diameter perforated pipe in the holedampens wave or ripple action on the water surfacecaused by the inflow of water resulting in more accuratewater level measurements. Water may also beintroduced through the pipe and water levelmeasurements made in the annular space between thepipe and the casing.
In an uncased test section in friable materials liable towash, the end of the pipe should rest on a 4- to 6-inch(100- to 150-mm) cushion of coarse gravel at the bottomof the hole. In more stable material, the pipe may besuspended above the bottom of the hole, but the bottomof the pipe should be located at least 2 feet (0.6 m) belowthe top of the water surface maintained in the hole.
Pumping Equipment and Controls
Pressure is not required in the test, but pump capacityshould be adequate to maintain a constant head duringthe test.

WATER TESTING FOR PERMEABILITY
141
Accurate control of the flow of water into the casing is aproblem on many gravity tests. The intake of the testsection necessary to maintain a constant head issometimes so small that inflow cannot be sufficientlycontrolled using a conventional arrangement. A precisemethod of controlling low flows, such as using needlevalves, is important. Many meters are inaccurate atvery low flows.
Water Meters
Water deliveries in gravity tests may range from lessthan 1 gal/min (3.8 L/min) to several hundred gallons perminute. No one meter is sufficiently accurate at allranges. Two meters are recommended: (1) a 4-inch(100-mm) propeller- or impeller-type meter to measureflows between 50 and 350 gal/min (200 and 1,300 L/min)and (2) a 1-inch (25-mm) disk-type meter for flowsbetween 1 and 50 gal/min (4 and 200 L/min). Each metershould be equipped with an instantaneous flow indicatorand a totalizer. Water meters should be testedfrequently.
Length of Time for Tests
As in pressure tests, stabilized conditions are veryimportant if good results are to be obtained from gravitytests. Depending on the type of test performed, one oftwo methods is used. In one method, the inflow of wateris controlled until a uniform inflow results in a stabilizedwater level at a predetermined depth. In the othermethod, a uniform flow of water is introduced into thehole until the water level stabilizes.

FIELD MANUAL
142
Arrangement of Equipment
A recommended arrangement of test equipment, startingat the source of water, is: suction line; pump; waterlineto settling and storage tank or basin, if required; suctionline; centrifugal or positive displacement pump; line towater meter inlet pipe; water meter; short length of pipe;valve; and the waterline to the casing. All connectionsshould be kept as short and straight as possible, and thechanges in diameter of hose, pipe, etc., should be kept toa minimum. If a constant head tank is used, the tankshould be placed so that water flows directly into thecasing.
Gravity Permeability Test - Method 1
For tests in unsaturated and unstable material usingonly one drill hole, Method 1 is the most accurateavailable. Because of mechanical difficulties, this testcannot be economically carried out at depths greaterthan about 40 feet (12 m) when gravel fill must be usedin the hole. When performing the test, after theobservation and intake pipes are set, add gravel in smallincrements as the casing is pulled back; otherwise, thepipes may become sandlocked in the casing. For tests inunsaturated and unstable material at depths greaterthan about 12 meters (40 feet), Method 2 should be used(described later).
The procedures for testing soil conditions are:
Unconsolidated Materials – A 6-inch (150-mm) orlarger hole is drilled or augered to the test depth andthen carefully developed. A cushion of coarse gravelis placed at the bottom of the hole, and the feed pipe

WATER TESTING FOR PERMEABILITY
143
(I) and the observation pipe (O) are set in position(figure 17-10). After the pipes are in position, thehole is filled with medium gravel to a depth at leastfive times the diameter of the hole. If the drill holewall material will not stand without support, the holemust be cased to the bottom. After casing, the gravelcushion and pipes are put in, and the casing is pulledback slowly as medium gravel is fed into the hole.The casing should be pulled back only enough toensure that the water surface to be maintained in thehole will be below the bottom of the casing. About 4inches (100 mm) of the gravel fill should extend upinto the casing.
A metered supply of water is poured into the feedpipe until three or more successive measurements ofthe water level taken at 5-minute intervals throughthe observation pipe are within 0.2 foot (5 mm). Thewater supply should be controlled so that thestabilized water level is not within the casing and islocated more than five times the hole diameter abovethe bottom of the hole. The water flow generally hasto be adjusted to obtain the required stabilized level.
Consolidated Materials – The gravel fill and casingmay be omitted in consolidated material orunconsolidated material that will stand withoutsupport even when saturated. A coarse gravelcushion is appropriate. The test is carried out as inunconsolidated, unstable materials.
Tests should be made at successive depths selected sothat the water level in each test is located at or above thebottom of the hole in the preceding test. Thepermeability coefficients within the limits ordinarily

FIELD MANUAL
144
employed in the field can be obtained from figures 17-7and 17-8. The test zone and applicable equations areshown in figures 17-6 and 17-10.
Data required for computing the permeability may not beavailable until the hole has penetrated the water table.The required data are:
• Radius of hole, r, in feet (meters)
• Depth of hole, D, in feet (meters)
• Depth to bottom of casing, in feet (meters)
• Depth of water in hole, H, in feet (meters)
• Depth to top of gravel in hole, in feet (meters)
• Length of test section, �, in feet (meters)
• Depth-to-water table, Tu, in feet (meters)
• Steady flow, Q, introduced into the hole to maintain auniform water level, in ft3/sec (m3/sec)
• Time test is started and time each measurement ismade
Some examples using Method 1 are:
Zone 1, Method 1
Given:
H = � = 5 feet,�� = 0.5 foot, D = 15 feet, U = 50 feet, andQ = 0.10 ft3/sec

WA
TE
R T
ES
TIN
G F
OR
PE
RM
EA
BIL
ITY
145 Figure 17-10.—Gravity permeability test (Method 1).

FIELD MANUAL
146
Tu = U-D + H = 50 - 15 + 5 = 40 feet, also Tu /� = 40/5 = 8
The values for X and Tu /� lie in zone 1 (figure 17-6).To determine the unsaturated conductivity coefficient,Cu, from figure 17-7:
Zone 2, Method 1
Given:
H, �, r, U, and Q are as given in example 1, D = 45 feet
Points Tu /� and X lie in zone 2 on figure 17-6.
WATER TESTING FOR PERMEABILITY
147
To determine the saturated conductivity coefficient, Cs,from figure 17-8:
From figure 17-10:
Gravity Permeability Test - Method 2
This method may give erroneous results when used inunconsolidated material because of severaluncontrollable factors. However, it is the best of theavailable pump-in tests for the conditions. The resultsobtained are adequate in most instances if the test isperformed carefully. When permeabilities in streambedsor lakebeds must be determined below water, Method 2is the only practical gravity test available.
A 5-foot (1.5-m) length of 3- to 6-inch- (75- to 150-mm-)diameter casing uniformly perforated with the maximumnumber of perforations possible without seriouslyaffecting the strength of the casing is best. The bottomof the perforated section of casing should be beveled onthe inside and case hardened for a cutting edge.
The casing is sunk by drilling or jetting and driving,whichever method will give the tightest fit of the casingin the hole. In poorly consolidated material and soilswith a nonuniform grain size, development by filling thecasing with water to about 3 feet (1 m) above theperforations and gently surging and bailing is advisable

FIELD MANUAL
148
before making the test. A 6-inch (150-mm) coarse gravelcushion is poured into the casing, and the observationpipe is set on the cushion.
A uniform flow of water sufficient to maintain the waterlevel in the casing above the top of the perforations ispoured into the well. The water should be pouredthrough a pipe and measurements made between thepipe and casing or reversed if necessary. Depth of watermeasurements are made at 5-minute intervals untilthree or more measurements are within ±0.2 foot(60 mm) of each other.
When a test is completed, the casing is sunk anadditional 5 feet (1.5 m), and the test is repeated.
The test may be run in stable consolidated materialusing an open hole for the test section. Because thebottom of the casing is seldom tight in the hole andsignificant error may result from seepage upward alongthe annular space between the casing and the wall of thehole, this is not recommended. Measurements should bemade to the nearest 0.01 foot (3 mm). The values of Cu
and Cs within the limits ordinarily employed in the fieldcan be obtained from figures 17-7 and 17-8. The zone inwhich the test is made and applicable equations can befound in figures 17-6 and 17-11, respectively.
Some data required for computing permeability are notavailable until the hole has encountered the water table.
The recorded data are supplemented by this informationas the data are acquired. The data recorded in each testare:

WA
TE
R T
ES
TIN
G F
OR
PE
RM
EA
BIL
ITY
149 Figure 17-11.—Gravity permeability test (Method 2).

FIELD MANUAL
150
• Outside radius of casing, r1
• Length of perforated section of casing, �
• Number and diameter of perforations in length �
• Depth to bottom of hole, D
• Depth-to-water surface in hole
• Depth of water in hole, H
• Depth-to-water table, U
• Thickness of saturated permeable material aboveunderlying relatively impermeable bed, S
• Steady flow into well to maintain a constant waterlevel in hole, Q
• Time test is started, and measurement is made
Some examples using Method 2 are:
Zone 1, Method 2
Given:
H = 10 feet, � = 5 feet, r1 = 0.25 foot, D = 20 feet,U = 50 feet, Q = 0.10 ft3/sec, 128 0.5-inch-diameterperforations, bottom of the hole is sealed
Area of perforations = 128� r1 2 = 128� (0.25)2 =
25.13 in2 = 0.174 ft2
Area of perforated section = 2�r� = 2� (0.25) (5) =
7.854 ft2

WATER TESTING FOR PERMEABILITY
151
Points Tu /� and X lie in zone 1 on figure 17-6.
Find Cu from figure 17-7:
then, Cu = 1,200
From figure 17-11:
Zone 2, Method 2
Given:
Q, H, �, r1, re, U, �/H, and H/re same as Zone 1,Method 2, D = 40 feet

FIELD MANUAL
152
Points Tu /� and X lie in zone 2 on figure 17-6.
Find Cs from figure 17-8:
From figure 17-11:
Zone 3, Method 2
Given:
Q, H, �, r1, re, �/H, H/re, U, Cs, and �/re are as given inZone 2, Method 2, S = 60 feet

WATER TESTING FOR PERMEABILITY
153
From figure 17-11:
Gravity Permeability Test - Method 3
This method is a combination of gravity permeability testMethods 1 and 2. The method is the least accurate, butis the only one available for gravelly or coarse soils(figure 17-12).
In some materials, a casing that is beveled and casehardened at the bottom will not stand up to the driving.This is particularly true in gravelly materials where theparticle size is greater than about 1 inch (25 mm).Under these conditions, Method 3 would probably not besatisfactory because a drive shoe must be used. Using adrive shoe causes excessive compaction of the materialsand forms an annular space around the casing.
On completion of each test, a 3- to 6-inch-diameter (90-to 150-millimeter) perforated casing is advanced 5 feet(1.5 m) by drilling and driving. After each new testsection is developed by surging and bailing, a 6-inch(150-mm) gravel cushion is placed on the bottom tosupport the observation pipe. A uniform flow of watersufficient to maintain the water level in the casing justat the top of the perforations is then poured into thewell. The water is poured directly into the casing, andmeasurements are made through a 1¼-inch (32-mm)observation pipe. The test should be run until three or

FIE
LD
MA
NU
AL
154
Figure 17-12.—Gravity permeability test (Method 3).

WATER TESTING FOR PERMEABILITY
155
more measurements taken at 5-minute intervals arewithin ±0.2 foot (60 mm) of the top of the perforations.
The values of Cu and Cs, within the limits ordinarilyemployed in the field, can be obtained from figures 17-7and 17-8. The zone in which the test is made andapplicable equations can be found on figures 17-6 and17-12, respectively.
The data recorded in each test are:
• Outside radius of casing, r1, in feet (meters)
• Length of perforated section of casing, �, in feet(meters)
• Number and diameter of perforations in length �
• Depth to bottom of hole, D, in feet (meters)
• Depth-to-water surface in hole, in feet (meters)
• Depth of water in hole, in feet (meters)
• Depth-to-water table, in feet (meters)
• Steady flow into well to maintain a constant waterlevel in hole, Q, in ft3/sec (m3/sec)
• Time test is started and time each measurement ismade

FIELD MANUAL
156
Zone 1, Method 3
Given: Q = 10.1 gal/min = 0.023 ft3/sec, H = � = 5 feet,D = 17 feet, U = 71 feet, Tu = 54.5 feet, re = 0.008 foot,and r1 = 1.75 inches = 0.146 foot (nominal 3-inchcasing)
These points lie in zone 1 (figure 17-6).
Find Cu from figure 17-7:
then, Cu = 640
From figure 17-12:
Zone 2, Method 3
Given: Q, H, �, U, re, and r1 are as given in Zone1,Method 3, D = 66 feet and Tu = 10 feet

WATER TESTING FOR PERMEABILITY
157
These points lie in zone 2 (figure 17-6).
Find Cs from figure 17-8:
From figure 17-12:
Gravity Permeability Test - Method 4
This method can be used to determine the overallaverage permeability of unsaturated materials above awidespread impermeable layer. The method does notdetect permeability variations with depth. The methodis actually an application of steady-state pumping testtheory.
A well, preferably 6 inches (150 mm) or larger indiameter, is drilled to a relatively impermeable layer ofwide areal extent or to the water table. If the saturatedthickness is small compared to the height of the watercolumn that can be maintained in the hole, a water tablewill act as an impermeable layer for this test. The wellis uncased in consolidated material, but a perforated

FIELD MANUAL
158
casing or screen should be set from the bottom to about5 feet (1.5 m) below the ground surface in unconsolidatedmaterial. The well should be developed by pouring waterinto the hole while surging and bailing before testing.
Before observation wells are drilled, a test run of theintake well should be made to determine the maximumheight, H, of the column of water that can be maintained(figure 17-13) above the top of the impermeable layer. A1- to 1¼-inch (25- to 32-mm) observation pipe should beinserted to near the bottom of the intake well to forwater-level measurements. The spacing of theobservation wells can be determined from this test run.
A minimum of three observation wells should beinstalled to the top of the impermeable layer or watertable. Suitable pipe, perforated for the bottom 10 to 15feet (3 to 4.5 m), should be set to the bottom of thesewells. The observation wells should be offset from theintake well by distances equal to multiples of one-halfthe height, H, of the water column that will bemaintained in the intake well.
The elevations of the top of the impermeable layer orwater table in each well are determined, and the test isstarted. After water has been poured into the intake ata constant rate for an hour, measurements are made ofwater levels in the observation wells. Measurements arethen made at 15-minute intervals, and each set ofmeasurements is plotted on semi-log paper. The square

WATER TESTING FOR PERMEABILITY
159
Figure 17-13.—Gravity permeability test(Method 4).
of the height of the water level above the top of theimpermeable bed, h2, is plotted against the distance fromthe intake well to the observation holes, d, for each hole(figure 17-14). When the plot of a set of measurementsis a straight line drawn through the points within thelimits of plotting, conditions are stable and thepermeability may be computed.

FIELD MANUAL
160
Figure 17-14.—Plot of h2 versus d for gravitypermeability test (Method 4).
The data recorded in each test are:
• Ground elevations at the intake well and theobservation wells
• Elevations of reference points at the intake well andthe observation wells, in feet (meters)

WATER TESTING FOR PERMEABILITY
161
• Distances from center of the observation wells tocenter of the intake well, d1, d2, and d3, in feet (meters)
• Elevation of top of impermeable bed at the intake welland the observation wells, in feet (meters)
• Depths of water below reference point in the intakewell and the observation wells at 15-minute intervals,in feet (meters)
• Uniform flow of water, Q, introduced into well, inft3/sec (m3/sec)
• Time pumping is started and time each measurementis made
Method 4
Given: U = 50 feet, Q = 1 ft3/sec, H = 30 feet, d1 =15 feet, d2 = 30 feet, d3 = 60 feet, h1 = 23.24 feet, h2 = 17.89 feet, h3 = 10.0 feet, h1
2 = 540 ft2, h22 = 320
ft2, and h32 = 100 ft2
A plot of d against h2, as shown on figure 17-14, showsthat a straight line can be drawn through the plottedpoints, meaning that stable conditions exist and thepermeability may be computed.
From figure 17-13:

FIELD MANUAL
162
Falling Head Tests
Falling head tests are used primarily in open holes inconsolidated rock. Falling head tests use inflatablepackers identical to those used for pressure testing andcan be used as an alternate method if the pressuretransducer or other instrumentation fails. The methodof cleaning the hole is the same as that described underpressure testing.
Tests Below the Static Water Level
Tests below the static water level should be done asfollows:
• Use inflatable straddle packers at 10-foot (3-m)spacing on a 1¼-inch (32-mm) drop pipe (insidediameter = 1.38 inches [35 mm]). Set packers initiallyat the bottom of the hole and inflate to 300 lb/in2
(2,000 kPa) of differential pressure.
• After packers are inflated, measure the water level inthe drop pipe three or more times at 5-minuteintervals until the water level stabilizes. Thestabilized level will be the static water level in the testsection.

WATER TESTING FOR PERMEABILITY
163
• Pour 2 gallons (8 liters [L]) or more of water as rapidlyas possible into the drop pipe after the water levelstabilizes. One gallon (4 l) of water will raise thewater level in a 1¼-inch (32-mm) pipe 13 feet (4 m) ifthe section is tight.
• Measure the water level as soon as possible after thewater is poured in. Measure the initial depth towater, record the time as soon as possible, and repeattwice at 5-minute intervals. If the rate of declineexceeds 15 feet (4.5 m) in 13 minutes, thetransmissivity of a 10-foot (3-m) test section is greaterthan 200 ft2 (18 m2) per year, and the averagepermeability is greater than 20 feet (6 m) per year.
The transmissivity value determined is only anapproximation, but the value is sufficiently accurate formany engineering purposes.
The equation for analysis is:
where:
T = transmissivity of test section, in ft2/sec (m2/sec)
V = volume of water entering test section in period�t, in ft3 (m3). (A 1-foot [30-cm] decline in1¼-inch [32-mm] pipe = 0.01 ft3 [0.000283 m3])
s = decline in water level in period �t, in feet(meters)
�t = period of time, in seconds, between successivewater level measurements (i.e., t1 - to, t2 - t1,etc.)
FIELD MANUAL
164
• If the log indicates the test section is uniform andwithout obvious points of concentrated leakage, theaverage permeability of the test section, in feet persecond (m/sec), can be estimated from K = T/�, where� is the length of the test section, in feet (m). If the logindicates a predominantly impervious test section, butincludes a zone or zones of concentrated flow, theaverage K of the zones can be estimated from K = T/��,where �� is the thickness of the permeable zone orzones, in feet (m).
• After each test, deflate the packers, raise the teststring 10 feet (3 m), and repeat the test until theentire hole below the static water level has beentested.
Tests Above the Water Table
Tests above the water table require different proceduresand analyses than tests in the saturated zone. Testsmade in sections straddling the water table or slightlyabove the water table will give high computed values ifthe equations for tests below the static water level areused and low computed values if the following equationsare used. For tests above the water table, the followingprocedure is used:
• Install a 10-foot- (3-m-) spaced straddle packer at thebottom of the hole, if the hole is dry, or with the top ofthe bottom packer at the water table if the holecontains water. Inflate the packer.
• Fill the drop pipe with water to the surface, if possible,otherwise, to the level permitted by pump capacity.
• Measure the water level in the drop pipe and recordwith time of measurement. Make two or more similarmeasurements while the water-table declines.

WATER TESTING FOR PERMEABILITY
165
• Upon completion of a test, raise the packer 10 feet (3 m) and repeat this procedure until all of the openor screened hole is tested.
The equation for analysis is:
where:
r1 = inside radius of drop pipe, in feet� ��������������� ����������� �������������������
�� � ��������������������������� �������������� ��� �� ������ ���� �� �� ������� ��������!��
�� � ������������!�������� ������� ����������
������ � ���������"���#!�������
�� � ������!�!$������
� � !��$����%������!�������#����������������!���%������������������������ ���������) (H0, H1, H2 lengths at time ofmeasurements t0, t1, t2, etc.)
• For the particular equipment specified and a 10-foot(3-m) test section, the equation may be simplified to:

FIELD MANUAL
166
Slug Tests
Slug tests are performed by “rapidly” changing waterlevels in a borehole. The rapid change is induced byadding or removing small quantities of water, air, or anobject that displaces the groundwater. The timerequired to restore the water level to its original level isused to calculate the permeability. Slug tests aretypically performed in areas where access or budget islimited or the extraction or addition of water has apotential impact to the surrounding area. Slug tests areappropriate where the aquifer will not yield enoughwater to conduct an aquifer test or the introduction ofwater could change or impact the water quality. A majorfactor in conducting slug tests is ensuring that the waterlevel during the test reflects the aquifer characteristicsand is not unduly affected by the well construction.Where the water surface is shallow and clean water isreadily available, water injection or bailing is often theeasiest method. The displacement or air injectionmethod may be desirable at locations where the waterlevel is deep and rapid injection or removal of water isdifficult.
A number of slug test methods exist. The choice dependson the hydrologic and geologic conditions and the wellsize and construction.
Selecting the Slug Test
The method of inducing a rise or fall in the water surfacedepends on the purpose of the test and conditions at thesite. Where the water level is shallow and clean wateris readily available, water injection or bailing is often theeasiest method. One limitation of the test accuracy isthe initial water flowing down the inside wall of the well.Causing a rapid rise by displacing water in the well by

WATER TESTING FOR PERMEABILITY
167
dropping a pipe or weight or injecting air may bepreferable at remote sites where water may not bereadily available. The displacement or air injectionmethod may also be desirable at locations where thewater level is deep and rapid injection or removal ofwater may require collection and treatment or at wellsites that are being used for water chemistry studies.
Conducting the Slug Test
Before introducing the slug, the well’s sidewall, screen,or filter pack needs to be clear of any obstructions thatwill impede the movement of water from the riser to thesurrounding materials. The riser diameter and lengthneed to be measured as accurately as possible, and thewater level must be stabilized and recorded as accuratelyas possible. The water level measurements must beginimmediately following the introduction of the slug.Where the water level changes slowly, measurementsmay be made by using a water level indicator. For mosttests, water levels should be recorded by a pressuretransducer and automatic data logger.
Hvorslev Slug Test
The Hvorslev slug test is the simplest method ofanalysis. This analysis assumes a homogeneous,isotropic, infinite medium in which both the soil andwater are incompressible. It neglects well bore storageand is not accurate where a gravel pack or thick sandpack is present. Figure 17-15 is a sketch of the geometryof this test and the method of analysis. This method isused where the slug test is conducted below an existingwater surface.
The test analysis requires graphing the change in headversus time. Head changes are given by (H-h)/H-H0 and

FIELD MANUAL
168
Figure 17-15.—Hvorslev piezometer test.
should be plotted semi-log against time. The graphshould approximate a straight line; and at the point 0.37,the T0 value is defined as the basic time lag. Using thegraphical solution for T0, the dimension of the cavity,and the appropriate shape factor, F, a solution forpermeability can be found by:
Figure 17-16 provides shape equations for various wellgeometries.
Bouwer Slug Test
The Bouwer slug test assumes no aquifer storage andfinite well bore storage. The well can be partiallypenetrating and partially screened. The method was

WA
TE
R T
ES
TIN
G F
OR
PE
RM
EA
BIL
ITY
169
Figure 17-16a.—Shape factors for computing permeability from variable head tests.

FIE
LD
MA
NU
AL
170
Figure 17-16a (cont.).—Shape factors for computing permeability from variable head
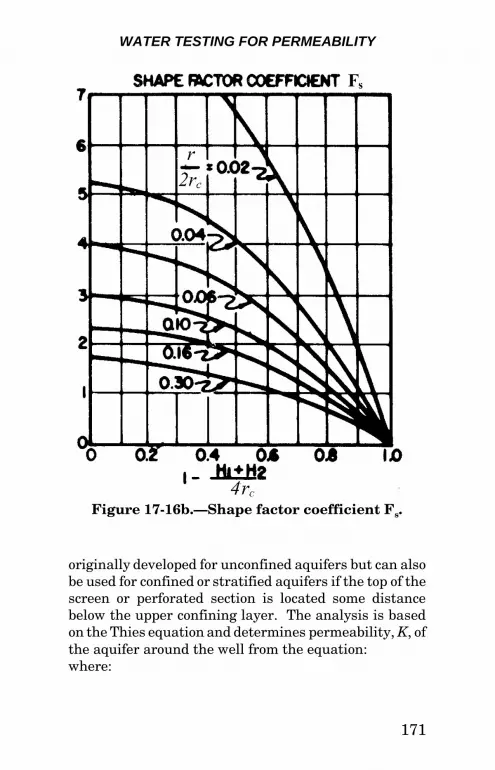
WATER TESTING FOR PERMEABILITY
171
Figure 17-16b.—Shape factor coefficient Fs.
originally developed for unconfined aquifers but can alsobe used for confined or stratified aquifers if the top of thescreen or perforated section is located some distancebelow the upper confining layer. The analysis is basedon the Thies equation and determines permeability, K, ofthe aquifer around the well from the equation:where:

FIELD MANUAL
172
� = length of the perforated section of the casing orriser
s0 = the vertical difference between the watersurface inside the well and the static water levelat time zero
st = s at time t
t = time of reading
rc = inside radius of the riser or casing
r = the effective radius of the well, including theperforated casing, sand or gravel pack, and anyremaining annular space to the sidewall of theborehole
de = effective radial distance; the distance between
the well and the observation well; the distanceover which the water level, s, returns to thestatic level
H = the height of water within the well
S = aquifer thickness
See figure 17-17 for the configuration definition.
The values of de were determined using an electricalresistance analog network. The effective radial distanceis influenced by the well diameter, well screen length,well depth, and the aquifer thickness. Various values forrc, �, H, and S were used in the analog network foranalysis of their impacts on de.

WATER TESTING FOR PERMEABILITY
173
Figure 17-17.—Slug test on partially penetrating,screened well in unconfined aquifer with gravel
pack and developed zone around screen.
The term, ln (de/r), is related to the geometry of the testzone and the amount of aquifer penetration of the well.Two separate solutions are required to address partiallypenetrating wells and fully penetrating wells. For

FIELD MANUAL
174
partially penetrating wells, an empirical equationrelating ln (de/r) to the geometry of the test zone is:
In this equation, A and B are dimensionless coefficientsthat can be read on figure 17-18. An effective upperlimit of ln[(S-H)/r] is 6. If the computed value of ln[(S-H)/r] is greater than 6, then 6 should be used in theequation for ln(de /r). When S = H, the well is fullypenetrating, and the value of C should be used fromfigure 17-18 in the equation.
Values of the field test data should be plotted asrecovery, s, versus time for each data point reading.The value s should be plotted on a y-axis log scale, andvalues for corresponding time should be plotted on the x-axis. The points should approximate a straight line,which indicates good test data. Areas of the data thatplot as curves (usually at the beginning of the test ornear the end of the test) should not be used in thecomputation.
Piezometer Test
The piezometer test measures the horizontalpermeability of individual soil layers below a water

WATER TESTING FOR PERMEABILITY
175
Figure 17-18.—Dimensionless parameters A, B,and C as a function of �/re (F for calculation
of ln(de/re)).
surface. This test may apply to large diameter directpush technology, as well as to any depth that an openhole can be maintained. This test is preferred over theauger-hole test described in section 10-6 of the GroundWater Manual, especially when the soils tested are lessthan 1.5 feet (0.5 m) thick and are below the water table.This method is particularly good for determining whichlayer below the capillary zone is an effective barrier.
Equipment
The following items are suggested equipment for thepiezometer test.
• Riser between 1- to 2-inch (24- to 50-mm) insidediameter for a depth of around 15 feet (4.5 m) andblack iron pipe with smooth inside wall for depthsgreater than 15 feet (4.5 m)

FIELD MANUAL
176
• Equipment capable of installing the riser and cavitybelow the riser
• Pump with hose and controller or bailer that will fitinside the casing
• Bottle brush for cleaning soil film from the inside ofthe test riser if the riser is driven without a protectivepoint that can prevent soils from filling the inside ofthe tube
• Water level detector, stop watch, and transducer anddata logger
Procedure
The test layer should be at least 1 foot (30 cm) thick sothat a 4-inch (10-cm) length of cased hole or cavity can belocated in the middle of the layer. This placement isespecially important if a marked difference in the layersexists above and below the test layer. The differencesmay be changes in the percentages of fines (>15 percent),overall changes in the soil gradations, soil structure, ordegree of cementation or induration within the soilhorizon. After selecting an appropriate interval based onthe soil investigation, an adjacent hole within 2 feet(0.6 m) of the test hole is advanced to around 2.0 feet(0.6 m) above the bottom of the 4-inch (10-cm) testinterval, if using direct push technology, or to the top ofthe 4-inch (10-cm) interval. Then use a smaller diameterauger to ream the final 4-inch (10-cm) interval for theriser pipe. The final 2.0 feet (0.6 m) are driven to ensurethat a reasonably good seal is obtained and also tominimize the disturbance. The lower 4 inches (10 cm) ofthe borehole are exposed, and the cavity must remainopen. After some recovery has occurred, the riser shouldbe cleaned with a brush to remove any soil film unless

WATER TESTING FOR PERMEABILITY
177
the riser was advanced by direct push. The end of theriser should be screened within the lower cavity and thencleaned out by gently pumping or bailing water andsediment from the piezometer.
After the water surface has stabilized, the transducer isinstalled. The riser is bailed or pumped, depending onthe diameter of riser and the depth to water. It is notnecessary to remove all the water in the screenedinterval, but the water level should be lowered enoughthat at least three readings during the first half of thewater rise will give consistent results.
Calculations
After completing the piezometer test, the permeability iscalculated from:
where:
s1 and s2 = distance from static water level at timest1 and t2, in inches (cm)
t2 - t1 = time for water level change from s1 to s2,in seconds
Ca = a constant for a given flow geometry, ininches (cm)
� = length of open cavity, in inches (cm)
d = H-�, distance from the static water levelto the top of the cavity, in inches (cm)
b = distance below the bottom of the cavity tothe top of next layer, in inches (cm)

FIELD MANUAL
178
A sample calculation using this equation is shown infigure 17-19. The constant, Ca, may be taken fromcurves shown in figures 17-19 or 17-20. The curve onfigure 17-19 is valid when d and b are both largecompared to �. When b = 0 and d is much greater than�, the curve will give a Ca factor for � = 4 and d = 1 thatwill be about 25 percent too large.
The chart on figure 17-20 is used for determining Ca
when upward pressure exists in the test zone. Whenpressures are present, additional piezometers must beinstalled. The tip of the second piezometer should beplaced just below the contact between layers in layeredsoil (figure 17-21). In deep, uniform soils, the secondpiezometer tip should be placed an arbitrary distancebelow the test cavity.
After installing the second piezometer, the followingmeasurements should be made:
• Distance, �d, in feet (m), between the ends of the riserpipes
• Difference, �H, in feet (m), between water surfaces inthe two piezometers at static conditions
• Distance, d’, in feet (m), between the center of thelower piezometer cavity and the contact between soillayers in the layered soils
The Ca value from figure 17-20 is used in the equation todetermine the permeability.
Limitations
Installation and sealing difficulties encountered in coarsesand and gravel are the principal limitations of the

WA
TE
R T
ES
TIN
G F
OR
PE
RM
EA
BIL
ITY
179 � � � � � � � � � � � � � � � � � � � � � � � � � � � � � � � � � � � � � � � � � � � � � � � � � � � � � � � � � � � � � � � � � � � � � �

FIELD MANUAL
180
Figure 17-20.—Chart for determining Ca if upward pressure exists in the test zone.

WATER TESTING FOR PERMEABILITY
181
Figure 17-21.— Sample calculation for the piezometer test with upward pressure
in the test zone.
piezometer test for permeability. Also, when the riserbottoms in gravel, a satisfactory cavity cannot beobtained. The practical limit of hole depth is about20 feet (6 meters). Deeper holes require largerdiameters (greater than 2 inches [5cm]), and driving theriser deeper is difficult.

FIELD MANUAL
182
Details on the equipment requirements and proceduresare provided in chapter 3 of the Drainage Manual.Permeameter tests are typically restricted to shallowboreholes or excavations and require time to set up theequipment and perform the test. Where thepermeability is relatively high (>1,000 feet per year [10-3
cm per second]), these tests require large amounts ofwater. With material having permeability values greaterthan 106 feet per year (10 cm/sec), laboratorypermeability testing is more cost effective. The samplesare collected and tested in the laboratory in accordancewith Reclamation Procedure 5605.
Bibliography
Bureau of Reclamation, U.S. Department of the Interior,Drainage Manual, 1993.
Bureau of Reclamation, U.S. Department of the Interior,Ground Water Manual, 1995.

Figure 18-1.—Riprap properly placed on bedding. The riprap is angular, quarried rock, and the
bedding is rounded stream gravel. The backhoe is placing and arranging the rock on the bedding.
Chapter 18
RIPRAP
Introduction
Riprap is preferably a relatively thin layer of large,approximately equidimensional, durable rock fragmentsor blocks placed on bedding to dissipate water energy andprotect a slope, channel bank or shore from erosion causedby the action of runoff, currents, waves or ice (figure 18-1).Bedding is usually a layer of sand and gravel placedunder the riprap to prevent erosion of the material fromunder the riprap. Most dam embankments contain atleast one zone that uses rock. Rock is used as riprap forprotection against erosion or as rockfill and filter zonesthat strengthen or drain the embankment.

FIELD MANUAL
184
The terms “slope protection” and “riprap” are often usedinterchangeably, but not all slope protection is riprap.Soil cement is also commonly used as slope protection.Riprap is an assemblage of rocks “nested” together toprotect a structure or area from the action of water. Thestability of an assemblage of rocks is a function of theindividual rock’s size, shape, weight, and durability. Anassemblage of rocks depends on the individual rockcharacteristics for stability and also on the site conditions,grading, and thickness. The assemblage of rocks isdesigned to minimize voids and thickness of the ripraplayer to keep the volume of material as low as possible.Proper placement interlocks the individual fragments intoa layer of rocks that resists the action of water.Figure 18-2 shows what can happen if riprap is notdesigned, obtained, and placed properly.
Riprap should be “hand” placed to reduce the void spaceand maximize the interlocking arrangement, but rarely isthis economical (figure 18-3). Most riprap is dumped andfalls into place by gravity with little or no additionaladjustment (figure 18-4). Because of this, individualpieces of riprap must have appropriate characteristics sothat the rocks can be processed, handled, and placed sothat the layer remains intact for the life of the project.
This chapter discusses: (1) riprap source evaluation,(2) onsite inspection to ensure that the samples are appro-priate and that specified material is being produced fromthe source, (3) presentation of information to designersand estimators, and (4) waste factors in riprap produc-tion. A geologic background, a knowledge of blastingmethods and types of explosives, and an understanding ofthe equipment involved in the processing, hauling, andplacing of riprap is important to riprap evaluation,production, and placement. Most of the following discus-sion applies to rock adequate for aggregate and to larger

RIPRAP
185
Figure 18-2.—Improperly designed, obtained, and placed riprap.

FIELD MANUAL
186
Figure 18-3.—Hand-placed riprap.

RIPRAP
187
Figure 18-4.—Dumped riprap.
rock fragments used for roads, breakwaters, and jetties.However, this chapter is oriented toward acquiringsuitable material for riprap.
This chapter should be used in conjunction withUSBR Procedure 6025, Sampling and Quality EvaluationTesting of Rock for Riprap Slope Protection, and

FIELD MANUAL
188
USBR Design Standard No. 13 for Embankment Dams(DS13). Riprap design is discussed in “Chapter 7, RiprapSlope Protection,” of USBR Design Standard DS13. Otherdocuments, such as the U.S. Army Corps of Engineers’Engineering Manual 1110-2-2301, Engineering andDesign - Test Quarries and Test Fills, and EngineeringManual 1110-20-1601, Engineering and Design -Hydraulic Design of Flood Control Channels, also provideinformation on design and source evaluation. Note: Testprocedures developed to test similar riprap characteristicsby different organizations are not necessarily the same.The appropriate test procedure should be selected basedon the actual test and the available test equipment.
Evaluation
Much of the following discussion is more guidance thanhard and fast rules or requirements. What is unac-ceptable riprap at one location may be acceptable atanother site. Remember that a riprap source must becapable of providing suitable material in sufficientquantities at a reasonable cost. The three elements inevery source evaluation are: quality, quantity, and cost.
Quality
Rock quality is determined by laboratory testing, but fieldpersonnel input and selection of the samples for testingare critical in determining the riprap quality. There arenumerous quarries and pits capable of producingaggregate, but not all sources are suitable for theproduction of riprap. Riprap sources must produce riprapof the necessary weight, size, shape, gradation, anddurability to be processed and placed and then remain“nested” for the life of the project. Performance on

RIPRAP
189
existing structures is a valuable method of assessingriprap quality from a particular source.
Shape
The shape of individual rock fragments affects theworkability and nesting of the rock assemblage. Natural“stones” from alluvial and glacial deposits are usuallyrounded to subrounded and are easier to obtain, handle,and place and, therefore, are more workable. Roundedstones are less resistant to movement.
The drag force on rounded stones is less than betweenangular rock fragments. Rounded stones interlock morepoorly than do equal-sized angular rock fragments. As aresult, a rounded stone assemblage is more likely to bemoved or eroded by water action. Angular-shaped rocksnested together resist movement by water and make thebest riprap. The rock fragments should have sharp, angu-lar, clean edges at the intersections of relatively flat faces.
Glacial or alluvial deposits are used as riprap sources onlyif rock quarries are unavailable, too distant, or incapableof producing the appropriate sizes. Unless the designslope is at an angle to the wave direction or wave energyand the erosive action of water on the slope is low,rounded to subrounded stones are typically used only onthe downstream face of embankments, in underlyingfilters, or as the packing material in gabions.
No more than 30 percent of the riprap fragments shouldhave a 2.5 ratio of longest to shortest axis of the rock.Stones having a ratio greater than 2.5 are either tabularor elongated. These tabular or elongated particles(figure 18-5) tend to bridge across the more blocky piecesor protrude out of the assemblage of rocks. Duringhandling, transporting, and placement, these elongated or

FIELD MANUAL
190
Figure 18-5.—Tabular rock fragment.
tabular rock fragments tend to break into smaller frag-ments and could significantly change the gradation orthickness of the protective layer.
Nearly all durable rock types can provide appropriatelyshaped material, but not all rock types can be blasted andprocessed economically into suitable shapes. Mineralalignment and fractures within the rock mass are theprimary factors affecting the development of the shape.Most igneous and some sedimentary rocks are capable ofmaking suitably shaped fragments. However, secondaryfracturing or shearing will affect the shape. Rocks havingclosely spaced discontinuities tend to produce fragmentsthat are too small. Sedimentary rocks that have beddingplane partings tend to produce flat shapes. Metamorphicrocks tend to break along jointing, rock cleavage, ormineral banding and often produce elongated shapes.

RIPRAP
191
Weight and Size The weight and size of individual riprap pieces areessential factors in resisting erosive water forces. Theweight of the rock fragment is one design element forriprap but is difficult to obtain in the field for the largersizes. The relationship between weight and size isapproximately:
Wn = 0.75 �Dn3
where: Wn - Percentage of total weight of rock wheren percent is smaller
� - Unit weight of rockDn - Representative diameter of rock where
n percent is smaller
This formula assumes the shape of the rock fragment isbetween a sphere and a cube. The weight and size may bedetermined in the laboratory or in the field. The unitweight of riprap generally varies from 150 to 175 poundsper cubic foot (2.4 to 2.8 g/cm3) and correlates with surfacesaturated dry specific gravity (SSSG). Rock having anSSSG above 2.6 is typically suitable for riprap.
Determination of the relationship between weight andsize is difficult. Rock is either graded by size or countedand weighed, but rarely are weight and size correlated.Rarely does rock break into perfect cubical shapes; andbecause of the various shapes and sizes, weighing andsorting the individual pieces is difficult. The AmericanSociety for Testing and Materials Procedure D-5519 pro-vides three methods for obtaining size and weight data.
Typically, for sizes up to 36 inches (1 meter) minimumdiameter, rock pieces are sorted by size with a sieve ortemplate, and the number of individual pieces is counted

FIELD MANUAL
192
within each group. These piles can then be weighed andindividual pieces adjusted to determine size. For indi-vidual pieces larger than 36 inches, the size is typicallydetermined by using a tape to measure the maximum andminimum size of each piece. The weight is determinedfrom a chart that assumes the shape is between a cubeand sphere.
Most rock sources are capable of producing suitableweights and sizes. The size rarely impacts use as a riprapsource unless more than 30 percent of the rocks areelongated or flat. In special circumstances, the rockmineralogy and porosity control the weight. The porosityof some sedimentary and extrusive volcanic rock couldaffect the weight. Rock having an SSSG under 2.3 istypically not considered for riprap. Generally, rockhaving a low unit weight is weak and tends to break downwith handling.
Gradation
The desired gradation consists of size fractions of theindividual particles that will nest together and withstandenvironmental conditions. The gradation design is basedon the ability of the source(s) to produce appropriate sizes.Inherent rock mineralogy, cleavage, and fractures controlthe size of the rock fragments. Blasting, excavating, andprocessing also affect the size. Most acceptable riprapgradations are obtained by understanding the inherentrock characteristics, by proper blasting techniques, and byprocessing. Rarely can blending rock sizes achieve anappropriate grading for riprap because the larger frag-ments tend to separate from the smaller fragments duringhandling and processing. Processing is typically limitedto running the rock fragments over a stationary grizzly(figure 18-6) or sorting with a rock bucket or rock rake(figure 18-7). Rarely is rock processed with jaw or

RIPRAP
193
Figure 18-7.—Rock rake. A dozer-mounted rock rake separates the larger fragments
from the smaller material.
Figure 18-6.—Stationary grizzly. Rock is dumped on the sloping rails, and the larger material slides
off and is separated from the smaller material which falls through.

FIELD MANUAL
194
gyratory crushers except for testing. Segregation of largeand small sizes is controlled by reducing the number andamount of drops during handling and processing.Handling should be kept to a minimum.
Most coarse-grained sedimentary and igneous rockquarries are capable of producing suitable riprapgradations. The range of gradations from sedimentarysources depends on the depositional environment. Rockderived from rapid depositional environments is morelikely to produce well-graded riprap.
Size range is controlled by discontinuities in the rock.Columnar basalt, some fine-grained sedimentary rock,and metamorphic rock commonly have inherent planes ofweakness that limit larger riprap sizes. Intensely tomoderately fractured rock rarely produces suitable riprapgradations.
Durability Riprap durability affects the ability of a source to providea consistent shape, size, and gradation and the ability toresist weathering and other environmental influences.Durability is typically determined by laboratory test; butdurability can be assessed by observing surface exposures,talus, and waste piles or by examining riprap applicationsalready using the potential source or similar sourcematerials. Cracking, spalling, delaminating, splitting,disaggregating, dissolving, and disintegrating arecommon forms of rock deterioration. Durability is afunction of the rock’s mineralogy, porosity, weathering,discontinuities, and site conditions. In rare instances,environmental considerations such as abnormal pH of thewater may be a controlling factor in selecting anappropriate riprap source. A high or low pH mayaccelerate disintegration of the rock.

RIPRAP
195
Alteration of minerals, such as feldspars to softer clays,will impact rock durability. Fine-grained rock types,rocks having high porosity, and chemically altered rocksmay tend to slake after cyclic wetting and drying orfreezing and thawing. Some rocks tend to break upbecause of discontinuities such as bedding plane parting,cementation or secondary mineralization, unstableminerals, banding, or foliation. Jointing, rock cleavage,and bedding plane partings often result in excessive finersizes or tabular and elongated rock fragments.
Rock that breaks down either physically or chemicallyshould be avoided. Obvious examples are most weatheredor altered rocks, rock containing soluble or expansiveminerals, vesicular basalts, shale, claystone, siltstone,weakly cemented or porous sandstone, schist, or phyllite.Even durable rocks such as slate and some gneisses maygenerally be unusable because other physicalcharacteristics (cleavage and foliation) will not allowproduction of large, nearly equidimensional blocks.
Mechanical breakdown and weathering may beaccelerated by microfracturing from the blasting,handling, weak cementation or may be the result ofalteration of more stable minerals to clay. In addition,there appears to be a significant correlation betweenporosity, absorption, and durability of rock. Rock that hasmore than 2 percent absorption is commonly impacted byfreezing and thawing and by wetting and dryingprocesses.
Quantity
Every riprap source investigation must provide theestimated quantity required. Estimating realisticquantities depends on an understanding of subsurfacegeologic conditions. The uniformity of rock and

FIELD MANUAL
196
discontinuities within a source area must be assessed.This estimate (often referred to as the reserve) providesnot only the amount of riprap available but also providesan understanding of wastage resulting from blasting,handling, processing, haulage, and placement. In strati-fied deposits such as limestones or sandstones, uniformitymust be evaluated because individual beds often differ incharacter and quality. The dip of stratified rocks andcontacts between dissimilar rock types, such as igneousintrusions, must also be considered. The larger theindividual pieces required, the more difficult it is for anyrock type to supply suitable quantities. Zones or layers ofundesirable clay or shale seams may be so large orprevalent that selective quarrying or wasting ofundesirable material is required. The geologic conditions,ability of the rock to produce suitable sizes, and thepotential reserve should be determined.
Existing commercial sources may be capable of producingriprap but may not be capable of expanding their opera-tion into similar quality rock. In any new source, theamount of burden that must be removed, stability of thecutslopes, uniformity of the rock, depth to water, andability to blast or process the rock into the appropriategradation must be evaluated. Since riprap is a surfacelayer, a smaller sized riprap of increased thickness maybe acceptable, or a less durable riprap may be used withthe understanding that the riprap may requirereplacement.
Cost
A primary factor in determining a suitable riprap sourceis cost. Design and environmental requirements, access,subsurface conditions, testing, depth to water, quantity ofsuitable rock, and location also affect the cost and shouldbe assessed early in any source investigation.

RIPRAP
197
Producing sources should be located first. Using existingquarries or pits is generally cheaper because there isconsiderably less cost associated with permitting,developing, and evaluating an existing source. Anexisting source provides easier access to rock; a history ofthe source provides an understanding of the source’sability to provide suitable rock; regulatory requirementsare often more easily met; development and processingcosts are often known; and often, some testing of materialhas been performed so that the quality is known.Although existing sources may be known, each of theseelements should be evaluated to ensure that informationis representative and appropriate for the particularrequirement. In areas where existing sources are not economical,evaluating the surrounding undeveloped areas orabandoned pits or quarries should be considered.Evaluating new or abandoned sources typically involvesconsiderable expense. A new quarry or pit investigationinvolves understanding subsurface conditions; obtaining,evaluating, and testing subsurface samples; andevaluating subsurface conditions to determine ifappropriate riprap can be produced. Factors such as thehaul distance, grade, width, and type of roadway shouldalso be assessed.
Investigation Stages
The complexity of investigations for suitable sources ofriprap is governed by the development stage and designrequirements of the project. Projects are normallydeveloped in four stages: reconnaissance, feasibility,design, and construction.

FIELD MANUAL
198
Reconnaissance
Initial exploration involves field surface reconnaissanceusing topographic maps, geologic and groundwater mapsand reports, and aerial photographs. Supplemental infor-mation is provided by records of known developed sourcesof material. Areas having steep topography could havethe best rock exposures. Geology maps providegeneralized locations of rock types. Groundwater mapsprovide indications of rock permeability, depths to water,and information on the need for dewatering or unwateringwithin the source area. During field reconnaissance, thecountryside should be examined for exposed rock outcropsor talus piles. Roadcuts and ditches may also provideuseful exposures. Existing sources and any projects thatpreviously used the rock source should be examined.
Service records are an excellent indication of the potentialdurability of rock. Federal (Reclamation, U.S. ArmyCorps of Engineers, Department of Transportation), State(highway, environmental quality), and county or local(highway or building) agencies usually maintain lists ofsources. The local telephone "Yellow Pages," Internet,and construction companies may also provide information.
Data obtained should define the major advantages ordisadvantages of potential material sources withinreasonable haul distance. A reconnaissance constructionmaterial report should be prepared at this stage.
Feasibility
Information acquired during the feasibility stage is usedto prepare preliminary designs and cost estimates.Sufficient information concerning potential sources shouldbe gathered to determine whether the rock should beobtained from an existing source or a new source.

RIPRAP
199
Selection of sources should be limited to those that mayeventually be used in specifications. Core drilling andblast tests may be required to confirm fragment size andquantity of material available in each source. Thepotential material sources should be examined todetermine size and character, and particularly to observejoint and fracture spacing, resistance to weathering, andvariability of the rock. The spacing of joints, fractures,schistosity, banding, bedding, and other planes ofweakness may control the rock fragment sizes andshapes. Weathering resistance of the rock will provide agood indication of durability. Quarry or pit developmentand the impacts of groundwater should be addressed.Particular attention should be given to location anddistribution of unsound seams or beds that must beavoided or wasted during the quarry operation. A generallocation map and detailed report describing the potentialsources and containing estimates of available quantities,overburden, haul roads, and accessibility should beprepared. Representative samples of riprap materialfrom the most promising potential sources should be sub-mitted to the laboratory for testing. A feasibility con-struction material report should be prepared at this stage.
Design
Investigations during the design stage furnish data andinformation required for the specifications. Sources indi-cated by feasibility investigations to be suitable arefurther investigated to establish quantities, determine thecapability to produce the required gradation, and to deter-mine uniformity. Depending on project needs, servicerecords may be used in conjunction with or instead oflaboratory testing. Blast and processing testing should beconsidered for new sources. All sampling and testing andthe laboratory’s Riprap Quality Evaluation Report shouldbe completed at this stage. If additional sources are

FIELD MANUAL
200
necessary, the new sources must be investigated asthroughly as the original sources.
Construction
Investigations during construction provide field anddesign personnel with additional detailed information forproper source development. This information should beobtained sufficiently ahead of quarrying or excavating toprovide for proper processing and placing of material. Ifunforeseen changes occur in the quality of material in thesource, sampling and quality evaluation testing of thematerial may be required to confirm material suitabilityor to delineate unsuitable areas.
Reports Reporting the results of any investigation is important.The level of detailed information requirements increaseswith each successive stage. Adequate information mustbe available by the feasibility stage to develop realisticcost estimates and to properly select sources. A suggestedoutline for reports for rock or riprap obtained from anypotential quarry or pit is as follows:
a. Ownership
b. Location of source and project shown on a map
c. General description of site
d. General hydrologic and geologic descriptions
e. Structural geology information (distribution andarrangement of rock types and discontinuitieswithin the deposit.)
f. Manner and sizes of rock breakage
g. Estimate of uniformity and wastage

RIPRAP
201
h. Shape and angularity of source material
i. Hardness and density of source material
j. Degree and extent of weathering
k. Any abnormal properties or conditions not coveredabove
l. Estimate of extent, volume, and depth of suitabledeposit(s)
m. Accessibility
n. Photographs
o. Geophysical and geologic data (e.g., drill logs,borehole geophysical logs, and seismic refraction orreflection survey data)
If commercial quarry or pit deposits are considered,obtain, as appropriate, the following information in addi-tion to the data needed for a new source.
• Name, address, and phone number of the plantoperator
• Location of the plant relative to quarry
• Description of the operation and plant withemphasis on capabilities for additional riprapproduction and maintaining current operationcapabilities
• Blasting methods and problems related to produc-tion of riprap
• Transportation facilities and any potentialdifficulties
• Actual or estimated riprap gradations achieved orachievable by current or adjusted operations
• Location of scales
• Estimate of reserve and wastage
FIELD MANUAL
202
• Approximate prices of riprap material
• Service history of material produced
• Any other pertinent information
Sampling Sampling is often the weak link in any source evaluation.The samples should represent the nature and condition ofthe materials and be appropriate for testing. Sampling isinitiated at the specifications stage of the project.Sampling should cover the entire riprap source. Thesample size should be at least 600 pounds (275 kilograms)and represent the quality range from poor to best as foundat the source in the same proportions as the source cansupply. If the material quality is quite variable, it may bepreferable to obtain three samples that represent thepoorest to best quality material available. The minimumsize of individual fragments selected should be at least0.5 foot (15 cm) square. An estimate of the relativepercentages of material at each quality level should bemade.
Representative samples may be difficult to obtain.Overburden may limit the areas where material can beobtained and obscure the true characteristics of thedeposit. Outcrops will often be more weathered than thesubsurface deposits. Samples obtained from talus piles orouter surfaces of rock outcrops are seldom representativeof quality, quantity, or gradation. Fresh material may beobtained by breaking away the outer surfaces, or bytrenching, blasting, or core drilling. If coring is the onlymethod of obtaining samples, the preferred size is6 inches (15 cm).

RIPRAP
203
Shipping
Samples of rock fragments can be shipped by conventionaltransport such as motor freight. Large rock fragmentsshould be securely banded to shipping pallets. Smallerfragments should be transported in bags or containers topreclude loss, contamination, or damage frommishandling during shipment.
Testing
The Riprap Quality Evaluation Report is based onlaboratory testing of the shipped representative samples.The quality evaluation tests include detailed petrographicexamination, determination of physical properties andabsorption, and a rapid freeze-thaw durability evaluation.
Petrographic Examination.—The petrographic exami-nation follows USBR Procedure 4295 or ASTM ProcedureC 295, which were developed for concrete aggregate. Thedecisions concerning specific procedural methods andspecimen preparation depend on the nature of the rockand the intended use of the rock.
The rock pieces are visually examined and the differentrock facies and types are segregated for individualevaluation. The following are evaluated:
• Size range
• Fragment shape
• Shape and size control by discontinuities such asjoints, banding, or bedding
• Surface weathering
• Secondary mineralization or alteration
• Hardness, toughness, and brittleness

FIELD MANUAL
204
• Voids and pore characteristics and their variations
• Texture, internal structure, grain size, cementation,and mineralogy of the various facies and rock types
• Thin sections, sometimes supplemented by X-raydiffraction as required
Freeze-Thaw Test.— For freeze-thaw durability testing,two 7/8-inch (73 millimeter) cubes are sawed from rockfragments selected by visual inspection to represent therange from poorest to best quality rock for each rock faciesor type. Because the rock pieces could have significantphysical or structural discontinuities, the number ofcubes obtained for testing will vary from sample tosample. The samples are photographed, the cubes areimmersed in water for 72 hours, and specific gravities(bulk, SSSG, and apparent) and absorptions aredetermined by USBR Procedure 4127 or ASTM ProcedureC 127. The cubes are reimmersed in water to maintain asaturated condition for freeze-thaw testing.
Rapid freezing and thawing durability tests areperformed on riprap samples according to USBRProcedure 4666 or ASTM Procedure D5312. The rockfailure criterion is 25 percent loss of cube mass calculatedfrom the difference in mass between the largest cubefragment remaining after testing and the initial cubemass.
Sodium Sulfate Soundness Test.—Sodium sulfatesoundness tests are performed on riprap samplesaccording to USBR Procedure 4088 or ASTM ProcedureD5240. The loss after an interval of screening isdetermined after at least five cycles of saturation anddrying of the samples. The test is a good indicator ofresistance to freeze-thaw deterioration.

RIPRAP
205
Physical Properties.—Material remaining after thepetrographic examination and freeze-thaw testing iscrushed into specific size fractions (USBR Procedure4702). Representative samples of each size fraction aretested for bulk, SSGS, and absorption followingUSBR Procedure 4127 or ASTM Procedure C 127; abra-sion is tested using the Los Angeles abrasion testfollowing USBR Procedure 4131 or ASTM ProcedureC 535. Both the Los Angeles abrasion and sodium sulfatesoundness tests are durability tests. The Los Angelesabrasion test is used to determine the ability of the rockto withstand handling and processing and water action.The sodium sulfate soundness test simulates weatheringof the rock pieces.
Waste in Riprap Production
Production of riprap generally requires drilling, blasting,and processing to obtain the desired sizes. This section isa guide to help estimate the amount of waste that can beexpected from riprap production.
Numerous factors in the parent rock contribute to wastein quarrying operations. The natural factors include:
• Weathering• Fracturing (joints, shears, and faults)• Bedding, schistosity, and foliation• Recementing of planar features
Other important, somewhat controllable contributors towaste are:
• Construction inspection• Size and gradation requirements• Drilling and blasting• Processing, hauling, and placement

FIELD MANUAL
206
Factors a through d relate to the geology in the quarryand probably are the most important factors that governwhat sizes can be produced. Weathering can extend 20 to60 feet (6 to 18 meters) below the original ground surface.Weathering breaks down the rock and weakens existingplanar features such as bedding, schistosity, and jointing.In rocks such as limestone and dolomite, secondarydeposits of calcium carbonate can cement existing joints.When first examined, this cementation appears to besound; but processing the rock can refracture theseplanes. Existing quarries, or quarries that have been inoperation for many years, probably will produce materialwith less waste because excavations are partly orcompletely through the zone of weathering. Newquarries, or quarries where rock production has beenlimited, must contend with the weathered zone and willlikely produce a less desirable product.
Gradation Requirements
Gradation requirements and inspection control aregoverned by the agency issuing the constructionspecifications. Adjustments in gradation or inspectionrequirements can drastically change the waste quantitiesproduced. Except in isolated cases, it becomes moredifficult to produce riprap when rock sizes are increasedand gradations are tightly controlled.
Production Methods
Production methods that include drilling, blasting, pro-cessing, and hauling also play an important role in thesizes that can be obtained. Rock that is well-graded andhas a large maximum size can be produced more readilywhen using large diameter, widely spaced shot holes.Close spaced, small diameter shot holes tend to maximizefragmentation. Blasting agents, delays, and loading

RIPRAP
207
methods vary considerably and have a significant effecton how the rock fractures. The most efficient andeconomical drilling and blasting methods must bedetermined by test blasting and performing gradations onthe blasted product. Test shots should be modified toachieve the desired product. Production should not startuntil it is proven that the required product can beproduced with a minimum of waste.
Many rock types, especially those that are banded (beddedor schistose) or contain healed joints, can break downsignificantly during processing. Some limestones areespecially susceptible to breakdown when the rock isdropped during blasting and processing operations. Rockfrom most quarries will fracture badly when droppedmore than 50 feet (15 meters).
Quarries must tailor their blasting techniques to get therequired gradations. Quarries that normally produceaggregates for concrete, road metal, and base courseusually have a very difficult time producing a reasonablywell-graded riprap. This is because their normal opera-tion already has shattered the face at least 100 feet back.To obtain good riprap, a working face or ledge should bereserved for riprap production.
The quantity of quarry waste shown in table 18-1 istypical of riprap quarries. Items that should be con-sidered when using the table include:
• Waste includes undersize and excessive intermediatesizes. Oversize riprap is reprocessed to the propersize.
• Rock produced is reasonably well graded from 6± to36± inches (.15 to 1 m), and the inspection control isvery strict. Much less waste will be incurred ifsmaller rock sizes

FIELD MANUAL
208
Table 18-1.—Rock types and typical usable quantities of riprap
Rock type
Estimated percentwaste to producesuitable riprap Remarks
IGNEOUS
Intrusive 25 to 75%Average 50%±
Extrusive 40 to 85%Average 60%±
METAMORPHIC
Gneiss 40 to 75%Average 55%±
Based on limited data
Schist 50 to 75%Average 65%±
Based on limited dataVery little riprapwould be salvaged inthe weathered zone
SEDIMENTARY
Limestone/Dolomite
55 to 85 %Average 65%±
Based on several goodquarry sites
Sandstone Average 60%± Based on limited data
are required or if the deposit is shot for rockfill or thespecific rock product.
• Drilling, blasting, processing, hauling, and placingare accomplished by a typical contractor.
• Rock quarried is the best material available and isnot severely fractured or weathered.
• Riprap production is generally limited to newquarries or unshot ledges or benches.

Chapter 19
BLAST DESIGN
Introduction
This chapter is an introduction to blasting techniquesbased primarily on the Explosives and BlastingProcedures Manual (Dick et al., 1987) and the Blaster’sHandbook (E.I. du Pont de Nemours & Co., Inc., 1978).Blast design is not a precise science. Because of widelyvarying properties of rock, geologic structure, and explo-sives, design of a blasting program requires field testing.Tradeoffs frequently must be made when designing thebest blast for a given geologic situation. This chapterprovides the fundamental concepts of blast design. Theseconcepts are useful as a first approximation for blastdesign and also in troubleshooting the cause of a badblast. Field testing is the best tool to refine individualblast designs.
Throughout the blast design process, two overriding prin-ciples must be kept in mind:
(1) Explosives function best when there is a free faceapproximately parallel to the explosive column atthe time of detonation.
(2) There must be adequate space for the broken rockto move and expand. Excessive confinement ofexplosives is the leading cause of poor blastingresults such as backbreak, ground vibrations,airblast, unbroken toe, flyrock, and poorfragmentation.
Properties and Geology of the Rock Mass
The rock mass properties are the single most criticalvariable affecting the design and results of a blast. The

FIELD MANUAL
210
rock properties are very qualitative and cannot be suffi-ciently quantified numerically when applied to blastdesign. Rock properties often vary greatly from one endof a construction job to another. Explosive selection, blastdesign, and delay pattern must consider the specific rockmass being blasted.
Characterizing the Rock Mass
The keys to characterizing the rock mass are a good geol-ogist and a good blasting driller. The geologist must con-centrate on detailed mapping of the rock surface for blastdesign. Jointing probably has the most significant effecton blasting design. The geologist should document thedirection, density, and spacing between the joint sets. Atleast three joint sets—one dominant and two lesspronounced—are in most sedimentary rocks. The strikeand dip of bedding planes, foliation, and schistosity arealso important to blast design and should be documentedby the geologist. The presence of major zones of weaknesssuch as faults, open joints, open beds, solution cavities, orzones of less competent rock or unconsolidated materialare also important to blast design and must beconsidered. Samples of freshly broken rock can be used todetermine the hardness and density of the rock.
An observant blasting driller can be of great help inassessing rock variations that are not apparent from thesurface. Slow penetration, excessive drill noise, andvibration indicate a hard rock that will be difficult tobreak. Fast penetration and a quiet drill indicate a softer,more easily broken zone of rock. Total lack of resistanceto penetration, accompanied by a lack of cuttings orreturn water or air, means that the drill has hit a void.Lack of cuttings or return water may also indicate thepresence of an open bedding plane or other crack. Adetailed drill log indicating the depth of these various

BLAST DESIGN
211
conditions can be very helpful in designing and loadingthe blast. The log should be kept by the driller. Thedriller should also document changes in the color ornature of the drill cuttings which will tell the geologistand blaster the location of various beds in the formation.
Rock Density and Hardness
Some displacement is required to prepare a muckpile forefficient excavation. The density of the rock is a majorfactor in determining how much explosive is needed todisplace a given volume of rock (powder factor). Theburden-to-charge diameter ratio varies with rock density,changing the powder factor. The average burden-to-charge diameter ratio of 25 to 30 is for average densityrocks similar to the typical rocks listed in table 19-1.Denser rocks such as basalt require smaller ratios (higherpowder factors). Lighter materials such as somesandstone or bituminous coal can be blasted with higherratios (lower powder factors).
The hardness or brittleness of rock can have a significanteffect on blasting results. If soft rock is slightly under-blasted, the rock probably will still be excavatable. If softrock is slightly overblasted, excessive violence will notusually occur. On the other hand, slight underblasting ofhard rock will often result in a tight muckpile that isdifficult to excavate. Overblasting of hard rock is likely tocause excessive flyrock and airblast. Blast designs forhard rock require closer control and tighter tolerancesthan those for soft rock.
Voids and Zones of Weakness
Undetected voids and zones of weakness such as solutioncavities, “mud” seams, and shears are serious problems in

FIELD MANUAL
212
Table 19-1.—Typical rocks, densities, and unit weights
Rock type
Densityrange
(g/cm3)1
Range of unit weights
U.S.customary
(lb/ft3)2Metric
(kg/m3)3
Limestone 2.5 to 2.8 156 to 174.7 2,500 to 2,800
Schist 2.6 to 2.8 162.2 to 174.7 2,600 to 2,800
Rhyolite 2.2 to 2.7 137.2 to 168.5 2,200 to 2,700
Basalt 2.7 to 2.9 168.5 to 181 2,700 to 2,900
Sandstone 2/0 to 2.6 124.8 to 162.2 2,000 to 2,600
Bituminous coal
1.2 to 1.5 74.9 to 93.6 1,200 to 1,500
1 Grams per cubic centimeter. 2 Pounds per cubic foot. 3 Kilograms per cubic meter.
blasting. Explosive energy always seeks the path of leastresistance. Where the rock burden is composed ofalternate zones of hard material, weak zones, or voids, theexplosive energy will be vented through the weak zonesand voids resulting in poor fragmentation. Depending onthe orientation of zones of weakness with respect to freefaces, excessive violence in the form of airblast and flyrockmay occur. When the blasthole intersects a void,particular care must be taken in loading the charge, orthe void will be loaded with a heavy concentration ofexplosive resulting in excessive air-blast and flyrock.

BLAST DESIGN
213
If these voids and zones of weakness can be identified andlogged, steps can be taken during borehole loading toimprove fragmentation and avoid violence. The best toolfor this is a good drill log. The depths of voids and zonesof weakness encountered by the drill should bedocumented. The geologist can help by plotting the trendsof “mud” seams and shears. When charging the blasthole,inert stemming materials rather than explosives shouldbe loaded through these weak zones. Voids should befilled with stemming. Where this is impractical becauseof the size of the void, it may be necessary to block thehole just above the void before continuing the explosivecolumn.
If the condition of the borehole is in doubt, the top of thepowder column should be checked frequently as loadingproceeds. A void probably exists if the column fails to riseas expected. At this point, a deck of inert stemmingmaterial should be loaded before powder loadingcontinues. If the column rises more rapidly thanexpected, frequent checking will ensure that adequatespace is left for stemming.
Alternate zones of hard and soft rock usually result in un-acceptably blocky fragmentation. A higher powder factorseldom will correct this problem; it will merely cause theblocks to be displaced farther. Usually, the best way to al-leviate this situation is to use smaller blastholes withsmaller blast pattern dimensions to get a better powderdistribution. The explosive charges should be concen-trated in the hard rock.
Jointing
Jointing can have a pronounced effect on both fragmenta-tion and the stability of the perimeter of the excavation.Close jointing usually results in good fragmentation.

FIELD MANUAL
214
Figure 19-1.—Effect of jointing on the stability of an excavation (plan view).
Widely spaced jointing, especially where the jointing ispronounced, often results in a very blocky muckpilebecause the joint planes tend to isolate large blocks inplace. Where the fragmentation is unacceptable, the bestsolution is to use smaller blast holes with smaller blastpattern dimensions. This extra drilling and blastingexpense will be more than justified by the savings inloading, hauling, and crushing costs and the savings insecondary blasting.
Where possible, the perimeter holes of a blast should bealigned with the principal joint sets. This produces amore stable excavation, whereas rows of holesperpendicular to a primary joint set produces a moreragged, unstable perimeter (figure 19-1). The jointing willgenerally determine how the corners at the back of theblast will break out. To minimize backbreak and flyrock,tight corners, as shown in figure 19-2, should be avoided.

BLAST DESIGN
215
Figure 19-2.—Tight and open cornerscaused by jointing (plan view).
The open corner at the left of figure 19-2 is preferable.Given the dominant jointing in figure 19-2, more stableconditions will result if the first blast is opened at the farright and designed so that the hole in the rear insidecorner contains the highest numbered delay.
Bedding/Foliation
Bedding has a pronounced effect on both the fragmen-tation and the stability of the excavation perimeter. Openbedding planes, open joints, or beds of weaker materialsshould be treated as zones of weakness. Stemming,rather than explosive, should be loaded into the boreholeat the location of these zones as shown in figure 19-3. Ina bed of hard material (greater than 3 feet [1 m] thick), itis often beneficial to load an explosive of higher densitythan is used in the remainder of the borehole. To breakan isolated bed or zone of hard rock (3 feet [1 m] thick orgreater) near the collar of the blasthole, a deck charge isrecommended, as shown in figure 19-4, with the deckbeing fired on the same delay as the main charge or onedelay later. Occasionally, satellite holes are used to helpbreak a hard zone in the upper part of the burden.Satellite holes (figure 19-4) are short holes, usuallysmaller in diameter than the main blastholes drilledbetween the main blastholes.

FIELD MANUAL
216
Figure 19-3.—Stemming through weakmaterial and open beds.

BLAST DESIGN
217
Figure 19-4.—Two methods of breakinga hard collar zone.
A pronounced foliation, bedding plane, or joint isfrequently a convenient location for the bench floor. It notonly gives a smoother floor but also may reducesubdrilling requirements.
Dipping beds frequently cause stability problems anddifficulty in breaking the toe of the excavation. Whenbedding or foliation dip into the excavation wall, thestability of the slope is enhanced. When the dip is out ofthe wall, slip planes exist that increase the likelihood ofslope deterioration or failure. Blasthole cutoffs (part of acolumn of explosives not fired) caused by differential bedmovement are also more likely. Beds dipping out of thefinal slope should be avoided wherever possible.
Although beds dipping into the face improve slopestability, the beds can create toe problems because the toerock tends to break along the bedding or foliation planes.
FIELD MANUAL
218
Dipping beds such as these require a tradeoff, dependingupon which is the more serious problem—a somewhatunstable slope or an uneven toe. In some cases,advancing the opening perpendicular to dipping beds maybe a compromise.
Many blasting jobs encounter site-specific geologic condi-tions not covered in this general discussion. Goodblasting techniques require constant study of the geologyto make every effort to advantageously use the geology, orat least minimize its unfavorable effects in blast designs.
Surface Blasting
Blast Hole Diameter
The blast hole size is the first consideration of any blastdesign. The blast hole diameter, along with the type ofexplosive being used and the type of rock being blasted,determines the burden (distance from the blast hole to thenearest free face). All other blast dimensions are afunction of the burden. This discussion assumes that theblaster has the freedom to select the borehole size. Manyoperations limit borehole size based on available drillingequipment.
Practical blasthole diameters for surface constructionexcavations range from 3 (75 mm) to approximately15 inches (38 cm). Large blasthole diameters generallyyield low drilling and blasting costs because large holesare cheaper to drill per unit volume, and less sensitive,cheaper blasting agents can be used in larger diameterholes. Larger diameter blastholes also allow large bur-dens and spacings and can give coarser fragmentation.Figure 19-5 illustrates this comparison using 2- (50-mm)and 20-inch (500-mm)-diameter blastholes as an example.

BLAST DESIGN
219
Figure 19-5.—The effect of large and smallblast holes on unit costs.
Pattern A contains four 20-inch (500-mm) blast boles, andpattern B contains 400 2-inch (5-mm) blast holes. In allbench blasting operations, some compromise betweenthese two extremes is chosen. Each pattern representsthe same area of excavation—15,000 square feet(1,400 m2)—each involves approximately the same volumeof blast holes, and each can be loaded with about the sameweight of explosive.
As a general rule, large diameter blast holes (6 to15 inches [15 to 38 cm]) have limited applications on mostconstruction projects because of the requirements for finefragmentation and the use of relatively shallow cuts.However, borehole size depends primarily on localconditions. Large holes are most efficient in deep cutswhere a free face has already been developed.

FIELD MANUAL
220
In most construction projects, small diameter drillingwith high-speed equipment provides relatively low unitcosts and permits fairly close spacing of holes. This closespacing provides better distribution of explosives through-out the rock mass, which in turn produces betterbreakage. An additional advantage of small diameterblast holes is that the reduction in the amount of eachexplosive used in each hole reduces ground vibrations.Construction blast hole diameters usually vary from 3.5 to4.5 inches (90 to 114 mm), and the normal drilling depthis less than 40 feet (12 m). Reclamation generally limitsblast hole diameters for structural excavation drilling to3.5 inches (90 mm). Blasting patterns usually range from6 by 8 feet (1.8 by 2.4 meters) to 8 by 15 feet (2.4 by 4.6 m)and are usually rectangular with the burden being lessthan the spacing.
In a given rock type, a four-hole pattern will giverelatively low drilling and blasting costs. Drilling costs forlarge blastholes will be low, a low-cost blasting agent willbe used, and the cost of detonators will be minimal. In adifficult blasting situation, the broken material will beblocky and nonuniform in size, resulting in higherloading, hauling, and crushing costs as well as requiringmore secondary breakage. Insufficient breakage at thetoe may also result.
The 400-hole pattern will yield high drilling and blastingcosts. Small holes cost more to drill per unit volume,powder for small diameter blastholes is usually moreexpensive, and the cost of detonators will be higher. Thefragmentation will be finer and more uniform, resultingin lower loading, hauling, and crushing costs. Secondaryblasting and toe problems will be minimized. Sizeof equipment, subsequent processing required for theblasted material, and economics will dictate the type offragmentation needed and the size of blast hole to beused.

BLAST DESIGN
221
Figure 19-6.—The effects of jointingon selection of blast hole size.
Geologic structure is a major factor in determining theblast hole diameter. Planes of weakness (i.e., joints,shears, or zones of soft rock) tend to isolate large blocks ofrock in the burden. The larger the blast pattern, the morelikely these blocks are to be thrown unbroken into themuckpile. Note that in the top pattern in figure 19-6,some of the blocks are not penetrated by a blast hole. Inthe smaller bottom pattern, all the blocks contain at leastone blast hole. Because of the better explosivesdistribution, the bottom pattern will give betterfragmentation.

FIELD MANUAL
222
Airblast and flyrock often occur because of an insufficientcollar distance (stemming column) above the explosivecharge. As the blast hole diameter increases, the collardistance required to prevent violence increases. The ratioof collar distance to blast hole diameter required toprevent violence varies from 14:1 to 28:1, depending onthe relative densities and velocities of the explosive androck, the physical condition of the rock, the type ofstemming used, and the point of initiation. A larger collardistance is required where the sonic velocity of the rockexceeds the detonation velocity of the explosive or wherethe rock is heavily fractured or low density. A top-initiated charge requires a larger collar distance than abottom-initiated charge. As the collar distance increases,the powder distribution becomes poorer, resulting inpoorer fragmentation of the rock in the upper part of thebench.
Ground vibrations are controlled by reducing the weightof explosive fired per delay interval. This is done moreeasily with small blast holes than with large blast holes.In many situations where large diameter blast holes areused near populated areas, several delays, along withdecking, must be used within each hole to controlvibrations.
Large holes with large blast patterns are best suited to anoperation with: (1) a large volume of material to bemoved, (2) large loading, hauling, and crushingequipment, (3) no requirement for fine, uniform fragmen-tation, (4) an easily broken toe, (5) few ground vibrationor airblast problems (few nearby buildings), and (6) arelatively homogeneous, easily fragmented rock withoutmany planes of weakness or voids. Many blasting jobshave constraints that require smaller blast holes.

BLAST DESIGN
223
Figure 19-7.—Three basic types of drill patterns.
The final selection of blast hole size is based oneconomics. Savings realized through inappropriate costcutting in the drilling and blasting program may well belost through increased loading, hauling, or crushing costs.
Blast Patterns
The three drill patterns commonly used are square,rectangular, and staggered. The square drill pattern(figure 19-7) has equal burdens and spacing, and therectangular pattern has a larger spacing than burden. Inboth the square and rectangular patterns, the holes ofeach row are lined up directly behind the holes in thepreceding row. In the staggered pattern (figure 19-8), theholes in each are positioned in the middle of the spacingsof the holes in the preceding row. In the staggeredpattern, the spacings should be larger than the burden.
Square or rectangular drilling patterns are used for firingV-cut (figure 19-9) or echelon rounds. The burdens andsubsequent rock displacement are at an angle to theoriginal free face either side of the blast round in V-cut orechelon patterns. The staggered drilling pattern is usedfor row-on-row firing where the holes of one row are firedbefore the holes in the row immediately behind them asshown in figure 19-9. Looking at figure 19-9, with theburdens developed at a 45-degree angle to the original

FIELD MANUAL
224
Figure 19-9.—V-Echelon blast round(true spacing, S, is twice the true burden, B).
Figure 19-8.—Corner cut staggered pattern withsimultaneous initiation within rows (blast hole
spacing, S, is twice the burden, B).
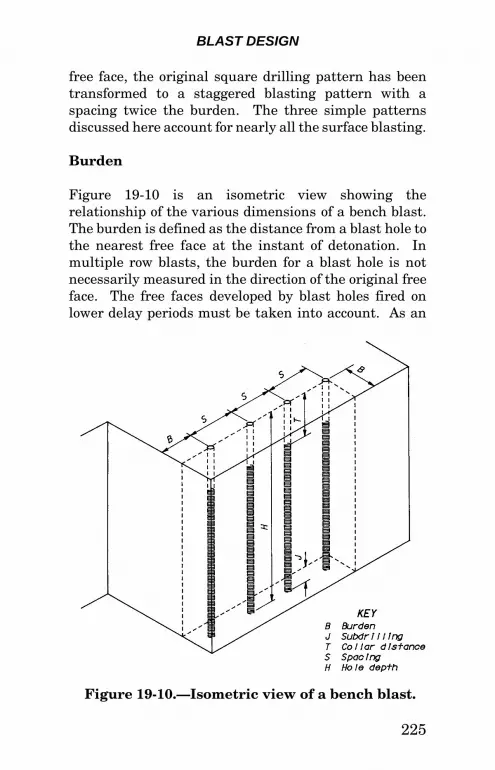
BLAST DESIGN
225
Figure 19-10.—Isometric view of a bench blast.
free face, the original square drilling pattern has beentransformed to a staggered blasting pattern with aspacing twice the burden. The three simple patternsdiscussed here account for nearly all the surface blasting.
Burden
Figure 19-10 is an isometric view showing therelationship of the various dimensions of a bench blast.The burden is defined as the distance from a blast hole tothe nearest free face at the instant of detonation. Inmultiple row blasts, the burden for a blast hole is notnecessarily measured in the direction of the original freeface. The free faces developed by blast holes fired onlower delay periods must be taken into account. As an

FIELD MANUAL
226
example, in figure 19-8, where one entire row is blastedbefore the next row begins, the burden is measuredperpendicular between rows.
In figure 19-9, the blast progresses in a V-shape. Thetrue burden on most of the holes is measured at an angleof 45 degrees from the original free face.
It is very important that the proper burden be calculated,accounting for the blast hole diameter, relative density ofthe rock and explosive, and, to some degree, the depth ofthe blast hole. An insufficient burden will cause excessiveairblast and flyrock. Too large a burden will produceinadequate fragmentation, toe problems, and excessiveground vibrations. If it is necessary to drill a roundbefore the previous round has been excavated, it isimportant to stake out the first row of the second roundbefore the first round is fired. This will ensure a properburden on the first row of blast holes in the second blastround.
For bulk-loaded charges (the charge is poured down thehole), the charge diameter is equal to the blast holediameter. For tamped cartridges, the charge diameterwill be between the cartridge diameter and the blast holediameter, depending on the degree of tamping. Foruntamped cartridges, the charge diameter is equal to thecartridge diameter. When blasting with ANFO(ammonium nitrate/fuel oil mixture) or other low densityblasting agents with densities near 53 lb/ft3 (0.85 g/cm3),in typical rock with a density near 170 lb/ft3 (2.7 g/cm3,the normal burden is approximately 25 times the chargediameter. When using denser products such as slurries ordynamites with densities near 75 lb/ft3 (1.2 g/cm3), thenormal burden is approximately 30 times the chargediameter. These are first approximations, and fieldtesting usually results in adjustments to these values.

BLAST DESIGN
227
The burden-to-charge-diameter ratio is seldom less than20 or seldom more than 40, even in extreme cases. Forinstance, when blasting with a low density blasting agentsuch as ANFO in a dense formation such as basalt, thedesired burden may be about 20 times the chargediameter. When blasting with denser slurries ordynamites in low density formations such as sandstones,the burden may approach 40 times the charge diameter.Table 19-2 summarizes these approximations.
Table 19-2.—Approximate burden charge diameter ratios for bench blasting
Material Ratio
ANFO (density 53.1 lb/ft3, 0.85 g/cm3)Light rock (density ~ 137.3 lb/ft3, 2.2 g/cm3)Average rock (density ~ 168.6 lb/ft3, 2.7 g/cm3)Dense rock (density ~ 199.8 lb/ft3, 3.2 g/cm3)
282523
Slurry, dynamite (density ~ 199.7 lb/ft3, 3.2 g/cm3)Light rock (density ~ 137.3 lb/ft3, 2.2 g/cm3,)Average rock (density ~ 168.6 lb/ft3, 2.7 g/cm3)Dense rock (density ~ 199.8 lb/ft3, 3.2 g/cm3)
333027
High-speed photographs of blasts show that flexing of theburden plays an important role in rock fragmentation. Arelatively deep, narrow burden flexes and breaks moreeasily than a shallow, wider burden. Figure 19-11 showsthe difference between using a 6-inch (150-mm) blast holeand a 12.25-inch (310-mm) blast hole in a 40-foot (12-m)bench with a burden-to-charge-diameter ratio of 30 andappropriate subdrilling and stemming dimensions. Notethe inherent stiffness of the burden with a 12.25-inch(310-mm) blast hole as compared to a 6-inch (150-mm)

FIELD MANUAL
228
Figure 19-11.—Comparison of a 12¼-inch- (300-mm) diameter blast hole (stiff burden)
on the left with a 6-inch- (150-mm) diameter blast hole (flexible burden) on the right
in a 40-foot (12-m) bench.
blast hole. Based on this, lower burden-to-charge-diameter ratios should be used as a first approximationwhen the blast hole diameter is large in comparison to thebench height. Care must be taken that the burden ratiois not so small as to create violence. Once the ratio hasbeen determined, it becomes the basis for calculatingsubdrilling, collar distance (stemming), and spacing.
Subdrilling
Subdrilling is the distance drilled below the floor level toensure that the full face of rock is removed. Where thereis a pronounced parting at floor level for the explosivecharge to conveniently break, subdrilling may not berequired. In coal strip mining, it is common practice to

BLAST DESIGN
229
drill down to the coal and then backfill a foot or two beforeloading explosives, resulting in a negative subdrill. Inmost surface blasting jobs, some subdrilling is necessaryto make sure the shot pulls to grade. In most constructionblasting, subdrilling is generally limited to 10 percent orless of the bench height. In blasting for civil engineeringstructures where a final grade is specified, subdrilling ofthe final lift is severely restricted. The final lift instructural excavations is usually limited to 5 or 10 feet(1.5 to 3 m). Subdrilling is not allowed in a 5-foot (1.5-m)lift and is limited to 2 feet (0.6 m) for the 10-foot (3-m) lift.To prevent damage to the foundation, the diameter of theblast hole is limited to 3.5 inches (90 mm).
Priming the explosive column at the toe level (bottom ofthe drill hole) gives maximum confinement and normallygives the best breakage. Toe priming usually requires lesssubdrilling than collar priming. Toe priming should berestricted in structural foundations because of thepotential damage to the unshot rock.
Excessive subdrilling is unnecessary, expensive, and maycause excessive ground vibrations because of the highdegree of confinement of the explosive in the bottom of theblast hole, particularly when the primer is placed in thebottom of the hole. In multiple-bench operations,excessive subdrilling may cause undue fracturing in theupper portion of the bench below, creating difficulties incollaring holes in the lower bench. Insufficient sub-drilling causes a high bottom, resulting in increased wearand tear on equipment and expensive secondary blastingor hand excavation in structural foundations.
Collar Distance (Stemming)
Collar distance is the distance from the top of theexplosive charge to the collar of the blast hole. This zone

FIELD MANUAL
230
usually is filled with an inert material called stemming togive some confinement to the explosive gases and toreduce airblast. A well-graded, crushed gravel works bestas stemming, but it is common practice to use drillcuttings because of availability and economics. Collar dis-tances that are too short result in excessive violence in theform of airblast and flyrock and may cause backbreak(breaking beyond the back wall). Collar distances thatare too long create large blocks in the upper part of themuck pile. The selection of a collar distance is often atradeoff between fragmentation and the amount ofairblast and flyrock that can be tolerated. This is trueespecially where the upper part of the bench contains rockthat is difficult to break or is of a different type. Thedifference between a violent blast and one that fails tofragment the upper zone properly may be a matter of onlya few feet of stemming. Collar or direct priming (placingthe primer at or near the collar of the blast hole with theblasting cap pointing toward the bottom of the hole) ofblast holes normally causes more violence than center ortoe priming and requires the use of a longer collardistance.
Field experience has shown that a collar distance equal to70 percent of the burden is a good first approximation.Careful observation of airblast, flyrock, and fragmen-tation will enable further refinement of this dimension.Where adequate fragmentation in the collar zone cannotbe attained while still controlling airblast and flyrock,deck charges or satellite (mid-spaced) holes may berequired (figure19-4).
A deck charge is an explosive charge near the top of theblast hole, separated from the main charge by inert stem-ming. If large blocky materials are being created in thecollar zone and less stemming would cause excessiveairblast or flyrock, the main charge should be reduced

BLAST DESIGN
231
slightly and a deck charge added. The deck charge isusually shot on the same delay as the main charge or onedelay later. Do not place the deck charge too near the topof the blast hole, or excessive flyrock may result.Alternatively, short satellite holes between the main blastholes can be used. The diameter of the satellite holes isusually smaller than the main blast holes, and thesatellite holes are loaded with a light charge of explosives.
Collar distance is a very important blast design variable.One violent blast can permanently alienate neighbors. Ina delicate situation, it may be best to start with a collardistance equal to the burden and gradually reduce this if,conditions warrant. Collar distances greater than theburden are seldom necessary.
Spacing
Spacing is defined as the distance between adjacent blastholes, measured perpendicular to the burden. Where therows are blasted one after the other as in figure 19-8, thespacing is measured between holes in a row. Where theblast progresses at an angle to the original free face, as infigure 19-9, the spacing is measured at an angle from theoriginal free face.
Spacing is calculated as a function of the burden and alsodepends on the timing between holes. Spacing that is tooclose causes crushing and cratering between holes, largeblocks in the burden, and toe problems. Spacing that istoo wide causes inadequate fracturing between holes, toeproblems, and is accompanied by humps on the face(figure 19-12).
When the holes in a row are initiated on the samedelay period, a spacing equal to twice the burden usuallywill pull the round satisfactorily. The V-cut round in

FIELD MANUAL
232
Figure 19-12.—Effects of too small and too large spacing.
figure 19-9 illustrates simultaneous initiation within arow, with the rows being the angled lines of holes fired onthe same delay. The true spacing is twice the trueburden, even though the holes originally were drilled ona square pattern.
Field experience has shown that the use of millisecond(ms) delays between holes in a row results in betterfragmentation and also reduces ground vibrationsproduced by the blast. When ms delays are used betweenholes in a row, the spacing-to-burden ratio must be

BLAST DESIGN
233
Figure 19-13.—Staggered blast pattern withalternate delays (blast hole spacing, S, is
1.4 times the burden, B).
reduced to somewhere between 1.2 and 1.8, with 1.5 beinga good first approximation. Various delay patterns maybe used within the rows, including alternate delays(figure 19-13) and progressive delays (figure 19-14).Generally, large diameter blast holes require lowerspacing-to-burden ratios (usually 1.2 to 1.5 with msdelays) than small diameter blast holes (usually 1.5 to1.8). Because of the geology complexities, the interactionof delays, differences in explosive and rock strengths, andother variables, the proper spacing-to-burden ratio mustbe determined through onsite experimentation, using thepreceding values as first approximations.
Except when using controlled blasting techniques such assmooth blasting and cushion blasting, described later, thespacing should never be less than the burden.
Hole Depth
In any blast design, the burden and the blast hole depth(or bench height) must be reasonably compatible. Therule of thumb for bench blasting is that the hole depth-to-burden ratio should be between 1.5 and 4.0. Hole depths

FIELD MANUAL
234
Figure 19-14.—Staggered blast pattern withprogressive delays (blast hole spacing, S, is
1.4 times the burden, B).
less than 1.5 times the burden cause excessive air blastand fly rock and, because of the short, thick shape of theburden, give coarse and uneven fragmentation. Whereoperational conditions require a ratio of less than 1.5, aprimer should be placed at the toe of the bench to assuremaximum confinement. Keep in mind that placing theprimer in the subdrill can cause increased groundvibrations and unacceptably irregular final grades forengineering structures. If the use of a hole depth-to-burden ratio of less than 1.5 is necessary or specified,consideration should be given to increasing the benchheight or using smaller drill hole diameters.
Hole depths greater than four times the burden are alsoundesirable. The longer a hole is with respect to itsdiameter, the more error there will be in the hole locationat toe level (hole wandering), the most critical portion ofthe blast. A poorly controlled blast will result. Extremelylong, slender holes have been known to intersect.
High benches with short burdens can also create safetyhazards, such as small equipment having to drill the front

BLAST DESIGN
235
row of holes near the edge of a high ledge or a smallshovel having to dig at the toe of a precariously high face.The obvious solution to this problem is to use a lowerbench height. There is no real advantage to a high bench.Lower benches yield more efficient blasting results, lowerdrilling costs, less chance of cutoffs, and are safer. If it isimpractical to reduce the bench height, larger rockhandling and drilling equipment should be used,effectively reducing the blast hole depth-to-burden ratio.
A major problem with long slender charges is the greaterpotential for cutoffs in the explosive column. If it isnecessary to use blast designs with large hole depth-to-burden ratios, multiple priming should be used asinsurance against cutoffs.
Delays
Millisecond delays are used between charges in a blastround to:
• To ensure that a proper free face is developed to en-able the explosive charge to efficiently fragment anddisplace the rock
• To enhance fragmentation between adjacent holes
• To reduce the ground vibrations created by the blast
Numerous delay patterns exist, several of which are cov-ered in figures 19-8, 19-9, 19-13, and 19-14. Keep in mindthe following:
• The delay time between holes in a row should be be-tween 1 and 5 ms per foot (0.3 m) of burden. Delaytimes less than 1 ms per foot of burden causepremature shearing between holes, resulting in

FIELD MANUAL
236
coarse fragmentation. If an excessive delay time isused between holes, rock movement from the firsthole prevents the adjacent hole from creatingadditional fractures between the two holes. A delayof 3 ms per foot (0.3 m) of burden gives good resultsin many types of rock.
• The delay time between rows should be two to threetimes the delay time between holes in a row. Toobtain good fragmentation and to control fly rock, asufficient delay is needed so that the burden frompreviously fired holes has enough time to moveforward to accommodate moving rock from subse-quent rows. If the delay between rows is too short,movement in the back rows will be upward ratherthan outward (figure19-15).
• Where airblast is a problem, the delay between holesin a row should be at least 2 ms per foot of spacing.This prevents airblast from one charge from addingto that of subsequent charges as the blast proceedsdown the row.
• For controlling ground vibrations, most regulatoryauthorities consider two charges to be separateevents if they are separated by a delay of 9 ms ormore.
These rules-of-thumb generally yield good blastingresults. When using surface delay systems such as deto-nating cord connectors and sequential timers, the chancesfor cutoffs will be increased. To solve this problem, in-hole delays should be used in addition to the surfacedelays. When using surface detonating cord connectors,the use of 100-ms delays in each hole is suggested. Thiswill cause ignition of the in-hole delays well in advance of

BLAST DESIGN
237
Figure 19-15.—The effect of inadequatedelays between rows.
rock movement, thus minimizing cutoffs. The same effectcan be accomplished with a sequential timer by avoidingthe use of electric caps with delays shorter than 75 to100 ms.
It is best if all the explosive in a blast hole is fired as asingle column charge. When firing large blast holes inpopulated areas, two or more delays within a blast holecan be used to reduce ground vibrations. Blast rounds ofthis type can become quite complex.
All currently used delay detonators employ pyrotechnicdelay elements that depend on a burning powder train fortheir delay. Although these delays are reasonablyaccurate, overlaps have been known to occur. When it isessential that one charge fires before an adjacent charge,such as in a tight corner of a blast, it is a good idea to skipa delay period.
Powder Factor
Powder factor, or pounds of explosive per cubic yard(kg/m3) of rock, is not the best tool for designing blasts.

FIELD MANUAL
238
( )( )P F
L d D
BSH. .
.=
0 340
27
2
Blast designs should be based on the dimensionsdiscussed earlier in this chapter. Powder factor is anecessary calculation for cost accounting purposes. Inconstruction blasting where the excavated material haslittle or no inherent value, powder factor is usuallyexpressed in pounds of explosives per cubic yard ofmaterial broken. Powder factors for surface blasting canvary from 0.25 to 2.5 pounds per cubic yards (lb/yd3 [0.1 to1.1 kg/m3]), with 0.5 to 1.0 lb/yd3 (0.2 to 0.45 kg/m3) beingmost typical.
Powder factor for a single blast hole is calculated by thefollowing:
P.F. = Powder factor in pounds of explosive per cubic yard of rockL = Length of explosive charge in feetd = Density of explosive charge in grams per cubic
centimeterD = Charge diameter in inchesB = Burden in feetS = Spacing in feetH = Bench height
A comparable formula can be developed for metricequivalents. Many companies that provide explosives alsopublish tables that give loading densities in pounds perfoot of blast hole for different combinations of d and D. Acommon nomograph found in most blasting handbookscan be used to calculate the density in pounds per foot ofborehole. The powder factor is a function of the explosivetype, rock density, and geologic structure. Table 19-3includes typical powder factors for surface blasting.
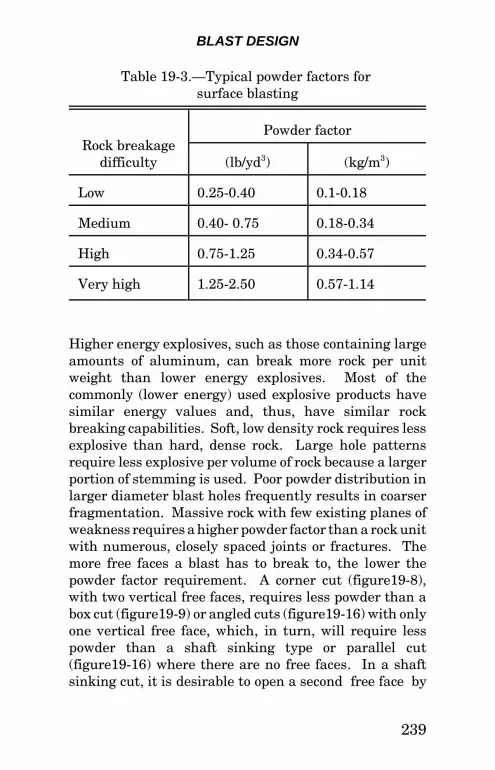
BLAST DESIGN
239
Table 19-3.—Typical powder factors for surface blasting
Rock breakagedifficulty
Powder factor
(lb/yd3) (kg/m3)
Low 0.25-0.40 0.1-0.18
Medium 0.40- 0.75 0.18-0.34
High 0.75-1.25 0.34-0.57
Very high 1.25-2.50 0.57-1.14
Higher energy explosives, such as those containing largeamounts of aluminum, can break more rock per unitweight than lower energy explosives. Most of thecommonly (lower energy) used explosive products havesimilar energy values and, thus, have similar rockbreaking capabilities. Soft, low density rock requires lessexplosive than hard, dense rock. Large hole patternsrequire less explosive per volume of rock because a largerportion of stemming is used. Poor powder distribution inlarger diameter blast holes frequently results in coarserfragmentation. Massive rock with few existing planes ofweakness requires a higher powder factor than a rock unitwith numerous, closely spaced joints or fractures. Themore free faces a blast has to break to, the lower thepowder factor requirement. A corner cut (figure19-8),with two vertical free faces, requires less powder than abox cut (figure19-9) or angled cuts (figure19-16) with onlyone vertical free face, which, in turn, will require lesspowder than a shaft sinking type or parallel cut(figure19-16) where there are no free faces. In a shaftsinking cut, it is desirable to open a second free face by

FIELD MANUAL
240
Figure 19-16.—Types of opening cuts.
creating a V-cut somewhere near the center of the round.V-cuts are discussed in the “Underground Blasting”section of this chapter.
When blasted materials have an inherent value per ton,such as aggregate or ore, powder factors are expressed asunit weight of explosives per ton of rock or tons of rock perunit weight of explosive.

BLAST DESIGN
241
Secondary Blasting
Some primary blasts will result in fragments too large tobe handled efficiently by the loading equipment and willcause plugging of crushers or preparation plants.Secondary fragmentation techniques must be used tobreak these oversize fragments. If fragments are too largeto be handled, the loader operator will set the rock asidefor treatment. Identifying material large enough to causecrusher plugging is not always easy. The loader operatormust be knowledgeable enough to watch for material thatis small enough for convenient loading but that is toolarge for the crusher.
Secondary fragmentation can be accomplished by:
• A heavy ball (headache ball) suspended from a cranemay be dropped repeatedly on the oversize fragmentuntil it breaks. This is a relatively inefficientmethod, and breaking a large or tough (nonbrittle)rock may take considerable time. This method isadequate where the number of oversize fragments issmall.
• A hole may be drilled into the oversize fragment anda hydraulic wedging device inserted to split the rock.This is also a slow method but may be satisfactorywhere a limited amount of secondary fragmentationis necessary. An advantage to this method is that itdoes not create the flyrock associated with explosivesand, to some degree, with the headache ball method.
• An explosive may be packed loosely into a crack ordepression in the oversize fragment then coveredwith a damp earth material and fired. This type ofcharge is called a mudcap, plaster, or adobe charge.This method is inefficient because of the limited

FIELD MANUAL
242
explosive confinement and the relatively largeamount of explosives required. Other results areexcessive noise, flyrock, and often, inadequatefragmentation. This method is also hazardousbecause the primed charge lying on the surface isprone to accidental initiation by external impactsfrom falling rocks or equipment. External chargesshould be used to break boulders only where drillingis impractical.
• The most efficient method of secondary fragmenta-tion is through the use of small (1- to 3-inch [25- to75-mm]) blast holes. The blast hole is normallycollared at the most convenient location, such as acrack or depression in the rock, and is directedtoward the center of the mass. The hole is drilledtwo-thirds to three-fourths of the way through therock. Because the powder charge is surrounded byfree faces, less explosive is required to break a givenamount of rock than in primary blasting. One-quarter pound per cubic yard (0.1 kg/m3) usually isadequate. Careful location of the charge is moreimportant than its precise size. When in doubt, it isbest to estimate on the low side and under load thehole. For larger fragments, it is best to drill severalholes and distribute the explosive charge rather thanplace the entire charge in a single hole. All secondaryblast holes should be stemmed. Usually, secondaryblasts are more violent than primary blasts. Anytype of initiation system may be used to initiate asecondary blast and for connecting large numbers ofoversize fragments. Detonating cord often is usedwhere noise is not a problem.
Although secondary blasting employs relatively smallcharges, the potential safety hazards must not be under-
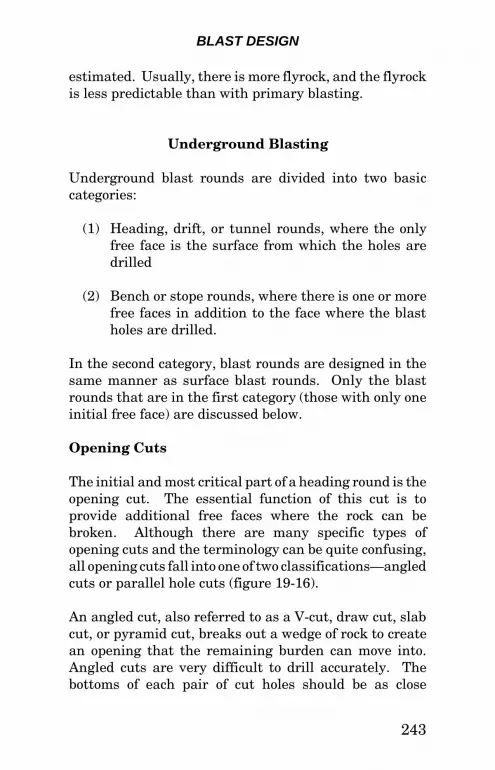
BLAST DESIGN
243
estimated. Usually, there is more flyrock, and the flyrockis less predictable than with primary blasting.
Underground Blasting
Underground blast rounds are divided into two basiccategories:
(1) Heading, drift, or tunnel rounds, where the onlyfree face is the surface from which the holes aredrilled
(2) Bench or stope rounds, where there is one or morefree faces in addition to the face where the blastholes are drilled.
In the second category, blast rounds are designed in thesame manner as surface blast rounds. Only the blastrounds that are in the first category (those with only oneinitial free face) are discussed below.
Opening Cuts
The initial and most critical part of a heading round is theopening cut. The essential function of this cut is toprovide additional free faces where the rock can bebroken. Although there are many specific types ofopening cuts and the terminology can be quite confusing,all opening cuts fall into one of two classifications—angledcuts or parallel hole cuts (figure 19-16).
An angled cut, also referred to as a V-cut, draw cut, slabcut, or pyramid cut, breaks out a wedge of rock to createan opening that the remaining burden can move into.Angled cuts are very difficult to drill accurately. Thebottoms of each pair of cut holes should be as close

FIELD MANUAL
244
together as possible but must not cross. If they cross, thedepth of round pulled will be less than designed. If thehole bottoms are more than a foot or so apart, the roundmay not pull to the proper depth. The angle between thecut holes should be 60 degrees or more to minimizebootlegging. One method to ensure getting a standardangle cut is to supply the drillers with a template with theproper spacing and angles for the angled holes. Theselection of the specific type of angled cut is a function ofthe rock, the type of drilling equipment, and thephilosophy of the blasting supervisor. A considerableamount of trial and error usually is involved indetermining the best angle cut for a specific site. In smalldiameter tunnels with narrow headings, it is oftenimpossible to position the drill properly to drill an angledcut. In this case, a parallel hole cut must be used.
Parallel hole cuts, also referred to as Michigan cuts,Cornish cuts, shatter cuts, burn cuts, or Coromant cuts,are basically a series of closely spaced holes, some loadedand some unloaded (figure 19-17) that, when fired,pulverize and eject a cylinder of rock to create an openingwhere the remaining burden can be broken. Because theyrequire higher powder factors and more drilling pervolume of rock blasted, the use of parallel hole cutsusually is restricted to narrow headings where there isnot enough room to drill an angled cut.
Parallel hole cuts involve more drilling than angled cutsbecause the closely spaced holes break relatively smallvolumes of rock. Parallel cuts are relatively easy to drillbecause the holes are parallel. Like angled cuts, accu-rately drilled parallel hole cuts are essential if the blastround is to be effective. Some drill jumbos have automaticcontrols to ensure that holes are drilled parallel. Drilljumbos of this type are a good investment where parallelhole cuts will be drilled routinely. A template also may

BLAST DESIGN
245
Figure 19-17.—Six designs for parallel hole cuts.
be used in drilling a parallel hole cut. The selection of thetype of parallel hole cut also depends on the rock, the typeof drilling equipment, and the philosophy of the blastingsupervisor. As with angled cuts, trial and error usually isinvolved in determining the best parallel hole cut for aspecific site.
All types of opening cuts must pull to the planned depthbecause the remainder of the round will not pull moredeeply than the opening cut. In blasting with burn cuts,care must be exercised to prevent overloading of the burnholes because overloading may cause the cut to “freeze” ornot pull properly. The design of the cut depends on thetype of rock and often must be designed and refined bytrial and error.

FIELD MANUAL
246
The advantage of a large central hole is that the holegives a dependable free face where succeeding holes canbreak. This free face is not always obtained withstandard burn cuts. The large central hole ensures amore dependable and deeper pull of the blast round. Thedisadvantages of a large central hole are the requirementsfor the proper equipment to drill the large central hole aswell as extra time. Intermediate-sized holes, usually 4 to5 inches (100-130 mm) in diameter, are sometimes drilledusing the standard blast hole equipment as a compromise.
In some soft materials, particularly coal, the blasted cutis replaced by a sawed kerf, usually at floor level(figure 19-18). In addition to giving the material adependable void to break into, the sawed cut ensures thatthe floor of the opening will be smooth.
Blasting Rounds
Once the opening cut has established the necessary freeface, the remainder of the blast holes must be designed sothat the burden successively breaks into the void space.The progression of the blast round should provide aproper free face parallel or nearly parallel to the hole atits time of initiation. Figure 19-19 gives the typicalnomenclature for blast holes in a heading round.
The holes fired immediately after the cut holes are calledthe relievers. The burden between these holes must beplanned carefully. If the burden is too small, the chargeswill not pull their share of the round. If the burden is toolarge, the round may freeze because the rock will haveinsufficient space to expand. After several relievers havebeen fired, the opening usually is large enough to permitthe remainder of the blast to be designed, as discussedunder “Surface Blasting.” Where heading rounds arelarge, the burden and spacing ratio usually is slightly less

BLAST DESIGN
247
Figure 19-18.—Blast round for soft rock using sawed kerf (numbers on loaded
holes show delay in milliseconds.)
than that for surface blasts. In small headings wherespace is limited, the burden and spacing ratio will be stillsmaller. Trial and error plays an important part in thistype of blast design.
The last holes to be fired in an underground round are theback holes at the top, the rib holes at the sides, and thelifters at the bottom of the heading. Unless controlledblasting is used (discussed below), the spacing betweenthese perimeter holes is about 20 to 25 blast holediameters. Figure 19-20 shows two typical angled cutblast rounds. After the initial wedge of rock is extractedby the cut, the angles of the subsequent blast holes are
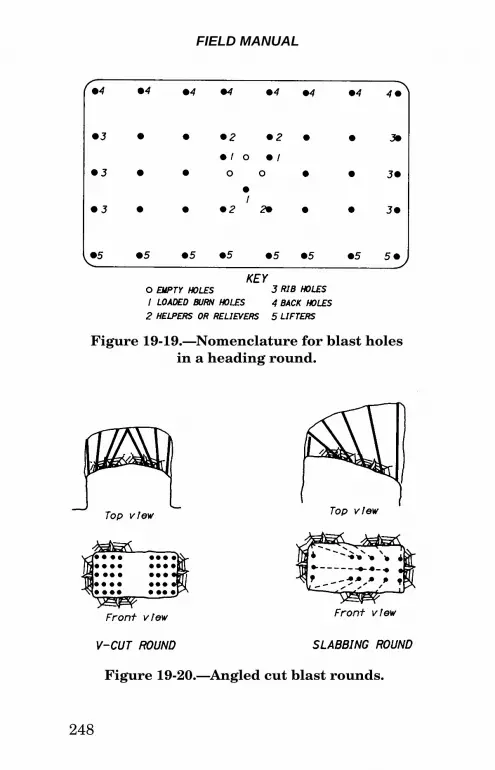
FIELD MANUAL
248
Figure 19-19.—Nomenclature for blast holesin a heading round.
Figure 19-20.—Angled cut blast rounds.
BLAST DESIGN
249
Figure 19-21.—Parallel hole cut blast rounds.
reduced progressively until the perimeter holes areparallel to the heading or looking slightly outward. Indesigning burden and spacing dimensions for angled cutblast rounds, the location of the bottom of the hole isconsidered rather than the collar.
Figure 19-21 shows two typical parallel hole cut blastrounds. These rounds are simpler to drill than angled cutrounds. Once the central opening has been established,the round resembles a bench round turned on its side.Figure 19-22 shows a comparison of typical muckpilesobtained from V-cut and burn-cut blast rounds. Burn cutsgive more uniform fragmentation and a more compactmuckpile than V-cuts. V-cut muckpiles are more spreadout and vary in fragmentation. Powder factors and theamount of drilling required are higher for burn cuts.

FIELD MANUAL
250
Figure 19-22.—Fragmentation and shape of muckpile as a function of type of cut.
Delays
Two series of delays are available for undergroundblasting—millisecond delays, the same as those used insurface blasting; and slow, or tunnel delays. The choiceof delay depends on the size of the heading being blastedand on the fragmentation and type of muckpile desired.Slow delays give coarser fragmentation and a morecompact muckpile. Millisecond delays give finer fragmen-tation and a looser muckpile (figure19-23). In smallheadings where space is limited, particularly when usingparallel hole cut rounds, slow delays are necessary toensure that the rock from each blast hole has time to beejected before the next hole fires. Where delays inter-mediate between millisecond delays and slow delays isdesired, use millisecond delays and skip delay periods.

BLAST DESIGN
251
Figure 19-23.—Fragmentation and shape ofmuckpile as a function of delay.
In an underground blast round, the delay pattern must bedesigned so that at the time of firing each hole has a goodfree face where the burden can be displaced. Figure 19-24shows a typical delay pattern for a burn cut blast roundin a heading in hard rock. Figure 19-25 shows a delaypattern for a V-cut blast round.
The shape of the muckpile is affected by the order that thedelays are fired (figure19-26). If the blast is designed sothat the back holes at the roof are fired last, a cascadingeffect is obtained, resulting in a compact muckpile. If thelifters are fired last, the muckpile will be displaced awayfrom the face.
Powder Factor
As with surface blasting, powder factors for undergroundblasting vary depending on several things. Powderfactors for underground blasting may vary from 1.5 to

FIELD MANUAL
252
Figure 19-25.—Typical V-cut blast rounddelay pattern (numbers on loaded holes
show delay in milliseconds).
Figure 19-24.—Typical burn cut blast round delay pattern (numbers on loaded
holes show delay in milliseconds).

BLAST DESIGN
253
Figure 19-26.—Shape of muckpile as a function of firing order.
12 lb/yd3 (0.7 to 5.5 kg/m3). Soft, light weight rock,headings with large cross sections, large blast holes, andangle cut rounds all tend to require lower powder factorsthan hard, dense rock, small headings, small blast holes,and parallel hole cuts.
Controlled Blasting Techniques
The term, controlled blasting, is used to describe severaltechniques that limit damage to the rock at the perimeterof the excavation by preventing the force of a blast fromcontinuing into the side walls. Normal blasting propa-gates cracks into the surrounding rock. These cracks canreduce the stability of the opening. The purpose of con-trolled blasting is to reduce this perimeter cracking and,

FIELD MANUAL
254
thus, increase stability of the final surface. Much of thefollowing discussion on controlled blasting techniques hasbeen determined through years of on-the-job testing andevaluation. The results of controlled blasting are afunction of the geology, especially the number andorientation of joint and fracture planes and the quality ofthe final rock surface that is required.
Line Drilling
Line drilling consists of drilling a row of closely spacedholes along the final excavation limits and not loading theholes with explosive. The line-drilled holes provide aplane of weakness to which the final row of blast holescan break and also reflect a portion of the blast’s shockwave. Line drilling is used mostly in small blastingoperations and involves small holes in the range of 2 to3 inches (50-75 mm) in diameter. Line drilling holes arespaced (center to center) two to four diameters apart butare more closely spaced at the corners. The maximumpractical depth to which line drilling can be done isgoverned by how accurately the alignment of the holes canbe held at depth (seldom more than 30 feet [10 m]).
To further protect the final perimeter, the blast holes ad-jacent to the line drill are spaced more closely and loadedmore lightly than the rest of the blast, and deck chargesare used as necessary. Best results are obtained in ahomogeneous rock with few joints or bedding planes orwhen the holes are aligned with a major joint plane. Linedrilling is sometimes used in conjunction with presplittingwhere the corners are line drilled and the remainder ofthe perimeter is presplit.
The use of line drilling is limited to jobs where even alight load of explosives in the perimeter holes would causeunacceptable damage. The results of line drilling are

BLAST DESIGN
255
often unpredictable, the cost of drilling is high, and theresults depend on the accuracy of the drilling.
Presplitting
Presplitting, sometimes called preshearing, is similar toline drilling except that the holes are drilled slightlyfarther apart and are loaded very lightly. Presplit holesare fired before any of the adjacent main blast holes. Thelight explosive charges propagate a crack between theholes. In badly fractured rock, unloaded guide holes maybe drilled between the loaded holes. The light powderload may be obtained by using specially designed slendercartridges, partial or whole cartridges taped to a deto-nating cord downline, an explosive cut from a continuousreel, or heavy grain detonating cord. A heavier charge oftamped cartridges is used in the bottom few feet of hole.Figure 19-27 shows three types of blast hole loads used forpresplitting. Cartridges ¾ or � inch by 2 feet (19 or22 mm by 0.6 m) connected with couplers are available.Manufacturers now produce continuous, small diameter,long-tubular water gel columns for loading presplit holes.The diameter of these continuous tubular columns usuallyis 1 inch (25 mm), and they come with a built-in downline.They can be loaded easily in rough and inclined holes.The continuous column presplit explosives produceincreased loading rates and reduced labor costs.
If possible, stem completely around and between thecartridges in the blast hole; and, although not essential,fire in advance of the main blast. The maximum depthfor a single presplit is limited by the accuracy of thedrillholes and is usually about 50 feet (15 m). Depthsbetween 20 and 40 feet (6 and 12 m) are recommended.A deviation of greater than 6 inches (152 mm) from thedesired plane or shear will give inferior results. Avoidpresplitting too

FIELD MANUAL
256
Figure 19-27.—Typical presplit blast hole loading.
far ahead of the production blast. If possible, presplit ashort section and dig that section out so that the qualityof the presplit can be checked. If the presplit results areunsatisfactory, adjustments can be made in subsequentblasts.
Presplitting is usually done in a separate operation andwell in advance of drilling and loading the main blast.The presplit holes can be fired with the main blast by

BLAST DESIGN
257
firing the presplit holes on the first delay period. Theincreased hole spacing compared with line drillingreduces drilling costs. Table 19-4 gives parameters forpresplitting.
Smooth Blasting
Smooth blasting, also called contour blasting, perimeterblasting, or sculpture blasting, is the most widely usedmethod of controlling overbreak in underground openingssuch as drifts and stopes (benches). Smooth blasting issimilar to presplitting in that an additional row of holesis drilled at the perimeter of the excavation. These holescontain light loads and are more closely spaced than theother holes in the round (figure19-28). The light powderload usually is continuously “string loaded” (loaded endto end) with slender cartridges or continuous reel explo-sive is used as shown in figure 19-27. Unlike presplitting,the smooth blast holes are fired after the main blast.Usually, this is done by loading and connecting the entireround and firing the perimeter holes one delay later thanthe last hole in the round. The burden on the perimeterholes should be approximately 1.5 times the spacing.Table 19-5 gives parameters for smooth blasting.
A compromise for smooth wall blasting is to slightlyreduce the spacing of the perimeter holes, compared to astandard design, and “string load” regular cartridges ofexplosive. The explosive column should be sealed with atamping plug, clay plug, or other type of stemming toprevent the string-loaded charges from being extractedfrom the hole by charges on earlier delays. Smoothblasting reduces overbreak and reduces the need forground support. These advantages usually outweigh thecost of the additional perimeter holes.

FIE
LD
MA
NU
AL
258 Table 19-4.—Parameters for presplitting
Hole diameter Spacing Explosive charge
(inch) (mm) (feet) (m) (lb/ft) (kg/m)
1.50-1.75 38-44 1.00-1.50 0.3-0.46 0.08-0.25 0.03-0.1
2.00-2.50 50-64 1.50-2.00 0.46-0.6 .08-0.25 0.03-0.1
3.00-3.50 75-90 1.50-3.00 0.6-1.0 0.13-0.50 0.05-0.23
4.00 100 2.00-4.00 0.6-1.2 0.25-0.75 0.23-0.34
Table 19-5.—Parameters for smooth blasting
Hole diameter Spacing Burden Explosive charge
(inch) (mm) (feet) (m) (feet) (m) (lb/ft) (kg/m)
1.50-1.75 38-44 2.00 0.6 3.00 1 0.12-0.25 0.05-0.55
2.0 50 2.50 0.75 3.50 1.06 0.12-0.25 0.05-0.55

BLAST DESIGN
259
Figure 19-28.—Typical smooth blastingpattern (Burden, B, is larger than spacing, S). Numbers on holes show delay in milliseconds.
Cushion Blasting
Cushion blasting, also called trimming, slabbing, orslashing, is the surface equivalent of smooth blasting.Like other controlled blasting techniques, cushionblasting involves a row of closely spaced, lightly loadedholes at the perimeter of the excavation. Holes up to

FIELD MANUAL
260
Figure 19-29.—Cushion blasting techniques.
6½ inches (165 mm) in diameter have been used incushion blasting. Drilling accuracy with this larger sizeborehole permits depths of up to 90 feet (27 m) for cushionblasting. After the explosives have been loaded, stem-ming is placed in the void space around the charges forthe entire length of the column. Stemming “cushions” theshock from the finished wall minimizing the stresses andfractures in the finished wall. The cushion blast holes arefired after the main excavation is removed (figure19-29).A minimum delay between the cushion blast holes is

BLAST DESIGN
261
desirable. The same loading techniques that apply to pre-splitting are used with cushion blasting. The burden onthe cushion holes should always be less than the width ofthe berm being removed.
The large diameter holes associated with cushion blastingresult in larger spacings as compared with presplittingreducing drilling costs. Better results can be obtained inpoorly lithified and weathered formations than withpresplitting, and the larger holes permit better alignmentat depth. Table 19-6 gives parameters for cushionblasting.
Riprap Blasting Techniques
Riprap blasting follows the usual rules for blast designs.A few special techniques can aid production of qualityriprap.
Powder distribution is the key to satisfactory results. Ifthe above principles of good blast design are followed,satisfactory results should be achieved. The blast designmust be monitored continually and changed to producethe best results.
Full column loading is usually the best for initial shots.The starting burden for riprap production should belarger than predicted from table 19-1. If a burden of7 feet (2.1 m) is predicted, a starting burden ofapproximately 9 feet (2.7 m) should be tried. Furtheradjustments can be made to optimize the breakage.
In typical quarry blasting, a spacing of 1.5 times theburden is a good first estimate. The spacing should beabout equal to the burden but not smaller than theburden for riprap. Either a square or a staggered drill

FIE
LD
MA
NU
AL
262
Table 19-6.—Parameters for cushion blasting
Hole diameter Spacing Burden Explosive charge
(inch) (mm) (feet) (m) (feet) (m) (lb/ft) (kg/m)
2.00-2.50 50-64 3.00 1.0 4.00 1.2 0.08-0.25 0.03-0.1
3.00-3.50 75-90 4.00 1.2 5.00 1.5 0.13-0.5 0.05-0.2
4.00-4.50 100-115 5.00 1.5 6.00 1.8 0.25-0.75 0.1-0.3
5.00-5.50 127-140 6.00 1.8 7.00 2.1 0.75-1.00 0.3-0.45
6.00-6.50 152-165 7.00 2.1 9.00 2.7 1.00-1.50 0.45-0.7

BLAST DESIGN
263
pattern should be used. The square pattern often gives acoarser product but also may give more erratic toeconditions. Where possible, rows of blast holes should beperpendicular to the major vertical plane of weaknesssuch as the primary vertical joint set.
If a reasonably well graded riprap is specified, it will benecessary to perform test or trial blasts. The productshould be analyzed for gradation, and further test blastsmade and gradations checked until the specifications havebeen met. If insufficient coarse product is produced, theburden and spacing of subsequent rounds should beincreased by 1 foot (0.3 m) per round until the amount ofcoarse product is adequate. If toe problems occur beforethe amount of coarse product is adequate, reduce theburden and spacing again and increase the stemming ortry deck loading in the upper part of the lift.
If too much coarse product is produced, determinewhether the material comes from the top or bottom partof the bench face. If the material comes from the bottomor is generally well-distributed, decrease the burden andspacing in 1-foot (0.3-m) increments until the oversize iscontrolled. If the oversize comes from the top, try usingsatellite holes (short, smaller diameter holes between themain blast holes, figure19-4) or less stemming.
It is essential that each blast be laid out accurately anddrilled and loaded so that there is a known baseline toadjust from if early results are not good. Keeping goodrecords is essential for later adjustments to the blastdesign. Single row firing, at least for the early shots, alsosimplifies blast pattern adjustments.
In dry conditions, ANFO will work well. A good, fast,bottom primer should be used. In wet conditions, anemulsion, water gel, slurry, or gelatin dynamite should be

FIELD MANUAL
264
used. The bottom of the blast hole should be primed.Excessive orange smoke from a blast indicates the needfor a water resistant product or for a better proportionalmix of the ANFO.
Bibliography
Dick, R.A., L.R. Fletcher, and D.V. Andrea, Explosivesand Blasting Procedures Manual. Bureau of MinesInformation Circular 8925, pp. 57-74, 1987.
E. I. du Pont de Nemours & Co., Inc., Blaster’s Handbook.16th edition, pp. 494, Wilmington, Delaware, 1978.
Glossary
A
Acoustical impedance - The mathematical expressioncharacterizing a material energy transfer property.The product of a material unit density and sonicvelocity.
Adobe charge - See mud cap.
Airblast - An airborne shock wave resulting from thedetonation of explosives; may be caused by burdenmovement or the release of expanding gas into the air.Airblast may or may not be audible.
Airdox - System that uses 10,000 lb/in2 compressed air tobreak undercut coal. Airdox will not ignite a gassy ordusty atmosphere.

BLAST DESIGN
265
Aluminum - A metal commonly used as a fuel or sen-sitizing agent in explosives and blasting agents;normally used in finely divided particle or flake form.
American Table of Distance - A quantity-distancetable published by the Institute of Makers ofExplosives (IME) as pamphlet No. 2, which specifiessafe explosive storage distances from inhabitedbuildings, public highways, passenger railways, andother stored explosive materials.
Ammonium nitrate (AN) - The most commonly usedoxidizer in explosives and blasting agents, NH4NO3.
ANFO - An explosive material consisting of a mixture ofammonium nitrate and fuel oil. The most commonlyused blasting agent.
ATF - Bureau of Alcohol, Tobacco and Firearms,U.S. Department of the Treasury, which enforcesexplosives control and security regulations.
Axial priming - A system for priming blasting agentswhere a core of priming materials extends throughmost or all of the blasting agent charge length.
B
Back break - Rock broken beyond the limits of the lastrow of holes.
Back holes - The top holes in a tunnel or drift round.
Base charge - The main explosive charge in a detonator.

FIELD MANUAL
266
Bench - The horizontal ledge in a quarry face alongwhere holes are drilled. Benching is the process ofexcavating where terraces or ledges are worked in astepped sequence.
Binary explosive - An explosive based on twononexplosive ingredients, such as nitromethane andammonium nitrate. Materials are shipped and storedseparately and mixed at the jobsite to form a highexplosive.
Black powder - A low energy explosive consisting ofsodium or potassium nitrate, carbon, and sulfur.Black powder is seldom used today because of the lowenergy, poor fume quality, and extreme sensitivity tosparks.
Blast - The detonation of explosives to break rock.
Blast area - The area near a blast within the influence offlying rock or concussion.
Blaster - A qualified person in charge of a blast. Also, aperson (blaster-in-charge) who has passed testapproved by Office of Surface Mining (OSM) whichcertifies the blaster’s qualifications to superviseblasting activities.
Blasters’ galvanometer - Blasters' multimeter; seegalvanometer, multimeter.
Blast hole - A hole drilled in rock or other material forthe placement of explosives.
Blasting agent - An explosive that meets prescribedcriteria for insensitivity to initiation. For storage, anymaterial or mixture consisting of a fuel and oxidizer,

BLAST DESIGN
267
intended for blasting, not otherwise defined as anexplosive, provided that the finished product, as mixedand packaged for use or shipment, cannot be detonatedby means of a No. 8 test blasting cap when unconfined(ATF). For transportation, a material designed forblasting that has been tested in accordance with theCode of Federal Regulations (CFR) Title 49, Section173.14a, and found to be so insensitive that there isvery little probability of accidental initiation toexplosion or transition from deflagration to detonation(Department of Transportation [DOT]).
Blasting cap - A detonator that is initiated by safety fuse(Mine Safety and Health Administration [MSHA]).See detonator.
Blasting circuit - The circuit used to fire one or moreblasting caps.
Blasting crew - A crew whose job is to load explosivecharges.
Blasting machine - Any machine built expressly for thepurpose of energizing blasting caps or other types ofinitiators.
Blasting mat - See mat.
Blasting switch - A switch used to connect a powersource to a blasting circuit.
Blistering - See mud cap.
Blockhole - A hole drilled into a boulder to allow theplacement of a small charge to break the boulder.

FIELD MANUAL
268
Booster - A unit of explosive or blasting agent used forperpetuating or intensifying an explosive reaction. Abooster does not contain an initiating device but isoften cap sensitive.
Bootleg - That portion of a borehole that remains rela-tively intact after having been charged with explosiveand fired. A bootleg may contain unfired explosiveand may be hazardous.
Borehole (blast hole) - A drilled hole, usually in rock,that is loaded with explosives.
Borehole pressure - The pressure that the hot gases ofdetonation exert on the borehole wall. Boreholepressure is primarily a function of the density of theexplosive and the heat of explosion.
Bridge wire - A very fine filament wire imbedded in theignition element of an electric blasting cap. An electriccurrent passing through the wire causes a sudden heatrise, causing the ignition element to be ignited.
Brisance - A property of an explosive roughly equivalentto detonation velocity. An explosive with a high deto-nation velocity has high brisance.
Bubble energy - The expanding gas energy of anexplosive, as measured in an underwater test.
Bulk mix - An explosive material prepared for usewithout packaging.
Bulk strength - The strength of an explosive per unitvolume.
Bulldoze - See mud cap.
BLAST DESIGN
269
Burden - The distance to the nearest free or open facefrom an explosive charge. There may be apparentburden and a true burden, the latter being measuredin the direction broken rock will be displaced followingfiring of the explosive charge. Also, the amount ofmaterial to be blasted by a given hole in tons or cubicyards (m3).
Burn cut - A parallel hole cut employing several closelyspaced blast holes. Not all of the holes are loaded withexplosive. The cut creates a cylindrical opening byshattering the rock.
Bus wires - The two wires joined to the connecting wirewhere the leg wires of the electric caps are connectedin a parallel circuit. Each leg wire of each cap isconnected to a different bus wire. In a series-in-parallel circuit, each end of each series is connected toa different bus wire.
Butt - See bootleg.
C
Cap - See detonator.
Capped fuse - A length of safety fuse with an attachedblasting cap.
Capped primer - A package or cartridge of cap-sensitiveexplosive that is specifically designed to transmitdetonation to other explosives and which contains adetonator (MSHA).
Cap sensitivity - The sensitivity of an explosive to initia-tion, relative to an IME No. 8 test detonator.

FIELD MANUAL
270
Carbon monoxide - A poisonous gas created bydetonating explosive materials. Excessive carbonmonoxide is caused by an inadequate amount ofoxygen in the explosive mixture (excessive fuel).
Cardox - A system that uses a cartridge filled with liquidcarbon dioxide, which when initiated by a mixture ofpotassium perchlorate and charcoal, creates a pressureadequate to break undercut coal.
Cartridge - A rigid or semirigid container of explosive orblasting agent of a specified length or diameter.
Cartridge count - The number of 1¼- by 8-inch (32- by203-mm) cartridges of explosives per 50-pound(22.7-kg) case.
Cartridge strength - A rating that compares a givenvolume of explosive with an equivalent volume ofstraight nitroglycerin dynamite expressed as apercentage.
Cast primer - A cast unit of explosive, usually pentoliteor composition B, commonly used to initiate detonationin a blasting agent.
Chambering - The process of enlarging a portion of blasthole (usually the bottom) by firing a series of smallexplosive charges. Chambering can also be done bymechanical or thermal methods.
Chapman-Jougeut (C-J) plane - The plane that definesthe rear boundary of the primary reaction zone in adetonating explosive column.
Circuit tester - See galvanometer or multimeter.

BLAST DESIGN
271
Class A explosive - Defined by the U.S. Department ofTransportation (DOT) as an explosive that possessesdetonating or otherwise maximum hazard; such as,but not limited to, dynamite, nitroglycerin, lead azide,black powder, blasting caps, and detonating primers.
Class B explosive - Defined by DOT as an explosive thatpossesses flammable hazard, such as, but not limitedto, propellant explosives, photographic flash powders,and some special fireworks.
Class C explosive - Defined by DOT as an explosive thatcontains Class A or Class B explosives, or both, ascomponents but in restricted quantities. For example,blasting caps or electric blasting caps in lots of lessthan 1,000.
Collar - The top or opening of a borehole or shaft. To“collar” in drilling means the act of starting a borehole.
Collar distance - The distance from the top of thepowder column to the collar of the blast hole, usuallyfilled with stemming.
Column charge - A long, continuous charge of explosiveor blasting agent in a borehole.
Commercial explosives - Explosives designed and usedfor commercial or industrial, rather than militaryapplications.
Composition B - A mixture of RDX and TNT that has adensity of 1.65 g/cm3 and a velocity of 25,000 feet persecond (7,622 m/sec), when cast. It is useful as aprimer for blasting agents.

FIELD MANUAL
272
Condenser-discharge blasting machine - A blastingmachine that uses batteries or magnets to energizeone or more condensers (capacitors) whose storedenergy is released into a blasting circuit.
Confined detonation velocity - The detonation velocityof an explosive or blasting agent under confinementsuch as in a borehole.
Connecting wire - A wire, smaller in gage than the leadwire, used in a blasting circuit to connect the capcircuit with the lead wire or to extend leg wires fromone borehole to another. Usually consideredexpendable.
Connector - See MS connector.
Controlled blasting - Techniques used to control over-break and produce a competent final excavation wall.See line drilling, presplitting, smooth blasting, andcushion blasting.
Cordeau detonant fuse - A term used to definedetonating cord.
Cornish cut - See parallel hole cut.
Coromant cut - See parallel hole cut.
Coupling - The degree that an explosive fills the bore-hole. Untamped cartridges are decoupled; alsocapacitive and inductive coupling from power lines toan electric blasting circuit.

BLAST DESIGN
273
Coyote blasting - The practice of driving tunnelshorizontally into a rock face at the foot of the shot.Explosives are loaded into these tunnels. Coyoteblasting is used where it is impractical to drillvertically.
Critical diameter - The minimum diameter of anyexplosive for propagation of a stable detonation.Critical diameter is effected by confinement,temperature, and pressure on the explosive.
Crosslinking agent - The final ingredient added to awater gel or slurry, causing the material to changefrom a liquid to a gel.
Current limiting device - A device used to preventarcing in electric blasting caps by limiting the amountor duration of current flow. Also used in a blasters’galvanometer or multimeter to ensure a safe currentoutput.
Cushion blasting - A surface blasting technique used toproduce competent slopes. The cushion holes, firedafter the main charge, have a reduced spacing andemploy decoupled charges.
Cushion stick - A cartridge of explosive loaded into asmall diameter borehole before the primer. The use ofa cushion stick is not generally recommended becauseof possible bootlegs.
Cut - An arrangement of holes used in undergroundmining and tunnel blasting providing a free face forthe remainder of the round to break.

FIELD MANUAL
274
Cutoffs - A portion of a column of explosives that hasfailed to detonate owing to bridging or a shifting of therock formation, often due to an improper delay system;also a cessation of detonation in detonating cord.
D
Dead pressing - Desensitization of an explosive causedby pressurization. Tiny air bubbles required for sensi-tivity are literally squeezed from the mixture.
Decibel - The unit of sound pressure commonly used tomeasure airblast from explosives. The decibel scale islogarithmic.
Deck - A small charge or portion of a blast hole loadedwith explosives that is separated from other chargesby stemming or an air cushion.
Decoupling - The use of cartridged products significantlysmaller in diameter than the borehole. Decoupledcharges are normally not used except in cushionblasting, smooth blasting, presplitting, and othersituations where crushing is undesirable.
Deflagration - A subsonic but extremely rapid explosivereaction accompanied by gas formation and boreholepressure but without shock.
Delay blasting - The use of delay detonators orconnectors that cause separate charges to detonate atdifferent times rather than simultaneously.
Delay connector - A nonelectric, short-interval delaydevice for use in delaying blasts that are initiated bydetonating cord.
BLAST DESIGN
275
Delay detonator - An electric or nonelectric detonatorwith a built-in element that creates a delay betweenthe input of energy and the explosion of the detonator.
Delay electric blasting cap - An electric blasting capwith a built-in delay that delays cap detonation inpredetermined time intervals from milliseconds up toa second or more.
Delay element - The portion of a blasting cap thatcauses a delay between the application of energy to thecap and the time of detonation of the base charge ofthe cap.
Density - The weight per unit volume of explosive,expressed as cartridge count or grams per cubiccentimeter. See loading density.
Department of Transportation (DOT) - A Federalagency that regulates safety in interstate shipping ofexplosives and other hazardous materials.
Detaline System - A nonelectric system for initiatingblasting caps where the energy is transmitted throughthe circuit by a low-energy detonating cord.
Detonating cord - A plastic covered core of high-velocityexplosive, usually PETN, used to detonate explosives.The plastic covering is covered with various combi-nations of textiles and waterproofing.
Detonation - A supersonic explosive reaction where ashock wave propagates through the explosiveaccompanied by a chemical reaction that furnishesenergy to sustain stable shock wave propagation.Detonation creates both a detonation pressure and aborehole pressure.
FIELD MANUAL
276
Detonation pressure - The head-on pressure created bythe detonation proceeding down the explosive column.Detonation pressure is a function of the explosivedensity and the square of the explosive velocity.
Detonation velocity - See velocity.
Detonator - Any device containing a detonating chargethat is used to initiate an explosive. Includes, but isnot limited to, blasting caps, electric blasting caps, andnonelectric instantaneous or delay blasting caps.
Ditch blasting - See propagation blasting.
DOT - See Department of Transportation.
Downline - The line of detonating cord in the boreholethat transmits energy from the trunkline down thehole to the primer.
Drilling pattern - See pattern.
Drop ball - Known also as a headache ball. An iron orsteel weight held on a wire rope that is dropped froma height onto large boulders to break them intosmaller fragments.
Dynamite - The high explosive invented by Alfred Nobel.Any high explosive where the sensitizer is nitrogly-cerin or a similar explosive oil.
E
Echelon pattern - A delay pattern that causes the trueburden at the time of detonation to be at an obliqueangle from the original free face.

BLAST DESIGN
277
Electric blasting cap - A blasting cap designed to beinitiated by an electric current.
Electric storm - An atmospheric disturbance of intenseelectrical activity presenting a hazard in all blastingactivities.
Emulsion - An explosive material containing substantialamounts of oxidizers dissolved in water droplets sur-rounded by an immiscible fuel. Similar to a slurry.
Exploding bridge wire (EBW) - A wire that explodesupon application of current. The wire takes the placeof the primary explosive in an electric detonator. Anexploding bridge wire detonator is an electricdetonator that employs an exploding bridge wirerather than a primary explosive. An exploding bridgewire detonator is instantaneous.
Explosion - A thermochemical process where mixtures ofgases, solids, or liquids react with the almost instan-taneous formation of gas pressures and sudden heatrelease.
Explosion pressure - See borehole pressure.
Explosive - Any chemical mixture that reacts at highvelocity to liberate gas and heat causing very highpressures. ATF classifications include high explosivesand low explosives. Also, any substance classified asan explosive by DOT.
Explosive materials - A term that includes, but is notnecessarily limited to, dynamite and other high explo-sives, slurries, water gels, emulsions, blasting agents,black powder, pellet powder, initiating explosives,detonators, safety fuses, squibs, detonating cord,igniter cord, and igniters.

FIELD MANUAL
278
Extra dynamite - Also called ammonia dynamite, adynamite that derives the major portion of its energyfrom ammonium nitrate.
Extraneous electricity - Electrical energy other thanactual firing current that may be a hazard withelectric blasting caps. Includes stray current, staticelectricity, lightning, radio frequency energy, andcapacitive or inductive coupling.
F
Face - A rock surface exposed to air. Also called a freeface, a face provides the rock with room to expandupon fragmentation.
Firing current - Electric current purposely introducedinto a blasting circuit for initiation. Also, the amountof current required to activate an electric blasting cap.
Firing line - A line, often permanent, extending from thefiring location to the electric blasting cap circuit. Alsocalled lead wire.
Flash over - Sympathetic detonation between explosivecharges or between charged blast holes.
Flyrock - Rock that is propelled through the air from ablast. Excessive flyrock may be caused by poor blastdesign or unexpected weak zones in the rock.
Fracturing - The breaking of rock with or without move-ment of the broken pieces.
Fragmentation - The extent that a rock is broken intopieces by blasting. Also the act of breaking rock.

BLAST DESIGN
279
Fuel - An ingredient in an explosive that reacts with anoxidizer to form gaseous products of detonation.
Fuel oil - The fuel in ANFO, usually No. 2 diesel.
Fume Classification - An IME quantification of theamount of fumes generated by an explosive or blastingagent.
Fume quality - A measure of the toxic fumes to beexpected when a specific explosive is properlydetonated. See fumes.
Fumes - Noxious or poisonous gases liberated from ablast. May be due to a low fume quality explosive orinefficient detonation.
Fuse - See safety fuse.
Fuse lighter - A pyrotechnic device for rapid and depend-able lighting of safety fuse.
G
Galvanometer - (More properly called blasters’ galva-nometer.) A measuring instrument containing asilver chloride cell and/or a current limiting devicethat is used to measure resistance in an electricblasting circuit. Only a device specifically identifiedas a blasting galvanometer or blasting multimetershould be used for this purpose.
Gap sensitivity - The gap distance an explosive canpropagate across. The gap may be air or a definedsolid material. Gap sensitivity is a measure of thelikelihood of sympathetic propagation.

FIELD MANUAL
280
Gas detonation system - A system for initiating capswhere the energy is transmitted through the circuit bya gas detonation inside a hollow plastic tube.
Gelatin - An explosive or blasting agent that has a gelati-nous consistency. The term is usually applied to agelatin dynamite but may also be a water gel.
Gelatin dynamite - A highly water-resistant dynamitewith a gelatinous consistency.
Generator blasting machine - A blasting machineoperated by vigorously pushing down a rack bar ortwisting a handle. Now largely replaced by condensordischarge blasting machines.
Grains - A weight measurement unit where 7,000 grains
equal 1 pound.
Ground vibration - Ground shaking caused by theelastic wave emanating from a blast. Excessivevibrations may cause damage to structures.
H
Hangfire - The detonation of an explosive charge afterthe designed firing time. A source of serious accidents.
Heading - The working face or end of an excavationdriven in an underground mine.
Hercudet - See gas detonation system.
Hertz - A term used to express the frequency of groundvibrations and airblast. One hertz is one cycle persecond.

BLAST DESIGN
281
High explosive - Any product used in blasting that issensitive to a No. 8 test blasting cap and reacts at aspeed faster than that of sound in the explosivemedium. A classification used by ATF for explosivestorage.
Highwall - The bench, bluff, or ledge on the edge of asurface excavation. This term is most commonly usedin coal strip mining.
I
Ignitacord – A cordlike fuse that burns progressivelyalong its length with an external flame at the zone ofburning and is used for lighting a series of safety fusesin sequence. Burns with a spitting flame similar to aFourth-of-July sparkler.
IME - The Institute of Makers of Explosives. A tradeorganization dealing with the use of explosives andconcerned with safety in manufacture, transportation,storage, handling, and use. The IME publishes aseries of blasting safety pamphlets.
Initiation - The act of detonating a high explosive bymeans of a cap, mechanical device, or other means.Also the act of detonating the initiator.
Instantaneous detonator - A detonator that contains nodelay element.
J
Jet 1oader - A system for loading ANFO into smallblastholes where the ANFO is sucked from a containerand blown into the hole at high velocity through aloading hose.

FIELD MANUAL
282
Jumbo - A machine designed to mount two or moredrilling units that may or may not be operatedindependently.
K
Kerf - A slot cut in a coal or soft rock face by amechanical cutter to provide a free face for blasting.
L
Lead wire - The wire connecting the electrical powersource with the leg wires or connecting wires of ablasting circuit. Also called a firing line.
LEDC - Low-energy detonating cord used to initiatenonelectric blasting caps.
Leg wires - Wires connected to the bridge wire of an elec-tric blasting cap and extending from the waterproofplug. The opposite ends are used to connect the capinto a circuit.
Lifters - The bottom holes in a tunnel or drift round.
Line drilling - An overbreak control method where aseries of very closely spaced holes are drilled at theperimeter of the excavation. These holes are notloaded with explosive.
Liquid oxygen explosive - A high explosive made bysoaking cartridges of carbonaceous materials in liquidoxygen. This explosive is rarely used today.

BLAST DESIGN
283
Loading density - The pounds of explosive per foot ofcharge of a specific diameter.
Loading factor - See powder factor.
Loading pole - A pole made of nonsparking materialused to push explosive cartridges into a borehole andto break and tightly pack the explosive cartridges intothe hole.
Low explosive - An explosive where the speed ofreaction is slower than the speed of sound, such asblack powder. A classification used by ATF forexplosive storage.
LOX - See liquid oxygen explosive.
M
Magazine - A building, structure, or container speciallyconstructed for storing explosives, blasting agents,detonators, or other explosive materials.
Mat - A covering placed over a shot to hold down flyingmaterial. The mat is usually made of woven wirecable, rope, or scrap tires.
Maximum firing current - The highest current(amperage) recommended for the safe and effectiveinitiation of an electric blasting cap.
Metallized - Sensitized or energized with finely dividedmetal flakes, powders, or granules, usually aluminum.
Michigan cut - See parallel hole cut.

FIELD MANUAL
284
Microballoons - Tiny hollow spheres of glass or plasticthat are added to explosive materials to enhancesensitivity by assuring adequate entrapped aircontent.
Millisecond (ms) - Short delay intervals equal to 1/1,000of a second.
Millisecond delay caps - Delay detonators that havebuilt-in time delays of various lengths. The intervalbetween the delays at the lower end of the series isusually 25 ms. The interval between delays at theupper end of the series may be 100 to 300 ms.
Minimum firing current - The lowest current(amperage) that will initiate an electric blasting capwithin a specified short interval of time.
Misfire - A charge or part of a charge that has failed tofire as planned. All misfires are dangerous.
Monomethylaminenitrate - A compound used to sensi-tize some water gels.
MS connector - A device used as a delay in a detonatingcord circuit connecting one hole in the circuit withanother or one row of holes to other rows of holes.
MSHA - The Mine Safety and Health Administration. Anagency under the Department of Labor that enforceshealth and safety regulations in the mining industry.
Muckpile - A pile of broken rock or dirt that is to beloaded for removal.
Mud cap - Referred to also as adobe, bulldoze, blistering,or plaster shot. A charge of explosive fired in contact

BLAST DESIGN
285
with the surface of a rock usually covered with aquantity of mud, wet earth, or similar substance. Noborehole is used.
Multimeter - A multipurpose test instrument used tocheck line voltages, firing currents, current leakage,stray currents, and other measurements pertinent toelectric blasting. (More properly called blasters’multimeter.) Only a meter specifically designated asa blasters’ multimeter or blasters’ galvanometershould be used to test electric blasting circuits.
N
National Fire Protection Association (NFPA) - Anindustry/government association that publishesstandards for explosive material and ammoniumnitrate.
Nitrocarbonitrate - A shipping classification once givento a blasting agent by DOT.
Nitrogen oxides - Poisonous gases created by detonatingexplosive materials. Excessive nitrogen oxides may becaused by an excessive amount of oxygen in theexplosive mixture (excessive oxidizer) or by inefficientdetonation.
Nitroglycerin (NG) - The explosive oil originally used asthe sensitizer in dynamites, C3H5(ONO2)3.
Nitromethane - A liquid compound used as a fuel in two-component (binary) explosives and as rocket anddragster fuel.

FIELD MANUAL
286
Nitropropane - A liquid fuel that can be combined withpulverized ammonium nitrate prills to make a denseblasting mixture.
Nitrostarch - A solid explosive similar to nitroglycerinused as the base of “nonheadache” powders.
Nonel - See shock tube system.
Nonelectric delay blasting cap - A detonator with adelay element capable of being initiatednonelectrically. See shock tube system; gas detonationsystem; Detaline System.
No. 8 test blasting cap - See test blasting cap No. 8.
O
OSHA - The Occupational Safety and Health Administra-tion. An agency under the Department of Labor thatenforces health and safety regulations in theconstruction industry, including blasting.
OSM - The Office of Surface Mining Reclamation andEnforcement. An agency under the Department of theInterior that enforces surface environmentalregulations in the coal mining industry.
Overbreak - Excessive breakage of rock beyond thedesired excavation limit.
Overburden - Worthless material lying on top of adeposit of useful materials. Overburden often refers todirt or gravel but can be rock, such as shale overlimestone or shale and limestone over coal.

BLAST DESIGN
287
Overdrive - Inducing a velocity higher than the steadystate velocity in a powder column by the use of apowerful primer. Overdrive is a temporary pheno-menon, and the powder quickly assumes its steadystate velocity.
Oxides of nitrogen - See nitrogen oxides.
Oxidizer - An ingredient in an explosive or blastingagent that supplies oxygen to combine with the fuel toform gaseous or solid detonation products. Ammo-nium nitrate is the most common oxidizer used incommercial explosives.
Oxygen balance - A mixture of fuels and oxidizers wherethe gaseous products of detonation are predominantlycarbon dioxide, water vapor (steam), and free nitrogen.A mixture containing excess oxygen has a negativeoxygen balance.
P
Parallel circuit - A circuit where two wires, called buswires, extend from the lead wire. One leg wire fromeach cap in the circuit is hooked to each of the buswires.
Parallel hole cut - A group of parallel holes, some ofwhich are loaded with explosives, used to establish afree face in tunnel or heading blasting. One or more ofthe unloaded holes may be larger than the blast holes;also called Coromant, Cornish, burn, shatter, orMichigan cut.
Parallel series circuit - Similar to a parallel circuit butinvolving two or more series of electric blasting caps.

FIELD MANUAL
288
One end of each series of caps is connected to each ofthe bus wires; sometimes called series-in-parallelcircuit.
Particle velocity - A measure of ground vibration.Describes the velocity of particle vibration whenexcited by a seismic wave.
Pattern - A drill hole plan laid out on a face or bench tobe drilled for blasting.
Pellet powder - Black powder pressed into 2-inch-long,1¼- to 2-inch diameter cylindrical pellets.
Pentaerythritoltetranitrate (PETN) - A militaryexplosive compound used as the core load of detonatingcord and the base charge of blasting caps.
Pentolite - A mixture of PETN and TNT used as a castprimer.
Permissible - A machine, material, apparatus, or devicethat has been investigated, tested, and approved bythe Bureau of Mines or MSHA maintained inpermissible condition.
Permissible blasting - Blasting according to MSHAregulations for underground coal mines or other gassyunderground mines.
Permissible explosives - Explosives that have been ap-proved by MSHA for use in underground coal mines orother gassy mines.
PETN - See pentaerythritoltetranitrate.
Plaster shot - See mud cap.

BLAST DESIGN
289
Pneumatic 1oader - One of a variety of machinespowered by compressed air used to load bulk blastingagents or cartridged water gels.
Powder - Any solid explosive.
Powder chest - A strong, nonconductive portable con-tainer equipped with a lid used at blasting sites fortemporary explosive storage.
Powder factor - A ratio between the amount of powderloaded and the amount of rock broken, usuallyexpressed as pounds per ton or pounds per cubic yard.In some cases, the reciprocals of these terms are used.
Preblast survey - A documentation of the existing condi-tion of a structure. The survey is used to determinewhether subsequent blasting causes damage to thestructure.
Premature - A charge that detonates before intended.
Preshearing - See presplitting.
Presplitting - Controlled blasting where decoupledcharges are fired in closely spaced holes at theperimeter of the excavation. A presplit blast is firedbefore the main blast. Also called preshearing.
Pressure vessel - A system for loading ANFO into smalldiameter blast holes. The ANFO is contained in asealed vessel where air pressure forces the ANFOthrough a hose and into the blast hole; also known aspressure pot.

FIELD MANUAL
290
Prill - A small porous sphere of ammonium nitratecapable of absorbing more than 6 percent by weight offuel oil. Blasting prills have a bulk density of 0.80 to0.85 g/cm3.
Primary blast - The main blast executed to sustainproduction.
Primary explosive - An explosive or explosive mixturesensitive to spark, flame, impact, or friction used in adetonator to initiate the explosion.
Primer - A unit, package, or cartridge of cap-sensitiveexplosive used to initiate other explosives or blastingagents and that contains a detonator.
Propagation - The detonation of explosive charges by animpulse from a nearby explosive charge.
Propagation blasting - The use of closely spaced,sensitive charges. The shock from the first chargepropagates through the ground, setting off theadjacent charge and so on. Only one detonator isrequired; primarily used for ditching in damp ground.
Propellant explosive - An explosive that normallydeflagrates and is used for propulsion.
Pull - The quantity of rock or length of advance excavatedby a blast round.
R
Radio frequency energy - Electrical energy travelingthrough the air as radio or electromagnetic waves.Under ideal conditions this energy can fire an electricblasting cap. IME Pamphlet No. 20 recommends safedistances from transmitters to electric blasting caps.

BLAST DESIGN
291
Radio frequency transmitter - An electric device, suchas a stationary or mobile radio transmitting station,that transmits a radio frequency wave.
RDX - Cyclotrimethylenetrinitramine, an explosivesubstance used in the manufacture of compositions B,C-3, and C-4. Composition B is useful as a castprimer.
Relievers - In a heading round, holes adjacent to the cutholes, used to expand the opening made by the cutholes.
Rib holes - The holes at the sides of a tunnel or driftround that determine the width of the opening.
Riprap - Coarse rocks used for river bank or dam stabili-zation to reduce erosion by water flow.
Rotational firing - A delay blasting system where eachcharge successively displaces its burden into a voidcreated by an explosive detonated on an earlier delayperiod.
Round - A group or set of blast holes used to produce aunit of advance in underground headings or tunnels.
S
Safety fuse - A core of potassium nitrate black powder,enclosed in a covering of textile and waterproofing,used to initiate a blasting cap or a black powdercharge. Safety fuse burns at a continuous, uniformrate.

FIELD MANUAL
292
Scaled distance - A ratio used to predict ground vibra-tions. Scaled distance equals the distance from theblast to the point of concern in feet divided by thesquare root of the charge weight of explosive per delayin pounds. When using the equation, the delay periodmust be at least 9 ms.
Secondary blasting - Using explosives to break bouldersor high bottom resulting from the primary blast.
Seismograph - An instrument that measures and maysupply a permanent record of earthborne vibrationsinduced by earthquakes or blasting.
Semiconductive hose - A hose used for pneumaticloading of ANFO that has a minimum electricalresistance of 1,000 ohms per foot, 10,000 ohms totalresistance, and a maximum total resistance of2,000,000 ohms.
Sensitiveness - A measure of an explosive’s ability topropagate a detonation.
Sensitivity - A measure of an explosive’s susceptibility todetonation by an external impulse such as impact,shock, flame, or friction.
Sensitizer - An ingredient used in explosive compoundsto promote greater ease in initiation or propagation ofthe detonation reaction.
Sequential blasting machine - A series of condenserdischarge blasting machines in a single unit that canbe activated at various accurately timed intervalsfollowing the application of electrical current.

BLAST DESIGN
293
Series circuit - A circuit of electric blasting caps whereeach leg wire of a cap is connected to a leg wire fromthe adjacent caps so that the electrical current followsa single path through the entire circuit.
Series-in-parallel circuit - See parallel series circuit.
Shatter cut - See parallel hole cut.
Shock energy - The shattering force of an explosivecaused by the detonation wave.
Shock tube system - A system for initiating caps wherethe energy is transmitted to the cap by a shock waveinside a hollow plastic tube.
Shock wave - A pressure pulse that propagates at super-sonic velocity.
Shot - See blast.
Shot firer - Also referred to as the shooter. The personwho actually fires a blast. A powderman may chargeor load blast holes with explosives but may not fire theblast.
Shunt - A piece of metal or metal foil that short circuitsthe ends of cap leg wires to prevent stray currentsfrom causing accidental detonation of the cap.
Silver chloride cell - A low-current cell used in ablasting galvanometer and other devices to measurecontinuity in electric blasting caps and circuits.
Slurry - An aqueous solution of ammonium nitrate, sen-sitized with a fuel, thickened, and crosslinked toprovide a gelatinous consistency. Sometimes called a

FIELD MANUAL
294
water gel. DOT may classify a slurry as a Class Aexplosive, a Class B explosive, or a blasting agent. Anexplosive or blasting agent containing substantialportions of water (MSHA). See emulsion; water gel.
Smooth blasting - Controlled blasting used undergroundwhere a series of closely spaced holes is drilled at theperimeter, loaded with decoupled charges, and fired onthe highest delay period of the blast round.
Snake hole - A borehole drilled slightly downward fromhorizontal into the floor of a quarry face. Also, a holedrilled under a boulder.
Sodium nitrate - An oxidizer used in dynamites andsometimes in blasting agents.
Spacing - The distance between boreholes or charges ina row measured perpendicular to the burden andparallel to the free face of expected rock movement.
Specific gravity - The ratio of the weight of a givenvolume of any substance to the weight of an equalvolume of water.
Spitter cord - See Ignitacord.
Springing - See chambering.
Square pattern - A blast hole pattern where the holes insucceeding rows are drilled directly behind the holes inthe front row. In a truly square pattern, the burdenand spacing are equal.
Squib - A firing device that burns with a flash. Used toignite black powder or pellet powder.

BLAST DESIGN
295
Stability - The ability of an explosive material tomaintain its physical and chemical properties over aperiod of time in storage.
Staggered pattern - A blast hole pattern where theholes in each row are drilled between the holes in thepreceding row.
Static electricity - Electrical energy stored on a personor object in a manner similar to that of a capacitor.Static electricity may be discharged into electricalinitiators, detonating them.
Steady state velocity - The characteristic velocity atwhich a specific explosive, under specific conditions ina given charge diameter, will detonate.
Stemming - The inert material such as drill cuttingsused in the collar portion (or elsewhere) of a blast holeto confine the gaseous products of detonation; also, thelength of blast hole left uncharged.
Stick count - See cartridge count.
Stray current - Current flowing outside the desiredconductor. Stray current may come from electricalequipment, electrified fences, electric railways, orsimilar sources. Flow is facilitated by conductivepaths such as pipelines and wet ground or other wetmaterials. Galvanic action of two dissimilar metals incontact or connected by a conductor may cause straycurrent.
Strength - An explosive property described variously ascartridge or weight strength, seismic strength, shockor bubble energy, crater strength, or ballistic mortar

FIELD MANUAL
296
strength. Not a well-defined property. Used to ex-press an explosive’s capacity to do work.
String 1oading - Loading cartridges end-to-end in aborehole without deforming them. Used mainly incontrolled blasting and permissible blasting.
Subdrill - To drill blast holes beyond the planned gradelines or below floor level to insure breakage to theplanned grade or floor level.
Subsonic - Slower than the speed of sound.
Supersonic - Faster than the speed of sound.
Swell factor - The ratio of the volume of a material in anundisturbed state to that when broken. May also beexpressed as the reciprocal of this number.
Sympathetic propagation (sympathetic detonation)- Detonation of an explosive material by an impulsefrom another detonation through air, earth, or water.
T
Tamping - Compressing the stemming or explosive in ablast hole. Sometimes used synonymously withstemming.
Tamping bag - A cylindrical bag containing stemmingmaterial used to confine explosive charges inboreholes.
Tamping pole - See loading pole.

BLAST DESIGN
297
Test blasting cap No. 8 - A detonator containing 0.40 to0.45 g of PETN base charge at a specific gravity of 1.4g/cm3 primed with standard weights of primer,depending on the manufacturer.
Toe - The burden or distance between the bottom of aborehole and the vertical free face of a bench in an ex-cavation. Also the rock left unbroken at the foot of aquarry blast.
Transient velocity - A velocity different from the steadystate velocity that a primer imparts to a column ofpowder. The powder column quickly attains steadystate velocity.
Trinitrotoluene (TNT) - A military explosive compoundused industrially as a sensitizer for slurries and as aningredient in pentolite and composition B. Once usedas a free-running pelletized powder.
Trunkline -A detonating cord line used to connect thedownlines of other detonating cord lines in a blast pat-tern. Usually runs along each row of blast holes.
Tunnel - A basically horizontal underground passage.
Two-component explosive - See binary explosive.
U
Unconfined detonation velocity - The detonationvelocity of an explosive material not confined by aborehole or other confining medium.

FIELD MANUAL
298
V
V-cut - A cut employing several pairs of angled holesmeeting at the bottoms used to create free faces for therest of the blast round.
Velocity - The rate that the detonation wave travelsthrough an explosive. May be measured confined orunconfined. Manufacturer’s data are sometimesmeasured with explosives confined in a steel pipe.
Venturi 1oader - See jet loader.
Volume strength - See cartridge strength or bulkstrength.
W
Water gel - An aqueous solution of ammonium nitrate,sensitized with a fuel, thickened, and crosslinked toprovide a gelatinous consistency; also called a slurry;may be an explosive or a blasting agent.
Water stemming bags - Plastic bags containing a self-sealing device that are filled with water. Classified asa permissible stemming device by MSHA.
Weight strength - A rating that compares the strengthof a given weight of explosive with an equivalentweight of straight nitroglycerin dynamite or otherexplosive standard, expressed as a percentage.
Chapter 20
WATER CONTROL
Introduction
This chapter discusses site conditions that needdewatering and the extent and basic requirements forconstruction dewatering. A more comprehensive discus-sion of technical requirements and methods for con-structing dewatering facilities is available in theReclamation Ground Water Manual. The subjects thatare discussed include:
� Site review
� Site investigations
� Data collection
� Data interpretation, evaluation, and presentation
� Specifications paragraphs
� Construction considerations
� Supervision and oversight
� Documentation of results (final construction report)
Water control is lumped into two categories—dewateringand unwatering. Water control is the removal or controlof groundwater or seepage from below the surface(dewatering) or the removal or control of ponded orflowing surface water by ditches, surface drains, or sumps(unwatering). Excavation of materials or constructionnear or below the water table or near surface water bodiesusually requires control of the groundwater or seepage.Control may involve isolation with cutoffs, stabilization byfreezing, grouting, or other methods, or by a combinationof methods. Control of groundwater and seepage usuallyinvolves installation and operation of wells or drains. Akey operation in most water control in unstable materialsis the removal of water from below the ground surface inadvance of excavation and maintaining the water level at

FIELD MANUAL
300
a suitable depth below the working surface. These stepspermit construction “in the dry,” unhampered by theadverse effects of water.
Understanding what factors control water is critical forensuring short-term stability during construction of anyfacility and for the long-term stability of any structure.This chapter discusses what should be considered. Ifwater is considered a potential problem, any fieldinvestigation must obtain information on the site’svarious potential water sources including seasonalprecipitation and runoff periods and the identification andunderstanding of the water bearing zones within a site.This means not only identifying and determining thedepths and extent of the various water bearing zones andtheir water surfaces but also understanding the formationhydraulic parameters (porosity, permeability, and, whennecessary, storage).
Figure 20-1 illustrates the importance of understandingthe site hydraulic parameters in selecting the appropriatedewatering method. Using the wrong method for the sitematerials can result in a totally ineffective dewateringsystem. Figure 20-1 can be used to assess what is theappropriate dewatering method based on the sitematerials.
In excavations in rock, cemented granular materials,clays, and other stable materials, water removal orunwatering may be by draining to sumps and usingsurface pumps concurrently with or following completionof the excavation. Subsurface cutoffs such as sheet pilingand slurry walls in soil or soft rock and grouting in rockare also used to control ground and surface water and forground support. Cutoffs are seldom 100-percent effective,and supplementary dewatering or unwatering is usuallyrequired. Soils are frozen for short periods such as for a

WA
TE
R C
ON
TR
OL
301
Figure 20-1.—Limits of dewatering methods for different materials.

FIELD MANUAL
302
temporary excavation, especially in clayey or silty soilsthat have low permeability and are difficult to drain.
Unwatering methods are commonly used in soils thathave high porosity but low permeabilities (clayey or siltysoils), bedrock that has solution cavities, and lava tubesthat carry large volumes of water in isolated areas.Unwatering methods are commonly used to controlsurface water.
Unwatering usually is performed in conjunction withdewatering to ensure control of surface water and topermit dewatering to proceed unaffected by recharge orflooding from nearby surface water. Failure to properlyremove or control water during unwatering or dewateringmay result in:
• Unstable natural or excavated slopes
• Unstable, unworkable, or unsuitable subgrade
• Boils, springs, blowouts, or seeps on slopes or in thesubgrade
• Flooding of excavations or structures
• Uplift of constructed features such as concrete slabs
• Dilution, corrosion, or other adverse effects on con-crete, metals, or other construction materials
• Instability of nearby structures
• Draining surrounding surface water and ground-water

WATER CONTROL
303
• Instability of cutoff facilities such as cofferdams
• Loss of fines from the foundation
• Safety problems
• Delays in construction
• Increased construction costs
Water control may vary widely in scope, magnitude, anddifficulty. Some controlling factors related to theconstructed feature include footprint, foundation depth,and construction time. Factors related to site conditionsare:
• Subsurface geology including general material types;bedding, attitudes and lateral extent of bedding; andattitudes, continuity, and apertures of fractures
• Subsurface hydraulic conditions including permea-bilities and thicknesses of different materials,groundwater occurrence, and levels
• Recharge conditions including proximity to surfacewater bodies and precipitation
• Other facilities including cofferdams and site access
Conditions that may indicate the need for dewatering andthe possibility for difficult dewatering include:
• Site location adjacent to a large body of surfacewater, a stream, a marshy area, or an area subject toflooding
• An excavation significantly below the water table

FIELD MANUAL
304
• Complex foundation geology
• An artesian zone immediately below grade
• Existing structures or facilities
• Existing use of groundwater
• Poor quality groundwater
• Presence of hazardous materials
• Thick zones of saturated, low-strength materials suchas silt or soft clay, especially under artesianconditions
• Presence of cofferdams or other similar features forwhich dewatering is needed for stability
• Conditions where failure of dewatering facilitiescould result in catastrophic failure of protective orother features and a hazard to life or property
Sites requiring groundwater or seepage control forconstruction or proper operation of a facility should beidentified as early in the planning or design process aspossible.
Exploration Program
Investigations for water control should be part of thegeneral exploration and design data collection program.Advantages of conducting investigations together include:

WATER CONTROL
305
• Maximizing the use of design data collection andlowering exploration costs
• Providing dewatering data early in the program
• Using field personnel efficiently
Water control investigations generally cannot beestablished in detail until some reconnaissance leveldrilling has been done and general subsurface geologicand hydrologic conditions are determined. Generalsurface conditions including topography and surfacehydrology should be known. A specialist should beconsulted as early in the program as possible to maximizethe benefits of the obtained data.
Design Data Requirements, Responsibilities,and Methods of Collection and Presentation
Adequate surface and subsurface data are essential to theproper design, installation, and operation of water controlfacilities. The amount of data required for water controlfacilities design may equal or exceed the foundation datarequired for design of the structure. Water controlfacilities may be designed in-house or by the contractor;but investigations may be extensive, complex, timeconsuming, and beyond the capability of a contractor toaccomplish in the bidding period. An in-house design isgenerally better because the time is usually available todo the job right, the designer has control over the designdata, responsibility for the water control design is clear tothe owner and the contractor, and the contractor can bidthe water control installation more accurately.
Design data for water control facilities should be obtainedregardless of who is ultimately responsible for the design.

FIELD MANUAL
306
The extent and level of data should be appropriate for theanticipated water control requirements and facilities. Allsubsurface investigations should be sufficiently detailedto determine the groundwater conditions, including thedepth of the vadose zone and the various potentiometricwater surfaces; and the investigations should provide atleast enough data to estimate the permeability of the soilor rock. Crude soil permeabilities can be estimated fromblow counts and the visual or laboratory soilclassification. Permeability tests should be considered inany exploration program. If aquifer tests are required,the test wells should approximate the size and capacity ofanticipated dewatering wells. Facilities should bepreserved and made available to prospective contractorsfor their testing or use, if appropriate.
If the contractor is responsible for the dewatering design,all field design data should be included in theconstruction specifications. Data include details ofdrilling and completion of exploratory drill holes, wells,piezometers, and other installations as well as test data.Data should be as concise as possible and clearly show thehistory, sequence, and location of all exploration. Designdata for water control facilities should be obtained con-currently with feature design data if possible. Specialistsshould be consulted when preparing design dataprograms, especially programs for foundation drilling andaquifer testing. Water control data are an essential partof the design data package and must be given therequired priority in funds, time, and personnel tominimize problems such as construction delays andclaims. Where dewatering may have impacts on existingadjacent structures, wells, facilities, or water resources,a study of the area surrounding the site may be necessaryto determine and document impacts. In addition to datainvolving the constructed feature such as a structure
WATER CONTROL
307
layout, excavation depth, and time to construct, otherinformation is required on site conditions such as:
Surface Data
• Site and surrounding topography at an appropriatescale and contour interval
• Cultural features on and off site
• Site and surrounding surface geology with descrip-tions of materials
• Site and adjacent surface water features such aslakes, streams, swamps, bogs, and marshes
• Plan map of all data points, including locations ofdrill holes, test holes, piezometers, observation wells,test wells, and overlays on the plan of the proposedfeature
Surface information should include data on soil erosion orresistance or how erosion relates to runoff or the potentialrecharge of the groundwater system. Soil infiltration datafrom Natural Resource Conservation Service mappingshould be included if available.
Subsurface Data
Subsurface data should include representativepermeabilities, a real distribution of permeabilities, lo-cation and potential recharge sources or barriers, andanticipated seasonal changes in the groundwater system.When a project has a relatively high soil or rockpermeability and the permeable formation extendslaterally over a large area, storage (storativity, effective

FIELD MANUAL
308
porosity) of the aquifer requires evaluation. Specific datathat may be necessary include:
• General geology of the site and surrounding areaincluding geologic cross sections that show verticaland lateral variations in materials
• Logs of drill holes, test holes, and piezometersshowing depths and thicknesses of materials,descriptions of materials, and results of testing
• Results of material sampling including depths,descriptions, mechanical analyses, and hydrometeranalyses
• Geophysical logs
• Aquifer or permeability test results including yieldsand drawdown with time and static water levels
• Layout of test holes and depths and designs of wellsand piezometers
• Water quality analyses
Other Data
• Climatic data for the nearest station including dailytemperature and precipitation and details on theoccurrence of severe storms
• Streamflow and elevation, lake or reservoir depth,elevation, and other similar data
• Groundwater levels for monitored observation wells,piezometers, test wells, drill holes, and pits

WATER CONTROL
309
• If a nearby surface water body and the groundwaterare connected, continuous monitoring of both featuresfor a typical hydrologic cycle
Presentation of Data
The presentation of dewatering data may differ from thepresentation of conventional geologic data because watercontrol data are subject to a variety of quantitativeinterpretations and because water levels, flow, and waterquality vary with time.
Because of the potential for different interpretations, mostdewatering data such as those from aquifer tests andpacker tests are presented as observed field data and asinterpretations. A complete description of the site,subsurface conditions, and test facilities should be givenalong with the data (figures 20-2 and 20-3).
Where time related data are presented, the informationshould be in a form that will ensure maximum recognitionand proper interpretation. Hydrographs that plot timeversus water levels mean a lot more than a table ofreadings.
Monitoring
Water control activities must be monitored duringconstruction and, in some cases, up to a year or morebefore and following completion of the facility. Details ofthe monitoring program including design and layout ofthe system, the responsibilities for installing the system,and monitoring and maintaining records must be includedin the specifications and construction considerations toensure adequate reliable data and inform constructionpersonnel of monitoring requirements.

FIE
LD
MA
NU
AL
310
Figure 20-3.—Aquifer test data.

���������� � ����������������� �������������

WATER CONTROL
311
Monitoring is intended to:
• Provide data on base level conditions
• Confirm that the specifications requirements arebeing met
• Maintain a general data base on conditions andimpacts resulting from the dewatering
• Alert personnel to unsuitable, hazardous, or poten-tially hazardous conditions
• Document conditions in the event of claims orlitigation
• Provide background data for a followup analysis inthe event of a slope, foundation, or structural failure
Monitoring of water control parameters, activities, andfeatures should include:
• Groundwater levels
• Discharges
• Sediment content of discharges
• Chemical and biologic quality of water discharged
• Horizontal and vertical control on constructedfeatures and natural and excavated slopes
• Levels and sizes of nearby surface water bodies
• Stability of nearby structures
The monitoring facilities may range from a fewobservation wells to a complex system involving sophisti-cated equipment and continuous and possibly remotemonitoring. The extent, complexity, and capability ofwater control facilities depend on the size and complexity

FIELD MANUAL
312
of the facilities and the hydrologic and geologic conditionsand excavation depths.
Groundwater Monitoring
Monitoring during construction should include ground-water levels in excavations, areas surrounding theexcavations, and off-site locations. Excavations of anysubstantial width (other than trenches) and a depth ofmore than a few feet below the anticipated water levelmay need groundwater monitoring instrumentation in-stalled directly in the excavation. Excavations underlainat shallow depths by artesian conditions may need to bemonitored because of the potential for blowout.
Groundwater Monitoring Locations
Groundwater monitoring instrumentation located withinan excavation may interfere with the contractor duringconstruction, but monitoring groundwater levels withinan excavation generally justifies inconveniences. Becausethe most difficult area to dewater is usually the center ofthe excavation, groundwater monitoring instrumentsshould be located near the center. Special provisions maybe necessary to ensure continued groundwater monitoringof the facilities during all stages of the excavation. Insome cases, groundwater monitoring instrumentationmay be incorporated into the structure. This may requirethat the monitoring instrument be embedded in concretesuch as a wall or pier to permit continuous monitoringand simplify backfill operations.
Water level monitoring instrumentation should be locatedin areas surrounding the excavation to monitor represen-tative areas and specific problem areas. Groundwaterlevels in off-site locations should be monitored tomaintain a general record of conditions and to document

WATER CONTROL
313
dewatering. Off-site monitoring is especially important inareas where groundwater is widely used, wheregroundwater levels are crucial to existing activities, orwhere there might be subsidence or groundwater leveldecline.
Locations of individual water level monitoring instru-ments must be based on conditions encountered at thesite, construction activities, and the dewatering facilities.Monitoring instrumentation locations generally will haveto be selected after other features such as dewatering sys-tems and roads have been located to avoid conflicts and toensure representative and reliable monitoring. Instru-mentation should be installed and functioning long beforeconstruction to obtain trends and base level conditions.Existing instrumentation may be used for monitoring; butunless the instrumentation construction and other detailsare known, instrumentation designed specifically for theconditions of the site should be installed as a part ofconstruction.
Groundwater Monitoring Instrumentation
Instrumentation for monitoring groundwater levels usu-ally consists of several observation wells or piezometers.The type of instrumentation, depth, and riser and holediameter depends primarily on subsurface conditions,desired operating life, and type of monitoring. The designof the instrumentation should be tailored to thesubsurface and data requirements so that measurementsare a true indication of in place conditions.
Observation wells intended to monitor general ground-water levels can be used in areas where the foundationmaterial is relatively uniform in depth, there is little or nolayering, and groundwater levels do not vary appreciably

FIELD MANUAL
314
with depth. Piezometers should be used where layeringexists or perching, artesian, or complex conditions areexpected.
Observation wells and piezometers usually consist of asection of well screen, perforated pipe, or porous tubeisolated in the zone to be monitored and connected to alength of standpipe, riser, or casing extending to thesurface. The section of well screen, perforations, or poroustube must be isolated with a watertight grout or bentoniteseal, and a watertight riser must be used. The diameterof the screen and standpipe should conform to ASTMD-5092. Water levels are measured directly in the well orpiezometer by use of tape or electric sounder (M-scope).Float-type recorders can be used to continuously recordwater level fluctuations but may require a minimum 4- to6-inch (10- to 15-cm) diameter casing or standpipe. Awide range of electronic and pneumatic instruments isavailable for monitoring and recording groundwaterlevels.
Special types of monitoring wells or piezometers may benecessary if hazardous materials are present.
Monitoring Discharges From Dewatering Systems
The discharge from dewatering facilities such as wells,well point systems, drains, and sump pumps should bemonitored to provide a record of the dewatering quan-tities. Data should include starting and stopping times,instantaneous rates of discharge, changes in rates,combined daily volumes, and, in some cases, waterchemistry, turbidity, and biologic content.
Discharge rates can be monitored by flow meters(propeller, pitot tube, and acoustic), free discharge

WATER CONTROL
315
orifices, weirs, flumes, and volumetric (tank-stopwatch)methods. Meters must be calibrated using a volumetrictest before flow testing. Measuring devices generallymust be accurate within 10 percent.
Sediment content of dewatering facilities including wells,well point systems, and drains should be monitored.Sediment can damage pumping equipment, cause deteri-oration of water quality in a receiving water body, andcreate voids in the foundation that result in well collapseand foundation settlement.
Sediment content usually is measured in parts per millionby volume of water or in nephelometric turbidity units(NTU) in water taken directly from the discharge.Measurement requires special equipment. If the limitsare 50 parts per million or less, a special centrifugalmeasuring device is required. If the limits are more than50 parts per million, an Imhoff cone can be used. A tur-bidity meter typically measures values less than2,000 NTUs. Values less than 200 NTUs are generallyacceptable for discharge. If sediment yield increasesrapidly, the facility may need to be shut down to avoidserious damage or contamination.
The chemical and biologic content of water dischargedfrom dewatering systems should be monitored by periodiccollection and analysis of samples taken directly from thesystem discharge. A single representative sample is ade-quate if there are a number of discharges from the samesource. If there is pumping from different sources,multiple samples may be needed. The initial samplesshould be taken shortly after startup of the dewateringsystem (or during any test pumping done duringexploration) and periodically during operation. Eachsample may need biologic and chemical analyses forheavy metals, organics, and pesticides. More frequent

FIELD MANUAL
316
sampling and analyses may be made to determine totaldissolved solids, conductivity, pH, and sediment contentor turbidity.
Monitoring Water and Ground Surfaces andStructures
Well or Piezometer Design.—Most groundwater moni-toring for water control investigations is to collect waterlevel information, but some monitoring is to obtain waterquality information. All monitoring wells should beconstructed according to ASTM D-5092 and constructedfor site conditions and purposes. Geologic conditions,available drilling equipment, depth to water, and thefrequency of the readings should be factored into thedesign of a monitoring well. If a monitoring well requiresdaily or weekly readings, the well may requireinstallation of an automated water level monitoringsystem. The type and diameter of riser should be basedon the intended use of the monitoring well. If monitoringis to continue into construction, protecting the well shouldbe part of the design. Too often, a piezometer orobservation well is constructed without any seriousattempt to design the well. Typically, monitoring wellsare constructed using 1-inch (2.5-cm) diameter PVC riserswith a screen slot size of 0.010 inch (0.25 mm) or with orwithout a 10/20 sand pack. This “low permeability”monitoring well design is appropriate if the well ismonitored only for water levels and the adjacent sourcesof recharge due to precipitation, dewatering, unwateringactivities, or other water bodies is not changing rapidly.
All monitoring wells should be completed using theappropriate seals, risers, and openings to allow the waterlevel in the riser or piezometer to respond to the formationrather than to the water within the riser, the screen, orthe sand pack. Improper or inadequate removal of

WATER CONTROL
317
cuttings and drill fluids, or too fine a slot or sand pack,can delay the response of groundwater within a riser. Toolarge openings can result in clogging of the monitoringwell and impact the chemistry of the groundwater. Awater quality monitoring well in soils or decomposed tointensely weathered bedrock should have a minimum of2-inch (5-cm) risers with an annular space of at least2 inches (5 cm). All wells with screen or slots should bedeveloped, especially if the well is being used to obtainwater quality samples. Clays and humic materials ofcolloidal sizes can skew water quality tests.
Ground Surface Monitoring.—The ground surface andother pertinent points should be monitored for settlementduring dewatering activities. Use standard surveyingmethods (at least third order) and temporary benchmarksor other facilities to maintain survey control. Horizontalcontrol is necessary in large or deep excavations that maybe susceptible to slope failure. Special instrumentationwith alarm warning capability may be necessary if groundfailure might endanger life or property.
Water Surface Monitoring.—Nearby surface waterbodies, swamps, drains, and other similar features shouldbe monitored, if appropriate, for elevation and dischargechanges and environmental changes.
Structural Monitoring.—Nearby structures that maybe influenced by settlement or horizontal displacementcaused by groundwater withdrawal should be monitored.Both horizontal and vertical measurements should beacquired to detect movement.

FIELD MANUAL
318
Performance Evaluation During Construction
The performance of the water control facilities should beevaluated and documented periodically during construc-tion. This will ensure that the specifications are beingmet and that unusual or unexpected conditions areproperly accommodated. Charts and diagrams such ashydrographs or plots of well or system discharge ratesshould be prepared at the start of dewatering operationsand updated throughout the construction period. Anevaluation, along with tables and graphs, should beincluded in monthly reports to provide essential data forfinal reports. The evaluation should be coordinated withthe design staff to ensure complete understanding ofconditions.
Final Reporting
The final construction report should include a section onwater control. This section should include a chronology ofdewatering and an evaluation of the performance of thefacilities as well as contractor compliance with thespecifications. Problem areas and unusual events such aspump or slope failures should be documented. Mon-itoring results, including groundwater levels anddischarge rates, should be presented in the form ofhydrographs and other similar plots or tabulated data.
Bibliography
Bureau of Reclamation, U.S. Department of the Interior,Ground Water Manual, 2nd Edition, 1995.
Cedergren, Harry R., Seepage, Drainage and Flow Nets,John Wiley and Sons, Inc., New York, New York, 1967.

WATER CONTROL
319
Driscoll, Fletcher, G., Ground Water and Wells, JohnsonDivision, St. Paul, Minnesota, 1986.
Joint AEG-ASCE Symposium, Practical ConstructionDewatering, Baltimore, Maryland, May 16, 1975.
Leonards, G.A., Editor, Foundation Engineering,McGraw-Hill Book Co., Inc., New York, New York, 1962.
Powers, J. Patrick, Construction Dewatering, John Wileyand Sons, New York, New York, 1981.
U.S. Departments of the Army, the Navy, and the AirForce, Dewatering and Groundwater Control for DeepExcavations, TM5-818-5, NAVFAC P-418, AFM 88-5,Chapter 6, April 1971.

Chapter 21
FOUNDATION PREPARATION,TREATMENT, AND CLEANUP
This chapter discusses foundation preparation for and theplacement of the first several layers of earthfill andconcrete. Preparation includes excavating overburden;shaping the foundation surface with dental concrete;filling surface irregularities with slush grout (usually acement/water mixture poured in cracks) or dental concrete(conventional concrete used to shape surfaces, fillirregularities, and protect poor rock); treating faults,shears, or weak zones; and cleanup.
Earthfill Dams
Shaping
Shape the foundation to ensure proper compaction of filland to prevent stress anomalies in the overlyingembankment. Fractures and resultant seepage problemsin embankment dams may be caused by irregularities inthe foundation such as stepped surfaces, abrupt changesin slope, and excessively steep surfaces. Embankmentzones may differentially settle adjacent to these areas,resulting in cracks. Arching occurs near stepped surfacesresulting in a zone of low horizontal stress adjacent to thesteep surface. Preventing arching is more important inthe upper 1/6 to 1/4 of a dam or in low dams wherestresses are low and tension zones develop along steep ordiverging abutments. Tension zones or areas of lowstresses are susceptible to hydraulic fracturing. Thefoundation surface should be shaped by excavating or byusing concrete to obtain a smooth, continuous surface thatminimizes crack potential. When an inclined core is usedin a rockfill dam, the core derives support from the

FIELD MANUAL
322
underlying filter and transition material. The zonebeneath the filter and transition should be shaped usingcore contact criteria.
Foundation outside the core contact must be shaped tofacilitate fill placement and compaction, and unsuitableweak or compressible materials must be removed.Impervious materials beneath drainage features whichwould prevent drainage features from properlyfunctioning must also be removed. Materials may moveinto the foundation, and erodible foundation materialsmay move into the embankment. Appropriately gradedfilters between the drainage materials and foundationmay be necessary.
The minimum treatment of any foundation consists ofstripping or removing organic material such as roots andstumps, sod, topsoil, wood, trash, and other unsuitablematerials. Cobbles and boulders may also requireremoval depending on the type of embankment materialto be placed.
The weak points in earthfill dams are generally withinthe foundation and especially at the contact of thefoundation with the embankment. Foundation seepagecontrol and stability features must be carefully supervisedby the inspection force during construction to ensureconformance with the design, specifications, and goodpractice. Water control methods used in connection withexcavating cutoff trenches or stabilizing the foundationsshould ensure that fine material is not washed out of thefoundation because of improper screening of wells andthat the water level is far enough below the foundationsurface to permit construction “in the dry.” Wheneverpossible, locate well points and sumps outside the area tobe excavated to avoid loosening soil or creating a "quick"bottom caused by the upward flow of water or equipment

FOUNDATION PREPARATION
323
vibration. Avoid locating sumps and associated drainagetrenches within the impervious zone because of thedifficulty in properly grouting them after fill placementand the danger of damaging the imperviouszone/foundation contact.
Found cutoff walls or concrete grout caps in the best rockavailable. Prohibit or strictly control blasting for theexcavation of these structures to avoid damaging thefoundation. If the material cannot be excavated with ahydraulic excavator fitted with a rock bucket, a grout capor cutoff wall is probably not needed and grout nipplescan be set directly in the foundation. A highly weatheredzone can be grouted effectively by:
• Leaving the foundation high.
• Setting grout nipples through the unsuitablematerial. Long grout nipples may be necessary inpoor rock.
• Excavating to final foundation grade aftergrouting.
In hard, sound rock, neither a grout cap nor a high foun-dation is necessary.
When overburden is stripped to rock, carefully clean therock surface and all pockets or depressions of soil and rockfragments before the embankment is placed. This mayrequire compressed air or water cleaning and handwork.Rock surfaces that slake or disintegrate rapidly onexposure must be protected or covered immediately withembankment material or concrete. Foundation rockshould be shaped to remove overhangs and steep surfaces(figure 21-1). High rock surfaces must be stable duringconstruction and should be cut back to maintain a

FIELD MANUAL
324
Figure 21-1.—Example foundation treatmentdetails from specifications.
smooth, continuous profile to minimize differentialsettlement and stress concentrations within theembankment. Final slopes should be 0.5:1 (horizontal tovertical [H:V]) or flatter. Beneath the impervious zone,all overhangs should be removed; stepped surfaces steeperthan 0.5:1 and higher than 0.5 foot (15 cm) should beexcavated or treated with dental concrete to a slope of0.5:1 or flatter. Outside the impervious zone, alloverhangs should be removed, and stepped surfacessteeper than 0.5:1 and higher than 5 ft (1.5 m) (should beexcavated or treated with dental concrete to a slope of0.5:1 or flatter.

FOUNDATION PREPARATION
325
Slush grout or joint mortar should be used to fill narrowcracks in the foundation (figure 21-1). However, theyshould not be used to cover exposed areas of thefoundation. Slush grout and joint mortar are composed ofPortland cement and water or, in some cases, Portlandcement, sand, and water. The slush grout is preferablyused just before fill placement to eliminate any tendencyfor hardened grout to crack under load. Dental concreteshould be used to fill potholes and grooves created bybedding planes and other irregularities such as previouslycleaned shear zones and large joints or channels in rocksurfaces. Formed dental concrete can be used to filletsteep slopes and fill overhangs.
Care should be used during all blasting to excavate or toshape rock surfaces. Controlled blasting techniques, suchas line drilling and smooth blasting, should be used.
Soil Foundations
When the foundation is soil, all organic or otherunsuitable materials, such as stumps, brush, sod, andlarge roots, should be stripped and wasted. Strippingshould be performed carefully to ensure the removal of allmaterial that may be unstable because of saturation,shaking, or decomposition; all material that may interferewith the creation of a proper bond between the foundationand the embankment; and all pockets of soil significantlymore compressible than the average foundation material.Stripping of pervious materials under the pervious orsemipervious zones of an embankment should be limitedto the removal of surface debris and roots unless materialremoval is required for seismic stability. Test pits shouldbe excavated if the stripping operations indicate the pres-ence of unstable or otherwise unsuitable material.

FIELD MANUAL
326
Before placing the first embankment layer (lift) on anearth foundation, moistening and compacting the surfaceby rolling with a tamping roller is necessary to obtainproper bond. An earth foundation surface sometimesrequires scarification by disks or harrows to ensure properbonding. No additional scarification is usually necessaryif the material is penetrated by tamping rollers.
All irregularities, ruts, and washouts should be removedto provide a satisfactory foundation. Cut slopes should beflat enough to prevent sloughing, and not steeper than1:1. Material that has been loosened to a depth of lessthan 6 in (15 cm) may be treated by compaction.Loosened material deeper than 6 in (15 cm) cannot beadequately compacted and should be removed.
Foundation materials at the core/foundation contact mustbe compacted to a density compatible with the overlyingfill material. A fine-grained foundation should be com-pacted and disked to obtain good mixing and bondbetween the foundation and the first lift of core material.
Fine-grained foundations should be compacted with aroller. If the foundation is too firm for the tamping feet topenetrate, the foundation surface should be disked to adepth of 6 in and moistened before compaction. Smoothsurfaces created by construction traffic on a previouslycompacted foundation surface should be disked to a depthof 2 in (5 cm).
Coarse-grained foundations should be compacted byrubber-tired or vibratory rollers. Vibratory compactorscreate a more uniform surface for placement of the firstearthfill and are the preferred method of compaction.
Cemented and highly overconsolidated soils that breakinto hard chunks should not be reworked or disked to mix

FOUNDATION PREPARATION
327
foundation and core material. The first lift ofembankment material should be placed in a mannersimilar to that required for rock foundations as describedabove.
Soil foundation compaction requirements beneath filterand shell zones should be the same as those outlinedabove, except bonding the foundation to the overlying fillis not required.
The moisture content of the upper 6 in (15 cm) of a fine-grained soil foundation should be within 2 percent dryand 1 percent wet of the Proctor optimum moisturecontent for adequate compaction. Coarse-grainedfoundation materials should be just wet enough to permitcompaction to the specified relative density, butsaturation is not permitted. Dry materials must bedisked and moistened to provide a homogeneous moisturecontent within the specified limits in the upper 6 in(15 cm) of the foundation. Wet materials must be dried bydisking to bring the upper 6 in of foundation materia1within the specified moisture content limits. Wetfoundations should be unwatered or dewateredsufficiently to prevent saturation of the upper 6 in (15 cm)of foundation material due to capillary rise or pumpingcaused by construction equipment travel.
All embankment materials should be protected fromeroding into coarser soil zones in the foundation bytransitions satisfying filter criteria or by select zones ofhighly plastic, nonerodible material. Transition zones orfilters on the downstream face of the cutoff trench andbeneath the downstream zones should prevent movementof fine material in the foundation into the embankment.Dispersive embankment materials must be protected frompiping into coarse material in the foundation by placingselect zones of nondispersive material between the

FIELD MANUAL
328
embankment and foundation. Lime-treated or naturallynondispersive earthfill is appropriate for the first severallifts of fill material or filters. Except for areas where animpervious seal between the embankment and foundationis required, filter zone(s) are the preferred method.
Rock Foundations
Rock foundation surfaces should be moistened, but nostanding water should be permitted when the first lift isplaced. The use of very wet soil for the first lift againstthe foundation should generally be avoided, but havingthe soil slightly wet of optimum moisture content isbetter. Any material more plastic than what is typicallyavailable for embankment construction is commonly usedon the first few lifts. The foundation should be properlymoistened to prevent drying of the soil. On steep,irregular rock abutments, material slightly wetter thanoptimum may be necessary to obtain good workability anda suitable bond. Be careful when special compaction isused to ensure that suitable bonds are created betweensuccessive layers of material. This usually requires lightscarification between lifts of compacted material. Wherea rock foundation would be damaged by penetration of thetamping roller feet, the first compacted lift can be thickerthan that specified. The first lift thickness should neverexceed 15 in (40 cm) loose for 9-in-long (23-cm) tamperfeet, and additional roller passes are probably required toensure proper compaction. Special compaction methods,such as hand tamping, should be used in pockets thatcannot be compacted by roller instead of permitting anunusually thick initial lift to obtain a uniform surface forcompaction. Irregular rock surfaces may prevent propercompaction by rollers, and hand compaction may benecessary. However, where foundation surfaces permit,a pneumatic-tire roller or pneumatic-tire equipmentshould be used near foundation contact surfaces. An

FOUNDATION PREPARATION
329
alternative to using thick lifts is using a pneumatic-tireroller or loader with a full bucket and disking orscarifying the lift surfaces to obtain a bond between lifts.The tamping roller can be used when the fill is sufficientlythick and regular to protect the foundation from thetamping feet. Unit weight and moisture should becarefully monitored in the foundation contact zone, andplacing and compacting operations should be carefullyinspected.
On steep surfaces, ramping the fill aids compaction; abouta 6:1 slope should be used for ramping the fill. Thesurfaces of structures should be sloped (battered) at about1:10 to facilitate compaction.
The basic objectives of foundation surface treatmentwithin the impervious core are:
• Obtain a good bond between the impervious corematerials and the foundation. The foundationsurface must be shaped by excavation or concreteplacement to provide a surface suitable forearthfill compaction. Compaction techniques usedfor initial earthfill placement should result inadequately compacted embankment material inintimate contact with and tightly bonded to thefoundation without damaging the foundationduring placement of the first lifts. A plasticmaterial is preferred next to the foundation, andspecial requirements on the plasticity, gradation,and moisture content are commonly specified.
• Defend against erosion of embankment materialsinto the foundation by filling or covering surfacecracks in the foundation, using blanket grouting,protective filters, and nonerodible embankment

FIELD MANUAL
330
materials (natural or manufactured) at thefoundation contact.
• Remove erodible, weak, unstable, compressible,loose, or pervious materials to ensure afoundation of adequate strength and appropriatepermeability. When in doubt, take it out. In rockfoundations, defects such as faults, fractures,erosion channels, or solution cavities or channelssometimes cannot be completely removed.Material defects in the rock mass include faultgouge, rock fragments, soft or pervious soil, orsolutioned rock. These materials require removalto an adequate depth and replacement with slushgrout, dental concrete, or specially compactedearthfill.
How the exposed rock surface is treated after removal ofunsuitable overlying materials depends on the type ofrock and the irregularities present. Construction activ-ities such as using tracked equipment on soft rocksurfaces, using rippers near foundation grade, or nearbyblasting may loosen rock or open joints in originallysatisfactory rock. This type of damage should and can beavoided to limit excavation and cleanup. Theconfiguration of exposed rock surfaces is controlled largelyby bedding, joints, other discontinuities, and excavationmethods. Depending on discontinuity orientations, thesefeatures can result in vertical surfaces, benches,overhangs, or sawteeth. Features such as potholes,buried river channels, solution cavities, and shear zonescan create additional irregularities requiring treatment.Unsuitable material must be removed from theirregularities, and the foundation surface must be shapedto provide a sufficiently regular surface that earthfill canbe placed without differential settlement. If theirregularities are small enough and discontinuous both

FOUNDATION PREPARATION
331
horizontally and vertically, overexcavation can beappropriate. Generally, the foundation surface can beshaped adequately by conventional excavation or smoothblasting. When smoothing of irregularities requiresexcessively large quantities of excavation or requiresblasting that may damage the foundation, shaping withdental concrete may be appropriate.
High rock surfaces must be stable during constructionand must be laid back to maintain a smooth, continuousprofile to minimize differential settlement and stressconcentrations. Slopes should be 0.5:1 (H:V) or flatter,depending on the fill material.
Remove overhangs. Stepped surfaces that are steeperthan 0.5:1 and higher than 1 foot (30 cm) should beexcavated or treated with dental concrete to a resultantslope of 0.5:1 or flatter, depending on the fill material(figure 21-1). In the lower portions of a high dam, thisrequirement may be relaxed. For example, a verticalsurface less than 20 ft (6.1 m) long and 5 ft (1.5 m) highmight be tolerated if the surface is well within theimpervious zone.
Remove all overhangs under the outer zones of earthfilldams and under transitions and filters of rockfill dams.Stepped surfaces that are steeper than 0.5:1 and higherthan 5 ft (1.5 m) should be flattened or treated withdental concrete to a slope of 0.5:1 or flatter. Beneath theouter rockfill zones of rockfill dams, nearly verticalabutment contact slopes have been permitted in high,steep-walled canyons. Overhangs should be trimmed orthe undercut below the overhang filled with concrete.
If shaping requires blasting, proper blasting proceduresare essential to ensure that the permeability and strengthof the rock is not adversely affected and that the rock can

FIELD MANUAL
332
stand on the slopes and handle the imposed loads.Existing fractures and joints in a rock mass, as well aspoor blasting, often result in unacceptable excavatedsurfaces. Prior competent review, approval, and enforce-ment of the Contractor’s blasting plan, control of blastingdetails, requirements for acceptabi1ity of the excavatedsurface, and control of vibration levels can help obtain thedesired excavation surface.
All loose or objectionable material should be removed byhandwork, barring, picking, brooming, water jetting, orair jetting. Remove accumulated water from cleaningoperations. When the rock surface softens or slakes bywater washing, compressed-air jetting or jetting with asmall amount of water added to the air should be used.Loose or unsuitable material in cavities, shear zones,cracks, or seams should be treated as follows (figure 21-1):
• Openings narrower than 2 in (5 cm) should becleaned to a depth of three times the width of theopening and treated.
• Openings wider than 2 in (5 cm) and narrowerthan 5 ft (1.5 m) should be cleaned to a depth ofthree times the width of the opening or to a depthwhere the opening is 0.5 in (12mm) wide or less,but not to a depth exceeding 5 ft (5 cm) andtreated.
• Openings wider than 5 ft (1.5 m) are a special casewhere the required depth of cleaning andtreatment is determined in the field.
Special cleanup procedures are required for foundationmaterials that deteriorate when exposed to air or water(slake). The foundation must be kept moist if deteriora-tion is caused by exposure to air and kept dry if

FOUNDATION PREPARATION
333
deterioration is caused by exposure to water. Spraycoating with material (similar to concrete curingcompound) designed to reduce slaking may (but probablywill not) be effective. Cleanup and placing a lean concrete“mud slab” approximately 4 in (15 cm) thick may beeffective. Usually, removing the last few inches ofmaterial and doing final cleanup just before firstplacement of fill is the best approach. A maximum timeinterval may also be specified between the time ofexposure of the final grade and the time that thefoundation is protected with earthfill or a suitableprotective coating.
Cleanup outside the core is normally less critical. Loosematerial should be removed so that the embankment is indirect contact with suitable rock. If defects are containedwithin the foundation area, they may not require cleaningand refill. If a defect crosses the entire foundation area,it may require cleaning similar to the foundation beneaththe core.
Dental concrete is used to fill or shape holes, grooves,extensive areas of vertical surfaces, and sawteeth createdby bedding planes, joints, and other irregularities such aspreviously cleaned out solution features, shear zones,large joints, or buried channels. Formed dental concretecan be used to fillet steep slopes and fill overhangs.Placing a concrete mat over a zone of closely spacedirregularities is appropriate in local areas that are notlarge in relation to the core dimensions. Dental concreteshaping can be used instead of excavation by blasting orwhen excessive amounts of excavation would otherwise berequired.
Slabs of dental concrete should have a minimumthickness of 6 in (15 cm) if the foundation is weak enoughto allow cracking of the concrete under load (figure 21-1).
FIELD MANUAL
334
Thin areas of dental concrete over rock projections on ajagged rock surface are likely places for concrete crackingand should be avoided by using a sufficient thickness ofdental concrete or by avoiding continuous slabs of concreteover areas containing numerous irregularities on weakfoundations. Feathering at the end of concrete slabs onweak foundations should not be permitted, and the edgesof slabs should be sloped no flatter than 45 degrees.Formed dental concrete should not be placed on slopesgreater than 0.5:1 (H:V). When dental concrete fillets areplaced against vertical or nearly vertical surfaces in weakrock, feathering should not be permitted, and a beveledsurface with a minimum thickness of 6 in (15 cm) isrequired at the top of the fillet.
Concrete mix proportions should provide a 28-daystrength of 3,000 pounds per square inch (21 MPa). Themaximum aggregate size should be less than one-thirdthe depth of slabs or one-fifth the narrowest dimensionbetween the side of a form and the rock surface. Cementtype will depend on the concentration of sulfates in thefoundation materials and groundwater. Low-alkalicement is required for alkali-reactive aggregates. Cementtype should be the same as used in structural concrete onthe job. Aggregate and water quality should be equal tothat required in structural concrete.
The rock surface should be thoroughly cleaned, asdescribed below, and moistened before concrete placementto obtain a good bond between the concrete and the rocksurface. When overhangs are filled with dental concrete,the concrete must be well bonded to the upper surface ofthe overhang. The overhang should be shaped to allow airto escape during concrete placement to prevent air pocketsbetween the concrete and the upper surface of theoverhang. The concrete must be formed and placed sothat the head of the concrete is higher than the upper
FOUNDATION PREPARATION
335
surface of the overhang. If this is impractical, grout pipesshould be installed in the dental concrete for later fillingof the air voids. If grouting through dental concrete isdone, pressures should be closely controlled to preventjacking the concrete or fracturing the fill.
Finished horizontal dental concrete slabs should have aroughened, broomed finish for satisfactory bonding of fillto concrete. Dental concrete should be cured by water oran approved curing compound for 7 days or covered byearthfill. Earthfill placement may not be permitted overdental concrete for a minimum of 72 hours or more afterconcrete placement to allow concrete time to developsufficient strength to withstand stress caused by placingearthfill. Inadequate curing may result in the concretecracking.
Slush grout is a neat cement grout or a sand-cementslurry that is applied to cracks in the foundation. Cracksor joints are filled with grout rather than spreading grouton the surface (figure 21-1). Slush grout should be usedto fill narrow surface cracks and not used to cover areasof the foundation. Slush grout may consist of cement andwater, or sand, cement, and water. To ensure adequatepenetration of the crack, the maximum particle size in theslush grout mixture should be no greater than one-thirdthe crack width. Generally, neat cement grout is used.The consistency of the slush grout mix may vary from avery thin mix to mortar as required to penetrate thecrack. The grout preferably should be mixed with amechanical or centrifugal mixer, and the grout should beused within 30 minutes after mixing.
The type of cement required will depend on theconcentration of sulfates in the foundation materials andgroundwater. Low-alkali cement is required for alkalisensitive aggregates. Cement type should be that

FIELD MANUAL
336
specified for structural concrete. Sand and water qualityshould be equal to that required for structural concrete.
Clean out cracks as described above. All cracks should bewetted before placing slush grout. Slush grout may beapplied by brooming over surfaces containing closelyspaced cracks or by troweling, pouring, rodding, orfunneling into individual cracks. Slush grout is bestapplied just before material placement so cracking willnot occur during compaction.
Shotcrete is concrete or mortar that is sprayed in place.The quality of the shotcrete depends on the skill andexperience of the crew, particularly regarding the amountof rebound, thickness, feather edges, and ensuringadequate thickness over protrusions on irregular surfaces.Untreated areas can be inadvertently covered because ofthe ease and rapidity of placement. Shotcrete should beused beneath impervious zones only when site conditionspreclude using dental concrete. If shotcrete is used, closeinspection and caution are necessary. Shotcrete is anacceptable alternative to dental concrete outside the corecontact area.
The fill compaction method used depends on the steepnessof the surface, the nature of the irregularities in thefoundation surface, and the soil material.
A hand tamper may be used to compact earthfill in oragainst irregular surfaces on abutments, in potholes anddepressions, and against structures not accessible toheavy compaction equipment. Hand-tamped, speciallycompacted earthfill is typically placed in 4-in (10-cm)maximum compacted lifts with scarification between lifts.

FOUNDATION PREPARATION
337
Site-specific conditions determine whether hand-compacted earthfill or filling with dental concrete is thebest solution.
The feet of the roller must not penetrate the first layer ofearthfill and damage the foundation. Penetration can beprevented by using a rubber-tired roller or loader tocompact the first few lifts above the foundation surfacewith scarification between lifts. Earthfill speciallycompacted by pneumatic-tired equipment is typicallyplaced in 6-in (15-cm) maximum compacted lifts.Placement of horizontal lifts against mildly sloping rocksurfaces can result in feathering of the earthfill lift nearthe rock contact. Placement of the initial lift parallel tothe foundation surface (as opposed to a horizontal lift) forfoundation surfaces flatter than 10:1 (H:V) is acceptableif the compactor climbing up the slope does not loosen ordisturb the previously compacted earthfill.
Core material compacted against steep surfaces istypically placed in 6-in (15-cm) compacted lifts withscarification between lifts. Earthfill 8 to 10 ft (2.4 to 3 m)from a steep surface should be ramped toward the steepsurface at a slope of 6:1 to 10:1 so that a component of thecompactive force acts toward the steep surface.
Earthfill placed against irregular surfaces should beplastic and deformable so that the material is forced(squished) into all irregularities on the foundation surfaceby compaction or subsequent loading. The first layer soilmoisture contents should range from 0 to 2 percent wet ofoptimum. Select material with a required plasticity rangeis commonly specified. A soil plasticity index rangingfrom 16 to 30 is preferred although not absolutelynecessary.

FIELD MANUAL
338
Core materials that are erodible include low plasticity ornonplastic, silty materials and dispersive clays.Preventing erosion of embankment materials into thefoundation includes sealing cracks in the foundation withslush grout and dental concrete and using filter zone(s)between the fine-grained material and the foundation.Sealing cracks is not totally reliable because concrete andmortar can crack due to shrinkage or loading. Usingnatural or manufactured nonerodible material for the firstseveral lifts of embankment at the core-foundation contactis good practice.
If erosion-resistant plastic materials are available, thesematerials should be used for the first several lifts alongthe foundation contact to avoid placing erodible nonplasticmaterials directly against the rock surface. If plasticmaterials are not available, the natural soil can be mixedwith sodium bentonite to produce core material to beplaced against the foundation. Laboratory testing shouldestablish the amount of sodium bentonite required to givethe soil the characteristics of a lean clay.
If nondispersive material is available, it should be usedinstead of dispersive material, at least in critical locationssuch as along the core-foundation contact. In depositscontaining dispersive material, the dispersion potentialgenerally varies greatly over short distances. Selectivelyexcavating nondispersive material from a depositcontaining dispersive materials is frequently difficult andunreliable. Lime can be added to dispersive materials toreduce or convert the soil to a nondispersive material.The amount of lime required to treat the dispersive soilshould be established by performing dispersivity tests onsamples of soils treated with varying percentages of lime.Adding lime to a soil results in reduced plasticity and amore brittle soil. The lime content should be the

FOUNDATION PREPARATION
339
minimum required to treat the soil. Do not treatmaterial that has naturally low plasticity with lime if itis not necessary.
Concrete Arch Dams
The entire area to be occupied by the base of a concretearch dam should be excavated to material capable ofwithstanding the loads imposed by the dam, reservoir,and appurtenant structures. Blasting operations mustnot damage the rock foundation. All excavations shouldconform to the lines and dimensions shown on theconstruction drawings, where practical, but it may benecessary to vary dimensions or excavation slopes becauseof local conditions.
Foundations containing seams of shale, siltstone, chalk,or mudstone may require protection against air and waterslaking or, in some environments, against freezing.Excavations can be protected by leaving a temporarycover of unexcavated material, by immediately coveringthe exposed surfaces with a minimum of 12 in (30 cm) ofconcrete, or by any other method that will preventdamage to the foundation.
Shaping
Although not considered essential, a symmetrical ornearly symmetrical profile is desirable for an arch dam forstress distribution. However, asymmetrical canyonsfrequently have to be chosen as arch dam sites. Theasymmetry may introduce stress problems, but these canbe overcome by proper design. Abutment pads betweenthe dam and foundation may be used to overcome some ofthe detrimental effects of asymmetry or foundationirregularities. Thrust blocks are sometimes used at

FIELD MANUAL
340
asymmetrical sites. The primary use of a thrust block isnot to provide symmetry but to establish an artificialabutment where a natural one does not exist.Overexcavation of a site to achieve symmetry is notrecommended. In all cases, the foundation should beexcavated in such a way as to eliminate sharp breaks inthe excavated profile because these may cause stressconcentrations in both the foundation rock and the dam.The foundation should also be excavated to about radialor part radial lines.
Dental Treatment
Exploratory drilling or final excavation often uncoversfaults, seams, or shattered or inferior rock extending todepths that are impracticable to remove. Geologicdiscontinuities can affect both the stability and thedeformation modulus of the foundation. In reality, thefoundation modulus need not be known accurately if theratio of the foundation modulus Ef to the concretemodulus Ec of the dam is known to be greater than 1:4.Canyons with extensive zones of highly deformablematerials and, consequently, Ef /Ec ratios less than 1:4should still be considered potential arch dam sites. Thedeformation modulus of weak zones can be improved byremoving sheared material, gouge, and inferior rock andreplacing the material with backfill concrete.
Analytical methods can provide a way to combine thephysical properties of different rock types and geologicdiscontinuities such as faults, shears, and joint sets intoa value representative of the stress and deformation in agiven segment of the foundation. This also permitssubstitution of backfill concrete in faults, shears, andzones of weak rock and evaluates the benefit contributedby dental treatment.
FOUNDATION PREPARATION
341
Data required for analysis are the dimensions andcomposition of the lithologic bodies and geologicdiscontinuities, deformation moduli for each of theelements incorporated into the study, and the loadingpattern imposed by the dam and reservoir.
Dental treatment concrete may also be required toimprove the stability of a rock mass. By using datarelated to the shear strength of faults, shears, joints,intact rock, pore water pressures induced by the reservoirand/or groundwater, the weight of the rock mass, and thedriving force induced by the dam and reservoir, a safetyfactor for a particular rock mass can be calculated.
Frequently, relatively homogeneous rock foundations withonly nominal faulting or shearing do not require thesophisticated analytical procedures described above. Thefollowing approximate formulas for determining the depthof dental treatment can be used:
d = 0.002 bH + 5 for H >_ 150 ft
d = 0.3b+5 for H<150 ft
where:
H = height of dam above general foundation level inft
b = width of weak zone in ftd = depth of excavation of the weak zone below the
surface of adjoining sound rock in ft. In claygouge seams, d should not be less than 0.1 H.
These rules provide an estimate of how much should beexcavated, but final decisions must be made in the fieldduring actual excavation.

FIELD MANUAL
342
Protection Against Piping
The methods described in the preceding paragraphs willsatisfy the stress, deformation, and stability requirementsfor a foundation, but the methods may not providesuitable protection against piping. Faults, shears, andseams may contain pipable material. To protect againstpiping, upstream and downstream cutoff shafts may benecessary in each seam, shear, or fault, and the shaftsbackfilled with concrete. The dimension of the shaftperpendicular to the seam should be equal to the width ofthe weak zone plus a minimum of 1 foot on each end tokey the concrete backfill into sound rock. The shaftdimension parallel to the seam should be at least one-halfthe other dimension. In any instance a minimum shaftdimension of 5 ft (1.6 m) each way should be used toprovide working space. The depth of cutoff shafts may becomputed by constructing flow nets and computing thecutoff depths required to eliminate piping.
Other adverse foundation conditions may be caused byhorizontally bedded clay and shale seams, caverns, orsprings. Procedures for treating these conditions willvary and will depend on the characteristics of theparticular condition to be remedied.
Foundation Irregularities
Although analyses and designs assume relatively uniformfoundation and abutment excavations, the finalexcavation may vary widely from that which wasassumed. Faults or crush zones are often uncoveredduring excavation, and the excavation of the unsound rockleaves depressions or holes which must be filled withconcrete. Unless this backfill concrete has undergonemost of its volumetric shrinkage at the time overlyingconcrete is placed, cracks can occur in the overlying

FOUNDATION PREPARATION
343
concrete near the boundaries of the backfill concrete asloss of support occurs because of continuing shrinkage ofthe backfill concrete. Where dental work is extensive, thebackfill concrete should be placed and cooled beforeadditional concrete is placed over the area.
Similar conditions exist where the foundation has abruptchanges in slope. At the break of slope, cracks oftendevelop because of the differential movement that takesplace between concrete held in place by rock and concreteheld in place by previously placed concrete that has notundergone its full volumetric shrinkage. A forced coolingof the concrete adjacent to and below the break in slopeand a delay in placement of concrete over the break inslope can minimize cracking at these locations. Ifeconomical, the elimination of these points of high stressconcentration is worthwhile. Cracks in lifts near theabutments very often develop leakage and lead to spallingand deterioration of the concrete.
Concrete Gravity Dams
The entire base area of a concrete gravity dam should beexcavated to material capable of withstanding the loadsimposed by the dam, reservoir, and appurtenantstructures. Blasting should not shatter, loosen, orotherwise adversely affect the suitability of the foundationrock. All excavations should conform to the lines anddimensions shown on the construction drawings, wherepracticable. Dimensions or excavation slopes may varybecause of local conditions.
Foundations such as shale, chalk, mudstone, and siltstonemay require protection against air and water slaking or,in some environments, against freezing. These excava-tions can be protected by leaving a temporary cover of

FIELD MANUAL
344
unexcavated material, by immediately applying a mini-mum of 12 in (30 cm) of mortar to the exposed surfaces, orby any other method that will prevent damage to thefoundation.
Shaping
If the canyon profile for a damsite is relatively narrowand the walls are steeply sloping, each vertical section ofthe dam from the center towards the abutments is shorterin height than the preceding one. Consequently, sectionscloser to the abutments will be deflected less by thereservoir load, and sections toward the center of thecanyon will be deflected more. Since most gravity damsare keyed at the contraction joints, a torsional effect onthe dam is transmitted to the foundation rock.
A sharp break in the excavated profile of the canyon willresult in an abrupt change in the height of the dam. Theeffect of the irregularity of the foundation rock causes amarked change in stresses in the dam and foundation andin stability factors. For this reason, the foundation shouldbe shaped so that a uniform profile without sharp offsetsand breaks is obtained.
Generally, a foundation surface will appear as horizontalin the transverse (upstream-downstream) direction.However, where an increased resistance to sliding isdesired, particularly for structures founded onsedimentary rock foundations, the surface can be slopedupward from heel to toe of the dam.
Dental Treatment
Faults, seams, or shattered or inferior rock extending todepths that are impractical to remove require specialtreatment by removing the weak material and backfilling

FOUNDATION PREPARATION
345
the resulting excavations with dental concrete. Generalrules for how deep transverse seams should be excavatedhave been formulated based on actual foundationconditions and stresses in dams. Approximate formulasfor determining the depth of dental treatment are:
d = 0.002 bH + 5 for H >_ 150 ft
d = 0.3 b + 5 for H < 150 ft
where:
H = height of dam above general foundation level infeet
b = width of weak zone in feet
d = depth of excavation of weak zone below surface ofadjoining sound rock in feet. In clay gougeseams, d should not be less than 0.1 H.
These rules provide guidance for how much should beexcavated, but actual quantities should be determined inthe field during excavation.
Although the preceding rules are suitable for foundationswith a relatively homogeneous rock foundation andnominal faulting, some damsites may have severaldistinct rock types interspersed with numerous faults andshears. The effect on the overall strength and stability ofthe foundation of rock differences complicated by largezones of faulting may require extensive analysis. Datarequired for analysis include the dimensions andcomposition of the rock mass and geologic discontinuities,deformation moduli for each of the elements incorporatedinto the study, and the loading pattern imposed on thefoundation by the dam and reservoir.

FIELD MANUAL
346
Dental treatment may also be required to improve thestability of the rock mass. A safety factor for a particularrock mass can be calculated using data related to thestrength of faults, shear zones, joints, intact rock, porewater pressures induced by the reservoir and/orgroundwater, the weight of the rock mass, and the drivingforces induced by the dam and reservoir.
Protection Against Piping
The methods discussed above can satisfy the stress,deformation, and stability requirements for a foundation,but they may not provide suitable protection againstpiping. Faults and seams may contain pipeable material,and concrete backfilled cutoff shafts may be required ineach fault or seam. The dimension of the shaftperpendicular to the seam should be equal to the width ofthe weak zone plus a minimum of 1 foot (0.3 m) on eachend to key the concrete backfill into sound rock. The shaftdimension parallel to the seam should be at least one-halfthe other dimension. A minimum shaft dimension of 5 ft(1.6 m) each way should be provided for working space.The depth of cutoff shafts may be computed byconstructing flow nets and calculating the cutoff depthsrequired to eliminate piping.
Other adverse foundation conditions may be caused byhorizontally bedded clay and shale seams, caverns, orsprings. Procedures for treating these conditions willvary and will depend on field studies of the characteristicsof the particular condition to be remedied.
Foundation Irregularities
Although analyses and designs assume relatively uniformfoundation and abutment excavations, the final excava-tion may vary widely from that which was assumed.

FOUNDATION PREPARATION
347
Faults or crush zones are often uncovered duringexcavation, and the excavation of the unsound rock leavesdepressions or holes that must be filled with concrete.Unless this backfill concrete has undergone most of itsvolumetric shrinkage at the time overlying concrete isplaced, cracks can occur in the overlying concrete near theboundaries of the backfill concrete. Shrinkage of thebackfill concrete results in loss of support. Where dentalwork is extensive, the backfill concrete should be placedand cooled before additional concrete is placed over thearea.
Similar conditions exist where the foundation has abruptchanges in slope. At the break of slope, cracks oftendevelop because of the differential movement that takesplace between concrete held in place by rock and concreteheld in place by previously placed concrete that has notundergone its full volumetric shrinkage. A forced coolingof the concrete adjacent to and below the break in slopeand a delay in placement of concrete over the break inslope can be employed to minimize cracking at theselocations. If economical, the elimination of these points ofhigh stress concentration is worthwhile. Cracks in liftsnear the abutments very often leak and lead to spallingand deterioration of the concrete.
Cleanup
Proper cleaning and water control on a foundation beforeplacing fill or concrete allows the structure and soil orrock contact to perform as designed. Good cleanup allowsthe contact area to have the compressive and shearstrength and the permeability anticipated in the design.Poor cleanup reduces the compressive and shear strengthresulting in a weak zone under the structure andproviding a highly permeable path for seepage.

FIELD MANUAL
348
Cleaning
Foundation cleanup is labor intensive and costly, so it isroutinely neglected. The result is substandard founda-tions that do not meet design requirements. Rock founda-tions should be cleaned by:
• Barring and prying loose all drummy rock
• Using an air/water jet to remove as much loosematerial and fluff as possible
• Removing by hand loose material that anair/water jet misses
Soil foundations should be cleaned by removing materialmissed by machine stripping that will not be suitablefoundation after compaction.
Foundations of weak rock or firm soil can be cleaned byplacing a steel plate (butter bar) across the teeth of abackhoe or hydraulic excavator and “shaving” or “peeling”objectionable material off the surface, leaving a cleanfoundation requiring very little hand cleaning.
Water Removal
Water in small quantities can be removed by vacuuming(with a shop vac or air-powered venturi pipe) or blottingwith soil and wasting the wet material just before fillplacement. Larger water quantities from seeps can beisolated in gravel sumps and pumped. Grout pipes shouldbe installed; the sumps covered with fabric or plastic; fillplaced over the fabric; and after the fill is a few feet abovethe sump, the sump should be cement grouted by gravitypressure. Seeps in concrete foundations can be isolatedand gravel sumps constructed and subsequently grouted

FOUNDATION PREPARATION
349
as described above or if the seeps are not too large, theconcrete can be used to displace the water out of thefoundation during placement.
Bibliography
Abutment and Foundation Treatment for High Embank-ment Dams on Rock, Journal of the Soil Mechanics andFoundations Division, Proceedings of the AmericanSociety of Civil Engineers, Vol. 98, No. SM10, pp.1017-1032, October 1972.
Current Practice in Abutment and Foundation Treatment,Journal of the Soil Mechanics and Foundations Division,Proceedings of the American Society of Civil Engineers,Vol. 98, No. SM10, pp. 1033-1052, October 1972.
Earth and Rockfill Dams, New York, John Wiley andSons, Inc., 1963.
Foundations and Abutments - Bennett and Mica Dams,Journal of the Soil Mechanics and Foundations Division,Proceedings of the American Society of Civil Engineers,Vol. 98, No. SM10, pp. 1053-1072, October 1972.
Foundation Practices for Talbingo Dam, Australia,Journal of the Soil Mechanics and Foundations Division,Proceedings of the American Society of Civil Engineers,Vol. 98, No. SM10, pp. 1081-1098, October 1972.
Foundation Treatment for Embankment Dams on Rock,Journal of the Soil Mechanics and Foundations Division,Proceedings of the American Society of Civil Engineers,Vol. 98, No. SM10, pp. 1073-1080, October 1972.
FIELD MANUAL
350
Foundation Treatment for Rockfill Dams, Journal of theSoil Mechanics and Foundations Division, Proceedings ofthe American Society of Civil Engineers, Vol. 98,No. SM10, pp. 995-1016, October 1972.
Preparation of Rock Foundations for Embankment Dams,Embankment Dams Engineering, New York, John Wileyand Sons, Inc., pp. 355-363, 1973.
Treatment of High Embankment Dam Foundations,Journal of the Soil Mechanics and Foundations Division,Proceedings of the American Society of Civil Engineers,Vol. 98, No. SM10, pp. 1099-1113, October 1972.

Chapter 22
PENETRATION TESTING
Introduction
This chapter discusses the Standard Penetration Test(SPT), Becker Penetration Test (BPT), and Cone Penetra-tion Test (CPT). Penetration tests are used to determinefoundation strength and to evaluate the liquefactionpotential of a material. SPTs for liquefaction evaluationsare stressed in the discussion. The significant aspects ofthe tests and the potential problems that can occur areincluded.
History
Penetration resistance testing and sampling with an openended pipe was started in the early 1900s. The RaymondConcrete Pile Company developed the Standard Penetra-tion Test with the split barrel sampler in 1927. Sincethen, the SPT has been performed worldwide. The SPT orvariations of the test are the primary means of collectinggeotechnical design data in the United States. Anestimated 80-90 percent of geotechnical investigationsconsist of SPTs.
Standard Penetration Testing
Equipment and Procedures
The SPT consists of driving a 2-inch (5-cm) outsidediameter (OD) “split barrel” sampler (figure 22-1) at thebottom of an open borehole with a 140-pound (63.6-kg)hammer dropped 30 inches (75 cm). The “N” value is thenumber of blows to drive the sampler the last 1 foot(30 cm), expressed in blows per foot. After the penetration

FIELD MANUAL
352
Figure 22-1.—ASTM and Reclamation SPT sampler requirements.

PENETRATION TESTING
353
test is completed, the sampler is retrieved from the hole.The split barrel is opened, the soil is classified, and amoisture specimen is obtained. After the test, theborehole is extended to the next test depth and theprocess is repeated. SPT soil samples are disturbedduring the driving process and cannot be used asundisturbed specimens for laboratory testing.
The American Society of Testing and Materials standard-ized the test in the 1950s. The procedure required a freefalling hammer, but the shape and drop method were notstandardized. Many hammer systems can be used toperform the test, and many do not really free fall. Thepredominant hammer system used in the United Statesis the safety hammer (figure 22-2) that is lifted anddropped with the a rope and cat head. Donut hammers(figure 22-3) are operated by rope and cat head ormechanical tripping. Donut hammers are not recom-mended because the hammers are more dangerous tooperate and are less efficient than safety hammers. Auto-matic hammer systems are used frequently and arepreferred because the hammers are safer and offer closeto true free fall conditions, and the results are morerepeatable.
The SPT should not be confused with other thick-walldrive sampling methods such as described inASTM Standard D 3550 which covers larger ring-linedsplit barrel samplers with up to 3-inch (7.6-cm) OD.These samplers are also know as “California” or “Dames& Moore” samplers. These drive samplers do not meetSPT requirements because they use bigger barrels,different hammers, and different drop heights to advancethe sampler.

FIELD MANUAL
354
Figure 22-2.—Safety hammer.

PENETRATION TESTING
355
Figure 22-3.—Donut hammer.
The energy delivered to the sampler can vary widelybecause of the wide variety of acceptable hammersystems. Numerous studies of SPT driving systemsindicate that the energy varies from 40 to 95 percent ofthe theoretical maximum energy. The “N” value isinversely proportional to the energy supplied to the

FIELD MANUAL
356
sampler, and the energy delivered to the sampler iscritical. Because of energy losses in the impact anvil,energy from the hammer should be measured on the drillrod below the impact surface. Drill rod energy ratio isdetermined by measuring the force-time history in thedrill string. Both acceleration and force-time history canbe measured and are important in determining thenormalized penetration resistance of sands forliquefaction resistance evaluations (ASTM D 6066).Common practice is to normalize the SPT N value to a60-percent drill rod energy ratio. Adjustment factors canbe as large as 20 to 30 percent.
The largest cause of error in the SPT is drillingdisturbance of the material to be tested. This is especiallytrue when testing loose sands below the water table.Field studies have shown that “sanding in” can beprevented by using rotary drilling with drill mud andupward-deflected-discharge bits and by maintaining thefluid level in the drill hole at all times. Hollow-stemaugers are especially popular for drilling in theimpervious zones in dams but can cause problems whenloose sand is encountered below the water table. Manyother drilling methods are available for performing SPTs,and each should be evaluated relative to potentialproblems and how the data will be used.
Information Obtainable by SPT
The SPT does provide a soil sample. Sampling is notcontinuous because the closest recommended test intervalis 2.5 feet (75 cm). Typical sampling is at 5-foot (1.5-m)intervals or at changes in materials. The test recovers adisturbed soil sample that can be classified on site, or thesample can be sent to the laboratory for physicalproperties tests.

PENETRATION TESTING
357
SPT N values have been correlated to numerous soilproperties. In cohesionless soils (sands), the SPT can beused to predict the relative density of sands (i.e., veryloose, loose, medium, etc.) (table 22-1).
Table 22-1.—Penetration resistance and soilproperties based on the SPT (Peck, et al.)
Sands(Fairly reliable)
Clays(Rather reliable)
Number ofblows per
foot (30 m), N
Relativedensity
Number ofblows per
foot (30 cm), N Consistency
Below 2 Very soft
0-4 Very loose 2-4 Soft
4-10 Loose 4-8 Medium
10-30 Medium 8-15 Stiff
30-50 Dense 15-30 Very stiff
Over 50 Very dense Over 30 Hard
The SPT has been widely used to predict the allowablebearing capacity of footings on sand. There are severalempirical methods that are based either on case historiesor on drained modulus of deformation predictions. Theapplication of these predictions should be tempered bylocal experience. There are many proposed methods forestimating bearing capacity. The methods are probablyslightly conservative and should be applied carefully.
FIELD MANUAL
358
SPT N values must be corrected for overburden pressuresand the location of the water table.
For clays, the SPT is less reliable for predicting strengthand compressibility, especially for weaker clays. The SPTis commonly used to assess the consistency of clays bygrouping clays as very soft, soft, medium, etc. Predictionsof undrained strengths should be used with extremecaution, especially in weak clays, because the SPT barrelremolds the clay, and the penetration resistance is morea measure of remolded strength. For evaluatingundrained strength in clays, vane shear, unconfinedcompression, or CPTs are better than SPTs. SPT datashould not be used to estimate the compressibility ofclays. To evaluate compression behavior of clays, useeither empirical factors based on water content andatterberg limits or obtain undisturbed samples forlaboratory consolidation testing.
SPT data routinely have been used for predictingliquefaction triggered by earthquake loading. Ifliquefaction is predicted, the SPT data can be used toestimate the post-earthquake shear strengths. Extensivecase history data have been collected to evaluateliquefaction; however, the data are subject to drillingdisturbance errors and the energy delivered by thehammer system must be known. If drilling disturbanceis evident or suspected, the CPT is an alternative becausethe soil can be tested in place. Procedures for evaluatingliquefaction from SPTs are given in Reclamation’s DesignStandards No. 13, Embankment Dams, “Chapter 13,Seismic Design and Analysis.” SPT N data can be usedto estimate the shear modulus of clean sands, but themethod is approximate. If the shear modulus is needed,directly measuring the shear wave velocity is preferred.

PENETRATION TESTING
359
Liquefaction occurs when water pressure builds up ingranular soils during an earthquake. Soils mostlysusceptible to liquefaction are “cohesionless” soils,primarily clean sands and gravels (GP, SP, GW, SW, GP-GM, SP-SM) and silty sands and gravels (SM, GM). Theterm, “sands,” in the following discussion refers to allthese soils. The water pressure buildup results instrength loss and possibly deformation, slippage, andfailure. Data collected at liquefaction sites have beenused to assess whether a deposit is liquefiable.
Testing Cohesionless Soils
Earthquake induced liquefaction is commonly associatedwith sands below the water table. Good drilling techniqueis critical to ensuring that the sands are undisturbedprior to the SPT. Unfortunately, loose sand is one of themost difficult materials to drill.
If disturbed sands are present, take measures to avoidcontinued disturbance. Perform depth checks to assessthe sand depth at the bottom of the drill hole. Thesedepth checks are made by seeing exactly where thesampler rests before testing. Depth checks that can bemade during drilling will be discussed below. Do not drillat excessive rates. Signs of disturbance are excessiveslough in the SPT barrel, drill fluid in the sample, andfailure of the sampler to rest at the proper cleanout depth.Slough is the disturbed material in the drill hole thatcaves from the sidewalls but can include disturbed sandthat heaves or flows upward into the drill hole. Sloughcan also consist of cuttings which settle from the drillfluid before testing.
The SPT sampler must rest at the intended depth. Thisdepth is to the end of the cleanout bit or the end of thepilot bit in hollow-stem augers. If the sampler rests at an

FIELD MANUAL
360
elevation that is 0.4 foot (12 cm) different from thecleanout depth, disturbance of the soil may be occurring,and the hole must be recleaned. There are a number of advantages to the SPT:
(1) The test is widely used, and often local experienceis well developed.
(2) The test is simple, and many drillers can performthe test.
(3) The SPT equipment is rugged, and the test can beperformed in a wide range of soil conditions.
(4) There are numerous correlations for predictingengineering properties with a good degree ofconfidence.
(5) The SPT is the only in place test that collects a soilsample.
Although the SPT is commonly used and is a flexible inplace test, there are significant disadvantages. The testdoes not provide continuous samples. Different soils inthe SPT interval tend to be logged as one soil, especiallyif the soil core is combined into one laboratory testspecimen and laboratory data are used in the logs.Hollow-stem augers can give disturbed samples betweentest intervals, and the intervals between tests can belogged. The greatest disadvantage to SPTs is the lack ofreproducibility of the test results. Drilling disturbance,mechanical variability, and operator variability all cancause a significant variation in test results. The SPTshould not be used unless the testing is observed andlogged in detail. Old data where drilling and testprocedures are not documented should be used with

PENETRATION TESTING
361
extreme caution. Another disadvantage to SPTs is thatprogress is slower than other in place tests because ofincremental drilling, testing, and sample retrieval, andSPTs may be more expensive than other in place tests.The SPT is influenced by more than just overburdenstress and soil density. The soil type, particle size, soilage, and stress history of the soil deposit all influenceSPT results.
Drilling Methods
Fluid Rotary Drilling
Rotary drilling with clear water results in N values thatare much lower than N values that are obtained whendrilling mud is used. Two factors are involved: (1) thewater from drilling can jet into the test intervaldisturbing the sand, and (2) the water level in theborehole can drop and the sand can heave up the boreholewhen the cleanout string is removed. These two factorsmust be minimized as much as is practical.
The best way to drill loose, saturated sands is to usebentonite or polymer-enhanced drill fluid and drill bitsthat minimize jetting disturbance. Also when drillingwith fluid, use a pump bypass line to keep the hole fullof fluid as the cleanout string is removed from the drillhole. The lack of fluid in the hole is one of the mostfrequent causes of disturbed sands. If the soils arefine-grained, use a fishtail-type drag bit with baffles thatdeflect the fluid upwards. A tricone rockbit is acceptableif gravels or harder materials are present, but adjust theflow rates to minimize jetting.
Casing can help keep the borehole stable, but keep thecasing back from the test interval a minimum of 2.5 feet

FIELD MANUAL
362
(75 cm) or more if the hole remains stable. Using abypass line to keep the hole full of fluid is even moreimportant with casing because the chance of sand heaveup into the casing is increased if the water in the casingdrops below natural groundwater level. The imbalance isfocused at the bottom, open end of the casing. In extremecases, the casing will need to be kept close to the testinterval. Under these conditions, set the casing at thebase of the previously tested interval before drilling to thenext test interval. Intervals of 2.5 feet (75 cm) arerecommended as the closest spacing for SPTs.
Use drilling mud when the SPT is performed forliquefaction evaluation when rotary drilling. Abentonite-based drilling mud has the maximumstabilizing benefit of mud. Bentonite provides themaximum weight, density, and wall caking propertiesneeded to keep the drill hole stable. When mixing mud,use enough bentonite for the mud to be effective. Thereare two ways to test drill mud density or viscosity—aMarsh Funnel or a mud balance. A mud sample is pouredthrough a Marsh Funnel, and the time needed to passthrough the funnel is a function of the viscosity. Waterhas a Marsh Funnel time of 26 seconds. Fine-grainedsoils require mud with Marsh Funnel times of 35 to50 seconds. Coarser materials such as gravels mayrequire funnel times of 65 to 85 seconds to carry thecuttings to the surface. If using a mud balance, typicaldrill mud should weigh 10-11 pounds per gallon (lbs/gal)(1-1.1 kilograms per liter [kg/L]). Water weighs about8 pounds per gallon (0.8 kg/L).
Exploration holes are often completed as piezometers.Revertible drilling fluids have been improved, and thereare synthetic polymers that break down more reliably. Ifnecessary, specific “breaker” compounds can be used tobreak down the mud and clean the borehole. If the

PENETRATION TESTING
363
borehole cannot be kept stable with polymer fluid,bentonite mud should be used and a second hole drilledfor the piezometer installation. Do not combine drill holepurposes if the data from SPTs or piezometers arecompromised.
Drilling sands with clear water is possible, but only if thedriller is very experienced. As long as drilling is carefullyperformed, drilling with water can result in SPT N valuesclose to those obtained using mud. Disturbance can beavoided; but without drill mud, jetting disturbance, cave,and sand heave caused by fluid imbalance are likely.
If the water level in the sand layer is higher than theground surface, sand heave is really going to be aproblem. Under these conditions, heavy bentonite mud(80 to100 sec on the Marsh Funnel) is required. A fluidbypass to keep the hole full of mud is required, and anelevated casing or drill pad to hold down the sand can beused. Some successful mud improvement is possible withBarite or Ilmenite additives. Mud can be weighted toabout 15 lb/gal with these additives. Sodium or calciumchloride can be used to give polymer fluid better gelstrength. In artesian conditions, it may not be possible tokeep the sand stable. In these cases, other tests such asthe CPT can be used to evaluate the sand.
When using fluid rotary drilling, circulate the drill fluidto remove the cuttings. Pull back the cutting bit severalfeet, cut fluid circulation, and then slowly and gentlylower the bit to rest on the bottom of the hole. Check tosee if the depth is within 0.4 foot (10 cm) of the cleanoutdepth. This check determines if there is cuttingssettlement, wall cave, or jetting disturbance.
The bottom of the borehole normally heaves when thecleanout drill string is pulled back creating suction. Fluid

FIELD MANUAL
364
should be added to the drill hole as the cleanout string isremoved to help avoid problems. Once the sampler isplaced, check the sampler depth and compare it to thecleanout depth. A difference of 0.4 foot (10 cm) isunsatisfactory. If sands or silty sands heave up into theborehole, the SPT sampler will often sink through most ofthe slough. The only way to check for this situation is tocarefully inspect the top of the sampler and the ball checkhousing for slough or cuttings. If the ball check area isplugged with cuttings, the SPT N value may have beenaffected. A thin plastic cover is sometimes used to keepthe slough out of the sampler. The cover is either shearedoff at the first blow or it is shoved up into the sampler.
The fluid rotary method is probably the best method fordetermining SPT N values in saturated sands. In thefollowing sections, two other acceptable drilling methodsare discussed. If these methods do not work, use the fluidrotary method.
Hollow-Stem Augers
Hollow-stem augers (HSA) have been used successfully todo SPTs in loose saturated sands. With the properprecautions, hollow-stems can be used reliably in sands,but there are some problems with HSAs. The primaryproblem with the HSA in loose sands is sand heaving intothe augers. This occurs when the pilot bit or the HSAsampler barrel is removed in preparation for the SPT.Sometimes, sand can heave 5 to 10 feet (1.5 to 3 m) upinside the augers. SPT N values taken with this amountof disturbance are unacceptable. These problems can beovercome in most cases by using water-filled augers andremoving the pilot bit or HSA sampler slowly to avoid thesuction. Drilling mud is not usually required and cancause sealing problems.

PENETRATION TESTING
365
There are two types of HSA systems shown infigure 22-4—wireline and rod type. With either type ofsystem, removal of the pilot bit or HSA sampler barrel canresult in sand heaving into the augers. The rod typesystem is best at preventing sample barrel rotationduring soil sampling. In sanding conditions, the wirelinesystem is sometimes harder to operate because thewithdrawal rate of the bit or HSA sampler is harder tocontrol. Sanding-in also prevents re-latching of thewireline barrel. Rod type systems are recommended whendrilling in heaving sands. If sand heaves a considerableheight into the augers, the auger will need to be cleanedor retracted in order to continue drilling using eithersystem. If the augers have to be pulled up 3 feet (1 m) tore-latch a pilot bit or sampler barrel, tremendous suctionoccurs at the base of the boring, which can disturb thenext SPT test interval.
When using HSAs below the water table, the hole must bekept full of fluid, just like it must when using fluid rotarymethods. A water or mud source and a bypass lineare required. Some successful techniques for hollow-stem drilling in flowing sands are:
� When approaching the test interval, slow the augerrotation to just enough to cut the soil; do not continueto rotate without advancement near the test interval.In flowing sands, continued rotation near the testinterval will create a large void around the holeannulus and increase the chance of caving anddisturbance of the test interval. If high down pres-sure is used with wireline systems, the pressureshould be relaxed; and the augers should be slightly

FIELD MANUAL
366
Figure 22-4.—Example of rod-type and wireline-type hollow-stem augers.

PENETRATION TESTING
367
retracted ½ inch (1 cm) or so to re-latch bits orbarrels. There is no need to release down pressure orretract the augers with rod-type systems.
� Add water to a level higher than the surroundinggroundwater level before pulling the pilot bit orsampling barrel. In most cases, water can be addedto the top of the augers without concern fordisturbance. Add water by removing the drive capusing a hose from the bypass line. When removingthe drive cap on rod-type systems, be careful todisconnect the drive cap bearing from the inner rods,or the pilot bit or sampler will be pulled prematurelybefore adding water. When using a wireline system,the latching device can be sent down the hole andlatched before adding water.
The water level is not always maintained at the top of thecolumn, especially if there is a thick layer of unsaturatedsoil above the test zone. Water can leak through theauger joints, and it may be necessary to add a lot of water.
Pulling the Sampler Barrel.—The sample barrelassembly is generally 5 feet (1.5 m) long. This barrel doesnot have much clearance with the inside of the augers,especially in the bushing at the base of the augers. Withthe augers full of water, reconnect the drive cap to theinner rods. Pull the barrel slowly up 0.1 to 0.3 foot (3 to10 cm) and observe the water level in the augers. If waterflows upward, out of the augers, there is a seal betweenthe augers and the sampler, and the sampler barrel isacting like a syringe. If water flows from the top with rodtype systems, rotate the barrel or work the barrel slightlydown and up to try to break the seal and vent. Forwireline systems, release the pulling force and re-apply.Pull slowly and attempt to break the seal. Once the sealis broken, remove the sampler slowly. Remember, with

FIELD MANUAL
368
rapid withdrawal rates, suction can be created anywherein the auger column. For rod systems, add water duringpulling to account for water level drop. The same ruleapplies for wireline systems, but less water is needed.
Pulling the Pilot Bit.—Most pilot bits are seated flushin a brass bushing in the end (crown) of the augers. Thepilot bit cutting teeth should be set to a lead distance thesame as the outer cutting teeth, so that the body of thepilot bit sits correctly in the bushing. Do not drill withthe pilot bit in advance of the outer cutting teeth. Auseful procedure in heaving sands is to use a pilot bit onesize smaller than the augers being used. For example, ifa 4.25-inch (11-cm) inside diameter (ID) HSA is used, a3.75-inch (9.5-cm) ID HSA pilot bit can be used to reducevacuum and suction effects.
When drilling with the pilot bit, pull the bit back slowlyabout 0.1 to 0.2 foot (3 to 6 cm) to allow any seal in thebushing to vent. If the bit is withdrawn quickly, suctionwill likely occur. If water flows out the top of the augers,suction is occurring. If suction is occurring, rotate thepilot bit and work it down and up to try to break the seal.Once the bit clears the bushing, the tendency to bind isreduced. Withdraw the pilot bit slowly and add water, toaccount for water level drop as the rods are removed.Remember, with rapid withdraw rates, suction effects canbe created anywhere in the auger column.
If sanding-in cannot be controlled with fluid or slowpulling, there are special flap valves that can be placed inthe pilot bit seat. Drill without the pilot bit with flapvalves.
Once the sampler has been inserted to the base of theboring, determine the depth to the sampler tip as aquality check. If there is more than 0.4 foot (12 cm) of

PENETRATION TESTING
369
slough or heave, the test may not be acceptable. Thisguideline is arbitrary, and it is possible to get a reliabletest with as much as 0.5 foot (15 cm) or more slough aslong as the vent and ball check of the sampler are notplugged. If the SPT barrel is used to test the bottom ofthe hole, the sampler will often penetrate loose slough orheave. Checks with a weighted tape may be moreaccurate in determining the depth to the slough. Whenusing the HSA sampler barrel to core before testing, sandfalling out of the barrel could be the cause of slough insidethe auger. To avoid this problem, use catcher baskets inthe HSA sampler barrel.
When testing at close intervals of 2.5 feet (75 cm) or less,it may be necessary to add water to the augers as theSPT sampling string is removed to avoid water levelimbalance and possible heave.
It’s a good idea to combine the continuous sampler of theHSA with SPT operations. If SPTs are at 2.5-foot (75-cm)intervals, perform the SPT and then sample the 2.5-foot(75-cm) and over-sample the 1.5-foot (45-cm) test interval.This adds some time, but allows continuous sampling.This sampling method provides a look at the soils betweenthe test intervals. It is also helpful if recovery is low.
Rotary Casing Advancers
Rotary casing advancers can provide good SPT N valuesin sands. The casing advancer method uses drilling fluid(bentonite and water) as a circulation medium and is afluid rotary drilling method. This method is successfulbecause the large diameter outer rods remain filled withdrill fluid and keep the sand down. The casing advancernormally has a diamond bit but can be equipped withtungsten carbide drag bits on the outside edge to over-cutsoil. Typically, an HQ- or HW-size casing advancer is
FIELD MANUAL
370
used with or without a pilot bit. The pilot bit can be atricone bit removed via wire line. Suction is possiblewhen a pilot bit is removed. If suction occurs, drillingwithout a pilot bit should be tried. An advantage ofdrilling with a wireline is that when the pilot bit isremoved, the line takes up little volume and results in aminor drop in fluid level inside the rod column. Since agood fluid column remains in the rods, a fluid bypass isnot needed. The only problem is that whenever addingrods to the SPT drill string, fluid flows out of theadvancer.
The casing advancer must be operated very carefully toavoid sand disturbance. Fluid is pumped down the casingand up a narrow annulus along the exterior of the casing.A casing advancer, especially without a pilot bit, isequivalent to a bottom discharge bit. If excessive fluidpressures are used or if circulation is lost, jetting orhydraulic fracturing the material in the SPT test intervalis possible. Drilling the material with a slow advancerate and with low pressure while maintaining circulationis necessary to drill successfully with this system. Ifcirculation return stops, blockage may be occurring; andif pump pressures increase, hydraulic fracturing couldoccur. If the advance rate is too fast, circulation will beblocked. Water is not an acceptable drill fluid with thismethod, and drill mud must be used.
Summary of Drilling Effects
Table 22-2 illustrates the effects of different drilling andmechanical variables on the SPT N value (items 1through 5). A typical N value in clean quartz sand is20 blows per foot (30 cm). The possible range of N for thematerial is shown if the material is subject to errors intesting.

PENETRATION TESTING
371
Table 22-2 shows that drilling disturbance can havedrastic effects on the N value. In fact, zero blows can beobtained. Zero blows may not be realistic because, inmany cases, loosened sand settles back to the bottom ofthe hole. Also, very loose sand normally does not allowthe sampler to settle under the weight of the assembly.Drilling disturbance usually results in a low N value.Low blow counts indicate loose, weak soils, and a weakfoundation may be assumed. Erroneous low disturbedN values can result in costly over design of structures.The most important aspect of SPT testing is the way thehole is drilled.
Procedure Variables
The recommended 2.5-foot (75-cm) interval is to ensurethat the next interval is not disturbed. If material thatonly has a few thin layers of sand is drilled, continuoussampling is possible, but difficult, and should not beattempted unless necessary.
Hammer Blow Rate
The blow count rate is important when soil drainageneeds to be considered. Most test standards requestSPT blows at a rate of 20 to 40 blows per minute (bpm).Blows at 55 bpm are not likely to have an effect on cleansand; but at some fines content, blows will be reduced bythe lack of drainage. Blows should be between 20 and40 bpm if a hammer with a controllable rate is used.Some hammer systems are designed to deliver blows at afaster rate. The automatic hammer is designed to deliverblows at a rate of 50 to 55 bpm. The hammer can be setto run at 40 bpm by adding a spacer ring to the impactanvil. If a hammer rate differs from 50 bpm, clearly noteit on the drill logs.

FIE
LD
MA
NU
AL
372 Table 22-2.—Estimated variability of SPT N Values
CauseTypical rawSPT value inclean sand
N = 20
Typical rawSPT value
in clayN=10Basic Description
Drillingmethod
1. Using drilling mud and fluid bypass 20 10
2. Using drill mud and no fluid bypass 0-20 8-10?
3. Using clear water with or without bypass 0-20 8-10?
4. Using hollow-stem augers with or withoutfluid
0-20 8-10?
5. 8-inch (20-cm) diameter hole compared to4 inches (10 cm)
17 8-10?
Sampler 6. Using a larger ID barrel, without the liners 17 9
7. Using a 3-inch (7.6-cm) OD barrel versus a2-inch (5-cm) barrel
e25-30 10
Procedure 8. Using a blow count rate of 55 blows perminute (bpm) as opposed to 30 bpm
e120 e110

PE
NE
TR
AT
ION
TE
ST
ING
373
Table 22-2.—Estimated variability of SPT N Values (continued)
CauseTypical rawSPT value inclean sand
N = 20
Typical rawSPT value
in clay N=10Basic Description
Energy Transmission Factors
Drill rods 9. AW rod versus NW rod e218-22 e28-10
10. SPT at 200 feet (60 m) as opposed to 50 feet (30 m) 422 e35
11. SPT at less than 10 feet (3 m) as opposed to 50 feet(30 m) with AW rods
30 15
12. SPT at less than 10 feet (3 m) as opposed to 50 feet (30 m)with NW rods
25 12
Hammeroperation
13. Three wraps versus two wraps around the cathead 22 11
14. Using new rope as opposed to old rope 19 9
15. Free fall string cut drops versus two wrap on cathead 16 8
16. Using high-efficiency automatic hammer versus twowrap safety hammer
14 7

FIE
LD
MA
NU
AL
374 Table 22-2.—Estimated variability of SPT N Values (continued)
CauseTypical rawSPT value inclean sand
N = 20
Typical rawSPT value
in clay N=10Basic Description
Energy Transmission Factors (continued)
HammerOperation
17. Using a donut hammer with large anvil as opposed tosafety hammer
24 12
18. Failure to obtain 30-inch (75-cm) drop height (28 inches[70 cm])
22 11
19. Failure to obtain 30-inch (75-cm) drop height (32 inches[80 cm])
18 9
20. Back tapping of safety hammer during testing 25 12
e = Estimated value. 1 = Difference occurs in dirty sands only. 2 = It is not known whether small drill holes are less or more efficient; with larger rods, N may be less in clay because ofthe weight. 3 = N in clay may be lower because of the weight of the rods. 4 = Actual N value will be much higher because of higher confining pressure at great depth. The difference shown hereis from energy only and confining pressure was not considered.

PENETRATION TESTING
375
Limiting Blow Counts
The Reclamation test procedure calls for stopping the testat 50 blows per foot (30 cm). Other agencies sometimes goto 100 blows per foot (30 cm) because the ASTM teststandard D 1586 sets a 100-blow limit. The Reclamationstandard is lower to reduce equipment wear. Using the soil liquefaction criteria for sand at a depth of100 feet (30 m), 50 blows would not be consideredliquefiable. SPT data are corrected to a stress level of1 ton per square foot (ton/ft2). In a typical ground mass,a 1 ton/ft2 stress level occurs at a depth of 20 to 30 feet(6 to 9 m), depending on the location of the groundwatertable. Blow counts in a sand of constant density increasewith depth. A correction factor is used to adjust for thisoverburden effect. In earthquake liquefaction clean sandN160 values greater 30 blows per foot (bpf) are notliquefiable. A blow count of 50 bpf at 100 feet (30 m)corrects to about 30 bpf at 1 ton/ft2. Higher blow countswould not be considered liquefiable. If testing is deeperthan 100 feet (30 m) it will be necessary to increase thelimiting blow counts to 100. The refusal rule still applies;if there is no successive advance after 10 blows, the testcan be stopped.
SPT N values in gravels generally are much higher thanin sands. Liquefaction criteria for sands are not reliablecriteria for gravels.
Penetration per Blow or Blows per 0.1 Foot (3 cm)
Penetration for each blow should be recorded whendrilling in gravelly soils. If penetration per blow isrecorded, sand layers can be resolved, and the N value ofthe sand can be estimated. The blow count in sand can beestimated from a graph of penetration per blow. The
FIELD MANUAL
376
extrapolation is generally reliable if the blows start insand. If the interval starts with gravel and then pene-trates into sand, the extrapolation is less reliable becausethe sampler could be plugged by gravel.
The number of blows for 0.1 feet (3 cm) is the minimumpenetration rate data that should be collected. If threepeople are present, it is very easy to record “penetrationper blow,” and these data are preferred over the coarserblows per 0.1 feet (3 cm). To record penetration per blow,make a form with three columns. In one column, list theblows 1 through 100. Mark the drill rods in 0.1-foot(3-cm) intervals or use a tape starting at zero from theedge of a reference point. In the second column, recordthe total penetration as the test is performed. This willrequire a reader to call off the total penetration. Thereader can interpolate between the 0.1-foot (3-cm)increments, or the penetration can be read directly froma tape. After the test is done the incremental penetrationcan be calculated from the cumulative penetration dataand recorded in the third column.
Equipment and Mechanical Variables
Sampler Barrel
The standard sampler barrel is 2 inches (5.1 cm) in ODand is the barrel that should be used. In private industry,2.5- (6.4-cm) and 3-inch (7.6-cm) OD barrels areoccasionally used. If sample recovery in coarse materialsis poor, it is acceptable to re-sample with a 3-inch (7.6-cm)barrel equipped with a catcher.
Gravelly soils generally do not provide reliable SPT datafor liquefaction evaluations that are based on sands.Other methods use larger samplers and hammers to

PENETRATION TESTING
377
evaluate the liquefaction potential of gravelly soils. TheBPT is used at gravel sites. Often, the BPT is used atgravel sites after a first round of SPT testing showsconsiderable gravels present.
Sampler Shoe
The dimensions of the sampler shoe should meet ASTM D1586 requirements. Some drill equipment catalogs claimto have special “heavy duty” sample barrels and shoes.The “Terzaghi” style does not meet the ASTM andReclamation requirements. When buying shoes, checktheir dimensions to be sure they meet test requirements.Figure 22-1 shows both Reclamation and ASTM samplerrequirements.
Shoe ruggedness can be improved by “carburizing” themetal. This is a process where the shoe is heated in acarbon gas to improve the surface hardness of the steel.This makes the shoe more rugged but also more brittle.Most drill manufacturers supply untreated low carbonsteel such as 1040 alloy. Generally, a local machine shopcan “carburize” the shoe, an inexpensive process.
Sample Retainers
A sample retainer should not be used for liquefactionstudies except in desperation because the effects areunknown. If the sample cannot be retained, a samplemay be taken with a large diameter split barrel samplerwith a retainer re-driven through the test interval. Theover coring procedure discussed earlier using HSAs couldalso be used.
There are several types of retainers available and sometypes are better than others. There is a flap valve devicethat actually looks like a toilet seat (a small one) that

FIELD MANUAL
378
places a large constriction inside the barrel. This deviceis the least desirable of the retainers if the N value isimportant. The basket type catcher is made of curvedfingers of steel, brass, or plastic. This type of retainer isonly a minor constriction because the holding ring fitsinto the recessed area between the shoe and the barrel.The problem with this catcher is that the fingers may notalways fall back into position to hold the core. A bettervariation of this catcher is the “Ladd” type retainer thatcombines the finger basket with a plastic sleeve. Thisretainer is the most successful at retaining flowing sandbecause the bag adds extra retaining capability.
Sampler Liners
Most of the SPT samplers in the USA accept liners, butthe liner is usually omitted. To determine if the samplerwill accept a liner, feel for an offset (increased diameter)inside the shoe. If an offset is present, the barrel is1½-inch (3.8-cm) ID. Log whether a constant diameter oran enlarged diameter barrel is used because the sampletype can effect recovery. For liquefaction evaluation, aconstant ID barrel is recommended.
A sampler used without liners is actually better forrecovery. Average recovery of a constant ID barrel isabout 60 percent, and the average for the barrel withoutliners is about 80 percent. The difference in N valuebetween constant and enlarged diameter barrels is notknown, but an increase in blows in the range of 1 to 4 islikely with a constant ID barrel.

PENETRATION TESTING
379
Sampler Length
A 24-inch- (61-cm-) long split barrel can normally accom-modate any slough in the drill hole without plugging theball check device.
Sampler Vent Ports
The required vent ports for the sampler top subassemblyin ASTM and Reclamation test procedures are inadequatewhen drilling with mud. The ASTM standard requirestwo �-inch (1-cm) diameter vents above the ball check.When drilling with mud, the fluid gets loaded with sandand can easily plug these ports. The sampler and rods fillwith mud as they are lowered into the drill hole. A bigcolumn of drill mud may try to push the sample out if theball check does not seat. Drill larger vent ports in the topsubassembly to avoid this problem. Some drillers use a0.5- to 1-foot (15- to 30-cm) drill rod sub just above thesampler with extra holes drilled in it to easily drain drillfluid from the rod column.
Hammers, Anvils, Rods, and Energy Effects
The variables in energy transmission are hammer type,hammer drop height, hammer drop friction, energy lossesin impact anvil(s), and energy losses in rods. The energyin the drill rods is called the “Drill Rod Energy Ratio” orERi.
Some hammers, especially donut (casing type) hammerswith large anvils, deliver approximately 50 percent of thetotal potential energy of a 140-lb (63.6-kg ) hammerdropping 30 inches (75 cm). The N value is proportionalto the energy delivered, and the N values can be adjustedto a common energy delivery level. The current practiceis to adjust SPT N values to 60-percent drill rod energy.

FIELD MANUAL
380
Safety Hammers
There are many kinds of SPT hammers. Pin-guided anddonut type hammers were common in the past, but thesehammers have generally been replaced by the “safety”hammer which has an enclosed anvil (figure 22-2). Thereare also new automatic hammers that improve therepeatability of delivered hammer energy to the sampler.
The safety hammer provides an economical and safemethod of performing the SPT. The enclosed anvilremoves hazards from flying metal chips, and operatorscannot get their hands in the impact surface. Due to theirinherent geometry, safety hammer energy transmissioncan vary only by about 20 percent as long as the hammersare operated correctly and consistently.
Safety hammers should be designed with a total stroke ofabout 32 inches (80 cm), and there should be a mark onthe guide rod so the operator can see the 30-inch (75-cm)drop. The hammer weight should be 140 pounds(63.6 kg). These characteristics should be verified on thehammer. An easy way to weigh the hammer is to placethe total assembly on a platform scale, get the totalweight, then lift the outer hammer off the anvil, andweigh the guide rod and anvil. The difference in the twoweights is the hammer weight. The hammer weightshould be 140 +/- 2 lb (63.6 kg +/- 0.9 kg). Hammersshould be stamped with an ID number. It is best to keepa given hammer for a specific drill, especially if the energytransmission of the drill has been measured in the past.
The assumption is that safety hammers deliver60-percent drill rod energy with two wraps of rope aroundthe cathead. Actually, the hammers deliver about 60 to75 percent depending on their construction. The guiderod is one factor that affects the energy transmission.
PENETRATION TESTING
381
Some safety hammers come with a solid steel guide rod,and others use a hollow AW drill rod. The solid guide rodabsorbs energy, and the solid steel guide rod safetyhammer will deliver lower energy than the hollow guiderod safety hammer. These differences are not enough torecommend one design over another. Another variablewith safety hammers is a vent. Some hammers havevents near the top of the hammer. A vent allows some airto escape as the anvil moves toward the impact surface.These vents allow the best free fall possible.
Donut Hammers
These hammers are not recommended except in specialcases such as when clearance is a problem. If the testingis for liquefaction evaluation, it may be necessary tomeasure the energy of the donut hammer used. Thedonut hammer is supposed to be inefficient, but if thehammer has a small anvil, efficiencies may be similar tothe safety hammer. The larger anvil absorbs part of thehammer energy.
Rope and Cathead Operations
Most SPTs are performed using the rope and catheadmethod. In this method, the hammer is lifted by acathead rope that goes over the crown sheaves. ASTMand Reclamation standards require two wraps of ropearound the cathead. After the hammer is lifted to the30-inch (75-cm) drop height, the rope is thrown towardthe cathead, allowing the hammer to drop as freely aspossible.
Three wraps will reduce the drill rod energy by about10 percent and will result in a higher N value. As therope gets old, burned, and dirty, there is more friction onthe cathead and across the crown sheaves. New rope is

FIELD MANUAL
382
stiffer and is likely to have higher friction than a ropethat has been broken in. A wet rope may have lessfriction, but the energy differences are small enough thatit is not necessary to stop testing in the rain. Rain shouldbe noted on the drill report and log. Frozen rope mayhave considerably more friction. Under wet and freezingconditions, exercise the rope and warm it up prior totesting.
Consistent rope and cathead operations depend on havingwell maintained crown sheaves on the mast. Crownsheaves should be cleaned and lubricated periodically toensure that they spin freely.
Automatic Hammers
Automatic hammers are generally safer and provide goodrepeatability. Central Mine Equipment (CME) made oneof the first automatic hammers commercially available inthe United States. This hammer uses a chain cam to lifta hammer that is enclosed in a guide tube. The chain camis driven with a hydraulic motor. The drop height of thishammer depends on the chain cam speed and the anvillength. Problems with this hammer system primarilyresult from the speed not being correctly adjusted. Thehammer should be run at 50 to 55 bpm to obtain a 30-inch(75-cm) drop. There are blow control adjustments on thehammer, and there is a slot on the side of the hammercasing to observe the hammer drop height. Be sure thehammer is providing a 30-inch (75-cm) drop by adjustingthe blow control.
The CME automatic hammer is designed to exert a downforce on the rods. This down force from the assembly isabout 500 lbs (227 kg). A safety hammer assemblyweighs from 170 to 230 pounds (77 to 104 kg). In very

PENETRATION TESTING
383
soft clays, the sampler will more easily sink under theweight of the assembly, and with the automatic hammer,the blow counts will be lower.
The Foremost Mobile Drilling Company hammer “floats”on a wireline system. The drop mechanism does notdepend on rate. Energy transfer is about 60 to 70 percent.
Energy transfer of some automatic hammers is signi-ficantly higher than rope and cathead operated hammers.The CME hammer can deliver up to 95 percent energy.This could result in very low blow counts in sands.Energy corrections are usually required for automatichammers. The Mobile Drilling Company hammer is lessefficient because of a large two-piece anvil.
If an automatic hammer is used, report detailedinformation on the hammer use. Report make, model,blow count rates, and any other specific adjustments onthe drilling log. In liquefaction investigations, the energytransfer must be known. For some hammer systems, suchas the CME and Mobile Drilling Company, the energytransfer is known if the hammers are operated correctly,but for some systems, energy measurements may berequired.
Spooling Winch Hammers
Mobile Drilling Company developed a hammer called the“Safety Driver.” This hammer system used a steel wire-line cable connected to an automated spooling winch withmagnetic trip contacts. The contacts sensed when thehammer was lifted 30 inches (75 cm), and the hammerthen dropped with the spool unrolling at the correct ratefor the dropping hammer.

FIELD MANUAL
384
Energy measurements of this hammer system show someextreme energy variations. Apparently, the contacts andspooling systems require continual adjustment to operatecorrectly. This type of hammer system is not recom-mended because of energy transmission problems.
Drill Rods
Any rod from AW to NW size is acceptable for testing.There is some concern about whipping or buckling ofsmaller AW rods at depths greater than 75 feet (23 m). Inthese cases, use BW rods or larger. There is not muchdifference in energy transfer between AW and NW rods.The type of rod changes a blow count in sand only byabout two blows and maybe less.
SPT drill rods should be relatively tight during testing.Energy measurements on differing locations of the drillrods do not show significant energy loss on joints that areloose. There has to be a real gap on the shoulders tocause significant energy loss. This is because when therod is resting in the hole, the shoulders of the joints are incontact. There is no need to wrench tighten joints unlessrod joints are really loosening during testing. Be sure tofirmly hand tighten each joint.
Drill Rod Length
When using very short rods, energy input to the sampleris attenuated early because of a reflected shock wave. Thedriller can usually hear this because there is a secondhammer tap. The early termination of energy is aproblem to depths of 30 feet (9 m), but the correction issmall and is often ignored. The energy termination is alsoa function of the size of the drill rods. There is someenergy loss for drill rod strings longer than 100 feet(30 m), and a correction is necessary. A constant density

PENETRATION TESTING
385
sand will have an increasingly higher penetrationresistance as depths increase. This is because theconfining pressure increases in the ground mass withdepth.
Summary How Good is the SPT Test
Figure 22-5 is a summary graph of a study performed inSeattle by the American Society of Civil Engineers(ASCE). In this study, several private geotechnical firmsand agencies drilled SPTs at the same site. Six drillswere used. Some had safety hammers, and others hadautomatic hammers. One drill was equipped with a300-lb (136-kg) safety hammer.
The graph shows a wide variation in raw N value versusdepth. The soil conditions at the site are not welldocumented. Some gravel layers are present. Note thatthe spooling winch system resulted in unreliably highSPT N values.
The variability of SPT drilling can be reduced if drillersare aware of the problems inherent to the SPT. Inter-pretation of the data improves if all unusual occurrencesduring SPTs are reported. Drill logs should clearlydescribe in detail the equipment used.
Liquefaction studies are done in loose sands below thewater table. Unfortunately, this material is the hardestto drill without disturbance. Fluid rotary drilling is thepreferred approach for keeping the sand stable. HSAsand casing advancer systems have also been successfullyused.

FIELD MANUAL
386
Figure 22-5.—Results of SPT with six different drills—ASCE Seattle study.

PENETRATION TESTING
387
The drilling part of SPTs is the most important.Generally, disturbance from improper drilling techniqueresults in lower N values.
Energy transfer effects can be important, especially ifhighly efficient automatic hammers are used.
Becker-Hammer Penetration Testing for Gravelly Soils
Introduction
The BPT is used to test the density of materials that aretoo coarse for the SPT or the CPT. Gravel can causemisleading results in the SPT and CPT. Because thediameter of the BPT penetrometer tip is much larger thanthat of the SPT sampler or the cone penetrometer, gravel-sized particles do not seriously affect the BPT.
The BPT consists of driving a plugged steel casing intothe ground using a diesel pile-driving hammer. The blowsper foot (30 cm) of penetration are recorded and adjustedfor driving conditions. An empirical correlation is thenused to estimate equivalent SPT values. The BPT isperformed with a Becker Drills, Ltd. model AP-1000 orB-180 drill rig, equipped with an InternationalConstruction Equipment (ICE) model 180 closed-enddiesel hammer. The standard configuration uses 6.6-inch(16.8-cm) OD double-wall casing and a plugged “crowd-out” bit. Some ICE 180 hammers are marked “Linkbelt.”
The BPT is rapid and economical to perform. Productioncan reach 500 feet (150 m) per day. A disadvantage isthat no sample is retrieved with the BPT, so othersampling, such as SPT or coring, is also required.Another disadvantage is the uncertainty in interpretation

FIELD MANUAL
388
of the data. Since the BPT is generally used to estimateequivalent SPT blow counts, significant uncertainty isintroduced by that step, in addition to the uncertaintythat exists in predictions of soil behavior from N values.
The penetration resistance of soils is influenced by a largenumber of factors, including soil type (grain-sizedistribution, plasticity, particle sizes, particle shapes),density, confining stress, energy delivered to thepenetrometer, size and shape of the penetrometer, andfriction on the sides of the penetrometer. The BPT differsfrom the SPT test in many ways, and correlation betweenBPT and SPT data is not consistent. The BPT is notperformed in an open hole with a diameter greater thanthe rod diameter, and the penetrometer tip is not openlike a SPT tip, so there is substantial friction on the drillstring. This greatly complicates the analysis. Like theSPT, the BPT may give misleading results in soilscontaining boulders, cobbles, or even large amounts ofgravel coarser than about 1½ inches (4 cm).
The effect of fines in the relationship between Beckerpenetration resistance and liquefaction potential has notbeen established by experiment or field performance. Theeffect of fines is generally assumed to be similar to whatoccurs with the SPT. Since the BPT does not return asample, it is often necessary to estimate the fines contentfrom nearby drill holes or to neglect the potential benefitof fines.
Role of BPT in Exploration
In soils containing gravel, measured SPT or CPT resist-ance may be misleadingly high, and there is potential fordamage to CPT equipment. CPT equipment generallycannot be advanced through thick gravel layers with morethan about 30 percent gravel, depending on the size of the

PENETRATION TESTING
389
gravel and the density of the soil. Results may bemisleading with smaller gravel contents. BPTs are rarelyperformed at the start of an investigation and aregenerally done after SPTs or CPTs have been attemptedand found to be inappropriate because of too much gravel.BPT testing generally should not be relied on as the solebasis for liquefaction evaluation without site-specificverification of the SPT-BPT correlation, corroboration byshear-wave velocities, or other liquefaction resistancepredictors.
A Becker drill can also be used for other tasks such asinstallation of instrumentation or holes for geophysicaltesting. Some soil is compacted around each Becker hole,and the holes may be more prone to deviate from verticalthan holes drilled by conventional methods. The extent ofdensification is not known, so if the holes are to be usedfor geophysical measurements (such as shear-wavevelocity), vary the spacings to evaluate the effect ofcompaction around the hole. Rotary drilling can also bedone inside the double-wall Becker casing to socketinstallations such as inclinometers into bedrock. This ismore expensive than standard Becker testing because ofdelays and the need for a second rig. Becker rigs do nothave rotary drilling capability.
Equipment
Becker drills can be operated with a variety of equipmentconfigurations, but for penetration testing, the standardtesting setup is as follows:
• Drill rig: Becker Drills, Ltd. model AP-1000 rig
• Hammer: Supercharged ICE model 180 dieselhammer

FIELD MANUAL
390
• Casing (rods): 168-mm (6.6-in) OD, double-wall
• Drive bit: Crowd-out plugged bit
The correlation between BPT and SPT data proposed byHarder and Seed relies on the use of the standardequipment configuration. The method proposed by Syrequires that at least the last two conditions be met. Allfour conditions should be met because analyses by theSy method would probably be duplicated by the Harder-Seed method for preliminary calculations and/orverification. Harder and Seed determined that open-bittests were inconsistent and erroneously low relative to theclosed-bit standard. The older model B-180 and HAV-180rigs, equipped with the same hammer, transfer about50 percent more of the energy to the drill string than doAP-1000 rigs. This factor has been tentatively confirmedby energy measurements, but it is preferable to avoid theissue by specifying the use of AP-1000 rigs only.
The diesel hammer does not provide consistent energy tothe drill string. This is because the energy depends oncombustion conditions, which are affected by fuelcondition, air mixture, ambient pressure, drivingresistance, and throttle control. The closed-end diesel pilehammer is equipped with a “bounce chamber” where airis compressed by the rising ram after each blow; the airacts as a spring to push the ram back down for the nextblow (unlike the more common open-ended diesel hammerthat uses gravity alone to return the ram). Measuring thebounce-chamber pressure provides an indirect measure ofcombustion energy.
Harder-Seed Method of BPT Interpretation
The Harder-Seed method of interpreting the BPT usesmeasurements of bounce-chamber pressure as an

PENETRATION TESTING
391
indication of the energy imparted to the rods by eachblow. The bounce-chamber pressure is used to adjust theblow count for the actual combustion condition to thatproduced by a hypothetical constant combustioncondition. The measured bounce-chamber pressure mustbe adjusted at altitudes above 1000 feet (300 m). Thethrottle should be kept wide open and the superchargershould be operated any time data are being recorded.Some drillers prefer to use a smaller throttle opening orno supercharger at the beginning of driving when theblowcounts are smaller, producing high blow counts. Ifthe blowcounts required for analysis are near the surface,the driller should be instructed to keep the throttle wideopen. Instances where full throttle and supercharger arenot used should be recorded in the field notes.
The bounce chamber pressure needs to be monitoredcontinuously during testing. An electronic recordingsystem is available to monitor the bounce chamber. Thepressure gauge provided by the hammer manufacturercan be used to record the data manually, but the gaugereading is sensitive to the length of hose used to connectthe gauge to the hammer.
If a B-180 or HAV-180 rig is used, the data can beadjusted by multiplying by the factor 1.5 to account forthe difference in energy transmitted to the rods. Thisfactor is supported by few data and is consideredapproximate. An AP-1000 rig is preferred.
Testing for the Harder-Seed Method of Interpretation
The Harder-Seed method requires that the number ofblows to drive BPT rods each foot (30 cm) of depth andbounce-chamber pressure during that interval be

FIELD MANUAL
392
recorded. Record the driving conditions and note if thedrillers pull the rods back to loosen them up to reduce thedriving friction.
Sy Method of BPT Interpretation
The method proposed by Sy and Campanella is morerigorous, but more costly and time-consuming. Frictionon the sides of the rods may contribute a substantialportion of the driving resistance. A pile-driving analyzer(PDA) is used to record acceleration and rod force duringindividual blows of the hammer. The PDA also measuresthe driving energy for each blow. The force and accelera-tion histories are then analyzed to separate the resistanceto driving contributed by the bearing capacity of the tipand by the side friction using a computer program calledCAPWAP. PDA operation and CAPWAP analyses areusually done by the contractor.
The PDA measurement eliminates concern about theperformance of the hammer, effects of altitude, or loss ofenergy between the hammer and the rods. At least intheory, analyses should eliminate the effects of varyingamounts of side friction on the blow count. The primarydrawback is the need for PDA measurements and specialanalyses. These substantially increase the cost of thetesting program and slow the process of testing andinterpretation.
The side friction can also be measured directly bypullback tests, where the force required to pull the rodsback a few inches is measured by a load cell. Thismeasurement can be substituted for some of the CAPWAPdata, but it is not recommended that CAPWAP calcu-lations be completely eliminated. CAPWAP data is thestandard from which the method was developed.
PENETRATION TESTING
393
Testing for the Sy Method of Interpretation
The Sy method requires:
Using the PDA, record rod force, acceleration, andtransmitted energy. Record the number of blows for each1-foot (30-cm) interval of BPT driving. Record drivingconditions, and note if the drillers pull the rods back toloosen them up to reduce the driving friction.
Discussion of Methods
For routine investigations of typical alluvial materialsthat do not have dense material overlying them, a PDA isgenerally not necessary, and the Harder-Seed approachshould usually be sufficient. In cases where drill rodfriction is likely to be a problem (penetration throughcompacted fill or deep deposits), the Sy method may bebetter. BPTs can be done after pre-drilling and casing orafter pre-driving the BPT with an open bit throughcompacted fill overlying the tested layers. This reducesthe friction but does not necessarily provide validpredictions of SPT N60 with the Harder-Seed method andmay cause them to be low.
With either method, the field notes should mention anytime that the drillers pull back the rods to reduce thefriction. There is no way to explicitly account for this inthe Harder-Seed method. When using the Sy method, thelocations for calculations should be selected with thepullbacks in mind. Ideally, pullbacks should be done onlybefore and after critical layers are penetrated. This way,the rod friction can be interpolated between analyzedzones with no pullbacks between them to invalidate theinterpolation. Zones to be tested and pullbacks should bediscussed with the drillers prior to each hole. Substantialuncertainties exist both in the correlations to estimate the

FIELD MANUAL
394
equivalent SPT N60 and in the correlations to estimate soilbehavior from the SPT blow count.
Contracting for Becker Drilling Services
In addition to the usual specifications requirements, thework statement for BPT should address:
� Work requirements — explain general workrequirements.
� Purpose and scope — state which portions of the workare for liquefaction assessment and which are forinstrumentation or other purposes.
� Local conditions and geology — describe anticipateddrilling conditions and potential problem areas.
� Equipment and personnel to be furnished by the con-tractor — specify complete details on the equipment:rig model numbers, hammers, superchargers, anddouble wall pipe for rods. See above for details.
� Drilling requirements — list special considerationssuch as staking, calibration requirements, andrefusal criteria.
� Hole completion — describe all hole completion orabandonment procedures.
� Driller’s logs — list requirements for the driller’sreport, including forms to be used.
� Field measurement — specify method of measure-ment of depths for payment.

PENETRATION TESTING
395
In the contract for PDA work, specify the following:
� Purpose and scope of testing.
� Estimated number of feet of driving to be monitoredby PDA.
Cone Penetration Test
Test History
The CPT was introduced in northern Europe in the 1930sto facilitate the design of driven pile foundations in softground. Early devices were mechanical penetrometersthat incrementally measured the cone tip resistance. Inthe 1960s, mechanical cones, known as Begemann frictioncones, were developed. This penetrometer measured boththe tip resistance and the side resistance along a sleeveabove the cone tip (figure 22-6). At about this same time,the CPT was introduced in North America. Usingtechnology from the rapidly advancing electronicsindustry, an electric cone penetrometer was developedthat used electrical transducers to measure the tip andside resistance (figure 22-7). Most of the work today isperformed with electronic cone penetrometers, and themanual does not discuss mechanical systems. The use ofelectronics allows the incorporation of additional sensorsin the cone system, including those for pore water stress,temperature, inclination, acoustic emissions, down-holeseismic, and resistivity/conductivity. In the 1990s,sensors such as laser or other energy-induced fluorescencespectroscopy sensors, membrane interface probes, andeven video cameras have been added to detectgroundwater contamination. Penetrometers capable ofmeasuring dynamic or static pore water pressures arecalled piezometric cones or piezocones (CPTU). CPT

FIELD MANUAL
396
Figure 22-6.—Mechanical conepenetrometers.
Figure 22-7.—Typical electrical cone penetrometers.
PENETRATION TESTING
397
has continued to gain wide acceptance as an effective siteinvestigation tool in North America.
Test Procedure
The procedures for performing CPTs are standardized inReclamation procedures USBR 7020 and 7021 andASTM D-5778 and D-6067. The test is highlyreproducible as opposed to SPTs. Test standards call fora cone tip 35.7 mm in diameter with a 10-square-centimeter (cm2) projected area and an apex angle of60 degrees. The friction sleeve is 150 cm2. Largerdiameter penetrometers of 15-cm2 projected area aresometimes used in very soft soils. Smaller diameterpenetrometers are sometimes used for laboratory studiesof soils.
The cone is advanced at a constant rate of 20 mm persecond. Since the penetration resistance dependssignificantly on the advance rate, the push rate must bechecked in the field. The basic equipment required toadvance any cone penetrometer is a hydraulic jackingsystem. Trucks or vehicles built for CPT are typicallyused; but, in some cases, the hydraulics of rotary drill rigsare used. Semi-portable equipment has been developedfor remote site testing. Rigs can be mounted on trucks,tracked vehicles, trailers, barges, or diving bells,depending on accessability. The capacity of cone rigsvaries from 100 to 200 kilonewtons (kN) (11.2 to22.4 tons). The upper bound is the maximum allowablethrust on the cone penetration rods.
Electronic cone penetrometers have built in load cells tomeasure the tip and side resistance simultaneously(Figure 22-7). Bonded strain gauges typically are used inthe load cells because of their simplicity and ruggedness.The load cells commonly have a range of 90 kN (10 tons)

FIELD MANUAL
398
for tip resistance and 9 kN (1 ton) for side resistance. Theload cell capacity can be varied, depending on thestrength of the soils to be penetrated. The load cells areusually connected by an electric cable passing through thedrill rods to a data acquisition system at the surface.Cordless models are also available that transmit sonicallyand “Memo” cones that store the data internally untilretrieved at the surface. Data are recorded digitally,which greatly enhances the use of CPT results inengineering applications. The data can be sent in daily bye-mail to the engineer and geologist.
Nearly all electronic cone penetrometers are equippedwith a pore pressure element. This pore pressure sensoris typically located between the tip and the friction sleeve.The element can record dynamic water pressure as thecone is being pushed, as well as static water pressuresduring pauses in testing. The typical capacity of thewater pressure transducer is 2.2 kN (500 lb/in2), and theaccuracy of water pressure head is about ± 3 cm (0.1 foot).Cones are almost always equipped with inclinometers.The inclinometers are used to monitor rod bending duringpush and are an essential part of protecting the cone fromdamage. The inclinometer can be monitored by computer,and pushing can be stopped if bending is excessive. Conerods can bend as much as 10 to 20 degrees. If the cone isused to detect bedrock or hard layers, this error can besignificant. The inclinometer is not directional, so theerror from bending can only be estimated.
Advantages and Disadvantages
The CPT has several advantages over other routine inplace tests. The tests are rapid and inexpensive comparedto other geotechnical profiling techniques. Penetrationrates of 3 feet (1 m) per minute are common in many soils.Penetration is stopped only to add sections of push rods,

PENETRATION TESTING
399
except when pore water stress dissipation measurementsare made with the piezocone. With electrical equipment,continuous profiles are recorded and plotted aspenetration progresses, and operator effects areminimized. As discussed below, the test results have beencorrelated to a variety of soil properties. Digital dataacquisition with electrical cones enhances interpretationand provides continuous profiles of soil propertyestimates.
Although the tests are applicable to a wide range of soilconditions, penetration is limited in certain groundconditions. Well-cemented soils, very stiff clays, and soilscontaining gravel and cobbles may cause damage to thepenetrometer tips.
The CPT can be used at nearly any site because portabledevices are available. Portable hydraulic jacking systemscan be used for soft soils in locations not accessible tostandard rigs.
The CPT has several disadvantages. The test does notprovide soil samples. The test is unsuited for well-cemented, very dense and gravelly soils because thesesoils may damage the relatively expensive penetrometertips.
Local experience with this test is less than that with theSPT. Although the test is rapidly gaining acceptance inthe United States, some drilling contractors do not havethe equipment or experience necessary to perform thetest. The equipment is expensive and may not beavailable in some locations. Maintaining the electronicsfor the CPT and CPTU equipment may be a problem insome test locations.

FIELD MANUAL
400
Data Obtainable
The CPT is primarily a logging tool and provides some ofthe most detailed stratigraphic information of anypenetration test. With electronic cones, data are typicallyrecorded at 5-cm-depth intervals, but data can be recordedat closer spacings. Layers as thin as 10 mm can bedetected using the CPT, but the tip resistance can beinfluenced by softer or harder material in the layer belowthe cone. Full tip resistance of an equivalent thicker layermay not be achieved. The penetration resistance of thesoil is a function of the drainage conditions duringpenetration. In sands that are drained, the penetrationresistance is high, but in clays that are undrained, thepenetration resistance is low.
A typical CPT data plot is shown in figure 22-8.CPT plots should show all recorded data (i.e., TipResistance, qc , Sleeve Resistance, fs , Pore pressure, u,and for this example, cone inclination and temperature).CPT data should be plotted to consistent scales on a givenproject so that the plots can be more easily evaluated.
The CPT does not obtain a soil sample. However, the soilsmay be classified by comparing the tip resistance to theratio of tip to sleeve resistance which is known as thefriction ratio, Fr . Friction ratio should also be shown onthe summary plots. Figures 22-9 and 10 show commonlyused relationships to estimate the “soil behavior type.”Clay soils have low tip resistance and high friction ratio,while sands have high tip resistance and low frictionratio. Mixed soils fall in zones 4 through 7. There arealso classification methods that incorporate the dynamicpore water pressure generation. The CPT cannot exactlyclassify soil according to the Unified Soil ClassificationSystem. Experience at many sites shows that soils giveconsistent signatures; and even though the soil behavior

PENETRATION TESTING
401
Figure 22-8.—Example CPT data plot.

FIELD MANUAL
402
Figure 22-9.—Chart for estimatingthe soil behavior type.

PENETRATION TESTING
403
Figure 22-10.—Chart for estimating the soilbehavior type and the coefficient of permeability.
type is generally correct, the soil types should beconfirmed with a sample boring. Soil behavior typeprediction in the unsaturated zone is less reliable butoften still useful. The summary plot in figure 22-8 alsoshows the soil behavior group on the right side bar.
Soil permeability can be estimated from CPT because thetip resistance is a function of drainage during penetra-tion. The permeability estimate is generally within anorder of magnitude, which is suitable for mostgroundwater and seepage studies (figure 22-10).
Numerous correlations of CPT data to strength andcompressibility of soils have been developed. Thesecorrelations are based primarily on tip resistance but arealso supplemented by sleeve friction and dynamic porewater pressure data.

FIELD MANUAL
404
Figure 22-11.—Relationships between cone tipresistance, relative density, and effective
vertical stress.
CPTs in clean sands have been performed in largecalibration chambers where the density and confiningpressure have been controlled. Based on the chamberdata, the relative density and friction angle of sand can beestimated using relationships such as those shown infigure 22-11. The tip resistance at a constant relativedensity increases with increasing confining pressure.Once the relative density is estimated, the friction angle

PENETRATION TESTING
405
Figure 22-12.—Empirical cone factor, Nk , for clays.
can be estimated. The compressibility of the sanddepends on the mineralogy of the sand particles. Highlycompressible sands may contain soft particles. If mica ispresent in the sand at percentages as low as 5 percent,the compressibility will increase. Samples of the sand todetermine mineralogy may be necessary. These estimatesfor sands are not applicable to sands containing morethan 10 percent fines.
The CPT can be used to estimate the undrained strength,Su, for clays because the CPT is like a cone bearing test inrapid, undrained loading. Figure 22-12 shows that thecone factor, Nk, must be estimated for clay. Typically, afactor of 12 to 15 is used. The factor can be refined bycross correlating with sampling and unconfinedcompression testing or by vane shear testing.
Compressibility of soils can be estimated by the CPT test,but the consolidation behavior should be confirmed bysampling and laboratory testing.

FIELD MANUAL
406
Figure 22-13.—Comparison of various cyclicresistance ratio (CRR) curves and field data.
The CPT is the best method for estimating theliquefaction resistance of sandy soils. The SPT is alsoused but has many problems in drilling and withequipment. The CPT tests the sand in place withoutdisturbance, and the test is highly repeatable.Figure 22-13 shows the chart used to estimateliquefaction triggering. The chart is based on “cleansands,” but the method includes conversion of dirty sandsfor evaluation. If the CPT can be used for liquefactionevaluation, it should definitely be considered in theexploration plan. SPT should still be performed at a fewsites, but the CPT can be used to rapidly and economically

PENETRATION TESTING
407
map the extent of liquefiable strata. CPT is also usedextensively for evaluating ground improvement ofliquefiable deposits.
The cone is like a miniature pile and is used forevaluating pile capacity. CPT tests are often performedat the abutments of bridges for pile design. Numerousmethods exist for estimating pile capacity.
Economics
Equipment costs for CPT range from low for mechanicaldevices to high for piezocones, and generally twotechnicians are required to perform CPTs. Thesepersonnel should have a working knowledge of theequipment, but highly trained technicians are notrequired. The equipment mobilization is similar to thatrequired for the SPT, but portable devices can be used forremote locations. Unit costs are difficult to estimatebecause the tests provide continuous or nearly continuousmeasurements. Rig costs are comparable to costs for theSPT, with an added capital cost to convert a conventionaldrilling rig for CPT testing. However, 200 feet (60 m) ofpenetration per day is typical; and in some cases,maximum production of 400 feet (120 m) per day ispossible. This cost is the lowest of any geotechnicaldrilling, sampling, and logging method.
Bibliography
Harder, L.F., Application of the Becker Penetration Testfor Evaluating the Liquefaction Potential of Gravelly Soils,NCEER Workshop on Evaluation of LiquefactionResistance, held in Salt Lake City, Utah, 1997.

FIELD MANUAL
408
Harder, L.F. and Seed, H.B., Determination of PenetrationResistance for Coarse-Grained Soils Using the BeckerHammer Drill, Report No. UC/EERC-86-06, NTIS PB87-124210, Earthquake Engineering Research Center,College of Engineering, University of California, Berkeley,California, May 1986.
Peck, Ralph B., Foundation Engineering, Second Edition,John Wiley & Sons, 1973.
Rausche, F., Goble, G.G., and Likins, Jr., G.E., DynamicDetermination of Pile Capacity, Journal of GeotechnicalEngineering, ASCE, Vol. 111, No. 3, pp. 367-383, 1985.
Sy, A. and Campanella, R.G., Becker and StandardPenetration Tests (BPT-SPT) Correlations withConsideration of Casing Friction, Canadian GeotechnicalJournal, 31(3): 343-356, 1994.
Sy, A., Campanella, R.G., and Stewart, R.A., BPT-SPTCorrelations for Evaluation of Liquefaction Resistance ofGravelly Soils, Static and Dynamic Properties of GravellySoils, ASCE Special Publication 56, M.D. Evans and R.J.Fragazy, Editors, American Society of Civil Engineers,New York, New York, 1995.

Chapter 23
HANDLING AND TRANSPORTINGROCK AND SOIL SAMPLES
Introduction
Subsurface sampling is expensive and time consuming, soit makes sense to obtain all information possible from theinvestigative process and the retrieved samples. Afterexpending the money and effort to obtain subsurfaceinformation, the samples should not be subjected tounacceptable temperature, rough handling, shoddypackaging, or harsh transportation methods. Any type ofmishandling of a sample may make the sample useless fortesting or logging, and the investigation may have to berepeated.
There are certain procedures in the handling andtransporting of samples that should be a part of everyinvestigation. However, some programs might requiremore demanding techniques in the handling of samplesthan others, depending on the types and ultimate uses ofthe samples. Proper handling results in lower overallcosts when the cost of repeating an investigation isconsidered.
The care and handling required for samples collected forhazardous or toxic material investigations can varyconsiderably, and details for this type of sampling are notprovided in this chapter. Information on requiredvolumes of material, types of storage containers, methodsof collection and preservation, and maximum holdingperiods should be obtained from the appropriateregulatory agency.
Poor samples are sometimes the result of poor drillingpractices rather than mishandling. Compressionfracturing of core, "spun" core, or uneven or wavy coresurfaces may indicate that drilling techniques are
FIELD MANUAL
410
inappropriate for the conditions. Problems should benoted in the logs and corrections or improvements shouldbe made immediately, if practicable, to the drillingprocedures.
When samples requiring extreme care are obtained,personnel involved in the investigation must be totallyfamiliar with the following procedures, and they musthave a clear understanding of which geologic features areto be sampled and why they are to be sampled.
The geologic characteristics and the intended use of therock and soil samples determine the extent and type ofcare required. If engineering properties are to bedetermined, the sample must be handled and preservedso that the properties are not significantly influenced bymechanical damage, changes in chemistry, andenvironmental conditions such as moisture andtemperature.
Design requirements for samples range from geologiclogging to complex and critical testing in the laboratory.Priorities for multiple uses or different types of tests mustsometimes be established when available samples arelimited and when a use or test precludes another test.When the required level of protection is unknown,overprotection is better than underprotection. If thesample is intended for geologic logging only, the care andpreservation may be entirely different from that whichwould be needed if testing in the laboratory is required.Even though the sample has been geologically logged,other studies might be necessary, and continuous care inhandling and proper storage may be required.
Samples can range from highly disturbed to relativelyundisturbed. The methods of obtaining soil samples varyand may range from "grab" samples to samples obtained
HANDLING AND TRANSPORTING SAMPLES
411
by highly refined drilling and sampling techniques. Soilcan be difficult to sample whether by drilling or test pits,and obtaining an “undisturbed” sample of soil can be anordeal. To obtain good “undisturbed” (minimally-disturbed) soil samples, extensive knowledge and exper-ience with numerous types of soil sampling equipment,drilling methods, and drilling fluid additives is necessary.
Specific procedures for the disposal of rock core andsamples depend on several factors; see chapter 24 forguidelines.
Sample Protection
The following describes recommended procedures forhandling rock and soil samples (samples). The samplegroupings are based on the type of testing to beperformed, rather than any physical condition of thesamples, and generally conform with ASTM Standards.Groups 1 through 4 deal with rock core, but note that thechange to soil-like characteristics is transitional ratherthan abrupt. Table 23-1 summarizes the procedures.
����������������� �������������������������� ������������������������������������������������������������������������ �������������������������� ��������������������������������������������������������������������������� ����������������� �������������������� ������ ����������������������������������� ����������������������������������������������������������� �������� ����� �������� �����������!�� ����������� ���� ���� �� �� ���������� ���� ������� ���� ��������� ������� � ��� ���� ����� ��� �� �������������������������������� ������������������������"��������������������������!��������������� ����� ��������������������������

FIELD MANUAL
412
��������� � �������� �������������� ������ ��������������������� ����� �
�� ��
� �� � ��
� � � � ! "
Cha
r������������
��
# ��������$�%�� �������� �
& ��������������$� �
'������%�� ������� ��������������������$�
�
� �������� �� �
��
(������������������ �%������� �
�
)�������� ������%�)� �� �%������*
�
+�����%������������������ �
+�����,��������� �������*�������$��� �����������������
�
�������
����������� - ����� � � � � � � � �
)�������& ������ � �
�
� � �
����������������� � � � � �
���� ���
���
�����������
����
! ���� .�� � � �
'���%�� ��%�����/�. � � � � �
�� ��� ��$������ ���� ����� � � � �
0���� ��� ����� ����� � � � �
����
�$ ���� ��������� � �
��*��*���� ������� �
������%�� �������� �� �������
� � � �
1���������������� ���� � � �
����������������������� ������������������������������������ ���������������������������������������������������������������������������������������������� �����������������������������

HANDLING AND TRANSPORTING SAMPLES
413
Figure 23-1.—Properly boxed and labeled core.
#��������� �������������������������� ������������������ ���$%�&���#���������� ����������������������� �� ���� ������� �������'������������� ��������� �������������������������'������ ������������������ �����!� ��� ���� �� ��� ��� $%�$!� �������� ��������������������������� ������
��������� �(��������!��������� �������� ��������������������������������������������������� ��
����� ��������)����&*����+&�)����%��,�� �!������������ � ���������� ��������� ��� ������� �� ����� ��� ��������� ���� ������ � ��������� ����� ���� �������������� �������������������������!���!������������������������������������-����������������������������������������������������������������!������������������������� � ����� ��������� ����� � �������� ��������������������� � ������ ���� ���� ������� ��� ������������#������������������������� ����� �������������������������������������������������� ���������� ������������ �������������������� �������� �����������

FIELD MANUAL
414
Figure 23-2.—Core storage area with boxes neatly arranged and separated by spacers for
ventilation. Note core photography frame in center of photograph.
#��� � ���� �� ��� ��� �����������!� � ��� ��� . ����� ��/�!�������������������������������� �����������������
���������0� �������������� �1���������� ������������ ��� � ��� ��� ������� ������ ������ �� ����� �� ��0�� �������� ��� ����� ������ �� �������� ��� ����� �����������2� ��&�
#��� ���� ��� ������ �� ���� �� �� ��� ���� ������� �������������� ��� �������������������������� ������������-������������������������������������������������������ ����������������� ��������������� ���!���������� �������������������������� �������#�������������� ���������������������������������������������������� ������������������!�� ���������������

HANDLING AND TRANSPORTING SAMPLES
415
#��� ����!� ���! � ������� �� �� ������� � ������������������ ���������������������������������������������������������������������������������������� ������������ � #���� ���� ��� �����'��� ��������� �������'�������������������������� ��������������#�������������� ��������������������������&3������������������+4��,�+&*�������������������+4��,�������������������!���������������������������������������������������������������������������"���������������������������������������������� ����-�������������������������!�������������������
5����������������������������� ����� �������������������� ������� �������� �� �� �������� ����!� � ��� ����������� �������� +5���� ����,!� ������� ��� �� ������������� �� �� �� �� ����� � 6���� �� ������ ���������� ��� ��� �������� �� ����� ��� ������� ���� ��� �������� ���������� ������� ���� ���������� � .��� ���� ���� �� ������������������������������������������������������ ���� ����� � ������!� ������ �� ���� �� ���� ���+%���,���������������������� �������������������������������������������������������������������������������������#�������� ������������ ���������������������������������������������������������������������!������������� ����7�����+8���,�������"����������������������� �������������������������������� ������� �� �� ������� �� ������� ����� � ����������!�������������������������������������������������
-� ���� �����!� �� �� �� ���� �������� ������ ��������������������������������������������������� ���� ����-���������������������!��� �� �������� ���������������������������������� ���� ����� ������������� ��� �������������������������������������������������������������� �����������������������-��������������������� ���!��������� ����������������������� ����������������7�����+8���,������������ ������������������������

FIELD MANUAL
416
+ �� �� &� ���,�� ��� �� ����� �����!� �� ���� ���� �������+9���,�������� ������������������������������ ��������������������������
���������#���������������������������������������� ������������ ��������������#��������������������� ���������� �����������2� ���&����$�
-�� ��� !� �������!� �� �������� �� �������� ��� ���� �1���� �������� �� ����������� ������� � ����������!��������������� ����������������������������������� � ������ �� �������� �� ������ � ���������������������� ������� �������� ��������������!� ���������� ��!�� ����!�5������!�+���, ����������!� ����� ����!� �� �������� ���������� � #��� � �������������������������������������������������� ������������� ������ ������&�����+$)���,������ ������������� ������ ������$�������+)*���,��������������������������#������������ �������� ���������������
5������� ����� ���� �������� ��� ��������� �� ��� ���� ������ ��� ������� ���� ���� ������� +��� �� � ��,�������������������������������������������������������� �������� �� ������ #����� �������� ������������ ���� ����� �� � ���� �� ������� ������� ��� ����������������������� � �������������������������
����������#���������������������������� ��������������������������� ����� ������ ������������������������������ ����������������������������������� ���������������������������������������������������� ����2� ��:����������������������� �������� ��� ���� �� ��� ��� �������� �������� �� ���� �������������� ��������2� �������� ����������

HANDLING AND TRANSPORTING SAMPLES
417
���������������������������������������������� ������������������������������������������#����������� �� ������� ����� ����� �� �� ��� �� ������������������������������2� ����������������������������� �� ��� ����� �� ������� ��� ��� ������������ ������� � -�� ���������� �����������!� ���� �������� ���� ��� ����� ���� ��� �������� �� ������������� ������ ��� ��� ����� ��� ������������������������������������
������ �� � #����� ���� �������� ��� ������ ��� ��������������������������������������� ��������������������!� ��������� ������!� �� ������� ������ ������ ������ �; � ���������������������������������������������������������������� ����������������� ��!������� �����!� ��������!� ������������!� ��� ����������������������� ����
-��������������2� ���;!��!����������!������������ ����� ������� ��� ����������� �� �� ������ ���� ������<��������������������� �������������������������������
2� ��;����������� ������������������������������������!����� �������������������������� ��������� � � ��� ��� ����� � ��� �� ������� ���������� ����������� ���������#������������������� ��=��������� �������� ����� �� �����!� ������ �� �������� 1���!����������� � ���!� ��� ������� � ����������� ��� � ���������� �� ��� ����������� �� � ������� �������� ����� ������������!������!������ ������������������������������������������������������� ��������2� ��$��������
-����������������������������� ���!������������ ������������ ��� �������� ��� �������� �� �� ���� ������!�� ��'������ � ��� ������ ��������������������#��

FIELD MANUAL
418
���������� ���������������������� ��������������� ����-������������������1�������� �������������������������!����������� ������������������������-������������������� ���� ��� ���� ����� ������ ���� �����!� ���� ����� �� ��� ��������������������������
#�������� � ��� � ���� ��� ��� ������� ����� ������������ ���!������������� �!�����������������������#������������ +���� ��� ��������,� ������ ��� ��������������� � ���� ��� ����� �������� �� ������ ������������ ���!������������������ ��������#������������!���������� ������������!������ ��������������������������������������� �����-�������������� ������ ���!������ ����������������������������������������������� ����� ������������������������������ ��!������� ������������������������������������������������5������������������� ���� ���� ���������� ���� �� ���� � ������� � #��� �������� ������ ���������������*�:�����+&*���,�
>������������������ ���������������������������������������� �������������� ������������� ������������������������� ����������������������������������������� ������������ ������������� ��������������� ��� � ��� � ����� ���� �������� ��� �� �������������������
?����!�� ����!��������������������� ������������������������������������������+���������&����,!�������������������� ������������������!��������������������������6����� ������������������������������� ������������������������������+������ ����������,�������������������
����������!�� �����!����������������������������������������� �������������������������� ����������������������������������� ���������������� ���������������������������������������� ����������������������� �� �� ������ ���������� �������� � ����������

HANDLING AND TRANSPORTING SAMPLES
419
������������������ ��������������������������� ����� �������� �� ����� ���� ��� ��� � ���� ����������� ���������������#��������� �������������������������� ���������� ������������� � #� ��������������������� ������� �� �����!� ������ � ��� �������!� � ��� �������� ��� ��������!��� ����������� ���������������� ��� ������� ���� ����� � 2�������!� ������ ��������� ��� ��� �������� �� �������� �� ���� ������ ����� �� ��������������������
#����� �������� ���� ��� ���������� ��� ��� ��������������������� � #��� �������� �� ��� ��� �������� ����������� �� ������� �� ������� �������� � ��� ��� ����!������������������!��������������������������� ���� ��������������������������� ������� �� ��������������� ���������������������������
����������#��������������!��� ������������������������������������������������������������������ ��!������� �����!� ��������!� ������������� ������!� �������������������������� �������������������� ������������� �������
#������������������������������������������������!���� ������� ��������� ����������� ������ ���� � ��� ��� ����� � ��� �� ������� ���� ���� ������ ���������#������������������� ��=���������������� �����!� ������ �� ��������� �������� 1���� ��� ���� �����������!���������������� ����������������������������� ������������� ����������������� ����������������������� �� ���������������������������������������� ��� ����������� �������� �� ���� ���� ����� ��2� ��$�����������5�������������������� �� �����<����������������������� �� �������� ����������������������������������������� �������������������#������� ��� ��������� 2� �� �� �������� �� ��� ���� ����������������2� ��%�

FIELD MANUAL
420
5��������������������������������������������������������������������������������!����������������������� ������������� ����!������!�����������
-��������������������������������������������!���������� ������������� �����������������!������!���������������� ����������������������������������� ���������� ����������������������#���� �������������� �� ��� ���������� ������ ����� �������� � #��� ��������������������������������������������������������� �������������� ������ ������&����+$)���,�� � ������ �� ���� ���� �� $� ������ +)*���,�� ��� ��� �������� � ���� ������� ������ � "����� ����!��������������� ������ ��������������������������������������������������������������������������� �� ���� ������� ��� ���������� � 5������� �������� �������������!�� ����������'��!����������������!��� ������������������������������������������
����������5�������������������������������������������� ����� ��� ���� ������ �� 2� �� �� ���� � �������� �2� ������#������ �����������2� ����� ���������������������������������� �������=��5��������� ��������������������!���� ����� ��������������!���������������������������������������������
Storage Containers
���������� ������������������� ��=
������
���������� ���������� �������������� ��������������������������������������������� ��� ��������������"�������������������� ������@����+����,�+&9���,����� ����������������������

HANDLING AND TRANSPORTING SAMPLES
421
������ ������������������������������������������������� �� ���� ���� � #��� ���� �� ��� ����� ���������������������������������������������������� ����� �� ���� ����� � �� �������� �� ���� ������ ���������������� ���$%�%�
#������������ ���������������������������������������� �� ���!� ��� ���� ��� ��� ��� ��� ������������������-������������������������������ ���!� �������� �� ��� ��� ��������� �� ��� ��������������������� ��������������������������������������������������-����������������� ������ ��� ���� ���!� ���� ���� �� ��� �� ���������������������
����������2� ������������������ ���2� ���%���:!������� ����=
#��� ������� �� ��� ��� ���� ����� �� ����� �������������������������������������������������������������� ���
#��� ������� �� ��� ��� ��� � �������� ��� ����������� �� � ���� �� ������� ���� �������� ����������������� �
#������������ ������ ���� ���������� ���������������������������'���
Shipping Containers
#�������������� ������ ��������� ��������������������������������=
������+����������������������,�A���@����+&%�����&9����,������ ����������� ����������������
FIELD MANUAL
422
����������#������+����,��� ���������������������� �� �������� ����� �������� � #��� ���������������������� ������������������ ���������� ����$�������+)*���,����� ����������������������'������������� ����� �� ����
?����������������������� ��������� �������� �� ����������������������� �������������������!� ���� ��� ��������� �������� ���� ��������� ������������ � � ������ ����� �� ������ ���������������������������������������������������������������������
; � �5��������������������� ��������������������� ������� � ��� �� ����� �� ��� ��� ������� �� ����������� ��������������������������
������������������������� ������������������������!� �������!� �� ��������� ��������� ������������������������
Core Handling
#��� ������������ ����������������� �� �� ��� ������ � ���� ��� ������� ������ �� ���� ���� ��� ��� ������������������������������������������=
>���������������������������������'����������������������������������������������������������������������� ��������������������������������������������������!���� ������������ !����� ���� �������� ������ ��� ���� ����� ������ ��������
������������� ��������������������� ������������������������������������

Figure 23-3.—Example core box construction.
HANDLING AND TRANSPORTING SAMPLES
423
0 �������������&**���������������������� ���������������������� ���������������������������� � �������� ������� �������� ��� �����������������
������ ����������� ��� ������ �������� �����������!������������������������������ ����������������������������� ��� ��� �� ������ �� ������� �������� � #��� ��� � �� ��� ��� �������������! ������������� ������������������������������ �
;��� ������������� ����������������� ������������ ������� ���������������������������������-�������������������� ����������������������!���������������������������������������������������� ���������������������������������� ����
-�������!������ ������������������ ������������������������������� ����� ���� �������������
��� ���$%�&�������������������������������������������
Identification of Samples
���� �������!� �������� �� � �� ���!� � ��� ��� ����������������!� ��� ���� ������� �������� �� ��� �����������������������������=
��1����������� ������B��!����!��������� ����#���������������������������������5�����������5������ ����

FIELD MANUAL
424
-������������������=
����������������������� ���������������� ���������� ����'��� ������������
������������������ ����� �������� ���� ����!������ ����� ��
����������� � �������� ������ ��� �����������������������������������������������!��������������� ����������������� �������������
Transportation Requirements and Procedures
������������������������!����������!����������!��� �������������������������� ������� �������������� ����������������#������������� ��������������� ������ �������������������������������=
0������������������������������������������������� ������ �� ����'�!� ����� �!� �� ��� �������� �������������������������������
B����� �������� ������ � ���� ������ �� ��������(����������������� ���<����������������� ���������� � -��������� � ��� ���������!����������������
#������� ��� �� ����������� �������� �� �������������������������� �������!� ��� !� ����'��!���������������� �������������������������� �����-����������!������������������������������� ���� ���� ��������������������� ��� �������������� ��������������������������� ��������
HANDLING AND TRANSPORTING SAMPLES
425
��������������������������� ��������������������������������������� ���
-��� ����������� ������������!���������������������2� �� %� ���2� ���� ���������� ��� �������� �� ���� �����!� ����!� ��� ��� �� ���� �����������
#���������� ��� ��������� ���� �� ���� �������!������������������ � !������������������������� �������� ����� � B�����!� ��� ���� �������� ��� ���!�� ��� ����� ���� �������� ���� ���������� �� �������!������ ��'���������������-������������������������������������������� � !��������� ������ ������ �1����� ����� � ��� ������ �� ���� ��� ������������������
#��� ������� �� ���� �������� �������� ���� ��������� ��������� ��������� �������������� �����������������������
#��������������������������������� ���������������������������������� ����������������� � ��� � ��� ������ ���� �������� ������� ������������������������
���������� ��������� �� ��� ��� ���� ��� ������������������������������������������������ ��� ������ ��� �� ������ ���� �������������������� ��������� �� ��� ��� ���� ��� ��� ����������������������������������������������������������� ������� � #��� ������� � ������ �� ���� ��������������������������� ����������������������������������������� ������
FIELD MANUAL
426
Upright Handling and Shipping of Samples
��� ���� ������ �� �� ����� �� ������!� � ��� ��� ����������������� ������������������������������!������������� ����������������������������� �������������-�� �������� �� ��� ����� ������ ���� ��������� �� �����������!�������������� ��������������=
5������������� ������������������������������� ��� ��� ������� ����� �� ��������� � ���� ������������#������������������������������������������������ ���������� ����#�������������������������������������������� ����
-�� ��������� � ��� � ��� �������� ���� �� �� �!����������������������������� ������ ����������� ����5��������+&)����,���������������������$������+*�8��,��������� ����������� ����'�������� ���������������5������������������������������������� ����������������������
5��������� ����������������������������������������� ���
5������ � ���� �� ��� ������ ��� �� ����� ��� �����������������������������
0�� �� ����� ����� ���� ���� �������� �� �� ������������� ������������������ �������������'����������������� ��
5������� ����� � ��� ��� ���������� ������������� ��� ��� ��� ��� �� ����� ����#���� �� ��� ���� ������ ������� �������� ��� ������� ��������������������������������������� �#����� �������� ����������������� ����� ������������������ ����������� �!��������������������������!� ��� ����� ���� ������ ��� ���� ���������������'���

HANDLING AND TRANSPORTING SAMPLES
427
�������������������
���� �������� �� ��� ��� �� ���� �������� �� ��������� ����������������������������������� ������� ����������������������������+��� ���$%�$,���5������������������������ ������ ��� ������ ������������������������� ���+C%�4�!�$$�4�,�������������������8*������������������ �������� �B������������������������ ������� ��� �� ��� � ���� ������� � 5������� �������� ���� �� ��� ��� ��������� ��� �� ��� ���������� ������'�� ������� ������� ����������� �� ������ ��� ������������������������������������������������ ���
"������������������������ ���������������������������������������������#����� ����� ������������ ����������� �� ���� ���� � #��� ����� �� ��� ���������������������������������������������������
Recommended Equipment
������� ��� �� ����� �� �� ������ ��������� �� ������!�����!��������������������� ��������������=
/����������������+5��������,� ����!��� �� ����!����!������ �!��/�!������������ ���
5��������������
. ��������/��� ���
5��� ��!�� ����!�5������!���������������������������������� �����������
?�������� �� �� �����!� � ��� ��� ��������� ���������������������������� ���

FIELD MANUAL
428
"����� �!���������!�&�����+$)���,����� !�������������������������������������������������������������������� ��
#���!���������������������������� �������
����������
����!���������������!�� ����!��������!����������������������������������� ���
�������� �������� ���������� ��� ����� �� ����� ������� �� �������� ������ ���� ����� � ���� �������������� �������� �� > � ���� ������� ���� �������
�������� �� ������ 1���!������� ����!������ � ���������������������������������������������������!������A� ���� +$)*������������ D�.E,� ��� � ���+&!***��.,
;���!������������������� ����!�������������������
���������������������������������
��� �����������������������������������������
-� ���������������������� �������������������������������'��
5������ � ��� ����� ��� ���������� � ��� +��� ,�������!� ���� ����� ����� A�� �� @����� +&%�� �&9���,�������+����������,
���������������������������������������������������������� ������������������

HANDLING AND TRANSPORTING SAMPLES
429
5��������������!����������������������������!������������ ���������������������������!��� !�����������<����������!������!���������������� �������� � ��� ��� ��������� ���� �����������������������
5��������� ������������������������������ �

Chapter 24
CARE, RETENTION, AND DISPOSALOF DRILL CORE, SOIL, AND
ROCK SAMPLES
General
These guidelines for the care, retention, and disposal ofdrill core, soil, and rock samples apply to (1) foundationexploration for structures, such as dams, canals, tunnels,powerplants and pumping plants, (2) constructionmaterials investigations including riprap and borrow, and(3) safety of existing structures investigations. Sampleretention and disposal guidelines for concrete aggregate,pozzolan, land classification, drainage (except fordrainage structures), and hazardous waste studies areexcluded.
These guidelines are intended to maximize care ofsamples and cores, minimize storage costs, meet mini-mum technical requirements, and avoid unnecessarilylong storage periods. Special circumstances or needs mayrequire modification of the guidelines.
These guidelines apply to rock and soil core and samplestaken without special sampling sleeves, tubes, or con-tainers. When undisturbed samples taken in sleeves orcontainers or undisturbed hand-cut samples arespecifically intended for laboratory examination or testingto supply design data, the samples should be taken,prepared, cared for, and handled in accordance withUSBR 7100 [1] and USBR 7105 [2]. Undisturbed samplesshould be shipped immediately to avoid deterioration andchanges in physical properties. Chapter 23 describesproper procedures for protecting and shipping samples.Appropriate logs, sample data sheets, or other pertinentinformation should be submitted with the samples.

FIELD MANUAL
432
Location of Storage Facilities
The preparation of an adequate log or description of thecore or samples should be done before storing and sub-sequently disposing of samples. If the sampled material,such as slaking shales, breaks down upon drying andloses in-place characteristics during storage, it may bebetter to drill new holes than to store large quantities ofcore that will seldom be looked at or will lead to wronginterpretations if inspected or tested after years ofstorage.
The following are the general requirements for storage ofcore and samples:
1. Provide minimum storage conditions. (See thenext section, “Conditions of Storage.”)
2. Eliminate unsupervised storage. The storagefacility should be at or near the site of a project orinvestigation.
3. Minimize transferring core and samples from onestorage facility to another because work on astructure site or project progresses through suc-cessive stages of investigation and construction.
4. Provide accessibility so that minimum travel isrequired for examination of the core and samples.Frequent inspection may be necessary for designpurposes and for prospective bidders on construc-tion specifications.
5. Survey existing unused space before constructingor acquiring new space or use space initiallyprovided for other purposes but adaptable to coreand sample storage. For example, the lower

CARE, RETENTION AND DISPOSAL
433
floors and galleries of many powerplants andsome pumping plants or buildings erected fortemporary use during construction have storagespace.
Storage During Investigations
Core and samples should be kept at the nearest existingstorage facility. A new storage facility should be estab-lished only if required by the location, the amount of coreand number of samples anticipated, and the duration ofinvestigation or access convenience. In some instancesduring periods when actual drilling and sampling opera-tions are in progress, temporary storage at the site maybe required to facilitate logging, selection of samples, orready reference while geologic, soils, or other field studiesare in progress. Temporary onsite storage should belimited to short periods of actual need and should preventdamage or deterioration of the core and samples.
When a field office maintaining core storage facilities isclosed following preliminary investigations, core and sam-ples no longer required should be discarded (see sectionentitled Retention of Rock Core and Samples), and theremaining core and samples should be transferred to anappropriate location. When exploration is resumed, thecore should be examined to determine whether thesamples are still useful or whether redrilling is necessary.
Storage During Construction
Core and samples should be stored locally during con-struction. The core and samples provide foundation andmaterials data to geologists, designers, and constructionpersonnel during construction and claim processing.

FIELD MANUAL
434
At the close of construction, special samples should beselected for possible future testing (See the section on“Retention of Rock Core and Samples”). Sample selectionis better when personnel familiar with the core, samples,and foundation conditions are available.
At the close of construction, arrangements should be madefor continued storage of core and samples until applicablecore and sample retention criteria have been met. Thecore and samples should remain at the local storagefacility, if practical.
Storage During Operation and Maintenance
Any transfer of a structure from one organization toanother should include arrangements for core and samplestorage until the applicable standard core and sampleretention periods are met.
Conditions of Storage
The minimum conditions for core and sample storage are:
1. Protection against wetting and drying but notagainst temperature changes. Cores that mightbe damaged by drying or freezing should beappropriately protected.
2. Protection against unauthorized access, damage,vandalism, and snake or rodent infestation.
3. Grouping core boxes and samples by drill holenumber, investigation site, and project and stack-ing to permit reasonably easy access and exami-nation. The core and samples should beaccessible without excessive unstacking andmoving of adjacent core boxes and samples. The

CARE, RETENTION AND DISPOSAL
435
safe height of core box or sample stacks dependson the strength of the boxes and reasonable easeof handling. Core box racks should be providedonly when repeated reexamination and study areanticipated and when the time saved by havingthe boxes separated in units of four or five boxeswould be cost effective.
4. The office responsible for storage should maintainadequate records including copies of final logs,photographs, inventory, and location map of thecore and samples stored at each core and samplestorage location. The records should include thename of the feature or investigation site, drillhole number, number of boxes and samples, andwhether the cores or samples have been tested.
Length of Storage
Proposed Structures or Projects
All core and samples collected during site investigationsshould be kept until the proposed structure, unit, or pro-ject is built and has performed satisfactorily for a periodof time or is abandoned. The following are exceptions.
Appraisal.—Core and samples obtained in investigationsfor dams, canals, etc., should be disposed of at the end ofappraisal stage investigations, such as the abandonmentof a proposed structure site or completion of recon-naissance designs and estimates, except in special cases.
Feasibility.—Disturbed soil samples from borrow pitinvestigations obtained during feasibility stage investiga-tions and not used for testing should be discarded at theend of the investigations unless interest in the project is

FIELD MANUAL
436
sufficient to ensure continuing development. If, at theend of 1 year, further development work has notmaterialized, the samples should be discarded on theassumption that deterioration makes tests on the samplesunreliable.
Undisturbed soil samples can be discarded after 1 year.
Design Investigations and Completed Structuresor Projects
Requirements for length of storage for various types ofsamples and core are as follows:
Borrow Pit Investigations for Design.—Borrow pitsoil samples collected for design investigations should beretained until construction is complete and all claims aresettled except as the samples are consumed in routinetesting.
Borrow Investigations for Construction Control.—Soil samples collected for construction control investiga-tions and field laboratory testing should be discardedafter completion of the field laboratory testing and allclaims are settled.
Record Samples from Fill.—Samples collected forrecord tests and not consumed should be retained unlessthe number of samples is more than necessary to repre-sent the materials used for construction.
Foundation Core and Samples.—Foundation core andsamples obtained during design and construction investi-gations and not consumed in testing may be disposed ofwhen the following requirements are met:

CARE, RETENTION AND DISPOSAL
437
1. Canals and distribution systems including pipe-lines, minor or small engineering structures, andlow dikes or embankments are trouble free for1 year.
2. Large or major engineering structures such asdams, powerplants or pumping plants, mainfeeder canals, and main power conduits aretrouble free for 5 years. The 5-year time periodshould begin after operating level reservoir fillingfor large dams. Representative core and samplesfrom a few representative drill holes should bekept for the life of the structure.
3. Contractual negotiations and settlement of claimswhich might involve reinspection or testing of thecore or samples are complete.
4. Initial safety of dams analysis, modification, andconstruction activities are complete.
Disposal of Core and Samples
Photographs and an adequate log or description of thecore and samples should be available before disposal.When the minimum retention periods and otherrequirements outlined above have been met, concurrenceof the design and operation and maintenance (O&M)offices should be obtained by the office responsible for thecore or samples before any core or samples are discarded.
The responsible office should consider giving the StateGeologist’s Office, technical schools, colleges, museums, orsimilar groups the opportunity to select samples or retainthe core.
The recommended disposal procedure is to place per-manent markers in the core boxes, wrap the boxes inplastic, and bury the boxes in a marked location.

FIELD MANUAL
438
Retention of Rock Core and Samples
If selected cores or samples are retained as representativeof the foundation and dam, appropriate assistance inselecting the samples is necessary. Assistance canusually be obtained from the design office.
To facilitate storage, handling, and inspection, standardcore box sizes and labeling procedures should be used.Core boxes should withstand a reasonable amount ofcareful handling, stacking, and shipping when filled withrock core.
To help identify the boxes when stacked, informationshould be shown on one end and the top of each core box.Temporary labeling of core boxes used while drilling ahole should be replaced with permanent labeling of coreboxes which will remain legible after handling, stacking,or storing for long periods. A map or an index file of drillhole core should be maintained which shows the locationof drill hole core if the boxes are stored in a large or con-gested storage area.
Bibliography
Bureau of Reclamation, U.S. Department of theInterior, USBR-7100, “Obtaining Undisturbed BlockSamples by the Hand and Chain Saw Methods,” EarthManual, Part II, 3rd edition, 1990.
Bureau of Reclamation, U.S. Department of theInterior, USBR-7105, “Performing Undisturbed SoilSampling by Mechanical Drilling Methods),” EarthManual, Part II, 3rd edition, 1990.

Chapter 25
GLOBAL POSITIONINGSYSTEM
System Description
The Navigation Satellite Time and Ranging (NAVSTAR)Global Positioning System (GPS) is a space-based satelliteradio navigation system developed by the U. S. Depart-ment of Defense (DoD). GPS receivers provide land,marine, and airborne users with continuous three-dimensional (3D) position, velocity, and time data (PVT).This information is available free of charge to anunlimited number of users. The system operates underall weather conditions, 24 hours a day, anywhere onEarth. The Union of Soviet Socialist Republics developeda similar system that is generally not used because it is aduplication of the NAVSTAR function.
GPS System Design
The GPS system consists of (1) the space segment, (2) thecontrol segment, and (3) the user segment.
Space Segment.—The space segment consists of anominal constellation of 24 operational satellites(including 3 spares) that have been placed in 6 orbitalplanes 10,900 miles (20,200 kilometers [km]) above theEarth’s surface. The satellites are in circular orbits witha 12-hour orbital period and an inclination angle of55 degrees. This orientation provides a minimum of fivesatellites in view at any time anywhere on Earth. Eachsatellite continuously broadcasts two low-power, spread-spectrum, RF Link signals (L1 and L2). The L1 signal iscentered at 1575.42 megahertz (MHz), and the L2 signalis centered at 1227.6 MHz.
Control Segment.—The control segment consists of aMaster Control Station (in Colorado Springs) and a

FIELD MANUAL
440
number of monitor stations at various locations aroundthe world. Each monitor station tracks all the GPS satel-lites in view and passes the signal measurement databack to the Master Control Station. Computations areperformed at the Master Control Station to determine aprecise satellite ephemeris and satellite clock errors.These data are then uplinked to the individual satellitesand, subsequently, rebroadcast by the satellite as part ofa navigation data message.
User Segment.—The user segment is all GPS receiversand their application support equipment such asantennas and processors. This equipment allows users toreceive, decode, and process the information necessary toobtain accurate position, velocity, and timing measure-ments. These data are used by the receiver’s supportequipment for specific application requirements.
GPS Basic Operating Concepts
Satellite Signals.—The satellites transmit their signalsusing spread-spectrum techniques that employ twodifferent spreading functions: a 1.023-MHZ coarse/acquisition (C/A) code on L1 only and a 10.23-MHzprecision (P) code on both L1 and L2. The two spreadingtechniques provide two levels of GPS service: PrecisePositioning Service (PPS) and Standard PositioningService (SPS). SPS uses C/A code to derive position, whilePPS uses the more precise P-code (Y-code).
C/A Code.—The C/A code is a 1,023 bit nonrepeating codesequence with a clock rate of 1.023 MHZ. The satelliterepeats the code once every millisecond. Each satellite isassigned a unique C/A code that is chosen from a set ofcodes known as Gold Codes.

GLOBAL POSITIONING SYSTEMS
441
Figure 25-1.—Satellite signal structure.
P(Y)-Code.—The P-code consists of a 2.36e+14 bitnonrepeating code sequence with a clock rate of10.23 MHZ. The entire code would take 267 days beforea repetition occurs; however, each satellite is assigned aunique 1-week segment of this code that restarts everySaturday/Sunday midnight.
The P-code has a number of advantages over C/A code.(1) The P-code rate is 10 times faster; therefore, thewavelength is 1/10th as long, giving the P-code a muchhigher resolution. (2) The higher rate spreads the signalover a wider frequency range (see figure 25-1). Thisfrequency spreading makes the P-code much moredifficult to jam. (3) By encrypting the P-code (creatingY-code), the receiver is not susceptible to spoofing (falseGPS signals intended to deceive the receiver).
The drawback of P-code is that it is relatively difficult toacquire because of its length and high speed. For thisreason, many PPS receivers first acquire C/A code, thenswitch over to the P(Y)-code. Y-code is an encrypted

FIELD MANUAL
442
version of P-code that is used for anti-spoofing (A-S).Because of the similarity of these two codes, they arereferred to collectively as P(Y)-code.
Navigation (NAV) Message
Superimposed on both the P-code and the C/A code is anavigation (NAV) message containing satellite ephemerisdata, atmospheric propagation correction data, satelliteclock-bias information, and almanac information for allsatellites in the constellation.
The navigation message consists of 25 1,500-bit framesand is broadcast at 50 bits per second. It takes 30 secondsto receive a data frame or 12.5 minutes to receive all25 data frames. Each satellite repeats its own ephemerisdata and clock bias every frame along with a portion ofthe almanac. The receiver will receive the critical acquisi-tion information within 30 seconds, but a full almanacwill require 12.5 minutes to download.
Signal Acquisition.—The GPS satellites use Bi-PhaseShift Keyed (BPSK) modulation to transmit the C/A andP(Y)-codes. The BPSK technique involves reversal of thecarrier phase whenever the C/A or P(Y)-code transitionsfrom 0 to 1 or from 1 to 0.
To the casual observer, the very long sequence of ones andzeros that make up the C/A and P-codes appears randomand blends into the background noise. For this reason,the codes are known as pseudo-random noise (PRN).
In actuality, the C/A and P-codes generated are preciselypredictable to the start time of the code sequence and canbe duplicated by the GPS receiver. The amount thereceiver must offset its code generator to match the

GLOBAL POSITIONING SYSTEMS
443
Figure 25-2.—Satellite ranging intersections.
incoming code from the satellite is directly proportional tothe range between the GPS receiver antenna and thesatellite.
By the time the spread-spectrum signal arrives at theGPS receiver, the signal power is well below the thermalnoise level. To recover the signal, the receiver uses acorrelation method to compare the incoming signals withits own generated C/A or P(Y) codes. The receiver shiftsits generated code until the two codes are correlated.
Satellite Ranging.—The receiver continuously deter-mines its geographic position by measuring the ranges(the distance between a satellite with known coordinatesin space and the receiver’s antenna) of several satellitesand computes the geometric intersection of these ranges.To determine a range, the receiver measures the timerequired for the GPS signal to travel from the satellite tothe receiver antenna. The resulting time shift ismultiplied by the speed of light, arriving at the rangemeasurement.

FIELD MANUAL
444
Because the resulting range measurement containspropagation delays caused by atmospheric effects as wellas satellite and receiver clock errors, the measurement isreferred to as a "pseudorange." A minimum of fourpseudorange measurements are required by the receiverto mathematically determine time and the three compo-nents of position (latitude, longitude, and elevation). Thesolution of these equations may be visualized as thegeometric intersections of ranges from known satellitelocations (see figure 25-2). If one of the variables, such aselevation, is known, only three satellite pseudorangemeasurements are required for a PVT solution, and onlythree satellites would need to be tracked.
GPS Accuracy
GPS accuracy has a statistical distribution that dependson a number of important factors, including dilution ofprecision (DOP) satellite position and clock errors,atmospheric delay of the satellite signals, selectiveavailability (SA), signal obstruction, and multipatherrors.
Dilution of Precision
Geometric Dilution of Precision (GDOP) is a measure ofthe amount of error due to the geometry of the satellites.The errors in the range measurements that are used tosolve for position may be magnified by poor geometry.The least error results when the lines of sight have thegreatest angular separation between satellites.
There are four other DOP components that indicate howthe geometry specifically affects errors in horizontalposition (HDOP), vertical position (VDOP), position(PDOP), and time (TDOP). DOPs are computed based on

GLOBAL POSITIONING SYSTEMS
445
the spatial relationships between the satellites and theuser and vary constantly due to the motion of thesatellites. Lower DOPs mean more accurate estimates.A PDOP less than six is necessary for accurate GPSpositioning.
Satellite Position and Clock Errors
Each satellite follows a known orbit around the earth andcontains a precise atomic clock. The monitor stationsclosely track each satellite to detect any errors in the orbitor the clock. Corrections for errors are sent to eachsatellite as ephemeris and almanac data. The ephemerisdata contain specific position and clock correction data foreach satellite while the almanac contains satelliteposition data for all satellites. The NAV set receives theephemeris and almanac data from the satellites and usesthese data to compensate for the position and clock errorswhen calculating the NAV data.
Atmospheric Delay of Satellite Signals
Electromagnetic signals (such as GPS signals) travel atthe speed of light, which is always a constant in a vacuumbut not in the atmosphere. There are two layers of theEarth’s atmosphere that affect satellite signals, theionosphere and the troposphere.
The ionosphere is a 90-mile (150-km) thick layer of theupper atmosphere in which ultraviolet radiation from thesun has ionized a fraction of the gas molecules, therebyreleasing free electrons (ions). The shape of the iono-sphere and its electron density varies with latitude, timeof day, time of year, number of sunspots, solar flares, andother cosmic activity. The magnitude of the error causedby ionospheric effects can translate to a position error aslarge as 130 ft (40 m).

FIELD MANUAL
446
The troposphere is the dense, humid layer of atmospherenear the surface of the Earth. This layer refracts thesatellite signals in proportion to the humidity and densityof the air. The magnitude of the tropospheric error can beas small as 8 ft (2.3 m) at the zenith, or as large as 65 ft(20 m) at 10 degrees above the horizon.
There are two ways to compensate for the atmosphericdelays: modeling and direct measurement. The iono-spheric and tropospheric delays are inversely proportionalto the square of the frequency. If a receiver can receive L1and L2 frequencies, it can measure the difference betweenthe two signals and calculate the exact atmospheric delay.
Most receivers currently use mathematical models toapproximate the atmospheric delay. The troposphericeffects are fairly static and predictable, and a model hasbeen developed that effectively removes 92-95 percent ofthe error. This reduces the total two-dimensional (2D)position error caused by the troposphere to around 8 ft(2.0 m).
The ionosphere is more difficult to model because of itsunusual shape and the number of factors that affect it. Amodel has been developed that requires eight variablecoefficients. Every day, the control segment calculates thecoefficients for the ionospheric model and uplinks them tothe satellites. The data are then rebroadcast in the NAVmessages of the C/A and P(Y)-codes. This model caneffectively remove 55 percent of the ionospheric delay,reducing the total 2D position error caused by theionosphere to around 25 ft (7.5 m).
Selective Availability and Anti-Spoofing
GPS satellites provide two levels of navigation service:Standard Position Service and Precise Position Service.

GLOBAL POSITIONING SYSTEMS
447
SPS receivers use GPS information that is broadcast inthe clear and is available to anyone in the world. Thisinformation may contain built-in errors that limit theaccuracy of the receiver. This is a security techniquecalled Selective Availability (SA). These SA errors arevariable. In normal conditions, the U.S. Governmentguarantees that these errors do not exceed 100 mhorizontal, 140 m vertical, and time accuracy of340 nanoseconds, 95 percent of the time. There are timeswhen an SPS receiver error exceeds these limits.SPS receivers are for civil use, and SA may or may not beon.
PPS receivers use the same information as SPS receivers.PPS receivers also read encoded information that containsthe corrections to remove the intentional SA errors. Onlyusers who have crypto keys to decode this information getthe PPS accuracy. U.S. Government agencies and someAllies are authorized to have these crypto keys. Areceiver with valid crypto keys loaded and verified is aPPS receiver.
To protect authorized users from hostile attempts toimitate the GPS signals, a security technique called anti-spoofing is also used. This is an encrypted signal from thesatellites that can be read only by PPS receivers.SPS receivers are not capable of using anti-spoofing. Areceiver with valid crypto keys loaded and verified readsthis encrypted signal and operates in a spoofingenvironment.
GPS Signal Obstruction
Normal operation of the GPS receiver requiresundisturbed reception of signals from as few as foursatellites (in normal 3D mode) or three satellites in fixed-

FIELD MANUAL
448
elevation mode. The signals propagating from thesatellites cannot penetrate water, soil, walls, or othersimilar obstacles.
The antenna and the satellites are required to be in "line-of-sight" with each other. GPS cannot be used for under-ground positioning in tunnels, mines, or subsurfacemarine navigation. In surface navigation, the signal canbe obscured by buildings, bridges, trees, and other matterthat might block an antenna’s line-of-sight from theGPS satellites. In airborne applications, the signal can beshaded by the aircraft’s body during high banking angles.For moving users, signal shading or temporary outagesare generally transitory and should not degrade theoverall positioning solution.
The GPS receiver uses five channels to minimize theeffects of obstruction. During normal operation, fourchannels track the four primary GPS satellites while thefifth channel tracks the remaining visible satellites andrecovers the ephemeris data for each satellite. If one ormore of the primary satellites are obscured, the receivercontains the data to support rapid acquisition ofalternative satellites.
If only three satellites can be tracked, receivers may fea-ture an “Elevation Hold” mode and continue to navigateas previously noted. The accuracy of the PVT in thismode will not be greatly affected unless the elevationchanges. The receiver will use either the last computedelevation or an elevation provided by the user or hostsystem. The accuracy of the “Elevation Hold” modedepends on the accuracy of the elevation provided to thereceiver.

GLOBAL POSITIONING SYSTEMS
449
Multipath Interference
Multipath errors result from the combination of data frommore than one propagation path. These errors distort thesignal characteristics of the range measurements andresult in pseudorange errors. These errors depend on thenature and location of a reflective surface peculiar to eachuser location. The effects are less detrimental for amoving user because small antenna movements cancompletely change the multipath characteristics.
The receiver is designed to reject multipath signals. First,the active patch antennas are designed to have a sharpgain roll-off near the horizon while providing nominalgain for the primary satellite signal. Since most multi-path signals are reflected from ground structures, theytend to be attenuated. Second, the antenna is right-handpolarized. When a right-hand polarized GPS signal isreflected off a conductive surface, the signal becomes left-hand polarized and rejected by the antenna. The receiveralso has hardware and software designed to reduce theeffects of any multipath interference errors.
Differential GPS
Differential GPS (DGPS) may be used to eliminate theeffects of SA and correct certain bias-like errors in theGPS signals. A Reference or Base Station Receivermeasures ranges from all visible satellites to its surveyedposition. Differences between the measured andestimated ranges are computed and saved for postprocessing or transmitted by radio or other signals todifferential equipped receivers. Sub-meter to centimeterposition accuracy is possible using local base stationdifferential GPS.
FIELD MANUAL
450
Quality of Measurement
The accuracy with which positions are determined usingGPS depends on two factors—satellite geometry and usermeasurement accuracy.
Satellite Geometry
Satellite geometry effects on specific position solutionscan be expressed as dilution of precision. DOP is used todescribe the contribution of satellite geometry to totalpositioning accuracy. An ideal satellite constellationwould not dilute the positioning accuracy.
Ideal Satellite Constellation
The term, “current satellite constellation,” refers to thesatellites being used in the current position solution.When the current satellite constellation geometry is ideal,the DOP value is 1. This means the current satellite con-stellation contributes a “dilution factor” of 1 to positioningaccuracy. Most of the time, the satellite geometry is notideal, which means the current satellite constellationgeometry "dilutes the precision" of the positioningaccuracy. As the satellite constellation becomes less ideal,the adverse effect on positioning accuracy is greater. Thedilution will change over time as satellites travel alongtheir orbits, as different satellites are used to solve forGPS position, and as the user moves.
DOP Effects
The effect of satellite geometry is not equally distributedin all three positional vectors (x, y, and z in Earth-centered, Earth-fixed coordinates). Several DOP relatedvalues are commonly used. Table 25-1 shows expectedvalues for HDOP, VDOP, and others. The range given for

GLOBAL POSITIONING SYSTEMS
451
Table 25-1.—Expected values of dilution of precision
DOP Description
68-percentprobability of
obtaining
95-percentprobability
of obtaining
HDOP Horizontal DOP is thesatellite geometryfactor in the 2D hori-zontal position solution.
1.50 1.78
VDOP Vertical DOP is thesatellite geometryfactor in the verticalposition (elevation)solution.
2.08 2.70
PDOP Positional DOP is thesatellite geometryfactor in the 3D positionsolution.
2.56 3.23
PDOP HDOP VDOP=
+2 2
TDOP Time DOP is thesatellite geometryfactor in the timesolution.
N/A N/A
HTDOP Horizontal and timeDOP is the satellitegeometry factor in the2D horizontal positionand time solutions.
N/A N/A
HTDOP = SQRT (HDOP2 + TDOP2)
GDOP Geometrical DOP is thesatellite geometryfactor in the 3D positionand time solutions.
2.79 3.61
GDOP = SQRT (HDOP2 + VDOP2 + TDOP2)
FIELD MANUAL
452
VDOP, HDOP, GDOP, and PDOP assumes a 5-degreeantenna mask (signals 5 degrees or more above thehorizon) and a 24 satellite constellation.
Unique user conditions, such as more than 5 degrees ofantenna masking (e.g., in deep canyons), satellite outages,and poor constellation choice may result in a degradedDOP.
Quality Indicators
The indicators of solution quality are computed based onseveral things. These include uncertainties in receivermeasurement processes, current satellite constellationgeometry, and errors as reported by the satellites, such asthe User Range Accuracy (URA) index. There are dif-ferent measures of quality. A quality indicator must beselected based on the requirements of the application andhow meaningful that measure will be. Some measures ofquality indicators are shown below.
Circular Error Probable.—Circular Error Probable(CEP) is an estimate of horizontal accuracy that expressesthe radius of a circle in the horizontal plane that willcontain at least 50 percent of the GPS 2D positionalsolutions. CEP is generally expressed in meters; asmaller value indicates a higher quality 2D positionsolution. CEP is not desirable as a quality measure fornavigation systems because a 50-percent probability is toosmall. This measure can be useful in some applications,for example, a bombing run where a better than50-percent chance of hitting a target is required. CEP isnot available from all GPS units. However, CEP may beestimated by the following equation.
CEP = 0.8323* EHE
EHE is the expected horizontal error.

GLOBAL POSITIONING SYSTEMS
453
R95.—R95 is similar to CEP except that the circlecontains at least 95 percent of the GPS 2D positionalsolutions. R95 is generally expressed in meters, and asmaller value indicates a higher quality 2D position. R95is better than CEP as a measure for navigation systemsbecause a 95-percent probability is more commonlyassociated with navigation requirements. R95 is notavailable from all GPS units. However, it may beestimated by the following equation.
R95 = 1.731 * EHE
Spherical Error Probable.—Spherical error probable(SEP) is an estimate of 3D accuracy that is the radius ofa sphere that will contain at least 50 percent of the GPS3D positional solutions. SEP is generally expressed inmeters, and a smaller value indicates a higher quality 3Dposition solution. SEP is not desirable as a quality mea-sure for navigation systems for the same reason that CEPis not; a 50-percent probability is too small. A sphericalmodel of errors is not well suited to the GPS modelbecause error probabilities in the horizontal plane are ofa smaller scale than those in the vertical plane (compareHDOP to VDOP). This leads to more of a football shapederror distribution than a spherical distribution. SEP isnot available from all GPS units.
Expected Position Error.—Expected position error(EPE) is a 1-sigma calculation of 3D position solutionestimate of error. EPE is expressed in meters, and asmaller EPE indicates a higher quality position solution.Similarly computed values are often referred to,including:
EHE, Expected Horizontal Error (1-sigma estimate of 2D error)

FIELD MANUAL
454
( )EPE EHE EVE= +2 2
EVE, Expected Vertical Error (1-sigma estimate of one-dimensional error)
EPE is one of the best available indicators of quality fornavigation systems.
EPE can also be output as Figure of Merit (FoM). (Seebelow.)
Root Mean Square.—Root Mean Square (RMS) is a1-sigma calculation of error in position. Horizontal RMSis equivalent to EHE, vertical RMS is equivalent to EVE,and 3D RMS is equivalent to EPE.
The above is true only if the mean values of the errorcomponents are zero or the biases of the errors can beindependently determined and removed.
Figure of Merit.—Figure of Merit (FOM) is anexpression of EPE, as shown in table 25-2.
From a historical perspective, FOM was created at theinception of GPS to provide users with a simple and quickmethod of indicating the solution accuracy; it is stillwidely used in many military applications today. It doesnot have the granularity to take advantage of thesignificant improvements in accuracies that may beachieved today. FOM is available from some GPS unitson the display.

GLOBAL POSITIONING SYSTEMS
455
Table 25-2.—FOM related to EPE
FOMEPE
(meters)
1 < 25
2 < 50
3 < 75
4 < 100
5 < 200
6 < 500
7 < 1,000
8 < 5,000
9 5,000
Expected Time Error.—Expected Time Error (ETE) isa calculation of time error that is computed similarly toEPE. ETE is a 1-sigma estimate of time solution error.ETE is expressed in seconds, and a lower ETE indicatesa higher quality time solution. Some GPS units calculateand output EPE in the form of Time Figure of Merit.
Time Figure of Merit.—Time Figure of Merit (TFOM)is an expression of ETE as shown in table 25-3.

FIELD MANUAL
456
Table 25-3.—TFOM related to ETE
TFOM ETE
1 < 1 nanosec
2 < 10 nanosec
3 < 100 nanosec
4 < 1 microsec
5 < 10 microsec
6 < 100 microsec
7 < 1 millisec
8 < 10 millisec
9 10 millisec
User Measurement Accuracy
Several factors are involved in the receiver’s ability toaccurately measure the distance to the satellites. Themost significant factors in user measurement accuracyare space and control segment errors, atmospherics, anduser equipment (UE) errors. These errors are generallygrouped together and referred to as User EquivalentRange Error (UERE).
≥

GLOBAL POSITIONING SYSTEMS
457
User Equivalent Range Error
User Equivalent Range Error represents the combinedeffect of space and control segment errors (satellite vehicleposition [ephemeris] and clock errors), atmospherics(ionospheric and tropospheric), and user equipmenterrors (receiver measurement uncertainties). UEREcannot be broadcast by the satellites and can be estimatedonly at the receiver. The point that sets UERE apart fromother measures of error is that UERE does not take intoaccount any satellite geometry effects, such as HDOP orVDOP. Table 25-4 shows a typical error budget for aP(Y)-code GPS receiver.
Table 25-4.—Typical GPS receiver error budget
Accuracy factor Error
Space and control segment 4.0 m
Ionospheric 5.0 m
Tropospheric 2.0 m
Receiver noise 1.5 m
Multipath 1.2 m
Miscellaneous 0.5 m
( )UERE = + + + + +4 5 2 15 12 0 52 2 2 2 2 2. . . 7.0 m

FIELD MANUAL
458
Space and Control Segment Errors
Satellites provide an estimate of their own satelliteposition and clock errors. Each satellite transmits anindication of these errors in the form of User RangeAccuracy (URA).
URA is a value transmitted by each GPS satellite that isa statistical indicator (1-sigma estimate) of rangingaccuracies obtainable from that satellite. URA includesall errors that the space and control segments areresponsible for—for example, satellite clock error andSA error. URA has very coarse granularity, however.
The URA value is received in the form of an index relatedto URA as shown in table 25-5.
The URA index broadcast by each satellite will changeover time. In practice, the control segment will uploadcorrection data to each satellite at least once every 24hours. When a satellite first receives its upload, it shouldhave a very low URA index. The amount of error willincrease over time, because of things such as satelliteclock drift, and the URA index for that satellite will grow.Some satellites’ URA index will grow more rapidly thanothers.
In practice, authorized PPS users should expect to seeURA index values in the range of 0 to 5. More commonly,values of 2-4 should be expected. The values depend onthe length of time since the last control segment upload tothat satellite.

GLOBAL POSITIONING SYSTEMS
459
Table 25-5.—URA index and values
URA index
URA(meters)
1 0.00 < URA <= 2.40
2 2.40 < URA <= 3.40
3 3.40 < URA <= 4.85
4 6.85 < URA <= 9.65
5 9.65 < URA <= 13.65
6 13.65 < URA <= 24.00
7 24.00 < URA <= 48.00
8 48.00 < URA <= 96.00
9 96.00 < URA <= 192.00
10 192.00 < URA <= 384.00
11 384.00 < URA <= 768.00
12 768.00 < URA <= 1,536.00
13 1,536 < URA <= 3,072.00
14 3,072.00 < URA <= 6,144
15 6,144 < URA (or no accuracy prediction available)
FIELD MANUAL
460
Wide Area GPS Enhancement
Wide Area GPS Enhancement (WAGE) is a featureavailable in Precise Positioning Service PLGR+96receivers. The WAGE feature uses encrypted satellitedata to reduce some space and control segment errors.
Each satellite broadcasts WAGE data that are valid for6 hours after that satellite receives a data upload. Thesedata may be used to correct satellite clock errors on othersatellites that have not received an upload recently.These clock corrections are used to reduce the errorcaused by satellite clock biases when a period of time haspassed since the last upload to those satellites. It takesapproximately 12.5 minutes to download a completeWAGE data set. Only WAGE data from the most recentlyupdated satellite are used in PLGR.
Atmospheric Errors
Atmospheric errors are those caused by the satelliteRF signal passing through the earth’s atmosphere. Theseerrors include ionospheric and tropospheric delays.
Ionospheric delay affects the GPS signal as it passesthrough the earth’s ionosphere. The ionospheric delay toGPS signals is very dynamic and depends on the time ofday, the elevation angle of the satellites, and solar flareactivity. Single frequency receivers use a modeledestimate of the range error induced by GPS navigationsignals passing through the Earth’s ionosphere. It is verydifficult, however, to estimate the error in this model.
Dual frequency receivers measure this delay by trackingboth the GPS L1 and L2 signals. The magnitude ofthe delay is frequency dependent, and the absolute

GLOBAL POSITIONING SYSTEMS
461
delay on either frequency can be scaled from thedifferential delay between L1 and L2.
Tropospheric delay is the expected measure of range errorinduced by GPS navigation signals passing through theEarth’s troposphere. This measure is based on satelliteelevation. Unlike the ionospheric delay, the troposphericdelay is very predictable, and there is very little error inthe compensation.
User Equipment Errors
User equipment errors are those uncertainties in themeasurements that are inherent in the receiver’scollection and computation of measurements. Severalfactors influence these uncertainties, including the GPShardware, the design of the tracking loops, the code typebeing tracked (C/A or P(Y)), and the strength of thesatellite signals. These uncertainties are taken intoaccount in the Kalman filter processing done in a PLGRwhen computing EPE and ETE.
Multipath effects are caused by a signal arriving at thereceiver site over two or more different paths. The dif-ference between the path lengths can cause them tointerfere with one another in the receiver. Buildings,parking lots, or other large objects may reflect a signalfrom a satellite, causing multipath effects. Signal aver-aging can be used to minimize the effects of multipathsignals.
Error Source Summary
There are many factors that influence the accuracy ofGPS measurements. Many of the factors do notcontribute large errors but cumulatively are important.

FIELD MANUAL
462
In practice, the three major sources of error are(1) performing the survey when satellite geometry is poor,(2) using equipment not designed to provide the desiredaccuracy, and (3) mixing datums and coordinate systems.
Satellite Geometry
The most useful error measurement available is positiondilution of precision (PDOP). PDOP is a number derivedfrom the geometry of the visible satellites and changes asthe satellites move in their orbits. The smaller the PDOPnumber, the better the satellite geometry. The PDOPvalue should be six, or preferably less, for accurate GPSwork. Some GPS units display the PDOP or an accuracyestimate in real time. Software is available that calcu-lates the PDOP for any planned GPS survey and shouldbe used before conducting the survey to determinewhether accurate GPS work is possible at the plannedlocation and time. The software also can be used todetermine satellite positions and whether terrain or otherobstructions will affect the survey. Presurvey planning,especially relative to PDOP, can make the differencebetween a mediocre or failed GPS survey and a successfulsurvey.
Equipment
Using inappropriate equipment is another major factor inGPS survey problems. The accuracy of the equipmentmust be known, and the equipment must be usedproperly. A small, inexpensive hand-held GPS unit canprovide an accuracy of 10s of feet when selectiveavailability is off and approximately 100 feet (30 m) whenSA is on. A PLGR (military GPS) can provide similaraccuracy when SA is on. A mapping grade GPS unit canprovide 1- to 2-ft (0.5-m) accuracy if the data are post-processed and 3-ft (1-m) real-time accuracy if a satellite

GLOBAL POSITIONING SYSTEMS
463
differential correction signal is available. Centimeter orsurvey-grade accuracy is possible with a local differentialbase station providing real-time or post-processingcorrection of rover data. Do not expect more accuracythan the equipment can deliver. Manufacturer estimatesof accuracy are generally better than what is commonlyencountered in the field.
The equipment must be well maintained. Many appar-ently satellite related problems are caused by equipmentmalfunctions, poorly charged batteries, or faulty cableconnections.
Datums and Coordinate Systems
An apparent GPS problem is introduced by collecting orcomparing position data based on different datums orcoordinate systems. Many old topographic maps andsurveys use the 1927 North American Datum (NAD27),and most new survey data are based on the 1983 NorthAmerican Datum (NAD83). Also, some sites use a localreference system that is not related to a regional datumor coordinate system. Systematic errors are a good indica-tion of a datum problem. Software is available that veryaccurately converts between datums and coordinatesystems and is very useful for diagnosing and correctingproblems. Chapter 6 of Volume 1 contains a discussion ofdatums, map projections, and coordinate systems.

APPENDIX A
ABBREVIATIONS AND ACRONYMSCOMMONLY USED IN
BUREAU OF RECLAMATIONENGINEERING GEOLOGY
AGC automatic gain controlAN ammonium nitrateA-S anti-spoofingASCE American Society of Civil EngineersASTM American Society for Testing
MaterialsATF Bureau of Alcohol, Tobacco, and
FirearmsAVIRIS Airborne Visible and Infrared Imaging
SpectrometerBIPS Borehole Image Processing Systembpf blow per footbpm blow per minuteBPSK bi-phase shift keyedBPT Becker Penetration TestC/A coarse/acquisitionCDP common depth pointCFR Code of Federal Regulationscm centimetercm2 centimeter squaredCME Central Mine Equipmentcm/sec centimeter per secondCPE Circular Probable ErrorCPT Cone Penetration TestCPTU piezometric cones or piezoconesCRR cyclic resistance ratioDGPS differential GPS

FIELD MANUAL
466
DoD U.S. Department of DefenseDOP dilution of precisionDOT Department of TransportationDS13 U.S. Bureau of Reclamation Design
Standard No. 13 for EmbankmentDams
EBW exploding bridge wireEHE expected horizontal errorEM electromagneticEPE expected position errorERi drill rod energy ratioETE expected time errorEVE expected vertical errorFoM Figure of MeritFr friction ratiofs sleeve resistanceft feetft/sec feet per secondft3/min cubic feet per minuteft3/sec cubic feet per secondgal/min gallons per minuteGDOP geometric dilution of precisiong/cm3 grams per cubic centimeterGPR ground penetrating radarGPS Global Positioning SystemHDOP horizontal dilution of precisionHSA hollow-stem augerICE International Construction EquipmentID inside diameterIME Institute of Makers of Explosivesin inch

APPENDIX A
467
in/sec inch per secondJPL Jet Propulsion Laboratorykg kilogramkg/cm2/m kilograms per square centimeter per
meterkg/L kilogram per literkg/m3 kilogram per cubic meterkHz kilohertzkm kilometerkPa kilopascalL literlb/ft3 pounds per cubic footlb/in2 pounds per square inchlb/gal pounds per gallonlb/yd3 pounds per cubic yardLEDC low-energy detonating cordL/min liter per minuteL/min/m liter per minute per meterlu LugeonLVL low-velocity layerm meterm2 square metersMHz megahertzmL millilitermm millimetermm/sec millimeters per secondm/sec meters per secondm3/sec cubic meters per secondms millisecondMSHA Mine Safety and Health
Administration

FIELD MANUAL
468
MSS multispectral scannerNAD27 1927 North American DatumNAD83 1983 North American DatumNASA National Aeronautics and Space
AdministrationNAV navigationNAVSTAR Navigation Satellite Time and
RangingNFPA National Fire Protection AssociationNG nitroglycerinNIST National Institute of Standards and
Technology NTU nephelometric turbidity unitOD outside diameterO&M operation and maintenanceOSHA Occupational Safety and Health
AdministrationOSM Office of Surface MiningP compressional wavePDA pile-driving analyzerPDOP position dilution of precisionPETN pentaerythritoltetranitratePMT photomultiplier tubePPS Precise Positioning ServicePRN pseudo-random noisepsi pounds per square inchpsi/ft pounds per square inch per footPVC polyvinyl chloridePVT position, velocity, and time dataqc tip resistanceRMS root mean square

APPENDIX A
469
rps revolutions per secondS shear waveSA selective availabilitySEP spherical error probableSLAR side-looking airborne radarSP self-potential, spontanious potentialSPS Standard Positioning ServiceSPT Standard Penetration TestSSS side scan sonarSSSG surface saturated dry specific gravityTDOP time dilution of precisionTFOM Time Figure of MeritTM thematic mapperTNT trinitrotolueneton/ft2 ton per square footUE user equipmentUERE User Equivalent Range ErrorURA User Range AccuracyUSGS U.S. Geological SurveyVDOP vertical position dilution of precisionWAGE Wide Area GPS Enhancement° C degrees Centigrade° F degrees Fahrenheit3D three-dimensional2D two-dimensional

“Column Diameter” equals hole diameter for poured and pumped blastingproducts. (For cartridged products, estimate the explosives columnaverage diameter, based upon cartridge diameter and amount of tampingor slump.) For example: a line drawn through the 0.8 gm/cc point (forANFO) and the 3-inch column diameter point intersects the “weight” line atabout 2.5 lb/ft.
APPENDIX B
NOMOGRAPH RELATING THEDENSITY OF AN EXPLOSIVE IN G/CC,
THE DIAMETER OF THE EXPLOSIVE IN INCHES, AND THE POUNDS OF
EXPLOSIVE PER LINEAL FOOT

APPENDIX C
CHART SHOWING RIPABILITY VERSUS SEISMIC VELOCITY FOR
A D11N BULLDOZER

APPENDIX D
CHARTS SHOWING WEIGHT OF MATERIALS REQUIRED FORTYPICAL LABORATORY TESTS

FIE
LD
MA
NU
AL
476
Weight of material required for aggregate soundness test
� � � � � � � � � �
�
� � � �
� � � � � � � � � �
� � � � � �
� � � � � � � �
� � � � � � � � � � � �
� � � � � � �
� � � � � � � � � � � �
� � � � � � � �
� � � � �
� � � � � �
� � � � � � � � � �
� � � � � � �
� � � � � � � � � � �
� � � � � � � �
� � � � � � �
� � � � � � � � � � � � � � � � � � � �
� � � � � � ! !
" � # � � � � ! ! $ ! %
& � � � � � � � '
� � � � � � � �
� � � � � � � � (�
� � % � & ) � * � ' � � + � & % � * � ' , � - � . / � + - � � 0 � % � . / � , % � � 0 , � � 0
0 1 � � � � � � � � � � � �
� 2 � � � � � � �
� � � � � � � � � �
� � � � � � � �
+ � � � � � � � � � �
� � �
0 0 � 3 � � � � � 2
� � � � � � � / � 4 � � 2 � �
, $ � � � 2 � & - + $ � � '
� � � � � � � � � � � � � 5 �
� � � � �
� � , ) � & , � , ! � � � ' � � % � & ) � * � ' , � - � . / � + - � � 0 � % � . / � , % � � 0 , � � 0
� � ! � & - � % ) � � � ' � � , ) � & , � , ! � � � ' , � - � . / � + - � � 0 � % � . / � , % � � 0 , � � 0
� � � � & � � 6 + � � � ' � � ! � & - � % ) � � � ' , � - � . / � + - � � 0 � % � . / � , % � � 0 , � � 0
� � � � � & 7 � + � � � ' � � � � & � � 6 + � � � ' , � - � . / � + - � � 0
� � � � � � � � � � � �
� � � � � � � �
, � � 0
8 � � � � & , 7 � � � ' � � � � � & 7 � + � � � ' + � . / � - � 9 � 0 + � � 0
, : � � � � & % 6 � + � � � ' 8 � � � � & , 7 � � � ' , ! � . / � ! � 9 � 0 + � . / � - � 9 � 0
- : � � � � & ) % � � � ' , : � � � � & % 6 � + � � � ' � � � . / � - � 9 � 0 , , � . / � + � 9 � 0
; � � � � � � � � � � � 0 0 , + � � � . / � 6 � 9 � 0 / 0 0
� � � � � � � # � � � � � � � � � � � � � � � � � � / � � 2 � � � � � � � � � � � � � � 2 � � � . � � � � � � � � � � � � � � 2 � � � � � � � � � � � 4 � � � 2 � � � � � 2 � � � � � � � � � � � � � � � # 2 � � � � � � � � � � � � � � � � � � � � � � � � < � � �
� 2 � � � � � � � � � � � � � � . � � � � � � � � � � � � � � � � � � � � � � � � � � � � �

AP
PE
ND
IX D
477
= � � � 2 � � � � � � � � � � � � � � � � � � � � � � � � � � � � � � � � � � � � � � . � � � < � � � � �
� � � � � � � � � �
�
� � � �
� � � � � � � � � �
� � � � � �
� � � � � � � �
� � � � � � � � � � � �
� � � � � � � �
� � � � � � � � � � � �
� � � � � � � � � � � � �
� � � � � �
� � � � � � � � � �
� � � � � � �
� � � � � � � � � � �
� � � � � � � �
� � � � � � �
� � � � � � � � � � � � � � � � � � � �
� � � � � � , % ,
" � # �
� � , % , $ ! ,
& � � � � � � � '
Resistance todegradation ofsmall-sizecoarse aggregate
No. 4 (4.75 mm) No. 8 (2.36 mm) 50 lb, 23 kg
Same as testspecimen
11.02 lb, 5,004 g
¼ in (6.3 mm) No. 4 (4.75 mm) 22 lb, 10 kg 5.51 lb, 2,502 g
� in (9.5 mm) ¼ in (6.3 mm) 22 lb, 10 kg 5.51 lb, 2,502 g
½ in (12.5 mm) � in (9.5 mm) 22 lb, 10 kg 5.51 lb, 2,502 g
¾ in (19 mm) ½ in (12.5 mm) 22 lb, 10 kg 5.51 lb, 2,502 g
1 in (25 mm) ¾ in (19 mm) 11 lb, 5 kg 2.76 lb, 1,253 g
1½ in (37.5 mm) 1 in (25 mm) 11 lb, 5 kg 2.76 lb, 1,253 g
USBR 4535
ASTMC 535-81
(modified)
Resistance todegradation oflarge-sizecoarse aggregate
1 in (25 mm) ¾ in (19 mm) 50 lb, 23 kg
Same as testspecimen
11.02 lb, 5,004 g
1½ in (37.5 mm) 1 in (25 mm) 50 lb, 23 kg 11.02 lb, 5,004 g
2 in (50 mm) 1½ in (37.5 mm) 50 lb, 23 kg 11.02 lb, 5,004 g
2½ in (63 mm) 2 in (50 mm) 22 lb, 10 kg 5.51 lb, 2,502 g
3 in (75 mm) 2½ in (63 mm) 22 lb, 10 kg 5.51 lb, 2,502 g
1 To permit quartering, the field sample should be � 4 times the required weight of the test sample. The test sample is sized to yield therequired number of prepared test specimens.
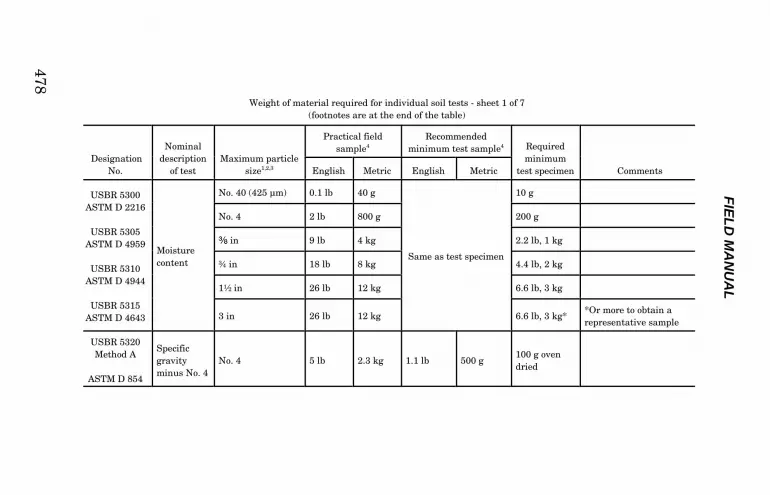
FIE
LD
MA
NU
AL
478
Weight of material required for individual soil tests - sheet 1 of 7(footnotes are at the end of the table)
DesignationNo.
Nominaldescription
of testMaximum particle
size1,2,3
Practical fieldsample4
Recommendedminimum test sample4 Required
minimumtest specimen CommentsEnglish Metric English Metric
USBR 5300ASTM D 2216
USBR 5305ASTM D 4959
USBR 5310ASTM D 4944
USBR 5315ASTM D 4643
Moisturecontent
No. 40 (425 µm) 0.1 lb 40 g
Same as test specimen
10 g
No. 4 2 lb 800 g 200 g
� in 9 lb 4 kg 2.2 lb, 1 kg
¾ in 18 lb 8 kg 4.4 lb, 2 kg
1½ in 26 lb 12 kg 6.6 lb, 3 kg
3 in 26 lb 12 kg 6.6 lb, 3 kg**Or more to obtain arepresentative sample
USBR 5320Method A
ASTM D 854
Specificgravityminus No. 4
No. 4 5 lb 2.3 kg 1.1 lb 500 g100 g ovendried

AP
PE
ND
IX D
479
Weight of material required for individual soil tests - sheet 2 of 7(footnotes at end of table)
DesignationNo.
Nominaldescription
of test
Maximumparticle size1,2,3
Practical field sample4Recommended minimum
test sample4 Requiredminimum test
specimen CommentsEnglish Metric English Metric
USBR 5320Method B or C
ASTM C 127
Specificgravity andabsorptionplus No. 4
� in 20 lb** 9.1 kg**
Same astest
specimen
4.4 lb, 2 kg****Requiredweight of plusNo. 4 particles,air dried
¾ in 30 lb** 14 kg** 6.6 lb, 3 kg**
1½ in 50 lb** 23 kg** 11 lb, 5 kg**
3 in 200 lb** 91 kg** 40 lb, 18 kg**
USBR 5330 orUSBR 5335
ASTM D 2487
Gradation:minus No. 4
No. 4 5 lb 2.3 kg 1.1 lb 500 g100 g oven dried
*10 lbrecommendedfor largemechanicalsieve shakers
**Air dried
USBR 5325
ASTM D 2487
Gradation:gravel sizes
� in 5 lb* 2.3 kg*If not air dried, need testspecimen weight plusamount equivalent toweight of moisture content
200 g*, **
¾ in 15 lb 6.8 kg2.4 lb,1.1 kg*, **
1½ in 100 lb 45 kg 20 lb, 9.1 kg**
3 in 200 lb 4n/a 91 kg 150 lb, 68 kg**

FIE
LD
MA
NU
AL
480
Weight of material required for individual soil tests - sheet 3 of 7(footnotes at end of table)
DesignationNo.
Nominaldescription
of test
Maximumparticle size1,2,3
Practical field sample4Recommended minimum
test sample4 Requiredminimum
test specimen CommentsEnglish Metric English Metric
USBR 5350
ASTM D 4318LL - 1 point
No. 4 5 lb* 2 kg* 1.1 lb*, ** 500 g*, **
100 g***Or more, asrequired, to have120 g of air-dried soil(150 g if shrinkagelimit is included)
**Air dried
USBR 5355
ASTM (none)LL - 3 point 100 g**
USBR 5360
ASTM D 4318Plastic limit 20 g**
Two 8-g wet-weightspecimens
USBR 5365
ASTM D 427
Shrinkagelimit
30 g**

AP
PE
ND
IX D
481
Weight of material required for individual soil tests - sheet 4 of 7(footnotes at end of table)
DesignationNo.
Nominaldescription
of test
Maximumparticle size1,2,3
Practical field sample4Recommended minimum
test sample4 Requiredminimum
test specimen CommentsEnglish Metric English Metric
USBR 5400ASTM (none)
USBR 5405ASTM D 4647
USBR 5410ASTM D 4221
Dispersivity (crumb,
pinhole,
doublehydrometer)
No. 4 5 lb 2.3 kg 1.1 lb 500 g 500 g
USBR 5525and/or
USBR 5530
ASTM D 4564
Minimumand/ormaximumindex unitweight(wet or drymaximum)
No. 4, � or¾ in
100 lb 45 kg 25 lb 12 kg 25 lb, 12 kg
1½ or 3 in 150 lb 68kg 75 lb 34 kg 75 lb, 34 kg
(Wet anddrymaximum)
No. 4, � or¾ in
100 lb 45 kg 50 lb 23 kg 50 lb, 23 kg
1½ or 3 in 200 lb 91 kg 150 lb 68 kg 150 lb, 68 kg

FIE
LD
MA
NU
AL
482
Weight of material required for individual soil tests - sheet 5 of 7 (footnotes at end of table)
DesignationNo.
Nominaldescription
of test
Maximumparticle size1,2,3
Practical fieldsample4
Recommended minimumtest sample4 Required
minimumtest specimen CommentsEnglish Metric English Metric
USBR 5500
ASTM D 2937
Laboratorycompaction:minus No. 4
No. 4 200 lb 91 kg 50 lb** 23 kg** 50 lb, 23 kg** **Air dried
USBR 5515
ASTM (none)
Laboratorycompaction:gravelly soils(one specimen)
3 in350 lb* 159 kg* 350 lb* 159 kg* 225 lb, 102 kg
*Or more as neededto have at least 50 lbof minus No. 4 and atleast 50 lb of plusNo. 4
3 specimens 900 lb 409 kg 900 lb 409 kg 900 lb, 409 kg
USBR 5600
ASTM D 2434
Permeabilityminus No. 4
No. 4 50 lb 23 kg 15 lb 7 kg 15 lb, 7 kg
Permeabilitygravelly soils
3 in 350 lb* 159 kg* 350 lb* 159 kg* 225 lb, 102 kg

AP
PE
ND
IX D
483
Weight of material required for individual soil tests - sheet 6 of 7(footnotes at end of table)
DesignationNo.
Nominaldescription
of test
Maximumparticle size1,2,3
Practical fieldsample4
Recommended minimumtest sample4 Required
minimumtest specimen CommentsEnglish Metric English Metric
USBR 5700ASTM D 2435
USBR 5705ASTM D 3877
USBR 5715ASTM D 3877
One-dimensionalconsolidation,
Expansion or
Uplift
No. 4 15 lb 7 kg 3 lb 1.4 kg 1.5 lb, 0.7 kg

FIE
LD
MA
NU
AL
484
Weight of material required for individual soil tests - sheet 7 of 7
DesignationNo.
Nominaldescription
of test
Maximumparticle size1,2,3
Practical fieldsample4
Recommended minimumtest sample4 Required
minimumtest specimen CommentsEnglish Metric English Metric
USBR 5740ASTM D 2850
USBR 5745ASTM D 2850
USBR 5740ASTM D 2850
USBR 5755ASTM (none)
Triaxial K0 (usu-ally performed inconjunction withother triaxialtests)
UU
CU or
CD
No. 4 20 lb 9.1 kg 4 lb 1.8 kg 2 lb, 0.9 kg One 2-in-dia specimen
¾ in 100 lb 45 kg 50 lb 23 kg 45 lb, 20 kg One 6-in-dia specimen
1½ in 200 lb 91 kg 170 lb 77 kg 150 lb, 68 kg One 9-in-dia specimen
No. 4 65 lb 30 kg 16 lb 7.3 kg 8 lb, 3.6 kg Four 2-in-dia specimens
¾in 200 lb 91 kg 200 lb 91 kg 180 lb, 82 kg Four 6-in-dia specimens
1½ in 700 lb 318 kg 700 lb 318 kg 600 lb, 273 kg Four 9-in dia specimens
1 Maximum particle size present in original sample. 2 No. 4 fraction means either maximum particle in original sample was No. 4 or smaller or a representative portion of the minus No. 4fraction of the original sample is required. 3 Metric equivalents are: No. 4 sieve - 4.75 mm, � inch - 9.5 mm, ¾ inch - 19.0 mm, 1½ inch - 37.5 mm, 3 inch - 75 mm and 5 inch - 125 mm. 4 To permit quartering, the field sample should be � 4 times the required weight of the test sample. The test sample is sized to yield therequired number of prepared test specimens.

APPENDIX D
485
Weight of material required for combinations of soil tests -sheet 1 of 1
Test combinations1Maximum
particle size2,3
Minimum samplerequired
English Metric
Laboratoryclassification(gradation, Atterberglimits)
No. 4
50 lb 23 kg� in
¾ in
1½ in 100 lb 46 kg
3 in 200 lb 91 kg
Physical properties -Cohesive soil(gradation, Atterberglimits, specificgravity, laboratorycompaction
No. 4 50 lb 23 kg
� in
100 lb4 46 kg4¾ in
1½ in
3 in 200 lb4 91kg4
Physical properties -Cohesionless soil(gradation, Atterberglimits, specificgravity, maximumand minimum indexunit weight)
No. 4100 lb 46 kg
� in
¾ in
200 lb 91 kg1½ in
3 in
Soil-cement (for3 cement contents)
1½ in 2,000 lb 908 kg
1 Assumes field sample will be used for more than onetest. If sample is divided to provide separate test samples,add up values for individual soil tests. 2 Maximum particle size present in original sample. 3 Metric equivalents are: No. 4 sieve - 4.75 mm, � inch -9.5 mm, ¾ inch - 19.0 mm, 1½ inches - 37.5 mm, 3 inches -75 mm, and 5 inch - 125 mm. 4 Or more, as needed to have 50 lb of minus No. 4.

FIELD MANUAL
486
In place density test requirements - test apparatus andminimum excavation
Cohesive materials
Maximumparticle size
(in)
Minimumrequiredvolume
(ft3)Apparatus and template
opening
¾ 0.25 8-in sand cone
1½ 0.5 12-in sand cone
3 120-in sand cone or24-in-square frame
5 2 30-in square frame
8 8 4-ft-diameter ring
12 27 6-ft-diameter ring
18 90 9-ft-diameter ring
>18 Determine on a case-by-case basis
Cohesionless materials
¾ 0.25 20-in sand cone
1½ 0.5 24-in-square frame
3 1 33-in-square frame
5 2 40-in-diameter ring
8 8 62-in-diameter ring
>8 Determine on a case-by-case basis

APPENDIX D
487
Weight of material required for slope protection tests
Reclamation designation
No.
Minimum requiredsample
CommentsEnglish Metric
6025Design
Standard No. 13
600 lb 275 kg
The minimum dimensionof individual rockfragments selectedshould be at least 0.5 feet(15 cm). If sourcematerial quality isvariable, the sampleshould include rockfragments representingthe quality range of thesource material.

APPENDIX E
USEFUL CONVERSION FACTORSMETRIC AND ENGLISH UNITS
(INCH-POUND)
To convert units in column 1 to units in column 4, multiply column 1 by the factor in column 2.To convert units in column 4 to units in column 1, multiply column 4 by the factor in column 3.
Column 1 Column 2 Column 3 Column 4
Lengthinch (in) 2.540 X 10 1 3.937 X 10⁻² millimeter (mm)hundredths of feet 3.048 X 10² 3.281 X 10 -3 millimeter (mm)foot (ft) 3.048 X 10 -1 3.281 meter (m)mile (mi) 1.6093 6.2137 X 10⁻¹ kilometer (km)
Areasquare inch (in2) 6.4516 X 10⁻⁴ 1.550 X 10⁻³ square meter (m2)square foot (ft2) 9.2903 X 10 -2 1.0764 X 101 square meter (m2)acre 4.0469 X 10 -1 2.4711 hectaresquare mile (mi2) 0.386 X 10 -2 259.0 hectares
Volumecubic inch (in3) 1.6387 X 10⁻² 6.102 X 10⁻² cubic centimeter (cm2)cubic feet (ft3) 2.8317 X 10⁻² 3.5315 x 101 cubic meter (m3)
cubic yard (yd3) 7.6455 X 101 1.3079 cubic meter (ms)cubic feet (ft3) 7.4805 1.3368 x 10⁻¹ gallon (gal)gallon (gal) 3.7854 2.6417 X 10⁻¹ liter (L)acre-feet (acre-ft) 1.2335 X 10³ 8.1071 X 10 -4 cubic meter (m3)
Flowgallon per minute (gal/min) 6.309 X 10⁻² 1.5850 X 101 liter per second (L/s)cubic foot per second (ft3/s) 4.4883 X 10² 2.228 X 10⁻³ gallons per minute (gal/min)
1.9835 5.0417 X 10⁻¹ acre-feet per day (acre-ft/d)cubic foot per second (ft3/s) 7.2398 X 10² 1.3813 X 10⁻³ acre-feet per year (acre-ft/yr)
2.8317 X 10⁻² 3.531 X 101 cubic meters per second (m3/s)8.93 X 105 1.119 X 10⁻⁶ cubic meters per year (m3/yr)
Permeabilityk, feet/year 9.651 X 10⁻⁷ 1.035 X 10⁶ k, centimeter per second
(cm/sec)Density
pound-mass per cubic foot 1.6018 X 101 6.2429 X 10⁻² kilogram per cubic meter (lb/ft3) (kg/m3)
Unit Weightpound force per cubic foot 0.157 6.366 kilonewton per cubic meter
(lb/ft3) (kN/m3)
Pressurepounds per square inch (psi) 7.03 X 10⁻² 1.4223 X 101 kilogram per square
centimeter (kg/cm3)
6.8948 0.145 kiloPascal (kPa)
Forceton 8.89644 1.12405 X 10⁻¹ kilonewton (kN)
pound-force 4.4482 X 10⁻³ 224.8096 kilonewton (kN)
Temperature °C = 5/9 (°F - 32 °) °F = (9/5 °C) + 32 °
GroutingMetric bag cement per meter 3.0 0.33 U.S. bag cement per foot
Water:cement ratio 0.7 1.4 water:cement ratio by weight
by volume
pounds per square inch 0.2296 4.3554 kilogram per square centi-
per foot meter per meter (kg/cm2/m)k, feet/year 0.1 10 Lugeon

Index
A
abandoned mines, 13absorption, 87, 88, 195, 203, 205abutment contact slopes, 331abutment pads, 339accelerometers, 77acoustic
beams, 61borehole imaging device, 61, 62caliper, 75energy, 57, 61, 91energy (seismic waves), 57imaging, 63, 64imaging device, 64logging, 19, 57, 58logging devices, 57, 58signal, 91transducer, 74, 75velocity devices, 61velocity logger, 56waves, 61
active remote sensing, 90adjusting the blow control, 382adobe charge, 241, 264aerial photography, 85, 90, 92, 198aggregate, 184, 188, 203, 207, 240, 334, 335, 431air injection method, 166, 167air jetting, 332air/water jet, 348air-powered venturi pipe, 348alkali sensitive aggregates, reactive, 334, 335alteration of minerals, 195alternate delays, 233aluminum foil wrapping, 415American Society of Testing and Materials, 353amplitude-modulated devices, 58ANFO (ammonium nitrate/fuel oil mixture), 226angled cut, 239, 243, 244, 245, 247, 249

FIELD MANUAL
492
angular-shaped rocks nested together, 189anti-spoofing, 442, 446, 447aperture, 67, 73apparent
attenuation, 66resistance, 42resistivity, 9, 45
appraisal stage investigations, 435aquaclude delineation, 11aquifer, 2, 11, 108, 111, 115, 116, 166, 168, 171-173,
306, 308, 309, aquifer tests, 111, 116, 306, 309archaeological investigations, 14, 18, 19arch dam sites, 339, 340arching, 321arrival times, 31, 55, 60, 64, 66artesian conditions, 304, 313, 363artificial abutment, 340ASTM D 1586, 377ASTM D-5778, 397ASTM D 3550, 353atmospheric delay, 444-446atmospheric spectral features, 88automated spooling winch, 383automated water level monitoring system, 317automatic data logger, 167automatic hammer, 371, 373, 380, 382, 383, 385, 387axial dipole array, 11
B
backfill concrete, 340, 342, 343, 347backflow, 104background potentials, 15, 16backhoe, 183, 348ball check housing, 364

INDEX
493
bar magnet, 17Barite, 363barring, 332, 348basement complex, 17basket type catcher, 378Becker Drills, Ltd. model AP-1000, 389Becker Penetration Test (BPT), 351bedding, riprap, 183, 190, 195,bedding planes, 114, 210, 215, 254, 325, 333bedrock
delineation studies, 11depths, 18topography, 14
Begemann friction cones, 395bench blasting, 219, 227, 233bench floor, 217benches, 234, 235, 257, 298, 330bentonite, 315, 338, 361-363, 369BIPS analysis, 73blanket grouting, 329blast and processing testing, 199blast hole size, 218, 221, 223blast tests, 199blasthole cutoffs, 217blasting procedures, techniques, 192, 207, 209, 218,
233, 253, 254, 259, 261, 264, 325, 331blotting with soil, 348blow count rate, 371, 372blow counts, 111, 306, 371, 375, 383, 388, 391blowout, 302, 313boils, 302bond, 325, 326, 328, 329, 334bonding of fill to concrete, 335borehole
caliper log, surveys, 74deviation, 75diameter, 49, 52, 57, 61, 74

FIELD MANUAL
494
effects, 74electric logs, 38film camera probe, 73film camera systems, 69fluid, 38, 39, 42, 45, 52, 57, 61, 77, 78, 81
acoustic velocity, 57temperature, 77
gravity log, 74, 78gravity logger, meter, 78, 79, 80imaging, 56, 61-63
device, 56, 61, 62velocity devices, 56
mapping, 69peculiarities, 38permeabilities, 112spacing (distance), 65television systems, 69temperature log, 74wireline surveying, 37
bounce chamber, 390, 391bounce-chamber pressure, 390, 391bound water, 41boundary definition of thick strata, 45Bouwer slug test, 168box cut, 239brooming, 332, 336buckling of smaller AW rods, 384bulk and shear moduli, 60bulk density, 49, 51-53, 78, 80, 290
log, 52bulk density/porosity logging methods, 80bulk-loaded charges, 226burden-to-charge diameter ratio, 211buried
channels, 5, 333manmade objects, 15metallic waste, 14

INDEX
495
pipelines, 14, 16, 18, 21stream channels, 13
burning powder train, 237bypass line, 361, 362, 365, 367
C
calcium chloride, 363calculated permeability values, 100, 114calibration
chambers, 404for hole diameter, 52pits, 49
caliper, 52, 61, 74-76caliper log, 52, 74camera, 32, 67-73, 75, 85, 395, 413canals (and distribution systems), 16, 431, 435, 437canyon profile for a damsite, 344capillary
fringe, 115rise, 327system, 15, 16zone, 110, 175
CAPWAP, 392carburizing, 377care of samples, 431cased boreholes, 37, 49, 50, 55casing advancer method, 369casing advancer systems, 385cat head, 353cathodic protection, 1, 10, 11, 21cavities, 15, 56, 62, 63, 66, 67, 69, 210, 211, 302,
330, 332cement, 77, 96, 184, 206, 321, 325, 334, 335, 348cementation, 66, 74, 176, 195, 204, 206centrifugal mixer, 335

FIELD MANUAL
496
channels, 5, 13, 84, 87, 188, 325, 330, 333, 448channels in rock surfaces, 325cheese cloth, 415-417chemical and biologic
content of water, 316quality of water discharged, 312
chemical concentration cells, 15Cherenkov
light, 55photons, 55
chronology of dewatering, 319claims, 306, 312, 436, 433, 437clay plug, 257cleanout bit, 359cleanup procedures, 332clock errors, 440, 444, 445, 457, 458, 460closed-end diesel pile hammer, 390CME automatic hammer, 382coefficient of storage, 108cofferdams, 303, 304cold protection, 412collar distance, 222, 228-231, 271color of the borehole wall, 67commercial
quarry or pit deposits, 201sources, 196
compaction, 66, 140, 153, 321, 322, 326-329, 336, 337,348, 389, 417
techniques, 329compass/clinometer, 68, 71compressed air or water cleaning (air jetting), 323, 332compression fracturing of core, 409compression packers, 118compressional
energy, 57(P) wave velocity, 5wave oscillations, 57

INDEX
497
wave velocities, 3, 5, 61waves, 5, 6, 57
concrete, 66, 67, 69, 203, 207, 302, 313, 321, 323-325,329-331, 333-343, 345-349, 351, 431
backfill, 342, 346backfilled cutoff shafts, 346cracking, 334, 335grout caps, 323joints, 69modulus, 340
conductive fluid in the borehole, 47conductivity, 13, 14, 32, 78, 107, 110, 132, 134, 146,
147, 317, 395cone tip resistance, 395connectivity, 96-98cone tip resistance, 395construction
specifications, 206, 306traffic, 326
contact log, 46contacts of rock or soil against concrete, 67contaminant plumes, 10, 14continuity of geologic strata, 38continuity of the bedding, 38continuous acoustic velocity (sonic) logger, 57continuously recorded hydrofracture/jacking test, 104contour blasting, 257contrasting lithologies, 63contractor compliance, 319contractual negotiations, 437control segment, 439, 446, 456-458, 460controlled blasting techniques, 233, 253, 254, 259, 325conventional flowmeters, 81conventionally excavated (drill-blast) tunnel, 106core
box, 411, 412, 413, 415, 416, 420-423, 434, 435, 437, 438

FIELD MANUAL
498
contact area, 336contact criteria, 322drilling, 199, 202materials, 329, 338storage facilities, 433
core/foundation contact, 326, 338coring, 202, 377, 387corner cut, 239cornish cuts, 244correlate strata, 41, 45, 48, 51corrosion, 21, 302CPT, 351, 358, 363, 387, 388, 395, 397-401, 403,
405-407crack potential, 321cracks in the foundation, 325, 329, 335, 338cross-hole
geophones, 64seismic tomography, 66test(s), 64, 65
crowd-out plugged bit, 390crown sheaves, 381, 382crypto keys, 447curing compound, 333, 335curve shapes, 45cushion blasting, 233, 259-262, 272-274cushion holes, 261, 273cushioning material, 416, 420cutoff
depths, 342, 346facilities, 303shafts, 342, 346trench(s), 322, 327wall, 323
cutoffs, 217, 235-237, 274, 299, 300cylindrical and cube samples, 417-419

INDEX
499
D
daily drill report, 423dam foundation, 95, 98, 106, 350dam height, 106damp sawdust, 419damsite foundation permeabilities, 96deck charge, 215, 230, 231deck of inert stemming material, 213deformation, 340-342, 345, 346, 357, 359
moduli, 340, 341, 345degree of compaction, 66delay
interval, 222pattern, 210, 251, 252, 276
delineating thin strata, 45densities of materials in the Earth, 18density
contrasts, 18, 19logger, 49, 78logging device, 51
dental concrete, 321, 324, 325, 330, 331, 333-338, 345
fillets, 334treatment, 340, 341, 344-346
concrete, 341work, 343, 347
depth of geologic materials, 38of investigation, 11, 14, 47of investigation for the microlog, 47of penetration, 45
design data, 304-306, 351, 431collection program, 304
Design Standards No. 13, Embankment Dams, 358detecting cavities, 15

FIELD MANUAL
500
determination, 18, 41, 52, 119, 133, 191, 203, 408, 417of lithologies from SP logs, 41of physical properties, 38, 203of the relationship between weight and size, 191of volumetric water content, 52
detonating cord, 236, 242, 255, 272, 274-277, 282, 284,connectors, 236
deviation surveys, 6, 65, 288, 297dewatering, 96, 198, 299, 300, 302-306, 309, 312,
314-320design, 306facilities, 299, 304, 314-316wells, 306
diesel pile-driving hammer, 387differential GPS (DGPS), 449differential
movement, 343, 347settlement, 324, 330, 331
digital processing, 84, 87dilution, 302, 444, 450, 451, 462
factor, 450of precision (DOP), 444
direct (non-refracted) arrivals, 64directional
detectors, 64surveys, 74, 75
discontinuity (discontinuities), 20, 56, 62, 63, 67, 69, 71,190, 194-196, 200, 203, 204, 330, 340, 341, 345
disk-type meter, 126, 141disks, 326, 418, 428disturbed zone, 106dispersive clays, 338dispersive
embankment materials, 327material(s), 338soil, 338
dispersivity tests, 338

INDEX
501
disposal guidelines, 431disposing of samples, 432ditches, 198, 299double packers, 119down-hole probe, 67, 69drag force, 189drainage trenches, 323draining, 300, 302
surrounding surface water and groundwater, 302drawdown with time, 308draw cut, 243drill hole deviation surveys, 6drill jumbos, 244drill rod energy ratio, 356, 379drilling
fluid loss, 67mud, 38, 39, 361, 362, 364, 372mudcake, 45
drive cap, 367drive shoe, 153driving friction, 392, 393drop pipe, 162-165drummy rock, 348dry boreholes, 47dual frequency receivers, 460durability tests, 204, 205durable rock types, 190dynamic elastic properties of rock, 60dynamites, 226, 227, 285, 294D-6067, 397
E
earthquake design analysis, 8liquefaction, 375

FIELD MANUAL
502
Earth’s magnetic field, 80effective porosity, 50, 56, 61, 108, 308effects
of bed thickness, 45of mud cake, 52of traffic, 9
on sensitive equipment, 9EHE, 452-454electric
log, 37, 38log correlation, 38sounder (M-scope), 315
electrical current, 9, 26, 32, 77, 292, 293field, 9properties, 2, 10, 11, 13, 37, 38resistivity, 1, 2, 9-11, 13surveys, 38, 45
electrode(s), 9-11, 23, 33, 37, 41, 43-45, 47 array, 11, 13, 42, 45spacing, 10, 11, 43, 45
electrolyte, 16electromagnetic (EM)
conductivity, 13, 14profiling surveys, 10, 13, 14
induction, 13radiation, 84spectrum, 84, 86surveying, 13wave propagation, 13
electromagnetically induced telluric, 16(large scale flow in the earth’s crust) currents, 16
electron density, 51, 445electro-filtration, 16electro-mechanical pulse, 57embankment, 183, 188, 321-329, 333, 338, 349,
350, 358

INDEX
503
embankment layer (lift), 326embankment zones, 321energy
losses in rods, 379transfer effects, 387
energy/count plot, 55EPE, 453-455, 461erodible
foundation materials, 322nonplastic materials, 338
erosion, 90, 183, 291, 307, 329, 330, 338channels, 330
erosional history, 96erosive
action of water, 189water forces, 191
erosion-resistant plastic materials, 338ETE, 455, 456, 461evaluating
an existing source, 197subsurface conditions, 197
excavated slopes, 302, 312excavating, 192, 200, 266, 321-323, 338excavation, 96, 211, 213-215, 217, 220, 229, 253, 254,
257, 259, 260, 272, 280-282, 286, 289, 297, 299,300, 302, 303, 307, 313, 323, 329-333, 339-343,345, 347
existing quarries, 197, 206expandable packers, 418, 426exploration program(s), 4, 17, 95, 99, 304, 306
F
fabricated well screens, 118falling head test(s), 112, 118, 120, 162false-color infrared images, 85

FIELD MANUAL
504
fault(s), 5, 23, 85, 96, 205, 210, 321, 330, 340-342,344-347
investigations, 4studies, 10, 14
feasibility stage, 198, 200, 435feathering (edges), 334, 336, 337feathering of the earthfill lift, 337feeder canals, 437field
laboratory testing, 436spectra, 88spectrometer, 88surface reconnaissance, 198
fill material, 326, 328, 331fillet steep slopes, 325, 333film, 67, 69-73, 75, 83-85, 176, 412, 415, 417, 419, 427film-recording cameras, 67filter(s), 25, 85, 189, 322, 327-329, 331
criteria, 327pack, 167zone(s), 328, 338
first lift, 326-328fishtail-type drag bit, 361flap valves, 368flooding, 302, 303flow in fractures, 103flow nets, 319, 342, 346flowing sands, 365flowmeter(s), 74, 81, 111
log, 74, 81fluff, 348fluid
content, 41, 53density, 51, 78flow, 81temperature logging device, 77velocity, 57

INDEX
505
fluid-filled borehole, 57, 64fluxgate compass, 77focused
device, 47logs, 45
focused-current, or guard, resistivity device, 43, 45foliation, 195, 205, 210, 215, 217FOM, 454, 455forced cooling, 343, 347Foremost Mobile Drilling Company hammer, 383formation water resistivities, 41foundation
and abutment excavations, 342, 346contact surfaces, 328data, 305depth, 303materials, 322, 326, 327, 332, 334, 335modulus, 340strength, 351studies, 4surface, 321, 322, 326, 329-331, 336, 337, 344
fracture(s), 60, 62, 74, 78, 81, 97, 98, 100, 103, 106, 107,113, 114, 120, 137-139, 190, 192, 199, 207, 236,239, 260, 303, 321, 330, 332
changes, 96orientations, 98zones, 66
fracturing, 66, 98, 104, 115, 190, 205, 229, 231, 278,321, 335, 370, 409
the fill, 335fragmentation, 9, 206, 209, 212-214, 218-222, 226, 227,
230, 232, 234-236, 239, 241, 242, 249, 250, 278free face, 209, 218, 219, 223, 225, 226, 231, 235, 239,
243, 246, 251, 273, 276, 278, 282, 287, 294, 297

FIELD MANUAL
506
freeze-thaw deterioration, 204durability testing, 204testing, 204, 205
freezing, 195, 204, 299, 339, 343, 382, 420-422, 424,426, 428, 434
French satellite, 89frequency
(number per foot of borehole) of discontinuities, 67fresh water, 13, 39, 41
sands, 41friction
loss, 105, 115ratio, Fr, 400sleeve, 397, 398
frozen rope, 382fs, 171, 400full column loading, 261fully penetrating wells, 173
G
gabions, 189gamma
radiation, 49-52ray(s), 49, 50-52, 55, 61
gamma borehole, 111logging techniques, 37, 38, 47, 56, 78, 111
gamma raycount, 50, 52detector, 50, 55energy, 55logs, 50
gamma-gammadensity log(s), 49, 50

INDEX
507
density logger, 78logs, 51, 52
gelatin dynamite, 263, 280geologic photogrammetry, 85geologic structure, 31, 60, 100, 114, 209, 238Geometric Dilution of Precision (GDOP), 444geometric distortions, 86geophones, 20, 27, 32, 34, 64geophysical
surveys, 1-3, 14, 16, 56tomography, 66
geotechnical exploration, 37investigations, 1-3, 5, 8, 15-18, 38, 48, 56, 351
geothermal applications, 16areas, 16exploration, 4, 13investigations, 11
glacial or alluvial deposits, 189Global Positioning System (GPS), 91, 439-450, 452-455,
457, 458, 460-463GPR, 14gradation requirements, 205, 206grading for riprap, 192grain density, 18, 51graphite, 15gravel
deposits, 10, 14sumps, 348
gravimeter, 26, 78gravity
anomalies, 18, 80effect, 18meter, 78, 79meter density, 78

FIELD MANUAL
508
permeability test, 112, 142, 147, 153, 157values, 80
grizzly, 192ground
conditions, 95, 399failure, 318roll, 7, 34support, 257, 300surface electrode, 42
groundwater aquifers, 18geophysics, 13investigations, 11, 14levels, 308, 312-315, 319 in excavations, 300, 313maps, 198monitoring, 313, 314monitoring instrumentation, 313, 314occurrence, 303quality investigations, 55withdrawal, 318
ground-truth, 3grout
cap, 323injection, 104, 114nipples, 323pipes, 335, 348potential, 97program, 95travel, 98
groutability, 95-98grouting, 19, 69, 95, 98, 99, 105, 106, 299, 300, 323,
329, 335depth, 106in rock, 300in tunnels, 106

INDEX
509
operations, 19, 69pressures, 98
guard arrays, 47gyratory crushers, 194gyroscope, 77gyroscopic sensors, 77
H
hammer drop friction, 379height, 379, 382
hammer type, 379hammers, 379
(casing type) hammers, 379hand
cleaning, 348compaction, 328tamper(tampering), 328, 336tighten each joint, 384
Harder-Seed method, 390, 391, 393harrows, 326haul distance, 197, 198hauling, 184, 205, 206, 208, 214, 220, 222, 223HAV-180 rig, 391hazardous materials (chemicals), 14, 275, 304, 315, 424hazardous waste studies (investigations), 10, 14, 17,
431HDOP, 444, 450-453, 457headache ball, 241, 276heading round, 243, 246, 248, 291heat pulse flowmeter, 81heavy grain detonating cord, 255high resolution seismic reflection, 5high-energy neutrinos, 55high-frequency acoustic energy, 61

FIELD MANUAL
510
hole wandering, 234hollow
AW drill rod, 381guide rod safety hammer, 381
hollow-stem, 356, 359, 360, 364-366, 372augers (HSAs), 364, 365, 377, 385
horizontal displacement, 318permeability, 111, 174plane, 71, 452, 453
hydraulic conductivity, 107excavator, 323, 348fracturing, 321, 370models, 98wedging device, 241
hydrofracture tests, 104hydrofractured rock, 100hydrofracturing, 98, 100, 104, 114hydrogen atoms (nuclei), 52hydrologic studies, 50hyperspectral data, 88hydrographs, 309, 319
I
igneous rock, 194Ilmenite additives, 363Imhoff cone, 316impact anvil, 356, 371, 379impeller-type meter, 126, 141impervious materials, 322impervious zone(s), 323, 324, 331, 336, 356
foundation contact, 323inclined core, 321inclinometer, 398

INDEX
511
inert stemming materials, 213infiltration, 307inflatable (straddle) packers, 118, 119, 162initial lift, 328, 337inspection control, 206, 207investigations during the design stage, 199ionosphere, 445, 446, 460irregular rock surfaces, 328
J
jacking, 97, 98, 100, 104, 114, 127, 335, 397, 399tests, 100
jetting and driving, 147joint
mortar, 325sets, 210, 214, 340
K
kerf, 246, 247, 282
L
Landsat, 83, 89, 90lateral, 1, 10, 13, 16, 24, 43-45, 47, 303, 308
array (resistivity), 43, 44array spacing, 43device(s), 43, 45logs, 45
lava tubes, 302layer velocities, 4leakage paths, 16leather cups, 118left-hand polarized, 449

FIELD MANUAL
512
lifts, 328, 329, 336-338, 343, 347lime, 328, 338, 339line drilling, 254, 255, 257, 272, 282, 325linear features, 63lining design, 96liquefaction, 351, 356, 358, 359, 362, 375-378, 381, 383,
385, 388, 389, 394, 406-408evaluation(s), 351, 362, 376, 378, 381, 389, 406resistance, 356, 389, 406-408resistance evaluations, 356triggering, 406
lithologic contacts, 60, 66lithology, 38, 39, 41, 48, 53, 74, 96litigation, 312load cells, 397, 398local differential base station, 463location
map of the core and samples, 435of drill hole core, 438of stratigraphic contacts, 67
logging tools, 37, 49, 55long-normal, 43, 45loss of fines, 303low
permeabilities, 108, 302plasticity, 338, 339
low-alkali cement, 334, 335Lugeon value, 100
M
machine stripping, 348machine-bored tunnel, 106magnetic
features, 17log, 74, 80

INDEX
513
materials, 17, 28north, 62surveys, 2, 13, 17, 18susceptibility, 80
material properties for static and dynamic stressanalysis, 65
mechanical breakdown, 195calipers, 74, 75penetrometers, 395
metal expandable packers, 418methods for obtaining size and weight data, 191Michigan cuts, 244microlog, 46, 47
electrode spacings, 47sonde, 47survey, 47
microsurvey, 46microwave bands, 84military GPS, 462millisecond delays, 235, 250mineral
composition, 38deposits, 15, 16exploration, 13, 17textures, 67
mineralogy, 38, 192, 194, 204, 405minilog, 47model input parameters, 99monitoring
during construction, 313leakage, 17of water control parameters, 312well design, 317wells, 116, 315, 317
mortar, 295, 325, 335, 336, 338, 344movement by water, 189

FIELD MANUAL
514
ms delays, 232, 233, 236MSS, 86, 89mud cake, 47, 52mud pumps, 121mud slab, 333mudcap, 241multiple
aquifers, 107electrode arrays, 42, 43pressure tests, 127, 136, 137
multiple-arm calipers, 74multiple-electrode resistivity
arrays, 45sonde, 38
multispectral photographs, 85multi-beam sonar, 91multi-beam systems, 91muon, 55
N
N value, 356, 364, 370, 371, 374, 375, 378, 379, 381,385
NAD27, 463NAD83, 463natural color images, 85natural electrical potential, 15natural gamma
log, 53logger, 49radiation, 49, 50, 52ray detector, 50ray logging, 61ray logs, 50
natural potential, 15, 33

INDEX
515
Navigation Satellite Time and Ranging (NAVSTAR), 439
near infrared wavelengths, 83near-infrared spectrum, 85neat cement grout, 335needle valves, 141negative subdrill, 229nephelometric turbidity units (NTU), 316neutron
activation, 55detectors, 52devices (source), 49, 53, 55log(s), 50, 52, 53logger, 49radiation, 52, 53water content log, 49
new quarry or pit investigation, 197Nk, 405nonconducting fluids, 47nondispersive earthfill (material), 327, 328, 338nonerodible embankment materials, 330normal
array(s), 43, 44devices, 43, 45resistivity arrays, 43spacing devices, 47
NTU, 316nuclear borehole measurements, 49nuclear logs, 49, 55nuclear radiation logging
systems, 49tools, 49

FIELD MANUAL
516
O
objectives of foundation surface treatment, 329observation well(s), 158, 160, 161, 172, 307, 308, 312,
314, 315, 317observed gravity, 18office responsible for the core or samples, 437oil exploration, 4, 7open discontinuities, 62, 67open holes, 37, 162open-ended diesel hammer, 390optical logging systems, 67optimum
drill hole orientations, 100moisture content, 327, 328
orange smoke, 264organic material, 322orientation of the drill hole relative to the fractures, 113outcrops, 198, 202overburden (depth), 98, 100, 114, 199, 202, 286, 321,
323, 358, 361, 375overexcavation, 331, 340overhangs, 323-325, 330, 331, 333, 334
P
packer, 105, 110, 112, 113, 115, 116, 118-120, 126, 128,130, 138, 164, 165 , 309
packer(s), 74, 105, 115, 118-120, 128, 130, 162, 164,418, 426
seal, 120test(s), 110, 112, 113, 116, 309
packing material, 189, 418, 421, 428pails, 417-419, 428panchromatic photography, 85parallel hole cuts, 243-245, 253partially penetrating wells, 173, 174

INDEX
517
PDA measurement, 392PDOP, 444, 445, 451, 452, 462peeling, 348penetration
per blow, 375, 376resistance, 351, 356, 358, 385, 388, 397,
400, 408penetrometer, 387, 388, 395, 397, 399
tip, 387, 388perforated pipe, 140, 315performance, 188, 319, 388, 392
on existing structures, 189performing gradations on the blasted product, 207perimeter
blasting, 257cracking, 253holes of a blast, 214
permafrost, 14permanent
labeling, 438markers, 437
permeabilities, 45, 95, 96, 99, 108, 111, 112, 114, 115,147, 302, 306, 307
permeabilities of strata, 45permeability, 39, 95-100, 103, 105, 106, 107-119, 121,
126, 128, 130, 131, 133, 136-139, 142-145,147-149, 153, 154, 157, 159-161, 163, 164, 166,168, 170, 171, 174, 177-179, 181, 182, 198, 300,302, 306-308, 316���330, 331, 347������������������
coefficients, 143of the soil, 306test(s), 97, 112-116, 118, 121, 126, 128, 131, 138,
139, 142, 145, 147, 149, 153, 154, 157, 159, 160,179, 306, 308

FIELD MANUAL
518
permeable, 38, 39, 41, 47, 81, 96, 106, 120, 137, 138,150, 164, 307, 347
path, 347sand bed, 41
permeameter, 115, 182pervious rock, 106petrographic examination, 203, 205petroleum
exploration, 1, 17, 18traps, 18
pH, 194, 317photographs, 69, 71, 83, 85, 198, 201, 227, 435, 437photography, 83, 85, 90, 92, 411, 414
frame, 414photomultiplier tubes, 55physical properties, 2, 37, 38, 81, 203, 205, 340, 356,
431piezoelectric transducer, 61piezometer(s), 178, 306-308, 314, 315, 362, 363
permeability test, 179pile-driving analyzer, 392pilot bit, 359, 364, 365, 367, 368, 370
cutting teeth, 368seat, 368
pipable material, 342pipelines, 16, 18, 21, 67, 295piping, 15, 105, 115, 327, 342, 346 pit development, 199planar discontinuities, 63, 71plastic
bags, 298, 417, 419material, 329pails, 418, 428
plasticity, 329, 337-339, 388, 415PLGR, 460-462PLGR+96 receivers, 460PMT, 55

INDEX
519
pneumatic instruments, 315pneumatic-tire(d)
equipment, 328, 337roller, 328, 329
points of high stress concentration, 343, 347Poisson’s ratio, 24polar regions, 17polymer-enhanced drill fluid, 361(poly)urethane foam, 416pore
fluid content, 41spaces, 9water, 41, 341, 346, 395, 399, 400, 403water stress, 395, 399
dissipation measurements, 399porosity, 9, 18, 38, 45, 49-53, 56, 61, 66, 67, 78, 80, 107,
108, 117, 192, 194, 195, 300, 302, 308porous
media, 16permeable zones, 47tube, 315
position dilution of precision (PDOP), 462positive ions, 16potassium isotope K40, 50potential electrodes, 11, 43-45power conduits, 437powerplants, 431, 433, 437powder factor, 211, 213, 237-239, 251, 283, 289PPS accuracy, 447precipitation, 300, 303, 308, 317Precise Position (Positioning) Service (PPS), 440, 446,
460preferred site frequencies, 8presentation of information, 184preshearing, 255, 289presplitting, 254-258, 261, 272, 274, 289

FIELD MANUAL
520
pressure transducer, 130, 131, 162, 167, 398versus flow curves, 100, 114
principal joint sets, 214production blast, 256progressive delays, 233, 234propagation velocities, 57protecting and shipping samples, 431Protection against wetting and drying, 434protective
filters, 329outer box, 422
pseudorange, 444, 449pseudo-random noise (PRN), 442pump bypass line, 361pumping caused by construction equipment travel, 327pyramid cut, 243pyrotechnic delay elements, 237P- and S-wave energies, 57P- and S-waves, 64P-code, 440-442P-wave, 56, 60, 66
R
R95, 453radar
interferometry, 90remote sensing, 90
radiation detector, 47logging device, 61logging systems, 49, 50
radioactiveisotopes, 50

INDEX
521
material, 53source (material), 47, 49, 52
ramping the fill, 329rapid freeze-thaw durability evaluation, 203real-time viewing, 67rebound, 336receiver measurement uncertainties, 457recharge conditions, 303record tests, 436rectangular pattern, 223reference electrode, 45reflectance spectra, 87reflected shock wave, 384refraction, 2-6, 21, 22, 25-28, 31-33, 35, 57, 64, 66, 201refusal rule, 375relationship between weight and size, 191relative
clay content, 49density, 50, 226, 327, 357, 404, 417
remote sensing, 83, 84, 89-93interpretations, 83
representative permeabilities, 307samples, 199, 202, 203, 205
requirements for length of storage, 436for storage of core and samples, 432
reservoir load, 344resistance
of a circuit, 41of the conductor, 41
resistivity, 1, 2, 9-11, 13, 32, 33, 38-48, 77, 395deflection, 41logs, 39, 43, 46, 77measurements, 43
revertible drilling fluids, 362RF Link signals, 439

FIELD MANUAL
522
right-hand polarized, 449rippers, 330rippability, 4riprap, 183-189, 191, 192, 194-197, 199-208, 261, 263,
291, 298, 431characteristics, 188durability, 194evaluation, production, and placement, 184fragments, 189quality, 188, 189, 199, 203Quality Evaluation Report, 199, 203quarries, 207source(s), 184, 188, 189, 192, 194-196, 202
evaluation, 184investigation, 195
riser and hole diameter, 314rock
abutments, 328breakage, 9, 200, 239bucket, 192, 323characteristics, 113, 184, 192durability, 195failure criterion, 204foundation(s), 327, 328, 330, 339, 341, 344, 345,
350surfaces, 328
fragments, 183, 187, 189, 190, 192, 195, 203, 204,323, 330
mass design parameters, 97, 114permeability, 97, 98, 113, 114
quarries, 189, 194rake, 192, 193
rockfill dams, 331, 349, 350roller, 326, 328, 329, 337
passes, 328

INDEX
523
rotary casing advancers, 369drilling, 356, 361-363, 369, 385, 389
rounded stone assemblage, 189rover data, 463rubber-tired roller, 337
S
SA, 444, 447, 449, 458, 462Safety Driver, 383safety
hammer, 353, 373, 374, 380-382, 385of dams analysis, 437
saline water, 15salinity, 9, 38, 39, 41, 46
of pore fluids, 46salt water intrusion, 14saltwater/fresh water interfaces, 13sample
data sheets, 431retention (criteria), 431, 434selection, 434size, 95, 99, 202
sampler shoe, 377tip, 368
sand heave, 362, 363pack, 110, 167, 317, 318
sanding in (sandlocked), 142, 356sand-cement slurry, 335satellite(s), 83, 89, 90, 215, 230, 231, 263, 317, 318,
439-452, 456-458, 460-463differential correction signal, 463vehicle position, 457

FIELD MANUAL
524
saturatedlow-strength materials, 304materials, 7, 52, 110, 115sand, 10, 53
saturation, 38, 53, 66, 204, 325, 327sawdust, 416, 419, 427sawed kerf, 246, 247sawteeth, 330, 333scarification, 326, 328, 336, 337scarifying the lift surfaces, 329schistosity, 199, 205, 206, 210screen slot size, 317screening of wells, 322screens of water wells, 69sculpture blasting, 257sealing samples, 415secondary arrivals, 5
blasting, 214, 220, 229, 241, 242, 292emission of neutrons and gamma rays, 52fragmentation, 241, 242fragmentation techniques, 241
sediment content, 312, 316, 317seepage, 11, 16, 95-98, 148, 299, 304, 319, 321, 322,
347, 403control, 96, 304, 322evaluation, 95
investigations, 11potential, 95, 98quantities, 96seeps, 302, 348, 349seismic
anomalies, 65energy, 26, 28, 29, 35, 56, 66pulse, 64P-wave velocity, 66refraction interpretation, 4signal, 32, 66

INDEX
525
source, 6, 64stability, 325surveys, 3, 14, 60tomography, 66velocities, 6, 56, 57, 60, 61, 64wave(s), 6, 25, 27, 30, 31, 32, 34, 57, 64, 288
velocities, 64Seisviewer, 61Selective Availability (SA), 444, 446, 447, 462selective quarrying, 196self-potential surveys, 2, 11, 15, 16sequential timers, 236service history of material produced, 202settlement during dewatering activities, 318settlement of claims, 437shaft sinking cut, 239shale baseline (line), 38, 39shape of individual rock fragments, 189shatter cuts, 244shaving, 348shear wave velocity (velocities), 2, 5, 6, 57, 61, 64, 358shear waves, 6, 57shell zones, 327shipping containers, 420-422, 429shop vac, 348short normal array, 44short rods, 384shotcrete, 336shotpoint depth, 65shrinkage, 338, 342, 343, 347Side Scan Sonar (SSS), 91side-looking airborne radar (SLAR), 90single
column charge, 237frequency receivers, 460packer, 110, 119
single-beam systems, 92

FIELD MANUAL
526
single-electrode array, 45single-point array, 43single-receiver devices, 57siting studies, 1, 4slab cut, 243slabbing, 259slake (slaking), 195, 323, 332, 333, 339, 343, 432slashing, 259slope
failure, 318protection, 184, 187, 188
sloughing, 139, 326slug tests, 112, 118, 166slush grout, 321, 325, 330, 335, 336, 338
mix, 335small-strain dynamic properties, 2smooth blasting, 233, 257-259, 272, 274, 294, 325, 331sodium sulfate soundness test, 204, 205soil
cement, 184foundation compaction requirements, 327infiltration data, 307liquefaction criteria, 375
solar flare(s) activity, 445, 460solid steel guide rod, 381solution
cavities, 56, 63, 66, 67, 210, 211, 302, 330features, 60, 333
sonde, 37, 38, 43, 45, 47, 49-53, 55-57, 61, 77electrodes, 45
sonic energy, 56vibrations, 9
SP log (logging), 38, 41, 43, 50SP peak, 41space segment, 439

INDEX
527
spacer blocks, 423ring, 371
spacing-to-burden ratio, 232, 233spalling, 194, 343, 347special purpose electric logging devices, 46specific gravity (gravities), 18, 78, 191, 204, 294, 297spectral
analyses, 55bands, 87, 88data, 83, 84logging sonde, 55logs, 55ranges, 83resolution, 83, 84, 87, 89signatures, 84
spectrometers, 84spontaneous potential, 15, 33, 38, 41spoofing, 441, 442, 446, 447
environment, 447spray coating, 333spring suspension system, 422springs, 74, 302, 342, 346, 439square drill pattern, 223SSGS, 205SSSG, 191, 192, 204stability requirements, 342, 346staggered pattern, 223, 224, 295Standard Penetration Test (SPT), 351Standard Position Service, 446standard surveying methods, 318standing water, 328standpipe, 165, 315Stanley waves, 6static
pore water pressures, 395water levels, 308

FIELD MANUAL
528
Station Receiver, 449statistically significant sample size, 99steeply dipping plane, 71stemming, 213, 215, 222, 227-230, 239, 257, 260, 263,
271, 274, 295, 296, 298stemming column, 222stepped
pressure tests (step test), 100, 104, 114surfaces, 321, 324, 331
stereo imaging, 89storage, 107-109, 128, 142, 167, 168, 265, 266, 281, 283,
289, 295, 300, 307, 409, 410, 414, 415, 418, 420,424, 427, 431-436, 438
costs, 431facility, 432-434of core, 432, 434periods, 431
storativity, 108, 307stove to melt wax, 427straddle packer, 164strain gauges, 397strata boundaries, 39, 41, 45stratum boundary resolution, 45stream gravel, 183stress
anomalies, 321caused by placing earthfill, 335concentrations, 324, 331, 340relief, 96
strike and dip of planar features (strikes and dips), 63,73
string loaded, 257stripping, 322, 325, 348
of pervious materials, 325operations, 325
structural concrete, 334, 336Su, 405

INDEX
529
subdrilling requirements, 217subsurface cutoffs, 300subsurface
geologic conditions, 37, 195, 305hydraulic conditions, 303, 305layer resistivities, 38materials, 2, 10, 11, 13, 48, 107, 112, 115
suitable riprap source, 196sulfates, 334, 335sulfide, 15sump pumps, 315sumps, 299, 300, 322, 323, 348sunspots, 445supplementary dewatering, 300surface
and subsurface data, 305cracks, 329, 335
in the foundation, 329drains, 299electrical surveys, 38, 45saturated dry specific gravity (SSSG), 191water, 299, 300, 302, 303, 307, 309, 312, 318wave(s), 5-8, 27, 34, 57, 60
surveying, 8survey control, 85, 318susceptibility logs, 80swelling rock, 103swivels, 126S-wave, 33, 57, 60, 64, 65
arrival, 64cross-hole tests, 65
Sy method, 390, 392, 393synthetic polymers, 362

FIELD MANUAL
530
T
talus, 7, 194, 198, 202piles, 198, 202
Televiewer, 61tamped cartridges, 226, 255tamping (tamper)
feet, 326, 328, 329plug, 257roller(s), 326, 328, 329roller feet, 328
TDOP, 444, 451television cameras, 67temperature
changes, 426, 434device, 77logging, 77, 78probe, 78variations in the fluid, 77
temporary labeling, 438storage, 433
tension zones, 321tensioned mechanical arms, 74test
blasting (blasts), 207, 263, 267, 281, 286, 297grout section, 105pressure(s), 96, 100, 103, 104, 113, 114, 119wells, 110, 133, 134, 306-308
testing subsurface samples, 197TFOM, 455, 456theoretical overburden stress, 114thermal
infrared, 84, 86, 87, 90systems, 86wavelengths, 87
properties of materials, 86

INDEX
531
thermistor (thermal resistor), 77thick-wall, 353thickness of the riprap, 184thrust blocks, 339tight, impermeable rock, 106timbers, 15time-varying, low frequency, electromagnetic fields, 13top of rock configuration, 19topographic maps, 198, 463total dissolved solids (TDS), 317total porosity, 108toxic waste studies, 11tracer elements, 50tracked equipment, 330tracking, 424, 460, 461transferring core, 432trapped water, 41travel times, 57trial blasts, 263triaxial arrays, 64tricone
bit, 370rockbit, 361
trimming, 259troposphere, 445, 446, 461true orientation (strike and dip), 67true P- and S-wave velocities, 65true velocities, 64tunnel alignments, 95tunnel delays, 250tunnel studies, 96tunnels, 67, 95, 98, 99, 106, 244, 273, 291, 431, 448turbidity, 116, 315-317turbulent flow, 103, 117, 127two-dimensional (2-D) projection, 73

FIELD MANUAL
532
U
UERE, 456, 457ultraviolet radiation, 445uncased boreholes, 51unconfined compression, 358, 405underground blast rounds, 243underwater surveys, 91undisturbed soil samples, 436undrained strength in clays, 358uniformity of rock, 195unsaturated conductivity coefficient, 132, 146unsuitable subgrade, 302unsupervised storage, 432unwatering (methods), 198, 299, 300, 302, 317uplift of constructed features, 302URA, 452, 458, 459USBR 7020, 397user
equipment (UE) errors, 456Equivalent Range Error (UERE), 456Range Accuracy (URA), 452, 458segment, 439, 440
V
vacuuming, 348vadose zone, 112, 115, 306vane shear, 358, 405
testing, 405variable head tests, 170variations in fluids, 45VDOP, 444, 450-453, 457velocity
contrast, 11, 66reversal, 5

INDEX
533
vertical electrical soundings, 11hammer device, 64surfaces, 330, 333, 334
very high resolution mapping of near-surface geology,15
vibration damage, 9levels, 9, 332protection, 412
vibratory compactors (rollers), 326videotaped, 69vinylidene chloride, 415, 427visible spectrum, 85void ratio, 53vugs, 63, 78
W
WAGE, 460wall
irregularity (irregularities), 52of a borehole, 37
washout zones, 74wastage, 196, 200, 201waste piles, 194water
action, 189, 205content, 38, 46, 49, 52, 53, 358, 417content (saturation), 38
by weight, 53of strata, 46
control, 299, 303-306, 309, 312, 317, 319, 322, 347data, 306, 309facilities, 305, 306, 312, 319

FIELD MANUAL
534
investigations, 305, 317methods, 322
energy, 183gel columns, 255jetting, 332level monitoring instrumentation, 313meters, 126, 141quality, 166, 308, 309, 316-318, 334, 336
analyses, 308removal, 300, 348salinity, 38table, 7, 15, 119, 127, 130, 144, 148, 150, 155, 157,
158, 164, 175, 299, 303, 356, 358, 359, 365, 385take(s), 96, 103, 105, 113, 127, 136test(s), 98, 100, 105, 114
calculation, 97data, 96, 106, 113information, 97pressure, 103results, 96, 97, 103
washing, 332watertight riser, 315wavelength range, 84wavy core surfaces, 409wax, 412, 415-419, 427waxed wood disks, 418weight of the rock fragment, 191well(s), 67, 69, 109, 110, 116, 133, 134, 158, 160, 161,
173, 174, 299, 306-308, 312, 314-318, 322 collapse, 316point systems, 315, 316points, 322screen(s), 64, 74, 118, 172, 315
well-graded riprap, 194, 207wet
and dry density, 53

INDEX
535
foundations, 327rope, 382
whipping, 384Wide Area GPS Enhancement (WAGE), 460wireline (wire line), 370
acoustic/seismic logging systems, 56devices, 73electrical systems, 42nuclear radiation systems, 49packers, 105, 115
wood shipping containers, 422workability and nesting of the rock assemblage, 189
Y
Young’s modulus, 24