Embed Size (px)
Citation preview

139
Animal Husbandry: the Mammal Bone
Chapter 8
Animal Husbandry: the Mammal Bone
Jennifer F. Harland
cable. When this procedure would have resulted in excessively tiny sample sizes the data are combined and potential recovery biases discussed in qualitative terms.
8.3. Methods
The Quoygrew mammal bone was recorded using the York System (Harland et al. 2003). Under this system, elements are divided into quantification codes (QC), with QC1 representing the suite of commonly identi-fied elements for which all relevant information is recorded. They include long bones, mandibles, the pelvic and shoulder girdles and select regions of the cranium. Other elements, including ribs and vertebrae, were assigned to QC0 and were not identified unless of special interest (if they exhibited a cut mark, for example).
Specimens from the ‘large mammal’ category are likely to be cattle (with potentially some horse), ‘medium mammal 1’ fragments are likely to be caprine or pig, and ‘medium mammal 2’ fragments are from dog- or cat-sized animals. For simplicity, the very few probable identifications have been grouped with definite ones as they do not alter the overall interpreta-tions. All sheep and goat identifications are included in the caprine total. Only one goat was positively identified at Quoygrew, so most are probably sheep.
Mammal-bone preservation was explored using bone surface texture, scored on an ordinal scale, and fragmentation, assessed as percent completeness (see Section 8.4 below). Evidence of gnawing, burning, partial digestion and/or other modification was also recorded. Phase 1 of the Farm Mound and Phases 2 to 3 of the Farm Mound and Fish Midden provide the most useful data. Only limited observations can be made regarding the other deposit and phase groups because of their smaller sample sizes. Butchery marks were recorded manually on cards, later digitized onto composite drawings of the skeleton during analysis. Butchery evidence was classed as either a ‘knife’ or a
8.1. Introduction
Mammal bones were recovered from several areas and phases at Quoygrew, permitting intra-site spatial and temporal analysis. Most of the analysed material (85%) was from the Farm Mound and the Fish Midden. Changes through time can be examined within the Farm Mound, between the earlier Phase 1 and later Phases 2 to 3, while spatial variation can be examined between contemporary (Phase 2 to 3) layers in the Farm Mound and Fish Midden. Other deposit and phase groups examined contained only small quanti-ties of mammal bone (the North and South Middens, the Phase 4 midden from Room 4 and the floor depos-its from House 1 and House 5). In total, approximately 38,000 mammal bones were examined (weighing 60 kg), of which 8616 (weighing 45.6 kg) were identi-fied to taxon (Table 8.1). Overall, the mammal bone evidence illuminates changes in animal husbandry at Quoygrew that are contemporary with the increase in sea fishing (Chapters 5 to 7) and implies a similar need to produce a greater storable surplus. A possible subsequent change in animal husbandry concurrent with the late medieval decline in fishing is more dif-ficult to evaluate due to the small number of mammal bones recovered from the Phase 4 midden of Room 2.
8.2. Recovery
The analysed mammal bone was recovered predomi-nantly by sieving to 4 mm (the Fish Midden and the relevant floor deposits of Houses 1 and 5) or by a combination of hand collecting and sieving to 4 mm (the Farm Mound, the North and South Middens and the Phase 4 midden in Room 4). A much smaller quantity of identifiable material, mainly of mice and voles, was also recovered from the 2–4 mm sieve fractions of selected flotation samples (the same ones used for study of the fish bone, see Chapters 5 and 7). The zooarchaeological evidence from each recovery method has been tabulated separately where practi-
140
Chapter 8
‘chop’ mark. Knife marks are thin, shallow lines that are often relatively short. They rarely extend more than 1 mm into the bone surface. In contrast, chop marks are deeper — extending a few millimetres into the bone or even severing it completely. Both cut- and chop marks have a ‘V’-shaped profile. Marrow extrac-tion was analysed using Outram’s (2001) methods.
Mammal age at death estimates are of crucial importance for understanding livestock manage-ment and dairying. A triple approach was thus taken when assessing age at slaughter. Firstly, each QC1 element was assigned a qualitative age estimate on an ordinal scale. The category ‘adult’ was used to describe full-sized elements with smooth and solid textures. If epiphyses were visible they were fused. ‘Sub-adult’ elements were just fused or in the process of fusing, but otherwise closely resembled adult bones in size and texture. ‘Juvenile’ elements were smaller than adult in size, but still had a fairly robust and smooth texture. If epiphyses were visible they were unfused, but with well-defined surfaces. Lastly, ‘neo-natal’ elements were small, roughly textured, fragile and porous. If the epiphyses were present they were unfused, poorly defined and had fragile surfaces. This very ‘broad-brush’ approach maximizes the sample size available for intra-site comparison — particularly the analysis of change through time. Age at slaughter was also assessed based on the timing of fusion of different epiphyses and on tooth eruption and wear. The interpretation of cattle and pig fusion ages fol-lowed Silver (1969), and sheep ageing followed Moran and O’Connor (1994). Mandibular tooth wear was recorded using Grant (1982) for cattle and pigs, and Payne (1973; 1987) for sheep and goats. O’Connor’s methods were used for analysis (1989; 1991).
Metrical data were recorded for all adult ele-ments, following von den Driesch (1976), with a few additional measurements as detailed in Harland et al. (2003). Elements were only measured if all epiphyses were fused, meaning that early fusing epiphyses were not measured if the state of later fusing epiphyses (on the same bone) was unknown. The Quoygrew mam-mals only produced a small data set because few were fully adult, making it difficult to compare with other sites or to examine any potential breed or sex variation.
The assemblage is quantified by number of identified specimens (NISP), with the basic data by taxon (divided by recovery, deposit and phase groups) provided in Table 8.1. Minimum number of elements (MNE) and minimum number of individu-als (MNI) estimates were not derived, partly because they are statistically problematic measures (Grayson 1984), but more pragmatically because the sample sizes were too small. A list of common and scientific
names for the taxa identified is provided in Appen-dix 8.1. The evidence regarding bone preservation is summarized in Table 8.2 and Appendix 8.2. Tables 8.3 to 8.5 summarize the relative abundance of each major skeletal element (by NISP) for the three most abundant taxa (cattle, caprines and pigs). Table 8.6 provides an overview of the pathological specimens in the collection. The butchery evidence is summa-rized in Figures 8.1 to 8.4, and the ageing evidence in Figures 8.5 to 8.7. Two sample Kolmogorov-Smirnov tests were used to investigate the statistical significance of variations between deposit and phase groups for important ordinal scale measures — including bone surface texture, percent completeness and ageing categories. The results are summarized in Appendix 8.3. A summary of the fracture type evidence is in Appendix 8.4. The measurement data are summarized in Appendices 8.5 to 8.7.
8.4. Taphonomy
The surface texture of most bone specimens from Quoygrew can be categorized as ‘good’ (solid, with some flaky or powdery patches) or ‘fair’ (solid, but with up to half of the surface flaky or powdery) for all deposit and phase groups, with very little ‘poor’ (very flaky or powdery) or ‘excellent’ (solid, fresh and glossy) material recorded (Table 8.2). Phases 2 to 3 of the Farm Mound produced significantly worse texture scores than the earlier Phase 1 of this deposit, Phases 2 to 3 of the Fish Midden and Phase 4 of Room 4 (p ≤0.001). However, the surface texture of mammal bone is strongly associated with age group — neo-natal and juvenile specimens generally have poorer texture scores than ‘adult’ bones — and a substantial portion of the cattle assemblage was from very young calves (see Section 8.7 below). Thus this result could reflect both taphonomic patterning and changes in the mortality profile of livestock remains through time. The texture data were therefore also divided by ordinal age category and reanalysed (Appendix 8.2). No differences in texture scores between deposit and phase groups were found for the adult and sub-adult specimens, indicating that these more robust bones can be compared directly. However, the neonatal and juvenile bones on their own were significantly different between deposit/phase groups, with mate-rial from Phases 2 to 3 of the Farm Mound containing better texture scores than Phase 1 of the Farm Mound (p <0.001), and worse texture scores than Phases 2 to 3 of the Fish Midden (p <0.001) and the Phase 4 midden of Room 4 (p <0.001).
Percent completeness scores provide a measure of element breakage (purposeful, for marrow extrac-

141
Animal Husbandry: the Mammal Bone
tion, or accidental). Here recovery biases apply — fewer of the 0–20% complete bones were recovered by hand, as would be expected — but the >4 mm and hand-collected data are shown separately in Table 8.2 to control for this problem. Comparing deposit and phase groups, fragments were significantly less com-plete in Phase 1 of the Farm Mound when compared with both Phases 2 to 3 of the Farm Mound and the Phase 4 midden of Room 4 (regardless of recovery method, see Appendix 8.3). High levels of fragmenta-tion can relate to more intensive marrow extraction (Outram 2001). In this instance, however, few of the breaks could be classified as having occurred when the bones were very fresh so the damage is more likely to be post-depositional (Appendix 8.4).
Combining the texture and percent complete-ness evidence it would appear that the mammal bone from Phase 1 was least well preserved. The material from other deposit and phase groups was less fragmented, with good preservation (as implied by texture scores) of all but the neonatal and juvenile bone from Phases 2 to 3 of the Farm Mound. These observations need to be taken into consideration when interpreting other patterning in the zooarchaeo logical data from Quoygrew.
Evidence of burning was found on just over a quarter of all fragments. It was heavily influenced by recovery methods, with far fewer burnt fragments recovered by hand. Considering only the >4 mm mate-rial, burning was more prevalent in Phases 2 to 3 of the Fish Midden (at 53%) than in the Farm Mound (at 39% in Phases 2 to 3 and 41% in Phase 1). Although the fish assemblage generally contained much lower proportions of burnt bone (see Chapter 7), the Fish Midden did contain slightly more than the Farm Mound, mirroring the pattern found in the mammal bone. Only 8% of all burnt mammal fragments were identified to taxon and therefore little patterning was observed by species.
Other taphonomic indicators were far less prevalent. Modern breakage affected less than 0.5% of the assemblage, carnivore gnawing was found on less than 0.8% of all bone, and crushing, root etching, acid etching and rodent gnawing were each found on less than 0.1% of all bone. Some rabbit burrowing was noted during excavation in Areas D and F, but very few rabbit bones were found in the deposits (Table 8.1) suggesting that disturbance from their activity was probably limited.
8.5. Species representation
The vast majority of the mammal bone was from domestic animals (Table 8.1), as is expected for an
Orcadian site of this period (cf. Harland 2006). Cattle and caprines (sheep, with one goat) dominate most phases in varying proportions, while pigs consistently represent less than 10% of the domestic mammals. Hand collecting favours large bones and therefore over-estimates the proportion of cattle. Using the >4 mm sieved material, some variation between deposits and phases can be observed. Within the Farm Mound, caprines are more numerous than cattle in Phase 1, at 34% and 14% respectively. This difference then decreases in Phases 2 to 3, with caprines repre-senting 24% and cattle 18%. Within the contemporary Phases 2 to 3 of the Fish Midden, cattle (37%) are conversely more numerous than sheep (27%). When these values are combined with the large mammal and medium mammal 1 categories (cow- and sheep-sized respectively), this trend becomes even more evident. Large mammals represent only 23% of the Phase 1 >4 mm subset, increasing to 32% by Phases 2 to 3 of the Farm Mound and 43% by Phases 2 to 3 of the Fish Mid-den. This pattern could be interpreted as an increase in the usage and demand for cattle through time. This possibility is considered further below when discuss-ing age profile changes through time.
The sample from the Phase 4 midden in Room 4 is small, but caprines once again appear to be the predominant domestic species, much more so than cattle or pigs. The high number of horse remains (55% of the hand-collected material) reflects parts of two individual animals (see below).
Phase 1 of the Farm Mound has the highest pro-portion of ‘minor’ taxa, at c. 8% of the identified bone. These include seals, cetaceans, dogs, cats, horses, red deer, voles and mice. Taxa not from the main domes-ticates comprise only approximately 2–3% of the bone from Phases 2 to 3 of the Farm Mound and Fish Mid-den. These include seals, cetaceans, dogs, cats, horses, voles, mice and (intrusive) rabbits.
The apparent decline in minor taxa from Phase 1 to Phases 2 to 3 primarily results from decreasing proportions of small mammals, including Orkney voles, wood mice, house mice, a pygmy shrew and many fragments only identified more broadly as mice or voles. House mice will live inside and readily eat stored grain, but they also survive in the wild. Wood mice live in houses, gardens or the wild — and will also eat stored produce and seeds. Orkney voles are common grassland species and were probably less of a risk to stored food than the mice (Corbet & Harris 1991). Wood mice and house mice are found in most phases at Quoygrew, but are very scarce in the Fish Midden and are rather more common in the house floors and the Phase 4 midden in Room 4 (the Room 4 midden also produced the pygmy shrew specimen, a

142
Chapter 8
Tabl
e 8.
1. N
umbe
r of i
dent
ified
spec
imen
s (N
ISP)
of Q
C1 m
amm
al b
ones
by
maj
or d
epos
it an
d ph
ase g
roup
s, di
vide
d by
reco
very
met
hod
(exc
lude
s 173
iden
tified
spec
imen
s fro
m P
hase
s 1 a
nd 7
of t
he
Fish
Mid
den
and
7 id
entifi
ed sp
ecim
ens f
rom
Pha
se 3
of t
he S
outh
Mid
den)
. Hc i
ndic
ates
han
d co
llect
ed.
Taxa
Farm
Mou
ndFi
sh M
idde
nPh
. 1Ph
. 2–3
Ph. 2
–3H
c>4
mm
2–4
mm
Tota
lH
c>4
mm
2–4
mm
Tota
l>4
mm
2–4
mm
Tota
lSe
al s
peci
es3
0.2%
40.
7%7
0.3%
200.
6%6
0.8%
260.
6%Py
gmy
shre
wC
etac
ean
20.
1%2
0.3%
40.
2%9
0.3%
20.
3%11
0.3%
Car
nivo
re1
0.1%
10.
0%D
og2
0.1%
20.
1%3
0.1%
10.
1%1
50.
1%C
at9
0.6%
90.
4%16
0.5%
40.
5%2
220.
5%1
10.
1%H
orse
40.
3%4
0.2%
70.
2%1
0.1%
80.
2%1
0.1%
10.
1%Pi
g12
58.
2%21
3.6%
146
6.6%
742.
2%57
7.8%
131
3.2%
192.
6%19
2.6%
Red
deer
20.
1%2
0.1%
Catt
le30
620
.1%
8314
.3%
389
17.6
%10
4831
.1%
133
18.2
%11
8128
.5%
257
35.5
%25
735
.0%
Cap
rine
294
19.3
%19
433
.5%
54.
5%49
322
.3%
804
23.9
%17
523
.9%
298
123
.7%
230
31.8
%1
231
31.5
% (
of w
hich
she
ep)
250.
7%6
0.8%
310.
7%1
0.1%
10.
1% (
of w
hich
goa
t)1
0.0%
10.
0%Vo
le/m
ouse
87.
3%8
0.4%
1010
0.2%
10.
1%3
40.
5%Vo
le s
peci
es1
0.1%
10.
2%7
6.4%
90.
4%1
0.0%
89
0.2%
10.
1%1
0.1%
Ork
ney
vole
152.
6%73
66.4
%88
4.0%
141.
9%6
200.
5%4
0.6%
40.
5%M
ouse
spe
cies
22
0.0%
10.
1%1
0.1%
Woo
d m
ouse
43.
6%4
0.2%
55
0.1%
Hou
se m
ouse
11
0.0%
Rabb
it2
0.1%
10.
1%1
40.
1%Sm
all m
amm
al14
2.4%
1210
.9%
261.
2%2
20.
0%1
0.1%
56
0.8%
Med
ium
mam
mal
24
0.3%
101.
7%14
0.6%
20.
1%3
0.4%
50.
1%2
0.3%
20.
3%M
ediu
m m
amm
al 1
506
33.2
%18
532
.0%
10.
9%69
231
.3%
1057
31.4
%23
432
.0%
1291
31.2
%17
223
.8%
172
23.4
%La
rge
mam
mal
261
17.1
%50
8.6%
311
14.1
%32
79.
7%10
013
.7%
427
10.3
%34
4.7%
344.
6%Se
a m
amm
al5
0.3%
50.
2%1
0.0%
10.
0%1
0.1%
10.
1%To
tal i
dent
ified
1524
100%
579
100%
110
100%
2213
100%
3371
100%
732
100%
4041
4310
0%72
410
0%10
734
100%
Uni
dent
ifiab
le
mam
mal
2465
8031
210
,498
3152
5934
9086
4257
142
58
Gra
nd to
tal
3989
8610
112
12,7
1165
2366
6640
13,2
2949
8111
4992

143
Animal Husbandry: the Mammal Bone
Taxa
Nor
th M
idde
nSo
uth
Mid
den
Roo
m 4
mid
den
Hou
se 5
floo
rsR
oom
1&
2 flo
ors
Ph. 2
Ph. 2
Ph. 4
Ph. 2
.3Ph
. 2.4
Ph. 4
.1H
c>4
m
m2–
4 m
mTo
tal
Hc
>4
mm
2–4
mm
Tota
lH
c>4
mm
2–4
mm
Tota
l>4
m
m2–
4 m
mTo
tal
>4
mm
2–4
mm
Tota
l>4
m
m2–
4 m
mTo
tal
Seal
spe
cies
21
32
210
3.5%
21.
0%12
2.0%
Pygm
y sh
rew
10.
9%1
0.2%
Cet
acea
n1
16
3.1%
61.
0%3
3C
arni
vore
11
Dog
41
16
11
42.
1%4
0.7%
Cat
10.
3%2
1.0%
30.
5%H
orse
11
21
115
955
.0%
31.
6%16
227
.5%
Pig
22
32
311
3.8%
63.
1%1
0.9%
183.
1%1
11
1Re
d de
erC
attle
67
137
610
41.
4%7
3.6%
111.
9%1
14
41
1C
apri
ne10
1121
2213
2556
19.4
%50
25.9
%4
3.7%
110
18.6
%9
98
81
1(o
f whi
ch s
heep
)(o
f whi
ch g
oat)
Vole
/mou
se11
1114
142
1.0%
3835
.2%
406.
8%9
92
21
2930
Vole
spe
cies
10.
9%1
0.2%
Ork
ney
vole
1111
318
216
3.1%
1413
.0%
203.
4%1
1112
44
14
5M
ouse
spe
cies
33
22
10.
5%6
5.6%
71.
2%6
61
1W
ood
mou
se3
32
1.0%
65.
6%8
1.4%
11
12
3H
ouse
mou
se2
22
23
2.8%
30.
5%Ra
bbit
113.
8%33
17.1
%32
29.6
%76
12.9
%1
1Sm
all m
amm
alM
ediu
m m
amm
al 2
11
115.
7%2
1.9%
132.
2%M
ediu
m m
amm
al 1
87
156
1013
3211
.1%
5528
.5%
8714
.7%
66
1212
Larg
e m
amm
al7
29
63
55
1.7%
31.
6%8
1.4%
11
11
Sea
mam
mal
Tota
l ide
ntifi
ed39
3231
102
4739
3710
128
910
0%19
310
0%10
810
0%59
010
0%18
2745
307
376
3541
Uni
dent
ifiab
le
mam
mal
5640
245
852
554
566
182
2123
2305
219
219
219
219
137
137
Gra
nd to
tal
9543
431
560
9959
337
667
471
2316
108
2895
237
2726
424
97
256
143
3517
8
Tabl
e 8.
1. (c
ont.)

144
Chapter 8
Table 8.2. Bone surface texture (top) and percent completeness (bottom) data for all identified mammal QC1 elements (major deposit and phase groups only).
Phases>4 mm Hand collected
Poor Fair Good Excellent Total Poor Fair Good Excellent Total
Farm MoundPh. 1
17 66 135 4 222 87 155 219 42 5038% 30% 61% 2% 100% 17% 31% 44% 8% 100%
Ph. 2–343 81 70 13 207 102 706 518 42 1368
21% 39% 34% 6% 100% 7% 52% 38% 3% 100%
Fish MiddenPh. 2–3
3 98 109 4 214 4 6 101% 46% 51% 2% 100% 40% 60% 100%
Ph. 71 13 23 2 39
3% 33% 59% 5% 100%
Room 4 midden Ph. 42 15 38 55 3 17 40 60
4% 27% 69% 0% 100% 5% 28% 67% 0% 100%
Phases>4 mm Hand collected
0–20% 21–40% 41–60% 61–80% 81–100% Total 0–20% 21–40% 41–60% 61–80% 81–100% TotalFarm Mound Ph. 1 118 33 11 21 39 222 198 115 47 75 68 503
53% 15% 5% 9% 18% 100% 39% 23% 9% 15% 14% 100%Ph. 2–3 68 32 26 40 39 205 364 329 151 339 185 1368
33% 16% 13% 20% 19% 100% 27% 24% 11% 25% 14% 100%Fish Midden Ph. 2–3 85 39 18 48 24 214 5 3 2 10
40% 18% 8% 22% 11% 100% 50% 30% 20% 100%Ph. 7 13 8 7 6 5 39
33% 21% 18% 15% 13% 100%Room 4 midden Ph. 4 16 16 10 11 2 55 11 14 12 8 15 60
29% 29% 18% 20% 4% 100% 18% 23% 20% 13% 25% 100%
mandible). Orkney voles are ubiquitous, but are much more common in Phase 1 of the Farm Mound than in later phases. This may suggest the grassland environ-ment around the Farm Mound was less intensively disturbed in this early phase of settlement. When house mice were first introduced to the Northern Isles is a matter of debate, but they were certainly present by the Viking Age — at which time it is likely that mice with a mtDNA lineage originating in Orkney were spread around the Irish Sea province (Nicholson et al. 2005; Searle et al. 2009).
Horse remains were found in most phases, but in low numbers (see Table 8.1). Most individuals were very small, of comparable size to a small pony. Phase 1 of the Farm Mound contained only juvenile bones, Phases 2 to 3 contained both juveniles and adults, and all others were from adult individuals. Teeth and fragmented maxillae and mandibles from the Phase 4 midden in Room 4 represent two adults of different size, one of which was a male of approximately 6 years with tooth wear indicating crib biting (C.J. Johnstone pers. comm. 2006). Pathologies on horse bones from Phases 2 to 3 of the Farm Mound included spavin, potential navicular bone disease and fused tarsals, all of which could be from the same long-lived indi-vidual (D.R. Brothwell pers. comm. 2004). Some horse remains were butchered (see Section 8.6), suggesting at least opportunistic consumption.
Carnivores were represented by both gnawing found on a small number of bones and by dog bones themselves (one of which, from the South Midden, displayed dog gnawing itself). Overall, however, there were very few dog remains — possibly indicating most were not incorporated into the middens. Adult and juvenile dogs were found, as were large and small individuals.
Cats were found primarily in the Farm Mound. Most were adult at death. Metrical data suggest the one measurable element was from a domestic rather than wild cat (T.P. O’Connor pers. comm. 2005). Cat gnawing was found on an unidentified mammal bone from Phases 2 to 3 of the Farm Mound, on a probable domestic fowl (chicken) bone from Phase 3 of the South Midden and on a cod bone from Phases 2 to 3 of the Fish Midden.
One probable and one definite identification of red deer bone (not antler) were made, both in Phase 1 of the Farm Mound. The probable identification was a juvenile and the definite identification was an adult, both with fresh fractures indicative of potential mar-row extraction. Their presence in the earlier phase at Quoygrew is consistent with other evidence from the Northern Isles. Red deer were found in low quantities from a number of sites, decreasing in quantity from the late Iron Age to the Viking Age (C. Smith 1994; Bond 1998; Morris 2005; Bond 2007b) until, by the end

145
Animal Husbandry: the Mammal Bone
of the twelfth century, historical evidence suggests none were left in Orkney (Pálsson & Edwards 1981, 209; Clutton-Brock & MacGregor 1988).
Seals and whales were found throughout all phases and areas, and were not identified to species. They may be under-represented if their bones were typically left at coastal butchery sites (cf. Smith & Kinahan 1984). Age profiles indicate exploitation of juveniles in preference to adults, and butchery evi-dence was found on several elements from the Farm Mound. Much higher proportions of dog gnawing were found on seal remains than on any other species, possibly indicating their use as dog food (or prefer-ential survival when used in this way). Ethnohistoric accounts from later periods suggest that seal meat was only eaten by humans in the Northern Isles if nothing else was available (Fenton 1978, 525). The fragmented cetacean remains were not identified to species because of their lack of diagnostic features and limited reference material. These occasional finds could represent opportunistic usage of stranded indi-viduals and (in the case of small whales) purposeful drives (Mulville 2002). The remains included ribs from small whales, a mandible from a small (toothed) whale, and a very large whale vertebra. Some elements were butchered or worked, and two were gnawed by dogs. Seals and whales could have been used for their oil and skins, as well as for their meat, while whale bone was also used for artefact manufacture (e.g. Owen & Dalland 1999, 73–86; see Chapter 13).
Rabbits were probably introduced to the North-ern Isles in the seventeenth century (Booth & Booth 1994; Berry 2000) and thus the Quoygrew specimens will be intrusive. They were found in very low quan-
tities in most phases. The exception is the Phase 4 midden in Room 4, where disturbance was greater.
One human deciduous canine was found from Phases 2 to 3 of the Farm Mound, and three human bones were found in a test pit dug in the Fish Midden by Sarah Colley (1983) in 1978. The latter included a proximal left ulna, distal right humerus and right ilium — all probably from an infant based on their size (Sarah Colley pers. comm.). Formal human burial is presently unknown at the site and probably occurred elsewhere, perhaps in the ‘pagan’ and later Christian cemeteries known from nearby Pierowall and the links between Pierowall and Quoygrew (Chapter 3).
8.6. Skeletal element representation and butchery
The relative abundance of different skeletal elements (restricted to those routinely identified to species) is quantified by NISP for cattle, caprines and pigs in Tables 8.3 to 8.5. Overall, entire animals seem to be represented, without any clear export, import or redis-tribution of particular cuts of meat. For both cattle and caprines, mandibles varied the most between deposit and phase groups, likely reflecting fragmentation and preservation differences because all loose molars and fourth premolars were tabulated as parts of mandibles (see Harland et al. 2003). It has been suggested that cuts of meat may have been differentially redistrib-uted between settlements in early historic Orkney (cf. Parker Pearson et al. 1996; Gilmour & Cook 1998), but there is no indication that this was so at Quoygrew.
Butchery marks were observed in small quanti-ties throughout most phases, with little patterning identified through time or space (Figs. 8.1 & 8.2).
Table 8.3. NISP of QC1 cattle elements for major deposit and phase groups, divided by recovery method. Hc indicates hand collected.
ElementPh. 1 Farm Mound Ph. 2–3 Farm Mound Ph. 2–3 Fish Midden
Hc >4 mm Total Hc >4 mm Total Hc >4 mm TotalSkull 18 8% 2 4% 20 7% 11 1% 11 1% 1 1% 1Mandible 34 15% 13 24% 47 17% 84 11% 5 5% 89 11% 11 12% 11Scapula 7 3% 7 3% 26 4% 26 3% 6 6% 6Humerus 17 8% 2 4% 19 7% 45 6% 5 5% 50 6% 1 1% 1Radius 16 7% 4 7% 20 7% 48 6% 4 4% 52 6% 2 12 13% 14Ulna 2 1% 1 2% 3 1% 22 3% 2 2% 24 3% 1 6 6% 7Metacarpal 13 6% 3 6% 16 6% 43 6% 4 4% 47 6% 1 1% 1Pelvis 18 8% 2 4% 20 7% 42 6% 3 3% 45 5% 1 1% 1Femur 8 4% 3 6% 11 4% 48 6% 5 5% 53 6% 6 6% 6Tibia 14 6% 3 6% 17 6% 48 6% 4 4% 52 6% 2 9 10% 11Astragalus 7 3% 1 2% 8 3% 33 4% 2 2% 35 4% 1 1% 1Calcaneum 7 3% 2 4% 9 3% 28 4% 3 3% 31 4% 1 1% 1Metatarsal 7 3% 1 2% 8 3% 35 5% 3 3% 38 5% 5 5% 5Metapodial 22 10% 10 19% 32 12% 41 6% 13 14% 54 6% 2 6 6% 8Phalanx 1 14 6% 4 7% 18 6% 80 11% 13 14% 93 11% 6 6% 6Phalanx 2 11 5% 2 4% 13 5% 57 8% 17 18% 74 9% 12 13% 12Phalanx 3 10 4% 1 2% 11 4% 48 6% 12 13% 60 7% 8 9% 8Total 225 100% 54 100% 279 100% 739 100% 95 100% 834 100% 7 93 100% 100

146
Chapter 8
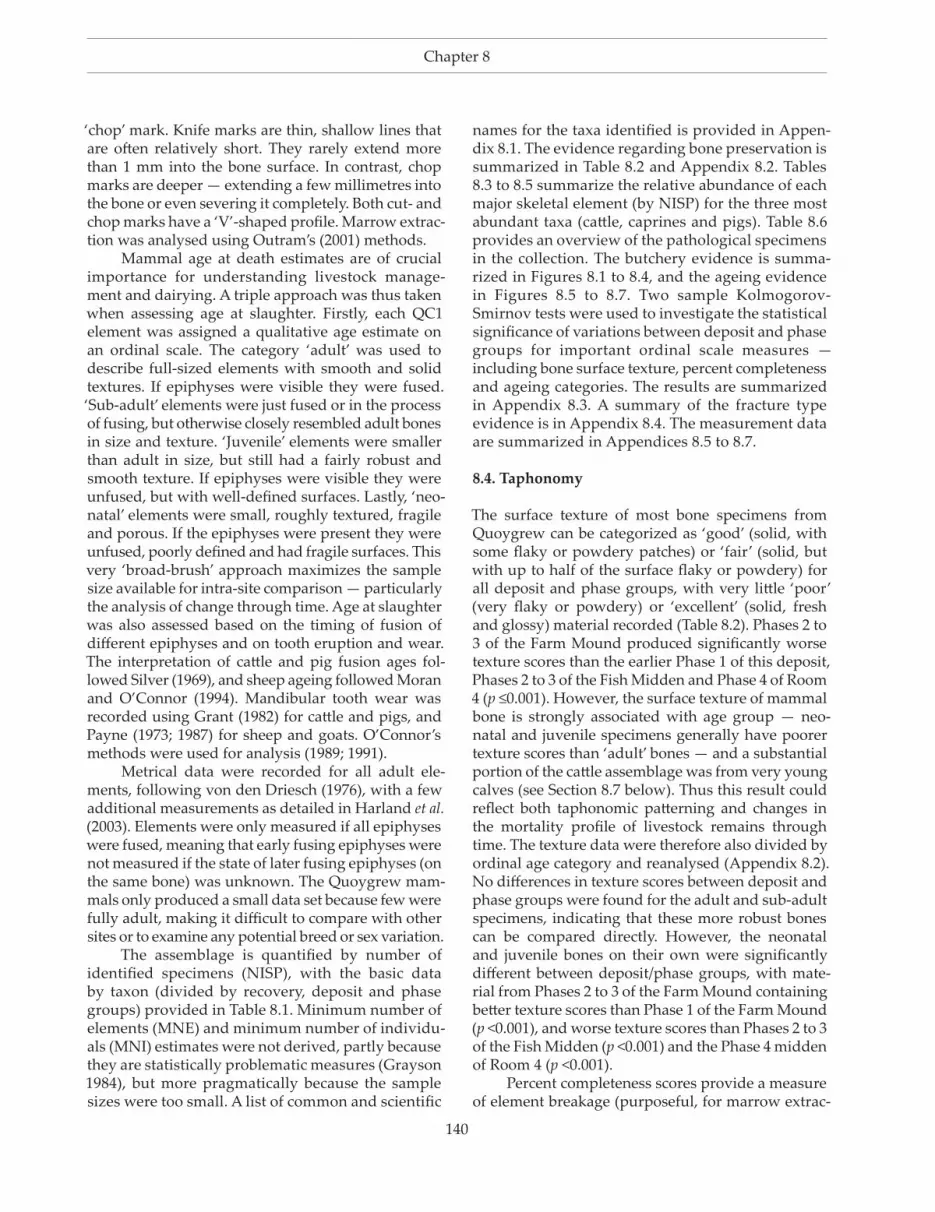
Figure 8.1. Butchery evidence on cattle bones from the Farm Mound. Cut marks were also found on (neonatal) cattle bones from the Fish Midden and South Midden. Cut marks are indicated by the solid black areas. (Images: Jennifer Harland, after Michel Coutureau and Cedric Beauval.)
Cattle knife marks, Farm MoundPhase 1
Cattle knife marks, Farm MoundPhases 2–3
Cattle chop marks, Farm MoundPhases 2–3
Cattle chop marks, Farm MoundPhase 1
Table 8.4. NISP of QC1 caprine elements for major deposit and phase groups, divided by recovery method. Hc indicates hand collected.
ElementPh. 1 Farm Mound Ph. 2–3 Farm Mound Ph. 2–3 Fish Midden
Hc >4 mm Total Hc >4 mm Total Hc >4 mm TotalSkull 8 4% 5 4% 13 4% 18 3% 6 6% 24 4% 4 4% 4 4%Mandible 40 18% 24 20% 64 18% 67 13% 8 7% 75 12% 8 8% 8 7%Scapula 19 8% 2 2% 21 6% 41 8% 4 4% 45 7% 6 6% 6 6%Humerus 14 6% 2 2% 16 5% 47 9% 7 7% 54 8% 5 5% 5 5%Radius 16 7% 6 5% 22 6% 48 9% 4 4% 52 8% 10 9% 10 9%Ulna 3 1% 3 1% 9 2% 1 1% 10 2% 6 6% 6 6%Metacarpal 12 5% 4 3% 16 5% 46 9% 7 7% 53 8% 6 6% 6 6%Pelvis 18 8% 5 4% 23 7% 36 7% 9 8% 45 7% 2 2% 2 2%Femur 13 6% 6 5% 19 5% 35 7% 2 2% 37 6% 8 8% 8 7%Tibia 11 5% 6 5% 17 5% 34 6% 4 4% 38 6% 7 7% 7 6%Astragalus 6 3% 4 3% 10 3% 17 3% 6 6% 23 4% 5 5% 5 5%Calcaneum 8 4% 5 4% 13 4% 19 4% 19 3% 3 3% 3 3%Metatarsal 16 7% 4 3% 20 6% 28 5% 4 4% 32 5% 6 6% 6 6%Metapodial 11 5% 17 14% 28 8% 24 4% 7 7% 31 5% 8 8% 8 7%Phalanx 1 17 8% 10 8% 27 8% 43 8% 14 13% 57 9% 1 6 6% 7 6%Phalanx 2 7 3% 16 13% 23 7% 13 2% 12 11% 25 4% 1 10 9% 11 10%Phalanx 3 5 2% 7 6% 12 4% 11 2% 12 11% 23 4% 1 6 6% 7 6%Total 224 100% 123 100% 347 100% 536 100% 107 100% 643 100% 3 106 100% 109 100%
147
Animal Husbandry: the Mammal Bone
Caprine knife marks, Farm MoundPhase 1
Caprine knife marks, Farm MoundPhases 2–3
Caprine chop marks, Farm MoundPhases 2–3
Caprine chop marks, Farm MoundPhase 1
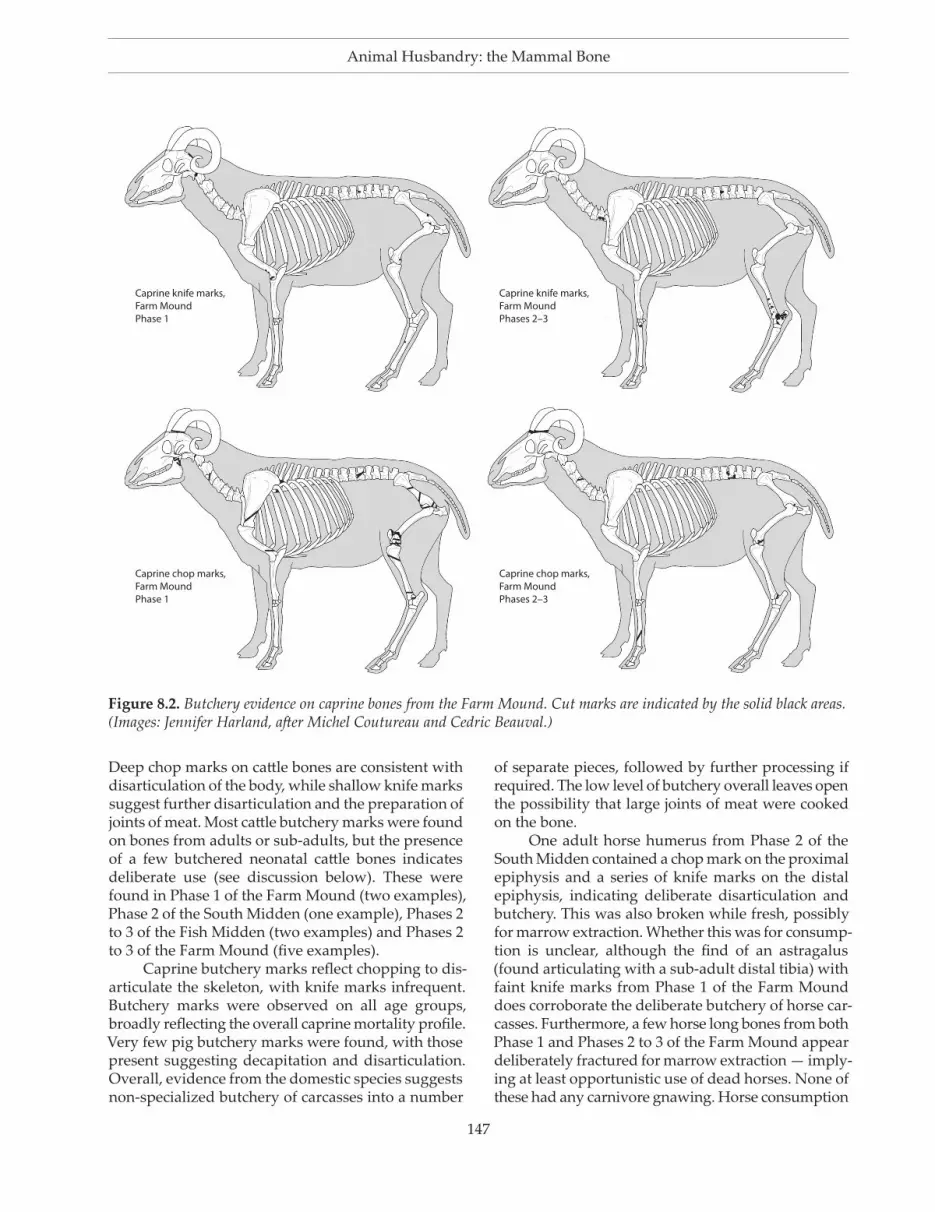
Figure 8.2. Butchery evidence on caprine bones from the Farm Mound. Cut marks are indicated by the solid black areas. (Images: Jennifer Harland, after Michel Coutureau and Cedric Beauval.)
Deep chop marks on cattle bones are consistent with disarticulation of the body, while shallow knife marks suggest further disarticulation and the preparation of joints of meat. Most cattle butchery marks were found on bones from adults or sub-adults, but the presence of a few butchered neonatal cattle bones indicates deliberate use (see discussion below). These were found in Phase 1 of the Farm Mound (two examples), Phase 2 of the South Midden (one example), Phases 2 to 3 of the Fish Midden (two examples) and Phases 2 to 3 of the Farm Mound (five examples).
Caprine butchery marks reflect chopping to dis-articulate the skeleton, with knife marks infrequent. Butchery marks were observed on all age groups, broadly reflecting the overall caprine mortality profile. Very few pig butchery marks were found, with those present suggesting decapitation and disarticulation. Overall, evidence from the domestic species suggests non-specialized butchery of carcasses into a number
of separate pieces, followed by further processing if required. The low level of butchery overall leaves open the possibility that large joints of meat were cooked on the bone.
One adult horse humerus from Phase 2 of the South Midden contained a chop mark on the proximal epiphysis and a series of knife marks on the distal epiphysis, indicating deliberate disarticulation and butchery. This was also broken while fresh, possibly for marrow extraction. Whether this was for consump-tion is unclear, although the find of an astragalus (found articulating with a sub-adult distal tibia) with faint knife marks from Phase 1 of the Farm Mound does corroborate the deliberate butchery of horse car-casses. Furthermore, a few horse long bones from both Phase 1 and Phases 2 to 3 of the Farm Mound appear deliberately fractured for marrow extraction — imply-ing at least opportunistic use of dead horses. None of these had any carnivore gnawing. Horse consumption

148
Chapter 8
was discouraged during the Christianization process in Scandinavia (e.g. Sephton 1899, 32), yet eleventh- to twelfth-century butchered horse remains were found in conjunction with pendant crosses at Cille Pheadair in the Western Isles (Smith & Mulville 2004, 55; Parker Pearson et al. 2004a, 247–8) — and in medieval Scottish towns (C. Smith 1998, 876). Horse meat may thus have been intermittently consumed during and perhaps even after the main period of late Viking Age conver-sion in Atlantic Scotland, during the tenth to eleventh centuries (see Barrett 2003a; Abrams 2007).
A small number of semi-worked mammal bones were recovered from Quoygrew, includ-ing two bi-perforated caprine metapodials from Phases 2 to 3 of the Farm Mound, one of which is illustrated in Figure 8.3. Contemporary examples are known from Shetland, Iceland and the Faroe Islands (Bigelow 1993; Arge 1995; Barrett & Oltmann 2000), but these are rare Orcadian examples of this typically Norse North Atlantic tradition of marrow extraction. A group of seven cattle long bones (from animals of different ages) from Phases 2 to 3 of the Farm Mound and Fish Midden were also partially perforated, but probably not for the same reason as the modifications do not all extend into the marrow cavity. Instead, they were cut longitudinally into or through the proximal or distal epiphyses (Fig. 8.4). None of the specimens exhibit wear or polishing. The purpose or purposes of these modifications is unclear.
Figure 8.3. Bi-perforated caprine metacarpal from Phases 2 to 3 of the Farm Mound. (Image: Jennifer Harland.)
0 5 cmFigure 8.4. Example of longitudinally perforated cattle long bone from Phases 2 to 3 of the Farm Mound. (Image: Jennifer Harland.)
0 5 cm
Table 8.5. NISP of QC1 pig elements for major deposit and phase groups, all recovery methods combined.Element Ph. 1
Farm MoundPh. 2–3 Farm
MoundPh. 2–3
Fish MiddenSkull 1 3% 3 5%Mandible 9 24% 12 18% 1Scapula 1 2%Humerus 2 5% 6 9% 1Radius 1 3% 1 2% 1Ulna 5 8%Metacarpal 1 2%Metacarpal 2 1Metacarpal 3 1 3% 2 3%Metacarpal 4 2 3%Metacarpal 5 1Pelvis 3 8% 7 11% 1Femur 1 2%Tibia 2 5%Astragalus 1 2% 1Calcaneum 3 5%Metatarsal 1 3%Metatarsal 3 1 3%Metatarsal 5 1 2% 2Metapodial 8 22% 2 3%Phalanx 1 1 3% 3 5%Phalanx 2 5 14% 5 8%Phalanx 3 5 8%Lateral phalanx 2 5% 5 8% 2Total 37 100% 66 100% 11

149
Animal Husbandry: the Mammal Bone
dence that cattle were killed at a younger age in Phases 2 to 3 than in Phase 1.
Epiphyseal fusion ages provide more detailed mortality profiles for the phases and areas with adequate sample sizes, as illustrated in Figure 8.6 for cattle and caprines (following Silver 1969; Moran & O’Connor 1994). For cattle, the percentage of fused epiphyses is low, even for the earlier fusing elements, thus confirming the propensity towards a young mor-tality profile. Moreover, Phase 1 exhibits a consistently
Figure 8.5. Cattle, caprine and pig ordinal age categories for all QC1 specimens (combining hand-collected and sieved material).
Cattle QC1 ages
Caprine QC1 ages
Pig QC1 ages
60%
40%
20%
0%Neonate Juvenile
Sub-adult
Adult
Ph. 2–3 Fish Midden (n = 58)Ph. 2–3 Farm Mound (n = 810)
Ph. 1 Farm Mound (n = 231)
60%
40%
20%
0%Neonate Juvenile
Sub-adult
Adult
Ph. 2–3 Fish Midden (n = 105)Ph. 2–3 Farm Mound (n = 607)
Ph. 1 Farm Mound (n = 290)
50%
30%
10%
60%
40%
20%
0%Neonate
Juvenile Sub-adult
Adult
Ph. 2–3 Farm Mound (n = 61)Ph. 1 Farm Mound (n = 35)
50%
30%
10%
8.7. Ageing
As introduced in Section 8.3 above, ageing was determined through a combination of methods. From the time of excavation it was clear that the Quoy-grew assemblage included a very high proportion of fragmented neonatal specimens that would not be fully represented by traditional assessments of epiphyseal fusion and tooth eruption or wear. This is because the mandibles (and often the epiphyseal ends of long bones) from young animals rarely survive intact. Identified specimens were therefore classified into broad ordinal categories (neonatal, juvenile, sub-adult and adult), based on overall size, state of epiphyseal fusion and surface texture — by comparison with reference material of known age. Although less precise than other methods, this broad classification allows easy comparison across phases and areas, as illustrated in Figure 8.5 (an almost complete articulated neonatal calf in Phases 2 to 3 of the Fish Midden has been given a count of 1 to avoid skewing the figures). Inter-analyst variability is likely to be high using this method — particularly in the division of ‘sub-adult’ and ‘adult’ specimens — but the Quoygrew material was classified by a single spe-cialist. Moreover, for the purposes of interpretation the most important distinction is between specimens from younger (‘neonatal’ and ‘juvenile’) and older (‘sub-adult’ and ‘adult’) animals.
Using this method, over half of the cattle from Phases 2 to 3 of both the Farm Mound and Fish Mid-den were neonatal. Conversely, in Phase 1 of the Farm Mound there was less of an emphasis on neonatal calves and a correspondingly higher proportion of juvenile and adult bone. This change through time was statistically significant (see Appendix 8.3) and likely indicates a real increase in deaths of neonatal cattle between Phase 1 and Phases 2 to 3. In contrast, the general ageing categories for caprines indicate lit-tle spatial or temporal patterning (Fig. 8.5). For pigs, it was only possible to contrast the two main phases of the Farm Mound (Fig. 8.5). Juveniles increased in importance through time while adults and neonatal individuals decreased, but this was not a statistically significant difference (Appendix 8.3).
These ageing data combine all hand collected and sieved material to provide an adequate sample size, which will under-represent the small neonatal and juvenile elements. Phases 2 to 3 from the Farm Mound had the smallest proportion of sieved material (vis-à-vis hand collected bone from the same contexts), so compared to the other two major deposit and phase groups, neonatal and juvenile cattle were probably under-represented here. This provides further evi-

150
Chapter 8
higher fusion rate than the later phases, indicating that the age at which cattle were slaughtered decreased through time.
Fusion ages for caprines indicate a different mortality profile, with far more individuals surviv-ing to adulthood. Phases 2 to 3 of the Fish Midden provided too little material to include, but both Farm Mound phases had very similar profiles. Slightly higher fusion rates for most elements were noted for Phase 1, suggesting the caprines were killed at a younger age in the later period. Recovery differences likely bias the caprine data in the same way as for cattle (the smaller and younger elements are probably
under-represented in Phases 2 to 3), emphasizing the increasingly young age at death through time.
Sufficient mandibles were recovered to enable tooth eruption and wear profiles (following O’Connor 1989; 1991) to be established for the two major phases of the Farm Mound. The results for cattle (Fig. 8.7) show differences between Phase 1 and Phases 2 to 3 of the Farm Mound. Over half the cattle in Phase 1 survived to ‘adult’, perhaps representing 4 to 8 years, but by Phases 2 to 3 only half survived to the ‘juvenile/immature’ stage. Almost 40% of the cattle in Phase 1 reached ‘elderly’, perhaps an age of 9 years or more, whereas in Phases 2 to 3, fewer than 10% survived to this age. The dental data thus confirm the patterns observed using other ageing methods, indicating an increase in the slaughter of neonatal and young cattle through time. Nevertheless, these results show fewer neonatal cattle than were estimated using the ordinal age category and epiphyseal fusion data. This differ-ence is almost certainly because, although neonatal mandibles were observed in quantity, they were heav-ily fragmented and isolated or even broken teeth often could not be identified to specific positions within the mouth. Thus, like all of the methods employed, the analysis of dental evidence probably underestimates the importance of slaughtering calves at Quoygrew. In contrast to the cattle, the mandibular wear patterning for caprines showed little difference between the major phases of the Farm Mound. Approximately half the population reached the ‘sub-adult’ stage (perhaps late in the first year to two years of life).
Combining the different forms of ageing evi-dence, conclusions can be drawn regarding the mortal-ity profiles of each domestic species. In the two main phases of the Farm Mound, the ordinal age categories, fusion and dental results vary (in degree rather than chronological trend) for cattle, with fewer neonatal cattle represented using tooth wear. This discrepancy likely reflects differential taphonomic biases: the iden-tification of neonatal cattle using mandibular wear stages relies on fragile tooth rows being recovered intact, whereas the epiphyseal fusion and ordinal age categories use a wider range of elements that are more likely to survive in a recordable form. It therefore appears likely that a high proportion of all cattle in the Farm Mound were slaughtered younger than 12–18 months, with more neonates and a younger age at death found in the later Phases 2 to 3. The proportion of adults was low regardless of method, and given that adult bone survives best and is more likely to be recovered, only a small minority of the cattle at Quoy-grew lived to maturity. The recovery biases present in the Farm Mound emphasize this pattern: Phases 2 to 3 had a higher proportion of hand-collected material
Figure 8.6. Approximate fusion ages by element for cattle (following Silver 1969) and caprines (following Moran & O’Connor 1994) for major deposit and phase groups (combining sieved and hand-collected material).
Veryearly
Early Intermediate Late
100%
80%
60%
40%
20%
0%
Scap
ula
Hum
erus
Radi
us
Phal
anx
1
Tibi
a
Met
acar
pal
Met
apod
ials
Met
atar
sal
Fem
ur
Fem
ur
Tibi
a
Hum
erus
Radi
us
Uln
a
Prox Prox Prox Prox Prox Prox ProxDist Dist Dist Dist Dist Dist Dist
7–10m
12–18m
12–18m
18m 2–2.5y
2–2.5y
2–3y
2.25–3y
3.5y 3.5–4y
3.5–4y
3.5–4y
3.5–4y
3.5–4y
Farm Mound Ph. 1% Fused (n = 131)Ph. 2–3 Farm Mound% Fused (n = 470)
Ph. 2–3 Fish Midden% Fused (n = 68)
Cattle fusion ages
Very early Early Intermediate Late
100%
80%
60%
40%
20%
0%
Scap
ula
Hum
erus
Radi
us
Phal
anx
1
Tibi
a
Met
acar
pal
Met
apod
ial
Met
atar
sal
Uln
a
Fem
ur
Radi
us
Hum
erus
Fem
ur
Tibi
a
Prox Prox Prox Prox Prox Prox ProxDist Dist Dist Dist Dist Dist Dist
6–9m
9m 4.5–6m
11–12m
23–30m
23–30m
23–30m
23–30m
23–30m
36–42m
36–40m
36–37m
36–42m
40–45m
Farm Mound Ph. 1% Fused (n = 161)Ph. 2–3 Farm Mound% Fused (n = 345)
Caprine fusion ages
Calc
aneu
m
Prox
23–30m

151
Animal Husbandry: the Mammal Bone
Figure 8.7. Cattle and caprine mortality profiles based on dental evidence from the major deposit and phase groups (combining hand collected and sieved material).
and thus the younger, fragile cattle elements are likely under-represented in this phase. Phases 2 to 3 of the Fish Midden yielded a smaller data set, but are consist-ent with the contemporary phases of the Farm Mound.
These age profiles suggest cattle were exploited primarily for dairy produce (Mulville et al. 2005), and secondarily for meat consumption. Calves were prob-ably killed when very young to allow greater quanti-ties of milk and milk products for human consump-tion, as well as providing some meat, fine skins, and rennet for cheese making. The increasing slaughter of neonatal and young calves observed in Phases 2 to 3 indicates an effort to intensify dairy production for local consumption, food renders (as rent, tax or tithe) and/or trade — a pattern also observed at other contemporary sites in the Northern Isles, including Pool in Orkney (Bond 1998; 2007b) and both Sandwick
South (Bigelow 1992) and Sandwick North (Barrett & Oltmann 2000) in Shetland. Nevertheless, the pres-ence of immature and sub-adult specimens indicates that some cattle were slaughtered for meat, and a few older individuals would also have been essential for traction and reproduction. Thus it is not surprising to have found some age and/or stress-related pathologi-cal evidence (see below) and a few horn cores (from the Farm Mound) that are likely to derive from very old individuals (following Armitage 1982).
Caprines were probably used for a variety of purposes at Quoygrew, as reflected in the broad range of ages recovered. The majority died at an age indica-tive of prime meat consumption following one or two years of wool production. A few old caprines were kept, presumably for breeding purposes. Recovery of neonatal bone was subject to the same biases as

152
Chapter 8
cattle bone, yet even accounting for these, few very young deaths occurred. These probably represented natural deaths during the lambing season, or deliber-ate killing of one lamb in the case of twins, as reported ethnographically (Berry 2000). In either case, lambing may have taken place close to the settlement because the dead stock were incorporated into the midden deposits.
Very little can be concluded about pig age at slaughter at Quoygrew because of small sample sizes. Little change through time or space was observed. Pigs were probably used for meat prior to reaching skeletal maturity, with a few individuals maintained as breeding stock.
8.8. Pathologies
A total of 90 pathological lesions were recorded on mammal bones. Most affected cattle, with the remain-ing found on other domestic animals, seals, cetaceans and unknown species (Table 8.6). Almost all of the cat-tle pathologies were found on the bones of adult indi-viduals, and most were joint-based. These were prob-ably age-and stress-related and, as noted above, may be linked to the use of cattle for traction. Several adult
phalanges from Phases 1 and 2 to 3 of the Farm Mound contained depressions of type one, two or three (sensu Baker & Brothwell 1980). They are included in the total counts, despite being of questionable aetiology (O’Connor 2000, 100). No dental pathologies were observed for cattle, nor was there evidence of pre-mortem tooth loss. One pathological cattle element from Phases 2 to 3 of the Farm Mound resulted from a healing infection, but otherwise the assemblage is con-sistent with general good health (accepting that many individuals were slaughtered very young). Caprines were also in good overall health, with one incidence of infection and one of trauma leading to joint disease. There were fewer incidences of arthropathies than in the cattle assemblage. However, pre-mortem tooth loss and dental problems were observed in Phases 2 to 3 of the Farm Mound and Phase 2 of the North Mid-den. Three incidences of pathology were observed on horse bones, all in Phases 2 to 3 of the Farm Mound, as discussed in Section 8.5 above.
8.9. Biometry
Withers heights could be calculated using three cat-tle measurements and five caprine (treated as sheep)
Table 8.6. Summary of pathological lesions on mammal bones.
Taxa ElementFarm Mound Fish Midden North Midden Room 4 midden House 5 floors
Ph. 1 Ph. 2–3 Ph. 2–3 Ph. 2 Ph. 4 Ph. 2Seal species Skull 1Cetacean Sternum 1Horse Incisor 1
Tarsal 2Pig Calcaneum 1Cattle Skull 1 1
Incisor 1Maxillary molar 1Hyoid 1Metapodial 1Tarsal 1Phalanx 2 3 14Phalanx 3 1 10 1Caudal vertebra 1Phalanx 1 5 18 1
Caprine Astragalus 1Mandible 1 4 1Radius 1Tibia 1Phalanx 1 1
Large mammal Rib 1Pelvis 1Vertebra 1
Medium mammal 1 Rib 5Cervical vertebra 1
Unidentifiable mammal Shaft 2

153
Animal Husbandry: the Mammal Bone
measurements (following von den Driesch & Boess-neck 1974). Cattle ranged from 99 cm to 111 cm, and caprines (‘sheep’) from 46 cm to 56 cm. Full metrical data are provided in Appendices 8.5 to 8.7. Because of the small number of adults, few bones were measura-ble and therefore the potential for analyses of changes through time or across space is limited.
The Quoygrew cattle and caprines are similar in size to those from other sites of broadly comparable date in the Northern Isles, including Pool, Sandwick North, St Boniface, Buckquoy, Saevar Howe, Skaill and Earl’s Bu (see Harland 2006 and references therein). Sample sizes are small in all cases, but the withers height estimates for caprines, for example, fall within the ranges observed elsewhere (c. 50–60 cm). They are also similar to modern primitive Sheltands (Davis 1996; 2000).
8.10. Summary and discussion
The mammal bone from Quoygrew was dominated by domestic species, predominantly caprines (mostly sheep) and cattle, as well as some pigs. This is typi-cal of Orcadian farmsteads of this period (Harland 2006). Cattle were slightly more frequent in Phases 2 to 3 than in the preceding Phase 1, when compared with caprines. Pigs remained constant at less than 10% of the assemblage. Horse remains were found in small quantities, with butchery marks indicating that these animals were probably eaten occasionally in addition to being used for transportation. Two red deer specimens, both from the earliest phase of the Farm Mound, corroborate the pattern observed at other sites that red deer were extirpated from the Northern Isles during the Viking Age. Dogs and cats were found, as was evidence of carnivore gnawing. Sea mammal remains were recovered in small num-bers. Given that they exhibited higher frequencies of carnivore gnawing than other species, they may have been preferentially used for dog food. Skeletal element and cut-mark patterns for the main domestic species indicate that all parts of animals were used at Quoy-grew and butchered on site. Fragmentation patterns indicate that marrow was also routinely extracted by breaking long bones.
The majority of cattle were very young in all phases, with an increase in neonatal deposition found through time. This age profile is probably indicative of a mixed economy with an emphasis on dairying, the excess calves being killed to allow better access to milk for making dairy produce (Bigelow 1992; Bond 1998; 2007b; Craig et al. 2004; Mulville et al. 2005). Dairy products in the form of butter and cheese are easily portable and storable. They are high in calories, and
are known to have played an important economic role in medieval Norway and Scandinavian Scotland, including being used to pay rent, tax and tithe (Chal-linor 2004; Øye 2004, 107; Critch 2011; see Chapter 2). Cattle themselves, the main milk producers, were sometimes also levied as tribute (Barrett 2007, 322). Some deaths of neonatal calves likely resulted from harsh winter conditions and lack of fodder, but ethnographic and biological studies of mortality patterns indicate far fewer new-born animals should be present if the pattern was natural (Mulville et al. 2005). High proportions of neonatal bone represent sustainable dairy herd management practices for the obvious reason that nearly 50% of calves (most of the males) can be culled without reducing production or reproduction. The intensification of dairy production through time has been observed at other sites in the Northern Isles, including Pool (Bond 1998; 2007b), Sandwick South (Bigelow 1992) and Sandwick North (Barrett & Oltmann 2000). Other sites in Caithness and the Northern Isles also contain high proportions of neonatal cattle bone, but lack the temporal resolu-tion and/or stratigraphic superposition necessary to clarify the chronology of intensification through time (see Harland 2006). Butter-making utensils such as churns (typically made of wood) have not survived from medieval Orkney, but are well known from later ethnohistoric evidence (e.g. Fenton 1978, 440–42). At Quoygrew, the evidence for increased production of dairy produce corresponds to an increase in fish-ing activity (Chapters 5 to 7), making Phases 2 to 3 a period of overall economic intensification. The impor-tance of cattle (and thus dairying?) may have declined again by Phase 4, the late Middle Ages, but as noted above the sample size is very small in this instance.
Most Viking Age and medieval sites in the Northern Isles have this distinctive high proportion of very young cattle remains, but the Birsay area in Orkney has proven an exception. Sites with very lit-tle or no neonatal cattle include the Brough of Birsay (Hunter & Morris 1982; Sellar et al. 1986), Saevar Howe (Rowley-Conwy 1983), Buckquoy (Noddle 1976–77) and Beachview Birsay (Rackham 1996). This pattern is not consistently taphonomic nor recovery based, given the variety of preservation conditions and recovery methods relevant to the Birsay sites. The Birsay Bay area was, however, known to be an important political and religious centre from at least the eleventh cen-tury (Ritchie 1983; Crawford 2005). Thus it may have received milk products as payment of rent, tax and/or tithe from farms throughout the Northern Isles. The draw of staple goods to ‘central places’ is paralleled in the zooarchaeological evidence from Earl’s Bu, another high-status site in Mainland Orkney (Batey & Morris

154
Chapter 8
1992). There, quantities of preserved cod and haddock were consumed, and these were likely imported from producer sites throughout the Northern Isles (Barrett 1997; Harland 2007; see Chapter 7). These two high-status areas may have functioned in similar ways, each receiving specialized food renders from settlements of more normal status.
Early historic rural Ireland has a wealth of histori-cal data relating to dairying, indicating its importance, yet few neonatal calves have been found there (and certainly nothing comparable with the Northern Isles) (Lucas 1989; McCormick 1992; 1998; McCormick & Murray 2007). This difference may reflect the complex role cattle played in the Irish economy. They embod-ied wealth and status and were thus less likely to be deliberately killed solely to allow human access to milk.
Unlike the Northern Isles of Scotland, Viking Age and medieval settlements in Norway, Denmark and Sweden were not typically characterized by such high levels of neonatal cattle bones (Barrett et al. 2007 and references therein; O’Connor 2010). Nor were other Scandinavian influenced areas of Britain and Ireland (e.g. O’Connor 2004; McCormick & Mur-ray 2007, 51–8; Dobney et al. 2007, 140–41). Instead, the culling of young calves may imply a husbandry strategy rooted in pre-Viking Age local practice (cf. C. Smith 1994, 144; Bond 2007b, 218–19). High levels of neonatal calves are also common in bone assemblages from Viking Age and medieval Iceland — where they are similarly interpreted as evidence for intensive dairying (McGovern 2009, 188–95). Thus this tradition ultimately became characteristic of the Scandinavian North Atlantic colonies.
Sheep were likely used for meat and wool, and potentially also for dairy products. Contra Noddle’s (1976–77) suggestion that wool from Viking Age and early medieval sheep was of little use, parasites from a tenth-century waterlogged pit at Tuquoy in Orkney (Owen 2005) and the ubiquity of spindle whorls in the North Atlantic region (cf. Mainland & Halstead 2005; Chapters 12 and 13) indicate wool production was an important part of the economy. Woollen cloth, vaðmál or wadmal, was Iceland’s main export and currency until the fourteenth century (Þorláksson 1991), and it is recorded as a Shetlandic product in late medieval and post-medieval sources (Chapter 2). Woollen cloth and cloth impressions have also been identified in the corrosion products of metal jewellery from Viking Age graves in Atlantic Scotland (Gabra-Sanders 1998, 179, 181–3). Ethnographic evidence from the Northern Isles and the Scandinavian North Atlantic region indicates sheep’s milk was used until the recent past, albeit not as intensively as cow’s milk (Bergsåker 1978; Fenton 1978, 454). Lambs were not seen as competitors to human use of the milk, so were not slaughtered in the same way as calves. Sheep’s milk can be turned into cheese or butter, although the latter is generally of poor quality (Challinor 2004). At Quoygrew caprines appear to have been most important in relative terms (vis-à-vis cattle, for example) during Phase 1, and then again (based on a small sample size) in Phase 4 after the main period of economic intensification in Phases 2 to 3. Regard-ing absolute abundance, however, it is possible that caprine herds remained stable or even increased during Phases 2 to 3 (see Chapter 11).


