Embed Size (px)
Citation preview

Proteomics 2013, 13, 3013–3029 3013DOI 10.1002/pmic.201300142
RESEARCH ARTICLE
Characterization of multiple myeloma vesicles by
label-free relative quantitation
Sean W. Harshman1,2∗, Alessandro Canella3∗, Paul D. Ciarlariello2, Alberto Rocci4,Kitty Agarwal5,6, Emily M. Smith3, Tiffany Talabere3, Yvonne A. Efebera3,Craig C. Hofmeister3, Don M. Benson Jr.3, Michael E. Paulaitis6,7,Michael A. Freitas1,2 and Flavia Pichiorri3∗∗
1 Department of Molecular Virology, Immunology and Medical Genetics, The Ohio State University, Columbus, OH,USA
2 Comprehensive Cancer Center, The Ohio State University, Columbus, OH, USA3 Department of Internal Medicine, Division of Hematology, The Ohio State University, Columbus, OH, USA4 Myeloma Unit, Division of Hematology, Azienda Ospedaliera Citta` della Salute e della Scienza di Torino,University of Turin, Torino, Italy
5 Department of Chemistry and Biochemistry, The Ohio State University, Columbus, OH, USA6 Nanoscale Science and Engineering Center, The Ohio State University, Columbus, OH, USA7 Department of Chemical and Biomolecular Engineering, The Ohio State University, Columbus, OH, USA
Multiple myeloma (MM) is a hematological malignancy caused by a microenviromentallyaided persistence of plasma cells in the bone marrow. The role that extracellular vesicles(EVs), microvesicles and exosomes, released by MM cells have in cell-to-cell communicationand signaling in the bone marrow is currently unknown. This paper describes the proteomiccontent of EVs derived from MM.1S and U266 MM cell lines. First, we compared the proteinidentifications between the vesicles and cellular lysates of each cell line finding a large overlapin protein identifications. Next, we applied label-free spectral count quantitation to determineproteins with differential abundance between the groups. Finally, we used bioinformatics tocategorize proteins with significantly different abundances into functional groups. The resultsillustrate the first use of label-free spectral counting applied to determine relative proteinabundances in EVs.
Keywords:
Cell biology / Exosomes / Label free / LC-MS/MS / Microvesicles
Received: April 9, 2013Revised: June 19, 2013
Accepted: July 13, 2013
� Additional supporting information may be found in the online version of this article atthe publisher’s web-site
1 Introduction
Multiple myeloma (MM) is the second most common hema-tological malignancy accounting for more than 10 000 deathsannually [1]. Recent improvements in antineoplastic drugs
Correspondence: Dr. Michael A. Freitas, The Ohio State UniversityMedical Center, 460 West 12th Avenue, Columbus, OH 43210, USAE-mail: [email protected]: +1-614-688-8675
Abbreviations: BST-2, bone marrow stromal cell antigen 2; cryo-
TEM, cryo-transmission electron microscopy; EV, extracellularvesicles; FDR, false discovery rate; IgG� LC, IgG kappa light chain;MM, multiple myeloma; NCL, nucleolin
including proteasome inhibitors and immune modulatingdrugs have improved overall patient outcomes [2]. There isa tight relationship between MM plasma cells and the bonemarrow stromal cells, and this stroma has a pivotal role inthe regulation of MM cell growth and survival, as well as sol-uble factors and adhesion molecules [3]. Although importantsoluble factors and adhesion molecules, such as TNF-� andCD49d have been identified, small lipid membrane boundvesicles are hypothesized to also play a role in cell–cell sig-naling [3–5]. Microvesicles or exosomes (called extracellular
∗These authors contributed equally to this work.∗∗Additional corresponding author: Dr. Flavia Pichiorri,E-mail: [email protected]
C© 2013 WILEY-VCH Verlag GmbH & Co. KGaA, Weinheim www.proteomics-journal.com
3014 S. W. Harshman et al. Proteomics 2013, 13, 3013–3029
vesicles (EVs)), released by almost all cell types, are smallstructures based on a lipid bilayer and are recognized as im-portant in facilitating intercellular communication withoutcell-to-cell contact [4,5]. Recently, several studies have focusedon the role of circulating EVs in cancer biology. These vesiclesincrease tumor survival and expansion by carrying bioactivemRNA, miRNA, and proteins into the extracellular space al-lowing for functional manipulation of the surrounding tumormicroenvironment [4, 5].
MS-based proteomics is a powerful tool used to charac-terize the protein content of EVs [6–31]. In this article, weused shotgun proteomics to identify proteins contained invesicles derived from two distinct MM cell lines. We fur-ther applied label-free spectral count relative quantitation toassess the differences in protein abundances [32, 33]. Thisapproach revealed proteins of variable abundance acrossthese MM cell-derived vesicles. Our results establish afoundation for further functional studies of MM biologythrough the identification of proteins associated with vesicletargets.
2 Materials and methods
2.1 Cell line tissue culture
MM.1S and U266 cell lines were obtained from AmericanType Culture Collection (ATCC Manassas, VA, USA) andcultured using modified conditions originally described byGoldman-Leikin et al. and Nilsson et al. [34,35]. Briefly, cellswere maintained at 0.4 × 10⁶ cells/mL by incubation at 37�Cwith 5% CO2 in RPMI-1640 media supplemented with 10%FBS, 2 mM glutamine (GlutaMAX), 50 U/mL penicillin-G, and 50 �g/mL streptomycin (Life Technologies, GrandIsland, NY, USA). To eliminate artifacts from serum-derivedvesicles, 48 h before analysis, 100–200 × 106 cells were pel-leted at 300 × g for 10 min and resuspended in serum freemedia at 1–1.5 × 10⁶ cells/mL.
2.2 Vesicle isolation
The method used for isolation of cell line derived vesicleswas previously described by Thery et al. [36]. In short, serum-starved cells and media were centrifuged at 300 × g for10 min at 4�C. Supernatant was collected and centrifugedagain at 2000 × g for 20 min at 4�C. The cell pellets werefrozen and stored at −80�C for later use. Supernatant washarvested and vacuum ultracentrifuged at 10 000 × g for30 min at 4�C to remove residual cell debris. Supernatantwas collected and ultracentrifuged at 100 000 × g for 70 minat 4�C with vacuum. The resulting supernatant was discarded,pellets from multiple tubes were resuspended in 1 mL of PBS,pooled into a single tube, and ultracentrifuged at 100 000 ×g as described previously. Supernatant was eliminated andpellets of vesicles were frozen and stored at −80�C.
2.3 Flow cytometry
MM.1S and U266 cell lines were analyzed for annexin V andpropidium iodide staining. Following serum starvation, cellswere washed 1× with PBS and annexin V and propidiumiodide staining solution (Clonetech Laboratories, MountainView, CA, USA) was added. Samples were allowed to standfor 15 min in the dark. Cells were washed 1× with PBSand immediately analyzed. All analyses were completed ona Beckman Coulter CXP flow cytometer (Beckman Coulter,Brea, CA, USA).
2.4 Cryo-transmission electron microscopy
(cryo-TEM)
Vesicles derived from MM1.S and U266 cells were preparedfor cryo-TEM within a controlled environment (22�C and 95%relative humidity) of an automated vitrification device (FEIVitrobot Mark IV, FEI, Hillsboro, OR, USA). To prepare vit-rified specimens, 4 �L suspensions of EVs were applied toglow discharged lacey carbon-coated copper grids (400 mesh,Pacific Grid-Tech, San Francisco, CA, USA) and flash-frozenin liquid ethane. The vitrified samples were stored underliquid nitrogen before transferring to a Gatan Cryo holder(Model 626.DH) and visualized in a FEI Tecnai G2 F20 STtransmission electron microscope (FEI). The microscope wasoperated at 200 kV and under low dose mode to minimize ra-diation damage to the samples. Images were captured usinga 4 k × 4 k Gatan Ultrascan CCD camera at a magnificationof 38 000×.
2.5 Dynamic light scattering (DLS)
Number distributions of EV hydrodynamic diameters werederived from DLS measurements using a Nano ZetasizerZen3600 (Malvern Instruments Ltd., Worcestershire, UnitedKingdom). Samples were diluted to the required count rateof 50–300 kilocounts per second and equilibrated at 25�C. Allmeasurements were made in triplicate. The Stokes–Einsteinrelation was used to calculate particle diameters from mea-sured translational diffusion coefficients.
2.6 Preparation of samples for MS
The preparation of both the cell-derived vesicles and theglobal lysates was done following a modified method previ-ously developed in our lab [32]. Briefly, three biological repli-cates of vesicle isolations or 48 h serum starved cell pellets(100 000 cells) were resuspended in 50 mM ammonium bi-carbonate (Sigma Aldrich, St. Louis, MO) supplemented with0.5% Rapigest SF surfactant (Waters, Milford, MA). A total of800 ng of sequencing grade modified trypsin (Promega, Madi-son, WI, USA) was added to each sample and incubatedovernight (>16 h) at 37�C. The reaction was suspended and
C© 2013 WILEY-VCH Verlag GmbH & Co. KGaA, Weinheim www.proteomics-journal.com

Proteomics 2013, 13, 3013–3029 3015
Rapigest was precipitated through the addition of 98% formicacid (Acros Organics, Geel, Belguim) to approximately 30%v/v. Samples were returned to 37�C for 30 min. Solutions werecentrifuged 3× at 21 000 × g removing the supernatant follow-ing each centrifugation. Peptides were speedvac’d to drynessand resuspended in 20 �L of 2% ACN with 0.1% formic acid(aq). Final peptide concentrations were measured by 280 nmabsorbance using a NanoDrop ND-1000 (NanoDrop, Wilm-ington, DE, USA) spectrometer.
2.7 LC-MS/MS
A total of 1–2 �g of peptides were loaded for RP-HPLC sep-aration on a Dionex Ultimate 3000 capillary/nano HPLC(Dionex, Sunnyvale, CA, USA) and mass analyzed by aThermoFisher LTQ Orbitrap XL mass spectrometer (Ther-moFisher, Waltham, MA, USA). The LTQ Orbitrap XL wasfitted with a micro/nanospray ionization source (MichromBioresources Inc., Auburn, CA, USA). HPLC separationswere carried at a flow rate of 2 �L/min on a 0.2 mm ×150 mm C18 column (5 �m, 300 A, Michrom BioresourcesInc., Auburn, CA, USA). Mobile phases were HPLC wa-ter (J.T. Baker, Center Valley, PA, USA) and ACN (EMDMillipore, Billerica, MA, USA) each supplemented with 0.1%v/v formic acid. The 300-min HPLC gradient was as follows.Starting at 2% mobile phase B, the gradient was increasedlinearly to 5% at 12 min, 15% at 40 min, 30% at 170 min,55% at 240 min, 85% at 265 min, and 90% at 270 min. Thecolumn was held at 90% for 5 min, followed by equilibra-tion at 2% for 24 min. The heated capillary temperature andelectrospray voltage on the LTQ Orbitrap XL were 175�C and2.0 kV, respectively. Top five data-dependent mode was uti-lized in positive ion mode with dynamic exclusion of repeatcount = 3, repeat duration = 30.00, exclusion list size =500, exclusion duration = 350 s, and exclusion mass width of±1.50 m/z. Protein identifications were obtained using theMassMatrix search engine (v 2.4.2) and the UniprotKB com-plete H. sapiens proteome (as of 18Sep12) [37–40]. Search pa-rameters included three trypsin missed cleavages, precursorion tolerance of ±10 ppm and a product ion tolerance of ±0.8Da. Cytoskeletal, epidermal, and cuticle keratin identifica-tions were recognized as contaminant proteins and removedfrom the analysis (listed in Supporting Information Data4–8). The false discovery rate (FDR) was estimated using thereversed sequences of the target database. The parsing of pro-tein identifications and spectral counts was conducted fromeach data file and combined using an in-house python appli-cation [41]. For combined protein lists, the protein matcheswere retained based on an FDR threshold of 5% and twounique peptide matches or a max decoy cutoff of 2 for eachset of protein identifications.
2.8 Label-free relative quantitation
Relative quantitation of the LC-MS/MS data was performedusing the label-free approach described by Liu et al. and
Colinge et al. [42, 43]. The spectral counts used in the analy-sis did not include modified, semitryptic, or shared peptides,including those from multiple protein isoforms. Protein listswere generated as follows. Search results were combined intoa single harmonized table. This table contains the protein ID,the number of spectral counts, the number of peptides, se-quence coverage, and protein scores. Proteins were groupedbased on common peptide sets. Each protein group is repre-sented by the protein ID with the highest number of spectralcounts. Spectral count quantitation was performed using onlythe top protein matches that had two or more distinct peptidesequences in at least one sample and protein scores above thedecoy match discriminant score threshold. The decoy matchdiscrimanty score was determined by taking the protein scorefor the third decoy match or the decoy score that exceeds thetarget-decoy FDR of 5%. Spectral count quantitation was per-formed on the proteins that had a minimum of five total spec-tral counts across all samples. These criteria are very conser-vative and may reduce the apparent limit of detection becauserare protein matches with low counts are removed from thequantitative analysis. The spectral count data and their esti-mated FDRs are provided in Supporting Information Data5–8. Significance analysis of relative protein abundance fromspectral count data was determined by using the edgeR bio-conductor package [44]. Peptide spectral count distributionswere modeled using a Poisson/negative binominal distribu-tion and normalized to the respective spectral count librarysize [44–46]. Differences in protein abundance were evaluatedbased upon an exact text for the overdispersed data [46]. Falsediscovery was controlled by applying a Benjamini–Hochbergmultitest correlation (� = 0.05) to final p-values [47]. The cpmwere calculated as the base 2 log of the normalized averagecounts across a row divided by one million.
2.9 Computational annotations, clustering, and
bioinformatics
Venn diagrams were created using the BioVenn web applica-tion (http://www.cmbi.ru.nl/cdd/biovenn/) [48]. Clusteringanalysis and visualization was performed using open sourcesoftware Cluster 3.0 and Java Tree View (ver. 1.1.6r2). Bioin-formatic annotations of gene ontology for identified proteinswere searched against the PANTHER Classification System(http://www.pantherdb.org/) [49, 50].
2.10 Immunoblotting
Cell and vesicles were lysed using a modified RIPA buffer(50 mM Tris pH 7.5, 150 mM NaCl, 10% glycerol, 1.0% NP-40,0.1% SDS, and protease and phosphatase inhibitors). Proteinconcentrations of the lysates were determined by Bradford as-say (Bio-Rad, Richmond, CA, USA). Equivalent amounts ofglobal lysates and vesicle lysates were run in a 4–15% Tris-HClSDS-PAGE TGX gel (Bio-Rad), transferred to nitrocellulose
C© 2013 WILEY-VCH Verlag GmbH & Co. KGaA, Weinheim www.proteomics-journal.com

3016 S. W. Harshman et al. Proteomics 2013, 13, 3013–3029
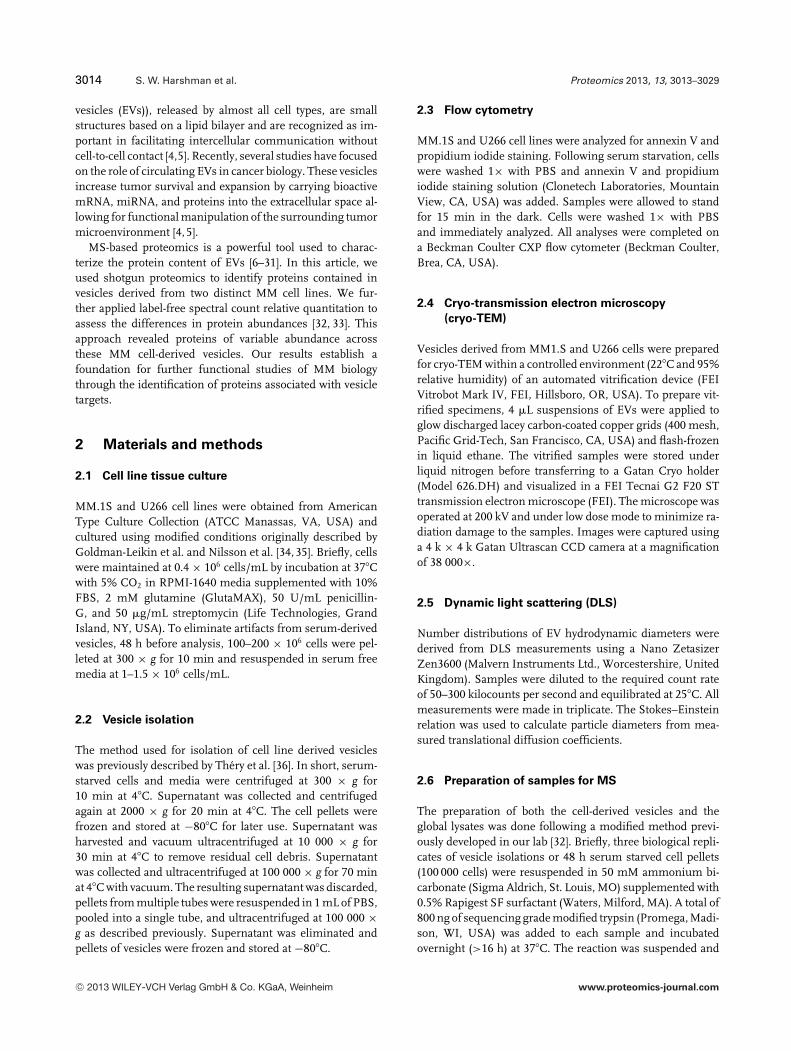
Figure 1. Cryo-transmission electron mi-croscopy (cryo-TEM) images of the (A)MM.1S cell-derived extracellular vesiclesand (B) U266 cell-derived extracellularvesicles, indicated by the black. The cryo-TEM carbon support grids (white ar-rows) are also seen in these images.(C) Number distributions of MM.1S andU266 extracellular vesicle diameters de-rived from dynamic light scattering (DLS)measurements.
and blotted for CD9, CD44, actin and nucleolin (NCL) (SantaCruz Biotechnology, Santa Cruz, CA, USA), glyceraldehyde3-phosphate dehydrogenase (GAPDH, Cell Signaling Tech-nology, Boston, MA, USA), IgG kappa light chain (IgG� LC),MHC class I, and bone marrow stromal cell antigen 2 (BST-2)(, Abcam, Cambridge, MA, USA). Chemiluminescent detec-tion was performed using anti-mouse and anti-rabbit IgG-HRP (GE Healthcare, Piscataway, NJ, USA) and either ECLWestern Blotting Detection Reagents (GE Healthcare) or Su-perSignal West Femto Kit (Pierce Biotechnology, Rockford,IL, USA). HeLa (CD9) and ARH77 (IgG� LC) global lysateswere used as positive controls for the immunoblots.
3 Results
3.1 Size distribution and structural characteristics
of MM-derived vesicles
The MM cell-derived vesicles were imaged by cryo-TEM to ob-tain morphological characteristics. Figure 1A and 1B showsrepresentative cryo-TEM images of vesicles derived from theMM.1S and U266 cell lines. The images depict vesicles thatare spherical in shape with a single lipid bilayer, and hydro-dynamic diameters that range roughly from 50 to 200 nm.Several vesicles are observed to contain daughter vesicles
C© 2013 WILEY-VCH Verlag GmbH & Co. KGaA, Weinheim www.proteomics-journal.com
Proteomics 2013, 13, 3013–3029 3017
(Fig. 1A, top) or internal, electron dense material (Fig. 1B,top). DLS was performed to assess the size distributionsof the enriched vesicles. The DLS analysis of the U266-derived vesicles shows a monomodal distribution of vesiclediameters ranging from 80 to 200 nm (average diameter of138 nm), while the MM.1S vesicle diameters are somewhatlarger, ranging from 100 to 200 nm (average diameter of177 nm) with a small population of even larger vesicles withdiameters between 240 and 260 nm (Fig. 1C). Collectively,these results indicate that our MM cell-derived vesicle prepa-rations yield EVs with similar size distributions and similarspherical morphologies for the two cell lines [4].
It has been shown that apoptotic cells release organelle-containing vesicles as part of their death program [51]. It ispossible therefore that vesicle isolations may contain apop-totic bodies. To address the possibility of apoptotic body con-tamination in our vesicle preparations, annexin V/popidiumiodide flow cytometry was conducted on serum-starved cellsprior to vesicle isolation. Supporting Information Data 1shows that more than 98% of cells are negative for annexinV/popidium iodide staining. Confirming that the majorityof the vesicles are derived from cells that are nonapoptotic.Taken together, the data indicate that vesicles obtained fromnonapoptotic MM.1S and U266 MM cell lines have diametersbetween 50 and 200 nm.
3.2 Proteomics of MM cell line derived vesicles
Vesicles isolated from the MM.1S and U266 cell lines andthe corresponding global cell lysates were characterized byLC-MS/MS proteomic analysis. An overview of the proteomicworkflow used is provided in Supporting Information Data2. The LC-MS/MS base peak chromatograms for the vesiclesand cell lysates (Supporting Information Data 3 & 4) showhigh similarity. A database search of the LC-MS/MS fromthree experimental replicates (starting from cells grown fromseparate cultures) for each of the vesicles yielded 311 and 272protein identifications for the MM.1S and U266 cell lines,respectively (Supporting Information Data 5 & 6). The LC-MS/MS analysis of the global MM.1S and U266 cell lysatesyielded 279 and 353 protein identifications (Supporting In-formation Data 7 & 8). Venn diagrams are provided in Fig. 2Aand 2B to show the overlap in protein identifications betweenthe cell-derived vesicles and their global lysates. While there isa high number of overlapping protein IDs, unique proteinswere observed in the cell line derived vesicles (24%, 72 forMM.1S, and 15%, 49 for U266) and the lysates (18%, 55 forMM.1S, and 35%, 111 for U266).
Recent literature on protein composition of vesicles ob-tained from many cell lines reported that several proteinsare similar irrespective of cell of origin [52–54]. However,vesicles may also harbor proteins unique to the cell of ori-gin. To determine if this hypothesis holds true for our dataset, we compared the protein IDs in MM.1S and U266 vesi-cles. The Venn diagram in Fig. 2C shows 32 (10%) proteins
unique to the MM.1S vesicles and 13 (4%) proteins unique toU266 with 324 common proteins. Additionally, comparisonof the MM.1S and U266 vesicle identifications to the down-loadable ExoCarta database of EV identified proteins yield alarge number of previously identified proteins (83% MM.1Sand 77% U266, Supporting Information Data 5 & 6) [30, 31].These results are consistent with recent proteomic analysesof EVs [30, 31, 53, 54].
3.3 Label-free comparison of cellular proteins
and vesicles
The LC-MS/MS data show a high similarity in protein IDsbetween the cell-derived vesicles and their corresponding cel-lular lysates. Hierarchical cluster analysis reveals significantdifferences in the relative protein spectral counts betweenvesicle and cellular proteins. Cluster heat maps are providedalong with ontological classification of the protein molecularfunctions and biological processes (Fig. 3). Label-free spec-tral count quantitation was then used to determine the sig-nificance of relative differences in protein abundance [32,33].Relative quantitation determined 298 and 366 proteins withsignificant differences in protein spectral counts betweenthe MM.1S and U266 vesicles and their corresponding cel-lular lysates (p < 0.05) (Supporting Information Data 9).Classification of significant proteins by molecular functionsand biological processes determined, using the PANTHERgene ontological search software, that vesicles have signifi-cantly different protein abundance than their cell of origin(Fig. 3).
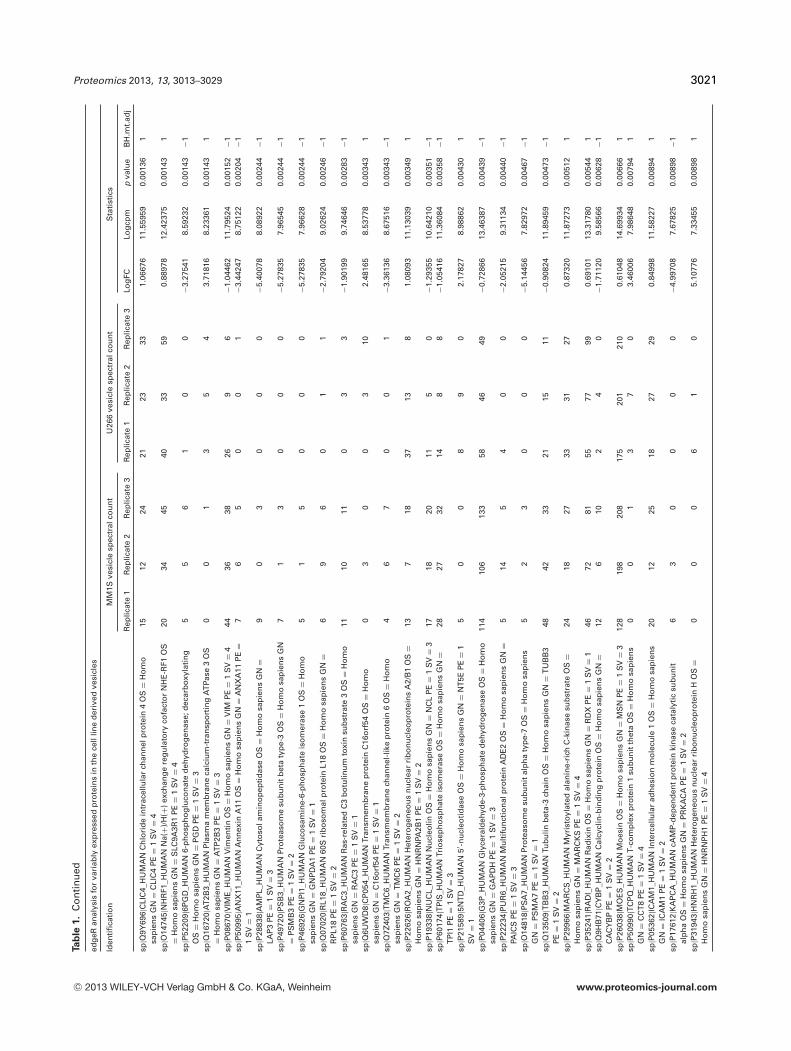
Hierarchical clustering of the MM.1S and U266 vesiclesshows tight grouping by cell of origin (Fig. 4A). Label-freerelative quantitation determined 125 proteins with signifi-cantly different abundance between the MM.1S and U266vesicles (p < 0.05) (Table 1 and Supporting InformationData 9). The smear plot (constructed by plotting the log foldchange versus logcpm is provided in Fig. 4C). The PAN-THER gene ontological annotations for biological processand molecular function for those proteins with statisticallydifferent abundance are provided in Fig. 4D. These data sug-gest that the protein abundances in vesicles can distinguishbetween the cells of origin. Additionally, the results showthat the measurement of these differences in relative abun-dance more closely reflects biologic function than protein IDalone.
The increase in the relative abundance of specific proteinsin the vesicles could be attributed to higher protein expressionin a given cell type rather than specific packaging of proteinsinto the vesicles. To determine if the differences in vesicularprotein compositions are driven by cell type versus packaging,we plotted the fold change (log fold change) of each proteinin the MM.1S versus U266 vesicles versus its correspondingchange in the cellular protein. Figure 5A shows proteins withno significant change in vesicular abundance or cellular ex-pression in the same direction (i.e. both increased/decreased
C© 2013 WILEY-VCH Verlag GmbH & Co. KGaA, Weinheim www.proteomics-journal.com

3018 S. W. Harshman et al. Proteomics 2013, 13, 3013–3029Ta
ble
1.
List
of
pro
tein
sw
ith
diff
eren
tial
abu
nd
ance
sb
ased
on
the
lab
el-f
ree
anal
ysis
of
the
vesi
cles
der
ived
fro
mb
oth
the
MM
.1S
and
U26
6ce
lllin
es
edg
eRan
alys
isfo
rva
riab
lyex
pre
ssed
pro
tein
sin
the
cell
line
der
ived
vesi
cles
Iden
tifi
cati
on
MM
1Sve
sicl
esp
ectr
alco
un
tU
266
vesi
cle
spec
tral
cou
nt
Sta
tist
ics
Rep
licat
e1
Rep
licat
e2
Rep
licat
e3
Rep
licat
e1
Rep
licat
e2
Rep
licat
e3
Log
FCLo
gcp
mp
valu
eB
H.m
t.ad
j
sp|B
9A06
4|IG
LL5_
HU
MA
NIm
mu
no
glo
bu
linla
mb
da-
like
po
lyp
epti
de
5O
S=H
om
osa
pie
ns
GN
=IG
LL5
PE=2
SV
=210
357
885
31
−4.2
7614
12.4
1465
3.01
E−2
6−1
sp|P
0183
4|IG
KC
_HU
MA
NIg
kap
pa
chai
nC
reg
ion
OS
=Ho
mo
sap
ien
sG
N=I
GK
CP
E=1
SV
=10
00
3436
218.
7690
511
.110
352.
20E−2
31
sp|P
0CG
04|LA
C1_
HU
MA
NIg
lam
bd
a-1
chai
nC
reg
ion
sO
S=H
om
osa
pie
ns
GN
=IG
LC1
PE=1
SV
=176
3657
53
0−3
.889
4511
.895
551.
41E−1
9−1
sp|P
5507
2|TE
RA
_HU
MA
NTr
ansi
tio
nal
end
op
lasm
icre
ticu
lum
AT
Pase
OS=H
om
osa
pie
ns
GN
=VC
PP
E=1
SV
=446
4856
50
0−4
.373
9011
.714
471.
41E−1
9−1
sp|P
2940
1|TK
T_H
UM
AN
Tran
sket
ola
seO
S=H
om
osa
pie
ns
GN
=TK
TP
E=1
SV
=342
3444
02
0−5
.290
2511
.374
666.
73E−1
9−1
sp|P
8072
3|BA
SP
1_H
UM
AN
Bra
inac
idso
lub
lep
rote
in1
OS
=Ho
mo
sap
ien
sG
N=B
AS
P1
PE=1
SV
=230
2736
00
0−8
.324
9210
.994
114.
02E−1
8−1
sp|P
3324
1|LS
P1_
HU
MA
NLy
mp
ho
cyte
-sp
ecifi
cp
rote
in1
OS
=Ho
mo
sap
ien
sG
N=L
SP
1P
E=1
SV
=10
03
915
374.
6938
710
.595
403.
17E−1
61
sp|P
0719
5|LD
HB
_HU
MA
NL-
lact
ate
deh
ydro
gen
ase
Bch
ain
OS
=Ho
mo
sap
ien
sG
N=L
DH
BP
E=1
SV
=251
5044
63
1−3
.354
3311
.719
432.
82E−1
5−1
sp|P
2273
2|GT
R5_
HU
MA
NS
olu
teca
rrie
rfa
mily
2;fa
cilit
ated
glu
cose
tran
spo
rter
mem
ber
5O
S=H
om
osa
pie
ns
GN
=SLC
2A5
PE=1
SV
=10
00
1215
217.
8491
810
.163
163.
84E−1
41
sp|P
5256
6|GD
IR2_
HU
MA
NR
ho
GD
P-d
isso
ciat
ion
inh
ibit
or
2O
S=H
om
osa
pie
ns
GN
=AR
HG
DIB
PE=1
SV
=321
2424
00
0−7
.895
8510
.576
444.
87E−1
4−1
sp|Q
1476
4|MV
P_H
UM
AN
Maj
or
vau
ltp
rote
inO
S=H
om
osa
pie
ns
GN
=MV
PP
E=1
SV
=416
514
2276
372.
4145
111
.999
662.
92E−1
31
sp|P
2363
4|AT
2B4_
HU
MA
NP
lasm
am
emb
ran
eca
lciu
m-t
ran
spo
rtin
gA
TPa
se4
OS
=Ho
mo
sap
ien
sG
N=A
TP
2B4
PE=1
SV
=20
00
1017
137.
5873
99.
8868
76.
32E−1
21
sp|Q
1518
1|IP
YR
_HU
MA
NIn
org
anic
pyr
op
ho
sph
atas
eO
S=H
om
osa
pie
ns
GN
=PPA
1P
E=1
SV
=217
1721
00
0−7
.570
2310
.256
971.
61E−1
1−1
sp|Q
9H4M
9|EH
D1_
HU
MA
NE
Hd
om
ain
-co
nta
inin
gp
rote
in1
OS=H
om
osa
pie
ns
GN
=EH
D1
PE=1
SV
=20
01
1112
125.
2461
59.
7306
75.
28E−1
11
sp|P
4932
7|FA
S_H
UM
AN
Fatt
yac
idsy
nth
ase
OS
=Ho
mo
sap
ien
sG
N=F
AS
NP
E=1
SV
=332
2110
03
0−3
.825
0810
.513
972.
83E−1
0−1
sp|Q
1622
2|UA
P1_
HU
MA
NU
DP
-N-a
cety
lhex
osa
min
ep
yro
ph
osp
ho
ryla
seO
S=H
om
osa
pie
ns
GN
=UA
P1
PE=1
SV
=30
00
119
107.
1748
59.
4636
22.
43E−0
91
sp|O
0076
4|PD
XK
_HU
MA
NP
yrid
oxal
kin
ase
OS
=Ho
mo
sap
ien
sG
N=P
DX
KP
E=1
SV
=113
1614
00
0−7
.217
259.
9099
32.
62E−0
9−1
sp|Q
96K
P4|C
ND
P2_
HU
MA
NC
yto
solic
no
n-s
pec
ific
dip
epti
das
eO
S=H
om
osa
pie
ns
GN
=CN
DP
2P
E=1
SV
=239
2523
61
2−2
.768
0111
.050
553.
27E−0
9−1
sp|P
1363
9|EF2
_HU
MA
NE
lon
gati
on
fact
or
2O
S=H
om
osa
pie
ns
GN
=EE
F2P
E=1
SV
=488
8999
1925
18−1
.674
3012
.847
603.
96E−0
9−1
sp|P
6116
0|AR
P2_
HU
MA
NA
ctin
-rel
ated
pro
tein
2O
S=H
om
osa
pie
ns
GN
=AC
TR
2P
E=1
SV
=118
1525
04
0−3
.315
0110
.430
811.
21E−0
8−1
sp|P
1461
8|KP
YM
_HU
MA
NP
yru
vate
kin
ase
iso
zym
esM
1/M
2O
S=H
om
osa
pie
ns
GN
=PK
MP
E=1
SV
=456
6767
116
138
107
1.40
132
13.7
0675
1.67
E−0
81
sp|P
0408
0|CY
TB
_HU
MA
NC
ysta
tin
-BO
S=H
om
osa
pie
ns
GN
=CS
TB
PE=1
SV
=217
1820
22
0−3
.238
7810
.362
382.
91E−0
8−1
sp|P
0555
6|IT
B1_
HU
MA
NIn
teg
rin
bet
a-1
OS
=Ho
mo
sap
ien
sG
N=I
TG
B1
PE=1
SV
=20
00
510
106.
9138
29.
1946
14.
15E−0
81
sp|Q
8WW
I5|C
TL1
_HU
MA
NC
ho
line
tran
spo
rter
-lik
ep
rote
in1
OS=H
om
osa
pie
ns
GN
=SLC
44A
1P
E=1
SV
=121
106
00
0−7
.002
019.
6932
46.
28E−0
8−1
sp|P
2770
1|CD
82_H
UM
AN
CD
82an
tig
enO
S=H
om
osa
pie
ns
GN
=CD
82P
E=1
SV
=110
1413
00
0−7
.002
019.
6976
26.
28E−0
8−1
sp|O
1524
7|CLI
C2_
HU
MA
NC
hlo
rid
ein
trac
ellu
lar
chan
nel
pro
tein
2O
S=H
om
osa
pie
ns
GN
=CLI
C2
PE=1
SV
=34
1015
00
0−6
.653
649.
3531
11.
32E−0
7−1
sp|P
4335
8|MA
GA
4_H
UM
AN
Mel
ano
ma-
asso
ciat
edan
tig
en4
OS
=Ho
mo
sap
ien
sG
N=M
AG
EA
4P
E=1
SV
=20
00
811
46.
7945
69.
0678
51.
32E−0
71
C© 2013 WILEY-VCH Verlag GmbH & Co. KGaA, Weinheim www.proteomics-journal.com

Proteomics 2013, 13, 3013–3029 3019
Ta
ble
1.
Co
nti
nu
ed
edg
eRan
alys
isfo
rva
riab
lyex
pre
ssed
pro
tein
sin
the
cell
line
der
ived
vesi
cles
Iden
tifi
cati
on
MM
1Sve
sicl
esp
ectr
alco
un
tU
266
vesi
cle
spec
tral
cou
nt
Sta
tist
ics
Rep
licat
e1
Rep
licat
e2
Rep
licat
e3
Rep
licat
e1
Rep
licat
e2
Rep
licat
e3
Log
FCLo
gcp
mp
valu
eB
H.m
t.ad
j
sp|P
6224
4|RS
15A
_HU
MA
N40
Sri
bo
som
alp
rote
inS
15a
OS
=Ho
mo
sap
ien
sG
N=R
PS
15A
PE=1
SV
=28
912
00
0−6
.653
649.
3515
02.
37E−0
7−1
sp|Q
0165
0|LA
T1_
HU
MA
NLa
rge
neu
tral
amin
oac
ids
tran
spo
rter
smal
lsu
bu
nit
1O
S=H
om
osa
pie
ns
GN
=SLC
7A5
PE=1
SV
=25
30
913
182.
7546
110
.145
752.
60E−0
71
sp|Q
1655
5|DP
YL2
_HU
MA
ND
ihyd
rop
yrim
idin
ase-
rela
ted
pro
tein
2O
S=H
om
osa
pie
ns
GN
=DP
YS
L2P
E=1
SV
=16
813
00
0−6
.551
609.
2504
04.
27E−0
7−1
sp|P
2192
6|CD
9_H
UM
AN
CD
9an
tig
enO
S=H
om
osa
pie
ns
GN
=CD
9P
E=1
SV
=48
1113
00
0−6
.794
319.
4917
65.
49E−0
7−1
sp|Q
0110
5|SE
T_H
UM
AN
Pro
tein
SE
TO
S=H
om
osa
pie
ns
GN
=SE
TP
E=1
SV
=316
812
01
0−4
.430
959.
6962
28.
01E−0
7−1
sp|O
0016
1|SN
P23
_HU
MA
NS
ynap
toso
mal
-ass
oci
ated
pro
tein
23O
S=H
om
osa
pie
ns
GN
=SN
AP
23P
E=1
SV
=11
30
916
53.
2923
19.
6339
89.
51E−0
71
sp|P
3135
0|RIR
2_H
UM
AN
Rib
on
ucl
eosi
de-
dip
ho
sph
ate
red
uct
ase
sub
un
itM
2O
S=H
om
osa
pie
ns
GN
=RR
M2
PE=1
SV
=19
79
00
0−6
.441
809.
1394
91.
40E−0
6−1
sp|P
3783
7|TA
LDO
_HU
MA
NTr
ansa
ldo
lase
OS
=Ho
mo
sap
ien
sG
N=T
ALD
O1
PE=1
SV
=27
612
00
0−6
.441
809.
1401
21.
40E−0
6−1
sp|O
0041
0|IP
O5_
HU
MA
NIm
po
rtin
-5O
S=H
om
osa
pie
ns
GN
=IP
O5
PE=1
SV
=48
98
00
0−6
.441
809.
1401
31.
40E−0
6−1
sp|P
4977
3|HIN
T1_
HU
MA
NH
isti
din
etr
iad
nu
cleo
tid
e-b
ind
ing
pro
tein
1O
S=H
om
osa
pie
ns
GN
=HIN
T1
PE=1
SV
=210
911
00
0−6
.702
079.
3989
91.
65E−0
6−1
sp|P
0276
8|ALB
U_H
UM
AN
Ser
um
alb
um
inO
S=H
om
osa
pie
ns
GN
=ALB
PE=1
SV
=224
00
00
0−6
.383
609.
0746
52.
55E−0
6−1
sp|P
2710
5|STO
M_H
UM
AN
Ery
thro
cyte
ban
d7
inte
gra
lmem
bra
ne
pro
tein
OS
=Ho
mo
sap
ien
sG
N=S
TOM
PE=1
SV
=30
00
39
76.
5216
68.
7904
12.
55E−0
61
sp|P
2969
2|EF1
D_H
UM
AN
Elo
nga
tio
nfa
cto
r1-
del
taO
S=H
om
osa
pie
ns
GN
=EE
F1D
PE=1
SV
=513
918
30
0−3
.173
549.
9147
22.
55E−0
6−1
sp|P
6233
0|AR
F6_H
UM
AN
AD
P-r
ibo
syla
tio
nfa
cto
r6
OS
=Ho
mo
sap
ien
sG
N=A
RF6
PE=1
SV
=20
02
76
83.
6873
79.
0686
34.
98E−0
61
sp|P
1379
6|PLS
L_H
UM
AN
Pla
stin
-2O
S=H
om
osa
pie
ns
GN
=LC
P1
PE=1
SV
=662
5683
2533
2−1
.264
5412
.486
486.
55E−0
6−1
sp|Q
0151
8|CA
P1_
HU
MA
NA
den
ylyl
cycl
ase-
asso
ciat
edp
rote
in1
OS
=Ho
mo
sap
ien
sG
N=C
AP
1P
E=1
SV
=519
1829
36
2−2
.087
4510
.747
548.
81E−0
6−1
sp|P
1785
8|K6P
L_H
UM
AN
6-p
ho
sph
ofr
uct
oki
nas
e;liv
erty
pe
OS
=Ho
mo
sap
ien
sG
N=P
FKL
PE=1
SV
=614
97
01
0−4
.170
239.
4456
61.
07E−0
5−1
sp|P
6324
4|GB
LP_H
UM
AN
Gu
anin
en
ucl
eoti
de-
bin
din
gp
rote
insu
bu
nit
bet
a-2-
like
1O
S=H
om
osa
pie
ns
GN
=GN
B2L
1P
E=1
SV
=36
87
00
0−6
.193
428.
8921
01.
58E−0
5−1
sp|Q
9BY
67|C
AD
M1_
HU
MA
NC
ella
dh
esio
nm
ole
cule
1O
S=H
om
osa
pie
ns
GN
=CA
DM
1P
E=1
SV
=210
65
00
0−6
.193
428.
8902
71.
58E−0
5−1
sp|Q
1357
6|IQ
GA
2_H
UM
AN
Ras
GT
Pase
-act
ivat
ing
-lik
ep
rote
inIQ
GA
P2
OS
=Ho
mo
sap
ien
sG
N=I
QG
AP
2P
E=1
SV
=45
915
01
0−4
.121
799.
4023
51.
80E−0
5−1
sp|Q
9995
9|PK
P2_
HU
MA
NP
lako
ph
ilin
-2O
S=H
om
osa
pie
ns
GN
=PK
P2
PE=1
SV
=22
28
513
192.
0747
510
.170
412.
11E−0
51
sp|P
1090
9|CLU
S_H
UM
AN
Clu
ster
inO
S=H
om
osa
pie
ns
GN
=CLU
PE=1
SV
=110
64
00
0−6
.124
028.
8206
02.
92E−0
5−1
sp|P
1301
0|XR
CC
5_H
UM
AN
X-r
ayre
pai
rcr
oss
-co
mp
lem
enti
ng
pro
tein
5O
S=H
om
osa
pie
ns
GN
=XR
CC
5P
E=1
SV
=311
54
00
0−6
.124
028.
8200
82.
92E−0
5−1
sp|O
1514
4|AR
PC
2_H
UM
AN
Act
in-r
elat
edp
rote
in2/
3co
mp
lex
sub
un
it2
OS
=Ho
mo
sap
ien
sG
N=A
RP
C2
PE=1
SV
=17
57
00
0−6
.051
108.
7483
82.
92E−0
5−1
sp|Q
0476
0|LG
UL_
HU
MA
NLa
cto
ylg
luta
thio
ne
lyas
eO
S=H
om
osa
pie
ns
GN
=GLO
1P
E=1
SV
=49
65
00
0−6
.124
028.
8210
02.
92E−0
5−1
sp|P
0987
4|PA
RP
1_H
UM
AN
Poly
[AD
P-r
ibo
se]
po
lym
eras
e1
OS
=Ho
mo
sap
ien
sG
N=P
AR
P1
PE=1
SV
=47
812
10
0−4
.019
769.
3038
03.
05E−0
5−1
sp|P
3780
2|TA
GL2
_HU
MA
NTr
ansg
elin
-2O
S=H
om
osa
pie
ns
GN
=TA
GLN
2P
E=1
SV
=37
710
1918
181.
6611
810
.862
153.
94E−0
51
C© 2013 WILEY-VCH Verlag GmbH & Co. KGaA, Weinheim www.proteomics-journal.com

3020 S. W. Harshman et al. Proteomics 2013, 13, 3013–3029Ta
ble
1.
Co
nti
nu
ed
edg
eRan
alys
isfo
rva
riab
lyex
pre
ssed
pro
tein
sin
the
cell
line
der
ived
vesi
cles
Iden
tifi
cati
on
MM
1Sve
sicl
esp
ectr
alco
un
tU
266
vesi
cle
spec
tral
cou
nt
Sta
tist
ics
Rep
licat
e1
Rep
licat
e2
Rep
licat
e3
Rep
licat
e1
Rep
licat
e2
Rep
licat
e3
Log
FCLo
gcp
mp
valu
eB
H.m
t.ad
j
sp|P
1512
1|ALD
R_H
UM
AN
Ald
ose
red
uct
ase
OS
=Ho
mo
sap
ien
sG
N=A
KR
1B1
PE=1
SV
=310
106
10
0−3
.965
919.
2511
65.
15E−0
5−1
sp|Q
96G
U1|G
GE
E1_
HU
MA
NG
anti
gen
fam
ilyE
mem
ber
1O
S=H
om
osa
pie
ns
GN
=PA
GE
5P
E=2
SV
=20
00
83
36.
0866
88.
3443
65.
43E−0
51
sp|P
1812
4|RL7
_HU
MA
N60
Sri
bo
som
alp
rote
inL7
OS
=Ho
mo
sap
ien
sG
N=R
PL7
PE=1
SV
=18
91
00
0−5
.974
318.
6712
75.
43E−0
5−1
sp|P
0819
5|4F2
_HU
MA
N4F
2ce
ll-su
rfac
ean
tig
enh
eavy
chai
nO
S=H
om
osa
pie
ns
GN
=SLC
3A2
PE=1
SV
=357
3232
5164
671.
0638
112
.816
455.
81E−0
51
sp|Q
1654
3|CD
C37
_HU
MA
NH
sp90
co-c
hap
ero
ne
Cd
c37
OS
=Ho
mo
sap
ien
sG
N=C
DC
37P
E=1
SV
=10
00
77
06.
0866
88.
3404
00.
0001
01
sp|P
2935
0|PT
N6_
HU
MA
NTy
rosi
ne-
pro
tein
ph
osp
hat
ase
no
n-r
ecep
tor
typ
e6
OS
=Ho
mo
sap
ien
sG
N=P
TP
N6
PE=1
SV
=13
410
00
0−5
.893
208.
5908
80.
0001
0−1
sp|P
1694
9|ST
MN
1_H
UM
AN
Sta
thm
inO
S=H
om
osa
pie
ns
GN
=ST
MN
1P
E=1
SV
=312
916
23
0−2
.363
049.
8841
30.
0001
0−1
sp|P
1531
1|EZ
RI_
HU
MA
NE
zrin
OS
=H
om
osa
pie
ns
GN
=E
ZR
PE
=1
SV
=4
5896
116
102
107
156
0.91
090
13.9
0258
0.00
011
1sp
|P08
133|A
NX
A6_
HU
MA
NA
nn
exin
A6
OS
=H
om
osa
pie
ns
GN
=A
NX
A6
PE
=1
SV
=3
147
145
140
8557
21−0
.928
5913
.676
680.
0001
3−1
sp|P
6324
1|IF5
A1_
HU
MA
NE
uka
ryo
tic
tran
slat
ion
init
iati
on
fact
or
5A-1
OS
=H
om
osa
pie
ns
GN
=E
IF5A
PE
=1
SV
=2
1413
140
33
−2.2
5669
10.0
4660
0.00
013
−1
sp|P
1432
4|FP
PS
_HU
MA
NFa
rnes
ylp
yro
ph
osp
hat
esy
nth
ase
OS
=H
om
osa
pie
ns
GN
=FD
PS
PE
=1
SV
=4
74
50
00
−5.8
0725
8.50
256
0.00
019
−1
sp|P
2664
1|EF1
G_H
UM
AN
Elo
nga
tio
nfa
cto
r1-
gam
ma
OS
=H
om
osa
pie
ns
GN
=E
EF1
GP
E=
1S
V=
314
1318
71
0−1
.987
2410
.219
110.
0002
2−1
sp|P
4121
9|PE
RI_
HU
MA
NPe
rip
her
inO
S=
Ho
mo
sap
ien
sG
N=
PR
PH
PE
=1
SV
=2
107
61
00
−3.7
9111
9.08
295
0.00
025
−1sp
|P59
998|A
RP
C4_
HU
MA
NA
ctin
-rel
ated
pro
tein
2/3
com
ple
xsu
bu
nit
4O
S=
Ho
mo
sap
ien
sG
N=
AR
PC
4P
E=
1S
V=
320
1111
22
3−2
.075
7710
.105
530.
0003
0−1
sp|P
3390
8|MA
1A1_
HU
MA
NM
ann
osy
l-o
ligo
sacc
har
ide
1;2-
alp
ha-
man
no
sid
ase
IAO
S=
Ho
mo
sap
ien
sG
N=
MA
N1A
1P
E=
1S
V=
30
00
011
15.
8678
38.
1140
50.
0003
61
sp|P
0CV
98|T
SP
Y3_
HU
MA
NTe
stis
-sp
ecifi
cY
-en
cod
edp
rote
in3
OS
=H
om
osa
pie
ns
GN
=T
SP
Y3
PE
=3
SV
=1
00
03
72
5.86
783
8.11
676
0.00
036
1
sp|P
1515
3|RA
C2_
HU
MA
NR
as-r
elat
edC
3b
otu
linu
mto
xin
sub
stra
te2
OS
=H
om
osa
pie
ns
GN
=R
AC
2P
E=
1S
V=
118
1918
27
3−1
.702
4010
.554
490.
0004
3−1
sp|P
2578
7|PS
A2_
HU
MA
NPr
ote
aso
me
sub
un
ital
ph
aty
pe-
2O
S=
Ho
mo
sap
ien
sG
N=
PS
MA
2P
E=
1S
V=
29
63
01
0−3
.442
478.
7493
20.
0004
6−1
sp|P
3194
9|S10
AB
_HU
MA
NPr
ote
inS
100-
A11
OS
=H
om
osa
pie
ns
GN
=S
100A
11P
E=
1S
V=
213
1118
13
4−1
.888
3710
.138
330.
0006
4−1
sp|Q
0843
1|MFG
M_H
UM
AN
Lact
adh
erin
OS
=H
om
osa
pie
ns
GN
=M
FGE
8P
E=
1S
V=
234
3434
99
13−1
.235
9511
.540
760.
0006
6−1
sp|Q
3013
4|2B
18_H
UM
AN
HLA
clas
sII
his
toco
mp
atib
ility
anti
gen
;DR
B1–
8b
eta
chai
nO
S=
Ho
mo
sap
ien
sG
N=
HLA
-DR
B1
PE
=1
SV
=2
83
30
00
−5.6
1828
8.31
090
0.00
067
−1
sp|Q
0153
4|TS
PY
1_H
UM
AN
Test
is-s
pec
ific
Y-e
nco
ded
pro
tein
1O
S=
Ho
mo
sap
ien
sG
N=
TS
PY
1P
E=
1S
V=
40
00
36
25.
7445
47.
9904
70.
0006
71
sp|Q
9BZ
Q8|N
IBA
N_H
UM
AN
Pro
tein
Nib
anO
S=
Ho
mo
sap
ien
sG
N=
FAM
129A
PE
=1
SV
=1
70
16
135
2.02
263
9.53
512
0.00
084
1
sp|P
5532
7|TP
D52
_HU
MA
NTu
mo
rp
rote
inD
52O
S=
Ho
mo
sap
ien
sG
N=
TP
D52
PE
=1
SV
=2
12
113
50
2.56
199
8.99
457
0.00
093
1
sp|P
0111
1|RA
SN
_HU
MA
NG
TPa
seN
Ras
OS
=H
om
osa
pie
ns
GN
=N
RA
SP
E=
1S
V=
13
03
310
82.
2300
39.
2931
10.
0012
11
sp|P
2328
4|PP
IB_H
UM
AN
Pep
tid
yl-p
roly
lcis
-tra
ns
iso
mer
ase
BO
S=
Ho
mo
sap
ien
sG
N=
PP
IBP
E=
1S
V=
20
03
83
42.
6850
68.
7059
80.
0012
11
sp|P
2453
4|EF1
B_H
UM
AN
Elo
nga
tio
nfa
cto
r1-
bet
aO
S=
Ho
mo
sap
ien
sG
N=
EE
F1B
2P
E=
1S
V=
33
37
00
0−5
.513
628.
2068
20.
0012
8−1
sp|P
4092
5|MD
HC
_HU
MA
NM
alat
ed
ehyd
rog
enas
e;cy
top
lasm
icO
S=
Ho
mo
sap
ien
sG
N=
MD
H1
PE
=1
SV
=4
812
192
33
−1.7
8222
10.0
5221
0.00
130
−1
C© 2013 WILEY-VCH Verlag GmbH & Co. KGaA, Weinheim www.proteomics-journal.com
Proteomics 2013, 13, 3013–3029 3021Ta
ble
1.
Co
nti
nu
ed
edg
eRan
alys
isfo
rva
riab
lyex
pre
ssed
pro
tein
sin
the
cell
line
der
ived
vesi
cles
Iden
tifi
cati
on
MM
1Sve
sicl
esp
ectr
alco
un
tU
266
vesi
cle
spec
tral
cou
nt
Sta
tist
ics
Rep
licat
e1
Rep
licat
e2
Rep
licat
e3
Rep
licat
e1
Rep
licat
e2
Rep
licat
e3
Log
FCLo
gcp
mp
valu
eB
H.m
t.ad
j
sp|Q
9Y69
6|CLI
C4_
HU
MA
NC
hlo
rid
ein
trac
ellu
lar
chan
nel
pro
tein
4O
S=
Ho
mo
sap
ien
sG
N=
CLI
C4
PE
=1
SV
=4
1512
2421
2333
1.06
676
11.5
5959
0.00
136
1
sp|O
1474
5|NH
RF1
_HU
MA
NN
a(+)
/H(+
)ex
chan
ge
reg
ula
tory
cofa
cto
rN
HE
-RF1
OS
=H
om
osa
pie
ns
GN
=S
LC9A
3R1
PE
=1
SV
=4
2034
4540
3359
0.88
978
12.4
2375
0.00
143
1
sp|P
5220
9|6P
GD
_HU
MA
N6-
ph
osp
ho
glu
con
ate
deh
ydro
gen
ase;
dec
arb
oxyl
atin
gO
S=
Ho
mo
sap
ien
sG
N=
PG
DP
E=
1S
V=
35
56
10
0−3
.275
418.
5923
20.
0014
3−1
sp|Q
1672
0|AT
2B3_
HU
MA
NP
lasm
am
emb
ran
eca
lciu
m-t
ran
spo
rtin
gA
TPa
se3
OS
=H
om
osa
pie
ns
GN
=A
TP
2B3
PE
=1
SV
=3
00
13
54
3.71
816
8.23
361
0.00
143
1
sp|P
0867
0|VIM
E_H
UM
AN
Vim
enti
nO
S=
Ho
mo
sap
ien
sG
N=
VIM
PE
=1
SV
=4
4436
3826
96
−1.0
4462
11.7
9524
0.00
152
−1sp
|P50
995|A
NX
11_H
UM
AN
An
nex
inA
11O
S=
Ho
mo
sap
ien
sG
N=
AN
XA
11P
E=
1S
V=
17
65
00
1−3
.442
478.
7512
20.
0020
4−1
sp|P
2883
8|AM
PL_
HU
MA
NC
yto
sola
min
op
epti
das
eO
S=
Ho
mo
sap
ien
sG
N=
LAP
3P
E=
1S
V=
39
03
00
0−5
.400
788.
0892
20.
0024
4−1
sp|P
4972
0|PS
B3_
HU
MA
NPr
ote
aso
me
sub
un
itb
eta
typ
e-3
OS
=H
om
osa
pie
ns
GN
=P
SM
B3
PE
=1
SV
=2
71
30
00
−5.2
7835
7.96
545
0.00
244
−1
sp|P
4692
6|GN
PI1
_HU
MA
NG
luco
sam
ine-
6-p
ho
sph
ate
iso
mer
ase
1O
S=
Ho
mo
sap
ien
sG
N=
GN
PD
A1
PE
=1
SV
=1
51
50
00
−5.2
7835
7.96
628
0.00
244
−1
sp|Q
0702
0|RL1
8_H
UM
AN
60S
rib
oso
mal
pro
tein
L18
OS
=H
om
osa
pie
ns
GN
=R
PL1
8P
E=
1S
V=
26
96
01
1−2
.792
049.
0262
40.
0024
6−1
sp|P
6076
3|RA
C3_
HU
MA
NR
as-r
elat
edC
3b
otu
linu
mto
xin
sub
stra
te3
OS
=H
om
osa
pie
ns
GN
=R
AC
3P
E=
1S
V=
111
1011
03
3−1
.901
999.
7464
60.
0028
3−1
sp|Q
6UW
D8|C
P05
4_H
UM
AN
Tran
smem
bra
ne
pro
tein
C16
orf
54O
S=
Ho
mo
sap
ien
sG
N=
C16
orf
54P
E=
1S
V=
10
30
03
102.
4816
58.
5377
80.
0034
31
sp|Q
7Z40
3|TM
C6_
HU
MA
NTr
ansm
emb
ran
ech
ann
el-l
ike
pro
tein
6O
S=
Ho
mo
sap
ien
sG
N=
TM
C6
PE
=1
SV
=2
46
70
01
−3.3
6136
8.67
516
0.00
343
−1
sp|P
2262
6|RO
A2_
HU
MA
NH
eter
og
eneo
us
nu
clea
rri
bo
nu
cleo
pro
tein
sA
2/B
1O
S=
Ho
mo
sap
ien
sG
N=
HN
RN
PA2B
1P
E=
1S
V=
213
718
3713
81.
0809
311
.130
390.
0034
91
sp|P
1933
8|NU
CL_
HU
MA
NN
ucl
eolin
OS
=H
om
osa
pie
ns
GN
=N
CL
PE
=1
SV
=3
1718
2011
50
−1.2
9355
10.6
4210
0.00
351
−1sp
|P60
174|T
PIS
_HU
MA
NTr
iose
ph
osp
hat
eis
om
eras
eO
S=
Ho
mo
sap
ien
sG
N=
TP
I1P
E=
1S
V=
328
2732
148
8−1
.054
1611
.360
840.
0035
8−1
sp|P
2158
9|5N
TD
_HU
MA
N5′
-nu
cleo
tid
ase
OS
=H
om
osa
pie
ns
GN
=N
T5E
PE
=1
SV
=1
50
08
90
2.17
827
8.98
862
0.00
430
1
sp|P
0440
6|G3P
_HU
MA
NG
lyce
rald
ehyd
e-3-
ph
osp
hat
ed
ehyd
rog
enas
eO
S=
Ho
mo
sap
ien
sG
N=
GA
PD
HP
E=
1S
V=
311
410
613
358
4649
−0.7
2866
13.4
6387
0.00
439
−1
sp|P
2223
4|PU
R6_
HU
MA
NM
ult
ifu
nct
ion
alp
rote
inA
DE
2O
S=
Ho
mo
sap
ien
sG
N=
PAIC
SP
E=
1S
V=
35
145
40
0−2
.052
159.
3113
40.
0044
0−1
sp|O
1481
8|PS
A7_
HU
MA
NPr
ote
aso
me
sub
un
ital
ph
aty
pe-
7O
S=
Ho
mo
sap
ien
sG
N=
PS
MA
7P
E=
1S
V=
15
23
00
0−5
.144
567.
8297
20.
0046
7−1
sp|Q
1350
9|TB
B3_
HU
MA
NTu
bu
linb
eta-
3ch
ain
OS
=H
om
osa
pie
ns
GN
=T
UB
B3
PE
=1
SV
=2
4842
3321
1511
−0.9
0824
11.8
9459
0.00
473
−1
sp|P
2996
6|MA
RC
S_H
UM
AN
Myr
isto
ylat
edal
anin
e-ri
chC
-kin
ase
sub
stra
teO
S=
Ho
mo
sap
ien
sG
N=
MA
RC
KS
PE
=1
SV
=4
2418
2733
3127
0.87
320
11.8
7273
0.00
512
1
sp|P
3524
1|RA
DI_
HU
MA
NR
adix
inO
S=
Ho
mo
sap
ien
sG
N=
RD
XP
E=
1S
V=
146
7281
5577
990.
6910
113
.317
800.
0054
41
sp|Q
9HB
71|C
YB
P_H
UM
AN
Cal
cycl
in-b
ind
ing
pro
tein
OS
=H
om
osa
pie
ns
GN
=C
AC
YB
PP
E=
1S
V=
212
610
24
0−1
.711
209.
5856
60.
0062
8−1
sp|P
2603
8|MO
ES
_HU
MA
NM
oes
inO
S=
Ho
mo
sap
ien
sG
N=
MS
NP
E=
1S
V=
312
819
820
817
520
121
00.
6104
814
.699
340.
0066
61
sp|P
5099
0|TC
PQ
_HU
MA
NT
-co
mp
lex
pro
tein
1su
bu
nit
thet
aO
S=
Ho
mo
sap
ien
sG
N=
CC
T8
PE
=1
SV
=4
00
13
70
3.46
006
7.98
648
0.00
794
1
sp|P
0536
2|IC
AM
1_H
UM
AN
Inte
rcel
lula
rad
hes
ion
mo
lecu
le1
OS
=H
om
osa
pie
ns
GN
=IC
AM
1P
E=
1S
V=
220
1225
1827
290.
8499
811
.582
270.
0089
41
sp|P
1761
2|KA
PC
A_H
UM
AN
cAM
P-d
epen
den
tp
rote
inki
nas
eca
taly
tic
sub
un
ital
ph
aO
S=
Ho
mo
sap
ien
sG
N=
PR
KA
CA
PE
=1
SV
=2
63
00
00
−4.9
9708
7.67
825
0.00
898
−1
sp|P
3194
3|HN
RH
1_H
UM
AN
Het
ero
gen
eou
sn
ucl
ear
rib
on
ucl
eop
rote
inH
OS
=H
om
osa
pie
ns
GN
=H
NR
NP
H1
PE
=1
SV
=4
00
06
10
5.10
776
7.33
455
0.00
898
1
C© 2013 WILEY-VCH Verlag GmbH & Co. KGaA, Weinheim www.proteomics-journal.com

3022 S. W. Harshman et al. Proteomics 2013, 13, 3013–3029
Ta
ble
1.
Co
nti
nu
ed
edg
eRan
alys
isfo
rva
riab
lyex
pre
ssed
pro
tein
sin
the
cell
line
der
ived
vesi
cles
Iden
tifi
cati
on
MM
1Sve
sicl
esp
ectr
alco
un
tU
266
vesi
cle
spec
tral
cou
nt
Sta
tist
ics
Rep
licat
e1
Rep
licat
e2
Rep
licat
e3
Rep
licat
e1
Rep
licat
e2
Rep
licat
e3
Log
FCLo
gcp
mp
valu
eB
H.m
t.ad
j
sp|O
9483
2|MY
O1D
_HU
MA
NU
nco
nven
tio
nal
myo
sin
-Id
OS
=H
om
osa
pie
ns
GN
=M
YO
1DP
E=
1S
V=
23
15
00
0−4
.997
087.
6792
30.
0089
8−1
sp|P
1059
9|TH
IO_H
UM
AN
Th
iore
dox
inO
S=
Ho
mo
sap
ien
sG
N=
TX
NP
E=
1S
V=
319
1516
16
8−1
.248
6810
.519
470.
0100
1−1
sp|P
2782
4|CA
LX_H
UM
AN
Cal
nex
inO
S=
Ho
mo
sap
ien
sG
N=
CA
NX
PE
=1
SV
=2
110
019
40
1.51
621
9.61
876
0.01
125
1sp
|P09
211|G
ST
P1_
HU
MA
NG
luta
thio
ne
S-t
ran
sfer
ase
PO
S=
Ho
mo
sap
ien
sG
N=
GS
TP
1P
E=
1S
V=
247
5045
2817
14−0
.788
2612
.139
620.
0115
7−1
sp|P
3114
6|CO
R1A
_HU
MA
NC
oro
nin
-1A
OS
=H
om
osa
pie
ns
GN
=C
OR
O1A
PE
=1
SV
=4
1730
2628
2636
0.77
633
11.9
0438
0.01
191
1
sp|P
0443
9|1A
03_H
UM
AN
HLA
clas
sIh
isto
com
pat
ibili
tyan
tig
en;A
-3al
ph
ach
ain
OS
=H
om
osa
pie
ns
GN
=H
LA-A
PE
=1
SV
=2
4337
3741
4649
0.69
242
12.5
3684
0.01
227
1
sp|P
1123
3|RA
LA_H
UM
AN
Ras
-rel
ated
pro
tein
Ral
-AO
S=
Ho
mo
sap
ien
sG
N=
RA
LAP
E=
1S
V=
17
21
69
61.
5200
09.
4869
40.
0123
01
sp|P
5114
9|RA
B7A
_HU
MA
NR
as-r
elat
edp
rote
inR
ab-7
aO
S=
Ho
mo
sap
ien
sG
N=
RA
B7A
PE
=1
SV
=1
108
1114
219
1.07
058
10.7
2745
0.01
245
1
sp|P
6115
8|AR
P3_
HU
MA
NA
ctin
-rel
ated
pro
tein
3O
S=
Ho
mo
sap
ien
sG
N=
AC
TR
3P
E=
1S
V=
316
1413
36
4−1
.235
8510
.305
140.
0136
8−1
sp|P
6095
3|CD
C42
_HU
MA
NC
elld
ivis
ion
con
tro
lpro
tein
42h
om
olo
gO
S=
Ho
mo
sap
ien
sG
N=
CD
C42
PE
=1
SV
=2
2013
172
105
−1.0
7044
10.5
6161
0.01
490
−1
sp|Q
1381
3|SP
TN
1_H
UM
AN
Sp
ectr
inal
ph
ach
ain
;no
ner
yth
rocy
tic
1O
S=
Ho
mo
sap
ien
sG
N=
SP
TAN
1P
E=
1S
V=
312
1613
43
5−1
.281
1810
.229
220.
0152
5−1
sp|P
2007
3|AN
XA
7_H
UM
AN
An
nex
inA
7O
S=
Ho
mo
sap
ien
sG
N=
AN
XA
7P
E=
1S
V=
33
12
104
21.
8421
58.
9911
80.
0155
31
sp|P
0794
8|LY
N_H
UM
AN
Tyro
sin
e-p
rote
inki
nas
eLy
nO
S=
Ho
mo
sap
ien
sG
N=
LYN
PE
=1
SV
=3
30
11
102
2.09
886
8.61
412
0.01
672
1
sp|Q
9982
8|CIB
1_H
UM
AN
Cal
ciu
m-
and
inte
gri
n-b
ind
ing
pro
tein
1O
S=
Ho
mo
sap
ien
sG
N=
CIB
1P
E=
1S
V=
45
83
00
2−2
.405
878.
6777
50.
0167
2−1
log
FC:l
og
fold
chan
ge.
C© 2013 WILEY-VCH Verlag GmbH & Co. KGaA, Weinheim www.proteomics-journal.com

Proteomics 2013, 13, 3013–3029 3023
Figure 2. Venn diagram renderings ofoverlapping and unique protein identifi-cations. (A) MM.1S vesicles (EV) versusglobal cell lysate (CL). (B) U266 vesicles(EV) versus global CL. (C) MM.1S vesicles(EV) versus U266 vesicles (EV). Data showmany overlapping protein identificationswhile also harboring unique IDs in eachcomparison.
in the vesicles and global lysates). As expected, these datapoints cluster about a line with a slope of 1 indicating vesicleabundance was driven predominantly by expression in theparent cell type. Conversely, Fig. 5B highlights the proteinswith opposing significant differences between the vesiclesand cellular lysates (i.e. increased abundance or expressionin one sample type while the other remains unchanged ordecreases). These data primarily cluster about the 0 intercept.However, there are several proteins located in the upper leftand lower right quadrant that are significantly enriched inthe vesicle samples independent of changes in the cellularprotein abundance (Fig. 5C). For the complete list of proteinswith independent changes in abundance, see Supporting In-formation Data 10. These results illustrate the power of thelabel-free approach in establishing the patterns of abundanceof vesicular proteins relative to cellular expression revealedin the global lysate expression.
3.4 Validation of LC-MS/MS protein identifications
and relative quantitation
To validate proteomic identifications and relative quantita-tion, we conducted immunoblots on the cell-derived vesicles(Fig. 6A) and both vesicles and parent cell lysates (Fig. 6B).Based on the LC-MS/MS data (Table 1 and Supporting In-formation Data 9) and antibody availability, several proteinswere identified for validation by immunoblot. First, CD9 wasselected, as it was not identified in the U266-derived vesi-cles while showing enrichment in the MM.1S-released vesi-cles. Conversely, IgG� LC was selected due to LC-MS/MSidentification in the U266-derived vesicles while remainingundetected in the MM.1S vesicles. Next, NCL was identi-fied for validation because the MS data showed enrichmentin the MM.1S vesicles compared to the U266 vesicles. Fi-nally, GAPDH was chosen as it was identified in both the
C© 2013 WILEY-VCH Verlag GmbH & Co. KGaA, Weinheim www.proteomics-journal.com

3024 S. W. Harshman et al. Proteomics 2013, 13, 3013–3029
Figure 3. Clustering of LC-MS/MS spectral counts and pie chart illustrations of the PANTHER gene ontology annotations for molecularfunction and biological process for those proteins with significantly different abundances between the cell line vesicles when comparedto the parent cell lysate. (A) Clustering of spectral count data for the MM.1S vesicles and parent cell lysate. (B) Enlarged clustering ofspectral count data for those proteins selected for validation from MM.1S cell line. (C) PANTHER gene ontological annotations for themolecular function and biological process for proteins with statistically different abundances from the MM.1S cell line. (D) Clustering ofspectral count data for the U266 vesicles and parent cell lysate. (E) Enlarged clustering of spectral count data for those proteins selectedfor validation from the U266 cell line. (F) PANTHER gene ontological annotations for the molecular function and biological process forproteins with statistically different abundances from the U266 cell line. Results suggest variable abundance of specific proteins, which canconfer different potential biological processes and molecular functions.
C© 2013 WILEY-VCH Verlag GmbH & Co. KGaA, Weinheim www.proteomics-journal.com

Proteomics 2013, 13, 3013–3029 3025
Figure 4. EdgeR label-free analysis for differentially expressed proteins from the MM.1S- and U266-derived vesicles. (A) Hierarchal cluster-ing of LC-MS/MS spectral count data. (B) Enlarged clustering of spectral count data for those proteins selected for validation. (C) Smear plotof the log fold change (logFC) by logcpm for the vesicle data from each cell line. (D) Pie chart illustrations of the PANTHER gene ontologyannotations for molecular function and biological process for those proteins differentially expressed between the MM-derived vesicles.Data suggest that vesicular protein abundance distinguishes between the cells of origin allowing for differential functional potential.
MM.1S- and U266-derived vesicles. The immunoblot shownin Fig. 6A confirms the presence and relative abundancesof CD9, IgG� LC, NCL, and GAPDH in the vesicles derivedfrom the respective cell lines as described above.
Further validation of the LC-MS/MS-derived relative abun-dances was confirmed through a second immunoblot con-taining both vesicle and cell lysates (Fig. 6B). First as above,CD9 was shown by MS to be only identified in the vesiclesof the MM.1S cell line. The blot in Fig. 6B further con-firms the MS data and Fig. 6A for the identification of CD9.Additionally, the LC-MS/MS data shows that CD44, MHCclass I, and BST-2 were enriched in the vesicles of both celllines when compared to the cell lysates. The immunoblotshown in Fig. 6B confirms the MS data shown in Table 1 andSupporting Information Data 9 for CD9, CD44, MHC class
I, and BST-2 proteins. Both GAPDH and actin were blot-ted as housekeeping genes. However, due to challenges inprotein loading associated with vesicles, the common house-keeping genes are not completely adequate for normaliza-tion proposes in this subcellular fraction. Regardless, the im-munoblots confirm the relative changes we observe in theproteomics experiments while also exposing challenges innormalization of protein abundances between vesicles andcells.
4 Discussion
Cellular communication through soluble factors and cell-to-cell adhesion molecules has long been established for many
C© 2013 WILEY-VCH Verlag GmbH & Co. KGaA, Weinheim www.proteomics-journal.com
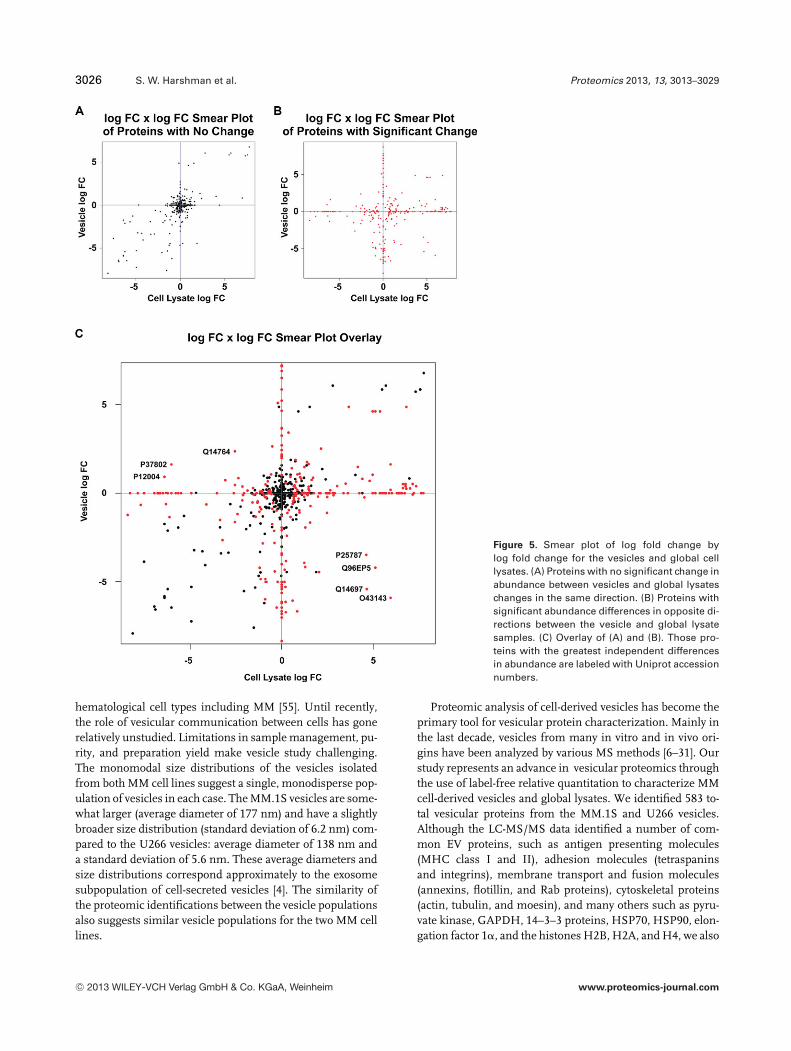
3026 S. W. Harshman et al. Proteomics 2013, 13, 3013–3029
Figure 5. Smear plot of log fold change bylog fold change for the vesicles and global celllysates. (A) Proteins with no significant change inabundance between vesicles and global lysateschanges in the same direction. (B) Proteins withsignificant abundance differences in opposite di-rections between the vesicle and global lysatesamples. (C) Overlay of (A) and (B). Those pro-teins with the greatest independent differencesin abundance are labeled with Uniprot accessionnumbers.
hematological cell types including MM [55]. Until recently,the role of vesicular communication between cells has gonerelatively unstudied. Limitations in sample management, pu-rity, and preparation yield make vesicle study challenging.The monomodal size distributions of the vesicles isolatedfrom both MM cell lines suggest a single, monodisperse pop-ulation of vesicles in each case. The MM.1S vesicles are some-what larger (average diameter of 177 nm) and have a slightlybroader size distribution (standard deviation of 6.2 nm) com-pared to the U266 vesicles: average diameter of 138 nm anda standard deviation of 5.6 nm. These average diameters andsize distributions correspond approximately to the exosomesubpopulation of cell-secreted vesicles [4]. The similarity ofthe proteomic identifications between the vesicle populationsalso suggests similar vesicle populations for the two MM celllines.
Proteomic analysis of cell-derived vesicles has become theprimary tool for vesicular protein characterization. Mainly inthe last decade, vesicles from many in vitro and in vivo ori-gins have been analyzed by various MS methods [6–31]. Ourstudy represents an advance in vesicular proteomics throughthe use of label-free relative quantitation to characterize MMcell-derived vesicles and global lysates. We identified 583 to-tal vesicular proteins from the MM.1S and U266 vesicles.Although the LC-MS/MS data identified a number of com-mon EV proteins, such as antigen presenting molecules(MHC class I and II), adhesion molecules (tetraspaninsand integrins), membrane transport and fusion molecules(annexins, flotillin, and Rab proteins), cytoskeletal proteins(actin, tubulin, and moesin), and many others such as pyru-vate kinase, GAPDH, 14–3–3 proteins, HSP70, HSP90, elon-gation factor 1�, and the histones H2B, H2A, and H4, we also
C© 2013 WILEY-VCH Verlag GmbH & Co. KGaA, Weinheim www.proteomics-journal.com

Proteomics 2013, 13, 3013–3029 3027
Figure 6. Validation of protein iden-tifications and spectral count relativequantitation from the proteomic anal-ysis of the MM.1S- and U266-derivedvesicles and global cell lysates by im-munoblot. (A) Immunoblot of vesicle-identified proteins. Blot was probed forCD9, IgG� LC, nucleolin, and GAPDH.(B) Immunoblot for comparison of pro-tein relative abundance between vesi-cles and cell lysates. Blots were probedfor CD9, CD44, MHC class I, BST-2,GAPDH, and actin. Data confirms theLC-MS/MS protein identifications andrelative abundances observed in thedata sets. HeLa (CD9) and ARH77 (IgG�
LC) global lysates were used as positivecontrols.
identified 32 and 13 proteins unique to the vesicles derivedfrom the MM.1S and U266 cell lines, respectively [52–54].These results support the hypothesis that EVs have commonprotein profiles in large part, but with small sets of uniqueproteins corresponding to the parent cells of origin [52–54].Furthermore, the exclusive presence of BST-2 in the EV com-partment of MM cells strongly supports the specificity of ouranalysis.
While there are only a small number of different identifi-cations between the MM.1S and U266 vesicles, the relativeabundances of proteins in the MM cell-derived vesicles aremore divergent. The label-free relative quantitation of theMM.1S and vesicle data sets shows 125 proteins with statisti-cally different protein abundance. These proteins correspondto an array of functions both biologically and molecularly. Forexample, the RNA-binding protein NCL was shown to havehigher abundance in the MM.1S vesicles. NCL is a highlyconserved multifunctional protein, abundantly expressed inthe nucleolus of normal cells [56]. It has long been knownas a protein critical for ribosomal RNA biogenesis [56]. Inthe cytoplasm, NCL functions to regulate mRNA translationand stability of several tumor progression genes, includingBCL2, thereby inhibiting apoptosis of cancer cells. NCL is anintegral component of the DROSHA-DGCR8 microprocessorcomplex and recently we have shown that NCL promotes thematuration of a specific set of miRNAs that are implicatedin the pathogenesis of several human cancers, such as miR-21, miR-103, miR-221, and miR-222, whose overexpressionis often associated with greater aggressiveness and resistanceto antineoplastic therapies [57–60]. The presence of NCL andother RNA-binding proteins in MM EVs may allow furtherstudies that will focus on the understanding their role in RNAtransfer in cancer cells.
Alignment of vesicular and global cell lysate protein iden-tifications shows a low number of unique identifications be-tween the samples. Similar to the vesicle-to-vesicle compar-isons, more divergent protein abundance was found with theapplication of the label-free edgeR analysis to the data sets.These data show 298 (MM.1S) and 268 (U266) proteins with
variable abundance. For example, MM.1S vesicles show anincreased abundance of HLA class II histocompatibility anti-gens when compared to the MM.1S global cell lysate. Theseresults are in line with previous studies of B-cell-derived ex-osomes [61, 62]. Raposo et al. [61] showed that the vesicularMHC class II complexes can stimulate T cells in vitro. MHCclass I has been identified as classical vesicle marker in theserum of cancer patients. The mechanisms of tumor cell re-sistance to immune effector functions are diverse and can beboth intrinsic and reactive. A central immune escape route isthe partial or complete downregulation of this complex at thecell surface, thereby limiting or avoiding recognition by cyto-toxic CD8+ T effector cells and the induction of apoptosis [63,64]. Based on these observations, it is reasonable to hypothe-size that the specific shedding of MHC class I can be a com-mon characteristic of MM cells to avoid the immune systemresponse and support their growth, although further studiesin MM patients will be required to support this observation.
Finally, we are the first to apply a label-free approach toidentify variably abundance among proteins in the vesiclesand their parent cell. Our study reveals that only a smallnumber of unique proteins are packaged into EVs [52–54].Our study also reveals a more divergent protein abundancein the vesicles of MM cell lines.
This work was supported by the Ohio State University Peloto-nia Fellowship Program (A.R.), by Ohio State University Pela-tonia Idea grant (F.P., D.B.), in part from NIH grants (R01CA107106, P01 CA124570 and RC2 AG036559), NSF (EEC-0425626 and EEC-019790) and funded in part by MultipleMyeloma Opportunities for Research & Education (MMORE)and in part from Sidney Kimmel Foundation Scholar Award(F.P.). The cryo-TEM data were obtained at the TEM facility atthe Liquid Crystal Institute, Kent State University, supported bythe Ohio Research Scholars Program Research Cluster on Sur-faces in Advanced Materials. The authors thank Dr. Min Gao fortechnical support provided for the TEM experiments.
The authors have declared no conflict of interest.
C© 2013 WILEY-VCH Verlag GmbH & Co. KGaA, Weinheim www.proteomics-journal.com

3028 S. W. Harshman et al. Proteomics 2013, 13, 3013–3029
5 References
[1] American Cancer Society. Cancer Facts & Figures 2011,American Cancer Society, Atlanta 2011.
[2] Kumar, S. K., Rajkumar, S. V., Dispenzieri, A., Lacy, M. Q.et al., Improved survival in multiple myeloma and the impactof novel therapies. Blood 2008, 111, 2516–2520.
[3] Raje, N., Hideshima, T., Anderson, K., Raphael, E., Pollock,M. D., in: Hong, W. K., Hait, W. N., Donald, W., Kufe, M. D.et al. (Eds.), Cancer Medicine 8, Pmph-usa, Shelton, CT 2010,pp. 1668–1685.
[4] Thery, C., Zitvogel, L., Amigorena, S., Exosomes: composi-tion, biogenesis and function. Nat. Rev. Immunol. 2002, 2,569–579.
[5] Thery, C., Exosomes: secreted vesicles and intercellularcommunications. F1000 Biol. Rep. 2011, 3, 15.
[6] Bard, M. P., Proteomic analysis of exosomes isolated fromhuman malignant pleural effusions. Am. J. Resp. Cell Mol.Biol. 2004, 31, 114–121.
[7] Miguet, L., Pacaud, K., Felden, C., Hugel, B. et al., Proteomicanalysis of malignant lymphocyte membrane microparticlesusing double ionization coverage optimization. Proteomics2006, 6, 153–171.
[8] Gonzales, P. A., Pisitkun, T., Hoffert, J. D., Tchapyjnikov,D. et al., Large-scale proteomics and phosphoproteomicsof urinary exosomes. J. Am. Soc. Nephrol. 2009, 20,363–379.
[9] Kesimer, M., Scull, M., Brighton, B., DeMaria, G. et al., Char-acterization of exosome-like vesicles released from humantracheobronchial ciliated epithelium: a possible role in innatedefense. FASEB J. 2009, 23, 1858–1868.
[10] Li, Y., Zhang, Y., Qiu, F., Qiu, Z., Proteomic identification ofexosomal LRG1: a potential urinary biomarker for detectingNSCLC. Electrophoresis 2011, 32, 1976–1983.
[11] Staubach, S., Razawi, H., Hanisch, F.-G., Proteomics of MUC1-containing lipid rafts from plasma membranes and exo-somes of human breast carcinoma cells MCF-7. Proteomics2009, 9, 2820–2835.
[12] Zhang, Y., Li, Y., Qiu, F., Qiu, Z., Comprehensive analysis oflow-abundance proteins in human urinary exosomes usingpeptide ligand library technology, peptide OFFGEL fraction-ation and nanoHPLC-chip-MS/MS. Electrophoresis 2010, 31,3797–3807.
[13] Mears, R., Craven, R. A., Hanrahan, S., Totty, N. et al., Pro-teomic analysis of melanoma-derived exosomes by two-dimensional polyacrylamide gel electrophoresis and massspectrometry. Proteomics 2004, 4, 4019–4031.
[14] Buschow, S. I., van Balkom, B. W. M., Aalberts, M., Heck,A. J. R. et al., MHC class II-associated proteins in B-cell ex-osomes and potential functional implications for exosomebiogenesis. Immunol. Cell Biol. 2010, 88, 851–856.
[15] Admyre, C., Johansson, S. M., Qazi, K. R., Filen, J.-J. et al.,Exosomes with immune modulatory features are present inhuman breast milk. J. Immunol. 2007, 179, 1969–1978.
[16] Wubbolts, R., Proteomic and biochemical analyses of hu-man B cell-derived exosomes. Potential implications for their
function and multivesicular body formation. J. Biol. Chem.2003, 278, 10963–10972.
[17] Mathivanan, S., Lim, J. W. E., Tauro, B. J., Ji, H. et al., Pro-teomics analysis of A33 immunoaffinity-purified exosomesreleased from the human colon tumor cell line LIM1215reveals a tissue-specific protein signature. Mol. Cell. Pro-teomics 2010, 9, 197–208.
[18] Welton, J. L., Khanna, S., Giles, P. J., Brennan, P. et al., Pro-teomics analysis of bladder cancer exosomes. Mol. Cell. Pro-teomics 2010, 9, 1324–1338.
[19] Pisitkun, T., Shen, R.-F., Knepper, M. A., Identification andproteomic profiling of exosomes in human urine. Proc. Natl.Acad. Sci. USA 2004, 101, 13368–13373.
[20] Choi, D.-S., Park, J. O., Jang, S. C., Yoon, Y. J. et al., Pro-teomic analysis of microvesicles derived from human col-orectal cancer ascites. Proteomics 2011, 11, 2745–2751.
[21] Choi, D.-S., Yang, J.-S., Choi, E.-J., Jang, S. C. et al., Theprotein interaction network of extracellular vesicles derivedfrom human colorectal cancer cells. J. Proteome Res. 2012,11, 1144–1151.
[22] Gonzalez-Begne, M., Lu, B., Han, X., Hagen, F. K. et al., Pro-teomic analysis of human parotid gland exosomes by mul-tidimensional protein identification technology (MudPIT). J.Proteome Res. 2009, 8, 1304–1314.
[23] Choi, D.-S., Lee, J.-M., Park, G. W., Lim, H.-W. et al., Pro-teomic analysis of microvesicles derived from human col-orectal cancer cells. J. Proteome Res. 2007, 6, 4646–4655.
[24] Looze, C., Yui, D., Leung, L., Ingham, M. et al., Proteomicprofiling of human plasma exosomes identifies PPAR� as anexosome-associated protein. Biochem. Biophys. Res. Com-mun. 2009, 378, 433–438.
[25] Hegmans, J. P. J. J., Bard, M. P. L., Hemmes, A., Luider, T. M.et al., Proteomic analysis of exosomes secreted by humanmesothelioma cells. Am. J. Pathol. 2010, 164, 1807–1815.
[26] Van Niel, G., Raposo, G., Candalh, C., Boussac, M. et al.,Intestinal epithelial cells secrete exosome-like vesicles. Gas-troenterology 2001, 121, 337–349.
[27] Atay, S., Gercel-Taylor, C., Kesimer, M., Taylor, D. D., Mor-phologic and proteomic characterization of exosomes re-leased by cultured extravillous trophoblast cells. Exp. CellRes. 2011, 317, 1192–1202.
[28] Adamczyk, K. A., Klein-Scory, S., Tehrani, M. M., Warnken, U.et al., Characterization of soluble and exosomal forms of theEGFR released from pancreatic cancer cells. Life Sci. 2011,89, 304–312.
[29] Stamer, W. D., Hoffman, E. A., Luther, J. M., Hachey, D. L.,Schey, K. L., Protein profile of exosomes from trabecularmeshwork cells. J. Proteomics 2011, 74, 796–804.
[30] Mathivanan, S., Fahner, C. J., Reid, G. E., Simpson, R. J., Ex-oCarta 2012: database of exosomal proteins, RNA and lipids.Nucleic Acids Res. 2012, 40, D1241–D1244.
[31] Mathivanan, S., Simpson, R. J., ExoCarta: a compendium ofexosomal proteins and RNA. Proteomics 2009, 9, 4997–5000.
[32] Shapiro, J. P., Biswas, S., Merchant, A. S., Satoskar, A.et al., A quantitative proteomic workflow for characteriza-tion of frozen clinical biopsies: laser capture microdissection
C© 2013 WILEY-VCH Verlag GmbH & Co. KGaA, Weinheim www.proteomics-journal.com

Proteomics 2013, 13, 3013–3029 3029
coupled with label-free mass spectrometry. J. Proteomics2012, 77, 433–440.
[33] Satoskar, A. A., Shapiro, J. P., Bott, C. N., Song, H. et al., Char-acterization of glomerular diseases using proteomic analy-sis of laser capture microdissected glomeruli. Mod. Pathol.2012, 25, 709–721.
[34] Goldman-Leikin, R. E., Salwen, H. R., Herst, C. V., Characteri-zation of a novel myeloma cell line, MM.1. J. Lab. Clin. Med.1989, 113, 335–345.
[35] Nilsson, K., Bennich, H., Johansson, S. G., Ponten, J., Estab-lished immunoglobulin producing myeloma (IgE) and lym-phoblastoid (IgG) cell lines from an IgE myeloma patient.Clin. Exp. Immunol. 1970, 7, 477–489.
[36] Thery, C., Amigorena, S., Raposo, G., Clayton, A., Isolationand characterization of exosomes from cell culture super-natants and biological fluids. Curr. Protoc. Cell Biol. 2006,Chapter 3, Unit 3.22.
[37] Xu, H., Freitas, M. A., A mass accuracy sensitive probabilitybased scoring algorithm for database searching of tandemmass spectrometry data. BMC Bioinform. 2007, 8, 133.
[38] Xu, H., Yang, L., Freitas, M. A., A robust linear regressionbased algorithm for automated evaluation of peptide identi-fications from shotgun proteomics by use of reversed-phaseliquid chromatography retention time. BMC Bioinform. 2008,9, 347.
[39] Xu, H., Zhang, L., Freitas, M. A., Identification and charac-terization of disulfide bonds in proteins and peptides fromtandem MS data by use of the MassMatrix MS/MS searchengine. J. Proteome Res. 2008, 7, 138–144.
[40] Xu, H., Freitas, M. A., Monte carlo simulation-based algo-rithms for analysis of shotgun proteomic data. J. ProteomeRes. 2008, 7, 2605–2615.
[41] Zhang, B., Chambers, M. C., Tabb, D. L., Proteomic parsi-mony through bipartite graph analysis improves accuracyand transparency. J. Proteome Res. 2007, 6, 3549–3557.
[42] Liu, H., Sadygov, R. G., Yates, J. R., A model for randomsampling and estimation of relative protein abundance inshotgun proteomics. Anal. Chem. 2004, 76, 4193–4201.
[43] Colinge, J., Chiappe, D., Lagache, S., Moniatte, M., Bouguel-eret, L., Differential proteomics via probabilistic peptideidentification scores. Anal. Chem. 2005, 77, 596–606.
[44] Robinson, M. D. M., McCarthy, D. J. D., Smyth, G. K. G.,edgeR: a bioconductor package for differential expressionanalysis of digital gene expression data. Bioinformatics.2010, 26, 139–140.
[45] Robinson, M. D. M., Smyth, G. K. G., Moderated statisticaltests for assessing differences in tag abundance. Bioinfor-matics 2007, 23, 2881–2887.
[46] Robinson, M. D. M., Smyth, G. K. G., Small-sample estima-tion of negative binomial dispersion, with applications toSAGE data. Biostatistics 2008, 9, 321–332.
[47] Benjamini, Y., Hochberg, Y., Controlling the false discoveryrate: a practical and powerful approach to multiple testing.J. R. Stat. Soc. Ser. B 1995, 57, 289–300.
[48] Hulsen, T., de Vlieg, J., Alkema, W., BioVenn – a web ap-plication for the comparison and visualization of biological
lists using area-proportional Venn diagrams. BMC Genomics2008, 9, 488.
[49] Thomas, P. D., Kejariwal, A., Campbell, M. J., Mi, H. et al.,Panther: a browsable database of gene products orga-nized by biological function, using curated protein familyand subfamily classification. Nucleic Acids Res. 2003, 31,334–341.
[50] Mi, H., Dong, Q., Muruganujan, A., Gaudet, P. et al., Pan-ther version 7: improved phylogenetic trees, orthologs andcollaboration with the Gene Ontology Consortium. NucleicAcids Res. 2010, 38, D204–D210.
[51] Elmore, S., Apoptosis: a review of programmed cell death.Toxicol. Pathol. 2007, 35, 495–516.
[52] Mathivanan, S., Ji, H., Simpson, R. J., Exosomes: extracel-lular organelles important in intercellular communication. J.Proteomics 2010, 73, 1907–1920.
[53] Cicero, A., Raposo, G., in: Zhang, H.-G. (Ed.), Emerging Con-cepts of Tumor Exosome–Mediated Cell-Cell Communica-tion, Springer, New York 2012.
[54] Fevrier, B., Raposo, G., Exosomes: endosomal-derived vesi-cles shipping extracellular messages. Curr. Opin. Cell Biol.2004, 16, 415–421.
[55] Klein, B., Seckinger, A., Moehler, T., Hose, D., in: Moehler, T.,Goldschmidt, H. (Eds.), Multiple Myeloma, Vol. 183, SpringerBerlin Heidelberg, Berlin, Heidelberg 2011, pp. 39–86.
[56] Srivastava, M., Pollard, H. B., Molecular dissection of nu-cleolin’s role in growth and cell proliferation: new insights.FASEB J. 1999, 13, 1911–1922.
[57] Pickering, B. F., Yu, D., Van Dyke, M. W., Nucleolin proteininteracts with microprocessor complex to affect biogenesisof microRNAs 15a and 16. J. Biol. Chem. 2011, 286, 44095–44103.
[58] Martello, G., Rosato, A., Ferrari, F., Manfrin, A. et al., A Mi-croRNA targeting dicer for metastasis control. Cell 2010, 141,1195–1207.
[59] Di Leva, G., Croce, C. M., Roles of small RNAs in tumor for-mation. Trends Mol. Med. 2010, 16, 257–267.
[60] Pichiorri, F., Palmieri, D., De Luca, L., Consiglio, J. et al.,In vivo NCL targeting affects breast cancer aggressivenessthrough miRNA regulation. J. Exp. Med. 2013, 210, 951–968.
[61] Raposo, G., Nijman, H. W., Stoorvogel, W., Liejendekker, R.et al., B lymphocytes secrete antigen-presenting vesicles. J.Exp. Med. 1996, 183, 1161–1172.
[62] Escola, J. M., Kleijmeer, M. J., Stoorvogel, W., Griffith, J. M.et al., Selective enrichment of tetraspan proteins on the inter-nal vesicles of multivesicular endosomes and on exosomessecreted by human B-lymphocytes. J. Biol. Chem. 1998, 273,20121–20127.
[63] Garrido, F., Cabrera, T., Aptsiauri, N., “Hard” and “soft” le-sions underlying the HLA class I alterations in cancer cells:implications for immunotherapy. Int. J. Cancer 2010, 127,249–256.
[64] Lee, C.-T., Mace, T., Repasky, E. A., Hypoxia-driven im-munosuppression: a new reason to use thermal therapyin the treatment of cancer? Int. J. Hyperthermia 2010, 26,232–246.
C© 2013 WILEY-VCH Verlag GmbH & Co. KGaA, Weinheim www.proteomics-journal.com


