Embed Size (px)
Citation preview
Characterization of the Oligomerization and Aggregationof Human Serum Amyloid ASanket Patke1,2, Saipraveen Srinivasan2, Ronak Maheshwari2, Sunit K. Srivastava2, J. Javier Aguilera2,3,
Wilfredo Colon2,3*, Ravi S. Kane1,2*
1Department of Chemical and Biological Engineering, Rensselaer Polytechnic Institute, Troy, New York, United States of America, 2Center for Biotechnology and
Interdisciplinary Studies, Rensselaer Polytechnic Institute, Troy, New York, United States of America, 3Department of Chemistry and Chemical Biology, Rensselaer
Polytechnic Institute, Troy, New York, United States of America
Abstract
The fibrillation of Serum Amyloid A (SAA) – a major acute phase protein – is believed to play a role in the disease Amyloid A(AA) Amyloidosis. To better understand the amyloid formation pathway of SAA, we characterized the oligomerization,misfolding, and aggregation of a disease-associated isoform of human SAA – human SAA1.1 (hSAA1.1) – using techniquesranging from circular dichroism spectroscopy to atomic force microscopy, fluorescence spectroscopy, immunoblot studies,solubility measurements, and seeding experiments. We found that hSAA1.1 formed alpha helix-rich, marginally stableoligomers in vitro on refolding and cross-beta-rich aggregates following incubation at 37uC. Strikingly, while hSAA1.1 wasnot highly amyloidogenic in vitro, the addition of a single N-terminal methionine residue significantly enhanced thefibrillation propensity of hSAA1.1 and modulated its fibrillation pathway. A deeper understanding of the oligomerizationand fibrillation pathway of hSAA1.1 may help elucidate its pathological role.
Citation: Patke S, Srinivasan S, Maheshwari R, Srivastava SK, Aguilera JJ, et al. (2013) Characterization of the Oligomerization and Aggregation of Human SerumAmyloid A. PLoS ONE 8(6): e64974. doi:10.1371/journal.pone.0064974
Editor: Jose M. Sanchez-Ruiz, Universidad de Granada, Spain
Received December 14, 2012; Accepted April 19, 2013; Published June 4, 2013
Copyright: � 2013 Patke et al. This is an open-access article distributed under the terms of the Creative Commons Attribution License, which permitsunrestricted use, distribution, and reproduction in any medium, provided the original author and source are credited.
Funding: The authors acknowledge support from National Institutes of Health grant R01 AG028158 to W.C. and from the P.K. Lashmet Chair Fund to R.S.K. Thefunders had no role in study design, data collection and analysis, decision to publish, or preparation of the manuscript.
Competing Interests: The authors have declared that no competing interests exist.
* E-mail: [email protected] (WC); [email protected] (RSK)
Introduction
Reactive amyloidosis or Amyloid A (AA) amyloidosis is a
condition in which amyloid deposits of the protein serum amyloid
A (SAA) appear in organs like the spleen, liver, and kidney [1–4].
Reactive amyloidosis generally accompanies other conditions that
induce chronic inflammation such as rheumatoid arthritis and
atherosclerosis [1,5,6]. Serum amyloid A is an acute-phase
reactant found circulating in the blood plasma primarily associated
with high density lipoproteins (HDL) [7,8]. SAA has been shown
to play critical roles in a wide range of functions including
cholesterol transport, HDL metabolism, and host defense [9–12].
A persistently high level of SAA in the plasma and specific tissues,
arising as a result of inflammation, is believed to be the
prerequisite for the development of reactive amyloidosis [2,4,5].
SAA is found in almost all vertebrates investigated and exhibits
a high degree of similarity between species [13,14]. The human
genome includes four SAA genes, of which SAA1 and SAA2 are
acute-phase proteins, SAA3 is a pseudogene and SAA4 is a
constitutively expressed protein [14,15]. Characterization of
amyloid A (AA) protein in tissues of patients suffering from
reactive amyloidosis has revealed the predominant deposition of
SAA1 and its proteolytic fragments as amyloid deposits [1,16]. In
particular, a specific allele of SAA1, human SAA1.1 (hSAA1.1)
(previously called SAA1a) was shown to be a principal component
of AA amyloid deposits [16,17]. Pioneering work by Parmelee
et al. [18] led to the amino acid sequence analysis of hSAA1.1
isolated from the high density lipoprotein fraction of a pool of
human sera with elevated levels of Amyloid A immunoreactivity.
In addition to its role in reactive amyloidosis, hSAA1.1 has also
been shown to play a role in other pathological conditions
including but not limited to asthma [19], chronic obstructive
pulmonary disease [20], and thrombosis [21].
Despite the significant amount of work done to understand the
physiological role of SAA [12,22–25], the exact role of SAA
misfolding and aggregation in reactive amyloidosis remains
unclear. As a first step towards addressing these issues, we
characterized the oligomerization and fibrillation properties of
hSAA1.1 in vitro. We note that we have used delipidated (apo)
hSAA1.1 for our studies. While physiologically, SAA is predom-
inantly associated with HDL [8,26], it has been shown that SAA
can exist in vivo in lipid-free form [5,27]. Moreover, since our goal
was to probe the intrinsic structure and fibrillation propensities of
hSAA1.1, the absence of HDL was necessary for these in vitro
studies.
Interestingly, most previous studies discussing the pathological
importance of hSAA1.1 use a protein expressed in E. coli [28] or
obtained commercially [19,20,29,30], that carries a N-terminal
methionine, a residue which is absent in the SAA protein found in
amyloid deposits in vivo [7,16,18]. We therefore used both
hSAA1.1 without the N-terminal methionine (hSAA1.1) and with
the N-terminal methionine (referred to as MetSAA1.1). Such a
side-by-side comparison of the commonly studied version of the
protein (MetSAA1.1) and the physiologically relevant isoform
(hSAA1.1) would help provide a more comprehensive under-
PLOS ONE | www.plosone.org 1 June 2013 | Volume 8 | Issue 6 | e64974
standing of the oligomerization and fibrillation properties of
hSAA1.1.
Based on size exclusion chromatography and circular dichroism
spectroscopy, we found that both MetSAA1.1 and hSAA1.1 form
alpha-helix-rich oligomers immediately upon refolding. While
incubation of both the proteins at 37uC resulted in the formation
of cross-beta-rich aggregates with similar aggregation kinetics,
there were some striking differences between the fibrillation
propensities and pathways of both the proteins, suggesting a
critical role for the amino-terminal methionine. Aggregation of
MetSAA1.1 resulted in the formation of soluble and spherical
oligomers in the early stages and long and insoluble ‘‘rod-like’’
amyloid fibrils in the later stages. In contrast, hSAA1.1, even upon
prolonged incubation at 37uC, existed as soluble spherical
oligomers and short curvilinear aggregates, all of these aggregates
being much smaller and having a different conformation relative
to the aggregates formed by MetSAA1.1. Interestingly, the
amyloid fibrils formed by MetSAA1.1 were able to seed the
fibrillation of MetSAA1.1 while hSAA1.1 did not exhibit seeding
properties further suggesting the importance of the methionine
residue in the aggregation of the protein. This insight into the
intrinsic oligomerization and fibrillation propensities of the AA
Amyloidosis-relevant isoform of human SAA will provide a useful
starting point in understanding the pathological activity of this
protein.
Materials and Methods
MetSAA1.1 and hSAA1.1 Expression and PurificationMetSAA1.1 was purified following a procedure described
previously for murine SAA [31]. Briefly, MetSAA1.1 cDNA was
cloned into a pET21-a(+) vector between the NdeI and BamHI
sites and transformed into E. coli BL21 (DE3) pLysS-competent
cells. The cells were grown, expressed, and lysed using standard
procedures. Cation exchange buffer (8 M urea/20 mM sodium
acetate, pH 4.7) was used as lysis buffer and the lysate was purified
using SP Sepharose cation exchange column (GE Healthcare
Biosciences) on an AKTA purifier UPC 10 FPLC (GE Healthcare
Biosciences) using an elution buffer (8 M urea/20 mM sodium
acetate/400 mM NaCl, pH 4.7) to isolate the protein. The
relevant fractions, based on analysis by sodium dodecyl sulfate –
polyacrylamide gel electrophoresis (SDS-PAGE), were pooled and
desalted by dialyzing them against anion exchange buffer (8 M
urea/20 mM Tris, pH 8.3). This desalted fraction was then loaded
on a DE52 anion exchange column and eluted with an anion
exchange elution buffer (8 M urea/20 mM Tris/400 mM NaCl,
pH 8.3) on an AKTA FPLC (GE Healthcare Biosciences) using a
10265% salt gradient. The relevant fractions, based on analysis
by SDS-PAGE, were pooled and concentrated via several rounds
of ultrafiltration and then loaded on a HiLoad 16/60 Superdex
200 preparative grade column (GE Healthcare Biosciences)
preequilibrated with size exclusion chromatography (SEC) buffer
(8 M urea/20 mM Tris/200 mM NaCl, pH 8.3), and the relevant
fractions were collected and concentrated using an Amicon
ultrafiltration cell.
We used a protocol similar to one used in one of our previous
studies to purify hSAA1.1 [32]. Similar to MetSAA1.1,
hSAA1.1 cDNA was also cloned into a pET21-a(+) vector
between the NdeI and BamHI sites. We first expressed the protein
with a N-terminal his-tag and a recognition site for tobacco etch
virus (TEV) ((His)6–TEV-SAA) in E.coli BL21 (DE3) pLysS-
competent cells and lysed the cells in lysis buffer (8 M urea/
20 mM Tris, pH 8.3). The ultracentrifuged and filtered lystate was
then loaded on a Histrap column (GE Healthcare Biosciences) and
(His)6–TEV-SAA was eluted using immobilized metal affinity
chromatography (IMAC) elution buffer (8 M urea/20 mM Tris/
400 mM imidazole, pH 8.3). The relevant fractions containing
(His)6–TEV-SAA were then pooled and loaded on a SEC column
(HiLoad 16/60 Superdex 200, GE Healthcare Biosciences) pre-
equilibrated with SEC buffer (8 M urea/20 mM Tris/200 mM
NaCl) to isolate pure (His)6-TEV-SAA. Purified (His)6–TEV-SAA
was then extensively dialyzed against Tris buffer (20 mM Tris/
1 mM EDTA, pH 7.4) to remove urea from the protein solution.
TEV protease was then used to cleave dialyzed (His)6–TEV-SAA
(1:20 TEV:SAA) resulting in the generation of cleaved protein
(hSAA1.1) and uncleaved (His)6–TEV-SAA. Protein sequence of
(His)6–TEV-SAA indicating TEV cleavage site has been included
in the supporting information section. Figure S1 in File S1
summarizes the TEV proteolysis reaction monitored as a function
of time. TEV cleaves (His)6-TEV-hSAA1.1 at a site between ‘‘Q’’
and ‘‘R’’ residues yielding hSAA1.1, sequence of which begins
with ‘‘R’’ and with no residues from TEV remaining in the protein
sequence. TEV proteolysis was quenched by adding a solution
containing urea and NaCl to bring up the final concentration of
the solution to 5 M urea and 500 mM NaCl. The protein solution
containing hSAA1.1, uncleaved (His)6–TEV-SAA, and (His)6–
TEV was then dialyzed against a buffer containing 8 M urea and
20 mM Tris, pH 8.3 to remove traces of EDTA. The resulting
protein solution in IMAC buffer (8 M urea/20 mM Tris, pH 8.3)
was then passed through a Histrap column (GE Healthcare
Biosciences) and hSAA1.1 was collected in the eluant. The
unbound protein was collected, concentrated, and further purified
using a gel filtration column (HiLoad 16/60 Superdex 200, GE
Healthcare Biosciences) preequilibrated with SEC buffer (8 M
urea/20 mM Tris/200 Mm NaCl) to obtain hSAA1.1. Relevant
fractions obtained after SEC were pooled and concentrated using
Amicon ultrafiltration cells. The purity of MetSAA1.1 and
hSAA1.1 was confirmed by SDS-PAGE and electrospray
ionization2mass spectroscopy (ESI-MS). Protein concentration
was determined by measuring the absorbance at 280 nm and
using calculated values of the extinction coefficients.
Refolding of hSAA1.1Both hSAA1.1 and MetSAA1.1 proteins were refolded by
dialyzing purified protein in SEC buffer (8 M urea/20 mM Tris-
HCl, 200 mM NaCl, pH 8.3) against Tris buffer (20 mM Tris-
HCl, pH 8.3) using a 3 kDa MWCO membrane at 4uC. Dialysis
was performed overnight with multiple buffer changes during the
course of the experiment. Buffer used for dialysis was pre-cooled to
4uC prior to dialysis and the apparatus was maintained at 4uC at
all times.
Size Exclusion Chromatography (SEC)All SEC studies were performed at 4uC on a Superdex 200 10/
300 GL analytical grade column (GE Healthcare Biosciences)
using an AKTA purifier UPC 10 (GE Healthcare Biosciences).
Molecular weight (MW) standards were used to calibrate the SEC
column. Approximately 30 mL of refolded proteins (20 mM)
obtained after dialysis against Tris buffer, was loaded in the
analytical SEC column pre-equilibrated with TBS (20 mM Tris/
200 mM NaCl, pH 8.3, 4uC). Elutions were performed at a flow
rate of 0.5 mL/min. All the experiments involving characteriza-
tion of the oligomeric state of refolded hSAA1.1 were performed
at 4uC.
Circular Dichroism (CD) SpectroscopyFar-UV CD experiments were performed using a J-815 CD
spectrometer (Jasco). Approximately 250 mL of SAA solution,
Oligomerization and Aggregation of Human SAA
PLOS ONE | www.plosone.org 2 June 2013 | Volume 8 | Issue 6 | e64974
diluted to a final concentration of 20 mM using Tris buffer
(20 mM Tris-HCl, pH 8.3, 4uC), was used for the measurement of
CD spectra and also for the thermal denaturation experiments.
The diluted protein samples were loaded in a rectangular quartz
cuvette (1 mm pathlength) and 10 spectra were collected from
200 nm to 260 nm and later averaged. Other experimental
settings were as follows: Data pitch, 0.5 nm; Scanning mode,
Continuous; Scanning speed, 50 nm/min; Bandwidth, 1 nm.
Thermal denaturation experiments on hSAA1.1 were performed
by measuring the molar ellipticity of hSAA1.1 with molar
ellipticity at 222 nm as the reference. The experimental settings
for thermal denaturation experiments were as follows: Tempera-
ture range, 4–80uC; Data pitch, 2uC; Slope, 1uC/min.
Tryptophan Fluorescence AssayTryptophan fluorescence measurements were performed using
a Spex FluoroLog Tau3 fluorometer (Horiba). Approximately
3 mL of SAA solution, diluted to a final concentration of 10 mg/mL using Tris buffer (20 mM Tris-HCl, pH 8.3, 4uC), was usedfor the measurement of fluorescence spectra and also for the
tryptophan fluorescence-based thermal denaturation experiments.
The diluted protein samples were loaded in a rectangular quartz
cuvette (10 mm pathlength) and 10 spectra were collected from
320 nm to 400 nm and later averaged. Other experimental
settings were as follows: Data pitch, 0.5 nm; Scanning mode,
Continuous; Scanning speed, 50 nm/min; Bandwidth, 1 nm;
Emission slit width, 5 nm; Excitation slit width; 3 nm. Thermal
denaturation experiments on both proteins were performed by
measuring the fluorescence intensity and emission maxima of the
proteins with emission maxima of freshly refolded proteins used as
the reference. The experimental settings for thermal denaturation
experiments were as follows: Temperature range, 4–80uC; Data
pitch, 2uC; Slope, 1uC/min.
Thioflavin T (ThT) Fluorescence AssayFor ThT fluorescence assay, a solution containing freshly
refolded protein (20 mM) in Tris buffer (20 mM Tris-HCl, pH 8.3,
4uC) was incubated at 37uC without agitation in an Eppendorf
Mastercycler (Eppendorf). At desired time intervals, 5 mL of this
solution were mixed with 5 mL ThT dye solution (260 mM) and
90 mL of glycine-NaOH buffer (50 mM glycine, pH 8.5) and
measurements were made on a Safire II microplate reader
(Tecan). Analysis was done in triplicates. The experimental
settings used were as follows: excitation wavelength, 440 nm;
emission wavelength, 485 nm; excitation bandwidth, 5 nm;
emission bandwidth, 5 nm; Number of scans, 6.
Congo Red Binding AssayWe followed the procedure described in Srinivasan et al. [33]
with some minor modifications. A Congo red stock solution
(10 mM) was prepared by dissolving Congo red in Tris:ethanol
(9:1) at pH 8.3. Ethanol was used to prevent micelle formation.
The stock solution was filtered three times using a 0.2 mm filter.
From this stock solution, a diluted solution of Congo red (20 mM)
was prepared. Accurate concentrations of the diluted Congo red
solution was determined by absorbance spectroscopy at 505 nm
and using the Beer-Lambert plot (e=5.536104 cm21 M21). Two
hundred microliters of the diluted Congo red solution (20 mM)
were then mixed with 100 mL of a protein solution (that had been
previously incubated for 24 h at 37uC at a starting concentration
of 20 mM) and the resulting mixture was incubated for 30 min at
RT. Congo red binding was confirmed by measuring a UV
absorbance spectrum from 400–600 nm using a Lambda 35 UV
spectrophotometer (Perkin – Elmer), with subtraction of the
baseline spectrum of the Tris buffer. The final spectrum was
compared to that of a solution containing Congo red (13.3 mM)
but no protein.
Measurement of Soluble Protein ConcentrationFor assays involving the measurement of soluble protein in the
protein sample, solutions containing freshly refolded protein
(20 mM) in Tris buffer (20 mM Tris-HCl, pH 8.3, 4uC) were
incubated at 37uC without agitation in an Eppendorf Mastercycler
(Eppendorf). At desired time intervals, 50 mL of sample was
centrifuged at 12,000 rpm (13,5236g) at 37uC for 10 min to
separate the soluble fraction (supernatant) from the insoluble
fraction (pellet). Soluble protein concentration was determined by
measuring the absorbance of the supernatant at 280 nm and using
the calculated value of the extinction coefficient.
Atomic Force Microscopy (AFM)AFM measurements were performed as described previously
[31]. Briefly, SAA samples at different incubation times were
diluted 10–20 fold in Tris buffer (20 mM Tris-HCl, pH 8.3) and
then applied on freshly cleaved mica. The samples were incubated
on the mica for 15 min and the mica was then washed 3–4 times
with filtered water. AFM was performed at room temperature
using an Asylum Research MFP 3D AFM instrument (Asylum
Research), operating in tapping mode in air. Specifications of the
silicon cantilevers (AC240TS, Olympus) used for AFM analysis
were as follows: spring constant, 1.8 N/m; tip radius, ,10 nm;
resonant frequency, 70 kHz; tip height, 14 mm; cantilever
thickness, 2.8 mm.
Immunoblot AssayImmunoblot assay using A11 and OC antibodies were
performed as described previously [34]. Solution containing
freshly refolded protein (20 mM) in Tris buffer (20 mM Tris-
HCl, pH 8.3, 4uC) was incubated at 37uC without agitation in an
Eppendorf Mastercycler (Eppendorf). 3–4 mL of this sample was
spotted on a nitrocellulose membrane (GE Healthcare Bioscienc-
es). The membrane was allowed to dry overnight at room
temperature (RT). The membrane was then blocked with 10%
nonfat dry milk (in PBS) for 2 h, followed by a wash with PBST for
10 min. The blots were then incubated with A11 (Invitrogen) or
OC (Millipore) antibodies (dilutions for the antibodies were:
1:700 for A11 and 1:1000 for OC in 5% nonfat dry milk in PBS)
for 1 h at RT, followed by a wash with PBST for 10 min. The
membrane was then incubated with anti-rabbit horseradish
peroxidase-conjugated secondary antibody for 1 h at RT, followed
by a wash with PBST for 10 min. After washing, the blots were
exposed to ECL Western blotting substrate (Thermofisher) and
then developed. Isotype rabbit antibodies were used for control
immunoblot experiments.
Results
MetSAA1.1 and hSAA1.1 Form Alpha Helical Oligomerson RefoldingBoth versions of SAA were expressed, purified and refolded
using the protocols described in the experimental procedures
section (See Supporting Information for more details about the
sequence, UniProtKD ID, estimated MW, and extinction
coefficient values of the proteins). In order to have a consistent
starting point for all the studies, the experiments were performed
on freshly refolded protein. By doing so, we ensured that
conformational changes associated with the storage of proteins
for extended periods of time did not affect the consistency of the
Oligomerization and Aggregation of Human SAA
PLOS ONE | www.plosone.org 3 June 2013 | Volume 8 | Issue 6 | e64974
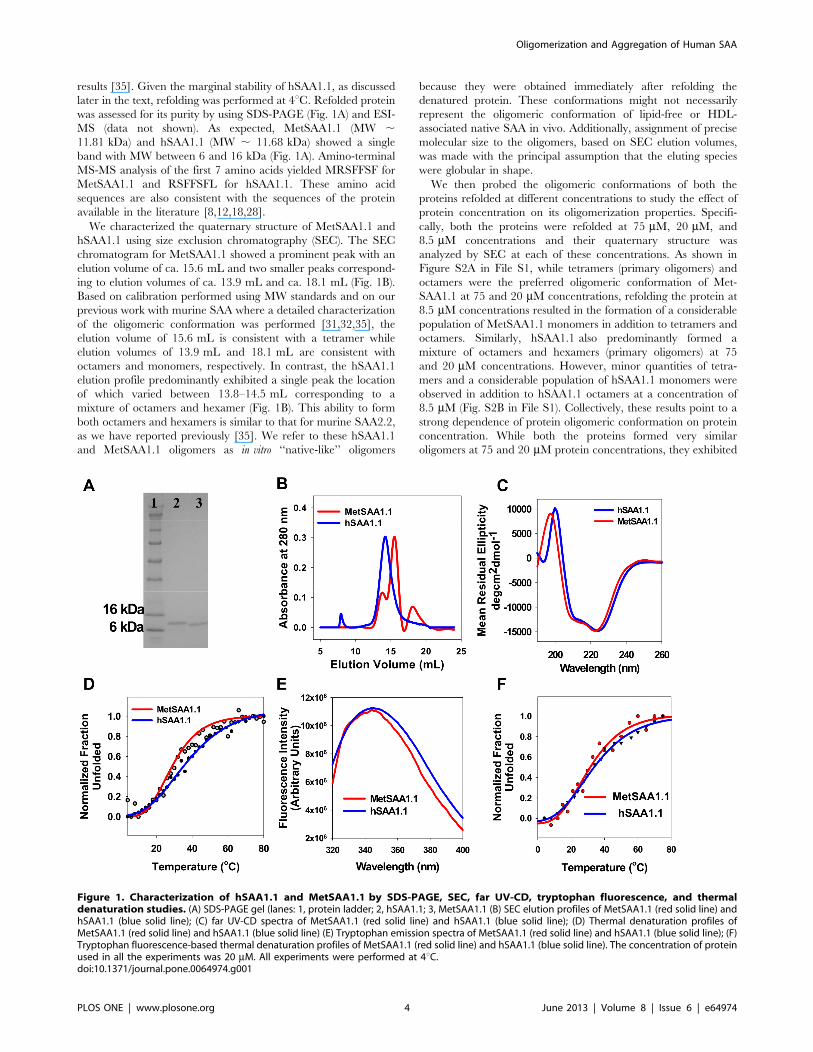
results [35]. Given the marginal stability of hSAA1.1, as discussed
later in the text, refolding was performed at 4uC. Refolded protein
was assessed for its purity by using SDS-PAGE (Fig. 1A) and ESI-
MS (data not shown). As expected, MetSAA1.1 (MW ,11.81 kDa) and hSAA1.1 (MW , 11.68 kDa) showed a single
band with MW between 6 and 16 kDa (Fig. 1A). Amino-terminal
MS-MS analysis of the first 7 amino acids yielded MRSFFSF for
MetSAA1.1 and RSFFSFL for hSAA1.1. These amino acid
sequences are also consistent with the sequences of the protein
available in the literature [8,12,18,28].
We characterized the quaternary structure of MetSAA1.1 and
hSAA1.1 using size exclusion chromatography (SEC). The SEC
chromatogram for MetSAA1.1 showed a prominent peak with an
elution volume of ca. 15.6 mL and two smaller peaks correspond-
ing to elution volumes of ca. 13.9 mL and ca. 18.1 mL (Fig. 1B).
Based on calibration performed using MW standards and on our
previous work with murine SAA where a detailed characterization
of the oligomeric conformation was performed [31,32,35], the
elution volume of 15.6 mL is consistent with a tetramer while
elution volumes of 13.9 mL and 18.1 mL are consistent with
octamers and monomers, respectively. In contrast, the hSAA1.1
elution profile predominantly exhibited a single peak the location
of which varied between 13.8–14.5 mL corresponding to a
mixture of octamers and hexamer (Fig. 1B). This ability to form
both octamers and hexamers is similar to that for murine SAA2.2,
as we have reported previously [35]. We refer to these hSAA1.1
and MetSAA1.1 oligomers as in vitro ‘‘native-like’’ oligomers
because they were obtained immediately after refolding the
denatured protein. These conformations might not necessarily
represent the oligomeric conformation of lipid-free or HDL-
associated native SAA in vivo. Additionally, assignment of precise
molecular size to the oligomers, based on SEC elution volumes,
was made with the principal assumption that the eluting species
were globular in shape.
We then probed the oligomeric conformations of both the
proteins refolded at different concentrations to study the effect of
protein concentration on its oligomerization properties. Specifi-
cally, both the proteins were refolded at 75 mM, 20 mM, and
8.5 mM concentrations and their quaternary structure was
analyzed by SEC at each of these concentrations. As shown in
Figure S2A in File S1, while tetramers (primary oligomers) and
octamers were the preferred oligomeric conformation of Met-
SAA1.1 at 75 and 20 mM concentrations, refolding the protein at
8.5 mM concentrations resulted in the formation of a considerable
population of MetSAA1.1 monomers in addition to tetramers and
octamers. Similarly, hSAA1.1 also predominantly formed a
mixture of octamers and hexamers (primary oligomers) at 75
and 20 mM concentrations. However, minor quantities of tetra-
mers and a considerable population of hSAA1.1 monomers were
observed in addition to hSAA1.1 octamers at a concentration of
8.5 mM (Fig. S2B in File S1). Collectively, these results point to a
strong dependence of protein oligomeric conformation on protein
concentration. While both the proteins formed very similar
oligomers at 75 and 20 mM protein concentrations, they exhibited
Figure 1. Characterization of hSAA1.1 and MetSAA1.1 by SDS-PAGE, SEC, far UV-CD, tryptophan fluorescence, and thermaldenaturation studies. (A) SDS-PAGE gel (lanes: 1, protein ladder; 2, hSAA1.1; 3, MetSAA1.1 (B) SEC elution profiles of MetSAA1.1 (red solid line) andhSAA1.1 (blue solid line); (C) far UV-CD spectra of MetSAA1.1 (red solid line) and hSAA1.1 (blue solid line); (D) Thermal denaturation profiles ofMetSAA1.1 (red solid line) and hSAA1.1 (blue solid line) (E) Tryptophan emission spectra of MetSAA1.1 (red solid line) and hSAA1.1 (blue solid line); (F)Tryptophan fluorescence-based thermal denaturation profiles of MetSAA1.1 (red solid line) and hSAA1.1 (blue solid line). The concentration of proteinused in all the experiments was 20 mM. All experiments were performed at 4uC.doi:10.1371/journal.pone.0064974.g001
Oligomerization and Aggregation of Human SAA
PLOS ONE | www.plosone.org 4 June 2013 | Volume 8 | Issue 6 | e64974
a high propensity to exist as their respective monomers at 8.5 mMconcentration. These results might suggest that oligomerization of
both the proteins is favorable at high protein concentrations.
Next, we used far-UV circular dichroism (CD) spectroscopy to
characterize the secondary structure of these ‘‘native-like’’ SAA
oligomers. As seen in Figure 1C, oligomers of both proteins were
primarily a-helical, as indicated by the two negative peaks
centered at 222 and 208 nm – hallmarks of a protein with high
alpha-helical content. We also characterized the thermal stability
of both proteins (20 mM) using CD-based thermal denaturation
studies. As seen in Figure 1D, the data can be fitted to a sigmoidal
curve. The Tm value for MetSAA1.1 was ca. 29uC. Low values of
melting temperatures suggest marginal stability of these ‘‘native-
like’’ MetSAA1.1 oligomers. Similar calculations for hSAA1.1
indicated that the melting temperature of this protein was ca.
35uC. Thus, addition of a hydrophobic methionine residue at the
N-terminus of hSAA1.1 resulted in a slight decrease in the thermal
stability of the protein. We note that the values of the melting
temperature (Tm) obtained from these experiments are only for
comparison purposes, as the thermal unfolding of the proteins was
found to be irreversible (data not shown). We also observed a
dependence of protein refolding concentration on the thermal
stabilities of both the proteins. While MetSAA1.1 refolded at
8.5 mM concentration yielded a Tm value of 25uC (Fig. S1C in File
S1), hSAA1.1 refolded at the same concentration yielded a Tm
value of 27uC (Fig. S1D in File S1). These Tm values mark a slight
reduction in the thermal stabilities for both the proteins (from
29uC to 25uC for MetSAA1.1 and from 35uC to 27uC for
hSAA1.1) as a result of refolding at lower concentrations.
Next we compared the tertiary structure of both hSAA1.1 and
MetSAA1.1. Since both the proteins have three tryptophan
residues each, comparison of tertiary structures was done by
comparing the intrinsic fluorescence values of both the proteins by
following tryptophan fluorescence. Protein solutions refolded at
20 mM concentrations were diluted in Tris buffer (20 mM Tris,
pH 8.3) to a final concentration of 10 mg/mL and fluorescence
measurements were made at 4uC as described in the materials and
methods section. As shown in figure 1E, ‘‘native-like’’ oligomers of
both the proteins exhibit similar tryptophan emission spectra with
similar quantum yields and wavelength maxima (ca. 345 nm).
Similarities in the emission spectra for both the proteins suggest
that they might have similar tertiary structures. We also monitored
the changes in the tertiary structure of both the proteins by
following tryptophan emission upon temperature increase. We
observed a red shift in emission maxima upon temperature
increase with the peak shifting from ca. 345 nm to ca. 356 nm for
both the proteins (data not shown). As shown in figure 1F, the data
for normalized change in the emission maxima with 345 nm
(emission maxima of ‘‘native-like’’ oligomers) as a reference can be
fitted to a sigmoidal curve. The Tm values for MetSAA1.1 and
hSAA1.1 calculated by monitoring changes in the tryptophan
emission maxima upon temperature increase was ca. 31uC and ca.
33uC respectively. To probe the influence of the concentration of
the proteins on their tertiary structures, we measured tryptophan
emission spectra for proteins refolded at concentrations of 20 mMand 8.5 mM. As shown in Figure S2E in File S1, the emission
spectrum of MetSAA1.1 ‘‘native-like’’ oligomers refolded at
20 mM yielded an emission maximum at 345 nm, while the
spectrum for MetSAA1.1 ‘‘native-like’’ oligomers refolded at
8.5 mM had emission maximum at 351 nm. This red shift in the
emission maximum suggests a greater exposure of tryptophan
residues for the protein refolded at lower concentration. Similar
results were obtained for hSAA1.1, with an emission maximum at
345 nm for protein refolded at 20 mM and 351 nm for protein
refolded at 8.5 mM (Fig. S2F in File S1).
We then performed structural studies to investigate whether the
starting SAA proteins in 8 M urea prior to refolding against Tris
buffer possessed any residual structure. Specifically, we monitored
the secondary and quaternary structure of both the proteins in
8 M urea using far-UV CD and size exclusion chromatography
techniques respectively. Quaternary structure analysis on SAA
samples containing 8 M urea using SEC (column equilibrated in
8 M urea/20 mM Tris/200 mM NaCl) suggested that both the
proteins eluted as a single peak with an elution volume of ca.
19.1 mL representing a monomeric species (Fig. S3A and B in File
S1). Additionally, we performed far-UV CD studies on protein
solutions in 8 M urea but were unable to obtain a reliable
spectrum due to heavy interference of high concentration urea
solutions with CD spectrometer. We therefore performed CD
measurements at lower urea concentrations which could be
expected to yield low urea interference and high reliability results.
As shown in Figure S3C and S3D in File S1, both the proteins
upon refolding formed alpha-helix rich oligomers (0 M urea).
Most of the secondary structure was lost in 2 M urea as indicated
by the small absolute mean residual ellipticity values around
220 nm, suggesting marginal chemical stability of the ‘‘native-like’’
oligomers formed by both the proteins. We have previously
reported that murine SAA2.2 loses its alpha-helical characteristics
in , 2 M urea [36]. Collectively, these results suggest that 8 M
urea is a condition harsh enough for the protein to retain any
structural features of ‘‘native-like’’ oligomers and therefore the
starting protein prior to refolding against Tris buffer is expected to
not possess any residual structure.
Additionally, we performed ‘‘cross-purification’’ studies to
ascertain that the minor differences in the conformations and
thermal stabilities of the ‘‘native-like’’ oligomers formed by both
the proteins was a result of the inherent properties of both the
proteins and not an artifact of differences in the manipulation
histories involved in the purification of these proteins. Specifically,
following purification of MetSAA1.1 (referred to as ‘‘regular’’
MetSAA1.1) using a sequential cation exchange chromatography,
anion exchange chromatography, and size exclusion chromatog-
raphy procedure, the purified protein in size exclusion chroma-
tography buffer (8 M urea/20 mM Tris/200 mM NaCl, pH 8.3)
was passed through a Histrap Ni-NTA column (please refer to
materials and methods sections for more details about the column)
and MetSAA1.1 proteins samples (referred to as ‘‘cross-purified’’
MetSAA1.1) were collected in the flowthrough. Similarly, follow-
ing purification of hSAA1.1 (referred to as ‘‘regular’’ hSAA1.1)
using the procedure described in the materials and methods
section (IMAC, SEC, TEV proteolysis, IMAC, SEC in that
sequence), the purified protein was further purified by using
sequential cation exchange chromatography and anion exchange
chromatography procedures to obtain ‘‘cross-purified’’ hSAA1.1.
Relevant buffer exchanges and ultrafiltration steps were followed
prior to each of the ion exchange chromatography steps. Both the
‘‘cross-purified’’ proteins were then refolded by using the same
refolding protocol which has been described in the materials and
methods section. ‘‘Cross-purification’’ therefore ensured that both
the proteins, which we expressed using the same expression vector,
same bacteria, and refolded using identical dialysis procedures,
were also exposed to the same ions and resins during their
purification and therefore had similar manipulation histories right
from protein expression until protein refolding. We found that
both ‘‘cross-purified’’ MetSAA1.1 and ‘‘regular’’ MetSAA1.1,
upon refolding at 20 mM concentrations, formed a heterogeneous
population consisting of tetramers (primary oligomer), octamers/
Oligomerization and Aggregation of Human SAA
PLOS ONE | www.plosone.org 5 June 2013 | Volume 8 | Issue 6 | e64974
hexamers, and monomers (Figure S4 in File S1). Similarly, as
shown in Figure S4B in File S1, even ‘‘cross-purified’’ hSAA1.1
refolded at 20 mM concentrations predominantly formed octa-
mers/hexamers upon refolding – an oligomeric conformation
similar to the one formed by refolded ‘‘regular’’ hSAA1.1 (Fig. S5
in File S1). Taken together, these results suggest that the minor
differences in the oligomeric conformation formed by both the
proteins were not due to the differences in their manipulation
histories.
Both MetSAA1.1 and hSAA1.1 Form Cross-Beta-richAggregates with Contrasting SolubilitiesNext, we investigated the ability of MetSAA1.1 and hSAA1.1
‘‘native-like’’ oligomers to aggregate at 37uC. We use the term
‘‘aggregation’’ to refer to higher-order self-assembly of SAA
beyond the ‘‘native-like’’ oligomers. We chose to study SAA
aggregation at 37uC since our previous studies using mouse
isoforms of SAA yielded amyloid fibrils at this temperature
[31,32,37,38]. We used the ThT fluorescence assay to investigate
the aggregation kinetics of hSAA1.1 and MetSAA1.1. Thioflavin
T dye shows a strong binding affinity to cross- beta structures and
exhibits enhanced fluorescence upon binding to such structures
[39].
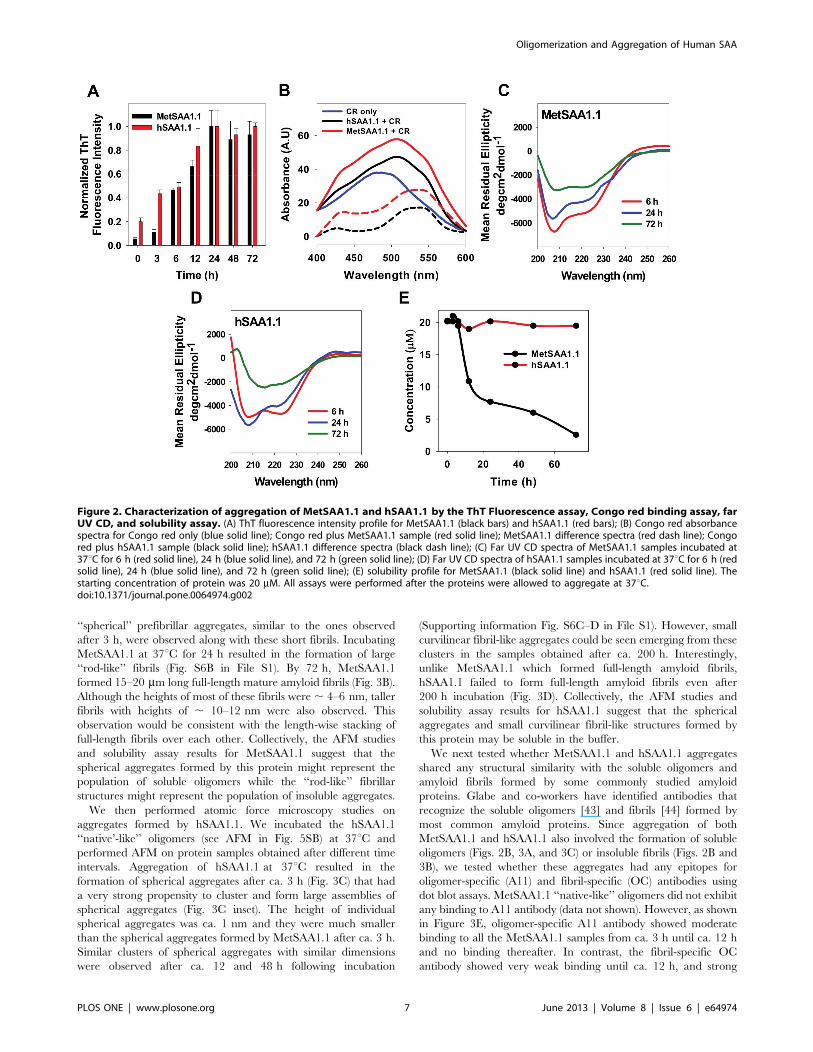
We induced aggregation of the ‘‘native-like’’ protein oligomers
by incubating the proteins (starting concentration 20 mM) at 37uCand monitored the intensity of ThT fluorescence as a function of
time. As seen in Figure 2A, MetSAA1.1 aggregation was
characterized by a time-dependent increase in the ThT fluores-
cence intensity suggesting a transformation of the ‘‘native-like’’
oligomers into aggregates rich in cross-beta structure. A measur-
able ‘‘lag time’’ of ca. 3 h was observed, and the ThT fluorescence
intensity reached its maximum value by ca. 24 h, after which there
was no significant change in the fluorescence intensity. Next, we
performed similar ThT fluorescence experiments using hSAA1.1.
hSAA1.1 showed similar ThT binding kinetics, with a time-
dependent increase in ThT fluorescence intensity followed by
saturation of ThT signal by ca. 24 h (Fig. 2A). Similar ThT
fluorescence intensity profiles for both proteins suggested the
formation of cross-beta-rich aggregates with similar aggregation
kinetics.
To ascertain that the aggregates formed by both the proteins
have cross-beta structures, we used the well-established Congo red
binding assay [33,40]. Amyloid aggregates with cross-beta
structure exhibit a characteristic red shift in their absorption
spectrum upon binding to Congo red [33]. We induced
aggregation by incubating the proteins at 37uC. Since both the
proteins had reached a ThT fluorescence maximum by ca. 24 h,
we chose to test the ability of the aggregates formed after 24 h to
bind to Congo red. While free Congo red solution exhibited
absorption spectra with absorption maxima at ca. 485 nm,
aggregates of both MetSAA1.1 and hSAA1.1 formed after 24 h
exhibited absorption maxima at ca. 506 nm upon Congo red
binding (Fig. 2B). The absorption shift is even more evident from
the difference spectrum (bound Congo red minus free Congo red),
which exhibits an absorption maxima at ca. 540 nm. These results
are consistent with the presence of cross-beta structures in the
aggregates formed by both MetSAA1.1 and hSAA1.1.
Next, we monitored changes in the secondary structures of
MetSAA1.1 and hSAA1.1 at different time intervals following
incubation at 37uC. While the ‘‘native-like’’ oligomers formed by
MetSAA1.1 were rich in alpha-helical content (Fig. 1C), the CD
spectra obtained after incubation of the protein at 37uC for 6 h
and 24 h exhibited a shoulder at 222 nm and a deep minimum
around 207 nm (Fig. 2C red and blue lines). These CD spectra
were consistent with those from a previous study reporting the
conversion of predominantly alpha-helix-rich structures of two
isoforms of murine SAA to a mixture of alpha-helix, random coil,
beta-sheet, and beta-turn structures [41]. Interestingly, the
spectrum for MetSAA1.1 after 72 h displayed enhanced alpha-
helicity relative to samples obtained at earlier time points (Fig. 2C
green line). However, caution must be exerted in interpreting this
data as the protein sample was found to contain high levels of
insoluble aggregates at this time (see discussion below). Therefore
the CD spectrum obtained for MetSAA1.1 after 72 h may
represent primarily the soluble protein fraction and cannot be
used to draw inferences about the secondary structure of the
‘‘entire’’ protein population. As shown in Figure 2D, far UV CD
studies on hSAA1.1 samples obtained after 6 h and 24 h yielded
results similar to those observed for MetSAA1.1. Aggregates of
hSAA1.1 obtained after these incubation times were also
characteristic of a mixture containing alpha-helical, random coil,
beta-sheet, and beta-turn structures. However, in the case of this
protein, 72 h samples, which did not contain any insoluble
precipitates, exhibited CD spectra with a minimum centered at
215 nm, providing direct evidence of beta-sheet structures.
These studies were followed by experiments to check the
solubilities of the aggregates formed during this 72 h period.
Samples from both the proteins obtained after different incubation
times were spun down at 12,000 rpm at 37uC for 10 min to
separate the soluble protein fraction (supernatant) from the
insoluble fraction (pellet) [42]. Concentrations of the soluble
protein fractions were determined by measuring the absorbance at
280 nm using known values of the extinction co-efficients of both
proteins. As shown in Figure 2E, MetSAA1.1 aggregation was
characterized by a time-dependent decrease in the concentration
of protein present in the supernatant, suggesting a conversion of
soluble oligomers into insoluble protein aggregates. In contrast,
hSAA1.1 aggregates were soluble even after ca. 72 h (Fig. 2E).
These results suggest that there are some fundamental differences
between the solubilities of the aggregates formed by MetSAA1.1
and hSAA1.1.
Collectively, these results suggest that the aggregation of
MetSAA1.1 involved the conversion of the alpha helix - rich
‘‘native-like’’ oligomers to soluble oligomers in the early stages of
aggregation and eventually into insoluble cross-beta-rich aggre-
gates. On the other hand, aggregation of hSAA1.1 was charac-
terized by the conversion of the ‘‘native-like’’ oligomers into
soluble oligomers rich in cross-beta structure. These critical
differences point to some fundamental differences between the
aggregation pathways of the two proteins, although they differ by
only a single methionine residue at the N-terminus.
Characterization of Aggregation by AFM andImmunoblotsIntrigued by the observation that both versions of hSAA1.1
exhibited similar aggregation kinetics, but differed in the
solubilities of their aggregates, we decided to further characterize
the species formed during aggregation. We performed AFM
studies for morphological characterization of the protein aggre-
gates. We incubated the MetSAA1.1 ‘‘native’-like’’ oligomers (see
AFM in Fig. S5A in File S1) at 37uC and performed AFM on
protein samples obtained after different time intervals. As shown in
Figure 3A, ‘‘spherical’’ aggregates with heights in the range of ,4–6 nm were predominantly observed following the incubation of
MetSAA1.1 at 37uC for 3 h. Further incubation up to 6 h at 37uCresulted in the formation of short fibrils with ‘‘rod-like’’
architecture (Fig. S6A in File S1and inset) with heights ranging
from 4–6 nm and lengths ranging from 10–15 nm. Small
Oligomerization and Aggregation of Human SAA
PLOS ONE | www.plosone.org 6 June 2013 | Volume 8 | Issue 6 | e64974
‘‘spherical’’ prefibrillar aggregates, similar to the ones observed
after 3 h, were observed along with these short fibrils. Incubating
MetSAA1.1 at 37uC for 24 h resulted in the formation of large
‘‘rod-like’’ fibrils (Fig. S6B in File S1). By 72 h, MetSAA1.1
formed 15–20 mm long full-length mature amyloid fibrils (Fig. 3B).
Although the heights of most of these fibrils were , 4–6 nm, taller
fibrils with heights of , 10–12 nm were also observed. This
observation would be consistent with the length-wise stacking of
full-length fibrils over each other. Collectively, the AFM studies
and solubility assay results for MetSAA1.1 suggest that the
spherical aggregates formed by this protein might represent the
population of soluble oligomers while the ‘‘rod-like’’ fibrillar
structures might represent the population of insoluble aggregates.
We then performed atomic force microscopy studies on
aggregates formed by hSAA1.1. We incubated the hSAA1.1
‘‘native’-like’’ oligomers (see AFM in Fig. 5SB) at 37uC and
performed AFM on protein samples obtained after different time
intervals. Aggregation of hSAA1.1 at 37uC resulted in the
formation of spherical aggregates after ca. 3 h (Fig. 3C) that had
a very strong propensity to cluster and form large assemblies of
spherical aggregates (Fig. 3C inset). The height of individual
spherical aggregates was ca. 1 nm and they were much smaller
than the spherical aggregates formed by MetSAA1.1 after ca. 3 h.
Similar clusters of spherical aggregates with similar dimensions
were observed after ca. 12 and 48 h following incubation
(Supporting information Fig. S6C–D in File S1). However, small
curvilinear fibril-like aggregates could be seen emerging from these
clusters in the samples obtained after ca. 200 h. Interestingly,
unlike MetSAA1.1 which formed full-length amyloid fibrils,
hSAA1.1 failed to form full-length amyloid fibrils even after
200 h incubation (Fig. 3D). Collectively, the AFM studies and
solubility assay results for hSAA1.1 suggest that the spherical
aggregates and small curvilinear fibril-like structures formed by
this protein may be soluble in the buffer.
We next tested whether MetSAA1.1 and hSAA1.1 aggregates
shared any structural similarity with the soluble oligomers and
amyloid fibrils formed by some commonly studied amyloid
proteins. Glabe and co-workers have identified antibodies that
recognize the soluble oligomers [43] and fibrils [44] formed by
most common amyloid proteins. Since aggregation of both
MetSAA1.1 and hSAA1.1 also involved the formation of soluble
oligomers (Figs. 2B, 3A, and 3C) or insoluble fibrils (Figs. 2B and
3B), we tested whether these aggregates had any epitopes for
oligomer-specific (A11) and fibril-specific (OC) antibodies using
dot blot assays. MetSAA1.1 ‘‘native-like’’ oligomers did not exhibit
any binding to A11 antibody (data not shown). However, as shown
in Figure 3E, oligomer-specific A11 antibody showed moderate
binding to all the MetSAA1.1 samples from ca. 3 h until ca. 12 h
and no binding thereafter. In contrast, the fibril-specific OC
antibody showed very weak binding until ca. 12 h, and strong
Figure 2. Characterization of aggregation of MetSAA1.1 and hSAA1.1 by the ThT Fluorescence assay, Congo red binding assay, farUV CD, and solubility assay. (A) ThT fluorescence intensity profile for MetSAA1.1 (black bars) and hSAA1.1 (red bars); (B) Congo red absorbancespectra for Congo red only (blue solid line); Congo red plus MetSAA1.1 sample (red solid line); MetSAA1.1 difference spectra (red dash line); Congored plus hSAA1.1 sample (black solid line); hSAA1.1 difference spectra (black dash line); (C) Far UV CD spectra of MetSAA1.1 samples incubated at37uC for 6 h (red solid line), 24 h (blue solid line), and 72 h (green solid line); (D) Far UV CD spectra of hSAA1.1 samples incubated at 37uC for 6 h (redsolid line), 24 h (blue solid line), and 72 h (green solid line); (E) solubility profile for MetSAA1.1 (black solid line) and hSAA1.1 (red solid line). Thestarting concentration of protein was 20 mM. All assays were performed after the proteins were allowed to aggregate at 37uC.doi:10.1371/journal.pone.0064974.g002
Oligomerization and Aggregation of Human SAA
PLOS ONE | www.plosone.org 7 June 2013 | Volume 8 | Issue 6 | e64974
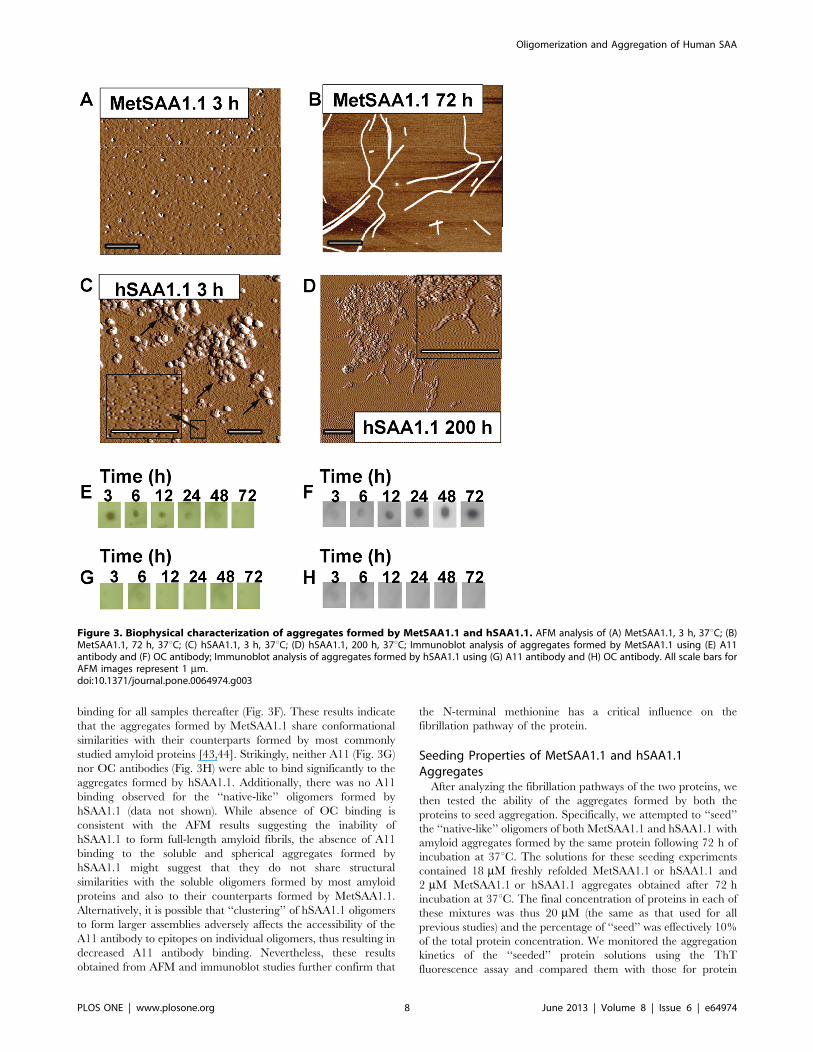
binding for all samples thereafter (Fig. 3F). These results indicate
that the aggregates formed by MetSAA1.1 share conformational
similarities with their counterparts formed by most commonly
studied amyloid proteins [43,44]. Strikingly, neither A11 (Fig. 3G)
nor OC antibodies (Fig. 3H) were able to bind significantly to the
aggregates formed by hSAA1.1. Additionally, there was no A11
binding observed for the ‘‘native-like’’ oligomers formed by
hSAA1.1 (data not shown). While absence of OC binding is
consistent with the AFM results suggesting the inability of
hSAA1.1 to form full-length amyloid fibrils, the absence of A11
binding to the soluble and spherical aggregates formed by
hSAA1.1 might suggest that they do not share structural
similarities with the soluble oligomers formed by most amyloid
proteins and also to their counterparts formed by MetSAA1.1.
Alternatively, it is possible that ‘‘clustering’’ of hSAA1.1 oligomers
to form larger assemblies adversely affects the accessibility of the
A11 antibody to epitopes on individual oligomers, thus resulting in
decreased A11 antibody binding. Nevertheless, these results
obtained from AFM and immunoblot studies further confirm that
the N-terminal methionine has a critical influence on the
fibrillation pathway of the protein.
Seeding Properties of MetSAA1.1 and hSAA1.1AggregatesAfter analyzing the fibrillation pathways of the two proteins, we
then tested the ability of the aggregates formed by both the
proteins to seed aggregation. Specifically, we attempted to ‘‘seed’’
the ‘‘native-like’’ oligomers of both MetSAA1.1 and hSAA1.1 with
amyloid aggregates formed by the same protein following 72 h of
incubation at 37uC. The solutions for these seeding experiments
contained 18 mM freshly refolded MetSAA1.1 or hSAA1.1 and
2 mM MetSAA1.1 or hSAA1.1 aggregates obtained after 72 h
incubation at 37uC. The final concentration of proteins in each of
these mixtures was thus 20 mM (the same as that used for all
previous studies) and the percentage of ‘‘seed’’ was effectively 10%
of the total protein concentration. We monitored the aggregation
kinetics of the ‘‘seeded’’ protein solutions using the ThT
fluorescence assay and compared them with those for protein
Figure 3. Biophysical characterization of aggregates formed by MetSAA1.1 and hSAA1.1. AFM analysis of (A) MetSAA1.1, 3 h, 37uC; (B)MetSAA1.1, 72 h, 37uC; (C) hSAA1.1, 3 h, 37uC; (D) hSAA1.1, 200 h, 37uC; Immunoblot analysis of aggregates formed by MetSAA1.1 using (E) A11antibody and (F) OC antibody; Immunoblot analysis of aggregates formed by hSAA1.1 using (G) A11 antibody and (H) OC antibody. All scale bars forAFM images represent 1 mm.doi:10.1371/journal.pone.0064974.g003
Oligomerization and Aggregation of Human SAA
PLOS ONE | www.plosone.org 8 June 2013 | Volume 8 | Issue 6 | e64974
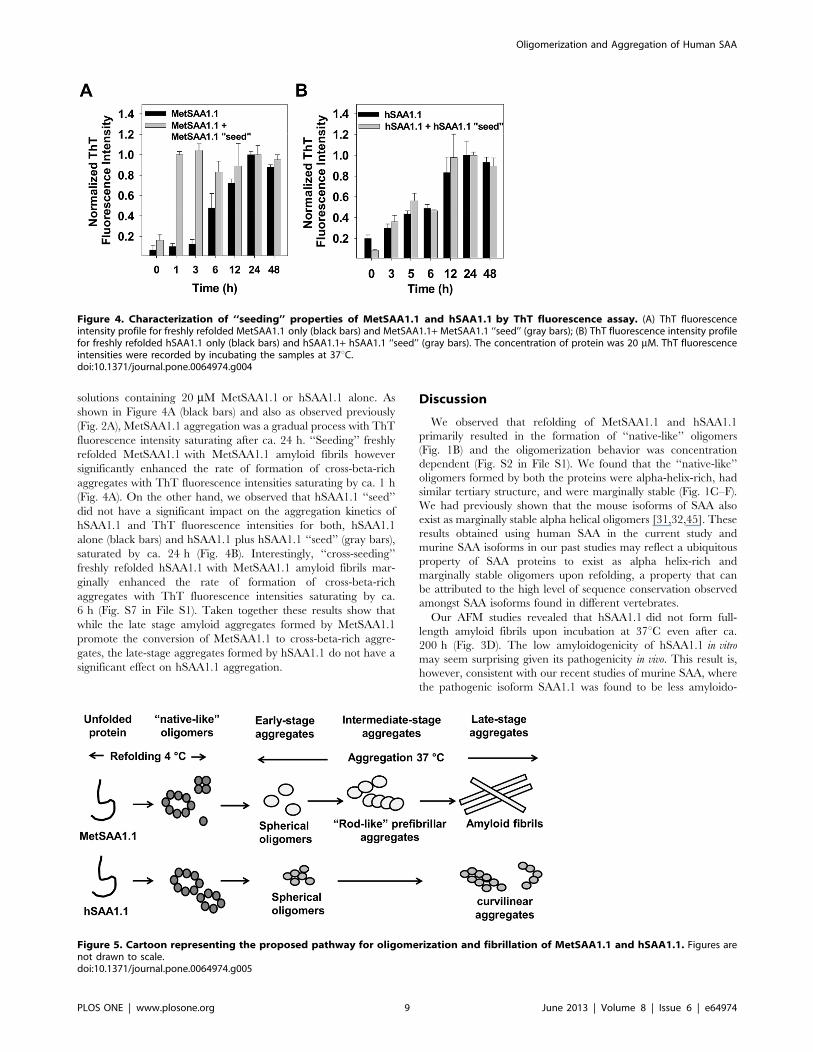
solutions containing 20 mM MetSAA1.1 or hSAA1.1 alone. As
shown in Figure 4A (black bars) and also as observed previously
(Fig. 2A), MetSAA1.1 aggregation was a gradual process with ThT
fluorescence intensity saturating after ca. 24 h. ‘‘Seeding’’ freshly
refolded MetSAA1.1 with MetSAA1.1 amyloid fibrils however
significantly enhanced the rate of formation of cross-beta-rich
aggregates with ThT fluorescence intensities saturating by ca. 1 h
(Fig. 4A). On the other hand, we observed that hSAA1.1 ‘‘seed’’
did not have a significant impact on the aggregation kinetics of
hSAA1.1 and ThT fluorescence intensities for both, hSAA1.1
alone (black bars) and hSAA1.1 plus hSAA1.1 ‘‘seed’’ (gray bars),
saturated by ca. 24 h (Fig. 4B). Interestingly, ‘‘cross-seeding’’
freshly refolded hSAA1.1 with MetSAA1.1 amyloid fibrils mar-
ginally enhanced the rate of formation of cross-beta-rich
aggregates with ThT fluorescence intensities saturating by ca.
6 h (Fig. S7 in File S1). Taken together these results show that
while the late stage amyloid aggregates formed by MetSAA1.1
promote the conversion of MetSAA1.1 to cross-beta-rich aggre-
gates, the late-stage aggregates formed by hSAA1.1 do not have a
significant effect on hSAA1.1 aggregation.
Discussion
We observed that refolding of MetSAA1.1 and hSAA1.1
primarily resulted in the formation of ‘‘native-like’’ oligomers
(Fig. 1B) and the oligomerization behavior was concentration
dependent (Fig. S2 in File S1). We found that the ‘‘native-like’’
oligomers formed by both the proteins were alpha-helix-rich, had
similar tertiary structure, and were marginally stable (Fig. 1C–F).
We had previously shown that the mouse isoforms of SAA also
exist as marginally stable alpha helical oligomers [31,32,45]. These
results obtained using human SAA in the current study and
murine SAA isoforms in our past studies may reflect a ubiquitous
property of SAA proteins to exist as alpha helix-rich and
marginally stable oligomers upon refolding, a property that can
be attributed to the high level of sequence conservation observed
amongst SAA isoforms found in different vertebrates.
Our AFM studies revealed that hSAA1.1 did not form full-
length amyloid fibrils upon incubation at 37uC even after ca.
200 h (Fig. 3D). The low amyloidogenicity of hSAA1.1 in vitro
may seem surprising given its pathogenicity in vivo. This result is,
however, consistent with our recent studies of murine SAA, where
the pathogenic isoform SAA1.1 was found to be less amyloido-
Figure 4. Characterization of ‘‘seeding’’ properties of MetSAA1.1 and hSAA1.1 by ThT fluorescence assay. (A) ThT fluorescenceintensity profile for freshly refolded MetSAA1.1 only (black bars) and MetSAA1.1+ MetSAA1.1 ‘‘seed’’ (gray bars); (B) ThT fluorescence intensity profilefor freshly refolded hSAA1.1 only (black bars) and hSAA1.1+ hSAA1.1 ‘‘seed’’ (gray bars). The concentration of protein was 20 mM. ThT fluorescenceintensities were recorded by incubating the samples at 37uC.doi:10.1371/journal.pone.0064974.g004
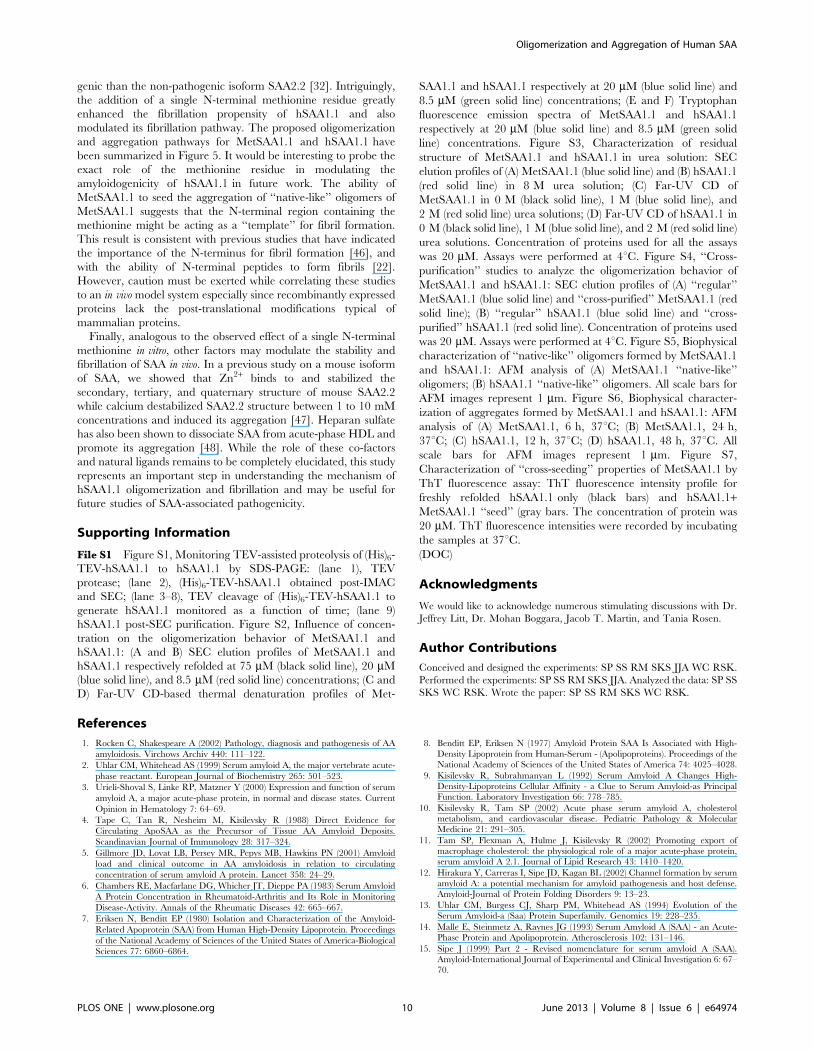
Figure 5. Cartoon representing the proposed pathway for oligomerization and fibrillation of MetSAA1.1 and hSAA1.1. Figures arenot drawn to scale.doi:10.1371/journal.pone.0064974.g005
Oligomerization and Aggregation of Human SAA
PLOS ONE | www.plosone.org 9 June 2013 | Volume 8 | Issue 6 | e64974
genic than the non-pathogenic isoform SAA2.2 [32]. Intriguingly,
the addition of a single N-terminal methionine residue greatly
enhanced the fibrillation propensity of hSAA1.1 and also
modulated its fibrillation pathway. The proposed oligomerization
and aggregation pathways for MetSAA1.1 and hSAA1.1 have
been summarized in Figure 5. It would be interesting to probe the
exact role of the methionine residue in modulating the
amyloidogenicity of hSAA1.1 in future work. The ability of
MetSAA1.1 to seed the aggregation of ‘‘native-like’’ oligomers of
MetSAA1.1 suggests that the N-terminal region containing the
methionine might be acting as a ‘‘template’’ for fibril formation.
This result is consistent with previous studies that have indicated
the importance of the N-terminus for fibril formation [46], and
with the ability of N-terminal peptides to form fibrils [22].
However, caution must be exerted while correlating these studies
to an in vivo model system especially since recombinantly expressed
proteins lack the post-translational modifications typical of
mammalian proteins.
Finally, analogous to the observed effect of a single N-terminal
methionine in vitro, other factors may modulate the stability and
fibrillation of SAA in vivo. In a previous study on a mouse isoform
of SAA, we showed that Zn2+ binds to and stabilized the
secondary, tertiary, and quaternary structure of mouse SAA2.2
while calcium destabilized SAA2.2 structure between 1 to 10 mM
concentrations and induced its aggregation [47]. Heparan sulfate
has also been shown to dissociate SAA from acute-phase HDL and
promote its aggregation [48]. While the role of these co-factors
and natural ligands remains to be completely elucidated, this study
represents an important step in understanding the mechanism of
hSAA1.1 oligomerization and fibrillation and may be useful for
future studies of SAA-associated pathogenicity.
Supporting Information
File S1 Figure S1, Monitoring TEV-assisted proteolysis of (His)6-
TEV-hSAA1.1 to hSAA1.1 by SDS-PAGE: (lane 1), TEV
protease; (lane 2), (His)6-TEV-hSAA1.1 obtained post-IMAC
and SEC; (lane 3–8), TEV cleavage of (His)6-TEV-hSAA1.1 to
generate hSAA1.1 monitored as a function of time; (lane 9)
hSAA1.1 post-SEC purification. Figure S2, Influence of concen-
tration on the oligomerization behavior of MetSAA1.1 and
hSAA1.1: (A and B) SEC elution profiles of MetSAA1.1 and
hSAA1.1 respectively refolded at 75 mM (black solid line), 20 mM(blue solid line), and 8.5 mM (red solid line) concentrations; (C and
D) Far-UV CD-based thermal denaturation profiles of Met-
SAA1.1 and hSAA1.1 respectively at 20 mM (blue solid line) and
8.5 mM (green solid line) concentrations; (E and F) Tryptophan
fluorescence emission spectra of MetSAA1.1 and hSAA1.1
respectively at 20 mM (blue solid line) and 8.5 mM (green solid
line) concentrations. Figure S3, Characterization of residual
structure of MetSAA1.1 and hSAA1.1 in urea solution: SEC
elution profiles of (A) MetSAA1.1 (blue solid line) and (B) hSAA1.1
(red solid line) in 8 M urea solution; (C) Far-UV CD of
MetSAA1.1 in 0 M (black solid line), 1 M (blue solid line), and
2 M (red solid line) urea solutions; (D) Far-UV CD of hSAA1.1 in
0 M (black solid line), 1 M (blue solid line), and 2 M (red solid line)
urea solutions. Concentration of proteins used for all the assays
was 20 mM. Assays were performed at 4uC. Figure S4, ‘‘Cross-
purification’’ studies to analyze the oligomerization behavior of
MetSAA1.1 and hSAA1.1: SEC elution profiles of (A) ‘‘regular’’
MetSAA1.1 (blue solid line) and ‘‘cross-purified’’ MetSAA1.1 (red
solid line); (B) ‘‘regular’’ hSAA1.1 (blue solid line) and ‘‘cross-
purified’’ hSAA1.1 (red solid line). Concentration of proteins used
was 20 mM. Assays were performed at 4uC. Figure S5, Biophysicalcharacterization of ‘‘native-like’’ oligomers formed by MetSAA1.1
and hSAA1.1: AFM analysis of (A) MetSAA1.1 ‘‘native-like’’
oligomers; (B) hSAA1.1 ‘‘native-like’’ oligomers. All scale bars for
AFM images represent 1 mm. Figure S6, Biophysical character-
ization of aggregates formed by MetSAA1.1 and hSAA1.1: AFM
analysis of (A) MetSAA1.1, 6 h, 37uC; (B) MetSAA1.1, 24 h,
37uC; (C) hSAA1.1, 12 h, 37uC; (D) hSAA1.1, 48 h, 37uC. Allscale bars for AFM images represent 1 mm. Figure S7,
Characterization of ‘‘cross-seeding’’ properties of MetSAA1.1 by
ThT fluorescence assay: ThT fluorescence intensity profile for
freshly refolded hSAA1.1 only (black bars) and hSAA1.1+MetSAA1.1 ‘‘seed’’ (gray bars. The concentration of protein was
20 mM. ThT fluorescence intensities were recorded by incubating
the samples at 37uC.(DOC)
Acknowledgments
We would like to acknowledge numerous stimulating discussions with Dr.
Jeffrey Litt, Dr. Mohan Boggara, Jacob T. Martin, and Tania Rosen.
Author Contributions
Conceived and designed the experiments: SP SS RM SKS JJA WC RSK.
Performed the experiments: SP SS RM SKS JJA. Analyzed the data: SP SS
SKS WC RSK. Wrote the paper: SP SS RM SKS WC RSK.
References
1. Rocken C, Shakespeare A (2002) Pathology, diagnosis and pathogenesis of AA
amyloidosis. Virchows Archiv 440: 111–122.
2. Uhlar CM, Whitehead AS (1999) Serum amyloid A, the major vertebrate acute-
phase reactant. European Journal of Biochemistry 265: 501–523.
3. Urieli-Shoval S, Linke RP, Matzner Y (2000) Expression and function of serum
amyloid A, a major acute-phase protein, in normal and disease states. Current
Opinion in Hematology 7: 64–69.
4. Tape C, Tan R, Nesheim M, Kisilevsky R (1988) Direct Evidence for
Circulating ApoSAA as the Precursor of Tissue AA Amyloid Deposits.
Scandinavian Journal of Immunology 28: 317–324.
5. Gillmore JD, Lovat LB, Persey MR, Pepys MB, Hawkins PN (2001) Amyloid
load and clinical outcome in AA amyloidosis in relation to circulating
concentration of serum amyloid A protein. Lancet 358: 24–29.
6. Chambers RE, Macfarlane DG, Whicher JT, Dieppe PA (1983) Serum Amyloid
A Protein Concentration in Rheumatoid-Arthritis and Its Role in Monitoring
Disease-Activity. Annals of the Rheumatic Diseases 42: 665–667.
7. Eriksen N, Benditt EP (1980) Isolation and Characterization of the Amyloid-
Related Apoprotein (SAA) from Human High-Density Lipoprotein. Proceedings
of the National Academy of Sciences of the United States of America-Biological
Sciences 77: 6860–6864.
8. Benditt EP, Eriksen N (1977) Amyloid Protein SAA Is Associated with High-
Density Lipoprotein from Human-Serum - (Apolipoproteins). Proceedings of the
National Academy of Sciences of the United States of America 74: 4025–4028.
9. Kisilevsky R, Subrahmanyan L (1992) Serum Amyloid A Changes High-
Density-Lipoproteins Cellular Affinity - a Clue to Serum Amyloid-as Principal
Function. Laboratory Investigation 66: 778–785.
10. Kisilevsky R, Tam SP (2002) Acute phase serum amyloid A, cholesterol
metabolism, and cardiovascular disease. Pediatric Pathology & Molecular
Medicine 21: 291–305.
11. Tam SP, Flexman A, Hulme J, Kisilevsky R (2002) Promoting export of
macrophage cholesterol: the physiological role of a major acute-phase protein,
serum amyloid A 2.1. Journal of Lipid Research 43: 1410–1420.
12. Hirakura Y, Carreras I, Sipe JD, Kagan BL (2002) Channel formation by serum
amyloid A: a potential mechanism for amyloid pathogenesis and host defense.
Amyloid-Journal of Protein Folding Disorders 9: 13–23.
13. Uhlar CM, Burgess CJ, Sharp PM, Whitehead AS (1994) Evolution of the
Serum Amyloid-a (Saa) Protein Superfamily. Genomics 19: 228–235.
14. Malle E, Steinmetz A, Raynes JG (1993) Serum Amyloid A (SAA) - an Acute-
Phase Protein and Apolipoprotein. Atherosclerosis 102: 131–146.
15. Sipe J (1999) Part 2 - Revised nomenclature for serum amyloid A (SAA).
Amyloid-International Journal of Experimental and Clinical Investigation 6: 67–
70.
Oligomerization and Aggregation of Human SAA
PLOS ONE | www.plosone.org 10 June 2013 | Volume 8 | Issue 6 | e64974
16. Liepnieks JJ, Kluvebeckerman B, Benson MD (1995) Characterization of
Amyloid-a Protein in Human Secondary Amyloidosis - the PredominantDeposition of Serum Amyloid-A1. Biochimica Et Biophysica Acta-Molecular
Basis of Disease 1270: 81–86.
17. Sletten K, Husby G, Natvig JB (1976) Complete Amino-Acid Sequence of anAmyloid Fibril Protein Aa1 of Unusual Size (64 Residues). Biochemical and
Biophysical Research Communications 69: 19–25.18. Parmelee DC, Titani K, Ericsson LH, Eriksen N, Benditt EP, et al. (1982)
Amino-Acid-Sequence of Amyloid-Related Apoprotein (Aposaa1) from Human
High-Density Lipoprotein. Biochemistry 21: 3298–3303.19. Ather JL, Ckless K, Martin R, Foley KL, Suratt BT, et al. (2011) Serum
Amyloid A Activates the NLRP3 Inflammasome and Promotes Th17 AllergicAsthma in Mice. Journal of Immunology 187: 64–73.
20. Bozinovski S, Uddin M, Vlahos R, Thompson M, McQualter JL, et al. (2012)Serum amyloid A opposes lipoxin A(4) to mediate glucocorticoid refractory lung
inflammation in chronic obstructive pulmonary disease. Proceedings of the
National Academy of Sciences of the United States of America 109: 935–940.21. Cai H, Song CJ, Endoh I, Goyette J, Jessup W, et al. (2007) Serum amyloid A
induces monocyte tissue factor. Journal of Immunology 178: 1852–1860.22. Westermark GT, Engstrom U, Westermark P (1992) The N-Terminal Segment
of Protein Aa Determines Its Fibrillogenic Property. Biochemical and
Biophysical Research Communications 182: 27–33.23. Kinkley SM, Bagshaw WLG, Tam SP, Kisilevsky R (2006) The path of murine
serum amyloid a through peritoneal macrophages. Amyloid-Journal of ProteinFolding Disorders 13: 123–134.
24. Kisilevsky R, Manley PN (2012) Acute-phase serum amyloid A: Perspectives onits physiological and pathological roles. Amyloid-Journal of Protein Folding
Disorders 19: 5–14.
25. Quist A, Doudevski I, Lin H, Azimova R, Ng D, et al. (2005) Amyloid ionchannels: a common structural link for protein-misfolding disease. Proc Natl
Acad Sci U S A 102: 10427–10432.26. Banka CL, Yuan T, Debeer MC, Kindy M, Curtiss LK, et al. (1995) Serum
Amyloid-a (Saa) - Influence on Hdl-Mediated Cellular Cholesterol Efflux.
Journal of Lipid Research 36: 1058–1065.27. Hosoai H, Webb NR, Glick JM, Tietge UJF, Purdom MS, et al. (1999)
Expression of serum amyloid A protein in the absence of the acute phaseresponse does not reduce HDL cholesterol or apoA-I levels in human apoA-I
transgenic mice. Journal of Lipid Research 40: 648–653.28. Yamada T, Kluve-Beckerman B, Liepnieks JJ, Benson MD (1994) Fibril
formation from recombinant human serum amyloid A. Biochim Biophys Acta
1226: 323–329.29. Cheng N, He R, Tian J, Ye PP, Ye RD (2008) Cutting edge: TLR2 is a
functional receptor for acute-phase serum amyloid A. Journal of Immunology181: 22–26.
30. He RL, Zhou J, Hanson CZ, Chen J, Cheng N, et al. (2009) Serum amyloid A
induces G-CSF expression and neutrophilia via Toll-like receptor 2. Blood 113:429–437.
31. Patke S, Maheshwari R, Litt J, Srinivasan S, Aguilera JJ, et al. (2012) Influenceof the Carboxy Terminus of Serum Amyloid A on Protein Oligomerization,
Misfolding, and Fibril Formation. Biochemistry 51: 3092–3099.32. Srinivasan S, Patke S, Wang Y, Ye Z, Litt J, et al. (2013) Pathogenic serum
amyloid A 1.1 shows a long oligomer-rich fibrillation lag phase contrary to the
highly amyloidogenic non-pathogenic SAA2.2. J Biol Chem 288: 2744–2755.
33. Srinivasan R, Jones EM, Liu K, Ghiso J, Marchant RE, et al. (2003) pH-
dependent amyloid and protofibril formation by the ABri peptide of familialBritish dementia. J Mol Biol 333: 1003–1023.
34. Ladiwala ARA, Lin JC, Bale SS, Marcelino-Cruz AM, Bhattacharya M, et al.
(2010) Resveratrol Selectively Remodels Soluble Oligomers and Fibrils ofAmyloid A beta into Off-pathway Conformers. Journal of Biological Chemistry
285: 24228–24237.35. Wang Y, Srinivasan S, Ye ZQ, Aguilera JJ, Lopez MM, et al. (2011) Serum
amyloid A 2.2 refolds into a octameric oligomer that slowly converts to a more
stable hexamer. Biochemical and Biophysical Research Communications 407:725–729.
36. Wang LM, Colon W (2005) Urea-induced denaturation of apolipoprotein serumamyloid A reveals marginal stability of hexamer. Protein Science 14: 1811–1817.
37. Wang LM, Lashuel HA, Colon W (2005) From hexamer to amyloid: Marginalstability of apolipoprotein SAA2.2 leads to in vitro fibril formation at
physiological temperature. Amyloid-Journal of Protein Folding Disorders 12:
139–148.38. Ye ZQ, Poueymiroy DB, Aguilera JJ, Srinivasan S, Wang Y, et al. (2011)
Inflammation Protein SAA2.2 Spontaneously Forms Marginally Stable AmyloidFibrils at Physiological Temperature. Biochemistry 50: 9184–9191.
39. Levine H (1993) Thioflavine-T Interaction with Synthetic Alzheimers-Disease
Beta-Amyloid Peptides - Detection of Amyloid Aggregation in Solution. ProteinScience 2: 404–410.
40. Klunk WE, Jacob RF, Mason RP (1999) Quantifying amyloid beta-peptide(Abeta) aggregation using the Congo red-Abeta (CR-abeta) spectrophotometric
assay. Anal Biochem 266: 66–76.41. McCubbin WD, Kay CM, Narindrasorasak S, Kisilevsky R (1988) Circular-
dichroism studies on two murine serum amyloid A proteins. Biochem J 256:
775–783.42. Digambaranath JL, Dang LA, Dembinska M, Vasyluk A, Finke JM (2010)
Conformations within Soluble Oligomers and Insoluble Aggregates Revealed byResonance Energy Transfer. Biopolymers 93: 299–317.
43. Kayed R, Head E, Thompson JL, McIntire TM, Milton SC, et al. (2003)
Common structure of soluble amyloid oligomers implies common mechanism ofpathogenesis. Science 300: 486–489.
44. Kayed R, Head E, Sarsoza F, Saing T, Cotman CW, et al. (2007) Fibril specific,conformation dependent antibodies recognize a generic epitope common to
amyloid fibrils and fibrillar oligomers that is absent in prefibrillar oligomers.Molecular Neurodegeneration 2: 18.
45. Wang LM, Lashuel HA, Walz T, Colon W (2002) Murine apolipoprotein serum
amyloid A in solution forms a hexamer containing a central channel.Proceedings of the National Academy of Sciences of the United States of
America 99: 15947–15952.46. Patel H, Bramall J, Waters H, De Beer MC, Woo P (1996) Expression of
recombinant human serum amyloid A in mammalian cells and demonstration of
the region necessary for high-density lipoprotein binding and amyloid fibrilformation by site-directed mutagenesis. Biochem J 318 (Pt 3): 1041–1049.
47. Wang LM, Colon W (2007) Effect of zinc, copper, and calcium on the structureand stability of serum amyloid A. Biochemistry 46: 5562–5569.
48. Noborn F, Ancsin JB, Ubhayasekera W, Kisilevsk R, Li JP (2012) HeparanSulfate Dissociates Serum Amyloid A (SAA) from Acute-phase High-density
Lipoprotein, Promoting SAA Aggregation. Journal of Biological Chemistry 287:
25669–25677.
Oligomerization and Aggregation of Human SAA
PLOS ONE | www.plosone.org 11 June 2013 | Volume 8 | Issue 6 | e64974


