Embed Size (px)
Citation preview
Characterizing Abhorrent, Misinformative, andMistargeted Content on YouTube
Kostantinos Papadamou
A thesis submitted in partial fulfillment
of the requirements for the degree of
Doctor of Philosophyof
Cyprus University of Technology
Department of Electrical Engineering, Computer Engineering and Informatics
Cyprus University of Technology
May 16, 2021
arX
iv:2
105.
0981
9v1
[cs
.CY
] 2
0 M
ay 2
021
Abstract
YouTube has revolutionized the way people discover and consume video content. Although
YouTube facilitates easy access to hundreds of well-produced educational, entertaining, and
trustworthy news videos, abhorrent, misinformative and mistargeted content is also common.
The platform is plagued by various types of inappropriate content including: 1) disturbing
videos targeting young children; 2) hateful and misogynistic content; and 3) pseudoscientific
and conspiratorial content. While YouTube’s recommendation algorithm plays a vital role in
increasing user engagement and YouTube’s monetization, its role in unwittingly promoting
problematic content is not entirely understood.
In this thesis, we shed some light on the degree of abhorrent, misinformative, and mistargeted
content on YouTube and the role of the recommendation algorithm in the discovery and
dissemination of such content. Following a data-driven quantitative approach, we analyze
thousands of videos posted on YouTube. Specifically, we devise various methodologies
to detect problematic content, and we use them to simulate the behavior of users casually
browsing YouTube to shed light on: 1) the risks of YouTube media consumption by young
children; 2) the role of YouTube’s recommendation algorithm in the dissemination of hateful
and misogynistic content, by focusing on the Involuntary Celibates (Incels) community; and
3) user exposure to pseudoscientific misinformation on various parts of the platform and how
this exposure changes based on the user’s watch history.
In a nutshell, our analysis reveals that young children are likely to encounter disturbing
content when they randomly browse the platform starting from benign videos relevant to
their interests and that YouTube’s currently deployed counter-measures are ineffective in
terms of detecting them in a timely manner. By analyzing the Incel community on YouTube,
we find that not only Incel activity is increasing over time, but platforms may also play an
active role in steering users towards extreme content. Finally, when studying pseudoscientific
misinformation, we find among other things that YouTube suggests more pseudoscientific
content regarding traditional pseudoscientific topics (e.g., flat earth) than for emerging ones
(like COVID-19), and that these recommendations are more common on the search results
page than on a user’s homepage or the video recommendations (up-next) section.
Acknowledgments
First and foremost, I am grateful to my advisor, Michael Sirivianos, for his continuous support
and valuable feedback throughout my PhD journey. His support and guidance was instrumental
in turning me into an independent and competent researcher. He was there to guide me when
the research seemed fuzzy and disheartening. More importantly, he has shown me how to
analyze an important and complex problem, and divide it in small manageable problems that
can be addressed in a more practical way.
Second, I would like to thank Jeremy Blackburn, Emiliano De Cristofaro, Gianluca Stringhini,
and Savvas Zannettou. Their expertise and valuable feedback complemented the one received
by my advisor, hence helping me in further expanding my research and writing skills.
Also, I want to thank various colleagues from the Cyprus University of Technology, Telefonica
Research, and Max Planck Institute. Their help and feedback was vital to undertaking the
studies presented in this thesis.
Furthermore, I would like to thank my family for their support, patience, and encouragement,
which ensured that I was mentally strong to overcome all the obstacles faced during my PhD
journey.
Finally, I owe gratitude to the European Commission’s Horizon 2020 program and the Cyprus
University of Technology for funding my research.
In Memoriam of Prof. Vassos Soteriou
I would like to pay tribute to the memory of Professor Vassos Soteriou. I am grateful for
having him as a professor during my barchelor’s and master’s studies, and I am thankful for the
valuable feedback he gave me as one of my PhD proposal examiners. His pressing questions
during my proposal examination have helped to improve this work and to make me a better
presenter and researcher.
Contents
1 Introduction . . . . . . . . . . . . . . . . . . . . . . . . . . . . . . . . . . . . . 101.1 Contributions . . . . . . . . . . . . . . . . . . . . . . . . . . . . . . . . . . 14
1.2 Research Papers . . . . . . . . . . . . . . . . . . . . . . . . . . . . . . . . . 16
1.3 Thesis Organization . . . . . . . . . . . . . . . . . . . . . . . . . . . . . . . 17
2 Background . . . . . . . . . . . . . . . . . . . . . . . . . . . . . . . . . . . . . . 182.1 YouTube . . . . . . . . . . . . . . . . . . . . . . . . . . . . . . . . . . . . . 18
2.1.1 YouTube . . . . . . . . . . . . . . . . . . . . . . . . . . . . . . . . . 18
2.1.2 YouTube Kids . . . . . . . . . . . . . . . . . . . . . . . . . . . . . . 20
2.2 Reddit . . . . . . . . . . . . . . . . . . . . . . . . . . . . . . . . . . . . . . 21
2.2.1 Remarks . . . . . . . . . . . . . . . . . . . . . . . . . . . . . . . . . 22
3 Literature Review . . . . . . . . . . . . . . . . . . . . . . . . . . . . . . . . . . 233.1 Inappropriate Content for Children . . . . . . . . . . . . . . . . . . . . . . . 23
3.1.1 Characterizing Inappropriate Content for Children . . . . . . . . . . . 23
3.1.2 Detection and Containment of Inappropriate Content for Children . . 25
3.1.3 Inappropriate Content for Children - Remarks . . . . . . . . . . . . . 30
3.2 Misogyny and Other Harmful Activity . . . . . . . . . . . . . . . . . . . . . 30
3.2.1 Misogyny and Other Harmful Activity on YouTube . . . . . . . . . . 30
3.2.2 Misogyny and Hateful Activity on the Rest of the Web . . . . . . . . 35
3.2.3 Misogyny and Other Harmful Activity - Remarks . . . . . . . . . . . 39
3.3 Pseudoscientific Misinformation and Conspiracy Theories . . . . . . . . . . . 39
3.3.1 Pseudoscientific Misinformation and Conspiracy Theories on YouTube 40
3.3.2 Pseudoscientific Misinformation and Conspiracy Theories on the Web 43
3.3.3 Pseudoscientific Misinformation and Conspiracy Theories - Remarks 46
3.4 Recommendation Algorithms and Audits . . . . . . . . . . . . . . . . . . . . 46
3.4.1 Understanding User Personalization on the Web . . . . . . . . . . . . 47
3.4.2 Auditing YouTube’s Recommendation Algorithm . . . . . . . . . . . 49
1
2
3.4.3 Recommendation Algorithms and Audits - Remarks . . . . . . . . . . 50
3.5 Other Related Work . . . . . . . . . . . . . . . . . . . . . . . . . . . . . . . 51
3.5.1 Understanding YouTube Characteristics . . . . . . . . . . . . . . . . 51
3.5.2 YouTube in Science and Education . . . . . . . . . . . . . . . . . . . 52
4 Characterizing and Detecting Inappropriate Videos Targeting Young Childrenon YouTube . . . . . . . . . . . . . . . . . . . . . . . . . . . . . . . . . . . . . . 534.1 Motivation . . . . . . . . . . . . . . . . . . . . . . . . . . . . . . . . . . . . 53
4.2 Datasets . . . . . . . . . . . . . . . . . . . . . . . . . . . . . . . . . . . . . 55
4.2.1 Data Collection . . . . . . . . . . . . . . . . . . . . . . . . . . . . . 55
4.2.2 Manual Annotation Process . . . . . . . . . . . . . . . . . . . . . . . 57
4.3 General Characterization . . . . . . . . . . . . . . . . . . . . . . . . . . . . 60
4.4 Detection of Disturbing Videos . . . . . . . . . . . . . . . . . . . . . . . . . 68
4.4.1 Dataset and Feature Description . . . . . . . . . . . . . . . . . . . . 69
4.4.2 Model Architecture . . . . . . . . . . . . . . . . . . . . . . . . . . . 69
4.4.3 Experimental Evaluation . . . . . . . . . . . . . . . . . . . . . . . . 71
4.5 Analysis . . . . . . . . . . . . . . . . . . . . . . . . . . . . . . . . . . . . . 74
4.5.1 Recommendation Graph Analysis . . . . . . . . . . . . . . . . . . . 75
4.5.2 How likely is it for a toddler to come across inappropriate videos? . . 76
4.6 Challenges and Limitations . . . . . . . . . . . . . . . . . . . . . . . . . . . 78
4.6.1 Challenges . . . . . . . . . . . . . . . . . . . . . . . . . . . . . . . 78
4.6.2 Limitations . . . . . . . . . . . . . . . . . . . . . . . . . . . . . . . 79
4.7 Remarks . . . . . . . . . . . . . . . . . . . . . . . . . . . . . . . . . . . . . 79
5 Characterizing Hateful and Misogynistic Content on YouTube Through theLens of the Incel Community . . . . . . . . . . . . . . . . . . . . . . . . . . . . 815.1 Motivation . . . . . . . . . . . . . . . . . . . . . . . . . . . . . . . . . . . . 81
5.2 Background . . . . . . . . . . . . . . . . . . . . . . . . . . . . . . . . . . . 84
5.3 Datasets . . . . . . . . . . . . . . . . . . . . . . . . . . . . . . . . . . . . . 85
5.3.1 Data Collection . . . . . . . . . . . . . . . . . . . . . . . . . . . . . 85
5.3.2 Video Annotation . . . . . . . . . . . . . . . . . . . . . . . . . . . . 88
5.3.3 Ethics . . . . . . . . . . . . . . . . . . . . . . . . . . . . . . . . . . 90
5.4 Analysis . . . . . . . . . . . . . . . . . . . . . . . . . . . . . . . . . . . . . 91
5.4.1 Evolution of Incel Community on YouTube . . . . . . . . . . . . . . 91
3
5.4.2 Does YouTube’s Recommendation Algorithm steer users towards
Incel-related videos? . . . . . . . . . . . . . . . . . . . . . . . . . . 94
5.5 Challenges and Limitations . . . . . . . . . . . . . . . . . . . . . . . . . . . 101
5.5.1 Challenges . . . . . . . . . . . . . . . . . . . . . . . . . . . . . . . 101
5.5.2 Limitations . . . . . . . . . . . . . . . . . . . . . . . . . . . . . . . 102
5.6 Remarks . . . . . . . . . . . . . . . . . . . . . . . . . . . . . . . . . . . . . 103
6 Assessing the Effect of Watch History on YouTube’s Pseudoscientific VideoRecommendations . . . . . . . . . . . . . . . . . . . . . . . . . . . . . . . . . . 1046.1 Motivation . . . . . . . . . . . . . . . . . . . . . . . . . . . . . . . . . . . . 104
6.2 Datasets . . . . . . . . . . . . . . . . . . . . . . . . . . . . . . . . . . . . . 107
6.2.1 Data Collection . . . . . . . . . . . . . . . . . . . . . . . . . . . . . 107
6.2.2 Crowdsourcing Data Annotation . . . . . . . . . . . . . . . . . . . . 108
6.2.3 Ethics . . . . . . . . . . . . . . . . . . . . . . . . . . . . . . . . . . 111
6.3 Detection of Pseudoscientific Videos . . . . . . . . . . . . . . . . . . . . . . 111
6.3.1 Classifier Architecture . . . . . . . . . . . . . . . . . . . . . . . . . 111
6.3.2 Experimental Evaluation . . . . . . . . . . . . . . . . . . . . . . . . 113
6.4 Analysis . . . . . . . . . . . . . . . . . . . . . . . . . . . . . . . . . . . . . 115
6.4.1 Experimental Design . . . . . . . . . . . . . . . . . . . . . . . . . . 115
6.4.2 Pseudoscientific Content on Homepage, Search Results, and Video
Recommendations . . . . . . . . . . . . . . . . . . . . . . . . . . . 120
6.4.3 Temporal Sensitivity . . . . . . . . . . . . . . . . . . . . . . . . . . 126
6.4.4 Experiments Summary . . . . . . . . . . . . . . . . . . . . . . . . . 128
6.5 Limitations . . . . . . . . . . . . . . . . . . . . . . . . . . . . . . . . . . . 129
6.6 Remarks . . . . . . . . . . . . . . . . . . . . . . . . . . . . . . . . . . . . . 129
7 Discussion & Conclusions . . . . . . . . . . . . . . . . . . . . . . . . . . . . . . 1317.1 Characterizing and Detecting Inappropriate Videos Targeting Young Children
on YouTube . . . . . . . . . . . . . . . . . . . . . . . . . . . . . . . . . . . 131
7.2 Characterizing Hateful and Misogynistic Content on You-Tube Through the
Lens of the Incel Community . . . . . . . . . . . . . . . . . . . . . . . . . . 133
7.3 Assessing the Effect of Watch History on YouTube’s Pseudoscientific Video
Recommendations . . . . . . . . . . . . . . . . . . . . . . . . . . . . . . . . 135
7.4 Challenges and Limitations . . . . . . . . . . . . . . . . . . . . . . . . . . . 137
7.5 Conclusion . . . . . . . . . . . . . . . . . . . . . . . . . . . . . . . . . . . 139
List of Figures
4.1 Examples of disturbing videos, i.e. inappropriate videos that target toddlers. . 54
4.2 Per class proportion of videos for top 15 stems found in titles of (a) Elsagate-
related; (b) other child-related; (c) random; and (d) popular videos. . . . . . . 61
4.3 Per class proportion of videos for the top 15 stems found in video tags of (a)
Elsagate-related; (b) other child-related; (c) random; and (d) popular videos. . 62
4.4 Per class proportion of videos for the top 15 labels found in thumbnails of (a)
Elsagate-related; (b) other child-related; (c) random; and (d) popular videos. . 63
4.5 Per class proportion of videos that their thumbnail contains spoofed, adult,
medical, violent, and/or racy content for (a) Elsagate-related; (b) other child-
related; (c) random; and (d) popular videos. . . . . . . . . . . . . . . . . . . 64
4.6 CDF of the number of views per class for (a) Elsagate-related (b) other child-
related, (c) random, and (d) popular videos. . . . . . . . . . . . . . . . . . . 65
4.7 CDF of the fraction of likes to dislikes per class for (a) Elsagate-related (b)
other child-related, (c) random, and (d) popular videos. . . . . . . . . . . . . 66
4.8 CDF of the number of comments/views per class for (a) Elsagate-related (b)
other child-related, (c) random, and (d) popular videos. . . . . . . . . . . . . 67
4.9 Architecture of our deep learning model for detecting disturbing videos. The
model processes almost all the video features: (a) tags; (b) title; (c) statistics
and style; and (d) thumbnail. . . . . . . . . . . . . . . . . . . . . . . . . . . 71
4.10 ROC curves (and AUC) of all the baselines and of the proposed model trained
for multi-class classification. . . . . . . . . . . . . . . . . . . . . . . . . . . 71
4.11 ROC Curves of all the baselines and of the proposed model trained for binary
classification. . . . . . . . . . . . . . . . . . . . . . . . . . . . . . . . . . . 74
4.12 Cumulative percentage of inappropriate videos encountered at each hop for:
(a) Elsagate-related, sanitized Elsagate-related, and other child-related seed
keywords; and (b) clusters of seed keywords. . . . . . . . . . . . . . . . . . . 77
5.1 Overview of our data collection and video annotation methodology. . . . . . 86
4
5
5.2 Temporal evolution of the number of YouTube videos shared on each subreddit
per month. (a) depicts the absolute number of videos shared in each subreddit
and (b) depicts the normalized number of videos shared per active user of each
subreddit. We annotate both figures with the date when Reddit decided to ban
the /r/Incels subreddit. . . . . . . . . . . . . . . . . . . . . . . . . . . . . . 92
5.3 Percentage of videos published per month for both Incel-derived and Control
videos. We also depict the date when Reddit decided to ban the /r/Incels
subreddit. . . . . . . . . . . . . . . . . . . . . . . . . . . . . . . . . . . . . 93
5.4 Temporal evolution of the number of comments per month. We also depict the
date when Reddit decided to ban the /r/Incels subreddit. . . . . . . . . . . . . 93
5.5 Temporal evolution of the number of unique commenting users per month. We
also depict the date when Reddit decided to ban the /r/Incels subreddit. . . . . 94
5.6 Self-similarity of commenting users in adjacent months for both Incel-derived
and Control videos. We also depict the date when Reddit decided to ban the
/r/Incels subreddit. . . . . . . . . . . . . . . . . . . . . . . . . . . . . . . . . 95
5.7 Percentage of random walks where the random walker encounters at least one
Incel-related video for both starting scenarios. Note that the random walker
selects, at each hop, the next video to watch at random. . . . . . . . . . . . . 97
5.8 Percentage of Incel-related videos across all unique videos that the random
walk encounters at hop k for both starting scenarios. Note that the random
walker selects, at each hop, the next video to watch at random. . . . . . . . . 98
5.9 CDF of the percentage of recommended Incel-related videos per video for
both Incel-related and other videos in the Incels-derived and Control recom-
mendation graphs. . . . . . . . . . . . . . . . . . . . . . . . . . . . . . . . . 101
6.1 Architecture of our deep learning classifier for the detection of pseudoscientific
videos. . . . . . . . . . . . . . . . . . . . . . . . . . . . . . . . . . . . . . . 113
6.2 The three main parts of the YouTube platform that we consider in our ex-
periments: (a) homepage; (b) search results; and (c) video recommendations
section. . . . . . . . . . . . . . . . . . . . . . . . . . . . . . . . . . . . . . 116
6.3 Overlap Coefficient with the reference recommendations of previous iterations
of the devised algorithm as a function of the number of videos in the user’s
watch history. . . . . . . . . . . . . . . . . . . . . . . . . . . . . . . . . . . 119
6.4 Percentage of pseudoscience videos found in the homepage of each user profile.120
6
6.5 Percentage of unique pseudoscience videos found in the search results of each
user profile. . . . . . . . . . . . . . . . . . . . . . . . . . . . . . . . . . . . 122
6.6 Percentage of unique pseudoscientific videos that the random walker encoun-
ters at hop k per user profile (December 2020). . . . . . . . . . . . . . . . . . 124
6.7 Percentage of unique pseudoscientific videos that the random walker encoun-
ters at hop k per user profile (April-May 2021). . . . . . . . . . . . . . . . . 127
List of Tables
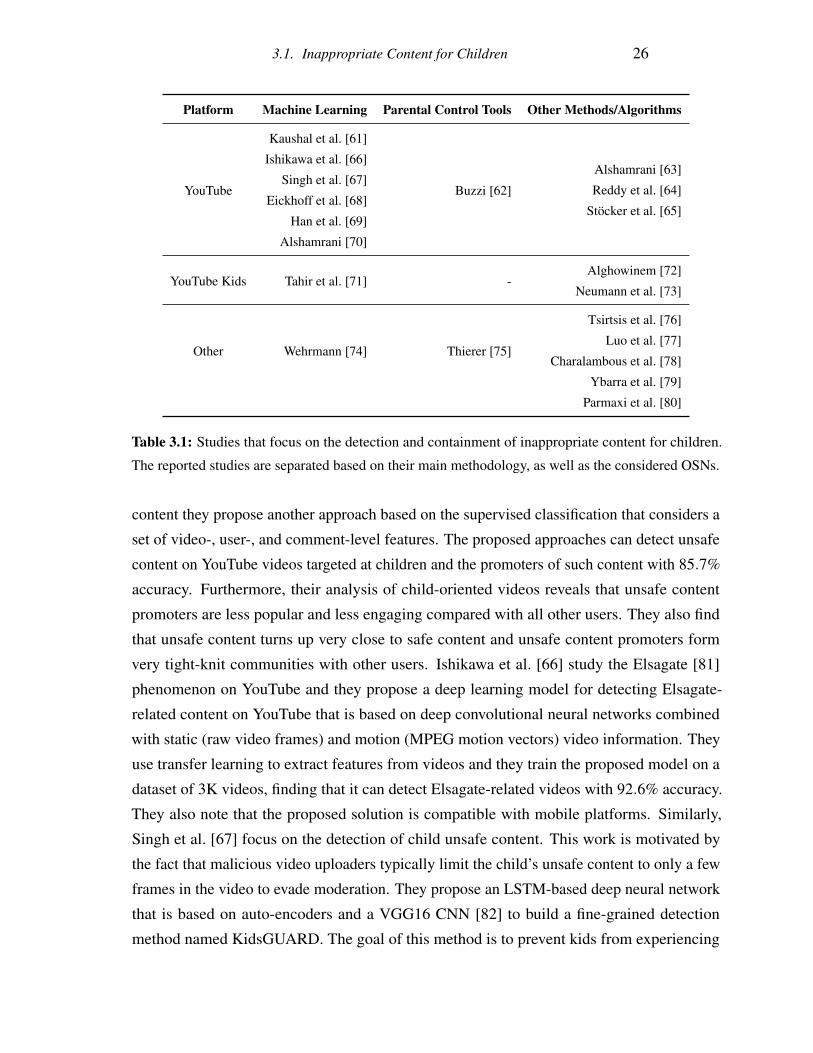
3.1 Studies that focus on the detection and containment of inappropriate content for
children. The reported studies are separated based on their main methodology,
as well as the considered OSNs. . . . . . . . . . . . . . . . . . . . . . . . . 26
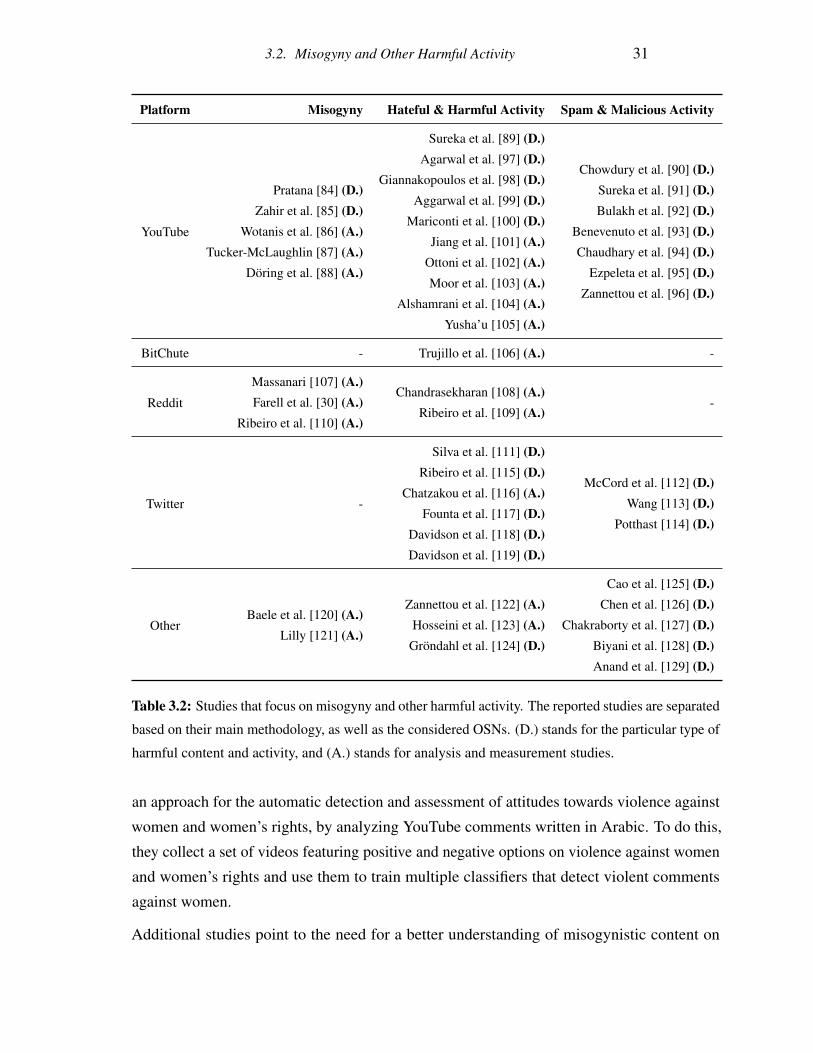
3.2 Studies that focus on misogyny and other harmful activity. The reported studies
are separated based on their main methodology, as well as the considered
OSNs. (D.) stands for the particular type of harmful content and activity, and
(A.) stands for analysis and measurement studies. . . . . . . . . . . . . . . . 31
3.3 Studies that focus on pseudoscientific misinformation and conspiracy theories.
The reported studies are separated based on their approach, as well as the
considered OSNs. . . . . . . . . . . . . . . . . . . . . . . . . . . . . . . . . 40
3.4 Studies that focus on auditing recommendation algorithms on the Web and on
auditing YouTube’s recommendation algorithm. The reported studies are sepa-
rated based on those focusing on understanding user personalization and those
investigating user radicalization, as well as the considered recommendation
algorithm. . . . . . . . . . . . . . . . . . . . . . . . . . . . . . . . . . . . . 47
4.1 Overview of the collected data: number of seed videos and number of their
recommended videos acquired using each crawling strategy. . . . . . . . . . 56
4.2 Summary of our final ground truth dataset. . . . . . . . . . . . . . . . . . . . 57
4.3 Number of videos in each category per class for each subset of videos in
our ground truth dataset. EN: Entertainment, F&A: Film & Animation, ED:
Education, P&B: People & Blogs, M: Music. . . . . . . . . . . . . . . . . . 59
4.4 List of the style features extracted from the available metadata of a video. . . 68
4.5 Performance metrics for the evaluated baselines and for the proposed deep
learning model. . . . . . . . . . . . . . . . . . . . . . . . . . . . . . . . . . 70
4.6 Performance of the proposed model trained with all the possible combinations
of the four input feature types. . . . . . . . . . . . . . . . . . . . . . . . . . 72
7
8
4.7 Performance of the evaluated baselines trained for binary classification and of
our proposed binary classifier. . . . . . . . . . . . . . . . . . . . . . . . . . 74
4.8 Number of appropriate and inappropriate videos found in each subset of videos
in our dataset. . . . . . . . . . . . . . . . . . . . . . . . . . . . . . . . . . . 75
4.9 Number of transitions between appropriate and inappropriate videos for each
subset of videos in our dataset. . . . . . . . . . . . . . . . . . . . . . . . . . 76
5.1 Overview of our Reddit dataset. We also include, for each subreddit, the
number of videos from our Incel-derived labeled dataset. The total number
of videos reported in the individual subreddits differs from the unique videos
collected since multiple videos have been shared in more than one subreddit. . 87
5.2 Performance metrics of the top combinations of the number of Incel-related
terms in a video’s transcript and comments. . . . . . . . . . . . . . . . . . . 88
5.3 Number of Incel-related and Other videos in each recommendation graph. . . 95
5.4 Number of transitions between Incel-related and Other videos in each recom-
mendation graph. . . . . . . . . . . . . . . . . . . . . . . . . . . . . . . . . 96
5.5 Probability of finding (a) at least one Incel-related video in the next 5−M hops
having already watched M consecutive Incel-related videos; and (b) an Incel-
related video at hop M+1 assuming the user already watched M consecutive
Incel-related videos for both the Incel-derived and Control recommendation
graphs. Note that in this scenario the random walker chooses to watch Incel-
related videos. . . . . . . . . . . . . . . . . . . . . . . . . . . . . . . . . . . 99
6.1 Overview of the collected data: number of seed videos and number of their
recommended videos. . . . . . . . . . . . . . . . . . . . . . . . . . . . . . . 108
6.2 Overview of our ground-truth dataset. . . . . . . . . . . . . . . . . . . . . . 110
6.3 Overview of our final ground-truth dataset. . . . . . . . . . . . . . . . . . . . 110
6.4 Performance of the evaluated baselines and of the proposed deep learning
classifier. . . . . . . . . . . . . . . . . . . . . . . . . . . . . . . . . . . . . . 113
6.5 Performance of the proposed classifier (considering the 0.7 classification
threshold) trained with all the possible combinations of the four input feature
types. . . . . . . . . . . . . . . . . . . . . . . . . . . . . . . . . . . . . . . 115
6.6 Percentage of unique pseudoscientific videos encountered by each user profile
in the three main parts of YouTube. . . . . . . . . . . . . . . . . . . . . . . . 128
Abbreviations
API: Application Programming Interface
AUC: Area under the ROC Curve
BERT: Bidirectional Encoder Representations
CEO: Chief Executive Officer
CNN: Convolutional Neural Networks
CDF: Cumulative Distribution Function
COVID: Coronavirus Disease
DDNN: Double Dense Neural Network
DL: Deep Learning
LSTM: Long Short-Term Memory
MGTOW: Men Going Their Own Way
ML: Machine Learning
MPAA Motion Picture Association of America
MRA: Men Rights Activists
NC-17: No Children Under 17
NLP: Natural Language Processing
OSN: Online Social Network
PG: Parental Guidance suggested
PUA: Pick Up Artists
ReLU: Rectified Linear Unit
REST: Representational State Transfer
RNN: Recurrent Neural Network
ROC: Receiver Operating Characteristic
SMOTE: Synthetic minority Over-sampling Technique
SVM: Support Vector Machines
URL: Uniform Resource Locator
Chapter 1
Introduction
Over the last decade, user-generated video platforms have exploded in popularity. YouTube is
the leading video-sharing platform on the Web and the second most visited website worldwide,
with billions of monthly active users, surpassing cable TV in terms of popularity, especially
among teenagers. For many users, YouTube has also become one of the most important
information sources for news, world events, and various other topics [1, 2]. However, while
YouTube facilitates easy access to hundreds of well-produced educational, entertaining and
credible news videos, the platform is also fertile ground for the spread of mistargeted and
abhorrent content.
In the last few years, we have seen extensive anecdotal evidence suggesting that YouTube, and
in particular its recommendation algorithm, promote offensive and potentially harmful content
(i.e., conspiracy theories), and even helping radicalize users [3, 4, 5, 6]. Some examples
include disturbing and harmful videos targeting young children evading YouTube’s attempts
to control them [7, 8]. Alas, the platform also hosts hateful and misogynistic content acting
as a medium for extremist ideologies to thrive [9, 10, 11]. On top of this, the platform is also
plagued by misinformation, pseudoscientific and conspiratorial content [12]. At the same time,
the opaque nature of YouTube’s recommendation algorithm aids the dissemination of such
content to millions of viewers [13]. This can have dire real-world consequences, especially
when pseudoscientific content is promoted to users at critical times, such as the COVID-19
pandemic [13, 14].
Despite numerous reports that have highlighted the alarming presence of problematic content,
YouTube and other social media platforms have struggled to mitigate the harm from this type
of content. The difficulty is partly due to the sheer scale and also because of the deployment
10
11
of recommendation algorithms [15]. In particular, to detect inappropriate content, YouTube
heavily relies on users reporting videos they consider inappropriate, which are then inspected
by YouTube employees. However, since the process involves manual labor, the process does
not scale to the number of videos that a platform like YouTube serves. On rare occasions,
the platforms have also refused to moderate such content stating that it does not violate their
community guidelines [16, 17].
In an attempt to solve the problem, YouTube employs automated moderation using Machine
Learning (ML) to detect and flag videos that violate their community guidelines. However,
purely automated moderation tools have thus far been insufficient to moderate content [18,
19], and human moderators had to be brought back into the loop [20, 21]. Whereas the
scientific community has repeatedly raised the need for effectively detecting and moderating
inappropriate content, the various types of problematic content on the platform are relatively
unstudied. At the same time, the role played by YouTube’s recommendation algorithm in
unwittingly promoting such content is not entirely understood, while its opaque nature makes
it difficult to audit.
In this thesis, we aim at: 1) investigating how we can classify the quality of content available
on YouTube; 2) developing methodologies that allow us to quantify the influence of YouTube’s
recommendation algorithm in the dissemination of problematic content and to investigate
whether the recommendation algorithm contributes to steering users towards hateful commu-
nities; and 3) assessing how likely it is for users to come across abhorrent and misleading
content while casually browsing the platform. We do this by focusing on three diverse types
of misleading and abhorrent content, namely: 1) inappropriate videos targeting young chil-
dren; 2) hateful and misogynistic content; and 3) pseudoscientific misinformation. We delve
into these types of content mainly because they are of great societal interest and because
the dissemination of such content to users can have dire real-consequences. We also argue
that providing knowledge, methodologies, and tools to analyze various types of content on
YouTube is a significant step towards understanding and mitigating inappropriate content, and
will help the research community shed additional light on the recommendation algorithm and
its potential influence. We elaborate on each type of abhorrent and misleading content below.
Characterizing and Detecting Inappropriate Videos Targeting Young Children. A plethora
of the most subscribed YouTube channels target children of very young age. While most of
these channels feature inoffensive and educational videos, recent reports have highlighted the
trend of inappropriate content targeting this demographic referring to such videos as disturb-
12
ing [22]. Unfortunately, YouTube’s algorithmic recommendation system regrettably suggests
inappropriate content because some of it mimics or is derived from otherwise appropriate
content. Despite the company’s attempts to curb this phenomenon, disturbing videos still
appear even in its “Kids” app [23], due to the difficulty in identifying them. Prior work studied
YouTube videos with inappropriate content for children at a small scale, however, none of
them focused on the characterization and detection of disturbing videos that explicitly target
toddlers. Hence, the prevalence of the problem at a large scale is not entirely understood,
neither is the role of YouTube’s recommendation algorithm in the dissemination of such videos
among young viewers.
Characterizing Hateful and Misogynistic Content on YouTube Through the Lens of theIncel Community. Despite YouTube’s attempts to tackle hateful and misogynistic content
on the platform, the problem still abounds [24]. One fringe community that has often been
linked to sharing and publishing such content is the so-called Involuntary Celibates, also
known as Incels [25]. This community is one of the most extreme in the Manosphere [26],
a larger collection of movements discussing men’s issues [27] (see Section 5.2). While the
concepts underpinning the Incel “ideology” may seem absurd, they also have grievous real-
world consequences [28]. Despite the important implications that Incel ideology can have
on society, research on Incels is limited and mostly qualitative [29]. At the same time, the
research community has mostly studied the Incel community and the broader Manosphere on
Reddit, 4chan, and other online discussion forums like Incels.me [30, 31]. However, the fact
that YouTube has been repeatedly accused of user radicalization prompts the need to study the
extent to which Incels are exploiting YouTube to spread their views.
Assessing the Effect of Watch History on YouTube’s Pseudoscientific Video Recommen-dations. YouTube provides an ideal environment for disseminating information to a vast
number of people in a short period of time. Yet, when exploited by bad actors, YouTube is
often fertile ground for the spread of misleading and potentially harmful information like
conspiracy theories. Conspiracy theories are usually built on tenuous connections between
various events, with little to no actual evidence to support them. On user-generated content
platforms like YouTube, these are often presented as facts, regardless of whether they are
supported by facts and even though they have been widely debunked. For certain types of
content (e.g., health-related topics), harmful videos can have devastating effects on society,
especially during crises like the COVID-19 pandemic [13]. Recently, YouTube has been under
scrutiny for suggesting pseudoscientific and conspiratorial content [12, 17, 15], mainly due
to the difficulty in identifying such videos. However, as a research community, we lack an
13
understanding of how YouTube’s recommendation algorithm contributes to the promotion of
pseudoscience. More importantly, we lack tools and methodologies for effectively auditing
video recommendation algorithms.
Motivated by the above aspects and the pressing need to suppress abhorrent and misleading
content on YouTube, we set out to answer the following overarching research questions (RQs):
• RQ1: Can we effectively detect and characterize abhorrent and misleading content on
YouTube?
• RQ2: Can we effectively quantify the influence of YouTube’s recommendation algo-
rithm in the dissemination of problematic content?
• RQ3: Does YouTube’s recommendation algorithm contribute to steering users towards
hateful communities?
• RQ4: How likely is it for a user to come across abhorrent and misleading content
when casually browsing the platform? What is the proportion of such content on
YouTube user’s homepage, in search results, and in the video recommendations section
of YouTube?
The above overarching research questions lead to several research sub-questions posed in the
relevant chapters. In particular, sub-questions annotated with RQX.a are posed in Chapter 4,
RQX.b in Chapter 5, and RQX.c in Chapter 6. To provide answers to these research questions,
we follow a large-scale data-driven quantitative approach. To do so, we first implement a data
collection infrastructure that consists of various crawlers, which allow us to collect information
from the Web. By mainly leveraging the YouTube Data API [32], we create large-scale datasets
from videos uploaded on YouTube. Then, we use various deep learning techniques to detect
abhorrent and misleading videos. Finally, we use statistical analysis and other techniques, and
we devise methodologies that allow us to quantify the influence of YouTube’s recommendation
algorithm in promoting problematic content and extract meaningful insights from the large-
scale datasets. Specifically, we use the following techniques:
• Neural Networks & Deep Learning: We apply neural networks for various purposes.
For instance, we use pre-trained neural networks to extract useful insights from images.
Also, we use neural networks to build two custom deep learning classifiers that consider
the various metadata of videos uploaded on YouTube (e.g., title, transcript, comments,
1.1. Contributions 14
etc.), and use them to detect various types of problematic content on YouTube (see
Sections 4.4 and 6.3).
• Graph Analysis: We leverage several graph analysis and visualization techniques to
analyze data that can be modeled with graphs. In the context of our work, we build
directed graphs that are snapshots of YouTube’s recommendation graph where nodes
are videos and edges are recommendations between them. Then, we use graph analysis
to extract meaningful conclusions (e.g., degree distribution) about the interplay between
various types of benign and inappropriate content.
• Random Walks: We perform ”random walks” by traversing snapshots of YouTube’s
recommendation graph while selecting videos according to recommendations. This is
particularly useful, as it allows us to simulate the behavior of various users who browse
YouTube starting from a certain type of videos and select the videos to watch based
on recommendations. This methodology allows us to understand what types of videos
YouTube’s recommendation algorithm suggests to various types of users for various
topics. More details regarding how the random walks methodology is used in each one
of our lines of work can be found in Sections 4.5.2, 5.4.2, and 6.4.2.
• Clustering Algorithms: We use traditional clustering algorithms to create groups of
similar information. More precisely, we use the k-means clustering algorithm [33] to
create clusters of similar topics from a list of keywords associated with young children
(see Section 4.5.2).
1.1 Contributions
This thesis makes several contributions towards classifying the quality of content on YouTube,
understanding the role of YouTube’s recommendation algorithm in promoting problematic
content, as well as towards quantifying the degree of various types of such content on the
platform. More precisely, we make the following contributions:
1. We provide the first large-scale characterization of inappropriate or disturbing videos
targeted at toddlers. Using a set of seed keywords that cover a wide range of child-related
content available on YouTube, we collect and analyze a large number of videos1 finding1We make publicly available the metadata of all the collected videos so that the research community can
further investigate the problem [34]
1.1. Contributions 15
1.1% of them to be inappropriate for young children (RQ1).
2. We propose and implement a deep learning classifier2 that can discern disturbing videos
that target toddlers with 0.84 accuracy. We then perform a live simulation in which
we mimic a toddler randomly clicking on YouTube’s suggested videos while using
the developed classifier to classify the quality of all the selected videos. We find a
3.5% chance that a toddler following YouTube’s recommendations will encounter an
inappropriate video within ten recommendation hops if she starts from a video that
appears among the top ten results of a toddler-appropriate keyword search (e.g., Peppa
Pig) (RQ1 and RQ4).
3. We devise a text-based methodology for collecting and annotating videos related to the
Incel community and use it to perform the first large-scale data-driven characterization
of this community on YouTube3. We found a non-negligible growth in Incel-related
activity on YouTube over the past few years, both in terms of published Incel-related
videos and comments likely posted by Incels. This result suggests that users gravitating
around the Incel community are increasingly using YouTube to disseminate their views
(RQ1).
4. We study how YouTube’s recommendation algorithm behaves with respect to Incel-
related videos. By performing random walks on YouTube’s recommendation graph,
we find a 6.3% chance for a user who starts by watching non-Incel-related videos to
be recommended Incel-related ones within five recommendation hops. At the same
time, users who have seen two or three Incel-related videos at the start of their walk
see recommendations that consist of 9.4% and 11.4% Incel-related videos, respectively.
Moreover, the portion of Incel-related recommendations increases substantially as the
user watches an increasing number of consecutive Incel-related videos (RQ3).
5. We propose an additional deep learning classifier4 that can detect pseudoscientific
content with 0.79 accuracy. Although our classifier outperforms several baselines,
ultimately, its accuracy reflects the subjective nature of pseudoscientific vs. scientific
content classification on YouTube. It is also evidence of the hurdles in devising models
that automatically discover pseudoscientific content. Nonetheless, we argue that our
2We make the disturbing videos detection classifier publicly available [35]3We make publicly available the metadata of all the collected Incel-derived and Control videos to assist
researchers further investigate the problem [36]4We make the pseudoscientific videos detection classifier publicly available [37]
1.2. Research Papers 16
classifier is only the first step in this direction and can be further improved; overall, it
does provide a meaningful signal on whether a video is pseudoscientific (RQ1).
6. To the best of our knowledge, we present the first study focusing on multiple health-
related pseudoscientific topics on YouTube pertaining to the COVID-19 pandemic.
Inspired by the literature, we develop a complete framework that allows us to assess
the prevalence of pseudoscientific content on various parts of the YouTube platform
(i.e., homepage, search results, video recommendations) while accounting for the effect
of a user’s watch history. Specifically, we build user profiles with distinct watch
histories and use them to perform experiments that allow us to quantify the prevalence
of pseudoscientific content on various parts of the YouTube platform. We find that the
watch history of the user substantially affects what videos are suggested to the user
and that it is more likely to encounter pseudoscientific videos in the search results (i.e.,
when searching for a specific topic) than in the video recommendations section or the
homepage of a user. We also perform experiments using the YouTube Data API finding
that the results using the API are similar to those of using a non-logged-in user profile
with no watch history (using a browser); this indicates that recommendations returned
using the API are not subject to personalization (RQ2 and RQ4).
7. We provide a set of resources5 to help researchers shed additional light on YouTube’s
recommendation algorithm and its potential influence. In particular, the ability to run
experiments while taking into account the users’ viewing history will be beneficial to re-
searchers focusing on demystifying YouTube’s recommendation algorithm, irrespective
of the topic of interest (RQ2).
1.2 Research Papers
The work presented in this thesis is already published or is currently under review in peer-
reviewed journals and conferences. Specifically, some aspects of our work (in collaboration
with other researchers and academics) appear in the following research articles:
• Papadamou, K., Papasavva, A., Zannettou, S., Blackburn, J., Kourtellis, N., Leon-
tiadis, I., Stringhini, G., and Sirivianos, M., 2020, May. Disturbed YouTube for Kids:
5We make the pseudoscientific videos ground-truth dataset [38], source code, and crawlers of our experi-
ments [37] publicly available
1.3. Thesis Organization 17
Characterizing and Detecting Inappropriate Videos Targeting Young Children. In Four-
teenth International AAAI Conference on Web and Social Media. [39] (Spotlight PaperAward).
• Papadamou, K., Zannettou, S., Blackburn, J., De Cristofaro, E., Stringhini, G., and
Sirivianos, M., 2021. ”How over is it?” Understanding the Incel Community on YouTube.
Under major revision. [40]
• Papadamou, K., Zannettou, S., Blackburn, J., De Cristofaro, E., Stringhini, G., and
Sirivianos, M., 2021. ”It is just a flu”: Assessing the Effect of Watch History on
YouTube’s Pseudoscientific Video Recommendations. Under major revision. [41]
1.3 Thesis Organization
The remainder of this thesis is organized as follows. In Chapter 2 we provide essential
background information, while Chapter 3 describes prior work on: 1) inappropriate content
for children; 2) harmful and other malicious activity; 3) misinformation and pseudoscientific
content; and 4) recommendation algorithms and their auditing. In Chapter 4 we present our
work on characterizing and detecting inappropriate videos targeting young children. Chapter 5
describes our work on characterizing hateful and misogynistic content on YouTube through
the lens of the Incel community. In Chapter 6 we present our work on assessing the effect of
watch history on YouTube’s pseudoscientific video recommendations. Finally, we discuss our
findings and conclude in Chapter 7.
Chapter 2
Background
In this chapter, we provide essential background information regarding YouTube and other
Web communities from which we collect and analyze data.
2.1 YouTube
In this section, we briefly describe YouTube, its recommendation algorithm, and the methodol-
ogy for collecting data from it.
2.1.1 YouTube
General. YouTube is the leading video-sharing platform on the Web1, owned by Google.
YouTube does not produce media content itself, instead, it focuses on user-generated content
by allowing users or content creators to create and upload content on the platform and YouTube
deals with the efficient distribution of this content to its billion of users. According to Burgess
et al. [42] YouTube has also been seen as a spearhead of participatory culture by allowing
everyone from industry experts, to governments, citizens’ groups, or any other person to make
their voices heard via YouTube. When uploading a video on the platform, among other things,
content creators can set a title, a description, define multiple tags, which are keywords that
describe a particular video, and they can even upload a transcript for its audio. Users and
content creators can also create their YouTube channel where they upload their videos. Other1According to Statista as of 2019 YouTube has over 2B monthly active users worldwide (http://bit.
ly/statista-youtube-viewers)
18
2.1. YouTube 19
users of the platform can subscribe to these channels and receive notifications when a new
video has been uploaded. Furthermore, anyone over 13 years old can search and watch videos
on YouTube. While watching videos, users can also like or dislike them, share them to other
social networks, or post a comment below them. Other users can also reply to those comments
in a structured manner (e.g., reply to a specific comment or reply to a specific reply).
YouTube’s Recommendation Algorithm. One of the main reasons for YouTube’s success
is its recommendation algorithm algorithm2. The recommendation algorithm is central to
YouTube’s user experience for three main reasons. First, it determines what videos are
presented to each user’s homepage. Second, it determines and ranks the videos when a user
searches the platform. Last, while users watch videos on the platform, the recommendation
system suggests “up-next” related videos appearing in the sidebar next to the currently playing
video.
In its early stages, YouTube was suggesting videos based on their number of views (a.k.a.
clicks), while in 2012 the platform announced an update to the discovery system designed
to identify videos that keep users engaged based on the watch time (a.k.a. view duration).
While not being fully transparent on how the recommendation algorithm operates, YouTube
released a paper describing how deep neural networks are used in the architecture of its
recommendation system [43]. At the same time, they state that YouTube recommends videos
based on user engagement and perceived satisfaction. More precisely, YouTube determines
the ranks of the videos recommended to users based on various user engagement (e.g., a user
clicks, degree of engagement with recommended videos, etc.) and satisfaction metrics (e.g.,
likes, dislikes, etc.). Aiming to increase the time that a user spends watching a particular video,
the platform also considers various other user personalization factors, such as demographics,
location, or the watch history of the user, etc. [44].
Monetization. YouTube established a very effective business model on top of its users and
content creators by serving advertisements on videos. At the same time, content creators
receive a small percentage of the income received by YouTube for serving advertisements on
their videos (revenue sharing). YouTube chooses the advertisements to be shown on a specific
video automatically based on context like the video’s metadata and whether the content is
advertiser-friendly. At the same time, content creators can enable or disable monetization for
their videos at any time.
2According to YouTube’s product chief, more than 70% of what people watch on YouTube is determined by its
recommendation algorithm (https://www.cnet.com/news/youtube-ces-2018-neal-mohan/)
2.1. YouTube 20
Moderation and De-monetization. YouTube moderates videos that violate the platform’s
community guidelines [45] by removing them. According to the community guidelines,
YouTube moderates the following types of content and activity: 1) spam and deceptive
practices like fake engagement, impersonation, etc.; 2) sensitive content related to child safety,
nudity, suicide, and self-injury, etc.; 3) violent and dangerous content; 4) hate speech; etc.
Due to the sheer scale, YouTube heavily relies on its users and machine learning to detect and
flag problematic content, and on YouTube employees to manually inspect and remove them.
However, YouTube has been lately criticized for promoting borderline content. Such videos do
not quite violate YouTube’s community guidelines but contain harmful or misleading content.
According to YouTube’s CEO, the platform punishes videos with borderline content by either
reducing exposure to them or de-monetizing such videos (removing advertisements) [46].
YouTube Data API. To collect data from YouTube we mainly use the official YouTube Data
API [32] to create the datasets we analyze in this thesis. While the YouTube Data API allows
developers to incorporate YouTube features into their own web applications, it also enables
obtaining the metadata of all videos publicly available on YouTube. More precisely, we use the
YouTube Data API to obtain the following metadata for each video: 1) title, description, and
duration; 2) a set of tags defined by the uploader; 3) video category; 4) thumbnail information;
5) video statistics such as the number of views; 6) video transcript; 7) top related videos; and
7) top comments, defined by YouTube’s relevance metric, and their replies.
2.1.2 YouTube Kids
General. In an attempt to offer a safer online experience for its young audience, YouTube
launched the YouTube Kids application [47], which equips parents with several controls over
what their children are allowed to watch on YouTube. Such controls include setting content
levels and disabling the search functionality. YouTube Kids is designed specifically for young
children aged 5 or younger and it has been promoted as ”a world of learning and fun, made
just for kids.” The YouTube Kids app includes both popular children’s videos and diverse
new content, delivered in a way that is usable for children. According to the company, videos
marked as age-restricted are not available on the YouTube Kids app. Age-restricted videos
usually contain content that is not suitable for anyone under 18 years old but does not violate
YouTube’s community guidelines.
Data Collection. We note that in this thesis we collect and analyze videos only from YouTube
2.2. Reddit 21
and not from YouTube Kids. This is because YouTube does not provide an open API for
collecting videos that appear on YouTube Kids.
2.2 Reddit
In this section, we briefly describe Reddit and the data collection methodology we used.
General. Reddit is called the ”front page of the Internet” and is a popular social news
aggregator, web content rating, and discussion platform. Reddit can also be viewed as a
collection of forums where users can share news and content. Users can create discussion
threads, also called ”submissions”, by posting a URL along with a title. Other users can
comment or reply below in a structured manner (e.g., reply to submission or reply to specific
reply). The popularity of content within the platform is determined via a voting system. Users
can up-vote or down-vote each comment or submission, hence a score can be calculated for
each one. Submissions and comments with higher scores appear on top of submissions and
comments with a lower score. In addition, a user-based score called ”karma” summarizes the
scores of all user comments and submissions. Last, the community structure on Reddit is not
defined by a friendship/follower relation like other social networks. Instead, a Reddit user can
list another user as a friend but this does not affect the structure or use of the platform.
Subreddits. Reddit consists of more than a million communities known as ”subreddits”. Sub-
reddits are created from users of the platform and this has lead to a plethora of communities
discussing a wide variety of topics ranging from generic entertainment topics (e.g., video
games, cartoons, etc.), to politics, men’s issues, and even meta-communities that summarize
interactions of users on other subreddits/social networks. Reddit’s administrators regularly
monitor subreddits and they remove them when they share extremely inappropriate or offensive
content. Several subreddits have been removed/banned from the platform in the last few years.
For instance, several subreddits have been removed for bullying and harassment and for pro-
moting rape and suicide (e.g., /r/Incels and /r/Braincels), or for promoting conspiracy theories
(e.g., /r/pizzagate and /r/greatawakening for promoting the Pizzagate [48] and QAnon [49]
conspiracy theories, respectively).
Data Collection. To obtain the submissions and comments of the various subreddits we
consider in this thesis, we use Pushshift [50]. Pushshift is a six-year-old platform that
collects all the submissions and comments posted on Reddit and exposes them to the research
2.2. Reddit 22
community via an open REST API. Specifically, Pushshift provides all the Reddit data since
the platform’s beginning in separate monthly dumps that someone can download and process.
We use Pushshift instead of the official Reddit API because it is much easier to query and
retrieve historical Reddit data. At the same time, it also provides extended functionality by
providing full-text search against comments and submissions and has larger query limits.
2.2.1 Remarks
In this section, we presented the data sources we used in this thesis. We selected them for
specific reasons. First, we elect to focus our efforts on YouTube because it is the most popular
video-sharing platform worldwide. This enables us to analyze and understand various types
of inappropriate content on a large scale. Second, we select YouTube mainly because of
anecdotal evidence suggesting that its recommendation algorithm promotes offensive and
dangerous content, and even that it helps radicalize users [12, 5, 6]. Last, we avoid using other
popular social networks and video-sharing platforms like Facebook and its video platforms
mainly due to limits imposed on their APIs by the company itself, hence constituting the task
of obtaining data non-straightforward. For more details on why we use Reddit as a data source
in some of our lines of work please see Section 4.2.1 and Section 5.3.1.
Chapter 3
Literature Review
In this chapter, we provide an extensive literature review of prior work that focuses on
problematic content and activity on YouTube and other video-sharing platforms on the Web.
We review the following lines of work: 1) inappropriate content targeting young children; 2)
harmful, hateful, and other malicious activity; 3) misinformation and pseudoscientific content;
4) recommendation algorithms and audits; and 5) various other relevant studies.
3.1 Inappropriate Content for Children
3.1.1 Characterizing Inappropriate Content for Children
Previous work focuses on characterizing and extracting meaningful insights about inappro-
priate content for children by analyzing data obtained from various video-sharing platforms
and other types of Online Social Networks (OSNs). Once the use of social media became one
of the most common activities of children and adolescents, the research community started
investigating the possible implications. O’Keeffe et al. [51] focus on the impact of online
social networks and video-sharing platforms such as Facebook, Twitter, and YouTube on
children, adolescents, and families in general. They conclude that it is important for parents
to become aware of the nature of such platforms, and highlight that parents must monitor
their children while using these platforms for potential problems such as cyberbullying, sex-
ting, and exposure to inappropriate content. Elias et al. [52] aim at profiling toddlers who
watch YouTube videos, based on the child, parent, and family-related characteristics. They
interview 289 parents of toddlers aged 18-36 months and they find that watching videos on
23
3.1. Inappropriate Content for Children 24
YouTube has become normative behavior among toddlers. They also find that online viewing
is deeply integrated into the daily routine of parents and that YouTube and other video-sharing
platforms have become a tool for them to fulfill a wide range of their child-rearing needs.
Chen et al. [53] are the first to study the appropriateness of advertising content in mobile
applications from a children’s online safety perspective. Among other things, they find that
free applications mainly designed for kids contain advertisements, and a substantial portion of
those advertisements contain inappropriate content. They suggest that a maturity monitoring
mechanism is needed to detect or filter inappropriate advertising in children’s applications.
Next, Izci et al. [54] survey research examining young children’s use of YouTube and YouTube
Kids, as well as experts and parental concerns about children’s digital media use. Bur-
roughs [55] focus on the relationship between the YouTube Kids application and the everyday
viewing patterns and lives of young children. He claims that YouTube and YouTube Kids’
recommendation algorithms consider infants as consumers, and as such, they are labeled
as “algorithmic infants.” For example, if they like watching toy car videos, similar videos
including toy cars appear on their screen as a result of the algorithm. Other scholars also focus
on YouTube videos targeting young children, and mainly on videos that feature controversial
and inappropriate themes.
Craig et al. [56] examine toy unboxing videos in social media and the concerns around these
videos. Toy-unboxing videos include other children’s or adults’ reviews of a set of objects
inside a box. Craig et al. provide a brief history of this phenomenon and describe how
these videos represent forms of creator labor and operate within the structural and material
interests of social media entertainment. They also provide a detailed discussion of YouTube
toy unboxing videos from a media regulation and economics perspective. Nicoll et al. [57]
also focus on toy unboxing videos on YouTube. They perform a content analysis of 100 toy
unboxing videos and analyze their genre features. They categorize those features into five
categories: 1) genre; 2) product; 3) narration; 4) production; and 5) branding, to analyze
variations of expertise, professionalism, and promotions across the genre. They find that
amateur child unboxers mimic the production and branding strategies of the ”professional”
channels that often produce a semblance of playful amateur authenticity. Jaakkola [58]
investigates the toy review genre as present in YouTube videos targeting children aiming
to understand the forms and functions of toy reviews in the contexts of YouTube’s political
economy, branding, commercialization, and regulation. She analyzes the strategies of 180
videos across 35 toy review channels finding that these channels produce repetitive content,
which they call ”kidbait”, and that they employ creative aims and strategies to convince adults
3.1. Inappropriate Content for Children 25
of the benefits of watching. She concludes that toy reviews are a complex hybrid genre
mediating children’s commodities and play culture and that more attention should be dedicated
to the ethical principles of their production.
Araujo et al. [59] study the audience profiles and comments posted on YouTube videos
in popular children-oriented channels, and conclude that children under the age of 13 use
YouTube and are exposed to advertising, inappropriate content, and privacy threats. Paolillo et
al. [60] focus on child-oriented YouTube videos that feature violent, disturbing, or otherwise
inappropriate content. They collect and characterize children’s videos published on YouTube
between 2016 and 2018. They code the collected videos for a variety of production and
content features and then perform a cluster analysis. Interestingly, they find that the use of
branded materials takes place more frequently in the context of toy play and unboxing, while
for other types of content they note that they do not find videos with inappropriate content in
the analyzed sample.
3.1.2 Detection and Containment of Inappropriate Content for Chil-dren
Detecting inappropriate or disturbing content tailored toward young viewers and preventing
its spread is not a straightforward task. This is because such videos usually feature popular
cartoon characters, like Spiderman, Mickey Mouse, etc., and include an innocent thumbnail
aiming at tricking the toddlers and their custodians. In Table 3.1 we summarize the studies that
aim to solve the problem by detecting and containing inappropriate content targeting young
children on YouTube. Most studies try to solve the problem with handcrafted features and
conventional machine learning techniques. Recently, leveraging recent advancements in deep
learning, the research community used deep neural networks to detect inappropriate content
for children. In addition, we report studies that proposed additional parental controls as a way
to prevent children from accessing inappropriate content on YouTube and other OSNs. Finally,
we also report a variety of other methodologies and techniques that have been proposed for
the detection and containment of inappropriate content for children.
Machine Learning. Kaushal et al. [61] focus on the characterization and detection of unsafe
content for children and its promoters on YouTube. For the detection of unsafe content on
videos, they propose a machine learning classifier based on Convolutional Neural Networks
(CNNs). The classifier considers video frames, while for the detection of promoters of unsafe
3.1. Inappropriate Content for Children 26
Platform Machine Learning Parental Control Tools Other Methods/Algorithms
YouTube
Kaushal et al. [61]
Buzzi [62]
Alshamrani [63]
Reddy et al. [64]
Stocker et al. [65]
Ishikawa et al. [66]
Singh et al. [67]
Eickhoff et al. [68]
Han et al. [69]
Alshamrani [70]
YouTube Kids Tahir et al. [71] -Alghowinem [72]
Neumann et al. [73]
Other Wehrmann [74] Thierer [75]
Tsirtsis et al. [76]
Luo et al. [77]
Charalambous et al. [78]
Ybarra et al. [79]
Parmaxi et al. [80]
Table 3.1: Studies that focus on the detection and containment of inappropriate content for children.
The reported studies are separated based on their main methodology, as well as the considered OSNs.
content they propose another approach based on the supervised classification that considers a
set of video-, user-, and comment-level features. The proposed approaches can detect unsafe
content on YouTube videos targeted at children and the promoters of such content with 85.7%
accuracy. Furthermore, their analysis of child-oriented videos reveals that unsafe content
promoters are less popular and less engaging compared with all other users. They also find
that unsafe content turns up very close to safe content and unsafe content promoters form
very tight-knit communities with other users. Ishikawa et al. [66] study the Elsagate [81]
phenomenon on YouTube and they propose a deep learning model for detecting Elsagate-
related content on YouTube that is based on deep convolutional neural networks combined
with static (raw video frames) and motion (MPEG motion vectors) video information. They
use transfer learning to extract features from videos and they train the proposed model on a
dataset of 3K videos, finding that it can detect Elsagate-related videos with 92.6% accuracy.
They also note that the proposed solution is compatible with mobile platforms. Similarly,
Singh et al. [67] focus on the detection of child unsafe content. This work is motivated by
the fact that malicious video uploaders typically limit the child’s unsafe content to only a few
frames in the video to evade moderation. They propose an LSTM-based deep neural network
that is based on auto-encoders and a VGG16 CNN [82] to build a fine-grained detection
method named KidsGUARD. The goal of this method is to prevent kids from experiencing
3.1. Inappropriate Content for Children 27
unsafe content by detecting sparsely present child unsafe content in a video.
Tahir et al. [71] focus on the problem of inappropriate content targeting young children
specifically on YouTube Kids. They collect, manually review, and analyze 5K videos available
on YouTube Kids finding more than 1K of them to contain fake, explicit, or violent content.
Then, using the curated dataset they develop a deep learning architecture that can detect
inappropriate videos with 90% accuracy. They conclude by stating that the proposed system
can be successfully applied to various types of animations, cartoons, and CGI videos to detect
any type of inappropriate content within them. Eickhoff et al. [68] also propose a binary
classifier based on the non-audio-visual data of a video, for identifying suitable YouTube
videos for children. In a similar context, Wehrmann [74] propose ACORDE, a deep learning
architecture for adult content detection in videos that is based on convolutional neural networks
and LSTM recurrent networks.
Han et al. [69] focus on the Elsagate phenomenon with a method for detecting Elsagate-related
inappropriate YouTube videos based on Sparse Linear Discrimination (LSD), which can detect
the violent scenes included in videos. Alshamrani [70] focuses on detecting and measuring the
exposure of young children to inappropriate comments posted under YouTube videos targeting
this demographic. He builds a data collection and processing pipeline and uses it to collect
3.7 million comments posted on 10K videos targeting young children on YouTube. Then, he
creates an ensemble of video deep neural networks that classify comments into toxic, obscene,
threat, insult, and identity hate. Using this ensemble of classifiers, he measures the exposure of
each comments category by different age groups finding that children between 13-17 comprise
the age group that is the most exposed to the inappropriate comments, followed by the 6-8 age
group.
Parental Control Tools. Several studies assess or propose parental controls to monitor the
use of YouTube and other social networks by young children, thus preventing them from
watching inappropriate content. Thierer [75] provides an extensive survey and collection of
useful resources and parental control tools for the protection of minors on the Web. Buzzi [62]
focuses on pornography and inappropriate content on YouTube targeted at young children.
Using an example of a video that features a famous Disney cartoon but its original audio
was substituted with pornographic audio, she analyzes the effectiveness of YouTube’s user
interface for reporting inappropriate content. She concludes by suggesting the addition of extra
parental controls and indicators on YouTube to prevent children from accessing inappropriate
content, such as an indication of whether a given video is suitable for all or adults only, before
3.1. Inappropriate Content for Children 28
allowing the user to access the video.
In another study, Charalambous et al. [78] propose a privacy-preserving architecture for the
protection of adolescents in OSNs, called Cybersafety Family Advice Suite (CFAS). The
proposed system includes virtual guardian avatars that provide cybersafety advice to children
while preserving their privacy towards their custodians and towards the advice tool itself. The
tool aims to prevent children’s exposure to numerous risks and dangers while using Facebook,
Twitter, and YouTube on a browser. Last, Ybarra et al. [79] provide an extensive study
conducted with teens (10-17 years old) and one of their custodians, in which they investigate
the consequences of using parental control tools and other software. They find that techniques
for preventing access to unsolicited inappropriate content, such as filtering, blocking, and
monitoring software, were associated with a considerable decrease in unwanted exposure to
sexual material.
Other Methodologies, Algorithms, and Systems Tsirtsis et al. [76] review existing work on
the internet activity and the motivation of use by young children and list the identified risks and
threats for young children who use the Web and OSNs. They also present a systematic process
for designing and developing modern and state of the art techniques to protect minors against
the identified risks and dangers. Alghowinem [72] investigates the safety of the YouTube
Kids application and proposes an advanced content filtering approach using automated video
and audio analysis as an extra layer for kids’ safety. The proposed solution is based on the
thin-slicing theory [83] for checking in real-time whether the videos in YouTube Kids have
problematic images or sounds. Specifically, this filter randomly cuts the clip into several 1-s
slices and then extracts images and audio texts from each slice. Motivated by the increased
popularity of YouTube and YouTube Kids among young children, Neumann et al. [73] discuss
the concerns raised by YouTube viewing on early childhood learning and development. They
also discuss the risks of children’s exposure to commercial advertisements and disturbing
videos, and they propose that the key factors that should be considered when selecting YouTube
videos for kids are age-appropriateness, content quality, video design features, and potential
for the video to support learning outcomes. They conclude with some practical strategies that
parents should adopt.
Alshamrani [63] investigates the exposure of young children to malicious content in comments
posted on YouTube videos targeting this demographic. They collect 4M comments posted
on children’s YouTube videos and look for URLs embedded in these comments that contain
inappropriate topics for children, as well as the interactions of the viewers with these comments.
3.1. Inappropriate Content for Children 29
They find an alarming number of inappropriate URLs embedded in comments available for
children and young users, and a high chance of kids exposure to them since the average number
of views on videos containing such URLs is 48M. Their findings indicate that monitoring the
URLs provided within the comments of videos targeting young children is of vital importance,
and would limit children’s exposure to problematic content.
Focusing on the same demographic, Luo et al. [77] propose an automatic content inspection
and forensics framework to identify Android applications that contain content not suitable
for children under 12 years old (such as violence, pornography, gambling, and drugs). In
addition, their proposed framework provides evidence to inform users on why the certain
inspected application is judged as unsuitable. They evaluate the proposed framework on
70 android applications for children showing that it can identify improper applications for
children with 85.7% accuracy, while they also find 40% of evaluated applications to contain
inappropriate content for children. Reddy et al. [64] propose a proactive approach for video-
sharing platforms like YouTube to handle situations where a child might accidentally open
a video that includes problematic content. The proposed methodology incorporates a face
unlock system for every video that is clicked on YouTube that is based on age detection and
a sentiment analysis model. Once the age detection process is successful, the detected age
is passed to the sentiment analysis model, which then calculates the percentage of positive
and negative sentiments of the requested video and decides whether the given video should be
viewed by the user or not.
Stocker et al. [65] focus on contextually inappropriate content on YouTube. They define
contextually inappropriate content as content that in a specific context or when targeted
at a different audience may be entirely harmful to the viewer. They focus their efforts
on the recommendation algorithm and they perform a simulation to assess whether the
recommendation algorithm steers users towards problematic content. Their findings indicate
that the autoplay feature of YouTube is a problematic feature. They conclude that completely
preventing inappropriate recommendations is technically infeasible in the current context, and
they propose some measures that can mitigate the problem of inappropriate recommendations,
such as improving the quantity and quality of the feedback users can provide.
Last, Parmaxi et al. [80] focus on the research development of safety and security in Web 2.0
learning environments, and provide a review of web-based tools and applications that attempt
to address security and privacy issues in OSNs.
3.2. Misogyny and Other Harmful Activity 30
3.1.3 Inappropriate Content for Children - Remarks
The main findings from the review of the prior work on inappropriate content for children
are that such content appears frequently on the platform, and reports on the presence of
inappropriate videos on YouTube increases over the years. At the same time, we infer that
machine learning techniques can assist in identifying inappropriate content. However, none of
the available research in the field has focused on inappropriate videos that explicitly targets
toddlers, thus it is not clear whether any of the proposed classifiers can really detect such
videos. Finally, none of the above studies analyzed the problem on a large scale on YouTube,
neither they quantify how likely it is for an inappropriate video to be served to a toddler who
casually browses the platform (RQ1 and RQ4).
3.2 Misogyny and Other Harmful Activity
Online misogyny and hate against women, as well as other forms of harmful activity, are on
the rise. Social media platforms became the number one place for psychological violence
– in the form of sexist and misogynistic content – and many other types of harmful activity.
In this section we review prior work that aims at characterizing, detecting, and containing
misogyny, hate, and other types of malicious activity on YouTube and other social media
platforms. Table 3.2 reports the reviewed work for each type of harmful activity as well as the
platform examined in each study.
3.2.1 Misogyny and Other Harmful Activity on YouTube
While YouTube has revolutionized the way people discover and consume video content online,
it has also enabled the spread of hateful content. It is also evident that misogyny, hate, and other
types of harmful and malicious activity have ballooned out of proportion on the platform [130].
A large body of previous work focused on understanding and detecting such activity on the
platform. In this section, we review the most relevant studies on misogynistic and hateful
content, as well as other harmful activity on YouTube.
Misogyny on YouTube. Pratana [84] focuses on identifying sexist language in the YouTube
comments section. She collects and analyzes 420 comments on videos that become popular
popularity and she finds 13% of them to be sexist. In a similar context, Zahir et al. [85] propose
3.2. Misogyny and Other Harmful Activity 31
Platform Misogyny Hateful & Harmful Activity Spam & Malicious Activity
YouTube
Pratana [84] (D.)Zahir et al. [85] (D.)
Wotanis et al. [86] (A.)Tucker-McLaughlin [87] (A.)
Doring et al. [88] (A.)
Sureka et al. [89] (D.)
Chowdury et al. [90] (D.)Sureka et al. [91] (D.)Bulakh et al. [92] (D.)
Benevenuto et al. [93] (D.)Chaudhary et al. [94] (D.)
Ezpeleta et al. [95] (D.)Zannettou et al. [96] (D.)
Agarwal et al. [97] (D.)Giannakopoulos et al. [98] (D.)
Aggarwal et al. [99] (D.)Mariconti et al. [100] (D.)
Jiang et al. [101] (A.)Ottoni et al. [102] (A.)Moor et al. [103] (A.)
Alshamrani et al. [104] (A.)Yusha’u [105] (A.)
BitChute - Trujillo et al. [106] (A.) -
Massanari [107] (A.)Chandrasekharan [108] (A.)
Ribeiro et al. [109] (A.)-Farell et al. [30] (A.)
Ribeiro et al. [110] (A.)
Twitter -
Silva et al. [111] (D.)
McCord et al. [112] (D.)Wang [113] (D.)
Potthast [114] (D.)
Ribeiro et al. [115] (D.)Chatzakou et al. [116] (A.)
Founta et al. [117] (D.)Davidson et al. [118] (D.)Davidson et al. [119] (D.)
OtherBaele et al. [120] (A.)
Lilly [121] (A.)
Zannettou et al. [122] (A.)Hosseini et al. [123] (A.)
Grondahl et al. [124] (D.)
Cao et al. [125] (D.)Chen et al. [126] (D.)
Chakraborty et al. [127] (D.)Biyani et al. [128] (D.)Anand et al. [129] (D.)
Table 3.2: Studies that focus on misogyny and other harmful activity. The reported studies are separated
based on their main methodology, as well as the considered OSNs. (D.) stands for the particular type of
harmful content and activity, and (A.) stands for analysis and measurement studies.
an approach for the automatic detection and assessment of attitudes towards violence against
women and women’s rights, by analyzing YouTube comments written in Arabic. To do this,
they collect a set of videos featuring positive and negative options on violence against women
and women’s rights and use them to train multiple classifiers that detect violent comments
against women.
Additional studies point to the need for a better understanding of misogynistic content on
3.2. Misogyny and Other Harmful Activity 32
YouTube. Wotanis et al. [86] analyze hostile and sexist comments on the platform. They claim
that a large number of YouTubers are male and that more negative feedback is given to females
than male YouTubers. Moreover, they examine which kinds of negative (including hostile and
sexist) and positive video comments were addressed at Jenna Mourey and Ryan Higa, the two
most prominent US YouTubers within the comedy genre. They find that 18% of the comments
that Jenna Mourey received under her videos are negative, while her male counterpart Ryan
Higa received only 4%. This finding is in line with other studies. Tucker-McLaughlin [87]
analyzes popular videos on YouTube and finds that roughly 25% of the most-viewed videos
on the platform include misogynistic language, violence, or both, while the primary actors
in those videos are male. Furthermore, Doring et al. [88] build on the study of Wotanis et
al. [86] by empirically investigating male dominance and sexism on YouTube. They perform
quantitative content analysis and they find that male YouTubers dominate the platform. More
precisely, they find that among the top 100 most subscribed YouTube channels in nine different
countries, female video producers were strongly underrepresented. By also analyzing 2.4K
video comments, they find that female content producers are prone to receiving more negative
and hostile comments. They conclude that female YouTubers possibly attract more negative
comments only if they display their sexuality or address feminist topics, but not if they conform
to gender role expectations.
Hateful and Other Harmful Activity on YouTube. Machine learning techniques have been
extensively used by the research community to detect hateful, toxic, extremist, and violent
content on YouTube. Sureka et al. [89] focus on the detection of extremism on YouTube, They
propose a semi-assisted system that uses data mining and social network analysis techniques
to discover hateful YouTube videos. The proposed system can be used by law enforcement
and intelligence agencies to assist the detection of hate videos, users, and hidden communities
in the ecosystem where hate speech flourishes. Agarwal et al. [97] formulate the problem of
identification of malicious videos disseminating hatred against a particular religion, country,
or person on YouTube as a search problem. They present a focused-crawler approach which
consists of three phases: a training profile collection, statistical model building, and a crawler
biased towards retrieving hateful videos. The proposed approach can be used for identifying
YouTube videos that promote hate and extremism. Giannakopoulos et al. [98] use video, audio,
and textual features of videos uploaded on YouTube to train a k-nearest classifier for detecting
violent videos on the platform. Aggarwal et al. [99] use video features for detecting videos
violating privacy or promoting harassment. Mariconti et al. [100] propose an ensemble of
machine learning classifiers to predict, during upload time, whether or not a YouTube video
3.2. Misogyny and Other Harmful Activity 33
will be targeted with hateful comments or dislikes by coordinated attacks.
Prior work has also characterized and measured hateful, toxic, and extreme content on YouTube.
Jiang et al. [101] investigate how channel partisanship and video misinformation affect
comment moderation on YouTube, finding that comments are more likely to be moderated if
the video channel is ideologically extreme. Ottoni et al. [102] perform an in-depth analysis
of 7K videos and 17M video comments retrieved from alt-right channels on YouTube to
understand possible issues related to hate, violence, and discriminatory bias. They investigate
similarities and differences between user comments and video content and compare it to a
baseline set using a three-layered approach, in which they analyze the use of language, the
topics discussed, and implicit biases present in the texts. They conclude that the comments of
a video are a better indicator for detecting alt-right videos when compared to the video’s title.
Moor et al. [103] study the use of offensive language on YouTube using surveys of users of the
platform. Although many of the participants claimed that they do not use insulting, swearing,
or otherwise offensive language, the study points that offensive language is common on
YouTube. Interestingly, they also find that users are reluctant to upload videos on the platform
because of the offensive comments that they may receive. They conclude that although some
users use offensive language for entertainment, this type of language is more often intended to
express disagreement or as a response to a perceived offense by others.
Alshamrani et al. [104] investigate the correlation of different toxic behaviors, such as identity
hate and obscenity, in users’ interactions on popular videos on YouTube. They collect 7.3M
comments and more than 10K news videos transcript, annotate some of them and use them
to train an ensemble of classifiers that can identify toxic comments on YouTube with high
accuracy. They then use the trained classifier to detect toxic comments under news videos
posted on YouTube and they find that religion and crime-related news have the highest
rate of toxic comments, while economy-related news has the lowest rate. In another study,
Yusha’u [105] study user comments under YouTube videos posted by popular news media
organizations to report the Norwegian attacks by Anders Breivik. Focusing on Islamophobia,
they use critical discourse analysis to understand the Islamophobic themes that emerged
in the reporting of the story, and how the user-generated comments can contribute to the
understanding of the rise of Islamophobia in the West. They conclude that there is a need to
address the way stories about Muslims are reported in the West.
Spam and Other Malicious Activity on YouTube. Machine learning techniques have been
extensively used by the research community to detect and mitigate spam and other malicious
3.2. Misogyny and Other Harmful Activity 34
activity on YouTube. Chowdury et al. [90] explore various video attributes that may enable the
detection of spam videos and their uploaders on YouTube. They collect and manually classify
videos from YouTube into spam and legitimate videos, and use them to train multiple machine
learning classifiers using a variety of video features to identify the most indicative ones. They
find that features like the comment count and the average rating of a video are among the
most indicative features for effective spam detection. Sureka et al. [91] propose a method
for automatically detecting comment spammers on YouTube based on mining the comment
activity log of a user and extracting patterns that indicate spam behavior like the time interval
between subsequent comments posted by a user who is likely to be a spammer. Using similar
features, Bulakh et al. [92] characterize and identify fraudulently promoted YouTube videos.
They collect 3.3K fraudulently promoted videos and 500 bot profiles that promote them and
they train supervised machine learning classifiers that can successfully detect fraudulently
promoted videos and the malicious user profiles that promote them.
In the same context, Benevenuto et al. [93] propose two supervised classification algorithms to
detect spammers, promoters, and legitimate YouTube users. Also, to improve the performance
of spam filtering on the platform, [93] test numerous approaches and propose a tool, based on
Naive Bayes, that filters spam comments on YouTube. Chaudhary et al. [94] use only video
features, and propose a one-class classifier approach for detecting spam videos. They divide
the problem into three sub-problems: 1) promotional video recognition; 2) pornographic
or dirty video recognition; and 3) botnet uploader recognition. For each sub-problem, they
collect videos and perform a characterization, which reveals that discourse, temporal features,
popularity-based features, and time-based features can be used to predict the type of the video.
Ezpeleta et al. [95] perform mood analysis of comments posted on YouTube videos and use
it as a feature in social spam filtering classifiers to show that mood information can improve
detection accuracy.
Finally, Zannettou et al. [96] leverage deep learning techniques to detect videos on YouTube
that use manipulative techniques to increase their views (i.e., clickbait). Specifically, they
propose a semi-supervised model based on variational auto-encoders. Their evaluation indi-
cates that they can detect clickbait videos with acceptable performance and that YouTube’s
recommendation engine does not suppress clickbait videos.
3.2. Misogyny and Other Harmful Activity 35
3.2.2 Misogyny and Hateful Activity on the Rest of the Web
In one of our lines of work in this thesis, we focus on characterizing hateful and misogynistic
content through the lens of the Incel Community. Hence, in this section, we also review
prior work that focuses on the Incel community, as well as other misogynistic and hateful
communities on the Web.
Misogyny on the Web. Massanari [107] performs a qualitative study of how Reddit’s algo-
rithms, policies, and general community structure enables, and even supports, toxic culture.
She focuses on the #GamerGate and Fappening incidents, both of which had primarily female
victims, and argues that specific design decisions make it even worse for victims. For instance,
the default ordering of posts on Reddit favors mobs of users promoting content over a smaller
set of victims attempting to have it removed. She notes that these issues are exacerbated in the
context of online misogyny because many of the perpetrators are extraordinarily techno-literate
and thus able to exploit more advanced features of social media platforms.
Baele et al. [120] study content shared by members of the Incel community in the online
forum Incels.me, focusing on how support and motivation for violence resulting from their
worldview. They find a link between the Incels’ worldview and violence, and that violence
within the Incel ideology is not only seen as acceptable but also as the only possible way to
solve the crisis endpoint in which society is supposedly stuck. They conclude that the Incel
community is an extremist ideology both in terms of its logic categorization and explanation.
Farell et al. [30] perform a large-scale quantitative study of the misogynistic language across
the Manosphere on Reddit. They create nine lexicons of misogynistic terms to investigate
how misogynistic language is used in 6M posts from Manosphere-related subreddits. Jaki
et al. [31] study misogyny on the Incels.me forum, analyzing users’ language and detecting
misogyny instances, homophobia, and racism using a deep learning classifier that achieves up
to 95% accuracy.
Furthermore, Ribeiro et al. [110] focus on the evolution of the broader Manosphere and
perform a large-scale characterization of multiple Manosphere communities mainly on Reddit
and six other Web forums associated with these communities. They find that older Manosphere
communities, such as Men’s Rights Activists and Pick Up Artists, are becoming less popular
and active. In comparison, newer communities like Incels and MGTOWs attract more attention.
They also find a substantial migration of users from old communities to new ones, and that
newer communities harbor more toxic and extreme ideologies. In another study, Ribeiro et
3.2. Misogyny and Other Harmful Activity 36
al. [109] investigate whether platform migration of toxic online communities compromises
content moderation. To do this, they focus on two communities on Reddit, namely, /r/Incels
and /r/The Donald, and use them to assess whether community-level moderation measures
were effective in reducing the negative impact of toxic communities. They conclude that a
given platforms’ moderation measures may create even more radical communities on other
platforms.
Finally, Lilly [121] focuses on the Manosphere, and using mixed-methods critical discourse
analysis they analyze the discourse of the two primary subcultures of the Manosphere. She
presents a taxonomy of the communities that together form the Manosphere, while also
highlighting the key ideas behind the Manosphere. Her taxonomy considers the four most
popular communities of the Manosphere, Men’s Rights Activists (MRA), Men Going Their
Own Way (MGTOW), Pick Up Artists (PUA), and Involuntary Celibates (Incels).
Hateful and Other Harmful Activity on the Web. A large body of prior work studied
how to detect and measure hate speech on the Web. Silva et al. [111] perform a large-scale
measurement study of the main targets of hate speech in Whisper and Twitter. They do
this they develop a methodology to identify hate speech on both these systems based on the
sentences’ structure by matching expressions towards something. Trujillo et al. [106] focus on
BitChute, a video-sharing platform alternative to YouTube. BitChute is part of an ecosystem
of alternative, low content moderation platforms, including Gab, Voat, and 4chan. Trujillo
et al. perform a characterization of BitChute finding that the platform facilitates conspiracy
theories and a high rate of hate speech, mostly anti-Semitic. Interestingly, they also find that
while some BitChute content promoters have been banned from other platforms, they continue
to maintain profiles on YouTube and other mainstream social media platforms. Zannettou
et al. [122] provide a large-scale characterization of Gab, an alternative social network of
Twitter with low content moderation. They collect and analyze 22M posts produced by 336K
users between August 2016 and January 2018 finding that attracts alt-right users, conspiracy
theorists, and other trolls. They also find that hate speech is much more prevalent in Gab
than in Twitter but lower than 4chan’s Politically Incorrect board. Chandrasekharan [108]
focuses on the efficacy of banning as a moderation approach in OSNs. In particular, they
focus on Reddit and they analyze 100M posts and comments from two banned subreddits,
/r/fatpeoplehate and /r/CoonTown. They first create lexicons of hate speech and use causal
inference methods to examine the usage of hate speech in other subreddits after the ban. They
find that ban worked for Reddit as that hate speech usage decreased on the platform, while
other related subreddits saw no significant changes in hate speech usage.
3.2. Misogyny and Other Harmful Activity 37
The research community also focused on understanding, detecting, and measuring hateful
content and activity on Twitter. Ribeiro et al. [115] perform a characterization of hateful users
on Twitter. They collect and analyze a sample of 100K users on the platform finding that
hateful/suspended users differ from normal/active ones in terms of their activity patterns, word
usage, and network structure. By exploiting Twitter’s users’ connections network, they also
find that a node embedding algorithm outperforms content-based approaches for detecting
both hateful and suspended users. Chatzakou et al. [116] study the #Gamergate controversy
focusing on Twitter. They perform a measurement analysis of a dataset of 340K unique users
and 1.6M tweets to study the properties of these users, the content they post, and how they
differ from other users on the platform. They find that users involved in the #Gamergate
controversy tend to be more engaged on Twitter having more friends and followers, and they
tend to post tweets with negative sentiment and more hate attitudes compared to what they
post to other users on the platform. Founta et al. [117] perform a large-scale characterization
of various forms of abusive behavior on Twitter, including offensive, abusive, and hateful
language. They propose an incremental and iterative methodology that leverages the power of
crowdsourcing to annotate a large collection of tweets with a set of abuse-related labels.
Furthermore, other studies highlight that detecting and measuring hateful content and harmful
activity is hard, as hate speech is contextual and subjective in nature [131]. Davidson et
al. [118] show that automatic hate speech detection in social media is not a trivial task. They
train a multi-class classifier to distinguish between tweets that contain hate speech, only
offensive language, and those with neither. By analyzing the predictions of their classifier
they find that racist and homophobic tweets are more likely to be classified as hate speech
but that sexist tweets are generally classified as offensive. They also find that machine
learning algorithms struggle to identify tweets that express hate but do not include explicit
hate keywords. Hosseini et al. [123] point to possible ways to deceive well-established APIs
that are used to detect toxic language, like Google’s Perspective API. Specifically, they show
how an adversary can subtly modify a highly toxic phrase in a way that the system assigns a
significantly lower toxicity score to it. Davidson et al. [119] point to racial bias in datasets used
for hate speech and abusive language detection. They train machine learning classifiers using
five different sets of Twitter data annotated for hate speech and abusive language and they find
that such hate speech detection classifiers tend to predict tweets written in African-American
English as abusive at a substantially higher rate due to racial bias in the datasets used to train
them. Grondahl et al. [124] focus on the difficulty in automatically detecting hate speech in
social networks. They reproduce seven state-of-the-art hate speech machine learning classifiers
3.2. Misogyny and Other Harmful Activity 38
proposed in prior work [118, 132, 133, 134] and they highlight their inability to generalize in
unseen data as all of them perform well only when tested on the datasets used to train them.
Finally, Ribeiro et al. [109] investigate whether platform migration of toxic online communities
compromises content moderation focusing on /r/The Donald and /r/Incels communities on
Reddit. They conclude that a given platforms’ moderation measures may create even more
radical communities on other platforms.
Spam and Other Malicious Activity. Several studies focus on the detection of spam and
other types of malicious activity on the Web using machine learning and other techniques.
Cao et al. [125] investigate the detection of fake accounts in large-scale social online services.
They propose SybilRank, a tool that relies on social graph properties to rank users according
to their perceived likelihood of being fake. They evaluate SybilRank on Tuenti, Spain’s
largest social network, and they find that almost 90% of the 200K accounts that SybilRank
flagged as most likely to be fake were indeed fake. Others focus on spam detection in Twitter
using machine learning. McCord et al. [112] analyze user- and content-based features that
are different between spammers and legitimate users and use them to train four convention
machine learning classifiers for spam detection on Twitter. They find that the Random Forest
classifier produces the best results from all the four evaluated classifiers and using the suggested
features can achieve 95.7% precision. Wang [113] collects around 25K users, 500K tweets,
and 49M follower/friend relationships from publicly available data on Twitter and uses them
to train a Bayesian classification algorithm that can detect malicious distinguish the suspicious
behaviors from normal ones on Twitter with 89% precision.
Furthermore, several studies focus on the detection of clickbait on the Web using machine
learning techniques. Chen et al. [126] consider clickbait as a deception problem and propose
the use of SVM and Naive Bayes classifiers for the automatic detection of clickbait on the
Web. Similarly, Chakraborty et al. [127] propose the use of SVM for the automatic detection
of clickbait news articles. They then build a browser extension that leverages the developed
classifier to detect clickbait and warn the readers about the possibility of being baited while
accessing different media sites. The evaluation of the proposed clickbait detection approach
shows that it can achieve 93% accuracy in detecting and 89% accuracy in blocking clickbait
news articles. In another study, Potthast [114] proposes the use of Random Forest for detecting
clickbait tweets. The proposed model is trained based on 215 features and can detect clickbait
tweets with 76% precision and 79% ROC-AUC. Moreover, Biyani et al. [128] propose the
use of Gradient Boosted Decision Trees for clickbait detection in news articles. They also
3.3. Pseudoscientific Misinformation and Conspiracy Theories 39
highlight that the degree of the informality of a webpage increases the likelihood of the specific
webpage being clickbait. Last, Anand et al. [129] is among the first studies that leverage
deep learning and propose a neural network architecture based on Recurrent Neural Networks
(RNNs) in conjunction with word2vec embeddings [135] for detecting clickbait news articles
on the Web.
3.2.3 Misogyny and Other Harmful Activity - Remarks
The main insights from the review of the existing research on misogyny and harmful activity on
YouTube and the Web in general are: 1) machine learning techniques can be used to effectively
detect misogyny, hate, and other types of malicious and harmful activity expressed in textual
format. However, for some types of harmful content, like hate speech, the proposed classifiers
fail to generalize or can be easily tricked by malicious actors; and 2) Extreme misogynistic
ideologies with their own lingo, such as the Incel ideology, have not been satisfactorily studied
on video-sharing platforms like YouTube, despite evidence that the members of this community
are extremely toxic against women and are prone to radicalization (RQ1 and RQ3).
3.3 Pseudoscientific Misinformation and Conspiracy Theo-
ries
Online Social Networks and video-generated platforms are often fertile ground for the dis-
semination of misleading and potentially harmful information like conspiracy theories and
pseudoscientific misinformation. YouTube and other social media platforms have struggled
with mitigating the harm from this type of content. The difficulty is partly due to the sheer
scale and also because of the deployment of recommendation algorithms [15]. In this section,
we review the most relevant studies on conspiracy theories, misinformation, and auditing of
recommendation algorithms on YouTube and other social networks. Table 3.3 reports the
reviewed work for each type of misleading information as well as the considered platform of
each study.
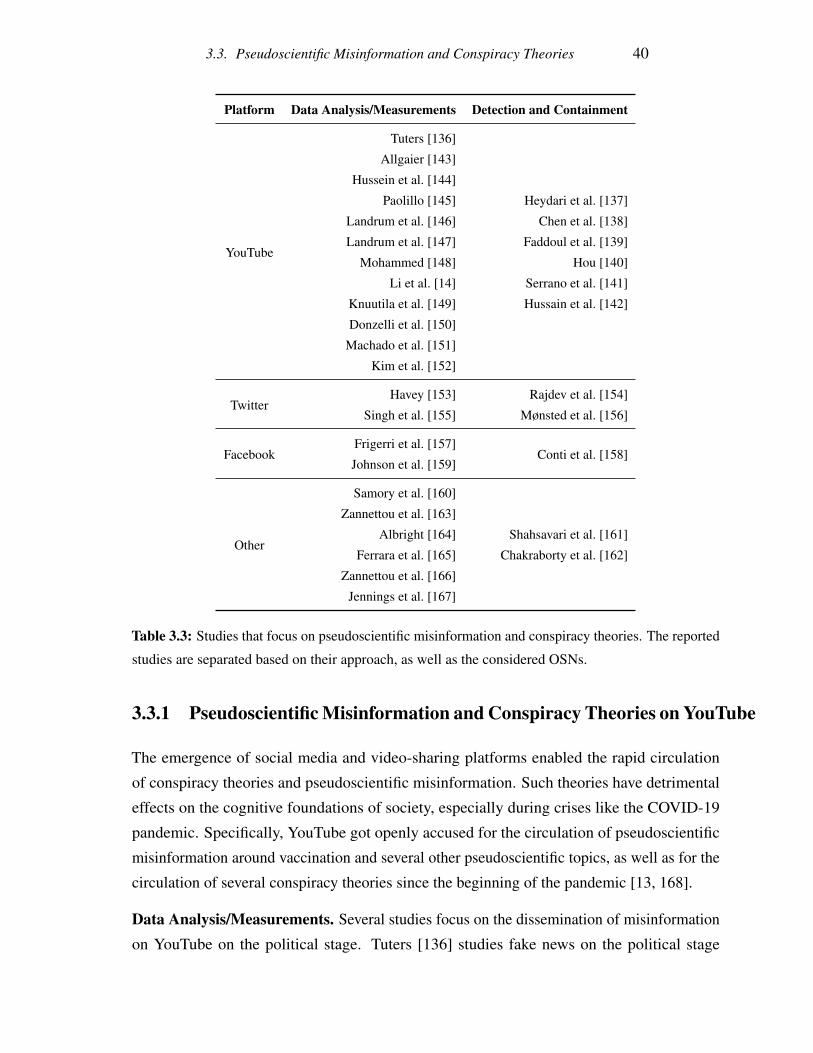
3.3. Pseudoscientific Misinformation and Conspiracy Theories 40
Platform Data Analysis/Measurements Detection and Containment
YouTube
Tuters [136]
Heydari et al. [137]
Chen et al. [138]
Faddoul et al. [139]
Hou [140]
Serrano et al. [141]
Hussain et al. [142]
Allgaier [143]
Hussein et al. [144]
Paolillo [145]
Landrum et al. [146]
Landrum et al. [147]
Mohammed [148]
Li et al. [14]
Knuutila et al. [149]
Donzelli et al. [150]
Machado et al. [151]
Kim et al. [152]
TwitterHavey [153] Rajdev et al. [154]
Singh et al. [155] Mønsted et al. [156]
FacebookFrigerri et al. [157]
Conti et al. [158]Johnson et al. [159]
Other
Samory et al. [160]
Shahsavari et al. [161]
Chakraborty et al. [162]
Zannettou et al. [163]
Albright [164]
Ferrara et al. [165]
Zannettou et al. [166]
Jennings et al. [167]
Table 3.3: Studies that focus on pseudoscientific misinformation and conspiracy theories. The reported
studies are separated based on their approach, as well as the considered OSNs.
3.3.1 Pseudoscientific Misinformation and Conspiracy Theories on YouTube
The emergence of social media and video-sharing platforms enabled the rapid circulation
of conspiracy theories and pseudoscientific misinformation. Such theories have detrimental
effects on the cognitive foundations of society, especially during crises like the COVID-19
pandemic. Specifically, YouTube got openly accused for the circulation of pseudoscientific
misinformation around vaccination and several other pseudoscientific topics, as well as for the
circulation of several conspiracy theories since the beginning of the pandemic [13, 168].
Data Analysis/Measurements. Several studies focus on the dissemination of misinformation
on YouTube on the political stage. Tuters [136] studies fake news on the political stage
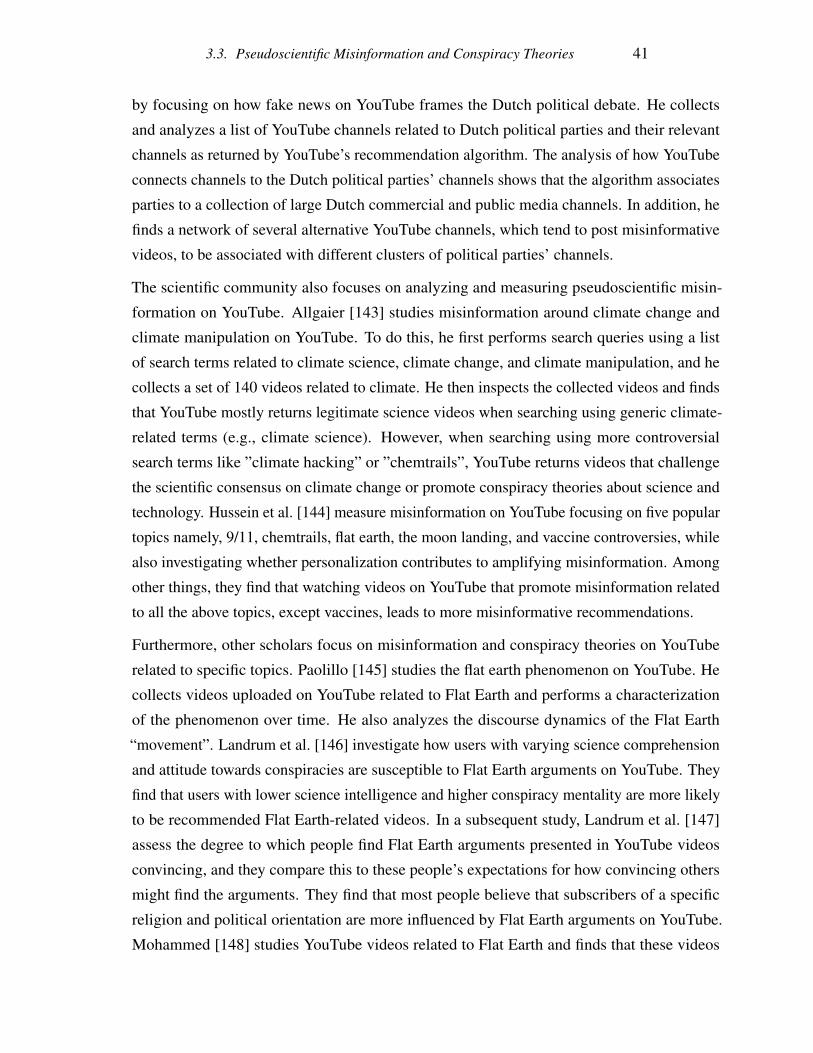
3.3. Pseudoscientific Misinformation and Conspiracy Theories 41
by focusing on how fake news on YouTube frames the Dutch political debate. He collects
and analyzes a list of YouTube channels related to Dutch political parties and their relevant
channels as returned by YouTube’s recommendation algorithm. The analysis of how YouTube
connects channels to the Dutch political parties’ channels shows that the algorithm associates
parties to a collection of large Dutch commercial and public media channels. In addition, he
finds a network of several alternative YouTube channels, which tend to post misinformative
videos, to be associated with different clusters of political parties’ channels.
The scientific community also focuses on analyzing and measuring pseudoscientific misin-
formation on YouTube. Allgaier [143] studies misinformation around climate change and
climate manipulation on YouTube. To do this, he first performs search queries using a list
of search terms related to climate science, climate change, and climate manipulation, and he
collects a set of 140 videos related to climate. He then inspects the collected videos and finds
that YouTube mostly returns legitimate science videos when searching using generic climate-
related terms (e.g., climate science). However, when searching using more controversial
search terms like ”climate hacking” or ”chemtrails”, YouTube returns videos that challenge
the scientific consensus on climate change or promote conspiracy theories about science and
technology. Hussein et al. [144] measure misinformation on YouTube focusing on five popular
topics namely, 9/11, chemtrails, flat earth, the moon landing, and vaccine controversies, while
also investigating whether personalization contributes to amplifying misinformation. Among
other things, they find that watching videos on YouTube that promote misinformation related
to all the above topics, except vaccines, leads to more misinformative recommendations.
Furthermore, other scholars focus on misinformation and conspiracy theories on YouTube
related to specific topics. Paolillo [145] studies the flat earth phenomenon on YouTube. He
collects videos uploaded on YouTube related to Flat Earth and performs a characterization
of the phenomenon over time. He also analyzes the discourse dynamics of the Flat Earth
“movement”. Landrum et al. [146] investigate how users with varying science comprehension
and attitude towards conspiracies are susceptible to Flat Earth arguments on YouTube. They
find that users with lower science intelligence and higher conspiracy mentality are more likely
to be recommended Flat Earth-related videos. In a subsequent study, Landrum et al. [147]
assess the degree to which people find Flat Earth arguments presented in YouTube videos
convincing, and they compare this to these people’s expectations for how convincing others
might find the arguments. They find that most people believe that subscribers of a specific
religion and political orientation are more influenced by Flat Earth arguments on YouTube.
Mohammed [148] studies YouTube videos related to Flat Earth and finds that these videos
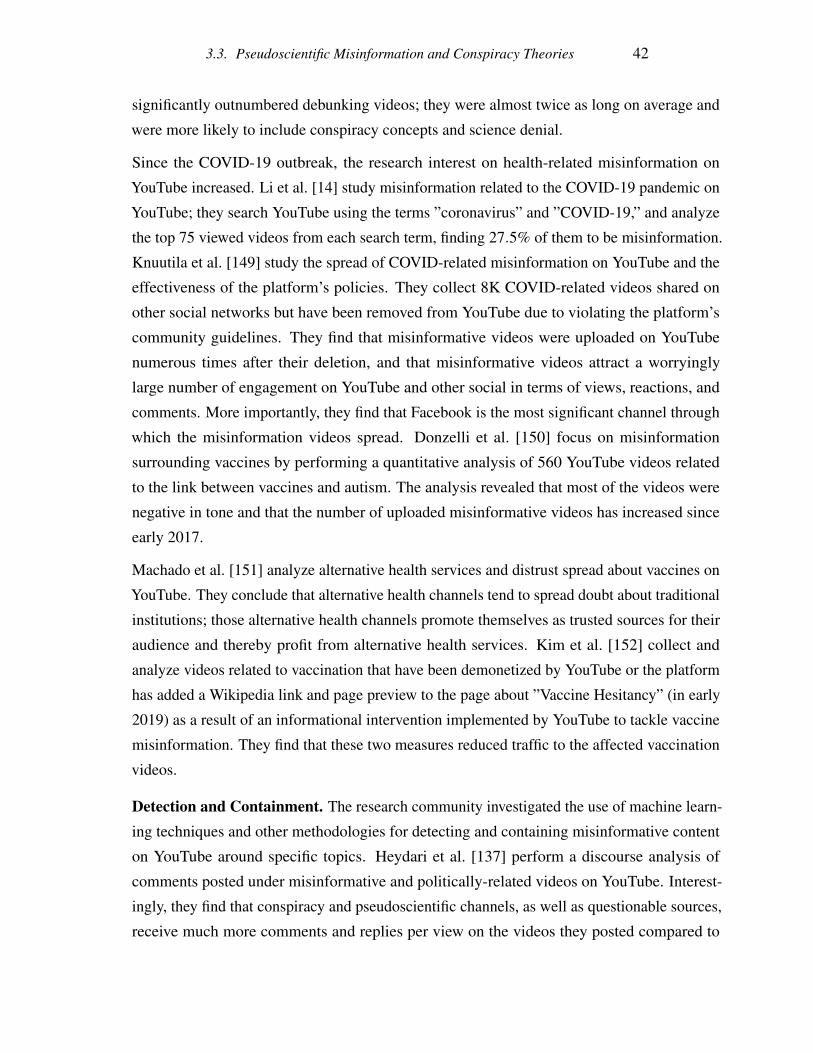
3.3. Pseudoscientific Misinformation and Conspiracy Theories 42
significantly outnumbered debunking videos; they were almost twice as long on average and
were more likely to include conspiracy concepts and science denial.
Since the COVID-19 outbreak, the research interest on health-related misinformation on
YouTube increased. Li et al. [14] study misinformation related to the COVID-19 pandemic on
YouTube; they search YouTube using the terms ”coronavirus” and ”COVID-19,” and analyze
the top 75 viewed videos from each search term, finding 27.5% of them to be misinformation.
Knuutila et al. [149] study the spread of COVID-related misinformation on YouTube and the
effectiveness of the platform’s policies. They collect 8K COVID-related videos shared on
other social networks but have been removed from YouTube due to violating the platform’s
community guidelines. They find that misinformative videos were uploaded on YouTube
numerous times after their deletion, and that misinformative videos attract a worryingly
large number of engagement on YouTube and other social in terms of views, reactions, and
comments. More importantly, they find that Facebook is the most significant channel through
which the misinformation videos spread. Donzelli et al. [150] focus on misinformation
surrounding vaccines by performing a quantitative analysis of 560 YouTube videos related
to the link between vaccines and autism. The analysis revealed that most of the videos were
negative in tone and that the number of uploaded misinformative videos has increased since
early 2017.
Machado et al. [151] analyze alternative health services and distrust spread about vaccines on
YouTube. They conclude that alternative health channels tend to spread doubt about traditional
institutions; those alternative health channels promote themselves as trusted sources for their
audience and thereby profit from alternative health services. Kim et al. [152] collect and
analyze videos related to vaccination that have been demonetized by YouTube or the platform
has added a Wikipedia link and page preview to the page about ”Vaccine Hesitancy” (in early
2019) as a result of an informational intervention implemented by YouTube to tackle vaccine
misinformation. They find that these two measures reduced traffic to the affected vaccination
videos.
Detection and Containment. The research community investigated the use of machine learn-
ing techniques and other methodologies for detecting and containing misinformative content
on YouTube around specific topics. Heydari et al. [137] perform a discourse analysis of
comments posted under misinformative and politically-related videos on YouTube. Interest-
ingly, they find that conspiracy and pseudoscientific channels, as well as questionable sources,
receive much more comments and replies per view on the videos they posted compared to
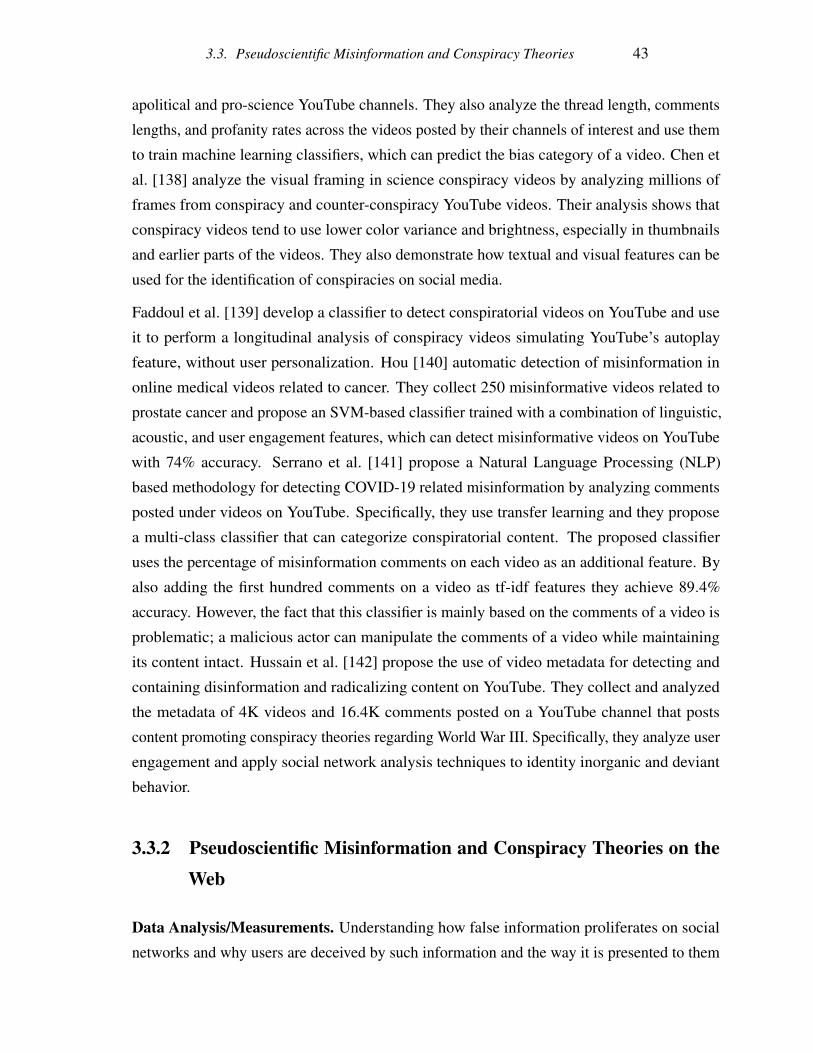
3.3. Pseudoscientific Misinformation and Conspiracy Theories 43
apolitical and pro-science YouTube channels. They also analyze the thread length, comments
lengths, and profanity rates across the videos posted by their channels of interest and use them
to train machine learning classifiers, which can predict the bias category of a video. Chen et
al. [138] analyze the visual framing in science conspiracy videos by analyzing millions of
frames from conspiracy and counter-conspiracy YouTube videos. Their analysis shows that
conspiracy videos tend to use lower color variance and brightness, especially in thumbnails
and earlier parts of the videos. They also demonstrate how textual and visual features can be
used for the identification of conspiracies on social media.
Faddoul et al. [139] develop a classifier to detect conspiratorial videos on YouTube and use
it to perform a longitudinal analysis of conspiracy videos simulating YouTube’s autoplay
feature, without user personalization. Hou [140] automatic detection of misinformation in
online medical videos related to cancer. They collect 250 misinformative videos related to
prostate cancer and propose an SVM-based classifier trained with a combination of linguistic,
acoustic, and user engagement features, which can detect misinformative videos on YouTube
with 74% accuracy. Serrano et al. [141] propose a Natural Language Processing (NLP)
based methodology for detecting COVID-19 related misinformation by analyzing comments
posted under videos on YouTube. Specifically, they use transfer learning and they propose
a multi-class classifier that can categorize conspiratorial content. The proposed classifier
uses the percentage of misinformation comments on each video as an additional feature. By
also adding the first hundred comments on a video as tf-idf features they achieve 89.4%
accuracy. However, the fact that this classifier is mainly based on the comments of a video is
problematic; a malicious actor can manipulate the comments of a video while maintaining
its content intact. Hussain et al. [142] propose the use of video metadata for detecting and
containing disinformation and radicalizing content on YouTube. They collect and analyzed
the metadata of 4K videos and 16.4K comments posted on a YouTube channel that posts
content promoting conspiracy theories regarding World War III. Specifically, they analyze user
engagement and apply social network analysis techniques to identity inorganic and deviant
behavior.
3.3.2 Pseudoscientific Misinformation and Conspiracy Theories on theWeb
Data Analysis/Measurements. Understanding how false information proliferates on social
networks and why users are deceived by such information and the way it is presented to them
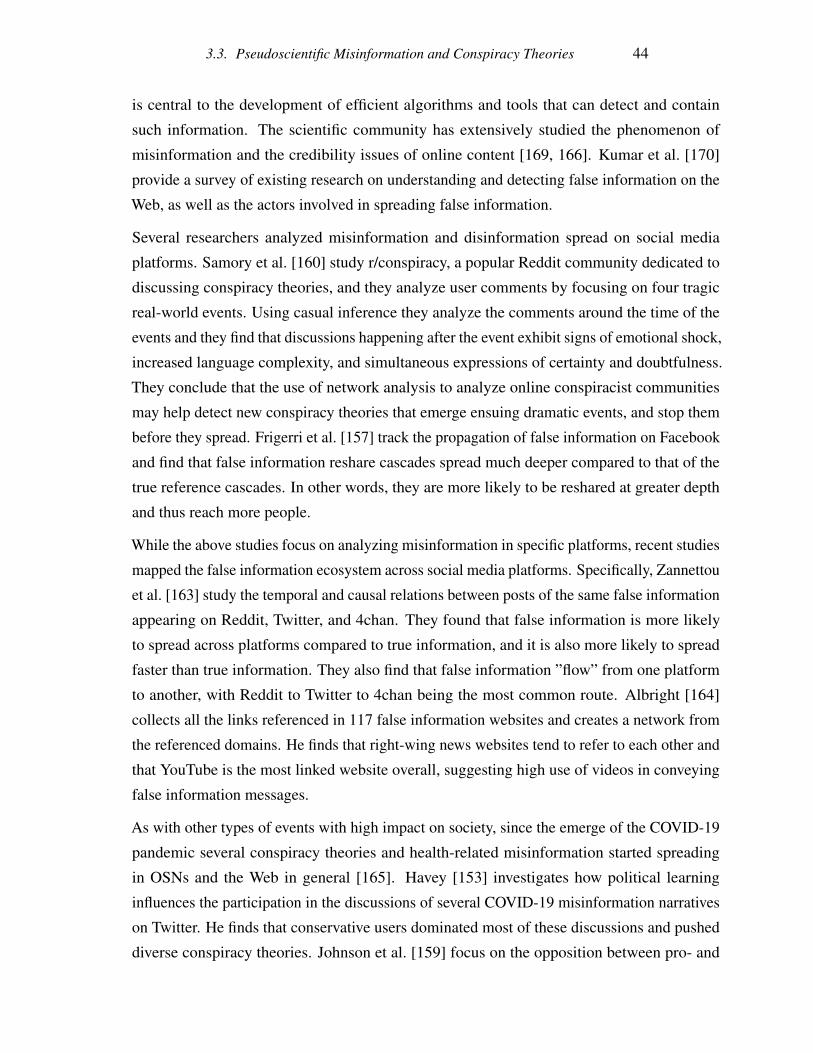
3.3. Pseudoscientific Misinformation and Conspiracy Theories 44
is central to the development of efficient algorithms and tools that can detect and contain
such information. The scientific community has extensively studied the phenomenon of
misinformation and the credibility issues of online content [169, 166]. Kumar et al. [170]
provide a survey of existing research on understanding and detecting false information on the
Web, as well as the actors involved in spreading false information.
Several researchers analyzed misinformation and disinformation spread on social media
platforms. Samory et al. [160] study r/conspiracy, a popular Reddit community dedicated to
discussing conspiracy theories, and they analyze user comments by focusing on four tragic
real-world events. Using casual inference they analyze the comments around the time of the
events and they find that discussions happening after the event exhibit signs of emotional shock,
increased language complexity, and simultaneous expressions of certainty and doubtfulness.
They conclude that the use of network analysis to analyze online conspiracist communities
may help detect new conspiracy theories that emerge ensuing dramatic events, and stop them
before they spread. Frigerri et al. [157] track the propagation of false information on Facebook
and find that false information reshare cascades spread much deeper compared to that of the
true reference cascades. In other words, they are more likely to be reshared at greater depth
and thus reach more people.
While the above studies focus on analyzing misinformation in specific platforms, recent studies
mapped the false information ecosystem across social media platforms. Specifically, Zannettou
et al. [163] study the temporal and causal relations between posts of the same false information
appearing on Reddit, Twitter, and 4chan. They found that false information is more likely
to spread across platforms compared to true information, and it is also more likely to spread
faster than true information. They also find that false information ”flow” from one platform
to another, with Reddit to Twitter to 4chan being the most common route. Albright [164]
collects all the links referenced in 117 false information websites and creates a network from
the referenced domains. He finds that right-wing news websites tend to refer to each other and
that YouTube is the most linked website overall, suggesting high use of videos in conveying
false information messages.
As with other types of events with high impact on society, since the emerge of the COVID-19
pandemic several conspiracy theories and health-related misinformation started spreading
in OSNs and the Web in general [165]. Havey [153] investigates how political learning
influences the participation in the discussions of several COVID-19 misinformation narratives
on Twitter. He finds that conservative users dominated most of these discussions and pushed
diverse conspiracy theories. Johnson et al. [159] focus on the opposition between pro- and
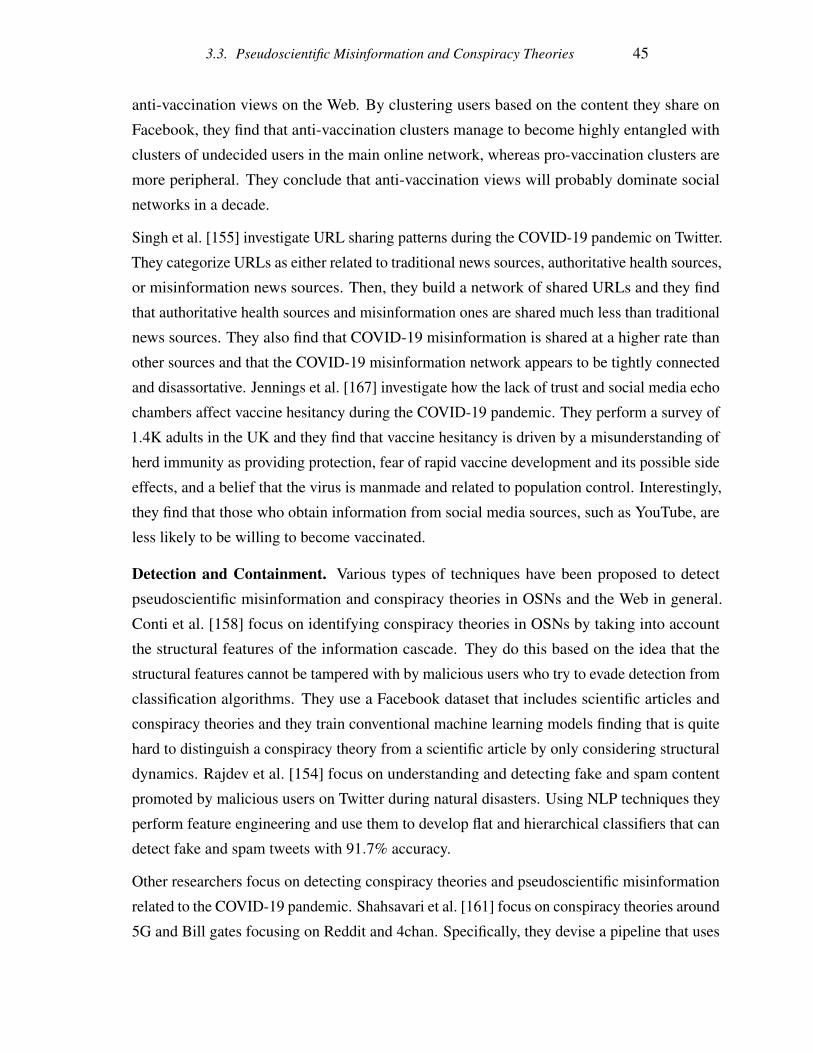
3.3. Pseudoscientific Misinformation and Conspiracy Theories 45
anti-vaccination views on the Web. By clustering users based on the content they share on
Facebook, they find that anti-vaccination clusters manage to become highly entangled with
clusters of undecided users in the main online network, whereas pro-vaccination clusters are
more peripheral. They conclude that anti-vaccination views will probably dominate social
networks in a decade.
Singh et al. [155] investigate URL sharing patterns during the COVID-19 pandemic on Twitter.
They categorize URLs as either related to traditional news sources, authoritative health sources,
or misinformation news sources. Then, they build a network of shared URLs and they find
that authoritative health sources and misinformation ones are shared much less than traditional
news sources. They also find that COVID-19 misinformation is shared at a higher rate than
other sources and that the COVID-19 misinformation network appears to be tightly connected
and disassortative. Jennings et al. [167] investigate how the lack of trust and social media echo
chambers affect vaccine hesitancy during the COVID-19 pandemic. They perform a survey of
1.4K adults in the UK and they find that vaccine hesitancy is driven by a misunderstanding of
herd immunity as providing protection, fear of rapid vaccine development and its possible side
effects, and a belief that the virus is manmade and related to population control. Interestingly,
they find that those who obtain information from social media sources, such as YouTube, are
less likely to be willing to become vaccinated.
Detection and Containment. Various types of techniques have been proposed to detect
pseudoscientific misinformation and conspiracy theories in OSNs and the Web in general.
Conti et al. [158] focus on identifying conspiracy theories in OSNs by taking into account
the structural features of the information cascade. They do this based on the idea that the
structural features cannot be tampered with by malicious users who try to evade detection from
classification algorithms. They use a Facebook dataset that includes scientific articles and
conspiracy theories and they train conventional machine learning models finding that is quite
hard to distinguish a conspiracy theory from a scientific article by only considering structural
dynamics. Rajdev et al. [154] focus on understanding and detecting fake and spam content
promoted by malicious users on Twitter during natural disasters. Using NLP techniques they
perform feature engineering and use them to develop flat and hierarchical classifiers that can
detect fake and spam tweets with 91.7% accuracy.
Other researchers focus on detecting conspiracy theories and pseudoscientific misinformation
related to the COVID-19 pandemic. Shahsavari et al. [161] focus on conspiracy theories around
5G and Bill gates focusing on Reddit and 4chan. Specifically, they devise a pipeline that uses
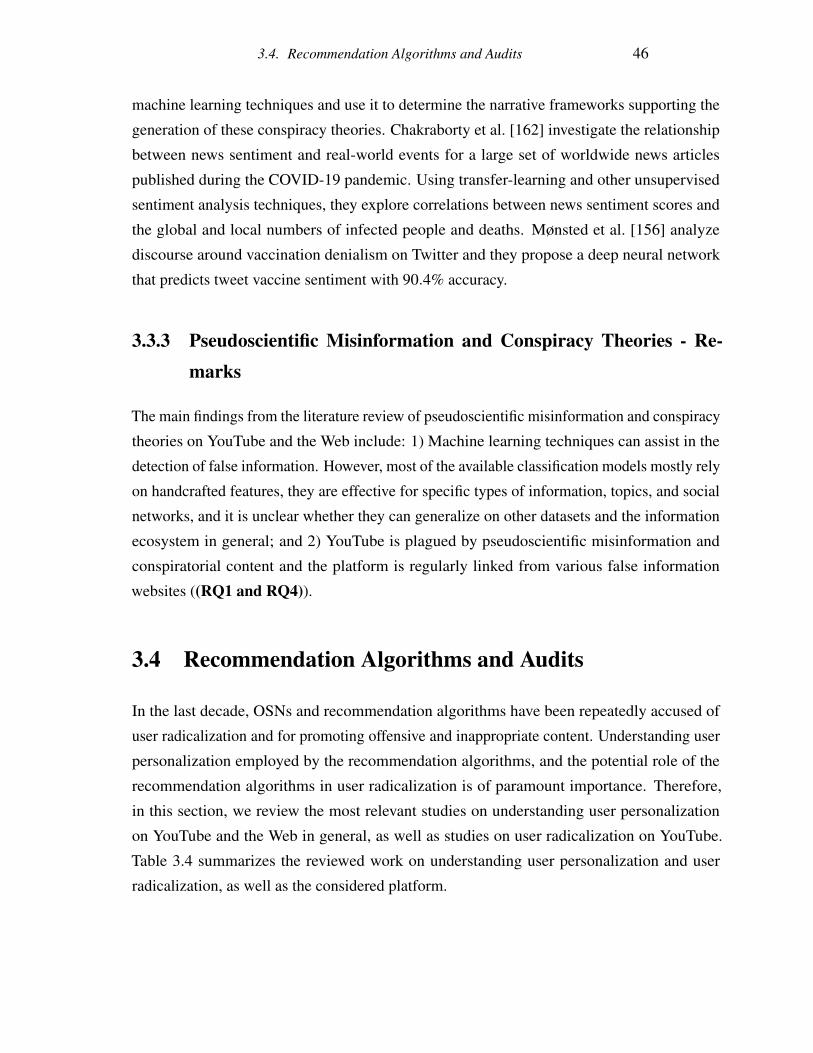
3.4. Recommendation Algorithms and Audits 46
machine learning techniques and use it to determine the narrative frameworks supporting the
generation of these conspiracy theories. Chakraborty et al. [162] investigate the relationship
between news sentiment and real-world events for a large set of worldwide news articles
published during the COVID-19 pandemic. Using transfer-learning and other unsupervised
sentiment analysis techniques, they explore correlations between news sentiment scores and
the global and local numbers of infected people and deaths. Mønsted et al. [156] analyze
discourse around vaccination denialism on Twitter and they propose a deep neural network
that predicts tweet vaccine sentiment with 90.4% accuracy.
3.3.3 Pseudoscientific Misinformation and Conspiracy Theories - Re-marks
The main findings from the literature review of pseudoscientific misinformation and conspiracy
theories on YouTube and the Web include: 1) Machine learning techniques can assist in the
detection of false information. However, most of the available classification models mostly rely
on handcrafted features, they are effective for specific types of information, topics, and social
networks, and it is unclear whether they can generalize on other datasets and the information
ecosystem in general; and 2) YouTube is plagued by pseudoscientific misinformation and
conspiratorial content and the platform is regularly linked from various false information
websites ((RQ1 and RQ4)).
3.4 Recommendation Algorithms and Audits
In the last decade, OSNs and recommendation algorithms have been repeatedly accused of
user radicalization and for promoting offensive and inappropriate content. Understanding user
personalization employed by the recommendation algorithms, and the potential role of the
recommendation algorithms in user radicalization is of paramount importance. Therefore,
in this section, we review the most relevant studies on understanding user personalization
on YouTube and the Web in general, as well as studies on user radicalization on YouTube.
Table 3.4 summarizes the reviewed work on understanding user personalization and user
radicalization, as well as the considered platform.
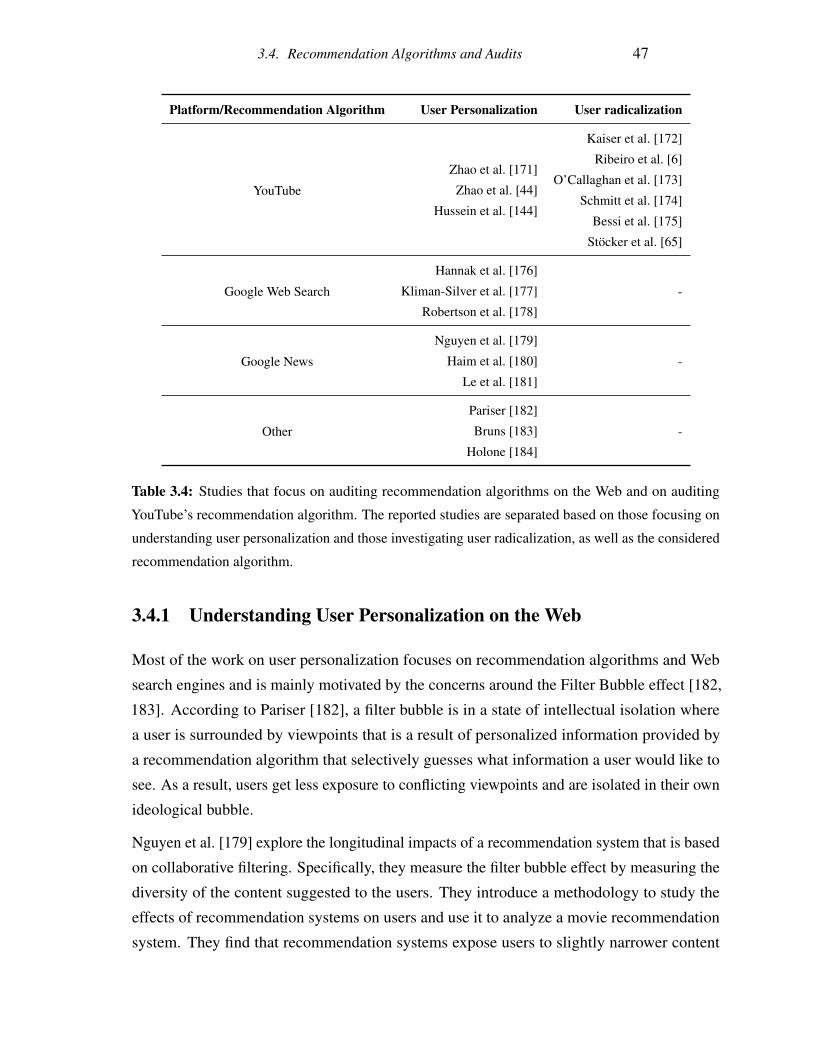
3.4. Recommendation Algorithms and Audits 47
Platform/Recommendation Algorithm User Personalization User radicalization
YouTube
Zhao et al. [171]
Zhao et al. [44]
Hussein et al. [144]
Kaiser et al. [172]
Ribeiro et al. [6]
O’Callaghan et al. [173]
Schmitt et al. [174]
Bessi et al. [175]
Stocker et al. [65]
Google Web Search
Hannak et al. [176]
-Kliman-Silver et al. [177]
Robertson et al. [178]
Google News
Nguyen et al. [179]
-Haim et al. [180]
Le et al. [181]
Other
Pariser [182]
-Bruns [183]
Holone [184]
Table 3.4: Studies that focus on auditing recommendation algorithms on the Web and on auditing
YouTube’s recommendation algorithm. The reported studies are separated based on those focusing on
understanding user personalization and those investigating user radicalization, as well as the considered
recommendation algorithm.
3.4.1 Understanding User Personalization on the Web
Most of the work on user personalization focuses on recommendation algorithms and Web
search engines and is mainly motivated by the concerns around the Filter Bubble effect [182,
183]. According to Pariser [182], a filter bubble is in a state of intellectual isolation where
a user is surrounded by viewpoints that is a result of personalized information provided by
a recommendation algorithm that selectively guesses what information a user would like to
see. As a result, users get less exposure to conflicting viewpoints and are isolated in their own
ideological bubble.
Nguyen et al. [179] explore the longitudinal impacts of a recommendation system that is based
on collaborative filtering. Specifically, they measure the filter bubble effect by measuring the
diversity of the content suggested to the users. They introduce a methodology to study the
effects of recommendation systems on users and use it to analyze a movie recommendation
system. They find that recommendation systems expose users to slightly narrower content
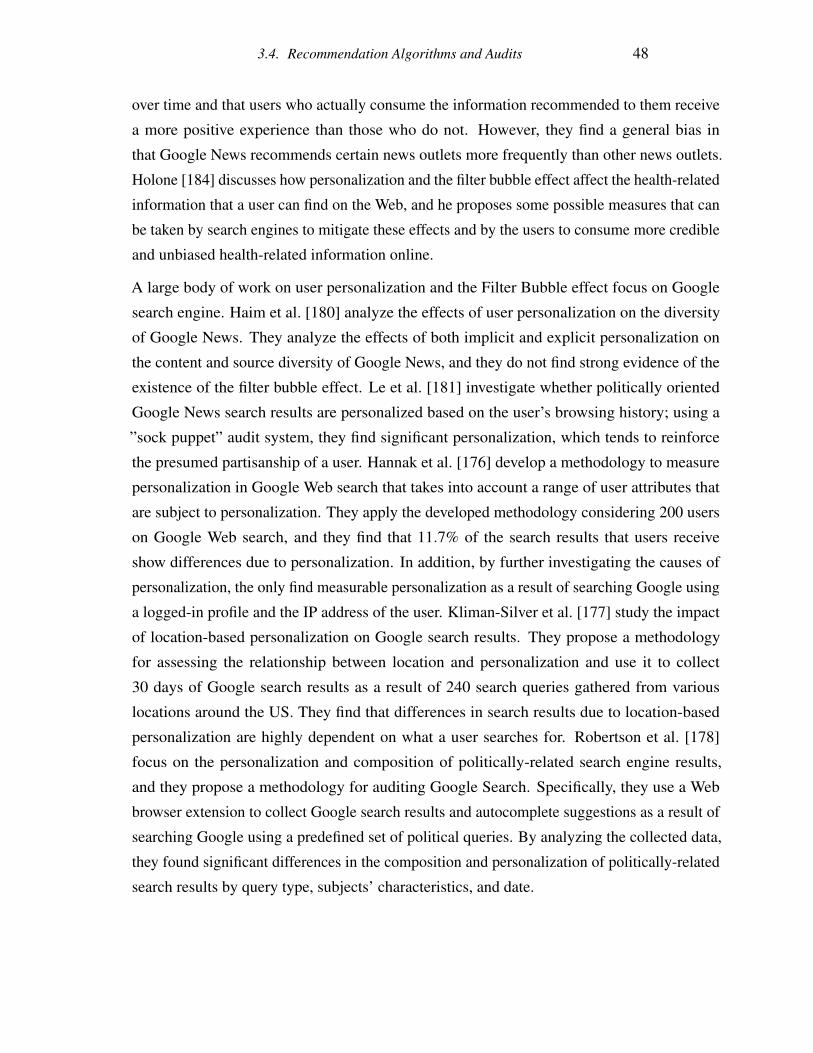
3.4. Recommendation Algorithms and Audits 48
over time and that users who actually consume the information recommended to them receive
a more positive experience than those who do not. However, they find a general bias in
that Google News recommends certain news outlets more frequently than other news outlets.
Holone [184] discusses how personalization and the filter bubble effect affect the health-related
information that a user can find on the Web, and he proposes some possible measures that can
be taken by search engines to mitigate these effects and by the users to consume more credible
and unbiased health-related information online.
A large body of work on user personalization and the Filter Bubble effect focus on Google
search engine. Haim et al. [180] analyze the effects of user personalization on the diversity
of Google News. They analyze the effects of both implicit and explicit personalization on
the content and source diversity of Google News, and they do not find strong evidence of the
existence of the filter bubble effect. Le et al. [181] investigate whether politically oriented
Google News search results are personalized based on the user’s browsing history; using a
”sock puppet” audit system, they find significant personalization, which tends to reinforce
the presumed partisanship of a user. Hannak et al. [176] develop a methodology to measure
personalization in Google Web search that takes into account a range of user attributes that
are subject to personalization. They apply the developed methodology considering 200 users
on Google Web search, and they find that 11.7% of the search results that users receive
show differences due to personalization. In addition, by further investigating the causes of
personalization, the only find measurable personalization as a result of searching Google using
a logged-in profile and the IP address of the user. Kliman-Silver et al. [177] study the impact
of location-based personalization on Google search results. They propose a methodology
for assessing the relationship between location and personalization and use it to collect
30 days of Google search results as a result of 240 search queries gathered from various
locations around the US. They find that differences in search results due to location-based
personalization are highly dependent on what a user searches for. Robertson et al. [178]
focus on the personalization and composition of politically-related search engine results,
and they propose a methodology for auditing Google Search. Specifically, they use a Web
browser extension to collect Google search results and autocomplete suggestions as a result of
searching Google using a predefined set of political queries. By analyzing the collected data,
they found significant differences in the composition and personalization of politically-related
search results by query type, subjects’ characteristics, and date.
3.4. Recommendation Algorithms and Audits 49
3.4.2 Auditing YouTube’s Recommendation Algorithm
In the last decade, YouTube has been repeatedly accused of user radicalization and for
promoting offensive and inappropriate content. In this section, we review the most relevant
studies on understanding the recommendation algorithm and user personalization on YouTube,
as well as studies investigating user radicalization on the platform.
User Personalization on YouTube. Zhao et al. [171] propose an approach on how to consider
a user’s viewing history for personalized video recommendations The proposed approach
calculates, for each user, a recommendation score for each candidate video which considers
the interest degree of this video by the user’s friends, and the taste similarities between the
user and his friends. Zhao et al. [44] introduce a large-scale ranking system for YouTube
recommendations, which ranks the candidate recommendations of a given video, taking into
account user engagement and satisfaction metrics (e.g., video likes). Hussein et al. [144] focus
on measuring misinformation on YouTube considering five popular misinformative topics
to investigate whether personalization contributes to amplifying misinformation. They find
that, once a user develops a watch history, the demographic attributes affect the extend of
misinformation recommended to the users. More importantly, they find a filter bubble effect
in the video recommendations section for almost all the topics they analyze. We note that part
of this thesis is party inspired and complementary to Hussein et al. [144].
User Radicalization. The research community has repeatedly focused on analyzing user
radicalization on YouTube, as well as on understanding the role of recommendation algorithms
in amplifying user radicalization focusing on specific topics. Kaiser et al. [172] investigate
far-right activity on YouTube and find that YouTube’s recommendation algorithm actively
contributes to the rise and unification of the far-right. They also find that the recommendation
algorithm suggests videos promoting bizarre conspiracy theories from channels with little or
no political content. Ribeiro et al. [6] perform a large-scale audit of user radicalization on
YouTube: they analyze videos from Intellectual Dark Web, Alt-lite, and Alt-right channels,
showing that they increasingly share the same user base. They also analyze YouTube’s recom-
mendation algorithm finding that Alt-right channels can be reached from both Intellectual Dark
Web and Alt-lite channels. O’Callaghan et al. [173] perform categorization of far-right content
on YouTube and use it to demonstrate the political articulations of YouTube’s recommendation
algorithm. They also collect and analyze data from English and German language far-right
YouTube channels and they find that users are likely to be recommended further far-right
content when they are watching a far-right video, hence leading them in an ideological bubble
3.4. Recommendation Algorithms and Audits 50
in just a few short clicks. Schmitt et al. [174] focus on counter- and extremist content on
YouTube and investigate the extent to which YouTube’s recommendation algorithm impacts the
inter-relatedness of these types of content. By creating and analyzing snapshots of YouTube’s
recommendation graph constructed mainly with videos of two counter-extremism campaigns
on YouTube, they find that counter-extremism videos are closely or even directly connected to
extremist content.
Furthermore, Bessi et al. [175] attempt to ”reverse” engineer the recommendation algorithm of
YouTube and Facebook by examining user polarization on both platforms. Specifically, they
perform a comparison study on how similar videos are consumed on Facebook and YouTube
from a sample of 12M users. They find that content drives the emergence of echo chambers on
both platforms and that the users’ commenting patterns can be used to accurately predict the
formation of echo chambers. Stocker et al. [65] analyze the effect of extreme recommendations
on YouTube. They develop a simulation system to analyze YouTube recommendations finding
that YouTube’s auto-play feature is problematic. They also state that completely preventing
inappropriate recommendations is technically hard due to the nature of recommendation
algorithms to suggest content similar to users’ interests.
3.4.3 Recommendation Algorithms and Audits - Remarks
In this section, we provided an overview of the existing work that focuses on understanding
user personalization and recommendation algorithms, as well as studies that investigate the role
of YouTube’s recommendation algorithm in amplifying user radicalization. Some of the main
findings of this literature review are: 1) Recommendation algorithms tend to suggest narrower
content over time, and several studies find significant personalization, which tends to reinforce
the presumed partisanship of a user; 2) User attributes such as demographics, location, and
browsing do affect the content being recommended to users on Google News and Google Web
search; 3) YouTube’s recommendation algorithm regrettably suggests extreme content to users.
Several studies find evidence of the filter bubble effect in the video recommendation sections
of YouTube for certain topics; and 4) Several approaches exist for effectively measuring
personalization in Google Web search while taking into account a range of user attributes that
are subject to personalization. However, a methodology for assessing the effect that various
user attributes and personalization factors have on extreme and inappropriate recommendations
on YouTube is not available, yet (RQ2 and RQ4).
3.5. Other Related Work 51
3.5 Other Related Work
In this section, we present other related work on YouTube that does not directly fit in the
aforementioned lines of work, Specifically, we group these studies in the following categories:
1) Understanding YouTube characteristics; and 2) YouTube in science and education.
3.5.1 Understanding YouTube Characteristics
Several studies attempt to understand the characteristics of YouTube and other video-sharing
platforms. Gill et al. [185] perform a characterization of traffic on YouTube during the early
stages of the platform. They characterize users’ activity on YouTube, usage patterns, and the
most popular videos of a period of three months, and perform a comparison between other
traditional Web and media streaming platforms. Cheng et al. [186] perform a systematic
and in-depth measurement analysis of the statistics of 3M YouTube videos. They find that
YouTube videos have noticeable differences compared to traditional streaming videos in terms
of duration and view patterns, growth trend, and active life span. They also investigate the
social networking aspect of YouTube finding, at the time of the study, that the links to related
videos generated by uploaders’ choices have clear small-world characteristics. Che et al. [187]
analyze the characteristics of YouTube videos and provide insights on how YouTube videos
have developed through the years. They find that YouTube exhibits unique characteristics
compared to other video-sharing platforms in terms of average video duration, type of videos,
and video resolution, and file size.
In the early stages of YouTube, considering a large number of videos available on the platform
and the absence of an efficient recommendation algorithm at that time, the research community
also proposed several methodologies for personalized video recommendations. Baluja et
al. [188] propose Adsorption, a methodology for personalized video suggestions to users,
and video search on YouTube based on the analysis of the entire user-video graph. Qin et
al. [189] propose a methodology for video recommendations on YouTube by extracting video
relationships using a network of videos formed from reviews left as comments in the videos.
Specifically, they create a network of videos called YouTube Recommender Network (YRN)
and use complex network analysis on this network as the basis of a recommender system.
3.5. Other Related Work 52
3.5.2 YouTube in Science and Education
Since its inception scholars from a wide range of disciplines and critical perspectives have
found YouTube useful as a source of examples and case studies. While a substantial body of
research focuses on describing and critically understanding YouTube’s practices and politics,
others have experimented directly with the scholarly and educational potential of the platform
itself. The research community has repeatedly studied how YouTube can be used as a tool in
education and science communication, as well as the impact of educational videos. Duffy [190]
proposes possible strategies for educators to use Web 2.0 technologies and social networks,
such as YouTube, as tools within education. Other researchers also show that YouTube videos
can be used to enhance math and history learning [191, 192]. Jones et al. [193] investigate the
potential and pitfalls of using YouTube in social studies instruction and as a teaching resource
in the elementary classroom. They also discuss the potential challenges of using YouTube in
the classroom and propose ways for educators for overcoming those challenges.
Furthermore, Thelwall et al. [194] go beyond these studies and assess the impact and char-
acteristics of online academic videos. They find that the most popular videos produced by
well-known academics are those aimed at a general audience and have been well-produced,
but more importantly, they find that the audience for such videos is small and cannot justify
the production cost of such videos. Others also focus on the use of YouTube in research
and science communication. Kousha et al. [195] investigate the role of online videos in
research communication by analyzing YouTube videos regularly cited in various academic
publications. Specifically, they analyze 551 YouTube videos cited by research articles and
they observe an increasing trend in citing YouTube videos in scientific publications. They also
find that in science, and medicine, and health sciences, cited videos contain direct scientific or
scientific-related content, while in other domains videos mostly contain other themes (e.g.,
history, news, politics, etc.). Welbourne et al. [196] focus on science communication videos
on YouTube. They collect and characterize 390 YouTube videos and examine the factors that
affect the popularity of science communication videos on the platform. Allgaier [197] analyzes
music videos related to science on YouTube, while in a more recent study he summarizes
existing research on scholarly communication, science, and medicine on the platform [198].
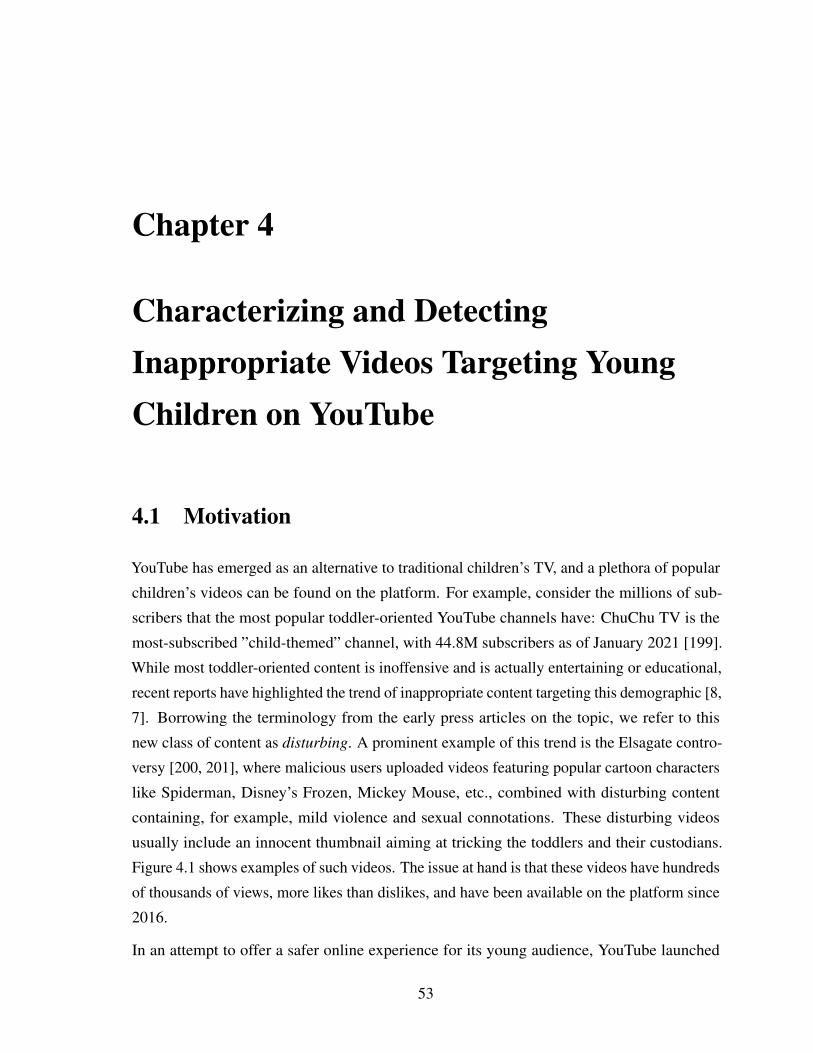
Chapter 4
Characterizing and DetectingInappropriate Videos Targeting YoungChildren on YouTube
4.1 Motivation
YouTube has emerged as an alternative to traditional children’s TV, and a plethora of popular
children’s videos can be found on the platform. For example, consider the millions of sub-
scribers that the most popular toddler-oriented YouTube channels have: ChuChu TV is the
most-subscribed ”child-themed” channel, with 44.8M subscribers as of January 2021 [199].
While most toddler-oriented content is inoffensive and is actually entertaining or educational,
recent reports have highlighted the trend of inappropriate content targeting this demographic [8,
7]. Borrowing the terminology from the early press articles on the topic, we refer to this
new class of content as disturbing. A prominent example of this trend is the Elsagate contro-
versy [200, 201], where malicious users uploaded videos featuring popular cartoon characters
like Spiderman, Disney’s Frozen, Mickey Mouse, etc., combined with disturbing content
containing, for example, mild violence and sexual connotations. These disturbing videos
usually include an innocent thumbnail aiming at tricking the toddlers and their custodians.
Figure 4.1 shows examples of such videos. The issue at hand is that these videos have hundreds
of thousands of views, more likes than dislikes, and have been available on the platform since
2016.
In an attempt to offer a safer online experience for its young audience, YouTube launched
53
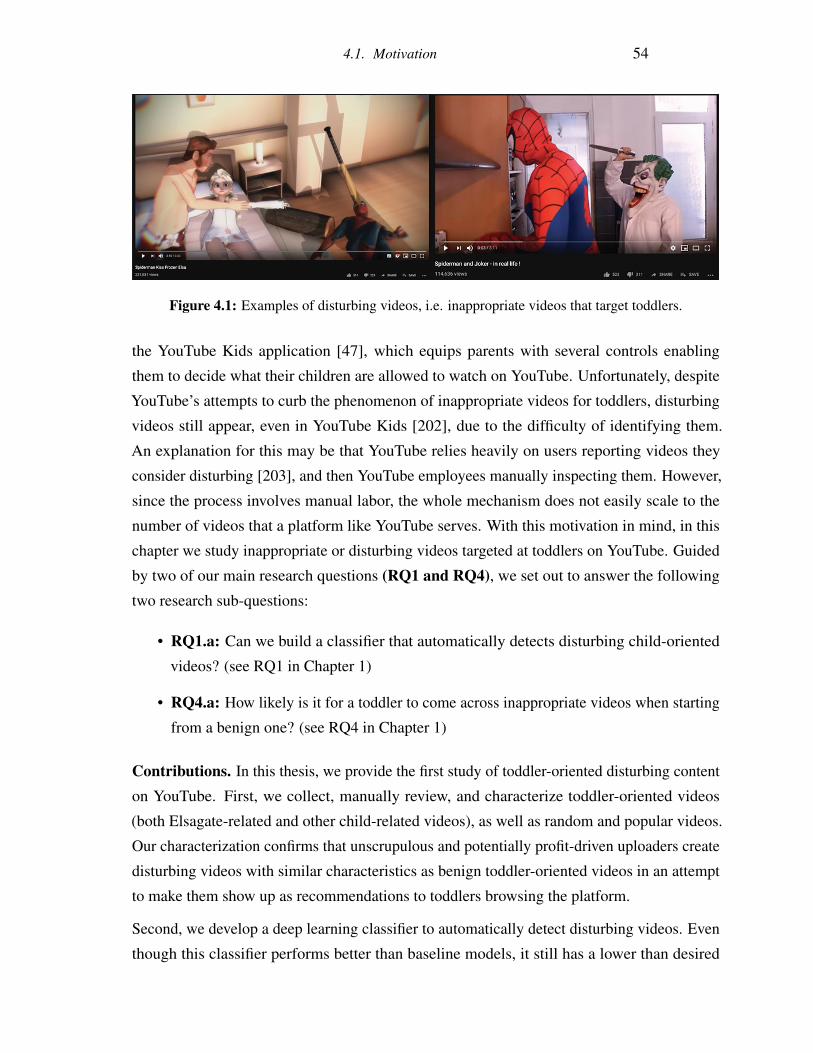
4.1. Motivation 54
Figure 4.1: Examples of disturbing videos, i.e. inappropriate videos that target toddlers.
the YouTube Kids application [47], which equips parents with several controls enabling
them to decide what their children are allowed to watch on YouTube. Unfortunately, despite
YouTube’s attempts to curb the phenomenon of inappropriate videos for toddlers, disturbing
videos still appear, even in YouTube Kids [202], due to the difficulty of identifying them.
An explanation for this may be that YouTube relies heavily on users reporting videos they
consider disturbing [203], and then YouTube employees manually inspecting them. However,
since the process involves manual labor, the whole mechanism does not easily scale to the
number of videos that a platform like YouTube serves. With this motivation in mind, in this
chapter we study inappropriate or disturbing videos targeted at toddlers on YouTube. Guided
by two of our main research questions (RQ1 and RQ4), we set out to answer the following
two research sub-questions:
• RQ1.a: Can we build a classifier that automatically detects disturbing child-oriented
videos? (see RQ1 in Chapter 1)
• RQ4.a: How likely is it for a toddler to come across inappropriate videos when starting
from a benign one? (see RQ4 in Chapter 1)
Contributions. In this thesis, we provide the first study of toddler-oriented disturbing content
on YouTube. First, we collect, manually review, and characterize toddler-oriented videos
(both Elsagate-related and other child-related videos), as well as random and popular videos.
Our characterization confirms that unscrupulous and potentially profit-driven uploaders create
disturbing videos with similar characteristics as benign toddler-oriented videos in an attempt
to make them show up as recommendations to toddlers browsing the platform.
Second, we develop a deep learning classifier to automatically detect disturbing videos. Even
though this classifier performs better than baseline models, it still has a lower than desired
4.2. Datasets 55
performance. In fact, this low performance reflects the high degree of similarity between
disturbing and suitable videos or restricted videos that do not target toddlers. It also reflects the
subjectivity in deciding how to label these controversial videos, as confirmed by our trained
annotators’ experience. For the sake of our analysis in the next steps, we collapse the initially
defined labels into two categories and develop a more accurate classifier that can discern
inappropriate from appropriate videos. Our experimental evaluation shows that the developed
binary classifier outperforms several baselines with an accuracy of 0.84.
In the last phase, we leverage the developed classifier to understand how prominent the
problem at hand is. From our analysis of different subsets of the collected videos, we find that
1.1% of the 233,337 Elsagate-related, and 0.5% of the 154,957 other children-related collected
videos are inappropriate for toddlers, which indicates that the problem is not negligible. To
further assess how safe YouTube is for toddlers, we run a live simulation in which we mimic
a toddler randomly clicking on YouTube’s suggested videos. We find that there is a 3.5%
chance that a toddler following YouTube’s recommendations will encounter an inappropriate
video within ten hops if she starts from a video that appears among the top ten results of a
toddler-appropriate keyword search (e.g., Peppa Pig).
4.2 Datasets
4.2.1 Data Collection
For our data collection, we use the YouTube Data API [32], which provides metadata of videos
uploaded on YouTube. Unfortunately, YouTube does not provide an API for retrieving videos
from YouTube Kids. We collect a set of seed videos using four different approaches. First,
we use information from /r/ElsaGate, a subreddit dedicated to raising awareness about the
disturbing videos problem [200]. Second, we use information from /r/fullcartoonsonyoutube, a
subreddit dedicated to listing cartoon videos available on YouTube. The other two approaches
focus on obtaining a set of random and popular videos.
Specifically: 1) we create a list of 64 keywords1 by extracting n-grams from the title of
videos posted on /r/ElsaGate. Subsequently, for each keyword, we obtain the first 30 videos as
returned by YouTube’s Data API search functionality. This approach resulted in the acquisition
1https://tinyurl.com/yxpf73j4
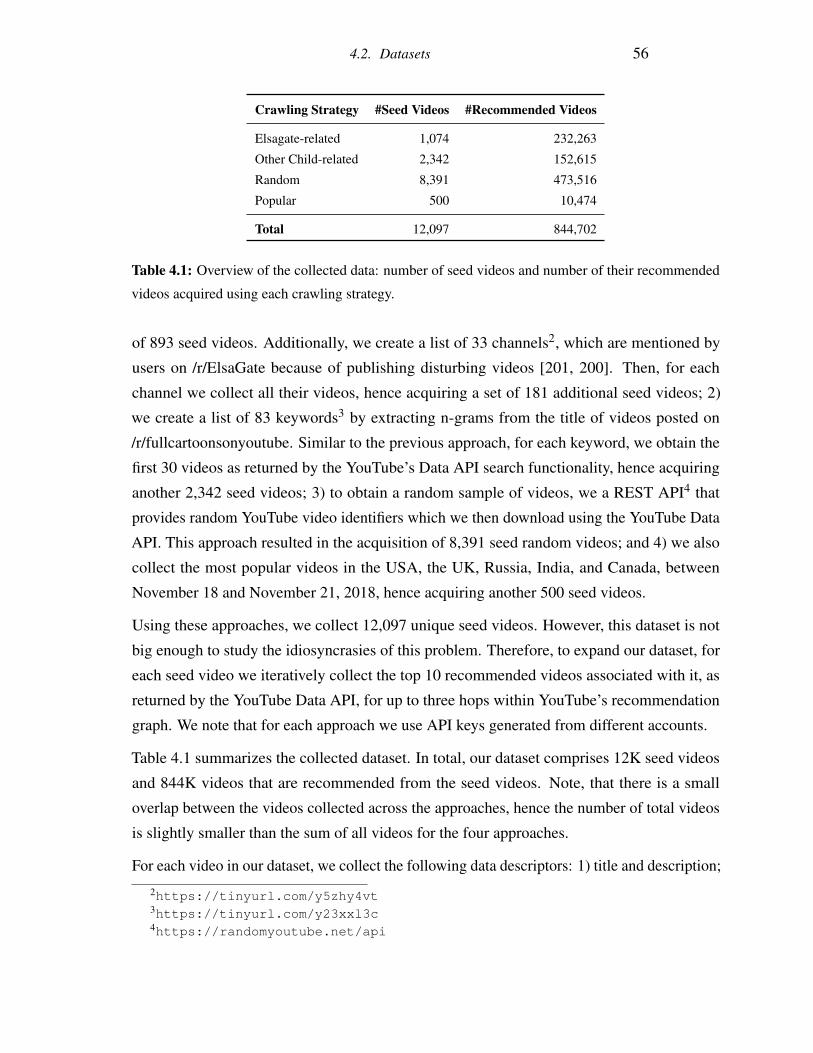
4.2. Datasets 56
Crawling Strategy #Seed Videos #Recommended Videos
Elsagate-related 1,074 232,263
Other Child-related 2,342 152,615
Random 8,391 473,516
Popular 500 10,474
Total 12,097 844,702
Table 4.1: Overview of the collected data: number of seed videos and number of their recommended
videos acquired using each crawling strategy.
of 893 seed videos. Additionally, we create a list of 33 channels2, which are mentioned by
users on /r/ElsaGate because of publishing disturbing videos [201, 200]. Then, for each
channel we collect all their videos, hence acquiring a set of 181 additional seed videos; 2)
we create a list of 83 keywords3 by extracting n-grams from the title of videos posted on
/r/fullcartoonsonyoutube. Similar to the previous approach, for each keyword, we obtain the
first 30 videos as returned by the YouTube’s Data API search functionality, hence acquiring
another 2,342 seed videos; 3) to obtain a random sample of videos, we a REST API4 that
provides random YouTube video identifiers which we then download using the YouTube Data
API. This approach resulted in the acquisition of 8,391 seed random videos; and 4) we also
collect the most popular videos in the USA, the UK, Russia, India, and Canada, between
November 18 and November 21, 2018, hence acquiring another 500 seed videos.
Using these approaches, we collect 12,097 unique seed videos. However, this dataset is not
big enough to study the idiosyncrasies of this problem. Therefore, to expand our dataset, for
each seed video we iteratively collect the top 10 recommended videos associated with it, as
returned by the YouTube Data API, for up to three hops within YouTube’s recommendation
graph. We note that for each approach we use API keys generated from different accounts.
Table 4.1 summarizes the collected dataset. In total, our dataset comprises 12K seed videos
and 844K videos that are recommended from the seed videos. Note, that there is a small
overlap between the videos collected across the approaches, hence the number of total videos
is slightly smaller than the sum of all videos for the four approaches.
For each video in our dataset, we collect the following data descriptors: 1) title and description;
2https://tinyurl.com/y5zhy4vt3https://tinyurl.com/y23xxl3c4https://randomyoutube.net/api
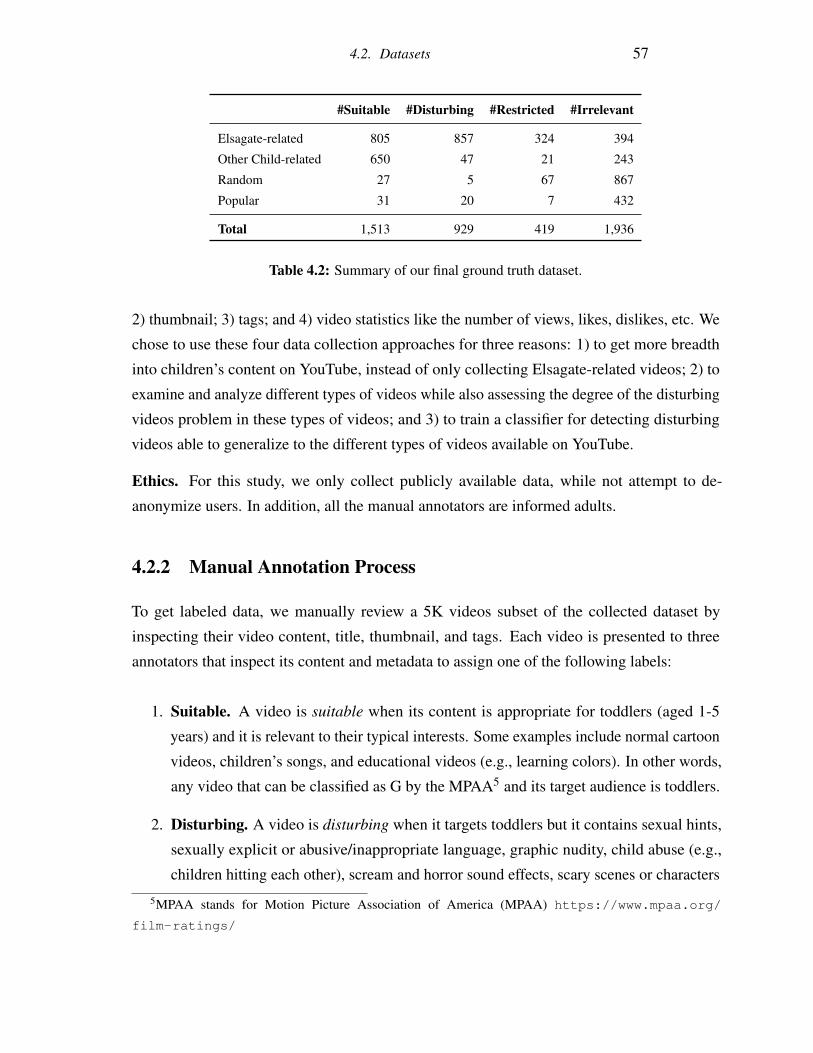
4.2. Datasets 57
#Suitable #Disturbing #Restricted #Irrelevant
Elsagate-related 805 857 324 394
Other Child-related 650 47 21 243
Random 27 5 67 867
Popular 31 20 7 432
Total 1,513 929 419 1,936
Table 4.2: Summary of our final ground truth dataset.
2) thumbnail; 3) tags; and 4) video statistics like the number of views, likes, dislikes, etc. We
chose to use these four data collection approaches for three reasons: 1) to get more breadth
into children’s content on YouTube, instead of only collecting Elsagate-related videos; 2) to
examine and analyze different types of videos while also assessing the degree of the disturbing
videos problem in these types of videos; and 3) to train a classifier for detecting disturbing
videos able to generalize to the different types of videos available on YouTube.
Ethics. For this study, we only collect publicly available data, while not attempt to de-
anonymize users. In addition, all the manual annotators are informed adults.
4.2.2 Manual Annotation Process
To get labeled data, we manually review a 5K videos subset of the collected dataset by
inspecting their video content, title, thumbnail, and tags. Each video is presented to three
annotators that inspect its content and metadata to assign one of the following labels:
1. Suitable. A video is suitable when its content is appropriate for toddlers (aged 1-5
years) and it is relevant to their typical interests. Some examples include normal cartoon
videos, children’s songs, and educational videos (e.g., learning colors). In other words,
any video that can be classified as G by the MPAA5 and its target audience is toddlers.
2. Disturbing. A video is disturbing when it targets toddlers but it contains sexual hints,
sexually explicit or abusive/inappropriate language, graphic nudity, child abuse (e.g.,
children hitting each other), scream and horror sound effects, scary scenes or characters
5MPAA stands for Motion Picture Association of America (MPAA) https://www.mpaa.org/
film-ratings/
4.2. Datasets 58
(e.g., injections, attacks by insects, etc.). In general, any video targeted at toddlers that
should be classified as PG, PG-13, NC-17, or R by MPAA is considered disturbing.
3. Restricted. We consider a video restricted when it does not target toddlers and it
contains content that is inappropriate for individuals under the age of 17 (rated as R or
NC-17 according to MPAA). Such videos usually contain sexually explicit language,
graphic nudity, pornography, violence (e.g., gaming videos featuring violence, or life-
like violence, etc.), abusive/inappropriate language, online gambling, drug use, alcohol,
or upsetting situations and activities.
4. Irrelevant. We consider a video irrelevant when it contains appropriate content that is
not relevant to a toddler’s interests. That is, videos that are not disturbing or restricted
but are only suitable for school-aged children (aged 6-11 years), adolescents (aged 12-17
years), and adults, like gaming videos (e.g., Minecraft) or music videos (e.g., a video
clip of John Legend’s song) reside in this category. In general, G, PG, and PG-13 videos
that do not target toddlers are considered irrelevant.
We elect to use these labels for our annotation process instead of adopting the five MPAA
ratings for two reasons. First, our scope is videos that would normally be rated as PG, PG-13,
R, and NC-17 but target very young audiences. We consider such targeting a malevolent
activity that needs to be treated separately. At the same time, we have observed that a
significant portion of videos that would normally be rated as R or NC-17 are already classified
by YouTube as “age-restricted” and target either adolescents or adults. Second, YouTube
does not use MPAA ratings to flag videos, thus, a ground truth dataset with such labels is not
available.
Sampling Process
We aim to create a ground truth dataset that enables us to: 1) understand the main characteristics
of disturbing toddler-oriented videos compared to suitable children videos on YouTube; and 2)
train a deep learning model that will detect disturbing videos with an acceptable performance
while being able to generalize to the various types of videos available on the platform. To this
end, we use the following videos for the annotation process. 1) We randomly select 1,000 of
the 2,342 seed child-related videos aiming to get suitable videos. 2) Since the Elsagate-related
collected videos are likely to include disturbing videos, we select all the seed Elsagate-related
videos (1,074), as well as a small, randomly selected set (1,171) of their recommended videos.
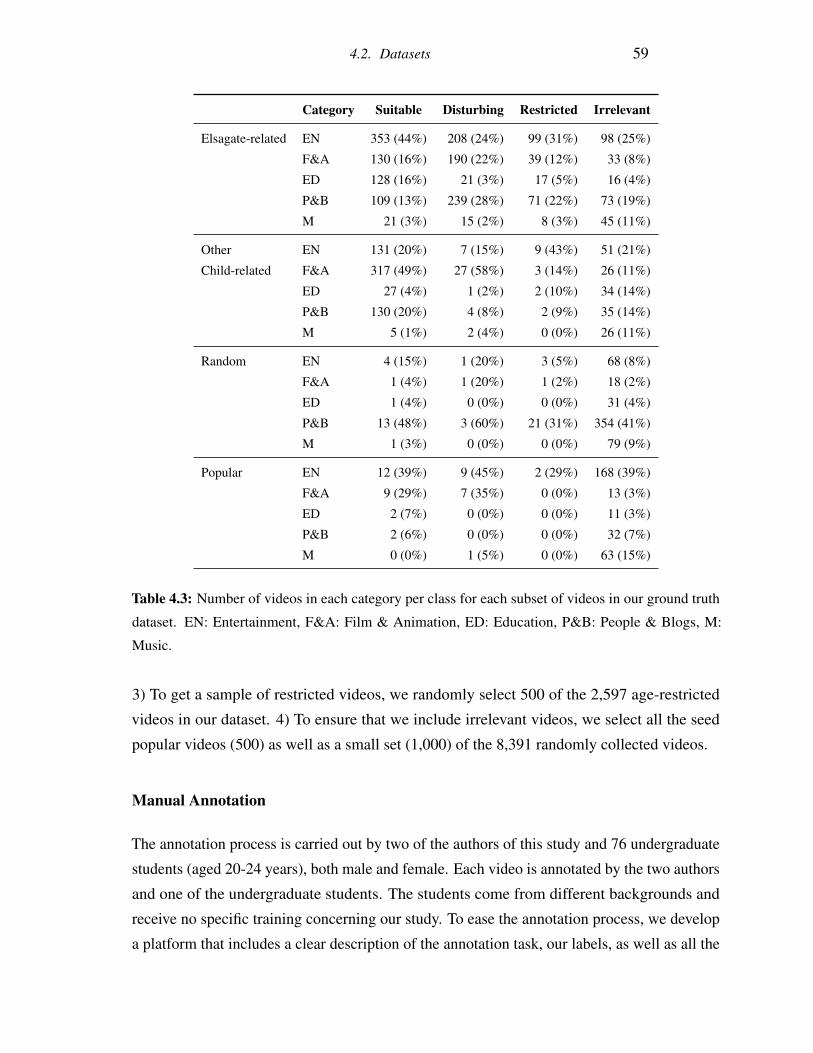
4.2. Datasets 59
Category Suitable Disturbing Restricted Irrelevant
Elsagate-related EN 353 (44%) 208 (24%) 99 (31%) 98 (25%)
F&A 130 (16%) 190 (22%) 39 (12%) 33 (8%)
ED 128 (16%) 21 (3%) 17 (5%) 16 (4%)
P&B 109 (13%) 239 (28%) 71 (22%) 73 (19%)
M 21 (3%) 15 (2%) 8 (3%) 45 (11%)
Other EN 131 (20%) 7 (15%) 9 (43%) 51 (21%)
Child-related F&A 317 (49%) 27 (58%) 3 (14%) 26 (11%)
ED 27 (4%) 1 (2%) 2 (10%) 34 (14%)
P&B 130 (20%) 4 (8%) 2 (9%) 35 (14%)
M 5 (1%) 2 (4%) 0 (0%) 26 (11%)
Random EN 4 (15%) 1 (20%) 3 (5%) 68 (8%)
F&A 1 (4%) 1 (20%) 1 (2%) 18 (2%)
ED 1 (4%) 0 (0%) 0 (0%) 31 (4%)
P&B 13 (48%) 3 (60%) 21 (31%) 354 (41%)
M 1 (3%) 0 (0%) 0 (0%) 79 (9%)
Popular EN 12 (39%) 9 (45%) 2 (29%) 168 (39%)
F&A 9 (29%) 7 (35%) 0 (0%) 13 (3%)
ED 2 (7%) 0 (0%) 0 (0%) 11 (3%)
P&B 2 (6%) 0 (0%) 0 (0%) 32 (7%)
M 0 (0%) 1 (5%) 0 (0%) 63 (15%)
Table 4.3: Number of videos in each category per class for each subset of videos in our ground truth
dataset. EN: Entertainment, F&A: Film & Animation, ED: Education, P&B: People & Blogs, M:
Music.
3) To get a sample of restricted videos, we randomly select 500 of the 2,597 age-restricted
videos in our dataset. 4) To ensure that we include irrelevant videos, we select all the seed
popular videos (500) as well as a small set (1,000) of the 8,391 randomly collected videos.
Manual Annotation
The annotation process is carried out by two of the authors of this study and 76 undergraduate
students (aged 20-24 years), both male and female. Each video is annotated by the two authors
and one of the undergraduate students. The students come from different backgrounds and
receive no specific training concerning our study. To ease the annotation process, we develop
a platform that includes a clear description of the annotation task, our labels, as well as all the
4.3. General Characterization 60
video information that an annotator needs to inspect and correctly annotate a video.
After obtaining all the annotations, we compute the Fleiss agreement score (κ) [204] across
all annotators: we find κ = 0.60, which is considered “moderate” agreement. We also assess
the level of agreement between the two authors, as we consider them experienced annotators,
finding κ = 0.69, which is considered “substantial” agreement. Finally, for each video, we
assign one of the labels according to the majority agreement of all the annotators, except
a small percentage (4%) where all annotators disagreed, which we also exclude from our
ground-truth dataset. Table 4.2 summarizes our ground truth dataset, which includes 1,513
suitable, 929 disturbing, 419 restricted, and 1,936 irrelevant videos.
4.3 General Characterization
Video Category. First, we look at the categories of the videos in our ground truth dataset.
Table 4.3 reports the top five categories, for each subset of videos. Most of the disturbing
and restricted in the Elsagate-related videos are in Entertainment (24% and 31%), People &
Blogs (28% and 22%), and Film & Animation (22% and 12%). These results are similar to
previous work [94]. A similar trend is also observed in all the other sets of videos. In addition,
in the Elsagate-related videos, we find a non-negligible percentage of disturbing videos in
seemingly innocent categories like Education (3%) and Music (2%). This is alarming since it
indicates that disturbing videos “infiltrate” categories of videos that are likely to be selected
by the toddler’s parents. Unsurprisingly, after manually inspecting all the disturbing videos in
the Education and Music categories, we find that the majority of them are nursery rhymes,
“wrong heads”, and “peppa pig” videos with disturbing content.
Title. The title of a video is an important factor that affects whether a particular video will be
recommended when viewing other toddler-oriented videos. Consequently, we study the titles in
our ground truth dataset to understand the tactics and terms that are usually used by uploaders
of disturbing or restricted videos on YouTube. First, we pre-process the title by tokenizing
the text into words and then we perform stemming using the Porter Stemmer [205] algorithm.
Figure 4.2 shows the top 15 stems found in titles along with their proportion for each class
of videos for all the different sets of videos in our ground truth dataset. Unsurprisingly, the
top 15 stems of the Elsagate-related videos refer to popular cartoons like Peppa Pig, Mickey
and Minnie Mouse, Elsa, and Spiderman (see Figure 4.2(a)). When looking at the results,
we observe that a substantial percentage of the videos that include these terms in their title
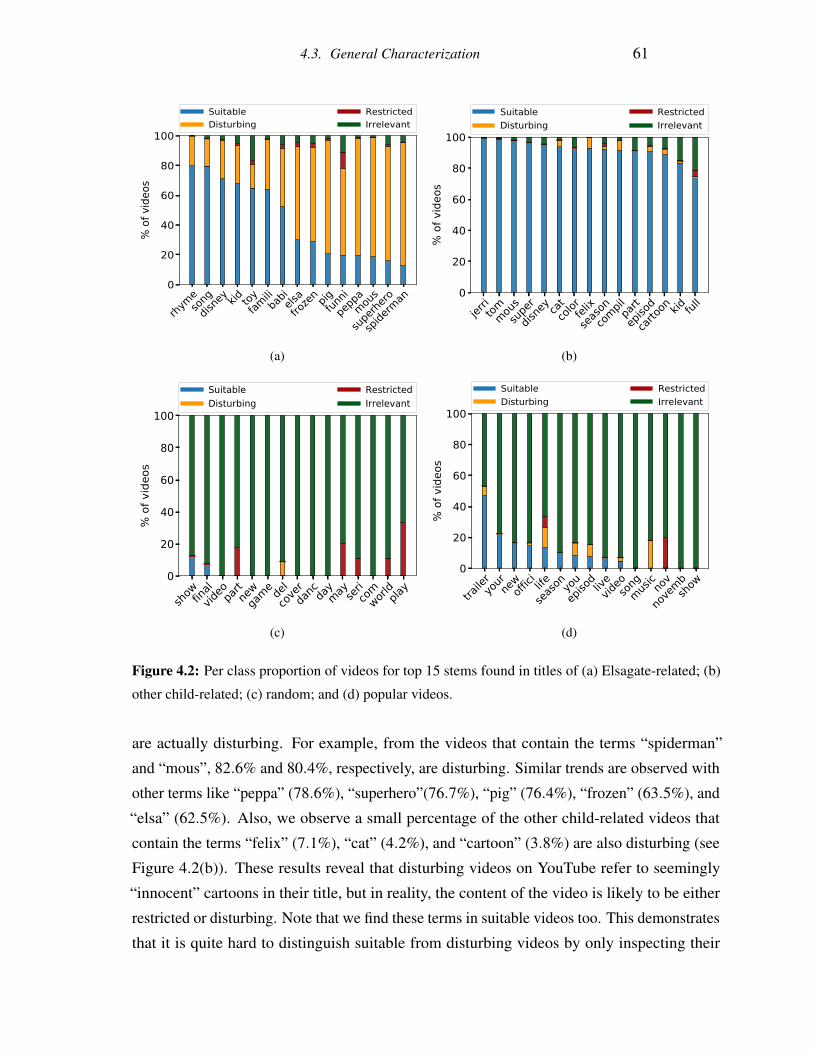
4.3. General Characterization 61
(a) (b)
(c) (d)
Figure 4.2: Per class proportion of videos for top 15 stems found in titles of (a) Elsagate-related; (b)
other child-related; (c) random; and (d) popular videos.
are actually disturbing. For example, from the videos that contain the terms “spiderman”
and “mous”, 82.6% and 80.4%, respectively, are disturbing. Similar trends are observed with
other terms like “peppa” (78.6%), “superhero”(76.7%), “pig” (76.4%), “frozen” (63.5%), and
“elsa” (62.5%). Also, we observe a small percentage of the other child-related videos that
contain the terms “felix” (7.1%), “cat” (4.2%), and “cartoon” (3.8%) are also disturbing (see
Figure 4.2(b)). These results reveal that disturbing videos on YouTube refer to seemingly
“innocent” cartoons in their title, but in reality, the content of the video is likely to be either
restricted or disturbing. Note that we find these terms in suitable videos too. This demonstrates
that it is quite hard to distinguish suitable from disturbing videos by only inspecting their
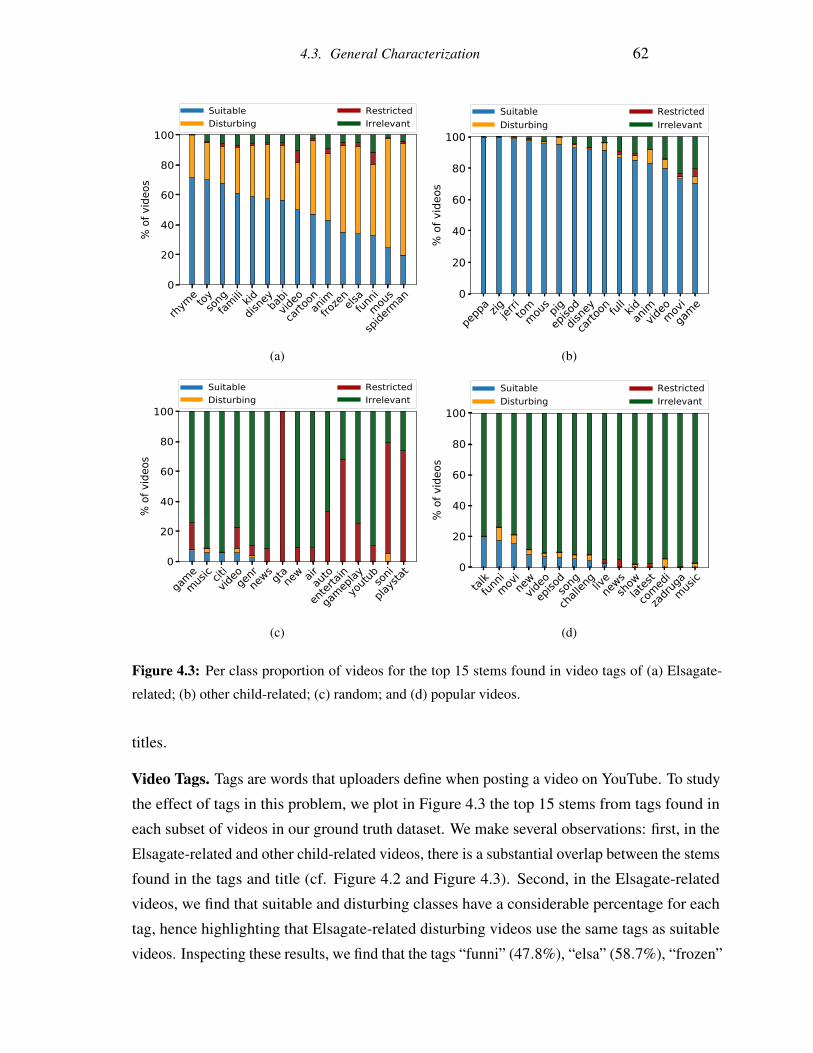
4.3. General Characterization 62
(a) (b)
(c) (d)
Figure 4.3: Per class proportion of videos for the top 15 stems found in video tags of (a) Elsagate-
related; (b) other child-related; (c) random; and (d) popular videos.
titles.
Video Tags. Tags are words that uploaders define when posting a video on YouTube. To study
the effect of tags in this problem, we plot in Figure 4.3 the top 15 stems from tags found in
each subset of videos in our ground truth dataset. We make several observations: first, in the
Elsagate-related and other child-related videos, there is a substantial overlap between the stems
found in the tags and title (cf. Figure 4.2 and Figure 4.3). Second, in the Elsagate-related
videos, we find that suitable and disturbing classes have a considerable percentage for each
tag, hence highlighting that Elsagate-related disturbing videos use the same tags as suitable
videos. Inspecting these results, we find that the tags “funni” (47.8%), “elsa” (58.7%), “frozen”
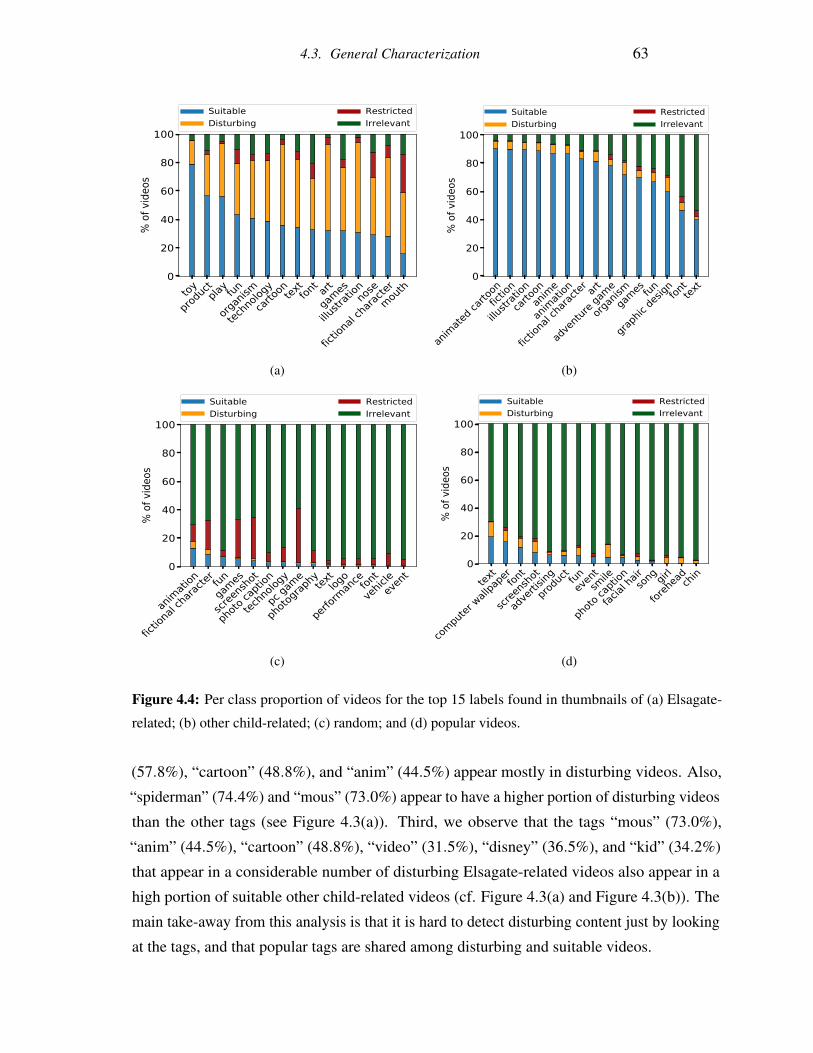
4.3. General Characterization 63
(a) (b)
(c) (d)
Figure 4.4: Per class proportion of videos for the top 15 labels found in thumbnails of (a) Elsagate-
related; (b) other child-related; (c) random; and (d) popular videos.
(57.8%), “cartoon” (48.8%), and “anim” (44.5%) appear mostly in disturbing videos. Also,
“spiderman” (74.4%) and “mous” (73.0%) appear to have a higher portion of disturbing videos
than the other tags (see Figure 4.3(a)). Third, we observe that the tags “mous” (73.0%),
“anim” (44.5%), “cartoon” (48.8%), “video” (31.5%), “disney” (36.5%), and “kid” (34.2%)
that appear in a considerable number of disturbing Elsagate-related videos also appear in a
high portion of suitable other child-related videos (cf. Figure 4.3(a) and Figure 4.3(b)). The
main take-away from this analysis is that it is hard to detect disturbing content just by looking
at the tags, and that popular tags are shared among disturbing and suitable videos.
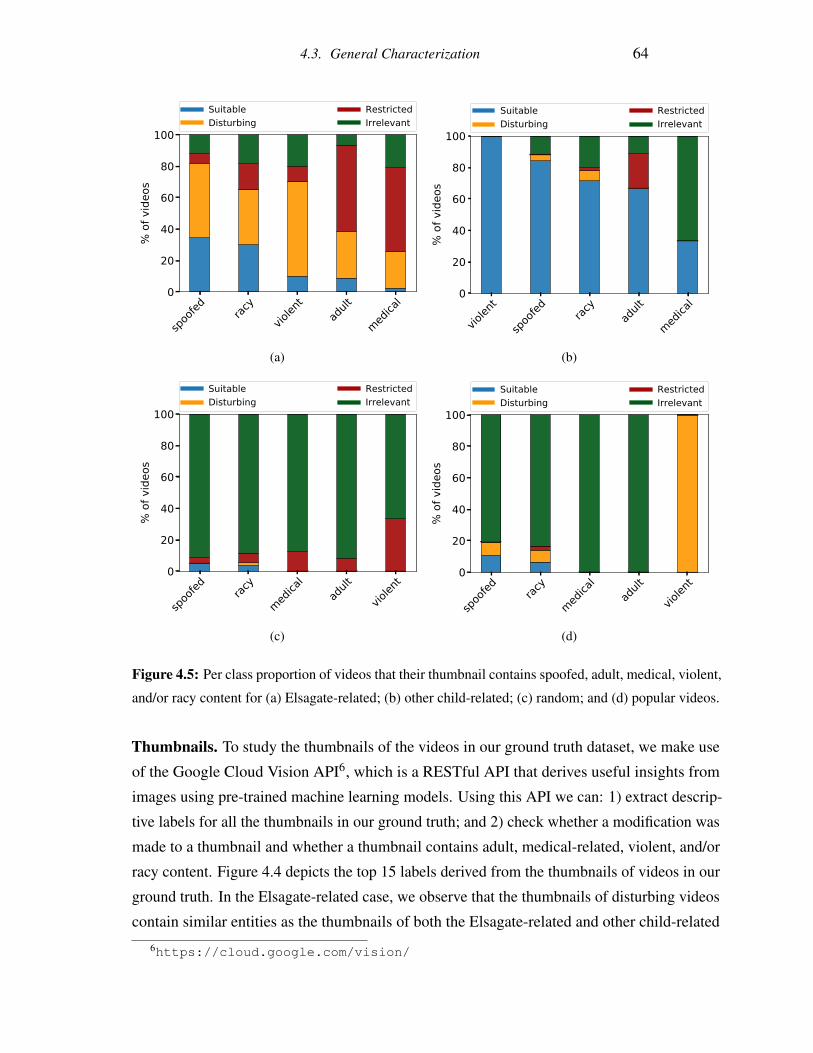
4.3. General Characterization 64
(a) (b)
(c) (d)
Figure 4.5: Per class proportion of videos that their thumbnail contains spoofed, adult, medical, violent,
and/or racy content for (a) Elsagate-related; (b) other child-related; (c) random; and (d) popular videos.
Thumbnails. To study the thumbnails of the videos in our ground truth dataset, we make use
of the Google Cloud Vision API6, which is a RESTful API that derives useful insights from
images using pre-trained machine learning models. Using this API we can: 1) extract descrip-
tive labels for all the thumbnails in our ground truth; and 2) check whether a modification was
made to a thumbnail and whether a thumbnail contains adult, medical-related, violent, and/or
racy content. Figure 4.4 depicts the top 15 labels derived from the thumbnails of videos in our
ground truth. In the Elsagate-related case, we observe that the thumbnails of disturbing videos
contain similar entities as the thumbnails of both the Elsagate-related and other child-related
6https://cloud.google.com/vision/
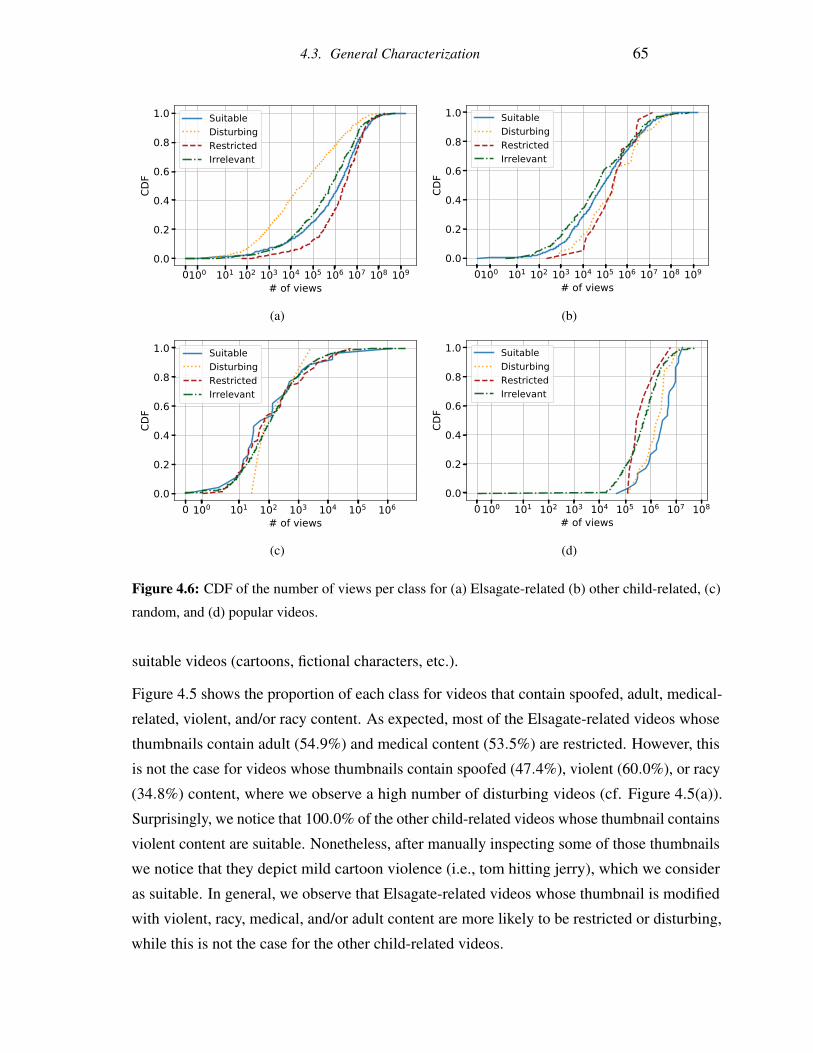
4.3. General Characterization 65
(a) (b)
(c) (d)
Figure 4.6: CDF of the number of views per class for (a) Elsagate-related (b) other child-related, (c)
random, and (d) popular videos.
suitable videos (cartoons, fictional characters, etc.).
Figure 4.5 shows the proportion of each class for videos that contain spoofed, adult, medical-
related, violent, and/or racy content. As expected, most of the Elsagate-related videos whose
thumbnails contain adult (54.9%) and medical content (53.5%) are restricted. However, this
is not the case for videos whose thumbnails contain spoofed (47.4%), violent (60.0%), or racy
(34.8%) content, where we observe a high number of disturbing videos (cf. Figure 4.5(a)).
Surprisingly, we notice that 100.0% of the other child-related videos whose thumbnail contains
violent content are suitable. Nonetheless, after manually inspecting some of those thumbnails
we notice that they depict mild cartoon violence (i.e., tom hitting jerry), which we consider
as suitable. In general, we observe that Elsagate-related videos whose thumbnail is modified
with violent, racy, medical, and/or adult content are more likely to be restricted or disturbing,
while this is not the case for the other child-related videos.
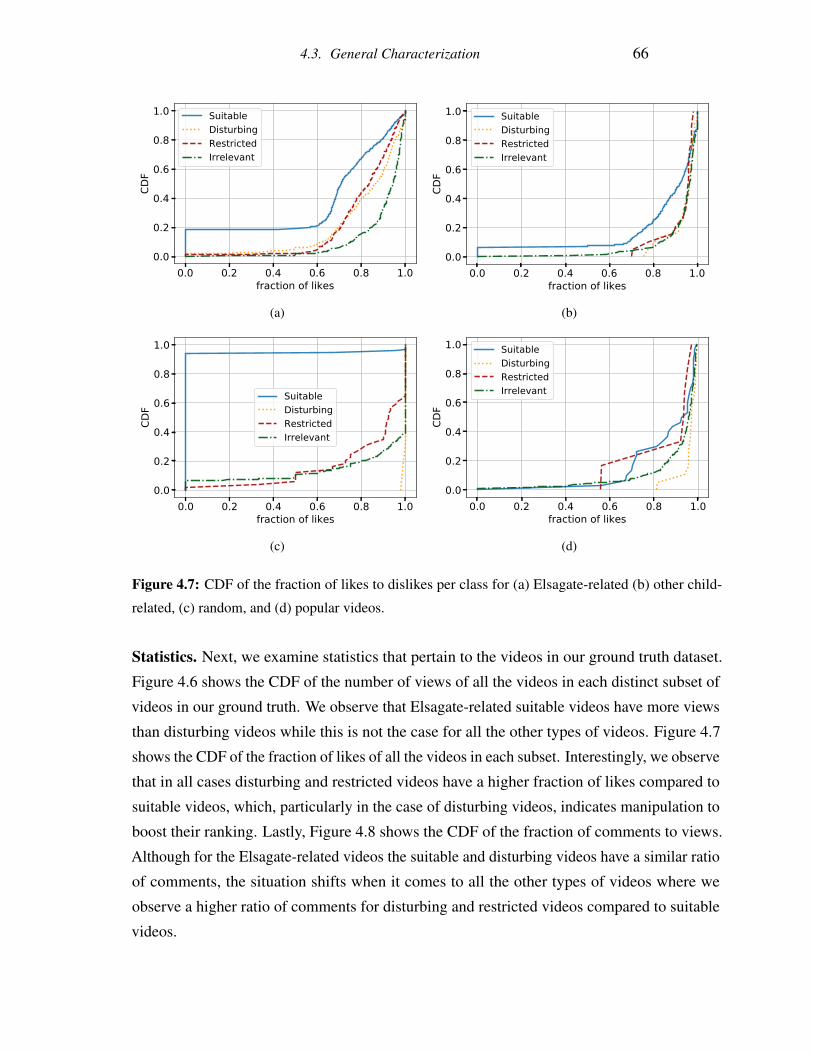
4.3. General Characterization 66
(a) (b)
(c) (d)
Figure 4.7: CDF of the fraction of likes to dislikes per class for (a) Elsagate-related (b) other child-
related, (c) random, and (d) popular videos.
Statistics. Next, we examine statistics that pertain to the videos in our ground truth dataset.
Figure 4.6 shows the CDF of the number of views of all the videos in each distinct subset of
videos in our ground truth. We observe that Elsagate-related suitable videos have more views
than disturbing videos while this is not the case for all the other types of videos. Figure 4.7
shows the CDF of the fraction of likes of all the videos in each subset. Interestingly, we observe
that in all cases disturbing and restricted videos have a higher fraction of likes compared to
suitable videos, which, particularly in the case of disturbing videos, indicates manipulation to
boost their ranking. Lastly, Figure 4.8 shows the CDF of the fraction of comments to views.
Although for the Elsagate-related videos the suitable and disturbing videos have a similar ratio
of comments, the situation shifts when it comes to all the other types of videos where we
observe a higher ratio of comments for disturbing and restricted videos compared to suitable
videos.
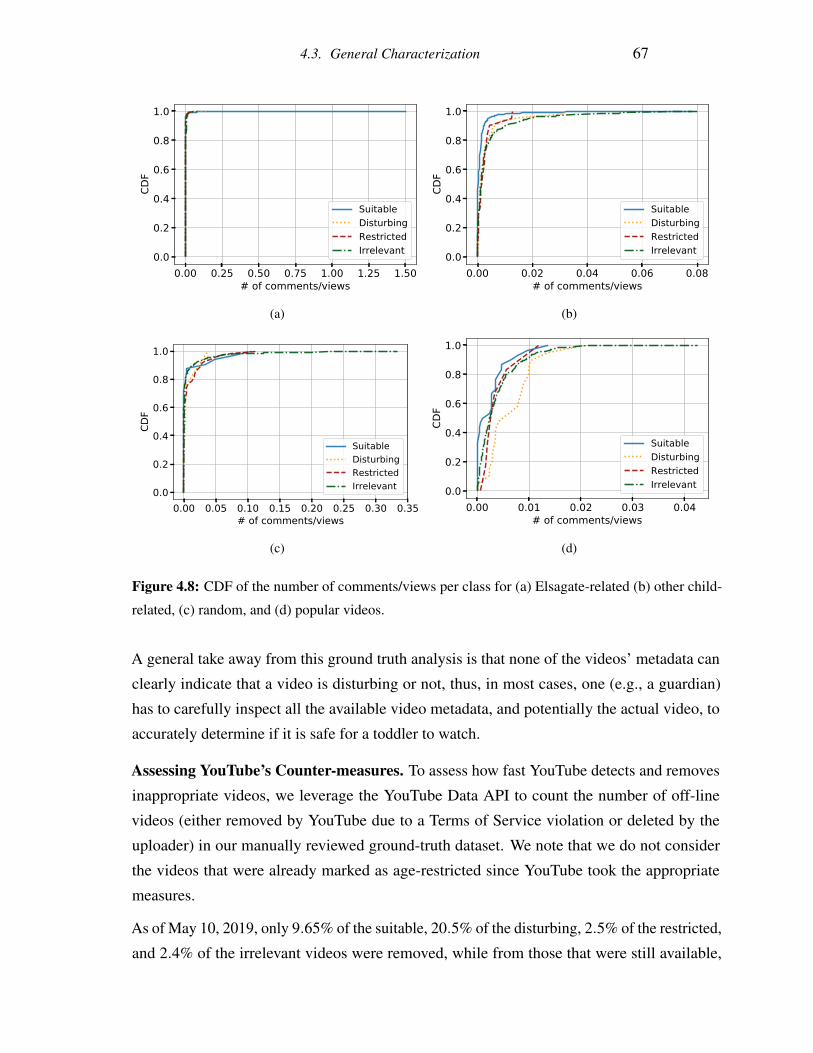
4.3. General Characterization 67
(a) (b)
(c) (d)
Figure 4.8: CDF of the number of comments/views per class for (a) Elsagate-related (b) other child-
related, (c) random, and (d) popular videos.
A general take away from this ground truth analysis is that none of the videos’ metadata can
clearly indicate that a video is disturbing or not, thus, in most cases, one (e.g., a guardian)
has to carefully inspect all the available video metadata, and potentially the actual video, to
accurately determine if it is safe for a toddler to watch.
Assessing YouTube’s Counter-measures. To assess how fast YouTube detects and removes
inappropriate videos, we leverage the YouTube Data API to count the number of off-line
videos (either removed by YouTube due to a Terms of Service violation or deleted by the
uploader) in our manually reviewed ground-truth dataset. We note that we do not consider
the videos that were already marked as age-restricted since YouTube took the appropriate
measures.
As of May 10, 2019, only 9.65% of the suitable, 20.5% of the disturbing, 2.5% of the restricted,
and 2.4% of the irrelevant videos were removed, while from those that were still available,
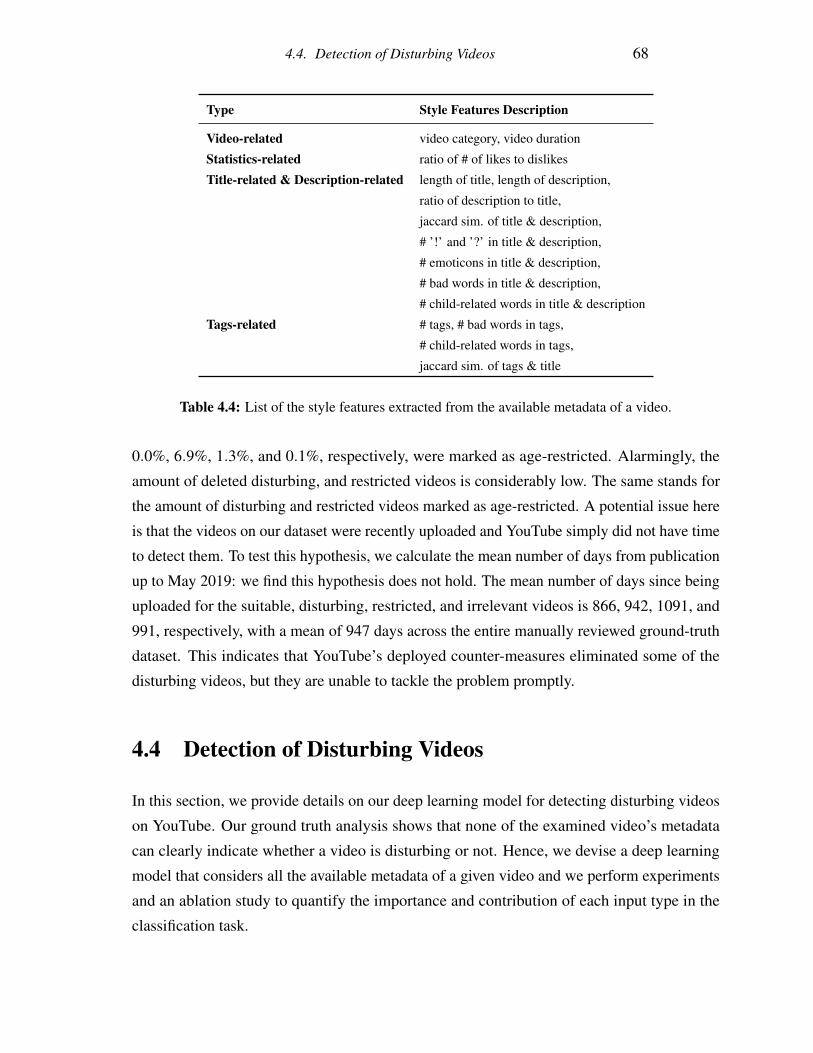
4.4. Detection of Disturbing Videos 68
Type Style Features Description
Video-related video category, video duration
Statistics-related ratio of # of likes to dislikes
Title-related & Description-related length of title, length of description,
ratio of description to title,
jaccard sim. of title & description,
# ’!’ and ’?’ in title & description,
# emoticons in title & description,
# bad words in title & description,
# child-related words in title & description
Tags-related # tags, # bad words in tags,
# child-related words in tags,
jaccard sim. of tags & title
Table 4.4: List of the style features extracted from the available metadata of a video.
0.0%, 6.9%, 1.3%, and 0.1%, respectively, were marked as age-restricted. Alarmingly, the
amount of deleted disturbing, and restricted videos is considerably low. The same stands for
the amount of disturbing and restricted videos marked as age-restricted. A potential issue here
is that the videos on our dataset were recently uploaded and YouTube simply did not have time
to detect them. To test this hypothesis, we calculate the mean number of days from publication
up to May 2019: we find this hypothesis does not hold. The mean number of days since being
uploaded for the suitable, disturbing, restricted, and irrelevant videos is 866, 942, 1091, and
991, respectively, with a mean of 947 days across the entire manually reviewed ground-truth
dataset. This indicates that YouTube’s deployed counter-measures eliminated some of the
disturbing videos, but they are unable to tackle the problem promptly.
4.4 Detection of Disturbing Videos
In this section, we provide details on our deep learning model for detecting disturbing videos
on YouTube. Our ground truth analysis shows that none of the examined video’s metadata
can clearly indicate whether a video is disturbing or not. Hence, we devise a deep learning
model that considers all the available metadata of a given video and we perform experiments
and an ablation study to quantify the importance and contribution of each input type in the
classification task.
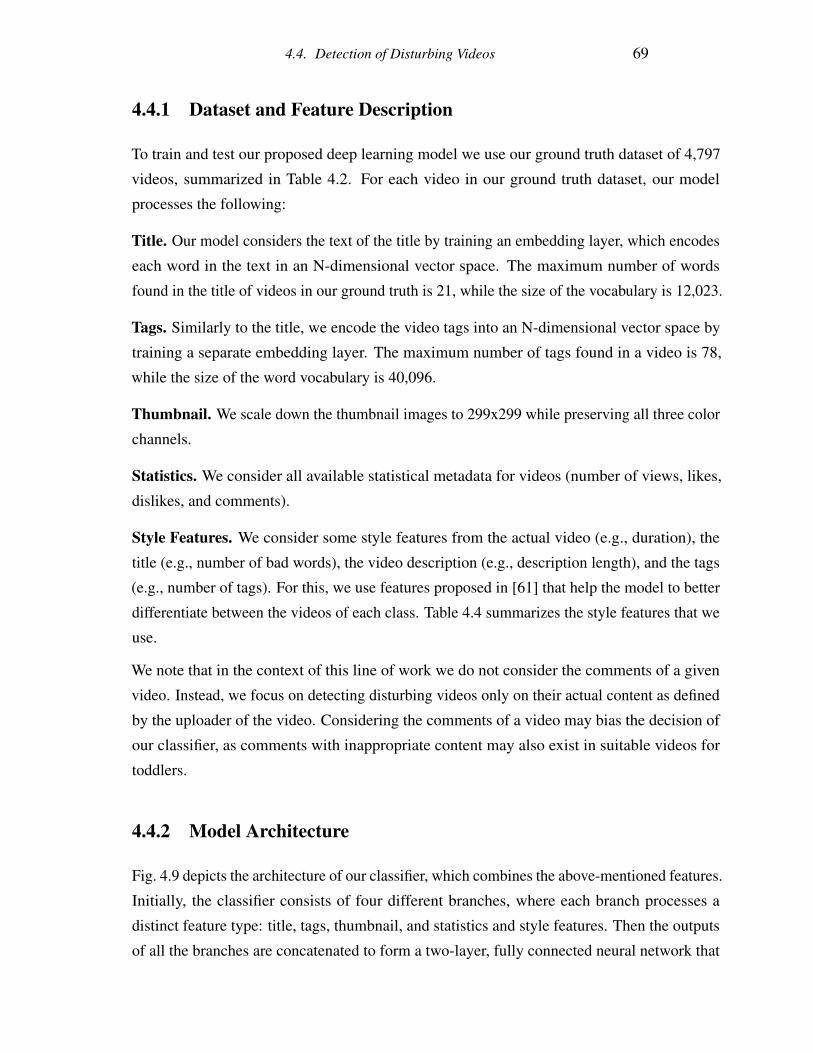
4.4. Detection of Disturbing Videos 69
4.4.1 Dataset and Feature Description
To train and test our proposed deep learning model we use our ground truth dataset of 4,797
videos, summarized in Table 4.2. For each video in our ground truth dataset, our model
processes the following:
Title. Our model considers the text of the title by training an embedding layer, which encodes
each word in the text in an N-dimensional vector space. The maximum number of words
found in the title of videos in our ground truth is 21, while the size of the vocabulary is 12,023.
Tags. Similarly to the title, we encode the video tags into an N-dimensional vector space by
training a separate embedding layer. The maximum number of tags found in a video is 78,
while the size of the word vocabulary is 40,096.
Thumbnail. We scale down the thumbnail images to 299x299 while preserving all three color
channels.
Statistics. We consider all available statistical metadata for videos (number of views, likes,
dislikes, and comments).
Style Features. We consider some style features from the actual video (e.g., duration), the
title (e.g., number of bad words), the video description (e.g., description length), and the tags
(e.g., number of tags). For this, we use features proposed in [61] that help the model to better
differentiate between the videos of each class. Table 4.4 summarizes the style features that we
use.
We note that in the context of this line of work we do not consider the comments of a given
video. Instead, we focus on detecting disturbing videos only on their actual content as defined
by the uploader of the video. Considering the comments of a video may bias the decision of
our classifier, as comments with inappropriate content may also exist in suitable videos for
toddlers.
4.4.2 Model Architecture
Fig. 4.9 depicts the architecture of our classifier, which combines the above-mentioned features.
Initially, the classifier consists of four different branches, where each branch processes a
distinct feature type: title, tags, thumbnail, and statistics and style features. Then the outputs
of all the branches are concatenated to form a two-layer, fully connected neural network that
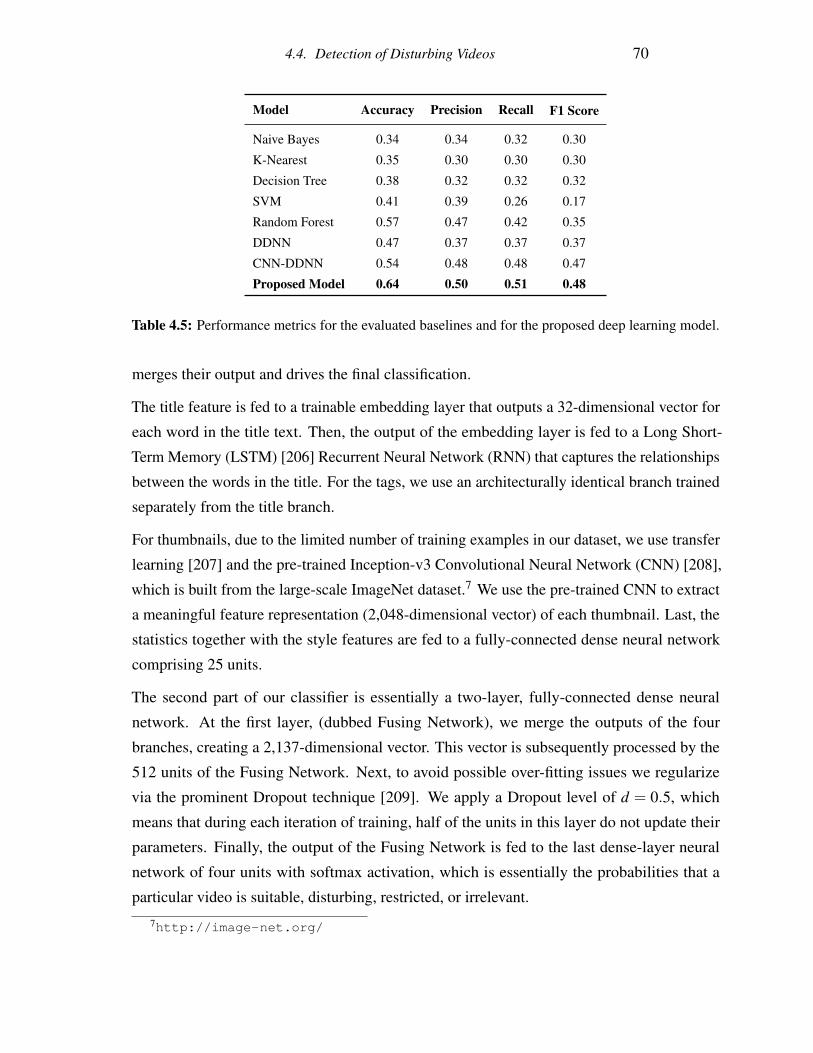
4.4. Detection of Disturbing Videos 70
Model Accuracy Precision Recall F1 Score
Naive Bayes 0.34 0.34 0.32 0.30
K-Nearest 0.35 0.30 0.30 0.30
Decision Tree 0.38 0.32 0.32 0.32
SVM 0.41 0.39 0.26 0.17
Random Forest 0.57 0.47 0.42 0.35
DDNN 0.47 0.37 0.37 0.37
CNN-DDNN 0.54 0.48 0.48 0.47
Proposed Model 0.64 0.50 0.51 0.48
Table 4.5: Performance metrics for the evaluated baselines and for the proposed deep learning model.
merges their output and drives the final classification.
The title feature is fed to a trainable embedding layer that outputs a 32-dimensional vector for
each word in the title text. Then, the output of the embedding layer is fed to a Long Short-
Term Memory (LSTM) [206] Recurrent Neural Network (RNN) that captures the relationships
between the words in the title. For the tags, we use an architecturally identical branch trained
separately from the title branch.
For thumbnails, due to the limited number of training examples in our dataset, we use transfer
learning [207] and the pre-trained Inception-v3 Convolutional Neural Network (CNN) [208],
which is built from the large-scale ImageNet dataset.7 We use the pre-trained CNN to extract
a meaningful feature representation (2,048-dimensional vector) of each thumbnail. Last, the
statistics together with the style features are fed to a fully-connected dense neural network
comprising 25 units.
The second part of our classifier is essentially a two-layer, fully-connected dense neural
network. At the first layer, (dubbed Fusing Network), we merge the outputs of the four
branches, creating a 2,137-dimensional vector. This vector is subsequently processed by the
512 units of the Fusing Network. Next, to avoid possible over-fitting issues we regularize
via the prominent Dropout technique [209]. We apply a Dropout level of d = 0.5, which
means that during each iteration of training, half of the units in this layer do not update their
parameters. Finally, the output of the Fusing Network is fed to the last dense-layer neural
network of four units with softmax activation, which is essentially the probabilities that a
particular video is suitable, disturbing, restricted, or irrelevant.
7http://image-net.org/
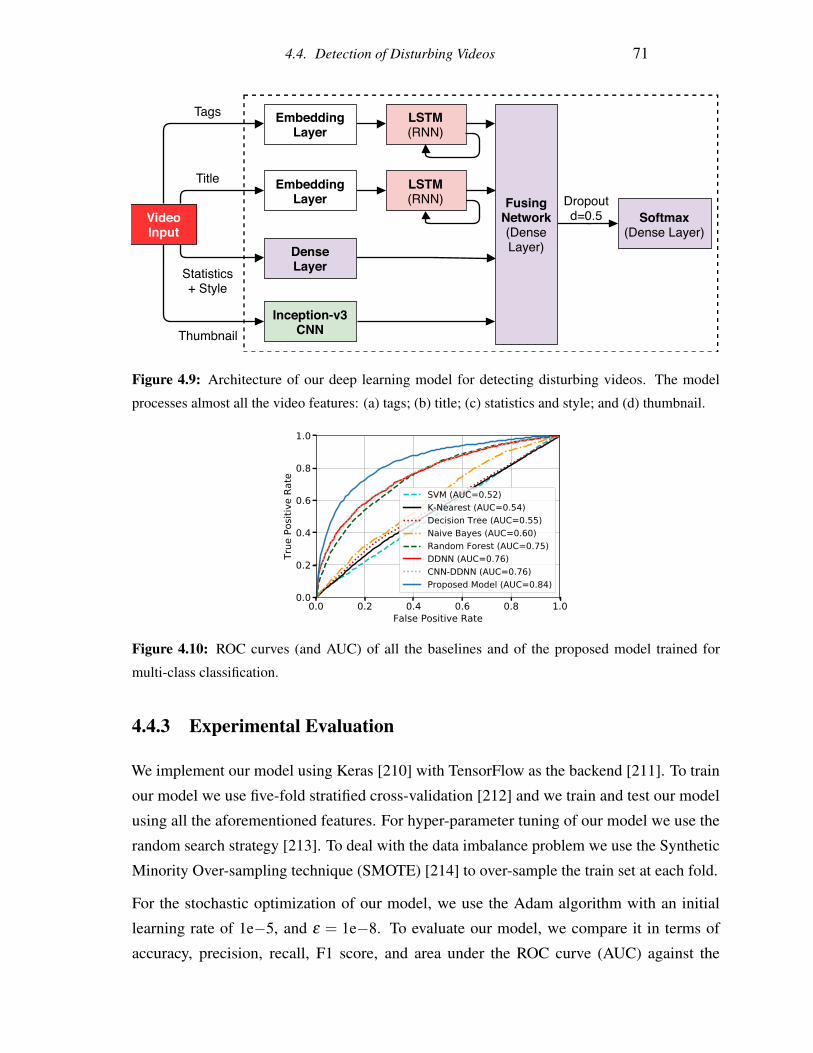
4.4. Detection of Disturbing Videos 71
9LGHR,QSXW
,QFHSWLRQ�Y�&11
(PEHGGLQJ/D\HU
'HQVH/D\HU
(PEHGGLQJ/D\HU
/670�511�
/670�511�
)XVLQJ1HWZRUN�'HQVH/D\HU�
6RIWPD[�'HQVH�/D\HU�
'URSRXWG ���
7DJV
6WDWLVWLFV��6W\OH
7LWOH
7KXPEQDLO
Figure 4.9: Architecture of our deep learning model for detecting disturbing videos. The model
processes almost all the video features: (a) tags; (b) title; (c) statistics and style; and (d) thumbnail.
Figure 4.10: ROC curves (and AUC) of all the baselines and of the proposed model trained for
multi-class classification.
4.4.3 Experimental Evaluation
We implement our model using Keras [210] with TensorFlow as the backend [211]. To train
our model we use five-fold stratified cross-validation [212] and we train and test our model
using all the aforementioned features. For hyper-parameter tuning of our model we use the
random search strategy [213]. To deal with the data imbalance problem we use the Synthetic
Minority Over-sampling technique (SMOTE) [214] to over-sample the train set at each fold.
For the stochastic optimization of our model, we use the Adam algorithm with an initial
learning rate of 1e−5, and ε = 1e−8. To evaluate our model, we compare it in terms of
accuracy, precision, recall, F1 score, and area under the ROC curve (AUC) against the

4.4. Detection of Disturbing Videos 72
Input Features Accuracy Precision Recall F1 Score
Thumbnail 0.64 0.48 0.50 0.45
Title 0.46 0.35 0.33 0.30
Tags 0.40 0.29 0.30 0.27
Style & Statistics 0.43 0.35 0.35 0.29
Thumbnail, Title 0.63 0.45 0.50 0.45
Thumbnail, Tags 0.63 0.47 0.49 0.45
Thumbnail, Style&Stats 0.63 0.48 0.50 0.47
Title, Tags 0.49 0.40 0.38 0.36
Title, Style & Statistics 0.44 0.39 0.37 0.34
Tags, Style & Statistics 0.41 0.36 0.34 0.28
Title, Tags, Style & Statistics 0.46 0.39 0.48 0.36
Thumbnail, Tags, Style & Statistics 0.64 0.48 0.51 0.48
Thumbnail, Title, Style & Statistics 0.63 0.46 0.50 0.46
Thumbnail, Title, Tags 0.64 0.48 0.51 0.47
All Input Features 0.64 0.50 0.51 0.48
Table 4.6: Performance of the proposed model trained with all the possible combinations of the four
input feature types.
following five baselines: 1) a Support Vector Machine (SVM) with parameters γ = auto and
C = 10.0; 2) a K-Nearest Neighbors classifier with n = 8 neighbors and leaf size equal to
10; 3) a Bernoulli Naive Bayes classifier with a = 1.0; 4) a Decision Tree classifier with an
entropy criterion; and 5) a Random Forest classifier with an entropy criterion and number of
trees equal to 100. To further evaluate the performance of our model, we also compare it with
two deep neural networks: 1) a simple double dense layer network (DDNN); and 2) a CNN
combined with a double dense layer network (CNN-DDNN). For hyper-parameter tuning of
all the baselines, we use the grid search strategy, while for the deep neural networks we use
the same hyper-parameters as with the proposed model. For a fair comparison, we note that
all the evaluated models use all the available input features. Table 4.5 reports the performance
of the proposed model as well as the 7 baselines, while Figure 4.10 shows their ROC curves.
Although the proposed model outperforms all the baselines in all performance metrics, it still
has poor performance.
In an attempt to achieve better accuracy, we consider the video itself as an additional input
feature to our model. We train our model considering 45 frames per video along with all
the other types of input. We then evaluate our model and we find that adding the video
4.4. Detection of Disturbing Videos 73
frames in the set of features of our model yields worse performance in terms of accuracy.
At the same time, the training of the model with the video frames is more than 50 times
more computationally expensive compared to the model without the video frames. Hence, we
decided to keep the previous model formulation ignoring the video frames.
Ablation Study. In an attempt to understand which of the input feature types contribute
the most to the classification of disturbing videos we perform an ablation study. That is,
we systematically remove each of the four input feature types (as well as their associated
branch in the proposed model’s architecture), while also training models with all the possible
combinations of the four input feature types. Again, to train and test these models we use five-
fold cross-validation and the oversampling technique to deal with data imbalance. Table 4.6
shows the performance metrics of all the models for each possible combination of inputs.
We observe that the thumbnail is more important than the other input feature types for good
classification performance.
Binary Classification. To perform a more representative analysis of the inappropriate videos
on YouTube, we need a more accurate classifier. Thus, for the sake of our analysis in the next
steps, we collapse our four labels into two general categories, by combining the suitable with
the irrelevant videos into one “appropriate” category (3,499 videos) and the disturbing with
the restricted videos into a second “inappropriate” category (1,348 videos). We call the first
category “appropriate” despite including PG and PG-13 videos because those videos are not
aimed at toddlers (irrelevant). On the other hand, videos rated as PG or PG-13 that target
toddlers (aged 1 to 5) are disturbing and fall under the inappropriate category. When such
videos appear on the video recommendation list of toddlers, it is a strong indication that they
are disturbing and our binary classifier is very likely to detect them as inappropriate.
We train and evaluate the proposed model for binary classification on our reshaped ground
truth dataset following the same approach as the one presented above. Table 4.7 reports
the performance of our model as well as the baselines, while Figure 4.11 shows their ROC
curves. We observe that our deep learning model outperforms all baseline models across
all performance metrics. Specifically, our model substantially outperforms the CNN-DDNN
model, which has the best overall performance from all the evaluated baselines, on accuracy,
precision, recall, F1 score, and AUC by 0.12, 0.13, 0.17, 0.14, 0.11 respectively.
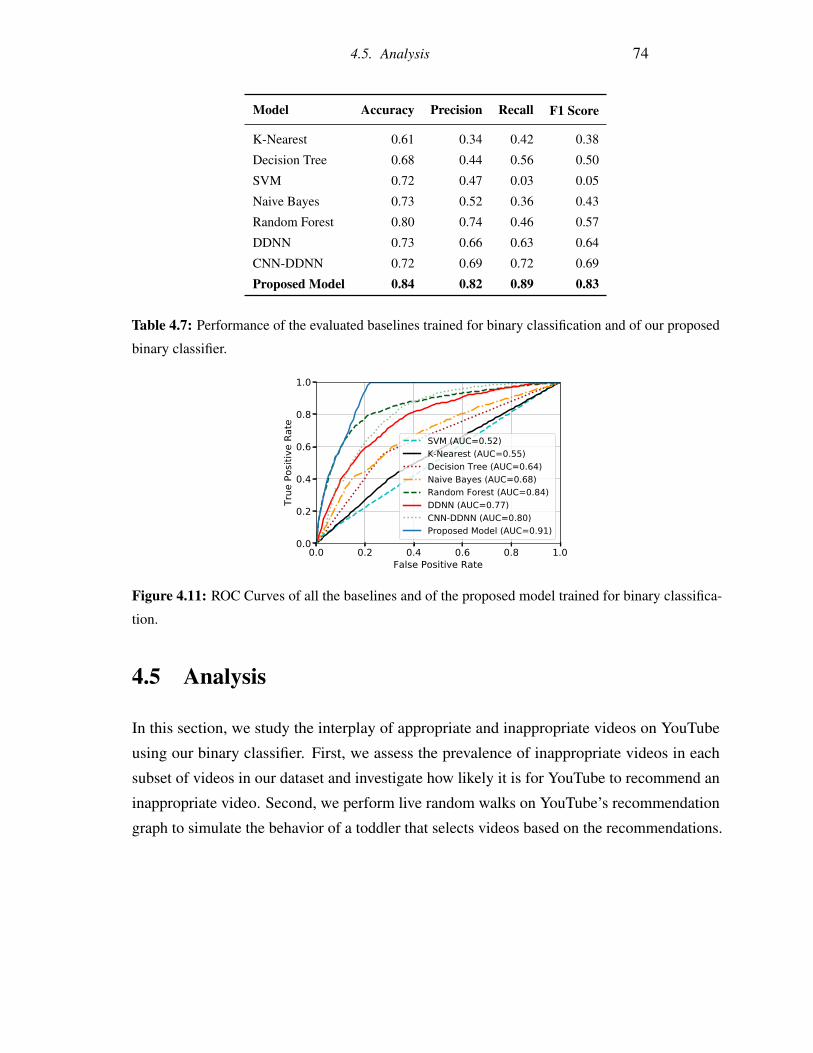
4.5. Analysis 74
Model Accuracy Precision Recall F1 Score
K-Nearest 0.61 0.34 0.42 0.38
Decision Tree 0.68 0.44 0.56 0.50
SVM 0.72 0.47 0.03 0.05
Naive Bayes 0.73 0.52 0.36 0.43
Random Forest 0.80 0.74 0.46 0.57
DDNN 0.73 0.66 0.63 0.64
CNN-DDNN 0.72 0.69 0.72 0.69
Proposed Model 0.84 0.82 0.89 0.83
Table 4.7: Performance of the evaluated baselines trained for binary classification and of our proposed
binary classifier.
Figure 4.11: ROC Curves of all the baselines and of the proposed model trained for binary classifica-
tion.
4.5 Analysis
In this section, we study the interplay of appropriate and inappropriate videos on YouTube
using our binary classifier. First, we assess the prevalence of inappropriate videos in each
subset of videos in our dataset and investigate how likely it is for YouTube to recommend an
inappropriate video. Second, we perform live random walks on YouTube’s recommendation
graph to simulate the behavior of a toddler that selects videos based on the recommendations.
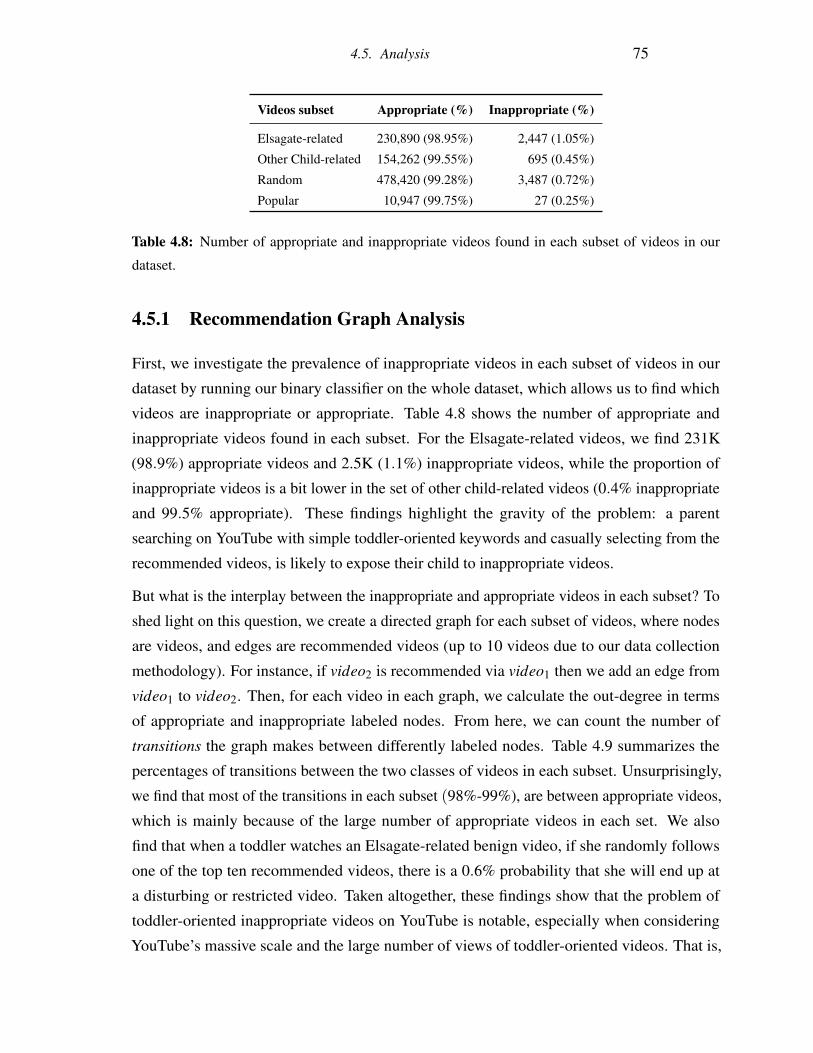
4.5. Analysis 75
Videos subset Appropriate (%) Inappropriate (%)
Elsagate-related 230,890 (98.95%) 2,447 (1.05%)
Other Child-related 154,262 (99.55%) 695 (0.45%)
Random 478,420 (99.28%) 3,487 (0.72%)
Popular 10,947 (99.75%) 27 (0.25%)
Table 4.8: Number of appropriate and inappropriate videos found in each subset of videos in our
dataset.
4.5.1 Recommendation Graph Analysis
First, we investigate the prevalence of inappropriate videos in each subset of videos in our
dataset by running our binary classifier on the whole dataset, which allows us to find which
videos are inappropriate or appropriate. Table 4.8 shows the number of appropriate and
inappropriate videos found in each subset. For the Elsagate-related videos, we find 231K
(98.9%) appropriate videos and 2.5K (1.1%) inappropriate videos, while the proportion of
inappropriate videos is a bit lower in the set of other child-related videos (0.4% inappropriate
and 99.5% appropriate). These findings highlight the gravity of the problem: a parent
searching on YouTube with simple toddler-oriented keywords and casually selecting from the
recommended videos, is likely to expose their child to inappropriate videos.
But what is the interplay between the inappropriate and appropriate videos in each subset? To
shed light on this question, we create a directed graph for each subset of videos, where nodes
are videos, and edges are recommended videos (up to 10 videos due to our data collection
methodology). For instance, if video2 is recommended via video1 then we add an edge from
video1 to video2. Then, for each video in each graph, we calculate the out-degree in terms
of appropriate and inappropriate labeled nodes. From here, we can count the number of
transitions the graph makes between differently labeled nodes. Table 4.9 summarizes the
percentages of transitions between the two classes of videos in each subset. Unsurprisingly,
we find that most of the transitions in each subset (98%-99%), are between appropriate videos,
which is mainly because of the large number of appropriate videos in each set. We also
find that when a toddler watches an Elsagate-related benign video, if she randomly follows
one of the top ten recommended videos, there is a 0.6% probability that she will end up at
a disturbing or restricted video. Taken altogether, these findings show that the problem of
toddler-oriented inappropriate videos on YouTube is notable, especially when considering
YouTube’s massive scale and the large number of views of toddler-oriented videos. That is,
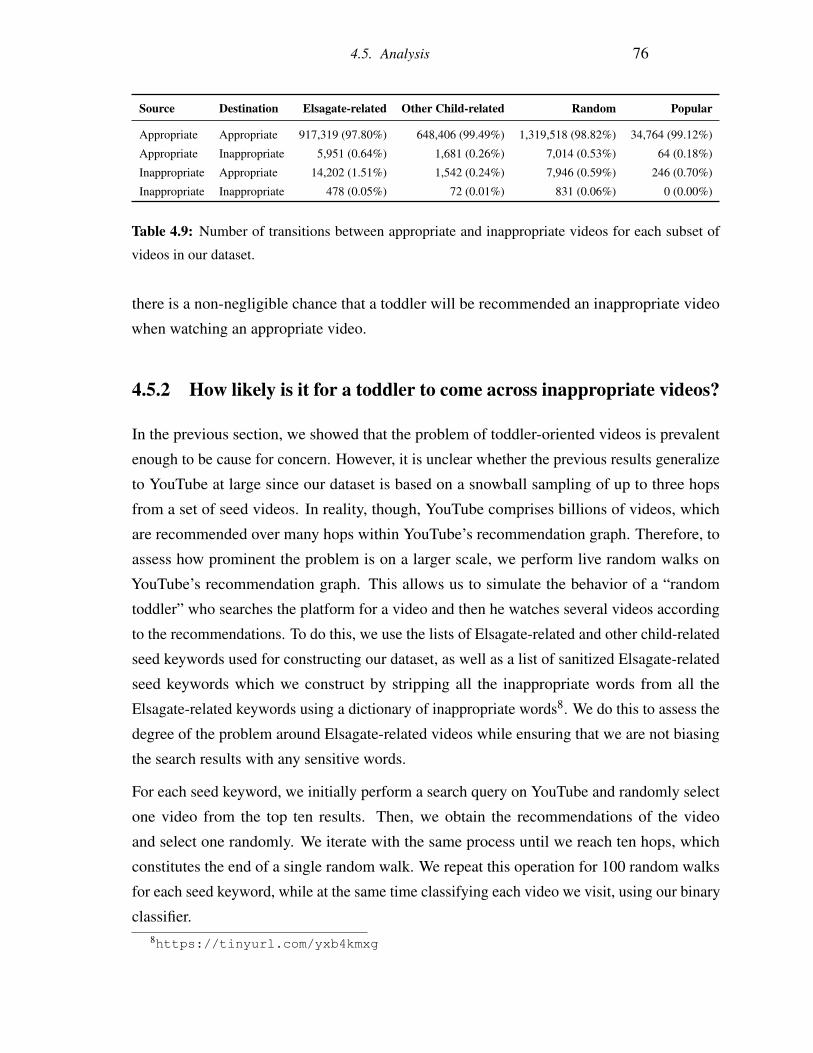
4.5. Analysis 76
Source Destination Elsagate-related Other Child-related Random Popular
Appropriate Appropriate 917,319 (97.80%) 648,406 (99.49%) 1,319,518 (98.82%) 34,764 (99.12%)
Appropriate Inappropriate 5,951 (0.64%) 1,681 (0.26%) 7,014 (0.53%) 64 (0.18%)
Inappropriate Appropriate 14,202 (1.51%) 1,542 (0.24%) 7,946 (0.59%) 246 (0.70%)
Inappropriate Inappropriate 478 (0.05%) 72 (0.01%) 831 (0.06%) 0 (0.00%)
Table 4.9: Number of transitions between appropriate and inappropriate videos for each subset of
videos in our dataset.
there is a non-negligible chance that a toddler will be recommended an inappropriate video
when watching an appropriate video.
4.5.2 How likely is it for a toddler to come across inappropriate videos?
In the previous section, we showed that the problem of toddler-oriented videos is prevalent
enough to be cause for concern. However, it is unclear whether the previous results generalize
to YouTube at large since our dataset is based on a snowball sampling of up to three hops
from a set of seed videos. In reality, though, YouTube comprises billions of videos, which
are recommended over many hops within YouTube’s recommendation graph. Therefore, to
assess how prominent the problem is on a larger scale, we perform live random walks on
YouTube’s recommendation graph. This allows us to simulate the behavior of a “random
toddler” who searches the platform for a video and then he watches several videos according
to the recommendations. To do this, we use the lists of Elsagate-related and other child-related
seed keywords used for constructing our dataset, as well as a list of sanitized Elsagate-related
seed keywords which we construct by stripping all the inappropriate words from all the
Elsagate-related keywords using a dictionary of inappropriate words8. We do this to assess the
degree of the problem around Elsagate-related videos while ensuring that we are not biasing
the search results with any sensitive words.
For each seed keyword, we initially perform a search query on YouTube and randomly select
one video from the top ten results. Then, we obtain the recommendations of the video
and select one randomly. We iterate with the same process until we reach ten hops, which
constitutes the end of a single random walk. We repeat this operation for 100 random walks
for each seed keyword, while at the same time classifying each video we visit, using our binary
classifier.8https://tinyurl.com/yxb4kmxg
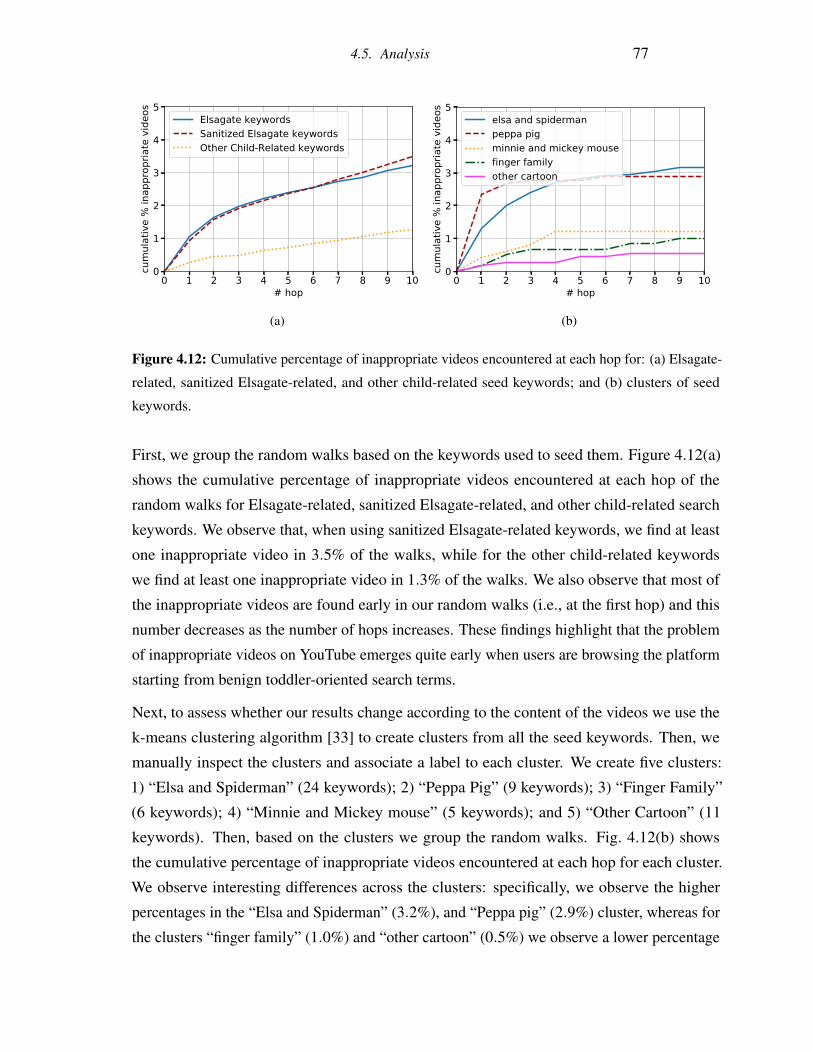
4.5. Analysis 77
(a) (b)
Figure 4.12: Cumulative percentage of inappropriate videos encountered at each hop for: (a) Elsagate-
related, sanitized Elsagate-related, and other child-related seed keywords; and (b) clusters of seed
keywords.
First, we group the random walks based on the keywords used to seed them. Figure 4.12(a)
shows the cumulative percentage of inappropriate videos encountered at each hop of the
random walks for Elsagate-related, sanitized Elsagate-related, and other child-related search
keywords. We observe that, when using sanitized Elsagate-related keywords, we find at least
one inappropriate video in 3.5% of the walks, while for the other child-related keywords
we find at least one inappropriate video in 1.3% of the walks. We also observe that most of
the inappropriate videos are found early in our random walks (i.e., at the first hop) and this
number decreases as the number of hops increases. These findings highlight that the problem
of inappropriate videos on YouTube emerges quite early when users are browsing the platform
starting from benign toddler-oriented search terms.
Next, to assess whether our results change according to the content of the videos we use the
k-means clustering algorithm [33] to create clusters from all the seed keywords. Then, we
manually inspect the clusters and associate a label to each cluster. We create five clusters:
1) “Elsa and Spiderman” (24 keywords); 2) “Peppa Pig” (9 keywords); 3) “Finger Family”
(6 keywords); 4) “Minnie and Mickey mouse” (5 keywords); and 5) “Other Cartoon” (11
keywords). Then, based on the clusters we group the random walks. Fig. 4.12(b) shows
the cumulative percentage of inappropriate videos encountered at each hop for each cluster.
We observe interesting differences across the clusters: specifically, we observe the higher
percentages in the “Elsa and Spiderman” (3.2%), and “Peppa pig” (2.9%) cluster, whereas for
the clusters “finger family” (1.0%) and “other cartoon” (0.5%) we observe a lower percentage
4.6. Challenges and Limitations 78
of walks with inappropriate videos. Also, we find that most of the inappropriate videos are
found at the beginning of the random walks in particular for the clusters “Peppa pig” (2.3%)
and “Elsa and Spiderman” (1.3%) (see the first hop in Fig. 4.12(b)).
Note that, by merging the two classes in the binary classifier while seeking out disturbing
videos with short random walks from suitable videos, we correct for the misclassification of
disturbing videos as restricted. That is, an NC-17 video in the proximity of benign toddler-
oriented videos could be erroneously classified as restricted by the multi-class classifier
(because of similarities with the NC-17 videos that do not target toddlers). However, due to
this proximity, this is probably an NC-17 video that targets toddlers and should have therefore
been classified as disturbing. Thus, the vast majority of inappropriate videos detected during
the random walks are expected to be disturbing. In fact, 84.6% of the detected inappropriate
videos are disturbing (obtained by inspecting all the 338 detected inappropriate videos). On
the other hand, videos that would be classified as irrelevant by the multi-class classifier, fall
under the appropriate category of the binary classifier. However, the training set for the
appropriate category includes irrelevant videos, which include PG and PG-13 videos that do
not target toddlers. Therefore, the binary classifier may classify such a video that is in the
proximity of suitable videos as appropriate. However, a PG and PG-13 video in the proximity
of suitable videos is likely to actually be disturbing, thus inappropriate. This negatively affects
the accuracy of the binary classifier. Yet, only 1.6% of the videos encountered during the
random walks and classified as appropriate were in fact disturbing (obtained by sampling 300
of the 176,619 detected appropriate videos).
4.6 Challenges and Limitations
In this section, we discuss the technical challenges we faced, how we addressed them, and we
highlight the limitations of this line of work.
4.6.1 Challenges
Our data collection and video annotation methodology faced many challenges. First, there was
no available dataset related to the Elsagate phenomenon nor there is a dataset with appropriate
and inappropriate videos targeting toddlers on YouTube. Following different approaches, we
compile lists of keywords from videos posted on Reddit and use them to search YouTube
4.7. Remarks 79
and collect videos. Second, devising a classifier that will detect disturbing videos targeting
young children is not trivial. To do this, we initially devised a multi-class deep learning
classifier that takes into account the various metadata of a given video. However, due to the
low performance of the multi-class classifier, we decide to collapse our labels into two and
train a binary classifier that can discern appropriate from inappropriate videos with rather
acceptable accuracy.
4.6.2 Limitations
Unfortunately, this line of work is not without limitations. First, we collect and analyze videos
only from YouTube and not YouTube Kids. This is because YouTube does not provide an open
API for collecting videos that appear on YouTube Kids. However, according to YouTube, only
videos marked as age-restricted are excluded from YouTube Kids unless specific settings are
set by the parent9. Second, we acknowledge that the performance of our classifier is highly
affected by the small training size: we were unable to provide a larger annotated dataset mainly
due to the lack of resources for the annotation process.
Moreover, the use of the YouTube Data API lets us analyze YouTube’s recommendation algo-
rithm’s output based on content relevance and the user base’s engagement in aggregate. Hence,
in this line of work, we do not consider per-user personalization; the video recommendations
we collect represent only some of the recommendation system’s facets. However, we believe
that our approach still allows us to understand how YouTube’s recommendation system is
behaving in our scenario.
4.7 Remarks
In this work, we presented the first characterization of inappropriate or disturbing videos
targeted at toddlers on YouTube. We collected thousands of Elsagate-related, other child-
related, as well as random and popular videos available on YouTube. We manually reviewed
5K of them, and we use them to develop a deep learning classifier that achieves an accuracy of
0.84. Our analysis on the manually reviewed videos showed that none of the videos’ metadata
can clearly indicate that a video is disturbing or not, thus, in most cases one (e.g., a guardian)
9https://support.google.com/youtubekids/answer/6130562?hl=en&ref_topic=
7556083
4.7. Remarks 80
has to carefully inspect all the available video metadata, and potentially the actual video, to
accurately determine if it is safe for a toddler to watch.
We then leveraged this classifier to perform a large-scale study of toddler-oriented content
on YouTube. We found 1.05% of the 233,337 Elsagate-related videos in our dataset to be
inappropriate, which indicates that the problem of toddler-oriented videos is prevalent enough
to be cause for concern. We also used the developed classifier to assess how prominent
the problem is on a larger scale. Specifically, we performed a live simulation of a toddler
who searches the platform for a video and then he watches several videos according to the
recommendations, finding a 3.5% chance of a toddler who starts by watching appropriate
videos to be recommended inappropriate ones within ten recommendations.
To the best of our knowledge, our analysis is the first large-scale attempt to characterize
disturbing videos targeted at toddlers on YouTube and to assess the chance of a toddler who
casually browses YouTube to come across such videos. Overall, our classifier and the insights
gained from our analysis can be used as a starting point to gain a deeper understanding and
begin mitigating this issue.
Chapter 5
Characterizing Hateful and MisogynisticContent on YouTube Through the Lens ofthe Incel Community
In the previous chapter, we show that inappropriate content exists on YouTube and we find
a non-negligible chance that its recommendation system will recommend such problematic
content to the wrong audience. At the same time, the platform and in particular its recommen-
dation algorithm has been repeatedly accused of promoting hateful and dangerous content, and
even for helping radicalize users [3, 5, 6]. Hence, in this chapter, we focus on characterizing
hateful and misogynistic content on YouTube to investigate these claims and to examine the
communities that the recommendation algorithm might create by promoting such problematic
content.
5.1 Motivation
One fringe community active on YouTube that has often been linked with sharing and pub-
lishing hateful and misogynistic content are the so-called Involuntary Celibates or Incels [24].
While not particularly structured, Incel’s ideology revolves around the idea of the “blackpill”
– a bitter and painful truth about society – which roughly postulates that life trajectories are
determined by how attractive one is. For example, Incels often deride the alleged rise of
lookism, whereby things that are largely out of personal control, like facial structure, are
more “valuable” than those under our control, like the fitness level. Incels are one of the most
81
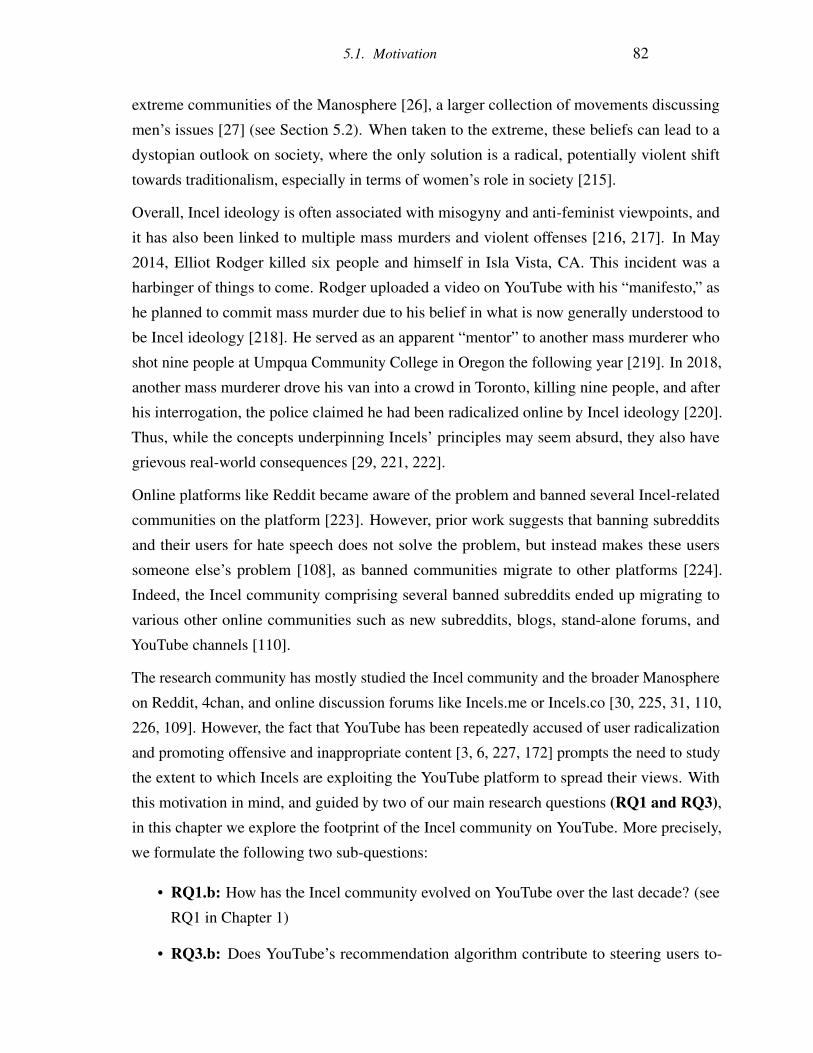
5.1. Motivation 82
extreme communities of the Manosphere [26], a larger collection of movements discussing
men’s issues [27] (see Section 5.2). When taken to the extreme, these beliefs can lead to a
dystopian outlook on society, where the only solution is a radical, potentially violent shift
towards traditionalism, especially in terms of women’s role in society [215].
Overall, Incel ideology is often associated with misogyny and anti-feminist viewpoints, and
it has also been linked to multiple mass murders and violent offenses [216, 217]. In May
2014, Elliot Rodger killed six people and himself in Isla Vista, CA. This incident was a
harbinger of things to come. Rodger uploaded a video on YouTube with his “manifesto,” as
he planned to commit mass murder due to his belief in what is now generally understood to
be Incel ideology [218]. He served as an apparent “mentor” to another mass murderer who
shot nine people at Umpqua Community College in Oregon the following year [219]. In 2018,
another mass murderer drove his van into a crowd in Toronto, killing nine people, and after
his interrogation, the police claimed he had been radicalized online by Incel ideology [220].
Thus, while the concepts underpinning Incels’ principles may seem absurd, they also have
grievous real-world consequences [29, 221, 222].
Online platforms like Reddit became aware of the problem and banned several Incel-related
communities on the platform [223]. However, prior work suggests that banning subreddits
and their users for hate speech does not solve the problem, but instead makes these users
someone else’s problem [108], as banned communities migrate to other platforms [224].
Indeed, the Incel community comprising several banned subreddits ended up migrating to
various other online communities such as new subreddits, blogs, stand-alone forums, and
YouTube channels [110].
The research community has mostly studied the Incel community and the broader Manosphere
on Reddit, 4chan, and online discussion forums like Incels.me or Incels.co [30, 225, 31, 110,
226, 109]. However, the fact that YouTube has been repeatedly accused of user radicalization
and promoting offensive and inappropriate content [3, 6, 227, 172] prompts the need to study
the extent to which Incels are exploiting the YouTube platform to spread their views. With
this motivation in mind, and guided by two of our main research questions (RQ1 and RQ3),in this chapter we explore the footprint of the Incel community on YouTube. More precisely,
we formulate the following two sub-questions:
• RQ1.b: How has the Incel community evolved on YouTube over the last decade? (see
RQ1 in Chapter 1)
• RQ3.b: Does YouTube’s recommendation algorithm contribute to steering users to-
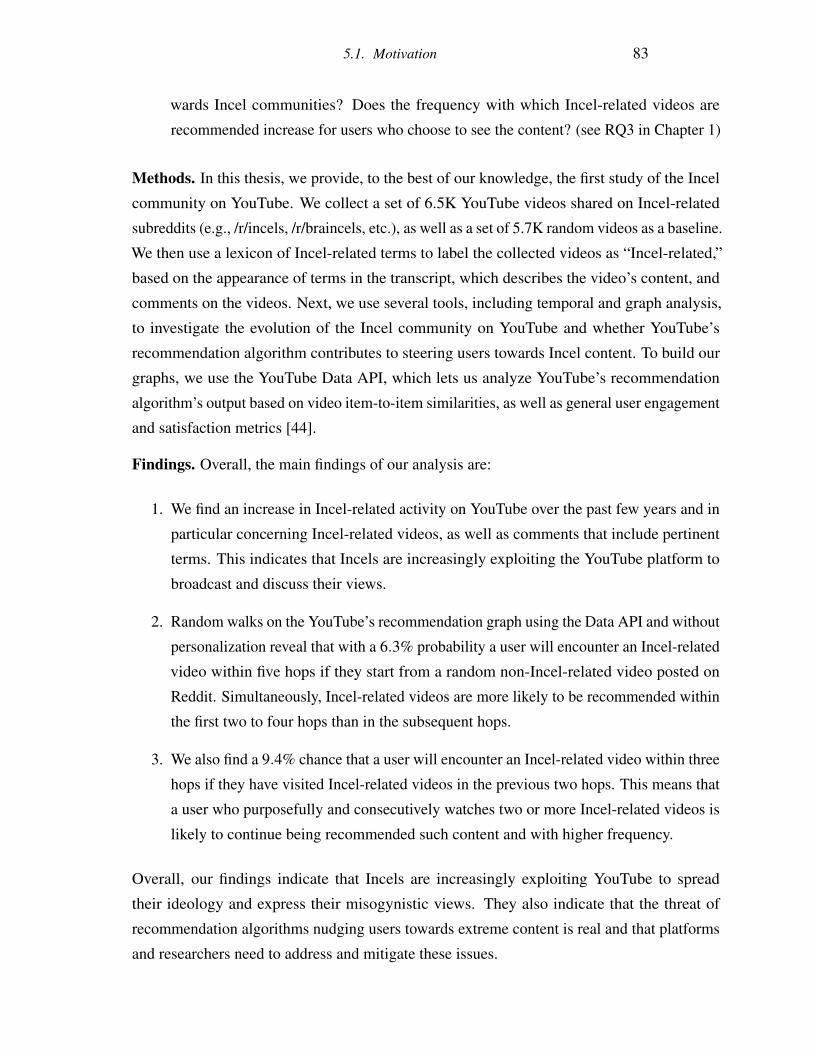
5.1. Motivation 83
wards Incel communities? Does the frequency with which Incel-related videos are
recommended increase for users who choose to see the content? (see RQ3 in Chapter 1)
Methods. In this thesis, we provide, to the best of our knowledge, the first study of the Incel
community on YouTube. We collect a set of 6.5K YouTube videos shared on Incel-related
subreddits (e.g., /r/incels, /r/braincels, etc.), as well as a set of 5.7K random videos as a baseline.
We then use a lexicon of Incel-related terms to label the collected videos as “Incel-related,”
based on the appearance of terms in the transcript, which describes the video’s content, and
comments on the videos. Next, we use several tools, including temporal and graph analysis,
to investigate the evolution of the Incel community on YouTube and whether YouTube’s
recommendation algorithm contributes to steering users towards Incel content. To build our
graphs, we use the YouTube Data API, which lets us analyze YouTube’s recommendation
algorithm’s output based on video item-to-item similarities, as well as general user engagement
and satisfaction metrics [44].
Findings. Overall, the main findings of our analysis are:
1. We find an increase in Incel-related activity on YouTube over the past few years and in
particular concerning Incel-related videos, as well as comments that include pertinent
terms. This indicates that Incels are increasingly exploiting the YouTube platform to
broadcast and discuss their views.
2. Random walks on the YouTube’s recommendation graph using the Data API and without
personalization reveal that with a 6.3% probability a user will encounter an Incel-related
video within five hops if they start from a random non-Incel-related video posted on
Reddit. Simultaneously, Incel-related videos are more likely to be recommended within
the first two to four hops than in the subsequent hops.
3. We also find a 9.4% chance that a user will encounter an Incel-related video within three
hops if they have visited Incel-related videos in the previous two hops. This means that
a user who purposefully and consecutively watches two or more Incel-related videos is
likely to continue being recommended such content and with higher frequency.
Overall, our findings indicate that Incels are increasingly exploiting YouTube to spread
their ideology and express their misogynistic views. They also indicate that the threat of
recommendation algorithms nudging users towards extreme content is real and that platforms
and researchers need to address and mitigate these issues.
5.2. Background 84
5.2 Background
Incels are a part of the broader ”Manosphere,” a loose collection of groups revolving around
a common shared interest in “men’s rights” in society [27]. While we focus on Incels,
understanding the overall Manosphere movement provides relevant context. In this section,
we provide background information about Incels and the Manosphere. We also review related
work focusing on understanding Incels on the Web.
The Manosphere. The emergence of the so-called Web 2.0 and popular social media platforms
have been crucial in enabling the Manosphere [228]. Although the Manosphere had roots in
anti-feminism [229, 230], it is ultimately a reactionary community, with its ideology evolving
and spreading mostly on the Web [27]. Coston et al. [231] argue about the growth of feminism:
”If women were imprisoned in the home [...] then men were exiled from the home, turned into
soulless robotic workers, in harness to a masculine mystique, so that their only capacity for
nurturing was through their wallets.” Further, Blais et al. [232] analyze the beliefs concerning
the Manosphere from a sociological perspective and refer to it as masculinism. They conclude
that masculinism is: ”a trend within the anti-feminist counter-movement mobilized not only
against the feminist movement but also for the defense of a non-egalitarian social and political
system, that is, patriarchy.” Subgroups within the Manosphere actually differ significantly.
For instance, Men Going Their Own Way (MGTOWs) are hyper-focused on a particular set
of men’s rights, often in the context of a bad relationship with a woman. These subgroups
should not be seen as distinct units. Instead, they are interconnected nodes in a network of
misogynistic discourses and beliefs [233]. According to Marwick and Lewis [228], what binds
the manosphere subgroups is “the idea that men and boys are victimized; that feminists, in
particular, are the perpetrators of such attacks.”
Overall, research studying the Manosphere has been mostly theoretical and qualitative in
nature [27, 234, 235, 236]. These qualitative studies are important because they guide our
study in terms of framework and conceptualization while motivating large-scale data-driven
work like ours.
Incels. Incels are arguably the most extreme subgroup of the Manosphere [237]. Incels
appear disarmingly honest about what is causing their grievances compared to other radical
ideologies. They openly put their sexual deprivation, which is supposedly caused by their
unattractive appearance, at the forefront, thus rendering their radical movement potentially
more persuasive and insidious [226]. Incel ideology differs from the other Manosphere
5.3. Datasets 85
subgroups in the significance of the ”involuntary” aspect of their celibacy. They believe that
society is rigged against them in terms of sexual activity, and there is no solution at a personal
level for the systemic dating problems of men [238, 239, 240]. Further, Incel ideology differs
from, for example, MGTOW, in the idea of voluntary vs. involuntary celibacy. MGTOWs
are choosing to not partake in sexual activities, while Incels believe that society adversarially
deprives them of sexual activity. This difference is crucial, as it gives rise to some of their
more violent tendencies [27].
Incels believe to be doomed from birth to suffer in a modern society where women are not only
able but encouraged to focus on superficial aspects of potential mates, e.g., facial structure
or racial attributes. Some of the earliest studies of ”involuntary celibacy” note that celibates
tend to be more introverted and that, unlike women, celibate men in their 30s tend to be
poorer or even unemployed [241]. In this distorted view of reality, men with these desirable
attributes (colloquially nicknamed Chads by Incels) are placed at the top of society’s hierarchy.
While a perusal of influential people in the world would perhaps lend credence to the idea that
”handsome” white men are indeed at the top, the Incel ideology takes it to the extreme. Incels
rarely hesitate to call for violence [120]. For example, seeking advice by other Incels based
on their physical appearance using the phrase ”How over is it?,” they may be encouraged to
“rope” (to hang oneself), or commit suicide [242]. Occasionally they also approach calls for
outright gendercide. Zimmerman et al. [243] associate Incel ideology with white supremacy,
highlighting how it should be taken as seriously as other forms of violent extremism.
5.3 Datasets
We now present our data collection and annotation process to identify Incel-related videos.
5.3.1 Data Collection
To collect Incel-related videos on YouTube, we look for YouTube links on Reddit (Step 1 in
Figure 5.1), since recent work highlighted that Incels are particularly active on Reddit [110].
We start by creating a list of subreddits that are relevant to Incels. To do so, we inspect around
15 posts on the Incel Wiki [244] looking for references to subreddits, and compile a list of
19 Incel-related subreddits. This list also includes a set of communities broadly relevant to
Incel ideology (even possibly anti-incel like /r/Inceltears) to capture a broader collection of
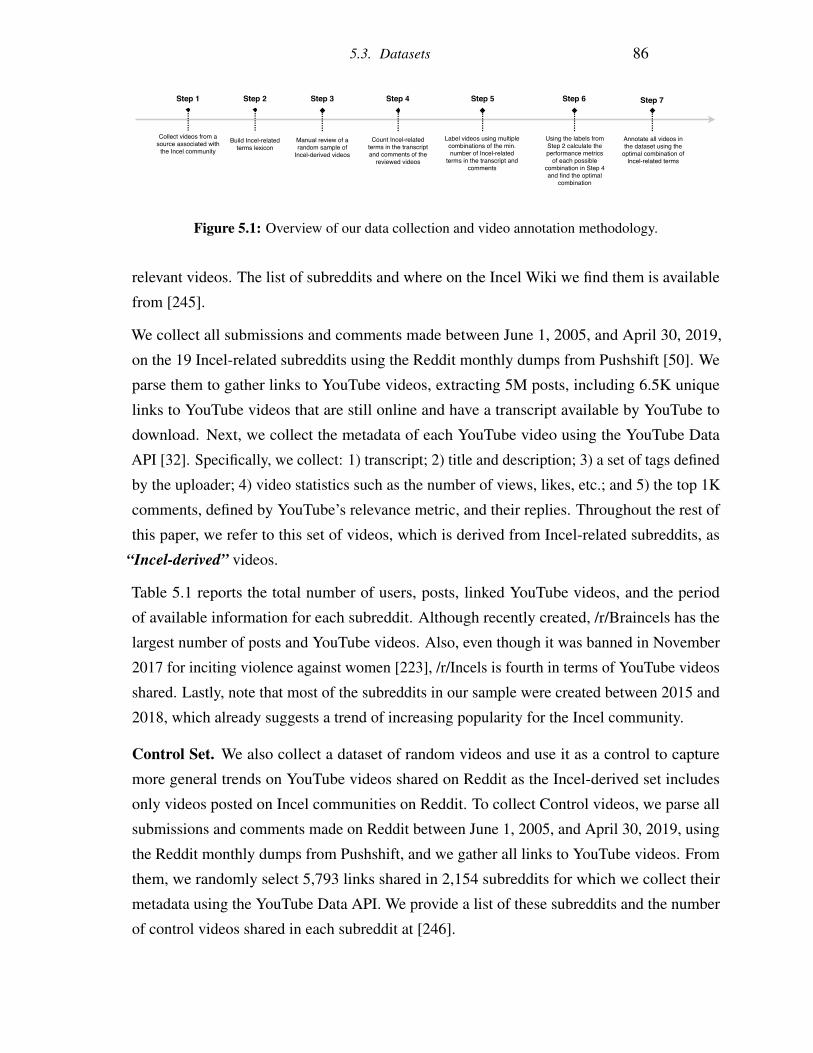
5.3. Datasets 86
Build Incel-relatedterms lexicon
Step 2 Step 3
Manual review of arandom sample of
Incel-derived videos
Step 4
Count Incel-relatedterms in the transcriptand comments of the
reviewed videos
Label videos using multiplecombinations of the min.number of Incel-related
terms in the transcript andcomments
Using the labels fromStep 2 calculate theperformance metrics
of each possiblecombination in Step 4and find the optimal
combination
Step 5 Step 6
Annotate all videos inthe dataset using the
optimal combination ofIncel-related terms
Step 7
Collect videos from asource associated with
the Incel community
Step 1
Figure 5.1: Overview of our data collection and video annotation methodology.
relevant videos. The list of subreddits and where on the Incel Wiki we find them is available
from [245].
We collect all submissions and comments made between June 1, 2005, and April 30, 2019,
on the 19 Incel-related subreddits using the Reddit monthly dumps from Pushshift [50]. We
parse them to gather links to YouTube videos, extracting 5M posts, including 6.5K unique
links to YouTube videos that are still online and have a transcript available by YouTube to
download. Next, we collect the metadata of each YouTube video using the YouTube Data
API [32]. Specifically, we collect: 1) transcript; 2) title and description; 3) a set of tags defined
by the uploader; 4) video statistics such as the number of views, likes, etc.; and 5) the top 1K
comments, defined by YouTube’s relevance metric, and their replies. Throughout the rest of
this paper, we refer to this set of videos, which is derived from Incel-related subreddits, as
“Incel-derived” videos.
Table 5.1 reports the total number of users, posts, linked YouTube videos, and the period
of available information for each subreddit. Although recently created, /r/Braincels has the
largest number of posts and YouTube videos. Also, even though it was banned in November
2017 for inciting violence against women [223], /r/Incels is fourth in terms of YouTube videos
shared. Lastly, note that most of the subreddits in our sample were created between 2015 and
2018, which already suggests a trend of increasing popularity for the Incel community.
Control Set. We also collect a dataset of random videos and use it as a control to capture
more general trends on YouTube videos shared on Reddit as the Incel-derived set includes
only videos posted on Incel communities on Reddit. To collect Control videos, we parse all
submissions and comments made on Reddit between June 1, 2005, and April 30, 2019, using
the Reddit monthly dumps from Pushshift, and we gather all links to YouTube videos. From
them, we randomly select 5,793 links shared in 2,154 subreddits for which we collect their
metadata using the YouTube Data API. We provide a list of these subreddits and the number
of control videos shared in each subreddit at [246].
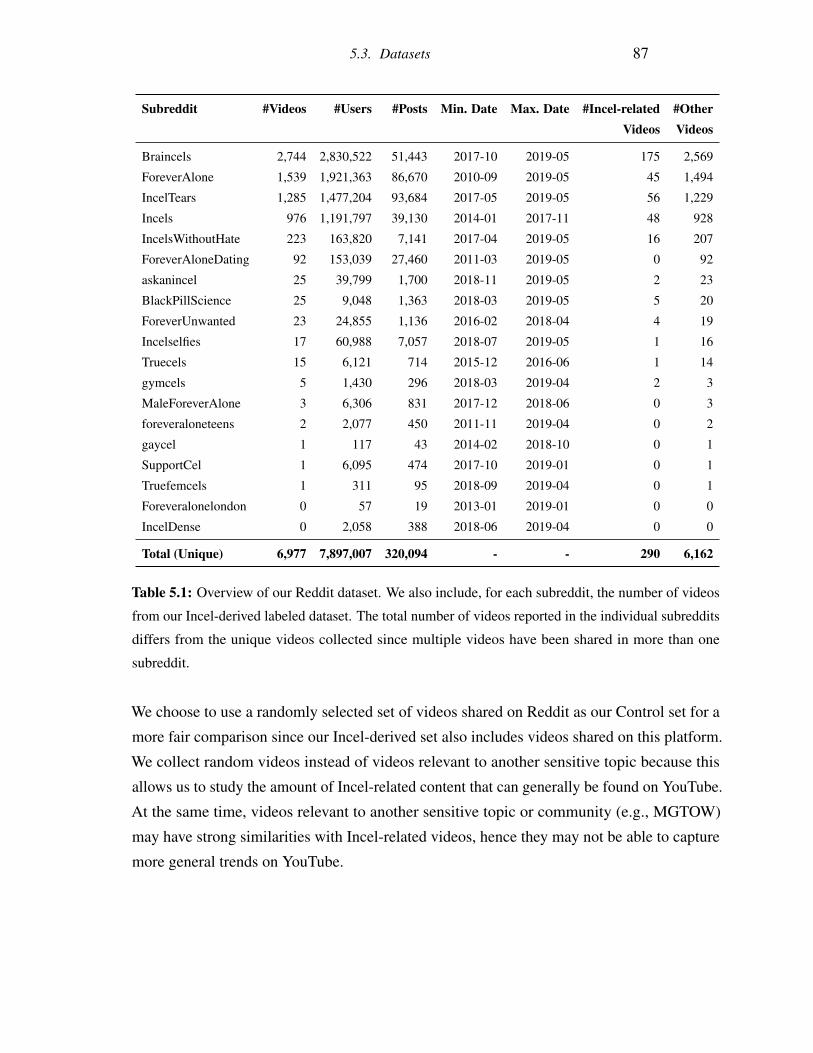
5.3. Datasets 87
Subreddit #Videos #Users #Posts Min. Date Max. Date #Incel-related #OtherVideos Videos
Braincels 2,744 2,830,522 51,443 2017-10 2019-05 175 2,569
ForeverAlone 1,539 1,921,363 86,670 2010-09 2019-05 45 1,494
IncelTears 1,285 1,477,204 93,684 2017-05 2019-05 56 1,229
Incels 976 1,191,797 39,130 2014-01 2017-11 48 928
IncelsWithoutHate 223 163,820 7,141 2017-04 2019-05 16 207
ForeverAloneDating 92 153,039 27,460 2011-03 2019-05 0 92
askanincel 25 39,799 1,700 2018-11 2019-05 2 23
BlackPillScience 25 9,048 1,363 2018-03 2019-05 5 20
ForeverUnwanted 23 24,855 1,136 2016-02 2018-04 4 19
Incelselfies 17 60,988 7,057 2018-07 2019-05 1 16
Truecels 15 6,121 714 2015-12 2016-06 1 14
gymcels 5 1,430 296 2018-03 2019-04 2 3
MaleForeverAlone 3 6,306 831 2017-12 2018-06 0 3
foreveraloneteens 2 2,077 450 2011-11 2019-04 0 2
gaycel 1 117 43 2014-02 2018-10 0 1
SupportCel 1 6,095 474 2017-10 2019-01 0 1
Truefemcels 1 311 95 2018-09 2019-04 0 1
Foreveralonelondon 0 57 19 2013-01 2019-01 0 0
IncelDense 0 2,058 388 2018-06 2019-04 0 0
Total (Unique) 6,977 7,897,007 320,094 - - 290 6,162
Table 5.1: Overview of our Reddit dataset. We also include, for each subreddit, the number of videos
from our Incel-derived labeled dataset. The total number of videos reported in the individual subreddits
differs from the unique videos collected since multiple videos have been shared in more than one
subreddit.
We choose to use a randomly selected set of videos shared on Reddit as our Control set for a
more fair comparison since our Incel-derived set also includes videos shared on this platform.
We collect random videos instead of videos relevant to another sensitive topic because this
allows us to study the amount of Incel-related content that can generally be found on YouTube.
At the same time, videos relevant to another sensitive topic or community (e.g., MGTOW)
may have strong similarities with Incel-related videos, hence they may not be able to capture
more general trends on YouTube.
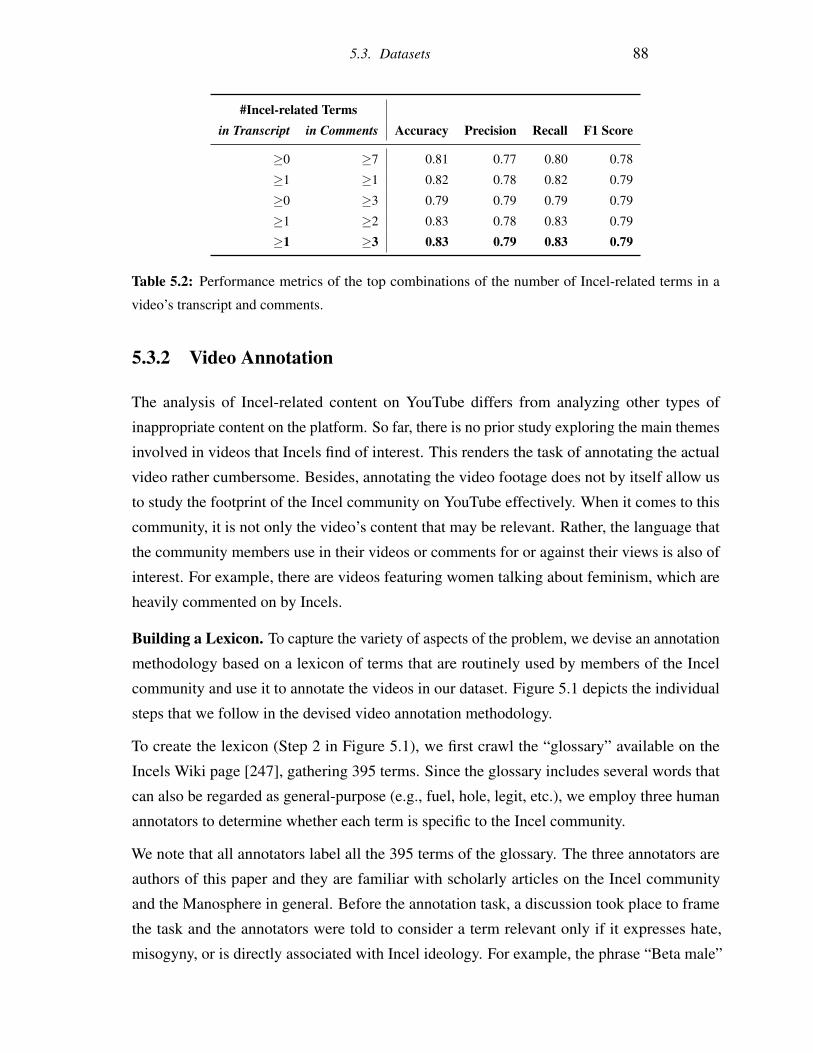
5.3. Datasets 88
#Incel-related Termsin Transcript in Comments Accuracy Precision Recall F1 Score
≥0 ≥7 0.81 0.77 0.80 0.78
≥1 ≥1 0.82 0.78 0.82 0.79
≥0 ≥3 0.79 0.79 0.79 0.79
≥1 ≥2 0.83 0.78 0.83 0.79
≥1 ≥3 0.83 0.79 0.83 0.79
Table 5.2: Performance metrics of the top combinations of the number of Incel-related terms in a
video’s transcript and comments.
5.3.2 Video Annotation
The analysis of Incel-related content on YouTube differs from analyzing other types of
inappropriate content on the platform. So far, there is no prior study exploring the main themes
involved in videos that Incels find of interest. This renders the task of annotating the actual
video rather cumbersome. Besides, annotating the video footage does not by itself allow us
to study the footprint of the Incel community on YouTube effectively. When it comes to this
community, it is not only the video’s content that may be relevant. Rather, the language that
the community members use in their videos or comments for or against their views is also of
interest. For example, there are videos featuring women talking about feminism, which are
heavily commented on by Incels.
Building a Lexicon. To capture the variety of aspects of the problem, we devise an annotation
methodology based on a lexicon of terms that are routinely used by members of the Incel
community and use it to annotate the videos in our dataset. Figure 5.1 depicts the individual
steps that we follow in the devised video annotation methodology.
To create the lexicon (Step 2 in Figure 5.1), we first crawl the “glossary” available on the
Incels Wiki page [247], gathering 395 terms. Since the glossary includes several words that
can also be regarded as general-purpose (e.g., fuel, hole, legit, etc.), we employ three human
annotators to determine whether each term is specific to the Incel community.
We note that all annotators label all the 395 terms of the glossary. The three annotators are
authors of this paper and they are familiar with scholarly articles on the Incel community
and the Manosphere in general. Before the annotation task, a discussion took place to frame
the task and the annotators were told to consider a term relevant only if it expresses hate,
misogyny, or is directly associated with Incel ideology. For example, the phrase “Beta male”
5.3. Datasets 89
or any Incel-related incident (e.g., “supreme gentleman,” an indirect reference to the Isla Vista
killer Elliot Rodgers [218]). We note that, during the labeling, the annotators had no discussion
or communication whatsoever about the task at hand.
We then create our lexicon by only considering the terms annotated as relevant, based on all
the annotators’ majority agreement, which yields a 200 Incel-related term dictionary. We
also compute the Fleiss’ Kappa Score [204] to assess the agreement between the annotators,
finding it to be 0.69, which is considered “substantial” agreement [248]. The final lexicon
with all the relevant terms is available from [249].
Labeling. Next, we use the lexicon to label the videos in our dataset. We look for these
terms in the transcript, title, tags, and comments of our dataset videos. Most matches are
from the transcript and the videos’ comments; thus, we decide to use these to determine
whether a video is Incel-related. To select the minimum number of Incel-related terms that
transcripts and comments should contain to be labeled as “Incel-related,” we devise the
following methodology:
1. We randomly select 1K videos from the Incel-derived set, which the first author of this
paper manually annotates as “Incel-related” or “Other” by watching them and looking
at the metadata. Note that Incel-related videos are a subset of Incel-derived ones (Step 3
in Figure 5.1).
2. We count the number of Incel-related terms in the transcript and the annotated videos’
comments (Step 4 in Figure 5.1).
3. For each possible combination of the minimum number of Incel-related terms in the
transcript and the comments, we label each video as Incel-related or not, and calculate
the accuracy, precision, recall, and F1 score based on the labels assigned to the videos
during the manual annotation (Steps 5 and 6 in Figure 5.1).
Table 5.2 shows the performance metrics for the top five combinations of the number of
Incel-related terms in the transcript and the comments. We pick the one yielding the best F1
score (to balance between false positives and false negatives), which is reached if we label a
video as Incel-related when there is at least one Incel-related term in the transcript and at least
three in the comments. Using this rule, we annotate all the videos in our dataset (Steps 6 and 7
in Figure 5.1).
Table 5.1 reports the label statistics of the Incel-derived videos per subreddit. Our final labeled
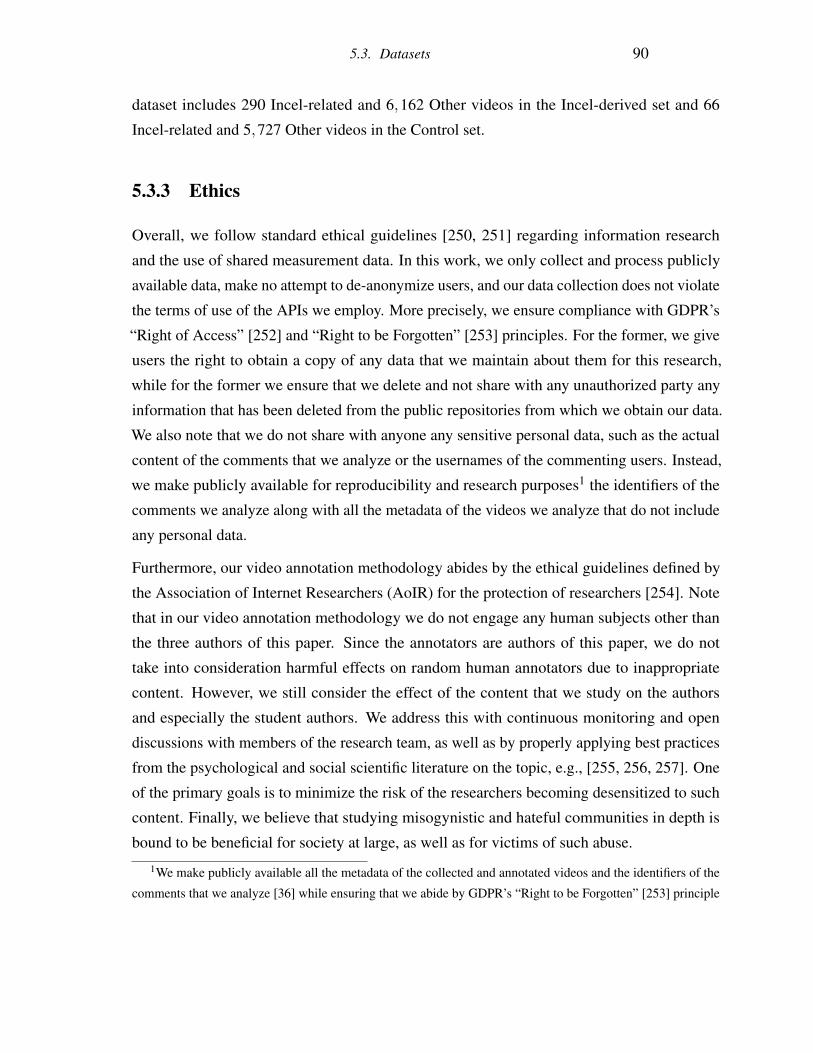
5.3. Datasets 90
dataset includes 290 Incel-related and 6,162 Other videos in the Incel-derived set and 66
Incel-related and 5,727 Other videos in the Control set.
5.3.3 Ethics
Overall, we follow standard ethical guidelines [250, 251] regarding information research
and the use of shared measurement data. In this work, we only collect and process publicly
available data, make no attempt to de-anonymize users, and our data collection does not violate
the terms of use of the APIs we employ. More precisely, we ensure compliance with GDPR’s
“Right of Access” [252] and “Right to be Forgotten” [253] principles. For the former, we give
users the right to obtain a copy of any data that we maintain about them for this research,
while for the former we ensure that we delete and not share with any unauthorized party any
information that has been deleted from the public repositories from which we obtain our data.
We also note that we do not share with anyone any sensitive personal data, such as the actual
content of the comments that we analyze or the usernames of the commenting users. Instead,
we make publicly available for reproducibility and research purposes1 the identifiers of the
comments we analyze along with all the metadata of the videos we analyze that do not include
any personal data.
Furthermore, our video annotation methodology abides by the ethical guidelines defined by
the Association of Internet Researchers (AoIR) for the protection of researchers [254]. Note
that in our video annotation methodology we do not engage any human subjects other than
the three authors of this paper. Since the annotators are authors of this paper, we do not
take into consideration harmful effects on random human annotators due to inappropriate
content. However, we still consider the effect of the content that we study on the authors
and especially the student authors. We address this with continuous monitoring and open
discussions with members of the research team, as well as by properly applying best practices
from the psychological and social scientific literature on the topic, e.g., [255, 256, 257]. One
of the primary goals is to minimize the risk of the researchers becoming desensitized to such
content. Finally, we believe that studying misogynistic and hateful communities in depth is
bound to be beneficial for society at large, as well as for victims of such abuse.
1We make publicly available all the metadata of the collected and annotated videos and the identifiers of the
comments that we analyze [36] while ensuring that we abide by GDPR’s “Right to be Forgotten” [253] principle
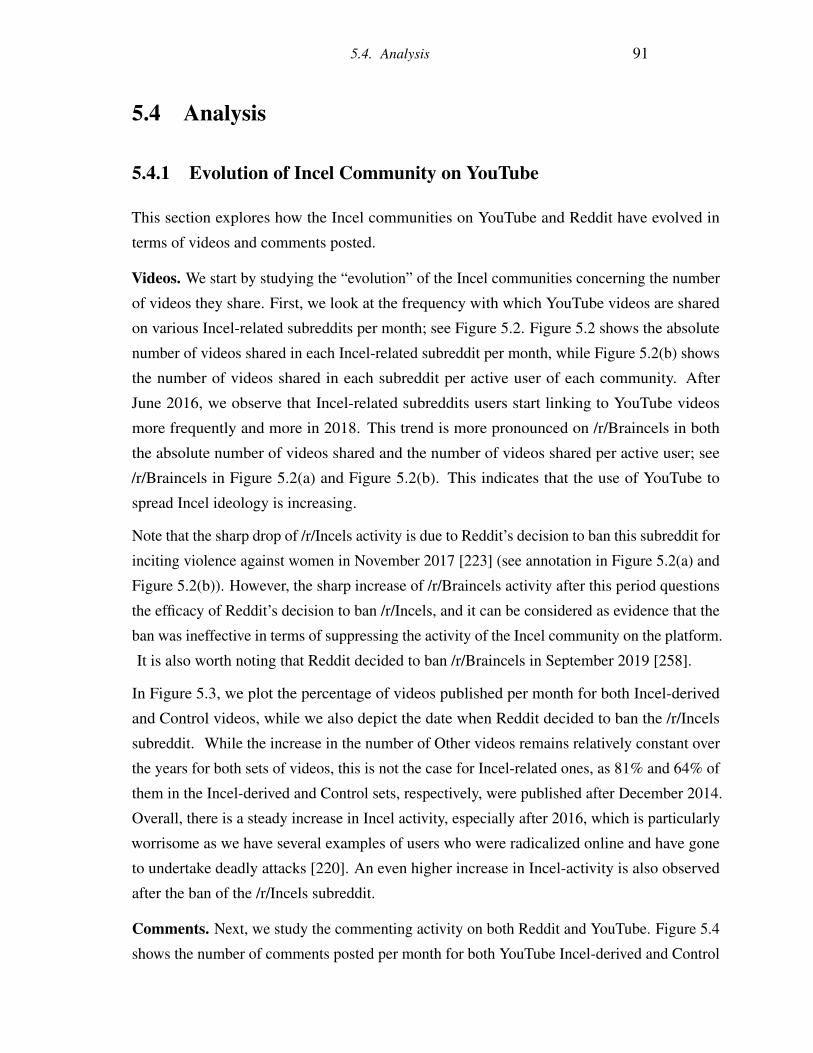
5.4. Analysis 91
5.4 Analysis
5.4.1 Evolution of Incel Community on YouTube
This section explores how the Incel communities on YouTube and Reddit have evolved in
terms of videos and comments posted.
Videos. We start by studying the “evolution” of the Incel communities concerning the number
of videos they share. First, we look at the frequency with which YouTube videos are shared
on various Incel-related subreddits per month; see Figure 5.2. Figure 5.2 shows the absolute
number of videos shared in each Incel-related subreddit per month, while Figure 5.2(b) shows
the number of videos shared in each subreddit per active user of each community. After
June 2016, we observe that Incel-related subreddits users start linking to YouTube videos
more frequently and more in 2018. This trend is more pronounced on /r/Braincels in both
the absolute number of videos shared and the number of videos shared per active user; see
/r/Braincels in Figure 5.2(a) and Figure 5.2(b). This indicates that the use of YouTube to
spread Incel ideology is increasing.
Note that the sharp drop of /r/Incels activity is due to Reddit’s decision to ban this subreddit for
inciting violence against women in November 2017 [223] (see annotation in Figure 5.2(a) and
Figure 5.2(b)). However, the sharp increase of /r/Braincels activity after this period questions
the efficacy of Reddit’s decision to ban /r/Incels, and it can be considered as evidence that the
ban was ineffective in terms of suppressing the activity of the Incel community on the platform.
It is also worth noting that Reddit decided to ban /r/Braincels in September 2019 [258].
In Figure 5.3, we plot the percentage of videos published per month for both Incel-derived
and Control videos, while we also depict the date when Reddit decided to ban the /r/Incels
subreddit. While the increase in the number of Other videos remains relatively constant over
the years for both sets of videos, this is not the case for Incel-related ones, as 81% and 64% of
them in the Incel-derived and Control sets, respectively, were published after December 2014.
Overall, there is a steady increase in Incel activity, especially after 2016, which is particularly
worrisome as we have several examples of users who were radicalized online and have gone
to undertake deadly attacks [220]. An even higher increase in Incel-activity is also observed
after the ban of the /r/Incels subreddit.
Comments. Next, we study the commenting activity on both Reddit and YouTube. Figure 5.4
shows the number of comments posted per month for both YouTube Incel-derived and Control
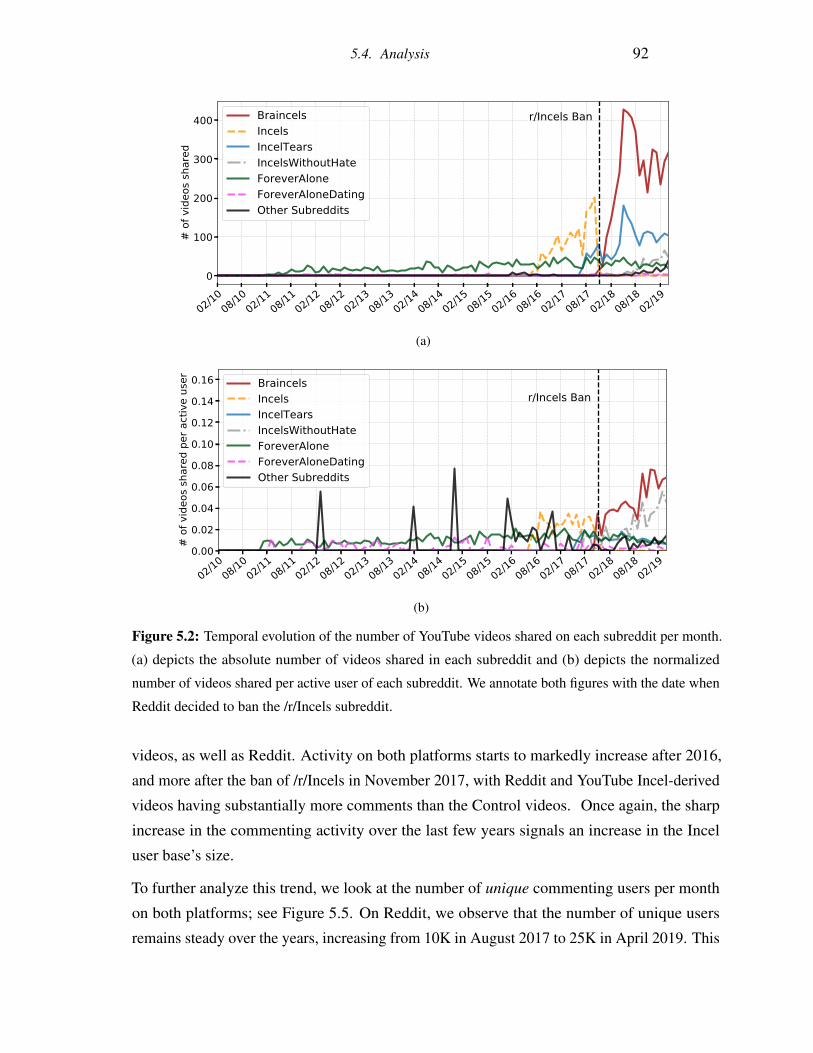
5.4. Analysis 92
02/1008/10
02/1108/11
02/1208/12
02/1308/13
02/1408/14
02/1508/15
02/1608/16
02/1708/17
02/1808/18
02/190
100
200
300
400
# of
vid
eos s
hare
d
r/Incels BanBraincelsIncelsIncelTearsIncelsWithoutHateForeverAloneForeverAloneDatingOther Subreddits
(a)
02/1008/10
02/1108/11
02/1208/12
02/1308/13
02/1408/14
02/1508/15
02/1608/16
02/1708/17
02/1808/18
02/190.00
0.02
0.04
0.06
0.08
0.10
0.12
0.14
0.16
# of
vid
eos s
hare
d pe
r act
ive
user
r/Incels BanBraincelsIncelsIncelTearsIncelsWithoutHateForeverAloneForeverAloneDatingOther Subreddits
(b)
Figure 5.2: Temporal evolution of the number of YouTube videos shared on each subreddit per month.
(a) depicts the absolute number of videos shared in each subreddit and (b) depicts the normalized
number of videos shared per active user of each subreddit. We annotate both figures with the date when
Reddit decided to ban the /r/Incels subreddit.
videos, as well as Reddit. Activity on both platforms starts to markedly increase after 2016,
and more after the ban of /r/Incels in November 2017, with Reddit and YouTube Incel-derived
videos having substantially more comments than the Control videos. Once again, the sharp
increase in the commenting activity over the last few years signals an increase in the Incel
user base’s size.
To further analyze this trend, we look at the number of unique commenting users per month
on both platforms; see Figure 5.5. On Reddit, we observe that the number of unique users
remains steady over the years, increasing from 10K in August 2017 to 25K in April 2019. This
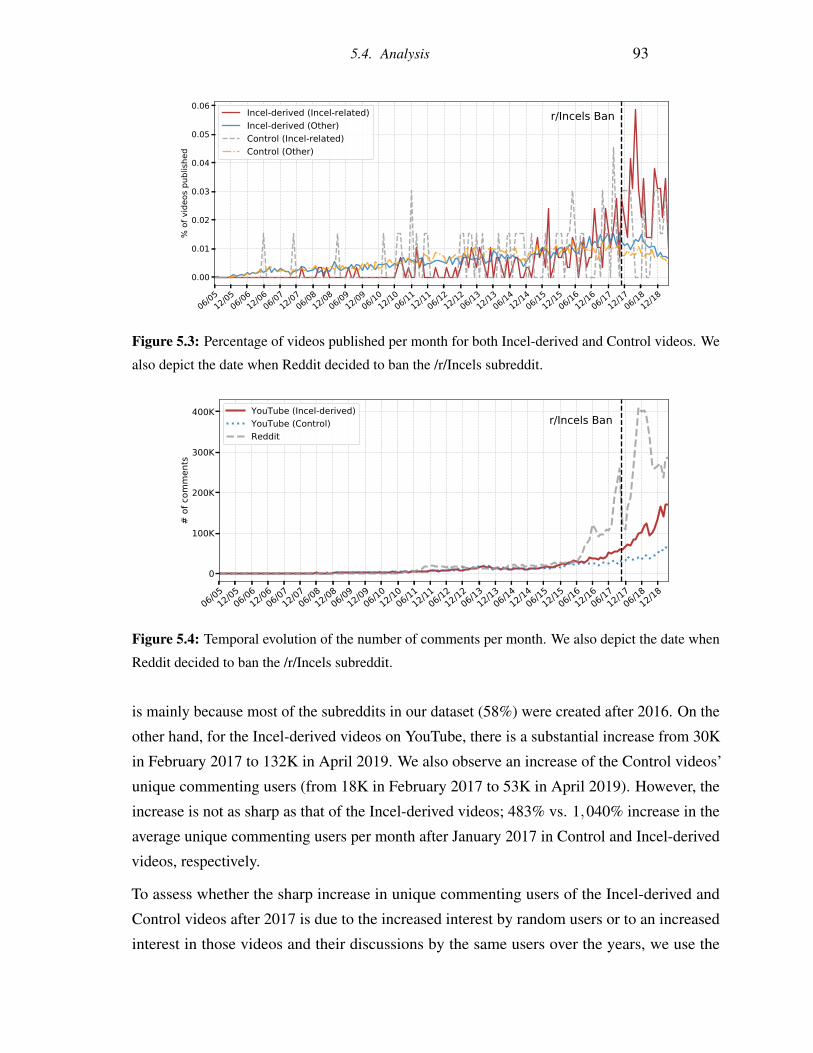
5.4. Analysis 93
06/0512/05
06/0612/06
06/0712/07
06/0812/08
06/0912/09
06/1012/10
06/1112/11
06/1212/12
06/1312/13
06/1412/14
06/1512/15
06/1612/16
06/1712/17
06/1812/18
0.00
0.01
0.02
0.03
0.04
0.05
0.06
% o
f vid
eos p
ublis
hed
r/Incels BanIncel-derived (Incel-related)Incel-derived (Other)Control (Incel-related)Control (Other)
Figure 5.3: Percentage of videos published per month for both Incel-derived and Control videos. We
also depict the date when Reddit decided to ban the /r/Incels subreddit.
06/0512/05
06/0612/06
06/0712/07
06/0812/08
06/0912/09
06/1012/10
06/1112/11
06/1212/12
06/1312/13
06/1412/14
06/1512/15
06/1612/16
06/1712/17
06/1812/18
0
100K
200K
300K
400K
# of
com
men
ts
r/Incels BanYouTube (Incel-derived)YouTube (Control)Reddit
Figure 5.4: Temporal evolution of the number of comments per month. We also depict the date when
Reddit decided to ban the /r/Incels subreddit.
is mainly because most of the subreddits in our dataset (58%) were created after 2016. On the
other hand, for the Incel-derived videos on YouTube, there is a substantial increase from 30K
in February 2017 to 132K in April 2019. We also observe an increase of the Control videos’
unique commenting users (from 18K in February 2017 to 53K in April 2019). However, the
increase is not as sharp as that of the Incel-derived videos; 483% vs. 1,040% increase in the
average unique commenting users per month after January 2017 in Control and Incel-derived
videos, respectively.
To assess whether the sharp increase in unique commenting users of the Incel-derived and
Control videos after 2017 is due to the increased interest by random users or to an increased
interest in those videos and their discussions by the same users over the years, we use the
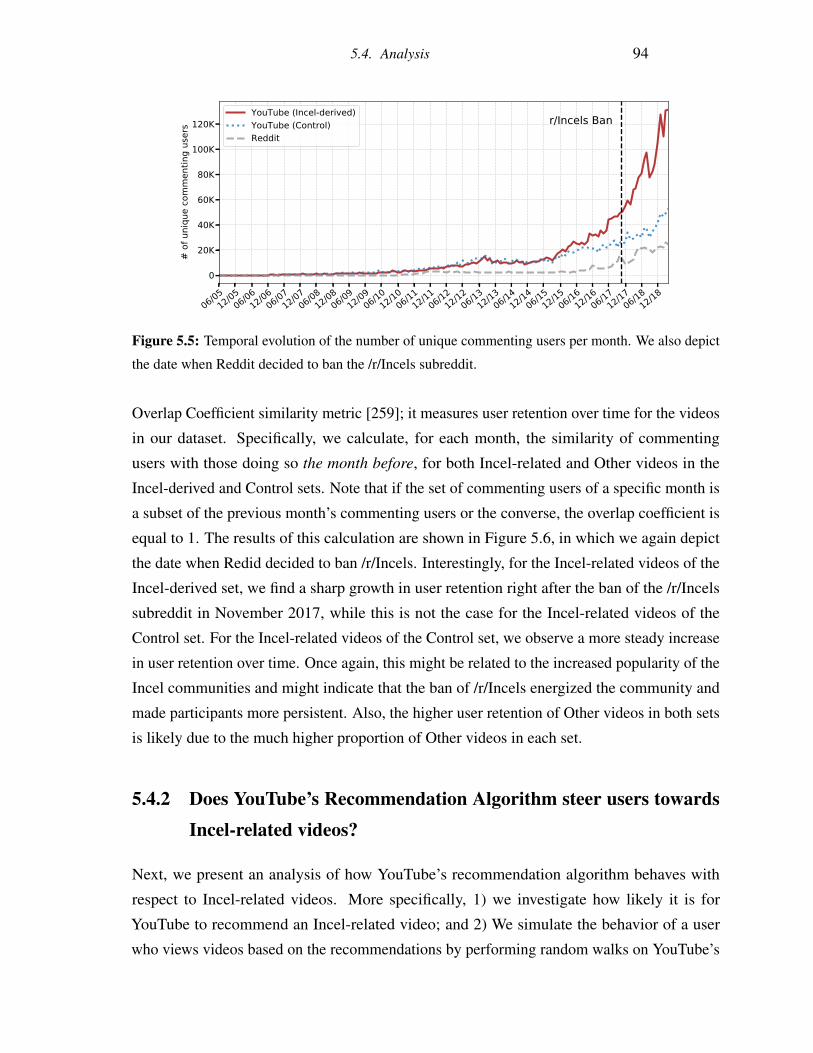
5.4. Analysis 94
06/0512/05
06/0612/06
06/0712/07
06/0812/08
06/0912/09
06/1012/10
06/1112/11
06/1212/12
06/1312/13
06/1412/14
06/1512/15
06/1612/16
06/1712/17
06/1812/18
0
20K
40K
60K
80K
100K
120K
# of
uni
que
com
men
ting
user
s r/Incels BanYouTube (Incel-derived)YouTube (Control)Reddit
Figure 5.5: Temporal evolution of the number of unique commenting users per month. We also depict
the date when Reddit decided to ban the /r/Incels subreddit.
Overlap Coefficient similarity metric [259]; it measures user retention over time for the videos
in our dataset. Specifically, we calculate, for each month, the similarity of commenting
users with those doing so the month before, for both Incel-related and Other videos in the
Incel-derived and Control sets. Note that if the set of commenting users of a specific month is
a subset of the previous month’s commenting users or the converse, the overlap coefficient is
equal to 1. The results of this calculation are shown in Figure 5.6, in which we again depict
the date when Redid decided to ban /r/Incels. Interestingly, for the Incel-related videos of the
Incel-derived set, we find a sharp growth in user retention right after the ban of the /r/Incels
subreddit in November 2017, while this is not the case for the Incel-related videos of the
Control set. For the Incel-related videos of the Control set, we observe a more steady increase
in user retention over time. Once again, this might be related to the increased popularity of the
Incel communities and might indicate that the ban of /r/Incels energized the community and
made participants more persistent. Also, the higher user retention of Other videos in both sets
is likely due to the much higher proportion of Other videos in each set.
5.4.2 Does YouTube’s Recommendation Algorithm steer users towardsIncel-related videos?
Next, we present an analysis of how YouTube’s recommendation algorithm behaves with
respect to Incel-related videos. More specifically, 1) we investigate how likely it is for
YouTube to recommend an Incel-related video; and 2) We simulate the behavior of a user
who views videos based on the recommendations by performing random walks on YouTube’s
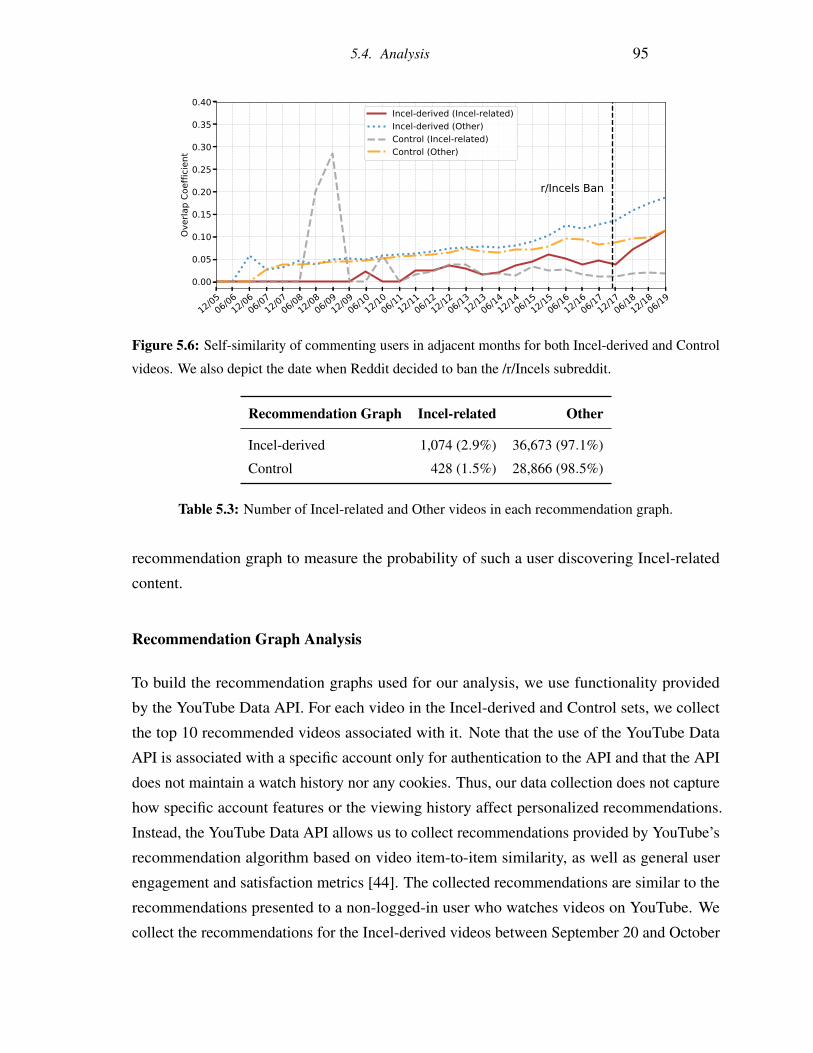
5.4. Analysis 95
12/0506/06
12/0606/07
12/0706/08
12/0806/09
12/0906/10
12/1006/11
12/1106/12
12/1206/13
12/1306/14
12/1406/15
12/1506/16
12/1606/17
12/1706/18
12/1806/19
0.00
0.05
0.10
0.15
0.20
0.25
0.30
0.35
0.40
Over
lap
Coef
ficie
ntr/Incels Ban
Incel-derived (Incel-related)Incel-derived (Other)Control (Incel-related)Control (Other)
Figure 5.6: Self-similarity of commenting users in adjacent months for both Incel-derived and Control
videos. We also depict the date when Reddit decided to ban the /r/Incels subreddit.
Recommendation Graph Incel-related Other
Incel-derived 1,074 (2.9%) 36,673 (97.1%)
Control 428 (1.5%) 28,866 (98.5%)
Table 5.3: Number of Incel-related and Other videos in each recommendation graph.
recommendation graph to measure the probability of such a user discovering Incel-related
content.
Recommendation Graph Analysis
To build the recommendation graphs used for our analysis, we use functionality provided
by the YouTube Data API. For each video in the Incel-derived and Control sets, we collect
the top 10 recommended videos associated with it. Note that the use of the YouTube Data
API is associated with a specific account only for authentication to the API and that the API
does not maintain a watch history nor any cookies. Thus, our data collection does not capture
how specific account features or the viewing history affect personalized recommendations.
Instead, the YouTube Data API allows us to collect recommendations provided by YouTube’s
recommendation algorithm based on video item-to-item similarity, as well as general user
engagement and satisfaction metrics [44]. The collected recommendations are similar to the
recommendations presented to a non-logged-in user who watches videos on YouTube. We
collect the recommendations for the Incel-derived videos between September 20 and October
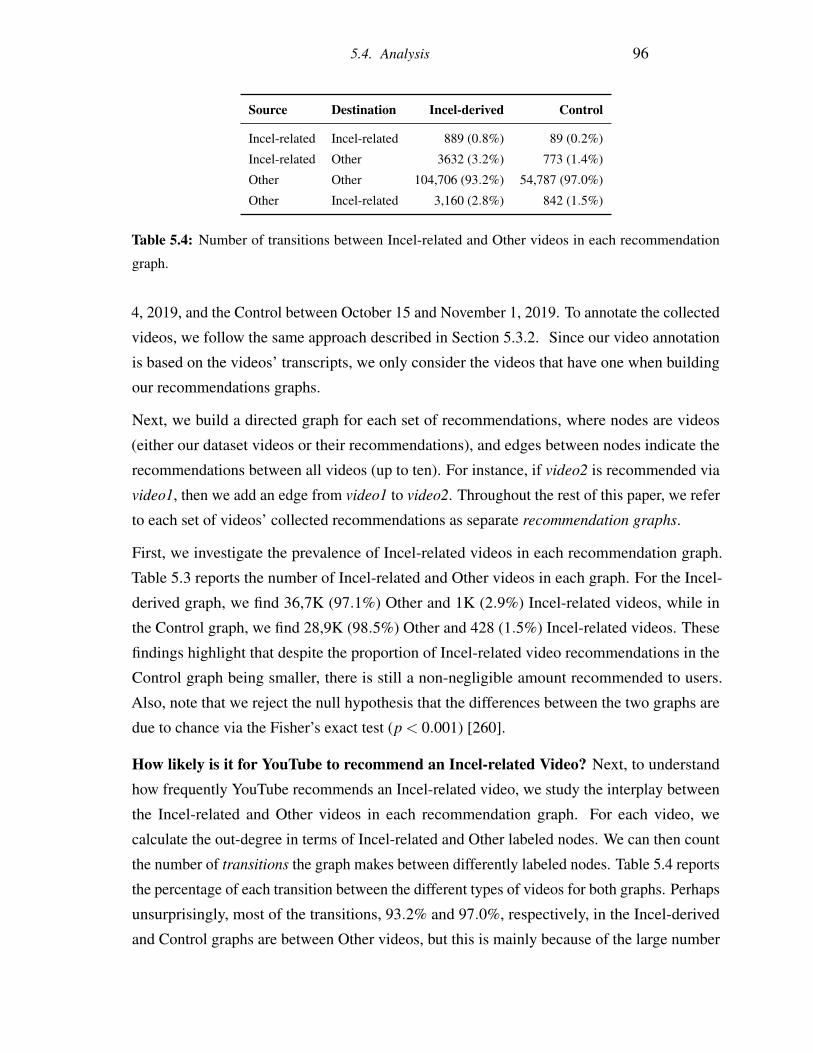
5.4. Analysis 96
Source Destination Incel-derived Control
Incel-related Incel-related 889 (0.8%) 89 (0.2%)
Incel-related Other 3632 (3.2%) 773 (1.4%)
Other Other 104,706 (93.2%) 54,787 (97.0%)
Other Incel-related 3,160 (2.8%) 842 (1.5%)
Table 5.4: Number of transitions between Incel-related and Other videos in each recommendation
graph.
4, 2019, and the Control between October 15 and November 1, 2019. To annotate the collected
videos, we follow the same approach described in Section 5.3.2. Since our video annotation
is based on the videos’ transcripts, we only consider the videos that have one when building
our recommendations graphs.
Next, we build a directed graph for each set of recommendations, where nodes are videos
(either our dataset videos or their recommendations), and edges between nodes indicate the
recommendations between all videos (up to ten). For instance, if video2 is recommended via
video1, then we add an edge from video1 to video2. Throughout the rest of this paper, we refer
to each set of videos’ collected recommendations as separate recommendation graphs.
First, we investigate the prevalence of Incel-related videos in each recommendation graph.
Table 5.3 reports the number of Incel-related and Other videos in each graph. For the Incel-
derived graph, we find 36,7K (97.1%) Other and 1K (2.9%) Incel-related videos, while in
the Control graph, we find 28,9K (98.5%) Other and 428 (1.5%) Incel-related videos. These
findings highlight that despite the proportion of Incel-related video recommendations in the
Control graph being smaller, there is still a non-negligible amount recommended to users.
Also, note that we reject the null hypothesis that the differences between the two graphs are
due to chance via the Fisher’s exact test (p < 0.001) [260].
How likely is it for YouTube to recommend an Incel-related Video? Next, to understand
how frequently YouTube recommends an Incel-related video, we study the interplay between
the Incel-related and Other videos in each recommendation graph. For each video, we
calculate the out-degree in terms of Incel-related and Other labeled nodes. We can then count
the number of transitions the graph makes between differently labeled nodes. Table 5.4 reports
the percentage of each transition between the different types of videos for both graphs. Perhaps
unsurprisingly, most of the transitions, 93.2% and 97.0%, respectively, in the Incel-derived
and Control graphs are between Other videos, but this is mainly because of the large number
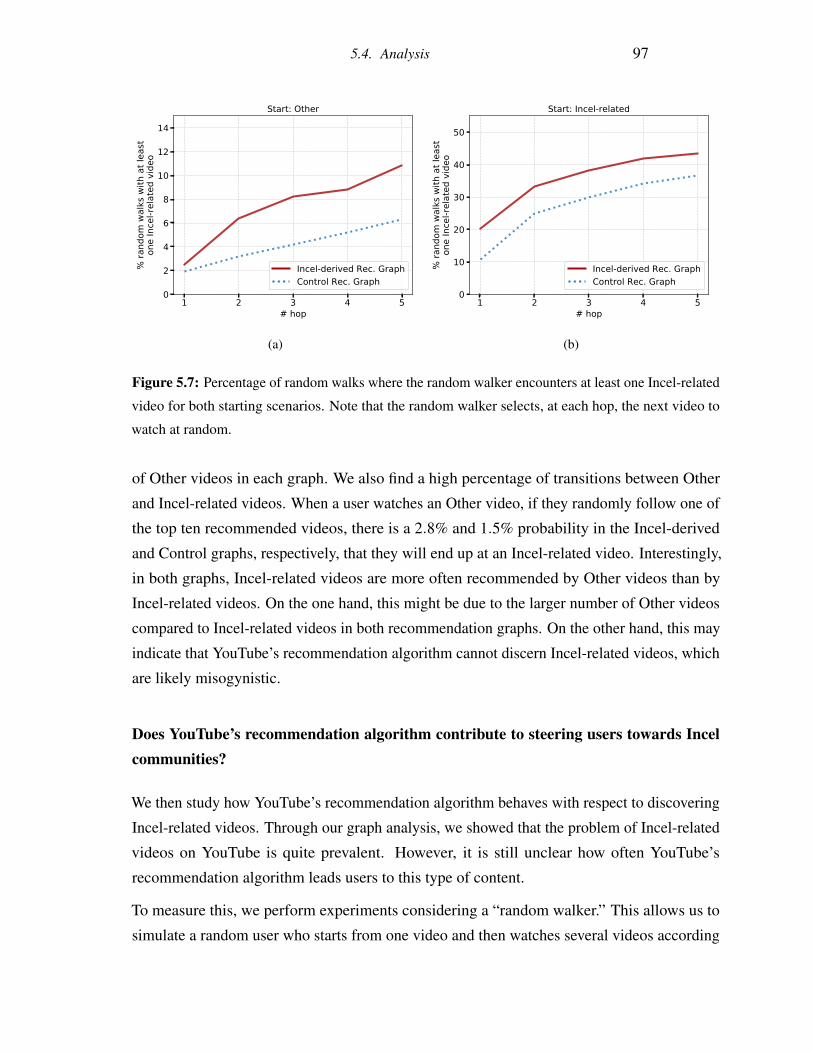
5.4. Analysis 97
1 2 3 4 5# hop
0
2
4
6
8
10
12
14%
rand
om w
alks
with
at l
east
one
Ince
l-rel
ated
vid
eo
Start: Other
Incel-derived Rec. GraphControl Rec. Graph
(a)
1 2 3 4 5# hop
0
10
20
30
40
50
% ra
ndom
wal
ks w
ith a
t lea
ston
e In
cel-r
elat
ed v
ideo
Start: Incel-related
Incel-derived Rec. GraphControl Rec. Graph
(b)
Figure 5.7: Percentage of random walks where the random walker encounters at least one Incel-related
video for both starting scenarios. Note that the random walker selects, at each hop, the next video to
watch at random.
of Other videos in each graph. We also find a high percentage of transitions between Other
and Incel-related videos. When a user watches an Other video, if they randomly follow one of
the top ten recommended videos, there is a 2.8% and 1.5% probability in the Incel-derived
and Control graphs, respectively, that they will end up at an Incel-related video. Interestingly,
in both graphs, Incel-related videos are more often recommended by Other videos than by
Incel-related videos. On the one hand, this might be due to the larger number of Other videos
compared to Incel-related videos in both recommendation graphs. On the other hand, this may
indicate that YouTube’s recommendation algorithm cannot discern Incel-related videos, which
are likely misogynistic.
Does YouTube’s recommendation algorithm contribute to steering users towards Incelcommunities?
We then study how YouTube’s recommendation algorithm behaves with respect to discovering
Incel-related videos. Through our graph analysis, we showed that the problem of Incel-related
videos on YouTube is quite prevalent. However, it is still unclear how often YouTube’s
recommendation algorithm leads users to this type of content.
To measure this, we perform experiments considering a “random walker.” This allows us to
simulate a random user who starts from one video and then watches several videos according
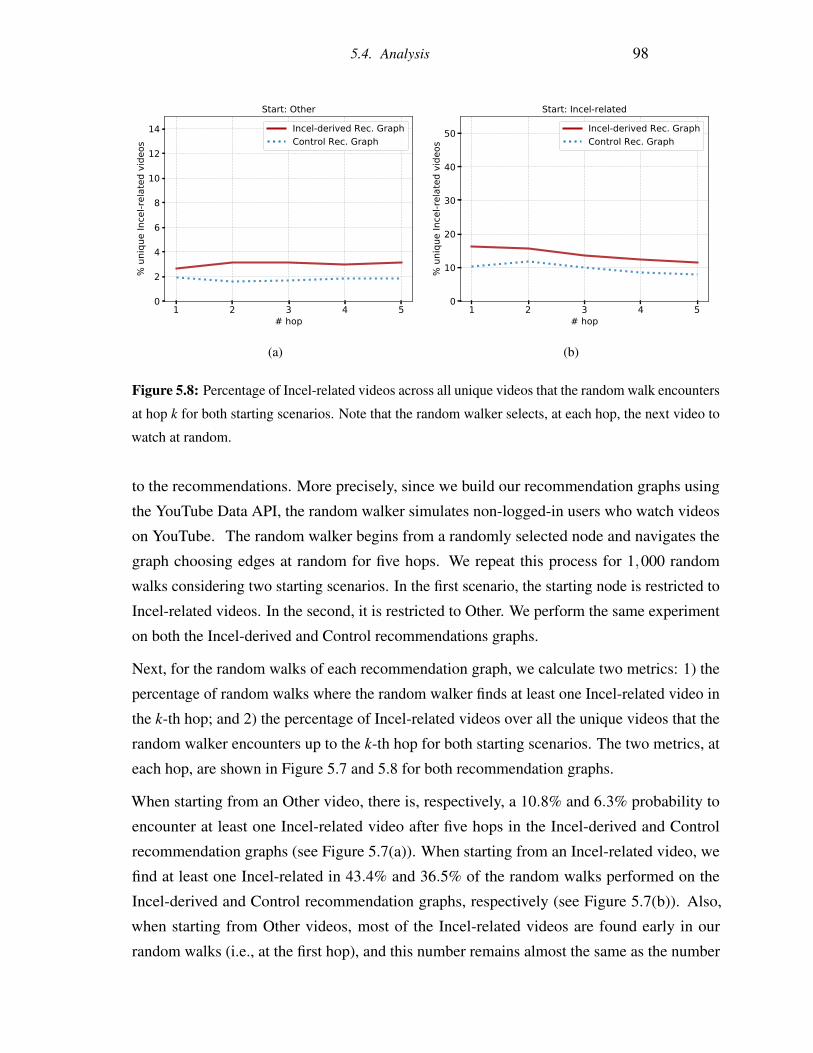
5.4. Analysis 98
1 2 3 4 5# hop
0
2
4
6
8
10
12
14%
uni
que
Ince
l-rel
ated
vid
eos
Start: Other
Incel-derived Rec. GraphControl Rec. Graph
(a)
1 2 3 4 5# hop
0
10
20
30
40
50
% u
niqu
e In
cel-r
elat
ed v
ideo
s
Start: Incel-related
Incel-derived Rec. GraphControl Rec. Graph
(b)
Figure 5.8: Percentage of Incel-related videos across all unique videos that the random walk encounters
at hop k for both starting scenarios. Note that the random walker selects, at each hop, the next video to
watch at random.
to the recommendations. More precisely, since we build our recommendation graphs using
the YouTube Data API, the random walker simulates non-logged-in users who watch videos
on YouTube. The random walker begins from a randomly selected node and navigates the
graph choosing edges at random for five hops. We repeat this process for 1,000 random
walks considering two starting scenarios. In the first scenario, the starting node is restricted to
Incel-related videos. In the second, it is restricted to Other. We perform the same experiment
on both the Incel-derived and Control recommendations graphs.
Next, for the random walks of each recommendation graph, we calculate two metrics: 1) the
percentage of random walks where the random walker finds at least one Incel-related video in
the k-th hop; and 2) the percentage of Incel-related videos over all the unique videos that the
random walker encounters up to the k-th hop for both starting scenarios. The two metrics, at
each hop, are shown in Figure 5.7 and 5.8 for both recommendation graphs.
When starting from an Other video, there is, respectively, a 10.8% and 6.3% probability to
encounter at least one Incel-related video after five hops in the Incel-derived and Control
recommendation graphs (see Figure 5.7(a)). When starting from an Incel-related video, we
find at least one Incel-related in 43.4% and 36.5% of the random walks performed on the
Incel-derived and Control recommendation graphs, respectively (see Figure 5.7(b)). Also,
when starting from Other videos, most of the Incel-related videos are found early in our
random walks (i.e., at the first hop), and this number remains almost the same as the number
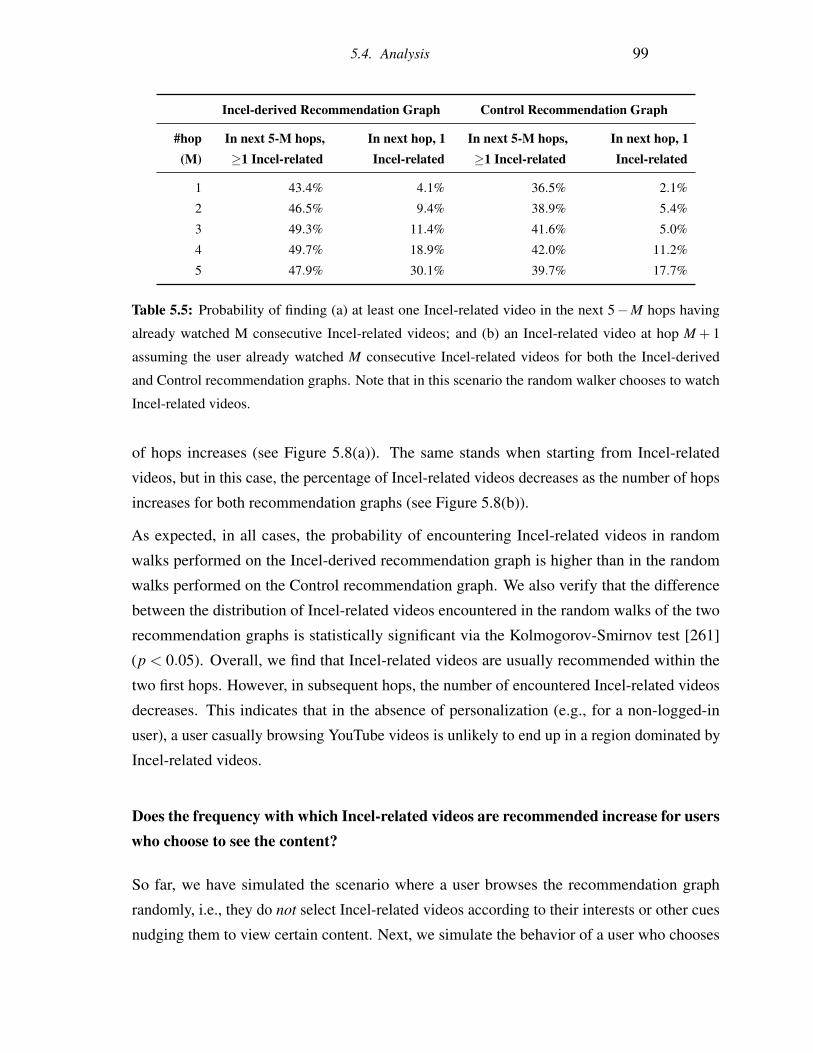
5.4. Analysis 99
Incel-derived Recommendation Graph Control Recommendation Graph
#hop(M)
In next 5-M hops,≥1 Incel-related
In next hop, 1Incel-related
In next 5-M hops,≥1 Incel-related
In next hop, 1Incel-related
1 43.4% 4.1% 36.5% 2.1%
2 46.5% 9.4% 38.9% 5.4%
3 49.3% 11.4% 41.6% 5.0%
4 49.7% 18.9% 42.0% 11.2%
5 47.9% 30.1% 39.7% 17.7%
Table 5.5: Probability of finding (a) at least one Incel-related video in the next 5−M hops having
already watched M consecutive Incel-related videos; and (b) an Incel-related video at hop M + 1
assuming the user already watched M consecutive Incel-related videos for both the Incel-derived
and Control recommendation graphs. Note that in this scenario the random walker chooses to watch
Incel-related videos.
of hops increases (see Figure 5.8(a)). The same stands when starting from Incel-related
videos, but in this case, the percentage of Incel-related videos decreases as the number of hops
increases for both recommendation graphs (see Figure 5.8(b)).
As expected, in all cases, the probability of encountering Incel-related videos in random
walks performed on the Incel-derived recommendation graph is higher than in the random
walks performed on the Control recommendation graph. We also verify that the difference
between the distribution of Incel-related videos encountered in the random walks of the two
recommendation graphs is statistically significant via the Kolmogorov-Smirnov test [261]
(p < 0.05). Overall, we find that Incel-related videos are usually recommended within the
two first hops. However, in subsequent hops, the number of encountered Incel-related videos
decreases. This indicates that in the absence of personalization (e.g., for a non-logged-in
user), a user casually browsing YouTube videos is unlikely to end up in a region dominated by
Incel-related videos.
Does the frequency with which Incel-related videos are recommended increase for userswho choose to see the content?
So far, we have simulated the scenario where a user browses the recommendation graph
randomly, i.e., they do not select Incel-related videos according to their interests or other cues
nudging them to view certain content. Next, we simulate the behavior of a user who chooses
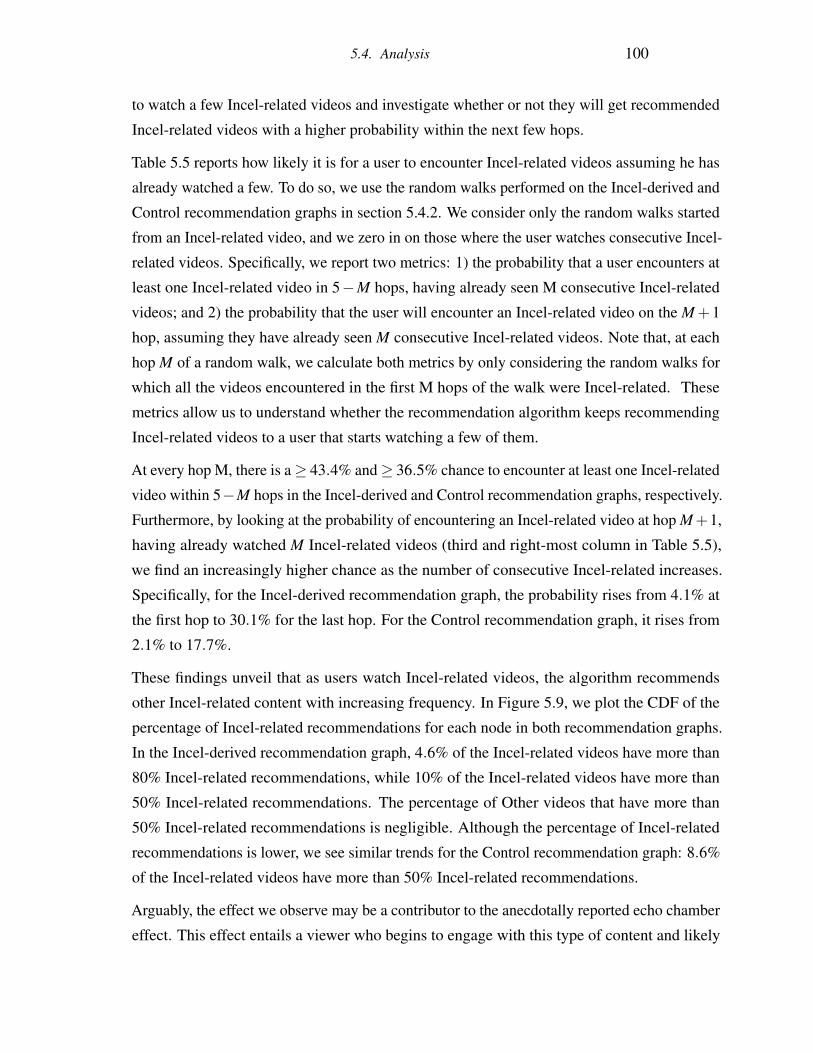
5.4. Analysis 100
to watch a few Incel-related videos and investigate whether or not they will get recommended
Incel-related videos with a higher probability within the next few hops.
Table 5.5 reports how likely it is for a user to encounter Incel-related videos assuming he has
already watched a few. To do so, we use the random walks performed on the Incel-derived and
Control recommendation graphs in section 5.4.2. We consider only the random walks started
from an Incel-related video, and we zero in on those where the user watches consecutive Incel-
related videos. Specifically, we report two metrics: 1) the probability that a user encounters at
least one Incel-related video in 5−M hops, having already seen M consecutive Incel-related
videos; and 2) the probability that the user will encounter an Incel-related video on the M+1
hop, assuming they have already seen M consecutive Incel-related videos. Note that, at each
hop M of a random walk, we calculate both metrics by only considering the random walks for
which all the videos encountered in the first M hops of the walk were Incel-related. These
metrics allow us to understand whether the recommendation algorithm keeps recommending
Incel-related videos to a user that starts watching a few of them.
At every hop M, there is a≥ 43.4% and≥ 36.5% chance to encounter at least one Incel-related
video within 5−M hops in the Incel-derived and Control recommendation graphs, respectively.
Furthermore, by looking at the probability of encountering an Incel-related video at hop M+1,
having already watched M Incel-related videos (third and right-most column in Table 5.5),
we find an increasingly higher chance as the number of consecutive Incel-related increases.
Specifically, for the Incel-derived recommendation graph, the probability rises from 4.1% at
the first hop to 30.1% for the last hop. For the Control recommendation graph, it rises from
2.1% to 17.7%.
These findings unveil that as users watch Incel-related videos, the algorithm recommends
other Incel-related content with increasing frequency. In Figure 5.9, we plot the CDF of the
percentage of Incel-related recommendations for each node in both recommendation graphs.
In the Incel-derived recommendation graph, 4.6% of the Incel-related videos have more than
80% Incel-related recommendations, while 10% of the Incel-related videos have more than
50% Incel-related recommendations. The percentage of Other videos that have more than
50% Incel-related recommendations is negligible. Although the percentage of Incel-related
recommendations is lower, we see similar trends for the Control recommendation graph: 8.6%
of the Incel-related videos have more than 50% Incel-related recommendations.
Arguably, the effect we observe may be a contributor to the anecdotally reported echo chamber
effect. This effect entails a viewer who begins to engage with this type of content and likely
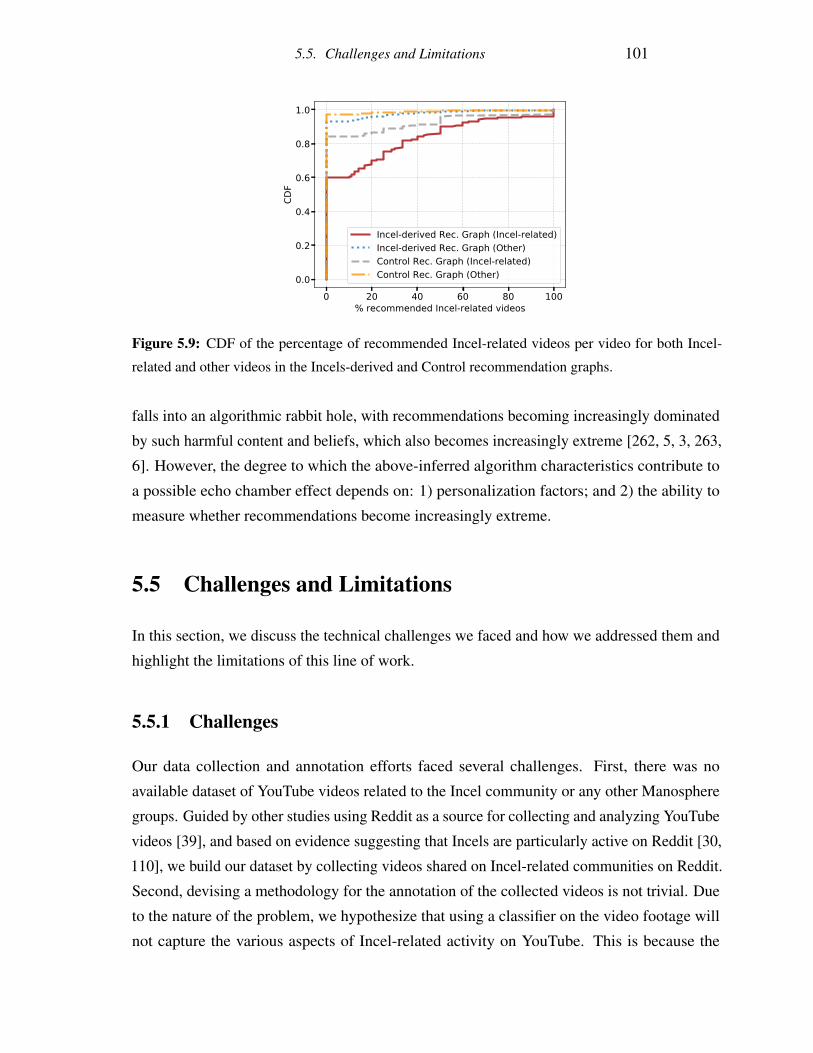
5.5. Challenges and Limitations 101
0 20 40 60 80 100% recommended Incel-related videos
0.0
0.2
0.4
0.6
0.8
1.0
CDF
Incel-derived Rec. Graph (Incel-related)Incel-derived Rec. Graph (Other)Control Rec. Graph (Incel-related)Control Rec. Graph (Other)
Figure 5.9: CDF of the percentage of recommended Incel-related videos per video for both Incel-
related and other videos in the Incels-derived and Control recommendation graphs.
falls into an algorithmic rabbit hole, with recommendations becoming increasingly dominated
by such harmful content and beliefs, which also becomes increasingly extreme [262, 5, 3, 263,
6]. However, the degree to which the above-inferred algorithm characteristics contribute to
a possible echo chamber effect depends on: 1) personalization factors; and 2) the ability to
measure whether recommendations become increasingly extreme.
5.5 Challenges and Limitations
In this section, we discuss the technical challenges we faced and how we addressed them and
highlight the limitations of this line of work.
5.5.1 Challenges
Our data collection and annotation efforts faced several challenges. First, there was no
available dataset of YouTube videos related to the Incel community or any other Manosphere
groups. Guided by other studies using Reddit as a source for collecting and analyzing YouTube
videos [39], and based on evidence suggesting that Incels are particularly active on Reddit [30,
110], we build our dataset by collecting videos shared on Incel-related communities on Reddit.
Second, devising a methodology for the annotation of the collected videos is not trivial. Due
to the nature of the problem, we hypothesize that using a classifier on the video footage will
not capture the various aspects of Incel-related activity on YouTube. This is because the
5.5. Challenges and Limitations 102
misogynistic views of Incels may force them to heavily comment on a seemingly benign video
(e.g., a video featuring a group of women discussing gender issues) [88]. Hence, we devise
a methodology to detect Incel-related videos based on a lexicon of Incel-related terms that
considers both the video’s transcript and its comments.
We believe that the scientific community can use our text-based approach to study other
misogynistic ideologies on the platform, which tend to have their particular glossary; see
Figure 5.1.
5.5.2 Limitations
Unfortunately, this line of work is not without limitations. Our video annotation methodology
might flag some benign videos as Incel-related. This can be a false positive or due to Incels
that heavily comment on (or even raid [100]) a benign video (e.g., a video featuring a group
of women discussing gender issues). However, by considering the video’s transcript in our
video annotation methodology, we can achieve an acceptable detection accuracy that uncovers
a substantial proportion of Incel-related videos (see Section 5.3.2). Despite this limitation, we
believe that our video annotation methodology allows us to capture and analyze various aspects
of Incel-related activity on the platform. Another limitation of this approach is that we may
miss some Incel-related videos. Notwithstanding such limitation, our approach approaches
the lower bound of the Incel-related videos available in our dataset, allowing us to conclude
that the implications of YouTube’s recommendation algorithm on disseminating misogynistic
content are at least as profound as we observe.
Moreover, our work does not consider per-user personalization; the video recommendations
we collect represent only some of the recommendation system’s facets. More precisely, we
analyze YouTube recommendations generated based on content relevance and the user base’s
engagement in aggregate. However, we believe that the recommendation graphs we obtain do
allow us to understand how YouTube’s recommendation system is behaving in our scenario.
Also, note that a similar methodology for auditing YouTube’s recommendation algorithm has
been used in previous work [6].
5.6. Remarks 103
5.6 Remarks
In this line of work, we presented a large-scale data-driven characterization of the Incel
community on YouTube. We collected 6.5K YouTube videos shared by users in Incel-related
communities within Reddit. We used them to understand how Incel ideology spreads on
YouTube and study the evolution of the community. We found a non-negligible growth in
Incel-related activity on YouTube over the past few years, both in terms of Incel-related videos
published and comments likely posted by Incels. This result suggests that users gravitating
around the Incel community are increasingly using YouTube to disseminate their views.
Overall, our study is a first step towards understanding the Incel community and other misog-
ynistic ideologies on YouTube. We argue that it is crucial to protect potential radicalization
“victims” by developing methods and tools to detect Incel-related videos and other misogynis-
tic activities on YouTube. Our analysis shows growth in Incel-related activities on Reddit and
highlights how the Incel community operates on multiple platforms and Web communities.
This also prompts the need to perform more multi-platform studies to understand Manosphere
communities further.
We also analyzed how YouTube’s recommendation algorithm behaves with respect to Incel-
related videos. By performing random walks on YouTube’s recommendation graph, we
estimated a 6.3% chance for a user who starts by watching non-Incel-related videos to be
recommended Incel-related ones within five recommendation hops. At the same time, users
who have seen two or three Incel-related videos at the start of their walk see recommendations
that consist of 9.4% and 11.4% Incel-related videos, respectively. Moreover, the portion
of Incel-related recommendations increases substantially as the user watches an increasing
number of consecutive Incel-related videos.
Our results highlight the pressing need to further study and understand the role of YouTube’s
recommendation algorithm in users’ radicalization and content consumption patterns. Ideally,
a recommendation algorithm should avoid recommending potentially harmful or extreme
videos. However, our analysis confirms prior work showing that this is not always the case on
YouTube [6].
Chapter 6
Assessing the Effect of Watch History onYouTube’s Pseudoscientific VideoRecommendations
So far, we do not take user personalization into account in our analysis, hence it is hard to derive
conclusions about YouTube at large. Instead, we obtain and analyze recommendation graphs
using the YouTube Data API, which allows us to analyze YouTube recommendations generated
based on content relevance and general user engagement and satisfaction metrics on YouTube.
However, one of the main reasons behind YouTube’s success is user personalization. YouTube
provides personalized recommendations to users based on their interests and various other
engagement and satisfaction metrics like, for example, the watch history of the user. Hence,
to get a better insight into how the user’s watch history affects YouTube recommendations,
this line of work has a special focus on how the user’s watch history affects YouTube’s video
recommendations.
6.1 Motivation
Platforms like YouTube are often fertile ground for the spread of misleading and potentially
harmful information like conspiracy theories and health-related disinformation [12]. YouTube
and other social media platforms have struggled with mitigating the harm from this type of
content. The difficulty is partly due to the sheer scale and also because of the deployment
of recommendation algorithms [15]. Purely automated moderation tools have thus far been
104
6.1. Motivation 105
insufficient to moderate content, and human moderators had to be brought back into the
loop [20]. Additionally, the machine learning algorithms that YouTube relies on to recommend
content to users also recommend potentially harmful content [39], and their opaque nature
makes them difficult to audit.
For certain types of content, e.g., health-related topics, harmful videos can have devastating
effects on society, especially during crises like the COVID-19 pandemic [13]. For instance,
conspiracy theories have suggested that COVID-19 is caused by 5G [264] or Bill Gates [265],
hindering social distancing, masking, and vaccination efforts [266]. Conspiracy theories are
usually built on tenuous connections between various events, with little to no actual evidence
to support them; on user-generated content platforms like YouTube, these are often presented
as facts, regardless of whether they are supported by facts and even though they have been
widely debunked. Motivated by the pressing need to mitigate the spread of pseudoscientific
content, we focus on detecting and characterizing pseudoscientific and conspiratorial content
on YouTube. In particular, we aim to: 1) assess how likely it is for users with different
watch histories to come across pseudoscientific content on YouTube, and 2) analyze how
YouTube’s recommendation algorithm contributes to promoting pseudoscience. To do this,
guided by three of our main research questions (RQ1, RQ2, and RQ4), we set out to answer
the following three research sub-questions:
• RQ1.c: Can we effectively detect and characterize pseudoscientific content on YouTube?
(see RQ1 in Chapter 1)
• RQ2.c: Can we effectively quantify the influence of YouTube’s recommendation algo-
rithm in the dissemination of pseudoscientific content? What is the effect of a user’s
watch history on pseudoscientific video recommendations? (see RQ2 in Chapter 1)
• RQ4.c: What is the proportion of pseudoscientific content on the homepage of a
YouTube user, in search results, and the video recommendations section of YouTube?
(see RQ4 in Chapter 1)
Methodology. In this line of work, we focus on four pseudoscientific topics: 1) COVID-19,
2) Flat Earth theory, 3) anti-vaccination, and 4) anti-mask movement. We collect 6.6K unique
videos and use crowdsourcing to label them in three categories: science, pseudoscience,
or irrelevant. We then assign labels to each video based on the majority agreement of the
annotators. We excluded videos where all the annotators disagreed resulting in a final dataset
6.1. Motivation 106
of 5.7K videos. We then train a deep learning classifier to detect pseudoscientific content
across multiple topics on YouTube.
Next, we use three carefully crafted user profiles, each with a different watch history, while all
other account information remains the same, to simulate logged-in users. We also perform
a set of experiments using a browser without a Google account to simulate non-logged-in
users and another set using the YouTube Data API exclusively. To populate the watch history
of the three user profiles, we devise a methodology to identify the minimum amount of
videos that must be watched by a user before YouTube’s recommendation algorithm starts
generating substantially personalized recommendations. We build three distinct profiles: 1) a
user interested in scientific content; 2) a user interested in pseudoscientific content; and 3) a
user interested in both scientific and pseudoscientific content. Using these profiles, we perform
three experiments to quantify the user’s exposure to pseudoscientific content on various parts
of the platform and how this exposure changes based on a user’s watch history. Note that we
manually review all the videos classified as pseudoscientific in all experiments.
Findings. Overall, our study leads to the following findings:
1. We can detect pseudoscientific content, as our deep learning classifier yields 0.79
accuracy and outperforms SVM, Random Forest, and BERT-based classifiers.
2. We find that the minimum amount of videos a user needs to watch before YouTube learns
her interests and starts generating more personalized science and pseudoscience-related
recommendations is 22.
3. The watch history of the user substantially affects search results and related video
recommendations. At the same time, pseudoscientific videos are more likely to appear
in search results than in the video recommendations section or the user’s homepage.
4. In traditional pseudoscience topics (e.g., Flat Earth), there is a higher rate of rec-
ommended pseudoscientific content than in more recent issues like COVID-19, anti-
vaccination, and anti-mask. For COVID-19, we find an even smaller amount of pseu-
doscientific content being suggested. This indicates that YouTube took partly effective
measures to mitigate pseudoscientific misinformation related to the COVID-19 pan-
demic.
5. The YouTube Data API results are similar to those of the non-logged-in profile with no
watch history (using a browser); this indicates that recommendations returned using the
API are not subject to personalization.
6.2. Datasets 107
Contributions. To the best of our knowledge, we present the first study focusing on multiple
health-related pseudoscientific topics on YouTube pertaining to the COVID-19 pandemic.
Inspired by the literature, we develop a complete framework that allows us to assess the preva-
lence of pseudoscientific content on various parts of the YouTube platform (i.e., homepage,
search results, video recommendations) while accounting for the effect of a user’s watch
history. Our methodology can be re-used for other studies focusing on other topics of interest.
We are confident that this will help the research community shed additional light on YouTube’s
recommendation algorithm and its potential influence.
6.2 Datasets
In this section, we present our data collection and crowdsourced annotation methodology. We
collect a set of YouTube videos related to science and then use crowdsourcing to annotate
videos as pseudoscientific or not.
6.2.1 Data Collection
Since we aim to detect pseudoscientific video content automatically, we collect a set of
YouTube videos related to four, arguably relevant, topics: 1) COVID-19 [267]; 2) the anti-
vaccination movement [268]; 3) the anti-mask movement [269]; and 4) the Flat Earth the-
ory [270]. We focus on COVID-19 and the anti-mask movement because both are timely topics
of great societal interest. We also choose anti-vaccination because it is both an increasingly
popular and traditional pseudoscientific topic. Last, we include the Flat Earth theory because
it is a “long-standing” pseudoscientific subject.
Then, for each topic of interest, we define search queries and use them to search YouTube and
collect videos. For COVID-19 we search using the terms “COVID-19” and “coronavirus,” and
for the anti-vaccination movement we use the terms “anti-vaccination” and “anti-vaxx”. On
the other hand, for the anti-mask movement and the Flat Earth theory we only use the terms
“anti-mask” and “flat earth,” respectively, since there are no other terms that point to the same
definition as is the case for the other two pseudoscientific topics.
Next, we search YouTube using the YouTube Data API [32] and the search queries defined
for each topic. For each search query of each selected topic we obtain the first 200 videos as
returned by YouTube’s Data API search functionality. We refer to those videos as the “seed”
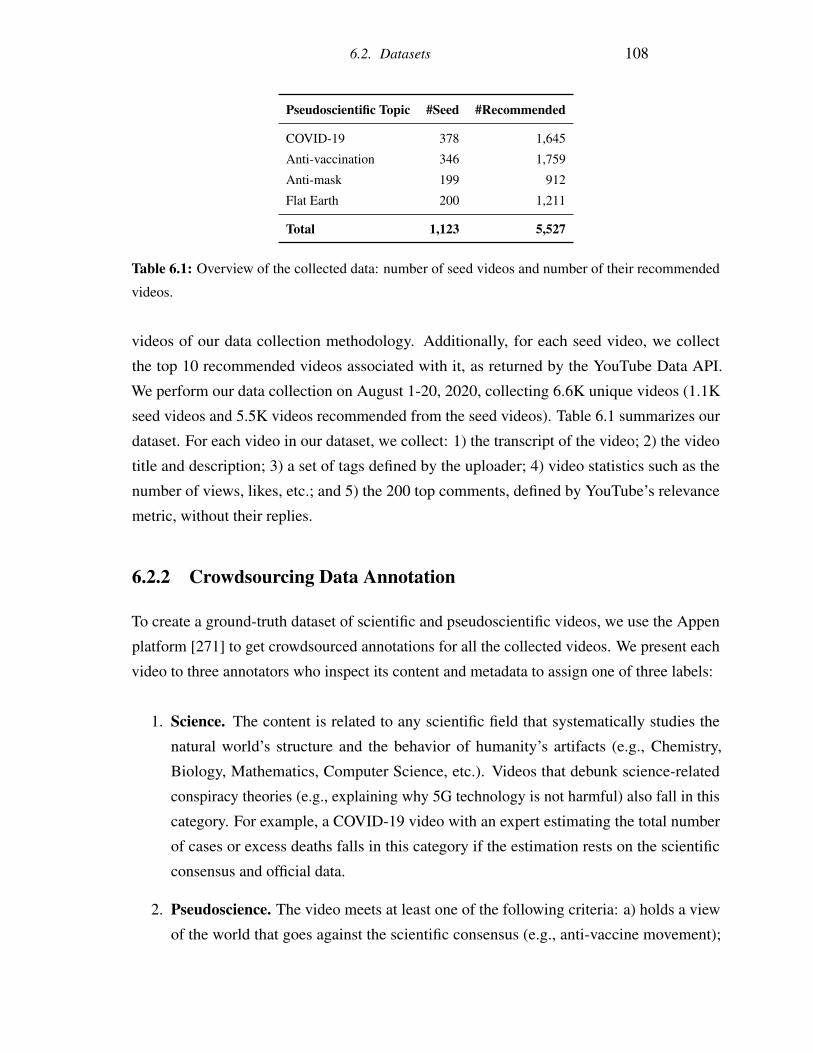
6.2. Datasets 108
Pseudoscientific Topic #Seed #Recommended
COVID-19 378 1,645
Anti-vaccination 346 1,759
Anti-mask 199 912
Flat Earth 200 1,211
Total 1,123 5,527
Table 6.1: Overview of the collected data: number of seed videos and number of their recommended
videos.
videos of our data collection methodology. Additionally, for each seed video, we collect
the top 10 recommended videos associated with it, as returned by the YouTube Data API.
We perform our data collection on August 1-20, 2020, collecting 6.6K unique videos (1.1K
seed videos and 5.5K videos recommended from the seed videos). Table 6.1 summarizes our
dataset. For each video in our dataset, we collect: 1) the transcript of the video; 2) the video
title and description; 3) a set of tags defined by the uploader; 4) video statistics such as the
number of views, likes, etc.; and 5) the 200 top comments, defined by YouTube’s relevance
metric, without their replies.
6.2.2 Crowdsourcing Data Annotation
To create a ground-truth dataset of scientific and pseudoscientific videos, we use the Appen
platform [271] to get crowdsourced annotations for all the collected videos. We present each
video to three annotators who inspect its content and metadata to assign one of three labels:
1. Science. The content is related to any scientific field that systematically studies the
natural world’s structure and the behavior of humanity’s artifacts (e.g., Chemistry,
Biology, Mathematics, Computer Science, etc.). Videos that debunk science-related
conspiracy theories (e.g., explaining why 5G technology is not harmful) also fall in this
category. For example, a COVID-19 video with an expert estimating the total number
of cases or excess deaths falls in this category if the estimation rests on the scientific
consensus and official data.
2. Pseudoscience. The video meets at least one of the following criteria: a) holds a view
of the world that goes against the scientific consensus (e.g., anti-vaccine movement);
6.2. Datasets 109
b) comprises statements or beliefs that are self-fulfilling or unfalsifiable (e.g., Medi-
tation) [272]); c) develops hypotheses that are not evaluated following the scientific
method (e.g., Astrology); or d) explains events as secret plots by powerful forces rather
than overt activities or accidents (e.g., the 5G-coronavirus conspiracy theory).
3. Irrelevant. The content is not relevant to any scientific field and does not fall in the
Pseudoscience category. For example, music videos and cartoon videos are considered
irrelevant. Conspiracy theory debunking videos that are not relevant to a scientific field
are deemed irrelevant (e.g., a video debunking the Pizzagate conspiracy theory).
Annotation. The annotation process is carried out by 992 annotators, both male and female,
recruited through the Appen platform. We give annotators instructions on what constitutes
scientific and pseudoscientific content using appropriate descriptions and several examples.
They are offered $0.03 per annotation. Three annotators label each video. To ease the
annotation process, we provide a clear description of the task and our labels, and all video
information that an annotator needs to inspect and correctly annotate a video. Screenshots of
the instructions are available from [273].
Appen provides no demographic information about the annotators, other than an assurance
that they are experienced and attained high accuracy in other tasks. To assess the annotators’
quality, before allowing them to submit annotations, we ask them to annotate 5 test videos
randomly selected from a set of 54 test videos (20 science, 21 pseudoscience, and 13 irrelevant)
annotated by the first author of this paper. An annotator can submit annotations only when she
labels at least 3 out of the 5 test videos correctly. This initial test guarantees that our annotators
are more likely to have a scientific rather than conspiratorial pseudoscientific outlook, which
would probably pollute our results.
Furthermore, using the collected annotations, we calculate the Fleiss’ Kappa Score (k) [204] to
assess the annotators’ agreement. We get k = 0.14, which is considered “slight” agreement. To
mitigate the effect of the low agreement score on our results, we first exclude from our dataset
all the 915 videos (13.8%) where all annotators disagreed with each other and we calculate
again the agreement score. We get k = 0.24, which is considered “fair” agreement. Next,
we assign labels to each video in our ground-truth dataset based to the majority agreement
of all the annotators resulting in a ground-truth dataset that includes 1,197 science, 1,325
pseudoscience, and 3,212 irrelevant videos (see Table 6.2).
Last, to further mitigate the effects of the low agreement score of our crowdsourced annotation,
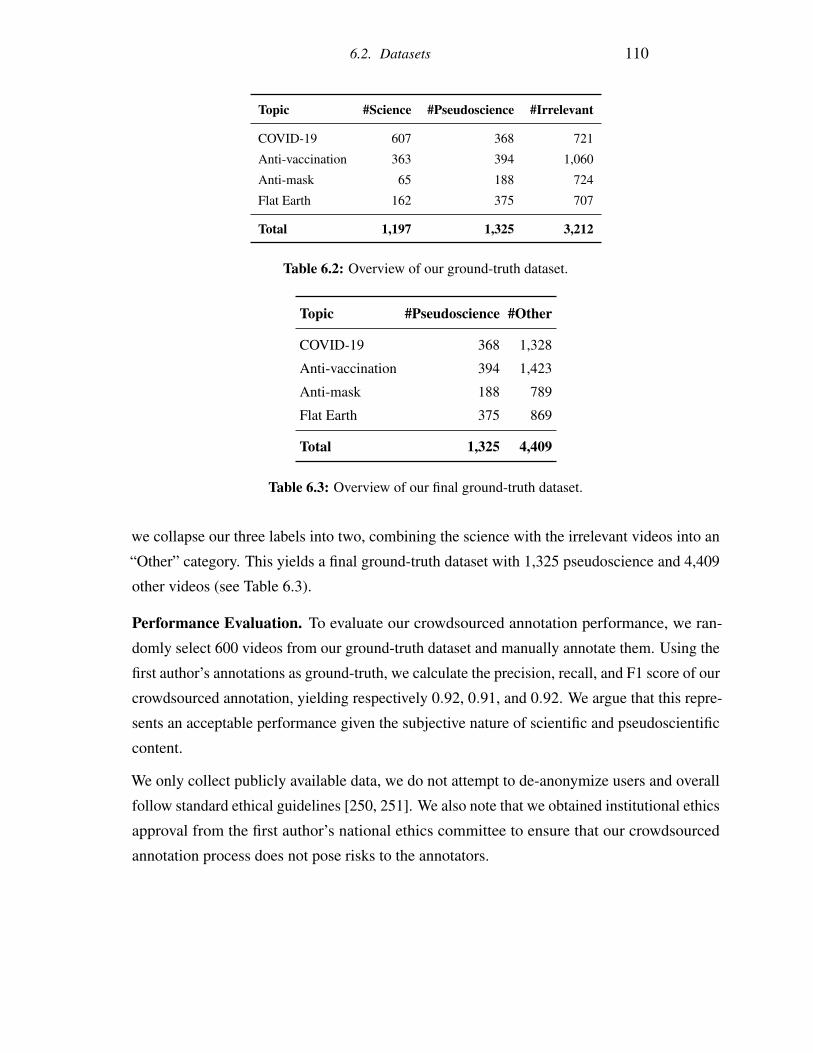
6.2. Datasets 110
Topic #Science #Pseudoscience #Irrelevant
COVID-19 607 368 721
Anti-vaccination 363 394 1,060
Anti-mask 65 188 724
Flat Earth 162 375 707
Total 1,197 1,325 3,212
Table 6.2: Overview of our ground-truth dataset.
Topic #Pseudoscience #Other
COVID-19 368 1,328
Anti-vaccination 394 1,423
Anti-mask 188 789
Flat Earth 375 869
Total 1,325 4,409
Table 6.3: Overview of our final ground-truth dataset.
we collapse our three labels into two, combining the science with the irrelevant videos into an
“Other” category. This yields a final ground-truth dataset with 1,325 pseudoscience and 4,409
other videos (see Table 6.3).
Performance Evaluation. To evaluate our crowdsourced annotation performance, we ran-
domly select 600 videos from our ground-truth dataset and manually annotate them. Using the
first author’s annotations as ground-truth, we calculate the precision, recall, and F1 score of our
crowdsourced annotation, yielding respectively 0.92, 0.91, and 0.92. We argue that this repre-
sents an acceptable performance given the subjective nature of scientific and pseudoscientific
content.
We only collect publicly available data, we do not attempt to de-anonymize users and overall
follow standard ethical guidelines [250, 251]. We also note that we obtained institutional ethics
approval from the first author’s national ethics committee to ensure that our crowdsourced
annotation process does not pose risks to the annotators.
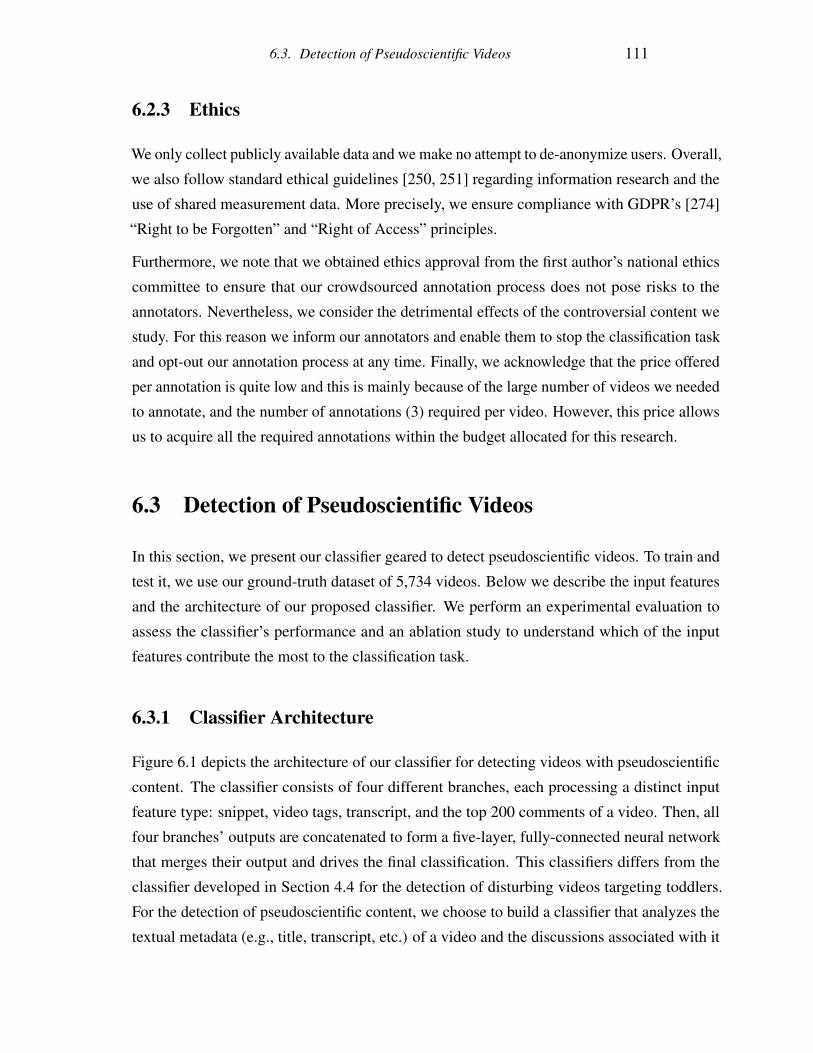
6.3. Detection of Pseudoscientific Videos 111
6.2.3 Ethics
We only collect publicly available data and we make no attempt to de-anonymize users. Overall,
we also follow standard ethical guidelines [250, 251] regarding information research and the
use of shared measurement data. More precisely, we ensure compliance with GDPR’s [274]
“Right to be Forgotten” and “Right of Access” principles.
Furthermore, we note that we obtained ethics approval from the first author’s national ethics
committee to ensure that our crowdsourced annotation process does not pose risks to the
annotators. Nevertheless, we consider the detrimental effects of the controversial content we
study. For this reason we inform our annotators and enable them to stop the classification task
and opt-out our annotation process at any time. Finally, we acknowledge that the price offered
per annotation is quite low and this is mainly because of the large number of videos we needed
to annotate, and the number of annotations (3) required per video. However, this price allows
us to acquire all the required annotations within the budget allocated for this research.
6.3 Detection of Pseudoscientific Videos
In this section, we present our classifier geared to detect pseudoscientific videos. To train and
test it, we use our ground-truth dataset of 5,734 videos. Below we describe the input features
and the architecture of our proposed classifier. We perform an experimental evaluation to
assess the classifier’s performance and an ablation study to understand which of the input
features contribute the most to the classification task.
6.3.1 Classifier Architecture
Figure 6.1 depicts the architecture of our classifier for detecting videos with pseudoscientific
content. The classifier consists of four different branches, each processing a distinct input
feature type: snippet, video tags, transcript, and the top 200 comments of a video. Then, all
four branches’ outputs are concatenated to form a five-layer, fully-connected neural network
that merges their output and drives the final classification. This classifiers differs from the
classifier developed in Section 4.4 for the detection of disturbing videos targeting toddlers.
For the detection of pseudoscientific content, we choose to build a classifier that analyzes the
textual metadata (e.g., title, transcript, etc.) of a video and the discussions associated with it
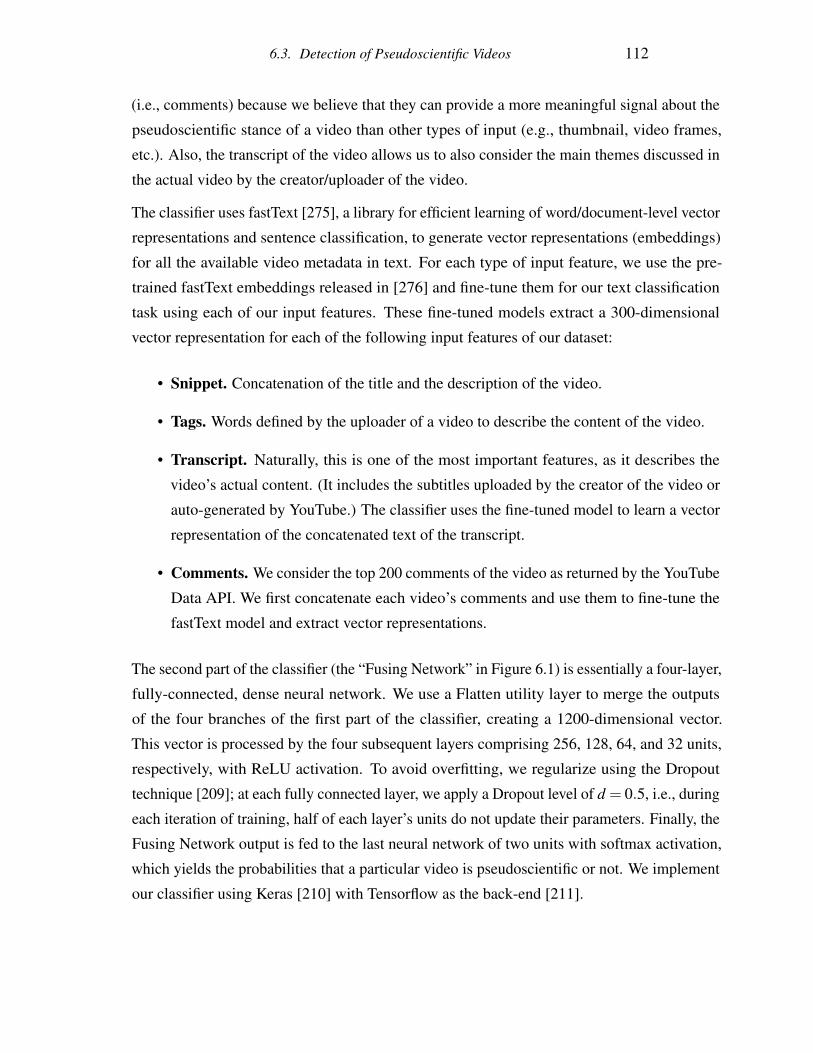
6.3. Detection of Pseudoscientific Videos 112
(i.e., comments) because we believe that they can provide a more meaningful signal about the
pseudoscientific stance of a video than other types of input (e.g., thumbnail, video frames,
etc.). Also, the transcript of the video allows us to also consider the main themes discussed in
the actual video by the creator/uploader of the video.
The classifier uses fastText [275], a library for efficient learning of word/document-level vector
representations and sentence classification, to generate vector representations (embeddings)
for all the available video metadata in text. For each type of input feature, we use the pre-
trained fastText embeddings released in [276] and fine-tune them for our text classification
task using each of our input features. These fine-tuned models extract a 300-dimensional
vector representation for each of the following input features of our dataset:
• Snippet. Concatenation of the title and the description of the video.
• Tags. Words defined by the uploader of a video to describe the content of the video.
• Transcript. Naturally, this is one of the most important features, as it describes the
video’s actual content. (It includes the subtitles uploaded by the creator of the video or
auto-generated by YouTube.) The classifier uses the fine-tuned model to learn a vector
representation of the concatenated text of the transcript.
• Comments. We consider the top 200 comments of the video as returned by the YouTube
Data API. We first concatenate each video’s comments and use them to fine-tune the
fastText model and extract vector representations.
The second part of the classifier (the “Fusing Network” in Figure 6.1) is essentially a four-layer,
fully-connected, dense neural network. We use a Flatten utility layer to merge the outputs
of the four branches of the first part of the classifier, creating a 1200-dimensional vector.
This vector is processed by the four subsequent layers comprising 256, 128, 64, and 32 units,
respectively, with ReLU activation. To avoid overfitting, we regularize using the Dropout
technique [209]; at each fully connected layer, we apply a Dropout level of d = 0.5, i.e., during
each iteration of training, half of each layer’s units do not update their parameters. Finally, the
Fusing Network output is fed to the last neural network of two units with softmax activation,
which yields the probabilities that a particular video is pseudoscientific or not. We implement
our classifier using Keras [210] with Tensorflow as the back-end [211].
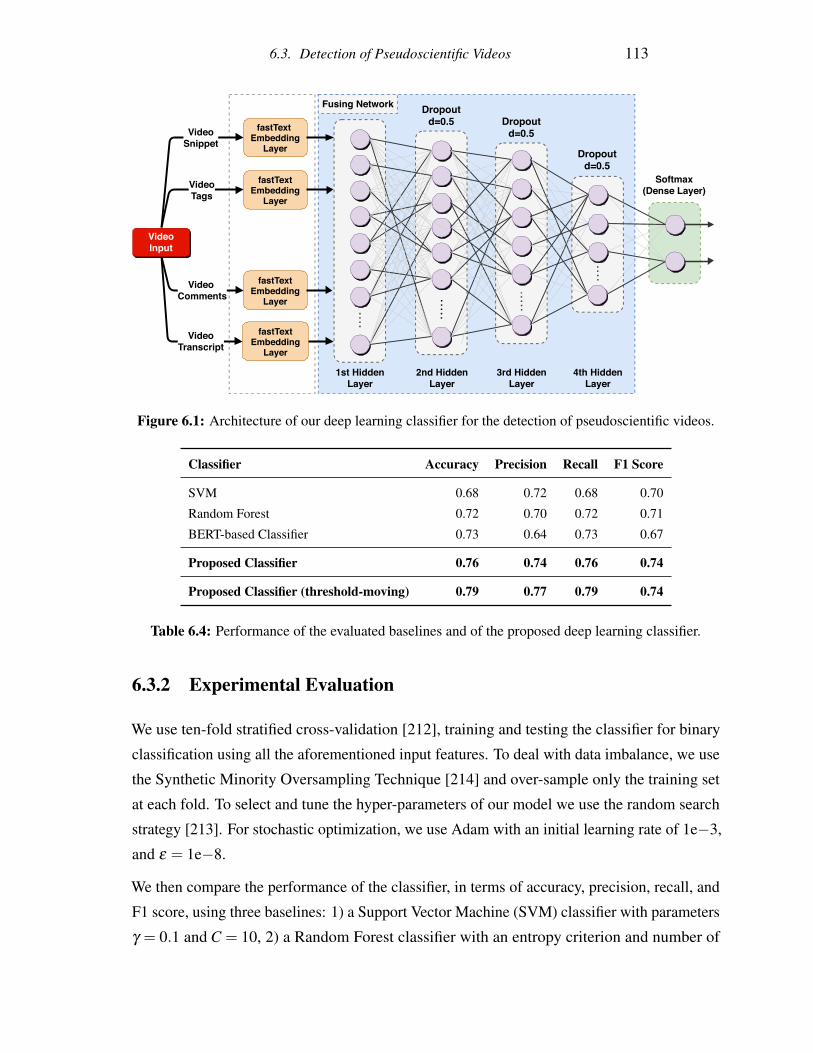
6.3. Detection of Pseudoscientific Videos 113
Video Tags
Video Snippet
Video Comments
Video Transcript
Video Input
fastText Embedding
Layer
fastText Embedding
Layer
fastText Embedding
Layer
fastText Embedding
Layer
Softmax (Dense Layer)
Dropout d=0.5
Dropout d=0.5
Dropout d=0.5
Fusing Network
1st HiddenLayer
2nd HiddenLayer
3rd HiddenLayer
4th HiddenLayer
Figure 6.1: Architecture of our deep learning classifier for the detection of pseudoscientific videos.
Classifier Accuracy Precision Recall F1 Score
SVM 0.68 0.72 0.68 0.70
Random Forest 0.72 0.70 0.72 0.71
BERT-based Classifier 0.73 0.64 0.73 0.67
Proposed Classifier 0.76 0.74 0.76 0.74
Proposed Classifier (threshold-moving) 0.79 0.77 0.79 0.74
Table 6.4: Performance of the evaluated baselines and of the proposed deep learning classifier.
6.3.2 Experimental Evaluation
We use ten-fold stratified cross-validation [212], training and testing the classifier for binary
classification using all the aforementioned input features. To deal with data imbalance, we use
the Synthetic Minority Oversampling Technique [214] and over-sample only the training set
at each fold. To select and tune the hyper-parameters of our model we use the random search
strategy [213]. For stochastic optimization, we use Adam with an initial learning rate of 1e−3,
and ε = 1e−8.
We then compare the performance of the classifier, in terms of accuracy, precision, recall, and
F1 score, using three baselines: 1) a Support Vector Machine (SVM) classifier with parameters
γ = 0.1 and C = 10, 2) a Random Forest classifier with an entropy criterion and number of
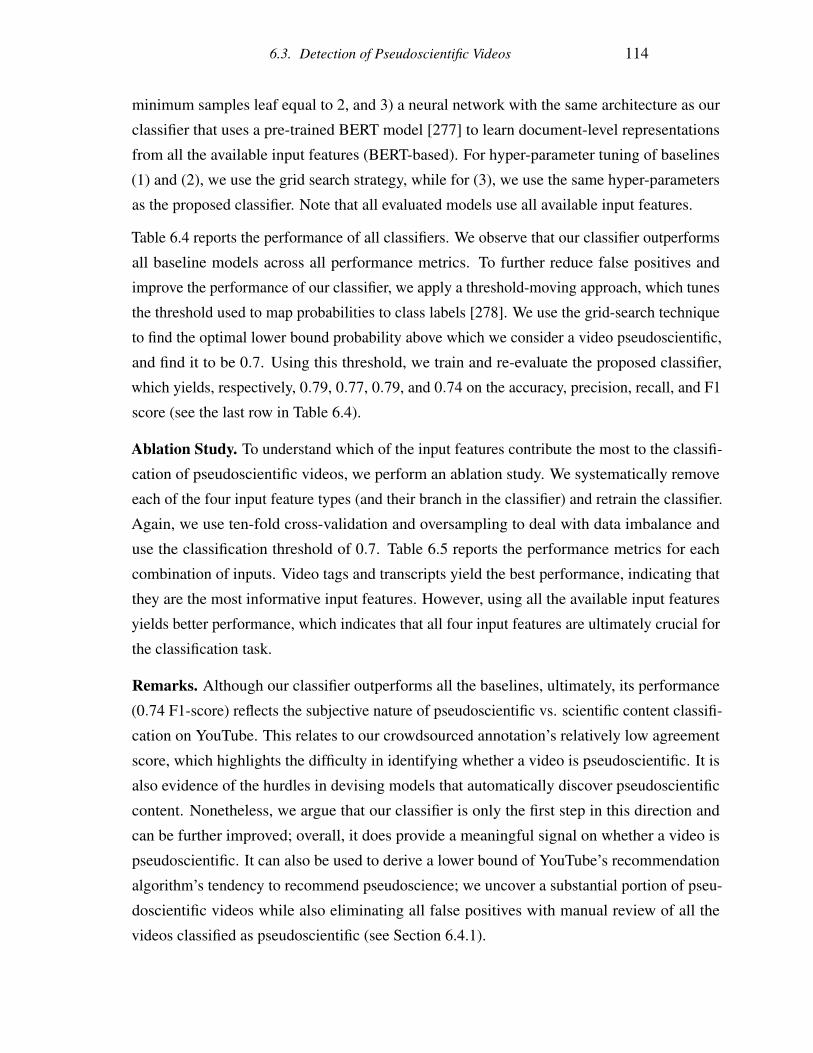
6.3. Detection of Pseudoscientific Videos 114
minimum samples leaf equal to 2, and 3) a neural network with the same architecture as our
classifier that uses a pre-trained BERT model [277] to learn document-level representations
from all the available input features (BERT-based). For hyper-parameter tuning of baselines
(1) and (2), we use the grid search strategy, while for (3), we use the same hyper-parameters
as the proposed classifier. Note that all evaluated models use all available input features.
Table 6.4 reports the performance of all classifiers. We observe that our classifier outperforms
all baseline models across all performance metrics. To further reduce false positives and
improve the performance of our classifier, we apply a threshold-moving approach, which tunes
the threshold used to map probabilities to class labels [278]. We use the grid-search technique
to find the optimal lower bound probability above which we consider a video pseudoscientific,
and find it to be 0.7. Using this threshold, we train and re-evaluate the proposed classifier,
which yields, respectively, 0.79, 0.77, 0.79, and 0.74 on the accuracy, precision, recall, and F1
score (see the last row in Table 6.4).
Ablation Study. To understand which of the input features contribute the most to the classifi-
cation of pseudoscientific videos, we perform an ablation study. We systematically remove
each of the four input feature types (and their branch in the classifier) and retrain the classifier.
Again, we use ten-fold cross-validation and oversampling to deal with data imbalance and
use the classification threshold of 0.7. Table 6.5 reports the performance metrics for each
combination of inputs. Video tags and transcripts yield the best performance, indicating that
they are the most informative input features. However, using all the available input features
yields better performance, which indicates that all four input features are ultimately crucial for
the classification task.
Remarks. Although our classifier outperforms all the baselines, ultimately, its performance
(0.74 F1-score) reflects the subjective nature of pseudoscientific vs. scientific content classifi-
cation on YouTube. This relates to our crowdsourced annotation’s relatively low agreement
score, which highlights the difficulty in identifying whether a video is pseudoscientific. It is
also evidence of the hurdles in devising models that automatically discover pseudoscientific
content. Nonetheless, we argue that our classifier is only the first step in this direction and
can be further improved; overall, it does provide a meaningful signal on whether a video is
pseudoscientific. It can also be used to derive a lower bound of YouTube’s recommendation
algorithm’s tendency to recommend pseudoscience; we uncover a substantial portion of pseu-
doscientific videos while also eliminating all false positives with manual review of all the
videos classified as pseudoscientific (see Section 6.4.1).
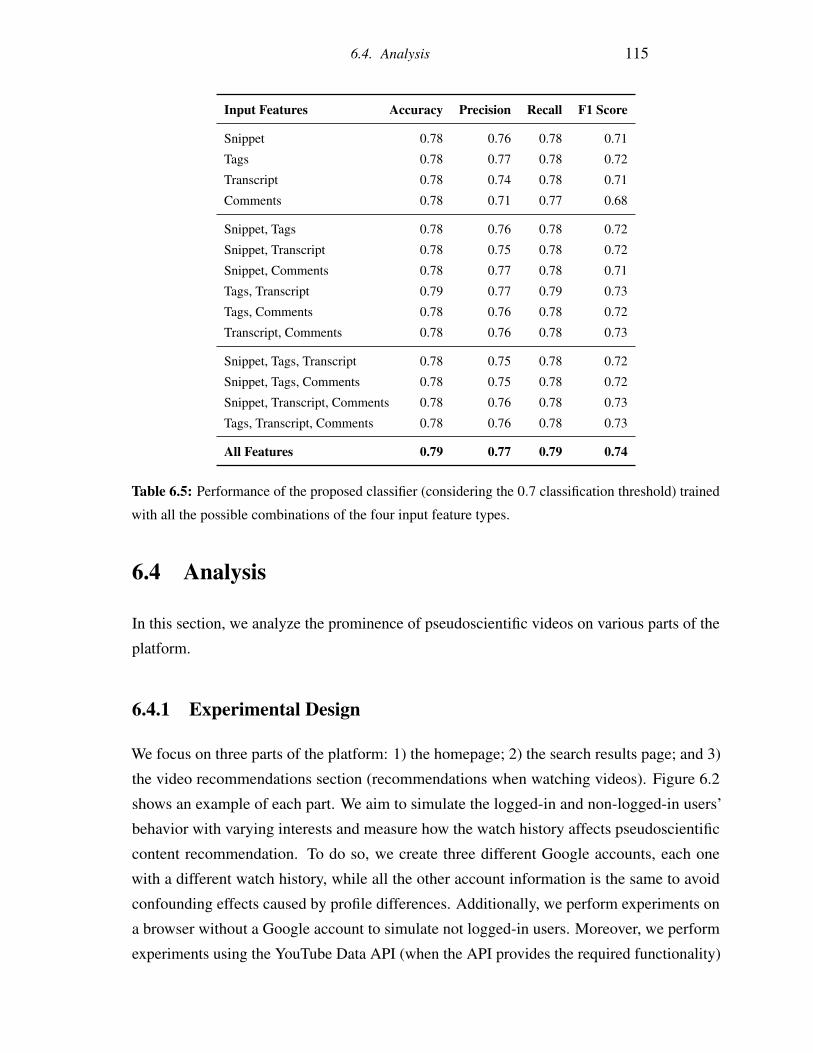
6.4. Analysis 115
Input Features Accuracy Precision Recall F1 Score
Snippet 0.78 0.76 0.78 0.71
Tags 0.78 0.77 0.78 0.72
Transcript 0.78 0.74 0.78 0.71
Comments 0.78 0.71 0.77 0.68
Snippet, Tags 0.78 0.76 0.78 0.72
Snippet, Transcript 0.78 0.75 0.78 0.72
Snippet, Comments 0.78 0.77 0.78 0.71
Tags, Transcript 0.79 0.77 0.79 0.73
Tags, Comments 0.78 0.76 0.78 0.72
Transcript, Comments 0.78 0.76 0.78 0.73
Snippet, Tags, Transcript 0.78 0.75 0.78 0.72
Snippet, Tags, Comments 0.78 0.75 0.78 0.72
Snippet, Transcript, Comments 0.78 0.76 0.78 0.73
Tags, Transcript, Comments 0.78 0.76 0.78 0.73
All Features 0.79 0.77 0.79 0.74
Table 6.5: Performance of the proposed classifier (considering the 0.7 classification threshold) trained
with all the possible combinations of the four input feature types.
6.4 Analysis
In this section, we analyze the prominence of pseudoscientific videos on various parts of the
platform.
6.4.1 Experimental Design
We focus on three parts of the platform: 1) the homepage; 2) the search results page; and 3)
the video recommendations section (recommendations when watching videos). Figure 6.2
shows an example of each part. We aim to simulate the logged-in and non-logged-in users’
behavior with varying interests and measure how the watch history affects pseudoscientific
content recommendation. To do so, we create three different Google accounts, each one
with a different watch history, while all the other account information is the same to avoid
confounding effects caused by profile differences. Additionally, we perform experiments on
a browser without a Google account to simulate not logged-in users. Moreover, we perform
experiments using the YouTube Data API (when the API provides the required functionality)
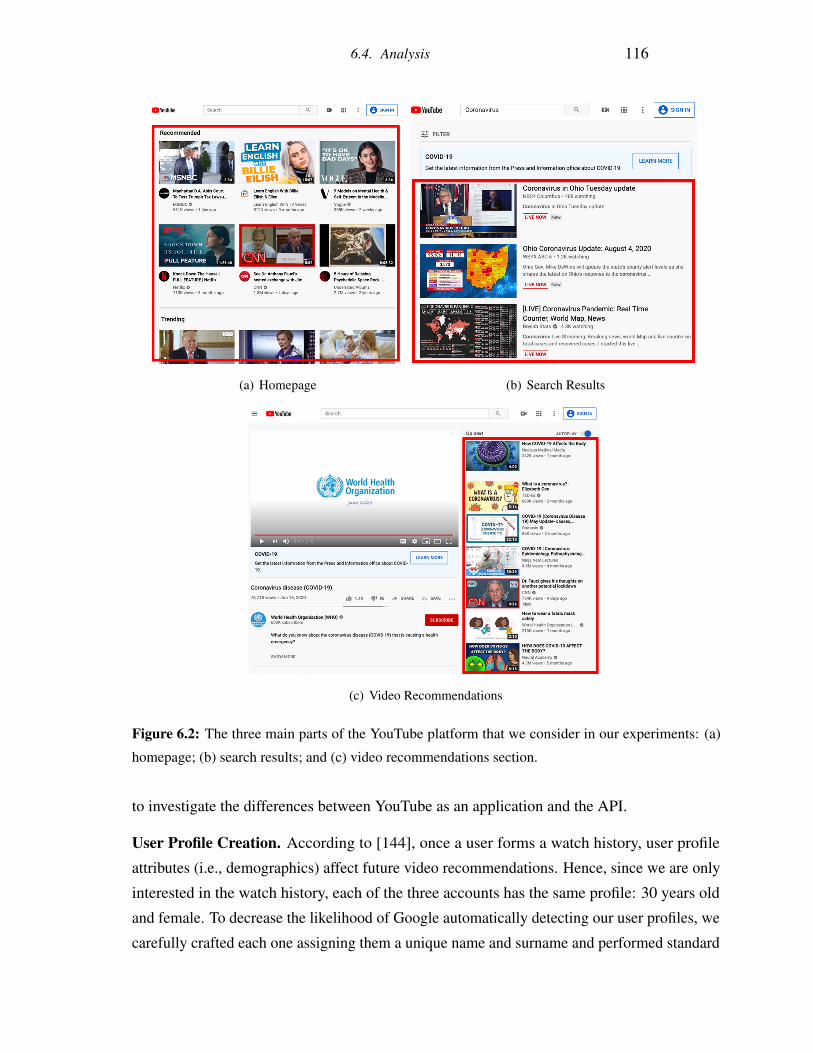
6.4. Analysis 116
(a) Homepage (b) Search Results
(c) Video Recommendations
Figure 6.2: The three main parts of the YouTube platform that we consider in our experiments: (a)
homepage; (b) search results; and (c) video recommendations section.
to investigate the differences between YouTube as an application and the API.
User Profile Creation. According to [144], once a user forms a watch history, user profile
attributes (i.e., demographics) affect future video recommendations. Hence, since we are only
interested in the watch history, each of the three accounts has the same profile: 30 years old
and female. To decrease the likelihood of Google automatically detecting our user profiles, we
carefully crafted each one assigning them a unique name and surname and performed standard
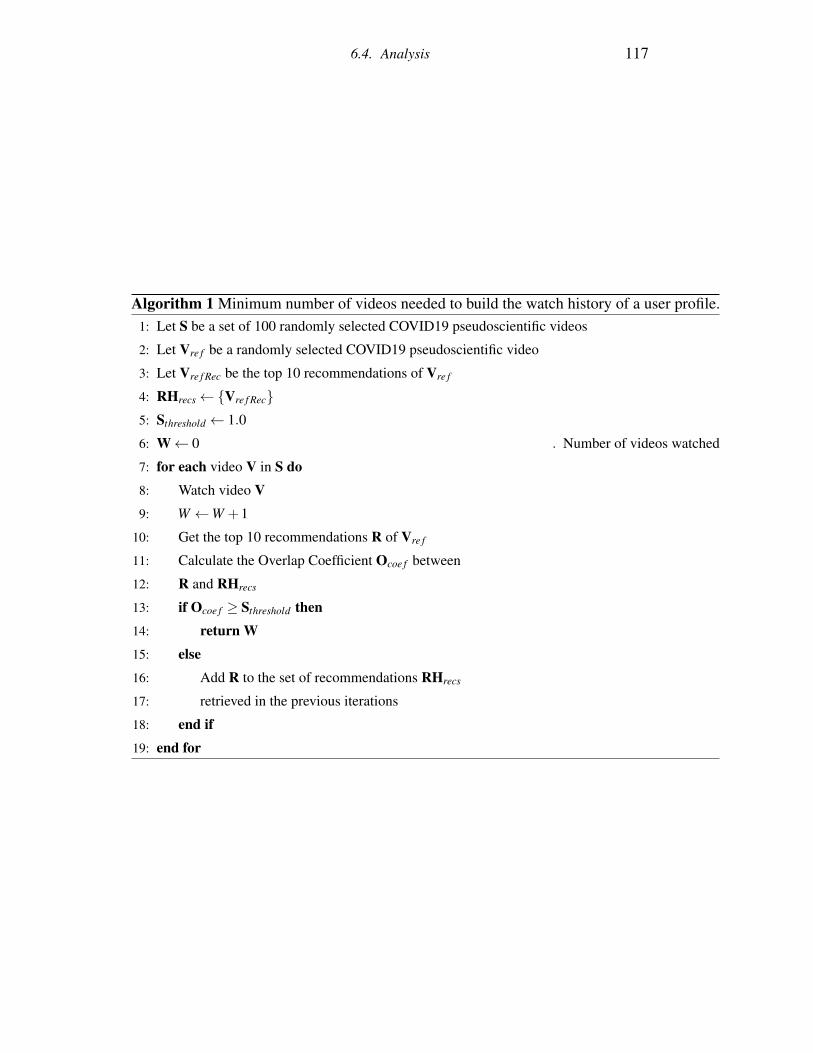
6.4. Analysis 117
Algorithm 1 Minimum number of videos needed to build the watch history of a user profile.1: Let S be a set of 100 randomly selected COVID19 pseudoscientific videos
2: Let Vre f be a randomly selected COVID19 pseudoscientific video
3: Let Vre f Rec be the top 10 recommendations of Vre f
4: RHrecs←{Vre f Rec}5: Sthreshold ← 1.0
6: W← 0 . Number of videos watched
7: for each video V in S do8: Watch video V9: W ←W +1
10: Get the top 10 recommendations R of Vre f
11: Calculate the Overlap Coefficient Ocoe f between
12: R and RHrecs
13: if Ocoe f ≥ Sthreshold then14: return W15: else16: Add R to the set of recommendations RHrecs
17: retrieved in the previous iterations
18: end if19: end for
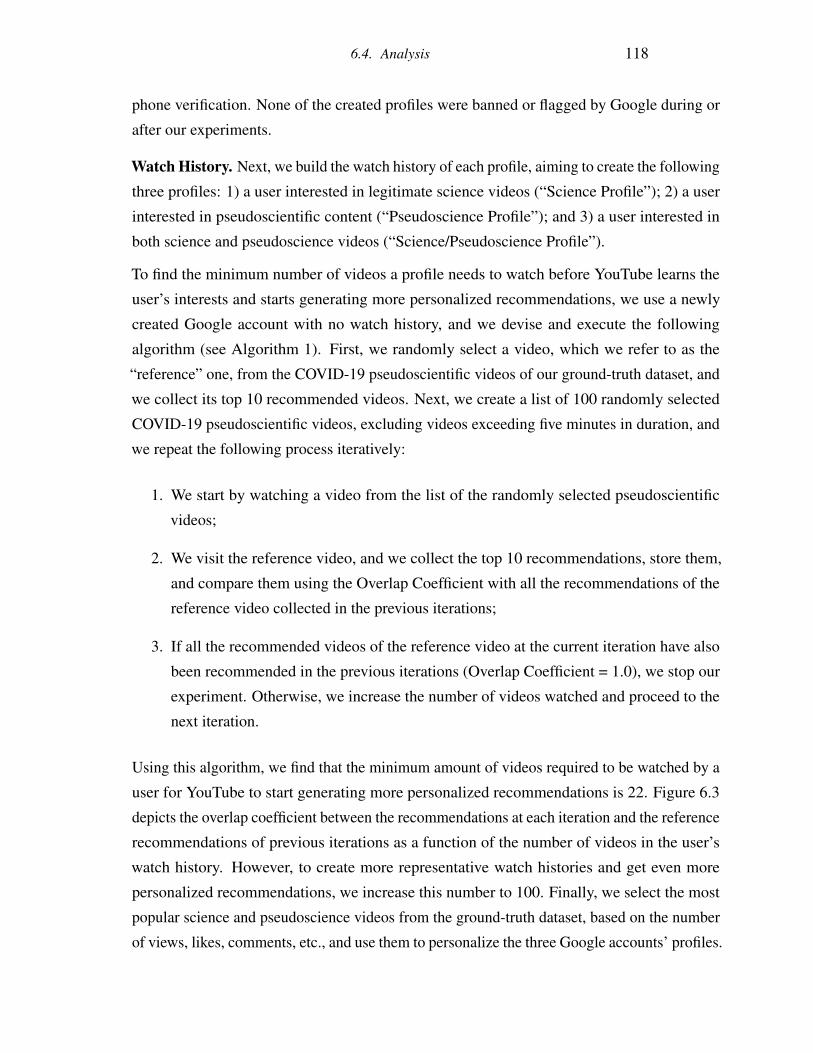
6.4. Analysis 118
phone verification. None of the created profiles were banned or flagged by Google during or
after our experiments.
Watch History. Next, we build the watch history of each profile, aiming to create the following
three profiles: 1) a user interested in legitimate science videos (“Science Profile”); 2) a user
interested in pseudoscientific content (“Pseudoscience Profile”); and 3) a user interested in
both science and pseudoscience videos (“Science/Pseudoscience Profile”).
To find the minimum number of videos a profile needs to watch before YouTube learns the
user’s interests and starts generating more personalized recommendations, we use a newly
created Google account with no watch history, and we devise and execute the following
algorithm (see Algorithm 1). First, we randomly select a video, which we refer to as the
“reference” one, from the COVID-19 pseudoscientific videos of our ground-truth dataset, and
we collect its top 10 recommended videos. Next, we create a list of 100 randomly selected
COVID-19 pseudoscientific videos, excluding videos exceeding five minutes in duration, and
we repeat the following process iteratively:
1. We start by watching a video from the list of the randomly selected pseudoscientific
videos;
2. We visit the reference video, and we collect the top 10 recommendations, store them,
and compare them using the Overlap Coefficient with all the recommendations of the
reference video collected in the previous iterations;
3. If all the recommended videos of the reference video at the current iteration have also
been recommended in the previous iterations (Overlap Coefficient = 1.0), we stop our
experiment. Otherwise, we increase the number of videos watched and proceed to the
next iteration.
Using this algorithm, we find that the minimum amount of videos required to be watched by a
user for YouTube to start generating more personalized recommendations is 22. Figure 6.3
depicts the overlap coefficient between the recommendations at each iteration and the reference
recommendations of previous iterations as a function of the number of videos in the user’s
watch history. However, to create more representative watch histories and get even more
personalized recommendations, we increase this number to 100. Finally, we select the most
popular science and pseudoscience videos from the ground-truth dataset, based on the number
of views, likes, comments, etc., and use them to personalize the three Google accounts’ profiles.
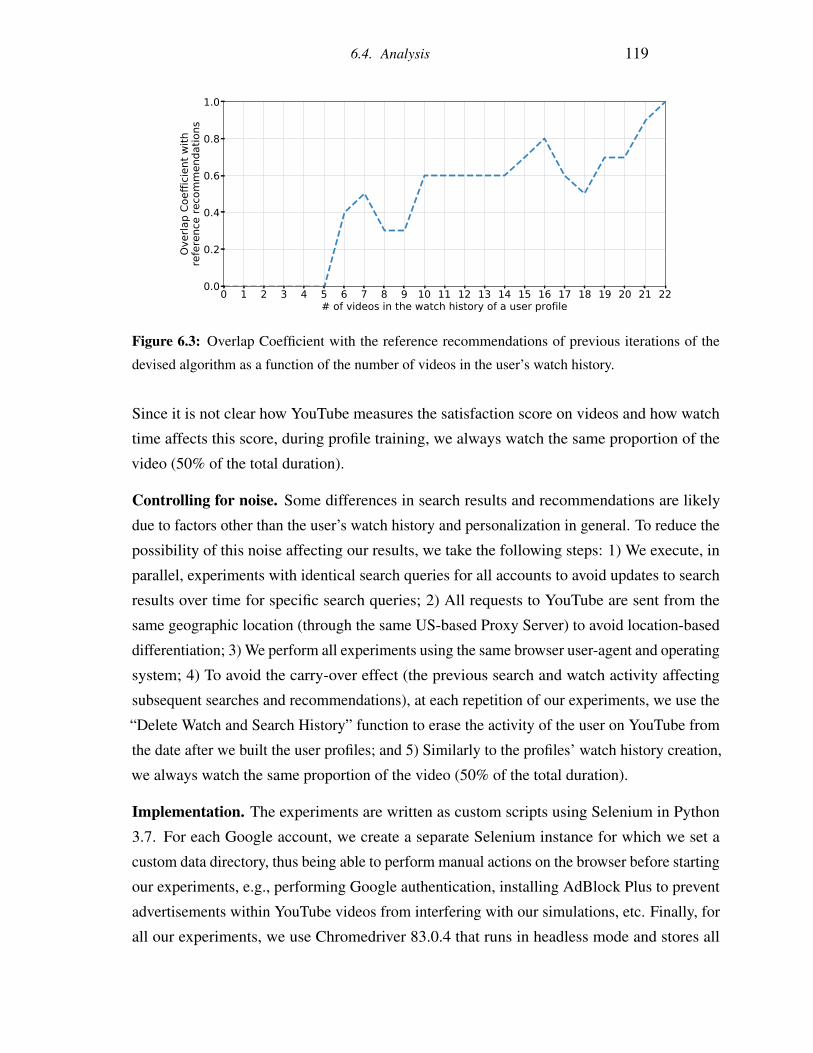
6.4. Analysis 119
0 1 2 3 4 5 6 7 8 9 10 11 12 13 14 15 16 17 18 19 20 21 22# of videos in the watch history of a user profile
0.0
0.2
0.4
0.6
0.8
1.0
Over
lap
Coef
ficie
nt w
ithre
fere
nce
reco
mm
enda
tions
Figure 6.3: Overlap Coefficient with the reference recommendations of previous iterations of the
devised algorithm as a function of the number of videos in the user’s watch history.
Since it is not clear how YouTube measures the satisfaction score on videos and how watch
time affects this score, during profile training, we always watch the same proportion of the
video (50% of the total duration).
Controlling for noise. Some differences in search results and recommendations are likely
due to factors other than the user’s watch history and personalization in general. To reduce the
possibility of this noise affecting our results, we take the following steps: 1) We execute, in
parallel, experiments with identical search queries for all accounts to avoid updates to search
results over time for specific search queries; 2) All requests to YouTube are sent from the
same geographic location (through the same US-based Proxy Server) to avoid location-based
differentiation; 3) We perform all experiments using the same browser user-agent and operating
system; 4) To avoid the carry-over effect (the previous search and watch activity affecting
subsequent searches and recommendations), at each repetition of our experiments, we use the
“Delete Watch and Search History” function to erase the activity of the user on YouTube from
the date after we built the user profiles; and 5) Similarly to the profiles’ watch history creation,
we always watch the same proportion of the video (50% of the total duration).
Implementation. The experiments are written as custom scripts using Selenium in Python
3.7. For each Google account, we create a separate Selenium instance for which we set a
custom data directory, thus being able to perform manual actions on the browser before starting
our experiments, e.g., performing Google authentication, installing AdBlock Plus to prevent
advertisements within YouTube videos from interfering with our simulations, etc. Finally, for
all our experiments, we use Chromedriver 83.0.4 that runs in headless mode and stores all
6.4. Analysis 120
0 5 10 15 20 25 30# top homepage videos
0
5
10
15
20
25
% u
niqu
e ps
eudo
scie
ntifi
c vi
deos Science Profile
Pseudoscience ProfileScience/Pseudoscience ProfileNo Profile (Browser)
Figure 6.4: Percentage of pseudoscience videos found in the homepage of each user profile.
received cookies.
Video Annotation. Here, we describe how we use our classifier in our experiments. In partic-
ular, we initially use our classifier to annotate all the videos encountered in our experiments
and identify videos that are more likely to be pseudoscientific. Then, the first author of this
paper manually inspects all the videos classified as pseudoscientific to confirm that they are
indeed pseudoscientific. Following this approach, we eliminate all the false positives.
6.4.2 Pseudoscientific Content on Homepage, Search Results, and VideoRecommendations
Homepage
We begin by assessing the magnitude of the pseudoscientific content problem on the YouTube
homepage. To do so, we use each one of the three user profiles (Science, Pseudoscience, and
Science/Pseudoscience), as well as another user with no account (No Profile) that simulates
the behavior of not logged-in users. We then visit each profile’s homepage to collect and
classify the top 30 videos as ranked by YouTube. Note that we cannot perform this experiment
using the YouTube Data API since it does not support this functionality. We repeat the same
experiment 50 times with a waiting time of 10 minutes between each repetition because
YouTube shows different videos on the homepage each time a user visits YouTube. We
perform this experiment during December, 2020.
Figure 6.4 shows the percentage of unique pseudoscientific videos on the homepage of each
6.4. Analysis 121
user profile. We find that 2.4%, 9.8%, 4.4%, and 1.9% of all the unique videos found in the
top 30 videos of the homepage of the Science, Pseudoscience, Science/Pseudoscience, and the
No profile (browser) users, respectively, are pseudoscientific. Overall, the Pseudoscience and
the Science/Pseudoscience profile get shown a higher amount of pseudoscientific content on
their homepage. We also verify the significance of the difference in the amount of pseudosci-
entific content in the homepage of the Pseudoscience and the Science/Pseudoscience profiles
compared to the one of the No profile (browser) using the Fisher’s Exact test (p < 0.05) [260].
We obtain similarly high significance (p < 0.05) when we compare the Pseudoscience and
Science/Pseudoscience profiles with the Science profile. This indicates that the users’ watch
history substantially affects the number of pseudoscientific recommendations on their home-
page. Nevertheless, users who are not interested in this type of content (i.e., science profile)
still receive a non-negligible amount of pseudoscientific content. We also observe that as
the number of videos on the user’s homepage increases (e.g., when a user scrolls down), the
pseudoscientific videos’ percentage remains approximately identical.
Search Results
Next, we focus on quantifying the prevalence of pseudoscientific content when users search
for videos on YouTube. For this experiment, we use the four pseudoscientific topics in our
ground-truth dataset, and we perform search queries on YouTube for each topic. For topics
with two search queries (i.e., COVID-19), we perform the experiment twice and average their
results. We retrieve the top 20 videos for each search query and use our classifier to classify
each video in the result set. We repeat this experiment 50 times for each pseudoscientific topic
using all three user profiles and two non-logged-in users with no profile (one using a browser
and another using YouTube’s Data API). Recall that we delete the user’s watch history at each
experiment repetition and between those performed with different search queries to ensure
that future search results are not affected by previous activity other than our controlled watch
history. We perform this experiment in December, 2020.
Overall, we find a large variation in the results across pseudoscientific topics (see Figure 6.5).
For more traditional pseudoscientific topics like Flat Earth, YouTube search returns even
more pseudoscientific content. In particular, when searching for Flat earth, the Science
profile, Pseudoscience profile, Science/Pseudoscience profile, no profile (browser), and the
YouTube Data API encounter, respectively, 5.0%, 2.0%, 3.9%, 5.0%, and 5.6% more unique
pseudoscientific content than when searching for Anti-vaccination. In fact, Anti-vaccination
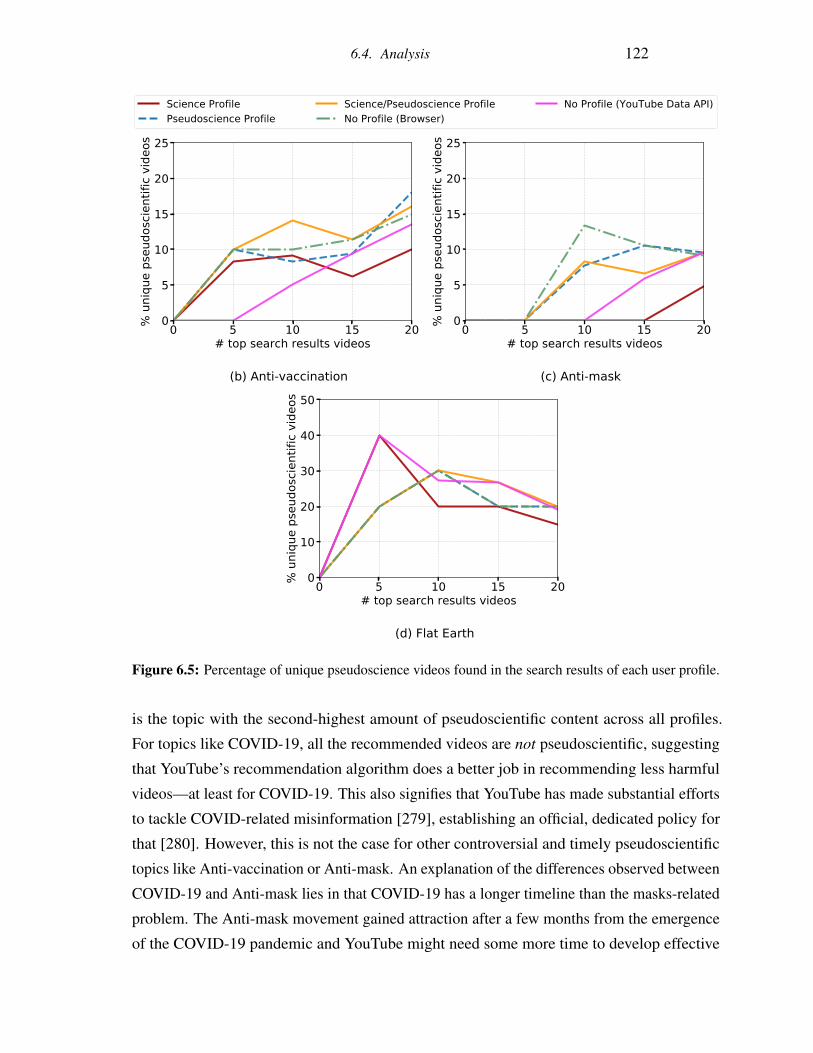
6.4. Analysis 122
1 2 3 4 5# hop
0
5
10
15
20
25
% u
niqu
e ps
eudo
scie
ntifi
c vi
deos
Flat Earth
Science ProfilePseudoscience Profile
Science/Pseudoscience ProfileNo Profile (Browser)
No Profile (YouTube Data API)
0 5 10 15 20# top search results videos
0
5
10
15
20
25%
uni
que
pseu
dosc
ient
ific
vide
os
(b) Anti-vaccination
0 5 10 15 20# top search results videos
0
5
10
15
20
25
% u
niqu
e ps
eudo
scie
ntifi
c vi
deos
(c) Anti-mask
0 5 10 15 20# top search results videos
0
10
20
30
40
50
% u
niqu
e ps
eudo
scie
ntifi
c vi
deos
(d) Flat Earth
Figure 6.5: Percentage of unique pseudoscience videos found in the search results of each user profile.
is the topic with the second-highest amount of pseudoscientific content across all profiles.
For topics like COVID-19, all the recommended videos are not pseudoscientific, suggesting
that YouTube’s recommendation algorithm does a better job in recommending less harmful
videos—at least for COVID-19. This also signifies that YouTube has made substantial efforts
to tackle COVID-related misinformation [279], establishing an official, dedicated policy for
that [280]. However, this is not the case for other controversial and timely pseudoscientific
topics like Anti-vaccination or Anti-mask. An explanation of the differences observed between
COVID-19 and Anti-mask lies in that COVID-19 has a longer timeline than the masks-related
problem. The Anti-mask movement gained attraction after a few months from the emergence
of the COVID-19 pandemic and YouTube might need some more time to develop effective
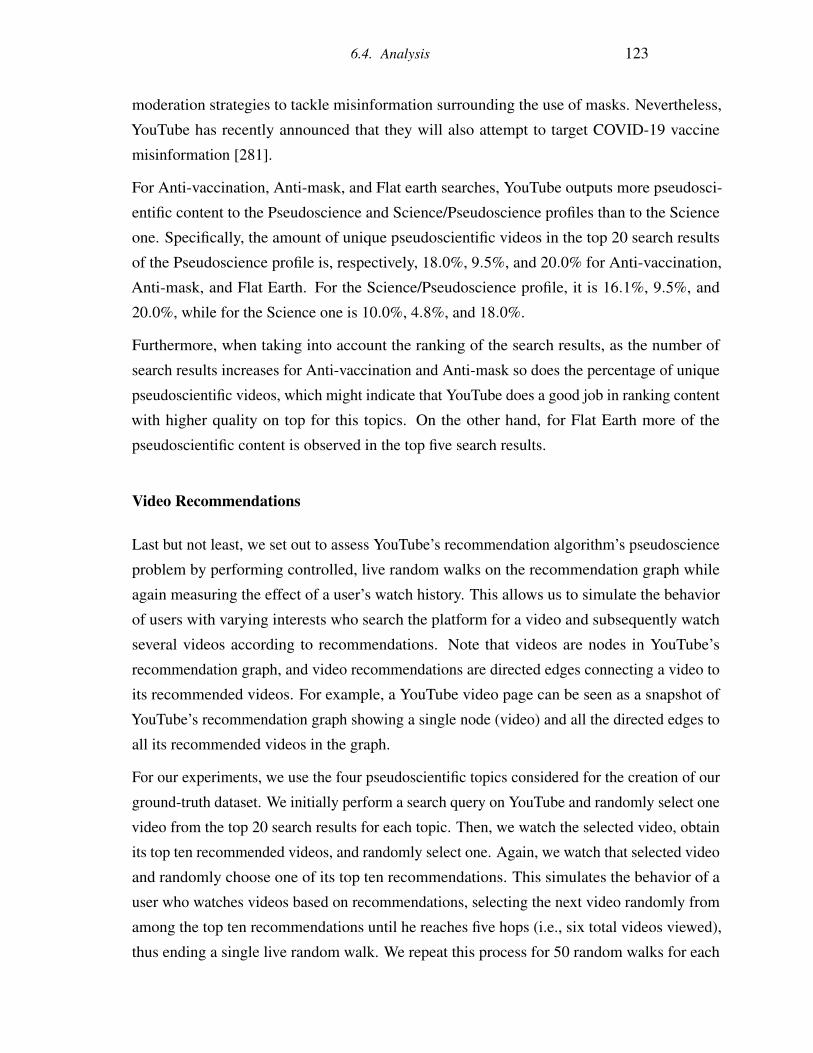
6.4. Analysis 123
moderation strategies to tackle misinformation surrounding the use of masks. Nevertheless,
YouTube has recently announced that they will also attempt to target COVID-19 vaccine
misinformation [281].
For Anti-vaccination, Anti-mask, and Flat earth searches, YouTube outputs more pseudosci-
entific content to the Pseudoscience and Science/Pseudoscience profiles than to the Science
one. Specifically, the amount of unique pseudoscientific videos in the top 20 search results
of the Pseudoscience profile is, respectively, 18.0%, 9.5%, and 20.0% for Anti-vaccination,
Anti-mask, and Flat Earth. For the Science/Pseudoscience profile, it is 16.1%, 9.5%, and
20.0%, while for the Science one is 10.0%, 4.8%, and 18.0%.
Furthermore, when taking into account the ranking of the search results, as the number of
search results increases for Anti-vaccination and Anti-mask so does the percentage of unique
pseudoscientific videos, which might indicate that YouTube does a good job in ranking content
with higher quality on top for this topics. On the other hand, for Flat Earth more of the
pseudoscientific content is observed in the top five search results.
Video Recommendations
Last but not least, we set out to assess YouTube’s recommendation algorithm’s pseudoscience
problem by performing controlled, live random walks on the recommendation graph while
again measuring the effect of a user’s watch history. This allows us to simulate the behavior
of users with varying interests who search the platform for a video and subsequently watch
several videos according to recommendations. Note that videos are nodes in YouTube’s
recommendation graph, and video recommendations are directed edges connecting a video to
its recommended videos. For example, a YouTube video page can be seen as a snapshot of
YouTube’s recommendation graph showing a single node (video) and all the directed edges to
all its recommended videos in the graph.
For our experiments, we use the four pseudoscientific topics considered for the creation of our
ground-truth dataset. We initially perform a search query on YouTube and randomly select one
video from the top 20 search results for each topic. Then, we watch the selected video, obtain
its top ten recommended videos, and randomly select one. Again, we watch that selected video
and randomly choose one of its top ten recommendations. This simulates the behavior of a
user who watches videos based on recommendations, selecting the next video randomly from
among the top ten recommendations until he reaches five hops (i.e., six total videos viewed),
thus ending a single live random walk. We repeat this process for 50 random walks for each
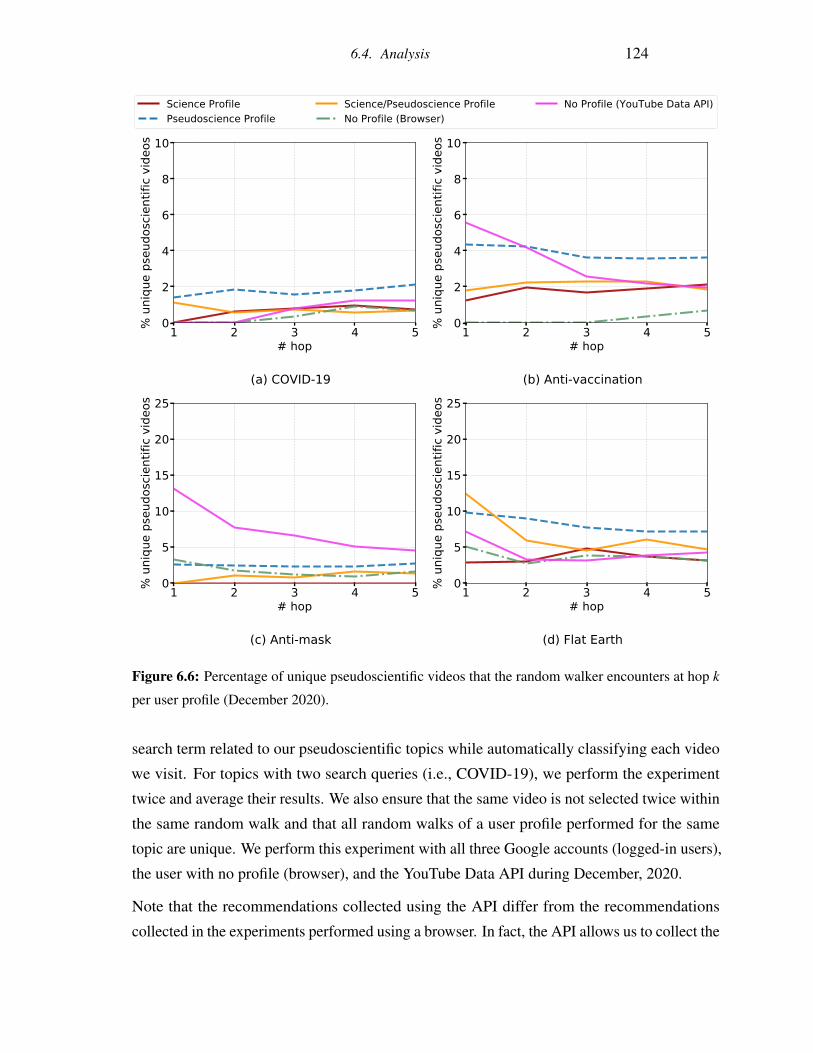
6.4. Analysis 124
1 2 3 4 5# hop
0
5
10
15
20
25
% u
niqu
e ps
eudo
scie
ntifi
c vi
deos
Flat Earth
Science ProfilePseudoscience Profile
Science/Pseudoscience ProfileNo Profile (Browser)
No Profile (YouTube Data API)
1 2 3 4 5# hop
0
2
4
6
8
10%
uni
que
pseu
dosc
ient
ific
vide
os
(a) COVID-19
1 2 3 4 5# hop
0
2
4
6
8
10
% u
niqu
e ps
eudo
scie
ntifi
c vi
deos
(b) Anti-vaccination
1 2 3 4 5# hop
0
5
10
15
20
25
% u
niqu
e ps
eudo
scie
ntifi
c vi
deos
(c) Anti-mask
1 2 3 4 5# hop
0
5
10
15
20
25
% u
niqu
e ps
eudo
scie
ntifi
c vi
deos
(d) Flat Earth
Figure 6.6: Percentage of unique pseudoscientific videos that the random walker encounters at hop k
per user profile (December 2020).
search term related to our pseudoscientific topics while automatically classifying each video
we visit. For topics with two search queries (i.e., COVID-19), we perform the experiment
twice and average their results. We also ensure that the same video is not selected twice within
the same random walk and that all random walks of a user profile performed for the same
topic are unique. We perform this experiment with all three Google accounts (logged-in users),
the user with no profile (browser), and the YouTube Data API during December, 2020.
Note that the recommendations collected using the API differ from the recommendations
collected in the experiments performed using a browser. In fact, the API allows us to collect the
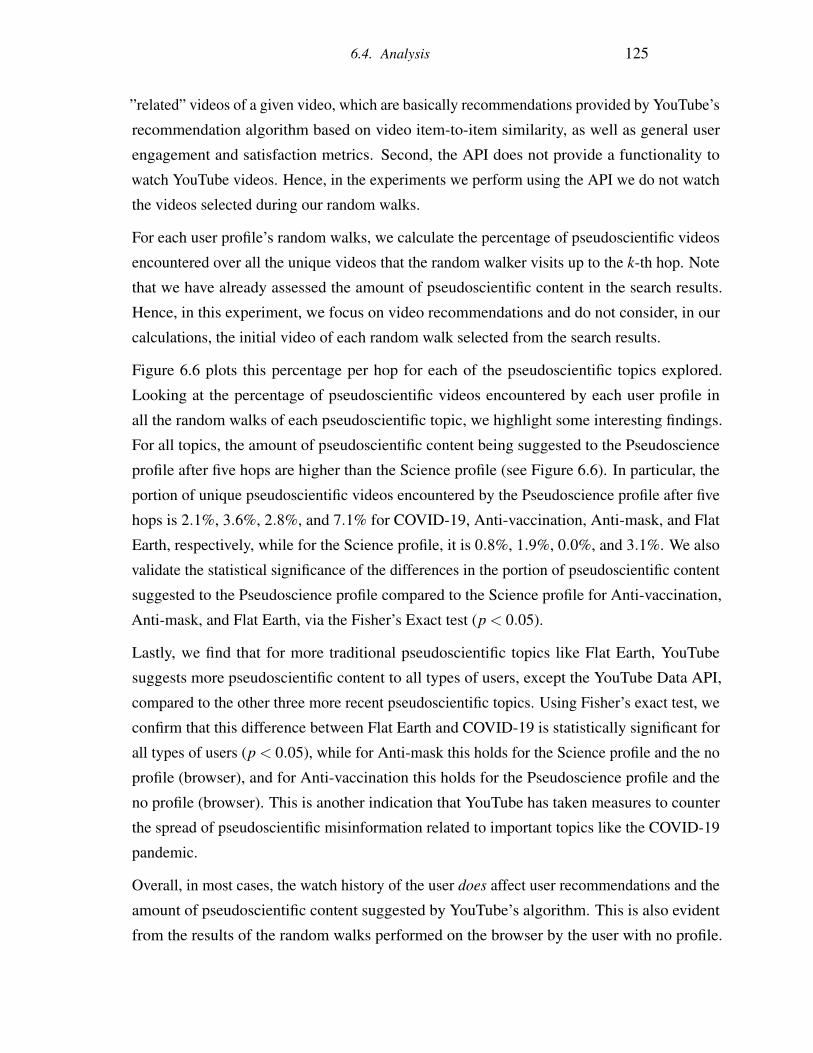
6.4. Analysis 125
”related” videos of a given video, which are basically recommendations provided by YouTube’s
recommendation algorithm based on video item-to-item similarity, as well as general user
engagement and satisfaction metrics. Second, the API does not provide a functionality to
watch YouTube videos. Hence, in the experiments we perform using the API we do not watch
the videos selected during our random walks.
For each user profile’s random walks, we calculate the percentage of pseudoscientific videos
encountered over all the unique videos that the random walker visits up to the k-th hop. Note
that we have already assessed the amount of pseudoscientific content in the search results.
Hence, in this experiment, we focus on video recommendations and do not consider, in our
calculations, the initial video of each random walk selected from the search results.
Figure 6.6 plots this percentage per hop for each of the pseudoscientific topics explored.
Looking at the percentage of pseudoscientific videos encountered by each user profile in
all the random walks of each pseudoscientific topic, we highlight some interesting findings.
For all topics, the amount of pseudoscientific content being suggested to the Pseudoscience
profile after five hops are higher than the Science profile (see Figure 6.6). In particular, the
portion of unique pseudoscientific videos encountered by the Pseudoscience profile after five
hops is 2.1%, 3.6%, 2.8%, and 7.1% for COVID-19, Anti-vaccination, Anti-mask, and Flat
Earth, respectively, while for the Science profile, it is 0.8%, 1.9%, 0.0%, and 3.1%. We also
validate the statistical significance of the differences in the portion of pseudoscientific content
suggested to the Pseudoscience profile compared to the Science profile for Anti-vaccination,
Anti-mask, and Flat Earth, via the Fisher’s Exact test (p < 0.05).
Lastly, we find that for more traditional pseudoscientific topics like Flat Earth, YouTube
suggests more pseudoscientific content to all types of users, except the YouTube Data API,
compared to the other three more recent pseudoscientific topics. Using Fisher’s exact test, we
confirm that this difference between Flat Earth and COVID-19 is statistically significant for
all types of users (p < 0.05), while for Anti-mask this holds for the Science profile and the no
profile (browser), and for Anti-vaccination this holds for the Pseudoscience profile and the
no profile (browser). This is another indication that YouTube has taken measures to counter
the spread of pseudoscientific misinformation related to important topics like the COVID-19
pandemic.
Overall, in most cases, the watch history of the user does affect user recommendations and the
amount of pseudoscientific content suggested by YouTube’s algorithm. This is also evident
from the results of the random walks performed on the browser by the user with no profile.
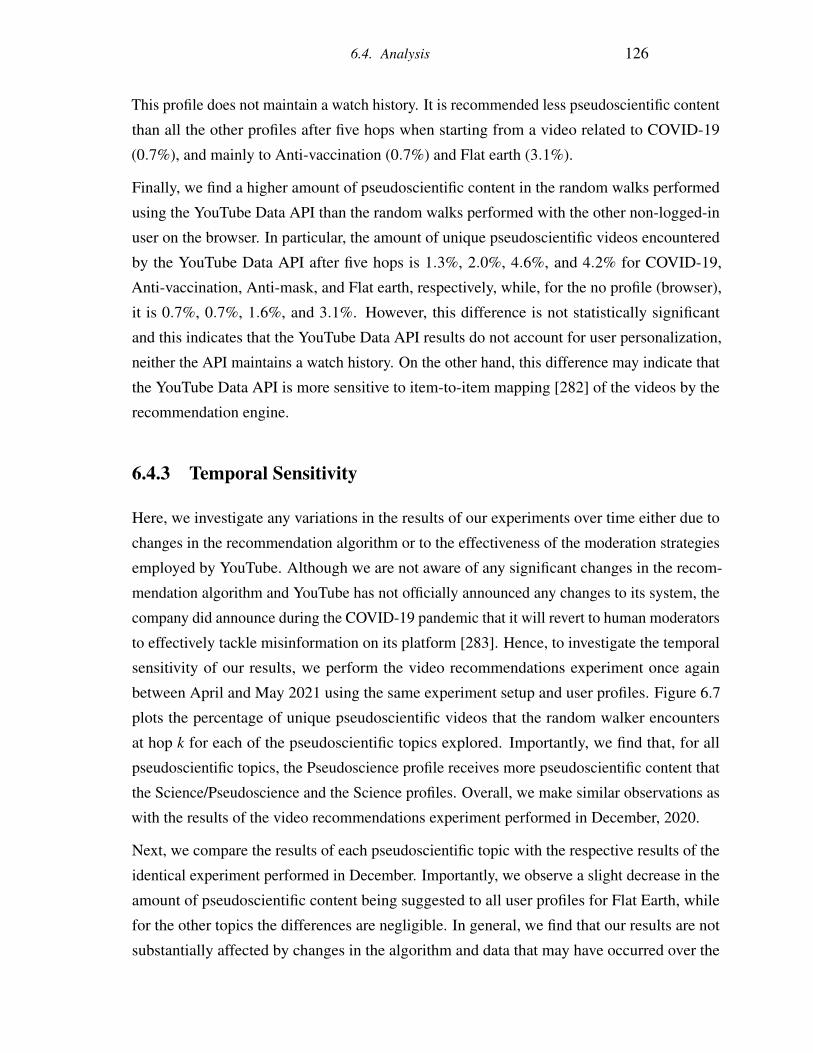
6.4. Analysis 126
This profile does not maintain a watch history. It is recommended less pseudoscientific content
than all the other profiles after five hops when starting from a video related to COVID-19
(0.7%), and mainly to Anti-vaccination (0.7%) and Flat earth (3.1%).
Finally, we find a higher amount of pseudoscientific content in the random walks performed
using the YouTube Data API than the random walks performed with the other non-logged-in
user on the browser. In particular, the amount of unique pseudoscientific videos encountered
by the YouTube Data API after five hops is 1.3%, 2.0%, 4.6%, and 4.2% for COVID-19,
Anti-vaccination, Anti-mask, and Flat earth, respectively, while, for the no profile (browser),
it is 0.7%, 0.7%, 1.6%, and 3.1%. However, this difference is not statistically significant
and this indicates that the YouTube Data API results do not account for user personalization,
neither the API maintains a watch history. On the other hand, this difference may indicate that
the YouTube Data API is more sensitive to item-to-item mapping [282] of the videos by the
recommendation engine.
6.4.3 Temporal Sensitivity
Here, we investigate any variations in the results of our experiments over time either due to
changes in the recommendation algorithm or to the effectiveness of the moderation strategies
employed by YouTube. Although we are not aware of any significant changes in the recom-
mendation algorithm and YouTube has not officially announced any changes to its system, the
company did announce during the COVID-19 pandemic that it will revert to human moderators
to effectively tackle misinformation on its platform [283]. Hence, to investigate the temporal
sensitivity of our results, we perform the video recommendations experiment once again
between April and May 2021 using the same experiment setup and user profiles. Figure 6.7
plots the percentage of unique pseudoscientific videos that the random walker encounters
at hop k for each of the pseudoscientific topics explored. Importantly, we find that, for all
pseudoscientific topics, the Pseudoscience profile receives more pseudoscientific content that
the Science/Pseudoscience and the Science profiles. Overall, we make similar observations as
with the results of the video recommendations experiment performed in December, 2020.
Next, we compare the results of each pseudoscientific topic with the respective results of the
identical experiment performed in December. Importantly, we observe a slight decrease in the
amount of pseudoscientific content being suggested to all user profiles for Flat Earth, while
for the other topics the differences are negligible. In general, we find that our results are not
substantially affected by changes in the algorithm and data that may have occurred over the
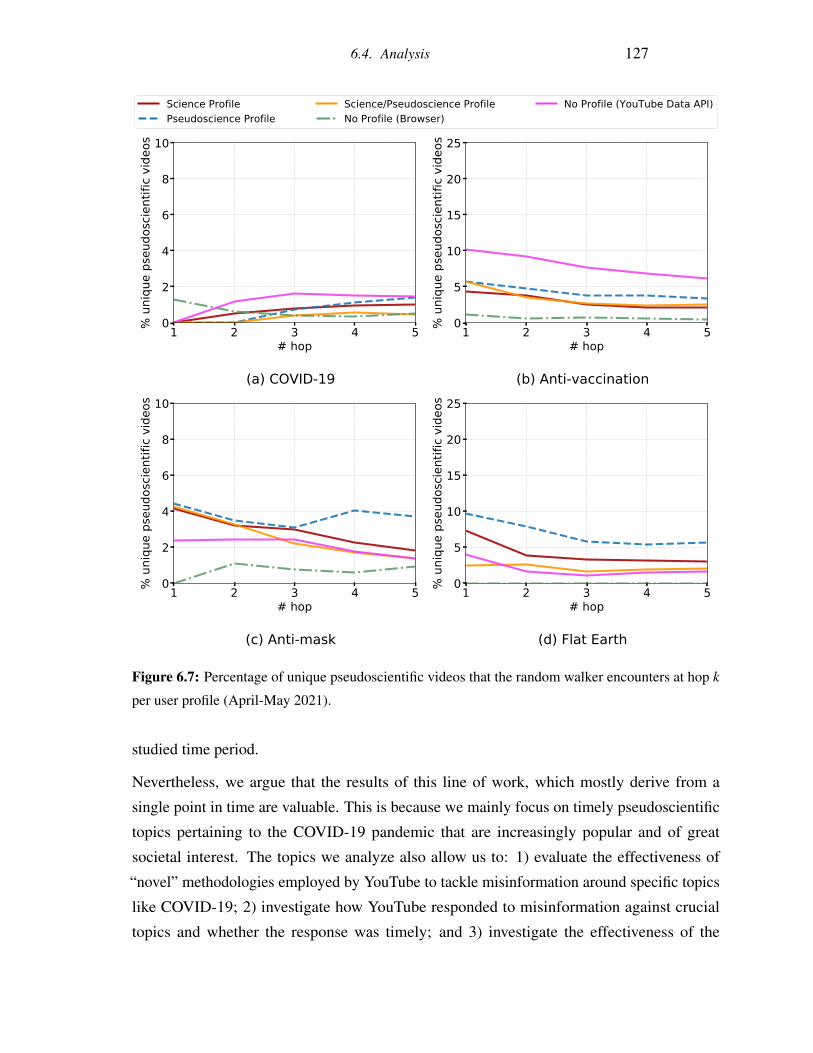
6.4. Analysis 127
1 2 3 4 5# hop
0
5
10
15
20
25
% u
niqu
e ps
eudo
scie
ntifi
c vi
deos
Flat Earth
Science ProfilePseudoscience Profile
Science/Pseudoscience ProfileNo Profile (Browser)
No Profile (YouTube Data API)
1 2 3 4 5# hop
0
2
4
6
8
10%
uni
que
pseu
dosc
ient
ific
vide
os
(a) COVID-19
1 2 3 4 5# hop
0
5
10
15
20
25
% u
niqu
e ps
eudo
scie
ntifi
c vi
deos
(b) Anti-vaccination
1 2 3 4 5# hop
0
2
4
6
8
10
% u
niqu
e ps
eudo
scie
ntifi
c vi
deos
(c) Anti-mask
1 2 3 4 5# hop
0
5
10
15
20
25
% u
niqu
e ps
eudo
scie
ntifi
c vi
deos
(d) Flat Earth
Figure 6.7: Percentage of unique pseudoscientific videos that the random walker encounters at hop k
per user profile (April-May 2021).
studied time period.
Nevertheless, we argue that the results of this line of work, which mostly derive from a
single point in time are valuable. This is because we mainly focus on timely pseudoscientific
topics pertaining to the COVID-19 pandemic that are increasingly popular and of great
societal interest. The topics we analyze also allow us to: 1) evaluate the effectiveness of
“novel” methodologies employed by YouTube to tackle misinformation around specific topics
like COVID-19; 2) investigate how YouTube responded to misinformation against crucial
topics and whether the response was timely; and 3) investigate the effectiveness of the
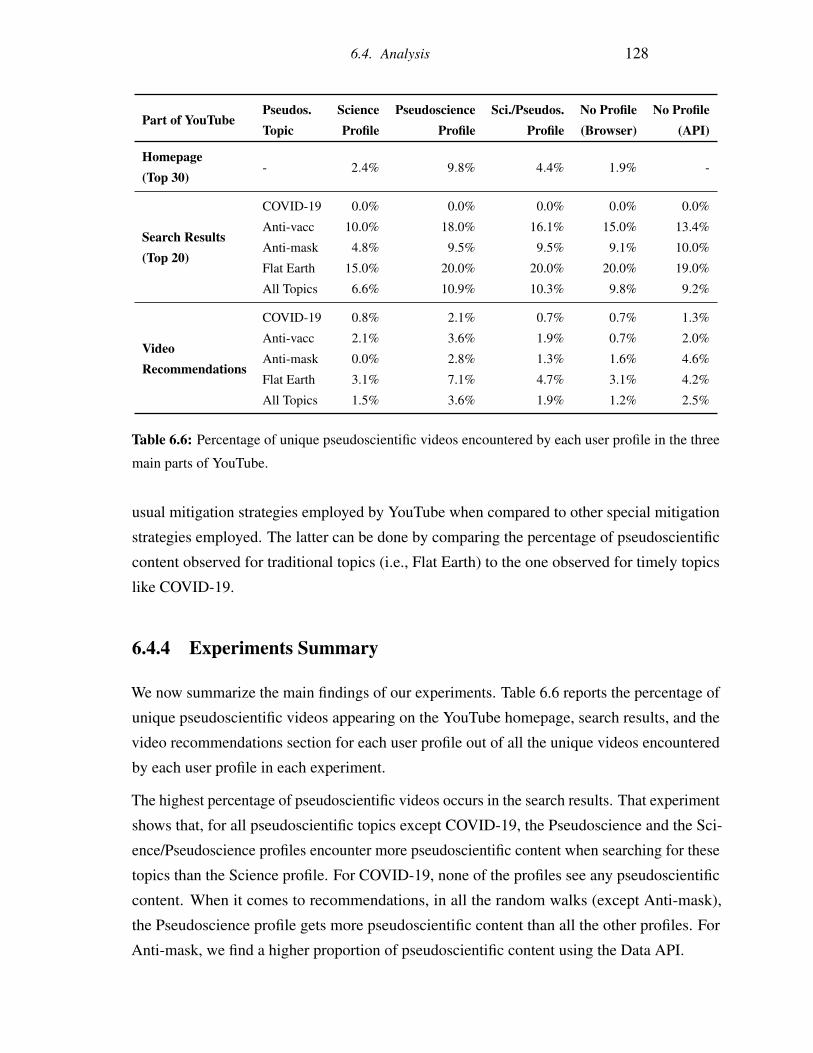
6.4. Analysis 128
Part of YouTubePseudos. Science Pseudoscience Sci./Pseudos. No Profile No ProfileTopic Profile Profile Profile (Browser) (API)
Homepage- 2.4% 9.8% 4.4% 1.9% -
(Top 30)
Search Results(Top 20)
COVID-19 0.0% 0.0% 0.0% 0.0% 0.0%
Anti-vacc 10.0% 18.0% 16.1% 15.0% 13.4%
Anti-mask 4.8% 9.5% 9.5% 9.1% 10.0%
Flat Earth 15.0% 20.0% 20.0% 20.0% 19.0%
All Topics 6.6% 10.9% 10.3% 9.8% 9.2%
VideoRecommendations
COVID-19 0.8% 2.1% 0.7% 0.7% 1.3%
Anti-vacc 2.1% 3.6% 1.9% 0.7% 2.0%
Anti-mask 0.0% 2.8% 1.3% 1.6% 4.6%
Flat Earth 3.1% 7.1% 4.7% 3.1% 4.2%
All Topics 1.5% 3.6% 1.9% 1.2% 2.5%
Table 6.6: Percentage of unique pseudoscientific videos encountered by each user profile in the three
main parts of YouTube.
usual mitigation strategies employed by YouTube when compared to other special mitigation
strategies employed. The latter can be done by comparing the percentage of pseudoscientific
content observed for traditional topics (i.e., Flat Earth) to the one observed for timely topics
like COVID-19.
6.4.4 Experiments Summary
We now summarize the main findings of our experiments. Table 6.6 reports the percentage of
unique pseudoscientific videos appearing on the YouTube homepage, search results, and the
video recommendations section for each user profile out of all the unique videos encountered
by each user profile in each experiment.
The highest percentage of pseudoscientific videos occurs in the search results. That experiment
shows that, for all pseudoscientific topics except COVID-19, the Pseudoscience and the Sci-
ence/Pseudoscience profiles encounter more pseudoscientific content when searching for these
topics than the Science profile. For COVID-19, none of the profiles see any pseudoscientific
content. When it comes to recommendations, in all the random walks (except Anti-mask),
the Pseudoscience profile gets more pseudoscientific content than all the other profiles. For
Anti-mask, we find a higher proportion of pseudoscientific content using the Data API.
6.5. Limitations 129
6.5 Limitations
Naturally, this line of work has several limitations. First, we use crowdworkers who are unlikely
to have any expertise in identifying pseudoscientific content. Hence, a small percentage of
the annotated videos may be misclassified. However, we mitigated this issue by not including
annotators with low accuracy on a classification task performed on a test dataset and annotating
each video based on the majority agreement. We also evaluated our crowdsourced annotation’s
performance by manually reviewing a randomly selected set of videos from our ground-truth
dataset, yielding 0.92 precision, 0.91 recall, and 0.92 F1 score. To further eliminate this issue,
we also collapsed our three labels into two, combining the science with the irrelevant videos
into an “Other” category.
Second, our ground-truth dataset is relatively small for such a subjective classification task.
Nonetheless, the classifier provides a meaningful signal, which, supported by manual review,
allows us to assess YouTube’s recommendation algorithm’s behavior with respect to pseudosci-
entific content. Third, there might be videos in our experiments that are pseudoscientific and
have been classified as “Other.” Hence, to verify our results’ accuracy, we manually reviewed
a random sample (10%) of the videos encountered during our experiments and classified
them as “Other,” finding that 98.0% of them were correctly classified. Finally, as for user
personalization, we only work with watch history, which is a fraction of YouTube’s signals for
user personalization.
6.6 Remarks
In this line of work, we studied pseudoscientific content on the YouTube platform. We collected
a dataset of 6.6K YouTube videos, and by using crowdsourcing, we annotated them according
to whether or not they include pseudoscientific content. We then trained a deep learning
classifier to detect pseudoscientific videos. We used the classifier to perform experiments
assessing the prevalence of pseudoscientific content on various parts of the platform while
accounting for the effects of the user’s watch history. To do so, we crafted a set of accounts
with different watch histories.
Overall, we found that the user’s watch history does substantially affect future user recom-
mendations by YouTube’s algorithm. This should be taken into consideration by research
communities aiming to audit the recommendation algorithm and understand how it drives
6.6. Remarks 130
users’ content consumption patterns. We also found that YouTube search results are more
likely to return pseudoscientific content than other parts of the platform like the video rec-
ommendations section or a user’s homepage. However, we also observed a non-negligible
number of pseudoscientific videos on both the video recommendations section and the users’
homepage. By investigating the differences across multiple pseudoscientific topics, we showed
that the recommendation algorithm is more likely to recommend pseudoscientific content
from traditional pseudoscience topics, e.g., Flat Earth, compared to more controversial topics
like COVID-19. This likely indicates that YouTube takes measures to counter the spread of
harmful information related to critical and emerging topics like the COVID-19 pandemic.
However, achieving this in a proactive and timely manner across topics remains a challenge.
Our work provides insights on pseudoscientific videos on YouTube and provides a set of
resources to the research community (the dataset, the classifier, and all the source code of
our experiments). In particular, the ability to run this kind of experiment while taking into
account users’ viewing history will be beneficial to researchers focusing on demystifying
YouTube’s recommendation algorithm—irrespective of the topic of interest. In other words,
our methodology and codebase are generic and can be used to study other topics besides
pseudoscience, e.g., additional conspiracy theories.
Chapter 7
Discussion & Conclusions
In this thesis, we studied several types of abhorrent, misinformative, and mistargeted content on
YouTube. Specifically, we shed light on three main relevant lines of inquiry: 1) characterizing
and detecting inappropriate videos targeting young children; 2) characterizing hateful and
misogynistic content on the platform through the lens of the Incel community; and 3) assessing
the effect of a user’s watch history on pseudoscientific video recommendations. Below, we
provide the main insights and possible future directions for each line of work.
7.1 Characterizing and Detecting Inappropriate Videos Tar-
geting Young Children on YouTube
Remarks. An increasing number of young children are shifting from broadcast to streaming
video consumption, with YouTube providing an endless array of content tailored toward young
viewers. While much of this content is age-appropriate, there is also an alarming amount of
inappropriate material available. In this line of work, we studied the problem at a large-scale
and we provided the first characterization of inappropriate or disturbing videos targeted at
young children on YouTube. By developing a deep learning classifier [35] we were able to
detect disturbing toddler-oriented videos with 0.84 accuracy. Using this classifier, we assessed
how prominent the problem is on a large-scale and we also performed a live simulation of a
toddler who searches the platform for a video and then she watches several videos according
to the recommendations. The main take-aways from this work are:
• Toddler-oriented disturbing videos have similar characteristics as benign videos, and
131
7.1. Characterizing and Detecting Inappropriate Videos Targeting Young Children onYouTube 132
YouTube’s algorithmic recommendation system is not able to discern them, thus regret-
tably suggesting them to users.
• We find that when a toddler watches an Elsagate-related benign video if she randomly
follows one of the top ten recommended videos, there is a non-negligible chance that
she will end up at a disturbing or restricted video.
• Young children are likely to encounter inappropriate videos when they randomly browse
the platform starting from appropriate videos.
• As of May 2019, YouTube was still plagued by inappropriate videos targeting young
children, and our assessment of YouTube’s current mitigatory measures shows that the
platform is not able to tackle the problem in a timely manner.
Although the scientific debate (and public opinion) on the risks associated with ”screen time”
for young children is still ongoing, based on our findings, we believe a more pressing concern
to be the dangers of crowd-sourced, uncurated content combined with engagement oriented,
gameable recommendation systems. Considering the advent of algorithmic content creation
(e.g., ”deep fakes”) and the monetization opportunities on sites like YouTube, there is no
reason to believe there will be an organic end to this problem. Our classifier, and the insights
gained from our analysis, can be used as a starting point to gain a deeper understanding and
begin mitigating this issue.
Note that in this line of work, we collect and analyze a large number of Elsagate-related, other
child-related, as well as random and popular videos available on YouTube. Although not
representative of the entirety of YouTube, we believe that the set of seed keywords (Elsagate-
related and other child-related keywords) cover a wide range of child-related content available
on the platform. Concerning our sampling process, we believe that by including a wide range
of child-related content as well as other types of videos in our ground truth dataset, we aid the
proposed model to generalize to different types of videos that are available on YouTube.
Future Directions. Several interesting future directions derive from the finding of this thesis.
First, we propose a deep learning classifier that can detect disturbing videos and we also
present a novel methodology that simulates the behavior of users casually browsing YouTube.
This methodology, together with the proposed model architecture, can be used in a lot of
different problems of inappropriate content on YouTube to assess how prominent each problem
is. For example, the proposed model architecture can be used to build classifiers that can detect
other types of violent or sexually explicit content, and together with the random walks-based
7.2. Characterizing Hateful and Misogynistic Content on You-Tube Through the Lens ofthe Incel Community 133
methodology can be used to measure how likely is for users to come across such content on
the platform. With regards to inappropriate or disturbing videos targeted at young children,
and considering the non-negligible amount of disturbing videos found in this line of work,
an interesting future direction is to study the intent of the uploaders of disturbing videos
on the platform. Another interesting future direction is to further focus on the detection
and mitigation of disturbing videos by also considering the video footage, video transcript,
and comments posted under toddler-oriented videos. With regards to user personalization,
an interesting future direction is to study the problem by performing random walks using
logged-in user profiles with child-related characteristics and watch history.
Moreover, in the meantime, YouTube started taking drastic measures to tackle the problem of
disturbing videos targeted at toddlers. More specifically, as of January 2020, YouTube requires
channel owners to specify, during upload, whether their content is directed at children or not.
On videos marked as directed at children, the platform blocks data collection for all viewers,
as well as comments and targeted ads. Hence, it would be interesting to investigate whether
these measures can effectively eliminate disturbing videos on the platform.
7.2 Characterizing Hateful and Misogynistic Content on You-
Tube Through the Lens of the Incel Community
Remarks. In this like of work, we performed a characterization of hateful and misogynistic
content on YouTube by focusing on the Incel community. The main goal was to assess how
has the Incel community grown on YouTube over the last decade and whether YouTube’s
recommendation algorithm contributes to steering users towards Incel communities. We
collected YouTube videos shared by users in Incel-related communities within Reddit, we
devised a methodology to effectively annotate them as ”Incel-related,” and used them to
understand how Incel ideology spreads on YouTube and study the evolution of the community.
We also analyzed how YouTube’s recommendation algorithm behaves with respect to Incel-
related videos.
The main take-aways from this work are:
• We find an increase in Incel-related activity on YouTube over the past few years and in
particular concerning Incel-related videos, as well as comments that include pertinent
terms.
7.2. Characterizing Hateful and Misogynistic Content on You-Tube Through the Lens ofthe Incel Community 134
• We find a non-negligible amount of Incel-related videos (2.9%) within YouTube’s
recommendation graph being recommended to users.
• When a user watches a non-Incel-related video, if they randomly follow one of the top
ten recommended videos, there is a 2.8% chance they will end up with an Incel-related
video.
• By performing random walks on YouTube’s recommendation graph, we find that when
starting from a random non-Incel-related video, there is a 6.3% probability to encounter
at least one Incel-related video within five hops. Simultaneously, Incel-related videos are
more likely to be recommended within the first two to four hops than in the subsequent
hops.
• As users choose to watch Incel-related videos, the algorithm recommends other Incel-
related videos with increasing frequency.
Last, despite YouTube’s attempts to tackle hate [284], our results show that the threat is clear
and present. Also, considering that the Incel ideology is often associated with misogyny,
multiple mass murders, and violent offenses [216, 217], we urge that YouTube develops
effective content moderation strategies to tackle misogynistic content on the platform.
Design Implications. Prior work has shown apparent user migration to increasingly extreme
subcommunities within the Manosphere on Reddit [110], and indications that YouTube
recommendations serve as a pathway to radicalization. When taken along with our results, a
more complete picture with respect to online extremist communities begins to emerge.
Radicalization and online extremism is clearly a multi-platform problem. Social media plat-
forms like Reddit, designed to allow organic creation and discovery of subcommunities, play
a role, and so do platforms with algorithmic content recommendation systems. The immediate
implication is that while the radicalization process and the spread of extremist content gen-
eralize (at least to some extent) across different online extremist communities, the specific
mechanism likely does not generalize across different platforms. However, that does not mean
that specific platform oriented-solutions should exist in a vacuum. For example, an approach
that could benefit both platforms involves using Reddit activity to help tune the YouTube
recommendation algorithm and using information from the recommendation algorithm to
help Reddit perform content moderation. In such a hypothetical arrangement, Reddit, whose
content moderation team is intimately familiar with the troublesome communities, could help
7.3. Assessing the Effect of Watch History on YouTube’s Pseudoscientific VideoRecommendations 135
YouTube understand how the content these communities consume fits within the recommenda-
tion graph. Similarly, Reddit’s moderation efforts could be bolstered with information from
the YouTube recommendation graph. The discovery of emerging dangerous communities
could be aided by understanding where the content posted by them fits within the YouTube
recommendation graph compared to the content posted by known troublesome communities.
Future Directions. Several future directions can be derived from the findings of this line of
work. First, misogynistic ideologies and other Manosphere communities on YouTube (e.g.,
Men Going Their Own Way) are relatively unstudied. We believe that the scientific community
can use and build upon our text-based approach to study other misogynistic ideologies on the
platform, which tend to have their particular glossary. Besides understanding each distinct
community, it would also be interesting to study user migration between Manosphere and other
reactionary communities on YouTube. Moreover, our random walks analysis does not consider
per-user personalization; the video recommendations we collect represent only some of the
recommendation system’s facets. Hence, an interesting future direction is the implementation
of crawlers that will allow the simulations of real users and perform random walks on YouTube
analyzing the problem of misogynistic content with personalization. However, note that this
task is not straightforward as it requires understanding and replicating multiple meaningful
characteristics of Incels’ behavior. Finally, we believe that an important future direction is the
detection and mitigation of misogynistic content on YouTube.
7.3 Assessing the Effect of Watch History on YouTube’s Pseu-
doscientific Video Recommendations
Remarks. In this line of work, we studied pseudoscientific content on YouTube by focusing
on four topics, namely, COVID-19, the anti-vaccine movement, the anti-mask movement, and
the Flat earth theory. We first collected videos from YouTube related to these topics, annotate
them using crowdsourcing and use them to build a classifier for detecting pseudoscientific
videos. The relatively low accuracy of the classifier and the low agreement score of our
crowdsourced annotation highlights the subjective nature of the pseudoscientific vs. scientific
content on YouTube. Then, we devise a novel methodology for assessing the prevalence of
pseudoscientific content on various parts of the platform, while also accounting for the effect
of the user’s watch history. More specifically, with this methodology, we can simulate the
behavior of users with different watch histories who browse YouTube while using our classifier
7.3. Assessing the Effect of Watch History on YouTube’s Pseudoscientific VideoRecommendations 136
to annotate all the videos we visit.
The main take-aways of this line of work are:
• The watch history of the user substantially affects what videos are suggested to the user.
• It is more likely to encounter pseudoscientific videos in the search results (i.e., when
searching for a specific topic) than in the video recommendations section or the home-
page of a user, except in the case of the COVID-19 topic.
• For “traditional” pseudoscience topics (e.g., Flat Earth), there is a higher rate of rec-
ommended pseudoscientific content than for more emerging/controversial topics like
COVID-19, anti-vaccination, and anti-mask. For COVID-19, we find an even smaller
amount of pseudoscientific content being suggested, which may result from measures
YouTube took to mitigate misinformation concerning the COVID-19 pandemic.
• Although YouTube seems to tackle COVID-19 related misinformation in its search
results, all profiles used in our experiments still receive recommendations to questionable
content related to the pandemic.
• The difference between the results of the YouTube Data API and the no profile (browser)
is statistically insignificant; this indicates that recommendations returned using the API
are not subject to personalization. This finding can be helpful to other researchers that
use YouTube’s Data API for their experiments.
Future Directions. Several interesting future directions derive from the main take-aways of
this thesis. First, we present a novel methodology for assessing the effect of watch history on
pseudoscientific recommendations on YouTube. Our findings indicate that recommendations
returned using the YouTube API are not subject to personalization, thus highlighting the
importance of accounting for personalization when studying YouTube for more representative
analysis. For this reason, we make our methodology publicly available [37], and the research
community can use it to assess the effect of the watch history while studying a lot of other
topics of interest on the platform. For instance, this methodology can be used to create user
profiles with child-related histories and investigate several types of inappropriate content
being recommended to children when browsing YouTube. Another interesting direction
is to build upon our methodology and devise a more comprehensive user personalization
methodology to account for factors outside of watch history, such as account characteristics
and user engagement. With regards to the detection of pseudoscientific misinformation, the
7.4. Challenges and Limitations 137
relatively low agreement score of our crowdsourced annotation points to the difficulty in
objectively identifying whether a video is pseudoscientific or not and also confirms that it is
not easy to automate the discovery of misinformation. Hence, further research is required to
develop classification models that can more effectively detect pseudoscientific misinformation
on YouTube considering additional features as input to the classification models (e.g., the
sentiment of the comments of the video, audio-related features, etc.). Finally, another future
direction is to understand how people share and view pseudoscientific content on other social
networks, including Twitter and Facebook, and how people engage with such content.
7.4 Challenges and Limitations
Here we summarize the main technical challenges we faced in this thesis, how we addressed
them and we highlight the limitations of this thesis.
Challenges. Our data collection and annotation efforts in this thesis faced several challenges.
First, there are no datasets of YouTube videos available related to the problems we analyzed,
neither there are any state-of-the-art classifiers that can detect with an acceptable performance
the type of videos we analyzed. To address this issue and build our datasets, we followed
different approaches depending on the peculiarities of the problem under study. To collect
disturbing videos targeting young children, we use Reddit to compile lists of keywords from
various sources and use them to search YouTube and collect videos. To collect Incel-related
videos, we again use Reddit and we collect videos shared in communities associated with
the Incel community. In our latest line of work, to collect pseudoscientific videos, we search
YouTube using keywords relevant to the topics of interest.
Second, devising methodologies for annotating the collected videos and for detecting videos
with abhorrent and misleading content is not trivial. To do this, we employed distinct method-
ologies for each different type of problematic content. For the detection of disturbing videos,
we built a deep learning classifier that analyzes various metadata of a given video, as well as
its thumbnail. Similarly, for the detection of pseudoscientific content, we built another deep
learning classifier that considers the comments and the transcript of a given video along with its
various metadata (e.g., title, description, etc.). On the other hand, when analyzing misogynistic
communities, we detect misogynistic content based on a lexicon of terms that considers both
the video’s transcript and its comments. We believe that the scientific community can use and
build upon our classifiers and text-based methodologies to study other types of inappropriate,
7.4. Challenges and Limitations 138
misogynistic, and misinformative content on YouTube.
Limitations. This thesis is not without limitations. First, the methodologies and results
presented in this thesis heavily rely on annotators who may have no expertise in identifying
problematic content. Hence, a small percentage of the annotated videos in this thesis may
be misclassified. However, we mitigate this issue by employing multiple annotators and by
annotating each video based on the majority agreement. Furthermore, when crowdsourcing
is employed, we take additional measures to reduce subjectivity. That is, we do not include
annotators with low accuracy on a classification task performed on a test database, and we
exclude from our datasets all the videos where all annotators disagree.
Second, our video annotation methodologies might flag some benign videos as inappropriate.
However, by considering the various metadata of a video we can achieve an acceptable
detection accuracy that uncovers a substantial proportion of the inappropriate videos. To
mitigate the issues of misclassification when studying pseudoscientific content, we use the
developed classifier to uncover possible pseudoscientific videos that we later manually review
to eliminate false positives. Another limitation of this thesis is that we may miss some
inappropriate videos. Notwithstanding such limitation, we believe that our methodologies
approach a lower bound of the inappropriate videos in our datasets, allowing us to conclude
that the implications of YouTube’s recommendation algorithm on disseminating abhorrent and
misleading content are at least as profound as we observe. Third, we acknowledge that the
ground truth datasets we use to train our classifiers are relatively small and the performance
of our classifiers is highly affected by this issue. We were unable to provide larger annotated
datasets mainly due to the limited resources for the annotation process. Nonetheless, we argue
that the proposed classifiers provide a meaningful signal, which allows us to assess YouTube’s
recommendation algorithm’s behavior with respect to inappropriate and pseudoscientific
content.
Moreover, for some of the problems analyzed in this thesis, we do not consider per-user
personalization; the video recommendations we collect represent only some of the recom-
mendation system’s facet. However, we believe that the recommendations we obtain in the
first two lines of work in this thesis allow us to understand how YouTube’s recommendation
system is behaving in our scenario. At the same time, in our latest line of work in which
we consider user personalization, we only work with watch history, which is a fraction of
YouTube’s signals for user personalization.
7.5. Conclusion 139
7.5 Conclusion
In this thesis, we shed light on the prevalence of several types of abhorrent and mistargeted
content on YouTube. Our work reveals the need to further study and understand the role of
YouTube’s recommendation algorithm in promoting abhorrent and misleading content. Also, it
prompts the need for YouTube and the research community to develop more effective content
moderation strategies to tackle such content on the platform. Nevertheless, our findings
indicate that the most proper way for YouTube to cope with certain types of content (i.e.,
pseudoscientific misinformation) on the platform effectively is to use deep learning models
that signal potential harmful videos to human annotators who examine the videos and make
the final decision. We argue that the aforementioned are of paramount importance. We are
confident enough that the findings and the resources provided by this thesis will be beneficial to
researchers focusing on demystifying YouTube’s recommendation algorithm, hence shedding
additional light on the recommendation algorithm and its potential influence, irrespective of
the topic of interest.
Bibliography
[1] Nic Newman et al. Reuters Institute Digital News Report. http://bit.ly/rtrs-
report. 2020.
[2] Galen Stocking et al. Many Americans Get News on YouTube, Where News Or-
ganizations and Independent Producers Thrive Side by Side. https://www.
journalism.org/2020/09/28/many-americans-get-news-on-
youtube-where-news-organizations-and-independent-producers-
thrive-side-by-side/. 2020.
[3] Kevin Roose. The Making of a YouTube Radical. https://www.nytimes.com/
interactive/2019/06/08/technology/youtube-radical.html.
2019.
[4] Zeynep Tufekci. “YouTube, the Great Radicalizer”. In: The New York Times (2018).
[5] Mozilla Foundation. Got YouTube Regrets? Thousands do! https://foundation.
mozilla.org/en/campaigns/youtube-regrets/. 2019.
[6] Manoel Horta Ribeiro et al. “Auditing Radicalization Pathways on YouTube”. In:
ACM FAT*. 2020.
[7] Sapna Maheshwari. On YouTube Kids, Startling Videos Slip Past Filters. https:
//www.nytimes.com/2017/11/04/business/media/youtube-
kids-paw-patrol.html. 2017.
[8] Anisa Subedar and Will Yates. The disturbing YouTube videos that are tricking children.
https://www.bbc.com/news/blogs-trending-39381889. 2017.
[9] Becca Lewis. Forget Facebook, YouTube videos are quietly radicalizing large num-
bers of people — and the company is profiting. https : / / www . nbcnews .
com/think/opinion/forget- facebook- youtube- videos- are-
140
Bibliography 141
radicalizing- millions- young- people- company- ncna916341.
2018.
[10] BBC News. Elliot Rodger: How misogynist killer became ’incel hero’. https:
//www.bbc.com/news/world-us-canada-43892189. 2018.
[11] Lucas Regner. “The YouTube-born Terrorist”. In: Journal Exit-Deutschland. Zeitschrift
fur Deradikalisierung und demokratische Kultur (2014).
[12] Nick Carne. ’Conspiracies’ dominate YouTube videos. https://cosmosmagazine.
com/social-sciences/conspiracies-dominate-youtube-climate-
modification-videos. 2019.
[13] Marianna Spring. Coronavirus: False claims viewed by millions on YouTube. https:
//www.bbc.com/news/technology-52662348. 2020.
[14] Heidi Oi-Yee Li et al. “YouTube as a Source of Information on COVID-19: A Pandemic
of Misinformation?” In: BMJ global health (2020).
[15] Cale Guthrie Weissman. Despite recent crackdown, YouTube still promotes plenty
of conspiracies. https://www.fastcompany.com/90307451/despite-
recent-crackdown-youtube-still-promotes-plenty-of-conspiracies.
2019.
[16] Kashmir Hill. Elliot Rodger’s Videos Were Removed From YouTube, But Only Tem-
porarily. https://www.forbes.com/sites/kashmirhill/2014/05/
27/youtube- finally- takes- down- all- of- elliot- rodgers-
videos/?sh=9e1fcd8779a1. 2014.
[17] Fernanda Ferreira. Antivaccine videos slip through YouTube’s advertising policies,
new study finds. https : / / www . sciencemag . org / news / 2020 / 11 /
antivaccine-videos-slip-through-youtube-s-advertising-
policies-new-study-finds. 2020.
[18] Dave Gershgorn. Artificial intelligence used by Google to scan videos could easily
be tricked by a picture of noodles. https://qz.com/948870/the-ai-used-
by-google-to-scan-videos-could-easily-be-tricked-by-a-
picture-of-noodles/. 2017.
Bibliography 142
[19] Catherine Shu. YouTube releases its first report about how it handles flagged videos
and policy violations. https://techcrunch.com/2018/04/23/youtube-
releases-its-first-report-about-how-it-handles-flagged-
videos-and-policy-violations. 2018.
[20] James Vincent. YouTube brings back more human moderators after AI systems over-
censor. https://www.theverge.com/2020/9/21/21448916/youtube-
automated-moderation-ai-machine-learning-increased-errors-
takedowns. 2020.
[21] Rebecca Heilweil. Social media companies are already losing the vaccine misinfor-
mation fight. https://www.vox.com/recode/22188680/facebook-
twitter - youtube - misinformation - anti - vaccine - covid - 19.
2020.
[22] K.G Orphanides. Children’s YouTube is still churning out blood, suicide and canni-
balism. https://www.wired.co.uk/article/youtube-for-kids-
videos-problems-algorithm-recommend. 2018.
[23] Phoebe Weston. YouTube Kids app is STILL showing disturbing videos, including
footage on how to sharpen knives and children’s cartoon Paw Patrol on a burning
plane. https://www.dailymail.co.uk/sciencetech/article-
5358365/YouTube-Kids-app-showing-disturbing-videos.html.
2018.
[24] Paris Martineau. YouTube Is Banning Extremist Videos. Will It Work? https://
www.wired.com/story/how-effective-youtube-latest-ban-
extremism/. 2019.
[25] Serena Kutchinsky. ’I used to be an incel’. https://www.bbc.co.uk/
bbcthree/article/45bdcd7a- 1cb1- 4ad1- a3e0- ebc2a05243ac.
2019.
[26] BBC News. Elliot Rodger: How misogynist killer became ’incel hero’. https:
//www.bbc.com/news/world-us-canada-43892189. 2018.
[27] Debbie Ging. “Alphas, Betas, and Incels: Theorizing the Masculinities of the Manosphere”.
In: Men and Masculinities (2019).
[28] Zack Beauchamp. Incel, the misogynistic ideology that inspired the deadly Toronto At-
tack, explained. https://www.vox.com/world/2018/4/25/17277496/
incel-toronto-attack-alek-minassian. 2018.
Bibliography 143
[29] Bruce Hoffman, Jacob Ware, and Ezra Shapiro. “Assessing the Threat of Incel Vio-
lence”. In: SCT (2020).
[30] Tracie Farrell et al. “Exploring Misogyny Across the Manosphere in Reddit”. In:
WebSci. 2019.
[31] Sylvia Jaki et al. “Online Hatred of Women in the Incels.me Forum: Linguistic
Analysis and Automatic Detection”. In: JLAC (2019).
[32] Google Developers. YouTube Data API. https://developers.google.com/
youtube/v3. 2021.
[33] John A Hartigan and Manchek A Wong. “Algorithm AS 136: A k-means clustering
algorithm”. In: JRSS (1979).
[34] Dataset for ”Disturbed YouTube for Kids: Characterizing and Detecting Inappropriate
Videos Targeting Young Children”. https://zenodo.org/record/3632781.
[35] Disturbed YouTube Paper Repository. https://github.com/kwstantinos-
papadamou/disturbed-youtube-for-kids-classifier.
[36] Dataset for ”How over is it?” Understanding the Incel Community on YouTube.
https://zenodo.org/record/4557039.
[37] Pseudoscience Paper Repository. https://github.com/kostantinos-
papadamou/pseudoscience-paper.
[38] Dataset for ”It is just a flu”: Assessing the Effect of Watch History on YouTube’s
Pseudoscientific Video Recommendations. https://zenodo.org/record/
4558469.
[39] Kostantinos Papadamou et al. “Disturbed YouTube for Kids: Characterizing and
Detecting Inappropriate Videos Targeting Young Children”. In: ICWSM. 2020.
[40] Kostantinos Papadamou et al. “’How over is it?’ Understanding the Incel Community
on YouTube”. In: arXiv preprint arXiv:2001.08293 (2020).
[41] Kostantinos Papadamou et al. “’It is just a flu’: Assessing the Effect of Watch His-
tory on YouTube’s Pseudoscientific Video Recommendations”. In: arXiv preprint
arXiv:2010.11638 (2020).
[42] Jean Burgess and Joshua Green. YouTube: Online Video and Participatory Culture.
John Wiley & Sons, 2018.
Bibliography 144
[43] Paul Covington, Jay Adams, and Emre Sargin. “Deep Neural Networks for YouTube
Recommendations”. In: RecSys. 2016.
[44] Zhe Zhao et al. “Recommending What Video to Watch Next: A Multitask Ranking
System”. In: RecSys. 2019.
[45] YouTube Community Guidelines. https://www.youtube.com/howyoutubeworks/
policies/community-guidelines.
[46] Kevin Roose et al. Four: Headquarters - A trip to YouTube for a conversation with
the woman trying to change it. https://www.nytimes.com/2020/05/07/
podcasts/rabbit-hole-youtube-susan-wojcicki-virus.html.
2020.
[47] YouTube Kids - An App Made Just For Kids. https://www.youtube.com/
kids/.
[48] Abby Ohlheiser. Fearing yet another witch hunt, Reddit bans ’Pizzagate’. https://
www.washingtonpost.com/news/the-intersect/wp/2016/11/23/
fearing-yet-another-witch-hunt-reddit-bans-pizzagate/.
2016.
[49] Abby Ohlheiser. Reddit bans r/greatawakening, the main subreddit for QAnon con-
spiracy theorists. https : / / www . washingtonpost . com / news / the -
intersect/wp/2018/09/12/reddit-bans-r-greatawakening-
the-main-subreddit-for-qanon-conspiracy-theorists/. 2018.
[50] Jason Baumgartner et al. “The Pushshift Reddit Dataset”. In: ICWSM. 2020.
[51] Gwenn Schurgin O’Keeffe, Kathleen Clarke-Pearson, et al. “The Impact of Social
Media on Children, Adolescents, and Families”. In: Pediatrics (2011).
[52] Nelly Elias and Idit Sulkin. “YouTube Viewers in Diapers: An Exploration of Factors
Associated with Amount of Toddlers’ Online Viewing”. In: Cyberpsychology (2017).
[53] Ying Chen et al. “Children’s Exposure to Mobile in-app Advertising: An Analysis of
Content Appropriateness”. In: ICSC. IEEE. 2013.
[54] Burcu Izci et al. “Youtube & Young Children: Research, Concerns and new Directions”.
In: Criancas, famılias e tecnologias. Que desafios? Que caminhos? (2019).
[55] Benjamin Burroughs. “YouTube Kids: The App Economy and Mobile Parenting”. In:
Social media+ society (2017).
Bibliography 145
[56] David Craig and Stuart Cunningham. “Toy Unboxing: Living in a (N Unregulated)
Material World”. In: Media International Australia (2017).
[57] Benjamin Nicoll and Bjorn Nansen. “Mimetic Production in YouTube Toy Unboxing
Videos”. In: Social Media+ Society (2018).
[58] Maarit Jaakkola. “From Vernacularized Commercialism to Kidbait: Toy Review Videos
on YouTube and the Problematics of the Mash-up Genre”. In: JCM (2020).
[59] Camila Souza Araujo et al. “Characterizing Videos, Audience and Advertising in
YouTube Channels for Kids”. In: ICSI. Springer. 2017.
[60] John Paolillo et al. “YouTube Children’s Videos: Development of a Genre under
Algorithm”. In: HICSS. 2020.
[61] Rishabh Kaushal et al. “KidsTube: Detection, Characterization and Analysis of Child
Unsafe Content & Promoters on YouTube”. In: PST. IEEE. 2016.
[62] Marina Buzzi. “Children and YouTube: Access to Safe Content”. In: SIGCHI. 2011.
[63] Sultan Alshamrani, Ahmed Abusnaina, and David Mohaisen. “Hiding in Plain Sight:
A Measurement and Analysis of Kids’ Exposure to Malicious URLs on YouTube”. In:
arXiv preprint arXiv:2009.07923 (2020).
[64] Sanjana Reddy, Nikitha Srikanth, and GS Sharvani. “Development of Kid-Friendly
YouTube Access Model Using Deep Learning”. In: DSS. Springer, 2021.
[65] Christian Stocker and Mike Preuss. “Riding the Wave of Misclassification: How We
End up with Extreme YouTube Content”. In: HCI. Springer. 2020.
[66] Akari Ishikawa, Edson Bollis, and Sandra Avila. “Combating the Elsagate Phe-
nomenon: Deep Learning Architectures for Disturbing Cartoons”. In: IWBF. IEEE.
2019.
[67] Shubham Singh et al. “KidsGUARD: Fine Grained Approach for Child Unsafe Video
Representation and Detection”. In: SIGAPP. 2019.
[68] Carsten Eickhoff and Arjen P de Vries. “Identifying Suitable YouTube Videos for
Children”. In: NEM (2010).
[69] Wenlin Han and Madhura Ansingkar. “Discovery of Elsagate: Detection of Sparse
Inappropriate Content from Kids Videos”. In: ZINC. IEEE. 2020.
[70] Sultan Alshamrani. “Detecting and Measuring the Exposure of Children and Adoles-
cents to Inappropriate Comments in YouTube”. In: CIKM. 2020.
Bibliography 146
[71] Rashid Tahir et al. “Bringing the Kid Back Into YouTube Kids: Detecting Inappropriate
Content on Video Streaming Platforms”. In: ASONAM. IEEE. 2019.
[72] Sharifa Alghowinem. “A Safer YouTube Kids: An Extra Layer of Content Filtering
Using Automated Multimodal Analysis”. In: SAI ISC. Springer. 2018.
[73] Michelle M Neumann and Christothea Herodotou. “Young Children and YouTube: A
Global Phenomenon”. In: Childhood Education (2020).
[74] Jonatas Wehrmann et al. “Adult Content Detection in Videos with Convolutional and
Recurrent Neural Networks”. In: Neurocomputing (2018).
[75] Adam D Thierer. “Parental Controls & Online Child Protection: A Survey of Tools &
Methods”. In: SSRN 1268433 (2009).
[76] Andreas Tsirtsis et al. “Cyber Security Risks for Minors: A Taxonomy and a Software
Architecture”. In: SMAP. IEEE. 2016.
[77] Qian Luo et al. “Automatic Content Inspection and Forensics for Children Android
Apps”. In: IoT Journal (2020).
[78] Markos Charalambous et al. “A Privacy-Preserving Architecture for the Protection of
Adolescents in Online Social Networks”. In: CYBER (2020).
[79] Michele L Ybarra et al. “Associations Between Blocking, Monitoring, and Filtering
Software on the Home Computer and Youth-reported Unwanted Exposure to sexual
Material Online”. In: Child Abuse & Neglect (2009).
[80] Antigoni Parmaxi et al. “E-safety in Web 2.0 Learning Environments: A Research
Synthesis and Implications for Researchers and Practitioners”. In: LCT. Springer.
2017.
[81] r/Elsagate: What is ElsaGate? https://www.reddit.com/r/ElsaGate/
comments/6o6baf/what_is_elsagate/. 2017.
[82] Xiangyu Zhang et al. “Accelerating Very Deep Convolutional Networks for Classifica-
tion and Detection”. In: TPAMI (2015).
[83] Michael L Slepian, Kathleen R Bogart, and Nalini Ambady. “Thin-Slice Judgments in
the Clinical Context”. In: Annual review of clinical psychology (2014).
[84] Hendi Pratama. “Identifying Sexist Language on YouTube Comment Section”. In:
Language in the Online & Offline World 6: The Fortitude (2018).
Bibliography 147
[85] Jihad Zahir, Youssef Mehdi Oukaja, and Oumayma El Ansari. “Arabic Sexist Com-
ments Detection in YouTube: A Context-Aware Opinion Analysis Approach”. In:
ICICT. Springer. 2020.
[86] Lindsey Wotanis and Laurie McMillan. “Performing Gender on YouTube: How Jenna
Marbles Negotiates a Hostile Online Environment”. In: Feminist Media Studies (2014).
[87] Mary Tucker-McLaughlin. “YouTube’s Most-viewed Videos: Where the Girls Aren’t”.
In: Women & Language (2013).
[88] Nicola Doring and M Rohangis Mohseni. “Male Dominance and Sexism on YouTube:
Results of Three Content Analyses”. In: FMS (2019).
[89] Ashish Sureka et al. “Mining YouTube to Discover Extremist Videos, Users and
Hidden Communities”. In: AIRS. Springer. 2010.
[90] Rashid Chowdury et al. “A Data Mining Based Spam Detection System for YouTube”.
In: ICDIM. IEEE. 2013.
[91] Ashish Sureka. “Mining User Comment Activity for Detecting Forum Spammers in
YouTube”. In: arXiv preprint arXiv:1103.5044 (2011).
[92] Vlad Bulakh, Christopher W Dunn, and Minaxi Gupta. “Identifying Fraudulently
Promoted Online Videos”. In: WWW. 2014.
[93] Fabrıcio Benevenuto et al. “Practical Detection of Spammers and Content Promoters
in Online Video Sharing Systems”. In: ITSMC (2011).
[94] Vidushi Chaudhary and Ashish Sureka. “Contextual Feature Based One-class Classifier
Approach for Detecting Video Response Spam on YouTube”. In: PST. IEEE. 2013.
[95] Enaitz Ezpeleta et al. “A Mood Analysis on YouTube Comments and a Method for
Improved Social Spam Detection”. In: HAIS. Springer. 2018.
[96] Savvas Zannettou et al. “The Good, the Bad and the Bait: Detecting and Characterizing
Clickbait on YouTube”. In: SPW. IEEE. 2018.
[97] Swati Agarwal and Ashish Sureka. “A Focused Crawler for Mining Hate and Extrem-
ism Promoting Videos on YouTube”. In: Hypertext. 2014.
[98] Theodoros Giannakopoulos, Aggelos Pikrakis, and Sergios Theodoridis. “A Mul-
timodal Approach to Violence Detection in Video Sharing Sites”. In: ICPR. IEEE.
2010.
Bibliography 148
[99] Nisha Aggarwal, Swati Agrawal, and Ashish Sureka. “Mining YouTube Metadata for
Detecting Privacy Invading Harassment and Misdemeanor Videos”. In: ICPST. IEEE.
2014.
[100] Enrico Mariconti et al. “’You Know What to Do’ Proactive Detection of YouTube
Videos Targeted by Coordinated Hate Attacks”. In: SIGCHI CSCW (2019).
[101] Shan Jiang, Ronald E Robertson, and Christo Wilson. “Bias Misperceived: The Role
of Partisanship and Misinformation in YouTube Comment Moderation”. In: ICWSM.
2019.
[102] Raphael Ottoni et al. “Analyzing Right-wing YouTube Channels: Hate, Violence and
Discrimination”. In: WebSci. 2018.
[103] Peter J Moor, Ard Heuvelman, and Ria Verleur. “Flaming on YouTube”. In: CHB
(2010).
[104] Sultan Alshamrani et al. “Investigating Online Toxicity in Users Interactions With the
Mainstream Media Channels on YouTube”. In: MAISN. 2020.
[105] Muhammad Jameel Yusha’u. “Extremism or Terrorism: Communicating Islamophobia
on YouTube in the Norwegian Attacks”. In: JAMMR (2015).
[106] Milo Trujillo et al. “What is BitChute? Characterizing the ’Free Speech’ Alternative
to YouTube”. In: arXiv preprint arXiv:2004.01984 (2020).
[107] Adrienne Massanari. “#Gamergate and The Fappening: How Reddit’s Algorithm,
Governance, and Culture Support Toxic Technocultures”. In: New media & society
(2017).
[108] Eshwar Chandrasekharan et al. “You Can’t Stay Here: The Efficacy of Reddit’s 2015
Ban Examined Through Hate Speech”. In: SIGCHI CSCW (2017).
[109] Manoel Horta Ribeiro et al. “Does Platform Migration Compromise Content Mod-
eration? Evidence from r/The Donald and r/Incels”. In: arXiv preprint 2010.10397.
2020.
[110] Manoel Horta Ribeiro et al. “The Evolution of the Manosphere Across the Web”. In:
ICWSM. 2021.
[111] Leandro Silva et al. “Analyzing the Targets of Hate in Online Social Media”. In:
ICWSM. 2016.
[112] Michael Mccord and M Chuah. “Spam Detection on Twitter using Traditional Classi-
fiers”. In: ICATC. Springer. 2011.
Bibliography 149
[113] Alex Hai Wang. “Don’t Follow Me: Spam Detection in Twitter”. In: SECRYPT. IEEE.
2010.
[114] Martin Potthast et al. “Clickbait Detection”. In: ECIR. Springer. 2016.
[115] Manoel Ribeiro et al. “Characterizing and Detecting Hateful Users on Twitter”. In:
ICWSM. 2018.
[116] Despoina Chatzakou et al. “Measuring #Gamergate: A Tale of Hate, Sexism, and
Bullying”. In: WWW. 2017.
[117] Antigoni Founta et al. “Large Scale Crowdsourcing and Characterization of Twitter
Abusive Behavior”. In: ICWSM. 2018.
[118] Thomas Davidson et al. “Automated Hate Speech Detection and the Problem of
Offensive Language”. In: ICWSM. 2017.
[119] Thomas Davidson, Debasmita Bhattacharya, and Ingmar Weber. “Racial Bias in Hate
Speech and Abusive Language Detection Datasets”. In: arXiv preprint arXiv:1905.12516
(2019).
[120] Stephane J Baele, Lewys Brace, and Travis G Coan. “From ’Incel’ to ’Saint’: Analyz-
ing the Violent Worldview Behind the 2018 Toronto Attack”. In: TPV (2019).
[121] Mary Lilly. “’The World is Not a Safe Place for Men’: The Representational Politics
Of The Manosphere”. PhD thesis. Universite d’Ottawa/University of Ottawa, 2016.
[122] Savvas Zannettou et al. “What is Gab: A Bastion of Free Speech or an Alt-right Echo
Chamber”. In: TheWebConf. 2018.
[123] Hossein Hosseini et al. “Deceiving Google’s Perspective Api Built for Detecting Toxic
Comments”. In: arXiv preprint arXiv:1702.08138 (2017).
[124] Tommi Grondahl et al. “All You Need is ’Love’ Evading Hate Speech Detection”. In:
AISec. 2018.
[125] Qiang Cao et al. “Aiding the Detection of Fake Accounts in Large Scale Social Online
Services”. In: NSDI. 2012.
[126] Yimin Chen, Niall J Conroy, and Victoria L Rubin. “Misleading Online Content:
Recognizing Clickbait as False News”. In: WMDD. 2015.
[127] Abhijnan Chakraborty et al. “Stop Clickbait: Detecting and Preventing Clickbaits in
Online News Media”. In: ASONAM. IEEE. 2016.
Bibliography 150
[128] Prakhar Biyani, Kostas Tsioutsiouliklis, and John Blackmer. “’8 Amazing Secrets for
Getting More Clicks’: Detecting Clickbaits in News Streams using Article Informality”.
In: IAAI. 2016.
[129] Ankesh Anand, Tanmoy Chakraborty, and Noseong Park. “We Used Neural Networks
to Detect Clickbaits: You Won’t Believe What Happened Next!” In: ECIR. Springer.
2017.
[130] Julia Alexander. More than 17,000 YouTube channels removed since new hateful
content policy implemented. https : / / www . theverge . com / 2019 / 9 /
3/20845071/youtube- hateful- content- policies- channels-
comments-videos-susan-wojcicki. 2019.
[131] Anna Schmidt and Michael Wiegand. “A Survey on Hate Speech Detection using
Natural Language Processing”. In: SocialNLP. 2017.
[132] Ellery Wulczyn, Nithum Thain, and Lucas Dixon. “Ex Machina: Personal Attacks
Seen at Scale”. In: WWW. 2017.
[133] Ziqi Zhang, David Robinson, and Jonathan Tepper. “Detecting Hate Speech on Twitter
using a Convolution-GRU Based Deep Neural Network”. In: ESWC. Springer. 2018.
[134] Pinkesh Badjatiya et al. “Deep Learning for Hate Speech Detection in Tweets”. In:
WWW. 2017.
[135] Tomas Mikolov et al. “Distributed Representations of Words and Phrases and Their
Compositionality”. In: arXiv preprint arXiv:1310.4546 (2013).
[136] Marc Tuters. “7 Fake News and the Dutch YouTube Political Debate Space”. In:
PSMM (2020).
[137] Aarash Heydari et al. “YouTube Chatter: Understanding Online Comments Discourse
on Misinformative and Political YouTube Videos”. In: arXiv preprint arXiv:1907.00435
(2019).
[138] Kaiping Chen et al. “Visual Framing of Science Conspiracy Videos: Integrating
Machine Learning with Communication Theories to Study the Use of Color and
Brightness”. In: arXiv preprint arXiv:2102.01163 (2021).
[139] Marc Faddoul, Guillaume Chaslot, and Hany Farid. “A Longitudinal Analysis of
YouTube’s Promotion of Conspiracy Videos”. In: arXiv preprint arXiv:2003.03318
(2020).
Bibliography 151
[140] R. Hou et al. “Towards Automatic Detection of Misinformation in Online Medical
Videos”. In: ArXiv (2019).
[141] Juan Carlos Medina Serrano, Orestis Papakyriakopoulos, and Simon Hegelich. “NLP-
based Feature Extraction for the Detection of COVID-19 Misinformation Videos on
YouTube”. In: NLP-COVID19. 2020.
[142] Muhammad Nihal Hussain et al. “Analyzing Disinformation and Crowd Manipulation
Tactics on YouTube”. In: ASONAM. IEEE. 2018.
[143] Joachim Allgaier. “Science on YouTube: What do People Find When They are Search-
ing for Climate Science and Climate Manipulation?” In: PCST. 2016.
[144] Eslam Hussein, Prerna Juneja, and Tanushree Mitra. “Measuring Misinformation in
Video Search Platforms: An Audit Study on YouTube”. In: SIGCHI CSCW (2020).
[145] John C Paolillo. “The Flat Earth Phenomenon on YouTube”. In: First Monday (2018).
[146] Asheley R Landrum, Alex Olshansky, and Othello Richards. “Differential Suscep-
tibility to Misleading Flat Earth Arguments on YouTube”. In: Media Psychology
(2019).
[147] Asheley R Landrum and Alex Olshansky. “Third-person Perceptions and Calls for
Censorship of Flat Earth Videos on YouTube”. In: MC (2020).
[148] Shaheed N Mohammed. “Conspiracy Theories and Flat-Earth Videos on YouTube”.
In: JSMS (2019).
[149] Aleksi Knuutila et al. COVID-Related Misinformation on YouTube. 2020.
[150] Gabriele Donzelli et al. “Misinformation on Vaccination: A Quantitative Analysis of
YouTube Videos”. In: HVI (2018).
[151] Dayane Fumiyo Tokojima Machado, Alexandre Fioravante de Siqueira, and Leda
Gitahy. “Natural Stings: Alternative Health Services Selling Distrust About Vaccines
on YouTube”. In: (2020).
[152] Sangyeon Kim et al. “The Effects of an Informational Intervention on Attention to
Anti-Vaccination Content on YouTube”. In: ICWSM. 2020.
[153] Nicholas Francis Havey. “Partisan Public Health: How does Political Ideology Influ-
ence Support for COVID-19 Related Misinformation?” In: JCSS (2020).
[154] Meet Rajdev and Kyumin Lee. “Fake and Spam Messages: Detecting Misinformation
During Natural Disasters on Social Media”. In: WI-IAT. IEEE. 2015.
Bibliography 152
[155] Lisa Singh et al. “Understanding High-and Low-quality URL Sharing on COVID-19
Twitter Streams”. In: JCSS (2020).
[156] Bjarke Mønsted and Sune Lehmann. “Algorithmic Detection and Analysis of Vaccine-
denialist Sentiment Clusters in Social Networks”. In: arXiv preprint arXiv:1905.12908
(2019).
[157] Adrien Friggeri et al. “Rumor Cascades”. In: ICWSM. 2014.
[158] Mauro Conti et al. “It’s Always April Fools’ Day!: On the Difficulty of Social Network
Misinformation Classification via Propagation Features”. In: WIFS. IEEE. 2017.
[159] Neil F Johnson et al. “The Online Competition Between Pro-and Anti-vaccination
Views”. In: Nature (2020).
[160] Mattia Samory and Tanushree Mitra. “Conspiracies Online: User Discussions in a
Conspiracy Community Following Dramatic Events”. In: ICWSM. 2018.
[161] Shadi Shahsavari et al. “Conspiracy in the Time of Corona: Automatic Detection of
COVID-19 Conspiracy Theories in Social Media and the News”. In: arXiv preprint
arXiv:2004.13783 (2020).
[162] Amartya Chakraborty and Sunanda Bose. “Around the World in 60 Days: An Ex-
ploratory Study of Impact of COVID-19 on Online Global News Sentiment”. In: JCSS
(2020).
[163] Savvas Zannettou et al. “The Web Centipede: Understanding How Web Communities
Influence Each Other Through the Lens of Mainstream and Alternative News Sources”.
In: IMC. 2017.
[164] Jonathan Albright. Data is the Real Post-truth, so Here’s the Truth About Post-
Election2016 Propaganda. 2016.
[165] Emilio Ferrara, Stefano Cresci, and Luca Luceri. “Misinformation, Manipulation, and
Abuse on Social Media in the Era of COVID-19”. In: JCSS (2020).
[166] Savvas Zannettou. “Towards Understanding the Information Ecosystem Through the
Lens of Multiple Web Communities”. In: arXiv preprint arXiv:1911.10517 (2019).
[167] Will Jennings et al. “Lack of Trust and Social Media Echo Chambers Predict COVID-
19 Vaccine Hesitancy”. In: medRxiv (2021).
[168] Mark Lynas. 5G: What’s behind the latest COVID conspiracy theory? http://bit.
ly/covid-5g-conspiracy-theory. 2020.
Bibliography 153
[169] Savvas Zannettou et al. “The Web of False Information: Rumors, Fake News, Hoaxes,
Clickbait, and Various Other Shenanigans”. In: JDIQ (2019).
[170] Srijan Kumar and Neil Shah. “False Information on Web and Social Media: A Survey”.
In: arXiv preprint arXiv:1804.08559 (2018).
[171] Xiaojian Zhao et al. “Personalized Video Recommendation Based on Viewing History
With the Study on YouTube”. In: ICIMCS. 2012.
[172] Jonas Kaiser and Adrian Rauchfleisch. “Unite the Right? How YouTube’s Recommen-
dation Algorithm Connects the US Far-Right”. In: DSMM (2018).
[173] Derek O’Callaghan et al. “Down the (White) Rabbit Hole: The Extreme Right and
Online Recommender Systems”. In: SSCR (2015).
[174] Josephine B Schmitt et al. “Counter-messages as Prevention or Promotion of Ex-
tremism?! The Potential Role of YouTube: Recommendation Algorithms”. In: JC
(2018).
[175] Alessandro Bessi et al. “Users Polarization on Facebook and YouTube”. In: PloS one
(2016).
[176] Aniko Hannak et al. “Measuring Personalization of Web Search”. In: TheWebConf.
2013.
[177] Chloe Kliman-Silver et al. “Location, Location, Location: The Impact of Geolocation
on Web Search Personalization”. In: IMC. 2015.
[178] Ronald E Robertson, David Lazer, and Christo Wilson. “Auditing the Personalization
and Composition of Politically-related Search Engine Results Pages”. In: TheWebConf.
2018.
[179] Tien T Nguyen et al. “Exploring the Filter Bubble: The Effect of Using Recommender
Systems on Content Diversity”. In: TheWebConf. 2014.
[180] Mario Haim, Andreas Graefe, and Hans-Bernd Brosius. “Burst of the Filter Bubble?
Effects of Personalization on the Diversity of Google News”. In: DJ (2018).
[181] Huyen Le et al. “Measuring Political Personalization of Google News Search”. In:
TheWebConf. 2019.
[182] Eli Pariser. The Filter Bubble: How the New Personalized Web is Changing What we
Read and How We Think. Penguin, 2011.
[183] Axel Bruns. “Filter Bubble”. In: Internet Policy Review (2019).
Bibliography 154
[184] Harald Holone. “The Filter Bubble and its Effect on Online Personal Health Informa-
tion”. In: Croatian medical journal (2016).
[185] Phillipa Gill et al. “YouTube Traffic Characterization: A View From the Edge”. In:
SIGCOMM. 2007.
[186] X. Cheng, C. Dale, and J. Liu. “Statistics and Social Network of YouTube Videos”. In:
IWQS. 2008.
[187] Xianhui Che, Barry Ip, and Ling Lin. “A Survey of Current YouTube Video Character-
istics”. In: MultiMedia (2015).
[188] Shumeet Baluja et al. “Video Suggestion and Discovery for YouTube: Taking Random
Walks Through the View Graph”. In: WWW. 2008.
[189] Song Qin, Ronaldo Menezes, and Marius Silaghi. “A Recommender System for
YouTube Based on its Network of Reviewers”. In: ICSC. IEEE. 2010.
[190] Peter Duffy. “Using YouTube: Strategies for Using New Media in Teaching and Learn-
ing”. In: Enhancing learning through technology: research on emerging technologies
and pedagogies. World Scientific, 2008.
[191] Margaret L Niess and Janet M Walker. “This Rock’n’Roll Video Teaches Math”. In:
LLT (2009).
[192] Elisa Joy White. “Coffy, YouTube, and Uncle Ben: The Use of Film and New Media
in the Teaching of African American Studies at the University of Hawai’i”. In: EP
(2009).
[193] Troy Jones and Kristen Cuthrell. “YouTube: Educational Potentials and Pitfalls”. In:
CS (2011).
[194] Mike Thelwall et al. “Assessing the Impact of Online Academic Videos”. In: SIR.
Emerald Group Publishing Limited, 2012.
[195] Kayvan Kousha, Mike Thelwall, and Mahshid Abdoli. “The Role of Online Videos in
Research Communication: A Content Analysis of YouTube Videos Cited in Academic
Publications”. In: JASIST (2012).
[196] Dustin J Welbourne and Will J Grant. “Science Communication on YouTube: Factors
that Affect Channel and Video Popularity”. In: PUS (2016).
[197] Joachim Allgaier. “On the Shoulders of YouTube: Science in Music Videos”. In: SC
(2013).
Bibliography 155
[198] Joachim Allgaier. “Science and Medicine on YouTube”. In: IHIR (2020).
[199] H. Tankovska. Most popular children-themed YouTube channels as of January 2021,
ranked by number of subscribers. https://www.statista.com/statistics/
785626/most-popular-youtube-children-channels-ranked-by-
subscribers/. 2021.
[200] Reddit. What is ElsaGate? http://bit.ly/reddit-elsagate. 2017.
[201] Russell Brandom. Inside Elsagate, the Conspiracy-fueled War on Creepy YouTube
Kids Videos. https://www.theverge.com/2017/12/8/16751206/
elsagate-youtube-kids-creepy-conspiracy-theory. 2017.
[202] Phoebe Weston. YouTube Kids App is still Showing Disturbing Videos. http://bit.
ly/youtube-kids-showing-disturbing-videos. 2018.
[203] YouTube Help Center. Report Inappropriate Content. http://bit.ly/youtube-
report-inappropriate-content. 2021.
[204] Joseph L Fleiss. “Measuring Nominal Scale Agreement Among Many Raters”. In:
Psychological bulletin. 1971.
[205] Martin F Porter. “An Algorithm for Suffix Stripping”. In: Program (1980).
[206] Sepp Hochreiter and Jurgen Schmidhuber. “Long Short-term Memory”. In: Neural
computation (1997).
[207] Maxime Oquab et al. “Learning and Transferring Mid-level Image Representations
Using Convolutional Neural Networks”. In: CVPR. 2014.
[208] Christian Szegedy et al. “Going Deeper With Convolutions”. In: CVPR. 2015.
[209] Nitish Srivastava et al. “Dropout: a Simple Way to Prevent Neural Networks from
Overfitting”. In: JMLR (2014).
[210] F. Chollet. Keras. https://github.com/fchollet/keras. 2015.
[211] Martın Abadi et al. “Tensorflow: A system for Large-scale Machine Learning”. In:
OSDI. 2016.
[212] Sylvain Arlot, Alain Celisse, et al. “A survey of Cross-validation Procedures for Model
Selection”. In: Statistics surveys (2010).
[213] James Bergstra and Yoshua Bengio. “Random search for hyper-parameter optimiza-
tion.” In: Journal of machine learning research 13.2 (2012).
Bibliography 156
[214] Nitesh V Chawla et al. “SMOTE: Synthetic Minority Over-sampling Technique”. In:
JAIR (2002).
[215] Jesselyn Cook. Inside Incels’ Looksmaxing Obsession: Penis Stretching, Skull Implants
And Rage. https://www.huffpost.com/entry/incels-looksmaxing-
obsession_n_5b50e56ee4b0de86f48b0a4f. 2018.
[216] Southern Poverty Law Center. Male Supremacy. https://www.splcenter.
org/fighting-hate/extremist-files/ideology/male-supremacy.
2019.
[217] The Fifth Estate. Why incels are a ’real and present threat’ for Canadians. https:
//www.cbc.ca/news/canada/incel-threat-canadians-fifth-
estate-1.4992184. 2019.
[218] Wikipedia. 2014 Isla Vista Killings. https://en.wikipedia.org/wiki/
2014_Isla_Vista_killings. 2019.
[219] Sdner Sara et al. Oregon Shooting: Gunman a Student at Umpqua Community College.
https://tinyurl.com/umpqua-community-college-shoot. 2015.
[220] Leyland Cecco. Toronto van attack suspect says he was ’radicalized’ online by ’in-
cels’. https://www.theguardian.com/world/2019/sep/27/alek-
minassian-toronto-van-attack-interview-incels. 2019.
[221] Abby Ohlheiser. Inside the online world of ’incels,’ the dark corner of the Inter-
net linked to the Toronto suspect. https://tinyurl.com/incels-link-
toronto-suspect. 2018.
[222] Zack Beauchamp. Incel, the misogynist ideology that inspired the deadly Toronto at-
tack, explained. https://www.vox.com/world/2018/4/25/17277496/
incel-toronto-attack-alek-minassian. 2018.
[223] Christine Hauser. Reddit Bans ’Incel’ Group for Inciting Violence Against Women.
https://www.nytimes.com/2017/11/09/technology/incels-
reddit-banned.html. 2017.
[224] Edward Newell et al. “User Migration in Online Social Networks: A Case Study on
Reddit During a Period of Community Unrest”. In: ICWSM. 2016.
[225] Angela Nagle. “An Investigation into Contemporary Online Anti-feminist Move-
ments”. PhD thesis. Dublin City University, 2015.
Bibliography 157
[226] December Maxwell et al. “’A Short Story of a Lonely Guy’: A Qualitative Thematic
Analysis of Involuntary Celibacy Using Reddit”. In: Sexuality & Culture (2020).
[227] Caroline O’Donovan et al. We Followed YouTube’s Recommendation Algorithm
Down The Rabbit Hole. https://www.buzzfeednews.com/article/
carolineodonovan/down-youtubes-recommendation-rabbithole.
2019.
[228] Alice Marwick and Rebecca Lewis. “Media manipulation and Disinformation Online”.
In: New York: Data & Society Research Institute (2017).
[229] Warren Farrell. The Myth of Male Power. Berkeley Publishing Group, 1996.
[230] Michael A Messner. “The Limits of ’The Male Sex Role’ An Analysis of the Men’s
Liberation and Men’s Rights Movements’ Discourse”. In: Gender & Society (1998).
[231] Bethany M Coston and Michael Kimmel. “White Men as the New Victims: Reverse
Discrimination Cases and the Men’s Rights Movement”. In: Nev. LJ (2012).
[232] Melissa Blais and Francis Dupuis-Deri. “Masculinism and the Antifeminist Counter-
movement”. In: SMS (2012).
[233] Jack Bratich and Sarah Banet-Weiser. “From Pick-up Artists to Incels: Con(fidence)
Games, Networked Misogyny, and the Failure of Neoliberalism”. In: IJC (2019).
[234] Lise Gotell and Emily Dutton. “Sexual Violence in the ’manosphere’: Antifeminist
men’s Rights Discourses on Rape”. In: IJCJSD (2016).
[235] ’Female Nature, Cucks, and Simps’: Understanding Men Going Their Own Way as
part of the Manosphere.
[236] Jie Liang Lin. “Antifeminism Online. MGTOW (Men Going Their Own Way)”. In:
JSTOR (2017).
[237] BBC News. How rampage killer became misogynist ’hero’. https://www.bbc.
com/news/world-us-canada-43892189. 2018.
[238] Incels Wiki. Blackpill. https://incels.wiki/w/Blackpill. 2019.
[239] Lauren Menzie. “Stacys, Beckys, and Chads: The Construction of Femininity and
Hegemonic Masculinity Within Incel Rhetoric”. In: Psychology & Sexuality (2020).
[240] Rational Wiki. Incel. https://rationalwiki.org/wiki/Incel. 2019.
[241] Kathleen E Kiernan. “Who Remains Celibate?” In: JBS (1988).
Bibliography 158
[242] Allie Conti. Learn to Decode the Secret Language of the Incel Subculture. http:
//bit.ly/incel-language-subculture. 2018.
[243] Shannon Zimmerman, Luisa Ryan, and David Duriesmith. “Recognizing the Violent
Extremist Ideology of ’Incels’”. In: Women In International Security Policy Brief
(2018).
[244] Incels Wiki. The Incel Wiki. https://incels.wiki. 2019.
[245] Incel-related Subreddits List and Sources. http://bit.ly/incel-related-
subreddits-list.
[246] List of Control Videos Subreddits. http://bit.ly/incels- control-
videos-subreddits.
[247] Incels Wiki. Incel Forums Term Glossary. https://incels.wiki/w/Incel_
Forums_Term_Glossary. 2019.
[248] J Richard Landis and Gary G Koch. “The Measurement of Observer Agreement for
Categorical Data”. In: biometrics (1977).
[249] Incel-related Terms Lexicon. http://bit.ly/incel-related-terms-
lexicon.
[250] David Dittrich, Erin Kenneally, et al. The Menlo Report: Ethical Principles Guiding
Information and Communication Technology Research. Tech. rep. US Department of
Homeland Security, 2012.
[251] Caitlin M Rivers and Bryan L Lewis. “Ethical Research Standards in a World of Big
Data”. In: F1000Research. 2014.
[252] GDPR: Right of Access. https://gdpr-info.eu/issues/right-of-
access/. 2018.
[253] GDPR: Right to be Forgotten. https://gdpr-info.eu/issues/right-
to-be-forgotten/. 2018.
[254] Association of Internet Research. Internet Research: Ethical Guidelines 3.0. https:
//aoir.org/reports/ethics3.pdf. 2019.
[255] Barbara Beale et al. “Impact of In-depth Interviews on the Interviewer: Roller Coaster
Ride”. In: Nursing & health sciences. 2004.
[256] Nadia Bashir. “Doing Research in Peoples’ Homes: Fieldwork, Ethics and Safety–On
the Practical Challenges of Researching and Representing Life on the Margins”. In:
Qualitative Research. 2018.
Bibliography 159
[257] Nicholas Blagden and Sarah Pemberton. “The Challenge in Conducting Qualitative
Research With Convicted Sex Offenders”. In: The Howard Journal of Criminal Justice.
2010.
[258] Adi Robertson. Reddit has broadened its anti-harassment rules and banned a major
incel forum. https://www.theverge.com/2019/9/30/20891920/
reddit- harassment- bullying- threats- new- policy- change-
rules-subreddits. 2019.
[259] MK Vijaymeena and K Kavitha. “A Survey on Similarity Measures in Text Mining”.
In: MLAIJ. 2016.
[260] Ronald A Fisher. “On the Interpretation of χ 2 From Contingency Tables, and the
Calculation of P”. In: Journal of the Royal Statistical Society (1922).
[261] Frank J Massey Jr. “The Kolmogorov-Smirnov Test for Goodness of Fit”. In: Journal
of the American statistical Association. Taylor & Francis, 1951.
[262] Matteo Cinelli et al. “The Echo Chamber Effect on Social Media”. In: Proceedings of
the National Academy of Sciences. 2021.
[263] Caroline O’Donovan et al. We Followed YouTube’s Recommendation Algorithm
Down The Rabbit Hole. https://www.buzzfeednews.com/article/
carolineodonovan/down-youtubes-recommendation-rabbithole.
2019.
[264] Mark Lynas. 5G: What’s behind the latest COVID conspiracy theory? http://bit.
ly/covid-5g. 2020.
[265] Jack Goodman and Flora Carmichael. Coronavirus: Bill Gates ’microchip’ conspiracy
theory and other vaccine claims fact-checked. http://bbc.in/3igJEkl. 2020.
[266] Martin Enserink and Jon Cohen. “Fact-checking Judy Mikovits, the Controversial
Virologist Attacking Anthony Fauci in a Viral Conspiracy Video”. In: Science. 2020.
[267] Joey D’Urso and Alex Wickham. YouTube Is Letting Millions Of People Watch Videos
Promoting Misinformation About The Coronavirus. http://bzfd.it/2L9xn5f.
2020.
[268] P Ball. “Anti-vaccine Movement Could Undermine Efforts to End Coronavirus Pan-
demic, Researchers Warn”. In: Nature. 2020.
[269] Karla Renic. Coronavirus: Dozens show up at anti-mask rally in Moncton, N.B.
http://bit.ly/covid-anti-mask. 2020.
Bibliography 160
[270] Elfy Scott. Why people believe the Earth is flat and we should listen to anti-vaxxers.
http://bit.ly/guardian-flat-earth. 2019.
[271] Appen. AI Solutions with confident Training Data. https://appen.com/
solutions/training-data/. 2020.
[272] Bret Stetka. “Where’s the Proof that Mindfulness Meditation Works?” In: Scientific
American. 2017.
[273] Pseudoscientific topics list, Annotation platform instructions, and YouTube parts
analyzed. http://bit.ly/paper-res.
[274] European Parliament. General Data Protection Regulation. https://gdpr-info.
eu/. 2018.
[275] Facebook. fastText - Efficient Text Classification and Representation Learning. http:
//bit.ly/fasttext-library. 2020.
[276] Tomas Mikolov et al. “Advances in Pre-Training Distributed Word Representations”.
In: LREC. 2018.
[277] Iulia Turc et al. “Well-read Students Learn Better: On the Importance of Pre-Training
Compact Models”. In: arXiv preprint arXiv:1908.08962. 2019.
[278] Foster Provost. “Machine Learning from Imbalanced Data Sets 101”. In: WLIDS.
2000.
[279] Leo Kelion. Coronavirus: YouTube Tightens Rules After David Icke 5G Interview.
http://bbc.in/38xHhqe. 2020.
[280] YouTube Help. COVID-19 Medical Misinformation Policy. http://bit.ly/
youtube-covid-policy. 2020.
[281] Nicole Westman. YouTube will remove videos with COVID-19 vaccine misinformation.
http://bit.ly/youtube-anti-vaxx. 2020.
[282] Greg Linden, Brent Smith, and Jeremy York. “Amazon.com Recommendations: Item-
to-item Collaborative Filtering”. In: IEEE Internet computing. 2003.
[283] Alex Barker and Hannah Murphy. YouTube Reverts To Human Annotators in Fight
Against Misinformation. https://on.ft.com/2Rqiiz4. 2020.
[284] The YouTube Team. Our ongoing work to tackle hate. https://blog.youtube/
news-and-events/our-ongoing-work-to-tackle-hate. 2019.


