Embed Size (px)
Citation preview

Characterizing scientific production andconsumption in PhysicsQian Zhang1, Nicola Perra1, Bruno Gonçalves2, Fabio Ciulla1 & Alessandro Vespignani1,3,4
1Laboratory for the Modelling of Biological and Socio-technical Systems, Northeastern University, Boston MA 02115 USA, 2AixMarseille Universite, CNRS, CPT, UMR 7332, 13288 Marseille, France, 3Institute for Scientific Interchange Foundation, Turin10133, Italy, 4Institute for Quantitative Social Sciences at Harvard University, Cambridge, MA, 02138.
We analyze the entire publication database of the American Physical Society generating longitudinal(50 years) citation networks geolocalized at the level of single urban areas. We define the knowledgediffusion proxy, and scientific production ranking algorithms to capture the spatio-temporal dynamics ofPhysics knowledge worldwide. By using the knowledge diffusion proxy we identify the key cities in theproduction and consumption of knowledge in Physics as a function of time. The results from the scientificproduction ranking algorithm allow us to characterize the top cities for scholarly research in Physics.Although we focus on a single dataset concerning a specific field, the methodology presented here opens thepath to comparative studies of the dynamics of knowledge across disciplines and research areas.
Over the last decade, the digitalization of publication datasets has propelled bibliographic studies allowingfor the first time access to the geospatial distribution of millions of publications, and citations at differentgranularities1–8 (see Ref. 9 for a review). More precisely, authors’ name, affiliations, addresses, and
references can be aggregated at different scales, and used to characterize publications and citations patterns ofsingle papers10,11, journals12,13, authors14–16, institutions17, cities18, or countries19. The sheer size of the datasetsallows also system level analysis on research production and consumption20, migration of authors21,22, and changein production in several regions of the world as a function of time5,6, just to name a few examples. At the same timethose analyses have spurred an intense research activity aimed at defining metrics able to capture the importance/ranking of authors, institutions, or even entire countries14,15,17,23–29. Whereas such large datasets are extremelyuseful in understanding scholarly networks and in charting the creation of knowledge, they are also pointing outthe limits of our conceptual and modeling frameworks30 and call for a deeper understanding of the dynamicsruling the diffusion and fruition of knowledge across the the social and geographical space.
In this paper we study citation patterns of articles published in the American Physical Society (APS) journals ina fifty-year time interval (1960-2009)31. Although in the early years of this period the dataset was obviously biasedtoward the scholarly activity within the USA, in the last twenty years only about 35% of the papers are produced inthe USA. The same amount of production has been observed in databases that include multiple journals, anddisciplines7,19. Indeed the journals of the APS are considered worldwide as reference publication venues that wellrepresent the international research activity in Physics. Furthermore this dataset does not bundle differentdisciplines and publication languages, providing a homogeneous dataset concerning Physics scholarly research.For each paper we geolocalize the institutions contained in the authors’ affiliations. In this way we are able toassociate each paper in the database with specific urban areas. This defines a time resolved, geolocalized citationnetwork including 2,307 cities around the world engaged in the production of scholarly work in the area ofPhysics. Following previous works8,17 we assume that the number of given or received citations is a proxy ofknowledge consumption or production, respectively. More precisely, we assume that citations are the currencytraded between parties in the knowledge exchange. Nodes that receive citations export their knowledge to others.Nodes that cite other works, import knowledge from others. According to this assumption we classify nodesconsidering the unbalance in their trade. Knowledge producers are nodes that are cited (export) more than theycite (import). On the contrary, we label as consumers nodes that cite (import) more than they are cited (export).Using this classification, we define the knowledge diffusion proxy algorithm to explore how scientific knowledgeflows from producers to consumers. This tool explicitly assumes a systemic perspective of knowledge diffusion,highlighting the global structure of scientific production and consumption in Physics.
The temporal analysis reveals interesting patterns and the progressive delocalization of knowledge producers.In particular, we find that in the last twenty years the geographical distribution of knowledge production hasdrastically changed. A paramount example is the transition in the USA from a knowledge production localized
SUBJECT AREAS:COMPLEX NETWORKS
COMPUTATIONAL SCIENCE
APPLIED PHYSICS
SCIENTIFIC DATA
Received20 February 2013
Accepted25 March 2013
Published10 April 2013
Correspondence andrequests for materials
should be addressed toA.V. (a.vespignani@
neu.edu)
SCIENTIFIC REPORTS | 3 : 1640 | DOI: 10.1038/srep01640 1

around major urban areas in the east and west coast to a broadgeographical distribution where a significant part of the knowledgeproduction is now occurring also in the midwestern and southernstates in the USA. Analogously, we observe the early 90s dominanceof UK and Northern Europe to subside to an increase of productionfrom France, Italy and several regions of Spain. Interestingly, the lastdecade shows that several of China’s urban areas are emerging as thelargest knowledge consumers worldwide. The reasons underlyingthis phenomenon may be related to the significant growth of theeconomy and the research/development compartment in China inthe early 21th century32. This positive stimulus, pushed up also thescientific consumption with a large number of paper citing workfrom other world areas. Indeed, the increase of publications is assoc-iated to an increase of the citations unbalance, moving China to thetop rank as consumers since the recent influx of its new papers hasnot yet had the time to accumulate citations.
Although the knowledge diffusion proxy provides a measure ofknowledge production and consumption, it may be inadequate inproviding a rank of the most authoritative cities for Physics research.Indeed, a key issue in appropriately ranking the knowledge produc-tion, is that not all citations have the same weight. Citations comingfrom authoritative nodes are heavier than others coming from lessimportant nodes, thus defining a recursive diffusion of ranking ofnodes in the citation network. In order to include this element in theranking of cities we propose the scientific production ranking algo-rithm. This tool, inspired by the PageRank33, allows us to define therank of each node, as function of time, going beyond the knowledgediffusion proxy or simple local measures such as citation counts or h-index14. In this algorithm the importance of each node diffusesthrough the citation links. The rank of a node is determined by therank of the nodes that cite it, recursively, thus implicitly weightingdifferently citations from highly (lowly) ranked nodes. Also in thiscase we observe noticeable changes in the ranking of cities along theyears. For instance the presence of both European and Asian cities inthe top 100 list increases by 50% in the last 20 years. This findingssuggest that the Internet, digitalization and accessibility of publica-tions are creating a more levelled playing field where the dominance
of specific area of the world is being progressively eroded to theadvantage of a more widespread and complex knowledge productionand consumption dynamic.
ResultsWe focus our analysis on the APS dataset31. It contains all the paperspublished by the APS from 1893 to 2009. We consider only the last50 years due to the incomplete geolocalization information availablefor the early years. During this period, the large majority of indexedpapers, 97.47%, contain complete information such as authors name,journal of publication, day of publication, list of affiliations and list ofcitations to other articles published in APS journals. We geolocalized96.97% of papers at urban area level with an accuracy of 98.5%. Werefer the reader to the Methods section and to the SupplementaryInformation (SI) for the detailed description of the dataset and thetechniques developed to geolocalize the affiliations.
In total, only 43% of papers has been produced inside the USA.Interestingly, over time this fraction has decreased. For example, inthe 60’s it was 85.59%, while in the last 10 years decreased to just36.67%. While one might assume that the APS dataset is biasedtoward the USA scientific community, the percentage of publicationscontributed by the USA in APS journals after 1990 is almost the sameas in other publication datasets7,19. These alternative datasets containjournals published all over the world and mix different scientificdisciplines. This supports the idea that the APS journals are nowattracting the worldwide physics scientific community indepen-dently of nationality, and fairly represent the world productionand consumption of Physics. It is not possible to provide quantitativeanalysis of possible nationality bias and disentangle it by an actualchange of the dynamic of knowledge production. For this reason, andin order to minimize any bias in the analysis we focus our analysis inthe last 20 years of data.
In order to construct the geolocalized citation network we con-sider nodes (urban areas) and directed links representing the pre-sence of citations from a paper with affiliation in one urban area to apaper with affiliation in another urban area. For example, if a paperwritten in node i cites one paper written in node j there is an link fromi to j, i.e., j receives a citation from i and i sends a citation to j. Eachpaper may have multiple affiliations and therefore citations have tobe proportionally distributed between all the nodes of the papers. Forthis reason we weight each link in order to take into account thepresence of multiple affiliations and multiple citations. In a giventime window, the total number of citations for papers written in jreceived from papers written in i, is the weight of the link i R j, andthe total number of citations for those paper written in j sent to thepapers written in k is the weight of the link j R k. For instance, if in atime window t, there is one paper written in node j, which cite twopapers written in node k and was cited by three papers written innode i, then wjk 5 2, wij 5 3, and we add all such weights for eachpaper written in that node j and obtain the weights for links. Forpapers written in multiple cities, say j1, j2, the weight will be countedequally. The time window we use in this manuscript is one year. Weshow an example of the network construction in Figure 1.
In order to define main actors in the production and consumptionof Physics, we consider citations as a currency of trade. This analogyallows us to immediately grasp the meaning and distinction betweenproducers and consumers of scientific knowledge. Nodes that receivecitations export their knowledge to the citing nodes. Instead, nodesthat cite, papers produced from other nodes of the network, importknowledge from the cited nodes. Measuring the unbalance tradebetween citations, we define producers as cities that export more thanthey import, and consumers as cities that import more than theyexport. More precisely, we can measure the total knowledgeimported by each urban area as
Pj wij and the total export asP
j wji in a given year. Those measures however acquire specificmeaning when considered relatively to the total trade of physics
Figure 1 | Projecting a paper citation relationship into a city-to-citycitation network. (A) Paper A written by authors from Ann Arbor , Los
Alamos and New York cites one paper B written by authors from Rome and
Madrid and another paper C from Oxford and Princeton. (B) In a city-to-
city citation network, directed links from Ann Arbor to Madrid, Rome,
Oxford and Princeton are generated, and similarly Los Alamos and New
York are connected to the above four cited cities.
www.nature.com/scientificreports
SCIENTIFIC REPORTS | 3 : 1640 | DOI: 10.1038/srep01640 2
knowledge worldwide in the same year; i.e. the total number of cita-tions worldwide S~
Pij wij. The relative trade unbalance of each
urban area i is then:
DSi~
Pj wji{
Pj wij
S: ð1Þ
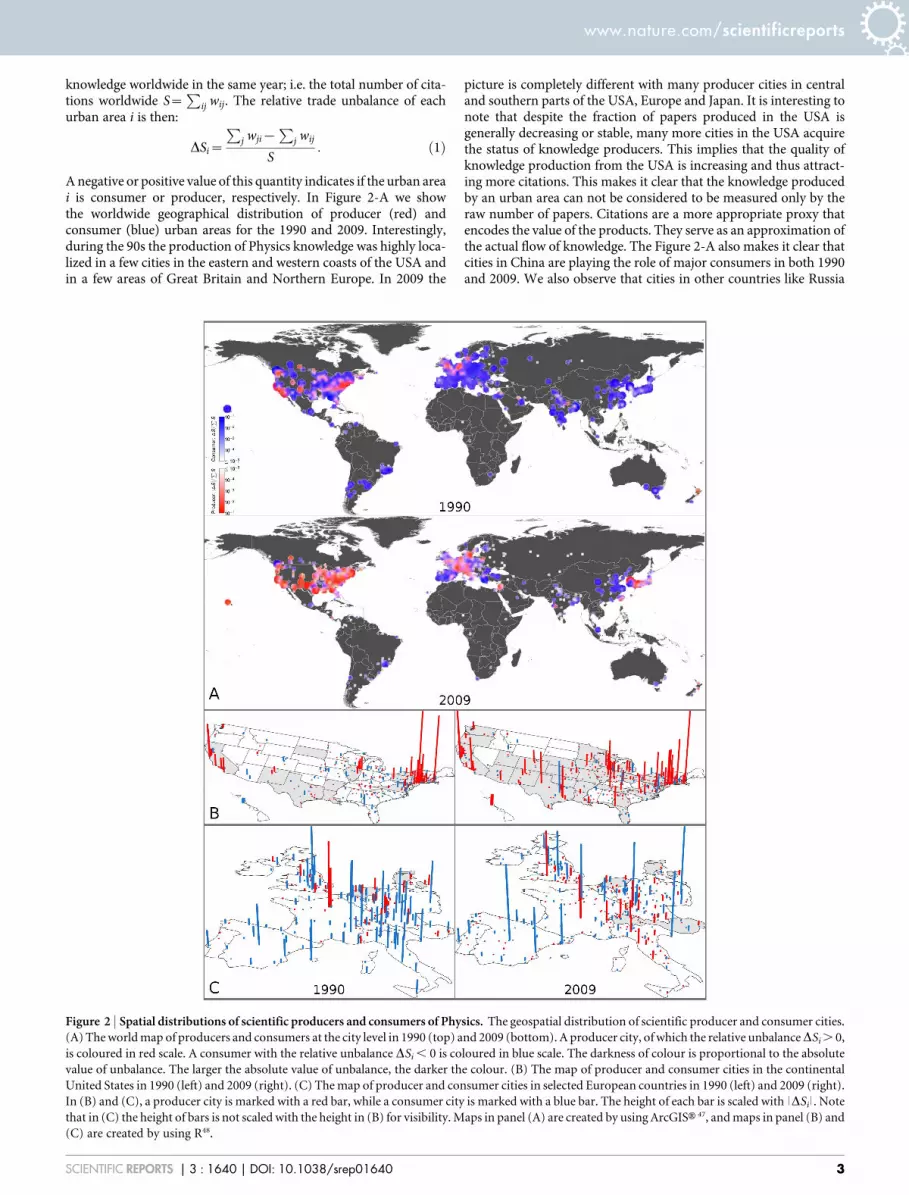
A negative or positive value of this quantity indicates if the urban areai is consumer or producer, respectively. In Figure 2-A we showthe worldwide geographical distribution of producer (red) andconsumer (blue) urban areas for the 1990 and 2009. Interestingly,during the 90s the production of Physics knowledge was highly loca-lized in a few cities in the eastern and western coasts of the USA andin a few areas of Great Britain and Northern Europe. In 2009 the
picture is completely different with many producer cities in centraland southern parts of the USA, Europe and Japan. It is interesting tonote that despite the fraction of papers produced in the USA isgenerally decreasing or stable, many more cities in the USA acquirethe status of knowledge producers. This implies that the quality ofknowledge production from the USA is increasing and thus attract-ing more citations. This makes it clear that the knowledge producedby an urban area can not be considered to be measured only by theraw number of papers. Citations are a more appropriate proxy thatencodes the value of the products. They serve as an approximation ofthe actual flow of knowledge. The Figure 2-A also makes it clear thatcities in China are playing the role of major consumers in both 1990and 2009. We also observe that cities in other countries like Russia
Figure 2 | Spatial distributions of scientific producers and consumers of Physics. The geospatial distribution of scientific producer and consumer cities.
(A) The world map of producers and consumers at the city level in 1990 (top) and 2009 (bottom). A producer city, of which the relative unbalanceDSi . 0,
is coloured in red scale. A consumer with the relative unbalance DSi , 0 is coloured in blue scale. The darkness of colour is proportional to the absolute
value of unbalance. The larger the absolute value of unbalance, the darker the colour. (B) The map of producer and consumer cities in the continental
United States in 1990 (left) and 2009 (right). (C) The map of producer and consumer cities in selected European countries in 1990 (left) and 2009 (right).
In (B) and (C), a producer city is marked with a red bar, while a consumer city is marked with a blue bar. The height of each bar is scaled with |DSi | . Note
that in (C) the height of bars is not scaled with the height in (B) for visibility. Maps in panel (A) are created by using ArcGISH 47, and maps in panel (B) and
(C) are created by using R48.
www.nature.com/scientificreports
SCIENTIFIC REPORTS | 3 : 1640 | DOI: 10.1038/srep01640 3
and India consumed less in 2009 than 1990. In other words, in 2009both the production and consumption of knowledge are less con-centrated on specific places and generally spread more evenly geo-graphically. In order to provide visual support to this conclusion weshow in Figure 2-B the geographical distribution of producers andconsumers inside the USA. From the two maps it is evident the driftof knowledge production from the two coastal areas in the USA to themidwest, central and southern states. Similarly, in Figure 2-C we plotthe same information for western Europe. In 1990 only a few urbanareas in Germany and France were clearly producers. By 2009 thisdominance has been consistently eroded by Italy, Spain and a morewidespread geographical distribution of producers in France,Germany and UK.
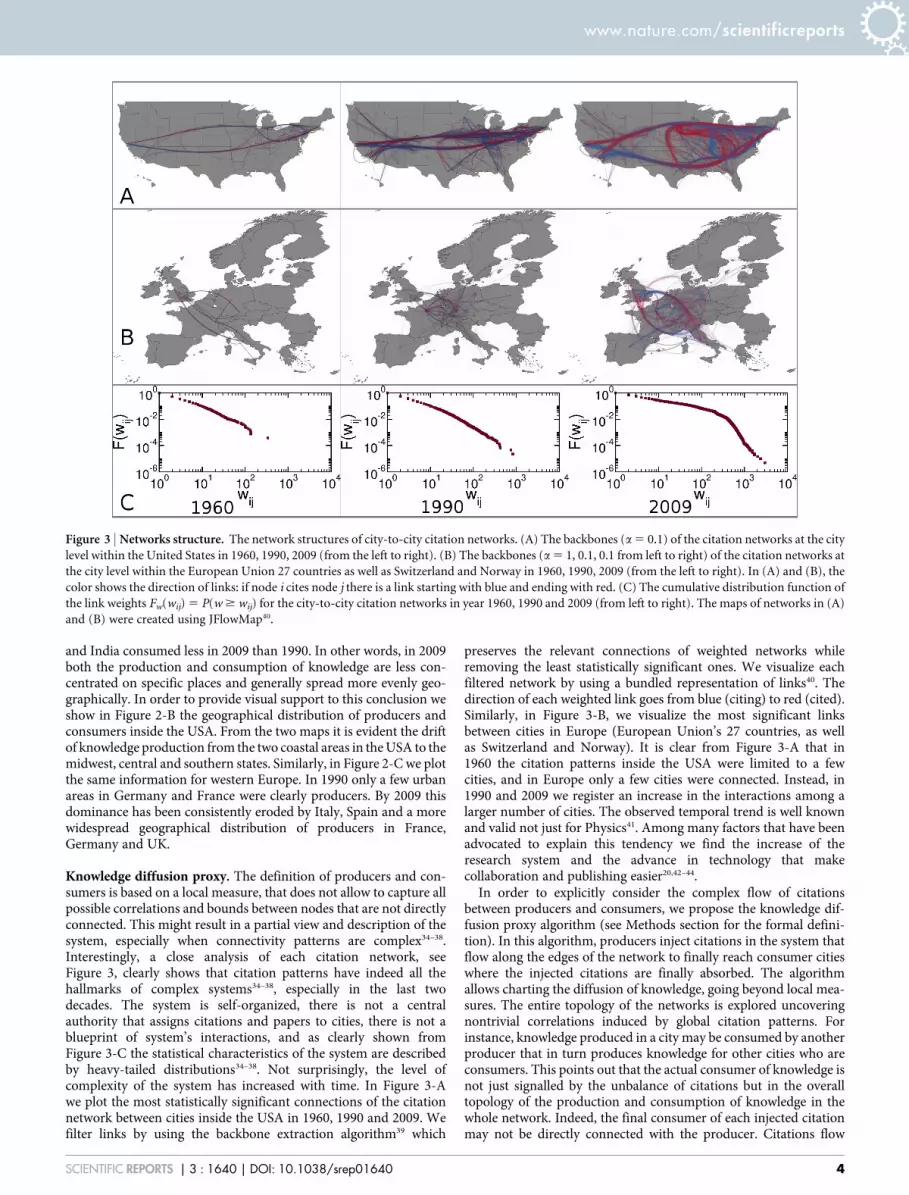
Knowledge diffusion proxy. The definition of producers and con-sumers is based on a local measure, that does not allow to capture allpossible correlations and bounds between nodes that are not directlyconnected. This might result in a partial view and description of thesystem, especially when connectivity patterns are complex34–38.Interestingly, a close analysis of each citation network, seeFigure 3, clearly shows that citation patterns have indeed all thehallmarks of complex systems34–38, especially in the last twodecades. The system is self-organized, there is not a centralauthority that assigns citations and papers to cities, there is not ablueprint of system’s interactions, and as clearly shown fromFigure 3-C the statistical characteristics of the system are describedby heavy-tailed distributions34–38. Not surprisingly, the level ofcomplexity of the system has increased with time. In Figure 3-Awe plot the most statistically significant connections of the citationnetwork between cities inside the USA in 1960, 1990 and 2009. Wefilter links by using the backbone extraction algorithm39 which
preserves the relevant connections of weighted networks whileremoving the least statistically significant ones. We visualize eachfiltered network by using a bundled representation of links40. Thedirection of each weighted link goes from blue (citing) to red (cited).Similarly, in Figure 3-B, we visualize the most significant linksbetween cities in Europe (European Union’s 27 countries, as wellas Switzerland and Norway). It is clear from Figure 3-A that in1960 the citation patterns inside the USA were limited to a fewcities, and in Europe only a few cities were connected. Instead, in1990 and 2009 we register an increase in the interactions among alarger number of cities. The observed temporal trend is well knownand valid not just for Physics41. Among many factors that have beenadvocated to explain this tendency we find the increase of theresearch system and the advance in technology that makecollaboration and publishing easier20,42–44.
In order to explicitly consider the complex flow of citationsbetween producers and consumers, we propose the knowledge dif-fusion proxy algorithm (see Methods section for the formal defini-tion). In this algorithm, producers inject citations in the system thatflow along the edges of the network to finally reach consumer citieswhere the injected citations are finally absorbed. The algorithmallows charting the diffusion of knowledge, going beyond local mea-sures. The entire topology of the networks is explored uncoveringnontrivial correlations induced by global citation patterns. Forinstance, knowledge produced in a city may be consumed by anotherproducer that in turn produces knowledge for other cities who areconsumers. This points out that the actual consumer of knowledge isnot just signalled by the unbalance of citations but in the overalltopology of the production and consumption of knowledge in thewhole network. Indeed, the final consumer of each injected citationmay not be directly connected with the producer. Citations flow
Figure 3 | Networks structure. The network structures of city-to-city citation networks. (A) The backbones (a 5 0.1) of the citation networks at the city
level within the United States in 1960, 1990, 2009 (from the left to right). (B) The backbones (a 5 1, 0.1, 0.1 from left to right) of the citation networks at
the city level within the European Union 27 countries as well as Switzerland and Norway in 1960, 1990, 2009 (from the left to right). In (A) and (B), the
color shows the direction of links: if node i cites node j there is a link starting with blue and ending with red. (C) The cumulative distribution function of
the link weights Fw(wij) 5 P(w $ wij) for the city-to-city citation networks in year 1960, 1990 and 2009 (from left to right). The maps of networks in (A)
and (B) were created using JFlowMap40.
www.nature.com/scientificreports
SCIENTIFIC REPORTS | 3 : 1640 | DOI: 10.1038/srep01640 4

along all possible paths, sometimes through intermediate cities. InTable 1, and Table 2 we report the rankings of Top 10 final consu-mers evaluated by the knowledge diffusion proxy for the Top 3producers in 2009 and 1990 respectively. We also list the Top 10neighbours according to the local citation unbalance. From these twotables, it is clear that the final rank of each consumer, obtained by ouralgorithm, can be extremely different from the ranking obtained byjust considering local unbalances. For instance, in 2009 Bratislavaand Mainz rank in top 10 consumers absorbing knowledge producedin Boston. However, according to local measure of unbalance, thesetwo cities are ranked out of top 10 (shown in bold in Table 1).Interestingly, even the Top consumer for New Haven, Berlin, alsodoes not rank among the Top 10 neighbours according to the citationunbalance. These findings confirm that in order to uncover the com-plex set of relationships among cities, it is crucial to consider theentire structure of the network, going beyond simple local measures.
In Figure 4-A and Figure 4-B we visualize the results consideringthe Top four producer cities in 2009 in the USA and in Europerespectively. We show their Top ten consumers over 20 years asfunction of time. The size of each circle is proportional to how manytimes each injected citation is absorbed by that consumer. In the plot,vertical grey strips indicate that the city was not a producer duringthose years (e.g. Orsay in 2008). The results show that, on average,Beijing is the top consumer for all of these producers in the past20 years. Since China registered a big economical growth and incre-ment of research population in the early 2000, it is reasonable toassume that, thanks to this positive stimulus, many more papers werewritten in its capital, a dominant city for scientific research in China.However, the fast publication growth increased the unbalancebetween sent and received citations. Each paper published in a given
city imports knowledge from the cited cities. Reaching a balancemight require some time. Each city needs to accumulate citationsback to export its knowledge to others cities. We can speculate that inthe near future cities in China might be moving among the strongestproducers if a fair number of papers start receiving enough citations,which obviously depends on the quality of the research carried out inthe last years. This is the case of cities like Tokyo which has graduallyapproached the citation balance in recent years. For instance, Table 2shows that in 1990 Tokyo, was among the top consumers. But by2009, its contribution to citation consumption had become lesssignificant as observed from Figure 4 and Table 1.
Ranking cities. Authors, departments, institutions, government andmany funding agencies are extremely interested in defining the mostimportant sources of knowledge. The necessity to find objectivemeasures of the importance of papers, authors, journals, anddisciplines leads to the definition of a wide variety of rankings23,24.Measures such as impact factor, number of citations and h-index14
are commonly used to assess the importance of scientific production.However, these common indicators might fail to account for theactual importance and prestige associated to each publication. Inorder to overcome these limitations, many different measures havebeen proposed25–28. Here we introduce the scientific productionranking algorithm (SPR), an iterative algorithm based on thenotion of diffusing scientific credits. It is analogous to PageRank33,CiteRank26, HITS25, SARA29, and others ranking metrics. In thealgorithm each node receives a credit that is redistributed to itsneighbours at the next iteration until the process converges in astationary distribution of credit to all nodes (see Methods sectionfor the formal definition). The credits diffuse following citations links
Table 2 | Rankings from Knowledge diffusion proxy algorithm for top 3 producer cities in 1990. In bold, we highlight cities that are present intop 10 consumers ranked according to the knowledge diffusion proxy but do not appear in top 10 cities ranked according to local citationunbalance
Piscataway Boston Palo Alto
Diffusion proxy Citation unbalance Diffusion proxy Citation unbalance Diffusion proxy Citation unbalance
Tokyo Stuttgart Tokyo Tokyo Tokyo TokyoBeijing Tokyo Grenoble Grenoble Beijing Ann ArborTsukuba Los Angeles Beijing Los Angeles Tsukuba BloomingtonGrenoble Urbana Tsukuba College Park Seoul BoulderTallahassee College Park Seoul Los Alamos Tallahassee UrbanaHamilton Grenoble Vancouver Urbana Charlottesville BerlinBuffalo Rochester Tallahassee Boulder Vancouver OrsayVancouver Boston Warsaw Rochester Berlin DenverCharlottesville Los Alamos Kolkata Vancouver Durham SeoulTempe Hamilton Charlottesville Bloomington Taipei Los Alamos
Table 1 | Rankings from Knowledge diffusion proxy algorithm for top 3 producer cities in 2009. In bold, we highlight cities that are present intop 10 consumers ranked according to the knowledge diffusion proxy but do not appear in top 10 cities ranked according to local citationunbalance
Boston Berkeley New Haven
Diffusion proxy Citation unbalance Diffusion proxy Citation unbalance Diffusion proxy Citation unbalance
Athens Madrid Athens Athens Berlin VancouverMadrid Athens Gwangju Madrid Athens ParisVancouver Vancouver Bratislava Bratislava Mainz TriesteGwangju Moscow Madrid Paris Vancouver AthensBratislava Paris Vancouver Vancouver Gwangju GwangjuBerlin Tokyo Trieste Gwangju Trieste BratislavaTrieste Trieste Waco Moscow Bratislava MadridMainz Beijing Paris Trieste Coventry LiverpoolParis Berlin Berlin Seoul Valencia OxfordWaco Gwangju Mainz Waco Madrid Santa Barbara
www.nature.com/scientificreports
SCIENTIFIC REPORTS | 3 : 1640 | DOI: 10.1038/srep01640 5

self-consistently, implying that not all links have the sameimportance. Any city in the network will be more prominent inrank if it receives citations from high-rank sources. This processensures that the rank of each city is self-consistently determinednot just by the raw number of citations but also if the citationscome from highly ranked cities. In Figure 5 we show the Top 20cities from 1990 to 2009. Interestingly, we clearly see the declineand rise of cities along the years as well as the steady leadership ofBoston and Berkeley. This behaviour is clear in Figure 6-B where weshow the rank for cities in USA in 1990 and 2009. Meanwhile, theranking of cities in European and Asian countries like France, Italyand Japan has increased significantly, as shown in both Figure 5 andFigure 6-A. In Figure 6-C we focus on the geographical distributionof ranks for a selected set of European countries in 1990 and 2009. InTable 3 we provide a quantitative measure of the change in thelandscape of the most highly ranked cities in the world by showing
the percentage of cities in the top 100 ranks for different continents.In Figure 7, we compare the ranking obtained by our recursivealgorithm with the ranking obtained by considering the totalvolume of publications produced in each city. Since we areconsidering only journals by the APS, the impact factor isconsistent across all cities and does not include disproportionateeffects that often happen when mixing disciplines or journal withvaried readership. It is then natural to consider a ranking based onthe raw productivity of each place. As we see in the figure though thetwo rankings, although obviously correlated, provide differentresults. A number of cities whose ranking, according to produc-tivity, is in the Top 20 cities in the world, are ranked one order ofmagnitude lower by the SPR algorithm. Valuing the number ofcitations and their origin in the ranking of cities produces resultsoften not consistent with the raw number of papers, signaling that insome places a large fraction of papers are not producing knowledge
Figure 4 | Knowledge diffusion proxy results. (A) The Top 4 producer cities in the USA in 2009 and their Top 10 consumers from knowledge diffusion
proxy algorithm in 1990 – 2009. (B) The Top 4 producer cities in the European Union 27 countries as well as Switzerland and Norway in 2009 and their
Top 10 consumers from knowledge diffusion proxy algorithm in 1990 – 2009. When a producer city becomes a consumer in some year, a grey strip is
marked in that year. For each producer city in (A) and (B), the major consumers of the first producer city m in 20 years are plotted as a function of time
from 1990 to 2009. The size of the bubble in position (Y, c) is also proportional to the counter gm,c(Y) in that year. The consumer cities for each producer
are ordered according to the total number of counters in 20 years, i.e.,PYmax
Ymingm,c Yð Þ.
www.nature.com/scientificreports
SCIENTIFIC REPORTS | 3 : 1640 | DOI: 10.1038/srep01640 6

as they are not cited. We believe that the present algorithm may beconsidered as an appropriate way to rank scientific production takingproperly into account the impact of papers as measured by citations.
DiscussionIn this paper we study the scientific knowledge flows among cities asmeasured by papers and citations contained in APS 31 journals. Inorder to make clear the meaning and difference between producersand consumers in the context of knowledge, we propose an econom-ical analogy referring to citations as a traded currency between urbanareas. We then study the flow of citations from producers to con-sumers with the knowledge production proxy algorithm. Finally, werank the importance of cities as function of time using the scien-tific production ranking algorithm. This method, inspired by the
PageRank33, allows us to evaluate the importance of cities explicitlyconsidering the complex nature of citation patterns. In our analysiswe considered just scientific publications contained in the APSjournals31. We do not have information on citations received orassigned to papers outside this dataset. These limitations certainlyaffect the count of citations of each city, potentially creating biases inour results. However, our findings, while limited to a particular data-set, are aligned with different observations reported by other studiesfocused on other datasets and fields. For example, we identify majorUS cities (e.g. Boston and San Francisco areas), as the most importantsources of Physics. Similar observations have been done by Borneret al.17 at the institution level considering papers published in theProceedings of the National Academy of Sciences, by Mazloumianet al.8 at country and city level with Web of Science dataset, and by
Figure 5 | Top 20 ranked cities as a function of time. The plot summarizes Top 20 ranked cities in 1990, 1995, 2000, 2005 and 2009 (from left to right),
and relations between the rankings in different years. The grey lines are used when the rank of that city drops out of Top 20.
Figure 6 | Geospatial distribution of city ranks. (A) The world map of city ranks in 1990 (left) and 2009 (right). The ranking of each city is represented by
color from blue (high ranks) to white (low ranks). (B) The map of ranks for cities in the United States in 1990 (left) and 2009 (right). (C) The map of ranks
for cities in the selected European countries in 1990 (left) and 2009 (right). In (B) and (C), each city is marked with a bar, and the height of each bar is
inversely proportional to the ranking position. The Top 3 rank positions in each region are labelled for reference. Note that in (C) the height of bars is not
scaled with the height in (B) for visibility. Maps in panel (A) are created by using ArcGISH47, and maps in panel (B) and (C) are created by using R48.
www.nature.com/scientificreports
SCIENTIFIC REPORTS | 3 : 1640 | DOI: 10.1038/srep01640 7

Batty4 at both institution and country level considering the Institutefor Scientific Information (ISI) HighlyCited database. We also findthat some European, Russian and Japanese cities have graduallyimproved their productivities and ranks in recent twenty years.Similarly, such growth in scientific production has been observedby King19 in the ISI database. As discussed in detail in the SI, byaggregating citations of cities to their respective countries, we findthe same correlation between the number of citations, as well as thenumber of papers, and the GDP invested on Research andDevelopment of several countries as reported by Pan et al.7 basedon the ISI database. This analogy between our results, and manyothers in the literature, suggests that the APS dataset, although lim-ited, is representative of the overall scientific production of the largestcountries and cities in the recent 20 years. The methodology pro-posed in this paper could be readily extended to larger datasets forwhich the geolocalization of multiple affiliation is possible. In view ofthe different rate of publications and citations in different scientificfields we believe however that the analysis of scientific knowledgeproduction should only consider homogeneous datasets. This wouldhelp the understanding of knowledge flows in different areas andidentify the hot spot of each discipline worldwide.
MethodsDataset. The dataset of the American Physical Society journals, considering paperspublished between 1893 and 2009 of which 450, 655 papers include a list ofaffiliations31. Each of paper may have multiple affiliations. In total there are 945, 767affiliation strings.
In order to geolocalize the articles, we parse the city names from the affiliationstrings for each article. First, we process each affiliation string and try to matchcountry or US state names from a list of known names and their variations in differentlanguages. We crosscheck the results with Google Map API obtaining validatedlocation information for 97.7% of affiliation strings, corresponding to 445, 223articles. It is worth noticing that we do not use Google Map API (or other map APIslike Yahoo! or Bing) directly for geocoding because, to our best knowledge, there areno accuracy guarantees to these API results. For each affiliation string with anextracted country or state name, we also match the city name against GeoNamedatabase45 corresponding to its country or US state. 92.6% of affiliation strings withextracted city names are subsequently verified with Google Map API. Finally, a totalof 425, 233 publication articles successfully pass the filters we describe here.
The dataset also provides 4, 710, 548 records of citations between articles publishedin APS journals. To build citation networks at the city level, we merge the citationlinks from the same source node to the same target node, and put the total citations onthis link as the weight. For articles with multiple city names, the weight will be equallydistributed to the links of these nodes. There are totally 2, 765, 565 links forcity-to-city citation networks from 1960 to 2009. (For the full details of parsingcountry and city names, as well as building networks, see Supplementary Information(SI)).
Knowledge diffusion proxy algorithm. This analysis tool is inspired by the dollarexperiment, originally developed to characterized the flow of money in economicnetworks46. Formally, it is a biased random walk with sources and sinks where acitation diffuses in the network. The diffusion takes place on top of the network of nettrade flows. Let us define wij as the number of citation that node i gives to j and wji asthe opposite flow. We can define the antisymmetric matrix Tij 5 wij – wji. Thenetwork of the net trade is defined by the matrix F with Fij 5 jTijj 5 jTjij for allconnected pairs (i, j) with Tij , 0 and Fij 5 0 for all connected pairs (i, j) with Tij $ 0.There are two types of nodes. Producers are nodes with a positive trade unbalanceDsi~sin
i {souti ~
Pj Fji{
Pj Fij . Their strength-in is larger than their strength-out.
On the other hand, consumers are nodes with a negative unbalance Ds. On top of thisnetwork a citation is injected in a producer city. The citation follows the outgoingedges with a probability proportional to their intensities, and the probability that the
citation is absorbed in a consumer city j equals to Pabs jð Þ~Dsj
.sin
j . By repeating
many times this process from each starting point (producers) we can build a matrixwith elements eij that measure how many times a citation injected in the producer cityi is absorbed in a city consumer j.
Scientific production ranking algorithm. The scientific production rank is definedfor each node i according to this self-consistent equation:
Pi~qziz 1{qð ÞX
j
Pj
soutj
wjiz 1{qð Þzi
Xj
PjD soutj
� �: ð2Þ
Pi is the score of the node i, 0 # q # 1 is the damping factor (defining the probability ofrandom jumps reaching any other node in the network), wji is the weight of thedirected connection from j to i, sout
j is the strength-out of the node j and finally d(x), isthe Dirac delta function that is 0 for x 5 0 and 1 for x 5 1. Here we use the dampingfactor q 5 0.15. The first term on the r.h.s. of Eq. (2) defines the redistribution ofcredits to all nodes in the network due to the random jumps in the diffusion. Thesecond term defines the diffusion of credit through the network. Each node i will get afraction of credit from each citing node j proportional to the ratio of the weight of linkj R i and the strength-out of node j. Finally the last term defines the redistribution ofcredits to all the nodes in the networks due to the nodes with zero strength-out. In theoriginal PageRank the vector z has all the components equal to 1/N (where N is thetotal number of nodes). Each component has the same value because the jumps arehomogeneous. In this case instead, the vector z considers the normalized scientificcredit given to the node i based on his productivity. Mathematically we have:
zi~
Pp Dp,i1
�npP
j
Pp Dp,j1
�np
, ð3Þ
where p defines the generic paper and np the number of nodes who have written thepaper. It is important to notice that dp,i 5 1 only if the i-th node wrote the paper p,otherwise it equals zero.
1. Narin, F. & Carpenter, M. P. National Publication and Citation Comparisons.Journal of the American Society for Information Science, 26, 80–93 (1975).
2. Frame, J. D., Narin, F. & Carpenter, M. P. The Distribution of World Science.Social Studies of Science, 7, 501–516 (1977).
3. May, R. M. The Scientific Wealth of Nations. Science, 7, 793–796 (1997).4. Batty, M. The Geography of Scientific Citation. Environ Plan A 35, 761–765
(2003).5. Leydesdorff, L. & Zhou, P. Are the contributions of China and Korea upsetting the
world system of science? Scientometrics, 63, 617–630 (2005).6. Horta, H. & Veloso, F. Opening the box: comparing EU and US scientific output
by scientific field. Technological Forecasting & Social Change, 74, 1334–1356(2007).
7. Pan, R. K., Kaski, K. & Fortunato, S. World citation and collaboration networks:uncovering the role of geography in science. Sci. Rep. 2, 902 (2012).
Table 3 | Percentage of top 100 ranked cities in continents in 1990and 2009
Continent 1990 2009
Asia 4.0% 11.0%Europe 24.0% 33.0%N. America 72.0% 56.0%
Figure 7 | Correlation between scientific production ranking andranking based on the number of publications in 2009. The x-axis
represents rankings based on the number of papers each city published in
2009, and the y-axis represents the scientific production ranking for each
city in 2009. The solid line corresponds to the power-law fitting of data
with slope –0.98, and separates the space into two regions. In the region
below the line (coloured blue), cities gain better rankings from scientific
production ranking algorithm even with relatively less publications, such
as Chicago and Piscataway. In the region above (coloured green) cities have
lower rankings from the algorithm even they have more papers published,
such as Beijing, Berlin, Wako and Shanghai.
www.nature.com/scientificreports
SCIENTIFIC REPORTS | 3 : 1640 | DOI: 10.1038/srep01640 8
8. Mazloumian, A., Helbing, D., Lozano, S., Light, R. P. & Borner, K. Global multi-level analysis of the ‘scientific food web’. Sci. Rep. 3, 1167 (2013).
9. Frenken, K., Hardeman, S. & Hoekman, J. Spatial scientometrics: Towards acumulative research program. Journal of Informetrics, 3, 222–232 (2009).
10. Redner, S. How popular is your paper? An empirical study of the citationdistribution. Eur. Phys. J. B 4, 131–134 (1998).
11. Chen, P., Xie, H., Maslov, S. & Redner, S. Finding scientific gems with Google’sPageRank algorithm. Journal of Informetrics, 1, 8–15 (2007).
12. Garfield, E. Citation Analysis as a Tool in Journal Evaluation. Science, 178,471–479 (1972).
13. Bergstrom, C. Eigenfactor: Measuring the value and prestige of scholarly journals.College & Research Libraries News, 68, 314–316 (2007).
14. Hirsch, J. E. An index to quantify an individual’s scientific research output.Proc. Natl. Acad. Sci., 102, 16569–16572 (2005).
15. Egghe, L. Theory and practise of the g-index. Scientometrics, 69, 131–152 (2006).16. Hirsch, J. E. Does the h index have predictive power? Proc. Natl. Acad. Sci. 104,
19193–19198 (2007).17. Borner, K., Penumarthy, S., Meiss, M. & Ke, W. Mapping the Diffusion of
Information Among Major U.S. Research Institutions. Scientometrics, 68,415–426 (2006).
18. Bornmann, L., Leydesdorff, L., Walch-Solimena, C. & Ettl, C. ‘‘Mappingexcellence in the geography of science: An approach based on Scopus data. Journalof Informetrics, 5 no. 4, 537–546 (2011).
19. King, D. K. The scientific impact of nations. Nature, 430 311–316 (2004).20. Adams, J. Collaborations: The rise of research networks. Nature, 490 335–336
(2012).21. Laudel, G. Studying the brain drain: Can bibliometric methods help?
Scientometrics, 57 215–237 (2003).22. Noorden, R. V. Global mobility: Science on the move. Nature, 490, 326–329
(2012).23. Garfield, E. Citation Indexing. Its Theory and Application in Science, Technology,
and Humanities. John Wiley & Sons Inc., 1979.24. Egghe, L. & Rousseau, R. Introduction to Informetrics : Quantitative Methods in
Library, Documentation and Information Science. Elsevier Science Publishers,1990.
25. Kleinberg, J. M. Authoritative sources in a hyperlinked environment. Journal ofthe ACM, 46, no. 5, 604–632 (1999).
26. Walker, D., Xie, H., Yan, K.-K. & Maslov, S. Ranking scientific publications using amodel of network traffic. Journal of Statistical Mechanics: Theory and Experiment2007, P06010 (2007).
27. Castillo, C., Donato, D. & Gionis, A. Estimating Number of Citations UsingAuthor Reputation. in String Processing and Information Retrieval, 4726 ofLecture Notes in Computer Science, Springer Berlin/Heidelberg (2007).
28. Sidiropoulos, A. & Manolopoulos, Y. Generalized comparison of graph-basedranking algorithms for publications and authors. Journal of Systems and Software,79, 1679–1700 (2007).
29. Radicchi, F., Fortunato, S., Markines, B. & Vespignani, A. Diffusion of scientificcredits and the ranking of scientists. Phys. Rev. E 80, 056103 (2009).
30. Scharnhorst, A., Borner, K. & van den Besselaar, P. eds., Models of ScienceDynamics: Encounters Between Complexity Theory and Information Sciences.Springer-Verlag, (2012).
31. APS, Data sets for research. (2010). (accessed June 8 2010).32. http://data.worldbank.org/. (2012). (accessed September 12 2012).33. Brin, S. & Page, L. The anatomy of a large-scale hypertextual web search engine,
Comp. Net. ISDN Sys. 30, 107, (1998).34. Barabasi, A.-L. & Albert, R. Emergence of scaling in random networks. Science
286, 509 (1999).
35. Barrat, A., Barthelemy, M. & Vespignani, A. Dynamical Processes on ComplexNetworks. Cambridge Univesity Press (2008).
36. Newman, M. Networks. An Introduction. Oxford Univesity Press (2010).37. Vespignani, A. Predicting the behavior of techno-social systems. Science 325, 425–
428 (2009).38. Vespignani, A. Modeling dynamical processes in complex socio-technical
systems. Nature Physics, 8, 32–30 (2012).39. Angeles Serrano, M., Boguna, M. & Vespignani, A. Extracting the multiscale
backbone of complex weighted networks. Proc. Natl. Acad. Sci. 106, 6483–6488,April (2009).
40. Boyandin, I., Bertini, E. & Lalanne, D. Using flow maps to explore migrations overtime, in Proceedings of Geospatial Visual Analytics Workshop in conjunction withThe 13th AGILE International Conference on Geographic Information Science(GeoVA) (2010).
41. Adams, J. & Griliches, Z. Measuring science: An exploration. Proc. Natl. Acad. Sci.93, 12664–12670 (1996).
42. Rosenblat, T. S. & Mobius, M. M. Getting Closer or Drifting Apart? QuarterlyJournal of Economics, 119, no. 3, 971–1009 (2004).
43. Havemann, F., Heinz, M. & Kretschmer, H. Collaboration and distances betweenGerman immunological institutes a trend analysis. Journal of BiomedicalDiscovery and Collaboration, 1, 6 (2006).
44. Agrawal, A. & Goldfar, A. Restructuring Research: Communication Costs and theDemocratization of University Innovation. American Economic Review, 98, no. 4,1578–1590 (2008).
45. GeoNames, GeoNames. http://www.geonames.org/, Retr. (2012). (accessedFebruary 7 2012).
46. Angeles Serrano, M., Boguna, M. & Vespignani, A. Patterns of dominant flows inthe world trade web J. Econ. Interac. Coord. 2, 111–124 (2007).
47. ESRI, ArcGIS Desktop: Release 9.3. Environmental Systems Research Institute,Redlands, CA (2010).
48. Core Team, R. R: A Language and Environment for Statistical Computing.R Foundation for Statistical Computing, Vienna, Austria,ISBN 3-900051-07-0. (2012).
AcknowledgmentsThis work has been partially funded by NSF CCF-1101743 and NSF CMMI-1125095awards. We acknowledge the American Physical Society for providing the data aboutPhysical Review’s journals.
Author contributionsA.V., N.P. and Q.Z. designed research, Q.Z., B.G. and F.C. parsed data, Q.Z., N.P. and A.V.analysed data. All authors wrote, reviewed and approved the manuscript.
Additional informationSupplementary information accompanies this paper at http://www.nature.com/scientificreports
Competing financial interests: The authors declare no competing financial interests.
License: This work is licensed under a Creative CommonsAttribution-NonCommercial-ShareAlike 3.0 Unported License. To view a copy of thislicense, visit http://creativecommons.org/licenses/by-nc-sa/3.0/
How to cite this article: Zhang, Q., Perra, N., Gonçalves, B., Ciulla, F. & Vespignani, A.Characterizing scientific production and consumption in Physics. Sci. Rep. 3, 1640;DOI:10.1038/srep01640 (2013).
www.nature.com/scientificreports
SCIENTIFIC REPORTS | 3 : 1640 | DOI: 10.1038/srep01640 9