Embed Size (px)
Citation preview
Faculty of Engineering, Architecture and Information Technology
THE UNIVERSITY OF QUEENSLAND
Ingredients impact on biscuit dimension variation
Student Name: Jenny Gustavsson
Course Code: ENGG7290
Supervisor: Sophia Rodrigues
Submission date: 19 December 2018
ii
Executive summary
This is the final report for the project “Ingredients impact on biscuit dough variation” conducted at
Arnott’s Biscuits in Virginia, Australia. This industry placement position is arranged by the University
of Queensland through the course ENGG7290 as a part of a Bachelor of Engineering and Master of
Engineering degree. The quality and quantity of ingredients have an impact on the quality and structure
of the baked biscuit. Furthermore, ingredients quality and quantity variation are suspected to be the
reason to biscuit dimension variation, which causes trouble when the biscuits go through packaging.
The variation is due to less or more spread of the biscuit, more spread results to a longer biscuit width
and a shorter biscuit height. When the biscuits enter the packaging step, a number of biscuits get stacked
together and are expected to reach a specific packet length, a lower biscuit height will result in a too
short packet length.
One of the production lines at Arnott’s produce two biscuits which have significant problems with
biscuit dimension variation and are therefore the reason for a high waste percentage on the production
line. An increase of the performance on the line is of great interest, due to the economic and the
environmental benefit of a lower waste percentage. The purpose of this project has been to evaluate a
couple of ingredients that are suspected to cause the dimension variation of the two biscuits.
Furthermore, to investigate the possibility to reduce its impact on the variation and thereby reduce the
waste on the production line. The ingredients which have been investigated are icing sugar, ammonium
bicarbonate and flour.
This report is the final report and it outlines an extended version of the Project Progress report. This
report present project findings and conclusions that have been found, together with recommendations
and results from implemented project recommendations.
A couple of major findings have been made in this project:
• The concentration of the liquid Vol is not controlled after it is dissolved and transferred to a
storage tank. The concentration decreases due to storage conditions. The concentration
decreases and varies even more from the storage tank to the manually tapped dough buckets.
• The variation of the Vol concentration does not contribute to the biscuit dimension variation of
biscuit A and biscuit B, based on the calculated correlation. The variation may have a greater
impact on other biscuits in the factory with liquid Vol as the only rising agent.
• Due to a shared ingredient handling system in the factory, different quantities of graded sugar
follow the icing sugar to the mixer dependent on the frequency of graded sugar calls. The graded
sugar increases the mean sugar particle size.
• The variation of the mean sugar particle size due to the sugar system has an impact on the dough
spread of biscuit A.
• The temperature of the flour has an impact on the dough temperature, based on the measured
moderate correlation. On the other hand, the dough temperature does not contribute to biscuit
dimension variation of biscuit A and biscuit B, based on the calculated correlation.
• Calculations show on a low correlation between dough weight variation and the biscuit
dimension variation, it seems to have a greater impact when the dough weight deviates
significantly from the expected weight. There is not an obvious trend between the dough weight
and which flour delivery system that is used.
iii
Recommendations have been made based on the investigation of the ingredient systems. The Vol
concentration variation can be reduced by a better-controlled make-up procedure and redesign of the
make-up and storage tanks. The biscuit dimension variation should be investigated for other biscuits
that only use liquid vol as the rising agent, to evaluate if the concentration variation may have a greater
impact on those biscuits. Conclusions could thereafter be taken whether the acceptable concentration
range is correct or not. Furthermore, recommendations are given to evaluate and maybe change the
titration procedure for the Vol, a stronger acid will reduce the error caused by sample dilution.
Furthermore, a recommended redesign of the sugar control sequence was given in the project progress
report to stop graded sugar from following the icing sugar to the mixer. The recommendation for the
sugar system has been implemented and the outcome from the process change has been greatly
successful with a less percentage of biscuits with dimensions outside the specification range of +/- 2
mm.
The flour used in the biscuits in the factory is of high quality, the quality parameters are rarely outside
specifications. Due to the dough weight variation that occurs, the recommendation is to investigate the
possibility and the expenses of installing a weight transmitter on the flour hopper above the mixer. The
transmitter would make it possible to detect weight difference caused by problems with the flour system
valves on the lines before it turns in to a problem.
Due to the long list of parameters that have an impact on the biscuit spread, some parameters have a
greater impact than others and a high correlation between a parameter and the biscuit spread will most
likely not exist due to the significant variation of all the other parameters. Further project opportunities
are to continue the investigation of the remaining parameters on the list given in section 2.2.2 Baking.

iv
Acknowledgement
The success and the outcome of this project required guidance and support from many people and I am
very privileged to have got this all along the placement, which made completion of my project possible.
The success of the project, as well as the professional development I have gained through this placement,
is only due to such supervision and assistance. I am extremely thankful to all the people at Arnott’s
biscuits in Virginia and everyone involved in the engineering placement semester course, ENGG7290.
I would like to give a special thanks to Mr Christopher Price, my workplace supervisor and Business
Improvement Manager at Arnott’s biscuit in Virginia, for making sure my placement experience has
been as good as possible through his support, guidance and feedback on project work and reports.
I would also like to thank Ms Hayley Erasmus, my project supervisor and Manufacturing Manager at
Arnott’s biscuit in Virginia, for the support, guidance and wisdom she has provided to make this project
successfully conducted.
I would also like to thank the Business Improvement team, for their support and feedback. A special
thanks to the team member Ms Wern Tan for her guidance, patience, wisdom and encouragements
through my placement.
I would also like to thank the lab coordinators, Mr Ben Collie and Ms Yue Wu, for providing me with
support, feedback and continuous encouragement through my placement.
I would also like to thank the course coordinator Ms Beverly Coulter of the Faculty of Engineering,
Architecture and Information Technology at the University of Queensland, for arranging this placement
that has given me priceless professional practise experience.
I would finally like to thank my UQ supervisor, Dr Sophia Rodrigues, for providing me with constant
support and valuable feedback and recommendations for improvements in this project. I am so grateful
to all the people from my two Universities, The University of Queensland and Lund University in
Sweden, that made this double master’s degree possible.
v
Table of Contents
Executive summary ................................................................................................................................. ii Acknowledgement .................................................................................................................................. iv List of Symbols ...................................................................................................................................... ix 1 Introduction .......................................................................................................................................... 1
1.1 Context ........................................................................................................................................... 1
1.2 Purpose .......................................................................................................................................... 1
1.3 Scope.............................................................................................................................................. 1
2 Technical Background .......................................................................................................................... 2 2.1 Biscuit A and Biscuit B ................................................................................................................. 2
2.2 Overview of Biscuit making ..................................................................................................... 3
2.2.1 Mixing ..................................................................................................................................... 3
2.2.2 Baking ..................................................................................................................................... 3
2.3 Structure of short doughs biscuits ........................................................................................... 4
2.4 Ingredients of importance ........................................................................................................ 5
2.4.1 Shortening ............................................................................................................................... 5
2.4.2 Sugar ....................................................................................................................................... 6
2.4.3 Ammonium Bicarbonate (NH4)HCO3 ..................................................................................... 7
2.4.4 Flour ........................................................................................................................................ 9
2.4.5 Statistical Analysis ................................................................................................................ 11
3 Project Plan ........................................................................................................................................ 12 3.1 Methodology ................................................................................................................................ 12
3.1.1 Biscuit Dimension and Packet Length Data Retrieval .......................................................... 12
3.1.2 Concentration of liquid Vol .................................................................................................. 13
3.1.3 Icing sugar ............................................................................................................................. 14
3.1.4 Flour ...................................................................................................................................... 15
3.2 Resources ..................................................................................................................................... 15
3.3 Work timeline .............................................................................................................................. 16
3.3.1 Deviations from the interim project report ............................................................................ 16
3.4 Project Risks and Opportunities .................................................................................................. 18
3.4.1 Risk Assessment ................................................................................................................... 18
3.4.2 Project Opportunities ............................................................................................................ 19
4 Results and Discussion ....................................................................................................................... 20 4.1 Vol Concentration - Results and Discussion ............................................................................... 20
4.1.1 Variation in Vol concentration in storage tanks .................................................................... 20
4.1.2 Vol concentration difference between make-up tank and storage tank ................................. 20
4.1.3 Variation of Vol concentration in buckets ............................................................................ 21
4.1.4 Correlation between a storage tank and biscuit dimensions.................................................. 21
4.1.5 Correlation between the bucket concentration and dimensions ............................................ 22
vi
4.2 Icing sugar - Results and Discussion ........................................................................................... 23
4.2.1 Icing sugar particle size ......................................................................................................... 23
4.2.2 Frequency of Sugar calls ....................................................................................................... 26
4.3 Flour – Results and Discussion .................................................................................................... 28
4.3.1 Protein level .......................................................................................................................... 28
4.3.2 Flour temperature variation ................................................................................................... 29
4.3.3 Dough weight variation ......................................................................................................... 29
5 Conclusions and Recommendations ................................................................................................... 32 5.1 Conclusions .................................................................................................................................. 32
5.1.1 Liquid Vol ............................................................................................................................. 32
5.1.2 Icing Sugar ............................................................................................................................ 32
5.1.3 Flour ...................................................................................................................................... 33
5.2 Recommendations ........................................................................................................................ 33
5.2.1 Liquid Vol ............................................................................................................................. 34
5.2.2 Icing Sugar ........................................................................................................................ 35
5.2.3 Flour .................................................................................................................................. 35
6 Project outcomes ............................................................................................................................ 35 7 Professional Development .................................................................................................................. 38
7.1 Key learnings and challenges ...................................................................................................... 38
7.2 Development of EA Competencies .............................................................................................. 38
8 References .......................................................................................................................................... 40 Appendix A .............................................................................................................................................. i Appendix B ............................................................................................................................................. ii Appendix C ............................................................................................................................................ iv Appendix D ............................................................................................................................................. v
vii
List of Tables Table 1: Scope of the project ................................................................................................................... 2
Table 2: Reasons for variations in dough spread during baking (Davidson, 2016). ............................... 4
Table 3: Variables that may cause quality and quantity variation of ingredients. ................................... 5
Table 4: Risk level identification matrix, (The University of Iowa, n.d.) ............................................. 18
Table 5: Possible risks and hazards for the project, how to avoid the risk and the risk level based on
table 6. .................................................................................................................................... 18
Table 6: Hazard information for chemicals (Ammonium Bicarbonate, u.d.; Sulfuric acid solution,
2018). ..................................................................................................................................... 19
Table 7: Average deviation of biscuit dimensions and packet length for the time-period .................... 22
Table 8: Average concentration of storage tank and buckets. ............................................................... 22
Table 9: Linear correlation coefficient between biscuit dimension deviation and the Vol concentration
for both biscuit A and B. ........................................................................................................ 22
Table 10: Correlation between packet length, biscuit dimensions and the Vol concentration in the
buckets. .................................................................................................................................. 23
Table 11: Average particle size distribution in bags and the IHS system. ............................................ 24
Table 12: Average particle size distribution for samples collected the 19th of September, when the
previous call was graded, when 2nd previous was graded and when the two previous calls
been icing sugar. .................................................................................................................... 25
Table 13: Average particle size distribution for samples collected the 27th of September, when the
previous call was graded, when 2nd previous was graded and when the two previous calls
been icing sugar. .................................................................................................................... 25
Table 14: Average particle size distribution for samples collected from the accumulation hopper the
12th of September. The average value for samples: when the previous call was graded, when
2nd previous was graded and when the two previous calls been icing sugar. ......................... 25
Table 15: Summary of measured data. The average dimension deviation and frequency of sugar calls
for each sample date............................................................................................................... 27
Table 16: Linear correlation between biscuit dimensions, packet length against the ratio of icing to
graded (G:I) sugar calls and the number of doughs with a previous call of graded sugar. .... 27
Table 17: Calculated correlation coefficient between dough weight and biscuit dimensions. .............. 31
Table 18: Average biscuit dimension deviations before the accumulation hopper was getting locked
out. ......................................................................................................................................... 36
Table 19: Average biscuit dimension deviations after the accumulation hopper was locked out. ........ 36
Table 20: Percentage of all biscuits over a time-period of 25 doughs that has a length that deviates
more than 2 mm from specification. The percentage is given per production-row A-H for
both length and width, the total shows the overall biscuit dimension percentage outside
specification. .......................................................................................................................... 37
viii
List of Figures Figure 1: Ratio between ingredients of importance in biscuit A. ............................................................ 2
Figure 2: Ratio between ingredients of importance in biscuit B. ............................................................ 2
Figure 3: Dimensions deviation of acceptance for biscuit A (mm). ........................................................ 3
Figure 4: Dimension deviation of acceptance for biscuit B (mm). ......................................................... 3
Figure 5: Biscuit height. .......................................................................................................................... 3
Figure 6: Packet length deviation acceptance (mm). ............................................................................... 3
Figure 7: Flowchart of the four main process steps for biscuit making. ................................................. 3
Figure 8: a) illustrates the gluten network in a structured product, b) the two phases in short dough, the
fat phase and the sugar solution with gluten and starch, c) the sugar phase are responsible for
the structure due to embedding and bridging of the other components. (Chevallier, Colonna,
Bule´on, & Della Valle, 2000) .................................................................................................. 5
Figure 9: A simplified process diagram for the bulk sugar system. ........................................................ 7
Figure 10: Liquid Vol is volatile and can easily decompose to CO2, H2O and NH3 vapour, as well as
recrystallise to solids. (Sutter, 2017) ......................................................................................... 8
Figure 11: A simplified process diagram for the Vol system. ................................................................. 8
Figure 12: Photo to the left is taken before cleaning is done on make-up tank number 1. Photo to the
top right is taken on one of the storage tanks before cleaning. Photo on the bottom right is
taken after cleaning of make-up tank 2. Photo credits: Corey Smith. ....................................... 9
Figure 13: A simplified process diagram for the flour system. ............................................................. 11
Figure 14: The correlation coefficient shows on the strength and direction of correlation. (Correlation
Coefficient 'r' and The Linear Model, 2018) ........................................................................... 12
Figure 15: The measured concentration is from the storage tank which is selected for delivery, current
day and time. Under the red line, the concentration is too low, under 16.4% is lower than the
accepted range. The accepted range is between the green lines.............................................. 20
Figure 16: Measured concentration of storage tank (ST) against the corresponding make-up tank (MT).
................................................................................................................................................ 20
Figure 17: The measured concentration in buckets are plotted with current storage tank (ST). The
green line shows the low limit of accepted concentration range. Dough= buckets. ............... 21
Figure 18: Concentration in buckets and dimension deviation for 11 doughs. ..................................... 23
Figure 19: Icing sugar particle size distribution in samples taken the 19th of September. ................... 24
Figure 20: Icing sugar particle size distribution in samples taken the 19th of September. ................... 24
Figure 21: Particle size distribution in icing sugar bags. ....................................................................... 24
Figure 22: Icing sugar particle size distribution in samples taken the 27th of September. ................... 24
Figure 23: Icing sugar particle size distribution in samples taken from the accumulator the 12th of
September. .............................................................................................................................. 26
Figure 24: Icing sugar particle size distribution in samples taken from the accumulator the 13th of
September. .............................................................................................................................. 26
Figure 25: Scatter plot of biscuit width against the number of sugar calls that had graded sugar as
previous call. ........................................................................................................................... 27
Figure 26: Average packet length deviation against number of sugar calls with graded sugar as
previous call. ........................................................................................................................... 28
ix
Figure 28: Time series of the biscuit length deviation the 30th-31st of October. A batch with a lower
protein level seems to generate a biscuit length deviation around 7pm. ................................. 28
Figure 29: Dough temperature for biscuit A between the 28th of October to the 2nd of November
together with corresponding flour sifter temperature.............................................................. 29
Figure 30: Scatter plot of dough temperature versus the dimension variation of the biscuit width. ..... 29
Figure 31: Dough weight distribution Biscuit B. .................................................................................. 30
Figure 32: Dough weight distribution Biscuit A. .................................................................................. 30
Figure 34: Dough weight for Biscuit B in November 2018. ................................................................. 30
Figure 33: Dough weight for Biscuit A in November 2018. ................................................................. 30
Figure 35: Dough weight variation for biscuit A together with information on which flour system that
was used for delivery, red for flour system A and blue for flour system B. ........................... 31
Figure 36: A scatter plot of the packet length deviation against the dough weight. .............................. 32
Figure 38: The figures to the right shows the flow profile with baffles and the figures to the right
shows the flow profile without baffles. (Nilsson, 2015) ......................................................... 35
Figure 37: Optimal ratio between dimensions of the tank, stirrer, 4 baffles and the liquid level.
(Nilsson, 2015) ........................................................................................................................ 35
Figure 39: The number of EA competencies achieved for each reflective journal. .............................. 39
List of Symbols
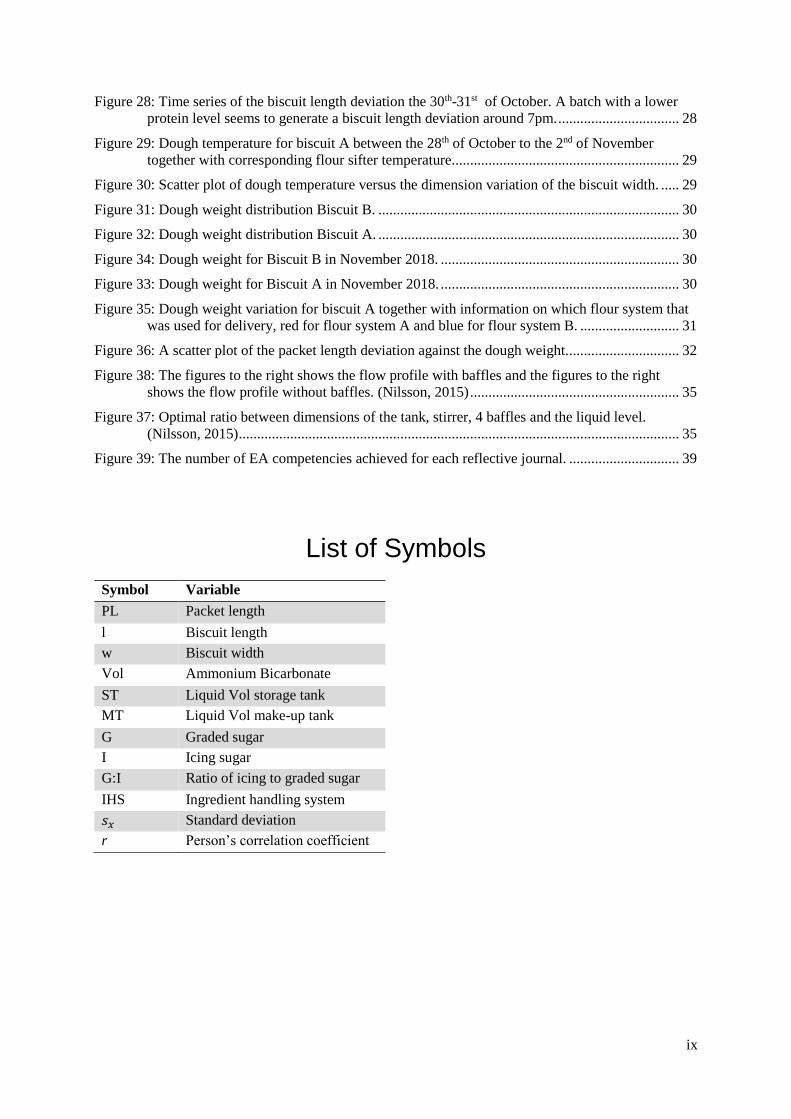
Symbol Variable
PL Packet length
l Biscuit length
w Biscuit width
Vol Ammonium Bicarbonate
ST Liquid Vol storage tank
MT Liquid Vol make-up tank
G Graded sugar
I Icing sugar
G:I Ratio of icing to graded sugar
IHS Ingredient handling system
𝑠𝑥 Standard deviation
r Person’s correlation coefficient
1
1 Introduction
1.1 Context
Campbell Arnott's Biscuits is one of the largest food companies in the Asia Pacific and it is a subsidiary
of the Campbell Soup Company in the United States. The company started in 1865 as a small bakery in
Newcastle, producing bread, biscuits and pies to the local community. Arnott’s biscuits have become a
national icon, and its products are delivered to more than 40 countries around the world (About Arnott's,
2018).
Biscuit making has been an art for the employees at the factory since they started back in the 19th century,
the workers knew their biscuits, they could see what changes the dough required if the dough or biscuits
did not appear as desired. Therefore, the technology and the science behind the processes have been a
few steps behind. Many changes have been done at the factory the last decade and the stakeholders have
understood the importance of science behind biscuit making. The company works hard to interpret
science in their processes, and there is still much room for improvements in the factory.
This project will focus on ingredients impact on Biscuit dimension variation, mainly on two of Arnott’s
iconic biscuits. These biscuits have doughs which are sensitive to the variation of the ingredients, which
results in a variation of the biscuits’ dimensions. The tolerance for biscuit dimension variation is limited
due to the packaging system used on the production line where these biscuits are packed. Biscuits that
get dimensions outside the accepted range are dumped, which results in a high waste-ratio on the
production line. It is therefore of both economic and environmental interest to reduce the waste on this
line. The two biscuits will be called biscuit A and biscuit B in this report. Some impacts that result in
biscuit dimension variation for the two biscuits are known and some are suspected. The ingredients that
are known to contribute to variation are shortening, icing sugar, flour and Vol. How much they impact
on the variation on the dough is unknown and are therefore to be investigated in this project.
1.2 Purpose
The main objective of this project is to determine the impact and to recommend what process changes
and quality measurements that can be implemented to reduce the variation caused by ingredients. This
will result in less waste and increased profit for the production line.
The first step of the project is to understand the dough make-up for biscuit A and biscuit B, and the
ingredients make-up and delivery process, and how quality analysis and process variables can be
measured to determine ingredient variation. Second step is to decide what methods are appropriate to
collect the necessary data which can be analysed to determine the impact of ingredient quality and
quantity variation on the dough and biscuit variation. Third step is to analyse the data, determine what
effect of ingredients’ variation is and make recommendations.
1.3 Scope
The scope of this project is summarised in Table 1 below. Even though studies of other biscuits are out
of scope, the correlations found between the ingredients and the doughs for biscuit A and biscuit B may
also be useful for other crackers and biscuits on other lines in the factory. Other biscuits will not be
investigated in this project.
2
Table 1: Scope of the project
In Scope Out of Scope
• Understand dough make-up for biscuit B and biscuit A
• Understand P&ID for each ingredient and make a simplified
version of the system from delivery to the mixer (Icing sugar,
flour, Vol)
• Understand each ingredient and its system
• Identify important variables
• Decide which methods to use for data collection
• Analysis of collected data
• Studies of other biscuits
• Studies of ingredients not
given in scope of this
project
2 Technical Background In this section, a literature review of interest will be presented. There will be necessary information
about biscuit A and biscuit B, the theory behind the baking process, the ingredients of interest and the
methods for data collection. The literature review and the methodology sections will be further extended
before the submission of the final report.
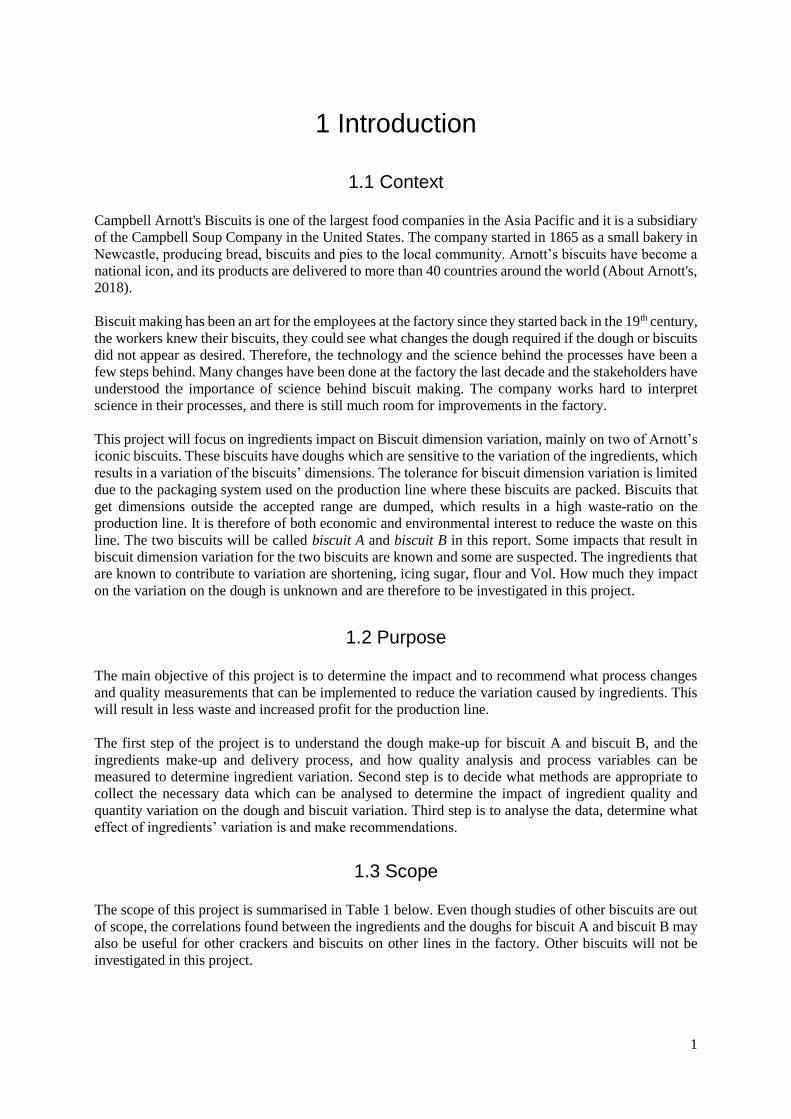
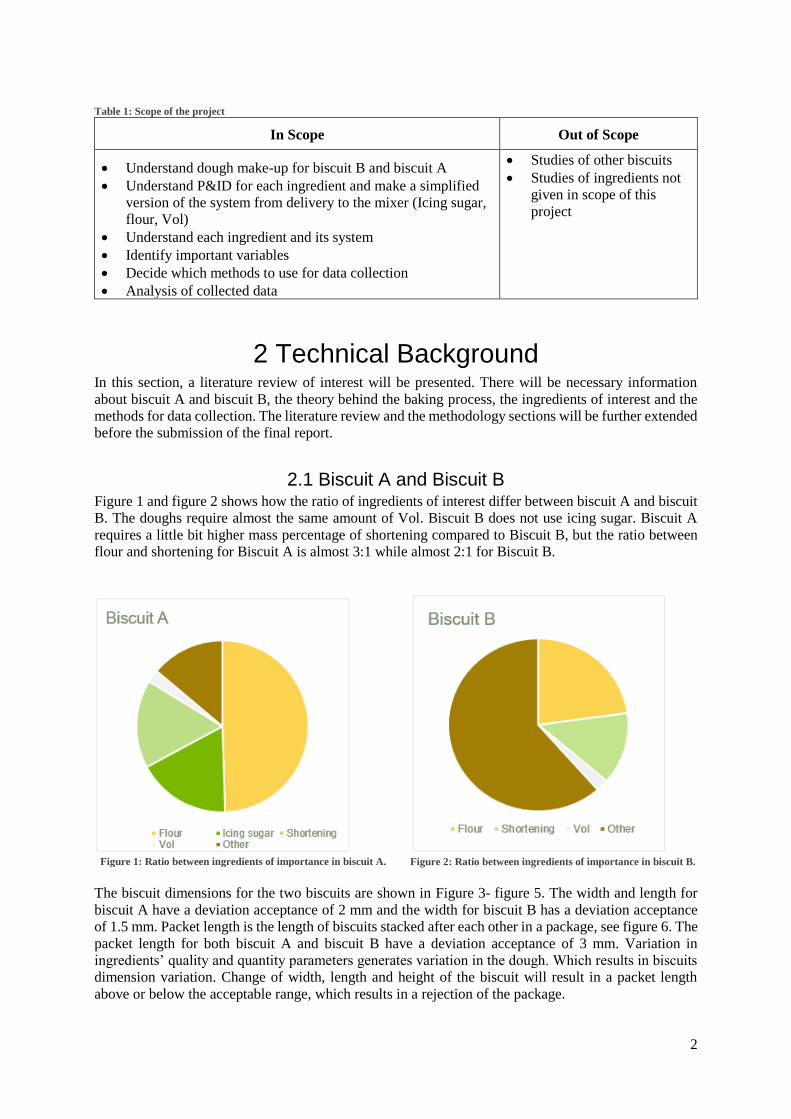
2.1 Biscuit A and Biscuit B Figure 1 and figure 2 shows how the ratio of ingredients of interest differ between biscuit A and biscuit
B. The doughs require almost the same amount of Vol. Biscuit B does not use icing sugar. Biscuit A
requires a little bit higher mass percentage of shortening compared to Biscuit B, but the ratio between
flour and shortening for Biscuit A is almost 3:1 while almost 2:1 for Biscuit B.
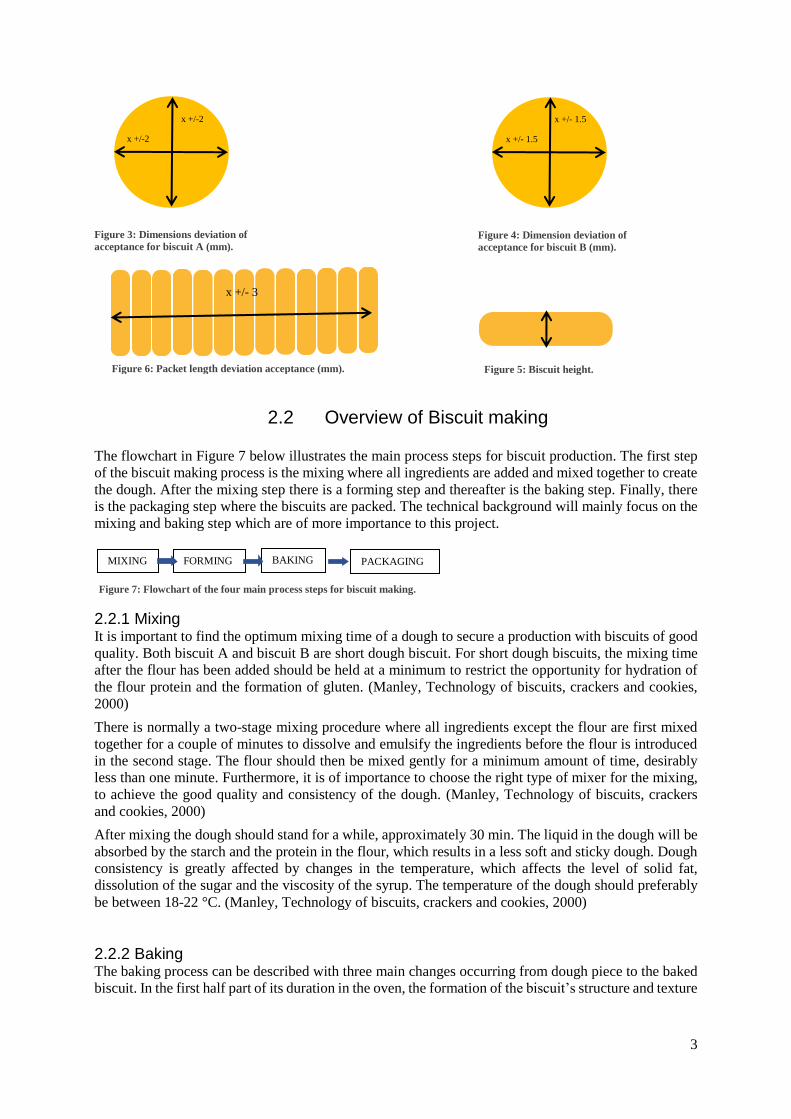
The biscuit dimensions for the two biscuits are shown in Figure 3- figure 5. The width and length for
biscuit A have a deviation acceptance of 2 mm and the width for biscuit B has a deviation acceptance
of 1.5 mm. Packet length is the length of biscuits stacked after each other in a package, see figure 6. The
packet length for both biscuit A and biscuit B have a deviation acceptance of 3 mm. Variation in
ingredients’ quality and quantity parameters generates variation in the dough. Which results in biscuits
dimension variation. Change of width, length and height of the biscuit will result in a packet length
above or below the acceptable range, which results in a rejection of the package.
Figure 2: Ratio between ingredients of importance in biscuit B.
Figure 1: Ratio between ingredients of importance in biscuit A.
3
Figure 6: Packet length deviation acceptance (mm).
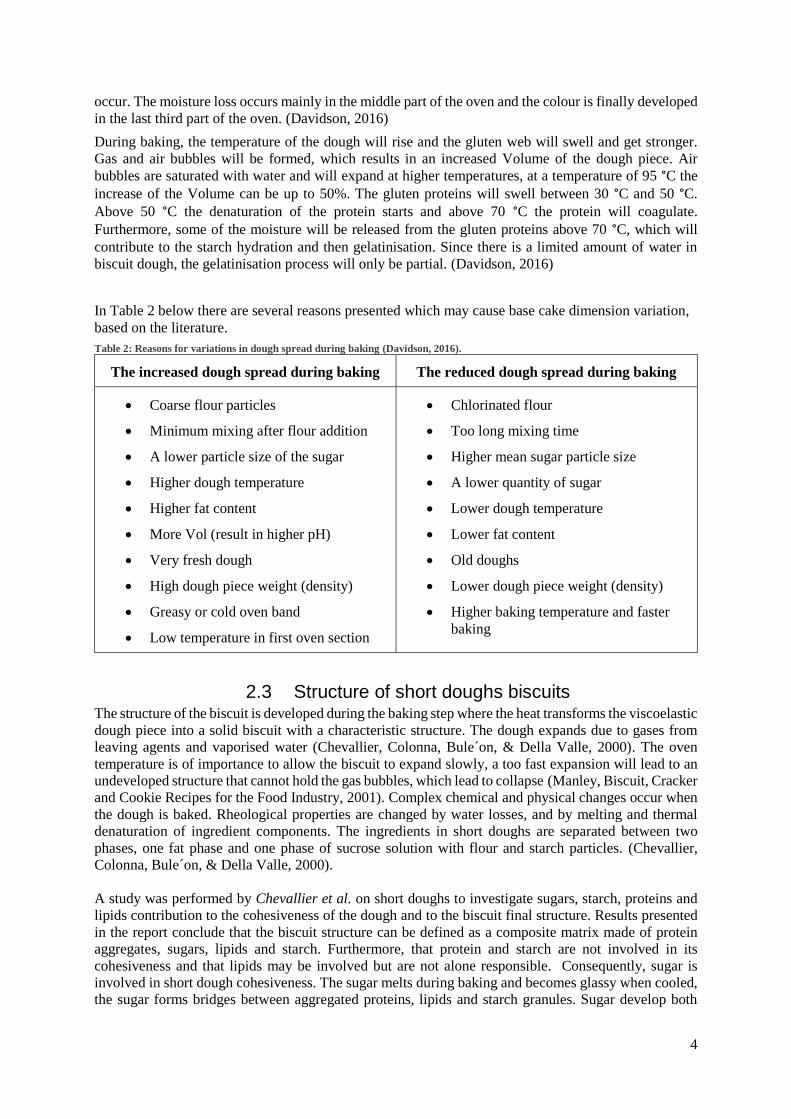
2.2 Overview of Biscuit making
The flowchart in Figure 7 below illustrates the main process steps for biscuit production. The first step
of the biscuit making process is the mixing where all ingredients are added and mixed together to create
the dough. After the mixing step there is a forming step and thereafter is the baking step. Finally, there
is the packaging step where the biscuits are packed. The technical background will mainly focus on the
mixing and baking step which are of more importance to this project.
2.2.1 Mixing It is important to find the optimum mixing time of a dough to secure a production with biscuits of good
quality. Both biscuit A and biscuit B are short dough biscuit. For short dough biscuits, the mixing time
after the flour has been added should be held at a minimum to restrict the opportunity for hydration of
the flour protein and the formation of gluten. (Manley, Technology of biscuits, crackers and cookies,
2000)
There is normally a two-stage mixing procedure where all ingredients except the flour are first mixed
together for a couple of minutes to dissolve and emulsify the ingredients before the flour is introduced
in the second stage. The flour should then be mixed gently for a minimum amount of time, desirably
less than one minute. Furthermore, it is of importance to choose the right type of mixer for the mixing,
to achieve the good quality and consistency of the dough. (Manley, Technology of biscuits, crackers
and cookies, 2000)
After mixing the dough should stand for a while, approximately 30 min. The liquid in the dough will be
absorbed by the starch and the protein in the flour, which results in a less soft and sticky dough. Dough
consistency is greatly affected by changes in the temperature, which affects the level of solid fat,
dissolution of the sugar and the viscosity of the syrup. The temperature of the dough should preferably
be between 18-22 °C. (Manley, Technology of biscuits, crackers and cookies, 2000)
2.2.2 Baking The baking process can be described with three main changes occurring from dough piece to the baked
biscuit. In the first half part of its duration in the oven, the formation of the biscuit’s structure and texture
x +/-2
x +/-2
x +/- 1.5
x +/- 1.5
x +/- 3
Figure 3: Dimensions deviation of
acceptance for biscuit A (mm). Figure 4: Dimension deviation of
acceptance for biscuit B (mm).
Figure 5: Biscuit height.
MIXING BAKING FORMING PACKAGING
Figure 7: Flowchart of the four main process steps for biscuit making.
4
occur. The moisture loss occurs mainly in the middle part of the oven and the colour is finally developed
in the last third part of the oven. (Davidson, 2016)
During baking, the temperature of the dough will rise and the gluten web will swell and get stronger.
Gas and air bubbles will be formed, which results in an increased Volume of the dough piece. Air
bubbles are saturated with water and will expand at higher temperatures, at a temperature of 95 °C the
increase of the Volume can be up to 50%. The gluten proteins will swell between 30 °C and 50 °C.
Above 50 °C the denaturation of the protein starts and above 70 °C the protein will coagulate.
Furthermore, some of the moisture will be released from the gluten proteins above 70 °C, which will
contribute to the starch hydration and then gelatinisation. Since there is a limited amount of water in
biscuit dough, the gelatinisation process will only be partial. (Davidson, 2016)
In Table 2 below there are several reasons presented which may cause base cake dimension variation,
based on the literature.
Table 2: Reasons for variations in dough spread during baking (Davidson, 2016).
The increased dough spread during baking The reduced dough spread during baking
• Coarse flour particles
• Minimum mixing after flour addition
• A lower particle size of the sugar
• Higher dough temperature
• Higher fat content
• More Vol (result in higher pH)
• Very fresh dough
• High dough piece weight (density)
• Greasy or cold oven band
• Low temperature in first oven section
• Chlorinated flour
• Too long mixing time
• Higher mean sugar particle size
• A lower quantity of sugar
• Lower dough temperature
• Lower fat content
• Old doughs
• Lower dough piece weight (density)
• Higher baking temperature and faster
baking
2.3 Structure of short doughs biscuits The structure of the biscuit is developed during the baking step where the heat transforms the viscoelastic
dough piece into a solid biscuit with a characteristic structure. The dough expands due to gases from
leaving agents and vaporised water (Chevallier, Colonna, Bule´on, & Della Valle, 2000). The oven
temperature is of importance to allow the biscuit to expand slowly, a too fast expansion will lead to an
undeveloped structure that cannot hold the gas bubbles, which lead to collapse (Manley, Biscuit, Cracker
and Cookie Recipes for the Food Industry, 2001). Complex chemical and physical changes occur when
the dough is baked. Rheological properties are changed by water losses, and by melting and thermal
denaturation of ingredient components. The ingredients in short doughs are separated between two
phases, one fat phase and one phase of sucrose solution with flour and starch particles. (Chevallier,
Colonna, Bule´on, & Della Valle, 2000).
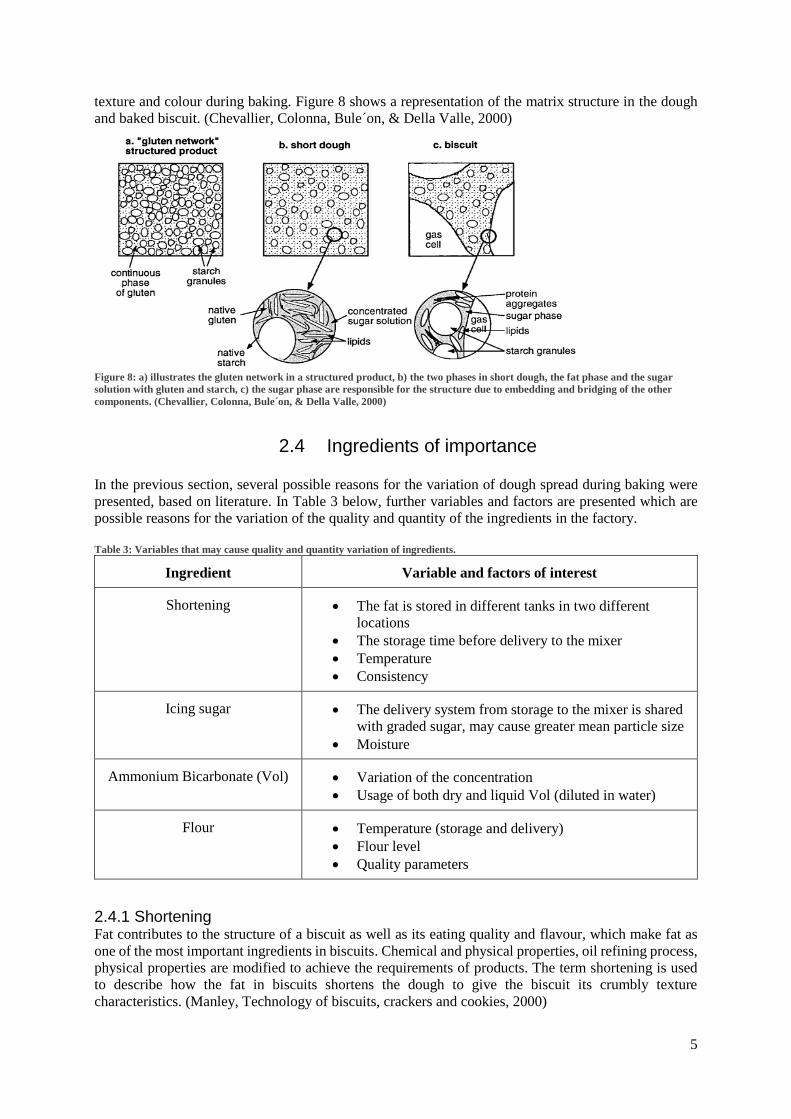
A study was performed by Chevallier et al. on short doughs to investigate sugars, starch, proteins and
lipids contribution to the cohesiveness of the dough and to the biscuit final structure. Results presented
in the report conclude that the biscuit structure can be defined as a composite matrix made of protein
aggregates, sugars, lipids and starch. Furthermore, that protein and starch are not involved in its
cohesiveness and that lipids may be involved but are not alone responsible. Consequently, sugar is
involved in short dough cohesiveness. The sugar melts during baking and becomes glassy when cooled,
the sugar forms bridges between aggregated proteins, lipids and starch granules. Sugar develop both
5
texture and colour during baking. Figure 8 shows a representation of the matrix structure in the dough
and baked biscuit. (Chevallier, Colonna, Bule´on, & Della Valle, 2000)
Figure 8: a) illustrates the gluten network in a structured product, b) the two phases in short dough, the fat phase and the sugar
solution with gluten and starch, c) the sugar phase are responsible for the structure due to embedding and bridging of the other
components. (Chevallier, Colonna, Bule´on, & Della Valle, 2000)
2.4 Ingredients of importance
In the previous section, several possible reasons for the variation of dough spread during baking were
presented, based on literature. In Table 3 below, further variables and factors are presented which are
possible reasons for the variation of the quality and quantity of the ingredients in the factory.
Table 3: Variables that may cause quality and quantity variation of ingredients.
Ingredient Variable and factors of interest
Shortening • The fat is stored in different tanks in two different
locations
• The storage time before delivery to the mixer
• Temperature
• Consistency
Icing sugar • The delivery system from storage to the mixer is shared
with graded sugar, may cause greater mean particle size
• Moisture
Ammonium Bicarbonate (Vol) • Variation of the concentration
• Usage of both dry and liquid Vol (diluted in water)
Flour • Temperature (storage and delivery)
• Flour level
• Quality parameters
2.4.1 Shortening Fat contributes to the structure of a biscuit as well as its eating quality and flavour, which make fat as
one of the most important ingredients in biscuits. Chemical and physical properties, oil refining process,
physical properties are modified to achieve the requirements of products. The term shortening is used
to describe how the fat in biscuits shortens the dough to give the biscuit its crumbly texture
characteristics. (Manley, Technology of biscuits, crackers and cookies, 2000)
6
The fat is added to the dough during the mixing phase. Fat forms a coat around the flour which prevent
the water to get in contact with the flour when it is added to the mixing phase. Flour in contact with
water and with the addition of energy will allow the protein gluten to be more extensible through the
mixing phase. As a result, more water in contact with flour will contribute to a harder and more brittle
dough. Moreover, the fat forms a coat around air bubbles which prevent the bubbles from rupturing and
coalescing into larger bubbles, this function is not as important but may be a factor in maintaining a
good structure in the dough. (Manley, Technology of biscuits, crackers and cookies, 2000)
Fats are composed of three fatty acids attached to a glycerol molecule, forms a triglyceride. What
characterise different fats are the number of carbon atoms in the fatty acid and if the fat is saturated or
unsaturated. Saturated fats have only single bonds between carbon atoms while unsaturated fats also
have double bonds between its carbon atoms. The double bonds can have different configurations, they
can be either in ‘cis' or ‘trans' formation. (Manley, Technology of biscuits, crackers and cookies, 2000)
The melting point decrease with the increased degree of saturation in the fat. Fat does not consist of one
single molecule, there are several different triglycerides present with different fatty acids which result
in a melting point that is not exact, as a consequence the fat melts over a temperature range. (Manley,
Technology of biscuits, crackers and cookies, 2000)
Fats can exist in several different forms and are therefore known as polymorphic. When the fat is cooled
it will first form α crystals which is an unstable form, depending on process and storage conditions the
fat will thereafter quickly recrystallize to β’ or β form. Chemical breakdown of the fat can occur if it is
exposed to oxygen or air, which is difficult to avoid. The breakdown reaction is catalyzed by factors
like temperature, light and certain metals. The fat is therefore ideally not to be stored at a temperature
of 10-15 °C above its melting temperature, in a darker location and stored away from metals like copper
and brass. If the fat is stored at a higher temperature β' crystals will transform to β crystals which result
in bigger crystals that are less functional, and the fat will look grainy will become difficult to handle.
(Manley, Technology of biscuits, crackers and cookies, 2000)
Palm oil consists of an equal amount of unsaturated and saturated fats. The unsaturated fatty acids are
1% Myristic acid (C14), 45% Palmitic acid (C16), 4% Stearic acid (C18) and saturated are 40% Oleic
acid (C18) and 10% Linolenic acid (C18). (Manley, Technology of biscuits, crackers and cookies, 2000)
2.4.2 Sugar Sucrose is a disaccharide which consists of the two monosaccharides, glucose and fructose (Davidson,
2016). Sucrose is primarily derived from sugar cane or sugar beet. Sugar is an important ingredient in
biscuits, it generates sweetness and flavour to the biscuit. Sugar retard the fat from rancidity, which
results in a longer shelf life of the biscuit. Furthermore, sugar affects the texture of the biscuit. Sugar
partially dissolves during mixing and baking, the amount of sugar that dissolves depends on the amount
of water. More water results in more dissolved sugar. After the baking step, the sugar recrystallises as a
supercooled liquid and forms an amorphous glass. A higher quantity of sugar will generate a harder
biscuit. The dissolution of sugar also depends on the particle size of the sugar. The sugar affects the
appearance of the biscuit, how much it spread when baked and the crunchiness. Furthermore, sucrose
rises the starch gelatinisation temperature, which results in a longer time for the dough to rise in the
oven. (Manley, Technology of biscuits, crackers and cookies, 2000)
Icing sugar has a fine particle size and is generated by milling of coarser sugar. The size of the crystal
is generally expressed in term of mean aperture (MA) and coefficient of variation (CV). Granulated
sugar has normally a value of MA between 570-635 µm and CV 26-30%. Smaller crystals dissolve
quicker in the mouth, as mentioned earlier. A particle size greater than 40 µm can feel gritty between
the teeth while a size greater than 20 µm can be detected by the tongue. (Manley, Technology of biscuits,
crackers and cookies, 2000)
Moisture of sugar is normally around 0.4%. It is important to store sugar at the place with even
temperature and with a temperature close to the delivery temperature. Furthermore, the humidity should
7
be low otherwise, the sugar will build lumps or stick to the silo wall. (Manley, Technology of biscuits,
crackers and cookies, 2000)
There is a relationship between short dough spread during the baking step and the particle size of the
sugar. Anything that can cause variation in the particle size is therefore of importance. The conveying
system can reduce the particle size, it depends on which conveying system that is used. There could be
a chain and bucket-type conveyor system or a pneumatic conveyor system which may reduce the particle
size more. The dust from the sugar should be collected and removed, the dust should not be used as
sugar in the mixing. The sugar should be kept insulated and at a constant temperature to minimize the
effect of fluctuations in temperature. (Manley, Technology of biscuits, crackers and cookies, 2000)
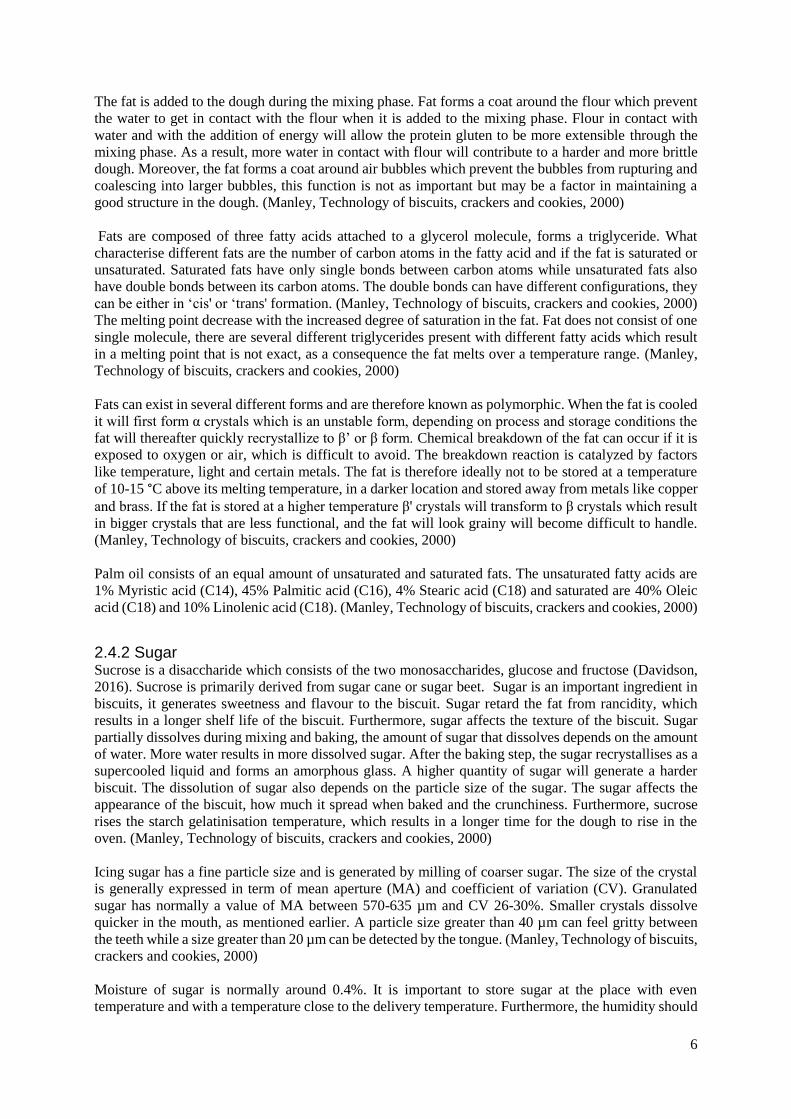
2.4.2.1 Icing Sugar at Arnott’s
The icing sugar process at Arnott’s is a controlled process and goes under the ingredient handling system
(IHS) at Arnott’s. The production line which produces biscuit A and B changed earlier this year from
using bags of icing sugar to using the IHS system. The sugar IHS system is a shared system between
icing and graded sugar. See the simplified process diagram in Figure 9. The motor keeps running when
a sugar call is finished to empty remaining sugar in the line. The remaining sugar accumulates in an
accumulation hopper together with collected dust from the system. A couple of kilos gets accumulated
in the hopper, exact quantity is unknown due to no weight control. The sugar in the accumulation hopper
gets emptied before the valve opens to the icing or graded sugar. A short description of each process
step can be found in Appendix B together with a decision tree for the current programming sequence
for an icing sugar call.
Figure 9: A simplified process diagram for the bulk sugar system.
2.4.3 Ammonium Bicarbonate (NH4)HCO3
Ammonium bicarbonate as a biscuit ingredient is called ‘Vol’, which derives from ‘Volatile salt'. Vol
decomposes completely to carbon dioxide gas, ammonia gas and water at a temperature between 45-65
°C. Vol is a leaving agent that causes the dough piece to rise and expand during baking due to the
produced gas. Vol is soluble in water and generates softer doughs which result in a smaller amount of
water needs to be added to the dough for a given consistency. This is a result of interactions between
the ammonium ion and the protein in the flour. (Manley, Technology of biscuits, crackers and cookies,
2000)
The salt is purchased as a white crystalline solid. Even though the salt is stored in a dry place it gets
easily lumps, the salt should preferably be used soon after delivery. There is a recommendation that Vol
should be dissolved in water before it is added to the mixer. Vol has a significant effect on the spread of
the dough during baking. (Manley, Technology of biscuits, crackers and cookies, 2000)
The liquid Vol is made up by mixing of hot water and Ammonium bicarbonate, see equation 1 below.
The reaction is endothermic, which cause a temperature drop in the water. The solution is clear and
colourless. (Sigma-Aldrich, Retrieved: 10/08/2018)
NH4HCO3 45−65 °C→ NH3 + H2O + CO2 (Equation 1)
8
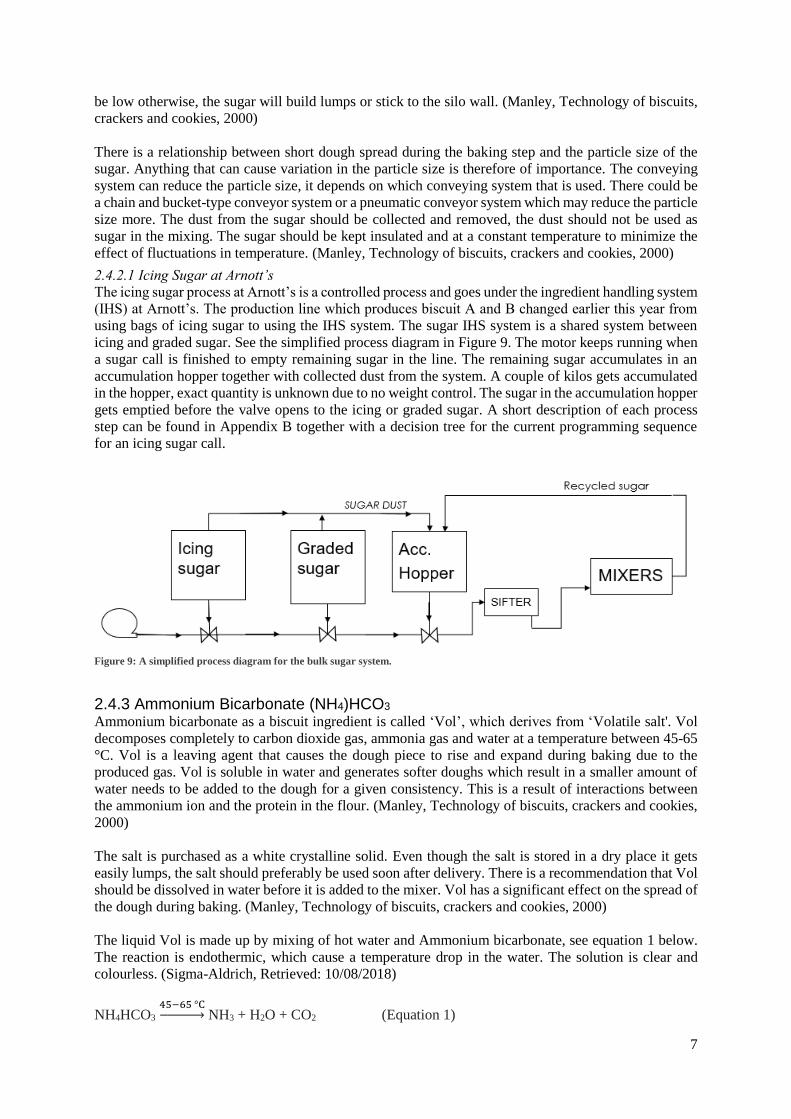
The formation of solid compounds in the Vol system is an important challenge since it will result in a
concentration drop in the liquid that is transferred to the mixers and the solids also cause clogging in the
system and regular cleaning of the process are therefore necessary. Figure 10 shows the four different
solids that can be formed in the liquid Vol solution. (Sutter, 2017)
Figure 10: Liquid Vol is volatile and can easily decompose to CO2, H2O and NH3 vapour, as well as recrystallise to solids. (Sutter,
2017)
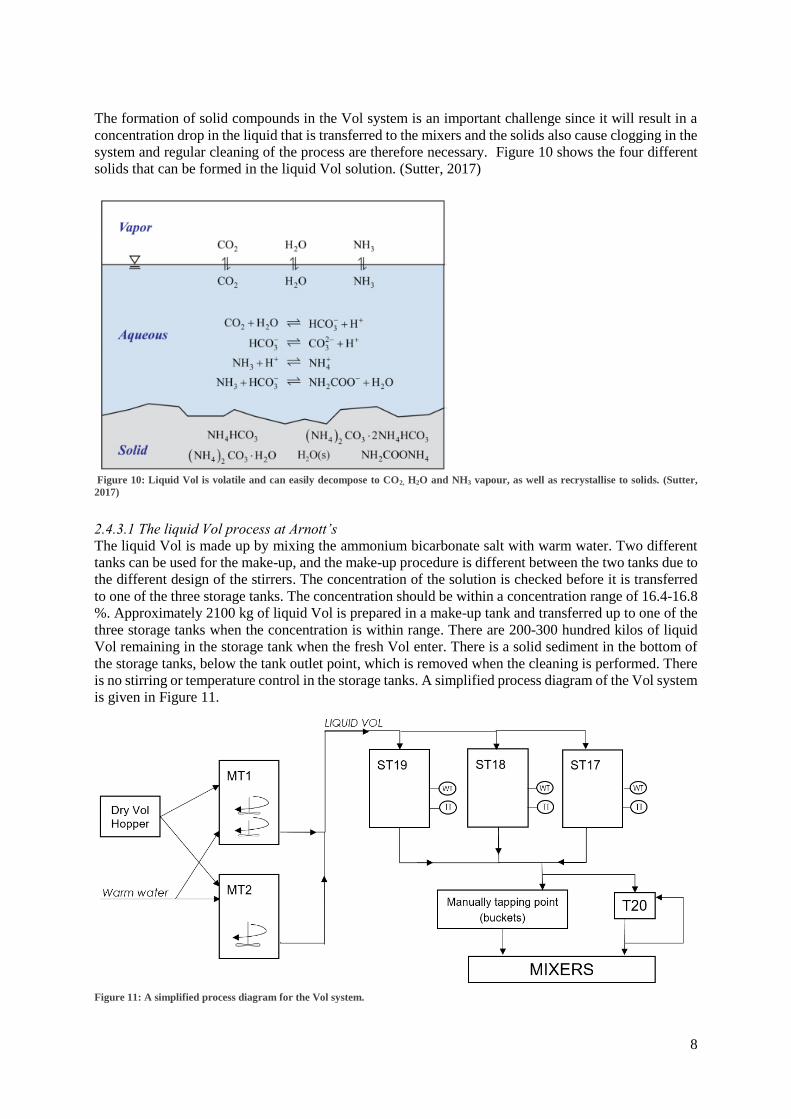
2.4.3.1 The liquid Vol process at Arnott’s
The liquid Vol is made up by mixing the ammonium bicarbonate salt with warm water. Two different
tanks can be used for the make-up, and the make-up procedure is different between the two tanks due to
the different design of the stirrers. The concentration of the solution is checked before it is transferred
to one of the three storage tanks. The concentration should be within a concentration range of 16.4-16.8
%. Approximately 2100 kg of liquid Vol is prepared in a make-up tank and transferred up to one of the
three storage tanks when the concentration is within range. There are 200-300 hundred kilos of liquid
Vol remaining in the storage tank when the fresh Vol enter. There is a solid sediment in the bottom of
the storage tanks, below the tank outlet point, which is removed when the cleaning is performed. There
is no stirring or temperature control in the storage tanks. A simplified process diagram of the Vol system
is given in Figure 11.
Figure 11: A simplified process diagram for the Vol system.
9
The liquid Vol has a temperature that is higher than ambient temperature when it is delivered up to the
storage tanks. When the tank is waiting to be activated for delivery, the temperature in the tank will drop
to a lower temperature. The solubility of the salt decrease with a decrease in temperature (Sutter, 2017).
The process is manual and almost no control is performed after the Vol is delivered.
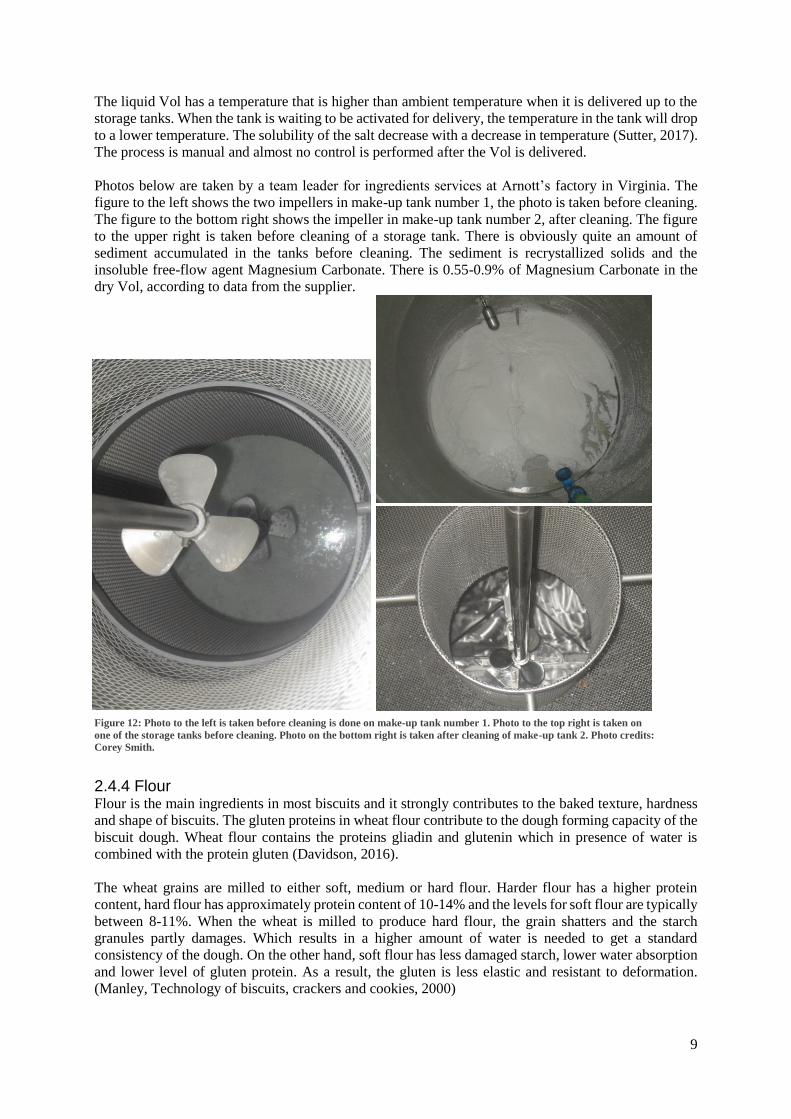
Photos below are taken by a team leader for ingredients services at Arnott’s factory in Virginia. The
figure to the left shows the two impellers in make-up tank number 1, the photo is taken before cleaning.
The figure to the bottom right shows the impeller in make-up tank number 2, after cleaning. The figure
to the upper right is taken before cleaning of a storage tank. There is obviously quite an amount of
sediment accumulated in the tanks before cleaning. The sediment is recrystallized solids and the
insoluble free-flow agent Magnesium Carbonate. There is 0.55-0.9% of Magnesium Carbonate in the
dry Vol, according to data from the supplier.
2.4.4 Flour Flour is the main ingredients in most biscuits and it strongly contributes to the baked texture, hardness
and shape of biscuits. The gluten proteins in wheat flour contribute to the dough forming capacity of the
biscuit dough. Wheat flour contains the proteins gliadin and glutenin which in presence of water is
combined with the protein gluten (Davidson, 2016).
The wheat grains are milled to either soft, medium or hard flour. Harder flour has a higher protein
content, hard flour has approximately protein content of 10-14% and the levels for soft flour are typically
between 8-11%. When the wheat is milled to produce hard flour, the grain shatters and the starch
granules partly damages. Which results in a higher amount of water is needed to get a standard
consistency of the dough. On the other hand, soft flour has less damaged starch, lower water absorption
and lower level of gluten protein. As a result, the gluten is less elastic and resistant to deformation.
(Manley, Technology of biscuits, crackers and cookies, 2000)
Figure 12: Photo to the left is taken before cleaning is done on make-up tank number 1. Photo to the top right is taken on
one of the storage tanks before cleaning. Photo on the bottom right is taken after cleaning of make-up tank 2. Photo credits:
Corey Smith.
10
Soft flour is preferable for biscuit making while hard flour suits better for bread making. The mean
particle size for biscuit flours is generally around 50 µm. After milling, the flour changes its dough-
making properties during the first two weeks due to oxidation. The oxidation of the flour is undesirable
for some biscuits, the proteins changes and it generally makes the gluten not as extensible. Different
storage time of flour may have an impact of the biscuit since there will be different properties of the
flour. (Manley, Technology of biscuits, crackers and cookies, 2000)
Wheat flour consists of 70-75% starch. Starch consists mainly of two glucose polymers, the linear
polymer amylose and the highly branched polymer amylopectin. The quality of a dough and the gluten
contained can be tested with rheological instruments. Flour quality is of interest to produce repeatable
consistencies, appropriate for forming and to produce a satisfactory biscuit. A cookie spread test is a
baking test for short dough cookies, to reduce the spreadability of the dough the miller can treat the flour
with chlorine gas. There are several different ways to determine the quality of the delivered flour. A
quick check is to dip some of the flour in water and compare the colour with a standard sample. If the
sample gets a different colour, further investigation is needed. Furthermore, moisture test and a baking
test could be used to confirm that the quality of the flour is acceptable. The moisture content should be
around 14%. The packaging density of flour is approximately 487 kg per cubic meter. Generally, strong
flour has a higher density than weak flour. (Manley, Technology of biscuits, crackers and cookies, 2000)
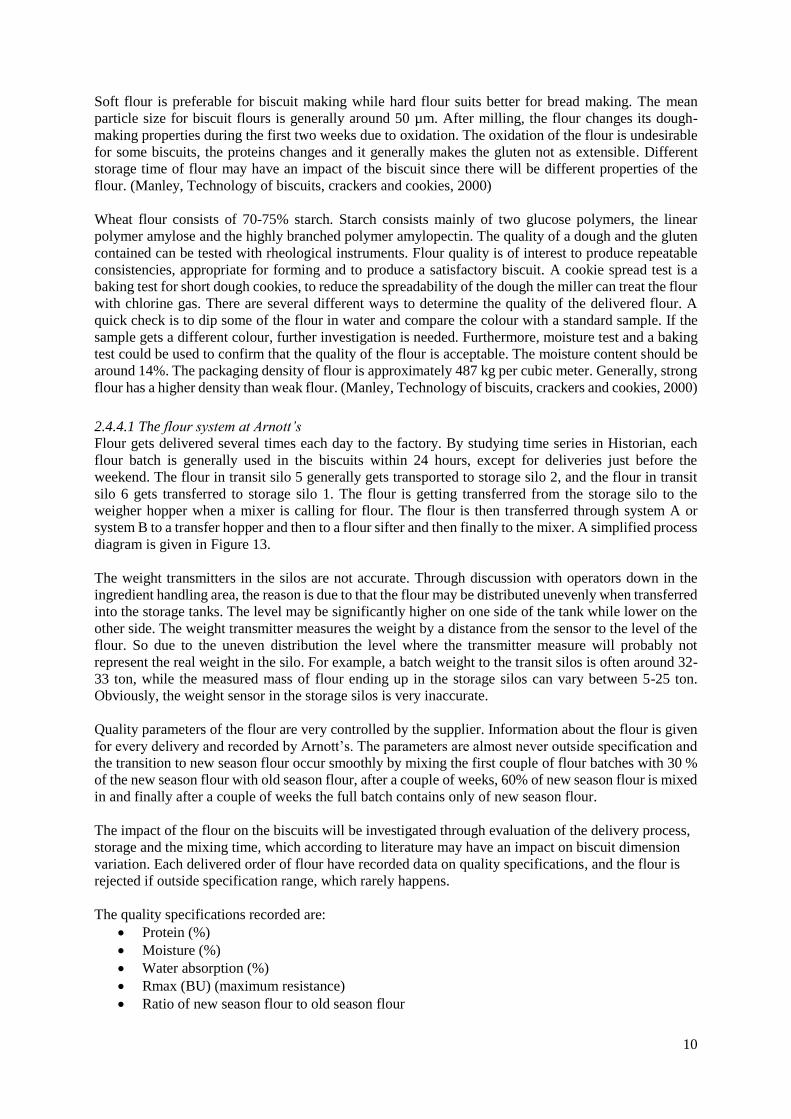
2.4.4.1 The flour system at Arnott’s
Flour gets delivered several times each day to the factory. By studying time series in Historian, each
flour batch is generally used in the biscuits within 24 hours, except for deliveries just before the
weekend. The flour in transit silo 5 generally gets transported to storage silo 2, and the flour in transit
silo 6 gets transferred to storage silo 1. The flour is getting transferred from the storage silo to the
weigher hopper when a mixer is calling for flour. The flour is then transferred through system A or
system B to a transfer hopper and then to a flour sifter and then finally to the mixer. A simplified process
diagram is given in Figure 13.
The weight transmitters in the silos are not accurate. Through discussion with operators down in the
ingredient handling area, the reason is due to that the flour may be distributed unevenly when transferred
into the storage tanks. The level may be significantly higher on one side of the tank while lower on the
other side. The weight transmitter measures the weight by a distance from the sensor to the level of the
flour. So due to the uneven distribution the level where the transmitter measure will probably not
represent the real weight in the silo. For example, a batch weight to the transit silos is often around 32-
33 ton, while the measured mass of flour ending up in the storage silos can vary between 5-25 ton.
Obviously, the weight sensor in the storage silos is very inaccurate.
Quality parameters of the flour are very controlled by the supplier. Information about the flour is given
for every delivery and recorded by Arnott’s. The parameters are almost never outside specification and
the transition to new season flour occur smoothly by mixing the first couple of flour batches with 30 %
of the new season flour with old season flour, after a couple of weeks, 60% of new season flour is mixed
in and finally after a couple of weeks the full batch contains only of new season flour.
The impact of the flour on the biscuits will be investigated through evaluation of the delivery process,
storage and the mixing time, which according to literature may have an impact on biscuit dimension
variation. Each delivered order of flour have recorded data on quality specifications, and the flour is
rejected if outside specification range, which rarely happens.
The quality specifications recorded are:
• Protein (%)
• Moisture (%)
• Water absorption (%)
• Rmax (BU) (maximum resistance)
• Ratio of new season flour to old season flour
11
Figure 13: A simplified process diagram for the flour system.
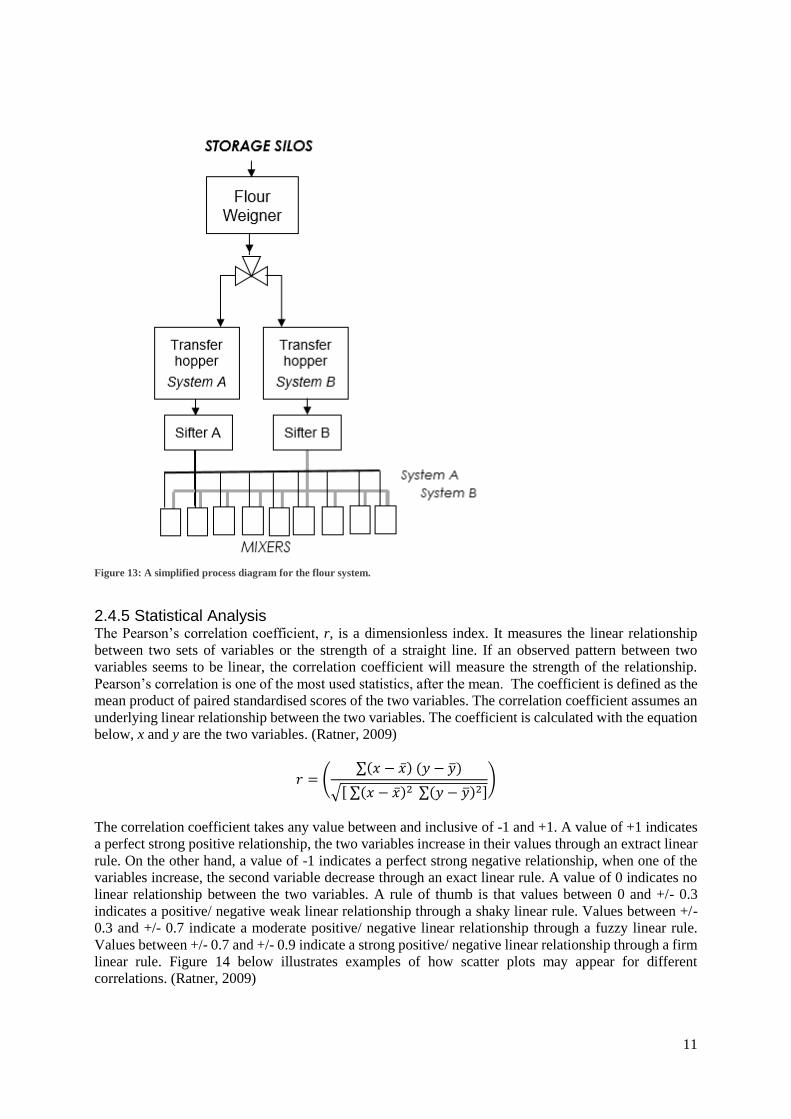
2.4.5 Statistical Analysis The Pearson’s correlation coefficient, r, is a dimensionless index. It measures the linear relationship
between two sets of variables or the strength of a straight line. If an observed pattern between two
variables seems to be linear, the correlation coefficient will measure the strength of the relationship.
Pearson’s correlation is one of the most used statistics, after the mean. The coefficient is defined as the
mean product of paired standardised scores of the two variables. The correlation coefficient assumes an
underlying linear relationship between the two variables. The coefficient is calculated with the equation
below, x and y are the two variables. (Ratner, 2009)
𝑟 = (∑(𝑥 − �̅�) (𝑦 − �̅�)
√[ ∑(𝑥 − �̅�)2 ∑(𝑦 − �̅�)2])
The correlation coefficient takes any value between and inclusive of -1 and +1. A value of +1 indicates
a perfect strong positive relationship, the two variables increase in their values through an extract linear
rule. On the other hand, a value of -1 indicates a perfect strong negative relationship, when one of the
variables increase, the second variable decrease through an exact linear rule. A value of 0 indicates no
linear relationship between the two variables. A rule of thumb is that values between 0 and +/- 0.3
indicates a positive/ negative weak linear relationship through a shaky linear rule. Values between +/-
0.3 and +/- 0.7 indicate a moderate positive/ negative linear relationship through a fuzzy linear rule.
Values between +/- 0.7 and +/- 0.9 indicate a strong positive/ negative linear relationship through a firm
linear rule. Figure 14 below illustrates examples of how scatter plots may appear for different
correlations. (Ratner, 2009)
12
Figure 14: The correlation coefficient shows on the strength and direction of correlation. (Correlation Coefficient 'r' and The Linear
Model, 2018)
3 Project Plan
In this section planned methods will be described. Furthermore, this paragraph will present the necessary
resources, the work timeline, risks with the project and the project opportunities.
In the laboratory, there are several different instruments that are available to use for different purposes
and tests. Possible instruments that may be used is a texture analyser that can measure the firmness and
stickiness of the dough. Furthermore, there is a Mettler Toledo T70 available in the lab which can
measure the concentration of free ammonia ions through titration. Data will also be collected and
analysed with the software Historian which is used in the factory to measure specific control variables.
The collected data from sampling and trials will then be analysed together with the data from the
historian.
3.1 Methodology The methodology of data collection and retrieval for the four ingredients will be described. Collection
time, mixing number and dough mixing start time are recorded for each sample that is collected for
testing. Additional data will be recorded for each ingredient, dependent on what parameters that are of
interest. The ingredients’ impact on the biscuit dimension variation will be evaluated by calculation of
the correlation between collected data, recorded quality data and corresponding dimensions of the
biscuits.
3.1.1 Biscuit Dimension and Packet Length Data Retrieval Packet length, biscuit length and biscuit width are measured and recorded with a software on the
production line.
3.1.1.1 Selection of data collection times
Different sizes of time series will be of interest, dependent on which parameters that are analysed. There
will be different sizes of the time series dependent on if there is one dough, several doughs or a storage
tank that is analysed. Furthermore, the different parameters will generate biscuit dimension results on
the line after different time-lags.
A new dough is getting mixed with a frequency of approximately 30-35 minutes for both Biscuit A and
Biscuit B. When a dough is tipped, it takes approximately 45 minutes until the first dough piece has
gone through the forming and baking step and generates dimension results in the software Wonderware/
Historian. Data for a specific dough will be retrieved 75 minutes after the dough mixing started and
finished when next dough should generate results on the line.
The Vol process is manual and the time when a bucket is filled, and the trolley is prepared is not
recorded. It is therefore not possible to know the exact time between filled bucket to biscuit dimension
results on the line. There are normally two to four ingredient trollies prepared for dough mixing, which
13
corresponds to a time-lag of one to two hours, from filling to emptying in the mixer. The total time-lag
from storage tank changeover to biscuit dimension results are therefore roughly 135 to 200 minutes.
When the concentration in a bucket is analysed, data will be matched with current storage tank and data
from the line retrieved 75 minutes after mixing start time. Data will be retrieved 3 hours after storage
tank changeover.
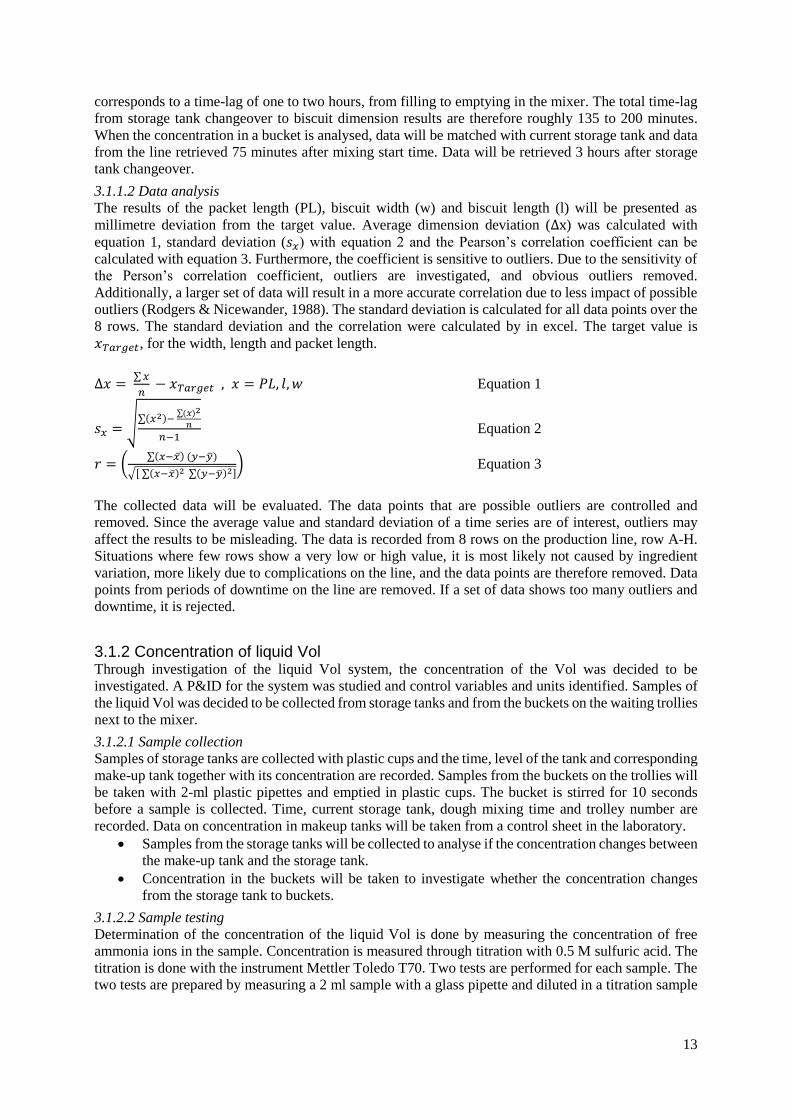
3.1.1.2 Data analysis
The results of the packet length (PL), biscuit width (w) and biscuit length (l) will be presented as
millimetre deviation from the target value. Average dimension deviation (∆x) was calculated with
equation 1, standard deviation (𝑠𝑥) with equation 2 and the Pearson’s correlation coefficient can be
calculated with equation 3. Furthermore, the coefficient is sensitive to outliers. Due to the sensitivity of
the Person’s correlation coefficient, outliers are investigated, and obvious outliers removed.
Additionally, a larger set of data will result in a more accurate correlation due to less impact of possible
outliers (Rodgers & Nicewander, 1988). The standard deviation is calculated for all data points over the
8 rows. The standard deviation and the correlation were calculated by in excel. The target value is
𝑥𝑇𝑎𝑟𝑔𝑒𝑡, for the width, length and packet length.
∆𝑥 = ∑𝑥
𝑛 − 𝑥𝑇𝑎𝑟𝑔𝑒𝑡 , 𝑥 = 𝑃𝐿, 𝑙, 𝑤 Equation 1
𝑠𝑥 =√∑(𝑥
2)− ∑(𝑥)2
𝑛
𝑛−1 Equation 2
𝑟 = (∑(𝑥−�̅�) (𝑦−�̅�)
√[ ∑(𝑥−�̅�)2 ∑(𝑦−�̅�)2]) Equation 3
The collected data will be evaluated. The data points that are possible outliers are controlled and
removed. Since the average value and standard deviation of a time series are of interest, outliers may
affect the results to be misleading. The data is recorded from 8 rows on the production line, row A-H.
Situations where few rows show a very low or high value, it is most likely not caused by ingredient
variation, more likely due to complications on the line, and the data points are therefore removed. Data
points from periods of downtime on the line are removed. If a set of data shows too many outliers and
downtime, it is rejected.
3.1.2 Concentration of liquid Vol Through investigation of the liquid Vol system, the concentration of the Vol was decided to be
investigated. A P&ID for the system was studied and control variables and units identified. Samples of
the liquid Vol was decided to be collected from storage tanks and from the buckets on the waiting trollies
next to the mixer.
3.1.2.1 Sample collection
Samples of storage tanks are collected with plastic cups and the time, level of the tank and corresponding
make-up tank together with its concentration are recorded. Samples from the buckets on the trollies will
be taken with 2-ml plastic pipettes and emptied in plastic cups. The bucket is stirred for 10 seconds
before a sample is collected. Time, current storage tank, dough mixing time and trolley number are
recorded. Data on concentration in makeup tanks will be taken from a control sheet in the laboratory.
• Samples from the storage tanks will be collected to analyse if the concentration changes between
the make-up tank and the storage tank.
• Concentration in the buckets will be taken to investigate whether the concentration changes
from the storage tank to buckets.
3.1.2.2 Sample testing
Determination of the concentration of the liquid Vol is done by measuring the concentration of free
ammonia ions in the sample. Concentration is measured through titration with 0.5 M sulfuric acid. The
titration is done with the instrument Mettler Toledo T70. Two tests are performed for each sample. The
two tests are prepared by measuring a 2 ml sample with a glass pipette and diluted in a titration sample
14
cup with 50 ml water measured with a 50-ml glass cylinder. The results of the concentration are
recorded.
3.1.2.3 Sample results
The collected data will be analysed and the results will be studied to see if the concentration of the Vol
is below or above the accepted concentration range, and the impact on biscuit dimension variation will
be evaluated. If there is a correlation, further investigation will be performed to find possible solutions
to eliminate or reduce the variation.
3.1.3 Icing sugar According to literature, the sugar particle size has an impact on the dough spread. Due to the use of the
current sugar system, more or less graded sugar will most likely be present in the icing sugar batches.
What goes into the accumulation hopper after a sugar call gets emptied out with next sugar call. That
translates to a few kilos of graded sugar in the batch of icing sugar, if the previous call was graded sugar.
On the other hand, there will almost only be icing sugar in the batch if the previous call was icing sugar.
Parameters to investigate:
• Comparison of the sugar particle size in the accumulation hopper after an icing sugar call and a
graded sugar call.
• Comparison of the sugar particle size in the mixer, when previous sugar call was an icing sugar
call or a graded sugar call.
• Correlation analysis of average biscuit dimensions variation for a certain amount of doughs, to
the ratio of icing sugar calls per graded sugar calls.
• Correlation analysis of average biscuit dimensions variation for a certain amount of doughs, to
the number of doughs which had a graded sugar call before the mixer called for icing sugar.
3.1.3.1 Sample collection - Particle size icing sugar
Samples of the sugar in the mixer will be collected by the operator at the mixer. A plastic bag will be
filled with sugar and the current trolley number recorded. The time for the sugar call, mixing time and
if previous calls in the system were graded or icing sugar will be generated from Historian.
Samples of the sugar in the accumulator will be collected between sugar calls. Time and previous sugar
calls will be recorded. The sample collection from the accumulator will give a smaller sample size
compared to the sample from the mixer due to a small spoon which collects the sample in a combination
of a fan which blows away some of the sugar.
3.1.3.2 Sample testing - Particle size icing sugar
Particle size is assessed by dry sieving, 50 grams of the sugar sample from the mixer is being sieved,
for the accumulation hopper, the whole sample is tested since the sample weight is less than 50 grams.
The sieves will separate the sugar particles: less than 75 µm, 75-150 µm, 150-250 µm and particles
greater than 250 µm. During procedure follows:
1. The weights of each sieve will first be measured and recorded.
2. The weight of the sample is weighted and recorded.
3. The sieves are sieved for 5 minutes with the amplitude set to 6.
4. The weight of each sieve together with the sugar on each sieve is checked and recorded.
5. The sieves are cleaned between sample testing with a brush and compressed air.
3.1.3.3 Sample results - Particle size icing sugar
Particle size distribution is checked by calculation of the weight percentage of the sugar sample present
on each sieve. The results will be visualized with a histogram for each sample.
3.1.3.4 Sample collection - Frequency of sugar calls
This data will be taken from the software Historian. A time period of 25 Biscuit A’s icing sugar calls
will be analysed.
Procedure:
1. Select a start and finish time which covers 25 icing sugar calls from Biscuit A’s mixer.
2. Count number of icing sugar calls and graded sugar calls during the selected period.
3. Count how many of the 25 selected sugar batches had graded sugar as the previous call.
15
4. The results are assumed to give dimension results on the line 75 minutes after the first sugar
gets called. Packet length, biscuit length and width during the period are generated from
Historian.
5. The average value and the standard deviation of the packet length, biscuit width and biscuit
length are calculated as single values of the average the 8 rows during the time-period. Obvious
outliers are removed.
3.1.4 Flour
3.1.4.1 Protein level
The protein level in the flour have deviated slightly from the specification range for some deliveries
during 2018. The impact on the biscuit dimension variation was evaluated by identifying a flour batch
with significant lower or higher protein level compared to previous flour batch. Time series of the biscuit
dimensions that corresponds to the period for when the flour should give a result on the line was then
analysed to see whether the protein level change may have a significant impact on the biscuit
dimensions.
3.1.4.2 Temperature
A higher dough temperature can according to literature increase the dough spread during baking. Flour
is the main ingredient in the two biscuits and represents more than half the weight in biscuit A. The
impact caused by temperature fluctuations of the flour delivered to the mixer will be evaluated against
the variation in the dough temperature. There is a temperature transmitter in sifter A and one in sifter B,
and the data is recorded in Historian. The dough temperature is measured and recorded by the mixing
operator before the dough is transported to the forming section. The temperature of the dough together
with corresponding flour sifter temperature will be retrieved for a couple of days.
3.1.4.3 Quantity
The weight of each dough batch is checked before it is sent to the forming step. The measured dough
weight deviates often from the expected weight. Through investigation of the weighing procedure,
almost everything is scraped out from the mixer, there could only be a few kilos left in the mixer. There
could be several different reasons for the weight variation. It could be due to that the scale is not accurate,
or that the operators are performing the procedure in different ways. A time series of the dough weight
is of interest to investigate if the weight variation could be due to that the operators are performing the
task differently.
The bulk ingredients are suspected to cause the variation. Ingredients which are manually added to the
mixer may vary slightly, but not enough to cause a great weight difference. Sugar, flour and shortening
are added through the bulk system. Due to the high ratio of flour in the dough, it may be the ingredient
that causes the weight difference. Furthermore, it has been previous issues with valves in the flour
system that do not close properly which causes the flour to leak into the wrong mixer. Ingredients must
have gone into another mixer or the weight transmitter or the flowmeter are not working properly, on
the other hand when the weight is getting too high ingredients from other lines may end up in the mixer.
The dough weight is generally either too high or too low compared to expected weight, the flour system
may cause the weight difference. The dough weight is to be analysed towards both flour system A and
system B.
3.2 Resources Several different types of resources have been necessary for the development of this project outcome.
The book Technology of biscuits, crackers and cookies by Duncan Manley has been used to generate
knowledge about biscuit making. The book has been very useful for the literature review and covers
much important information about biscuit manufacturing.
16
Operators and technical personnel in the factory have been very important resources. Demonstrations
and shared knowledge have been helpful to gain an understanding of how the different processes and
instruments work in the factory, which has been of importance for the project. Furthermore, it has been
necessary to study previous project reports completed by personnel at Arnott’s which were relevant to
the project. For the Vol testing, a previous report done at Arnott’s was very useful to get information
about the Vol used in the factory, Style of Vol addition received by Ken Brown.
Another important sources for this project have been Wern Tan who did her placement at Arnott’s
previous year and are now employed by Arnott’s. Christopher Price who has been my workplace
supervisor and Hayley Erasmus who has been my project supervisor have been important sources for
the project. My UQ supervisor Sophia Rodrigues has been an important resource for the success of the
project outcome, both for the practical performance, the literature review and the reports writing.
University of Queensland’s online library and Lund University’s online library have been used as
resources to further extend the literature review.
3.3 Work timeline
The project timeline is shown in the Gantt chart on the next page. This timeline was created upon the
project proposal report with the purpose to be followed as good as possible to make sure the progress of
the project went efficient and ensure tasks were finished prior to deadlines. Already when the timeline
was created, assumptions were taken that some activities may require longer or shorter time, due to the
limited knowledge about the project when the project proposal was written. Contribution to other
projects in the plant have been conducted simultaneously as this project work, which have contributed
to the development of my professional experience as a graduate engineer. Furthermore, the contribution
in side projects have been of benefit for the company.
3.3.1 Deviations from the interim project report There have been a few deviations from the project timeline which was created upon the project proposal
report. Due to a large number of variables to understand, collect and analyse, the variables icing sugar,
Vol and flour have only been investigated in the project. The ingredient shortening was not evaluated
due to that the other ingredients required more time than planned. No time was planned in the Gantt
chart to evaluate the implemented changes of the icing sugar system, based on recommendations given
in the project proposal. Shortening is known to be an ingredient that has a significant impact on biscuit
dimension variations on the line for both biscuit A and biscuit B, but also for other lines. Other work is
currently conducted to evaluate the shortening system and the focus on that ingredients in this project
was therefore excluded. The focus was instead moved to collect the results gained by the implementation
of the icing sugar recommendations. Furthermore, sections have been extended in this report since the
Project Progress Report and a section for project outcomes have been added.
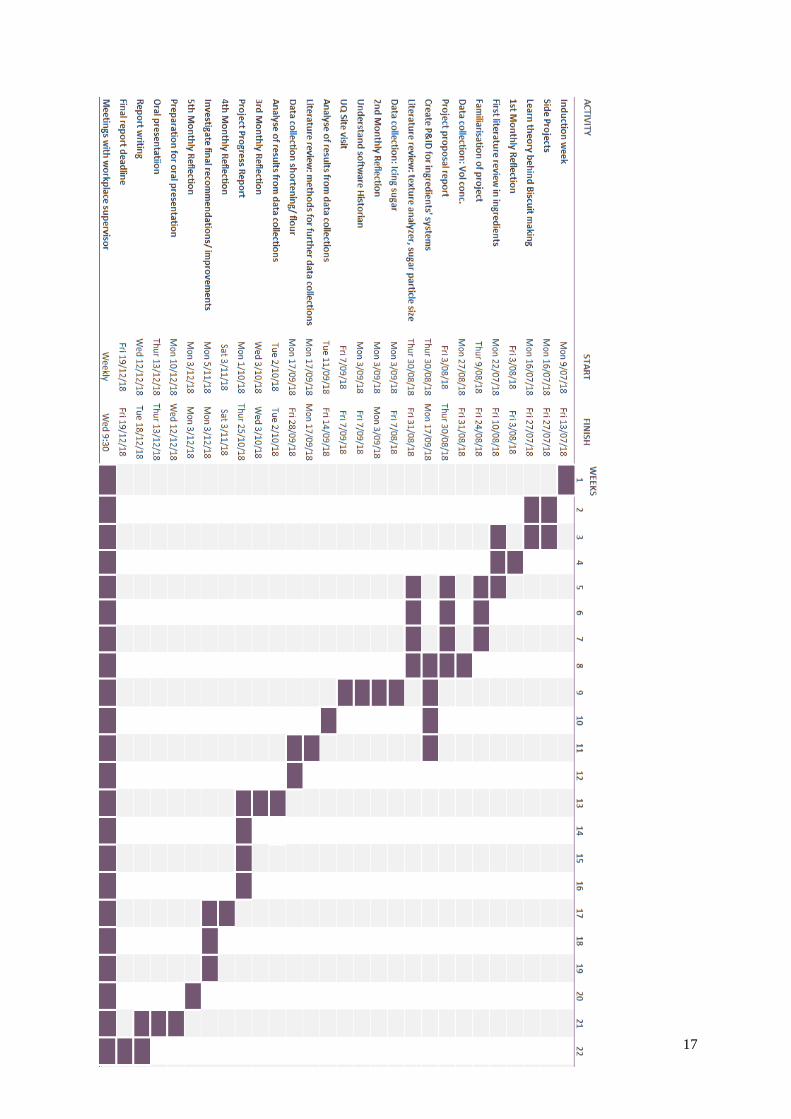
17
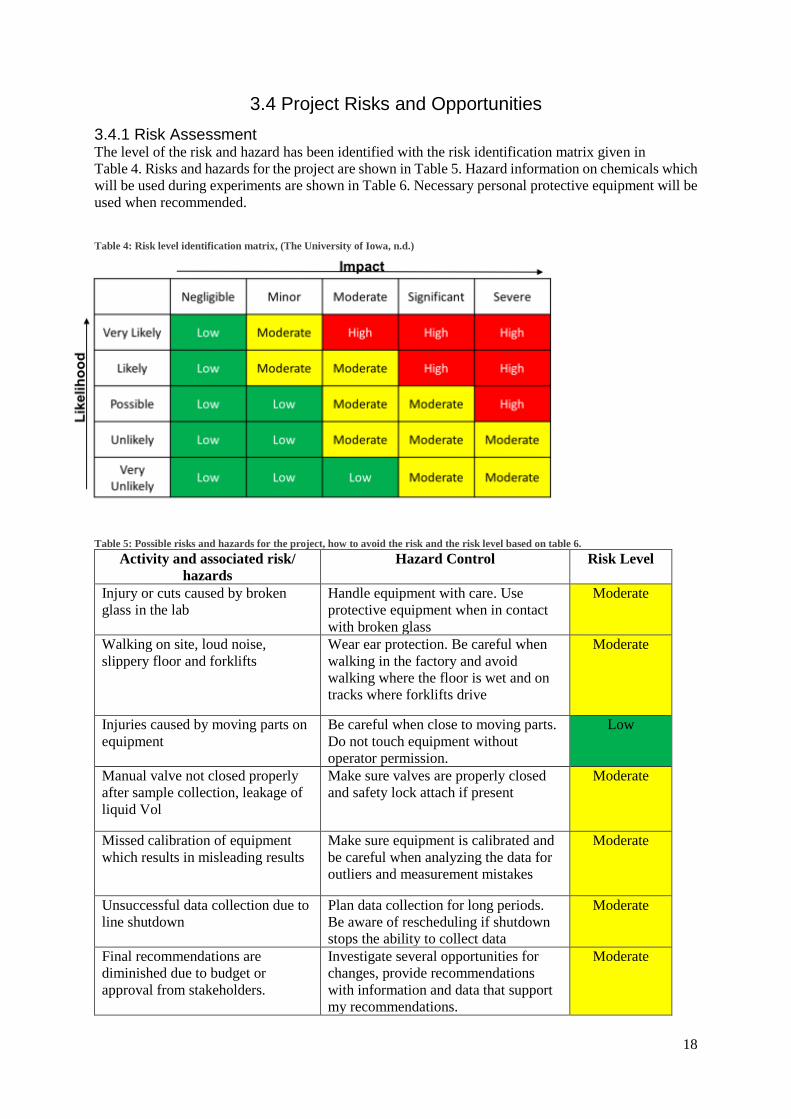
18
3.4 Project Risks and Opportunities
3.4.1 Risk Assessment The level of the risk and hazard has been identified with the risk identification matrix given in
Table 4. Risks and hazards for the project are shown in Table 5. Hazard information on chemicals which
will be used during experiments are shown in Table 6. Necessary personal protective equipment will be
used when recommended.
Table 4: Risk level identification matrix, (The University of Iowa, n.d.)
Table 5: Possible risks and hazards for the project, how to avoid the risk and the risk level based on table 6.
Activity and associated risk/
hazards
Hazard Control Risk Level
Injury or cuts caused by broken
glass in the lab
Handle equipment with care. Use
protective equipment when in contact
with broken glass
Moderate
Walking on site, loud noise,
slippery floor and forklifts
Wear ear protection. Be careful when
walking in the factory and avoid
walking where the floor is wet and on
tracks where forklifts drive
Moderate
Injuries caused by moving parts on
equipment
Be careful when close to moving parts.
Do not touch equipment without
operator permission.
Low
Manual valve not closed properly
after sample collection, leakage of
liquid Vol
Make sure valves are properly closed
and safety lock attach if present
Moderate
Missed calibration of equipment
which results in misleading results
Make sure equipment is calibrated and
be careful when analyzing the data for
outliers and measurement mistakes
Moderate
Unsuccessful data collection due to
line shutdown
Plan data collection for long periods.
Be aware of rescheduling if shutdown
stops the ability to collect data
Moderate
Final recommendations are
diminished due to budget or
approval from stakeholders.
Investigate several opportunities for
changes, provide recommendations
with information and data that support
my recommendations.
Moderate
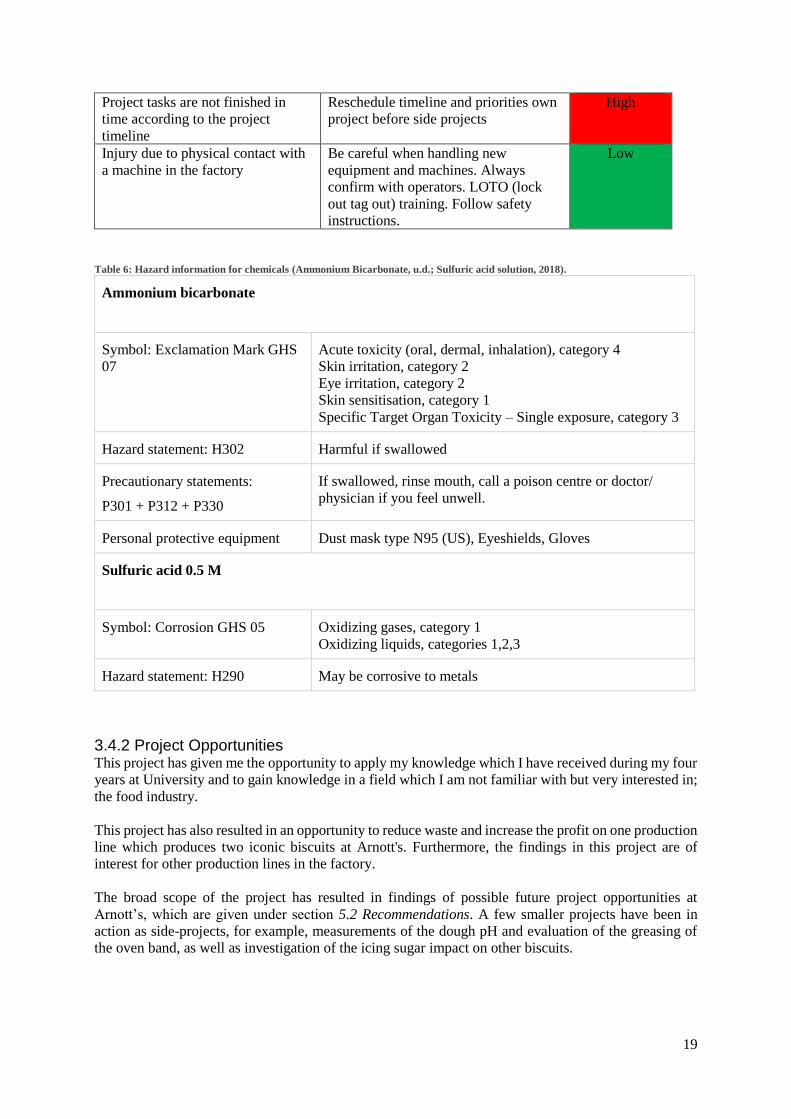
19
Project tasks are not finished in
time according to the project
timeline
Reschedule timeline and priorities own
project before side projects
High
Injury due to physical contact with
a machine in the factory
Be careful when handling new
equipment and machines. Always
confirm with operators. LOTO (lock
out tag out) training. Follow safety
instructions.
Low
Table 6: Hazard information for chemicals (Ammonium Bicarbonate, u.d.; Sulfuric acid solution, 2018).
Ammonium bicarbonate
Symbol: Exclamation Mark GHS
07
Acute toxicity (oral, dermal, inhalation), category 4
Skin irritation, category 2
Eye irritation, category 2
Skin sensitisation, category 1
Specific Target Organ Toxicity – Single exposure, category 3
Hazard statement: H302 Harmful if swallowed
Precautionary statements:
P301 + P312 + P330
If swallowed, rinse mouth, call a poison centre or doctor/
physician if you feel unwell.
Personal protective equipment Dust mask type N95 (US), Eyeshields, Gloves
Sulfuric acid 0.5 M
Symbol: Corrosion GHS 05 Oxidizing gases, category 1
Oxidizing liquids, categories 1,2,3
Hazard statement: H290 May be corrosive to metals
3.4.2 Project Opportunities This project has given me the opportunity to apply my knowledge which I have received during my four
years at University and to gain knowledge in a field which I am not familiar with but very interested in;
the food industry.
This project has also resulted in an opportunity to reduce waste and increase the profit on one production
line which produces two iconic biscuits at Arnott's. Furthermore, the findings in this project are of
interest for other production lines in the factory.
The broad scope of the project has resulted in findings of possible future project opportunities at
Arnott’s, which are given under section 5.2 Recommendations. A few smaller projects have been in
action as side-projects, for example, measurements of the dough pH and evaluation of the greasing of
the oven band, as well as investigation of the icing sugar impact on other biscuits.
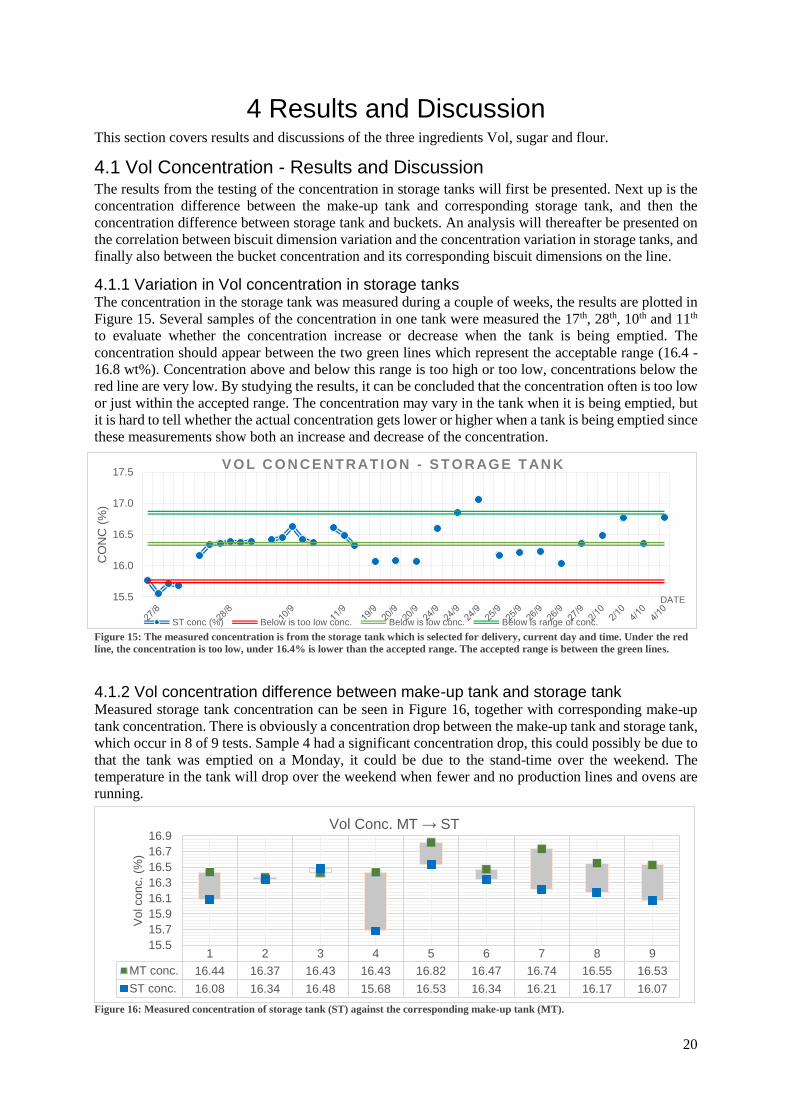
20
4 Results and Discussion This section covers results and discussions of the three ingredients Vol, sugar and flour.
4.1 Vol Concentration - Results and Discussion The results from the testing of the concentration in storage tanks will first be presented. Next up is the
concentration difference between the make-up tank and corresponding storage tank, and then the
concentration difference between storage tank and buckets. An analysis will thereafter be presented on
the correlation between biscuit dimension variation and the concentration variation in storage tanks, and
finally also between the bucket concentration and its corresponding biscuit dimensions on the line.
4.1.1 Variation in Vol concentration in storage tanks The concentration in the storage tank was measured during a couple of weeks, the results are plotted in
Figure 15. Several samples of the concentration in one tank were measured the 17th, 28th, 10th and 11th
to evaluate whether the concentration increase or decrease when the tank is being emptied. The
concentration should appear between the two green lines which represent the acceptable range (16.4 -
16.8 wt%). Concentration above and below this range is too high or too low, concentrations below the
red line are very low. By studying the results, it can be concluded that the concentration often is too low
or just within the accepted range. The concentration may vary in the tank when it is being emptied, but
it is hard to tell whether the actual concentration gets lower or higher when a tank is being emptied since
these measurements show both an increase and decrease of the concentration.
Figure 15: The measured concentration is from the storage tank which is selected for delivery, current day and time. Under the red
line, the concentration is too low, under 16.4% is lower than the accepted range. The accepted range is between the green lines.
4.1.2 Vol concentration difference between make-up tank and storage tank Measured storage tank concentration can be seen in Figure 16, together with corresponding make-up
tank concentration. There is obviously a concentration drop between the make-up tank and storage tank,
which occur in 8 of 9 tests. Sample 4 had a significant concentration drop, this could possibly be due to
that the tank was emptied on a Monday, it could be due to the stand-time over the weekend. The
temperature in the tank will drop over the weekend when fewer and no production lines and ovens are
running.
Figure 16: Measured concentration of storage tank (ST) against the corresponding make-up tank (MT).
15.5
16.0
16.5
17.0
17.5
CO
NC
(%
)
DATE
V O L C O N C ENTR AT I O N - S T O R AG E T AN K
ST conc (%) Below is too low conc. Below is low conc. Below is range of conc.
1 2 3 4 5 6 7 8 9
MT conc. 16.44 16.37 16.43 16.43 16.82 16.47 16.74 16.55 16.53
ST conc. 16.08 16.34 16.48 15.68 16.53 16.34 16.21 16.17 16.07
15.5
15.7
15.9
16.1
16.3
16.5
16.7
16.9
Vo
l co
nc. (%
)
Vol Conc. MT → ST
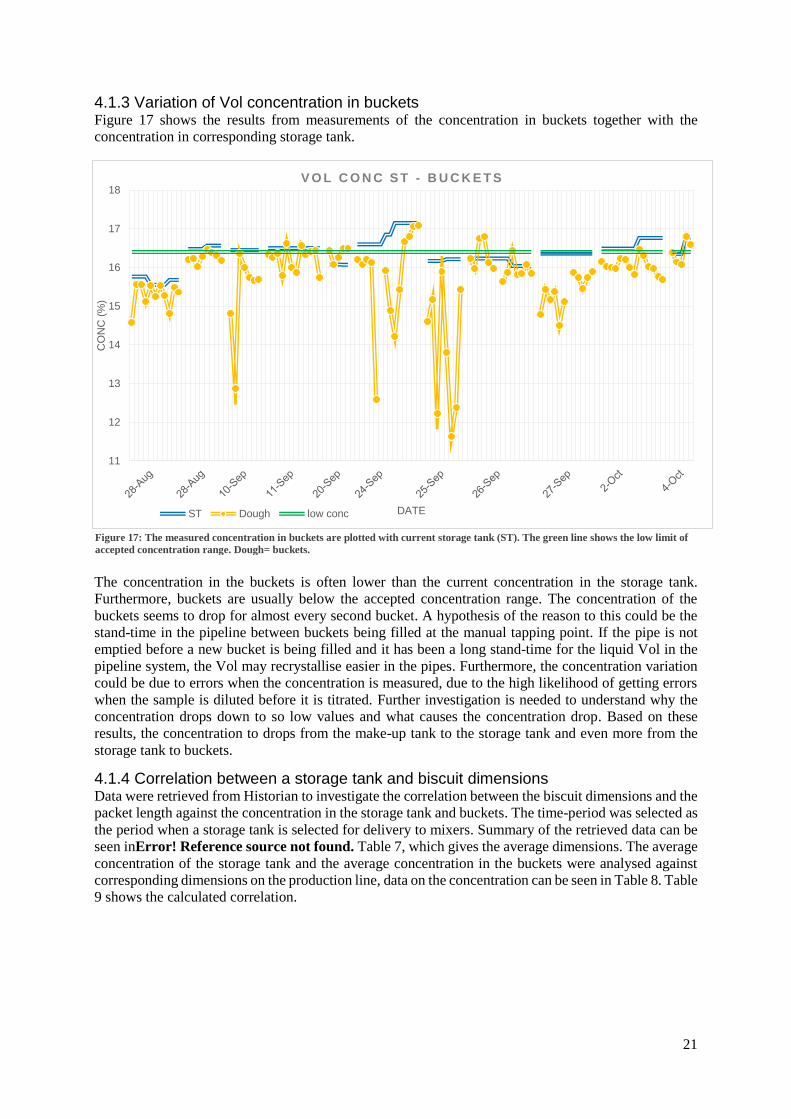
21
4.1.3 Variation of Vol concentration in buckets Figure 17 shows the results from measurements of the concentration in buckets together with the
concentration in corresponding storage tank.
The concentration in the buckets is often lower than the current concentration in the storage tank.
Furthermore, buckets are usually below the accepted concentration range. The concentration of the
buckets seems to drop for almost every second bucket. A hypothesis of the reason to this could be the
stand-time in the pipeline between buckets being filled at the manual tapping point. If the pipe is not
emptied before a new bucket is being filled and it has been a long stand-time for the liquid Vol in the
pipeline system, the Vol may recrystallise easier in the pipes. Furthermore, the concentration variation
could be due to errors when the concentration is measured, due to the high likelihood of getting errors
when the sample is diluted before it is titrated. Further investigation is needed to understand why the
concentration drops down to so low values and what causes the concentration drop. Based on these
results, the concentration to drops from the make-up tank to the storage tank and even more from the
storage tank to buckets.
4.1.4 Correlation between a storage tank and biscuit dimensions Data were retrieved from Historian to investigate the correlation between the biscuit dimensions and the
packet length against the concentration in the storage tank and buckets. The time-period was selected as
the period when a storage tank is selected for delivery to mixers. Summary of the retrieved data can be
seen inError! Reference source not found. Table 7, which gives the average dimensions. The average
concentration of the storage tank and the average concentration in the buckets were analysed against
corresponding dimensions on the production line, data on the concentration can be seen in Table 8. Table
9 shows the calculated correlation.
11
12
13
14
15
16
17
18
CO
NC
(%
)
DATE
V O L C O N C S T - B U C K E T S
ST Dough low conc
Figure 17: The measured concentration in buckets are plotted with current storage tank (ST). The green line shows the low limit of
accepted concentration range. Dough= buckets.
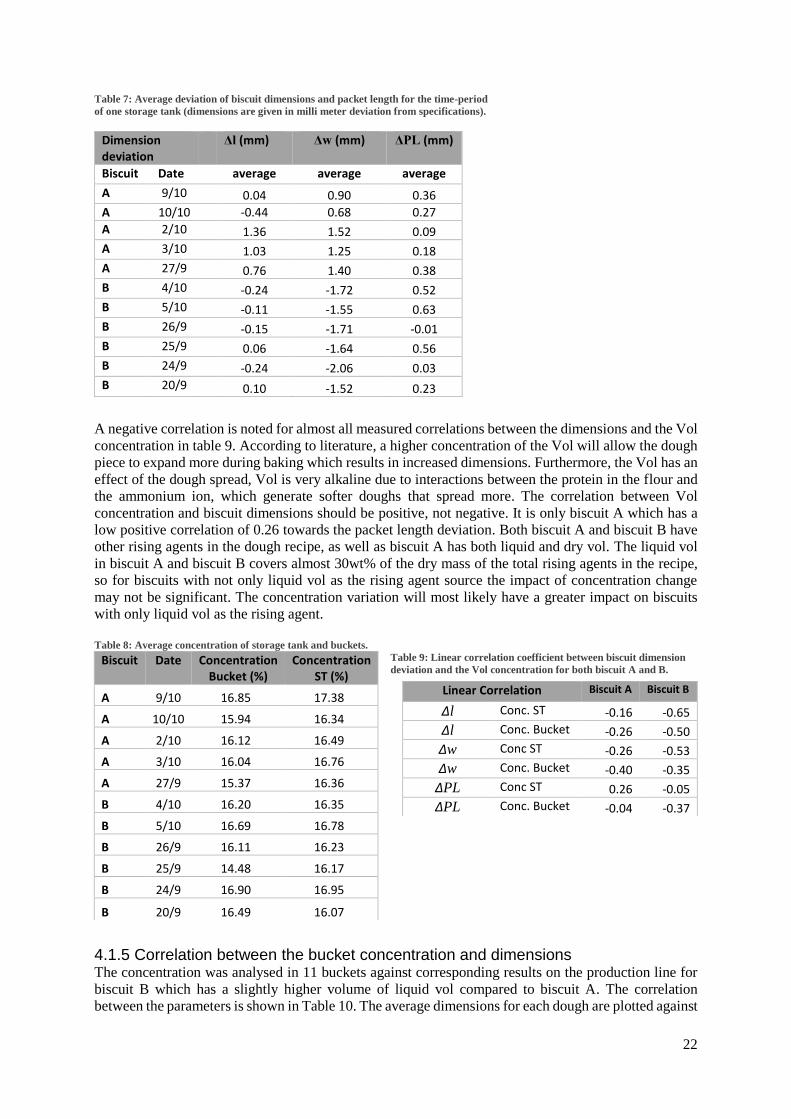
22
Table 7: Average deviation of biscuit dimensions and packet length for the time-period
of one storage tank (dimensions are given in milli meter deviation from specifications).
A negative correlation is noted for almost all measured correlations between the dimensions and the Vol
concentration in table 9. According to literature, a higher concentration of the Vol will allow the dough
piece to expand more during baking which results in increased dimensions. Furthermore, the Vol has an
effect of the dough spread, Vol is very alkaline due to interactions between the protein in the flour and
the ammonium ion, which generate softer doughs that spread more. The correlation between Vol
concentration and biscuit dimensions should be positive, not negative. It is only biscuit A which has a
low positive correlation of 0.26 towards the packet length deviation. Both biscuit A and biscuit B have
other rising agents in the dough recipe, as well as biscuit A has both liquid and dry vol. The liquid vol
in biscuit A and biscuit B covers almost 30wt% of the dry mass of the total rising agents in the recipe,
so for biscuits with not only liquid vol as the rising agent source the impact of concentration change
may not be significant. The concentration variation will most likely have a greater impact on biscuits
with only liquid vol as the rising agent.
Table 8: Average concentration of storage tank and buckets.
Table 9: Linear correlation coefficient between biscuit dimension
deviation and the Vol concentration for both biscuit A and B.
4.1.5 Correlation between the bucket concentration and dimensions The concentration was analysed in 11 buckets against corresponding results on the production line for
biscuit B which has a slightly higher volume of liquid vol compared to biscuit A. The correlation
between the parameters is shown in Table 10. The average dimensions for each dough are plotted against
Dimension deviation
Δl (mm) Δw (mm) ΔPL (mm)
Biscuit Date average average average
A 9/10 0.04 0.90 0.36
A 10/10 -0.44 0.68 0.27
A 2/10 1.36 1.52 0.09
A 3/10 1.03 1.25 0.18
A 27/9 0.76 1.40 0.38
B 4/10 -0.24 -1.72 0.52
B 5/10 -0.11 -1.55 0.63
B 26/9 -0.15 -1.71 -0.01
B 25/9 0.06 -1.64 0.56
B 24/9 -0.24 -2.06 0.03
B 20/9 0.10 -1.52 0.23
Biscuit Date Concentration Bucket (%)
Concentration ST (%)
A 9/10 16.85 17.38
A 10/10 15.94 16.34
A 2/10 16.12 16.49
A 3/10 16.04 16.76
A 27/9 15.37 16.36
B 4/10 16.20 16.35
B 5/10 16.69 16.78
B 26/9 16.11 16.23
B 25/9 14.48 16.17
B 24/9 16.90 16.95
B 20/9 16.49 16.07
Linear Correlation Biscuit A Biscuit B
Δl Conc. ST -0.16 -0.65
Δl Conc. Bucket -0.26 -0.50
Δw Conc ST -0.26 -0.53
Δw Conc. Bucket -0.40 -0.35
ΔPL Conc ST 0.26 -0.05
ΔPL Conc. Bucket -0.04 -0.37
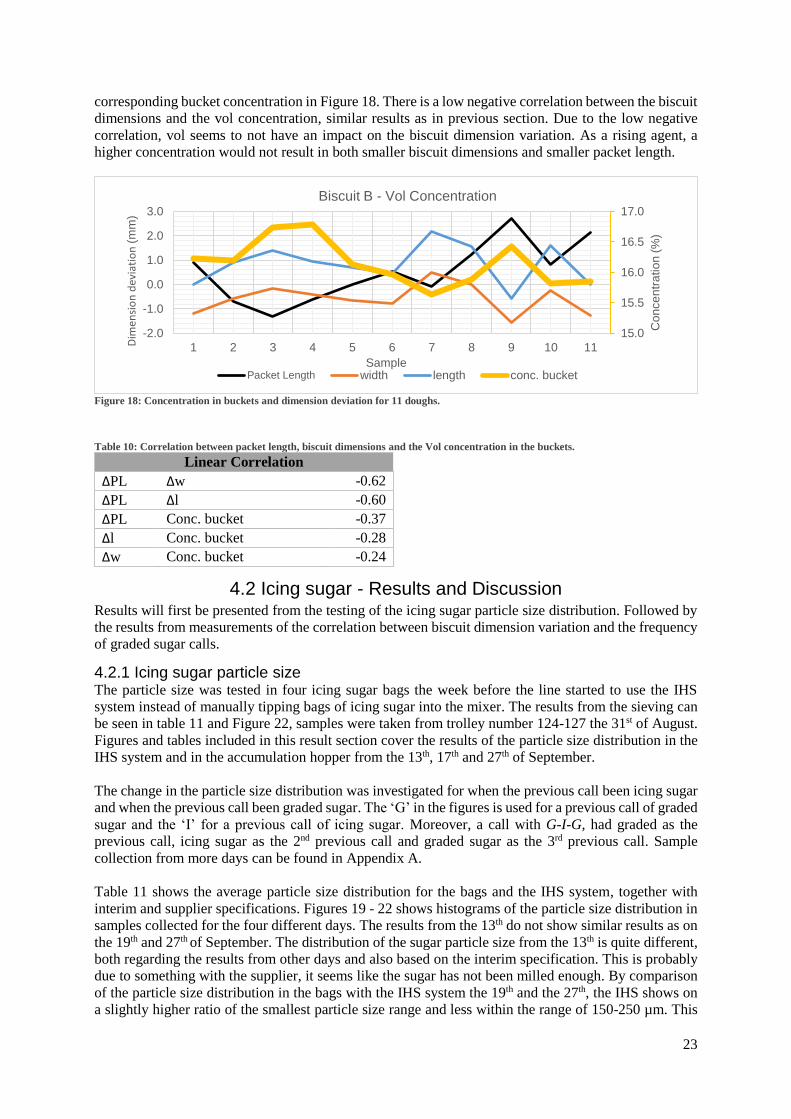
23
corresponding bucket concentration in Figure 18. There is a low negative correlation between the biscuit
dimensions and the vol concentration, similar results as in previous section. Due to the low negative
correlation, vol seems to not have an impact on the biscuit dimension variation. As a rising agent, a
higher concentration would not result in both smaller biscuit dimensions and smaller packet length.
Figure 18: Concentration in buckets and dimension deviation for 11 doughs.
Table 10: Correlation between packet length, biscuit dimensions and the Vol concentration in the buckets.
Linear Correlation
ΔPL Δw -0.62
ΔPL Δl -0.60
ΔPL Conc. bucket -0.37
Δl Conc. bucket -0.28
Δw Conc. bucket -0.24
4.2 Icing sugar - Results and Discussion Results will first be presented from the testing of the icing sugar particle size distribution. Followed by
the results from measurements of the correlation between biscuit dimension variation and the frequency
of graded sugar calls.
4.2.1 Icing sugar particle size The particle size was tested in four icing sugar bags the week before the line started to use the IHS
system instead of manually tipping bags of icing sugar into the mixer. The results from the sieving can
be seen in table 11 and Figure 22, samples were taken from trolley number 124-127 the 31st of August.
Figures and tables included in this result section cover the results of the particle size distribution in the
IHS system and in the accumulation hopper from the 13th, 17th and 27th of September.
The change in the particle size distribution was investigated for when the previous call been icing sugar
and when the previous call been graded sugar. The ‘G’ in the figures is used for a previous call of graded
sugar and the ‘I’ for a previous call of icing sugar. Moreover, a call with G-I-G, had graded as the
previous call, icing sugar as the 2nd previous call and graded sugar as the 3rd previous call. Sample
collection from more days can be found in Appendix A.
Table 11 shows the average particle size distribution for the bags and the IHS system, together with
interim and supplier specifications. Figures 19 - 22 shows histograms of the particle size distribution in
samples collected for the four different days. The results from the 13th do not show similar results as on
the 19th and 27th of September. The distribution of the sugar particle size from the 13th is quite different,
both regarding the results from other days and also based on the interim specification. This is probably
due to something with the supplier, it seems like the sugar has not been milled enough. By comparison
of the particle size distribution in the bags with the IHS system the 19th and the 27th, the IHS shows on
a slightly higher ratio of the smallest particle size range and less within the range of 150-250 µm. This
15.0
15.5
16.0
16.5
17.0
-2.0
-1.0
0.0
1.0
2.0
3.0
1 2 3 4 5 6 7 8 9 10 11
Co
nce
ntr
atio
n (
%)
Dim
ensi
on
dev
iati
on
(m
m)
Sample
Biscuit B - Vol Concentration
Packet Length width length conc. bucket
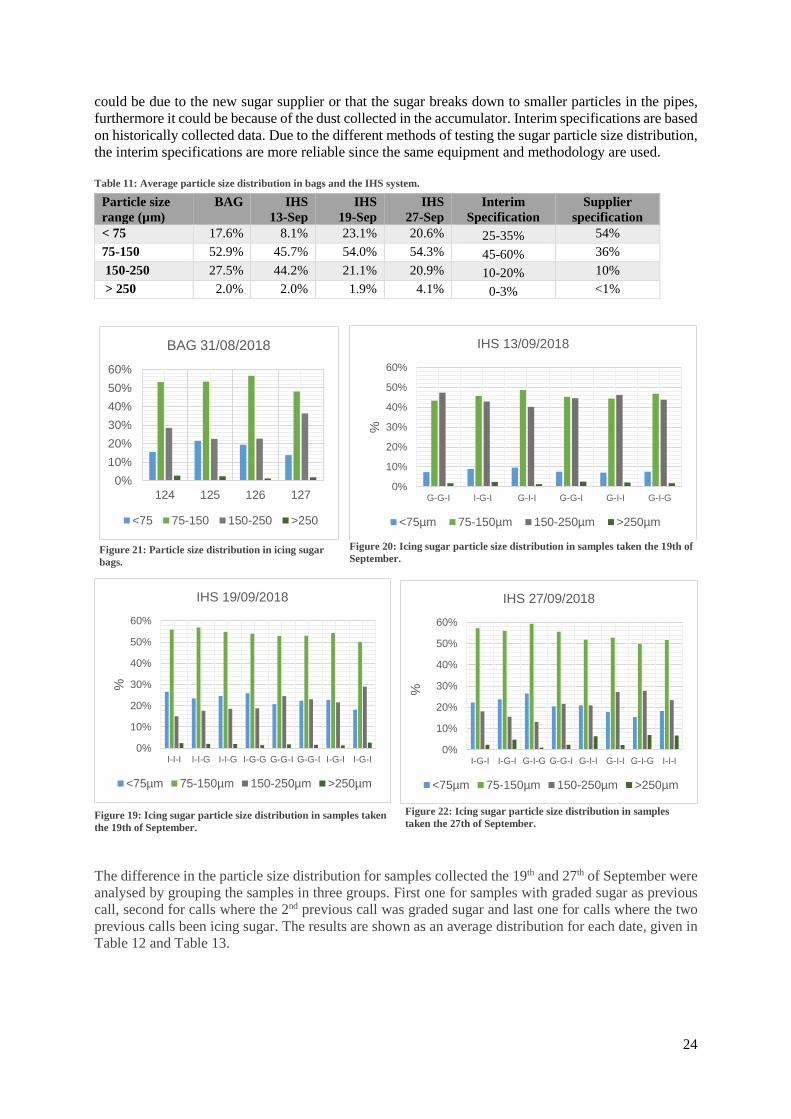
24
could be due to the new sugar supplier or that the sugar breaks down to smaller particles in the pipes,
furthermore it could be because of the dust collected in the accumulator. Interim specifications are based
on historically collected data. Due to the different methods of testing the sugar particle size distribution,
the interim specifications are more reliable since the same equipment and methodology are used.
Table 11: Average particle size distribution in bags and the IHS system.
The difference in the particle size distribution for samples collected the 19th and 27th of September were
analysed by grouping the samples in three groups. First one for samples with graded sugar as previous
call, second for calls where the 2nd previous call was graded sugar and last one for calls where the two
previous calls been icing sugar. The results are shown as an average distribution for each date, given in
Table 12 and Table 13.
Particle size
range (µm)
BAG IHS
13-Sep
IHS
19-Sep
IHS
27-Sep
Interim
Specification
Supplier
specification
< 75 17.6% 8.1% 23.1% 20.6% 25-35% 54%
75-150 52.9% 45.7% 54.0% 54.3% 45-60% 36%
150-250 27.5% 44.2% 21.1% 20.9% 10-20% 10%
> 250 2.0% 2.0% 1.9% 4.1% 0-3% <1%
0%
10%
20%
30%
40%
50%
60%
I-I-I I-I-G I-I-G I-G-G G-G-I G-G-I I-G-I I-G-I
%
IHS 19/09/2018
<75µm 75-150µm 150-250µm >250µm
0%
10%
20%
30%
40%
50%
60%
G-G-I I-G-I G-I-I G-G-I G-I-I G-I-G
%
IHS 13/09/2018
<75µm 75-150µm 150-250µm >250µm
0%
10%
20%
30%
40%
50%
60%
I-G-I I-G-I G-I-G G-G-I G-I-I G-I-I G-I-G I-I-I
%
IHS 27/09/2018
<75µm 75-150µm 150-250µm >250µm
Figure 19: Icing sugar particle size distribution in samples taken
the 19th of September.
0%
10%
20%
30%
40%
50%
60%
124 125 126 127
BAG 31/08/2018
<75 75-150 150-250 >250
Figure 22: Icing sugar particle size distribution in samples
taken the 27th of September.
Figure 20: Icing sugar particle size distribution in samples taken the 19th of
September. Figure 21: Particle size distribution in icing sugar
bags.
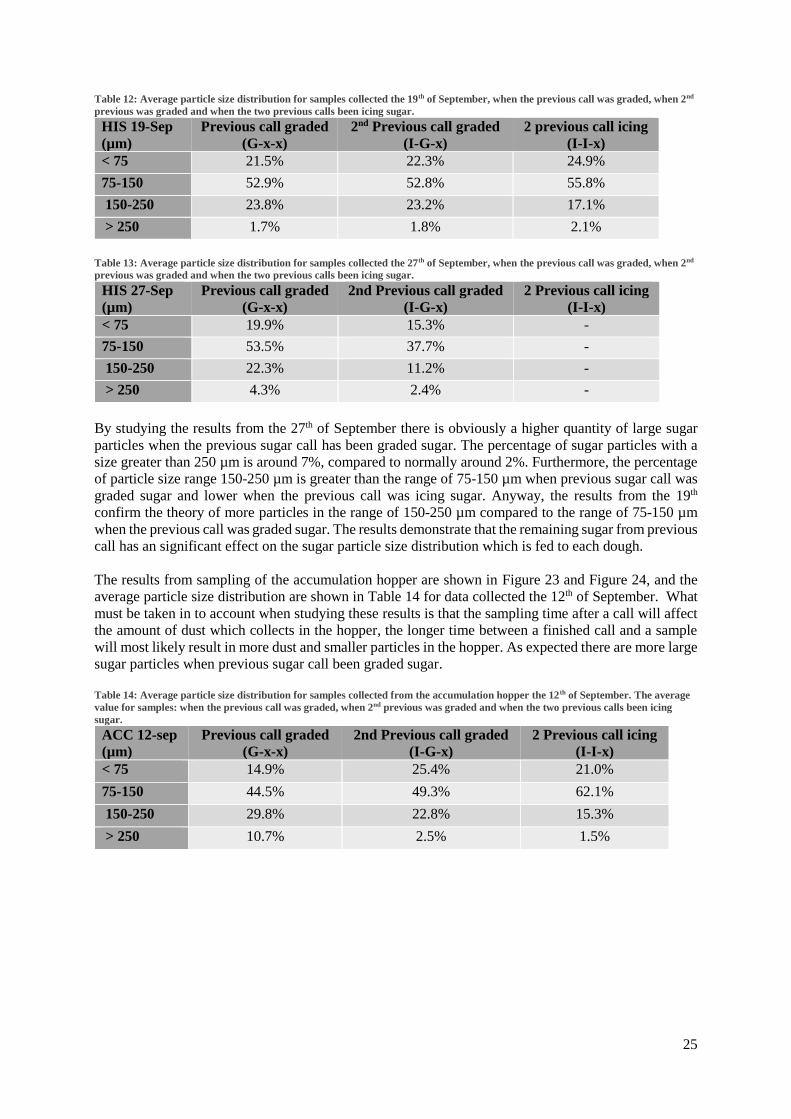
25
Table 12: Average particle size distribution for samples collected the 19th of September, when the previous call was graded, when 2nd
previous was graded and when the two previous calls been icing sugar.
HIS 19-Sep
(µm)
Previous call graded
(G-x-x)
2nd Previous call graded
(I-G-x)
2 previous call icing
(I-I-x)
< 75 21.5% 22.3% 24.9%
75-150 52.9% 52.8% 55.8%
150-250 23.8% 23.2% 17.1%
> 250 1.7% 1.8% 2.1%
Table 13: Average particle size distribution for samples collected the 27th of September, when the previous call was graded, when 2nd
previous was graded and when the two previous calls been icing sugar.
HIS 27-Sep
(µm)
Previous call graded
(G-x-x)
2nd Previous call graded
(I-G-x)
2 Previous call icing
(I-I-x)
< 75 19.9% 15.3% -
75-150 53.5% 37.7% -
150-250 22.3% 11.2% -
> 250 4.3% 2.4% -
By studying the results from the 27th of September there is obviously a higher quantity of large sugar
particles when the previous sugar call has been graded sugar. The percentage of sugar particles with a
size greater than 250 µm is around 7%, compared to normally around 2%. Furthermore, the percentage
of particle size range 150-250 µm is greater than the range of 75-150 µm when previous sugar call was
graded sugar and lower when the previous call was icing sugar. Anyway, the results from the 19th
confirm the theory of more particles in the range of 150-250 µm compared to the range of 75-150 µm
when the previous call was graded sugar. The results demonstrate that the remaining sugar from previous
call has an significant effect on the sugar particle size distribution which is fed to each dough.
The results from sampling of the accumulation hopper are shown in Figure 23 and Figure 24, and the
average particle size distribution are shown in Table 14 for data collected the 12th of September. What
must be taken in to account when studying these results is that the sampling time after a call will affect
the amount of dust which collects in the hopper, the longer time between a finished call and a sample
will most likely result in more dust and smaller particles in the hopper. As expected there are more large
sugar particles when previous sugar call been graded sugar.
Table 14: Average particle size distribution for samples collected from the accumulation hopper the 12th of September. The average
value for samples: when the previous call was graded, when 2nd previous was graded and when the two previous calls been icing
sugar.
ACC 12-sep
(µm)
Previous call graded
(G-x-x)
2nd Previous call graded
(I-G-x)
2 Previous call icing
(I-I-x)
< 75 14.9% 25.4% 21.0%
75-150 44.5% 49.3% 62.1%
150-250 29.8% 22.8% 15.3%
> 250 10.7% 2.5% 1.5%
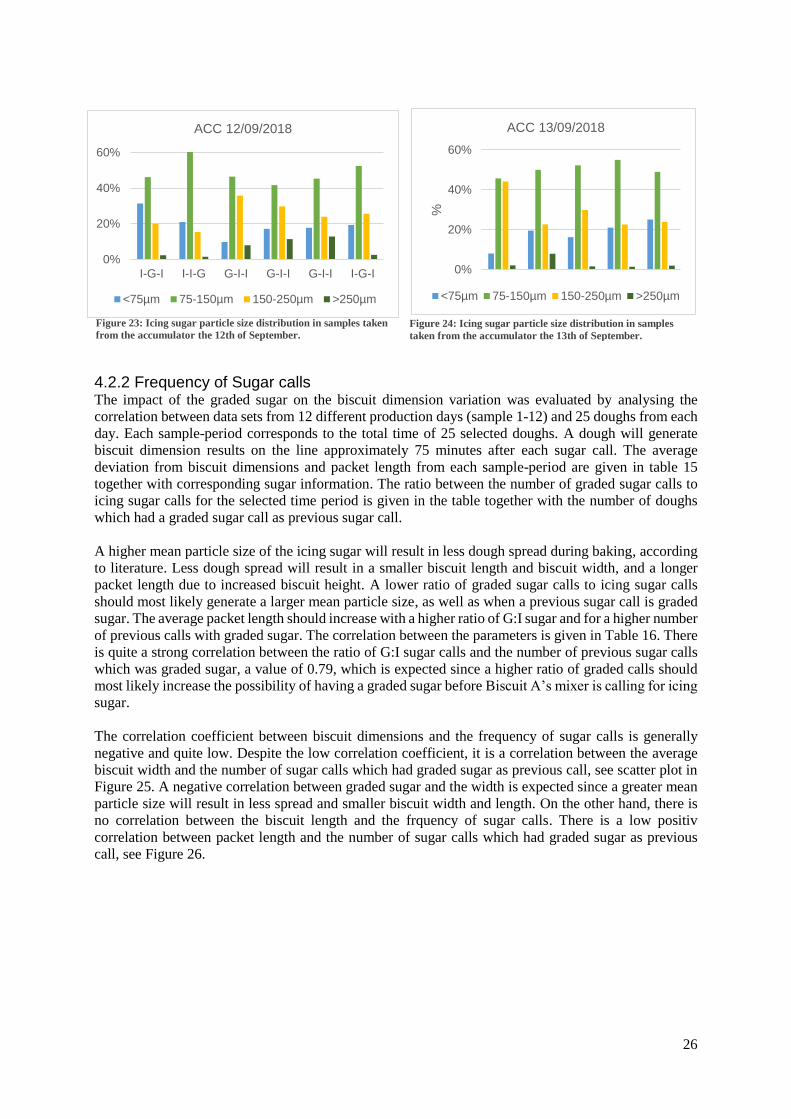
26
4.2.2 Frequency of Sugar calls The impact of the graded sugar on the biscuit dimension variation was evaluated by analysing the
correlation between data sets from 12 different production days (sample 1-12) and 25 doughs from each
day. Each sample-period corresponds to the total time of 25 selected doughs. A dough will generate
biscuit dimension results on the line approximately 75 minutes after each sugar call. The average
deviation from biscuit dimensions and packet length from each sample-period are given in table 15
together with corresponding sugar information. The ratio between the number of graded sugar calls to
icing sugar calls for the selected time period is given in the table together with the number of doughs
which had a graded sugar call as previous sugar call.
A higher mean particle size of the icing sugar will result in less dough spread during baking, according
to literature. Less dough spread will result in a smaller biscuit length and biscuit width, and a longer
packet length due to increased biscuit height. A lower ratio of graded sugar calls to icing sugar calls
should most likely generate a larger mean particle size, as well as when a previous sugar call is graded
sugar. The average packet length should increase with a higher ratio of G:I sugar and for a higher number
of previous calls with graded sugar. The correlation between the parameters is given in Table 16. There
is quite a strong correlation between the ratio of G:I sugar calls and the number of previous sugar calls
which was graded sugar, a value of 0.79, which is expected since a higher ratio of graded calls should
most likely increase the possibility of having a graded sugar before Biscuit A’s mixer is calling for icing
sugar.
The correlation coefficient between biscuit dimensions and the frequency of sugar calls is generally
negative and quite low. Despite the low correlation coefficient, it is a correlation between the average
biscuit width and the number of sugar calls which had graded sugar as previous call, see scatter plot in
Figure 25. A negative correlation between graded sugar and the width is expected since a greater mean
particle size will result in less spread and smaller biscuit width and length. On the other hand, there is
no correlation between the biscuit length and the frquency of sugar calls. There is a low positiv
correlation between packet length and the number of sugar calls which had graded sugar as previous
call, see Figure 26.
Figure 23: Icing sugar particle size distribution in samples taken
from the accumulator the 12th of September. Figure 24: Icing sugar particle size distribution in samples
taken from the accumulator the 13th of September.
0%
20%
40%
60%
%
ACC 13/09/2018
<75µm 75-150µm 150-250µm >250µm
0%
20%
40%
60%
I-G-I I-I-G G-I-I G-I-I G-I-I I-G-I
ACC 12/09/2018
<75µm 75-150µm 150-250µm >250µm
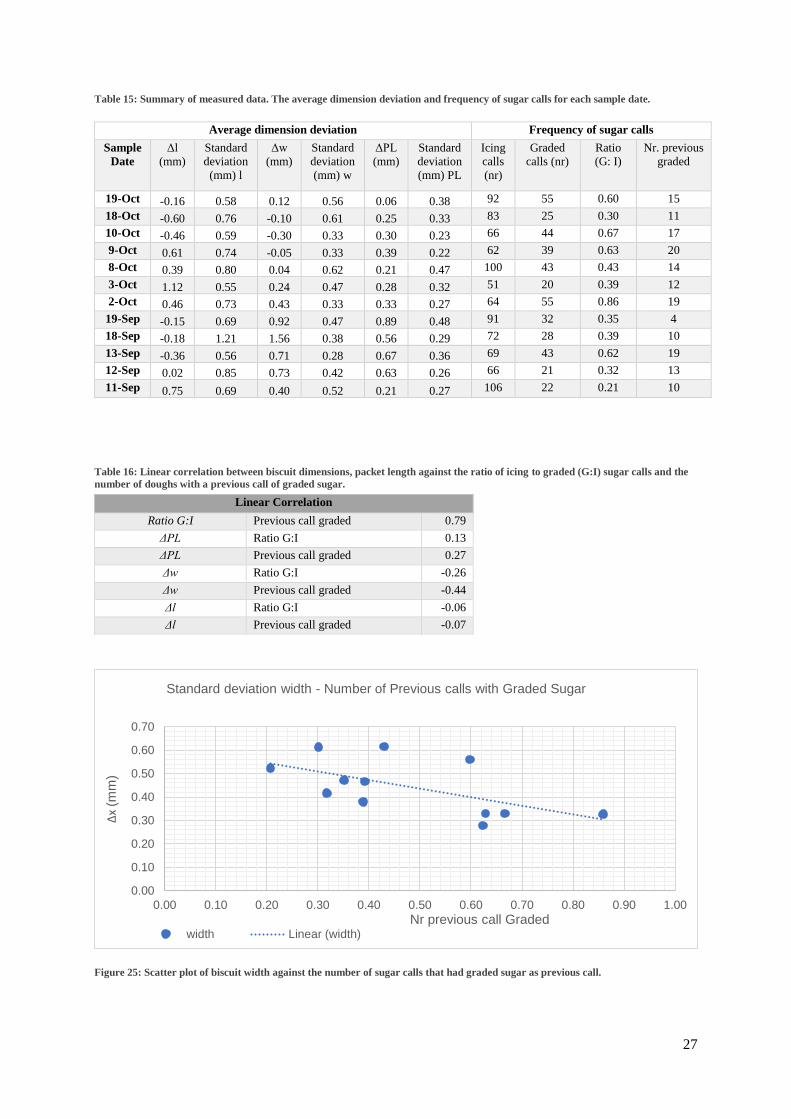
27
Table 15: Summary of measured data. The average dimension deviation and frequency of sugar calls for each sample date.
Average dimension deviation Frequency of sugar calls
Sample
Date
Δl
(mm)
Standard
deviation
(mm) l
Δw
(mm)
Standard
deviation
(mm) w
ΔPL
(mm)
Standard
deviation
(mm) PL
Icing
calls
(nr)
Graded
calls (nr)
Ratio
(G: I)
Nr. previous
graded
19-Oct -0.16 0.58 0.12 0.56 0.06 0.38 92 55 0.60 15
18-Oct -0.60 0.76 -0.10 0.61 0.25 0.33 83 25 0.30 11
10-Oct -0.46 0.59 -0.30 0.33 0.30 0.23 66 44 0.67 17
9-Oct 0.61 0.74 -0.05 0.33 0.39 0.22 62 39 0.63 20
8-Oct 0.39 0.80 0.04 0.62 0.21 0.47 100 43 0.43 14
3-Oct 1.12 0.55 0.24 0.47 0.28 0.32 51 20 0.39 12
2-Oct 0.46 0.73 0.43 0.33 0.33 0.27 64 55 0.86 19
19-Sep -0.15 0.69 0.92 0.47 0.89 0.48 91 32 0.35 4
18-Sep -0.18 1.21 1.56 0.38 0.56 0.29 72 28 0.39 10
13-Sep -0.36 0.56 0.71 0.28 0.67 0.36 69 43 0.62 19
12-Sep 0.02 0.85 0.73 0.42 0.63 0.26 66 21 0.32 13
11-Sep 0.75 0.69 0.40 0.52 0.21 0.27 106 22 0.21 10
Table 16: Linear correlation between biscuit dimensions, packet length against the ratio of icing to graded (G:I) sugar calls and the
number of doughs with a previous call of graded sugar.
Figure 25: Scatter plot of biscuit width against the number of sugar calls that had graded sugar as previous call.
Linear Correlation
Ratio G:I Previous call graded 0.79
ΔPL Ratio G:I 0.13
ΔPL Previous call graded 0.27
Δw Ratio G:I -0.26
Δw Previous call graded -0.44
Δl Ratio G:I -0.06
Δl Previous call graded -0.07
0.00
0.10
0.20
0.30
0.40
0.50
0.60
0.70
0.00 0.10 0.20 0.30 0.40 0.50 0.60 0.70 0.80 0.90 1.00
Δx
(mm
)
Nr previous call Graded
Standard deviation width - Number of Previous calls with Graded Sugar
width Linear (width)
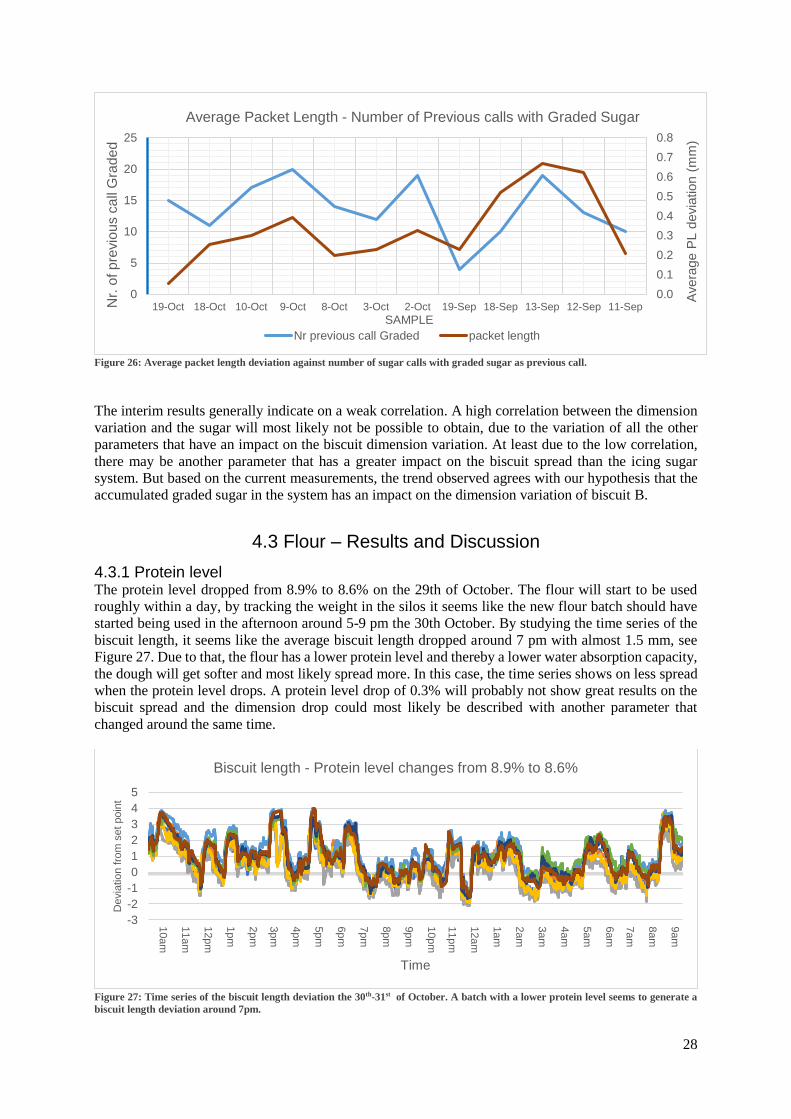
28
Figure 26: Average packet length deviation against number of sugar calls with graded sugar as previous call.
The interim results generally indicate on a weak correlation. A high correlation between the dimension
variation and the sugar will most likely not be possible to obtain, due to the variation of all the other
parameters that have an impact on the biscuit dimension variation. At least due to the low correlation,
there may be another parameter that has a greater impact on the biscuit spread than the icing sugar
system. But based on the current measurements, the trend observed agrees with our hypothesis that the
accumulated graded sugar in the system has an impact on the dimension variation of biscuit B.
4.3 Flour – Results and Discussion
4.3.1 Protein level The protein level dropped from 8.9% to 8.6% on the 29th of October. The flour will start to be used
roughly within a day, by tracking the weight in the silos it seems like the new flour batch should have
started being used in the afternoon around 5-9 pm the 30th October. By studying the time series of the
biscuit length, it seems like the average biscuit length dropped around 7 pm with almost 1.5 mm, see
Figure 27. Due to that, the flour has a lower protein level and thereby a lower water absorption capacity,
the dough will get softer and most likely spread more. In this case, the time series shows on less spread
when the protein level drops. A protein level drop of 0.3% will probably not show great results on the
biscuit spread and the dimension drop could most likely be described with another parameter that
changed around the same time.
Figure 27: Time series of the biscuit length deviation the 30th-31st of October. A batch with a lower protein level seems to generate a
biscuit length deviation around 7pm.
0.0
0.1
0.2
0.3
0.4
0.5
0.6
0.7
0.8
0
5
10
15
20
25
19-Oct 18-Oct 10-Oct 9-Oct 8-Oct 3-Oct 2-Oct 19-Sep 18-Sep 13-Sep 12-Sep 11-Sep
Avera
ge P
L d
evia
tion (
mm
)
Nr.
of p
revio
us c
all
Gra
de
d
SAMPLE
Average Packet Length - Number of Previous calls with Graded Sugar
Nr previous call Graded packet length
-3
-2
-1
0
1
2
3
4
5
10am
11am
12pm
1pm
2pm
3pm
4pm
5pm
6pm
7pm
8pm
9pm
10pm
11pm
12am
1am
2am
3am
4am
5am
6am
7am
8am
9am
Devia
tio
n fro
m s
et poin
t
Time
Biscuit length - Protein level changes from 8.9% to 8.6%
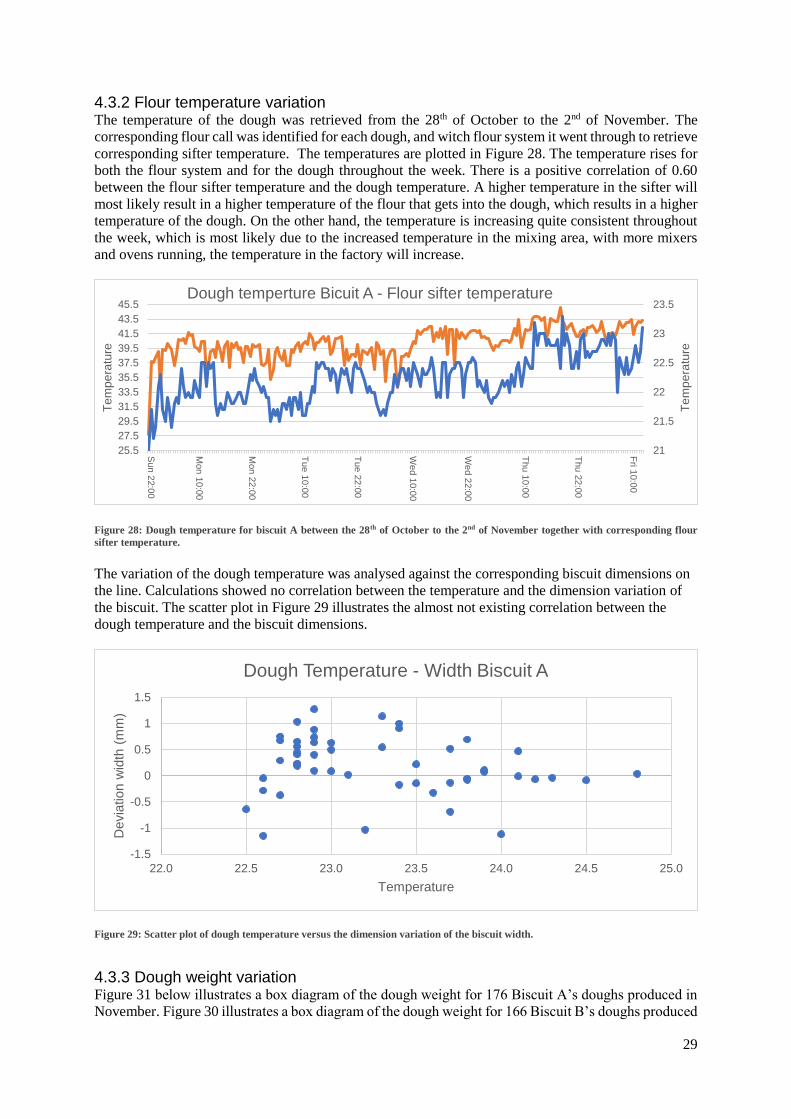
29
4.3.2 Flour temperature variation The temperature of the dough was retrieved from the 28th of October to the 2nd of November. The
corresponding flour call was identified for each dough, and witch flour system it went through to retrieve
corresponding sifter temperature. The temperatures are plotted in Figure 28. The temperature rises for
both the flour system and for the dough throughout the week. There is a positive correlation of 0.60
between the flour sifter temperature and the dough temperature. A higher temperature in the sifter will
most likely result in a higher temperature of the flour that gets into the dough, which results in a higher
temperature of the dough. On the other hand, the temperature is increasing quite consistent throughout
the week, which is most likely due to the increased temperature in the mixing area, with more mixers
and ovens running, the temperature in the factory will increase.
Figure 28: Dough temperature for biscuit A between the 28th of October to the 2nd of November together with corresponding flour
sifter temperature.
The variation of the dough temperature was analysed against the corresponding biscuit dimensions on
the line. Calculations showed no correlation between the temperature and the dimension variation of
the biscuit. The scatter plot in Figure 29 illustrates the almost not existing correlation between the
dough temperature and the biscuit dimensions.
Figure 29: Scatter plot of dough temperature versus the dimension variation of the biscuit width.
4.3.3 Dough weight variation Figure 31 below illustrates a box diagram of the dough weight for 176 Biscuit A’s doughs produced in
November. Figure 30 illustrates a box diagram of the dough weight for 166 Biscuit B’s doughs produced
21
21.5
22
22.5
23
23.5
25.5
27.5
29.5
31.5
33.5
35.5
37.5
39.5
41.5
43.5
45.5
Sun
22:0
0
Mon
10
:00
Mon
22
:00
Tue
10
:00
Tue
22
:00
We
d 1
0:0
0
We
d 2
2:0
0
Thu
10
:00
Thu
22
:00
Fri 1
0:0
0
Te
mp
era
ture
Te
mp
era
ture
Dough temperture Bicuit A - Flour sifter temperature
-1.5
-1
-0.5
0
0.5
1
1.5
22.0 22.5 23.0 23.5 24.0 24.5 25.0
Devia
tion w
idth
(m
m)
Temperature
Dough Temperature - Width Biscuit A
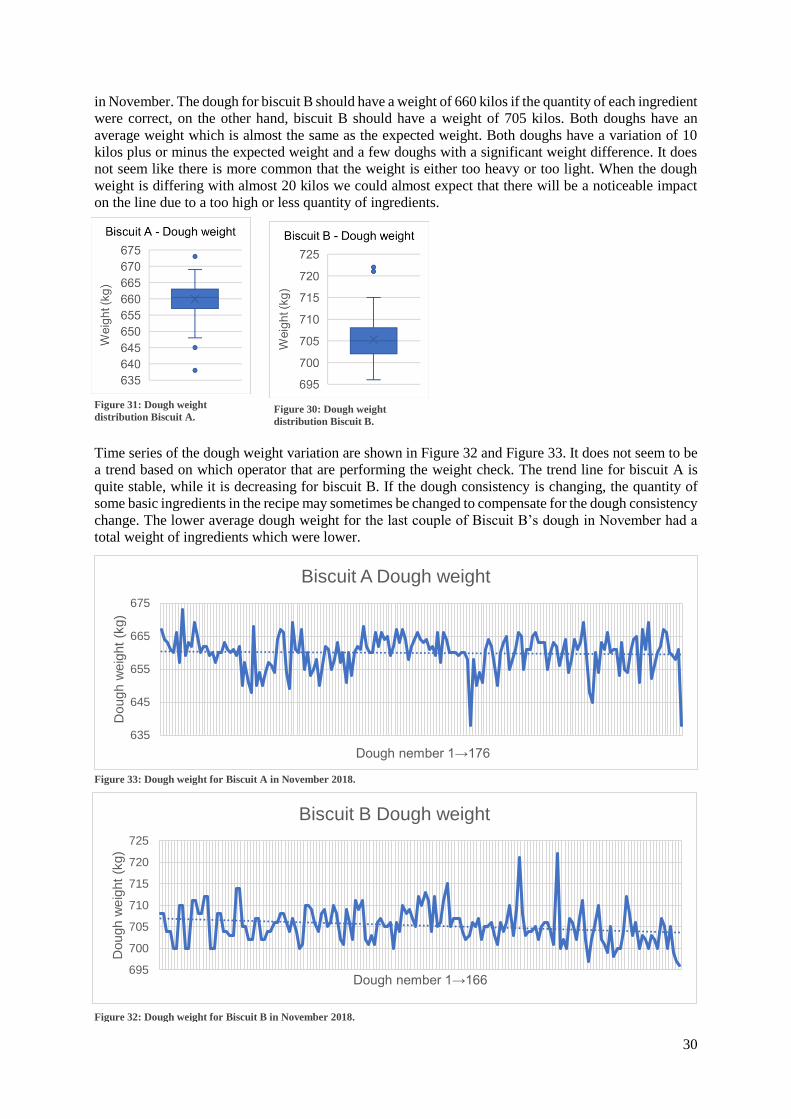
30
in November. The dough for biscuit B should have a weight of 660 kilos if the quantity of each ingredient
were correct, on the other hand, biscuit B should have a weight of 705 kilos. Both doughs have an
average weight which is almost the same as the expected weight. Both doughs have a variation of 10
kilos plus or minus the expected weight and a few doughs with a significant weight difference. It does
not seem like there is more common that the weight is either too heavy or too light. When the dough
weight is differing with almost 20 kilos we could almost expect that there will be a noticeable impact
on the line due to a too high or less quantity of ingredients.
Time series of the dough weight variation are shown in Figure 32 and Figure 33. It does not seem to be
a trend based on which operator that are performing the weight check. The trend line for biscuit A is
quite stable, while it is decreasing for biscuit B. If the dough consistency is changing, the quantity of
some basic ingredients in the recipe may sometimes be changed to compensate for the dough consistency
change. The lower average dough weight for the last couple of Biscuit B’s dough in November had a
total weight of ingredients which were lower.
Figure 31: Dough weight
distribution Biscuit A. Figure 30: Dough weight
distribution Biscuit B.
695
700
705
710
715
720
725
Dough w
eig
ht
(kg)
Dough nember 1→166
Biscuit B Dough weight
635
645
655
665
675
Dough w
eig
ht
(kg)
Dough nember 1→176
Biscuit A Dough weight
Figure 32: Dough weight for Biscuit B in November 2018.
Figure 33: Dough weight for Biscuit A in November 2018.
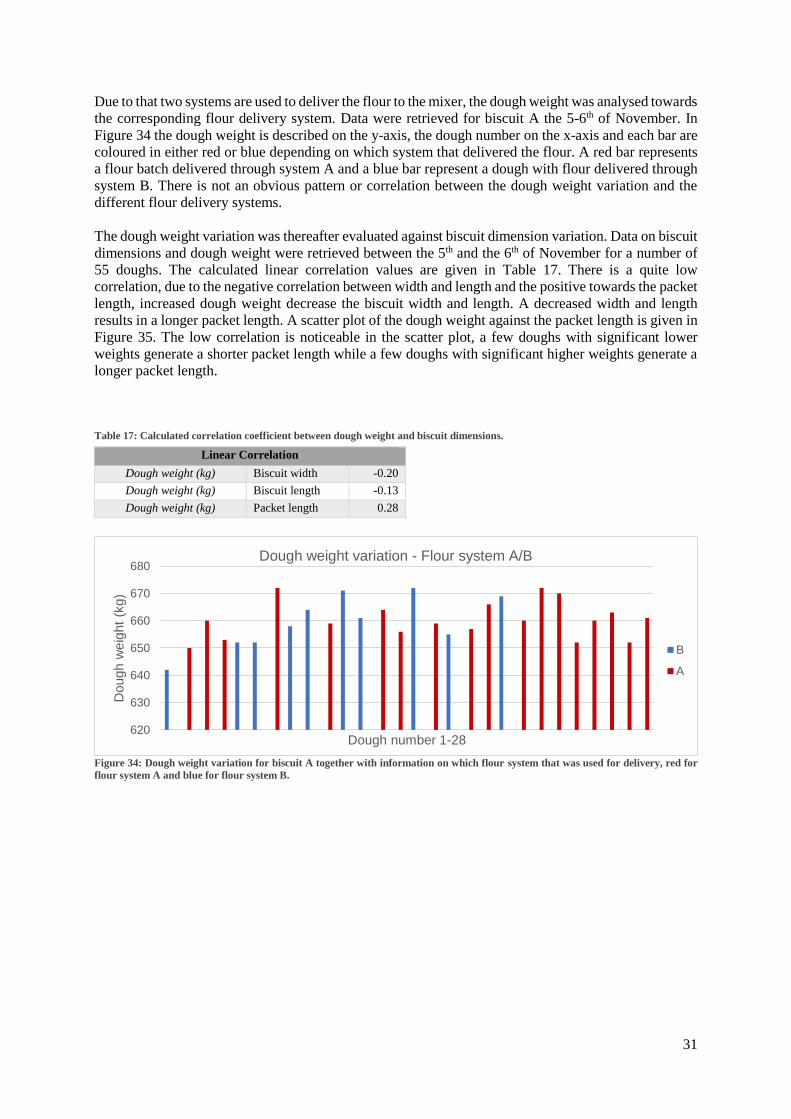
31
Due to that two systems are used to deliver the flour to the mixer, the dough weight was analysed towards
the corresponding flour delivery system. Data were retrieved for biscuit A the 5-6th of November. In
Figure 34 the dough weight is described on the y-axis, the dough number on the x-axis and each bar are
coloured in either red or blue depending on which system that delivered the flour. A red bar represents
a flour batch delivered through system A and a blue bar represent a dough with flour delivered through
system B. There is not an obvious pattern or correlation between the dough weight variation and the
different flour delivery systems.
The dough weight variation was thereafter evaluated against biscuit dimension variation. Data on biscuit
dimensions and dough weight were retrieved between the 5th and the 6th of November for a number of
55 doughs. The calculated linear correlation values are given in Table 17. There is a quite low
correlation, due to the negative correlation between width and length and the positive towards the packet
length, increased dough weight decrease the biscuit width and length. A decreased width and length
results in a longer packet length. A scatter plot of the dough weight against the packet length is given in
Figure 35. The low correlation is noticeable in the scatter plot, a few doughs with significant lower
weights generate a shorter packet length while a few doughs with significant higher weights generate a
longer packet length.
Table 17: Calculated correlation coefficient between dough weight and biscuit dimensions.
Figure 34: Dough weight variation for biscuit A together with information on which flour system that was used for delivery, red for
flour system A and blue for flour system B.
Linear Correlation
Dough weight (kg) Biscuit width -0.20
Dough weight (kg) Biscuit length -0.13
Dough weight (kg) Packet length 0.28
620
630
640
650
660
670
680
Dough w
eig
ht
(kg)
Dough number 1-28
Dough weight variation - Flour system A/B
B
A
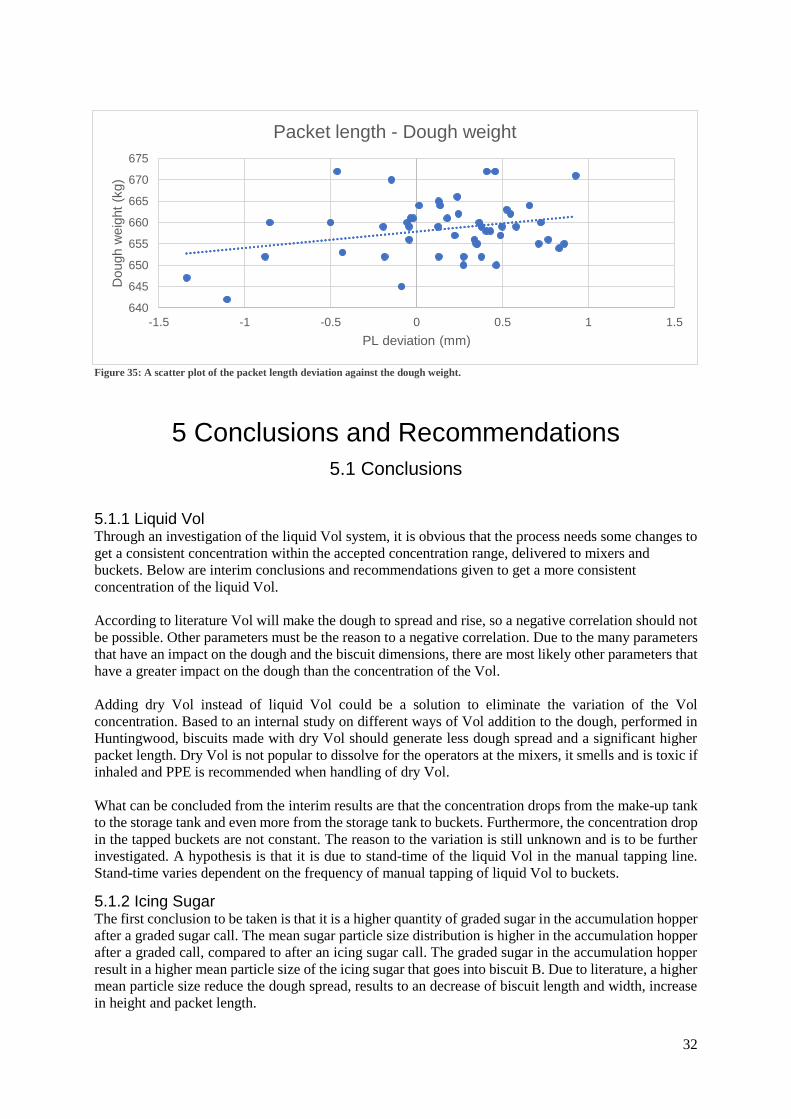
32
Figure 35: A scatter plot of the packet length deviation against the dough weight.
5 Conclusions and Recommendations
5.1 Conclusions
5.1.1 Liquid Vol Through an investigation of the liquid Vol system, it is obvious that the process needs some changes to
get a consistent concentration within the accepted concentration range, delivered to mixers and
buckets. Below are interim conclusions and recommendations given to get a more consistent
concentration of the liquid Vol.
According to literature Vol will make the dough to spread and rise, so a negative correlation should not
be possible. Other parameters must be the reason to a negative correlation. Due to the many parameters
that have an impact on the dough and the biscuit dimensions, there are most likely other parameters that
have a greater impact on the dough than the concentration of the Vol.
Adding dry Vol instead of liquid Vol could be a solution to eliminate the variation of the Vol
concentration. Based to an internal study on different ways of Vol addition to the dough, performed in
Huntingwood, biscuits made with dry Vol should generate less dough spread and a significant higher
packet length. Dry Vol is not popular to dissolve for the operators at the mixers, it smells and is toxic if
inhaled and PPE is recommended when handling of dry Vol.
What can be concluded from the interim results are that the concentration drops from the make-up tank
to the storage tank and even more from the storage tank to buckets. Furthermore, the concentration drop
in the tapped buckets are not constant. The reason to the variation is still unknown and is to be further
investigated. A hypothesis is that it is due to stand-time of the liquid Vol in the manual tapping line.
Stand-time varies dependent on the frequency of manual tapping of liquid Vol to buckets.
5.1.2 Icing Sugar The first conclusion to be taken is that it is a higher quantity of graded sugar in the accumulation hopper
after a graded sugar call. The mean sugar particle size distribution is higher in the accumulation hopper
after a graded call, compared to after an icing sugar call. The graded sugar in the accumulation hopper
result in a higher mean particle size of the icing sugar that goes into biscuit B. Due to literature, a higher
mean particle size reduce the dough spread, results to an decrease of biscuit length and width, increase
in height and packet length.
640
645
650
655
660
665
670
675
-1.5 -1 -0.5 0 0.5 1 1.5
Dough w
eig
ht
(kg)
PL deviation (mm)
Packet length - Dough weight
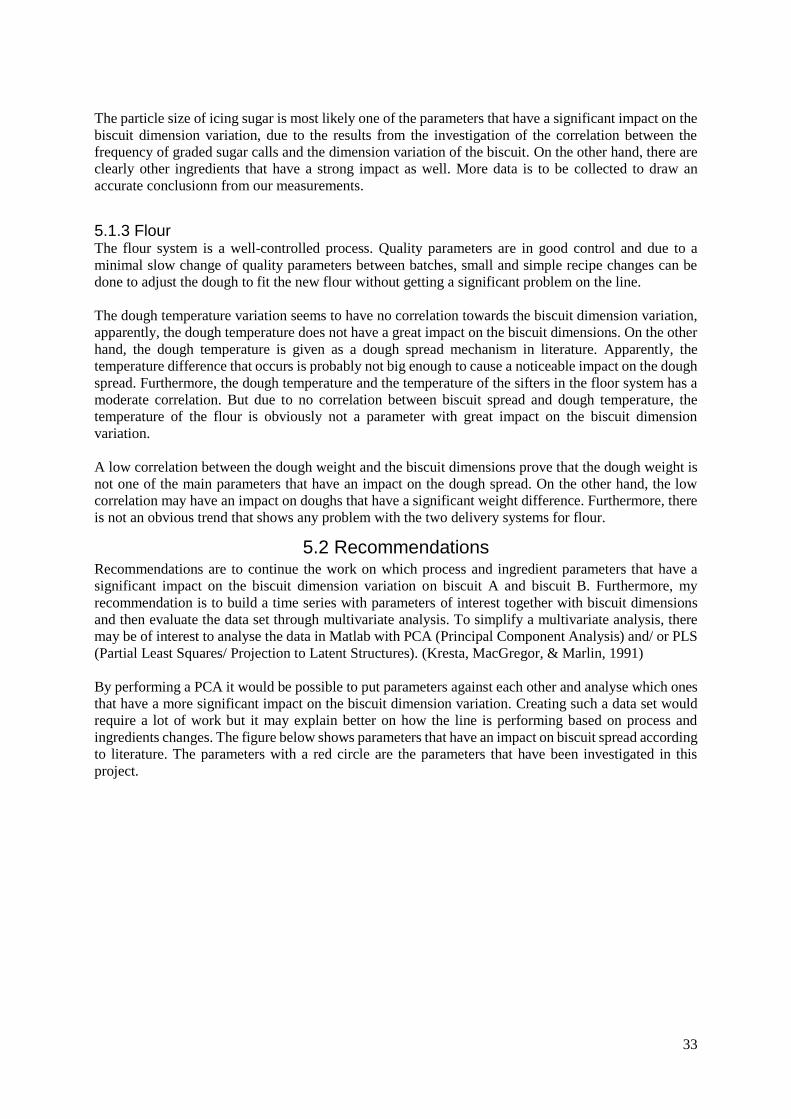
33
The particle size of icing sugar is most likely one of the parameters that have a significant impact on the
biscuit dimension variation, due to the results from the investigation of the correlation between the
frequency of graded sugar calls and the dimension variation of the biscuit. On the other hand, there are
clearly other ingredients that have a strong impact as well. More data is to be collected to draw an
accurate conclusionn from our measurements.
5.1.3 Flour The flour system is a well-controlled process. Quality parameters are in good control and due to a
minimal slow change of quality parameters between batches, small and simple recipe changes can be
done to adjust the dough to fit the new flour without getting a significant problem on the line.
The dough temperature variation seems to have no correlation towards the biscuit dimension variation,
apparently, the dough temperature does not have a great impact on the biscuit dimensions. On the other
hand, the dough temperature is given as a dough spread mechanism in literature. Apparently, the
temperature difference that occurs is probably not big enough to cause a noticeable impact on the dough
spread. Furthermore, the dough temperature and the temperature of the sifters in the floor system has a
moderate correlation. But due to no correlation between biscuit spread and dough temperature, the
temperature of the flour is obviously not a parameter with great impact on the biscuit dimension
variation.
A low correlation between the dough weight and the biscuit dimensions prove that the dough weight is
not one of the main parameters that have an impact on the dough spread. On the other hand, the low
correlation may have an impact on doughs that have a significant weight difference. Furthermore, there
is not an obvious trend that shows any problem with the two delivery systems for flour.
5.2 Recommendations Recommendations are to continue the work on which process and ingredient parameters that have a
significant impact on the biscuit dimension variation on biscuit A and biscuit B. Furthermore, my
recommendation is to build a time series with parameters of interest together with biscuit dimensions
and then evaluate the data set through multivariate analysis. To simplify a multivariate analysis, there
may be of interest to analyse the data in Matlab with PCA (Principal Component Analysis) and/ or PLS
(Partial Least Squares/ Projection to Latent Structures). (Kresta, MacGregor, & Marlin, 1991)
By performing a PCA it would be possible to put parameters against each other and analyse which ones
that have a more significant impact on the biscuit dimension variation. Creating such a data set would
require a lot of work but it may explain better on how the line is performing based on process and
ingredients changes. The figure below shows parameters that have an impact on biscuit spread according
to literature. The parameters with a red circle are the parameters that have been investigated in this
project.
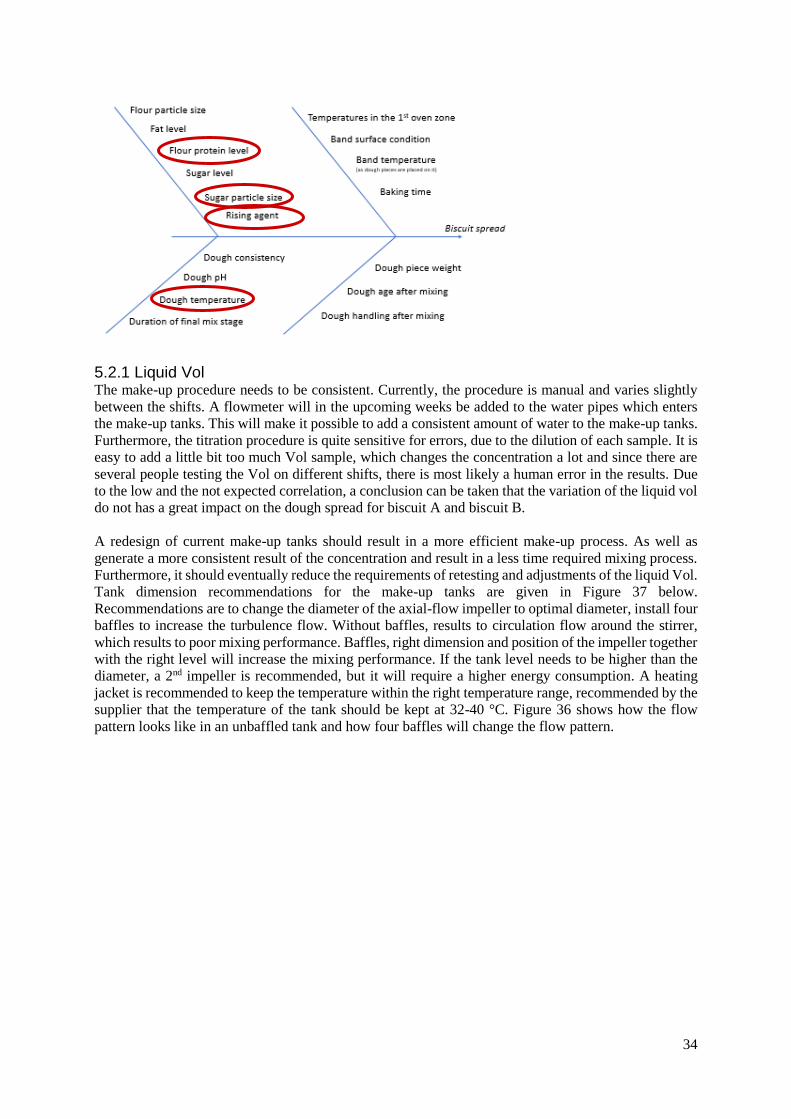
34
5.2.1 Liquid Vol The make-up procedure needs to be consistent. Currently, the procedure is manual and varies slightly
between the shifts. A flowmeter will in the upcoming weeks be added to the water pipes which enters
the make-up tanks. This will make it possible to add a consistent amount of water to the make-up tanks.
Furthermore, the titration procedure is quite sensitive for errors, due to the dilution of each sample. It is
easy to add a little bit too much Vol sample, which changes the concentration a lot and since there are
several people testing the Vol on different shifts, there is most likely a human error in the results. Due
to the low and the not expected correlation, a conclusion can be taken that the variation of the liquid vol
do not has a great impact on the dough spread for biscuit A and biscuit B.
A redesign of current make-up tanks should result in a more efficient make-up process. As well as
generate a more consistent result of the concentration and result in a less time required mixing process.
Furthermore, it should eventually reduce the requirements of retesting and adjustments of the liquid Vol.
Tank dimension recommendations for the make-up tanks are given in Figure 37 below.
Recommendations are to change the diameter of the axial-flow impeller to optimal diameter, install four
baffles to increase the turbulence flow. Without baffles, results to circulation flow around the stirrer,
which results to poor mixing performance. Baffles, right dimension and position of the impeller together
with the right level will increase the mixing performance. If the tank level needs to be higher than the
diameter, a 2nd impeller is recommended, but it will require a higher energy consumption. A heating
jacket is recommended to keep the temperature within the right temperature range, recommended by the
supplier that the temperature of the tank should be kept at 32-40 °C. Figure 36 shows how the flow
pattern looks like in an unbaffled tank and how four baffles will change the flow pattern.
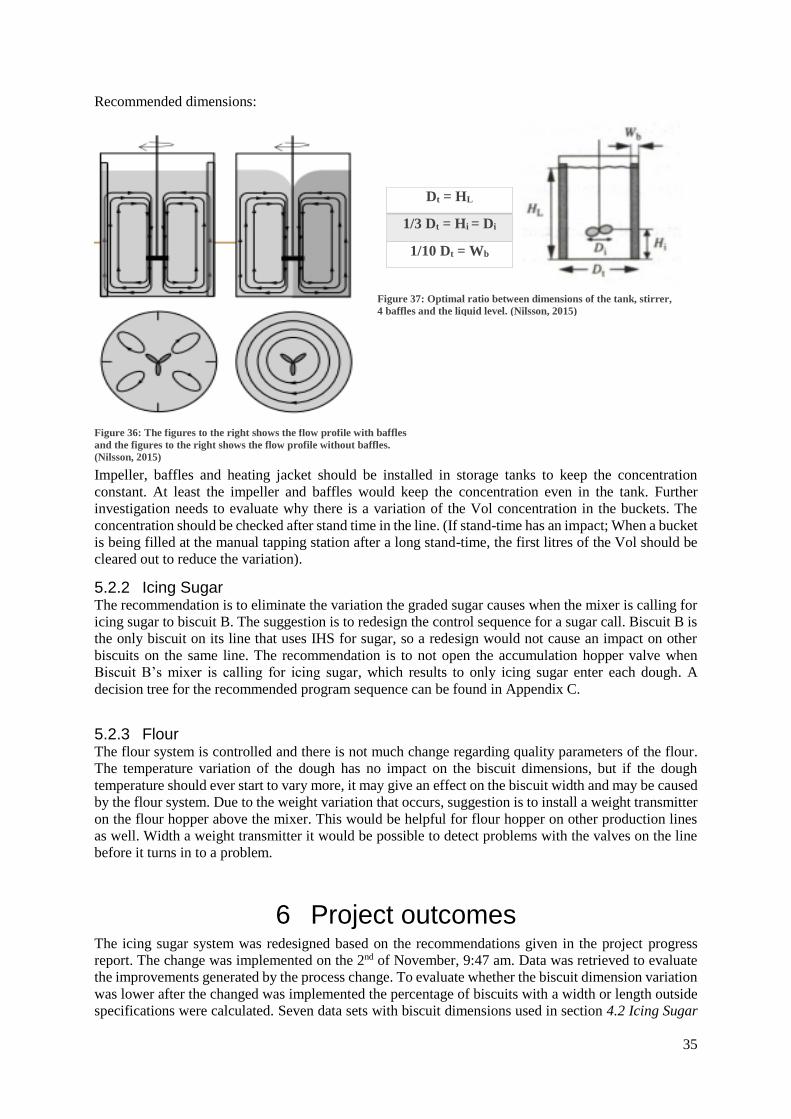
35
Recommended dimensions:
Impeller, baffles and heating jacket should be installed in storage tanks to keep the concentration
constant. At least the impeller and baffles would keep the concentration even in the tank. Further
investigation needs to evaluate why there is a variation of the Vol concentration in the buckets. The
concentration should be checked after stand time in the line. (If stand-time has an impact; When a bucket
is being filled at the manual tapping station after a long stand-time, the first litres of the Vol should be
cleared out to reduce the variation).
5.2.2 Icing Sugar The recommendation is to eliminate the variation the graded sugar causes when the mixer is calling for
icing sugar to biscuit B. The suggestion is to redesign the control sequence for a sugar call. Biscuit B is
the only biscuit on its line that uses IHS for sugar, so a redesign would not cause an impact on other
biscuits on the same line. The recommendation is to not open the accumulation hopper valve when
Biscuit B’s mixer is calling for icing sugar, which results to only icing sugar enter each dough. A
decision tree for the recommended program sequence can be found in Appendix C.
5.2.3 Flour The flour system is controlled and there is not much change regarding quality parameters of the flour.
The temperature variation of the dough has no impact on the biscuit dimensions, but if the dough
temperature should ever start to vary more, it may give an effect on the biscuit width and may be caused
by the flour system. Due to the weight variation that occurs, suggestion is to install a weight transmitter
on the flour hopper above the mixer. This would be helpful for flour hopper on other production lines
as well. Width a weight transmitter it would be possible to detect problems with the valves on the line
before it turns in to a problem.
6 Project outcomes The icing sugar system was redesigned based on the recommendations given in the project progress
report. The change was implemented on the 2nd of November, 9:47 am. Data was retrieved to evaluate
the improvements generated by the process change. To evaluate whether the biscuit dimension variation
was lower after the changed was implemented the percentage of biscuits with a width or length outside
specifications were calculated. Seven data sets with biscuit dimensions used in section 4.2 Icing Sugar
Dt = HL
1/3 Dt = Hi = Di
1/10 Dt = Wb
Figure 37: Optimal ratio between dimensions of the tank, stirrer,
4 baffles and the liquid level. (Nilsson, 2015)
Figure 36: The figures to the right shows the flow profile with baffles
and the figures to the right shows the flow profile without baffles.
(Nilsson, 2015)
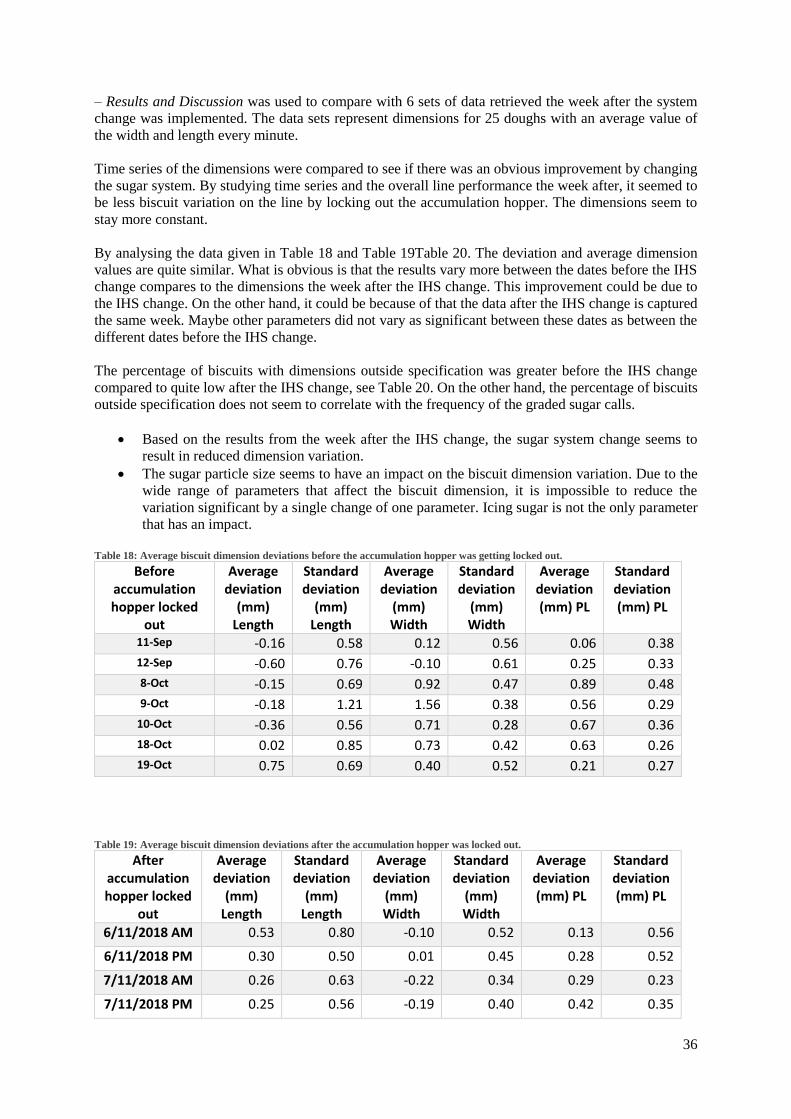
36
– Results and Discussion was used to compare with 6 sets of data retrieved the week after the system
change was implemented. The data sets represent dimensions for 25 doughs with an average value of
the width and length every minute. Time series of the dimensions were compared to see if there was an obvious improvement by changing
the sugar system. By studying time series and the overall line performance the week after, it seemed to
be less biscuit variation on the line by locking out the accumulation hopper. The dimensions seem to
stay more constant.
By analysing the data given in Table 18 and Table 19Table 20. The deviation and average dimension
values are quite similar. What is obvious is that the results vary more between the dates before the IHS
change compares to the dimensions the week after the IHS change. This improvement could be due to
the IHS change. On the other hand, it could be because of that the data after the IHS change is captured
the same week. Maybe other parameters did not vary as significant between these dates as between the
different dates before the IHS change.
The percentage of biscuits with dimensions outside specification was greater before the IHS change
compared to quite low after the IHS change, see Table 20. On the other hand, the percentage of biscuits
outside specification does not seem to correlate with the frequency of the graded sugar calls.
• Based on the results from the week after the IHS change, the sugar system change seems to
result in reduced dimension variation.
• The sugar particle size seems to have an impact on the biscuit dimension variation. Due to the
wide range of parameters that affect the biscuit dimension, it is impossible to reduce the
variation significant by a single change of one parameter. Icing sugar is not the only parameter
that has an impact.
Table 18: Average biscuit dimension deviations before the accumulation hopper was getting locked out.
Before accumulation hopper locked
out
Average deviation
(mm) Length
Standard deviation
(mm) Length
Average deviation
(mm) Width
Standard deviation
(mm) Width
Average deviation (mm) PL
Standard deviation (mm) PL
11-Sep -0.16 0.58 0.12 0.56 0.06 0.38
12-Sep -0.60 0.76 -0.10 0.61 0.25 0.33
8-Oct -0.15 0.69 0.92 0.47 0.89 0.48
9-Oct -0.18 1.21 1.56 0.38 0.56 0.29
10-Oct -0.36 0.56 0.71 0.28 0.67 0.36
18-Oct 0.02 0.85 0.73 0.42 0.63 0.26
19-Oct 0.75 0.69 0.40 0.52 0.21 0.27
Table 19: Average biscuit dimension deviations after the accumulation hopper was locked out.
After accumulation hopper locked
out
Average deviation
(mm) Length
Standard deviation
(mm) Length
Average deviation
(mm) Width
Standard deviation
(mm) Width
Average deviation (mm) PL
Standard deviation (mm) PL
6/11/2018 AM 0.53 0.80 -0.10 0.52 0.13 0.56
6/11/2018 PM 0.30 0.50 0.01 0.45 0.28 0.52
7/11/2018 AM 0.26 0.63 -0.22 0.34 0.29 0.23
7/11/2018 PM 0.25 0.56 -0.19 0.40 0.42 0.35
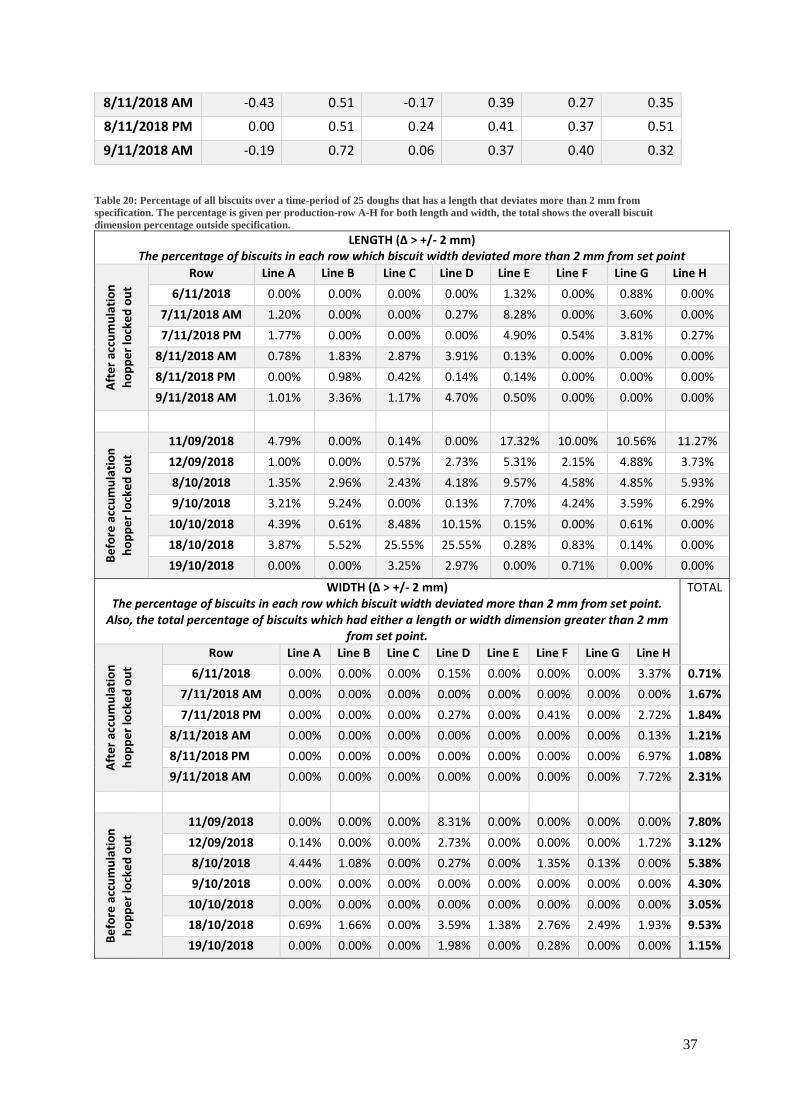
37
8/11/2018 AM -0.43 0.51 -0.17 0.39 0.27 0.35
8/11/2018 PM 0.00 0.51 0.24 0.41 0.37 0.51
9/11/2018 AM -0.19 0.72 0.06 0.37 0.40 0.32
Table 20: Percentage of all biscuits over a time-period of 25 doughs that has a length that deviates more than 2 mm from
specification. The percentage is given per production-row A-H for both length and width, the total shows the overall biscuit
dimension percentage outside specification.
LENGTH (Δ > +/- 2 mm) The percentage of biscuits in each row which biscuit width deviated more than 2 mm from set point
Aft
er
accu
mu
lati
on
ho
pp
er
lock
ed
ou
t
Row Line A Line B Line C Line D Line E Line F Line G Line H
6/11/2018 0.00% 0.00% 0.00% 0.00% 1.32% 0.00% 0.88% 0.00%
7/11/2018 AM 1.20% 0.00% 0.00% 0.27% 8.28% 0.00% 3.60% 0.00%
7/11/2018 PM 1.77% 0.00% 0.00% 0.00% 4.90% 0.54% 3.81% 0.27%
8/11/2018 AM 0.78% 1.83% 2.87% 3.91% 0.13% 0.00% 0.00% 0.00%
8/11/2018 PM 0.00% 0.98% 0.42% 0.14% 0.14% 0.00% 0.00% 0.00%
9/11/2018 AM 1.01% 3.36% 1.17% 4.70% 0.50% 0.00% 0.00% 0.00%
Be
fore
acc
um
ula
tio
n
ho
pp
er
lock
ed
ou
t
11/09/2018 4.79% 0.00% 0.14% 0.00% 17.32% 10.00% 10.56% 11.27%
12/09/2018 1.00% 0.00% 0.57% 2.73% 5.31% 2.15% 4.88% 3.73%
8/10/2018 1.35% 2.96% 2.43% 4.18% 9.57% 4.58% 4.85% 5.93%
9/10/2018 3.21% 9.24% 0.00% 0.13% 7.70% 4.24% 3.59% 6.29%
10/10/2018 4.39% 0.61% 8.48% 10.15% 0.15% 0.00% 0.61% 0.00%
18/10/2018 3.87% 5.52% 25.55% 25.55% 0.28% 0.83% 0.14% 0.00%
19/10/2018 0.00% 0.00% 3.25% 2.97% 0.00% 0.71% 0.00% 0.00%
WIDTH (Δ > +/- 2 mm) The percentage of biscuits in each row which biscuit width deviated more than 2 mm from set point.
Also, the total percentage of biscuits which had either a length or width dimension greater than 2 mm from set point.
TOTAL
Aft
er
accu
mu
lati
on
ho
pp
er
lock
ed
ou
t
Row Line A Line B Line C Line D Line E Line F Line G Line H
6/11/2018 0.00% 0.00% 0.00% 0.15% 0.00% 0.00% 0.00% 3.37% 0.71%
7/11/2018 AM 0.00% 0.00% 0.00% 0.00% 0.00% 0.00% 0.00% 0.00% 1.67%
7/11/2018 PM 0.00% 0.00% 0.00% 0.27% 0.00% 0.41% 0.00% 2.72% 1.84%
8/11/2018 AM 0.00% 0.00% 0.00% 0.00% 0.00% 0.00% 0.00% 0.13% 1.21%
8/11/2018 PM 0.00% 0.00% 0.00% 0.00% 0.00% 0.00% 0.00% 6.97% 1.08%
9/11/2018 AM 0.00% 0.00% 0.00% 0.00% 0.00% 0.00% 0.00% 7.72% 2.31%
Be
fore
acc
um
ula
tio
n
ho
pp
er
lock
ed
ou
t
11/09/2018 0.00% 0.00% 0.00% 8.31% 0.00% 0.00% 0.00% 0.00% 7.80%
12/09/2018 0.14% 0.00% 0.00% 2.73% 0.00% 0.00% 0.00% 1.72% 3.12%
8/10/2018 4.44% 1.08% 0.00% 0.27% 0.00% 1.35% 0.13% 0.00% 5.38%
9/10/2018 0.00% 0.00% 0.00% 0.00% 0.00% 0.00% 0.00% 0.00% 4.30%
10/10/2018 0.00% 0.00% 0.00% 0.00% 0.00% 0.00% 0.00% 0.00% 3.05%
18/10/2018 0.69% 1.66% 0.00% 3.59% 1.38% 2.76% 2.49% 1.93% 9.53%
19/10/2018 0.00% 0.00% 0.00% 1.98% 0.00% 0.28% 0.00% 0.00% 1.15%

38
7 Professional Development Engineers Australia has a list of competencies that are expected by an engineer to be fulfilled before
graduation. Stage 1 competencies cover elements of competency within 3 main categories 1) knowledge
and skill base, 2) engineering application ability and 3) professional and personal attributes. (Engineers
Australia, 2017)
Monthly reflections have been done to analyse and evaluate my professional development based on the
EA competencies. The monthly reflections have made me realise what competencies I have gained at
the workplace and what more I need to practice, to be able to demonstrate all competencies at the point
of graduation and entry to engineering practice. Some key learnings that have been gained during the
placement so far are stated below. Five monthly reflection journals that have been handed in and can be
found in Appendix D.
7.1 Key learnings and challenges • Experience in working in an FMCG environment and understand how a factory system work.
• Understanding and investigation of a real process and its units.
• Identify the problem, its associated risks and opportunities, and to formulate a solution.
• Relate prior knowledge gained at University to identify a problem and tackle the problem.
• Conduct and lead smaller projects, increased sense of responsibility and ownership.
There have been several challenges through the placement. During the first couple of weeks, the
challenges were to navigate around the plant and trying to understand all the abbreviations used at
Arnott’s. Furthermore, I found it a challenging and frustrating to deal with the feeling that I could not
really show 100% of myself due to knowledge gaps and language limitations. By staying a step behind
the first couple of weeks I analysed and gained an understanding of the environment and the culture in
the factory, I finally found myself very comfortable after a couple of weeks at the workplace. My
experience is that people sometimes assume there is a lack of knowledge when language limitations
sometimes result in communication problems. I have developed my communication skills during the
placement and this challenge has made me dedicated to continuing to improve my language and
communication skills.
Another challenge was to decide what and how to investigate and analyse the ingredients, it was much
more of a challenge than I first expected. It was challenging due to that this was the first time I have
conducted a project by myself and that there was not an obvious right or wrong path to solve the
problems, instead, I had to redo or change the methods when weaknesses in the methods were found.
This was a challenge that has developed my professional engineering skills, I will most likely face the
same kind of challenges in my future career.
7.2 Development of EA Competencies 4-6 situations have been described in each monthly reflection journal. Furthermore, there been one
situation per journal that has been described more in-depth with the SEAL format. The Engineer
Australia (EA) competencies that have conducted for each situation are also given. A summary of the
number of competencies within the three EA categories is given in Figure 38 below.
The number of EA 3 competencies achieved before the first journal was very high and slightly less for
the second journal but clearly, EA 3 competencies were successfully achieved the first weeks at the
workplace. The EA 3 competencies cover professional and personal attributes. For example,
professional oral and written communication, professional use and management of information and
effective team membership and leadership. Many of these competencies were new for me during the
first weeks at the workplace, and the situation around these competencies clearly occurred during the
first weeks when I was new to working in an FMCG environment. The number of EA 3.6 competencies
is significantly higher than the other competencies, effective team membership and leadership, which is
obviously the competency that I have conducted and mostly developed my skills in through the
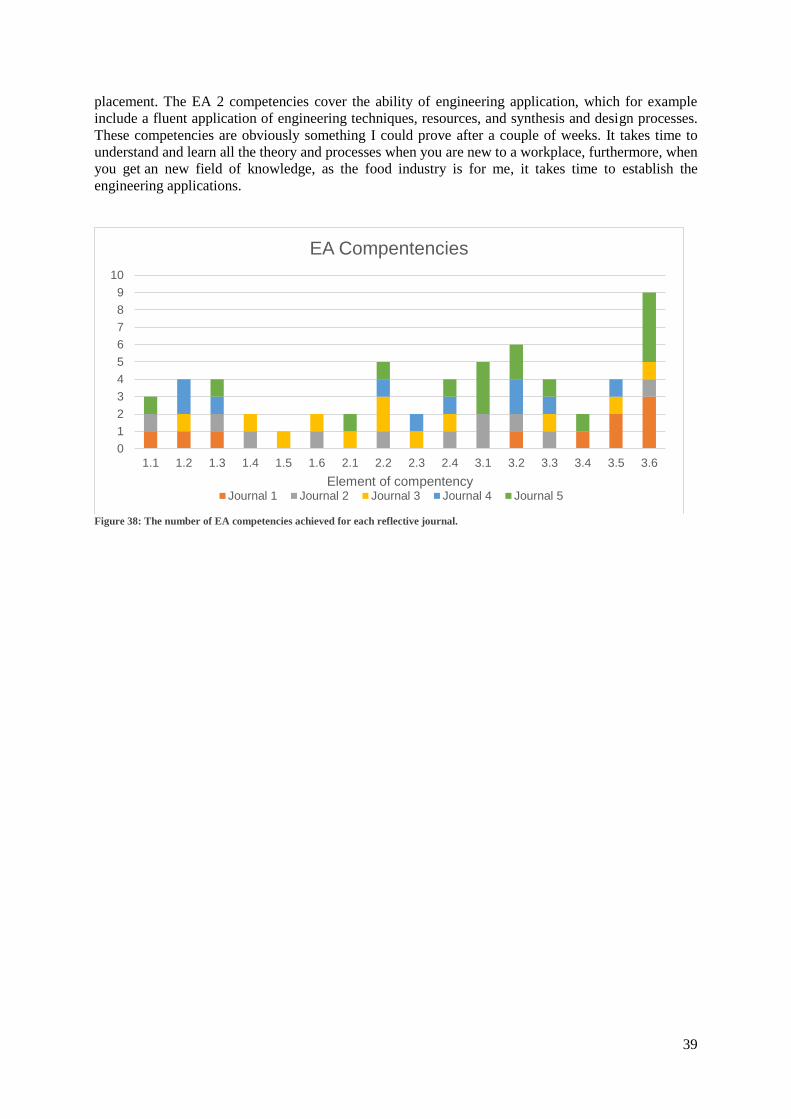
39
placement. The EA 2 competencies cover the ability of engineering application, which for example
include a fluent application of engineering techniques, resources, and synthesis and design processes.
These competencies are obviously something I could prove after a couple of weeks. It takes time to
understand and learn all the theory and processes when you are new to a workplace, furthermore, when
you get an new field of knowledge, as the food industry is for me, it takes time to establish the
engineering applications.
Figure 38: The number of EA competencies achieved for each reflective journal.
0
1
2
3
4
5
6
7
8
9
10
1.1 1.2 1.3 1.4 1.5 1.6 2.1 2.2 2.3 2.4 3.1 3.2 3.3 3.4 3.5 3.6
Element of compentency
EA Compentencies
Journal 1 Journal 2 Journal 3 Journal 4 Journal 5
40
8 References About Arnott's. (2018). Retrieved July 22, 2018, from Arnott's: https://www.arnotts.com.au/about-
arnotts/
Ammonium Bicarbonate. (n.d.). Retrieved from Merck:
https://www.sigmaaldrich.com/catalog/search?term=Ammonium+bicarbonate&interface=All
&N=0&mode=match%20partialmax&lang=en®ion=AU&focus=product
Arnott's. (Retrieved: 10/08/2018). Style of Vol addition. Virginia.
Chevallier, S., Colonna, P., Bule´on, A., & Della Valle, G. (2000). Physicochemical Behaviors of
Sugars, Lipids, and Gluten in Short. Journal of Agricultural and Food Chemistry, 1322−1326.
Correlation Coefficient 'r' and The Linear Model. (2018). Retrieved from Nayland College -
Mathematics :
http://maths.nayland.school.nz/Year_13_Maths/3.9_Bivariate_data/7_Corr_Coefficient_r.html
Davidson, I. (2016). Biscuit Baking Technology 2nd Edition. Academic Press.
Engineers Australia. (2017). Stage 1 Competency standard for professional engineer. Australia:
Engineers Australia.
Kresta, J., MacGregor, J., & Marlin, T. ( 1991). Multivariate Statistical Monitoring of Process
Operating Performance. The Canadian J. Chem Eng, 35-47.
Ludger, O. F., & Arthur, A. T. (2007). Food Physics. Berlin, Heidelberg: Springer.
Manley, D. (2000). Technology of biscuits, crackers and cookies. Cambridge: Woodhead Publishing
Limited.
Manley, D. (2001). Biscuit, Cracker and Cookie Recipes for the Food Industry. Burlington: Elsevier
Science.
Ratner, B. (2009). The correlation coefficient: Its values range between +1/−1, or do they? Journal of
Targeting, Measurement and Analysis for Marketing, 139–142.
Rodgers, J. L., & Nicewander, A. W. ( 1988). Thirteen Ways to Look at the Correlation Coefficient.
The American Statistician, 59-66.
Sigma-Aldrich. (Retrieved: 10/08/2018). Product Information - Ammonium Bicarbonate. Saint Louise:
Sigma-Aldrich.
Sulfuric acid solution. (2018). Retrieved from Merck:
https://www.sigmaaldrich.com/catalog/product/saj/285940?lang=en®ion=AU&gclid=EAI
aIQobChMIq-v2-9yE3QIVQnRgCh05XQc5EAAYASAAEgJ5t_D_BwE
Sutter, D. M. (2017, Crystal Growth and Design, 7 June 2017, Vol.17(6), pp.3048-3054). Solubility
and Growth Kinetics of Ammonium Bicarbonate in. Crystal Growth and Design, 3048-3054.
The University of Iowa. (n.d.). System Risk Analysis. Retrieved from IT Security & Policy Office:
https://itsecurity.uiowa.edu/resources/everyone/determining-risk-levels
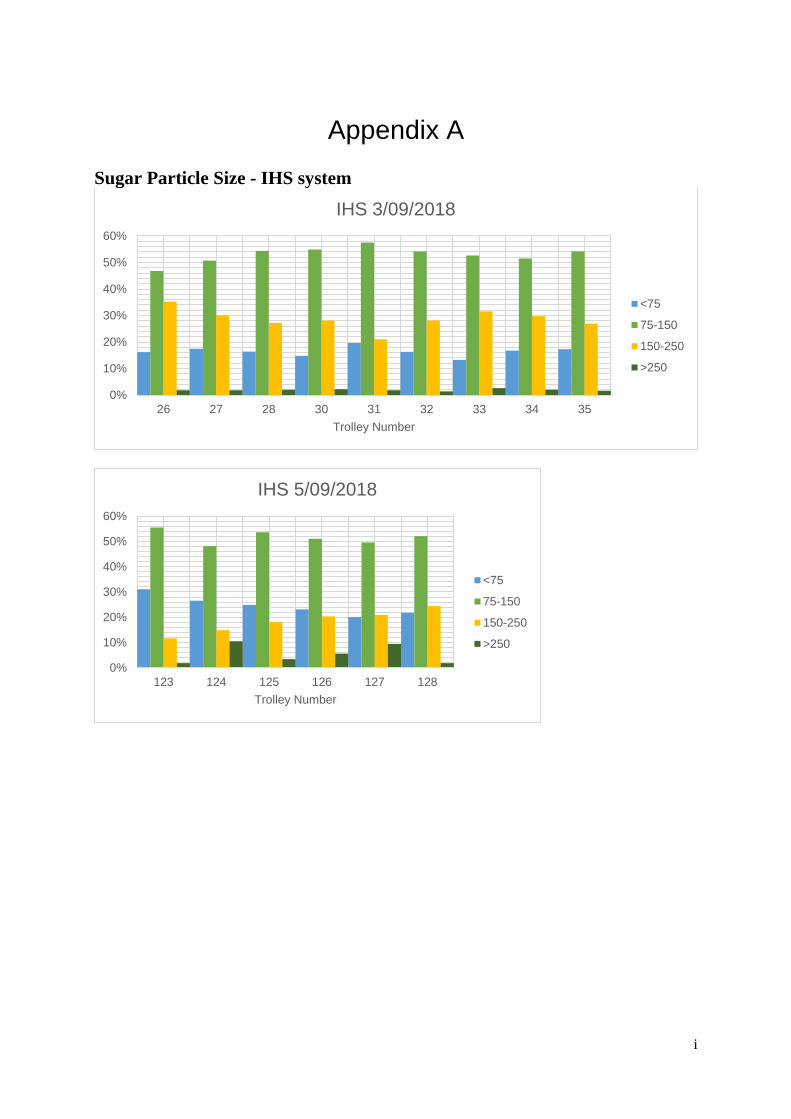
i
Appendix A
Sugar Particle Size - IHS system
0%
10%
20%
30%
40%
50%
60%
26 27 28 30 31 32 33 34 35
Trolley Number
IHS 3/09/2018
<75
75-150
150-250
>250
0%
10%
20%
30%
40%
50%
60%
123 124 125 126 127 128
Trolley Number
IHS 5/09/2018
<75
75-150
150-250
>250
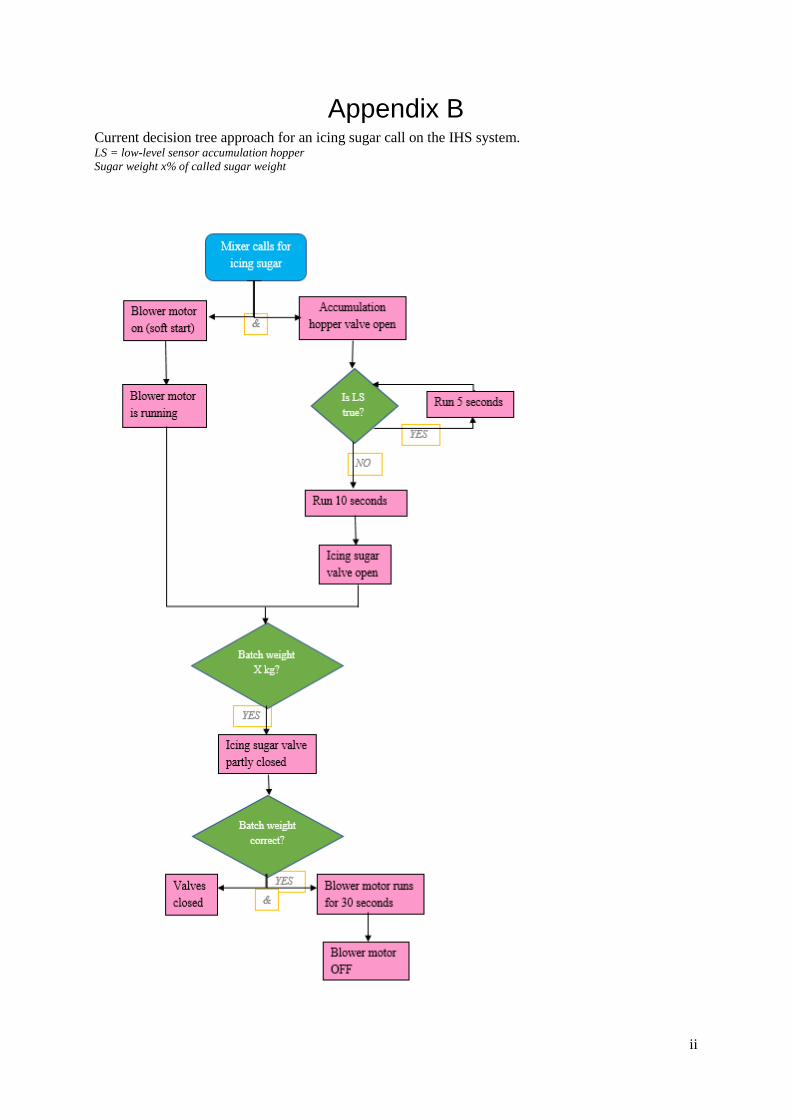
ii
Appendix B Current decision tree approach for an icing sugar call on the IHS system. LS = low-level sensor accumulation hopper
Sugar weight x% of called sugar weight
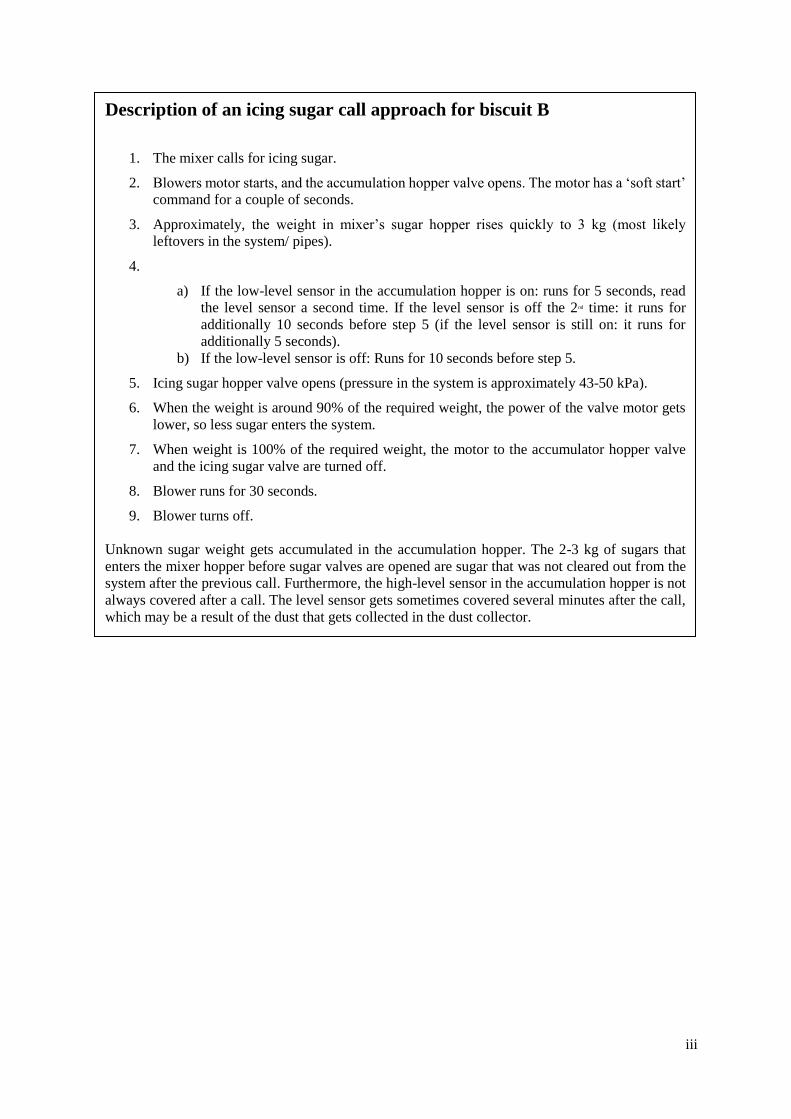
iii
Description of an icing sugar call approach for biscuit B
1. The mixer calls for icing sugar.
2. Blowers motor starts, and the accumulation hopper valve opens. The motor has a ‘soft start’
command for a couple of seconds.
3. Approximately, the weight in mixer’s sugar hopper rises quickly to 3 kg (most likely
leftovers in the system/ pipes).
4.
a) If the low-level sensor in the accumulation hopper is on: runs for 5 seconds, read
the level sensor a second time. If the level sensor is off the 2nd time: it runs for
additionally 10 seconds before step 5 (if the level sensor is still on: it runs for
additionally 5 seconds).
b) If the low-level sensor is off: Runs for 10 seconds before step 5.
5. Icing sugar hopper valve opens (pressure in the system is approximately 43-50 kPa).
6. When the weight is around 90% of the required weight, the power of the valve motor gets
lower, so less sugar enters the system.
7. When weight is 100% of the required weight, the motor to the accumulator hopper valve
and the icing sugar valve are turned off.
8. Blower runs for 30 seconds.
9. Blower turns off.
Unknown sugar weight gets accumulated in the accumulation hopper. The 2-3 kg of sugars that
enters the mixer hopper before sugar valves are opened are sugar that was not cleared out from the
system after the previous call. Furthermore, the high-level sensor in the accumulation hopper is not
always covered after a call. The level sensor gets sometimes covered several minutes after the call,
which may be a result of the dust that gets collected in the dust collector.
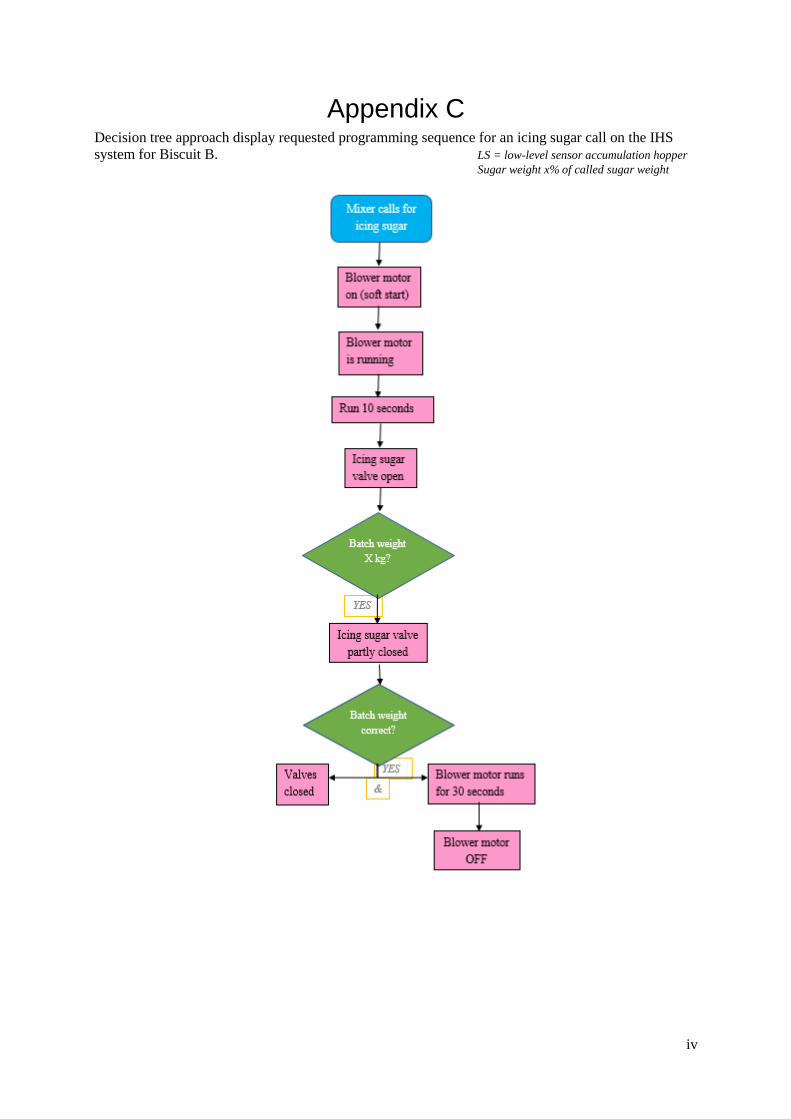
iv
Appendix C Decision tree approach display requested programming sequence for an icing sugar call on the IHS
system for Biscuit B. LS = low-level sensor accumulation hopper Sugar weight x% of called sugar weight
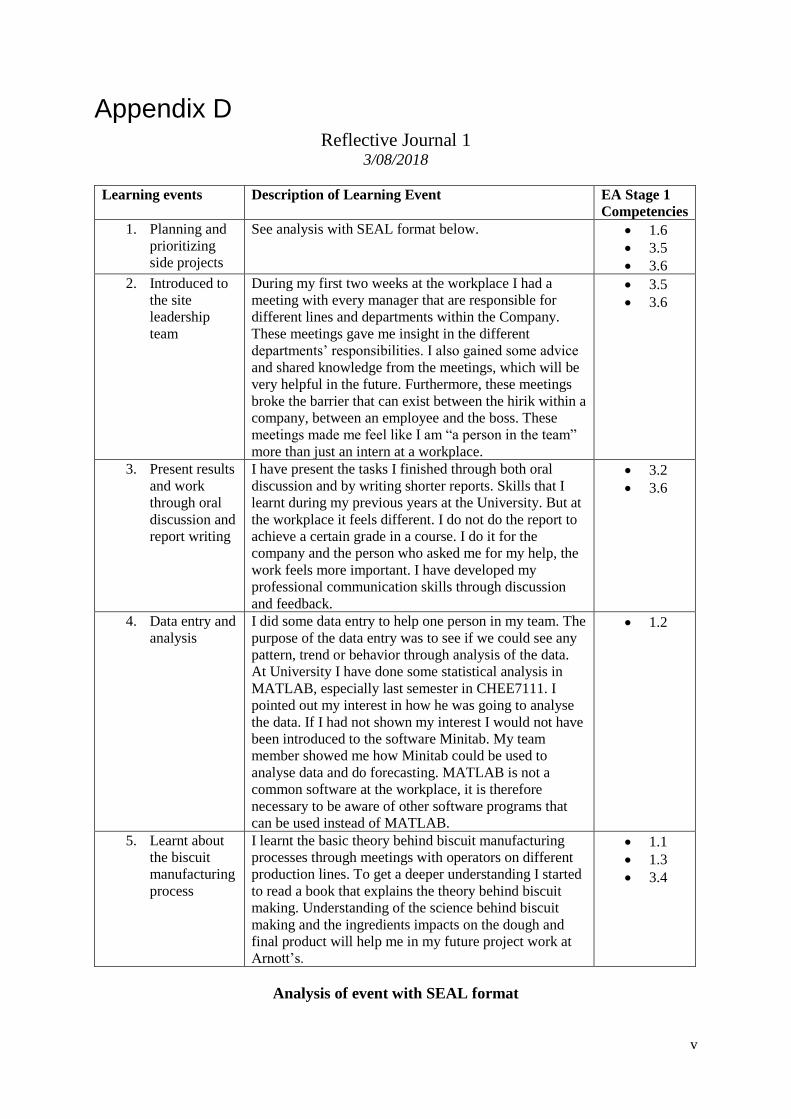
v
Appendix D Reflective Journal 1
3/08/2018
Learning events Description of Learning Event EA Stage 1
Competencies
1. Planning and
prioritizing
side projects
See analysis with SEAL format below. • 1.6
• 3.5
• 3.6
2. Introduced to
the site
leadership
team
During my first two weeks at the workplace I had a
meeting with every manager that are responsible for
different lines and departments within the Company.
These meetings gave me insight in the different
departments’ responsibilities. I also gained some advice
and shared knowledge from the meetings, which will be
very helpful in the future. Furthermore, these meetings
broke the barrier that can exist between the hirik within a
company, between an employee and the boss. These
meetings made me feel like I am “a person in the team”
more than just an intern at a workplace.
• 3.5
• 3.6
3. Present results
and work
through oral
discussion and
report writing
I have present the tasks I finished through both oral
discussion and by writing shorter reports. Skills that I
learnt during my previous years at the University. But at
the workplace it feels different. I do not do the report to
achieve a certain grade in a course. I do it for the
company and the person who asked me for my help, the
work feels more important. I have developed my
professional communication skills through discussion
and feedback.
• 3.2
• 3.6
4. Data entry and
analysis
I did some data entry to help one person in my team. The
purpose of the data entry was to see if we could see any
pattern, trend or behavior through analysis of the data.
At University I have done some statistical analysis in
MATLAB, especially last semester in CHEE7111. I
pointed out my interest in how he was going to analyse
the data. If I had not shown my interest I would not have
been introduced to the software Minitab. My team
member showed me how Minitab could be used to
analyse data and do forecasting. MATLAB is not a
common software at the workplace, it is therefore
necessary to be aware of other software programs that
can be used instead of MATLAB.
• 1.2
5. Learnt about
the biscuit
manufacturing
process
I learnt the basic theory behind biscuit manufacturing
processes through meetings with operators on different
production lines. To get a deeper understanding I started
to read a book that explains the theory behind biscuit
making. Understanding of the science behind biscuit
making and the ingredients impacts on the dough and
final product will help me in my future project work at
Arnott’s.
• 1.1
• 1.3
• 3.4
Analysis of event with SEAL format
vi
Situation
What was the new experience or challenge you faced and what happened to you?
The first week was full of meetings with different people at the company and there were a lot of things
to learn. I really wanted to start work on something, so I could feel that I did something useful and to
not only be the person that everyone should show around and babysit. I was therefore very excited
when I started to get requests from employees at Arnott’s who asked for my help with different
projects. I said happily yes. Shortly after other employees had heard that I was available to help with
different projects, so I started to get a lot of requests. Which resulted to confusion and I did not know
what to start with and what to priorities.
Effect
What impact did it have on you and what were the consequences of this impact?
I got a small feeling of panic, I did not know how to priorities and if I should say yes to every request I
received. I was very confused and did not know how to really handle the situation. I wanted to do a
good job and make a good impression as an intern. And I wanted to do everything since it was hard to
decide what to say no to, since every task would gain me experience and I would also develop
relations with different people in different departments at the plant.
Action
What actions did you take to deal with the challenge you faced and why did you do those things?
When I got the feeling of panic I told the person who asked me for help that I had got a lot of requests
that day so I needed to talk with my supervisor since I was not sure what actions I should take when I
got so many requests. I talked with Christopher about the situation. I asked if I should ta asked him for
advice about how to decide which project to priorities and when to say yes and no.
Learning
What have you learnt from the experience and how will you apply this in the future?
At University prioritizing and planning was a daily task, but it is mainly to the favor of myself. I learnt
that at the workplace it is more complex, I could have realized it would be more complex but from this
situation I truly gained experience in how prioritizing and communication are important when
planning and accepting projects. From the conversation with Christopher I learnt that I should
priorities my own projects in the future. And that I can help other employees when I have time, since it
contributes to a wider range of knowledge and experience. In the future I will focus on my own
projects and accept requests when I have time. I said yes to all the requests I got, by conversation with
the persons involved I could plan which task to prioritize. By doing side projects I gain knowledge
about other departments work and get to know more employees at Arnott’s which contribute to my
professional development and will benefit me in the future both with my work at Arnott’s but also in
my future career as an engineer.
Reflective Journal 2 3/09/2018
Learning events Description of Learning Event EA Stage 1
Competencies
See description of EA Stage 1 competencies in table on page 3.
1. Writing a
project
proposal report
See analysis with SEAL format below. • 1.1
• 1.4
• 1.6
• 3.1
• 3.2
2. Read a P&ID I have worked with P&IDs before, both in courses at
Lund University and in courses at UQ. But I have never
been able to read a P&ID and identify all the units for a
real process. I knew how to read a P&ID but I have
never had the opportunity to study a process with the
P&ID. This was very interesting, and I learned a lot by
studying the different P&IDs for the ingredient systems
in the factory. It was very interesting to see how a
• 1.3
• 2.2
vii
control and sensor can look like. I could identify both
temperature, pressure and flow sensors and it was very
interesting to see the different valves.
3. Familiarization
with a process
and its units
When I first got my project my project supervisor told
me to first familiarise with the different ingredients. She
told me to learn as much as possible, to become the
expert on the four ingredients. It was challenging to
know how to learn everything. Obviously, literature is
not the only source. To understand the processes, I
talked to the operators who are responsible for the
different ingredients. They showed me around and told
me about the process, what changes that have been made
and what issues they knew. It was an effective and very
good way to get much knowledge in a short period of
time. Furthermore, I understand how important it is to
have a good relation and communication with the
operators. I will work in their area this semester and by
having a good relationship with them, we can share both
help and knowledge.
• 3.3
4. Conduct and
lead smaller
projects
In the previous reflective journal, I mentioned that I have
been given a few side projects. These projects have
given me a lot of knowledge and experience already, and
they keep me constantly busy. Furthermore, they give
me experience in leading a trail as well. Since I have
attended a trial for a project a couple of times I got to
lead the last trial. This was a great experience since I had
to organize and plan before the trail. And during the trial
delegate instructions to the operators who worked in the
area. It was an easy trail and the operators involved have
been a part of these trails before. But it felt good to be
given responsibility which proof that my supervisor trust
and believe that I will perform a good job.
• 2.4
• 3.1
• 3.6
Analysis of event with SEAL format Situation
What was the new experience or challenge you faced and what happened to you?
Writing a report is not a new experience, but for this report, the circumstances made it to a new
experience and challenge. I felt comfortable when I first started to write the project proposal report.
Search for relevant literature and plan the structure of a report are tasks that I have done for every written
report at University, and the two given example reports were very useful as well. I started with the report
writing in week 3 even though my project was not defined yet. I started with a general project plan,
report structure and I started with the literature review. I knew that my project would be about
ingredients impact on the dough so the literature review was possible to start with.
I finally got my project properly described after a few weeks. There is a quite wide project scope, four
ingredients impact on the dough. I got the project quite close to the deadline for the project proposal
report. I understood that I would not be able to plan the methodology for all ingredients before the
deadline. Furthermore, I have never done something similar before. I have done lab work and lab reports
by myself but never something this big, not a project.
Effect
What impact did it have on you and what were the consequences of this impact?
I felt that it was impossible to get everything ready before the hand-in of the project proposal report.
Which made me very stressed. The project felt almost overwhelming. I did not know where to start,
what to focus on and how I would be able to present this project in a report.
viii
Action
What actions did you take to deal with the challenge you faced and why did you do those things?
I worked hard to understand as much as possible about the four ingredients. But still, it felt
overwhelming since I was unsure of how I would be able to present the methodology for the project in
the project proposal report. I finally did my first data collection the same week as the report was due. It
required a lot of time and I had to stay late at work that week to be able to finish my lab work and to
write the last parts of the project proposal report. It was hard to write the report since the methodology
was not finished. Since the project scope is quite wide it was hard to know what to write about and what
to focus on, since I could include so much more. Furthermore, I excluded a few pages from the report.
Which included information that included confidential information about the company. I was very
stressed the days before the hand-in, and I did not want to go to my supervisor one day before hand-in
to ask if he could read through the report and see whether the information was confidential or not. I
knew that I probably would not have time to change the report. I excluded everything I thought may be
confidential. After the hand-in of the report I talked to my workplace supervisor and my project
supervisor, I asked them for feedback on the report and told them that I appreciate if they want to give
me feedback which I can include for next deadline, the project progress report.
Learning
What have you learnt from the experience and how will you apply this in the future?
I will finish the project progress report at least a week before. Finishing a report a few days before the
deadline is a wish that is common among students, but often stays as a wish. But to make sure I keep
my word, I also told my supervisor that I will be done with the report early for next hand in, since it may
contain more confidential information due to results from tests. By telling her that she will get it one
week early, it works as a guarantee for myself that I will not be to be stressed the last days before hand-
in. This situation gave me experience in how it is to get a wide project which is not perfect defined as
in University. Furthermore, to handle the stress and solve the problem mainly by myself, something I
have almost never done before. I have solved greater problems and have written bigger reports in groups
but never done a project of this size by myself.
EA Stage 1 Competencies
EA 1.1 Comprehensive, theory based understanding of the underpinning natural and
physical sciences and the engineering fundamentals applicable to the
engineering discipline
EA 1.3 In-depth understanding of specialist bodies of knowledge within the engineering
discipline
EA 1.4 Discernment of knowledge development and research directions within the
engineering discipline
EA 1.6 Understanding of the scope, principles, norms, accountabilities and bounds of
sustainable engineering practice in the specific discipline
EA 2.2 Fluent application of engineering techniques, tools and resources
EA 2.4 Application of systematic approaches to the conducts and management of
engineering projects
EA 3.1 Ethical conduct and professional accountability
EA 3.2 Effective oral and written communication in professional and lay domains
ix
EA 3.3 Creative, innovative and proactive demeanor
EA 3.6 Effective team membership and team leadership
Reflective Journal 3 3/10/2018
Learning events Description of Learning Event EA Stage 1
Competencies
See description of EA Stage 1 competencies in table on page 3.
1. Conduct a project
by myself
In University we do most of the projects together in
groups and the tasks and expectations are often
clear described. My placement project scope is
quite wide and I have had to take many decisions
and actions on my own. Which been very
challenging. It is easier to take decisions by a
discussion with a group member contrary to a
discussion with yourself. But I feel that I have
learned so much these last couple of weeks at my
workplace working on my project. More than I
possibly could lean at the University in a course. I
already feel much more comfortable in manage
projects and tasks by myself, compared to when I
first started at the workplace. Even though I
probably will perform projects in groups in the
future and I will always do projects and tasks by my
own. I really feel that I so far have developed these
skills a lot and I am hoping to be even more ready
for future workplaces when this placement is
finished.
• 2.1
• 3.5
2. Data results are not
always as expected
See analysis with SEAL format below. • 1.4
• 2.2
3. Familiarization
with the software
Historian, and how
to use it together
with collected data
There is a software at the workplace which stores
control data from the plant. When I first started to
use the software it was a little bit tricky. I got a
brief introduction several weeks ago, during my
second week at the workplace. So I had forgotten a
lot when I opened the program last week. Anyway,
by testing around in the program and by using
google when I got stuck, I started to figure out how
to use it. When you start to learn something, it gets
really interesting. I have learned how to download
the data to excel and how to add my testing results
from laboratory tests to match the control data time
series. I have started to build data files that I soon
will start analyse in MATLAB by using the skills I
learned in CHEE7111 last semester.
• 1.2
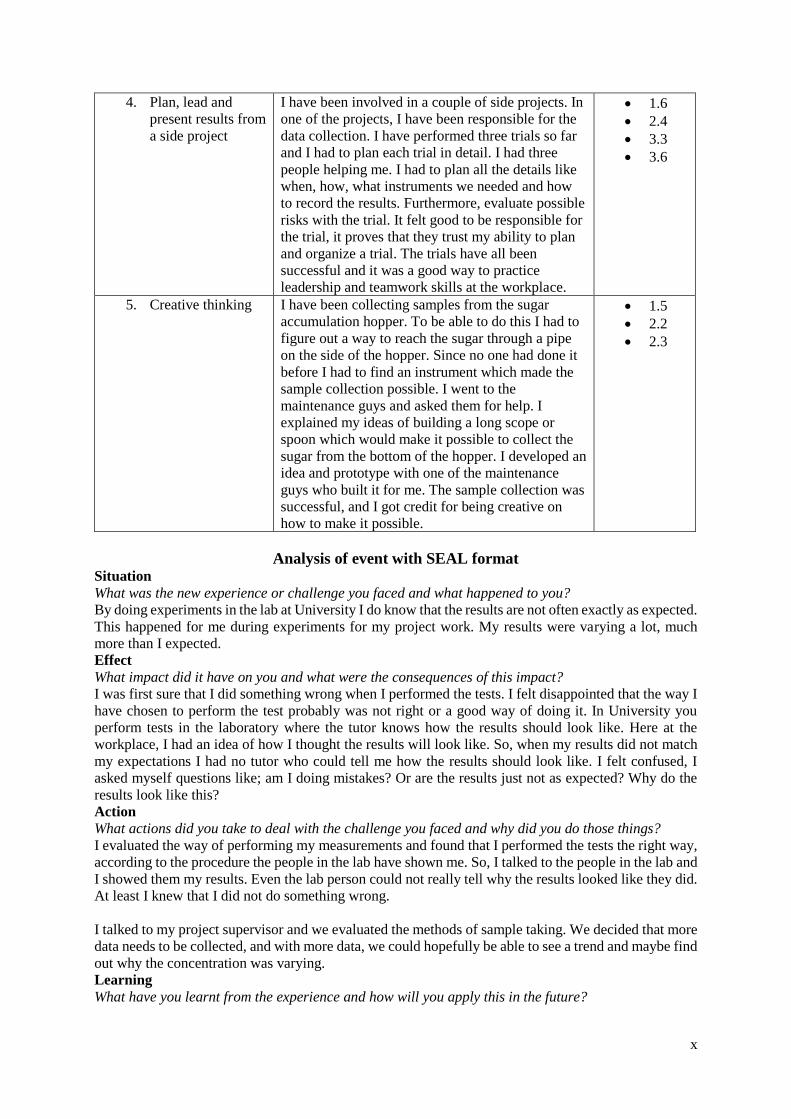
x
4. Plan, lead and
present results from
a side project
I have been involved in a couple of side projects. In
one of the projects, I have been responsible for the
data collection. I have performed three trials so far
and I had to plan each trial in detail. I had three
people helping me. I had to plan all the details like
when, how, what instruments we needed and how
to record the results. Furthermore, evaluate possible
risks with the trial. It felt good to be responsible for
the trial, it proves that they trust my ability to plan
and organize a trial. The trials have all been
successful and it was a good way to practice
leadership and teamwork skills at the workplace.
• 1.6
• 2.4
• 3.3
• 3.6
5. Creative thinking I have been collecting samples from the sugar
accumulation hopper. To be able to do this I had to
figure out a way to reach the sugar through a pipe
on the side of the hopper. Since no one had done it
before I had to find an instrument which made the
sample collection possible. I went to the
maintenance guys and asked them for help. I
explained my ideas of building a long scope or
spoon which would make it possible to collect the
sugar from the bottom of the hopper. I developed an
idea and prototype with one of the maintenance
guys who built it for me. The sample collection was
successful, and I got credit for being creative on
how to make it possible.
• 1.5
• 2.2
• 2.3
Analysis of event with SEAL format Situation
What was the new experience or challenge you faced and what happened to you?
By doing experiments in the lab at University I do know that the results are not often exactly as expected.
This happened for me during experiments for my project work. My results were varying a lot, much
more than I expected.
Effect
What impact did it have on you and what were the consequences of this impact?
I was first sure that I did something wrong when I performed the tests. I felt disappointed that the way I
have chosen to perform the test probably was not right or a good way of doing it. In University you
perform tests in the laboratory where the tutor knows how the results should look like. Here at the
workplace, I had an idea of how I thought the results will look like. So, when my results did not match
my expectations I had no tutor who could tell me how the results should look like. I felt confused, I
asked myself questions like; am I doing mistakes? Or are the results just not as expected? Why do the
results look like this?
Action
What actions did you take to deal with the challenge you faced and why did you do those things?
I evaluated the way of performing my measurements and found that I performed the tests the right way,
according to the procedure the people in the lab have shown me. So, I talked to the people in the lab and
I showed them my results. Even the lab person could not really tell why the results looked like they did.
At least I knew that I did not do something wrong.
I talked to my project supervisor and we evaluated the methods of sample taking. We decided that more
data needs to be collected, and with more data, we could hopefully be able to see a trend and maybe find
out why the concentration was varying.
Learning
What have you learnt from the experience and how will you apply this in the future?
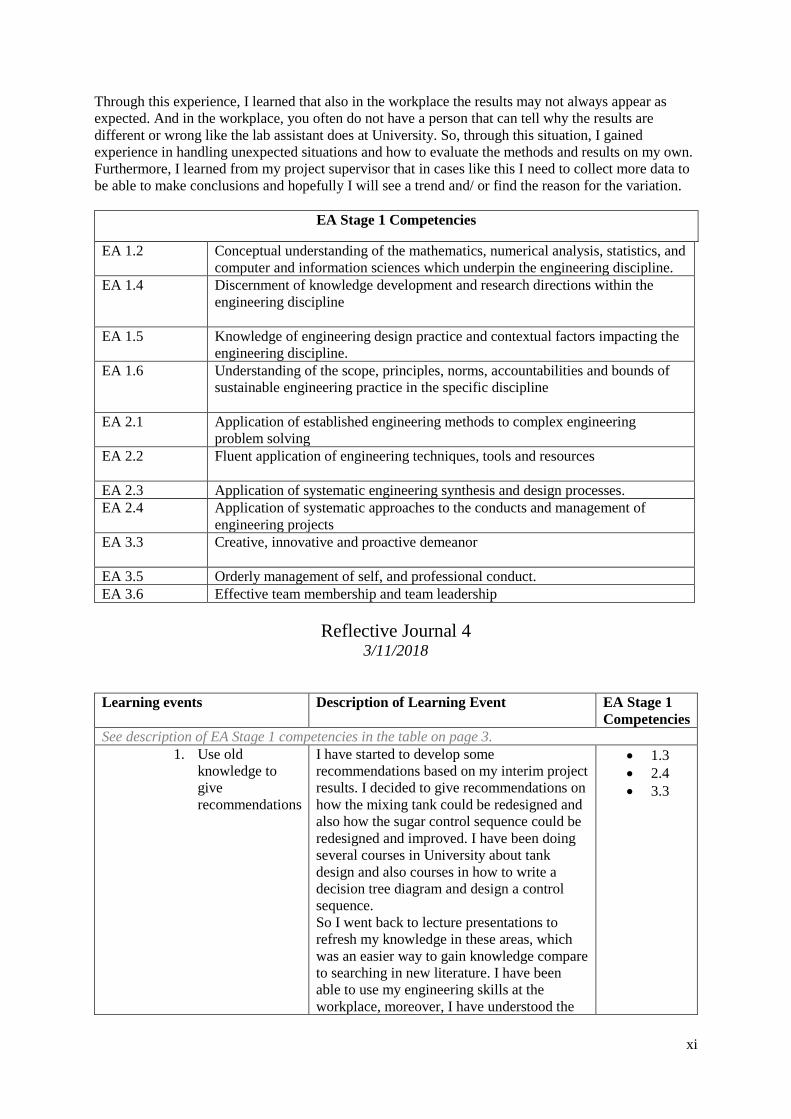
xi
Through this experience, I learned that also in the workplace the results may not always appear as
expected. And in the workplace, you often do not have a person that can tell why the results are
different or wrong like the lab assistant does at University. So, through this situation, I gained
experience in handling unexpected situations and how to evaluate the methods and results on my own.
Furthermore, I learned from my project supervisor that in cases like this I need to collect more data to
be able to make conclusions and hopefully I will see a trend and/ or find the reason for the variation.
EA Stage 1 Competencies
EA 1.2 Conceptual understanding of the mathematics, numerical analysis, statistics, and
computer and information sciences which underpin the engineering discipline.
EA 1.4 Discernment of knowledge development and research directions within the
engineering discipline
EA 1.5 Knowledge of engineering design practice and contextual factors impacting the
engineering discipline.
EA 1.6 Understanding of the scope, principles, norms, accountabilities and bounds of
sustainable engineering practice in the specific discipline
EA 2.1 Application of established engineering methods to complex engineering
problem solving
EA 2.2 Fluent application of engineering techniques, tools and resources
EA 2.3 Application of systematic engineering synthesis and design processes.
EA 2.4 Application of systematic approaches to the conducts and management of
engineering projects
EA 3.3 Creative, innovative and proactive demeanor
EA 3.5 Orderly management of self, and professional conduct.
EA 3.6 Effective team membership and team leadership
Reflective Journal 4 3/11/2018
Learning events Description of Learning Event EA Stage 1
Competencies
See description of EA Stage 1 competencies in the table on page 3.
1. Use old
knowledge to
give
recommendations
I have started to develop some
recommendations based on my interim project
results. I decided to give recommendations on
how the mixing tank could be redesigned and
also how the sugar control sequence could be
redesigned and improved. I have been doing
several courses in University about tank
design and also courses in how to write a
decision tree diagram and design a control
sequence.
So I went back to lecture presentations to
refresh my knowledge in these areas, which
was an easier way to gain knowledge compare
to searching in new literature. I have been
able to use my engineering skills at the
workplace, moreover, I have understood the
• 1.3
• 2.4
• 3.3
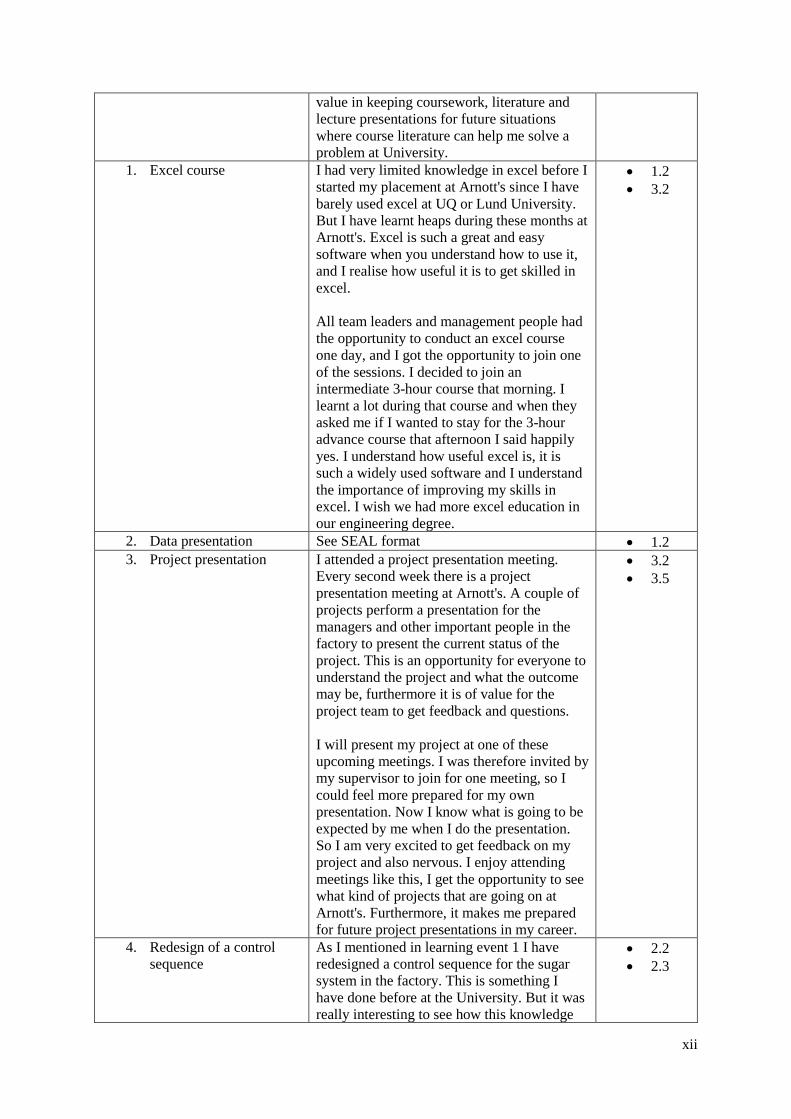
xii
value in keeping coursework, literature and
lecture presentations for future situations
where course literature can help me solve a
problem at University.
1. Excel course I had very limited knowledge in excel before I
started my placement at Arnott's since I have
barely used excel at UQ or Lund University.
But I have learnt heaps during these months at
Arnott's. Excel is such a great and easy
software when you understand how to use it,
and I realise how useful it is to get skilled in
excel.
All team leaders and management people had
the opportunity to conduct an excel course
one day, and I got the opportunity to join one
of the sessions. I decided to join an
intermediate 3-hour course that morning. I
learnt a lot during that course and when they
asked me if I wanted to stay for the 3-hour
advance course that afternoon I said happily
yes. I understand how useful excel is, it is
such a widely used software and I understand
the importance of improving my skills in
excel. I wish we had more excel education in
our engineering degree.
• 1.2
• 3.2
2. Data presentation See SEAL format • 1.2
3. Project presentation I attended a project presentation meeting.
Every second week there is a project
presentation meeting at Arnott's. A couple of
projects perform a presentation for the
managers and other important people in the
factory to present the current status of the
project. This is an opportunity for everyone to
understand the project and what the outcome
may be, furthermore it is of value for the
project team to get feedback and questions.
I will present my project at one of these
upcoming meetings. I was therefore invited by
my supervisor to join for one meeting, so I
could feel more prepared for my own
presentation. Now I know what is going to be
expected by me when I do the presentation.
So I am very excited to get feedback on my
project and also nervous. I enjoy attending
meetings like this, I get the opportunity to see
what kind of projects that are going on at
Arnott's. Furthermore, it makes me prepared
for future project presentations in my career.
• 3.2
• 3.5
4. Redesign of a control
sequence
As I mentioned in learning event 1 I have
redesigned a control sequence for the sugar
system in the factory. This is something I
have done before at the University. But it was
really interesting to see how this knowledge
• 2.2
• 2.3
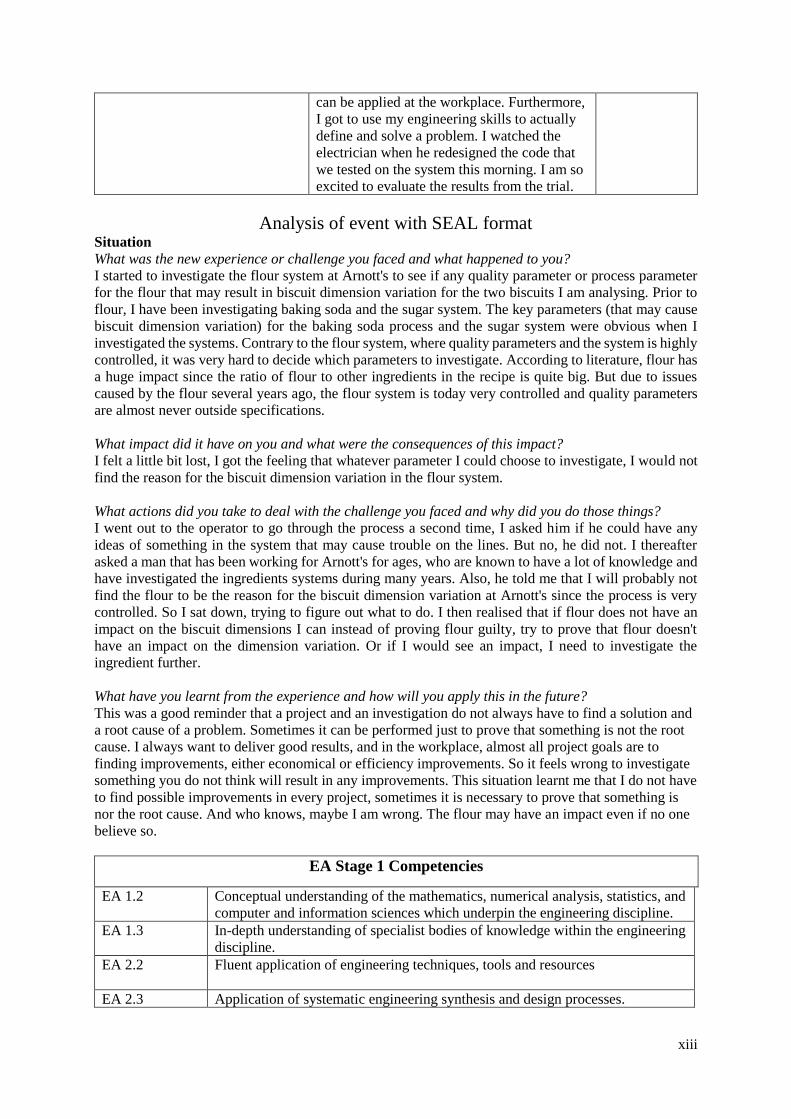
xiii
can be applied at the workplace. Furthermore,
I got to use my engineering skills to actually
define and solve a problem. I watched the
electrician when he redesigned the code that
we tested on the system this morning. I am so
excited to evaluate the results from the trial.
Analysis of event with SEAL format Situation
What was the new experience or challenge you faced and what happened to you?
I started to investigate the flour system at Arnott's to see if any quality parameter or process parameter
for the flour that may result in biscuit dimension variation for the two biscuits I am analysing. Prior to
flour, I have been investigating baking soda and the sugar system. The key parameters (that may cause
biscuit dimension variation) for the baking soda process and the sugar system were obvious when I
investigated the systems. Contrary to the flour system, where quality parameters and the system is highly
controlled, it was very hard to decide which parameters to investigate. According to literature, flour has
a huge impact since the ratio of flour to other ingredients in the recipe is quite big. But due to issues
caused by the flour several years ago, the flour system is today very controlled and quality parameters
are almost never outside specifications.
What impact did it have on you and what were the consequences of this impact?
I felt a little bit lost, I got the feeling that whatever parameter I could choose to investigate, I would not
find the reason for the biscuit dimension variation in the flour system.
What actions did you take to deal with the challenge you faced and why did you do those things?
I went out to the operator to go through the process a second time, I asked him if he could have any
ideas of something in the system that may cause trouble on the lines. But no, he did not. I thereafter
asked a man that has been working for Arnott's for ages, who are known to have a lot of knowledge and
have investigated the ingredients systems during many years. Also, he told me that I will probably not
find the flour to be the reason for the biscuit dimension variation at Arnott's since the process is very
controlled. So I sat down, trying to figure out what to do. I then realised that if flour does not have an
impact on the biscuit dimensions I can instead of proving flour guilty, try to prove that flour doesn't
have an impact on the dimension variation. Or if I would see an impact, I need to investigate the
ingredient further.
What have you learnt from the experience and how will you apply this in the future?
This was a good reminder that a project and an investigation do not always have to find a solution and
a root cause of a problem. Sometimes it can be performed just to prove that something is not the root
cause. I always want to deliver good results, and in the workplace, almost all project goals are to
finding improvements, either economical or efficiency improvements. So it feels wrong to investigate
something you do not think will result in any improvements. This situation learnt me that I do not have
to find possible improvements in every project, sometimes it is necessary to prove that something is
nor the root cause. And who knows, maybe I am wrong. The flour may have an impact even if no one
believe so.
EA Stage 1 Competencies
EA 1.2 Conceptual understanding of the mathematics, numerical analysis, statistics, and
computer and information sciences which underpin the engineering discipline.
EA 1.3 In-depth understanding of specialist bodies of knowledge within the engineering
discipline.
EA 2.2 Fluent application of engineering techniques, tools and resources
EA 2.3 Application of systematic engineering synthesis and design processes.
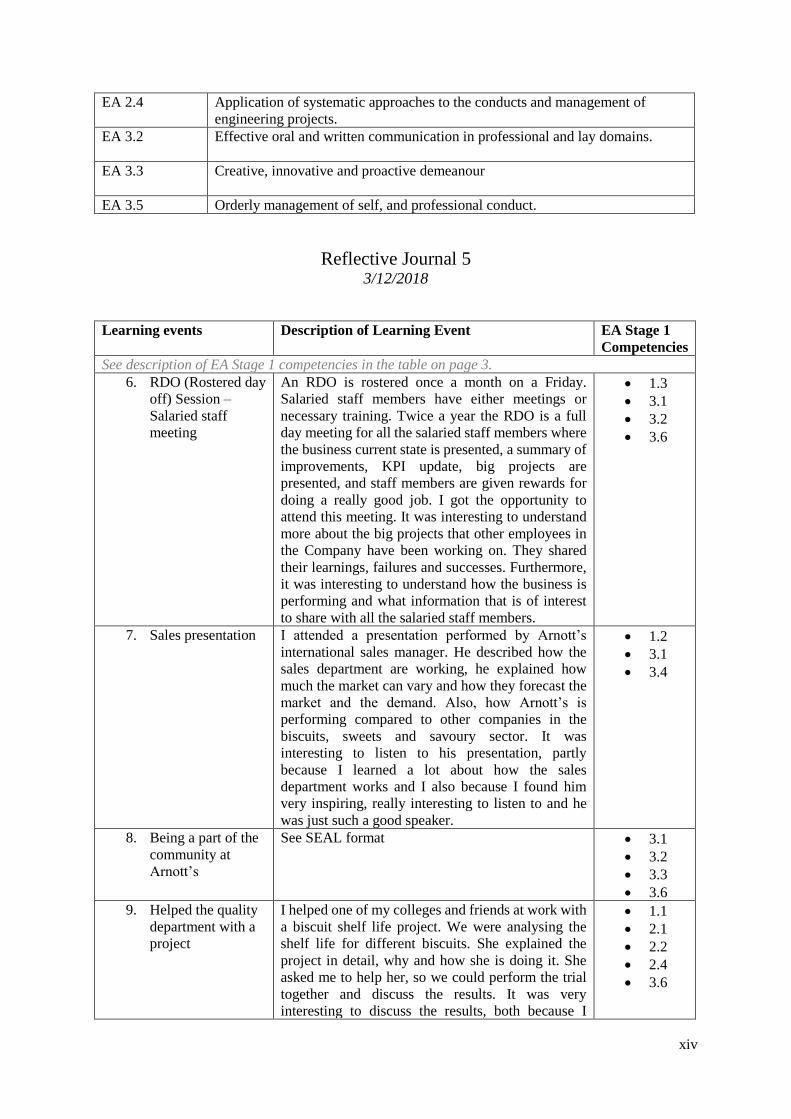
xiv
EA 2.4 Application of systematic approaches to the conducts and management of
engineering projects.
EA 3.2 Effective oral and written communication in professional and lay domains.
EA 3.3 Creative, innovative and proactive demeanour
EA 3.5 Orderly management of self, and professional conduct.
Reflective Journal 5 3/12/2018
Learning events Description of Learning Event EA Stage 1
Competencies
See description of EA Stage 1 competencies in the table on page 3.
6. RDO (Rostered day
off) Session –
Salaried staff
meeting
An RDO is rostered once a month on a Friday.
Salaried staff members have either meetings or
necessary training. Twice a year the RDO is a full
day meeting for all the salaried staff members where
the business current state is presented, a summary of
improvements, KPI update, big projects are
presented, and staff members are given rewards for
doing a really good job. I got the opportunity to
attend this meeting. It was interesting to understand
more about the big projects that other employees in
the Company have been working on. They shared
their learnings, failures and successes. Furthermore,
it was interesting to understand how the business is
performing and what information that is of interest
to share with all the salaried staff members.
• 1.3
• 3.1
• 3.2
• 3.6
7. Sales presentation I attended a presentation performed by Arnott’s
international sales manager. He described how the
sales department are working, he explained how
much the market can vary and how they forecast the
market and the demand. Also, how Arnott’s is
performing compared to other companies in the
biscuits, sweets and savoury sector. It was
interesting to listen to his presentation, partly
because I learned a lot about how the sales
department works and I also because I found him
very inspiring, really interesting to listen to and he
was just such a good speaker.
• 1.2
• 3.1
• 3.4
8. Being a part of the
community at
Arnott’s
See SEAL format • 3.1
• 3.2
• 3.3
• 3.6
9. Helped the quality
department with a
project
I helped one of my colleges and friends at work with
a biscuit shelf life project. We were analysing the
shelf life for different biscuits. She explained the
project in detail, why and how she is doing it. She
asked me to help her, so we could perform the trial
together and discuss the results. It was very
interesting to discuss the results, both because I
• 1.1
• 2.1
• 2.2
• 2.4
• 3.6
xv
learnt a lot on how they are working in the quality
departments and because we have different
experiences and knowledge which was a very good
combination when discussing the results. She also
gave me instructions on how to do a sensory test of
the biscuits, which was very interesting to learn. Her
background is food science at UQ, so she made
interested to select a food science course as an
elective course next semester.
Analysis of event with SEAL format Situation
What was the new experience or challenge you faced and what happened to you?
When I started to work at Arnott’s in July I did not like Brisbane as much as I do today. I felt quite
lonely since almost all my friends had left the country, the friends I got during my first semester at UQ
were international students which were in Australia for only one semester. Furthermore, I did not like
my accommodation, the people I lived with were very unfriendly. So, I felt that it was very challenging
when I started at Arnott’s, I felt lonely and I almost wanted to go back home to Sweden.
What impact did it have on you and what were the consequences of this impact?
I did not feel very well, and I was questioning my decision of staying in Australia. I am a person that
does not like failure, so I was questioning myself if I stayed in Australia only because I would see it as
a failure to not finish my two years exchange. “What doesn’t kill you, makes you stronger”, I was
questioning whether it was worth fighting for or not. I found myself not acting and behaving as usual, it
was frustrating. I wanted the people at Arnott’s to see who I really am.
What actions did you take to deal with the challenge you faced and why did you do those things?
I smiled, I gave everyone a smile and a hello. I talked a lot with the operators and other salaried staff
members. I was longing for more deep relations with people. So, I started to ask people more personal
questions, not only the standard question “how are you?”. Sometimes I wrote up the name of the person
together with the story, just to make sure I remembered and could ask him or her some following
questions the next time we had a chat. I started to feel that some people really liked and cared about me
as well. It is hard to explain how good it felt, feeling lonely on the other side of the world, is just so
lonely. After 5 months at Arnott’s, I do really feel that I am a part of the work community, the people
here almost feel like a second family. I have got many friends with different positions and different ages
in the workplace, and truly love working here at Arnott’s.
What have you learnt from the experience and how will you apply this in the future?
I have learnt how important it is to have a good working environment. When the environment
is positive, and people are friends with their work colleagues, it is easier and fun to go to work,
people work harder and with passion. People spend so much time at work, the working culture
is therefore so important. Furthermore, I have learnt a lot about myself through this experience.
I went through a hard part of my life and the outcome is just so much better than I expected. I
feel that I have developed and improved my social skills, something I will apply both in my
future career but also just in life in general. I will always try to contribute to a good working
environment. It is important to be surrounded by good people, people that care about you. It
will be hard to leave Arnott’s in three weeks, they have been so good to me.
EA Stage 1 Competencies
EA 1.1 Comprehensive, theory based understanding of the underpinning natural and
physical sciences and the engineering fundamentals applicable to the
engineering discipline
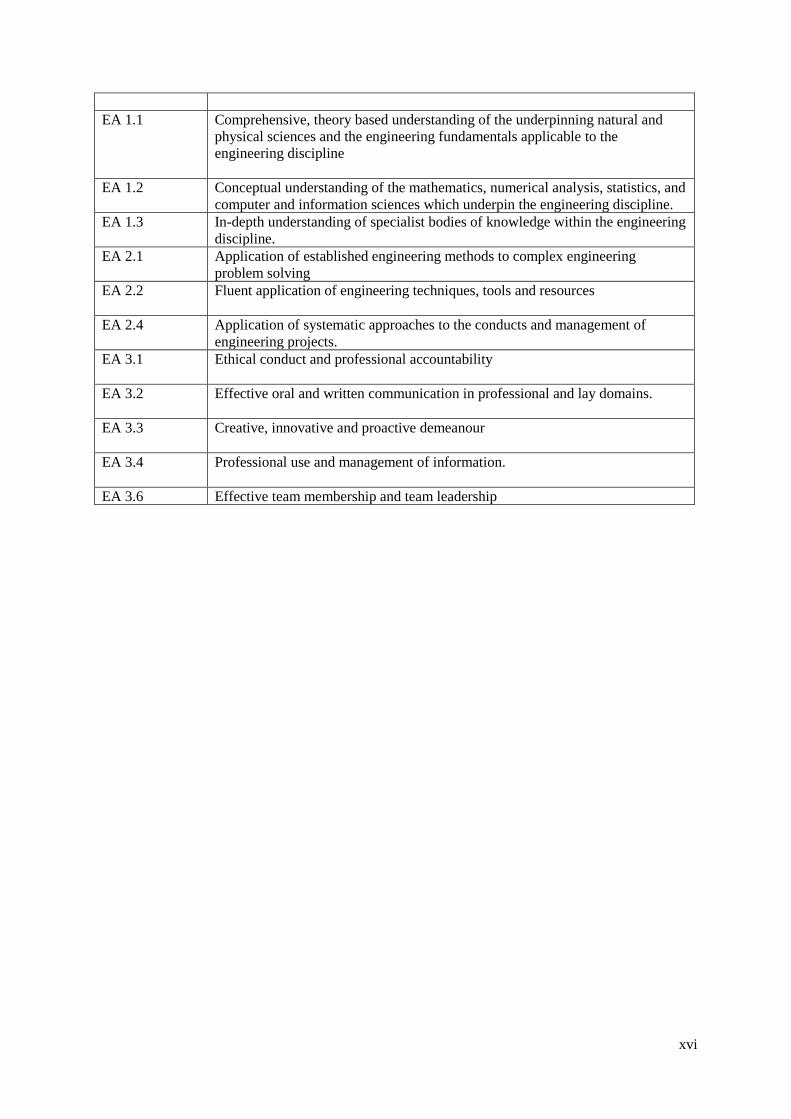
xvi
EA 1.1 Comprehensive, theory based understanding of the underpinning natural and
physical sciences and the engineering fundamentals applicable to the
engineering discipline
EA 1.2 Conceptual understanding of the mathematics, numerical analysis, statistics, and
computer and information sciences which underpin the engineering discipline.
EA 1.3 In-depth understanding of specialist bodies of knowledge within the engineering
discipline.
EA 2.1 Application of established engineering methods to complex engineering
problem solving
EA 2.2 Fluent application of engineering techniques, tools and resources
EA 2.4 Application of systematic approaches to the conducts and management of
engineering projects.
EA 3.1 Ethical conduct and professional accountability
EA 3.2 Effective oral and written communication in professional and lay domains.
EA 3.3 Creative, innovative and proactive demeanour
EA 3.4 Professional use and management of information.
EA 3.6 Effective team membership and team leadership


