Embed Size (px)
Citation preview

Ž .The Science of the Total Environment 287 2002 177�201
Chemical composition of PM and PM in Mexico2.5 10
City during winter 1997
Judith C. Chowa,�, John G. Watsona, Sylvia A. Edgertonb,Elizabeth Vegac
aDesert Research Institute, 2215 Raggio Parkway, Reno, NV 89512, USAbBattelle Pacific Northwest National Laboratory, Washington, DC, USA
cInstituto Mexicano del Petroleo, Mexico City, Mexico´
Received 13 February 2001; accepted 1 June 2001
Abstract
PM and PM were measured over 24-h intervals at six core sites and at 25 satellite sites in and around Mexico2.5 10City from 23 February to 22 March 1997. In addition, four 6-h samples were taken each day at three of the core sites.Sampling locations were selected to represent regional, central city, commercial, residential, and industrial portionsof the city. Mass and light transmission concentrations were determined on all of the samples, while elements, ionsand carbon were measured on approximately two-thirds of the samples. PM concentrations were highly variable,10with almost three-fold differences between the highest and lowest concentrations. Fugitive dust was the major causeof PM differences, although carbon concentrations were also highly variable among the sampling sites. Approxi-10mately 50% of PM was in the PM fraction. The majority of PM mass was comprised of carbon, sulfate, nitrate,10 2.5ammonium and crustal components, but in different proportions on different days and at different sites. The largestfine-particle components were carbonaceous aerosols, constituting �50% of PM mass, followed by �30%2.5secondary inorganic aerosols and �15% geological material. Geological material is the largest component of PM ,10constituting �50% of PM mass, followed by �32% carbonaceous aerosols and �17% secondary inorganic10aerosols. Sulfate concentrations were twice as high as nitrate concentrations. Sulfate and nitrate were present asammonium sulfate and ammonium nitrate. Approximately two-thirds of the ammonium sulfate measured in urbanareas appears to have been transported from regions outside of the study domain, rather than formed from emissionsin the urban area. Diurnal variations are apparent, with two-fold increases in concentration from night-time todaytime. Morning samples had the highest PM and PM mass, secondary inorganic aerosols and carbon2.5 10concentrations, probably due to a shallow surface inversion and rush-hour traffic. � 2002 Elsevier Science B.V. Allrights reserved.
Keywords: PM ; PM ; Mexico City; Satellite sites2.5 10
� Corresponding author. Tel.: �1-775-674-7050; fax: �1-775-674-7009.Ž .E-mail address: [email protected] J.C. Chow .
0048-9697�02�$ - see front matter � 2002 Elsevier Science B.V. All rights reserved.Ž .PII: S 0 0 4 8 - 9 6 9 7 0 1 0 0 9 8 2 - 2
( )J.C. Chow et al. � The Science of the Total En�ironment 287 2002 177�201178
1. Introduction
Mexico City occupies �1300 km2 at �2250 mŽ .above mean sea level MSL in the Valle de
Mexico, which is bounded by mountains exceed-ing 1000 m on all sides except the north. TheMexico City metropolitan area produces over 30%of the nation’s economic output and contains
Ž�20% of the nation’s entire population �20.million inhabitants , with over 3 million motor
vehicles traveling on the roads every day.Poor air quality, particularly during the dry
winter months, causes adverse health effects fromexposure to carbon monoxide, ozone and sus-
Žpended particles Romieu et al., 1992, 1996; Fer-nandez-Bremauntz and Ashmore, 1995; Hernan-
.dez-Gardutho et al., 1997; Loomis et al., 1999 .Although 24-h average HIVOL�SSI and 1-h av-
Žerage TEOM Tapered Element Oscillating Mi-. Žcrobalance PM particulate matter with aero-10
.dynamic diameters of less than 10 �m concen-Ž .trations are high Vega et al., 2001a , little is
known about particulate chemical compositionŽand size, especially the PM particulate matter2.5
.with aerodynamic diameters of less than 2.5 �mfraction. Reported here are chemical concentra-tions of PM and PM in the Valley of Mexico2.5 10
between 2 March and 19 March 1997, measuredas part of the ‘Investigacion sobre Materia Partic-´ulada y Deterioro Atmosferico � Aerosol and´
Ž .Visibility Evaluation Research IMADA�AVER ’Ž .Doran et al., 1998; Edgerton et al., 1999 .
The following presentation examines thechemical characteristics of PM and PM con-2.5 10
centrations and characterizes their temporal andŽ .spatial variations. Vega et al. 2001a describe
PM and PM mass concentrations from10 2.5
IMADA and Mexico City long-term monitors andcompare levels during the 23 February to 22March 1997 study period to annual and previous
Ž .years’ concentrations. Chow et al. 2001a de-scribe zones of representation for the core sitesusing measurements from the satellite sites.
2. PM measurements
2.1. Aerosol network
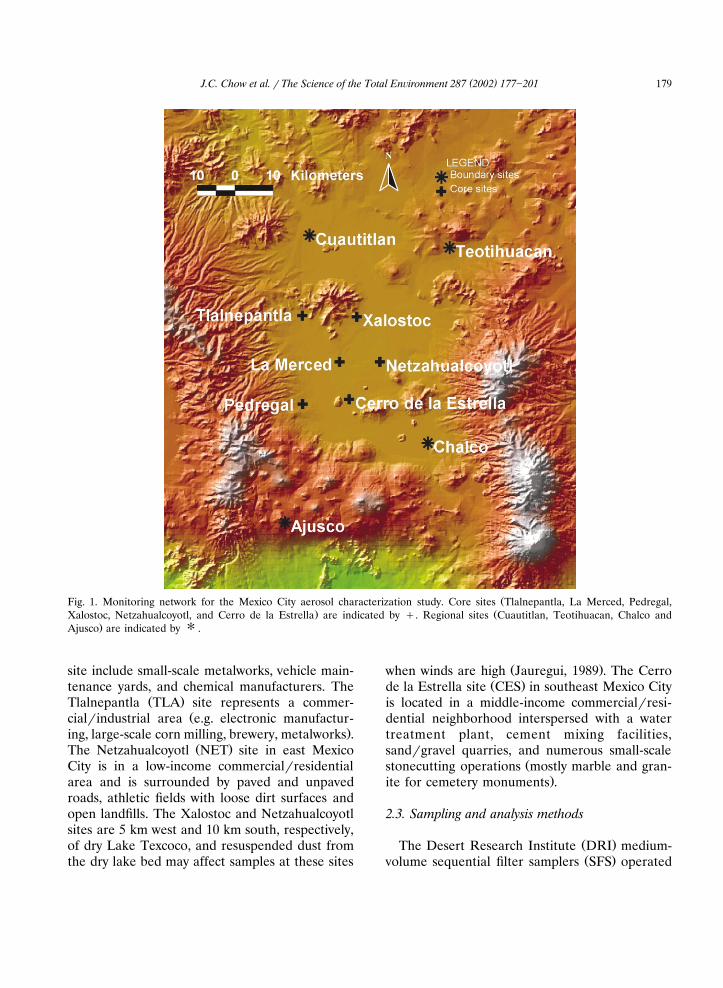
The IMADA�AVER aerosol monitoring net-Ž .work shown in Fig. 1 measures boundary, source,
and receptor areas. Six core sampling sites wereselected from Mexico City’s long-term monitoringnetwork to represent different industrial,commercial and residential land uses in urbanand suburban areas, different socioeconomicstrata, and different source emissions. The coresites were located in a 20-km east�west by 25-kmnorth�south area. Four regional-scale samplingsites on the periphery of the city were chosen torepresent non-urban agricultural settings �50km beyond the urban center, at the border of theMexico City basin. In addition, 21 satellite siteswere located near pollution sources, next to coresites, and between receptor sites. These satellitesites were intended to evaluate the zones of rep-
Ž .resentation of the six receptor core sites and tounderstand the zones of influence from motorvehicle, fugitive dust, and industrial sources.
ŽChemical and physical characteristics of PM par-.ticulate matter at the six core sites are reported
here.
2.2. Sampling sites
Ž .The La Merced MER site is located in adowntown commercial and financial district, with
Ž .a major food market mercado �0.2 km to thewest. This site is surrounded by the other fivecore sites that represent different population den-sities and emission activities, as shown in Fig. 1.Motor vehicle emissions affected all of these sites.Traffic volumes ranged from relatively light at the
ŽPedregal site PED, in an affluent suburban�resi-.dential neighborhood in southwest Mexico City
to relatively congested, including heavy-duty dieseland older light-duty gasoline vehicles, at the
ŽXalostoc site XAL, in an urban�industrial sec-.tor . Potential emission sources near the Xalostoc
( )J.C. Chow et al. � The Science of the Total En�ironment 287 2002 177�201 179
ŽFig. 1. Monitoring network for the Mexico City aerosol characterization study. Core sites Tlalnepantla, La Merced, Pedregal,. ŽXalostoc, Netzahualcoyotl, and Cerro de la Estrella are indicated by �. Regional sites Cuautitlan, Teotihuacan, Chalco and
.Ajusco are indicated by �.
site include small-scale metalworks, vehicle main-tenance yards, and chemical manufacturers. The
Ž .Tlalnepantla TLA site represents a commer-Žcial�industrial area e.g. electronic manufactur-
.ing, large-scale corn milling, brewery, metalworks .Ž .The Netzahualcoyotl NET site in east Mexico
City is in a low-income commercial�residentialarea and is surrounded by paved and unpavedroads, athletic fields with loose dirt surfaces andopen landfills. The Xalostoc and Netzahualcoyotlsites are 5 km west and 10 km south, respectively,of dry Lake Texcoco, and resuspended dust fromthe dry lake bed may affect samples at these sites
Ž .when winds are high Jauregui, 1989 . The CerroŽ .de la Estrella site CES in southeast Mexico City
is located in a middle-income commercial�resi-dential neighborhood interspersed with a watertreatment plant, cement mixing facilities,sand�gravel quarries, and numerous small-scale
Žstonecutting operations mostly marble and gran-.ite for cemetery monuments .
2.3. Sampling and analysis methods
Ž .The Desert Research Institute DRI medium-Ž .volume sequential filter samplers SFS operated
( )J.C. Chow et al. � The Science of the Total En�ironment 287 2002 177�201180
at a flow rate of 113 l�min and equipped withŽ . ŽPM Bendix 240 cyclone and PM Andersen2.5 10.SA254 size-selective inlets and nitric acid
anodized aluminum parallel-tube denuders wereused at the six core sites for aerosol samplingŽ .Chow et al., 1996a . Daily 24-h samples weretaken at the Tlalnepantla, Netzahualcoyotl, and
ŽPedregal sites. Diurnal 6-h samples i.e.00.00�06.00, 06.00�12.00, 12.00�18.00 and
.18.00�24.00 h MST were taken daily, four timesper day, at the Xalostoc, La Merced, and Cerrode la Estrella sites. In addition, 6-h average nitric
Ž . Ž .acid HNO and ammonia NH precursor gases3 3were measured at the La Merced site with se-
Ž .quential gas samplers SGS using the denuder-Ždifference method Chow et al., 1993a; Chow,
.1995 . Dual sampling channels on each SFS wereconfigured with 47-mm Teflon-membrane�quartz-fiber and quartz-fiber�sodium-chloride-impregnated cellulose-fiber filter packs at a flowrate of 30 l�min. The two SGS channels wereconfigured with citric-acid-im pregnatedcellulose-fiber filter packs and preceding citric-acid-coated parallel-tube denuders for NH sam-3pling, and with quartz-fiber�sodium-chloride-impregnated cellulose-fiber filter packs and pre-ceding nitric acid anodized aluminum parallel-tube denuders for HNO sampling at a flow rate3
Ž .of 30 l�min Chow et al., 1993a . PM mass,10chemical composition and NH were also ac-3quired at the four regional-scale sampling siteswith parallel Teflon-membrane�citric-acid-im-pregnated cellulose-fiber and quartz-fiber�sodium-chloride-impregnated cellulose-fiber filter
Žpacks installed in Minivol samplers Airmetrics,.Eugene, OR operating at a flow rate of 5 l�min.
The NH measurement on backup filters also3included volatilized ammonia from ammoniumnitrate, so it is positively biased, as the front filterammonium is negatively biased. The backup filterNH is adequate to determine the effects of local3sources, such as NH from animal husbandry.3
Ž .Substrates used during the study included: 1Ž .Gelman Teflon-membrane filters �R2PJ047 for
Ž . Ž .mass, light transmission b , and elements; 2absŽ .Pallflex quartz-fiber filters �2500 QAT-UP for
water-soluble anions and cations and for particu-Ž .late carbon; and 3 Whatman 41 cellulose-fiber
Ž .filters �1441047 impregnated with citric acid forNH and with sodium chloride for HNO .3 3
Teflon-membrane filters were analyzed for massŽ .by gravimetry, for light transmission b by den-abs
Ž .sitometry, and for 38 elements Al to U by X-rayŽ .fluorescence XRF; Watson et al., 1999 . The
front quartz-fiber filters were analyzed for water-Ž 2�. Ž �.soluble sulfate SO and nitrate NO by ion4 3Ž .chromatography Chow and Watson, 1999 ; for
Ž �.water-soluble ammonium NH by automated4Ž �.colorimetry; for water-soluble sodium Na and
Ž �.potassium K by atomic absorption spectropho-Ž .tometry Chow et al., 2002 ; and for organic car-
Ž . Ž .bon OC and elemental carbon EC by theŽ .IMPROVE thermal�optical reflectance TOR
Ž .protocol Chow et al., 1993b, 2001b . Backupquartz-fiber filters placed behind the Teflon-membrane filters were used to estimate the mag-nitude of organic artifacts. Backup sodium-chlo-ride-impregnated cellulose-fiber filters placed be-hind the quartz-fiber filters were used to estimatethe extent of nitrate volatilization.
2.4. Quality assurance�quality control
Field blanks were acquired and replicate analy-ses were performed for �10% of all ambientsamples. Quality audits of sample flow rates, con-ducted at the beginning and end of the studyperiod, were found to be within �10% of speci-fications. Data were submitted to three levels of
Ždata validation Chow et al., 1994a; Watson et al.,.2001a . Most of the missing data is attributable to
power failures, which were most frequent at theNetzahualcoyotl site.
3. Results and discussion
3.1. Statistical summary of PM and PM2.5 10chemical concentrations
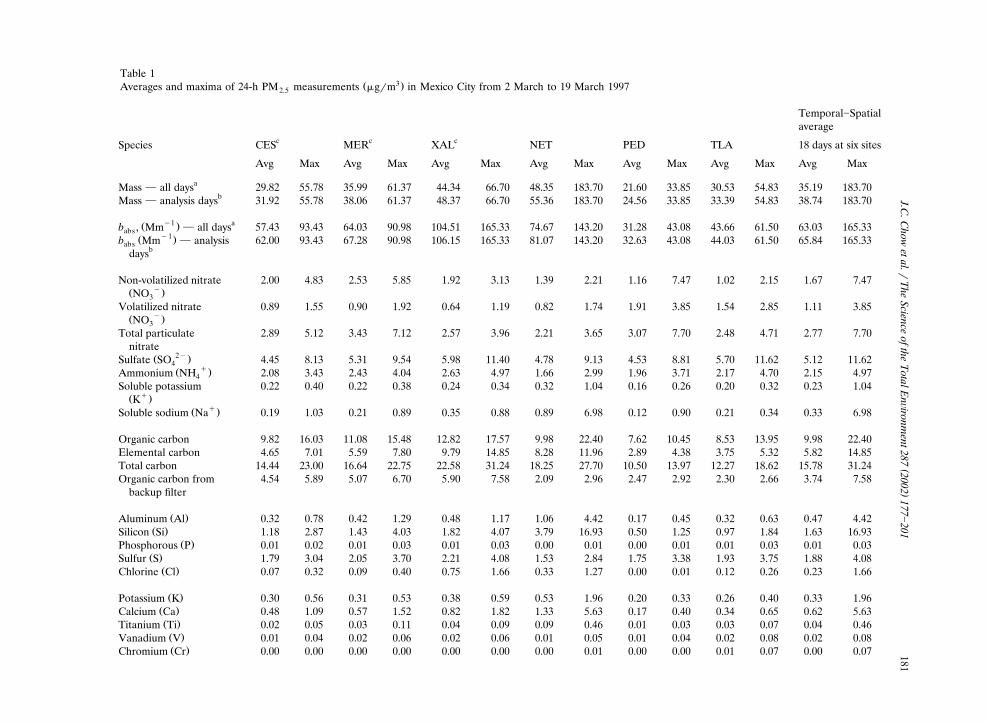
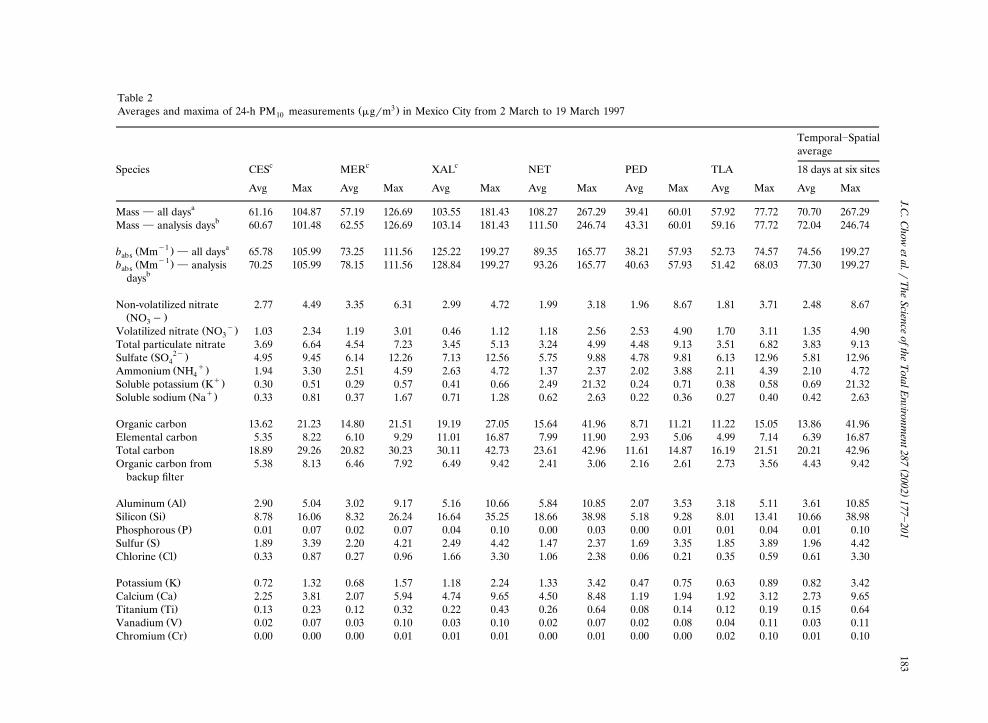
Tables 1 and 2 summarize average and maxi-mum 24-h PM and PM chemical concentra-2.5 10tions for the core sites, respectively. Average massand b concentrations over the entire 28-dayabssampling period are also listed in Tables 1 and 2
()
J.C.C
howetal.�
The
Scienceofthe
TotalE
n�ironment287
2002177
�201181
Table 13Ž .Averages and maxima of 24-h PM measurements �g�m in Mexico City from 2 March to 19 March 19972.5
Temporal�Spatialaverage
c c cSpecies CES MER XAL NET PED TLA 18 days at six sites
Avg Max Avg Max Avg Max Avg Max Avg Max Avg Max Avg Max
aMass � all days 29.82 55.78 35.99 61.37 44.34 66.70 48.35 183.70 21.60 33.85 30.53 54.83 35.19 183.70bMass � analysis days 31.92 55.78 38.06 61.37 48.37 66.70 55.36 183.70 24.56 33.85 33.39 54.83 38.74 183.70
�1 aŽ .b , Mm � all days 57.43 93.43 64.03 90.98 104.51 165.33 74.67 143.20 31.28 43.08 43.66 61.50 63.03 165.33abs�1Ž .b Mm � analysis 62.00 93.43 67.28 90.98 106.15 165.33 81.07 143.20 32.63 43.08 44.03 61.50 65.84 165.33abs
bdays
Non-volatilized nitrate 2.00 4.83 2.53 5.85 1.92 3.13 1.39 2.21 1.16 7.47 1.02 2.15 1.67 7.47�Ž .NO3
Volatilized nitrate 0.89 1.55 0.90 1.92 0.64 1.19 0.82 1.74 1.91 3.85 1.54 2.85 1.11 3.85�Ž .NO3
Total particulate 2.89 5.12 3.43 7.12 2.57 3.96 2.21 3.65 3.07 7.70 2.48 4.71 2.77 7.70nitrate
2�Ž .Sulfate SO 4.45 8.13 5.31 9.54 5.98 11.40 4.78 9.13 4.53 8.81 5.70 11.62 5.12 11.624�Ž .Ammonium NH 2.08 3.43 2.43 4.04 2.63 4.97 1.66 2.99 1.96 3.71 2.17 4.70 2.15 4.974
Soluble potassium 0.22 0.40 0.22 0.38 0.24 0.34 0.32 1.04 0.16 0.26 0.20 0.32 0.23 1.04�Ž .K
�Ž .Soluble sodium Na 0.19 1.03 0.21 0.89 0.35 0.88 0.89 6.98 0.12 0.90 0.21 0.34 0.33 6.98
Organic carbon 9.82 16.03 11.08 15.48 12.82 17.57 9.98 22.40 7.62 10.45 8.53 13.95 9.98 22.40Elemental carbon 4.65 7.01 5.59 7.80 9.79 14.85 8.28 11.96 2.89 4.38 3.75 5.32 5.82 14.85Total carbon 14.44 23.00 16.64 22.75 22.58 31.24 18.25 27.70 10.50 13.97 12.27 18.62 15.78 31.24Organic carbon from 4.54 5.89 5.07 6.70 5.90 7.58 2.09 2.96 2.47 2.92 2.30 2.66 3.74 7.58
backup filter
Ž .Aluminum Al 0.32 0.78 0.42 1.29 0.48 1.17 1.06 4.42 0.17 0.45 0.32 0.63 0.47 4.42Ž .Silicon Si 1.18 2.87 1.43 4.03 1.82 4.07 3.79 16.93 0.50 1.25 0.97 1.84 1.63 16.93
Ž .Phosphorous P 0.01 0.02 0.01 0.03 0.01 0.03 0.00 0.01 0.00 0.01 0.01 0.03 0.01 0.03Ž .Sulfur S 1.79 3.04 2.05 3.70 2.21 4.08 1.53 2.84 1.75 3.38 1.93 3.75 1.88 4.08
Ž .Chlorine Cl 0.07 0.32 0.09 0.40 0.75 1.66 0.33 1.27 0.00 0.01 0.12 0.26 0.23 1.66
Ž .Potassium K 0.30 0.56 0.31 0.53 0.38 0.59 0.53 1.96 0.20 0.33 0.26 0.40 0.33 1.96Ž .Calcium Ca 0.48 1.09 0.57 1.52 0.82 1.82 1.33 5.63 0.17 0.40 0.34 0.65 0.62 5.63Ž .Titanium Ti 0.02 0.05 0.03 0.11 0.04 0.09 0.09 0.46 0.01 0.03 0.03 0.07 0.04 0.46Ž .Vanadium V 0.01 0.04 0.02 0.06 0.02 0.06 0.01 0.05 0.01 0.04 0.02 0.08 0.02 0.08Ž .Chromium Cr 0.00 0.00 0.00 0.00 0.00 0.00 0.00 0.01 0.00 0.00 0.01 0.07 0.00 0.07

()
J.C.C
howetal.�
The
Scienceofthe
TotalE
n�ironment287
2002177
�201182Ž .Table 1 Continued
Temporal�Spatialaverage
c c cSpecies CES MER XAL NET PED TLA 18 days at six sites
Avg Max Avg Max Avg Max Avg Max Avg Max Avg Max Avg Max
Ž .Manganese Mn 0.01 0.02 0.02 0.03 0.03 0.06 0.02 0.09 0.01 0.03 0.03 0.08 0.02 0.09Ž .Iron Fe 0.35 0.73 0.49 1.15 0.78 1.39 1.09 4.99 0.18 0.37 0.47 0.95 0.56 4.99
Ž .Cobalt Co 0.00 0.00 0.00 0.00 0.00 0.00 0.00 0.00 0.00 0.00 0.00 0.00 0.00 0.00Ž .Nickel Ni 0.00 0.01 0.00 0.01 0.00 0.01 0.00 0.01 0.00 0.01 0.01 0.04 0.00 0.04Ž .Copper Cu 0.02 0.02 0.03 0.04 0.03 0.07 0.03 0.06 0.01 0.01 0.02 0.05 0.02 0.07
Ž .Zinc Zn 0.16 0.48 0.26 0.60 0.49 1.05 0.14 0.33 0.06 0.09 0.40 0.92 0.26 1.05Ž .Gallium Ga 0.00 0.00 0.00 0.00 0.00 0.00 0.00 0.00 0.00 0.00 0.00 0.00 0.00 0.00Ž .Arsenic As 0.00 0.00 0.00 0.01 0.00 0.01 0.00 0.00 0.00 0.00 0.00 0.01 0.00 0.01Ž .Selenium Se 0.00 0.00 0.00 0.01 0.00 0.00 0.00 0.00 0.00 0.00 0.00 0.01 0.00 0.01Ž .Bromine Br 0.01 0.02 0.02 0.02 0.02 0.05 0.02 0.03 0.01 0.01 0.01 0.02 0.02 0.05
Ž .Rubidium Rb 0.00 0.00 0.00 0.00 0.00 0.00 0.00 0.01 0.00 0.00 0.00 0.00 0.00 0.01Ž .Strontium Sr 0.00 0.01 0.01 0.01 0.01 0.01 0.01 0.05 0.00 0.00 0.00 0.01 0.01 0.05
Ž .Yttrium Y 0.00 0.00 0.00 0.00 0.00 0.00 0.00 0.00 0.00 0.00 0.00 0.00 0.00 0.00Ž .Zirconium Zr 0.00 0.00 0.00 0.01 0.00 0.01 0.01 0.03 0.00 0.00 0.00 0.01 0.00 0.03
Ž .Molybdenum Mo 0.00 0.00 0.00 0.00 0.00 0.01 0.00 0.00 0.00 0.00 0.00 0.00 0.00 0.01
Ž .Palladium Pd 0.00 0.01 0.00 0.01 0.00 0.01 0.00 0.01 0.00 0.00 0.00 0.00 0.00 0.01Ž .Silver Ag 0.01 0.03 0.01 0.02 0.01 0.02 0.00 0.01 0.00 0.01 0.00 0.00 0.01 0.03
Ž .Cadmium Cd 0.00 0.01 0.00 0.01 0.01 0.01 0.00 0.01 0.00 0.01 0.01 0.04 0.00 0.04Ž .Indium In 0.01 0.02 0.01 0.02 0.01 0.01 0.00 0.00 0.00 0.01 0.00 0.00 0.00 0.02
Ž .Tin Sn 0.02 0.02 0.02 0.03 0.03 0.09 0.01 0.03 0.01 0.01 0.01 0.03 0.02 0.09
Ž .Antimony Sb 0.01 0.02 0.01 0.02 0.01 0.04 0.01 0.02 0.00 0.01 0.01 0.01 0.01 0.04Ž .Barium Ba 0.05 0.10 0.05 0.10 0.06 0.08 0.03 0.12 0.02 0.06 0.02 0.06 0.04 0.12
Ž .Lanthanum La 0.06 0.12 0.04 0.11 0.04 0.09 0.01 0.04 0.02 0.05 0.01 0.04 0.03 0.12Ž .Gold Au 0.00 0.00 0.00 0.00 0.00 0.00 0.00 0.00 0.00 0.00 0.00 0.00 0.00 0.00
Ž .Mercury Hg 0.00 0.00 0.00 0.00 0.00 0.00 0.00 0.00 0.00 0.00 0.00 0.00 0.00 0.00
Ž .Thallium Tl 0.00 0.00 0.00 0.00 0.00 0.00 0.00 0.00 0.00 0.00 0.00 0.00 0.00 0.00Ž .Lead Pb 0.07 0.11 0.12 0.28 0.14 0.22 0.08 0.15 0.05 0.07 0.13 0.19 0.10 0.28
Ž .Uranium U 0.00 0.00 0.00 0.00 0.00 0.00 0.00 0.00 0.00 0.00 0.00 0.00 0.00 0.00
CES�Cerro de la Estrella; NET�Netzahualcoyotl; MER�La Merced; PED�Pedregal; XAL�Xalostoc; TLA�Tlalnepantla.a Field sampling between 23 February and 22 March 1997.bChemical speciation of 18 days of samples from between 2 March and 19 March 1997.c 24-h averages are average of four 6-h samples.
()
J.C.C
howetal.�
The
Scienceofthe
TotalE
n�ironment287
2002177
�201183
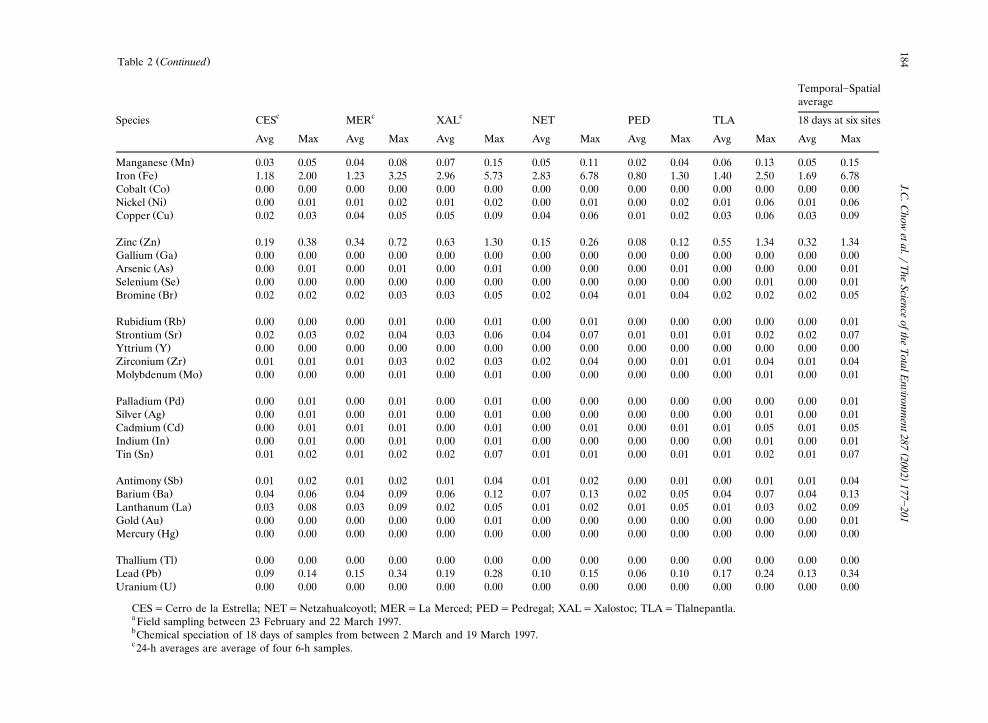
Table 23Ž .Averages and maxima of 24-h PM measurements �g�m in Mexico City from 2 March to 19 March 199710
Temporal�Spatialaverage
c c cSpecies CES MER XAL NET PED TLA 18 days at six sites
Avg Max Avg Max Avg Max Avg Max Avg Max Avg Max Avg Max
aMass � all days 61.16 104.87 57.19 126.69 103.55 181.43 108.27 267.29 39.41 60.01 57.92 77.72 70.70 267.29bMass � analysis days 60.67 101.48 62.55 126.69 103.14 181.43 111.50 246.74 43.31 60.01 59.16 77.72 72.04 246.74
�1 aŽ .b Mm � all days 65.78 105.99 73.25 111.56 125.22 199.27 89.35 165.77 38.21 57.93 52.73 74.57 74.56 199.27abs�1Ž .b Mm � analysis 70.25 105.99 78.15 111.56 128.84 199.27 93.26 165.77 40.63 57.93 51.42 68.03 77.30 199.27abs
bdays
Non-volatilized nitrate 2.77 4.49 3.35 6.31 2.99 4.72 1.99 3.18 1.96 8.67 1.81 3.71 2.48 8.67Ž .NO �3
�Ž .Volatilized nitrate NO 1.03 2.34 1.19 3.01 0.46 1.12 1.18 2.56 2.53 4.90 1.70 3.11 1.35 4.903Total particulate nitrate 3.69 6.64 4.54 7.23 3.45 5.13 3.24 4.99 4.48 9.13 3.51 6.82 3.83 9.13
2�Ž .Sulfate SO 4.95 9.45 6.14 12.26 7.13 12.56 5.75 9.88 4.78 9.81 6.13 12.96 5.81 12.964�Ž .Ammonium NH 1.94 3.30 2.51 4.59 2.63 4.72 1.37 2.37 2.02 3.88 2.11 4.39 2.10 4.724
�Ž .Soluble potassium K 0.30 0.51 0.29 0.57 0.41 0.66 2.49 21.32 0.24 0.71 0.38 0.58 0.69 21.32�Ž .Soluble sodium Na 0.33 0.81 0.37 1.67 0.71 1.28 0.62 2.63 0.22 0.36 0.27 0.40 0.42 2.63
Organic carbon 13.62 21.23 14.80 21.51 19.19 27.05 15.64 41.96 8.71 11.21 11.22 15.05 13.86 41.96Elemental carbon 5.35 8.22 6.10 9.29 11.01 16.87 7.99 11.90 2.93 5.06 4.99 7.14 6.39 16.87Total carbon 18.89 29.26 20.82 30.23 30.11 42.73 23.61 42.96 11.61 14.87 16.19 21.51 20.21 42.96Organic carbon from 5.38 8.13 6.46 7.92 6.49 9.42 2.41 3.06 2.16 2.61 2.73 3.56 4.43 9.42
backup filter
Ž .Aluminum Al 2.90 5.04 3.02 9.17 5.16 10.66 5.84 10.85 2.07 3.53 3.18 5.11 3.61 10.85Ž .Silicon Si 8.78 16.06 8.32 26.24 16.64 35.25 18.66 38.98 5.18 9.28 8.01 13.41 10.66 38.98
Ž .Phosphorous P 0.01 0.07 0.02 0.07 0.04 0.10 0.00 0.03 0.00 0.01 0.01 0.04 0.01 0.10Ž .Sulfur S 1.89 3.39 2.20 4.21 2.49 4.42 1.47 2.37 1.69 3.35 1.85 3.89 1.96 4.42
Ž .Chlorine Cl 0.33 0.87 0.27 0.96 1.66 3.30 1.06 2.38 0.06 0.21 0.35 0.59 0.61 3.30
Ž .Potassium K 0.72 1.32 0.68 1.57 1.18 2.24 1.33 3.42 0.47 0.75 0.63 0.89 0.82 3.42Ž .Calcium Ca 2.25 3.81 2.07 5.94 4.74 9.65 4.50 8.48 1.19 1.94 1.92 3.12 2.73 9.65Ž .Titanium Ti 0.13 0.23 0.12 0.32 0.22 0.43 0.26 0.64 0.08 0.14 0.12 0.19 0.15 0.64Ž .Vanadium V 0.02 0.07 0.03 0.10 0.03 0.10 0.02 0.07 0.02 0.08 0.04 0.11 0.03 0.11Ž .Chromium Cr 0.00 0.00 0.00 0.01 0.01 0.01 0.00 0.01 0.00 0.00 0.02 0.10 0.01 0.10
()
J.C.C
howetal.�
The
Scienceofthe
TotalE
n�ironment287
2002177
�201184Ž .Table 2 Continued
Temporal�Spatialaverage
c c cSpecies CES MER XAL NET PED TLA 18 days at six sites
Avg Max Avg Max Avg Max Avg Max Avg Max Avg Max Avg Max
Ž .Manganese Mn 0.03 0.05 0.04 0.08 0.07 0.15 0.05 0.11 0.02 0.04 0.06 0.13 0.05 0.15Ž .Iron Fe 1.18 2.00 1.23 3.25 2.96 5.73 2.83 6.78 0.80 1.30 1.40 2.50 1.69 6.78
Ž .Cobalt Co 0.00 0.00 0.00 0.00 0.00 0.00 0.00 0.00 0.00 0.00 0.00 0.00 0.00 0.00Ž .Nickel Ni 0.00 0.01 0.01 0.02 0.01 0.02 0.00 0.01 0.00 0.02 0.01 0.06 0.01 0.06Ž .Copper Cu 0.02 0.03 0.04 0.05 0.05 0.09 0.04 0.06 0.01 0.02 0.03 0.06 0.03 0.09
Ž .Zinc Zn 0.19 0.38 0.34 0.72 0.63 1.30 0.15 0.26 0.08 0.12 0.55 1.34 0.32 1.34Ž .Gallium Ga 0.00 0.00 0.00 0.00 0.00 0.00 0.00 0.00 0.00 0.00 0.00 0.00 0.00 0.00Ž .Arsenic As 0.00 0.01 0.00 0.01 0.00 0.01 0.00 0.00 0.00 0.01 0.00 0.00 0.00 0.01Ž .Selenium Se 0.00 0.00 0.00 0.00 0.00 0.00 0.00 0.00 0.00 0.00 0.00 0.01 0.00 0.01Ž .Bromine Br 0.02 0.02 0.02 0.03 0.03 0.05 0.02 0.04 0.01 0.04 0.02 0.02 0.02 0.05
Ž .Rubidium Rb 0.00 0.00 0.00 0.01 0.00 0.01 0.00 0.01 0.00 0.00 0.00 0.00 0.00 0.01Ž .Strontium Sr 0.02 0.03 0.02 0.04 0.03 0.06 0.04 0.07 0.01 0.01 0.01 0.02 0.02 0.07
Ž .Yttrium Y 0.00 0.00 0.00 0.00 0.00 0.00 0.00 0.00 0.00 0.00 0.00 0.00 0.00 0.00Ž .Zirconium Zr 0.01 0.01 0.01 0.03 0.02 0.03 0.02 0.04 0.00 0.01 0.01 0.04 0.01 0.04
Ž .Molybdenum Mo 0.00 0.00 0.00 0.01 0.00 0.01 0.00 0.00 0.00 0.00 0.00 0.01 0.00 0.01
Ž .Palladium Pd 0.00 0.01 0.00 0.01 0.00 0.01 0.00 0.00 0.00 0.00 0.00 0.00 0.00 0.01Ž .Silver Ag 0.00 0.01 0.00 0.01 0.00 0.01 0.00 0.00 0.00 0.00 0.00 0.01 0.00 0.01
Ž .Cadmium Cd 0.00 0.01 0.01 0.01 0.00 0.01 0.00 0.01 0.00 0.01 0.01 0.05 0.01 0.05Ž .Indium In 0.00 0.01 0.00 0.01 0.00 0.01 0.00 0.00 0.00 0.00 0.00 0.01 0.00 0.01
Ž .Tin Sn 0.01 0.02 0.01 0.02 0.02 0.07 0.01 0.01 0.00 0.01 0.01 0.02 0.01 0.07
Ž .Antimony Sb 0.01 0.02 0.01 0.02 0.01 0.04 0.01 0.02 0.00 0.01 0.00 0.01 0.01 0.04Ž .Barium Ba 0.04 0.06 0.04 0.09 0.06 0.12 0.07 0.13 0.02 0.05 0.04 0.07 0.04 0.13
Ž .Lanthanum La 0.03 0.08 0.03 0.09 0.02 0.05 0.01 0.02 0.01 0.05 0.01 0.03 0.02 0.09Ž .Gold Au 0.00 0.00 0.00 0.00 0.00 0.01 0.00 0.00 0.00 0.00 0.00 0.00 0.00 0.01
Ž .Mercury Hg 0.00 0.00 0.00 0.00 0.00 0.00 0.00 0.00 0.00 0.00 0.00 0.00 0.00 0.00
Ž .Thallium Tl 0.00 0.00 0.00 0.00 0.00 0.00 0.00 0.00 0.00 0.00 0.00 0.00 0.00 0.00Ž .Lead Pb 0.09 0.14 0.15 0.34 0.19 0.28 0.10 0.15 0.06 0.10 0.17 0.24 0.13 0.34
Ž .Uranium U 0.00 0.00 0.00 0.00 0.00 0.00 0.00 0.00 0.00 0.00 0.00 0.00 0.00 0.00
CES�Cerro de la Estrella; NET�Netzahualcoyotl; MER�La Merced; PED�Pedregal; XAL�Xalostoc; TLA�Tlalnepantla.a Field sampling between 23 February and 22 March 1997.bChemical speciation of 18 days of samples from between 2 March and 19 March 1997.c 24-h averages are average of four 6-h samples.
( )J.C. Chow et al. � The Science of the Total En�ironment 287 2002 177�201 185
for comparison. Average PM and PM for the2.5 10subset of samples selected for chemical analysisare approximately 3% and 10% higher, respec-tively, than the averages for the entire data set.The chemical concentration statistics might beslightly biased toward higher concentrations.
Approximately 50% of PM was in the PM10 2.5fraction. PM averages ranged from 24.6 �g�m3
2.5at the Pedregal site to 55.4 �g�m3 at the Netza-hualcoyotl site, with a spatial average of 38.7
3 Ž�g�m . Larger site-to-site variations almost.three-fold were found for PM , which ranged10
from 43.3 �g�m3 at the Pedregal site to 111.5�g�m3 at the Netzahualcoyotl site, with a spatialaverage of 72.0 �g�m3. The highest PM concen-trations were found at the Netzahualcoyotl site,with 183.7 �g�m3 of PM on 5 March 1997, and2.5246.7 �g�m3 of PM on 6 March 1997. PM10 2.5maxima exceeded 65 �g�m3 and PM exceeded10
3 Ž150 �g�m related to the US 24-h PM and2.5.PM standards; USEPA, 1997 only at the10
Xalostoc and Netzahualcoyotl sites. Eighteen- and3 Ž28-day average PM exceeded 15 �g�m re-2.5
.lated to the US annual standard at all sites, andby a factor of two or more at all sites but Pedre-
3 Žgal. The average PM exceeded 50 �g�m re-10.lated to the US annual standard at all sites but
Pedregal. Three years of monitoring are neededto determine compliance with US annual stan-dards.
On 5 March 1997, when the highest PM2.5concentration was found at the Netzahualcoyotlsite, PM mass from the Teflon-membrane filter10substrate was invalid, but elevated ion and carbonconcentrations were found on correspondingquartz-fiber filters. Among all sampling sites anddays, PM concentrations of Na�, K�, OC, Al,2.5Si, K, Ca, Ti, Mn, Fe, Rb, Sr, Y and Ba werehighest at the Netzahualcoyotl site on 5 March1997. Organic carbon, geological material, andelements contributed to the elevated PM mass2.5on this day. On 6 March 1997, when the highestŽ 3.246.7 �g�m PM concentrations were found10at Netzahualcoyotl, the corresponding PM mass2.5Ž 3.68.4 �g�m was only one-third of PM , less10than the site PM �PM average ratio of 0.442.5 10Ž .Vega et al., 2001a . Elevated PM concentra-10tions can be attributed to local fugitive dust
sources because the maximum concentrations ofAl, Si, K, Fe, Rb, Sr, Y, Ba and U were measuredat the Netzahualcoyotl site on 6 March 1997.
Ž 3. ŽConcentrations of PM Al 10.8 �g�m , Si 39.0103. Ž 3. Ž 3.�g�m , K 3.4 �g�m , Ca 8.5 �g�m and Fe
Ž 3.6.8 �g�m on this date were 3�4 times thetemporal-spatial average.
Average PM Na� concentrations at the Net-10Ž 3. Žzahualcoyotl 0.62 �g�m and Xalostoc 0.71
3.�g�m sites were 2�3 times higher than at theother sites and more than 50% to 70% higher
Ž 3.than the temporal-spatial average 0.42 �g�m ,indicative of dust suspended from the nearby drylake which contains higher abundances of sodium,chloride, and calcium than other Mexico City dust
Ž .sources Vega et al., 2001b . Average PM Ca10Ž 3.was highest at the Xalostoc site 4.7 �g�m ,Ž 3.followed by the Netzahualcoyotl site 4.4 �g�m .
Dust from the nearby dry lake and unpaved roadsaffected calcium levels at the Xalostoc and Netza-hualcoyotl sites more than local marble-carvingoperations contributed to the Cerro de la Estrella
Ž 3. Ž .site average 2.3 �g�m . Chow et al. 1994bshowed that the size distribution of TSP from theOwens Lake, California, dry lake bed consisted of7% PM , 13% PM and 51% PM . Particles1.0 2.5 10with aerodynamic diameters less than 10 �m areexpected to be lifted from the bare ground when
Žsurface wind speeds exceed 6�7 m�s Chow et al.,.1999 .
Ž 3The most abundant species �1 �g�m aver-.age in PM and PM were OC, EC, nitrate2.5 10
and sulfate. Average geological components ex-ceeding 1 �g�m3 were Al, Si, Ca and Fe in PM ,10
�and Si in PM . Carbonaceous aerosol or total2.5Ž .carbon TC , the sum of organic and elemental
�carbon accounted for 45% of PM and 28% of2.5PM . The OC�TC ratio was 0.63 in PM and10 2.50.69 in PM , which is similar to OC�TC ratios in10
Žvehicle exhaust profiles e.g. Watson and Chow,.2001a; Watson et al., 1994a,b, 2001b , and much
lower than ratios found for woodburningŽ . Ž . Ž0.81�0.93 and meat cooking 0.95�0.97 Mc-Donald et al., 2000; Watson and Chow, 2001a;
.Watson et al., 2001b . On average, more thanthree-quarters of the PM carbon was in the10PM size fraction. Regression analysis of b vs.2.5 absEC results in correlation coefficients of 0.92 and
( )J.C. Chow et al. � The Science of the Total En�ironment 287 2002 177�201186
0.93, and slopes of 9.2 m2�g and 9.5 m2�g, forPM and PM , respectively. These statistics2.5 10
Žshow that EC which originates mainly from mo-.tor vehicle exhaust and vegetative burning is the
substance most responsible for particle light ab-sorption.
PM TC averaged 20 �g�m3 for all sites, and10ranged from 11.6 �g�m3 at the Pedregal site to30.1 �g�m3 at the Xalostoc site. The averagePM TC was 15.8 �g�m3, with a range of 10.52.5�g�m3 at the Pedregal site to 22.6 �g�m3 at theXalostoc site. Larger site-to-site variations werefound for PM EC, ranging from 2.9 �g�m3 at10the Pedregal site to 11.0 �g�m3 at the Xalostocsite. PM EC was also high at the Netzahualcoy-10
Ž 3. Ž 3.otl 8.0 �g�m , La Merced 6.1 �g�m , andŽ 3.Cerro de la Estrella 5.3 �g�m sites, compared
to levels at Pedregal. These sampling sites arecloser to moderately and heavily traveled road-ways than the other sites.
PM sulfate was more homogeneously dis-2.5tributed among the six sites than other chemicalcomponents, with average concentrations of 5�6�g�m3; these levels were nearly twice the totalparticulate nitrate levels. More than 88% of thePM sulfate was in the PM fraction, compared10 2.5to 72% for nitrate. The �16% nitrate abundancein the coarse fraction indicates the presence ofcoarse-particle sodium nitrate, especially at theXalostoc and Netzahualcoyotl sites, which wereaffected by dry lake dust.
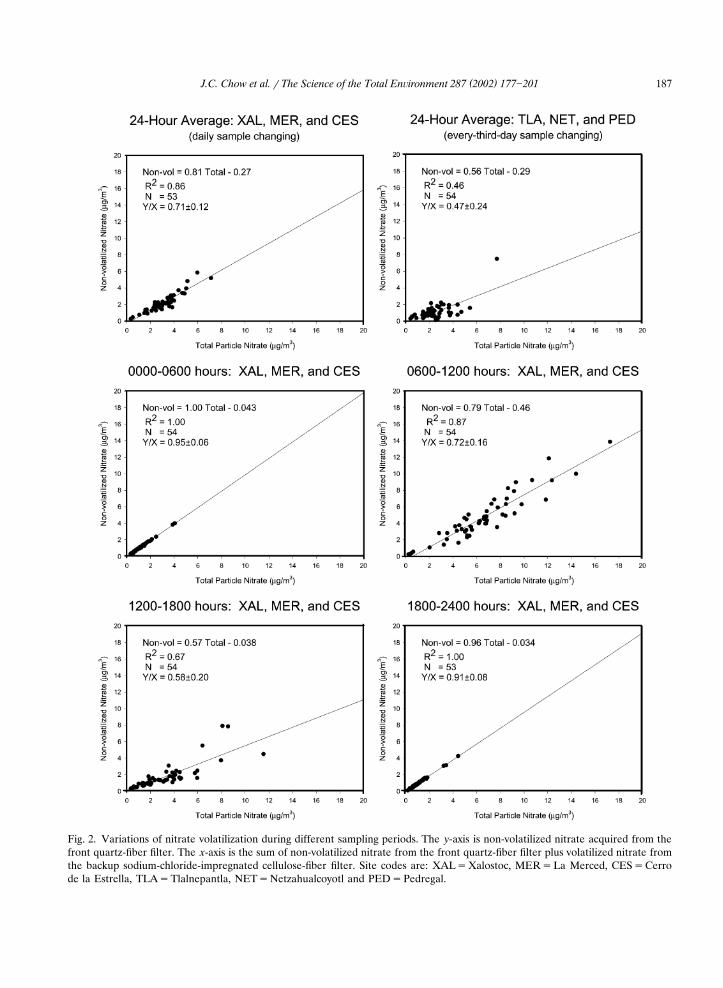
Fig. 2 compares non-volatilized PM nitrate2.5Žand total particulate nitrate sum of non-volati-
lized nitrate from the front quartz-fiber filter andvolatilized nitrate from the backup sodium-chlo-
.ride-impregnated cellulose-fiber filter . Similarplots were made for PM , and the slopes, inter-10cepts, and correlations are similar to those in Fig.2. Nitrate volatilization was significant, varyingfrom 29% at 6-h sampling sites to 53% at 24-hsampling sites. Because the sample-changingschedule was every 24 h at 6-h sampling sites andevery 72 h at 24-h sampling sites, nitratevolatilization may have been somewhat enhancedby the longer passive period in the sampler, butthis is not the main cause of different volatiliza-tion rates. Fig. 2 shows that nitrate volatilizationwas 42% for samples taken during the afternoon
Ž .periods 12.00�18.00 h MST , 28% during lateŽ .morning periods 06.00�12.00 h MST , 9% duringŽ .evening periods 18.00�24.00 h MST and 5%
Žduring early morning periods 00.00�06.00 h.MST . PM total particulate nitrate was highest2.5
Ž 3.�17 �g�m during the morning when lowertemperatures favored the particle phase. PM2.5
Žnitrate was also high in the afternoon �123.�g�m when photochemical production of nitric
acid was at its peak, but was attenuated by equi-librium favoring gaseous nitric acid at higher tem-
Žperatures Stelson and Seinfeld, 1982; Watson et. Ž 3.al., 1994c . Very little nitrate �5 �g�m was
found during the night-time and early morningperiods. Correlation coefficients between non-volatilized and total particulate nitrate are unityduring evening and early morning periods, butreduce to 0.82 during afternoon periods.
The same diurnal accumulation of nitrateprobably occurred at the 24-h sites, but thehigher-temperature air drawn through the filterduring the afternoon probably volatilized much ofthe ammonium nitrate collected during the early-and late-morning periods. Because nitratevolatilization was significant during the study pe-
Žriod, total particulate nitrate the sum of front.and backup filter PM nitrate is used for the2.5
following data analysis.Table 1 shows that average PM Pb exceeded2.5
0.1 �g�m3 at all sites. This level is similar tothose found in a 1992�1993 study in Mexicali,Baja California, 10 km south of the US�Mexico
Ž .border Chow et al., 2000 , but 10 times higherthan concentrations from 1988�1989 measure-
Žments in California’s San Joaquin Valley Chow.et al., 1993c , and 10�100 times higher than 1990
levels at non-urban sites in the San Joaquin Val-Ž .ley Chow et al., 1996b . PM Pb concentrations2.5
were 20�30% higher than six-site averages at thecentral and northern sites, with 0.14 �g�m3 atthe Xalostoc site, 0.13 �g�m3 at the Tlalnepantlasite and 0.12 �g�m3 at the La Merced site.Similarly elevated concentrations of Br were alsofound at these sites. Approximately 50% of thegasoline sold in Mexico City during 1992 con-tained lead additives, but this proportion is de-creasing as more catalyst-equipped vehicles pene-trate the fleet.
( )J.C. Chow et al. � The Science of the Total En�ironment 287 2002 177�201 187
Fig. 2. Variations of nitrate volatilization during different sampling periods. The y-axis is non-volatilized nitrate acquired from thefront quartz-fiber filter. The x-axis is the sum of non-volatilized nitrate from the front quartz-fiber filter plus volatilized nitrate fromthe backup sodium-chloride-impregnated cellulose-fiber filter. Site codes are: XAL�Xalostoc, MER�La Merced, CES�Cerrode la Estrella, TLA�Tlalnepantla, NET�Netzahualcoyotl and PED�Pedregal.
( )J.C. Chow et al. � The Science of the Total En�ironment 287 2002 177�201188
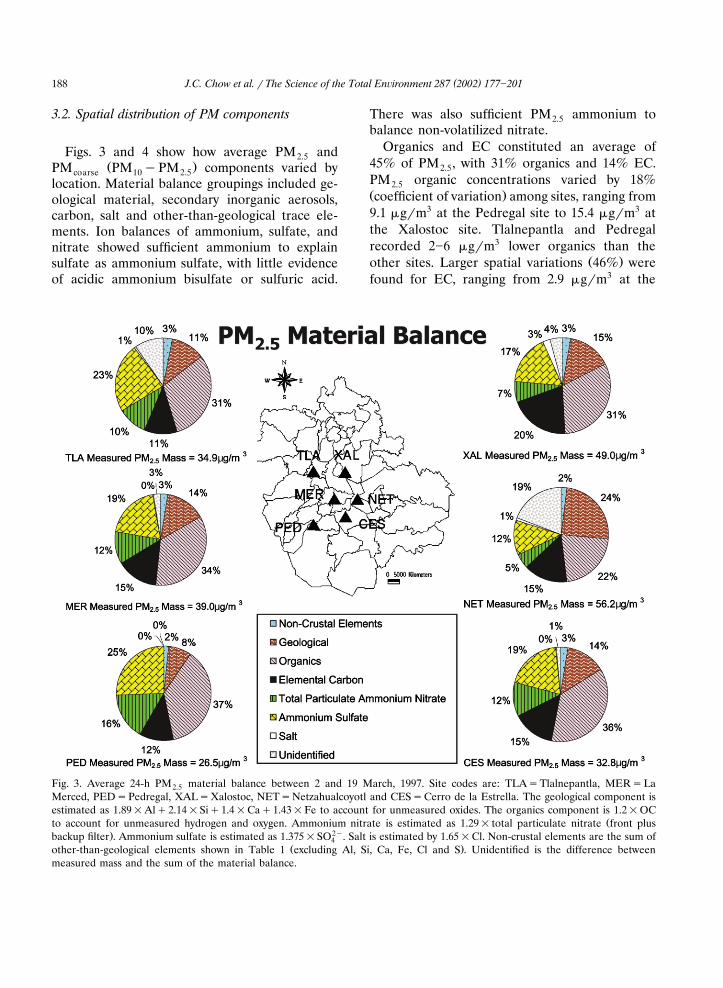
3.2. Spatial distribution of PM components
Figs. 3 and 4 show how average PM and2.5Ž .PM PM �PM components varied bycoarse 10 2.5
location. Material balance groupings included ge-ological material, secondary inorganic aerosols,carbon, salt and other-than-geological trace ele-ments. Ion balances of ammonium, sulfate, andnitrate showed sufficient ammonium to explainsulfate as ammonium sulfate, with little evidenceof acidic ammonium bisulfate or sulfuric acid.
There was also sufficient PM ammonium to2.5balance non-volatilized nitrate.
Organics and EC constituted an average of45% of PM , with 31% organics and 14% EC.2.5
PM organic concentrations varied by 18%2.5Ž .coefficient of variation among sites, ranging from9.1 �g�m3 at the Pedregal site to 15.4 �g�m3 atthe Xalostoc site. Tlalnepantla and Pedregalrecorded 2�6 �g�m3 lower organics than the
Ž .other sites. Larger spatial variations 46% werefound for EC, ranging from 2.9 �g�m3 at the
Fig. 3. Average 24-h PM material balance between 2 and 19 March, 1997. Site codes are: TLA�Tlalnepantla, MER�La2.5Merced, PED�Pedregal, XAL�Xalostoc, NET�Netzahualcoyotl and CES�Cerro de la Estrella. The geological component isestimated as 1.89�Al�2.14�Si�1.4�Ca�1.43�Fe to account for unmeasured oxides. The organics component is 1.2�OC
Žto account for unmeasured hydrogen and oxygen. Ammonium nitrate is estimated as 1.29� total particulate nitrate front plus. 2�backup filter . Ammonium sulfate is estimated as 1.375�SO . Salt is estimated by 1.65�Cl. Non-crustal elements are the sum of4
Ž .other-than-geological elements shown in Table 1 excluding Al, Si, Ca, Fe, Cl and S . Unidentified is the difference betweenmeasured mass and the sum of the material balance.
( )J.C. Chow et al. � The Science of the Total En�ironment 287 2002 177�201 189
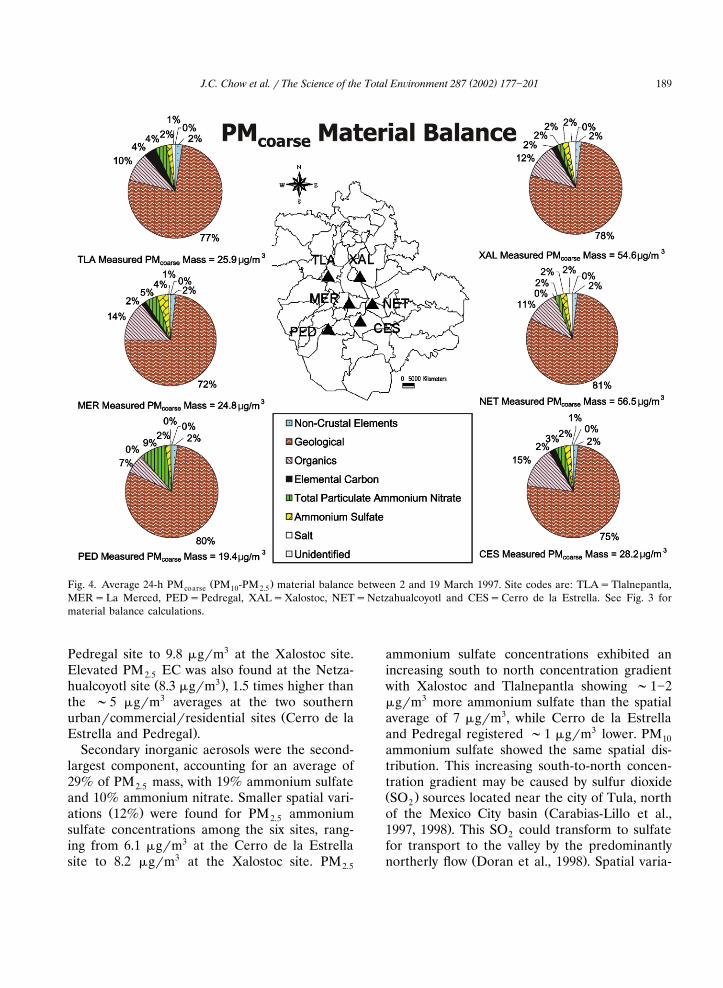
Ž .Fig. 4. Average 24-h PM PM -PM material balance between 2 and 19 March 1997. Site codes are: TLA�Tlalnepantla,coarse 10 2.5MER�La Merced, PED�Pedregal, XAL�Xalostoc, NET�Netzahualcoyotl and CES�Cerro de la Estrella. See Fig. 3 formaterial balance calculations.
Pedregal site to 9.8 �g�m3 at the Xalostoc site.Elevated PM EC was also found at the Netza-2.5
Ž 3.hualcoyotl site 8.3 �g�m , 1.5 times higher thanthe �5 �g�m3 averages at the two southern
Žurban�commercial�residential sites Cerro de la.Estrella and Pedregal .
Secondary inorganic aerosols were the second-largest component, accounting for an average of29% of PM mass, with 19% ammonium sulfate2.5and 10% ammonium nitrate. Smaller spatial vari-
Ž .ations 12% were found for PM ammonium2.5sulfate concentrations among the six sites, rang-ing from 6.1 �g�m3 at the Cerro de la Estrellasite to 8.2 �g�m3 at the Xalostoc site. PM2.5
ammonium sulfate concentrations exhibited anincreasing south to north concentration gradientwith Xalostoc and Tlalnepantla showing �1�2�g�m3 more ammonium sulfate than the spatialaverage of 7 �g�m3, while Cerro de la Estrellaand Pedregal registered �1 �g�m3 lower. PM10ammonium sulfate showed the same spatial dis-tribution. This increasing south-to-north concen-tration gradient may be caused by sulfur dioxideŽ .SO sources located near the city of Tula, north2
Žof the Mexico City basin Carabias-Lillo et al.,.1997, 1998 . This SO could transform to sulfate2
for transport to the valley by the predominantlyŽ .northerly flow Doran et al., 1998 . Spatial varia-
( )J.C. Chow et al. � The Science of the Total En�ironment 287 2002 177�201190
tions of PM ammonium nitrate concentrations2.5Žwere 16% similar to ammonium sulfate and or-
. 3ganics , varying from 2.8 �g�m at the Netza-hualcoyotl site to 4.4 �g�m3 at the La Mercedsite. In contrast to ammonium sulfate, elevatedPM ammonium nitrate concentrations were2.5found in the central and southern sectors of thevalley, with 4.4 �g�m3 at the La Merced site, 4.0�g�m3 at the Pedregal site and 3.7 �g�m3 at theCerro de la Estrella site. These concentrationswere �0.5�1.0 �g�m3 higher than at the north-ern sites. Among the regional-scale sites, PM10ammonium nitrate concentrations were highestŽ 3. Ž5.1 �g�m at the Ajusco site �20 km south-
. 3west of Pedregal , 0.7 �g�m lower than thePedregal site and double those at the other regio-nal-scale sites.
Geological material constituted 14% of PM2.5mass, the third-largest component. Large site-to-
Ž .site variations 68% were found for geologicalcontributions, ranging from 1.9 �g�m3 at thePedregal site to 13.6 �g�m3 at the Netzahualcoy-otl site. Netzahualcoyotl dust contributions weretwice the levels at the Xalostoc site, and 3�7times the levels at the other sites.
Non-crustal elements and sodium chloride saltconstituted less than 2.4% and 0.8% of PM ,2.5respectively. The PM salt spatial coefficient of2.5variation was 123%, more than any other PM2.5component. Nineteen percent of the PM mass2.5at the Netzahualcoyotl site was unidentified. Thismay be due to a fugitive dust composition thatdiffers from the assumption in Fig. 3. Unidenti-fied mass was less than 10% at the other sites.
For the PM fraction, geological materialcoarsewas the largest constituent, accounting for anaverage of 88% of coarse mass, followed by or-
Ž . Ž . Ž .ganics 13% , nitrate 4.6% , sulfate 2.7% , non-Ž . Ž .crustal elements 2.3% , EC 2.0% , and salt
Ž .1.6% . Average coarse geological material wasŽ 3.largest at the Xalostoc 49.2 �g�m and Netza-
Ž 3.hualcoyotl 47.8 �g�m sites. Less than half ofthese concentrations were found at the othersites. Organics were the second-largest con-stituent, which is consistent with measurements
Žof suspendable dust from Mexico Vega et al.,. Ž2001b and elsewhere Chow and Watson, 1994;
.Boon et al., 1998; Watson et al., 2001b . Site-to-
site variations were high but similar for geologicalŽ . Ž .material 46% and organics 49% , further con-
firming the correspondance between crustal ele-ments and organics.
Large spatial variations were also found forŽ . 3PM EC 88% , with more than 1.2 �g�m atcoarse
the Xalostoc and Tlalnepantla sites and belowdetection limits at the Netzahualcoyotl site. Thesevariations probably reflect differences in local ve-hicle fleets, traffic densities, and road dust com-position, but the large spatial variations are alsodue in part to uncertainties associated with lowconcentrations. Elevated PM EC at thecoarseXalostoc and Tlalnepantla sites are consistent
Žwith vehicle emissions e.g. deposited exhaust and.ground-up asphalt in industrial areas with stop-
and-go diesel traffic. Although most diesel ex-haust particles are in the PM fraction, coarse2.5particles are found during hard accelerations ac-
Žcompanied by intense black smoke e.g. Reilly et.al., 1998 . PM salt also exhibited large spatialcoarse
Ž .variations 87% , with elevated concentrationsŽ 3.found at the sites west Xalostoc, 1.5 �g�m and
Ž 3.south Netzahualcoyotl, 1.2 �g�m of Lake Tex-coco; these were 10 times the concentrations at
Ž 3.the Pedregal site 0.1 �g�m . Coarse-particlenitrate was present at 1�2 �g�m3, �0.4 �g�m3
higher than average coarse particle sulfate.Ž .Overall, approximately half 48% of the PM10
mass was attributable to geological material, with23.1% organics, 11.5% ammonium sulfate, 8.4%EC, 7.5% ammonium nitrate, 2.3% non-crustalmetals, 1.2% salt and 1.1% unidentified. PM10spatial coefficients of variation were highest for
Ž . Ž .salt 99% , geological material 48% , and ECŽ .44% , while they were lowest were for organicsŽ . Ž . Ž .26% , nitrate 15% , and sulfate 15% .
3.3. Day-to-day and diurnal �ariations of PMcomponents
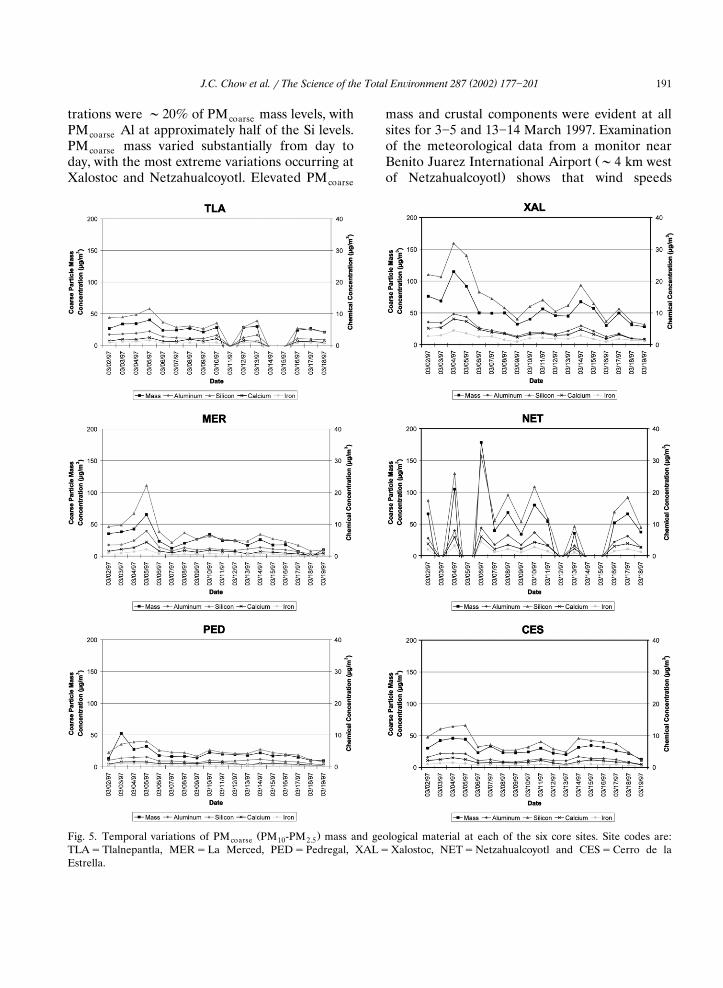
Because fugitive dust is the major cause ofdifferences in PM concentrations among the six10sites, the relationship between PM mass andcrustal components in coarse fractions is furtherexamined. Fig. 5 shows that day-to-day variabilityof PM mass is driven by the geological com-coarse
Ž .ponents Al, Si, Ca and Fe . PM Si concen-coarse
( )J.C. Chow et al. � The Science of the Total En�ironment 287 2002 177�201 191
trations were �20% of PM mass levels, withcoarsePM Al at approximately half of the Si levels.coarsePM mass varied substantially from day tocoarseday, with the most extreme variations occurring atXalostoc and Netzahualcoyotl. Elevated PMcoarse
mass and crustal components were evident at allsites for 3�5 and 13�14 March 1997. Examinationof the meteorological data from a monitor near
ŽBenito Juarez International Airport �4 km west.of Netzahualcoyotl shows that wind speeds
Ž .Fig. 5. Temporal variations of PM PM -PM mass and geological material at each of the six core sites. Site codes are:coarse 10 2.5TLA�Tlalnepantla, MER�La Merced, PED�Pedregal, XAL�Xalostoc, NET�Netzahualcoyotl and CES�Cerro de laEstrella.
( )J.C. Chow et al. � The Science of the Total En�ironment 287 2002 177�201192
doubled from 3.5 to 6 m�s from 12.00 to 13.00 hMST on 5 March 1997, and attained a speed of 13m�s at 18.00 h MST. Winds also increased atother monitoring locations, though few of theseare as well exposed as the airport site. ElevatedPM concentrations corresponded with highcoarse
Ž .winds �6 m�s across the entire valley thatpersisted through the night. PM mass andcoarsecrustal concentrations at the Xalostoc and Netza-
hualcoyotl sites were 2�3 times higher than at theother sites. These coarse crustal components werethe major cause of the highest PM concentra-10tions found for the 5�6 March 1997 period atthese sites.
Elevated crustal concentrations occurredsporadically, consistent with the presence and in-fluence from nearby fugitive dust sources. PMcoarseconcentrations varied three-fold among the six
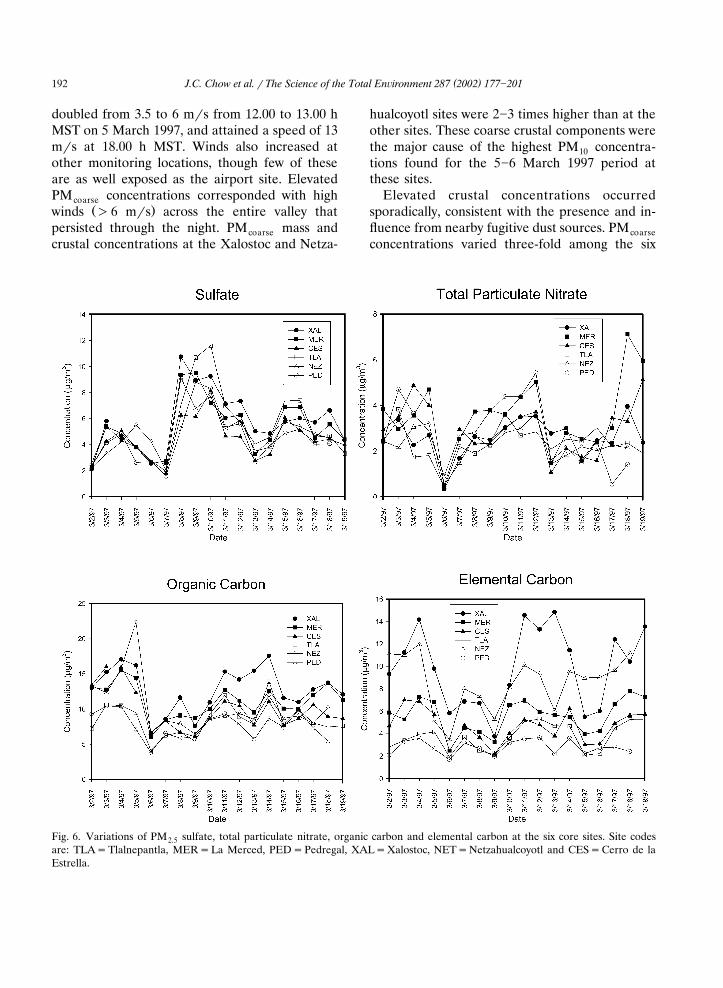
Fig. 6. Variations of PM sulfate, total particulate nitrate, organic carbon and elemental carbon at the six core sites. Site codes2.5are: TLA�Tlalnepantla, MER�La Merced, PED�Pedregal, XAL�Xalostoc, NET�Netzahualcoyotl and CES�Cerro de laEstrella.
( )J.C. Chow et al. � The Science of the Total En�ironment 287 2002 177�201 193
3 Ž . 3sites, from 19 �g�m Pedregal to 56 �g�mŽ . 3Netzahualcoyotl , with an average of 33 �g�m .
Fig. 6 compares day-to-day changes in PM2.5sulfate, total particulate nitrate, OC, and ECamong the six sites. Valleywide events are notapparent for EC, which derives from primary
Žemissions, some of which are from nearby �1. Ž .km distant or neighborhood 1�5 km distant
Ž .emitters Watson and Chow, 2001b , and onlypartially evident for the other PM components.2.5Total particulate nitrate, sulfate, and OC in-creased from 7�8 and 13�14 March 1997. PM2.5sulfate increased for 9�10 March at the two
Ž .northern sites Tlalnepantla and Xalostoc , andhigh nitrate concentrations occurred from 7�12
ŽMarch at the central and southern La Merced,.Pedregal and Cerro de la Estrella sites. Pairwise
correlations show that only PM sulfate concen-2.5Ž .trations are highly correlated R�0.82 between
sites, with lower correlations between the Netza-Ž .hualcoyotl and Tlalnepantla sites R�0.77 and
between the Netzahualcoyotl and Pedregal sitesŽ .R�0.73 .
Table 2 shows that PM sulfate averaged 5.810�g�m3 for the six sites, with concentrations rang-ing from 4.8 �g�m3 at the Pedregal site to 7.1�g�m3 at the Xalostoc site. PM sulfate was 3�410
3 Ž .�g�m at the Teotihuacan northeast , ChalcoŽ . Ž .southeast and Ajusco southwest regional
Ž .boundary sites Chow et al., 2001a ; �65% ofsulfate at the urban sites. PM sulfate concentra-10
Ž .tions at the Cuautitlan north�northwest site, 6.5�g�m3, was almost twice as high as at the otherregional sites, and similar to levels at the Tlal-
Ž 3.nepantla site 6.1 �g�m �20 km directly southof Cuautitlan.
These sulfate concentrations are consistent withthe results from meteorological analysis and a
Žparticle transport model Fast and Zhong, 1998;.Whiteman et al., 2000 showing within-valley cir-
culations resulting in a local sink at the northwestregion of the valley. It is possible that much ofthe sulfate results from regional transport, whichis why it exhibits such strong spatial correlations.Due to the influence of local farming and ranch-ing activities near the Cuautitlan site, NH con-3
Ž 3.centrations 14.8 �g�m were also 2�4 timesthose at the Teotihuacan and Ajusco sites. PM2.5
ammonium concentrations were also moderatelyŽ .correlated 0.70�R�0.90 among the six sites.
Low correlations were found for PM total par-2.5Ž .ticulate nitrate �0.17�R�0.68 . PM OC was2.5Ž .highly correlated R�0.8 among the central and
northern sites, between Xalostoc and Tlal-nepantla, and between Xalostoc and La Merced.
Ž .Correlations were low R�0.38 for Netzahual-coyotl and Tlalnepantla, and for Netzahualcoyotland Pedregal. PM EC was also highly corre-2.5
Ž .lated R � 0.82 between Tlalnepantla andXalostoc, and between Tlalnepantla and LaMerced, partially due to similar vehicle trafficnear these sites.
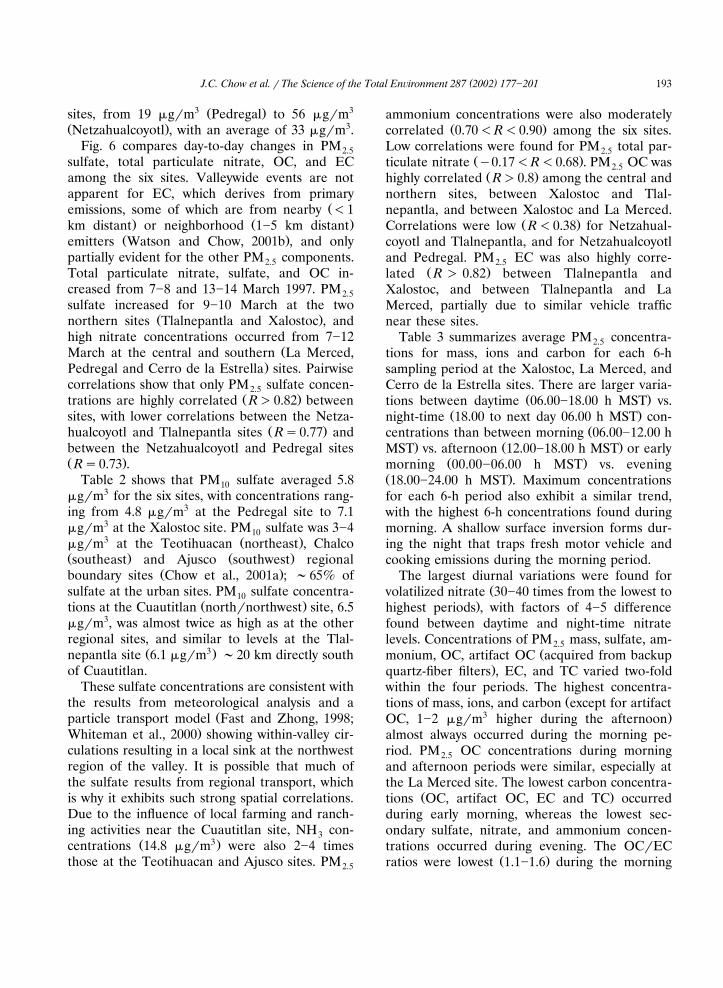
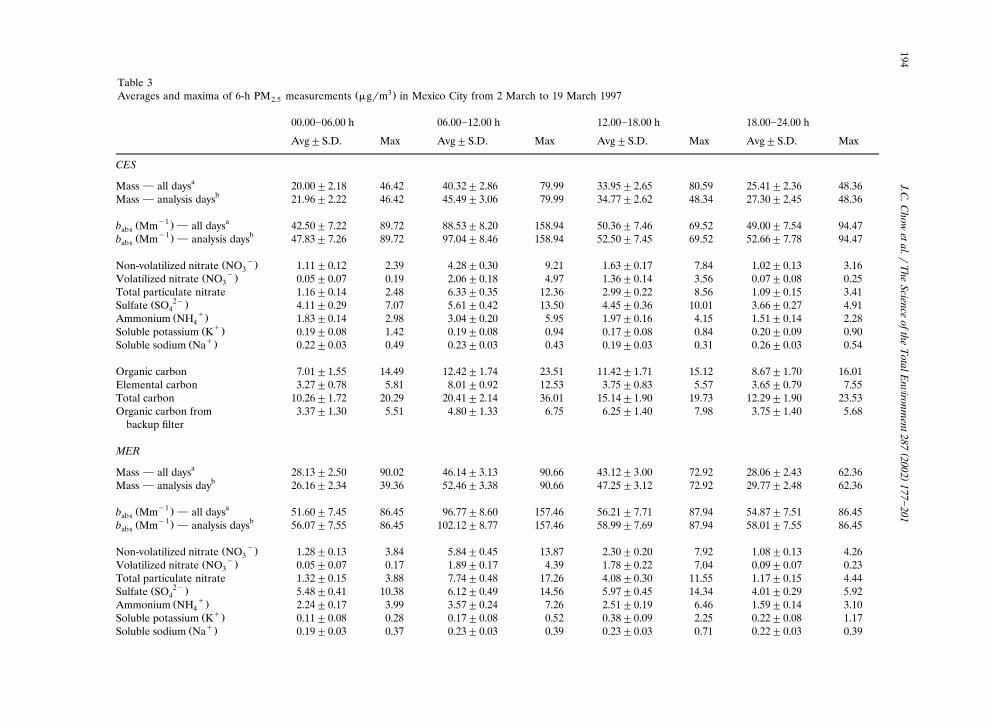
Table 3 summarizes average PM concentra-2.5tions for mass, ions and carbon for each 6-hsampling period at the Xalostoc, La Merced, andCerro de la Estrella sites. There are larger varia-
Ž .tions between daytime 06.00�18.00 h MST vs.Ž .night-time 18.00 to next day 06.00 h MST con-
Žcentrations than between morning 06.00�12.00 h. Ž .MST vs. afternoon 12.00�18.00 h MST or early
Ž .morning 00.00�06.00 h MST vs. eveningŽ .18.00�24.00 h MST . Maximum concentrationsfor each 6-h period also exhibit a similar trend,with the highest 6-h concentrations found duringmorning. A shallow surface inversion forms dur-ing the night that traps fresh motor vehicle andcooking emissions during the morning period.
The largest diurnal variations were found forŽvolatilized nitrate 30�40 times from the lowest to
.highest periods , with factors of 4�5 differencefound between daytime and night-time nitratelevels. Concentrations of PM mass, sulfate, am-2.5
Žmonium, OC, artifact OC acquired from backup.quartz-fiber filters , EC, and TC varied two-fold
within the four periods. The highest concentra-Žtions of mass, ions, and carbon except for artifact
3 .OC, 1�2 �g�m higher during the afternoonalmost always occurred during the morning pe-riod. PM OC concentrations during morning2.5and afternoon periods were similar, especially atthe La Merced site. The lowest carbon concentra-
Ž .tions OC, artifact OC, EC and TC occurredduring early morning, whereas the lowest sec-ondary sulfate, nitrate, and ammonium concen-trations occurred during evening. The OC�EC
Ž .ratios were lowest 1.1�1.6 during the morning
()
J.C.C
howetal.�
The
Scienceofthe
TotalE
n�ironment287
2002177
�201194
Table 33Ž .Averages and maxima of 6-h PM measurements �g�m in Mexico City from 2 March to 19 March 19972.5
00.00�06.00 h 06.00�12.00 h 12.00�18.00 h 18.00�24.00 h
Avg�S.D. Max Avg�S.D. Max Avg�S.D. Max Avg�S.D. Max
CESaMass � all days 20.00�2.18 46.42 40.32�2.86 79.99 33.95�2.65 80.59 25.41�2.36 48.36
bMass � analysis days 21.96�2.22 46.42 45.49�3.06 79.99 34.77�2.62 48.34 27.30�2.45 48.36
�1 aŽ .b Mm � all days 42.50�7.22 89.72 88.53�8.20 158.94 50.36�7.46 69.52 49.00�7.54 94.47abs�1 bŽ .b Mm � analysis days 47.83�7.26 89.72 97.04�8.46 158.94 52.50�7.45 69.52 52.66�7.78 94.47abs
�Ž .Non-volatilized nitrate NO 1.11�0.12 2.39 4.28�0.30 9.21 1.63�0.17 7.84 1.02�0.13 3.163�Ž .Volatilized nitrate NO 0.05�0.07 0.19 2.06�0.18 4.97 1.36�0.14 3.56 0.07�0.08 0.253
Total particulate nitrate 1.16�0.14 2.48 6.33�0.35 12.36 2.99�0.22 8.56 1.09�0.15 3.412�Ž .Sulfate SO 4.11�0.29 7.07 5.61�0.42 13.50 4.45�0.36 10.01 3.66�0.27 4.914Ž �.Ammonium NH 1.83�0.14 2.98 3.04�0.20 5.95 1.97�0.16 4.15 1.51�0.14 2.284
�Ž .Soluble potassium K 0.19�0.08 1.42 0.19�0.08 0.94 0.17�0.08 0.84 0.20�0.09 0.90�Ž .Soluble sodium Na 0.22�0.03 0.49 0.23�0.03 0.43 0.19�0.03 0.31 0.26�0.03 0.54
Organic carbon 7.01�1.55 14.49 12.42�1.74 23.51 11.42�1.71 15.12 8.67�1.70 16.01Elemental carbon 3.27�0.78 5.81 8.01�0.92 12.53 3.75�0.83 5.57 3.65�0.79 7.55Total carbon 10.26�1.72 20.29 20.41�2.14 36.01 15.14�1.90 19.73 12.29�1.90 23.53Organic carbon from 3.37�1.30 5.51 4.80�1.33 6.75 6.25�1.40 7.98 3.75�1.40 5.68
backup filter
MERaMass � all days 28.13�2.50 90.02 46.14�3.13 90.66 43.12�3.00 72.92 28.06�2.43 62.36
bMass � analysis day 26.16�2.34 39.36 52.46�3.38 90.66 47.25�3.12 72.92 29.77�2.48 62.36
�1 aŽ .b Mm � all days 51.60�7.45 86.45 96.77�8.60 157.46 56.21�7.71 87.94 54.87�7.51 86.45abs�1 bŽ .b Mm � analysis days 56.07�7.55 86.45 102.12�8.77 157.46 58.99�7.69 87.94 58.01�7.55 86.45abs
�Ž .Non-volatilized nitrate NO 1.28�0.13 3.84 5.84�0.45 13.87 2.30�0.20 7.92 1.08�0.13 4.263�Ž .Volatilized nitrate NO 0.05�0.07 0.17 1.89�0.17 4.39 1.78�0.22 7.04 0.09�0.07 0.233
Total particulate nitrate 1.32�0.15 3.88 7.74�0.48 17.26 4.08�0.30 11.55 1.17�0.15 4.442�Ž .Sulfate SO 5.48�0.41 10.38 6.12�0.49 14.56 5.97�0.45 14.34 4.01�0.29 5.924
�Ž .Ammonium NH 2.24�0.17 3.99 3.57�0.24 7.26 2.51�0.19 6.46 1.59�0.14 3.104�Ž .Soluble potassium K 0.11�0.08 0.28 0.17�0.08 0.52 0.38�0.09 2.25 0.22�0.08 1.17
�Ž .Soluble sodium Na 0.19�0.03 0.37 0.23�0.03 0.39 0.23�0.03 0.71 0.22�0.03 0.39
()
J.C.C
howetal.�
The
Scienceofthe
TotalE
n�ironment287
2002177
�201195
Ž .Table 3 Continued
00.00�06.00 h 06.00�12.00 h 12.00�18.00 h 18.00�24.00 h
Avg�S.D. Max Avg�S.D. Max Avg�S.D. Max Avg�S.D. Max
Organic carbon 7.30�1.55 14.02 13.73�1.79 22.69 13.91�1.82 18.99 9.73�1.62 14.77Elemental carbon 4.05�0.82 7.33 9.64�0.91 15.53 4.54�0.89 8.37 4.28�0.89 7.35Total carbon 11.32�1.75 21.02 23.34�2.27 38.19 18.41�2.05 26.50 13.98�1.83 21.55Organic carbon from 3.87�1.34 5.77 5.25�1.37 7.97 7.03�1.44 10.01 4.33�1.35 6.36
backup filter
Ž .Nitric acid HNO 0.63�0.08 4.93 3.05�0.29 8.38 3.24�0.24 13.73 0.70�0.09 2.883Ž .Ammonia NH 10.81�0.19 18.79 12.08�0.23 23.13 4.39�0.16 10.53 4.10�0.17 21.333
XALaMass � all days 31.99�2.55 55.70 62.05�3.77 107.06 49.09�3.32 92.36 35.54�2.62 49.76
bMass � analysis days 34.98�2.63 55.70 68.95�4.04 107.06 55.73�3.44 92.36 35.84�2.62 49.55
Ž �1 . ab Mm � all days 97.22�8.65 204.10 169.02�11.31 308.67 69.62�8.16 109.92 87.32�8.17 149.73abs�1 bŽ .b Mm � analysis days 87.54�8.28 141.71 175.98�11.61 308.67 77.41�7.90 109.92 90.73�8.25 149.73abs
�Ž .Non-volatilized nitrate NO 1.23�0.14 4.01 4.37�0.48 6.99 1.36�0.14 2.47 0.93�10.13 3.093�Ž .Volatilized nitrate NO 0.05�0.07 0.15 1.54�0.14 3.12 0.98�0.11 2.35 0.07�0.07 0.163
Total particulate nitrate 1.28�0.16 4.06 5.91�0.50 8.55 2.35�0.18 4.46 1.00�0.14 3.212�Ž .Sulfate SO 5.37�0.41 12.27 8.52�0.76 21.02 6.12�0.52 12.25 4.09�0.30 7.284
�Ž .Ammonium NH 2.40�0.19 4.73 4.24�0.28 10.02 2.35�0.18 4.92 1.64�0.14 3.114�Ž .Soluble potassium K 0.41�0.09 2.19 0.58�0.09 1.12 0.30�0.08 0.93 0.15�0.08 1.14
Ž �.Soluble sodium Na 0.22�0.03 0.49 0.32�0.03 0.50 0.23�0.03 0.38 0.19�0.03 0.30
Organic carbon 10.08�1.66 16.98 16.99�1.96 28.80 14.14�1.81 18.37 10.37�1.66 14.88Elemental carbon 7.84�0.83 14.09 15.91�1.41 25.71 7.14�0.99 10.63 8.96�0.95 15.74Total carbon 17.89�2.05 30.74 32.87�2.82 54.08 21.25�2.16 26.45 19.31�2.08 30.28Organic carbon from 5.17�1.34 7.84 5.86�1.35 9.82 7.53�1.41 9.49 5.18�1.33 8.01
backup filter
CES�Cerro de la Estrella; MER�La Merced; XAL�Xalostoc.a Field sampling between 23 February and 22 March 1997.bChemical speciation of 18 days of samples from between 2 March and 19 March 1997.
( )J.C. Chow et al. � The Science of the Total En�ironment 287 2002 177�201196
Ž .period and highest 2.0�3.3 during the afternoonperiod. OC�EC ratios exceeding 2.0 have beenused to identify the presence of secondary or-
Žganic aerosols Gray et al., 1986; Turpin et al.,.1991; Turpin and Huntzicker, 1991 . It is possible
that some secondary organic aerosols were formedduring afternoon periods when photochemical ac-tivity was most probable. More specific organiccompounds, especially oxygenated species, areneeded to better distinguish between primary andsecondary organic aerosol contributions.
Table 3 shows that the highest 6-h HNO con-3Žcentrations occurred during afternoon 3.2
3.�g�m , with lowest concentrations occurringŽ 3.during early morning 0.63 �g�m . Daytime
HNO concentrations were five times higher than3night-time levels. Afternoon nitric acid maximacorrespond with the highest ozone concentrations
Žbetween 14.00 and 16.00 h MST Doran et al.,.1998 . HNO was lower at night because it is not3
produced photochemically, there is sufficient ni-Ž .trogen oxide NO from traffic to preclude night-
Ž .time formation Richards, 1983 . There was suf-ficient NH to neutralize HNO at lower night-3 3time temperatures. There was little carryover ofHNO aloft from one day to the next during this3
Ž .experiment Doran et al., 1998 .NH concentrations at La Merced were highest3
Ž 3.during early morning 10.8 �g�m and lateŽ 3.morning 12.1 �g�m . The nearby food market,
which contains acres of produce, meats, and somelive animals, might contribute to the elevatedmorning concentrations. There is a three-folddifference between the highest and lowestŽ 3.night-time, 4.1 �g�m concentrations of NH ,3with the afternoon and nighttime levels being
Ž40% lower than the all-period average 7.93.�g�m . Lower afternoon and nighttime NH3
concentrations may also result from ventilationand lower emissions. There may be some carry-over of ground-level NH from the evening to the3next day’s early morning periods, but the amountis not large.
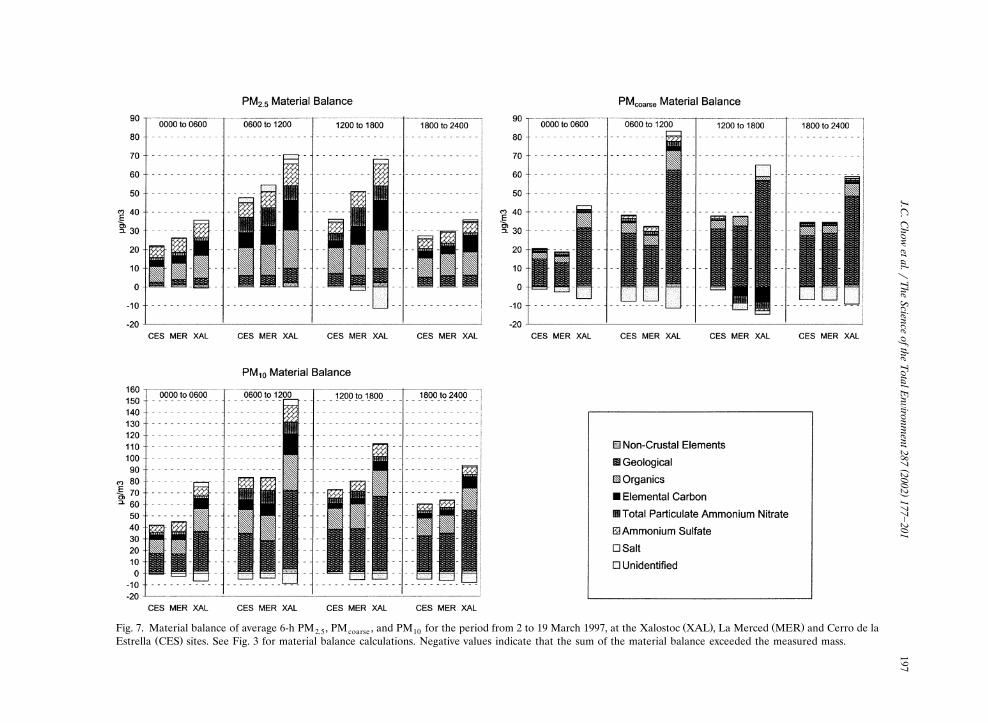
Fig. 7 shows average PM , PM , and PM2.5 coarse 10compositions for the four 6-h periods. The largest
Ž .diurnal variations four-to-five-fold were foundfor PM total particulate ammonium nitrate,2.5averaging more than 7�9 �g�m3 during the day
and decreasing to 1�2 �g�m3 at night, mainlydue to the large variations in volatilized nitrateconcentrations. Diurnal variations were less forammonium sulfate, with �9 �g�m3 during theday, decreasing by 2�4 �g�m3 at night. Carbona-ceous aerosol doubled from nighttime to daytime.PM organics were 17 �g�m3 during the day,2.5decreasing to 10�11 �g�m3 at night. Similarly,EC decreased from 10�11 �g�m3 during the dayto 5�6 �g�m3 at night. Levels of geological mate-rial remained fairly constant at 5�6 �g�m3 from
Žmorning to evening, but decreased by half 2.73.�g�m during the early morning period. The
highest concentrations for each component al-ways occurred during the morning period. Thelowest concentrations of geological material, or-
Žganics, and EC occurred in early morning before.06.00 h MST , and the lowest concentrations of
ammonium sulfate, ammonium nitrate, salt, andnon-crustal elements occurred during eveningŽ .after 18.00 h MST .
The largest diurnal variations in PM werecoarsefound for geological material and organics. Theafternoon period exhibited the highest geological
Ž 3. Žcomponents 40 �g�m and lowest organics 3.83.�g�m among the four periods. Organics were
Ž 3.highest during the morning 7.1 �g�m , almostdouble those found in the afternoon. PMcoarseEC, nitrate, sulfate, salt and non-crustal elementsexhibited the lowest levels during the afternoon,which resulted in negligible contributions.
Diurnal variations in PM geological compo-10nents peaked at 46.2 �g�m3 during the after-noon, after the night-time and morning, the sur-face layer coupled with flows aloft, thereby in-creasing surface wind speeds. PM decreased to1022 �g�m3 during early morning after the surfacelayer was well established and traffic volumeswere low. Organics accounted for 25�30% of
Ž 3.PM , with the highest levels 24.3 �g�m occur-10ring in the morning. EC constituted 7�12% ofPM . PM EC averaged 12.4 �g�m3 in the10 10morning, and was half that amount for all otherperiods.
Similar to PM , the largest PM diurnal vari-2.5 10ation was found for total particulate ammoniumnitrate, averaging 10 �g�m3 in the morning, re-ducing to 5 �g�m3 in the afternoon, and present
()
J.C.C
howetal.�
The
Scienceofthe
TotalE
n�ironment287
2002177
�201197
Ž . Ž .Fig. 7. Material balance of average 6-h PM , PM , and PM for the period from 2 to 19 March 1997, at the Xalostoc XAL , La Merced MER and Cerro de la2.5 coarse 10Ž .Estrella CES sites. See Fig. 3 for material balance calculations. Negative values indicate that the sum of the material balance exceeded the measured mass.
( )J.C. Chow et al. � The Science of the Total En�ironment 287 2002 177�201198
at �2 �g�m3 at night. PM ammonium sulfate10varied by two-fold, ranging from 6.0 �g�m3
Ž . 3 Ž .evening to 11.5 �g�m morning .PM salt exhibited large spatial and temporal10
variations, often 3�10 times higher at Xalostoc ascompared to La Merced and Cerro de la Estrella.PM salt at the Xalostoc site varied from 0.7310�g�m3 during the afternoon to 5.1 �g�m3 duringthe morning.
4. Summary and conclusions
For the period of 2�19 March 1997, �50% ofPM was in the PM fraction, with lower10 2.5PM -to-PM ratios on higher-PM days. Aver-2.5 10 10age PM and PM mass concentrations at all2.5 10sites were 38.7 �g�m3 and 72.0 �g�m3, respec-tively. Site-to-site variations exceeded twofold
Ž .from the southeast sector Pedregal site to theŽ .eastern part of the basin Netzahualcoyotl site .
The highest PM concentrations in Mexico Citywere found at the Netzahualcoyotl site, with 183.7�g�m3 of PM on 5 March 1997 and 246.72.5�g�m3 of PM on 6 March 1997. Local fugitive10dust sources were the major cause of these highvalues.
Ž 3.The most abundant species �1 �g�m inPM and PM were OC, EC, sulfate, nitrate2.5 10and ammonium. Geological components exceed-ing an average of 1 �g�m3 were Al, Si, Ca and Fein PM and Si in PM . The most abundant10 2.5PM component was carbonaceous aerosol, ac-2.5
Žcounting for 45% of PM mass 31% organics,2.5.14% EC , followed by secondary inorganic aero-
Žsol 29%, including 19% ammonium sulfate and.10% ammonium nitrate , geological material
Ž . Ž .14% , non-crustal elements 2.4% and saltŽ .0.8% . The largest PM component was geo-coarse
Ž .logical material 88% , followed by organicsŽ . Ž . Ž .13% , nitrate 4.6% , sulfate 2.7% , non-crustal
Ž . Ž . Ž .elements 2.3% , EC 2.0% and salt 1.6% . Geo-logical material was the largest PM contributor,10constituting 48% of the mass, followed by 32%
Žcarbonaceous aerosol 23.1% organics and 8.4%. ŽEC , 19% secondary inorganic aerosol 11.5%
.ammonium sulfate and 7.5% ammonium nitrate ,2.3% non-crustal elements and 1.2% salt. For
PM , the salt contribution was most variable2.5Žamong the sites with a coefficient of variation of
. Ž .123% , followed by geological material 68% andŽ .EC 46% . Similar spatial variations were found
Ž . Ž .for PM organics 18% , nitrate 16% , and sul-2.5Ž .fate 12% . For PM , the greatest site-to-sitecoarse
Ž . Ž .variations were for EC 88% and salt 87% ,Ž .followed by organics 49% , geological material
Ž . Ž .46% , and non-crustal elements 44% . Coarseparticle nitrate was present at 1�2 �g�m3 levels.Spatial variations of PM were highest for salt10Ž . Ž . Ž .99% , geological material 48% , and EC 44% ,
Ž . Ž .and lowest for organics 25% , nitrate 15% andŽ .sulfate 15% .
PM concentrations varied by three-foldcoarseamong the six sites, averaging 33 �g�m3. Average24-h PM mass followed the peaks and valleyscoarseof major crustal components. PM Si concen-coarsetrations were �20% of PM mass, with Al atcoarsehalf of the Si levels. Elevated PM concentra-coarsetions occurred sporadically at different sites ex-cept on 3�5 and 13�14 March 1997, when highwinds apparently contributed to fugitive dustloadings, resulting in elevated PM concentra-10tions at all sites. Within each site, PM masscoarsewas highly correlated with the major crustal com-
Ž .ponents Al, Si, Ca, Fe .Sulfate concentrations were double the nitrate
concentrations. Sulfate and nitrate were presentin the forms of ammonium sulfate and am-monium nitrate due to abundant NH throughout3the region. Sulfate concentrations were more ho-mogeneously distributed than other components
Žwithin the study area, with high correlations R�.0.82 among most of the sites. Sulfate levels de-
creased from the northern to southern parts ofthe basin, consistent with higher SO emissions2north of Mexico City and meteorological transportfrom that direction. Approximately two-thirds ofammonium sulfate measured in the urban areaappears to have been transported from regionsoutside of the study domain rather than formedfrom emissions within the urban area.
Volatilized nitrate varied by 30�40-fold amongthe four 6-h sampling periods at these sites. Re-gression analysis shows that nitrate volatilizationreached 42% during afternoon, decreased to 28%
( )J.C. Chow et al. � The Science of the Total En�ironment 287 2002 177�201 199
during morning, and was as low as 9% duringevening and 5% during early morning. Thevolatilized-nitrate-to-total-nitrate ratios were 0.29for 6-h samples on a daily sample changing sched-ule, and 0.53 for 24-h samples on an every-third-day sample changing schedule. Changing samplesmore frequently and sampling for shorter dura-tion minimizes the extent of nitrate loss duringsampling.
Ammonium nitrate was not as homogeneouslydistributed as ammonium sulfate. Higher nitrateconcentrations were found at the suburban Pe-dregal site and at the regional-scale Ajusco site inthe southwestern part of the valley than at theother sites.
The highest 6-h mass concentrations almostalways occurred during the morning, and weretwice as high as night-time samples. The lowestsecondary inorganic aerosol was found during theevening, compared with the lowest carbonaceousaerosol being found during the early morning.Meteorological factors played an important rolein these variations. Subsidence inversions duringwinter nights with low wind speeds allowed theaccumulation of freshly injected motor vehicleand cooking emissions during morning.
Nitric acid concentrations varied by five-foldŽ 3.between early morning 0.63 �g�m and after-
Ž 3.noon 3.2 �g�m , and between night and day,consistent with emissions and photochemical re-actions. An abundance of neutralizing ammoniashifted equilibrium to the particle phase at lowertemperatures. Ammonia concentrations at La
Ž 3.Merced peaked during morning 12.1 �g�mŽ 3.and early morning 10.8 �g�m , with afternoon
Ž 3.levels 40% less than average 7.9 �g�m . Thenearby food market with livestock may contributeto the elevated morning concentrations. Lowerammonia levels in the afternoon may be due toincreased ventilation and lower emissions.
A material balance of 6-h samples showed thegreatest diurnal variations for PM total am-2.5
Žmonium nitrate four- to five-fold among theXalostoc, La Merced, and Cerro de la Estrella
.sites . Most other species such as ammoniumsulfate, organics, and EC varied by two-foldbetween day and night. Geological components
remained at a nearly constant level of 5�6 �g�m3
Žduring all but the early morning period 2.73.�g�m . The lowest ammonium sulfate, am-
monium nitrate, salt and non-crustal elementsacquired during evening, and the lowest crustalcomponents, organics, and EC were found duringearly morning. The afternoon period experiencedthe highest PM geological material concen-coarse
Ž 3. Žtrations 40 �g�m and lowest organics 3.83.�g�m . Among the three 6-h sampling sites,
approximately 40�60% of PM can be attributed10to geological material, with 25�30% from organ-ics, 7�12% from EC, 9�15% from ammoniumsulfate and 3�11% from total particulate am-monium nitrate, as well as 0.5�3% from salt andnon-crustal elements.
Local, subregional, and regional emissions, me-teorology, and particles of primary and secondaryorigin are important contributors to elevatedPM and PM concentrations in Mexico City.2.5 10PM secondary ammonium sulfate contained re-2.5gional contributions from distant sources, whereasmost of the fugitive dust in PM was fromcoarsenearby emitters. Quantitative source contribu-tions to PM concentrations need to be calculatedto provide more definitive source contributionestimates. Since secondary inorganic aerosol was�30% of PM , the effect of precursor gases on2.5secondary aerosol concentrations needs to be ex-amined in order to estimate the effects of sulfurdioxide, nitrogen oxides, ammonia, and hydrocar-bon emissions reductions.
Acknowledgements
This work was funded by the AtmosphericChemistry Program of the US Department ofEnergy. The authors acknowledge the supportfrom the Instituto Mexicano del Petroleo, with´special thanks to Elba Ortiz and Teresa Limon´for their invaluable field support. The authorsalso acknowledge Douglas Lowenthal, StevenKohl, and Norman Mankim from the Desert Re-search Institute for their help with graphics andassembly of this manuscript.
( )J.C. Chow et al. � The Science of the Total En�ironment 287 2002 177�201200
References
Boon KF, Kiefert L, McTainsh GH. Organic matter contentof rural dusts in Australia. Atmos Environ 1998;32:2817�2823.
Carabias-Lillo J, Quadri de la Torre G, Fernandez-Bremauntz´A, Paramo-Figueroa VH, Martınez-Castillejos J. Primer´ ´Informe Sobre la Calidad del Aire en Ciudades Mexicanas1996. Mexico City, Mexico: Instituto Nacional de Ecologıa,´1997.
Carabias-Lillo J, Provencio-Durazo E, Fernandez-Bremauntz´A, Paramo-Figueroa VH, Gutierrez-Avedoy V, Martınez-´ ´ ´Castillejos J. Segundo Informe Sobre la Calidad del Aireen Ciudades Mexicanas 1997. Mexico City, Mexico: Insti-tuto Nacional de Ecologia, 1998.
Chow JC. Critical review: measurement methods to determinecompliance with ambient air quality standards for sus-pended particles. JAWMA 1995;45:320�382.
Chow JC, Watson JG. Contemporary source profiles for geo-logical material and motor vehicle emissions. Report No.DRI 2625.2F. Prepared for US EPA, Office of Air QualityPlanning and Standards, Research Triangle Park, NC, byDesert Research Institute, Reno, NV, 1994.
Chow JC, Watson JG. Ion chromatography. In: LandsbergerS, Creatchman M, editors. Elemental analysis of airborneparticles. Newark, NJ: Gordon and Breach, 1999:97�137.
Chow JC, Watson JG, Bowen JL et al. A sampling system forreactive species in the western US. In: Winegar ED, KeithLH, editors. Sampling and analysis of airborne pollutants.Ann Arbor, MI: Lewis Publishers, 1993a:209�228.
Chow JC, Watson JG, Pritchett LC, Pierson WR, Frazier CA,Purcell RG. The DRI thermal�optical reflectance carbonanalysis system: description, evaluation and applicationsin US air quality studies. Atmos Environ 1993b;27A:1185�1201.
Chow JC, Watson JG, Lowenthal DH, Solomon PA, MaglianoKL, Ziman SD, Richards LW. PM and PM composi-10 2.5tions in California’s San Joaquin Valley. Aerosol Sci Tech-nol 1993c;18:105�128.
Chow JC, Fujita EM, Watson JG, Lu Z, Lawson DR, Ash-baugh LL. Evaluation of filter-based aerosol measurementsduring the 1987 Southern California Air Quality Study.Environ Monit Assessment 1994a;30:49�80.
Chow JC, Watson JG, Houck JE et al. A laboratory resuspen-sion chamber to measure fugitive dust size distributionsand chemical compositions. Atmos Environ 1994b;28:3463�3481.
Chow JC, Watson JG, Divita Jr. F. Particulate matter withaerodynamic diameters smaller than 10 �m � measure-ment methods and sampling strategies. In: Keith LH, edi-tor. Principles of environmental sampling. Washington, DC:American Chemical Society, 1996a:539�573.
Chow JC, Watson JG, Lu Z et al. Descriptive analysis ofPM and PM at regionally representative locations dur-2.5 10ing SJVAQS�AUSPEX. Atmos Environ 1996b;30:2079�2112.
Chow JC, Watson JG, Green MC et al. Middle- and neighbor-hood-scale variations of PM source contributions in Las10Vegas, Nevada. JAWMA 1999;49:641�654.
Chow JC, Watson JG, Green MC et al. Cross-border transportand spatial variability of suspended particles in Mexicaliand California’s Imperial Valley. Atmos Environ2000;34:1833�1843.
Chow, JC, Watson, JG, Edgerton, SA, Vega, E. Spatial dif-ferences in outdoor PM mass and aerosol composition in10
Ž .Mexico City. JAWMA. 2001a submitted .Chow JC, Watson JG, Crow D, Lowenthal DH, Merrifield T.
Comparison of IMPROVE and NIOSH carbon measure-Ž .ments. Aerosol Sci Technol 2001b;34 1 :23�41.
Chow JC, Watson JG, Hackett EI, Stone RH, Hinsvark BA.Method No. 822: general atomic absorption procedure fortrace metals in airborne material collected on filters. In:Lodge JP, editor. Methods of air sampling and analysis,fourth edition. 4 Pittsburgh, PA: Air and Waste Manage-
Ž .ment Association, 2002 submitted .Doran JC, Abbott JL, Archuleta J et al. The IMADA�AVER
boundary layer experiment in the Mexico City area. BullAm Meteor Soc 1998;79:2497�2508.
Edgerton SA, Arriaga JL, Archuleta J et al. Particulate airpollution in Mexico City: a collaborative research project.JAWMA 1999;49:1221�1229.
Fast JD, Zhong S. Meteorological factors associated withinhomogeneous ozone concentrations within the MexicoCity basin. J Geophys Res 1998;103:18927�18946.
Fernandez-Bremauntz AA, Ashmore MR. Exposure of com-muters to carbon monoxide in Mexico City � I. Measure-ment of in-vehicle concentrations. Atmos Environ1995;29:525�532.
Gray HA, Cass GR, Huntzicker JJ, Heyerdahl EK, Rau JA.Characteristics of atmospheric organic and elemental car-bon particle concentrations in Los Angeles. Environ SciTechnol 1986;20:580�589.
Hernandez-Gardutho E, Perez-Neria J, Paccagenella AM, Pi-tha-Garcia MA. Air pollution and respiratory health inMexico City. J Occup Environ Med 1997;39:299.
Jauregui E. The dust storms of Mexico City. Int J Climatol1989;9:169�180.
Loomis D, Castillejos M, Gold DR, McDonnell W, Borja-Aburto VH. Air pollution and infant mortality in MexicoCity. Epidemiology 1999;10:118.
McDonald JD, Zielinska B, Fujita EM, Sagebiel JC, Chow JC,Watson JG. Fine particle and gaseous emission rates fromresidential wood combustion. Environ Sci Technol
Ž .2000;34 11 :2080�2091.Reilly PTA, Gieray RA, Whitten WB, Ramsey JM. Real-time
characterization of the organic composition and size ofindividual diesel engine smoke particles. Environ Sci Tech-nol 1998;32:2672�2679.
Richards LW. Comments on the oxidation of NO to nitrate2� day and night. Atmos Environ 1983;17:397�402.
Romieu I, Cortes-Lugo M, Ruiz-Velasco S, Sanchez S, Mene-ses F. Air pollution and school absenteeism among childrenin Mexico City. Am J Epidemiol 1992;136:1524.
( )J.C. Chow et al. � The Science of the Total En�ironment 287 2002 177�201 201
Romieu I, Meneses F, Ruiz S, Sienra JJ, Huerta J, White MC,Etzel RA. Asthma�airway inflammation � effects of airpollution on the respiratory health of asthmatic childrenliving in Mexico City. Am J Respir Crit Care Med1996;154:300�307.
Stelson AW, Seinfeld JH. Relative humidity and temperaturedependence of the ammonium nitrate dissociation con-stant. Atmos Environ 1982;16:983�992.
Turpin BJ, Huntzicker JJ. Secondary formation of organicaerosol in the Los Angeles Basin: a descriptive analysis oforganic and elemental carbon concentrations. Atmos Envi-ron 1991;25A:207�215.
Turpin BJ, Huntzicker JJ, Larson SM, Cass GR. Los Angelessummer midday particulate carbon: primary and secondaryaerosol. Environ Sci Technol 1991;25:1788�1793.
US Environmental Protection Agency. National ambient airquality standards for particulate matter: final rule. FederalRegister 1997;62:38651�38701.
Vega, E, Reyes, E, Sanchez, G, Ortiz, E, Ruiz, M, Chow, JC,´Watson, JG, Edgerton, S. Basic statistics of PM and2.5PM in the atmosphere of Mexico City. Sci Total Environ10Ž .2001a in press.
Vega, E, Mugica, V, Reyes, E, Sanchez, G, Chow, JC, Watson,JG. Chemical composition of fugitive dust emitters in Mex-ico City. Atmos Environ 2001b;35:4033�4039.
Watson, JG, Chow, JC. Source characterization of major emis-sion sources in the Imperial and Mexicali valleys along theUS�Mexico border. Sci Total Environ, 2001a;276:33�48.
Watson, JG, Chow, JC. Estimating middle-, neighborhood-,and urban-scale contributions to elemental carbon in Mex-
ico City with a rapid response aethalometer. JAWMAŽ .2001b accepted.
Watson JG, Chow JC, Lu Z, Fujita EM, Lowenthal DH,Lawson DR. Chemical mass balance source apportionmentof PM during the Southern California Air Quality Study.10Aerosol Sci Technol 1994a;21:1�36.
Watson JG, Chow JC, Lowenthal DH, Pritchett LC, FrazierCA, Neuroth GR, Robbins R. Differences in the carboncomposition of source profiles for diesel- and gasoline-powered vehicles. Atmos Environ 1994b;28:2493�2505.
Watson JG, Chow JC, Lurmann FW, Musarra S. Ammoniumnitrate, nitric acid, and ammonia equilibrium in wintertimePhoenix, Arizona. JAWMA 1994c;44:405�412.
Watson JG, Chow JC, Frazier CA. X-Ray fluorescence analy-sis of ambient air samples. In: Landsberger S, CreatchmanM, editors. Elemental analysis of airborne particles.Newark, NJ: Gordon and Breach, 1999:67�96.
Watson JG, Turpin BJ, Chow JC. Air sampling instrumentsfor evaluation of atmospheric contaminants. In: Cohen B,editor. The measurement process: precision, accuracy, andvalidity, 9th ed. Cincinnati, OH: American Conference ofGovernmental Industrial Hygienists 2001a:201�216.
Watson JG, Chow JC, Houck JE. PM chemical source2.5profiles for vehicle exhaust, vegetative burning, geologicalmaterial and coal burning in northwestern Colorado during
Ž .1996. Chemosphere 2001b;43 8 :1141�1151.Whiteman CD, Zhong S, Bian X, Fast JD, Doran JC. Boundary
layer evolution and regional-scale diurnal circulations overthe Mexico Basin and Mexican plateau. J Geophys Res2000;105:10081�10102.