Embed Size (px)
Citation preview
258 Int. J. Nuclear Energy Science and Technology, Vol. 7, No. 3, 2013
Copyright © 2013 Inderscience Enterprises Ltd.
Chemical kinetics parameters of nuclear graphite gasification
Mohamed S. El-Genk* Institute for Space & Nuclear Power Studies, Chemical & Nuclear Engineering Department, Mechanical Engineering Department, University of New Mexico, Albuquerque, NM, USA Email: [email protected] *Corresponding author
Jean-Michel P. Tournier Institute for Space & Nuclear Power Studies, Chemical & Nuclear Engineering Department, University of New Mexico, Albuquerque, NM, USA Email: [email protected]
Abstract: This paper provides chemical kinetics parameters for the gasification of nuclear graphite grades of IG-110, IG-430, NBG-18 and NBG-25 and presents empirical correlations for their surface areas of free active sites as a function of mass. The kinetics parameters for the four elementary chemical reactions of gasification of these grades of nuclear graphite include the values and Gaussian distributions of the specific activation energies and the values of the pre-exponential rate coefficients for the adsorption of oxygen and desorption of CO and CO2 gases. The values of these parameters and the surface area of free active sites for IG-110 and NB-25, with fine and medium petroleum coke filler particles, are nearly the same, but slightly different from those of NBG-18 and IG-430, with medium and fine coal tar pitch coke filler particles. Recommended parameters are applicable to future safety analysis of high and very high temperature gas cooled reactors in the unlikely event of a massive air ingress accident.
Keywords: nuclear graphite gasification; chemical reaction kinetics; high and very high temperature nuclear reactors; air ingress accident; safety analysis.
Reference to this paper should be made as follows: El-Genk, M.S. and Tournier, J-M.P. (2013) ‘Chemical kinetics parameters of nuclear graphite gasification’, Int. J. Nuclear Energy Science and Technology, Vol. 7, No. 3, pp.258–284.
Biographical notes: Mohamed S. El-Genk, Regents’ Professor of Chemical, Nuclear and Mechanical Engineering and Founding Director of Institute for Space and Nuclear Power Studies at University of New Mexico. He is widely published and an expert in nuclear reactors neutronics and thermal-hydraulics design and safety; space nuclear power sytems; energy conversion; heat pipes and thermal management; boiling heat transfer and two-phase flow; nuclear
Chemical kinetics parameters of nuclear graphite gasification 259
fuel and materials; oxidation kinetics of nuclear graphite; advanced electronics cooling; CFD analysis & heat transfer; and shielding space energetics particles. He is Fellow of the American Nuclear Society, the American Society of Mechanical Engineers, and the American Institute for Chemical Engineers and Associate Fellow of the American Institute for Aeronautics and Astronautics.
Jean-Michel P. Tournier, Research Assistant Professor of Chemical & Nuclear Engineering at the Institute for space and nuclear Power Studies, University of New Mexico (UNM). He holds a MS in Applied Mathematics from the University Paris XIII, a French PE from École Centrale des Arts et Manufactures of Paris, and a PhD in Nuclear Engineering from UNM. His specialises include design and optimisation analyses of static and dynamic energy conversion devices and space nuclear reactor power systems; thermal management; heat pipes; chemical reaction kinetics for the gasification of nuclear graphite; and numerical analysis and simulation of complex systems.
1 Introduction
High-Temperature and Very High Temperature Gas-cooled Reactor (HTGR and VHTR) designs are being developed for generating electricity, at high thermal efficiency close to 50%, and the co-generation of process heat for the thermo-chemical production of hydrogen fuel and a host of other industrial applications. These reactors employ nuclear graphite in the active core and the axial and radial neutron reflector regions. The circulated helium gas at high pressure of 4–7 MPa removes the fission heat generated in the reactor core and exits at ~600–650°C in HTGRs and 850–900°C in VHTRs (INL, 2007).
For these reactors, massive air ingress in the unlikely event of a pipe break and depressurisation of the reactor is a design basis accident. Analysis of such an accident requires reliable estimates and validated capability for predicting the gasification rate of nuclear graphite in the reactor core as well as in the lower plenum and the reflector regions. The total gasification rate and transient weight loss of graphite and the production rates of CO and CO2 gases would need to be calculated as functions of the total pressure, oxygen partial pressure and temperature up to 1300 K, or even higher.
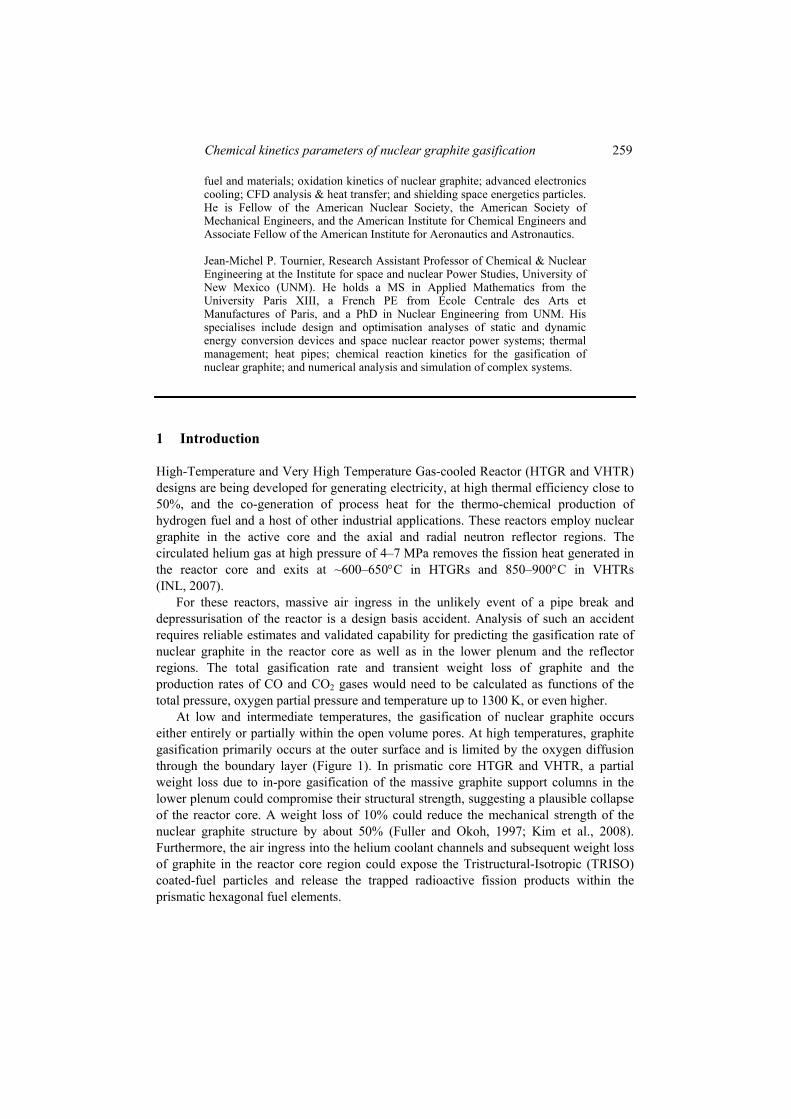
At low and intermediate temperatures, the gasification of nuclear graphite occurs either entirely or partially within the open volume pores. At high temperatures, graphite gasification primarily occurs at the outer surface and is limited by the oxygen diffusion through the boundary layer (Figure 1). In prismatic core HTGR and VHTR, a partial weight loss due to in-pore gasification of the massive graphite support columns in the lower plenum could compromise their structural strength, suggesting a plausible collapse of the reactor core. A weight loss of 10% could reduce the mechanical strength of the nuclear graphite structure by about 50% (Fuller and Okoh, 1997; Kim et al., 2008). Furthermore, the air ingress into the helium coolant channels and subsequent weight loss of graphite in the reactor core region could expose the Tristructural-Isotropic (TRISO) coated-fuel particles and release the trapped radioactive fission products within the prismatic hexagonal fuel elements.
260 M.S. El-Genk and J-M.P. Tournier
Figure 1 Oxidation modes of porous nuclear graphite (see online version for colours)
Co δ
Oxi
dant
Con
cent
ratio
n
Bou
ndar
y-la
yer
C (x)
Tota
l Gas
ifica
tion
Rat
e
104 / T
Mode (a):Chemical kinetics controlled regime
Mode (b):In-pore diffusion controlled regime
Mode (c):Boundary-layer diffusion
controlled regime
Co δ
Oxi
dant
Con
cent
ratio
n
Bou
ndar
y-la
yer
C (x)
Co δ
Oxi
dant
Con
cent
ratio
n
Bou
ndar
y-la
yer
C (x)
Tota
l Gas
ifica
tion
Rat
e
104 / T
Mode (a):Chemical kinetics controlled regime
Mode (b):In-pore diffusion controlled regime
Mode (c):Boundary-layer diffusion
controlled regime
The two primary products of graphite gasification are CO and CO2 gases, whose generation rates and total production depend on the temperature, the total and oxygen partial pressures and the surface area of active free sites and stable complexes. While the production of CO2 gas dominates at low temperatures, CO is the primary contributor to the gasification of nuclear graphite at intermediate and high temperatures. The gasification of nuclear graphite proceeds in four successive processes: adsorption of oxygen, formation of (CO) stable complexes, and desorption of CO and CO2 gaseous products. The chemical kinetics parameters for these four primary chemical reactions depend on the grade of the nuclear graphite, the graphitisation temperature during fabrication, and micro-structure (Kane et al., 2011; Contescu et al., 2012). The latter affects not only the surface area of free active sites and stable (CO) complexes, but also the volume porosity and the fraction of open pores.
The variables that affect the total gasification rate and transient weight loss of nuclear graphite in the unlikely event of an air ingress accident are both operational and intrinsic. Operation variables include the total flow rate and total pressure of air or bulk gas mixture, the oxygen partial pressure and the graphite temperature. The intrinsic variables, which depend on the grade of nuclear graphite, include the specific activation energies for adsorption of oxygen and desorption of CO and CO2 gaseous products; the surface area of active free sites and stable complexes; the graphite microstructure; and the volume porosity and the size and fraction of open volume pores. The impurities that could act as catalysts for oxidation also increase the reactivity and the total gasification rate of nuclear graphite.
Chemical kinetics parameters of nuclear graphite gasification 261
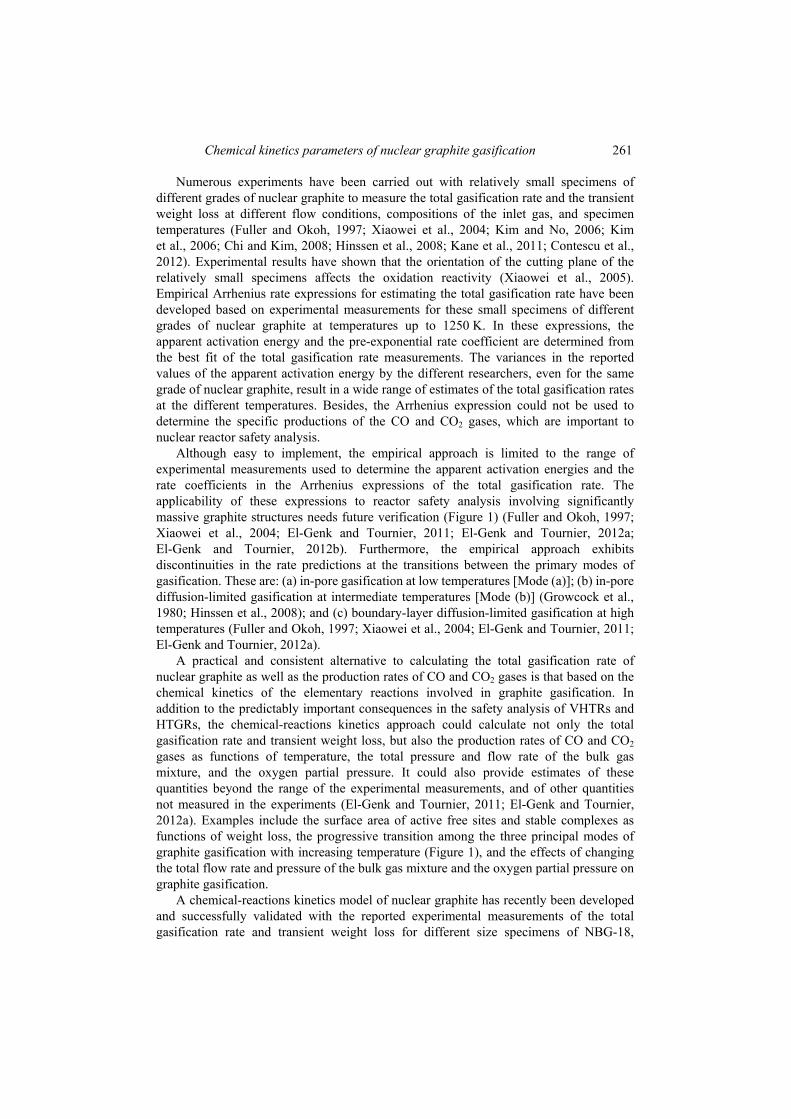
Numerous experiments have been carried out with relatively small specimens of different grades of nuclear graphite to measure the total gasification rate and the transient weight loss at different flow conditions, compositions of the inlet gas, and specimen temperatures (Fuller and Okoh, 1997; Xiaowei et al., 2004; Kim and No, 2006; Kim et al., 2006; Chi and Kim, 2008; Hinssen et al., 2008; Kane et al., 2011; Contescu et al., 2012). Experimental results have shown that the orientation of the cutting plane of the relatively small specimens affects the oxidation reactivity (Xiaowei et al., 2005). Empirical Arrhenius rate expressions for estimating the total gasification rate have been developed based on experimental measurements for these small specimens of different grades of nuclear graphite at temperatures up to 1250 K. In these expressions, the apparent activation energy and the pre-exponential rate coefficient are determined from the best fit of the total gasification rate measurements. The variances in the reported values of the apparent activation energy by the different researchers, even for the same grade of nuclear graphite, result in a wide range of estimates of the total gasification rates at the different temperatures. Besides, the Arrhenius expression could not be used to determine the specific productions of the CO and CO2 gases, which are important to nuclear reactor safety analysis.
Although easy to implement, the empirical approach is limited to the range of experimental measurements used to determine the apparent activation energies and the rate coefficients in the Arrhenius expressions of the total gasification rate. The applicability of these expressions to reactor safety analysis involving significantly massive graphite structures needs future verification (Figure 1) (Fuller and Okoh, 1997; Xiaowei et al., 2004; El-Genk and Tournier, 2011; El-Genk and Tournier, 2012a; El-Genk and Tournier, 2012b). Furthermore, the empirical approach exhibits discontinuities in the rate predictions at the transitions between the primary modes of gasification. These are: (a) in-pore gasification at low temperatures [Mode (a)]; (b) in-pore diffusion-limited gasification at intermediate temperatures [Mode (b)] (Growcock et al., 1980; Hinssen et al., 2008); and (c) boundary-layer diffusion-limited gasification at high temperatures (Fuller and Okoh, 1997; Xiaowei et al., 2004; El-Genk and Tournier, 2011; El-Genk and Tournier, 2012a).
A practical and consistent alternative to calculating the total gasification rate of nuclear graphite as well as the production rates of CO and CO2 gases is that based on the chemical kinetics of the elementary reactions involved in graphite gasification. In addition to the predictably important consequences in the safety analysis of VHTRs and HTGRs, the chemical-reactions kinetics approach could calculate not only the total gasification rate and transient weight loss, but also the production rates of CO and CO2 gases as functions of temperature, the total pressure and flow rate of the bulk gas mixture, and the oxygen partial pressure. It could also provide estimates of these quantities beyond the range of the experimental measurements, and of other quantities not measured in the experiments (El-Genk and Tournier, 2011; El-Genk and Tournier, 2012a). Examples include the surface area of active free sites and stable complexes as functions of weight loss, the progressive transition among the three principal modes of graphite gasification with increasing temperature (Figure 1), and the effects of changing the total flow rate and pressure of the bulk gas mixture and the oxygen partial pressure on graphite gasification.
A chemical-reactions kinetics model of nuclear graphite has recently been developed and successfully validated with the reported experimental measurements of the total gasification rate and transient weight loss for different size specimens of NBG-18,
262 M.S. El-Genk and J-M.P. Tournier
NBG-25, IG-110 and IG-430 (El-Genk and Tournier, 2011; El-Genk and Tournier, 2012a; El-Genk and Tournier, 2012b). NBG-18 and IG-430 are fabricated using medium (~300 μm) and super fine (~10 μm) coal tar pitch coke filler particles that are mostly isotropic and spherical (Kane et al., 2011; Contescu et al., 2012). The NBG-25 and IG-110 graphite grades have medium (~300 μm) and super fine (~10–25 μm) anisotropic, acicular, petroleum coke filler particles, respectively (Kane et al., 2011; Contescu et al., 2012).
The chemical kinetics gasification model employs only four elementary reactions. The reaction parameters include the values and Gaussian-like distributions of the specific activation energies and rate constants for the adsorption of oxygen and desorption of CO and CO2 gaseous products, and the surface area of active free sites. The chemical kinetics parameters for IG-110, IG-430, NBG-18 and NBG-25 are obtained from the reported measurements of the total gasification rate and transient weight loss in the experiments with small specimens. The values of these parameters are determined using a multi-parameter optimisation algorithm. However, for consistency and future application to the safety analysis of VHTR and HTGR in the unlikely event of an air ingress accident, the applicability of the determined chemical kinetics parameters to large graphite structures is examined in this paper. In particular, the dependence of the initial surface area of the active free sites on the mass or volume of the graphite structure is examined.
This paper compares the values of recently determined chemical kinetics parameters for the gasification of nuclear graphite grades of NBG-18, IG-430, NBG-25 and IG-110 and makes recommendations for future safety analyses of VHTR and HTGR with massive graphite structures. Also presented are the results of an analysis investigating the effects of the graphite grade and mass as well as temperature on the total gasification rate of the different grades of nuclear graphite. Analysis used the recently developed and validated chemical-reactions kinetics model for the gasification of the different grades of nuclear graphite, and the recommended chemical kinetics parameters in this paper. The next section briefly describes the model.
2 Chemical-reactions kinetics model
The chemical-reactions kinetics model for the gasification of nuclear graphite comprises the following successive processes: (a) adsorption of oxygen onto surface active free sites; (b) simultaneous formation of C–O bonds and break up of C–C bonds to form stable surface complexes; and (c) the desorption of CO and CO2 gaseous products. These processes are carried out through the following reactions (El-Genk and Tournier, 2011; El-Genk and Tournier, 2012a):
1 Adsorption of oxygen molecules to form un-dissociated C(O2) surface complexes:
,
, 2 2( )a i
i i
k
fC O C Oε ε+ → . (1a)
The rate constants for these reactions are given by: , /( )
, . i a gR Toa i ak k e ε−= . (1b)
Chemical kinetics parameters of nuclear graphite gasification 263
2 Break-up of un-dissociated C(O2) oxygen radicals to form stable (CO) complexes:
, 2( ) ( ) ( )b
j i i j
k
fC C O CO COε ε ε ε+ → + . (2a)
The rate constants for these reactions are given as: /( ). b gR To
b bk k e ε−= . (2b)
3 Desorption of (CO) complexes to produce CO gas:
,
,( )d j
j j
k
fCO CO Cε ε→ + (3a)
The rate constants for these reactions are given by: , / ( )
, . j d gR Tod j dk k e ε−= (3b)
4 Desorption of CO2 gas:
2
, 2 2 ,( ) ( )CO
i j j i
k
f fC CO O CO CO Cε ε ε ε+ + → + + . (4a)
The rate constants for these reactions are given as: *
2
/ ( )* . d gR TCO dk k e ε−= . (4b)
The stable surface complexes and adjacent free sites serve as a catalyst for the production of CO2 gas at low and intermediate temperatures (Moulijn and Kapteijn, 1995; El-Genk and Tournier, 2011). Although desorption of a CO2 molecule frees an active site, the reactions in equation (4a) consume only oxygen to remove carbon from the surface. However, the desorption rate of CO2 is limited by the availability of both surface free sites and (CO) surface complexes in close proximity [equation (4a)]. The specific activation energy for desorption of CO2 gas [equation (4a)] *
dε is considerably lower than that for desorption of CO gas molecules [equation (3a)].
The specific activation energies for the adsorption of oxygen onto surface active free sites [equation (1a)] have a Gaussian-like distribution (Figure 2), with most-probable specific energy, aε , and standard deviation, σa (El-Genk and Tournier, 2011; El-Genk and Tournier, 2012a). Similarly, the specific activation energies for desorption of CO gas have a Gaussian distribution with most-probable specific energy, d aε ε> , and standard deviation d aσ σ< (Figure 3). The constituent equations for calculating the reaction rates of the elementary reactions in the chemical-reaction kinetics model [equations (1a)–(4a)] are detailed elsewhere (El-Genk and Tournier, 2011) and will not be repeated here.
The input to the chemical-reactions kinetics model for graphite gasification includes ten parameters: (a) most-probable specific activation energies for adsorption of oxygen and desorption of CO ( aε and dε ) and standard deviations (σa and σd) characterising their Gaussian distributions; (b) specific activation energies bε and *
dε for elementary reactions in equations (2a) and (4a); and (c) the pre-exponential rate coefficients, o
ak , obk ,
odk and *
dk , for the rate constants of the four elementary reactions [equations (1b), (2b), (3b) and (4b)].
264 M.S. El-Genk and J-M.P. Tournier
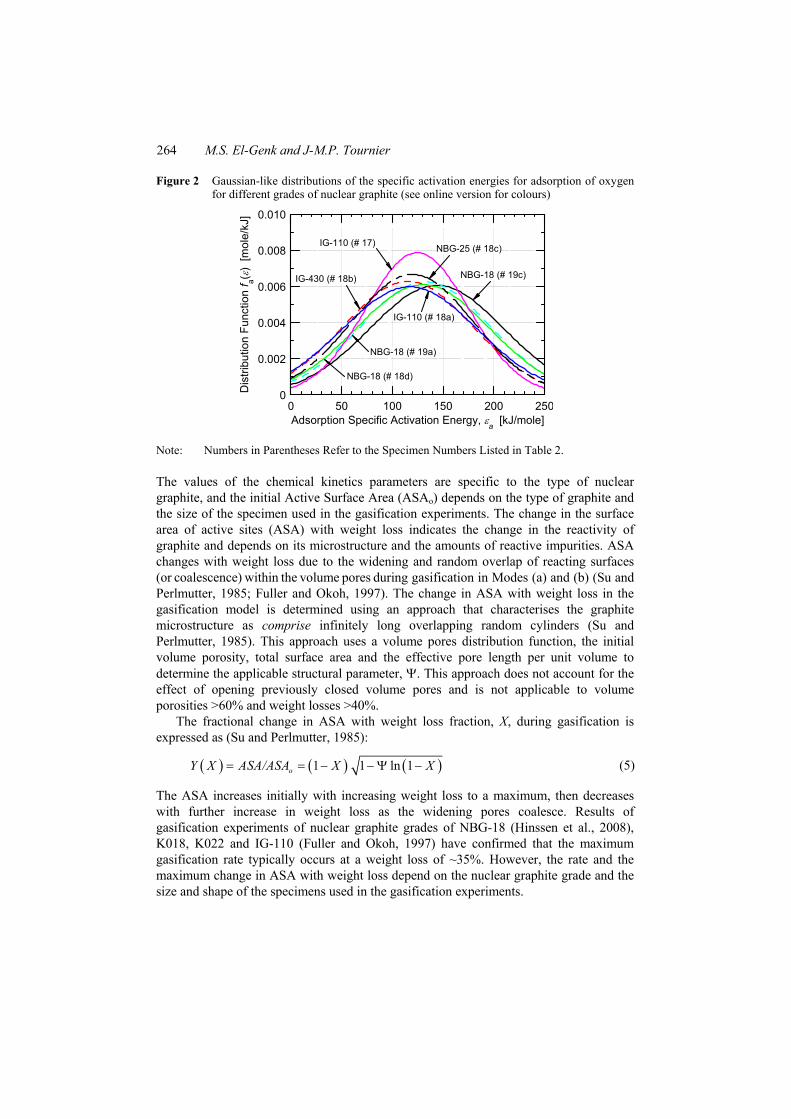
Figure 2 Gaussian-like distributions of the specific activation energies for adsorption of oxygen for different grades of nuclear graphite (see online version for colours)
0
0.002
0.004
0.006
0.008
0.010
0 50 100 150 200 250
NBG-18 (# 19c)
NBG-18 (# 19a)
NBG-18 (# 18d)
NBG-25 (# 18c)
IG-430 (# 18b)
IG-110 (# 18a)
IG-110 (# 17)
Adsorption Specific Activation Energy, εa [kJ/mole]
Dis
tribu
tion
Func
tion f a(ε
) [m
ole/
kJ]
Note: Numbers in Parentheses Refer to the Specimen Numbers Listed in Table 2.
The values of the chemical kinetics parameters are specific to the type of nuclear graphite, and the initial Active Surface Area (ASAo) depends on the type of graphite and the size of the specimen used in the gasification experiments. The change in the surface area of active sites (ASA) with weight loss indicates the change in the reactivity of graphite and depends on its microstructure and the amounts of reactive impurities. ASA changes with weight loss due to the widening and random overlap of reacting surfaces (or coalescence) within the volume pores during gasification in Modes (a) and (b) (Su and Perlmutter, 1985; Fuller and Okoh, 1997). The change in ASA with weight loss in the gasification model is determined using an approach that characterises the graphite microstructure as comprise infinitely long overlapping random cylinders (Su and Perlmutter, 1985). This approach uses a volume pores distribution function, the initial volume porosity, total surface area and the effective pore length per unit volume to determine the applicable structural parameter, Ψ. This approach does not account for the effect of opening previously closed volume pores and is not applicable to volume porosities >60% and weight losses >40%.
The fractional change in ASA with weight loss fraction, X, during gasification is expressed as (Su and Perlmutter, 1985):
( ) ( ) ( )1 1 ln 1oY X ASA/ASA X X= = − − Ψ − (5)
The ASA increases initially with increasing weight loss to a maximum, then decreases with further increase in weight loss as the widening pores coalesce. Results of gasification experiments of nuclear graphite grades of NBG-18 (Hinssen et al., 2008), K018, K022 and IG-110 (Fuller and Okoh, 1997) have confirmed that the maximum gasification rate typically occurs at a weight loss of ~35%. However, the rate and the maximum change in ASA with weight loss depend on the nuclear graphite grade and the size and shape of the specimens used in the gasification experiments.
Chemical kinetics parameters of nuclear graphite gasification 265
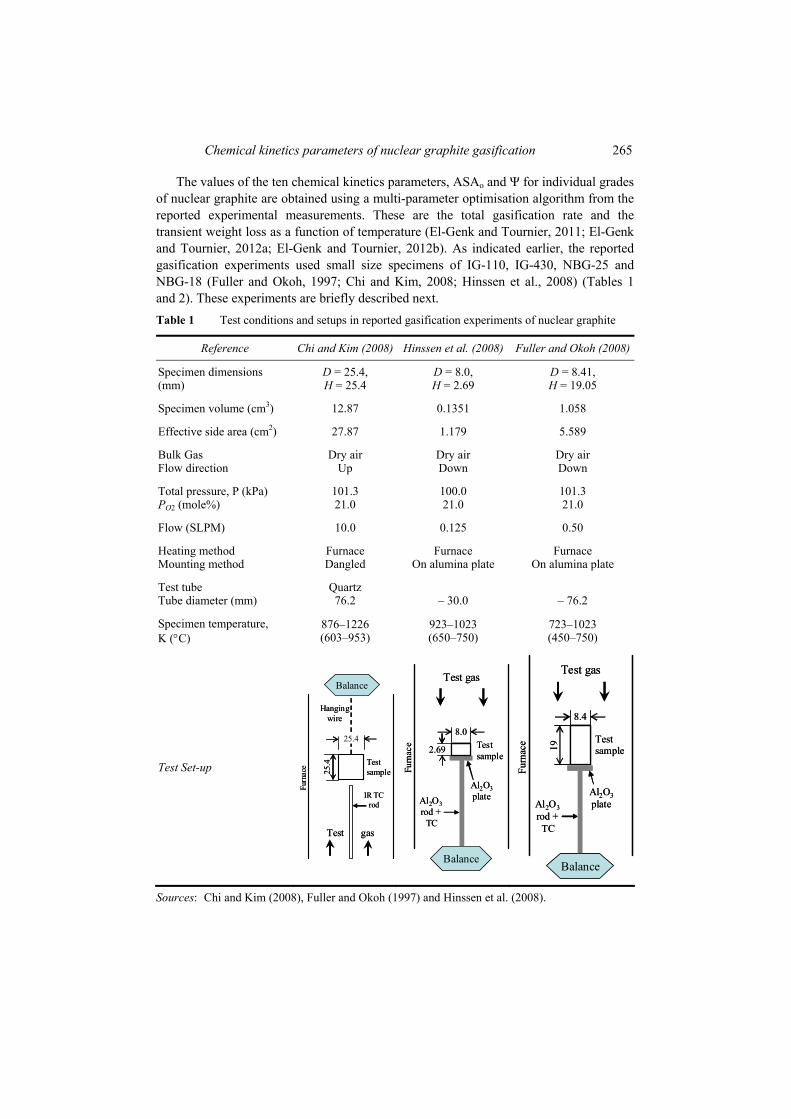
The values of the ten chemical kinetics parameters, ASAo and Ψ for individual grades of nuclear graphite are obtained using a multi-parameter optimisation algorithm from the reported experimental measurements. These are the total gasification rate and the transient weight loss as a function of temperature (El-Genk and Tournier, 2011; El-Genk and Tournier, 2012a; El-Genk and Tournier, 2012b). As indicated earlier, the reported gasification experiments used small size specimens of IG-110, IG-430, NBG-25 and NBG-18 (Fuller and Okoh, 1997; Chi and Kim, 2008; Hinssen et al., 2008) (Tables 1 and 2). These experiments are briefly described next. Table 1 Test conditions and setups in reported gasification experiments of nuclear graphite
Reference Chi and Kim (2008) Hinssen et al. (2008) Fuller and Okoh (2008)
Specimen dimensions (mm)
D = 25.4, H = 25.4
D = 8.0, H = 2.69
D = 8.41, H = 19.05
Specimen volume (cm3) 12.87 0.1351 1.058
Effective side area (cm2) 27.87 1.179 5.589
Bulk Gas Flow direction
Dry air Up
Dry air Down
Dry air Down
Total pressure, P (kPa) PO2 (mole%)
101.3 21.0
100.0 21.0
101.3 21.0
Flow (SLPM) 10.0 0.125 0.50
Heating method Mounting method
Furnace Dangled
Furnace On alumina plate
Furnace On alumina plate
Test tube Tube diameter (mm)
Quartz 76.2
– 30.0
– 76.2
Specimen temperature, K (°C)
876–1226 (603–953)
923–1023 (650–750)
723–1023 (450–750)
Test Set-up 25.4
IR TCrod
Testsample
Furn
ace
Test gas
Hangingwire
25.4
Balance
25.4
IR TCrod
Testsample
Furn
ace
Test gas
Hangingwire
25.4
Balance
2.69
8.0
Al2O3plateAl2O3
rod + TC
Testsample
Furn
ace
Balance
Test gas
2.69
8.0
Al2O3plateAl2O3
rod + TC
Testsample
Furn
ace
Balance
Test gas
19
8.4
Al2O3plateAl2O3
rod + TC
Testsample
Furn
ace
Balance
Test gas
19
8.4
Al2O3plateAl2O3
rod + TC
Testsample
Furn
ace
Balance
Test gas
Sources: Chi and Kim (2008), Fuller and Okoh (1997) and Hinssen et al. (2008).
266 M.S. El-Genk and J-M.P. Tournier
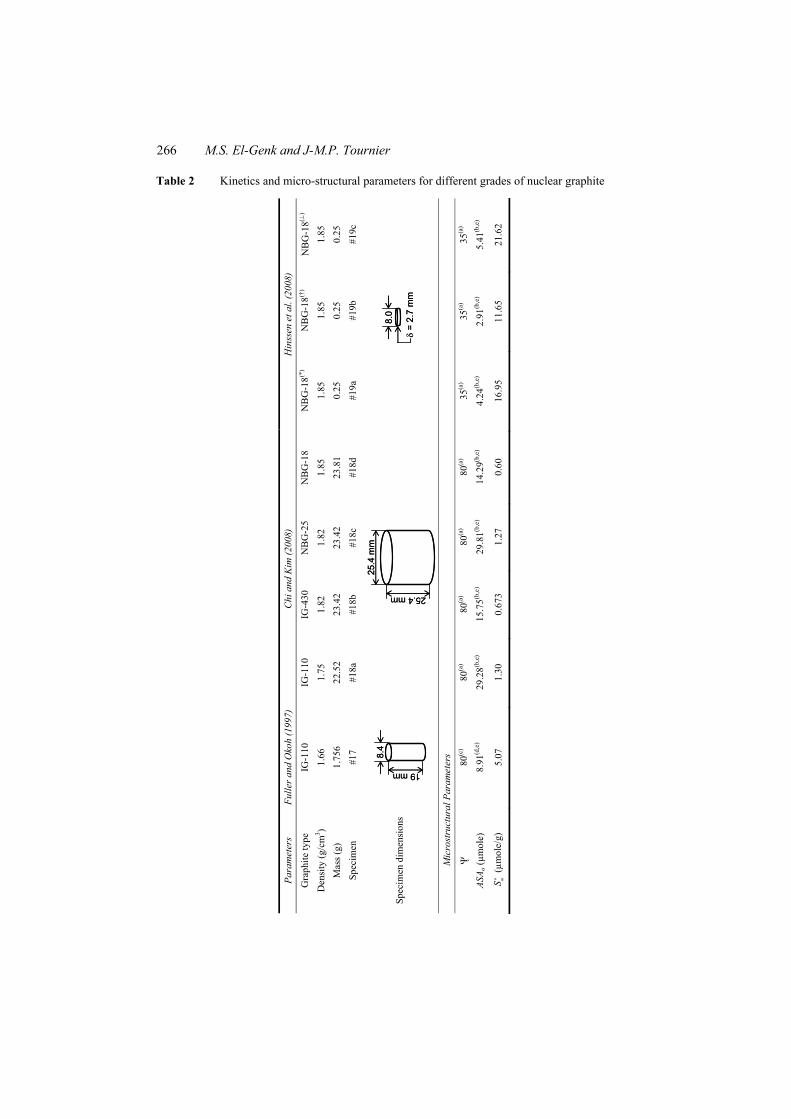
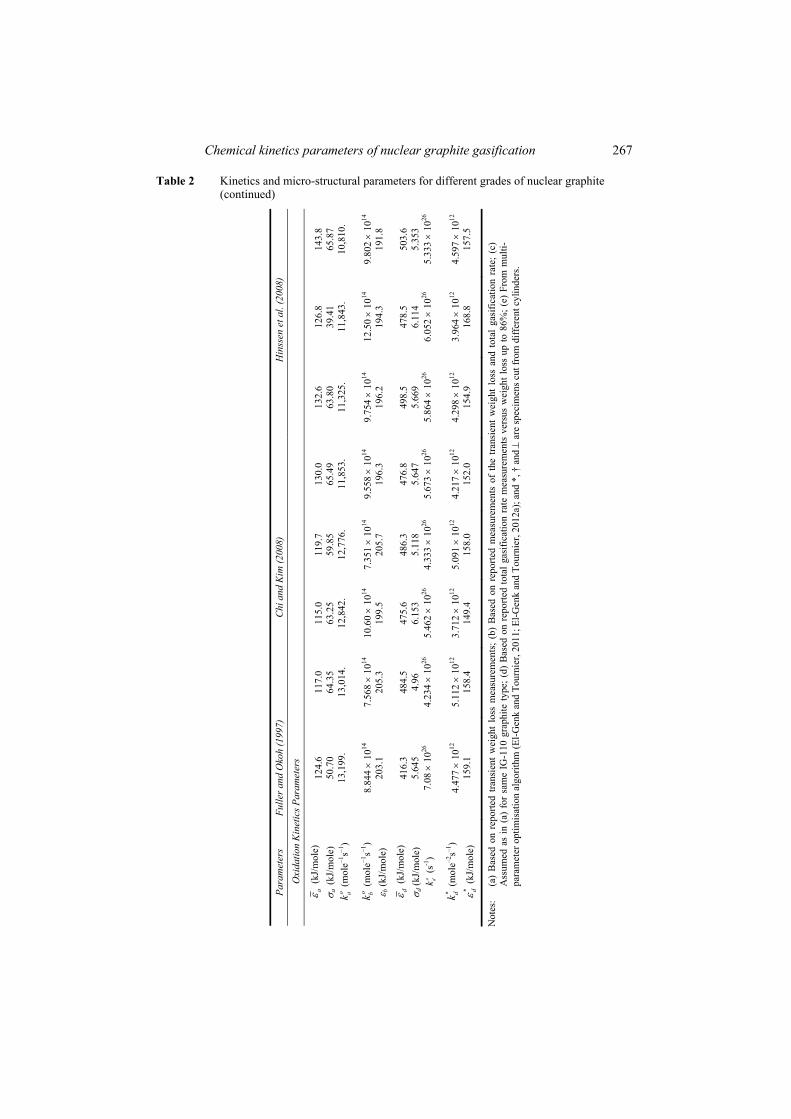
Table 2 Kinetics and micro-structural parameters for different grades of nuclear graphite
Para
met
ers
Fulle
r and
Oko
h (1
997)
Chi
and
Kim
(200
8)
Hin
ssen
et a
l. (2
008)
Gra
phite
type
IG
-110
IG
-110
IG
-430
N
BG
-25
NB
G-1
8 N
BG
-18(*
) N
BG
-18(†
) N
BG
-18(⊥
)
Den
sity
(g/c
m3 )
1.66
1.
75
1.82
1.
82
1.85
1.
85
1.85
1.
85
Mas
s (g)
1.
756
22.5
2 23
.42
23.4
2 23
.81
0.25
0.
25
0.25
Sp
ecim
en
#17
#18a
#1
8b
#18c
#1
8d
#19a
#1
9b
#19c
Spec
imen
dim
ensi
ons
19 mm
8.4
19 mm
8.4
25.4
mm
25.4 mm
25.4
mm
25.4 mm
8.0
δ=
2.7
mm
8.0
δ=
2.7
mm
Mic
rost
ruct
ural
Par
amet
ers
Ψ
80(c
) 80
(a)
80(a
) 80
(a)
80(a
) 35
(a)
35(a
) 35
(a)
ASA o
(µm
ole)
8.
91(d
,e)
29.2
8(b,e
) 15
.75(b
,e)
29.8
1(b,e
) 14
.29(b
,e)
4.24
(b,e
) 2.
91(b
,e)
5.41
(b,e
)
o mS (µ
mol
e/g)
5.
07
1.30
0.
673
1.27
0.
60
16.9
5 11
.65
21.6
2
Chemical kinetics parameters of nuclear graphite gasification 267
Table 2 Kinetics and micro-structural parameters for different grades of nuclear graphite (continued)
Para
met
ers
Fulle
r and
Oko
h (1
997)
Chi
and
Kim
(200
8)
Hin
ssen
et a
l. (2
008)
Oxi
datio
n K
inet
ics P
aram
eter
s
aε (k
J/m
ole)
σ a
(kJ
/mol
e)
o ak (m
ole–1
s–1)
124.
6 50
.70
13,1
99.
117.
0 64
.35
13,0
14.
115.
0 63
.25
12,8
42.
119.
7 59
.85
12,7
76.
130.
0 65
.49
11,8
53.
132.
6 63
.80
11,3
25.
126.
8 39
.41
11,8
43.
143.
8 65
.87
10,8
10.
o bk (m
ole–1
s–1)
ε b (k
J/m
ole)
8.
844 ×
1014
20
3.1
7.56
8 ×
1014
20
5.3
10.6
0 ×
1014
199.
5 7.
351 ×
1014
205.
7 9.
558 ×
1014
19
6.3
9.75
4 ×
1014
19
6.2
12.5
0 ×
1014
19
4.3
9.80
2 ×
1014
191.
8
dε (k
J/m
ole)
σ d
(kJ/
mol
e)
o dk (s
-1)
416.
3 5.
645
7.08
× 1
026
484.
5 4.
96
4.23
4 ×
1026
475.
6 6.
153
5.46
2 ×
1026
486.
3 5.
118
4.33
3 ×
1026
476.
8 5.
647
5.67
3 ×
1026
498.
5 5.
669
5.86
4 ×
1026
478.
5 6.
114
6.05
2 ×
1026
503.
6 5.
353
5.33
3 ×
1026
* dk (m
ole–2
s–1)
* dε (k
J/m
ole)
4.
477 ×
1012
15
9.1
5.11
2 ×
1012
15
8.4
3.71
2 ×
1012
149.
4 5.
091 ×
1012
158.
0 4.
217 ×
1012
15
2.0
4.29
8 ×
1012
15
4.9
3.96
4 ×
1012
16
8.8
4.59
7 ×
1012
157.
5
Not
es:
(a)
Bas
ed o
n re
porte
d tra
nsie
nt w
eigh
t lo
ss m
easu
rem
ents
; (b
) B
ased
on
repo
rted
mea
sure
men
ts o
f th
e tra
nsie
nt w
eigh
t los
s an
d to
tal
gasi
ficat
ion
rate
; (c)
A
ssum
ed a
s in
(a)
for
sam
e IG
-110
gra
phite
type
; (d)
Bas
ed o
n re
porte
d to
tal g
asifi
catio
n ra
te m
easu
rem
ents
ver
sus
wei
ght l
oss
up to
86%
; (e)
Fro
m m
ulti-
para
met
er o
ptim
isat
ion
algo
rithm
(El-G
enk
and
Tour
nier
, 201
1; E
l-Gen
k an
d To
urni
er, 2
012a
); an
d *,
† a
nd ⊥
are
spec
imen
s cut
from
diff
eren
t cyl
inde
rs.
268 M.S. El-Genk and J-M.P. Tournier
3 Gasification experiments
Table 1 summarises the set-ups and conditions used in the gasification experiments of Chi and Kim (2008), Fuller and Okoh (1997) and Hinssen et al. (2008). These experiments employed small size specimens of IG-110, IG-430, NBG-25 and NBG-18 nuclear graphite. In the experiments of Chi and Kim (2008), the cylindrical graphite specimen is placed inside a quartz tube and attached with wire to an overhead micro-scale balance. The balance measures the graphite weight loss with time in the experiments. A non-contact infrared thermometer measured the bottom temperature of the specimen (Table 1). The graphite specimen is heated using an external vertical furnace. A continuous flow of atmospheric air enters through the bottom of the quartz tube (Table 1). Transient weight loss measurements from 5% to 10% are reported at 876, 975, 1081 and 1184 K; and the total gasification rate measurements at a 7.5% weight loss are also reported at 1127 and 1226 K.
In the experiments of Fuller and Okoh (1997), the IG-110 cylindrical specimen was seated onto an alumina crucible. The crucible is connected to a weight-scale below by a small-diameter alumina support rod. A Pt-10% Rh thermo-couple, inserted through the rod to the base of the crucible, measured the temperature of the specimen (Table 1). The graphite specimen is heated using an electric furnace. Fuller and Okoh (1997) reported transient weight loss data up to 86% in atmospheric air flow at a specimen temperature of 750°C (1023 K). They also reported the total gasification rates for 13.3% weight loss at 723–1023 K.
The total gasification measurements reported by Fuller and Okoh (1997) are only applicable to Modes (a) and (b), which are shown in Figure 1. In their experiments, Hinssen et al. (2008) used three very small graphite specimens cut from different cylinders. The specimen was seated onto an alumina plate, and the introduced air flowed downward over the specimens (Table 1).
The IG-110 cylindrical specimens used in the experiments of Fuller and Okoh (1997) (1.756 g) are an order of magnitude smaller than the IG-110, IG-430, NBG-25 and NBG-18 specimens in the experiments of Chi and Kim (2008), weighing between 22.52 and 23.81 g (Table 2). The IG-110 specimens of Chi and Kim are also 5.4% denser than those of Fuller and Okoh (1.75 g/cm3 versus 1.66 g/cm3). The IG-430 and NBG-25 specimens used in the experiments of Chi and Kim (2008) are 4% denser than IG-110 (1.82 g/cm3 versus 1.75 g/cm3). Although the experiments were performed with dry air at atmospheric pressure (inlet oxygen partial pressure of 21.4 kPa), the standard air inlet flow rate in the experiments of Chi and Kim (2008) (10 SLPM) was 20 times that used in the experiments by Fuller and Okoh (0.50 SLPM).
The NBG-18 dime-sized cylindrical specimens in the experiment of Hinssen et al. (2008) are much smaller (0.25 g) (Table 1), with markedly different reactivity. Since the specific surface areas of active free sites for the specimens in these experiments are not reported, the values listed in Table 2 are obtained from the total gasification rate measurements using a multi-parameter optimisation algorithm, in conjunction with the chemical-reaction kinetics model (El-Genk and Tournier, 2012a; El-Genk and Tournier, 2012b). Table 2 compares the obtained values of Ψ, ASAo and o
mS for the nuclear graphite specimens of IG-110, IG-430, NBG-18 and NBG-25 in the gasification experiments (Fuller and Okoh, 1997; Chi and Kim, 2008; Hinssen et al., 2008; see Table 1).
Chemical kinetics parameters of nuclear graphite gasification 269
4 Chemical kinetics parameters
The chemical kinetics parameters obtained for the different grades of nuclear graphite in the aforementioned gasification experiments include: 1 The Gaussian-like distributions of the specific activation energies (Figures 2 and 3)
for adsorption of oxygen and desorption of CO gas, εa and εd, and the corresponding pre-exponential rate coefficients, o
ak and odk (Figures 7 and 9), for the reactions in
equations (1) and (3). These distributions (Figures 2 and 3) are fully described using the most probable activation energies aε and dε (Figures 4a and 4b), and the standard deviations σa and σd (Figures 5a and 5b).
2 The specific activation energy for desorption of CO2 gas, *dε (Figure 6), and
corresponding pre-exponential coefficient, *dk (Figure 8), for the reactions in
equations (4a) and (4b). 3 The specific activation energy for un-dissociated surface oxides to form stable
complexes, εb and pre-exponential coefficient, obk (equations (2a) and (2b)] in
Figures 6 and 7.
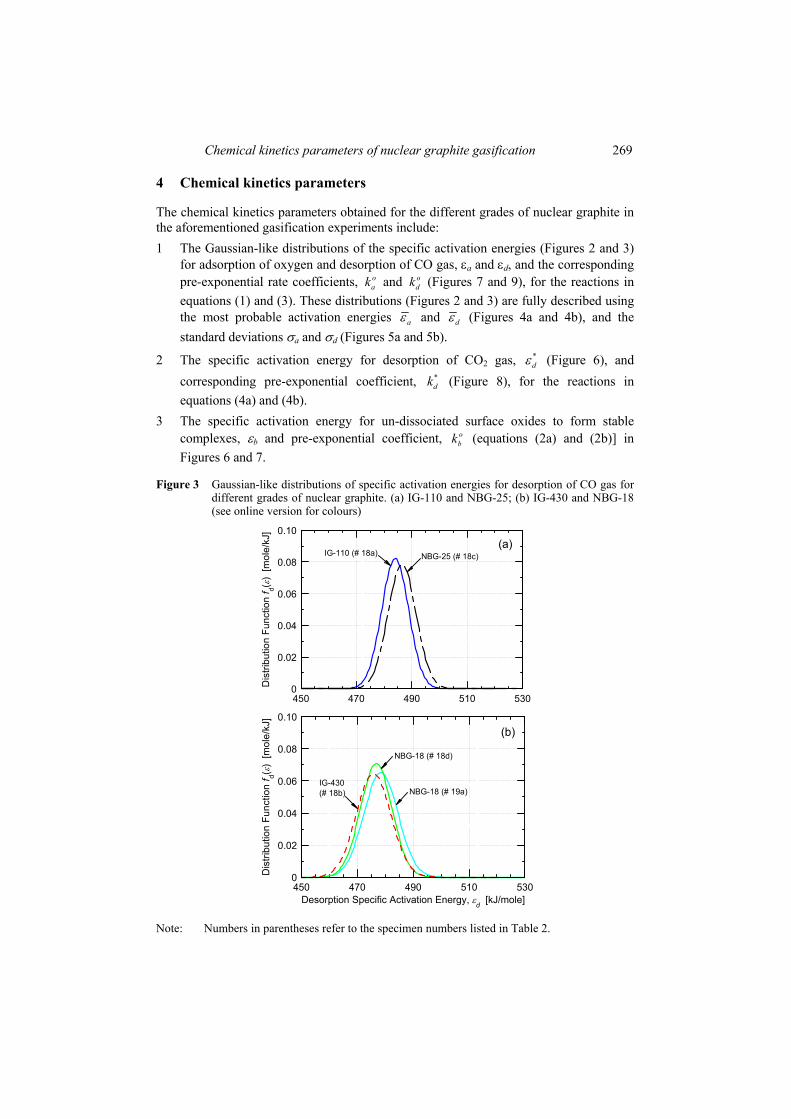
Figure 3 Gaussian-like distributions of specific activation energies for desorption of CO gas for different grades of nuclear graphite. (a) IG-110 and NBG-25; (b) IG-430 and NBG-18 (see online version for colours)
0
0.02
0.04
0.06
0.08
0.10
450 470 490 510 530
(a)NBG-25 (# 18c)IG-110 (# 18a)
Dis
tribu
tion
Func
tion f d(ε
) [m
ole/
kJ]
0
0.02
0.04
0.06
0.08
0.10
450 470 490 510 530
NBG-18 (# 19a)
NBG-18 (# 18d)
(b)
IG-430(# 18b)
Desorption Specific Activation Energy, εd [kJ/mole]
Dis
tribu
tion
Func
tion f d(ε
) [m
ole/
kJ]
Note: Numbers in parentheses refer to the specimen numbers listed in Table 2.
270 M.S. El-Genk and J-M.P. Tournier
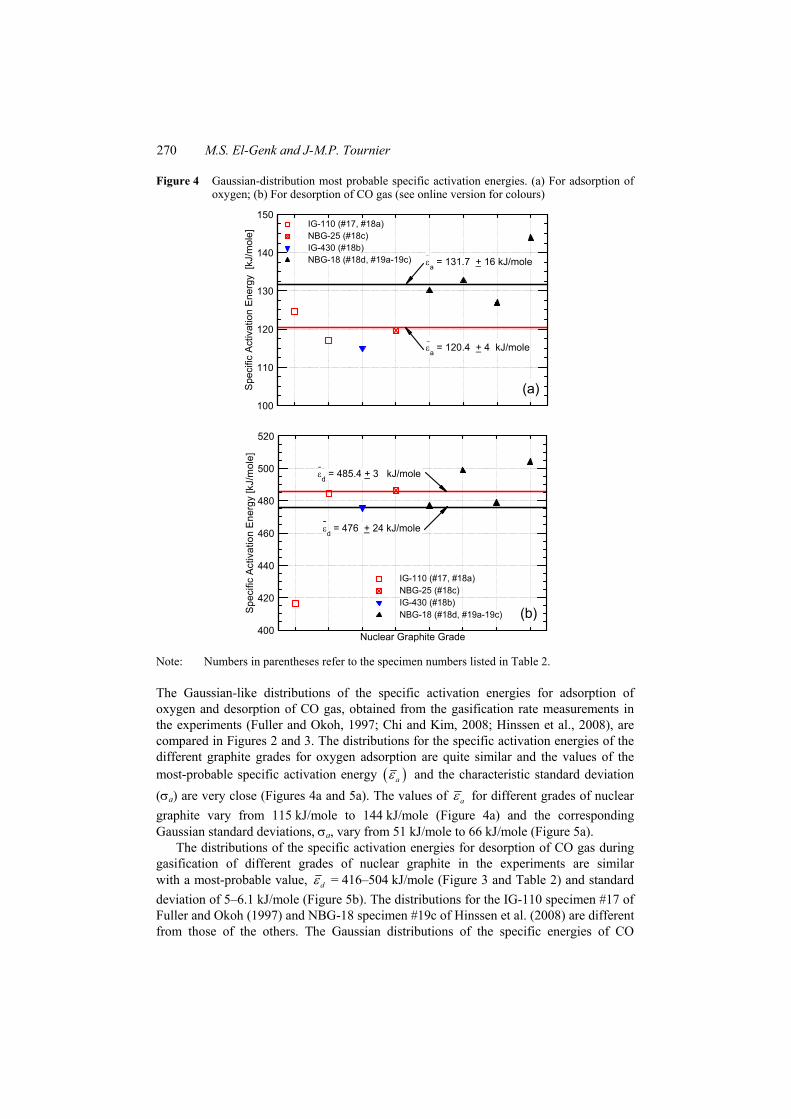
Figure 4 Gaussian-distribution most probable specific activation energies. (a) For adsorption of oxygen; (b) For desorption of CO gas (see online version for colours)
100
110
120
130
140
150IG-110 (#17, #18a)NBG-25 (#18c)IG-430 (#18b)NBG-18 (#18d, #19a-19c)
(a)
-
-
εa = 131.7 + 16 kJ/mole
εa = 120.4 + 4 kJ/mole
Spe
cific
Act
ivat
ion
Ene
rgy
[kJ/
mol
e]
400
420
440
460
480
500
520
IG-110 (#17, #18a)NBG-25 (#18c)IG-430 (#18b)NBG-18 (#18d, #19a-19c) (b)
-εd = 476 + 24 kJ/mole
-εd = 485.4 + 3 kJ/mole
Nuclear Graphite Grade
Spe
cific
Act
ivat
ion
Ene
rgy
[kJ/
mol
e]
Note: Numbers in parentheses refer to the specimen numbers listed in Table 2.
The Gaussian-like distributions of the specific activation energies for adsorption of oxygen and desorption of CO gas, obtained from the gasification rate measurements in the experiments (Fuller and Okoh, 1997; Chi and Kim, 2008; Hinssen et al., 2008), are compared in Figures 2 and 3. The distributions for the specific activation energies of the different graphite grades for oxygen adsorption are quite similar and the values of the most-probable specific activation energy ( )aε and the characteristic standard deviation (σa) are very close (Figures 4a and 5a). The values of aε for different grades of nuclear graphite vary from 115 kJ/mole to 144 kJ/mole (Figure 4a) and the corresponding Gaussian standard deviations, σa, vary from 51 kJ/mole to 66 kJ/mole (Figure 5a).
The distributions of the specific activation energies for desorption of CO gas during gasification of different grades of nuclear graphite in the experiments are similar with a most-probable value, dε = 416–504 kJ/mole (Figure 3 and Table 2) and standard deviation of 5–6.1 kJ/mole (Figure 5b). The distributions for the IG-110 specimen #17 of Fuller and Okoh (1997) and NBG-18 specimen #19c of Hinssen et al. (2008) are different from those of the others. The Gaussian distributions of the specific energies of CO
Chemical kinetics parameters of nuclear graphite gasification 271
desorption for the IG-110 specimen #18a and NBG-25 specimen #18c (Chi and Kim 2008) are nearly identical (Figure 3a). Similarly, the IG-430 specimen #18b and NBG-18 specimen #18d of Chi and Kim (2008), and the NBG-18 specimen #19a of Hinssen et al. (2008) exhibit nearly identical Gaussian distributions (Figure 3b).
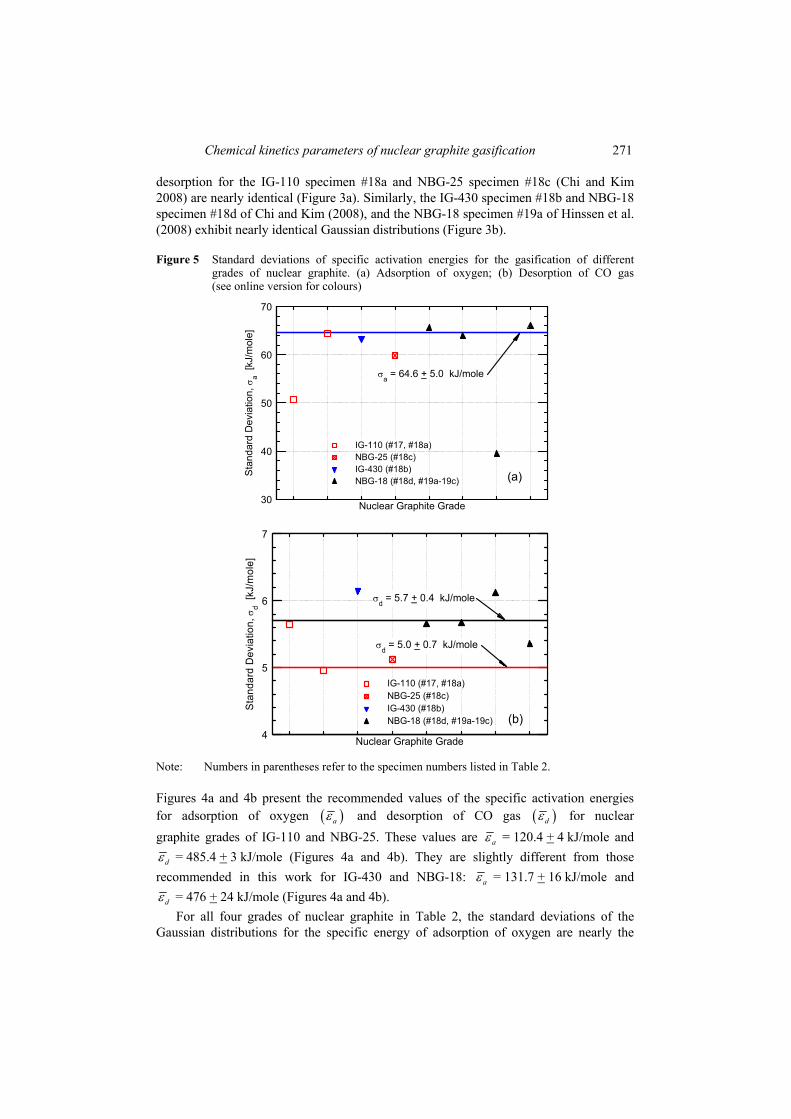
Figure 5 Standard deviations of specific activation energies for the gasification of different grades of nuclear graphite. (a) Adsorption of oxygen; (b) Desorption of CO gas (see online version for colours)
30
40
50
60
70
IG-110 (#17, #18a)NBG-25 (#18c)IG-430 (#18b)NBG-18 (#18d, #19a-19c) (a)
σa = 64.6 + 5.0 kJ/mole
Nuclear Graphite Grade
Sta
ndar
d D
evia
tion,
σa [
kJ/m
ole]
4
5
6
7
IG-110 (#17, #18a)NBG-25 (#18c)IG-430 (#18b)NBG-18 (#18d, #19a-19c)
σd = 5.7 + 0.4 kJ/mole
(b)
σd = 5.0 + 0.7 kJ/mole
Nuclear Graphite Grade
Sta
ndar
d D
evia
tion,
σd [
kJ/m
ole]
Note: Numbers in parentheses refer to the specimen numbers listed in Table 2.
Figures 4a and 4b present the recommended values of the specific activation energies for adsorption of oxygen ( )aε and desorption of CO gas ( )dε for nuclear graphite grades of IG-110 and NBG-25. These values are aε = 120.4 + 4 kJ/mole and
dε = 485.4 + 3 kJ/mole (Figures 4a and 4b). They are slightly different from those recommended in this work for IG-430 and NBG-18: aε = 131.7 + 16 kJ/mole and
dε = 476 + 24 kJ/mole (Figures 4a and 4b). For all four grades of nuclear graphite in Table 2, the standard deviations of the
Gaussian distributions for the specific energy of adsorption of oxygen are nearly the
272 M.S. El-Genk and J-M.P. Tournier
same, σa = 64.6 + 5 kJ/mole (Figure 5a). On the other hand, for nuclear graphite grades IG-110 and NBG-25, the recommended standard deviation of the Gaussian distribution of the specific activation energy for desorption of CO gas is σd = 5.0 + 0.7 kJ/mole, and σd = 5.7 + 0.4 kJ/mole for IG-430 and NBG-18 (Figure 5b).
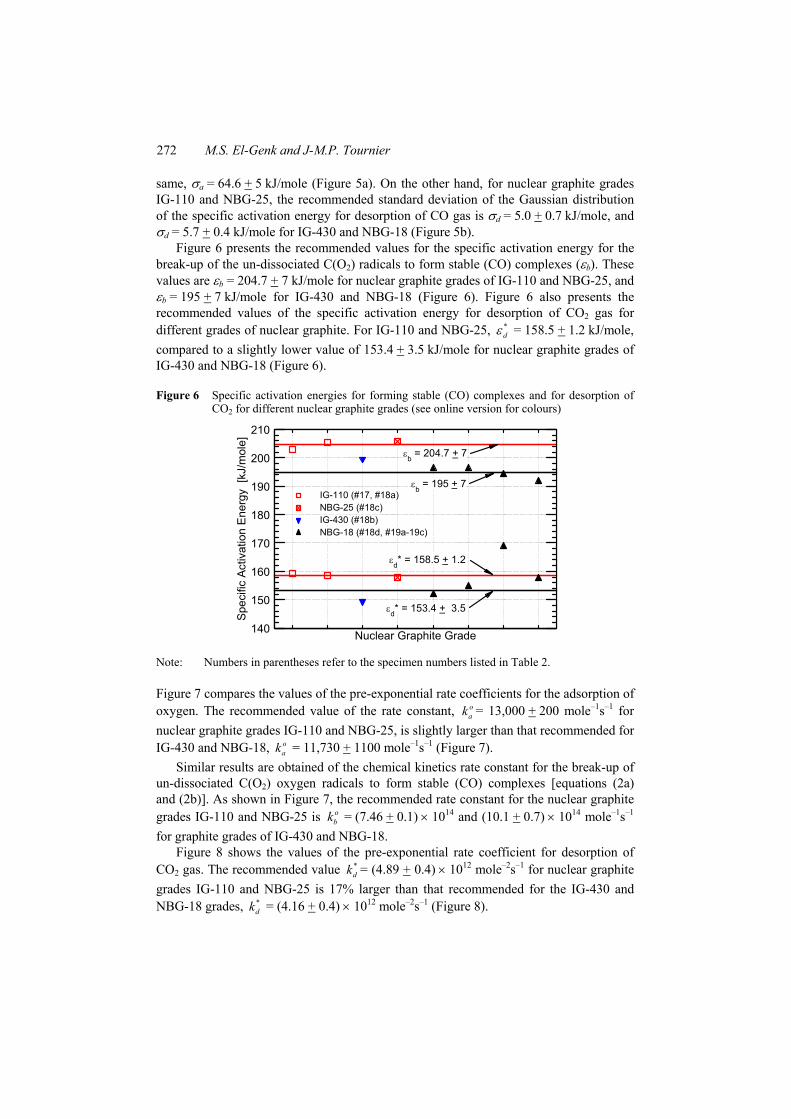
Figure 6 presents the recommended values for the specific activation energy for the break-up of the un-dissociated C(O2) radicals to form stable (CO) complexes (εb). These values are εb = 204.7 + 7 kJ/mole for nuclear graphite grades of IG-110 and NBG-25, and εb = 195 + 7 kJ/mole for IG-430 and NBG-18 (Figure 6). Figure 6 also presents the recommended values of the specific activation energy for desorption of CO2 gas for different grades of nuclear graphite. For IG-110 and NBG-25, *
dε = 158.5 + 1.2 kJ/mole, compared to a slightly lower value of 153.4 + 3.5 kJ/mole for nuclear graphite grades of IG-430 and NBG-18 (Figure 6).
Figure 6 Specific activation energies for forming stable (CO) complexes and for desorption of CO2 for different nuclear graphite grades (see online version for colours)
140
150
160
170
180
190
200
210
IG-110 (#17, #18a)NBG-25 (#18c)IG-430 (#18b)NBG-18 (#18d, #19a-19c)
εd* = 153.4 + 3.5
εd* = 158.5 + 1.2
εb = 195 + 7
εb = 204.7 + 7
Nuclear Graphite Grade
Spe
cific
Act
ivat
ion
Ene
rgy
[kJ/
mol
e]
Note: Numbers in parentheses refer to the specimen numbers listed in Table 2.
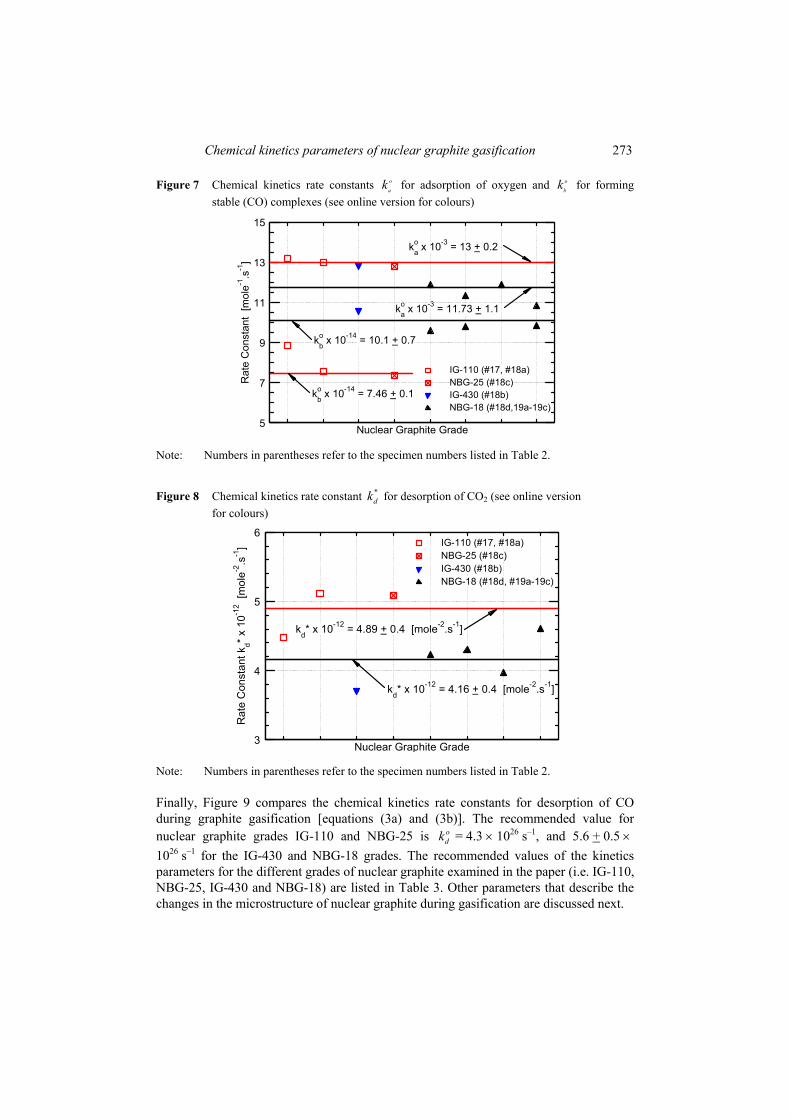
Figure 7 compares the values of the pre-exponential rate coefficients for the adsorption of oxygen. The recommended value of the rate constant, o
ak = 13,000 + 200 mole–1s–1 for nuclear graphite grades IG-110 and NBG-25, is slightly larger than that recommended for IG-430 and NBG-18, o
ak = 11,730 + 1100 mole–1s–1 (Figure 7). Similar results are obtained of the chemical kinetics rate constant for the break-up of
un-dissociated C(O2) oxygen radicals to form stable (CO) complexes [equations (2a) and (2b)]. As shown in Figure 7, the recommended rate constant for the nuclear graphite grades IG-110 and NBG-25 is o
bk = (7.46 + 0.1) × 1014 and (10.1 + 0.7) × 1014 mole–1s–1 for graphite grades of IG-430 and NBG-18.
Figure 8 shows the values of the pre-exponential rate coefficient for desorption of CO2 gas. The recommended value *
dk = (4.89 + 0.4) × 1012 mole–2s–1 for nuclear graphite grades IG-110 and NBG-25 is 17% larger than that recommended for the IG-430 and NBG-18 grades, *
dk = (4.16 + 0.4) × 1012 mole–2s–1 (Figure 8).
Chemical kinetics parameters of nuclear graphite gasification 273
Figure 7 Chemical kinetics rate constants o
ak for adsorption of oxygen and o
bk for forming stable (CO) complexes (see online version for colours)
5
7
9
11
13
15
IG-110 (#17, #18a)NBG-25 (#18c)IG-430 (#18b)NBG-18 (#18d,19a-19c)
kbo x 10-14 = 7.46 + 0.1
kbo x 10-14 = 10.1 + 0.7
kao x 10-3 = 11.73 + 1.1
kao x 10-3 = 13 + 0.2
Nuclear Graphite Grade
Rat
e C
onst
ant
[mol
e-1.s
-1]
Note: Numbers in parentheses refer to the specimen numbers listed in Table 2.
Figure 8 Chemical kinetics rate constant *dk for desorption of CO2 (see online version
for colours)
3
4
5
6IG-110 (#17, #18a)NBG-25 (#18c)IG-430 (#18b)NBG-18 (#18d, #19a-19c)
kd* x 10-12 = 4.16 + 0.4 [mole-2.s-1]
kd* x 10-12 = 4.89 + 0.4 [mole-2.s-1]
Nuclear Graphite Grade
Rat
e C
onst
ant k
d* x
10-1
2 [m
ole-2
.s-1
]
Note: Numbers in parentheses refer to the specimen numbers listed in Table 2.
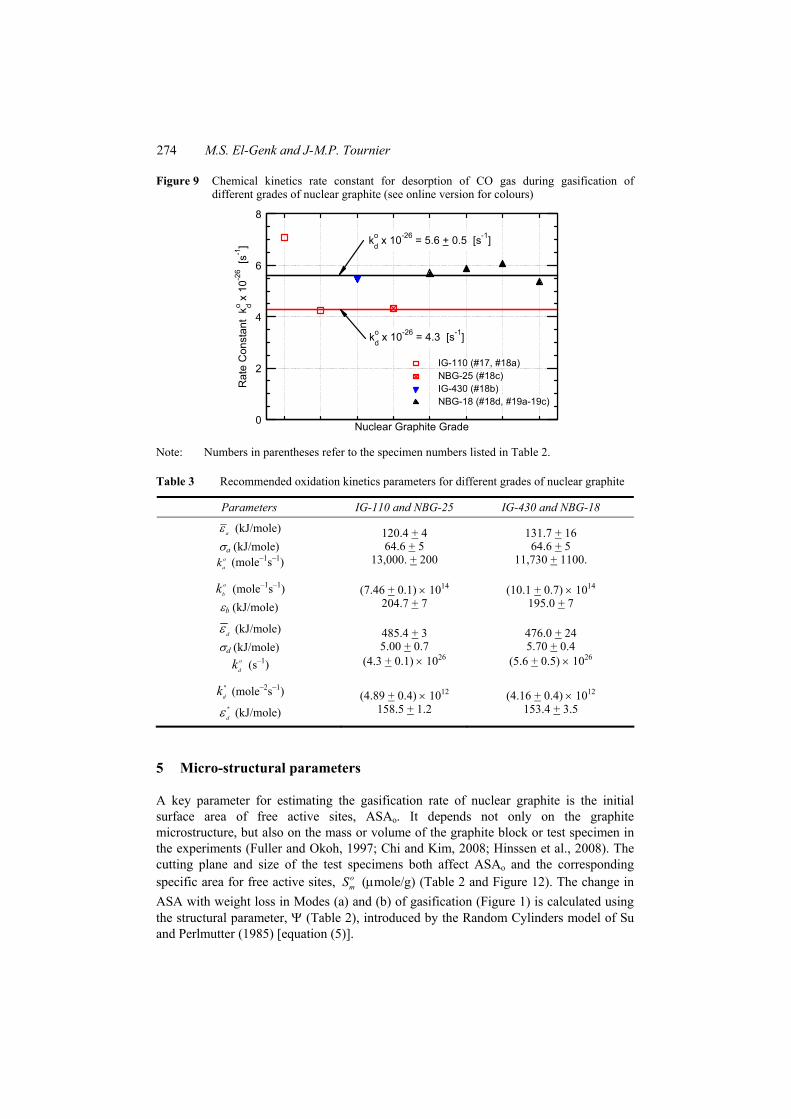
Finally, Figure 9 compares the chemical kinetics rate constants for desorption of CO during graphite gasification [equations (3a) and (3b)]. The recommended value for nuclear graphite grades IG-110 and NBG-25 is o
dk = 4.3 × 1026 s–1, and 5.6 + 0.5 × 1026 s–1 for the IG-430 and NBG-18 grades. The recommended values of the kinetics parameters for the different grades of nuclear graphite examined in the paper (i.e. IG-110, NBG-25, IG-430 and NBG-18) are listed in Table 3. Other parameters that describe the changes in the microstructure of nuclear graphite during gasification are discussed next.
274 M.S. El-Genk and J-M.P. Tournier
Figure 9 Chemical kinetics rate constant for desorption of CO gas during gasification of different grades of nuclear graphite (see online version for colours)
0
2
4
6
8
IG-110 (#17, #18a)NBG-25 (#18c)IG-430 (#18b)NBG-18 (#18d, #19a-19c)
kdo x 10-26 = 5.6 + 0.5 [s-1]
kdo x 10-26 = 4.3 [s-1]
Nuclear Graphite Grade
Rat
e C
onst
ant
k do x 1
0-26 [
s-1]
Note: Numbers in parentheses refer to the specimen numbers listed in Table 2.
Table 3 Recommended oxidation kinetics parameters for different grades of nuclear graphite
Parameters IG-110 and NBG-25 IG-430 and NBG-18
aε (kJ/mole) σa (kJ/mole)
oak (mole–1s–1)
120.4 + 4 64.6 + 5
13,000. + 200
131.7 + 16 64.6 + 5
11,730 + 1100.
o
bk (mole–1s–1) εb (kJ/mole)
(7.46 + 0.1) × 1014 204.7 + 7
(10.1 + 0.7) × 1014 195.0 + 7
dε (kJ/mole) σd (kJ/mole)
o
dk (s–1)
485.4 + 3 5.00 + 0.7
(4.3 + 0.1) × 1026
476.0 + 24 5.70 + 0.4
(5.6 + 0.5) × 1026
*
dk (mole–2s–1) *
dε (kJ/mole) (4.89 + 0.4) × 1012
158.5 + 1.2 (4.16 + 0.4) × 1012
153.4 + 3.5
5 Micro-structural parameters
A key parameter for estimating the gasification rate of nuclear graphite is the initial surface area of free active sites, ASAo. It depends not only on the graphite microstructure, but also on the mass or volume of the graphite block or test specimen in the experiments (Fuller and Okoh, 1997; Chi and Kim, 2008; Hinssen et al., 2008). The cutting plane and size of the test specimens both affect ASAo and the corresponding specific area for free active sites, o
mS (μmole/g) (Table 2 and Figure 12). The change in ASA with weight loss in Modes (a) and (b) of gasification (Figure 1) is calculated using the structural parameter, Ψ (Table 2), introduced by the Random Cylinders model of Su and Perlmutter (1985) [equation (5)].
Chemical kinetics parameters of nuclear graphite gasification 275
Transient weight loss measurements have been reported for IG-110 in the experiments of Fuller and Okoh (1997) and Chi and Kim (2008) and for IG-430, NBG-25 and NBG-18 in the experiments of Chi and Kim (2008). For these measurements, the change in ASA with weight loss is best described by Ψ = 80. In contrast, for the NBG-18 specimens in the experiments of Hinssen et al. (2008), the change in ASA with weight loss is best predicted using Ψ = 35. This lower value is attributed to the fact that the specimens in the experiments of Hinssen et al. (2008) are 2 orders of magnitude smaller than those of Chi and Kim (2008) and have a much higher surface-to-volume ratio (8.73 versus 2.16 cm–1) (Table 2). The results of the gasification experiments of Hinssen et al. (2008) showed that the specimens used exhibited large differences in reactivity; specimen #19c was the most reactive, with a gasification rate more than double that of the least reactive specimen #19b (Table 2). Hinssen et al. attributed such large differences in reactivity to local variances in both the microstructure and impurities.
The determined values of omS using a multi-parameter optimisation algorithm, from the
gasification measurements reported by Chi and Kim (2008) and Fuller and Okoh (1997), are presented in Figure 12. The results for NBG-18 specimens #19a, 19b and 19c of Hinssen et al. (2008) in Table 2 are omitted due to their extremely small size (0.25 g) and large variances in reactivity. As expected from the results obtained for the chemical kinetics parameters, the identical-size right cylinders of IG-110 and NBG-25 (specimens #18a and #18c of Chi and Kim, 2008) have nearly identical o
mS values of 1.30 and 1.273 μmole/g (Table 2 and Figure 12). Similarly, the IG-430 and NBG-18 test specimens #18b and #18d in Table 2, also of same size and shape, have close o
mS values, 0.673 and 0.60 μmole/g (Figure 12).
6 Effect of graphite mass
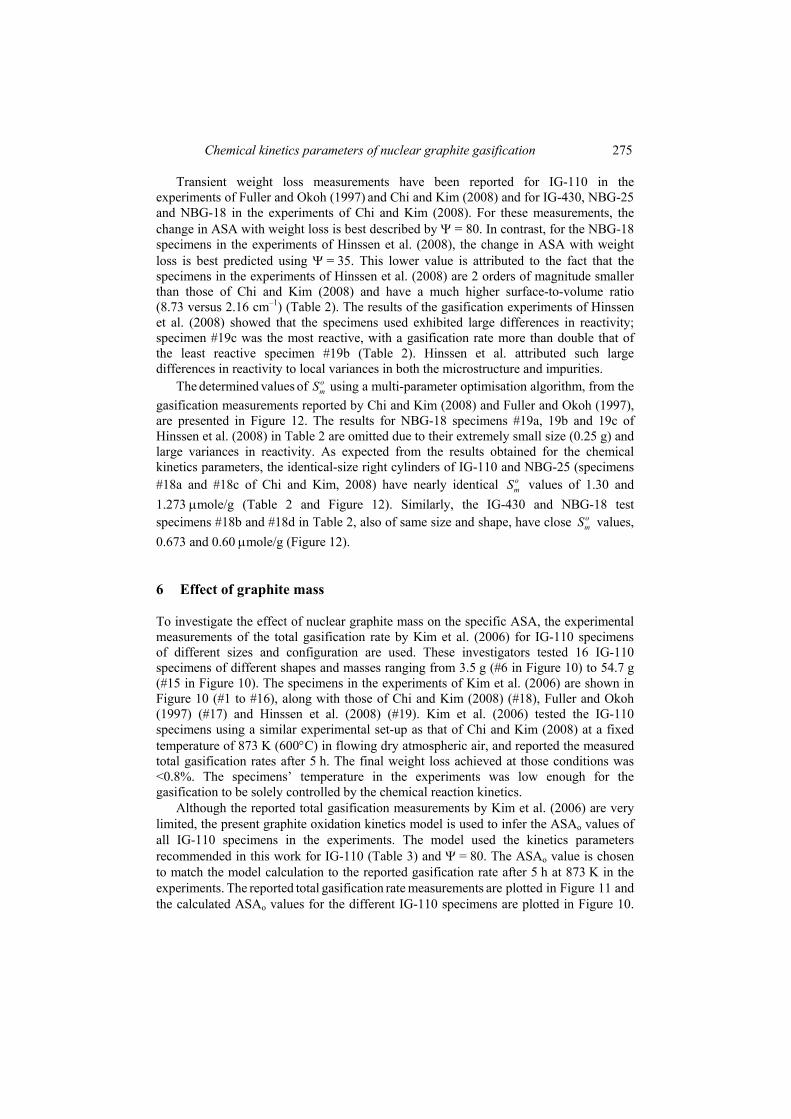
To investigate the effect of nuclear graphite mass on the specific ASA, the experimental measurements of the total gasification rate by Kim et al. (2006) for IG-110 specimens of different sizes and configuration are used. These investigators tested 16 IG-110 specimens of different shapes and masses ranging from 3.5 g (#6 in Figure 10) to 54.7 g (#15 in Figure 10). The specimens in the experiments of Kim et al. (2006) are shown in Figure 10 (#1 to #16), along with those of Chi and Kim (2008) (#18), Fuller and Okoh (1997) (#17) and Hinssen et al. (2008) (#19). Kim et al. (2006) tested the IG-110 specimens using a similar experimental set-up as that of Chi and Kim (2008) at a fixed temperature of 873 K (600°C) in flowing dry atmospheric air, and reported the measured total gasification rates after 5 h. The final weight loss achieved at those conditions was <0.8%. The specimens’ temperature in the experiments was low enough for the gasification to be solely controlled by the chemical reaction kinetics.
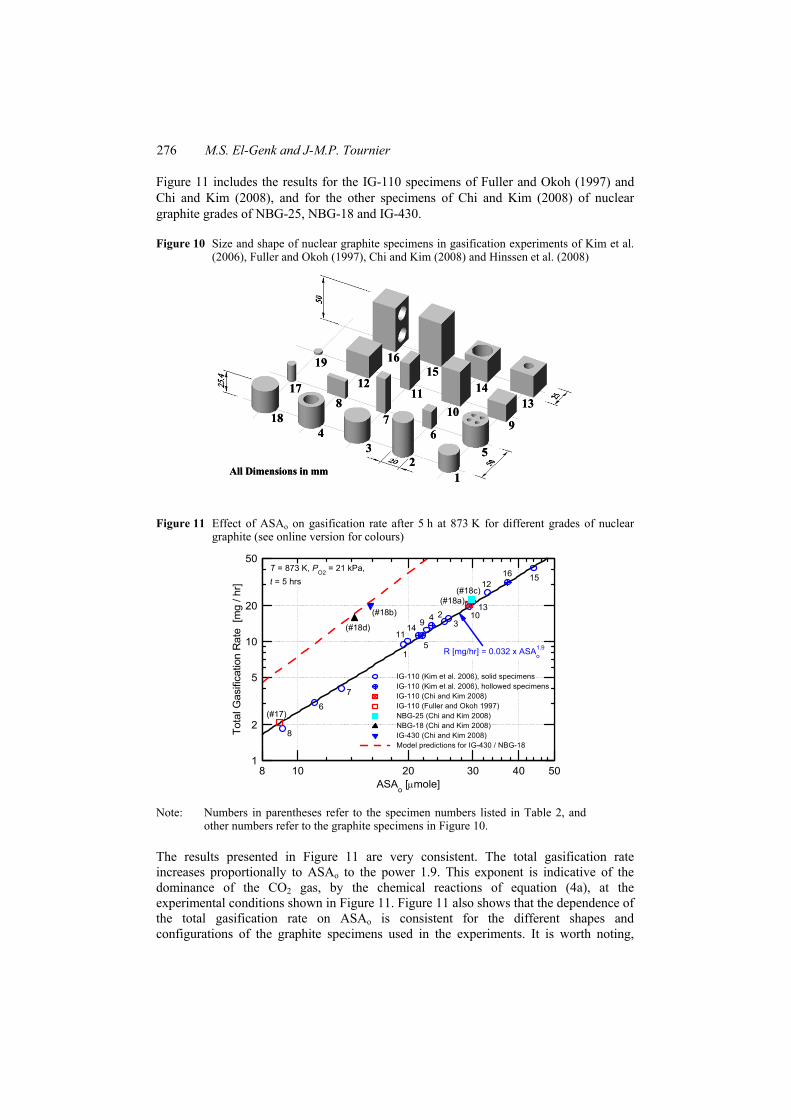
Although the reported total gasification measurements by Kim et al. (2006) are very limited, the present graphite oxidation kinetics model is used to infer the ASAo values of all IG-110 specimens in the experiments. The model used the kinetics parameters recommended in this work for IG-110 (Table 3) and Ψ = 80. The ASAo value is chosen to match the model calculation to the reported gasification rate after 5 h at 873 K in the experiments. The reported total gasification rate measurements are plotted in Figure 11 and the calculated ASAo values for the different IG-110 specimens are plotted in Figure 10.
276 M.S. El-Genk and J-M.P. Tournier
Figure 11 includes the results for the IG-110 specimens of Fuller and Okoh (1997) and Chi and Kim (2008), and for the other specimens of Chi and Kim (2008) of nuclear graphite grades of NBG-25, NBG-18 and IG-430.
Figure 10 Size and shape of nuclear graphite specimens in gasification experiments of Kim et al. (2006), Fuller and Okoh (1997), Chi and Kim (2008) and Hinssen et al. (2008)
All Dimensions in mm 12
34
56
7 910
118
12
1314
1516
17
18
19
All Dimensions in mm 12
34
56
7 910
118
12
1314
1516
17
18
19
All Dimensions in mm 12
34
56
7 910
118
12
1314
1516
17
18
19
Figure 11 Effect of ASAo on gasification rate after 5 h at 873 K for different grades of nuclear graphite (see online version for colours)
1
2
5
10
20
50
10 20 30 40 508
IG-110 (Kim et al. 2006), solid specimensIG-110 (Kim et al. 2006), hollowed specimensIG-110 (Chi and Kim 2008)IG-110 (Fuller and Okoh 1997)NBG-25 (Chi and Kim 2008)NBG-18 (Chi and Kim 2008)IG-430 (Chi and Kim 2008)Model predictions for IG-430 / NBG-18
151612
13
(#18c)
10
(#18a)
3249
5
1411
1
(#18b)
(#18d)
7
6
8
(#17)
T = 873 K, PO2 = 21 kPa, t = 5 hrs
R [mg/hr] = 0.032 x ASAo1.9
ASAo [μmole]
Tota
l Gas
ifica
tion
Rat
e [m
g / h
r]
Note: Numbers in parentheses refer to the specimen numbers listed in Table 2, and other numbers refer to the graphite specimens in Figure 10.
The results presented in Figure 11 are very consistent. The total gasification rate increases proportionally to ASAo to the power 1.9. This exponent is indicative of the dominance of the CO2 gas, by the chemical reactions of equation (4a), at the experimental conditions shown in Figure 11. Figure 11 also shows that the dependence of the total gasification rate on ASAo is consistent for the different shapes and configurations of the graphite specimens used in the experiments. It is worth noting,
Chemical kinetics parameters of nuclear graphite gasification 277
however, that the results for the NBG-25 specimen #18c in Table 2 of Chi and Kim (2008) are consistent with those of the IG-110 specimens. On the other hand, the results for the NBG-18 and IG-430 specimens of Chi and Kim (2008), #18d and #18b in Table 2, fall on a different curve, confirming again the present classification of the nuclear graphite grades in terms of their gasification reactivity into two distinct groups: (a) IG-110 and NBG-25, and (b) NBG-18 and IG-430 (Figure 11 and Table 3).
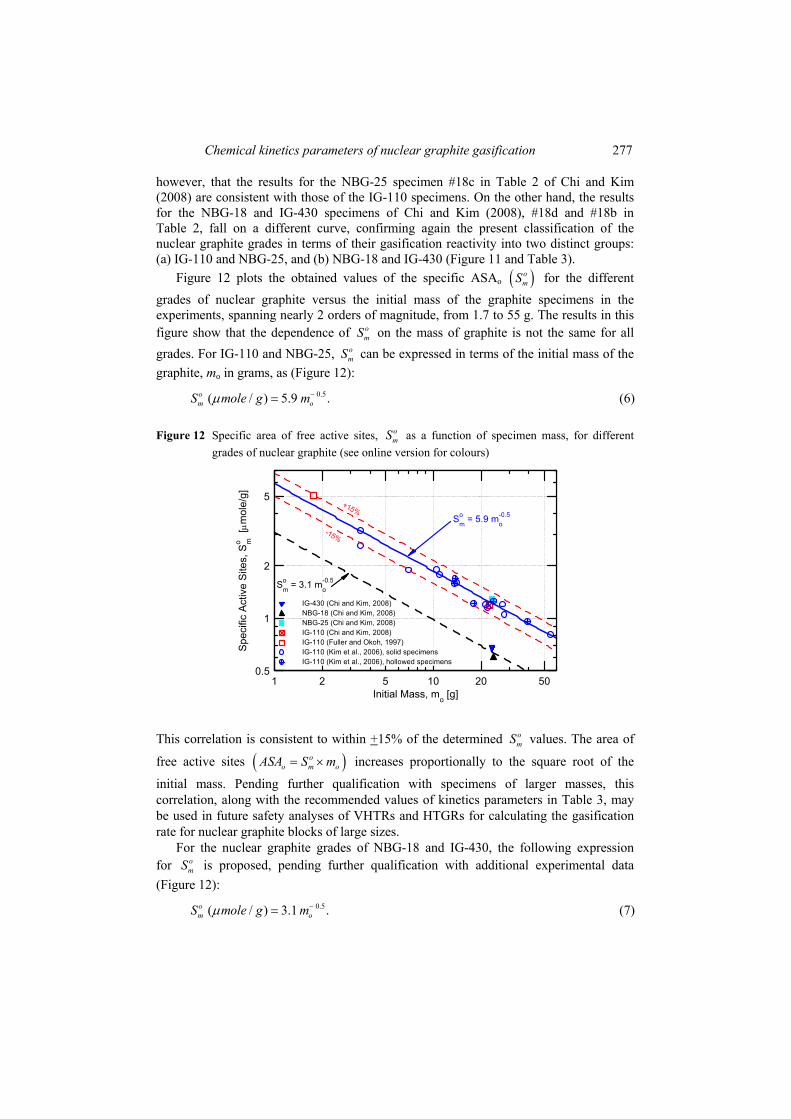
Figure 12 plots the obtained values of the specific ASAo ( )omS for the different
grades of nuclear graphite versus the initial mass of the graphite specimens in the experiments, spanning nearly 2 orders of magnitude, from 1.7 to 55 g. The results in this figure show that the dependence of o
mS on the mass of graphite is not the same for all grades. For IG-110 and NBG-25, o
mS can be expressed in terms of the initial mass of the graphite, mo in grams, as (Figure 12):
0.5( / ) 5.9 .om oS mole g mμ −= (6)
Figure 12 Specific area of free active sites, omS as a function of specimen mass, for different
grades of nuclear graphite (see online version for colours)
0.5
1
2
5
1 2 5 10 20 50
IG-430 (Chi and Kim, 2008)NBG-18 (Chi and Kim, 2008)NBG-25 (Chi and Kim, 2008)IG-110 (Chi and Kim, 2008)IG-110 (Fuller and Okoh, 1997)IG-110 (Kim et al., 2006), solid specimensIG-110 (Kim et al., 2006), hollowed specimens
Smo = 3.1 mo
-0.5
-15%
+15%Sm
o = 5.9 mo-0.5
Initial Mass, mo [g]
Spe
cific
Act
ive
Site
s, S
mo [μm
ole/
g]
This correlation is consistent to within +15% of the determined omS values. The area of
free active sites ( )oo m oASA S m= × increases proportionally to the square root of the
initial mass. Pending further qualification with specimens of larger masses, this correlation, along with the recommended values of kinetics parameters in Table 3, may be used in future safety analyses of VHTRs and HTGRs for calculating the gasification rate for nuclear graphite blocks of large sizes.
For the nuclear graphite grades of NBG-18 and IG-430, the following expression for o
mS is proposed, pending further qualification with additional experimental data (Figure 12):
0.5( / ) 3.1 .om oS mole g mμ −= (7)
278 M.S. El-Genk and J-M.P. Tournier
The recommended chemical kinetics parameters in Table 3, along with equations (6) and (7) are used in the analysis presented next to examine the effect of the graphite mass on the total gasification rate for IG-110 and NBG-18, as representatives of the two groups in Table 3, as function of temperatures covering all three modes of gasification in Figure 1.
7 Effect of graphite mass on total gasification rate
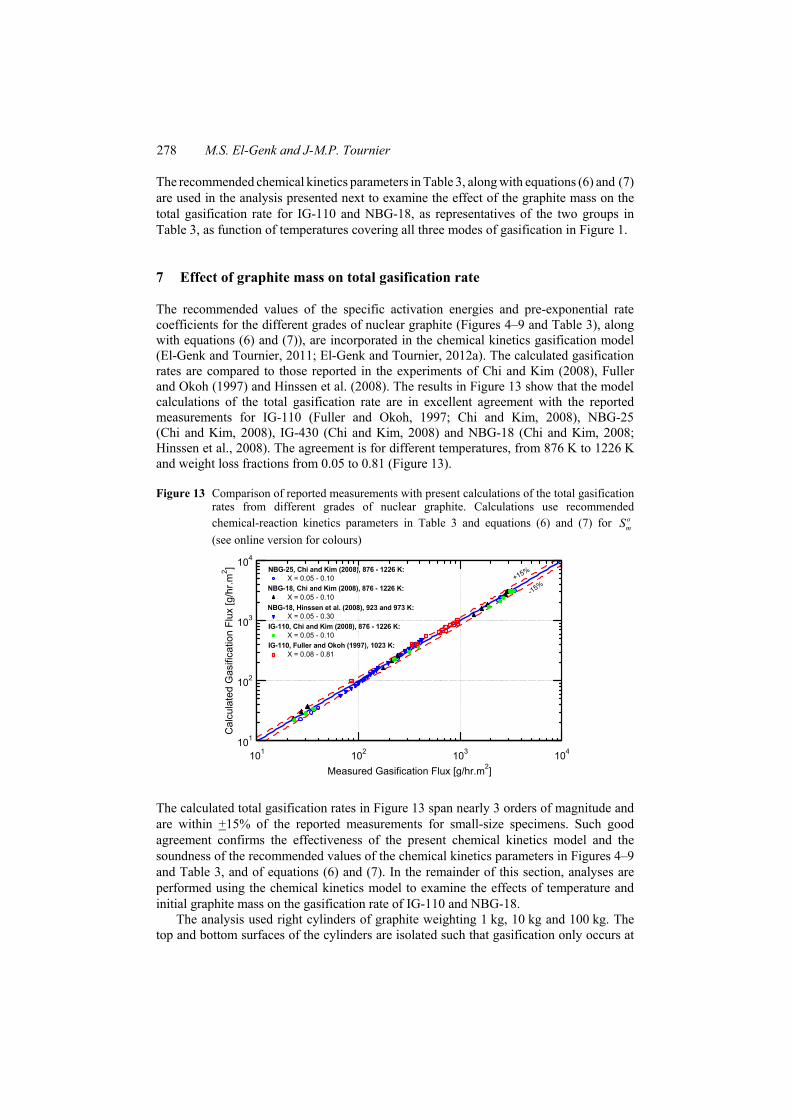
The recommended values of the specific activation energies and pre-exponential rate coefficients for the different grades of nuclear graphite (Figures 4–9 and Table 3), along with equations (6) and (7)), are incorporated in the chemical kinetics gasification model (El-Genk and Tournier, 2011; El-Genk and Tournier, 2012a). The calculated gasification rates are compared to those reported in the experiments of Chi and Kim (2008), Fuller and Okoh (1997) and Hinssen et al. (2008). The results in Figure 13 show that the model calculations of the total gasification rate are in excellent agreement with the reported measurements for IG-110 (Fuller and Okoh, 1997; Chi and Kim, 2008), NBG-25 (Chi and Kim, 2008), IG-430 (Chi and Kim, 2008) and NBG-18 (Chi and Kim, 2008; Hinssen et al., 2008). The agreement is for different temperatures, from 876 K to 1226 K and weight loss fractions from 0.05 to 0.81 (Figure 13).
Figure 13 Comparison of reported measurements with present calculations of the total gasification rates from different grades of nuclear graphite. Calculations use recommended chemical-reaction kinetics parameters in Table 3 and equations (6) and (7) for o
mS (see online version for colours)
101
102
103
104
101 102 103 104
X = 0.05 - 0.10 X = 0.05 - 0.10 X = 0.05 - 0.30
X = 0.05 - 0.10 X = 0.08 - 0.81
IG-110, Fuller and Okoh (1997), 1023 K:
IG-110, Chi and Kim (2008), 876 - 1226 K:
NBG-18, Hinssen et al. (2008), 923 and 973 K:
NBG-18, Chi and Kim (2008), 876 - 1226 K:
NBG-25, Chi and Kim (2008), 876 - 1226 K:
-15%+15%
Measured Gasification Flux [g/hr.m2]
Cal
cula
ted
Gas
ifica
tion
Flux
[g/h
r.m2 ]
The calculated total gasification rates in Figure 13 span nearly 3 orders of magnitude and are within +15% of the reported measurements for small-size specimens. Such good agreement confirms the effectiveness of the present chemical kinetics model and the soundness of the recommended values of the chemical kinetics parameters in Figures 4–9 and Table 3, and of equations (6) and (7). In the remainder of this section, analyses are performed using the chemical kinetics model to examine the effects of temperature and initial graphite mass on the gasification rate of IG-110 and NBG-18.
The analysis used right cylinders of graphite weighting 1 kg, 10 kg and 100 kg. The top and bottom surfaces of the cylinders are isolated such that gasification only occurs at
Chemical kinetics parameters of nuclear graphite gasification 279
the lateral surface exposed to atmospheric ambient airflow at a velocity of 1 cm/s. At 800 K, the corresponding Reynolds numbers, based on the diameter of these graphite cylinders, are 10.6, 22.8 and 49.2, and the values of the Sherwood number (El-Genk and Tournier, 2012a) are 1.72, 2.35 and 3.31, respectively. The performed parametric analyses for IG-110 and NBG-18 use the recommended values of the kinetics parameters in Table 3, and the specific areas of active sites, o
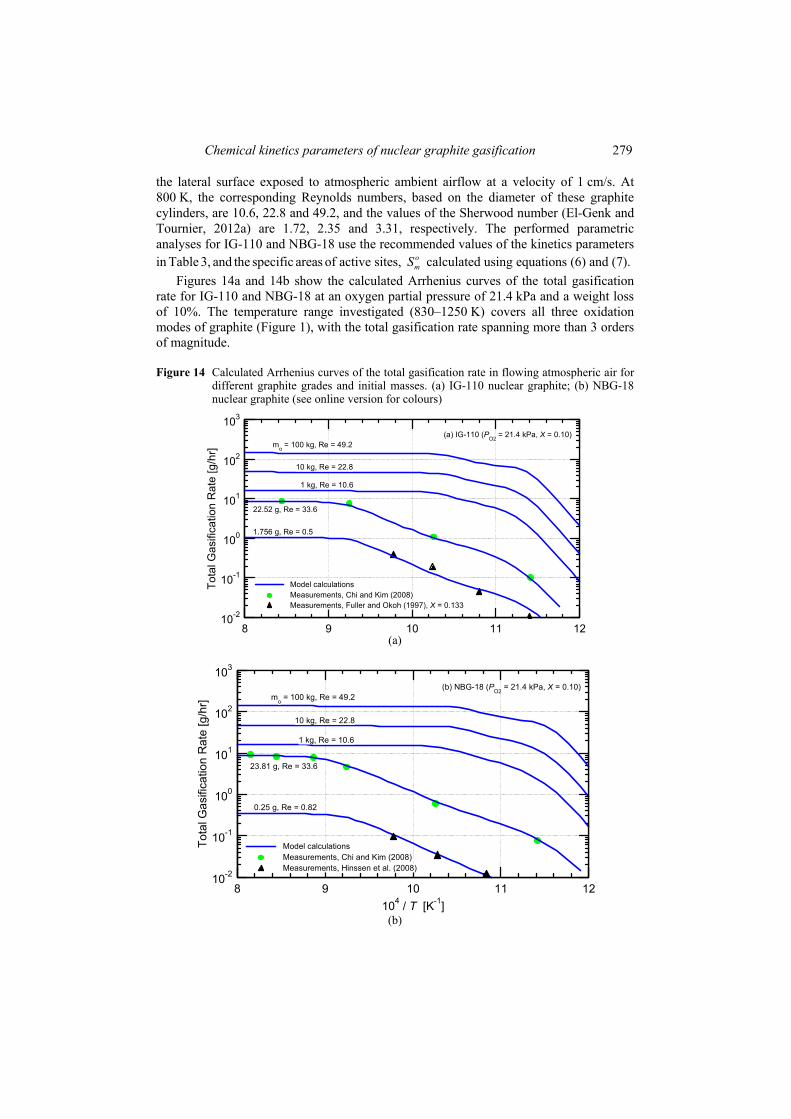
mS calculated using equations (6) and (7). Figures 14a and 14b show the calculated Arrhenius curves of the total gasification
rate for IG-110 and NBG-18 at an oxygen partial pressure of 21.4 kPa and a weight loss of 10%. The temperature range investigated (830–1250 K) covers all three oxidation modes of graphite (Figure 1), with the total gasification rate spanning more than 3 orders of magnitude.
Figure 14 Calculated Arrhenius curves of the total gasification rate in flowing atmospheric air for different graphite grades and initial masses. (a) IG-110 nuclear graphite; (b) NBG-18 nuclear graphite (see online version for colours)
10-2
10-1
100
101
102
103
8 9 10 11 12
Model calculationsMeasurements, Chi and Kim (2008)Measurements, Fuller and Okoh (1997), X = 0.133
1.756 g, Re = 0.5
22.52 g, Re = 33.6
mo = 100 kg, Re = 49.2
1 kg, Re = 10.6
10 kg, Re = 22.8
(a) IG-110 (PO2 = 21.4 kPa, X = 0.10)
Tota
l Gas
ifica
tion
Rat
e [g
/hr]
(a)
10-2
10-1
100
101
102
103
8 9 10 11 12
Model calculationsMeasurements, Chi and Kim (2008)Measurements, Hinssen et al. (2008)
0.25 g, Re = 0.82
23.81 g, Re = 33.6
1 kg, Re = 10.6
10 kg, Re = 22.8
mo = 100 kg, Re = 49.2(b) NBG-18 (PO2 = 21.4 kPa, X = 0.10)
104 / T [K-1]
Tota
l Gas
ifica
tion
Rat
e [g
/hr]
(b)
280 M.S. El-Genk and J-M.P. Tournier
At high temperatures >950 K, when graphite gasification is diffusion-limited (Mode (c) in Figure 1), the total gasification rate is weakly dependent on temperature. It is proportional to the product of the oxygen diffusion velocity through the boundary layer and the lateral surface area of the nuclear graphite cylinder (Figure 14). As a result, in the diffusion-limited mode of gasification, the rate increases proportionally to the diameter of the right graphite cylinder raised to the power ~1.40. The 1 kg, 10 kg and 100 kg IG-110 right cylinders have diameters of 9 cm, 19.38 cm and 41.75 cm, respectively. The corresponding NBG-18 cylinders of the same initial masses have slightly smaller diameters of 8.83 cm, 19 cm and 41 cm, due to the higher density of NBG-18 (1.85 versus 1.75 g/cm3
for IG-110). At lower temperatures <950 K, the total gasification rate in Modes (a) and (b) is chemical-kinetics limited, and increases exponentially with temperature (Figures 14a and 14b).
The total gasification rate of the nuclear graphite cylinders is the sum of the production rates of CO and CO2 gases. At low temperatures ≤900 K, when graphite gasification is controlled by the chemical kinetics and in-pores diffusion, the gasification is dominated by the production of CO2. At these temperatures, the production rate of CO gas is negligibly small because of its higher desorption specific energy. The production rate of CO gas, however, increases rapidly with increasing temperature, at the expense of decreasing that of CO2 gas. Thus, at intermediate temperatures (Mode (b) in Figure 1) and high temperatures in the diffusion-limited Mode (c), gasification of graphite is almost entirely by CO gas desorption.
This trend reflects the dependence of the CO2 desorption reaction in equation (4a) on the availability of both surface free sites and stable (CO) complexes in close proximity to act as catalysts for the formation and desorption of CO2 (Moulijn and Kapteijn, 1995). The CO2 production rate peaks at ~900 K, when the ASA fractional coverage with surface complexes reaches ~50% (Figures 14a and 14b). These figures also compare the calculated total gasification rates with reported measurements for the small size specimens of IG-110 and NBG-18 in the experiments (Fuller and Okoh, 1997; Chi and Kim, 2008; Hinssen et al., 2008).
The calculated gasification rates for the smaller IG-110 specimens of Chi and Kim (2008) (#18a in Table 2, weighting 22.52 g) and Fuller and Okoh (1997) (#17 in Table 2, weighting only 1.756 g) using the kinetics parameters in Table 3 are also shown in Figure 14a for comparison, along with the reported experimental data. As shown in this Figure, the model calculations compare well with the measurements.
For the IG-110 specimen of Chi and Kim (2008), the diffusion-limited Mode (c) of gasification begins at much higher temperature (>1073 K) than for the larger mass right cylinders, and the corresponding rate is relatively high for such a smaller specimen. This is because of the larger air velocity used (10 cm/s) in the experiments of Chi and Kim (2008), corresponding to Re = 33.6 (Figures 14a and 14b).
Similar results are obtained in Figure 14b for the small NBG-18 specimens in the experiments of Chi and Kim (2008) (#18d in Table 2, weighting 23.81 g) and Hinssen et al. (2008) (#19 in Table 2, weighting only 0.25 g). Again, the comparison shows good agreement between the model calculations and reported measurements of the total gasification rate for NBG-18.
8 Summary and conclusions
Recommendations of the chemical kinetics parameters for the gasification of nuclear graphite grades IG-110, IG-430, NBG-18 and NBG-25 are developed based on the
Chemical kinetics parameters of nuclear graphite gasification 281
reported gasification rate and transient weight loss measurements by various investigators. These parameters, along with the reported total gasification rate measurements of Kim et al. (2006) for IG-110, are used to develop empirical correlations of the area of free active sites as functions of the initial mass and grade of nuclear graphite.
The kinetics parameters for the four elementary chemical reactions in the graphite oxidation model include the values and Gaussian distributions of the specific activation energies and the values of the pre-exponential rate coefficients for the adsorption of oxygen and desorption of CO and CO2 gases. Results show that the chemical kinetics parameters and the surface area of free active sites for IG-110 and NBG-25 with petroleum coke filler particles are similar, but slightly different from those of NBG-18 and IG-430 with coal tar pitch coke filler particles. The origin of the filler particles appears to affect the activity of nuclear graphite, regardless of the size of the particles, which could be attributed to the differences in the surface area of free active sites. This has been shown to be true in the present work (see Figure 12).
The developed empirical expressions of the initial specific area of free active sites, omS
as a function of mass of the different grades of nuclear graphite may be used and applied, in conjunction with the recommended chemical kinetics parameters, to the gasification of large graphite structures in VHTRs and HTGRs. For nuclear graphite specimens of varied shapes, results show that o
mS (μmole/g) decreases inversely proportionally to the square root of the initial graphite mass. Conversely, the initial surface area of free active sites, ASAo (μmole) increases proportionally to the square root of the initial mass.
Estimates of the gasification rates for IG-110 and NBG-18, using the recommended chemical-reaction kinetics parameters and the developed empirical correlations to calculate o
mS , are given as functions of graphite mass and temperature. Estimates for right cylinders weighing 1, 10 and 100 kg show that increasing the initial mass rapidly increases the total gasification rate. This rate also increases with increasing temperatures. For the small test specimens of IG-110 and NBG-18 (0.25–23.81 g) in experiments, the calculations are in good agreement to within +15% of the total gasification rate measurements. The reported measurements cover a wide range of temperatures spanning all three modes of graphite gasification (Figure 1). The calculated Arrhenius curves of the total gasification rate smoothly progress from one mode to the next with increasing temperature.
The results presented in this paper are the first to compare the gasification kinetics of different grades of nuclear graphite, and to make recommendations of the specific activation energies and pre-exponential rate coefficients of the primary chemical processes of gasification. In addition, the results on the effects of the initial mass of graphite on the specific area of active free sites and the total gasification rate as a function of temperature are a welcome new contribution, with practical implication to future design and analysis of VHTRs and HTGRs. The recommended chemical kinetics parameters and the developed empirical correlations for o
mS would be useful in the safety analysis of these reactors in the unlikely event of a massive air ingress accident.
The chemical kinetics approach, based on a solid understanding of the primary processes taking place, provides valuable insight into the gasification of different grades of nuclear graphite. Unlike the empirically developed Arrhenius correlations for predicting the total gasification rate, the chemical kinetics approach provides smooth and gradual transitions in the total rate of gasification through the prevailing modes with
282 M.S. El-Genk and J-M.P. Tournier
increasing temperature. The chemical kinetics approach can also predict the effect of various important variables on the total gasification rate and transient weight loss. These variables include the oxygen partial pressure, the total pressure and flow velocity of the oxidising gas mixture and the initial mass of the graphite structure. Furthermore, the chemical kinetics approach tracks the changes in ASA and oxides fractional coverage with time and weight loss, and calculates the production rates of CO and CO2 gases and their relative contributions to the total gasification rate for different grades of nuclear graphite.
Acknowledgements
This research is partially funded by a DOE NEUP contract No. 00044825 00002, Project No. 09-830, to the University of New Mexico (UNM) and UNM’s Institute for Space and Nuclear Power Studies.
References Chi, A-H. and Kim, G-C. (2008) ‘Comparison of the oxidation rate and degree of graphitization
of selected IG and NBG nuclear graphite grades’, Journal of Nuclear Materials, Vol. 381, pp.9–14.
Contescu, C.I., Guldan, T., Wang, P. and Burchell, T.D. (2012) ‘The effect of microstructure on air oxidation resistance of nuclear graphite’, Carbon, Vol. 50, pp.3354–3366.
El-Genk, M.S. and Tournier, J-M. (2011) ‘Development and validation of a graphite oxidation model’, Journal of Nuclear Materials, Vol. 411, pp.193–207.
El-Genk, M.S. and Tournier, J-M. (2012a) ‘Comparison of oxidation model predictions with gasification data of IG-110, IG-430 and NBG-25 nuclear graphite’, Journal of Nuclear Materials, Vol. 420, pp.141–158.
El-Genk, M.S. and Tournier, J-M. (2012b) ‘Validation of gasification model for NBG-18 nuclear graphite’, Journal of Nuclear Engineering and Design, Vol. 250, pp.142–155.
Fuller, E.L. and Okoh, J.M. (1997) ‘Kinetics and mechanisms of the reaction of air with nuclear grade graphite IG-110’, Journal of Nuclear Materials, Vol. 240, pp.241–250.
Growcock, F.B., Barry, J.J., Eto, M., Heiser, J.H. the Third and Sastre, C.A. (1980) ‘Oxidation-induced strength loss in HTGR graphites’, Advanced Reactor Safety Research Division, Quarterly Progress Report, 1 January–31 March 1980, Brookhaven National Laboratory Upton NY, USA, pp.4–24.
Hinssen, H-K., Kühn, K., Moorman, R., Schlögl, B., Fechter, M. and Mitchell, M. (2008) ‘Oxidation experiments and theoretical examinations on graphite materials relevant for the PBMR’, Nuclear Engineering and Design, Vol. 238, No. 11, pp.3018–3025.
INL (2007) Next Generation Nuclear Plant Pre-Conceptual Design Report, Idaho National Laboratory, Idaho Falls, ID, Report No. INL/EXT-07-12967.
Kane, J., Karthik, C., Butt, D.P., Windes, W.E. and Ubic, R. (2011) ‘Microstructural characterization and pore structure analysis of nuclear graphite’, Journal of Nuclear Materials, Vol. 415, pp.189–197.
Kim, E.S., Lee, K.W. and No, H.C. (2006) ‘Analysis of geometrical effects on graphite oxidation through measurement of internal surface area’, Journal of Nuclear Materials, Vol. 348, pp.174–180.
Kim, E.S. and No, H.C. (2006) ‘Experimental study on the oxidation of nuclear graphite and development of an oxidation model’, Journal of Nuclear Materials, Vol. 349, pp.182–194.
Chemical kinetics parameters of nuclear graphite gasification 283
Kim, E.S., No, H.C., Kim, B.J. and Oh, C.H. (2008) ‘Estimation of graphite density and mechanical strength variation of VHTR during air-ingress accident’, Nuclear Engineering and Design, Vol. 238, No. 4, pp.837–847.
Moulijn, J.A. and Kapteijn, F. (1995) ‘Towards a unified theory of reactions of carbon with oxygen-containing molecules’, Carbon, Vol. 33, No. 3, pp.1155–1165.
Su, J-L. and Perlmutter, D.D. (1985) ‘Effect of pore structure on char oxidation kinetics’, AIChE Journal, Vol. 31, No. 6, pp.973–981.
Xiaowei, L., Jean-Charles, R. and Suyuan, Y. (2004) ‘Effect of temperature on graphite oxidation behavior’, Nuclear Engineering and Design, Vol. 227, pp.273–280.
Xiaowei, L., Jean-Charles, R. and Suyuan, Y. (2005) ‘Comparison of oxidation behaviors of different grades of nuclear graphite’, Nuclear Sciences and Engineering, Vol. 151, pp.121–127.
284 M.S. El-Genk and J-M.P. Tournier
Appendix A
Nomenclature ASA Active surface area (mole)
, ifC ε Active free sites with activation energies in bin i
2( )i
C O ε Un-dissociated oxygen complexes in energy bin i
( ) iCO ε Surface stable oxide complexes in energy bin i
D Diameter of nuclear graphite test cylinder (m)
f(ε) Normal probability function (mole/J)
H Height of nuclear graphite test cylinder (m)
ko, k* Pre-exponential rate constants (mole–ns–1)
m Mass of nuclear graphite specimen (g)
PO2 Partial pressure of oxygen (Pa)
Re Air inlet Reynolds number at graphite surface temperature
Rg Perfect gas constant (8.3144 J/mole K)
Sm Specific active surface area (mole/g)
T Temperature (K)
X Weight loss fraction
Y Normalised active surface area (ASA/ASAo).
Greek
ε Specific activation energy (J/mole)
ε Gaussian most-probable specific activation energy (J/mole)
σ Gaussian standard deviation (J/mole)
Ψ Dimensionless structural parameter, equation (5)
Subscript/Superscript
a Adsorption of oxygen onto active free sites to form un-dissociated complexes
b Break-up of un-dissociated surface oxides to form stable complexes
CO Carbon monoxide gas
CO2 Carbon dioxide gas
d Desorption of CO gas
i, j Energy bin numbers
o Initial value
O2 Oxygen gas
* Desorption of CO2 gas.